Notebookcheck Logo

EA Sports 世界拉力锦标赛回顾:笔记本电脑和台式机基准测试

技术一般。 以《F1》、《Dirt》和《Grit》系列而闻名的英国公司 Codemasters 与 EA 联合推出了一款全新的赛车游戏。我们对 WRC 的硬件规格进行了更详细的评测。
Gaming Laptop / Notebook Desktop Gamecheck
EA Sports WRC

测试系统

XMG Neo 17 E23(RTX 4090)
Razer Blade 16 Mid 23(RTX 4080)
XMG Pro 15 E23(RTX 4070)
Razer Blade 14 Mid 23(RTX 4060)
Medion Erazer Scout E20(RTX 4050)
华硕 ROG Strix Scar 17(RTX 3080 Ti)
华硕 TUF Gaming Advantage A16(RX 7600S 和 780M)
安静静音底座 802(RTX 4080 和 RX 7900 XT)
飞利浦 Evnia 8000 系列 41.5 英寸 UHD OLED 游戏显示器

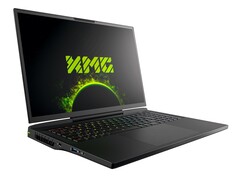
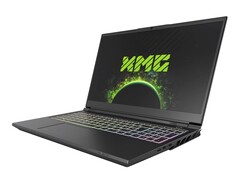
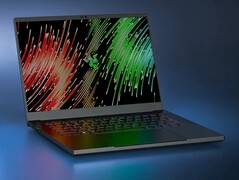
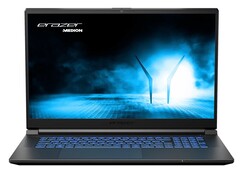
我们在这些设备上运行了游戏基准测试。点击图片可进入公司网站。有关要求的更多信息,请参阅文章末尾。

技术

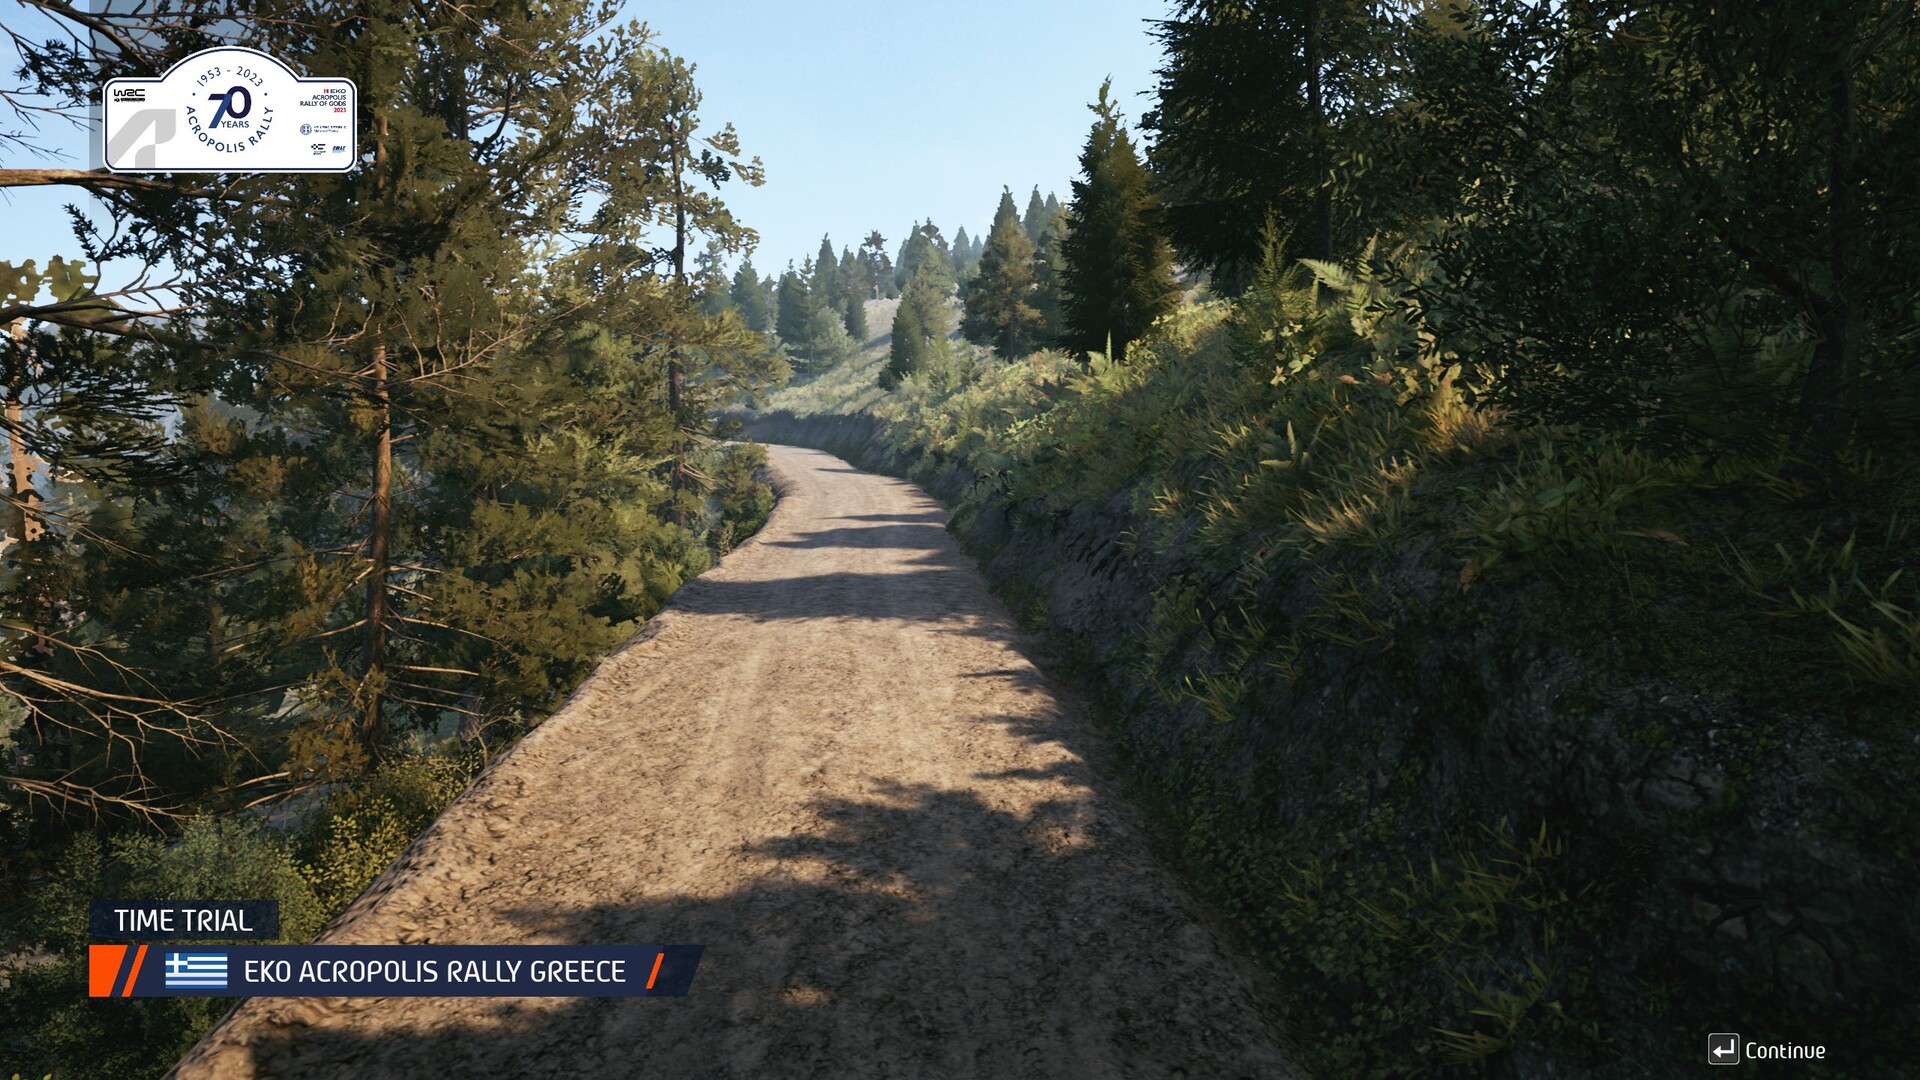
EA Sports WRC》基于虚幻引擎 4,该引擎一直以来都能提供不错甚至非常出色的图形效果。然而,在《世界汽车拉力锦标赛》中,开发人员并没有充分发挥其潜力。虽然邻近的事物非常清晰明了,但远处的物体即使在最高设置下也会显得有些浑浊,甚至无法 "弹出 "屏幕,令人遗憾的是,这种情况经常发生。

EA Sports WRC
EA Sports WRC
EA Sports WRC
EA Sports WRC
EA Sports WRC
EA Sports WRC

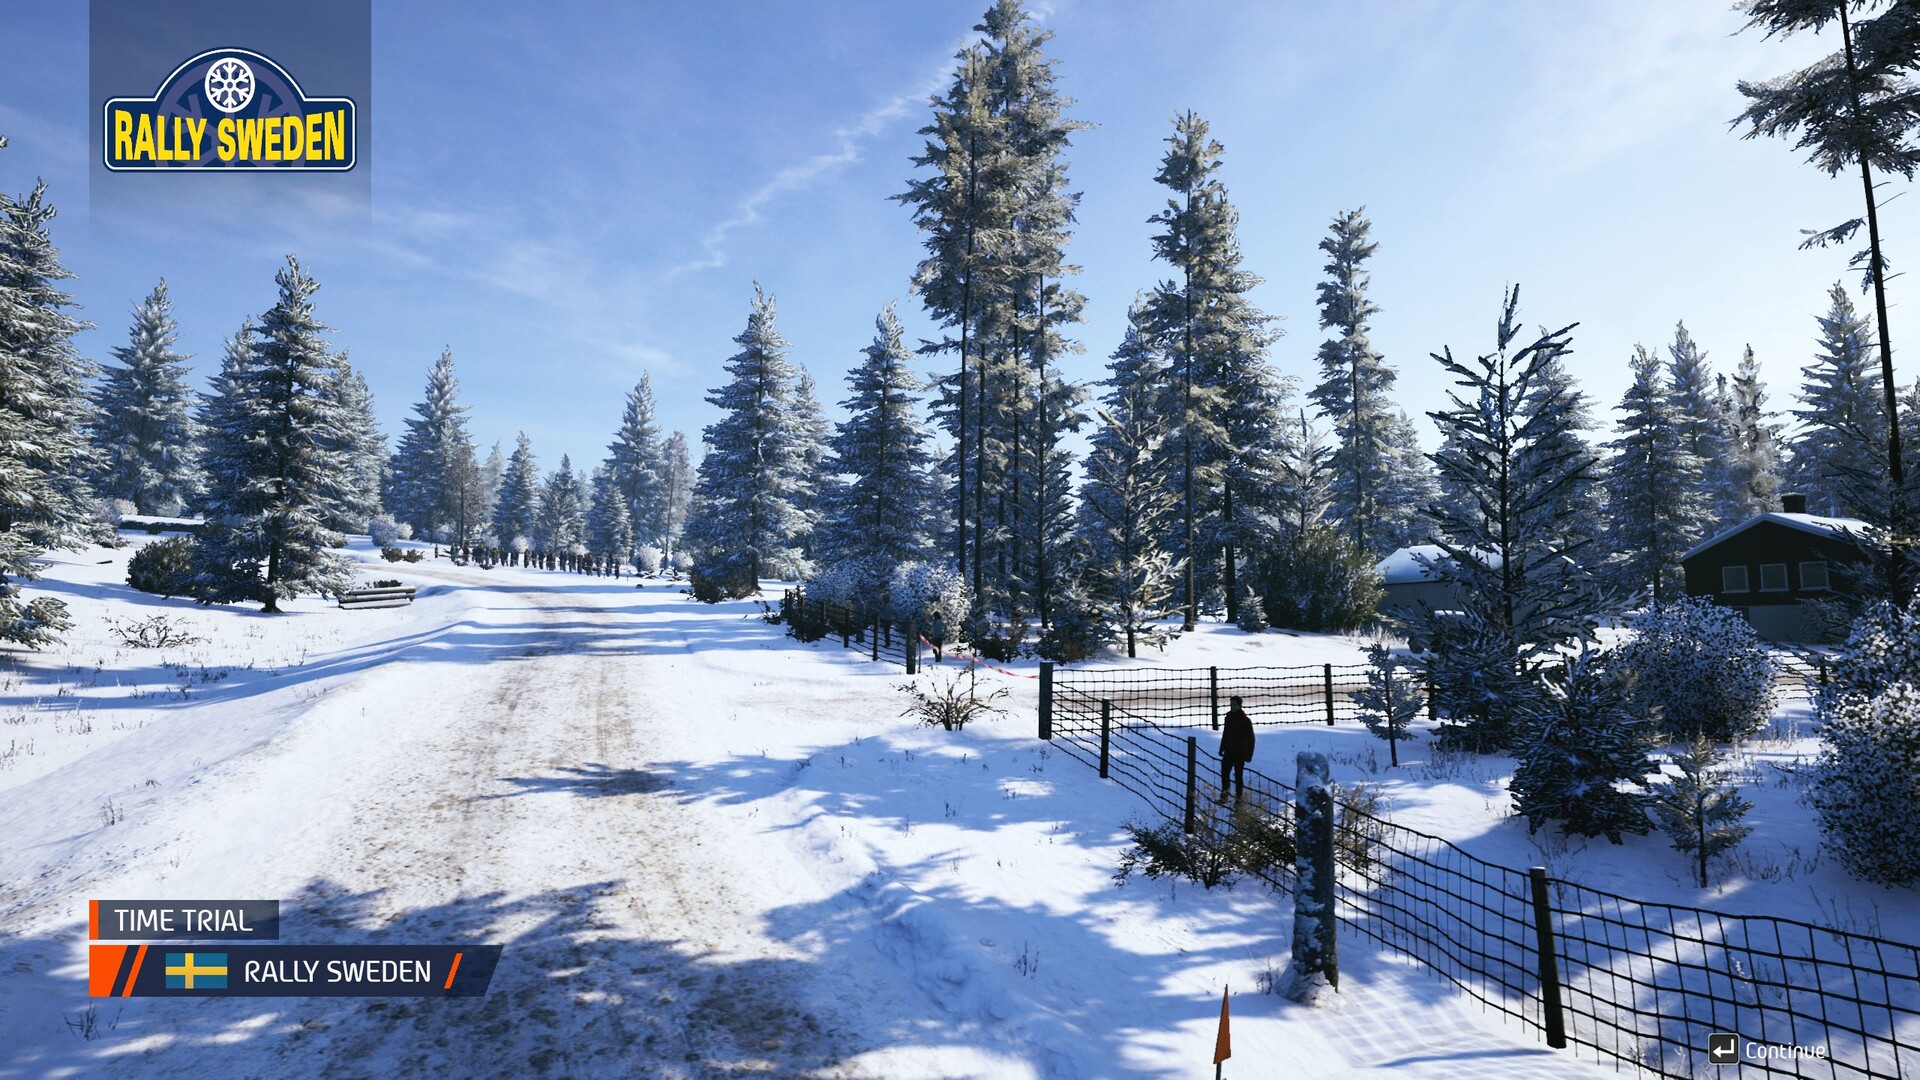
在较低或最低设置下,我们甚至会认为《世界无线电通信会议》很难看。在高分辨率下,标题显得相当小(由于边缘平滑效果较差,图像还经常闪烁)。此外,无论安装了何种硬件,我们在测试过程中都不得不经常面对难看的中间抖动和较低的最低 FPS,这进一步降低了驾驶乐趣。

EA Sports WRC
EA Sports WRC
EA Sports WRC
EA Sports WRC
EA Sports WRC
EA Sports WRC

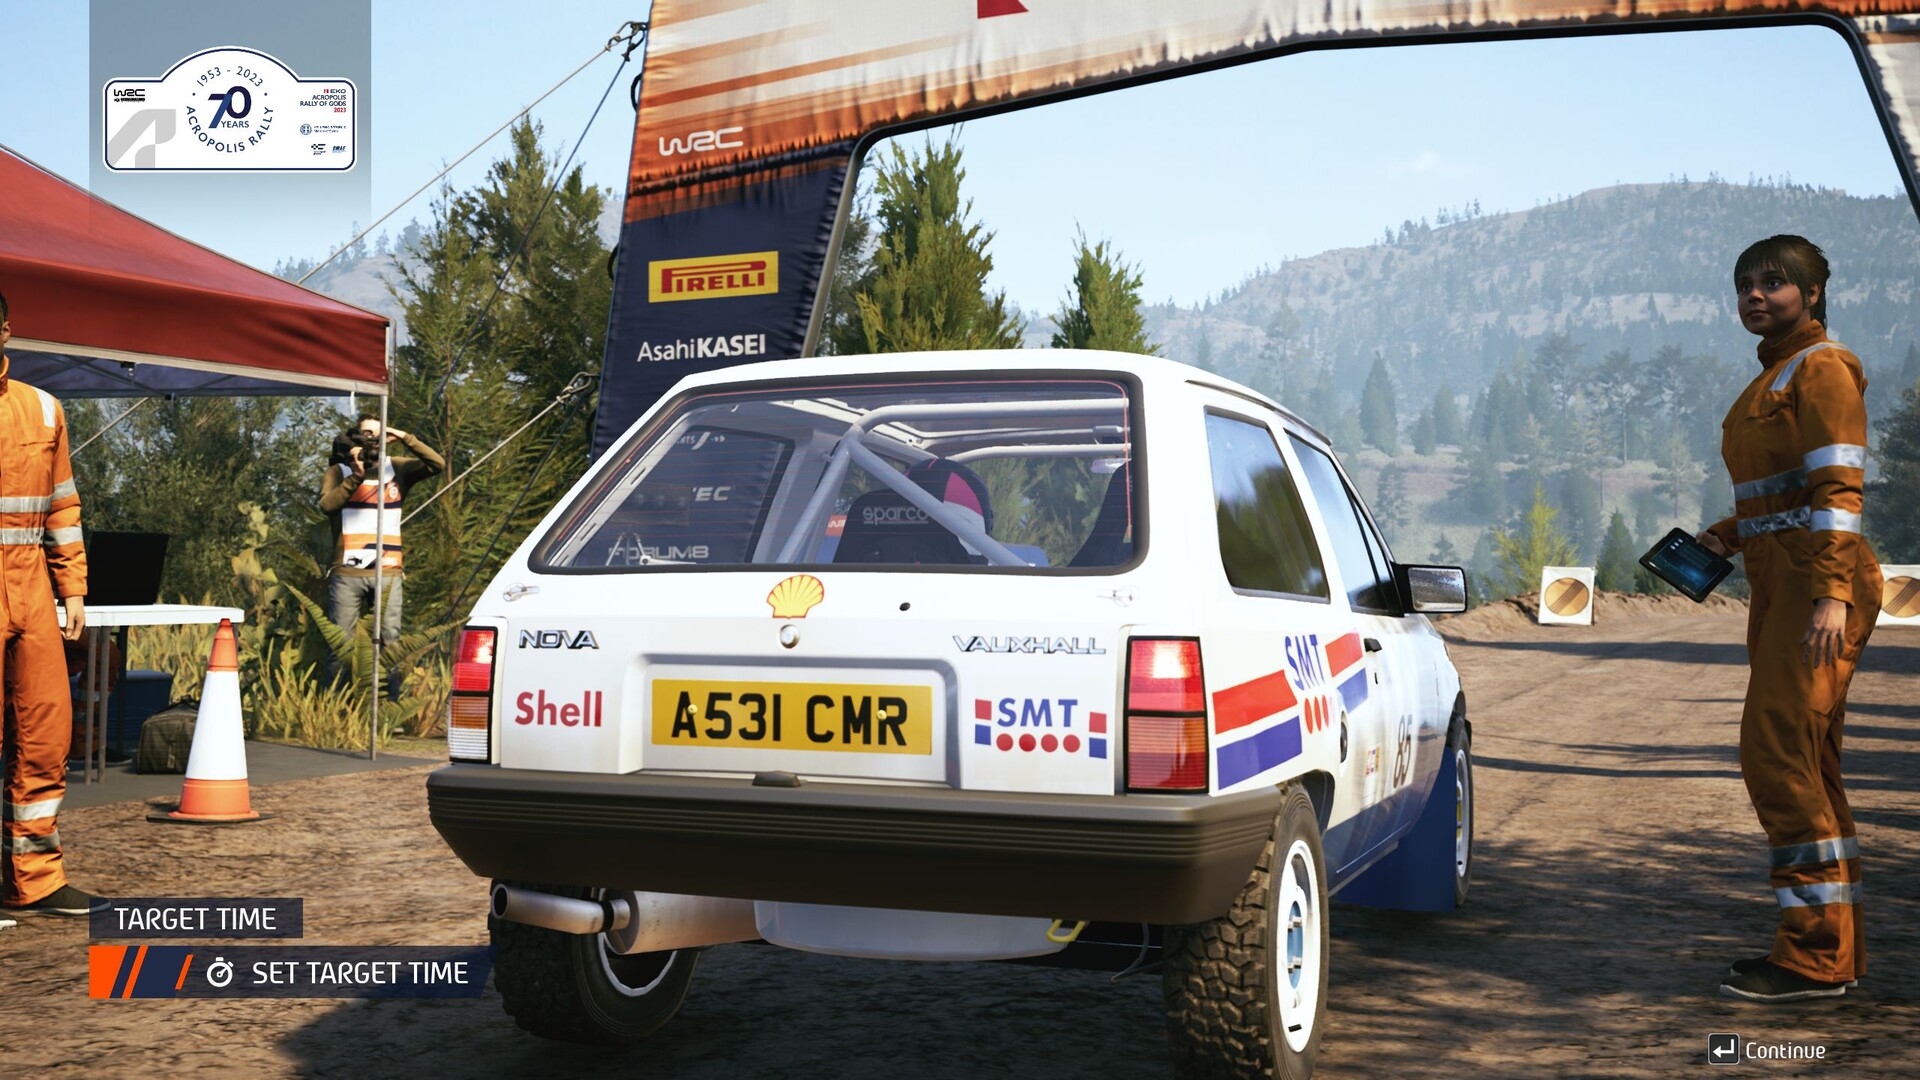
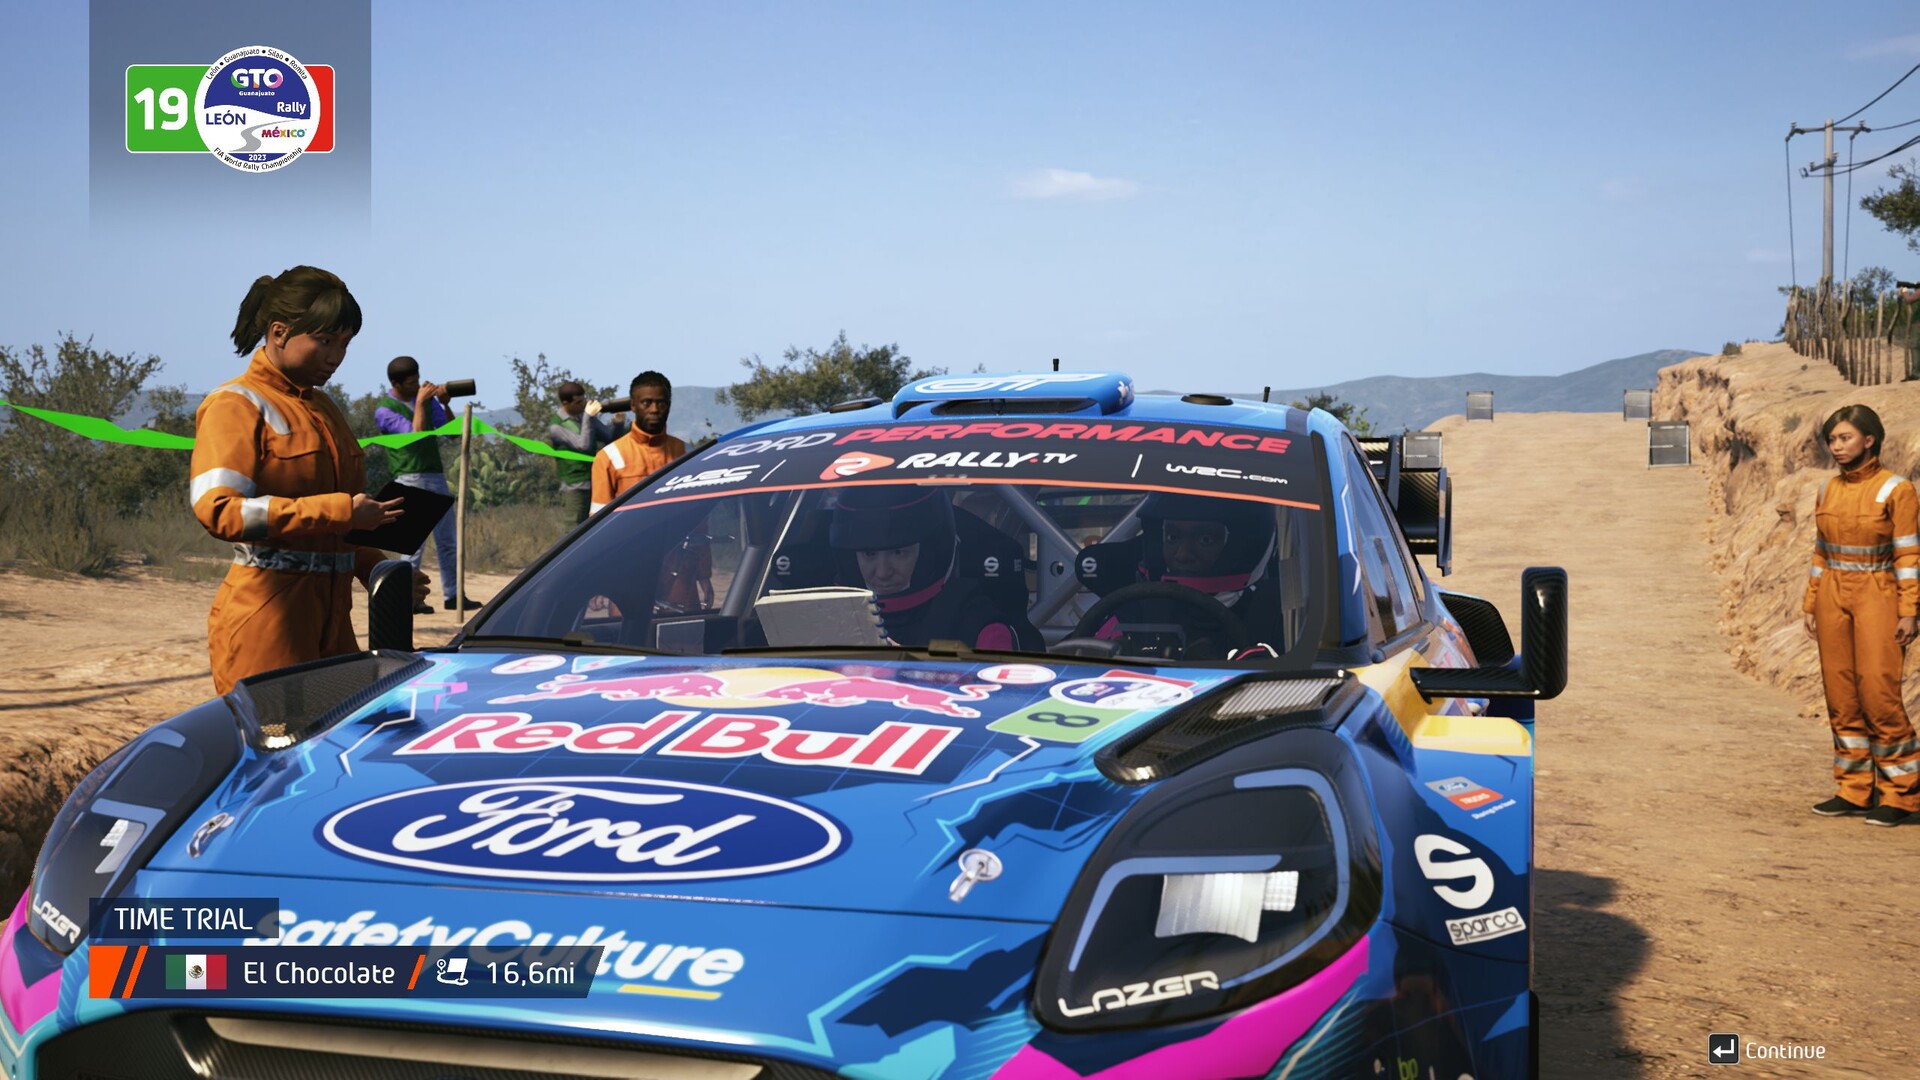
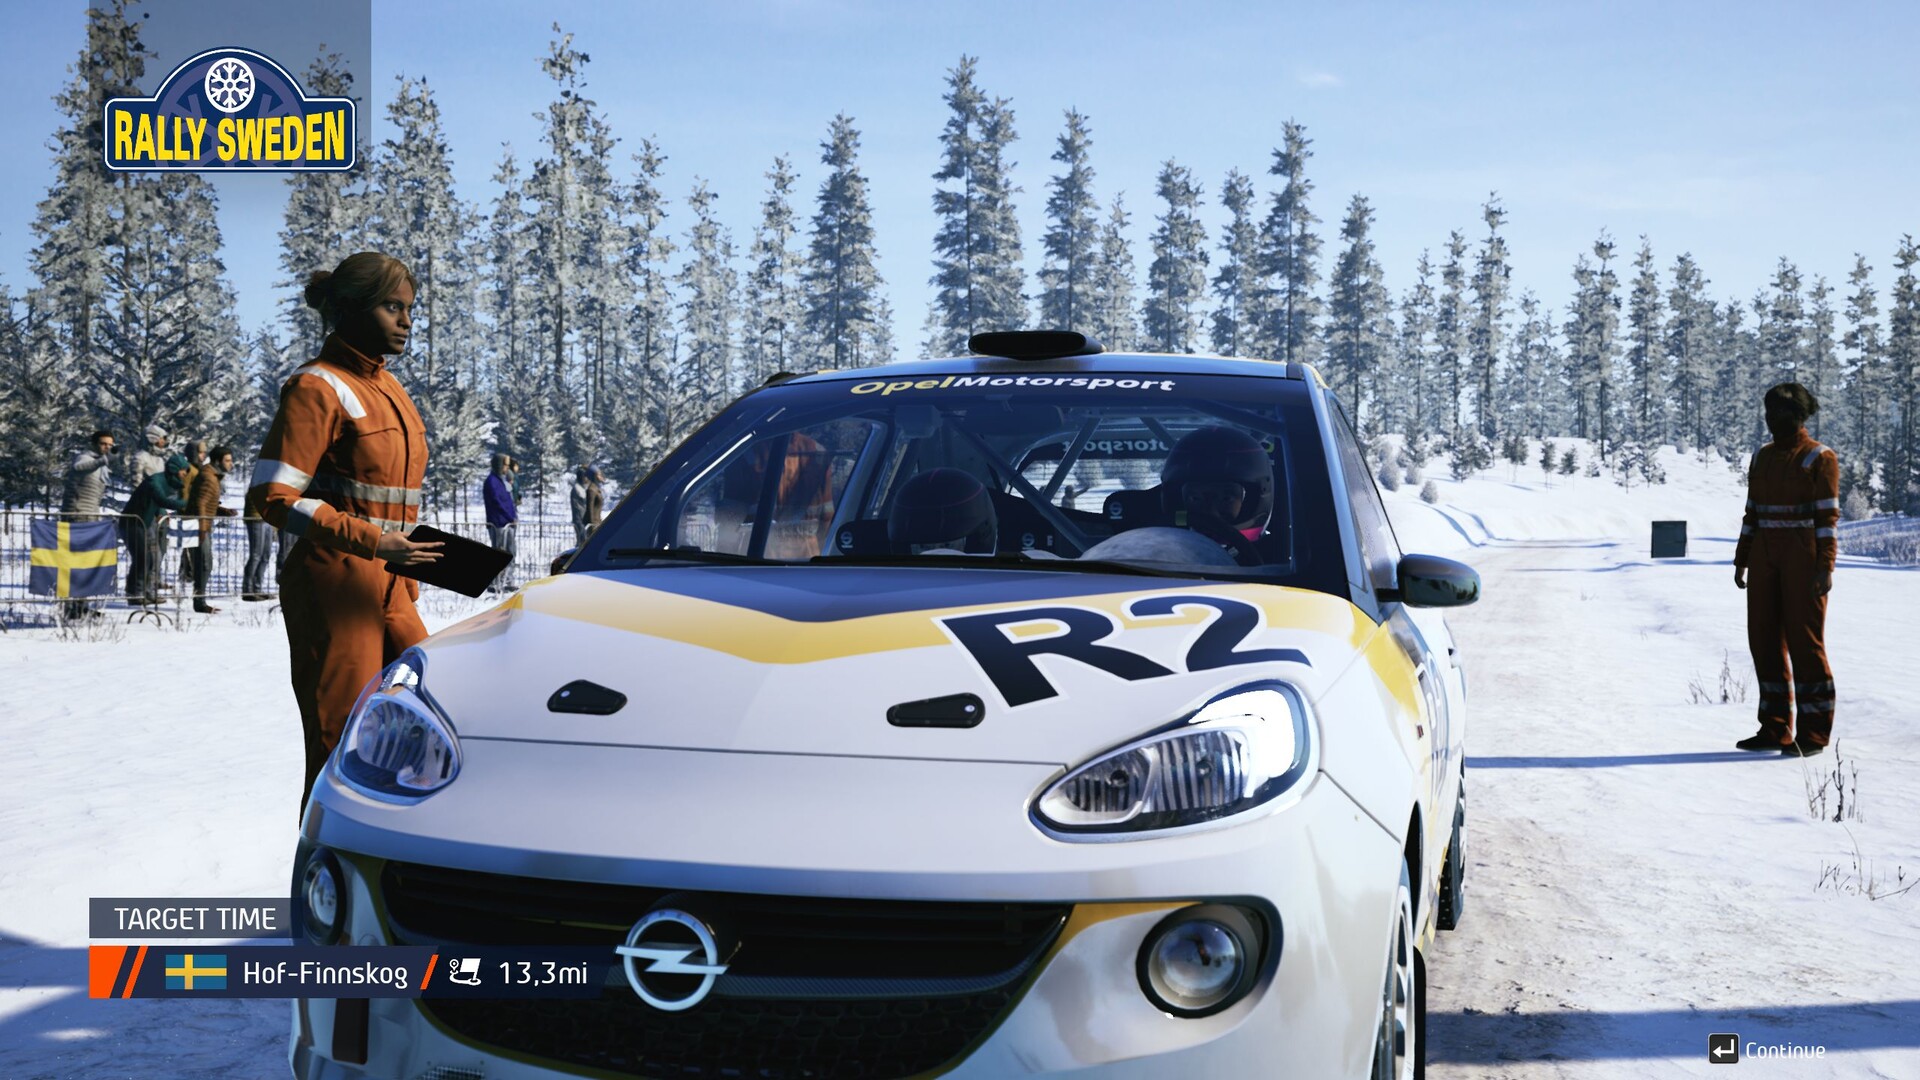
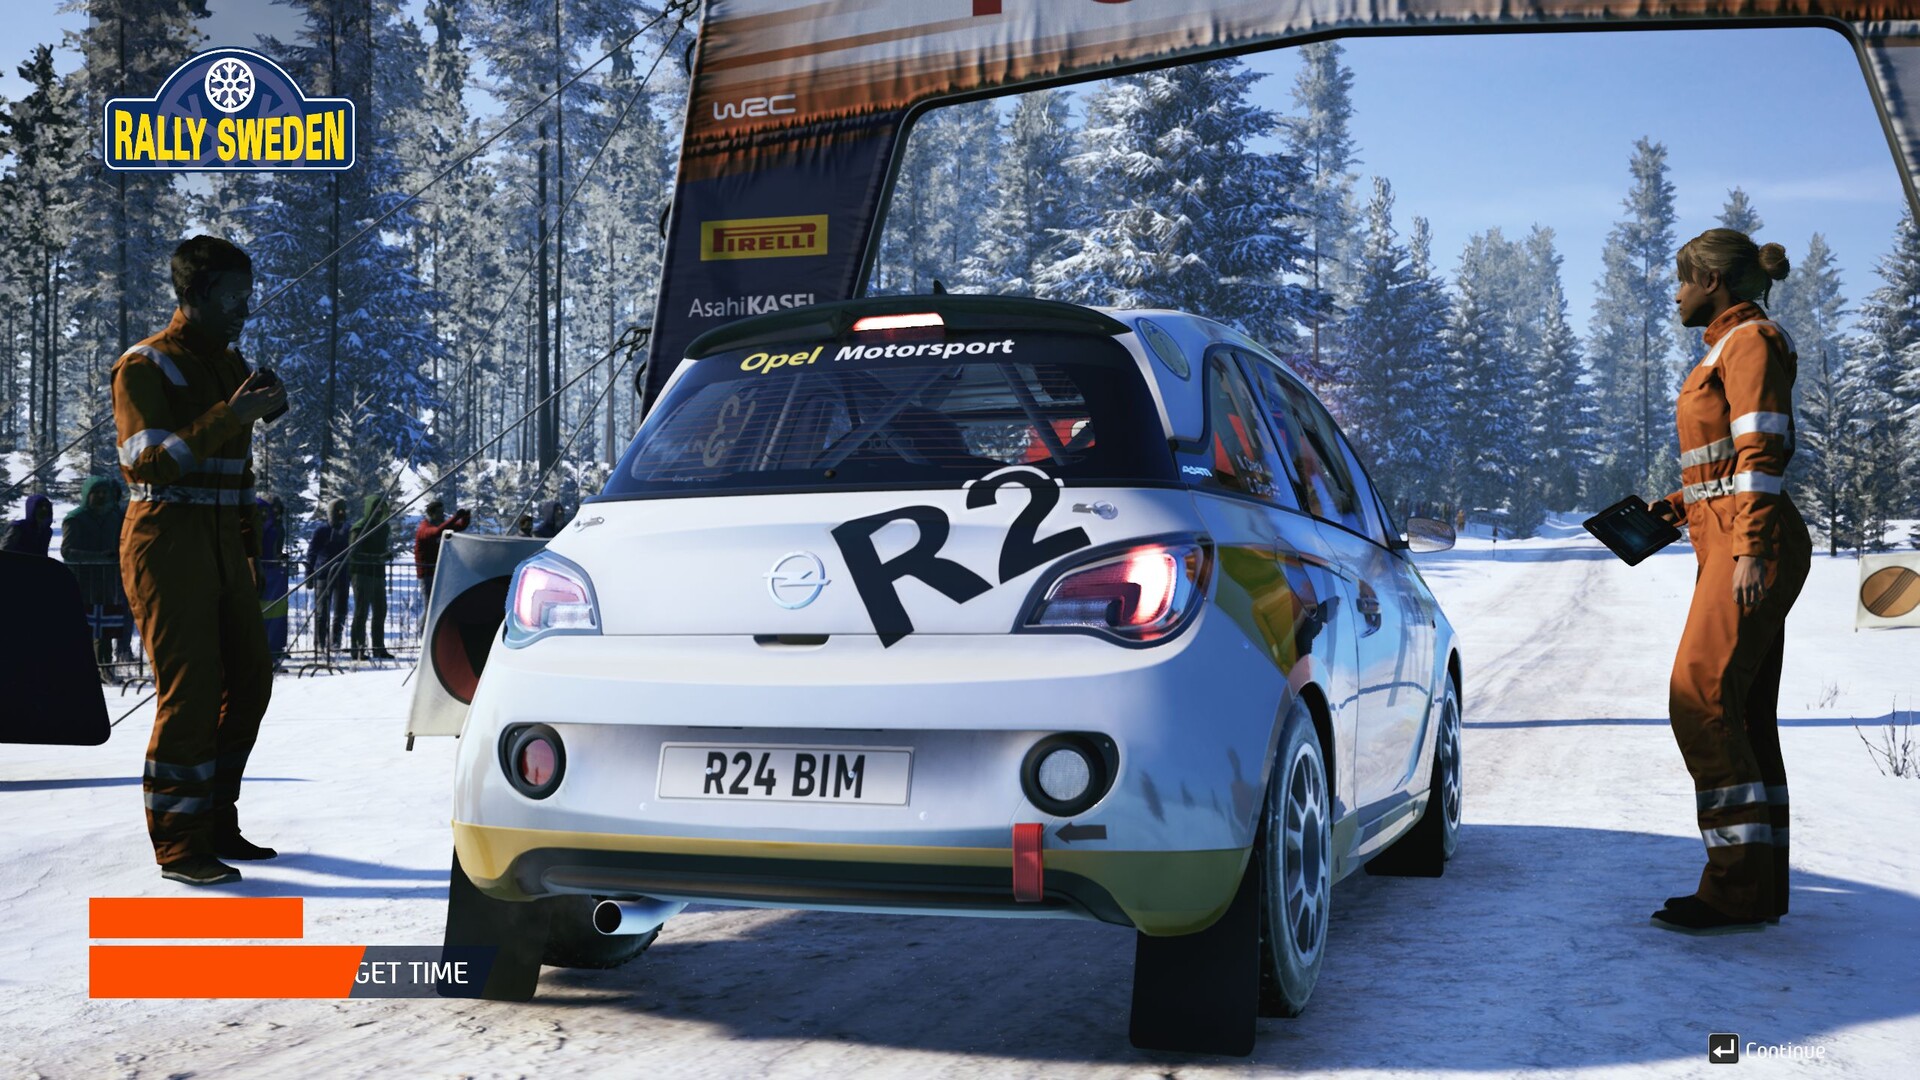
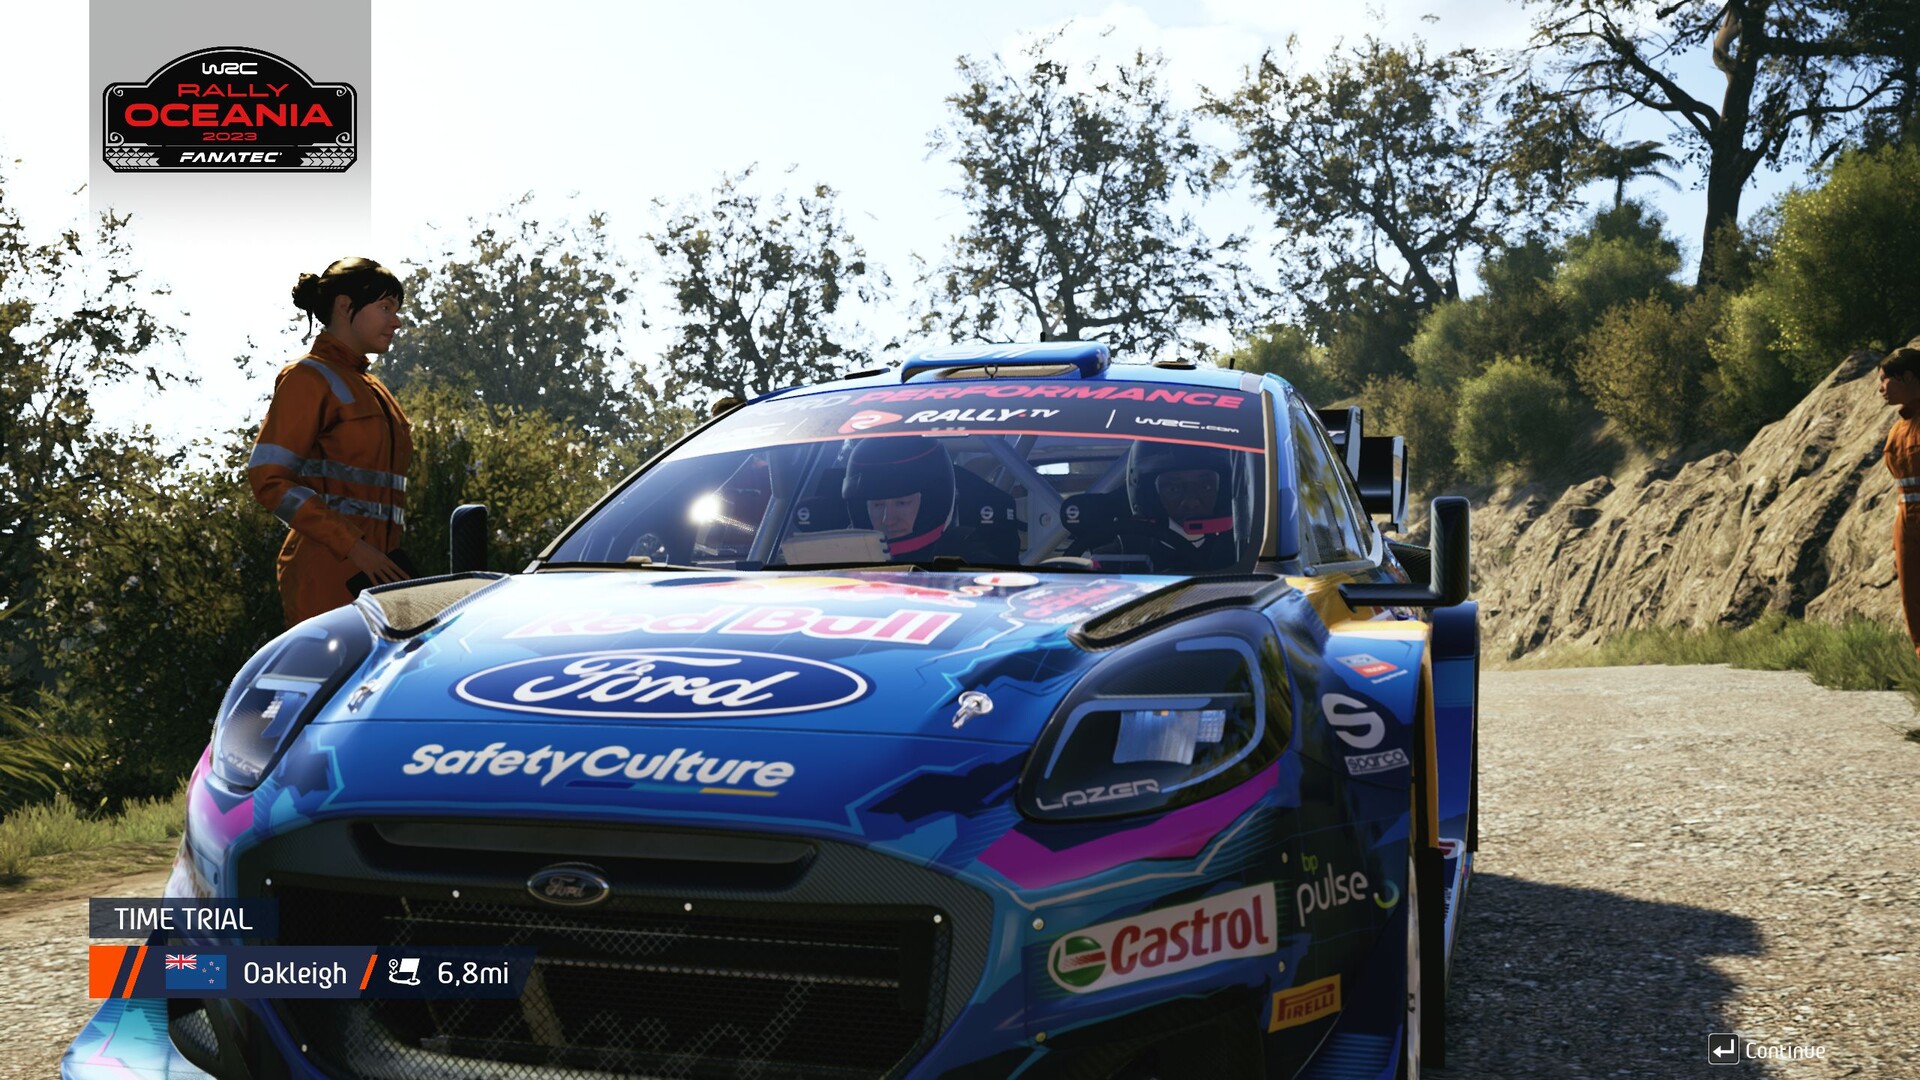
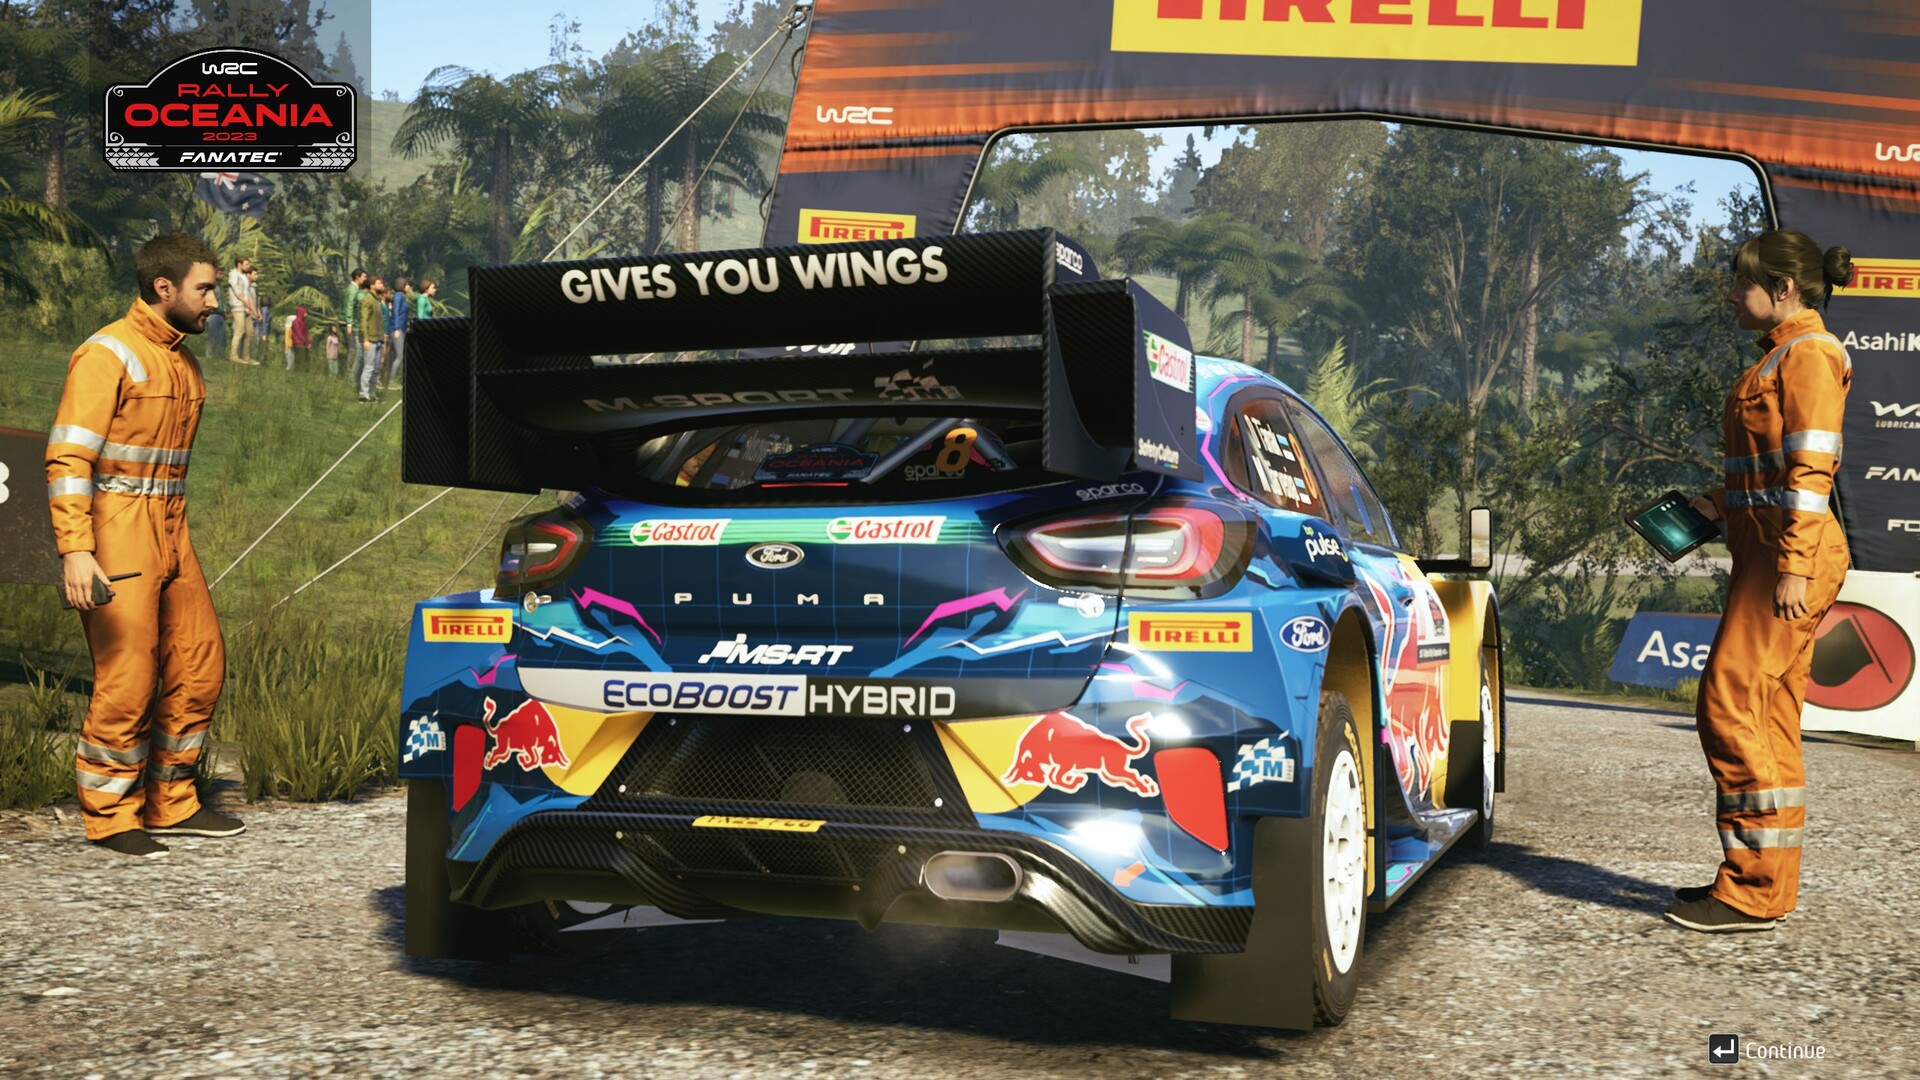
Codemasters 的成功车辆值得称赞。除了整体驾驶风格外,引擎音效、逼真度和破坏模型都非常出色。
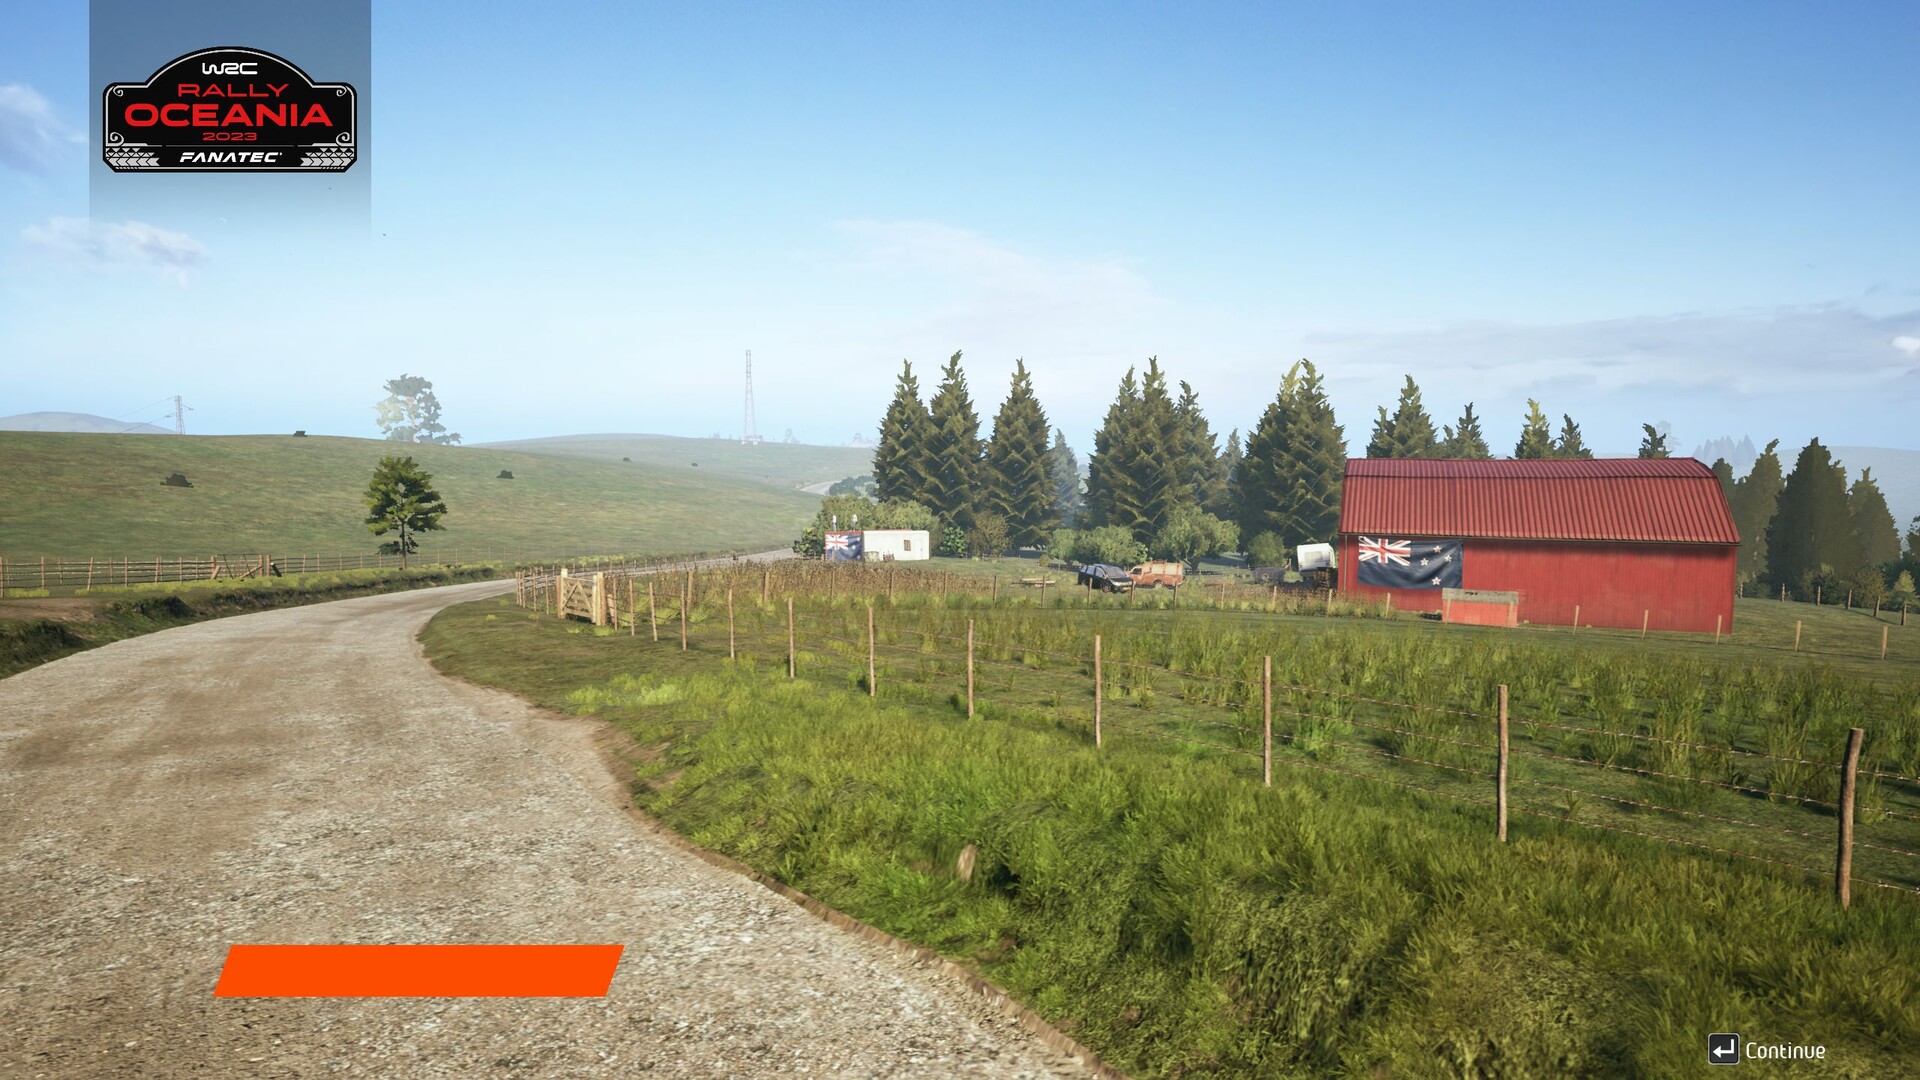
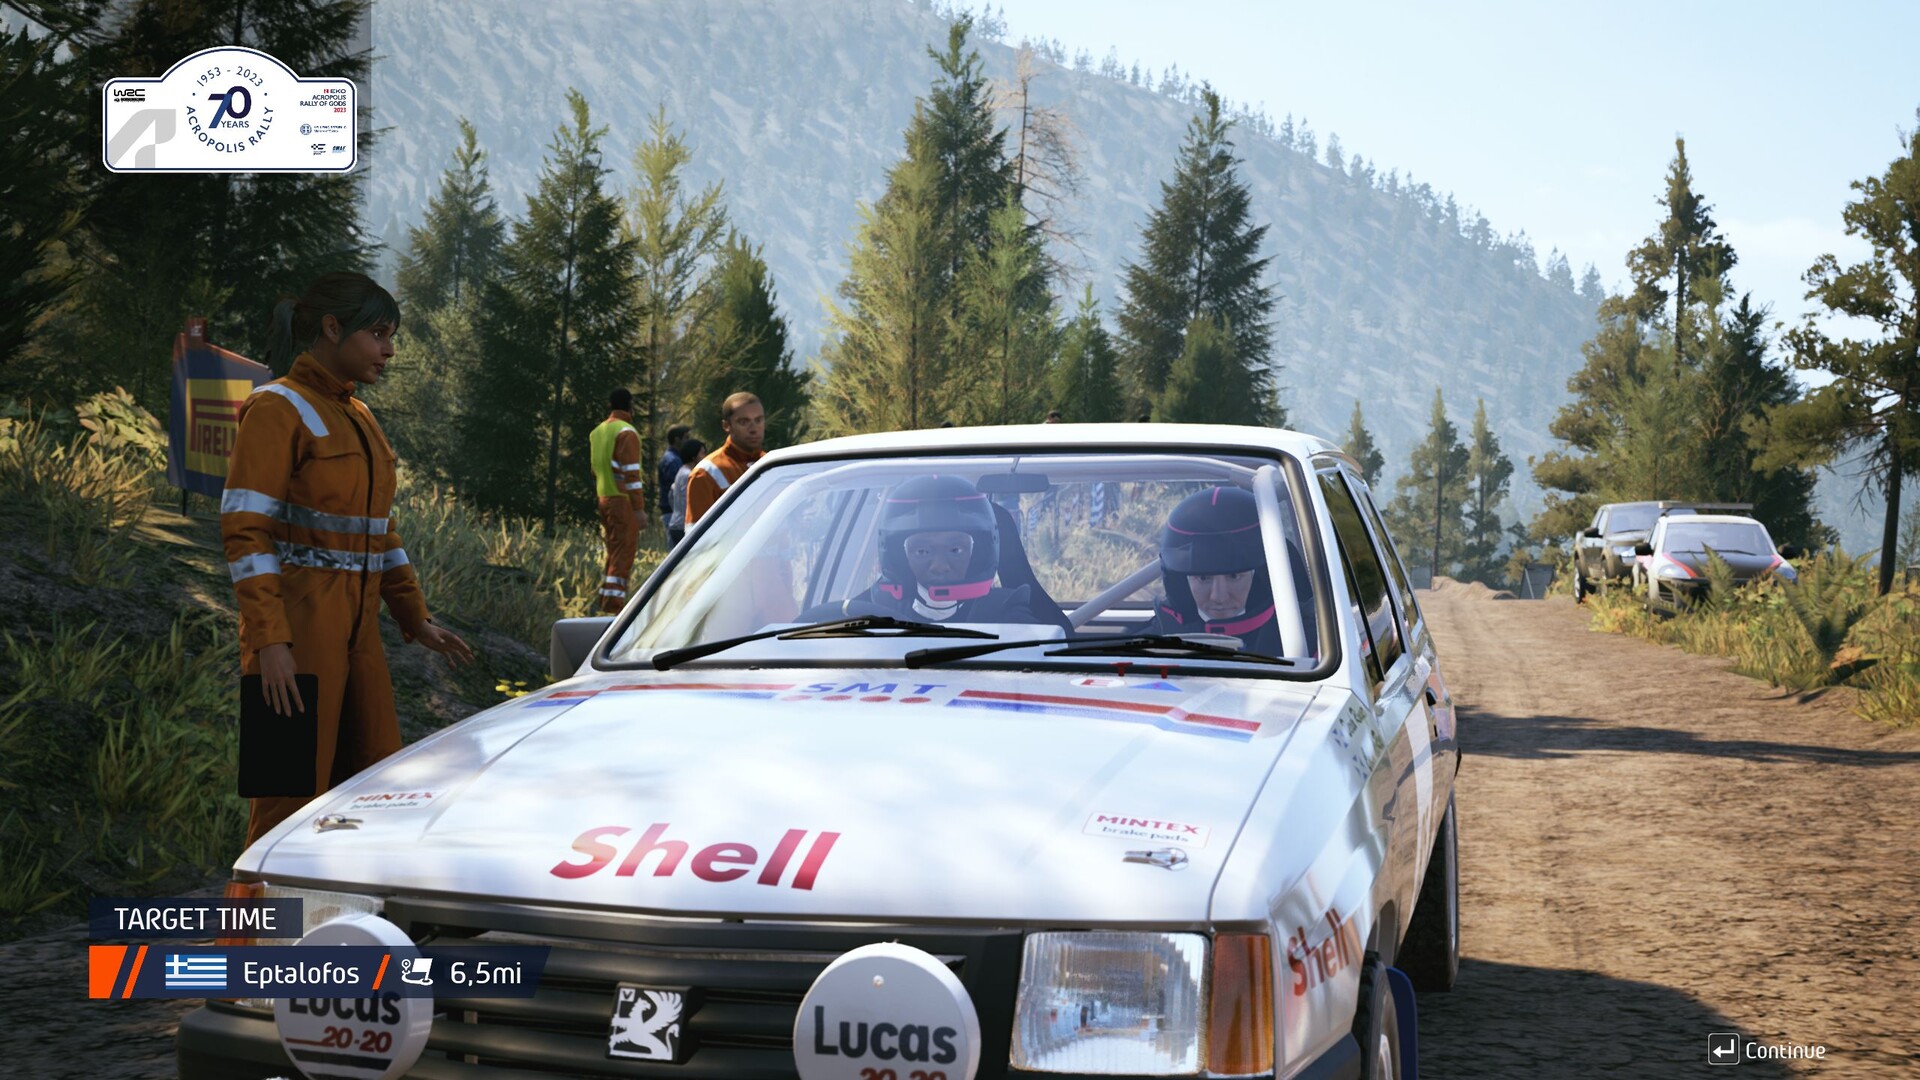
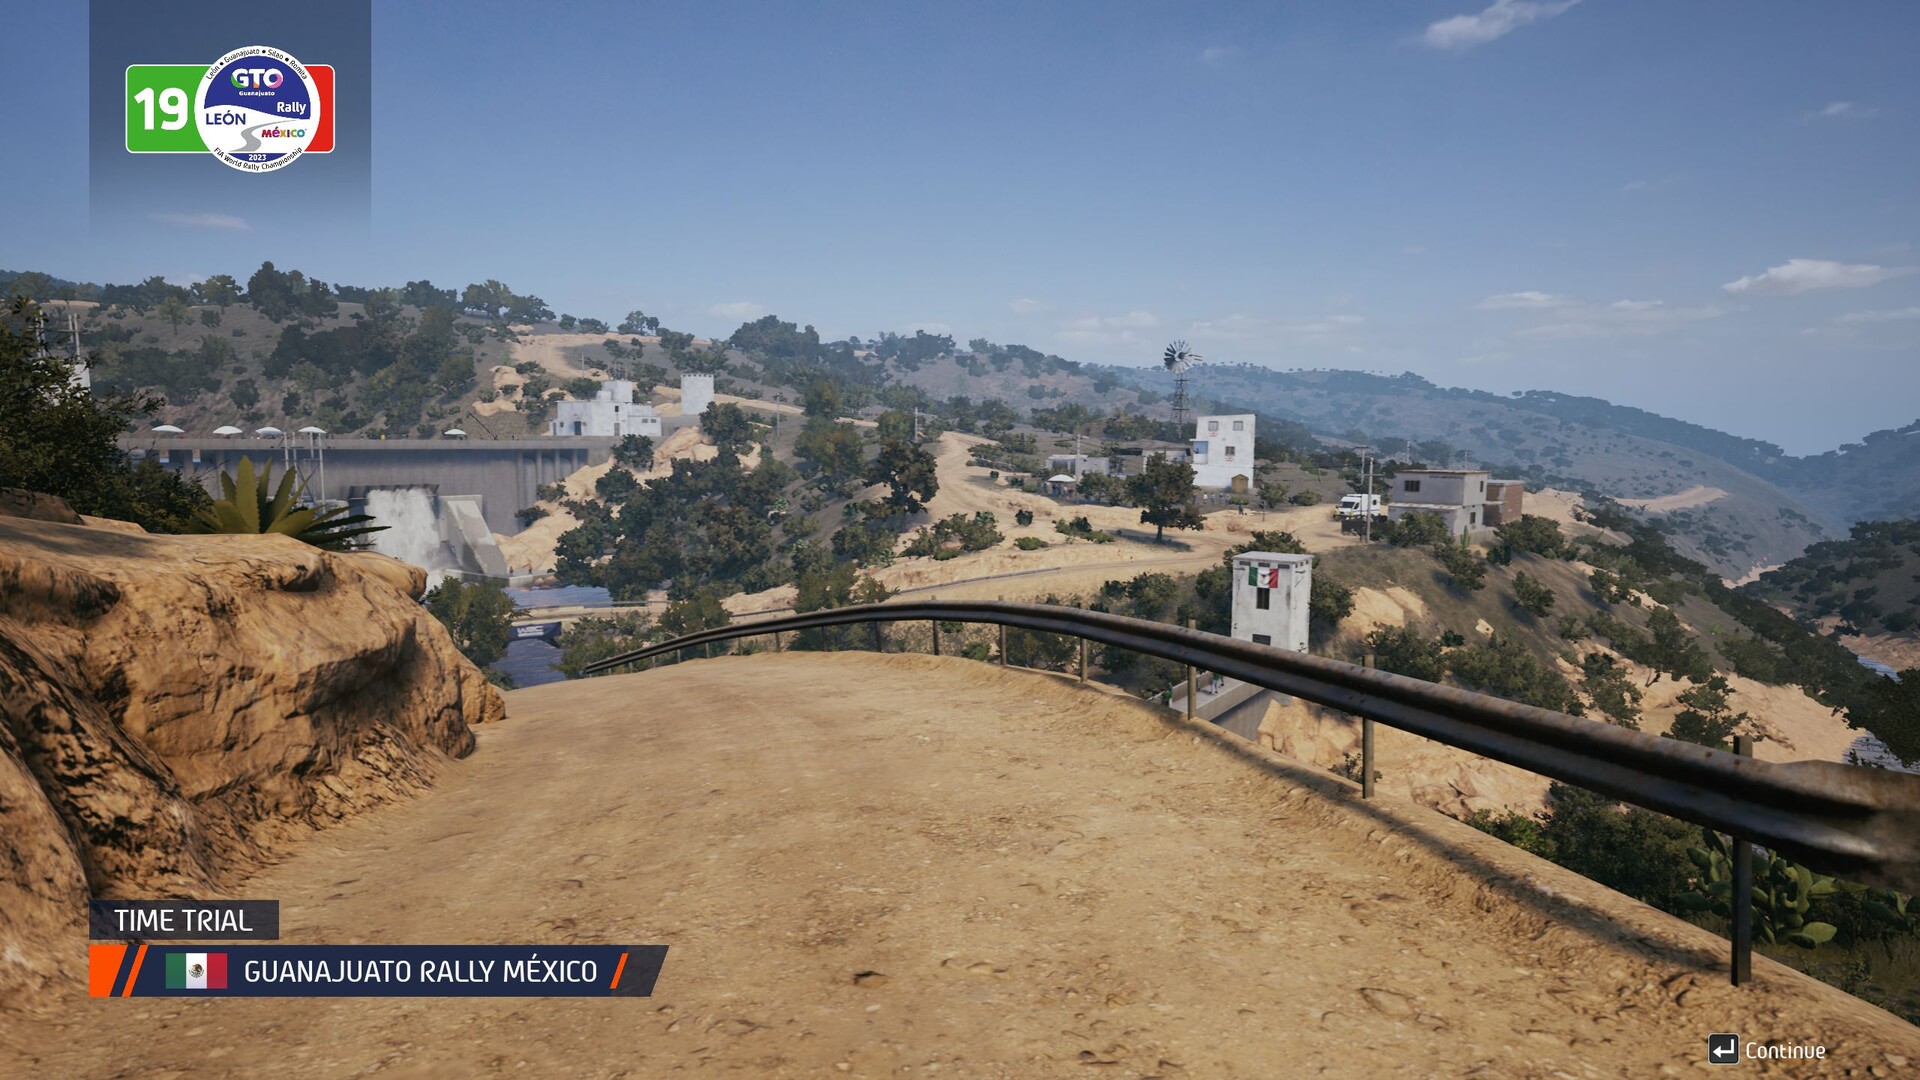
此外,该游戏还提供了茂密的植被(至少在近距离)、不同的区域和赛道以及一些不错的特效(灰尘等)。

EA Sports WRC
EA Sports WRC
EA Sports WRC

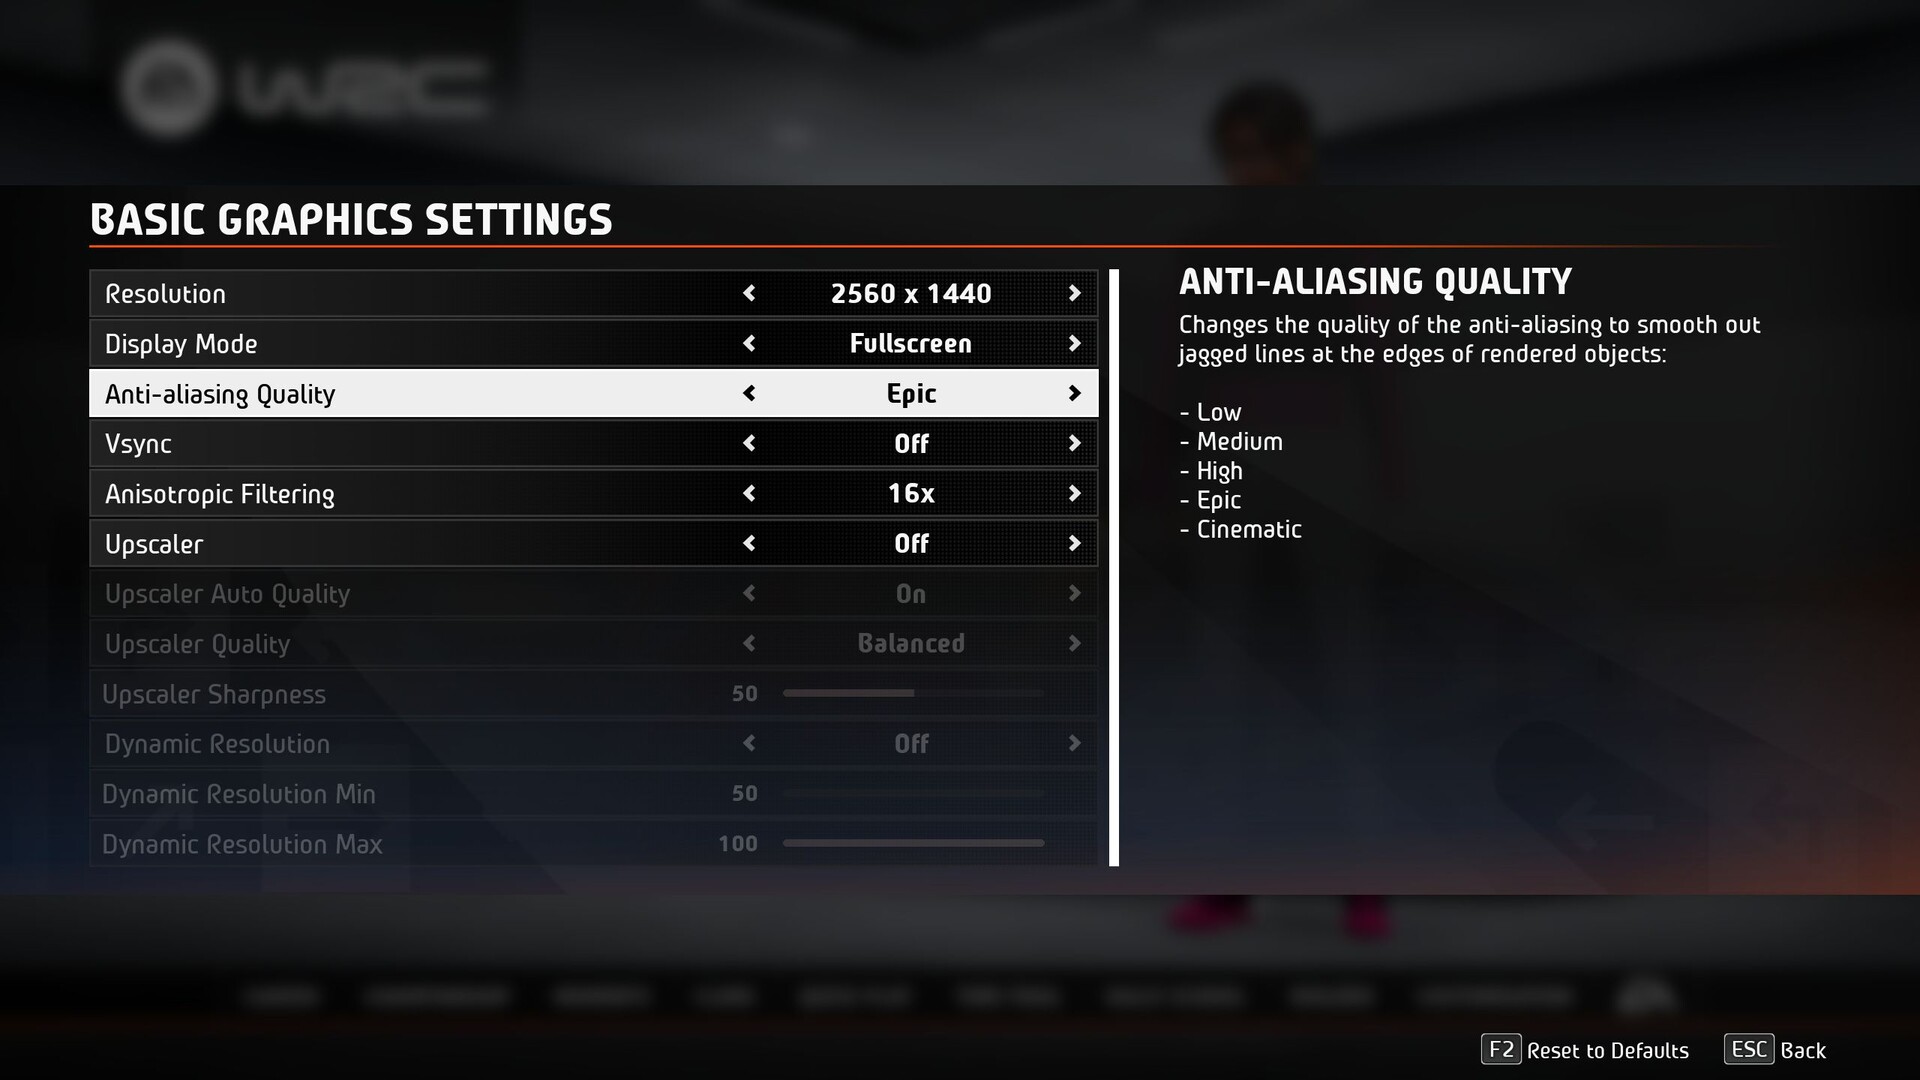
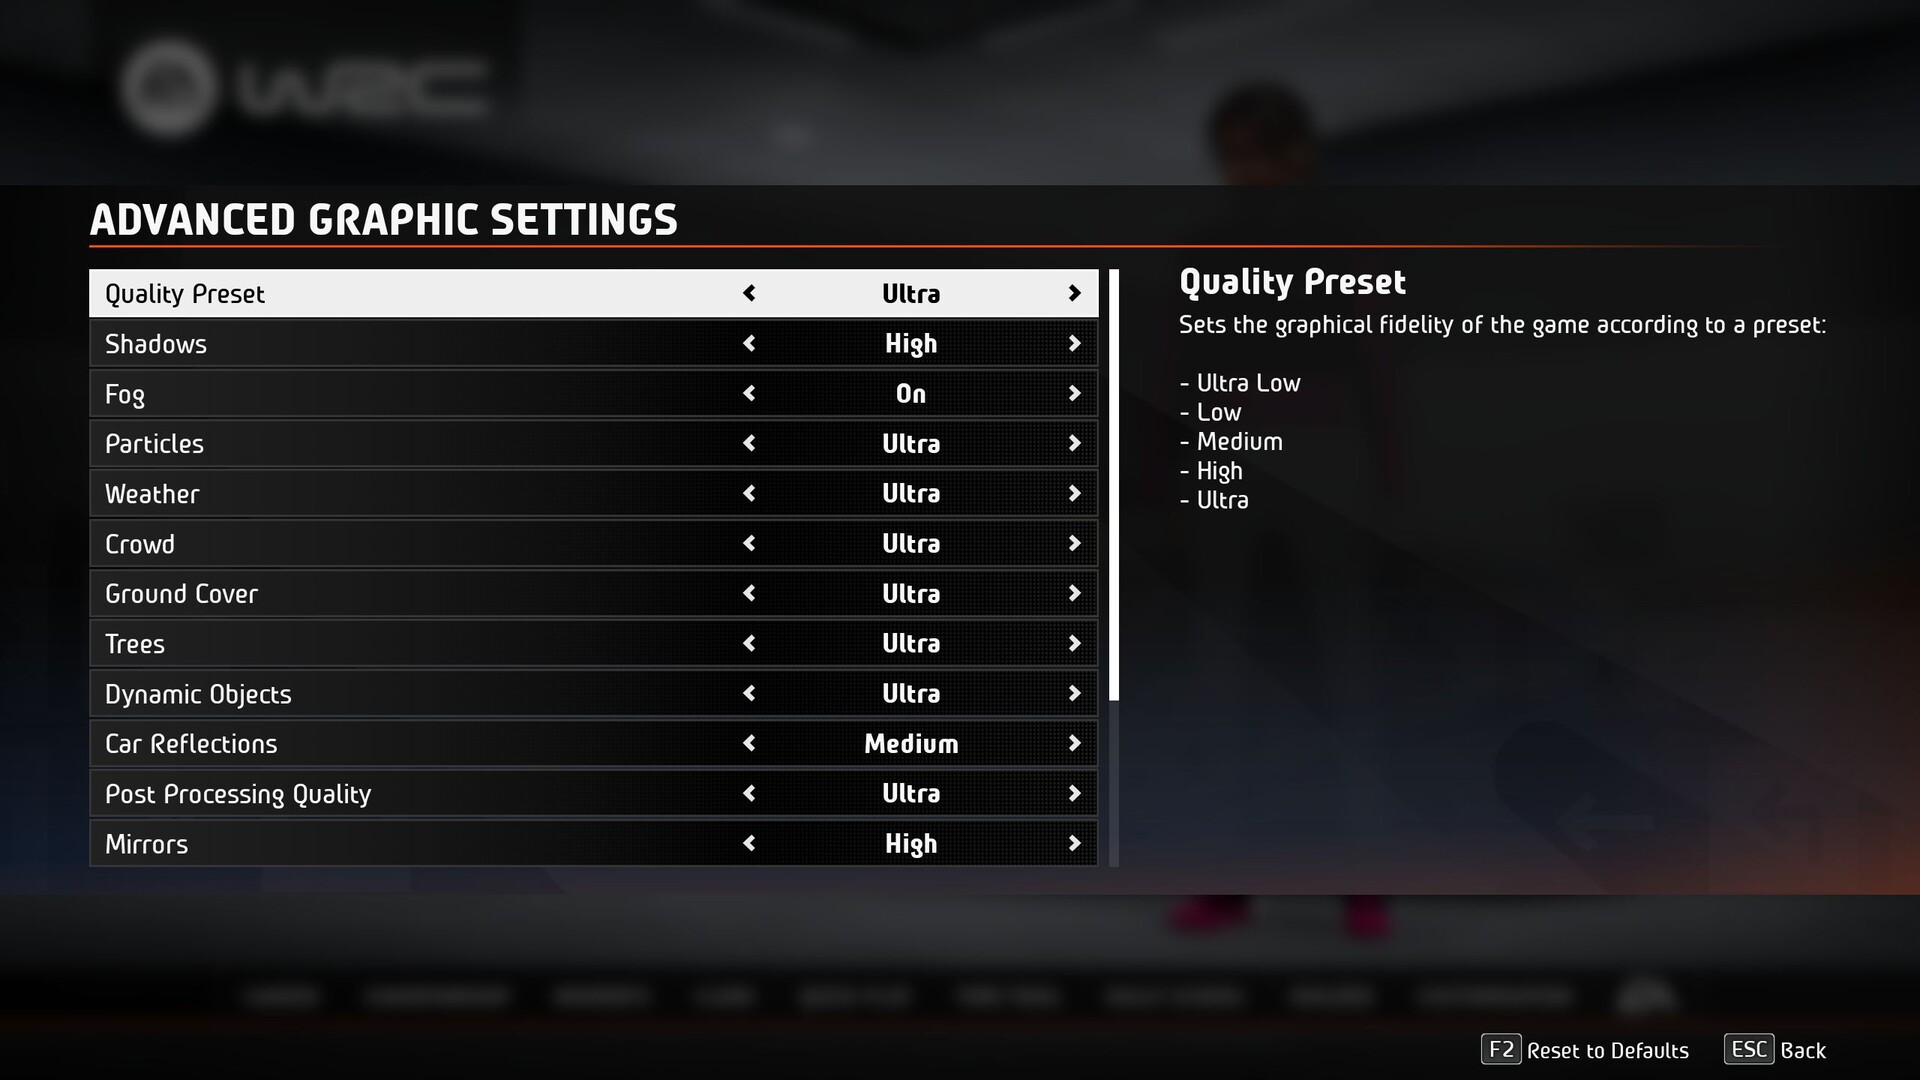
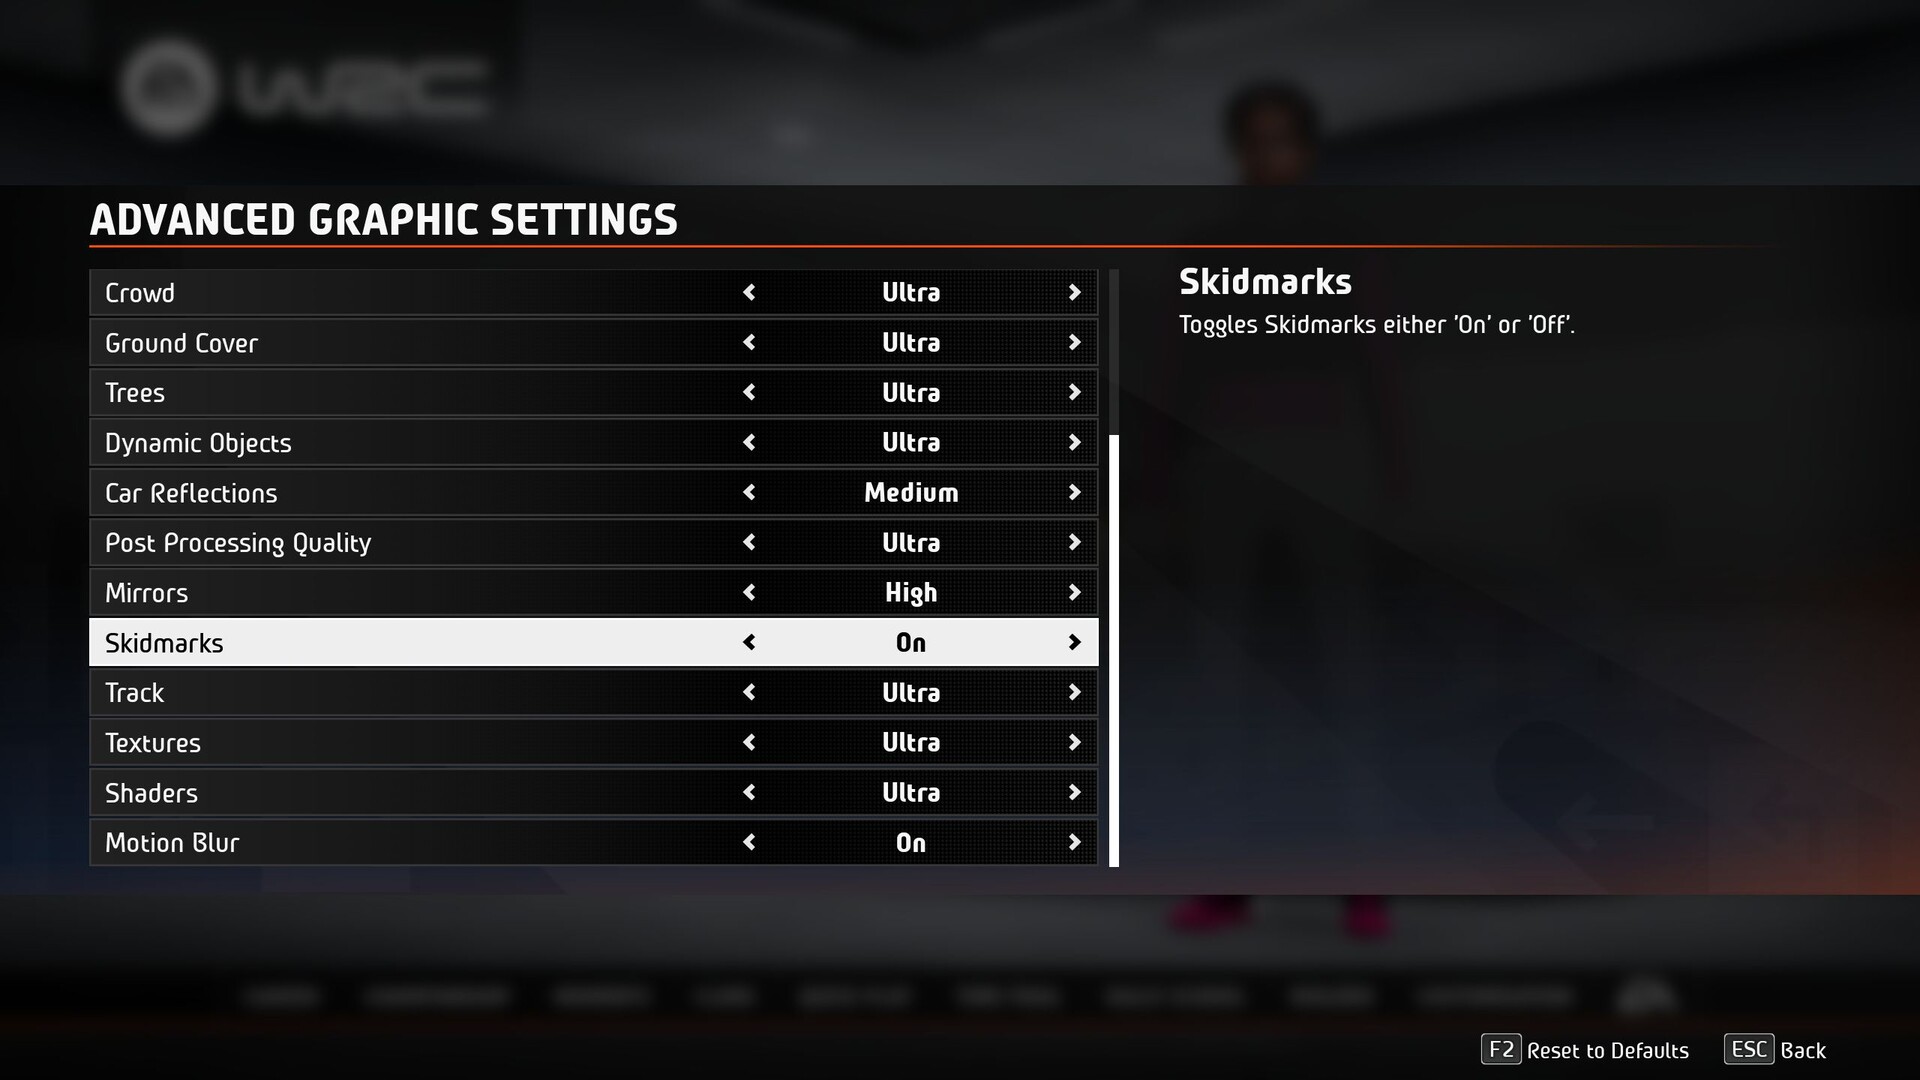
图形菜单几乎没有什么不满意的地方。高级 "选项卡提供了近 20 个画质和细节选项,可通过预设进行一次性调整,无需重启。基本选项卡可处理分辨率、图像模式、抗锯齿、VSync、各向异性过滤和可选的升频(支持 FSR 和 DLSS)。另一个有用的功能是,虽然创建者省略了对比图片,但所有选项都有说明。除了一次无法重现的崩溃外,WRC 运行稳定。我们测试的 Steam 版本需要约 85 GB 的硬盘空间(下载约 72 GB)。

基准

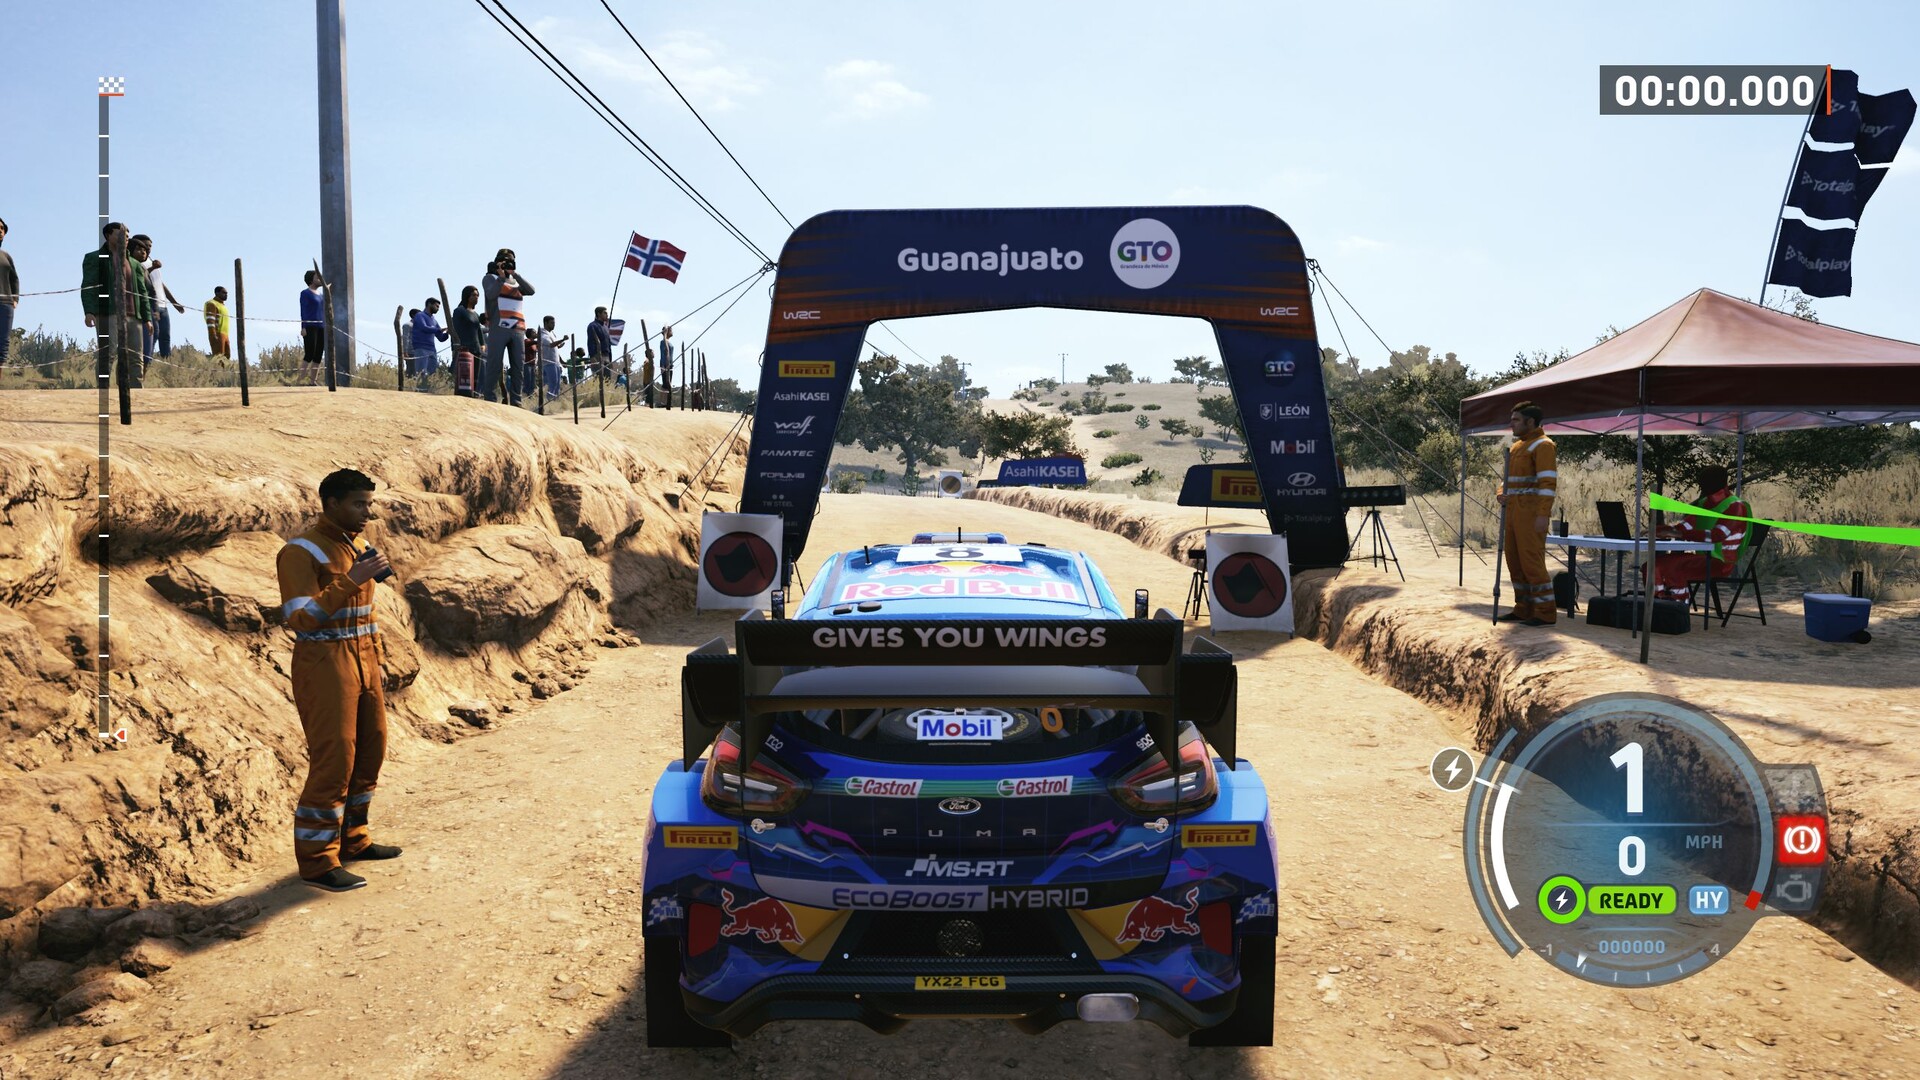
由于世界拉力锦标赛缺乏综合基准,我们使用了克罗地亚的计时赛进行速度测量,特别是在干燥环境下使用 Puma Rally1 Hybrid 在 Bliznec 赛道上进行的测量(参见视频)。我们使用 CapFrameX 工具捕获了从开始到第一次计时测量的帧频,整个过程大约需要一分钟。40 FPS 足以满足正常游戏的要求;60 FPS 或更高则为最佳。

成果


全高清(1,920 x 1,080)

尽管 iGPUS 的图形处理能力适中,但这款游戏的图形处理能力往往超过了它。当使用 1,920 x 1,080 像素组合和低预设值时,即使是 AMD 的 Radeon 780M也只能达到每秒 30 帧左右(而在超低预设值下,每秒运行帧数可高达 70 帧)。不过,使用相当先进的中端 GPU,您在全高清环境中的表现还是不错的。这里的 GeForce RTX 4050Radeon RX 7600S在高细节下每秒帧数均超过 60 帧。

EA Sports WRC
    1920x1080 Low Preset AA:Low AF:16x     1920x1080 Medium Preset AA:Medium AF:16x     1920x1080 High Preset AA:High AF:16x     1920x1080 Ultra Preset AA:Epic AF:16x
NVIDIA GeForce RTX 4080, i9-13900K
Desktop-PC Asus ROG Strix Z790-F
179.5 (53.6min, 123.2P0.1, 148.2P1) fps ∼100%
170.1 (51.6min, 106.6P0.1, 140.5P1) fps ∼100%
153 (53.9min, 85.3P0.1, 126.4P1) fps ∼100%
NVIDIA GeForce RTX 4090 Laptop GPU, i9-13900HX
XMG Neo 17 E23
124.4 (19.3min, 21.3P0.1, 95.7P1) fps ∼69%
117.2 (17.7min, 20.7P0.1, 88.6P1) fps ∼69%
105.4 (6.67min, 21.8P0.1, 81.2P1) fps ∼69%
NVIDIA GeForce RTX 4080 Laptop GPU, i9-13950HX
Razer Blade 16 Mid 23
115.1 (27.9min, 36.1P0.1, 72.4P1) fps ∼64%
107.3 (33.3min, 41.3P0.1, 69.1P1) fps ∼63%
97.8 (29.5min, 37.1P0.1, 68.5P1) fps ∼64%
NVIDIA GeForce RTX 3080 Ti Laptop GPU, i9-12900H
Asus ROG Strix Scar 17 G733ZX
107.8 (6.76min, 34.2P0.1, 69.8P1) fps ∼60%
101 (22.6min, 37.8P0.1, 63.7P1) fps ∼59%
91.6 (11min, 36.3P0.1, 60.9P1) fps ∼60%
AMD Radeon RX 7900 XT, i9-13900K
Desktop-PC Asus ROG Strix Z790-F
104.4 (38.8min, 71.3P0.1, 82.7P1) fps ∼58%
97.9 (14.3min, 56.6P0.1, 78.1P1) fps ∼58%
90 (6.75min, 42.1P0.1, 71.8P1) fps ∼59%
NVIDIA GeForce RTX 4070 Laptop GPU, i9-13900HX
XMG Pro 15 E23
94.9 (9.52min, 37.4P0.1, 70.6P1) fps ∼53%
89.6 (25.2min, 38.6P0.1, 66.7P1) fps ∼53%
81.2 (22.7min, 42.3P0.1, 61.1P1) fps ∼53%
NVIDIA GeForce RTX 4060 Laptop GPU, R9 7940HS
Razer Blade 14 Mid 23
91.5 (24.1min, 41.3P0.1, 70.3P1) fps ∼51%
85.7 (26.1min, 39.8P0.1, 62.5P1) fps ∼50%
78.4 (21.9min, 39.1P0.1, 58.5P1) fps ∼51%
NVIDIA GeForce RTX 4050 Laptop GPU, i7-13700H
Medion Erazer Scout E20
79 (35.8min, 58.7P0.1, 65.9P1) fps ∼44%
72.9 (20.6min, 51.5P0.1, 60P1) fps ∼43%
67.3 (41.9min, 49.4P0.1, 55.9P1) fps ∼44%
AMD Radeon RX 7600S, R9 7940HS
Asus TUF Gaming Advantage A16
80.4 (15.1min, 50.5P0.1, 63.2P1) fps ∼45%
73.7 (32.2min, 46.2P0.1, 58.9P1) fps ∼43%
66.6 (5.87min, 37.1P0.1, 55P1) fps ∼44%
AMD Radeon 780M, R9 7940HS
Asus TUF Gaming Advantage A16
30.6 (9.13min, 11.6P0.1, 18.1P1) fps ∼100%
20.8 (5.42min, 10.8P0.1, 17.1P1) fps ∼12%
18.5 (7.01min, 10P0.1, 15.5P1) fps ∼11%
17.3 (11.4min, 13.2P0.1, 14.9P1) fps ∼11%

QHD (2,560 x 1,440)

快速的中端机型也足以支持 QHD。前面提到的 RX 7600S 或 RTX 4050 在 2560 x 1440 像素和 Ultra 设置下可达到 40 FPS 以上。

EA Sports WRC
    2560x1440 Ultra Preset AA:Epic AF:16x
NVIDIA GeForce RTX 4080, i9-13900K
Desktop-PC Asus ROG Strix Z790-F
149.4 (49.4min, 94.9P0.1, 121.8P1) fps ∼100%
NVIDIA GeForce RTX 4090 Laptop GPU, i9-13900HX
XMG Neo 17 E23
103 (13.4min, 21.3P0.1, 76.4P1) fps ∼69%
NVIDIA GeForce RTX 4080 Laptop GPU, i9-13950HX
Razer Blade 16 Mid 23
94.3 (9.64min, 31.9P0.1, 61P1) fps ∼63%
AMD Radeon RX 7900 XT, i9-13900K
Desktop-PC Asus ROG Strix Z790-F
87.9 (38min, 58.2P0.1, 71.2P1) fps ∼59%
NVIDIA GeForce RTX 3080 Ti Laptop GPU, i9-12900H
Asus ROG Strix Scar 17 G733ZX
72.9 (4.49min, 27.7P0.1, 49.6P1) fps ∼49%
NVIDIA GeForce RTX 4070 Laptop GPU, i9-13900HX
XMG Pro 15 E23
68.8 (13.6min, 30.9P0.1, 54.1P1) fps ∼46%
NVIDIA GeForce RTX 4060 Laptop GPU, R9 7940HS
Razer Blade 14 Mid 23
59.6 (20.4min, 30.1P0.1, 45.8P1) fps ∼40%
AMD Radeon RX 7600S, R9 7940HS
Asus TUF Gaming Advantage A16
48.2 (13min, 27.4P0.1, 40.4P1) fps ∼32%
NVIDIA GeForce RTX 4050 Laptop GPU, i7-13700H
Medion Erazer Scout E20
42.9 (8.54min, 20.3P0.1, 36.4P1) fps ∼29%

超高清(3,840 x 2,160)

只有在 4K 范围内,要求才会越来越高。虽然GeForce RTX 4060 足以满足高质量 DLSS 的全部细节要求,但真正的高端或顶级型号(如GeForce RTX 3080 Ti或更好)则不需要 DLSS。

EA Sports WRC
    3840x2160 Ultra Preset AA:Epic AF:16x     3840x2160 Ultra Preset + Quality DLSS AA:Epic AF:16x
NVIDIA GeForce RTX 4080, i9-13900K
Desktop-PC Asus ROG Strix Z790-F
89.1 (37.7min, 49.4P0.1, 75.3P1) fps ∼100%
128.9 (21.8min, 84.4P0.1, 107.4P1) fps ∼100%
AMD Radeon RX 7900 XT, i9-13900K
Desktop-PC Asus ROG Strix Z790-F
81.6 (7.6min, 36.1P0.1, 63.3P1) fps ∼92%
NVIDIA GeForce RTX 4090 Laptop GPU, i9-13900HX
XMG Neo 17 E23
67.9 (10.1min, 17.7P0.1, 39.2P1) fps ∼76%
95.8 (7.58min, 20P0.1, 71.3P1) fps ∼74%
NVIDIA GeForce RTX 4080 Laptop GPU, i9-13950HX
Razer Blade 16 Mid 23
57.3 (19.1min, 25.4P0.1, 43.9P1) fps ∼64%
81.2 (25.9min, 38.2P0.1, 56.6P1) fps ∼63%
NVIDIA GeForce RTX 3080 Ti Laptop GPU, i9-12900H
Asus ROG Strix Scar 17 G733ZX
42.9 (21.9min, 25.4P0.1, 35.5P1) fps ∼48%
61.5 (22.9min, 29.1P0.1, 49.6P1) fps ∼48%
NVIDIA GeForce RTX 4070 Laptop GPU, i9-13900HX
XMG Pro 15 E23
37.7 (5.06min, 19.8P0.1, 31P1) fps ∼42%
56.2 (19.5min, 30P0.1, 46.5P1) fps ∼44%
NVIDIA GeForce RTX 4060 Laptop GPU, R9 7940HS
Razer Blade 14 Mid 23
32.6 (3.47min, 6.88P0.1, 26.3P1) fps ∼37%
49.3 (7.23min, 25.8P0.1, 38.6P1) fps ∼38%
AMD Radeon RX 7600S, R9 7940HS
Asus TUF Gaming Advantage A16
26.6 (8.35min, 10.8P0.1, 22.8P1) fps ∼30%
NVIDIA GeForce RTX 4050 Laptop GPU, i7-13700H
Medion Erazer Scout E20
22 (7.87min, 17.6P0.1, 19.1P1) fps ∼25%
38.2 (23.7min, 29.2P0.1, 32.9P1) fps ∼30%

Overview

Show Restrictions
PosModel< PrevNext >EA Sports WRC
 EA Sports WRC (2023)
low
1920x1080
Low Preset
16xAF LowAA
med.
1920x1080
Medium Preset
16xAF MediumAA
high
1920x1080
High Preset
16xAF HighAA
ultra
1920x1080
Ultra Preset
16xAF EpicAA
QHD
2560x1440
Ultra Preset
16xAF EpicAA
4K
3840x2160
Ultra Preset
16xAF EpicAA

3840x2160
Ultra Preset + Quality DLSS
16xAF EpicAA
NVIDIA GeForce RTX 4090
239.5n2
158.95n2
148.05n2
143.65n2
139.55n2
120.85n2
131.4n2
AMD Radeon RX 7900 XTX
322
209
195.5
188.9
179.2
106.8
NVIDIA GeForce RTX 4080 Super
300n2
204.5n2
191.35n2
184.55n2
158.4n2
90.85n2
131.7n2
NVIDIA GeForce RTX 4080
179.5
170.1
153
149.4
89.1
128.9
AMD Radeon RX 7900 XT
104.4
97.9
90
87.9
81.6
AMD Radeon RX 6950 XT
272
178.9
162.9
158.9
128.2
76.7
NVIDIA GeForce RTX 4090 Laptop GPU
124.4
126.2n2
110.25n2
100.45n2
67.9
95.8
NVIDIA GeForce RTX 3090
234.5n2
169.25n2
158.2n2
147.75n2
114.8n2
67.65n2
96.9n2
NVIDIA GeForce RTX 4080 Laptop GPU
115.1
107.3
97.8
94.3
57.3
81.2
NVIDIA GeForce RTX 3080 12 GB
167.8
154.5
143.1
107.3
61.4
AMD Radeon RX 6800
240
150.9
138.4
123.4
95.6
55.7
AMD Radeon RX 7700 XT
240
155.8
140.4
125.5
92.8
51.8
NVIDIA Titan RTX
175.3
133.1
122.3
111.5
83.3
49.5
70.6
NVIDIA GeForce RTX 3070 Ti
191.4
146.5
134.9
126.3
93.8
52.2
77.5
NVIDIA GeForce RTX 3080 Ti Laptop GPU
107.8
101
91.6
72.9
42.9
61.5
NVIDIA GeForce RTX 4070 Laptop GPU
92.75n2
87.3n2
79.15n2
64.2n2
37.7
56.2
NVIDIA GeForce RTX 3070
137.4
126.8
118.3
84.5
48.6
AMD Radeon RX 6750 XT
209
129.4
115.8
103.4
78.1
45.4
AMD Radeon RX 6700 XT
192.8
123
110.2
98.2
74.1
42.5
PosModel< PrevNext >EA Sports WRC
low med. high ultra QHD 4K
NVIDIA GeForce RTX 3080 Laptop GPU
125.1
95
87.6
80.35n2
65.1n2
37.55n2
50
NVIDIA GeForce RTX 3060 Ti
164.2
122.3
113.4
105.2
75.5
41.7
62.2
Intel Arc A770
107.1
77.7
70.1
65.9
52.7
33.2
AMD Radeon RX 7600
158.8
107.4
95.8
86.1
61.2
33.8
NVIDIA GeForce RTX 4060 Laptop GPU
91.5
85.7
78.4
59.6
32.6
49.3
AMD Radeon RX 6650 XT
169
109.6
96.4
89
64
35.6
NVIDIA GeForce RTX 3070 Laptop GPU
130.8
98.1
90.7
83.4
63.2
35.5
52.5
AMD Radeon RX 7600M XT
140.7
95.6
85.4
76.9
54.9
30
Intel Arc A750
98.4
72.3
66
61
49
30.3
NVIDIA Titan X Pascal
118
85.4
78.6
71.7
53.7
31.8
NVIDIA GeForce RTX 2070 Super (Desktop)
134.4
100.8
93.3
85.5
62.2
34.9
50.8
AMD Radeon RX 5700 XT (Desktop)
138
89.4
80.1
72.6
52.7
30.1
AMD Radeon RX 7600S
80.4
73.7
66.6
48.2
26.6
Intel Arc A580
91.7
65.7
60.3
55.5
42.8
26.7
NVIDIA GeForce RTX 2060 Super (Desktop)
122.3
89.6
81.4
73
53.6
29.7
44
AMD Radeon RX 6600
133.7
90.1
79.6
71.7
51
27.6
AMD Radeon RX 5700 (Desktop)
123.5
79.3
72.4
65.6
47.7
26.9
AMD Radeon RX 5600 XT (Desktop)
113.9
71.8
64.6
58.3
43.4
22
NVIDIA GeForce GTX 1660 Super (Desktop)
82
59.6
55.4
50.6
35.7
11.1
AMD Radeon RX 6500 XT
80.3
58.3
17.8
15.6
8.9
PosModel< PrevNext >EA Sports WRC
low med. high ultra QHD 4K
AMD Radeon RX 5500 XT (Desktop)
79
50
44.9
40.9
29.6
16.6
NVIDIA GeForce RTX 4050 Laptop GPU
75.1n2
69.75n2
64.15n2
42.9
22
38.2
Intel Arc A730M
65.9
48.8
42.9
40.2
27.8
NVIDIA GeForce GTX 1660 Ti Mobile
77.9
56.8
51.8
46.9
NVIDIA GeForce GTX 1660 (Desktop)
76.1
55
50.8
47.1
27.8
12.9
NVIDIA GeForce GTX 1650 Super (Desktop)
71.3
55.3
31.4
27.4
10.7
NVIDIA GeForce RTX 3050 4GB Laptop GPU
65.7
51.8
34.4
30
NVIDIA GeForce GTX 1650 Ti Mobile
51.6
42.5
31.8
26.7
NVIDIA GeForce RTX 2050 Mobile
33.8
27
20.4
14.9
NVIDIA GeForce GTX 1650 Mobile
50.5
40.8
26.4
17.8
Intel Arc A380
41.2
30.2
27.5
25.2
Intel Arc A310
34.3
27.3
18.6
16.8
Intel Arc 8-Cores iGPU
35.8
26.6
24.7
22.4
Intel Arc 7-Cores iGPU
28.6
21
19.2
17.9
AMD Radeon 780M
36.5n2
24.9n2
22n2
20.6n2
16
NVIDIA GeForce MX350
10.1
NVIDIA GeForce MX250
10.6
Intel Iris Plus Graphics G7 (Ice Lake 64 EU)
12.4
Intel UHD Graphics Xe 32EUs (Tiger Lake-H)
11.1
AMD Radeon RX Vega 8 (Ryzen 4000/5000)
14.2
PosModel< PrevNext >EA Sports WRC
low med. high ultra QHD 4K
Intel UHD Graphics Xe 16EUs (Tiger Lake-H)
6.6
Intel UHD Graphics 620
5.46
AMD Radeon R5 M255
2.72
AMD Radeon RX Vega 3
6.99
(-) * Smaller values are better. / n123 Number of benchmarks for this median value / * Approximate position


Legend
5Stutters – This game is very likely to stutter and have poor frame rates. Based on all known benchmarks using the specified graphical settings, average frame rates are expected to fall below 25fps
May Stutter – This graphics card has not been explicitly tested on this game. Based on interpolated information from surrounding graphics cards of similar performance levels, stutters and poor frame rates are expected.
30Fluent – Based on all known benchmarks using the specified graphical settings, this game should run at or above 25fps
40Fluent – Based on all known benchmarks using the specified graphical settings, this game should run at or above 35fps
60Fluent – Based on all known benchmarks using the specified graphical settings, this game should run at or above 58fps
May Run Fluently – This graphics card has not been explicitly tested on this game. Based on interpolated information from surrounding graphics cards of similar performance levels, fluent frame rates are expected.
?Uncertain – This graphics card experienced unexpected performance issues during testing for this game. A slower card may be able to achieve better and more consistent frame rates than this particular GPU running the same benchmark scene.
Uncertain – This graphics card has not been explicitly tested on this game and no reliable interpolation can be made based on the performances of surrounding cards of the same class or family.
The value in the fields displays the average frame rate of all values in the database. Move your cursor over the value to see individual results.

Test system details

笔记本 显卡 处理器 内存
XMG Neo 17 E23 NvidiaGeForce RTX 4090 @175 W TGP (16 GB GDDR6X) Intel Core i9-13900HX 2 x 16 GB DDR5
Razer Blade 16 Mid 23 NvidiaGeForce RTX 4080 @175 W TGP (12 GB GDDR6X) Intel Core i9-13950HX 2 x 16 GB DDR5
XMG Pro 15 E23 NvidiaGeForce RTX 4070 @140 W TGP (8 GB GDDR6) Intel Core i9-13900HX 2 x 16 GB DDR5
Razer Blade 14 Mid 23 NvidiaGeForce RTX 4060 @140 W TGP (8 GB GDDR6) AMD Ryzen 9 7940HS 2 x 8 GB DDR5
Medion Erazer Scout E20 NvidiaGeForce RTX 4050 @100 W TGP (6 GB GDDR6) Intel Core i7-13700H 2 x 8 GB DDR5
华硕 ROG Strix Scar 17 NvidiaGeForce RTX 3080 Ti @150 W TGP (16 GB GDDR6) Intel Core i9-12900H 2 x 16 GB DDR5
华硕 TUF Gaming Advantage A16 AMD Radeon RX 7600S (8 GB GDDR6) & AMD Radeon 780M AMD Ryzen 9 7940HS 2 x 8 GB DDR5
塔式电脑 显卡 处理器 内存
华硕 ROG Strix Z790-F NvidiaGeForce RTX 4080 (16 GB GDDR6X)
AMD Radeon RX 7900 XT (20 GB GDDR6)
Intel Core i9-13900K 2 x 24 GB DDR5 G.Skill
4K 显示器 操作系统 Nvidia 驱动程序 AMD 驱动程序
Philips Evnia 42M2N8900 Windows 11 ForceWare 546.17 Adrenalin 23.11.1
Please share our article, every link counts!
> Notebookcheck中文版(NBC中国) > 评测 > EA Sports 世界拉力锦标赛回顾:笔记本电脑和台式机基准测试
Florian Glaser, 2023-11-22 (Update: 2023-11-22)