微星 GL72 7RD-028 笔记本电脑(酷睿i7, 全高清) 简短评测

| SD Card Reader | |
| average JPG Copy Test (av. of 3 runs) | |
| Nexoc G739 | |
| Asus GL753VE-DS74 | |
| MSI GE72 7RE-046 | |
| Acer Aspire Nitro BE VN7-793G-5811 | |
| MSI GL72 7RDX-602 | |
| maximum AS SSD Seq Read Test (1GB) | |
| Asus GL753VE-DS74 | |
| Nexoc G739 | |
| MSI GE72 7RE-046 | |
| Acer Aspire Nitro BE VN7-793G-5811 | |
| MSI GL72 7RDX-602 | |
| Networking | |
| iperf3 transmit AX12 | |
| Acer Aspire Nitro BE VN7-793G-5811 | |
| Asus GL753VE-DS74 | |
| Nexoc G739 | |
| MSI GL72 7RDX-602 | |
| MSI GE72 7RE-046 | |
| iperf3 receive AX12 | |
| Asus GL753VE-DS74 | |
| Acer Aspire Nitro BE VN7-793G-5811 | |
| Nexoc G739 | |
| MSI GE72 7RE-046 | |
| MSI GL72 7RDX-602 | |
| |||||||||||||||||||||||||
Brightness Distribution: 80 %
Center on Battery: 300 cd/m²
Contrast: 1196:1 (Black: 0.25 cd/m²)
ΔE ColorChecker Calman: 12.92 | ∀{0.5-29.43 Ø4.72}
ΔE Greyscale Calman: 13.16 | ∀{0.09-98 Ø4.97}
94% sRGB (Argyll 1.6.3 3D)
60% AdobeRGB 1998 (Argyll 1.6.3 3D)
65.6% AdobeRGB 1998 (Argyll 3D)
94.3% sRGB (Argyll 3D)
65.2% Display P3 (Argyll 3D)
Gamma: 2.36
CCT: 15046 K
| MSI GL72 7RDX-602 Chi Mei CMN1735 N173HGE-E11, , 1920x1080, 17.3" | Acer Aspire Nitro BE VN7-793G-5811 AU Optronics, , 1920x1080, 17.3" | Nexoc G739 CMN1738, , 1920x1080, 17.3" | Asus GL753VE-DS74 LG Philips LP173WF4-SPF3, , 1920x1080, 17.3" | MSI GE72 7RE-046 N173HHE-G32 (CMN1747), , 1920x1080, 17.3" | MSI GL72 6QF 1920x1080, 17.3" | |
|---|---|---|---|---|---|---|
| Display | -5% | 0% | 25% | 1% | ||
| Display P3 Coverage (%) | 65.2 | 63.1 -3% | 66.7 2% | 90.7 39% | 65.9 1% | |
| sRGB Coverage (%) | 94.3 | 86.5 -8% | 91 -3% | 99.9 6% | 95.6 1% | |
| AdobeRGB 1998 Coverage (%) | 65.6 | 63.3 -4% | 66.4 1% | 85.2 30% | 66.7 2% | |
| Response Times | -18% | -32% | -5% | 36% | -28% | |
| Response Time Grey 50% / Grey 80% * (ms) | 29 ? | 38 ? -31% | 45 ? -55% | 36 ? -24% | 27 ? 7% | 45.6 ? -57% |
| Response Time Black / White * (ms) | 26 ? | 27 ? -4% | 28 ? -8% | 22 ? 15% | 9 ? 65% | 25.6 ? 2% |
| PWM Frequency (Hz) | 961 | 450 ? | 980 ? | |||
| Screen | 12% | 23% | 19% | 16% | -7% | |
| Brightness middle (cd/m²) | 299 | 301 1% | 312 4% | 366 22% | 253 -15% | 194.7 -35% |
| Brightness (cd/m²) | 274 | 270 -1% | 304 11% | 348 27% | 230 -16% | 183 -33% |
| Brightness Distribution (%) | 80 | 79 -1% | 85 6% | 90 13% | 86 8% | 79 -1% |
| Black Level * (cd/m²) | 0.25 | 0.38 -52% | 0.23 8% | 0.35 -40% | 0.24 4% | 0.247 1% |
| Contrast (:1) | 1196 | 792 -34% | 1357 13% | 1046 -13% | 1054 -12% | 788 -34% |
| Colorchecker dE 2000 * | 12.92 | 3.49 73% | 4.19 68% | 4.4 66% | 5.01 61% | 11.44 11% |
| Colorchecker dE 2000 max. * | 19.91 | 7.49 62% | 8.7 56% | 9.7 51% | 10.4 48% | 18.78 6% |
| Greyscale dE 2000 * | 13.16 | 1.88 86% | 3.72 72% | 3 77% | 7.26 45% | 11.36 14% |
| Gamma | 2.36 93% | 2.35 94% | 2.29 96% | 2.1 105% | 2.09 105% | 2.12 104% |
| CCT | 15046 43% | 6587 99% | 7104 91% | 6362 102% | 6329 103% | 12948 50% |
| Color Space (Percent of AdobeRGB 1998) (%) | 60 | 56 -7% | 59 -2% | 56 -7% | 76 27% | 60.8 1% |
| Color Space (Percent of sRGB) (%) | 94 | 86 -9% | 91 -3% | 86 -9% | 100 6% | 95.3 1% |
| Total Average (Program / Settings) | -4% /
5% | -3% /
11% | 7% /
15% | 26% /
20% | -11% /
-8% |
* ... smaller is better
Display Response Times
| ↔ Response Time Black to White | ||
|---|---|---|
| 26 ms ... rise ↗ and fall ↘ combined | ↗ 21 ms rise | 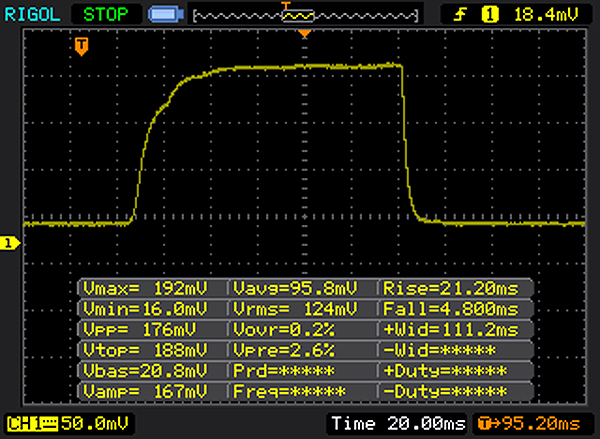 |
| ↘ 5 ms fall | ||
| The screen shows relatively slow response rates in our tests and may be too slow for gamers. In comparison, all tested devices range from 0.1 (minimum) to 240 (maximum) ms. » 63 % of all devices are better. This means that the measured response time is worse than the average of all tested devices (19.8 ms). | ||
| ↔ Response Time 50% Grey to 80% Grey | ||
| 29 ms ... rise ↗ and fall ↘ combined | ↗ 14 ms rise | 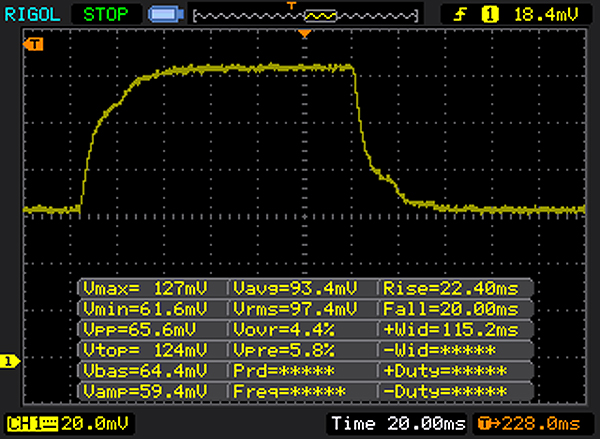 |
| ↘ 15 ms fall | ||
| The screen shows relatively slow response rates in our tests and may be too slow for gamers. In comparison, all tested devices range from 0.165 (minimum) to 636 (maximum) ms. » 39 % of all devices are better. This means that the measured response time is similar to the average of all tested devices (31 ms). | ||
Screen Flickering / PWM (Pulse-Width Modulation)
| Screen flickering / PWM detected | 961 Hz | 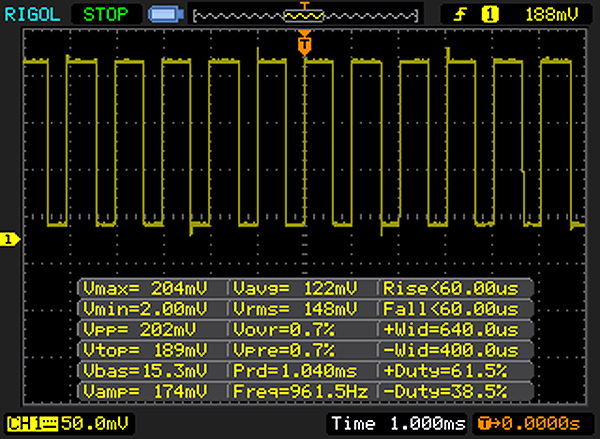 | |
The display backlight flickers at 961 Hz (worst case, e.g., utilizing PWM) . The frequency of 961 Hz is quite high, so most users sensitive to PWM should not notice any flickering. In comparison: 52 % of all tested devices do not use PWM to dim the display. If PWM was detected, an average of 7747 (minimum: 5 - maximum: 343500) Hz was measured. | |||
| Cinebench R15 | |
| CPU Single 64Bit | |
| Nexoc G739 | |
| Asus GL753VE-DS74 | |
| MSI GL72 7RDX-602 | |
| MSI GE72 7RE-046 | |
| MSI GL72 6QF | |
| Acer Aspire Nitro BE VN7-793G-5811 | |
| CPU Multi 64Bit | |
| Nexoc G739 | |
| Asus GL753VE-DS74 | |
| MSI GE72 7RE-046 | |
| MSI GL72 7RDX-602 | |
| MSI GL72 6QF | |
| Acer Aspire Nitro BE VN7-793G-5811 | |
| PCMark 8 | |
| Home Score Accelerated v2 | |
| Nexoc G739 | |
| MSI GL72 6QF | |
| Acer Aspire Nitro BE VN7-793G-5811 | |
| Asus GL753VE-DS74 | |
| MSI GL72 7RDX-602 | |
| Work Score Accelerated v2 | |
| Nexoc G739 | |
| Asus GL753VE-DS74 | |
| MSI GL72 6QF | |
| MSI GL72 7RDX-602 | |
| Acer Aspire Nitro BE VN7-793G-5811 | |
| PCMark 8 Home Score Accelerated v2 | 3220 points | |
| PCMark 8 Creative Score Accelerated v2 | 3553 points | |
| PCMark 8 Work Score Accelerated v2 | 4735 points | |
Help | ||
| MSI GL72 7RDX-602 HGST Travelstar 7K1000 HTS721010A9E630 | Acer Aspire Nitro BE VN7-793G-5811 Seagate Mobile HDD 1TB ST1000LM035 | Nexoc G739 Samsung PM961 MZVLW256HEHP | Asus GL753VE-DS74 Intel SSD 600p SSDPEKKW512G7 | MSI GL72 6QF Samsung SSD 950 Pro 256GB m.2 NVMe | |
|---|---|---|---|---|---|
| CrystalDiskMark 3.0 | 67% | 17392% | 5607% | 14630% | |
| Read Seq (MB/s) | 135.3 | 117.6 -13% | 1666 1131% | 1049 675% | 2217 1539% |
| Write Seq (MB/s) | 127 | 109.1 -14% | 1192 839% | 584 360% | 950 648% |
| Read 512 (MB/s) | 45.57 | 39.93 -12% | 857 1781% | 583 1179% | 938 1958% |
| Write 512 (MB/s) | 58.3 | 98.6 69% | 827 1319% | 458 686% | 719 1133% |
| Read 4k (MB/s) | 0.582 | 0.435 -25% | 60.7 10330% | 14.1 2323% | 51.9 8818% |
| Write 4k (MB/s) | 1.022 | 3.152 208% | 154.5 15017% | 108 10468% | 149.7 14548% |
| Read 4k QD32 (MB/s) | 1.068 | 1.008 -6% | 636 59451% | 57.8 5312% | 634 59263% |
| Write 4k QD32 (MB/s) | 1.102 | 4.705 327% | 544 49265% | 264 23856% | 322.1 29129% |

| 3DMark 11 - 1280x720 Performance GPU | |
| Acer Aspire Nitro BE VN7-793G-5811 | |
| MSI GE72 7RE-046 | |
| Nexoc G739 | |
| MSI GL72 7RDX-602 | |
| MSI GL72 6QF | |
| 3DMark | |
| 1280x720 Cloud Gate Standard Graphics | |
| Nexoc G739 | |
| Acer Aspire Nitro BE VN7-793G-5811 | |
| MSI GE72 7RE-046 | |
| Asus GL753VE-DS74 | |
| MSI GL72 7RDX-602 | |
| MSI GL72 6QF | |
| 1920x1080 Fire Strike Graphics | |
| MSI GE72 7RE-046 | |
| Nexoc G739 | |
| Acer Aspire Nitro BE VN7-793G-5811 | |
| Asus GL753VE-DS74 | |
| MSI GL72 7RDX-602 | |
| MSI GL72 6QF | |
| 3DMark 11 Performance | 7594 points | |
| 3DMark Ice Storm Standard Score | 63241 points | |
| 3DMark Cloud Gate Standard Score | 19306 points | |
| 3DMark Fire Strike Score | 5622 points | |
Help | ||
| BioShock Infinite | |
| 1366x768 High Preset | |
| Acer Aspire Nitro BE VN7-793G-5811 | |
| MSI GL72 7RDX-602 | |
| MSI GL72 6QF | |
| 1920x1080 Ultra Preset, DX11 (DDOF) | |
| Asus GL753VE-DS74 | |
| Nexoc G739 | |
| Acer Aspire Nitro BE VN7-793G-5811 | |
| MSI GL72 7RDX-602 | |
| MSI GL72 6QF | |
| The Witcher 3 | |
| 1920x1080 High Graphics & Postprocessing (Nvidia HairWorks Off) | |
| Nexoc G739 | |
| MSI GE72 7RE-046 | |
| Acer Aspire Nitro BE VN7-793G-5811 | |
| MSI GL72 7RDX-602 | |
| 1920x1080 Ultra Graphics & Postprocessing (HBAO+) | |
| Asus GL753VE-DS74 | |
| Nexoc G739 | |
| MSI GE72 7RE-046 | |
| Acer Aspire Nitro BE VN7-793G-5811 | |
| MSI GL72 7RDX-602 | |
| Rise of the Tomb Raider | |
| 1366x768 Medium Preset AF:2x | |
| Nexoc G739 | |
| MSI GL72 6QF | |
| MSI GL72 7RDX-602 | |
| 1920x1080 High Preset AA:FX AF:4x | |
| Nexoc G739 | |
| MSI GE72 7RE-046 | |
| MSI GL72 7RDX-602 | |
| MSI GL72 6QF | |
| 1920x1080 Very High Preset AA:FX AF:16x | |
| Nexoc G739 | |
| MSI GE72 7RE-046 | |
| Asus GL753VE-DS74 | |
| MSI GL72 7RDX-602 | |
| MSI GL72 6QF | |
| low | med. | high | ultra | |
|---|---|---|---|---|
| BioShock Infinite (2013) | 178.2 | 146.7 | 140 | 65.2 |
| The Witcher 3 (2015) | 94.1 | 64 | 36.3 | 23.8 |
| Rise of the Tomb Raider (2016) | 110.4 | 63.3 | 38.4 | 32.2 |
Noise level
| Idle |
| 32.4 / 32.4 / 32.8 dB(A) |
| HDD |
| 32.8 dB(A) |
| DVD |
| 47 / dB(A) |
| Load |
| 40.9 / 43.6 dB(A) |
 | ||
30 dB silent 40 dB(A) audible 50 dB(A) loud |
||
min: | ||
(±) The maximum temperature on the upper side is 45 °C / 113 F, compared to the average of 40.4 °C / 105 F, ranging from 21.2 to 68.8 °C for the class Gaming.
(±) The bottom heats up to a maximum of 44 °C / 111 F, compared to the average of 43.2 °C / 110 F
(+) In idle usage, the average temperature for the upper side is 26.4 °C / 80 F, compared to the device average of 33.9 °C / 93 F.
(+) The palmrests and touchpad are reaching skin temperature as a maximum (34 °C / 93.2 F) and are therefore not hot.
(-) The average temperature of the palmrest area of similar devices was 28.8 °C / 83.8 F (-5.2 °C / -9.4 F).
MSI GL72 7RDX-602 audio analysis
(±) | speaker loudness is average but good (78 dB)
Bass 100 - 315 Hz
(-) | nearly no bass - on average 21.1% lower than median
(±) | linearity of bass is average (10.7% delta to prev. frequency)
Mids 400 - 2000 Hz
(±) | higher mids - on average 8% higher than median
(±) | linearity of mids is average (7.3% delta to prev. frequency)
Highs 2 - 16 kHz
(±) | higher highs - on average 5.1% higher than median
(+) | highs are linear (4.4% delta to prev. frequency)
Overall 100 - 16.000 Hz
(±) | linearity of overall sound is average (22.4% difference to median)
Compared to same class
» 80% of all tested devices in this class were better, 6% similar, 14% worse
» The best had a delta of 6%, average was 18%, worst was 132%
Compared to all devices tested
» 66% of all tested devices were better, 6% similar, 29% worse
» The best had a delta of 4%, average was 23%, worst was 134%
Apple MacBook 12 (Early 2016) 1.1 GHz audio analysis
(+) | speakers can play relatively loud (83.6 dB)
Bass 100 - 315 Hz
(±) | reduced bass - on average 11.3% lower than median
(±) | linearity of bass is average (14.2% delta to prev. frequency)
Mids 400 - 2000 Hz
(+) | balanced mids - only 2.4% away from median
(+) | mids are linear (5.5% delta to prev. frequency)
Highs 2 - 16 kHz
(+) | balanced highs - only 2% away from median
(+) | highs are linear (4.5% delta to prev. frequency)
Overall 100 - 16.000 Hz
(+) | overall sound is linear (10.2% difference to median)
Compared to same class
» 7% of all tested devices in this class were better, 2% similar, 90% worse
» The best had a delta of 5%, average was 18%, worst was 53%
Compared to all devices tested
» 5% of all tested devices were better, 1% similar, 94% worse
» The best had a delta of 4%, average was 23%, worst was 134%
Nexoc G739 audio analysis
(±) | speaker loudness is average but good (76 dB)
Bass 100 - 315 Hz
(-) | nearly no bass - on average 23.2% lower than median
(±) | linearity of bass is average (13.3% delta to prev. frequency)
Mids 400 - 2000 Hz
(±) | higher mids - on average 7.8% higher than median
(±) | linearity of mids is average (8% delta to prev. frequency)
Highs 2 - 16 kHz
(±) | higher highs - on average 6.4% higher than median
(±) | linearity of highs is average (12.4% delta to prev. frequency)
Overall 100 - 16.000 Hz
(-) | overall sound is not linear (31.5% difference to median)
Compared to same class
» 97% of all tested devices in this class were better, 1% similar, 2% worse
» The best had a delta of 6%, average was 18%, worst was 132%
Compared to all devices tested
» 90% of all tested devices were better, 2% similar, 8% worse
» The best had a delta of 4%, average was 23%, worst was 134%
| Off / Standby | |
| Idle | |
| Load |
|
Key:
min: | |
| MSI GL72 7RDX-602 i7-7700HQ, GeForce GTX 1050 Mobile, HGST Travelstar 7K1000 HTS721010A9E630, TN LED, 1920x1080, 17.3" | Nexoc G739 i7-7700HQ, GeForce GTX 1050 Ti Mobile, Samsung PM961 MZVLW256HEHP, IPS, 1920x1080, 17.3" | Asus GL753VE-DS74 i7-7700HQ, GeForce GTX 1050 Ti Mobile, Intel SSD 600p SSDPEKKW512G7, IPS, 1920x1080, 17.3" | MSI GE72 7RE-046 i7-7700HQ, GeForce GTX 1050 Ti Mobile, Toshiba HG6 THNSNJ256G8NY, TN LED, 1920x1080, 17.3" | MSI GL72 6QF 6700HQ, GeForce GTX 960M, Samsung SSD 950 Pro 256GB m.2 NVMe, TN, 1920x1080, 17.3" | |
|---|---|---|---|---|---|
| Power Consumption | -2% | 21% | -23% | -58% | |
| Idle Minimum * (Watt) | 9.6 | 7 27% | 7.5 22% | 14 -46% | 22.1 -130% |
| Idle Average * (Watt) | 15 | 14 7% | 11.3 25% | 20 -33% | 28.3 -89% |
| Idle Maximum * (Watt) | 16.5 | 23 -39% | 11.8 28% | 25 -52% | 29.8 -81% |
| Load Average * (Watt) | 104 | 82 21% | 82.1 21% | 82 21% | 87 16% |
| Load Maximum * (Watt) | 129 | 163 -26% | 116.6 10% | 135 -5% | 134.1 -4% |
| Witcher 3 ultra * (Watt) | 96.3 |
* ... smaller is better
| MSI GL72 7RDX-602 i7-7700HQ, GeForce GTX 1050 Mobile, 43.2 Wh | Acer Aspire Nitro BE VN7-793G-5811 i5-7300HQ, GeForce GTX 1050 Ti Mobile, 52.5 Wh | Nexoc G739 i7-7700HQ, GeForce GTX 1050 Ti Mobile, 62 Wh | Asus GL753VE-DS74 i7-7700HQ, GeForce GTX 1050 Ti Mobile, 48 Wh | MSI GE72 7RE-046 i7-7700HQ, GeForce GTX 1050 Ti Mobile, 51.4 Wh | MSI GL72 6QF 6700HQ, GeForce GTX 960M, 43 Wh | |
|---|---|---|---|---|---|---|
| Battery runtime | 35% | 105% | 29% | 5% | -10% | |
| Reader / Idle (h) | 5.5 | 10.2 85% | 8.7 58% | 4 -27% | ||
| H.264 (h) | 2.8 | 5.4 93% | 3.3 18% | |||
| WiFi v1.3 (h) | 3.4 | 4.6 35% | 4.8 41% | 3.9 15% | 3.1 -9% | 1.8 -47% |
| Load (h) | 0.7 | 2.1 200% | 0.8 14% | 1 43% |
Pros
Cons
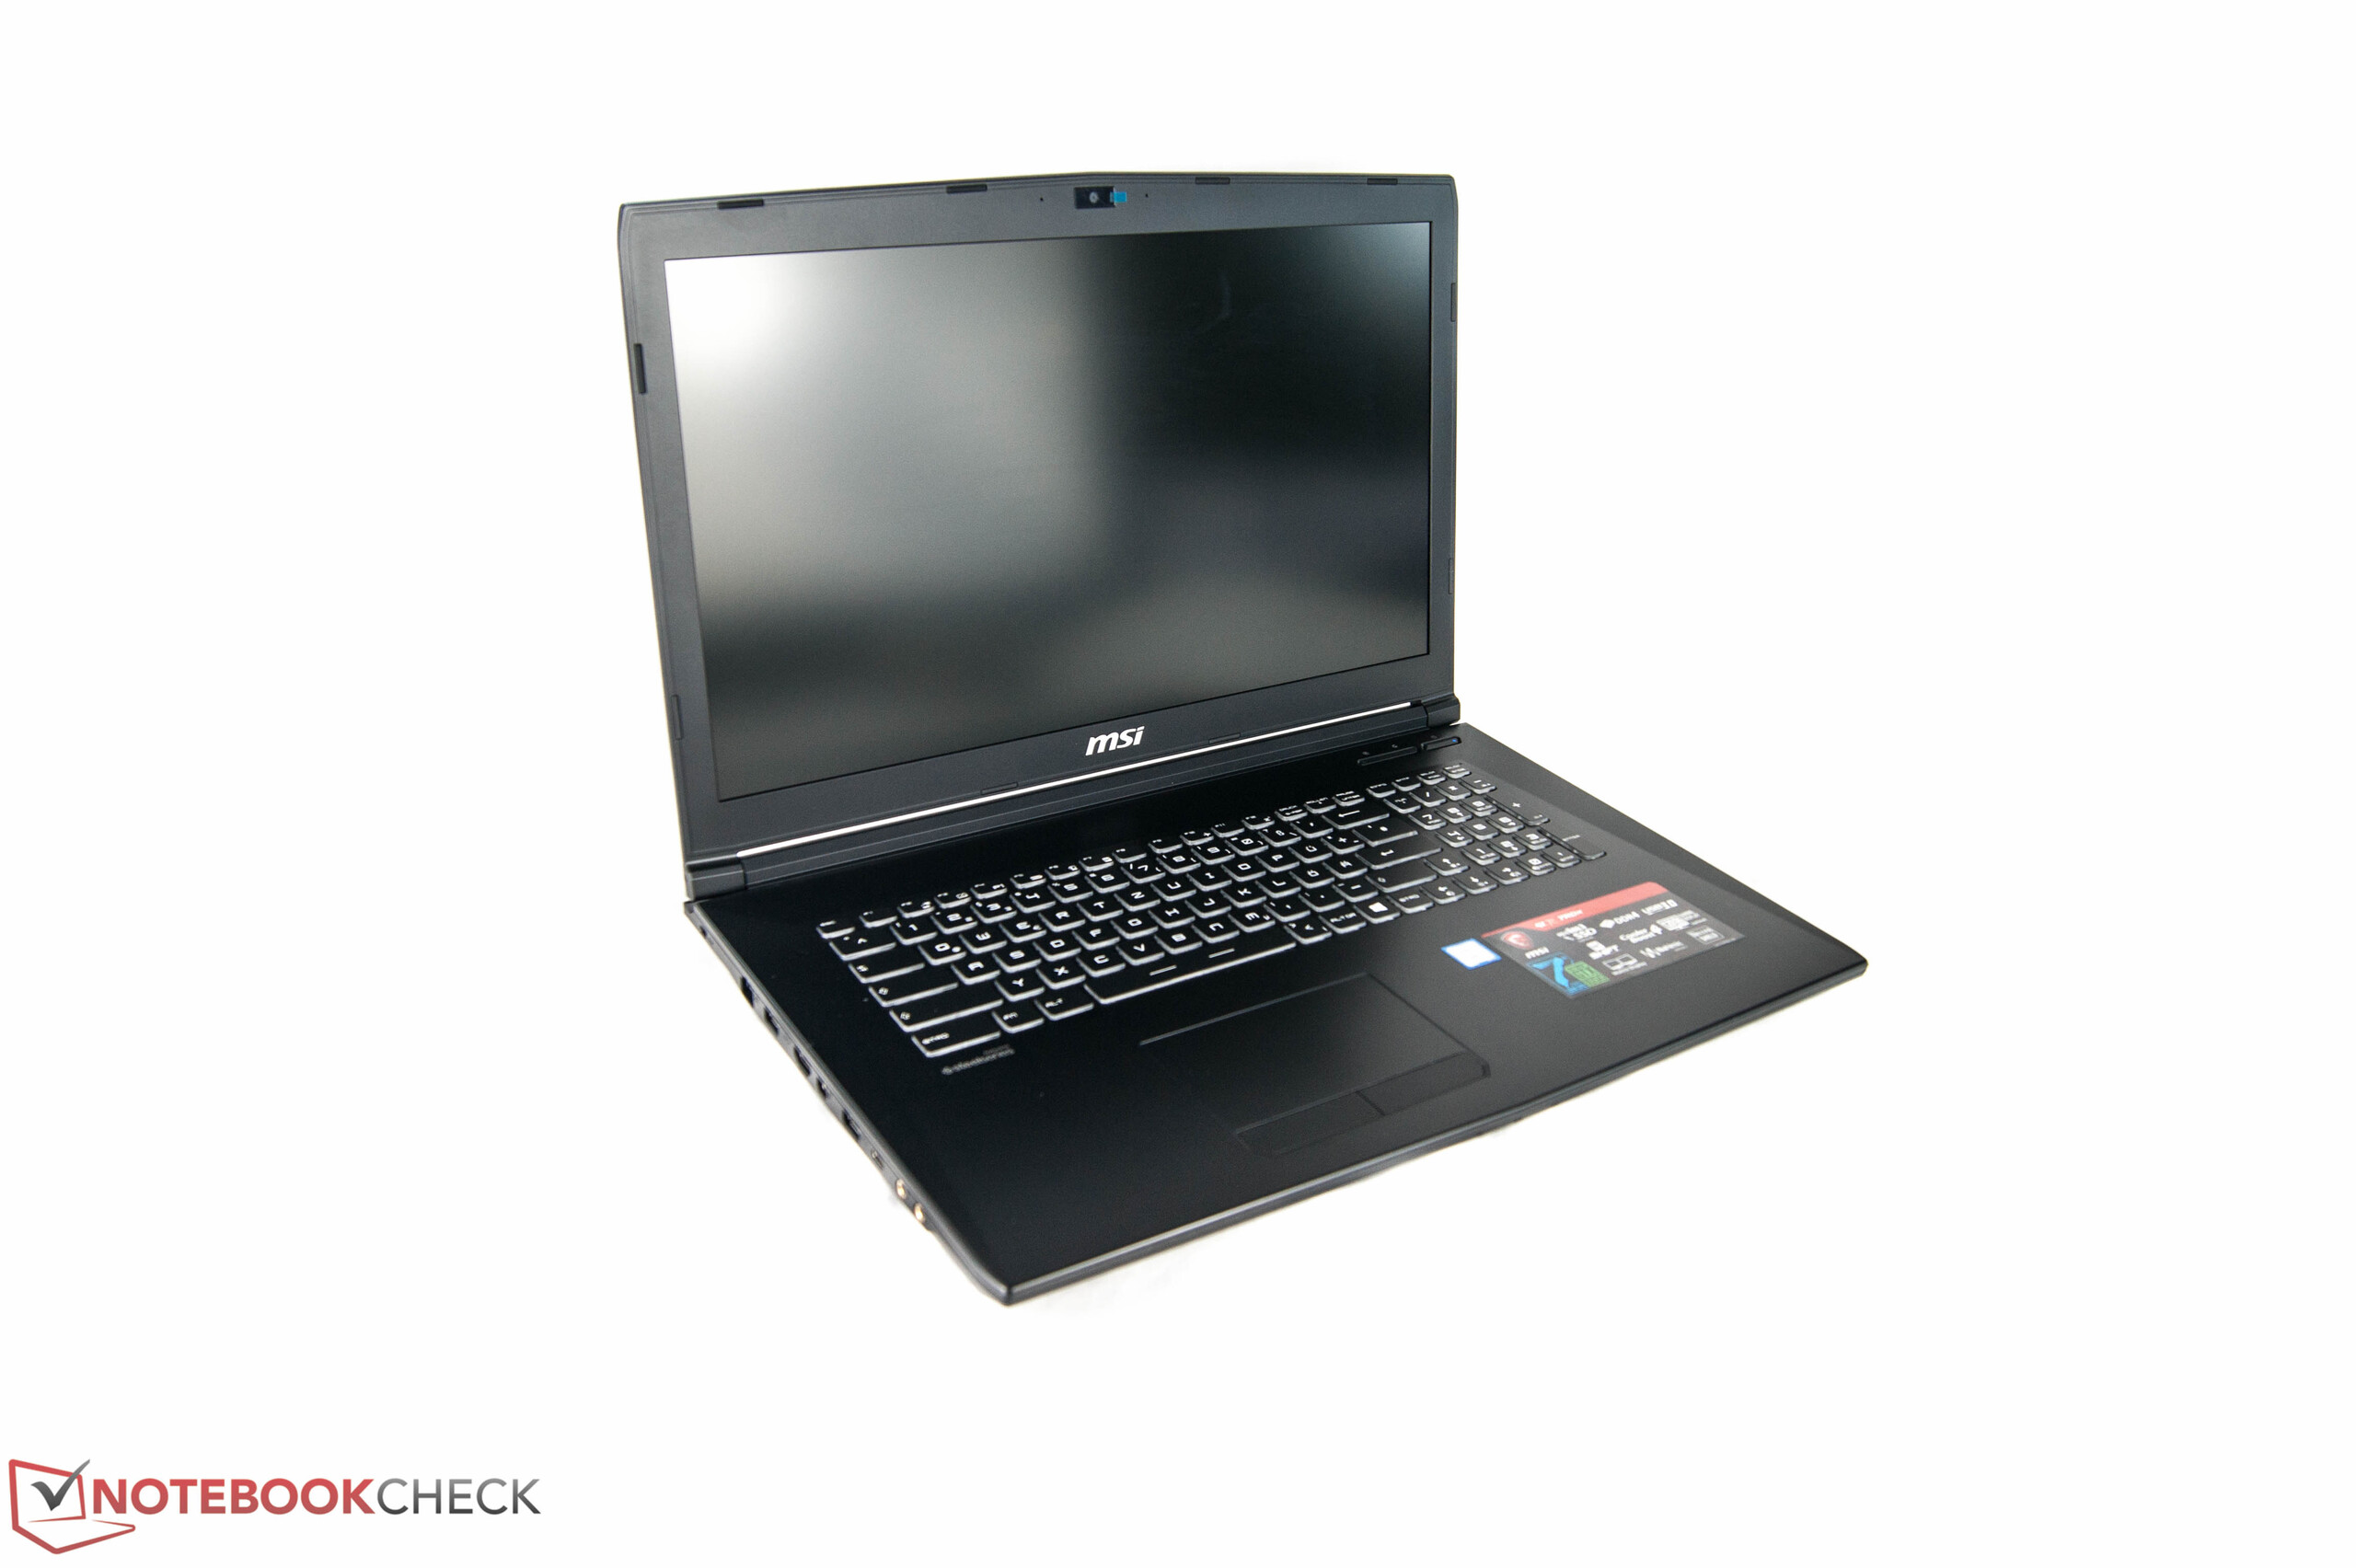
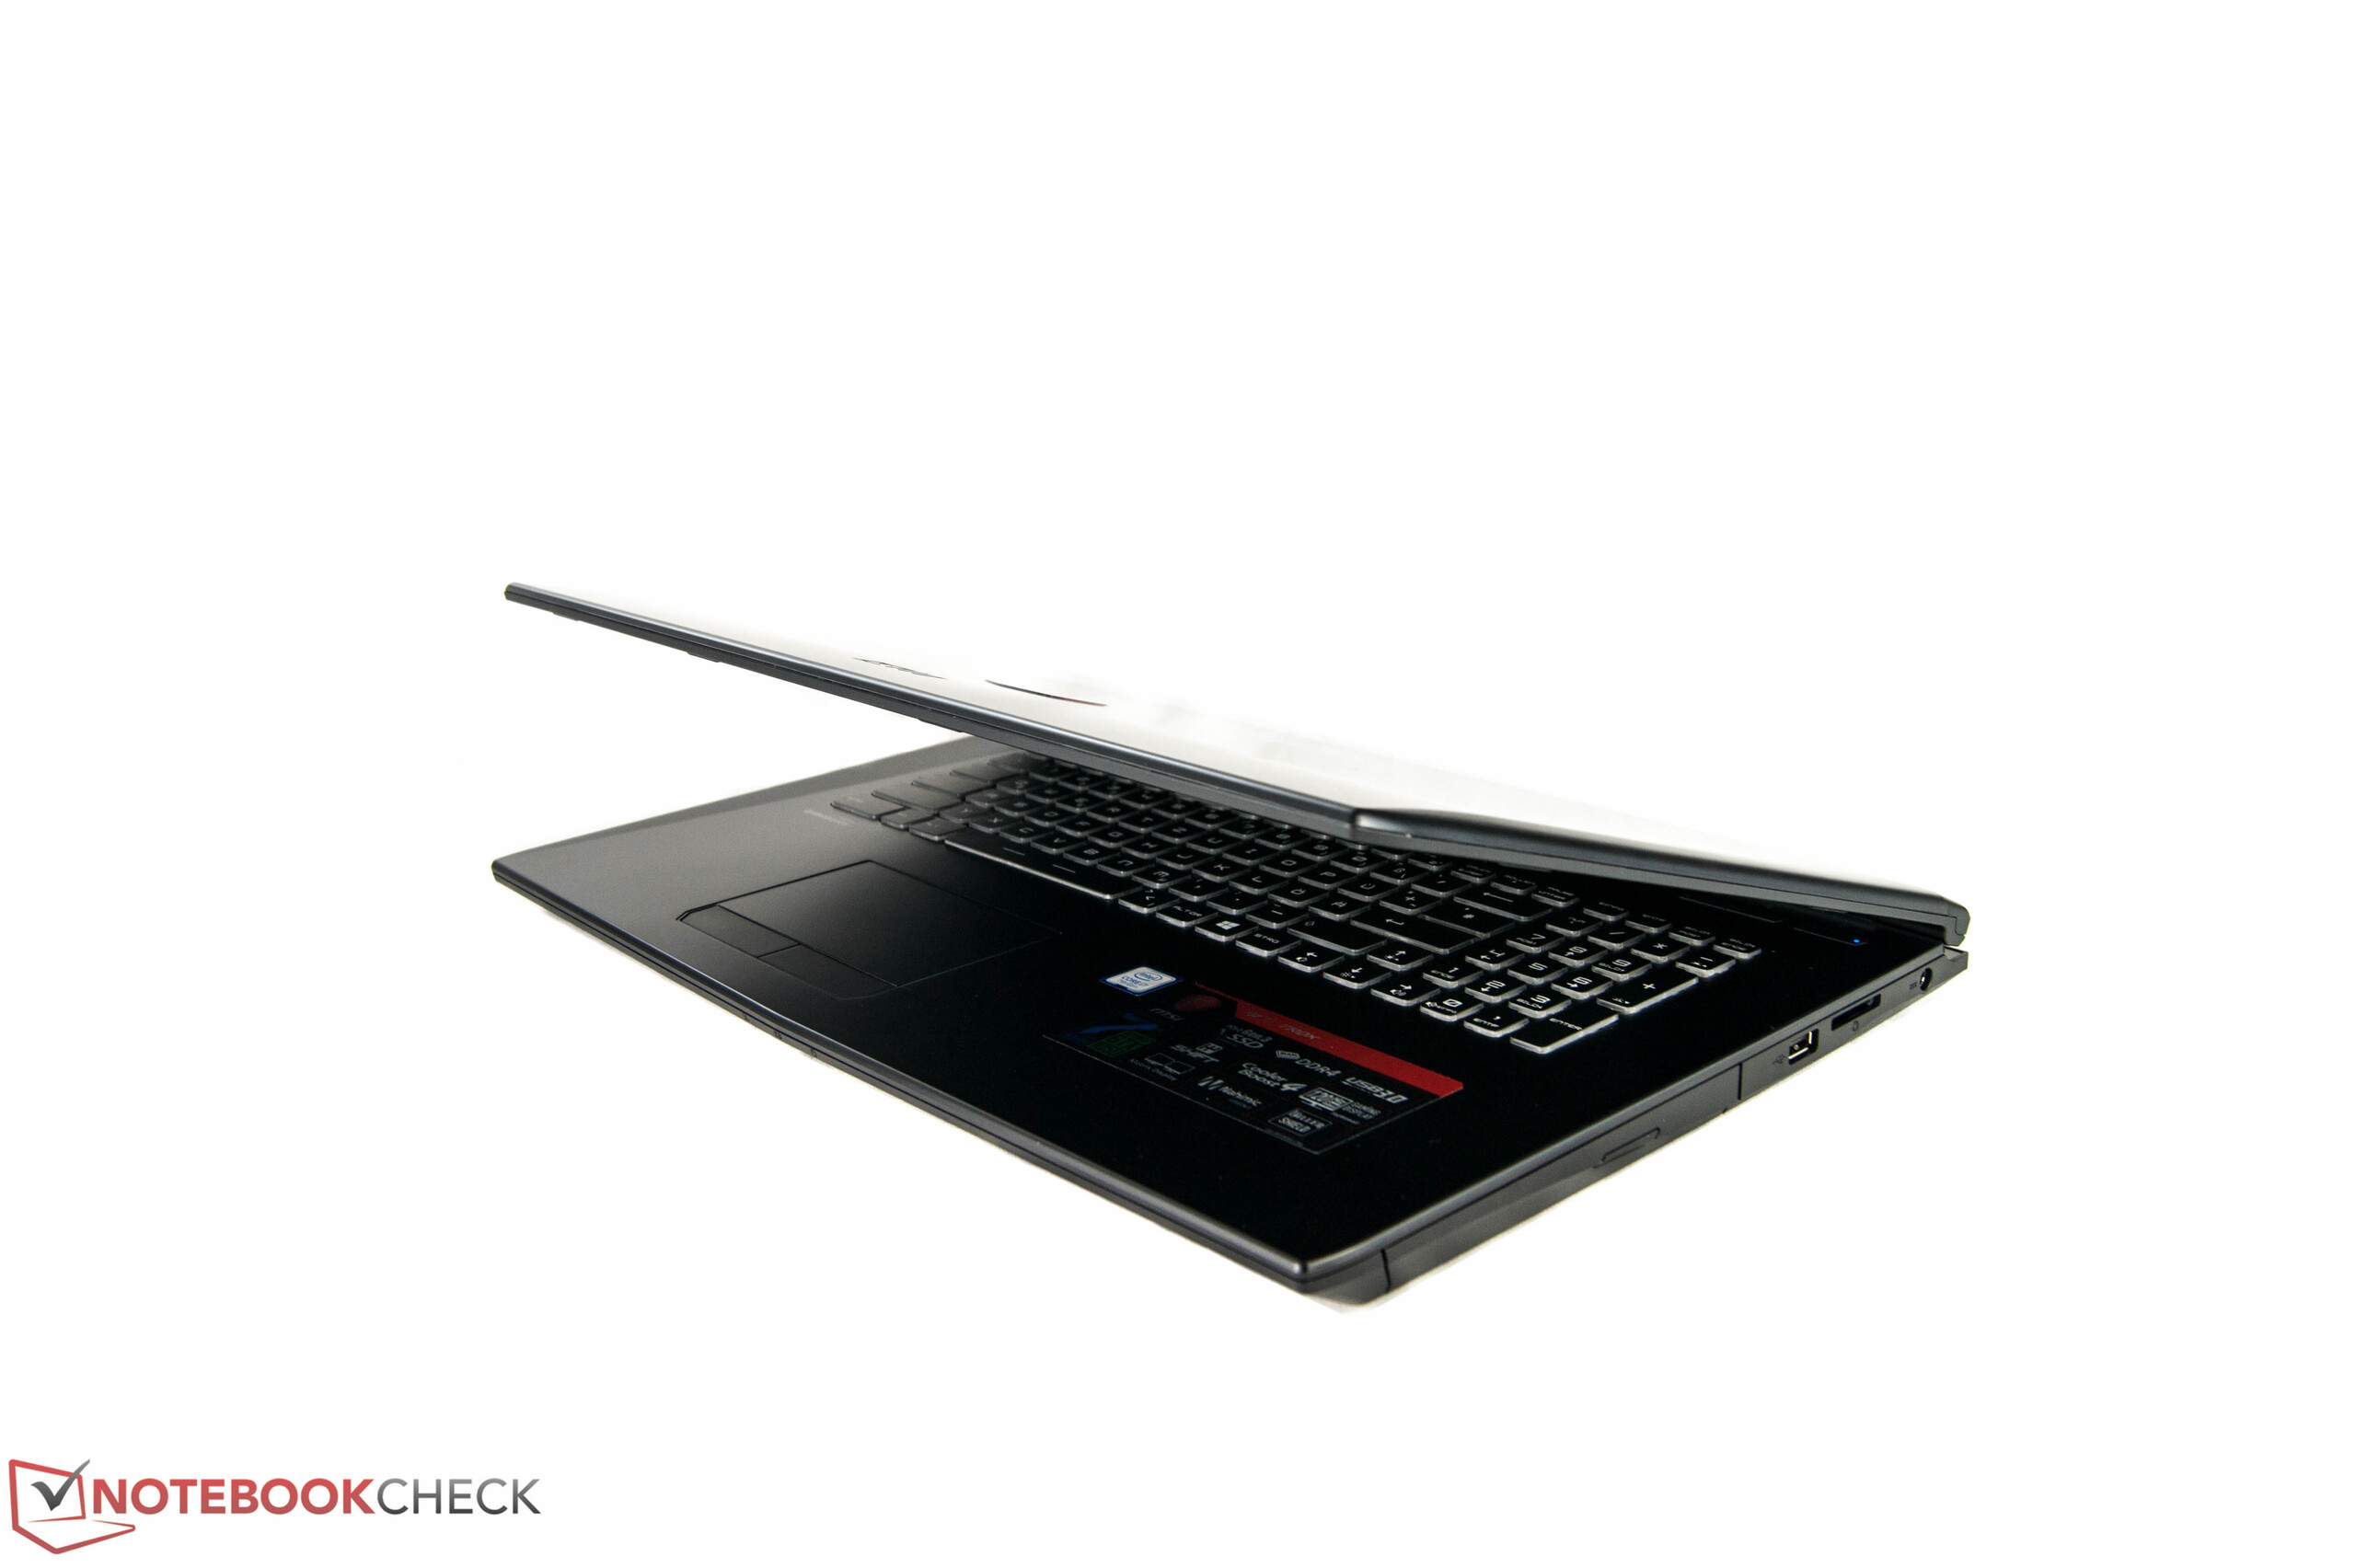
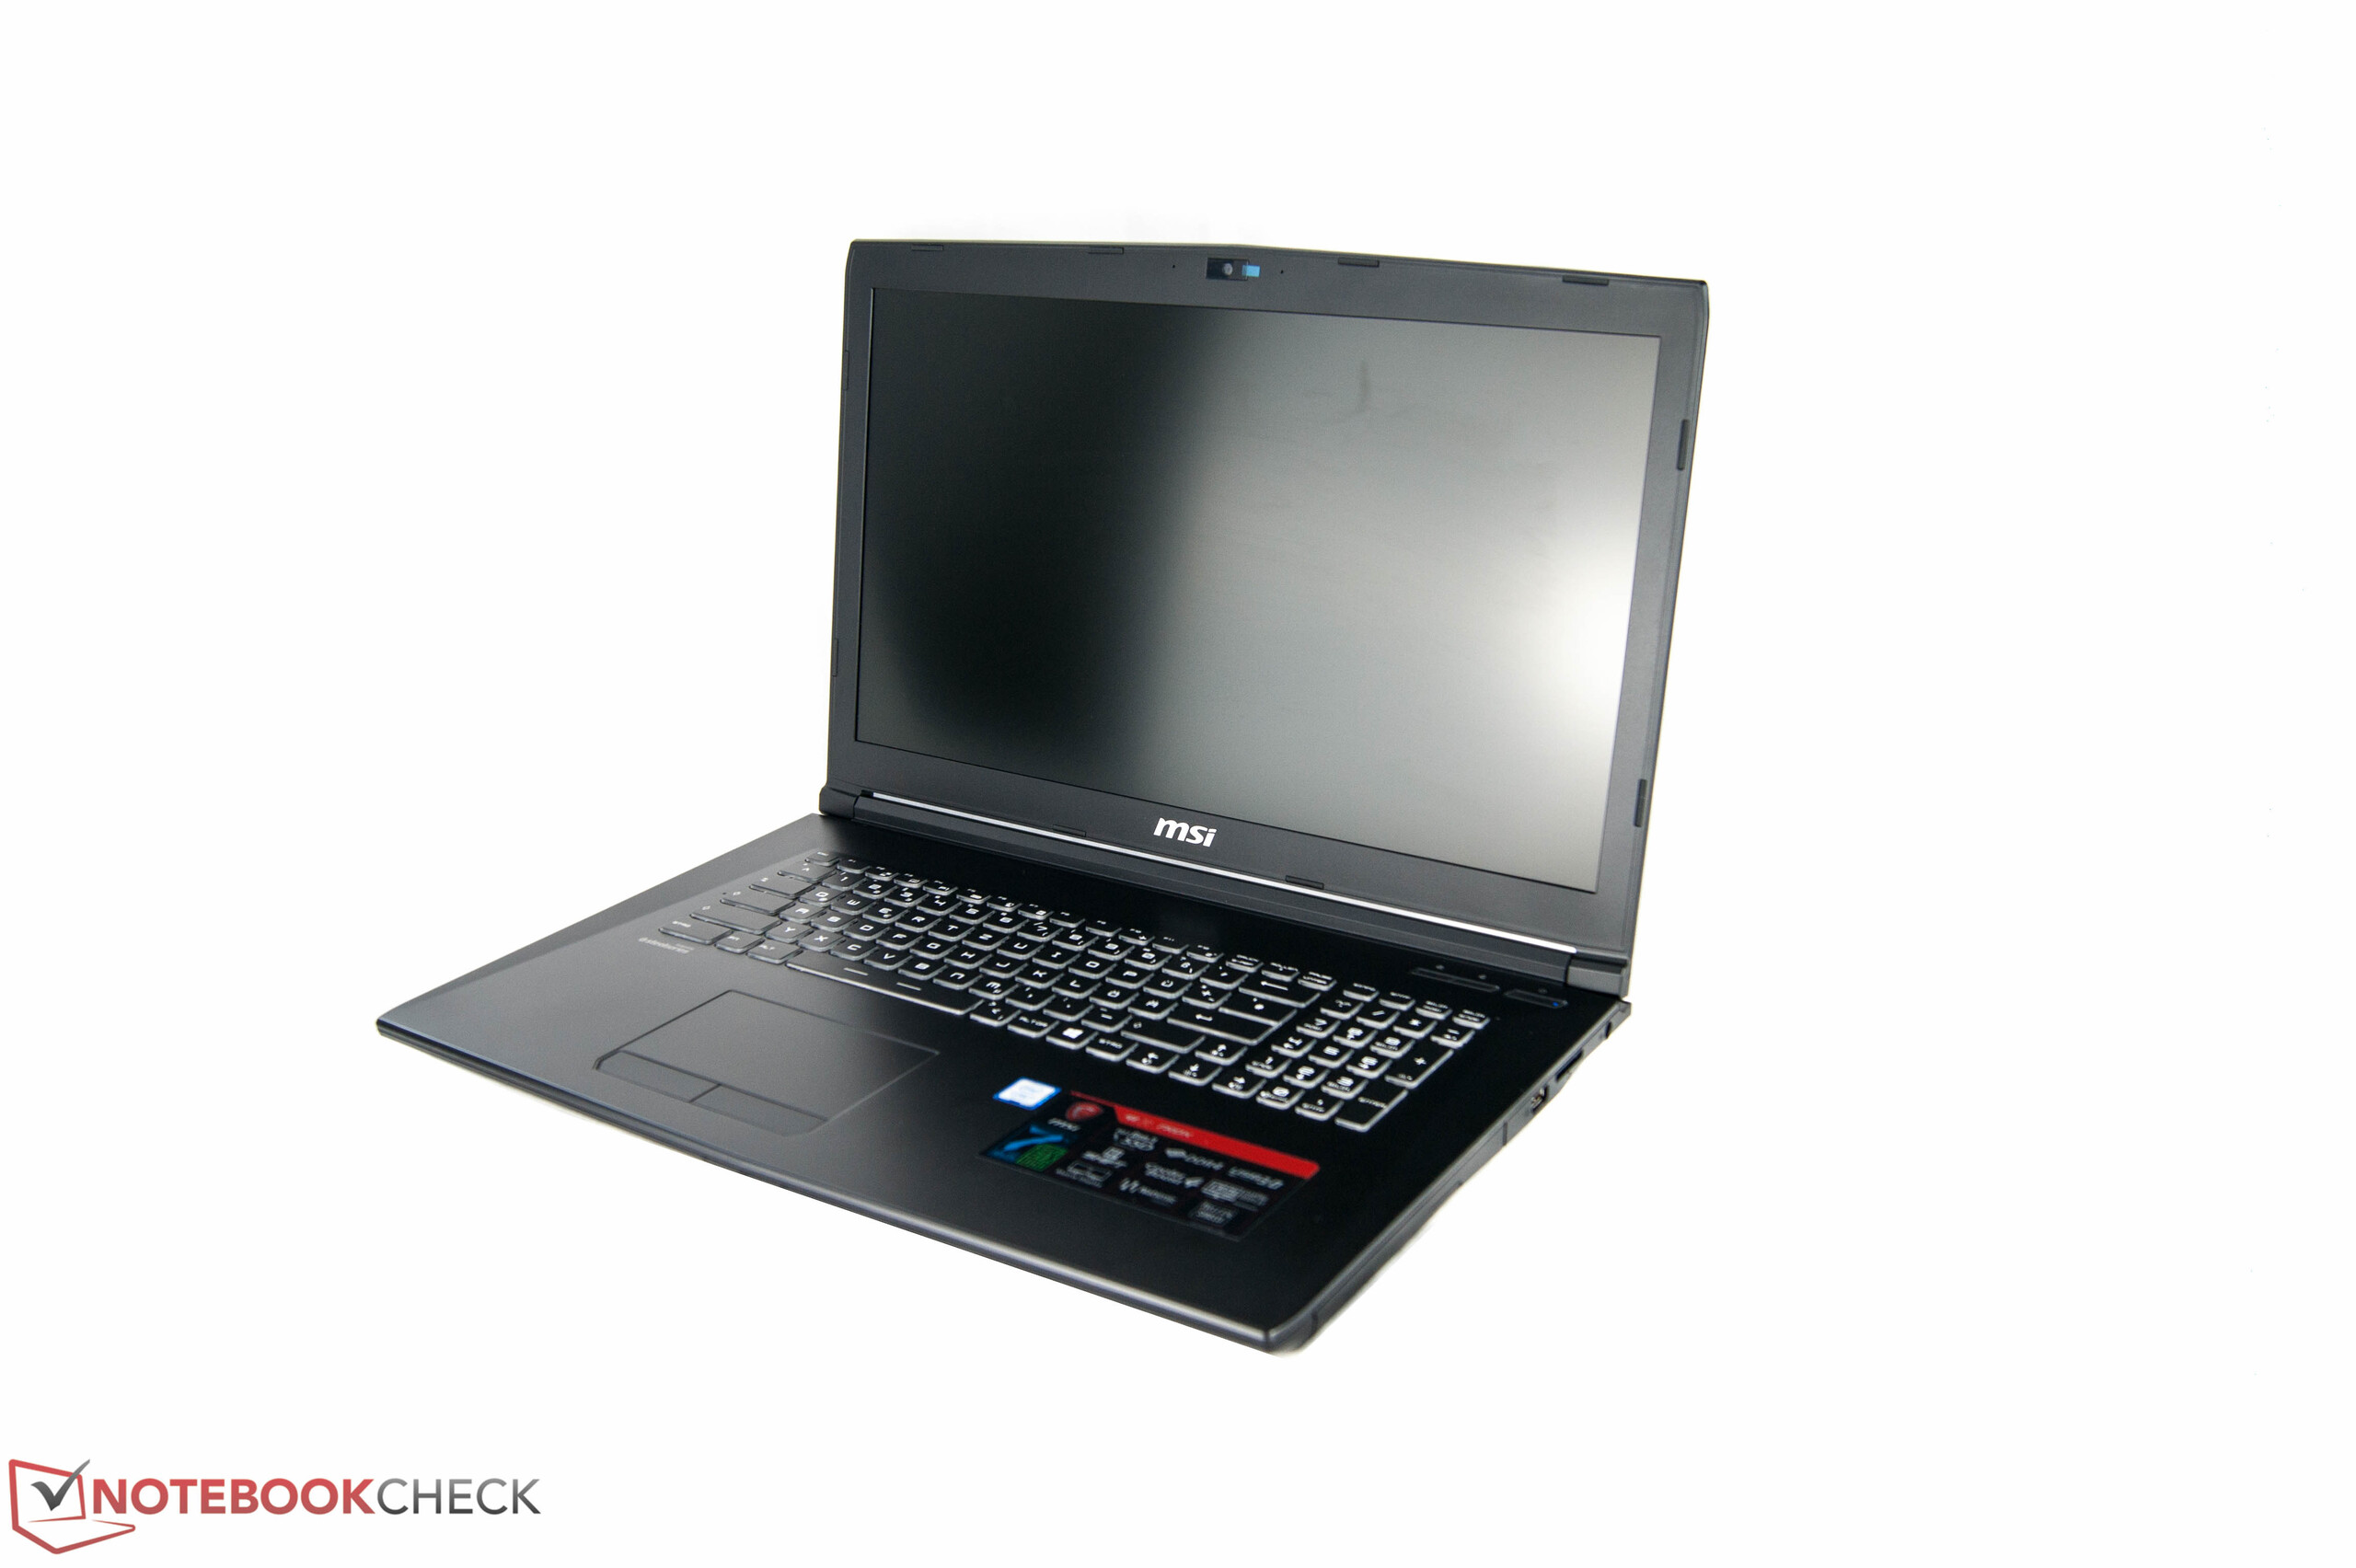
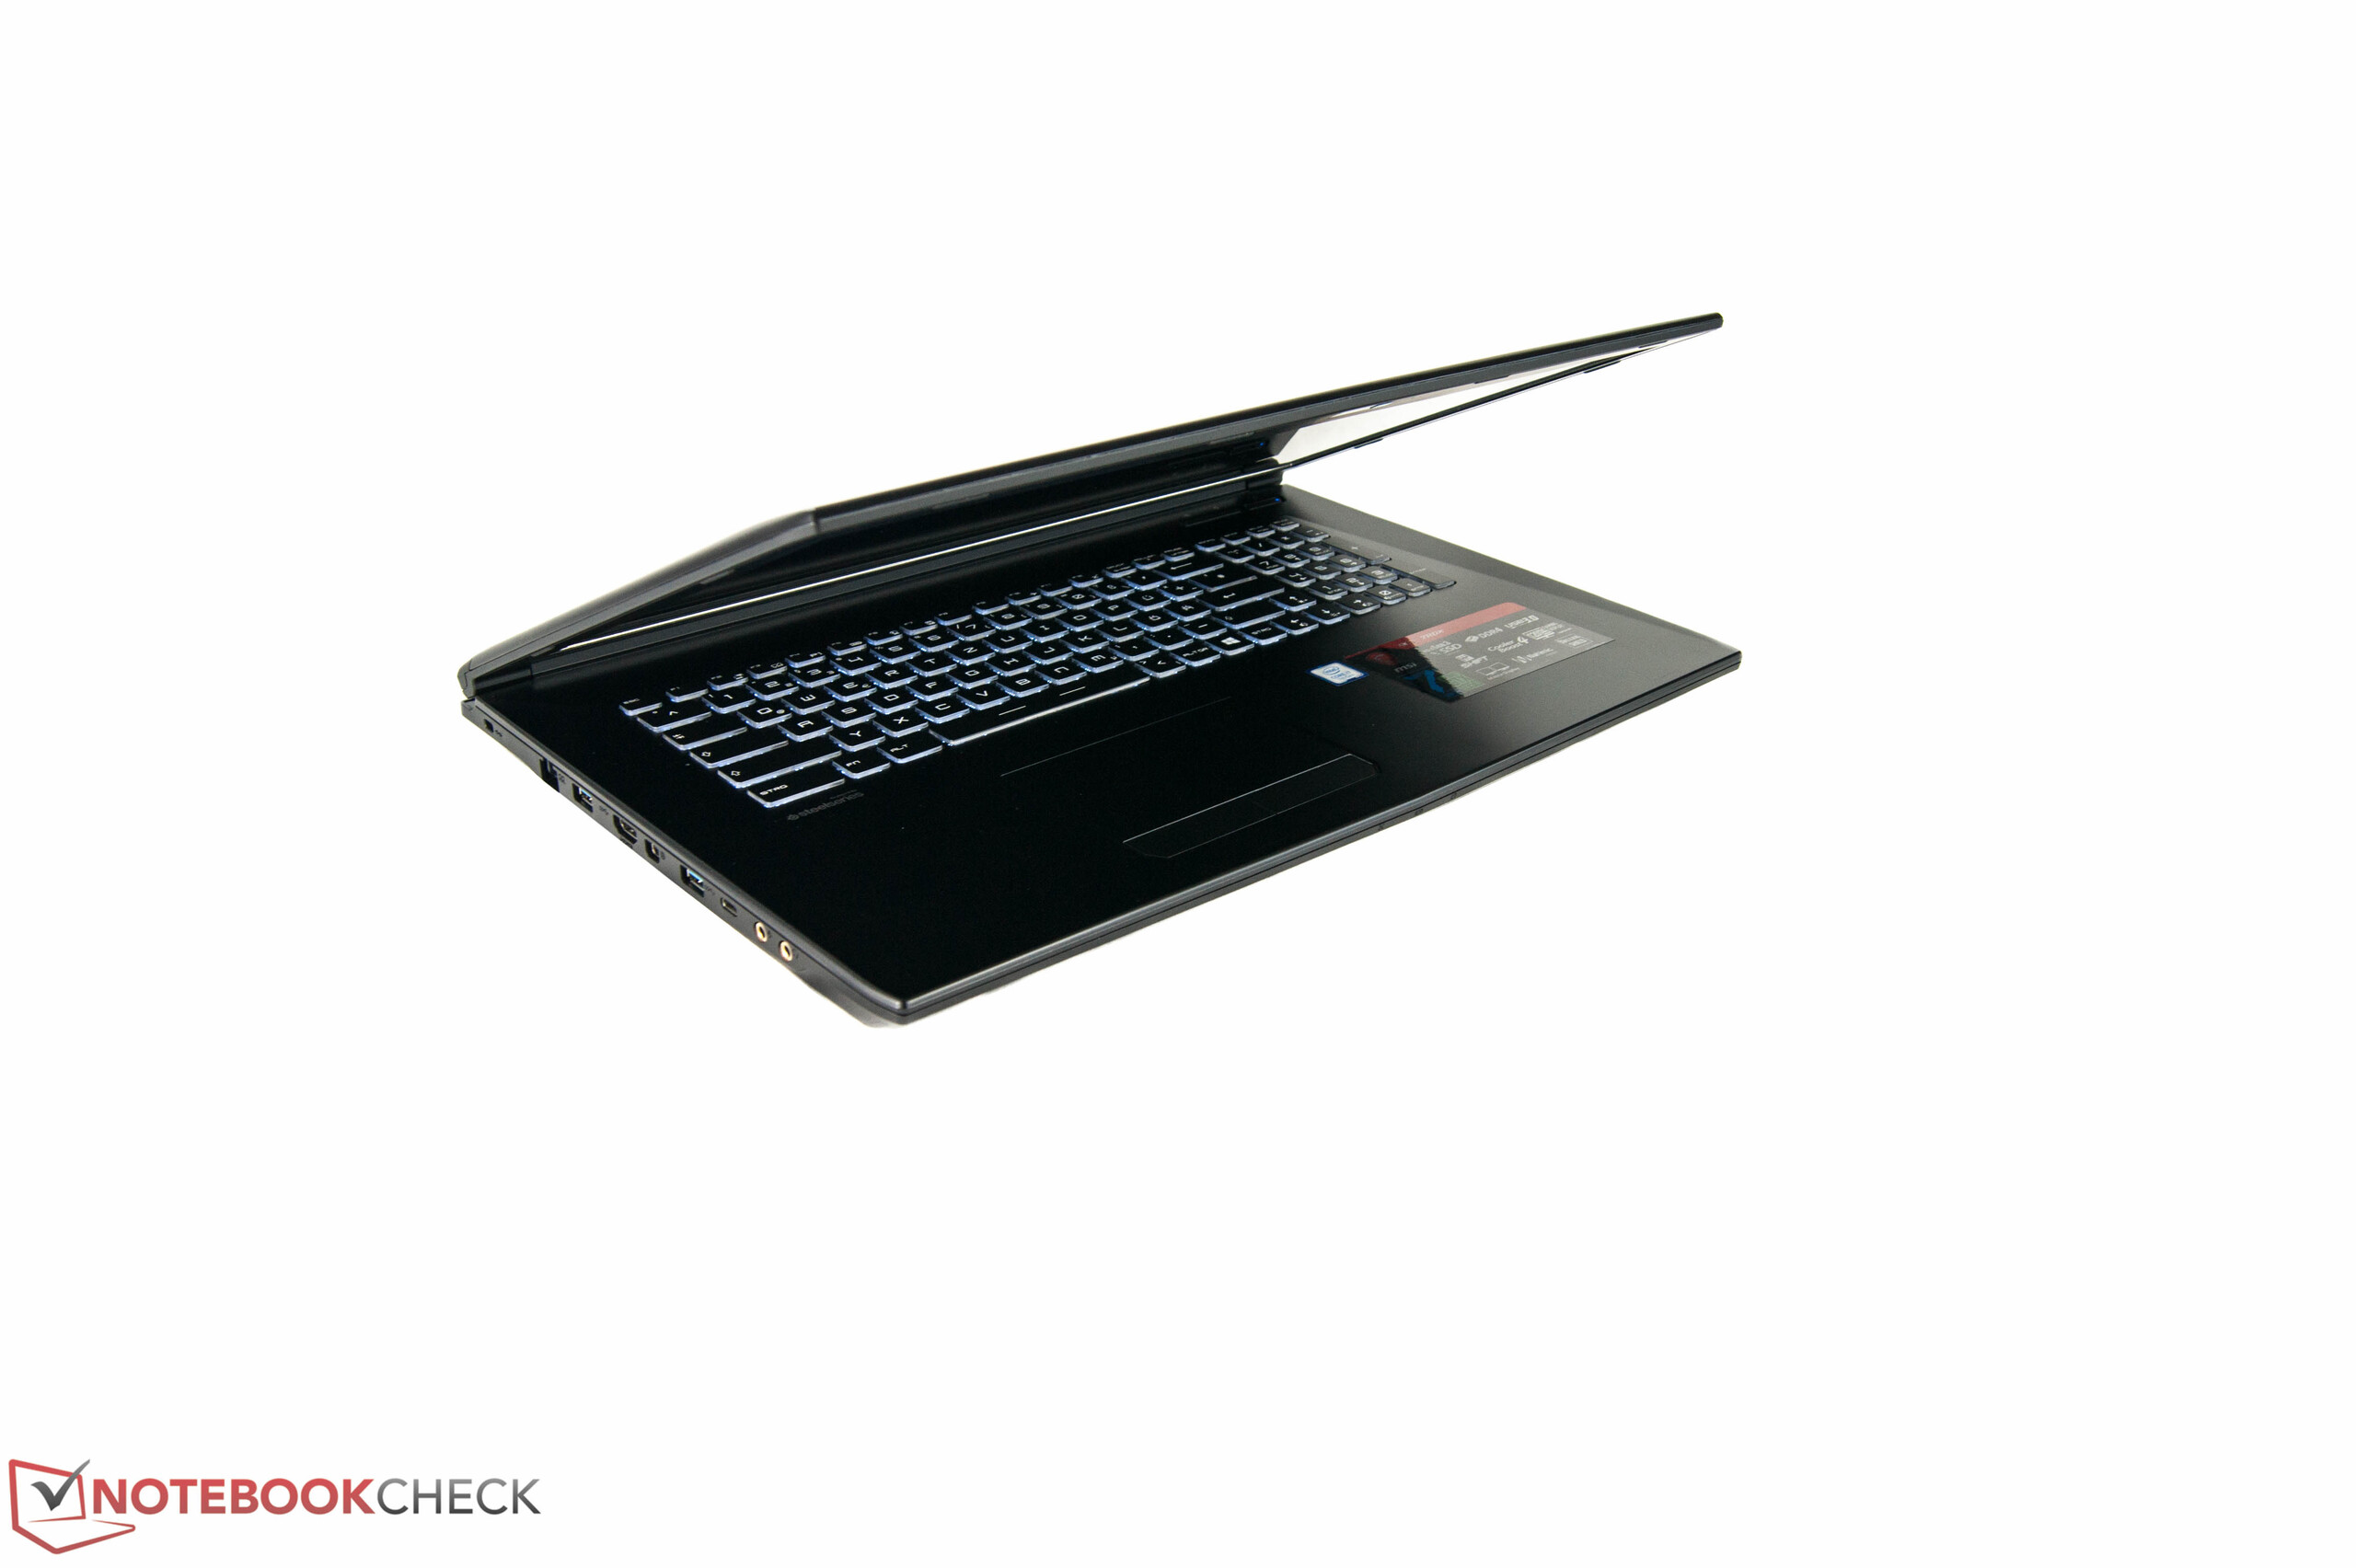
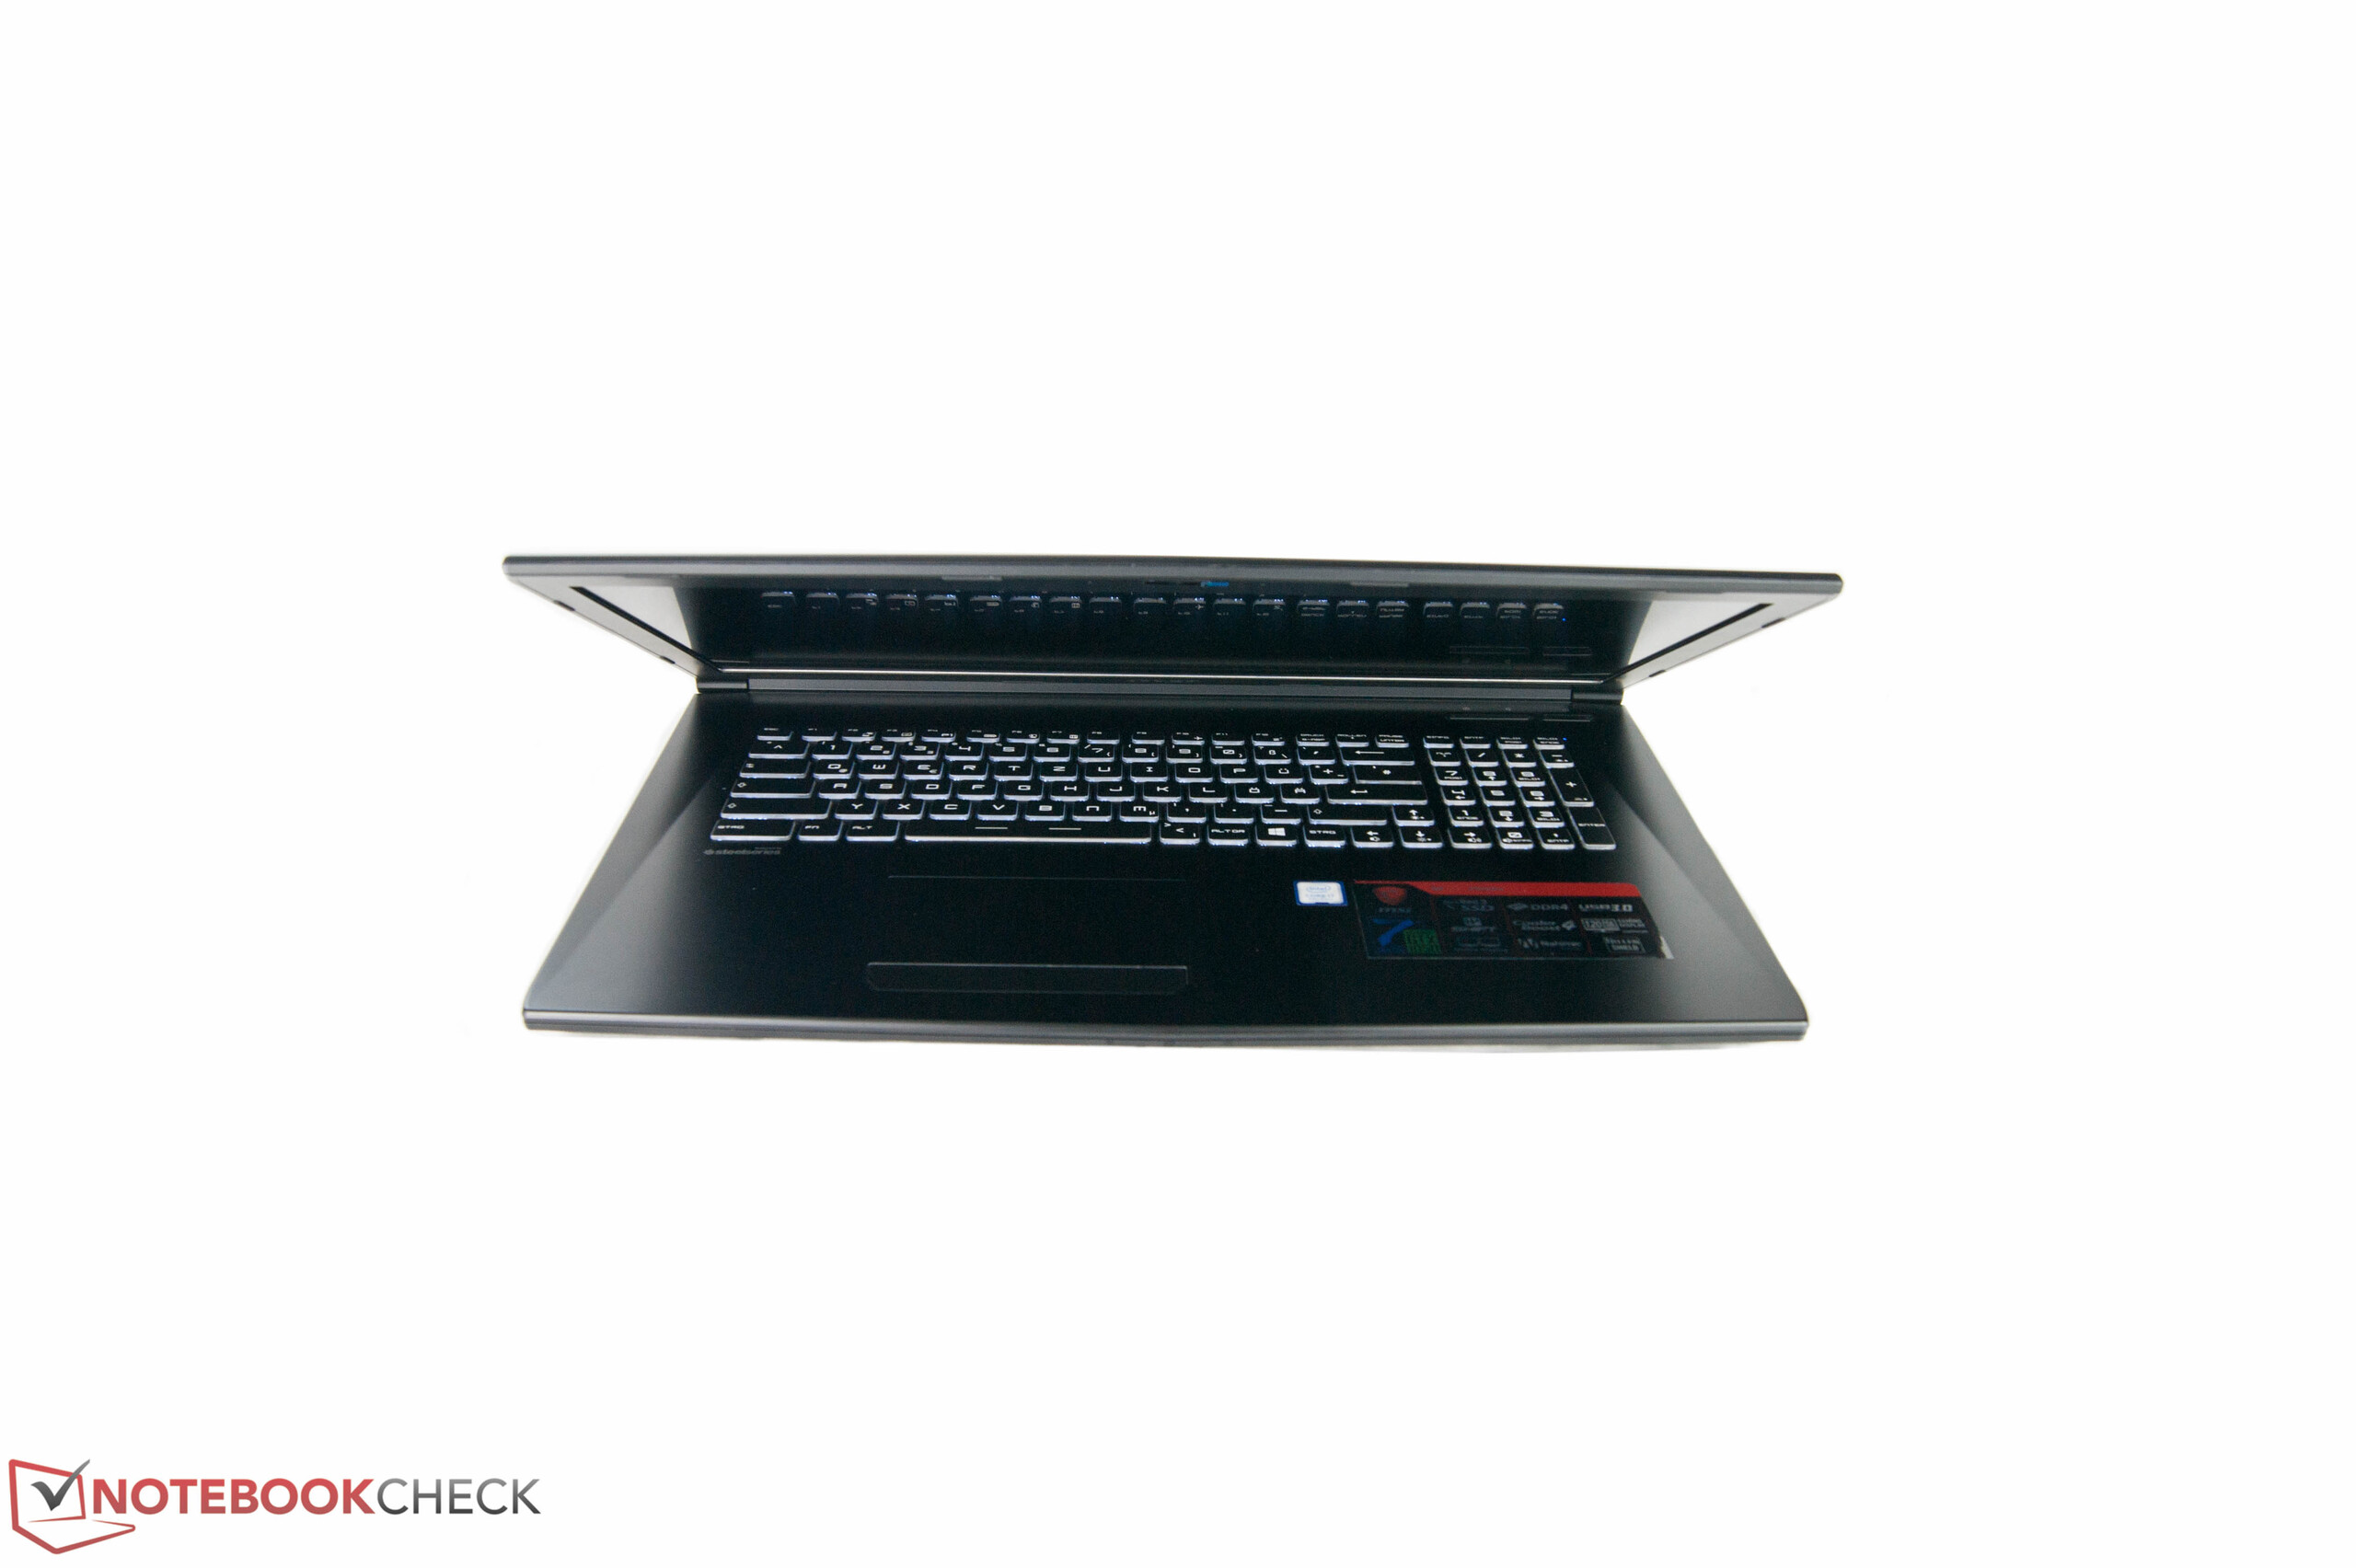
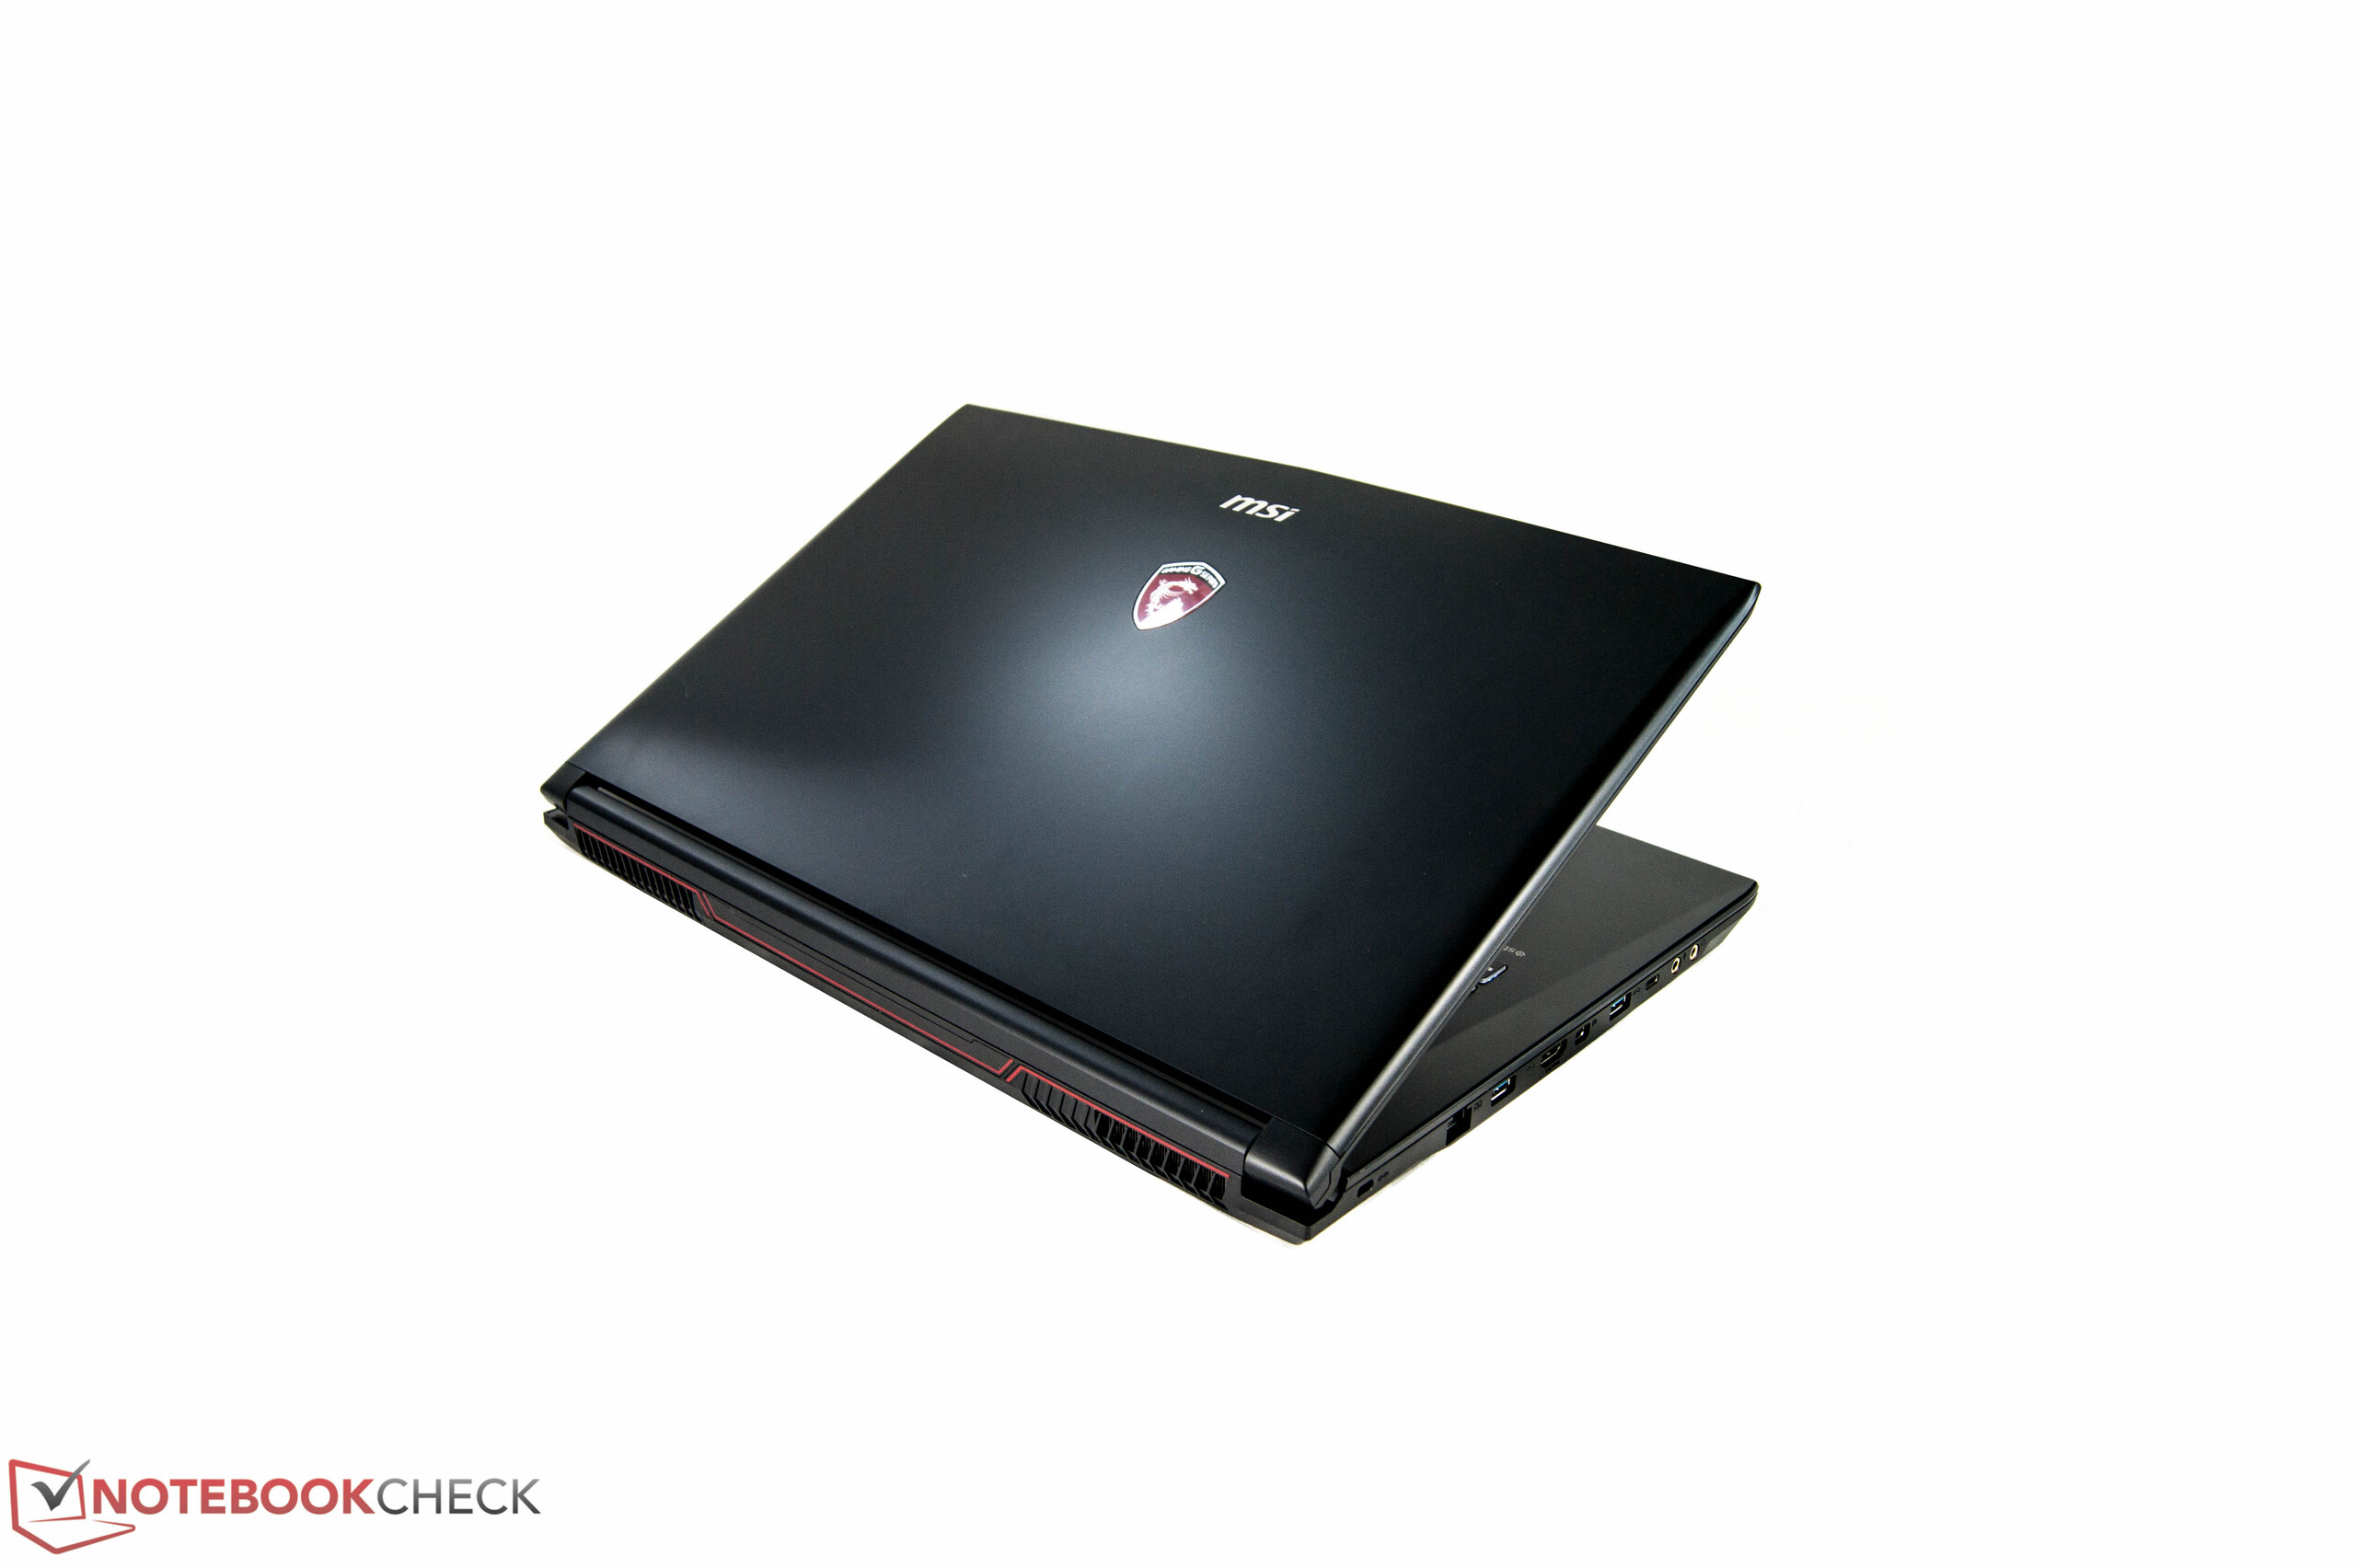
体型较大,运行快速的游戏笔记本有着实惠的价格。这就是微星 GL72想要的样子。为了能够以1100美元的价格获得游戏笔记本电脑,您必须做出一些牺牲。一切从哑光且优雅的外壳开始的。可惜,它完全由塑料制成。工艺和质量达到基本预期,但可以做到更好。特别烦人的是:沾染指纹的情况很严重。显示屏已经得到了改进,比其前身更亮,可这种改进也是有限的——其他类似的设备提供了更好的屏幕。它使用TN面板不是最新型号。而它的竞争对手都配有IPS屏幕。缺点之外,新的MSI GL72有一个很大的优势:它时刻准备着去执行任务。17寸笔记本电脑完美展示了,游戏笔记本电脑应如何使用其组件。
噪音水平和温度都保持在可接受的水平。那些正在寻找一个体型大的笔记本电脑,并且清楚了解他们预算的休闲玩家,将对MSI GL72满意。
花费稍微多点钱,您可以获得配备更亮的IPS面板,PCIe 固态硬盘和更强显卡的机型,例如:华硕GL753VE或 Nexoc G739。
注:本文是基于完整评测的缩减版本,阅读完整的英文评测,请点击这里。
MSI GL72 7RDX-602
- 06/21/2017 v6 (old)
Nino Ricchizzi