英特尔酷睿i7-12800H首次亮相。Razer Blade 15笔记本电脑评测
Razer今年刷新了其Blade 15系列,包括最新的英特尔CPU和Nvidia GPU。在这种情况下,该型号得到了第12代Alder Lake-H Core i7-12800H和Core i9-12900H CPU以及GeForce RTX 3070 Ti和3080 Ti(110 W TGP),以取代旧的第11代Core i7-11800H、Core i9-11900H、RTX 3070和RTX 3080(105 W TGP)选项。这篇评论将集中在用户从旧的Razer Blade 15升级到评论中最新的2022配置时可以期待的性能差异。
刀片15的替代品包括其他超薄的15.6英寸游戏笔记本电脑,如 Eurocom RX315, 微星GS66, 威刚XPG Xenia 15, 或 华硕Zephyrus S系列.
更多Razer评论。
Potentiella konkurrenter i jämförelse
Rating | Date | Model | Weight | Height | Size | Resolution | Price |
|---|---|---|---|---|---|---|---|
| 89.1 % v7 (old) | 03 / 2022 | Razer Blade 15 2022 i7-12800H, GeForce RTX 3080 Ti Laptop GPU | 2.1 kg | 16.99 mm | 15.60" | 2560x1440 | |
| 87.5 % v7 (old) | Razer Blade 15 Advanced Model Early 2021 i7-10875H, GeForce RTX 3080 Laptop GPU | 2 kg | 16.99 mm | 15.60" | 1920x1080 | ||
| 85.9 % v7 (old) | 08 / 2020 | Razer Blade 15 RTX 2080 Super Max-Q i7-10875H, GeForce RTX 2080 Super Max-Q | 2.2 kg | 17.8 mm | 15.60" | 1920x1080 | |
v (old) | 03 / 2022 | Schenker XMG Neo 15 E22 (Early 2022, RTX 3080 Ti) i7-12700H, GeForce RTX 3080 Ti Laptop GPU | 2.2 kg | 26.6 mm | 15.60" | 2560x1440 | |
| 87.3 % v7 (old) | 10 / 2021 | ADATA XPG Xenia 15 i7-11800H, GeForce RTX 3070 Laptop GPU | 1.9 kg | 20.5 mm | 15.60" | 2560x1440 | |
| 83 % v7 (old) | 01 / 2022 | Eurocom Nightsky ARX315 R9 5900X, GeForce RTX 3070 Laptop GPU | 2.6 kg | 32.5 mm | 15.60" | 1920x1080 |
案例
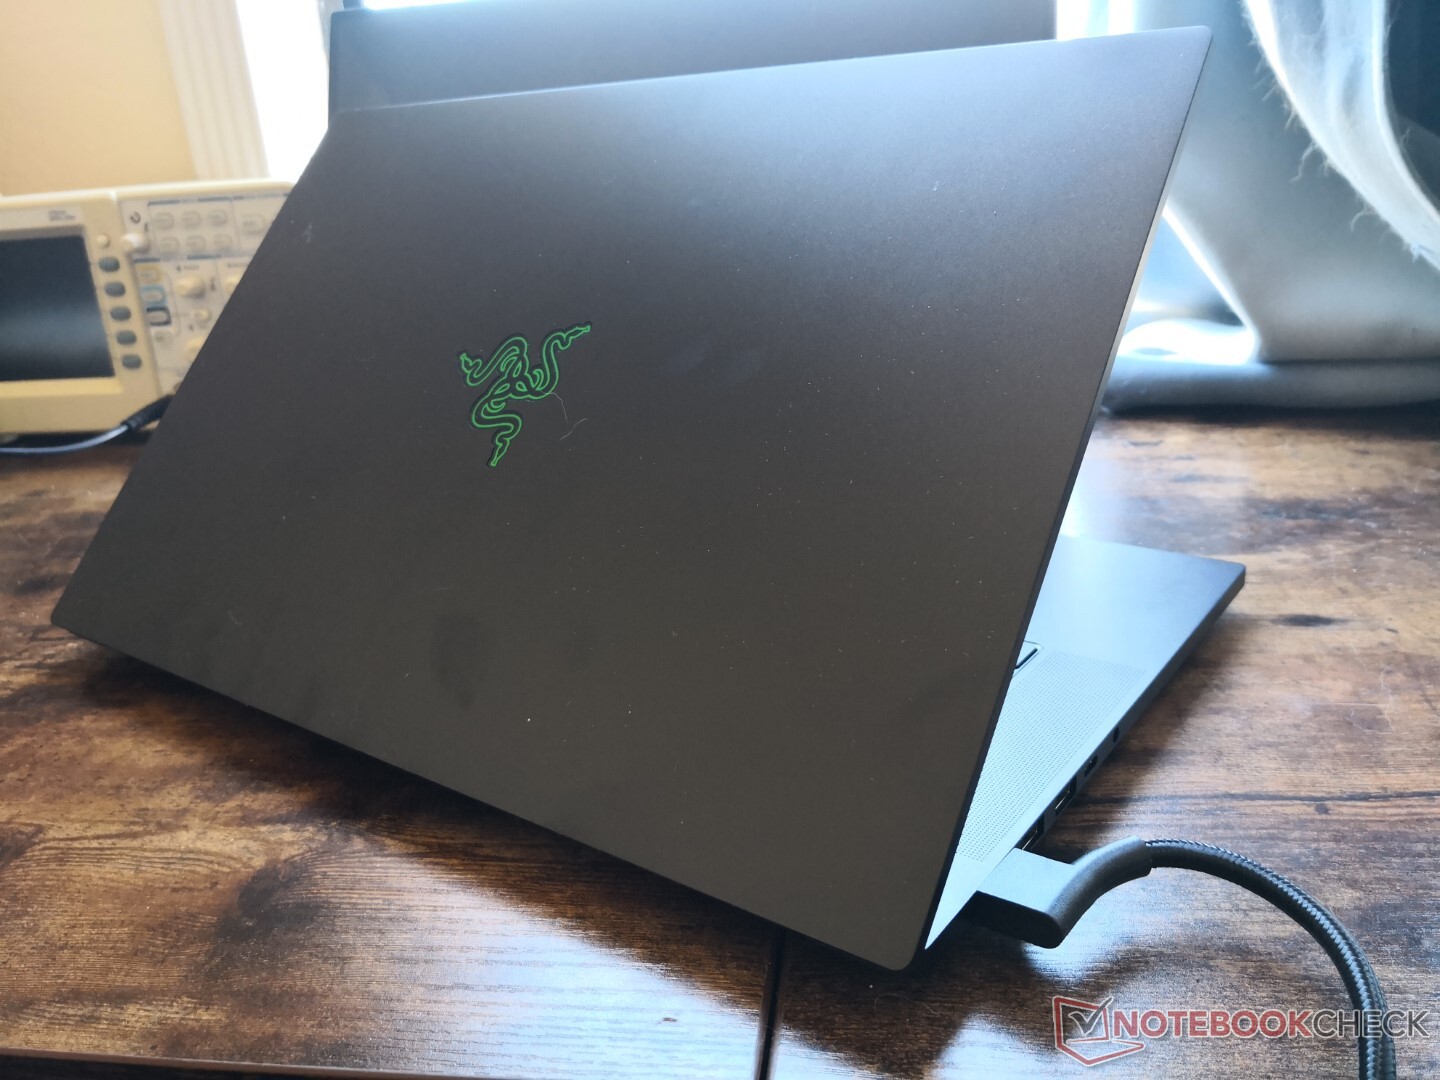
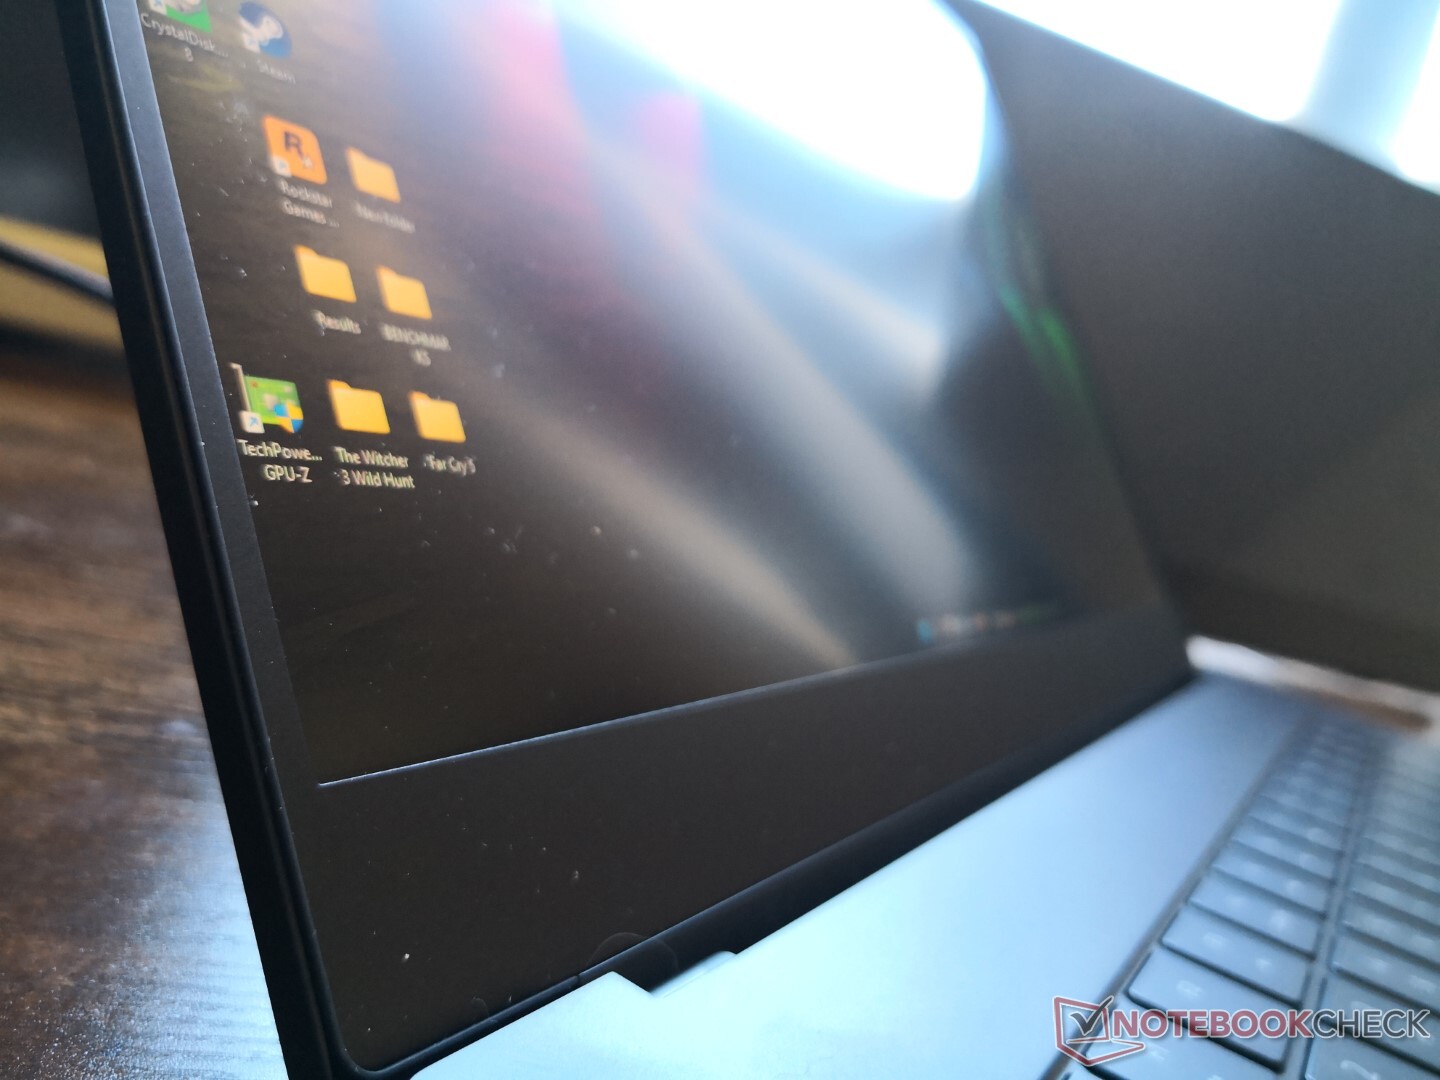
底盘与去年的高级型号基本保持一致,因此,系统的尺寸和感觉没有变化。如果你处理过一个 Blade Stealth, 刀片14, 刀片15, 或 刀锋专业版17在过去,那么这个最新的2022年将感到熟悉。
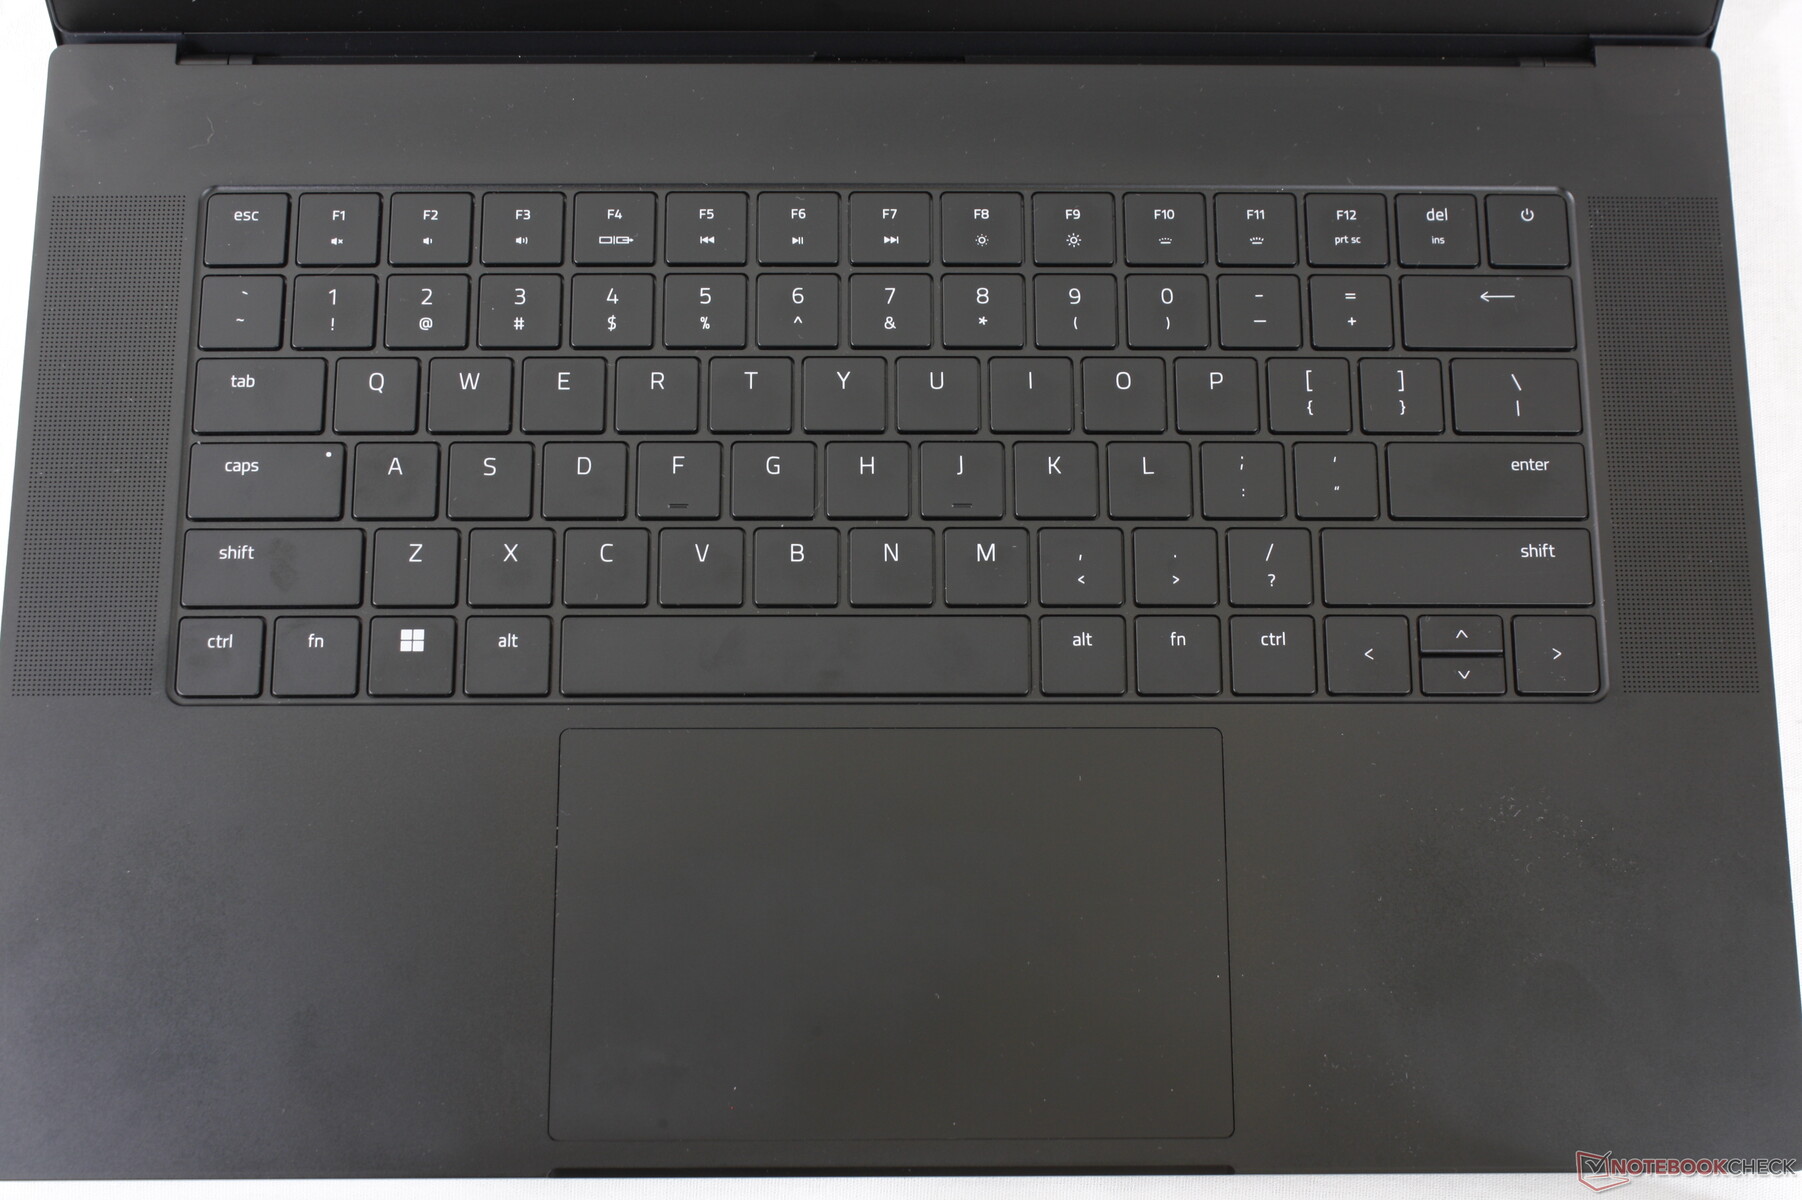
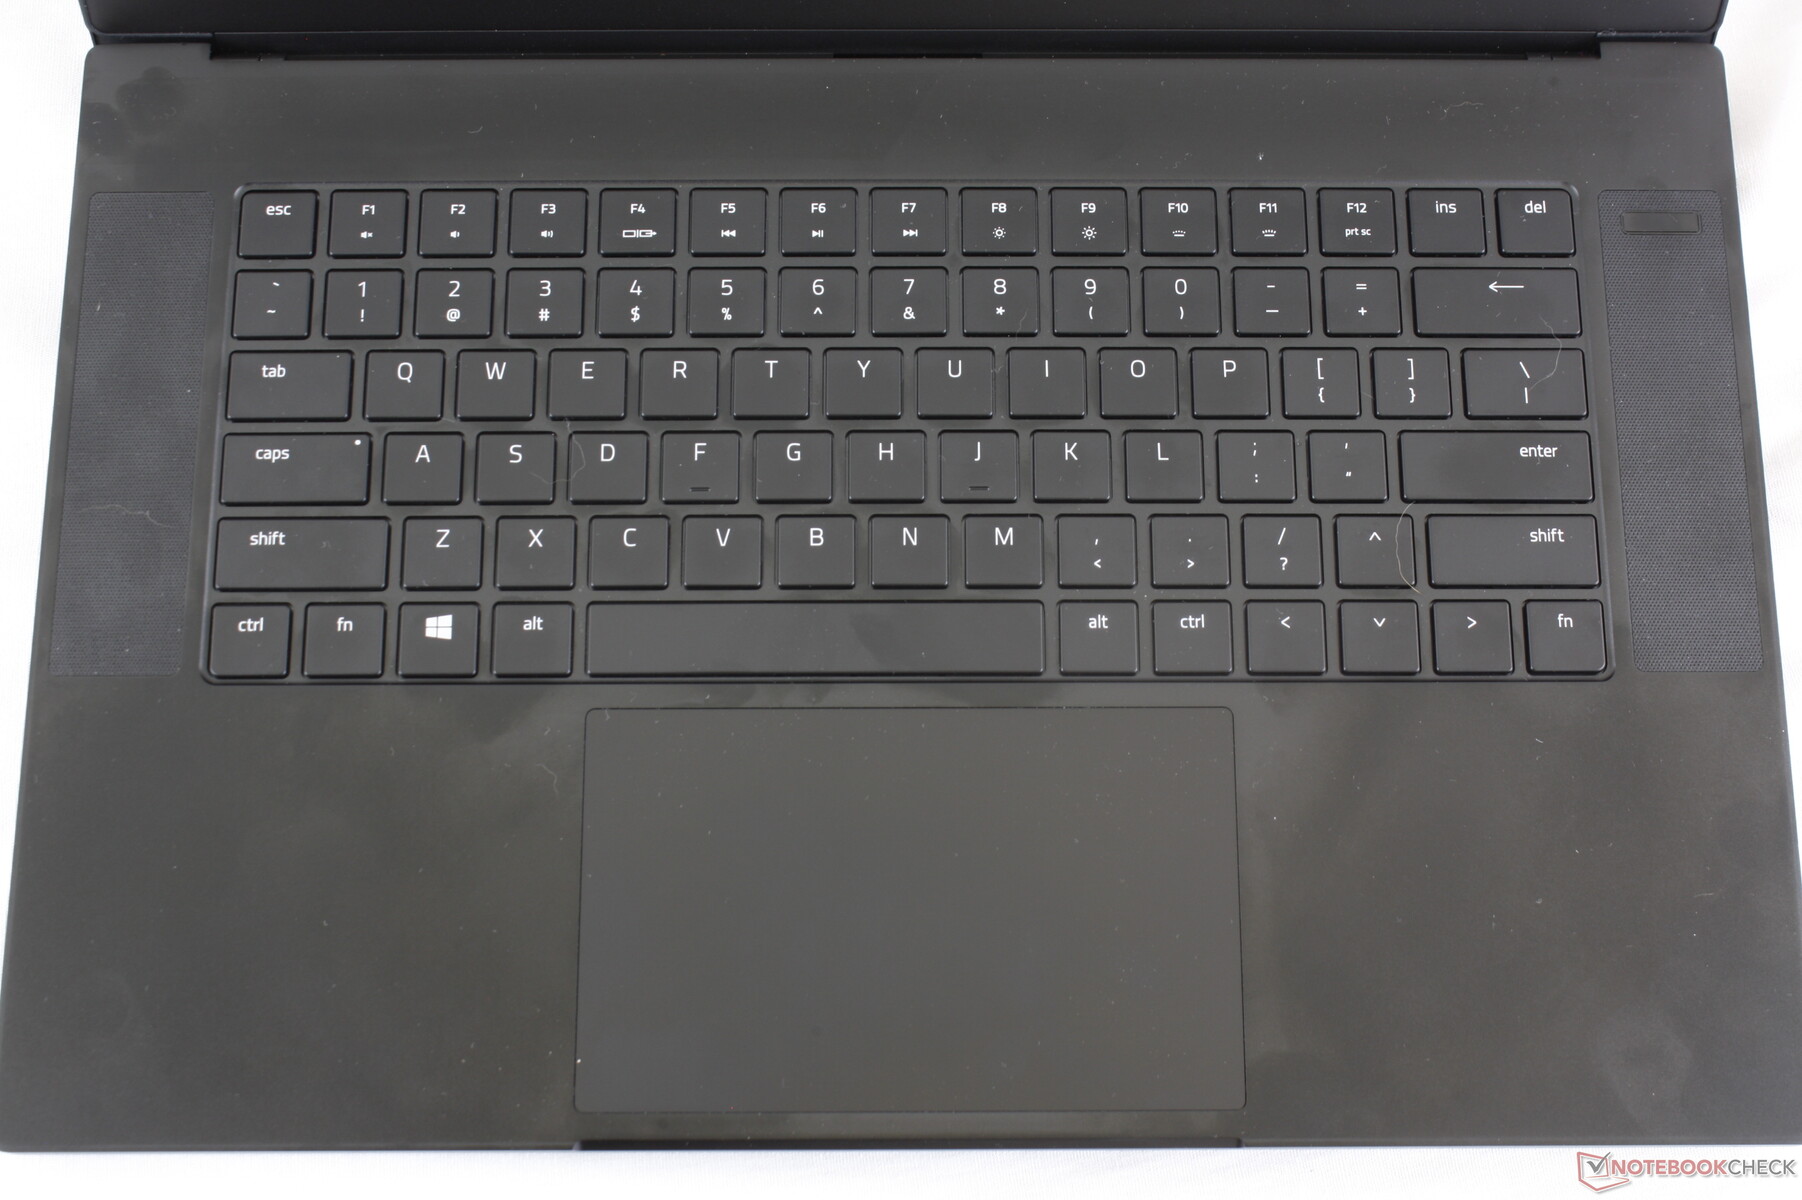
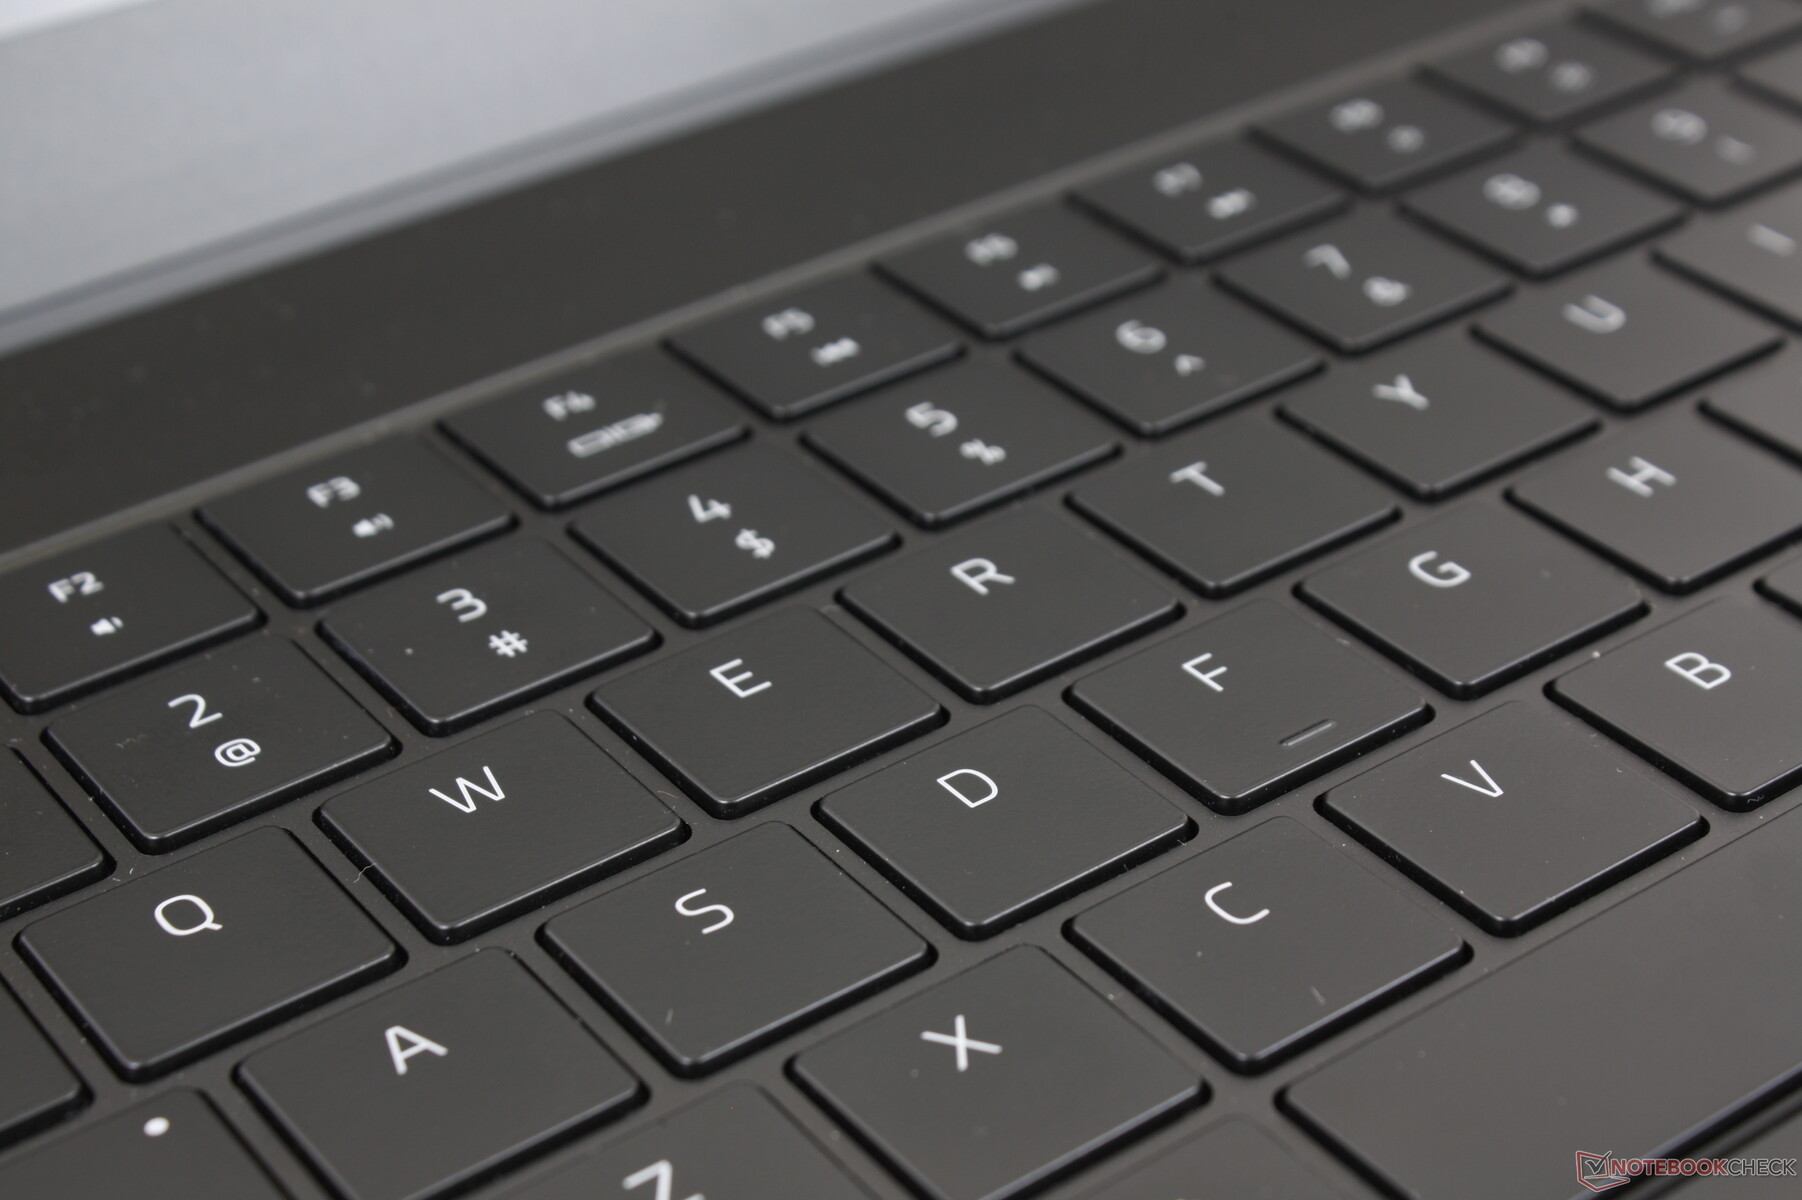
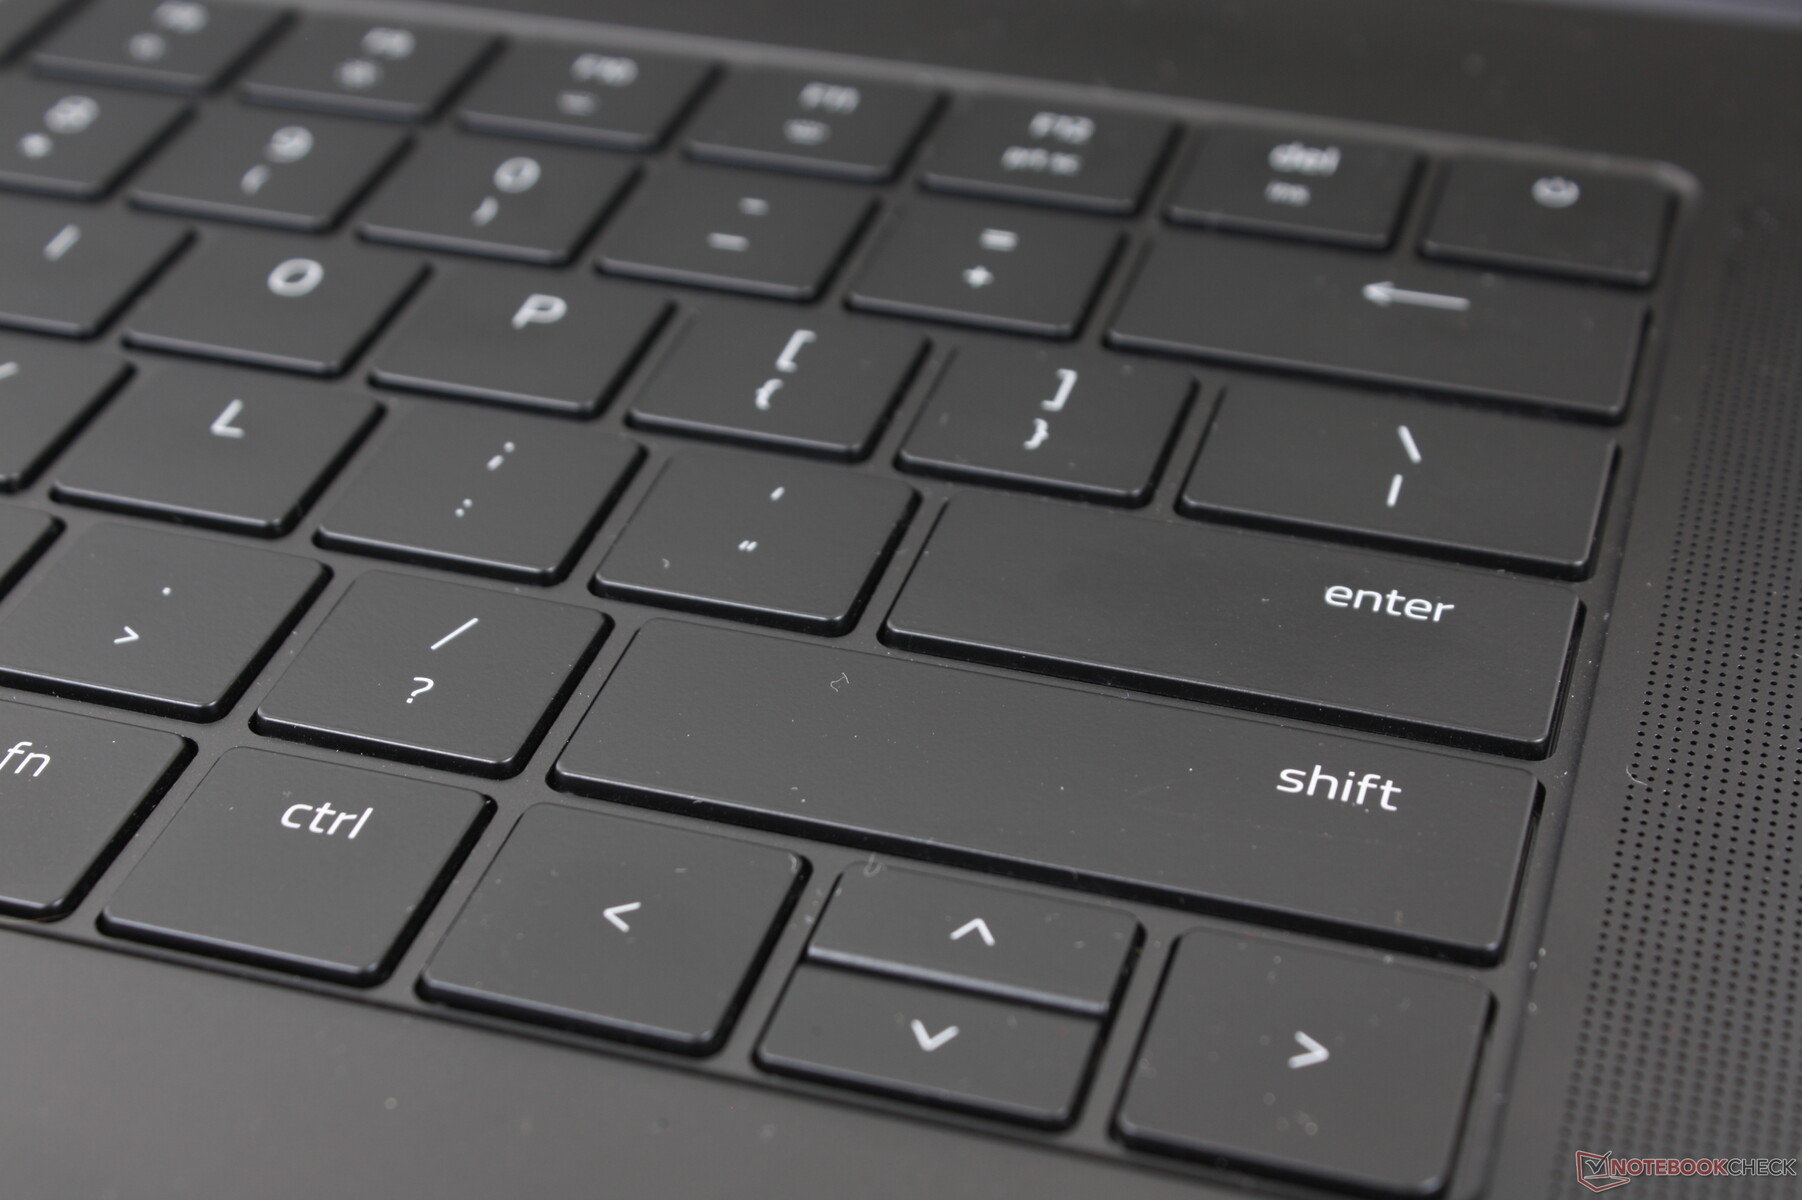
今年唯一的重大物理变化是键盘键帽,现在比以前略大。电源按钮也被重新定位,这也是一个简单的方法,可以从视觉上区分2022型和早期型号。
SD卡阅读器
| SD Card Reader | |
| average JPG Copy Test (av. of 3 runs) | |
| Razer Blade 15 Advanced Model Early 2021 (AV PRO microSD 128 GB V60) | |
| Razer Blade 15 RTX 2080 Super Max-Q (Toshiba Exceria Pro SDXC 64 GB UHS-II) | |
| Razer Blade 15 2022 (Toshiba Exceria Pro SDXC 64 GB UHS-II) | |
| ADATA XPG Xenia 15 (AV Pro V60) | |
| Schenker XMG Neo 15 E22 (Early 2022, RTX 3080 Ti) | |
| Eurocom Nightsky ARX315 (AV Pro V60) | |
| maximum AS SSD Seq Read Test (1GB) | |
| Razer Blade 15 RTX 2080 Super Max-Q (Toshiba Exceria Pro SDXC 64 GB UHS-II) | |
| Razer Blade 15 Advanced Model Early 2021 (AV PRO microSD 128 GB V60) | |
| Razer Blade 15 2022 (Toshiba Exceria Pro SDXC 64 GB UHS-II) | |
| ADATA XPG Xenia 15 (AV Pro V60) | |
| Eurocom Nightsky ARX315 (AV Pro V60) | |
| Schenker XMG Neo 15 E22 (Early 2022, RTX 3080 Ti) | |
沟通
WLAN模块已经升级到杀手AX1690i,这基本上是现有英特尔Wi-Fi 6E AX210的游戏版本。
| Networking | |
| iperf3 transmit AX12 | |
| Razer Blade 15 2022 | |
| Razer Blade 15 RTX 2080 Super Max-Q | |
| Schenker XMG Neo 15 E22 (Early 2022, RTX 3080 Ti) | |
| ADATA XPG Xenia 15 | |
| Eurocom Nightsky ARX315 | |
| Razer Blade 15 Advanced Model Early 2021 | |
| iperf3 receive AX12 | |
| Razer Blade 15 2022 | |
| Razer Blade 15 RTX 2080 Super Max-Q | |
| Razer Blade 15 Advanced Model Early 2021 | |
| ADATA XPG Xenia 15 | |
| Schenker XMG Neo 15 E22 (Early 2022, RTX 3080 Ti) | |
| Eurocom Nightsky ARX315 | |
网络摄像头


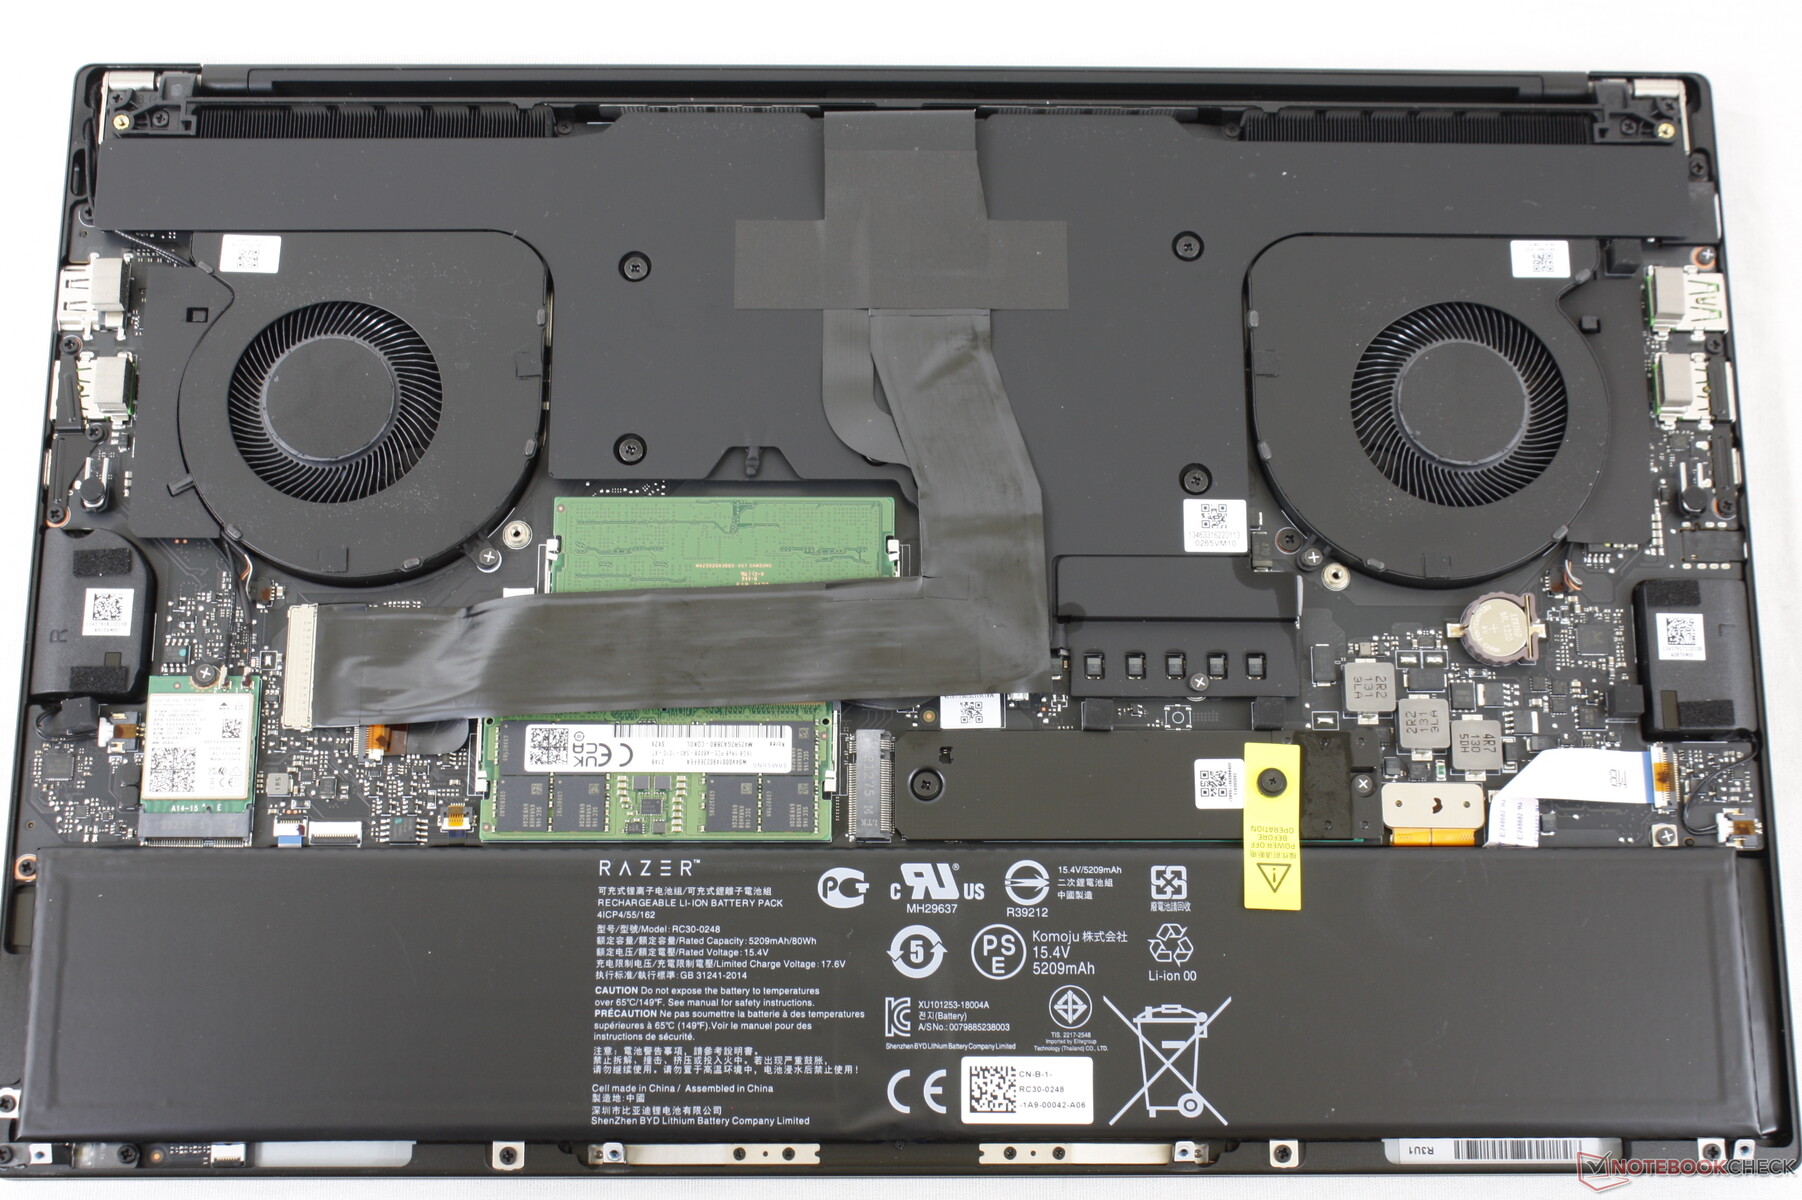
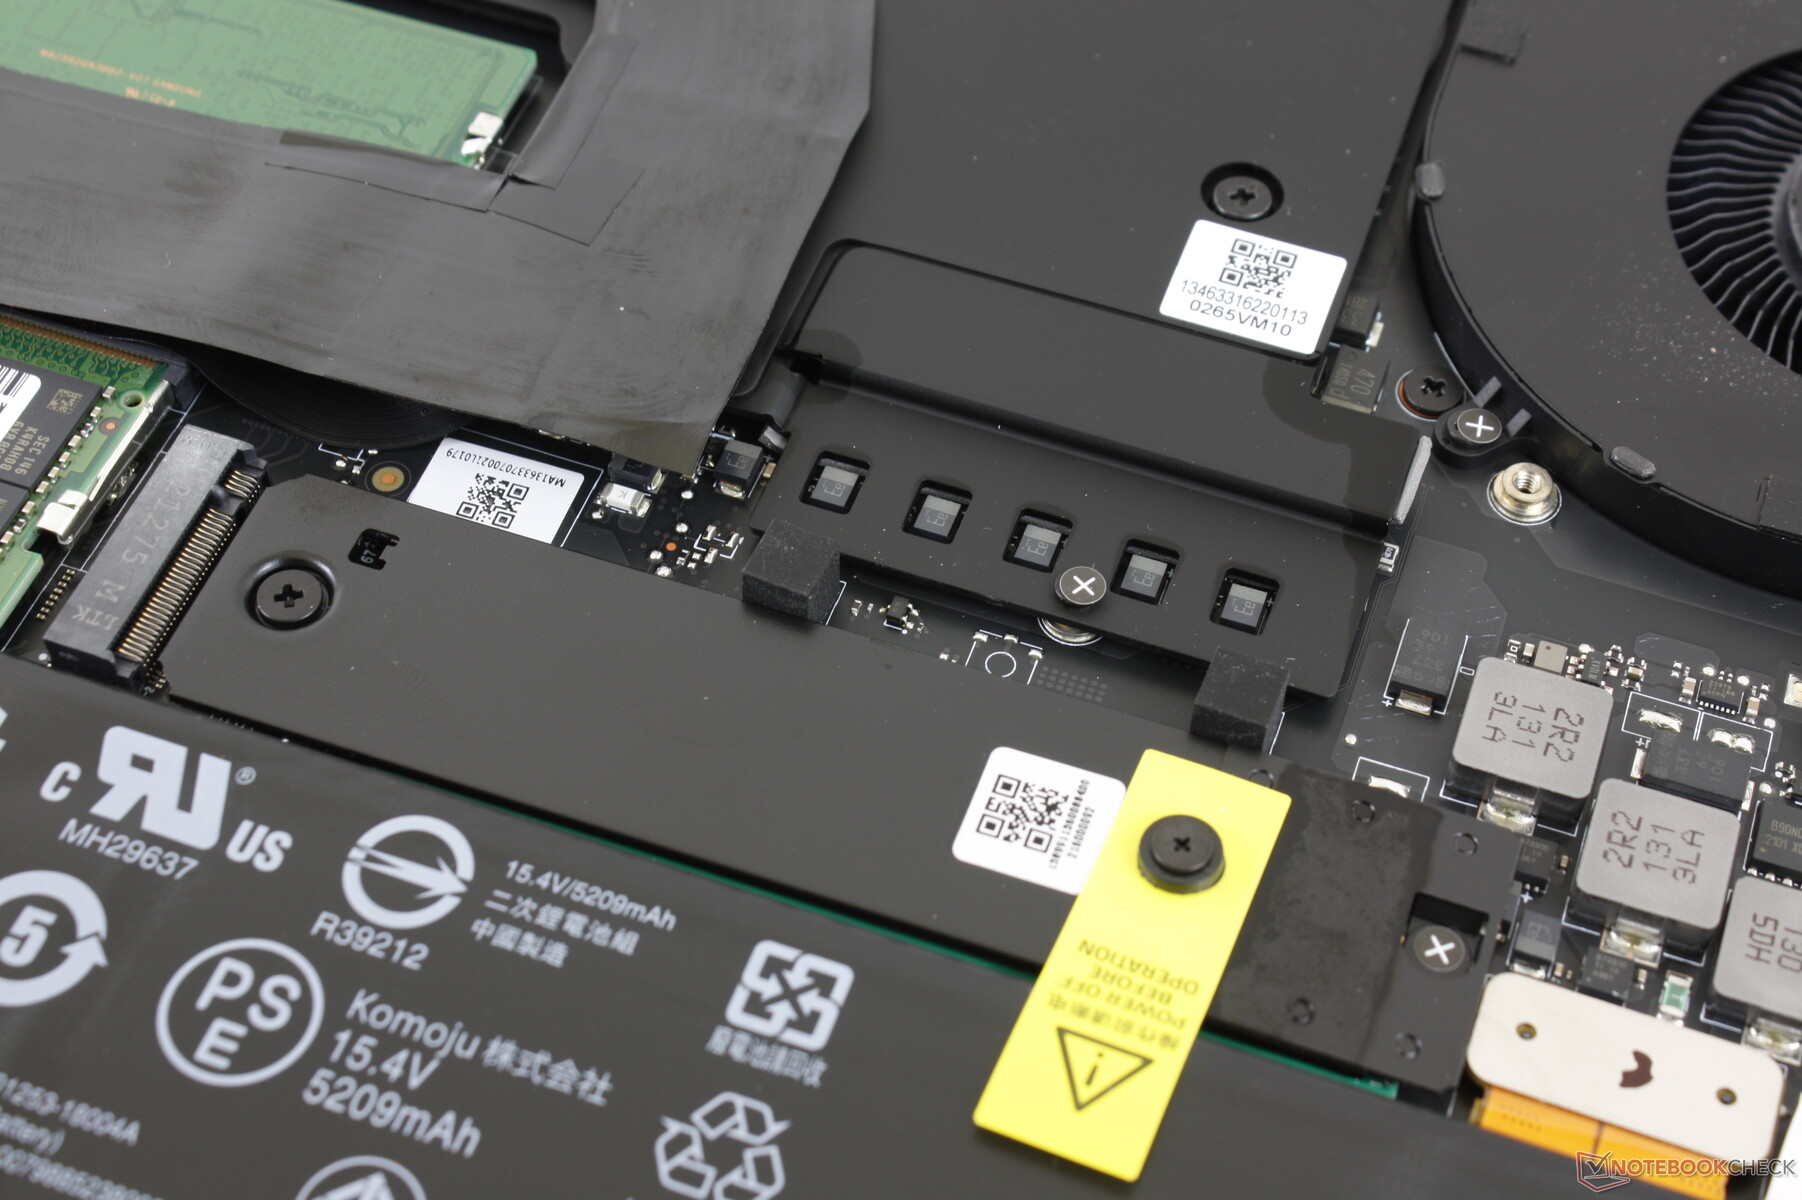
维护
与去年的模型相比,内部结构和风扇有微小的变化,如下图所示。2个M.2 2280 PCIe4插槽、2个SODIMM插槽和可移动的WLAN模块仍然存在。

配件和保修
除了交流电适配器和文件外,盒子里没有其他东西。
每一个新购买的第12代Blade机型都包括一年的基本保修和两年的电池保修。但是,请注意,两年的电池保修期目前不适用于旧的刀片型号。
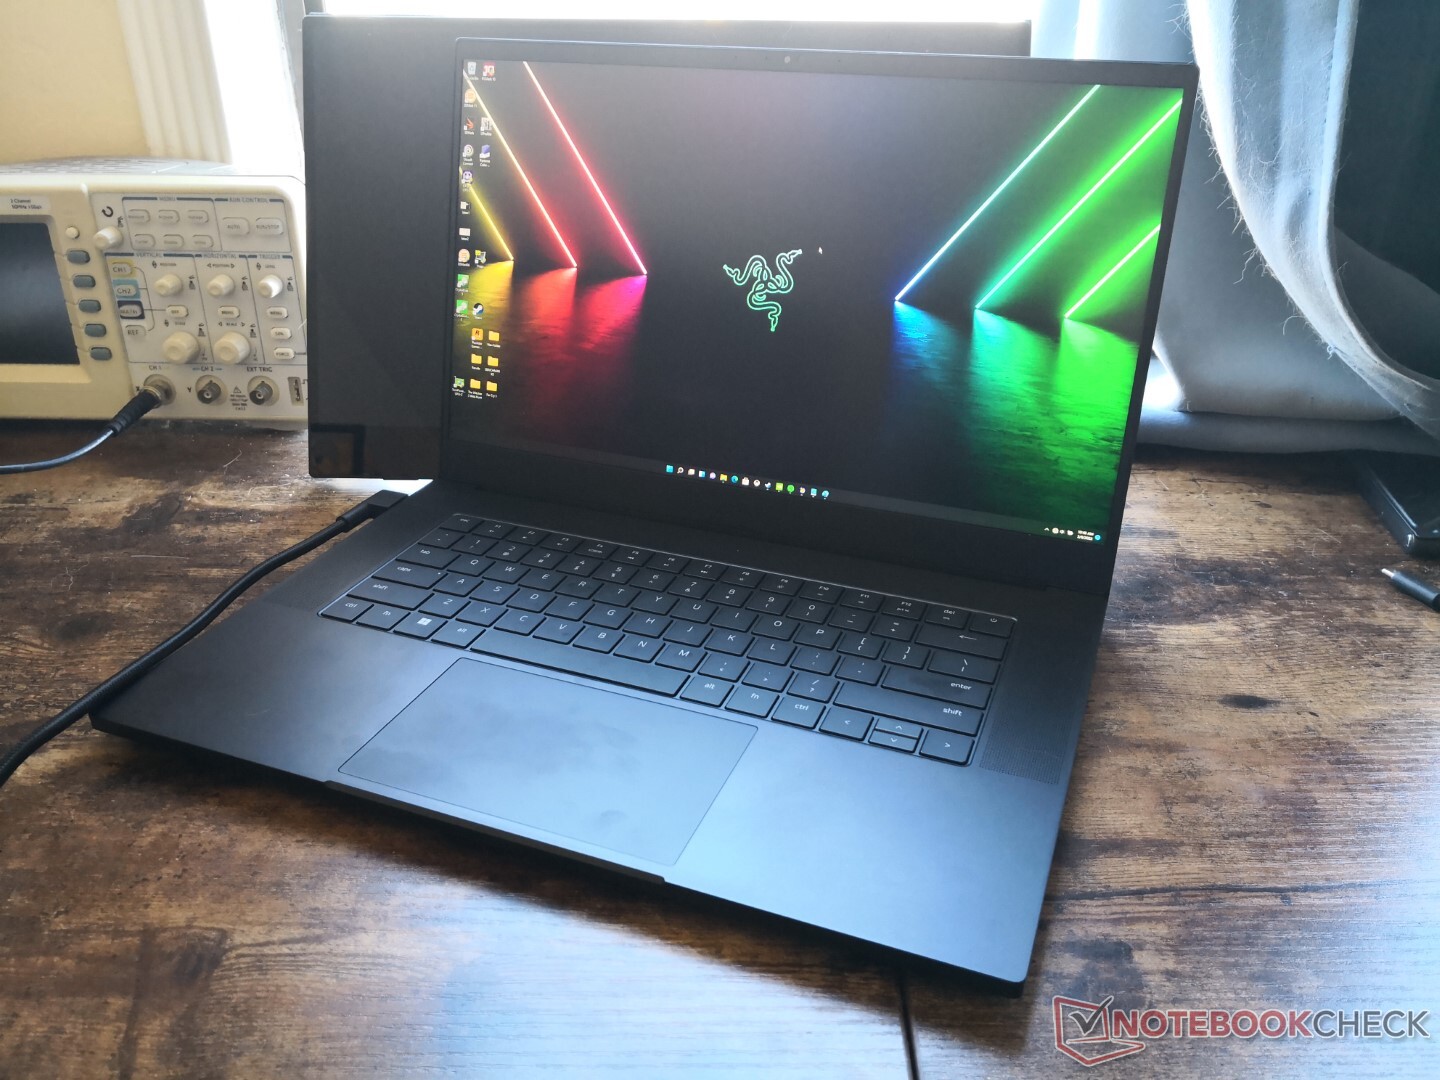
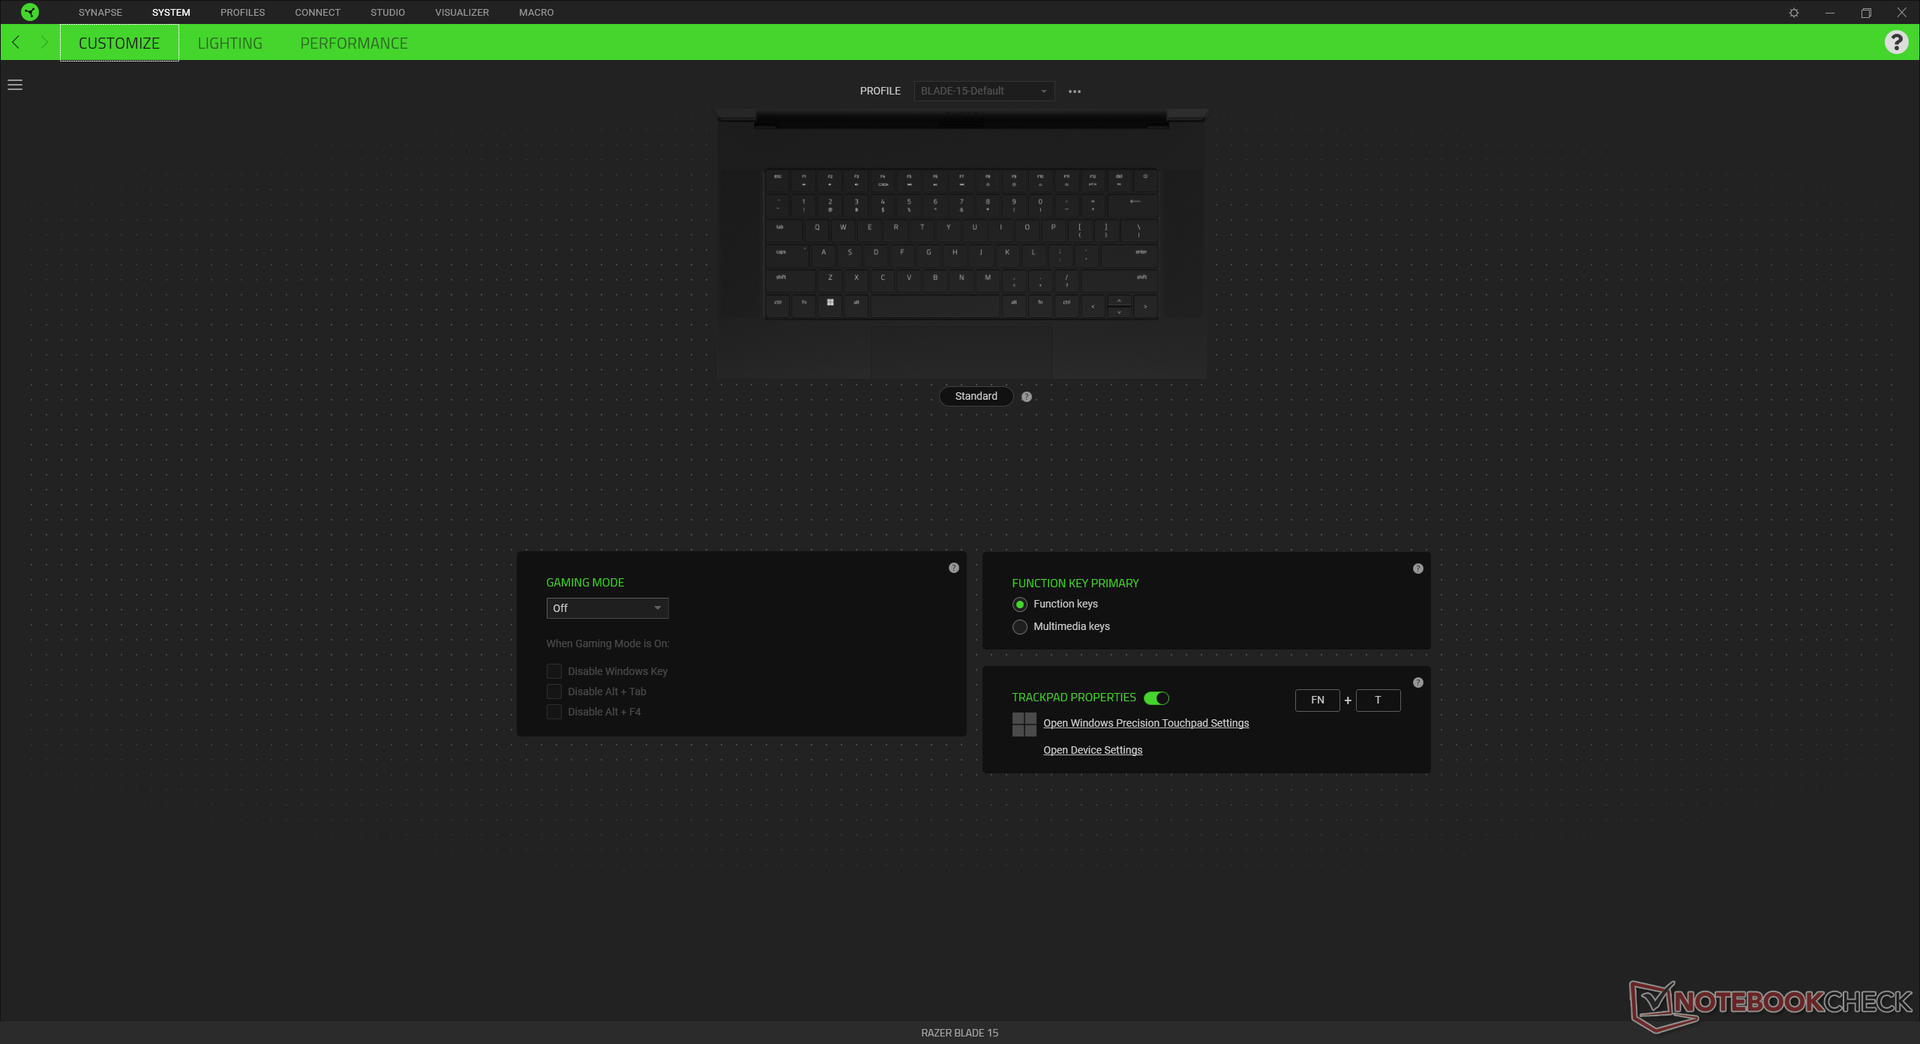
输入设备
虽然大型点击板保持不变,但雷蛇对2022年的刀片15的键盘进行了升级,键帽比上一代机型略大,以减少打字错误。因此,每个键之间的空间也被缩小了。其他方面的行程和反馈与往年相同。
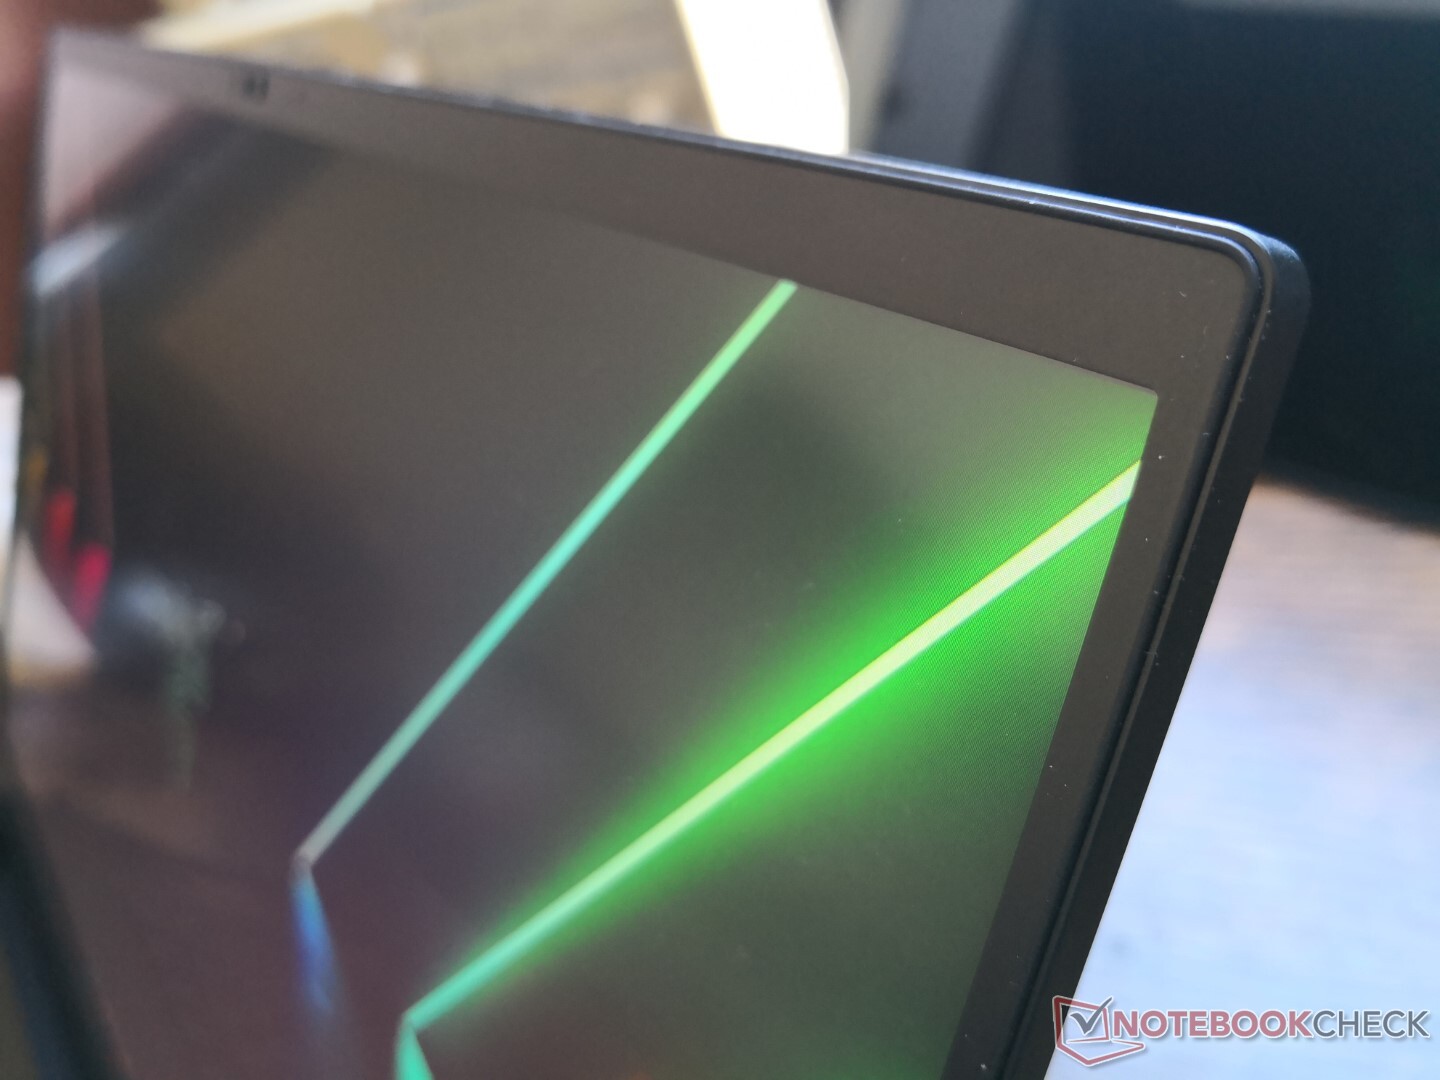
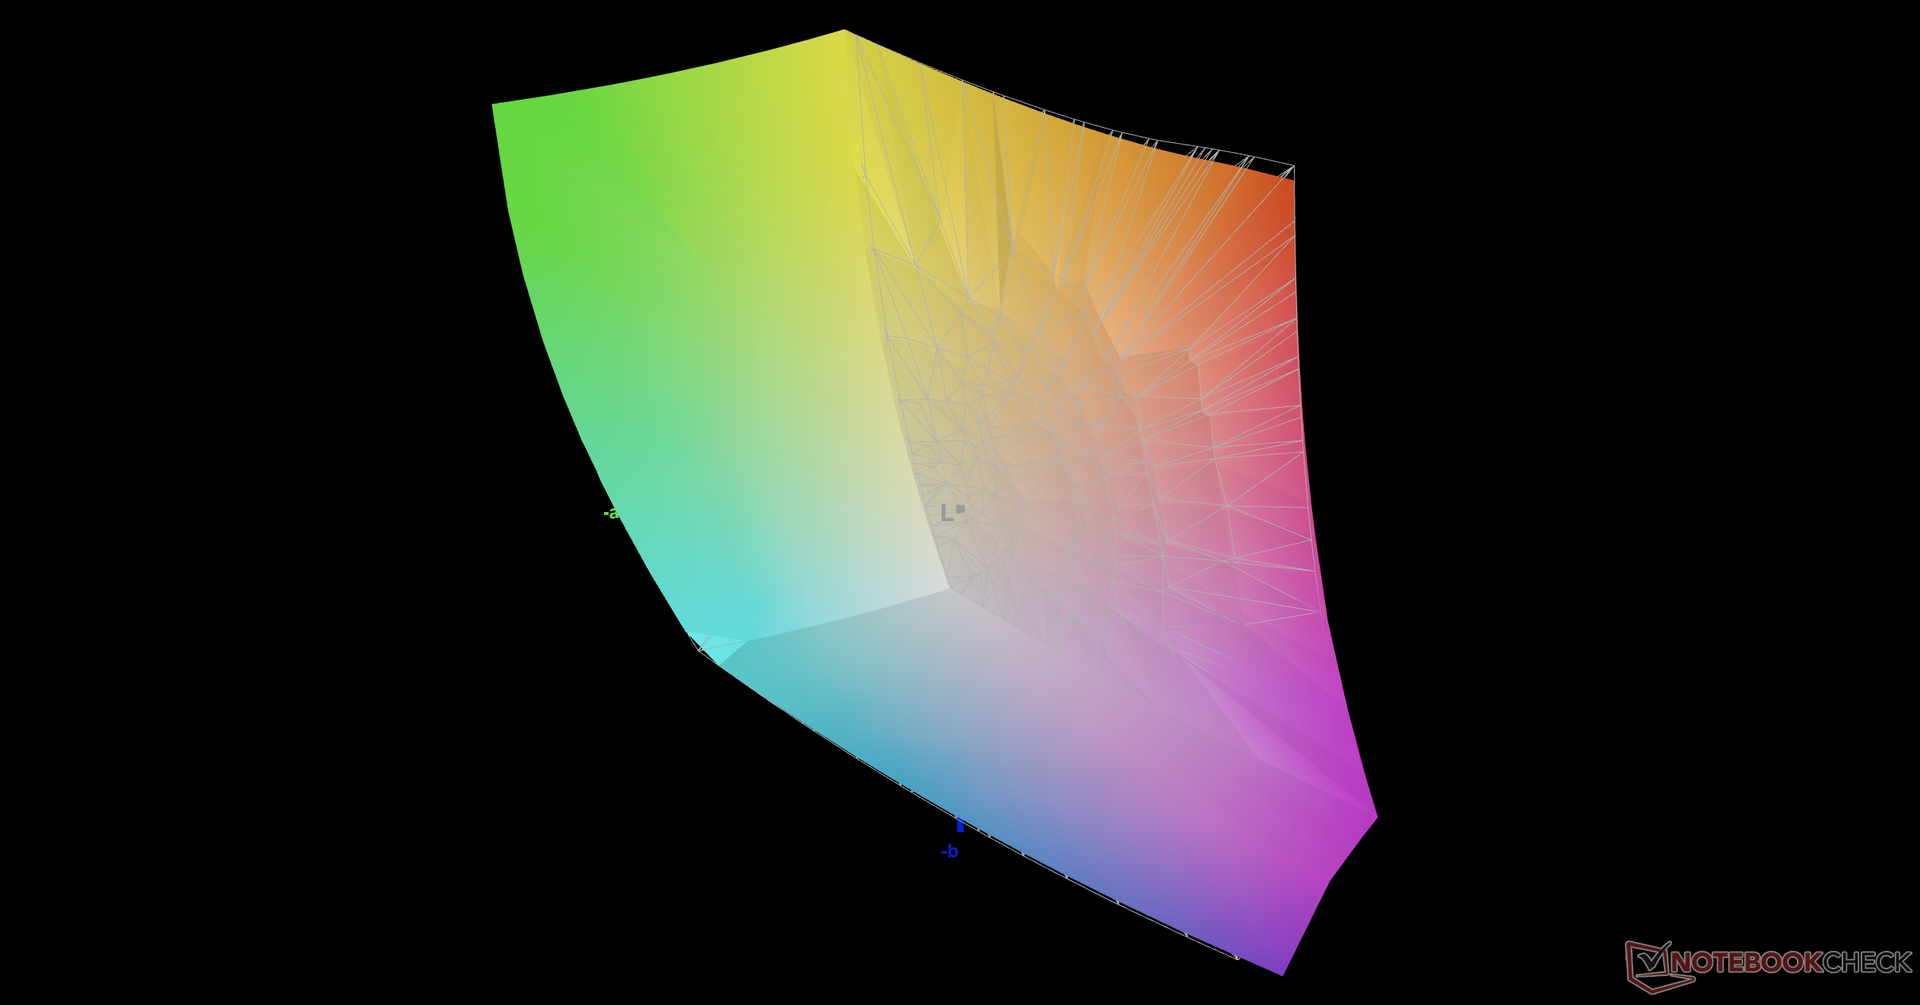
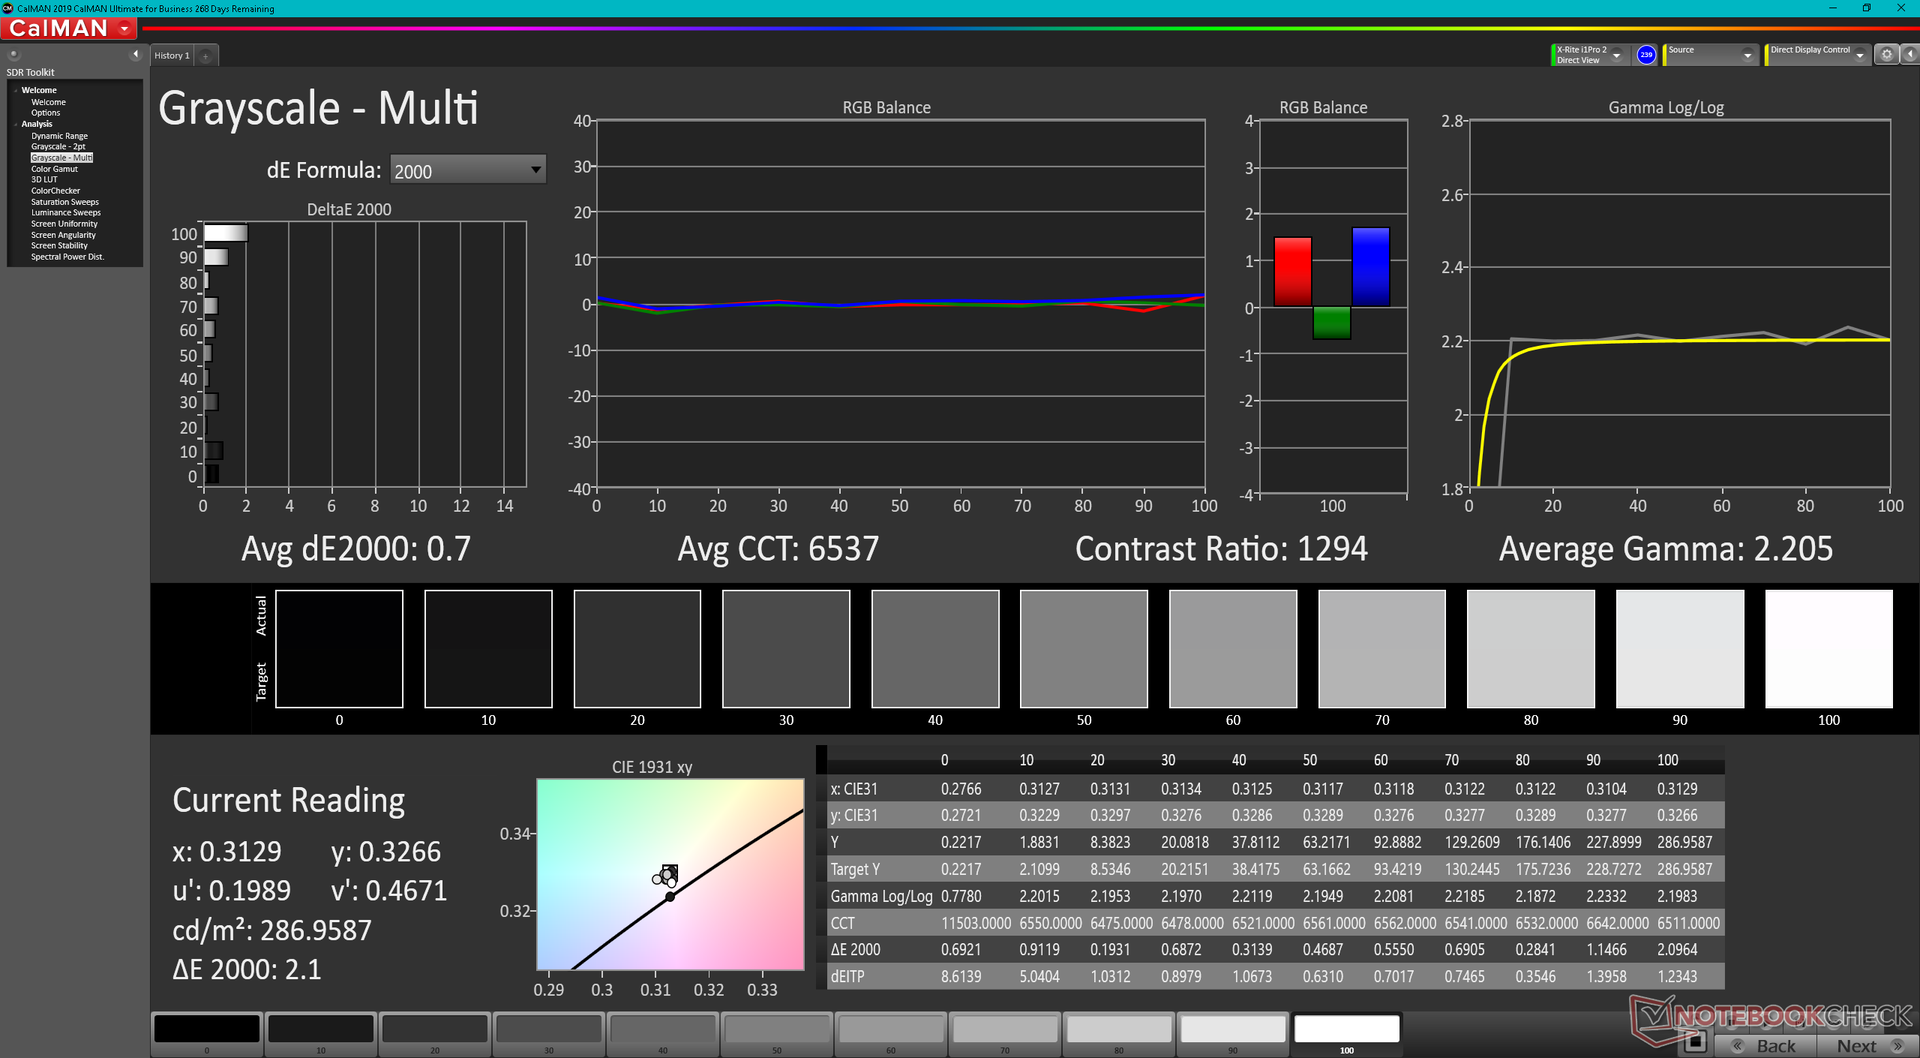
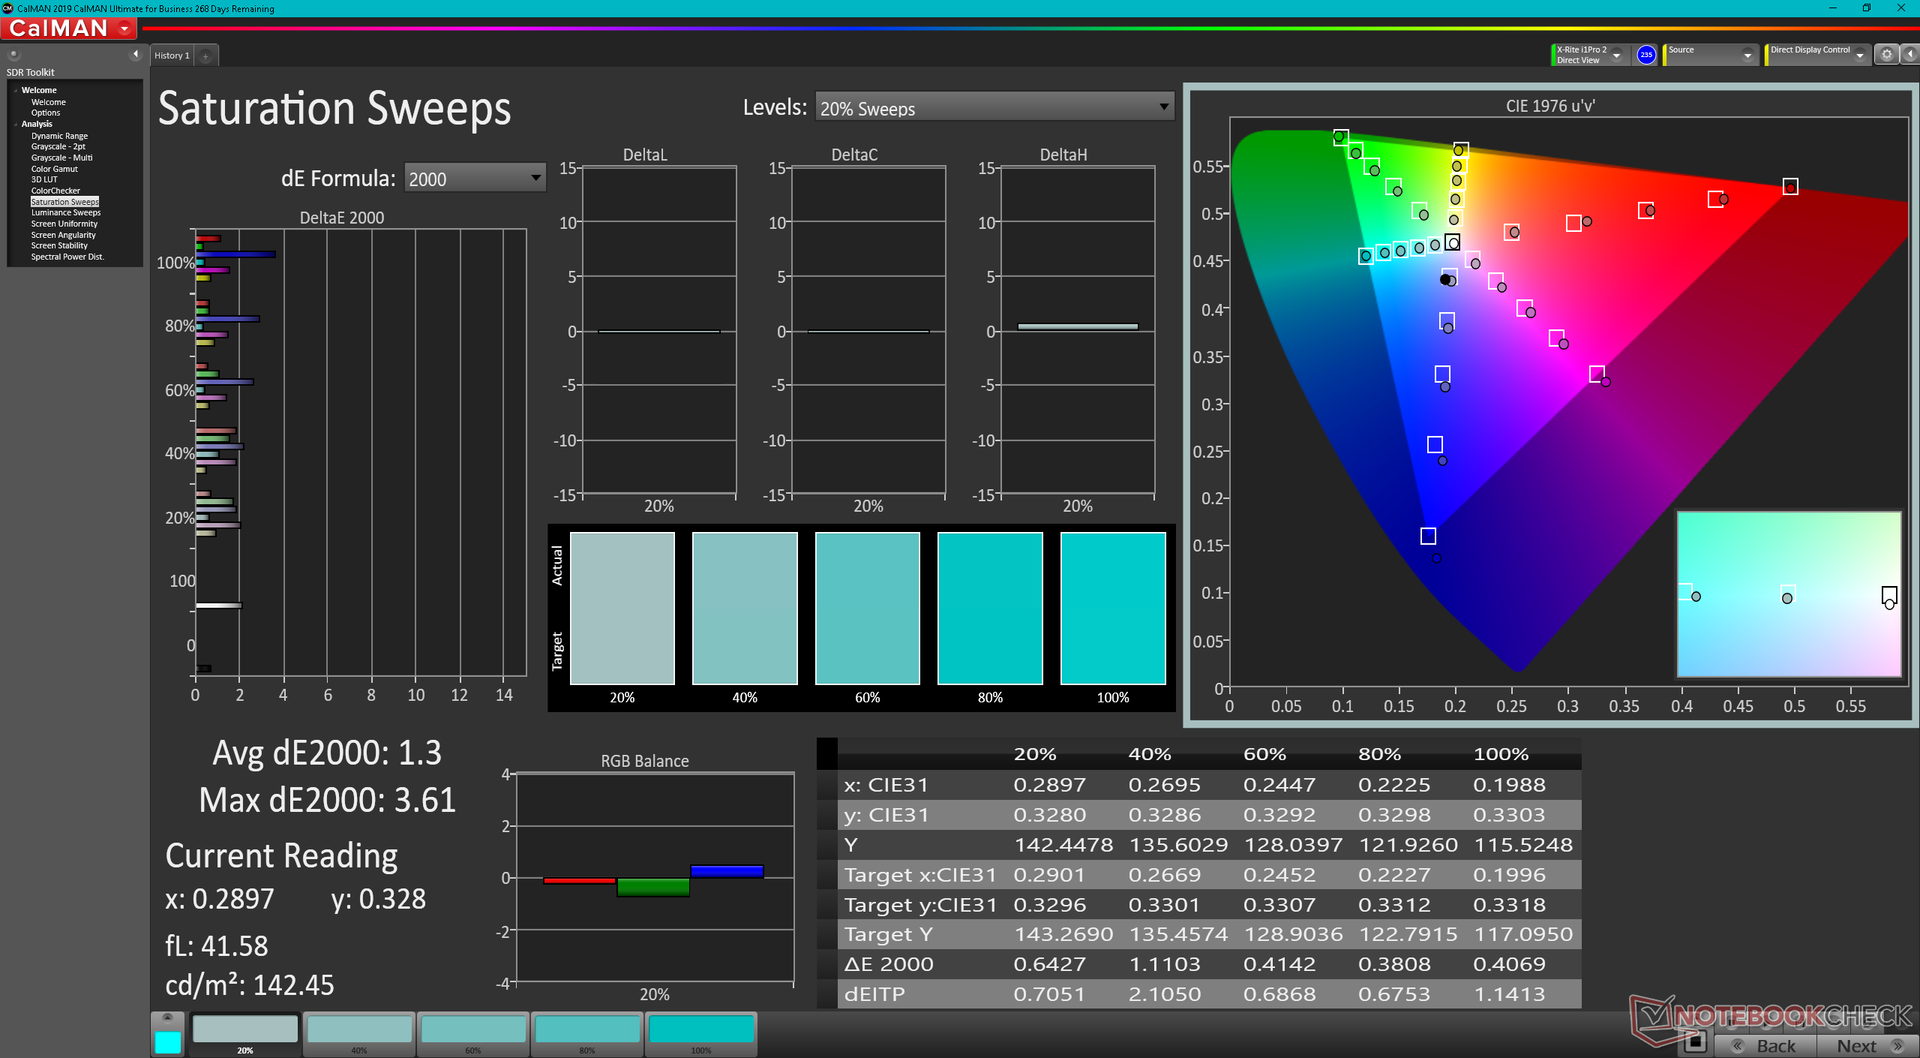
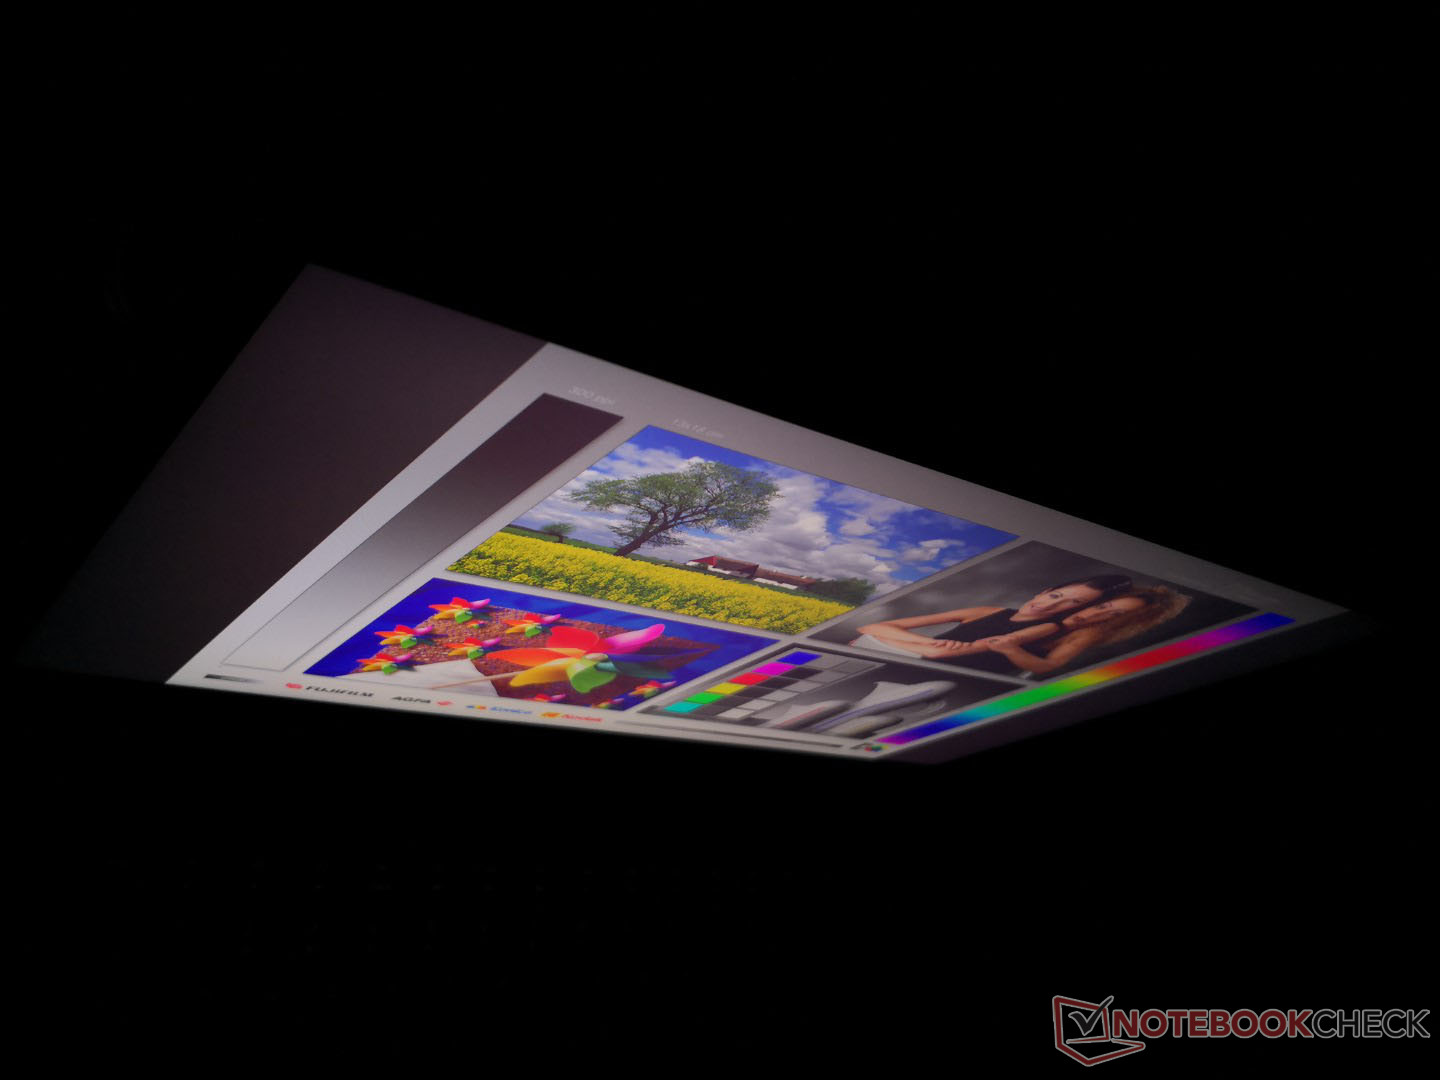
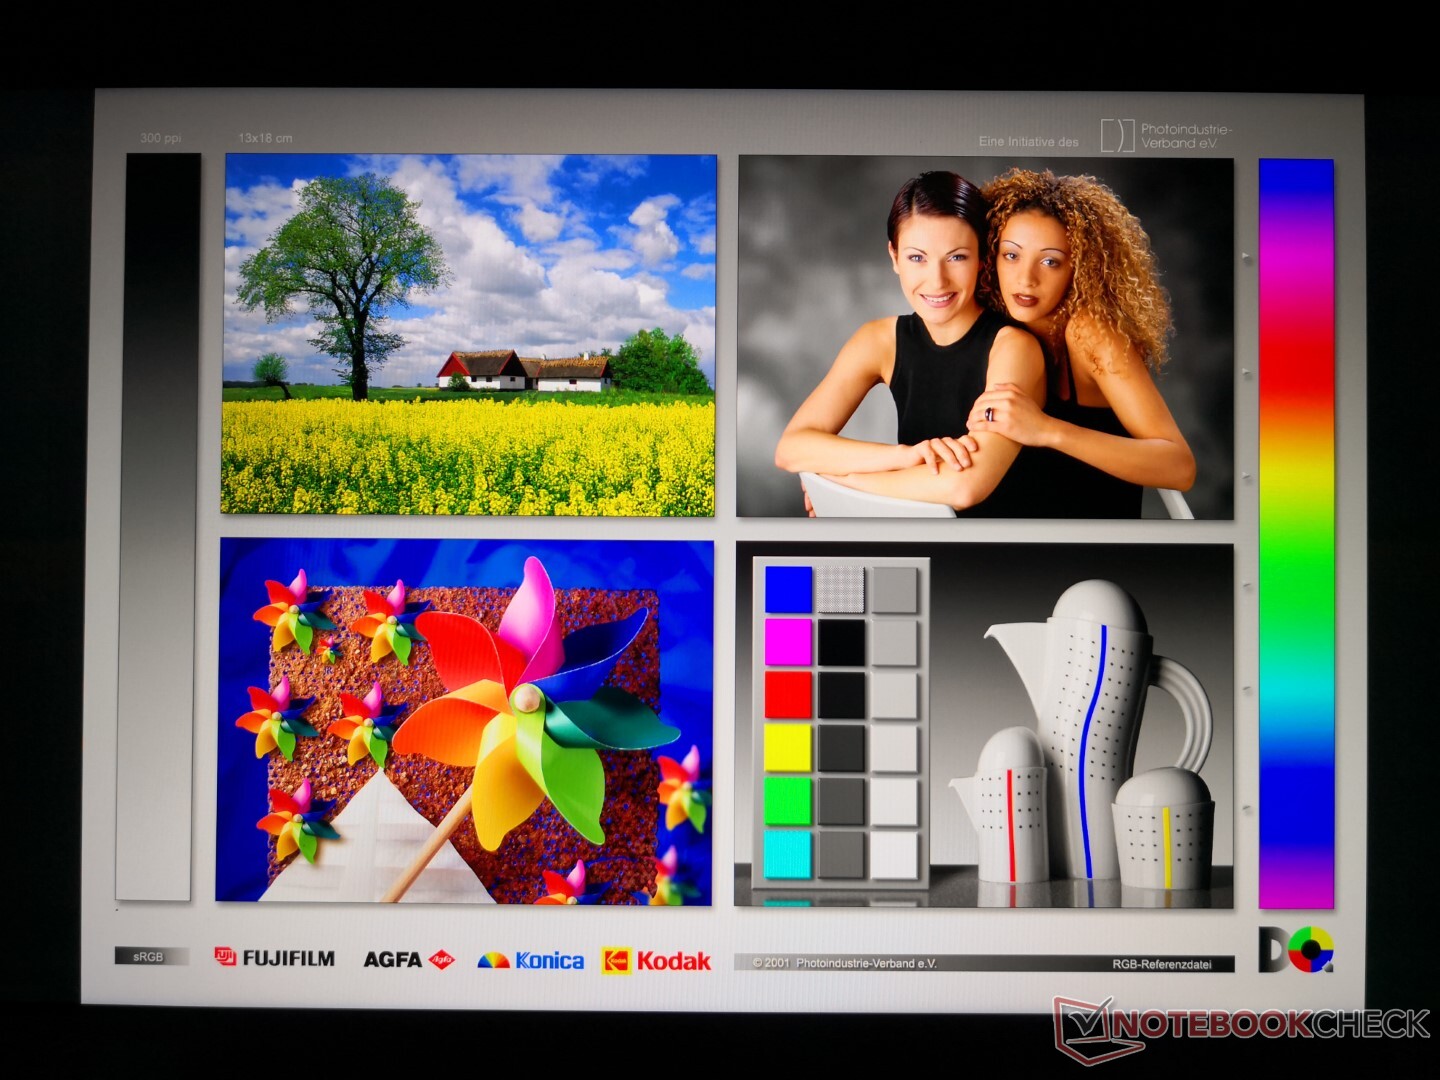
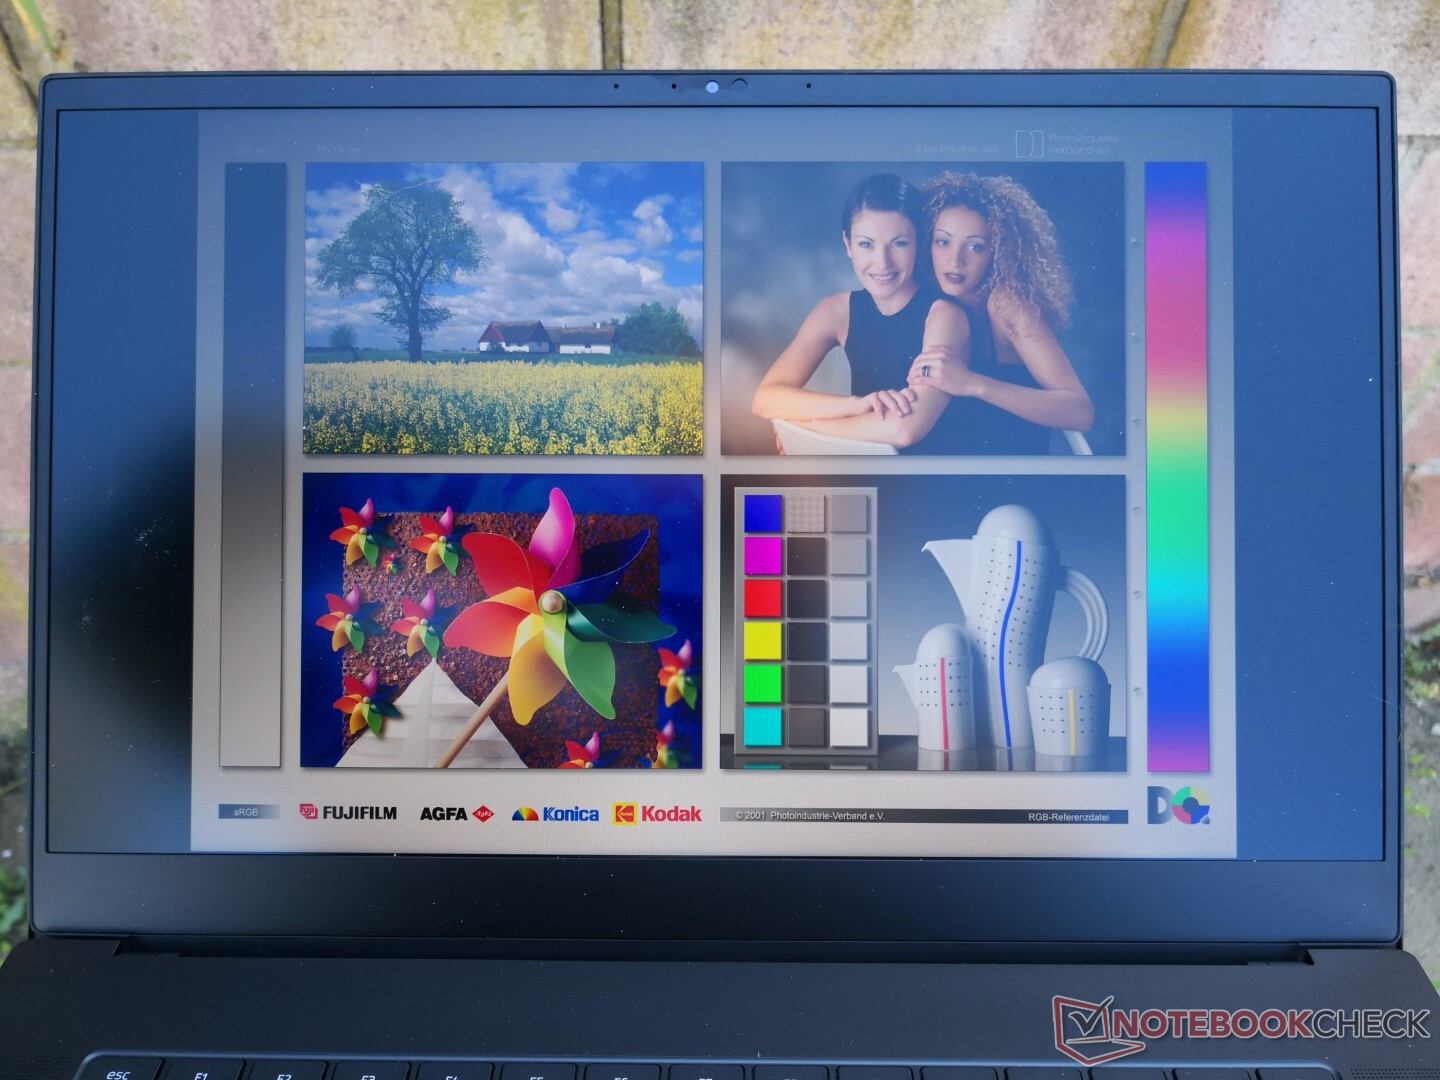
显示
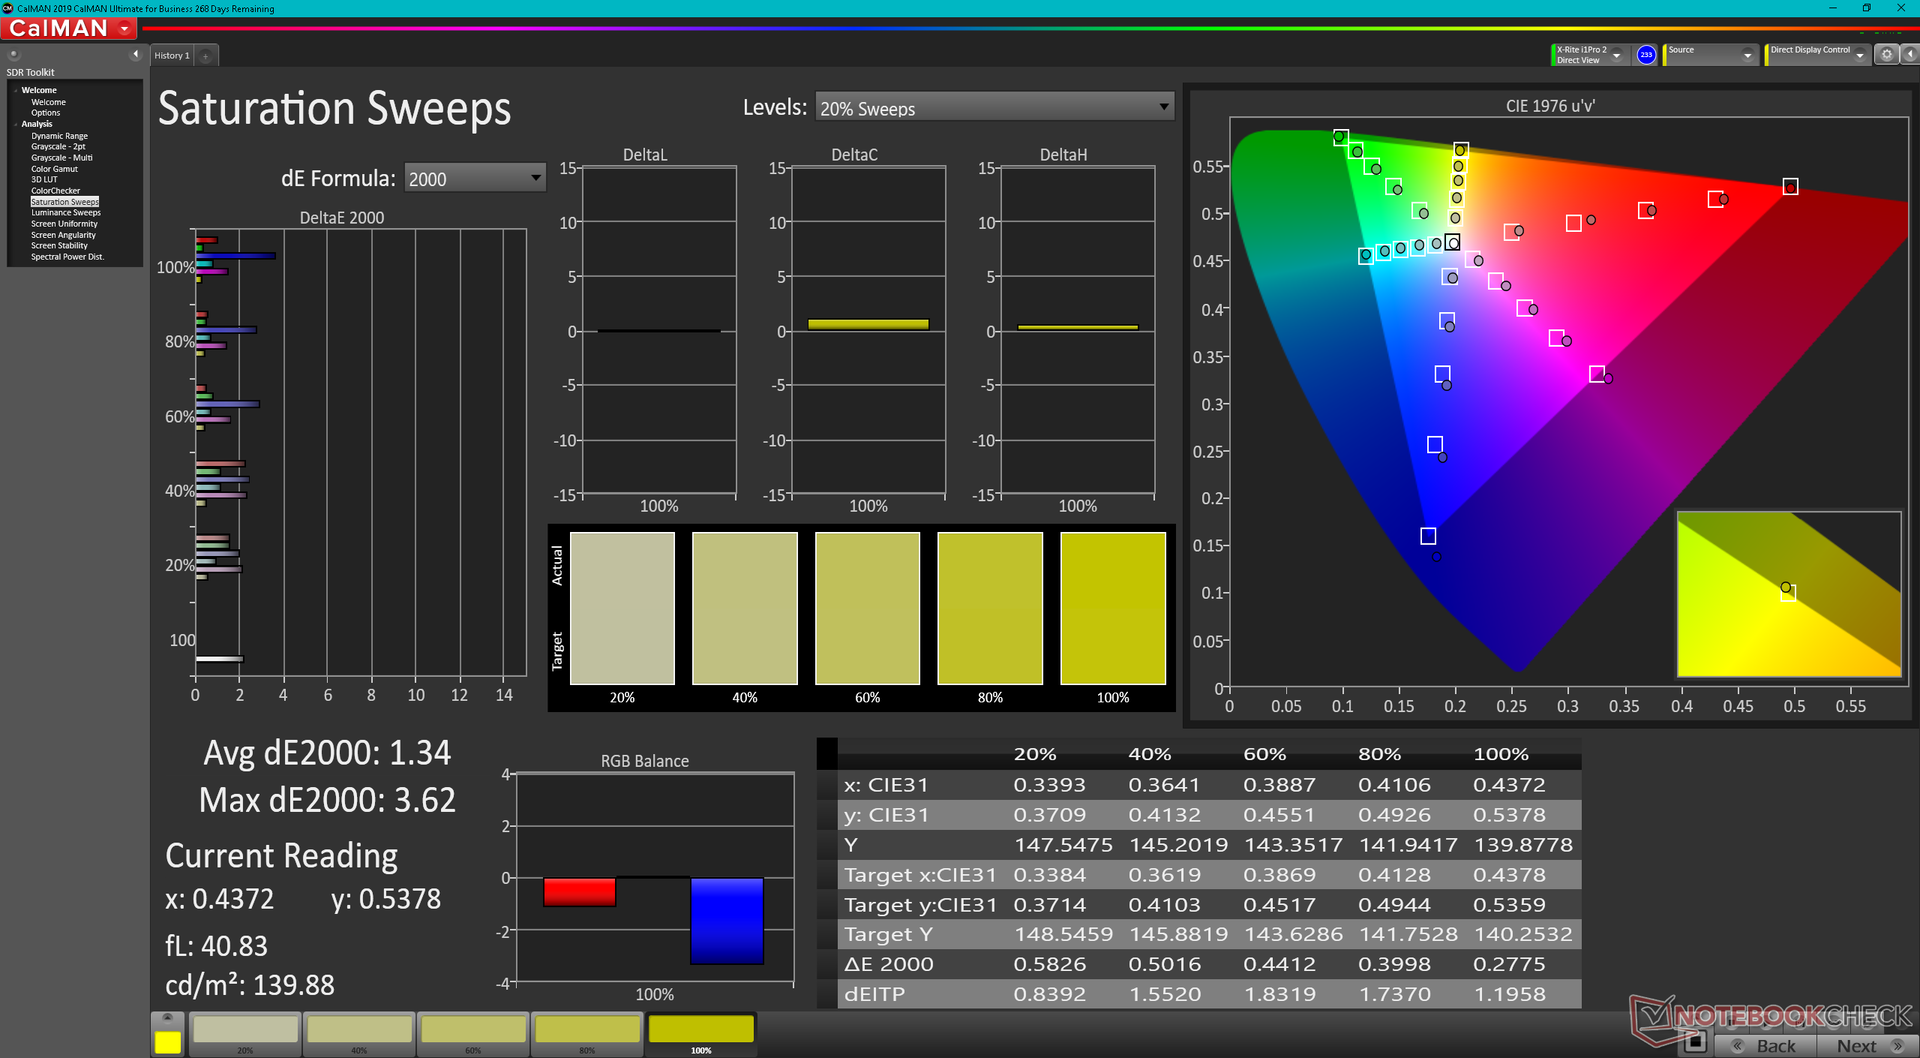
刀片15是为数不多的配备240赫兹1440p面板的15.6英寸笔记本电脑之一,涵盖了整个DCI-P3标准。而Xenia 15上的165赫兹1440p面板则 氙气15例如,它覆盖了所有的sRGB,但只覆盖了68%的P3。黑白和灰度响应时间也非常好,这意味着该面板可用于游戏和数字编辑。在前几年,Blade 15的所有者不得不选择4K UHD选项,而不是完整的DCI-P3覆盖。

| |||||||||||||||||||||||||
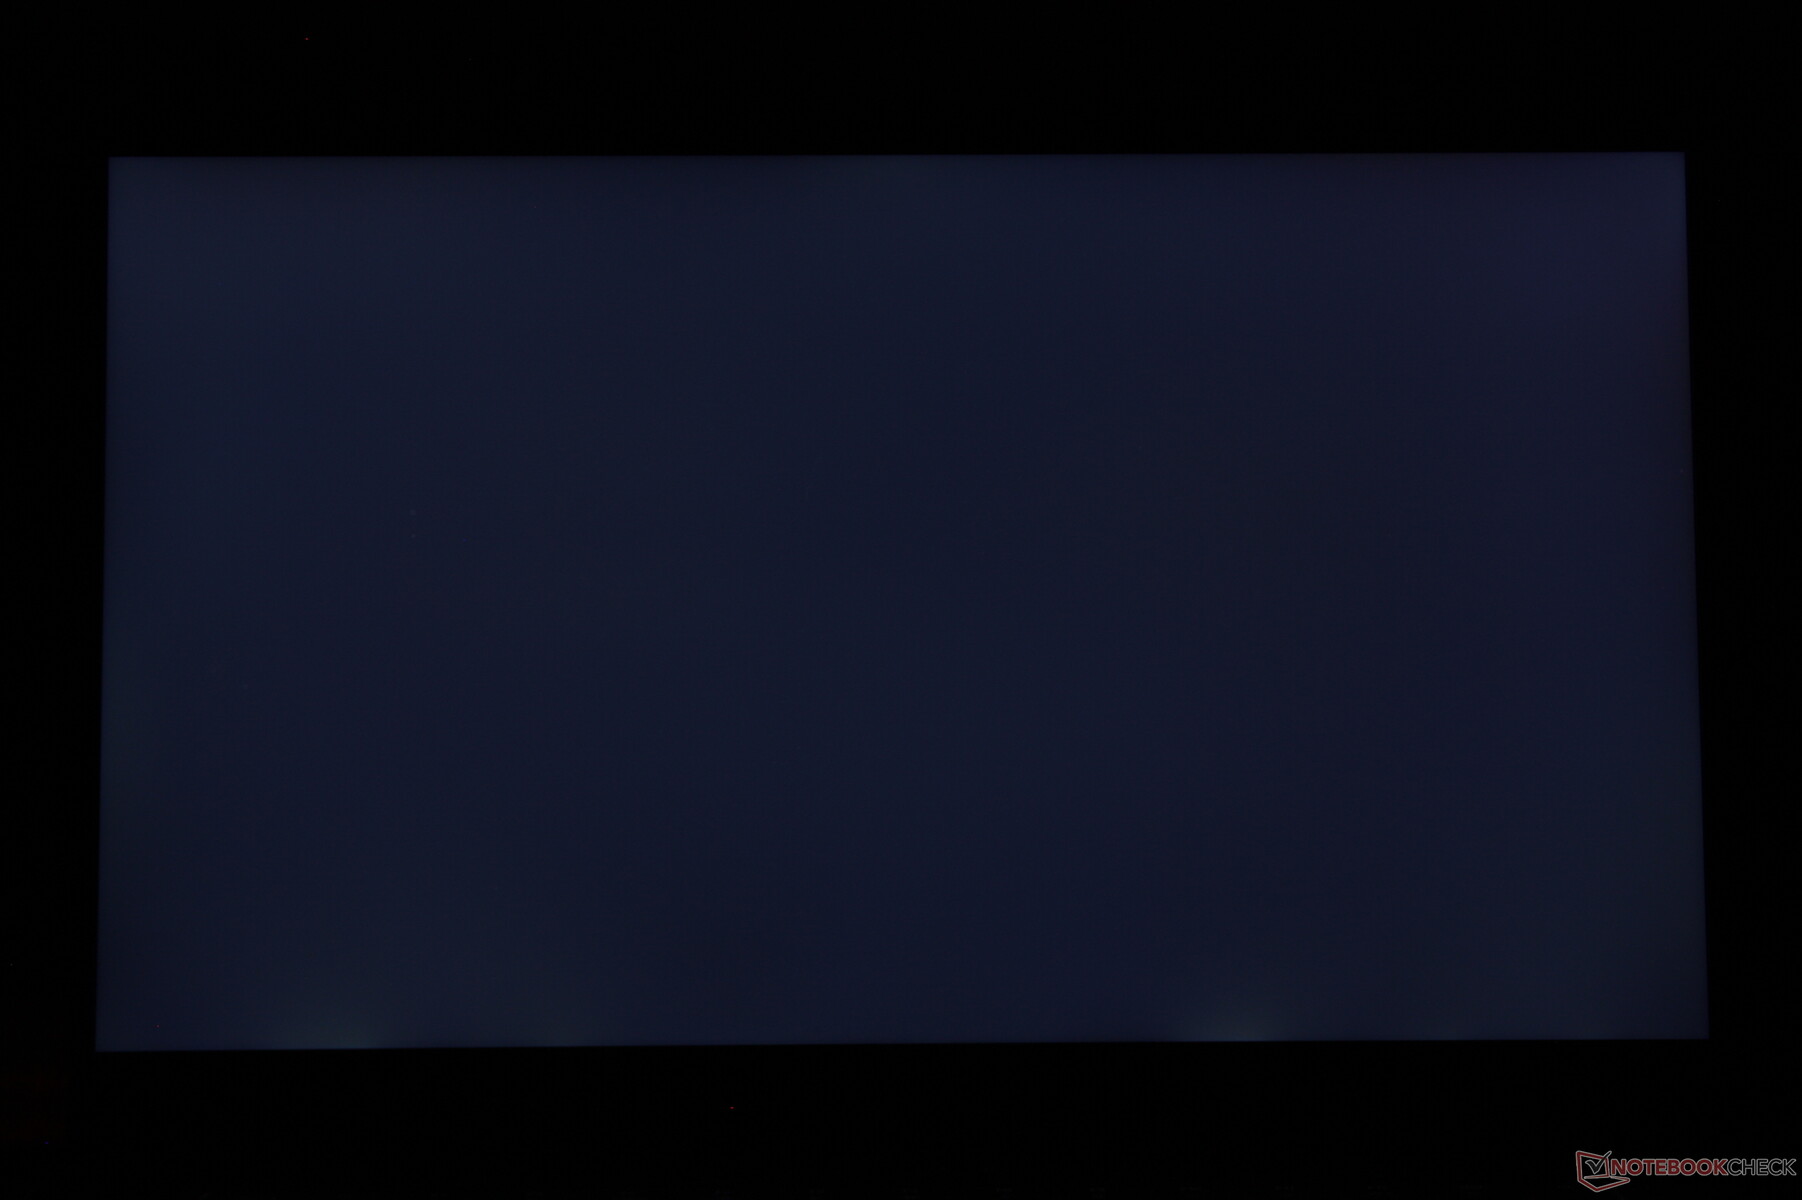
Brightness Distribution: 89 %
Center on Battery: 286 cd/m²
Contrast: 1144:1 (Black: 0.25 cd/m²)
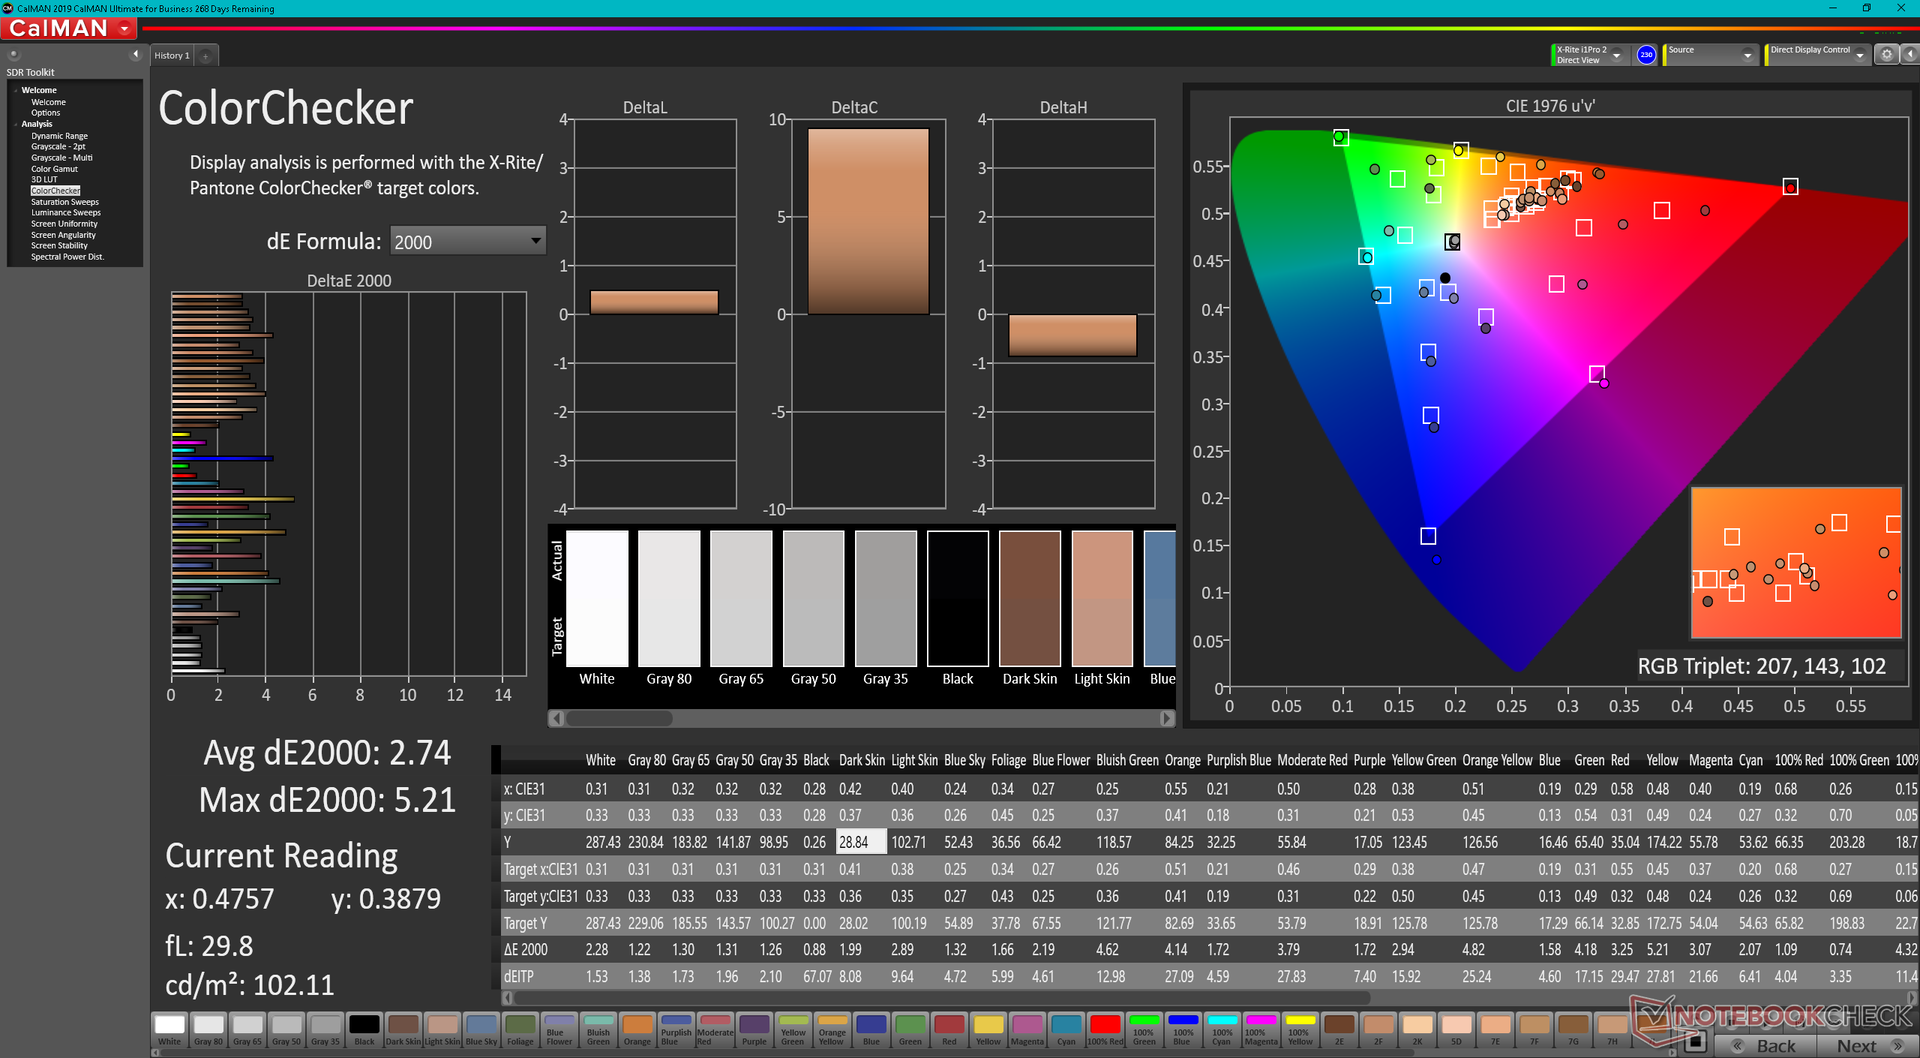
ΔE ColorChecker Calman: 2.74 | ∀{0.5-29.43 Ø4.71}
calibrated: 2.52
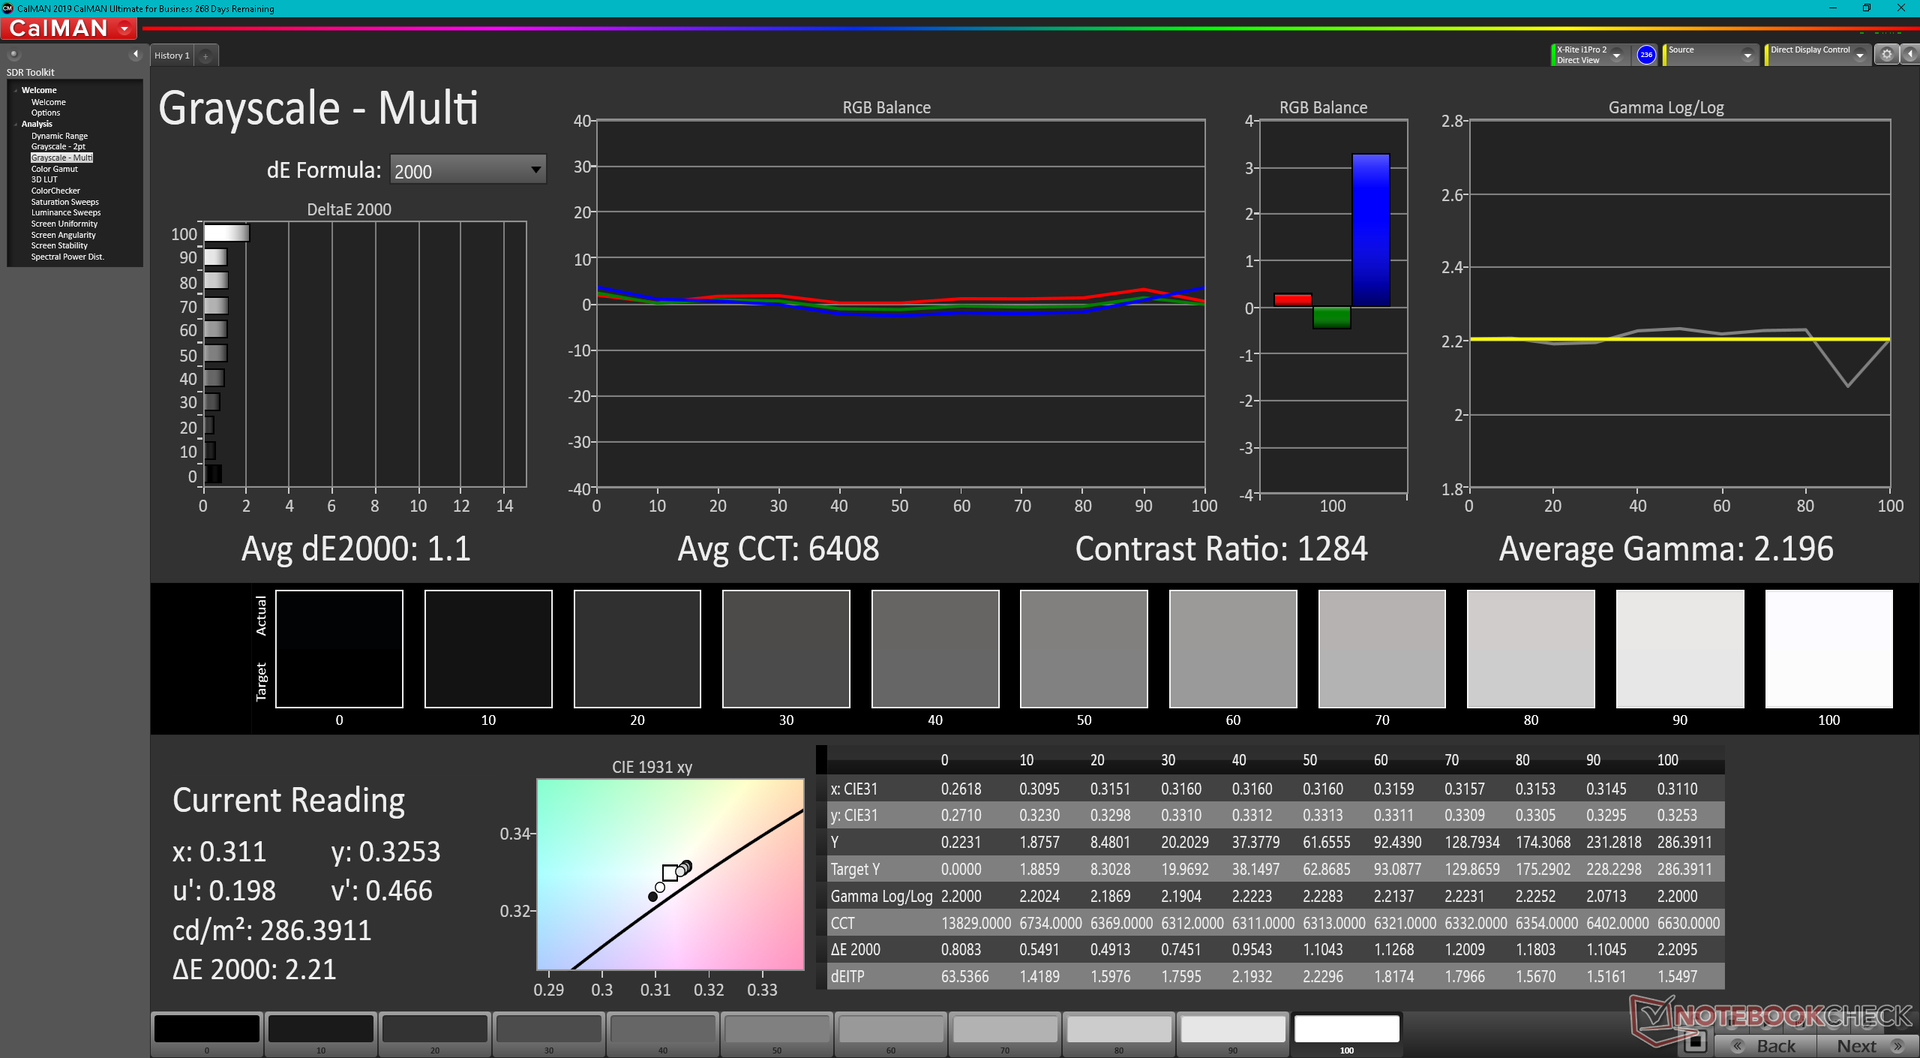
ΔE Greyscale Calman: 1.1 | ∀{0.09-98 Ø4.96}
86.8% AdobeRGB 1998 (Argyll 3D)
99.9% sRGB (Argyll 3D)
99.1% Display P3 (Argyll 3D)
Gamma: 2.2
CCT: 6408 K
| Razer Blade 15 2022 Sharp LQ156T1JW03, IPS, 2560x1440, 15.6" | Razer Blade 15 Advanced Model Early 2021 TL156VDXP02-0, IPS, 1920x1080, 15.6" | Razer Blade 15 RTX 2080 Super Max-Q AU Optronics B156HAN12.0, IPS, 1920x1080, 15.6" | Schenker XMG Neo 15 E22 (Early 2022, RTX 3080 Ti) BOE0A67 (BOE CQ NE156QHM-NZ1), IPS, 2560x1440, 15.6" | ADATA XPG Xenia 15 BOE CQ NE156QHM-NY2, IPS, 2560x1440, 15.6" | Eurocom Nightsky ARX315 Sharp LQ156M1JW03, IPS, 1920x1080, 15.6" | |
|---|---|---|---|---|---|---|
| Display | -20% | -16% | -18% | -15% | ||
| Display P3 Coverage (%) | 99.1 | 65.9 -34% | 70.2 -29% | 68.2 -31% | 67.9 -31% | |
| sRGB Coverage (%) | 99.9 | 96.4 -4% | 99 -1% | 98.1 -2% | 99.7 0% | |
| AdobeRGB 1998 Coverage (%) | 86.8 | 68 -22% | 71.4 -18% | 69.1 -20% | 73.7 -15% | |
| Response Times | -1% | 40% | 4% | 2% | -2% | |
| Response Time Grey 50% / Grey 80% * (ms) | 14.4 ? | 16 ? -11% | 6 ? 58% | 14.4 ? -0% | 13.6 ? 6% | 15.2 ? -6% |
| Response Time Black / White * (ms) | 11.6 ? | 10.4 ? 10% | 9 ? 22% | 10.8 ? 7% | 12 ? -3% | 11.2 ? 3% |
| PWM Frequency (Hz) | 23150 ? | |||||
| Screen | 20% | -6% | -28% | -62% | -38% | |
| Brightness middle (cd/m²) | 286 | 338 18% | 347 21% | 295 3% | 321.1 12% | 312.8 9% |
| Brightness (cd/m²) | 271 | 334 23% | 328 21% | 277 2% | 308 14% | 294 8% |
| Brightness Distribution (%) | 89 | 94 6% | 89 0% | 62 -30% | 82 -8% | 90 1% |
| Black Level * (cd/m²) | 0.25 | 0.24 4% | 0.285 -14% | 0.28 -12% | 0.38 -52% | 0.28 -12% |
| Contrast (:1) | 1144 | 1408 23% | 1218 6% | 1054 -8% | 845 -26% | 1117 -2% |
| Colorchecker dE 2000 * | 2.74 | 1.39 49% | 2.35 14% | 2.36 14% | 3.21 -17% | 2.96 -8% |
| Colorchecker dE 2000 max. * | 5.21 | 3.31 36% | 4.15 20% | 4.24 19% | 10.56 -103% | 6.23 -20% |
| Colorchecker dE 2000 calibrated * | 2.52 | 0.97 62% | 1.16 54% | 1.53 39% | ||
| Greyscale dE 2000 * | 1.1 | 1.6 -45% | 3.04 -176% | 3.43 -212% | 5.7 -418% | 4.2 -282% |
| Gamma | 2.2 100% | 2.291 96% | 2.35 94% | 2.44 90% | 2.09 105% | 2.32 95% |
| CCT | 6408 101% | 6626 98% | 6658 98% | 6266 104% | 7194 90% | 7145 91% |
| Color Space (Percent of AdobeRGB 1998) (%) | 68 | 65 | ||||
| Color Space (Percent of sRGB) (%) | 89 | 99 | ||||
| Total Average (Program / Settings) | -0% /
8% | 6% /
-2% | -12% /
-22% | -26% /
-44% | -18% /
-27% |
* ... smaller is better
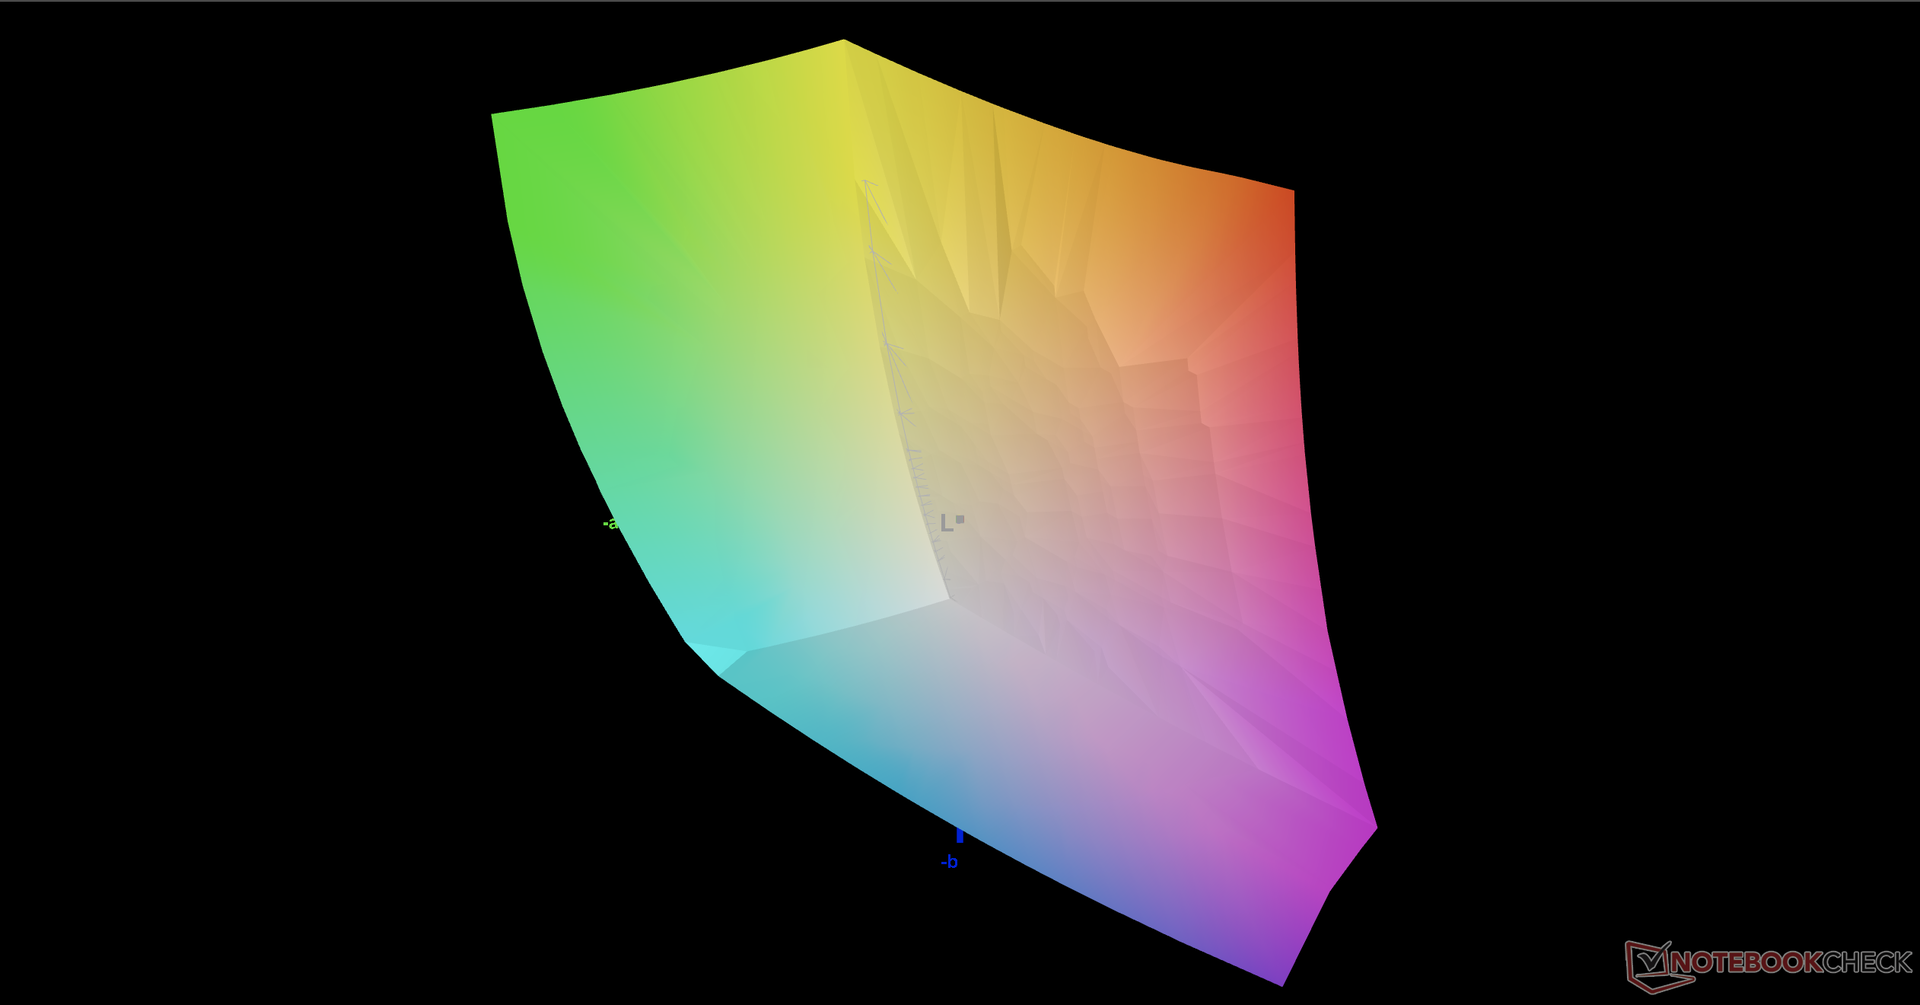
该显示器开箱即被很好地校准,根据DCI-P3标准,其平均灰度和色彩DeltaE值分别仅为1.1和2.74。Razer说它在出厂时对每个面板都进行了单独的校准,我们用X-Rite色度计进行的独立测量可以确认其准确的颜色和灰度。

Display Response Times
| ↔ Response Time Black to White | ||
|---|---|---|
| 11.6 ms ... rise ↗ and fall ↘ combined | ↗ 5.6 ms rise | 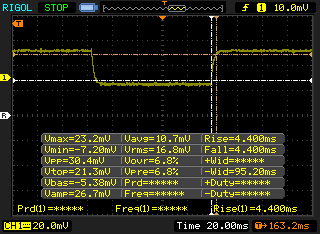 |
| ↘ 6 ms fall | ||
| The screen shows good response rates in our tests, but may be too slow for competitive gamers. In comparison, all tested devices range from 0.1 (minimum) to 240 (maximum) ms. » 31 % of all devices are better. This means that the measured response time is better than the average of all tested devices (19.8 ms). | ||
| ↔ Response Time 50% Grey to 80% Grey | ||
| 14.4 ms ... rise ↗ and fall ↘ combined | ↗ 6.8 ms rise | 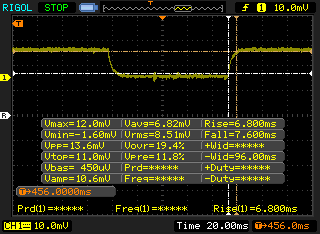 |
| ↘ 7.6 ms fall | ||
| The screen shows good response rates in our tests, but may be too slow for competitive gamers. In comparison, all tested devices range from 0.165 (minimum) to 636 (maximum) ms. » 28 % of all devices are better. This means that the measured response time is better than the average of all tested devices (31 ms). | ||
Screen Flickering / PWM (Pulse-Width Modulation)
| Screen flickering / PWM not detected | 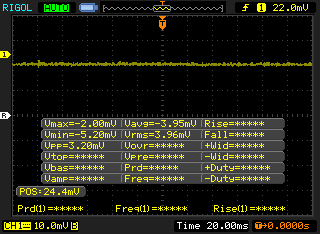 | ||
In comparison: 52 % of all tested devices do not use PWM to dim the display. If PWM was detected, an average of 7757 (minimum: 5 - maximum: 343500) Hz was measured. | |||

业绩
测试条件
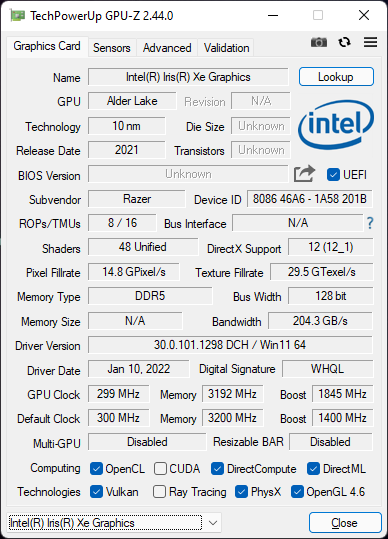
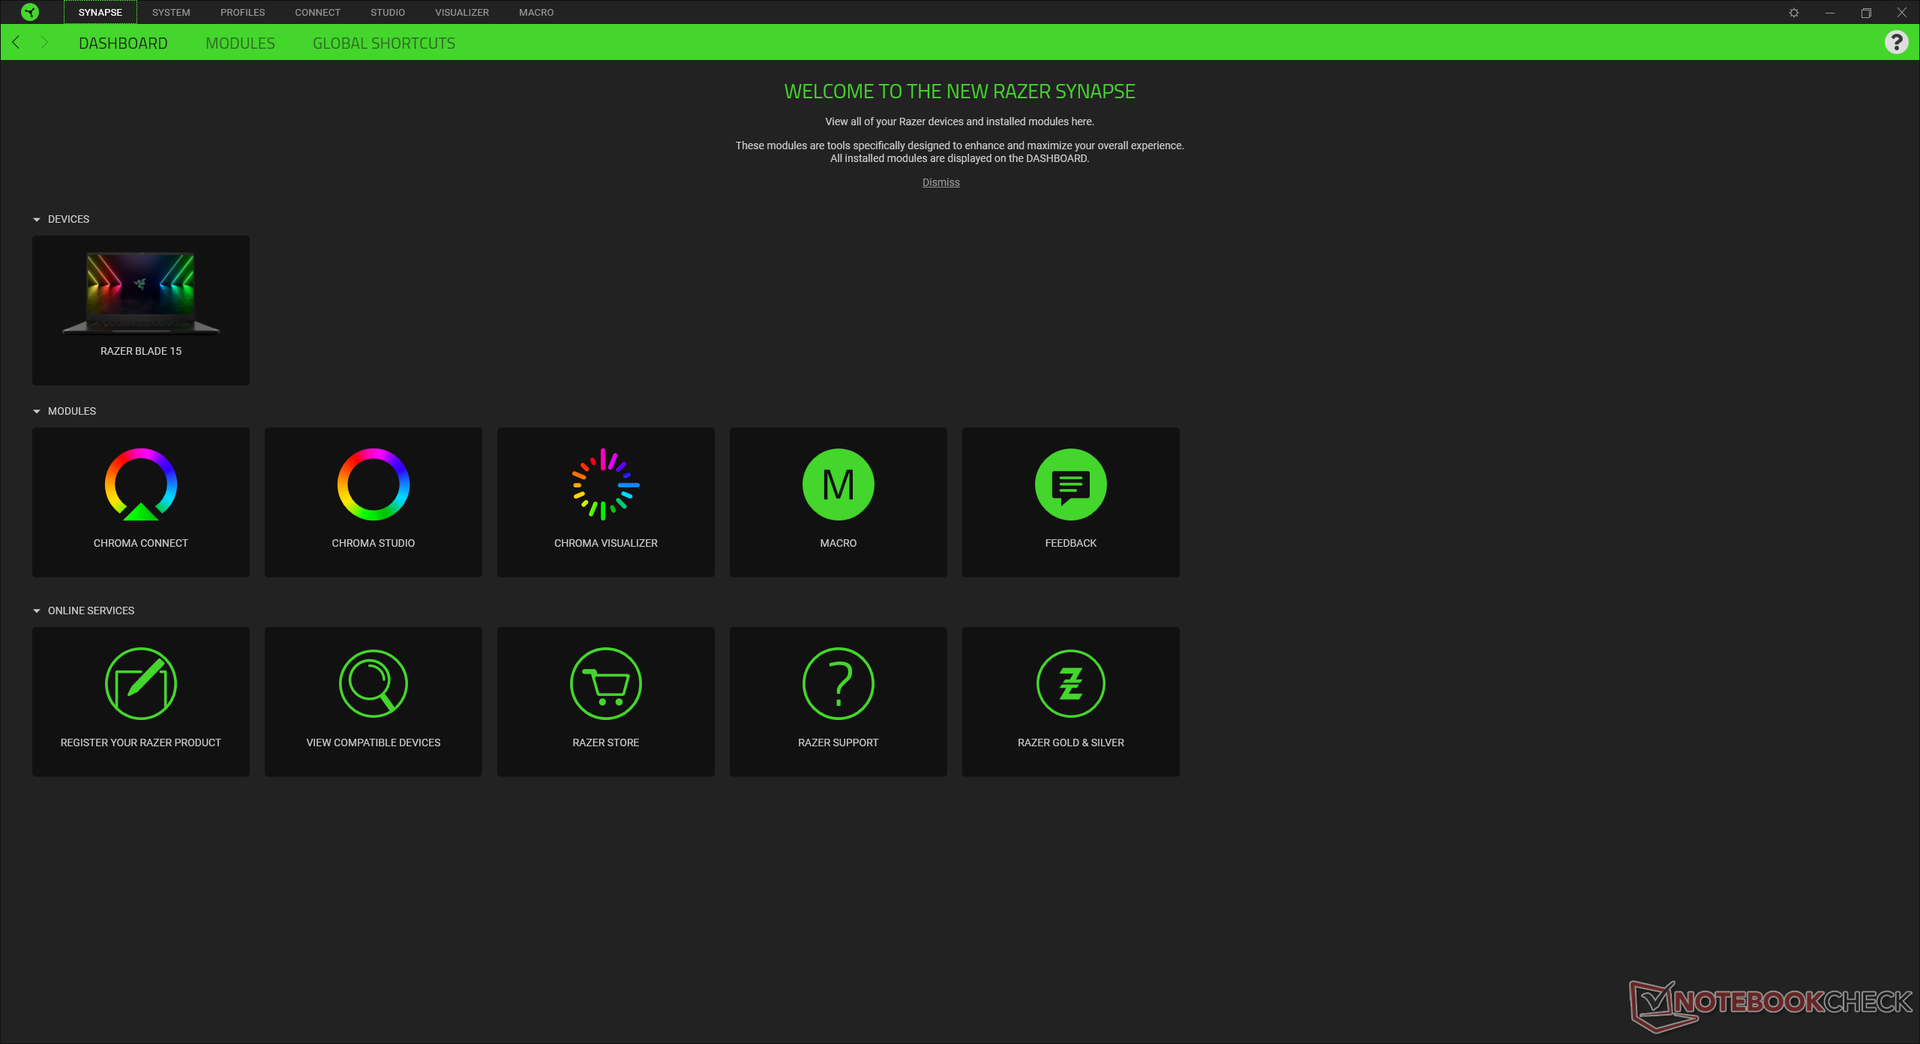
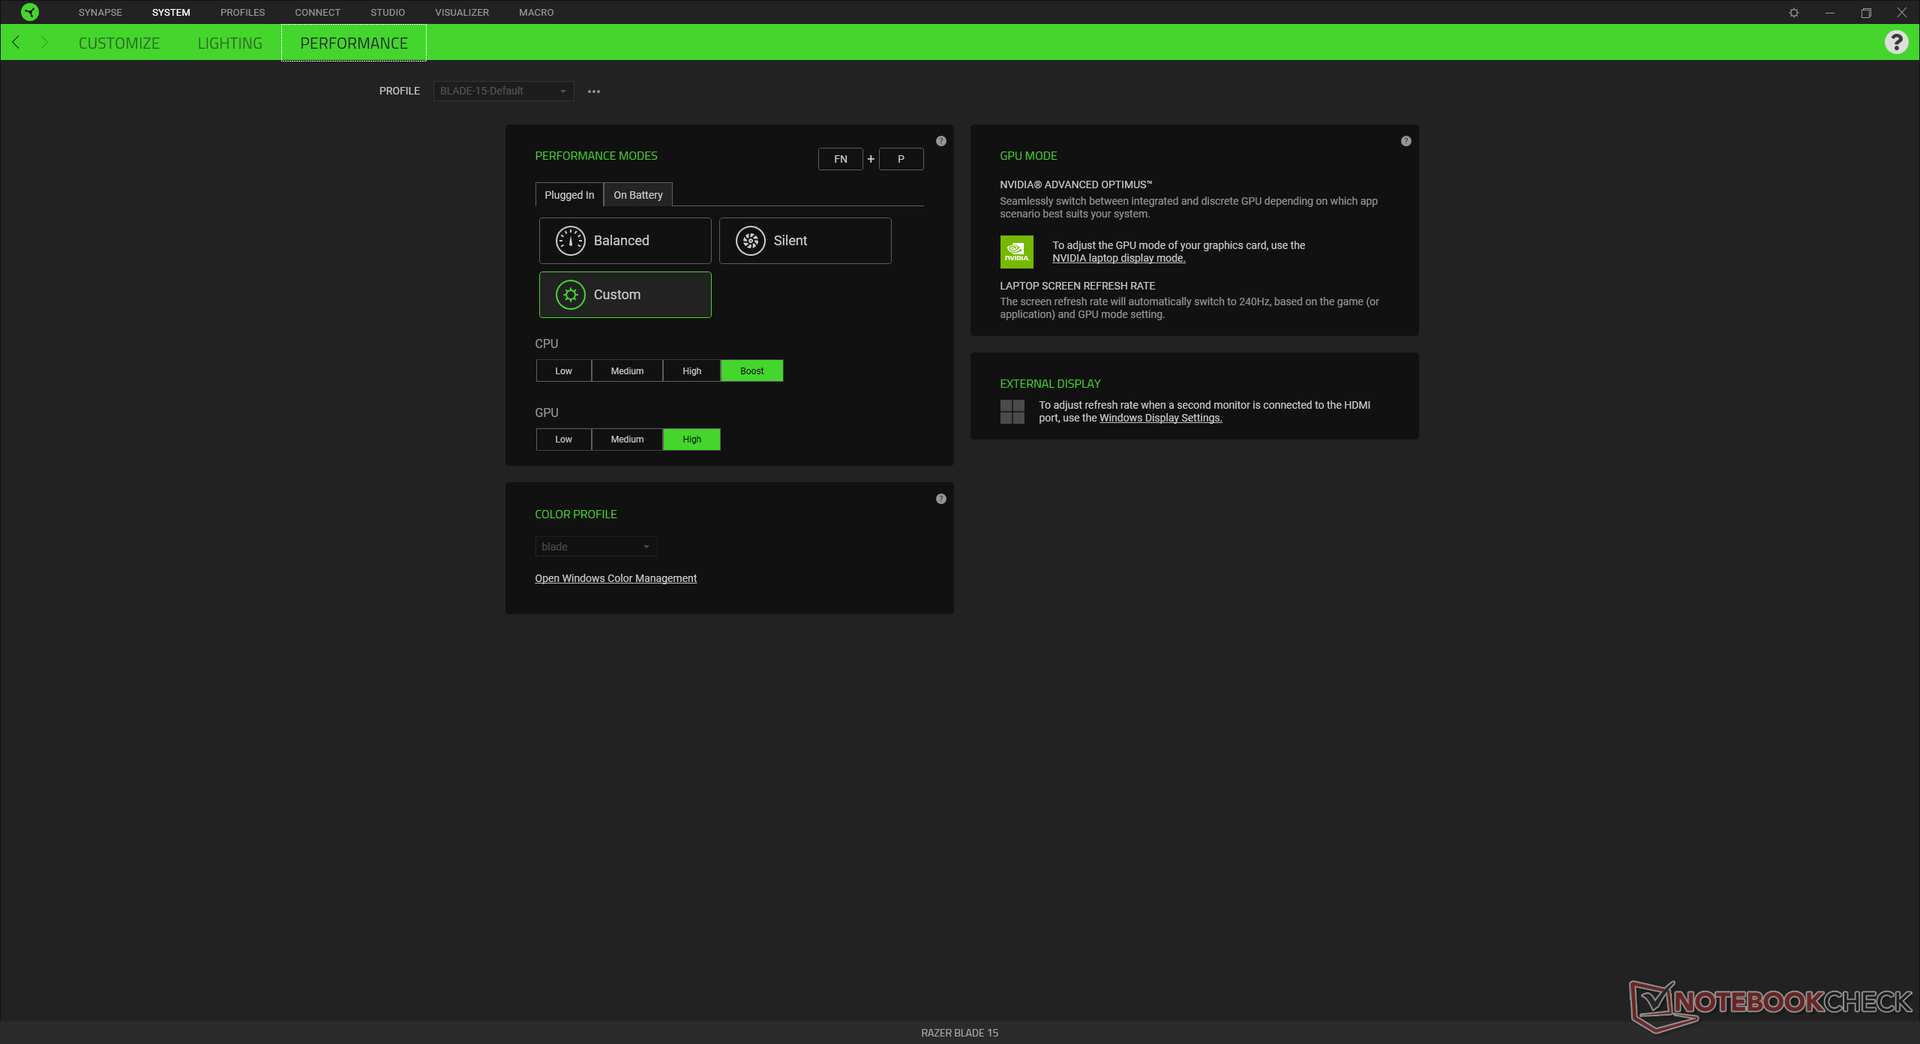
在运行以下任何性能基准测试之前,我们的设备通过Razer Synapse软件被设置为自定义性能模式,CPU为Boost,GPU为High,以获得尽可能高的分数。我们还通过禁用Optimus启用了dGPU。我们强烈建议熟悉Razer Synapse,因为它是控制性能和功能的软件中心。
用户可以在仅有dGPU或Nvidia Optimus(MUX)之间进行切换,而不需要重新启动系统,因为Blade 15是少数支持Advanced Optimus或Optimus 2.0的游戏笔记本电脑之一。请记住,内部显示器的G-Sync只有在不处于Optimus模式时才会工作。此外,只有在Optimus模式下才会支持Thunderbolt 4,这与其他运行12代Alder Lake-H CPU的笔记本电脑一样。
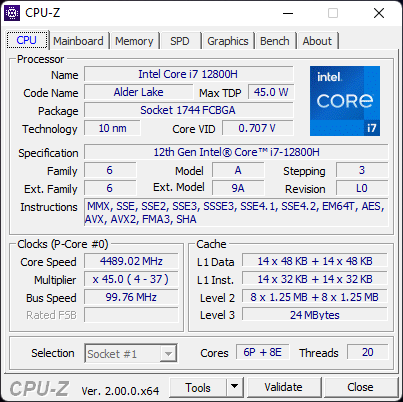
处理器
芯片 酷睿i7-12800H比上一代产品的单线程和多线程性能快20%。 酷睿i7-11800H它所直接取代的上一代酷睿i7-11800H。升级到 酷睿i9-12900HSKU,根据我们对微星Vector GP66的经验,预计可以将CPU性能再提高5%到15%。 微星Vector GP66.
Cinebench R15 Multi Loop
Cinebench R23: Multi Core | Single Core
Cinebench R15: CPU Multi 64Bit | CPU Single 64Bit
Blender: v2.79 BMW27 CPU
7-Zip 18.03: 7z b 4 | 7z b 4 -mmt1
Geekbench 5.5: Multi-Core | Single-Core
HWBOT x265 Benchmark v2.2: 4k Preset
LibreOffice : 20 Documents To PDF
R Benchmark 2.5: Overall mean
| Cinebench R20 / CPU (Multi Core) | |
| MSI Vector GP66 12UGS | |
| Razer Blade 15 2022 | |
| Average Intel Core i7-12800H (3741 - 6433, n=5) | |
| Asus ROG Zephyrus M16 GU603H | |
| Razer Blade 14 Ryzen 9 RTX 3070 | |
| Razer Blade 15 Advanced (Mid 2021) | |
| MSI Alpha 15 B5EEK-008 | |
| Asus ROG Zephyrus G15 GA502IU-ES76 | |
| Aorus 15P XC | |
| Lenovo Legion C7 15IMH05 82EH0030GE | |
| Razer Blade 15 Advanced Model Early 2021 | |
| Cinebench R20 / CPU (Single Core) | |
| MSI Vector GP66 12UGS | |
| Average Intel Core i7-12800H (690 - 714, n=5) | |
| Razer Blade 15 2022 | |
| Asus ROG Zephyrus M16 GU603H | |
| Razer Blade 15 Advanced (Mid 2021) | |
| MSI Alpha 15 B5EEK-008 | |
| Lenovo Legion C7 15IMH05 82EH0030GE | |
| Asus ROG Zephyrus G15 GA502IU-ES76 | |
| Razer Blade 15 Advanced Model Early 2021 | |
| Aorus 15P XC | |
| Razer Blade 14 Ryzen 9 RTX 3070 | |
| Cinebench R23 / Multi Core | |
| MSI Vector GP66 12UGS | |
| Razer Blade 15 2022 | |
| Average Intel Core i7-12800H (9777 - 16597, n=5) | |
| Razer Blade 14 Ryzen 9 RTX 3070 | |
| Razer Blade 15 Advanced (Mid 2021) | |
| MSI Alpha 15 B5EEK-008 | |
| Aorus 15P XC | |
| Lenovo Legion C7 15IMH05 82EH0030GE | |
| Razer Blade 15 Advanced Model Early 2021 | |
| Cinebench R23 / Single Core | |
| MSI Vector GP66 12UGS | |
| Average Intel Core i7-12800H (1796 - 1859, n=5) | |
| Razer Blade 15 2022 | |
| Razer Blade 15 Advanced (Mid 2021) | |
| MSI Alpha 15 B5EEK-008 | |
| Lenovo Legion C7 15IMH05 82EH0030GE | |
| Aorus 15P XC | |
| Razer Blade 14 Ryzen 9 RTX 3070 | |
| Razer Blade 15 Advanced Model Early 2021 | |
| Cinebench R15 / CPU Multi 64Bit | |
| MSI Vector GP66 12UGS | |
| Average Intel Core i7-12800H (1566 - 2697, n=5) | |
| Asus ROG Zephyrus M16 GU603H | |
| Razer Blade 15 2022 | |
| Razer Blade 14 Ryzen 9 RTX 3070 | |
| MSI Alpha 15 B5EEK-008 | |
| Razer Blade 15 Advanced (Mid 2021) | |
| Aorus 15P XC | |
| Lenovo Legion C7 15IMH05 82EH0030GE | |
| Asus ROG Zephyrus G15 GA502IU-ES76 | |
| Razer Blade 15 Advanced Model Early 2021 | |
| Cinebench R15 / CPU Single 64Bit | |
| MSI Vector GP66 12UGS | |
| Average Intel Core i7-12800H (242 - 269, n=5) | |
| Razer Blade 15 2022 | |
| Asus ROG Zephyrus M16 GU603H | |
| MSI Alpha 15 B5EEK-008 | |
| Razer Blade 15 Advanced (Mid 2021) | |
| Lenovo Legion C7 15IMH05 82EH0030GE | |
| Aorus 15P XC | |
| Razer Blade 15 Advanced Model Early 2021 | |
| Razer Blade 14 Ryzen 9 RTX 3070 | |
| Asus ROG Zephyrus G15 GA502IU-ES76 | |
| Blender / v2.79 BMW27 CPU | |
| Razer Blade 15 Advanced Model Early 2021 | |
| Lenovo Legion C7 15IMH05 82EH0030GE | |
| Aorus 15P XC | |
| Asus ROG Zephyrus G15 GA502IU-ES76 | |
| Razer Blade 15 Advanced (Mid 2021) | |
| MSI Alpha 15 B5EEK-008 | |
| Razer Blade 14 Ryzen 9 RTX 3070 | |
| Asus ROG Zephyrus M16 GU603H | |
| Average Intel Core i7-12800H (192 - 306, n=5) | |
| Razer Blade 15 2022 | |
| MSI Vector GP66 12UGS | |
| 7-Zip 18.03 / 7z b 4 | |
| MSI Vector GP66 12UGS | |
| Razer Blade 15 2022 | |
| Average Intel Core i7-12800H (44553 - 68930, n=5) | |
| MSI Alpha 15 B5EEK-008 | |
| Asus ROG Zephyrus M16 GU603H | |
| Razer Blade 15 Advanced (Mid 2021) | |
| Razer Blade 14 Ryzen 9 RTX 3070 | |
| Asus ROG Zephyrus G15 GA502IU-ES76 | |
| Aorus 15P XC | |
| Lenovo Legion C7 15IMH05 82EH0030GE | |
| Razer Blade 15 Advanced Model Early 2021 | |
| 7-Zip 18.03 / 7z b 4 -mmt1 | |
| MSI Vector GP66 12UGS | |
| Average Intel Core i7-12800H (5726 - 5976, n=5) | |
| Razer Blade 15 2022 | |
| Asus ROG Zephyrus M16 GU603H | |
| MSI Alpha 15 B5EEK-008 | |
| Razer Blade 15 Advanced (Mid 2021) | |
| Lenovo Legion C7 15IMH05 82EH0030GE | |
| Razer Blade 15 Advanced Model Early 2021 | |
| Aorus 15P XC | |
| Razer Blade 14 Ryzen 9 RTX 3070 | |
| Asus ROG Zephyrus G15 GA502IU-ES76 | |
| Geekbench 5.5 / Multi-Core | |
| Razer Blade 15 2022 | |
| MSI Vector GP66 12UGS | |
| Average Intel Core i7-12800H (9607 - 12940, n=5) | |
| Asus ROG Zephyrus M16 GU603H | |
| MSI Alpha 15 B5EEK-008 | |
| Lenovo Legion C7 15IMH05 82EH0030GE | |
| Aorus 15P XC | |
| Asus ROG Zephyrus G15 GA502IU-ES76 | |
| Razer Blade 15 Advanced Model Early 2021 | |
| Geekbench 5.5 / Single-Core | |
| MSI Vector GP66 12UGS | |
| Average Intel Core i7-12800H (1739 - 1842, n=5) | |
| Razer Blade 15 2022 | |
| Asus ROG Zephyrus M16 GU603H | |
| MSI Alpha 15 B5EEK-008 | |
| Lenovo Legion C7 15IMH05 82EH0030GE | |
| Razer Blade 15 Advanced Model Early 2021 | |
| Aorus 15P XC | |
| Asus ROG Zephyrus G15 GA502IU-ES76 | |
| HWBOT x265 Benchmark v2.2 / 4k Preset | |
| MSI Vector GP66 12UGS | |
| Razer Blade 15 2022 | |
| Average Intel Core i7-12800H (11.7 - 19.4, n=5) | |
| Razer Blade 14 Ryzen 9 RTX 3070 | |
| MSI Alpha 15 B5EEK-008 | |
| Asus ROG Zephyrus M16 GU603H | |
| Razer Blade 15 Advanced (Mid 2021) | |
| Aorus 15P XC | |
| Asus ROG Zephyrus G15 GA502IU-ES76 | |
| Lenovo Legion C7 15IMH05 82EH0030GE | |
| Razer Blade 15 Advanced Model Early 2021 | |
| LibreOffice / 20 Documents To PDF | |
| Razer Blade 14 Ryzen 9 RTX 3070 | |
| Asus ROG Zephyrus G15 GA502IU-ES76 | |
| Lenovo Legion C7 15IMH05 82EH0030GE | |
| MSI Alpha 15 B5EEK-008 | |
| Razer Blade 15 Advanced Model Early 2021 | |
| Aorus 15P XC | |
| Razer Blade 15 2022 | |
| Razer Blade 15 Advanced (Mid 2021) | |
| Average Intel Core i7-12800H (41.3 - 51.5, n=5) | |
| Asus ROG Zephyrus M16 GU603H | |
| MSI Vector GP66 12UGS | |
| R Benchmark 2.5 / Overall mean | |
| Razer Blade 14 Ryzen 9 RTX 3070 | |
| Aorus 15P XC | |
| Lenovo Legion C7 15IMH05 82EH0030GE | |
| Asus ROG Zephyrus G15 GA502IU-ES76 | |
| Razer Blade 15 Advanced Model Early 2021 | |
| Razer Blade 15 Advanced (Mid 2021) | |
| Asus ROG Zephyrus M16 GU603H | |
| MSI Alpha 15 B5EEK-008 | |
| Razer Blade 15 2022 | |
| Average Intel Core i7-12800H (0.4442 - 0.4715, n=5) | |
| MSI Vector GP66 12UGS | |
* ... smaller is better
AIDA64: FP32 Ray-Trace | FPU Julia | CPU SHA3 | CPU Queen | FPU SinJulia | FPU Mandel | CPU AES | CPU ZLib | FP64 Ray-Trace | CPU PhotoWorxx
| Performance rating | |
| Eurocom Nightsky ARX315 | |
| Schenker XMG Neo 15 E22 (Early 2022, RTX 3080 Ti) | |
| Average Intel Core i7-12800H | |
| Razer Blade 15 2022 | |
| Razer Blade 15 RTX 2080 Super Max-Q | |
| Razer Blade 15 Advanced Model Early 2021 | |
| ADATA XPG Xenia 15 -9! | |
| AIDA64 / FP32 Ray-Trace | |
| Eurocom Nightsky ARX315 | |
| Schenker XMG Neo 15 E22 (Early 2022, RTX 3080 Ti) | |
| Razer Blade 15 RTX 2080 Super Max-Q | |
| Average Intel Core i7-12800H (5839 - 15206, n=5) | |
| Razer Blade 15 Advanced Model Early 2021 | |
| Razer Blade 15 2022 | |
| AIDA64 / FPU Julia | |
| Eurocom Nightsky ARX315 | |
| Razer Blade 15 RTX 2080 Super Max-Q | |
| Razer Blade 15 Advanced Model Early 2021 | |
| Average Intel Core i7-12800H (27801 - 80002, n=5) | |
| Schenker XMG Neo 15 E22 (Early 2022, RTX 3080 Ti) | |
| Razer Blade 15 2022 | |
| AIDA64 / CPU SHA3 | |
| Schenker XMG Neo 15 E22 (Early 2022, RTX 3080 Ti) | |
| Eurocom Nightsky ARX315 | |
| Average Intel Core i7-12800H (2013 - 3684, n=5) | |
| Razer Blade 15 2022 | |
| Razer Blade 15 RTX 2080 Super Max-Q | |
| Razer Blade 15 Advanced Model Early 2021 | |
| AIDA64 / CPU Queen | |
| Eurocom Nightsky ARX315 | |
| Schenker XMG Neo 15 E22 (Early 2022, RTX 3080 Ti) | |
| Average Intel Core i7-12800H (85965 - 108084, n=5) | |
| Razer Blade 15 2022 | |
| Razer Blade 15 RTX 2080 Super Max-Q | |
| Razer Blade 15 Advanced Model Early 2021 | |
| AIDA64 / FPU SinJulia | |
| Eurocom Nightsky ARX315 | |
| Schenker XMG Neo 15 E22 (Early 2022, RTX 3080 Ti) | |
| Razer Blade 15 2022 | |
| Average Intel Core i7-12800H (7027 - 9658, n=5) | |
| Razer Blade 15 RTX 2080 Super Max-Q | |
| Razer Blade 15 Advanced Model Early 2021 | |
| AIDA64 / FPU Mandel | |
| Eurocom Nightsky ARX315 | |
| Schenker XMG Neo 15 E22 (Early 2022, RTX 3080 Ti) | |
| Razer Blade 15 RTX 2080 Super Max-Q | |
| Average Intel Core i7-12800H (15765 - 38179, n=5) | |
| Razer Blade 15 Advanced Model Early 2021 | |
| Razer Blade 15 2022 | |
| AIDA64 / CPU AES | |
| Eurocom Nightsky ARX315 | |
| Schenker XMG Neo 15 E22 (Early 2022, RTX 3080 Ti) | |
| Average Intel Core i7-12800H (55371 - 73928, n=5) | |
| Razer Blade 15 2022 | |
| Razer Blade 15 RTX 2080 Super Max-Q | |
| Razer Blade 15 Advanced Model Early 2021 | |
| AIDA64 / CPU ZLib | |
| Schenker XMG Neo 15 E22 (Early 2022, RTX 3080 Ti) | |
| Eurocom Nightsky ARX315 | |
| Razer Blade 15 2022 | |
| Average Intel Core i7-12800H (701 - 1047, n=5) | |
| Razer Blade 15 RTX 2080 Super Max-Q | |
| Razer Blade 15 Advanced Model Early 2021 | |
| ADATA XPG Xenia 15 | |
| AIDA64 / FP64 Ray-Trace | |
| Eurocom Nightsky ARX315 | |
| Schenker XMG Neo 15 E22 (Early 2022, RTX 3080 Ti) | |
| Razer Blade 15 RTX 2080 Super Max-Q | |
| Average Intel Core i7-12800H (3257 - 8559, n=5) | |
| Razer Blade 15 Advanced Model Early 2021 | |
| Razer Blade 15 2022 | |
| AIDA64 / CPU PhotoWorxx | |
| Razer Blade 15 2022 | |
| Schenker XMG Neo 15 E22 (Early 2022, RTX 3080 Ti) | |
| Average Intel Core i7-12800H (31329 - 40992, n=5) | |
| Razer Blade 15 Advanced Model Early 2021 | |
| Eurocom Nightsky ARX315 | |
| Razer Blade 15 RTX 2080 Super Max-Q | |
系统性能
| PCMark 10 / Score | |
| Razer Blade 15 2022 | |
| Average Intel Core i7-12800H, NVIDIA GeForce RTX 3080 Ti Laptop GPU (7313 - 7744, n=3) | |
| Razer Blade 15 Advanced (Mid 2021) | |
| Razer Blade 17 RTX 3070 | |
| Razer Blade 14 Ryzen 9 RTX 3070 | |
| Razer Blade 15 RTX 2070 Super Max-Q | |
| Razer Blade Pro 17 2021 (QHD Touch) | |
| Razer Blade 15 Base Edition 2021, i7-10750H RTX 3060 | |
| Razer Blade 15 Advanced Model Early 2021 | |
| PCMark 10 / Essentials | |
| Razer Blade 15 Advanced (Mid 2021) | |
| Razer Blade 17 RTX 3070 | |
| Razer Blade 15 2022 | |
| Average Intel Core i7-12800H, NVIDIA GeForce RTX 3080 Ti Laptop GPU (10597 - 10814, n=3) | |
| Razer Blade 14 Ryzen 9 RTX 3070 | |
| Razer Blade 15 RTX 2070 Super Max-Q | |
| Razer Blade 15 Base Edition 2021, i7-10750H RTX 3060 | |
| Razer Blade Pro 17 2021 (QHD Touch) | |
| Razer Blade 15 Advanced Model Early 2021 | |
| PCMark 10 / Productivity | |
| Razer Blade 15 2022 | |
| Average Intel Core i7-12800H, NVIDIA GeForce RTX 3080 Ti Laptop GPU (9470 - 9675, n=3) | |
| Razer Blade 14 Ryzen 9 RTX 3070 | |
| Razer Blade 17 RTX 3070 | |
| Razer Blade 15 Advanced (Mid 2021) | |
| Razer Blade 15 RTX 2070 Super Max-Q | |
| Razer Blade Pro 17 2021 (QHD Touch) | |
| Razer Blade 15 Advanced Model Early 2021 | |
| Razer Blade 15 Base Edition 2021, i7-10750H RTX 3060 | |
| PCMark 10 / Digital Content Creation | |
| Razer Blade 15 2022 | |
| Average Intel Core i7-12800H, NVIDIA GeForce RTX 3080 Ti Laptop GPU (10351 - 12306, n=3) | |
| Razer Blade 15 Advanced (Mid 2021) | |
| Razer Blade 17 RTX 3070 | |
| Razer Blade 15 RTX 2070 Super Max-Q | |
| Razer Blade 14 Ryzen 9 RTX 3070 | |
| Razer Blade Pro 17 2021 (QHD Touch) | |
| Razer Blade 15 Base Edition 2021, i7-10750H RTX 3060 | |
| Razer Blade 15 Advanced Model Early 2021 | |
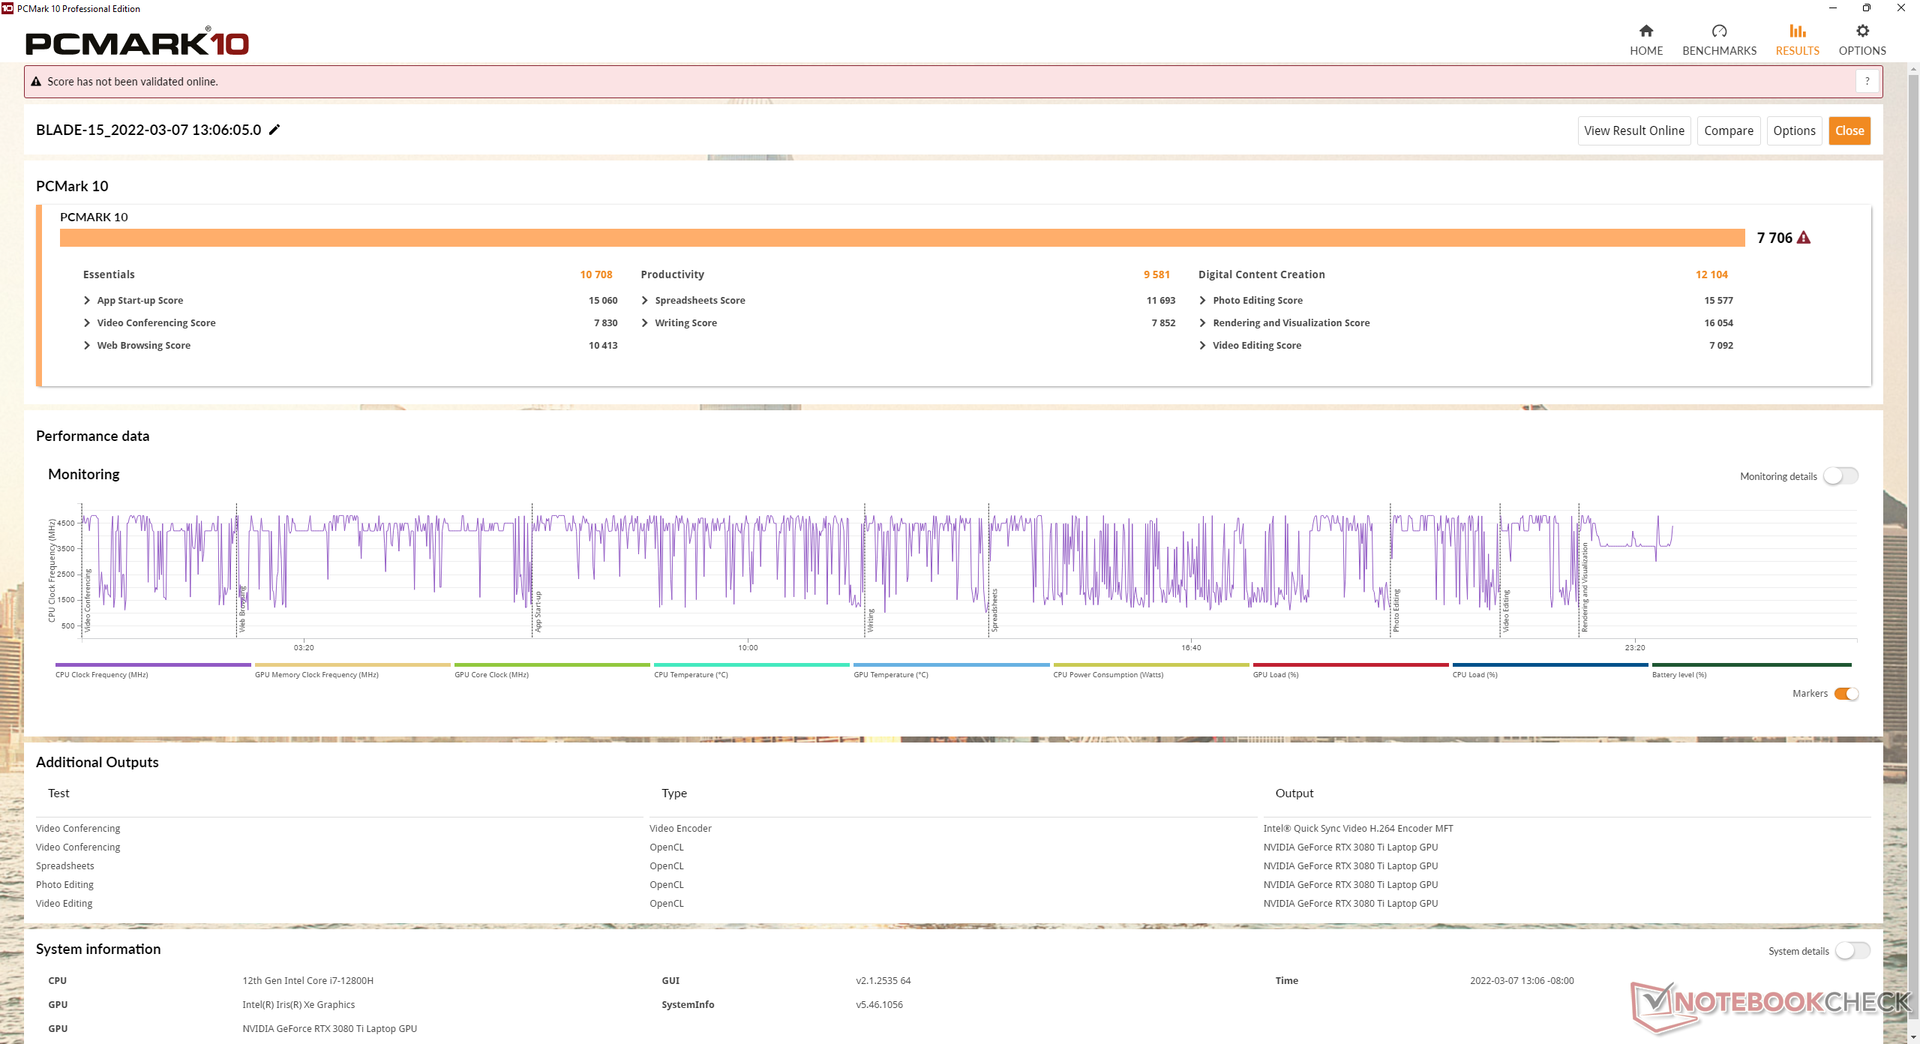
| PCMark 10 Score | 7706 points | |
Help | ||
| AIDA64 / Memory Copy | |
| Schenker XMG Neo 15 E22 (Early 2022, RTX 3080 Ti) | |
| Razer Blade 15 2022 | |
| Average Intel Core i7-12800H (48643 - 62522, n=5) | |
| Eurocom Nightsky ARX315 | |
| Razer Blade 15 Advanced Model Early 2021 | |
| Razer Blade 15 RTX 2080 Super Max-Q | |
| AIDA64 / Memory Read | |
| Schenker XMG Neo 15 E22 (Early 2022, RTX 3080 Ti) | |
| Razer Blade 15 2022 | |
| Average Intel Core i7-12800H (56629 - 66199, n=5) | |
| Eurocom Nightsky ARX315 | |
| Razer Blade 15 Advanced Model Early 2021 | |
| Razer Blade 15 RTX 2080 Super Max-Q | |
| AIDA64 / Memory Write | |
| Razer Blade 15 2022 | |
| Schenker XMG Neo 15 E22 (Early 2022, RTX 3080 Ti) | |
| Average Intel Core i7-12800H (50923 - 66074, n=5) | |
| Eurocom Nightsky ARX315 | |
| Razer Blade 15 Advanced Model Early 2021 | |
| Razer Blade 15 RTX 2080 Super Max-Q | |
| AIDA64 / Memory Latency | |
| Eurocom Nightsky ARX315 | |
| Razer Blade 15 Advanced Model Early 2021 | |
| Razer Blade 15 RTX 2080 Super Max-Q | |
| Average Intel Core i7-12800H (89.3 - 95.2, n=5) | |
| ADATA XPG Xenia 15 | |
| Schenker XMG Neo 15 E22 (Early 2022, RTX 3080 Ti) | |
| Razer Blade 15 2022 | |
* ... smaller is better
DPC延时
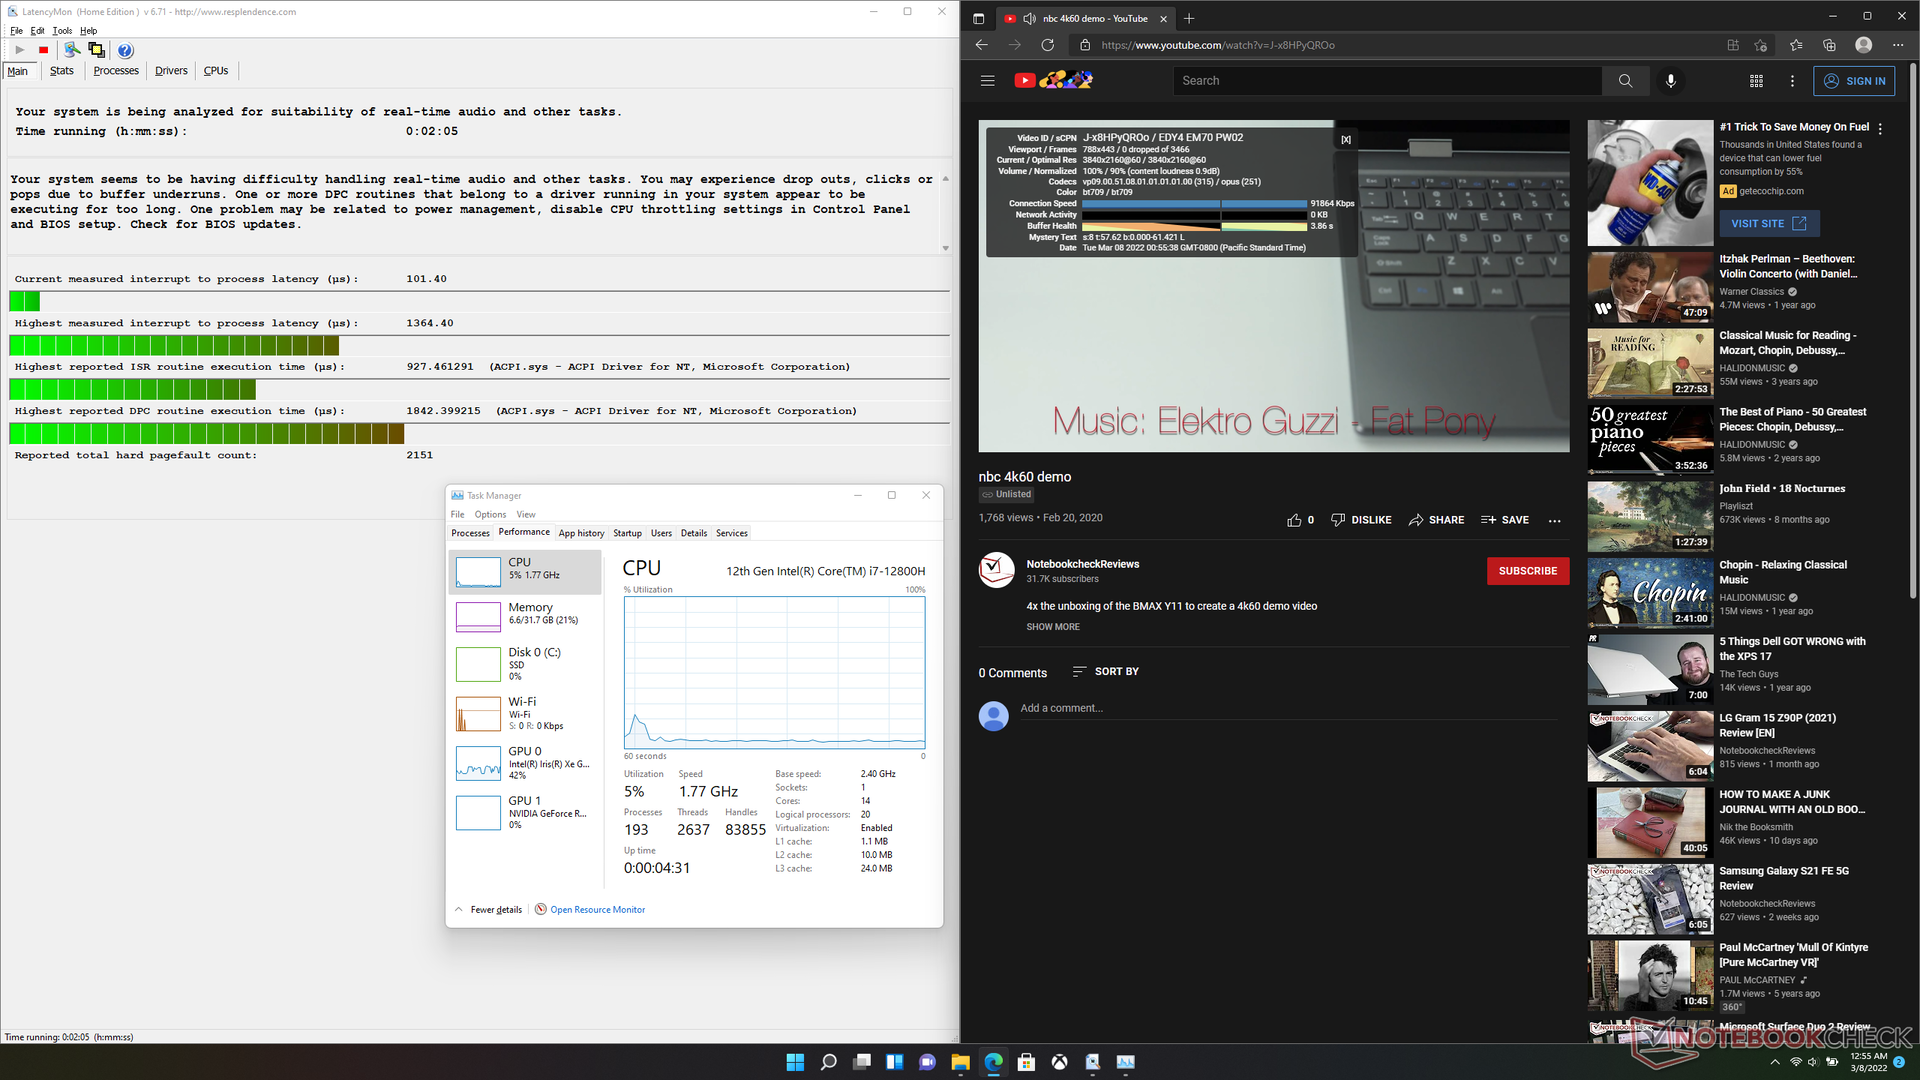
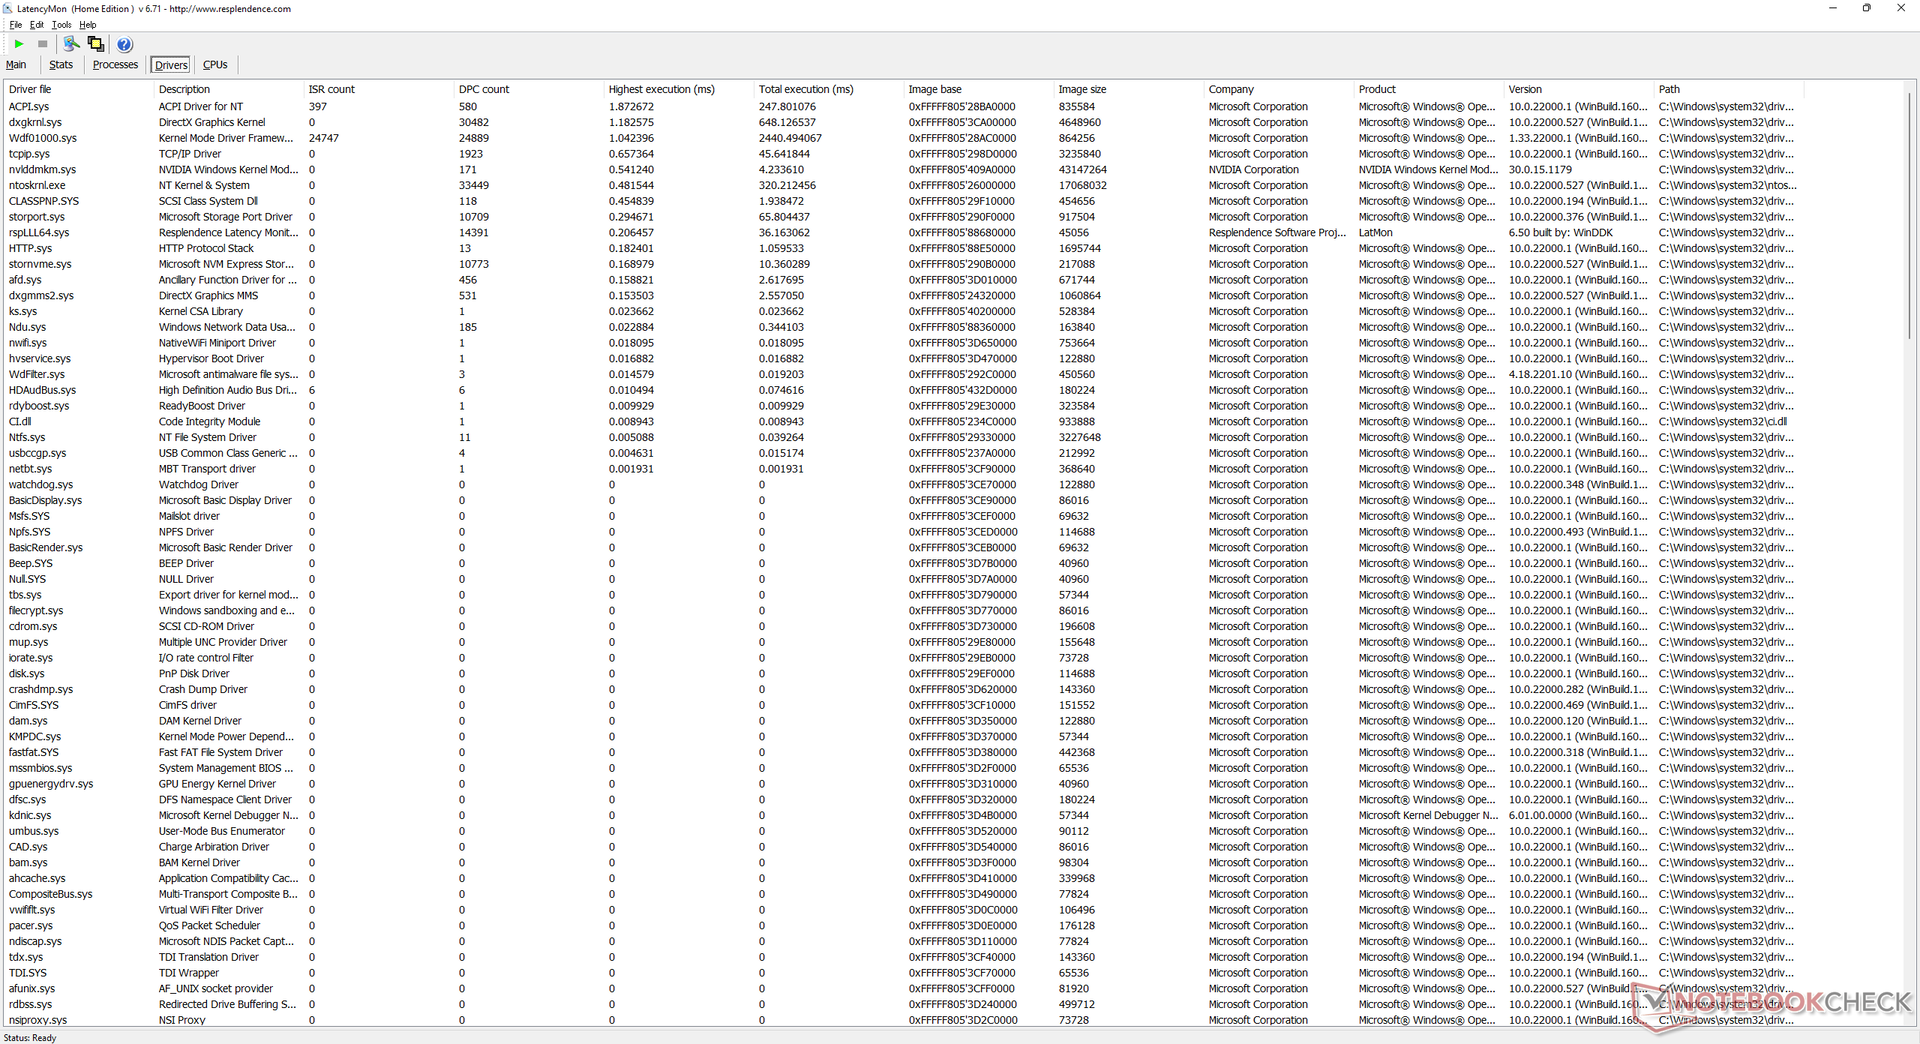
LatencyMon显示在我们的主页上打开多个浏览器标签时存在DPC问题。在Optimus模式下,以60 FPS播放4K视频是顺畅的,没有掉帧。
| DPC Latencies / LatencyMon - interrupt to process latency (max), Web, Youtube, Prime95 | |
| ADATA XPG Xenia 15 | |
| Razer Blade 15 2022 | |
| Schenker XMG Neo 15 E22 (Early 2022, RTX 3080 Ti) | |
| Razer Blade 15 RTX 2080 Super Max-Q | |
| Razer Blade 15 Advanced Model Early 2021 | |
| Eurocom Nightsky ARX315 | |
* ... smaller is better
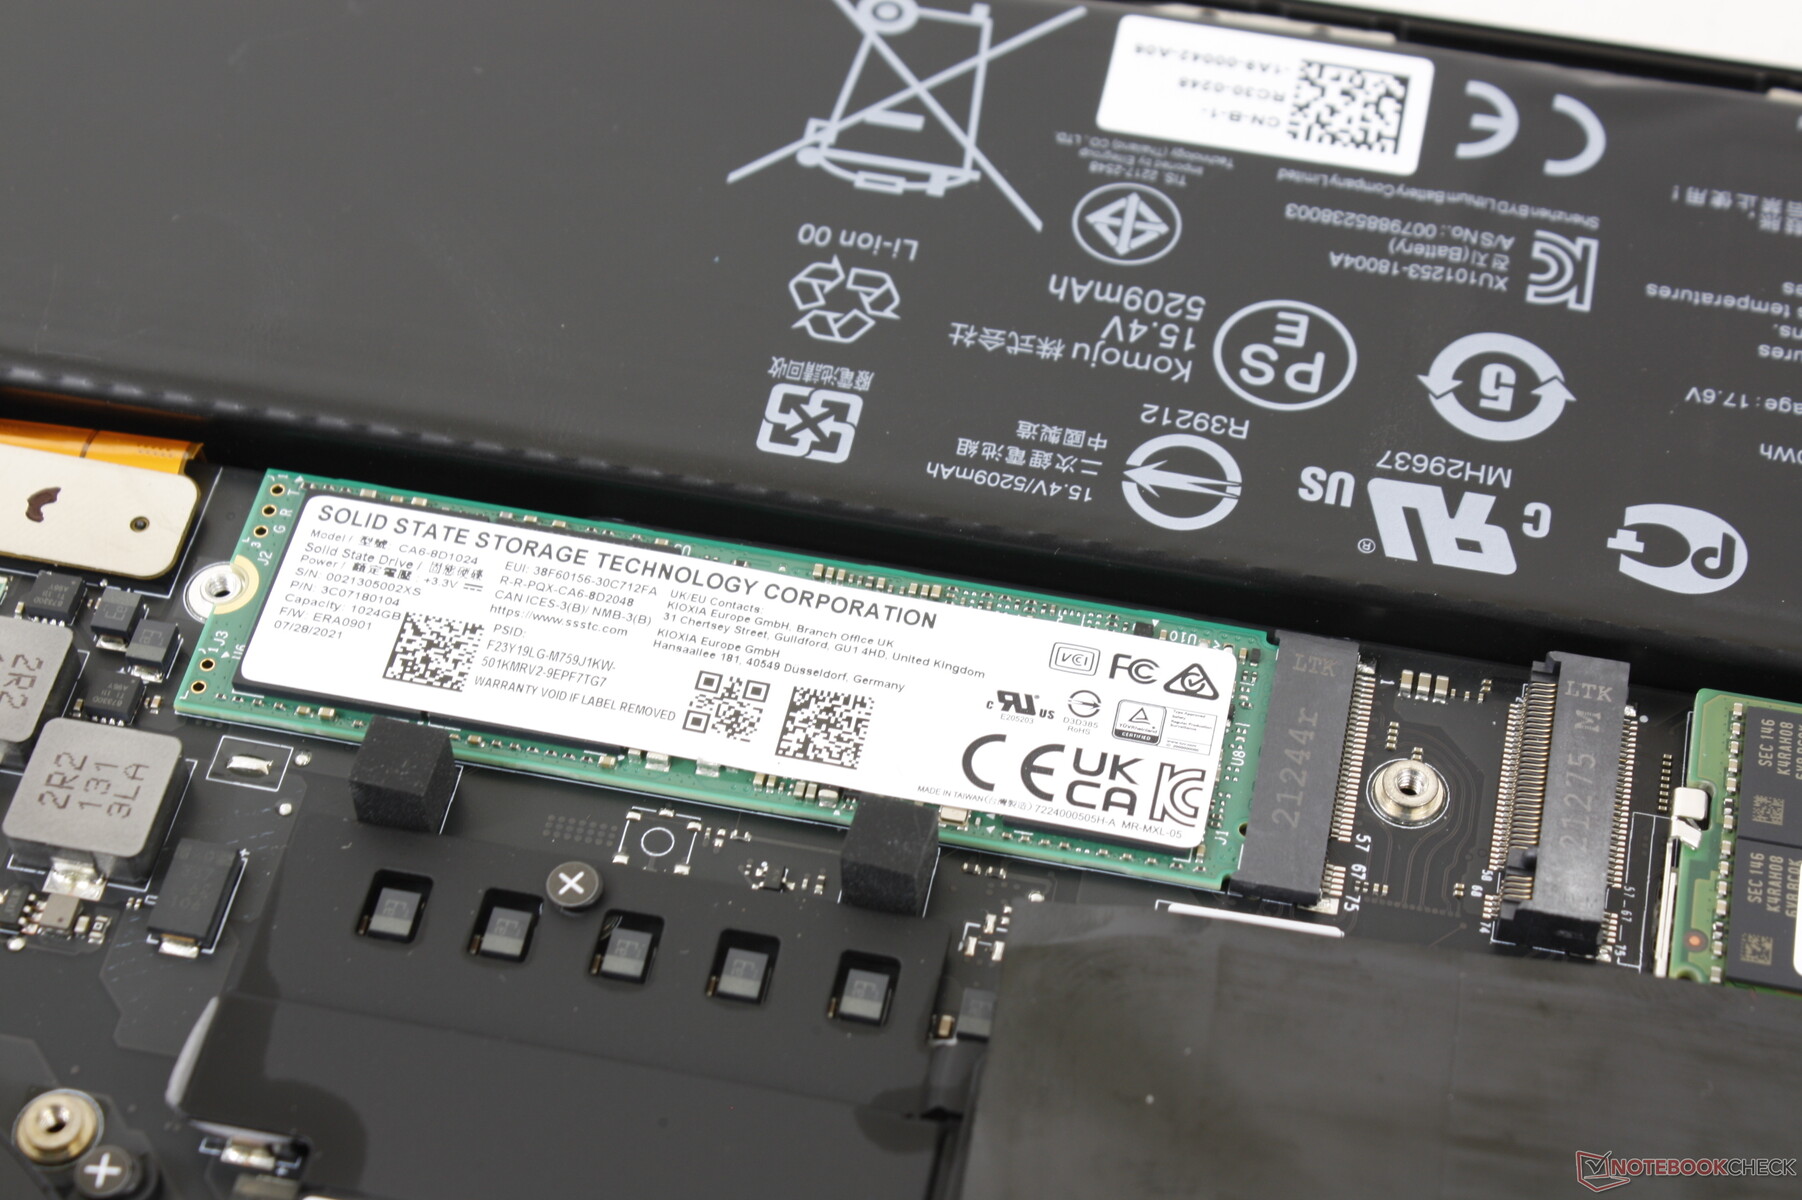
存储设备
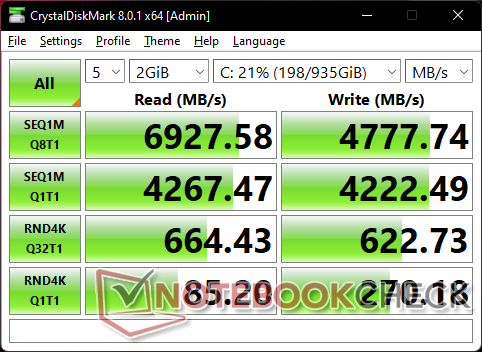
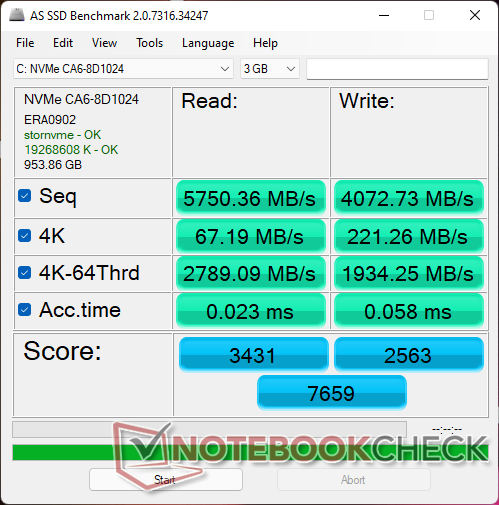
几乎所有的Razer Blade笔记本电脑都使用Lite-On或三星SSD,最新的Blade 15也不例外。我们的测试装置配备了 1TB Lite-On CA6-8D1024PCIe4 x4 NVMe固态硬盘,连续读取和写入速度分别高达6800 MB/s和4800 MB/s。我们的DiskSpd读取循环测试显示,该硬盘在长时间内保持其最大性能水平没有问题。

| Drive Performance rating - Percent | |
| Razer Blade 15 2022 | |
| Schenker XMG Neo 15 E22 (Early 2022, RTX 3080 Ti) | |
| ADATA XPG Xenia 15 | |
| Eurocom Nightsky ARX315 | |
| Razer Blade 15 Advanced Model Early 2021 | |
| Razer Blade 15 RTX 2080 Super Max-Q | |
* ... smaller is better
Disk Throttling: DiskSpd Read Loop, Queue Depth 8
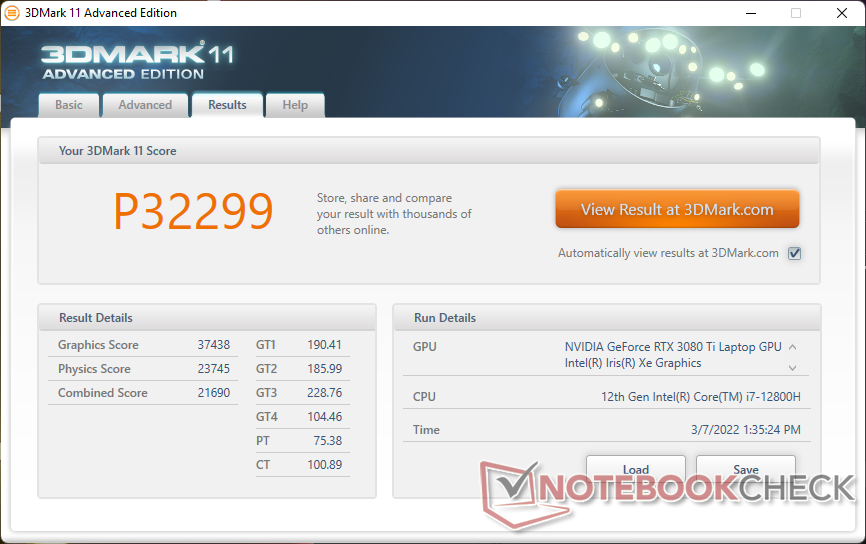
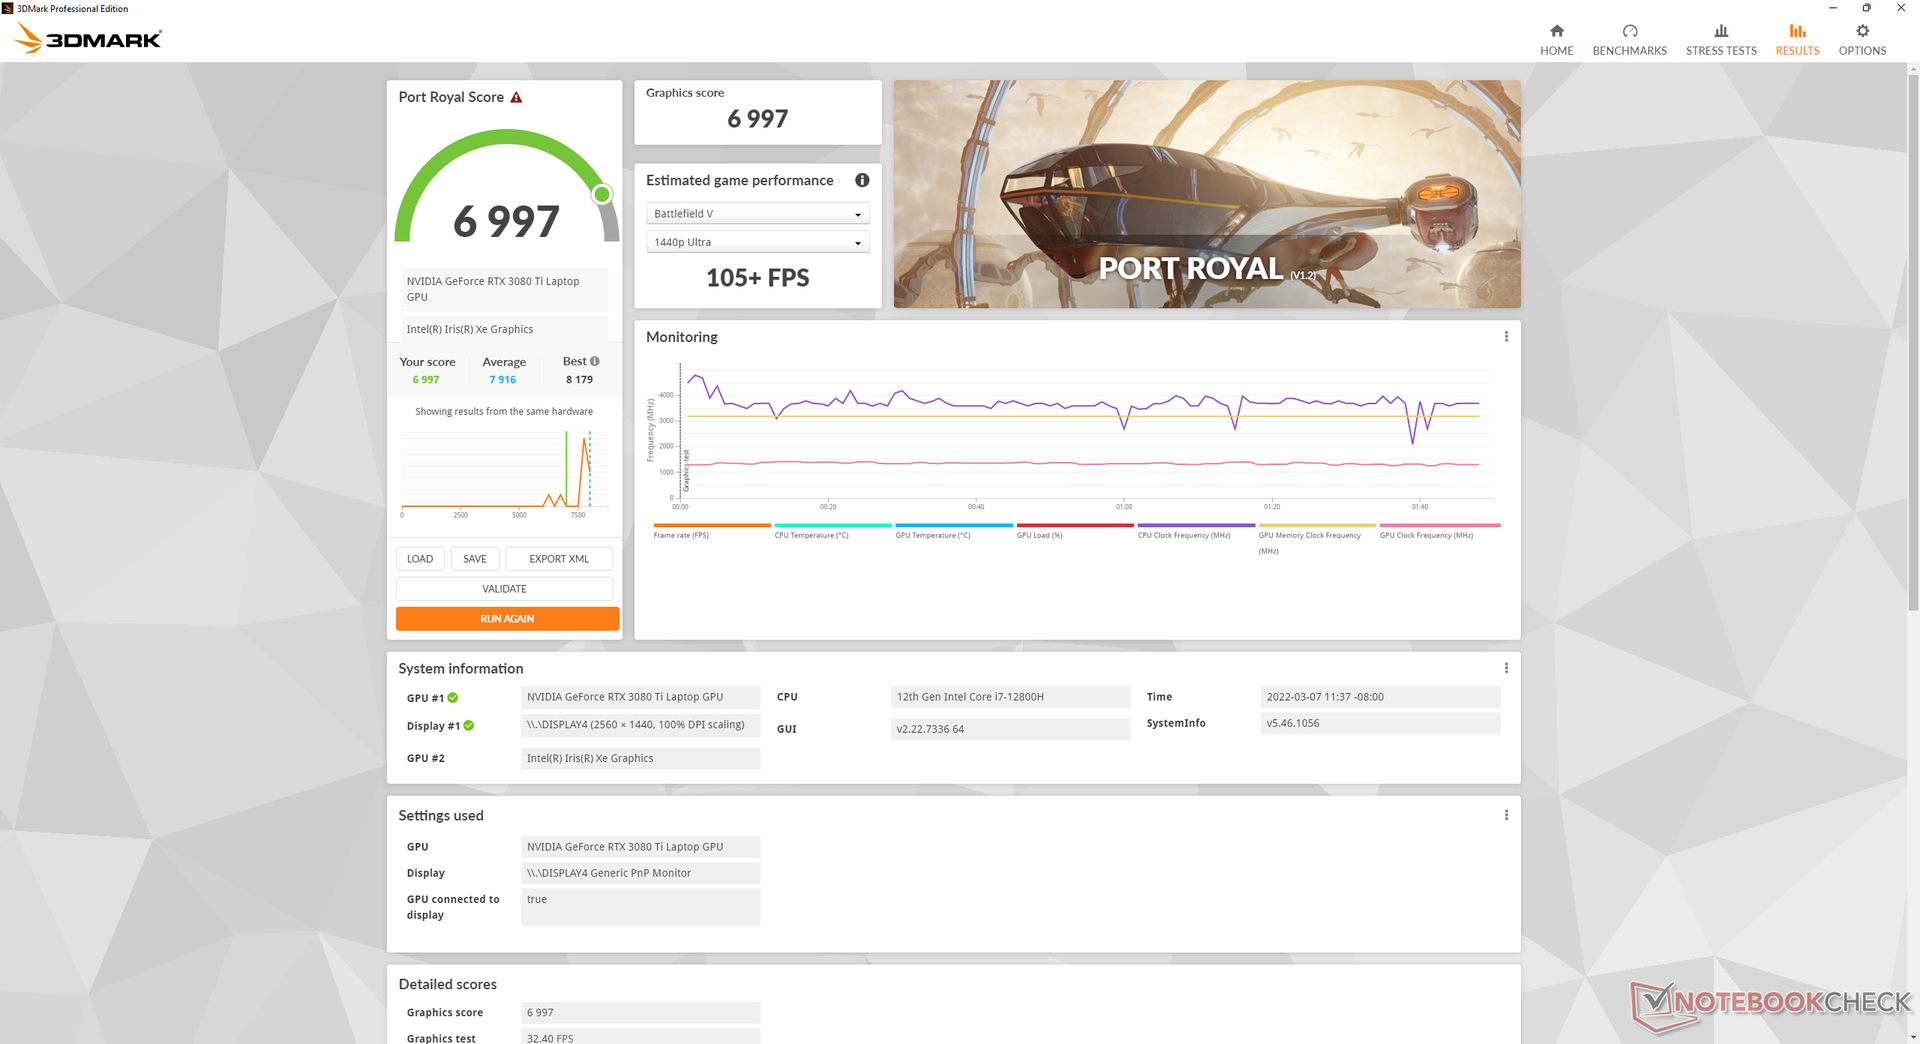
GPU性能
图形性能比刀片15高约15%至25%。 RTX 3080或比Blade 15的RTX 3080快30%到45%。 RTX 2080 Max-Q.某些替代品,如Schenker XMG Neo 15 E22或申克公司Uniwill Technology GM7AG8P配备了更高功率的150+W版本的相同GeForce RTX 3080 Ti GPU,比我们的Blade 15的性能提升10%至15%。 RTX 3080 Ti.
| 3DMark 11 - 1280x720 Performance GPU | |
| MSI GeForce RTX 3080 Gaming X Trio | |
| Schenker XMG Neo 15 E22 (Early 2022, RTX 3080 Ti) | |
| Average NVIDIA GeForce RTX 3080 Ti Laptop GPU (13920 - 45841, n=45) | |
| Razer Blade 15 2022 | |
| Eurocom Nightsky ARX315 | |
| Razer Blade 15 Advanced Model Early 2021 | |
| Razer Blade 15 RTX 2080 Super Max-Q | |
| Asus TUF Gaming F15 FX506HM | |
| Asus ROG Zephyrus M15 GU502LU-BI7N4 | |
| Gigabyte G5 GD | |
| 3DMark 11 Performance | 32299 points | |
| 3DMark Cloud Gate Standard Score | 60579 points | |
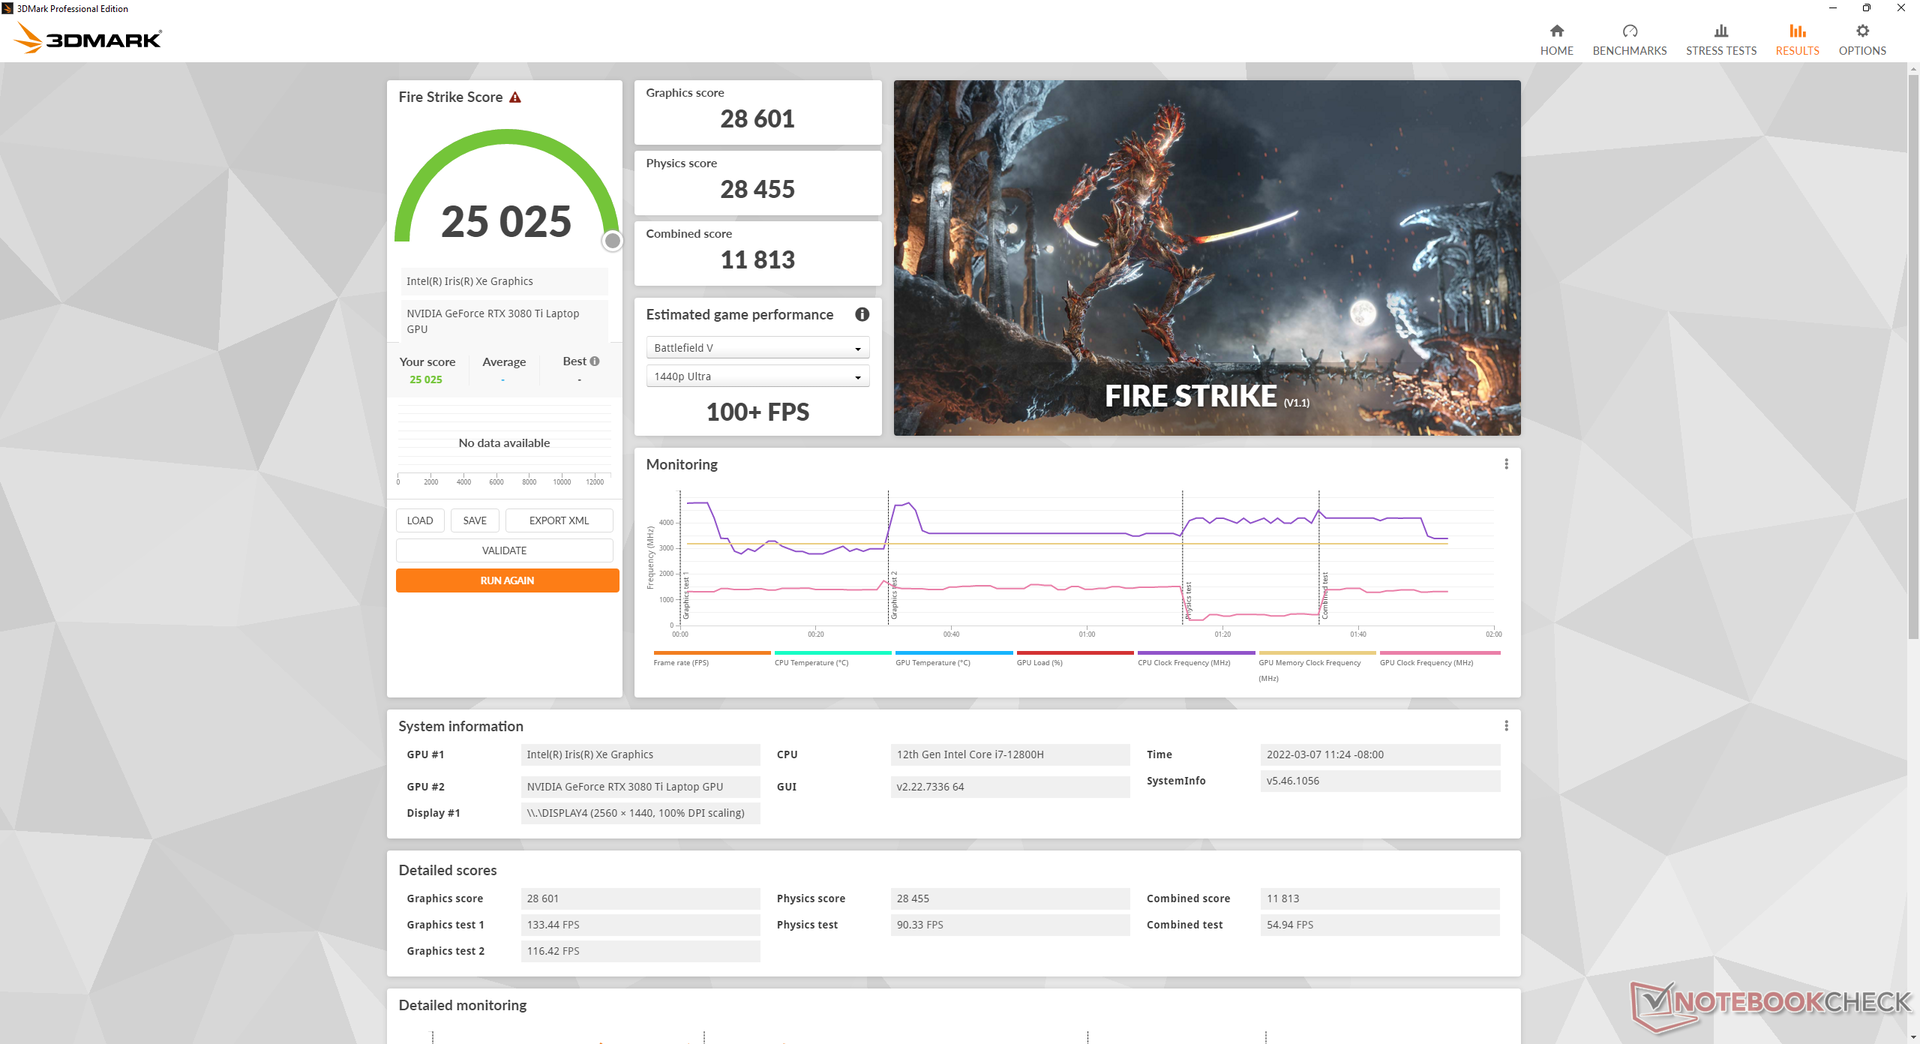
| 3DMark Fire Strike Score | 25025 points | |
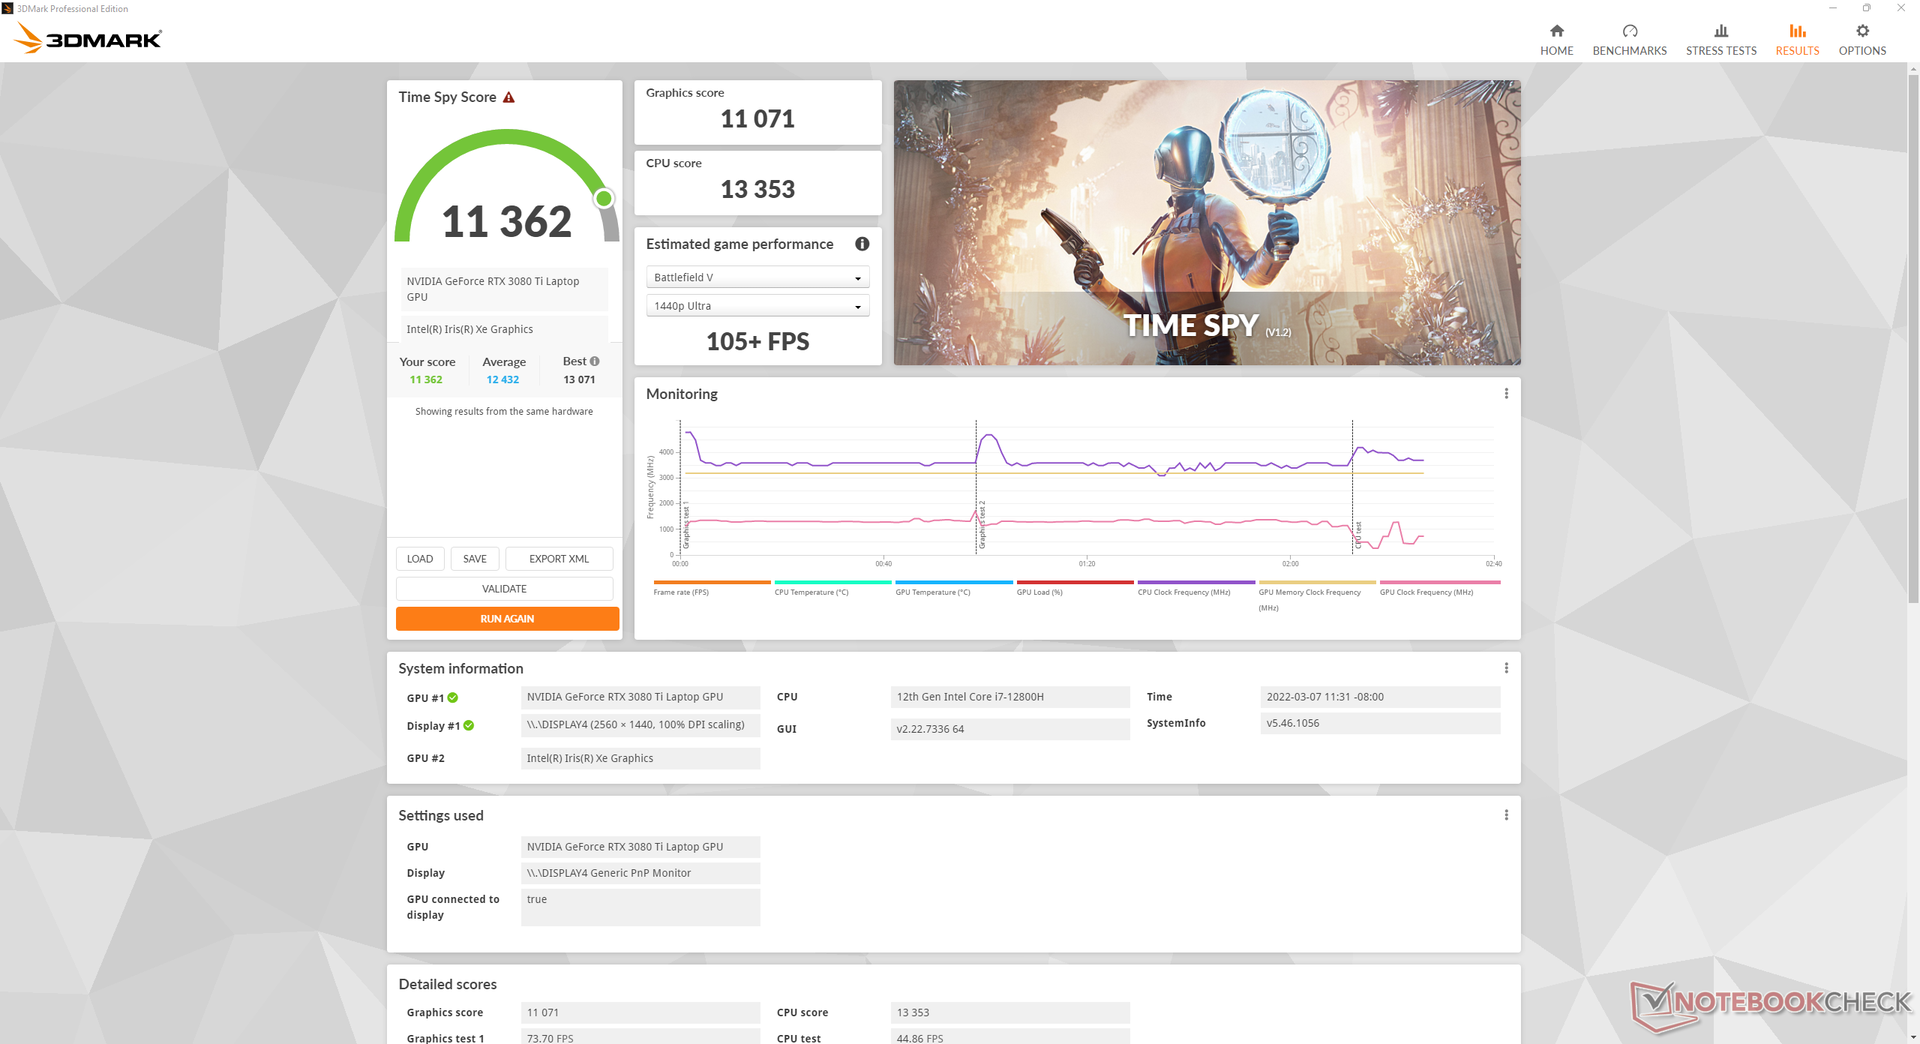
| 3DMark Time Spy Score | 11362 points | |
Help | ||
| Final Fantasy XV Benchmark | |
| 1280x720 Lite Quality | |
| Eurocom Nightsky ARX315 | |
| Average NVIDIA GeForce RTX 3080 Ti Laptop GPU (148.3 - 223, n=24) | |
| Razer Blade 15 2022 | |
| Asus TUF Gaming F15 FX506HM | |
| MSI GeForce RTX 3080 Gaming X Trio | |
| Asus ROG Zephyrus M15 GU502LU-BI7N4 | |
| Gigabyte G5 GD | |
| 1920x1080 Standard Quality | |
| Average NVIDIA GeForce RTX 3080 Ti Laptop GPU (110 - 189.3, n=27) | |
| Eurocom Nightsky ARX315 | |
| Razer Blade 15 2022 | |
| MSI GeForce RTX 3080 Gaming X Trio | |
| Asus TUF Gaming F15 FX506HM | |
| Asus ROG Zephyrus M15 GU502LU-BI7N4 | |
| Gigabyte G5 GD | |
| 1920x1080 High Quality | |
| Average NVIDIA GeForce RTX 3080 Ti Laptop GPU (30.7 - 140.6, n=42) | |
| MSI GeForce RTX 3080 Gaming X Trio | |
| Eurocom Nightsky ARX315 | |
| Razer Blade 15 2022 | |
| Asus TUF Gaming F15 FX506HM | |
| Asus ROG Zephyrus M15 GU502LU-BI7N4 | |
| Gigabyte G5 GD | |
| 2560x1440 High Quality | |
| MSI GeForce RTX 3080 Gaming X Trio | |
| Average NVIDIA GeForce RTX 3080 Ti Laptop GPU (30.8 - 105.8, n=34) | |
| Razer Blade 15 2022 | |
| X-Plane 11.11 | |
| 1280x720 low (fps_test=1) | |
| MSI GeForce RTX 3080 Gaming X Trio | |
| Razer Blade 15 2022 | |
| Eurocom Nightsky ARX315 | |
| Average NVIDIA GeForce RTX 3080 Ti Laptop GPU (38.9 - 187.7, n=43) | |
| Asus TUF Gaming F15 FX506HM | |
| Gigabyte G5 GD | |
| Razer Blade 15 RTX 2080 Super Max-Q | |
| Razer Blade 15 Advanced Model Early 2021 | |
| Asus ROG Zephyrus M15 GU502LU-BI7N4 | |
| 1920x1080 med (fps_test=2) | |
| MSI GeForce RTX 3080 Gaming X Trio | |
| Razer Blade 15 2022 | |
| Eurocom Nightsky ARX315 | |
| Average NVIDIA GeForce RTX 3080 Ti Laptop GPU (35.2 - 164.7, n=43) | |
| Asus TUF Gaming F15 FX506HM | |
| Razer Blade 15 RTX 2080 Super Max-Q | |
| Gigabyte G5 GD | |
| Razer Blade 15 Advanced Model Early 2021 | |
| Asus ROG Zephyrus M15 GU502LU-BI7N4 | |
| 1920x1080 high (fps_test=3) | |
| MSI GeForce RTX 3080 Gaming X Trio | |
| Razer Blade 15 2022 | |
| Eurocom Nightsky ARX315 | |
| Average NVIDIA GeForce RTX 3080 Ti Laptop GPU (32.6 - 127, n=45) | |
| Asus TUF Gaming F15 FX506HM | |
| Razer Blade 15 RTX 2080 Super Max-Q | |
| Gigabyte G5 GD | |
| Razer Blade 15 Advanced Model Early 2021 | |
| Asus ROG Zephyrus M15 GU502LU-BI7N4 | |
| Strange Brigade | |
| 1280x720 lowest AF:1 | |
| Eurocom Nightsky ARX315 | |
| Razer Blade 15 2022 | |
| Average NVIDIA GeForce RTX 3080 Ti Laptop GPU (205 - 563, n=26) | |
| MSI GeForce RTX 3080 Gaming X Trio | |
| Asus TUF Gaming F15 FX506HM | |
| Asus ROG Zephyrus M15 GU502LU-BI7N4 | |
| Gigabyte G5 GD | |
| 1920x1080 medium AA:medium AF:4 | |
| MSI GeForce RTX 3080 Gaming X Trio | |
| Eurocom Nightsky ARX315 | |
| Average NVIDIA GeForce RTX 3080 Ti Laptop GPU (194 - 314, n=27) | |
| Razer Blade 15 2022 | |
| Asus TUF Gaming F15 FX506HM | |
| Asus ROG Zephyrus M15 GU502LU-BI7N4 | |
| Gigabyte G5 GD | |
| 1920x1080 high AA:high AF:8 | |
| MSI GeForce RTX 3080 Gaming X Trio | |
| Eurocom Nightsky ARX315 | |
| Average NVIDIA GeForce RTX 3080 Ti Laptop GPU (156 - 255, n=29) | |
| Razer Blade 15 2022 | |
| Asus TUF Gaming F15 FX506HM | |
| Asus ROG Zephyrus M15 GU502LU-BI7N4 | |
| Gigabyte G5 GD | |
| 1920x1080 ultra AA:ultra AF:16 | |
| MSI GeForce RTX 3080 Gaming X Trio | |
| Eurocom Nightsky ARX315 | |
| Average NVIDIA GeForce RTX 3080 Ti Laptop GPU (42.3 - 224, n=41) | |
| Razer Blade 15 2022 | |
| Asus TUF Gaming F15 FX506HM | |
| Asus ROG Zephyrus M15 GU502LU-BI7N4 | |
| Gigabyte G5 GD | |
Witcher 3 FPS Chart
| low | med. | high | ultra | QHD | |
|---|---|---|---|---|---|
| GTA V (2015) | 186 | 181 | 177 | 118 | 97.8 |
| The Witcher 3 (2015) | 457.4 | 320.9 | 213.7 | 107.2 | |
| Dota 2 Reborn (2015) | 181 | 169 | 164 | 156 | |
| Final Fantasy XV Benchmark (2018) | 178 | 141 | 106 | 82.9 | |
| X-Plane 11.11 (2018) | 158 | 140 | 110 | ||
| Far Cry 5 (2018) | 179 | 151 | 144 | 135 | 107 |
| Strange Brigade (2018) | 442 | 252 | 205 | 184 | 132 |
排放
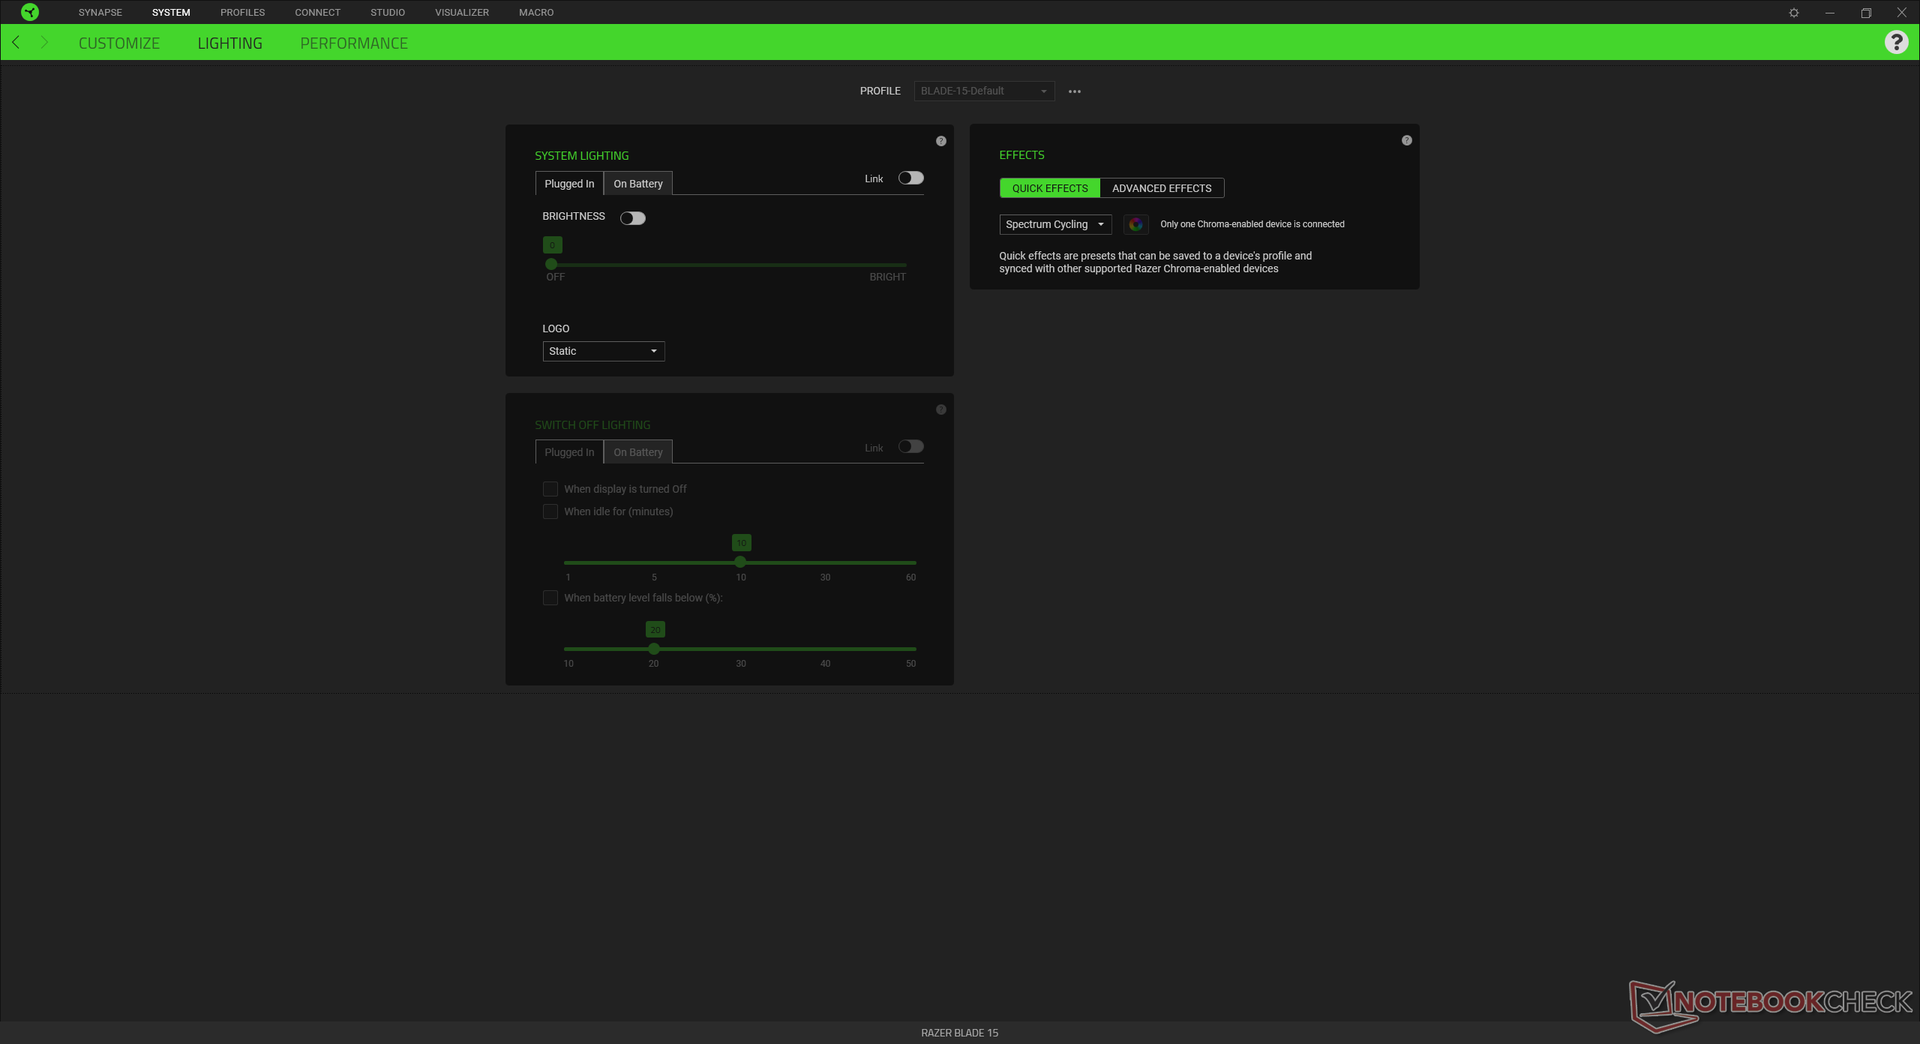
系统噪音
风扇噪音取决于Synapse的电源配置。我们建议在浏览网页或播放视频时将系统运行在静音模式下,因为如果在平衡或高性能模式下,风扇的脉冲会更频繁。静音模式的缺点是,由于风扇运行得更慢,掌托和笔记本底部会明显发热。
在高性能模式下运行Witcher 3 ,风扇噪音与我们在旧的Blade 15型号上记录的类似,约为45 dB(A),这仍然比竞争者XPG Xenia 15或其他产品安静得多。Eurocom Nightsky ARX315.然而,如果CPU的压力更大,这可能会增加到49至52 dB(A)范围。
Noise level
| Idle |
| 26.2 / 26.2 / 28.4 dB(A) |
| Load |
| 44.7 / 51.9 dB(A) |
 | ||
30 dB silent 40 dB(A) audible 50 dB(A) loud |
||
min: | ||
| Razer Blade 15 2022 GeForce RTX 3080 Ti Laptop GPU, i7-12800H, SSSTC CA6-8D1024 | Razer Blade 15 Advanced Model Early 2021 GeForce RTX 3080 Laptop GPU, i7-10875H, Samsung PM981a MZVLB1T0HBLR | Razer Blade 15 RTX 2080 Super Max-Q GeForce RTX 2080 Super Max-Q, i7-10875H, Samsung PM981a MZVLB1T0HBLR | Schenker XMG Neo 15 E22 (Early 2022, RTX 3080 Ti) GeForce RTX 3080 Ti Laptop GPU, i7-12700H, Samsung SSD 980 Pro 250GB MZ-V8P250BW | ADATA XPG Xenia 15 GeForce RTX 3070 Laptop GPU, i7-11800H, ADATA XPG Gammix S70 1TB | Eurocom Nightsky ARX315 GeForce RTX 3070 Laptop GPU, R9 5900X, Samsung SSD 980 Pro 1TB MZ-V8P1T0BW | |
|---|---|---|---|---|---|---|
| Noise | -4% | -8% | 2% | 5% | -15% | |
| off / environment * (dB) | 25.4 | 24 6% | 30.1 -19% | 24 6% | 24.8 2% | 25.3 -0% |
| Idle Minimum * (dB) | 26.2 | 26 1% | 30.1 -15% | 24 8% | 24.9 5% | 25.9 1% |
| Idle Average * (dB) | 26.2 | 28 -7% | 30.1 -15% | 24 8% | 24.9 5% | 27.9 -6% |
| Idle Maximum * (dB) | 28.4 | 40 -41% | 30.1 -6% | 27.76 2% | 24.9 12% | 40.8 -44% |
| Load Average * (dB) | 44.7 | 45 -1% | 46.8 -5% | 38.81 13% | 28.8 36% | 55.2 -23% |
| Witcher 3 ultra * (dB) | 44.7 | 43 4% | 48.4 -8% | 54.2 -21% | 52.7 -18% | 52.4 -17% |
| Load Maximum * (dB) | 51.9 | 45 13% | 46 11% | 54.18 -4% | 54.9 -6% | 60.3 -16% |
* ... smaller is better
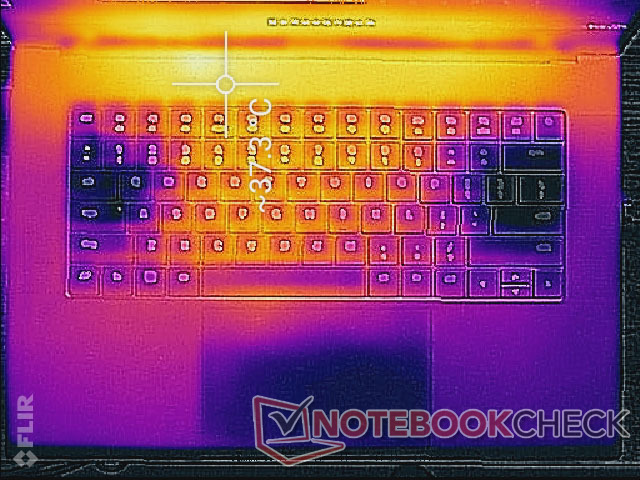
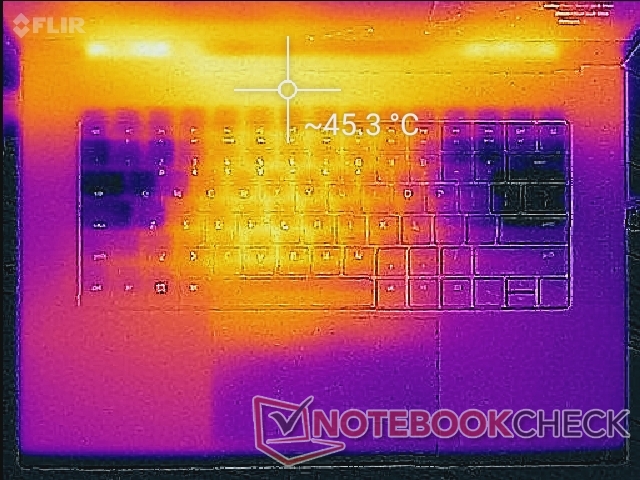
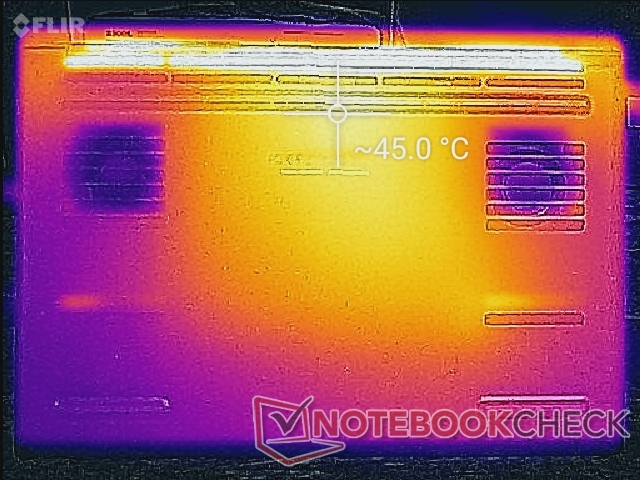
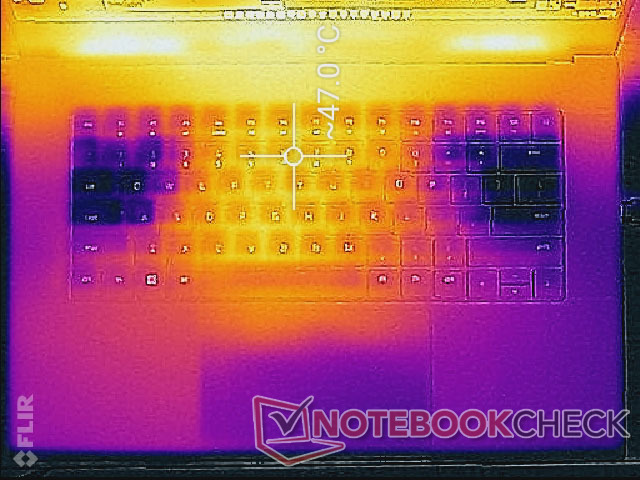
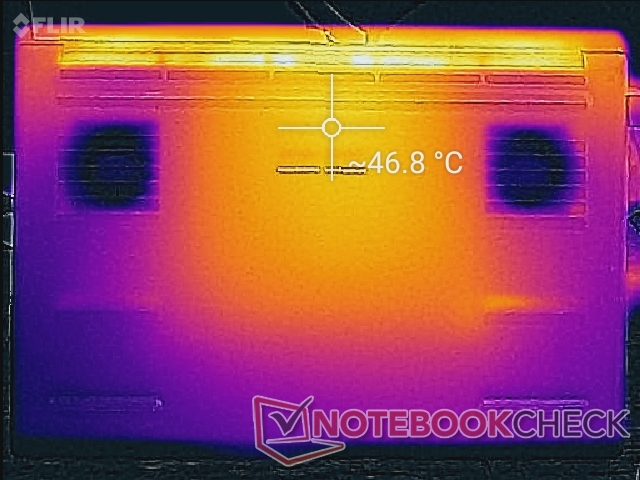
温度
即使在桌面上空转时,表面温度也很高。热点在顶部和底部可以达到37摄氏度以上,这与超薄的 XPG Xenia 15或 MSI Vector GP66在类似条件下。预计游戏时,键盘中心的温度将达到48摄氏度。
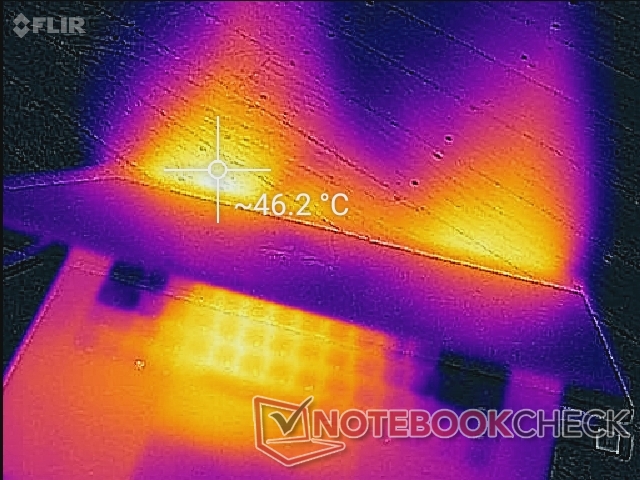
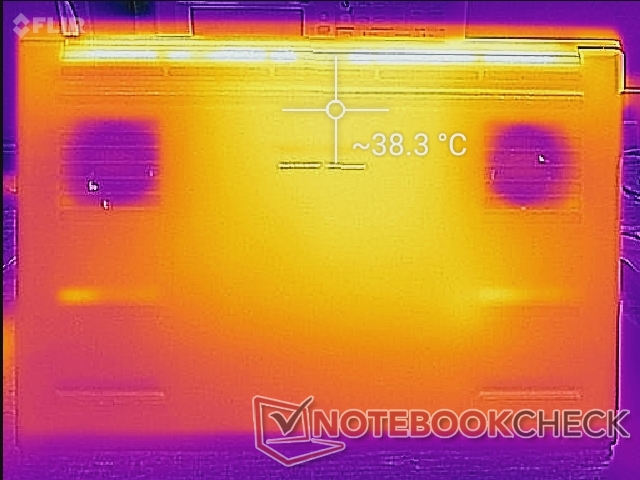
(-) The maximum temperature on the upper side is 50 °C / 122 F, compared to the average of 40.4 °C / 105 F, ranging from 21.2 to 68.8 °C for the class Gaming.
(-) The bottom heats up to a maximum of 47 °C / 117 F, compared to the average of 43.2 °C / 110 F
(±) In idle usage, the average temperature for the upper side is 32.4 °C / 90 F, compared to the device average of 33.9 °C / 93 F.
(±) Playing The Witcher 3, the average temperature for the upper side is 36 °C / 97 F, compared to the device average of 33.9 °C / 93 F.
(+) The palmrests and touchpad are reaching skin temperature as a maximum (34 °C / 93.2 F) and are therefore not hot.
(-) The average temperature of the palmrest area of similar devices was 28.8 °C / 83.8 F (-5.2 °C / -9.4 F).
| Razer Blade 15 2022 Intel Core i7-12800H, NVIDIA GeForce RTX 3080 Ti Laptop GPU | Razer Blade 15 Advanced Model Early 2021 Intel Core i7-10875H, NVIDIA GeForce RTX 3080 Laptop GPU | Razer Blade 15 RTX 2080 Super Max-Q Intel Core i7-10875H, NVIDIA GeForce RTX 2080 Super Max-Q | Schenker XMG Neo 15 E22 (Early 2022, RTX 3080 Ti) Intel Core i7-12700H, NVIDIA GeForce RTX 3080 Ti Laptop GPU | ADATA XPG Xenia 15 Intel Core i7-11800H, NVIDIA GeForce RTX 3070 Laptop GPU | Eurocom Nightsky ARX315 AMD Ryzen 9 5900X, NVIDIA GeForce RTX 3070 Laptop GPU | |
|---|---|---|---|---|---|---|
| Heat | 6% | 7% | -7% | -12% | 6% | |
| Maximum Upper Side * (°C) | 50 | 49 2% | 52 -4% | 52 -4% | 49 2% | 36.2 28% |
| Maximum Bottom * (°C) | 47 | 54 -15% | 53 -13% | 68 -45% | 64.2 -37% | 49.6 -6% |
| Idle Upper Side * (°C) | 37.4 | 30 20% | 29.3 22% | 32 14% | 37.6 -1% | 32.6 13% |
| Idle Bottom * (°C) | 38.4 | 32 17% | 30.2 21% | 36 6% | 42.2 -10% | 43.2 -13% |
* ... smaller is better
压力测试
当使用Prime95时,CPU会在最初的几秒钟内提升到3.1 GHz,直到达到80 C的核心温度。此后,时钟速率和温度将分别稳定在2.2 GHz和66 C左右。CPU的封装功耗也将从最初的90W峰值下降到更稳定的55W。
运行 Witcher 3将导致CPU和GPU分别稳定在74摄氏度和67摄氏度,而去年的Blade 15 RTX 3080模型为73摄氏度和71摄氏度(或Blade 15基本模型为67摄氏度和75摄氏度)。因此,尽管CPU和GPU性能增加,但核心温度同比差异不大。
用电池供电运行将限制性能。在电池上进行的Fire Strike 测试将返回物理和图形分数,分别为10560和8439分,而在主电源上则为28455和28601分。
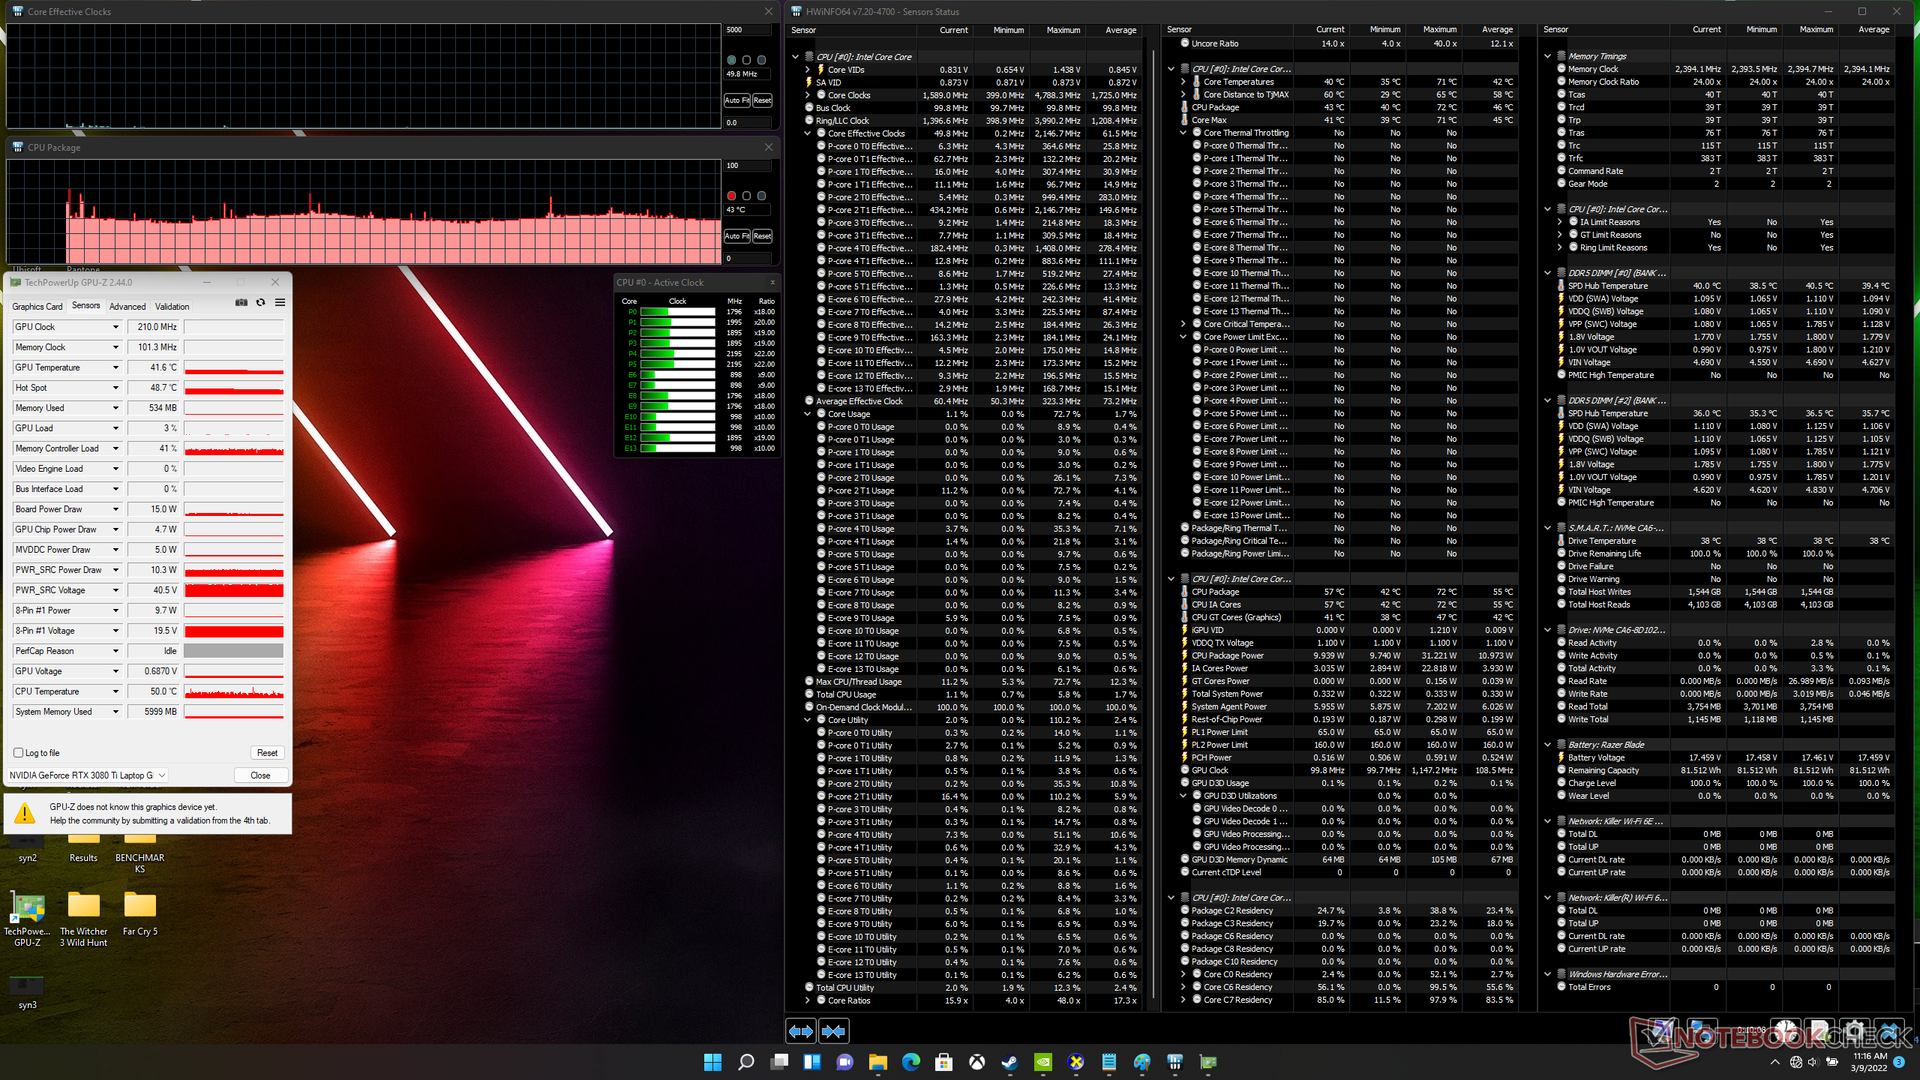
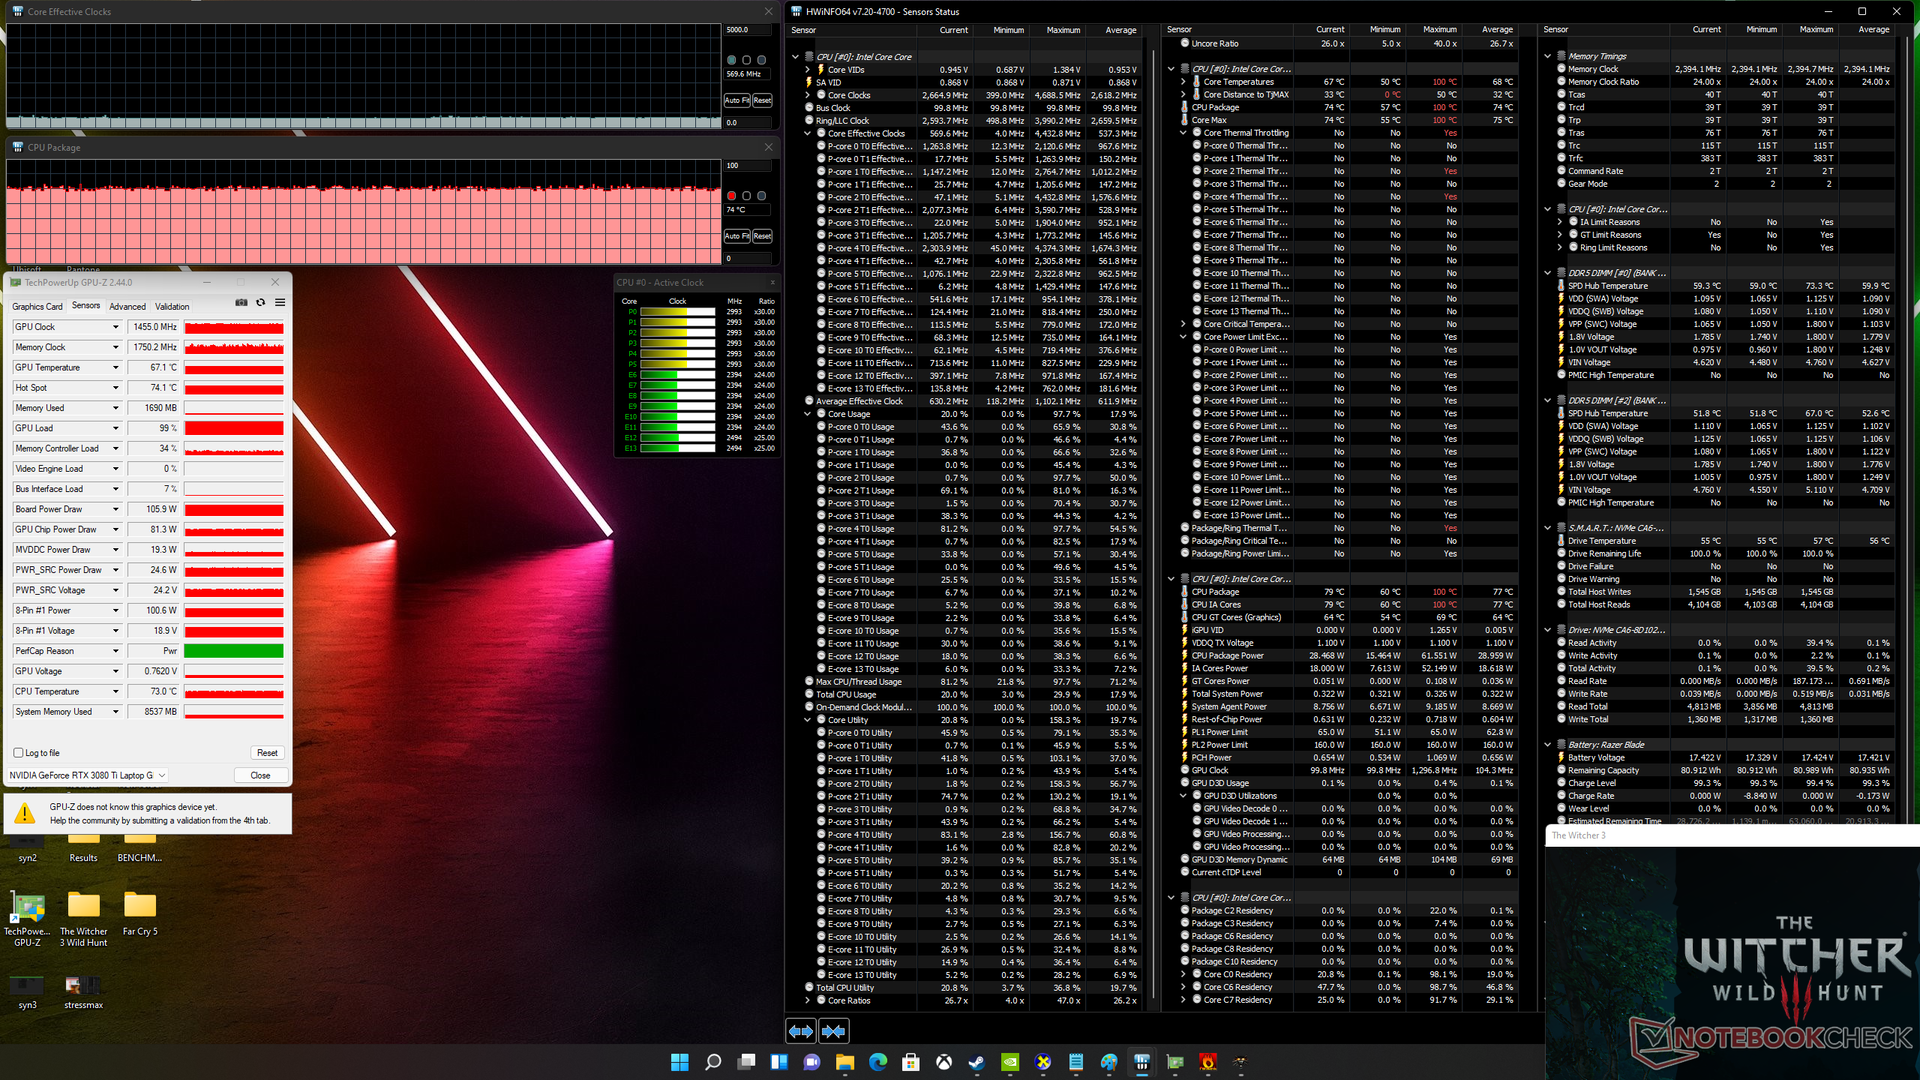
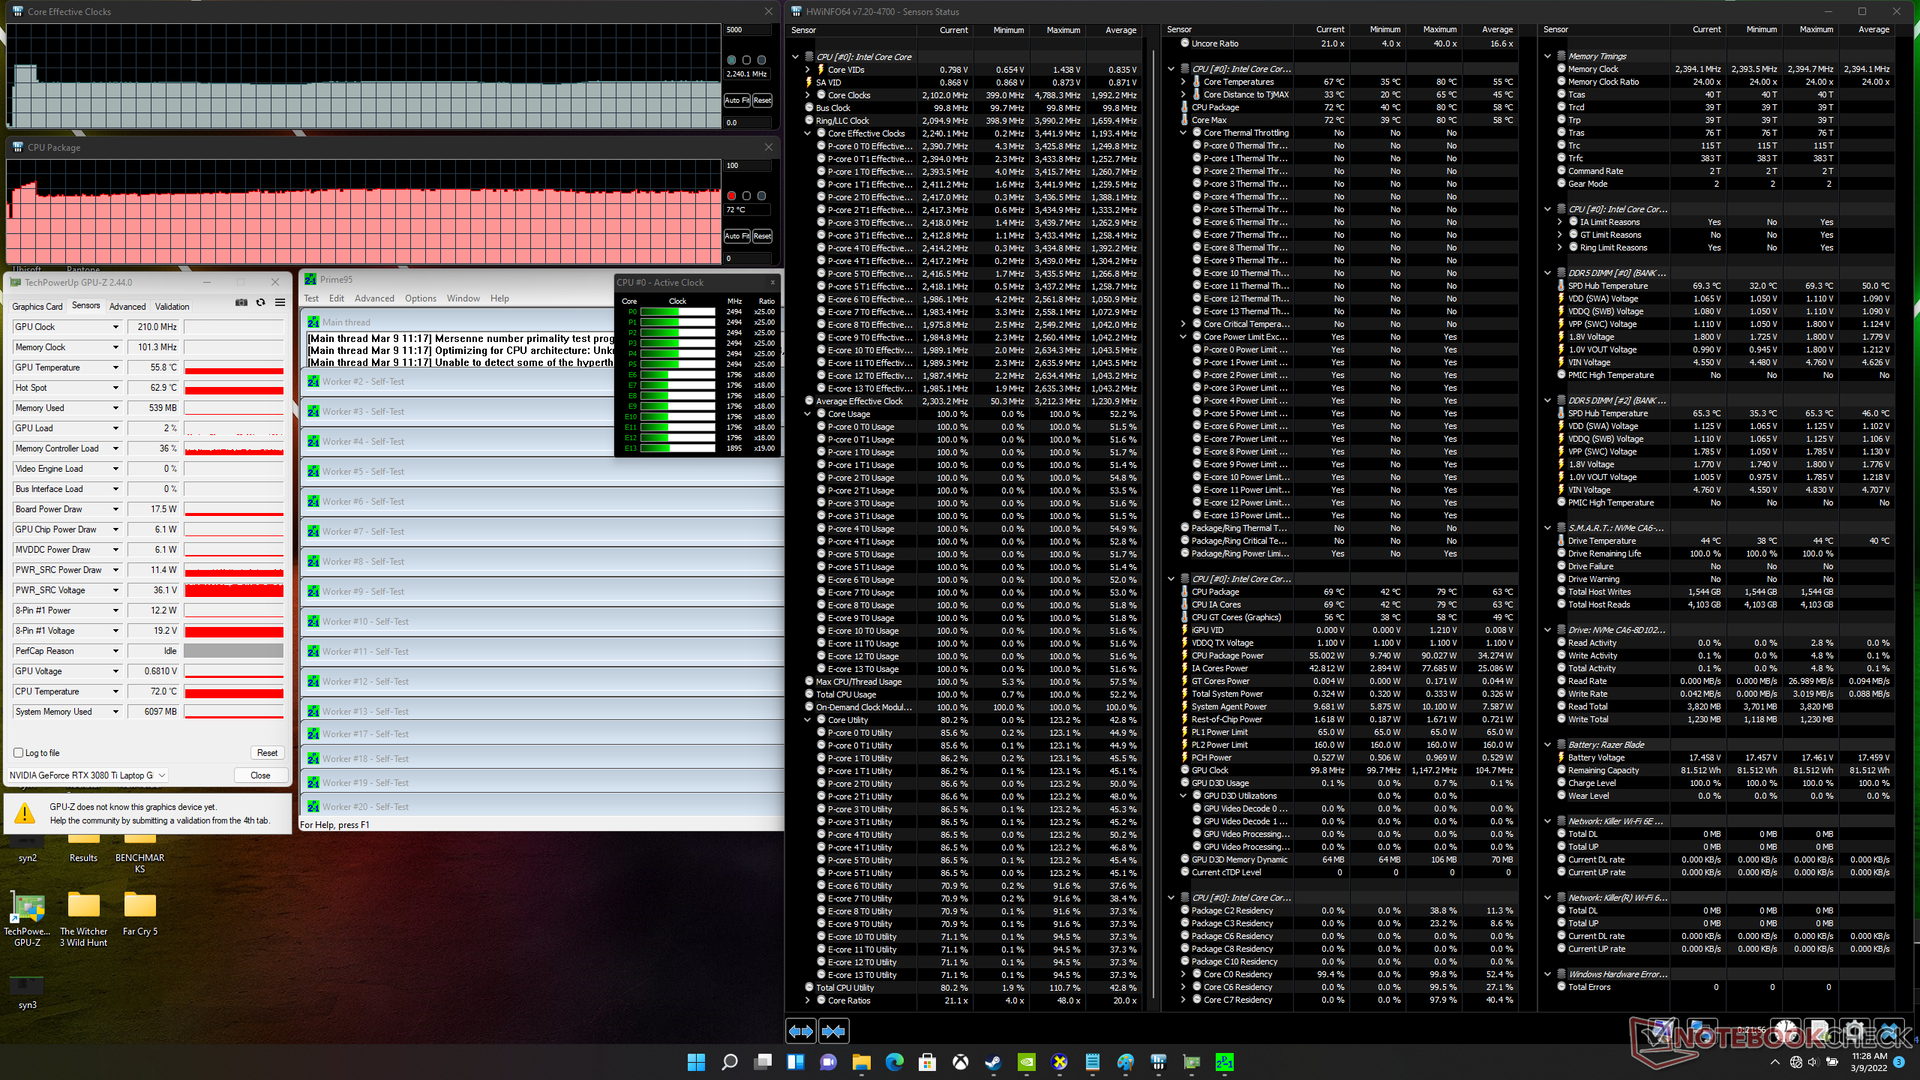
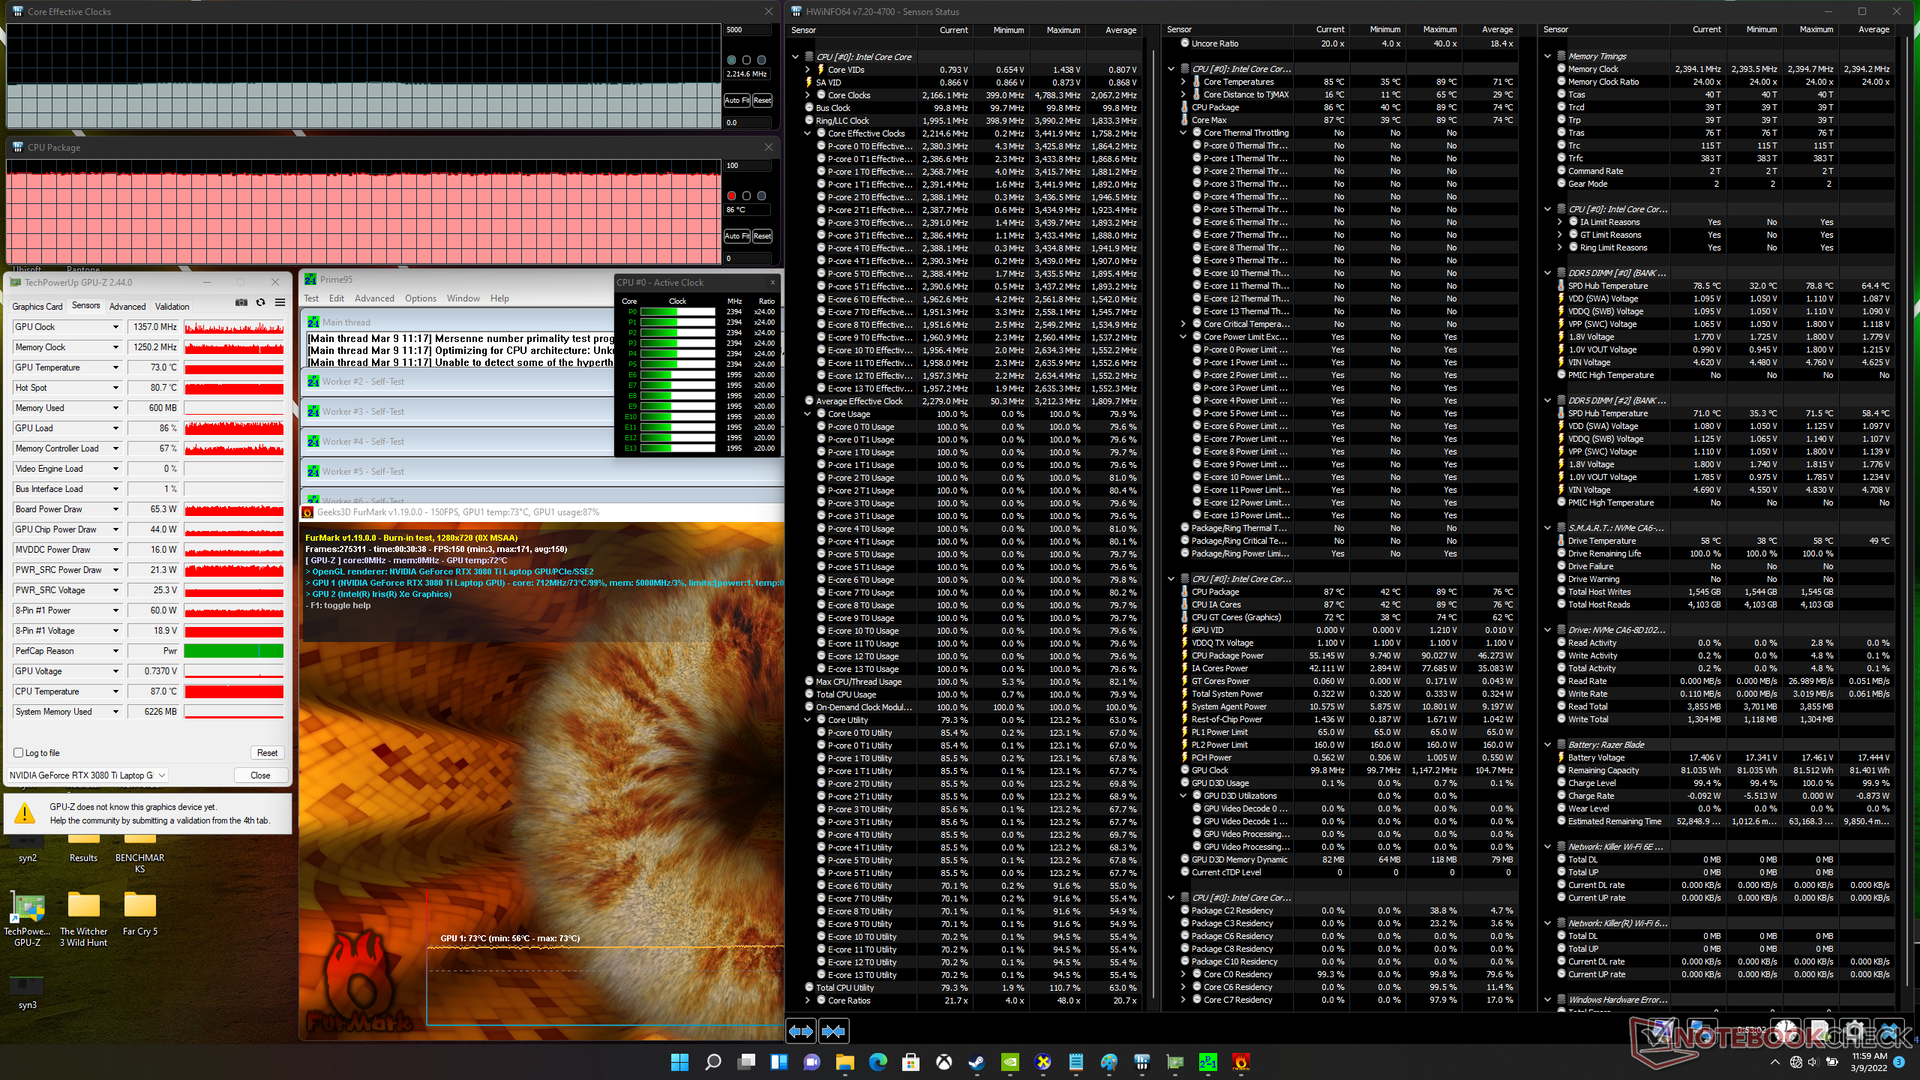
| CPU时钟(GHz) | GPU时钟(MHz) | CPU平均温度(℃) | GPU平均温度(℃) | |
| 系统空闲 | -- | -- | 43 | 42 |
| Prime95压力 | 2.2 | -- | 72 | 56 |
| Prime95 + FurMark 压力 | 2.2 | ~1357 | 86 | 73 |
| Witcher 3 应力 | 0.6 | 1455 | 74 | 67 |
发言人
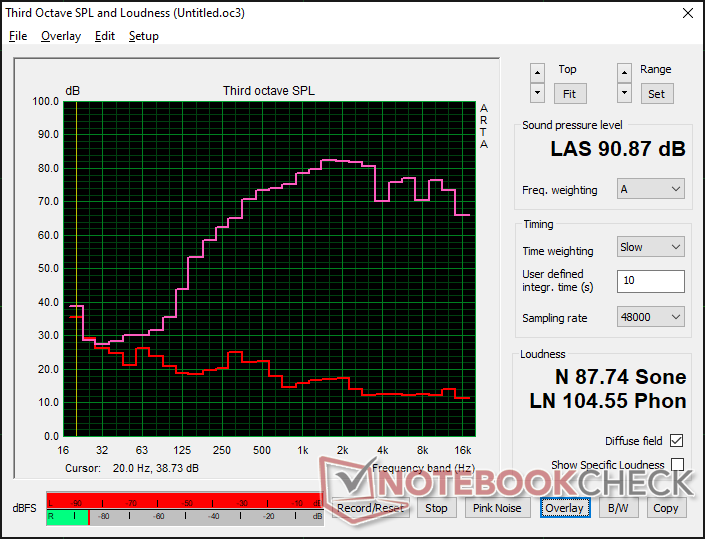
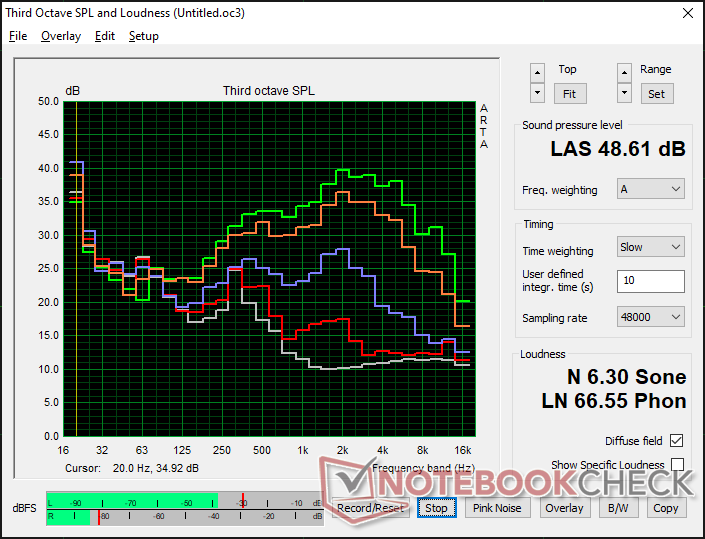
Razer Blade 15 2022 audio analysis
(+) | speakers can play relatively loud (90.9 dB)
Bass 100 - 315 Hz
(-) | nearly no bass - on average 21% lower than median
(±) | linearity of bass is average (9.7% delta to prev. frequency)
Mids 400 - 2000 Hz
(+) | balanced mids - only 3.9% away from median
(+) | mids are linear (3.9% delta to prev. frequency)
Highs 2 - 16 kHz
(+) | balanced highs - only 4.2% away from median
(±) | linearity of highs is average (7.8% delta to prev. frequency)
Overall 100 - 16.000 Hz
(±) | linearity of overall sound is average (15.7% difference to median)
Compared to same class
» 37% of all tested devices in this class were better, 7% similar, 57% worse
» The best had a delta of 6%, average was 18%, worst was 132%
Compared to all devices tested
» 24% of all tested devices were better, 5% similar, 71% worse
» The best had a delta of 4%, average was 23%, worst was 134%
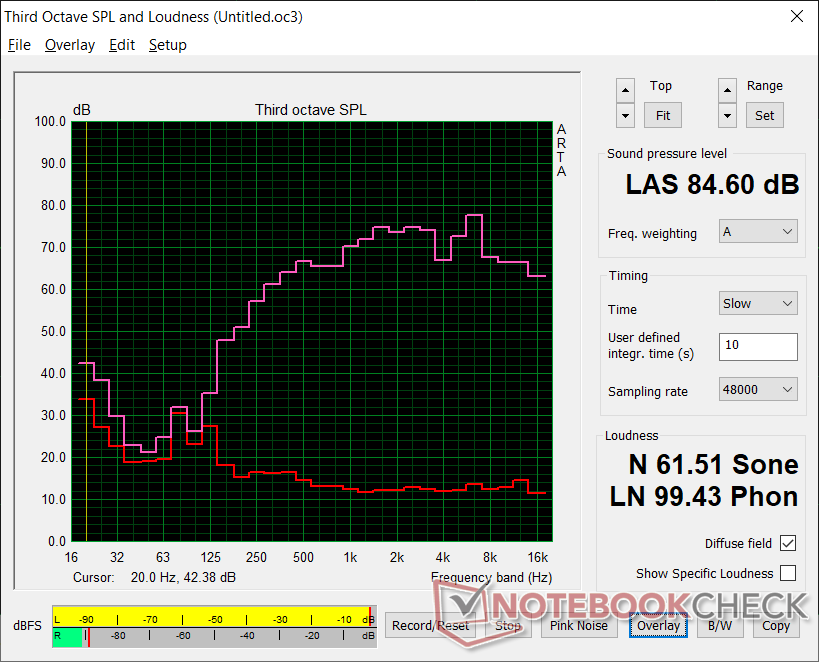
Apple MacBook Pro 16 2021 M1 Pro audio analysis
(+) | speakers can play relatively loud (84.7 dB)
Bass 100 - 315 Hz
(+) | good bass - only 3.8% away from median
(+) | bass is linear (5.2% delta to prev. frequency)
Mids 400 - 2000 Hz
(+) | balanced mids - only 1.3% away from median
(+) | mids are linear (2.1% delta to prev. frequency)
Highs 2 - 16 kHz
(+) | balanced highs - only 1.9% away from median
(+) | highs are linear (2.7% delta to prev. frequency)
Overall 100 - 16.000 Hz
(+) | overall sound is linear (4.6% difference to median)
Compared to same class
» 0% of all tested devices in this class were better, 0% similar, 100% worse
» The best had a delta of 5%, average was 17%, worst was 45%
Compared to all devices tested
» 0% of all tested devices were better, 0% similar, 100% worse
» The best had a delta of 4%, average was 23%, worst was 134%
能源管理
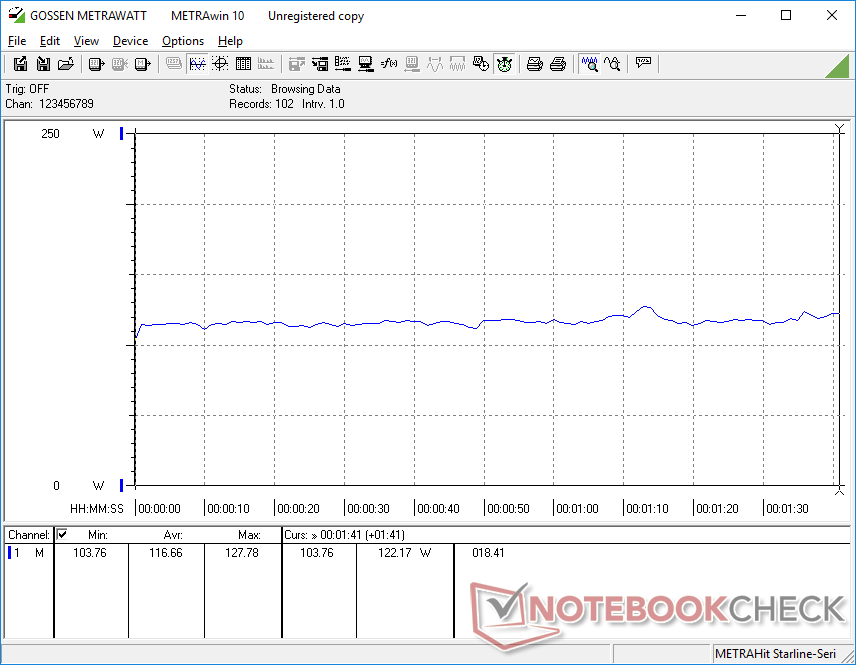
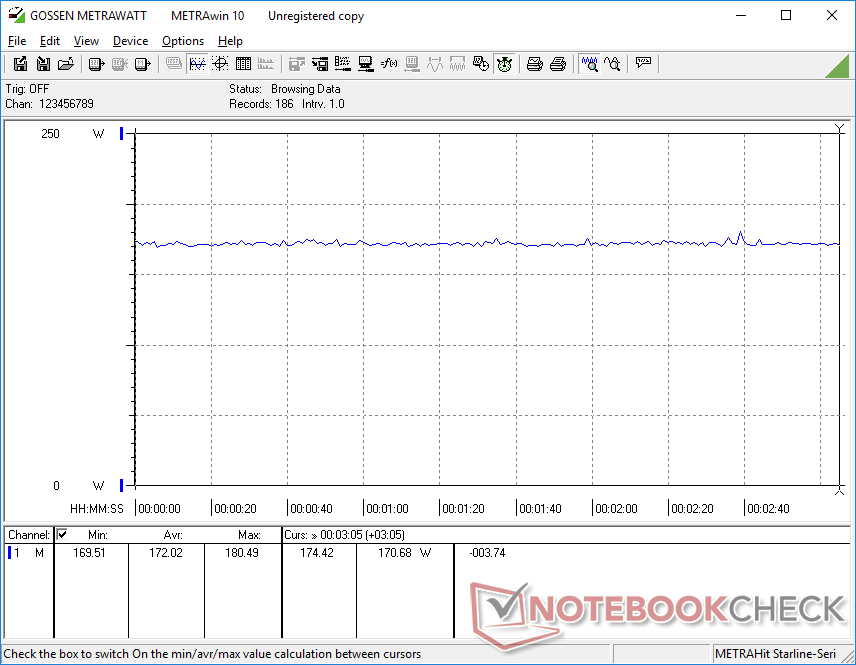
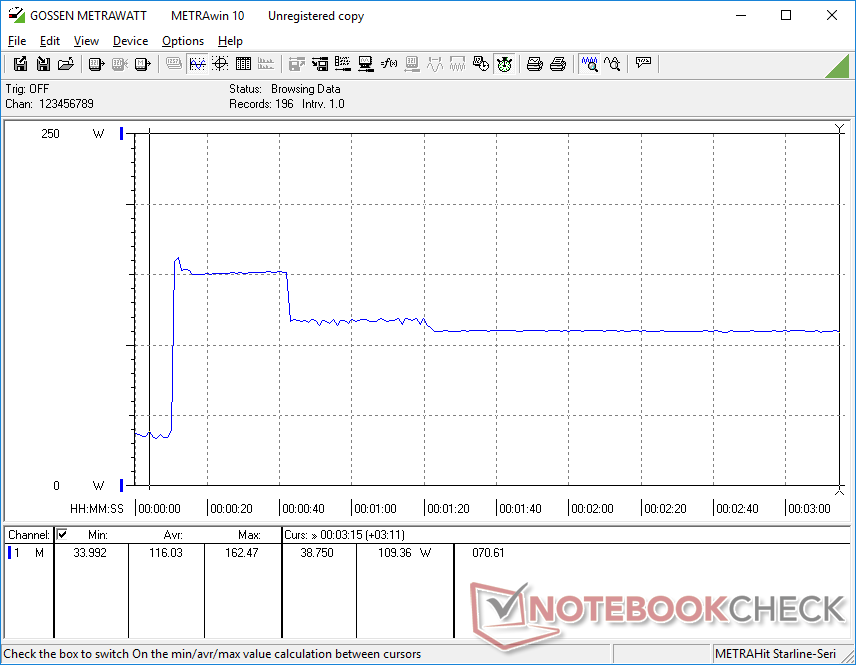
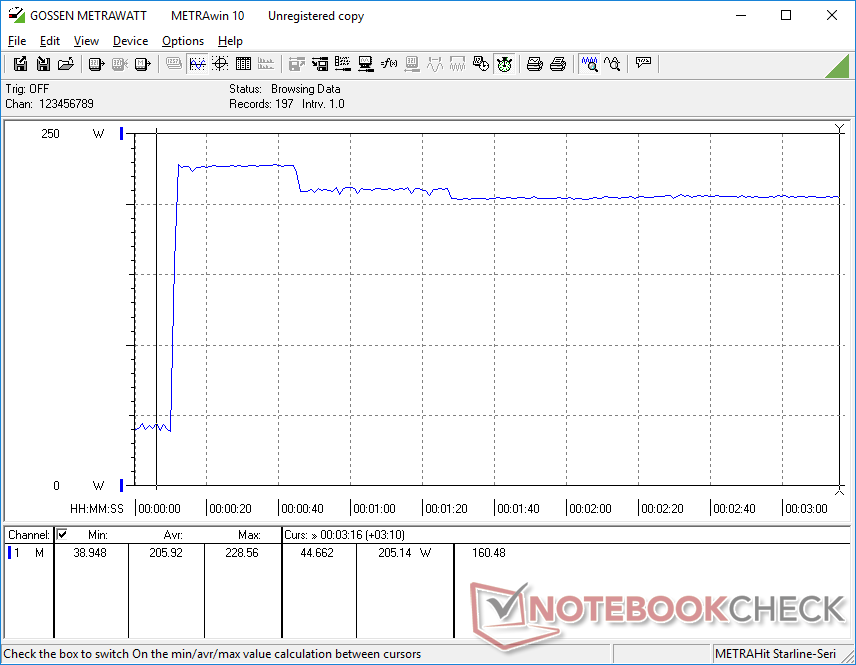
消耗功率
与2021年早期的Blade 15相比,用户获得了2倍以上的CPU多线程性能和15%到25%的图形提升。随后,我们最新的Blade 15模型的功耗更高,在完全紧张时高达60瓦,或在运行游戏时约30瓦。拥有175瓦RTX 3080 Ti的Schenker XMG Neo 15 E22将比我们的Blade 15及其110瓦RTX 3080 Ti消耗更多电力。
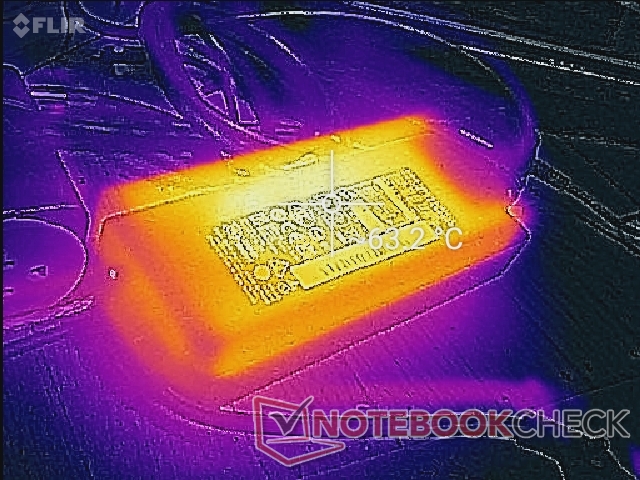
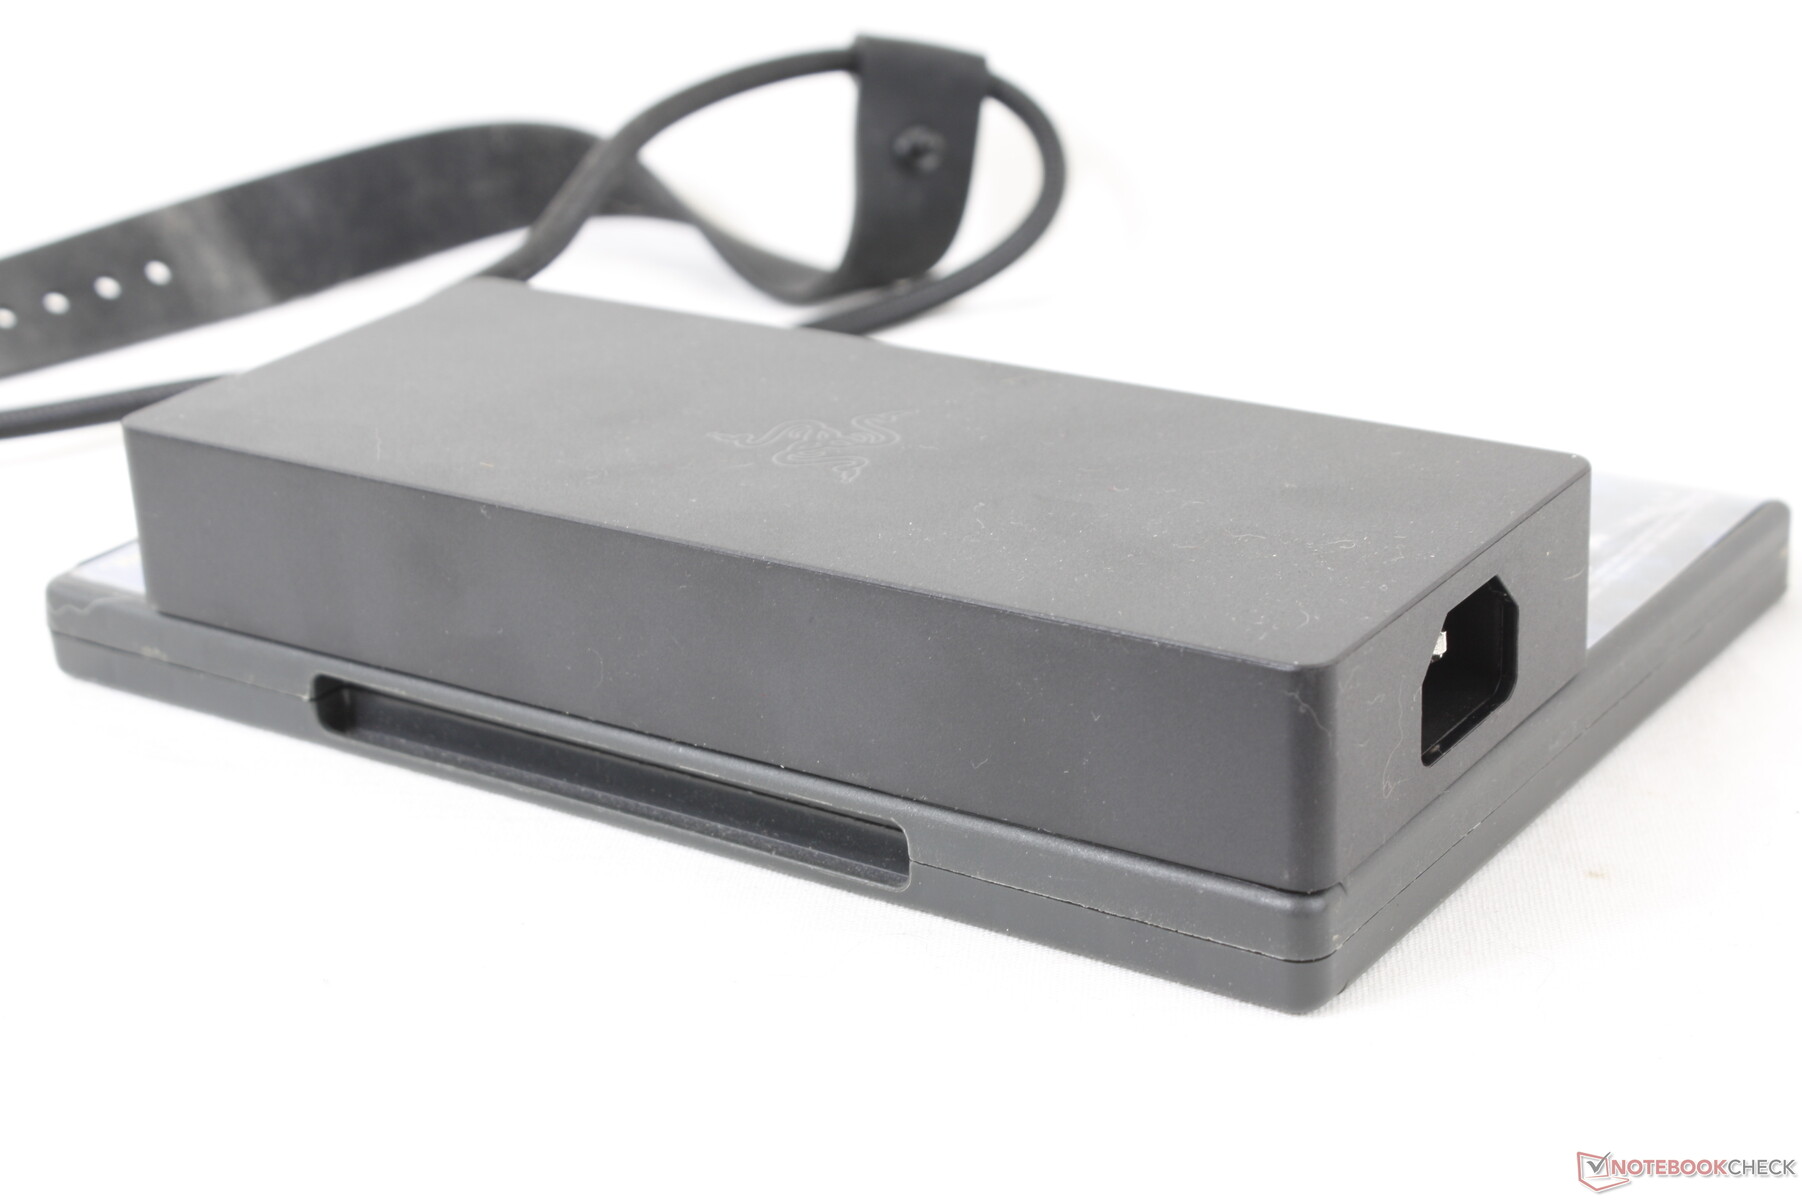
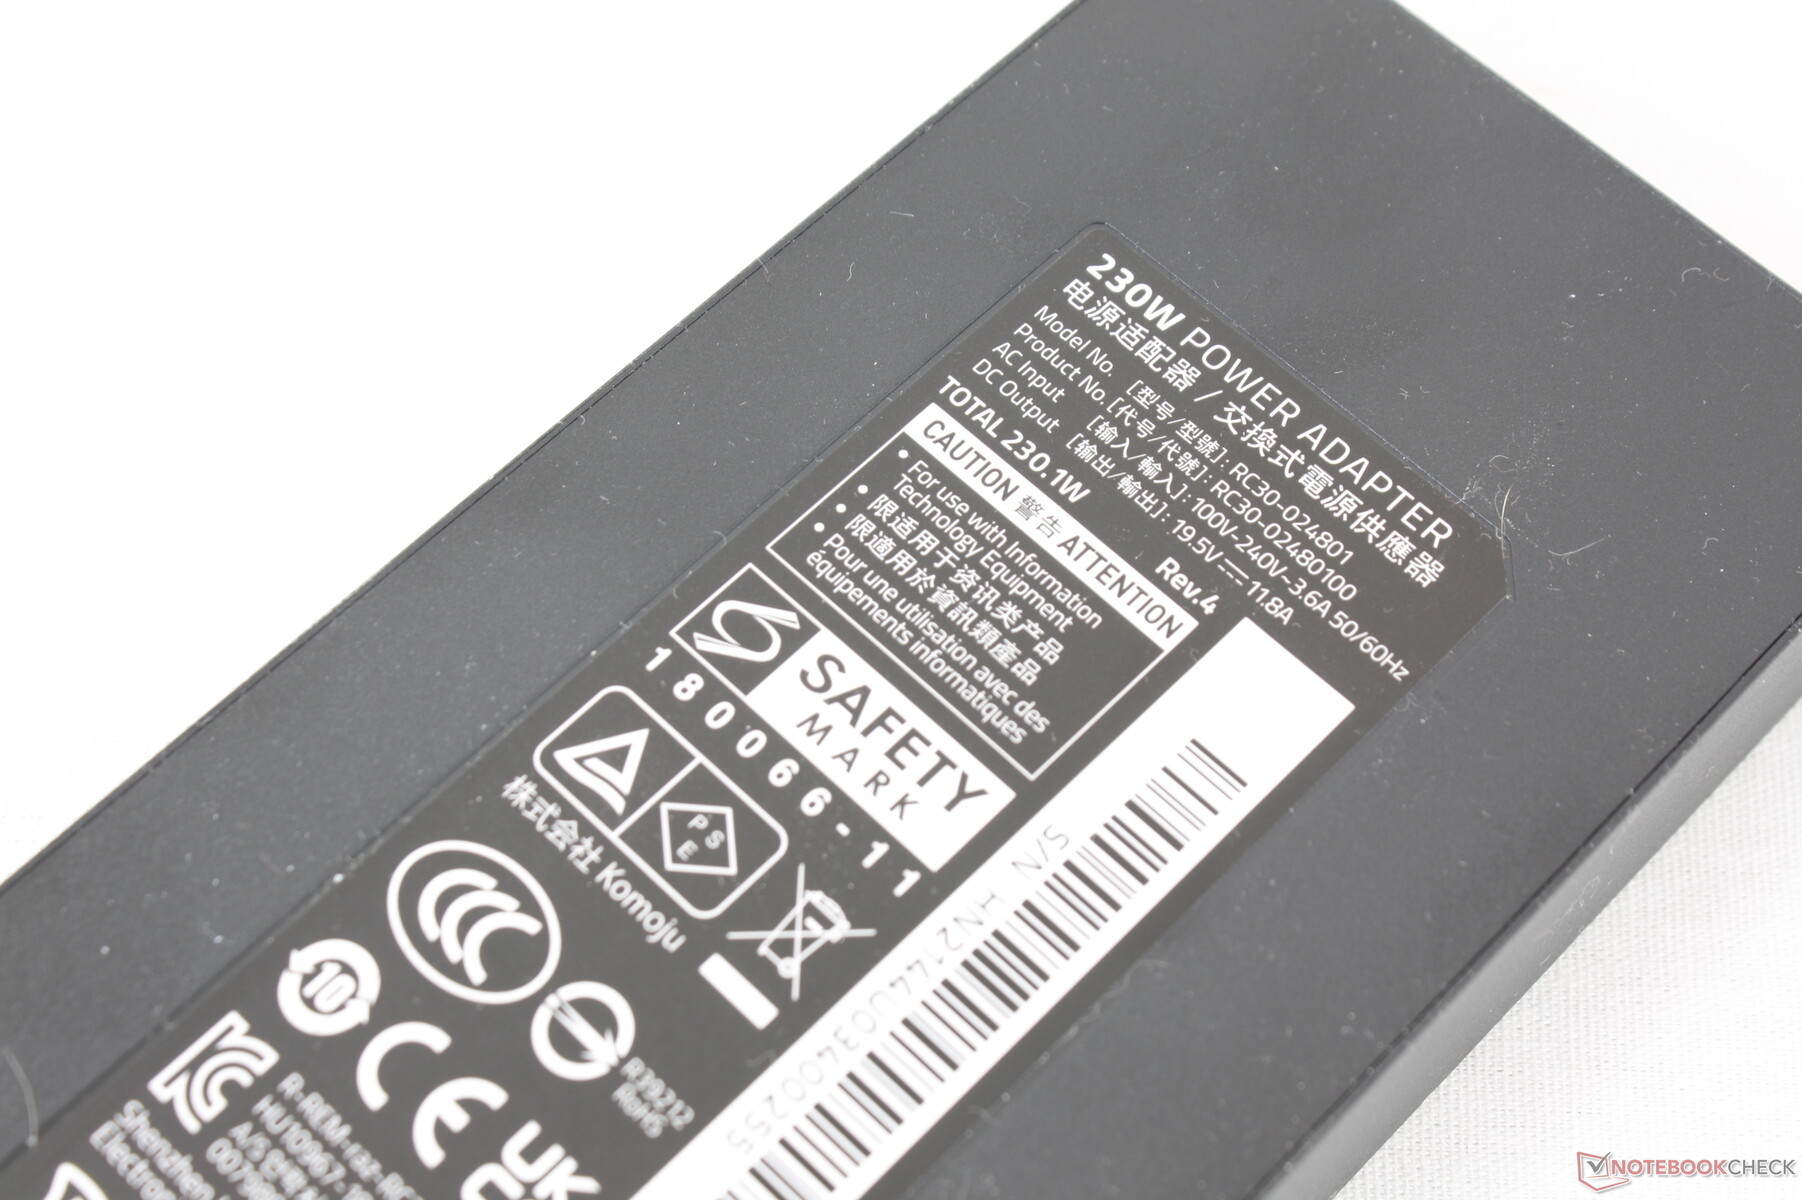
与其他大多数同等功率的适配器相比,230瓦的交流适配器相对较小(~17 x 7 x 2.5厘米),便于运输。当CPU和GPU都处于100%的利用率时,我们能够记录到228W的临时最大电流。
| Off / Standby | |
| Idle | |
| Load |
|
Key:
min: | |
| Razer Blade 15 2022 i7-12800H, GeForce RTX 3080 Ti Laptop GPU, SSSTC CA6-8D1024, IPS, 2560x1440, 15.6" | Razer Blade 15 Advanced Model Early 2021 i7-10875H, GeForce RTX 3080 Laptop GPU, Samsung PM981a MZVLB1T0HBLR, IPS, 1920x1080, 15.6" | Razer Blade 15 RTX 2080 Super Max-Q i7-10875H, GeForce RTX 2080 Super Max-Q, Samsung PM981a MZVLB1T0HBLR, IPS, 1920x1080, 15.6" | Schenker XMG Neo 15 E22 (Early 2022, RTX 3080 Ti) i7-12700H, GeForce RTX 3080 Ti Laptop GPU, Samsung SSD 980 Pro 250GB MZ-V8P250BW, IPS, 2560x1440, 15.6" | ADATA XPG Xenia 15 i7-11800H, GeForce RTX 3070 Laptop GPU, ADATA XPG Gammix S70 1TB, IPS, 2560x1440, 15.6" | Eurocom Nightsky ARX315 R9 5900X, GeForce RTX 3070 Laptop GPU, Samsung SSD 980 Pro 1TB MZ-V8P1T0BW, IPS, 1920x1080, 15.6" | |
|---|---|---|---|---|---|---|
| Power Consumption | 39% | 37% | 15% | 27% | -54% | |
| Idle Minimum * (Watt) | 33.2 | 13 61% | 10.6 68% | 14 58% | 8.9 73% | 55 -66% |
| Idle Average * (Watt) | 36.4 | 15 59% | 13.1 64% | 18 51% | 14.4 60% | 68.2 -87% |
| Idle Maximum * (Watt) | 37.6 | 22 41% | 15.8 58% | 19 49% | 31.1 17% | 72.5 -93% |
| Load Average * (Watt) | 116.7 | 98 16% | 131 -12% | 115 1% | 97 17% | 149.2 -28% |
| Witcher 3 ultra * (Watt) | 172 | 126 27% | 146 15% | 228 -33% | 188 -9% | 233 -35% |
| Load Maximum * (Watt) | 228.6 | 165 28% | 169 26% | 307 -34% | 222.2 3% | 255.8 -12% |
* ... smaller is better
Power Consumption Witcher 3 / Stresstest
Power Consumption external Monitor
电池寿命
WLAN运行时间比上一代机型短,部分原因可能是由于更需要1440p 240 Hz面板。在Nvidia Optimus设置为iGPU、显示屏设置为150尼特的情况下,我们能够在平衡电源配置文件中挤出近5小时的实际WLAN使用时间。相比之下,在类似的测试条件下,我们能够在2021年的Blade 15上挤出6小时或更长时间。
用附带的交流适配器从空电到满电需要不到90分钟。该系统还可以通过第三方USB-C适配器充电。
| Razer Blade 15 2022 i7-12800H, GeForce RTX 3080 Ti Laptop GPU, 80 Wh | Razer Blade 15 Advanced Model Early 2021 i7-10875H, GeForce RTX 3080 Laptop GPU, 80 Wh | Razer Blade 15 RTX 2080 Super Max-Q i7-10875H, GeForce RTX 2080 Super Max-Q, 80 Wh | Schenker XMG Neo 15 E22 (Early 2022, RTX 3080 Ti) i7-12700H, GeForce RTX 3080 Ti Laptop GPU, 93 Wh | ADATA XPG Xenia 15 i7-11800H, GeForce RTX 3070 Laptop GPU, 94 Wh | Eurocom Nightsky ARX315 R9 5900X, GeForce RTX 3070 Laptop GPU, 62 Wh | |
|---|---|---|---|---|---|---|
| Battery runtime | 84% | 24% | 37% | 78% | -80% | |
| WiFi v1.3 (h) | 4.9 | 9 84% | 6.1 24% | 6.7 37% | 8.7 78% | 1 -80% |
| Reader / Idle (h) | 14.4 | 8.7 | 14 | |||
| H.264 (h) | 8.9 | 7.3 | 6.9 | |||
| Load (h) | 2 | 1.9 | 3.8 | 1.5 |
Pros
Cons
判决书
与去年的酷睿i7-11800H和RTX 3080模型相比,2022年的刀片15提供了大约15%至25%的图形性能和20%的CPU性能 。值得庆幸的是,该系统不需要运行得明显更响或更热就能达到更快的效果,但耗电量和电池寿命都受到了冲击。特别是较高的消耗似乎是许多第12代酷睿笔记本电脑中的一个趋势,包括Schenker Uniwill Technology GM7AG8P 或MSI Vector GP66 ,当与上一代的同类产品相比。我们也很高兴没有看到低于平均水平的CPU性能,而10代酷睿i7-10875H型号就是这种情况。
采用第12代英特尔的Blade 15在熟悉的设计下塞进了更多的性能,而不需要在噪音或热量上做出妥协。然而,不要指望电池寿命会更长。
考虑到这一点,最新的Blade 15是对一个已经很好的机箱进行的年度迭代更新。较大的传统键帽受到欢迎,特别是对于那些不喜欢Razer在2019年Blade 15上的光学键盘 "实验 "的人来说,而相对较小的AC适配器值得认可,因为它比其他大多数人更容易携带。也许明年的机型终于可以增加一个网络摄像头快门,现在许多便宜的笔记本电脑都有这个功能。
价格和可用性
雷泽尔 现在正在运送2022年的刀片15和刀片17。我们的具体配置为3700美元。
Razer Blade 15 2022
- 03/12/2022 v7 (old)
Allen Ngo
Price comparison

