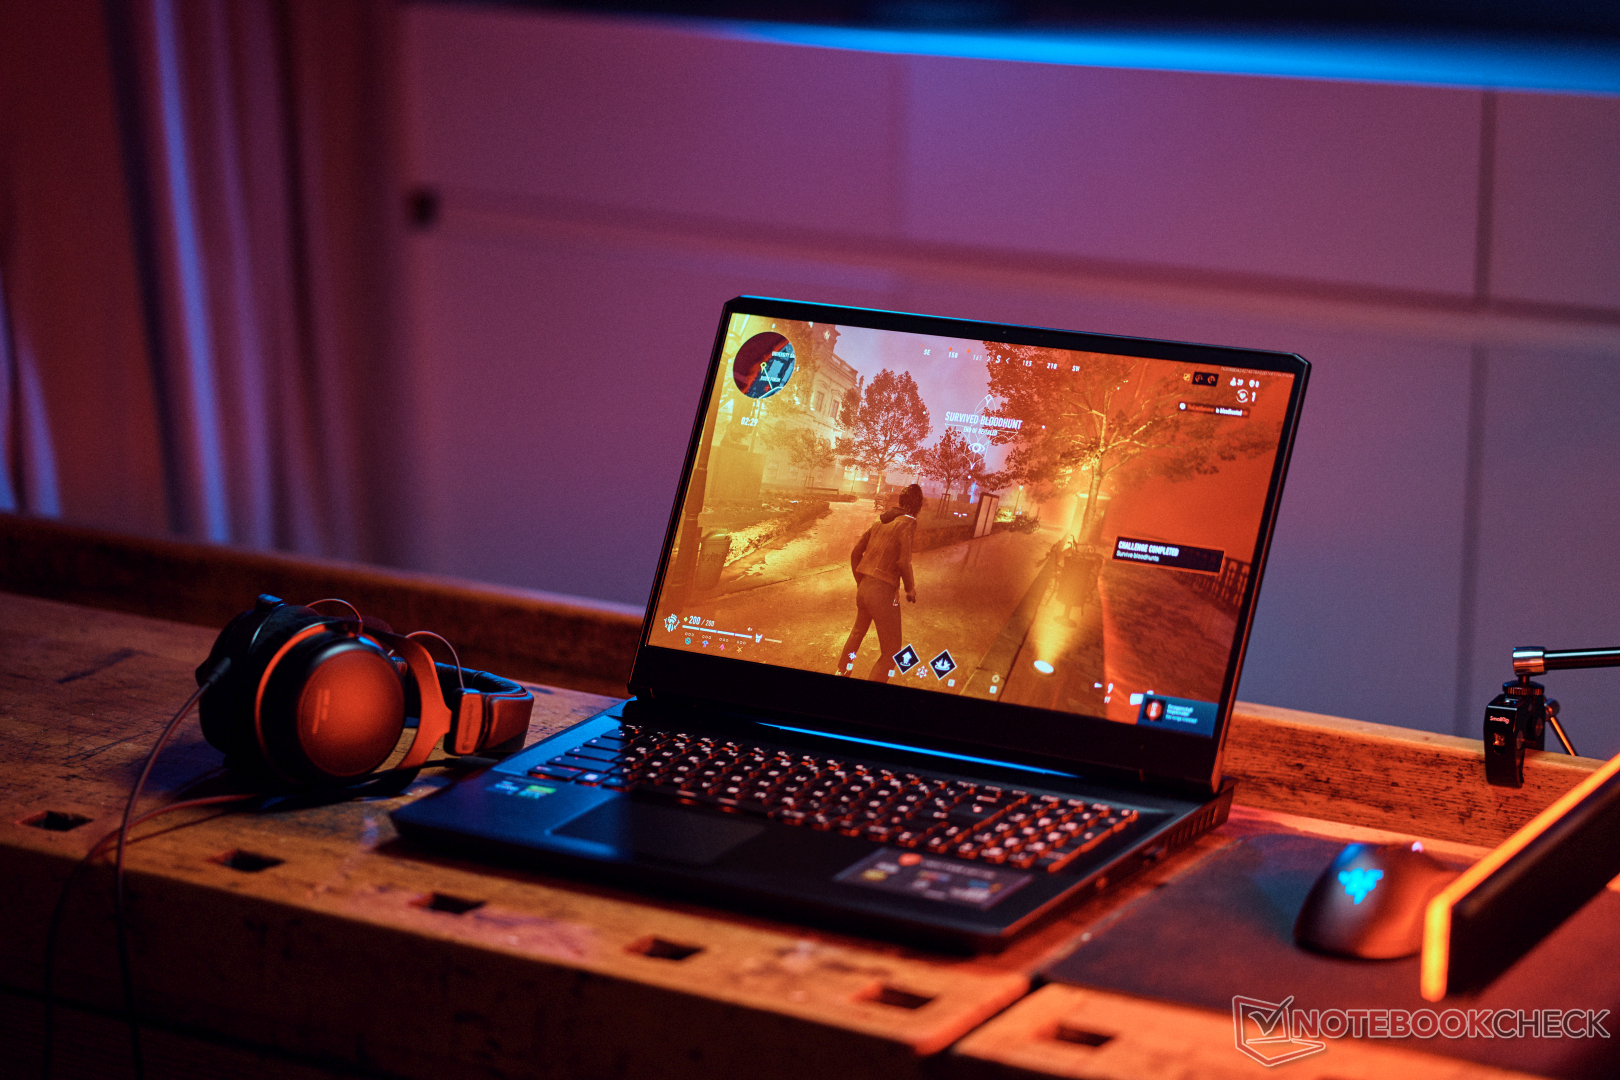
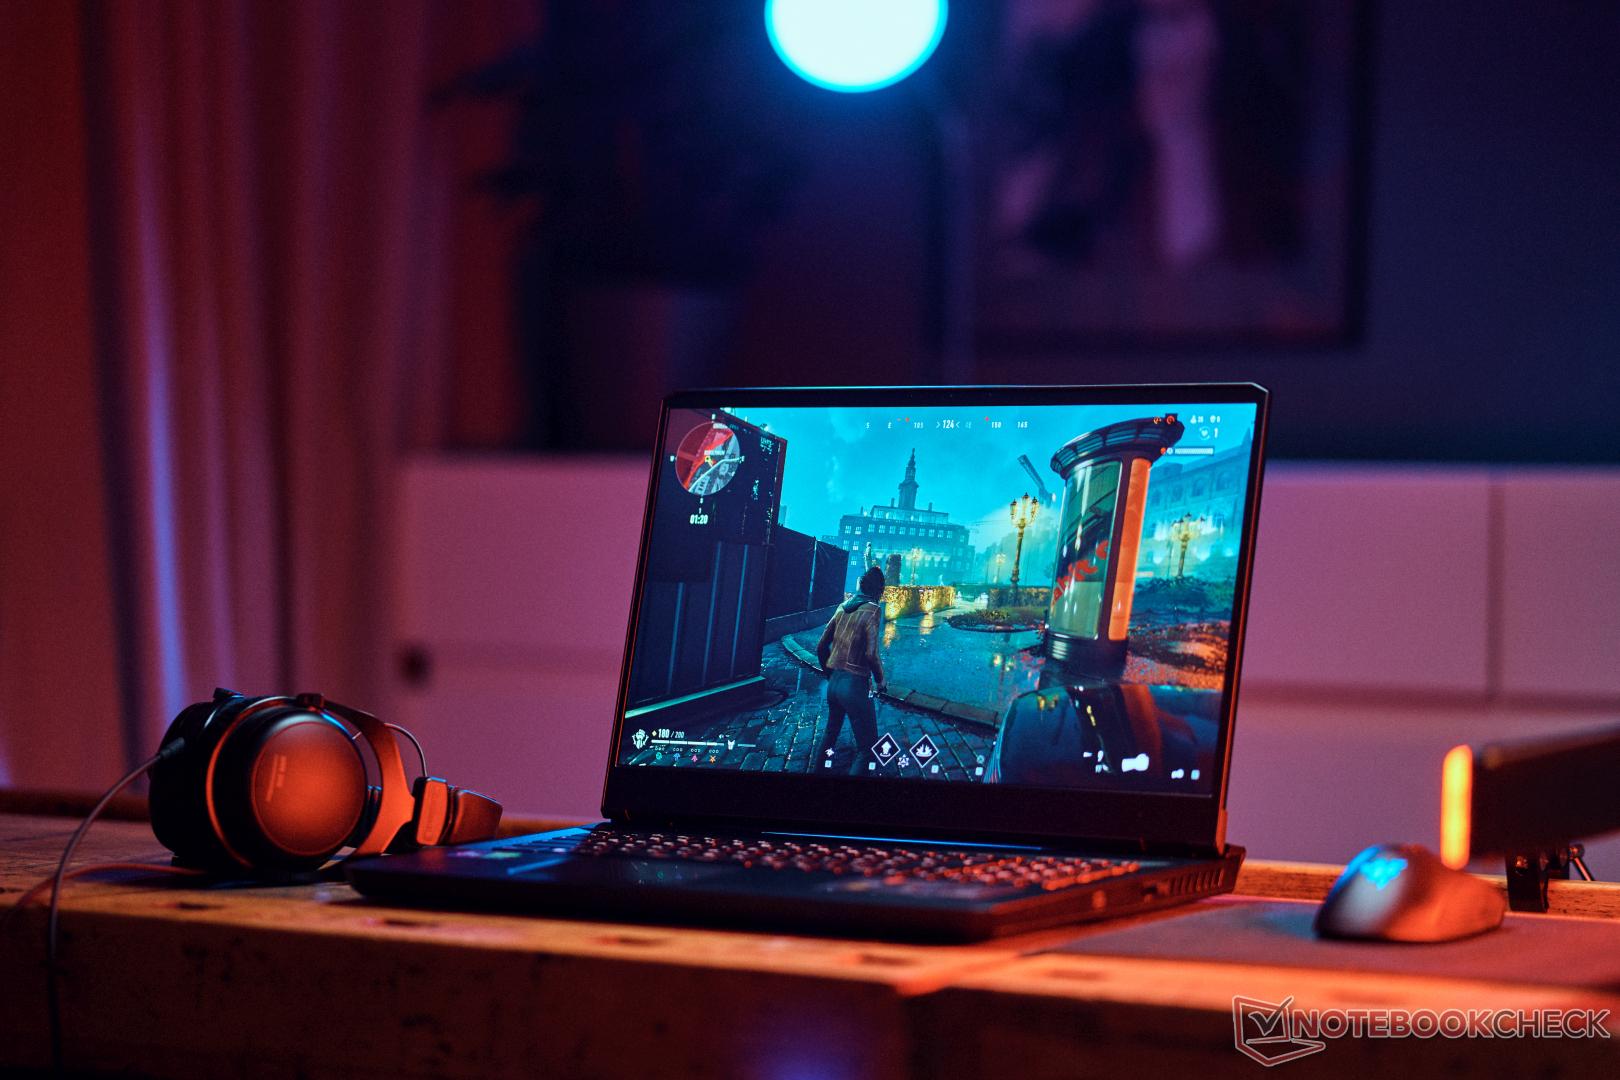
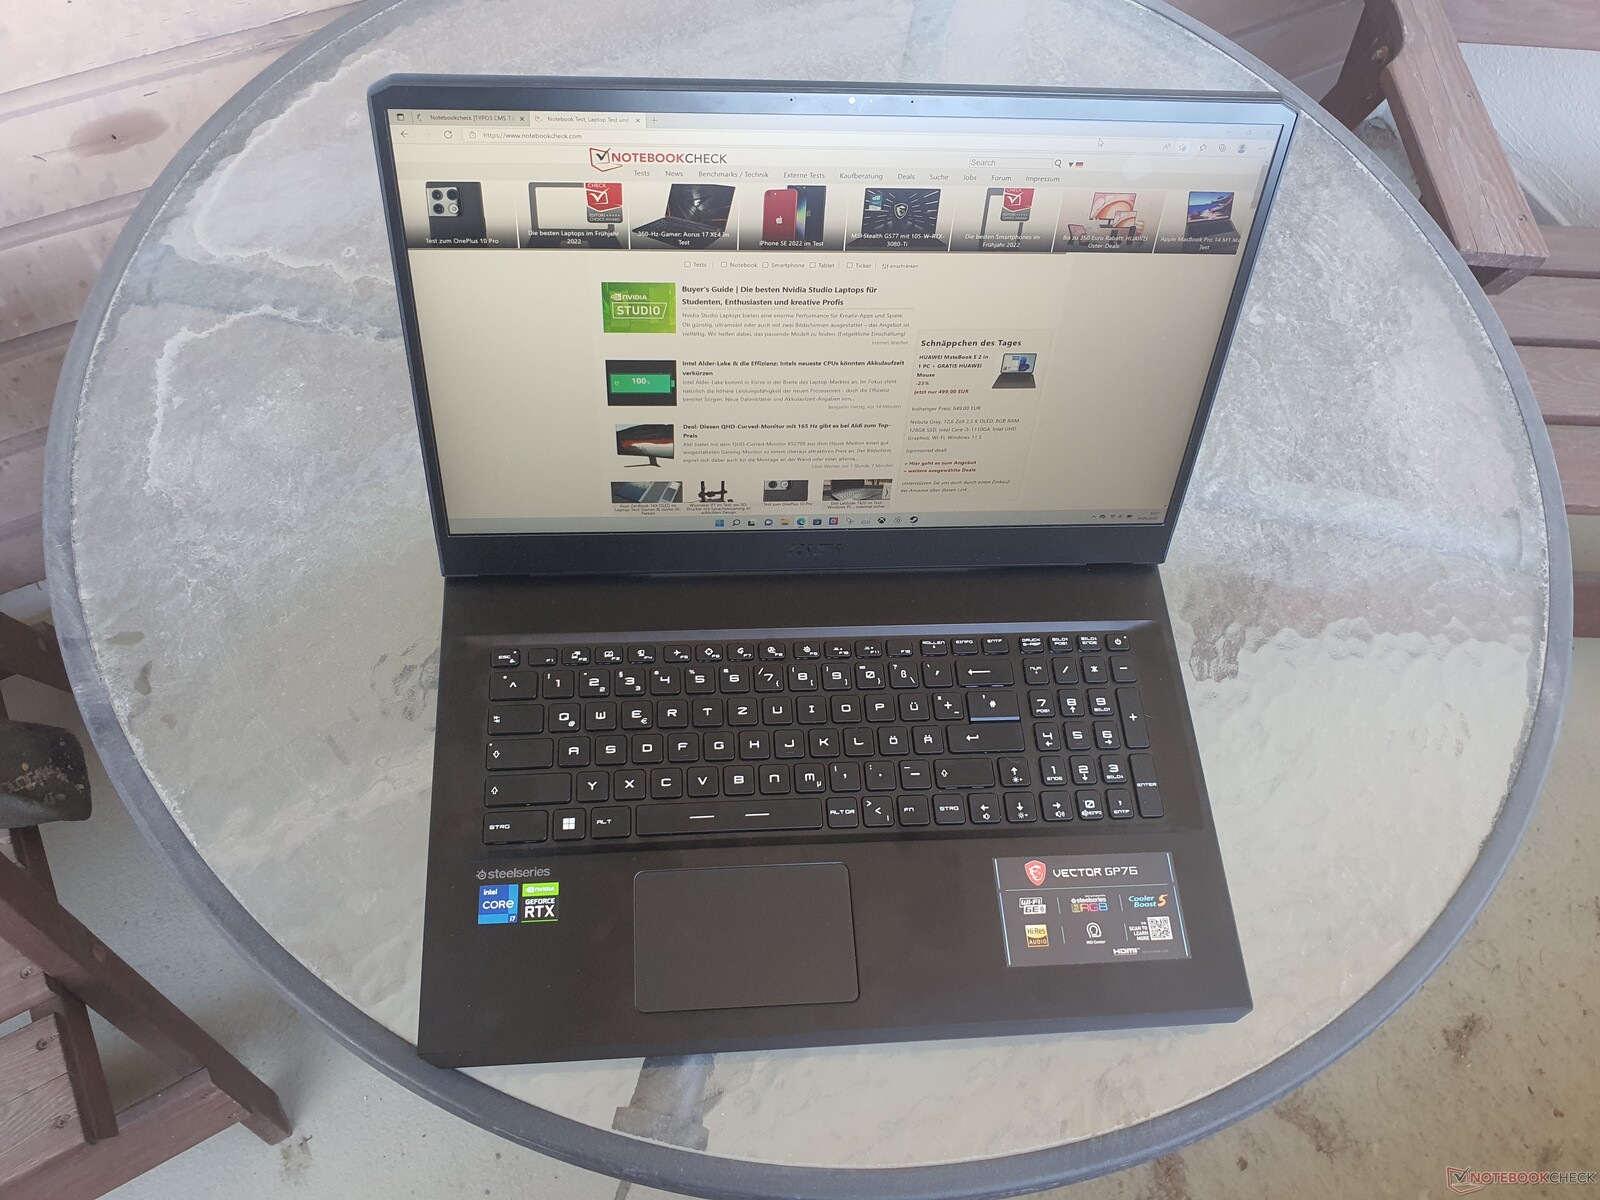
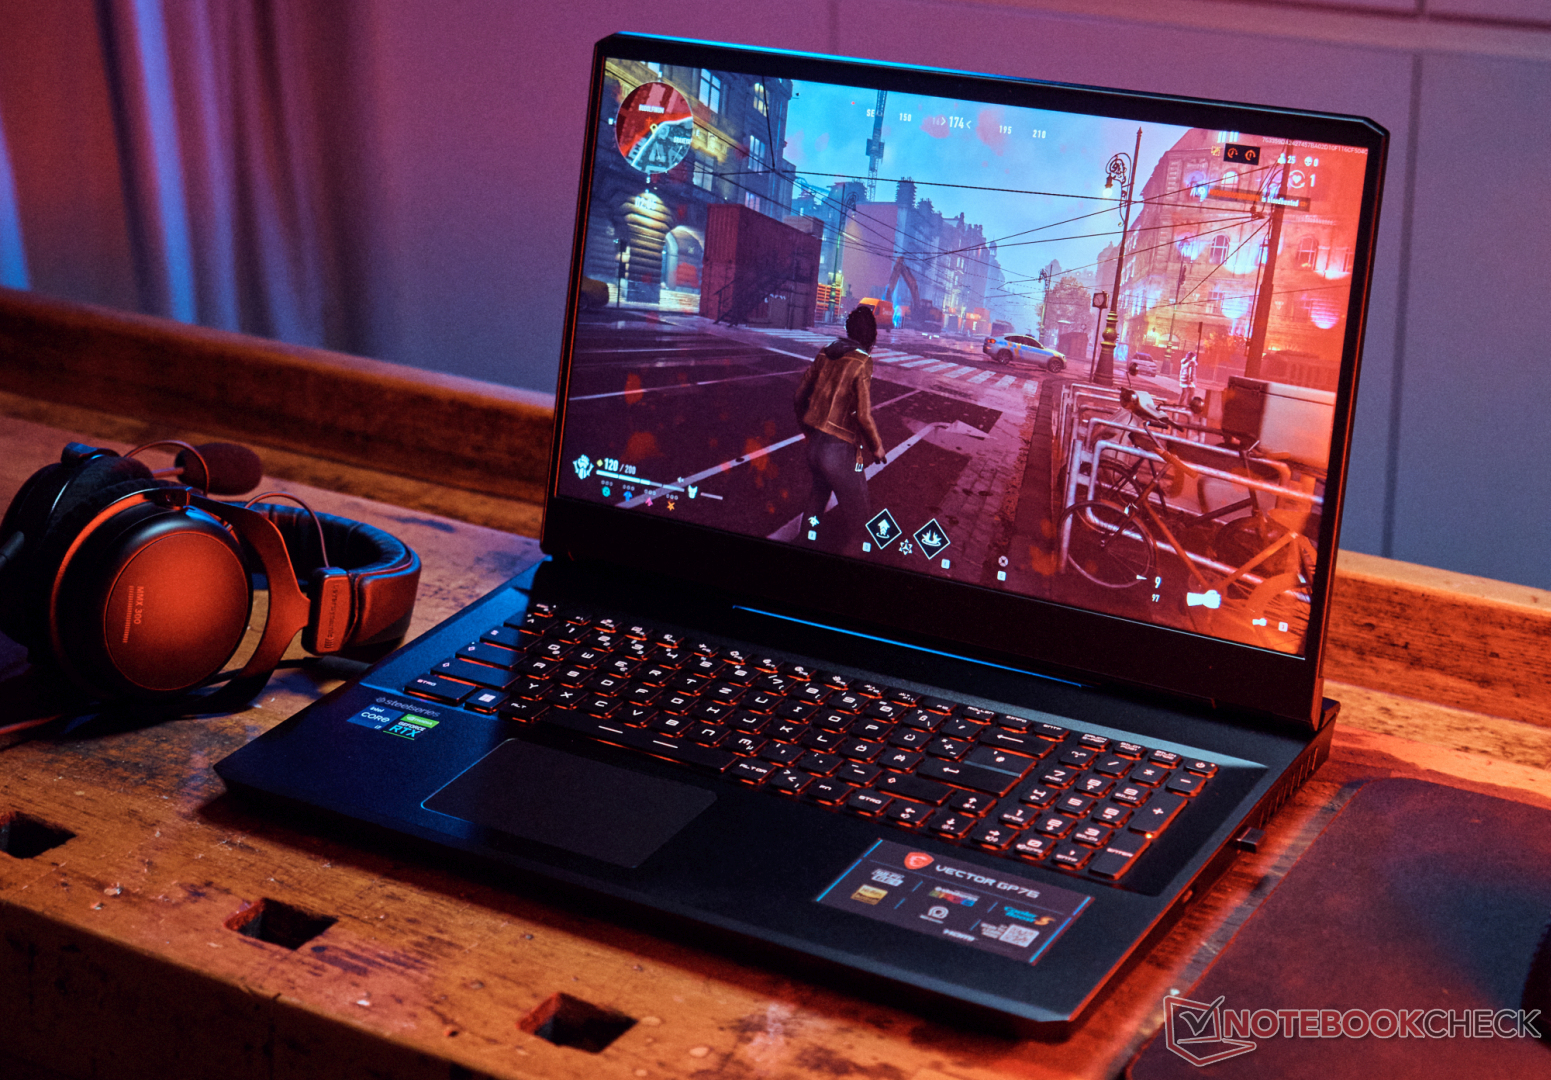
微星Vector GP76 12UGS回顾。游戏笔记本电脑的速度

凭借其新的Vector系列,微星今年将在游戏战场上推出两款新的笔记本。这款笔记本 较小的15英寸笔记本 已经提供了出色的性能,但作为GP76的直接继承者,Vector GP76提供了哪些升级?GP76 Leopard不同于 MSI Alpha, 卡塔纳或 脉冲, Vector系列不是为入门级或中端用户设计的,而是提供具有中端元素的高端游戏机,这也反映在2,600美元左右的价格上。
然而,与GE系列相比,缺少一些功能。GE系列发烧友的GE系列和紧凑型的 GS系列.例如,省略了Thunderbolt 4、读卡器和USB-C充电,以及缺乏QHD或UHD显示器的选项,或一个 NvidiaGeForce RTX 3080 Ti。此外,它还配备了稍慢的DDR4内存和较小的电池。尽管如此,我们在本报告中强调了许多强大的功能和升级,如360赫兹快速面板,4毫秒的响应时间。
竞争者包括 华硕ROG Strix G17,以及 技嘉Aorus 17, 申克的XMG Neo 17和 联想的Legion 5 Pro.同样值得关注的是与价格相近的 华硕ROG Zephyrus M16.
潜在的竞争对手比较
Rating | Date | Model | Weight | Height | Size | Resolution | Price |
|---|---|---|---|---|---|---|---|
| 86.7 % v7 (old) | 05 / 2022 | MSI Vector GP76 12UGS-434 i7-12700H, GeForce RTX 3070 Ti Laptop GPU | 2.9 kg | 25.9 mm | 17.30" | 1920x1080 | |
| 85.1 % v7 (old) | 05 / 2021 | MSI GP76 Leopard 10UG i7-10750H, GeForce RTX 3070 Laptop GPU | 2.9 kg | 26 mm | 17.30" | 1920x1080 | |
| 83.4 % v7 (old) | 09 / 2021 | Asus ROG Strix G17 G713QE-RB74 R7 5800H, GeForce RTX 3050 Ti Laptop GPU | 2.5 kg | 24.6 mm | 17.30" | 1920x1080 | |
| 85.2 % v7 (old) | 04 / 2022 | Aorus 17 XE4 i7-12700H, GeForce RTX 3070 Ti Laptop GPU | 2.6 kg | 27 mm | 17.30" | 1920x1080 | |
| 87.4 % v7 (old) | Schenker XMG NEO 17 GM7TG8S i7-11800H, GeForce RTX 3080 Laptop GPU | 2.6 kg | 27.45 mm | 17.30" | 2560x1440 | ||
| 88 % v7 (old) | 03 / 2022 | Lenovo Legion 5 Pro 16 G7 i7 RTX 3070Ti i7-12700H, GeForce RTX 3070 Ti Laptop GPU | 2.6 kg | 26.6 mm | 16.00" | 2560x1600 | |
| 85.6 % v7 (old) | 06 / 2021 | Asus ROG Zephyrus M16 GU603H i9-11900H, GeForce RTX 3070 Laptop GPU | 2 kg | 20 mm | 16.00" | 2560x1600 | |
| 86.9 % v7 (old) | 03 / 2022 | MSI Vector GP66 12UGS i9-12900H, GeForce RTX 3070 Ti Laptop GPU | 2.3 kg | 23.4 mm | 15.60" | 1920x1080 |
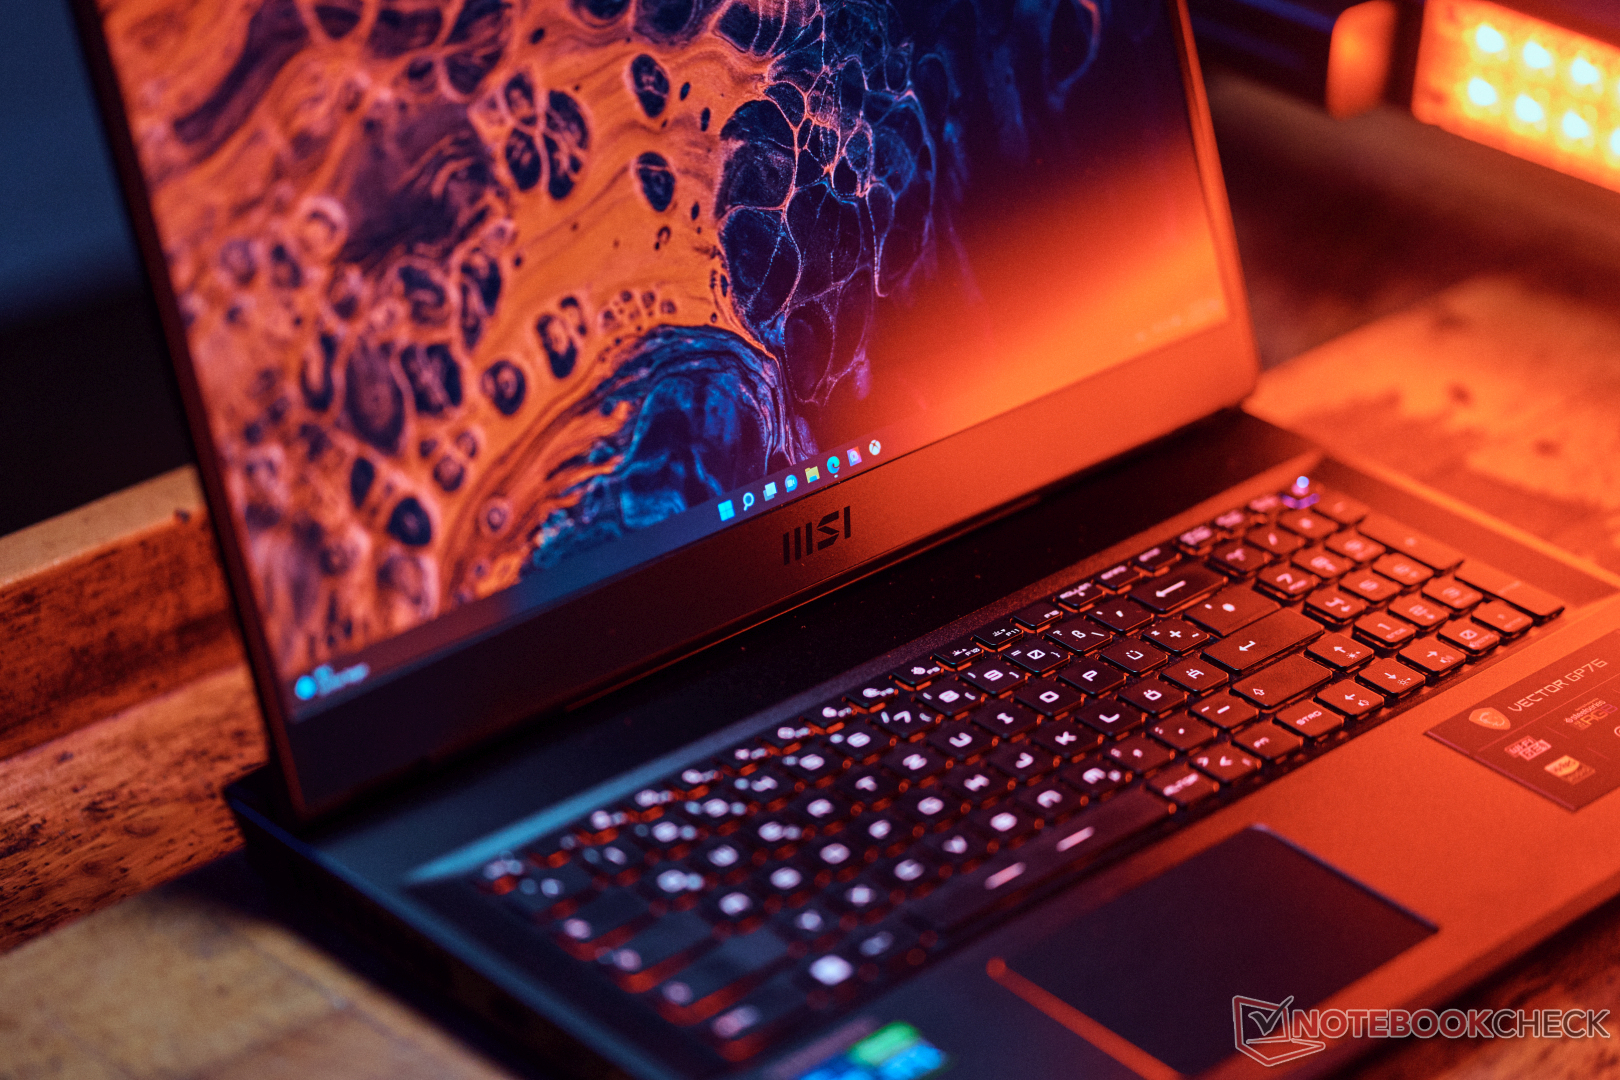
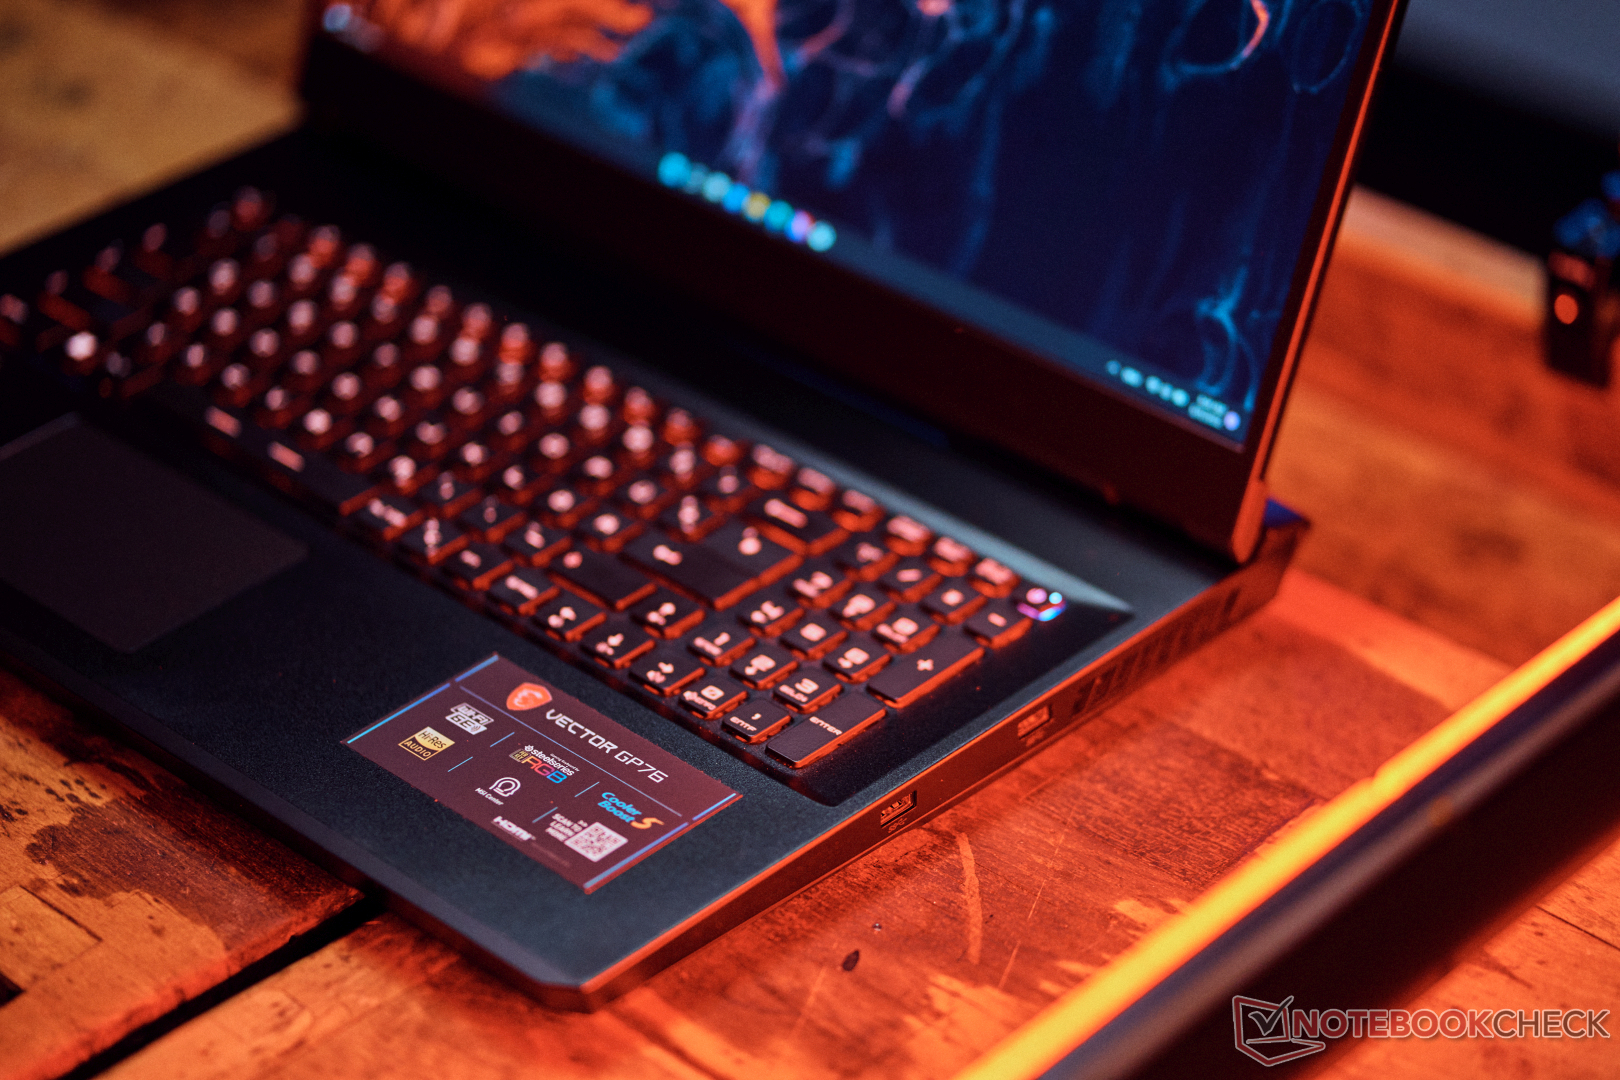
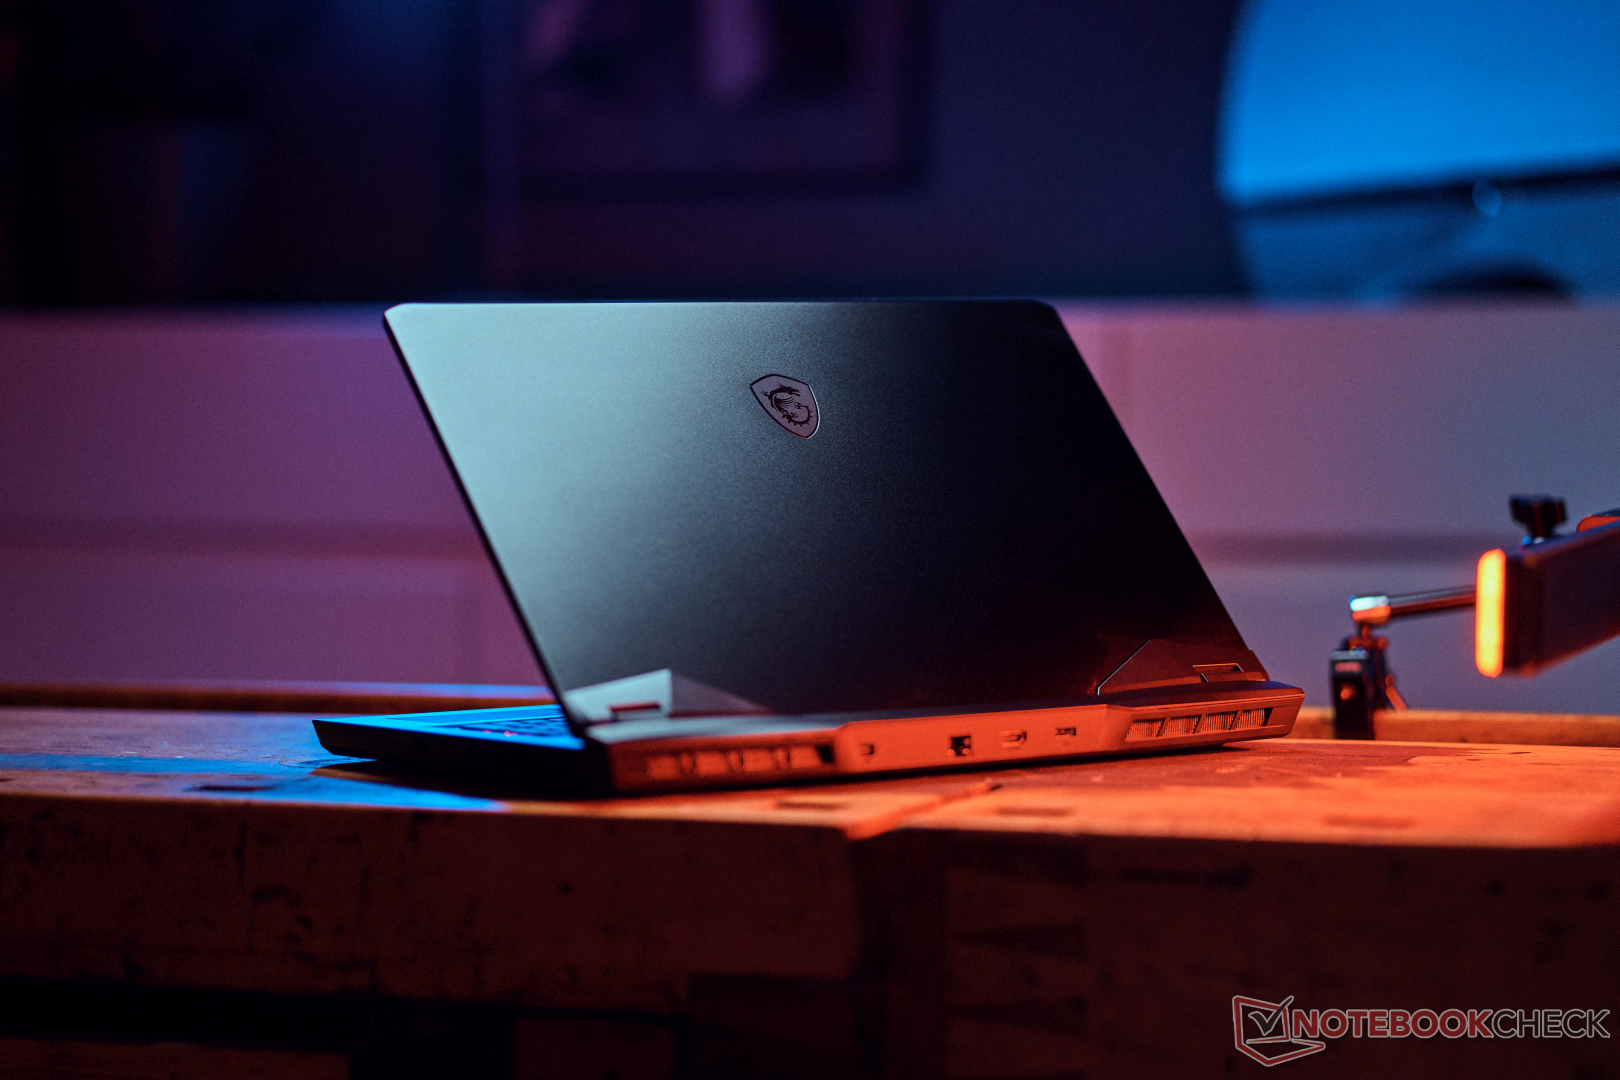
外壳。微星具有稳定的矢量和大量的金属
微星Vector GP76只有 "珊瑚黑 "一种颜色,它有一个非常坚固的外壳,显示盖和键盘区域由铝制成。与前代机型相比,机箱基本保持不变,底部为塑料材质。Vector抗扭,包括显示屏,对显示屏背面的有针对性的压力不会造成任何图像失真。只有显示器框架的底部对压力有一点屈服,但这不是一个大问题。屏幕只是轻微地晃动。
盖子可以用一只手打开,而140度的最大开启角度有点小。键盘被很好地嵌入机箱,完全没有弯曲。表面略显粗糙,有一种高质量的感觉。由于游戏设计的原因,一些边缘有点尖锐,但仍可接受。然而,由于机箱的前缘与底板相连,随着时间的推移,这可能会有一些松动或脱落,这破坏了质量的整体印象。

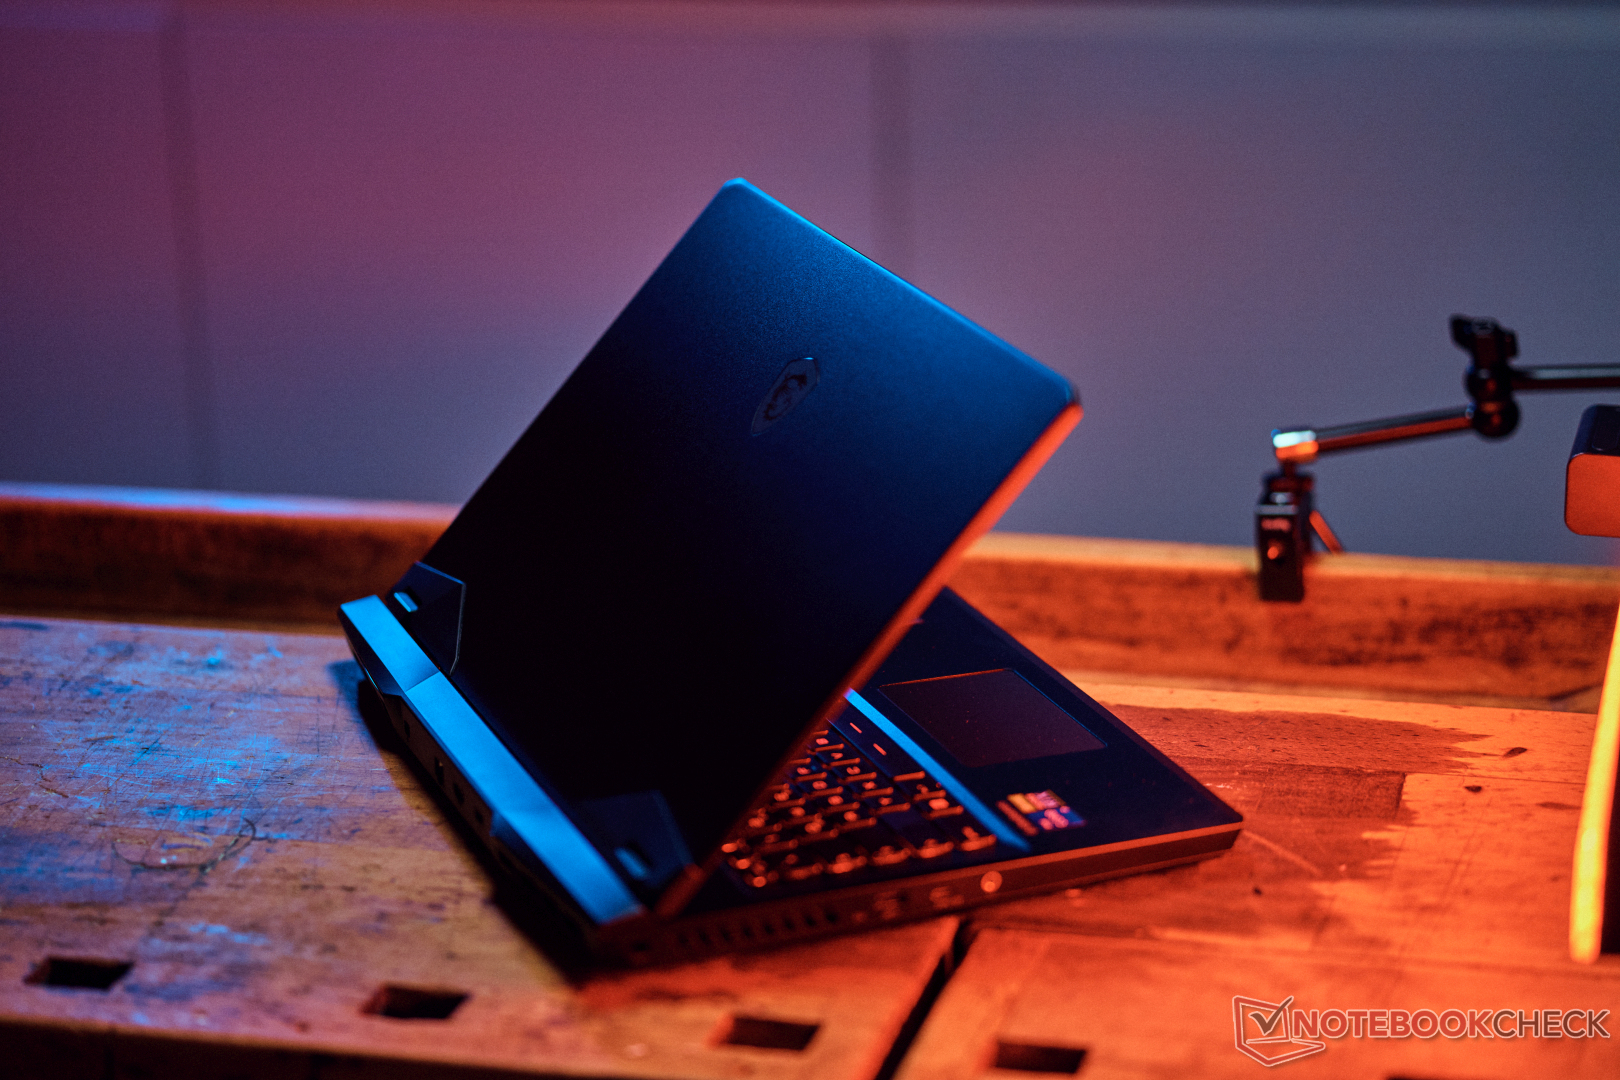
2.85公斤的重量是可以接受的,因为这是一台拥有强大组件的17英寸游戏机。竞争者提供了不易察觉的更轻的设备,其中16英寸级别,如 华硕ROG Zephyrus M16显著更轻,重量只有2公斤,也是到目前为止比较领域中最紧凑的设备。这里的差异是相当大的,绝对值得在移动游戏方面加以考虑。26毫米的厚度也不赖。总体而言,GP76比其他可比的17英寸设备略厚。
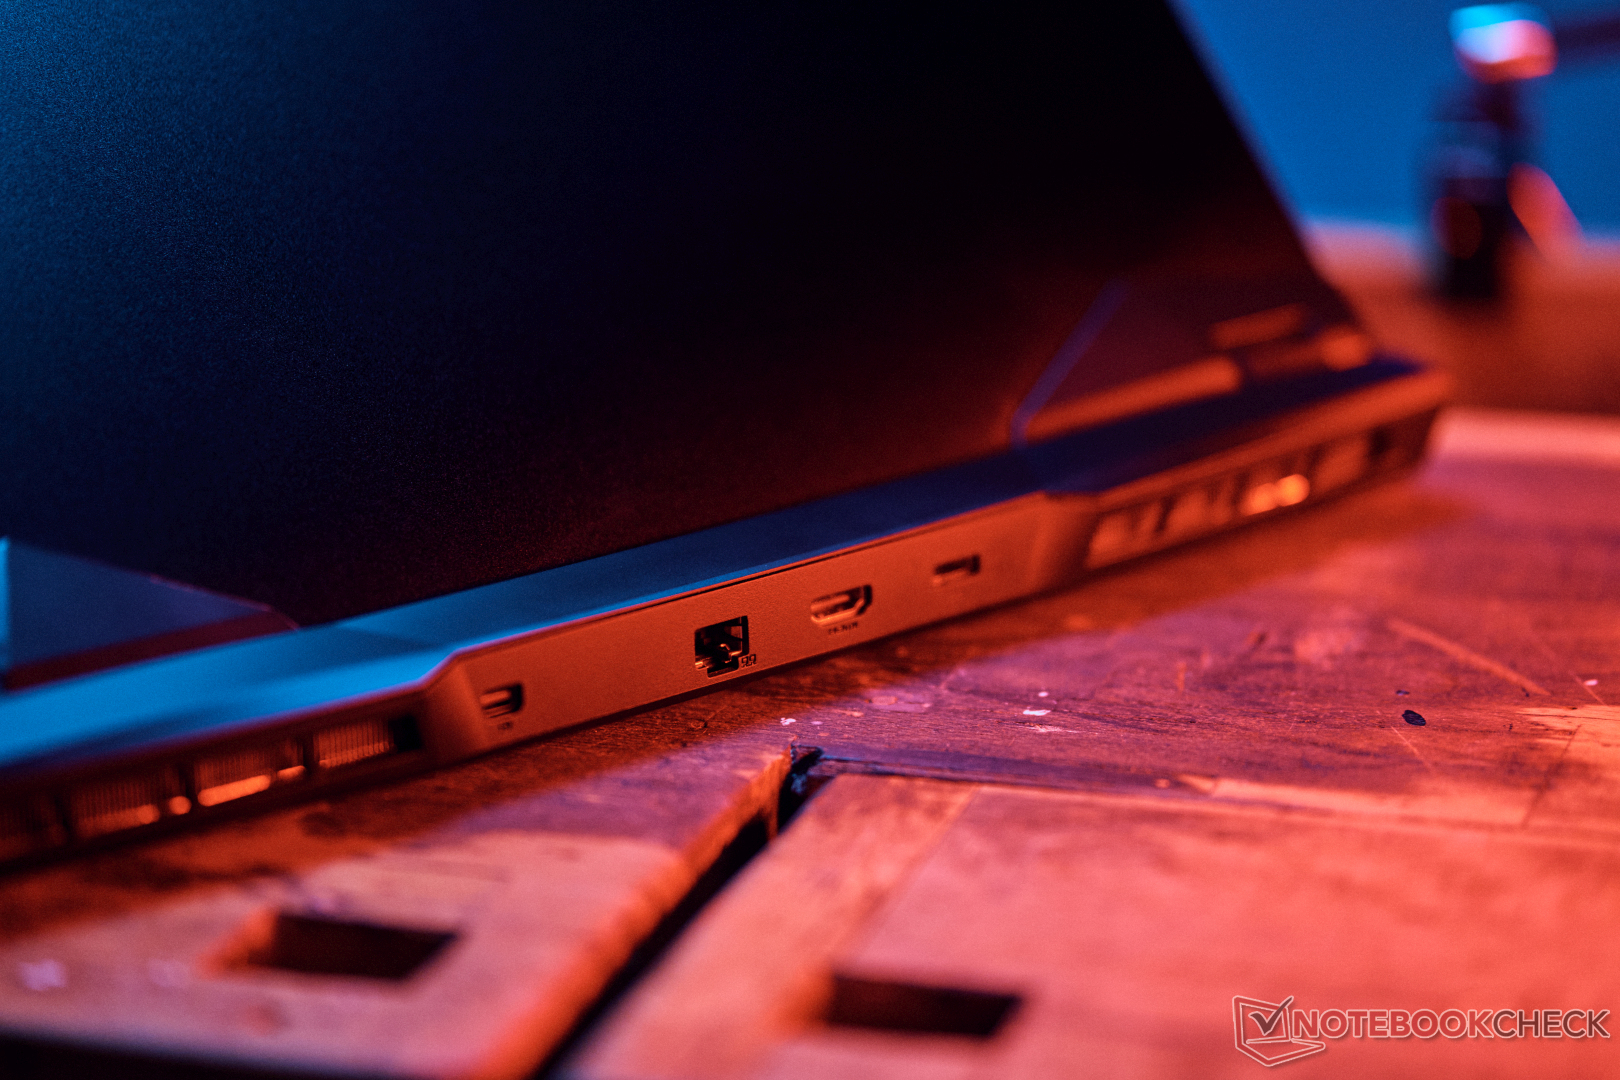
硬件。不能通过USB-C充电
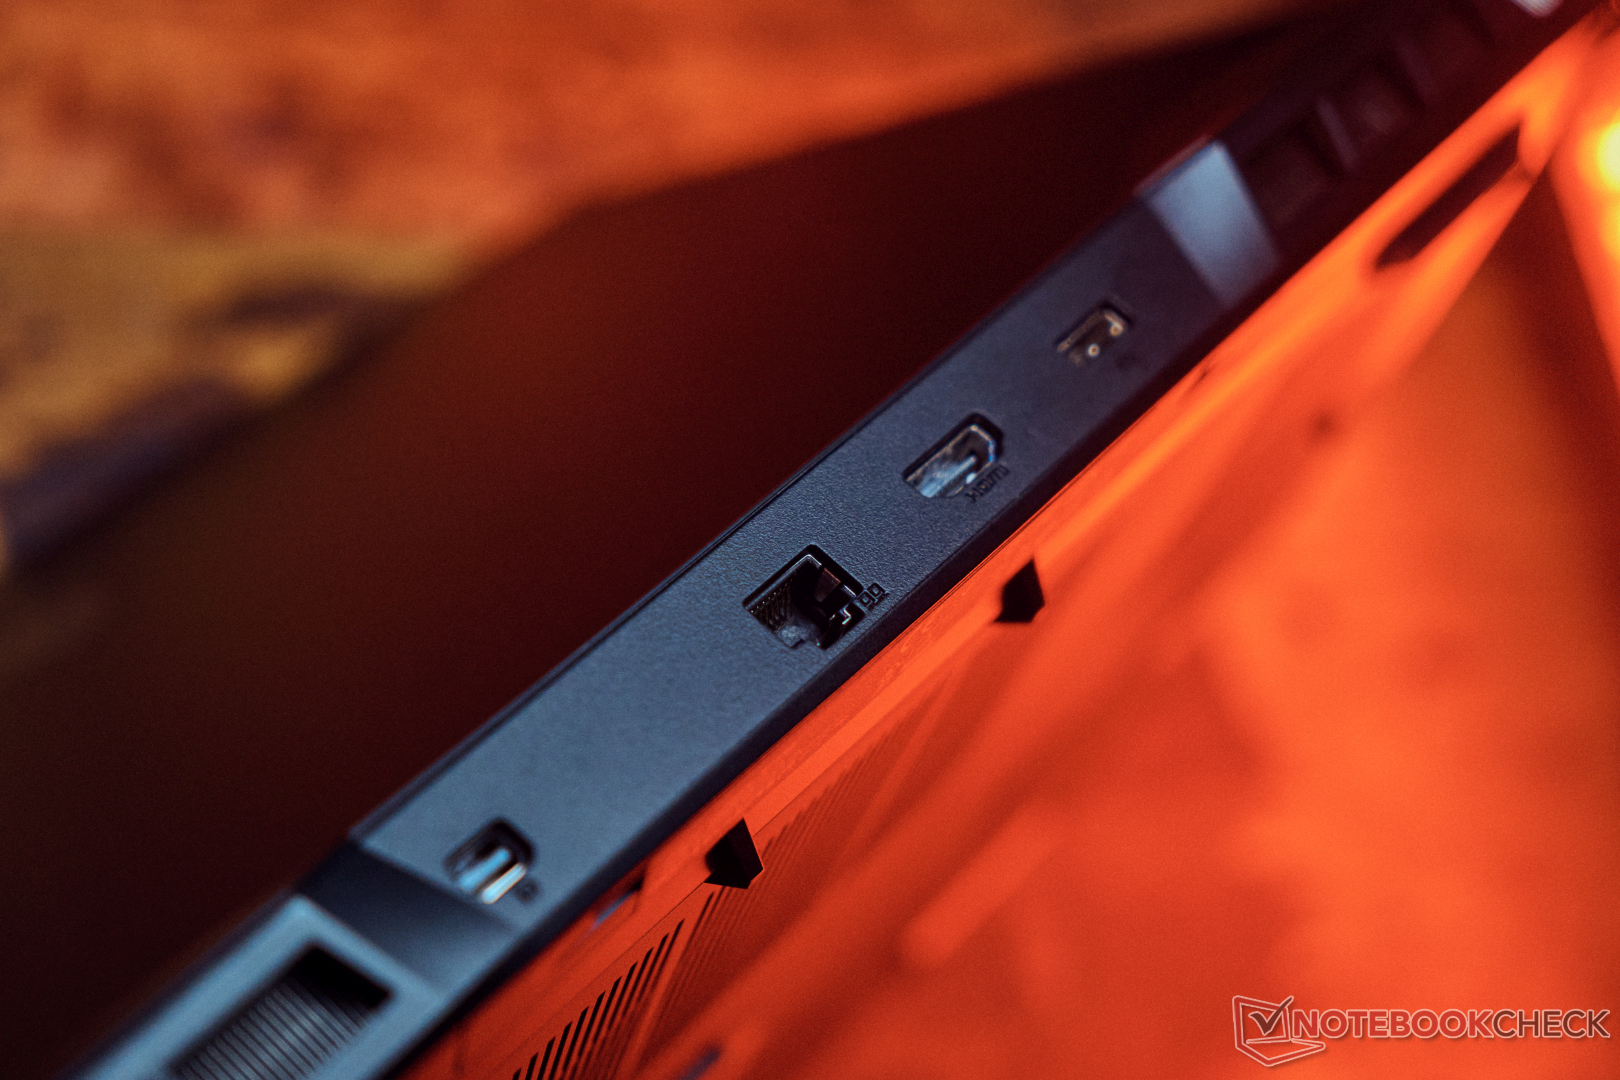
幸运的是,一些端口位于设备的背面,因此相应的电缆是不可见的。一个带有自适应同步功能的迷你DisplayPort,以及一个HDMI输出(4K @120Hz)、2.5-Bit LAN和专有的电源接口。
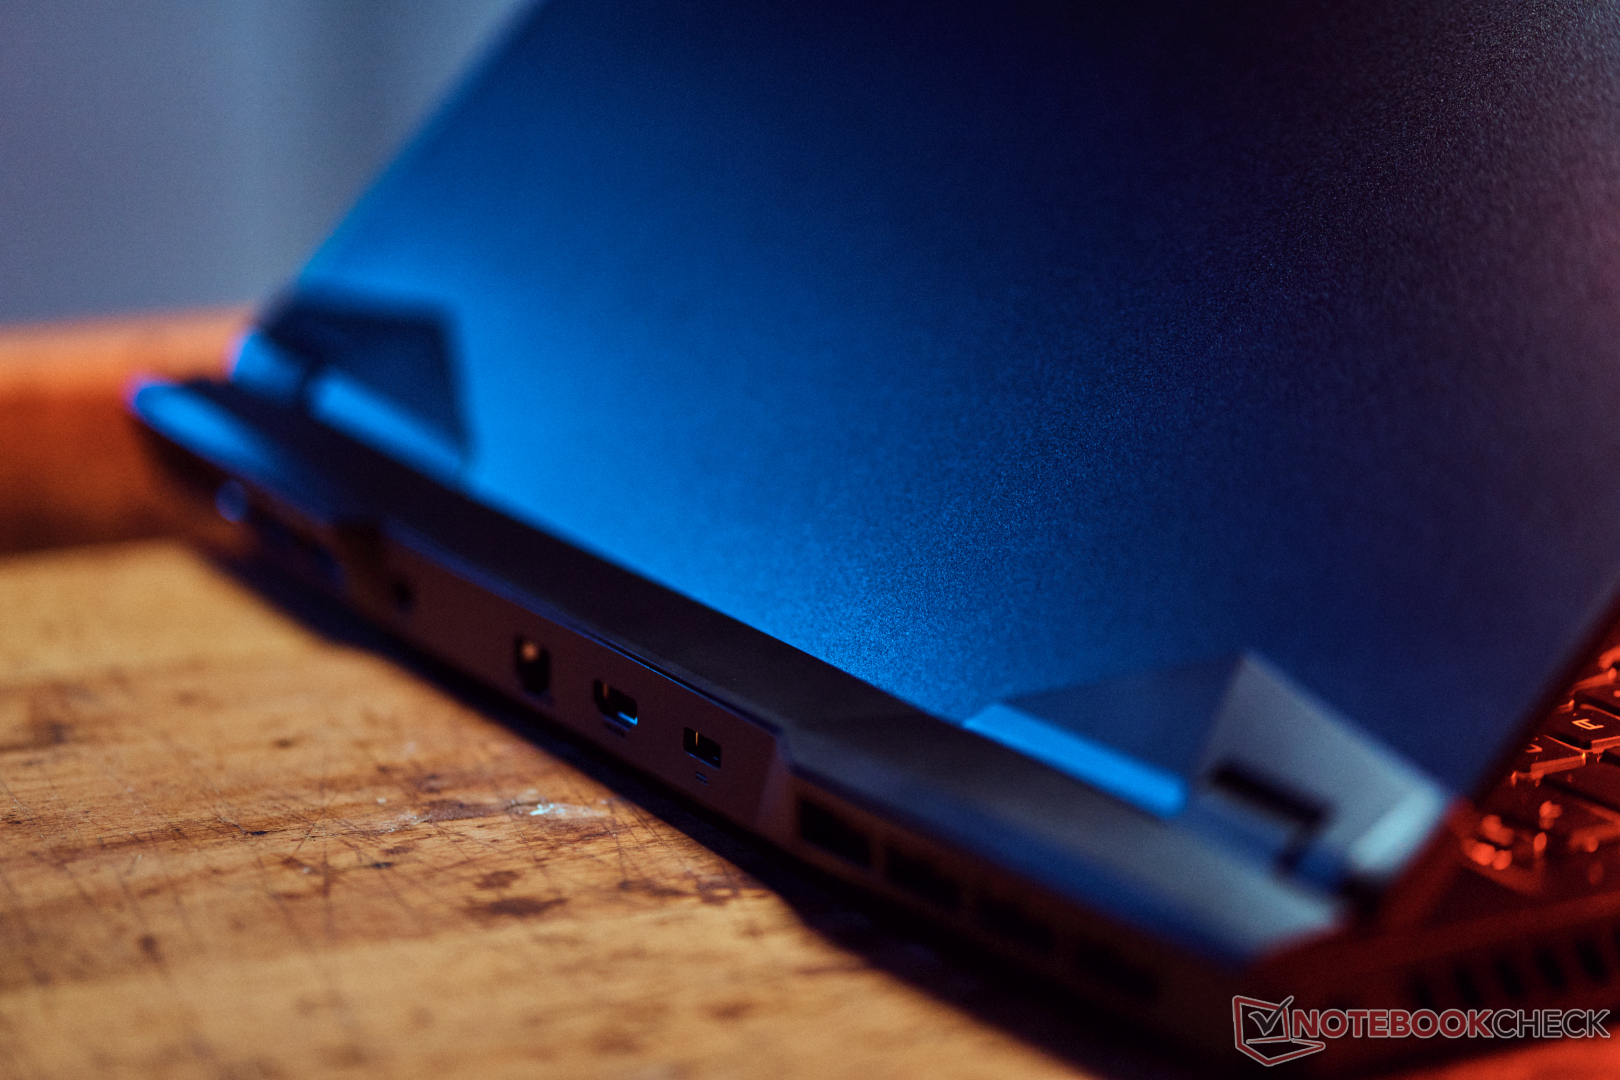
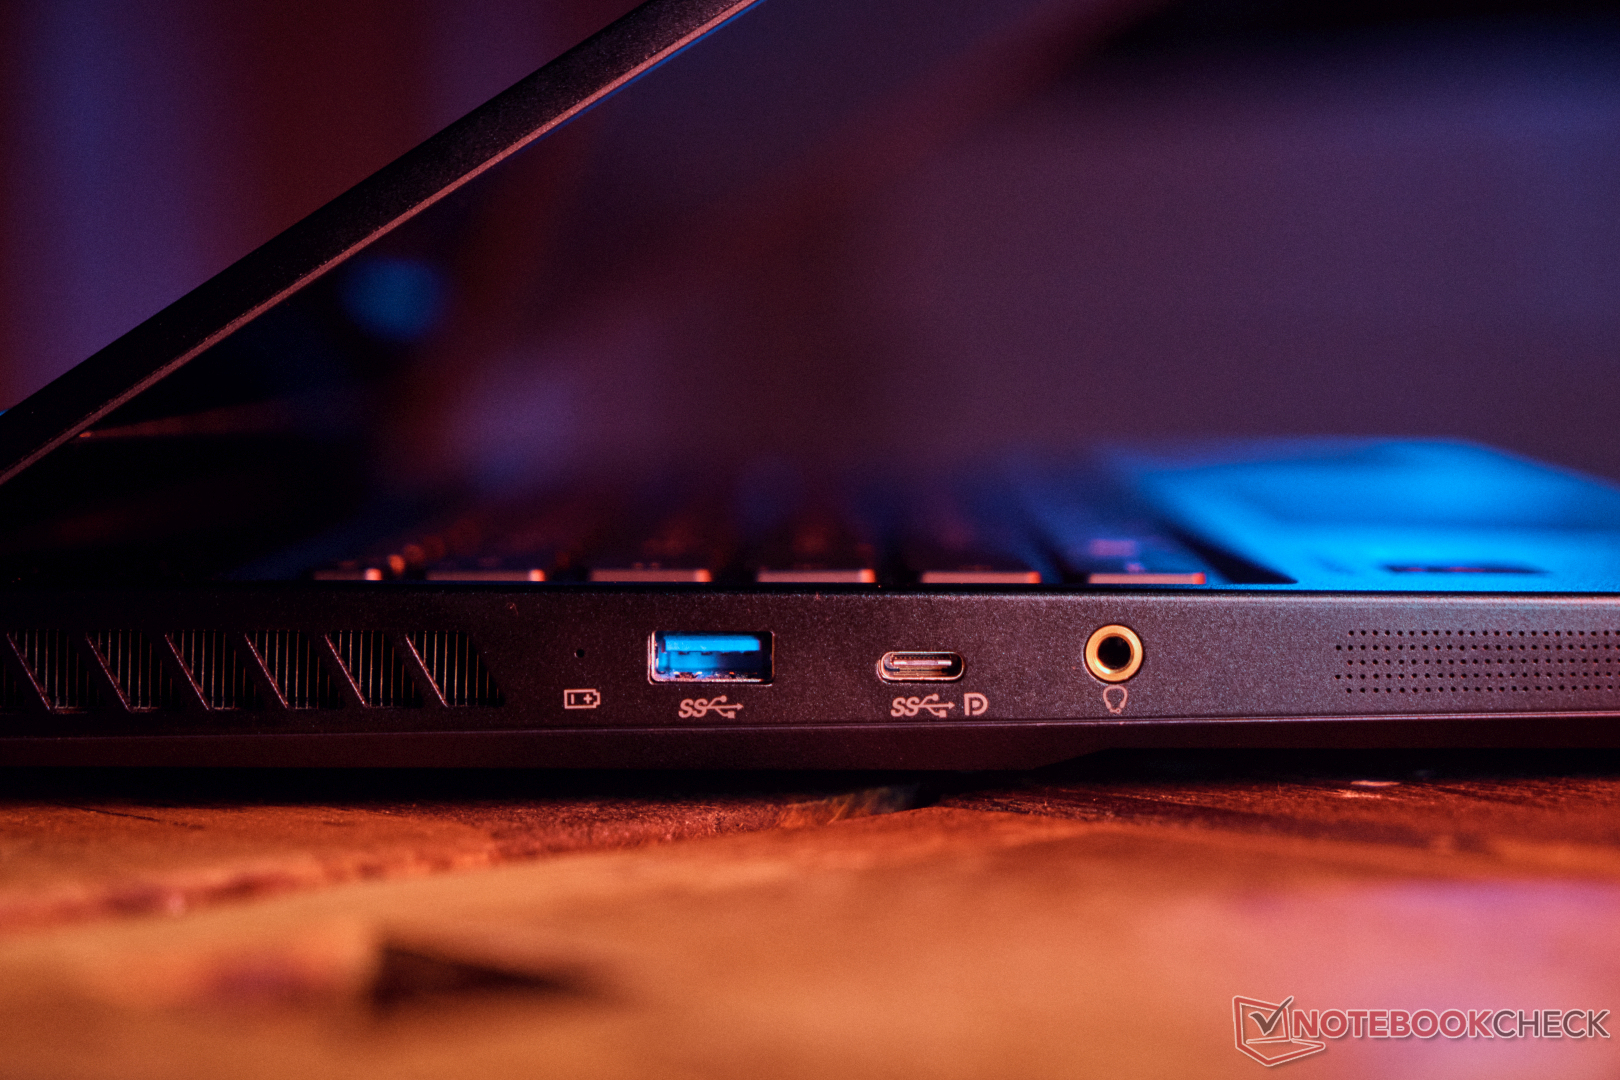
左侧是一个肯辛顿锁,1个USB-A 3.2 Gen1(5 GBit/s),1个USB-C 3.2 Gen2(10 GBit/s),具有显示端口功能。然而,缺少Power Delivery和Thunderbolt。因此,在没有800克电源的情况下,移动游戏无法得到保证。也不能使用更强大的外部显卡。
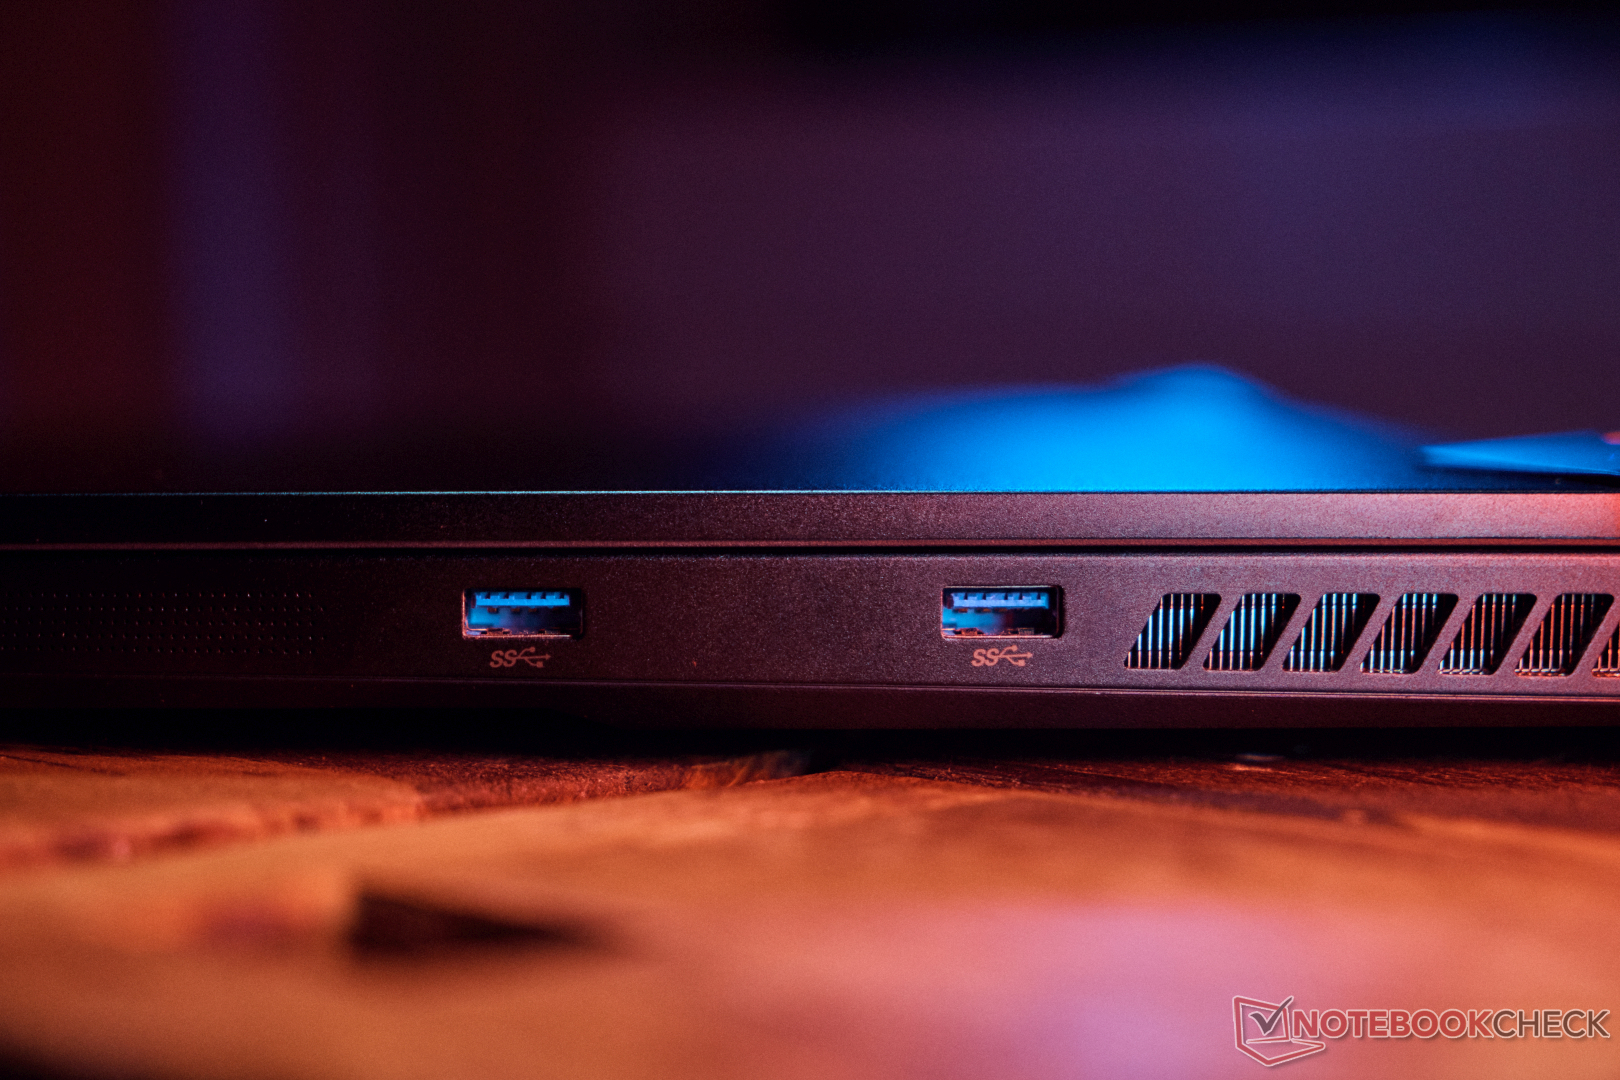
除此之外,在笔记本的右侧还有一个插孔连接和两个USB A 3.2 Gen1端口。没有SD卡读卡器或指纹识别器。使用外置硬盘,我们在最快的端口(10GBIt/s的USB-C)上实现了约1GB/s的传输率,这大致上是该端口的最大值。外置SSD(USB 3.2 Gen 2x2)在Thunderbolt端口上实现了两倍的传输率。
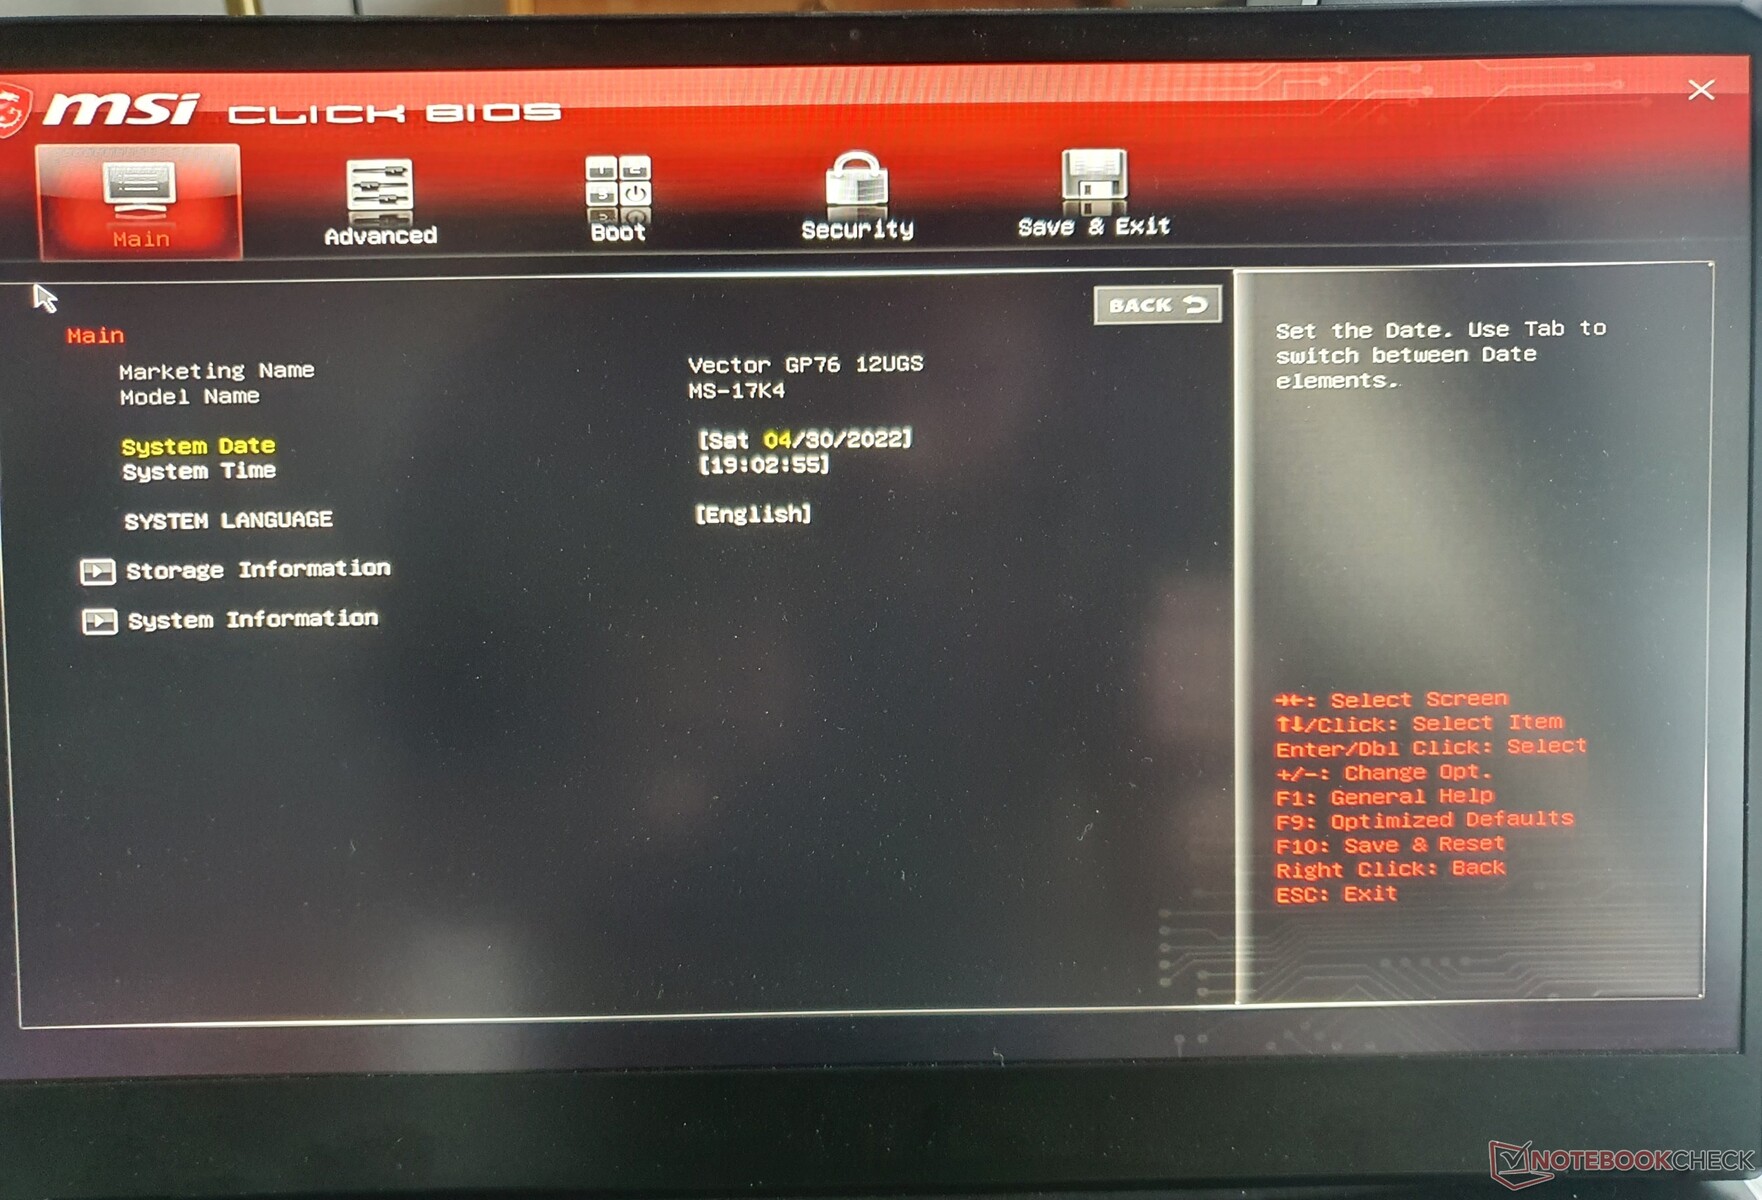
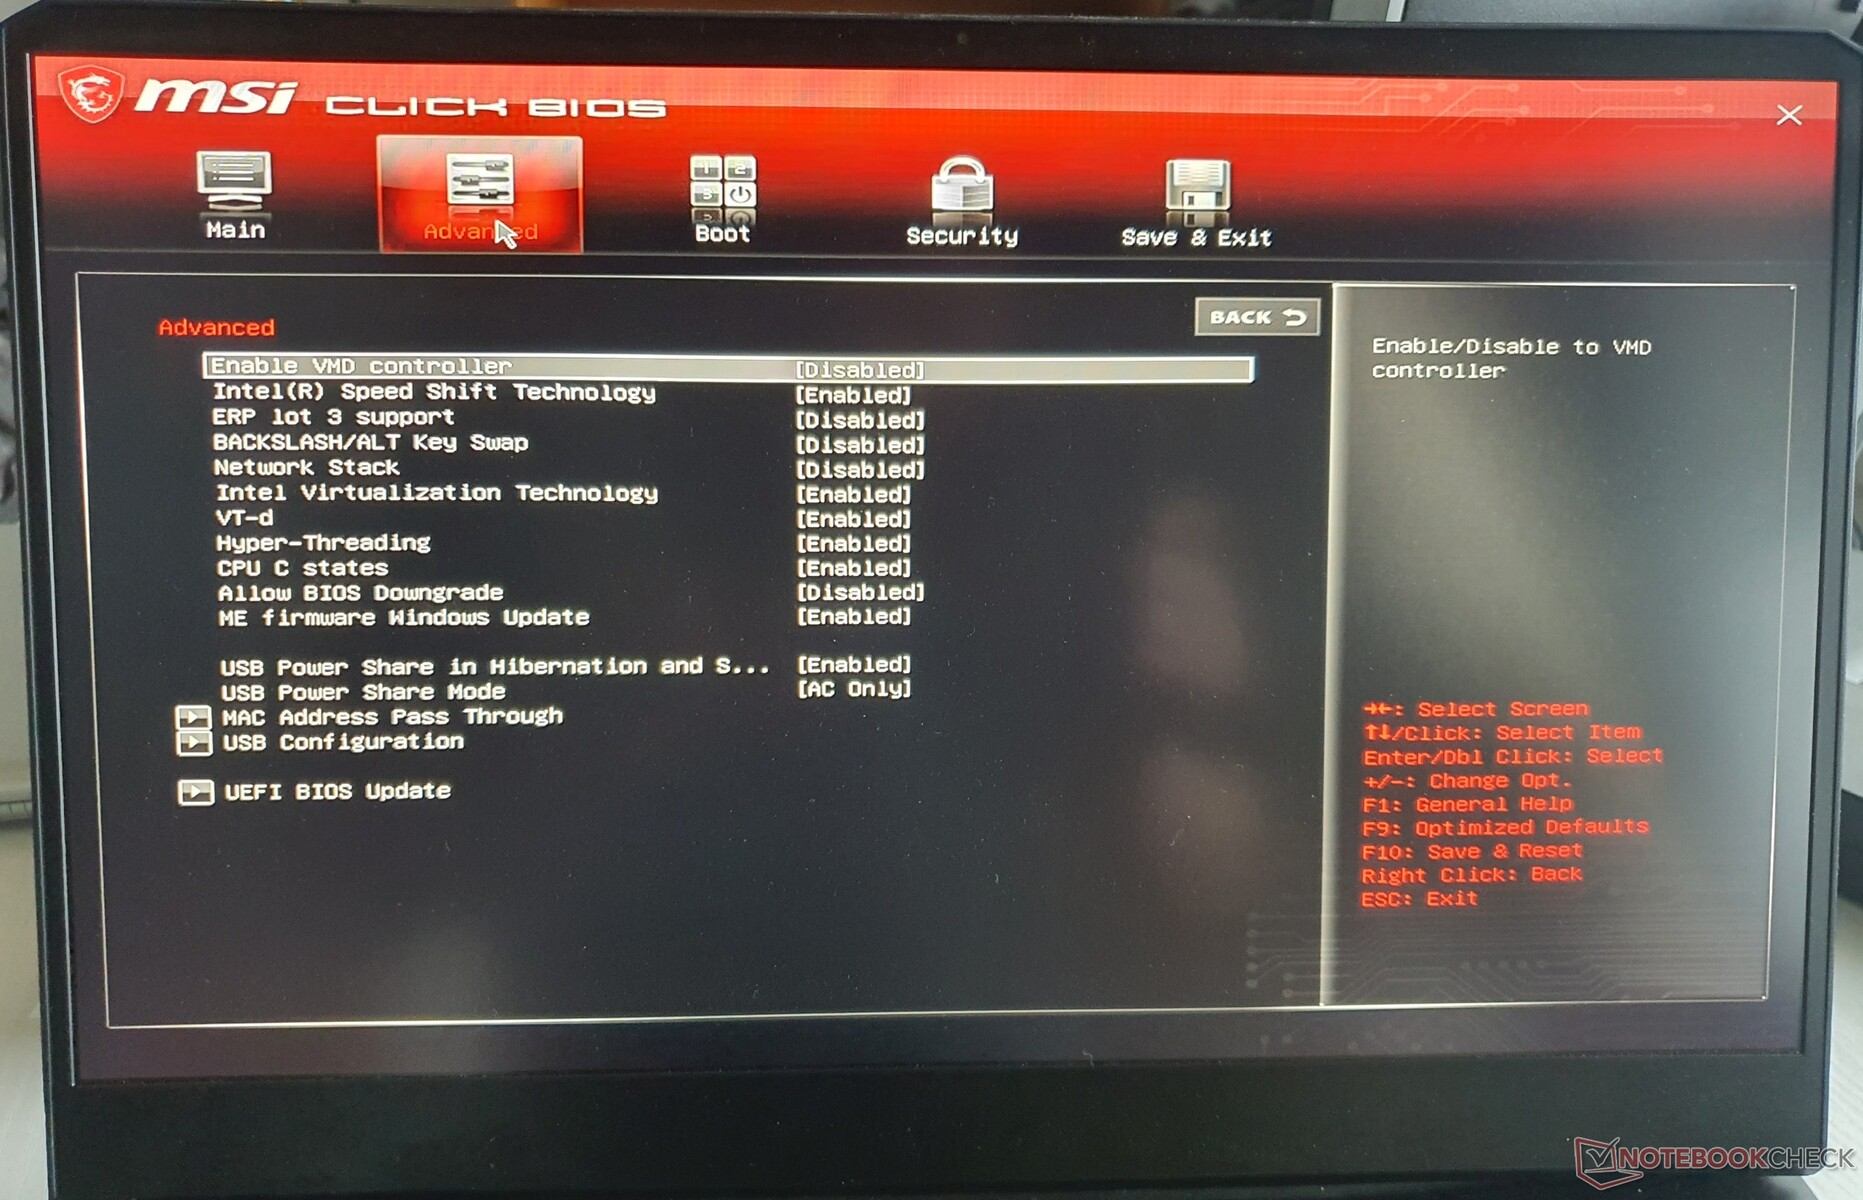
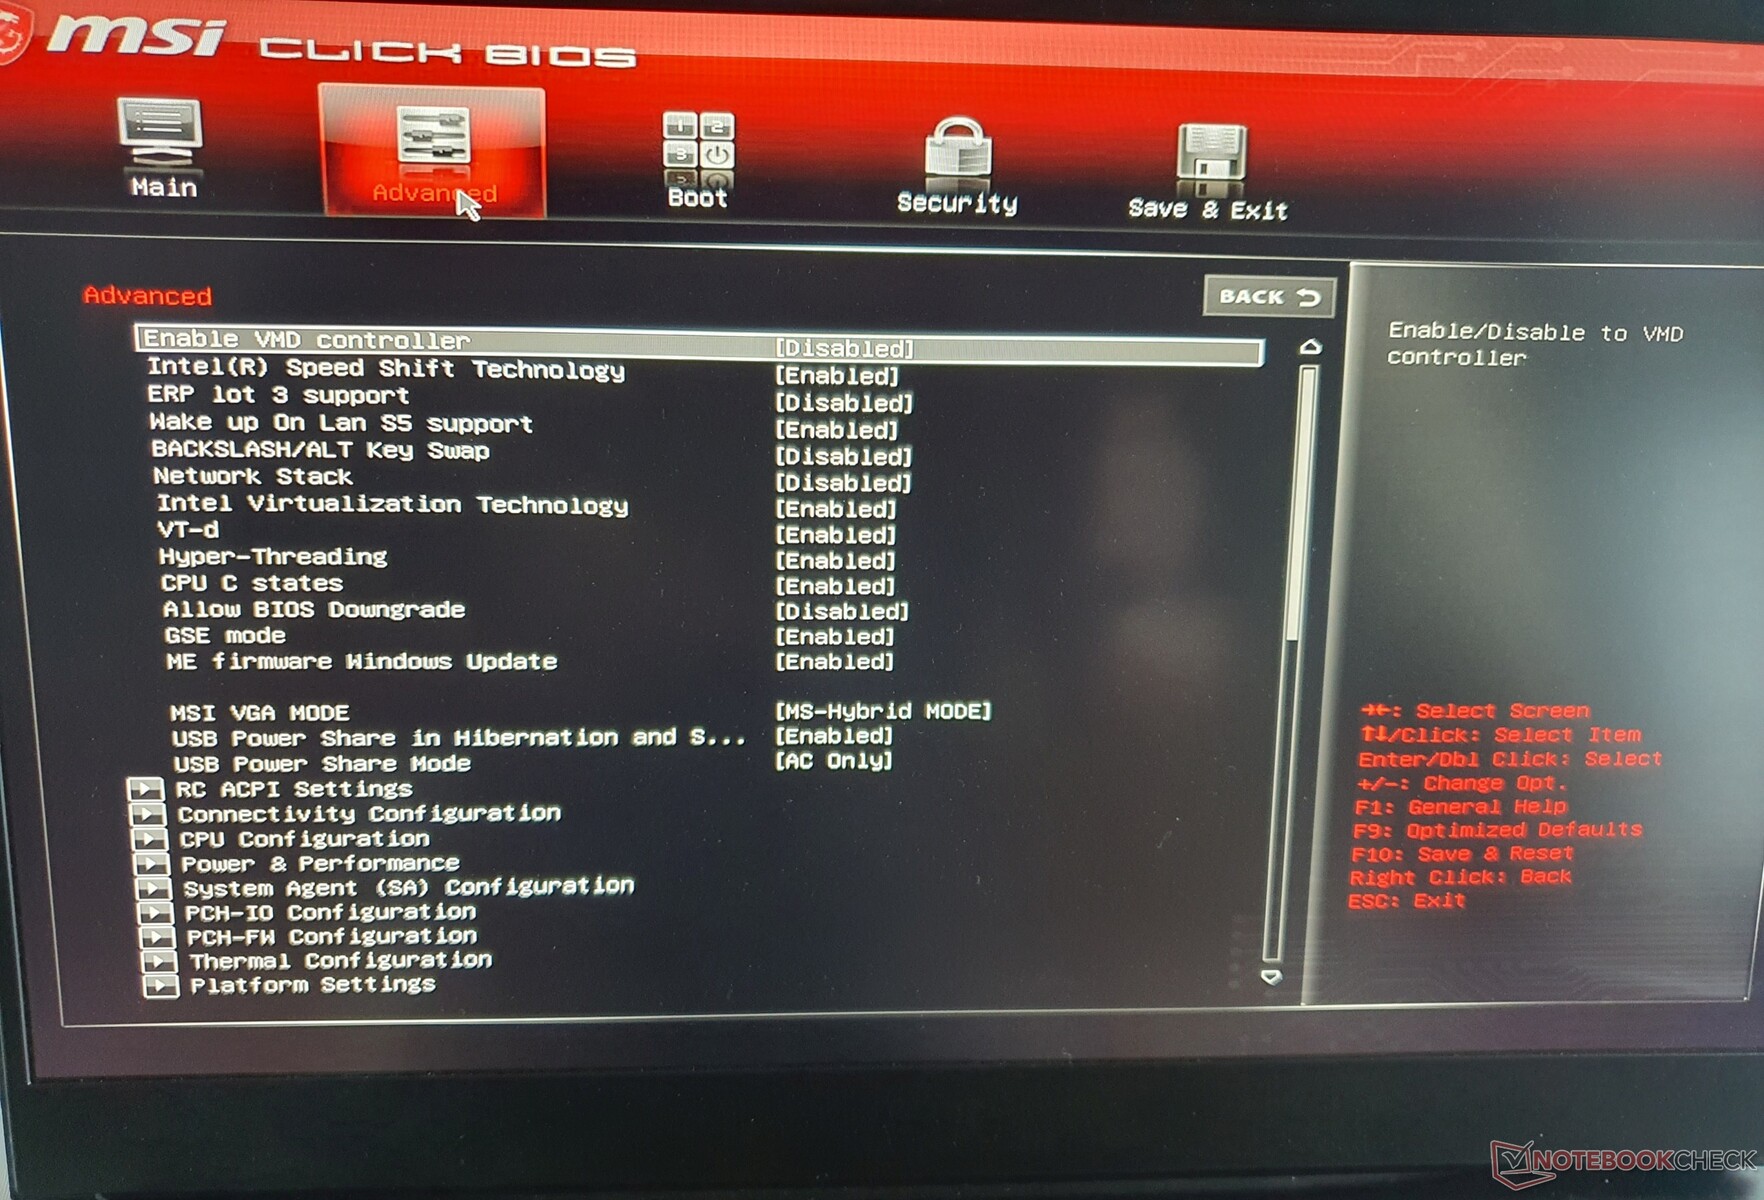
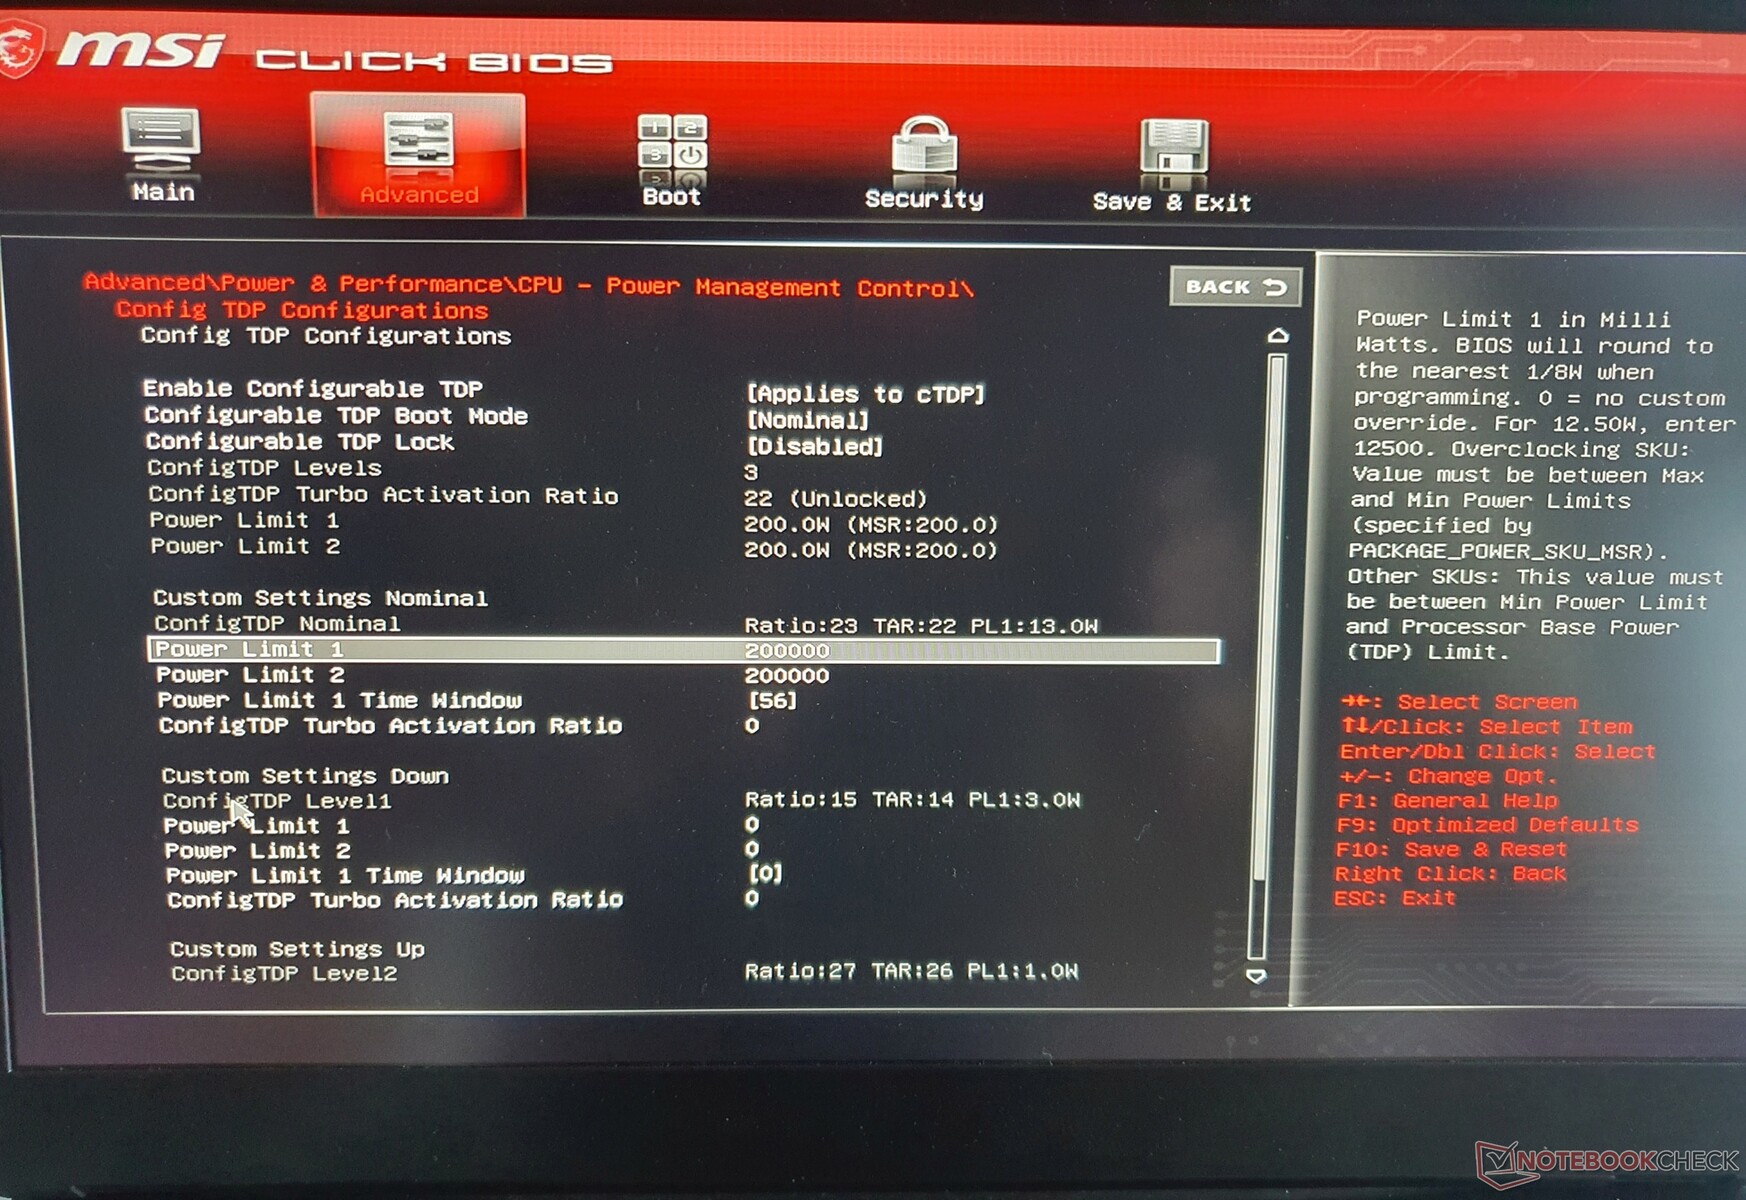
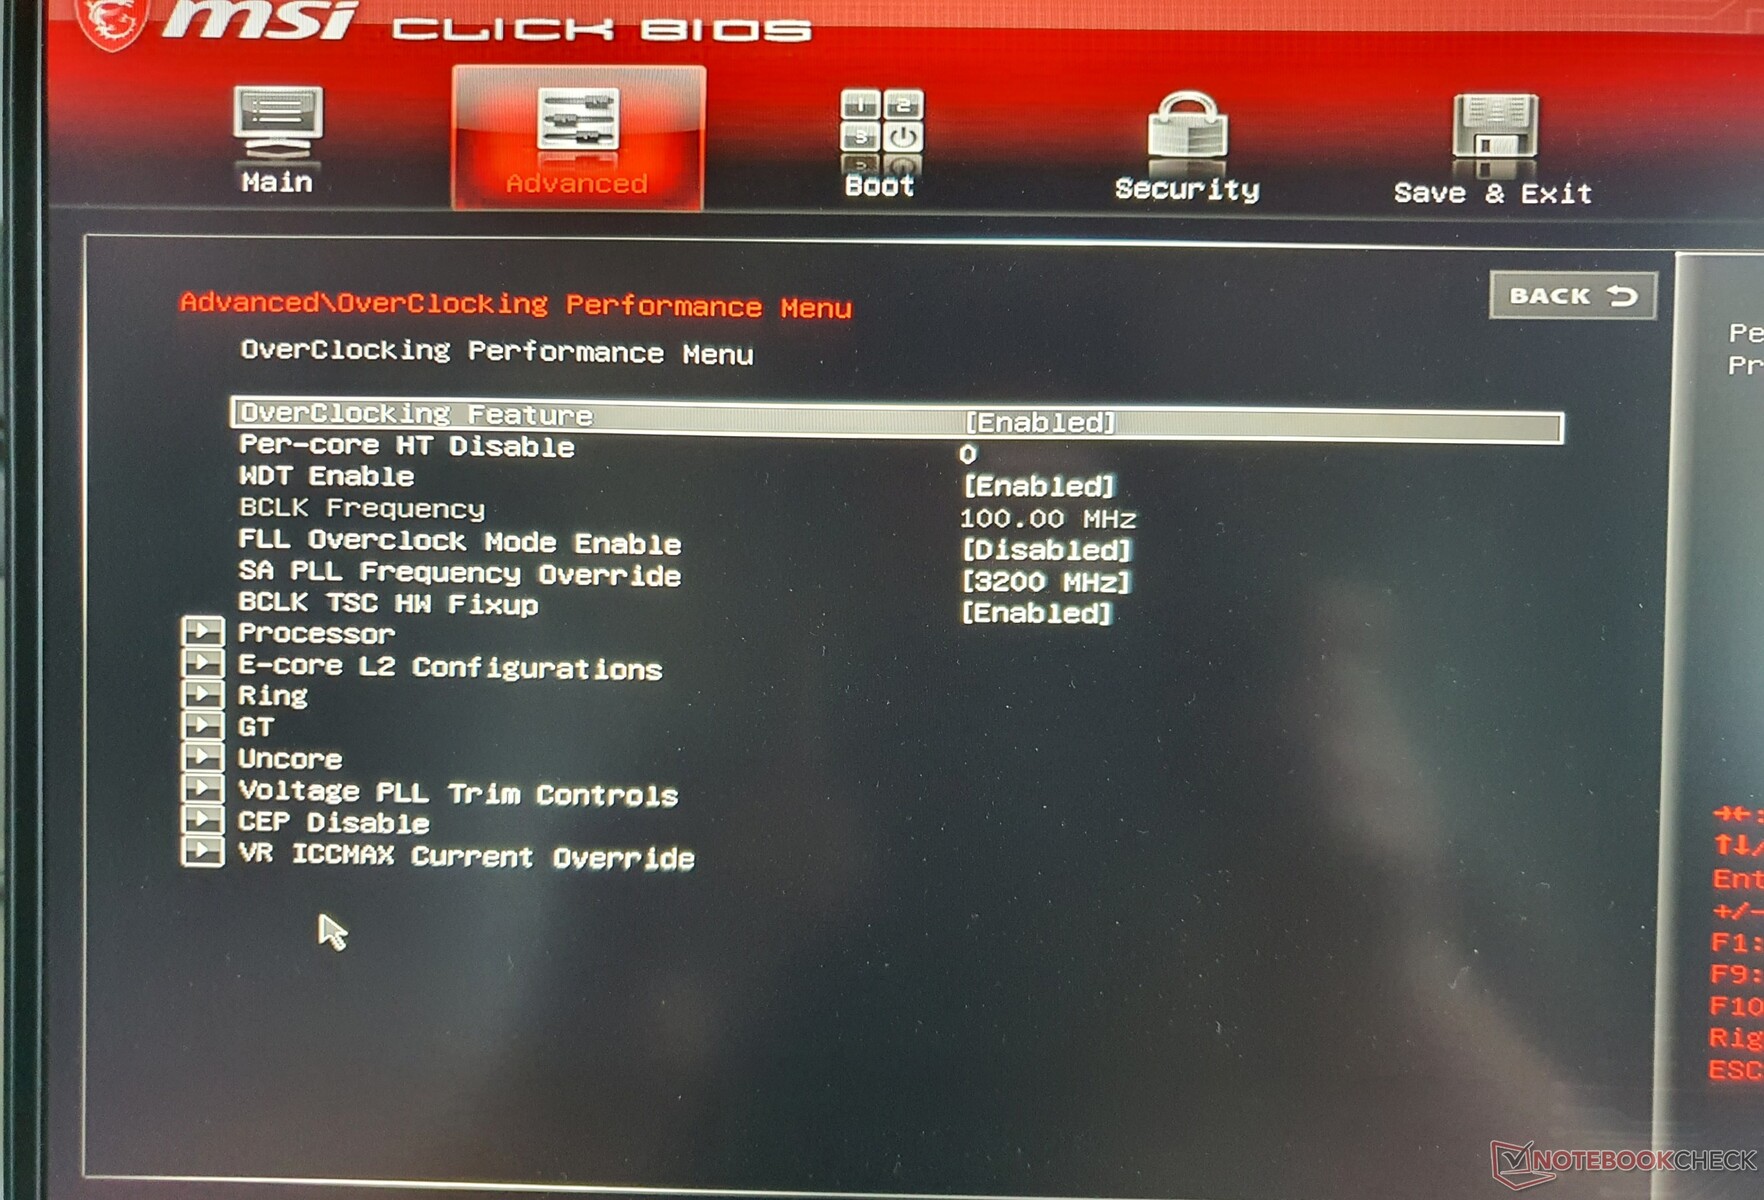
BIOS
在微星游戏笔记本上,通常可以通过 "F1+DEL "组合进入BIOS。乍一看,没有什么可看的,但 "Shift(右)+CTRL(右)+ALT+F2 "的组合键可以解锁所有可能的BIOS功能,从性能限制、散热设置到超频可能性(当然,风险自负)。
沟通
来自英特尔(AX211)的支持Wi-Fi 6的螺丝模块以大约1.6GBit/s的信号功率充分释放了其潜力。具有相同或类似WLAN卡的竞争笔记本电脑平均水平相似。这两台华硕笔记本电脑在比较领域中远远落后。
此外,Vector GP76有蓝牙5.2,但没有WWAN,也不能加装。
| Networking | |
| iperf3 transmit AX12 | |
| Lenovo Legion 5 Pro 16 G7 i7 RTX 3070Ti | |
| MSI Vector GP66 12UGS | |
| MSI Vector GP76 12UGS-434 | |
| Average Intel Wi-Fi 6E AX211 (1003 - 1501, n=4) | |
| MSI GP76 Leopard 10UG | |
| Schenker XMG NEO 17 GM7TG8S | |
| Asus ROG Strix G17 G713QE-RB74 | |
| Asus ROG Zephyrus M16 GU603H | |
| iperf3 receive AX12 | |
| MSI Vector GP76 12UGS-434 | |
| Lenovo Legion 5 Pro 16 G7 i7 RTX 3070Ti | |
| MSI Vector GP66 12UGS | |
| Average Intel Wi-Fi 6E AX211 (1178 - 1623, n=4) | |
| MSI GP76 Leopard 10UG | |
| Schenker XMG NEO 17 GM7TG8S | |
| Asus ROG Strix G17 G713QE-RB74 | |
| Asus ROG Zephyrus M16 GU603H | |
网络摄像头

分辨率为1280x720的网络摄像头,提供了不合格的质量。1080p是尚未达到Vector系列的,甚至在2022年。红外线、Windows Hello和机械快门也都没有。


辅料
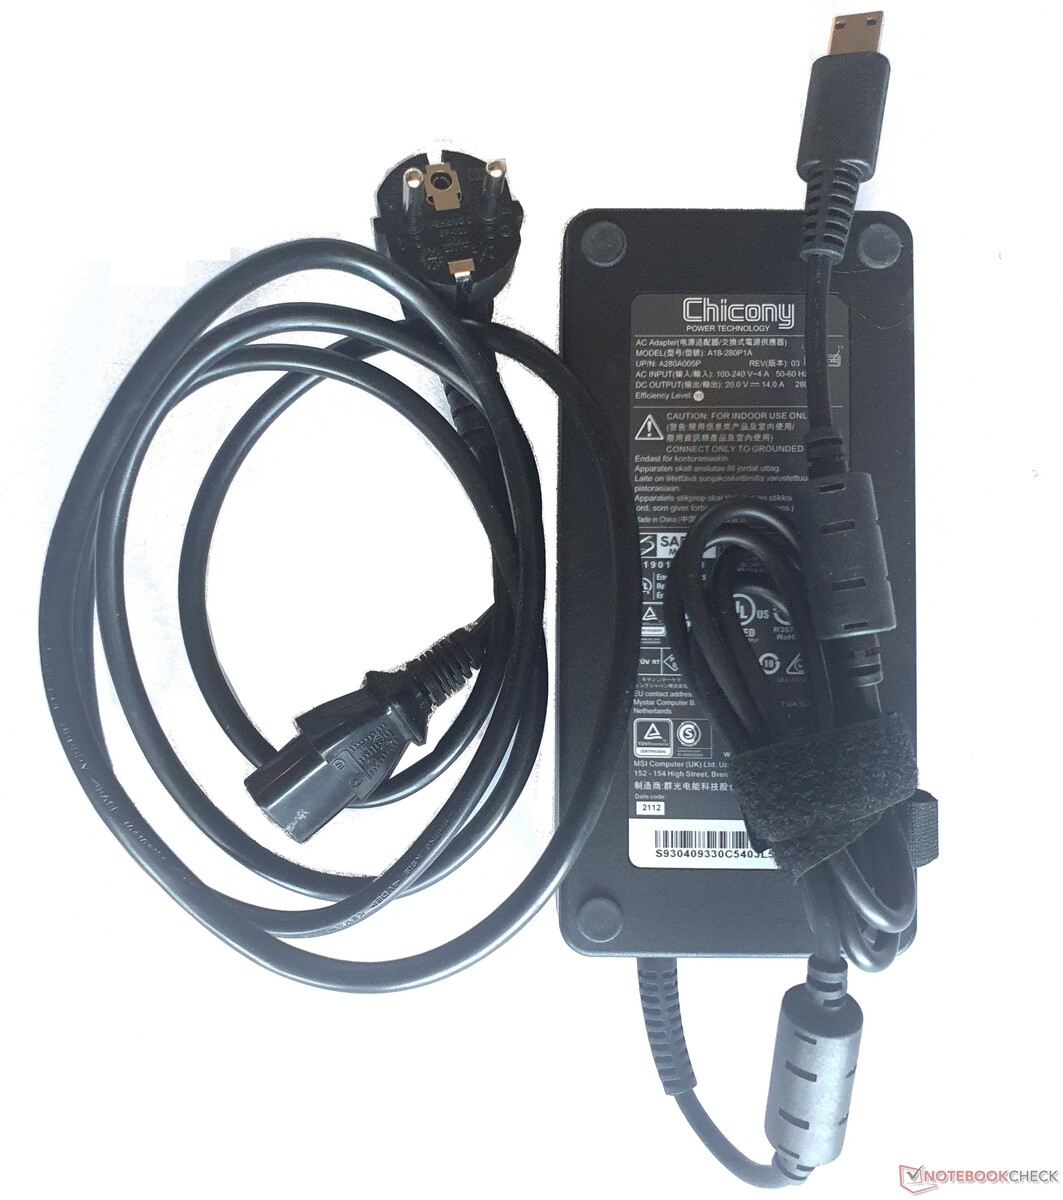
交货时包括一个280瓦的电源装置,它比上一代产品多提供50瓦的功率。没有其他附件,包装中也没有使用回收材料(还没有)。
维护
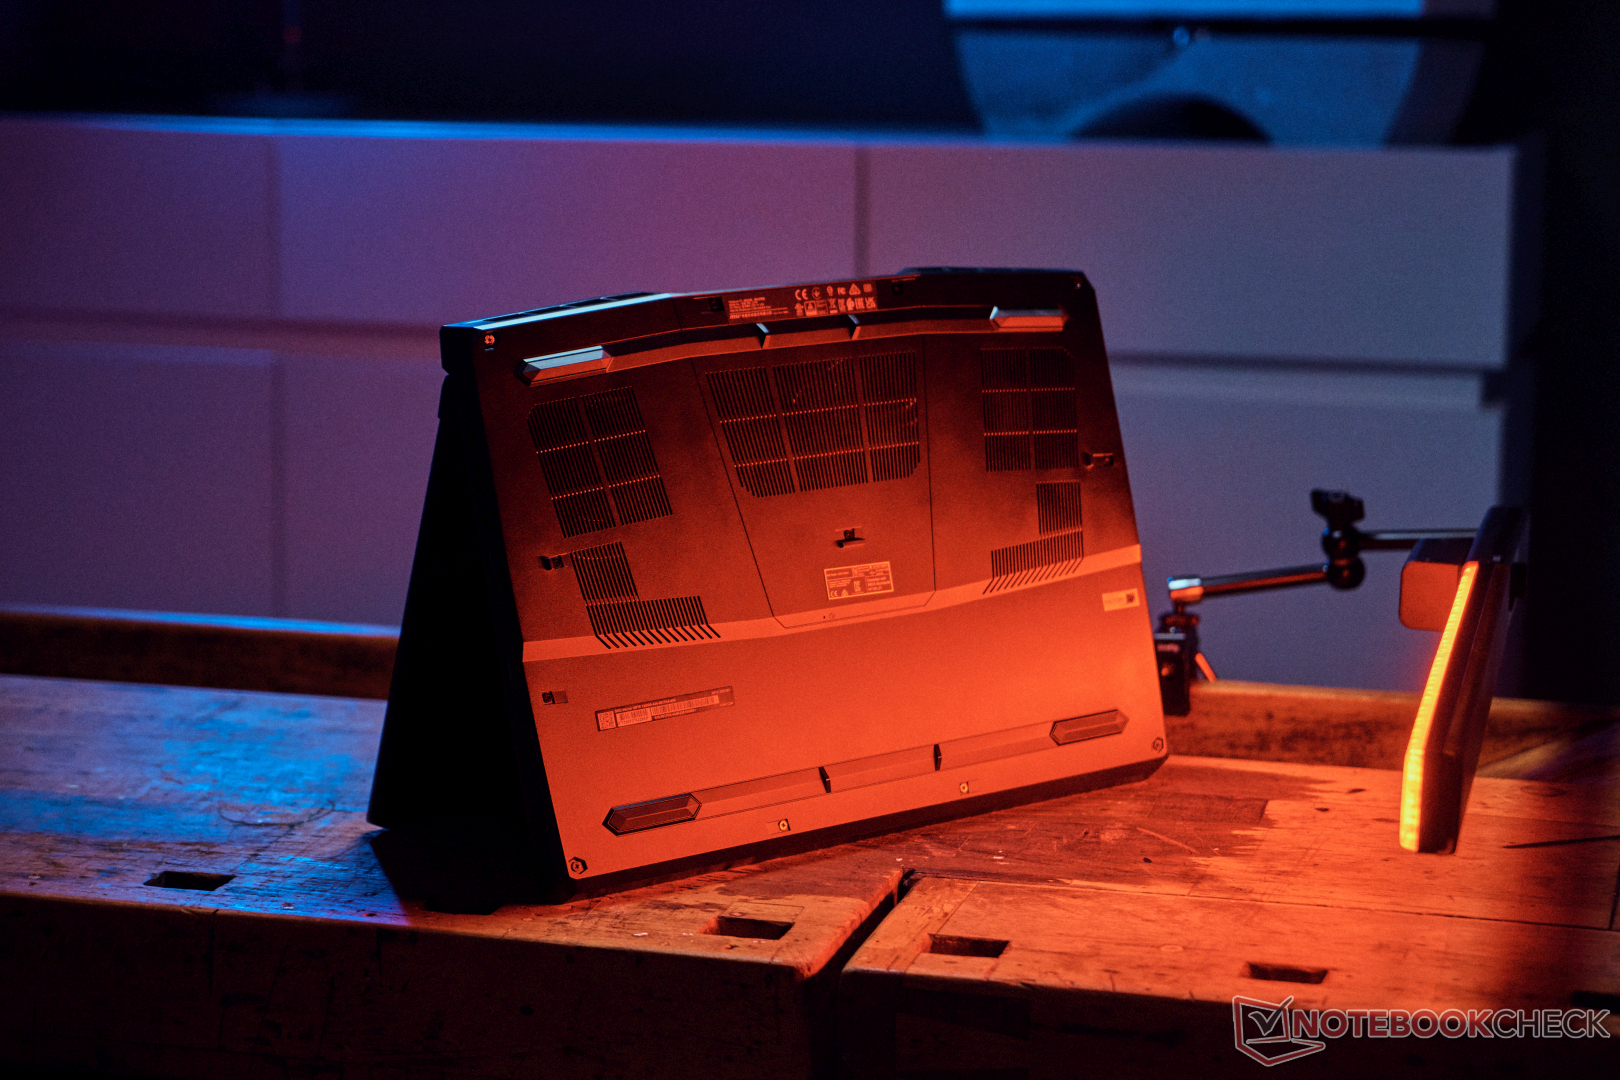
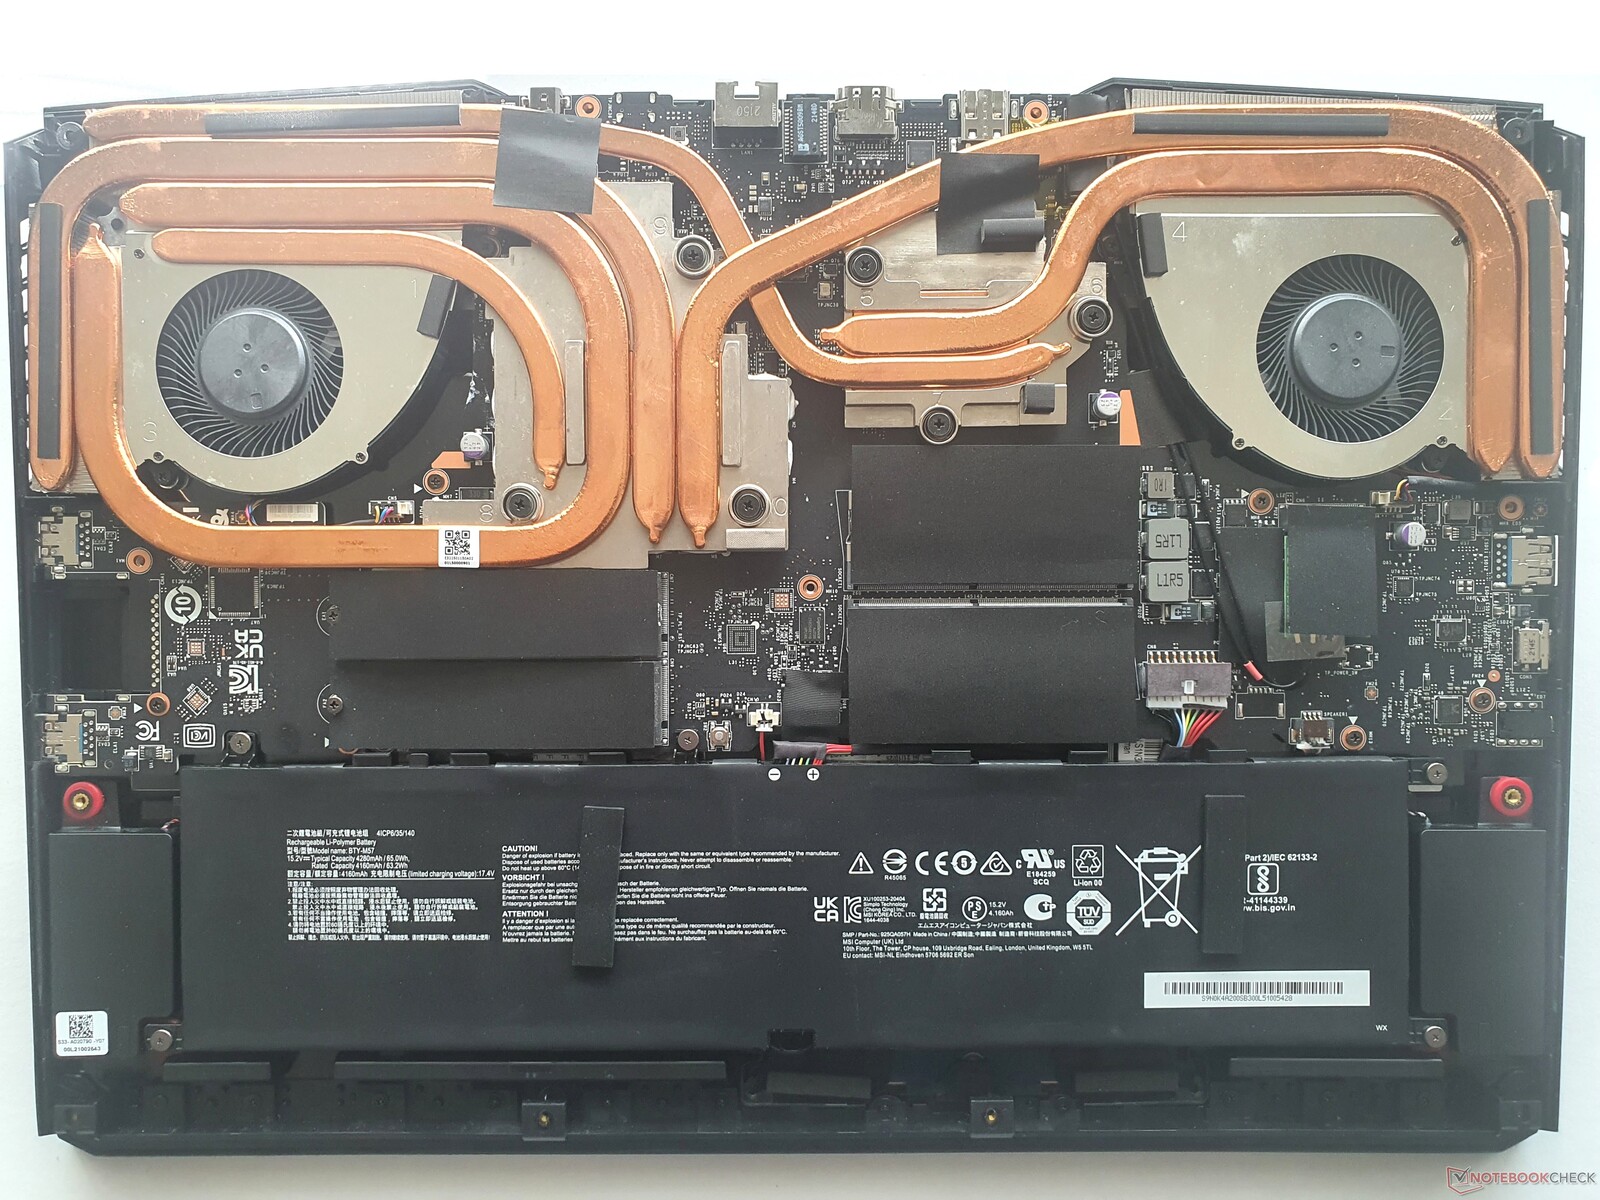
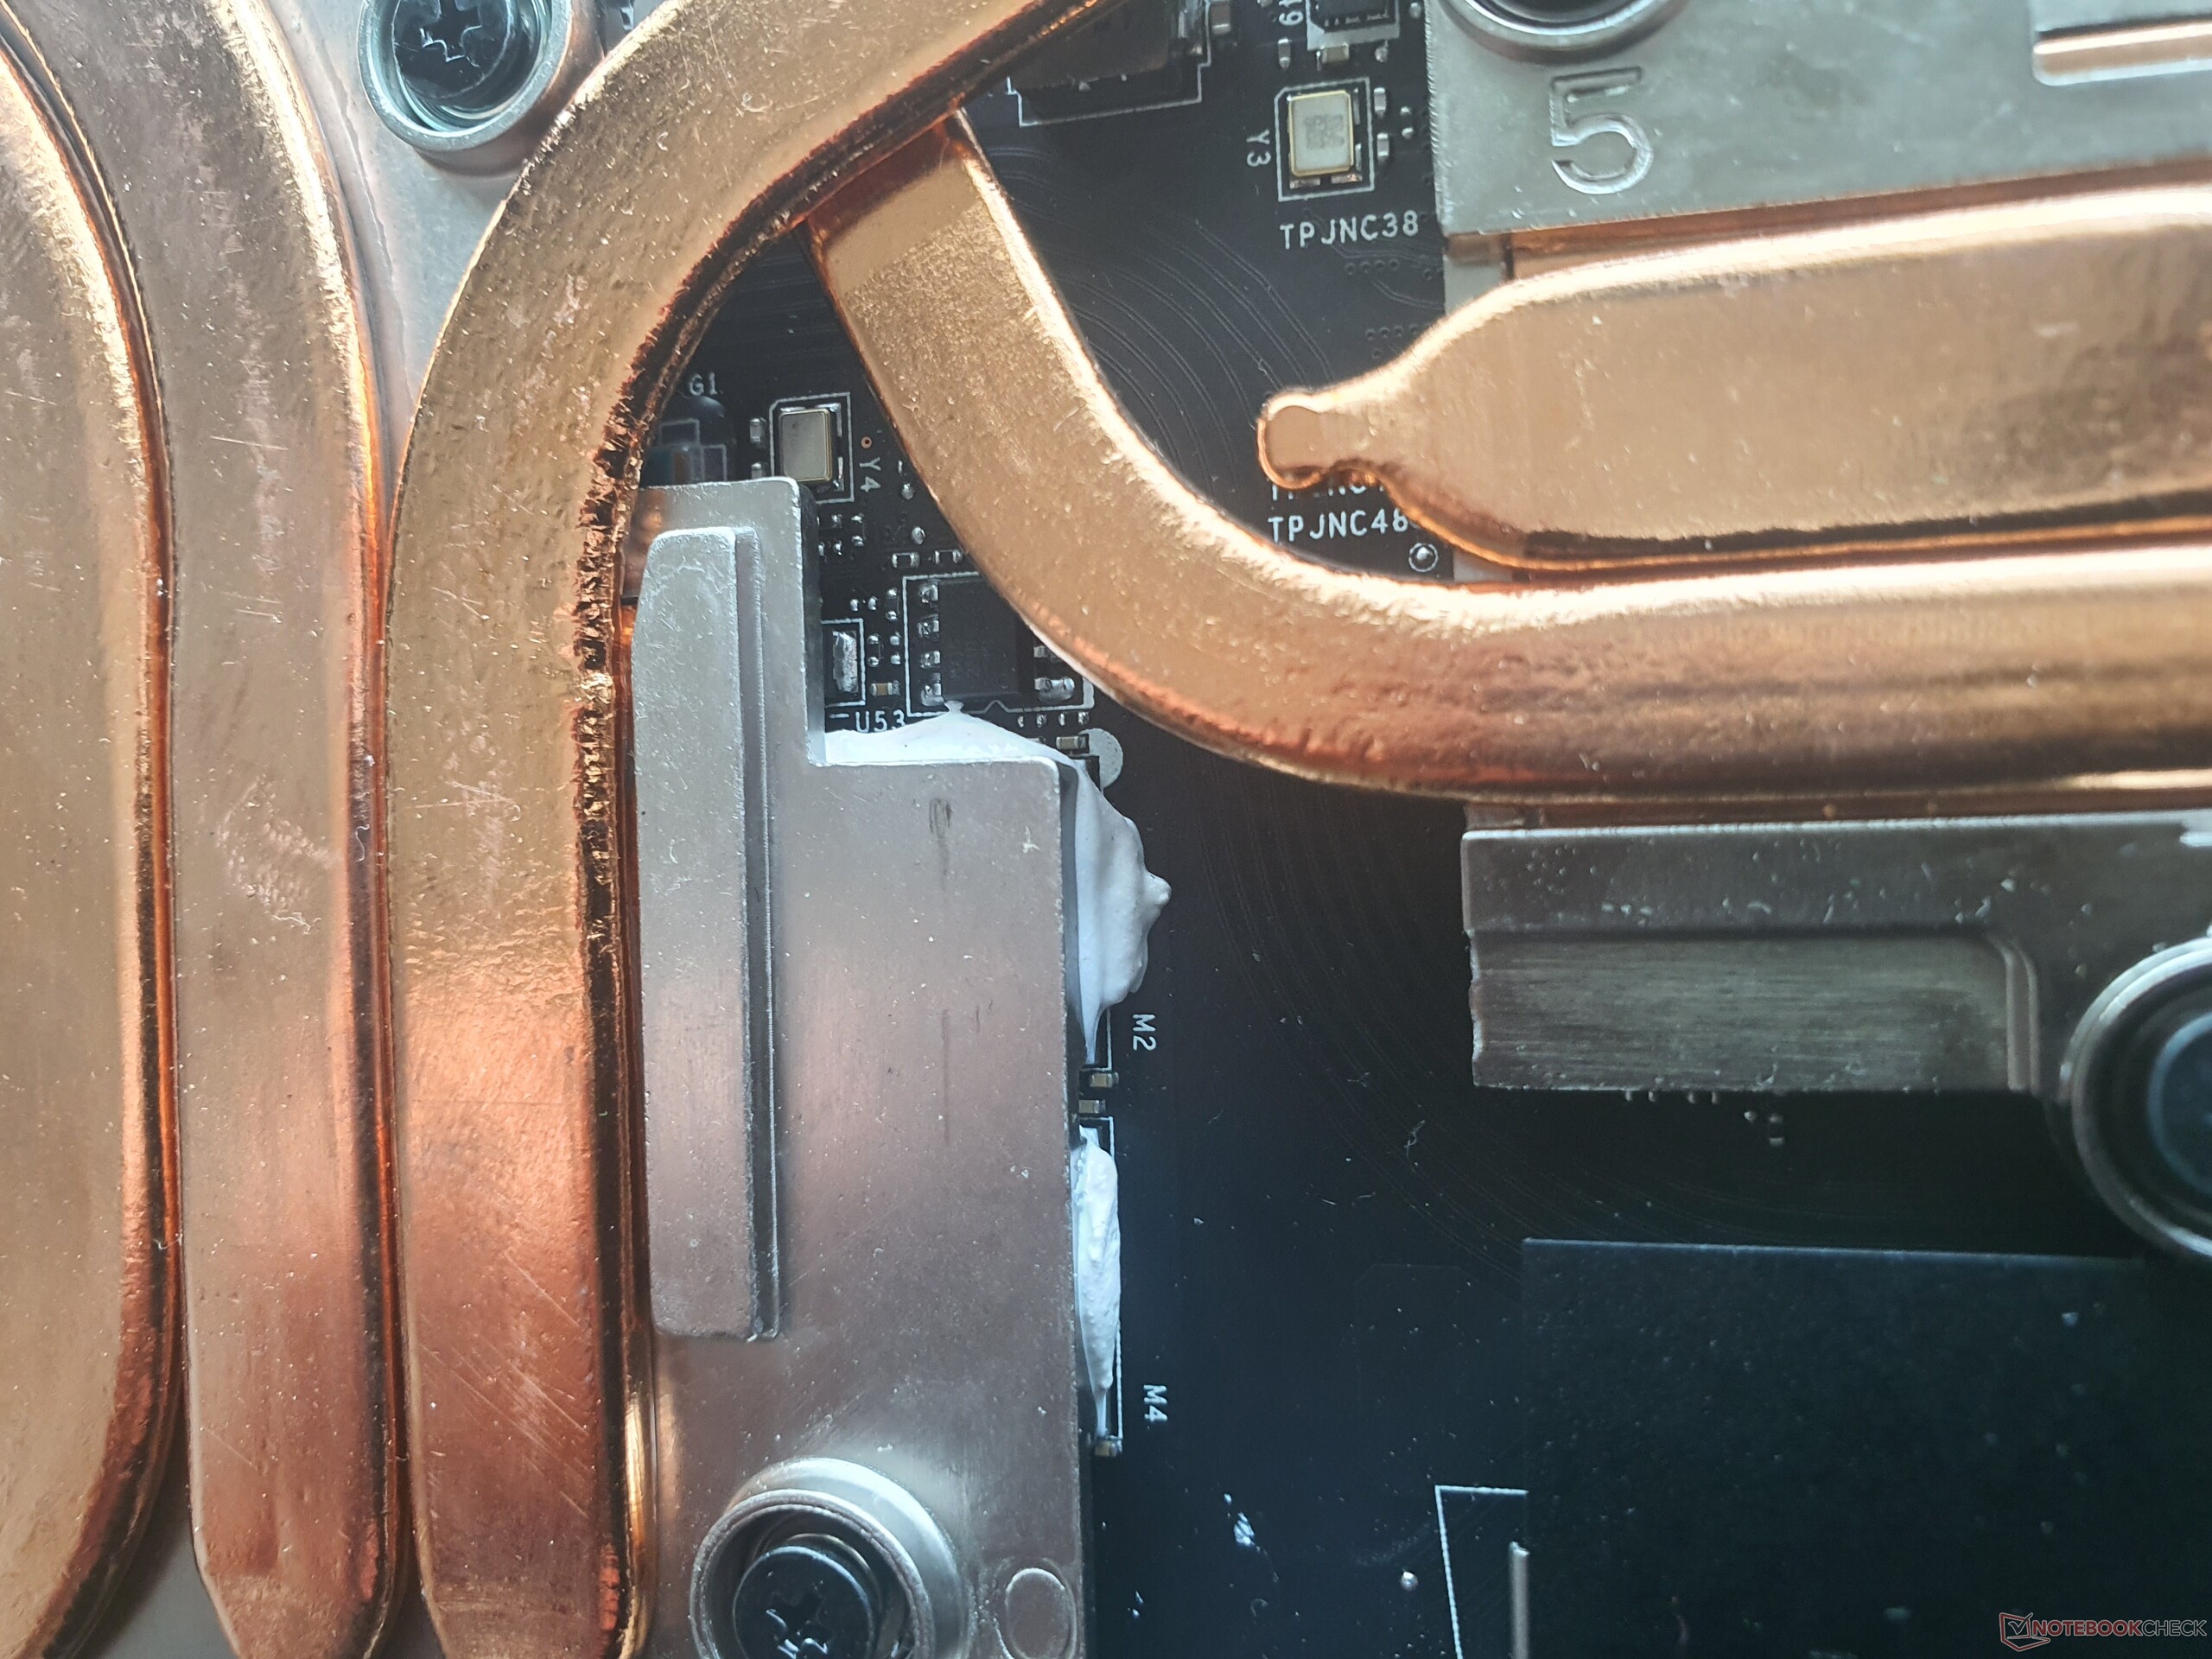
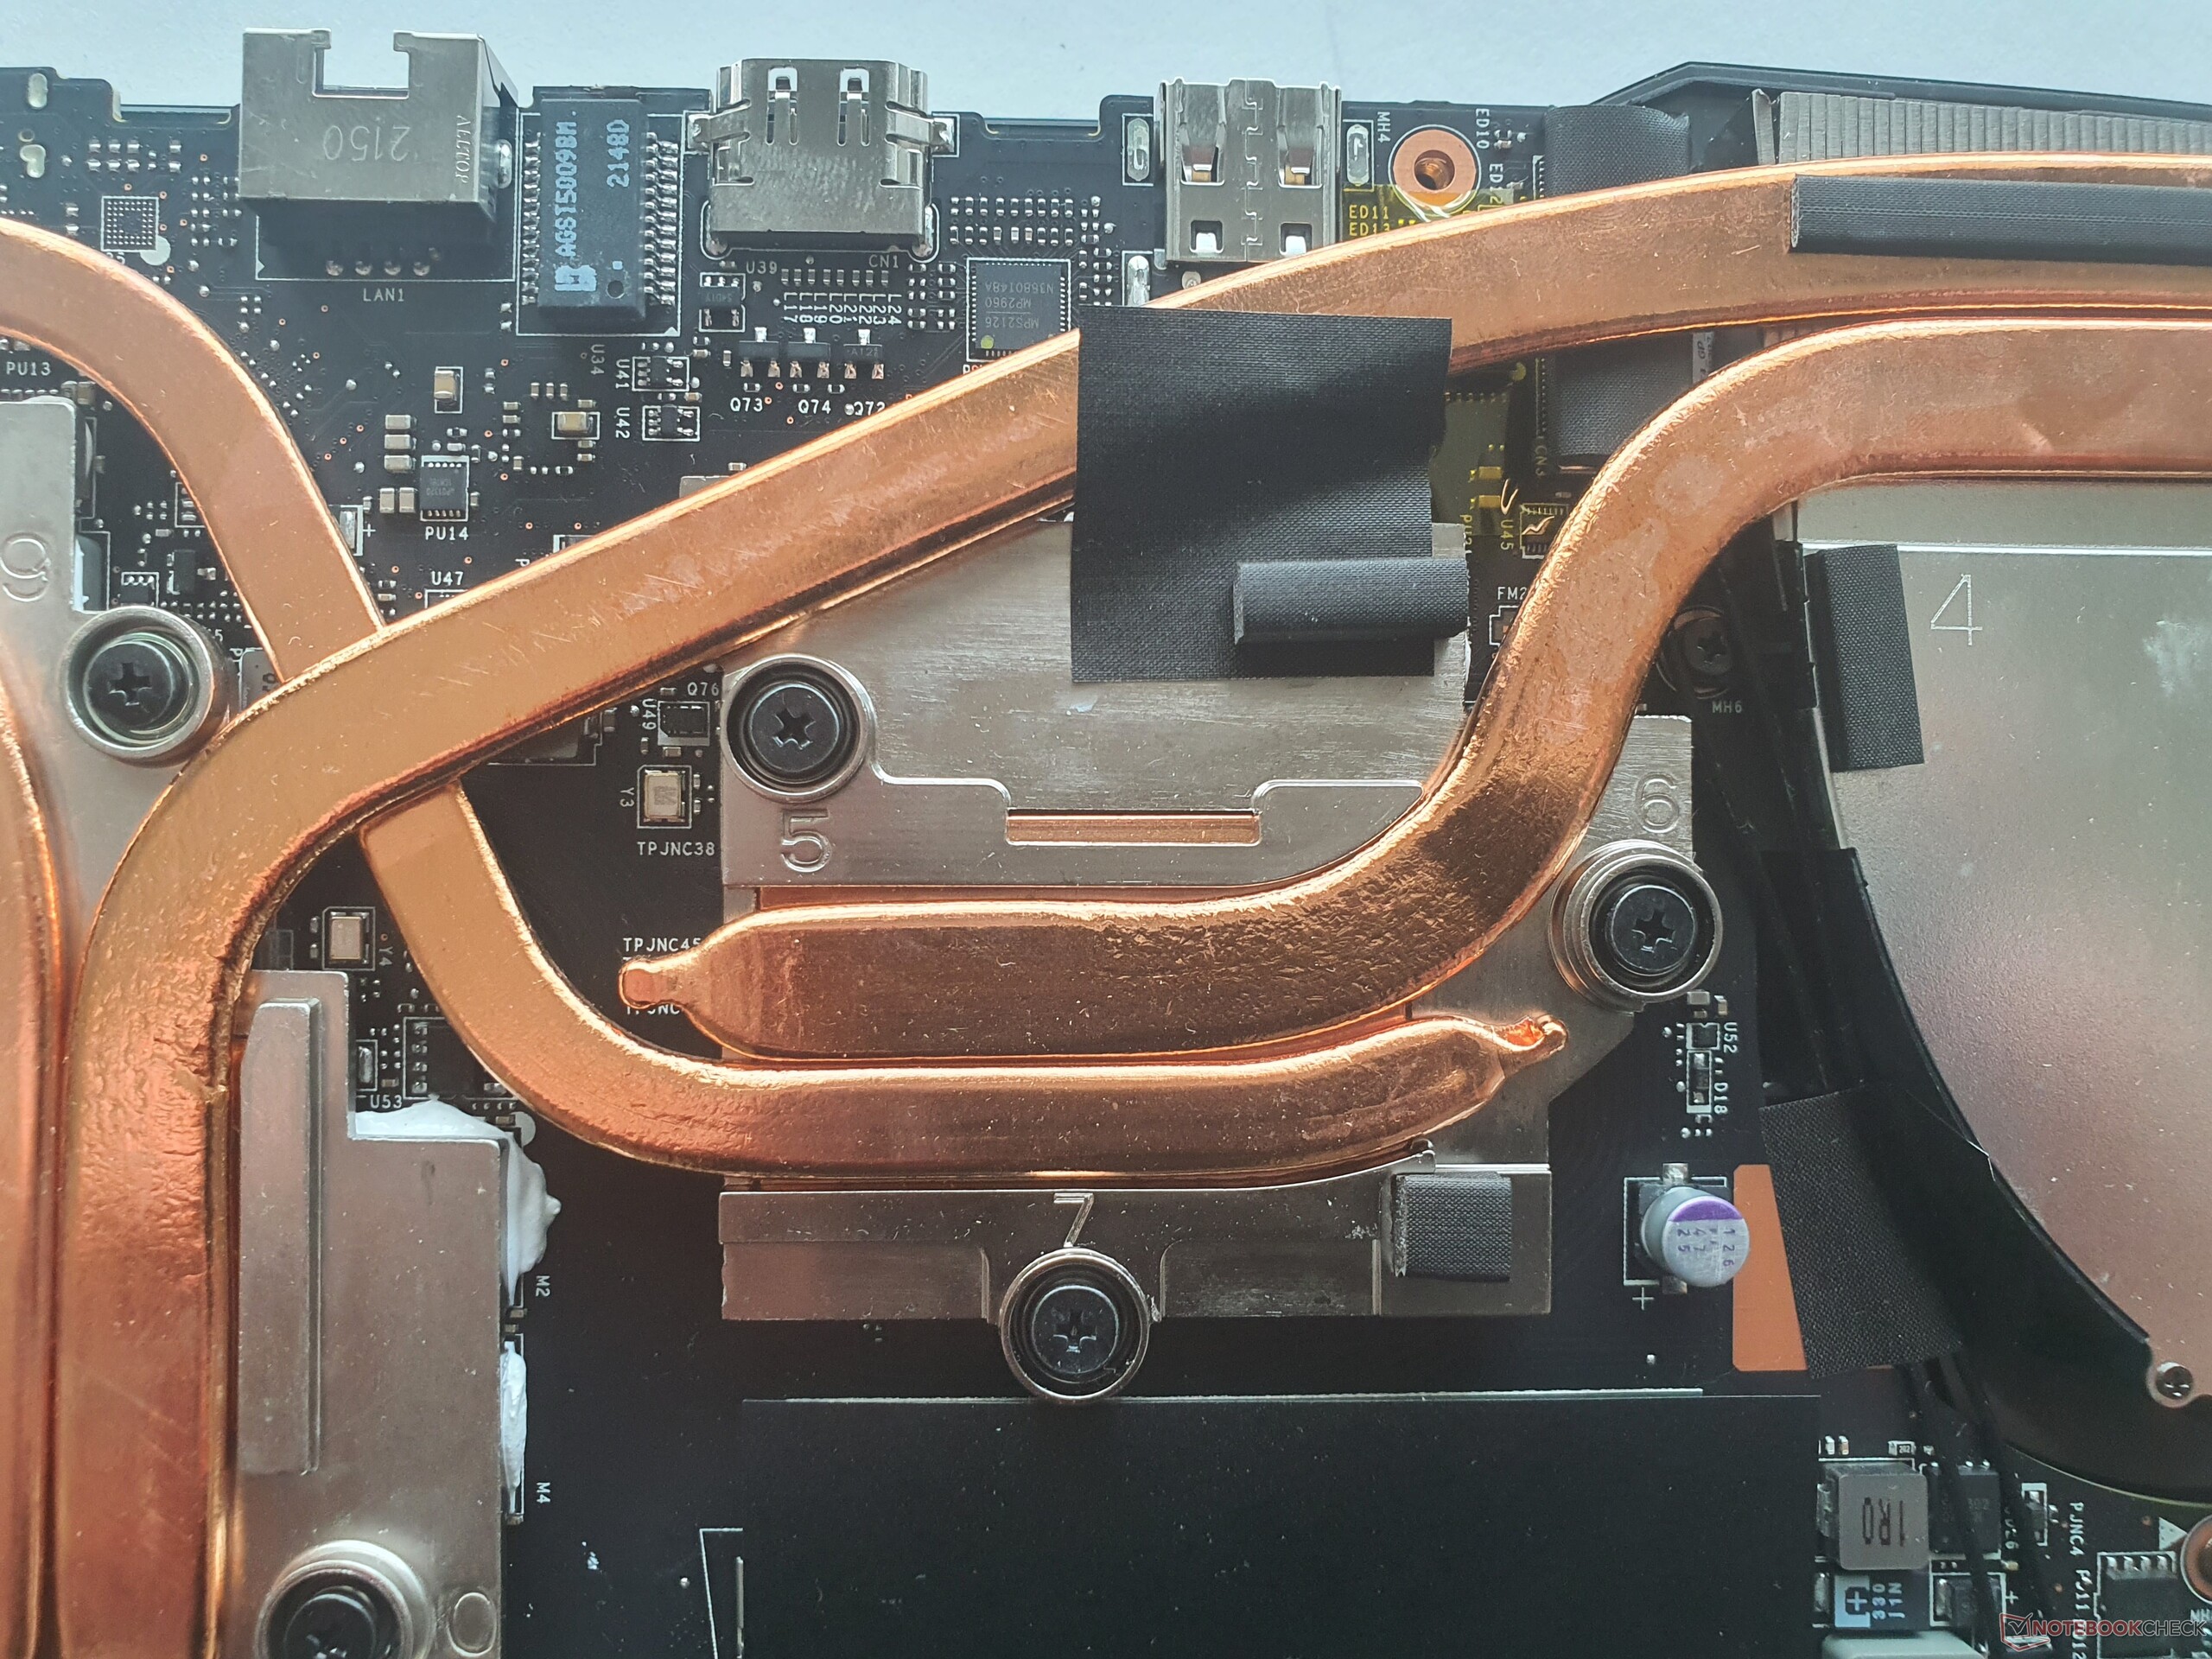
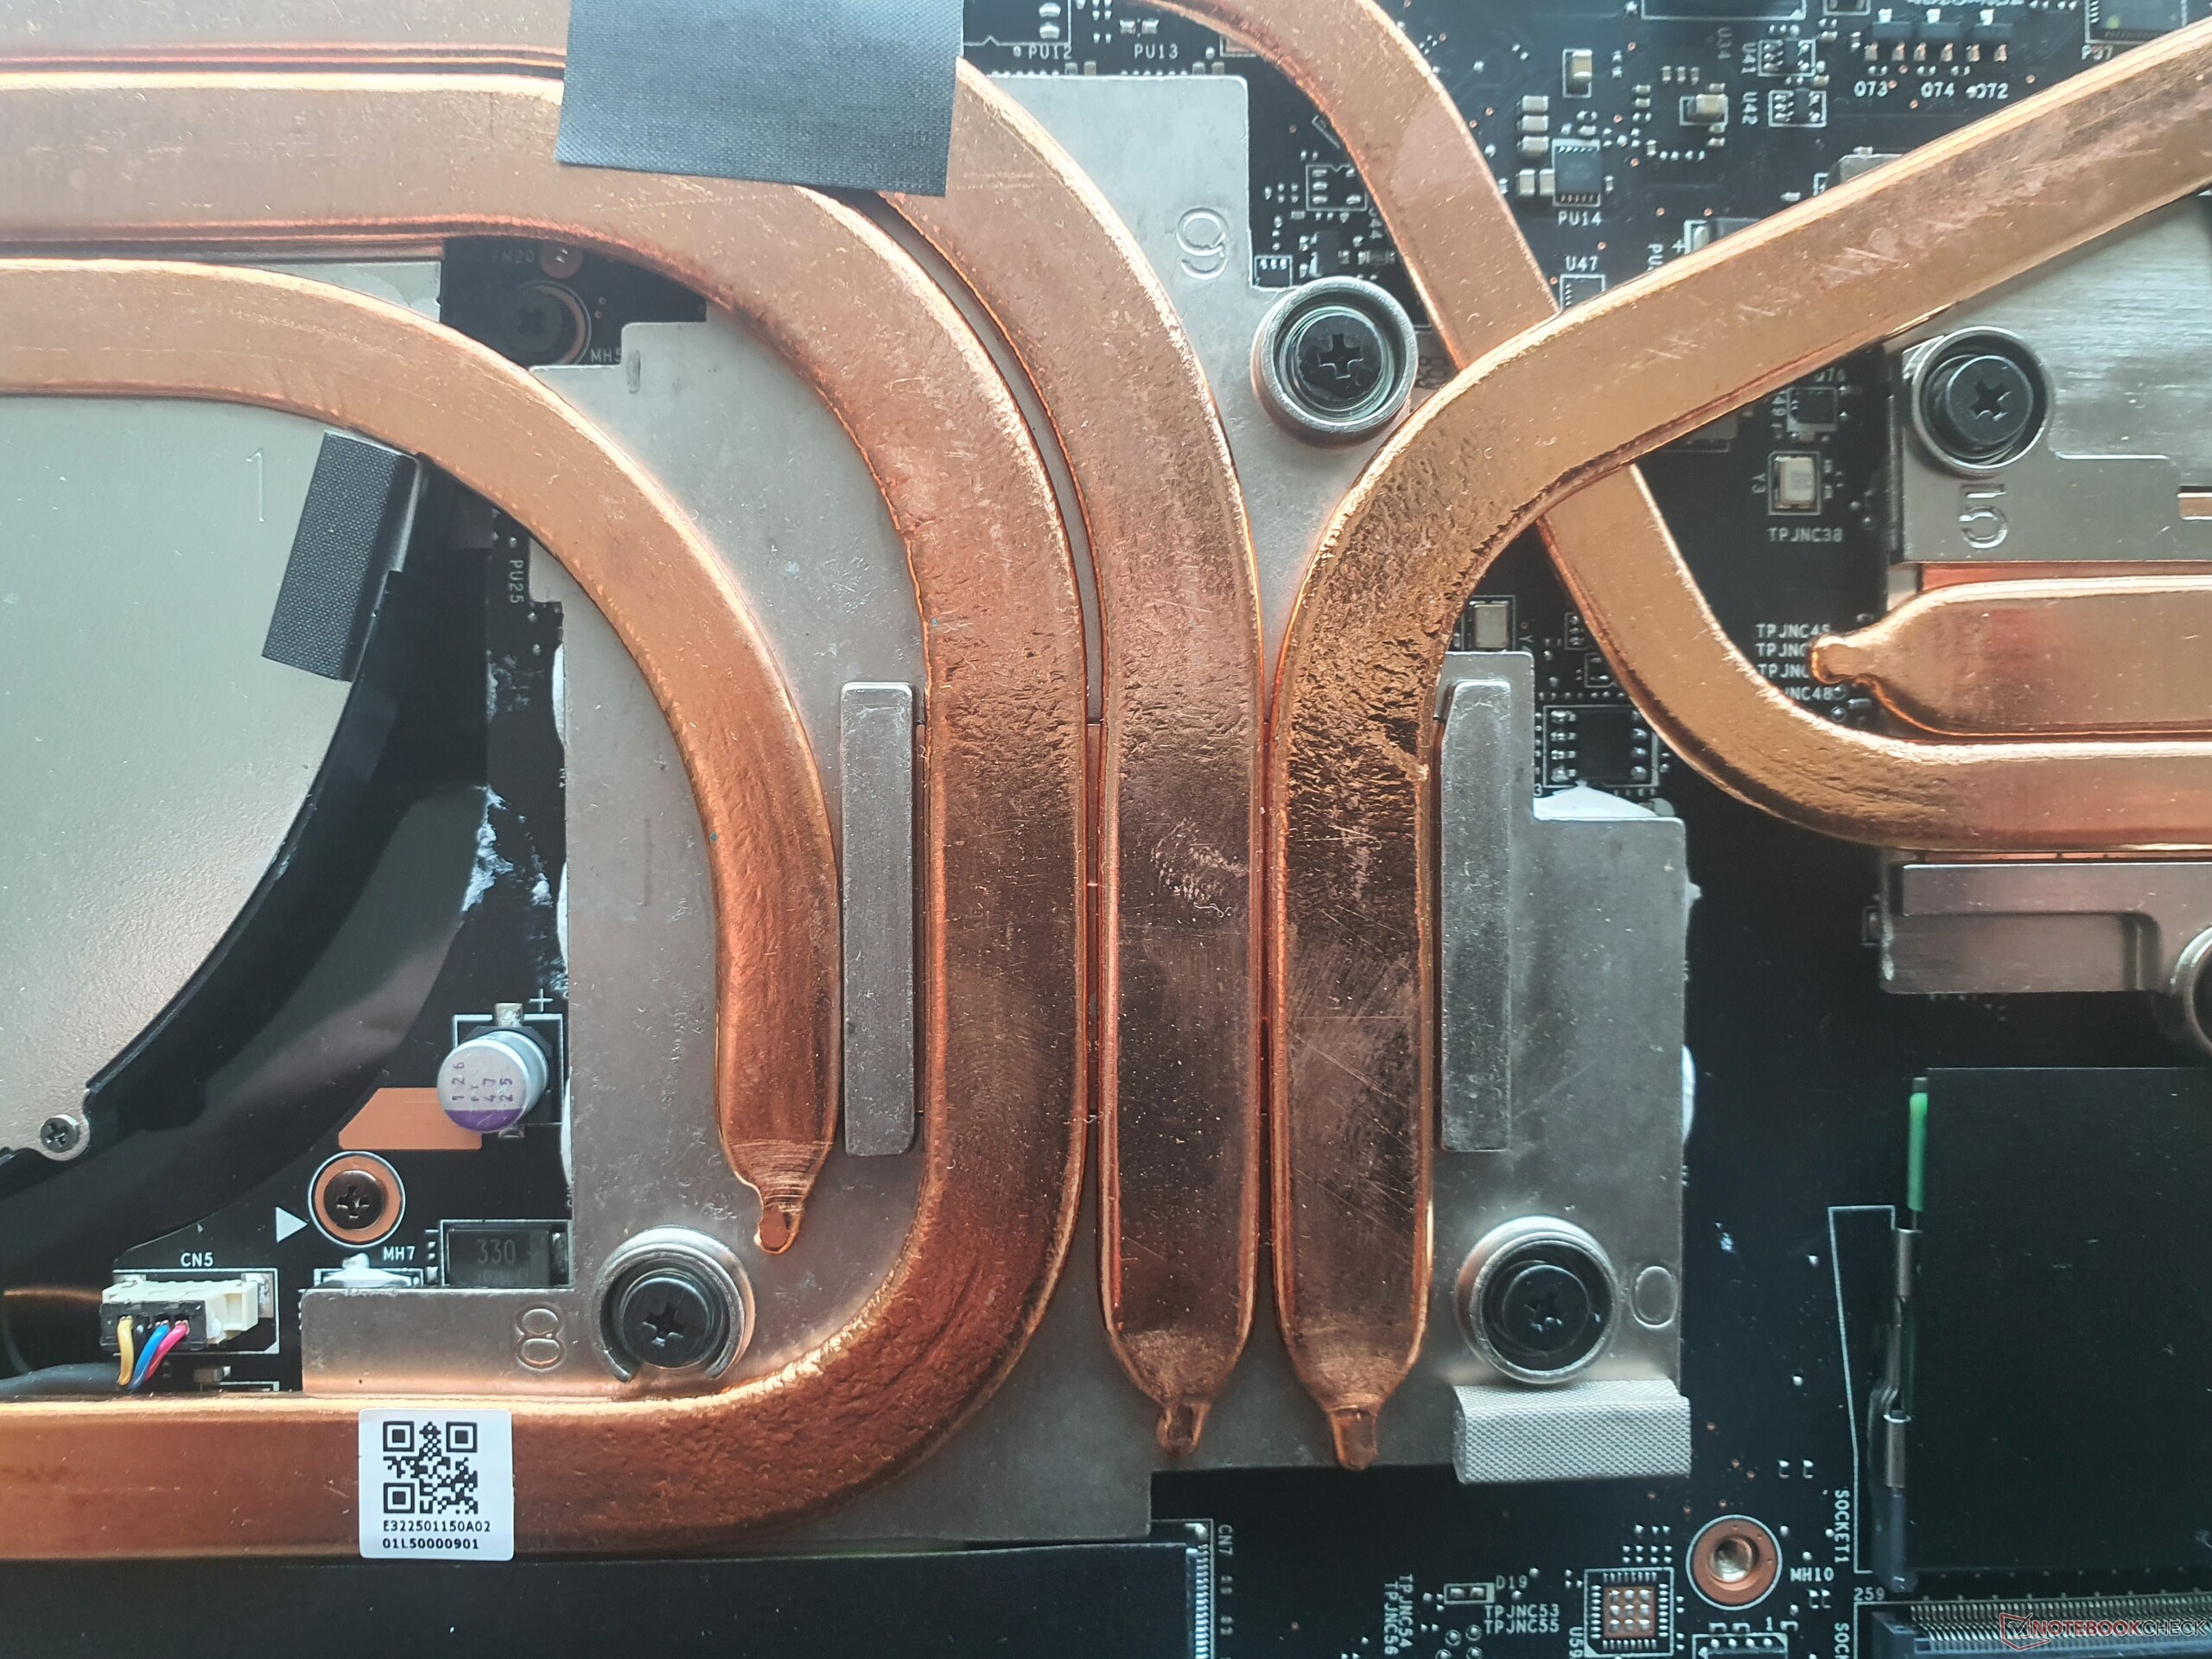
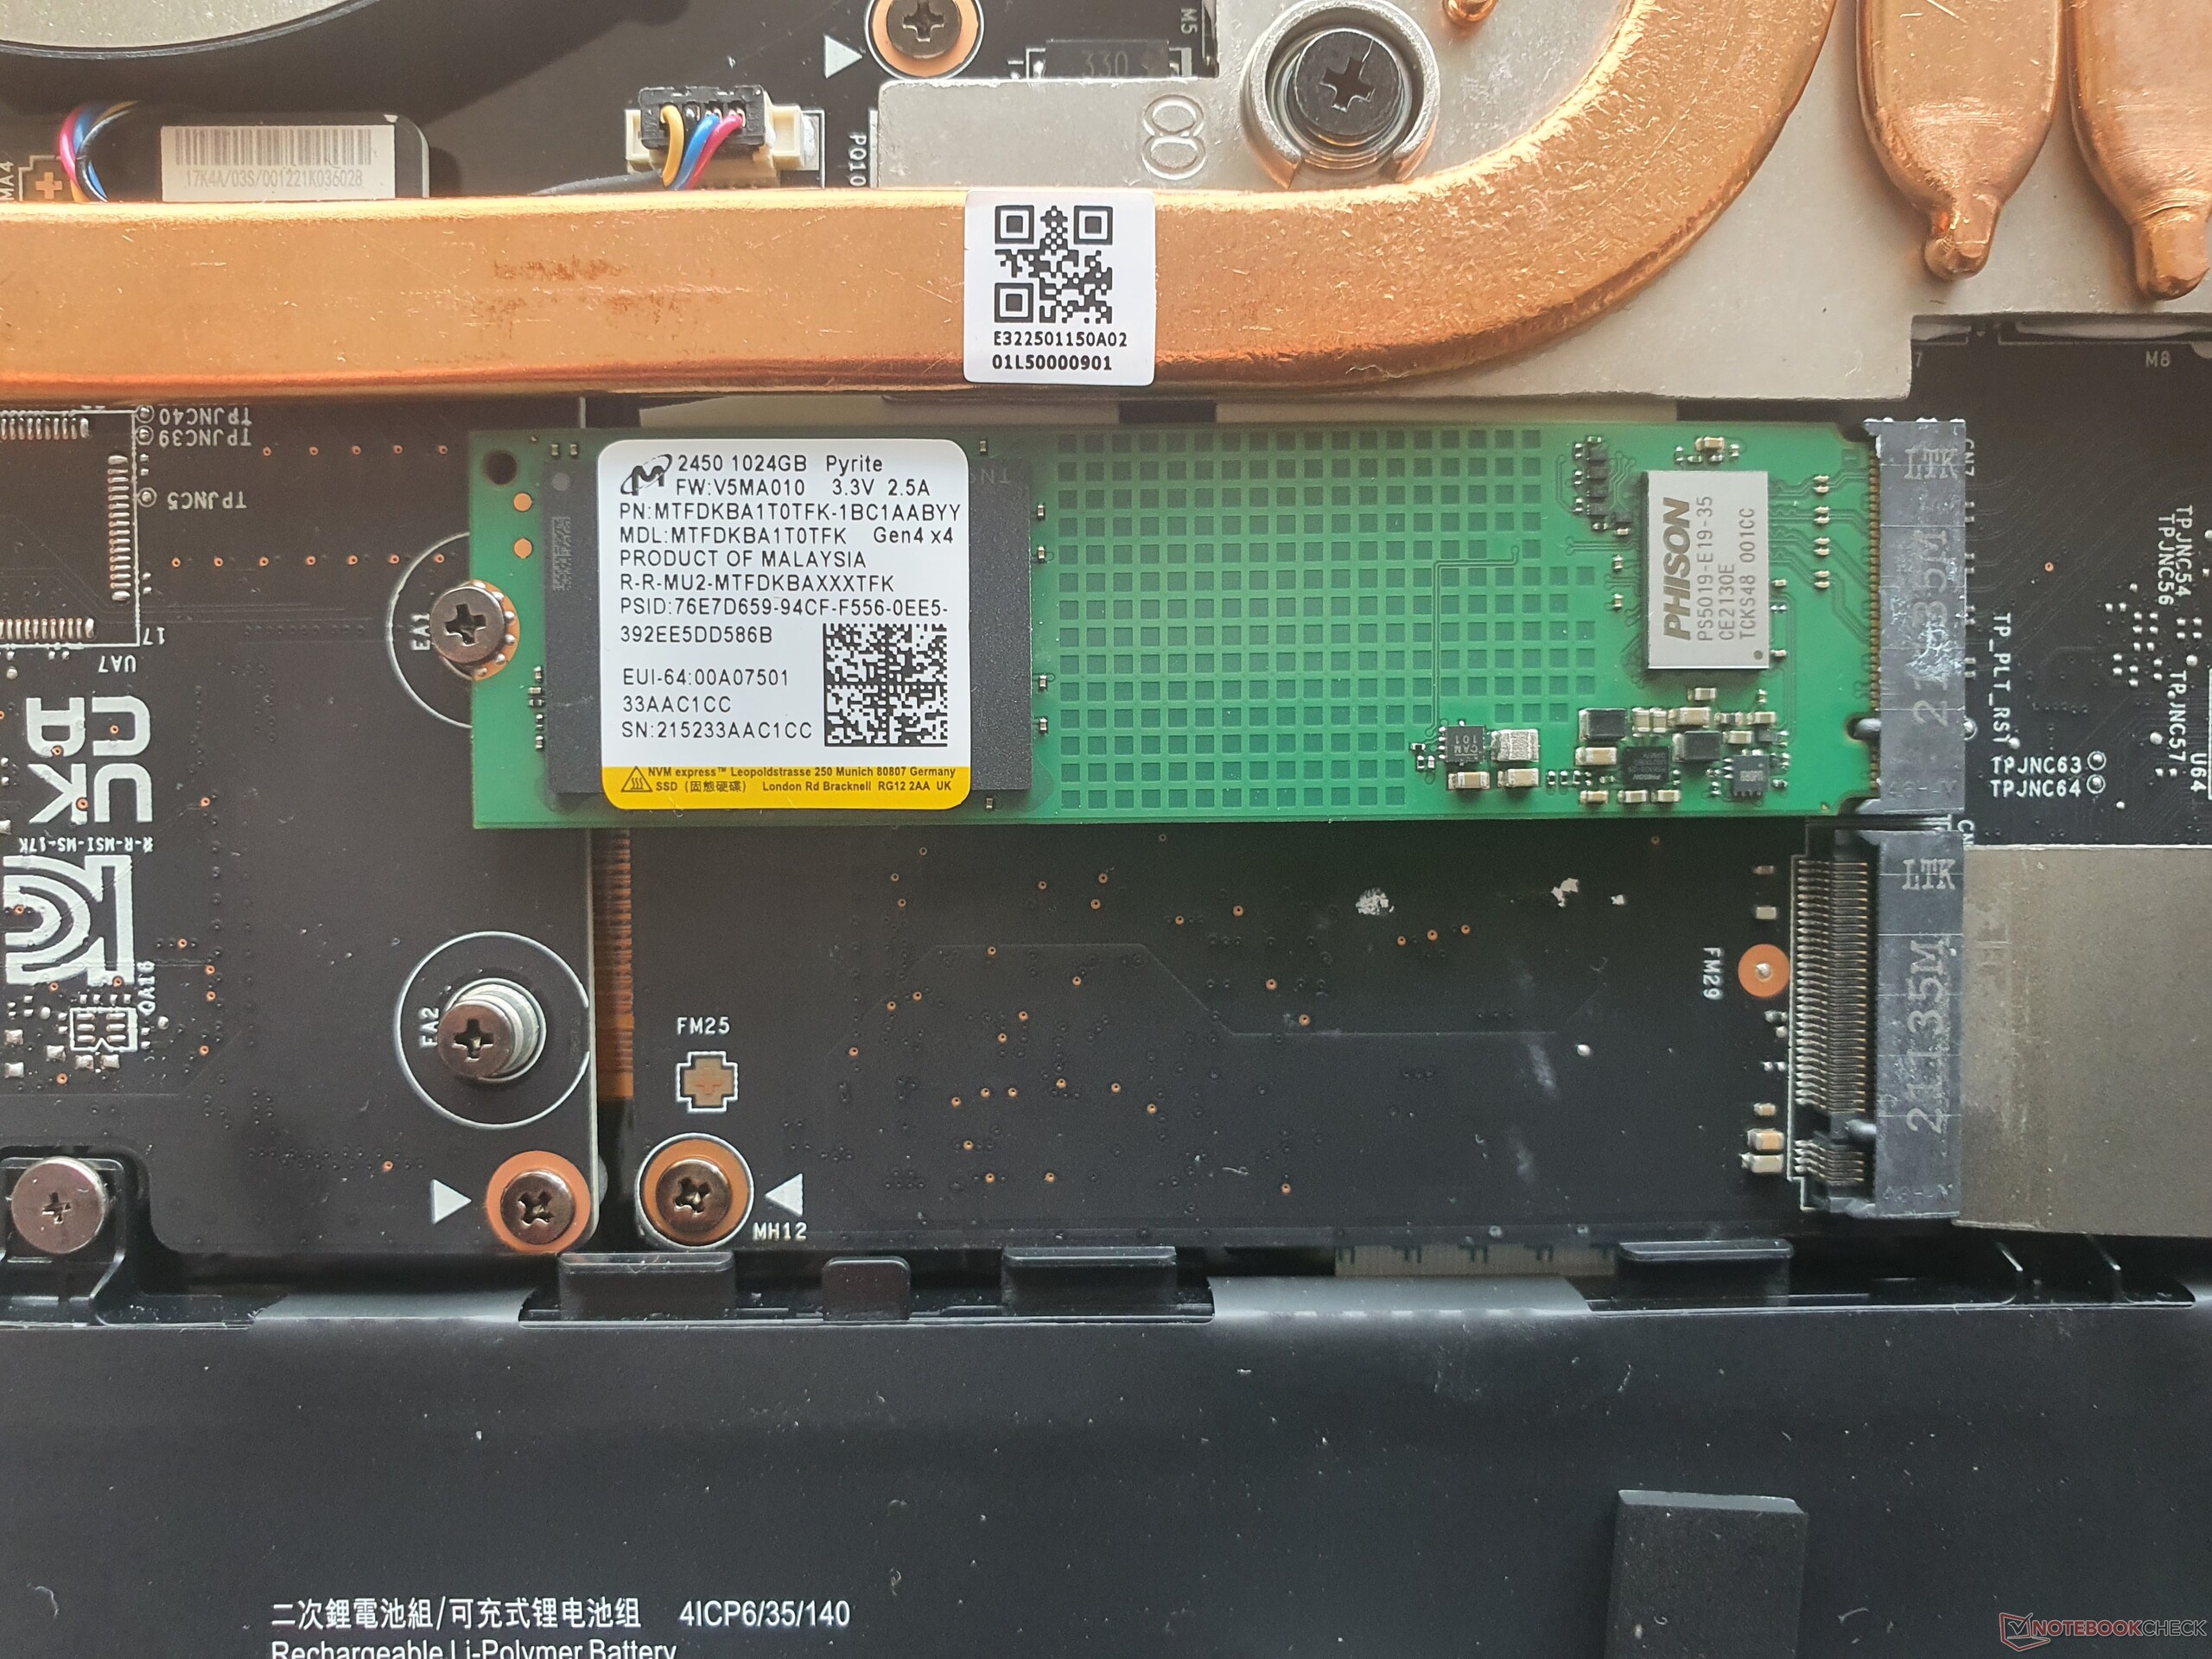
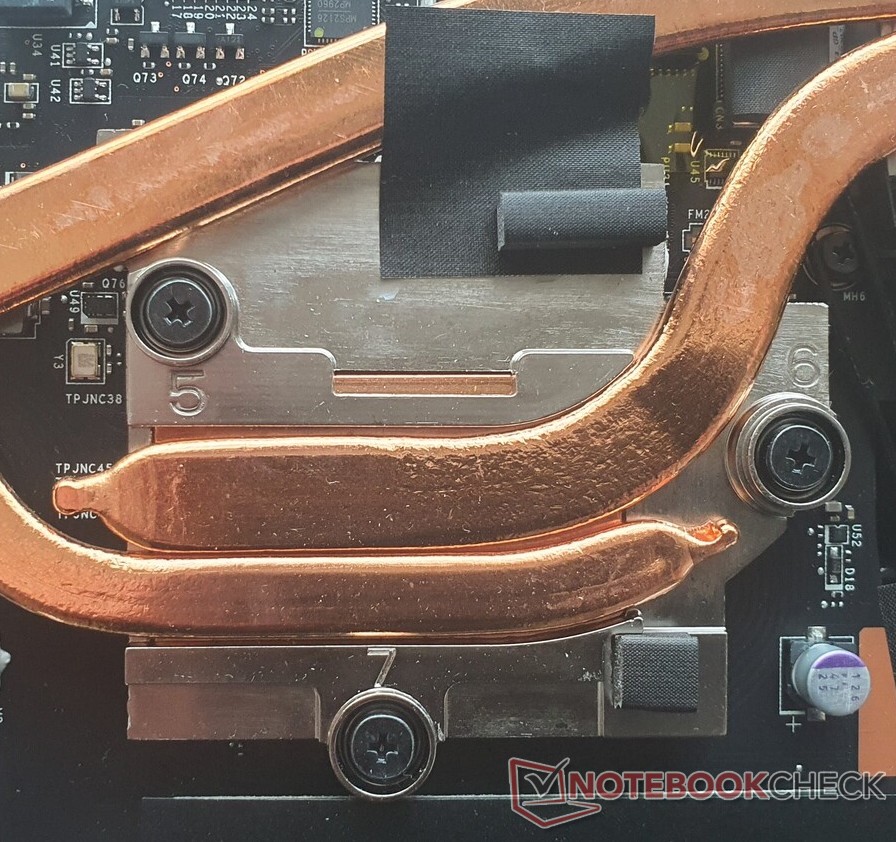
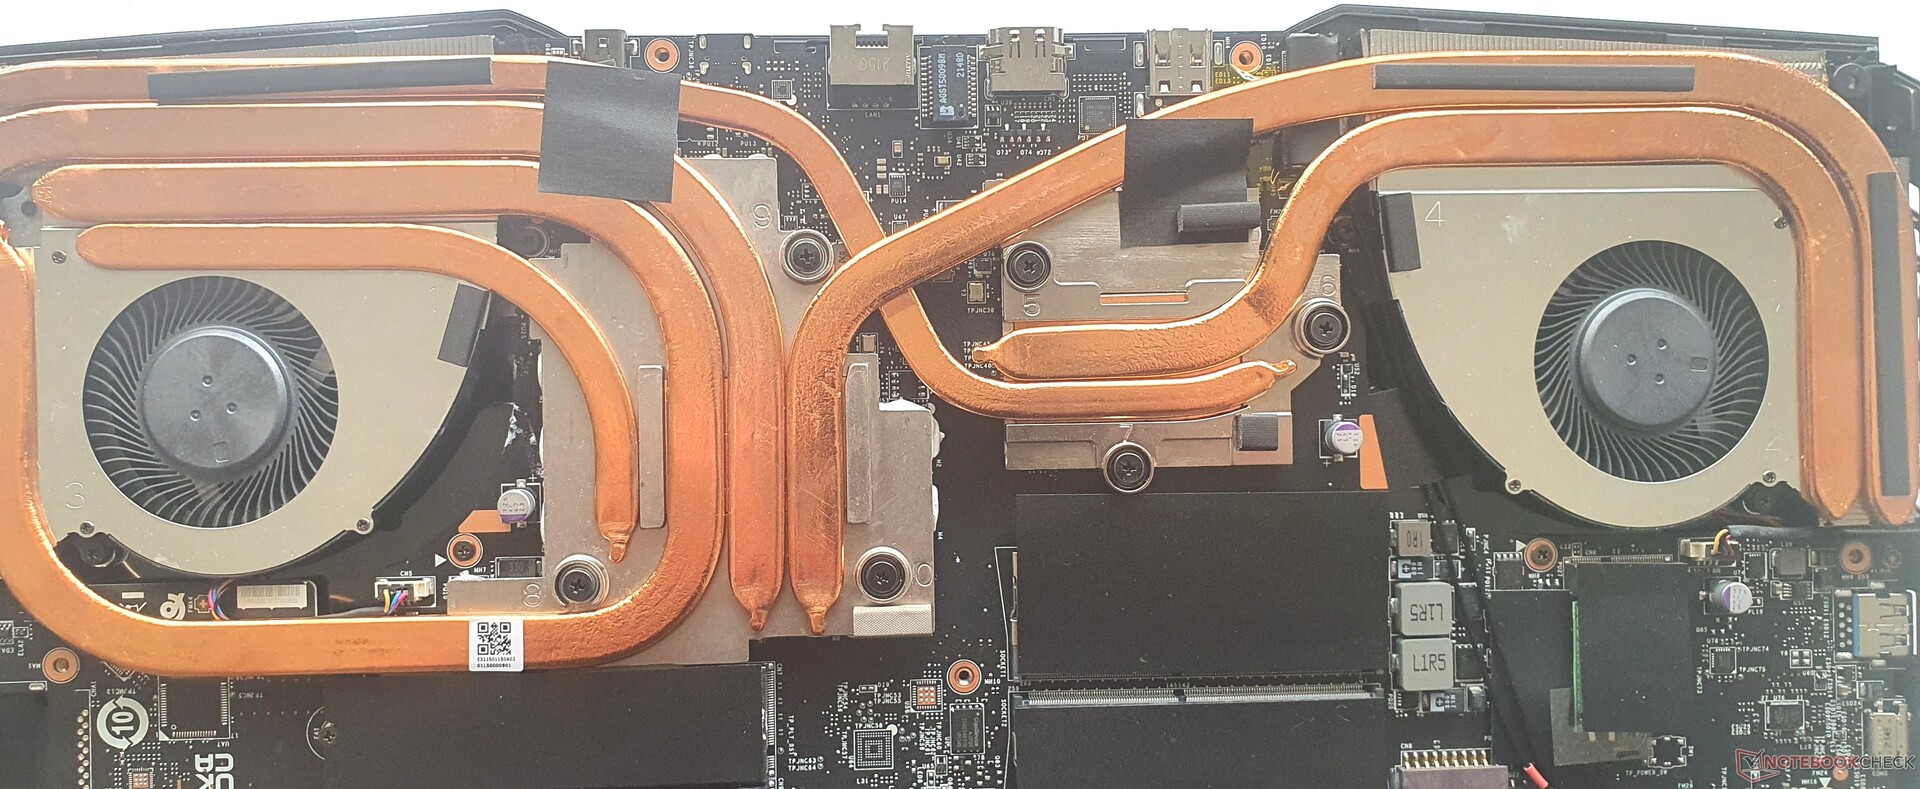
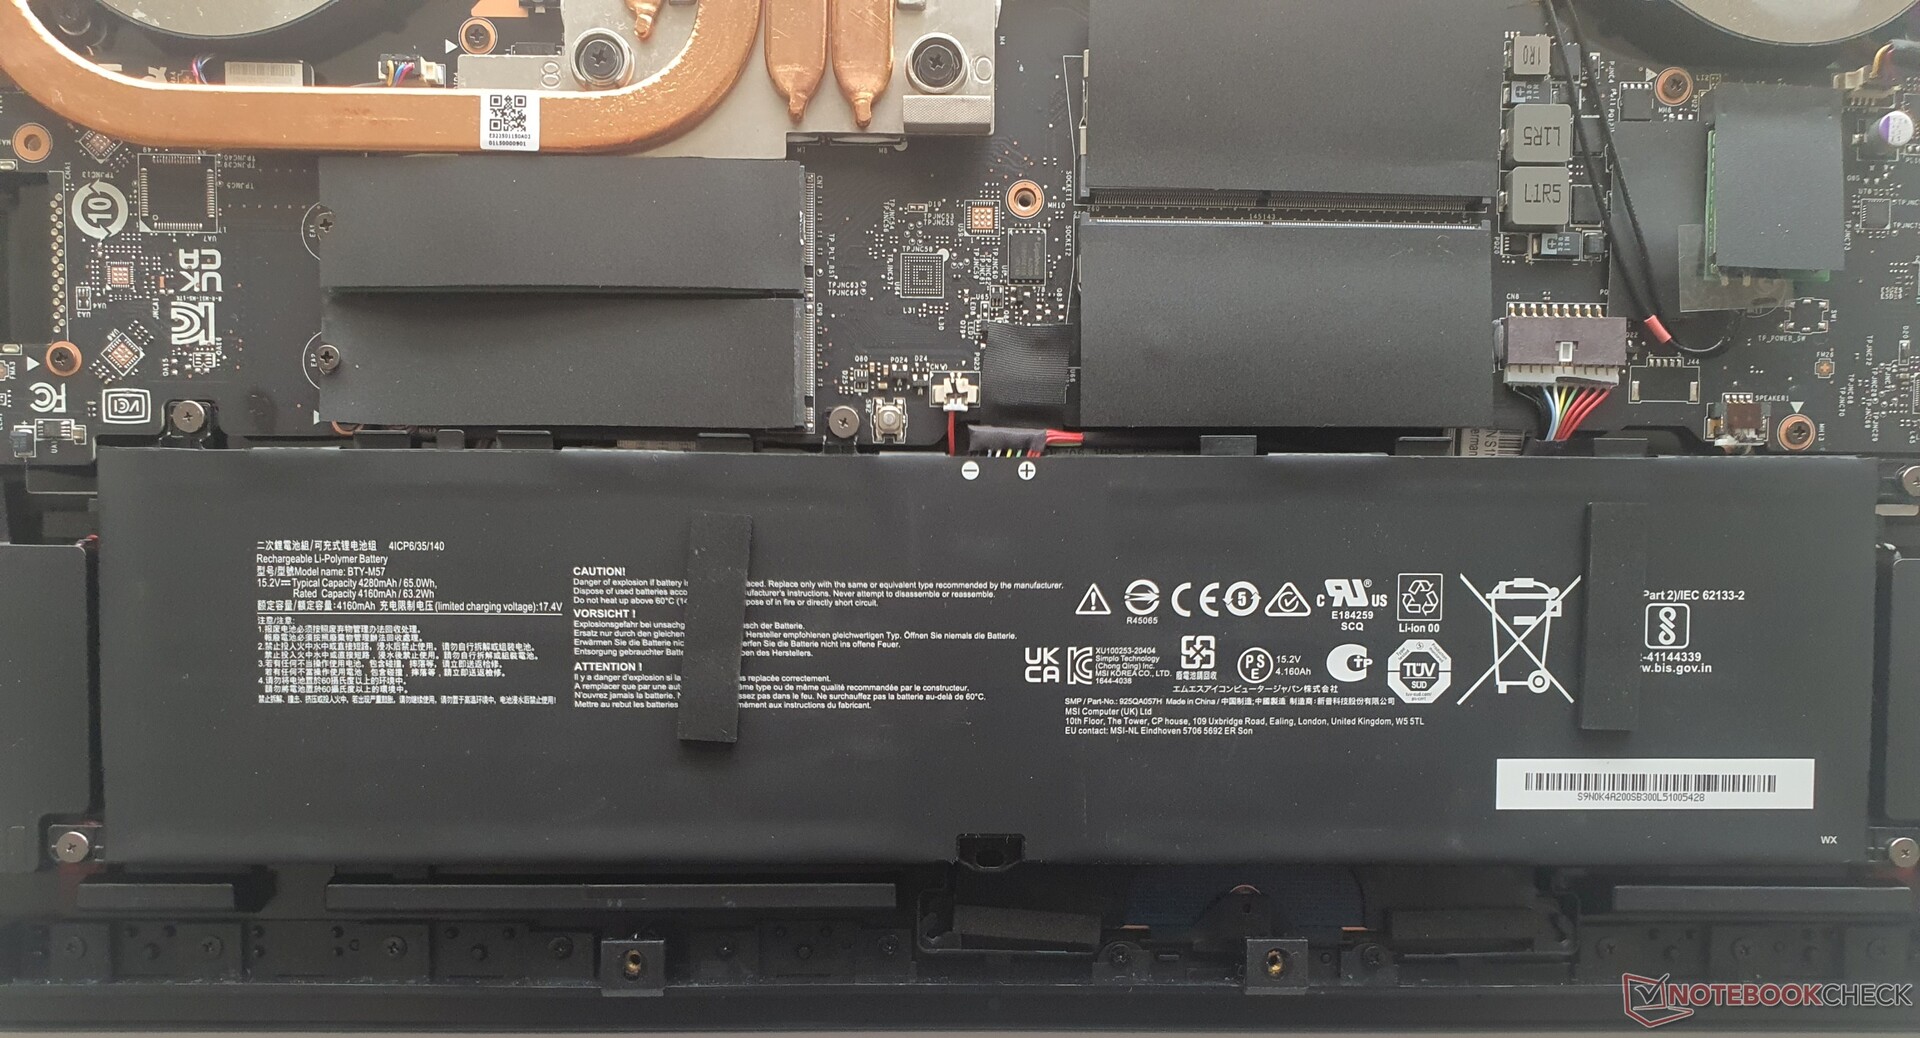
在卸下13颗十字螺丝后,可以用挖土机工具将机箱的背面拆开。前面的边缘一直延伸到笔记本电脑的顶部,并有很多钩子,需要一些剂量的力量和技巧的良好应用。
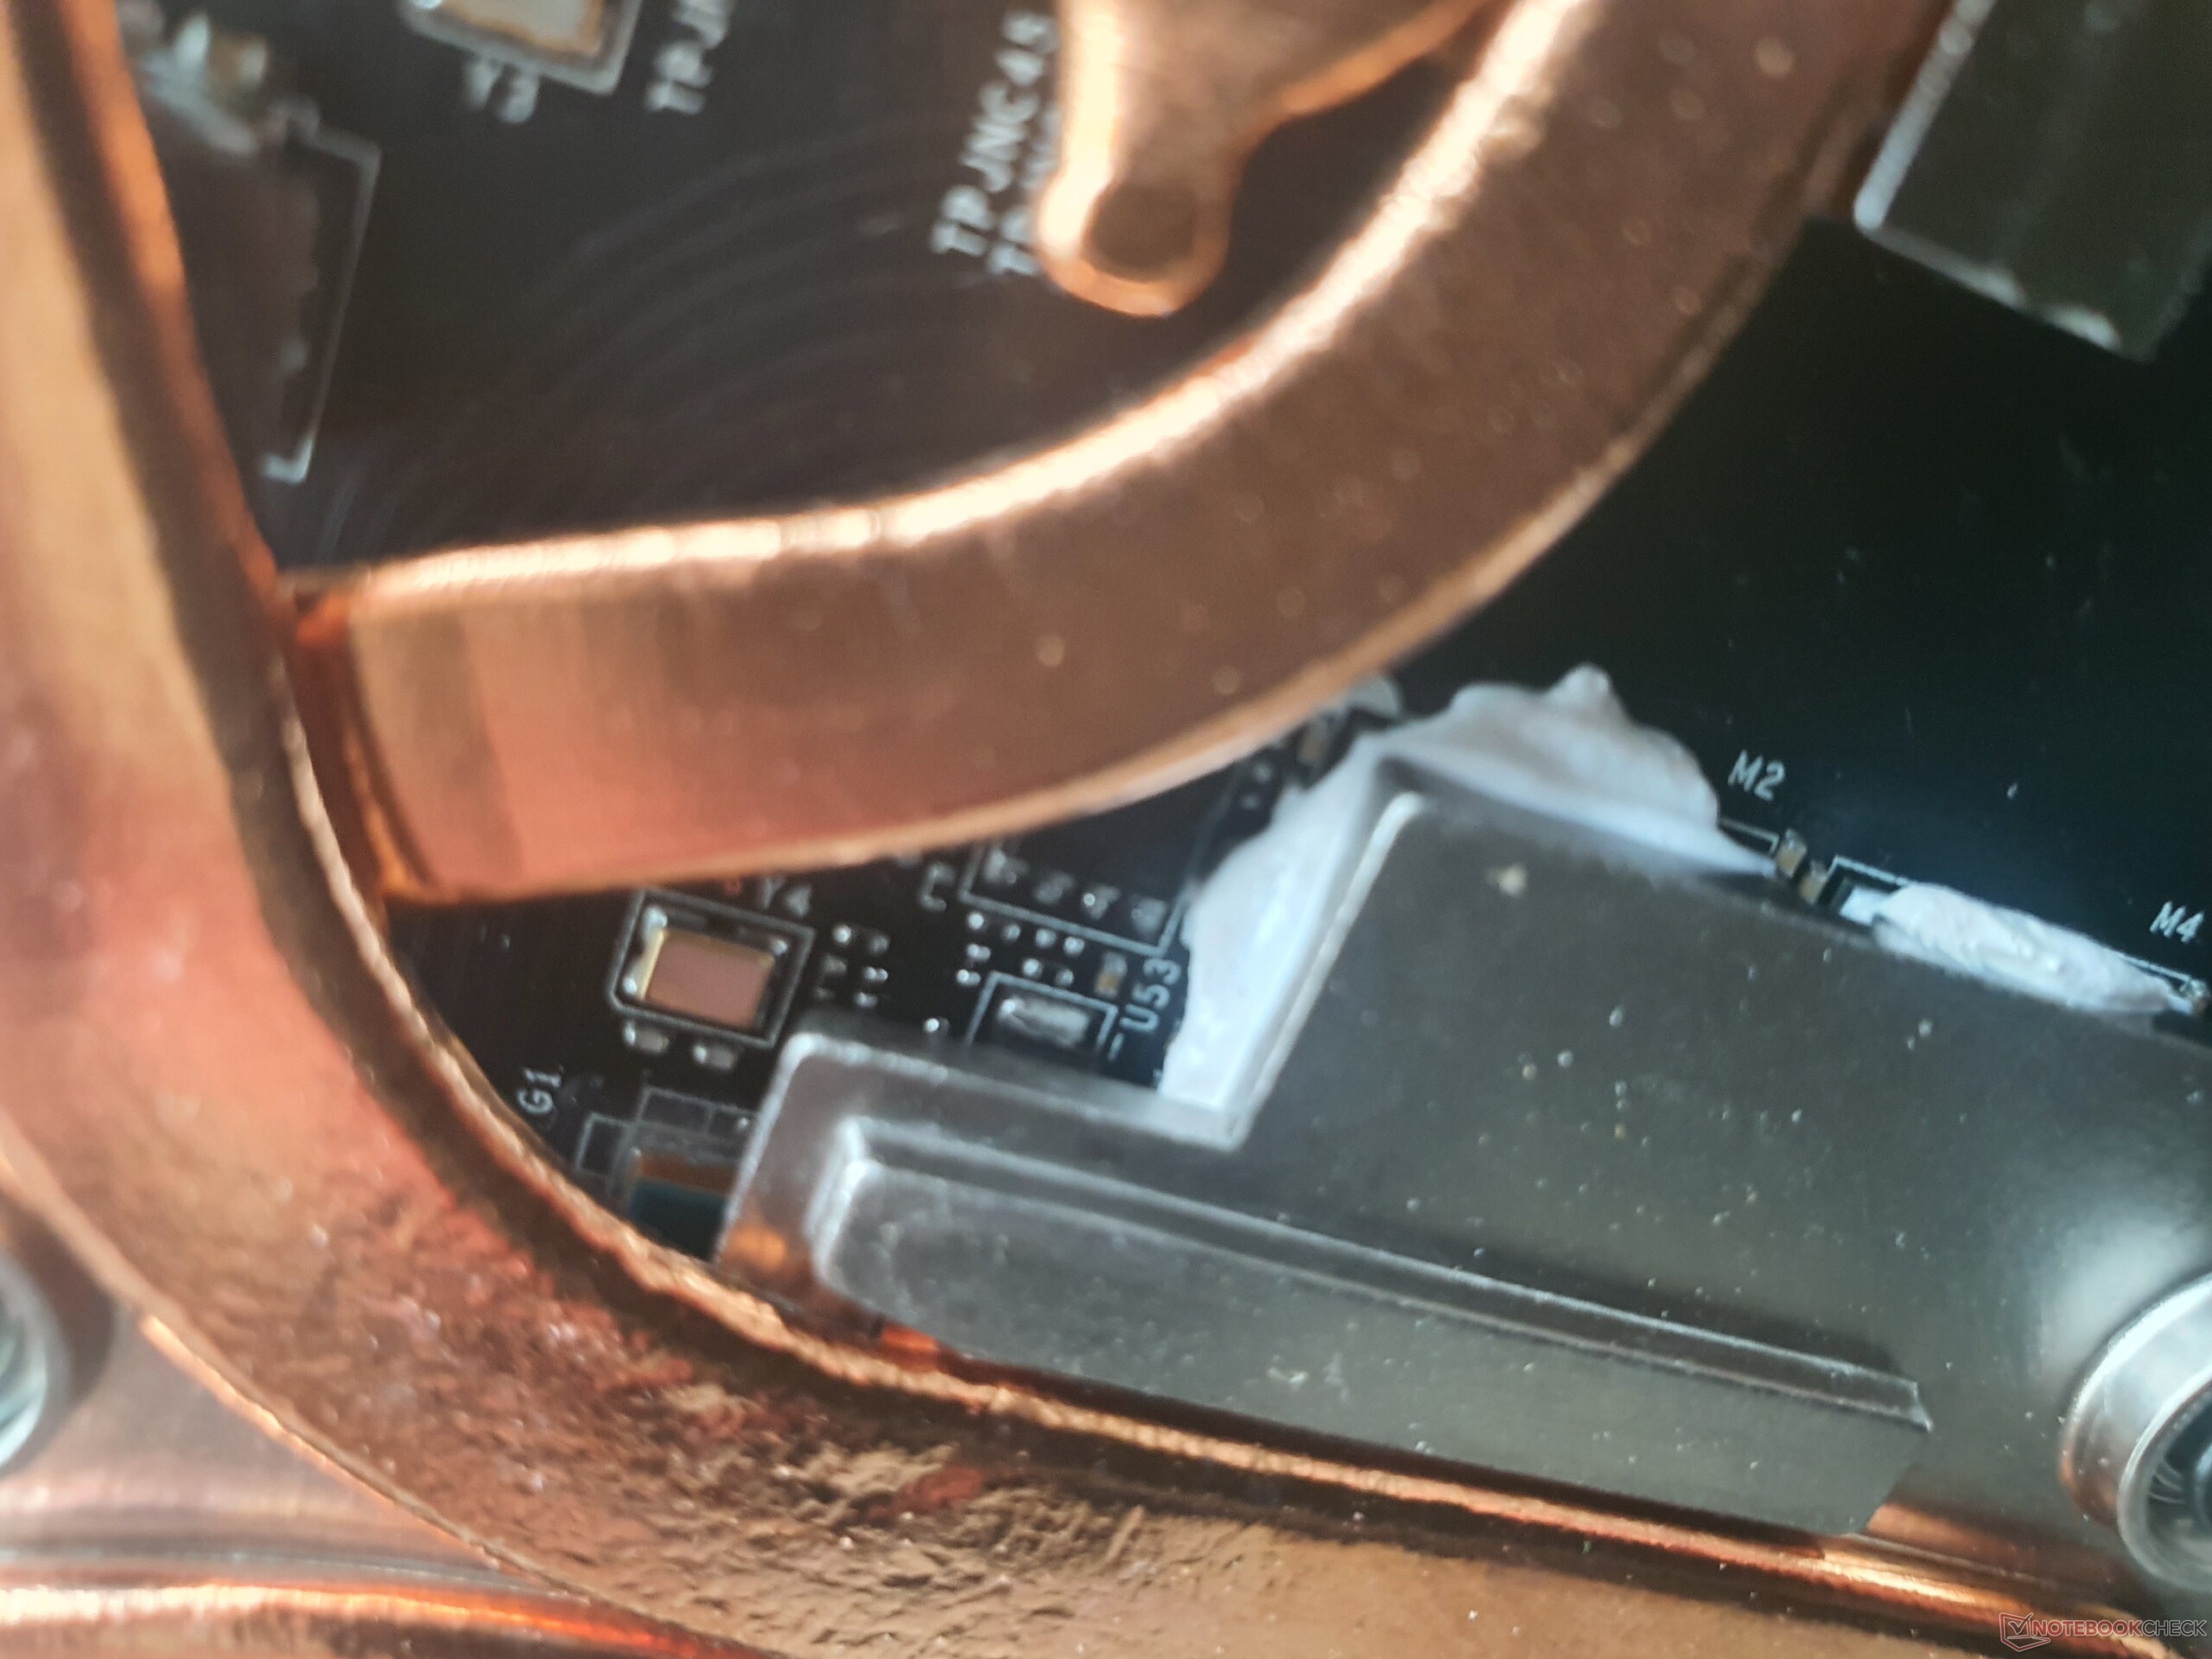
之后,人们遇到了大量的铜,其形式是6根热管,包括两个可以清洗的大风扇。可以冷却的元件,如CPU和GPU,被覆盖着导热膏,导热膏 "溢出 "并部分溢出到电路板上。
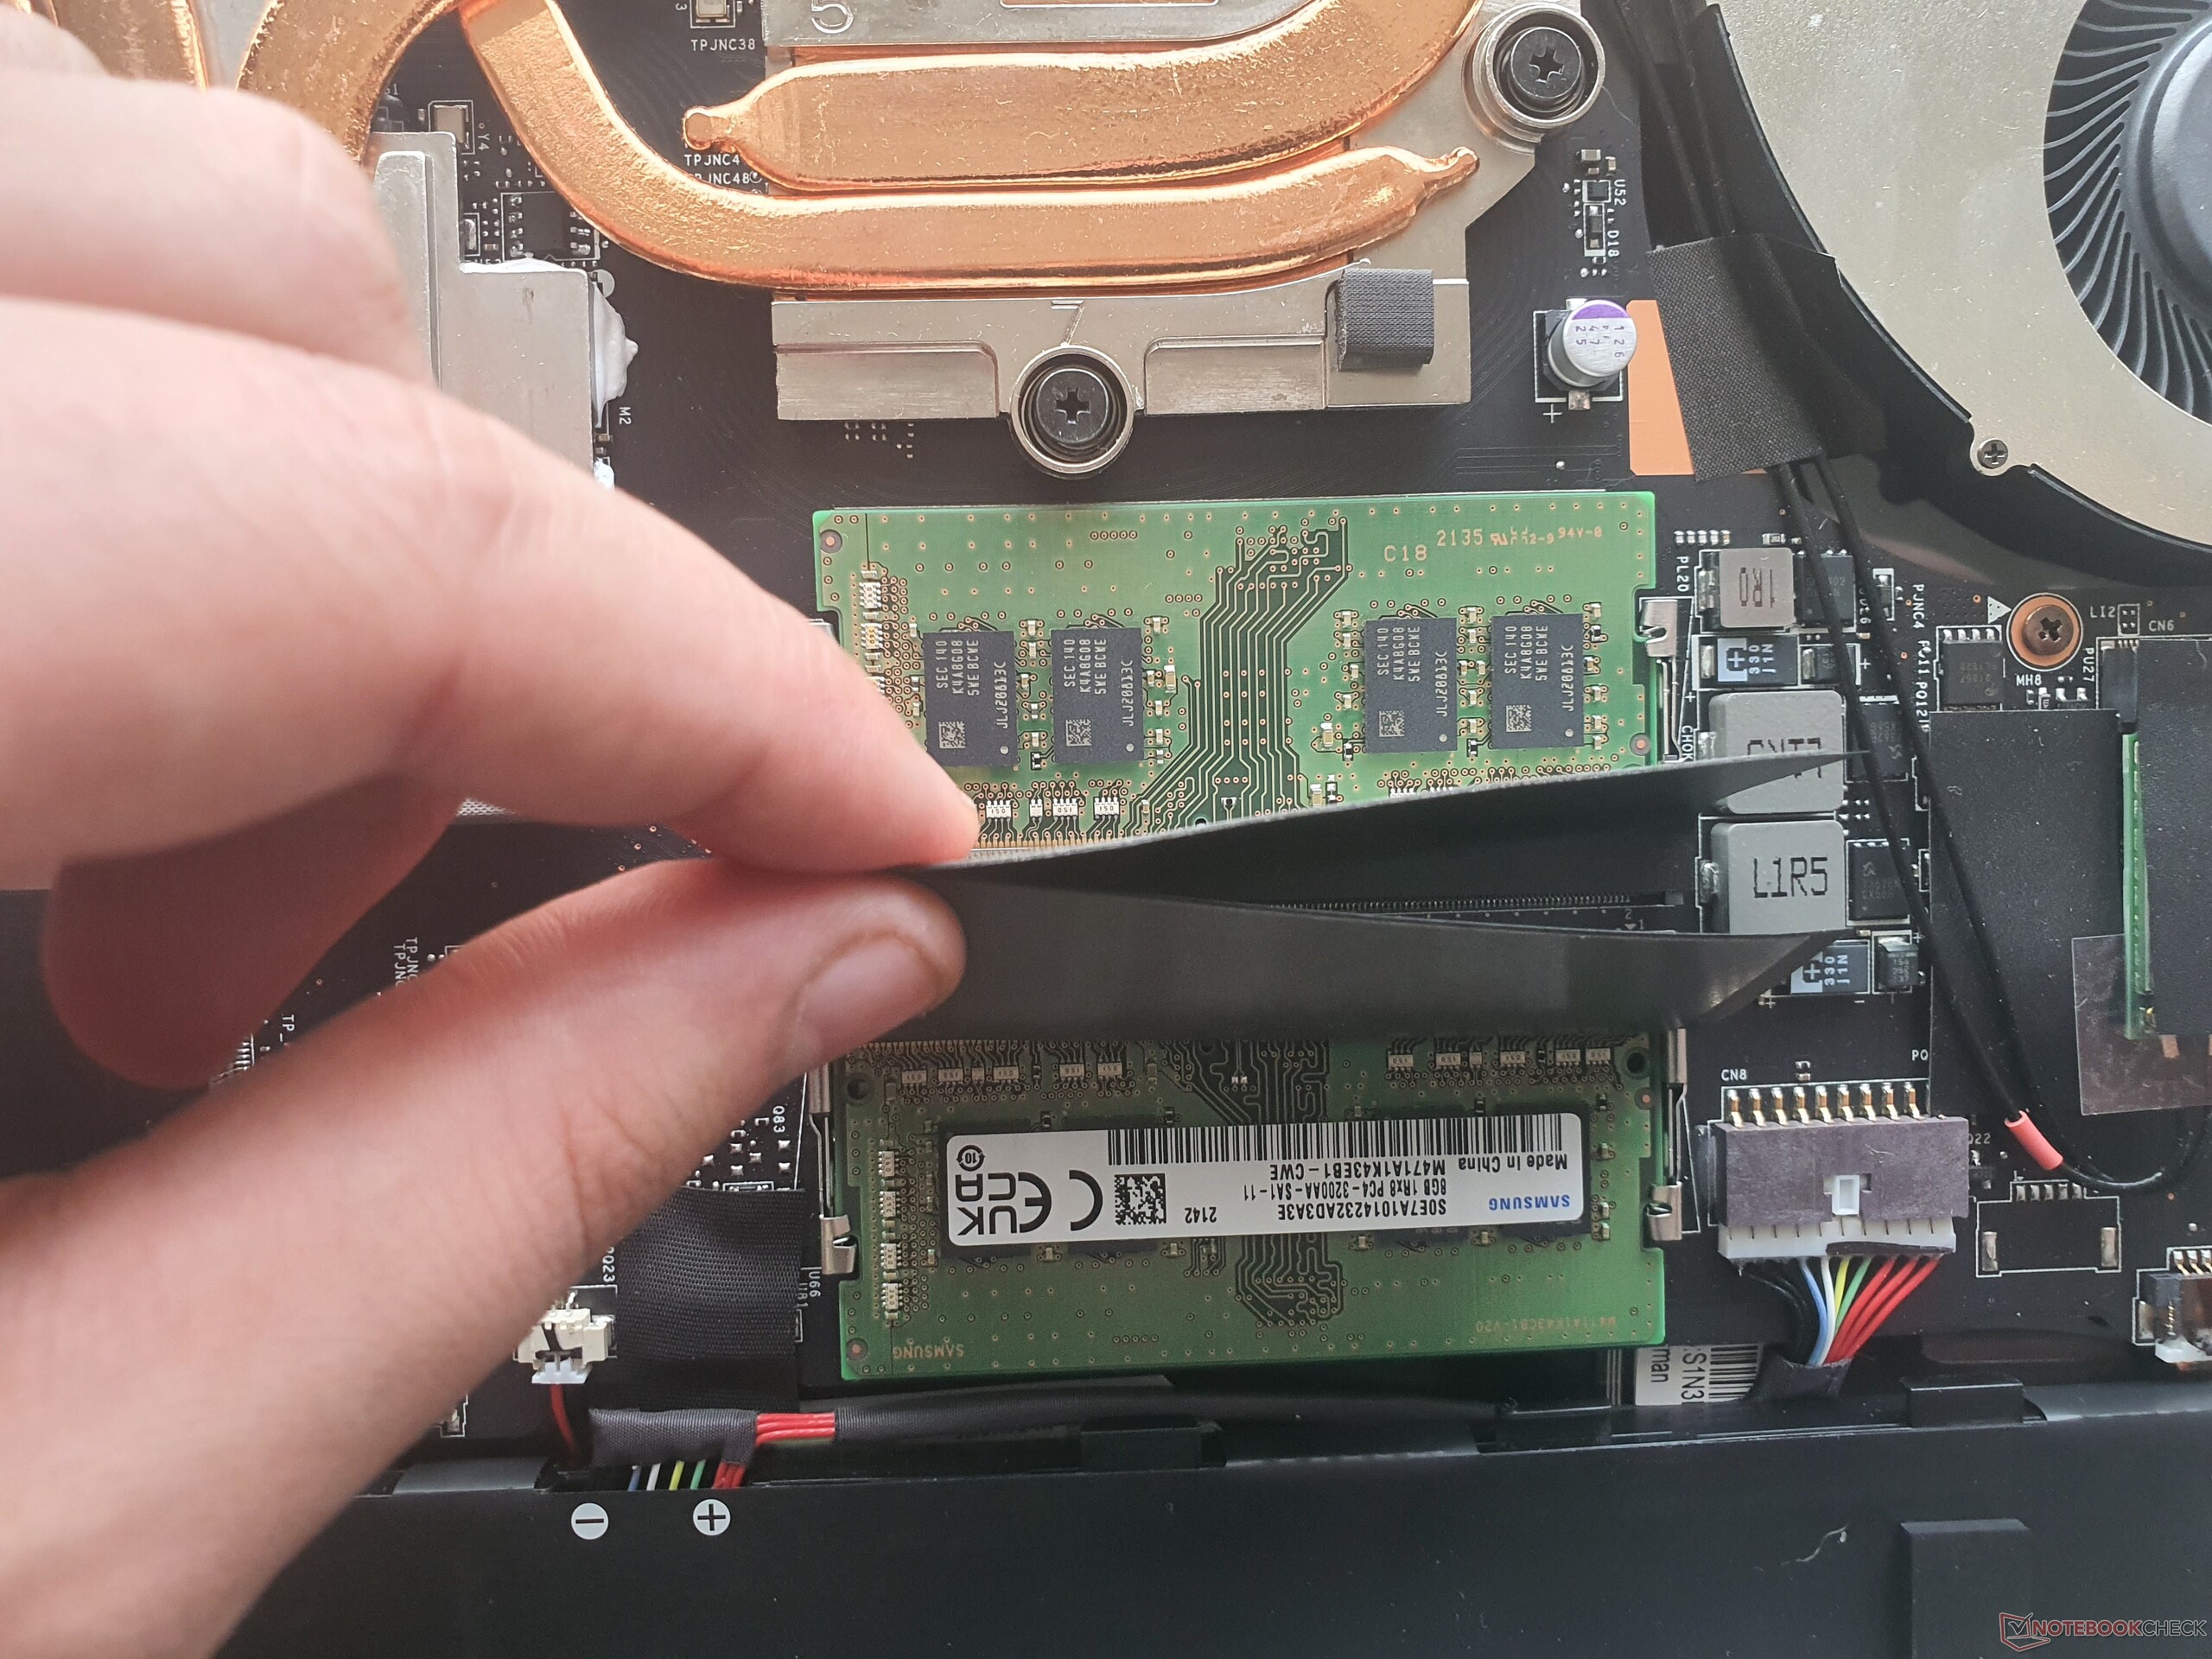
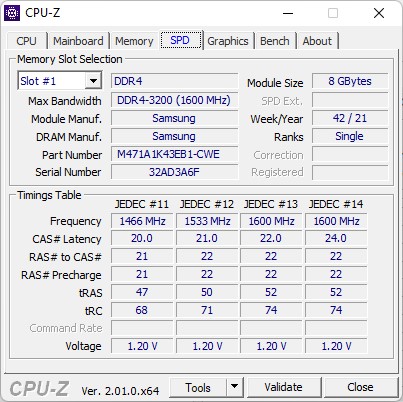
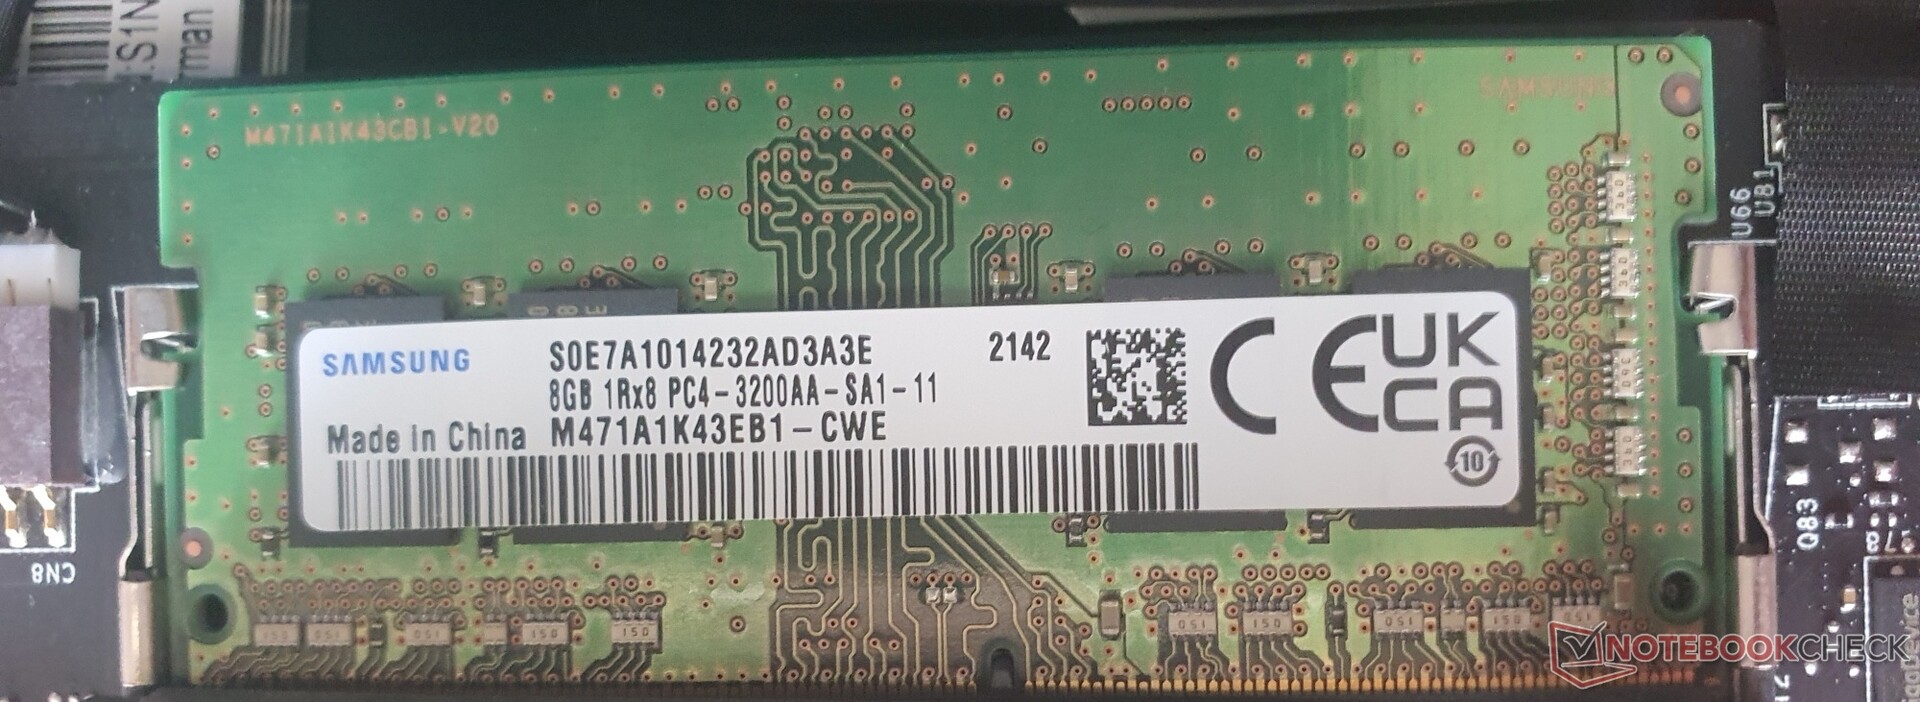
下一个最大的、可维护的元件是65Wh的电池(已拧紧)。此外,还提供了两个PCIe4x4规格的M.2插槽(能够进行RAID 0.1),由两个SODIMMs来完成,最多可容纳64GB的DDR4-3200内存。如前所述,Wi-Fi模块也是可以更换的。因此,总的来说,Vector GP76是便于维护的。
担保
欧盟范围内的保修期为24个月,并提供提货服务。在大多数其他地区,这是12个月。延长保修期也是有可能的,但要收取附加费。
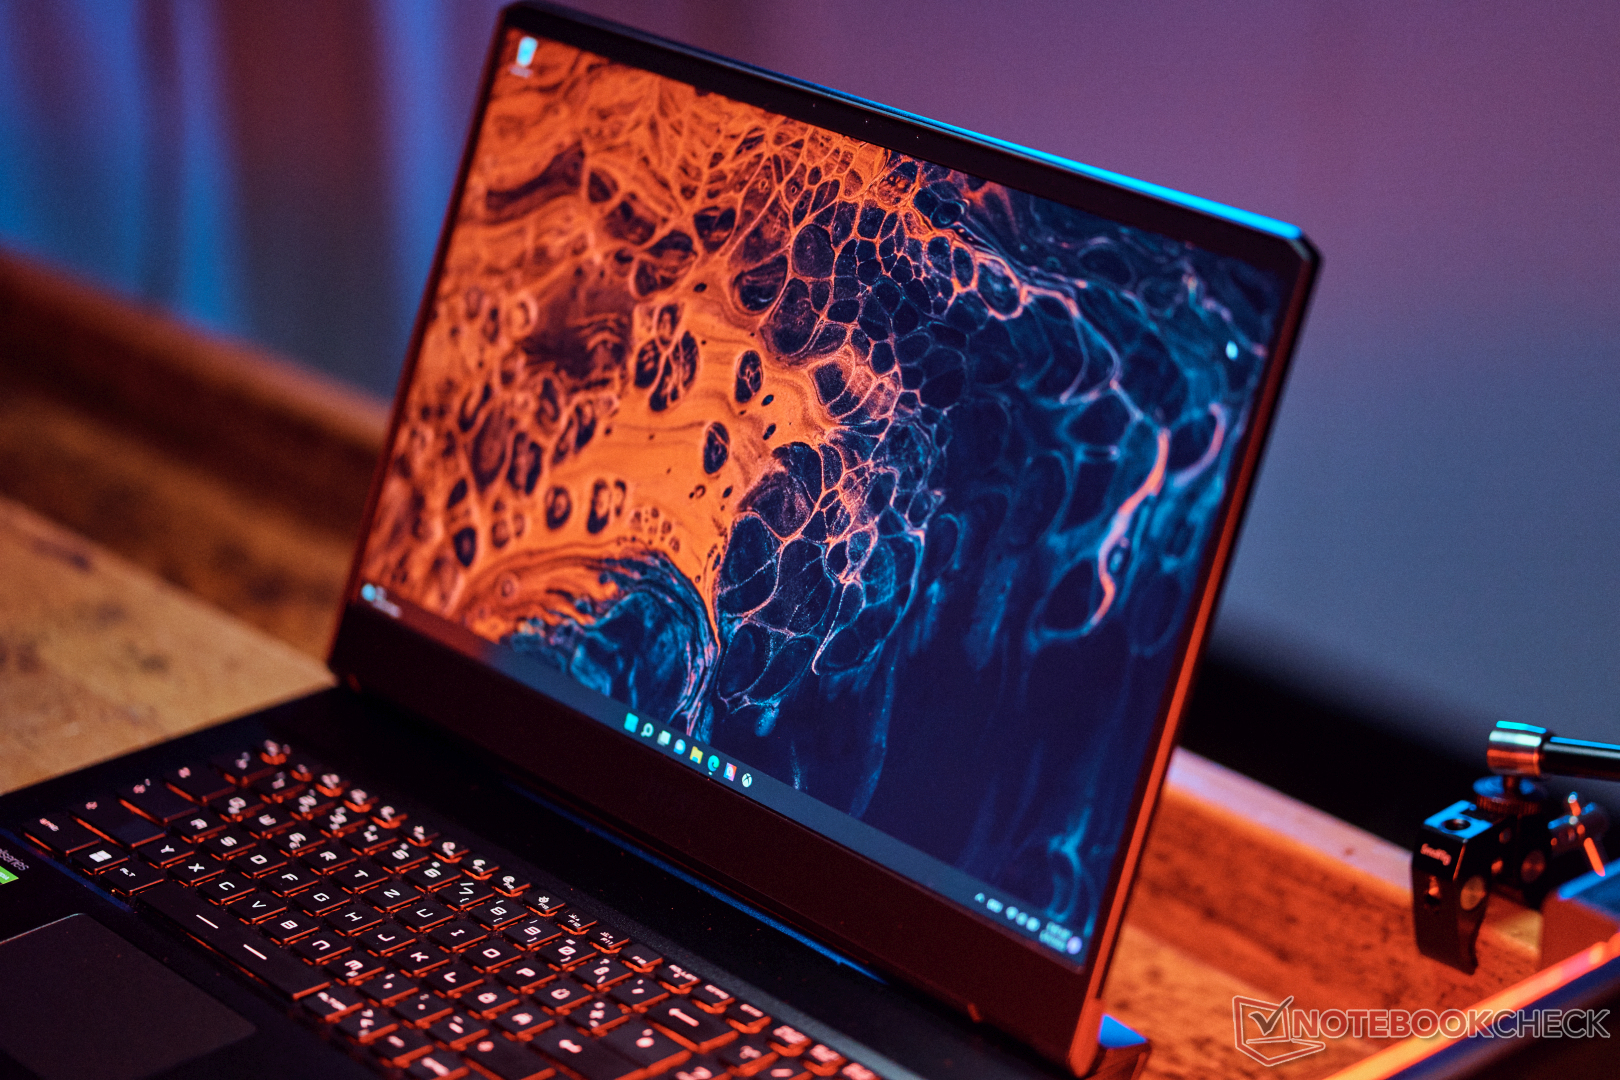
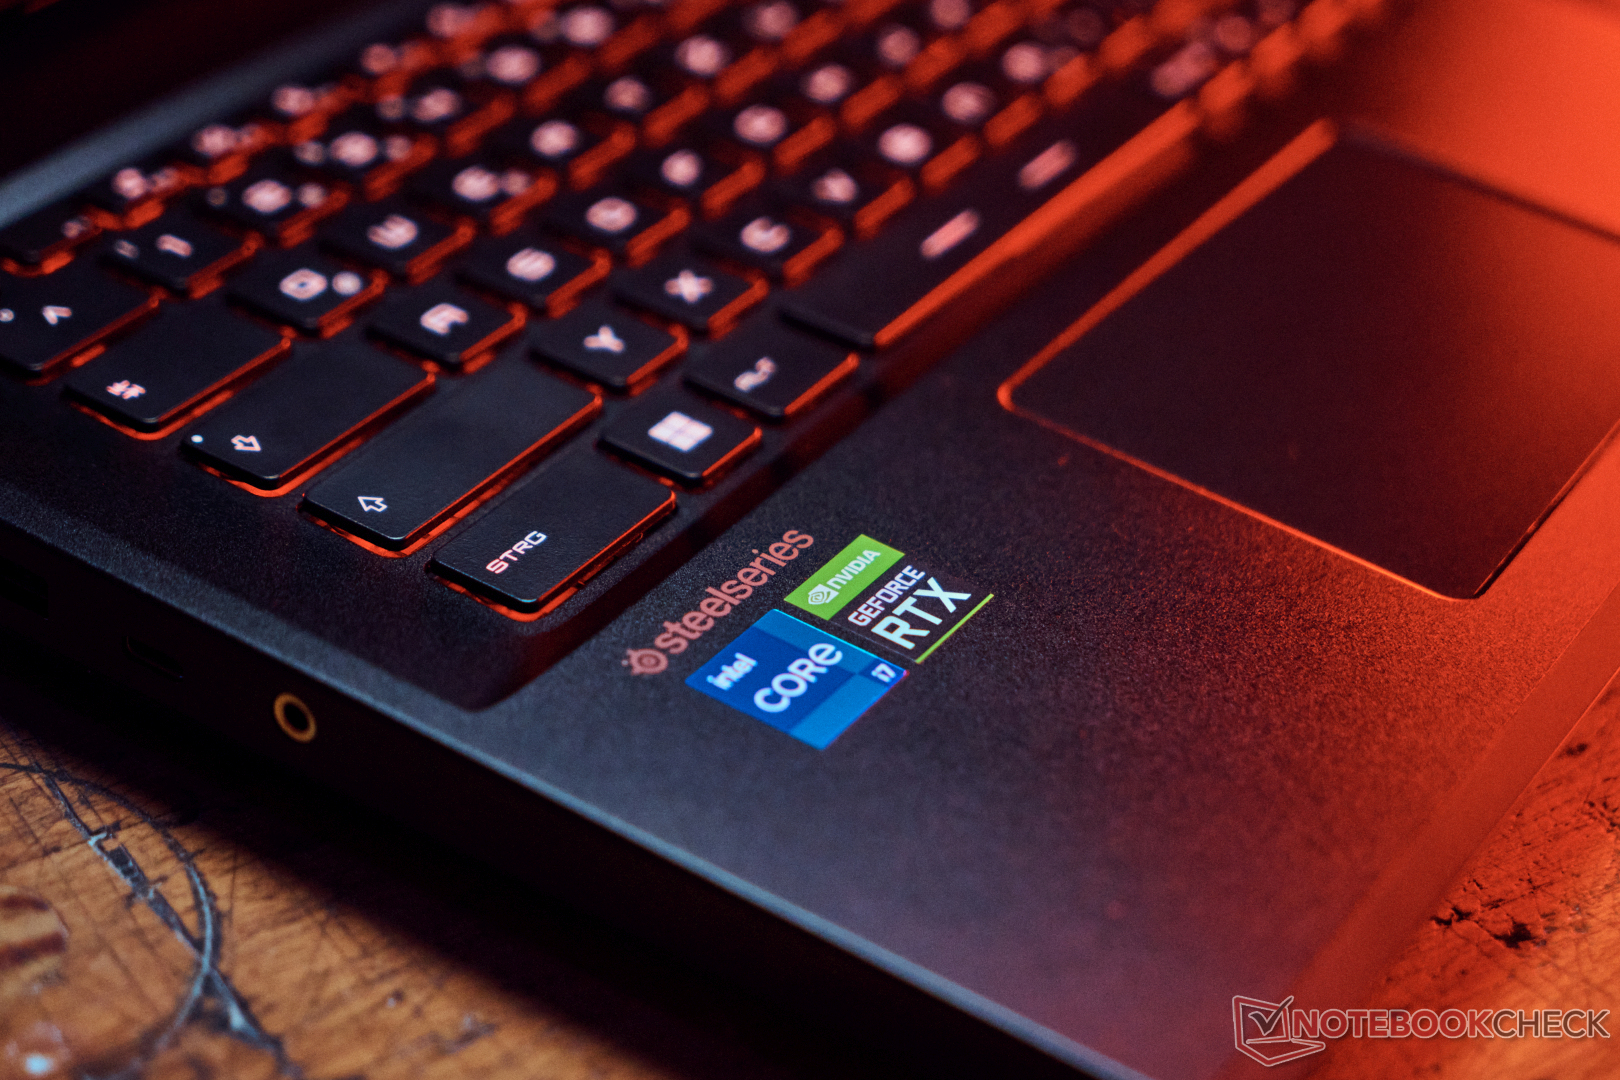
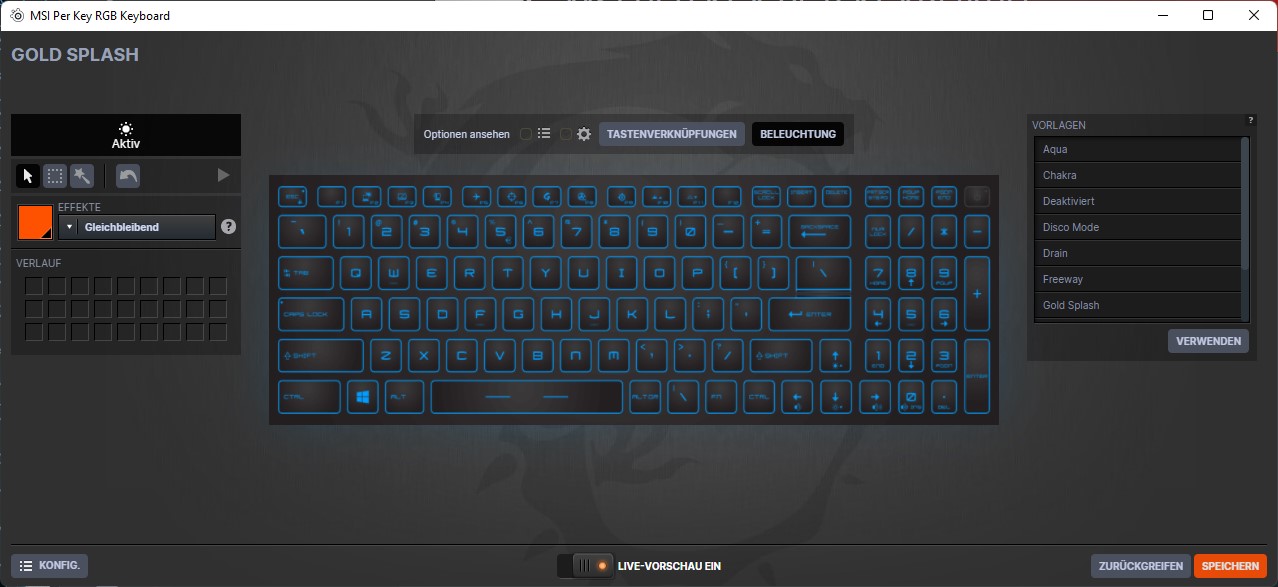
输入设备。微星具有每键RGB的绚丽色彩
键盘
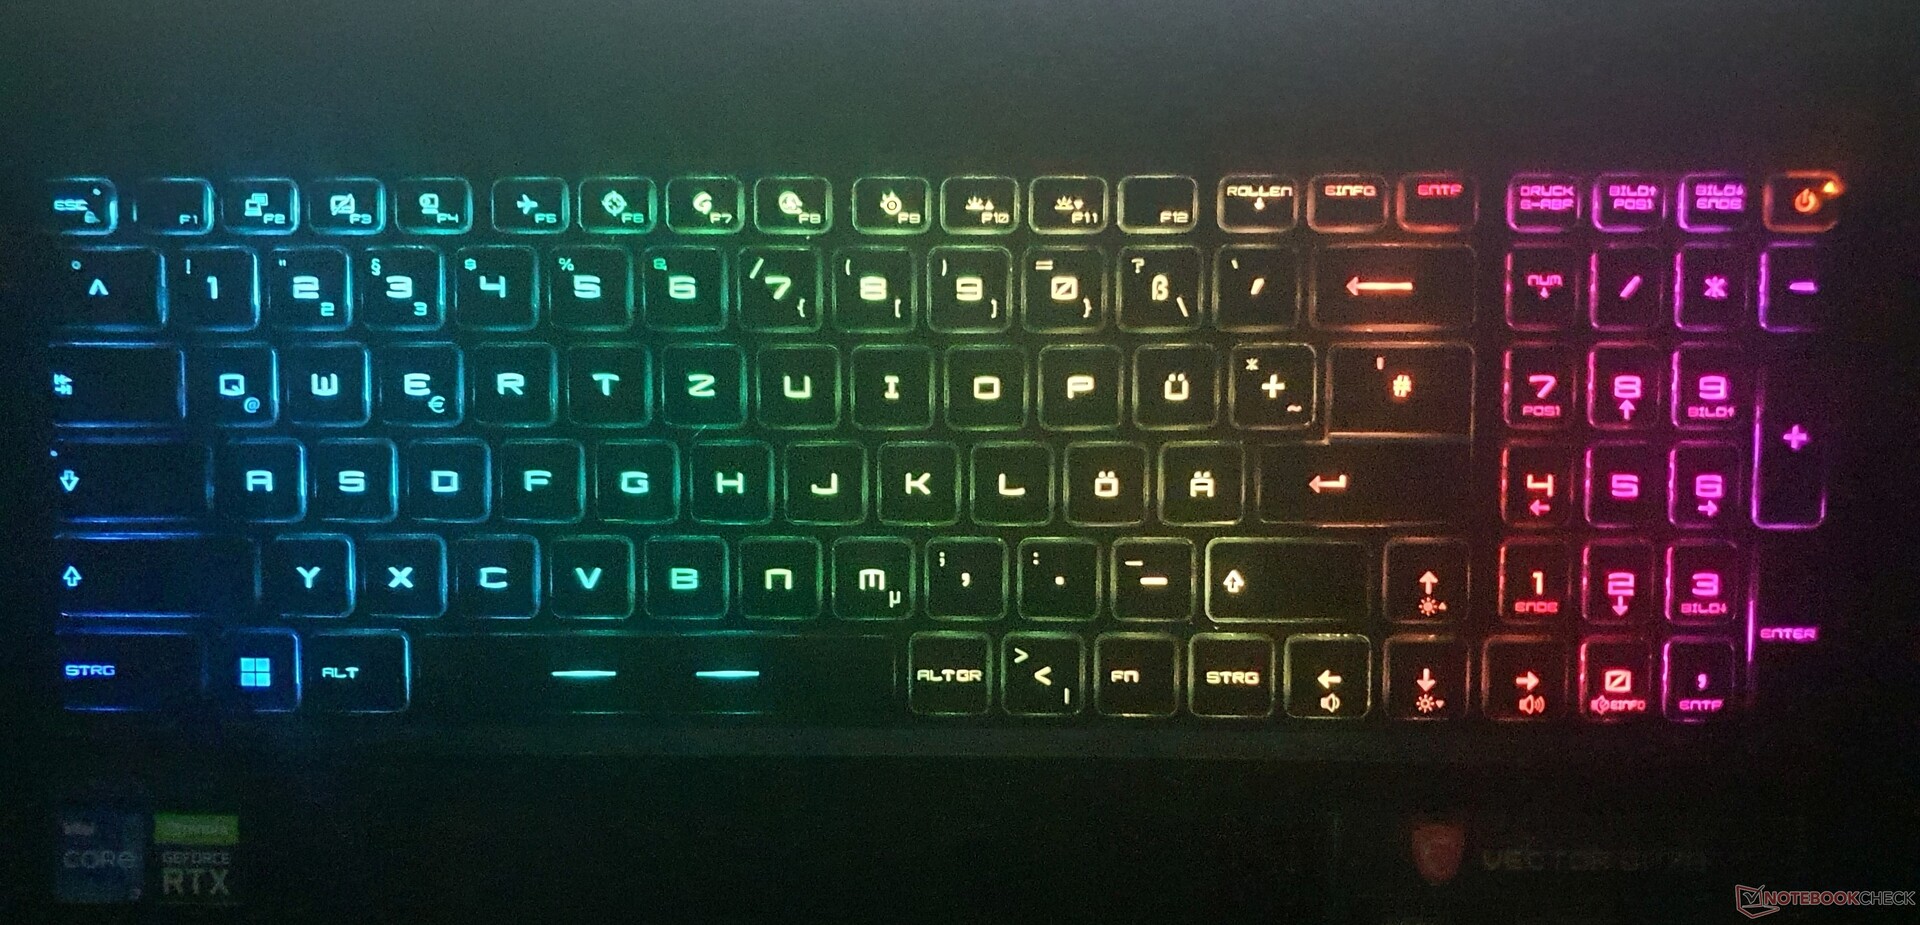
SteelSeries的键盘几代人都没有改变过,它的按键有点小,但抓地力强,压力点适中,行程中等。
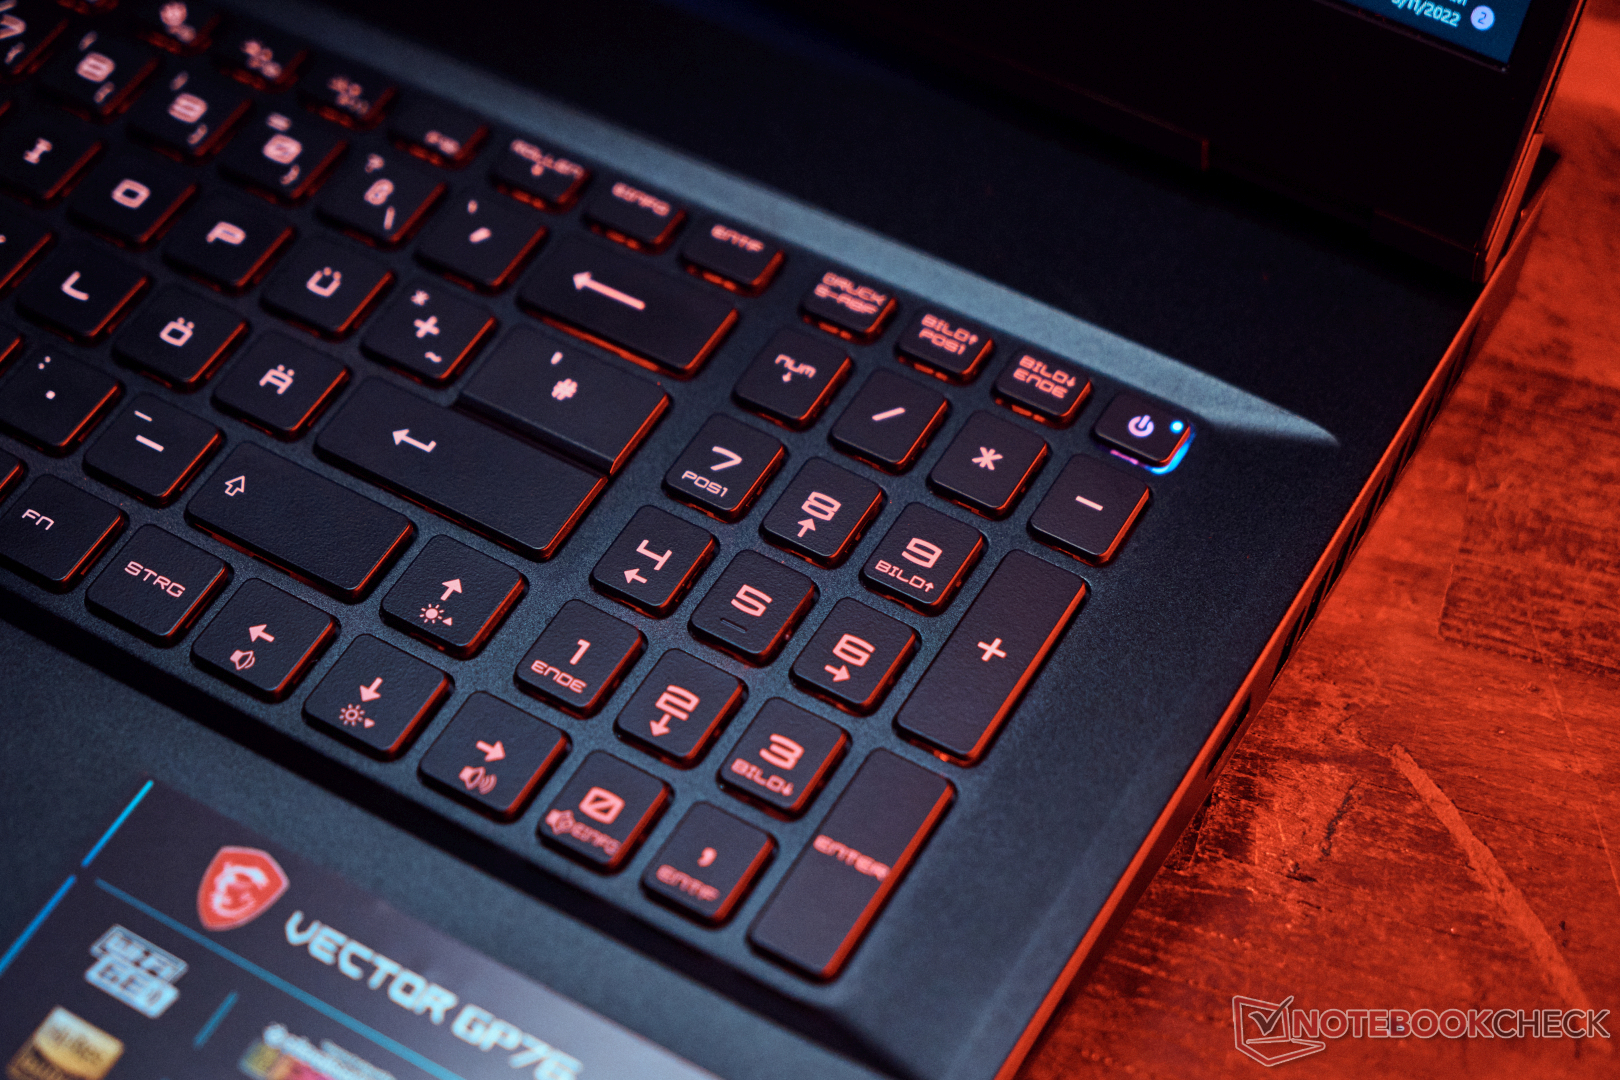
较长的文本可以毫无问题地书写,即使笔触有点软。关于布局,有几件事需要注意。与其他大多数按键一样,方向键的尺寸为15x15毫米,但回车键被分割开来,右边的Shift、数字块和F键则较小。因此,该键盘与美国市场的键盘相对应,有适应的DE标签。一些功能键也有双重功能。
一个优点是噪音水平低。由于有防鬼魂功能,最多可以同时敲击10个按键,并且可以使用 "SteelSeries Engine 3 "软件配置各个按键的背光。
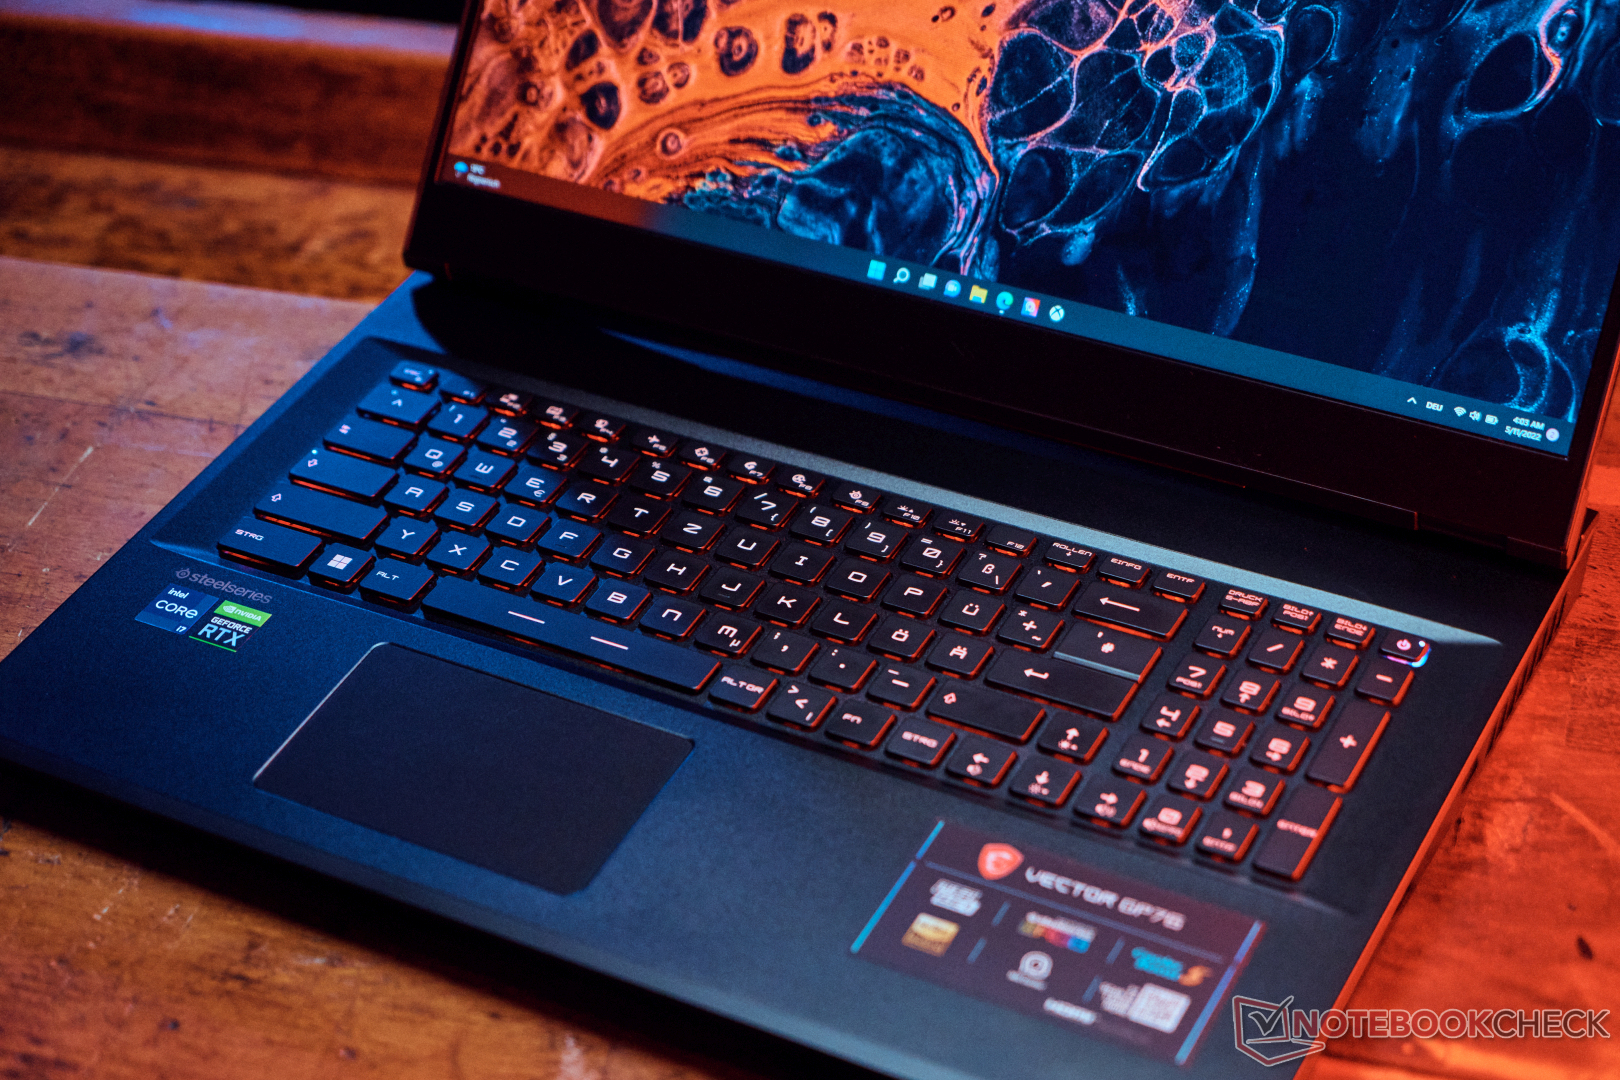
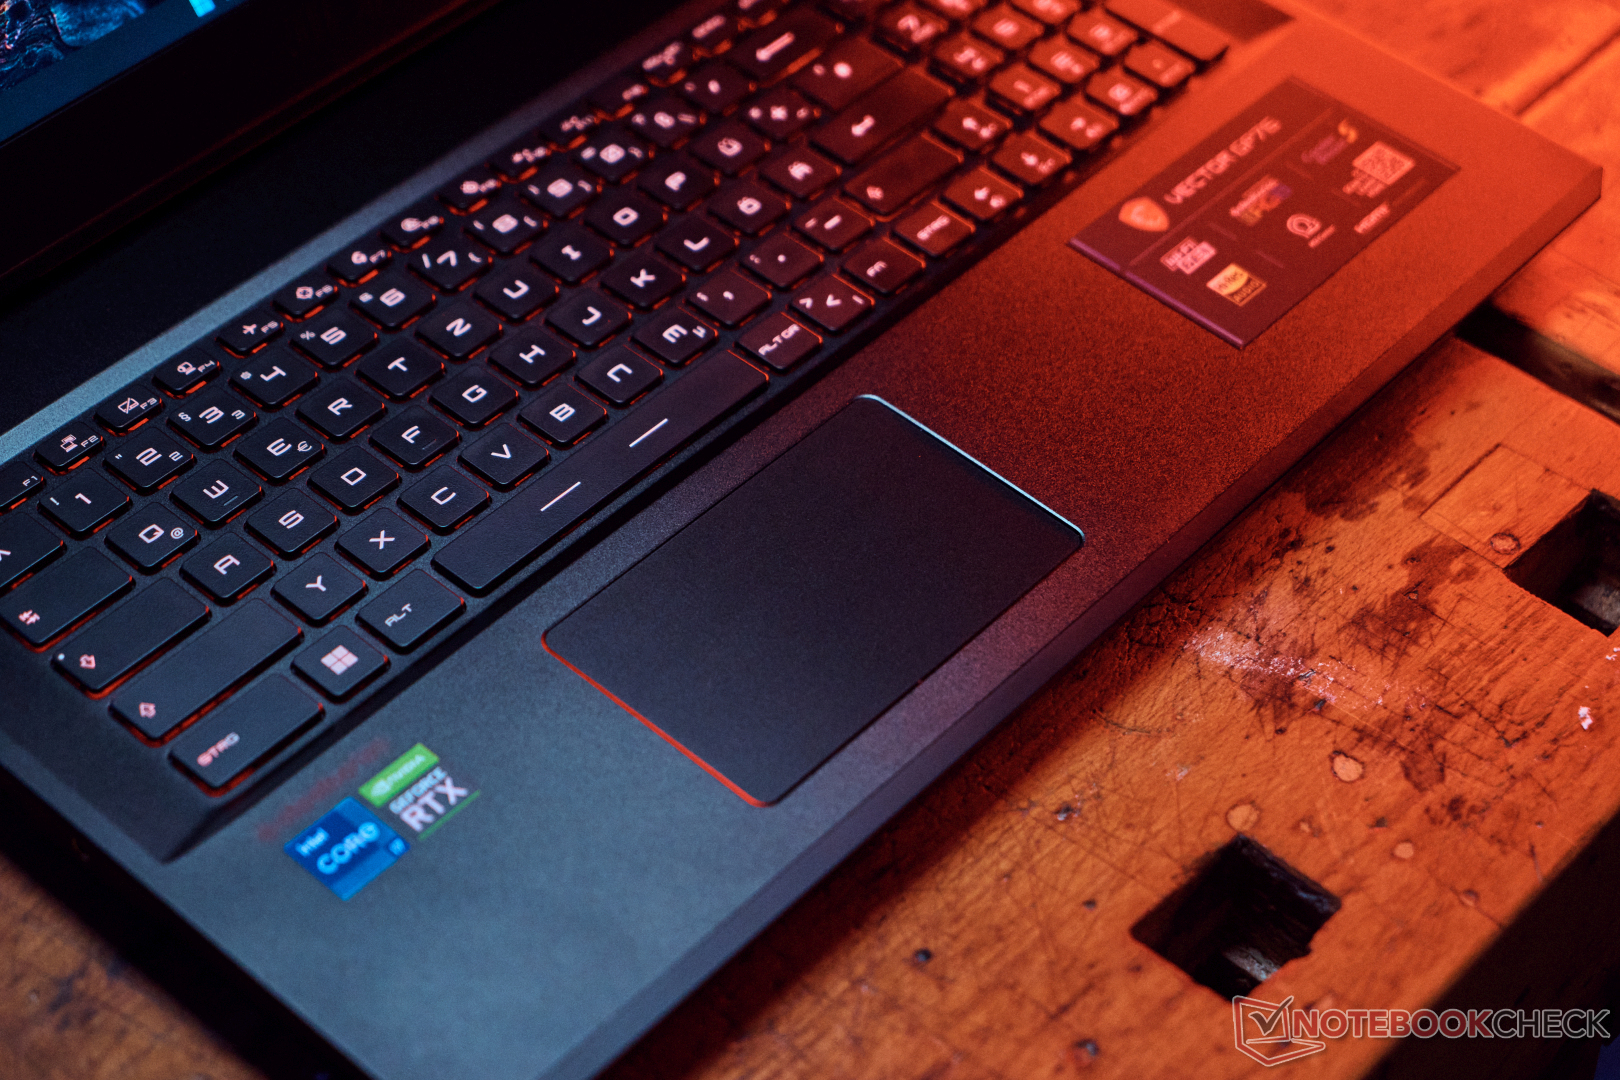
触摸板

触摸板的尺寸为10.5 x 6.5厘米,因此不是最大的,但滑行质量非常好,工作非常准确。然而,集成的点击按钮只能在很大的压力下发挥作用,而且不能提供最佳反馈。也就是说,市场上还有更糟糕的点击板。
显示。Vector GP76上的快速360赫兹和4ms灰度到灰度

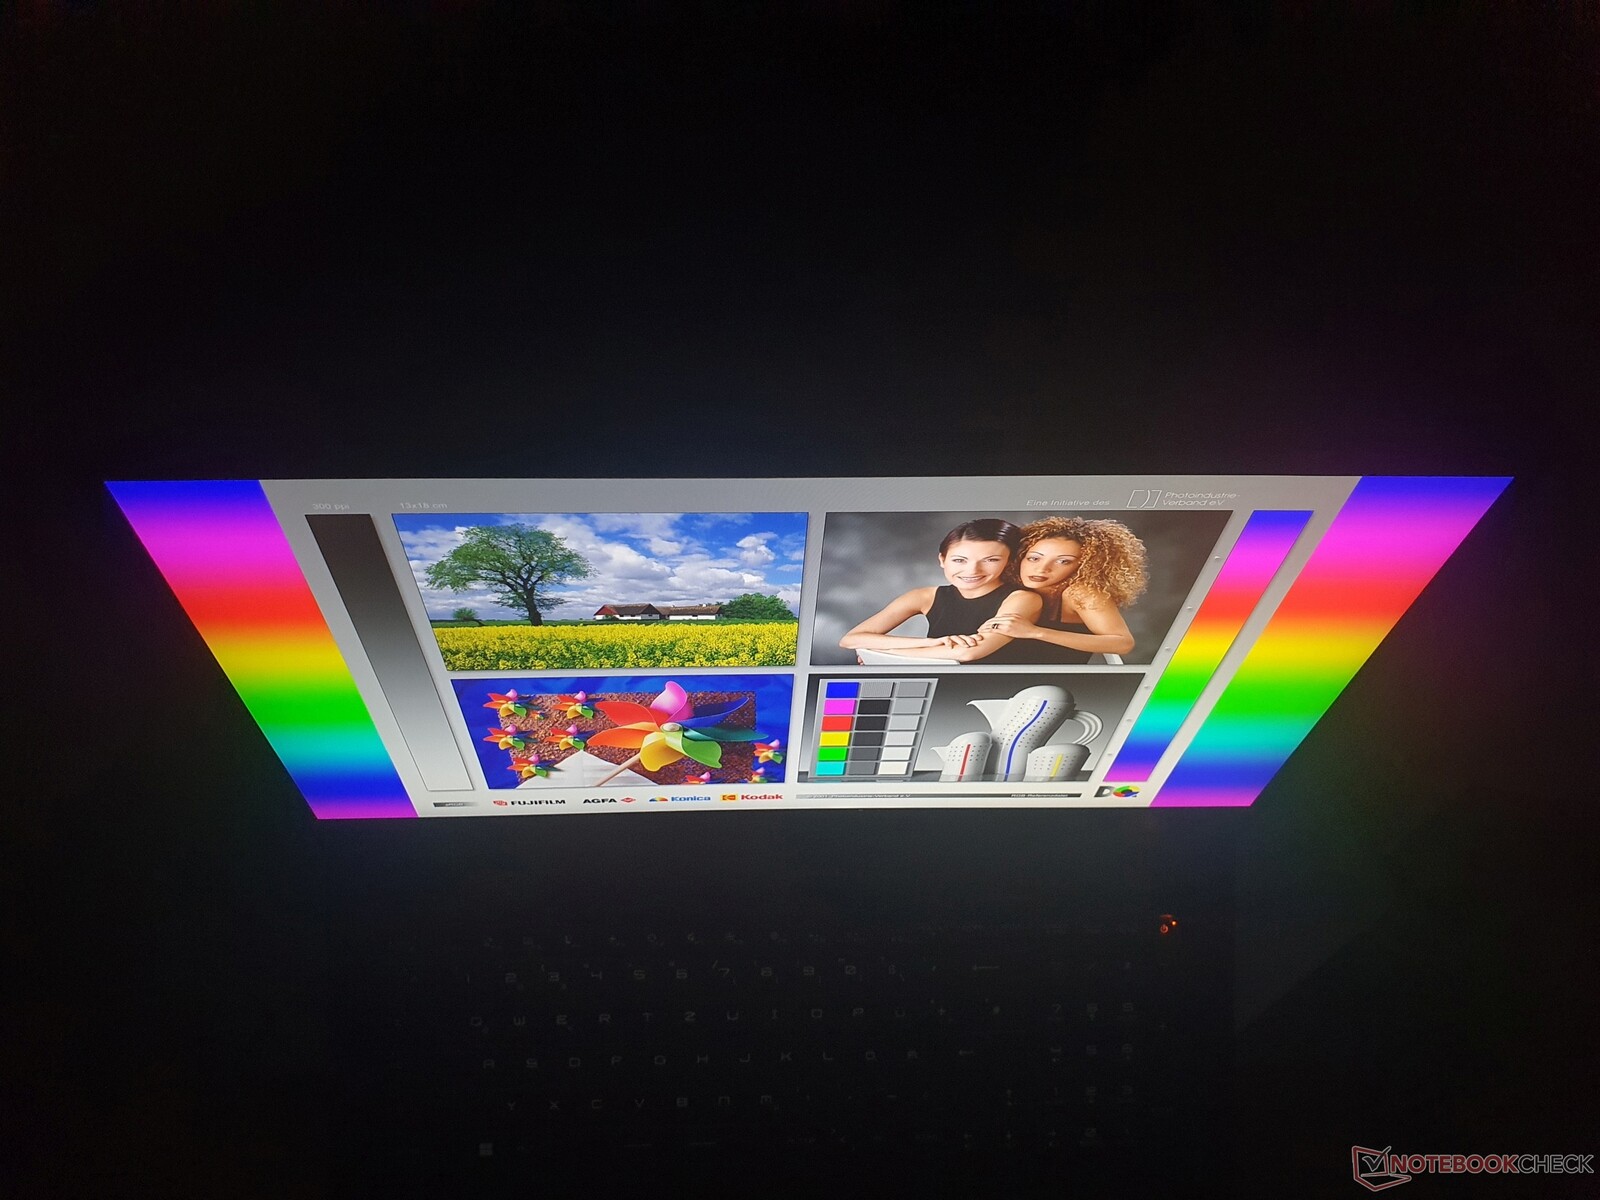
哑光的17.3英寸16:9格式的IPS显示屏提供了264cd/m²的平庸亮度,这证明对于室内使用是足够的。1920x1080(全高清)的分辨率是微星在Vector系列中提供的唯一分辨率,只要你不把鼻子贴在显示屏上,就会有足够的清晰度。图像也非常锐利和清晰,通过良好的子像素质量得到加强。
1,096:1的对比度是可以接受的,0.25的良好黑色值带来了丰富的黑色。虽然对比场一般都在一个类似的水平上,但较小的 Vector GP66(连同它自己的 前辈)甚至更亮,为324cd/m²。然而,Vector的 Legion 5个专业和 Zephyrus M16以不到500cd/m²的亮度超越了竞争对手,因此也适合在户外使用。
在响应时间方面,没有什么能与GP76竞争。除了360赫兹的超快刷新率外,灰色到灰色信号只需要4毫秒,黑色到白色仍然是非常好的8毫秒。竞争者的灰色到灰色的时间在15至27毫秒之间。总体而言,该面板符合适合游戏的高端规格。前代产品使用144赫兹面板。
然而,没有内部G-Sync。通过DisplayPort在外部显示器上支持自适应同步。没有检测到PWM闪烁。
| |||||||||||||||||||||||||
Brightness Distribution: 87 %
Center on Battery: 270 cd/m²
Contrast: 1096:1 (Black: 0.25 cd/m²)
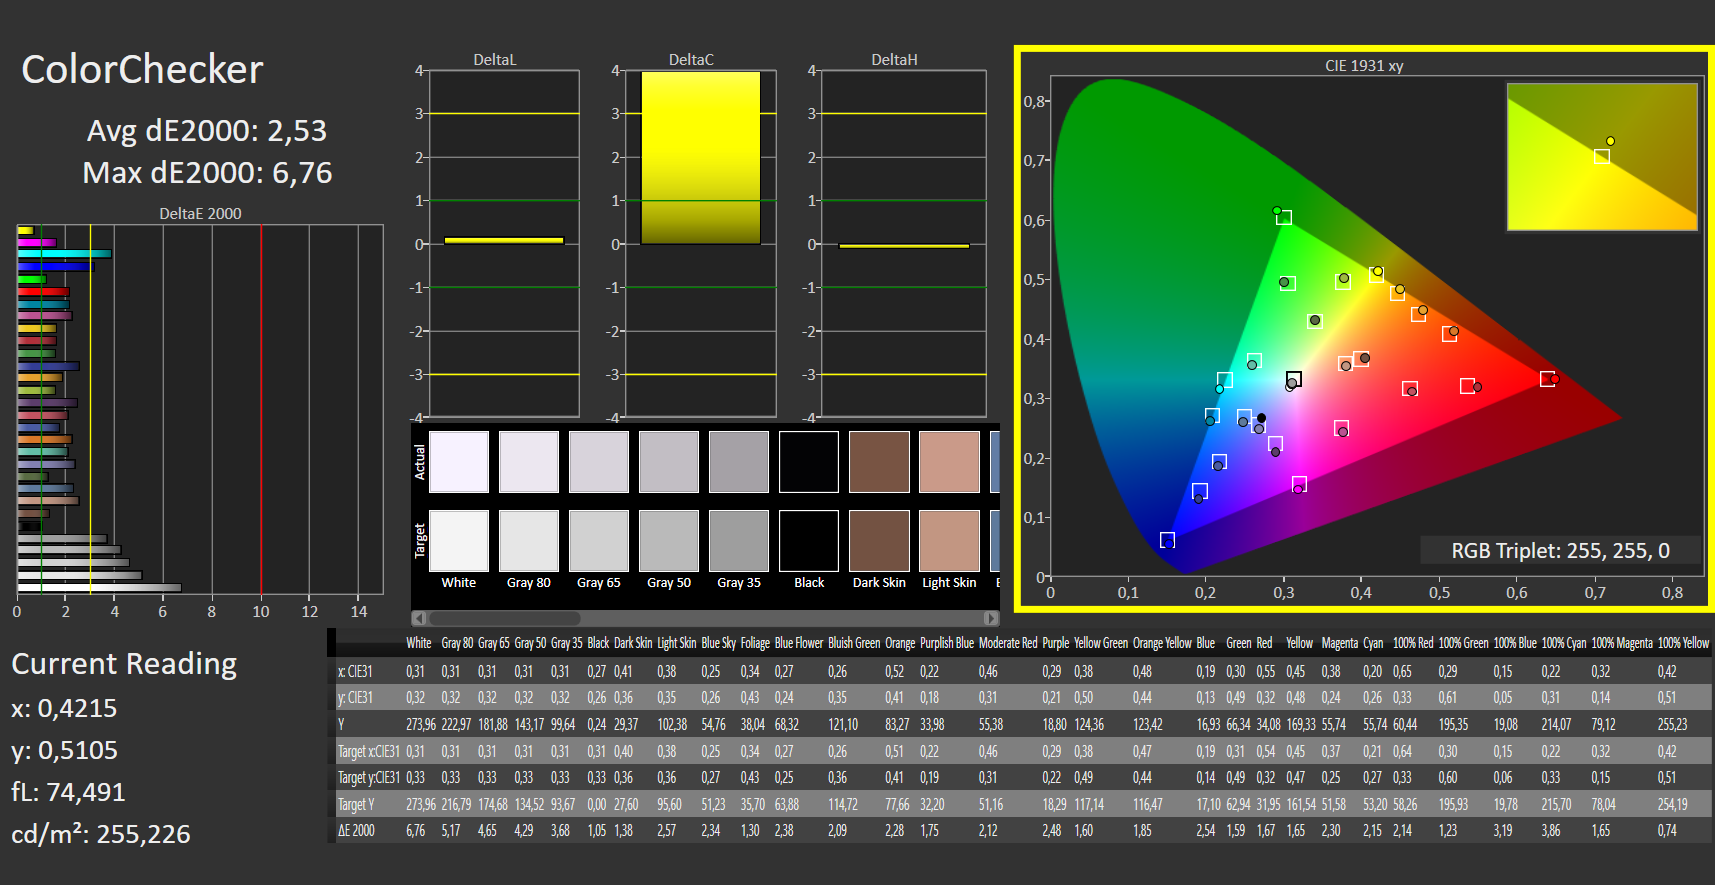
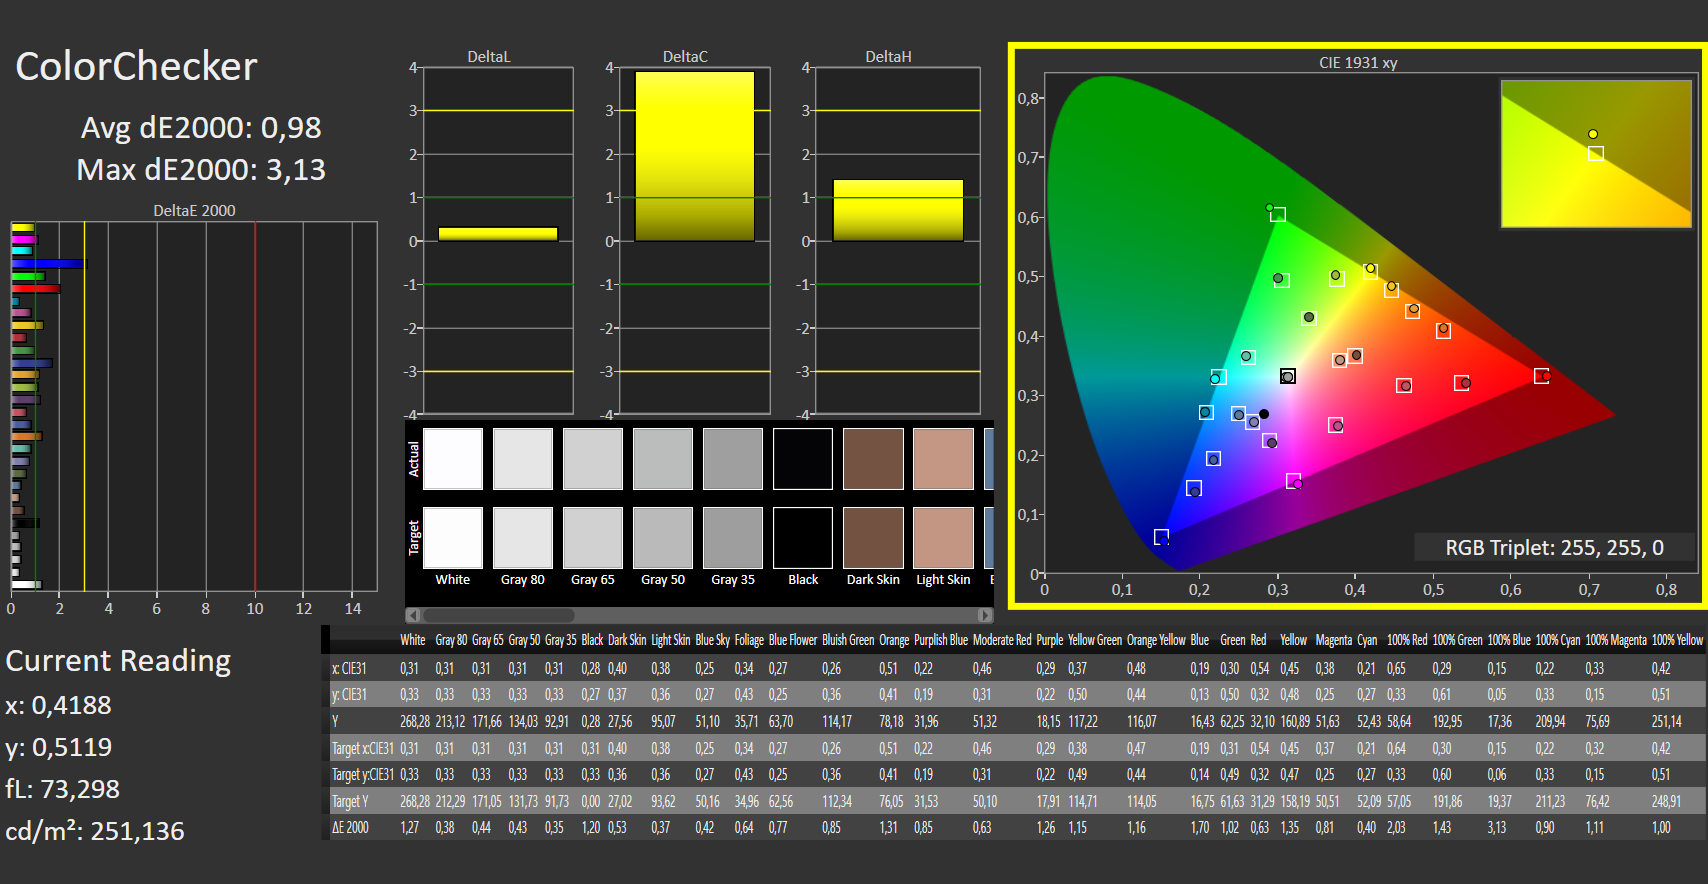
ΔE ColorChecker Calman: 2.53 | ∀{0.5-29.43 Ø4.71}
calibrated: 0.98
ΔE Greyscale Calman: 3.49 | ∀{0.09-98 Ø4.96}
70.91% AdobeRGB 1998 (Argyll 3D)
98.98% sRGB (Argyll 3D)
70.09% Display P3 (Argyll 3D)
Gamma: 2.31
CCT: 6714 K
| MSI Vector GP76 12UGS-434 AUO B173HAN05.4, IPS, 1920x1080, 17.3" | MSI GP76 Leopard 10UG Chi Mei CMN176E, IPS, 1920x1080, 17.3" | Asus ROG Strix G17 G713QE-RB74 AU Optronics B173HAN04.9, IPS, 1920x1080, 17.3" | Aorus 17 XE4 Sharp LQ173M1JW12, IPS, 1920x1080, 17.3" | Schenker XMG NEO 17 GM7TG8S BOE0977 (NE173QHM-NY2), IPS, 2560x1440, 17.3" | Lenovo Legion 5 Pro 16 G7 i7 RTX 3070Ti NE160QDM-NY1, IPS, 2560x1600, 16" | Asus ROG Zephyrus M16 GU603H AU Optronics AUOC199, IPS, 2560x1600, 16" | MSI Vector GP66 12UGS BOE NE156FHM-NZ3, IPS, 1920x1080, 15.6" | |
|---|---|---|---|---|---|---|---|---|
| Display | -6% | -41% | -1% | -3% | -1% | 1% | ||
| Display P3 Coverage (%) | 70.09 | 64.7 -8% | 40.2 -43% | 69 -2% | 67.1 -4% | 68.7 -2% | 70.1 0% | |
| sRGB Coverage (%) | 98.98 | 96.4 -3% | 60.3 -39% | 99.4 0% | 96.3 -3% | 97.6 -1% | 99.5 1% | |
| AdobeRGB 1998 Coverage (%) | 70.91 | 66.9 -6% | 41.6 -41% | 71.2 0% | 68.6 -3% | 70.9 0% | 72.1 2% | |
| Response Times | -60% | -355% | -160% | -145% | -168% | 3% | -33% | |
| Response Time Grey 50% / Grey 80% * (ms) | 4 ? | 7.4 ? -85% | 26.8 ? -570% | 15.2 ? -280% | 15.2 -280% | 17.6 ? -340% | 4.8 ? -20% | 5.8 ? -45% |
| Response Time Black / White * (ms) | 8 ? | 10.8 ? -35% | 19.2 ? -140% | 11.2 ? -40% | 8.8 -10% | 7.6 ? 5% | 6 ? 25% | 9.6 ? -20% |
| PWM Frequency (Hz) | 24510 ? | |||||||
| Screen | 14% | -30% | 8% | 11% | 17% | -19% | 0% | |
| Brightness middle (cd/m²) | 274 | 328 20% | 270.5 -1% | 274 0% | 396 45% | 502 83% | 448 64% | 353.1 29% |
| Brightness (cd/m²) | 264 | 314 19% | 269 2% | 267 1% | 366 39% | 491 86% | 446 69% | 325 23% |
| Brightness Distribution (%) | 87 | 87 0% | 92 6% | 82 -6% | 82 -6% | 91 5% | 86 -1% | 85 -2% |
| Black Level * (cd/m²) | 0.25 | 0.29 -16% | 0.19 24% | 0.25 -0% | 0.45 -80% | 0.37 -48% | 0.48 -92% | 0.38 -52% |
| Contrast (:1) | 1096 | 1131 3% | 1424 30% | 1096 0% | 880 -20% | 1357 24% | 933 -15% | 929 -15% |
| Colorchecker dE 2000 * | 2.53 | 1.93 24% | 4.39 -74% | 2.07 18% | 1.43 43% | 2.7 -7% | 2.76 -9% | 2.24 11% |
| Colorchecker dE 2000 max. * | 6.76 | 4.94 27% | 20.8 -208% | 4.89 28% | 2.2 67% | 4.5 33% | 7.09 -5% | 5 26% |
| Colorchecker dE 2000 calibrated * | 0.98 | 0.68 31% | 1.56 -59% | 0.83 15% | 1.34 -37% | 1.4 -43% | 2.86 -192% | 1.02 -4% |
| Greyscale dE 2000 * | 3.49 | 2.8 20% | 3.1 11% | 3 14% | 1.8 48% | 2.7 23% | 3.1 11% | 4 -15% |
| Gamma | 2.31 95% | 2.18 101% | 2.14 103% | 2.207 100% | 2.4 92% | 2.44 90% | 2.153 102% | 2.24 98% |
| CCT | 6714 97% | 7023 93% | 6927 94% | 6999 93% | 6489 100% | 6326 103% | 6826 95% | 6864 95% |
| Color Space (Percent of AdobeRGB 1998) (%) | 67 | 87 | ||||||
| Color Space (Percent of sRGB) (%) | 89 | 100 | ||||||
| Total Average (Program / Settings) | -17% /
-1% | -142% /
-79% | -51% /
-18% | -46% /
-14% | -51% /
-13% | -8% /
-15% | -11% /
-4% |
* ... smaller is better
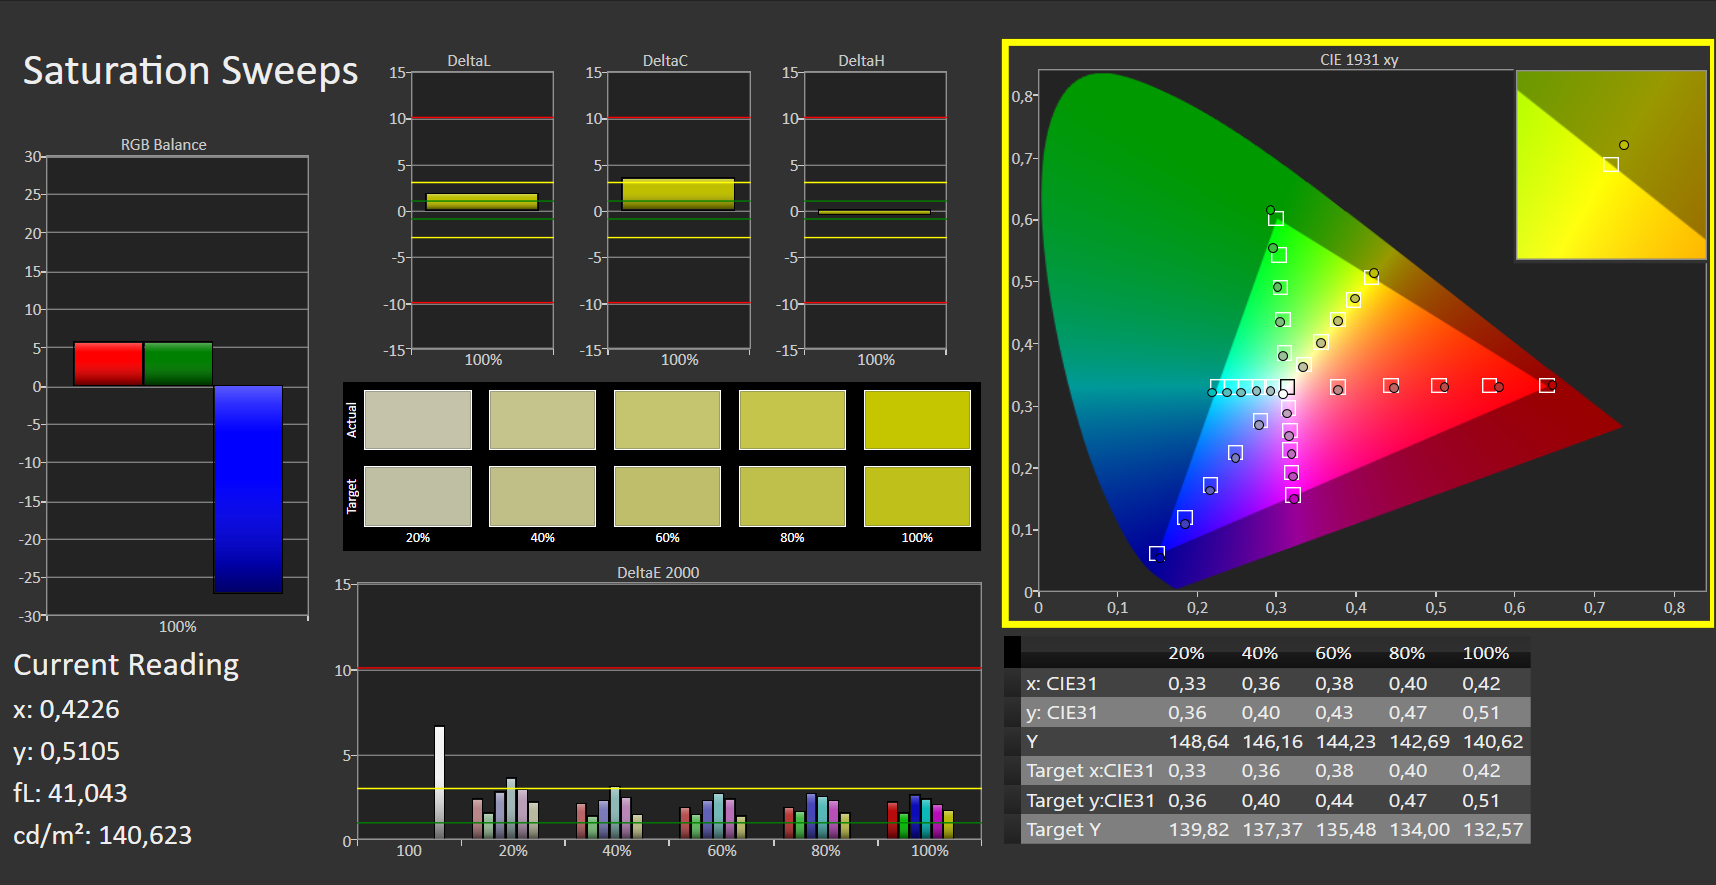
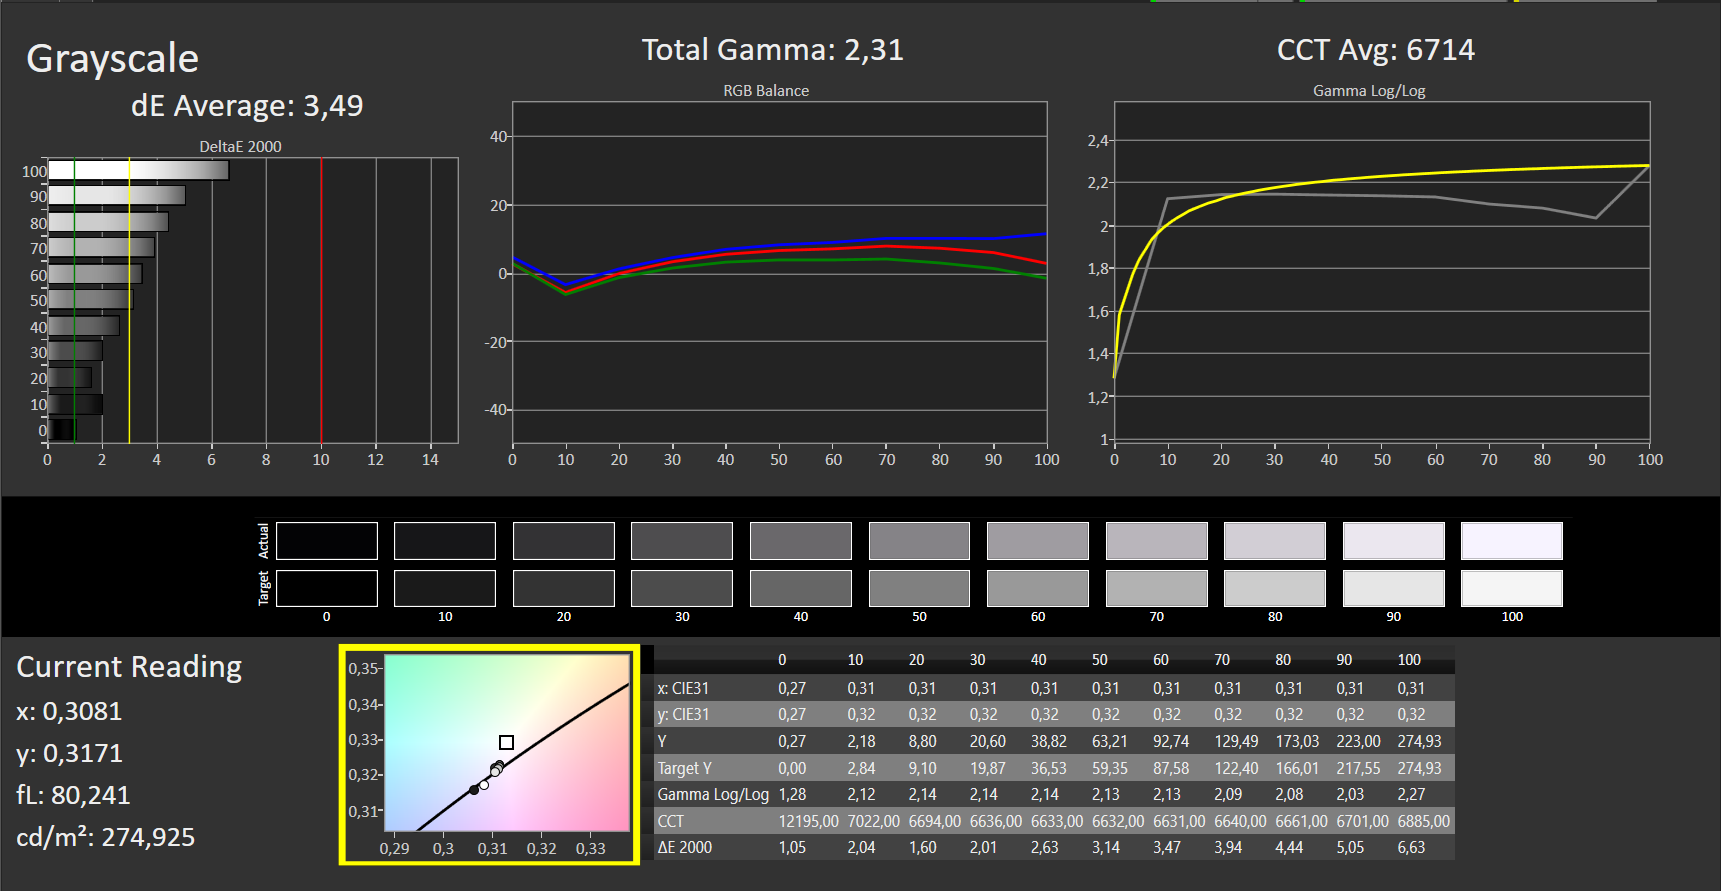
sRGB色彩范围覆盖得非常好,略低于99%。对于DCI-P3和AdobeRGB来说,这是70%至71%,这对于这个级别的笔记本电脑来说是足够的。DeltaE值为2.54,略高于2的阈值,因此与竞争产品基本一致。
校准改善了这些数值,但对代表度略低的蓝色只能稍作优化。主观色彩感觉也证明了相对不掺假的色调,它显得非常丰富,但不是特别过饱和。校准的ICC文件可以在覆盖率图旁边的窗口中下载。
Display Response Times
| ↔ Response Time Black to White | ||
|---|---|---|
| 8 ms ... rise ↗ and fall ↘ combined | ↗ 4 ms rise |  |
| ↘ 4 ms fall | ||
| The screen shows fast response rates in our tests and should be suited for gaming. In comparison, all tested devices range from 0.1 (minimum) to 240 (maximum) ms. » 22 % of all devices are better. This means that the measured response time is better than the average of all tested devices (19.8 ms). | ||
| ↔ Response Time 50% Grey to 80% Grey | ||
| 4 ms ... rise ↗ and fall ↘ combined | ↗ 1 ms rise |  |
| ↘ 3 ms fall | ||
| The screen shows very fast response rates in our tests and should be very well suited for fast-paced gaming. In comparison, all tested devices range from 0.165 (minimum) to 636 (maximum) ms. » 15 % of all devices are better. This means that the measured response time is better than the average of all tested devices (31 ms). | ||
Screen Flickering / PWM (Pulse-Width Modulation)
| Screen flickering / PWM not detected |  | ||
In comparison: 52 % of all tested devices do not use PWM to dim the display. If PWM was detected, an average of 7754 (minimum: 5 - maximum: 343500) Hz was measured. | |||
如果你想在新鲜空气中享受游戏,你必须在阴凉处进行。在264cd/m²的亮度下,即使使用哑光屏幕,也不可能在亭子下举行超过局域网聚会。
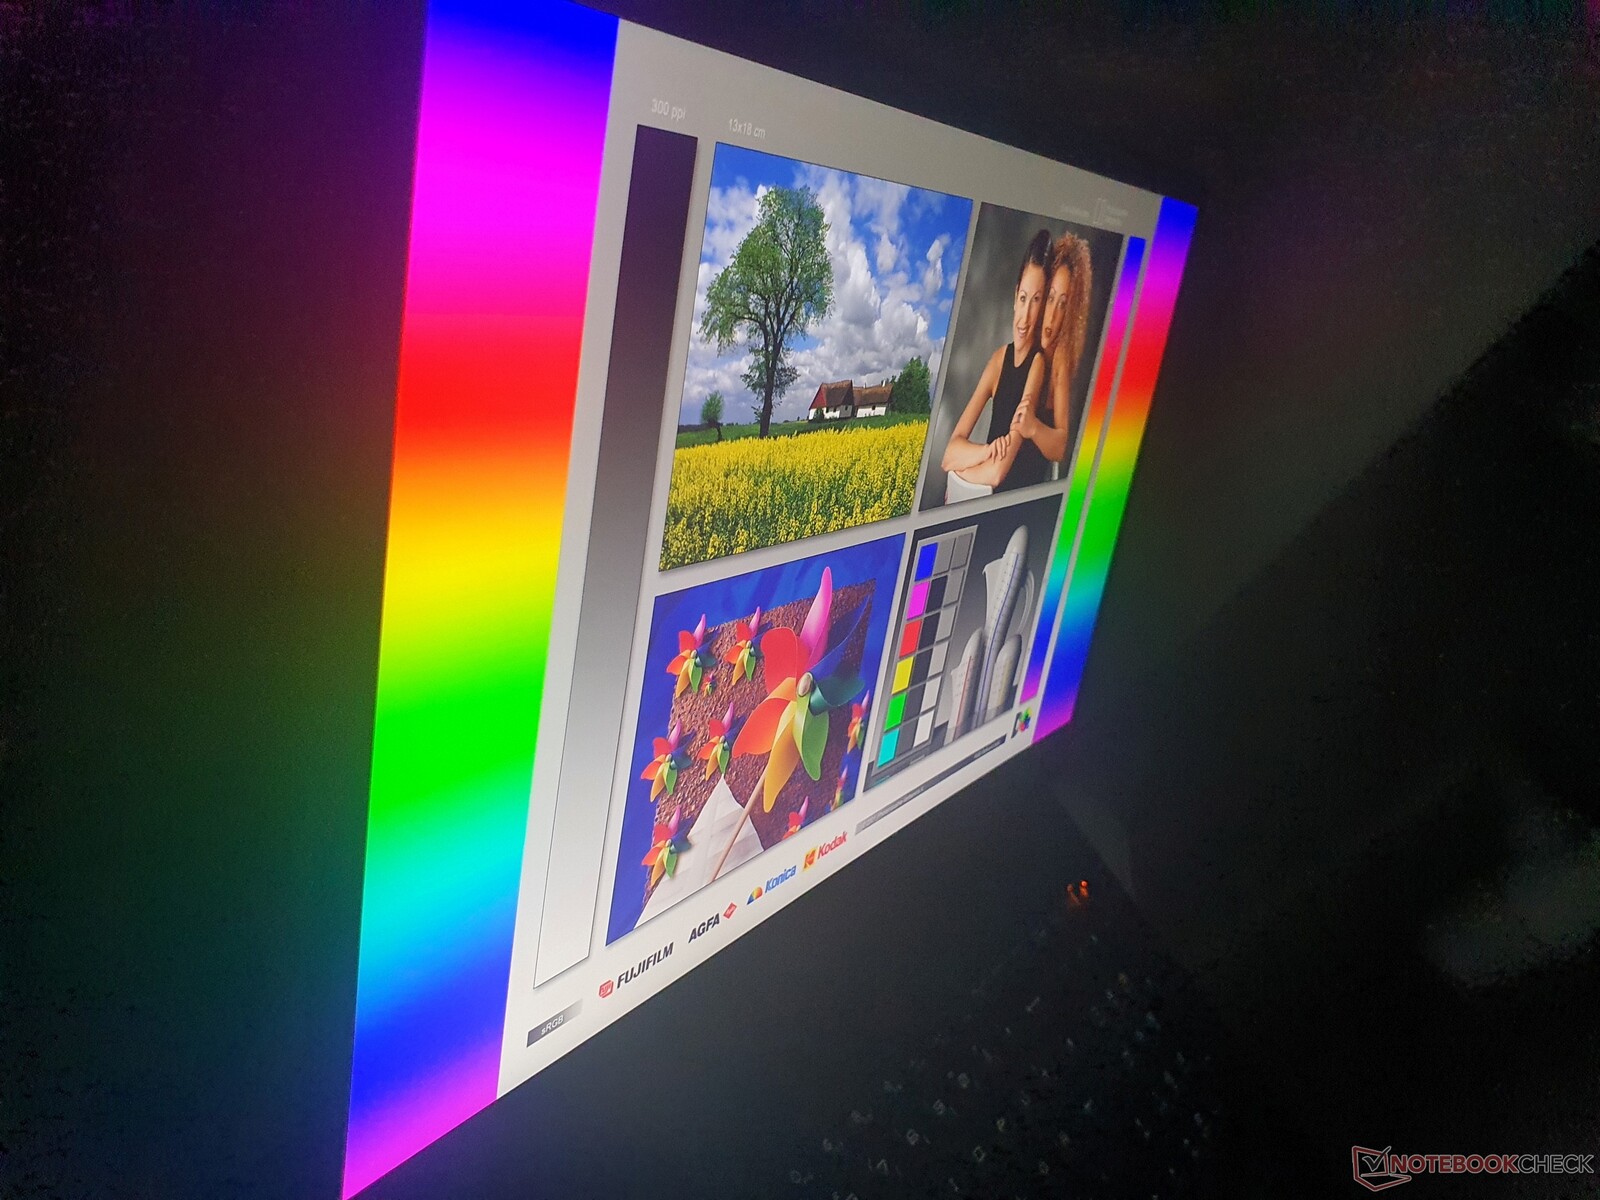
每个IPS显示屏的可视角度都很好,包括我们的测试模型。这里没有任何愿望没有得到满足。例如,OLED可以提供更好的视角稳定性。
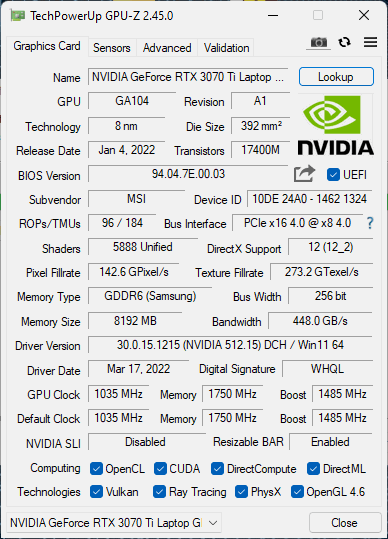
性能。微星将GeForce RTX 3070 Ti的性能提升到极致
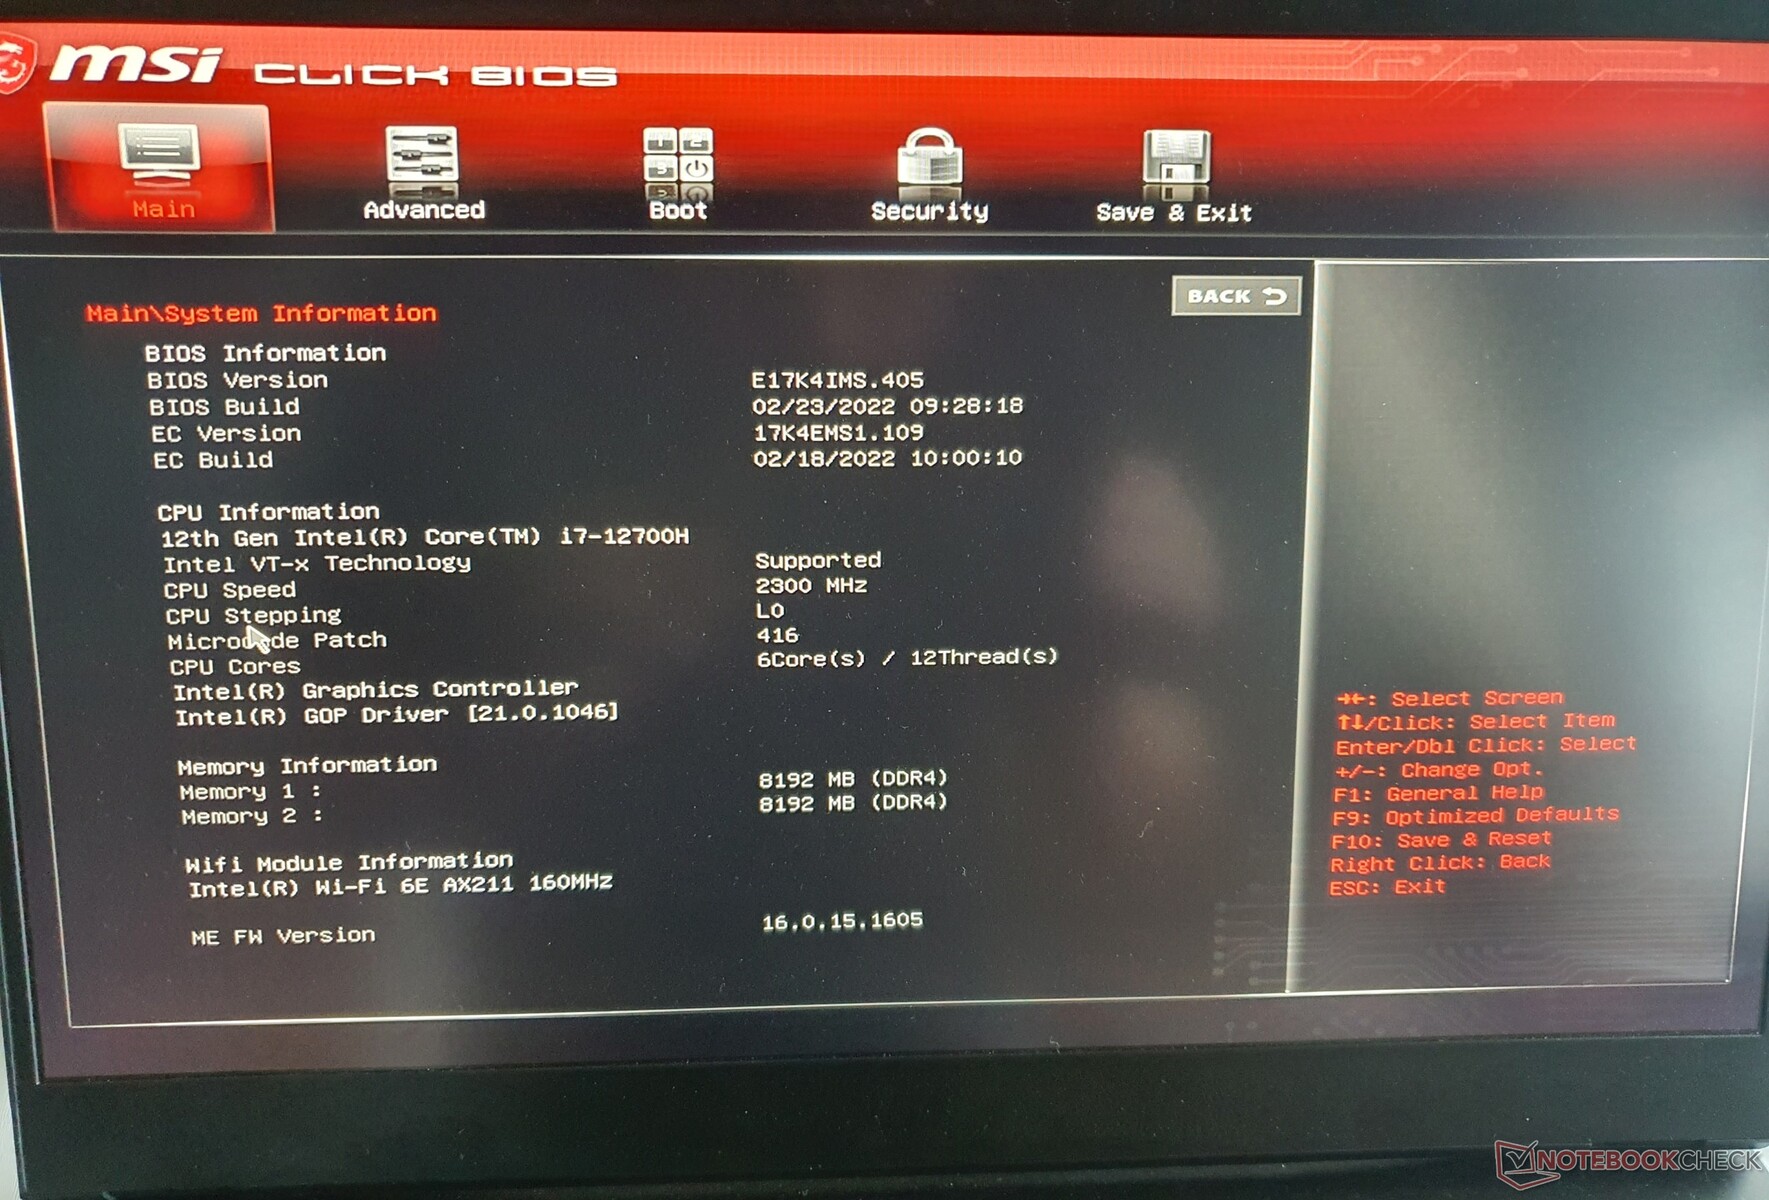
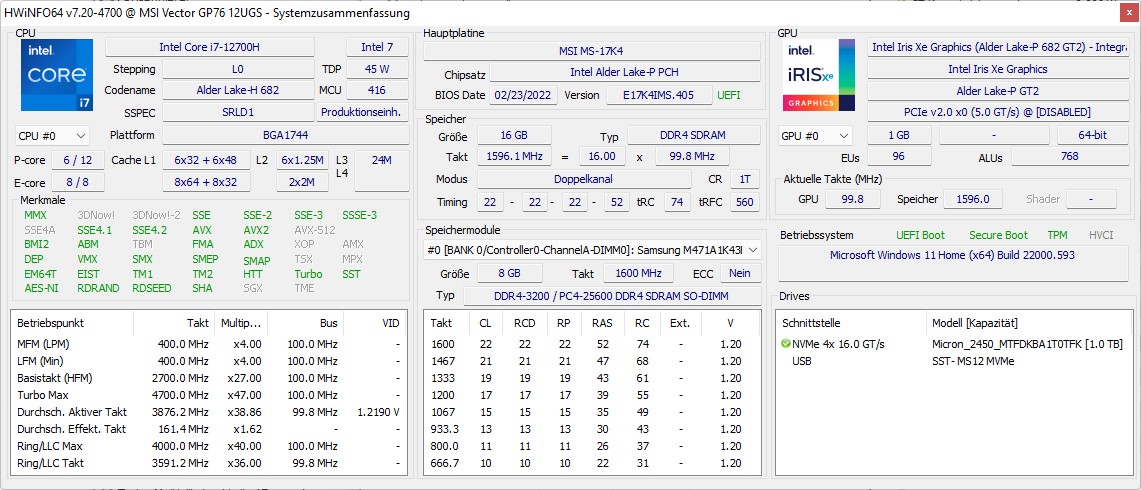
在CPU方面,感兴趣的买家可以在以下几个方面做出决定酷睿i7-12700H或英特尔 i9-12900HK.在图形方面,只有 Nvidia RTX 3070 Ti(150 W)和 RTX 3080(非Ti,165 W)。内存出厂时总是2个8GB DDR4-3200(世界其他地区是2个16GB)。
速度约为25%的DDR5内存(见下文:AIDA比较表)是为微星的高端等级保留的。然而,这对游戏和专业图形应用没有负面影响,Vector GP76就是为这些应用而设计的。另外,标准配置是一个1TB PCIe4x4固态硬盘,其性能测试见下文。
测试条件
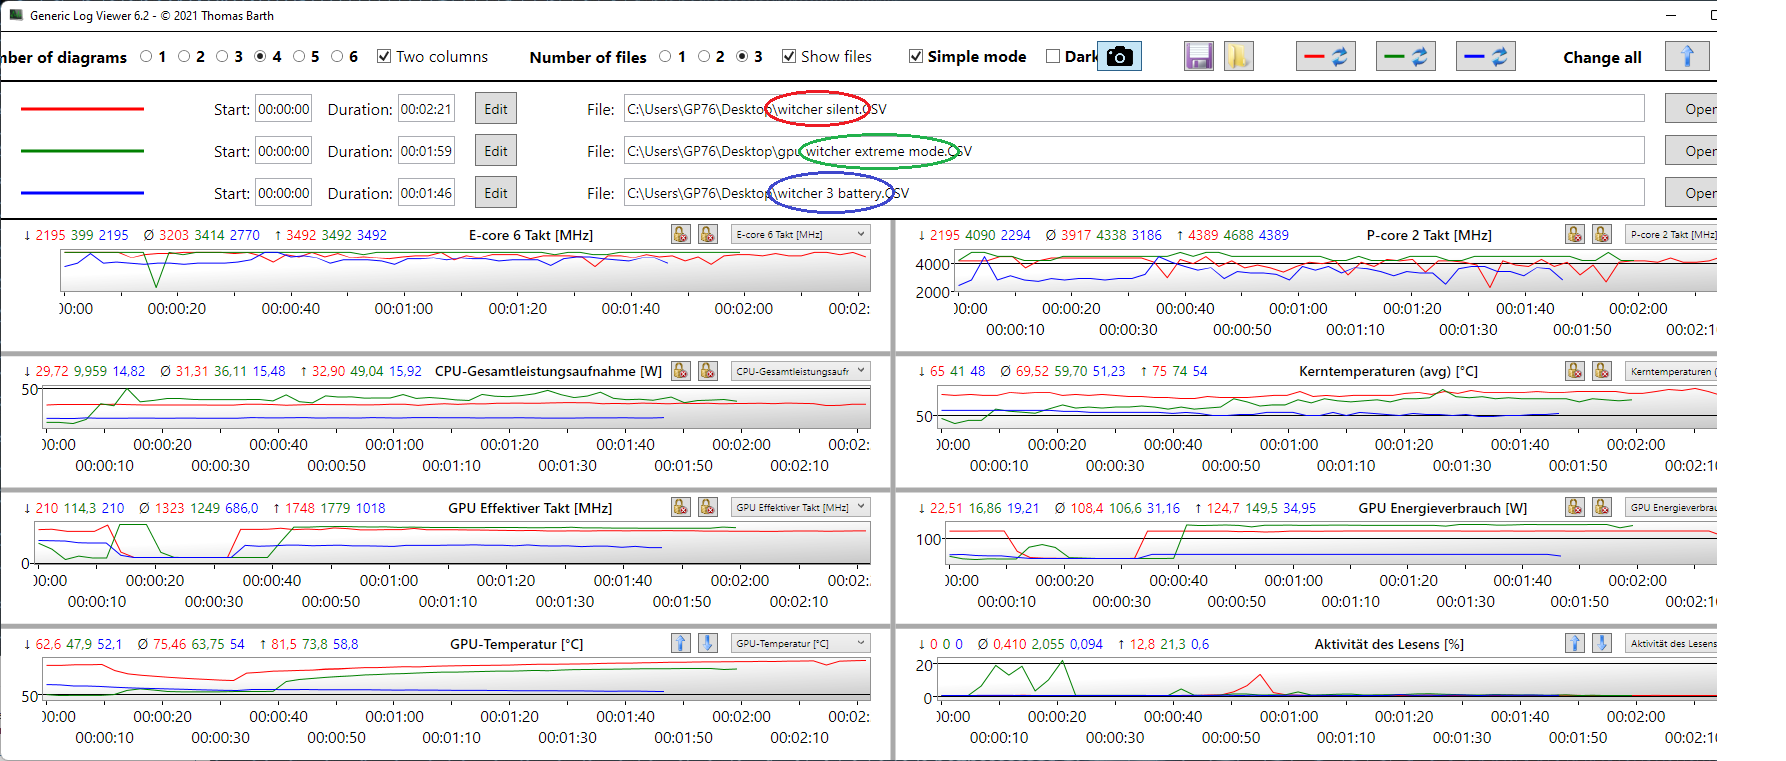
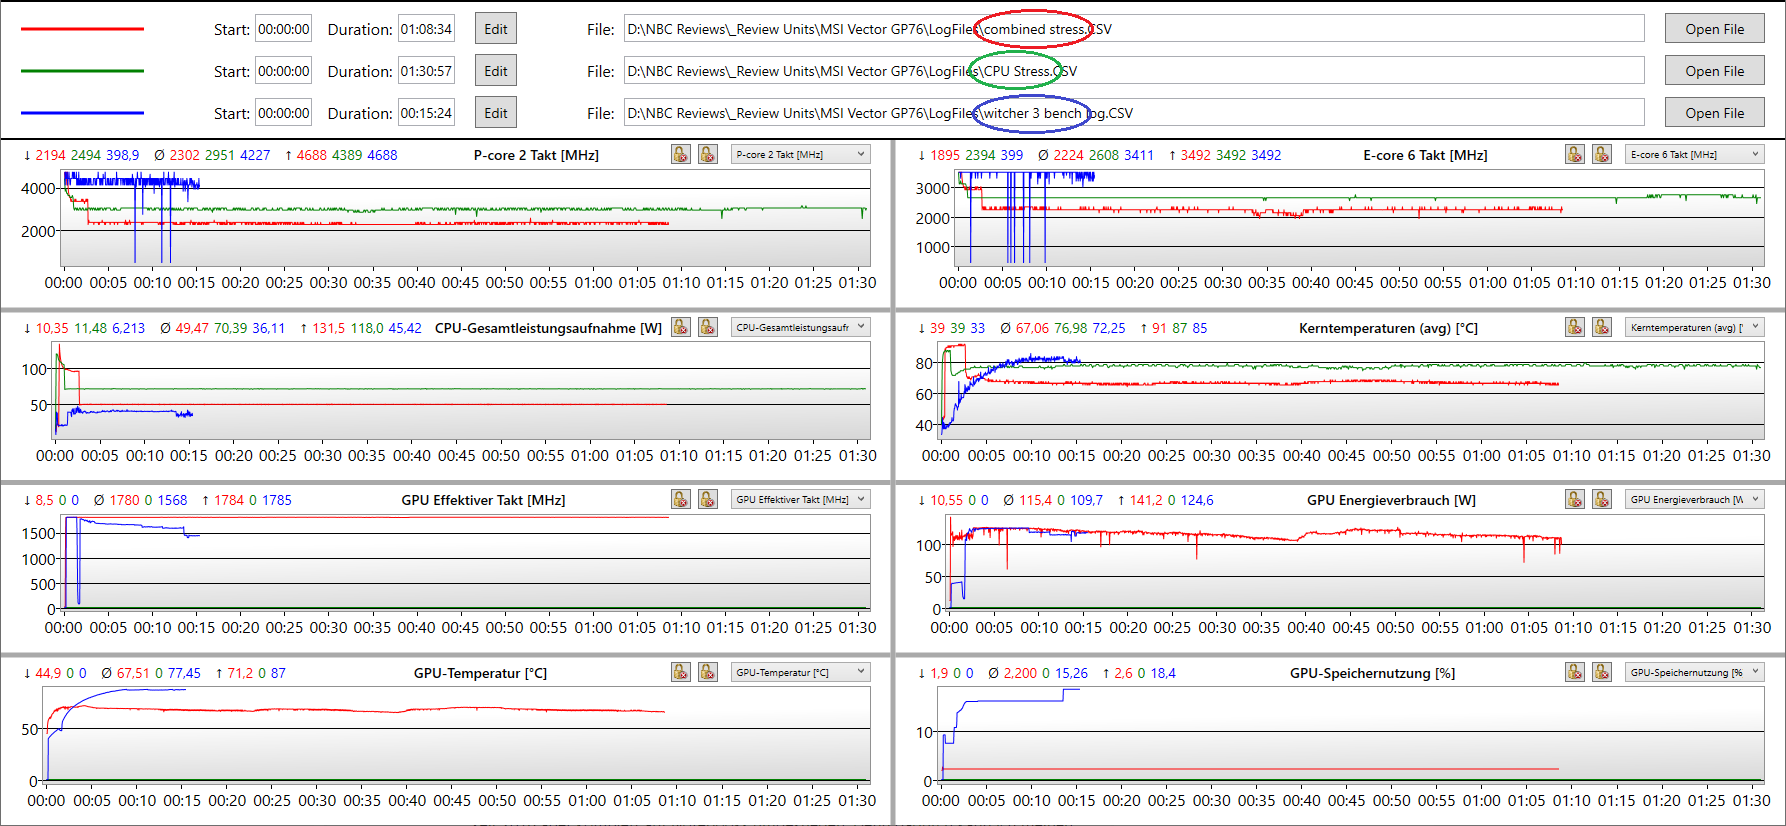
我们首先在自动模式下测试了MSI Vector GP76。当然,我们也测试了极限性能模式下的性能,但在中间我们遇到了风扇控制的以下问题。
即使在满负荷的情况下,风扇也只能以很低的速度运转,这导致了系统过热,随之而来的是严重的节流,甚至到了系统无法使用的地步。我们已经熟悉微星游戏笔记本的这个错误,之前通过BIOS和EC更新解决了这个问题。
由于此时我们已经使用了最新的BIOS,我们能够通过按两次 "涡轮风扇 "按钮来暂时解决这个问题,但过了一会儿又出现了这个问题,所以我们无法在极限性能模式下完成测试。
然而,该模式对纯粹的CPU性能没有影响,而在游戏中则可以多出大约7%的性能。Witcher 3 和PCMark 10仍然能够在极限性能模式下运行。你也可以看看我们最近评测的微星Vector GP66 ,它在Extreme Performance模式下进行了全面测试,产生了非常相似的数值。GPU基准测试也是在独立GPU模式下进行的。
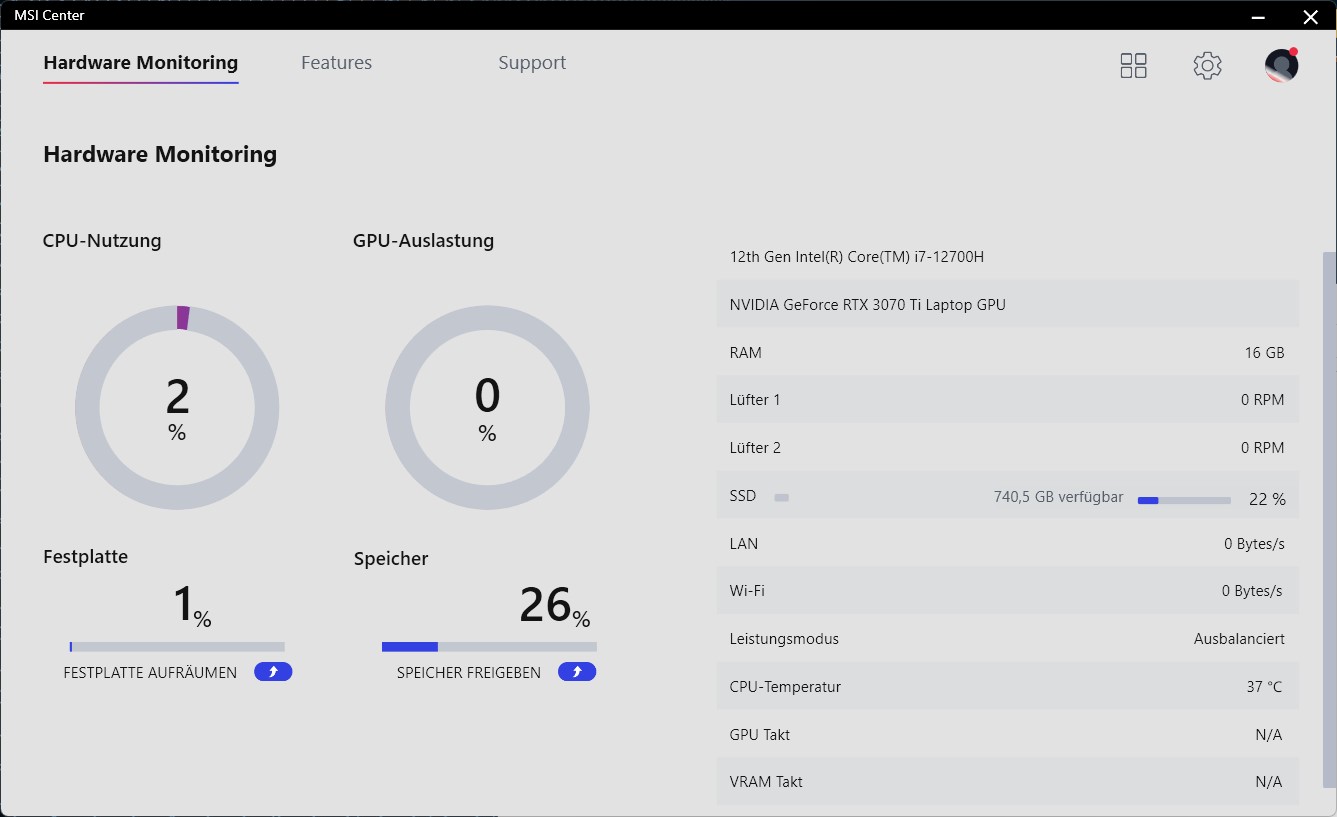
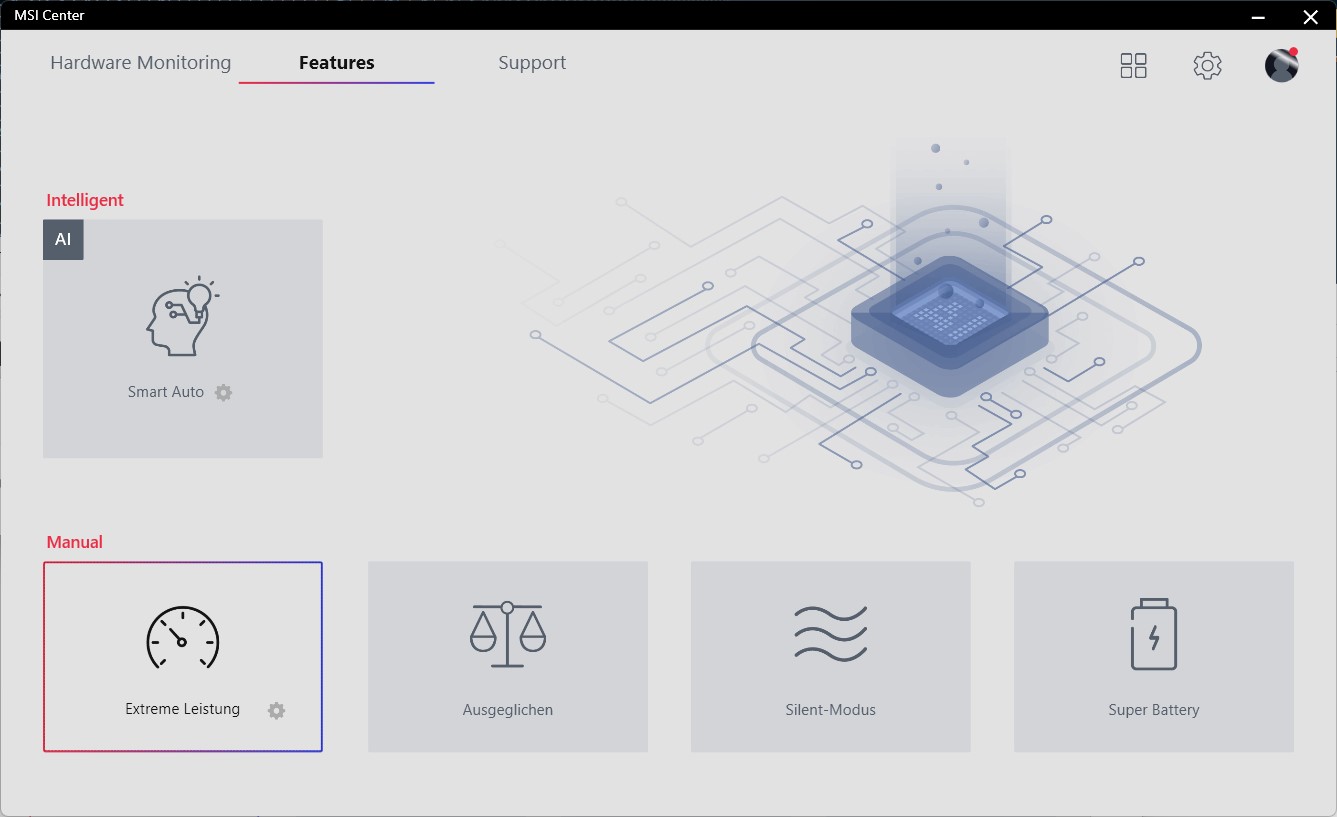
微星中心。
微星中心除了四个 "极限性能"、"平衡"、"静音 "和 "超级电池 "模式外,还提供了一些设置,例如MUX开关和一个允许在电池模式下切换到60赫兹刷新率的功能,以节省能源。
| 静音模式 | 自动模式 | 极限功能。 | 电池 | |
|---|---|---|---|---|
| CPU-Last | 30 Watt | 45 Watt | 70 Watt | 15 Watt |
| GPU-Last | 125瓦特 | 125瓦特 | 150瓦特 | 35瓦特 |
| Stresstest | CPU:30 瓦 | CPU:50 Watt | CPU:70瓦特 | |
| GPU。35 Watt | GPU:120 Watt | GPU:150瓦 |
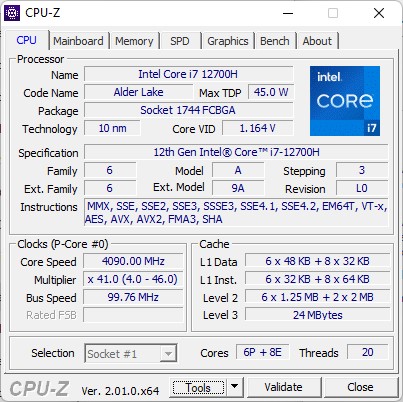
处理器
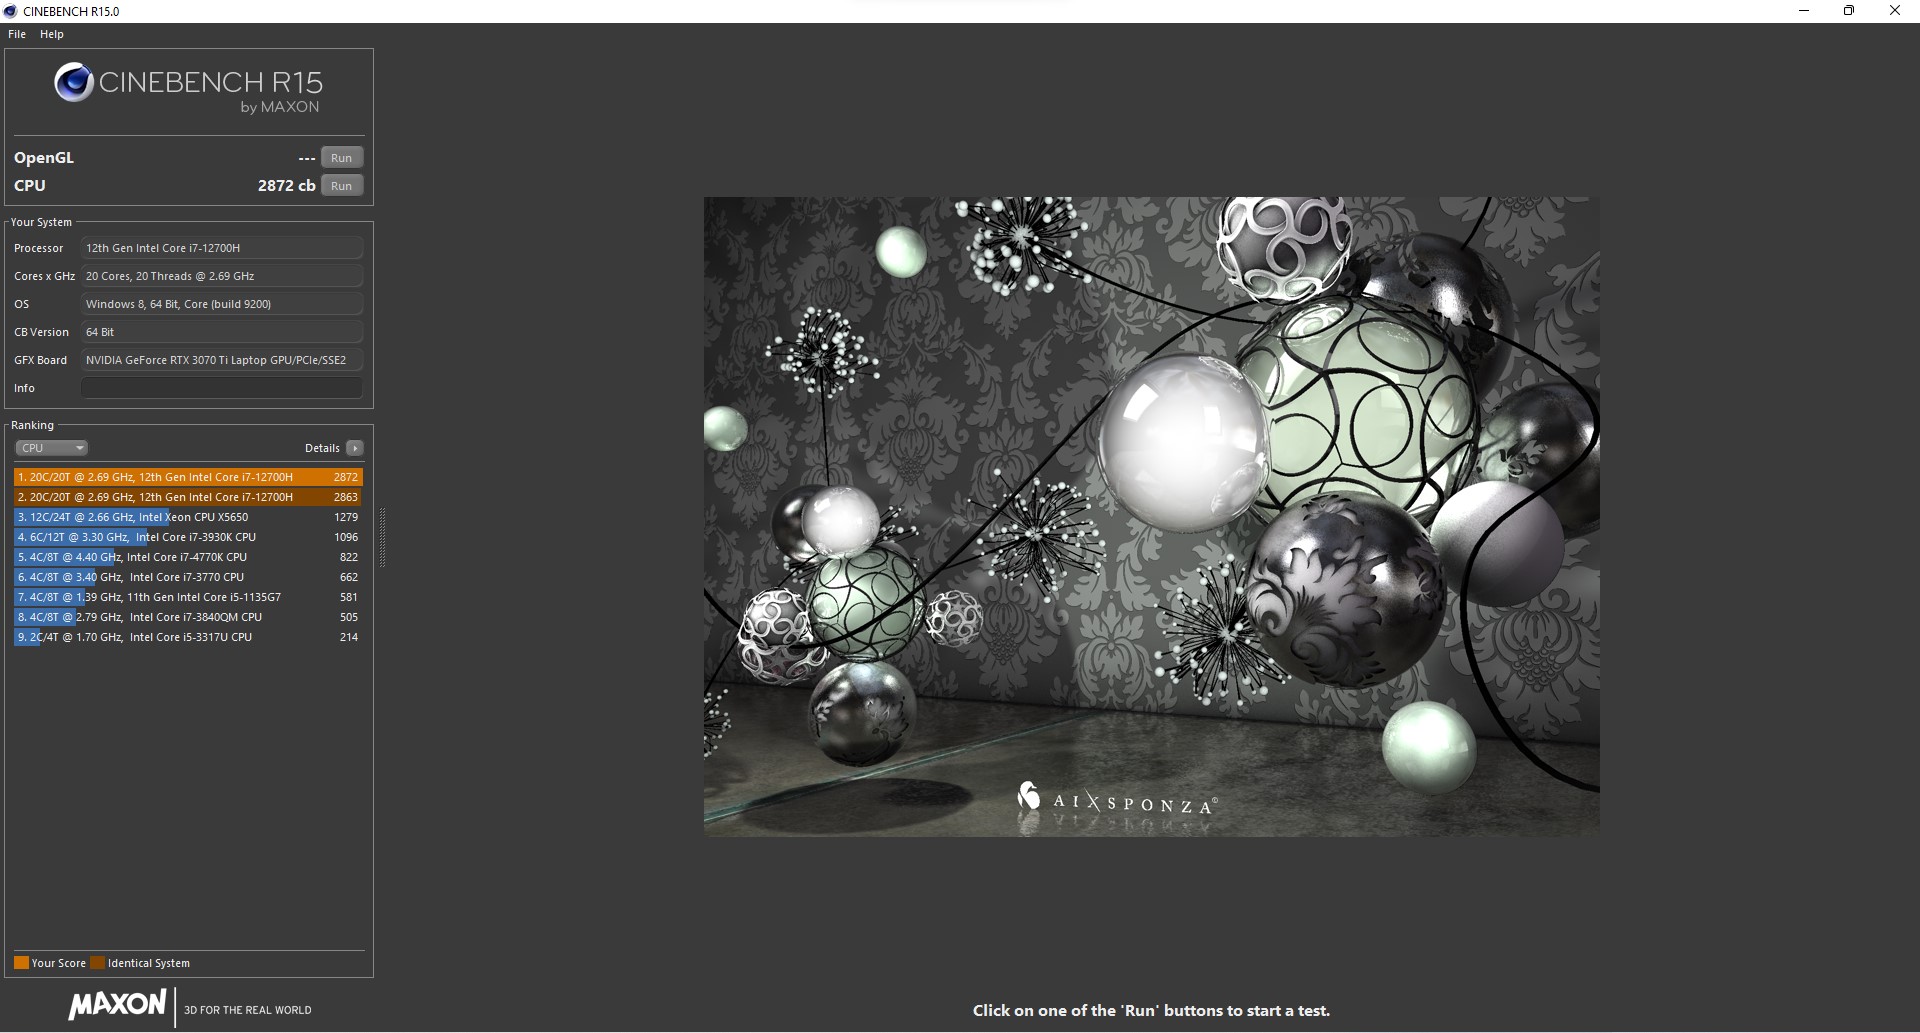
的 酷睿i7-12700H在持续负载下的速度约为前代产品的两倍,并不逊于 酷睿i9-12900H.只是 联想的Legion 5 Pro更快,因为它没有TDP锁,可以连续消耗127瓦的能量。另一方面,Vector GP76中的酷睿i7在短时间内从100瓦降至45瓦,Cinebench R15循环显示。性能因此降低了20%。
性能核心的时钟频率是稳定的3.7GHz,温度在74℃左右,处于较冷的区域。在纯粹的处理器负载方面,冷却系统有很大的改进余地。在极限性能模式下,CPU将自己处理为70瓦,这并没有真正改善结果,至少在Cinebench R15中没有。
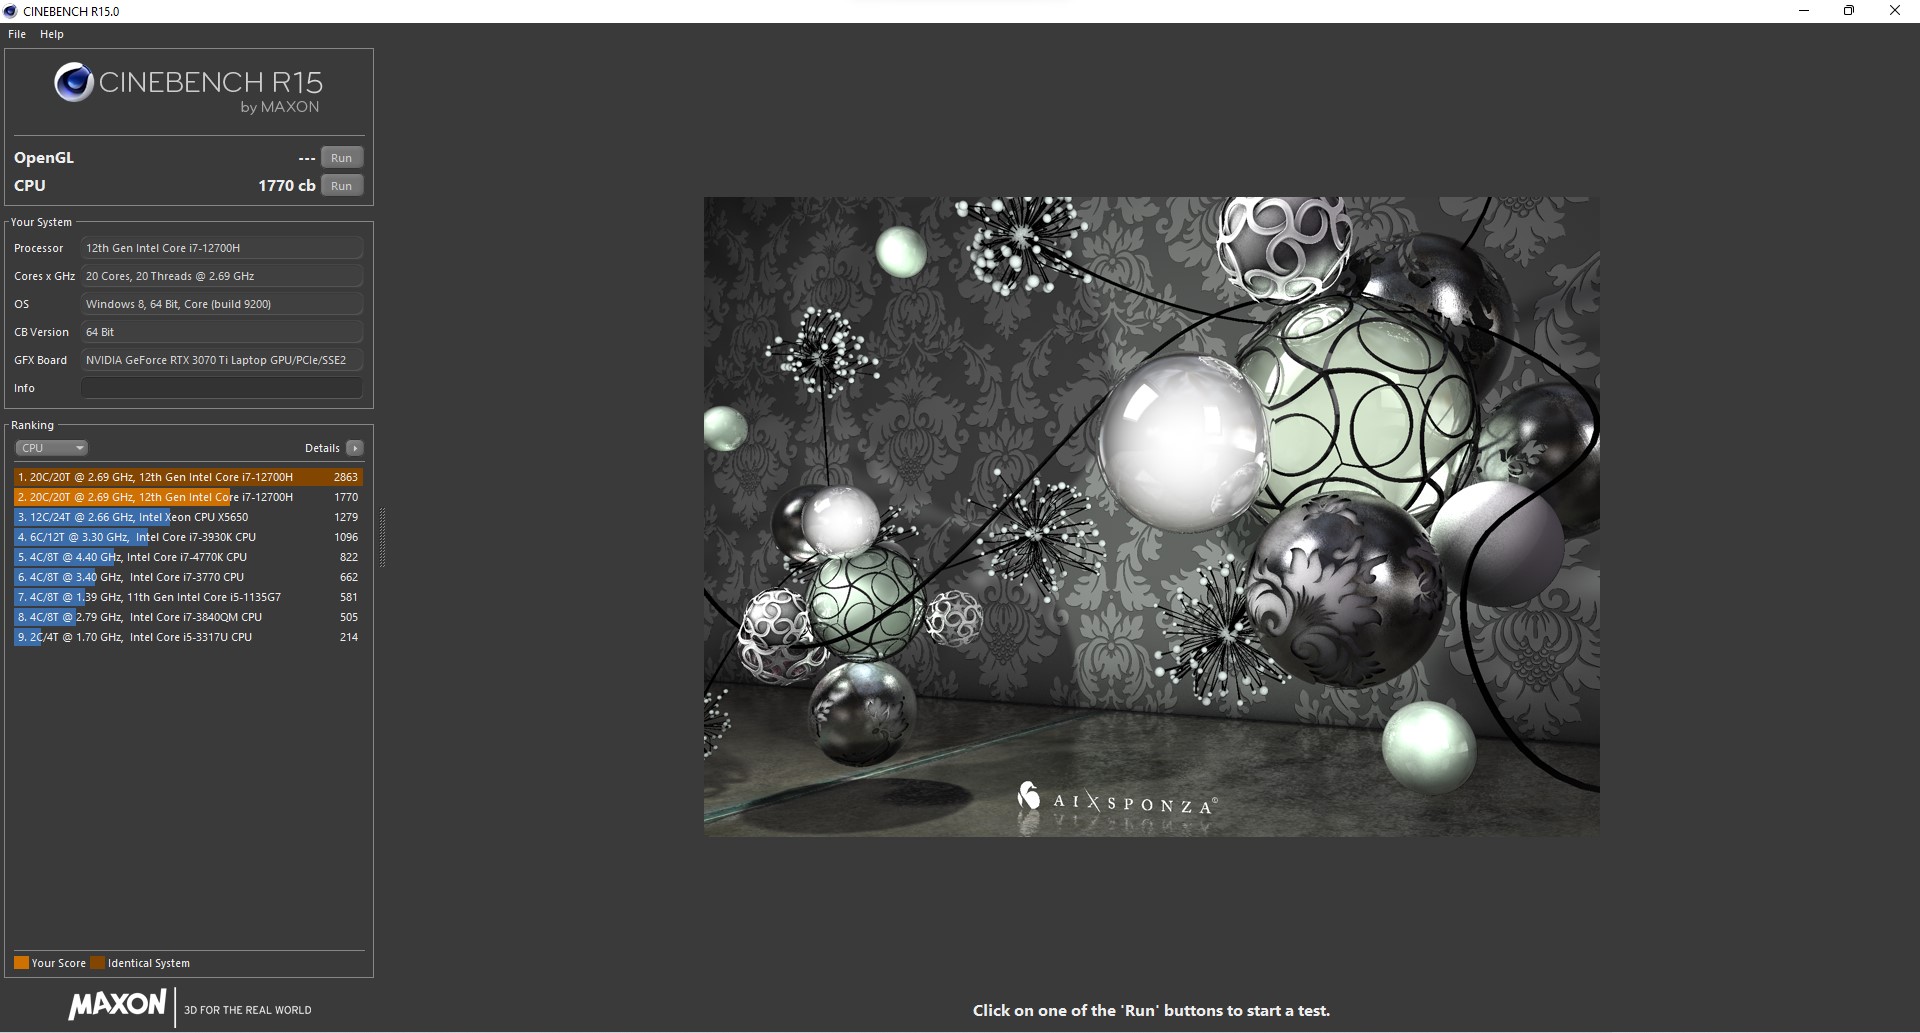
在电池模式下,CPU的TDP(典型的高综合TDP的笔记本电脑)被严重限制在15瓦。相应地,英特尔处理器的性能下降了高达40%(见CB15屏幕截图)。然而,这仍然比前辈的全部性能快45%,如果你看一下持续负载下的数值,损失只有25%左右。
AMD的45瓦的CPU,如 Ryzen 7 5800H中的 华硕ROG Strix G17,一般来说有点慢,但它们在电池供电运行时几乎没有显示任何性能损失。
Cinebench R15 Multi Sustained Load
Cinebench R23: Multi Core | Single Core
Cinebench R20: CPU (Multi Core) | CPU (Single Core)
Cinebench R15: CPU Multi 64Bit | CPU Single 64Bit
Blender: v2.79 BMW27 CPU
7-Zip 18.03: 7z b 4 | 7z b 4 -mmt1
Geekbench 5.5: Multi-Core | Single-Core
HWBOT x265 Benchmark v2.2: 4k Preset
LibreOffice : 20 Documents To PDF
R Benchmark 2.5: Overall mean
Geekbench 5.5: OpenCL Score
| CPU Performance rating | |
| Average of class Gaming | |
| Lenovo Legion 5 Pro 16 G7 i7 RTX 3070Ti | |
| MSI Vector GP66 12UGS | |
| MSI Vector GP76 12UGS-434 | |
| Aorus 17 XE4 | |
| Average Intel Core i7-12700H | |
| Asus ROG Zephyrus M16 GU603H -2! | |
| Schenker XMG NEO 17 GM7TG8S | |
| Asus ROG Strix G17 G713QE-RB74 -3! | |
| MSI GP76 Leopard 10UG -2! | |
| Cinebench R23 / Multi Core | |
| Average of class Gaming (10488 - 42661, n=107, last 2 years) | |
| Lenovo Legion 5 Pro 16 G7 i7 RTX 3070Ti | |
| MSI Vector GP76 12UGS-434 | |
| MSI Vector GP66 12UGS | |
| Aorus 17 XE4 | |
| Average Intel Core i7-12700H (4032 - 19330, n=64) | |
| Asus ROG Strix G17 G713QE-RB74 | |
| Schenker XMG NEO 17 GM7TG8S | |
| Cinebench R23 / Single Core | |
| Average of class Gaming (1166 - 2415, n=107, last 2 years) | |
| MSI Vector GP66 12UGS | |
| Lenovo Legion 5 Pro 16 G7 i7 RTX 3070Ti | |
| Aorus 17 XE4 | |
| MSI Vector GP76 12UGS-434 | |
| Average Intel Core i7-12700H (778 - 1826, n=63) | |
| Schenker XMG NEO 17 GM7TG8S | |
| Asus ROG Strix G17 G713QE-RB74 | |
| Cinebench R20 / CPU (Multi Core) | |
| Average of class Gaming (4029 - 16433, n=106, last 2 years) | |
| Lenovo Legion 5 Pro 16 G7 i7 RTX 3070Ti | |
| MSI Vector GP76 12UGS-434 | |
| MSI Vector GP66 12UGS | |
| Aorus 17 XE4 | |
| Average Intel Core i7-12700H (1576 - 7407, n=64) | |
| Asus ROG Zephyrus M16 GU603H | |
| Asus ROG Strix G17 G713QE-RB74 | |
| Schenker XMG NEO 17 GM7TG8S | |
| MSI GP76 Leopard 10UG | |
| Cinebench R20 / CPU (Single Core) | |
| Average of class Gaming (442 - 913, n=106, last 2 years) | |
| MSI Vector GP66 12UGS | |
| Lenovo Legion 5 Pro 16 G7 i7 RTX 3070Ti | |
| Aorus 17 XE4 | |
| MSI Vector GP76 12UGS-434 | |
| Average Intel Core i7-12700H (300 - 704, n=64) | |
| Asus ROG Zephyrus M16 GU603H | |
| Schenker XMG NEO 17 GM7TG8S | |
| Asus ROG Strix G17 G713QE-RB74 | |
| MSI GP76 Leopard 10UG | |
| Cinebench R15 / CPU Multi 64Bit | |
| Average of class Gaming (1578 - 6330, n=105, last 2 years) | |
| Lenovo Legion 5 Pro 16 G7 i7 RTX 3070Ti | |
| MSI Vector GP76 12UGS-434 | |
| Aorus 17 XE4 | |
| Average Intel Core i7-12700H (1379 - 2916, n=70) | |
| MSI Vector GP66 12UGS | |
| Asus ROG Zephyrus M16 GU603H | |
| Asus ROG Strix G17 G713QE-RB74 | |
| Schenker XMG NEO 17 GM7TG8S | |
| MSI GP76 Leopard 10UG | |
| Cinebench R15 / CPU Single 64Bit | |
| Average of class Gaming (188.8 - 350, n=106, last 2 years) | |
| MSI Vector GP66 12UGS | |
| Lenovo Legion 5 Pro 16 G7 i7 RTX 3070Ti | |
| Aorus 17 XE4 | |
| MSI Vector GP76 12UGS-434 | |
| Average Intel Core i7-12700H (113 - 263, n=65) | |
| Asus ROG Zephyrus M16 GU603H | |
| Asus ROG Strix G17 G713QE-RB74 | |
| Schenker XMG NEO 17 GM7TG8S | |
| MSI GP76 Leopard 10UG | |
| Blender / v2.79 BMW27 CPU | |
| MSI GP76 Leopard 10UG | |
| Schenker XMG NEO 17 GM7TG8S | |
| Asus ROG Zephyrus M16 GU603H | |
| Asus ROG Strix G17 G713QE-RB74 | |
| Aorus 17 XE4 | |
| Average Intel Core i7-12700H (168 - 732, n=63) | |
| MSI Vector GP76 12UGS-434 | |
| MSI Vector GP66 12UGS | |
| Lenovo Legion 5 Pro 16 G7 i7 RTX 3070Ti | |
| Average of class Gaming (79 - 330, n=104, last 2 years) | |
| 7-Zip 18.03 / 7z b 4 | |
| Average of class Gaming (33491 - 148086, n=105, last 2 years) | |
| Lenovo Legion 5 Pro 16 G7 i7 RTX 3070Ti | |
| MSI Vector GP66 12UGS | |
| MSI Vector GP76 12UGS-434 | |
| Average Intel Core i7-12700H (22844 - 73067, n=63) | |
| Aorus 17 XE4 | |
| Asus ROG Strix G17 G713QE-RB74 | |
| Asus ROG Zephyrus M16 GU603H | |
| Schenker XMG NEO 17 GM7TG8S | |
| MSI GP76 Leopard 10UG | |
| 7-Zip 18.03 / 7z b 4 -mmt1 | |
| Average of class Gaming (4199 - 7436, n=105, last 2 years) | |
| MSI Vector GP66 12UGS | |
| Aorus 17 XE4 | |
| Lenovo Legion 5 Pro 16 G7 i7 RTX 3070Ti | |
| Average Intel Core i7-12700H (2743 - 5972, n=63) | |
| Asus ROG Zephyrus M16 GU603H | |
| Asus ROG Strix G17 G713QE-RB74 | |
| Schenker XMG NEO 17 GM7TG8S | |
| MSI Vector GP76 12UGS-434 | |
| MSI GP76 Leopard 10UG | |
| Geekbench 5.5 / Multi-Core | |
| Average of class Gaming (6460 - 28263, n=105, last 2 years) | |
| Lenovo Legion 5 Pro 16 G7 i7 RTX 3070Ti | |
| MSI Vector GP66 12UGS | |
| Aorus 17 XE4 | |
| MSI Vector GP76 12UGS-434 | |
| Average Intel Core i7-12700H (5144 - 13745, n=64) | |
| Asus ROG Zephyrus M16 GU603H | |
| Schenker XMG NEO 17 GM7TG8S | |
| MSI GP76 Leopard 10UG | |
| Geekbench 5.5 / Single-Core | |
| Average of class Gaming (986 - 2474, n=105, last 2 years) | |
| MSI Vector GP66 12UGS | |
| Aorus 17 XE4 | |
| MSI Vector GP76 12UGS-434 | |
| Lenovo Legion 5 Pro 16 G7 i7 RTX 3070Ti | |
| Average Intel Core i7-12700H (803 - 1851, n=64) | |
| Asus ROG Zephyrus M16 GU603H | |
| Schenker XMG NEO 17 GM7TG8S | |
| MSI GP76 Leopard 10UG | |
| HWBOT x265 Benchmark v2.2 / 4k Preset | |
| Average of class Gaming (11.5 - 44.4, n=105, last 2 years) | |
| Lenovo Legion 5 Pro 16 G7 i7 RTX 3070Ti | |
| MSI Vector GP66 12UGS | |
| MSI Vector GP76 12UGS-434 | |
| Average Intel Core i7-12700H (4.67 - 21.8, n=64) | |
| Aorus 17 XE4 | |
| Asus ROG Zephyrus M16 GU603H | |
| Asus ROG Strix G17 G713QE-RB74 | |
| Schenker XMG NEO 17 GM7TG8S | |
| MSI GP76 Leopard 10UG | |
| LibreOffice / 20 Documents To PDF | |
| Asus ROG Strix G17 G713QE-RB74 | |
| MSI GP76 Leopard 10UG | |
| Average of class Gaming (33.2 - 88.8, n=105, last 2 years) | |
| Average Intel Core i7-12700H (34.2 - 95.3, n=63) | |
| MSI Vector GP76 12UGS-434 | |
| Lenovo Legion 5 Pro 16 G7 i7 RTX 3070Ti | |
| Asus ROG Zephyrus M16 GU603H | |
| MSI Vector GP66 12UGS | |
| Schenker XMG NEO 17 GM7TG8S | |
| Aorus 17 XE4 | |
| R Benchmark 2.5 / Overall mean | |
| MSI GP76 Leopard 10UG | |
| Schenker XMG NEO 17 GM7TG8S | |
| Asus ROG Zephyrus M16 GU603H | |
| Asus ROG Strix G17 G713QE-RB74 | |
| Average Intel Core i7-12700H (0.4441 - 1.052, n=63) | |
| MSI Vector GP76 12UGS-434 | |
| Aorus 17 XE4 | |
| Lenovo Legion 5 Pro 16 G7 i7 RTX 3070Ti | |
| Average of class Gaming (0.3439 - 0.759, n=106, last 2 years) | |
| MSI Vector GP66 12UGS | |
| Geekbench 5.5 / OpenCL Score | |
| Average of class Gaming (80702 - 277970, n=101, last 2 years) | |
| Aorus 17 XE4 | |
| Schenker XMG NEO 17 GM7TG8S | |
| Lenovo Legion 5 Pro 16 G7 i7 RTX 3070Ti | |
| MSI Vector GP76 12UGS-434 | |
| MSI Vector GP66 12UGS | |
| Asus ROG Zephyrus M16 GU603H | |
| MSI GP76 Leopard 10UG | |
| Average Intel Core i7-12700H (13944 - 148757, n=62) | |
* ... smaller is better
AIDA64: FP32 Ray-Trace | FPU Julia | CPU SHA3 | CPU Queen | FPU SinJulia | FPU Mandel | CPU AES | CPU ZLib | FP64 Ray-Trace | CPU PhotoWorxx
| Performance rating | |
| Average of class Gaming | |
| Asus ROG Strix G17 G713QE-RB74 | |
| Lenovo Legion 5 Pro 16 G7 i7 RTX 3070Ti | |
| Average Intel Core i7-12700H | |
| MSI Vector GP76 12UGS-434 | |
| MSI Vector GP66 12UGS | |
| Aorus 17 XE4 | |
| MSI GP76 Leopard 10UG | |
| AIDA64 / FP32 Ray-Trace | |
| Average of class Gaming (10227 - 85542, n=105, last 2 years) | |
| Asus ROG Strix G17 G713QE-RB74 | |
| Average Intel Core i7-12700H (2585 - 17957, n=64) | |
| Lenovo Legion 5 Pro 16 G7 i7 RTX 3070Ti | |
| MSI GP76 Leopard 10UG | |
| MSI Vector GP66 12UGS | |
| MSI Vector GP76 12UGS-434 | |
| Aorus 17 XE4 | |
| AIDA64 / FPU Julia | |
| Average of class Gaming (51376 - 238426, n=105, last 2 years) | |
| Asus ROG Strix G17 G713QE-RB74 | |
| Average Intel Core i7-12700H (12439 - 90760, n=64) | |
| MSI GP76 Leopard 10UG | |
| Lenovo Legion 5 Pro 16 G7 i7 RTX 3070Ti | |
| MSI Vector GP76 12UGS-434 | |
| MSI Vector GP66 12UGS | |
| Aorus 17 XE4 | |
| AIDA64 / CPU SHA3 | |
| Average of class Gaming (2180 - 10115, n=105, last 2 years) | |
| Lenovo Legion 5 Pro 16 G7 i7 RTX 3070Ti | |
| MSI Vector GP76 12UGS-434 | |
| Asus ROG Strix G17 G713QE-RB74 | |
| Average Intel Core i7-12700H (833 - 4242, n=64) | |
| MSI Vector GP66 12UGS | |
| Aorus 17 XE4 | |
| MSI GP76 Leopard 10UG | |
| AIDA64 / CPU Queen | |
| Average of class Gaming (49785 - 173351, n=90, last 2 years) | |
| MSI Vector GP66 12UGS | |
| Aorus 17 XE4 | |
| Lenovo Legion 5 Pro 16 G7 i7 RTX 3070Ti | |
| Average Intel Core i7-12700H (57923 - 103202, n=63) | |
| MSI Vector GP76 12UGS-434 | |
| Asus ROG Strix G17 G713QE-RB74 | |
| MSI GP76 Leopard 10UG | |
| AIDA64 / FPU SinJulia | |
| Average of class Gaming (4424 - 33636, n=105, last 2 years) | |
| Asus ROG Strix G17 G713QE-RB74 | |
| Lenovo Legion 5 Pro 16 G7 i7 RTX 3070Ti | |
| MSI Vector GP76 12UGS-434 | |
| MSI Vector GP66 12UGS | |
| Average Intel Core i7-12700H (3249 - 9939, n=64) | |
| Aorus 17 XE4 | |
| MSI GP76 Leopard 10UG | |
| AIDA64 / FPU Mandel | |
| Average of class Gaming (25115 - 128721, n=105, last 2 years) | |
| Asus ROG Strix G17 G713QE-RB74 | |
| Average Intel Core i7-12700H (7135 - 44760, n=64) | |
| Lenovo Legion 5 Pro 16 G7 i7 RTX 3070Ti | |
| MSI Vector GP66 12UGS | |
| MSI GP76 Leopard 10UG | |
| MSI Vector GP76 12UGS-434 | |
| Aorus 17 XE4 | |
| AIDA64 / CPU AES | |
| Asus ROG Strix G17 G713QE-RB74 | |
| Average of class Gaming (39258 - 247074, n=105, last 2 years) | |
| Lenovo Legion 5 Pro 16 G7 i7 RTX 3070Ti | |
| MSI Vector GP76 12UGS-434 | |
| MSI Vector GP66 12UGS | |
| Average Intel Core i7-12700H (31839 - 144360, n=64) | |
| Aorus 17 XE4 | |
| MSI GP76 Leopard 10UG | |
| AIDA64 / CPU ZLib | |
| Average of class Gaming (574 - 2531, n=105, last 2 years) | |
| Lenovo Legion 5 Pro 16 G7 i7 RTX 3070Ti | |
| MSI Vector GP76 12UGS-434 | |
| MSI Vector GP66 12UGS | |
| Average Intel Core i7-12700H (305 - 1171, n=64) | |
| Aorus 17 XE4 | |
| Asus ROG Strix G17 G713QE-RB74 | |
| MSI GP76 Leopard 10UG | |
| AIDA64 / FP64 Ray-Trace | |
| Average of class Gaming (5509 - 45446, n=105, last 2 years) | |
| Asus ROG Strix G17 G713QE-RB74 | |
| Average Intel Core i7-12700H (1437 - 9692, n=64) | |
| Lenovo Legion 5 Pro 16 G7 i7 RTX 3070Ti | |
| MSI GP76 Leopard 10UG | |
| MSI Vector GP66 12UGS | |
| MSI Vector GP76 12UGS-434 | |
| Aorus 17 XE4 | |
| AIDA64 / CPU PhotoWorxx | |
| Average of class Gaming (12271 - 89891, n=105, last 2 years) | |
| Lenovo Legion 5 Pro 16 G7 i7 RTX 3070Ti | |
| Average Intel Core i7-12700H (12863 - 52207, n=64) | |
| MSI Vector GP66 12UGS | |
| MSI Vector GP76 12UGS-434 | |
| Aorus 17 XE4 | |
| MSI GP76 Leopard 10UG | |
| Asus ROG Strix G17 G713QE-RB74 | |
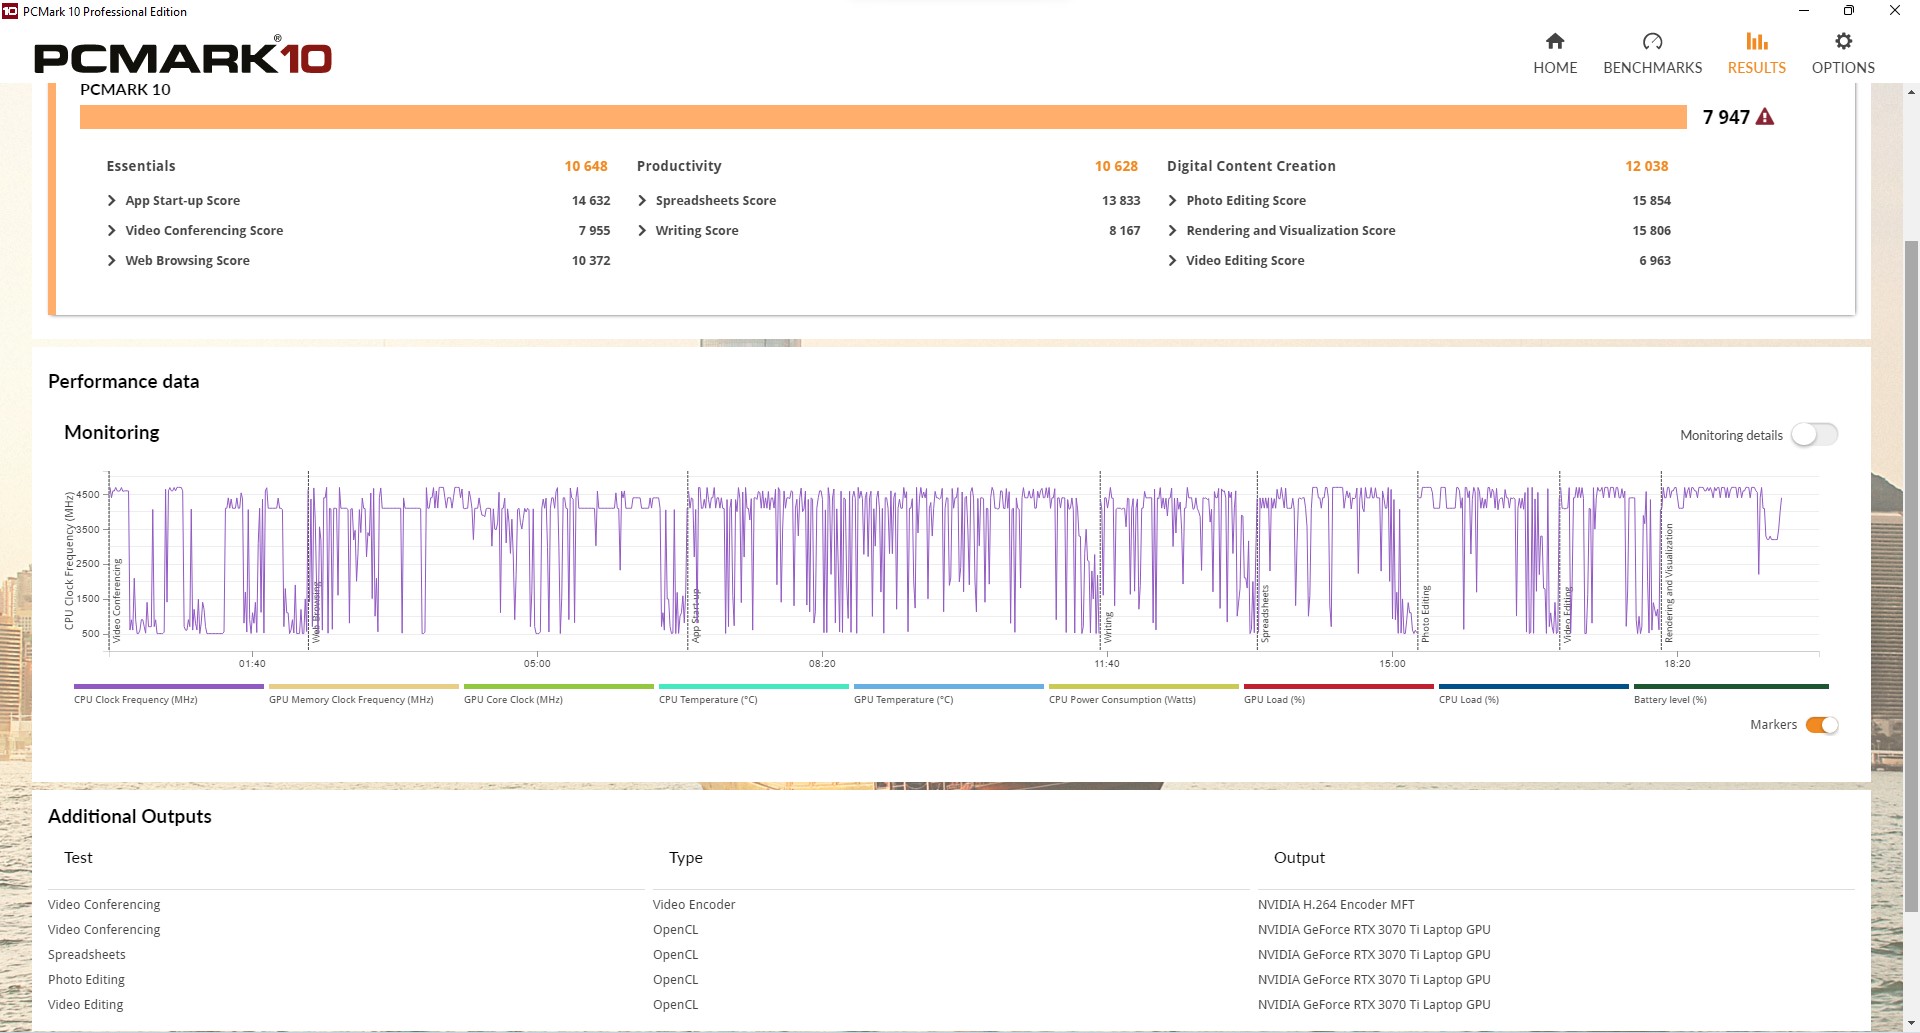
系统性能
在这里,我们的评测设备正处于顶端;事实上,在我们整个数据库中几乎没有更好的结果。前者的表现比后者高出33%。程序立即打开,多个浏览器标签也是如此。
360赫兹的面板绝对有助于形成一个高响应的系统。4K YouTube播放也只需要很少的CPU资源。
CrossMark: Overall | Productivity | Creativity | Responsiveness
| PCMark 10 / Score | |
| Average of class Gaming (5828 - 12414, n=93, last 2 years) | |
| MSI Vector GP66 12UGS | |
| MSI Vector GP76 12UGS-434 | |
| Aorus 17 XE4 | |
| Lenovo Legion 5 Pro 16 G7 i7 RTX 3070Ti | |
| Average Intel Core i7-12700H, NVIDIA GeForce RTX 3070 Ti Laptop GPU (6941 - 7947, n=11) | |
| Schenker XMG NEO 17 GM7TG8S | |
| Asus ROG Zephyrus M16 GU603H | |
| Asus ROG Strix G17 G713QE-RB74 | |
| MSI GP76 Leopard 10UG | |
| PCMark 10 / Essentials | |
| MSI Vector GP66 12UGS | |
| Aorus 17 XE4 | |
| Average of class Gaming (8810 - 11935, n=97, last 2 years) | |
| MSI Vector GP76 12UGS-434 | |
| Asus ROG Zephyrus M16 GU603H | |
| Average Intel Core i7-12700H, NVIDIA GeForce RTX 3070 Ti Laptop GPU (9892 - 10935, n=11) | |
| Schenker XMG NEO 17 GM7TG8S | |
| Asus ROG Strix G17 G713QE-RB74 | |
| Lenovo Legion 5 Pro 16 G7 i7 RTX 3070Ti | |
| MSI GP76 Leopard 10UG | |
| PCMark 10 / Productivity | |
| Average of class Gaming (6845 - 25323, n=95, last 2 years) | |
| MSI Vector GP76 12UGS-434 | |
| MSI Vector GP66 12UGS | |
| Lenovo Legion 5 Pro 16 G7 i7 RTX 3070Ti | |
| Aorus 17 XE4 | |
| Average Intel Core i7-12700H, NVIDIA GeForce RTX 3070 Ti Laptop GPU (9024 - 10638, n=11) | |
| Schenker XMG NEO 17 GM7TG8S | |
| Asus ROG Strix G17 G713QE-RB74 | |
| Asus ROG Zephyrus M16 GU603H | |
| MSI GP76 Leopard 10UG | |
| PCMark 10 / Digital Content Creation | |
| Average of class Gaming (7602 - 19954, n=95, last 2 years) | |
| MSI Vector GP66 12UGS | |
| MSI Vector GP76 12UGS-434 | |
| Lenovo Legion 5 Pro 16 G7 i7 RTX 3070Ti | |
| Aorus 17 XE4 | |
| Average Intel Core i7-12700H, NVIDIA GeForce RTX 3070 Ti Laptop GPU (10165 - 12546, n=11) | |
| Schenker XMG NEO 17 GM7TG8S | |
| Asus ROG Zephyrus M16 GU603H | |
| Asus ROG Strix G17 G713QE-RB74 | |
| MSI GP76 Leopard 10UG | |
| CrossMark / Overall | |
| Aorus 17 XE4 | |
| Average of class Gaming (1366 - 2409, n=94, last 2 years) | |
| MSI Vector GP76 12UGS-434 | |
| Lenovo Legion 5 Pro 16 G7 i7 RTX 3070Ti | |
| Average Intel Core i7-12700H, NVIDIA GeForce RTX 3070 Ti Laptop GPU (974 - 2000, n=12) | |
| CrossMark / Productivity | |
| Aorus 17 XE4 | |
| MSI Vector GP76 12UGS-434 | |
| Lenovo Legion 5 Pro 16 G7 i7 RTX 3070Ti | |
| Average of class Gaming (1386 - 2254, n=94, last 2 years) | |
| Average Intel Core i7-12700H, NVIDIA GeForce RTX 3070 Ti Laptop GPU (907 - 1962, n=12) | |
| CrossMark / Creativity | |
| Average of class Gaming (1343 - 2786, n=94, last 2 years) | |
| Lenovo Legion 5 Pro 16 G7 i7 RTX 3070Ti | |
| Aorus 17 XE4 | |
| MSI Vector GP76 12UGS-434 | |
| Average Intel Core i7-12700H, NVIDIA GeForce RTX 3070 Ti Laptop GPU (1027 - 2057, n=12) | |
| CrossMark / Responsiveness | |
| Aorus 17 XE4 | |
| MSI Vector GP76 12UGS-434 | |
| Lenovo Legion 5 Pro 16 G7 i7 RTX 3070Ti | |
| Average Intel Core i7-12700H, NVIDIA GeForce RTX 3070 Ti Laptop GPU (1029 - 2142, n=12) | |
| Average of class Gaming (1226 - 2334, n=94, last 2 years) | |
| PCMark 10 Score | 7947 points | |
Help | ||
| AIDA64 / Memory Copy | |
| Average of class Gaming (21750 - 129946, n=105, last 2 years) | |
| Average Intel Core i7-12700H (25615 - 80511, n=64) | |
| Lenovo Legion 5 Pro 16 G7 i7 RTX 3070Ti | |
| MSI Vector GP66 12UGS | |
| Aorus 17 XE4 | |
| MSI Vector GP76 12UGS-434 | |
| Asus ROG Strix G17 G713QE-RB74 | |
| MSI GP76 Leopard 10UG | |
| AIDA64 / Memory Read | |
| Average of class Gaming (22956 - 118858, n=105, last 2 years) | |
| Lenovo Legion 5 Pro 16 G7 i7 RTX 3070Ti | |
| Average Intel Core i7-12700H (25586 - 79442, n=64) | |
| MSI Vector GP66 12UGS | |
| Aorus 17 XE4 | |
| MSI Vector GP76 12UGS-434 | |
| Asus ROG Strix G17 G713QE-RB74 | |
| MSI GP76 Leopard 10UG | |
| AIDA64 / Memory Write | |
| Average of class Gaming (22297 - 135096, n=105, last 2 years) | |
| Lenovo Legion 5 Pro 16 G7 i7 RTX 3070Ti | |
| Average Intel Core i7-12700H (23679 - 88660, n=64) | |
| MSI Vector GP76 12UGS-434 | |
| MSI Vector GP66 12UGS | |
| Aorus 17 XE4 | |
| MSI GP76 Leopard 10UG | |
| Asus ROG Strix G17 G713QE-RB74 | |
| AIDA64 / Memory Latency | |
| Average of class Gaming (75.3 - 259, n=105, last 2 years) | |
| Lenovo Legion 5 Pro 16 G7 i7 RTX 3070Ti | |
| MSI Vector GP76 12UGS-434 | |
| Aorus 17 XE4 | |
| MSI Vector GP66 12UGS | |
| Asus ROG Strix G17 G713QE-RB74 | |
| Average Intel Core i7-12700H (76.2 - 133.9, n=62) | |
| MSI GP76 Leopard 10UG | |
| Asus ROG Zephyrus M16 GU603H | |
| Schenker XMG NEO 17 GM7TG8S | |
* ... smaller is better
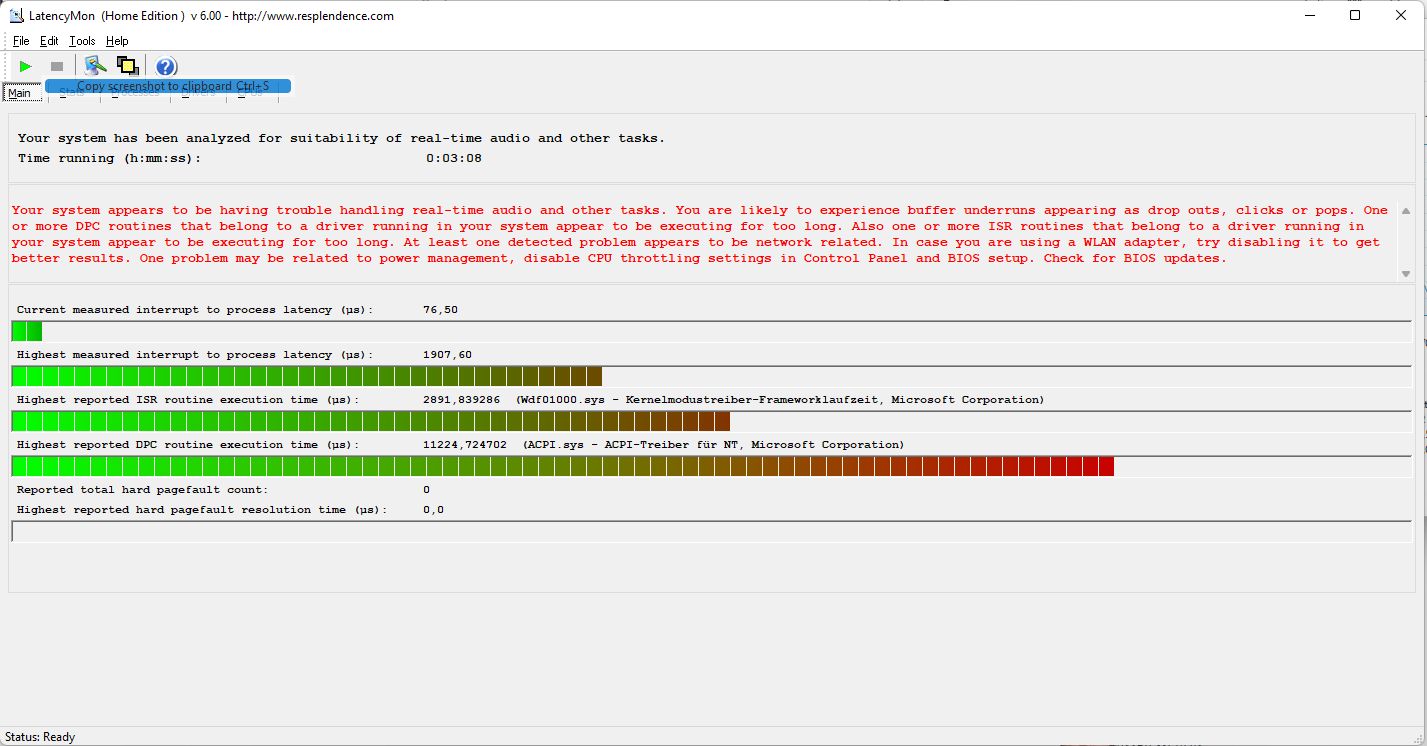
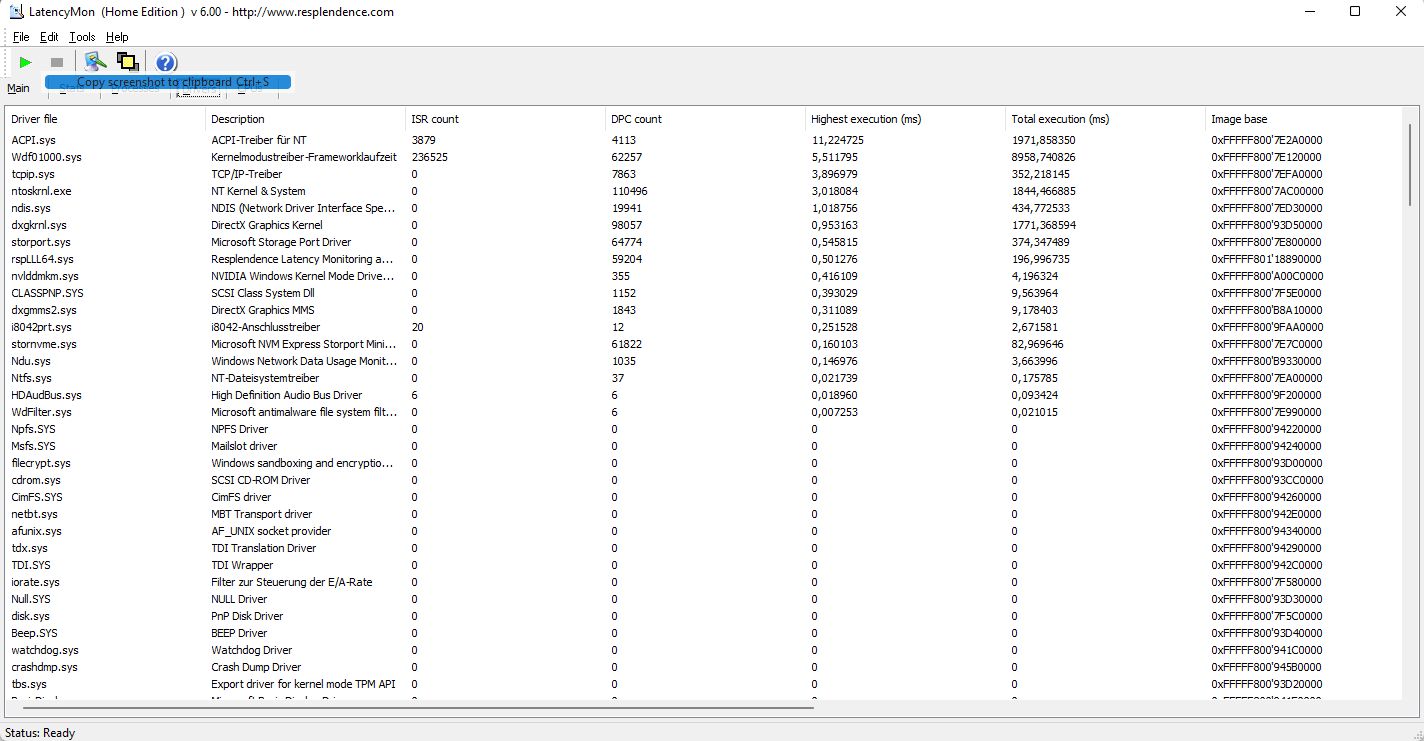
DPC延迟
DPC延迟显示了从输入到显示的延迟:这里的系统被证明不适合实时视频和音频编辑,因为延迟非常高,达到了1907ms。ACPI驱动程序是这里的罪魁祸首。然而,在更新BIOS之后,这一点可以得到改善。
幸运的是,在YouTube 4K播放过程中没有丢帧,CPU负载仍然很低。然而,集成的英特尔GPU仍然有一点占用,负载为23%。
| DPC Latencies / LatencyMon - interrupt to process latency (max), Web, Youtube, Prime95 | |
| Schenker XMG NEO 17 GM7TG8S | |
| MSI Vector GP66 12UGS | |
| MSI Vector GP76 12UGS-434 | |
| Aorus 17 XE4 | |
| MSI GP76 Leopard 10UG | |
| Asus ROG Strix G17 G713QE-RB74 | |
| Asus ROG Zephyrus M16 GU603H | |
| Lenovo Legion 5 Pro 16 G7 i7 RTX 3070Ti | |
* ... smaller is better
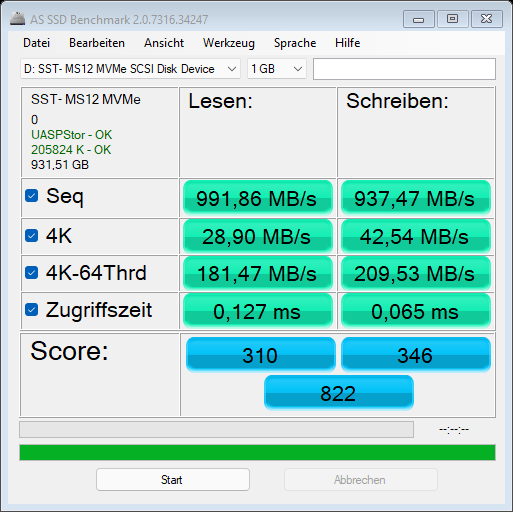
存储设备
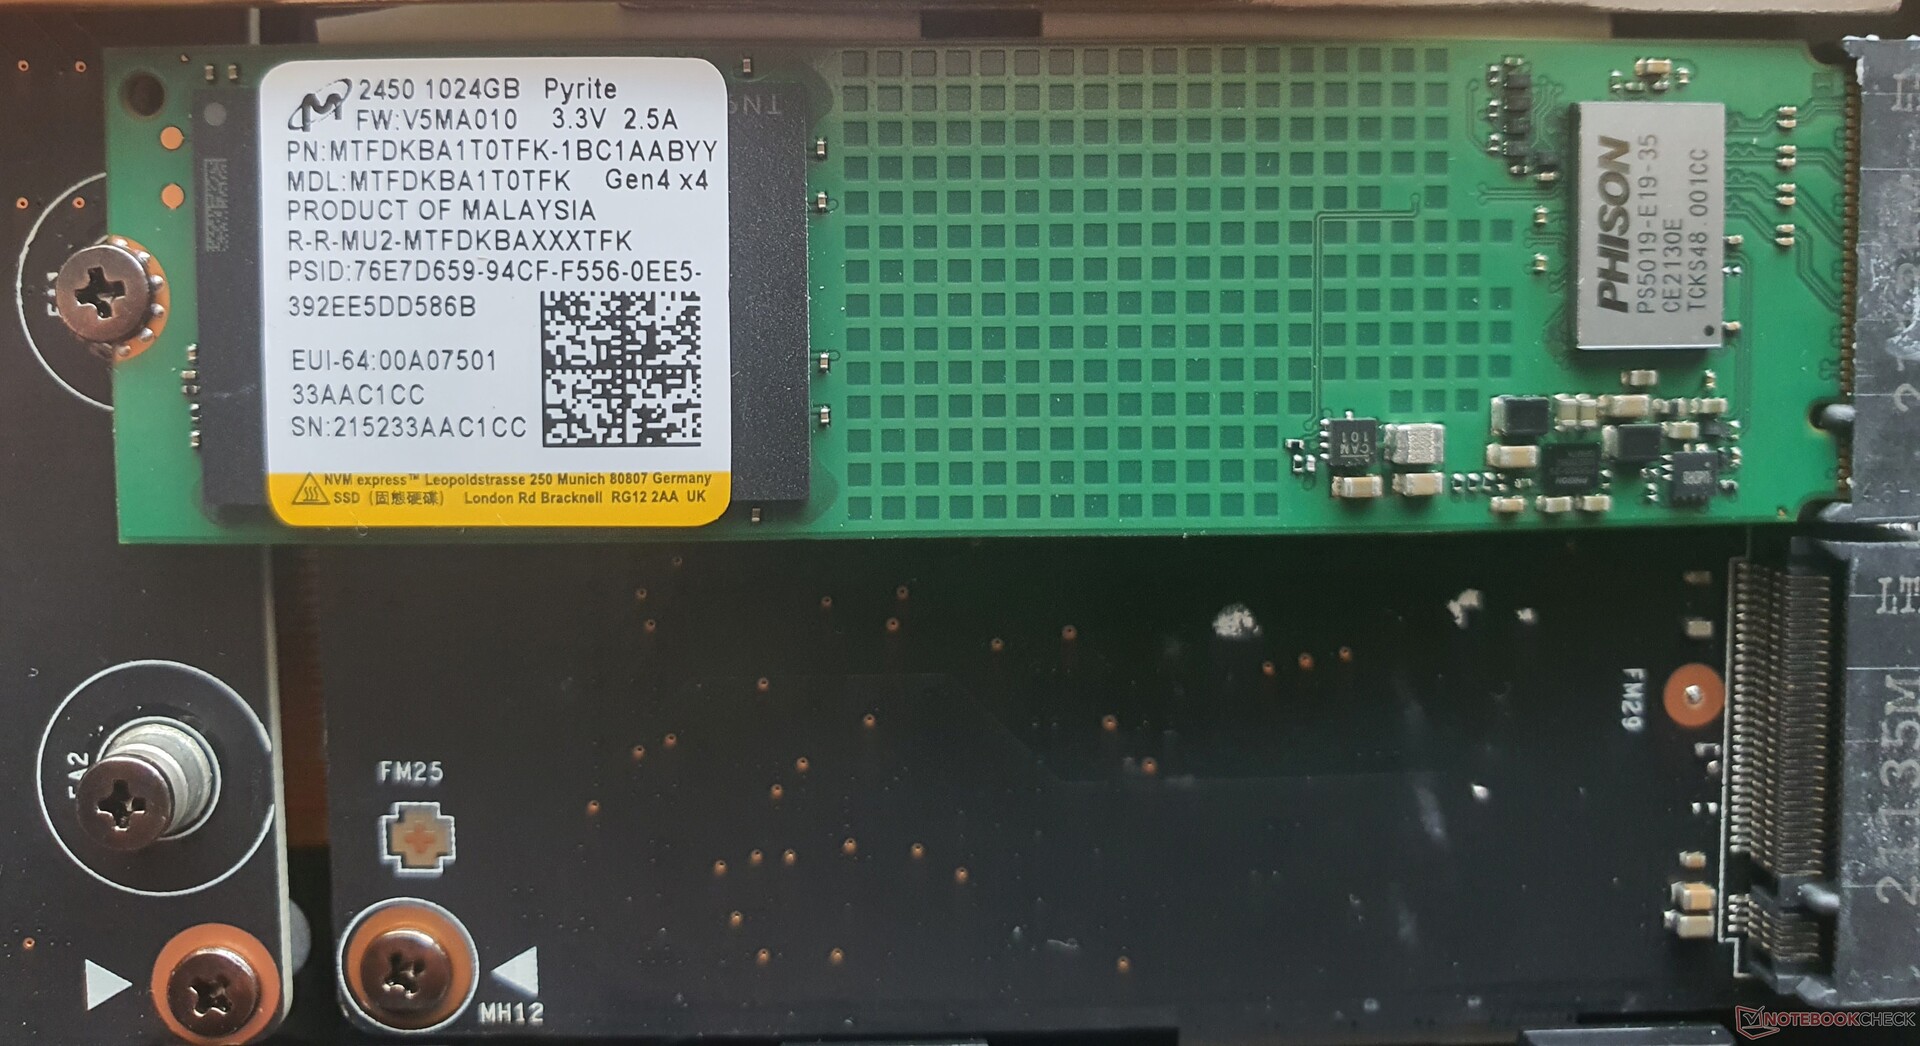
美光公司的1TB M.2 2280 NVMe固态硬盘采用了最新的PCIe4x4标准,但这应该被看作是一种经济型固态硬盘,只能达到PCIe 3.0的速度。
尽管如此,可以加装两个更快的硬盘,也可以采用RAID(0,1)配置。比较领域提供了更快的固态硬盘,但至少前者被明显超越了。
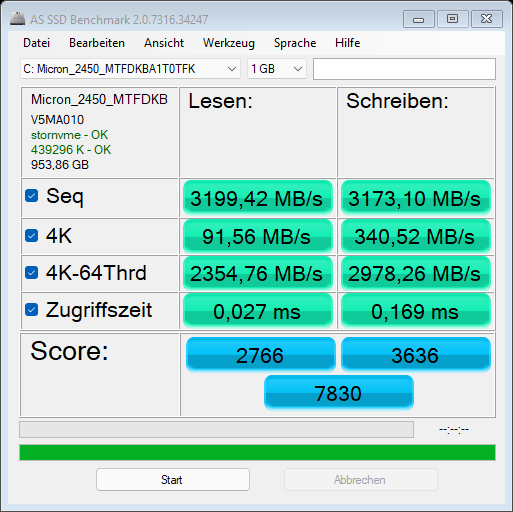
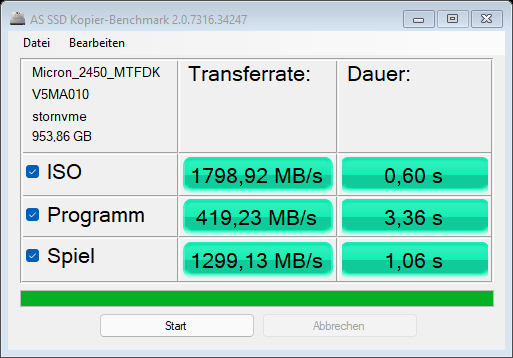
| MSI Vector GP76 12UGS-434 GeForce RTX 3070 Ti Laptop GPU, i7-12700H, Micron 2450 1TB MTFDKBA1T0TFK | MSI GP76 Leopard 10UG GeForce RTX 3070 Laptop GPU, i7-10750H, Kingston OM8PCP3512F-AB | Asus ROG Strix G17 G713QE-RB74 GeForce RTX 3050 Ti Laptop GPU, R7 5800H, Samsung PM991 MZVLQ512HBLU | Aorus 17 XE4 GeForce RTX 3070 Ti Laptop GPU, i7-12700H, Gigabyte AG470S1TB-SI B10 | Schenker XMG NEO 17 GM7TG8S GeForce RTX 3080 Laptop GPU, i7-11800H, Samsung SSD 980 Pro 1TB MZ-V8P1T0BW | Lenovo Legion 5 Pro 16 G7 i7 RTX 3070Ti GeForce RTX 3070 Ti Laptop GPU, i7-12700H, Samsung PM9A1 MZVL21T0HCLR | Asus ROG Zephyrus M16 GU603H GeForce RTX 3070 Laptop GPU, i9-11900H, Samsung PM9A1 MZVL22T0HBLB | MSI Vector GP66 12UGS GeForce RTX 3070 Ti Laptop GPU, i9-12900H | |
|---|---|---|---|---|---|---|---|---|
| AS SSD | -98% | -45% | 13% | 27% | 36% | 9% | -5% | |
| Seq Read (MB/s) | 3199 | 1659 -48% | 2602 -19% | 5031 57% | 5223 63% | 5036 57% | 5615 76% | 3080 -4% |
| Seq Write (MB/s) | 3173 | 921 -71% | 1218 -62% | 3162 0% | 3922 24% | 3784 19% | 4297 35% | 2997 -6% |
| 4K Read (MB/s) | 91.56 | 51 -44% | 42.31 -54% | 108 18% | 82.2 -10% | 88.1 -4% | 55.3 -40% | 70 -24% |
| 4K Write (MB/s) | 340.52 | 120.1 -65% | 122 -64% | 308.6 -9% | 207.6 -39% | 240.4 -29% | 170.5 -50% | 352 3% |
| 4K-64 Read (MB/s) | 2355 | 463.5 -80% | 1182 -50% | 2938 25% | 2439 4% | 2788 18% | 2591 10% | 1630 -31% |
| 4K-64 Write (MB/s) | 2978 | 909 -69% | 972 -67% | 3371 13% | 2652 -11% | 3424 15% | 3190 7% | 2435 -18% |
| Access Time Read * (ms) | 0.027 | 0.179 -563% | 0.101 -274% | 0.048 -78% | 0.022 19% | 0.02 26% | 0.04 -48% | 0.033 -22% |
| Access Time Write * (ms) | 0.169 | 0.032 81% | 0.096 43% | 0.013 92% | 0.021 88% | 0.018 89% | 0.025 85% | 0.425 -151% |
| Score Read (Points) | 2766 | 680 -75% | 1484 -46% | 3549 28% | 3044 10% | 3380 22% | 3208 16% | 2008 -27% |
| Score Write (Points) | 3636 | 1121 -69% | 1216 -67% | 3996 10% | 3252 -11% | 4043 11% | 3790 4% | 3087 -15% |
| Score Total (Points) | 7830 | 2130 -73% | 3394 -57% | 9279 19% | 7794 0% | 9094 16% | 8563 9% | 6130 -22% |
| Copy ISO MB/s (MB/s) | 1799 | 1538 -15% | 1967 9% | 3221 79% | 3221 79% | 3576 99% | ||
| Copy Program MB/s (MB/s) | 419 | 805 92% | 458.2 9% | 1151 175% | 939 124% | 791 89% | ||
| Copy Game MB/s (MB/s) | 1299 | 1418 9% | 1194 -8% | 1194 -8% | 1995 54% | 2134 64% |
* ... smaller is better

| Drive Performance rating - Percent | |
| Lenovo Legion 5 Pro 16 G7 i7 RTX 3070Ti | |
| Aorus 17 XE4 | |
| Asus ROG Zephyrus M16 GU603H | |
| Schenker XMG NEO 17 GM7TG8S | |
| Average of class Gaming | |
| MSI Vector GP76 12UGS-434 | |
| Average Micron 2450 1TB MTFDKBA1T0TFK | |
| MSI Vector GP66 12UGS | |
| Asus ROG Strix G17 G713QE-RB74 | |
| MSI GP76 Leopard 10UG | |
* ... smaller is better
Sustained Read Performance: DiskSpd Read Loop, Queue Depth 8
GPU
微星承诺为RTX 3070 Ti提供更高的100MHz提升时钟,即1,585MHz。RTX 3070 Ti (8GB VRAM)。总的来说,GPU的性能只比移动式的RTX3070 Ti慢5%左右。RTX 3080和低于台式机的10%左右 RTX-3070.薄薄的 华硕ROG Zephyrus M16甚至被打败了80%。
在移动领域,几乎没有比这更强大的GPU。应该指出的是,极限模式下的结果要高7%左右。静音模式只减少了10%的结果,而风扇则更安静,你甚至可以在游戏时使用内部扬声器。然而,这增加了表面温度。
在电池模式下,TGP,从而性能大大降低。在允许的总消耗量为50瓦(CPU:15瓦+GPU:35瓦)的情况下,3DMarkTime Spy 的结果几乎翻了三倍,因此大约是在一个GTX 1650 Ti.
| 3DMark Performance rating - Percent | |
| Average of class Gaming | |
| MSI Vector GP66 12UGS | |
| Schenker XMG NEO 17 GM7TG8S | |
| Lenovo Legion 5 Pro 16 G7 i7 RTX 3070Ti -1! | |
| MSI Vector GP76 12UGS-434 | |
| MSI GP76 Leopard 10UG | |
| Aorus 17 XE4 | |
| Average NVIDIA GeForce RTX 3070 Ti Laptop GPU | |
| Asus ROG Zephyrus M16 GU603H | |
| Asus ROG Strix G17 G713QE-RB74 | |
| 3DMark 11 - 1280x720 Performance GPU | |
| Average of class Gaming (21841 - 80022, n=104, last 2 years) | |
| Schenker XMG NEO 17 GM7TG8S | |
| MSI Vector GP66 12UGS | |
| MSI Vector GP76 12UGS-434 | |
| MSI GP76 Leopard 10UG | |
| Aorus 17 XE4 | |
| Average NVIDIA GeForce RTX 3070 Ti Laptop GPU (13799 - 42569, n=36) | |
| Asus ROG Strix G17 G713QE-RB74 | |
| Asus ROG Zephyrus M16 GU603H | |
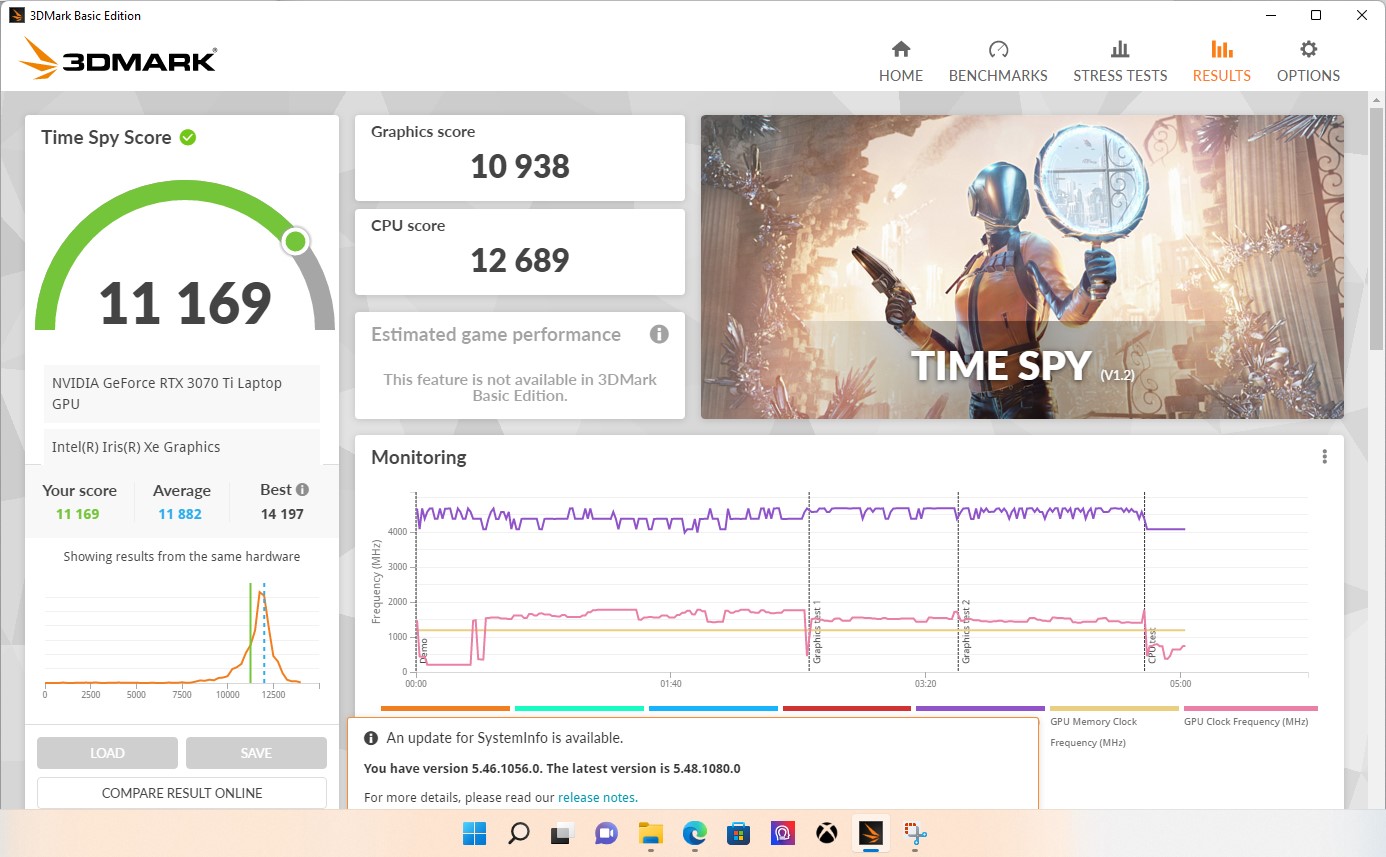
| 3DMark 11 Performance | 32326 points | |
| 3DMark Fire Strike Score | 25633 points | |
| 3DMark Time Spy Score | 11169 points | |
Help | ||
游戏性能
拥有150瓦TGP的RTX 3070 Ti的稳固性能也体现在游戏中。所有游戏都以高FPS运行。即使在最大设置下并使用相应的外部显示器,4K分辨率也是完美无缺的。
虽然TheWitcher 3 在最大设置下@FHD达到113 FPS,但在静音模式下这一数字略微下降到105 FPS,在电池模式下略低于24 FPS,所以你必须在没有外部电源的情况下大幅减少细节。
下图显示了 "极限"、"静音 "和 "电池 "模式。在静音模式下,TGP下降到大约125瓦。在极限模式下,GPU时钟几乎被完全利用,频率为1,780 MHz。
| The Witcher 3 | |
| 1920x1080 High Graphics & Postprocessing (Nvidia HairWorks Off) | |
| Average of class Gaming (341 - 404, n=2, last 2 years) | |
| MSI Vector GP66 12UGS | |
| Lenovo Legion 5 Pro 16 G7 i7 RTX 3070Ti | |
| MSI Vector GP76 12UGS-434 | |
| Schenker XMG NEO 17 GM7TG8S | |
| Average NVIDIA GeForce RTX 3070 Ti Laptop GPU (139.7 - 226, n=27) | |
| Aorus 17 XE4 | |
| Asus ROG Strix G17 G713QE-RB74 | |
| 1920x1080 Ultra Graphics & Postprocessing (HBAO+) | |
| Average of class Gaming (104.7 - 240, n=7, last 2 years) | |
| MSI Vector GP66 12UGS | |
| Schenker XMG NEO 17 GM7TG8S | |
| MSI Vector GP76 12UGS-434 | |
| MSI GP76 Leopard 10UG | |
| Lenovo Legion 5 Pro 16 G7 i7 RTX 3070Ti | |
| Average NVIDIA GeForce RTX 3070 Ti Laptop GPU (76.8 - 124.1, n=39) | |
| Aorus 17 XE4 | |
| Asus ROG Zephyrus M16 GU603H | |
| Asus ROG Strix G17 G713QE-RB74 | |
| Strange Brigade | |
| 1920x1080 high AA:high AF:8 | |
| Average of class Gaming (129.5 - 494, n=75, last 2 years) | |
| Schenker XMG NEO 17 GM7TG8S | |
| MSI Vector GP66 12UGS | |
| Lenovo Legion 5 Pro 16 G7 i7 RTX 3070Ti | |
| MSI Vector GP76 12UGS-434 | |
| Average NVIDIA GeForce RTX 3070 Ti Laptop GPU (112 - 248, n=27) | |
| Aorus 17 XE4 | |
| Asus ROG Zephyrus M16 GU603H | |
| Asus ROG Strix G17 G713QE-RB74 | |
| 1920x1080 ultra AA:ultra AF:16 | |
| Average of class Gaming (76.3 - 458, n=87, last 2 years) | |
| Schenker XMG NEO 17 GM7TG8S | |
| MSI Vector GP66 12UGS | |
| Lenovo Legion 5 Pro 16 G7 i7 RTX 3070Ti | |
| MSI Vector GP76 12UGS-434 | |
| Average NVIDIA GeForce RTX 3070 Ti Laptop GPU (109 - 221, n=37) | |
| Aorus 17 XE4 | |
| Asus ROG Zephyrus M16 GU603H | |
| Asus ROG Strix G17 G713QE-RB74 | |
| Shadow of the Tomb Raider | |
| 1920x1080 High Preset AA:SM | |
| Schenker XMG NEO 17 GM7TG8S | |
| MSI Vector GP76 12UGS-434 | |
| Average NVIDIA GeForce RTX 3070 Ti Laptop GPU (124 - 131, n=2) | |
| Average of class Gaming (107 - 127, n=2, last 2 years) | |
| Asus ROG Strix G17 G713QE-RB74 | |
| 1920x1080 Highest Preset AA:T | |
| Schenker XMG NEO 17 GM7TG8S | |
| MSI Vector GP76 12UGS-434 | |
| Average NVIDIA GeForce RTX 3070 Ti Laptop GPU (119 - 129, n=2) | |
| Average of class Gaming (96 - 116, n=2, last 2 years) | |
| Asus ROG Strix G17 G713QE-RB74 | |
| Elden Ring | |
| 1920x1080 High Preset | |
| MSI Vector GP76 12UGS-434 | |
| Average NVIDIA GeForce RTX 3070 Ti Laptop GPU (59.8 - 59.9, n=2) | |
| 1920x1080 Maximum Preset | |
| Average NVIDIA GeForce RTX 3070 Ti Laptop GPU (46.3 - 59.7, n=2) | |
| MSI Vector GP76 12UGS-434 | |
| Elex 2 | |
| 1920x1080 High / On AA:FX AF:16x | |
| MSI Vector GP76 12UGS-434 | |
| Average NVIDIA GeForce RTX 3070 Ti Laptop GPU (83 - 99.4, n=3) | |
| Aorus 17 XE4 | |
| 1920x1080 Ultra / On AA:SM AF:16x | |
| MSI Vector GP76 12UGS-434 | |
| Average NVIDIA GeForce RTX 3070 Ti Laptop GPU (75 - 89, n=3) | |
| Aorus 17 XE4 | |
Witcher 3 ,在测试模式中没有发现掉帧和卡顿现象。
Witcher 3 FPS Diagram
| low | med. | high | ultra | |
|---|---|---|---|---|
| GTA V (2015) | 179.1 | 167.9 | 109.7 | |
| The Witcher 3 (2015) | 219 | 112.8 | ||
| Dota 2 Reborn (2015) | 164.8 | 150.7 | 140.9 | 134.5 |
| Final Fantasy XV Benchmark (2018) | 107.7 | |||
| X-Plane 11.11 (2018) | 139.1 | 114.7 | 91.1 | |
| Far Cry 5 (2018) | 147 | 138 | ||
| Strange Brigade (2018) | 263 | 222 | 195.1 | |
| Shadow of the Tomb Raider (2018) | 131 | 129 | ||
| Elden Ring (2022) | 59.9 | 46.3 | ||
| Elex 2 (2022) | 99.4 | 89 |
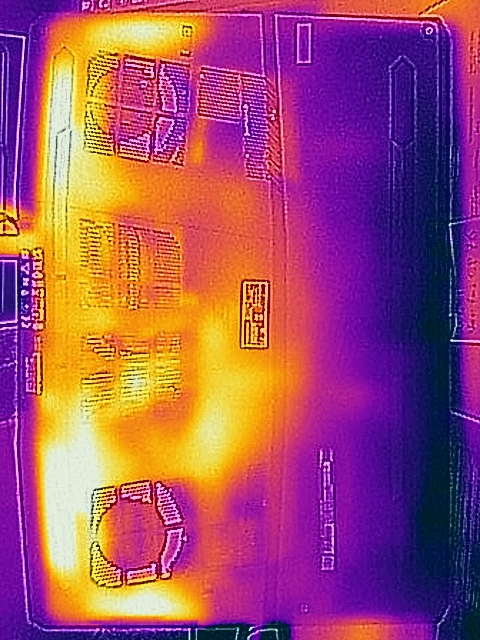
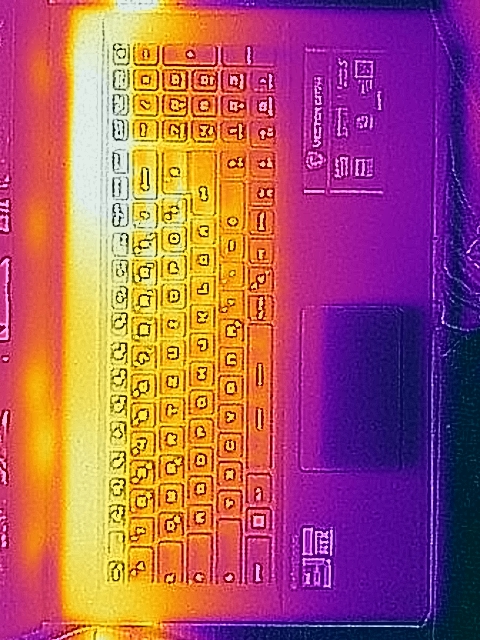
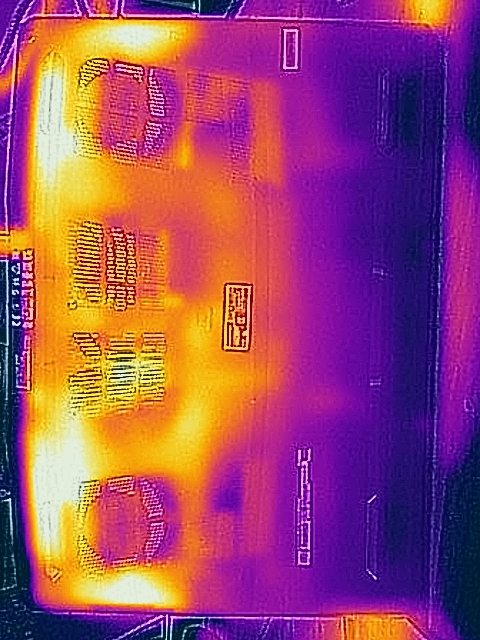
Vector GP76的排放。静音模式的胜利
噪声
当空转时,微星Vector GP76几乎是无声的,由于静音模式不限制CPU的性能,在适当的负载下没有过于恼人的风扇噪音,也听不到高音调的频率。
然而,当在极限模式下进行游戏时,它变得相当响亮,以至于会让人感到讨厌。这里适合使用外部音响系统或耳机,或者你可以使用静音模式。但是,即使在平衡模式下,噪音也要好得多,只有非常轻微的性能损失。
Noise level
| Idle |
| 27 / 27 / 30.1 dB(A) |
| Load |
| 54.4 / 56.2 dB(A) |
 | ||
30 dB silent 40 dB(A) audible 50 dB(A) loud |
||
min: | ||
| MSI Vector GP76 12UGS-434 GeForce RTX 3070 Ti Laptop GPU, i7-12700H, Micron 2450 1TB MTFDKBA1T0TFK | MSI GP76 Leopard 10UG GeForce RTX 3070 Laptop GPU, i7-10750H, Kingston OM8PCP3512F-AB | Asus ROG Strix G17 G713QE-RB74 GeForce RTX 3050 Ti Laptop GPU, R7 5800H, Samsung PM991 MZVLQ512HBLU | Aorus 17 XE4 GeForce RTX 3070 Ti Laptop GPU, i7-12700H, Gigabyte AG470S1TB-SI B10 | Schenker XMG NEO 17 GM7TG8S GeForce RTX 3080 Laptop GPU, i7-11800H, Samsung SSD 980 Pro 1TB MZ-V8P1T0BW | Lenovo Legion 5 Pro 16 G7 i7 RTX 3070Ti GeForce RTX 3070 Ti Laptop GPU, i7-12700H, Samsung PM9A1 MZVL21T0HCLR | Asus ROG Zephyrus M16 GU603H GeForce RTX 3070 Laptop GPU, i9-11900H, Samsung PM9A1 MZVL22T0HBLB | MSI Vector GP66 12UGS GeForce RTX 3070 Ti Laptop GPU, i9-12900H | |
|---|---|---|---|---|---|---|---|---|
| Noise | -2% | 13% | -0% | 16% | 2% | -6% | 13% | |
| off / environment * (dB) | 25.6 | 24 6% | 24.9 3% | 24 6% | 23 10% | 24.6 4% | 25 2% | 22.9 11% |
| Idle Minimum * (dB) | 27 | 25 7% | 25.1 7% | 30 -11% | 23 15% | 28.4 -5% | 25 7% | 23.4 13% |
| Idle Average * (dB) | 27 | 32 -19% | 25.1 7% | 31 -15% | 23 15% | 28.4 -5% | 31 -15% | 23.4 13% |
| Idle Maximum * (dB) | 30.1 | 34 -13% | 25.1 17% | 34 -13% | 23 24% | 28.4 6% | 42 -40% | 27.4 9% |
| Load Average * (dB) | 54.4 | 54 1% | 36.3 33% | 44 19% | 39.5 27% | 49.4 9% | 48 12% | 36 34% |
| Load Maximum * (dB) | 56.2 | 54 4% | 49.9 11% | 49 13% | 55.09 2% | 54.7 3% | 56 -0% | 58 -3% |
| Witcher 3 ultra * (dB) | 51 | 49.9 | 51 | 54.5 | 49.4 | 52 | 58.2 |
* ... smaller is better
温度
微星的游戏笔记本在任何情况下都相当凉爽,除了在游戏期间的静音模式,此时风扇旋转得更慢。然而,表面不会变得太热。更薄的设备,如微星Stealth GS66或 Razer Blade 15在明显更高的温度下挣扎。
(-) The maximum temperature on the upper side is 46.3 °C / 115 F, compared to the average of 40.4 °C / 105 F, ranging from 21.2 to 68.8 °C for the class Gaming.
(±) The bottom heats up to a maximum of 45 °C / 113 F, compared to the average of 43.2 °C / 110 F
(+) In idle usage, the average temperature for the upper side is 30.8 °C / 87 F, compared to the device average of 33.9 °C / 93 F.
(±) Playing The Witcher 3, the average temperature for the upper side is 34.8 °C / 95 F, compared to the device average of 33.9 °C / 93 F.
(+) The palmrests and touchpad are cooler than skin temperature with a maximum of 27.4 °C / 81.3 F and are therefore cool to the touch.
(±) The average temperature of the palmrest area of similar devices was 28.8 °C / 83.8 F (+1.4 °C / 2.5 F).
| MSI Vector GP76 12UGS-434 Intel Core i7-12700H, NVIDIA GeForce RTX 3070 Ti Laptop GPU | MSI GP76 Leopard 10UG Intel Core i7-10750H, NVIDIA GeForce RTX 3070 Laptop GPU | Asus ROG Strix G17 G713QE-RB74 AMD Ryzen 7 5800H, NVIDIA GeForce RTX 3050 Ti Laptop GPU | Aorus 17 XE4 Intel Core i7-12700H, NVIDIA GeForce RTX 3070 Ti Laptop GPU | Schenker XMG NEO 17 GM7TG8S Intel Core i7-11800H, NVIDIA GeForce RTX 3080 Laptop GPU | Lenovo Legion 5 Pro 16 G7 i7 RTX 3070Ti Intel Core i7-12700H, NVIDIA GeForce RTX 3070 Ti Laptop GPU | Asus ROG Zephyrus M16 GU603H Intel Core i9-11900H, NVIDIA GeForce RTX 3070 Laptop GPU | MSI Vector GP66 12UGS Intel Core i9-12900H, NVIDIA GeForce RTX 3070 Ti Laptop GPU | |
|---|---|---|---|---|---|---|---|---|
| Heat | 7% | -0% | -2% | -12% | 0% | -12% | 4% | |
| Maximum Upper Side * (°C) | 46.3 | 43 7% | 43.8 5% | 50 -8% | 51 -10% | 45.3 2% | 52 -12% | 40.2 13% |
| Maximum Bottom * (°C) | 45 | 47 -4% | 47.2 -5% | 58 -29% | 62 -38% | 61.2 -36% | 53 -18% | 43.8 3% |
| Idle Upper Side * (°C) | 34.2 | 30 12% | 33.4 2% | 30 12% | 35 -2% | 28.6 16% | 38 -11% | 34.8 -2% |
| Idle Bottom * (°C) | 38.3 | 33 14% | 39.4 -3% | 32 16% | 38 1% | 31.4 18% | 41 -7% | 37 3% |
* ... smaller is better
压力测试
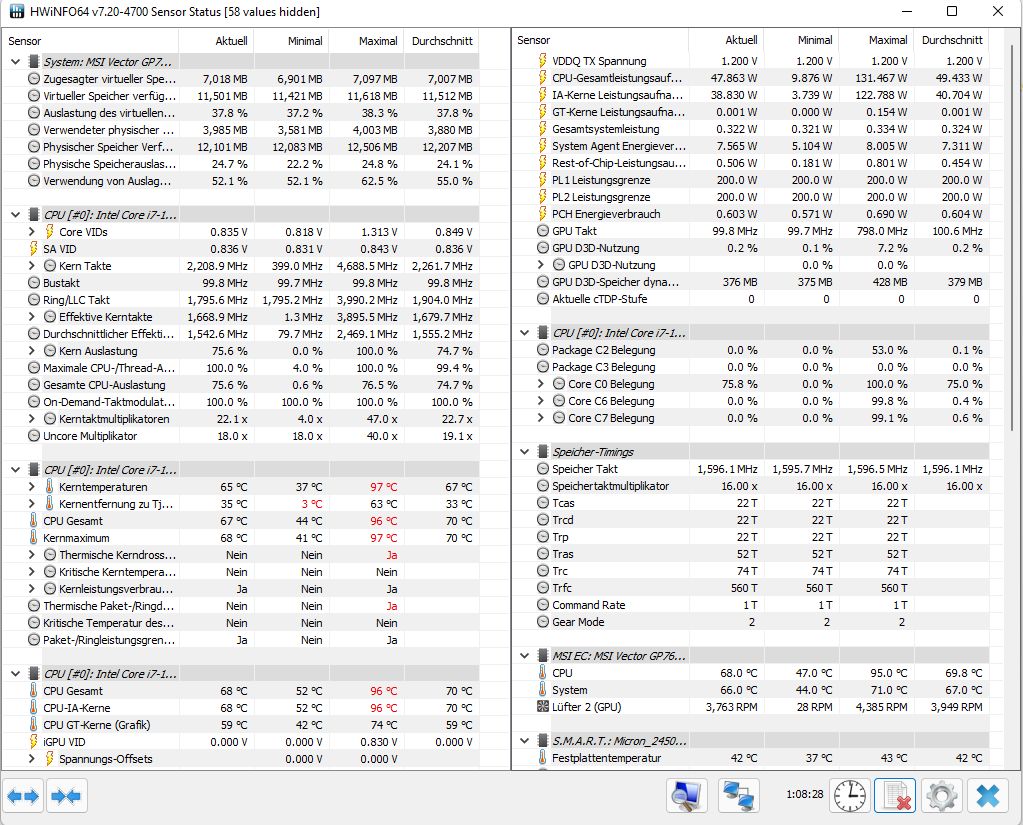
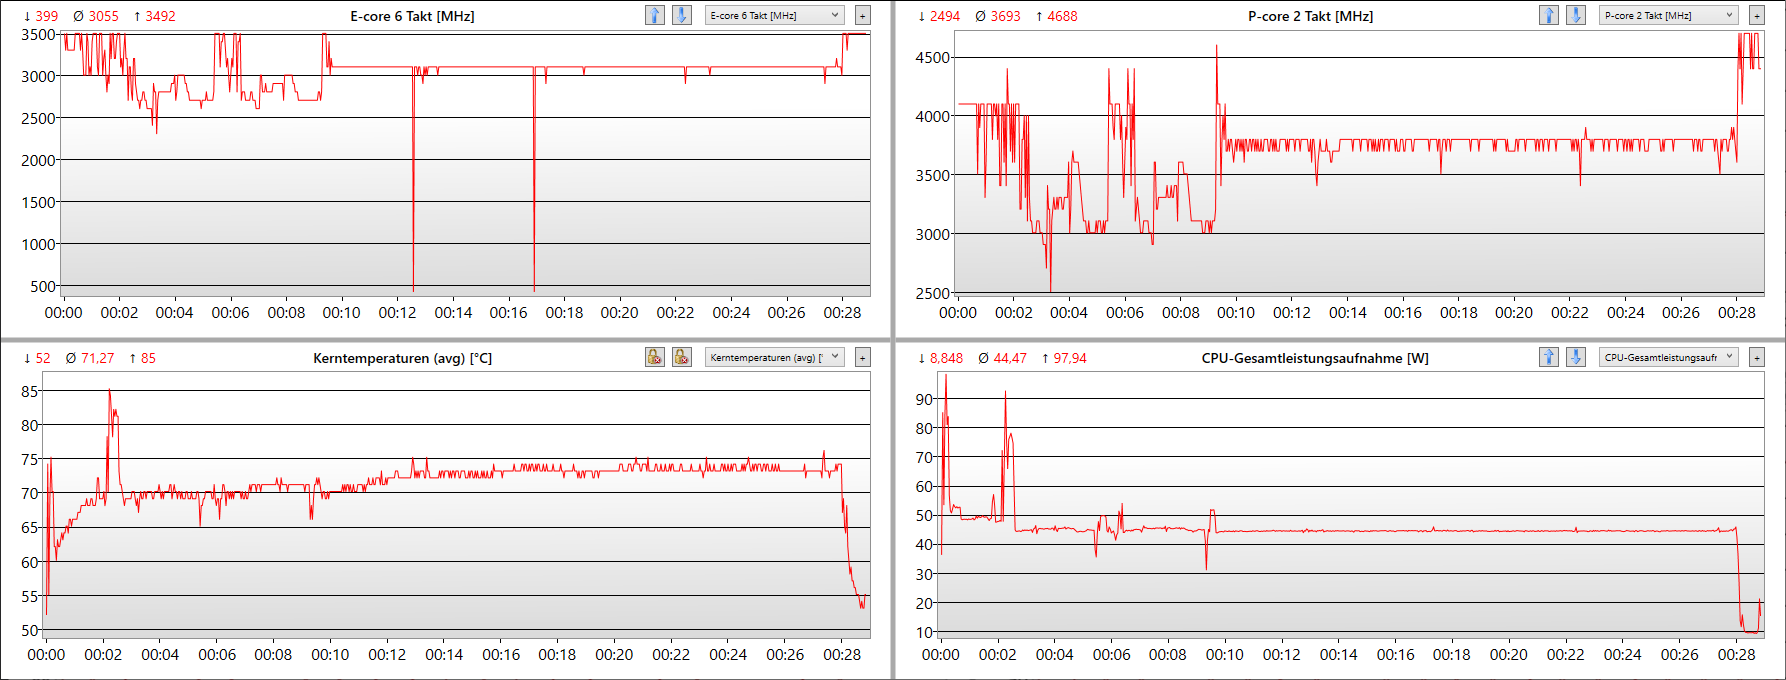
在2.3 GHz时,CPU在综合压力测试(Prime95 + FurMark)中只工作在低于基本时钟速度的100 MHz,而较小的Vector GP66只能管理1 GHz。在这种极端情况下,GPU也能以全时钟速度工作。因此,节流并没有发挥作用,在压力测试后直接进行的3D基准测试中也看不到性能下降。
处理器最初的功率为131瓦,但这一功率很快就被节流到50瓦,这使得核心温度非常低。Nvidia GPU的温度也可以说是非常不明显,尽管它的消耗量仍然超过140瓦。在纯粹的CPU压力下,它允许自己有恒定的70瓦(极限模式),并在76℃时保持相当凉爽。
| CPU时钟(GHz) | GPU时钟(MHz) | CPU平均温度(℃) | GPU平均温度(℃) | |
| 系统空闲 | -- | 200 | 36 | 40 |
| Prime95压力 | 2.6 | 200 | 77 | -- |
| Prime95 + FurMark 压力 | 2.2 | 1.780 | 67 | 68 |
| Witcher 3 应力 | 3.4 | 1.780 | 82 | 78 |
| Witcher 3 @Battery | 3.2 | 1.000 | 51 | 59 |
发言人
扬声器是体面的,即使华硕在其SCAR系列扬声器。但它们肯定比技嘉的Aorus系列好。
高音和中音重现得非常好,而低音则很简陋。最大音量是好的。你不可能从一个有2个2.5瓦的立体声扬声器系统中得到更多。
MSI Vector GP76 12UGS-434 audio analysis
(±) | speaker loudness is average but good (76.7 dB)
Bass 100 - 315 Hz
(-) | nearly no bass - on average 15.3% lower than median
(±) | linearity of bass is average (9% delta to prev. frequency)
Mids 400 - 2000 Hz
(+) | balanced mids - only 2.8% away from median
(+) | mids are linear (4% delta to prev. frequency)
Highs 2 - 16 kHz
(+) | balanced highs - only 2% away from median
(+) | highs are linear (3.4% delta to prev. frequency)
Overall 100 - 16.000 Hz
(+) | overall sound is linear (12.6% difference to median)
Compared to same class
» 16% of all tested devices in this class were better, 4% similar, 81% worse
» The best had a delta of 6%, average was 18%, worst was 132%
Compared to all devices tested
» 11% of all tested devices were better, 3% similar, 86% worse
» The best had a delta of 4%, average was 23%, worst was 134%
Asus ROG Strix G17 G713QE-RB74 audio analysis
(±) | speaker loudness is average but good (73.5 dB)
Bass 100 - 315 Hz
(±) | reduced bass - on average 13% lower than median
(±) | linearity of bass is average (9.8% delta to prev. frequency)
Mids 400 - 2000 Hz
(±) | higher mids - on average 5.6% higher than median
(+) | mids are linear (6.5% delta to prev. frequency)
Highs 2 - 16 kHz
(+) | balanced highs - only 3.4% away from median
(±) | linearity of highs is average (12% delta to prev. frequency)
Overall 100 - 16.000 Hz
(±) | linearity of overall sound is average (16.9% difference to median)
Compared to same class
» 44% of all tested devices in this class were better, 11% similar, 44% worse
» The best had a delta of 6%, average was 18%, worst was 132%
Compared to all devices tested
» 30% of all tested devices were better, 8% similar, 62% worse
» The best had a delta of 4%, average was 23%, worst was 134%
电源管理。微星改善了Vector GP76的电池寿命
消耗功率
对于一台游戏机来说,15.6瓦的空闲消耗是平均水平,而0.5瓦的待机消耗是令人高兴的,并承诺待机时间超过5天(通常在实践中更长)。
在合并负载和游戏的情况下,永久的最大消耗略低于200瓦。原则上,这里的高值是好的,意味着GPU可以消耗大量的电力,从而更快地工作。在纯粹的CPU负载下,该值(根据HWInfo)应该在50到80瓦之间,这取决于模式。
在平衡和静音模式下,根据上表("测试条件"),消耗值会更低。略低于320瓦的峰值负载只在综合压力测试开始时非常短暂地出现,在日常使用中不会出现。总的来说,280瓦的电源装置的尺寸是足够的。
| Off / Standby | |
| Idle | |
| Load |
|
Key:
min: | |
| MSI Vector GP76 12UGS-434 i7-12700H, GeForce RTX 3070 Ti Laptop GPU, Micron 2450 1TB MTFDKBA1T0TFK, IPS, 1920x1080, 17.3" | MSI GP76 Leopard 10UG i7-10750H, GeForce RTX 3070 Laptop GPU, Kingston OM8PCP3512F-AB, IPS, 1920x1080, 17.3" | Asus ROG Strix G17 G713QE-RB74 R7 5800H, GeForce RTX 3050 Ti Laptop GPU, Samsung PM991 MZVLQ512HBLU, IPS, 1920x1080, 17.3" | Aorus 17 XE4 i7-12700H, GeForce RTX 3070 Ti Laptop GPU, Gigabyte AG470S1TB-SI B10, IPS, 1920x1080, 17.3" | Schenker XMG NEO 17 GM7TG8S i7-11800H, GeForce RTX 3080 Laptop GPU, Samsung SSD 980 Pro 1TB MZ-V8P1T0BW, IPS, 2560x1440, 17.3" | Lenovo Legion 5 Pro 16 G7 i7 RTX 3070Ti i7-12700H, GeForce RTX 3070 Ti Laptop GPU, Samsung PM9A1 MZVL21T0HCLR, IPS, 2560x1600, 16" | Asus ROG Zephyrus M16 GU603H i9-11900H, GeForce RTX 3070 Laptop GPU, Samsung PM9A1 MZVL22T0HBLB, IPS, 2560x1600, 16" | MSI Vector GP66 12UGS i9-12900H, GeForce RTX 3070 Ti Laptop GPU, , IPS, 1920x1080, 15.6" | Average NVIDIA GeForce RTX 3070 Ti Laptop GPU | Average of class Gaming | |
|---|---|---|---|---|---|---|---|---|---|---|
| Power Consumption | 10% | 29% | -12% | -12% | 12% | 8% | -24% | -0% | 5% | |
| Idle Minimum * (Watt) | 13.5 | 12 11% | 9.2 32% | 20 -48% | 19 -41% | 8.6 36% | 11 19% | 17.5 -30% | 14.2 ? -5% | 13 ? 4% |
| Idle Average * (Watt) | 15.6 | 16 -3% | 12.6 19% | 23 -47% | 25 -60% | 17.6 -13% | 20 -28% | 20.1 -29% | 19.9 ? -28% | 19 ? -22% |
| Idle Maximum * (Watt) | 20.6 | 28 -36% | 23.3 -13% | 28 -36% | 28 -36% | 18.5 10% | 30 -46% | 47.3 -130% | 26.2 ? -27% | 24.6 ? -19% |
| Load Average * (Watt) | 198 | 92 54% | 89.3 55% | 120 39% | 105 47% | 110 44% | 111 44% | 107.3 46% | 125.8 ? 36% | 110.7 ? 44% |
| Witcher 3 ultra * (Watt) | 199 | 198 1% | 136 32% | 196 2% | 223 -12% | 227 -14% | 156 22% | 225 -13% | ||
| Load Maximum * (Watt) | 319 | 210 34% | 162.7 49% | 257 19% | 226 29% | 294.6 8% | 197 38% | 277.7 13% | 248 ? 22% | 259 ? 19% |
* ... smaller is better
Power Consumption Witcher 3 / Stress test
Power Consumption with external monitor
电池寿命
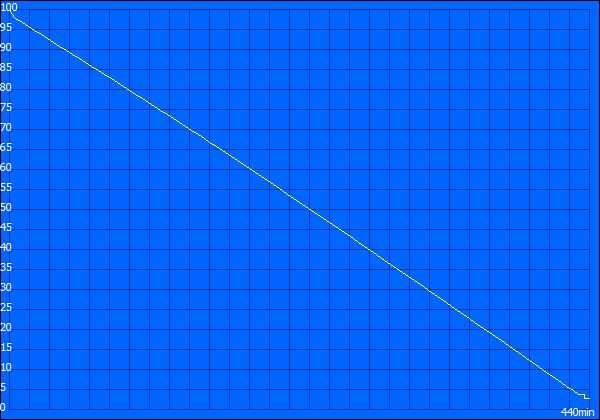
与前代产品相比,电池寿命平均提高了20%。在测试领域的其他产品中,即使有更强的电池,也没有提供更多,除了纤细的Zephyrus M16.
在我们的WLAN测试中,在150cd/m²的亮度下,在平衡的Windows性能模式下,只可能超过5小时。65Wh的电池需要将近2.5小时才能完全充电。这比其他任何级别的笔记本都要长很多。
| MSI Vector GP76 12UGS-434 i7-12700H, GeForce RTX 3070 Ti Laptop GPU, 65 Wh | MSI GP76 Leopard 10UG i7-10750H, GeForce RTX 3070 Laptop GPU, 65 Wh | Asus ROG Strix G17 G713QE-RB74 R7 5800H, GeForce RTX 3050 Ti Laptop GPU, 56 Wh | Aorus 17 XE4 i7-12700H, GeForce RTX 3070 Ti Laptop GPU, 99 Wh | Schenker XMG NEO 17 GM7TG8S i7-11800H, GeForce RTX 3080 Laptop GPU, 62 Wh | Lenovo Legion 5 Pro 16 G7 i7 RTX 3070Ti i7-12700H, GeForce RTX 3070 Ti Laptop GPU, 80 Wh | Asus ROG Zephyrus M16 GU603H i9-11900H, GeForce RTX 3070 Laptop GPU, 90 Wh | MSI Vector GP66 12UGS i9-12900H, GeForce RTX 3070 Ti Laptop GPU, 65 Wh | Average of class Gaming | |
|---|---|---|---|---|---|---|---|---|---|
| Battery runtime | -31% | 12% | 4% | -17% | -30% | 42% | -7% | 13% | |
| Reader / Idle (h) | 7.3 | 5.6 -23% | 11.1 52% | 8.6 18% | 13.3 82% | 7.9 8% | 8.27 ? 13% | ||
| WiFi v1.3 (h) | 5.1 | 4.2 -18% | 6 18% | 5.1 0% | 3.7 -27% | 5.4 6% | 7.7 51% | 5.7 12% | 7.11 ? 39% |
| Load (h) | 1.7 | 0.8 -53% | 1.1 -35% | 1.6 -6% | 1.6 -6% | 0.6 -65% | 1.6 -6% | 1 -41% | 1.502 ? -12% |
| H.264 (h) | 6.1 | 3.7 | 6.3 | 8.32 ? |
Pros
Cons
结论:由于微星矢量显卡的存在,在所有层面上都具有顶级性能

优势很明显:Vector GP76拥有360赫兹的显示效果和超快的响应时间,是一个真正的游戏玩家。此外 酷睿i7-12700H具有双倍于其前代CPU的功率,另一个亮点是 Nvidia RTX 3070 Ti 实际耗电量为150瓦。这使该设备处于我们数据库的顶级范围。
Vector还可以相当安静地运行,提供完整的声音范围,改进的电池运行时间,可按键配置的RGB键盘,非常稳定的机箱和良好的升级选项。此外,显示屏产生了一个很好的、丰富的、清晰的画面,但可以照得更亮一点,并提供更高的分辨率作为选择。
微星Vector GP76在所有层面上都以速度运行。显示器、CPU和带有150瓦TGP的GPU。批评只适用于小的方面,如有点暗的屏幕。
此外,没有Thunderbolt,也没有通过USB-C的Power Delivery。电源又重又笨重,而且没有SD卡读卡器。固态硬盘不是市场上最快的,在电池模式下,性能会明显下降。此外,目前2,649美元的价格有点高了。
如果你能接受这些限制,你会得到一台非常坚实的游戏机。另外,如果紧凑性对你来说比全面性能更重要,你可以选择Zephyrus M16 ,或者Legion 5 Pro ,以获得更好的价值、更亮的屏幕、更好的键盘和未释放的Core i9。华硕ROG Strix G17 ,如果配置合适(QHD显示屏+RTX 3070),也是一个不错的选择,因为它不仅价格合理,而且非常坚固,由于AMD的原因,它非常安静和凉爽。它还拥有同类产品中最好的键盘。
价格和可用性
MSI Vector GP76 12UGS-434
- 05/06/2022 v7 (old)
Marvin Gollor
Price comparison

