微星Vector GP66 12UGS笔记本电脑回顾。150 W TGPGeForce RTX 3070 Ti甜蜜点
微星是第一批在上个月早些时候推出12代Alder Lake-H游戏笔记本的主要厂商之一。虽然新的微星型号在视觉上与去年的第11代型号几乎相同,但它们携带了更快的CPU和GPU以及新的显示选项,发烧友可以欣赏。
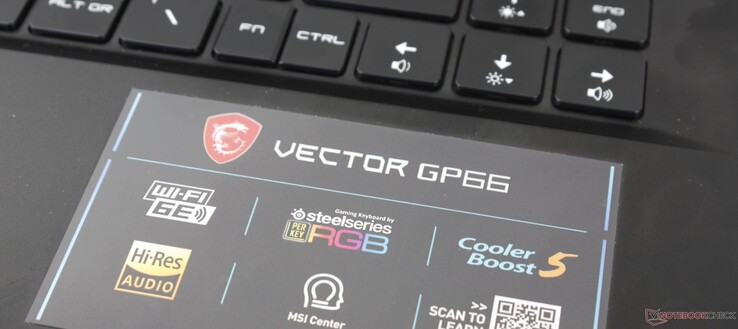
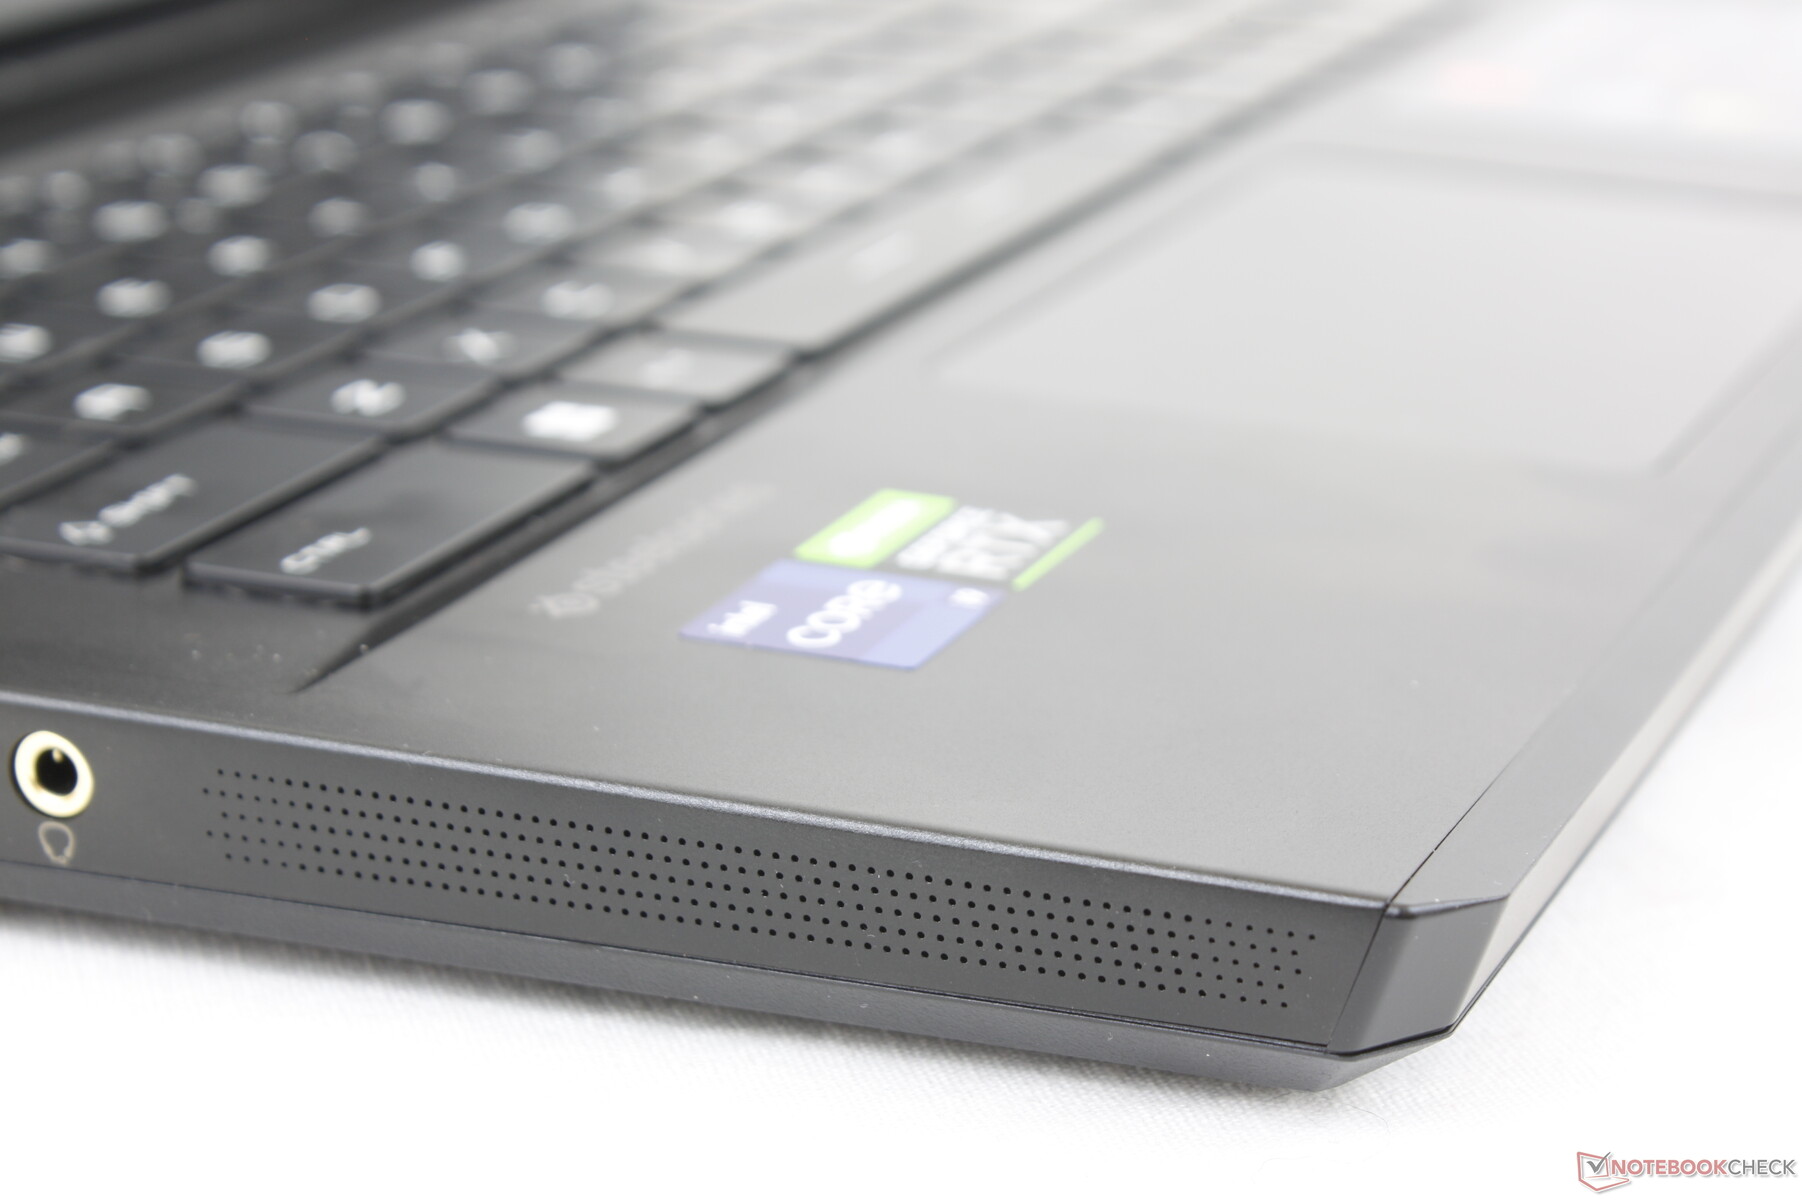
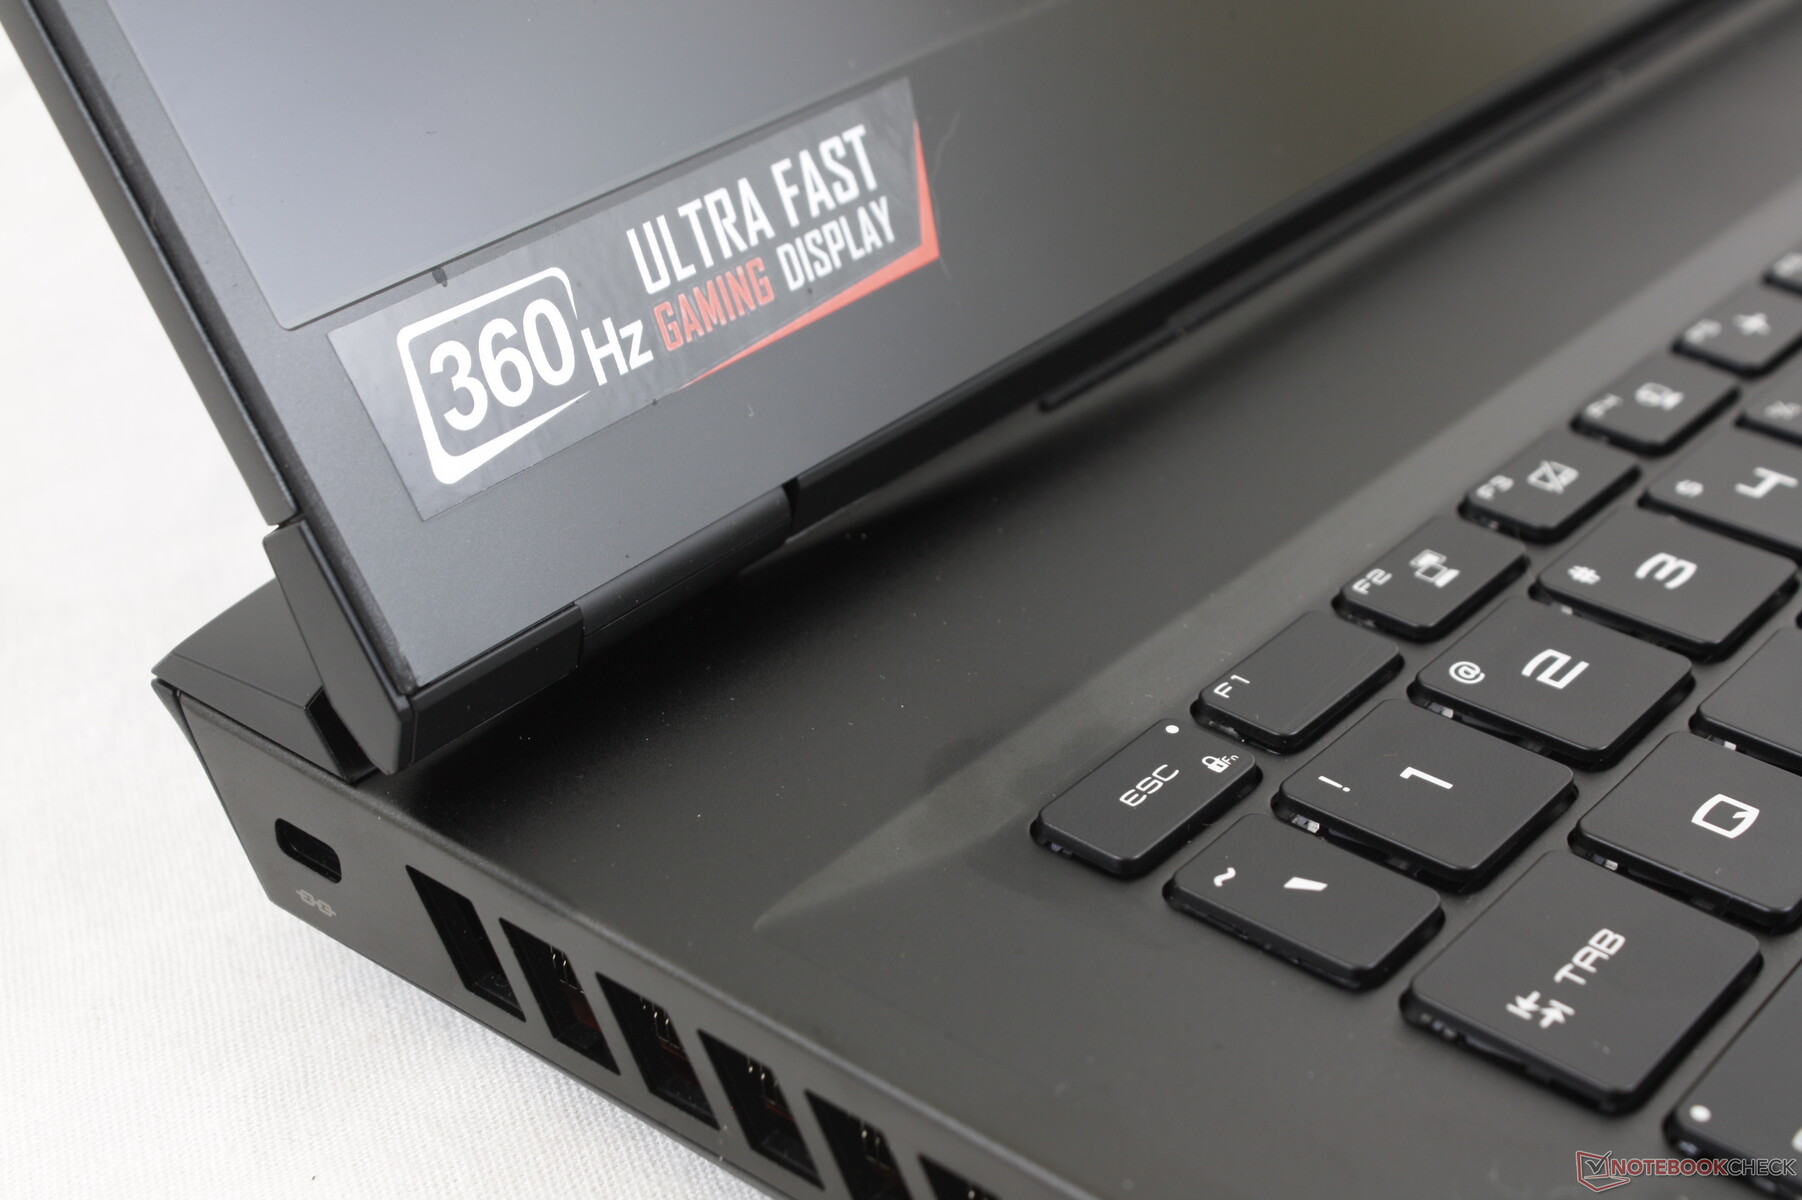
今天评论的设备是Vector GP66,它继承了去年的 GP66 Leopard.我们的具体配置包括Core i9-12900H CPU、150 WGeForce RTX 3070 Ti GPU、32 GB RAM、360 Hz 1080p IPS显示屏和1 TB NVMe SSD,在网上可以找到,价格约为2400美元。其他SKU可使用RTX 3060、RTX 3080、QHD 165 Hz或FHD 144 Hz显示屏,或用酷睿i7-12700H代替。
微星Vector的替代品包括其他中高档的15.6英寸游戏笔记本,如 华硕ROG Strix系列, Razer Blade 15 Base Model, 戴尔G15系列, 或 联想Legion S7系列.微星Vector不应该与Maingear Vector混淆。 微星Vector.
更多的微星评论。
潜在的竞争对手比较
Rating | Date | Model | Weight | Height | Size | Resolution | Price |
|---|---|---|---|---|---|---|---|
| 86.9 % v7 (old) | 03 / 2022 | MSI Vector GP66 12UGS i9-12900H, GeForce RTX 3070 Ti Laptop GPU | 2.3 kg | 23.4 mm | 15.60" | 1920x1080 | |
| 85.4 % v7 (old) | 12 / 2021 | MSI GP66 Leopard 11UH-028 i7-11800H, GeForce RTX 3080 Laptop GPU | 2.3 kg | 23.4 mm | 15.60" | 1920x1080 | |
| 79.2 % v7 (old) | 09 / 2021 | MSI Katana GF66 11UG-220 i7-11800H, GeForce RTX 3070 Laptop GPU | 2.3 kg | 25 mm | 15.60" | 1920x1080 | |
| 85.9 % v7 (old) | 10 / 2021 | Asus TUF Gaming F15 FX506HM i7-11800H, GeForce RTX 3060 Laptop GPU | 2.3 kg | 24.9 mm | 15.60" | 1920x1080 | |
| 85.5 % v7 (old) | 04 / 2021 | Razer Blade 15 Base Edition 2021, i7-10750H RTX 3060 i7-10750H, GeForce RTX 3060 Laptop GPU | 2.1 kg | 19.9 mm | 15.60" | 1920x1080 | |
| 84.7 % v7 (old) | 08 / 2025 | Alienware m15 R5 Ryzen Edition R7 5800H, GeForce RTX 3060 Laptop GPU | 2.5 kg | 22.85 mm | 15.60" | 1920x1080 |
案例
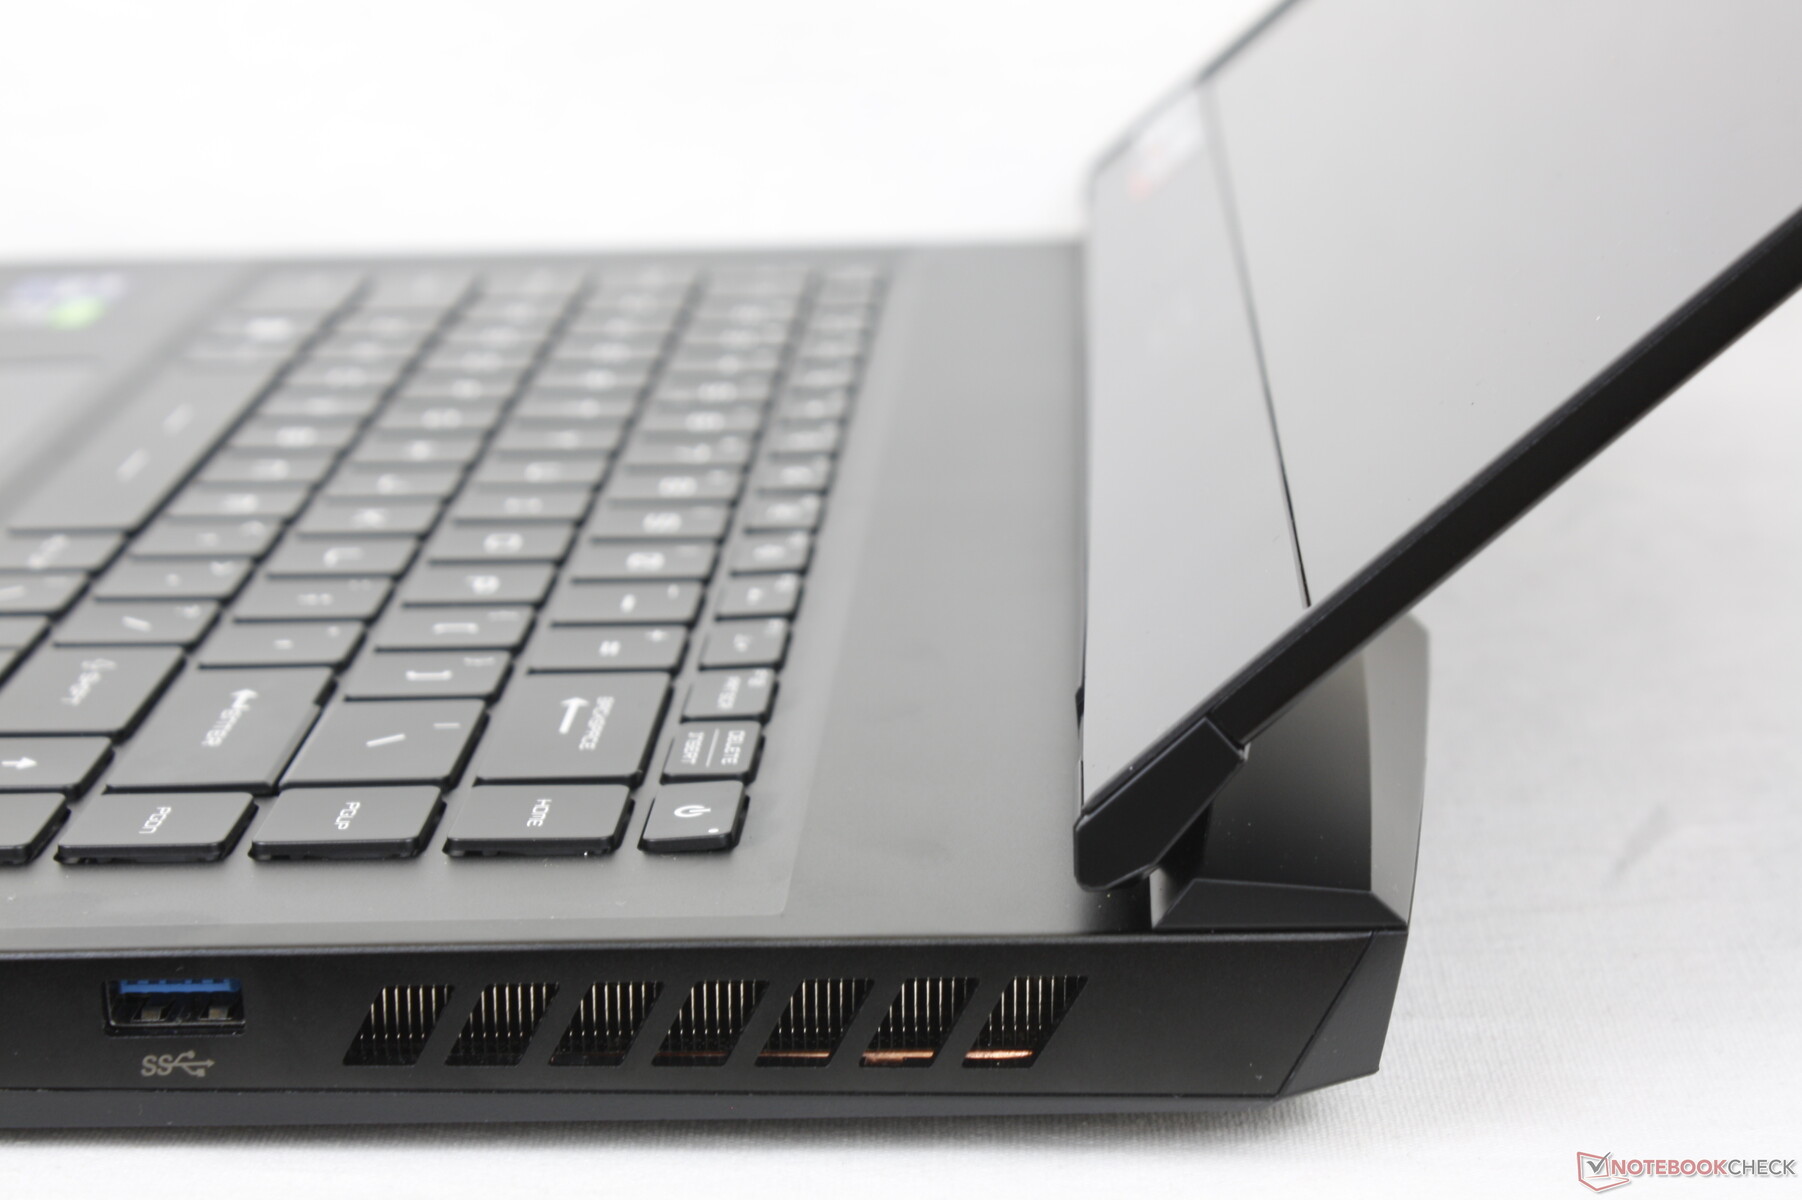
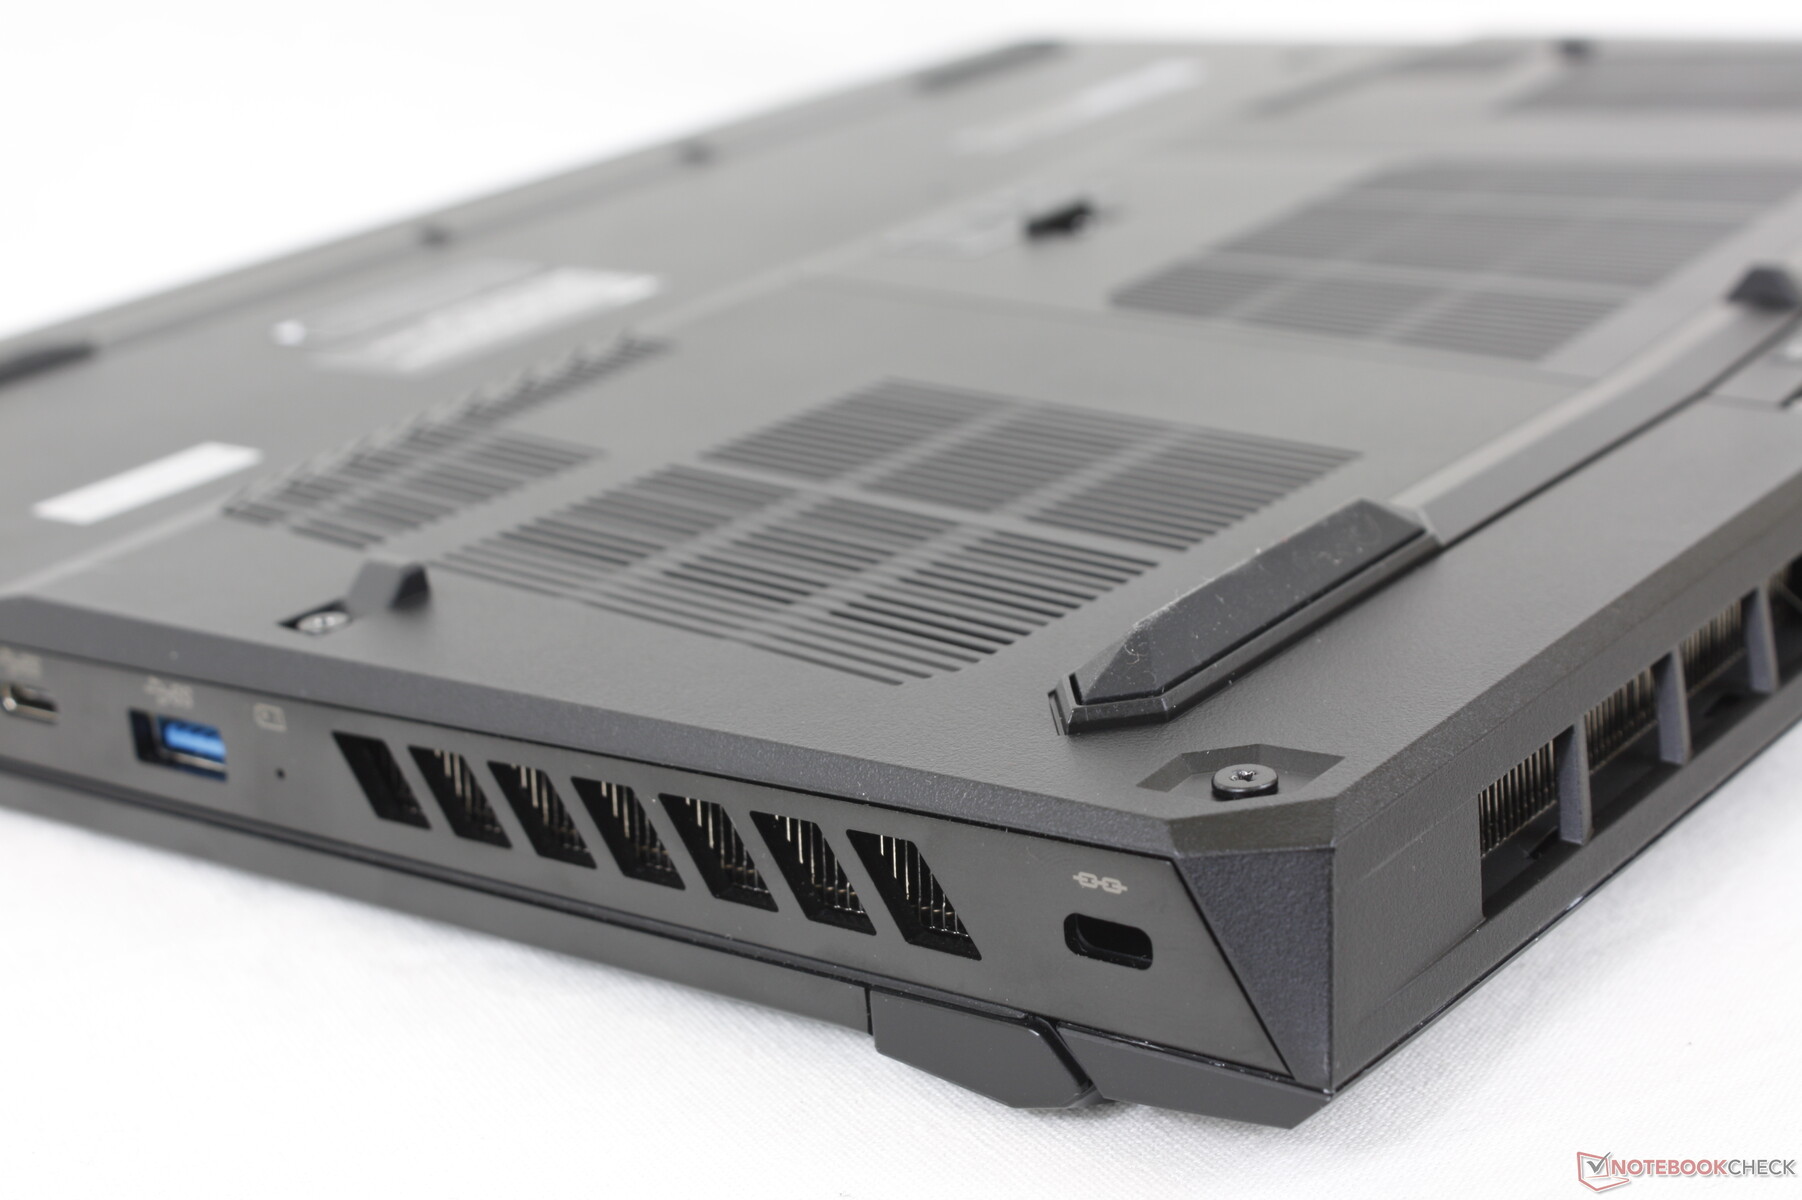
微星去年年初重新设计了其GP66,因此现在再进行视觉上的刷新还为时过早。因此,我们建议查看我们现有的关于 配备第十代英特尔的GP66和 11代英特尔的GP66因为我们对机箱的大部分评论仍然适用于我们这里的GP66 12代英特尔型号。然而,在端口方面仍有一些细微的差别,我们将在下一节中进行介绍。
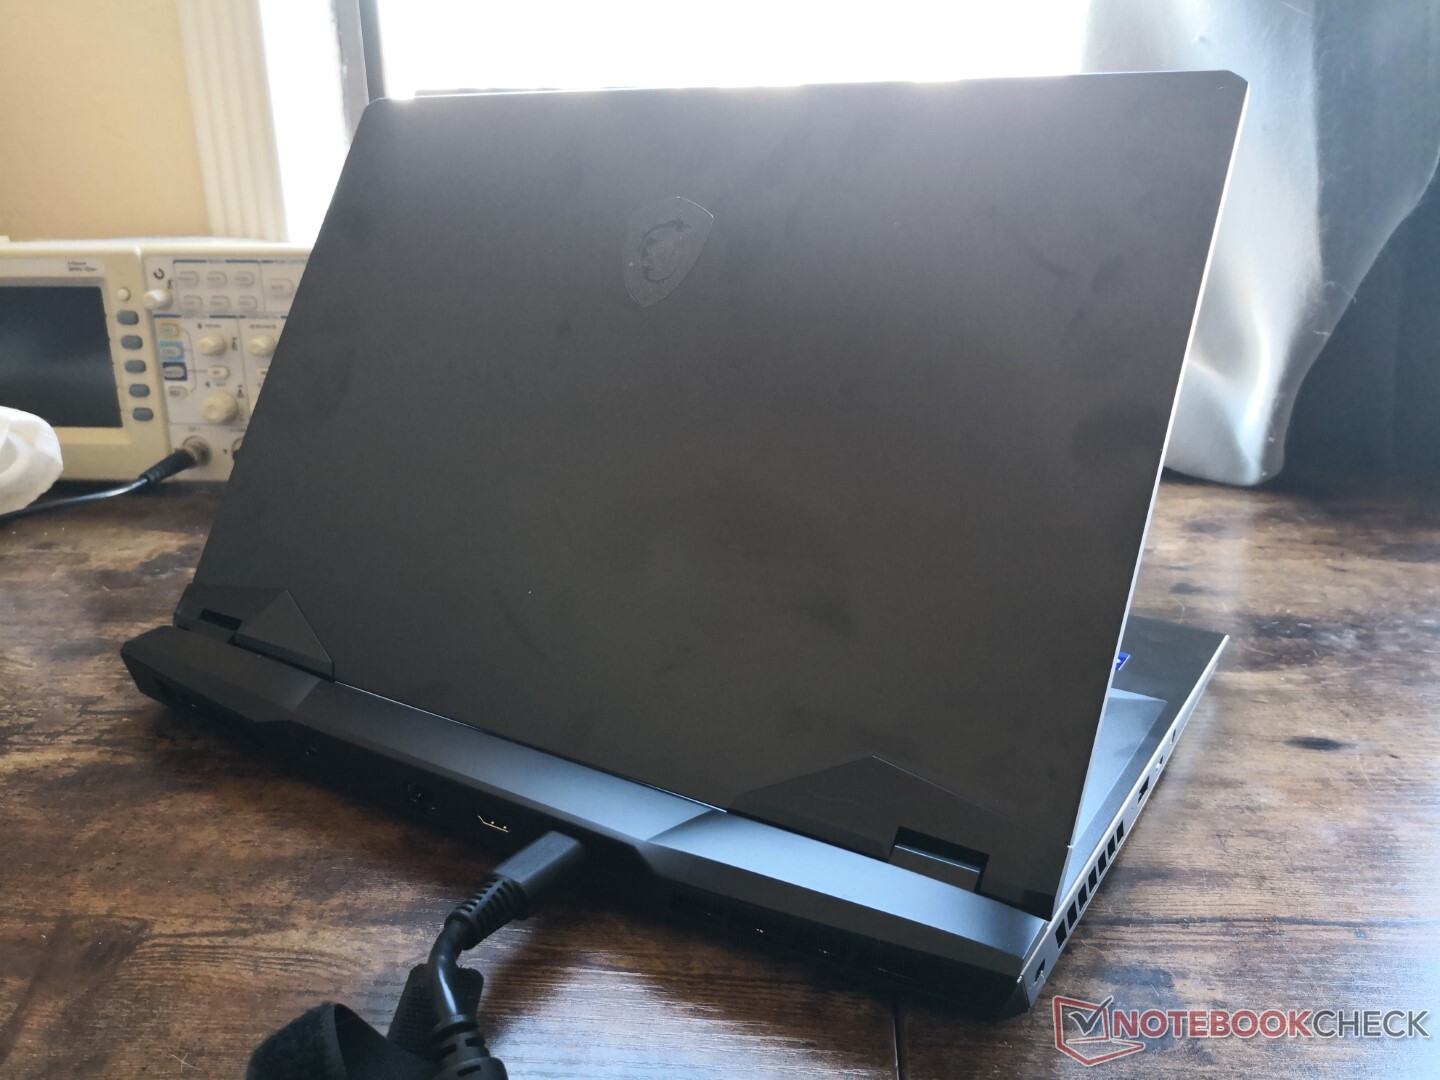
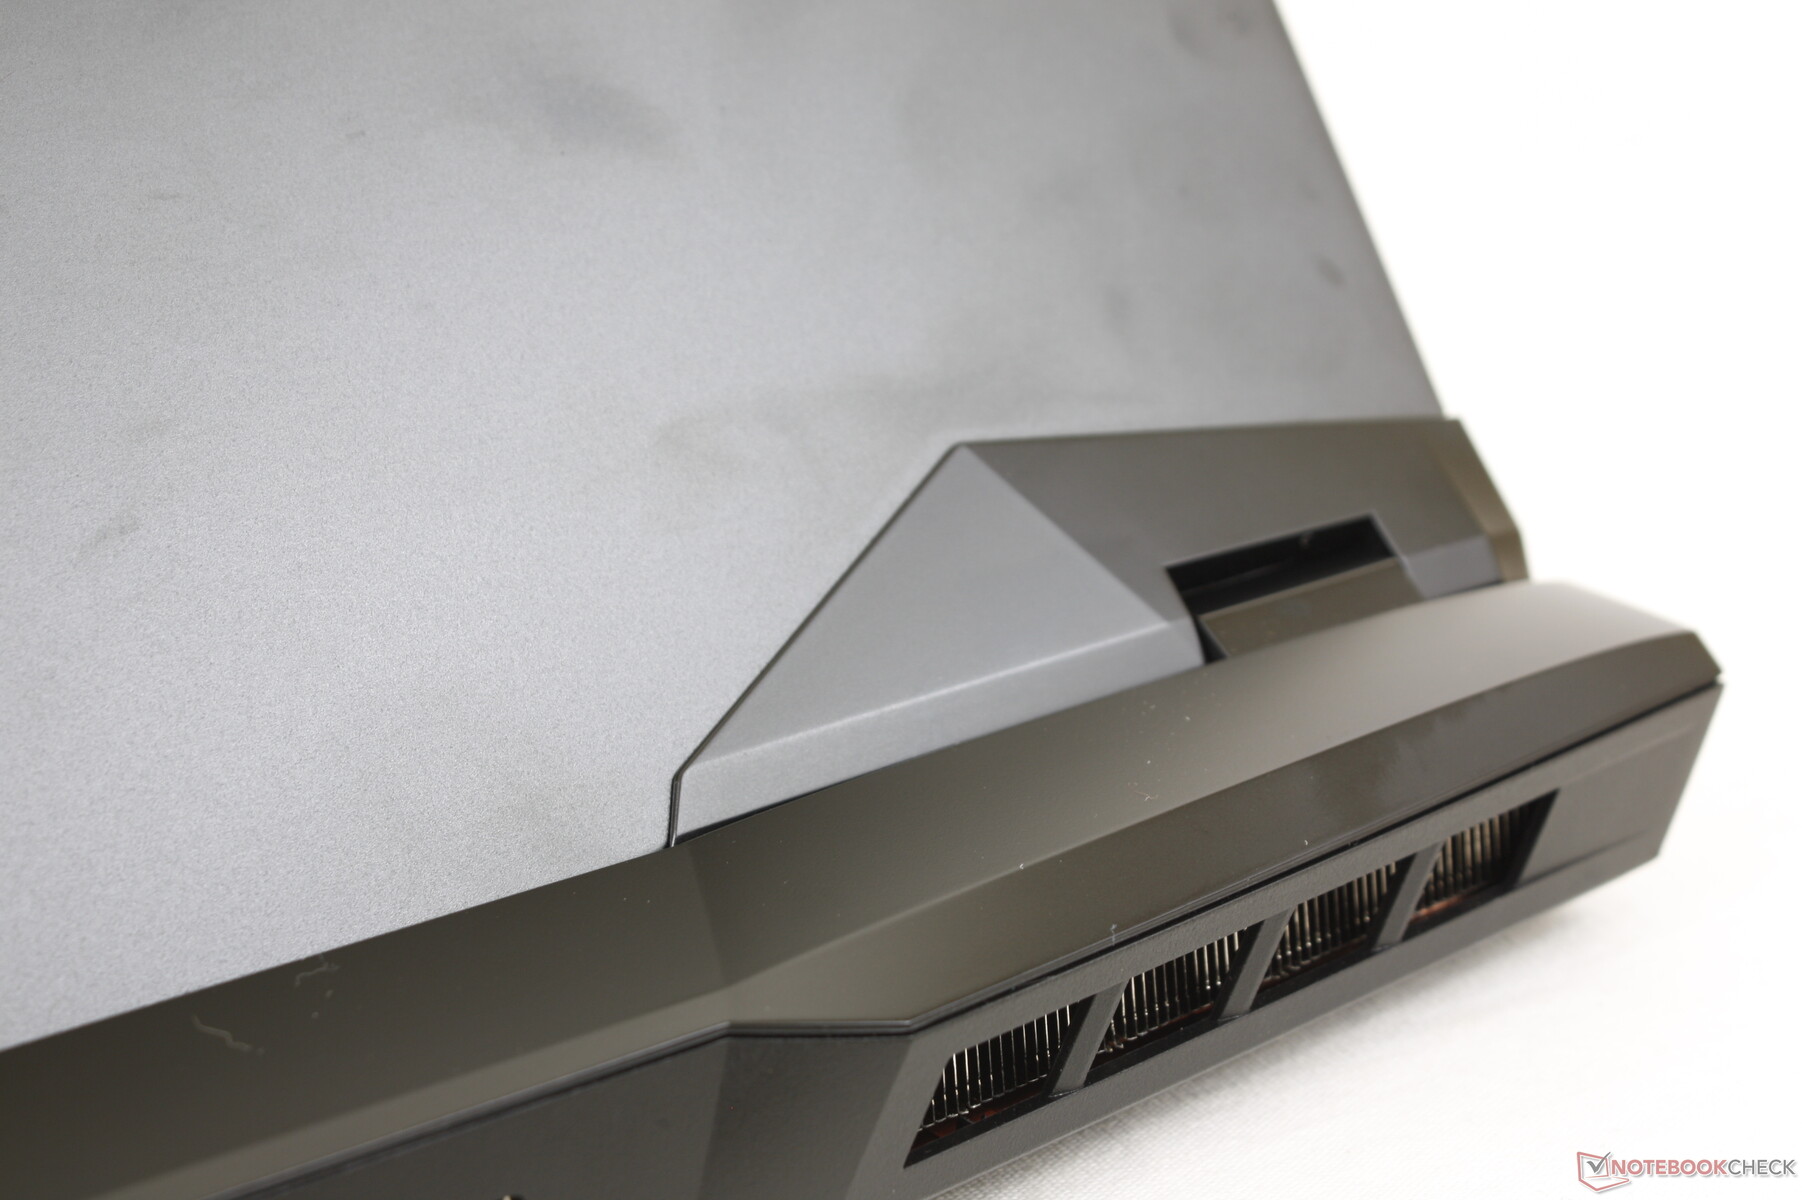
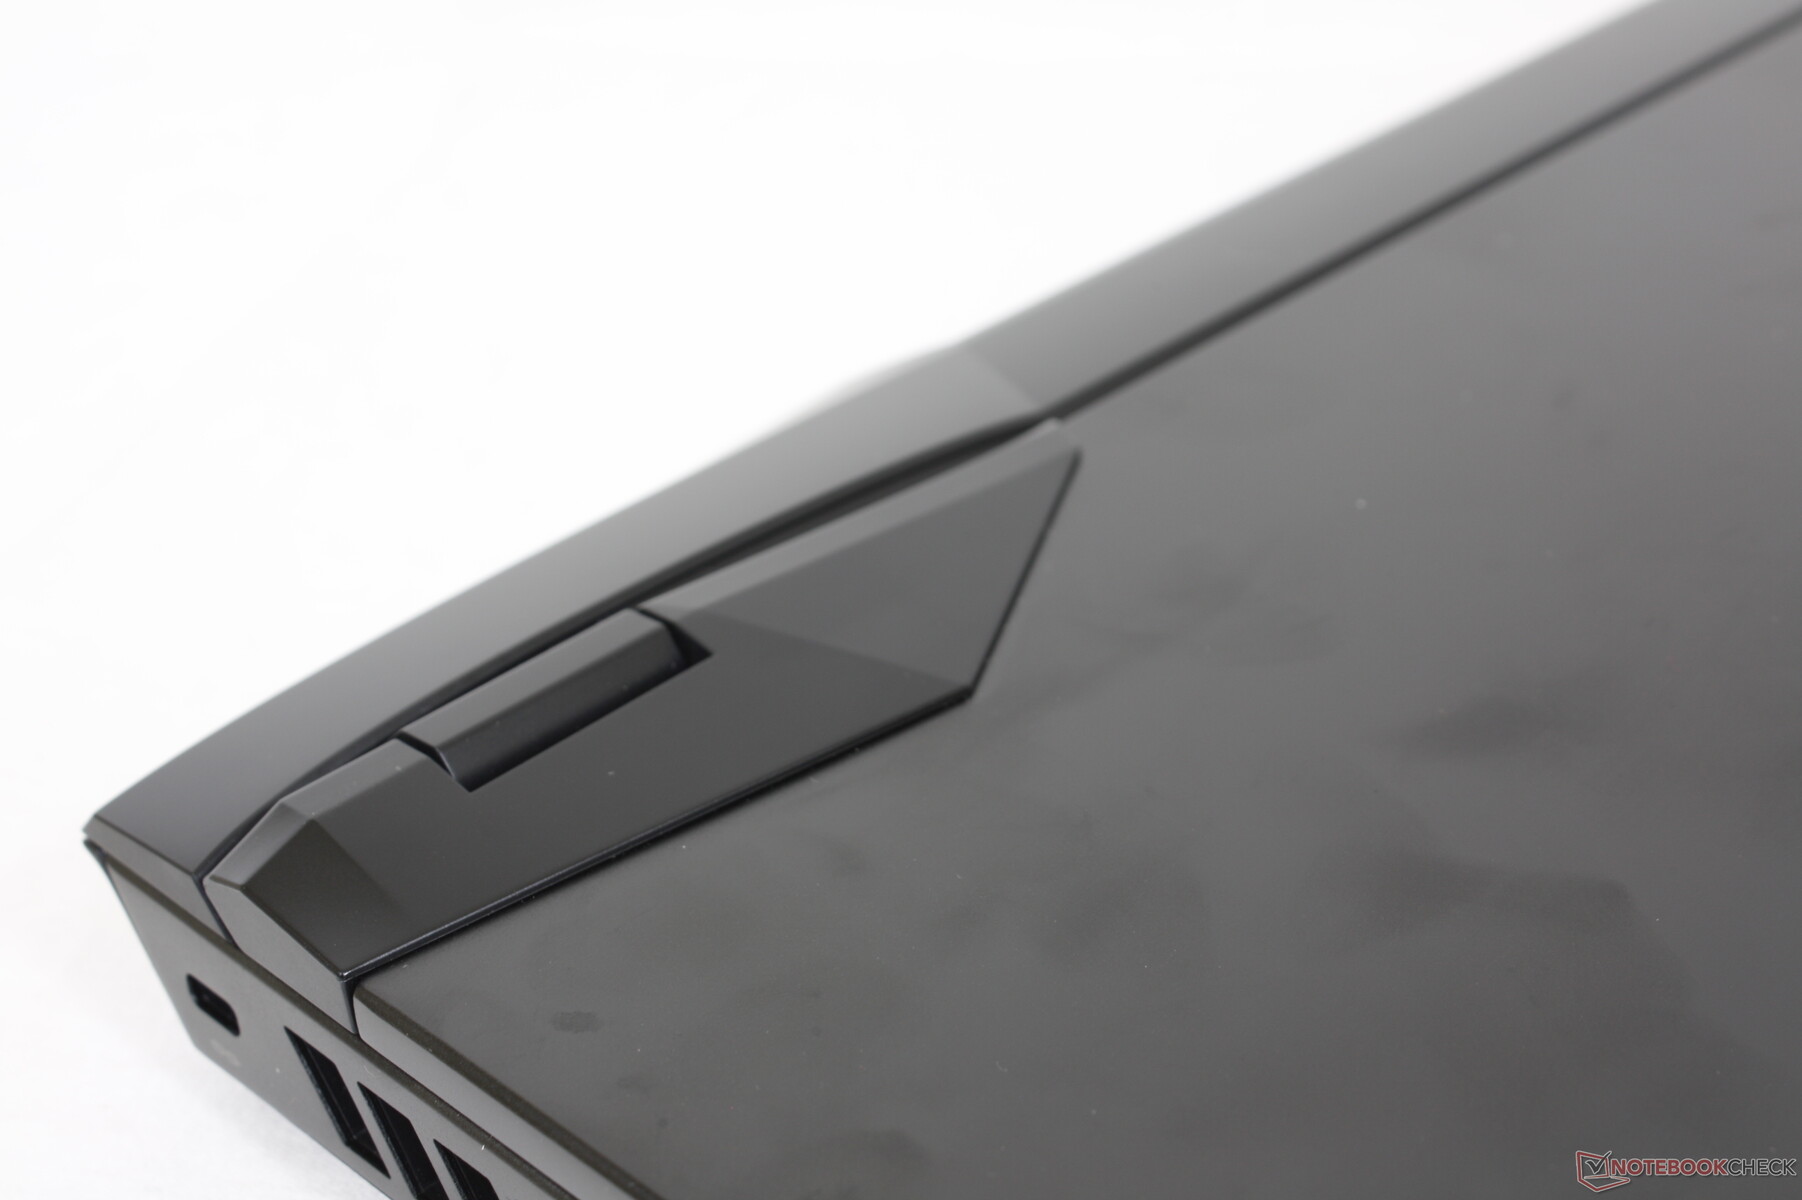
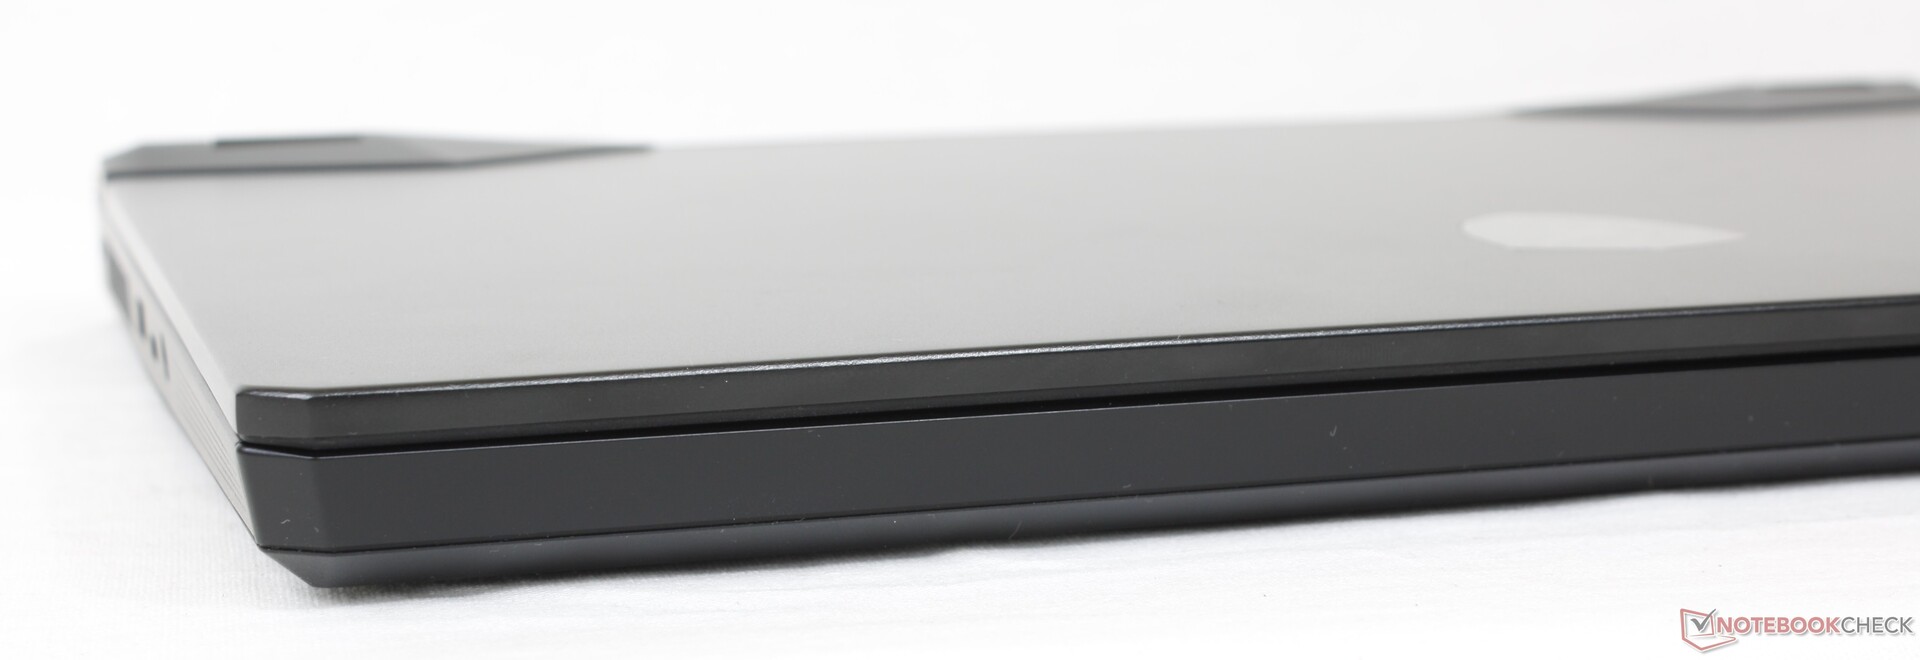
缺乏任何重大变化意味着2022年的Vector GP66仍然受到我们在2021年的GP66 Leopard上发现的相同缺陷的影响。特别是,我们设备的前缘片有时会变得松动,给人留下不太积极的第一印象。在其他方面,视觉设计是较大的GE或GT系列的更光滑和更微妙的衍生品。
连接性
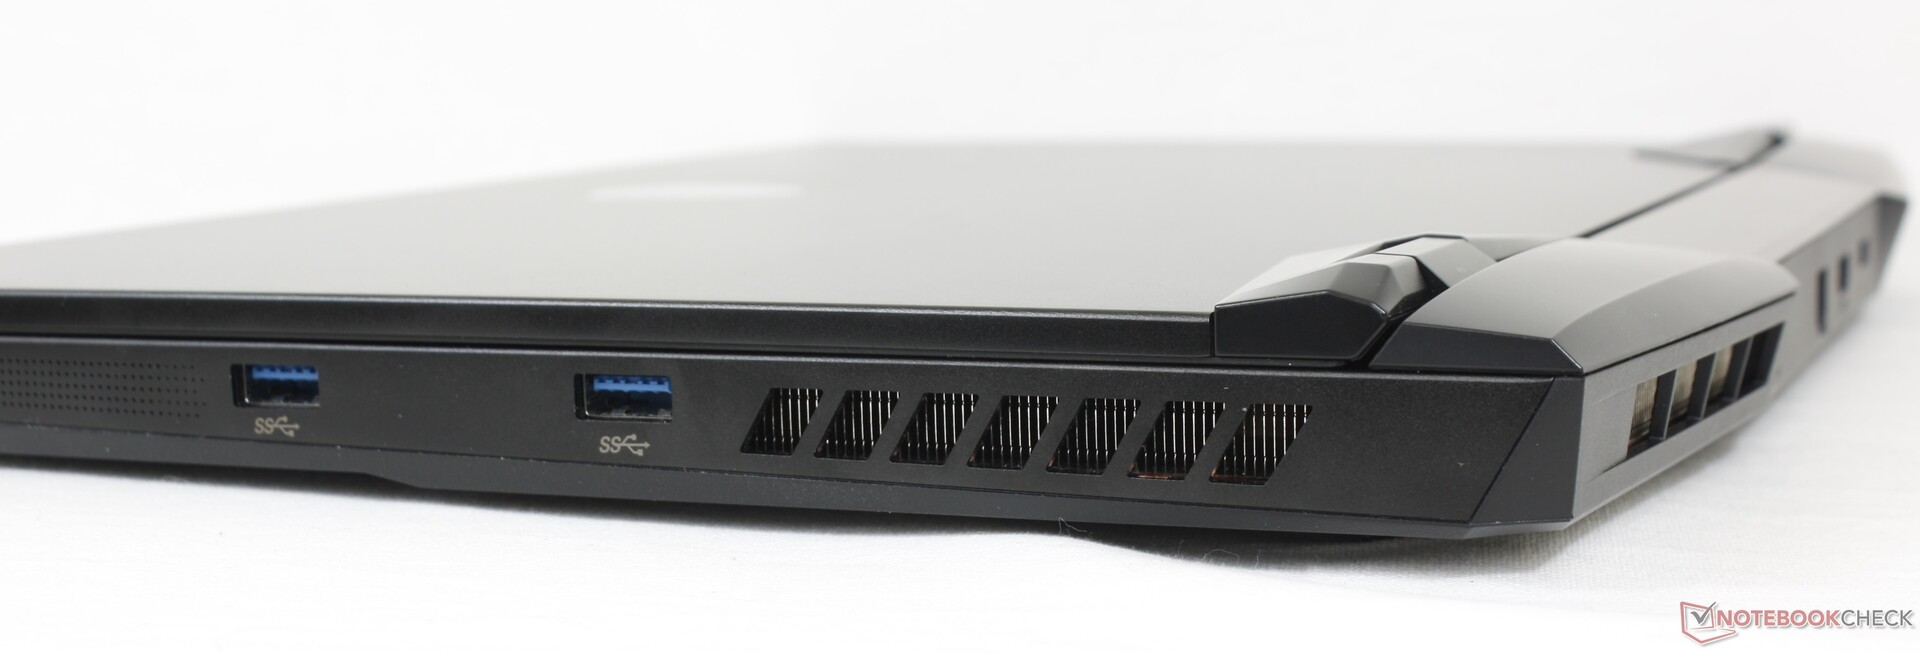
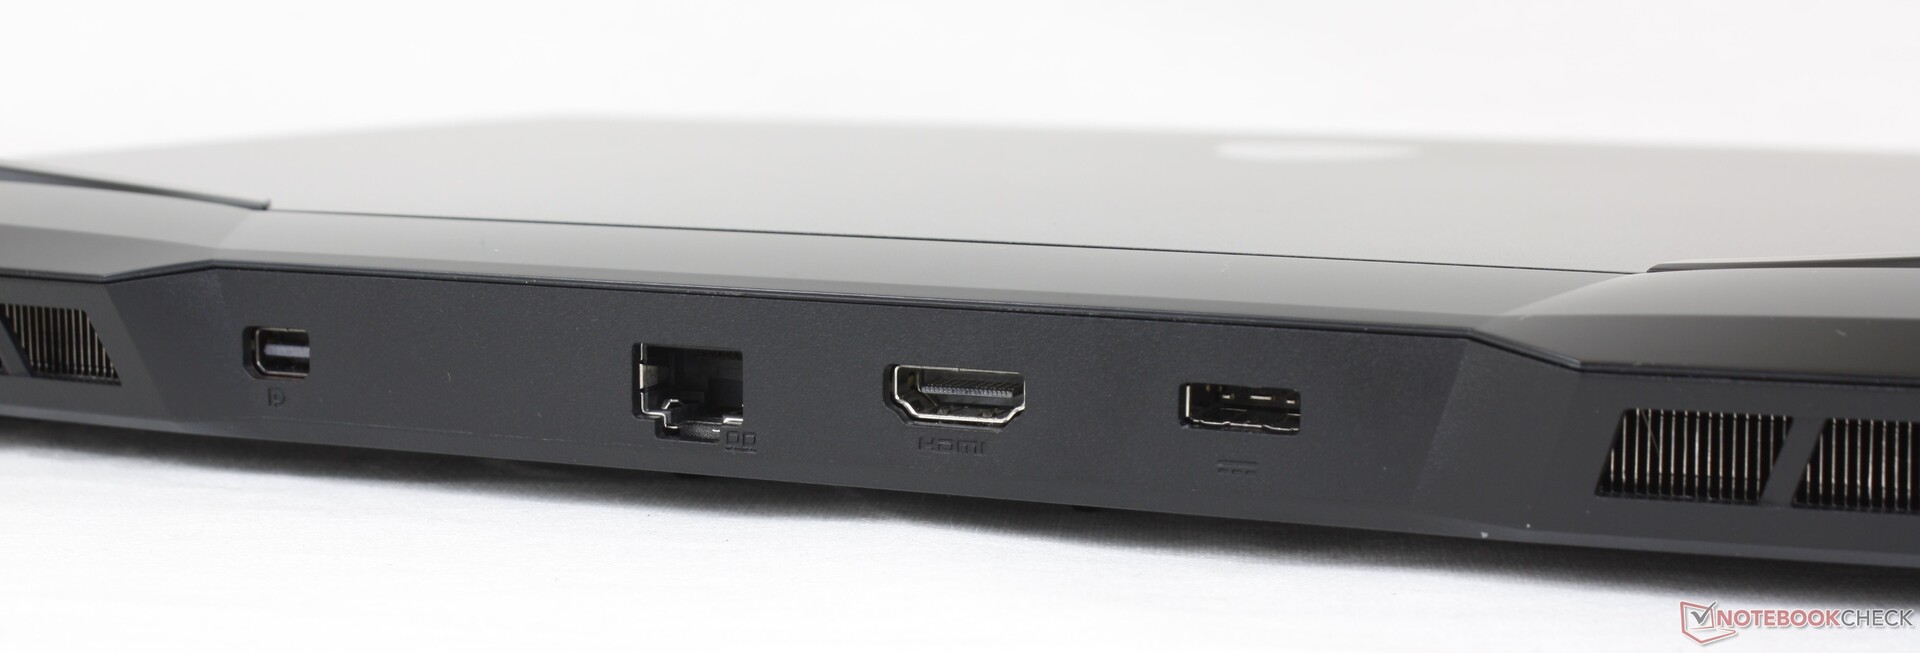
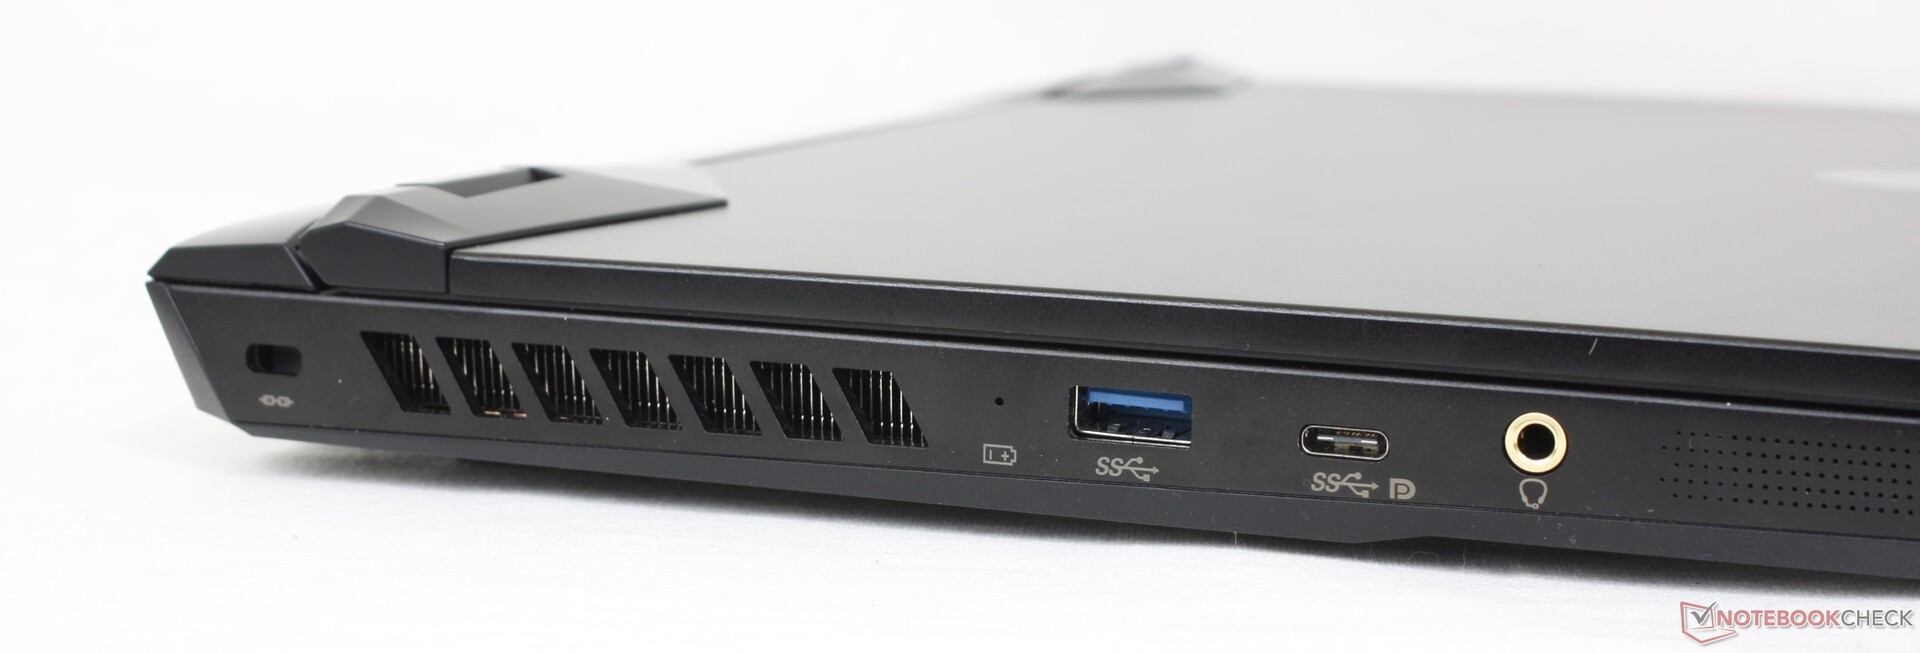
端口选项与GP66 Leopard上提供的略有不同。首先,GP66 Leopard后面的USB-C端口现在在左边的边缘,更容易使用。此外,还增加了一个迷你显示端口,以提高与支持自适应同步的外部显示器的兼容性。
请注意,USB-C端口仍然不支持Thunderbolt。用户将不得不升级到更昂贵的微星GS、GE或GT系列,以获得这种功能。
沟通
网络摄像头
摄像头仍然是720p,不支持红外或Windows Hello。微星笔记本电脑继续使用电子快门,而不是像大多数超极本或商务笔记本电脑那样使用物理快门。


维护
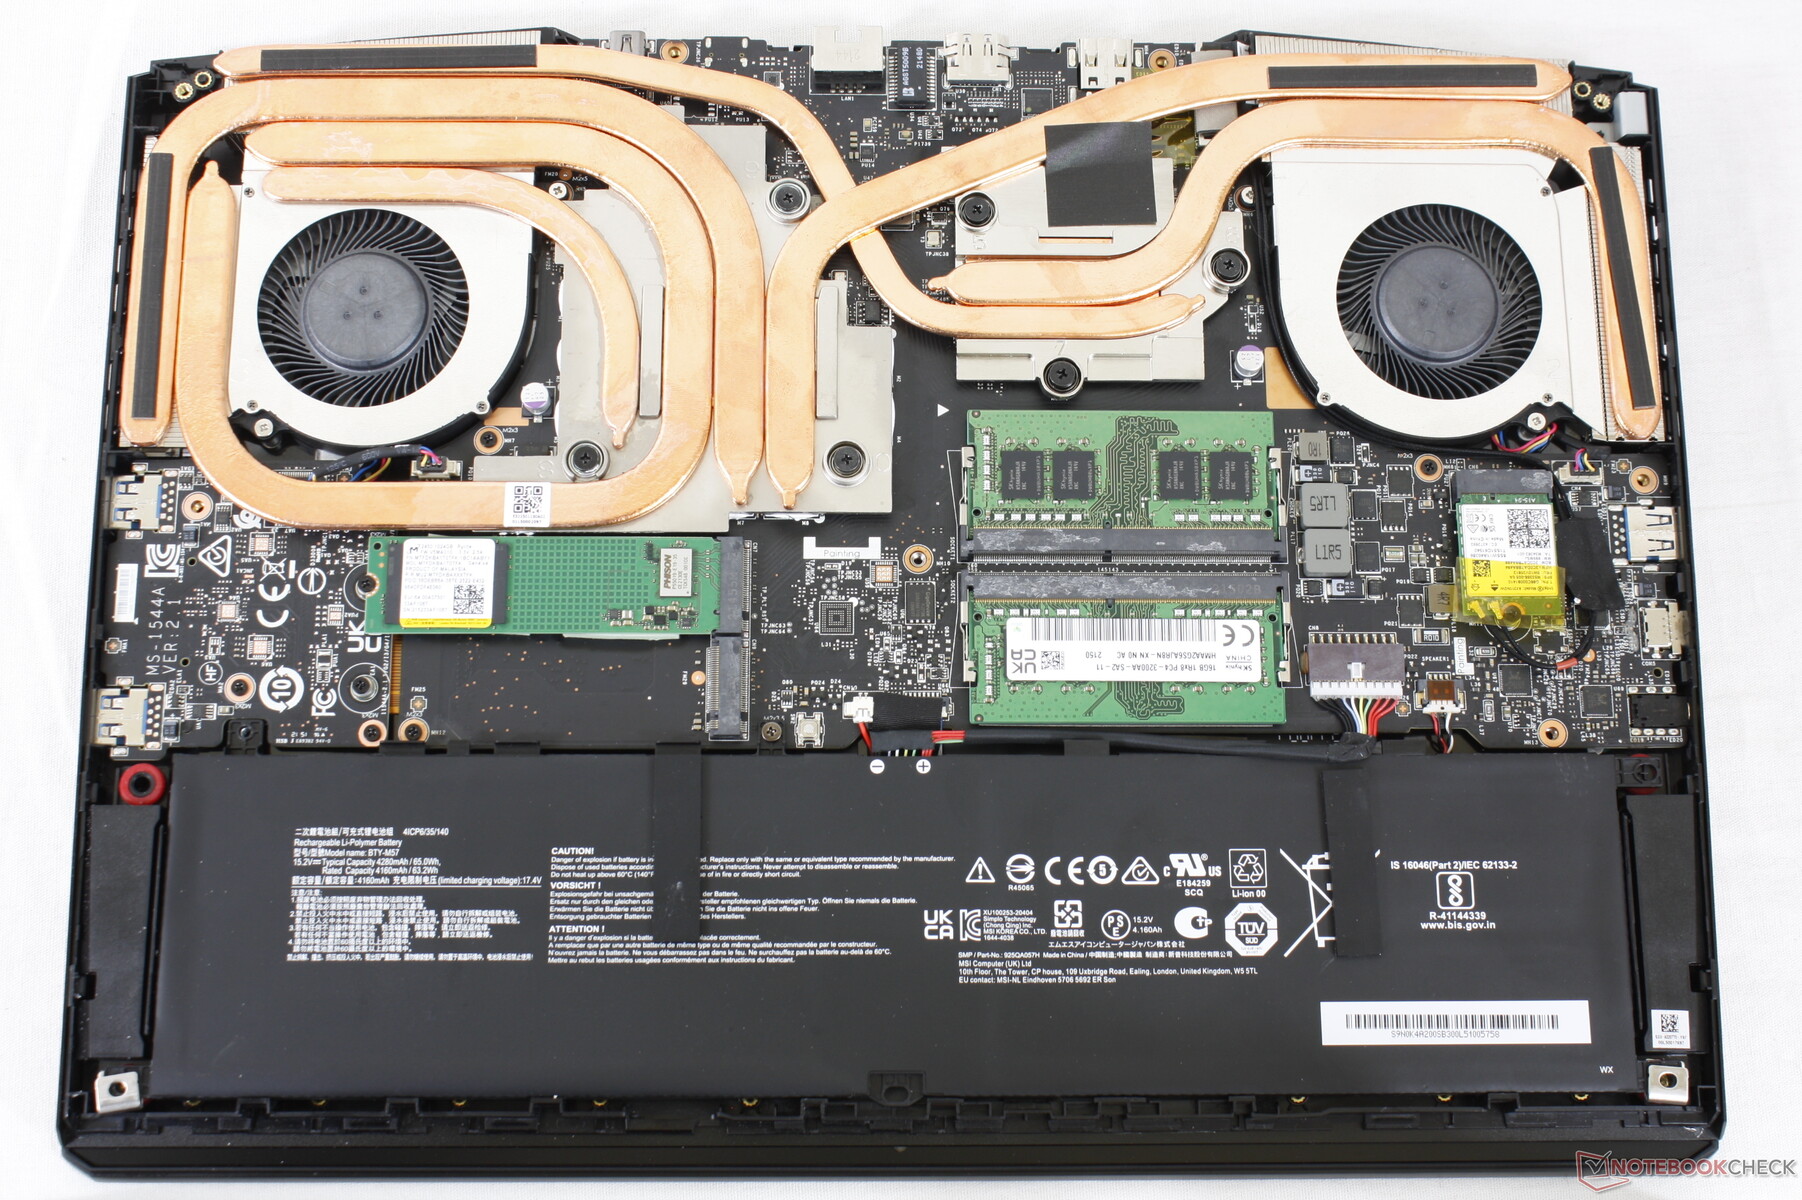
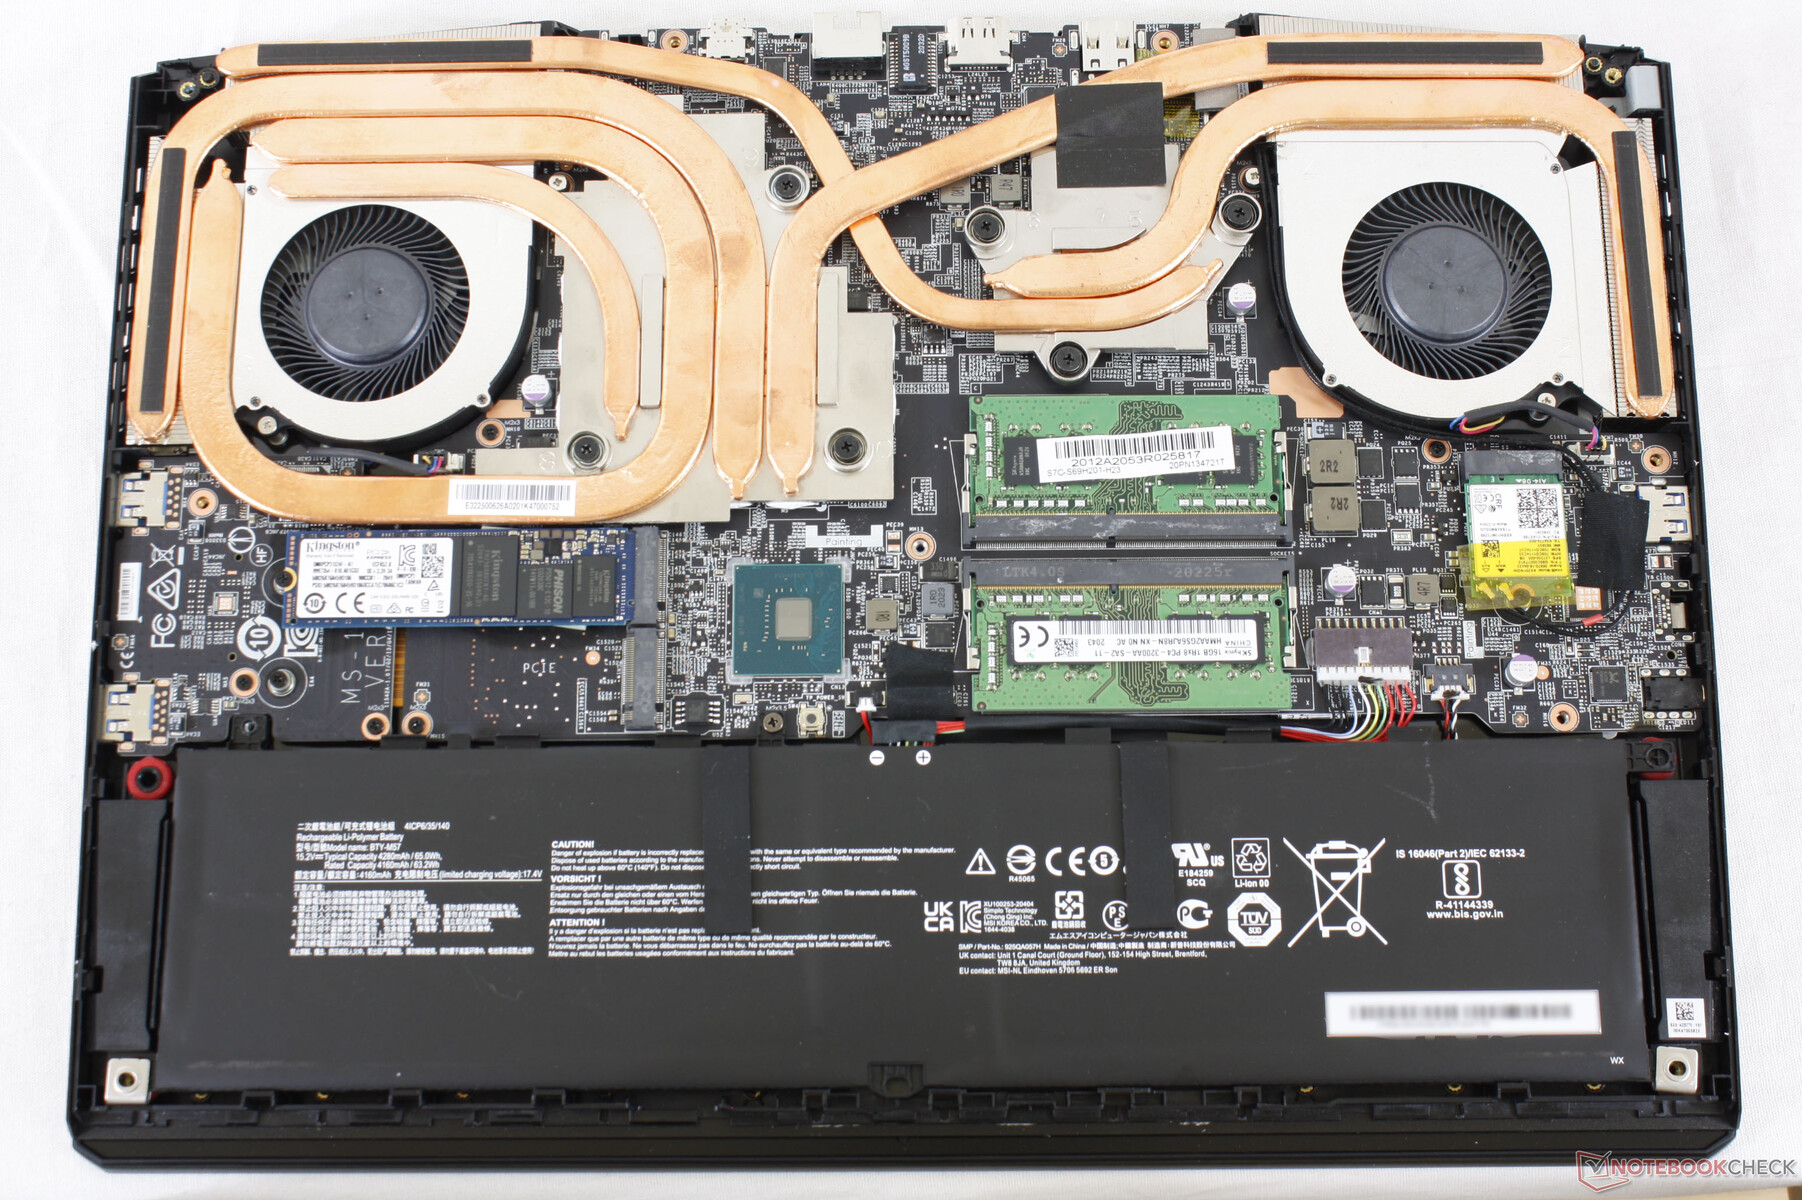
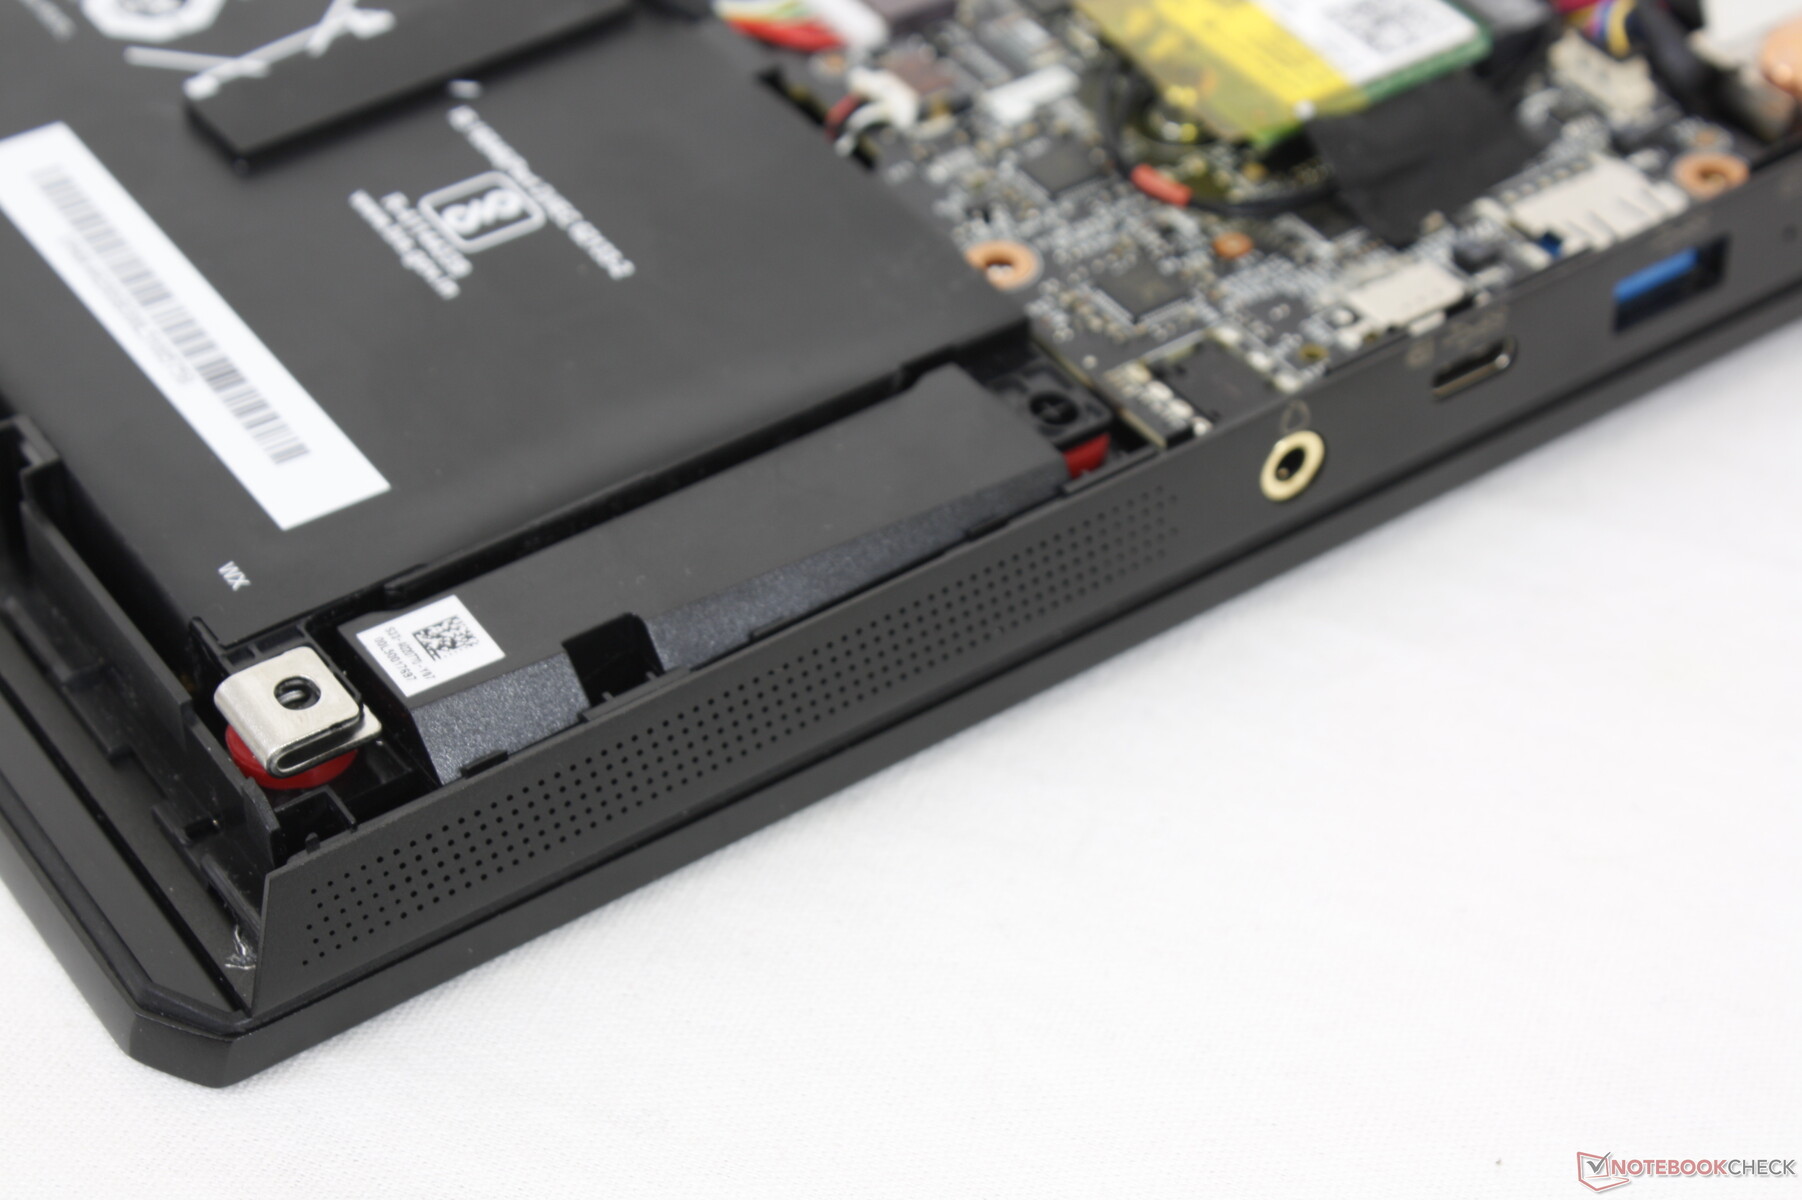
底部面板由11颗飞利浦螺钉固定,下面没有任何橡胶脚,以方便维修。不过要注意的是,必须撕掉一个 "工厂密封 "贴纸。
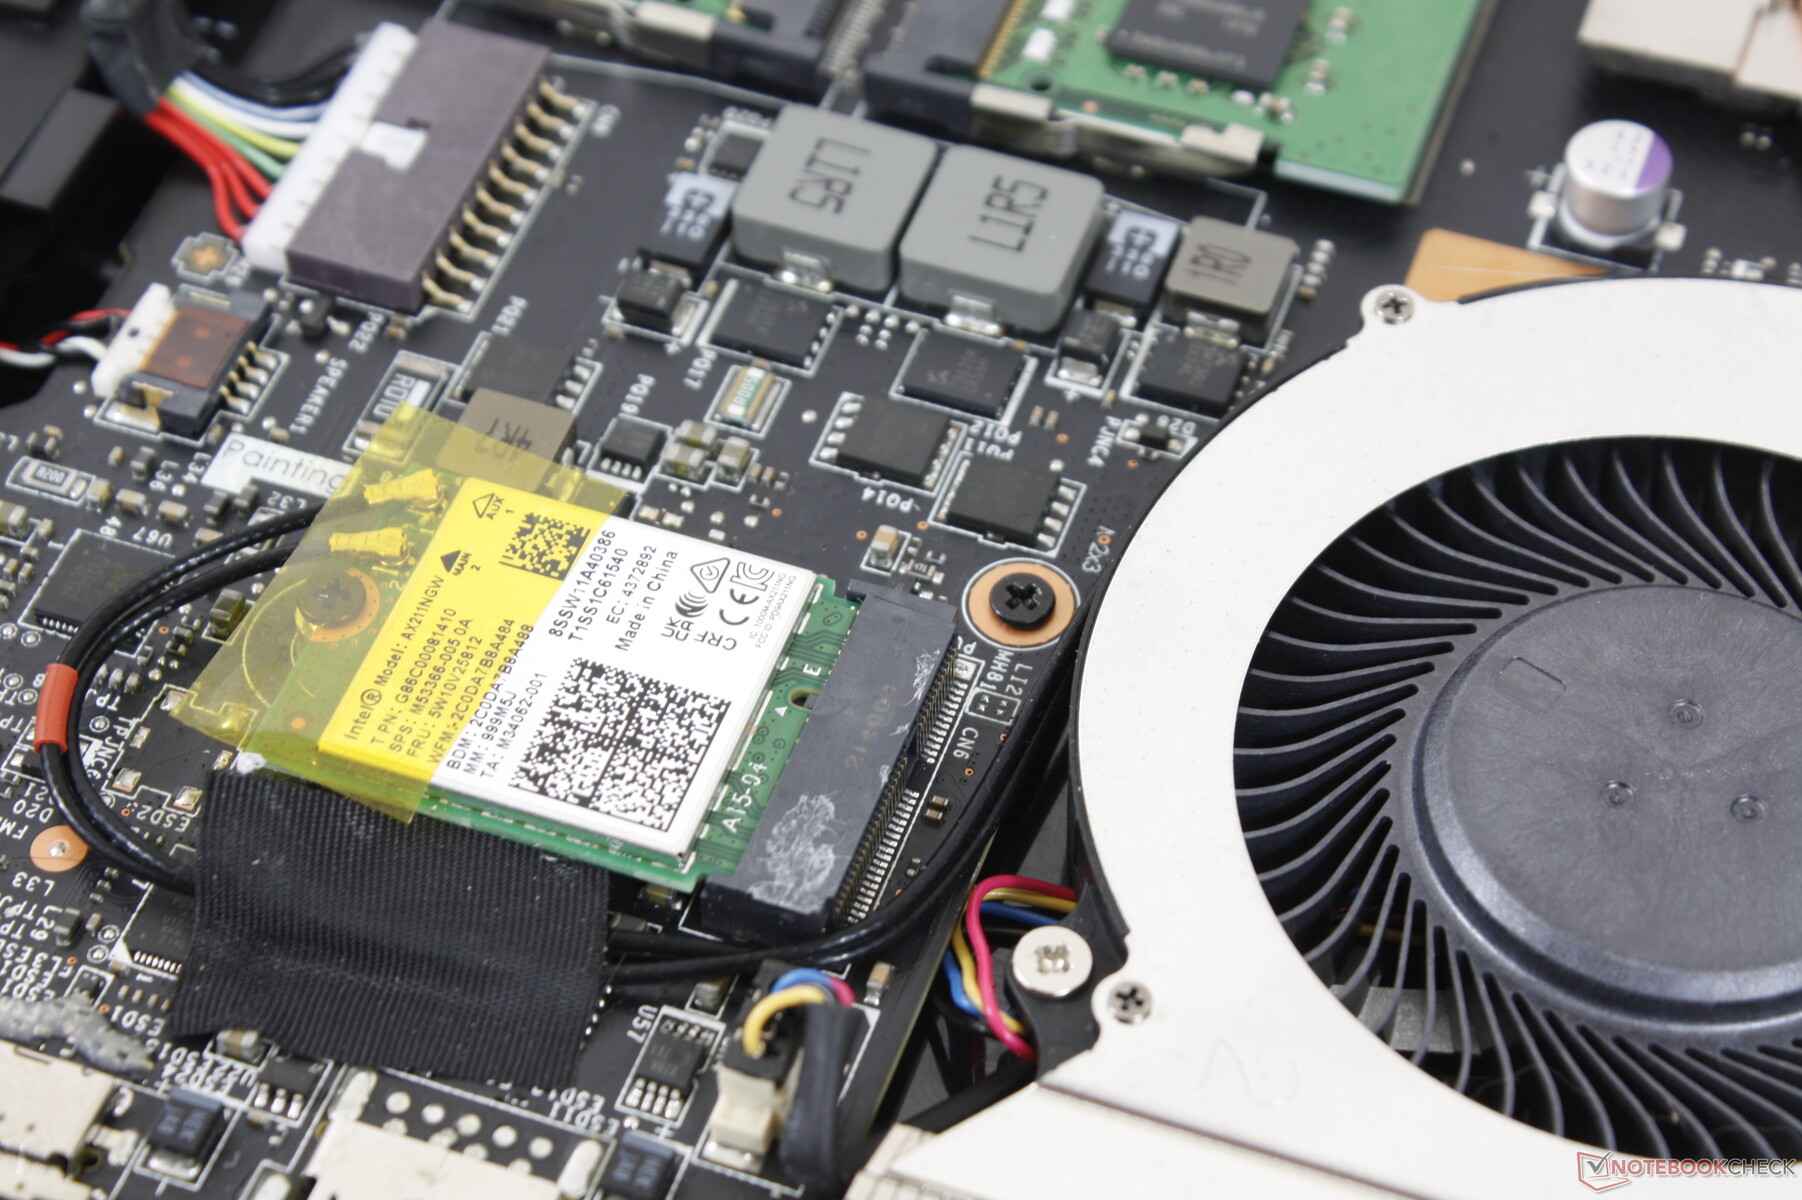
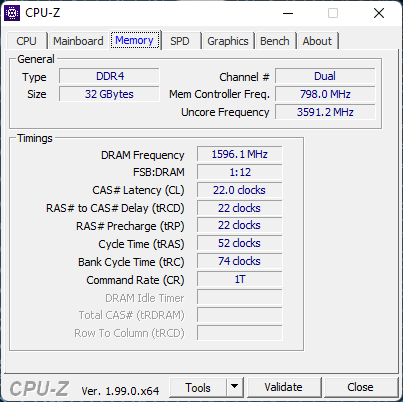
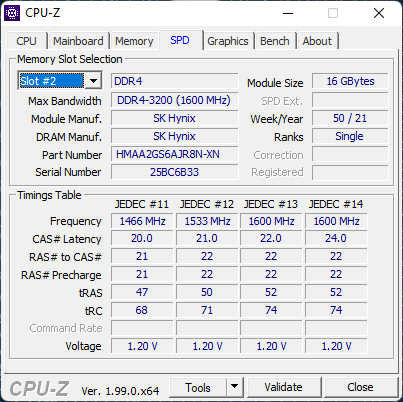
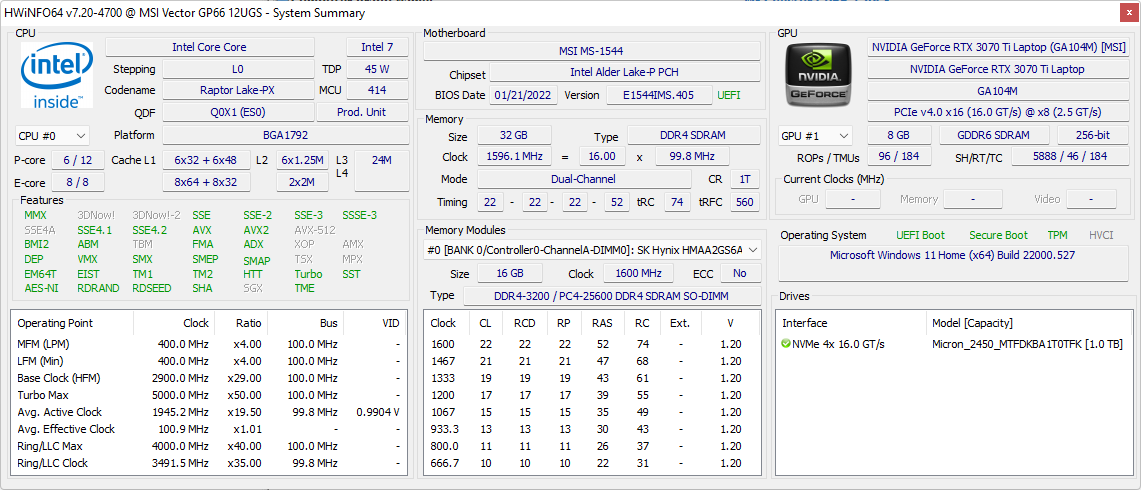
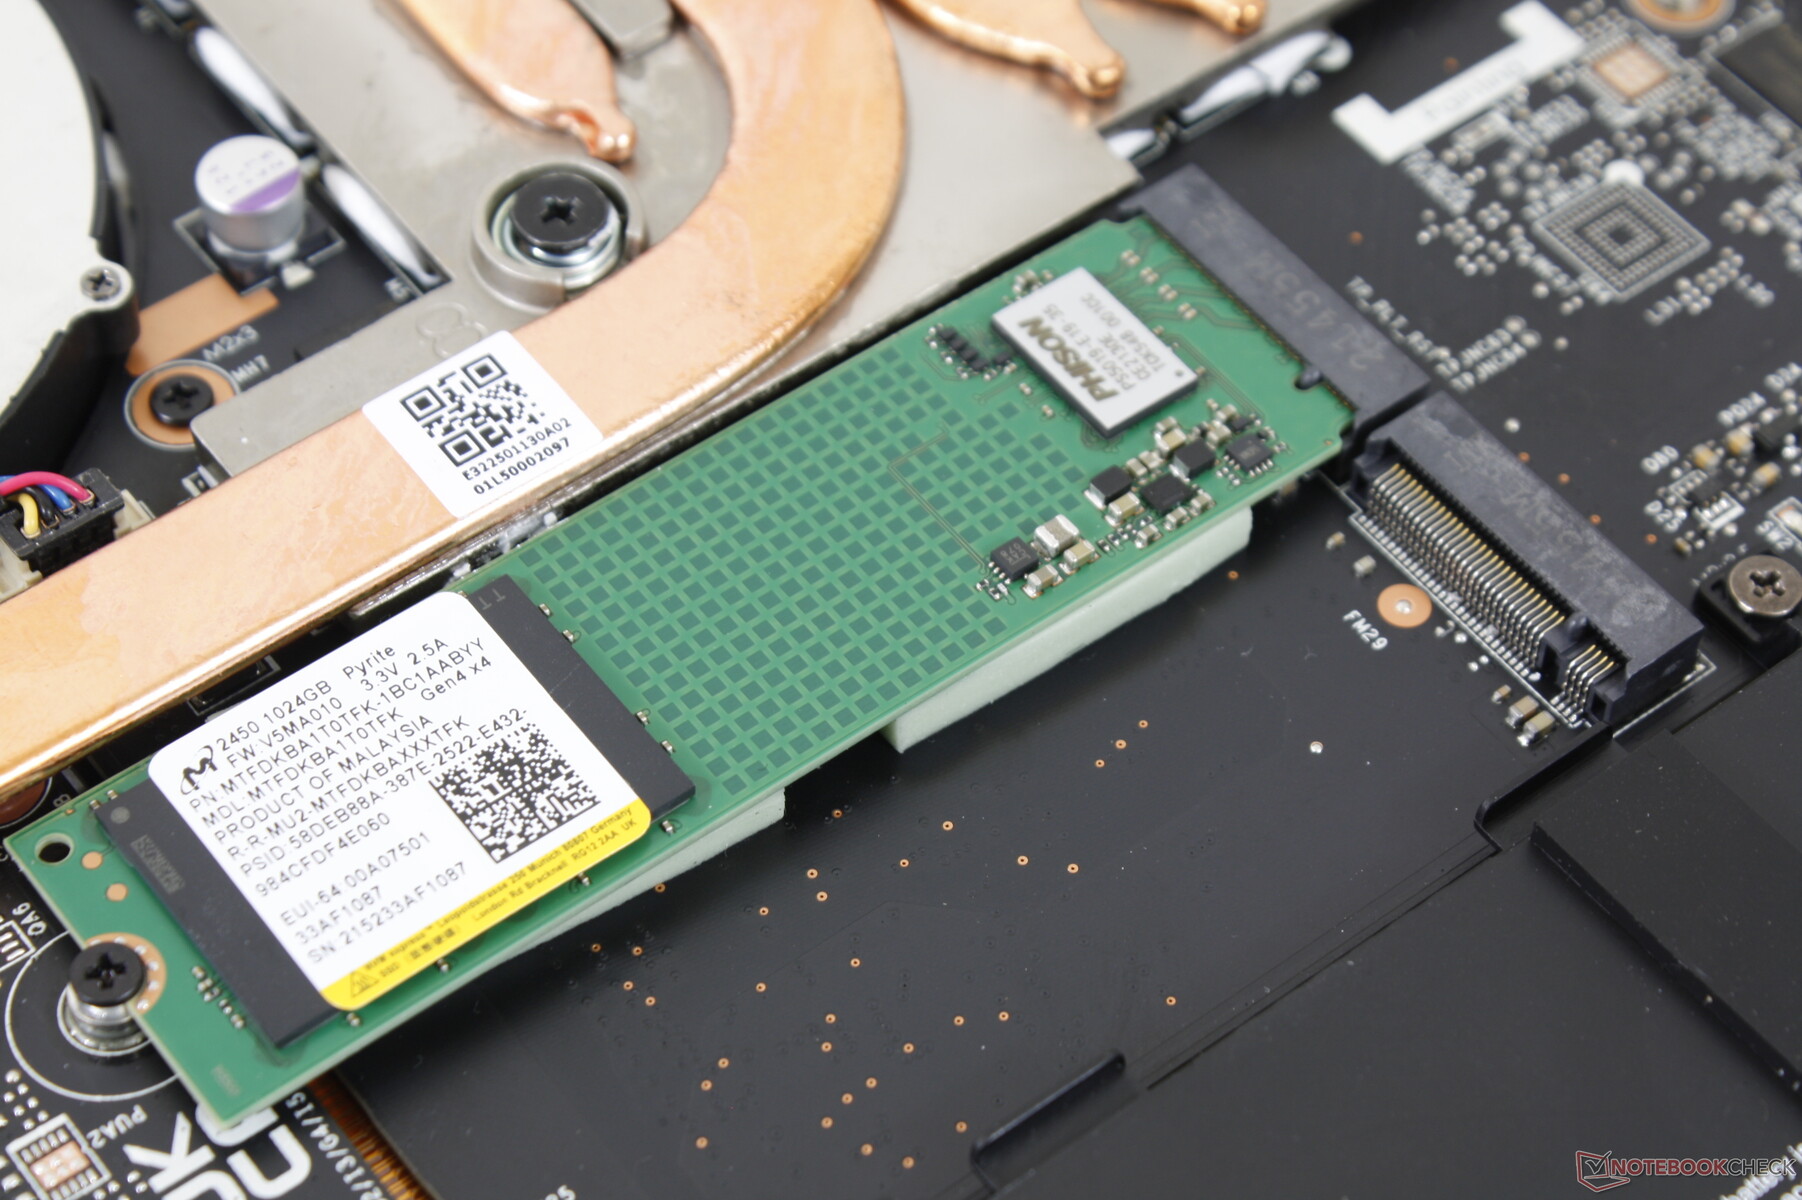
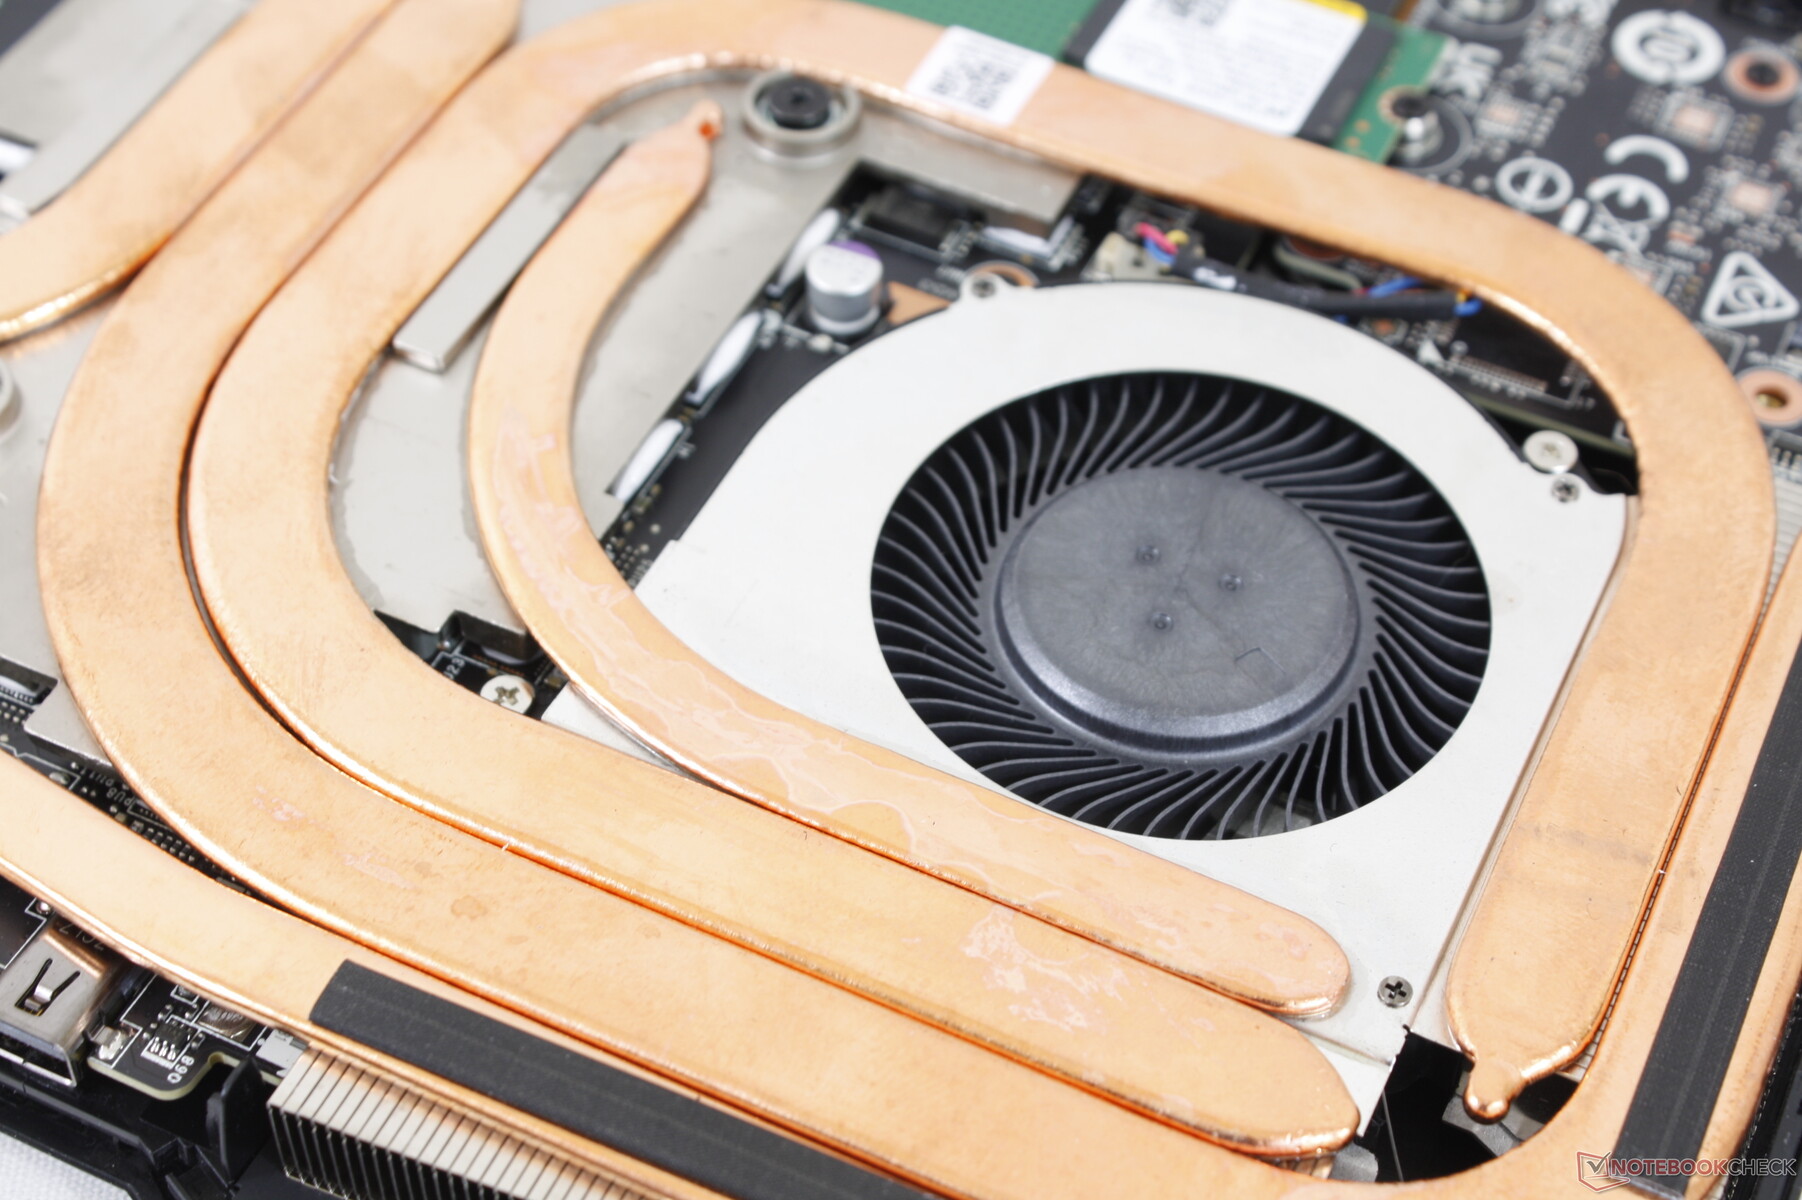
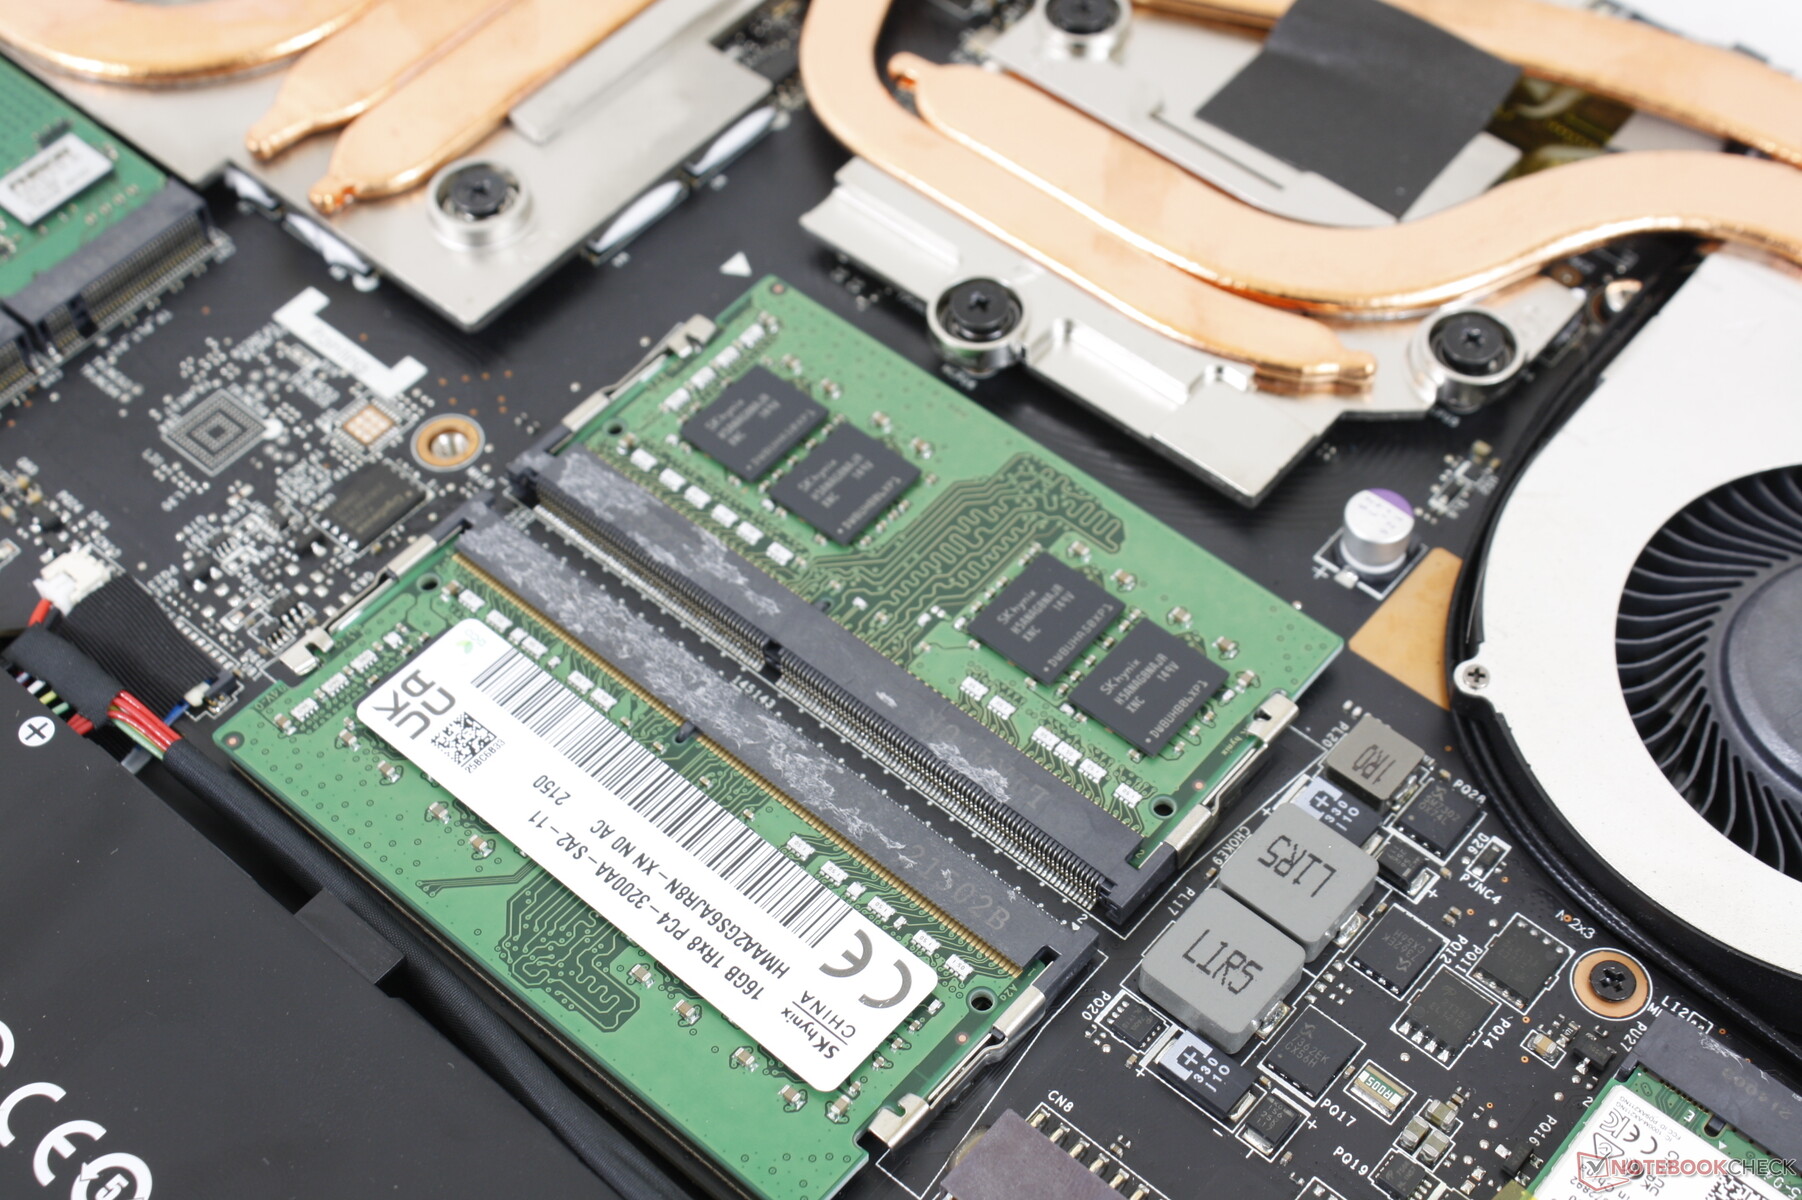
内部布局与GP66 Leopard基本相同,如下图所示。用户可以直接访问两个SODIMM插槽和两个M.2 2280 PCIe4 x4插槽。高端笔记本电脑,如GM7AG8P可能会支持更快的DDR5内存。
配件和保修
盒子里除了交流电适配器或文件外,没有其他的东西。在美国,通常的一年有限保修期适用。
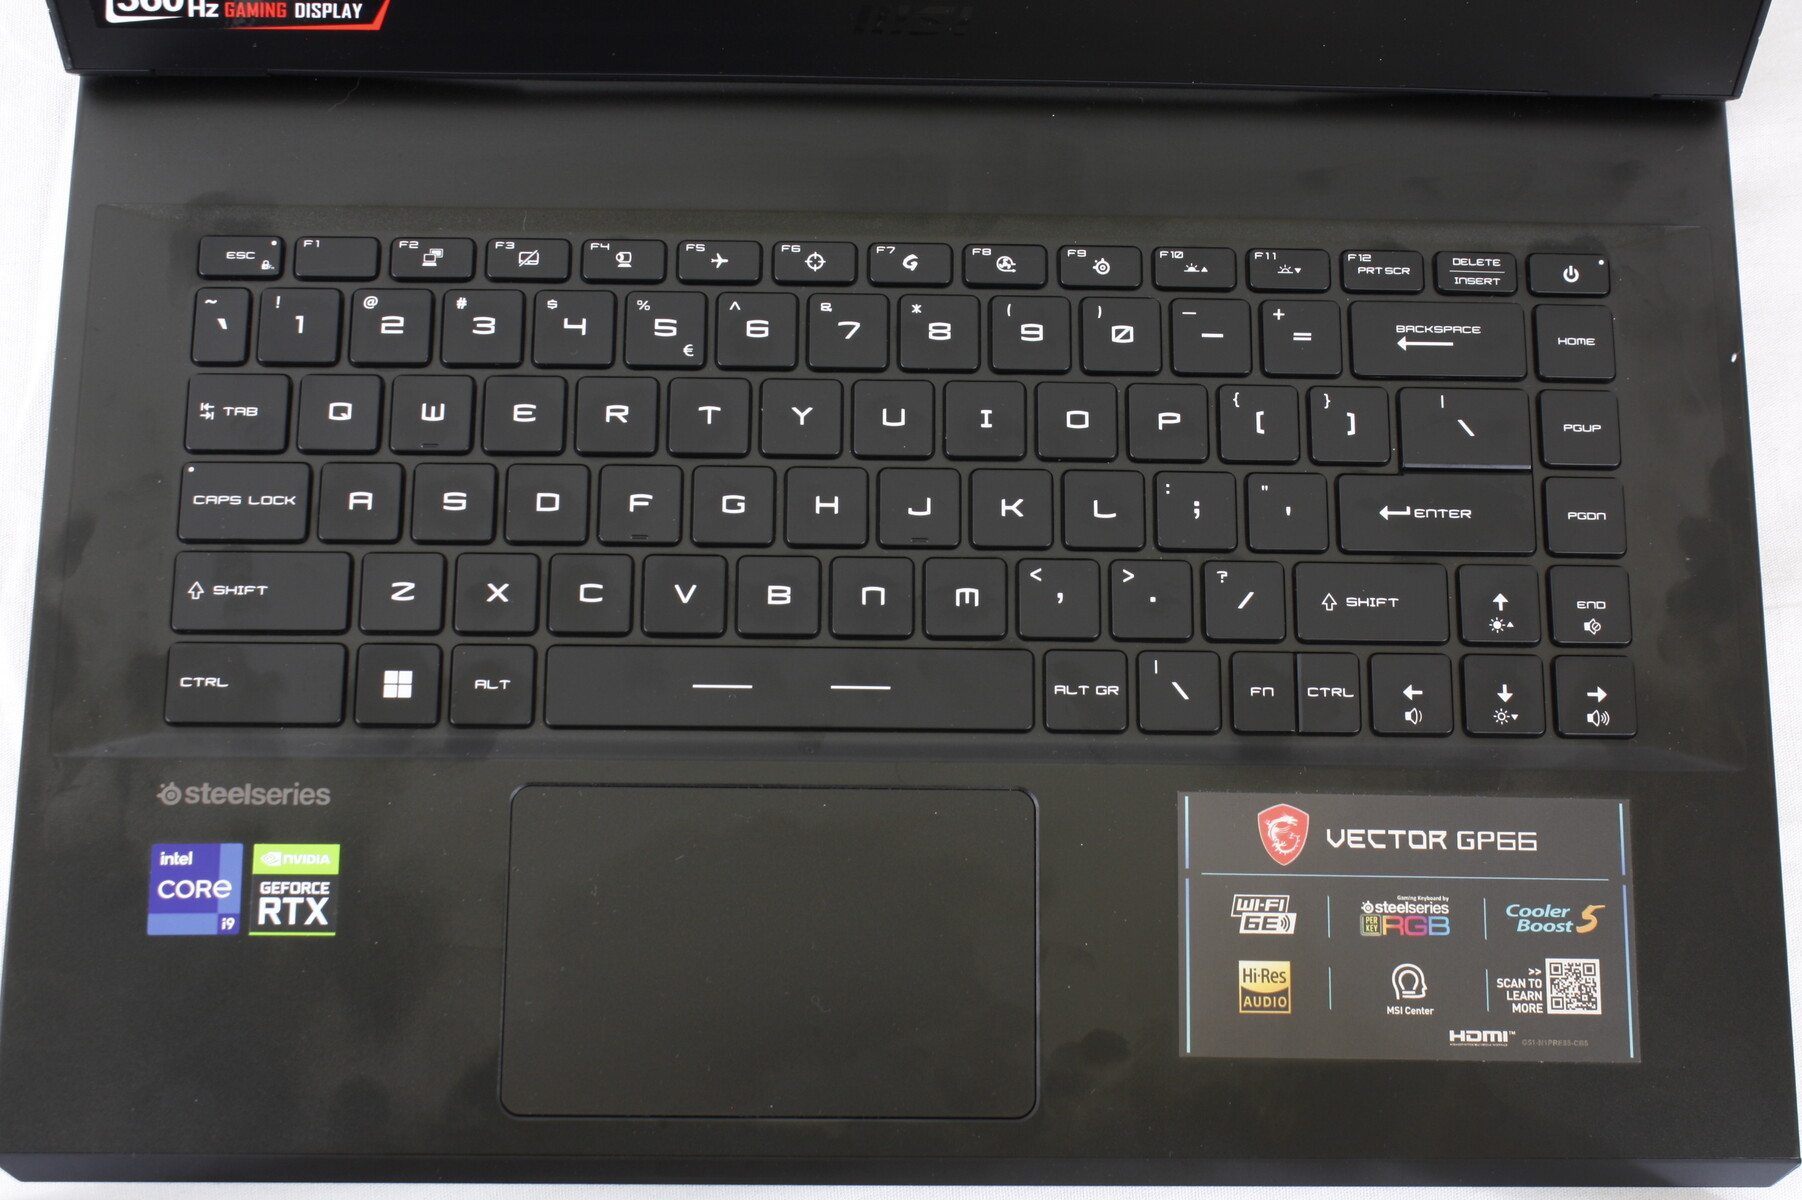
输入设备
键盘和触摸板
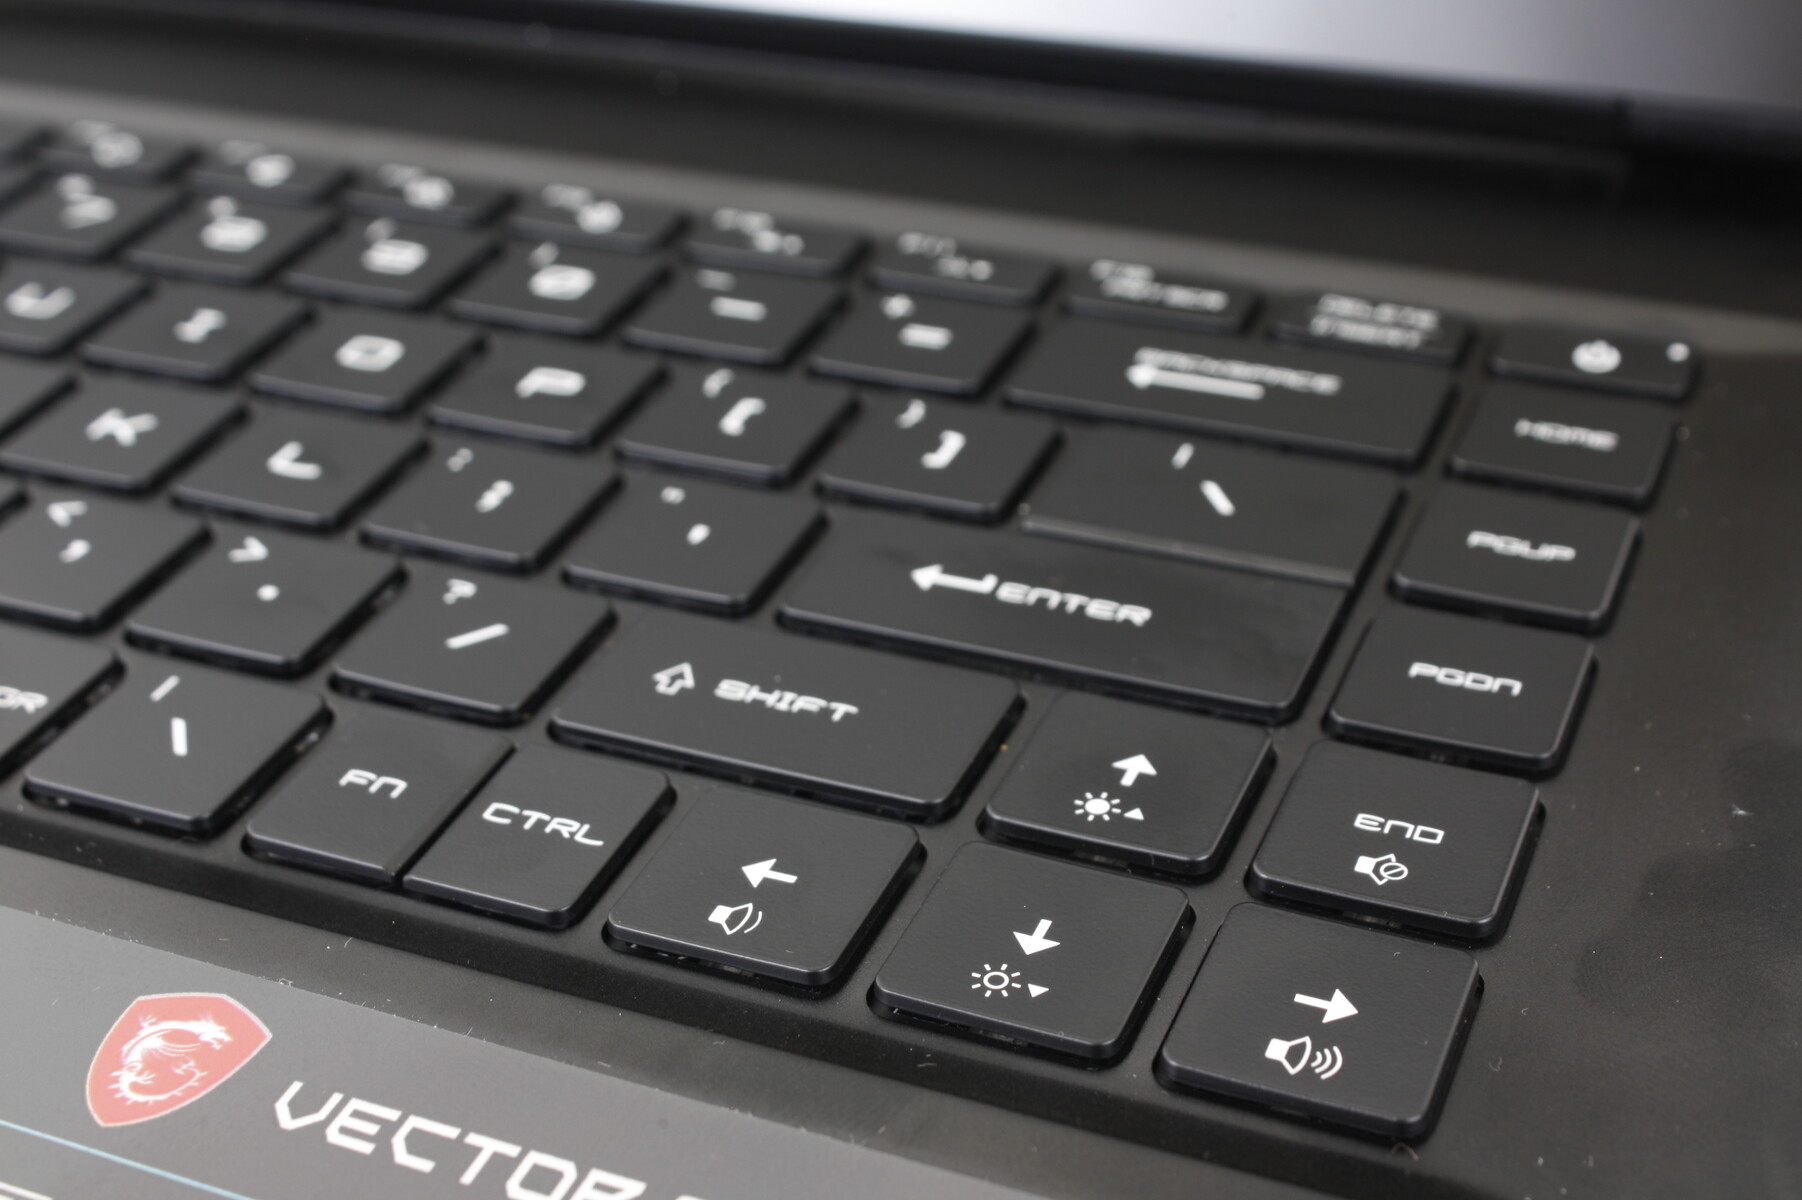
每键RGB照明键盘和点击板(10.5 x 6.5厘米)与原来的2020 GP66 Leopard相比没有变化。虽然打字的体验令人满意,甚至有点偏软,但点击键盘仍然太有弹性。光标控制在老款 GP65 因为它集成了物理鼠标按钮,在过渡到GP66设计时被取消。


显示
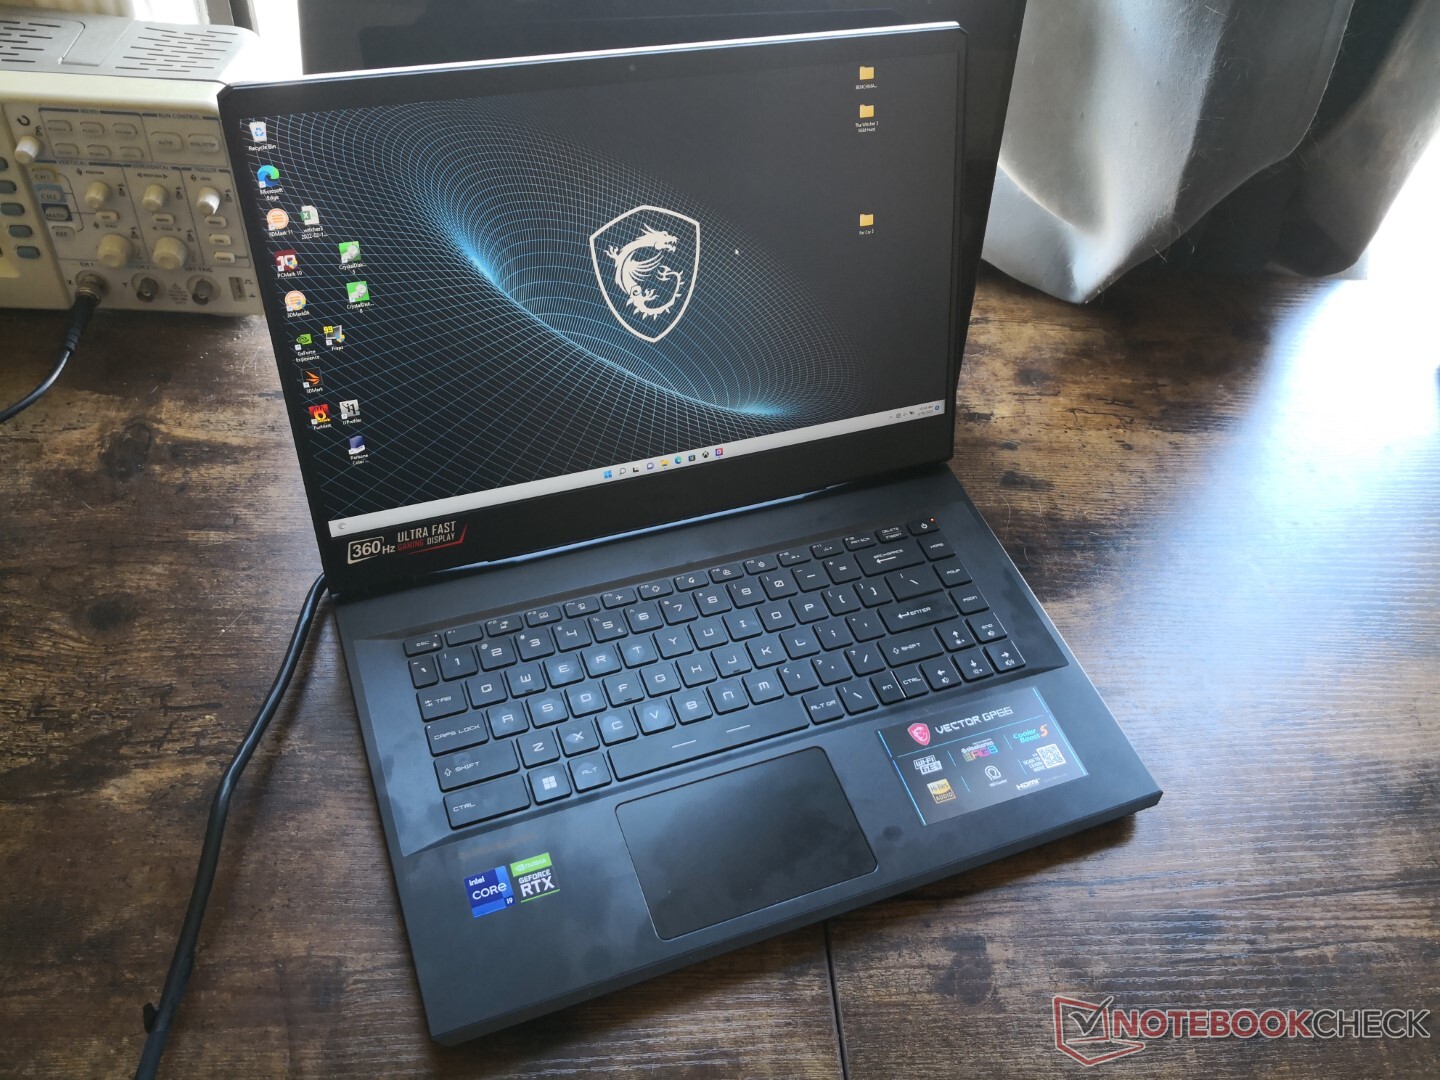
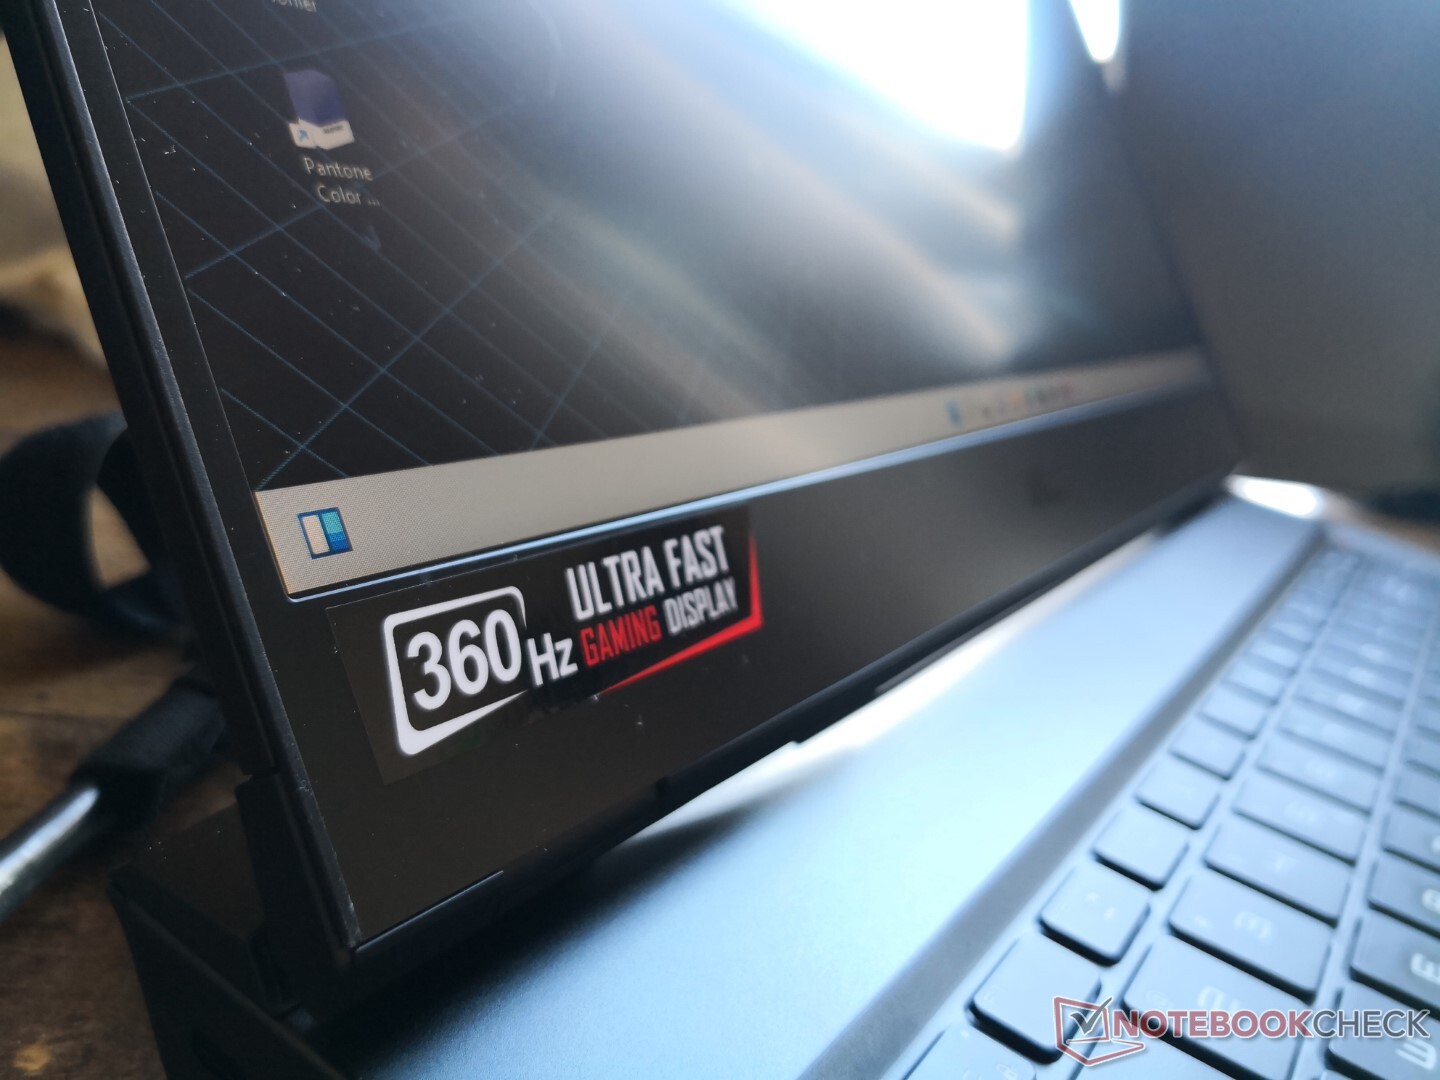
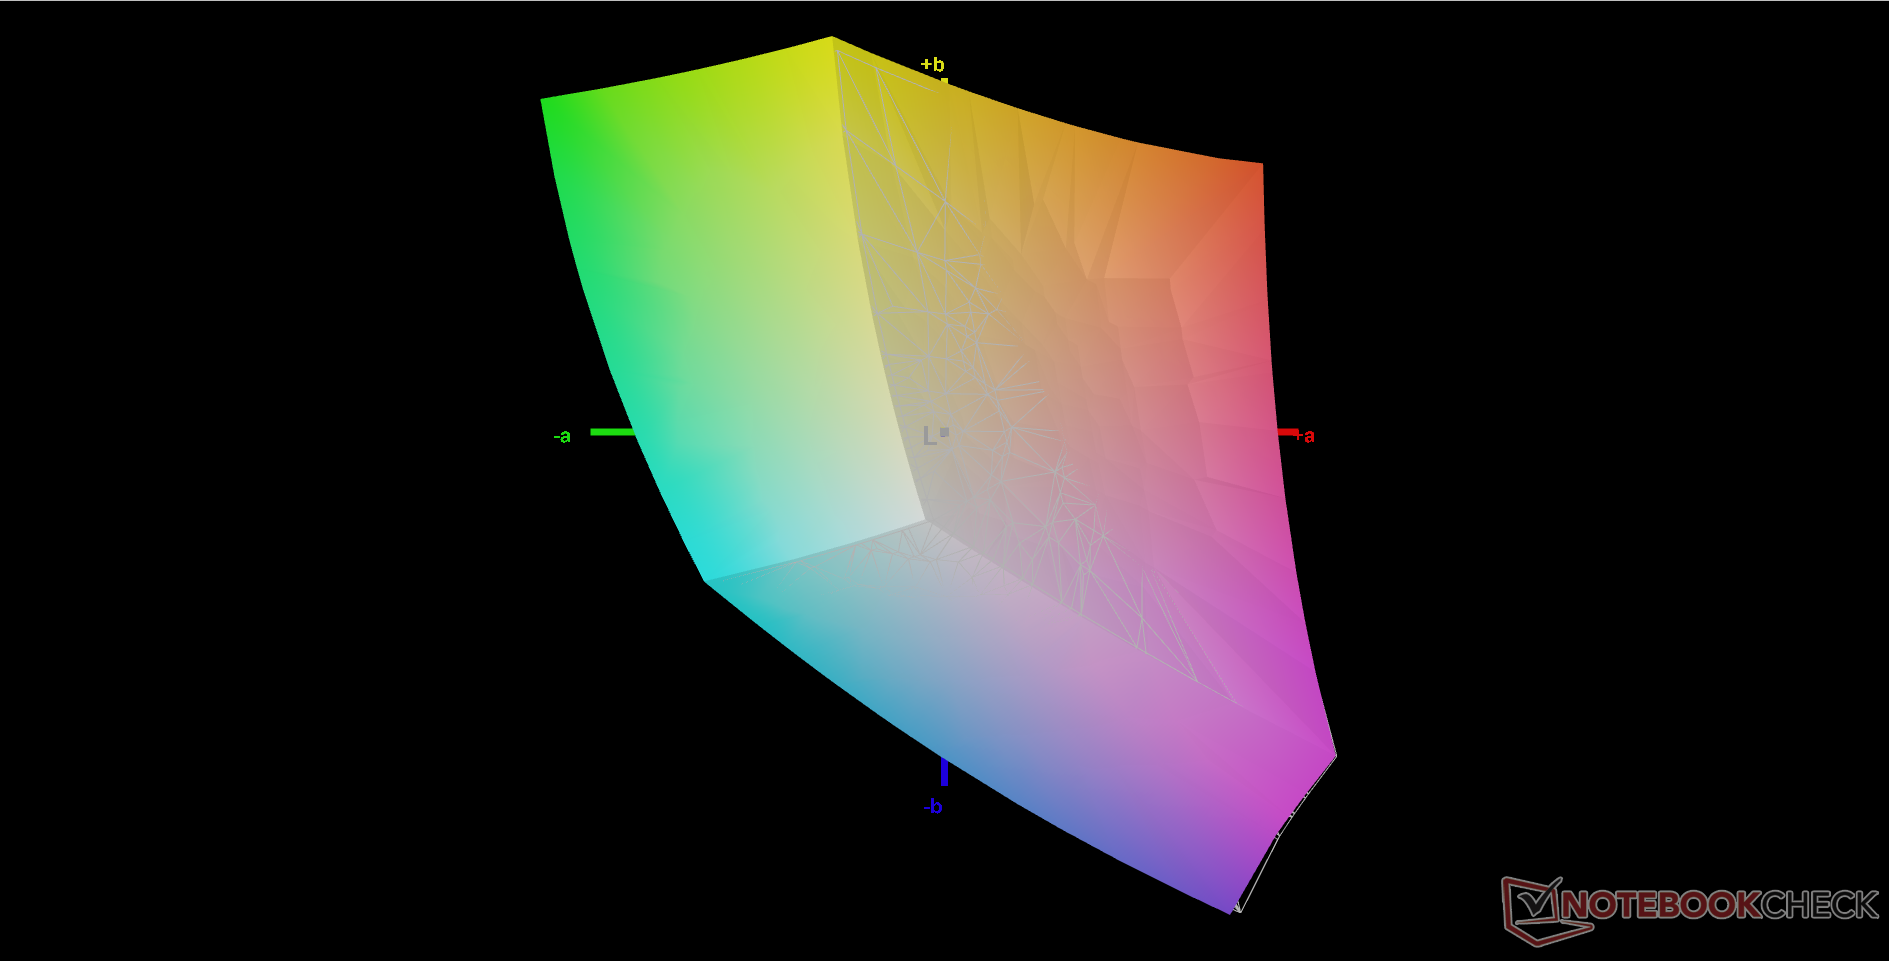
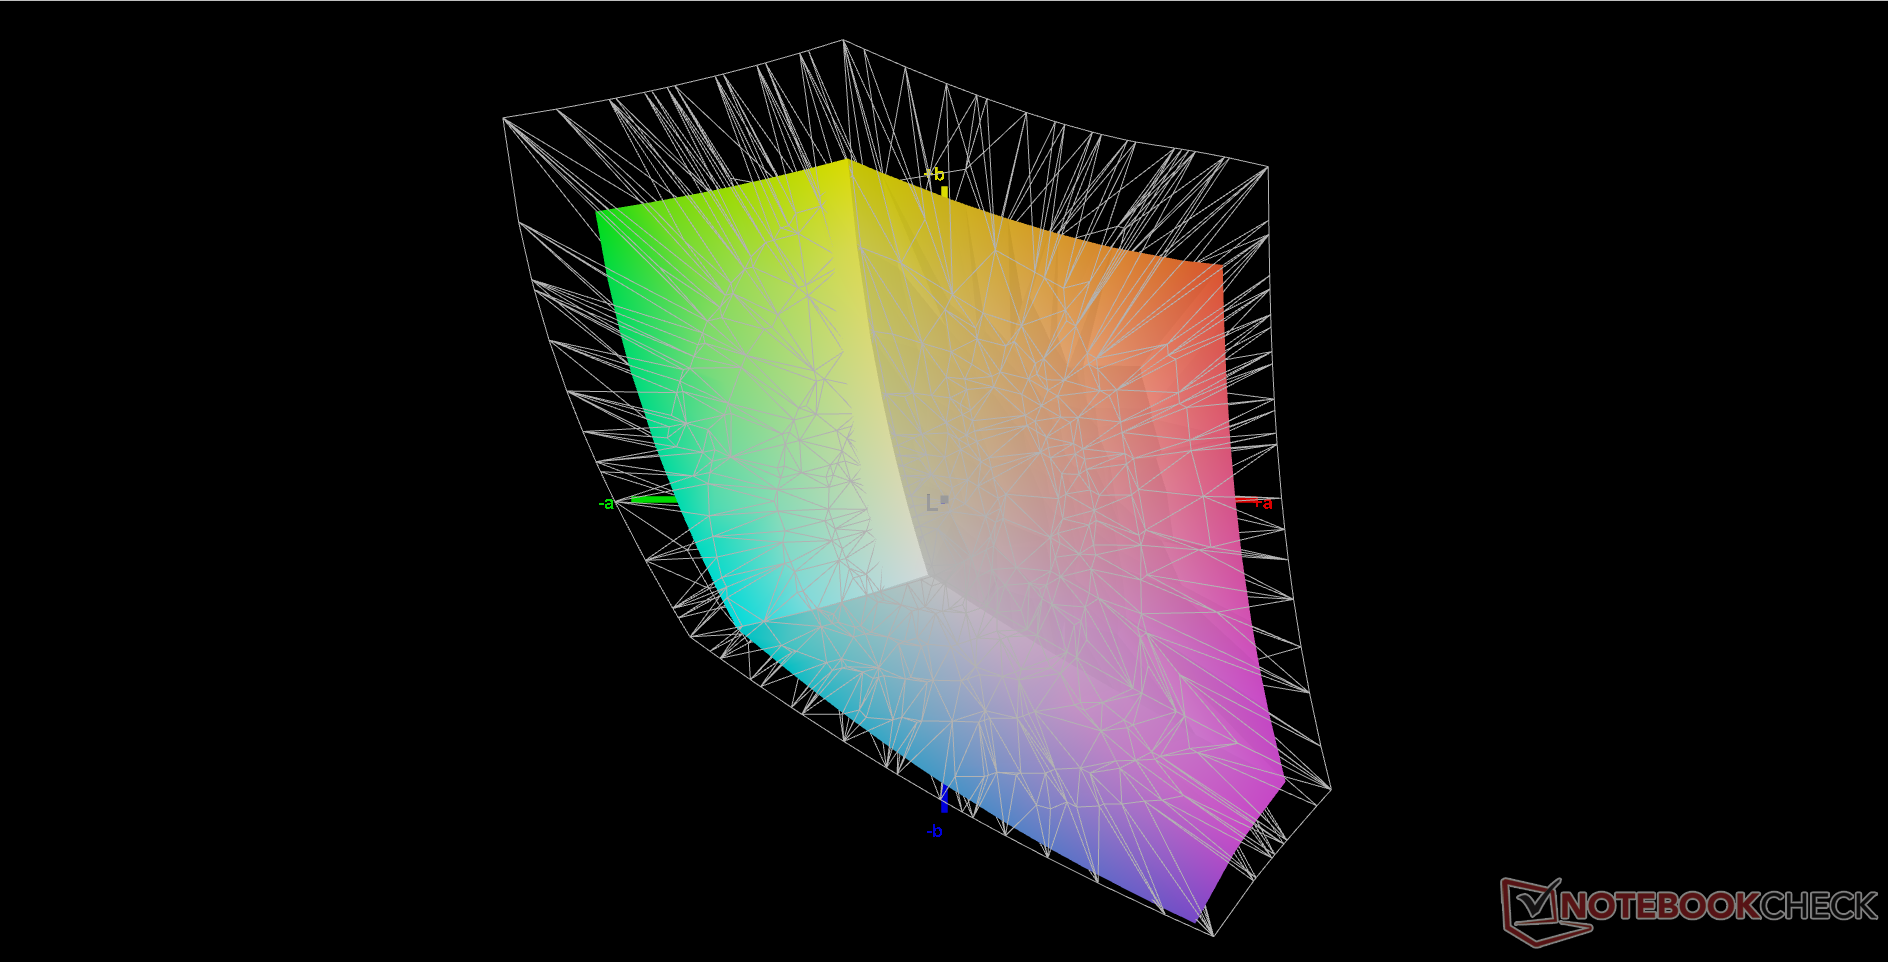
Vector GP66是我们数据库中第一台配备360赫兹京东方NE156FHM-NZ3 IPS面板的笔记本电脑,与我们较早的GP66 Leopard上的144赫兹LG LP156WFG-SPB3 IPS面板形成对比。京东方的面板提供更快的刷新率和灰度响应时间,同时保持与上述LG面板相同的全sRGB覆盖率和对比度。最大亮度略低,但没有明显的差距。这是一款适合中高档游戏电脑的高端面板。
请记住,微星还在Vector GP66的低价SKU上提供了一个较慢的144赫兹选项。这款144赫兹面板的颜色明显更差,只有sRGB的60%,因此,如果显示质量是一个优先事项,避免这些SKU可能是明智的。


| |||||||||||||||||||||||||
Brightness Distribution: 85 %
Center on Battery: 353.1 cd/m²
Contrast: 929:1 (Black: 0.38 cd/m²)
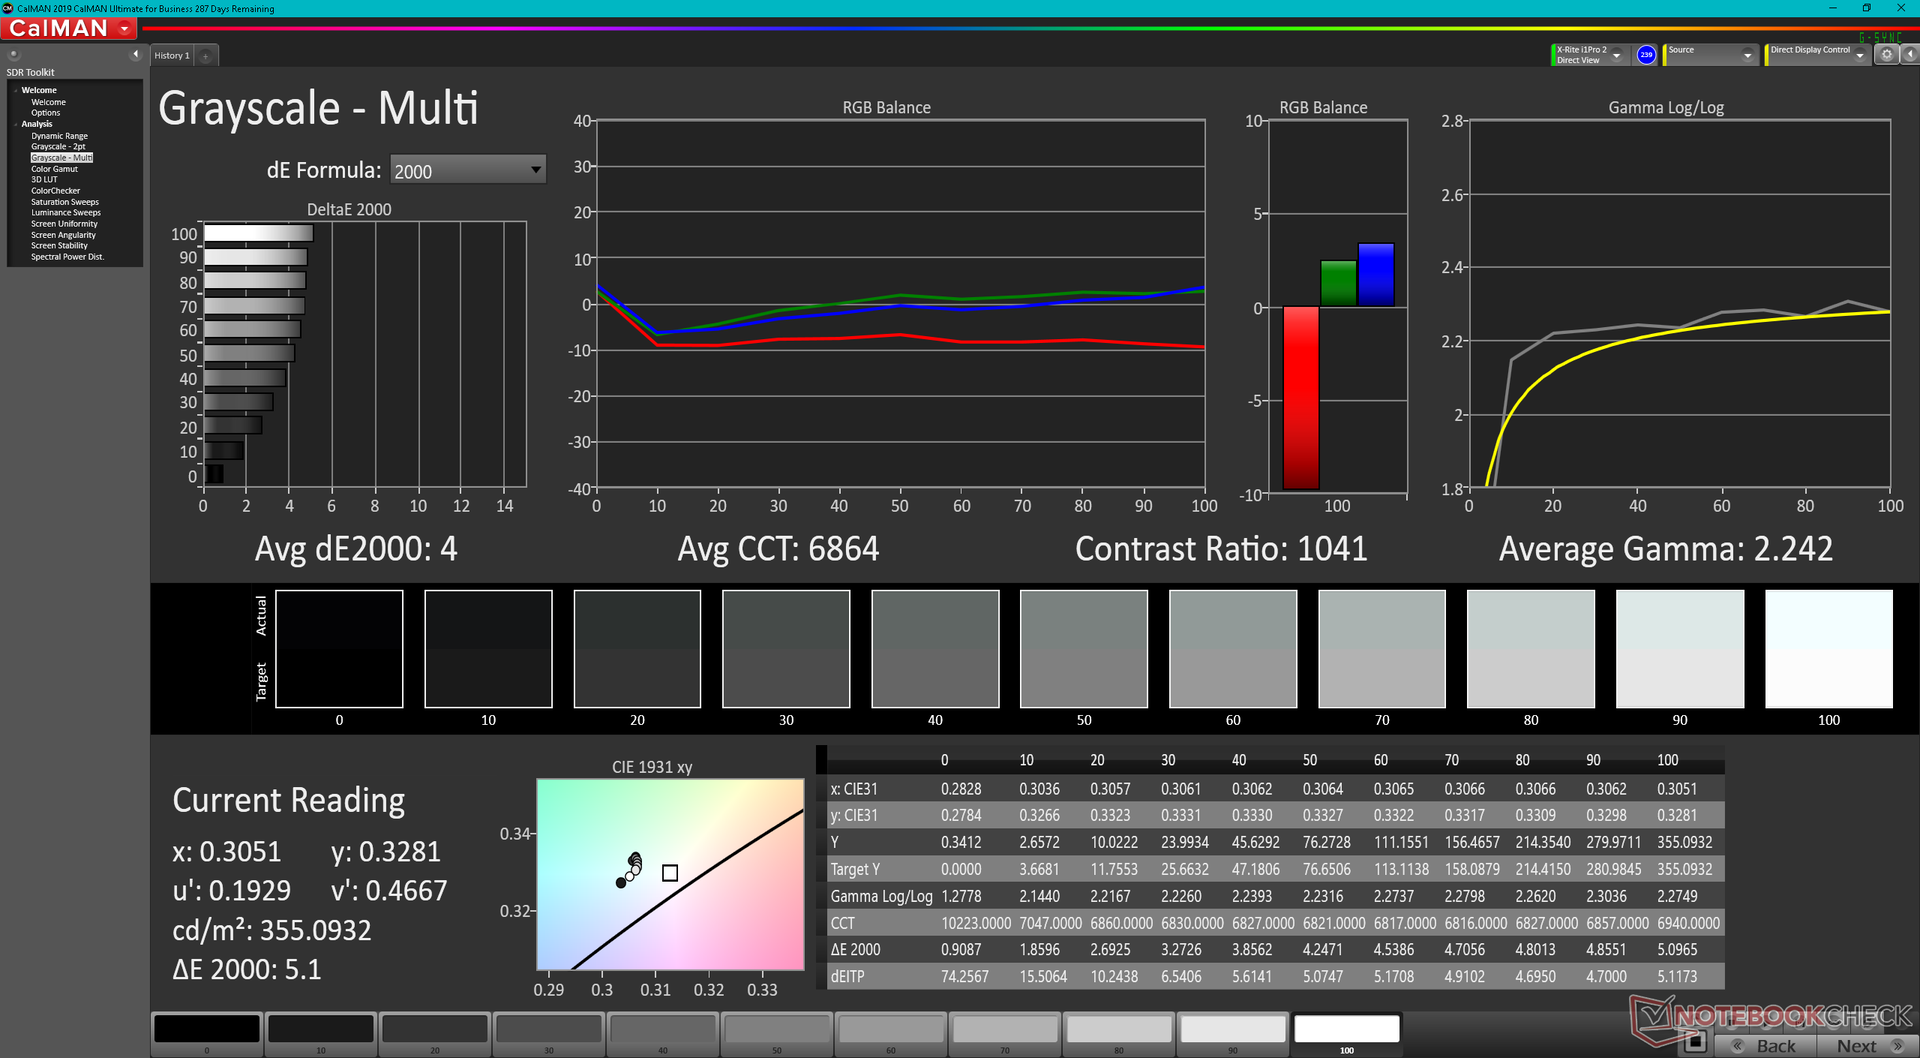
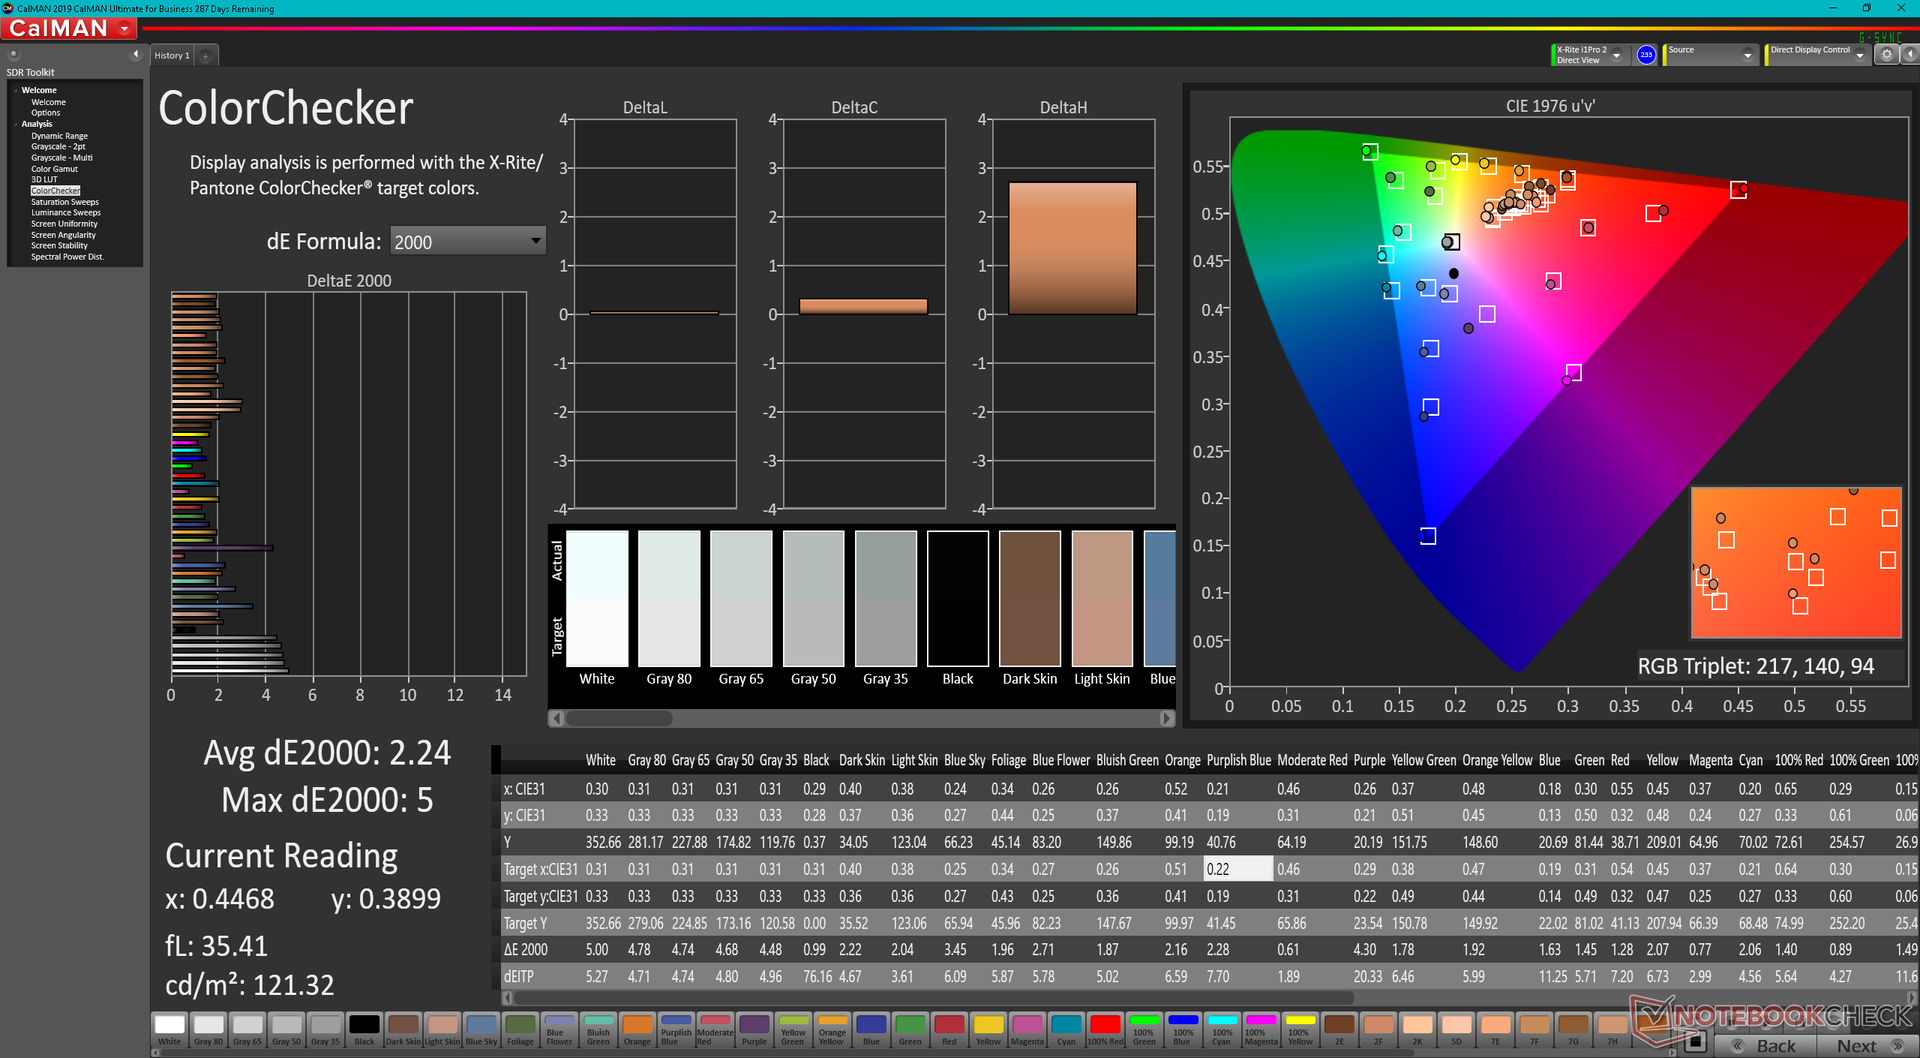
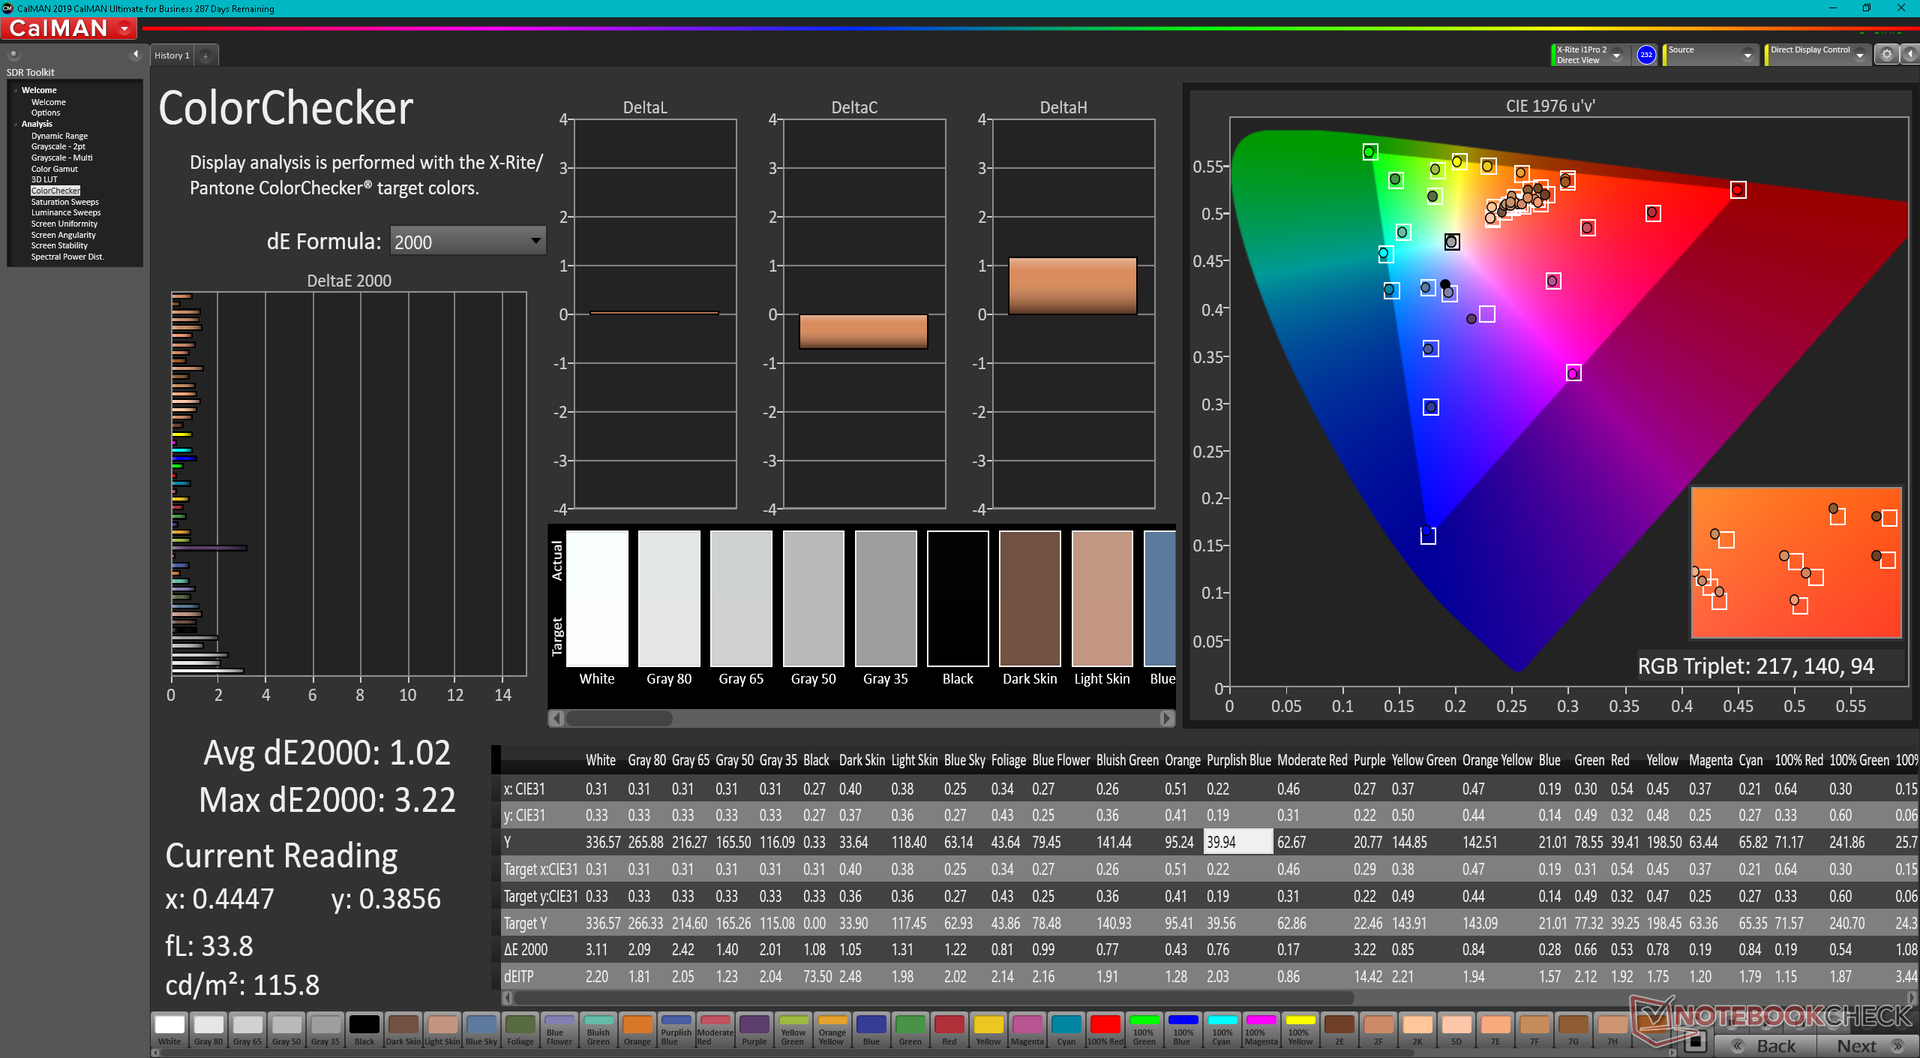
ΔE ColorChecker Calman: 2.24 | ∀{0.5-29.43 Ø4.71}
calibrated: 1.02
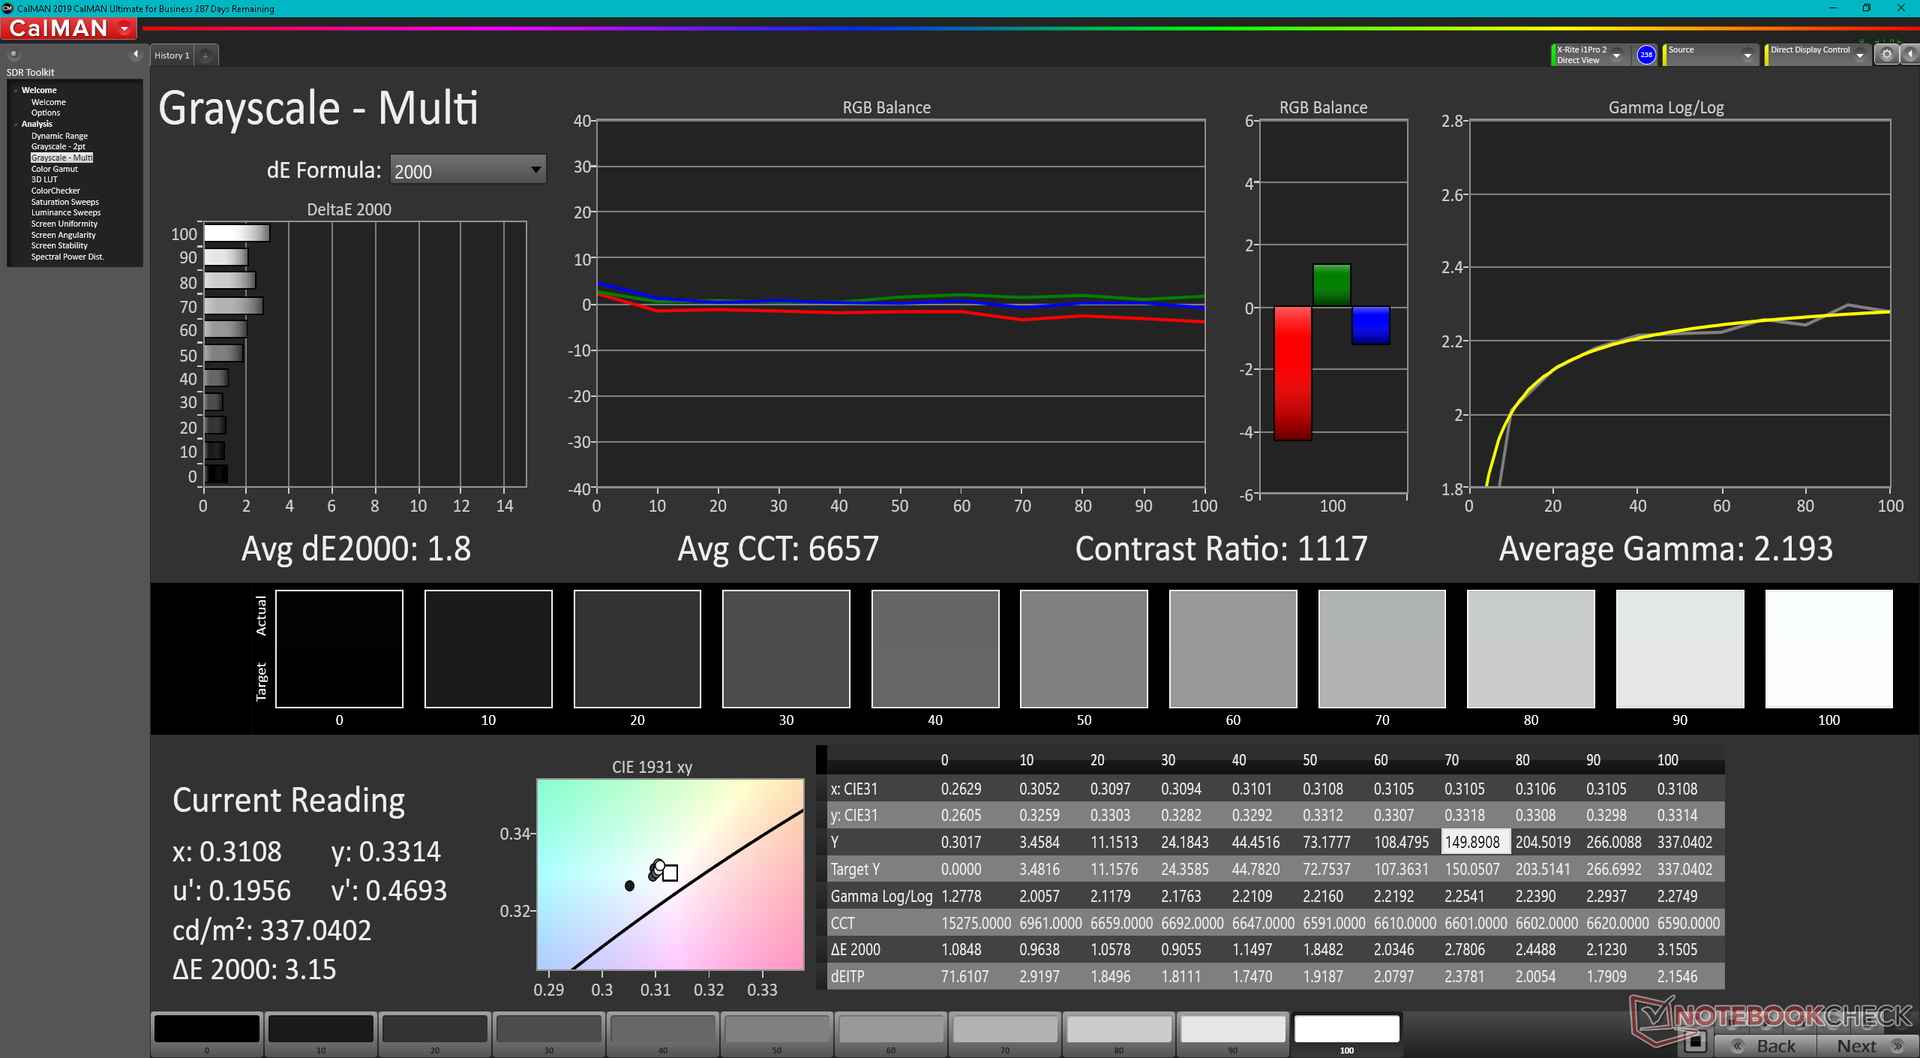
ΔE Greyscale Calman: 4 | ∀{0.09-98 Ø4.96}
72.1% AdobeRGB 1998 (Argyll 3D)
99.5% sRGB (Argyll 3D)
70.1% Display P3 (Argyll 3D)
Gamma: 2.24
CCT: 6864 K
| MSI Vector GP66 12UGS BOE NE156FHM-NZ3, IPS, 1920x1080, 15.6" | MSI GP66 Leopard 11UH-028 LGD0625 (LP156WFG-SPB3), IPS, 1920x1080, 15.6" | MSI Katana GF66 11UG-220 AU Optronics B156HAN08.0, IPS, 1920x1080, 15.6" | Asus TUF Gaming F15 FX506HM Chi Mei N156HRA-EA1, IPS, 1920x1080, 15.6" | Razer Blade 15 Base Edition 2021, i7-10750H RTX 3060 BOE NV156FHM-N4K, IPS, 1920x1080, 15.6" | Alienware m15 R5 Ryzen Edition B156HAN, IPS, 1920x1080, 15.6" | |
|---|---|---|---|---|---|---|
| Display | -6% | -7% | -39% | -8% | ||
| Display P3 Coverage (%) | 70.1 | 65.2 -7% | 65.4 -7% | 41.9 -40% | 64.3 -8% | |
| sRGB Coverage (%) | 99.5 | 95.8 -4% | 91.3 -8% | 62.9 -37% | 91.8 -8% | |
| AdobeRGB 1998 Coverage (%) | 72.1 | 66 -8% | 66.7 -7% | 43.3 -40% | 65.5 -9% | |
| Response Times | -77% | -23% | -258% | -28% | 22% | |
| Response Time Grey 50% / Grey 80% * (ms) | 5.8 ? | 14 ? -141% | 7.4 ? -28% | 28.4 ? -390% | 8.8 ? -52% | 4 ? 31% |
| Response Time Black / White * (ms) | 9.6 ? | 10.8 ? -13% | 11.2 ? -17% | 21.6 ? -125% | 10 ? -4% | 8.4 ? 12% |
| PWM Frequency (Hz) | 1000 ? | |||||
| Screen | -21% | -30% | -71% | -32% | 2% | |
| Brightness middle (cd/m²) | 353.1 | 390 10% | 307 -13% | 268.3 -24% | 317.2 -10% | 329 -7% |
| Brightness (cd/m²) | 325 | 362 11% | 321 -1% | 257 -21% | 306 -6% | 321 -1% |
| Brightness Distribution (%) | 85 | 87 2% | 83 -2% | 84 -1% | 89 5% | 92 8% |
| Black Level * (cd/m²) | 0.38 | 0.41 -8% | 0.27 29% | 0.34 11% | 0.31 18% | 0.27 29% |
| Contrast (:1) | 929 | 951 2% | 1137 22% | 789 -15% | 1023 10% | 1219 31% |
| Colorchecker dE 2000 * | 2.24 | 2.66 -19% | 4.67 -108% | 5.05 -125% | 4.37 -95% | 2.78 -24% |
| Colorchecker dE 2000 max. * | 5 | 7.14 -43% | 7.53 -51% | 15.43 -209% | 6.62 -32% | 4.88 2% |
| Colorchecker dE 2000 calibrated * | 1.02 | 2.56 -151% | 2.41 -136% | 3.21 -215% | 2.67 -162% | 1.63 -60% |
| Greyscale dE 2000 * | 4 | 3.63 9% | 4.5 -13% | 5.5 -38% | 4.5 -13% | 2.5 37% |
| Gamma | 2.24 98% | 2.57 86% | 2.276 97% | 2.35 94% | 2.4 92% | 2.106 104% |
| CCT | 6864 95% | 6894 94% | 6824 95% | 7392 88% | 7418 88% | 6201 105% |
| Color Space (Percent of AdobeRGB 1998) (%) | 59.2 | 76 | ||||
| Color Space (Percent of sRGB) (%) | 91.4 | 99 | ||||
| Total Average (Program / Settings) | -35% /
-26% | -20% /
-24% | -123% /
-91% | -23% /
-26% | 12% /
5% |
* ... smaller is better
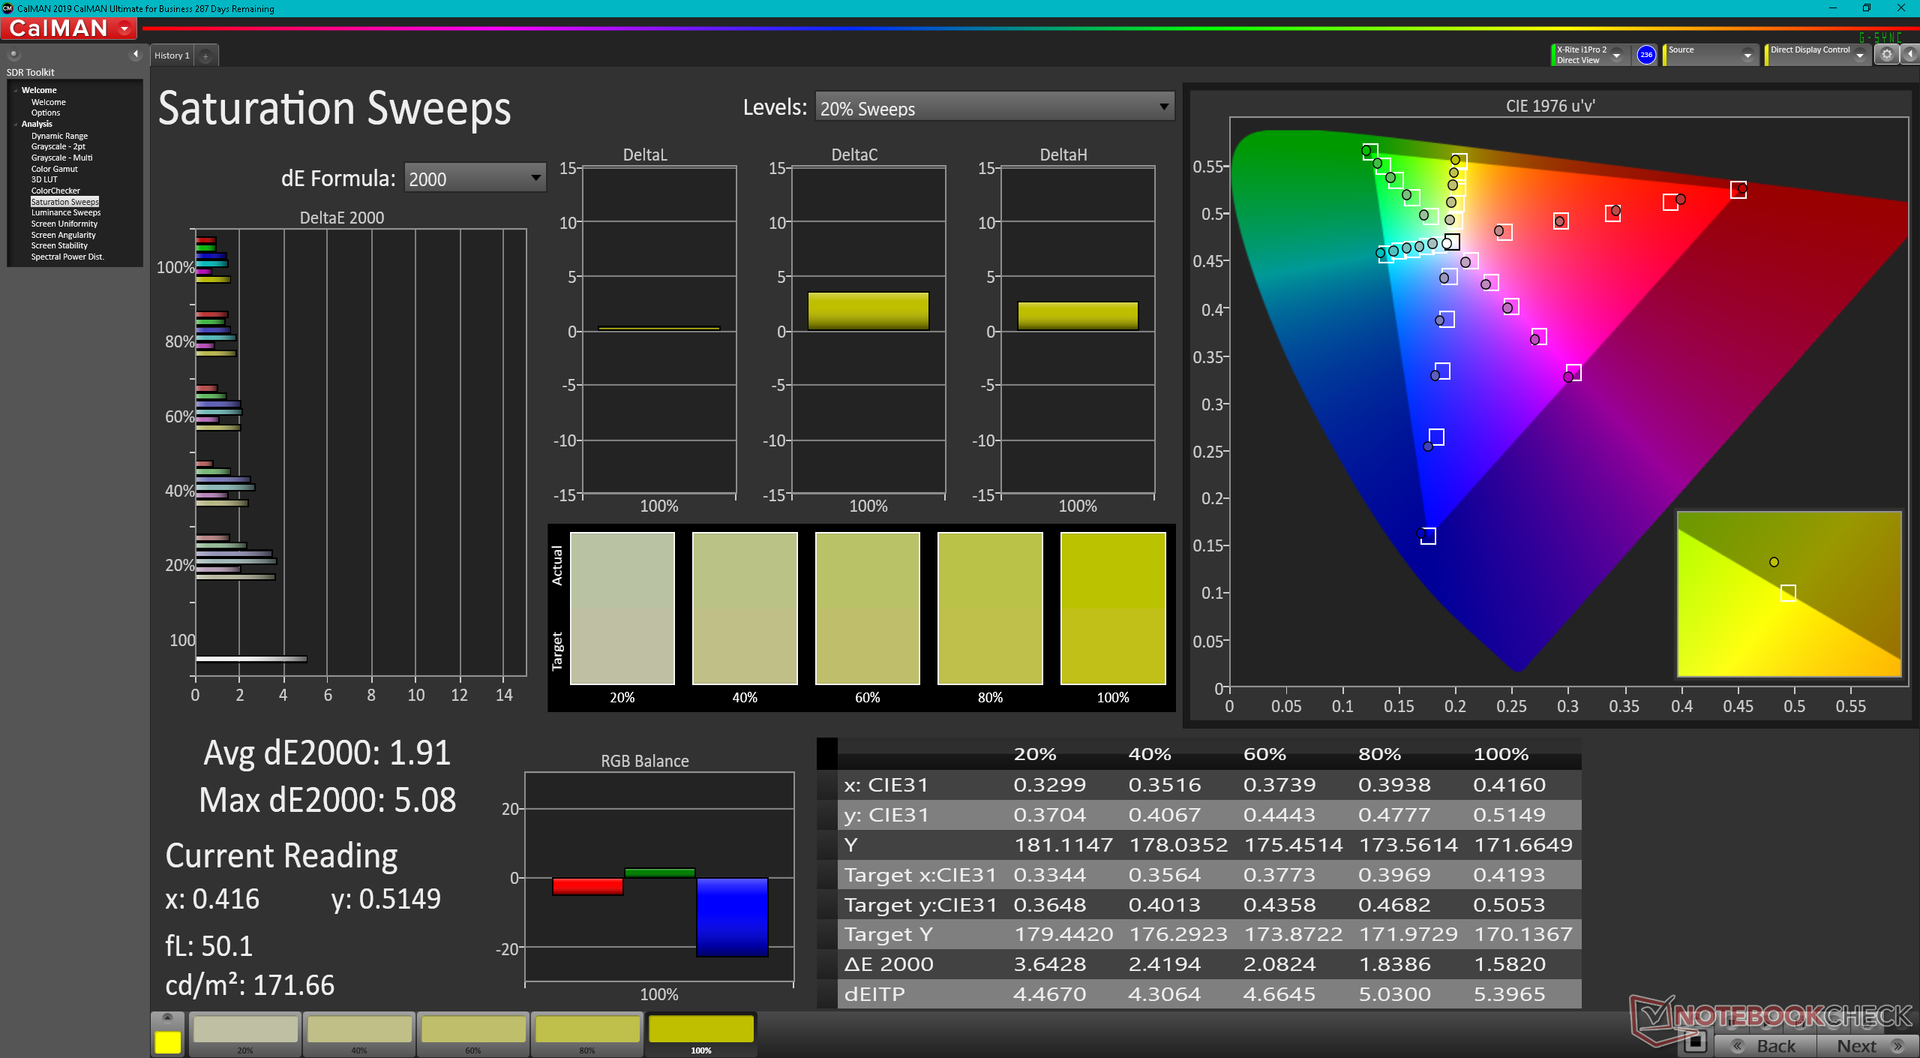
与GF66 Katana或GP66 Leopard的面板相比,该面板涵盖了所有的sRGB,甚至更多的AdobeRGB。我们很高兴在这里看到一个高质量的面板,而不是华硕TUF Gaming F15上的智美,后者覆盖的色域明显更窄。
该显示器开箱即被校准,尽管其色温可能略微偏暖。X-Rite色度计校准解决了这个问题,使平均灰度和彩色DeltaE值分别从4和2.24提高到1.8和1.02。
Display Response Times
| ↔ Response Time Black to White | ||
|---|---|---|
| 9.6 ms ... rise ↗ and fall ↘ combined | ↗ 5.2 ms rise | 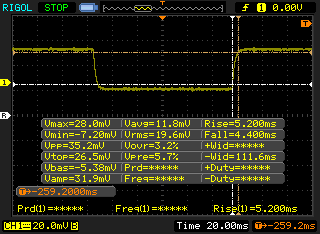 |
| ↘ 4.4 ms fall | ||
| The screen shows fast response rates in our tests and should be suited for gaming. In comparison, all tested devices range from 0.1 (minimum) to 240 (maximum) ms. » 26 % of all devices are better. This means that the measured response time is better than the average of all tested devices (19.8 ms). | ||
| ↔ Response Time 50% Grey to 80% Grey | ||
| 5.8 ms ... rise ↗ and fall ↘ combined | ↗ 3.4 ms rise | 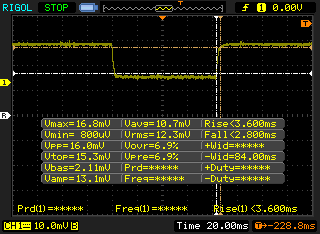 |
| ↘ 2.4 ms fall | ||
| The screen shows very fast response rates in our tests and should be very well suited for fast-paced gaming. In comparison, all tested devices range from 0.165 (minimum) to 636 (maximum) ms. » 19 % of all devices are better. This means that the measured response time is better than the average of all tested devices (31 ms). | ||
Screen Flickering / PWM (Pulse-Width Modulation)
| Screen flickering / PWM not detected | 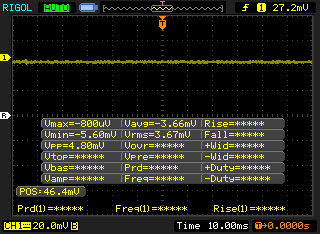 | ||
In comparison: 52 % of all tested devices do not use PWM to dim the display. If PWM was detected, an average of 7757 (minimum: 5 - maximum: 343500) Hz was measured. | |||

业绩
测试条件
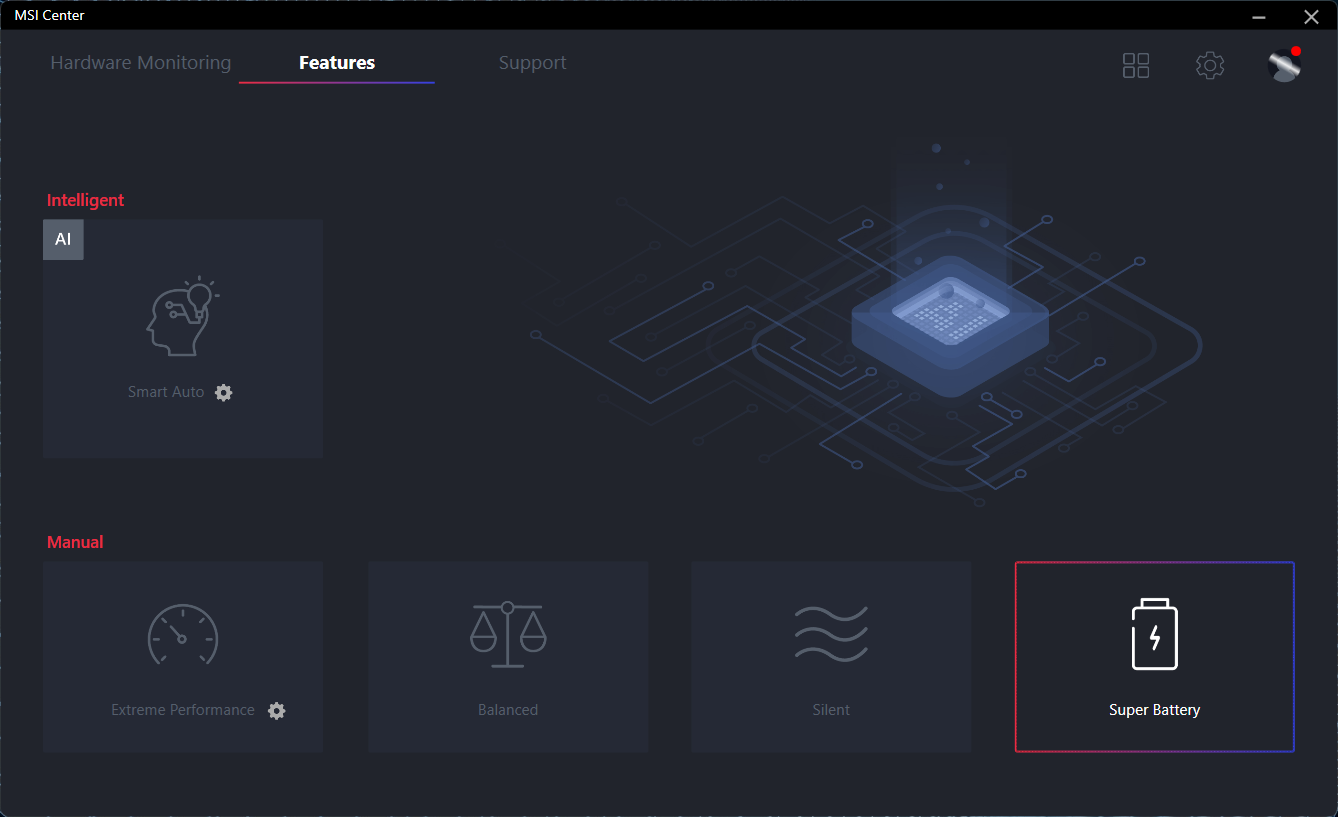
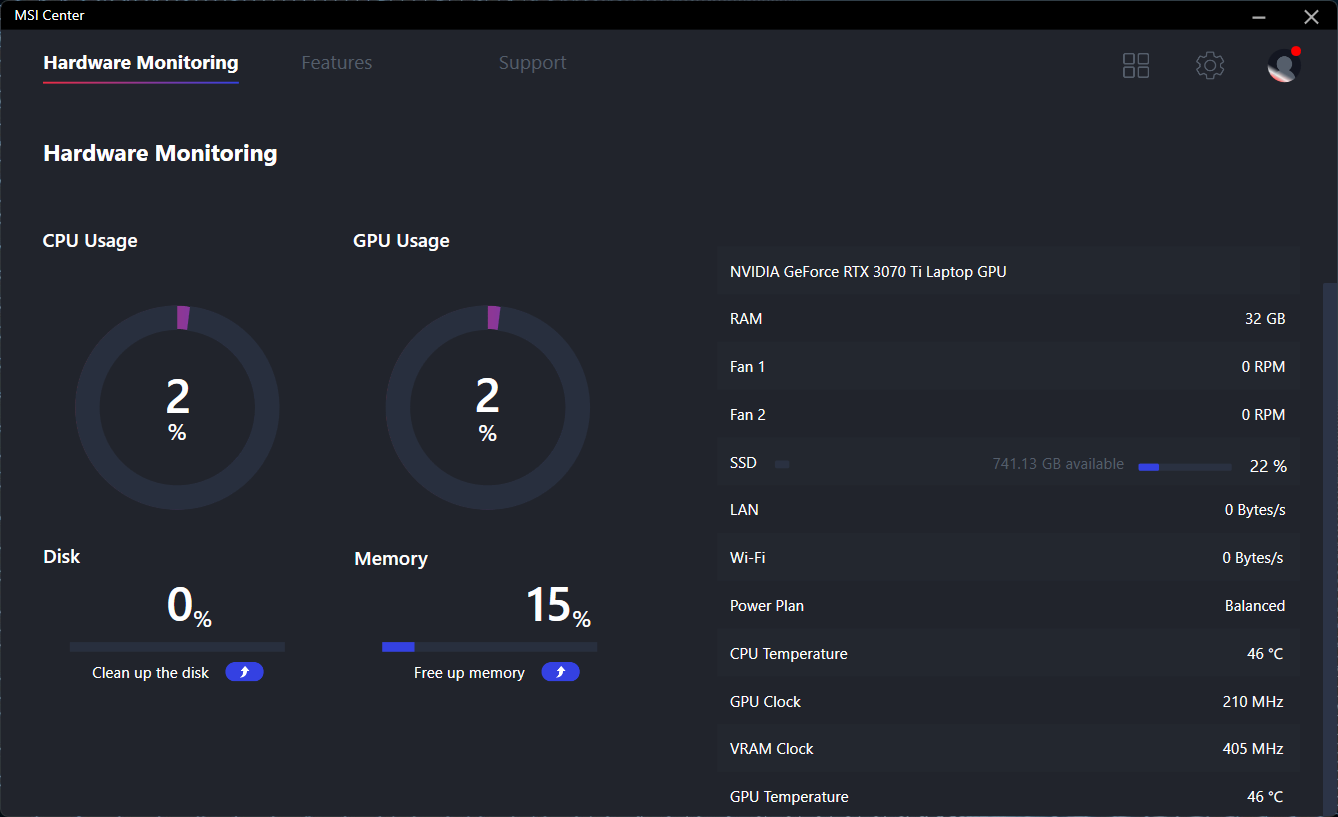
我们的设备被设置为极限性能模式,通过微星中心软件激活独立GPU,以获得尽可能高的分数。我们强烈建议用户熟悉这个软件,因为许多重要的功能都在这里切换,包括MSHybrid、硬件监控、HDR和其他QoL设置。对于键盘灯光效果,用户必须依靠预装的SteelSeries GG软件。
如果在MSHybrid和独立GPU模式之间切换,则需要重新启动。
处理器
芯片 酷睿i9-12900H与上一代产品相比,在单线程和多线程应用中分别快了约25%和35%。 酷睿i7-11800H在GP66 Leopard上的表现。总体性能甚至可以超过更耗电的台式机酷睿i9-11900K.在英特尔推出Alder Lake-H系列之前,AMD Zen 3 H系列曾占据性能冠军。
关于Alder Lake的更多信息可以在我们对该平台的概述中找到 这里.
Cinebench R15 Multi Loop
Cinebench R23: Multi Core | Single Core
Cinebench R15: CPU Multi 64Bit | CPU Single 64Bit
Blender: v2.79 BMW27 CPU
7-Zip 18.03: 7z b 4 | 7z b 4 -mmt1
Geekbench 5.5: Multi-Core | Single-Core
HWBOT x265 Benchmark v2.2: 4k Preset
LibreOffice : 20 Documents To PDF
R Benchmark 2.5: Overall mean
| Cinebench R20 / CPU (Multi Core) | |
| Intel Core i9-12900K | |
| MSI Vector GP66 12UGS | |
| MSI MEG Z590 ACE | |
| Average Intel Core i9-12900H (2681 - 7471, n=28) | |
| Eurocom Nightsky ARX315 | |
| MSI GP66 Leopard 11UH-028 | |
| HP ZBook Fury 15 G8 | |
| MSI Alpha 15 B5EEK-008 | |
| MSI Delta 15 A5EFK | |
| Alienware m15 R4 | |
| MSI GE65 Raider 9SF-049US | |
| Razer Blade 15 Advanced Model Early 2021 | |
| Cinebench R20 / CPU (Single Core) | |
| Intel Core i9-12900K | |
| MSI Vector GP66 12UGS | |
| Average Intel Core i9-12900H (624 - 738, n=28) | |
| MSI MEG Z590 ACE | |
| HP ZBook Fury 15 G8 | |
| Eurocom Nightsky ARX315 | |
| MSI GP66 Leopard 11UH-028 | |
| MSI Delta 15 A5EFK | |
| MSI Alpha 15 B5EEK-008 | |
| Alienware m15 R4 | |
| Razer Blade 15 Advanced Model Early 2021 | |
| MSI GE65 Raider 9SF-049US | |
| Cinebench R23 / Multi Core | |
| Intel Core i9-12900K | |
| MSI Vector GP66 12UGS | |
| MSI MEG Z590 ACE | |
| Average Intel Core i9-12900H (7359 - 19648, n=28) | |
| Eurocom Nightsky ARX315 | |
| MSI GP66 Leopard 11UH-028 | |
| HP ZBook Fury 15 G8 | |
| MSI Alpha 15 B5EEK-008 | |
| MSI Delta 15 A5EFK | |
| Razer Blade 15 Advanced Model Early 2021 | |
| Cinebench R23 / Single Core | |
| Intel Core i9-12900K | |
| MSI Vector GP66 12UGS | |
| Average Intel Core i9-12900H (1634 - 1930, n=28) | |
| MSI MEG Z590 ACE | |
| HP ZBook Fury 15 G8 | |
| Eurocom Nightsky ARX315 | |
| MSI GP66 Leopard 11UH-028 | |
| MSI Delta 15 A5EFK | |
| MSI Alpha 15 B5EEK-008 | |
| Razer Blade 15 Advanced Model Early 2021 | |
| Cinebench R15 / CPU Multi 64Bit | |
| Intel Core i9-12900K | |
| Average Intel Core i9-12900H (1395 - 3077, n=28) | |
| MSI Vector GP66 12UGS | |
| MSI MEG Z590 ACE | |
| Eurocom Nightsky ARX315 | |
| MSI Delta 15 A5EFK | |
| MSI GP66 Leopard 11UH-028 | |
| MSI Alpha 15 B5EEK-008 | |
| HP ZBook Fury 15 G8 | |
| MSI GE65 Raider 9SF-049US | |
| Alienware m15 R4 | |
| Razer Blade 15 Advanced Model Early 2021 | |
| Cinebench R15 / CPU Single 64Bit | |
| Intel Core i9-12900K | |
| MSI Vector GP66 12UGS | |
| Average Intel Core i9-12900H (235 - 277, n=29) | |
| MSI MEG Z590 ACE | |
| Eurocom Nightsky ARX315 | |
| HP ZBook Fury 15 G8 | |
| MSI Delta 15 A5EFK | |
| MSI Alpha 15 B5EEK-008 | |
| MSI GP66 Leopard 11UH-028 | |
| Alienware m15 R4 | |
| Razer Blade 15 Advanced Model Early 2021 | |
| MSI GE65 Raider 9SF-049US | |
| Blender / v2.79 BMW27 CPU | |
| Razer Blade 15 Advanced Model Early 2021 | |
| Alienware m15 R4 | |
| HP ZBook Fury 15 G8 | |
| MSI Alpha 15 B5EEK-008 | |
| MSI GP66 Leopard 11UH-028 | |
| MSI Delta 15 A5EFK | |
| Average Intel Core i9-12900H (160 - 451, n=28) | |
| Eurocom Nightsky ARX315 | |
| MSI Vector GP66 12UGS | |
| MSI MEG Z590 ACE | |
| Intel Core i9-12900K | |
| 7-Zip 18.03 / 7z b 4 | |
| Intel Core i9-12900K | |
| Eurocom Nightsky ARX315 | |
| MSI Vector GP66 12UGS | |
| MSI MEG Z590 ACE | |
| Average Intel Core i9-12900H (34684 - 76677, n=28) | |
| MSI Delta 15 A5EFK | |
| MSI Alpha 15 B5EEK-008 | |
| MSI GP66 Leopard 11UH-028 | |
| HP ZBook Fury 15 G8 | |
| Alienware m15 R4 | |
| Razer Blade 15 Advanced Model Early 2021 | |
| 7-Zip 18.03 / 7z b 4 -mmt1 | |
| Intel Core i9-12900K | |
| Eurocom Nightsky ARX315 | |
| MSI MEG Z590 ACE | |
| MSI Vector GP66 12UGS | |
| Average Intel Core i9-12900H (5302 - 6289, n=28) | |
| HP ZBook Fury 15 G8 | |
| MSI Delta 15 A5EFK | |
| MSI GP66 Leopard 11UH-028 | |
| MSI Alpha 15 B5EEK-008 | |
| Alienware m15 R4 | |
| Razer Blade 15 Advanced Model Early 2021 | |
| Geekbench 5.5 / Multi-Core | |
| Intel Core i9-12900K | |
| MSI Vector GP66 12UGS | |
| Average Intel Core i9-12900H (8519 - 14376, n=31) | |
| MSI MEG Z590 ACE | |
| Eurocom Nightsky ARX315 | |
| MSI GP66 Leopard 11UH-028 | |
| MSI Delta 15 A5EFK | |
| MSI Alpha 15 B5EEK-008 | |
| Alienware m15 R4 | |
| Razer Blade 15 Advanced Model Early 2021 | |
| Geekbench 5.5 / Single-Core | |
| Intel Core i9-12900K | |
| MSI Vector GP66 12UGS | |
| Average Intel Core i9-12900H (1631 - 1897, n=31) | |
| MSI MEG Z590 ACE | |
| Eurocom Nightsky ARX315 | |
| MSI GP66 Leopard 11UH-028 | |
| MSI Delta 15 A5EFK | |
| MSI Alpha 15 B5EEK-008 | |
| Alienware m15 R4 | |
| Razer Blade 15 Advanced Model Early 2021 | |
| HWBOT x265 Benchmark v2.2 / 4k Preset | |
| Intel Core i9-12900K | |
| MSI Vector GP66 12UGS | |
| MSI MEG Z590 ACE | |
| Eurocom Nightsky ARX315 | |
| Average Intel Core i9-12900H (8.05 - 22.5, n=28) | |
| MSI Delta 15 A5EFK | |
| MSI GP66 Leopard 11UH-028 | |
| MSI Alpha 15 B5EEK-008 | |
| HP ZBook Fury 15 G8 | |
| Alienware m15 R4 | |
| Razer Blade 15 Advanced Model Early 2021 | |
| LibreOffice / 20 Documents To PDF | |
| MSI Alpha 15 B5EEK-008 | |
| Razer Blade 15 Advanced Model Early 2021 | |
| MSI Delta 15 A5EFK | |
| HP ZBook Fury 15 G8 | |
| Alienware m15 R4 | |
| MSI GP66 Leopard 11UH-028 | |
| Eurocom Nightsky ARX315 | |
| Average Intel Core i9-12900H (36.8 - 59.8, n=28) | |
| MSI MEG Z590 ACE | |
| Intel Core i9-12900K | |
| MSI Vector GP66 12UGS | |
| R Benchmark 2.5 / Overall mean | |
| Razer Blade 15 Advanced Model Early 2021 | |
| Alienware m15 R4 | |
| MSI GP66 Leopard 11UH-028 | |
| HP ZBook Fury 15 G8 | |
| MSI Alpha 15 B5EEK-008 | |
| MSI Delta 15 A5EFK | |
| Eurocom Nightsky ARX315 | |
| MSI MEG Z590 ACE | |
| Average Intel Core i9-12900H (0.4218 - 0.506, n=28) | |
| MSI Vector GP66 12UGS | |
| Intel Core i9-12900K | |
* ... smaller is better
AIDA64: FP32 Ray-Trace | FPU Julia | CPU SHA3 | CPU Queen | FPU SinJulia | FPU Mandel | CPU AES | CPU ZLib | FP64 Ray-Trace | CPU PhotoWorxx
| Performance rating | |
| MSI GP66 Leopard 11UH-028 | |
| Alienware m15 R5 Ryzen Edition | |
| Average Intel Core i9-12900H | |
| MSI Vector GP66 12UGS | |
| MSI Katana GF66 11UG-220 -9! | |
| Asus TUF Gaming F15 FX506HM -9! | |
| AIDA64 / FP32 Ray-Trace | |
| MSI GP66 Leopard 11UH-028 | |
| Alienware m15 R5 Ryzen Edition | |
| Average Intel Core i9-12900H (4074 - 18289, n=29) | |
| MSI Vector GP66 12UGS | |
| AIDA64 / FPU Julia | |
| Alienware m15 R5 Ryzen Edition | |
| MSI GP66 Leopard 11UH-028 | |
| Average Intel Core i9-12900H (22307 - 93236, n=29) | |
| MSI Vector GP66 12UGS | |
| AIDA64 / CPU SHA3 | |
| MSI GP66 Leopard 11UH-028 | |
| Alienware m15 R5 Ryzen Edition | |
| Average Intel Core i9-12900H (1378 - 4215, n=29) | |
| MSI Vector GP66 12UGS | |
| AIDA64 / CPU Queen | |
| MSI Vector GP66 12UGS | |
| Average Intel Core i9-12900H (78172 - 111241, n=28) | |
| Alienware m15 R5 Ryzen Edition | |
| MSI GP66 Leopard 11UH-028 | |
| AIDA64 / FPU SinJulia | |
| Alienware m15 R5 Ryzen Edition | |
| MSI GP66 Leopard 11UH-028 | |
| MSI Vector GP66 12UGS | |
| Average Intel Core i9-12900H (5709 - 10410, n=29) | |
| AIDA64 / FPU Mandel | |
| Alienware m15 R5 Ryzen Edition | |
| MSI GP66 Leopard 11UH-028 | |
| Average Intel Core i9-12900H (11257 - 45581, n=29) | |
| MSI Vector GP66 12UGS | |
| AIDA64 / CPU AES | |
| MSI GP66 Leopard 11UH-028 | |
| Alienware m15 R5 Ryzen Edition | |
| MSI Vector GP66 12UGS | |
| Average Intel Core i9-12900H (31935 - 151546, n=29) | |
| AIDA64 / CPU ZLib | |
| MSI Vector GP66 12UGS | |
| Average Intel Core i9-12900H (449 - 1193, n=29) | |
| MSI GP66 Leopard 11UH-028 | |
| Alienware m15 R5 Ryzen Edition | |
| Asus TUF Gaming F15 FX506HM | |
| MSI Katana GF66 11UG-220 | |
| AIDA64 / FP64 Ray-Trace | |
| MSI GP66 Leopard 11UH-028 | |
| Alienware m15 R5 Ryzen Edition | |
| Average Intel Core i9-12900H (2235 - 10511, n=29) | |
| MSI Vector GP66 12UGS | |
| AIDA64 / CPU PhotoWorxx | |
| Average Intel Core i9-12900H (20960 - 48269, n=30) | |
| MSI Vector GP66 12UGS | |
| MSI GP66 Leopard 11UH-028 | |
| Alienware m15 R5 Ryzen Edition | |
系统性能
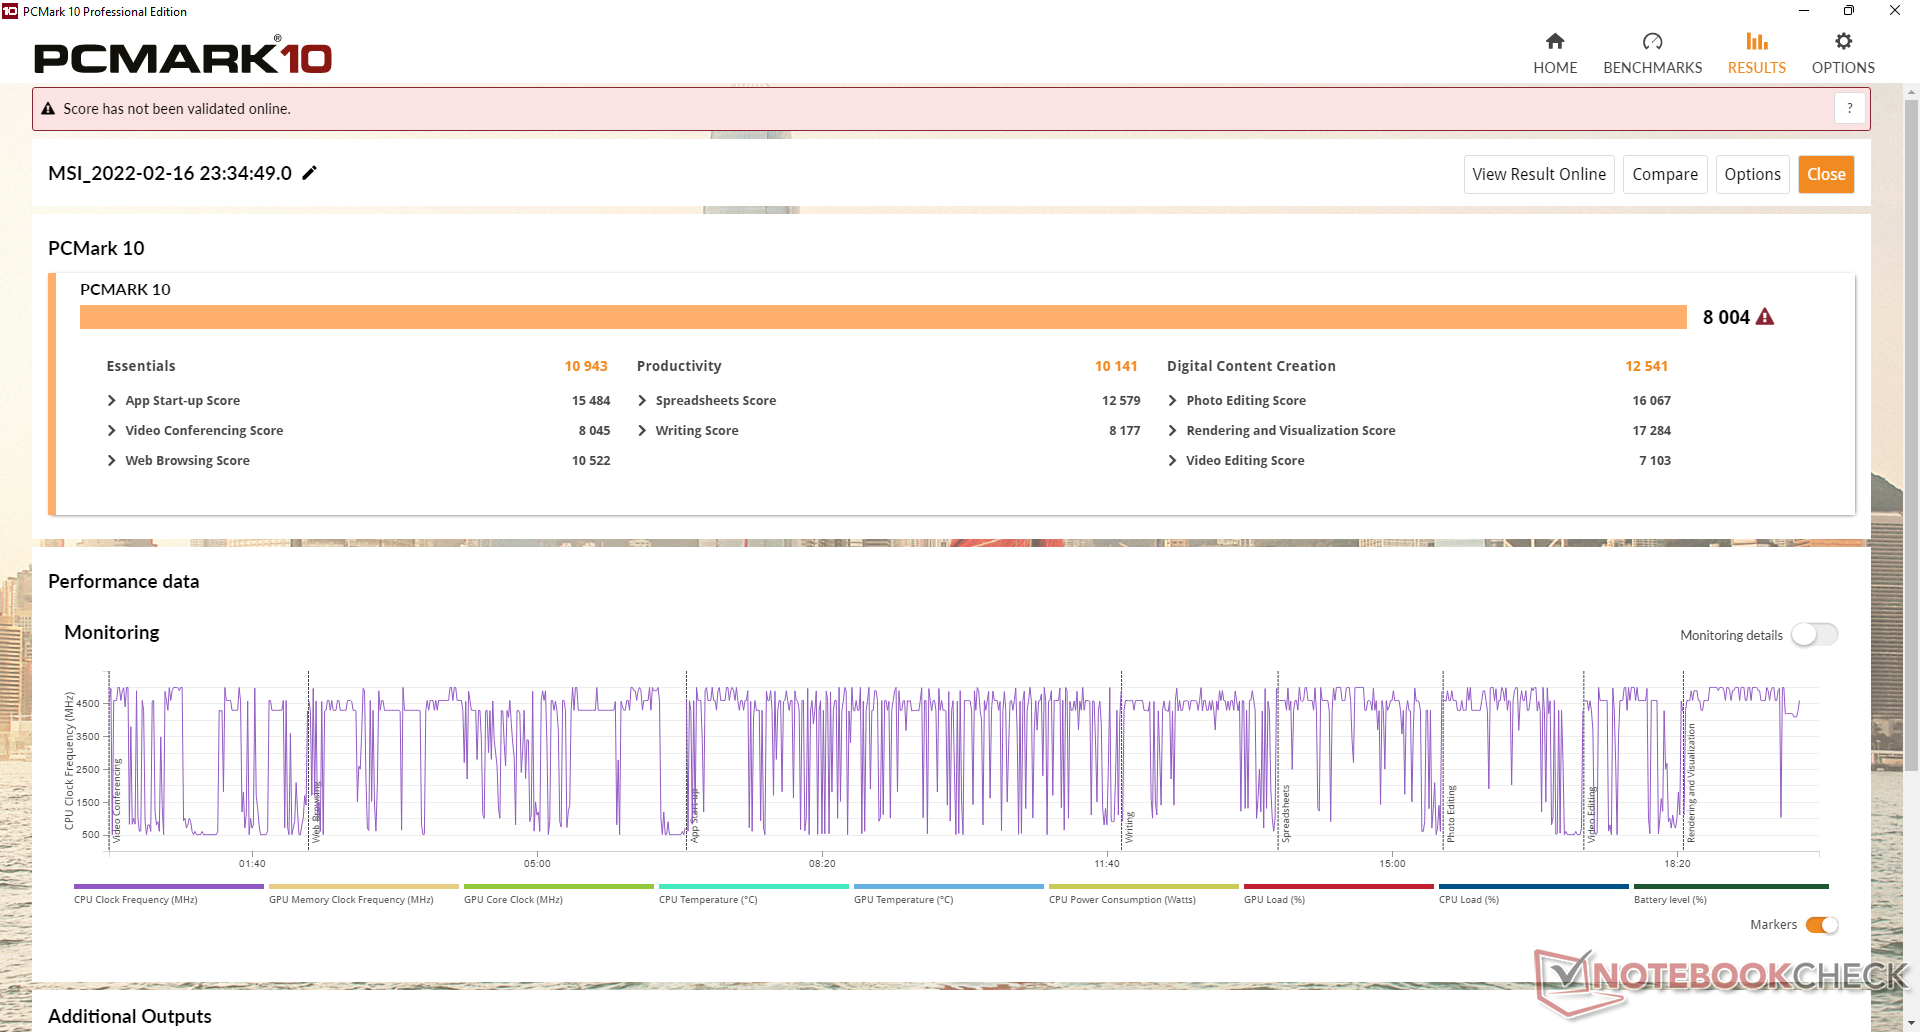
PCMark的结果是我们数据库中最高的一些,刚刚超过8000分。微星微星Raider GE76配备了解锁的酷睿i9-12900HK和更快的GeForce RTX 3080 Ti,将返回与我们的GP66基本相同的分数。
值得注意的是,我们的测试设备出现了唤醒和睡眠问题,在GPU模式之间切换或进入睡眠模式时,屏幕有时会保持黑色。然后需要硬性重启。
| PCMark 10 / Score | |
| MSI Vector GP66 12UGS | |
| Average Intel Core i9-12900H, NVIDIA GeForce RTX 3070 Ti Laptop GPU (7087 - 8072, n=6) | |
| MSI GP66 Leopard 11UH-028 | |
| Asus TUF Gaming F15 FX506HM | |
| MSI Katana GF66 11UG-220 | |
| Alienware m15 R5 Ryzen Edition | |
| Razer Blade 15 Base Edition 2021, i7-10750H RTX 3060 | |
| PCMark 10 / Essentials | |
| MSI Vector GP66 12UGS | |
| Average Intel Core i9-12900H, NVIDIA GeForce RTX 3070 Ti Laptop GPU (10266 - 11663, n=6) | |
| Asus TUF Gaming F15 FX506HM | |
| MSI GP66 Leopard 11UH-028 | |
| Razer Blade 15 Base Edition 2021, i7-10750H RTX 3060 | |
| Alienware m15 R5 Ryzen Edition | |
| MSI Katana GF66 11UG-220 | |
| PCMark 10 / Productivity | |
| Average Intel Core i9-12900H, NVIDIA GeForce RTX 3070 Ti Laptop GPU (9402 - 10742, n=6) | |
| MSI Vector GP66 12UGS | |
| MSI Katana GF66 11UG-220 | |
| Alienware m15 R5 Ryzen Edition | |
| Asus TUF Gaming F15 FX506HM | |
| MSI GP66 Leopard 11UH-028 | |
| Razer Blade 15 Base Edition 2021, i7-10750H RTX 3060 | |
| PCMark 10 / Digital Content Creation | |
| MSI Vector GP66 12UGS | |
| Average Intel Core i9-12900H, NVIDIA GeForce RTX 3070 Ti Laptop GPU (10009 - 12541, n=6) | |
| MSI GP66 Leopard 11UH-028 | |
| MSI Katana GF66 11UG-220 | |
| Asus TUF Gaming F15 FX506HM | |
| Alienware m15 R5 Ryzen Edition | |
| Razer Blade 15 Base Edition 2021, i7-10750H RTX 3060 | |
| PCMark 10 Score | 8004 points | |
Help | ||
| AIDA64 / Memory Copy | |
| Average Intel Core i9-12900H (34438 - 74264, n=29) | |
| MSI Vector GP66 12UGS | |
| MSI GP66 Leopard 11UH-028 | |
| Alienware m15 R5 Ryzen Edition | |
| AIDA64 / Memory Read | |
| Average Intel Core i9-12900H (36365 - 74642, n=29) | |
| MSI GP66 Leopard 11UH-028 | |
| MSI Vector GP66 12UGS | |
| Alienware m15 R5 Ryzen Edition | |
| AIDA64 / Memory Write | |
| Average Intel Core i9-12900H (32276 - 67858, n=29) | |
| MSI Vector GP66 12UGS | |
| MSI GP66 Leopard 11UH-028 | |
| Alienware m15 R5 Ryzen Edition | |
| AIDA64 / Memory Latency | |
| MSI GP66 Leopard 11UH-028 | |
| MSI Vector GP66 12UGS | |
| Average Intel Core i9-12900H (74.7 - 118.1, n=28) | |
| Alienware m15 R5 Ryzen Edition | |
| Asus TUF Gaming F15 FX506HM | |
| MSI Katana GF66 11UG-220 | |
| MSI Katana GF66 11UG-220 | |
* ... smaller is better
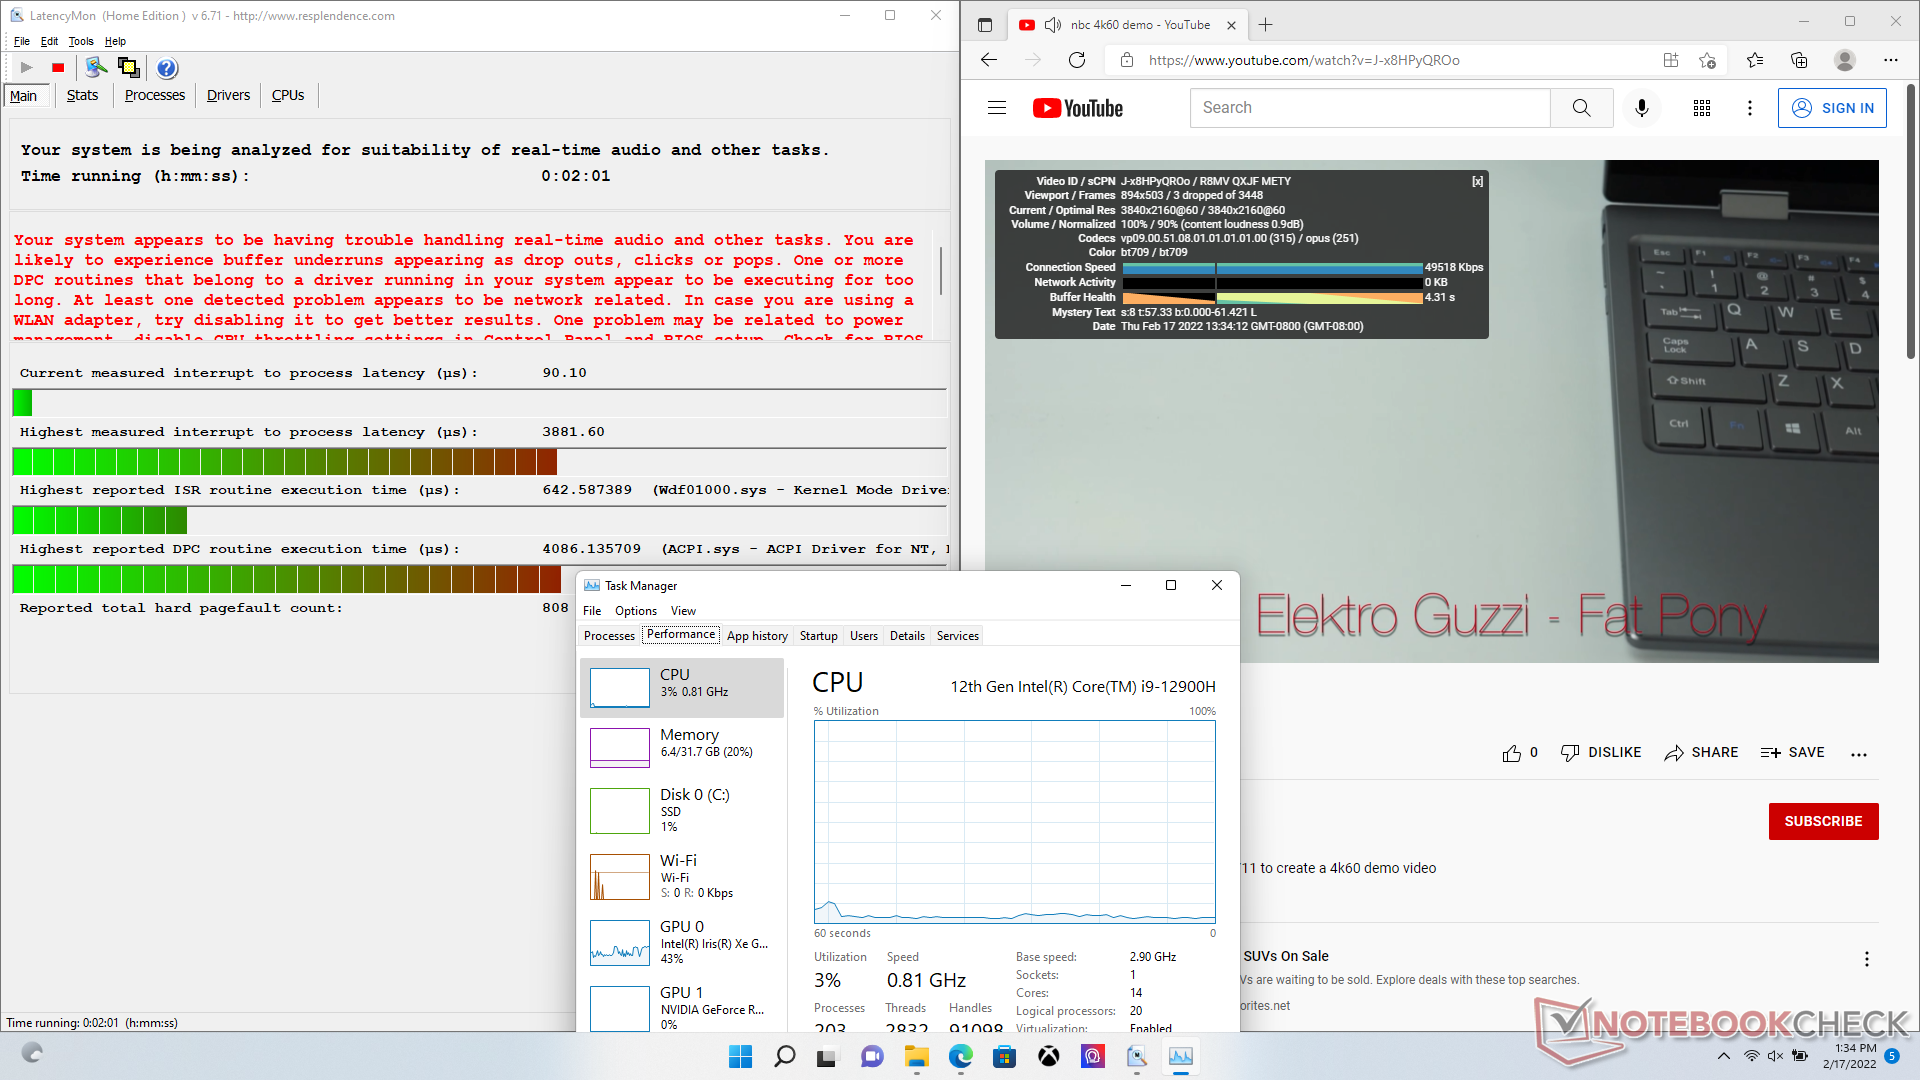
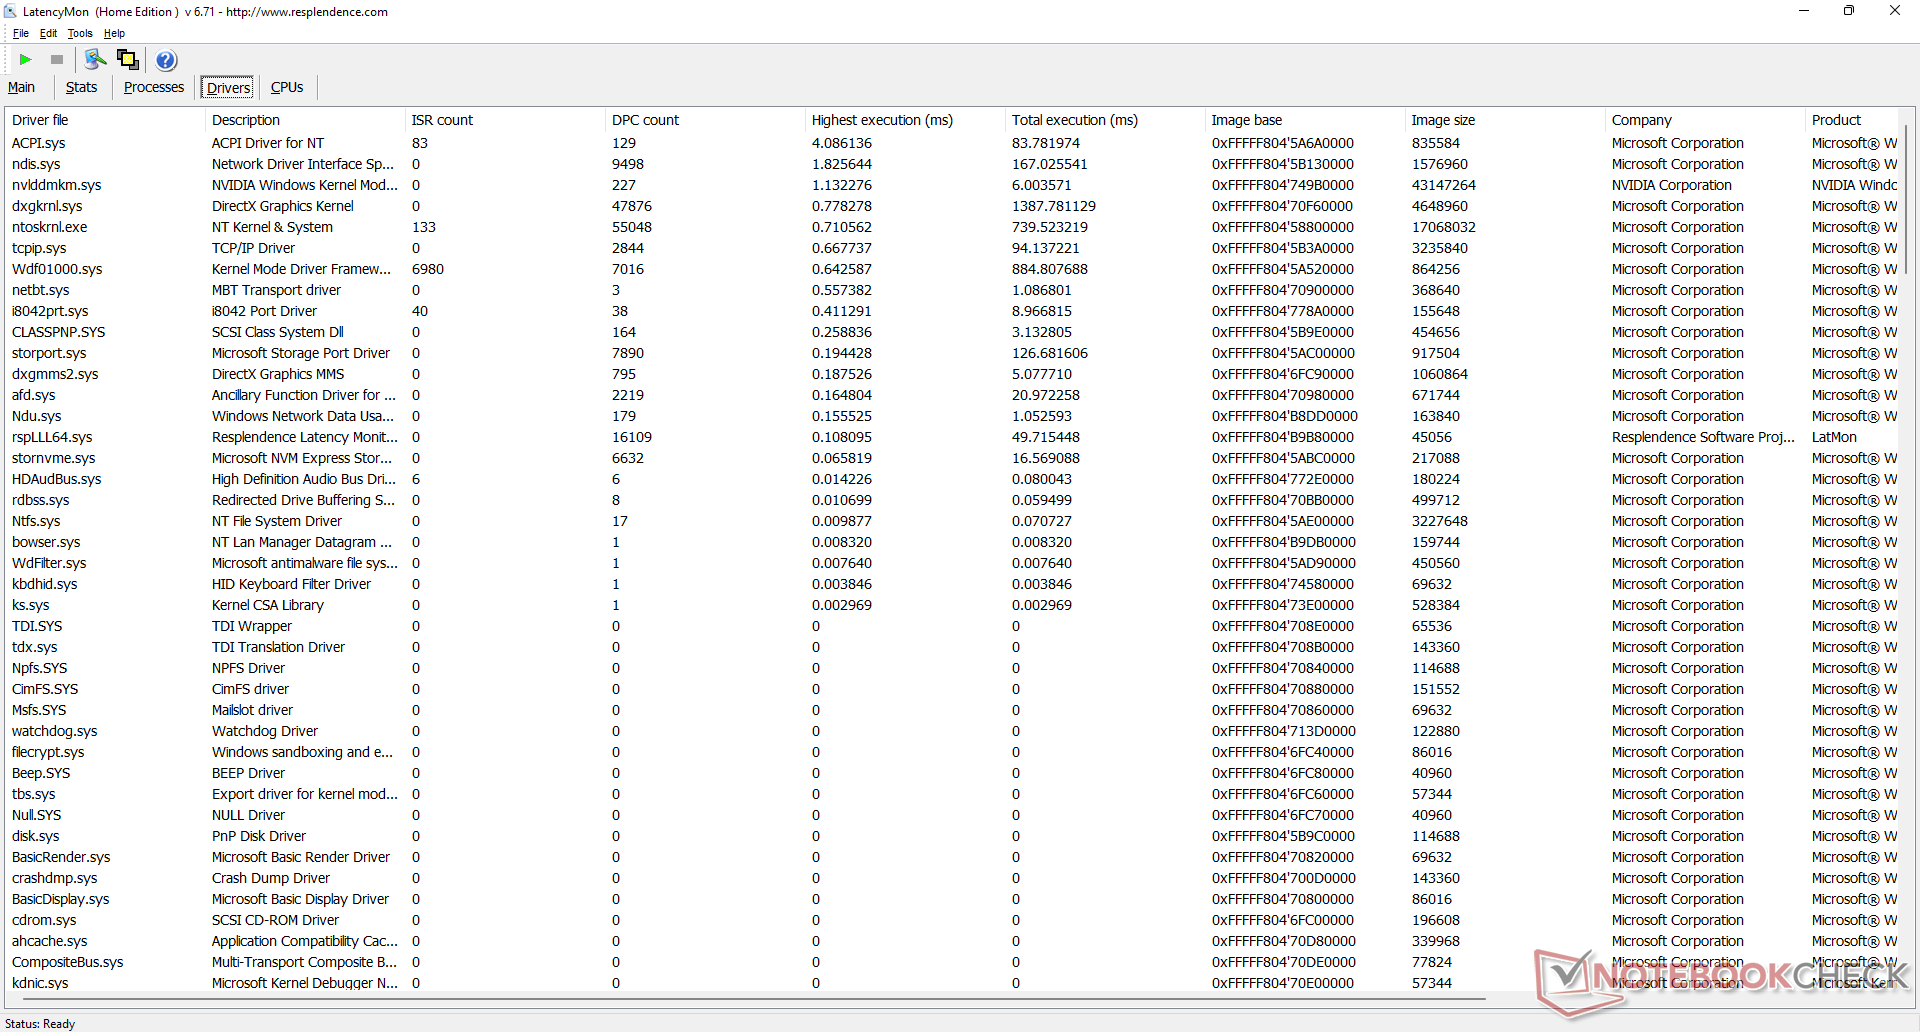
DPC延时
LatencyMon显示了在我们的主页上打开多个浏览器标签时的DPC问题。在我们长达1分钟的视频测试中,4K视频在60FPS下的播放很流畅,只有3个丢帧。
| DPC Latencies / LatencyMon - interrupt to process latency (max), Web, Youtube, Prime95 | |
| MSI Vector GP66 12UGS | |
| Asus TUF Gaming F15 FX506HM | |
| MSI Katana GF66 11UG-220 | |
| MSI GP66 Leopard 11UH-028 | |
| Razer Blade 15 Base Edition 2021, i7-10750H RTX 3060 | |
| Alienware m15 R5 Ryzen Edition | |
* ... smaller is better
存储设备
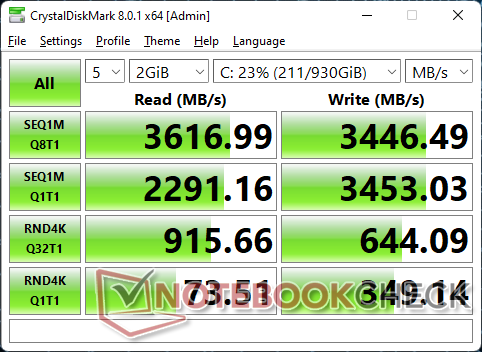
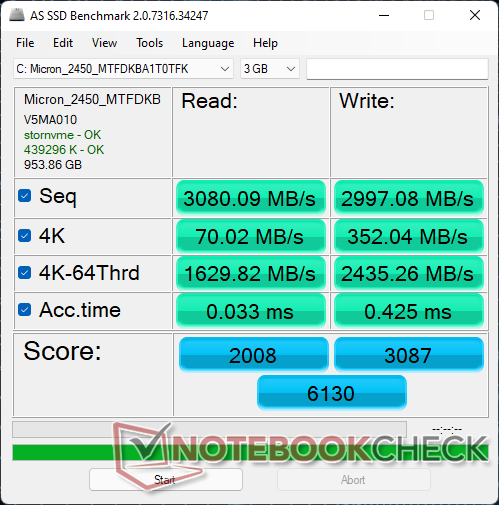
我们的测试装置配备了预算 1TB美光2450 MTFDKBA1T0TFKPCIe4 x4 NVMe固态硬盘。与许多其他PCIe4 x4固态硬盘可以达到7000MB/s以北的传输率不同,1TB美光2450只承诺最高3500MB/s的读取和3000MB/s的写入,而与大多数PCIe3 x4固态硬盘相媲美。当然,如果需要的话,用户仍然可以换掉或安装更快的PCIe4 x4驱动器,就像我们的GP66 Leopard所包含的那样。更高端的微星型号,如GT或GS系列,更有可能配备三星更快的PCIe4驱动器。
我们的样品中的驱动器不会表现出任何问题,可以长时间保持3500MB/s的最大读取率。

* ... smaller is better
Disk Throttling: DiskSpd Read Loop, Queue Depth 8
GPU性能
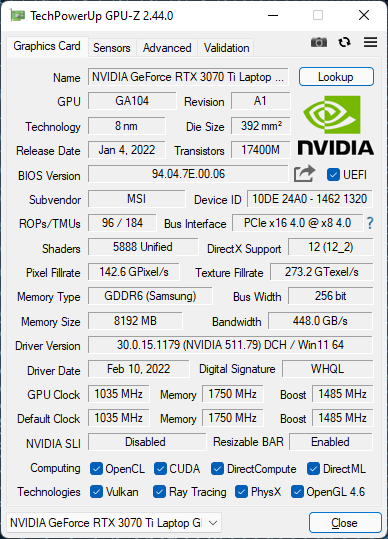
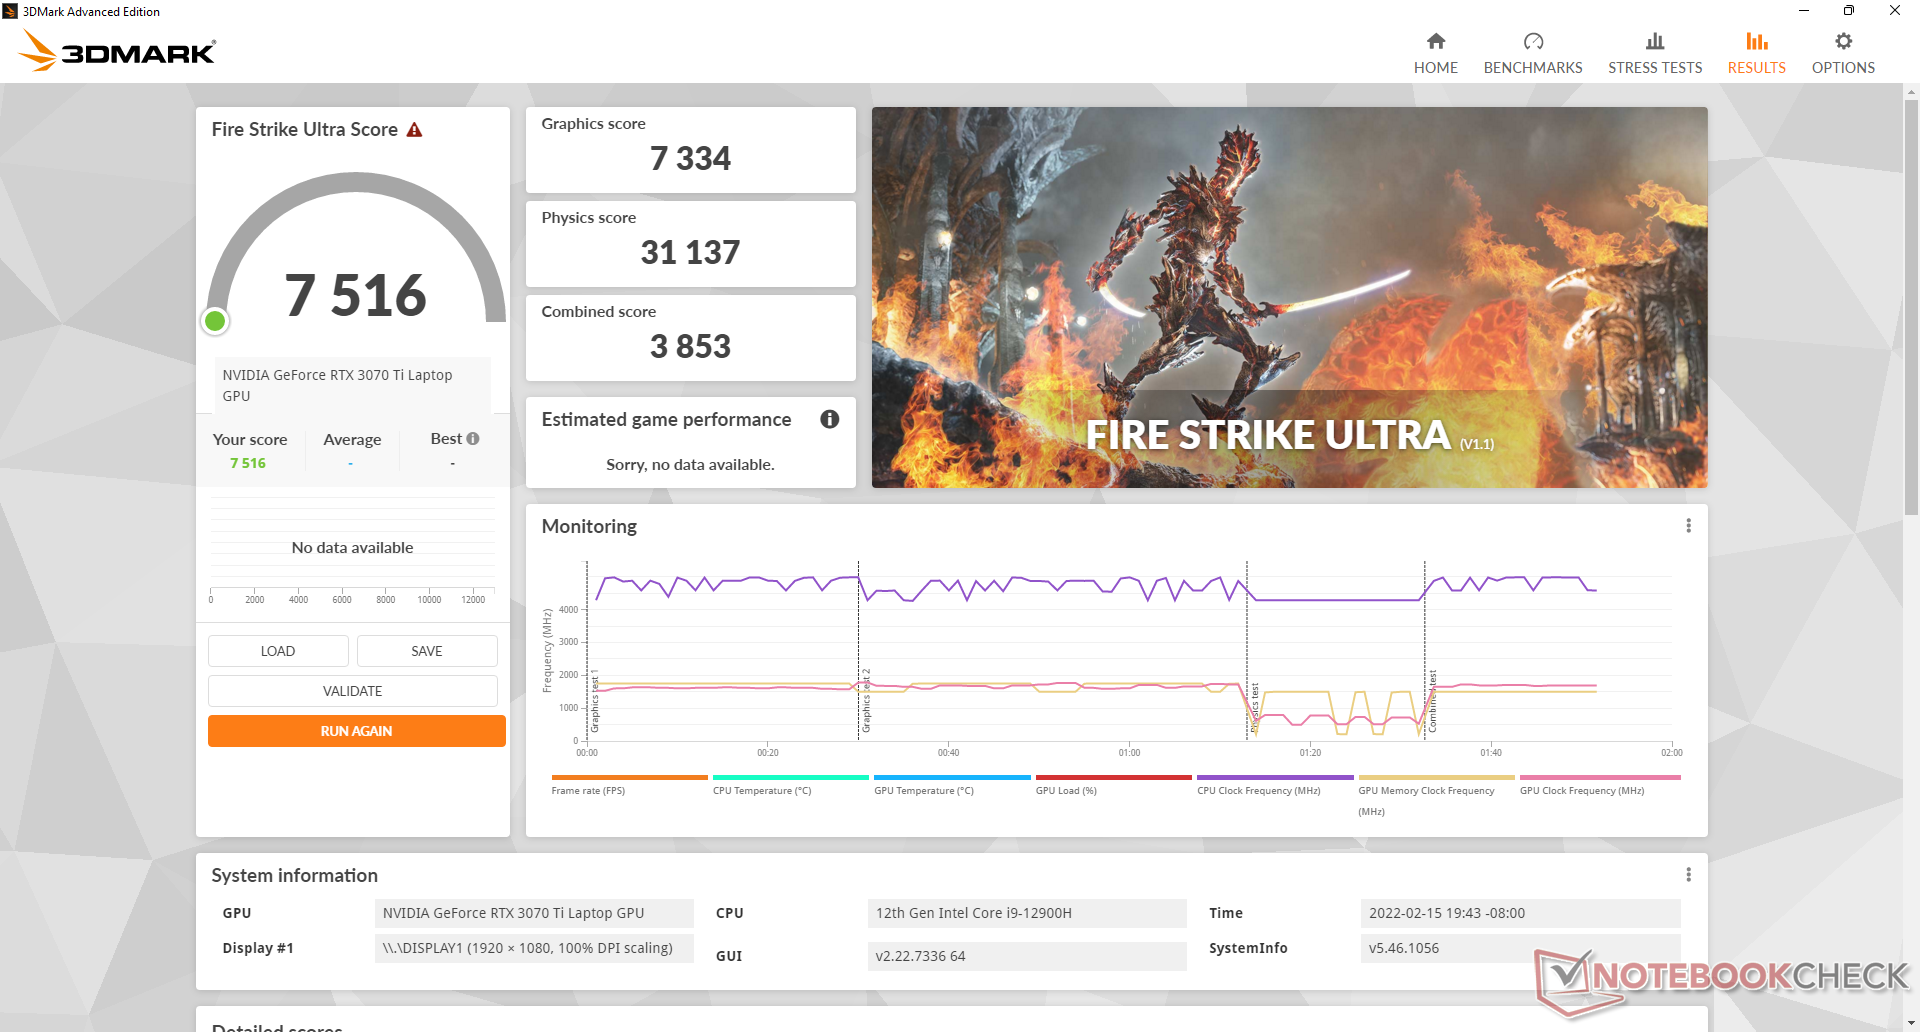
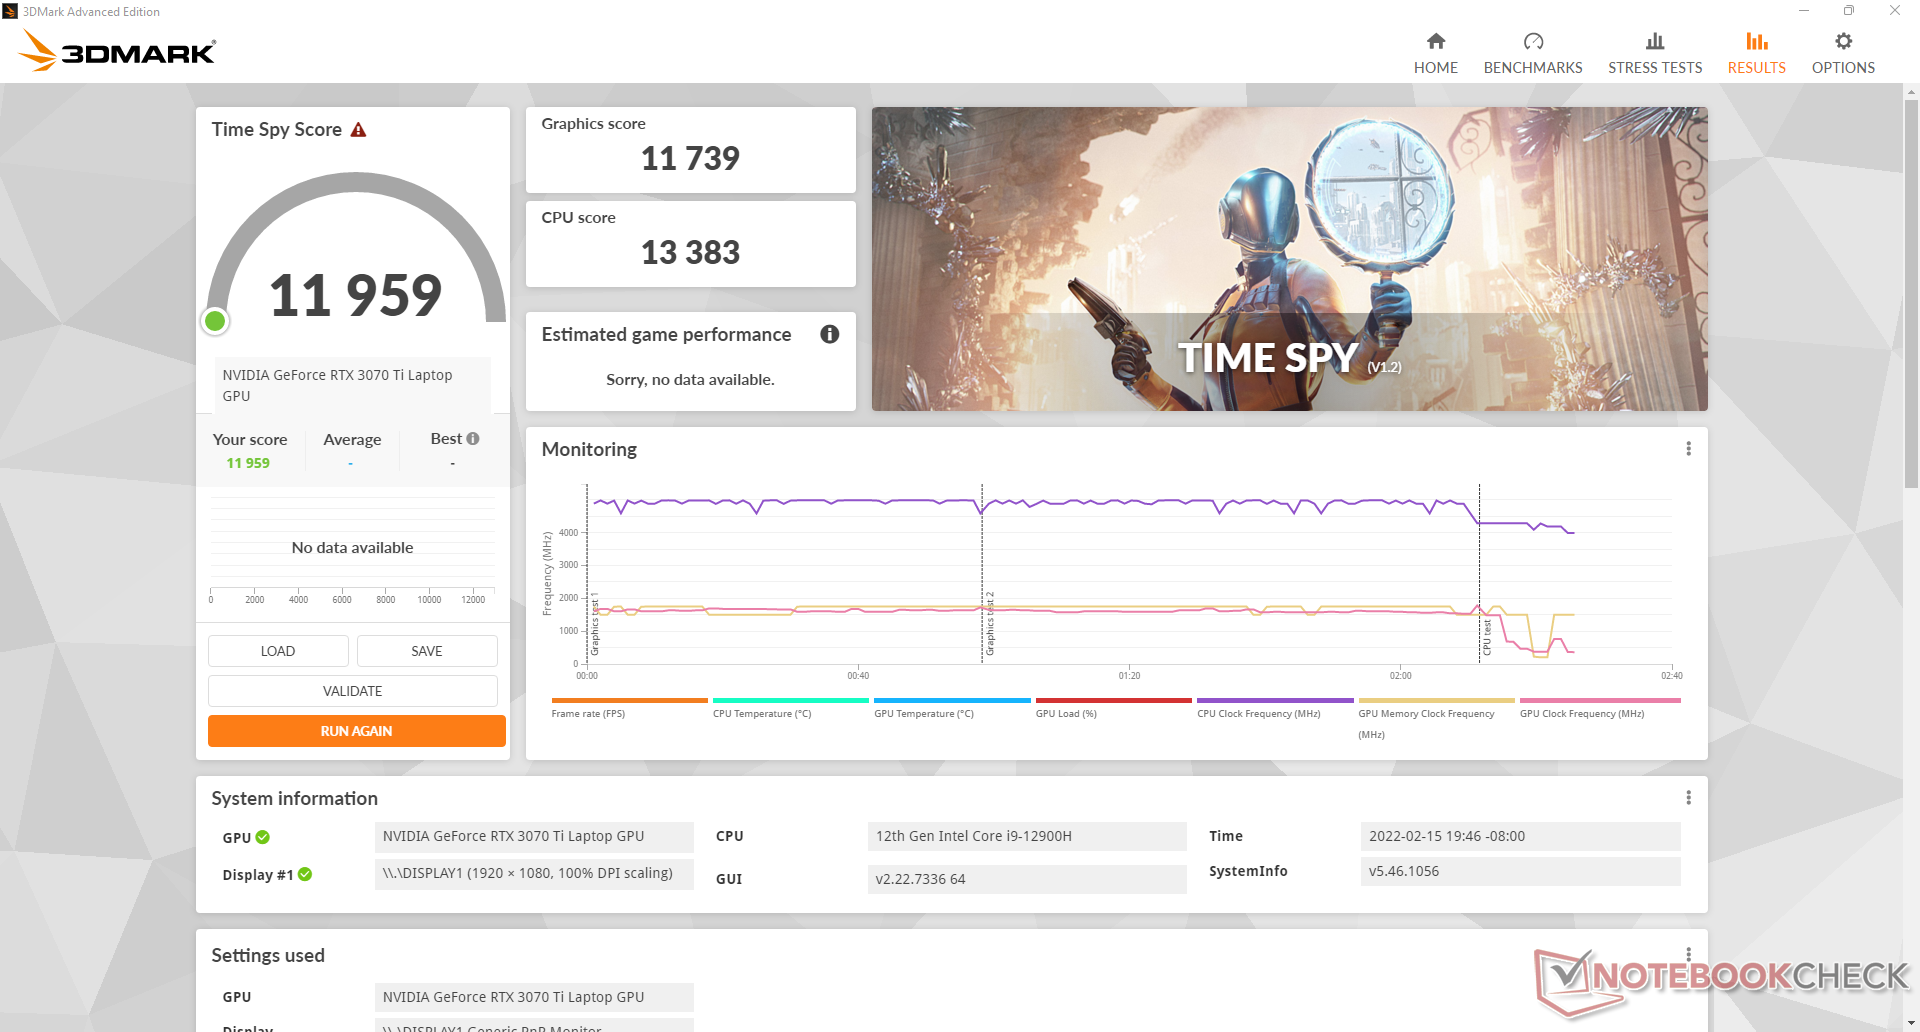
图形性能只比移动的RTX 3080 Ti慢5%到10%。 移动GeForce RTX 3080 Ti或约15%至20%的速度比 移动GeForce RTX 3070上发现的那样 威刚XPG Xenia 15.这些结果使我们的移动GeForce RTX 3070 Ti在5%至15%的 桌面GeForce RTX 3070.
在MSHybrid模式下运行,而不是在dGPU模式下运行,不会造成性能上的损失。Time Spy MSHybrid模式下的图形得分与dGPU模式下的得分基本相同(11880分vs.11739分)。
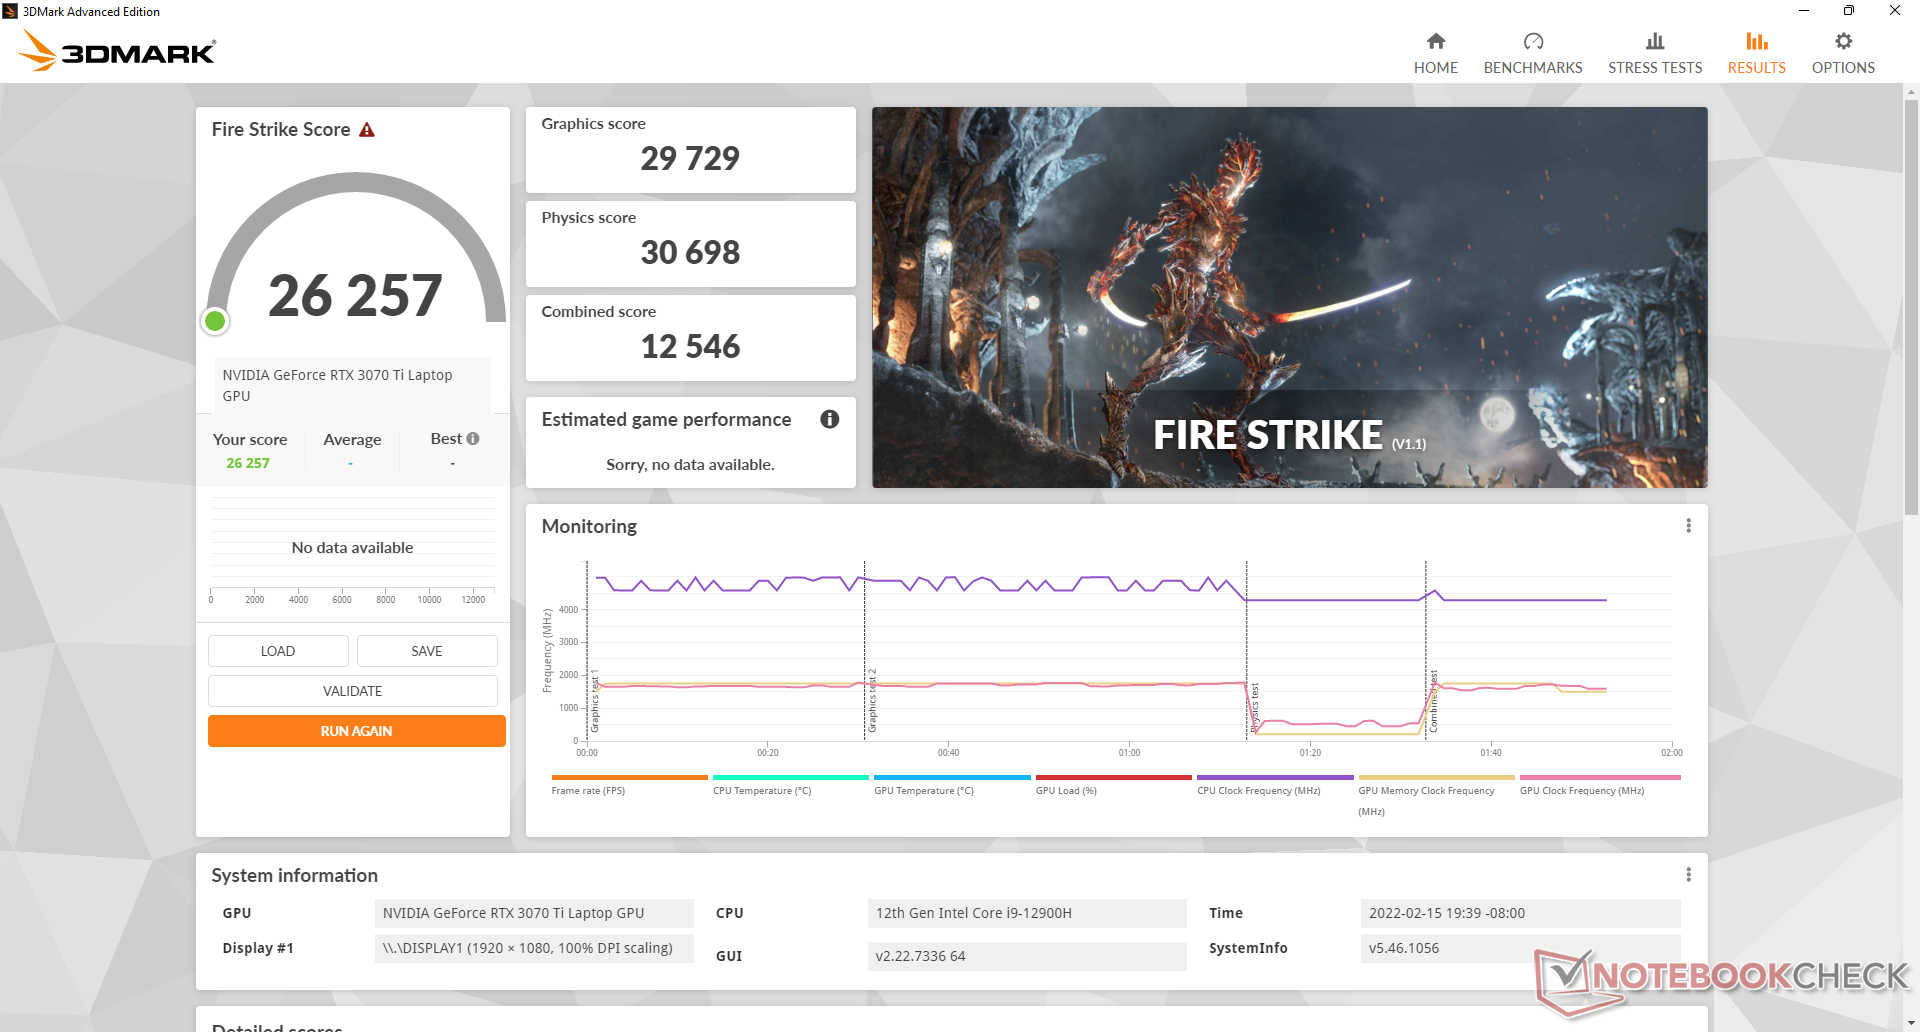
平衡模式下的图形性能只降低了4%到5%,其代价是更安静的风扇噪音和更温暖的处理器和表面。我们的Fire Strike 图形得分将从平衡模式运行时的29729分降至28508分。
请注意,3DMark的分数比微星GS66的分数快20%。 微星GS66配备相同的GeForce RTX 3070 Ti,由于我们的GP66的TGP目标较高(150 W对105 W),3DMark得分比微星GS66快了20%。
| 3DMark 11 - 1280x720 Performance GPU | |
| NVIDIA GeForce RTX 3080 Ti Founders Edition | |
| MSI GeForce RTX 3080 Gaming X Trio | |
| Schenker XMG Neo 15 E22 (Early 2022, RTX 3080 Ti) | |
| Asus ROG Strix G15 G513QY | |
| MSI Vector GP66 12UGS | |
| MSI GeForce RTX 3070 Gaming X Trio | |
| Average NVIDIA GeForce RTX 3070 Ti Laptop GPU (13799 - 42569, n=36) | |
| ADATA XPG Xenia 15 | |
| MSI Stealth GS66 12UGS | |
| Asus ROG Strix G15 G512LW | |
| Alienware m15 R5 Ryzen Edition | |
| MSI GS66 Stealth 10SE-045 | |
| Dell G15 5515 | |
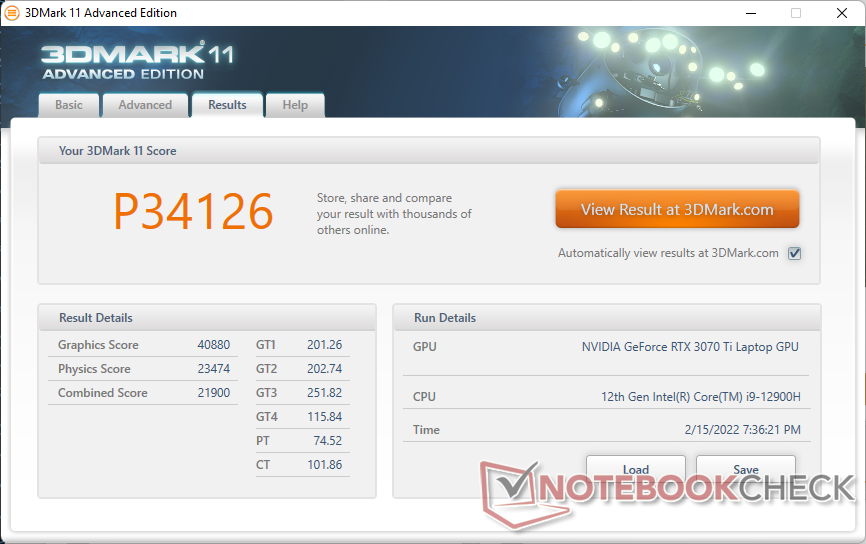
| 3DMark 11 Performance | 34126 points | |
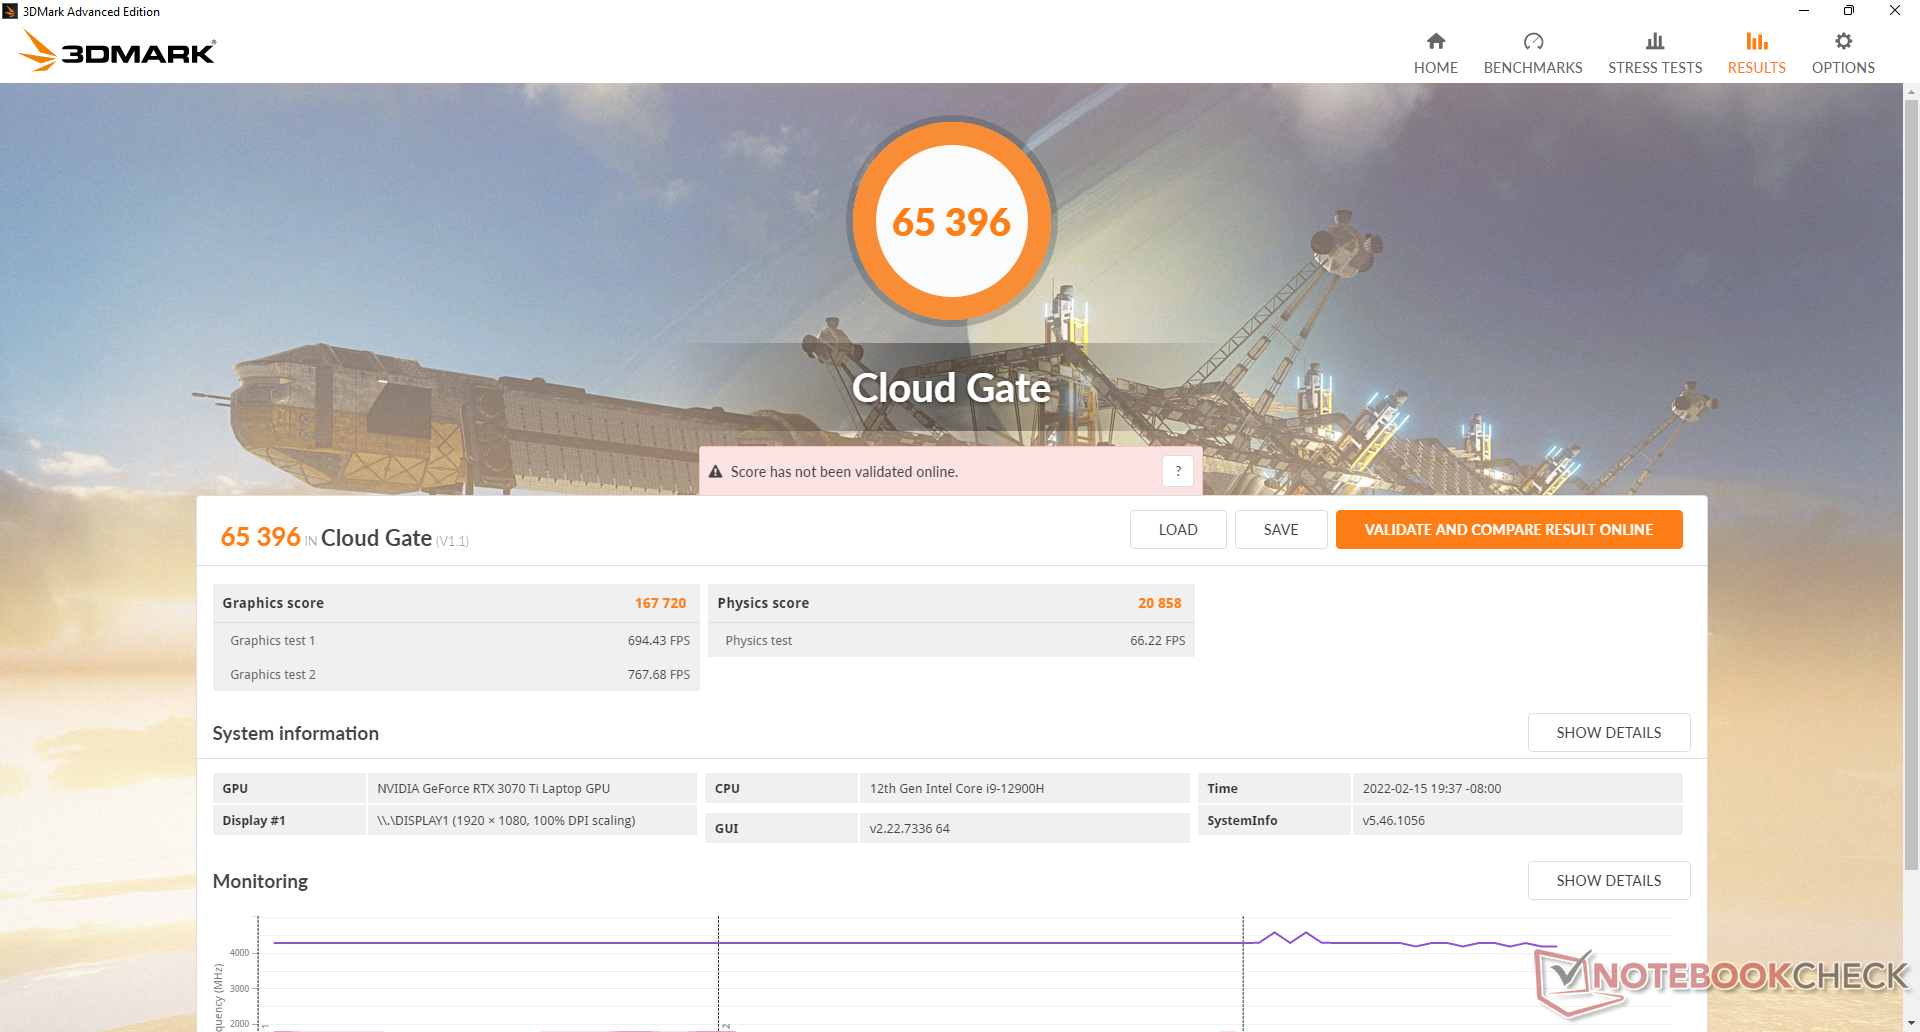
| 3DMark Cloud Gate Standard Score | 65396 points | |
| 3DMark Fire Strike Score | 26257 points | |
| 3DMark Time Spy Score | 11959 points | |
Help | ||
Witcher 3 FPS Chart
| low | med. | high | ultra | |
|---|---|---|---|---|
| GTA V (2015) | 185 | 184 | 179 | 123 |
| The Witcher 3 (2015) | 492.3 | 360 | 223.9 | 114.6 |
| Dota 2 Reborn (2015) | 185 | 169 | 164 | 155 |
| Final Fantasy XV Benchmark (2018) | 207 | 152 | 115 | |
| X-Plane 11.11 (2018) | 161 | 143 | 112 | |
| Far Cry 5 (2018) | 180 | 152 | 145 | 136 |
| Strange Brigade (2018) | 471 | 298 | 244 | 213 |
排放
系统噪音
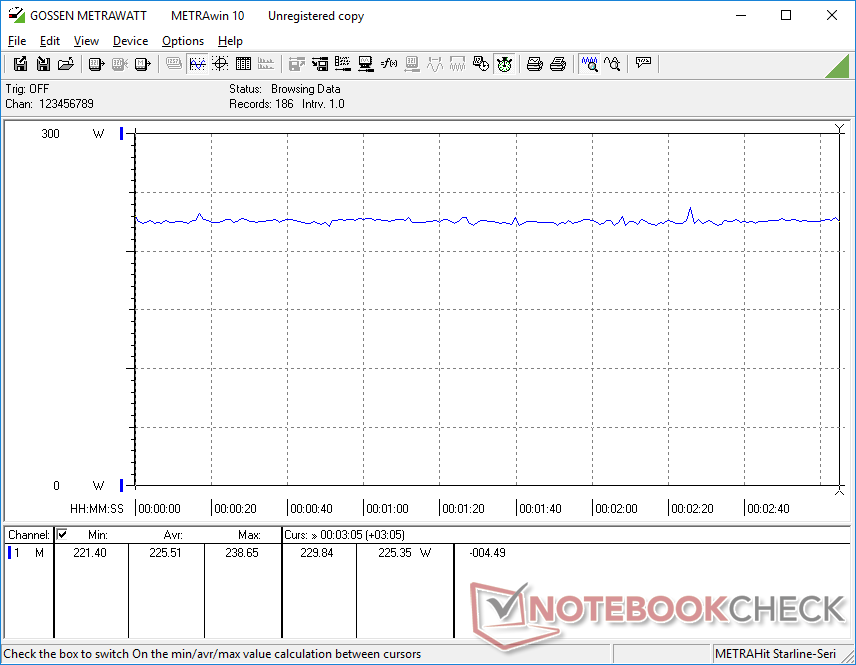
风扇噪音在很大程度上取决于四个微星中心电源配置文件。超级电池、静音、平衡和极限性能。即使设置为静音模式,在24.7分贝(A)的静音背景下,总会有一些风扇噪音,但这个水平足够低,在日常使用中很难注意到。如果只是简单的网络浏览或视频流,我们推荐这种模式,因为与其他两种快速模式相比,风扇的脉冲频率要低得多。
在平衡模式下的游戏将导致风扇噪音略低于40分贝(A),而在极限性能模式下则为58分贝(A)。在平衡模式下,GPU的性能会慢一点,但节省的噪音却很明显。50分贝(A)以上的范围通常比我们测试过的大多数其他游戏笔记本电脑的噪音要大。
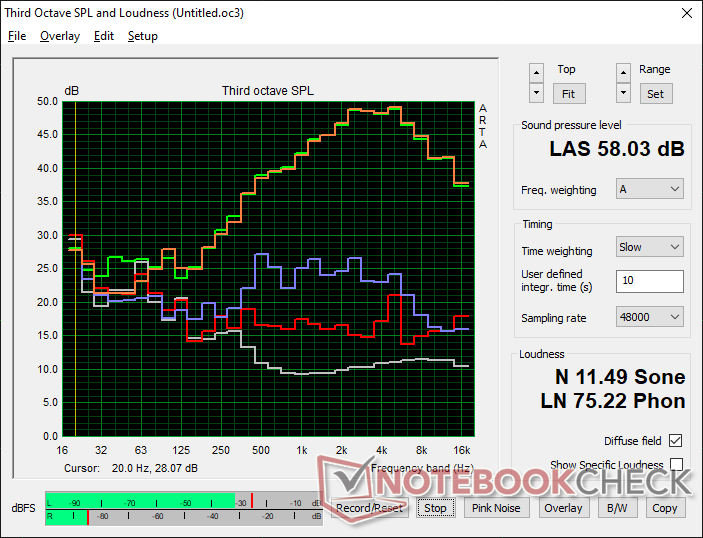
Noise level
| Idle |
| 23.4 / 23.4 / 27.4 dB(A) |
| Load |
| 36 / 58 dB(A) |
 | ||
30 dB silent 40 dB(A) audible 50 dB(A) loud |
||
min: | ||
| MSI Vector GP66 12UGS GeForce RTX 3070 Ti Laptop GPU, i9-12900H | MSI GP66 Leopard 11UH-028 GeForce RTX 3080 Laptop GPU, i7-11800H, Samsung PM9A1 MZVL21T0HCLR | MSI Katana GF66 11UG-220 GeForce RTX 3070 Laptop GPU, i7-11800H, Kingston OM8PDP3512B-AI1 | Asus TUF Gaming F15 FX506HM GeForce RTX 3060 Laptop GPU, i7-11800H, SK Hynix HFM001TD3JX013N | Razer Blade 15 Base Edition 2021, i7-10750H RTX 3060 GeForce RTX 3060 Laptop GPU, i7-10750H, Samsung SSD PM981a MZVLB512HBJQ | Alienware m15 R5 Ryzen Edition GeForce RTX 3060 Laptop GPU, R7 5800H, Toshiba KBG40ZNS512G NVMe | |
|---|---|---|---|---|---|---|
| Noise | 1% | -19% | 7% | -0% | -5% | |
| off / environment * (dB) | 22.9 | 23 -0% | 25 -9% | 24.8 -8% | 25.3 -10% | 24 -5% |
| Idle Minimum * (dB) | 23.4 | 23 2% | 34 -45% | 24.6 -5% | 25.4 -9% | 24 -3% |
| Idle Average * (dB) | 23.4 | 23 2% | 35 -50% | 24.9 -6% | 25.4 -9% | 25 -7% |
| Idle Maximum * (dB) | 27.4 | 30.11 -10% | 36 -31% | 24.9 9% | 25.4 7% | 35 -28% |
| Load Average * (dB) | 36 | 41.86 -16% | 48 -33% | 27.1 25% | 42.5 -18% | 44 -22% |
| Witcher 3 ultra * (dB) | 58.2 | 47.79 18% | 46 21% | 46.4 20% | 42 28% | 48 18% |
| Load Maximum * (dB) | 58 | 53 9% | 49 16% | 49 16% | 52.2 10% | 50 14% |
* ... smaller is better
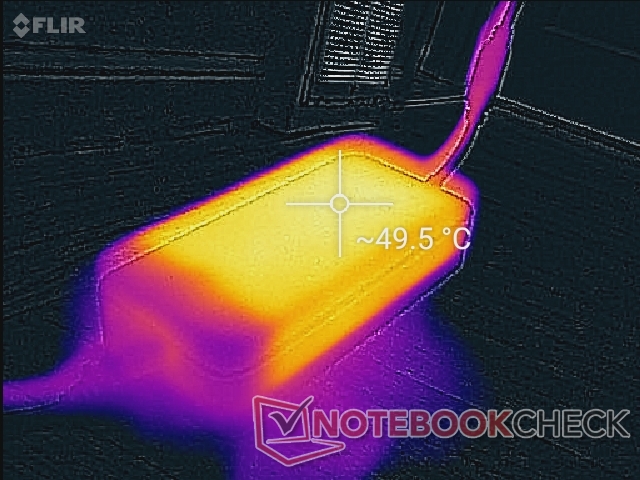
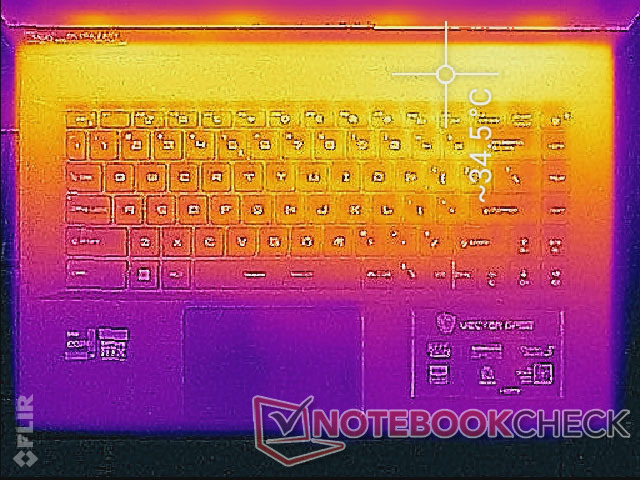
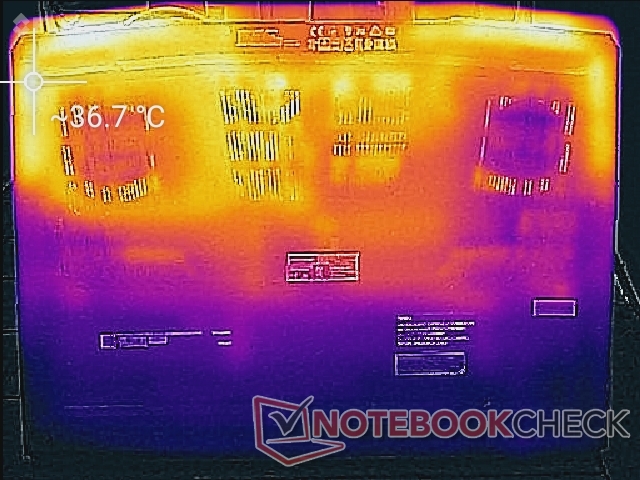
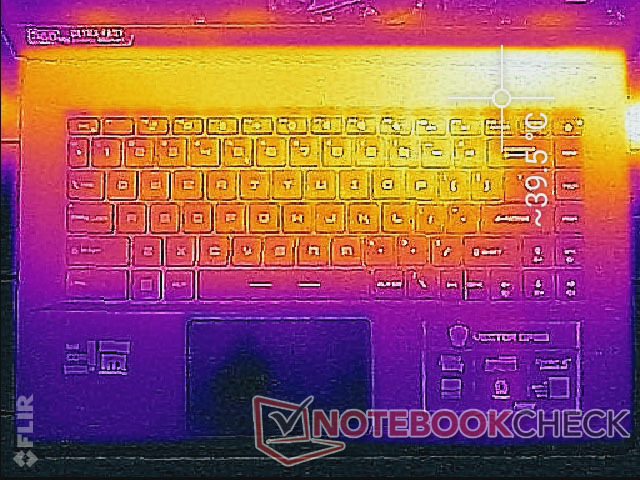
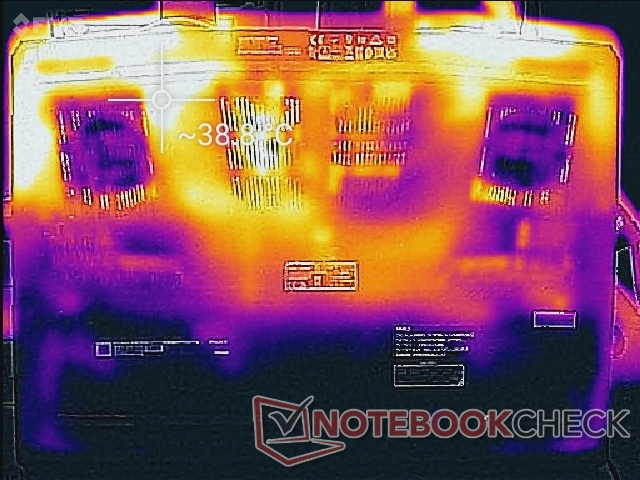
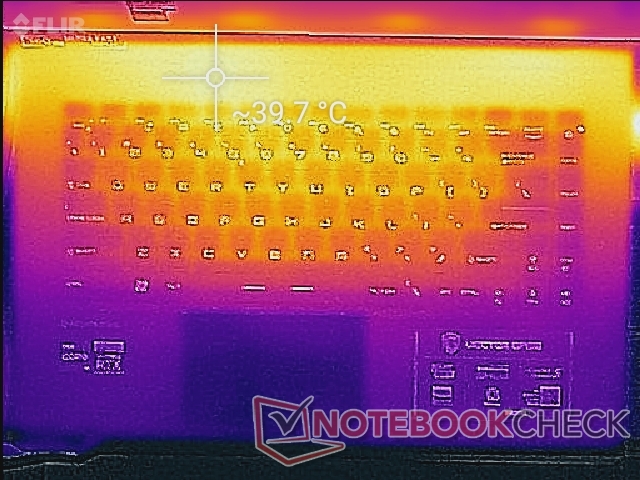
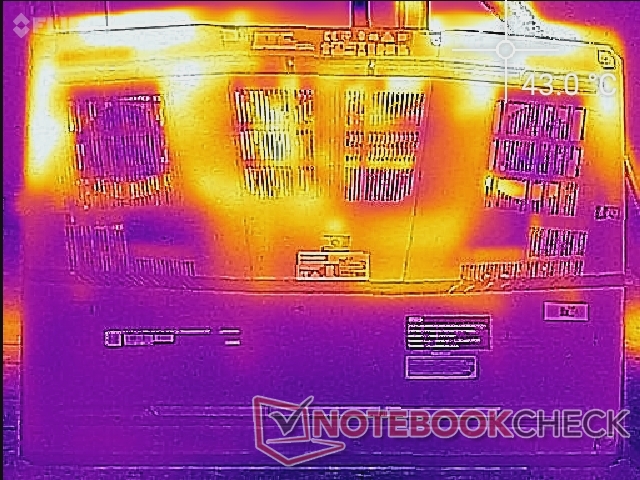
温度
表面温度在很大程度上取决于微星中心的电源配置文件设置。在平衡模式下,热点温度可以达到49摄氏度,而在极限性能设置下只有42摄氏度,因为更高的风扇转速上限是与极限性能模式联系在一起的。
热点主要集中在机箱的后部,正如我们下面的温度图所示。键盘按键和掌托可能会发热,但不会造成困扰或不舒服。更薄的 GS66或 Razer Blade 15相比之下,掌托和键盘的温度平均要高几度以上。
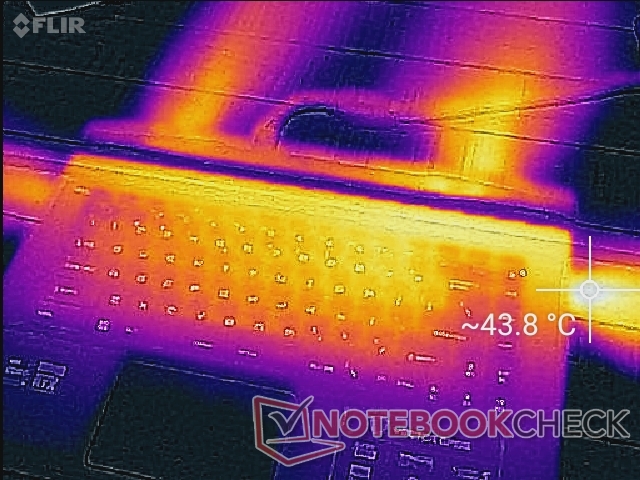
(±) The maximum temperature on the upper side is 40.2 °C / 104 F, compared to the average of 40.4 °C / 105 F, ranging from 21.2 to 68.8 °C for the class Gaming.
(±) The bottom heats up to a maximum of 43.8 °C / 111 F, compared to the average of 43.2 °C / 110 F
(+) In idle usage, the average temperature for the upper side is 29.6 °C / 85 F, compared to the device average of 33.9 °C / 93 F.
(+) Playing The Witcher 3, the average temperature for the upper side is 30.7 °C / 87 F, compared to the device average of 33.9 °C / 93 F.
(+) The palmrests and touchpad are cooler than skin temperature with a maximum of 24.8 °C / 76.6 F and are therefore cool to the touch.
(+) The average temperature of the palmrest area of similar devices was 28.8 °C / 83.8 F (+4 °C / 7.2 F).
| MSI Vector GP66 12UGS Intel Core i9-12900H, NVIDIA GeForce RTX 3070 Ti Laptop GPU | MSI GP66 Leopard 11UH-028 Intel Core i7-11800H, NVIDIA GeForce RTX 3080 Laptop GPU | MSI Katana GF66 11UG-220 Intel Core i7-11800H, NVIDIA GeForce RTX 3070 Laptop GPU | Asus TUF Gaming F15 FX506HM Intel Core i7-11800H, NVIDIA GeForce RTX 3060 Laptop GPU | Razer Blade 15 Base Edition 2021, i7-10750H RTX 3060 Intel Core i7-10750H, NVIDIA GeForce RTX 3060 Laptop GPU | Alienware m15 R5 Ryzen Edition AMD Ryzen 7 5800H, NVIDIA GeForce RTX 3060 Laptop GPU | |
|---|---|---|---|---|---|---|
| Heat | -2% | -8% | 8% | -6% | -21% | |
| Maximum Upper Side * (°C) | 40.2 | 49 -22% | 56 -39% | 46.4 -15% | 45.2 -12% | 62 -54% |
| Maximum Bottom * (°C) | 43.8 | 47 -7% | 49 -12% | 45.4 -4% | 48 -10% | 61 -39% |
| Idle Upper Side * (°C) | 34.8 | 31 11% | 36 -3% | 26 25% | 34.4 1% | 36 -3% |
| Idle Bottom * (°C) | 37 | 33 11% | 28 24% | 27.4 26% | 37.2 -1% | 33 11% |
* ... smaller is better
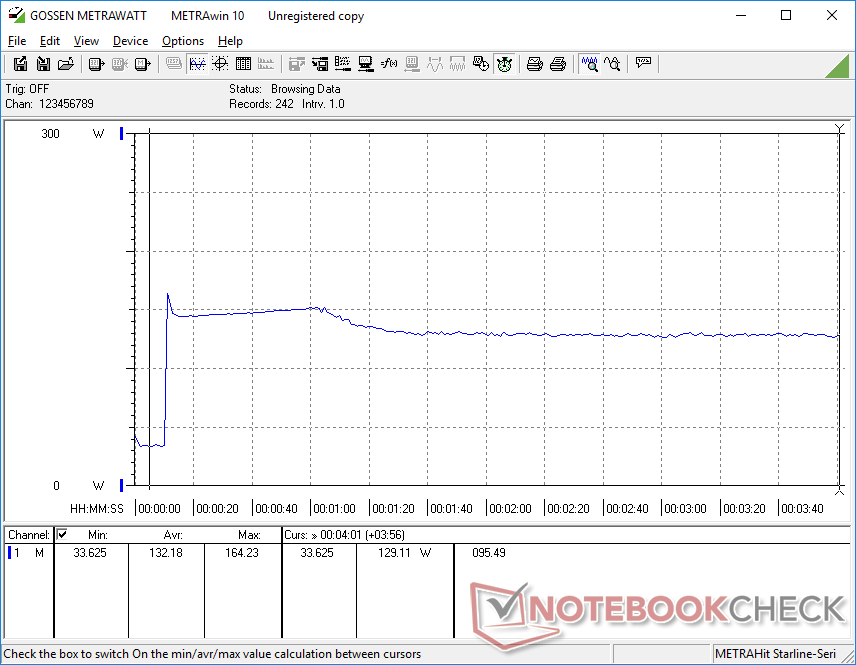
压力测试
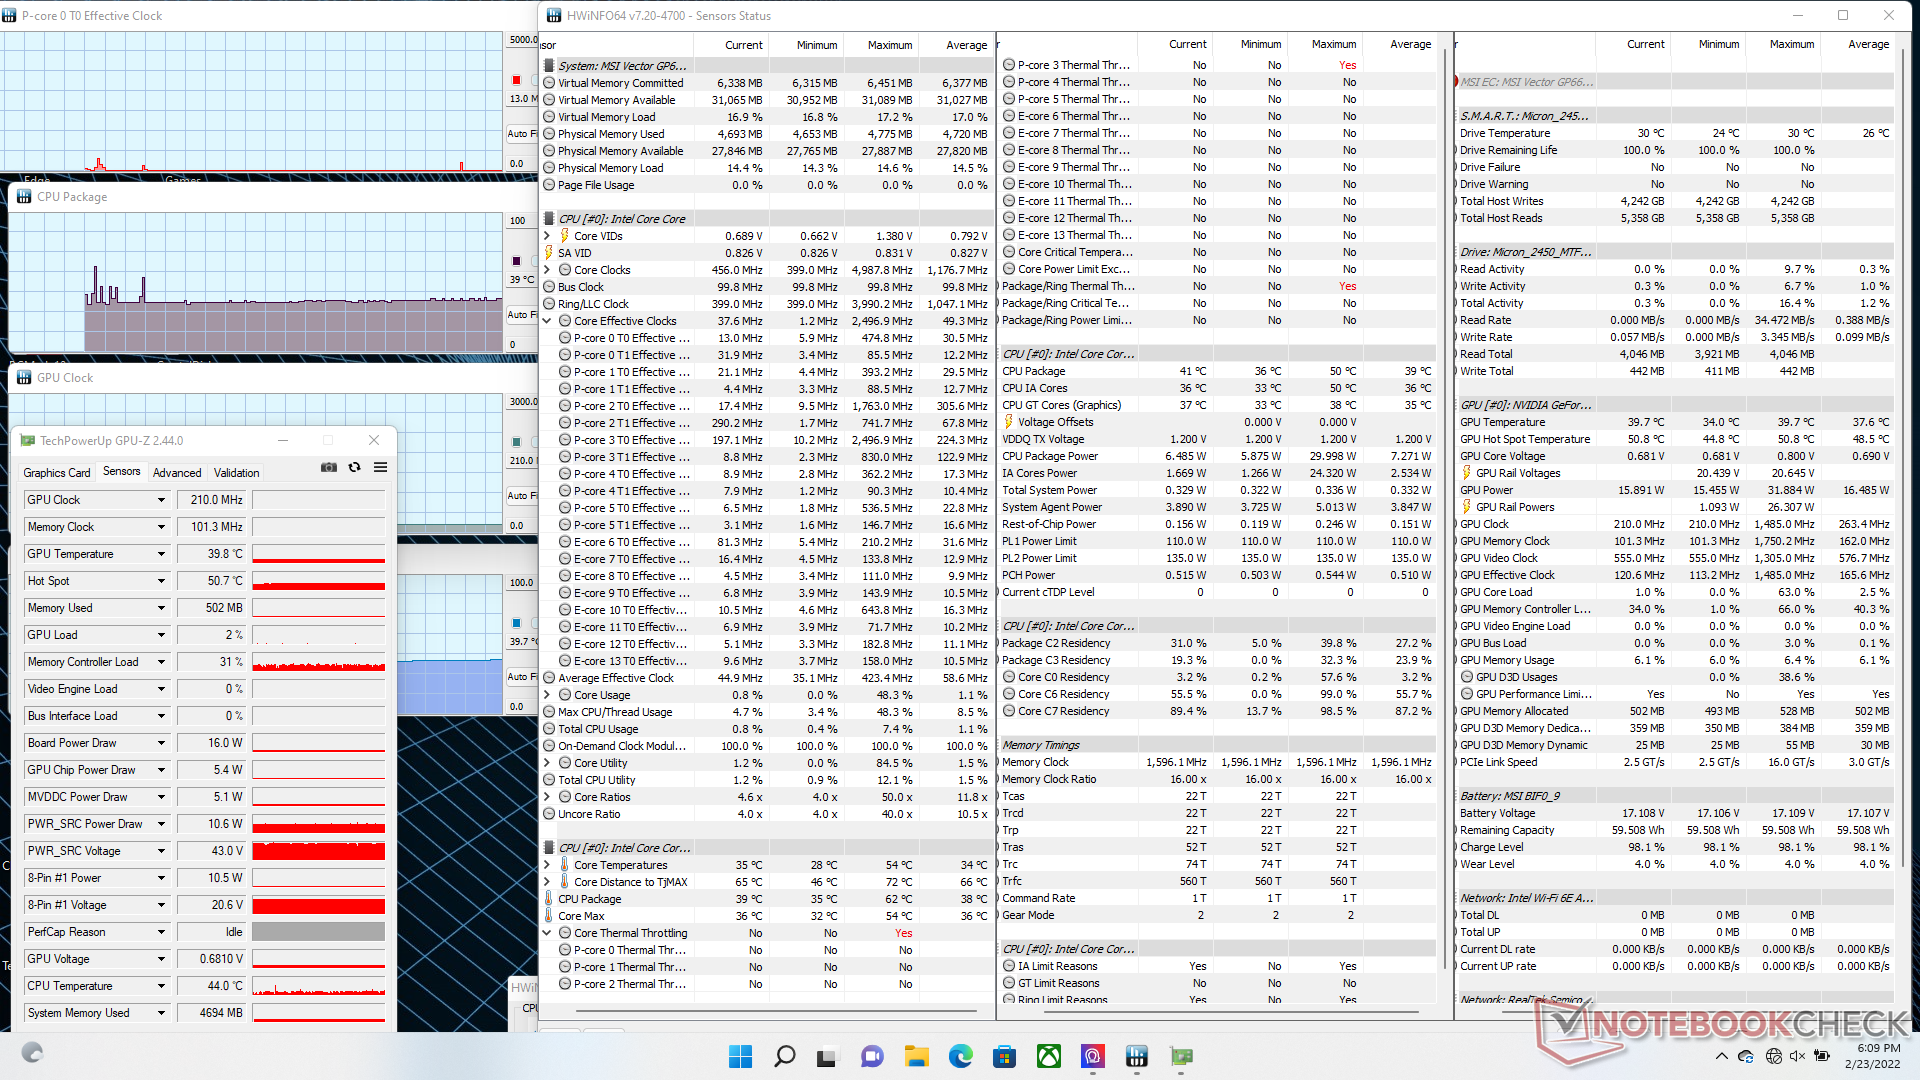
当用Prime95的极限性能配置文件进行测试时,CPU的时钟频率会在一两秒钟内提升到4.2GHz,然后迅速下降到3.7GHz。再过一分钟左右,时钟频率将进一步下降到只有3 GHz,以保持90 C的核心温度。CPU封装功率在启动Prime95时最初会飙升到100 W,然后下降并稳定在70 W。 联合利华科技GM7AG8P运行速度(3.2 GHz对3.0 GHz)和温度(80 C对90 C),而且稳定的TDP(75 W对70 W)高于我们在Vector GP66上的记录。
在极限性能配置下,CPU和GPU的温度将分别稳定在71℃和70℃。下降到平衡模式将导致更高的CPU和GPU温度,分别为85摄氏度和78摄氏度,而且GPU的时钟频率也稍慢(1650 MHz对1755 MHz)。尽管如此,时钟频率还是比我们在微星GS66(1155 MHz)上观察到的要快得多,后者配备了相同的GeForce RTX 3070 Ti GPU,尽管TGP较低(105 W vs 150 W)。
用电池供电运行将大大限制性能。在电池上进行的Fire Strike 测试,物理和图形分别为10913分和6061分,而在电源上则为30698分和29729分。
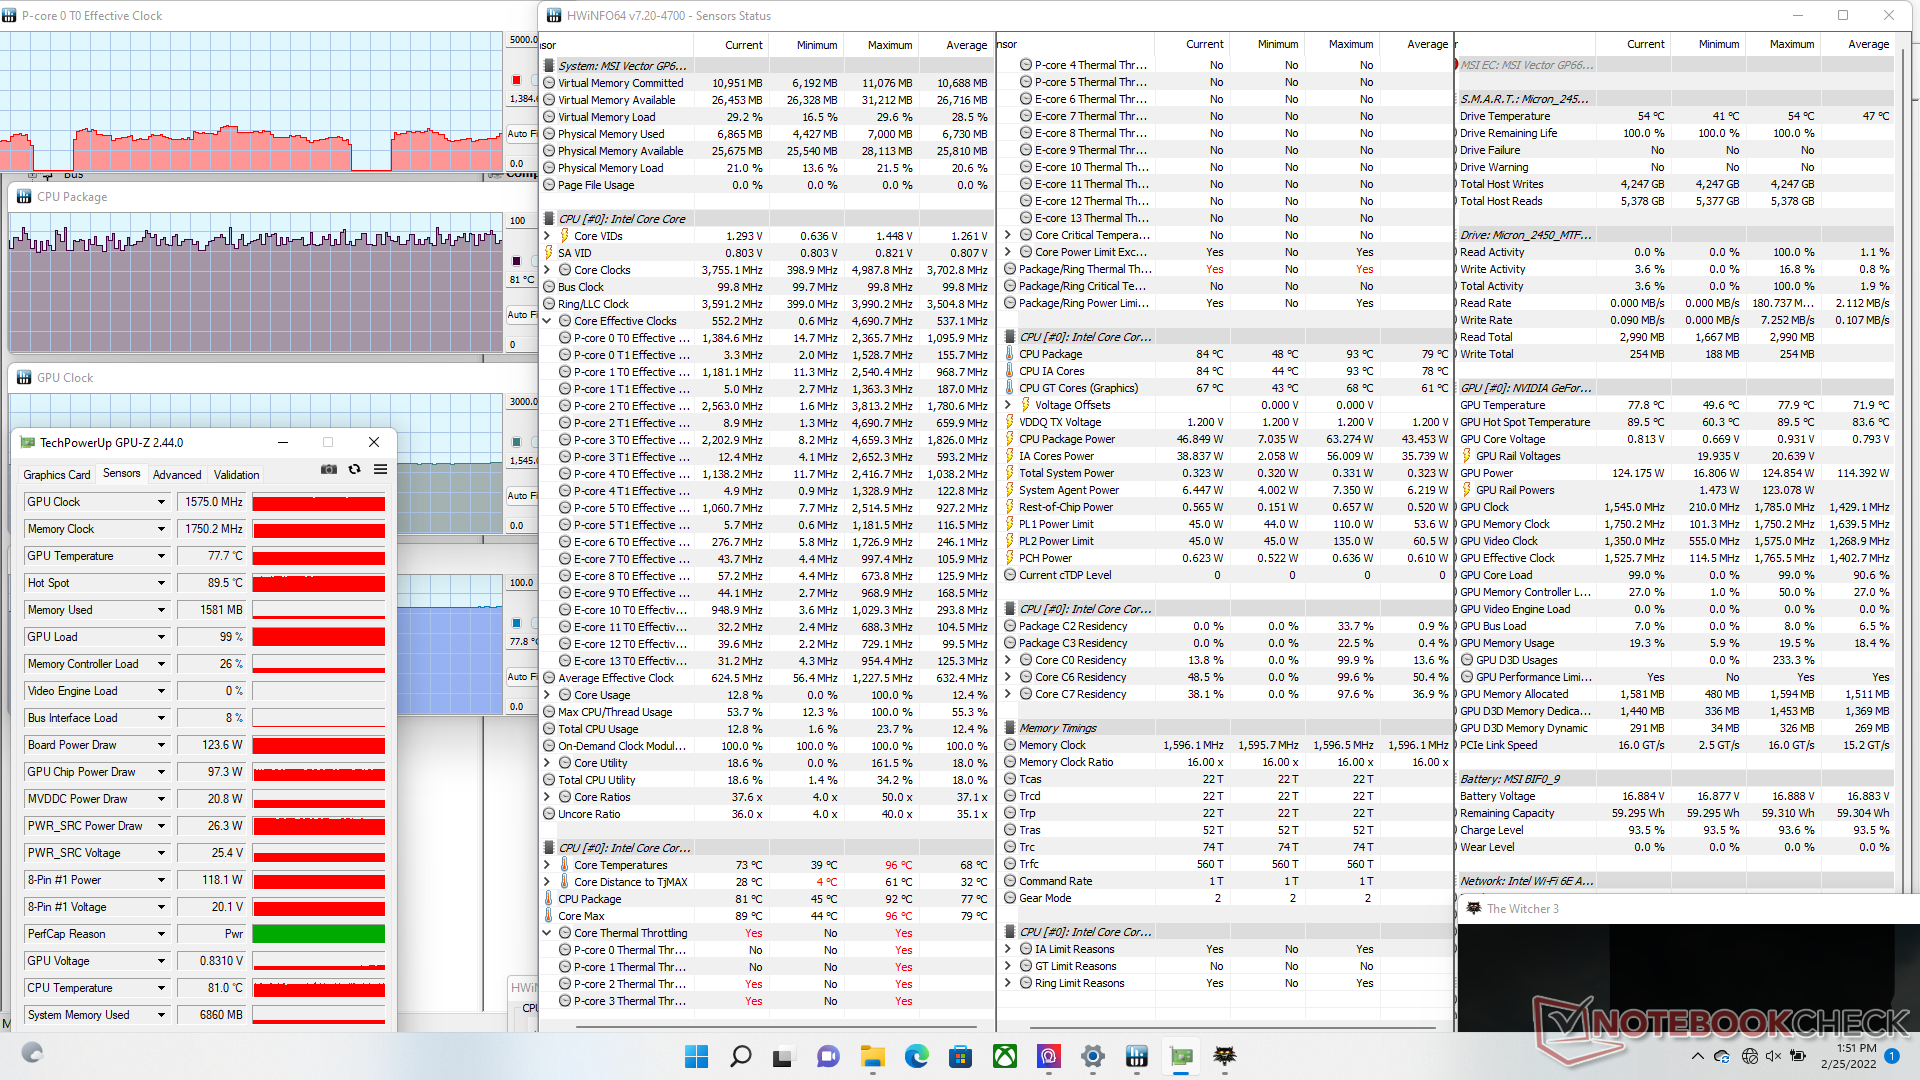
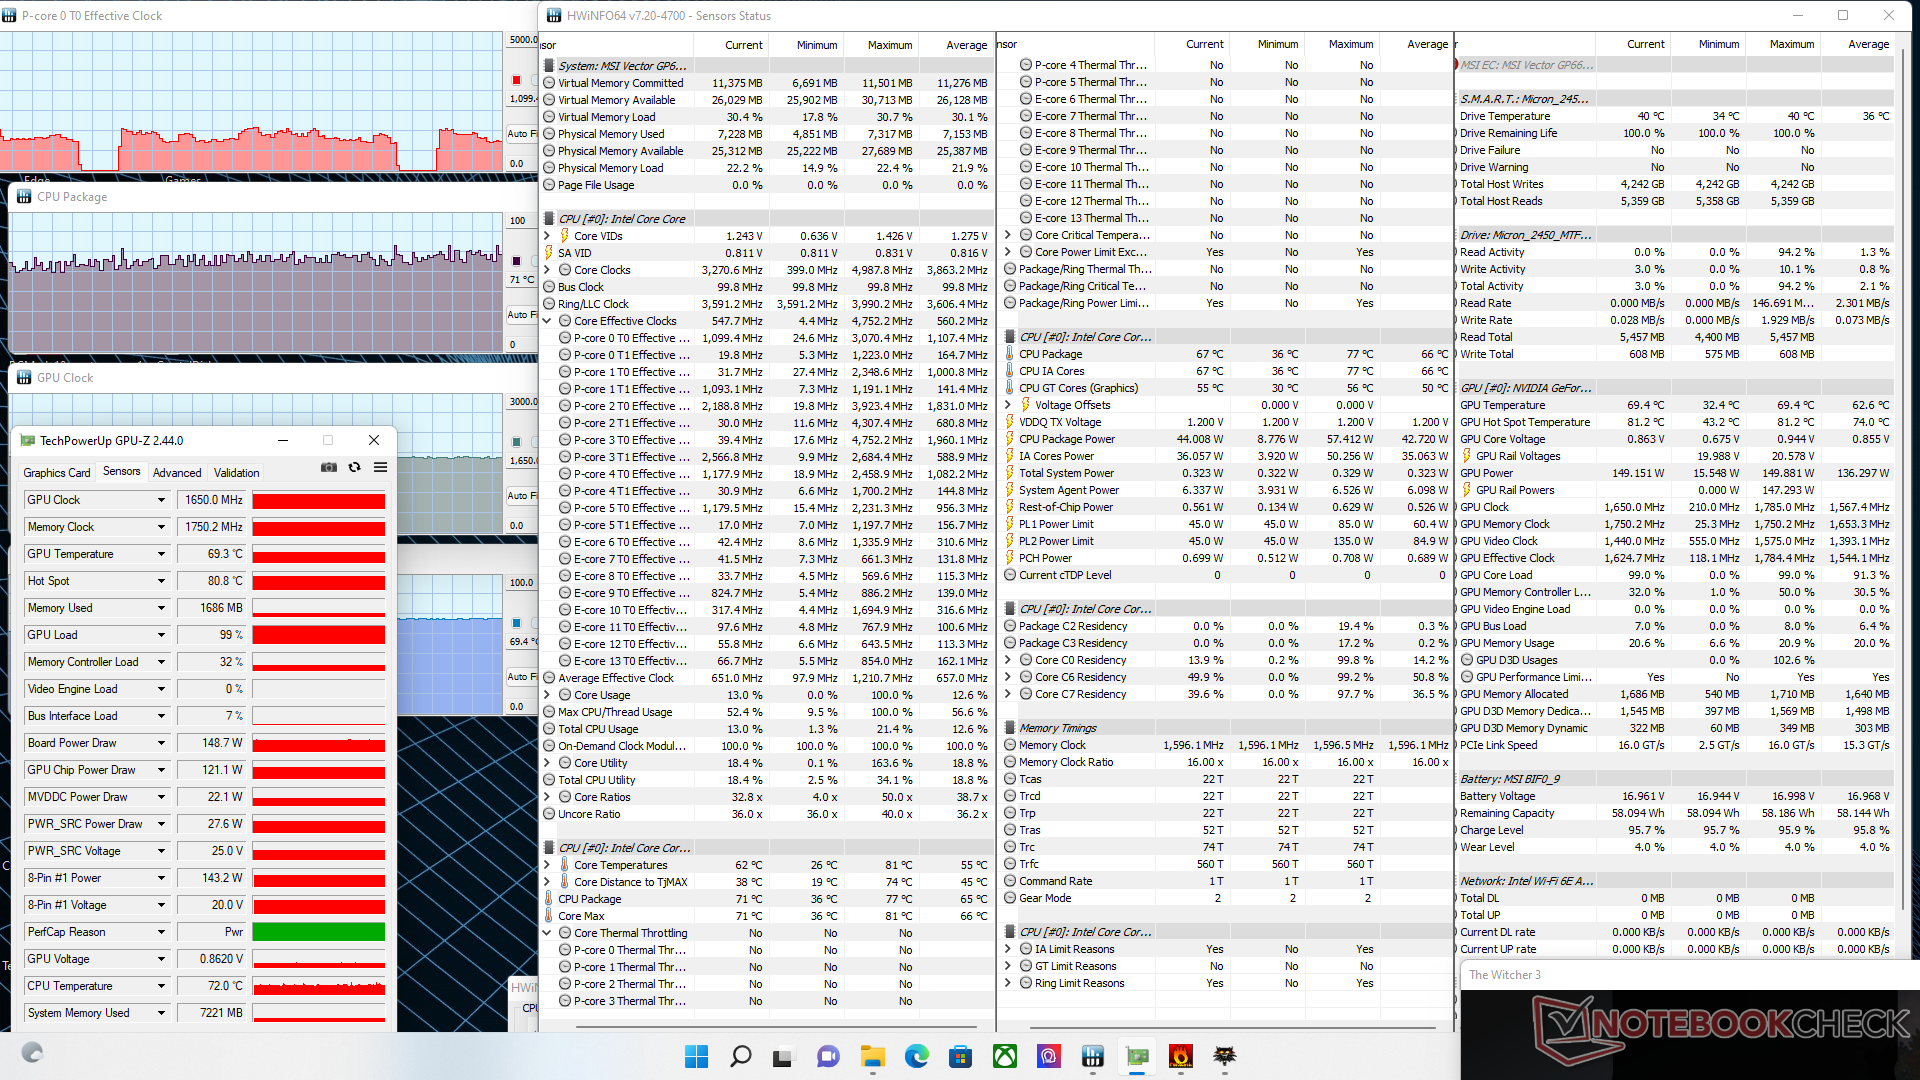
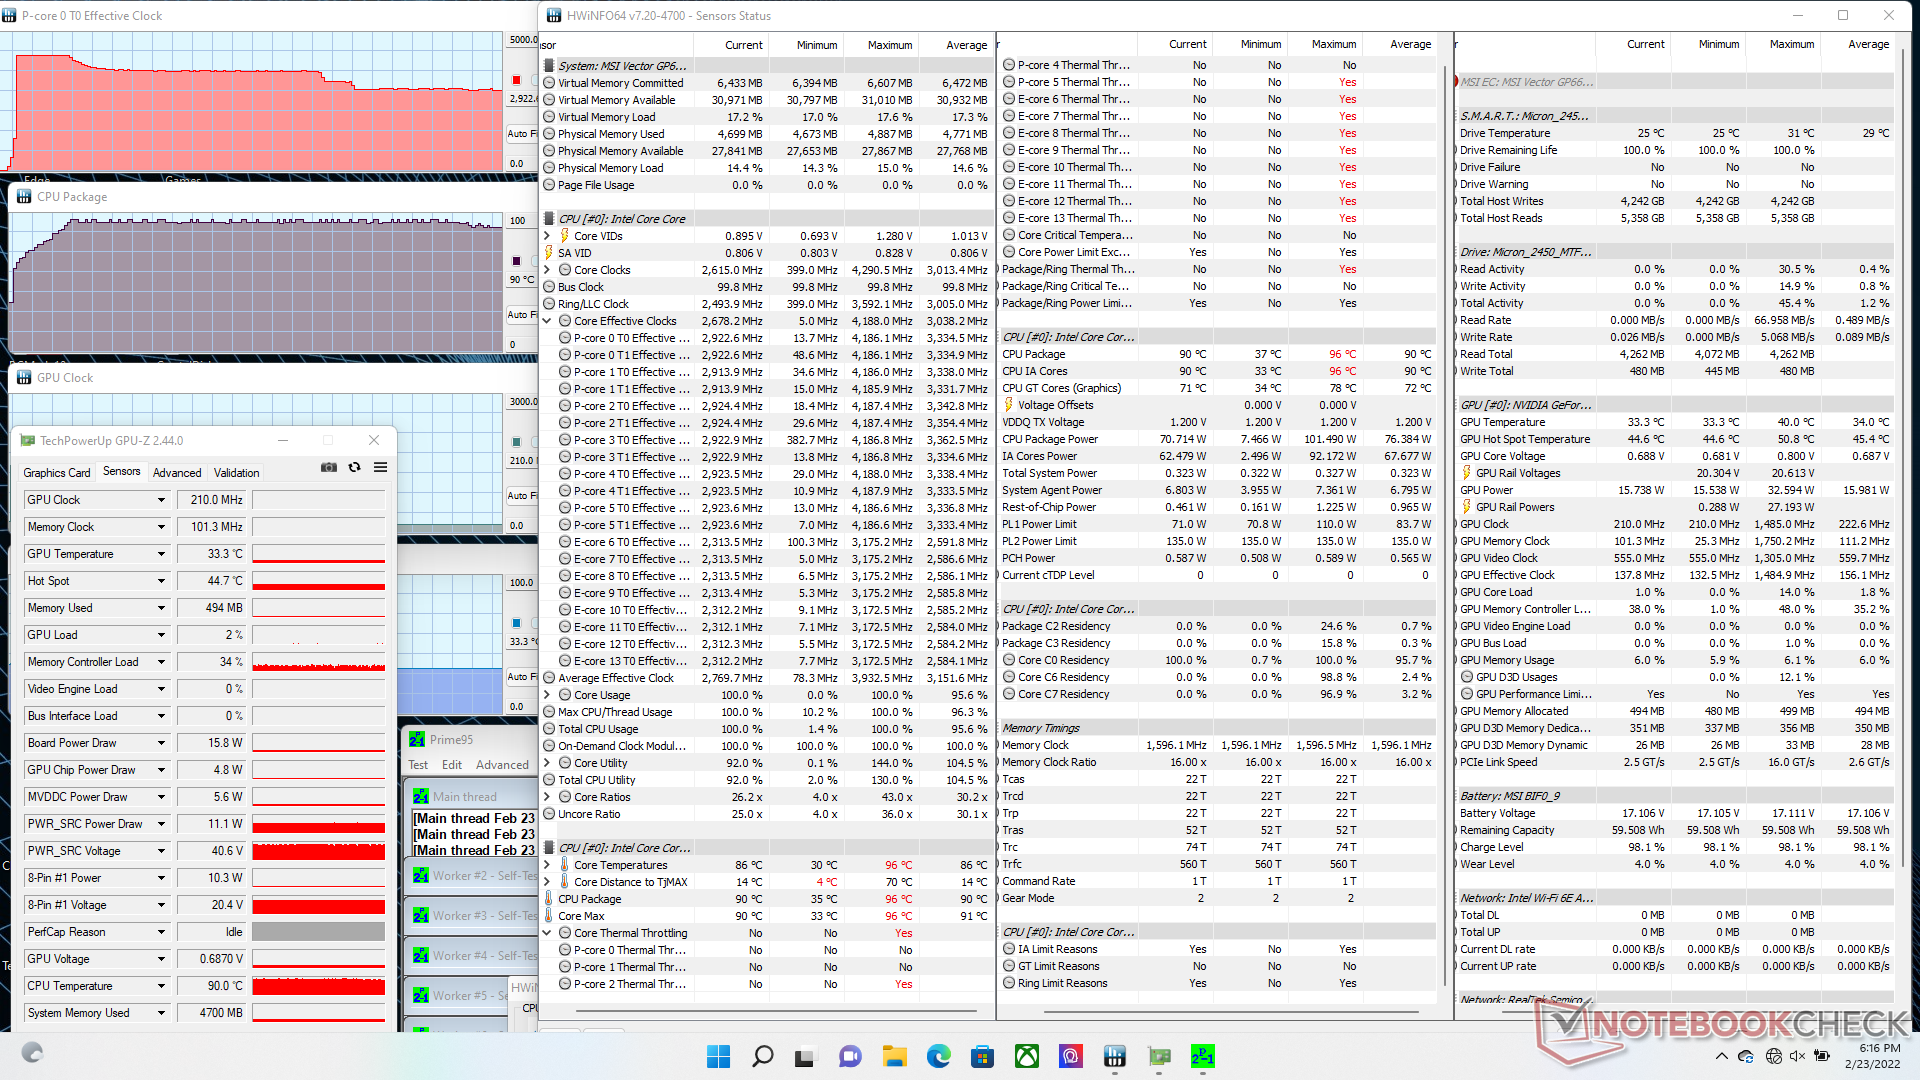
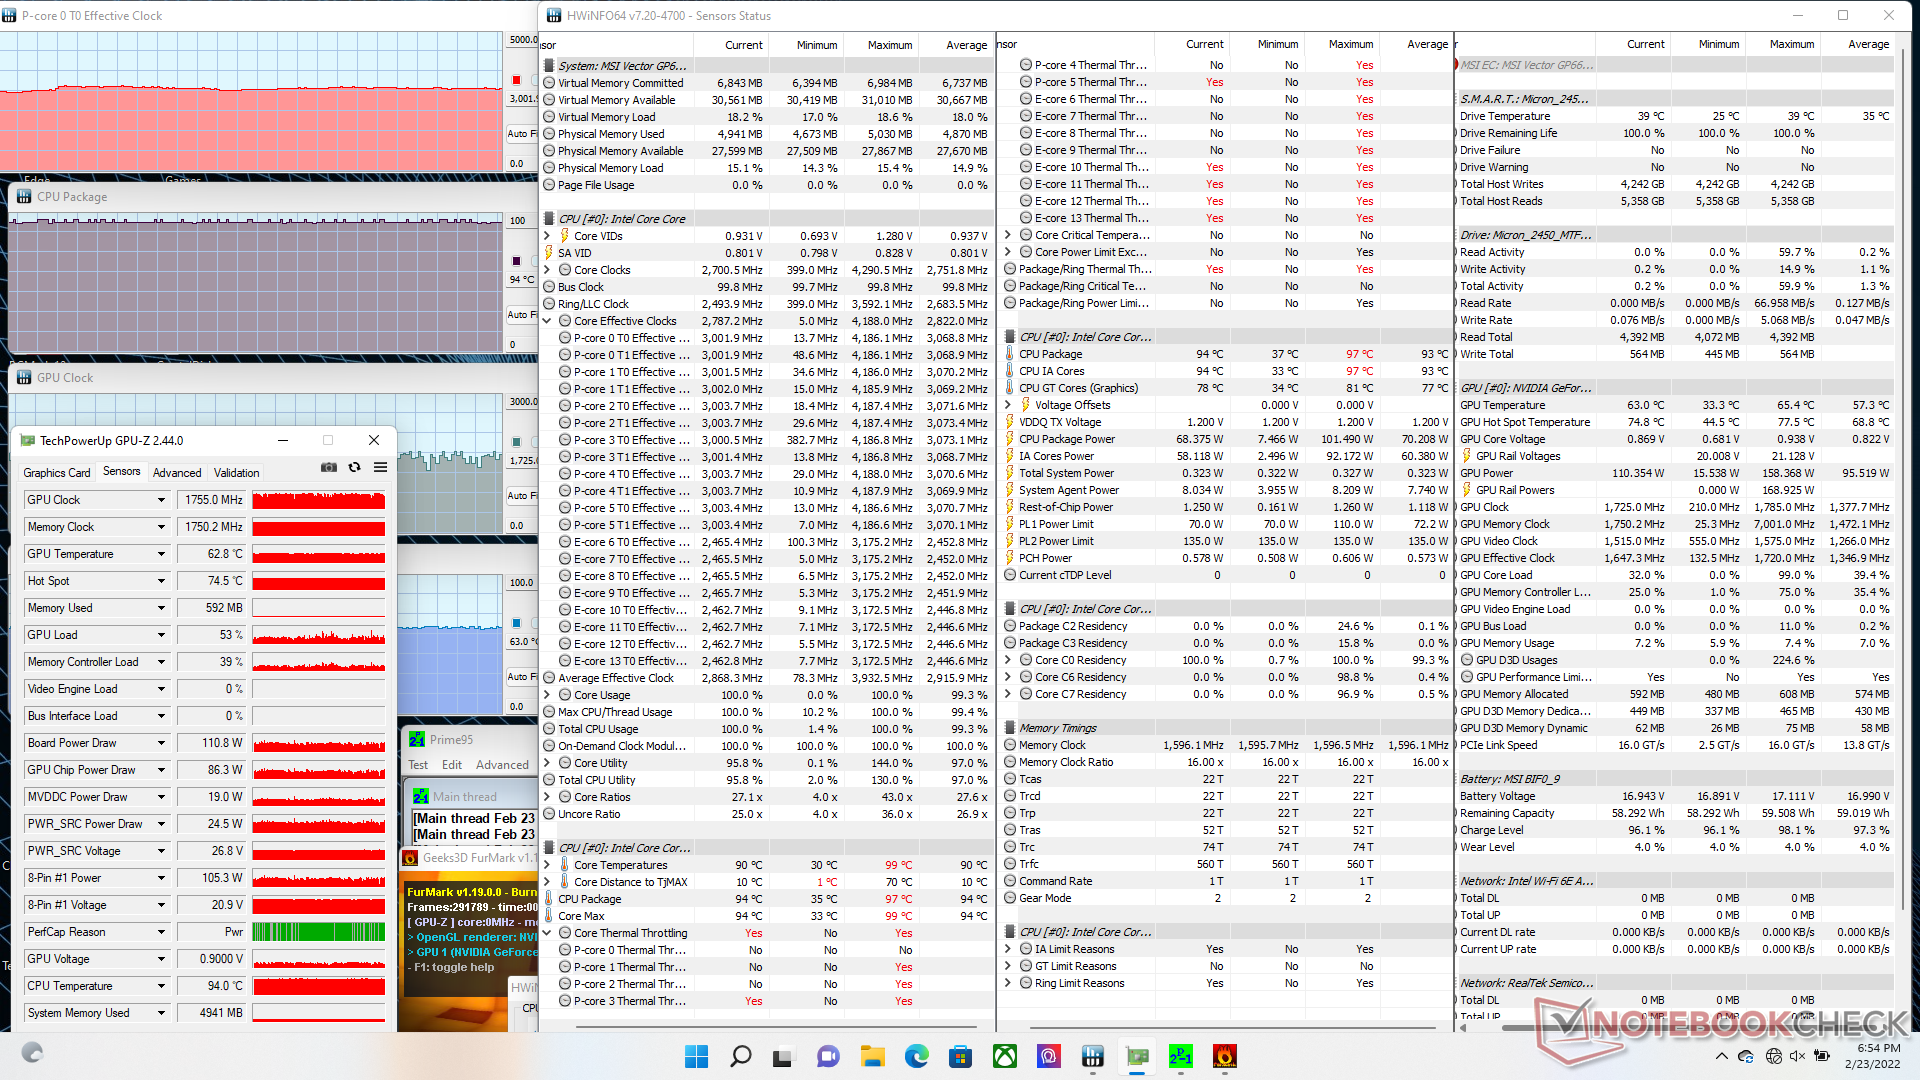
| CPU时钟(GHz) | GPU时钟(MHz) | CPU平均温度(°C) | GPU平均温度(°C) | |
| 系统空闲(平衡模式) | -- | -- | 39 | 40 |
| Prime95压力(极限性能模式) | 3.0 | -- | 90 | 33 |
| Prime95 + FurMark压力(极限性能模式) | 3.0 | 1755 | 94 | 63 |
| Witcher 3 压力(极端性能模式) | ~1.0 | 1650 | 71 | 70 |
| Witcher 3 压力(平衡模式) | ~1.0 | 1515 | 85 | 78 |
发言人
MSI Vector GP66 12UGS audio analysis
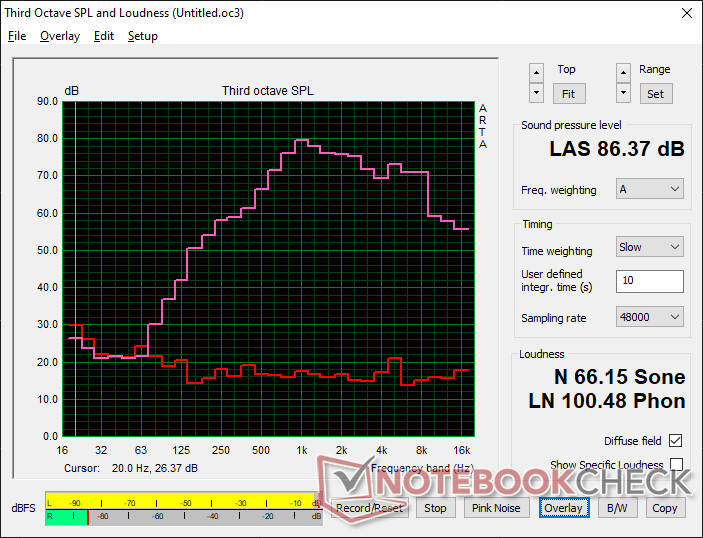
(+) | speakers can play relatively loud (86.4 dB)
Bass 100 - 315 Hz
(-) | nearly no bass - on average 19.2% lower than median
(±) | linearity of bass is average (9.1% delta to prev. frequency)
Mids 400 - 2000 Hz
(±) | higher mids - on average 6.5% higher than median
(+) | mids are linear (5.8% delta to prev. frequency)
Highs 2 - 16 kHz
(+) | balanced highs - only 3.7% away from median
(+) | highs are linear (6.5% delta to prev. frequency)
Overall 100 - 16.000 Hz
(±) | linearity of overall sound is average (18.1% difference to median)
Compared to same class
» 57% of all tested devices in this class were better, 8% similar, 35% worse
» The best had a delta of 6%, average was 18%, worst was 132%
Compared to all devices tested
» 39% of all tested devices were better, 8% similar, 54% worse
» The best had a delta of 4%, average was 23%, worst was 134%
Apple MacBook Pro 16 2021 M1 Pro audio analysis
(+) | speakers can play relatively loud (84.7 dB)
Bass 100 - 315 Hz
(+) | good bass - only 3.8% away from median
(+) | bass is linear (5.2% delta to prev. frequency)
Mids 400 - 2000 Hz
(+) | balanced mids - only 1.3% away from median
(+) | mids are linear (2.1% delta to prev. frequency)
Highs 2 - 16 kHz
(+) | balanced highs - only 1.9% away from median
(+) | highs are linear (2.7% delta to prev. frequency)
Overall 100 - 16.000 Hz
(+) | overall sound is linear (4.6% difference to median)
Compared to same class
» 0% of all tested devices in this class were better, 0% similar, 100% worse
» The best had a delta of 5%, average was 17%, worst was 45%
Compared to all devices tested
» 0% of all tested devices were better, 0% similar, 100% worse
» The best had a delta of 4%, average was 23%, worst was 134%
能源管理
消耗功率
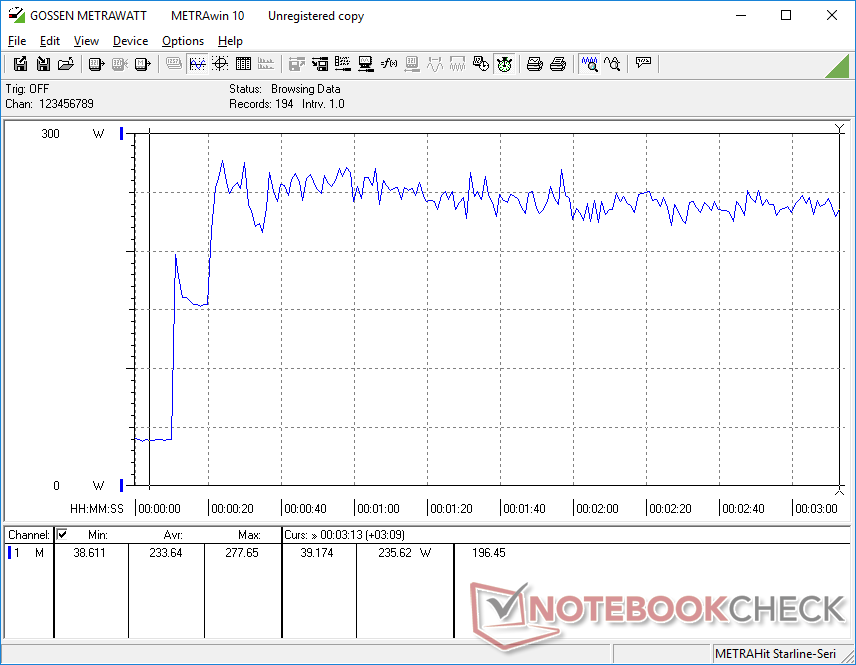
与去年的GP66 Leopard相比,预计Vector GP66的整体功耗会更高,因为它的原生显示刷新率更高(360 Hz对144 Hz),CPU PL目标更高(70 W对45 W),TGP更高(150 W对140 W)。运行游戏将从插座中多出约20瓦,比许多其他配备GeForce RTX 3080图形的17英寸游戏笔记本电脑要求更高。虽然用户逐年获得更高的性能,特别是在CPU方面,但每瓦性能可能不会有太大的改善。
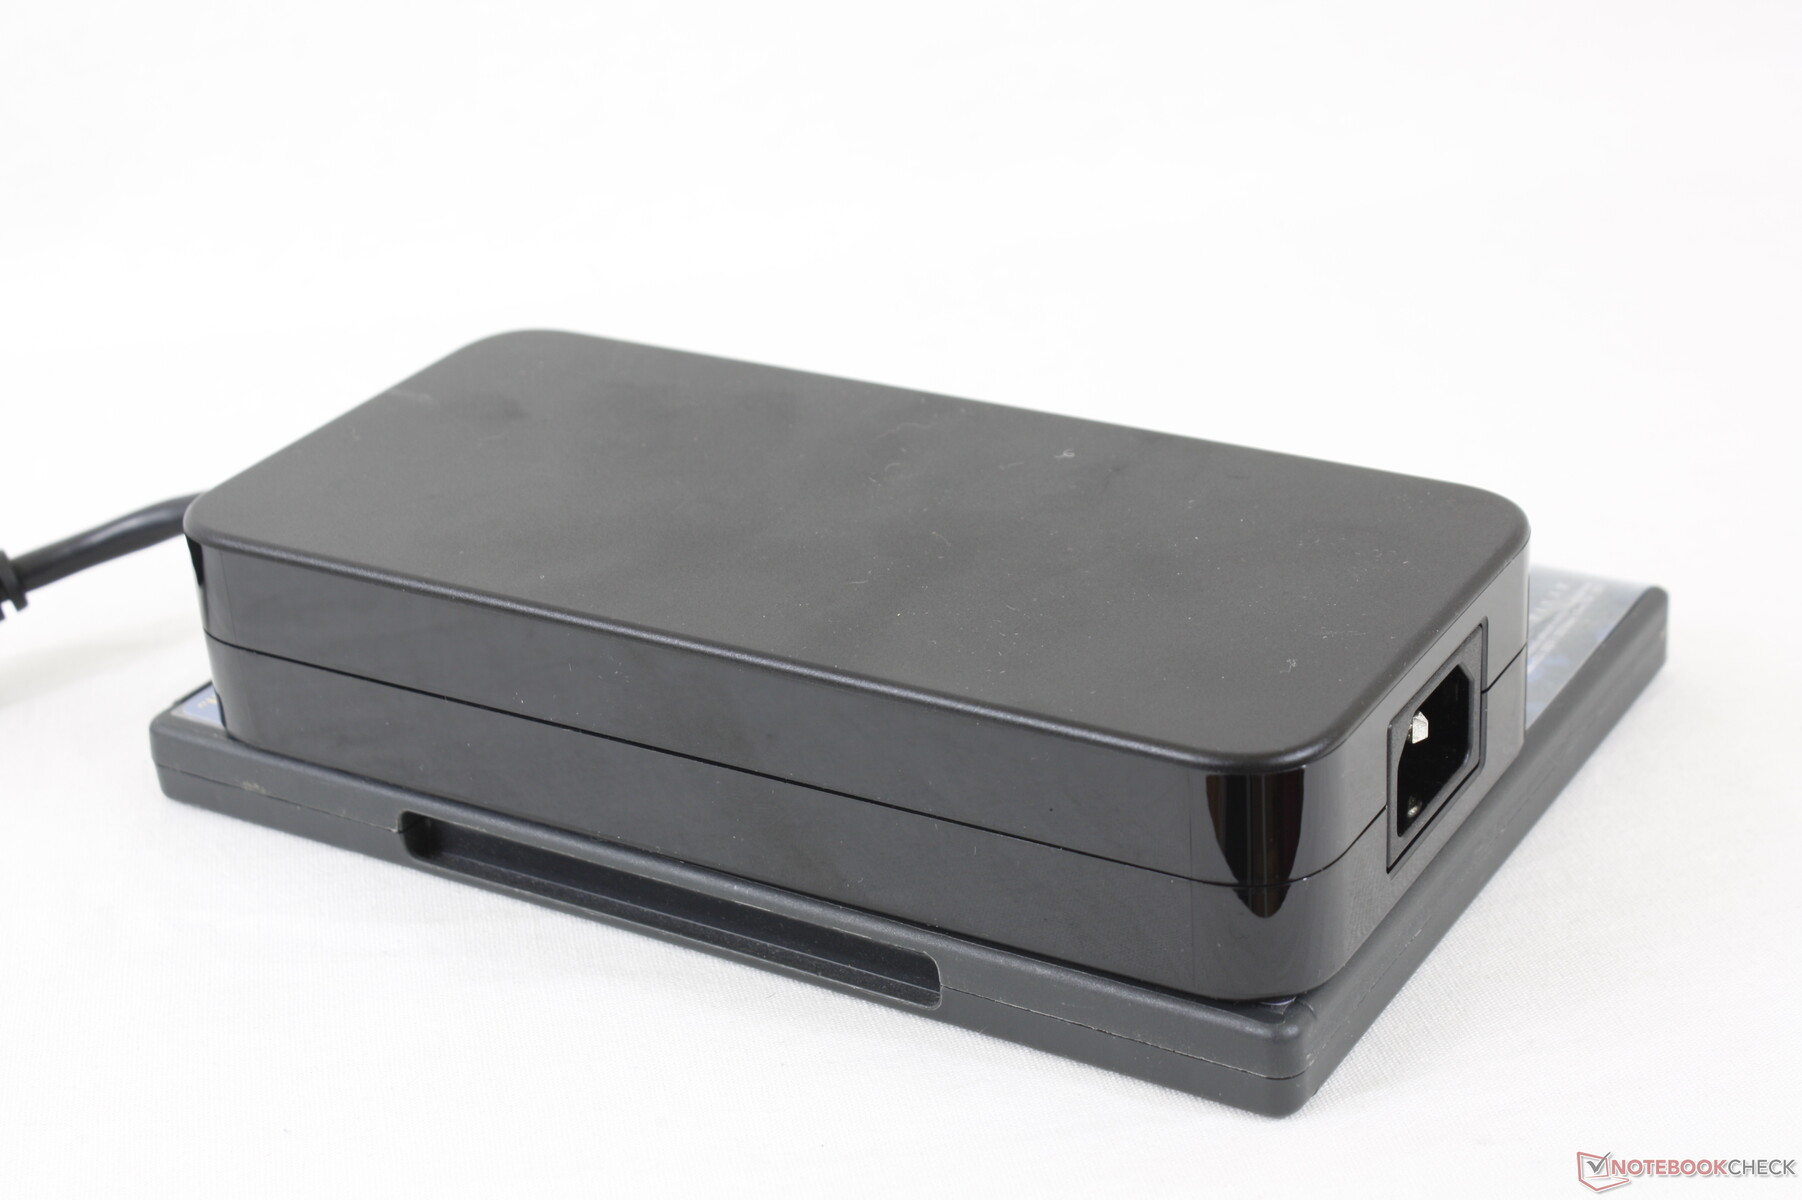
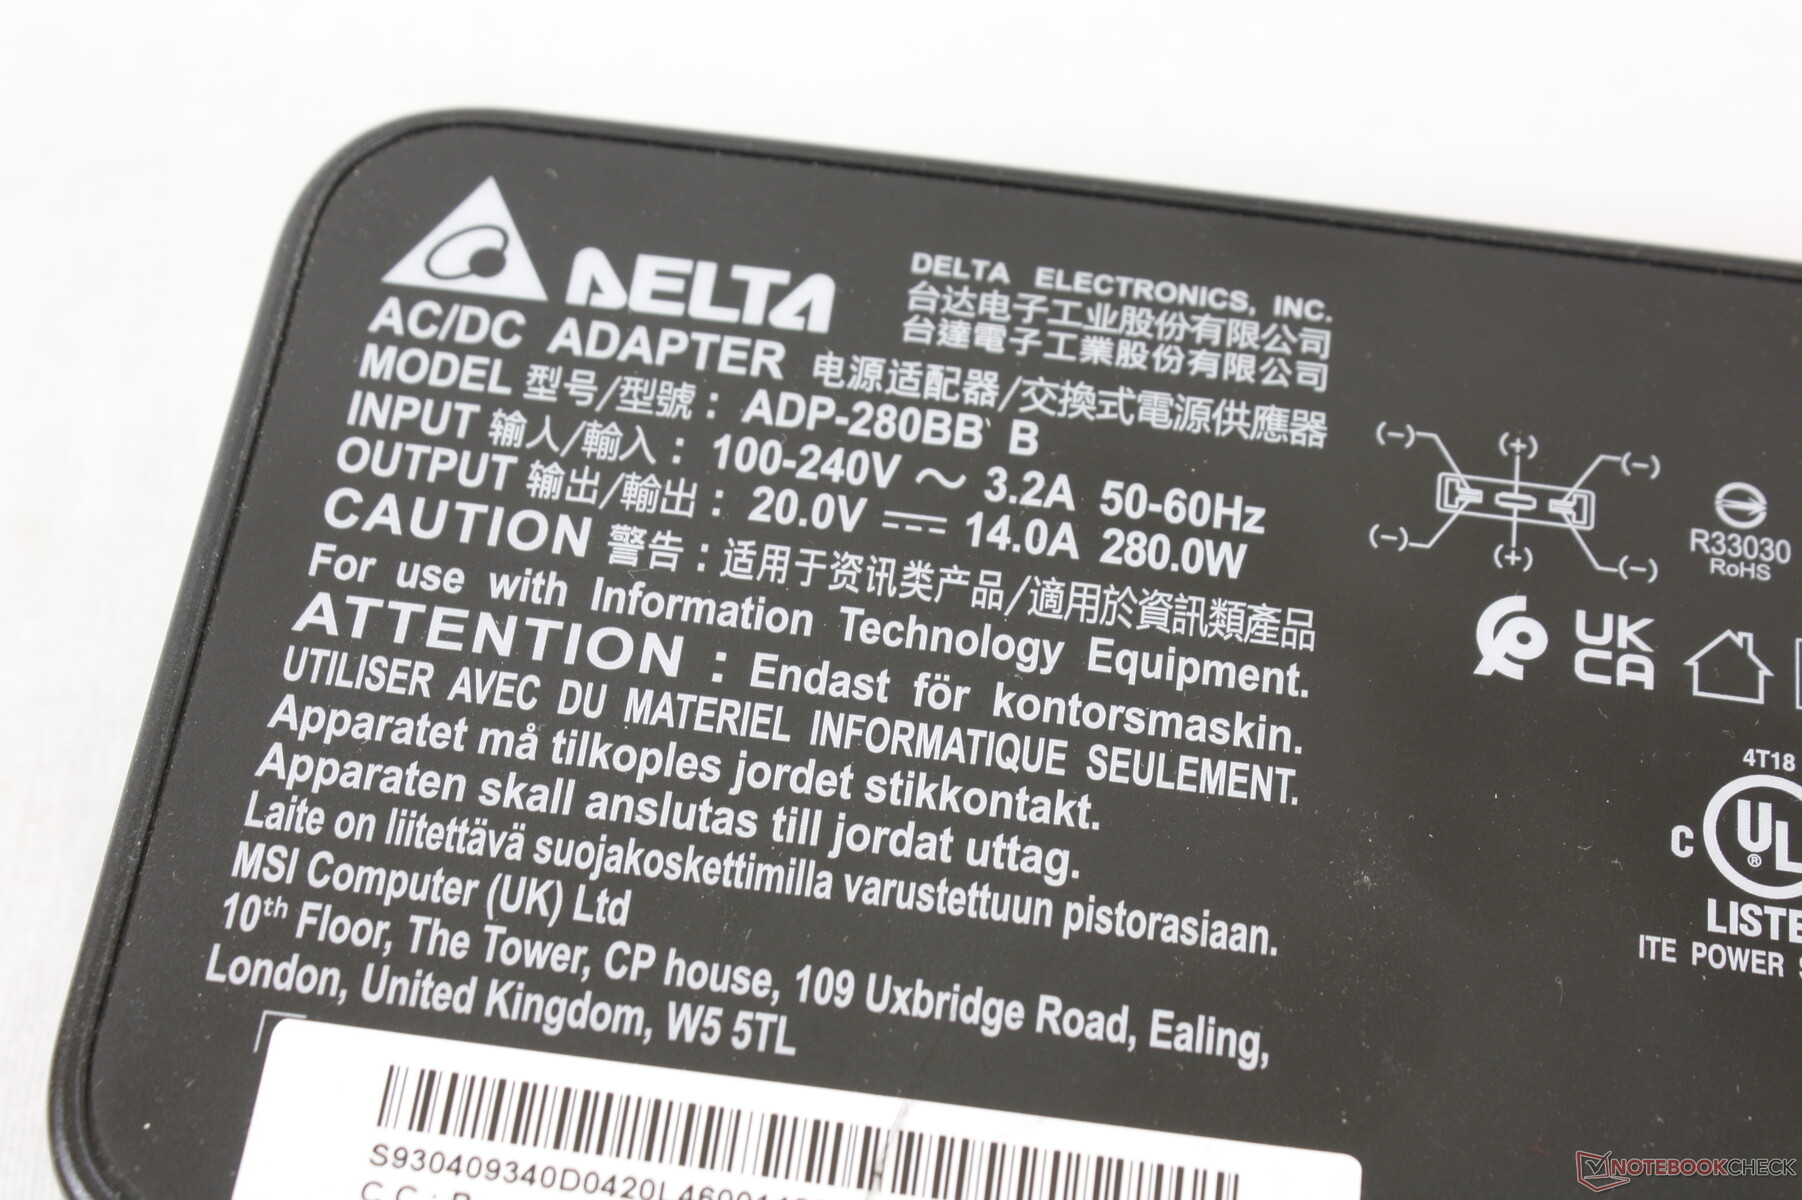
在同时运行Prime95和FurMark时,我们能够从280瓦(约18 x 8.5 x 3.5厘米)的大型交流适配器中记录到278瓦的临时最大功耗。游戏时,电池仍会以适当的速度充电。
| Off / Standby | |
| Idle | |
| Load |
|
Key:
min: | |
| MSI Vector GP66 12UGS i9-12900H, GeForce RTX 3070 Ti Laptop GPU, , IPS, 1920x1080, 15.6" | MSI GP66 Leopard 11UH-028 i7-11800H, GeForce RTX 3080 Laptop GPU, Samsung PM9A1 MZVL21T0HCLR, IPS, 1920x1080, 15.6" | MSI Katana GF66 11UG-220 i7-11800H, GeForce RTX 3070 Laptop GPU, Kingston OM8PDP3512B-AI1, IPS, 1920x1080, 15.6" | Asus TUF Gaming F15 FX506HM i7-11800H, GeForce RTX 3060 Laptop GPU, SK Hynix HFM001TD3JX013N, IPS, 1920x1080, 15.6" | Razer Blade 15 Base Edition 2021, i7-10750H RTX 3060 i7-10750H, GeForce RTX 3060 Laptop GPU, Samsung SSD PM981a MZVLB512HBJQ, IPS, 1920x1080, 15.6" | Alienware m15 R5 Ryzen Edition R7 5800H, GeForce RTX 3060 Laptop GPU, Toshiba KBG40ZNS512G NVMe, IPS, 1920x1080, 15.6" | |
|---|---|---|---|---|---|---|
| Power Consumption | 24% | 38% | 36% | 28% | 23% | |
| Idle Minimum * (Watt) | 17.5 | 13 26% | 8 54% | 9.5 46% | 11.7 33% | 11 37% |
| Idle Average * (Watt) | 20.1 | 17 15% | 12 40% | 12.1 40% | 16 20% | 14 30% |
| Idle Maximum * (Watt) | 47.3 | 18 62% | 22 53% | 22.5 52% | 29.3 38% | 25 47% |
| Load Average * (Watt) | 107.3 | 96 11% | 98 9% | 99.5 7% | 95.6 11% | 123 -15% |
| Witcher 3 ultra * (Watt) | 225 | 207 8% | 152 32% | 157 30% | 141.3 37% | 176 22% |
| Load Maximum * (Watt) | 277.7 | 223 20% | 162 42% | 173.5 38% | 197 29% | 226 19% |
* ... smaller is better
Power Consumption Witcher 3 / Stresstest
Power Consumption external Monitor
电池寿命
GP66 Vector和去年的GP66 Leopard之间的电池容量相同,都是65Wh。尽管如此,我们能够在较新的型号上记录更长的WLAN运行时间,多了两个多小时。我们建议在MSHybrid模式下运行系统,以延长电池寿命,如果dGPU模式不是一个优先事项。
使用随附的交流适配器从空电到满电大约需要2.5小时,而大多数其他笔记本电脑则需要2小时或更快。与华硕或雷蛇的许多替代品不同,不支持用USB-C适配器充电。
| MSI Vector GP66 12UGS i9-12900H, GeForce RTX 3070 Ti Laptop GPU, 65 Wh | MSI GP66 Leopard 11UH-028 i7-11800H, GeForce RTX 3080 Laptop GPU, 65 Wh | MSI Katana GF66 11UG-220 i7-11800H, GeForce RTX 3070 Laptop GPU, 90 Wh | Asus TUF Gaming F15 FX506HM i7-11800H, GeForce RTX 3060 Laptop GPU, 90 Wh | Razer Blade 15 Base Edition 2021, i7-10750H RTX 3060 i7-10750H, GeForce RTX 3060 Laptop GPU, 65 Wh | Alienware m15 R5 Ryzen Edition R7 5800H, GeForce RTX 3060 Laptop GPU, 86 Wh | |
|---|---|---|---|---|---|---|
| Battery runtime | -9% | 9% | 59% | 11% | 22% | |
| Reader / Idle (h) | 7.9 | 9.1 15% | 11 39% | 7.8 -1% | 14.7 86% | |
| WiFi v1.3 (h) | 5.7 | 3.6 -37% | 5.3 -7% | 7.9 39% | 4.8 -16% | 5.1 -11% |
| Load (h) | 1 | 1.2 20% | 1.2 20% | 2 100% | 1.5 50% | 0.9 -10% |
| H.264 (h) | 3.5 | 8.8 | ||||
| Witcher 3 ultra (h) | 0.8 | 1.6 |
Pros
Cons
判决书
GP66的热力学性能较之于 完善的热能,使其能够支持更强大的150W TGP图形,而GP65 允许它支持更强大的150 W TGP图形,而在Razer Blade 15上只有约100 W。 Razer Blade 15或 微星GS66系列。换句话说,你得到的是最好的一个版本的 移动GeForce RTX 3070 Ti在任何15.6英寸的笔记本电脑上,目前由于GP66的TGP上限较高。GS66可能更薄、更便携,但其GeForce RTX 3070 Ti的速度也明显较慢,这是一个直接后果。为了获得更平衡的体验,GP66将是更好的选择。
如果你想从GPU中挤出尽可能多的性能,极限性能模式是必要的。这种模式也是风扇噪音最大的模式,这意味着如果想要获得最大的性能,比平均水平更响的风扇是不可避免的。在平衡模式下进行游戏,将大大限制风扇的噪音,而在图形性能上只有5%的小下降。我们发现这种模式对于那些不喜欢使用耳机或被超大声的游戏笔记本所困扰的玩家来说是理想的。
Vector GP66凭借其更高功率的150W GPU选项,比大多数其他超薄游戏笔记本电脑更好地平衡了便携性和性能。
对于未来的修订,我们希望看到对海绵状的点击板和PCIe4 x4固态硬盘的性能可持续性的改进。点击板比老款GP65有所下降,而NVMe固态硬盘缺乏散热片,这意味着在短时间的密集使用后,传输率会有所下降。
价格和可用性
我们所评论的确切配置目前在Best Buy上有售,价格为2400美元。.
MSI Vector GP66 12UGS
- 03/03/2022 v7 (old)
Allen Ngo
Price comparison

