英特尔Alder Lake-S评论。英特尔是否再次拥有最快的游戏CPU?
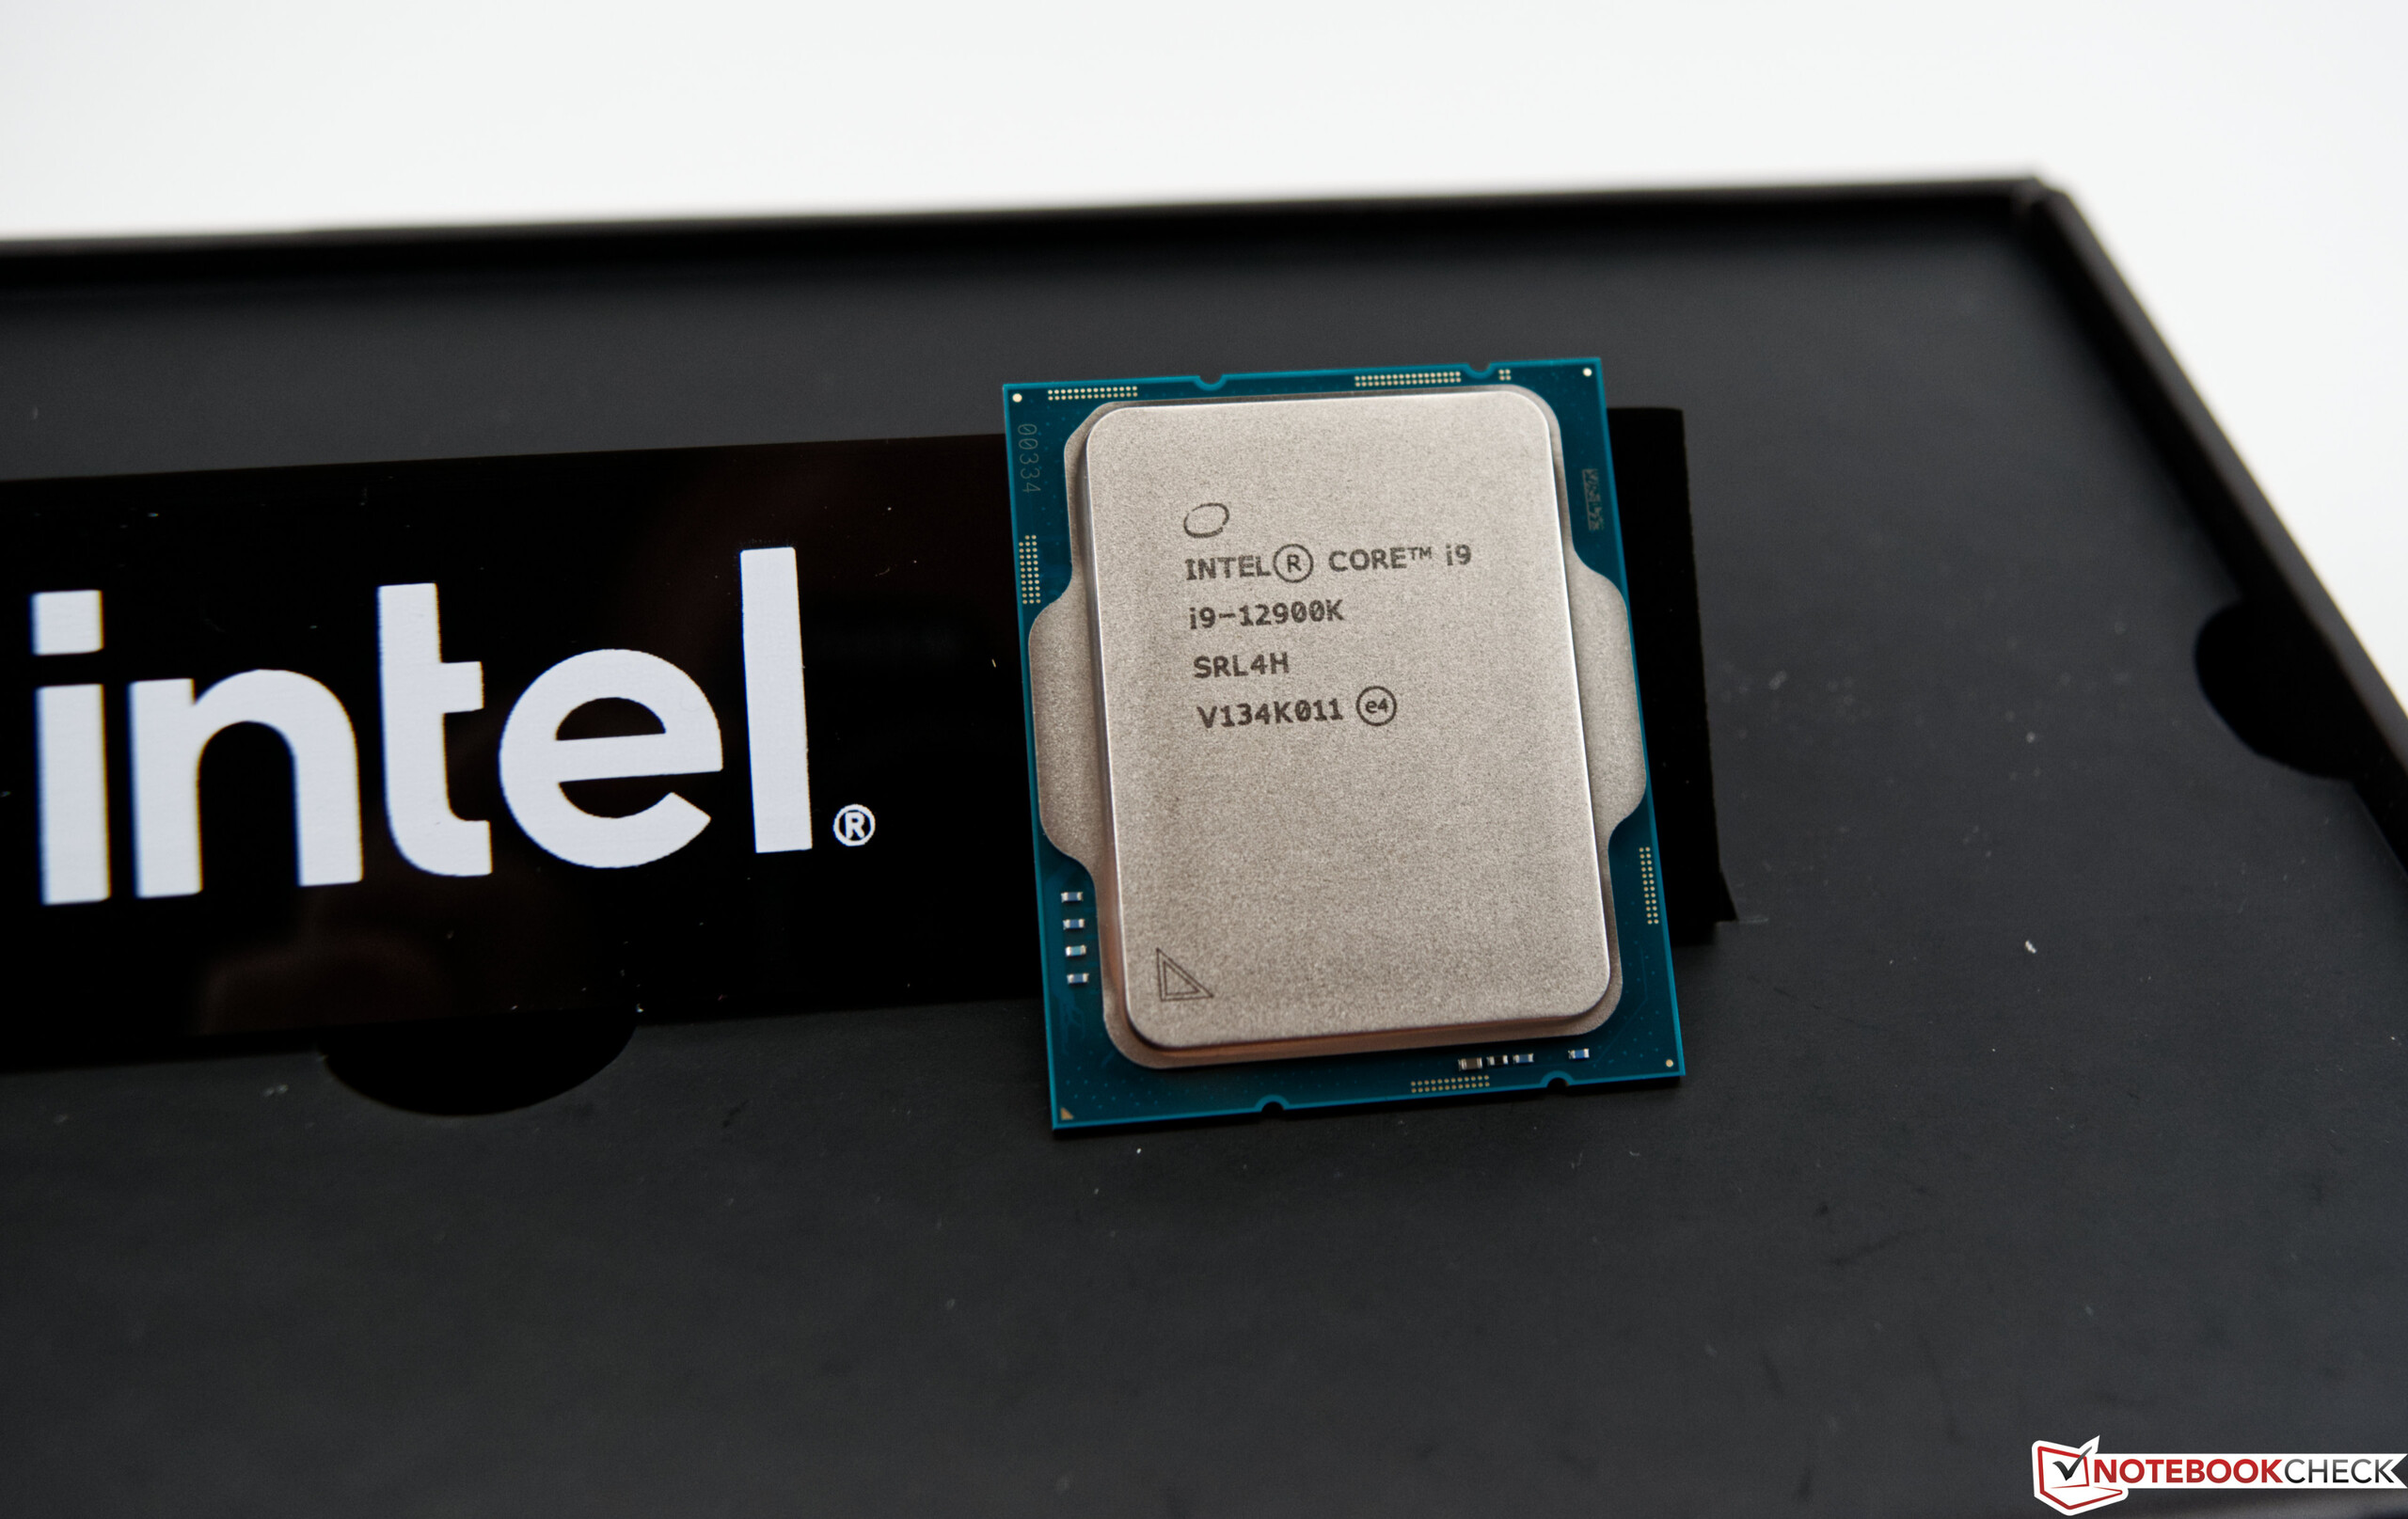
英特尔有很多计划,包括ALDER LAKE-S.多年来,英特尔是最快游戏CPU的基准标准,直到AMD以其Ryzen 5000加速并夺得桂冠。对于终端用户来说,这种猫捉老鼠的游戏有很多好处,因为它有助于更快地将改进的东西带给大众。
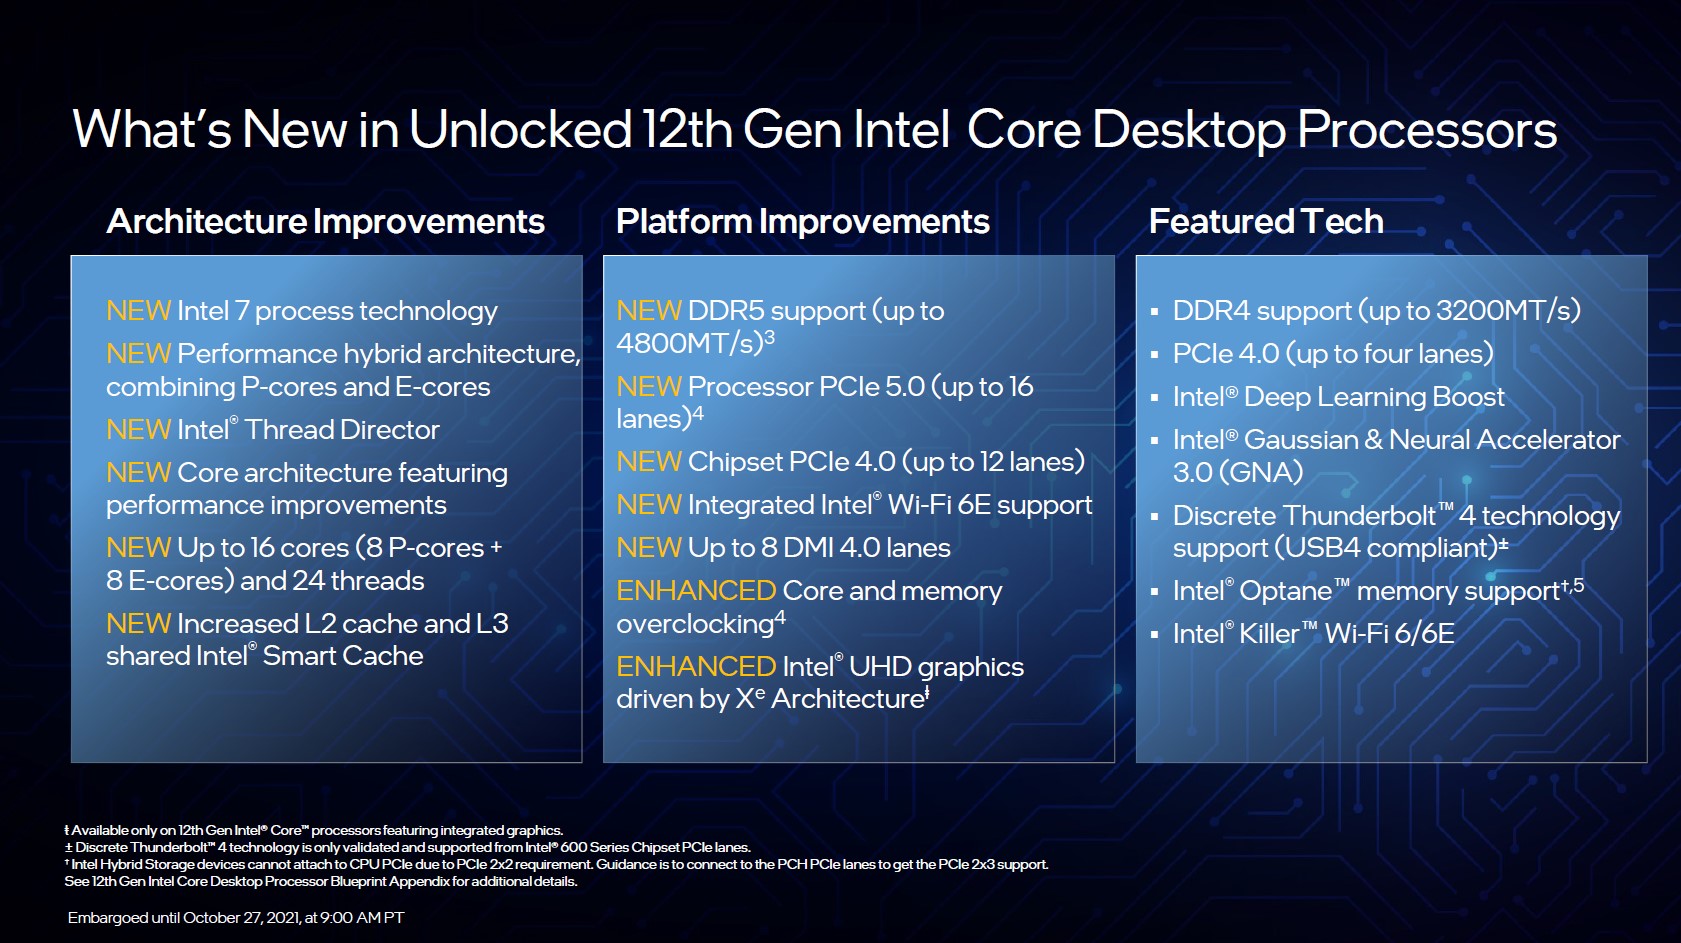
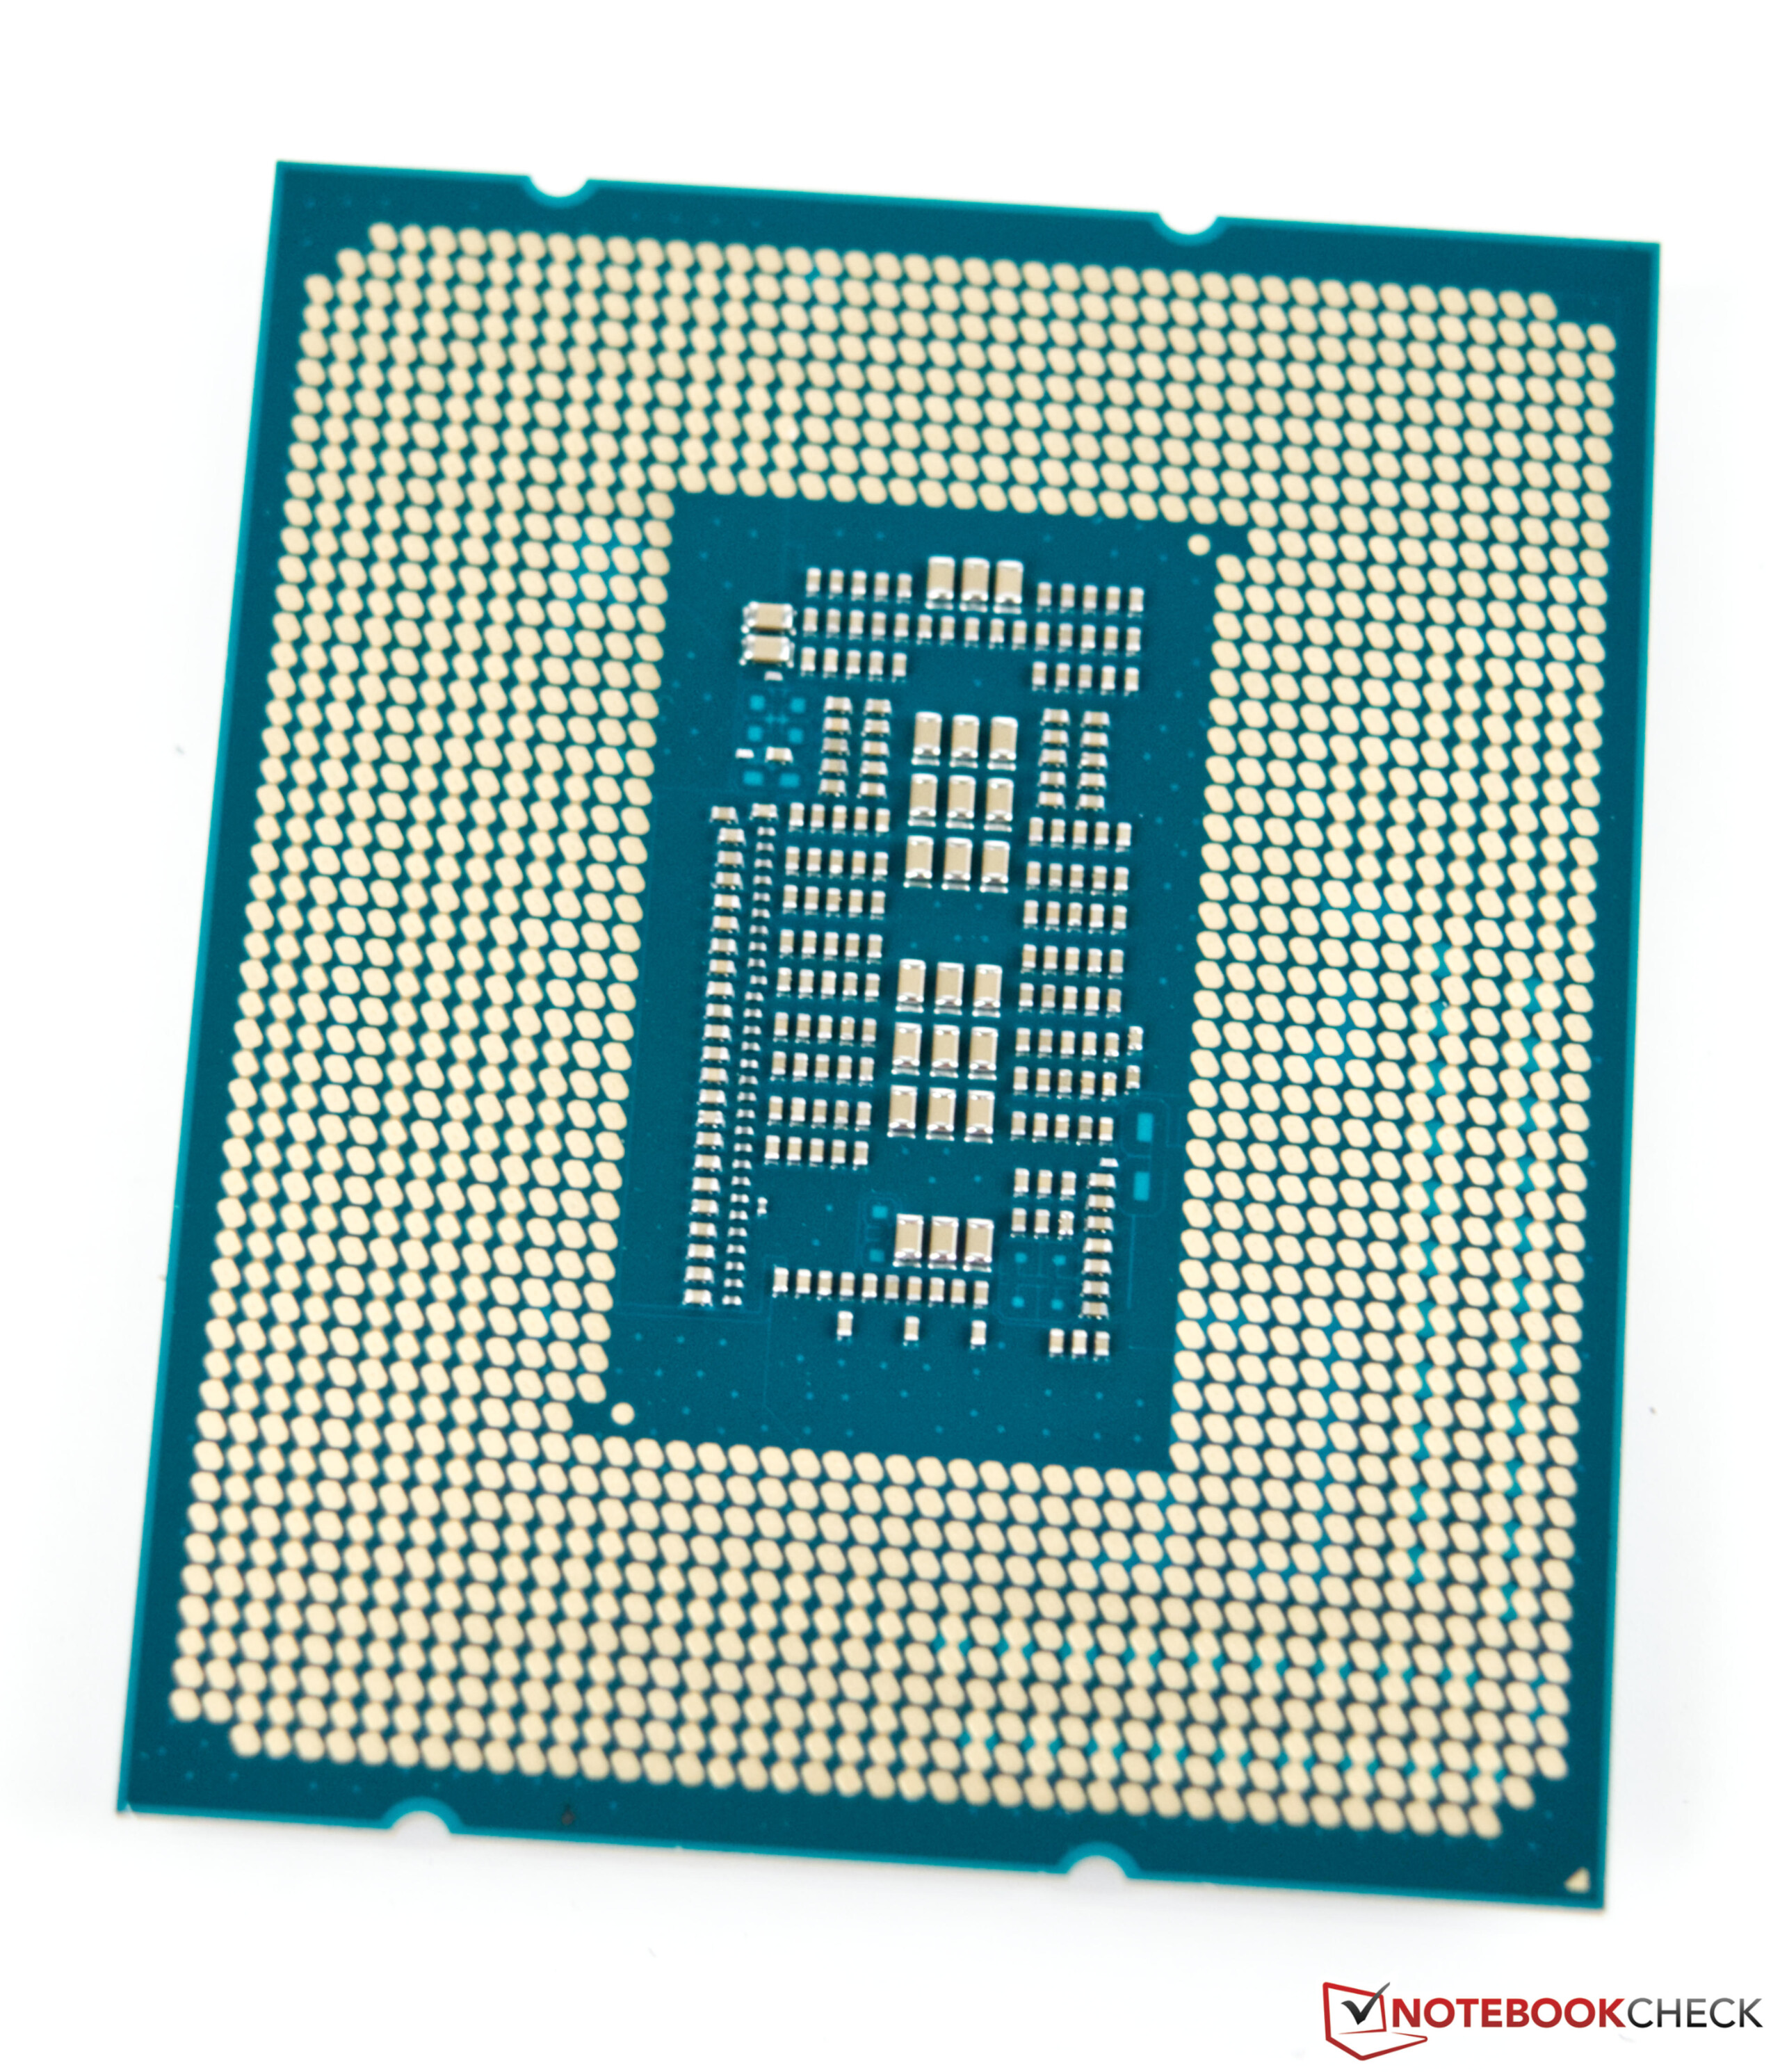
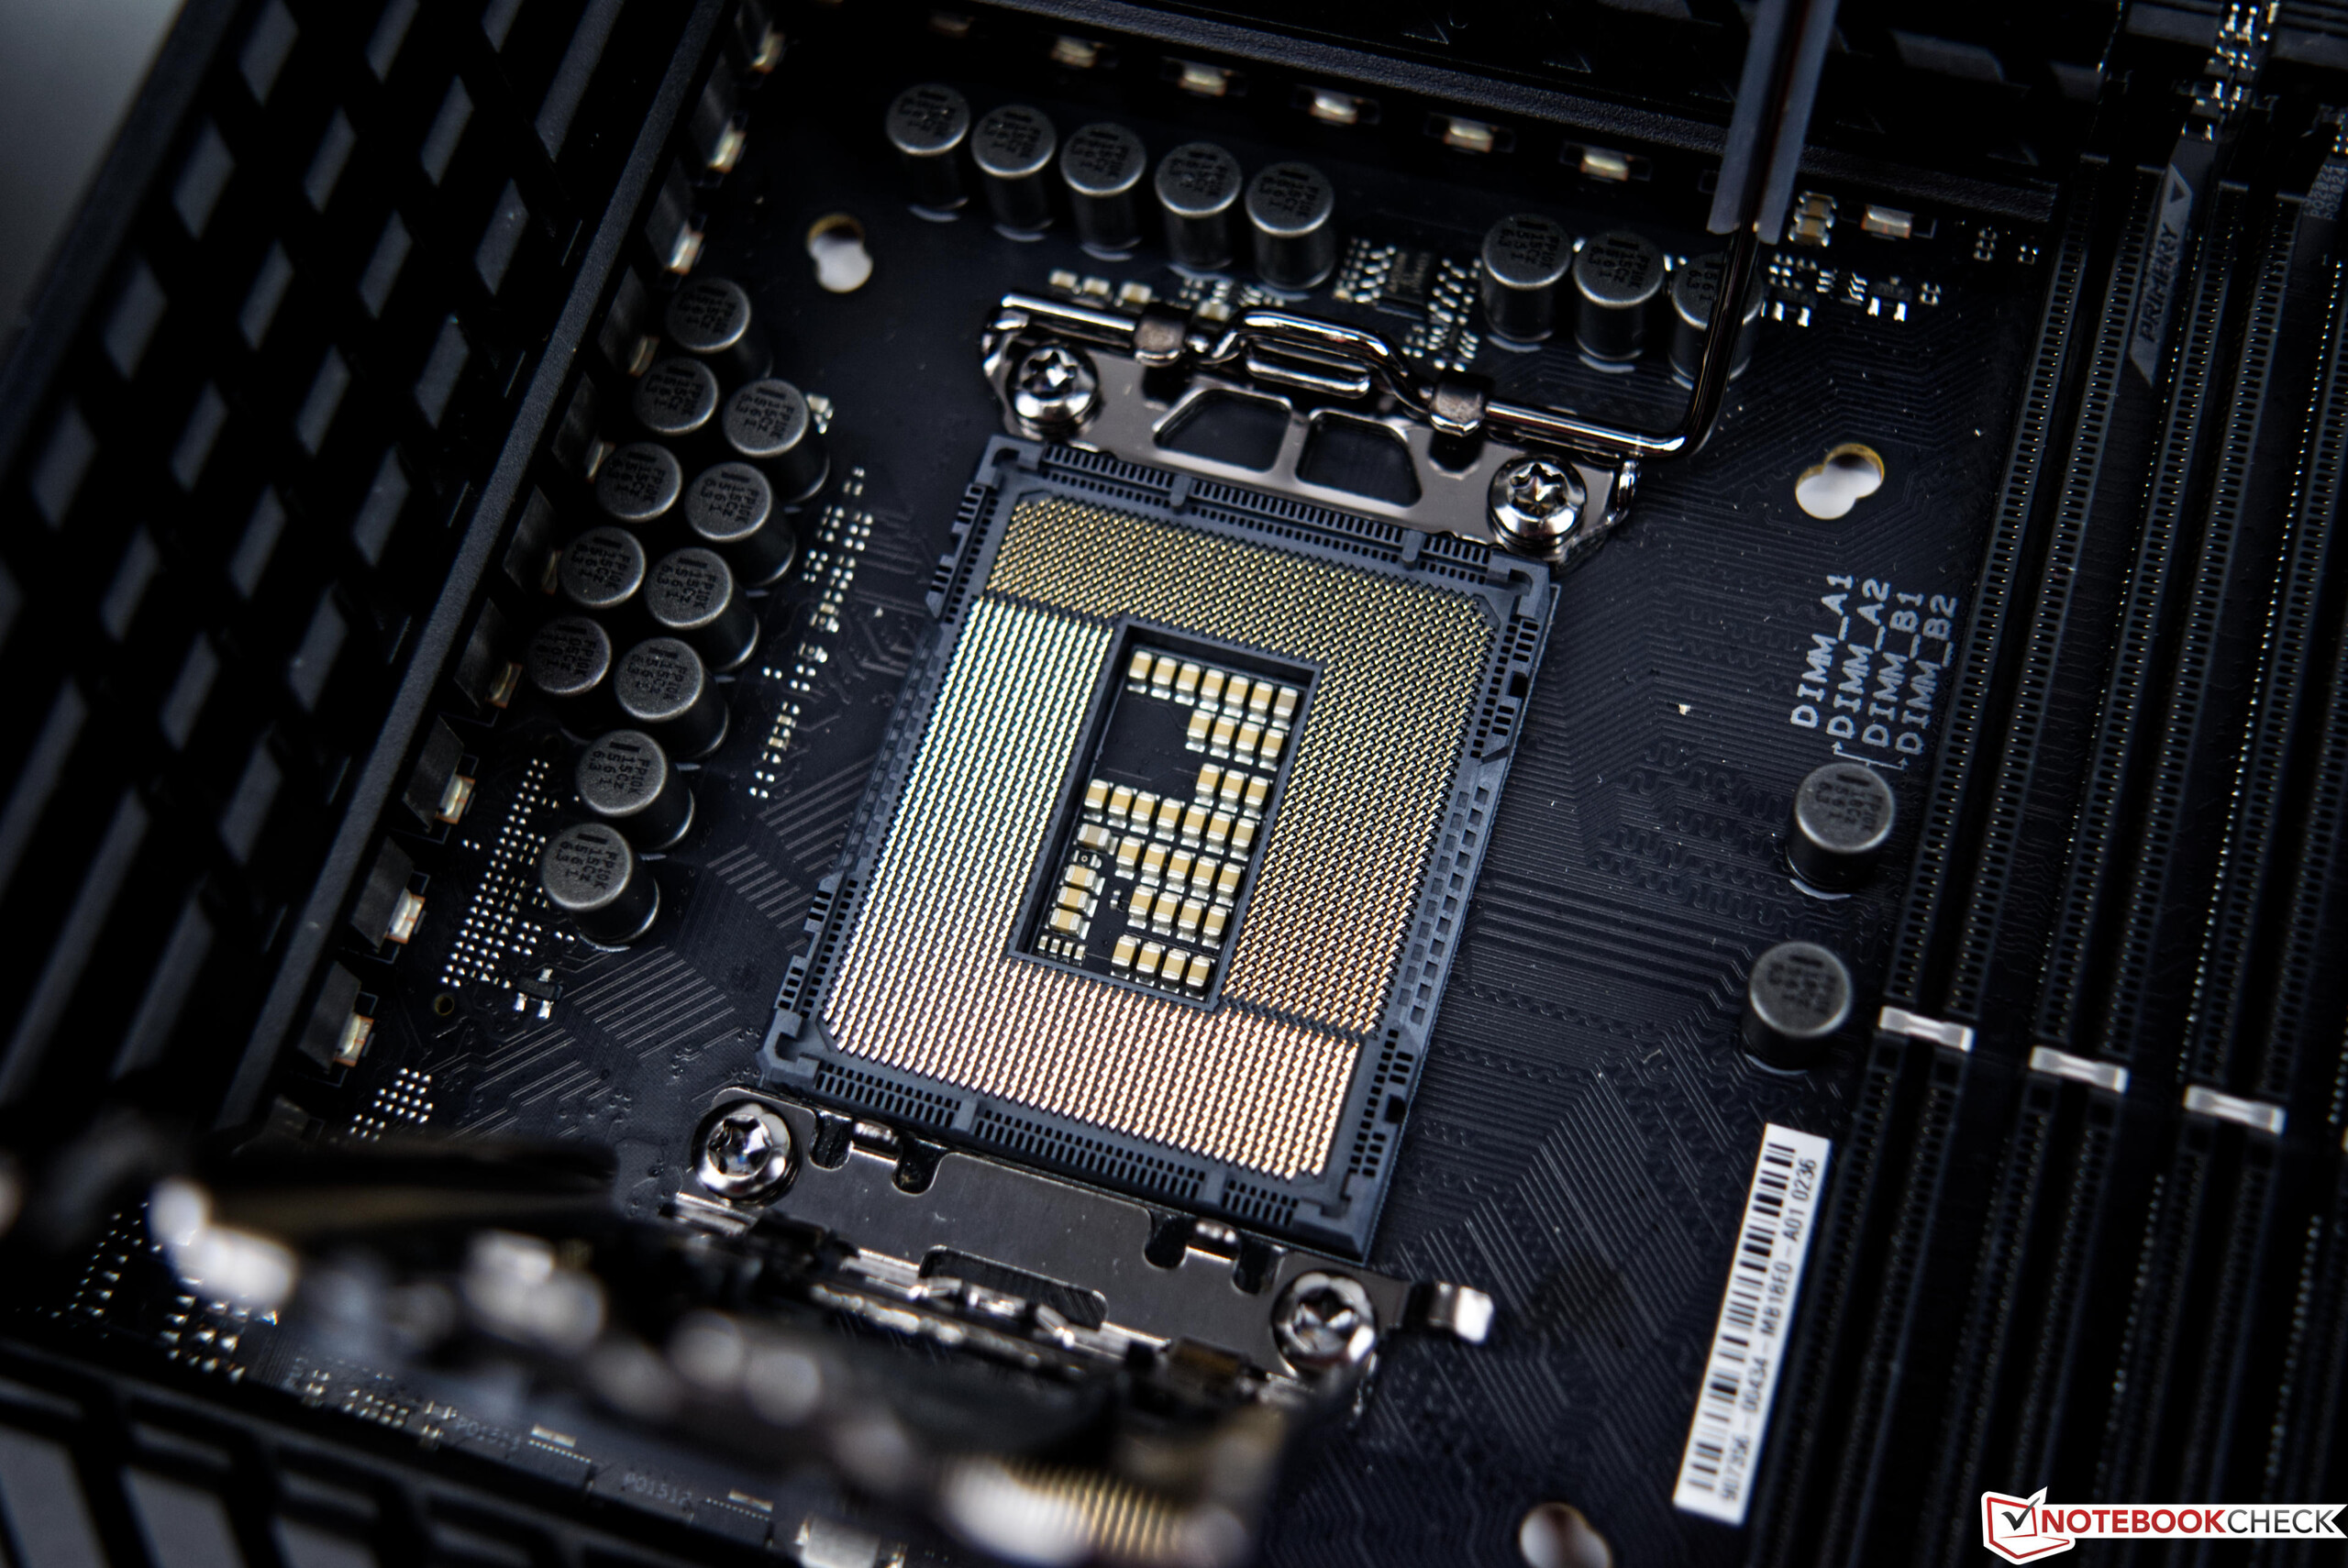
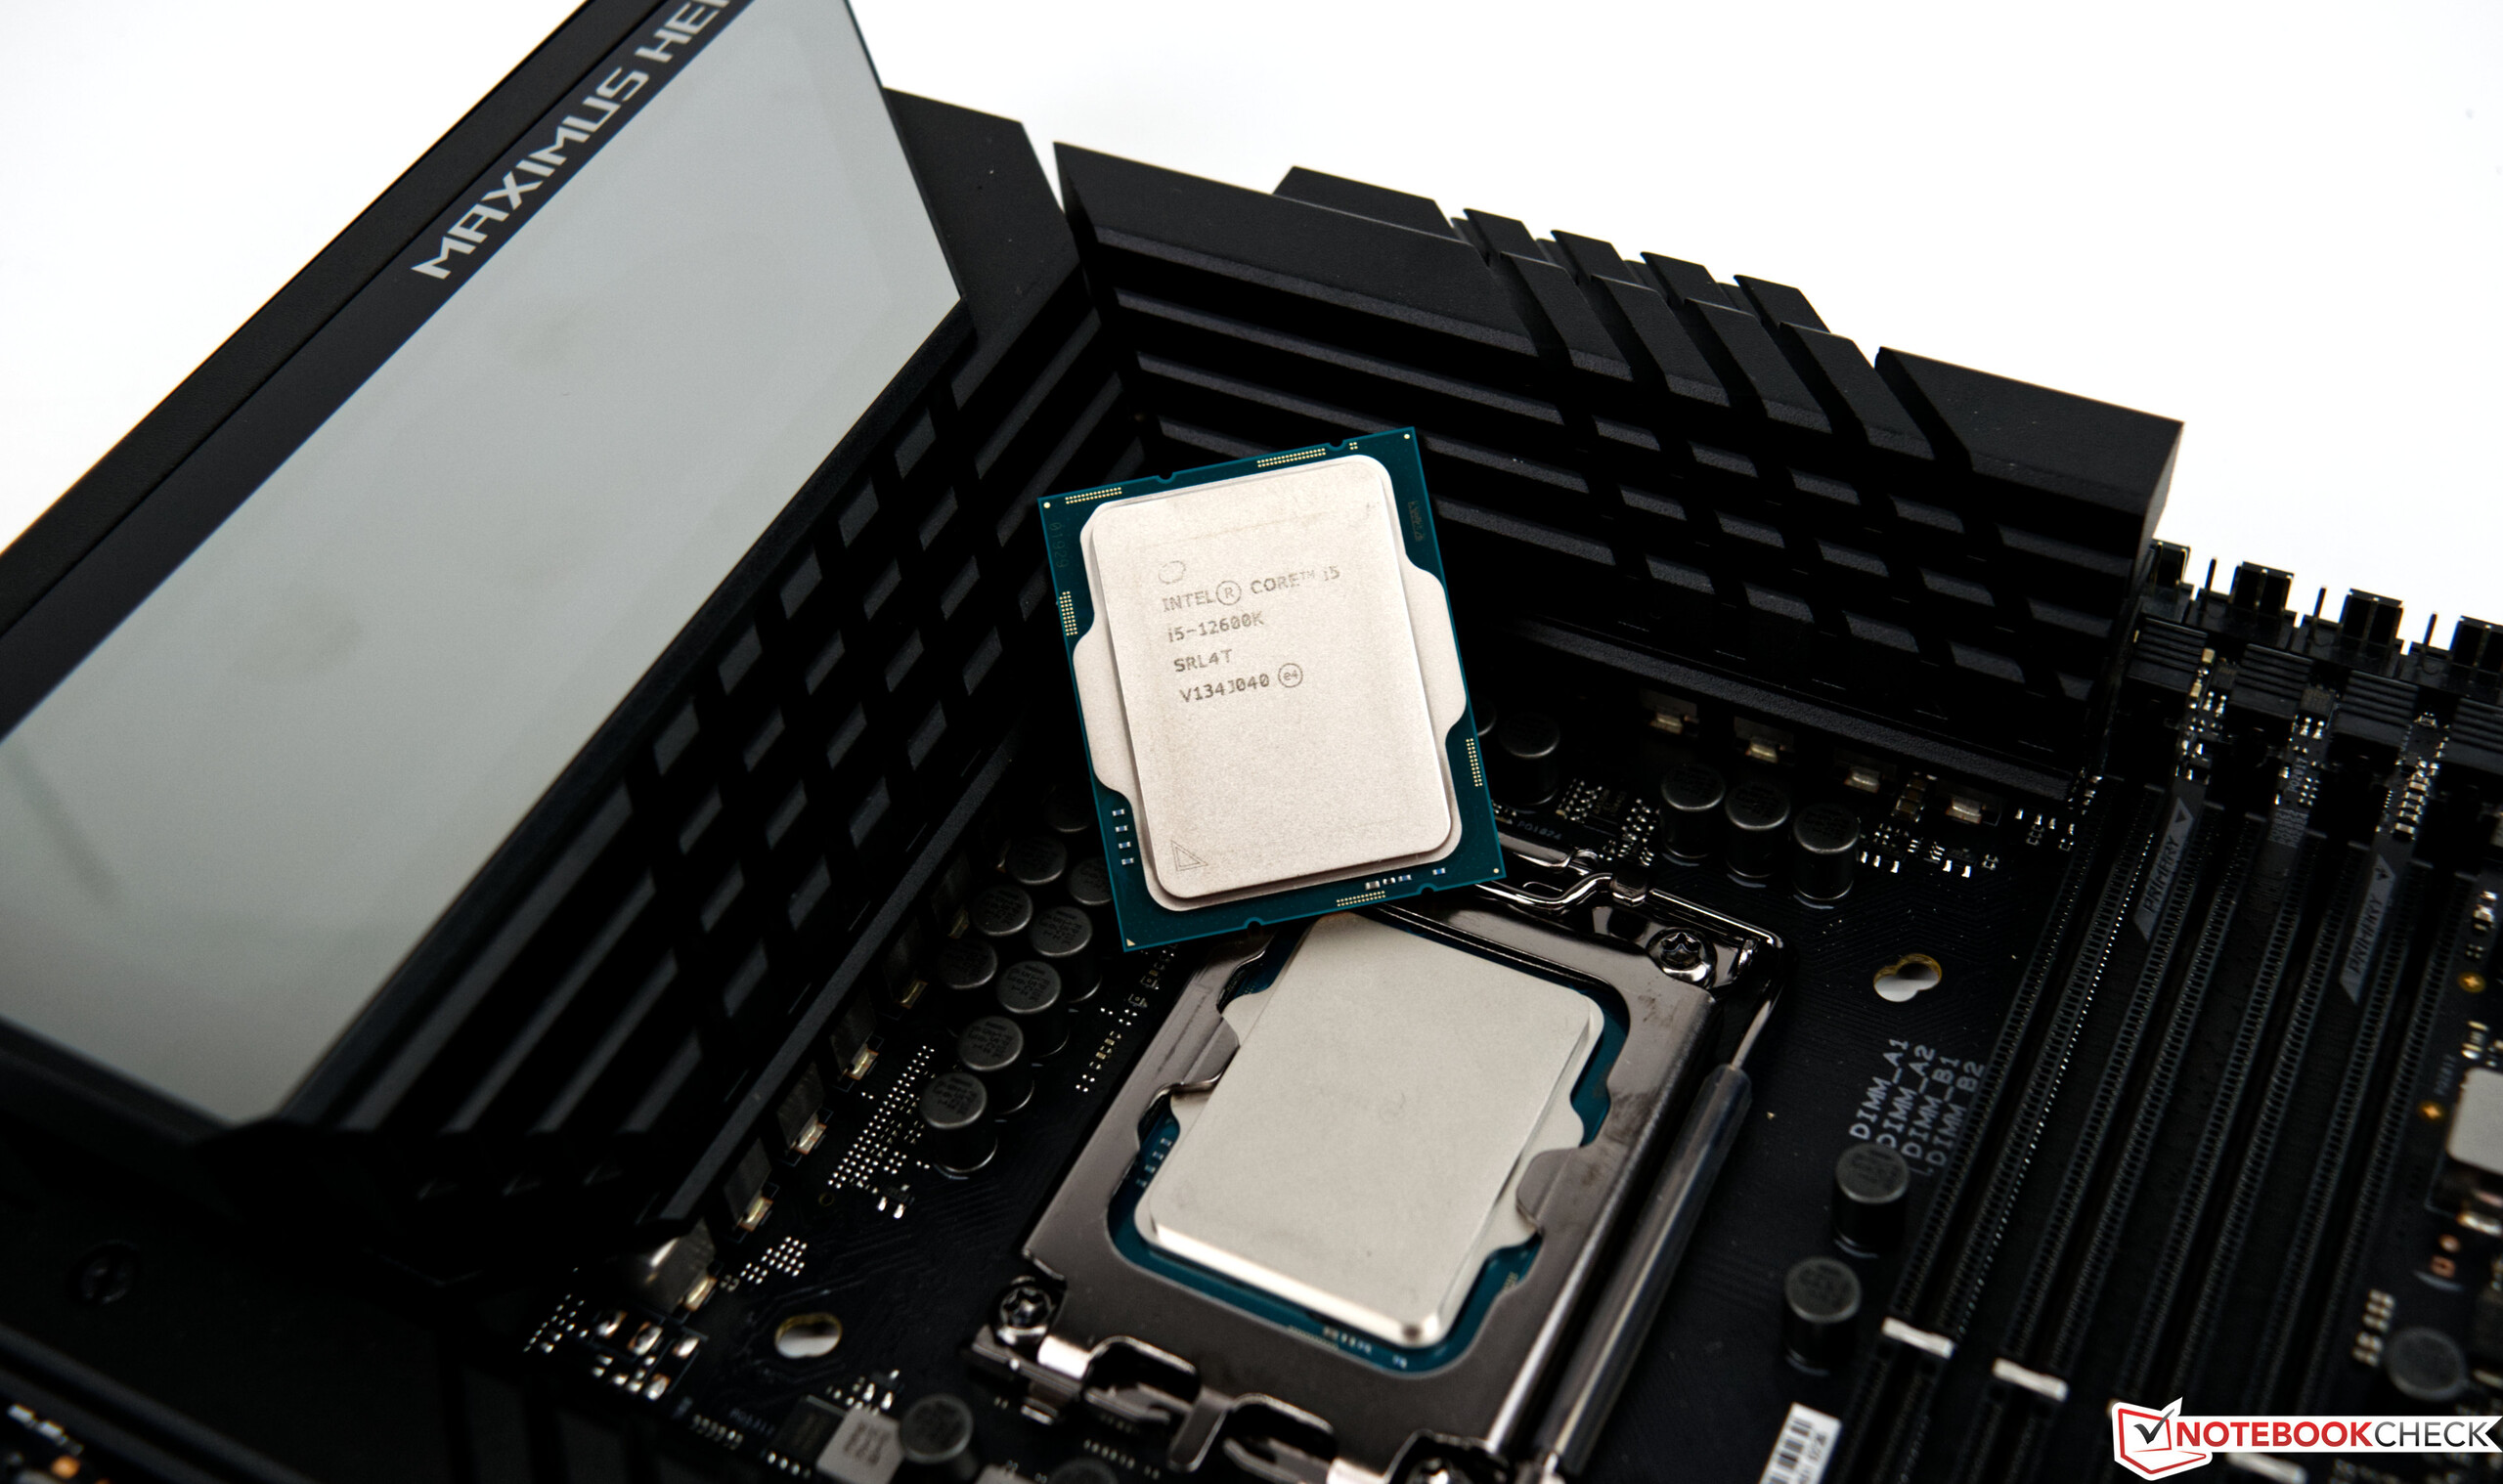
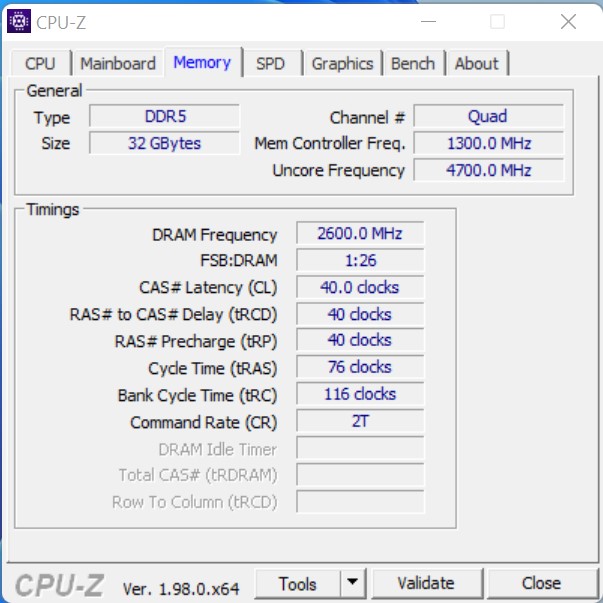
随着最新的台式机处理器和第12代酷睿系列的推出,英特尔再次引入了平台的变化。 在Comet Lake-S和Rocket Lack-S之后,LGA1200已经成为历史,更大的LGA 1700插座取代了它。最知名的改进是对DDR5和PCIe 5.0的支持。然而,在这一点上,仍然没有可以使用这种全带宽的产品。这使得对该平台的投资成为只能在未来使用的投资。 工作存储器方面的情况看起来好一点。那些想加入最新潮流并获得最佳性能的人不会绕过新的DDR5工作内存。但英特尔Alder Lake-S处理器也支持DDR4内存。你可以找到相应的板子出售,也有新的高端Z690芯片组。
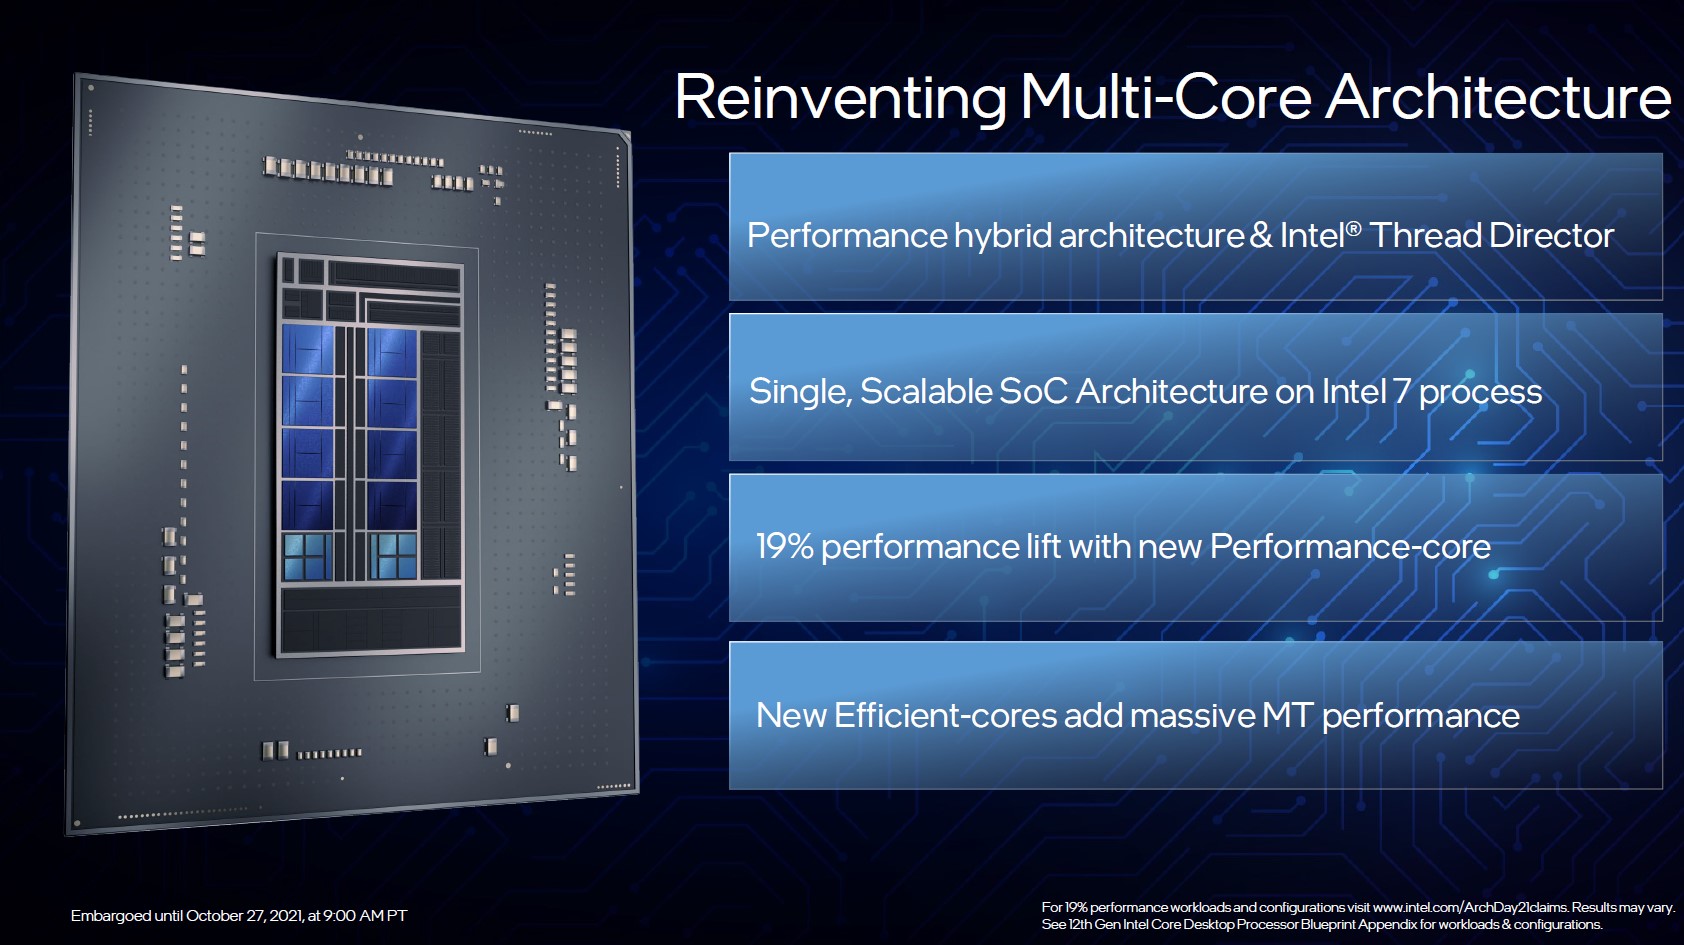
通过Alder Lake-S,英特尔向前迈出了一大步,这不仅仅是Rocket Lake-S的小规模更新。新设计分为性能核心,即所谓的P-核心,以及节能核心,即E-核心。这使得顶级型号可以处理24个线程,由8个包括超线程(HT)的P-核和8个没有HT的E-核组成。在较小的英特尔酷睿i5-12600K中,我们在这次审查中也进行了审查,它是6个P-cores和4个E-cores,导致16个线程。新的E-cores应该能减轻P-cores的一些负担,使它们能够为要求高的应用程序提供足够的计算性能,而E-cores则处理后台进程。但是E-cores绝不是缓慢的计算单元,其性能达到了Skylake的水平。核心的最佳管理是由英特尔线程主管处理的。作为操作系统的Windows 11是 最佳使用的要求。
我们在下面的列表中为你收集了新Alder Lake-S家族最重要的代表。
Alder Lake-S系列的酷睿处理器一览
| 型号 | 内核/ 线程 |
时钟速度P-Core / Turbo | Turbo 3.0 | 时钟速度E-Core / Turbo | 缓存L2 + L3 | 图形 | PBP | MTB | 价格(SRP |
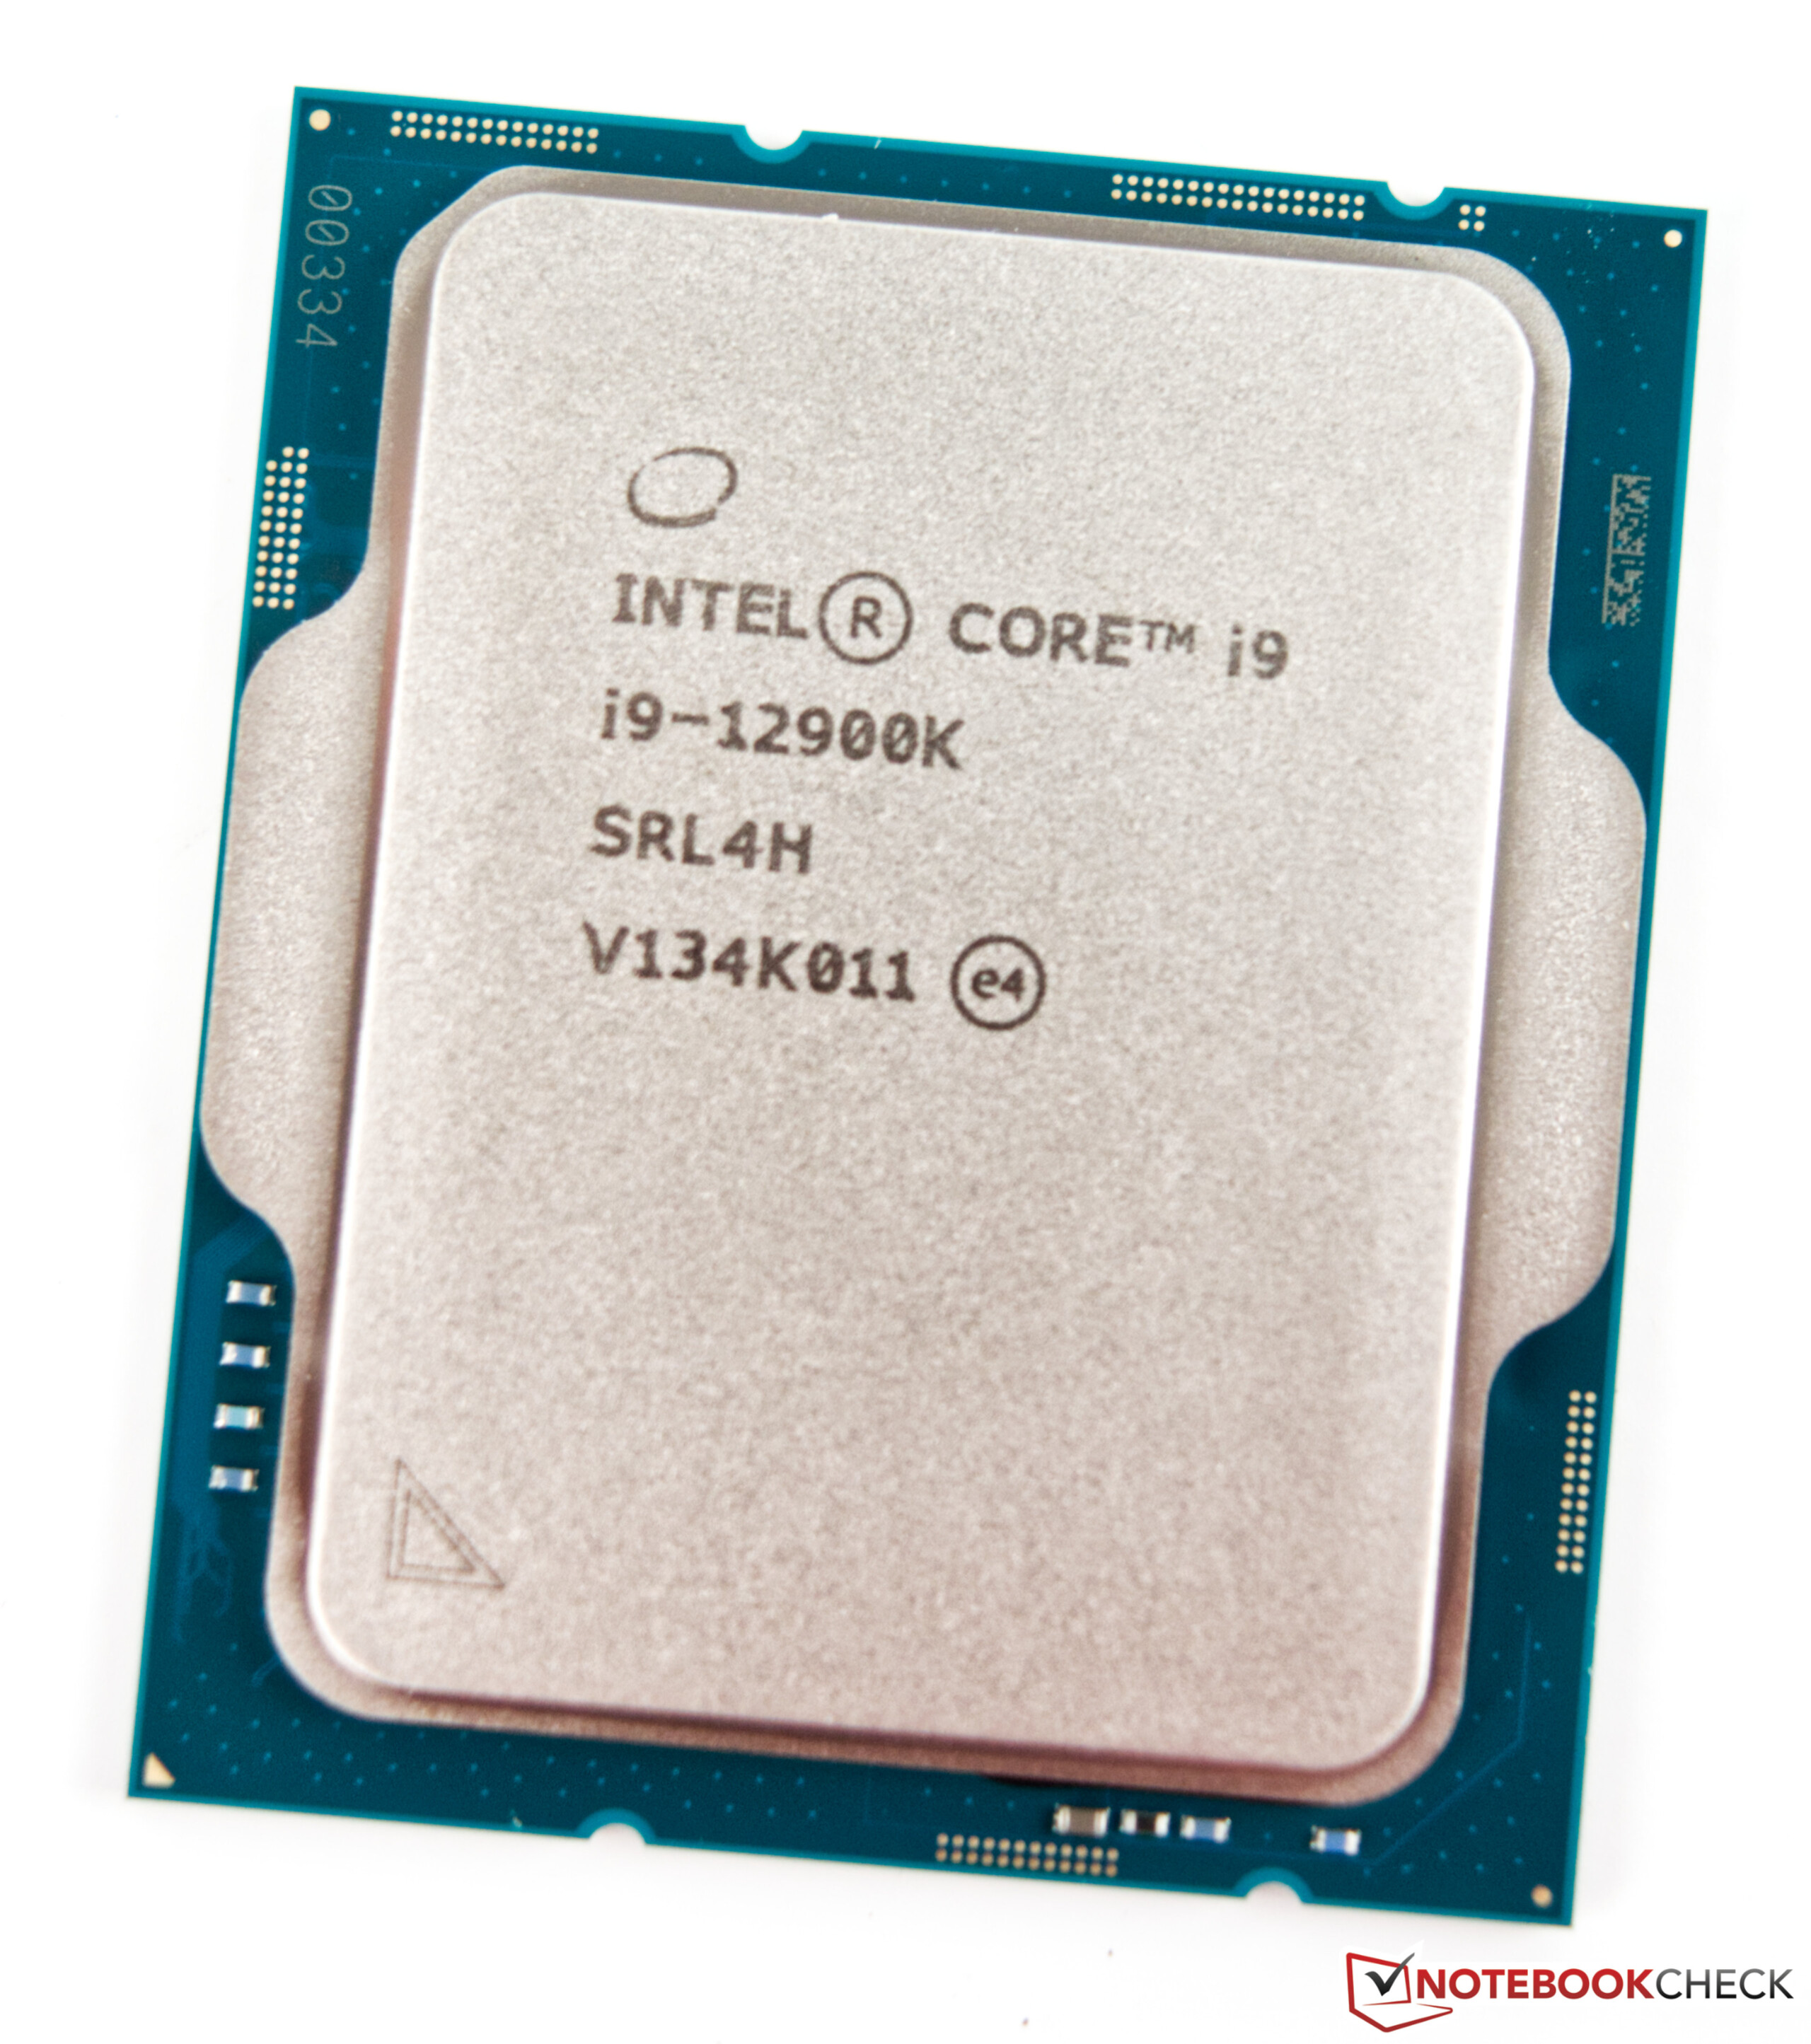
| Core i9-12900K | 16 (8P + 8E) /24 | 3.2 GHz / 5.1 GHz | 5.2 GHz | 2.4 GHz / 3.9 GHz | 14 + 30 MB | UHD 770 | 125 W | 241 W | $ 589 |
| Core i9-12900KF | 16 (8P + 8E) /24 | 3.2 GHz / 5.1 GHz | 5.2 GHz | 2.4 GHz / 3.9 GHz | 14 + 30 MB | - | 125 W | 241 W | $ 564 |
| Core i7-12700K | 12 (8P + 4E) /20 | 3.6 GHz / 4.9 GHz | 5.0 GHz | 2.7 GHz / 3.8 GHz | 12 + 25 MB | UHD 770 | 125 W | 190 W | $ 409 |
| Core i7-12700KF | 12 (8P + 4E) /20 | 3.6 GHz / 4.9 GHz | 5.0 GHz | 2.7 GHz / 3.8 GHz | 12 + 25 MB | - | 125 W | 190 W | $ 384 |
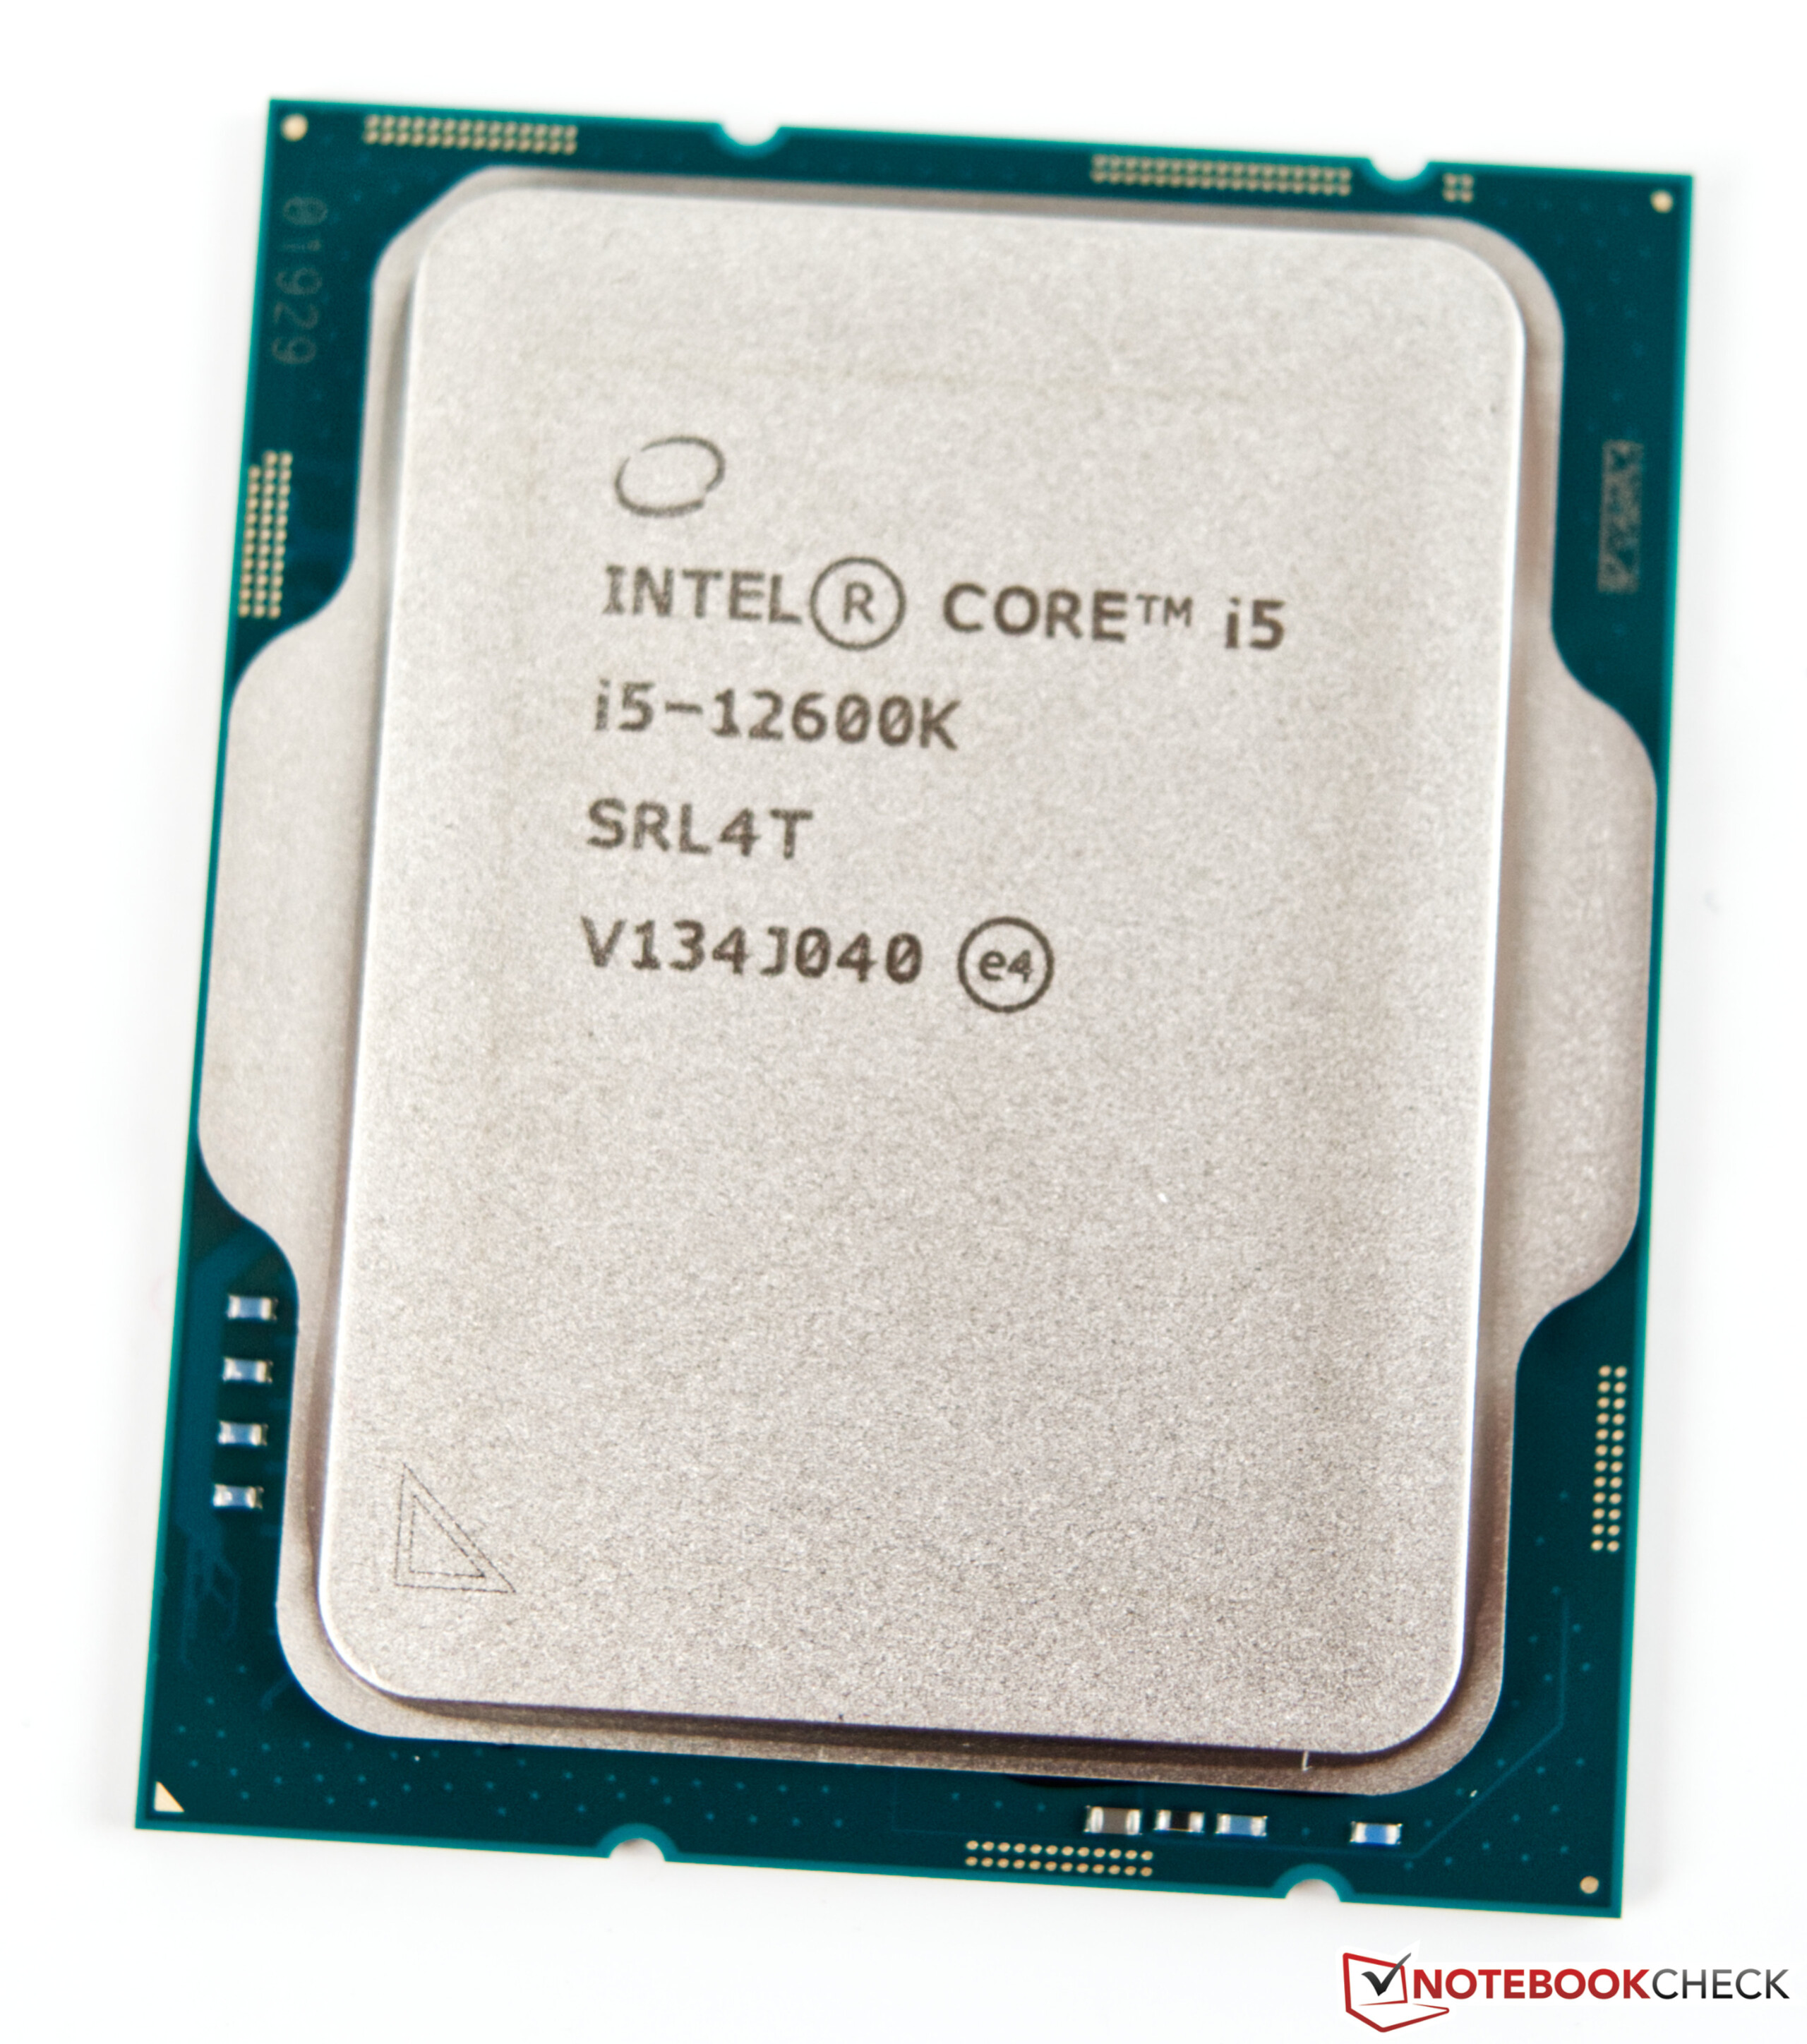
| Core i5-12600K | 10 (6P + 4E) /16 | 3.7 GHz / 4.9 GHz | - | 2.8 GHz / 3.6 GHz | 9.5 + 20 MB | UHD 770 | 125 W | 150 W | $ 289 |
| Core i5-12600KF | 10 (6P + 4E) /16 | 3,7 GHz / 4,9 GHz | - | 2,8 GHz / 3,6 GHz | 9,5 + 20 MB | - | 125 W | 150 W | $ 264 |
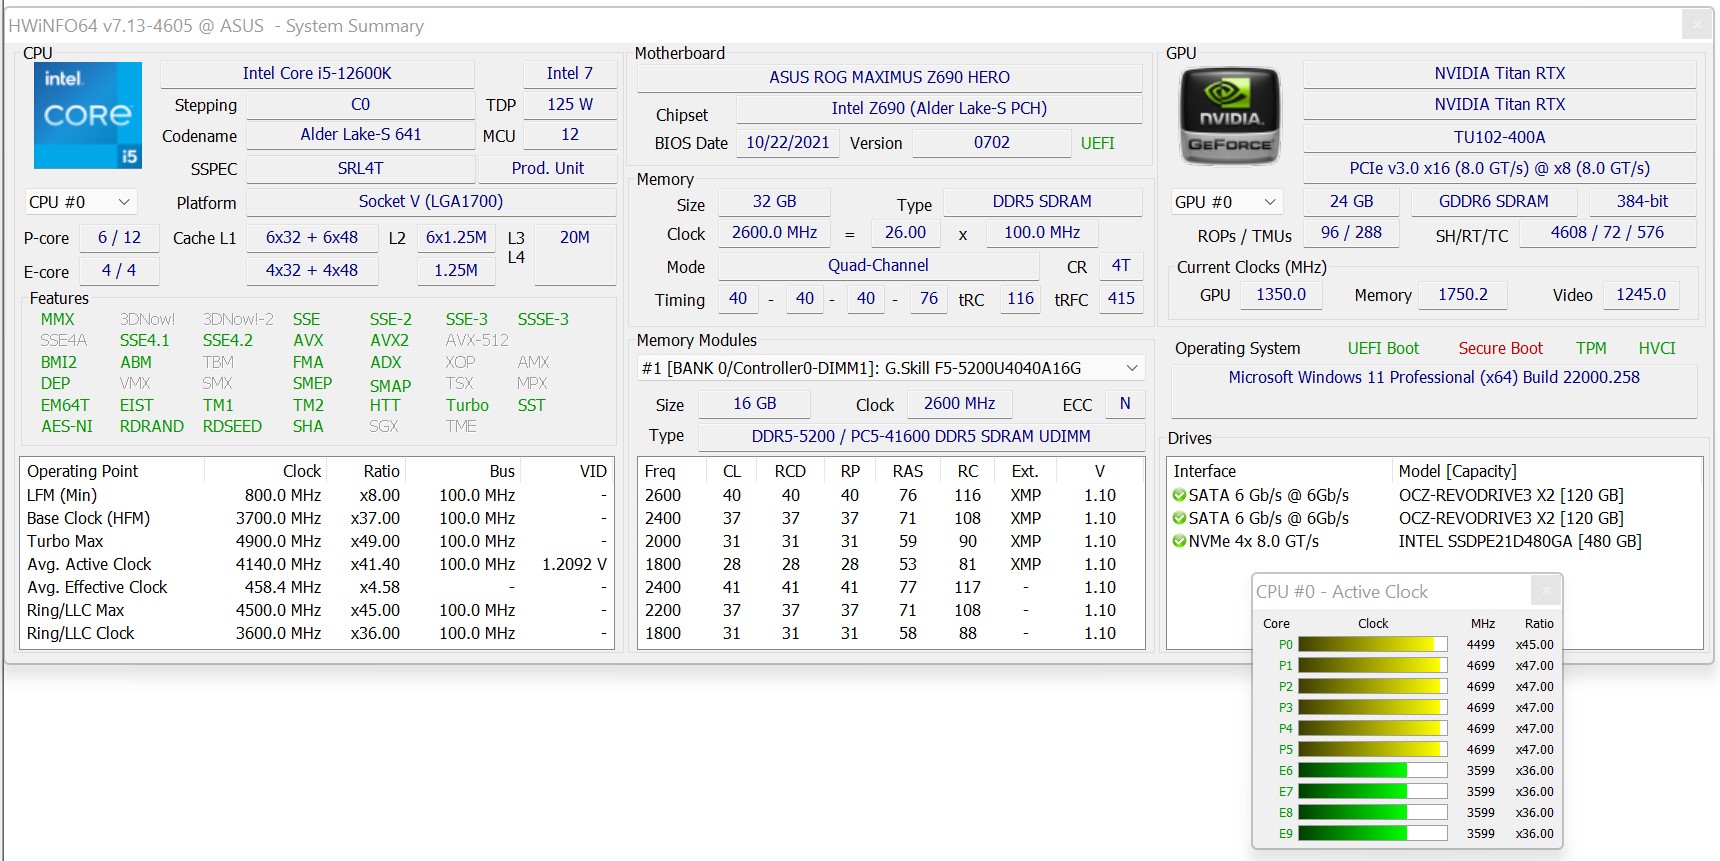
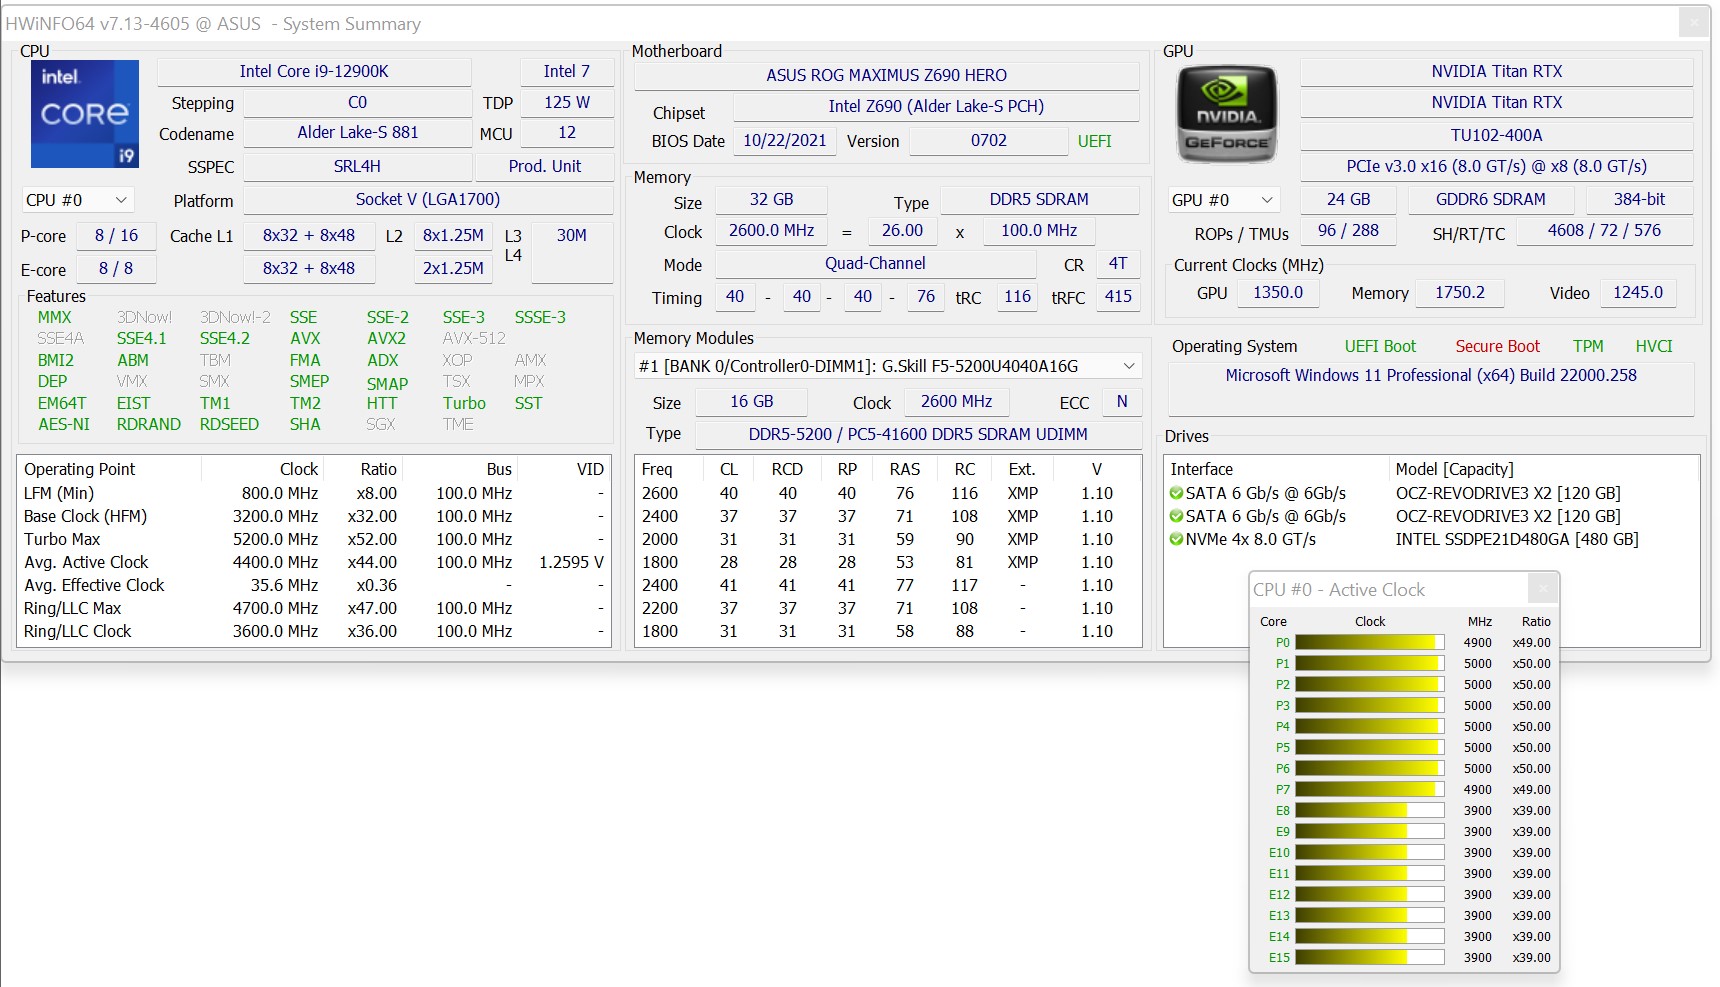
我们测试系统的细节
我们在下面的基准和测试中使用以下系统。
- 瑞金德培安表
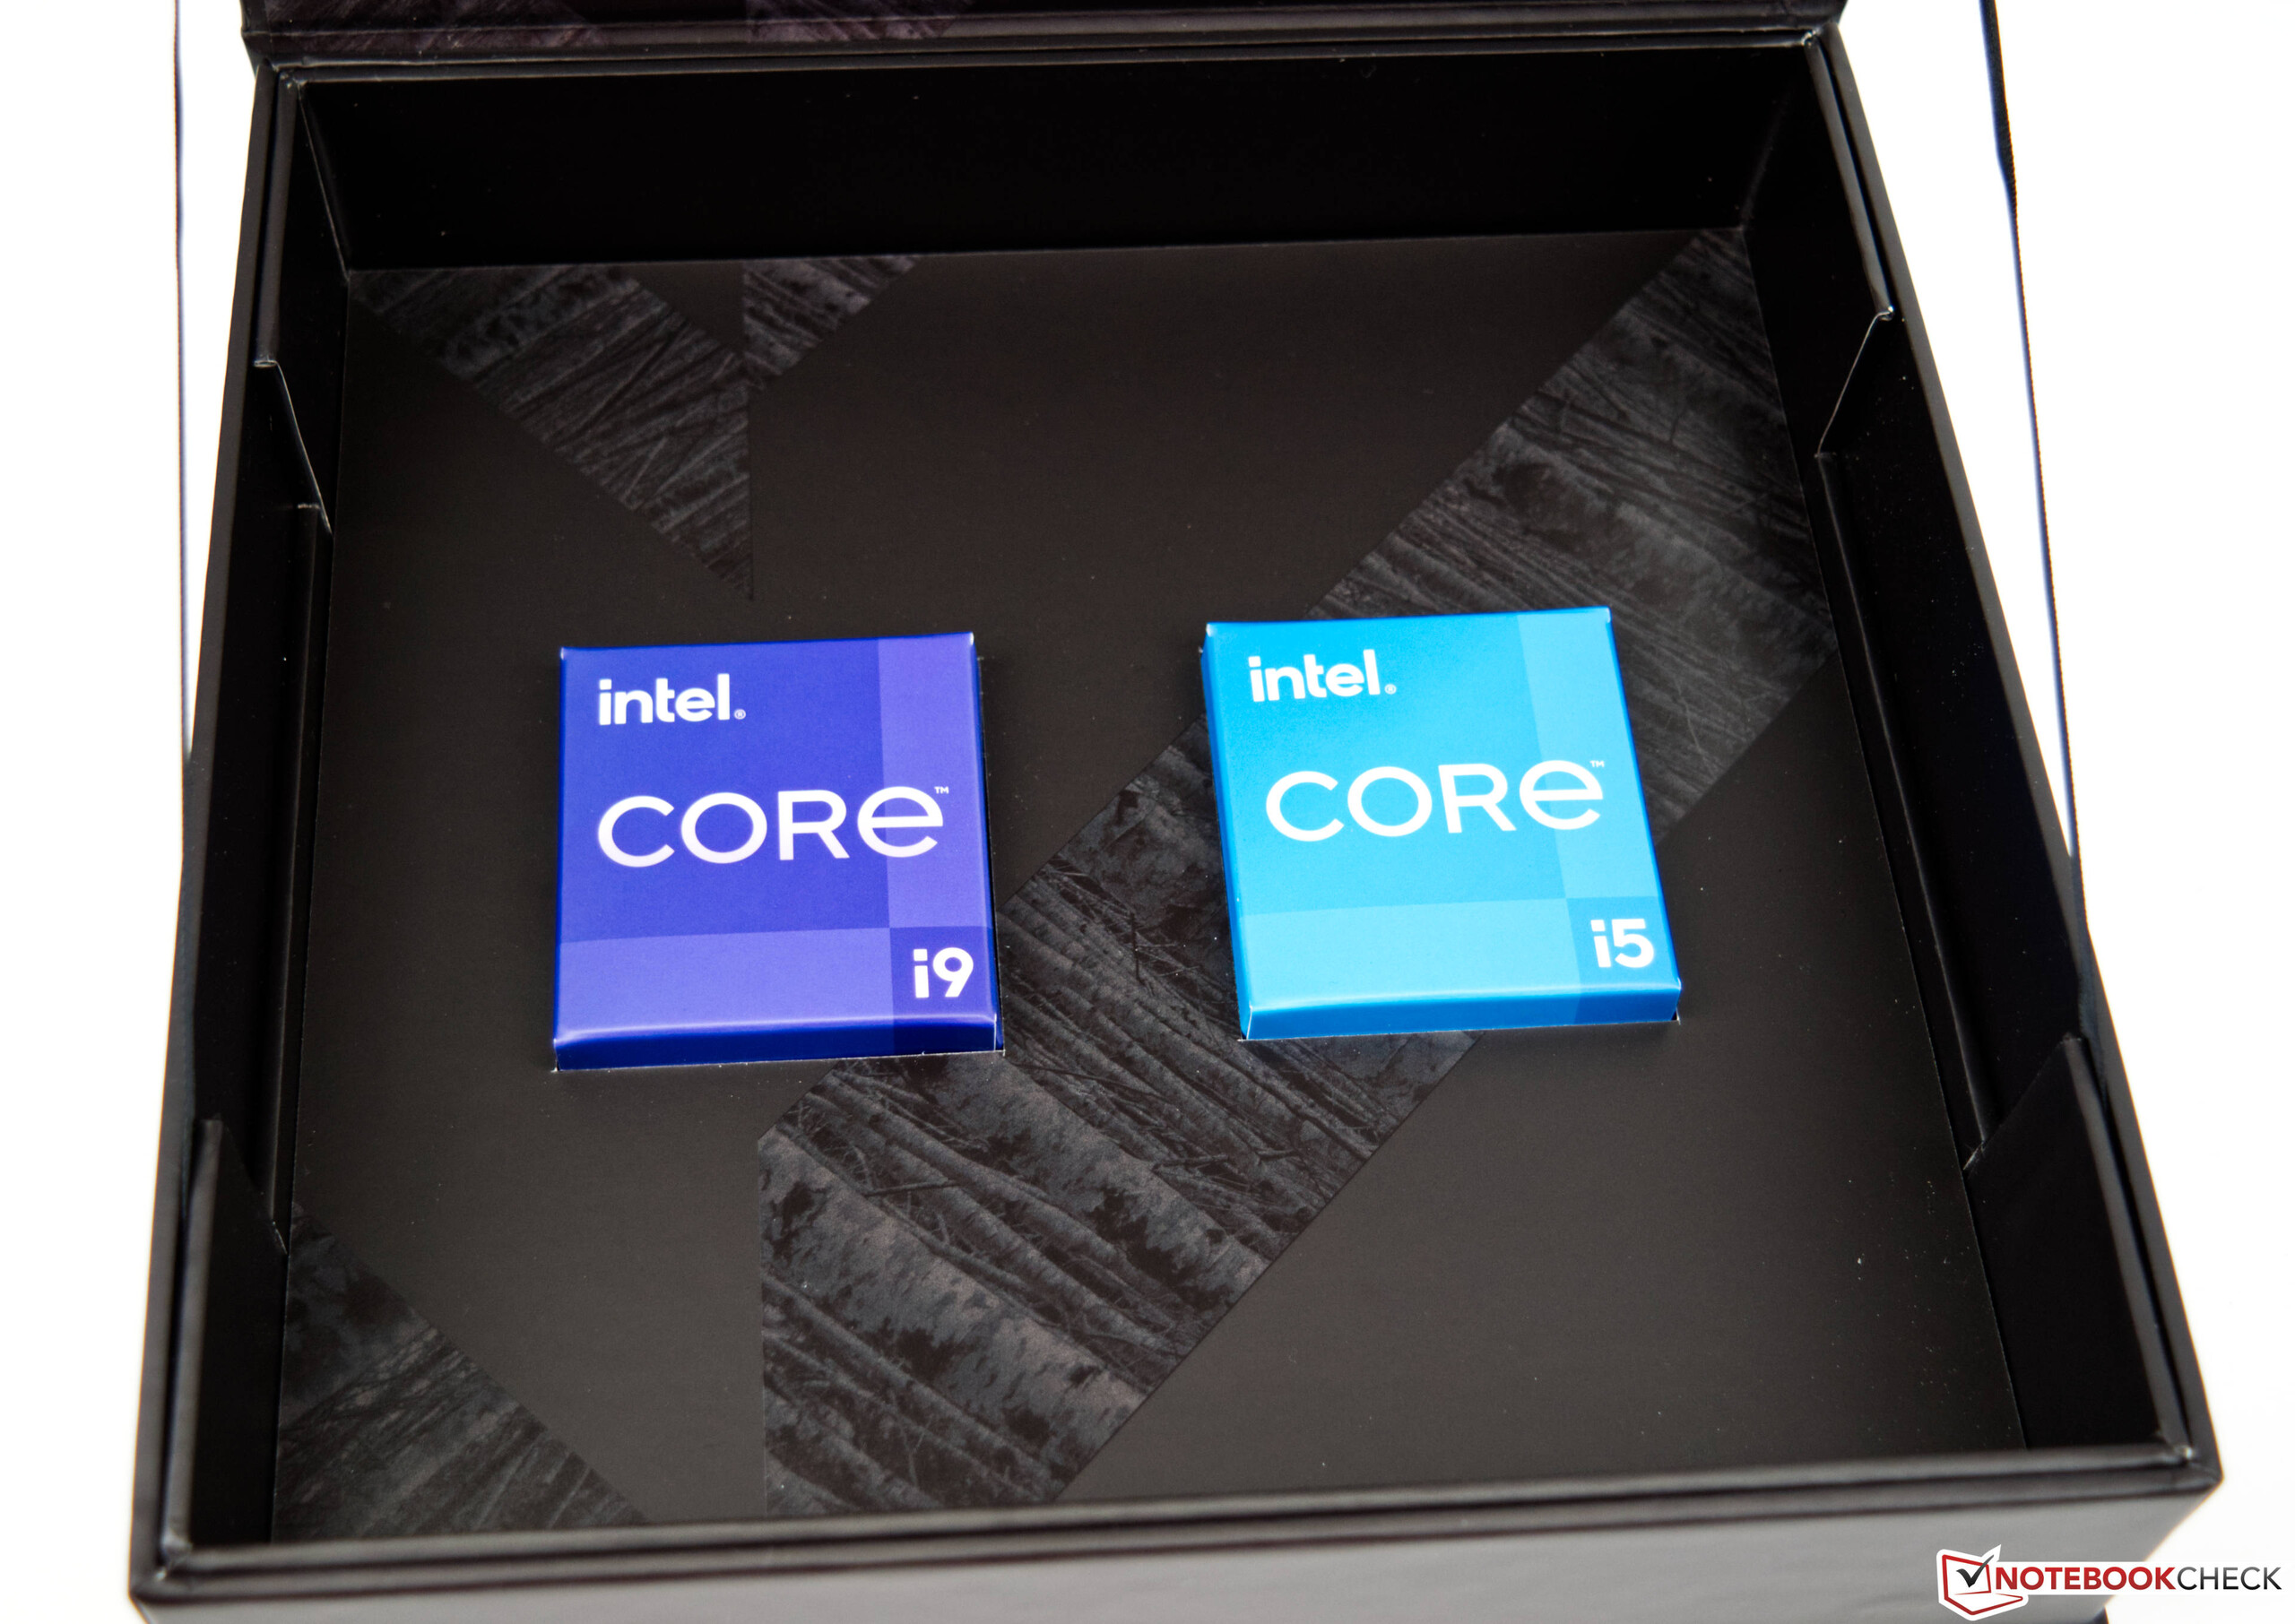
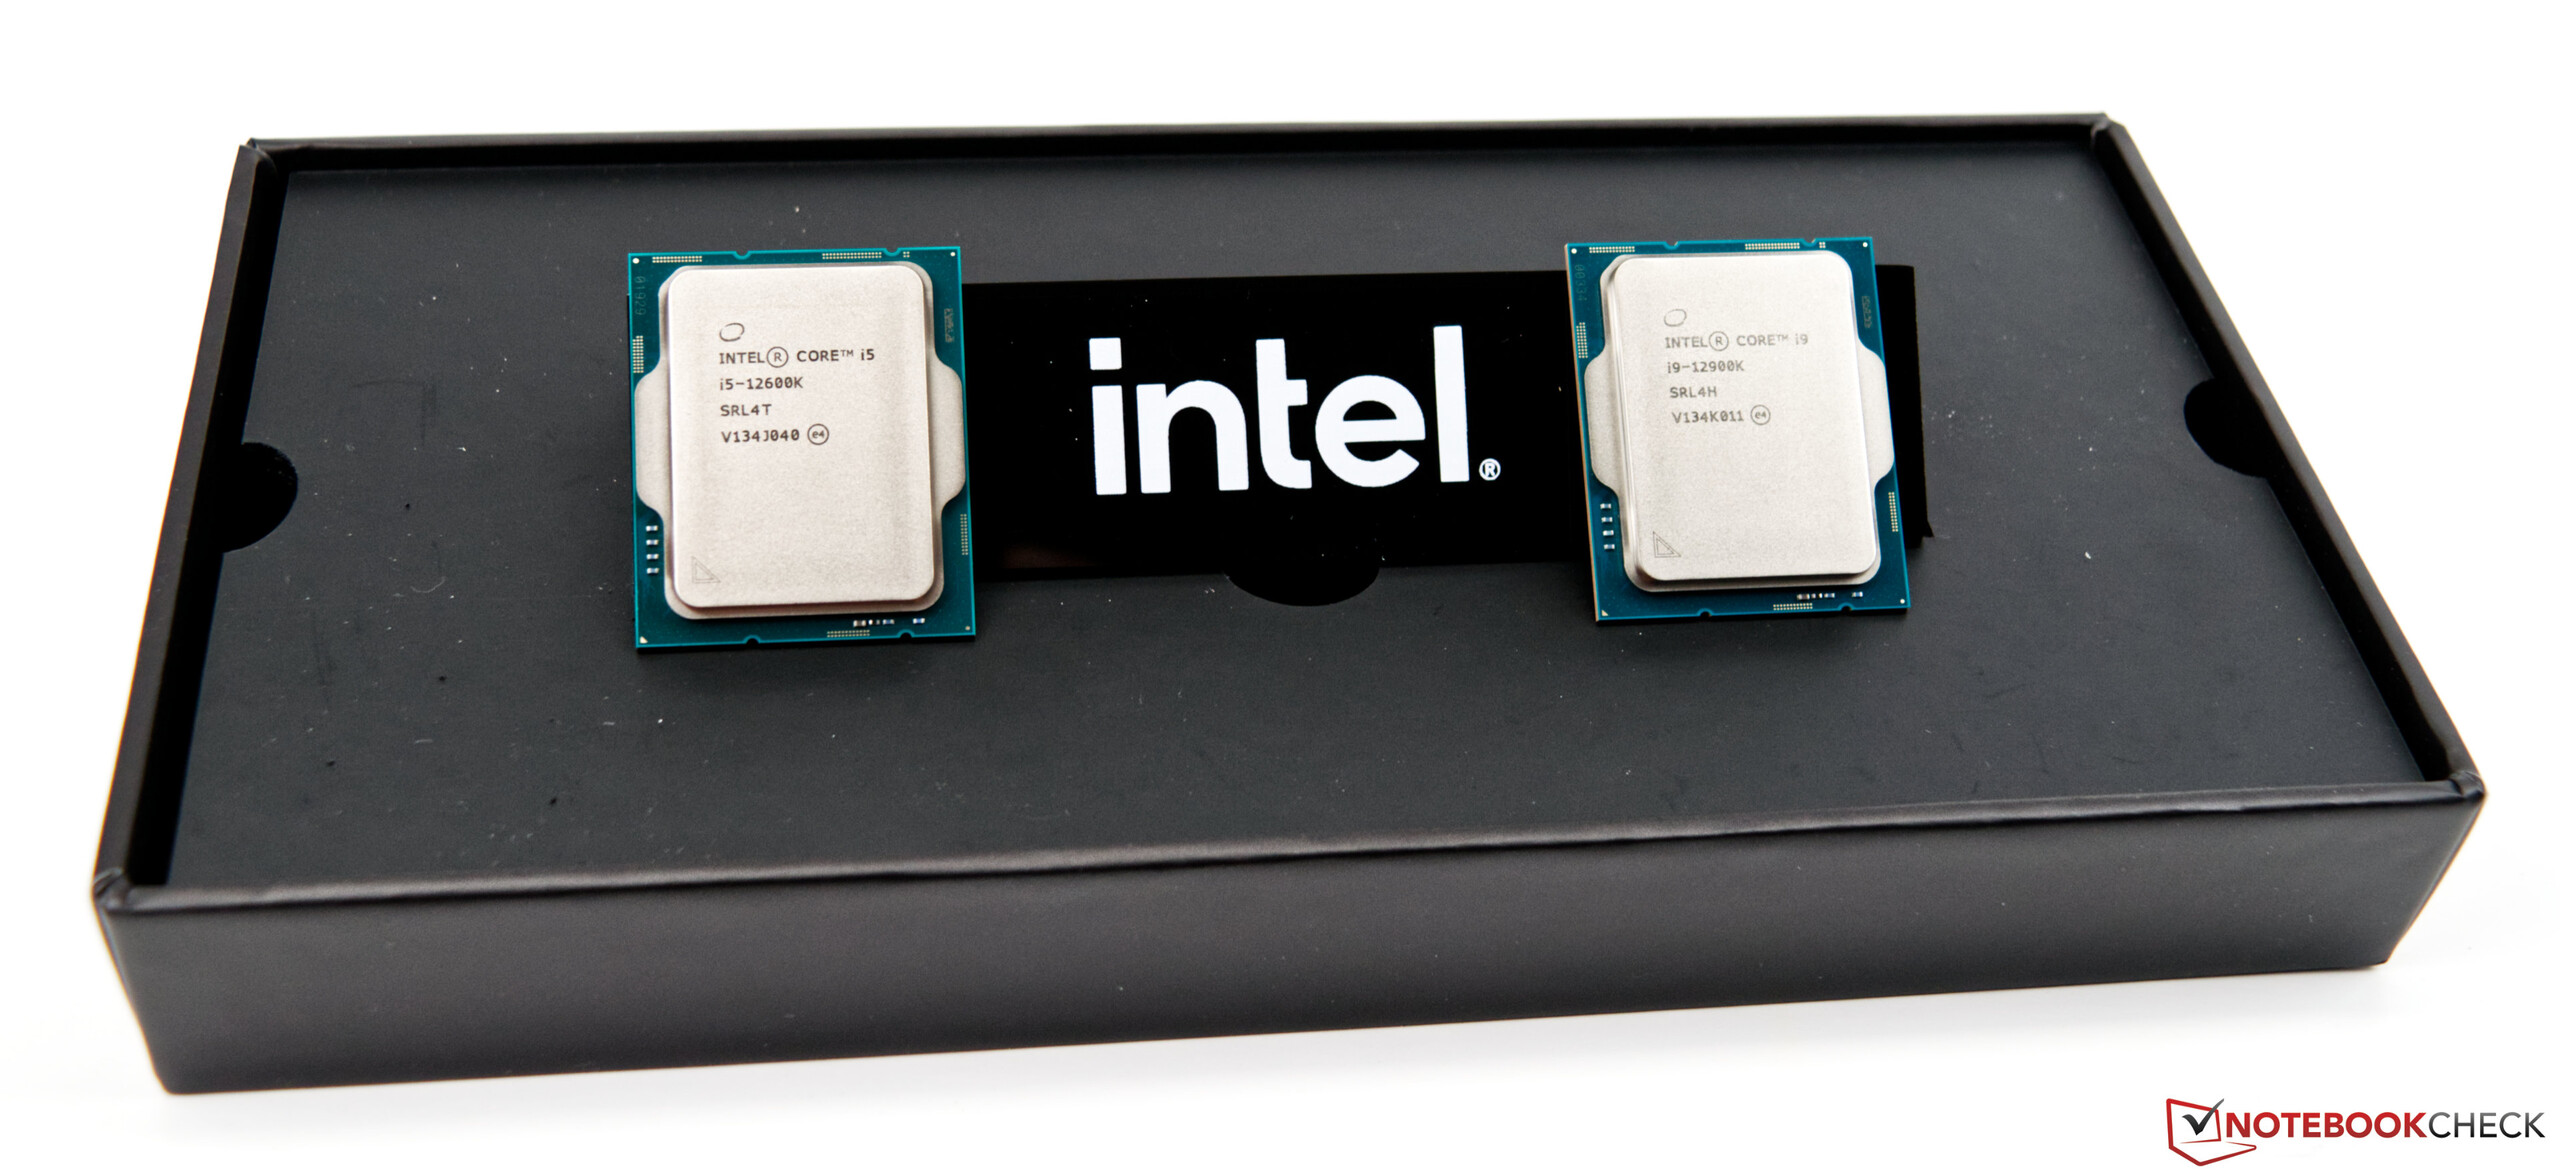
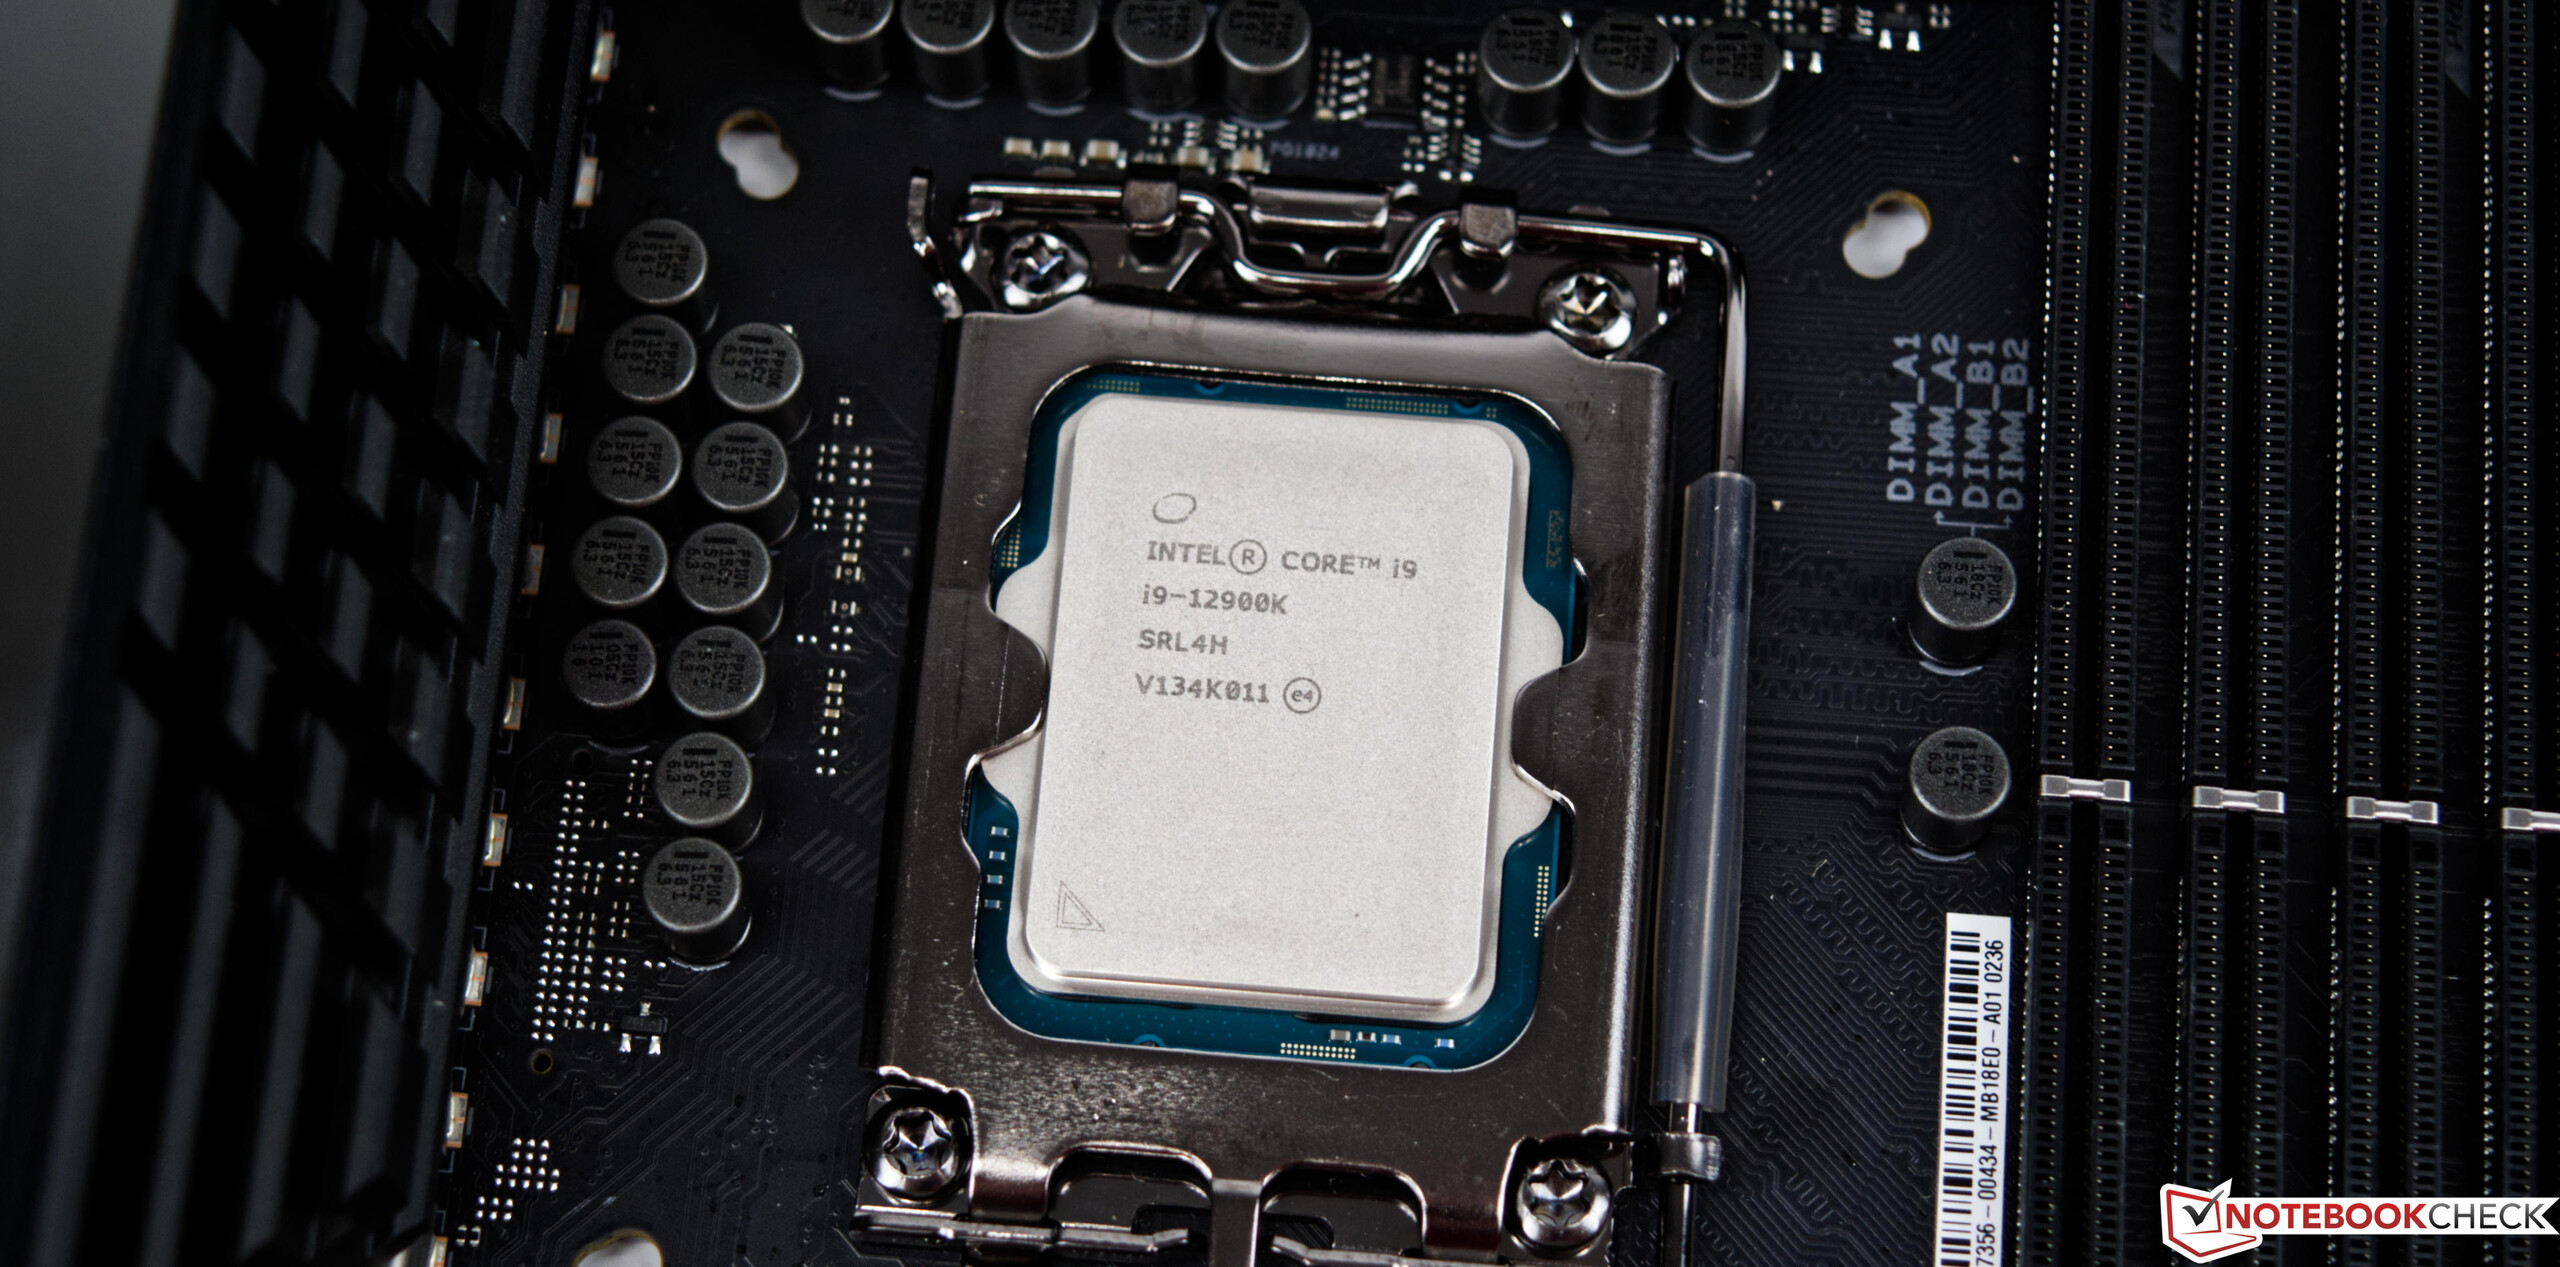
- 英特尔酷睿i9-12900K, 英特尔酷睿i5-12600K
- 华硕ROG Maximus Z690 Hero
- Alphacool Eisbear Aurora 280 AiO
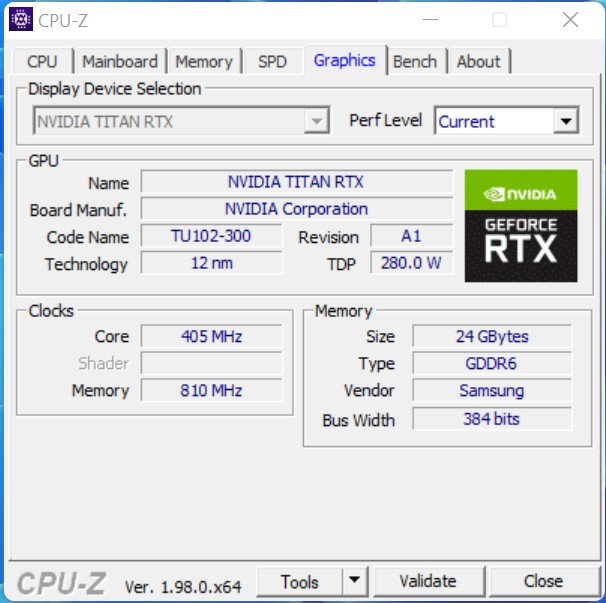
- Nvidia Titan RTX
- 海瑟尔HX 1200X电源
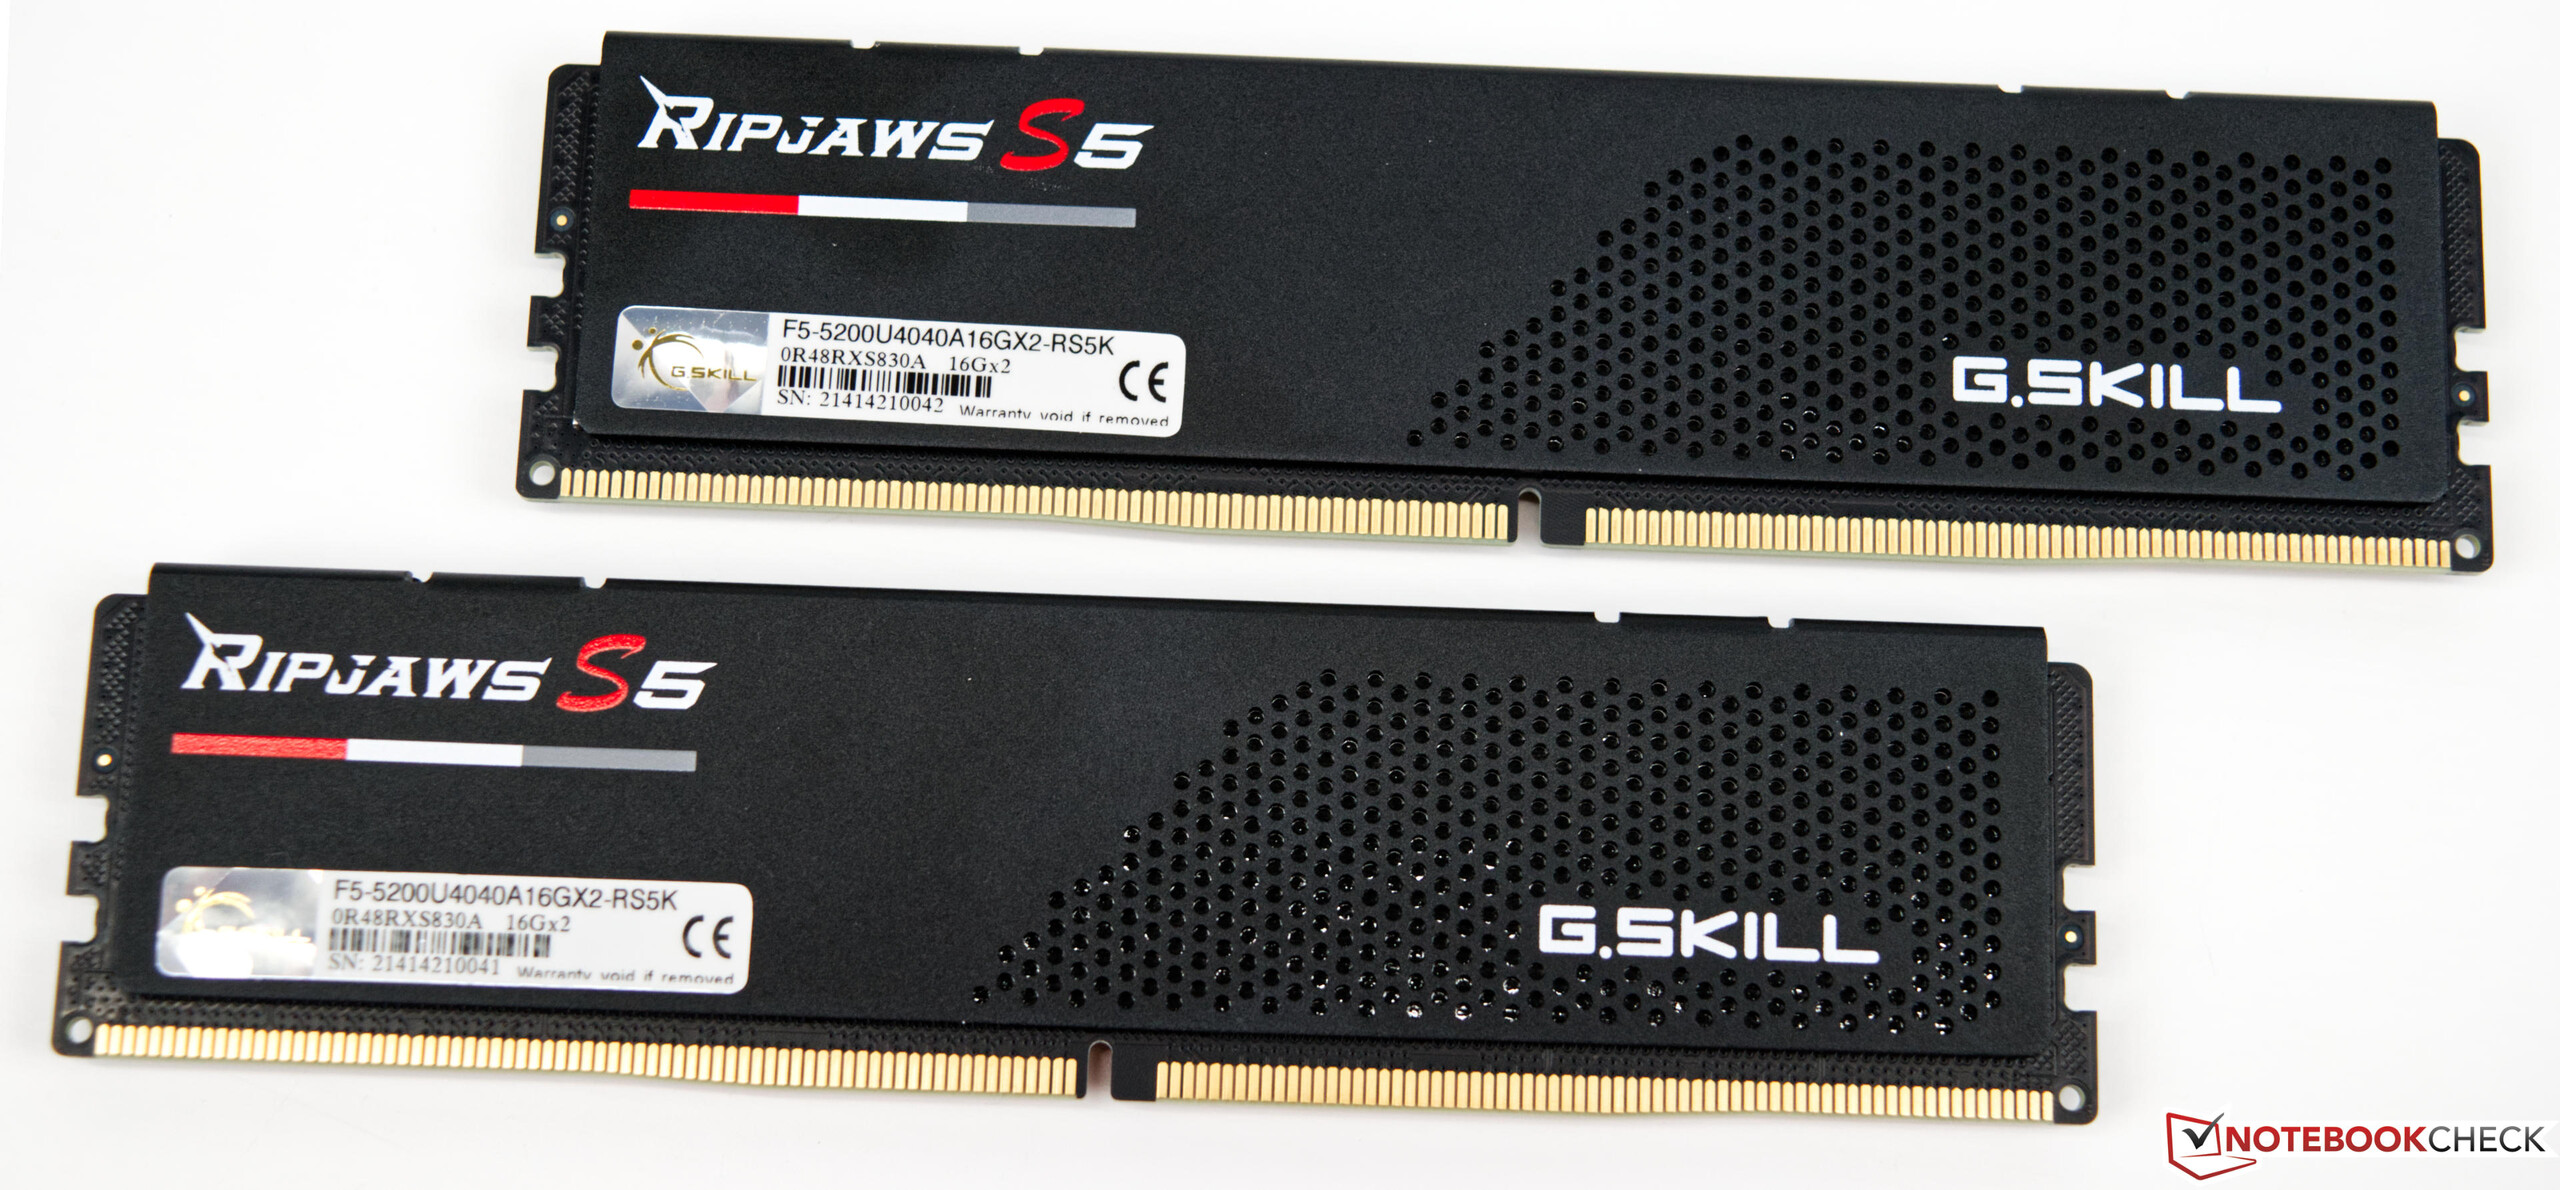
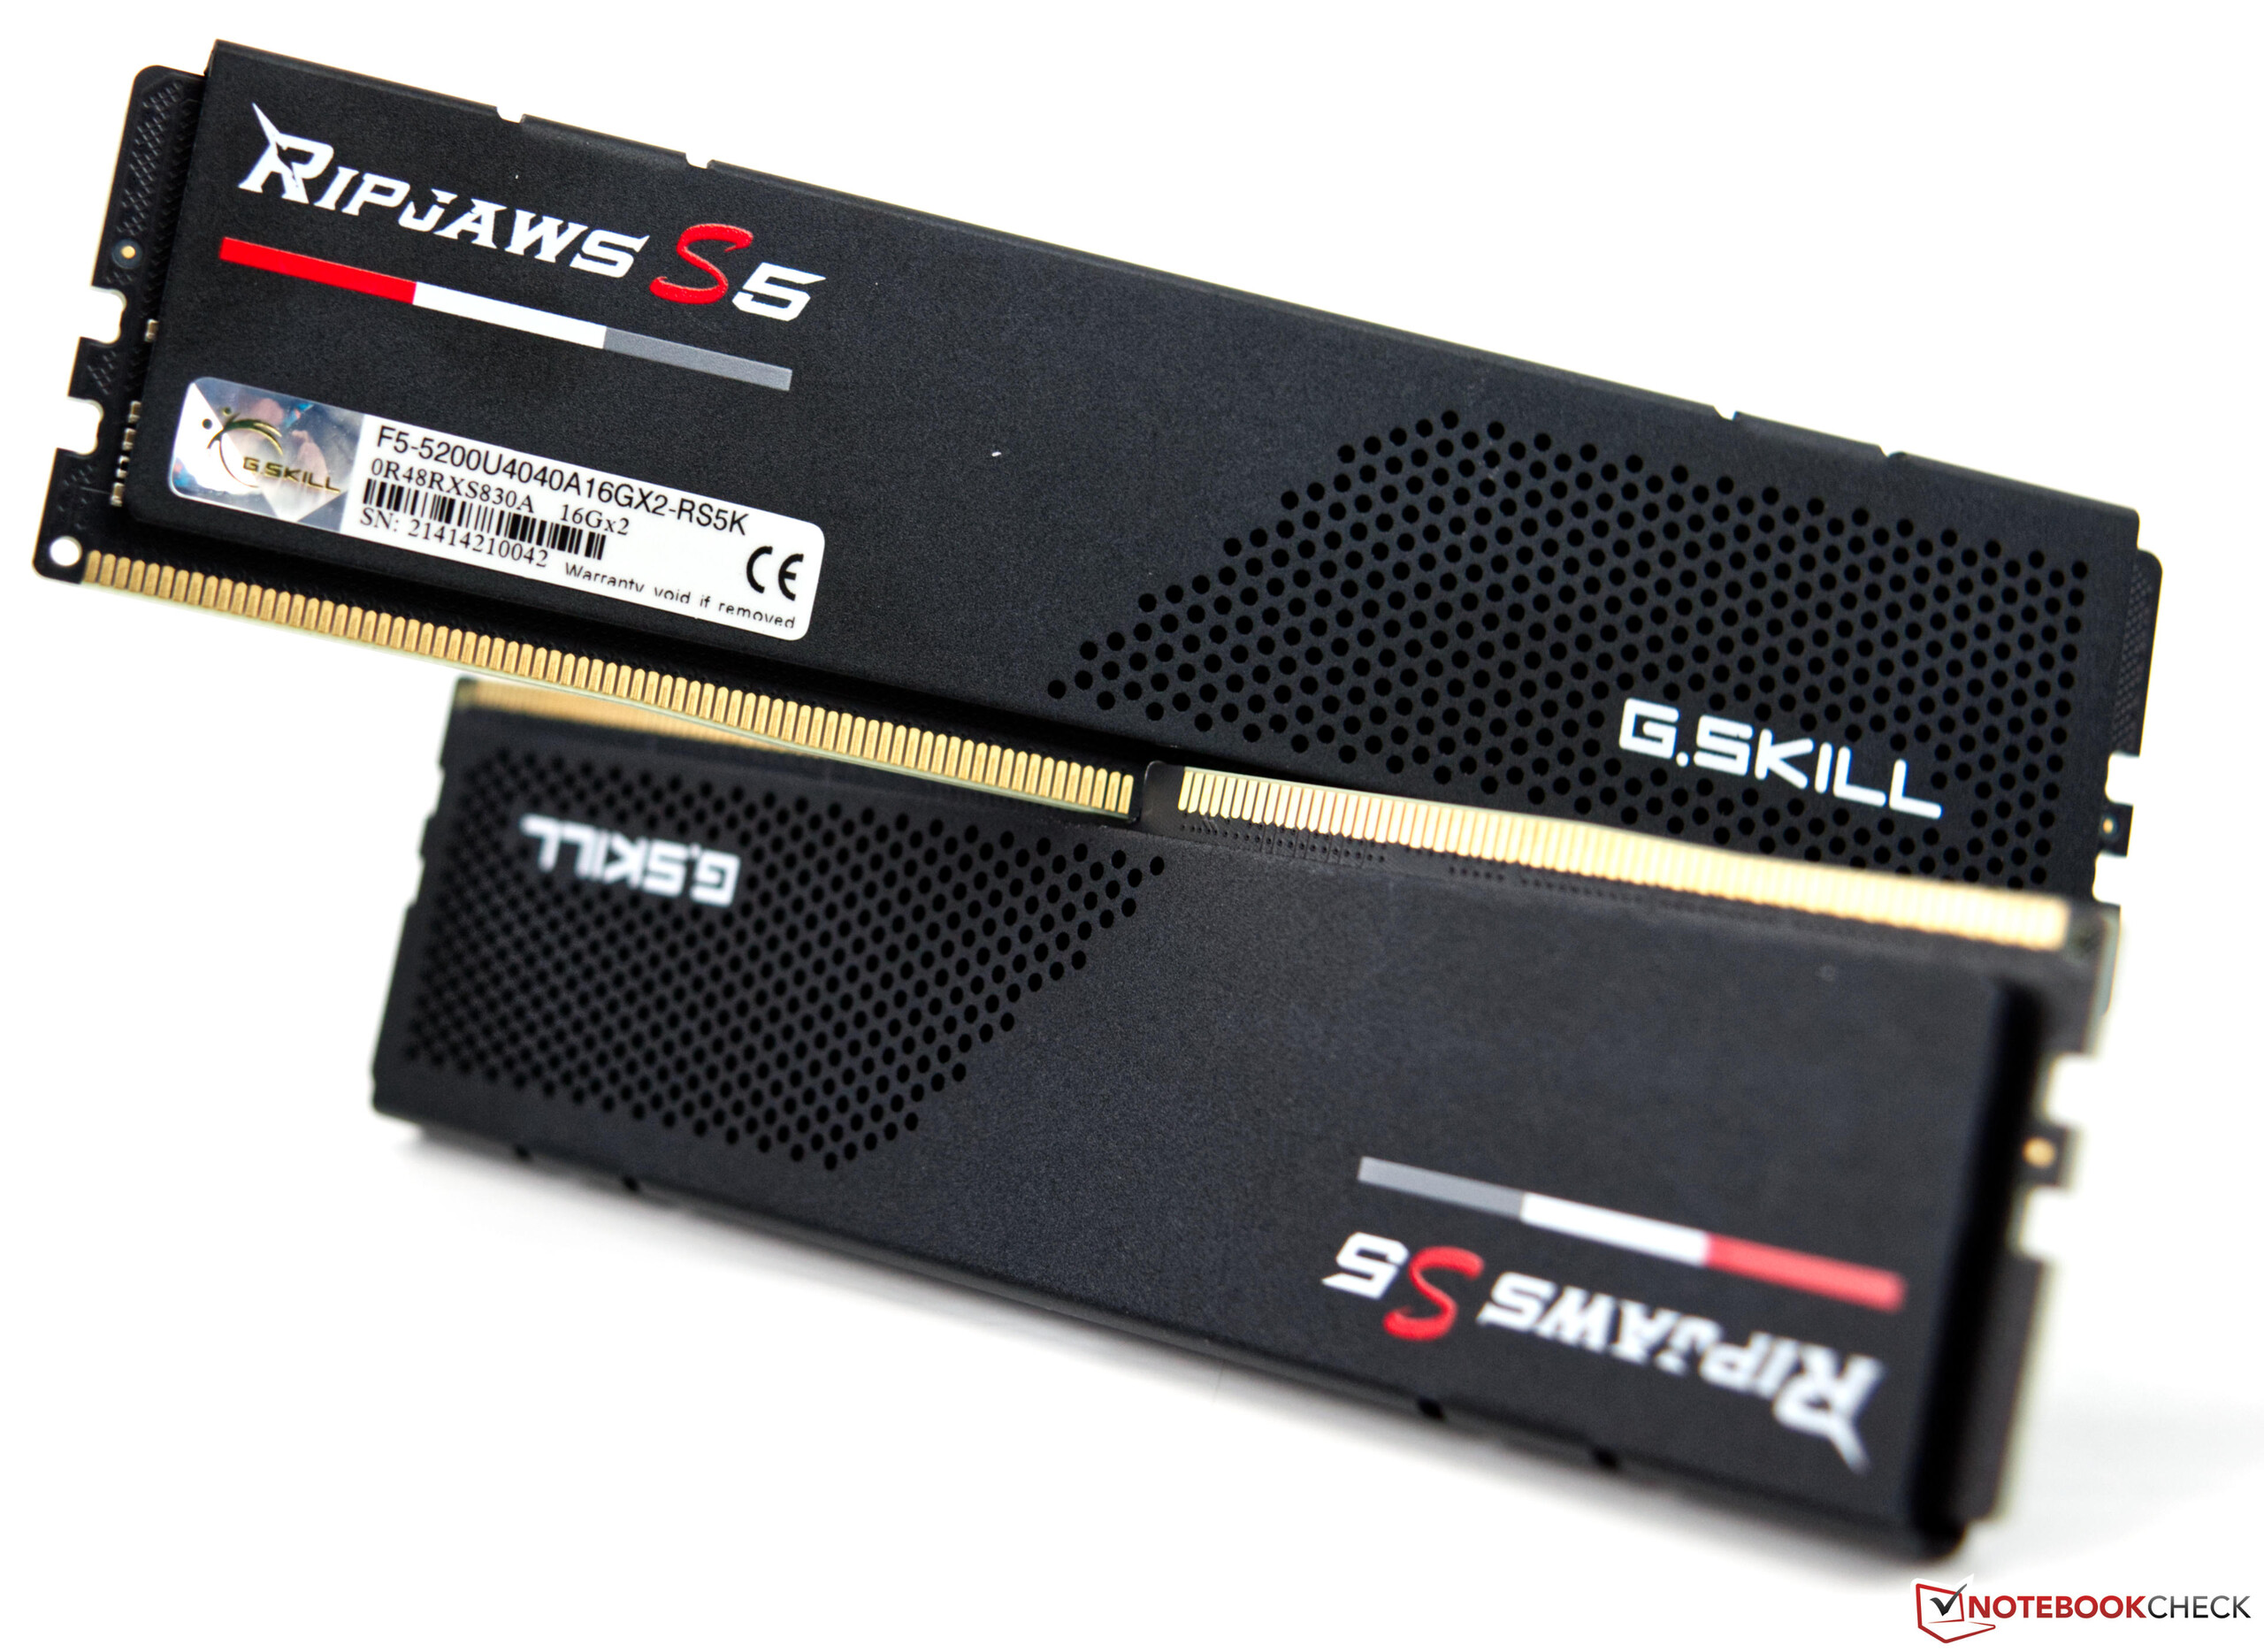
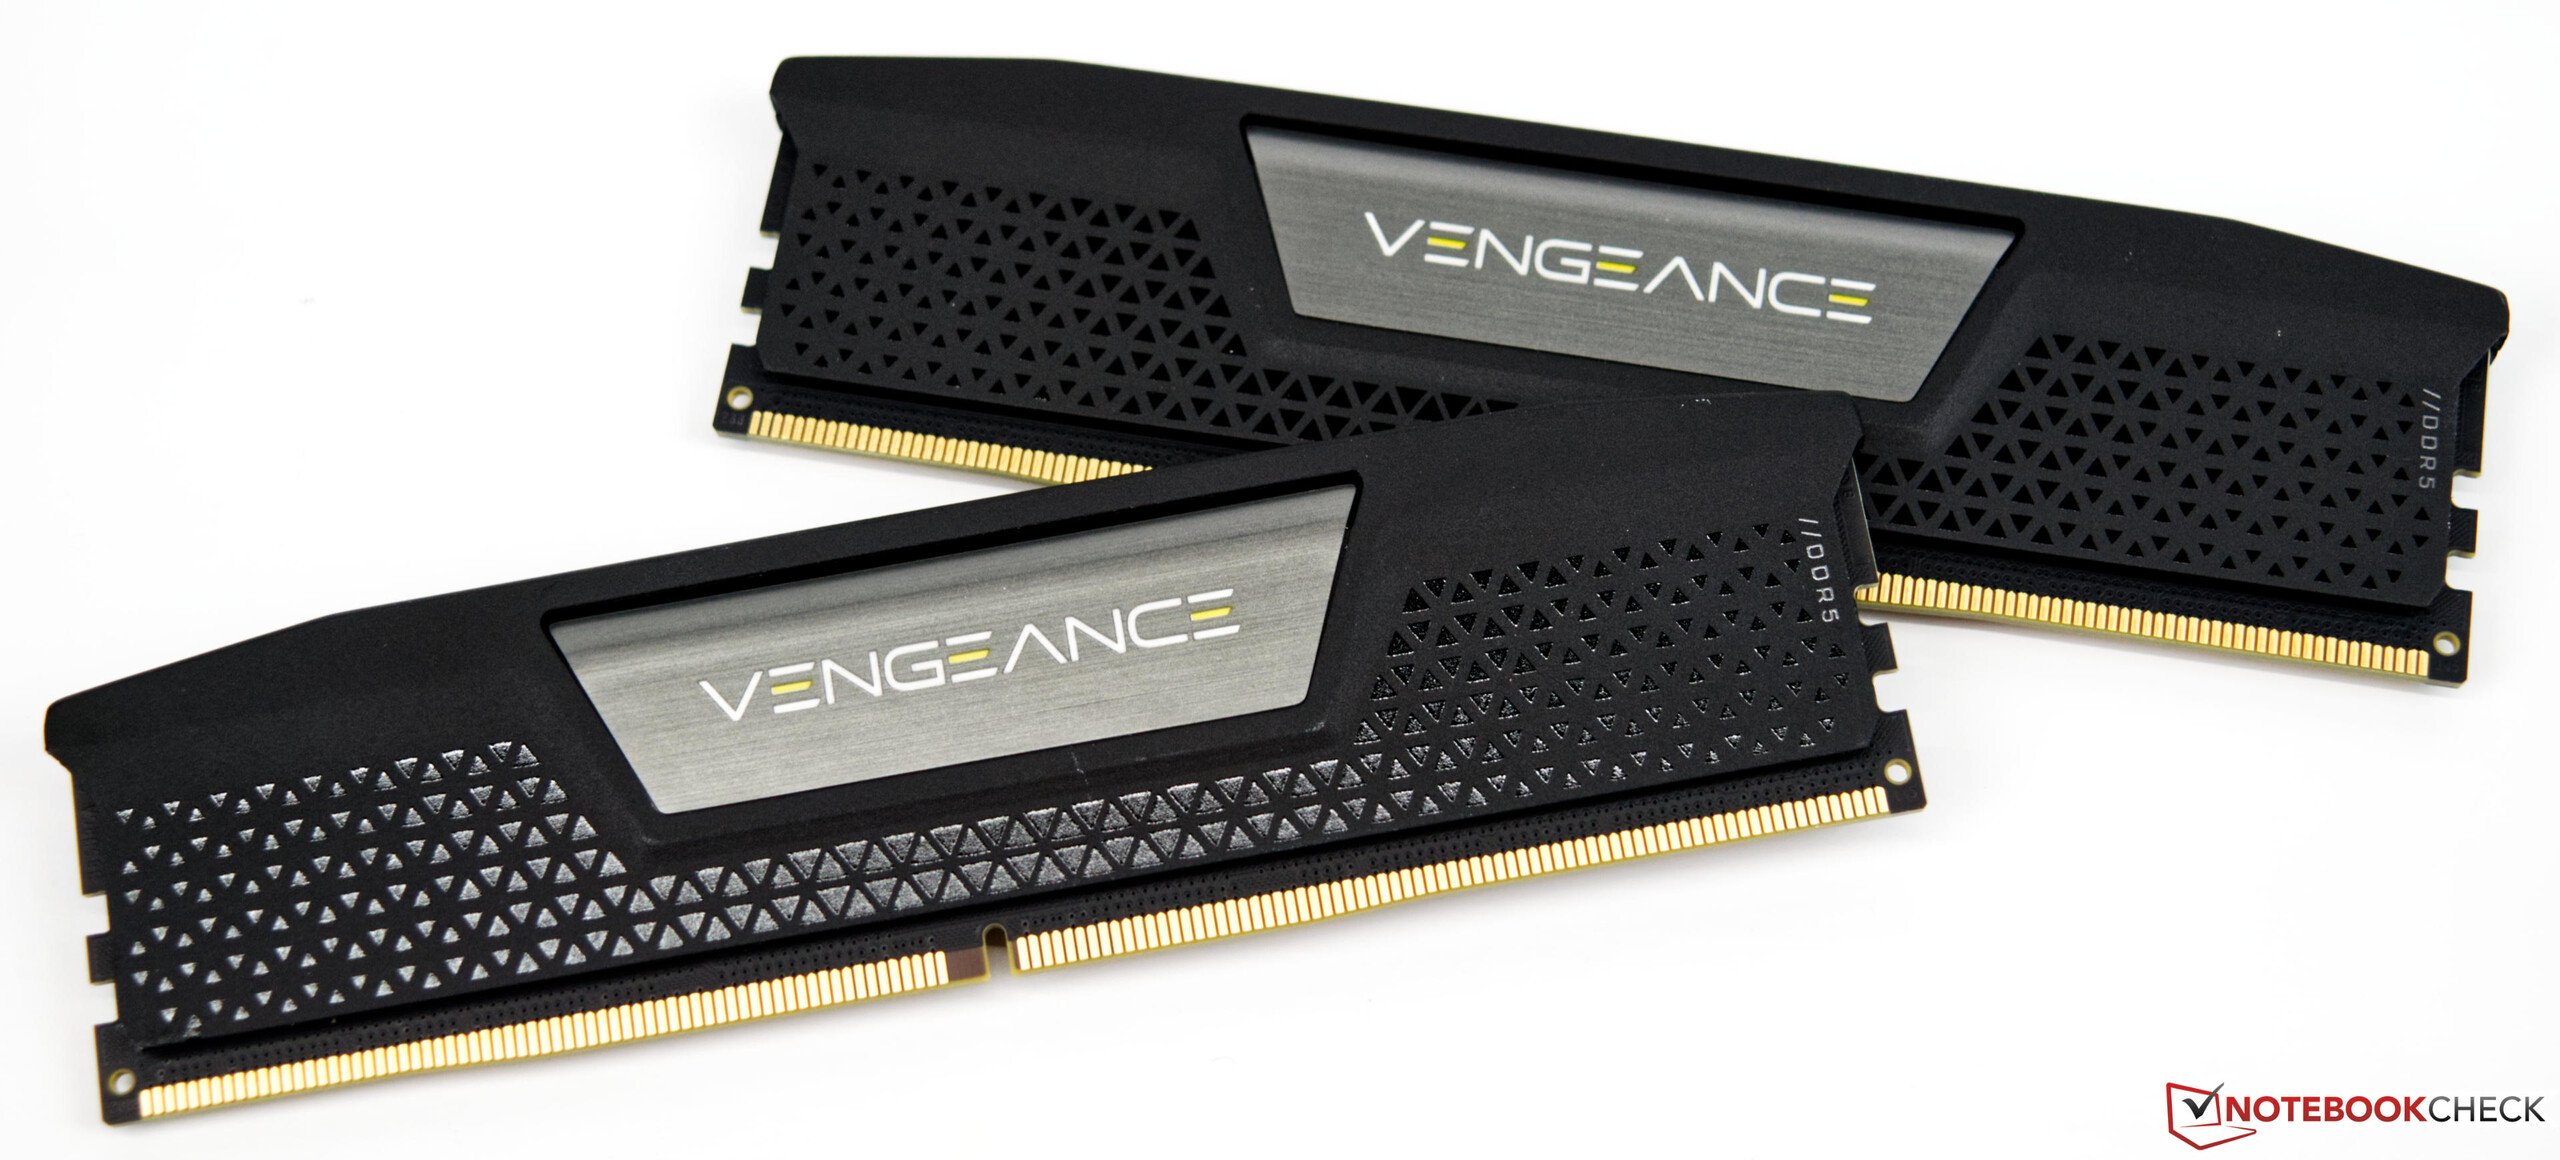
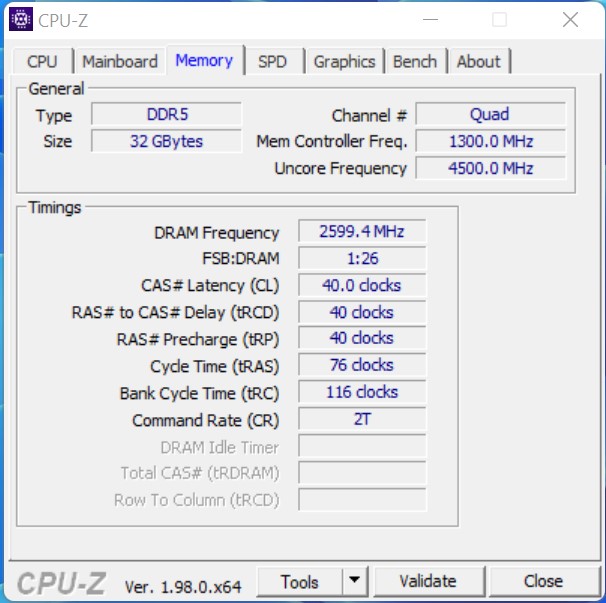
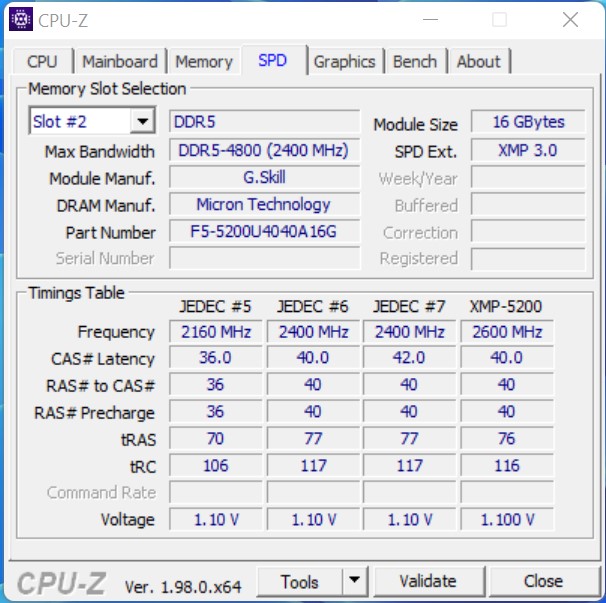
- G.Skill Ripjaws S5 (2x 16GB - DDR5-5200) / Corsair Vengeance (2x 16GB - DDR5-5200)
- 英特尔Optane 905p(480GB系统+基准)。
- OCZ Revodrive (480 GB用于游戏)
- 微软Windows 11专业版64位(版本21H2)。
这两个处理器直接来自英特尔。G.Skill和Corsair为我们提供了全新的DDR5工作内存,而新的Z690主板直接来自华硕。Caseking为我们提供了Raijintek Pean Showcase,而作为冷却,我们使用Alphacool Eisbear Aurora 280 AiO这是由Alphacool提供给我们的。
重要说明。
所有的基准测试都是在新安装的Windows 11系统上进行的。最新的Bios版本是由华硕提供给我们的。需要知道的是,在标准设置下,PL1和PL2是相等的,这意味着CPU总是可以不受任何限制地发挥最大性能。我们在这次审查中使用了标准设置。


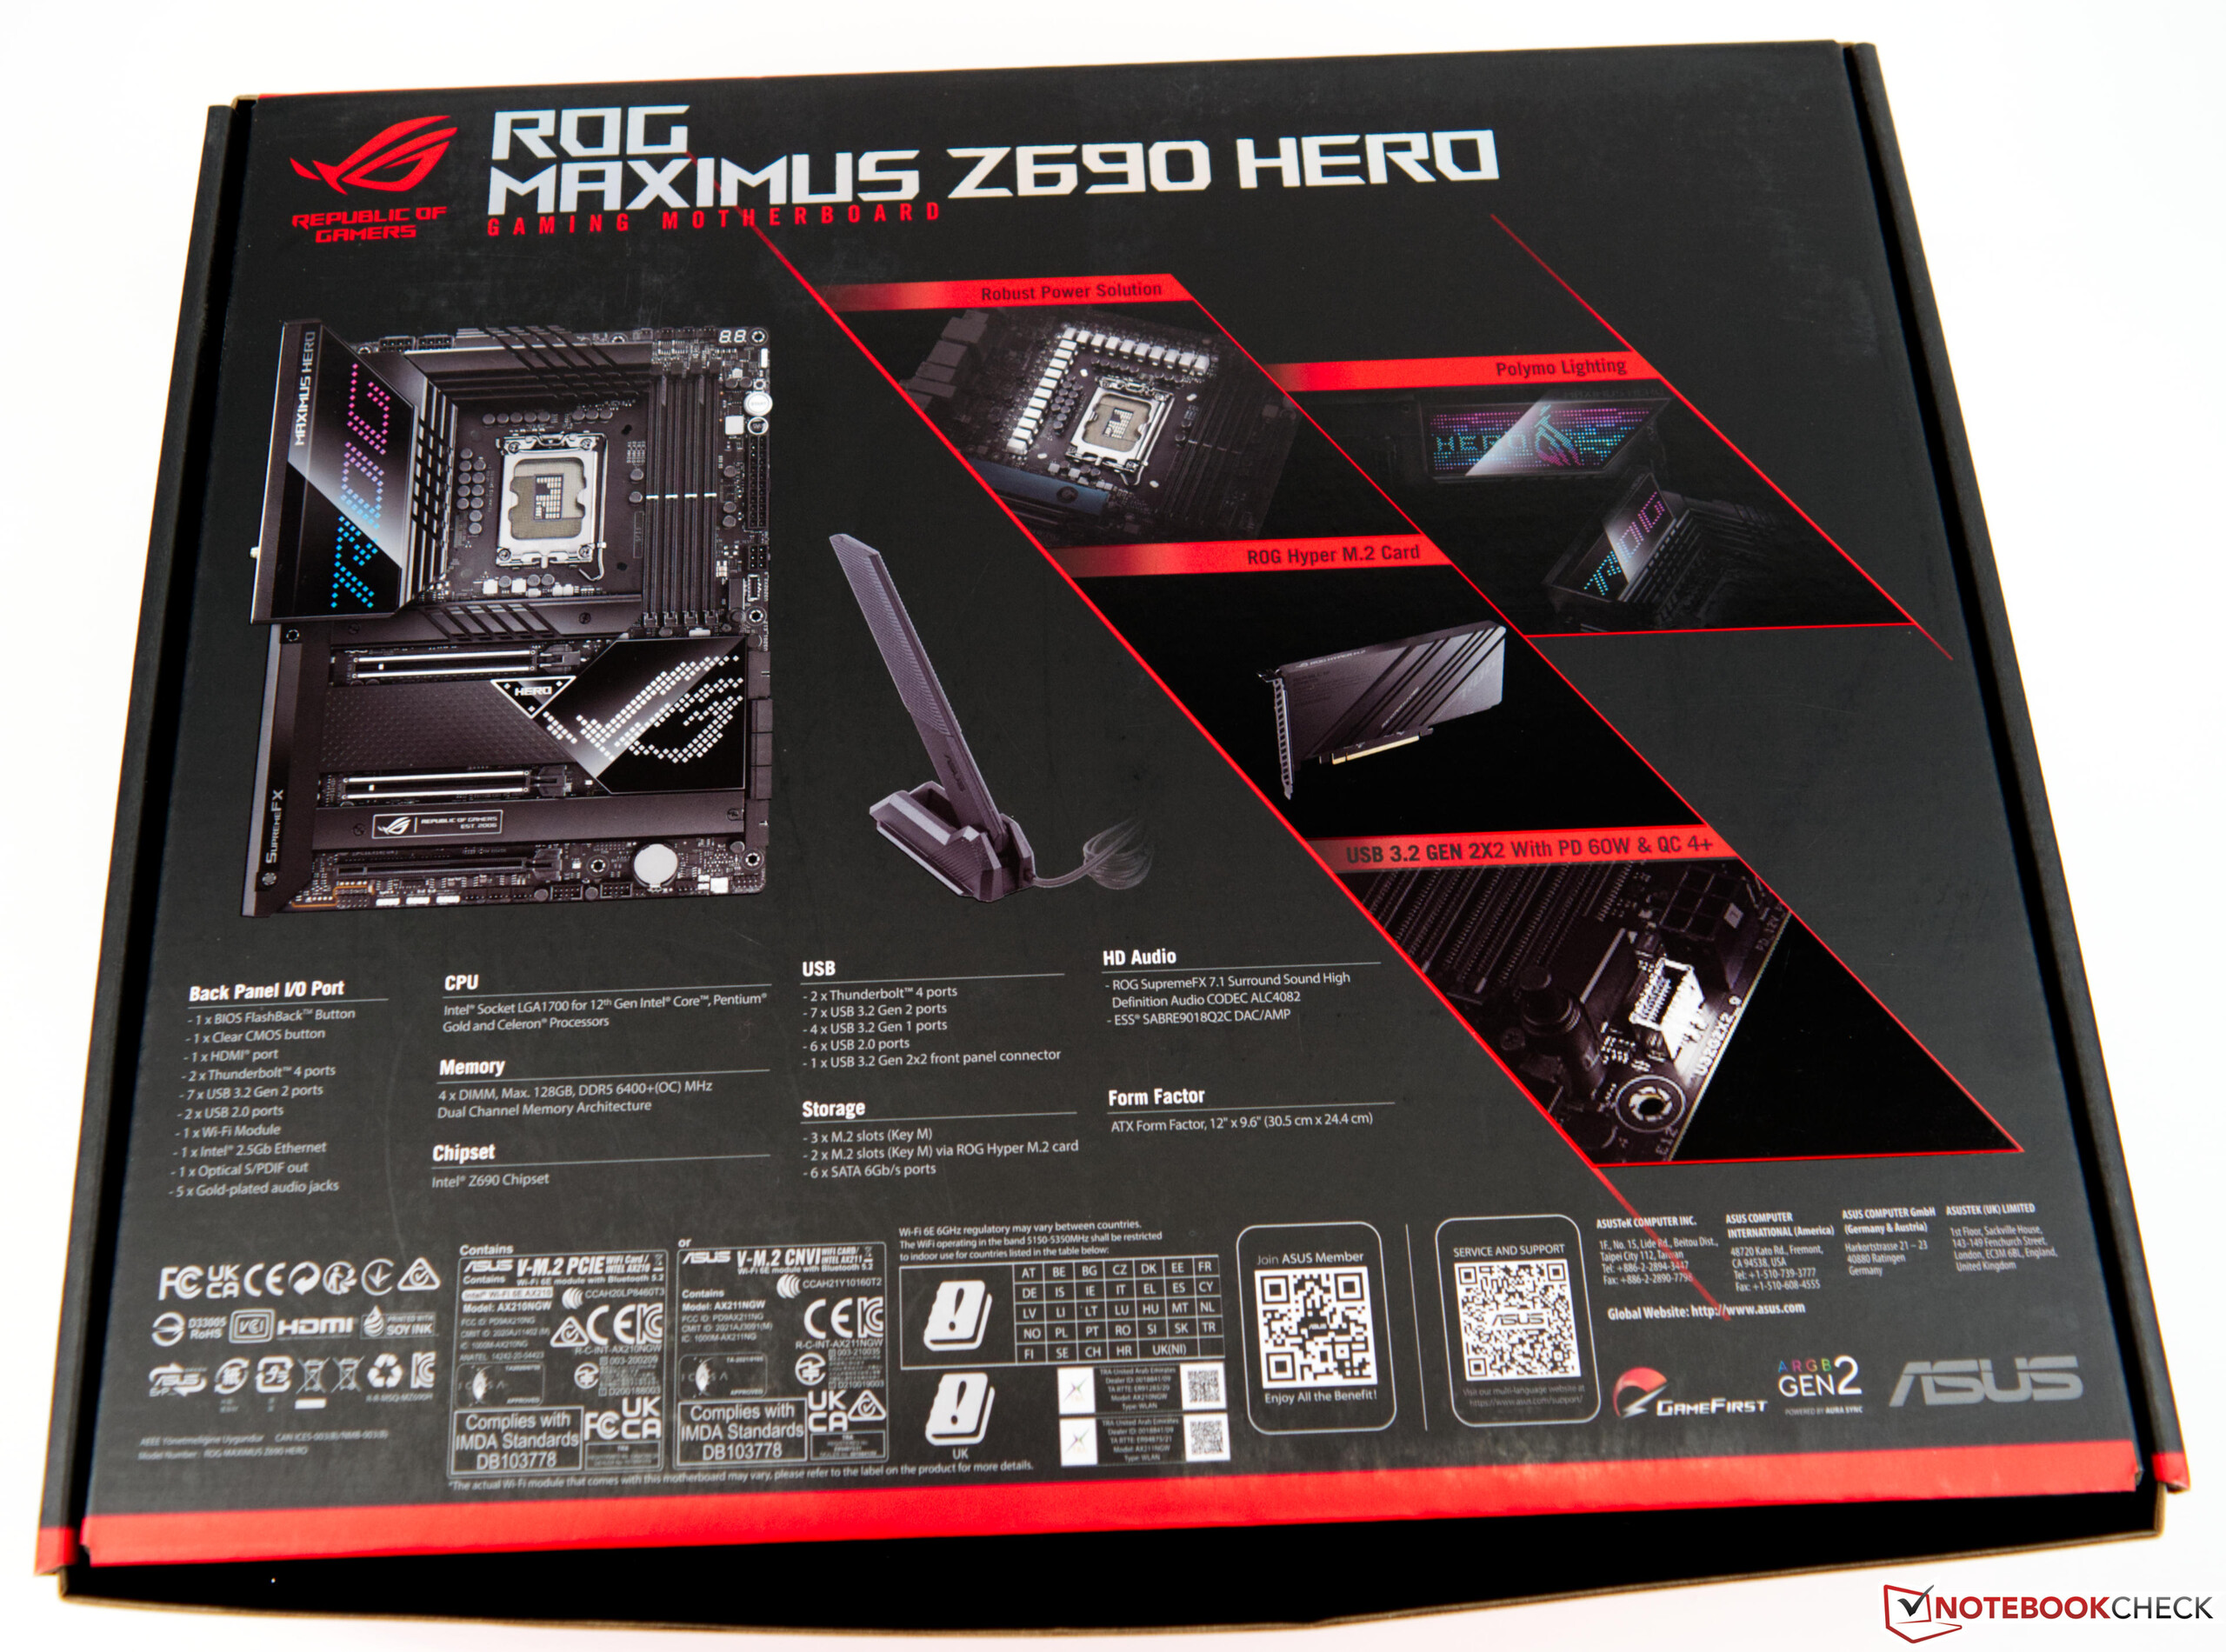
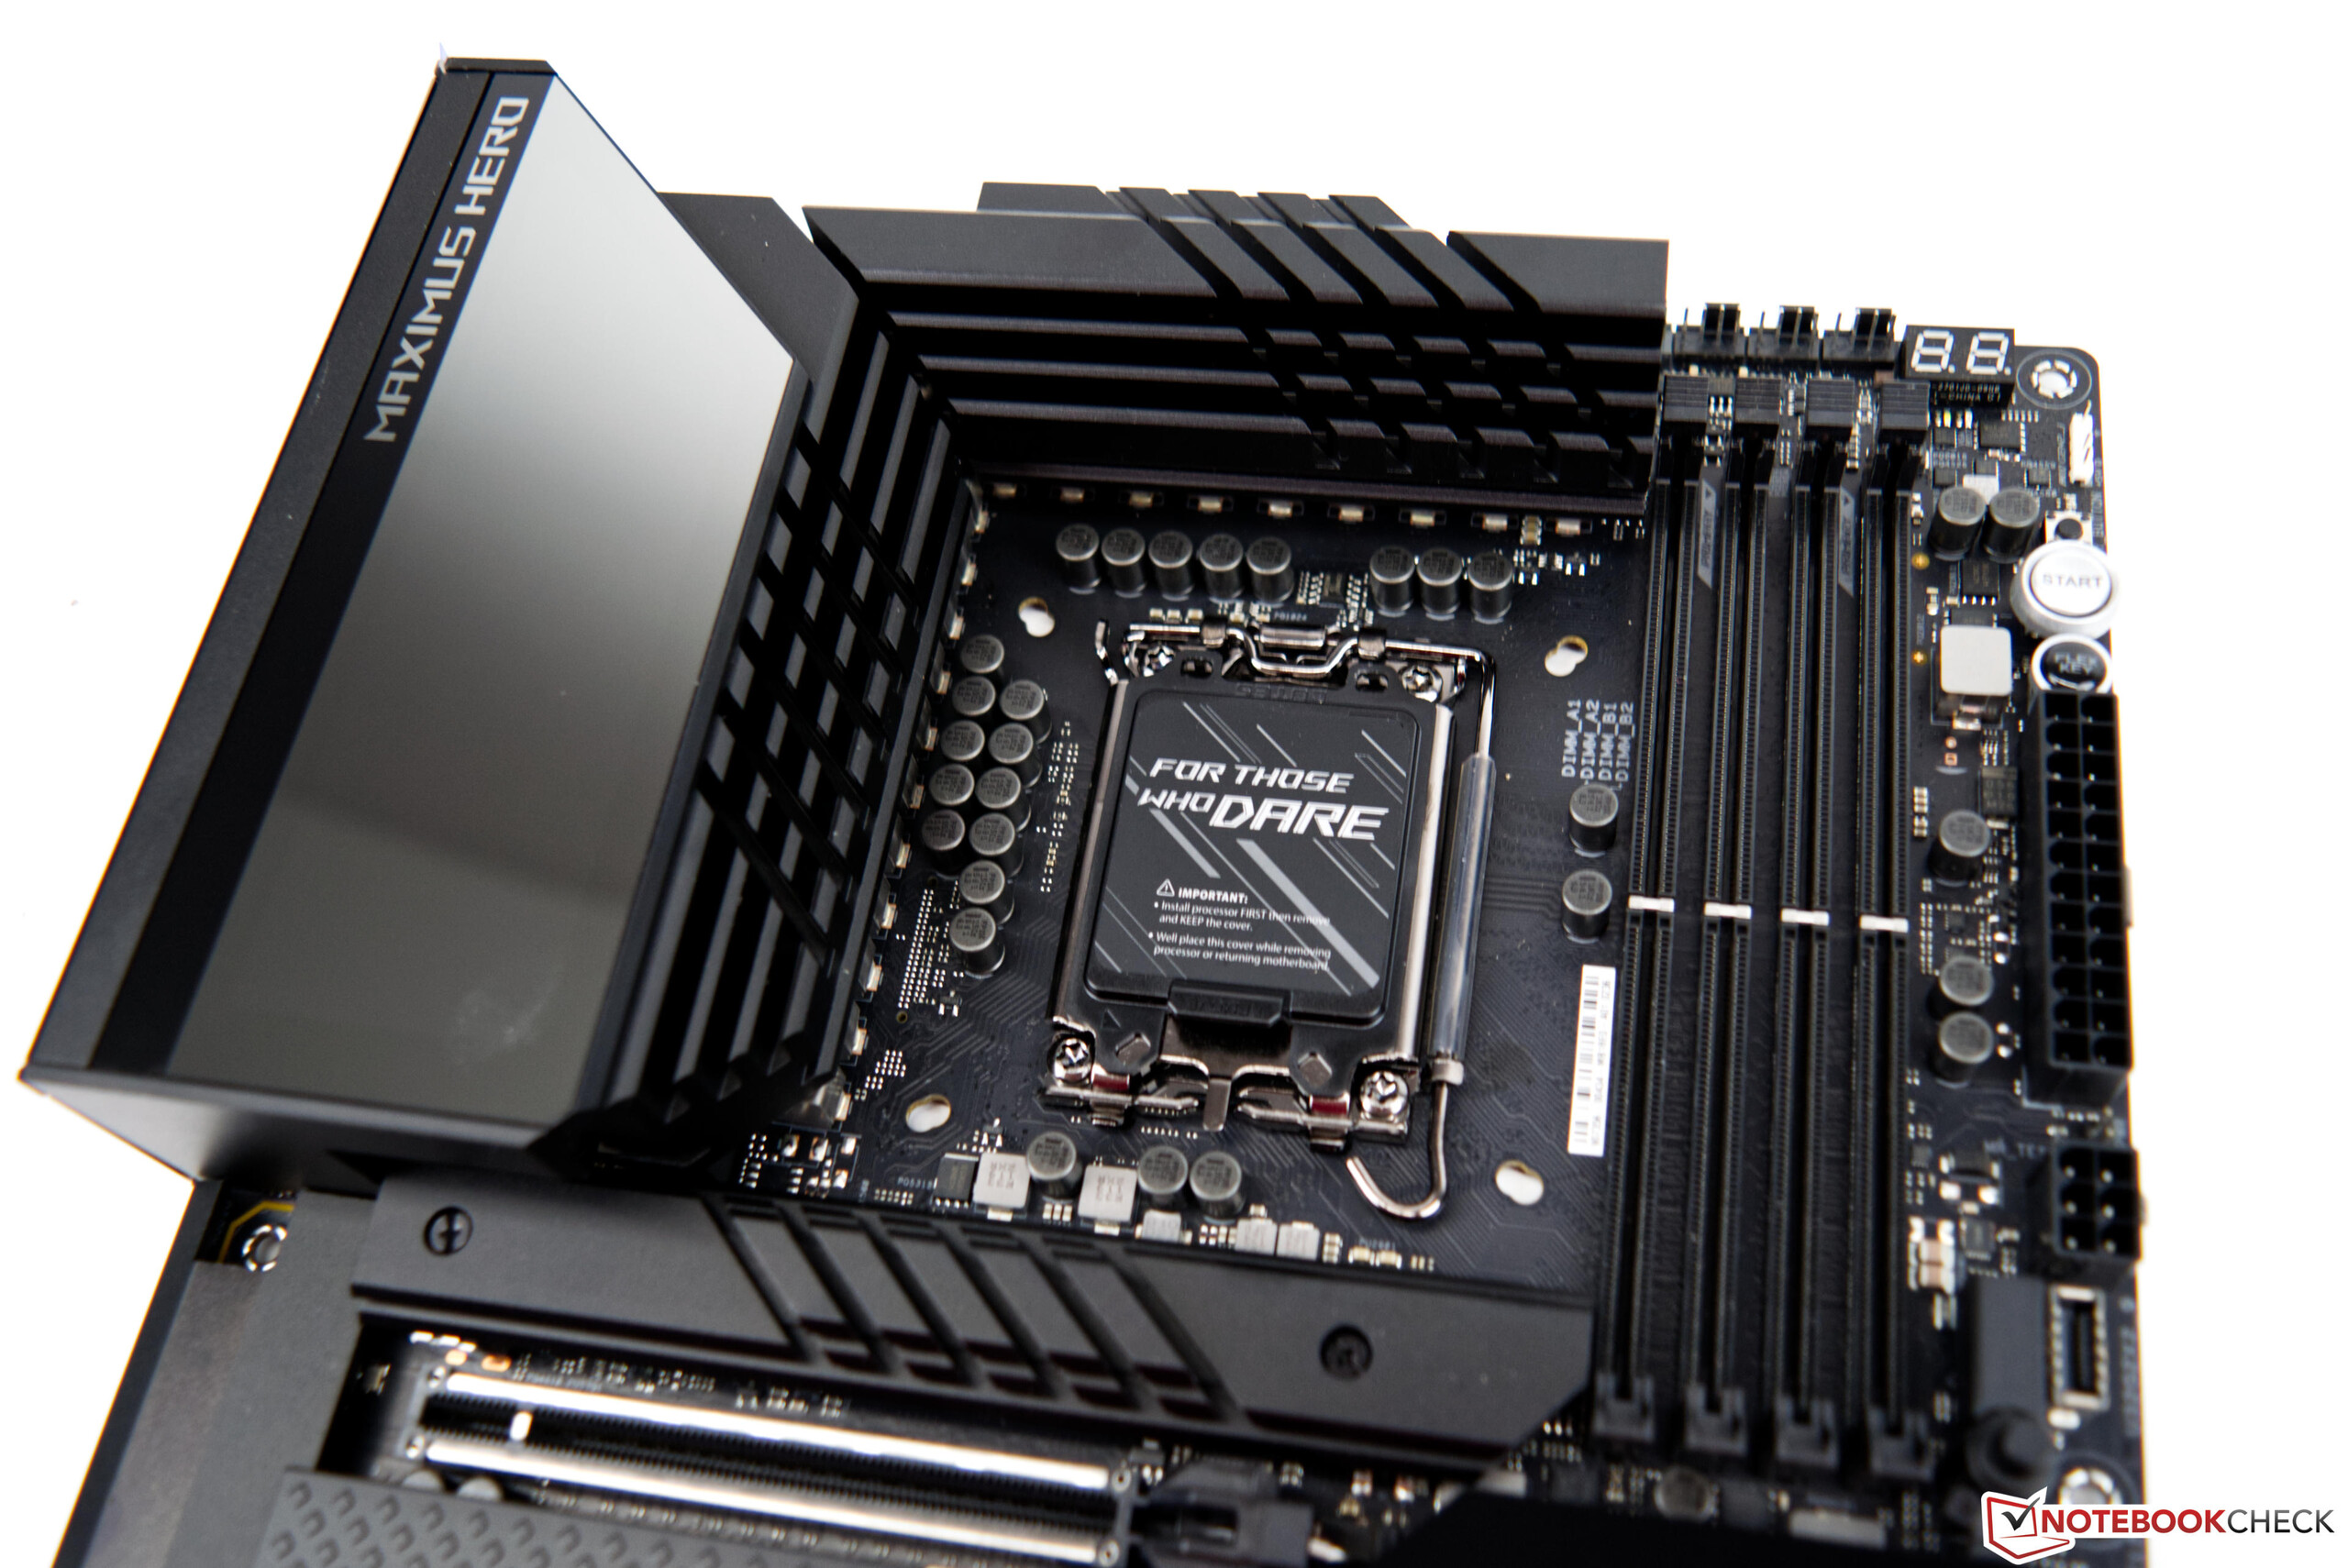
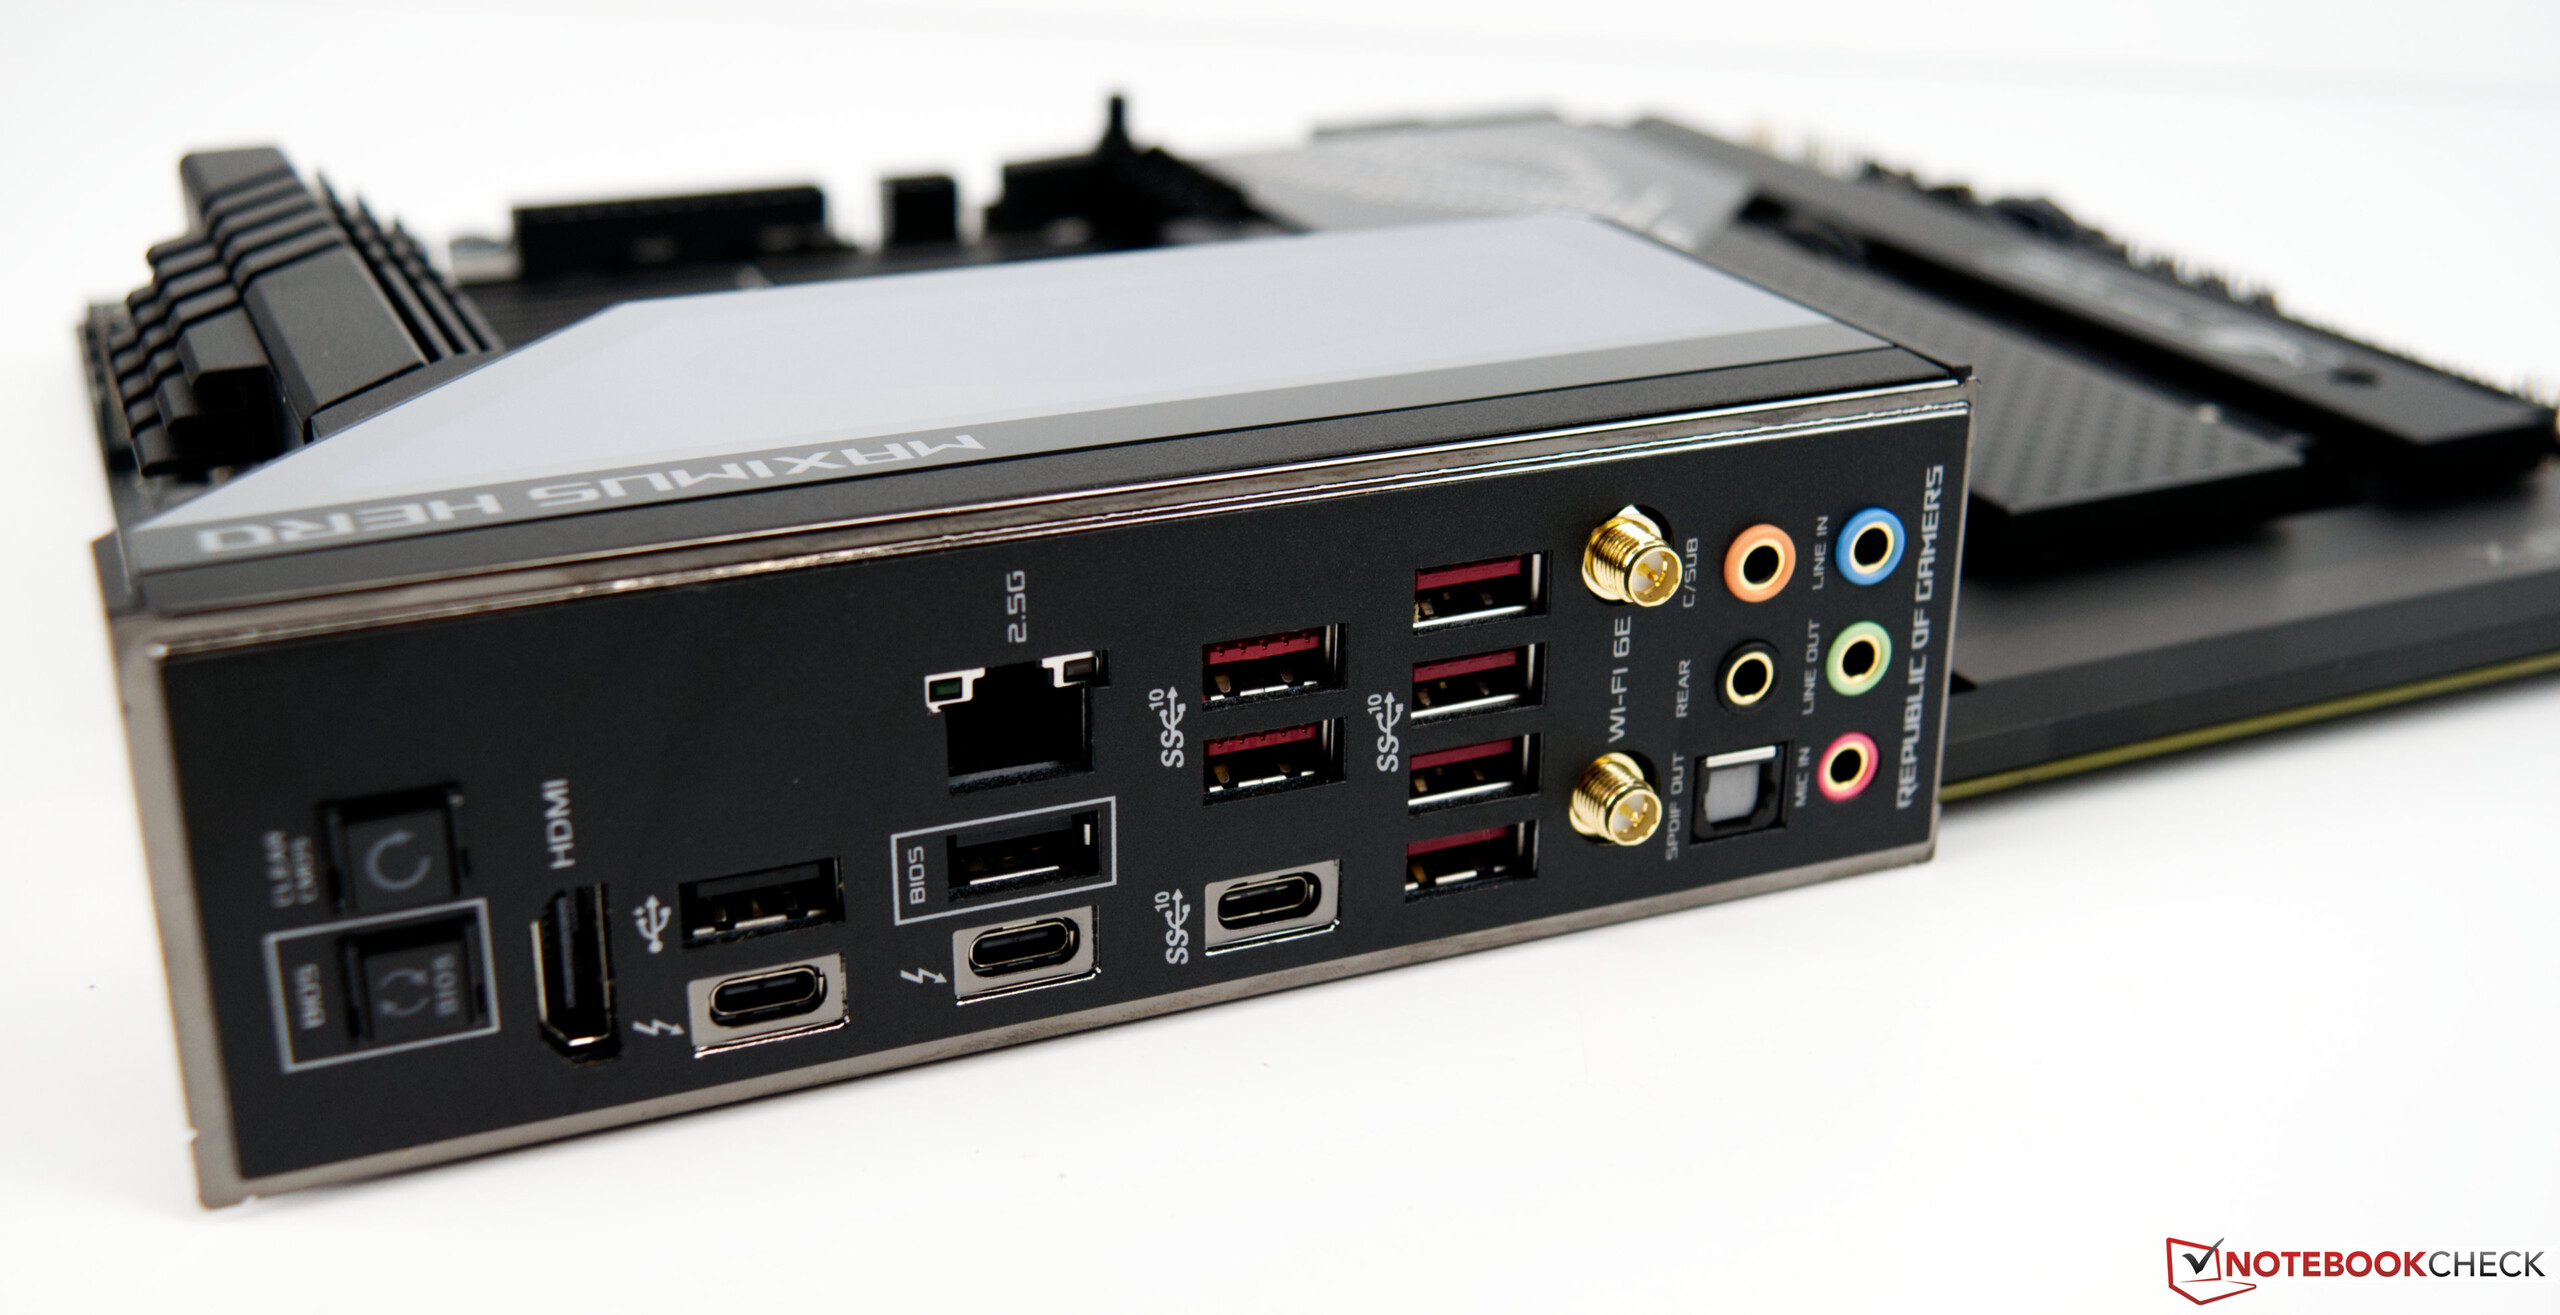
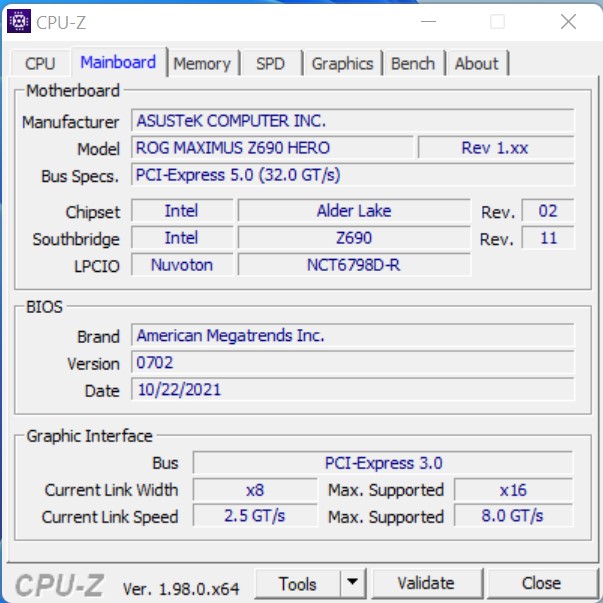
华硕ROG Maximus Z690 Hero的详细介绍
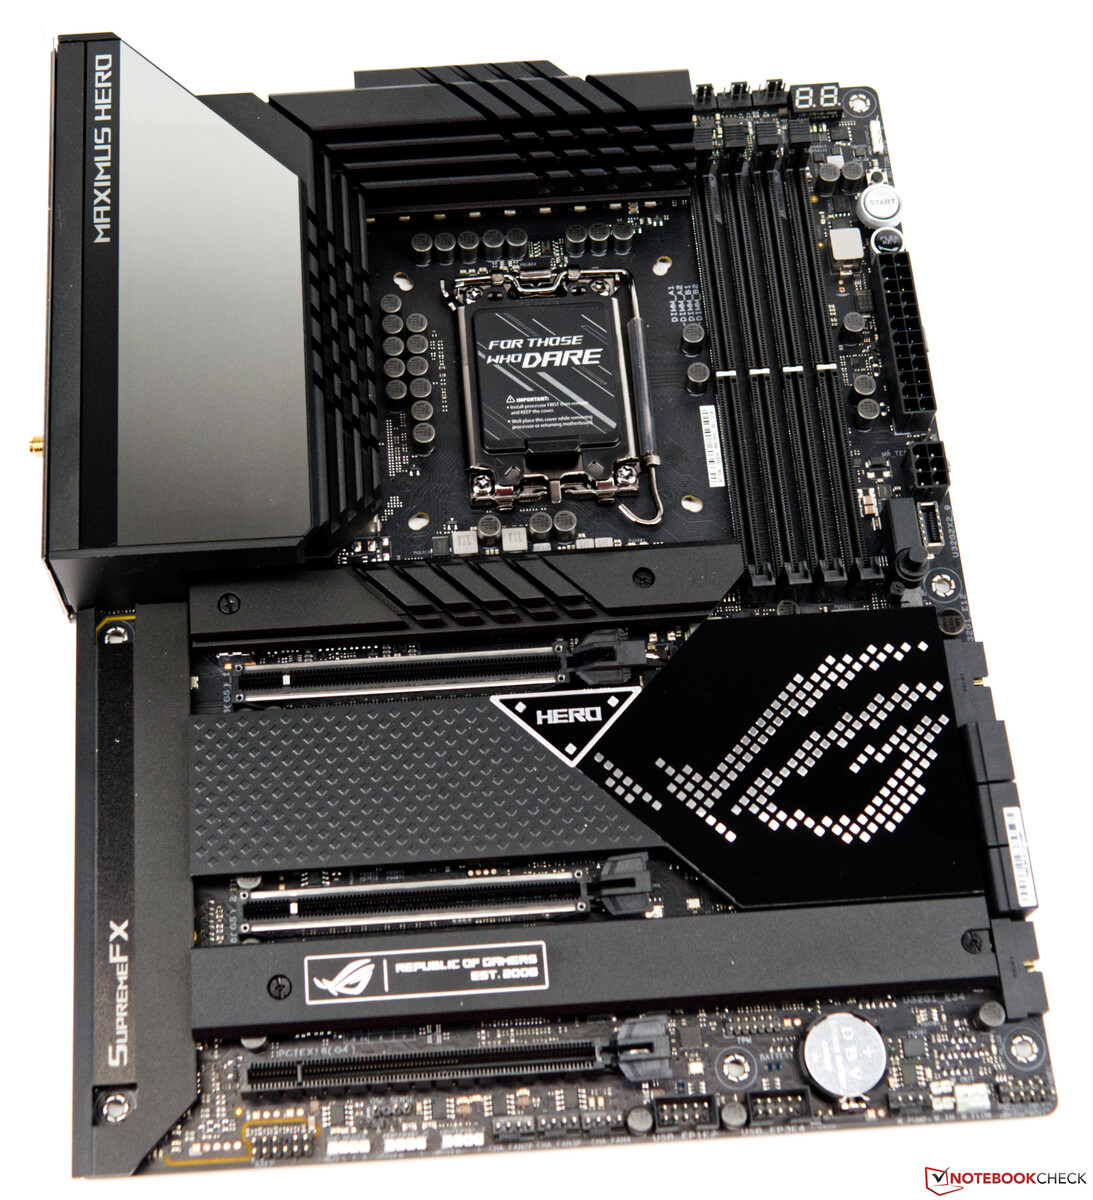
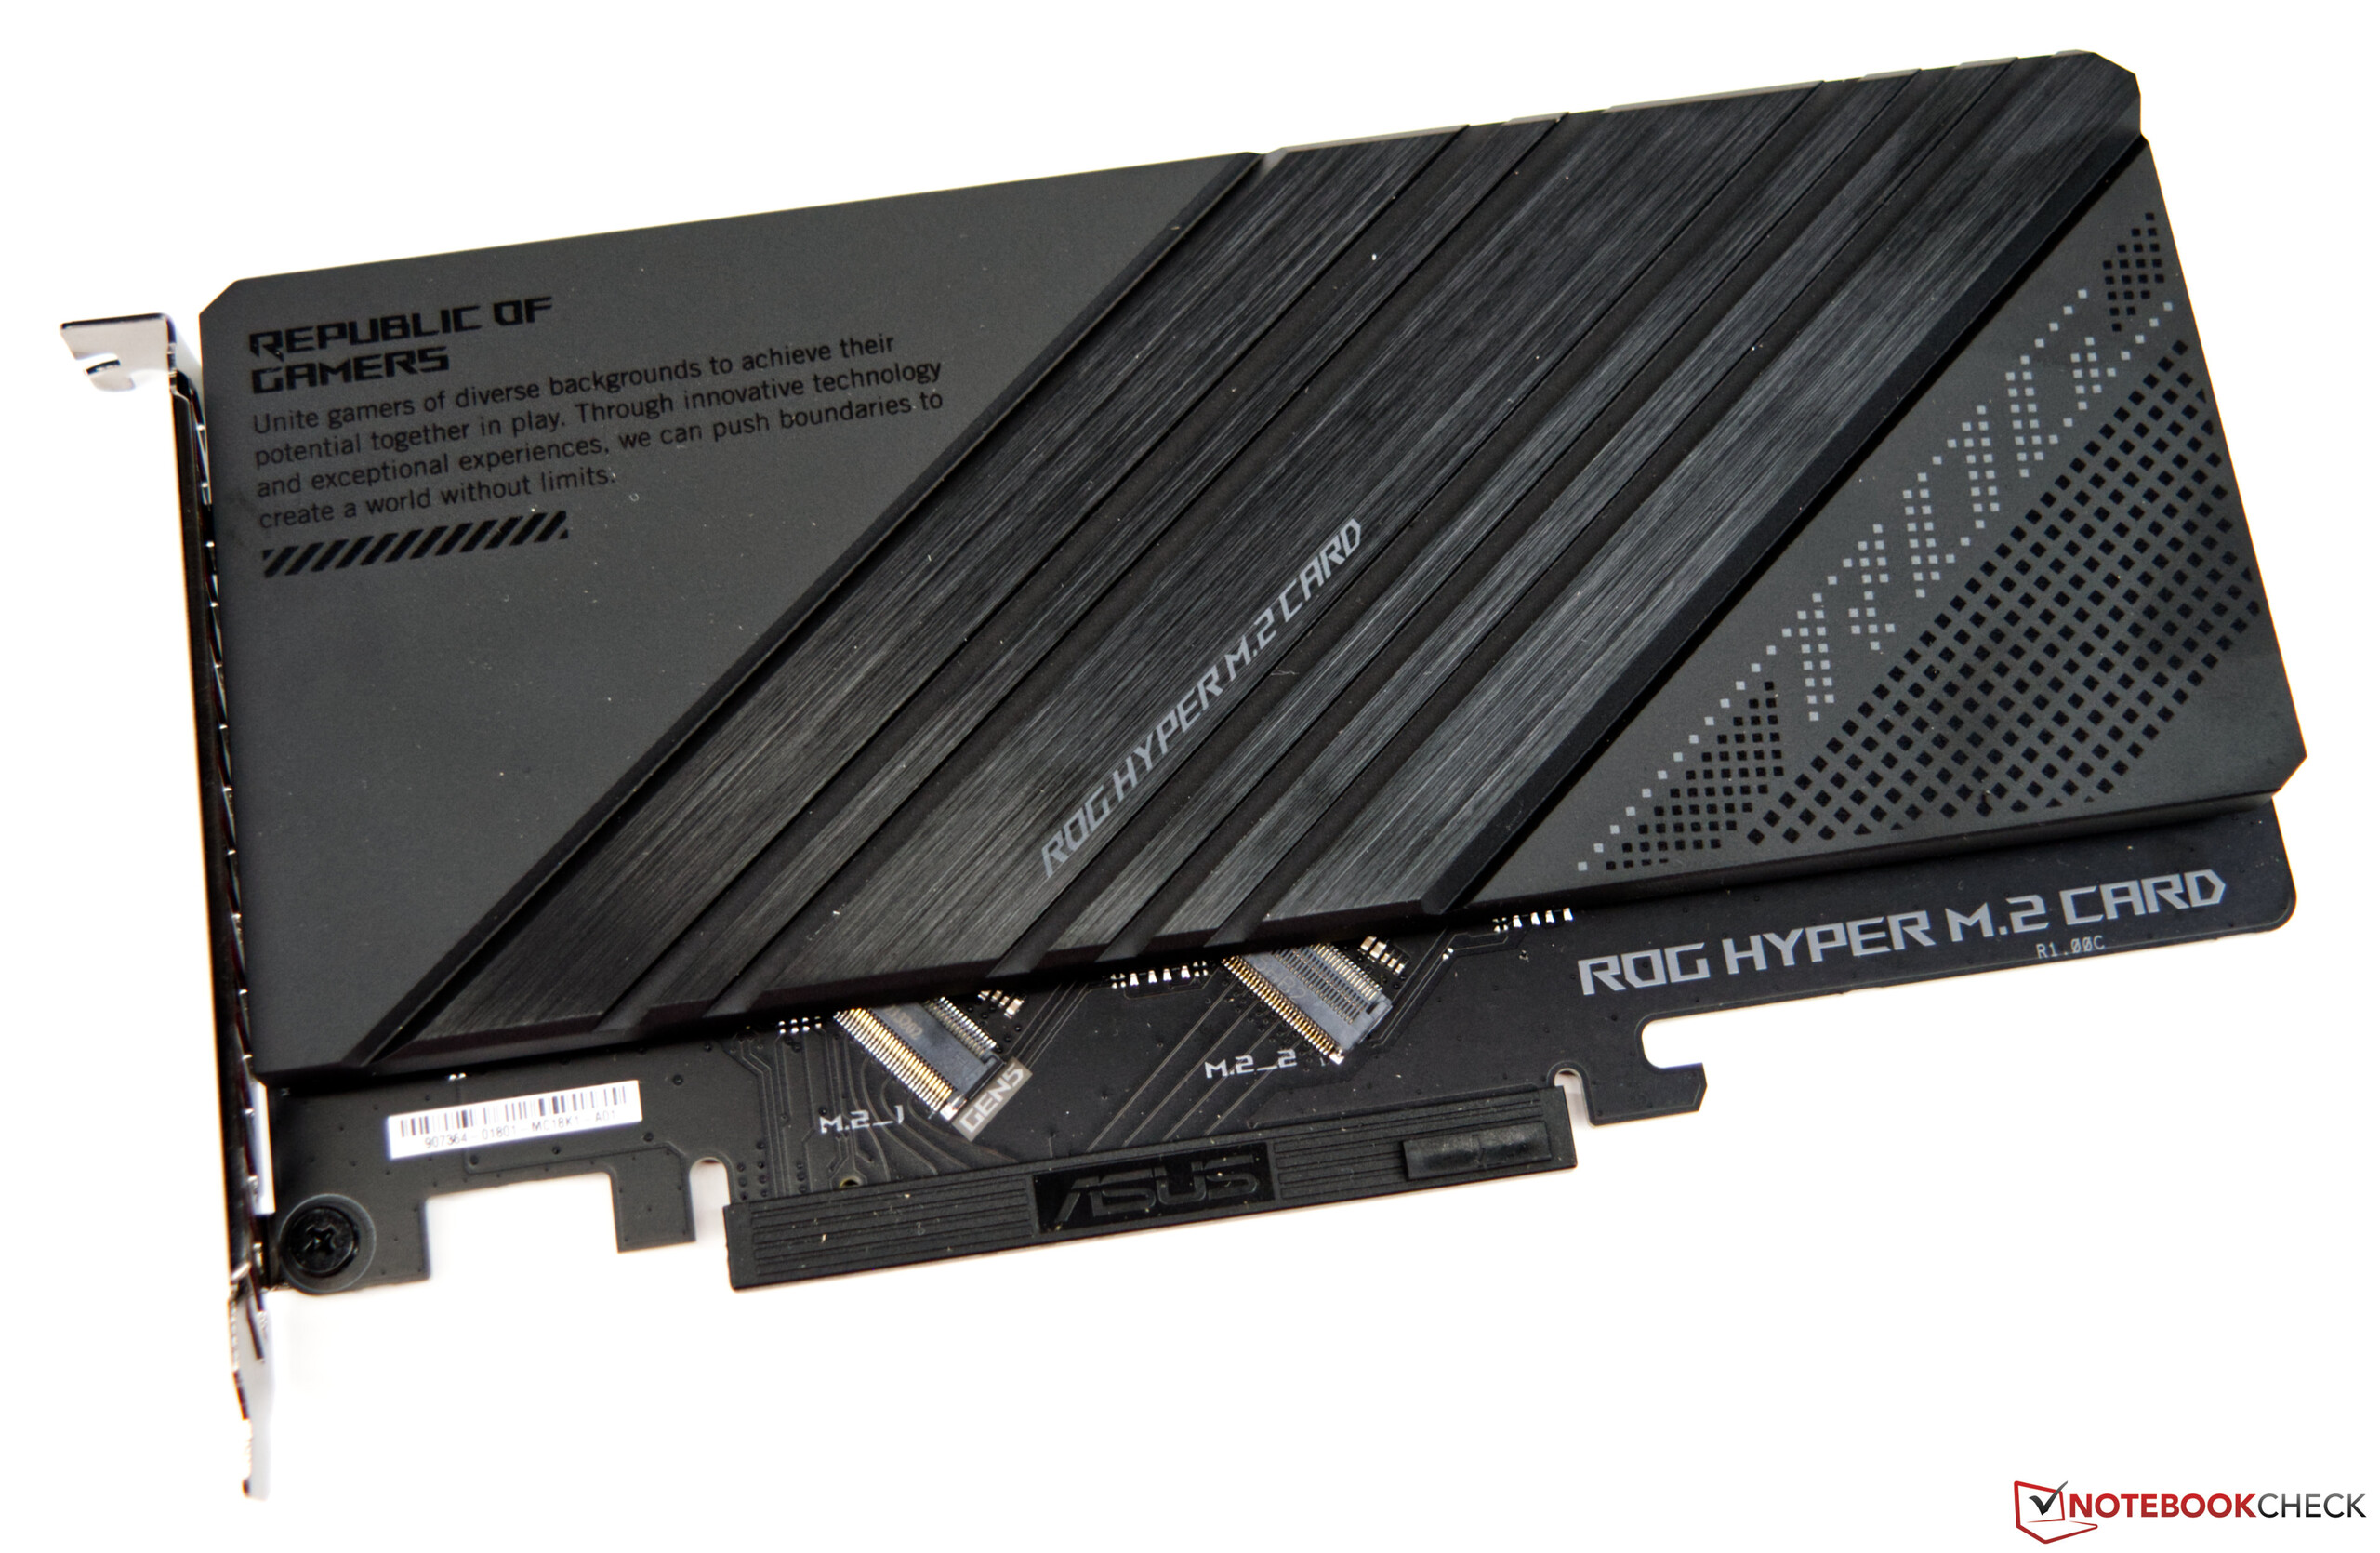
华硕及时向我们提供了ROG Maximus Z690 Hero。我们感谢华硕德国公司提供的这批借阅品。华硕ROG Maximus Z690 Hero看起来非常庞大,这可以追溯到大型冷却系统。主板上总共可以安装五块M.2固态硬盘,但随后你必须将五块固态硬盘中的两块安装在单独的Hyper M.2卡上。这将能够使用第5代支持的全部带宽,并作为一个附件包含在盒子里。新的LGA 1700插座因其略微拉长的设计而脱颖而出。许多LGA 1200冷却系统也与新的LGA 1700插座兼容,但你应该确保直接询问制造商。有时为LGA 1700提供其他安装支架,以确保对CPU的最佳接触压力。
你可以安装高达128GB的新DDR5工作内存。WiFi、2.5Gbit LAN和总共20个USB端口确保你有足够的连接性。
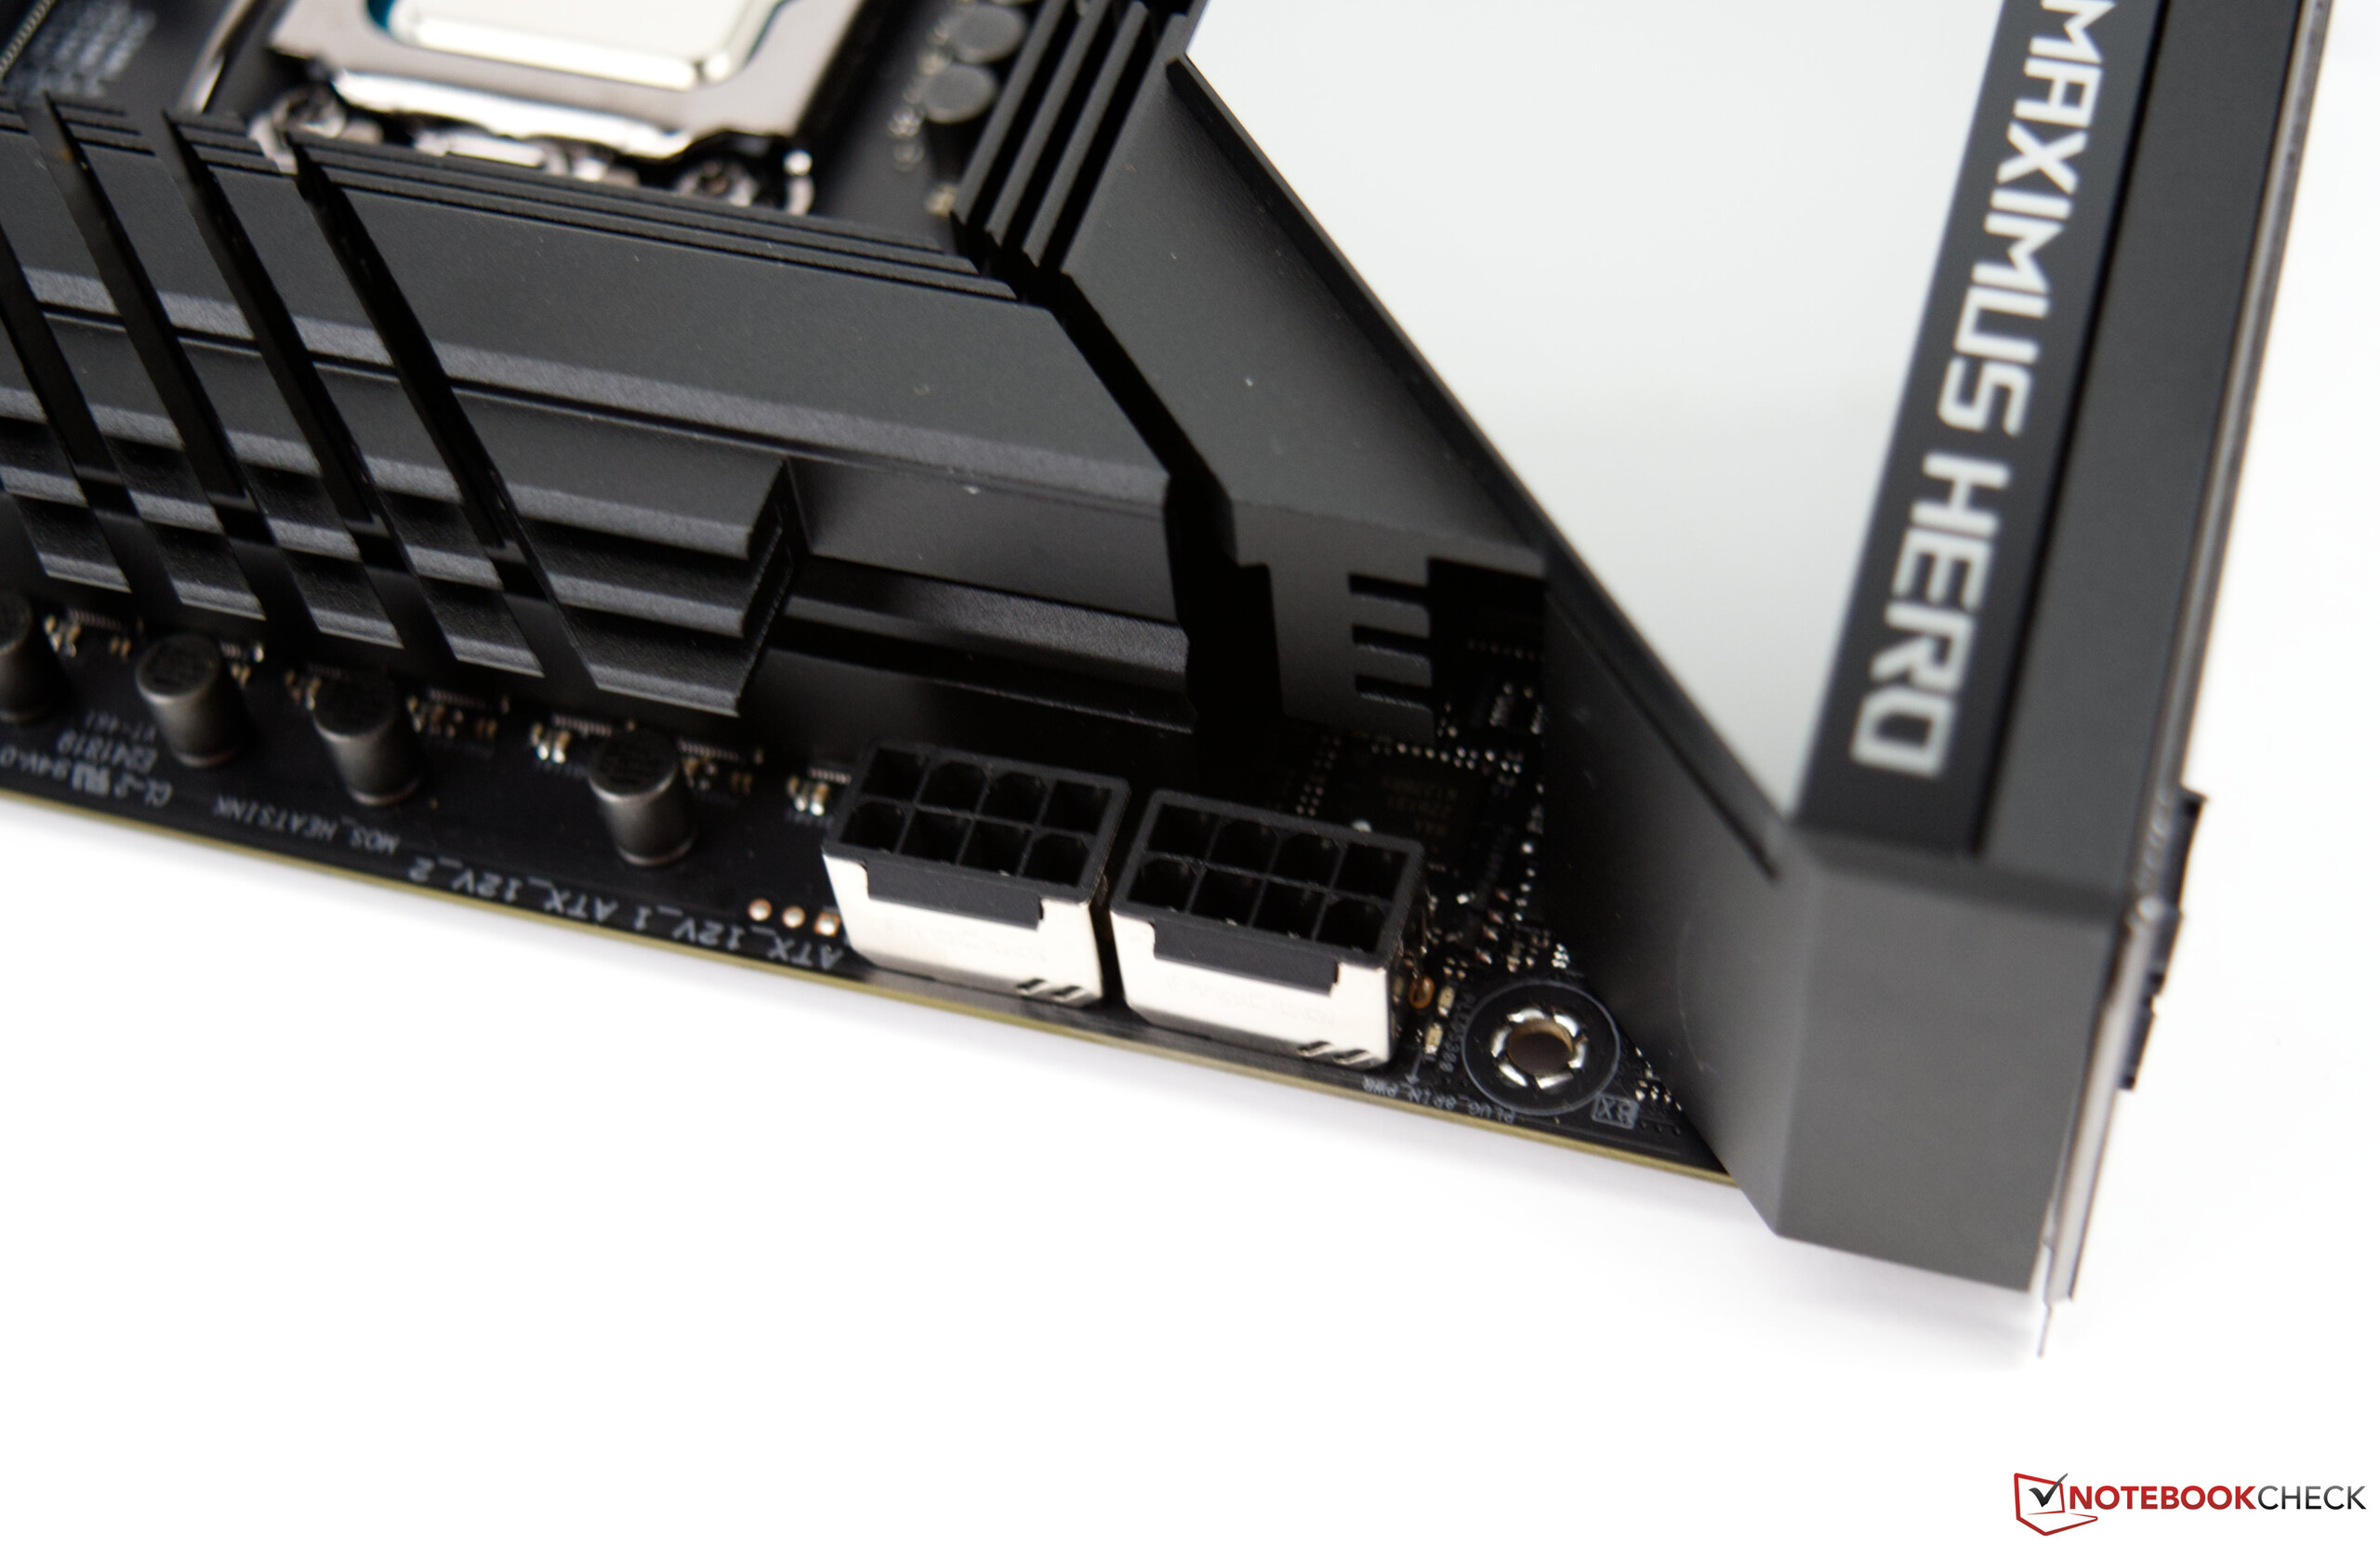
离插座不远的两个8针电源接口为CPU提供电源。电压互感器被一个非常巨大的冷却块所覆盖,包括一个热管。此外,在I/O盾牌上方还有一个有吸引力的Polymo闪电板,这是很好看的。
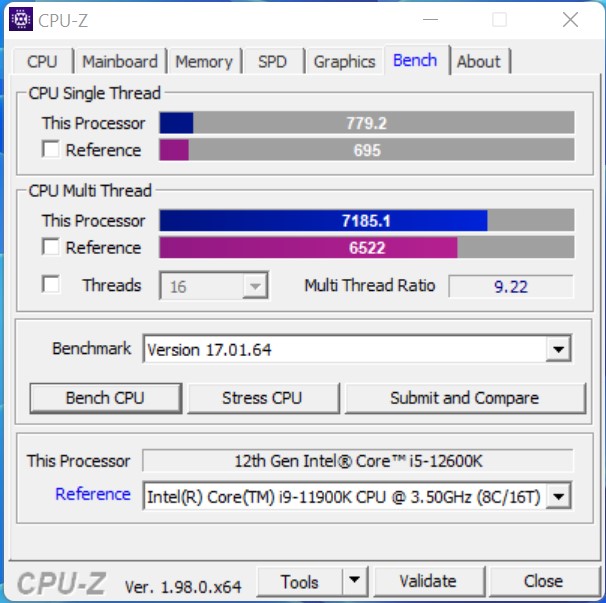
处理器基准测试
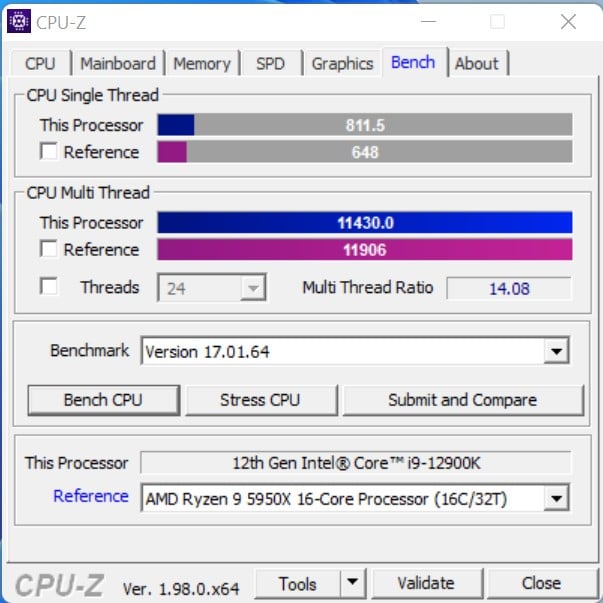
英特尔能够兑现承诺,与火箭湖-S处理器相比,性能有了大幅提高。在性能评级中,反映了所有列出的基准的性能差异,英特尔酷睿i9-12900K能够明显地排在首位。相比之下AMD Ryzen 9 5900X同样提供24个线程,英特尔的新旗舰领先13个百分点。如果我们把英特尔酷睿i9-11900K作为参考,酷睿i9-12900K运行速度快23%。虽然在单独的基准测试中差异略有不同,但这是由于相应的CPU架构造成的。
我们在较小的英特尔酷睿i5-12600K上看到类似的情况。如果我们使用 AMD Ryzen 7 5800X作为竞争对手,因为它有相同数量的线程,这两个竞争对手在累计基准测试结果中的表现都不相上下。另一方面,Zen3处理器很难与英特尔的强大单核性能竞争。但是你还不应该注销AMD,因为Zen3处理器已经在市场上销售了一年,根据一些传言,继任者已经在起步阶段。当它出现时,模具将被重新铸造,火箭湖-S必须再次证明自己。
由于PL1=PL2的讨论,我们采用了Cinebench R23,在PL1值限制为125瓦的情况下进行了另一次运行。结果没有任何值得一提的变化。差异很小,可以认为是在测量公差范围内。
很明显,英特尔将通过P和E-cores的新设计实现一个重大的跳跃。借此,英特尔也能够缩小与AMD的12和16核心处理器的差距,这在Core i9-11900K上是不可能的。
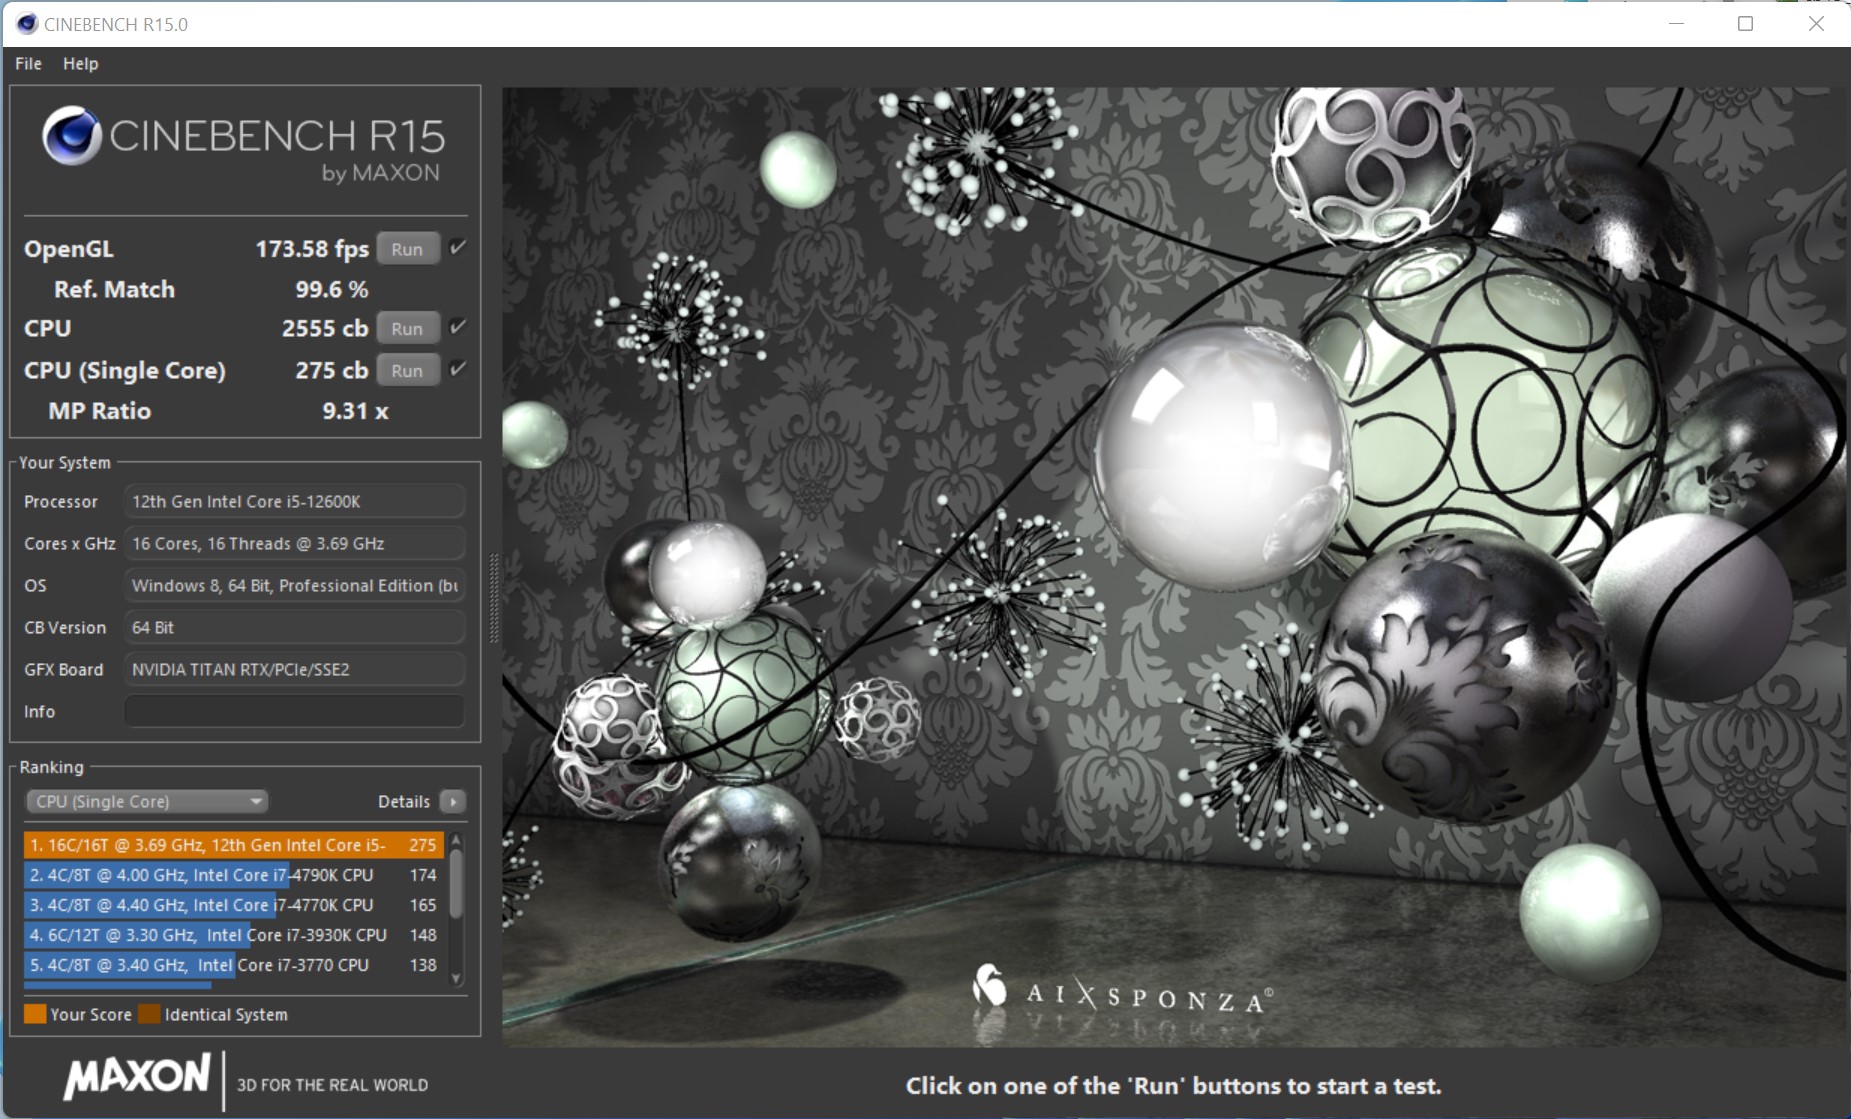
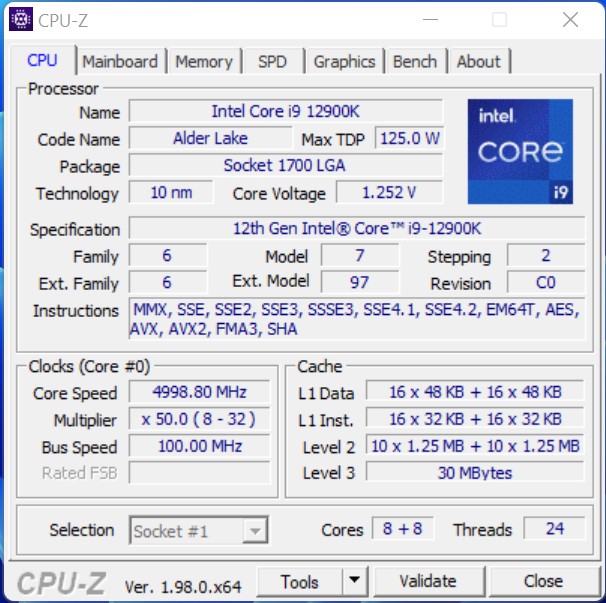
英特尔酷睿i5-12600K


英特尔酷睿i9-12900K


| Performance rating - Percent | |
| Intel Core i9-12900K | |
| AMD Ryzen 9 5950X | |
| Intel Core i5-12600K | |
| AMD Ryzen 9 5900X -2! | |
| AMD Ryzen 7 5800X | |
| Intel Core i9-11900K | |
| Intel Core i9-10900K | |
| AMD Ryzen 5 5600X | |
| Intel Core i5-11600K | |
| Intel Core i5-10600K | |
| Cinebench R15 | |
| CPU Single 64Bit | |
| Intel Core i9-12900K | |
| Intel Core i5-12600K | |
| AMD Ryzen 9 5950X | |
| AMD Ryzen 9 5900X | |
| AMD Ryzen 7 5800X | |
| Intel Core i9-11900K | |
| AMD Ryzen 5 5600X | |
| Intel Core i5-11600K | |
| Intel Core i9-10900K | |
| Intel Core i5-10600K | |
| CPU Multi 64Bit | |
| AMD Ryzen 9 5950X | |
| Intel Core i9-12900K | |
| AMD Ryzen 9 5900X | |
| Intel Core i9-10900K | |
| AMD Ryzen 7 5800X | |
| Intel Core i5-12600K | |
| Intel Core i9-11900K | |
| AMD Ryzen 5 5600X | |
| Intel Core i5-11600K | |
| Intel Core i5-10600K | |
| Cinebench R20 | |
| CPU (Single Core) | |
| Intel Core i9-12900K | |
| Intel Core i5-12600K | |
| Intel Core i9-11900K | |
| AMD Ryzen 9 5950X | |
| AMD Ryzen 9 5900X | |
| AMD Ryzen 7 5800X | |
| AMD Ryzen 5 5600X | |
| Intel Core i5-11600K | |
| Intel Core i9-10900K | |
| Intel Core i5-10600K | |
| CPU (Multi Core) | |
| AMD Ryzen 9 5950X | |
| Intel Core i9-12900K | |
| AMD Ryzen 9 5900X | |
| Intel Core i5-12600K | |
| Intel Core i9-10900K | |
| AMD Ryzen 7 5800X | |
| Intel Core i9-11900K | |
| AMD Ryzen 5 5600X | |
| Intel Core i5-11600K | |
| Intel Core i5-10600K | |
| Cinebench R23 | |
| Single Core | |
| Intel Core i9-12900K | |
| Intel Core i5-12600K | |
| Intel Core i9-11900K | |
| AMD Ryzen 9 5950X | |
| AMD Ryzen 9 5900X | |
| Intel Core i5-11600K | |
| AMD Ryzen 7 5800X | |
| AMD Ryzen 5 5600X | |
| Intel Core i5-10600K | |
| Intel Core i9-10900K | |
| Multi Core | |
| AMD Ryzen 9 5950X | |
| Intel Core i9-12900K | |
| AMD Ryzen 9 5900X | |
| Intel Core i5-12600K | |
| Intel Core i9-10900K | |
| Intel Core i9-11900K | |
| AMD Ryzen 7 5800X | |
| AMD Ryzen 5 5600X | |
| Intel Core i5-11600K | |
| Intel Core i5-10600K | |
| Cinebench R11.5 | |
| CPU Single 64Bit | |
| Intel Core i9-12900K | |
| Intel Core i5-12600K | |
| AMD Ryzen 9 5900X | |
| AMD Ryzen 9 5950X | |
| Intel Core i9-11900K | |
| AMD Ryzen 7 5800X | |
| AMD Ryzen 5 5600X | |
| Intel Core i5-11600K | |
| Intel Core i9-10900K | |
| Intel Core i5-10600K | |
| CPU Multi 64Bit | |
| AMD Ryzen 9 5950X | |
| Intel Core i9-12900K | |
| AMD Ryzen 9 5900X | |
| Intel Core i5-12600K | |
| AMD Ryzen 7 5800X | |
| Intel Core i9-10900K | |
| Intel Core i9-11900K | |
| AMD Ryzen 5 5600X | |
| Intel Core i5-11600K | |
| Intel Core i5-10600K | |
| Cinebench R10 | |
| Rendering Single CPUs 64Bit | |
| Intel Core i9-12900K | |
| Intel Core i5-12600K | |
| Intel Core i9-11900K | |
| AMD Ryzen 9 5950X | |
| AMD Ryzen 7 5800X | |
| Intel Core i5-11600K | |
| AMD Ryzen 9 5900X | |
| AMD Ryzen 5 5600X | |
| Intel Core i9-10900K | |
| Intel Core i5-10600K | |
| Rendering Multiple CPUs 64Bit | |
| Intel Core i9-12900K | |
| AMD Ryzen 9 5950X | |
| AMD Ryzen 9 5900X | |
| Intel Core i5-12600K | |
| AMD Ryzen 7 5800X | |
| Intel Core i9-11900K | |
| Intel Core i9-10900K | |
| AMD Ryzen 5 5600X | |
| Intel Core i5-11600K | |
| Intel Core i5-10600K | |
| Blender - v2.79 BMW27 CPU | |
| Intel Core i5-10600K | |
| Intel Core i5-11600K | |
| AMD Ryzen 5 5600X | |
| AMD Ryzen 7 5800X | |
| Intel Core i9-11900K | |
| Intel Core i5-12600K | |
| Intel Core i9-10900K | |
| AMD Ryzen 9 5900X | |
| Intel Core i9-12900K | |
| AMD Ryzen 9 5950X | |
| wPrime 2.10 | |
| 32m | |
| Intel Core i9-12900K | |
| Intel Core i5-11600K | |
| Intel Core i5-12600K | |
| Intel Core i5-10600K | |
| Intel Core i9-11900K | |
| AMD Ryzen 5 5600X | |
| Intel Core i9-10900K | |
| AMD Ryzen 7 5800X | |
| AMD Ryzen 9 5950X | |
| 1024m | |
| Intel Core i5-12600K | |
| Intel Core i9-12900K | |
| AMD Ryzen 5 5600X | |
| Intel Core i5-10600K | |
| Intel Core i5-11600K | |
| AMD Ryzen 7 5800X | |
| Intel Core i9-11900K | |
| Intel Core i9-10900K | |
| AMD Ryzen 9 5950X | |
| X264 HD Benchmark 4.0 | |
| Pass 1 | |
| Intel Core i9-12900K | |
| AMD Ryzen 7 5800X | |
| AMD Ryzen 9 5950X | |
| AMD Ryzen 9 5900X | |
| Intel Core i5-12600K | |
| AMD Ryzen 5 5600X | |
| Intel Core i9-11900K | |
| Intel Core i5-11600K | |
| Intel Core i9-10900K | |
| Intel Core i5-10600K | |
| Pass 2 | |
| AMD Ryzen 9 5950X | |
| Intel Core i9-12900K | |
| AMD Ryzen 9 5900X | |
| AMD Ryzen 7 5800X | |
| Intel Core i9-10900K | |
| Intel Core i5-12600K | |
| Intel Core i9-11900K | |
| AMD Ryzen 5 5600X | |
| Intel Core i5-11600K | |
| Intel Core i5-10600K | |
| WinRAR - Result | |
| AMD Ryzen 7 5800X | |
| AMD Ryzen 9 5900X | |
| AMD Ryzen 5 5600X | |
| AMD Ryzen 9 5950X | |
| Intel Core i9-12900K | |
| Intel Core i9-10900K | |
| Intel Core i9-11900K | |
| Intel Core i5-11600K | |
| Intel Core i5-10600K | |
| Intel Core i5-12600K | |
| TrueCrypt | |
| AES Mean 100MB | |
| AMD Ryzen 9 5950X | |
| AMD Ryzen 9 5900X | |
| Intel Core i9-12900K | |
| AMD Ryzen 7 5800X | |
| Intel Core i9-10900K | |
| Intel Core i9-11900K | |
| Intel Core i5-12600K | |
| AMD Ryzen 5 5600X | |
| Intel Core i5-11600K | |
| Intel Core i5-10600K | |
| Twofish Mean 100MB | |
| AMD Ryzen 9 5950X | |
| Intel Core i9-12900K | |
| AMD Ryzen 9 5900X | |
| Intel Core i9-10900K | |
| Intel Core i5-12600K | |
| AMD Ryzen 7 5800X | |
| Intel Core i9-11900K | |
| AMD Ryzen 5 5600X | |
| Intel Core i5-11600K | |
| Intel Core i5-10600K | |
| Serpent Mean 100MB | |
| AMD Ryzen 9 5950X | |
| Intel Core i9-12900K | |
| AMD Ryzen 9 5900X | |
| Intel Core i9-10900K | |
| AMD Ryzen 7 5800X | |
| Intel Core i5-12600K | |
| Intel Core i9-11900K | |
| AMD Ryzen 5 5600X | |
| Intel Core i5-11600K | |
| Intel Core i5-10600K | |
| Geekbench 5.5 | |
| Multi-Core | |
| Intel Core i9-12900K | |
| AMD Ryzen 9 5950X | |
| AMD Ryzen 9 5900X | |
| Intel Core i5-12600K | |
| Intel Core i9-10900K | |
| AMD Ryzen 7 5800X | |
| Intel Core i9-11900K | |
| AMD Ryzen 5 5600X | |
| Intel Core i5-11600K | |
| Intel Core i5-10600K | |
| Single-Core | |
| Intel Core i9-12900K | |
| Intel Core i5-12600K | |
| Intel Core i9-11900K | |
| Intel Core i5-11600K | |
| AMD Ryzen 9 5950X | |
| AMD Ryzen 9 5900X | |
| AMD Ryzen 7 5800X | |
| AMD Ryzen 5 5600X | |
| Intel Core i9-10900K | |
| Intel Core i5-10600K | |
| Geekbench 5.0 | |
| 5.0 Multi-Core | |
| Intel Core i9-12900K | |
| AMD Ryzen 9 5950X | |
| AMD Ryzen 9 5900X | |
| Intel Core i5-12600K | |
| Intel Core i9-10900K | |
| AMD Ryzen 7 5800X | |
| Intel Core i9-11900K | |
| AMD Ryzen 5 5600X | |
| Intel Core i5-11600K | |
| Intel Core i5-10600K | |
| 5.0 Single-Core | |
| Intel Core i9-12900K | |
| Intel Core i9-11900K | |
| Intel Core i5-12600K | |
| Intel Core i5-11600K | |
| AMD Ryzen 9 5950X | |
| AMD Ryzen 7 5800X | |
| AMD Ryzen 9 5900X | |
| AMD Ryzen 5 5600X | |
| Intel Core i9-10900K | |
| Intel Core i5-10600K | |
| Geekbench 4.4 | |
| 64 Bit Single-Core Score | |
| Intel Core i9-12900K | |
| Intel Core i5-12600K | |
| Intel Core i9-11900K | |
| Intel Core i5-11600K | |
| AMD Ryzen 7 5800X | |
| AMD Ryzen 9 5900X | |
| AMD Ryzen 9 5950X | |
| AMD Ryzen 5 5600X | |
| Intel Core i9-10900K | |
| Intel Core i5-10600K | |
| 64 Bit Multi-Core Score | |
| Intel Core i9-12900K | |
| AMD Ryzen 9 5950X | |
| AMD Ryzen 9 5900X | |
| Intel Core i5-12600K | |
| AMD Ryzen 7 5800X | |
| Intel Core i9-10900K | |
| Intel Core i9-11900K | |
| AMD Ryzen 5 5600X | |
| Intel Core i5-11600K | |
| Intel Core i5-10600K | |
| 3DMark 11 - 1280x720 Performance Physics | |
| Intel Core i9-12900K | |
| AMD Ryzen 9 5950X | |
| Intel Core i5-12600K | |
| AMD Ryzen 9 5900X | |
| AMD Ryzen 7 5800X | |
| Intel Core i9-10900K | |
| Intel Core i9-11900K | |
| AMD Ryzen 5 5600X | |
| Intel Core i5-11600K | |
| Intel Core i5-10600K | |
| 7-Zip 18.03 | |
| 7z b 4 | |
| AMD Ryzen 9 5950X | |
| Intel Core i9-12900K | |
| AMD Ryzen 9 5900X | |
| AMD Ryzen 7 5800X | |
| Intel Core i9-10900K | |
| Intel Core i5-12600K | |
| Intel Core i9-11900K | |
| AMD Ryzen 5 5600X | |
| Intel Core i5-11600K | |
| Intel Core i5-10600K | |
| 7z b 4 -mmt1 | |
| AMD Ryzen 9 5950X | |
| AMD Ryzen 7 5800X | |
| AMD Ryzen 9 5900X | |
| Intel Core i9-11900K | |
| AMD Ryzen 5 5600X | |
| Intel Core i9-12900K | |
| Intel Core i5-11600K | |
| Intel Core i9-10900K | |
| Intel Core i5-12600K | |
| Intel Core i5-10600K | |
| HWBOT x265 Benchmark v2.2 - 4k Preset | |
| AMD Ryzen 9 5950X | |
| Intel Core i5-12600K | |
| Intel Core i9-12900K | |
| AMD Ryzen 9 5900X | |
| Intel Core i9-10900K | |
| AMD Ryzen 7 5800X | |
| Intel Core i9-11900K | |
| AMD Ryzen 5 5600X | |
| Intel Core i5-11600K | |
| Intel Core i5-10600K | |
| R Benchmark 2.5 - Overall mean | |
| Intel Core i5-10600K | |
| Intel Core i9-10900K | |
| Intel Core i5-11600K | |
| AMD Ryzen 5 5600X | |
| Intel Core i9-11900K | |
| AMD Ryzen 9 5950X | |
| AMD Ryzen 9 5900X | |
| AMD Ryzen 7 5800X | |
| Intel Core i5-12600K | |
| Intel Core i9-12900K | |
| LibreOffice - 20 Documents To PDF | |
| Intel Core i9-10900K | |
| Intel Core i9-11900K | |
| Intel Core i5-12600K | |
| AMD Ryzen 9 5900X | |
| Intel Core i5-10600K | |
| AMD Ryzen 9 5950X | |
| AMD Ryzen 5 5600X | |
| AMD Ryzen 7 5800X | |
| Intel Core i9-12900K | |
| Intel Core i5-11600K | |
| WebXPRT 3 - Overall | |
| Intel Core i9-12900K | |
| AMD Ryzen 7 5800X | |
| Intel Core i5-12600K | |
| AMD Ryzen 9 5950X | |
| AMD Ryzen 5 5600X | |
| AMD Ryzen 9 5900X | |
| Intel Core i5-11600K | |
| Intel Core i9-10900K | |
| Intel Core i5-10600K | |
| Intel Core i9-11900K | |
| Mozilla Kraken 1.1 - Total | |
| Intel Core i5-10600K | |
| Intel Core i9-10900K | |
| Intel Core i5-11600K | |
| AMD Ryzen 5 5600X | |
| AMD Ryzen 9 5900X | |
| AMD Ryzen 7 5800X | |
| AMD Ryzen 9 5950X | |
| Intel Core i9-11900K | |
| Intel Core i5-12600K | |
| Intel Core i9-12900K | |
| 3DMark | |
| 3840x2160 Fire Strike Ultra Physics | |
| Intel Core i9-12900K | |
| AMD Ryzen 9 5950X | |
| AMD Ryzen 9 5900X | |
| AMD Ryzen 7 5800X | |
| Intel Core i5-12600K | |
| Intel Core i9-10900K | |
| Intel Core i9-11900K | |
| AMD Ryzen 5 5600X | |
| Intel Core i5-11600K | |
| Intel Core i5-10600K | |
| 1920x1080 Fire Strike Physics | |
| AMD Ryzen 9 5950X | |
| Intel Core i9-12900K | |
| AMD Ryzen 9 5900X | |
| AMD Ryzen 7 5800X | |
| Intel Core i9-10900K | |
| Intel Core i5-12600K | |
| Intel Core i9-11900K | |
| AMD Ryzen 5 5600X | |
| Intel Core i5-11600K | |
| Intel Core i5-10600K | |
| 2560x1440 Time Spy CPU | |
| Intel Core i9-12900K | |
| Intel Core i9-10900K | |
| Intel Core i5-12600K | |
| AMD Ryzen 9 5950X | |
| Intel Core i9-11900K | |
| AMD Ryzen 9 5900X | |
| AMD Ryzen 7 5800X | |
| Intel Core i5-11600K | |
| AMD Ryzen 5 5600X | |
| Intel Core i5-10600K | |
* ... smaller is better
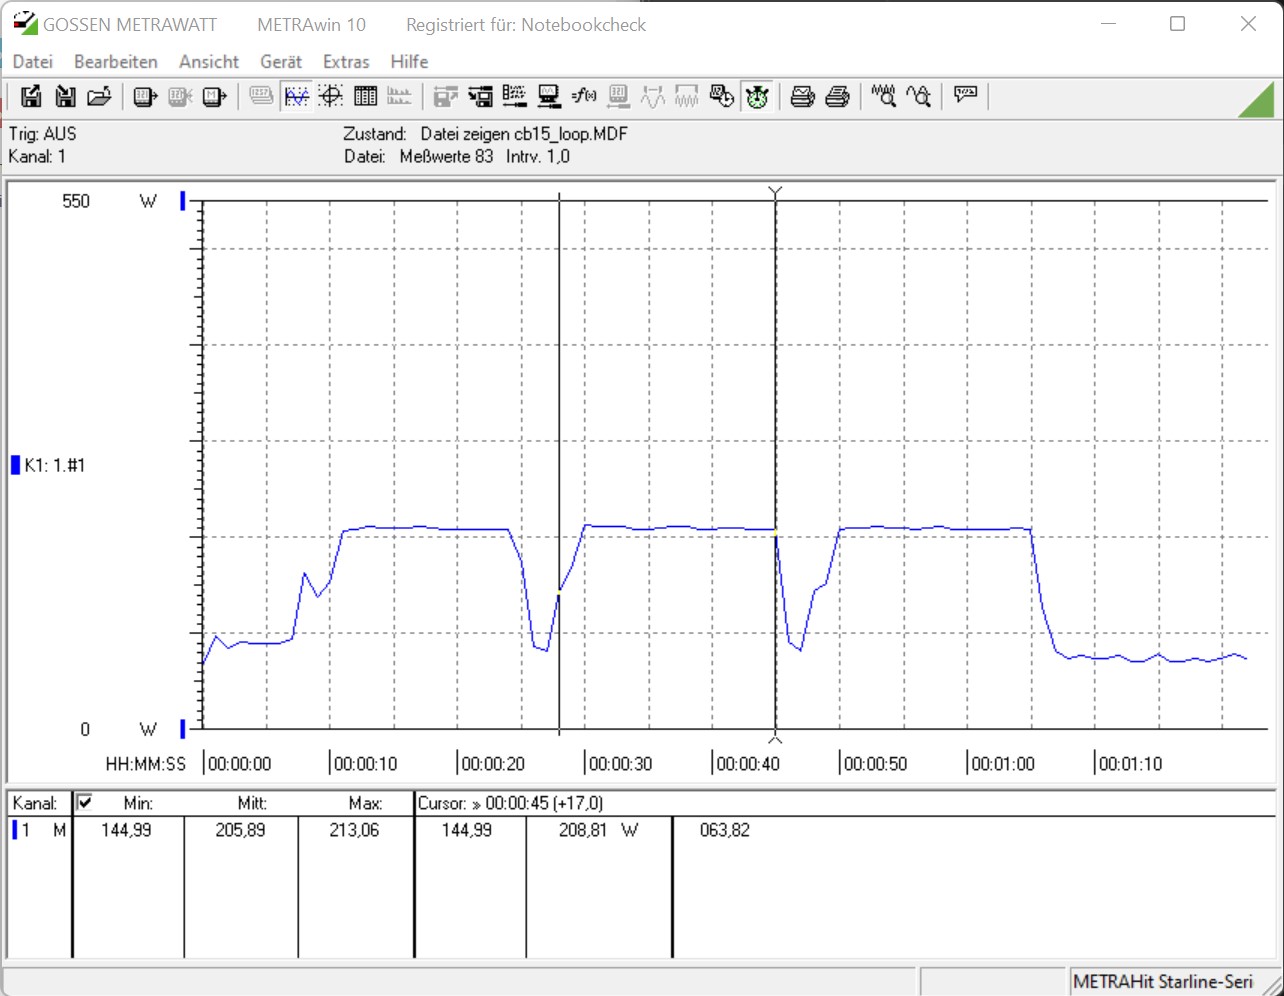
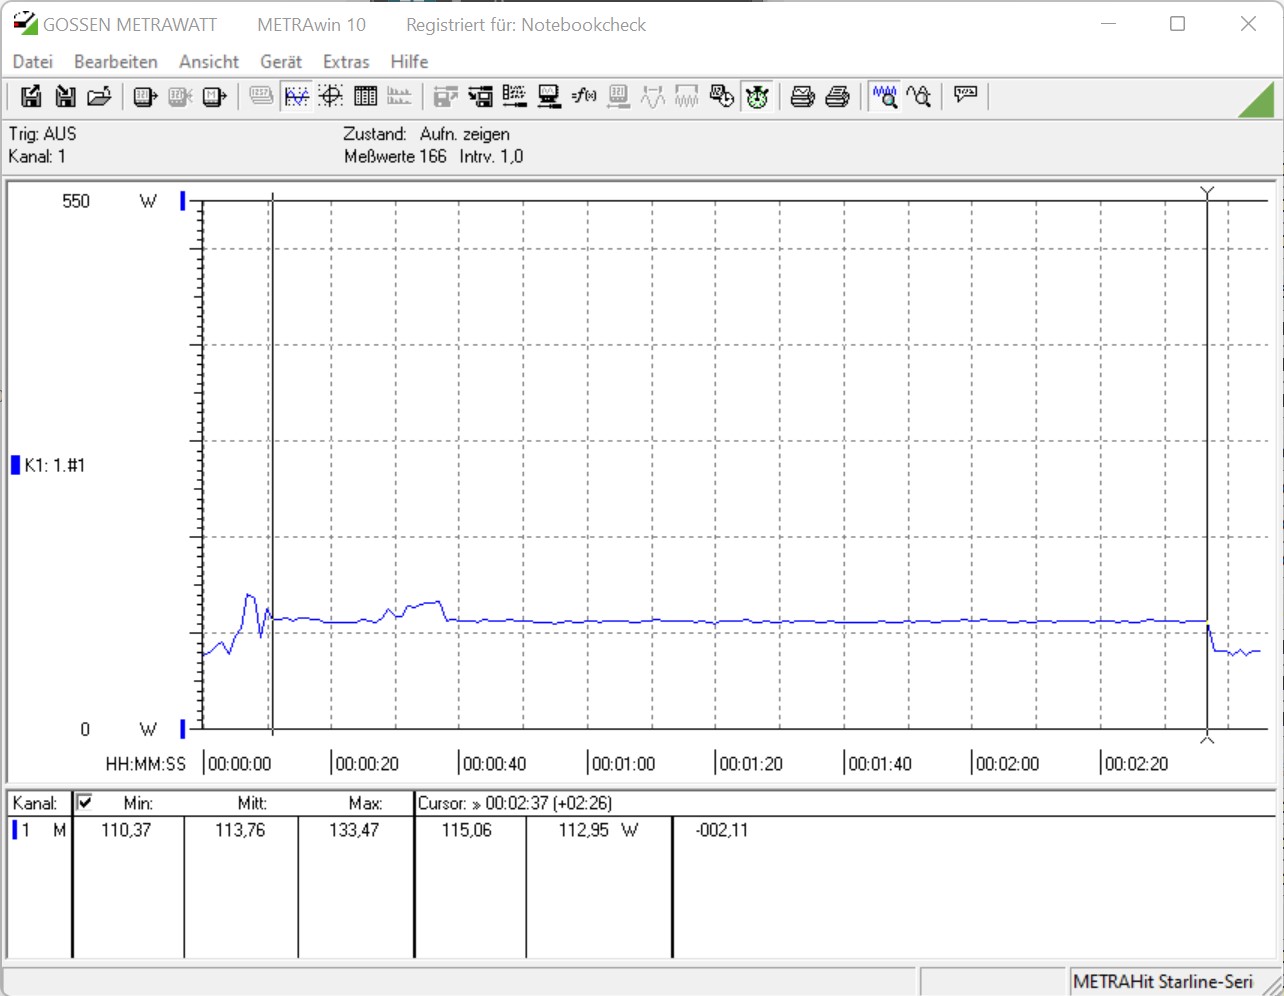
Alder Lake-S与Cinebench R15 Multi Loop的比较
我们的两个测试装置在负载测试中都显示出非常稳定的性能。相比于英特尔酷睿i9-11900K相比,英特尔酷睿i9-12900K能够以平均3987分的成绩连续进入第一名,并且没有任何性能下降。英特尔酷睿i5-12600K也能够稳定地领先于英特尔酷睿i5-11600K火箭湖-S的前辈,优势明显。更高的原生计算核心数量确保了这种性能差异的整体性。
合成基准和应用性能
在合成基准测试中,新的Alder Lake-S处理器处于领先地位。除了AMD应该提供更好的平台的少数例外情况外,英特尔酷睿i9-12900K能够取得坚实的优势。因此,这两款Alder Lake-S处理器在两个累积基准测试结果中分享了两个榜首位置,这并不令人惊讶。然而,我们还是有点惊讶,因为我们没有想到英特尔酷睿i5-12600K会在总排名中排名第二。
| Performance rating - Percent | |
| Intel Core i9-12900K | |
| Intel Core i5-12600K | |
| AMD Ryzen 7 5800X | |
| AMD Ryzen 9 5950X | |
| AMD Ryzen 5 5600X | |
| AMD Ryzen 9 5900X | |
| Intel Core i9-11900K | |
| Intel Core i9-10900K | |
| Intel Core i5-11600K | |
| Intel Core i7-10700K | |
| Intel Core i5-10600K | |
| 3DMark | |
| 1920x1080 Fire Strike Physics | |
| AMD Ryzen 9 5950X | |
| Intel Core i9-12900K | |
| AMD Ryzen 9 5900X | |
| AMD Ryzen 7 5800X | |
| Intel Core i9-10900K | |
| Intel Core i5-12600K | |
| Intel Core i9-11900K | |
| AMD Ryzen 5 5600X | |
| Intel Core i7-10700K | |
| Intel Core i5-11600K | |
| Intel Core i5-10600K | |
| 1920x1080 Fire Strike Graphics | |
| Intel Core i5-12600K | |
| Intel Core i9-12900K | |
| Intel Core i7-10700K | |
| Intel Core i5-11600K | |
| AMD Ryzen 7 5800X | |
| Intel Core i9-10900K | |
| Intel Core i9-11900K | |
| AMD Ryzen 9 5950X | |
| AMD Ryzen 5 5600X | |
| Intel Core i5-10600K | |
| AMD Ryzen 9 5900X | |
| Fire Strike Extreme Graphics | |
| Intel Core i5-12600K | |
| Intel Core i9-12900K | |
| Intel Core i5-11600K | |
| AMD Ryzen 5 5600X | |
| Intel Core i7-10700K | |
| Intel Core i9-11900K | |
| AMD Ryzen 9 5950X | |
| AMD Ryzen 7 5800X | |
| Intel Core i9-10900K | |
| AMD Ryzen 9 5900X | |
| Intel Core i5-10600K | |
| 3840x2160 Fire Strike Ultra Graphics | |
| Intel Core i5-12600K | |
| Intel Core i9-12900K | |
| Intel Core i5-11600K | |
| Intel Core i9-11900K | |
| AMD Ryzen 7 5800X | |
| AMD Ryzen 5 5600X | |
| Intel Core i7-10700K | |
| AMD Ryzen 9 5950X | |
| Intel Core i9-10900K | |
| AMD Ryzen 9 5900X | |
| Intel Core i5-10600K | |
| 3DMark 11 | |
| 1280x720 Performance GPU | |
| Intel Core i7-10700K | |
| Intel Core i5-12600K | |
| Intel Core i9-10900K | |
| AMD Ryzen 9 5950X | |
| AMD Ryzen 7 5800X | |
| Intel Core i9-12900K | |
| AMD Ryzen 5 5600X | |
| Intel Core i9-11900K | |
| Intel Core i5-10600K | |
| Intel Core i5-11600K | |
| AMD Ryzen 9 5900X | |
| 1280x720 Performance Physics | |
| Intel Core i9-12900K | |
| AMD Ryzen 9 5950X | |
| Intel Core i5-12600K | |
| AMD Ryzen 9 5900X | |
| AMD Ryzen 7 5800X | |
| Intel Core i9-10900K | |
| Intel Core i9-11900K | |
| AMD Ryzen 5 5600X | |
| Intel Core i7-10700K | |
| Intel Core i5-11600K | |
| Intel Core i5-10600K | |
| PCMark 10 - Score | |
| AMD Ryzen 9 5950X | |
| Intel Core i9-12900K | |
| AMD Ryzen 9 5900X | |
| AMD Ryzen 5 5600X | |
| Intel Core i5-12600K | |
| AMD Ryzen 7 5800X | |
| Intel Core i9-11900K | |
| Intel Core i5-11600K | |
| Intel Core i9-10900K | |
| Intel Core i7-10700K | |
| Intel Core i5-10600K | |
| SPECviewperf 12 | |
| 1900x1060 Solidworks (sw-03) | |
| AMD Ryzen 7 5800X | |
| AMD Ryzen 9 5950X | |
| AMD Ryzen 5 5600X | |
| Intel Core i9-11900K | |
| AMD Ryzen 9 5900X | |
| Intel Core i9-12900K | |
| Intel Core i9-10900K | |
| Intel Core i5-11600K | |
| Intel Core i7-10700K | |
| Intel Core i5-12600K | |
| Intel Core i5-10600K | |
| 1900x1060 Siemens NX (snx-02) | |
| Intel Core i9-12900K | |
| Intel Core i5-12600K | |
| Intel Core i7-10700K | |
| AMD Ryzen 9 5900X | |
| AMD Ryzen 7 5800X | |
| AMD Ryzen 5 5600X | |
| AMD Ryzen 9 5950X | |
| Intel Core i9-10900K | |
| Intel Core i5-10600K | |
| Intel Core i5-11600K | |
| Intel Core i9-11900K | |
| 1900x1060 Showcase (showcase-01) | |
| Intel Core i9-11900K | |
| Intel Core i5-11600K | |
| Intel Core i9-12900K | |
| Intel Core i5-12600K | |
| Intel Core i5-10600K | |
| Intel Core i7-10700K | |
| Intel Core i9-10900K | |
| AMD Ryzen 5 5600X | |
| AMD Ryzen 9 5900X | |
| AMD Ryzen 9 5950X | |
| AMD Ryzen 7 5800X | |
| 1900x1060 Medical (medical-01) | |
| Intel Core i9-12900K | |
| Intel Core i5-12600K | |
| Intel Core i5-10600K | |
| Intel Core i9-10900K | |
| Intel Core i7-10700K | |
| AMD Ryzen 9 5900X | |
| Intel Core i5-11600K | |
| AMD Ryzen 7 5800X | |
| AMD Ryzen 5 5600X | |
| AMD Ryzen 9 5950X | |
| Intel Core i9-11900K | |
| 1900x1060 Maya (maya-04) | |
| AMD Ryzen 7 5800X | |
| AMD Ryzen 5 5600X | |
| Intel Core i9-12900K | |
| Intel Core i9-11900K | |
| Intel Core i5-12600K | |
| AMD Ryzen 9 5950X | |
| Intel Core i9-10900K | |
| AMD Ryzen 9 5900X | |
| Intel Core i5-11600K | |
| Intel Core i7-10700K | |
| Intel Core i5-10600K | |
| 1900x1060 Energy (energy-01) | |
| Intel Core i9-12900K | |
| Intel Core i5-12600K | |
| Intel Core i5-10600K | |
| Intel Core i9-10900K | |
| Intel Core i7-10700K | |
| AMD Ryzen 9 5900X | |
| Intel Core i5-11600K | |
| Intel Core i9-11900K | |
| AMD Ryzen 9 5950X | |
| AMD Ryzen 7 5800X | |
| AMD Ryzen 5 5600X | |
| 1900x1060 Creo (creo-01) | |
| Intel Core i9-12900K | |
| Intel Core i5-12600K | |
| AMD Ryzen 7 5800X | |
| AMD Ryzen 9 5900X | |
| Intel Core i9-11900K | |
| AMD Ryzen 5 5600X | |
| Intel Core i5-11600K | |
| Intel Core i9-10900K | |
| Intel Core i7-10700K | |
| Intel Core i5-10600K | |
| AMD Ryzen 9 5950X | |
| 1900x1060 Catia (catia-04) | |
| Intel Core i9-12900K | |
| Intel Core i5-12600K | |
| Intel Core i9-11900K | |
| AMD Ryzen 7 5800X | |
| AMD Ryzen 5 5600X | |
| AMD Ryzen 9 5900X | |
| Intel Core i5-11600K | |
| AMD Ryzen 9 5950X | |
| Intel Core i9-10900K | |
| Intel Core i5-10600K | |
| Intel Core i7-10700K | |
| 1900x1060 3ds Max (3dsmax-05) | |
| AMD Ryzen 5 5600X | |
| Intel Core i9-10900K | |
| Intel Core i5-10600K | |
| AMD Ryzen 7 5800X | |
| Intel Core i7-10700K | |
| AMD Ryzen 9 5900X | |
| AMD Ryzen 9 5950X | |
| Intel Core i9-11900K | |
| Intel Core i5-11600K | |
| Intel Core i5-12600K | |
| Intel Core i9-12900K | |
| SPECviewperf 13 | |
| Solidworks (sw-04) | |
| AMD Ryzen 7 5800X | |
| Intel Core i9-12900K | |
| Intel Core i9-11900K | |
| AMD Ryzen 9 5900X | |
| AMD Ryzen 5 5600X | |
| Intel Core i5-12600K | |
| Intel Core i5-11600K | |
| AMD Ryzen 9 5950X | |
| Intel Core i9-10900K | |
| Intel Core i7-10700K | |
| Intel Core i5-10600K | |
| Siemens NX (snx-03) | |
| Intel Core i9-12900K | |
| Intel Core i5-12600K | |
| Intel Core i7-10700K | |
| AMD Ryzen 9 5900X | |
| AMD Ryzen 7 5800X | |
| AMD Ryzen 5 5600X | |
| AMD Ryzen 9 5950X | |
| Intel Core i9-10900K | |
| Intel Core i5-10600K | |
| Intel Core i5-11600K | |
| Intel Core i9-11900K | |
| Showcase (showcase-02) | |
| Intel Core i9-12900K | |
| Intel Core i5-12600K | |
| Intel Core i5-10600K | |
| Intel Core i7-10700K | |
| Intel Core i9-10900K | |
| Intel Core i9-11900K | |
| Intel Core i5-11600K | |
| AMD Ryzen 7 5800X | |
| AMD Ryzen 9 5950X | |
| AMD Ryzen 5 5600X | |
| AMD Ryzen 9 5900X | |
| Medical (medical-02) | |
| Intel Core i9-12900K | |
| Intel Core i5-12600K | |
| AMD Ryzen 9 5900X | |
| AMD Ryzen 7 5800X | |
| Intel Core i7-10700K | |
| AMD Ryzen 9 5950X | |
| AMD Ryzen 5 5600X | |
| Intel Core i9-11900K | |
| Intel Core i5-11600K | |
| Intel Core i5-10600K | |
| Intel Core i9-10900K | |
| Maya (maya-05) | |
| Intel Core i9-12900K | |
| Intel Core i5-12600K | |
| AMD Ryzen 9 5950X | |
| AMD Ryzen 7 5800X | |
| AMD Ryzen 9 5900X | |
| Intel Core i9-11900K | |
| AMD Ryzen 5 5600X | |
| Intel Core i5-11600K | |
| Intel Core i7-10700K | |
| Intel Core i9-10900K | |
| Intel Core i5-10600K | |
| Energy (energy-02) | |
| Intel Core i5-11600K | |
| Intel Core i5-12600K | |
| Intel Core i9-11900K | |
| Intel Core i5-10600K | |
| Intel Core i9-10900K | |
| Intel Core i9-12900K | |
| Intel Core i7-10700K | |
| AMD Ryzen 7 5800X | |
| AMD Ryzen 5 5600X | |
| AMD Ryzen 9 5900X | |
| AMD Ryzen 9 5950X | |
| Creo (creo-02) | |
| Intel Core i9-12900K | |
| Intel Core i5-12600K | |
| Intel Core i9-11900K | |
| Intel Core i5-11600K | |
| Intel Core i7-10700K | |
| AMD Ryzen 7 5800X | |
| AMD Ryzen 5 5600X | |
| AMD Ryzen 9 5900X | |
| AMD Ryzen 9 5950X | |
| Intel Core i9-10900K | |
| Intel Core i5-10600K | |
| Catia (catia-05) | |
| Intel Core i9-12900K | |
| Intel Core i5-12600K | |
| AMD Ryzen 9 5950X | |
| AMD Ryzen 5 5600X | |
| AMD Ryzen 7 5800X | |
| Intel Core i9-11900K | |
| Intel Core i5-11600K | |
| AMD Ryzen 9 5900X | |
| Intel Core i9-10900K | |
| Intel Core i7-10700K | |
| Intel Core i5-10600K | |
| 3ds Max (3dsmax-06) | |
| AMD Ryzen 5 5600X | |
| AMD Ryzen 7 5800X | |
| Intel Core i5-10600K | |
| Intel Core i9-10900K | |
| AMD Ryzen 9 5900X | |
| Intel Core i7-10700K | |
| AMD Ryzen 9 5950X | |
| Intel Core i5-11600K | |
| Intel Core i9-11900K | |
| Intel Core i9-12900K | |
| Intel Core i5-12600K | |
游戏基准
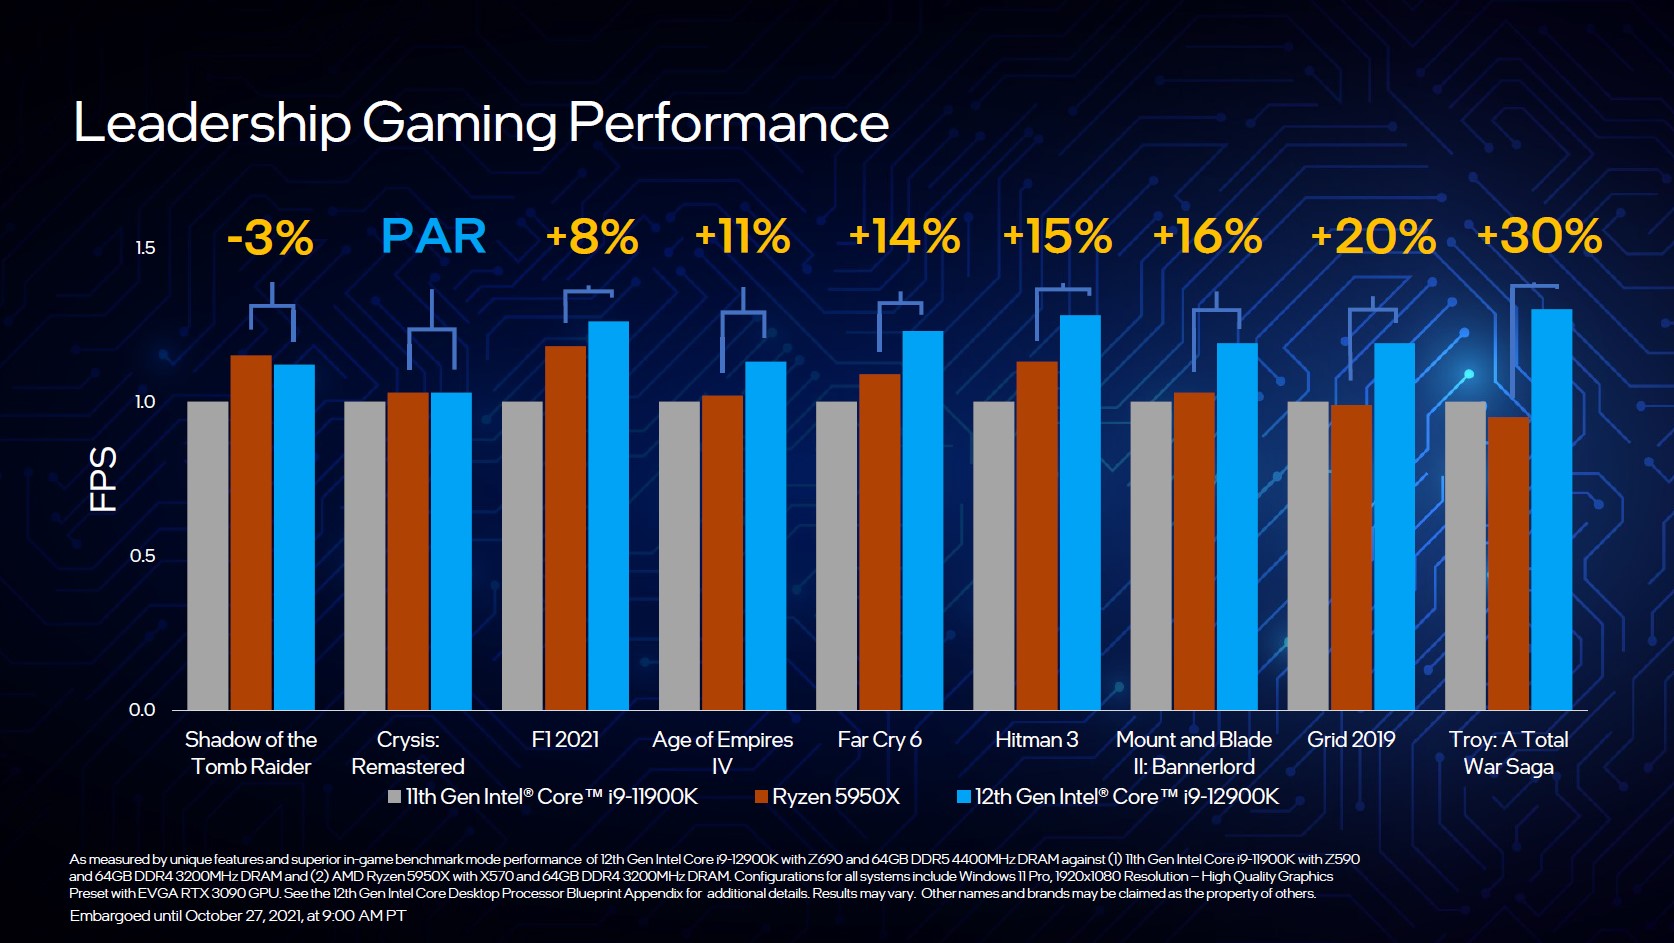
现在我们进入最有趣的基准测试,以及新的英特尔Alder Lake-S处理器能够真正展示其能力的学科。与Rocket Lake-S相比,新处理器能够显著提高其性能,正如你在游戏基准测试中看到的那样。在九个游戏的累计比较中,英特尔酷睿i9-12900K能够仅仅领先于 AMD Ryzen 9 5900X.你还必须知道,有些游戏与英特尔处理器的协调性更好,而另一些游戏则与AMD处理器的性能更好。在两款Alder Lake-S处理器的内部竞争中,英特尔酷睿i5-12600K输给了旗舰产品8个百分点,最终仅勉强领先于 英特尔酷睿i5-11600K与此。
尽管如此,这两款处理器都能提供非常好的游戏性能。由于平台和操作系统的许多变化,我们可能还能期待未来以更新的形式进行一些更多的性能改进。在纯粹的CPU限制下,性能非常高,而且根据游戏的不同也明显领先于竞争对手。然而,我们仍然要注意到,尽管英特尔在其产品组合中拥有最快的游戏CPU,但与Zen3处理器的距离并不突出。 此外,所有的竞争对手都随着分辨率的提高而逐渐接近,因此,CPU只能在GPU后面扮演第二小提琴手的角色,成为提升FPS的决定因素。那些除了实际游戏之外还流媒体内容的人将从更高的线程量中获利,这也将使新机型对内容创作者非常有趣。
| Performance rating - Percent | |
| Intel Core i9-12900K | |
| AMD Ryzen 9 5900X -2! | |
| AMD Ryzen 7 5800X -2! | |
| AMD Ryzen 9 5950X -2! | |
| AMD Ryzen 5 5600X -2! | |
| Intel Core i9-11900K | |
| Intel Core i5-12600K | |
| Intel Core i5-11600K | |
| Intel Core i9-10900K | |
| Intel Core i7-10700K -4! | |
| Intel Core i5-10600K | |
| Borderlands 3 | |
| 1280x720 Very Low Overall Quality (DX11) | |
| AMD Ryzen 9 5900X | |
| AMD Ryzen 7 5800X | |
| AMD Ryzen 9 5950X | |
| AMD Ryzen 5 5600X | |
| Intel Core i9-12900K | |
| Intel Core i9-11900K | |
| Intel Core i9-10900K | |
| Intel Core i5-11600K | |
| Intel Core i7-10700K | |
| Intel Core i5-12600K | |
| Intel Core i5-10600K | |
| 1920x1080 Badass Overall Quality (DX11) | |
| Intel Core i9-12900K | |
| Intel Core i5-12600K | |
| AMD Ryzen 9 5900X | |
| Intel Core i9-11900K | |
| Intel Core i9-10900K | |
| Intel Core i7-10700K | |
| AMD Ryzen 9 5950X | |
| Intel Core i5-11600K | |
| AMD Ryzen 7 5800X | |
| AMD Ryzen 5 5600X | |
| Intel Core i5-10600K | |
| Far Cry New Dawn | |
| 1280x720 Low Preset | |
| Intel Core i9-12900K | |
| Intel Core i9-11900K | |
| AMD Ryzen 9 5900X | |
| Intel Core i5-12600K | |
| Intel Core i5-11600K | |
| AMD Ryzen 7 5800X | |
| AMD Ryzen 9 5950X | |
| Intel Core i7-10700K | |
| AMD Ryzen 5 5600X | |
| Intel Core i9-10900K | |
| Intel Core i5-10600K | |
| 1920x1080 Ultra Preset | |
| Intel Core i9-12900K | |
| Intel Core i9-11900K | |
| AMD Ryzen 9 5900X | |
| Intel Core i5-11600K | |
| Intel Core i7-10700K | |
| Intel Core i5-12600K | |
| AMD Ryzen 7 5800X | |
| AMD Ryzen 9 5950X | |
| AMD Ryzen 5 5600X | |
| Intel Core i5-10600K | |
| Intel Core i9-10900K | |
| Forza Horizon 4 | |
| 1280x720 Very Low Preset | |
| Intel Core i9-12900K | |
| Intel Core i5-12600K | |
| Intel Core i9-11900K | |
| Intel Core i9-10900K | |
| Intel Core i5-11600K | |
| Intel Core i5-10600K | |
| 1920x1080 Ultra Preset AA:2xMS | |
| Intel Core i9-10900K | |
| Intel Core i9-11900K | |
| Intel Core i5-11600K | |
| Intel Core i5-10600K | |
| Intel Core i9-12900K | |
| Intel Core i5-12600K | |
| Far Cry 5 | |
| 1280x720 Low Preset AA:T | |
| Intel Core i9-12900K | |
| AMD Ryzen 9 5900X | |
| Intel Core i9-11900K | |
| AMD Ryzen 7 5800X | |
| AMD Ryzen 9 5950X | |
| AMD Ryzen 5 5600X | |
| Intel Core i5-12600K | |
| Intel Core i5-11600K | |
| Intel Core i9-10900K | |
| Intel Core i7-10700K | |
| Intel Core i5-10600K | |
| 1920x1080 Ultra Preset AA:T | |
| Intel Core i9-12900K | |
| Intel Core i9-11900K | |
| AMD Ryzen 9 5900X | |
| AMD Ryzen 7 5800X | |
| Intel Core i5-11600K | |
| AMD Ryzen 9 5950X | |
| Intel Core i5-12600K | |
| AMD Ryzen 5 5600X | |
| Intel Core i7-10700K | |
| Intel Core i9-10900K | |
| Intel Core i5-10600K | |
| X-Plane 11.11 | |
| 1280x720 low (fps_test=1) | |
| Intel Core i9-12900K | |
| AMD Ryzen 7 5800X | |
| AMD Ryzen 9 5900X | |
| AMD Ryzen 5 5600X | |
| Intel Core i5-12600K | |
| Intel Core i9-11900K | |
| AMD Ryzen 9 5950X | |
| Intel Core i5-11600K | |
| Intel Core i9-10900K | |
| Intel Core i7-10700K | |
| Intel Core i5-10600K | |
| 1920x1080 high (fps_test=3) | |
| Intel Core i9-12900K | |
| AMD Ryzen 9 5900X | |
| AMD Ryzen 7 5800X | |
| Intel Core i9-11900K | |
| AMD Ryzen 5 5600X | |
| Intel Core i5-12600K | |
| AMD Ryzen 9 5950X | |
| Intel Core i5-11600K | |
| Intel Core i9-10900K | |
| Intel Core i7-10700K | |
| Intel Core i5-10600K | |
| Final Fantasy XV Benchmark | |
| 1280x720 Lite Quality | |
| Intel Core i9-12900K | |
| AMD Ryzen 9 5900X | |
| AMD Ryzen 7 5800X | |
| AMD Ryzen 9 5950X | |
| AMD Ryzen 5 5600X | |
| Intel Core i9-10900K | |
| Intel Core i9-11900K | |
| Intel Core i5-12600K | |
| Intel Core i5-11600K | |
| Intel Core i5-10600K | |
| Intel Core i7-10700K | |
| 1920x1080 High Quality | |
| Intel Core i9-12900K | |
| Intel Core i9-11900K | |
| Intel Core i9-10900K | |
| AMD Ryzen 9 5950X | |
| Intel Core i5-11600K | |
| Intel Core i5-12600K | |
| Intel Core i5-10600K | |
| AMD Ryzen 7 5800X | |
| AMD Ryzen 9 5900X | |
| AMD Ryzen 5 5600X | |
| Intel Core i7-10700K | |
| Dota 2 Reborn | |
| 1280x720 min (0/3) fastest | |
| AMD Ryzen 7 5800X | |
| AMD Ryzen 9 5900X | |
| AMD Ryzen 5 5600X | |
| AMD Ryzen 9 5950X | |
| Intel Core i9-12900K | |
| Intel Core i9-10900K | |
| Intel Core i9-11900K | |
| Intel Core i7-10700K | |
| Intel Core i5-11600K | |
| Intel Core i5-12600K | |
| Intel Core i5-10600K | |
| 1920x1080 ultra (3/3) best looking | |
| Intel Core i9-12900K | |
| AMD Ryzen 7 5800X | |
| AMD Ryzen 9 5900X | |
| AMD Ryzen 5 5600X | |
| AMD Ryzen 9 5950X | |
| Intel Core i5-12600K | |
| Intel Core i9-10900K | |
| Intel Core i9-11900K | |
| Intel Core i5-11600K | |
| Intel Core i7-10700K | |
| Intel Core i5-10600K | |
| The Witcher 3 | |
| 1024x768 Low Graphics & Postprocessing | |
| AMD Ryzen 9 5900X | |
| AMD Ryzen 7 5800X | |
| AMD Ryzen 9 5950X | |
| Intel Core i9-12900K | |
| AMD Ryzen 5 5600X | |
| Intel Core i9-10900K | |
| Intel Core i9-11900K | |
| Intel Core i5-12600K | |
| Intel Core i7-10700K | |
| Intel Core i5-11600K | |
| Intel Core i5-10600K | |
| 1920x1080 Ultra Graphics & Postprocessing (HBAO+) | |
| Intel Core i5-11600K | |
| Intel Core i5-12600K | |
| Intel Core i7-10700K | |
| AMD Ryzen 9 5900X | |
| AMD Ryzen 9 5950X | |
| Intel Core i5-10600K | |
| Intel Core i9-11900K | |
| Intel Core i9-10900K | |
| AMD Ryzen 7 5800X | |
| AMD Ryzen 5 5600X | |
| Intel Core i9-12900K | |
| Shadow of the Tomb Raider | |
| 1280x720 Lowest Preset | |
| AMD Ryzen 7 5800X | |
| AMD Ryzen 9 5950X | |
| AMD Ryzen 9 5900X | |
| Intel Core i9-12900K | |
| AMD Ryzen 5 5600X | |
| Intel Core i9-10900K | |
| Intel Core i9-11900K | |
| Intel Core i5-12600K | |
| Intel Core i5-11600K | |
| Intel Core i5-10600K | |
| 1920x1080 Highest Preset AA:T | |
| AMD Ryzen 7 5800X | |
| Intel Core i9-12900K | |
| Intel Core i9-11900K | |
| AMD Ryzen 9 5950X | |
| AMD Ryzen 9 5900X | |
| Intel Core i9-10900K | |
| AMD Ryzen 5 5600X | |
| Intel Core i5-12600K | |
| Intel Core i5-11600K | |
| Intel Core i5-10600K | |
Intel Core i9-12900K + Nvidia Titan RTX
| low | med. | high | ultra | QHD | 4K | |
|---|---|---|---|---|---|---|
| GTA V (2015) | 187 | 187 | 185 | 135 | 123 | 138 |
| The Witcher 3 (2015) | 589 | 422 | 271 | 139 | 103 | |
| Dota 2 Reborn (2015) | 203.5 | 208.7 | 201.7 | 189.7 | 178.9 | |
| Final Fantasy XV Benchmark (2018) | 227 | 195 | 144 | 108 | 64.1 | |
| X-Plane 11.11 (2018) | 200 | 176 | 137 | 117 | ||
| Far Cry 5 (2018) | 220 | 191 | 178 | 167 | 145 | 83 |
| Strange Brigade (2018) | 593 | 371 | 308 | 266 | 197 | 115 |
| Shadow of the Tomb Raider (2018) | 221 | 192 | 183 | 169 | 124 | 69.3 |
| Forza Horizon 4 (2018) | 293 | 227 | 216 | 178 | 153 | 111 |
| Far Cry New Dawn (2019) | 188 | 162 | 154 | 140 | 129 | 84 |
| Borderlands 3 (2019) | 202 | 172 | 147 | 124 | 89.9 | 49.2 |
| F1 2020 (2020) | 432 | 343 | 303 | 213 | 167 | 101 |
| F1 2021 (2021) | 491 | 383 | 307 | 160 | 121 | 71.9 |
| Far Cry 6 (2021) | 185 | 157 | 142 | 134 | 109 | 64 |
Intel Core i5-12600K + Nvidia Titan RTX
| low | med. | high | ultra | QHD | 4K | |
|---|---|---|---|---|---|---|
| GTA V (2015) | 186 | 185 | 181 | 124 | 115 | 136 |
| The Witcher 3 (2015) | 500 | 406 | 277 | 144 | 107 | |
| Dota 2 Reborn (2015) | 183.7 | 188 | 181.1 | 174.9 | 165.8 | |
| Final Fantasy XV Benchmark (2018) | 218 | 192 | 141 | 107 | 63.6 | |
| X-Plane 11.11 (2018) | 172 | 153 | 119 | 104 | ||
| Far Cry 5 (2018) | 200 | 174 | 165 | 154 | 140 | 81 |
| Strange Brigade (2018) | 489 | 352 | 301 | 262 | 196 | 114 |
| Shadow of the Tomb Raider (2018) | 195 | 176 | 172 | 163 | 124 | 70.1 |
| Forza Horizon 4 (2018) | 263 | 218 | 212 | 178 | 154 | 112 |
| Far Cry New Dawn (2019) | 171 | 147 | 141 | 126 | 121 | 84 |
| Metro Exodus (2019) | 227 | 174 | 135 | 108 | 87.7 | 56.6 |
| Borderlands 3 (2019) | 175 | 155 | 138 | 119 | 90.4 | 49.8 |
| F1 2020 (2020) | 340 | 291 | 288 | 216 | 168 | 103 |
| F1 2021 (2021) | 407 | 367 | 302 | 160 | 122 | 72.6 |
| Far Cry 6 (2021) | 164 | 136 | 129 | 124 | 105 | 64 |
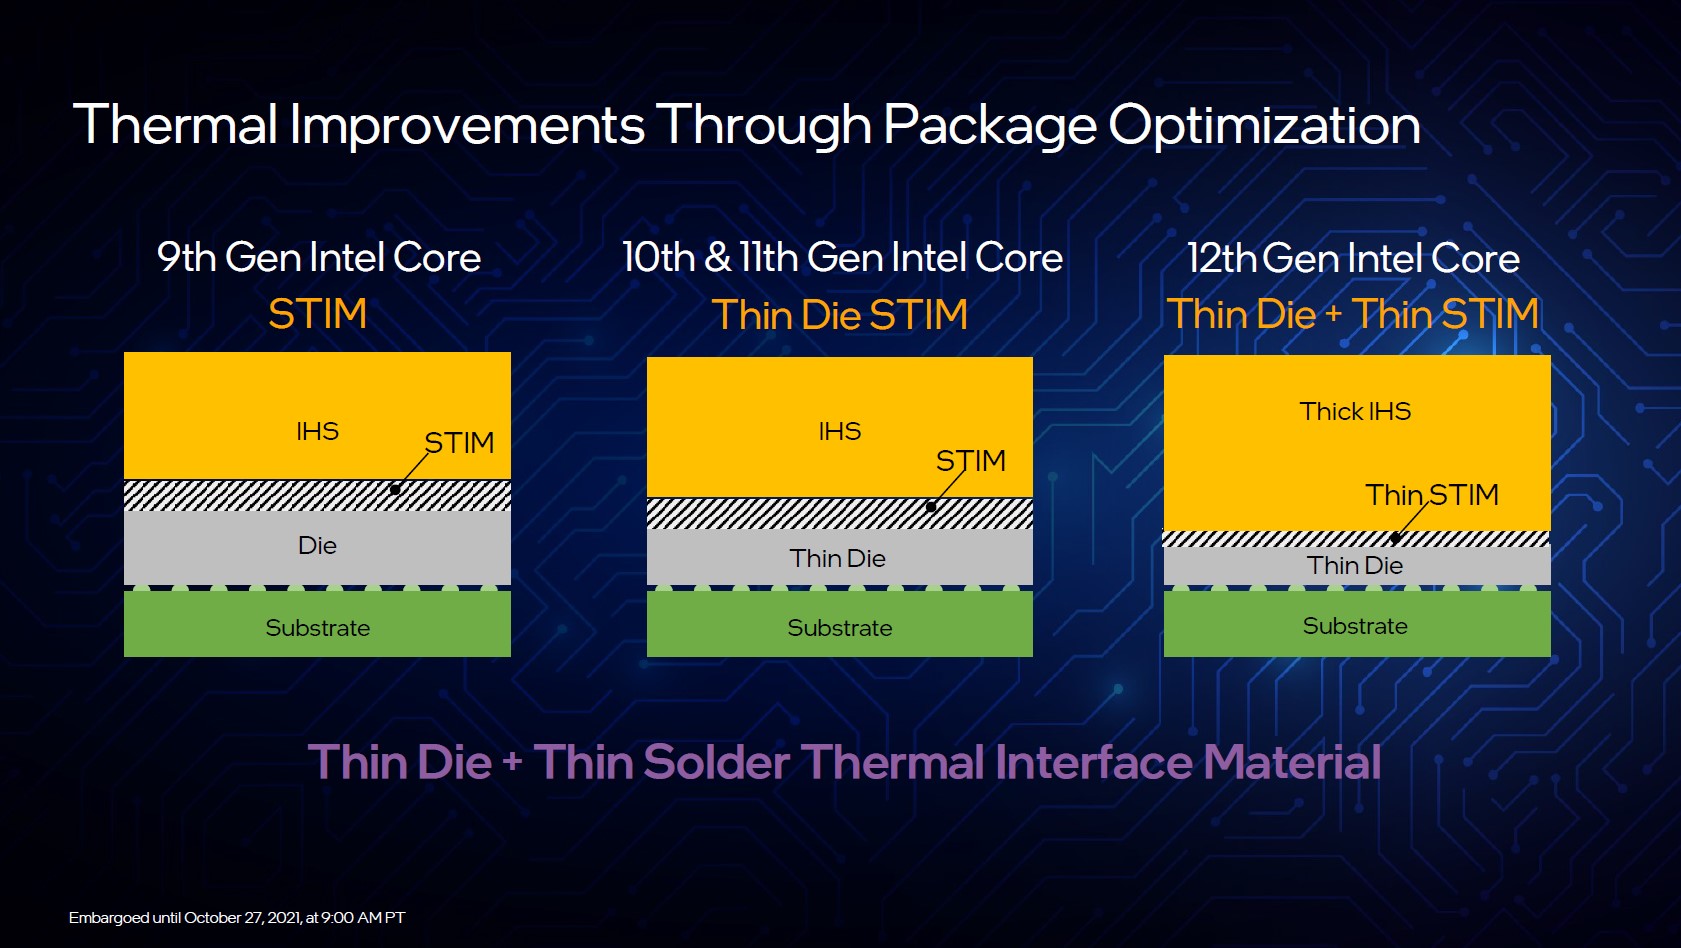
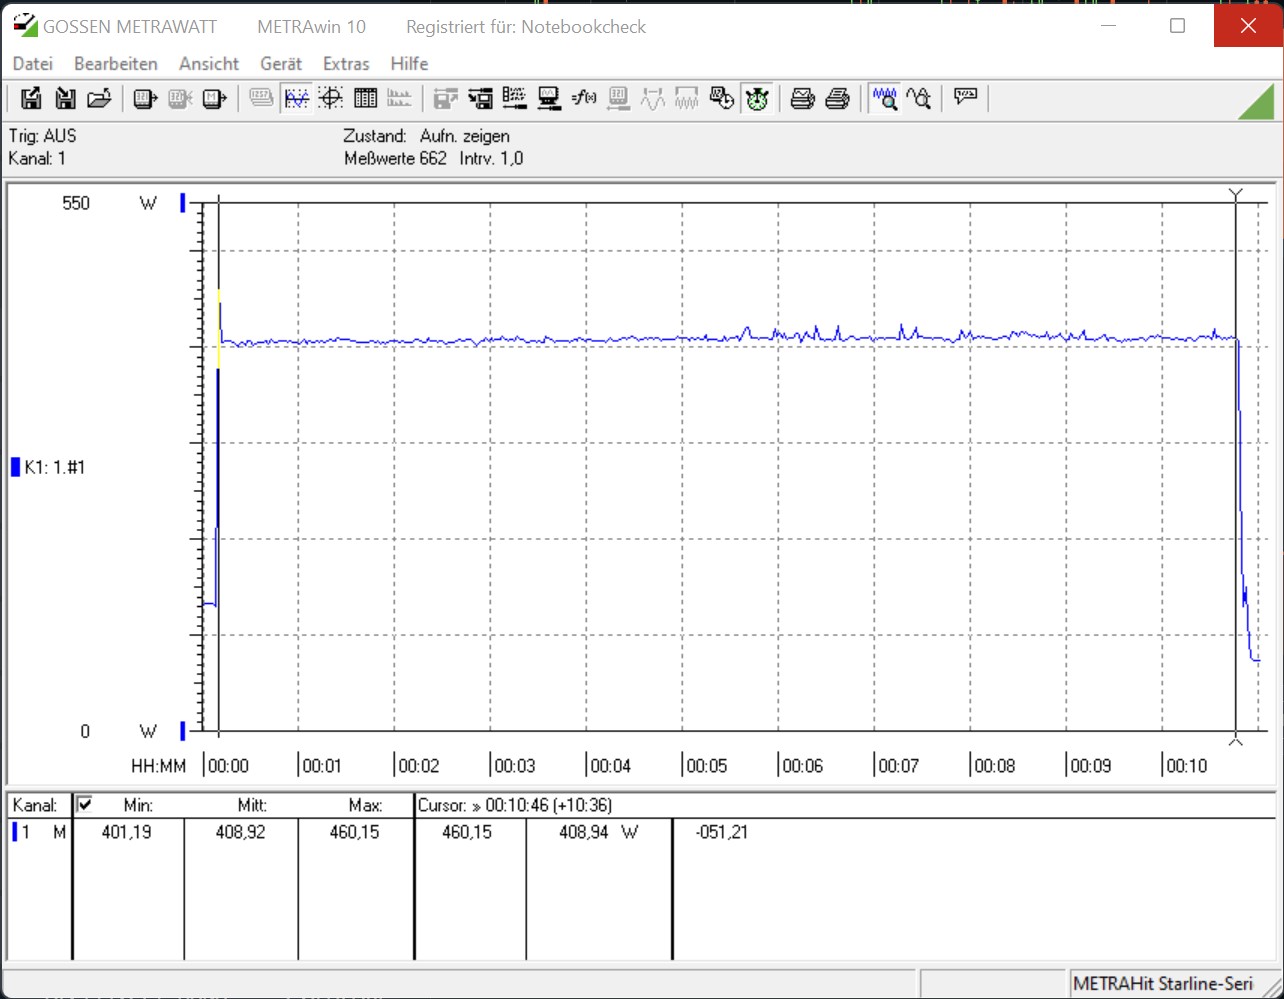
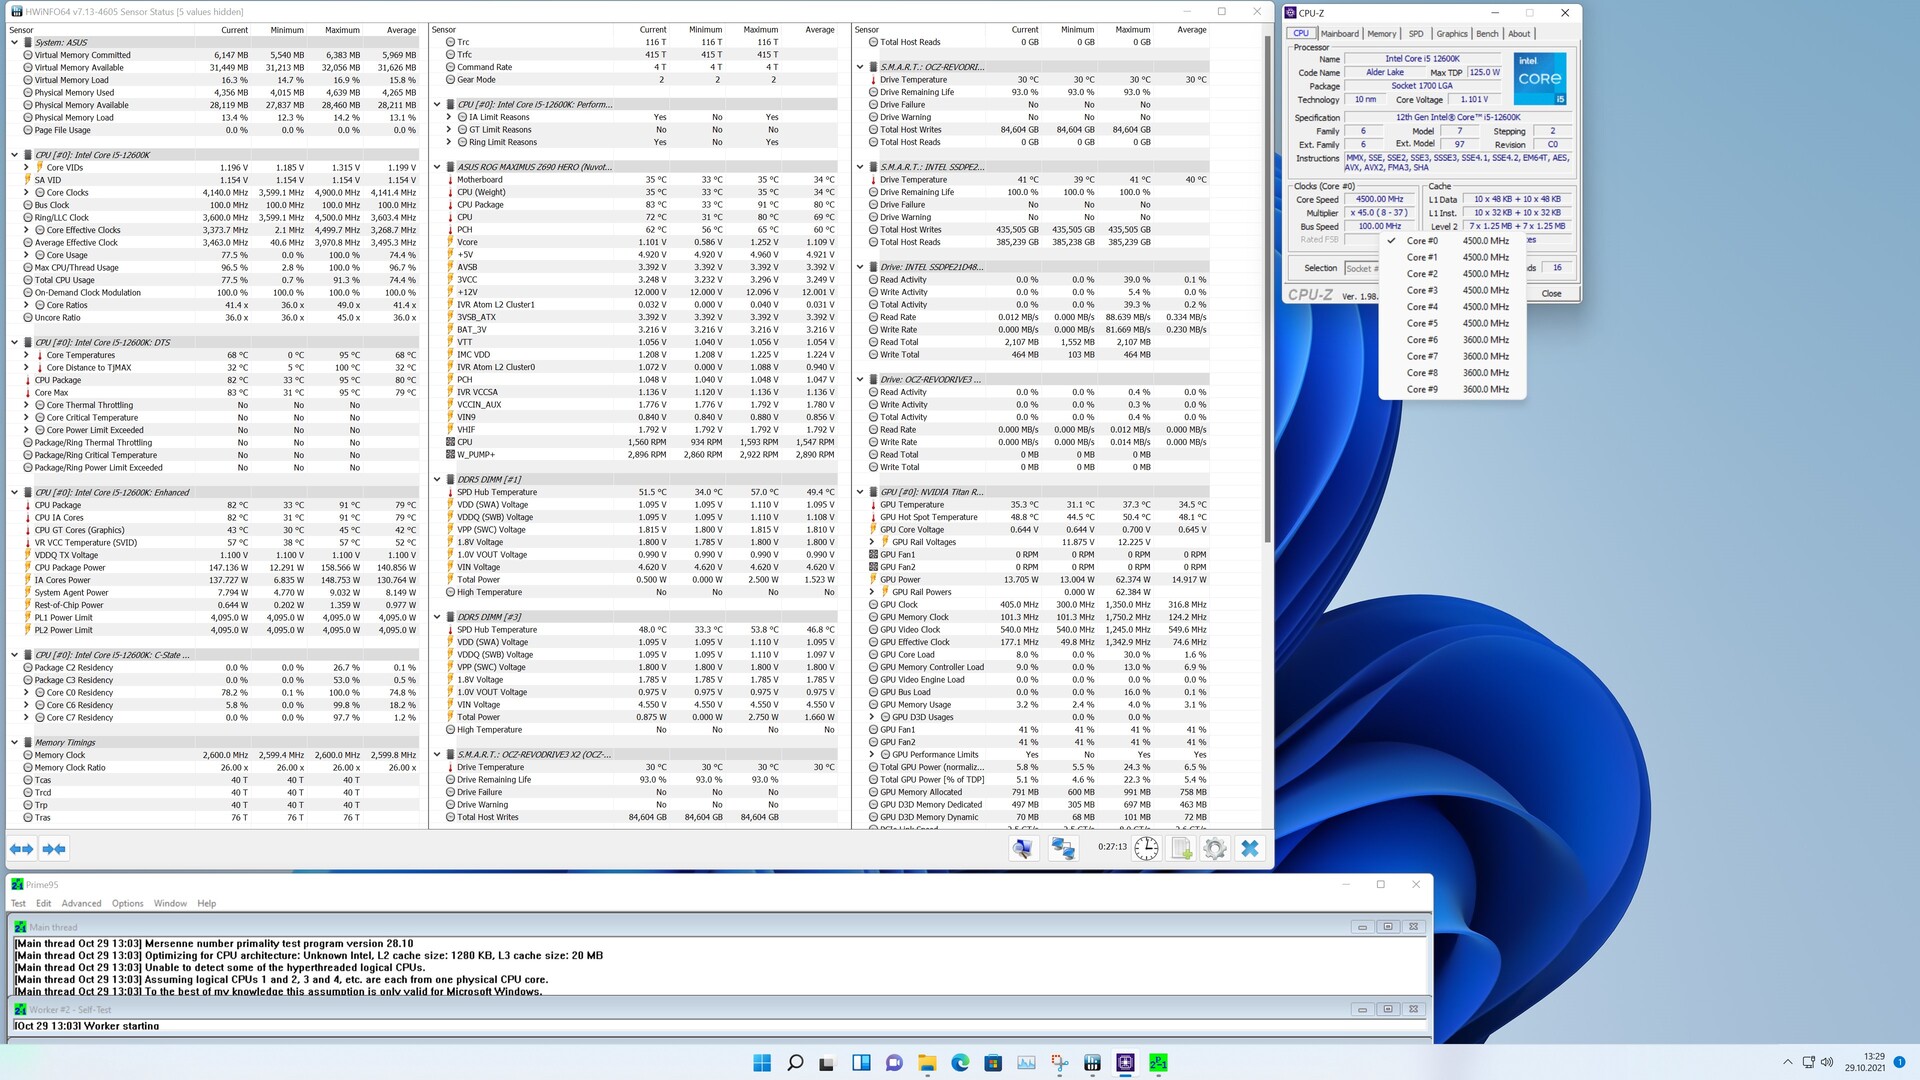
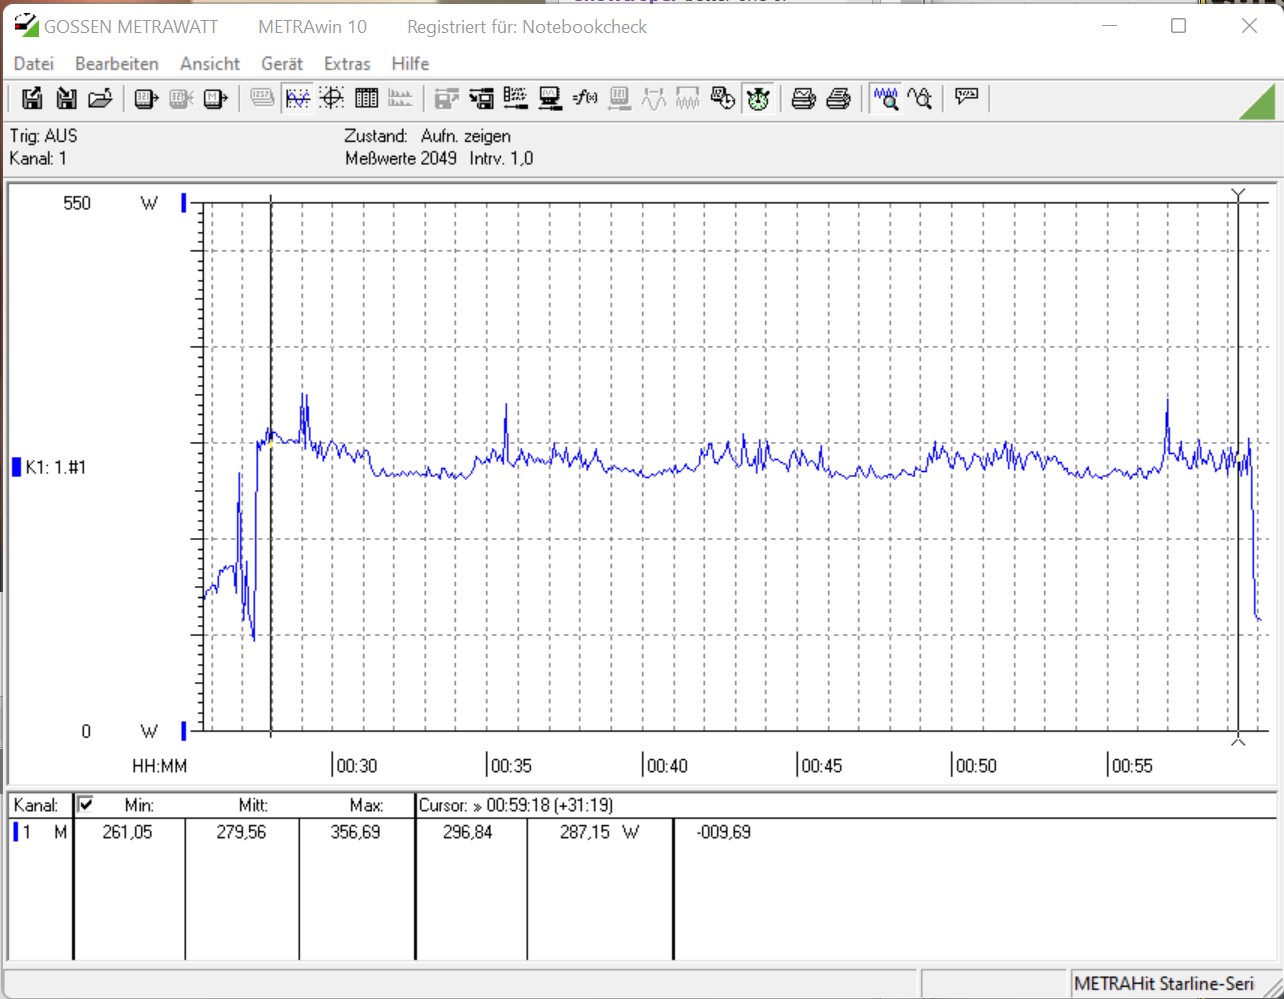
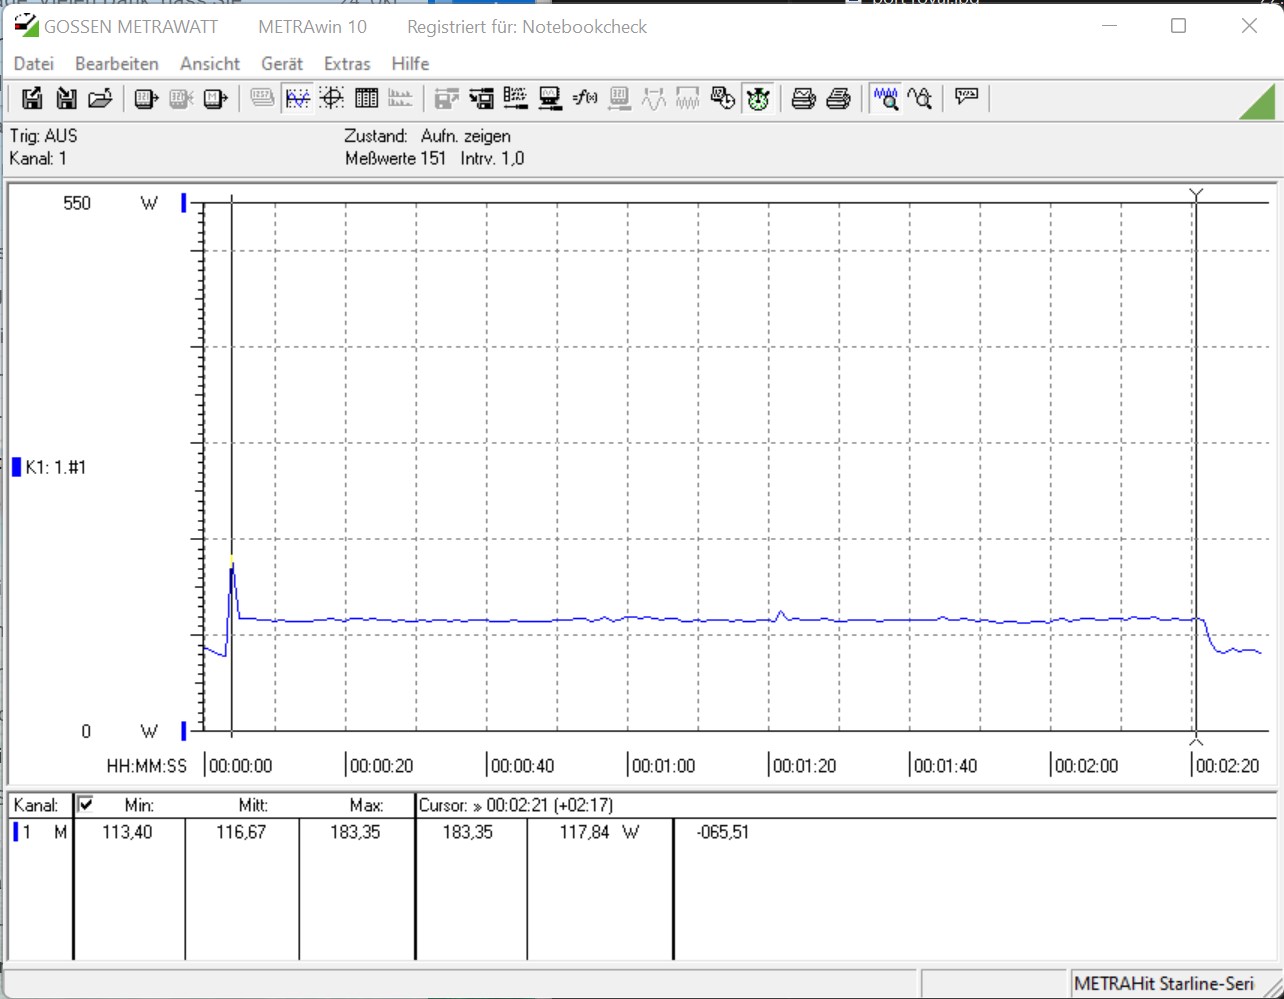
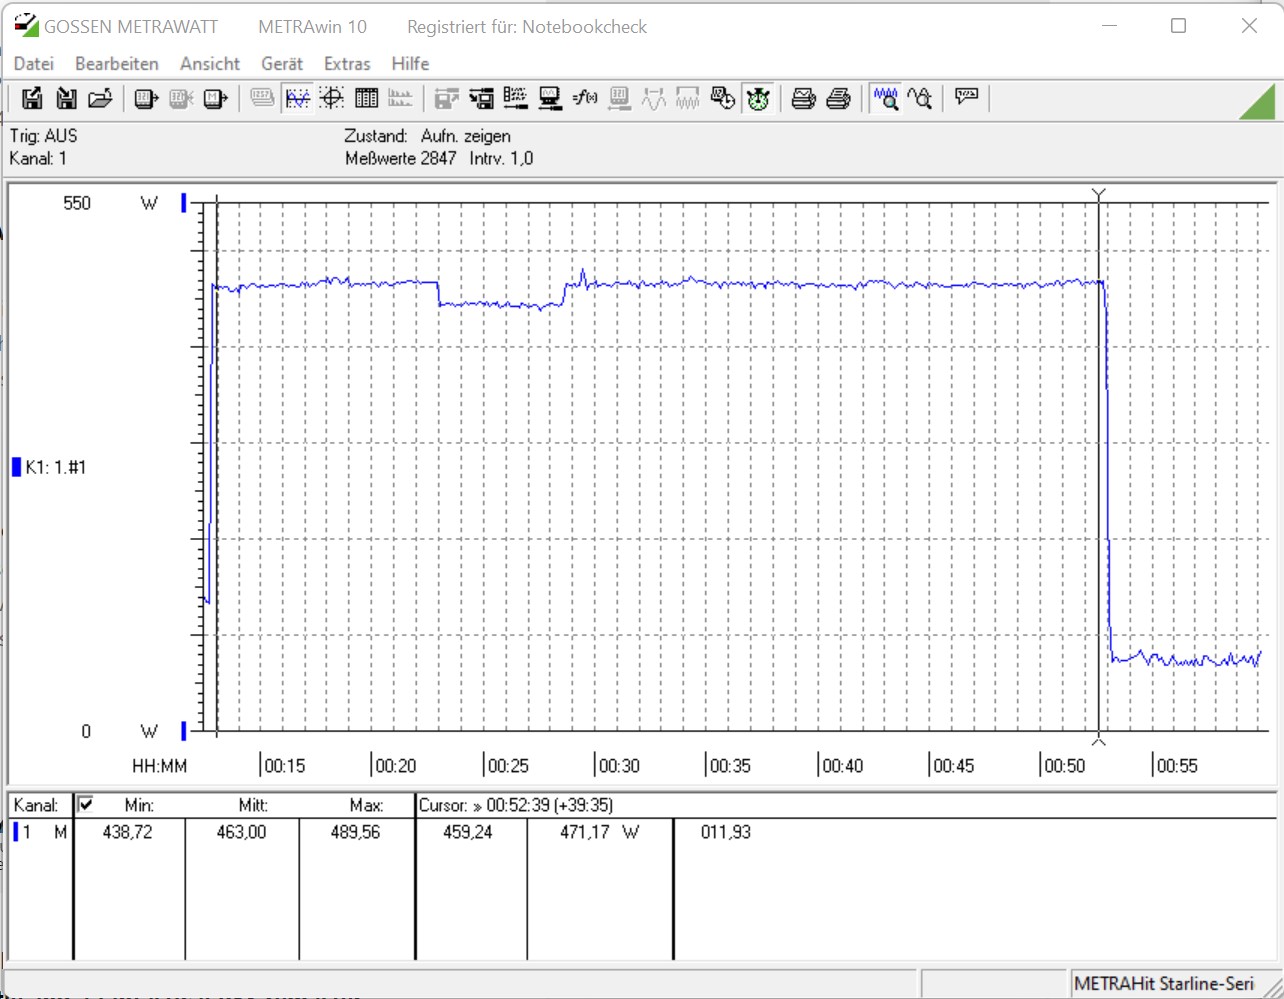
功耗和温度
根据技术规格,这些处理器提供的TDP为125瓦。这指的是PL1值。PL2值规定了在满足所有要求的情况下,处理器在满负荷情况下的可用瓦数。在最大241瓦的情况下,英特尔酷睿i9-12900K的效率略高于 英特尔酷睿i9-11900K.在我们的测试中,在Prime95压力测试中,Alder Lake-S旗舰产品确实只比前代产品更有效率。然而,我们的测量结果仍然显示整个系统的功率略低于280瓦。在Cinebench R15 Multi测试中,我们的测试系统消耗的功率几乎增加了25%。这是一个不能随便丢弃的增长。在英特尔酷睿i5-12600K中,PL2值被限制在150瓦,这也反映在我们的测量结果中。与之相比 英特尔酷睿i5-11600K,英特尔酷睿i5-12600K的效率要高7%。 然而,在压力测试中,图像发生了变化,酷睿i5-12600K从插座上多消耗了13%的电力。当然,游戏期间的测量值是由 Nvidia Titan RTX.然而,我们在这里也可以看到,Alder Lake-S平台并没有邀请节省能源。
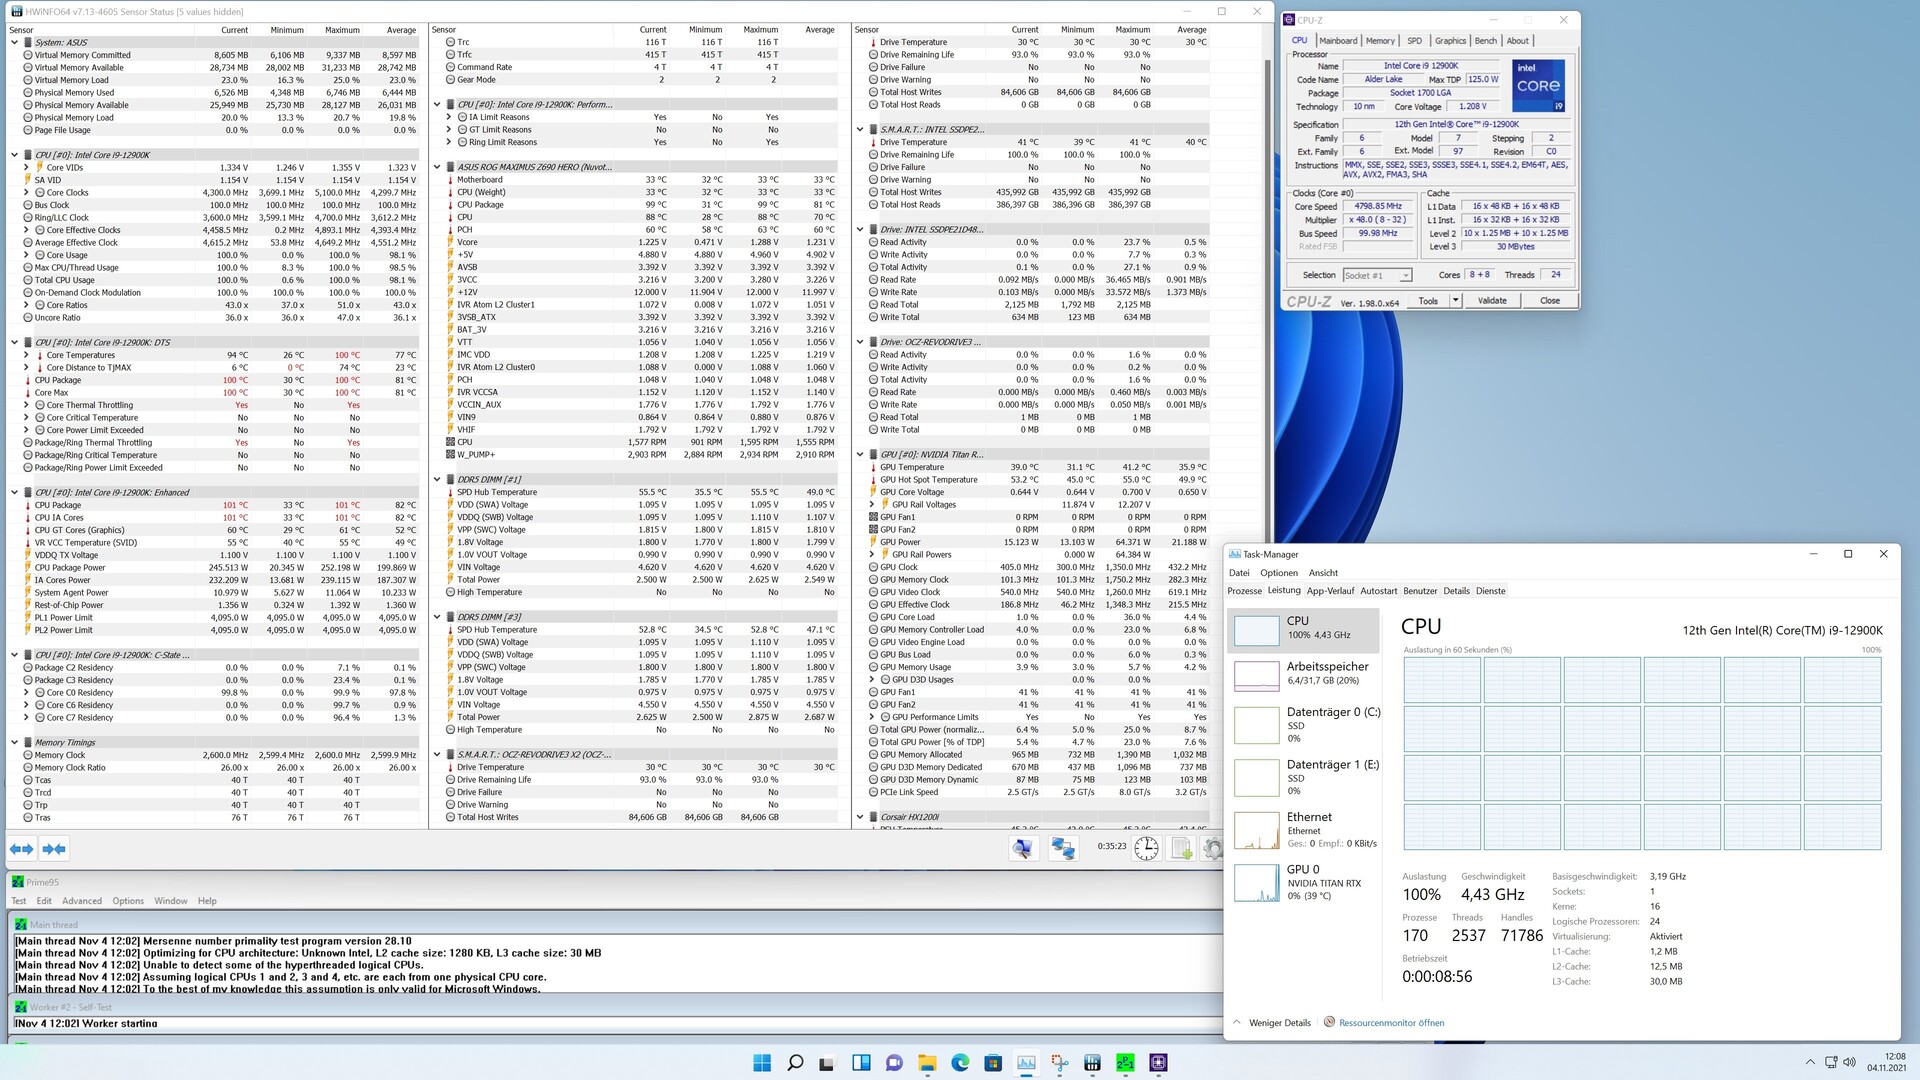
我们测量的温度显示,英特尔酷睿i9-12900K在开始 Prime95基准测试几分钟后已经达到100℃(212°F )。继续进行压力测试,然后不得不对CPU进行节流以避免伤害它。这就是Bios中PL1=PL2设置的缺点。然而,在Cinebench R15多重循环中,我们没有注意到任何负载下的节流。为了排除冷却系统安装不良的情况,我们还一度将其拆除,然后重新安装,但之后的结果是一样的。我们还联系了Alphacool,以确保我们使用的冷却器没有不兼容的情况。根据制造商的说法,我们使用的Alphacool Eisbear Aurora 280 AiO与LGA 1700插座兼容。英特尔酷睿i5-12600K在负载下稍微容易冷却,但我们仍然注意到最高温度为95℃(203°F)。
因此,那些想使用英特尔酷睿i9-12900K的人也应该得到一个非常强大的冷却系统,以获得处理器的最大效益。
| Power Consumption | |
| 1920x1080 The Witcher 3 ultra (external Monitor) | |
| Intel Core i9-12900K (Idle: 70.5 W) | |
| AMD Ryzen 9 5950X (Idle: 78 W) | |
| AMD Ryzen 9 5900X (Idle: 78.1 W) | |
| Intel Core i5-11600K (Idle: 69.49 W) | |
| AMD Ryzen 7 5800X (Idle: 77.5 W) | |
| AMD Ryzen 5 5600X (Idle: 79.23 W) | |
| Intel Core i5-12600K (Idle: 70.45 W) | |
| Intel Core i7-10700K (Idle: 67.7 W) | |
| Intel Core i9-10900K (Idle: 52.3 W) | |
| Intel Core i9-11900K (Idle: 57.3 W) | |
| Intel Core i5-10600K (Idle: 52.2 W) | |
| Prime95 V2810 Stress (external Monitor) | |
| Intel Core i9-11900K (Idle: 57.3 W) | |
| Intel Core i9-12900K (Idle: 70.5 W) | |
| Intel Core i9-10900K (Idle: 52.3 W) | |
| Intel Core i5-12600K (Idle: 70.45 W) | |
| AMD Ryzen 9 5950X (Idle: 78 W) | |
| AMD Ryzen 7 5800X (Idle: 77.5 W) | |
| AMD Ryzen 9 5900X (Idle: 78.1 W) | |
| Intel Core i5-11600K (Idle: 69.49 W) | |
| Intel Core i7-10700K (Idle: 67.7 W) | |
| Intel Core i5-10600K (Idle: 52.2 W) | |
| AMD Ryzen 5 5600X (Idle: 79.23 W) | |
| Cinebench R15 Multi (external Monitor) | |
| Intel Core i9-12900K (Idle: 70.5 W) | |
| Intel Core i9-10900K (Idle: 52.3 W) | |
| Intel Core i9-11900K (Idle: 57.3 W) | |
| AMD Ryzen 9 5900X (Idle: 78.1 W) | |
| AMD Ryzen 9 5950X (Idle: 78 W) | |
| AMD Ryzen 7 5800X (Idle: 77.5 W) | |
| Intel Core i5-11600K (Idle: 69.49 W) | |
| Intel Core i7-10700K (Idle: 67.7 W) | |
| Intel Core i5-12600K (Idle: 70.45 W) | |
| Intel Core i5-10600K (Idle: 52.2 W) | |
| AMD Ryzen 5 5600X (Idle: 79.23 W) | |
| Temperatures - CPU Temperature Prime95 | |
| Intel Core i9-11900K | |
| AMD Ryzen 7 5800X | |
| Intel Core i9-10900K | |
| Intel Core i5-11600K | |
| AMD Ryzen 9 5900X | |
| Intel Core i5-10600K | |
| AMD Ryzen 9 5950X | |
* ... smaller is better


Pros
Cons
结论--回到顶部,共有24条线索
凭借Alder Lake-S,英特尔确实成功地拥有了最快的游戏CPU,至少目前是这样。但这还不是全部。Alder Lake-S并不是像我们以前经常看到的那样,只是一个经过强化的上一代处理器。这里的情况并非如此,因为新架构包括许多改进。其中许多我们在移动领域已经知道,因为智能手机和平板电脑多年来已经包含了具有性能和节能内核的处理器。英特尔在其目前的台式机阵容中也使用了这种设计,大大增加了多核性能。通过这种方式,英特尔酷睿i9-12900K能够在总共24个线程上并行运行。此外,IPC也得到了显著改善,这对游戏有极大的好处。
底层基础也已经完全改变,如果不更换主板,从火箭湖-S的简单升级是不可能的。你肯定要把这一点纳入你的成本计算中。关于成本,建议购买价格为589美元,目前在一些地方可以买到659欧元(约762美元)起。根据供应情况,这里可能会有一些价格上涨,比如显卡。据英特尔称,稍弱但仍然非常快的英特尔酷睿i5-12600K的推荐价格为289美元起。根据我们的初步研究,该型号在一些地方已经可以从319欧元(约369美元)起售。 这是一个有吸引力的价格,甚至AMD目前都无法击败。相应的 AMD Ryzen 7 5800X目前的价格是379欧元(约合438美元)。这里的情况与顶级型号有点不同,其中的 AMD Ryzen 9 5900X的价格明显更实惠,为519欧元(约600美元)。
英特尔酷睿i9-12900K是一款非常好的游戏CPU,为未来做了一些储备。有了市场上最快的游戏CPU,英特尔目前可以给自己拍拍胸脯了。
然而,为了使英特尔酷睿i9-12900K更具竞争力,价格应该下降,因为正如我们已经提到的,你肯定还必须投资新的主板,在某些情况下,如果必须是DDR5,还必须投资新的工作内存。但是我们喜欢这样的事实,即你也可以选择继续使用DDR4。主板制造商为此提供了一些带有DDR4内存的特定型号。但遗憾的是,届时这些是否也会支持猛禽湖-S,目前还不得而知。
我们对耗电量有点失望。当然,性能得到了极大的提高,相应的略高的功耗也在限制范围内。但是,如果这种性能的提高能够与明显较低的功耗相结合,那就太好了。这也将有助于更好地处理冷却问题。
那些已经想抓住它的人现在可以从亚马逊获得英特尔酷睿i5-12600K,价格约为323美元和英特尔酷睿i9-12900K也来自亚马逊,价格约为1400美元.虽然Newegg上市价格为649美元,但目前已经售罄。

