华硕TUF游戏F15 FX507ZM笔记本评测。GeForce RTX 3060的峰值性能
华硕已经为2022年刷新了其TUF Gaming F15系列,现在英特尔12代CPU系列已经广泛使用。然而,制造商并没有简单地更换CPU,而是更新了去年FX506机箱的重要方面,以创建FX507。这篇评论将介绍2021年FX506和2022年FX507之间的所有关键差异,以及用户可以从FX507中期待的性能水平。
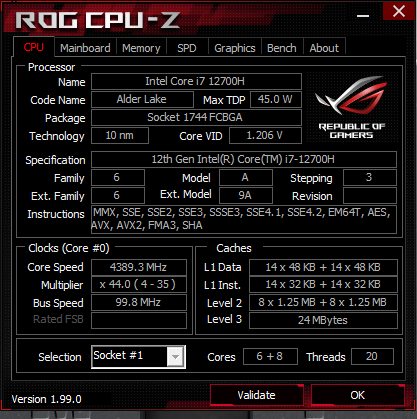
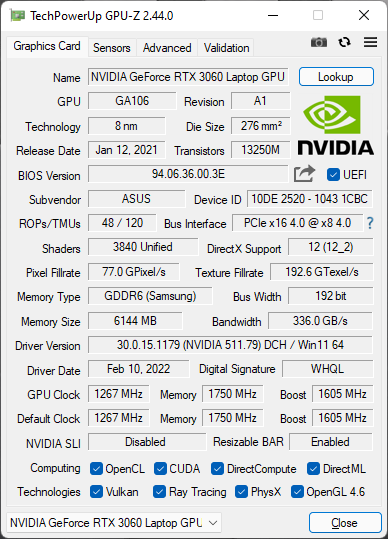
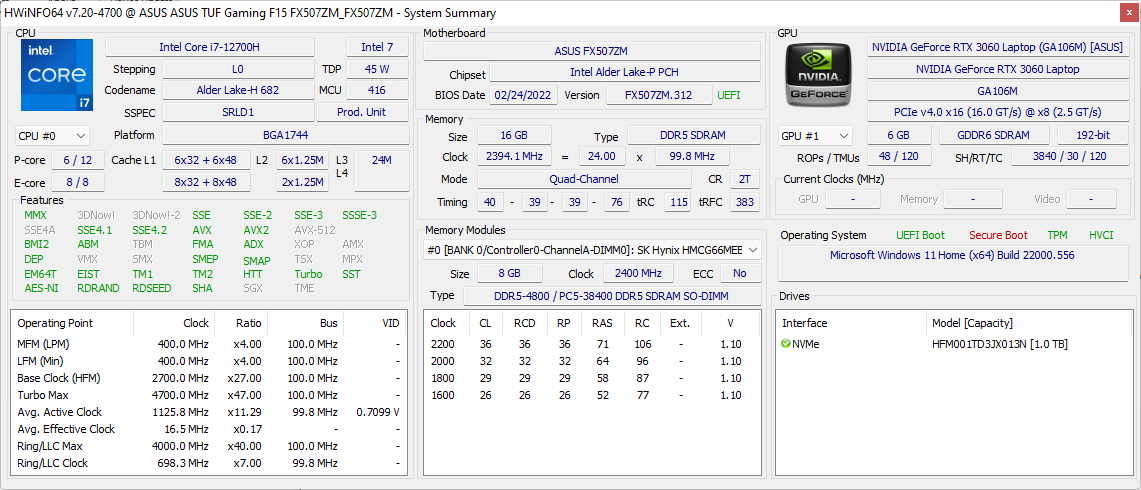
我们审查的配置配备了Alder Lake-H Core i7-12700H CPU,GeForce RTX 3060 GPU,300 Hz 1080p IPS面板,以及90 Wh电池,零售价约为1500美元。其他SKU可能有较慢的显示刷新率、较小的56Wh电池和较慢的CPU选项。请注意,尽管FX507配备了与老款FX506相同的GeForce RTX 3060 GPU,但较新型号的GPU以更高的TGP为目标,以挤出更多的性能(140W比95W)。
FX507的竞争对手包括其他中端15.6英寸轻薄型游戏笔记本,如 Razer Blade 15 Base Model, MSI GP66, Acer Predator Triton, 或 技嘉Aorus 5系列.
更多华硕评论。
潜在的竞争对手比较
Rating | Date | Model | Weight | Height | Size | Resolution | Price |
|---|---|---|---|---|---|---|---|
| 87.2 % v7 (old) | 03 / 2022 | Asus TUF Gaming F15 FX507ZM i7-12700H, GeForce RTX 3060 Laptop GPU | 2.1 kg | 24.95 mm | 15.60" | 1920x1080 | |
| 85.9 % v7 (old) | 10 / 2021 | Asus TUF Gaming F15 FX506HM i7-11800H, GeForce RTX 3060 Laptop GPU | 2.3 kg | 24.9 mm | 15.60" | 1920x1080 | |
| 82.4 % v7 (old) | 02 / 2021 | Asus TUF Dash F15 FX516PR i7-11370H, GeForce RTX 3070 Laptop GPU | 2 kg | 20 mm | 15.60" | 1920x1080 | |
| 86.3 % v7 (old) | 09 / 2021 | Asus ROG Strix Scar 15 G533QS R9 5900HX, GeForce RTX 3080 Laptop GPU | 2.3 kg | 27.2 mm | 15.60" | 2560x1440 | |
| 82.9 % v7 (old) | Asus Zephyrus S15 GX502L i7-10875H, GeForce RTX 2070 Super Mobile | 2.1 kg | 19 mm | 15.60" | 1920x1080 | ||
| 85.8 % v7 (old) | 07 / 2021 | Asus ZenBook Pro Duo UX582 LR-1BH2 i7-10870H, GeForce RTX 3070 Laptop GPU | 2.4 kg | 21.5 mm | 15.60" | 3840x2160 |
外壳 - 更小更轻
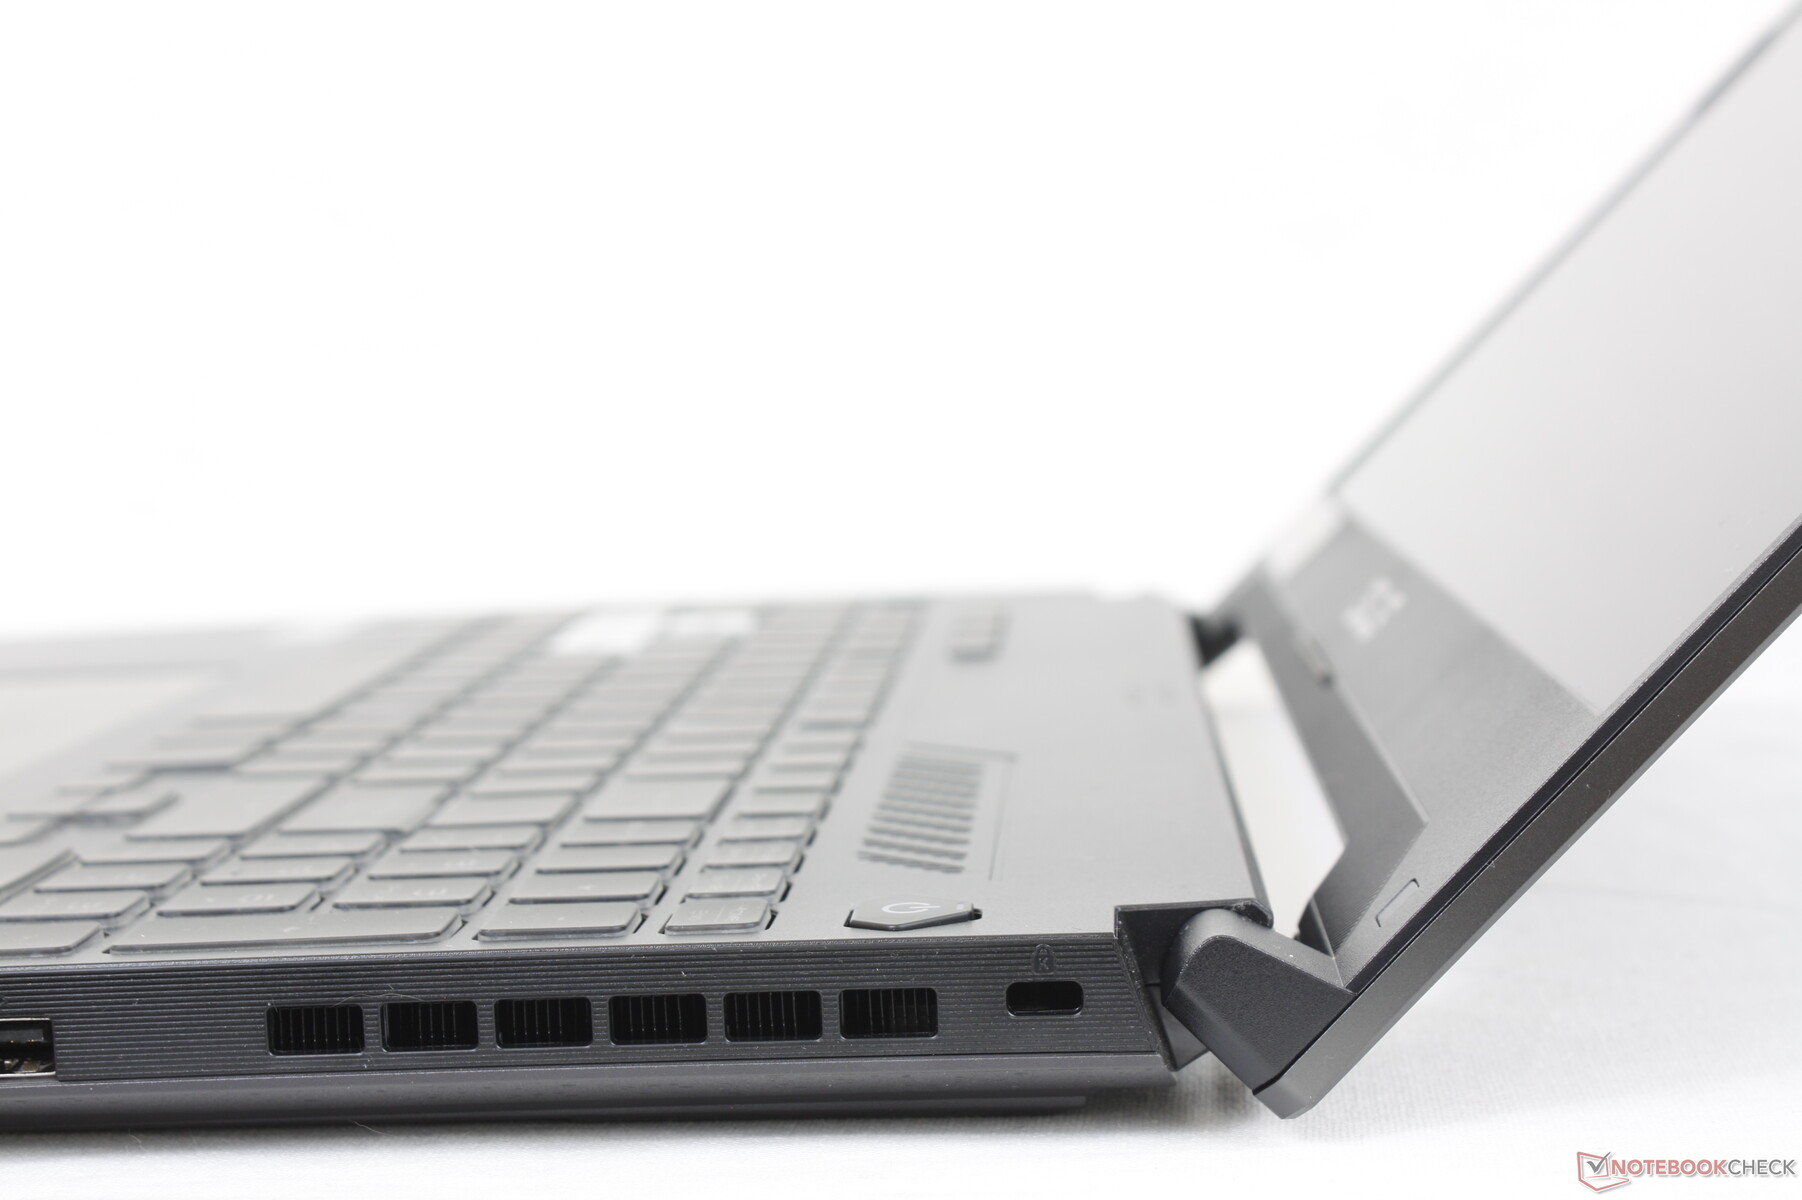
FX507第一眼看上去与FX506完全一样,但实际上有许多小的变化。例如,边角比以前更尖锐,而仿磨砂的光面掌托现在是更平坦的亚光质地。FX506上的大部分凸起和交替的纹理都已被移除,以获得更干净、更简约的外观。底盘材料似乎与去年的模型相同,以达到类似的刚性水平。
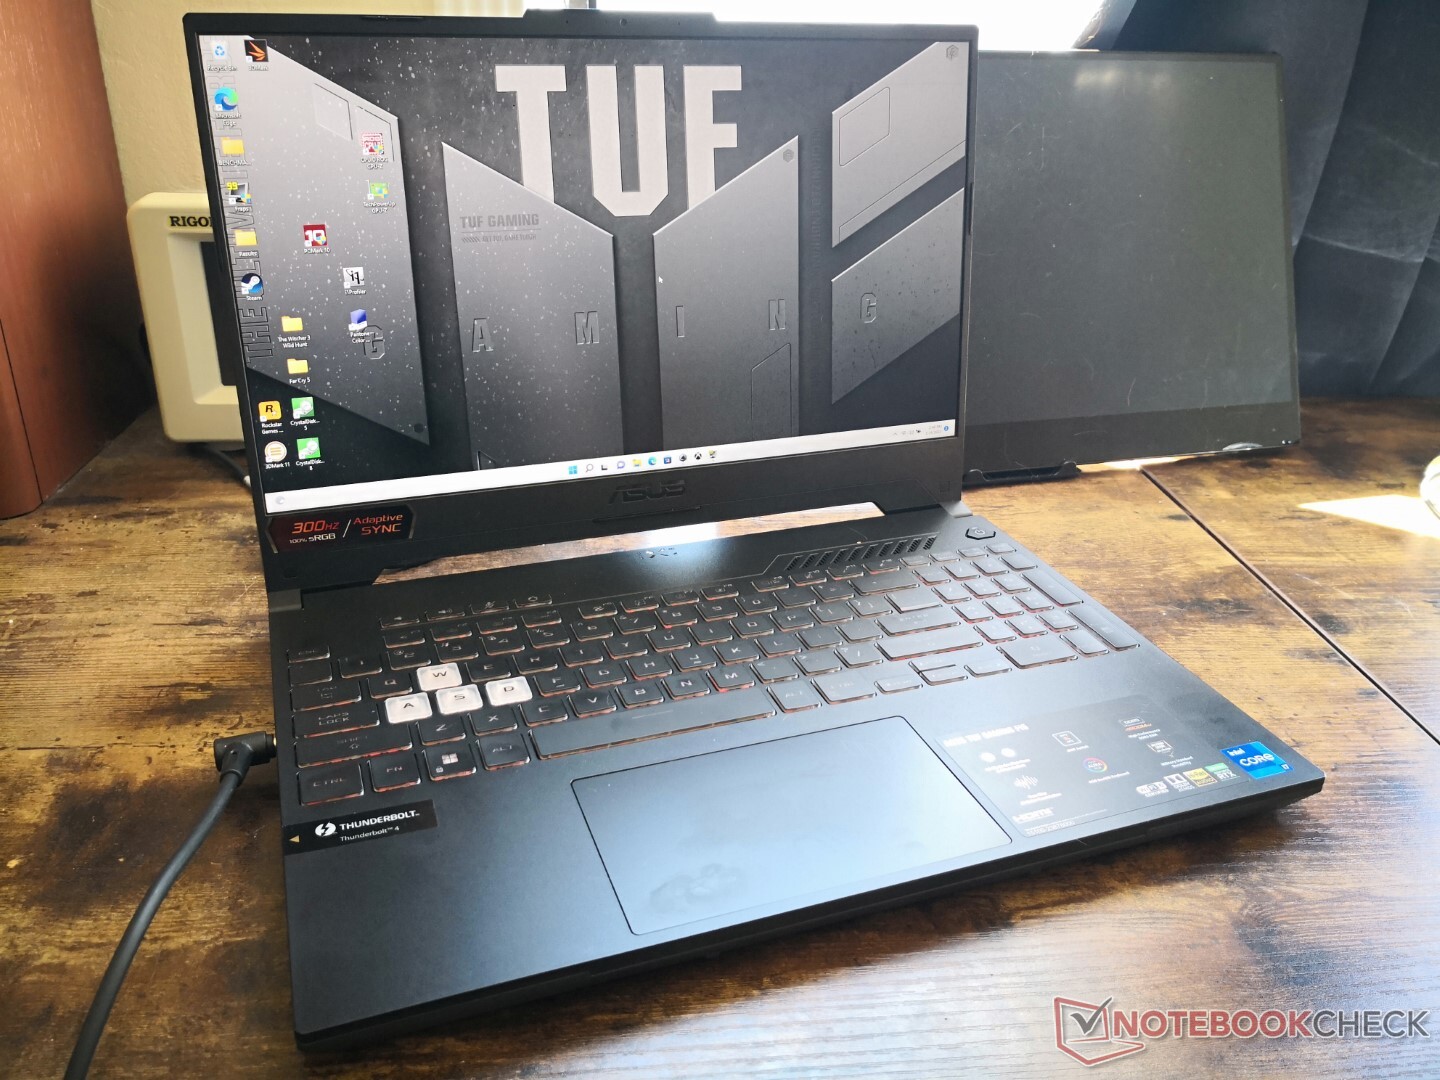
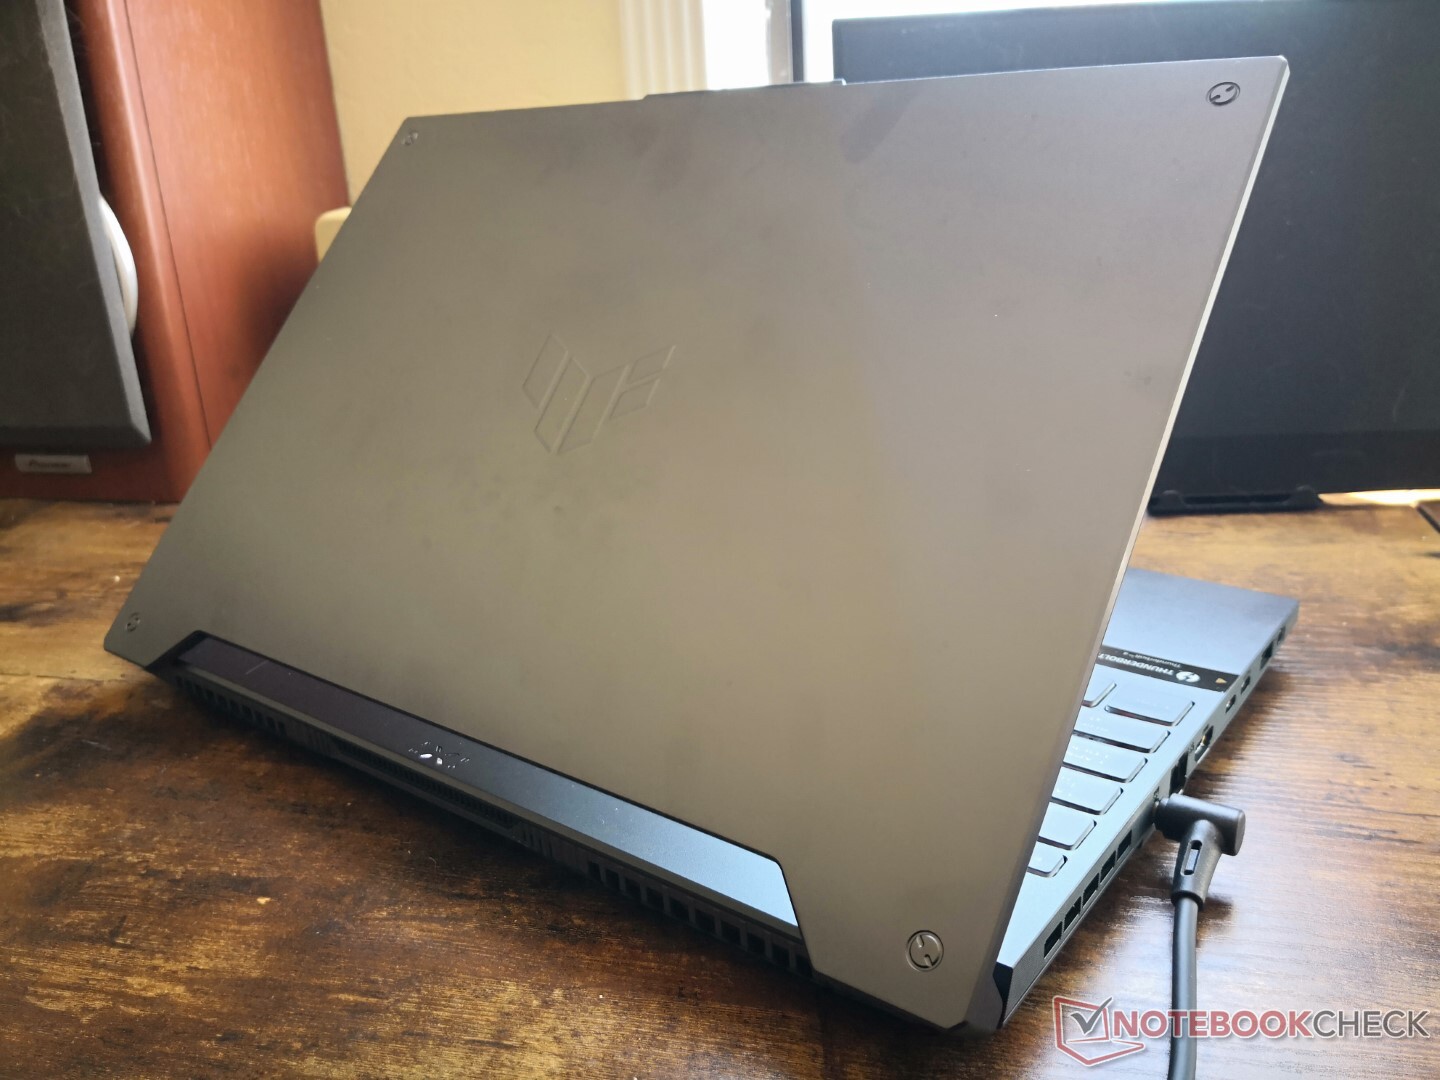
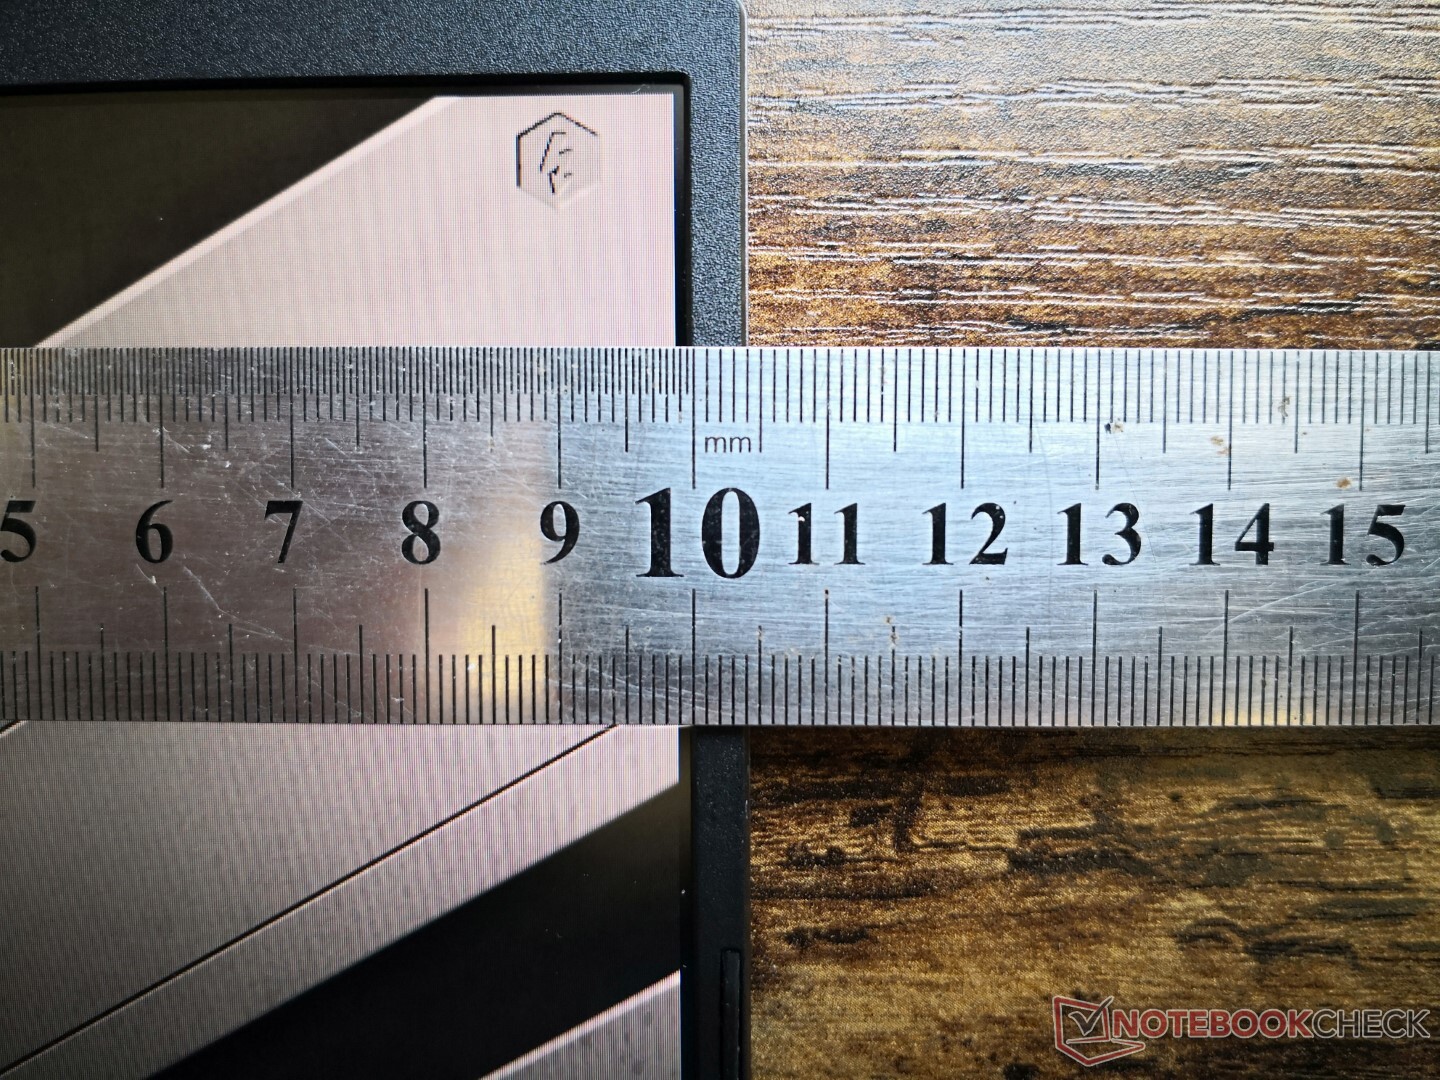
与其前身FX506相比,华硕已经成功地减少了FX507的尺寸和重量。新机型略短(354.9毫米对359.8毫米),略窄(251.9毫米×256毫米),并且相当轻(2.1公斤对2.3公斤),与更薄的Zephyrus S15设计一样轻。
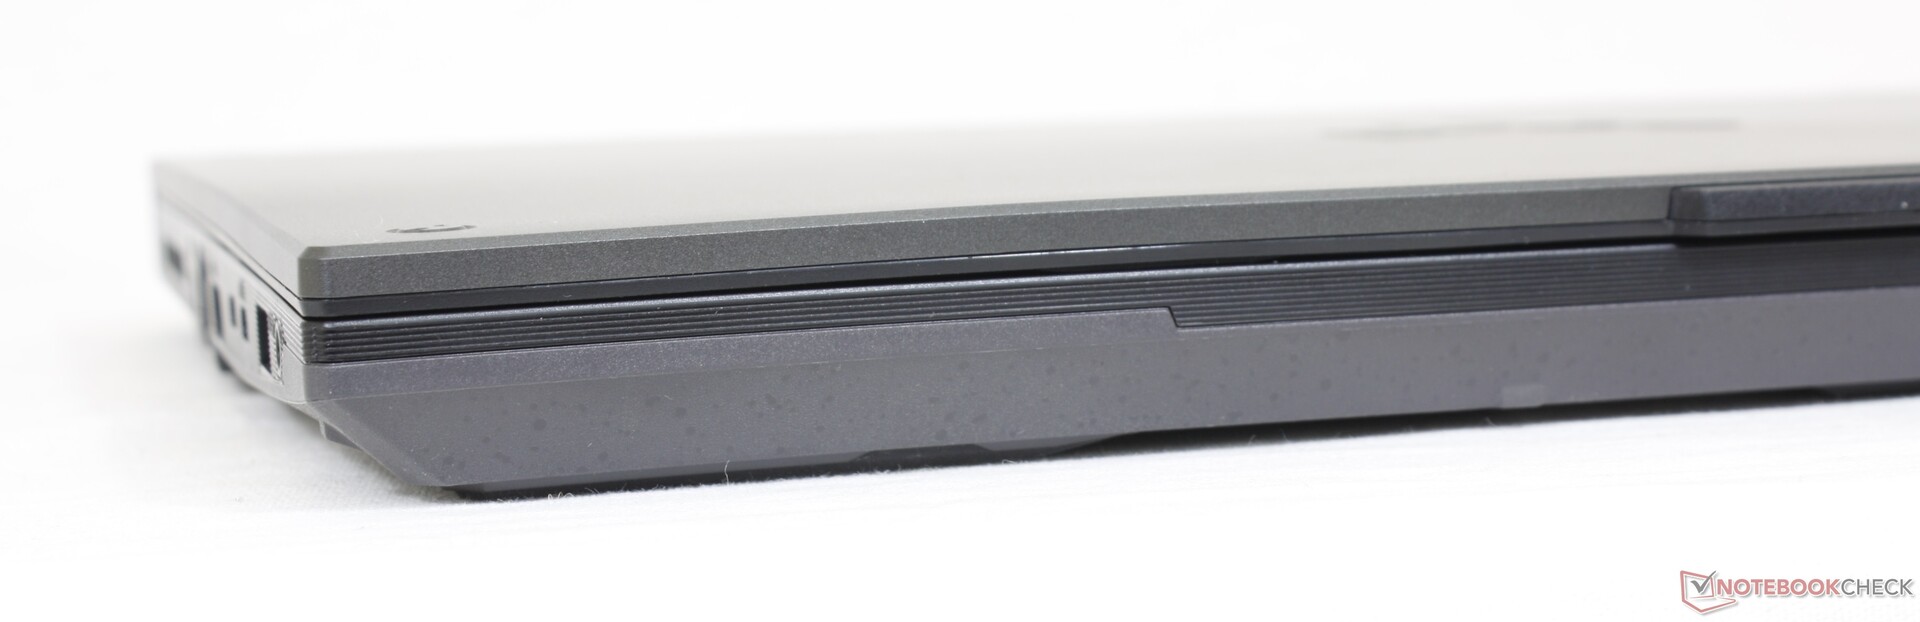
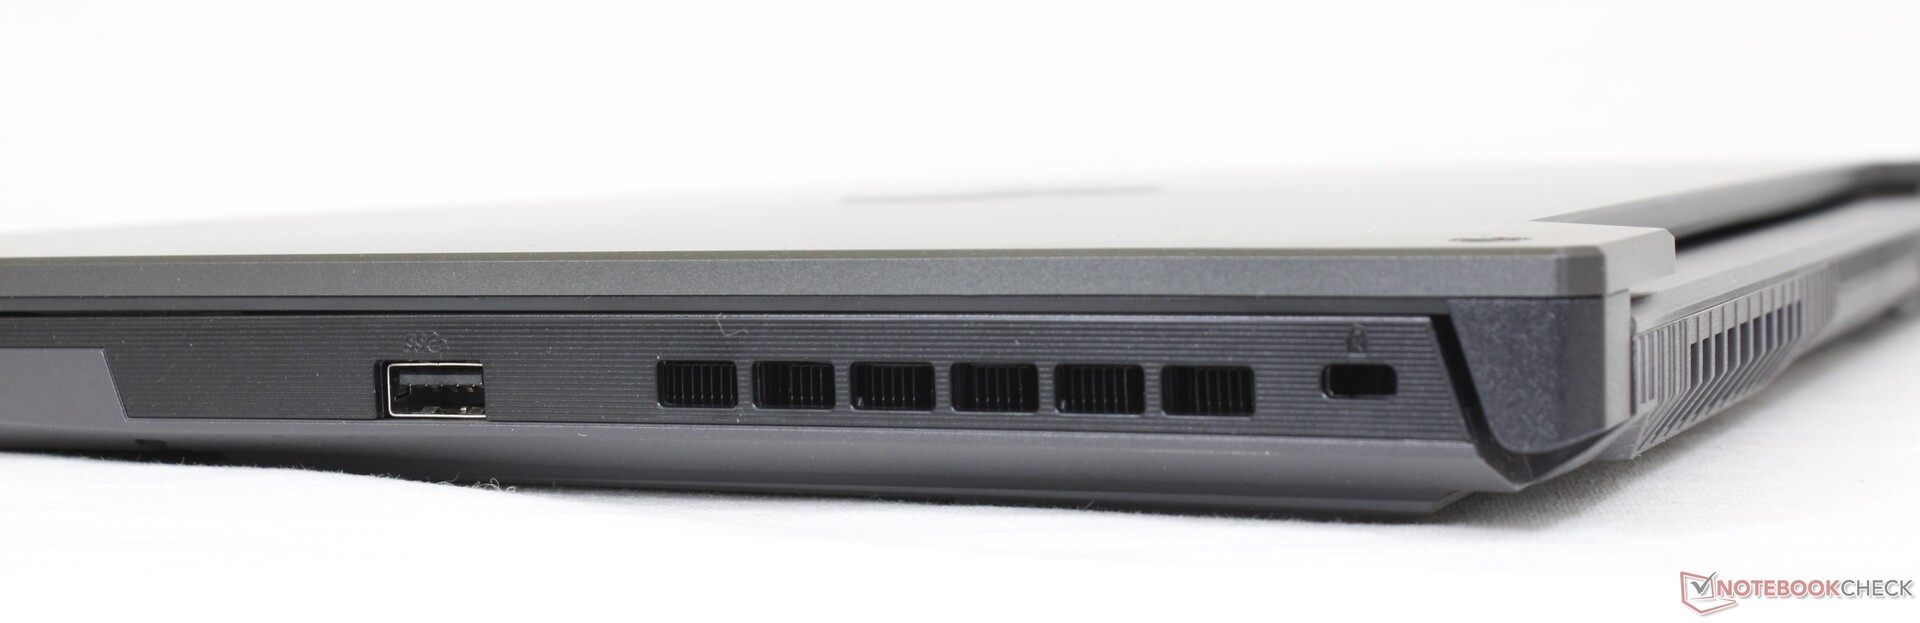
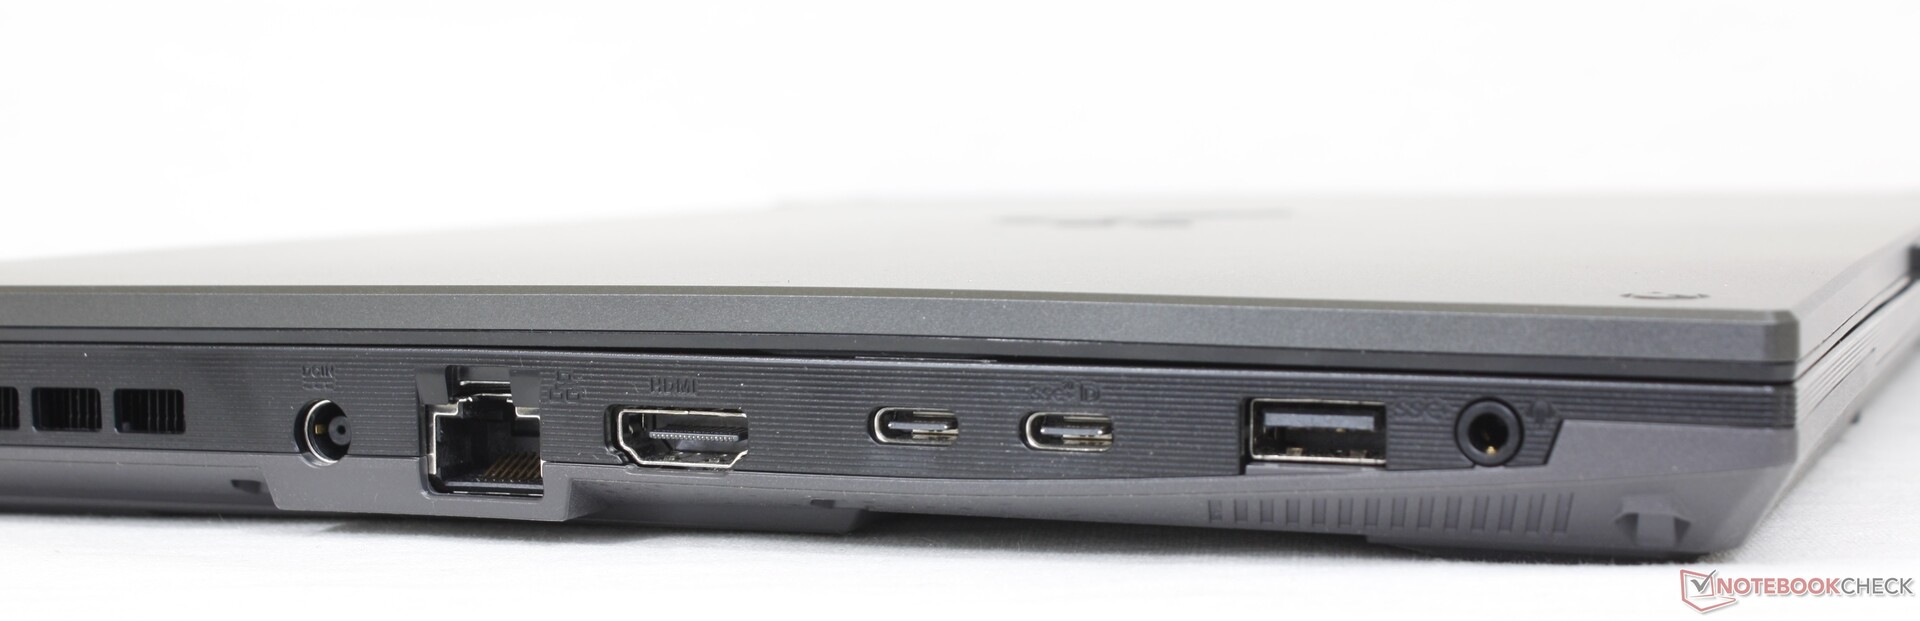
连接性 - 多一个USB-C端口
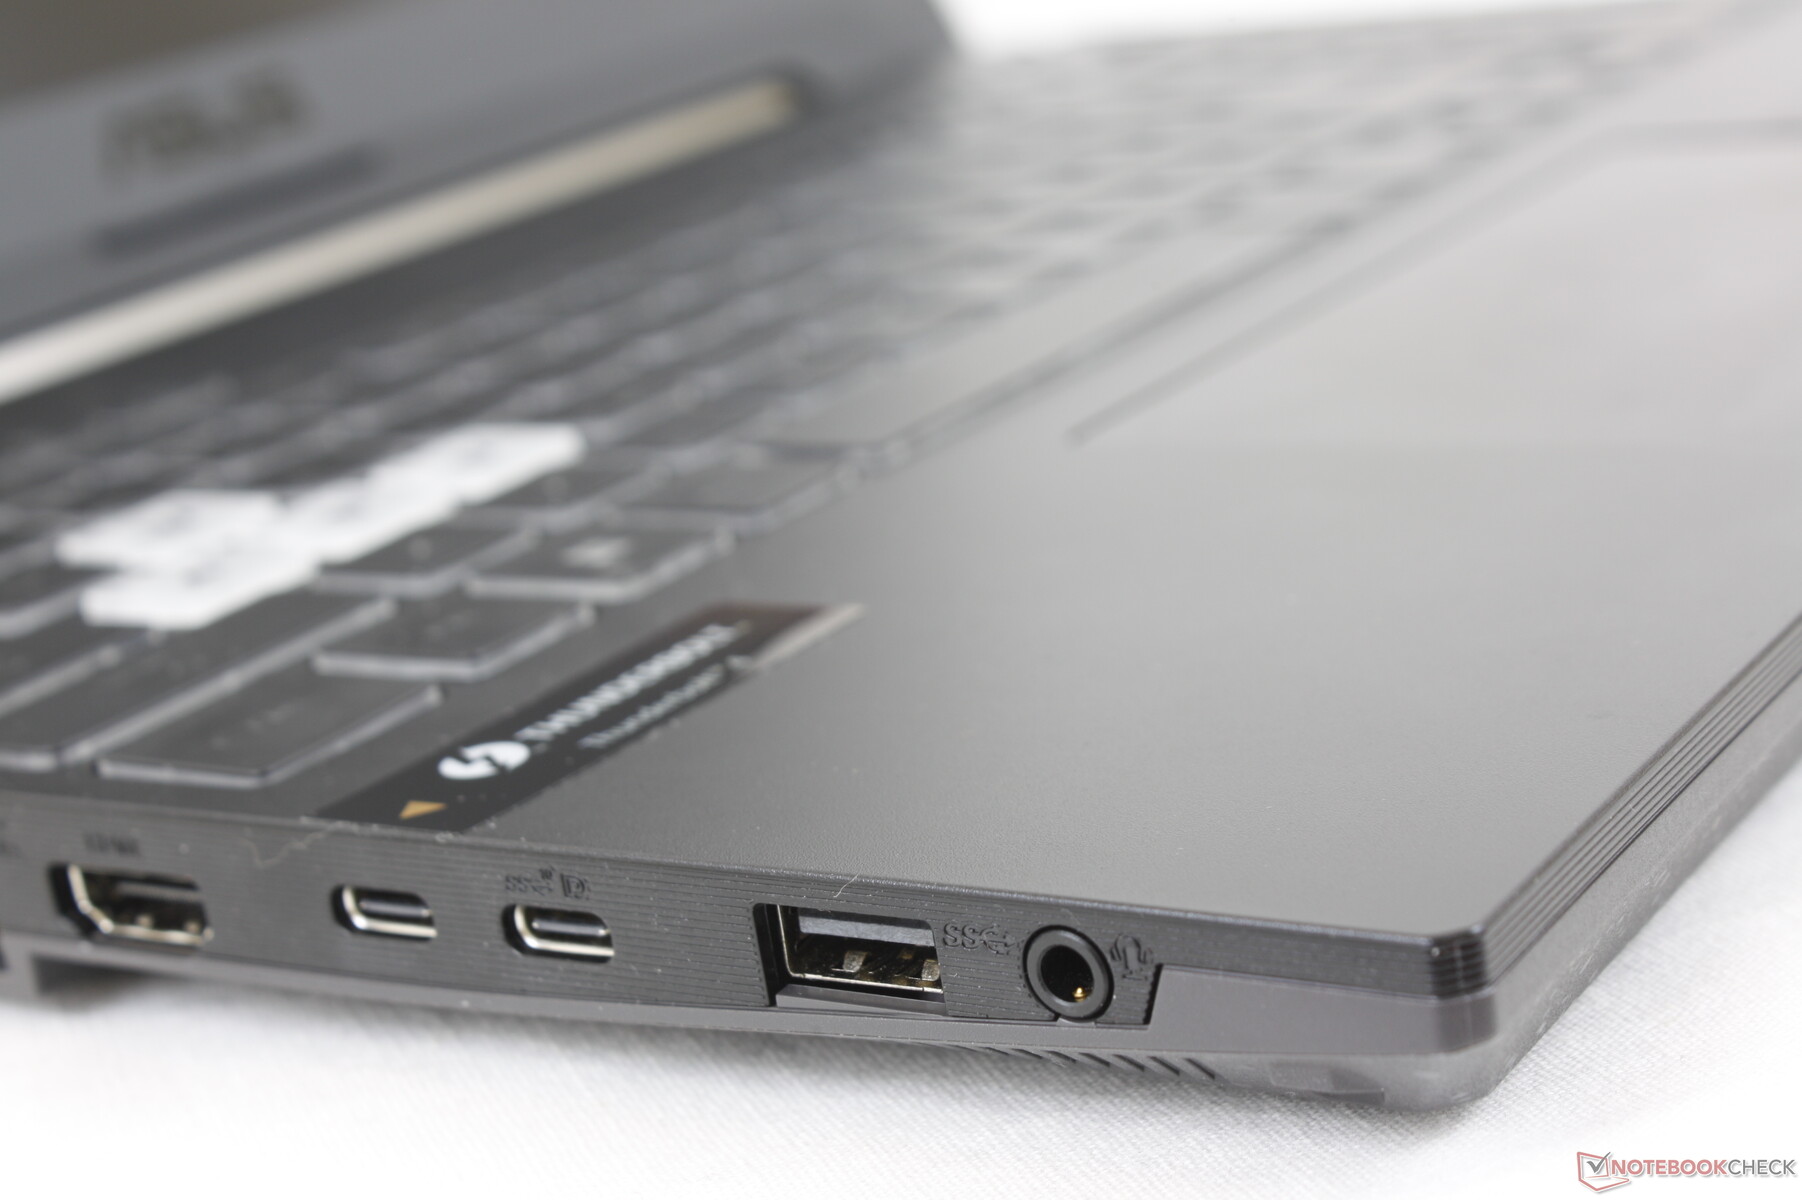
与FX506相比,端口选项略有变化。更具体地说,FX507放弃了一个USB-A端口,换成了第二个USB-C端口。所有其他的端口都是相同的。
请记住,如果连接任何Thunderbolt 4设备,笔记本电脑必须处于MSHybrid模式。这是迄今为止所有运行在第12代Alder Lake-H CPU上的笔记本电脑的一个限制。
沟通
| Networking | |
| iperf3 transmit AX12 | |
| Asus ZenBook Pro Duo UX582 LR-1BH2 | |
| Asus Zephyrus S15 GX502L | |
| Asus TUF Gaming F15 FX507ZM | |
| Asus TUF Dash F15 FX516PR | |
| Asus TUF Gaming F15 FX506HM | |
| Asus ROG Strix Scar 15 G533QS | |
| iperf3 receive AX12 | |
| Asus TUF Gaming F15 FX507ZM | |
| Asus Zephyrus S15 GX502L | |
| Asus TUF Dash F15 FX516PR | |
| Asus ZenBook Pro Duo UX582 LR-1BH2 | |
| Asus TUF Gaming F15 FX506HM | |
| Asus ROG Strix Scar 15 G533QS | |
网络摄像头
720p网络摄像头的摄像质量很差。也没有隐私快门或Windows Hello支持。


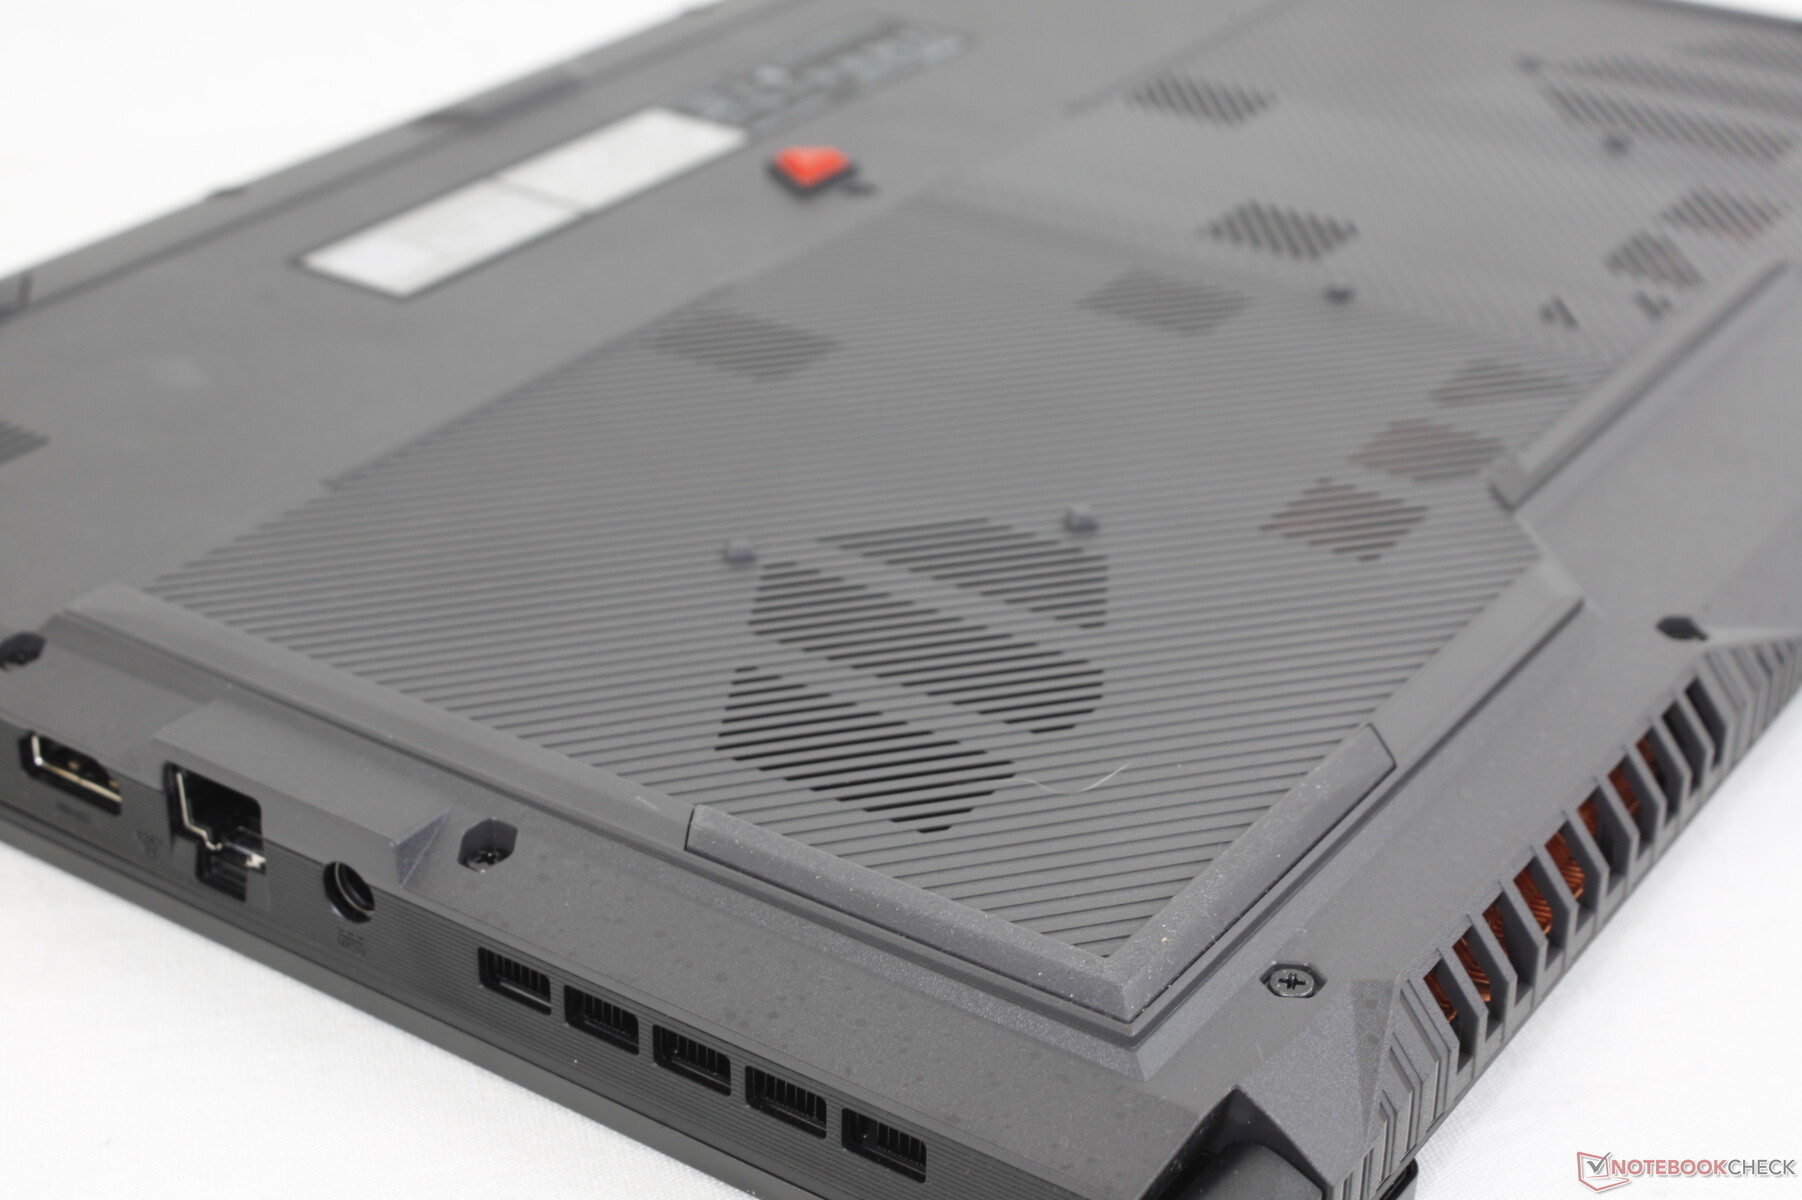
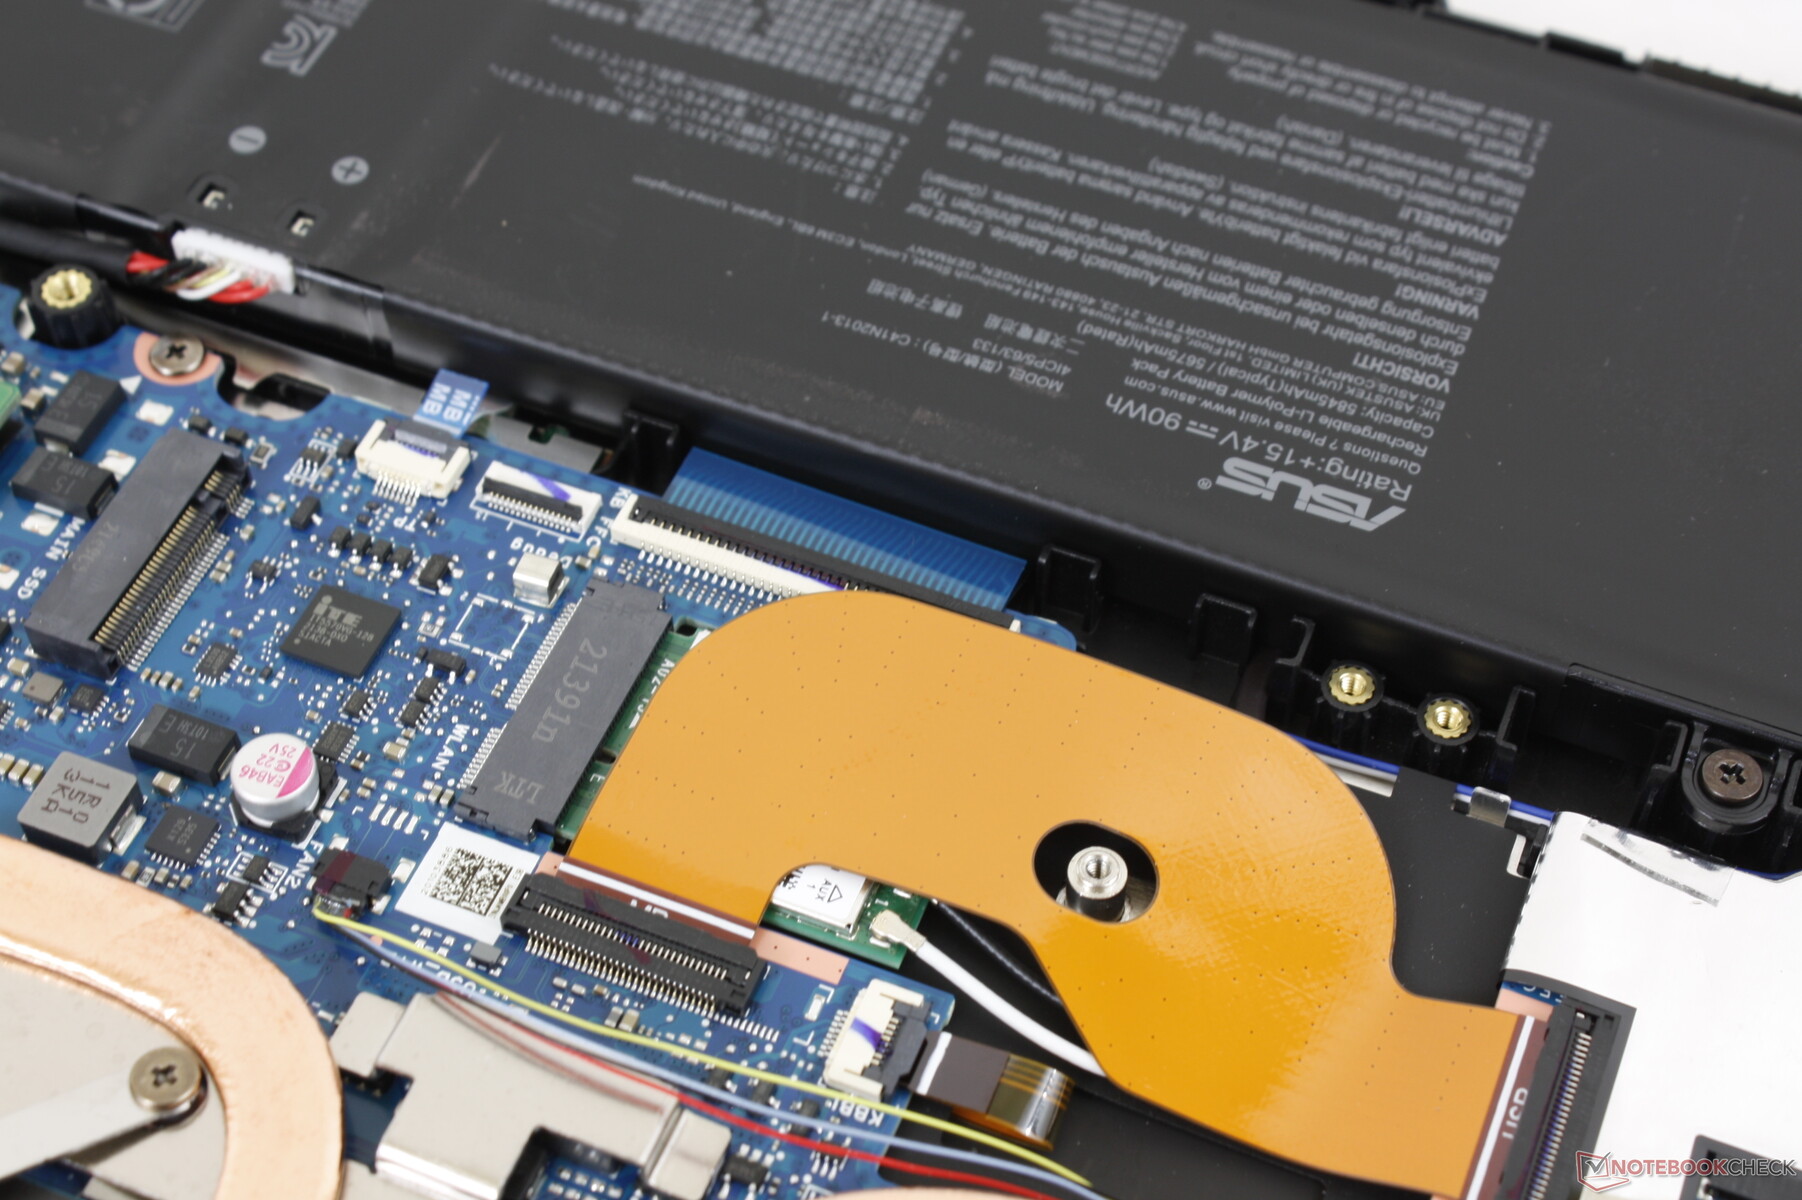
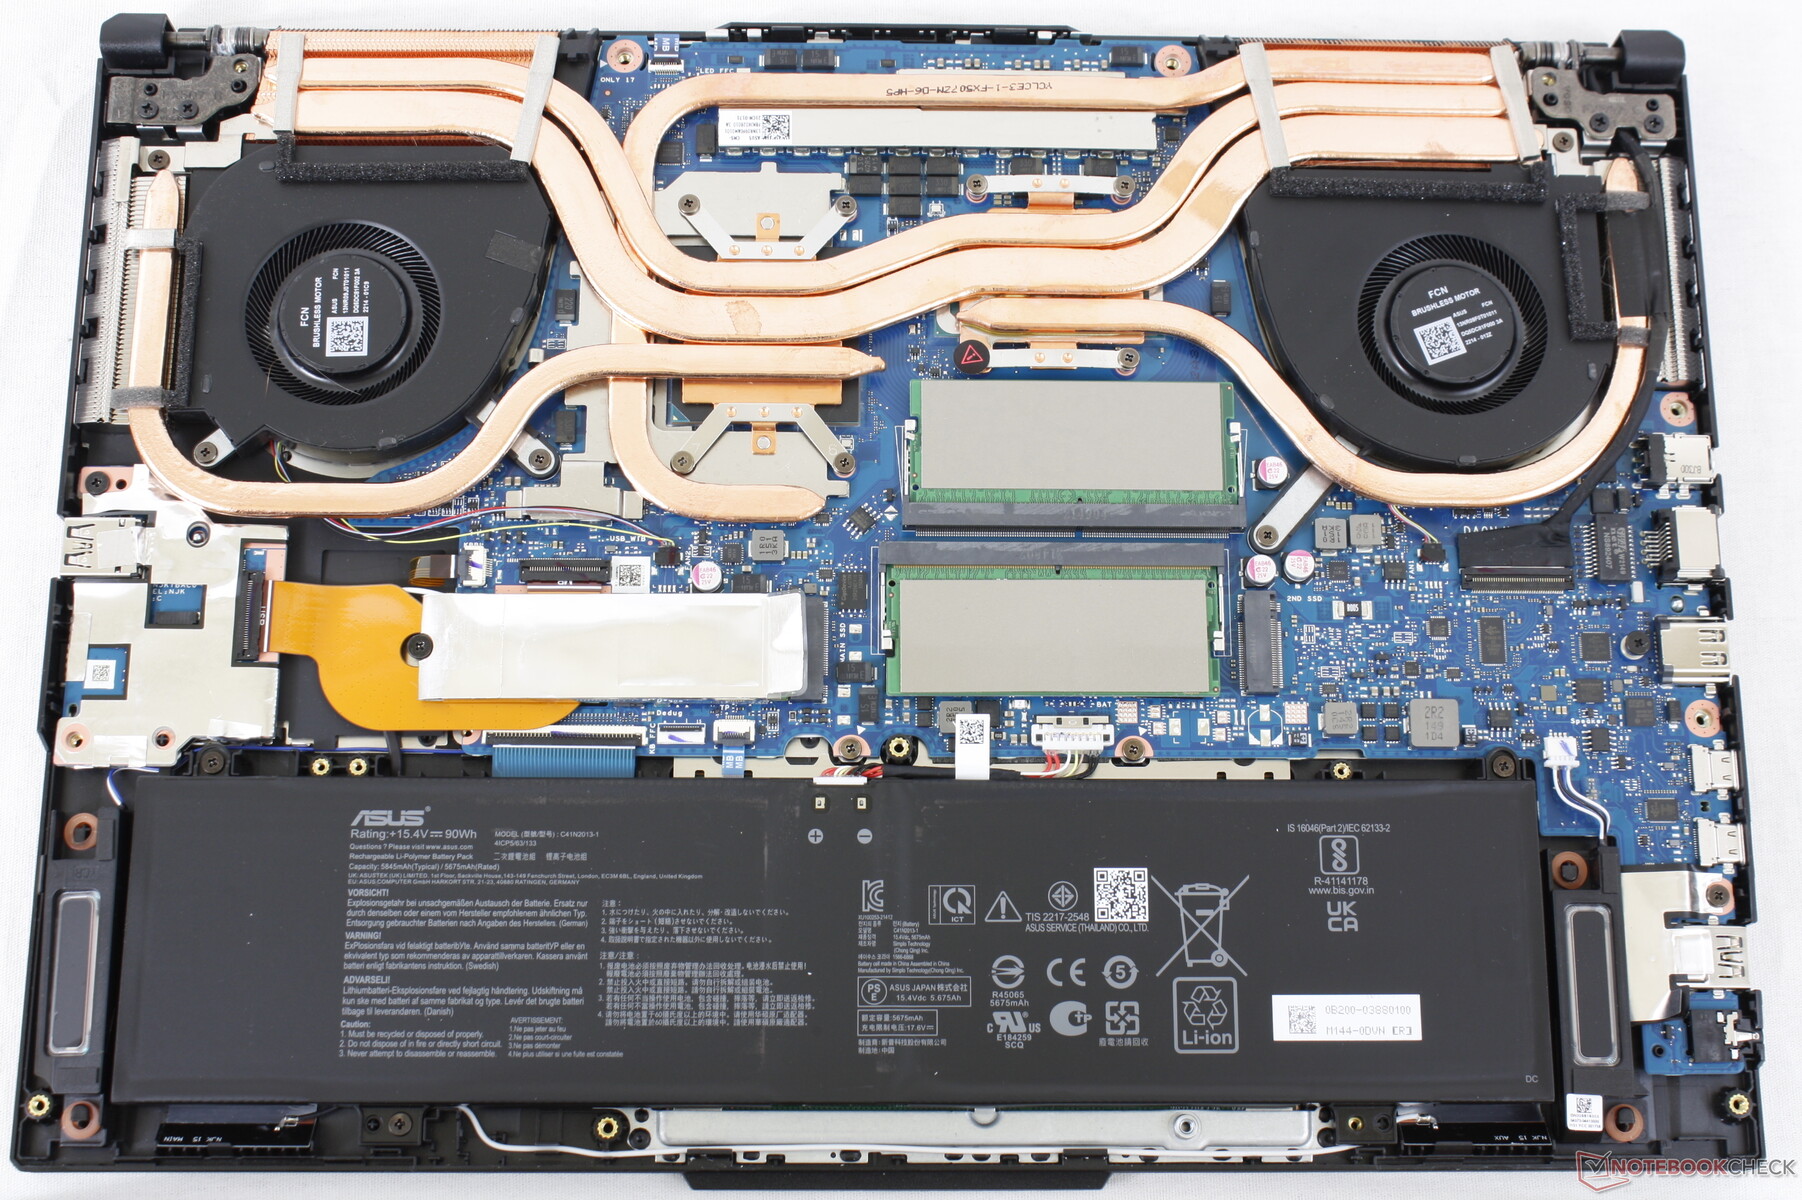
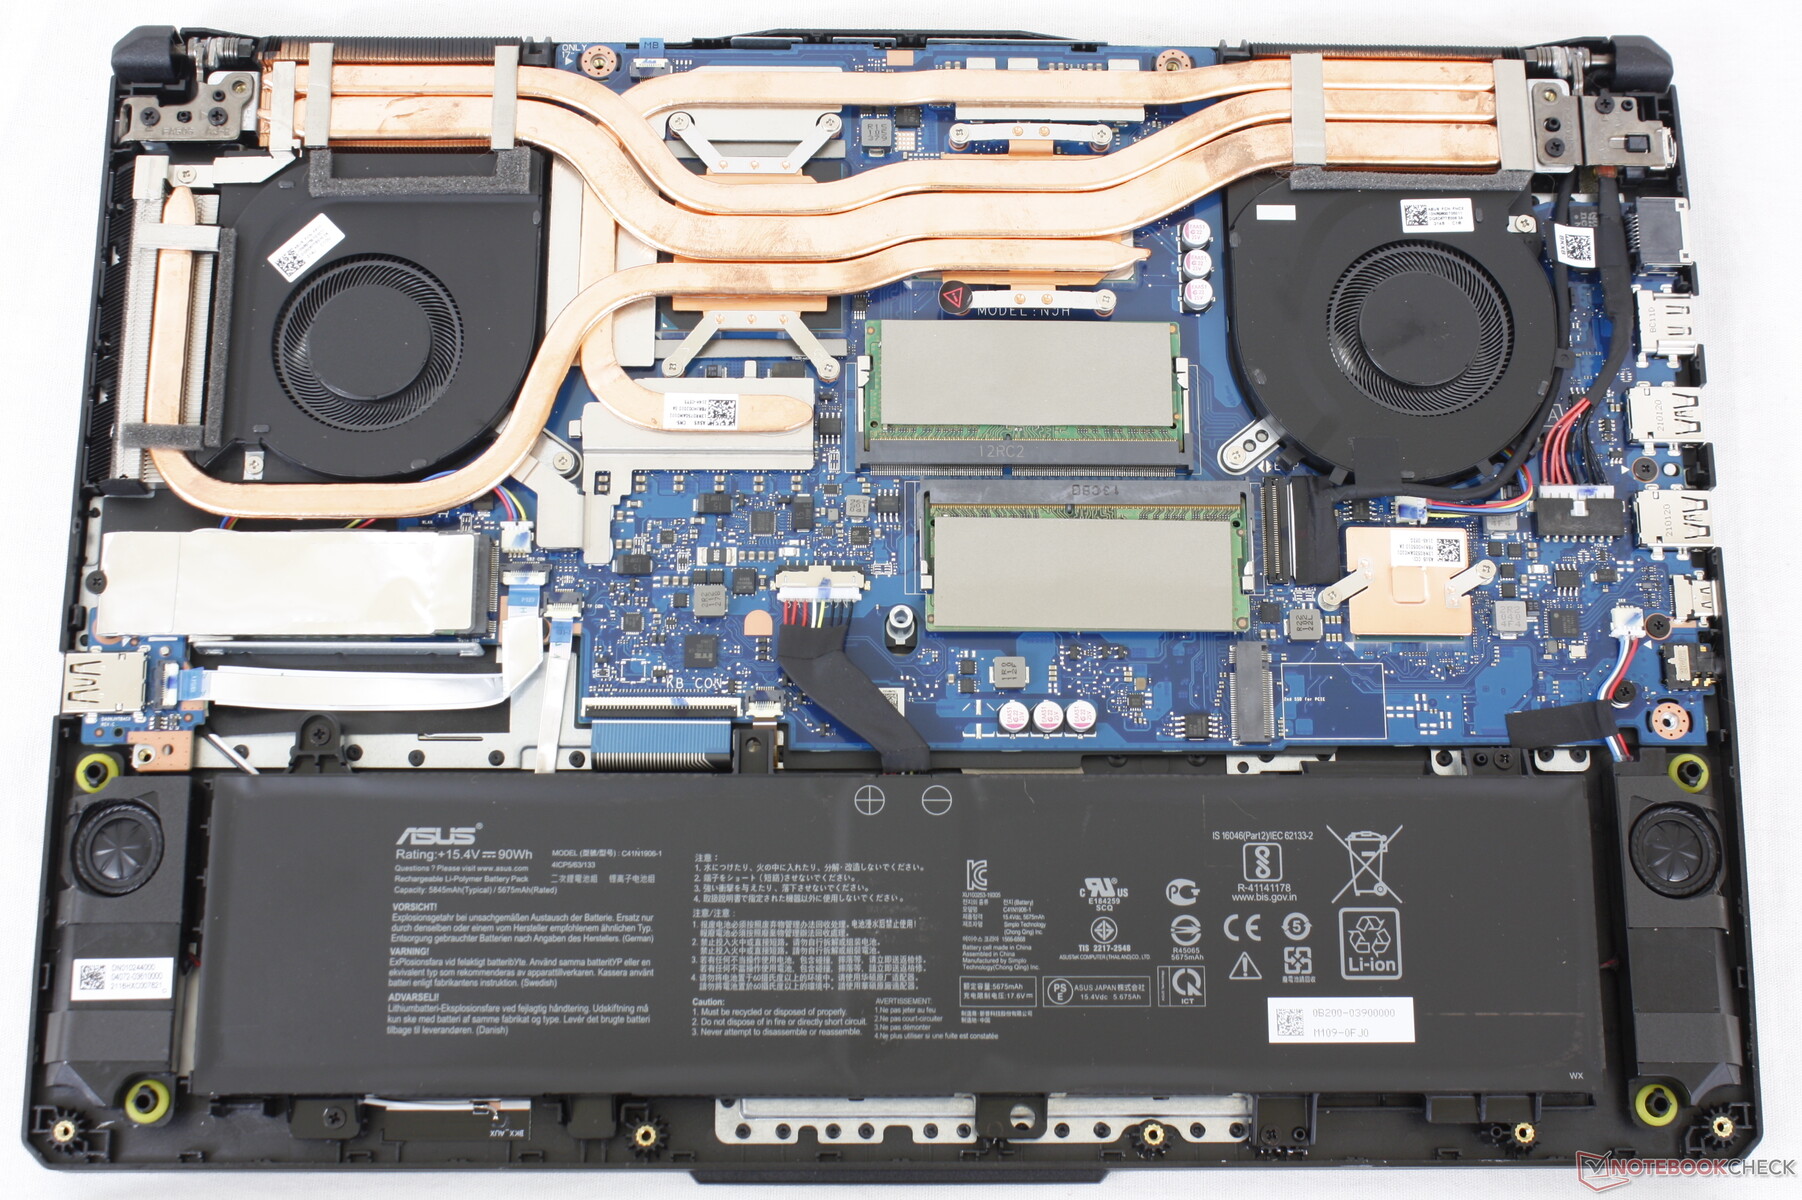
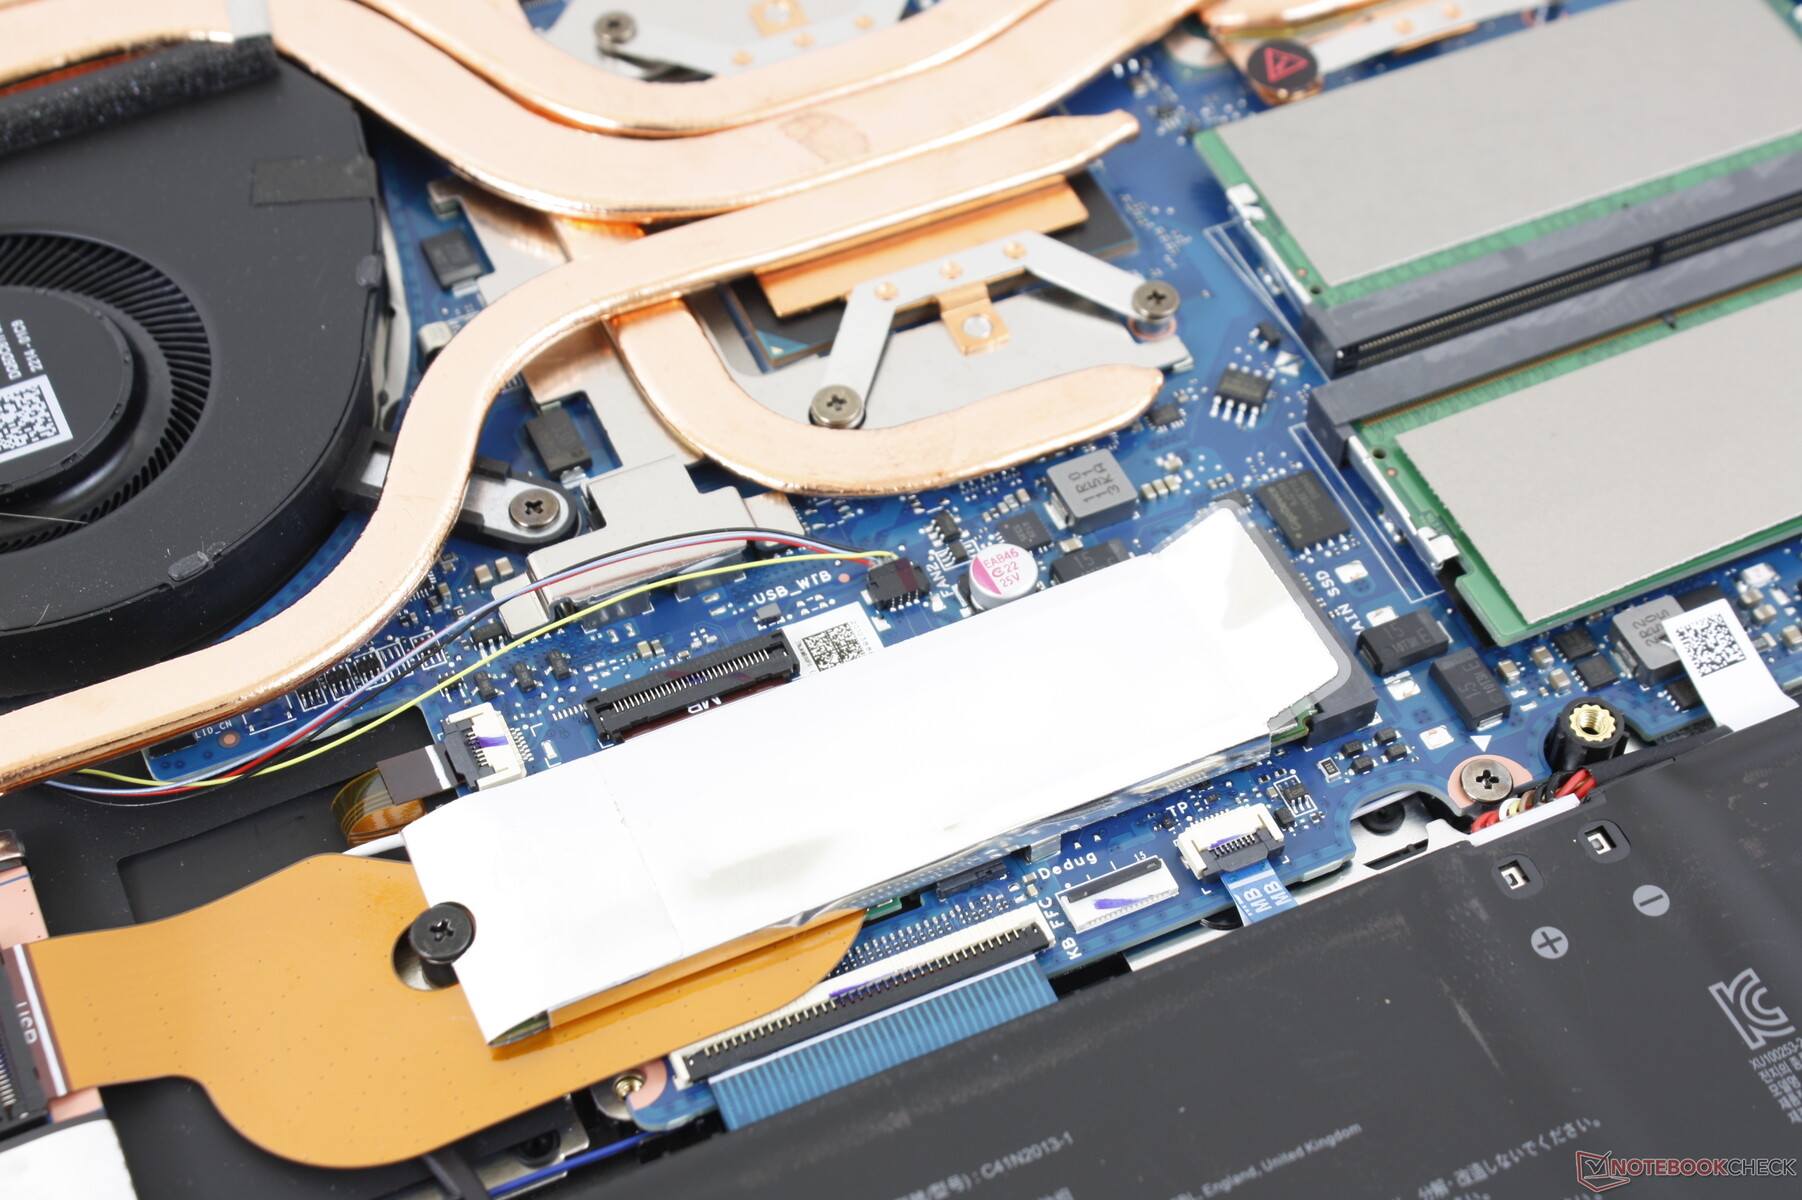
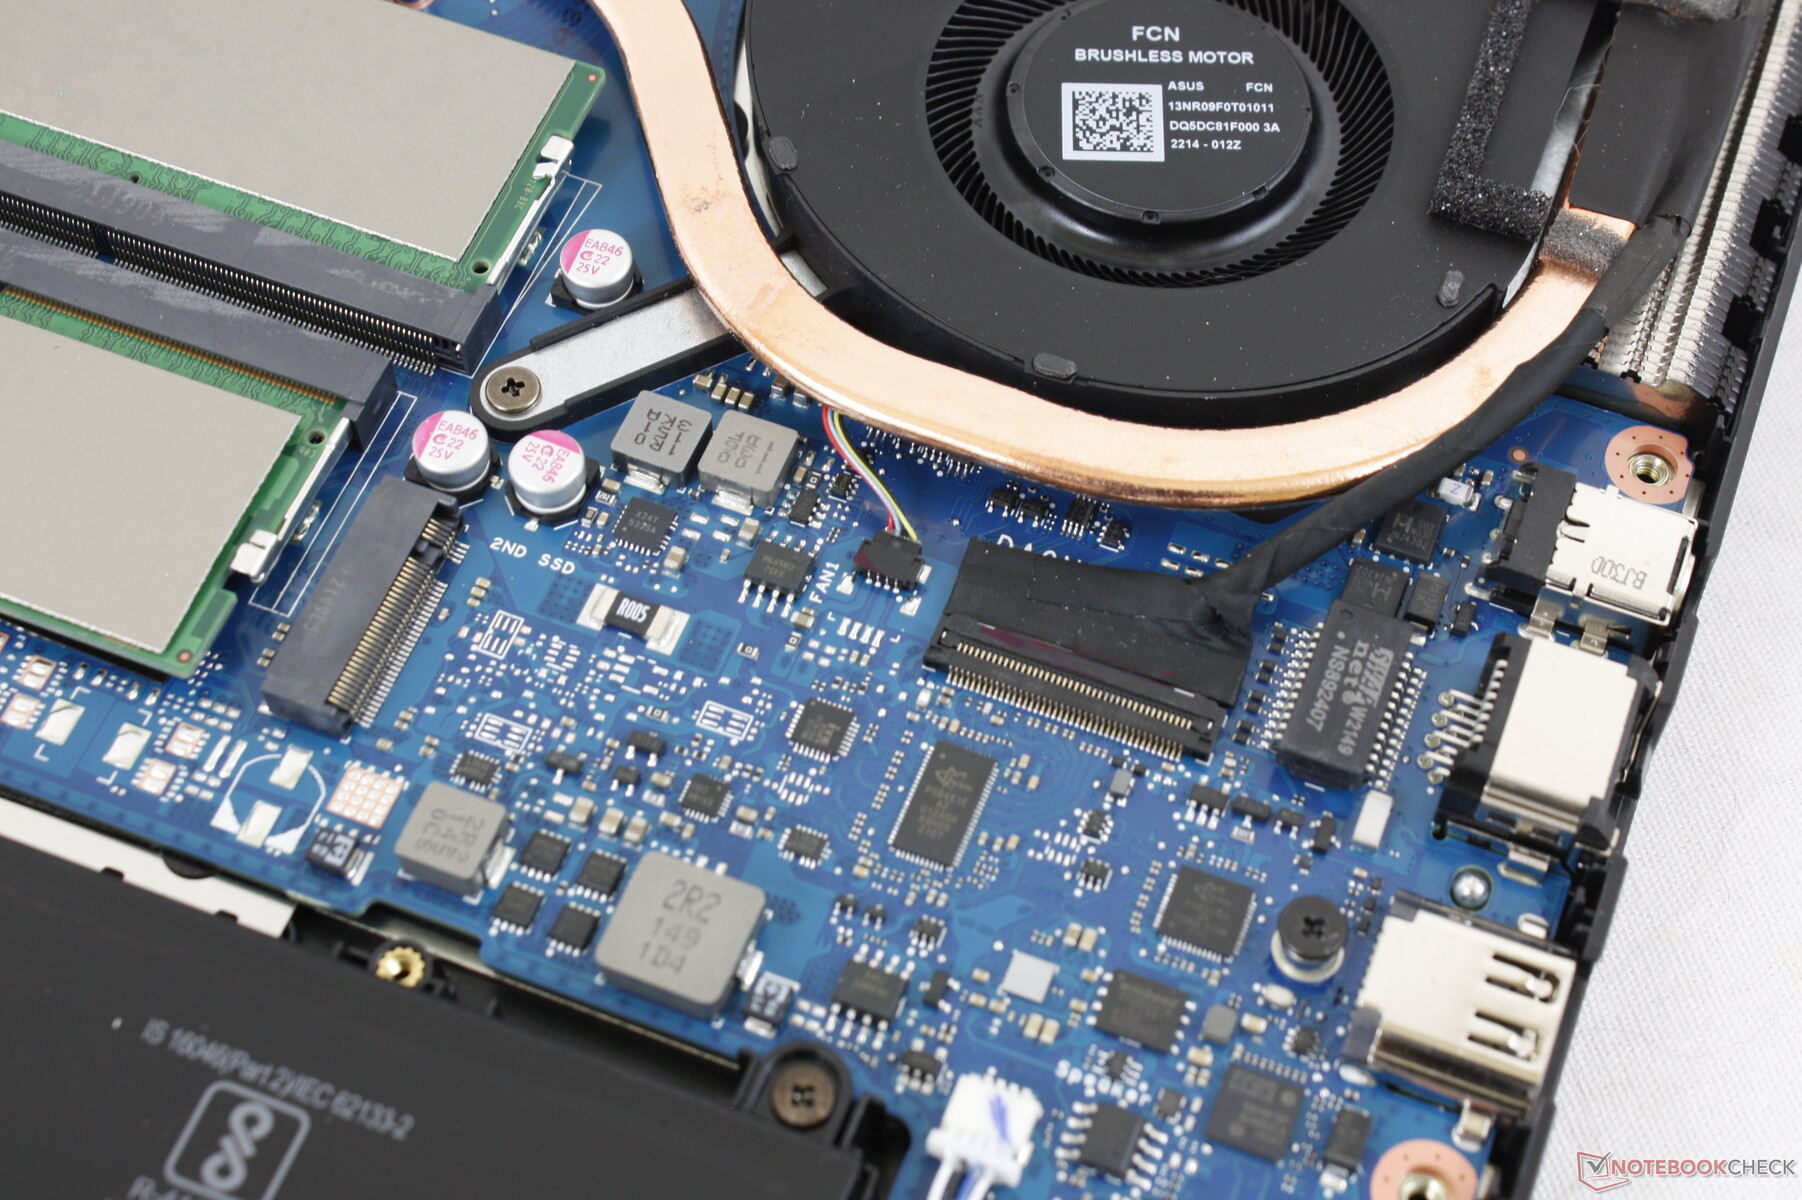
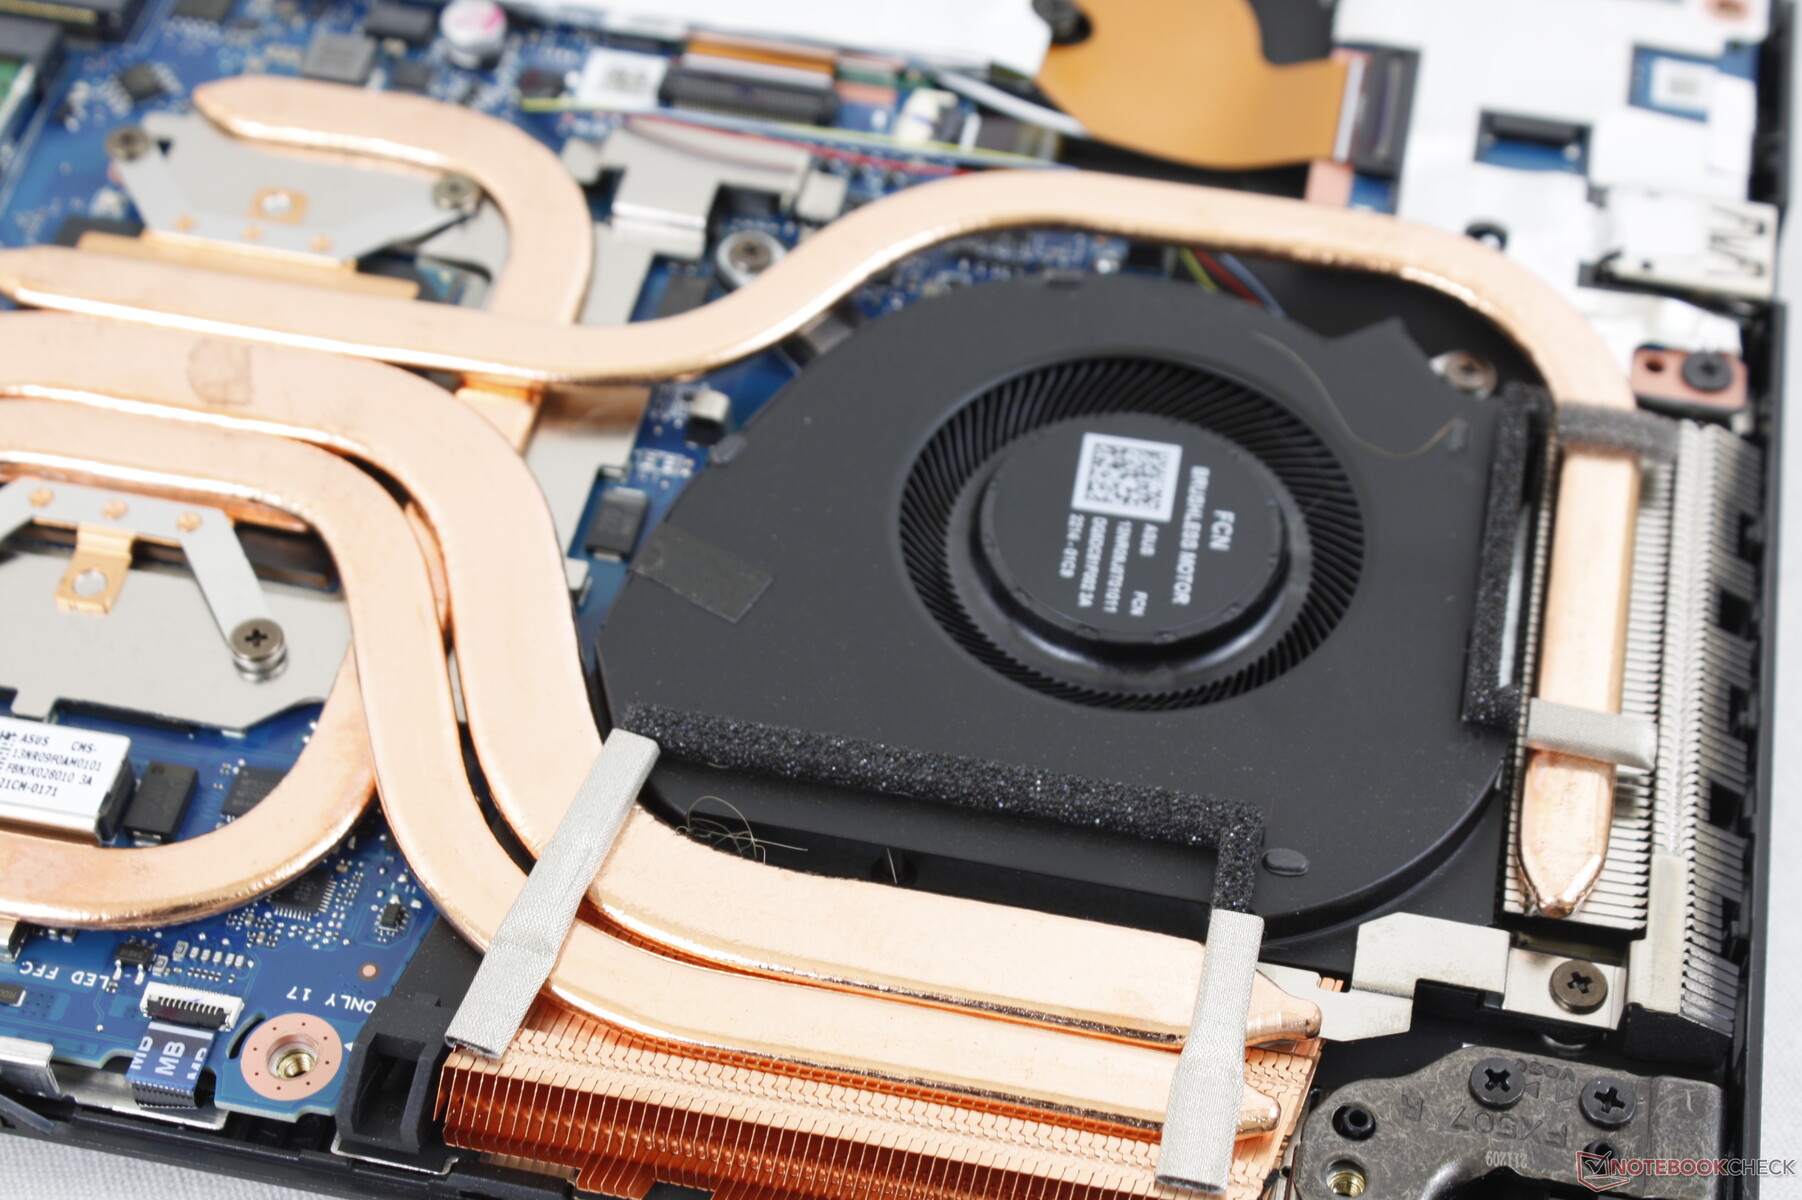
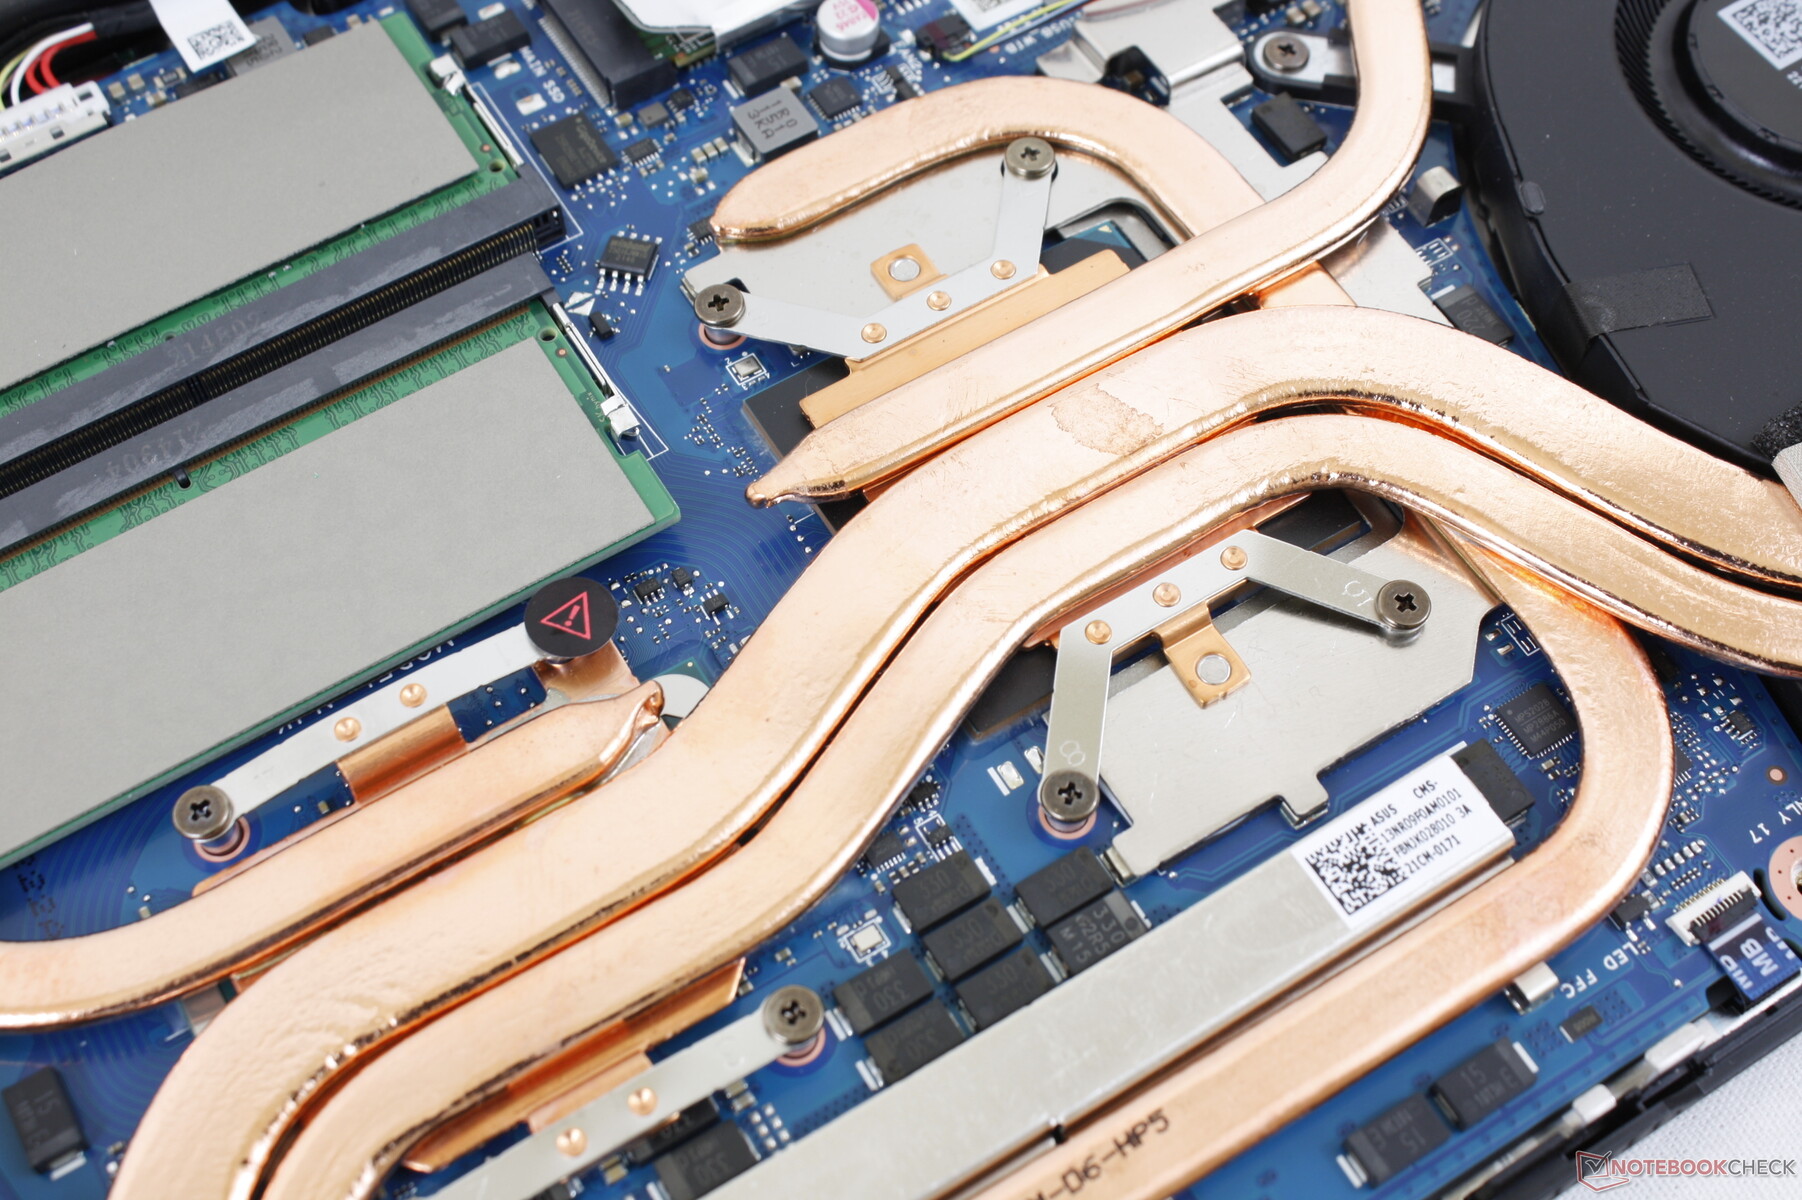
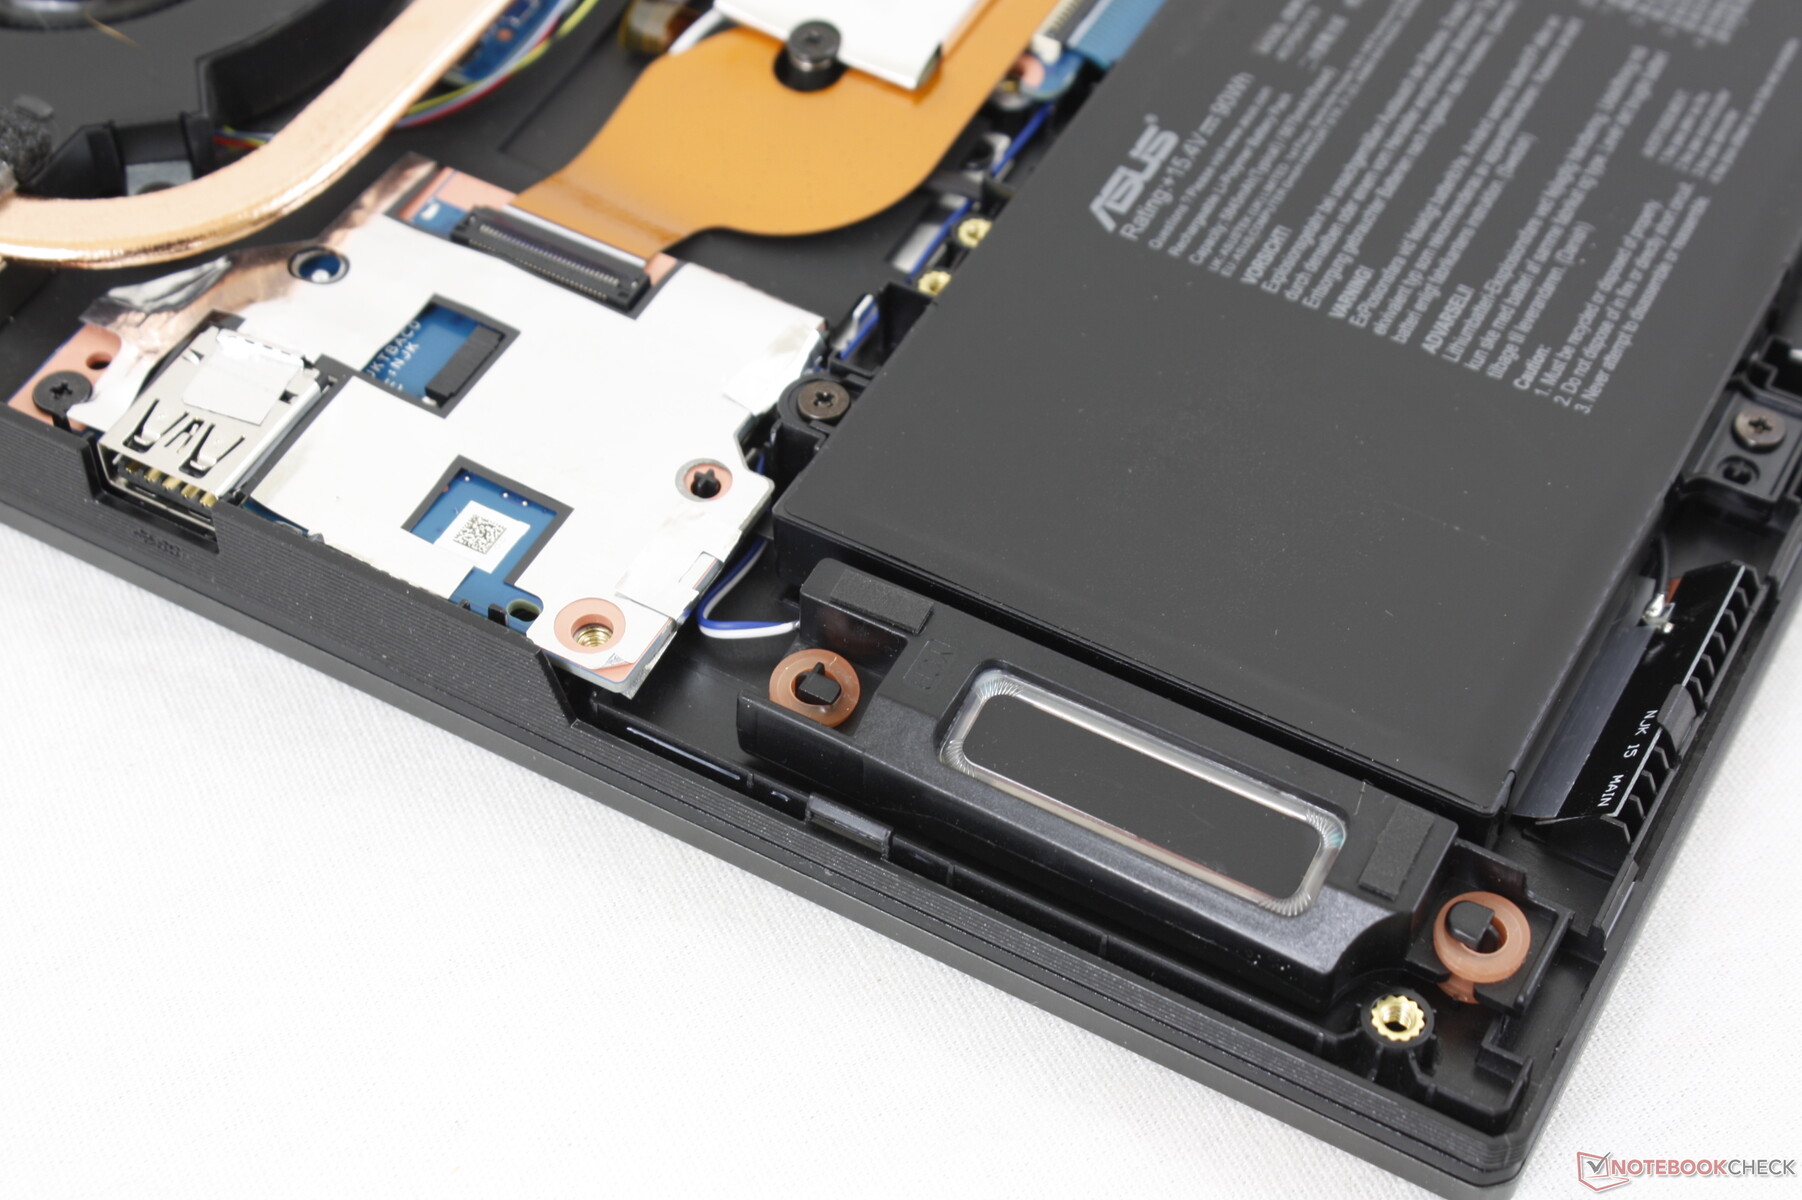
维护
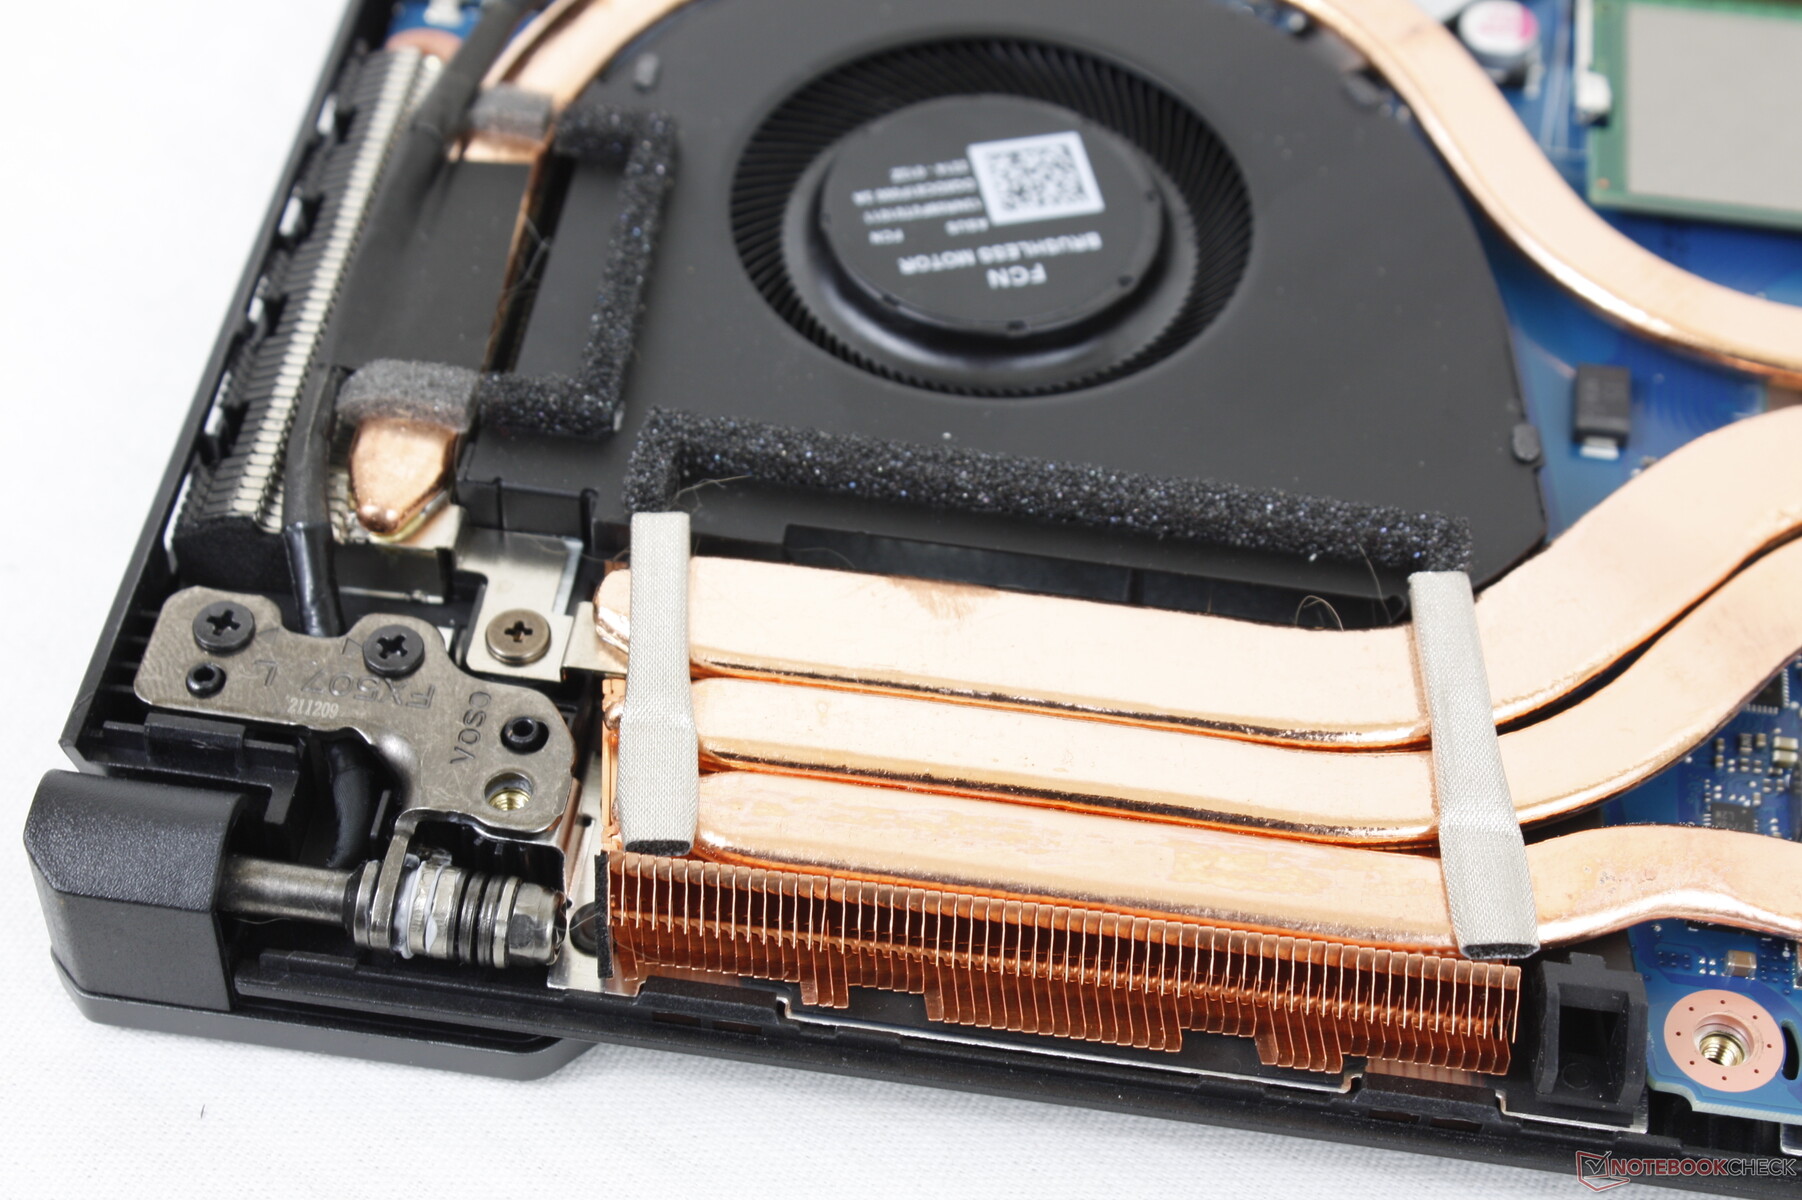
底部面板用飞利浦螺丝刀和平整的边缘相对容易拆卸。如下面的对比图所示,内部结构已经被改造,但2个SODIMM插槽、2个M.2 SSD插槽和可拆卸的WLAN模块仍然存在。
配件和保修
除了通常的交流电适配器和文件之外,盒子里没有任何额外的东西。典型的一年制造商保修期适用。
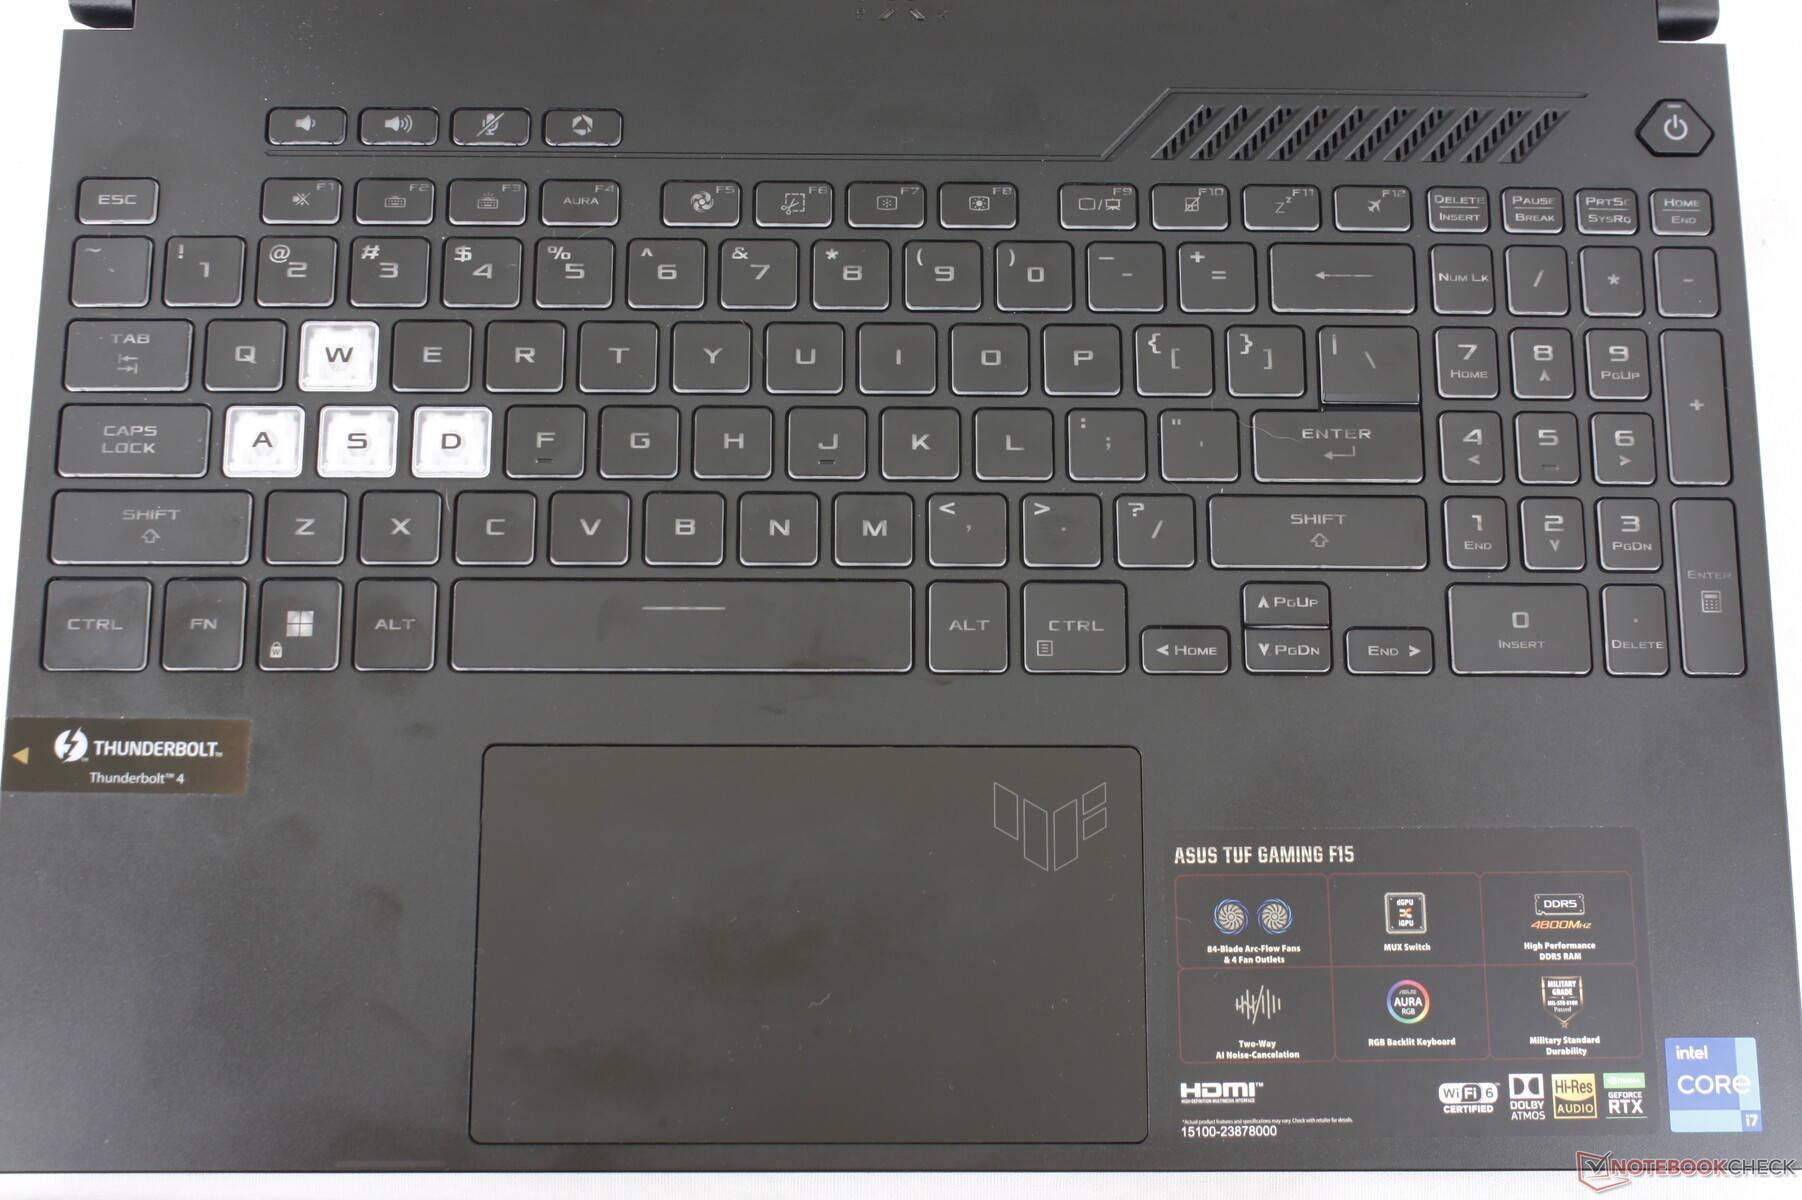
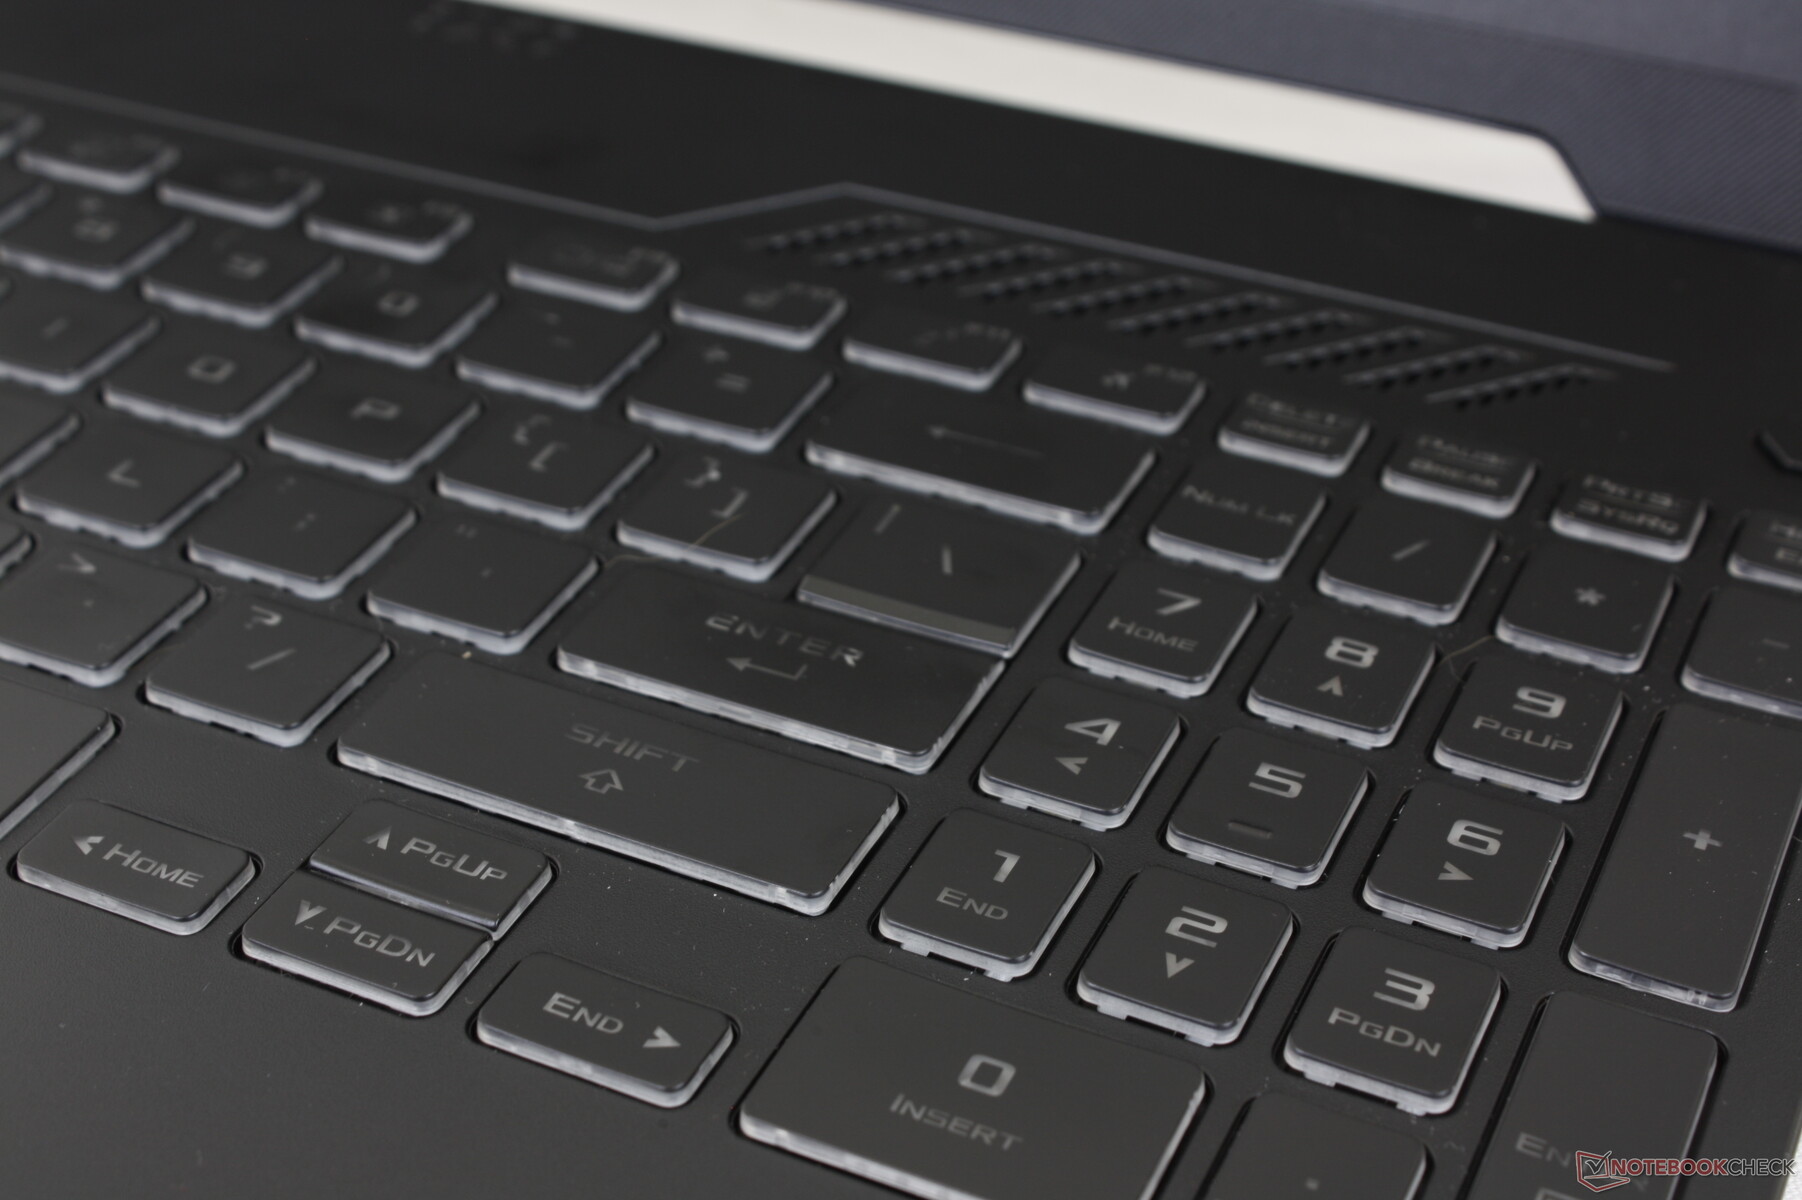
输入设备--不同但不一定更好
键盘
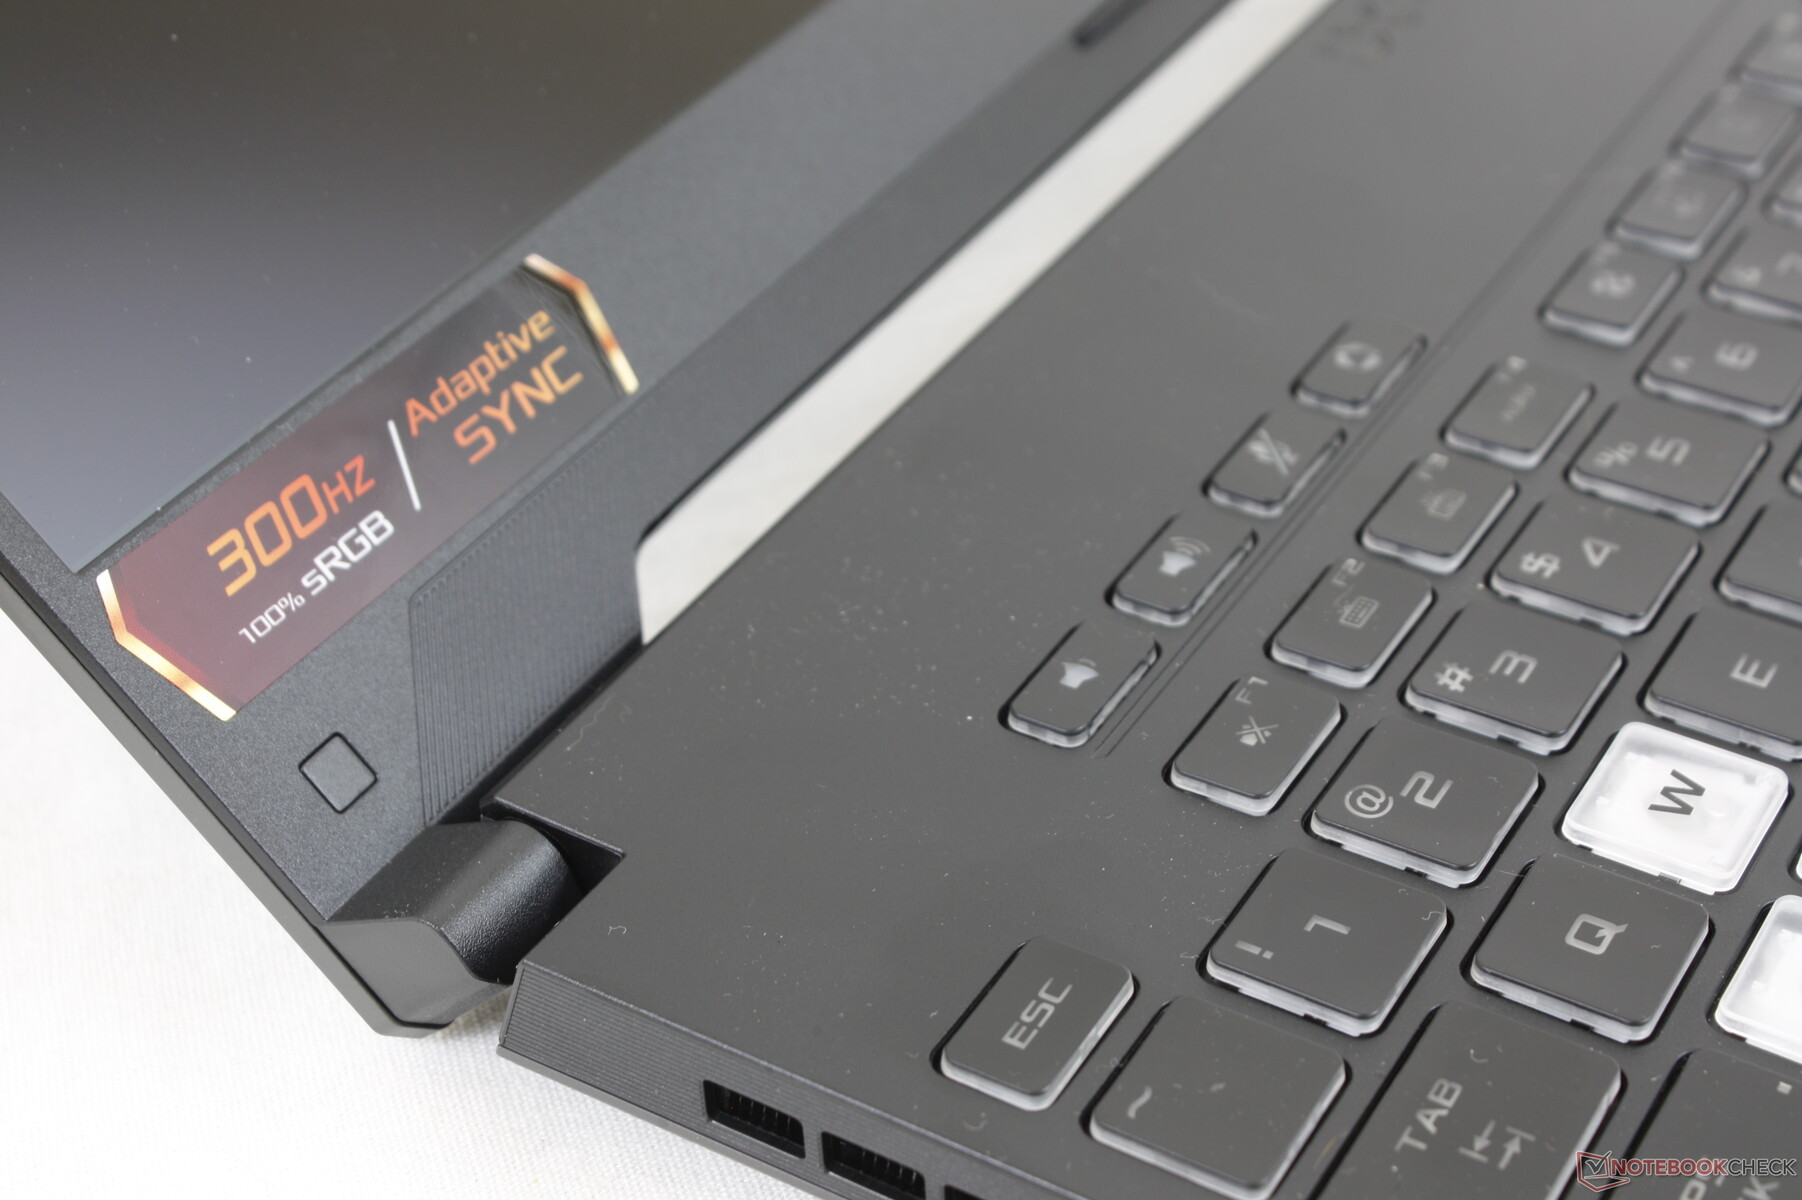
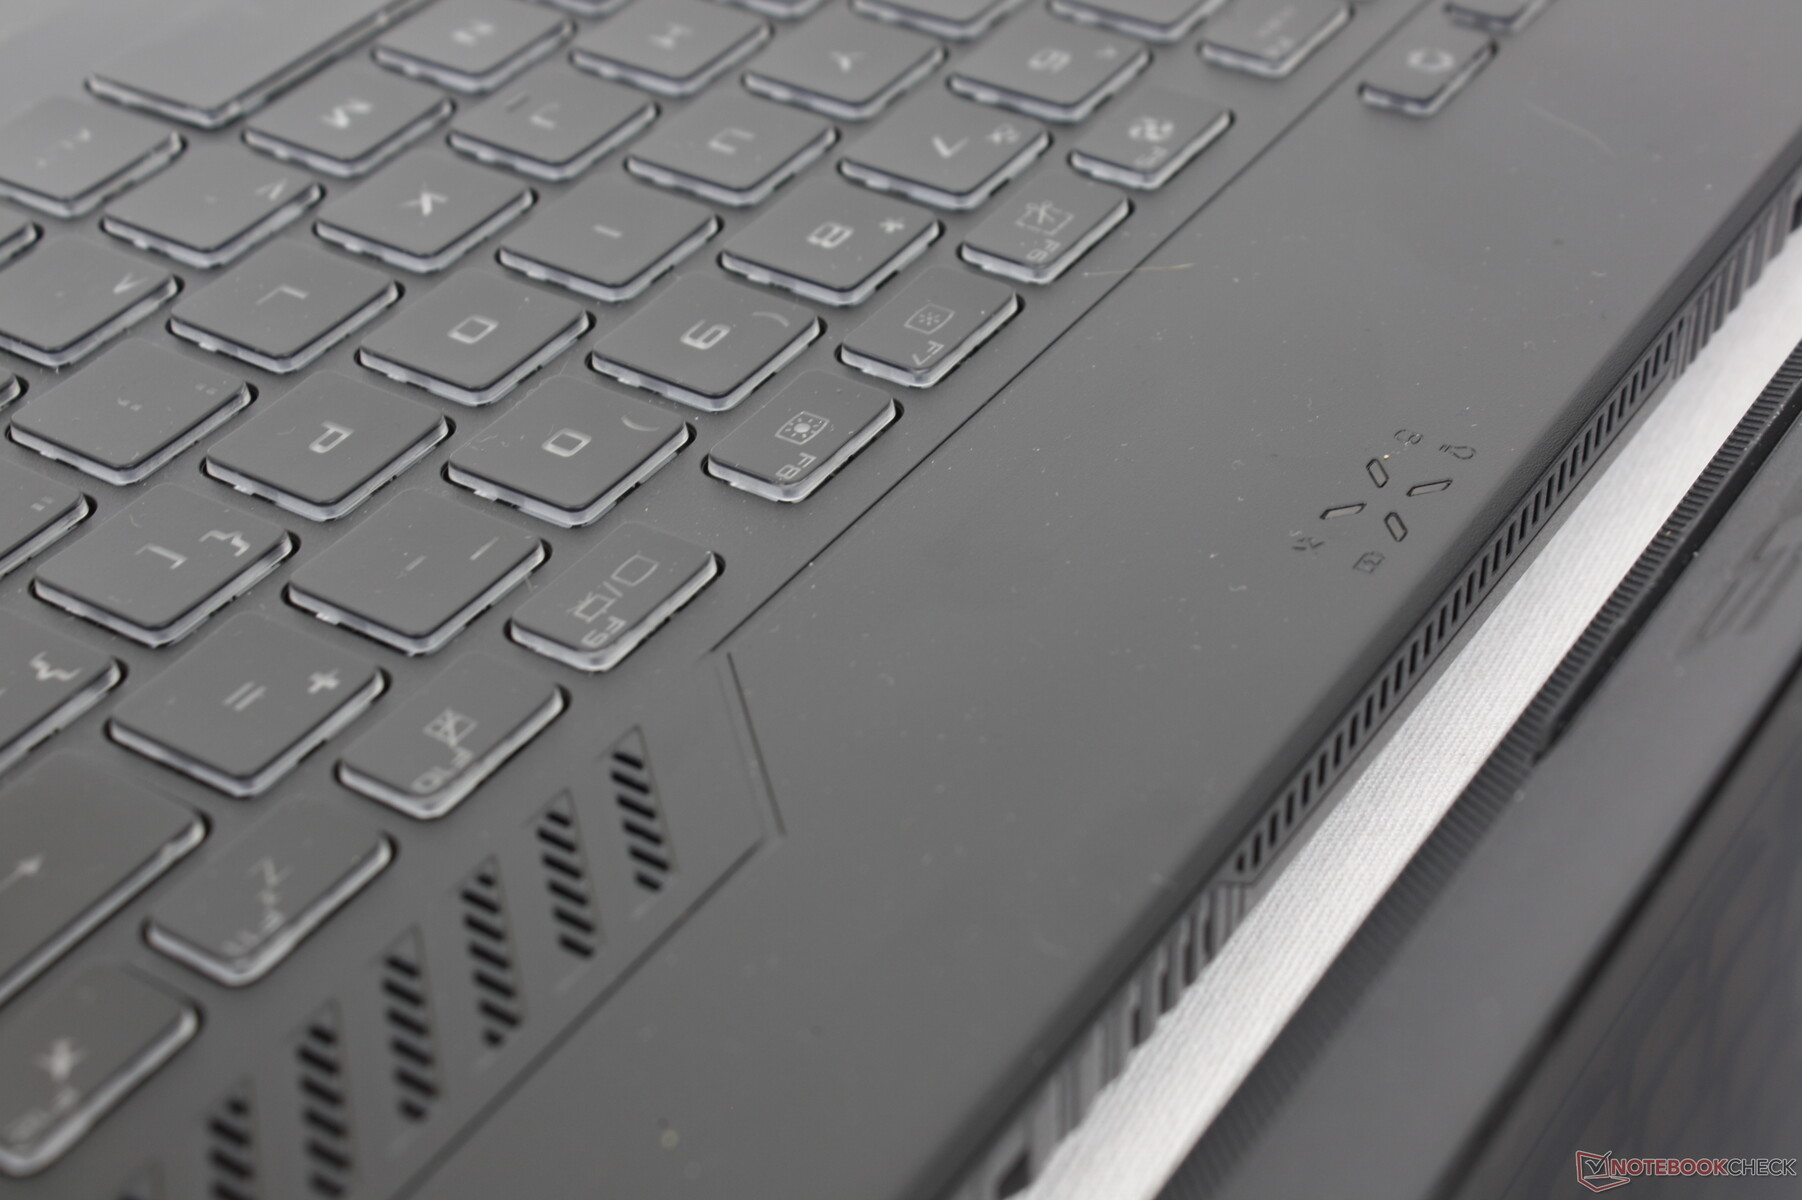
与FX506相比,华硕修改了键盘布局。一些辅助键现在在靠近左上角的地方有自己的一排,而方向键的长度现在稍长。每个键上的字体也更深更灰,不幸的是,这使得它更难以阅读。
键的反馈和单区RGB背光与去年相比都保持一致。我们发现,与Eurocom RX315上的按键相比,这些按键更轻更软。 欧通RX315而与大多数Zephyrus S型号的键盘非常接近。
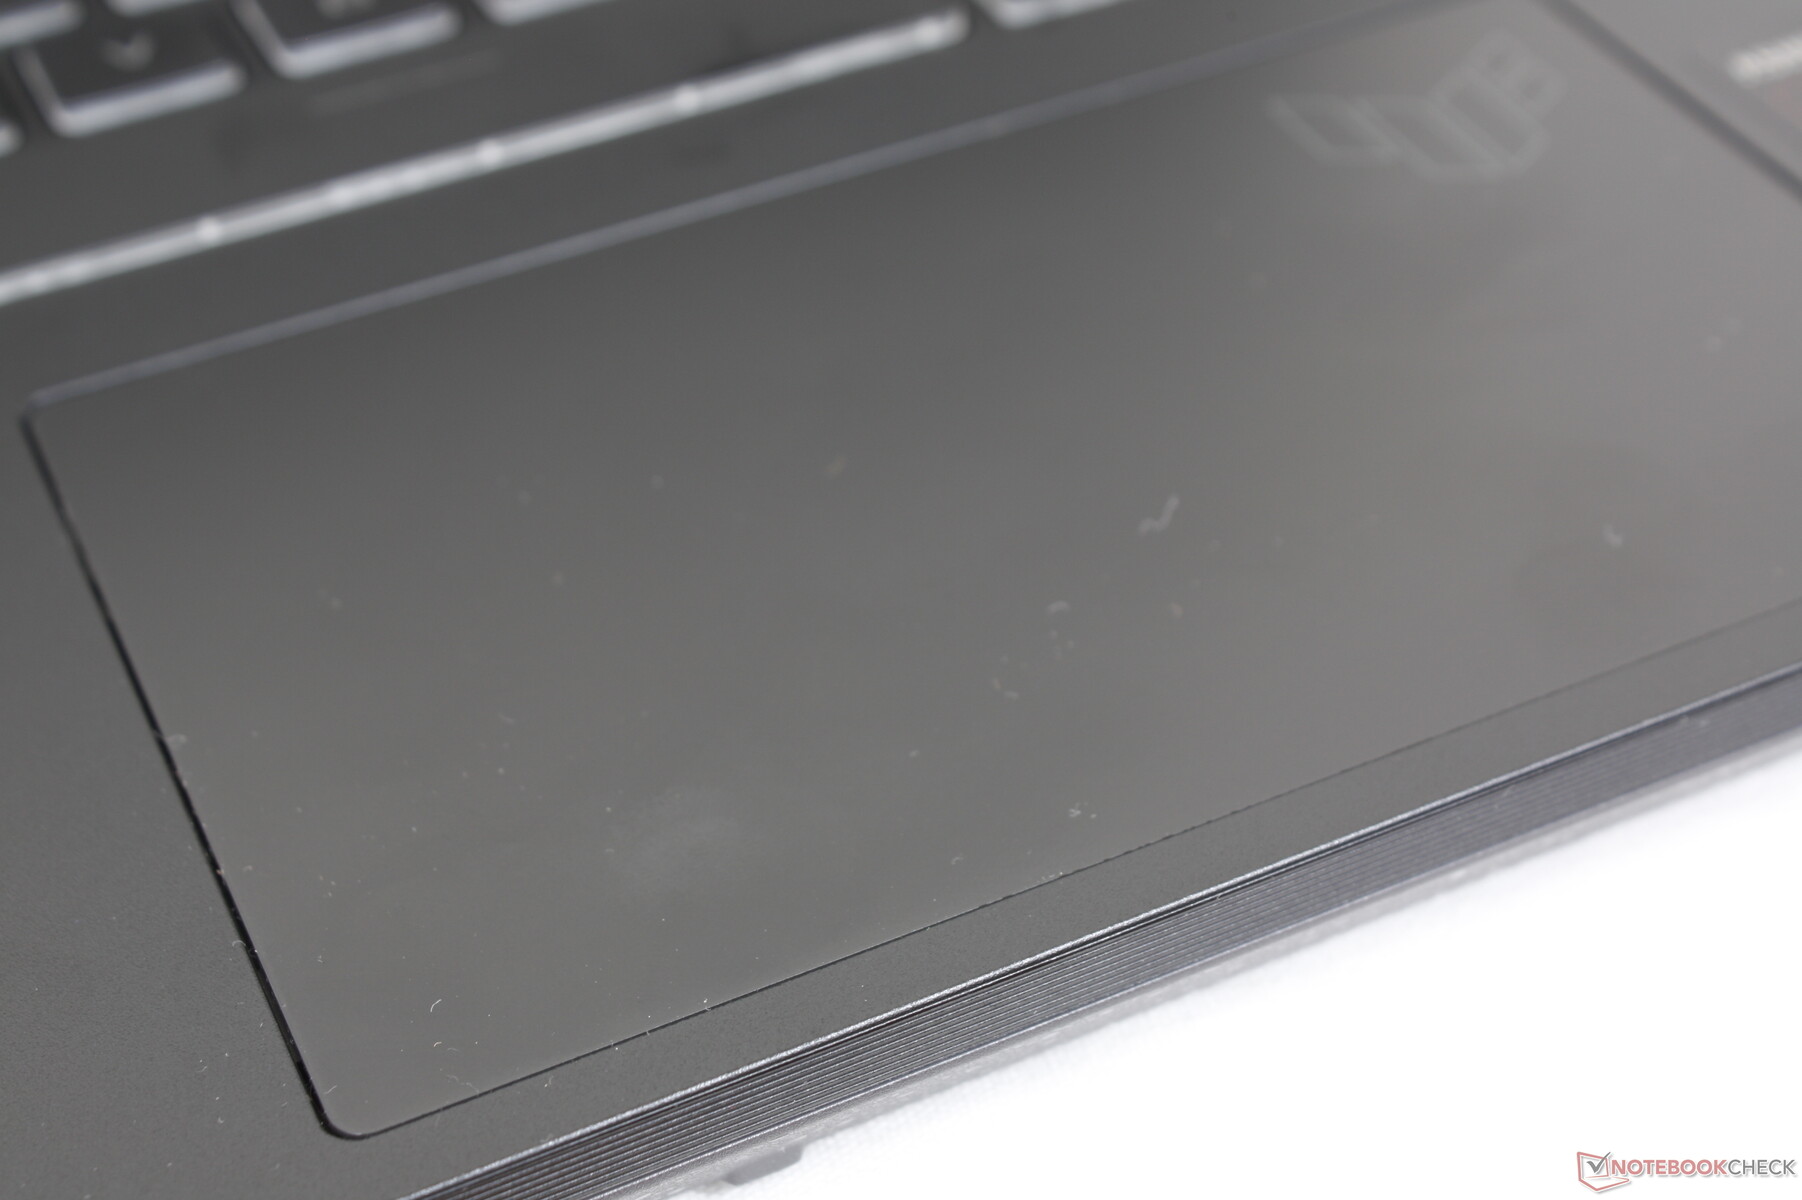
触摸板
FX507放弃了FX506上的专用鼠标按键,而采用了更大的点击板面积(13 x 7.8 cm vs. 10.6 x 8.0 cm)。在所有的速度下,滑行都很顺畅,几乎没有粘连,但在输入点击时,反馈很弱,而且有些松动。因此,拖动动作没有老款FX506那么舒适。

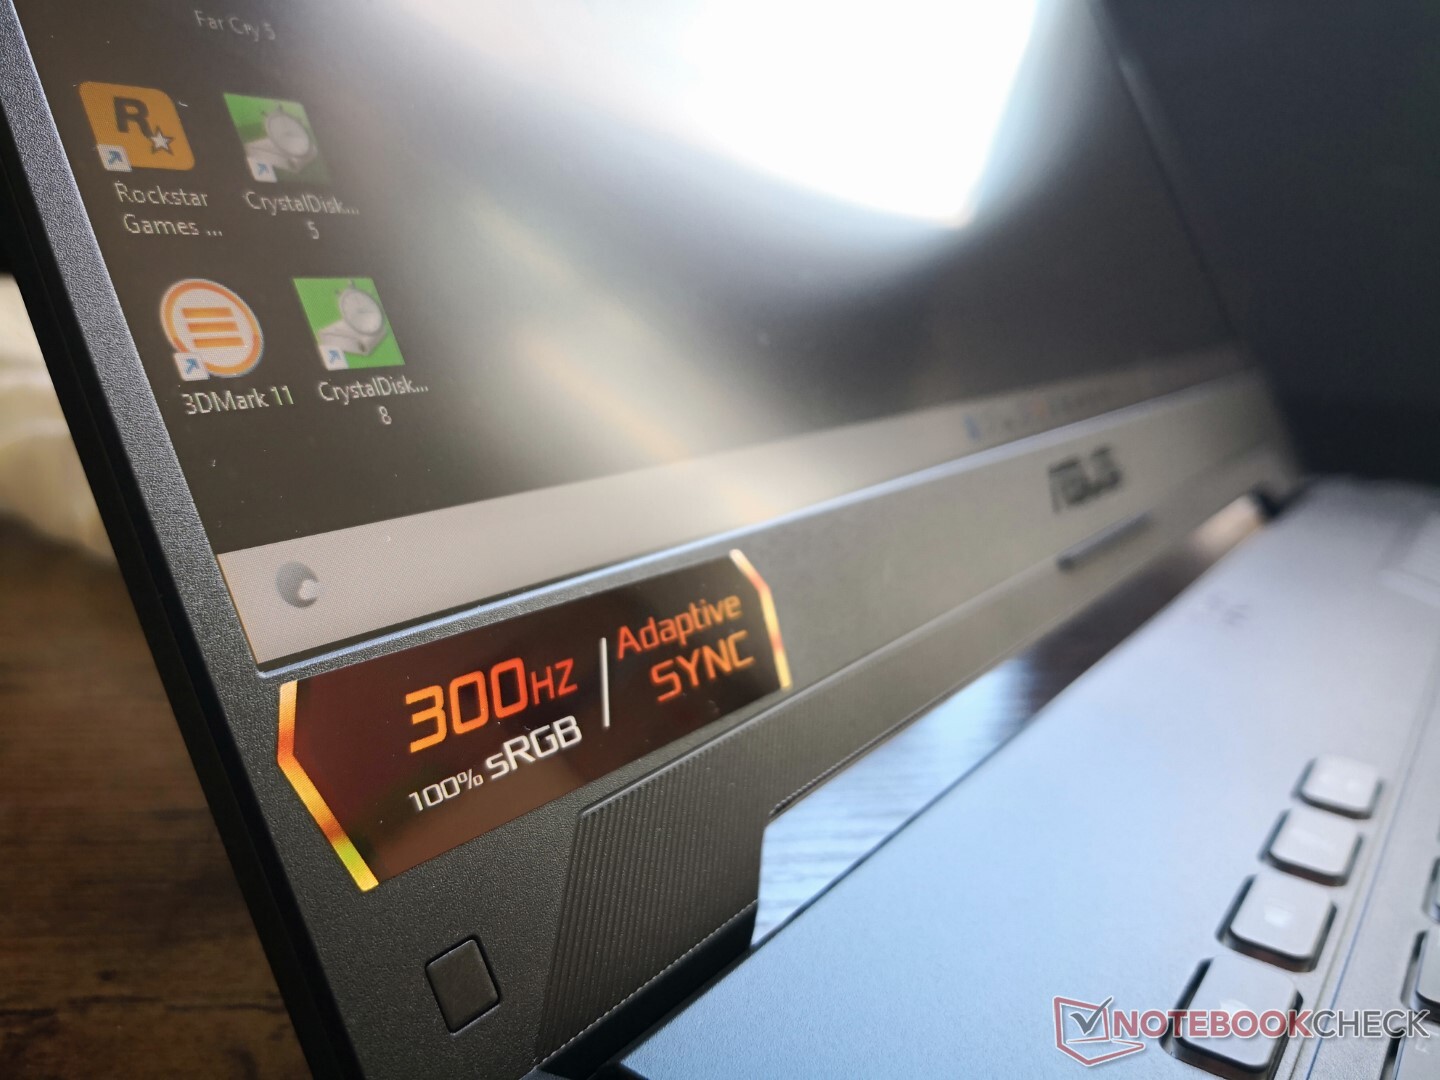
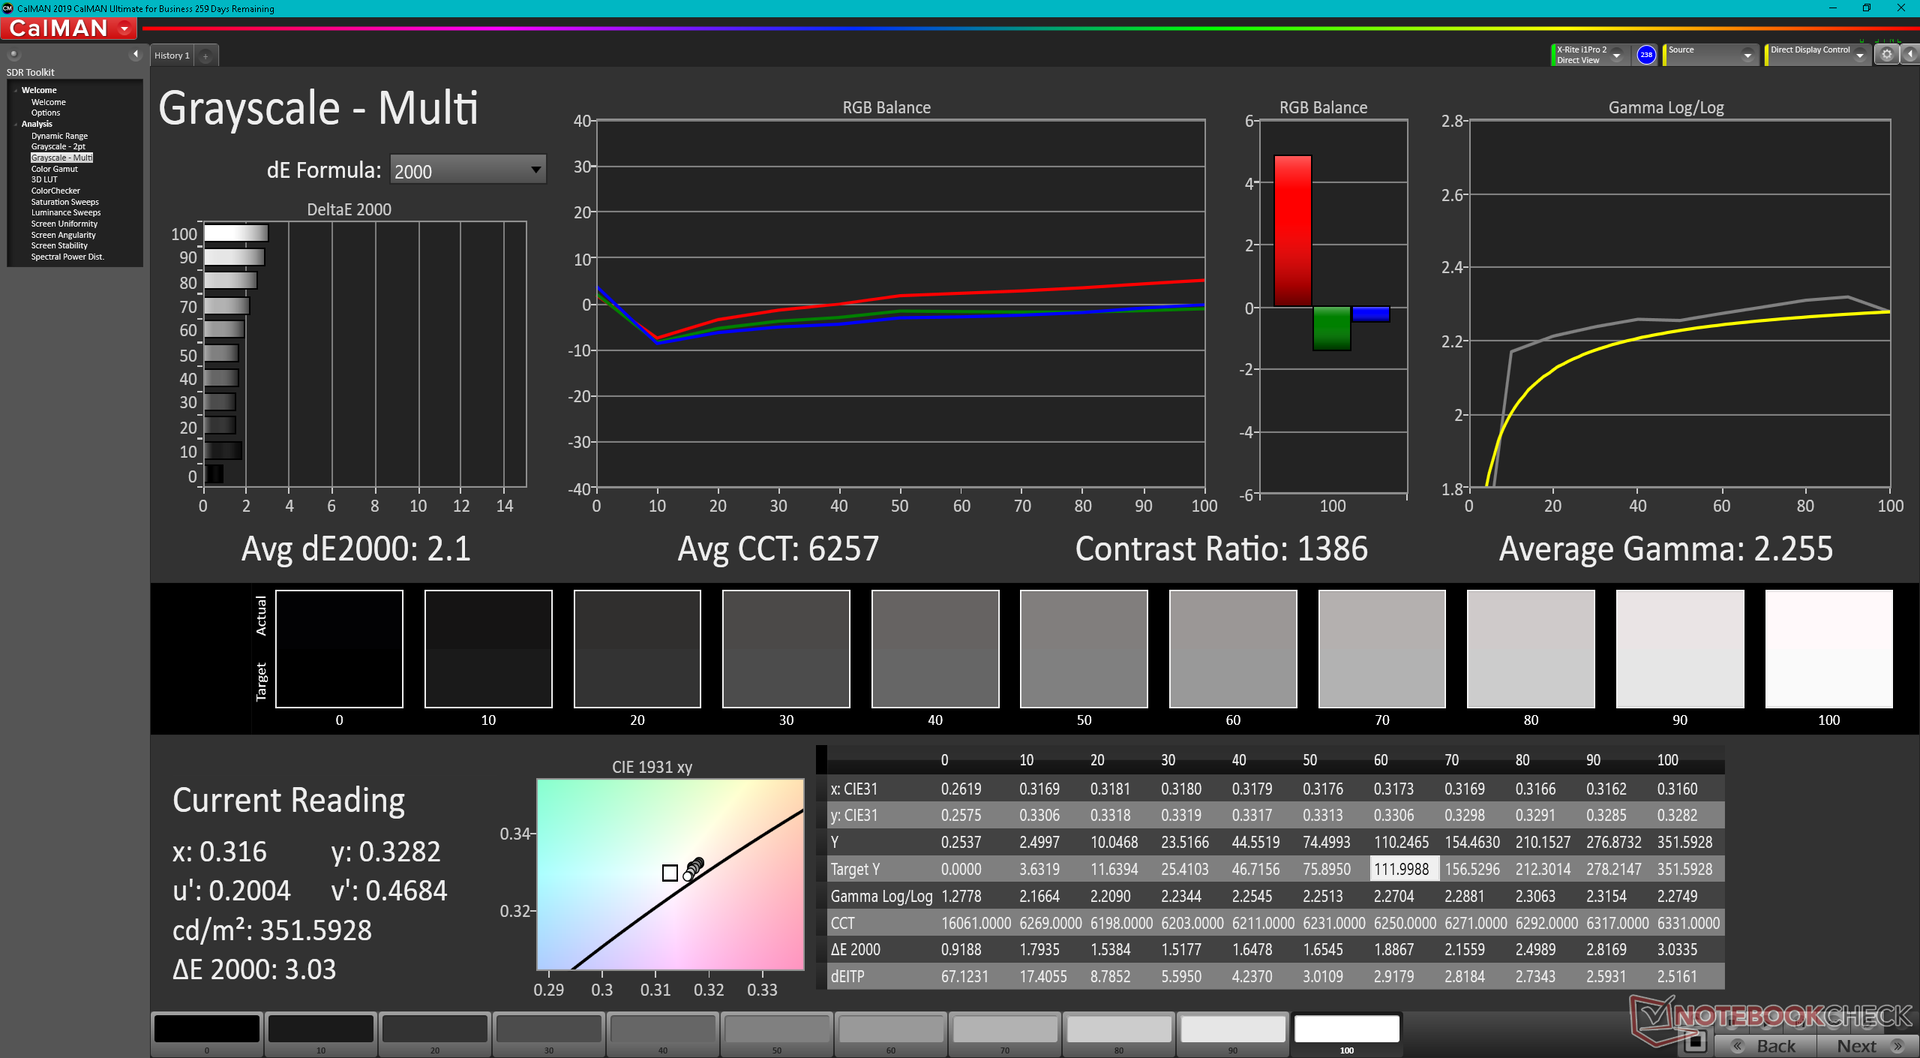
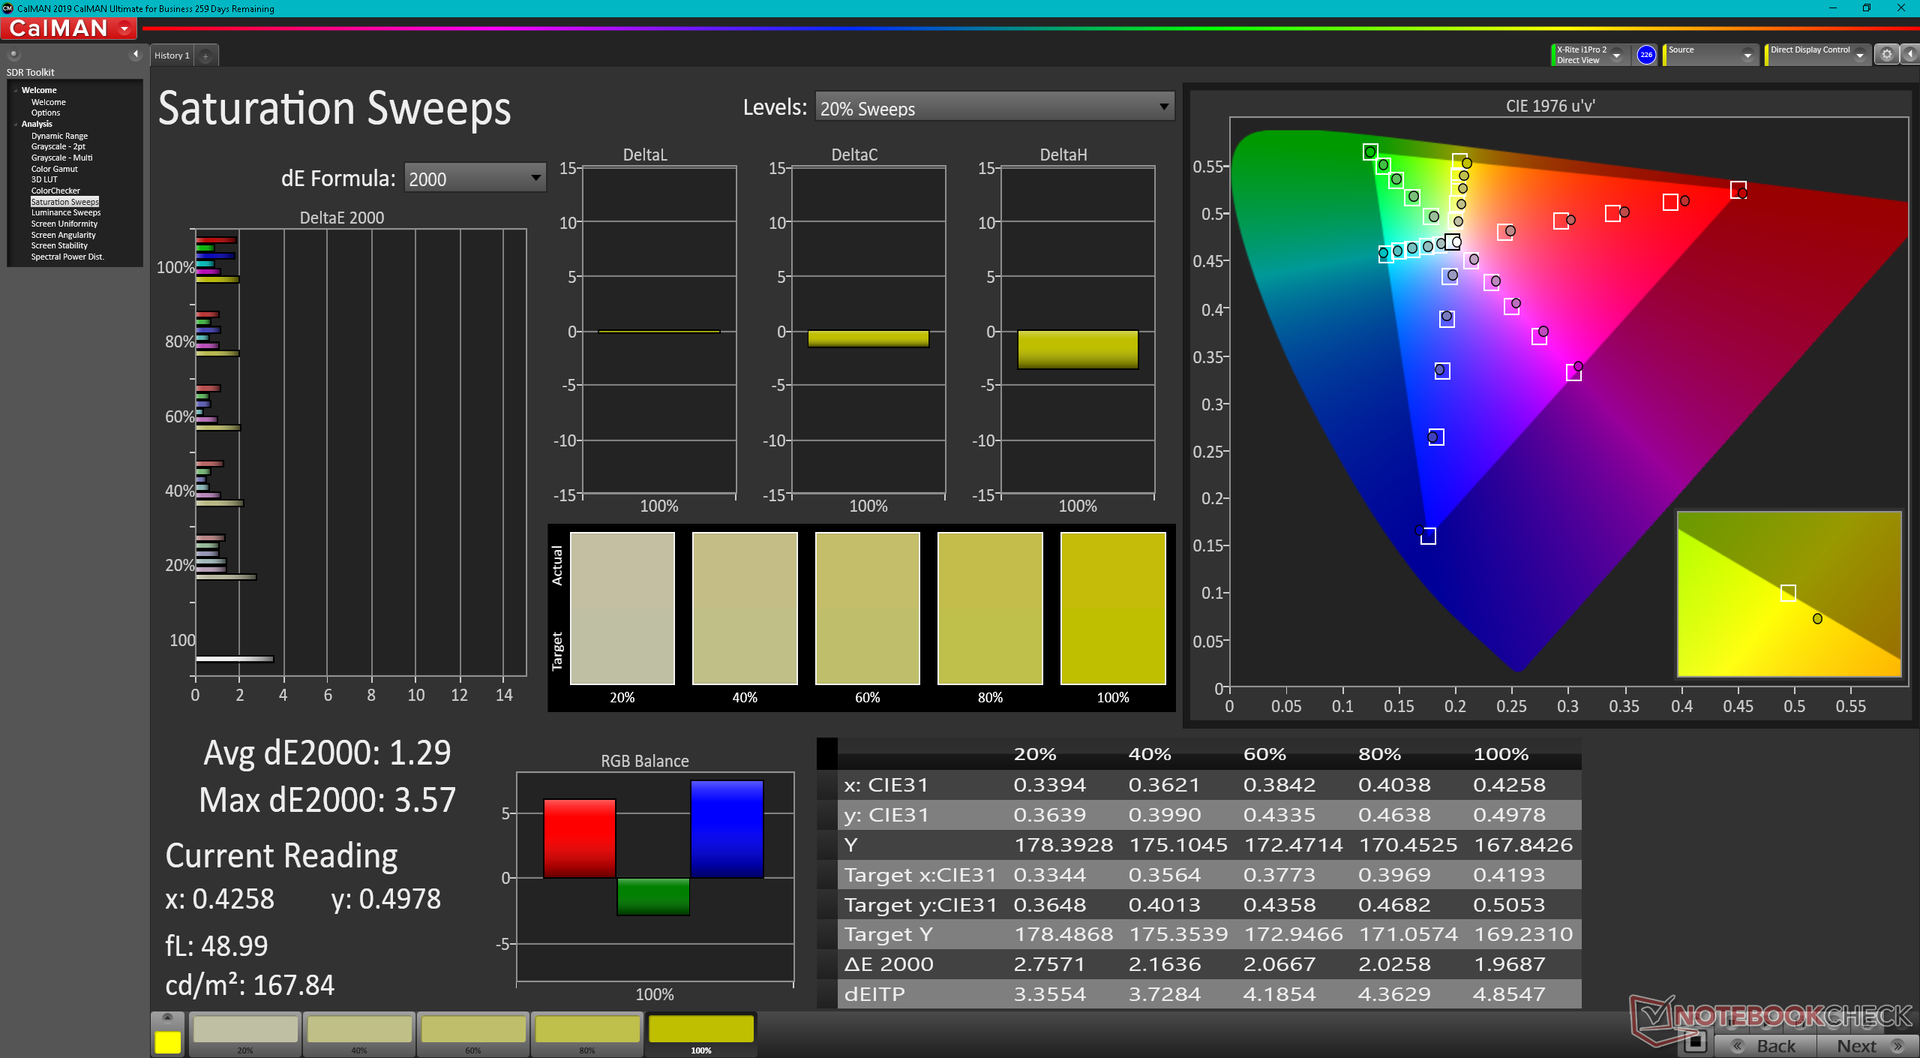
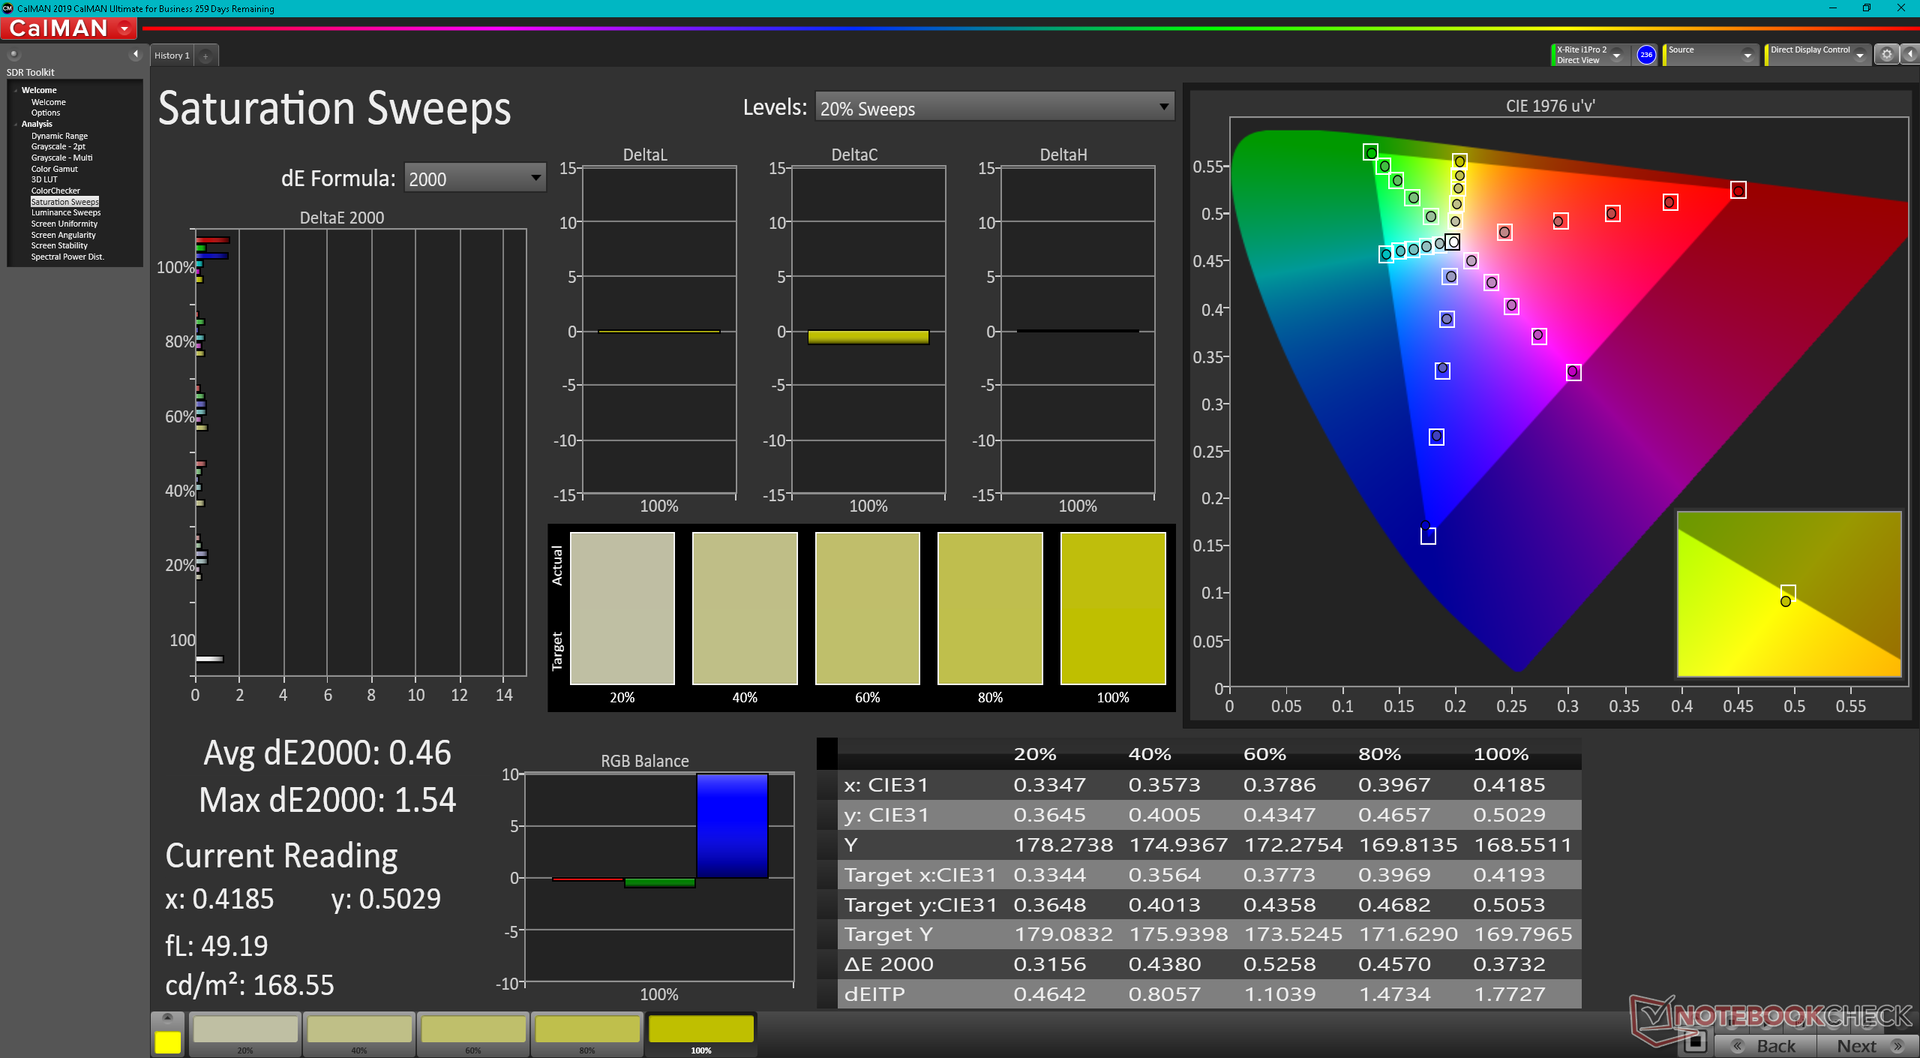
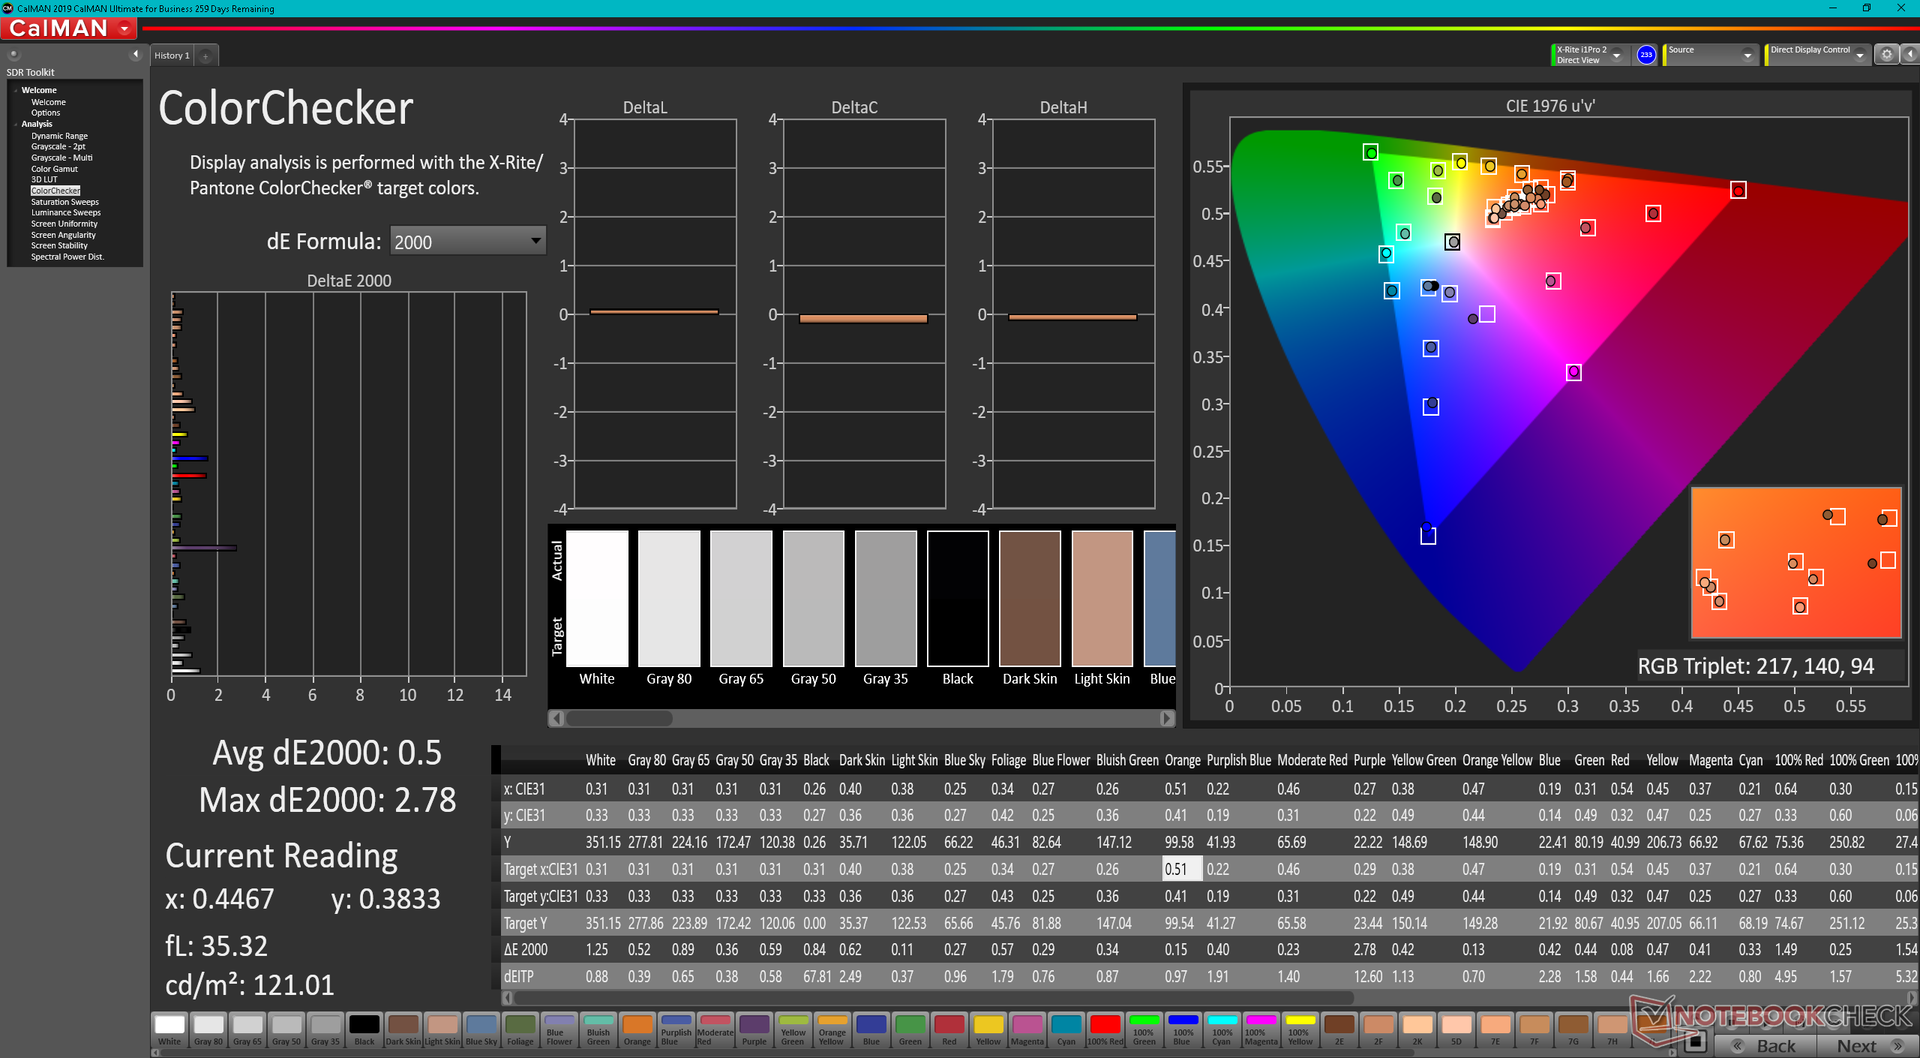
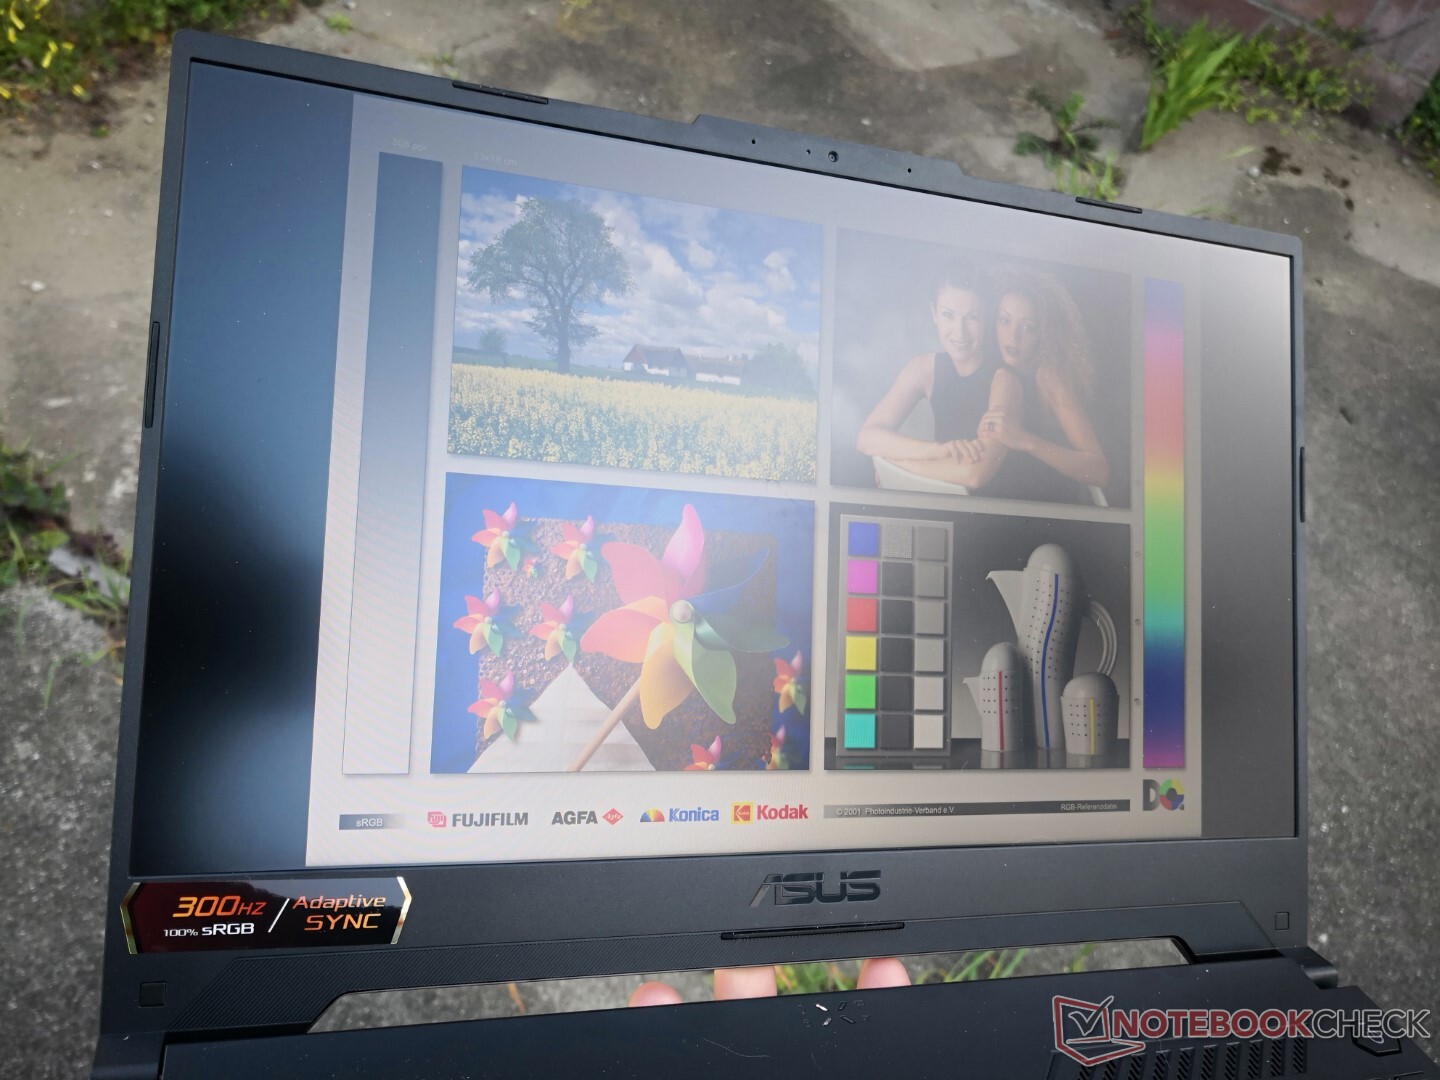
显示 - 300赫兹与自适应同步
华硕已经升级了老款的240赫兹夏普LQ156M1JW26 IPS面板。 FX516PR 为FX507上的更快的300赫兹夏普TL156VDXP0101 IPS面板。除了更高的刷新率,较新的面板还提供更快的灰度响应时间和更明亮的背光,同时保持与FX516PR上大致相同的对比度和色域。
我们很高兴看到华硕放弃了FX506上那块可怕的智美面板,它的色彩和响应时间都明显逊色。

| |||||||||||||||||||||||||
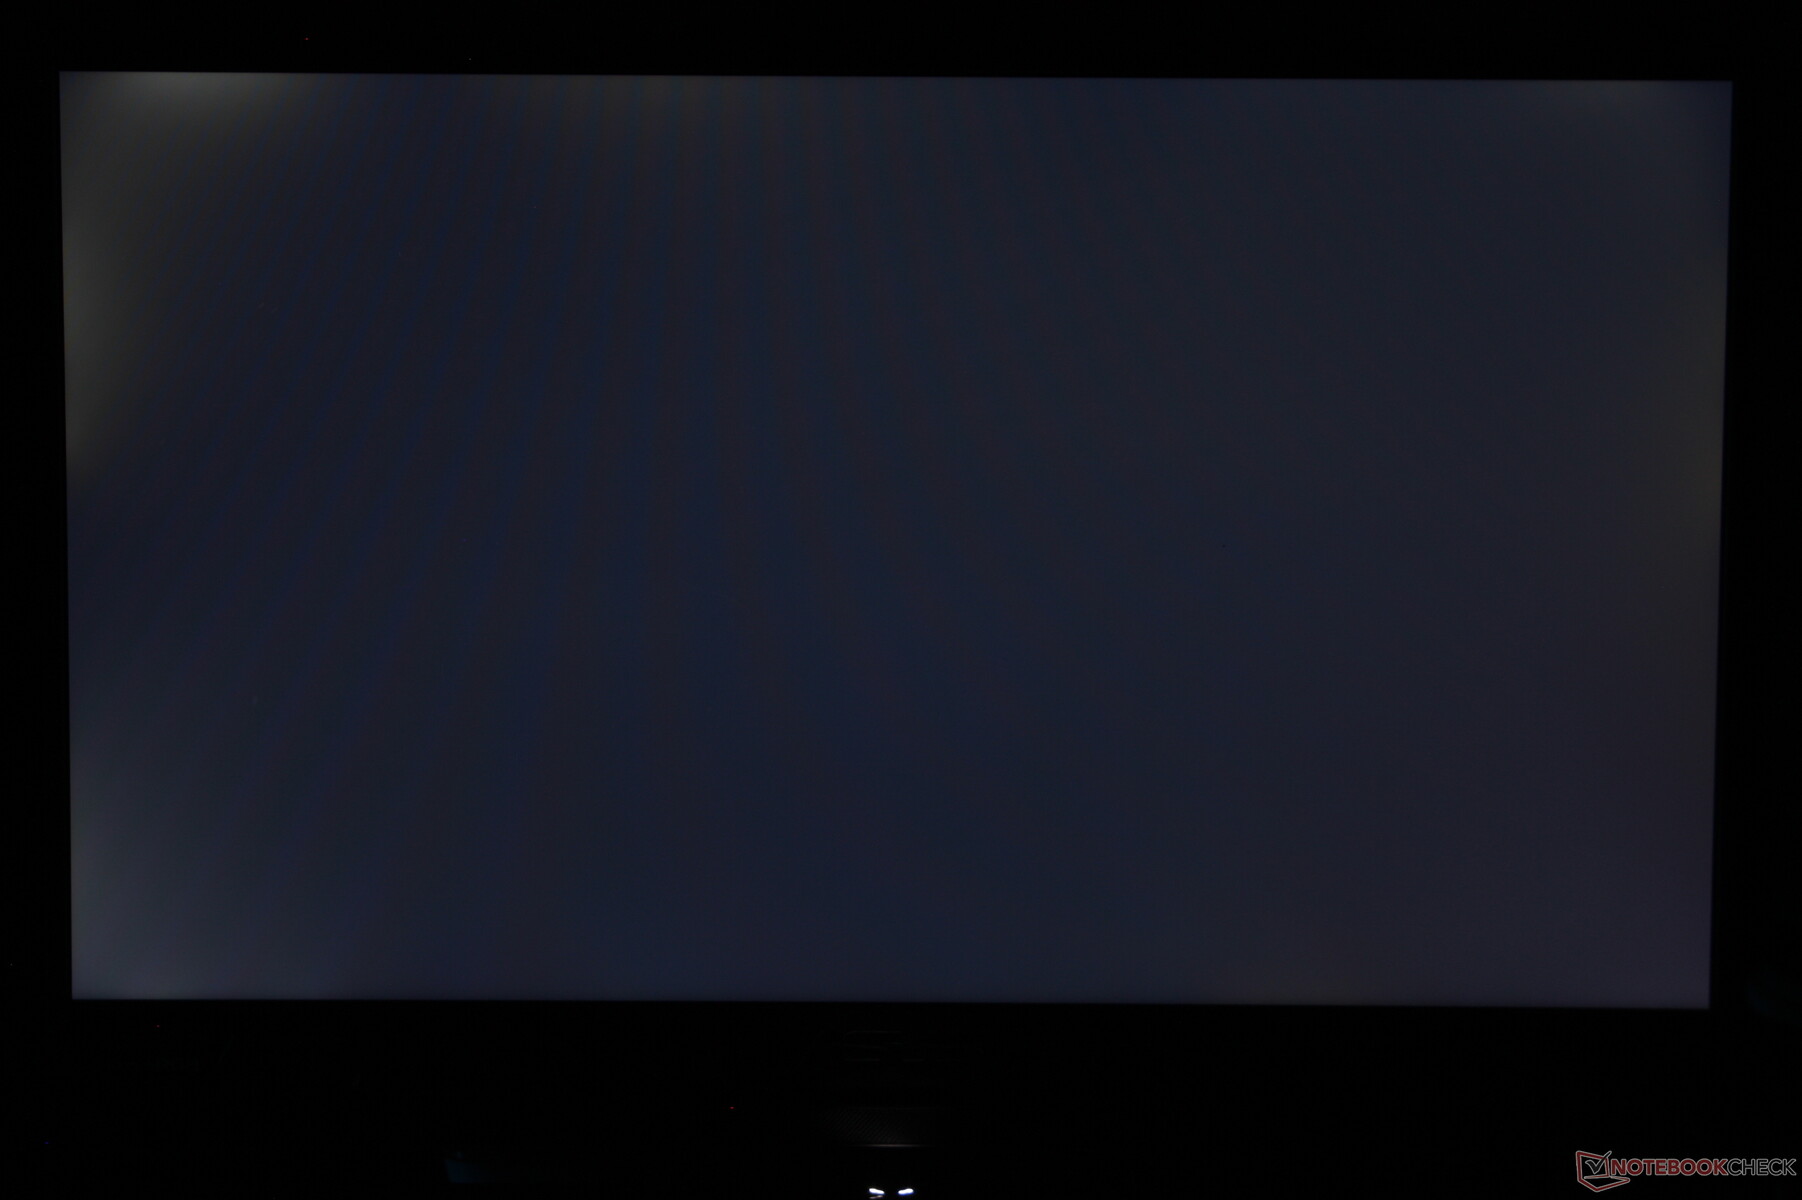
Brightness Distribution: 89 %
Center on Battery: 353.7 cd/m²
Contrast: 1040:1 (Black: 0.34 cd/m²)
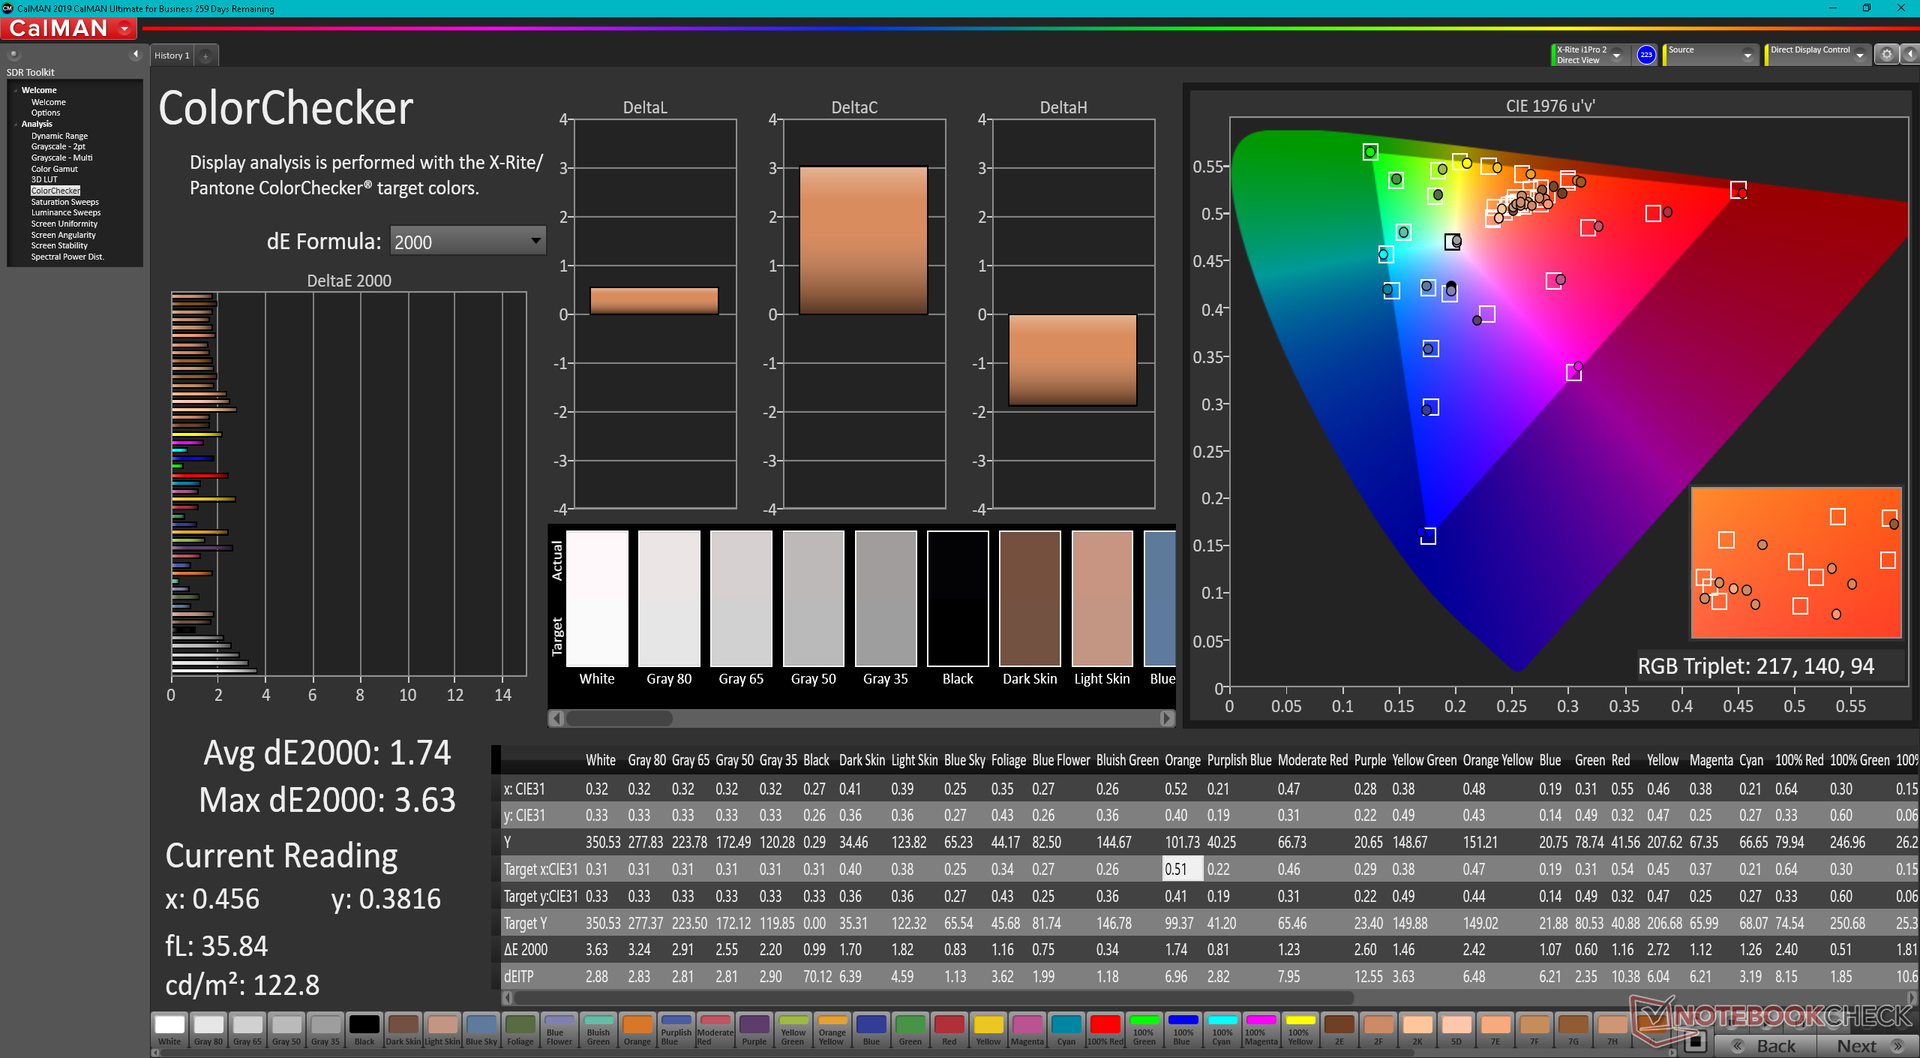
ΔE ColorChecker Calman: 1.74 | ∀{0.5-29.43 Ø4.71}
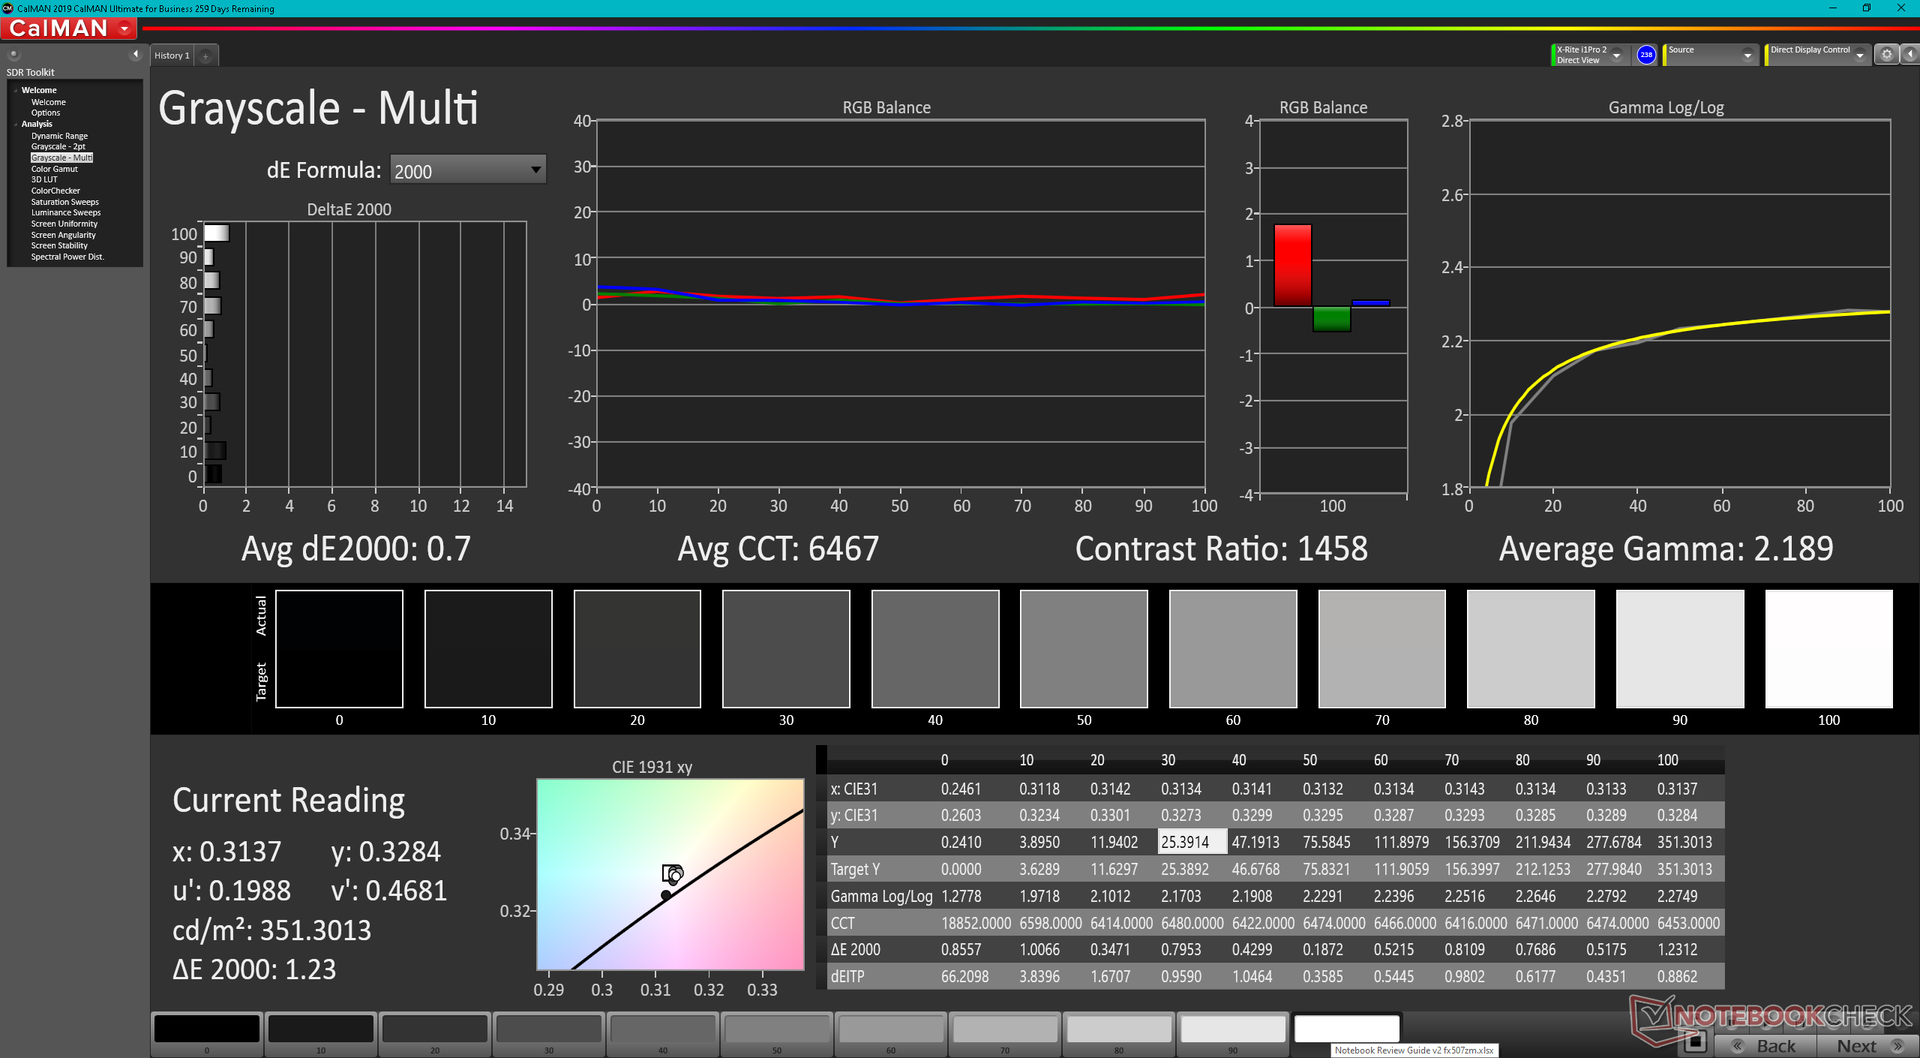
calibrated: 0.5
ΔE Greyscale Calman: 2.1 | ∀{0.09-98 Ø4.96}
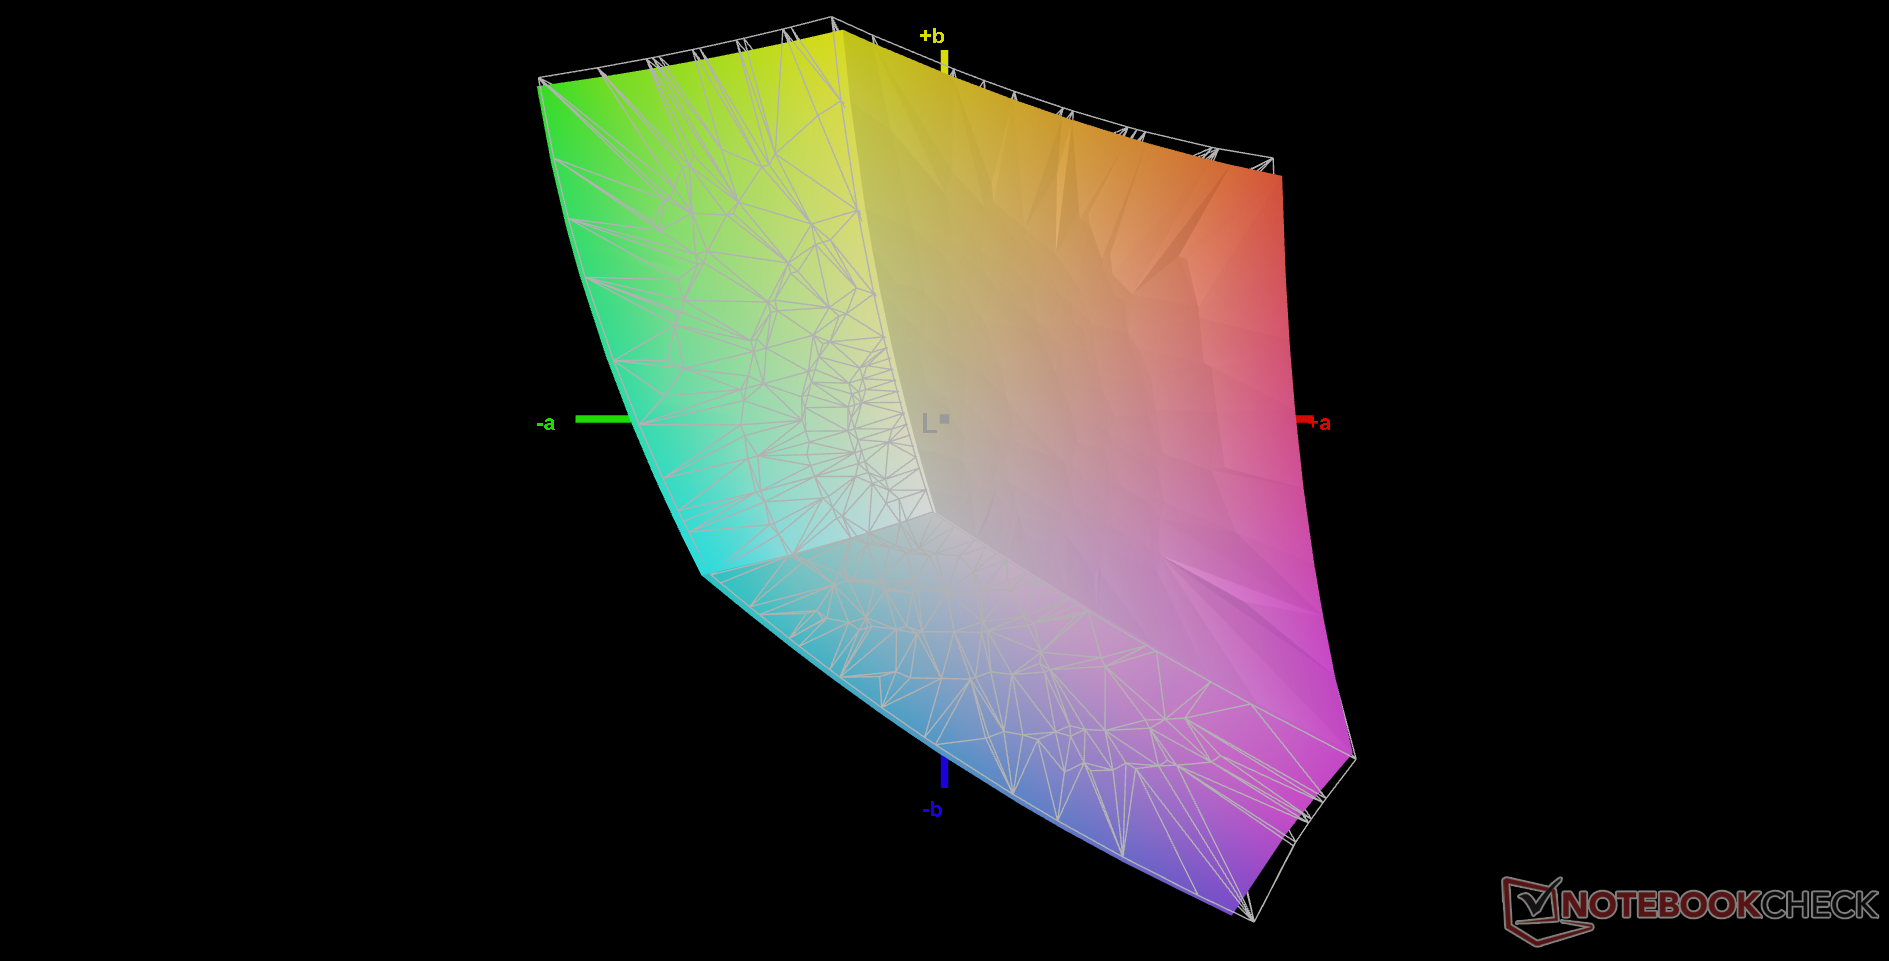
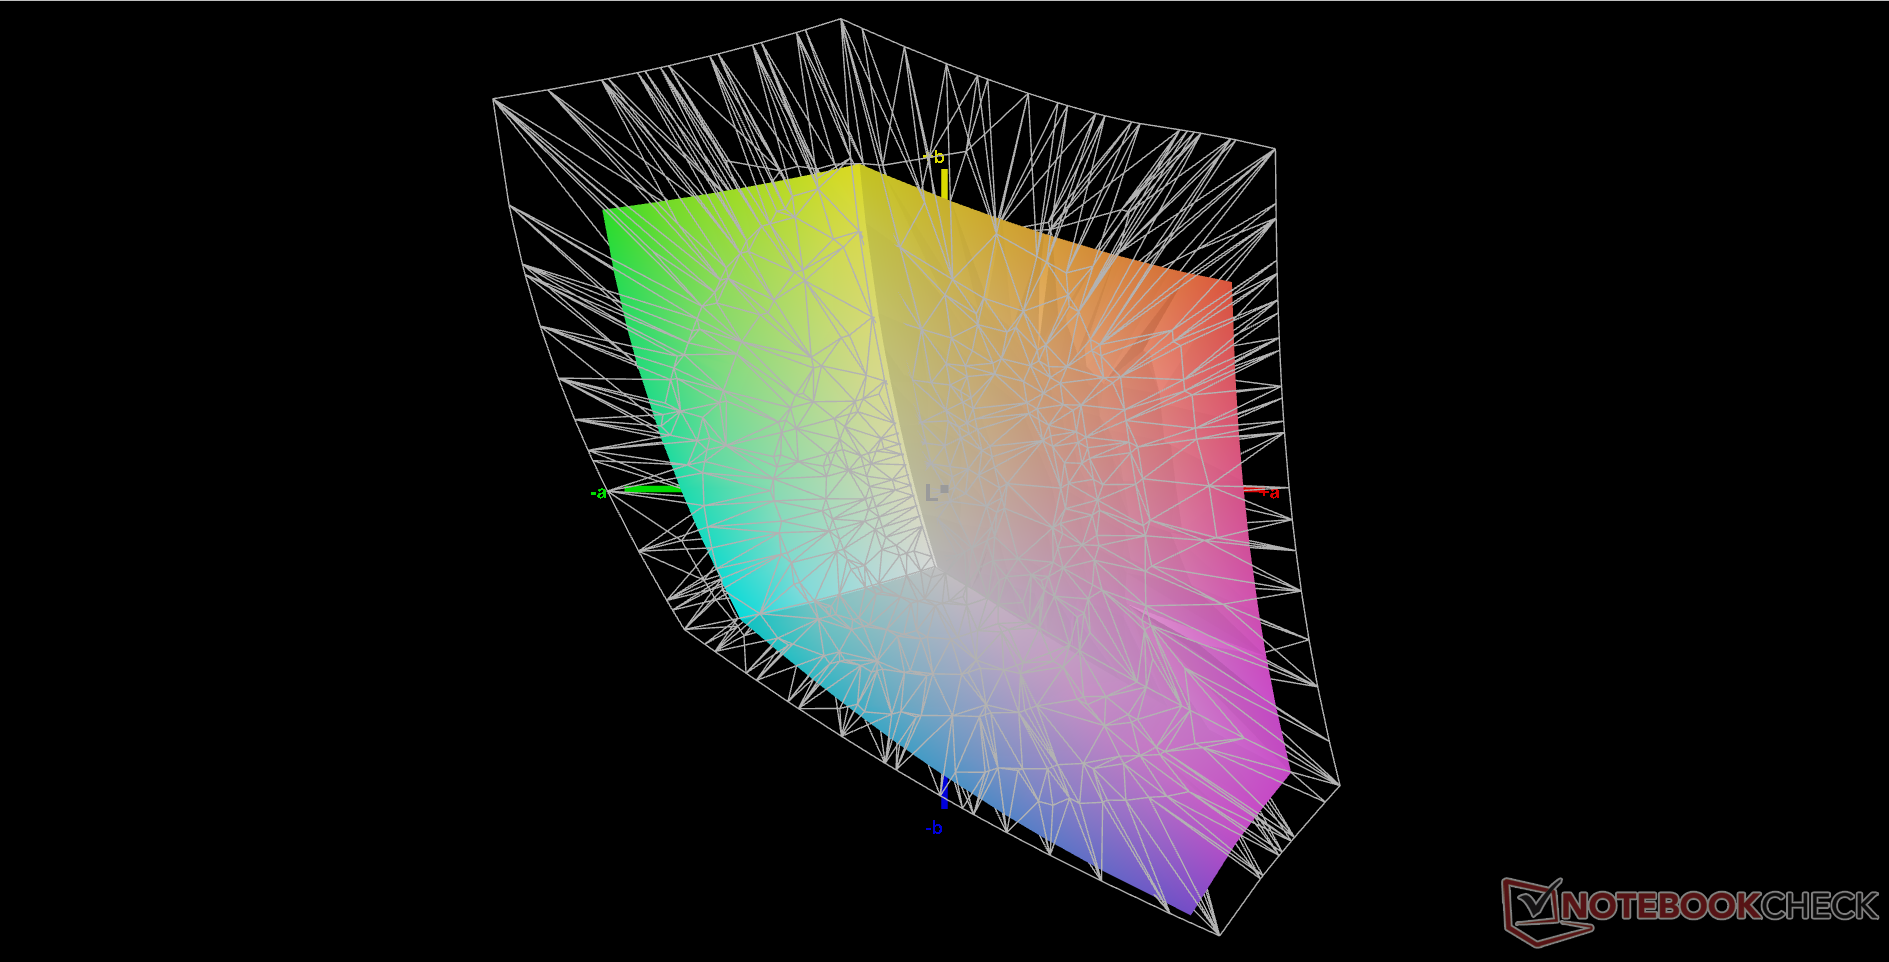
68.5% AdobeRGB 1998 (Argyll 3D)
97% sRGB (Argyll 3D)
66.4% Display P3 (Argyll 3D)
Gamma: 2.3
CCT: 6257 K
| Asus TUF Gaming F15 FX507ZM TL156VDXP0101, IPS, 1920x1080, 15.6" | Asus TUF Gaming F15 FX506HM Chi Mei N156HRA-EA1, IPS, 1920x1080, 15.6" | Asus TUF Dash F15 FX516PR LQ156M1JW26 (SHP1532), IPS, 1920x1080, 15.6" | Asus ROG Strix Scar 15 G533QS BOE CQ NE156QHM-NY1, IPS, 2560x1440, 15.6" | Asus Zephyrus S15 GX502L B156HAN12.0 (AUOBC8C), IPS, 1920x1080, 15.6" | Asus ZenBook Pro Duo UX582 LR-1BH2 SDC4143, OLED + IPS, 3840x2160, 15.6" | |
|---|---|---|---|---|---|---|
| Display | -36% | 0% | 25% | 4% | 33% | |
| Display P3 Coverage (%) | 66.4 | 41.9 -37% | 66.9 1% | 97.6 47% | 69.7 5% | 99.9 50% |
| sRGB Coverage (%) | 97 | 62.9 -35% | 98.1 1% | 99.9 3% | 99.7 3% | 100 3% |
| AdobeRGB 1998 Coverage (%) | 68.5 | 43.3 -37% | 67.9 -1% | 85.3 25% | 71.1 4% | 99.7 46% |
| Response Times | -238% | -46% | -74% | -63% | 69% | |
| Response Time Grey 50% / Grey 80% * (ms) | 5.6 ? | 28.4 ? -407% | 12 ? -114% | 14 ? -150% | 14 ? -150% | 2.4 ? 57% |
| Response Time Black / White * (ms) | 12.8 ? | 21.6 ? -69% | 10 ? 22% | 12.4 ? 3% | 9.6 ? 25% | 2.4 ? 81% |
| PWM Frequency (Hz) | 23580 ? | 59.5 ? | ||||
| Screen | -144% | -27% | -70% | -29% | -87% | |
| Brightness middle (cd/m²) | 353.7 | 268.3 -24% | 286 -19% | 304.3 -14% | 283 -20% | 345 -2% |
| Brightness (cd/m²) | 340 | 257 -24% | 275 -19% | 286 -16% | 289 -15% | 332 -2% |
| Brightness Distribution (%) | 89 | 84 -6% | 91 2% | 76 -15% | 90 1% | 87 -2% |
| Black Level * (cd/m²) | 0.34 | 0.34 -0% | 0.25 26% | 0.33 3% | 0.24 29% | |
| Contrast (:1) | 1040 | 789 -24% | 1144 10% | 922 -11% | 1179 13% | |
| Colorchecker dE 2000 * | 1.74 | 5.05 -190% | 2.43 -40% | 2.76 -59% | 2.26 -30% | 3.3 -90% |
| Colorchecker dE 2000 max. * | 3.63 | 15.43 -325% | 6.33 -74% | 5.57 -53% | 5.64 -55% | 7.2 -98% |
| Colorchecker dE 2000 calibrated * | 0.5 | 3.21 -542% | 0.83 -66% | 2.38 -376% | 1.11 -122% | 2.6 -420% |
| Greyscale dE 2000 * | 2.1 | 5.5 -162% | 3.5 -67% | 4 -90% | 3.4 -62% | 2 5% |
| Gamma | 2.3 96% | 2.35 94% | 2.32 95% | 2.14 103% | 2.228 99% | 2.01 109% |
| CCT | 6257 104% | 7392 88% | 7145 91% | 6844 95% | 7249 90% | 6566 99% |
| Color Space (Percent of AdobeRGB 1998) (%) | 68 | 71 | 89.2 | |||
| Color Space (Percent of sRGB) (%) | 91 | 93 | 100 | |||
| Total Average (Program / Settings) | -139% /
-134% | -24% /
-24% | -40% /
-50% | -29% /
-27% | 5% /
-31% |
* ... smaller is better
FX506和FX507之间没有明显的色彩空间变化。华硕没有为其FX507系列提供任何AdobeRGB或DCI-P3覆盖选项,不像在 Razer Blade 15系列或专业的ZenBook系列不同。
该显示器开箱即被很好地校准,平均灰度和彩色deltaE值分别只有2.1和1.74。用X-Rite色度计进一步校准显示器,将进一步改善deltaE,使其分别小于1。
Display Response Times
| ↔ Response Time Black to White | ||
|---|---|---|
| 12.8 ms ... rise ↗ and fall ↘ combined | ↗ 6.8 ms rise | 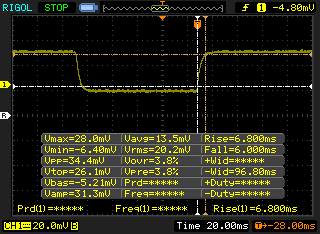 |
| ↘ 6 ms fall | ||
| The screen shows good response rates in our tests, but may be too slow for competitive gamers. In comparison, all tested devices range from 0.1 (minimum) to 240 (maximum) ms. » 33 % of all devices are better. This means that the measured response time is better than the average of all tested devices (19.8 ms). | ||
| ↔ Response Time 50% Grey to 80% Grey | ||
| 5.6 ms ... rise ↗ and fall ↘ combined | ↗ 3.2 ms rise | 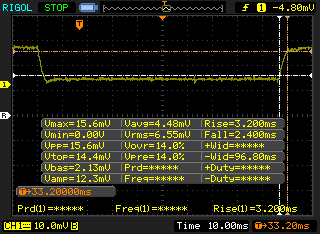 |
| ↘ 2.4 ms fall | ||
| The screen shows very fast response rates in our tests and should be very well suited for fast-paced gaming. In comparison, all tested devices range from 0.165 (minimum) to 636 (maximum) ms. » 18 % of all devices are better. This means that the measured response time is better than the average of all tested devices (31 ms). | ||
Screen Flickering / PWM (Pulse-Width Modulation)
| Screen flickering / PWM not detected |  | ||
In comparison: 52 % of all tested devices do not use PWM to dim the display. If PWM was detected, an average of 7754 (minimum: 5 - maximum: 343500) Hz was measured. | |||

性能--英特尔第12代产品的差异
测试条件
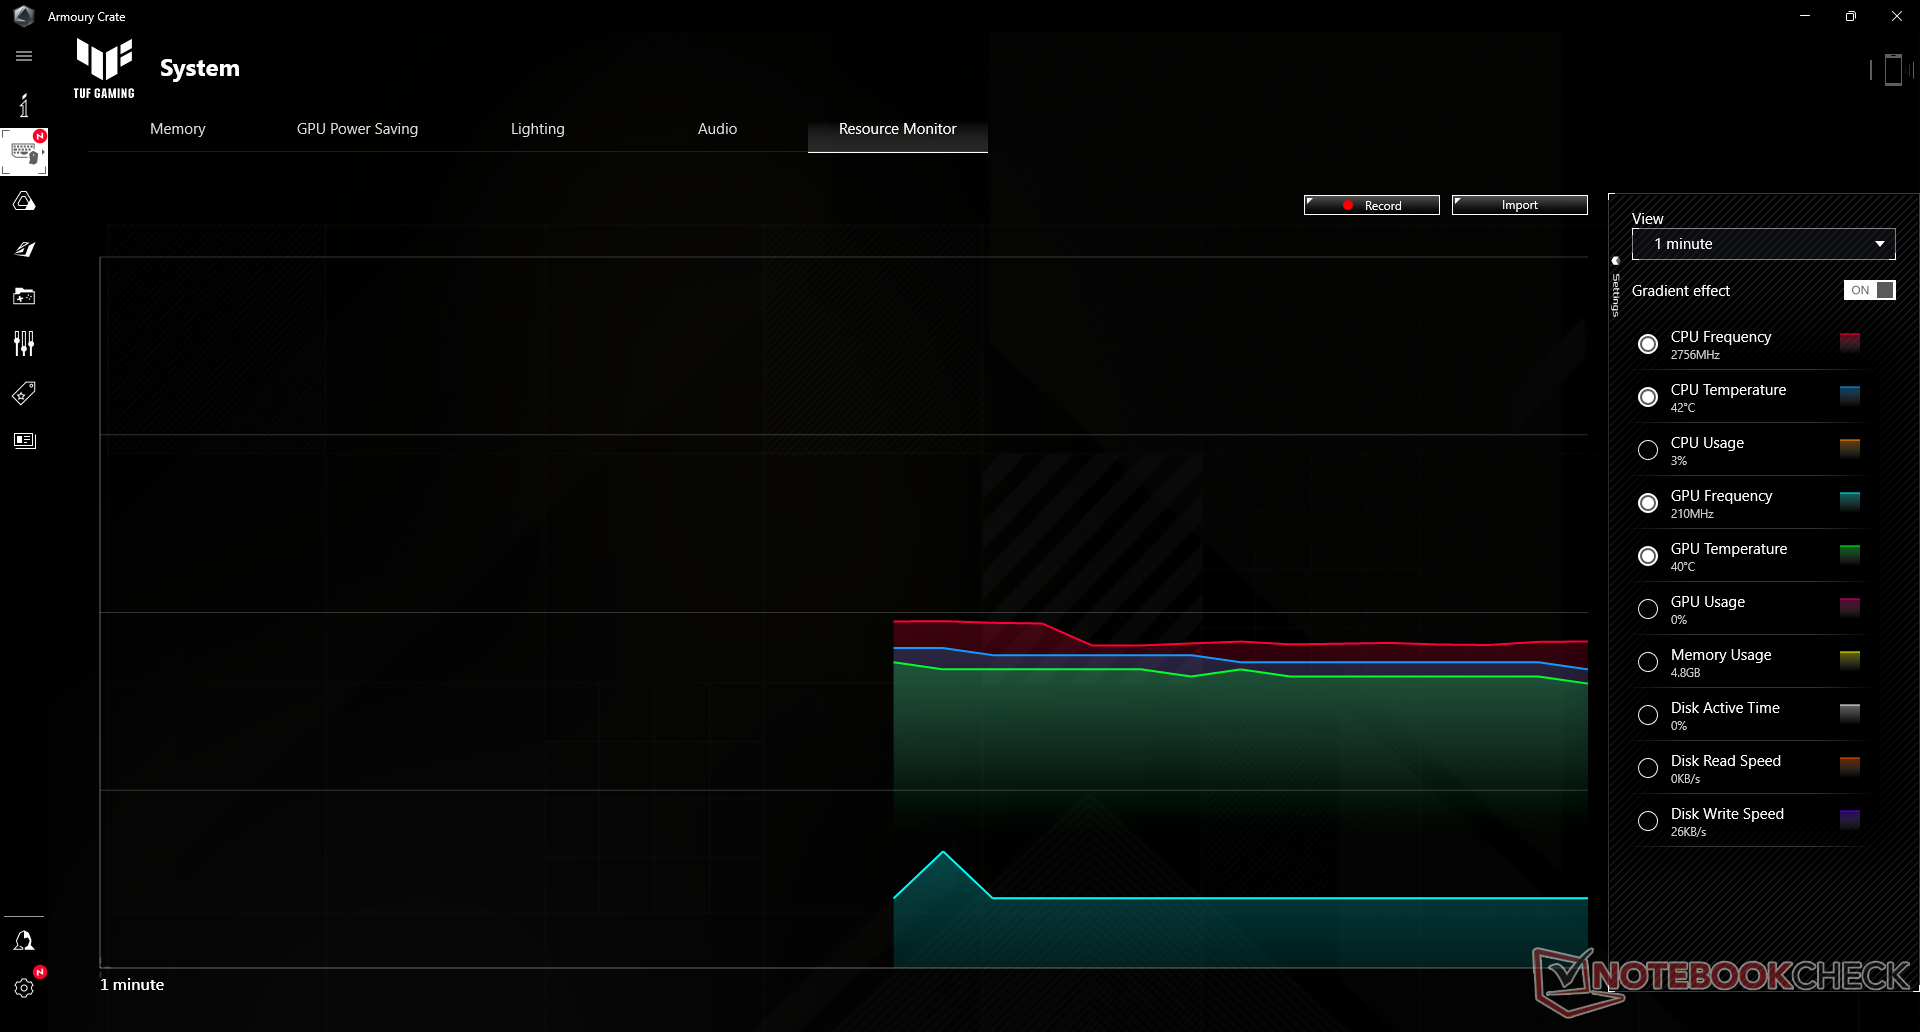
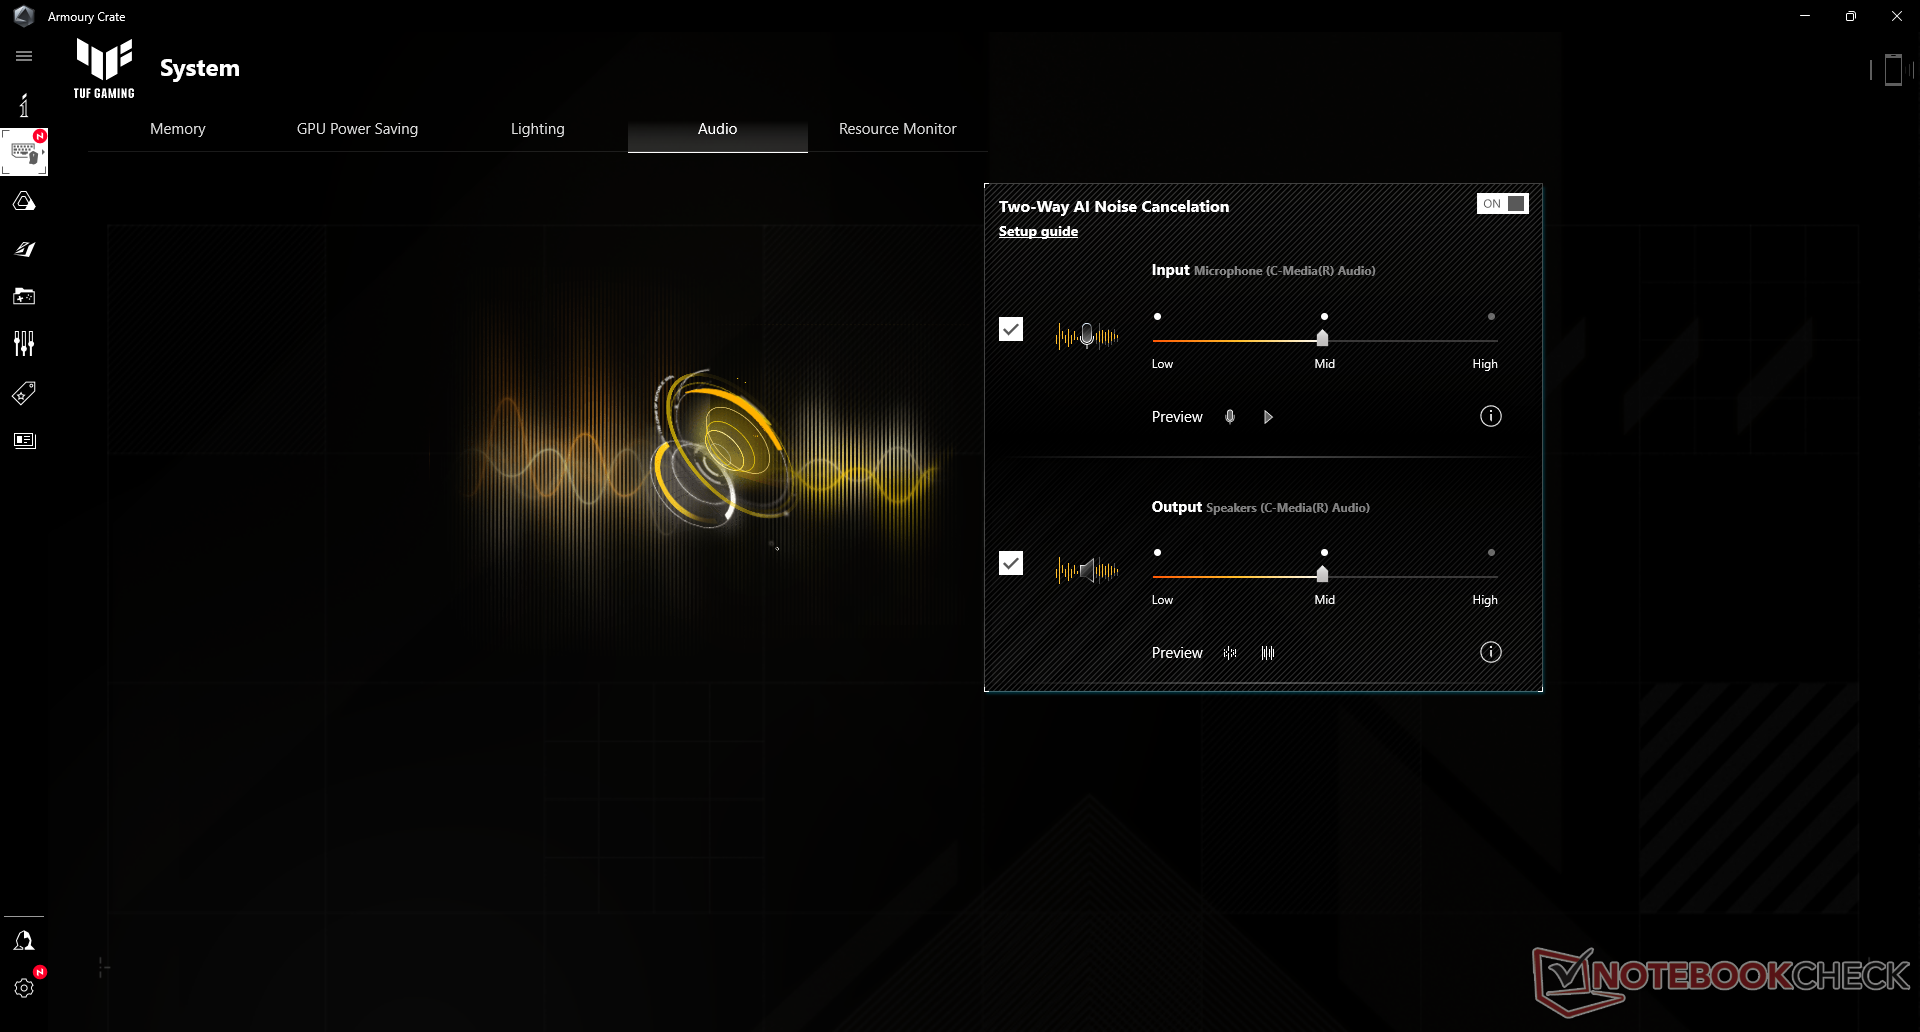
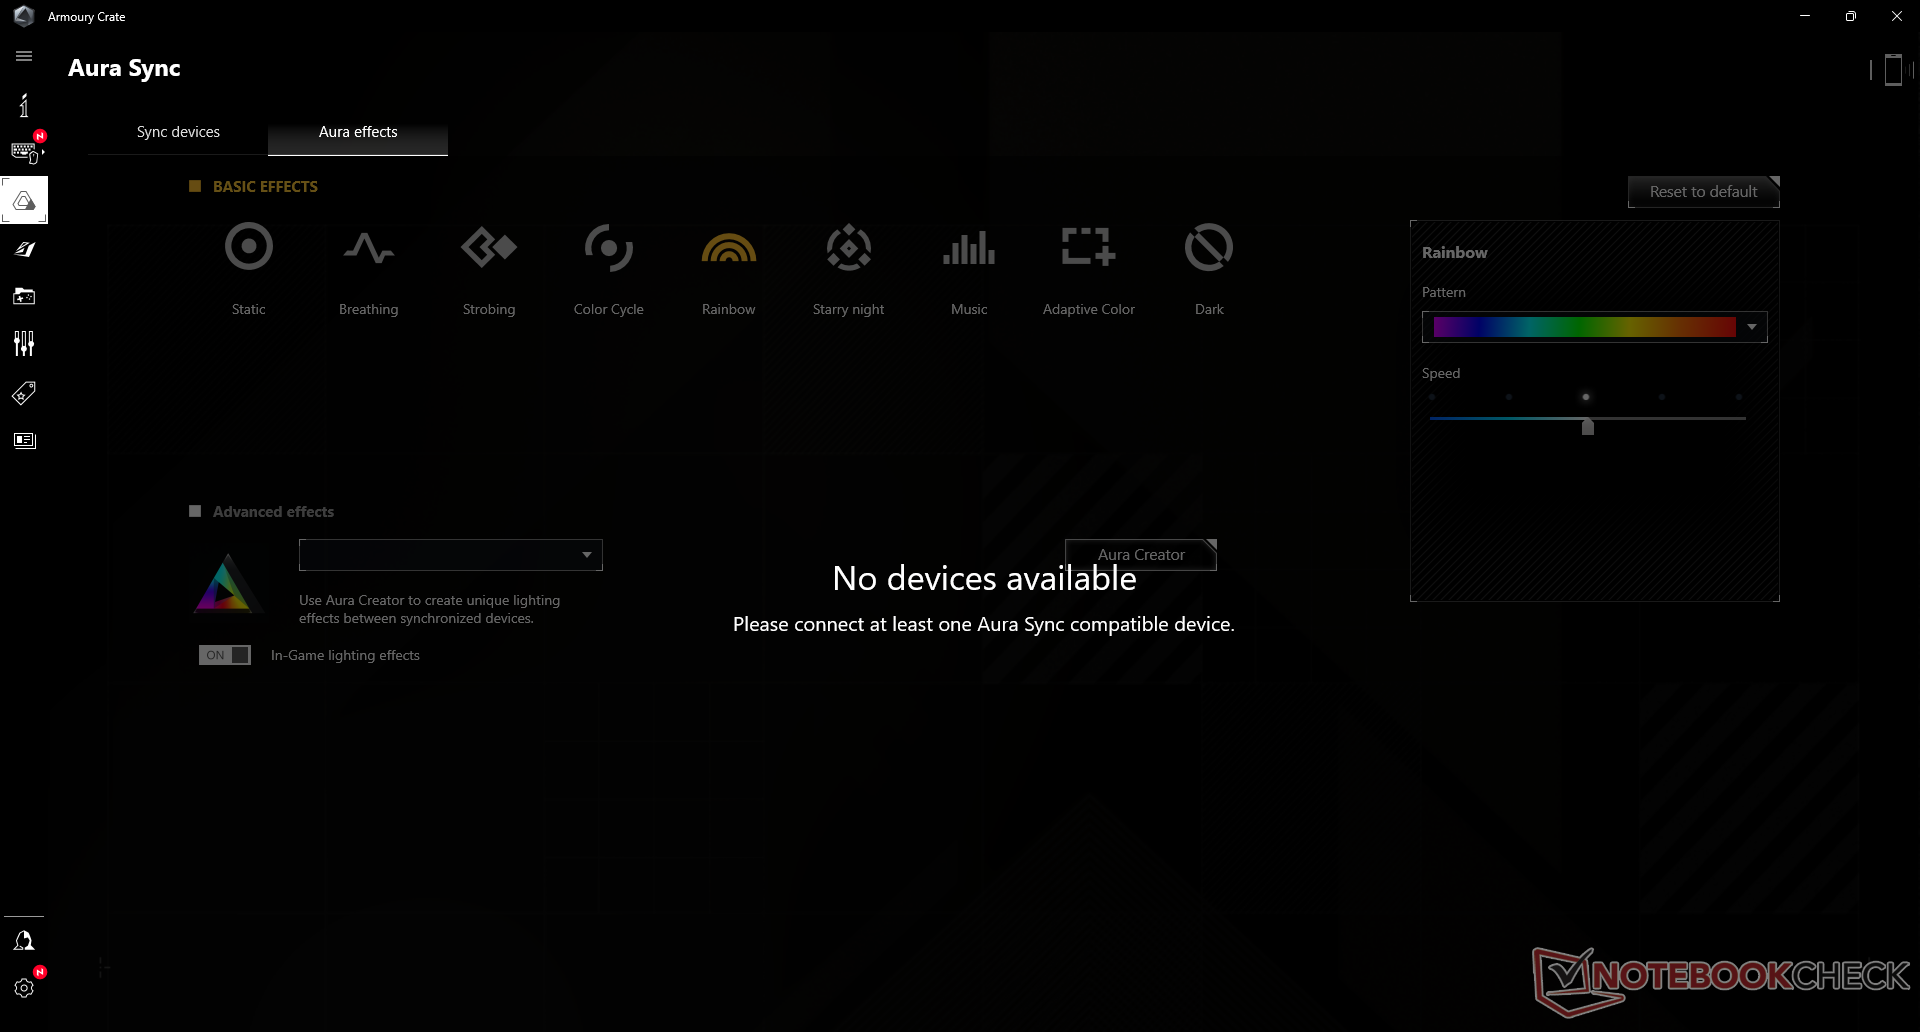
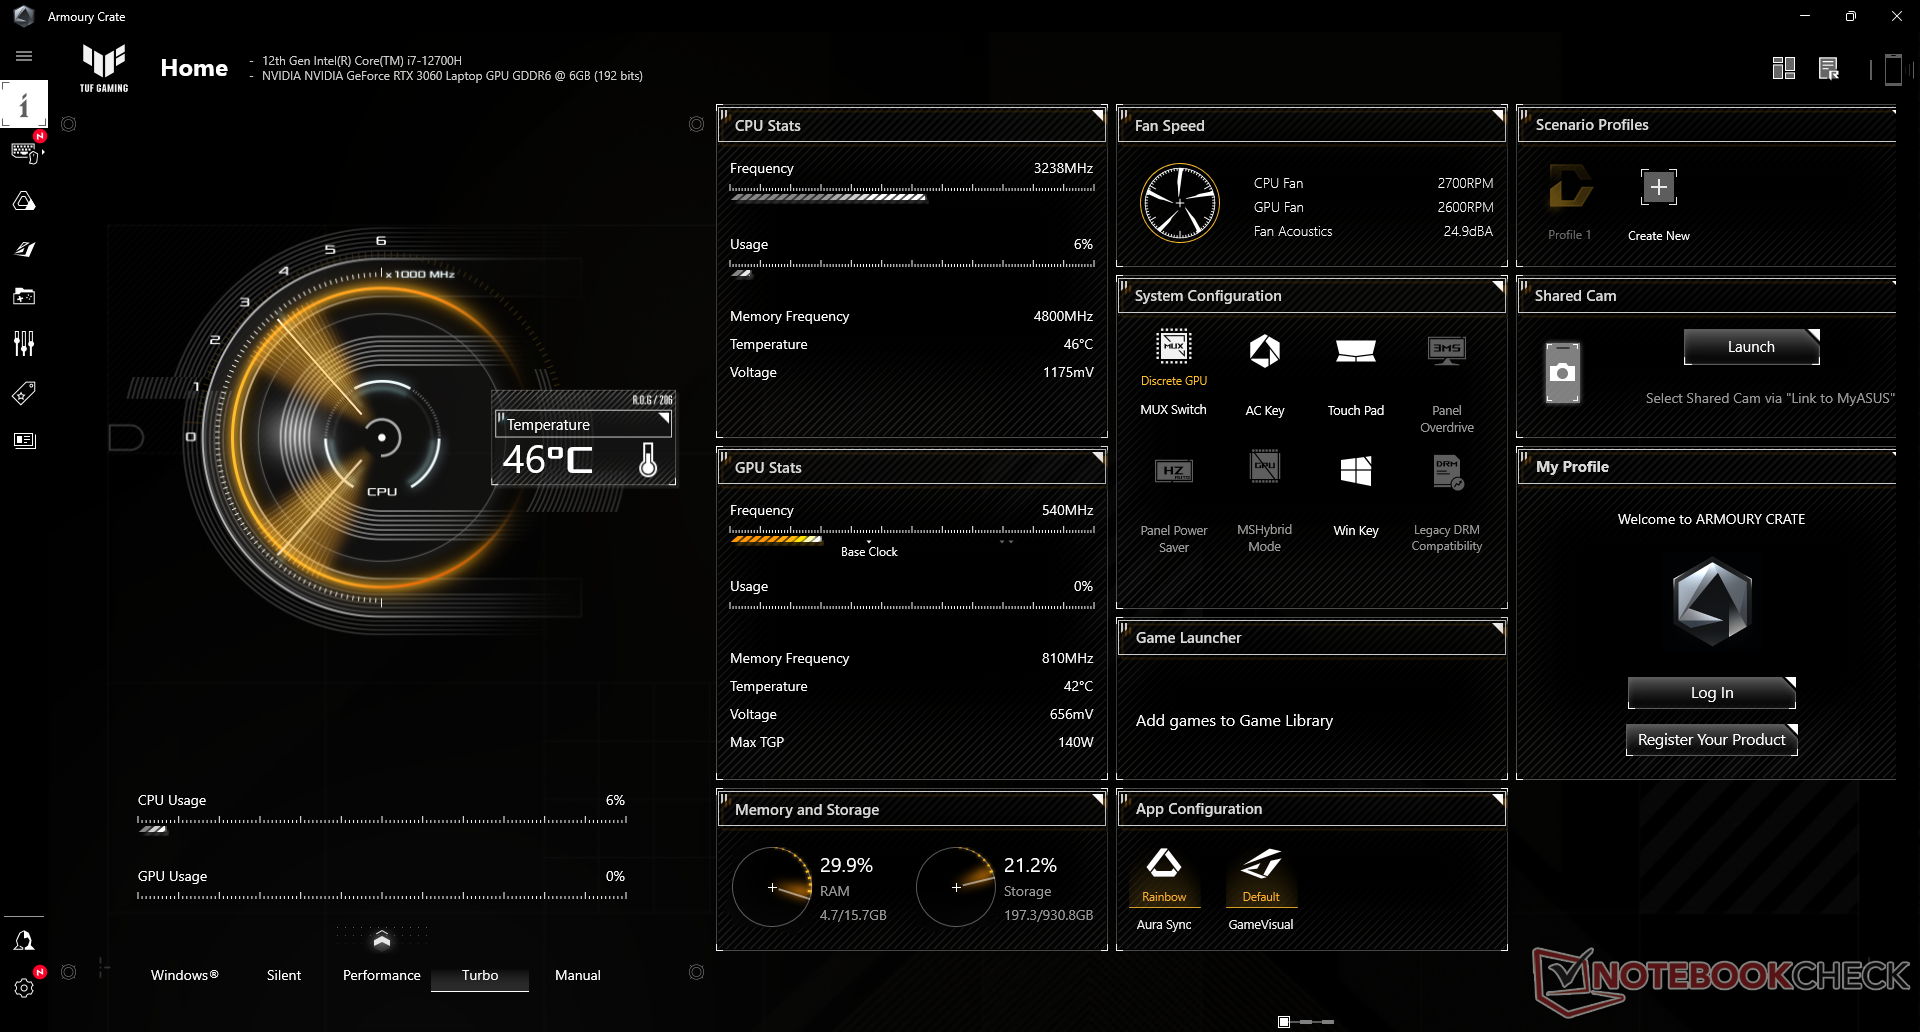
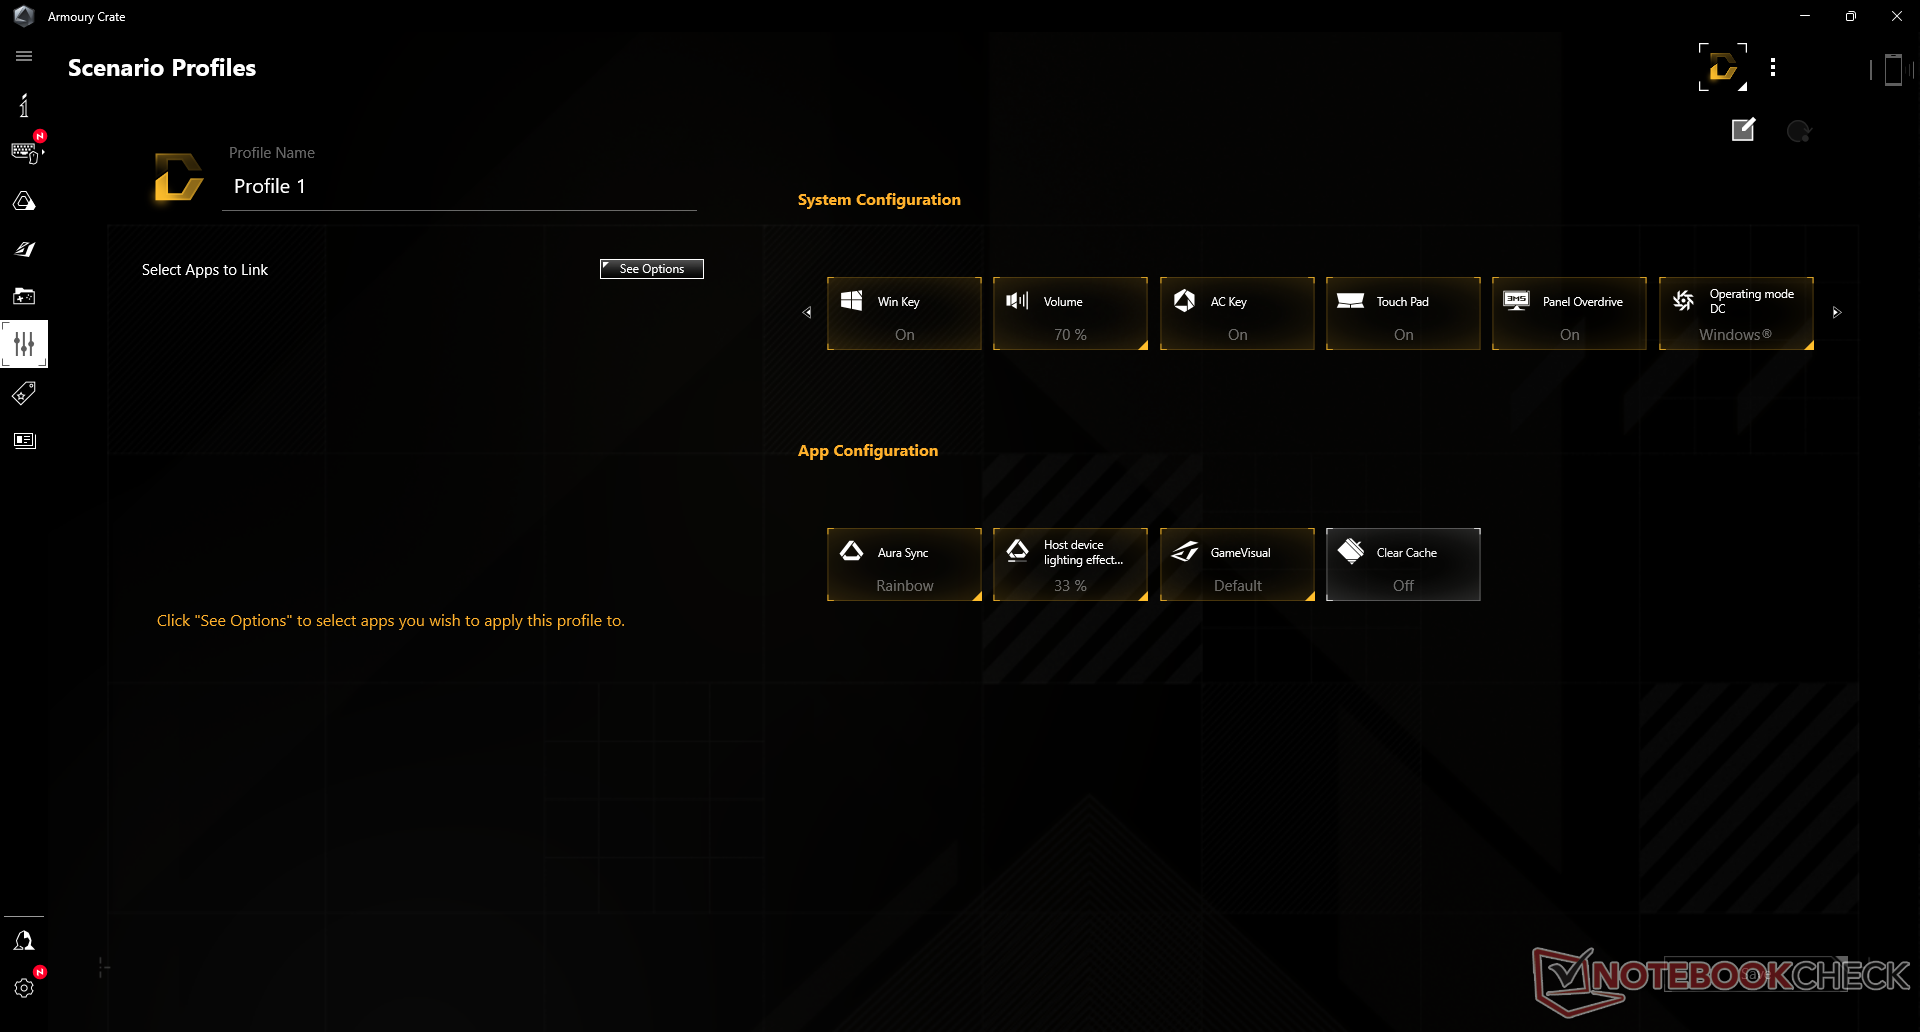
在运行以下任何性能基准之前,我们的设备通过预装的Armoury Crate配置文件被设置为涡轮模式和独立GPU模式。建议用户熟悉这个软件,因为它是监测性能、切换辅助功能和在性能配置文件之间切换的枢纽。最值得注意的是,用户可以通过该软件直接在MSHybrid或MUX图形模式之间切换。之前的FX506型号没有MUX开关。
不支持高级Optimus,这意味着在独立或Optimus图形之间切换时,需要软重启。为了使自适应同步在内部显示器上工作,用户必须在MSHybrid模式下运行,因为dGPU MUX模式不支持自适应同步。只要是通过USB-C DisplayPort而不是HDMI连接的支持的外部显示器,无论GPU模式如何,都可以启用G-Sync和FreeSync。
CPU TDP和GPU TGP目标将根据Armoury Crate电源配置文件而有所不同,详见下表。因此,用户必须在涡轮或手动模式下运行系统,以获得FX507的最大功率。
| 电源简介 | 静音 | 性能表现 | 涡轮机 | 指南 |
| 目标CPU PL1 | 45 W | 70 W | 90 W | 100 W |
| 目标CPU PL2 | 60 W | 105 W | 115 W | 135 W |
| 目标GPU TGP | <115 W (WhisperMode 2.0开启) | 100 W + 15 W | 115 W + 25 W | 115 W + 25 W |
| 目标最大TDP+TGP | 25 W + <100 W (WhisperMode 2.0 on) | 35 W + 100 W | 45 W + 115 W | 45 W + 115 W |
| 目标分贝(A)(制造商提供) | <35 dB(A) | 40分贝(A) | 48分贝(A) | 52分贝(A) |
处理器
CPU的性能很好,而且正是我们所期望的相对于其他具有完全相同CPU的笔记本电脑的性能。当与 酷睿i7-11800H相比,去年的FX506上的 酷睿i7-12700H 可以分别提供大约17%和30%的单线程和多线程性能。总体性能基本上与更昂贵的 酷睿i9-12900H同时领先于 酷睿i7-12800H上发现的 Razer Blade 15.
涡轮增压的可持续性很好,因为我们最初的2735分在循环运行CineBench R15 xT时只会下降几个百分点。
Cinebench R15 Multi Loop
Cinebench R23: Multi Core | Single Core
Cinebench R15: CPU Multi 64Bit | CPU Single 64Bit
Blender: v2.79 BMW27 CPU
7-Zip 18.03: 7z b 4 | 7z b 4 -mmt1
Geekbench 5.5: Multi-Core | Single-Core
HWBOT x265 Benchmark v2.2: 4k Preset
LibreOffice : 20 Documents To PDF
R Benchmark 2.5: Overall mean
| Cinebench R20 / CPU (Multi Core) | |
| Corsair One i300 | |
| Asus TUF Gaming F15 FX507ZM | |
| MSI Vector GP66 12UGS | |
| Average Intel Core i7-12700H (1576 - 7407, n=64) | |
| Razer Blade 15 2022 | |
| Asus TUF Gaming F15 FX506HM | |
| Schenker XMG Apex 15 NH57E PS | |
| MSI Delta 15 A5EFK | |
| Alienware m15 R4 RTX 3080 | |
| Asus VivoBook 15 Pro M3500QC-L1062 | |
| Acer Predator Helios 300 PH315-53-786B | |
| Schenker XMG Pro 15 | |
| Cinebench R20 / CPU (Single Core) | |
| Corsair One i300 | |
| MSI Vector GP66 12UGS | |
| Razer Blade 15 2022 | |
| Asus TUF Gaming F15 FX507ZM | |
| Average Intel Core i7-12700H (300 - 704, n=64) | |
| Asus TUF Gaming F15 FX506HM | |
| MSI Delta 15 A5EFK | |
| Schenker XMG Apex 15 NH57E PS | |
| Asus VivoBook 15 Pro M3500QC-L1062 | |
| Alienware m15 R4 RTX 3080 | |
| Acer Predator Helios 300 PH315-53-786B | |
| Schenker XMG Pro 15 | |
| Cinebench R15 / CPU Single 64Bit | |
| Corsair One i300 | |
| MSI Vector GP66 12UGS | |
| Razer Blade 15 2022 | |
| Asus TUF Gaming F15 FX507ZM | |
| Average Intel Core i7-12700H (113 - 263, n=65) | |
| MSI Delta 15 A5EFK | |
| Schenker XMG Apex 15 NH57E PS | |
| Asus TUF Gaming F15 FX506HM | |
| Asus VivoBook 15 Pro M3500QC-L1062 | |
| Alienware m15 R4 RTX 3080 | |
| Acer Predator Helios 300 PH315-53-786B | |
| Schenker XMG Pro 15 | |
| Blender / v2.79 BMW27 CPU | |
| Schenker XMG Pro 15 | |
| Acer Predator Helios 300 PH315-53-786B | |
| Asus VivoBook 15 Pro M3500QC-L1062 | |
| Alienware m15 R4 RTX 3080 | |
| Schenker XMG Apex 15 NH57E PS | |
| MSI Delta 15 A5EFK | |
| Asus TUF Gaming F15 FX506HM | |
| Razer Blade 15 2022 | |
| Average Intel Core i7-12700H (168 - 732, n=63) | |
| MSI Vector GP66 12UGS | |
| Asus TUF Gaming F15 FX507ZM | |
| Corsair One i300 | |
| 7-Zip 18.03 / 7z b 4 | |
| Corsair One i300 | |
| Asus TUF Gaming F15 FX507ZM | |
| MSI Vector GP66 12UGS | |
| Razer Blade 15 2022 | |
| Average Intel Core i7-12700H (22844 - 73067, n=63) | |
| MSI Delta 15 A5EFK | |
| Schenker XMG Apex 15 NH57E PS | |
| Asus TUF Gaming F15 FX506HM | |
| Alienware m15 R4 RTX 3080 | |
| Asus VivoBook 15 Pro M3500QC-L1062 | |
| Acer Predator Helios 300 PH315-53-786B | |
| Schenker XMG Pro 15 | |
| 7-Zip 18.03 / 7z b 4 -mmt1 | |
| Corsair One i300 | |
| MSI Vector GP66 12UGS | |
| MSI Delta 15 A5EFK | |
| Razer Blade 15 2022 | |
| Asus TUF Gaming F15 FX506HM | |
| Average Intel Core i7-12700H (2743 - 5972, n=63) | |
| Schenker XMG Apex 15 NH57E PS | |
| Asus VivoBook 15 Pro M3500QC-L1062 | |
| Asus TUF Gaming F15 FX507ZM | |
| Alienware m15 R4 RTX 3080 | |
| Acer Predator Helios 300 PH315-53-786B | |
| Schenker XMG Pro 15 | |
| Geekbench 5.5 / Multi-Core | |
| Corsair One i300 | |
| Razer Blade 15 2022 | |
| MSI Vector GP66 12UGS | |
| Asus TUF Gaming F15 FX507ZM | |
| Average Intel Core i7-12700H (5144 - 13745, n=64) | |
| MSI Delta 15 A5EFK | |
| Schenker XMG Apex 15 NH57E PS | |
| Alienware m15 R4 RTX 3080 | |
| Asus VivoBook 15 Pro M3500QC-L1062 | |
| Acer Predator Helios 300 PH315-53-786B | |
| Schenker XMG Pro 15 | |
| Geekbench 5.5 / Single-Core | |
| Corsair One i300 | |
| MSI Vector GP66 12UGS | |
| Razer Blade 15 2022 | |
| Asus TUF Gaming F15 FX507ZM | |
| Average Intel Core i7-12700H (803 - 1851, n=64) | |
| MSI Delta 15 A5EFK | |
| Schenker XMG Apex 15 NH57E PS | |
| Asus VivoBook 15 Pro M3500QC-L1062 | |
| Alienware m15 R4 RTX 3080 | |
| Acer Predator Helios 300 PH315-53-786B | |
| Schenker XMG Pro 15 | |
| HWBOT x265 Benchmark v2.2 / 4k Preset | |
| Corsair One i300 | |
| Asus TUF Gaming F15 FX507ZM | |
| MSI Vector GP66 12UGS | |
| Razer Blade 15 2022 | |
| Average Intel Core i7-12700H (4.67 - 21.8, n=64) | |
| Asus TUF Gaming F15 FX506HM | |
| MSI Delta 15 A5EFK | |
| Schenker XMG Apex 15 NH57E PS | |
| Alienware m15 R4 RTX 3080 | |
| Asus VivoBook 15 Pro M3500QC-L1062 | |
| Acer Predator Helios 300 PH315-53-786B | |
| Schenker XMG Pro 15 | |
| R Benchmark 2.5 / Overall mean | |
| Schenker XMG Pro 15 | |
| Acer Predator Helios 300 PH315-53-786B | |
| Alienware m15 R4 RTX 3080 | |
| Asus TUF Gaming F15 FX506HM | |
| Asus VivoBook 15 Pro M3500QC-L1062 | |
| Schenker XMG Apex 15 NH57E PS | |
| MSI Delta 15 A5EFK | |
| Average Intel Core i7-12700H (0.4441 - 1.052, n=63) | |
| Razer Blade 15 2022 | |
| Asus TUF Gaming F15 FX507ZM | |
| MSI Vector GP66 12UGS | |
| Corsair One i300 | |
* ... smaller is better
AIDA64: FP32 Ray-Trace | FPU Julia | CPU SHA3 | CPU Queen | FPU SinJulia | FPU Mandel | CPU AES | CPU ZLib | FP64 Ray-Trace | CPU PhotoWorxx
| Performance rating | |
| Asus ROG Strix Scar 15 G533QS | |
| Average Intel Core i7-12700H | |
| Asus Zephyrus S15 GX502L | |
| Asus TUF Gaming F15 FX507ZM | |
| Asus ZenBook Pro Duo UX582 LR-1BH2 | |
| Asus TUF Dash F15 FX516PR | |
| Asus TUF Gaming F15 FX506HM -9! | |
| AIDA64 / FP32 Ray-Trace | |
| Asus ROG Strix Scar 15 G533QS | |
| Asus Zephyrus S15 GX502L | |
| Asus ZenBook Pro Duo UX582 LR-1BH2 | |
| Average Intel Core i7-12700H (2585 - 17957, n=64) | |
| Asus TUF Gaming F15 FX507ZM | |
| Asus TUF Dash F15 FX516PR | |
| AIDA64 / FPU Julia | |
| Asus ROG Strix Scar 15 G533QS | |
| Asus Zephyrus S15 GX502L | |
| Asus ZenBook Pro Duo UX582 LR-1BH2 | |
| Average Intel Core i7-12700H (12439 - 90760, n=64) | |
| Asus TUF Gaming F15 FX507ZM | |
| Asus TUF Dash F15 FX516PR | |
| AIDA64 / CPU SHA3 | |
| Asus ROG Strix Scar 15 G533QS | |
| Asus TUF Gaming F15 FX507ZM | |
| Asus Zephyrus S15 GX502L | |
| Average Intel Core i7-12700H (833 - 4242, n=64) | |
| Asus ZenBook Pro Duo UX582 LR-1BH2 | |
| Asus TUF Dash F15 FX516PR | |
| AIDA64 / CPU Queen | |
| Asus ROG Strix Scar 15 G533QS | |
| Asus TUF Gaming F15 FX507ZM | |
| Average Intel Core i7-12700H (57923 - 103202, n=63) | |
| Asus Zephyrus S15 GX502L | |
| Asus ZenBook Pro Duo UX582 LR-1BH2 | |
| Asus TUF Dash F15 FX516PR | |
| AIDA64 / FPU SinJulia | |
| Asus ROG Strix Scar 15 G533QS | |
| Asus Zephyrus S15 GX502L | |
| Asus TUF Gaming F15 FX507ZM | |
| Asus ZenBook Pro Duo UX582 LR-1BH2 | |
| Average Intel Core i7-12700H (3249 - 9939, n=64) | |
| Asus TUF Dash F15 FX516PR | |
| AIDA64 / FPU Mandel | |
| Asus ROG Strix Scar 15 G533QS | |
| Asus Zephyrus S15 GX502L | |
| Asus ZenBook Pro Duo UX582 LR-1BH2 | |
| Average Intel Core i7-12700H (7135 - 44760, n=64) | |
| Asus TUF Gaming F15 FX507ZM | |
| Asus TUF Dash F15 FX516PR | |
| AIDA64 / CPU AES | |
| Asus ROG Strix Scar 15 G533QS | |
| Average Intel Core i7-12700H (31839 - 144360, n=64) | |
| Asus TUF Dash F15 FX516PR | |
| Asus TUF Gaming F15 FX507ZM | |
| Asus Zephyrus S15 GX502L | |
| Asus ZenBook Pro Duo UX582 LR-1BH2 | |
| AIDA64 / CPU ZLib | |
| Asus TUF Gaming F15 FX507ZM | |
| Average Intel Core i7-12700H (305 - 1171, n=64) | |
| Asus ROG Strix Scar 15 G533QS | |
| Asus Zephyrus S15 GX502L | |
| Asus ZenBook Pro Duo UX582 LR-1BH2 | |
| Asus TUF Dash F15 FX516PR | |
| Asus TUF Gaming F15 FX506HM | |
| AIDA64 / FP64 Ray-Trace | |
| Asus ROG Strix Scar 15 G533QS | |
| Asus Zephyrus S15 GX502L | |
| Asus ZenBook Pro Duo UX582 LR-1BH2 | |
| Average Intel Core i7-12700H (1437 - 9692, n=64) | |
| Asus TUF Gaming F15 FX507ZM | |
| Asus TUF Dash F15 FX516PR | |
| AIDA64 / CPU PhotoWorxx | |
| Asus TUF Gaming F15 FX507ZM | |
| Average Intel Core i7-12700H (12863 - 52207, n=64) | |
| Asus ROG Strix Scar 15 G533QS | |
| Asus Zephyrus S15 GX502L | |
| Asus TUF Dash F15 FX516PR | |
| Asus ZenBook Pro Duo UX582 LR-1BH2 | |
系统性能
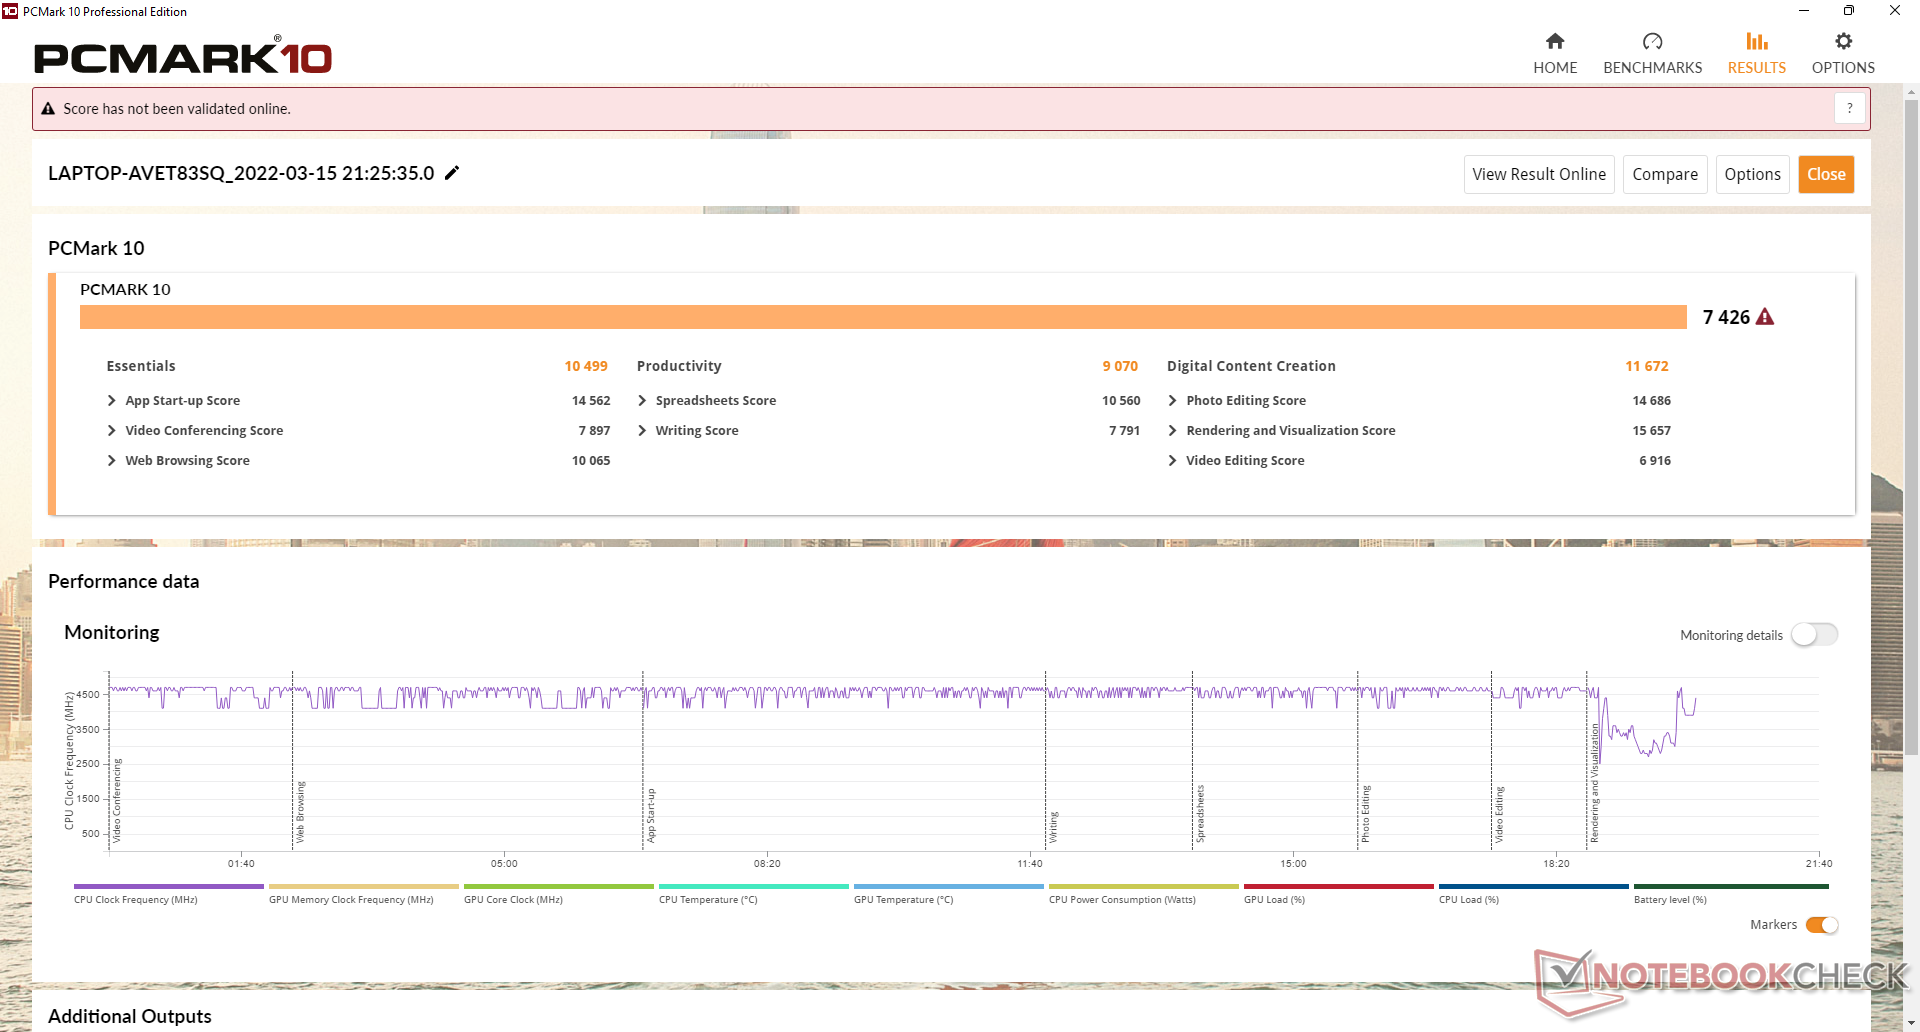
PCMark 10的结果与FX506基本相同,这意味着尽管CPU和GPU进行了升级,但日常活动不一定会感觉更快。然而,数字内容创作分测试明显更高,这可能是由于GPU时钟速率比老款RTX 3060更快。
| PCMark 10 / Score | |
| Asus TUF Gaming F15 FX507ZM | |
| Average Intel Core i7-12700H, NVIDIA GeForce RTX 3060 Laptop GPU (5986 - 8156, n=12) | |
| Asus ROG Strix Scar 15 G533QS | |
| Asus TUF Gaming F15 FX506HM | |
| Asus TUF Dash F15 FX516PR | |
| Asus ZenBook Pro Duo UX582 LR-1BH2 | |
| Asus Zephyrus S15 GX502L | |
| PCMark 10 / Essentials | |
| Average Intel Core i7-12700H, NVIDIA GeForce RTX 3060 Laptop GPU (9289 - 12144, n=12) | |
| Asus TUF Gaming F15 FX506HM | |
| Asus TUF Gaming F15 FX507ZM | |
| Asus ROG Strix Scar 15 G533QS | |
| Asus Zephyrus S15 GX502L | |
| Asus TUF Dash F15 FX516PR | |
| Asus ZenBook Pro Duo UX582 LR-1BH2 | |
| PCMark 10 / Productivity | |
| Asus ROG Strix Scar 15 G533QS | |
| Asus TUF Dash F15 FX516PR | |
| Average Intel Core i7-12700H, NVIDIA GeForce RTX 3060 Laptop GPU (6161 - 10362, n=12) | |
| Asus TUF Gaming F15 FX507ZM | |
| Asus TUF Gaming F15 FX506HM | |
| Asus Zephyrus S15 GX502L | |
| Asus ZenBook Pro Duo UX582 LR-1BH2 | |
| PCMark 10 / Digital Content Creation | |
| Asus TUF Gaming F15 FX507ZM | |
| Average Intel Core i7-12700H, NVIDIA GeForce RTX 3060 Laptop GPU (8950 - 12554, n=12) | |
| Asus ROG Strix Scar 15 G533QS | |
| Asus TUF Gaming F15 FX506HM | |
| Asus ZenBook Pro Duo UX582 LR-1BH2 | |
| Asus TUF Dash F15 FX516PR | |
| Asus Zephyrus S15 GX502L | |
| PCMark 10 Score | 7426 points | |
Help | ||
| AIDA64 / Memory Copy | |
| Average Intel Core i7-12700H (25615 - 80511, n=64) | |
| Asus TUF Gaming F15 FX507ZM | |
| Asus ROG Strix Scar 15 G533QS | |
| Asus Zephyrus S15 GX502L | |
| Asus ZenBook Pro Duo UX582 LR-1BH2 | |
| Asus TUF Dash F15 FX516PR | |
| AIDA64 / Memory Read | |
| Asus TUF Gaming F15 FX507ZM | |
| Average Intel Core i7-12700H (25586 - 79442, n=64) | |
| Asus ROG Strix Scar 15 G533QS | |
| Asus Zephyrus S15 GX502L | |
| Asus ZenBook Pro Duo UX582 LR-1BH2 | |
| Asus TUF Dash F15 FX516PR | |
| AIDA64 / Memory Write | |
| Asus TUF Gaming F15 FX507ZM | |
| Average Intel Core i7-12700H (23679 - 88660, n=64) | |
| Asus ROG Strix Scar 15 G533QS | |
| Asus Zephyrus S15 GX502L | |
| Asus ZenBook Pro Duo UX582 LR-1BH2 | |
| Asus TUF Dash F15 FX516PR | |
| AIDA64 / Memory Latency | |
| Asus TUF Dash F15 FX516PR | |
| Asus ROG Strix Scar 15 G533QS | |
| Average Intel Core i7-12700H (76.2 - 133.9, n=62) | |
| Asus Zephyrus S15 GX502L | |
| Asus ZenBook Pro Duo UX582 LR-1BH2 | |
| Asus TUF Gaming F15 FX506HM | |
| Asus TUF Gaming F15 FX507ZM | |
* ... smaller is better
DPC延时
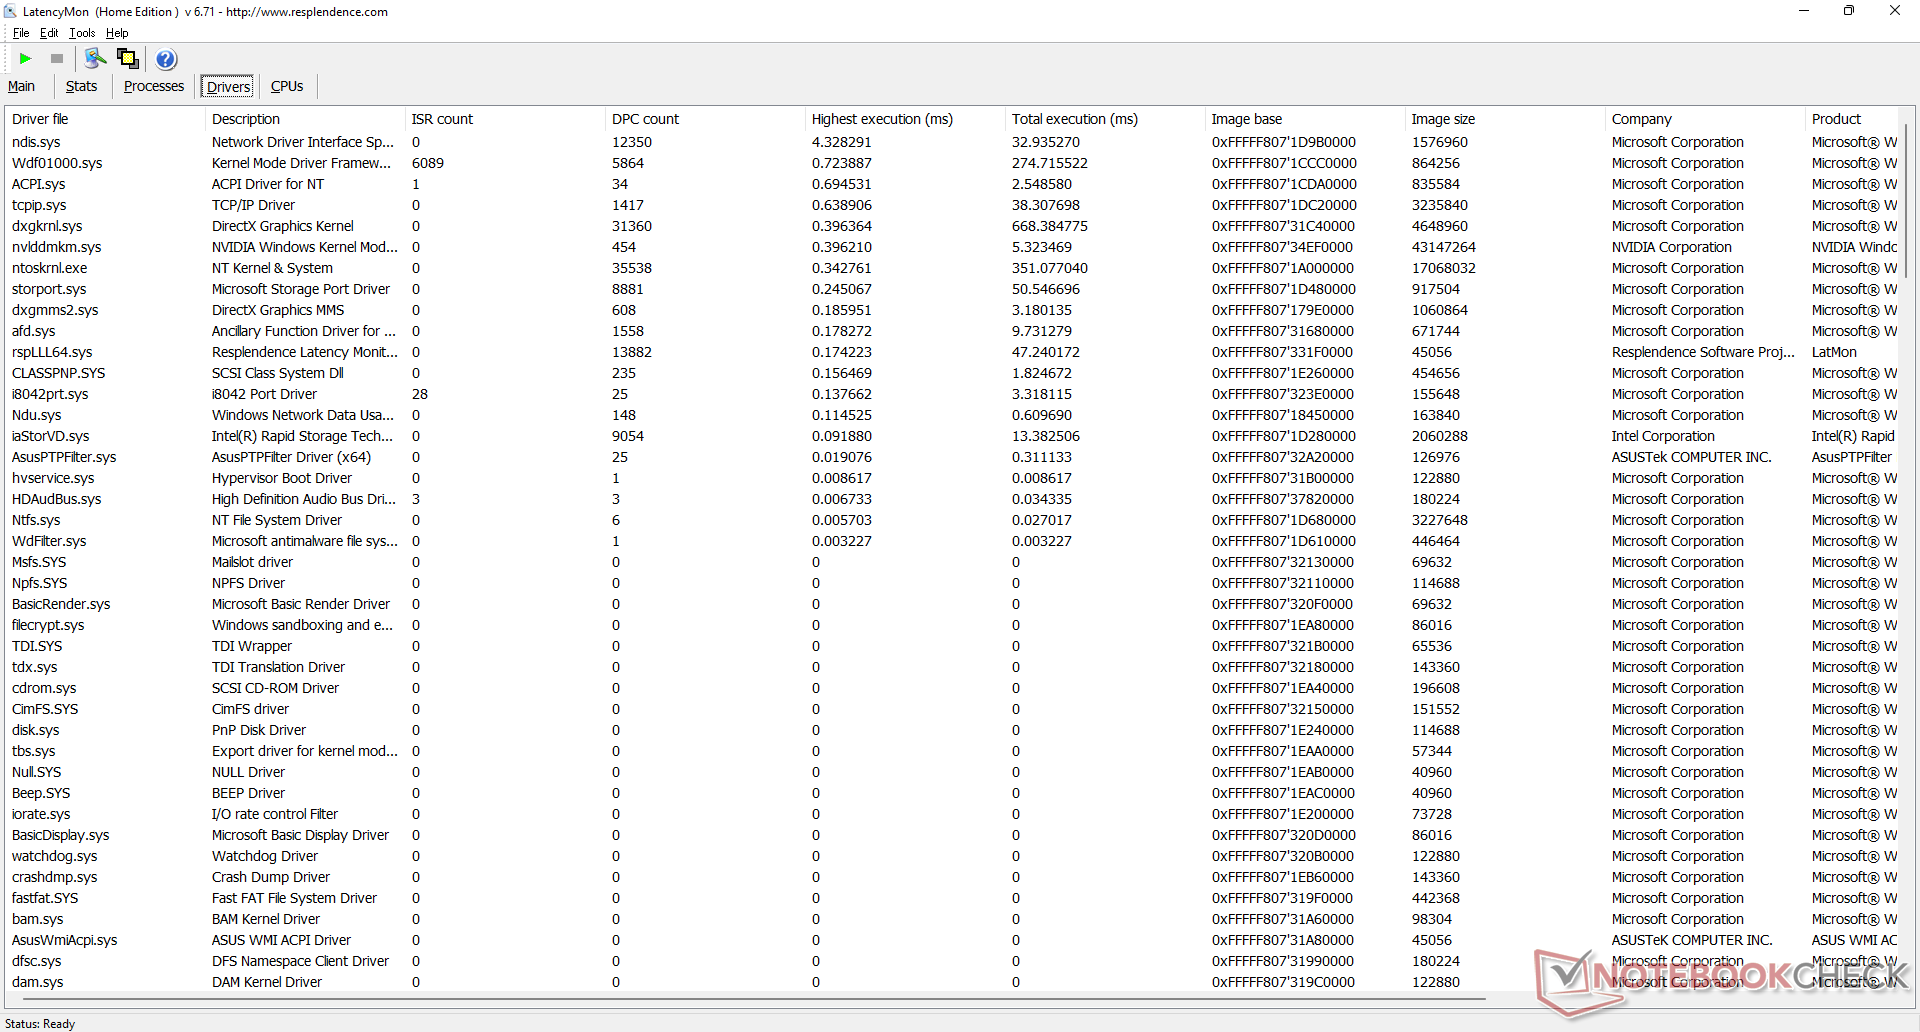
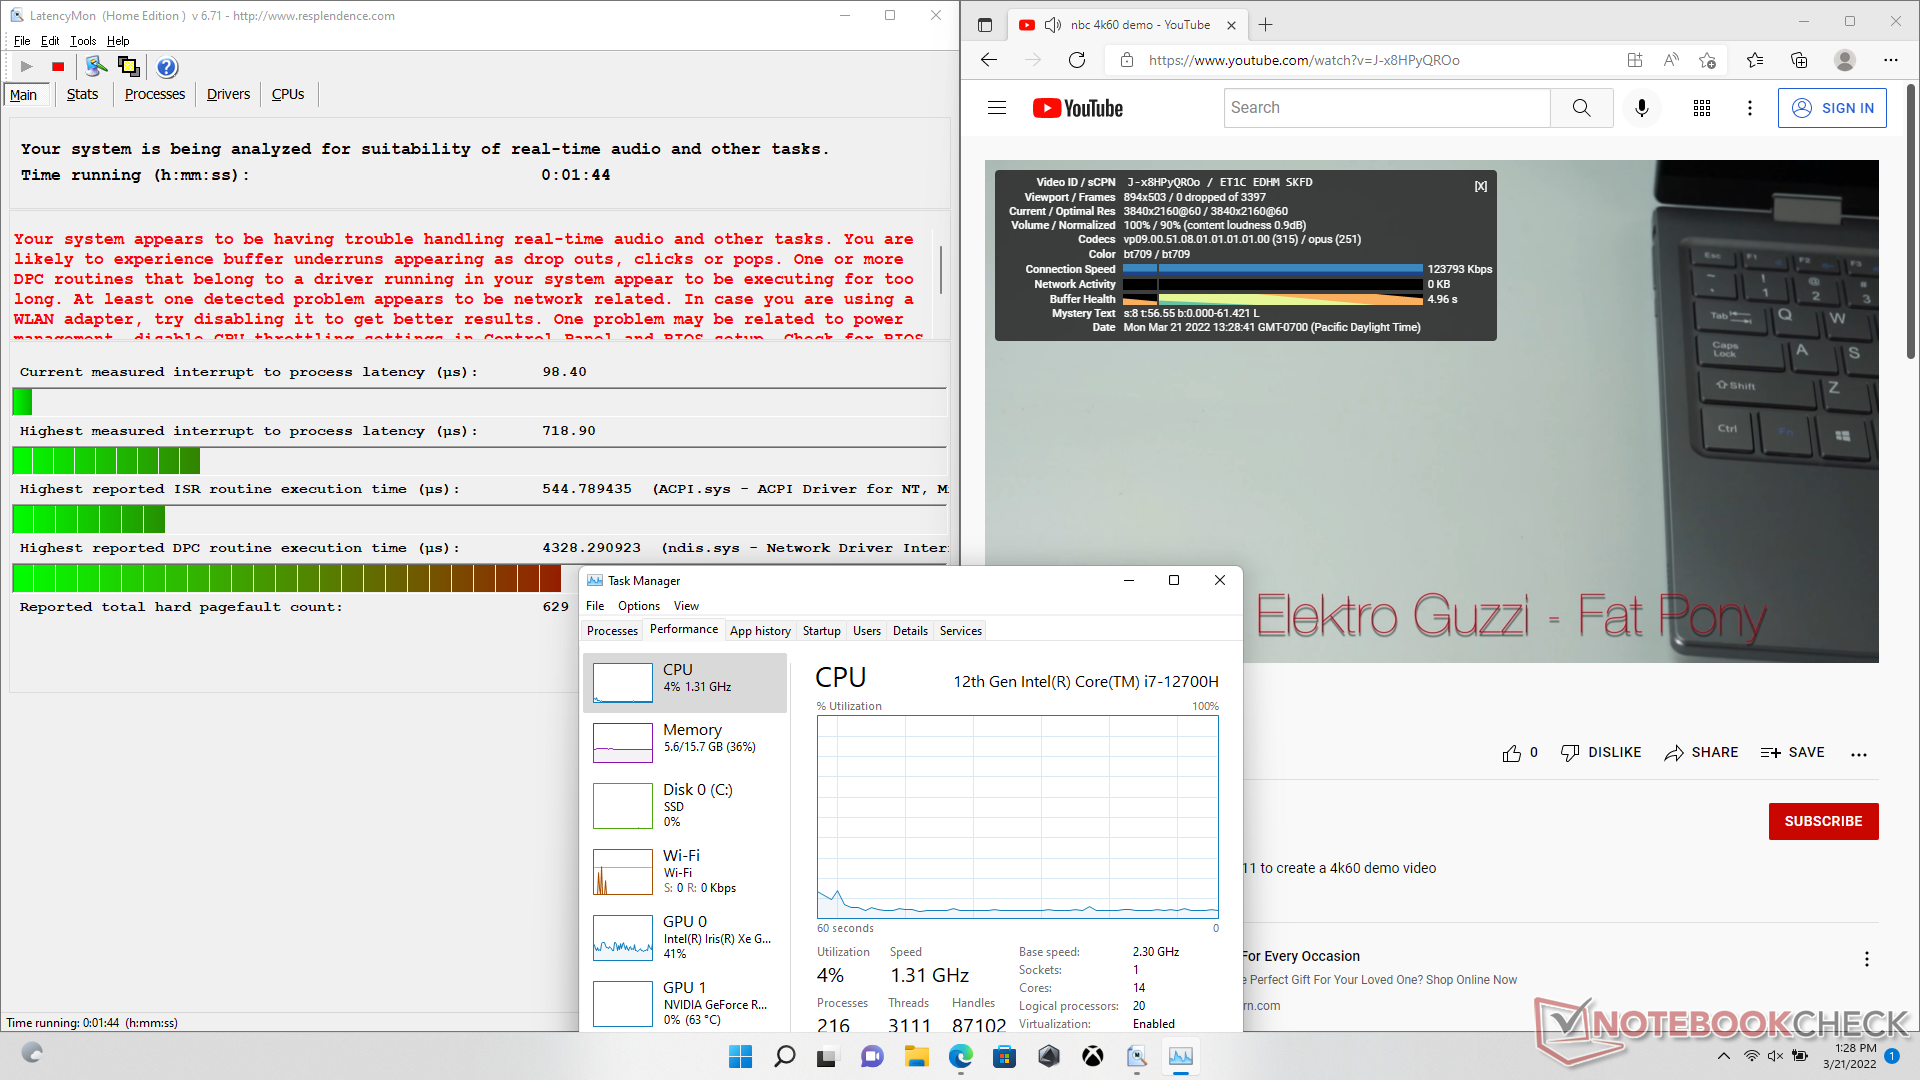
LatencyMon显示了在打开我们的主页的多个浏览器标签时的DPC问题。在60 FPS的情况下,4K视频播放很流畅,没有掉帧。
| DPC Latencies / LatencyMon - interrupt to process latency (max), Web, Youtube, Prime95 | |
| Asus Zephyrus S15 GX502L | |
| Asus TUF Gaming F15 FX506HM | |
| Asus ROG Strix Scar 15 G533QS | |
| Asus TUF Dash F15 FX516PR | |
| Asus ZenBook Pro Duo UX582 LR-1BH2 | |
| Asus TUF Gaming F15 FX507ZM | |
* ... smaller is better
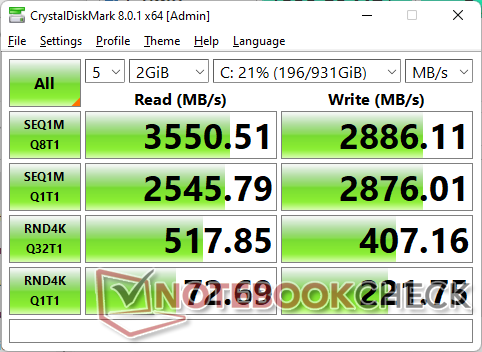
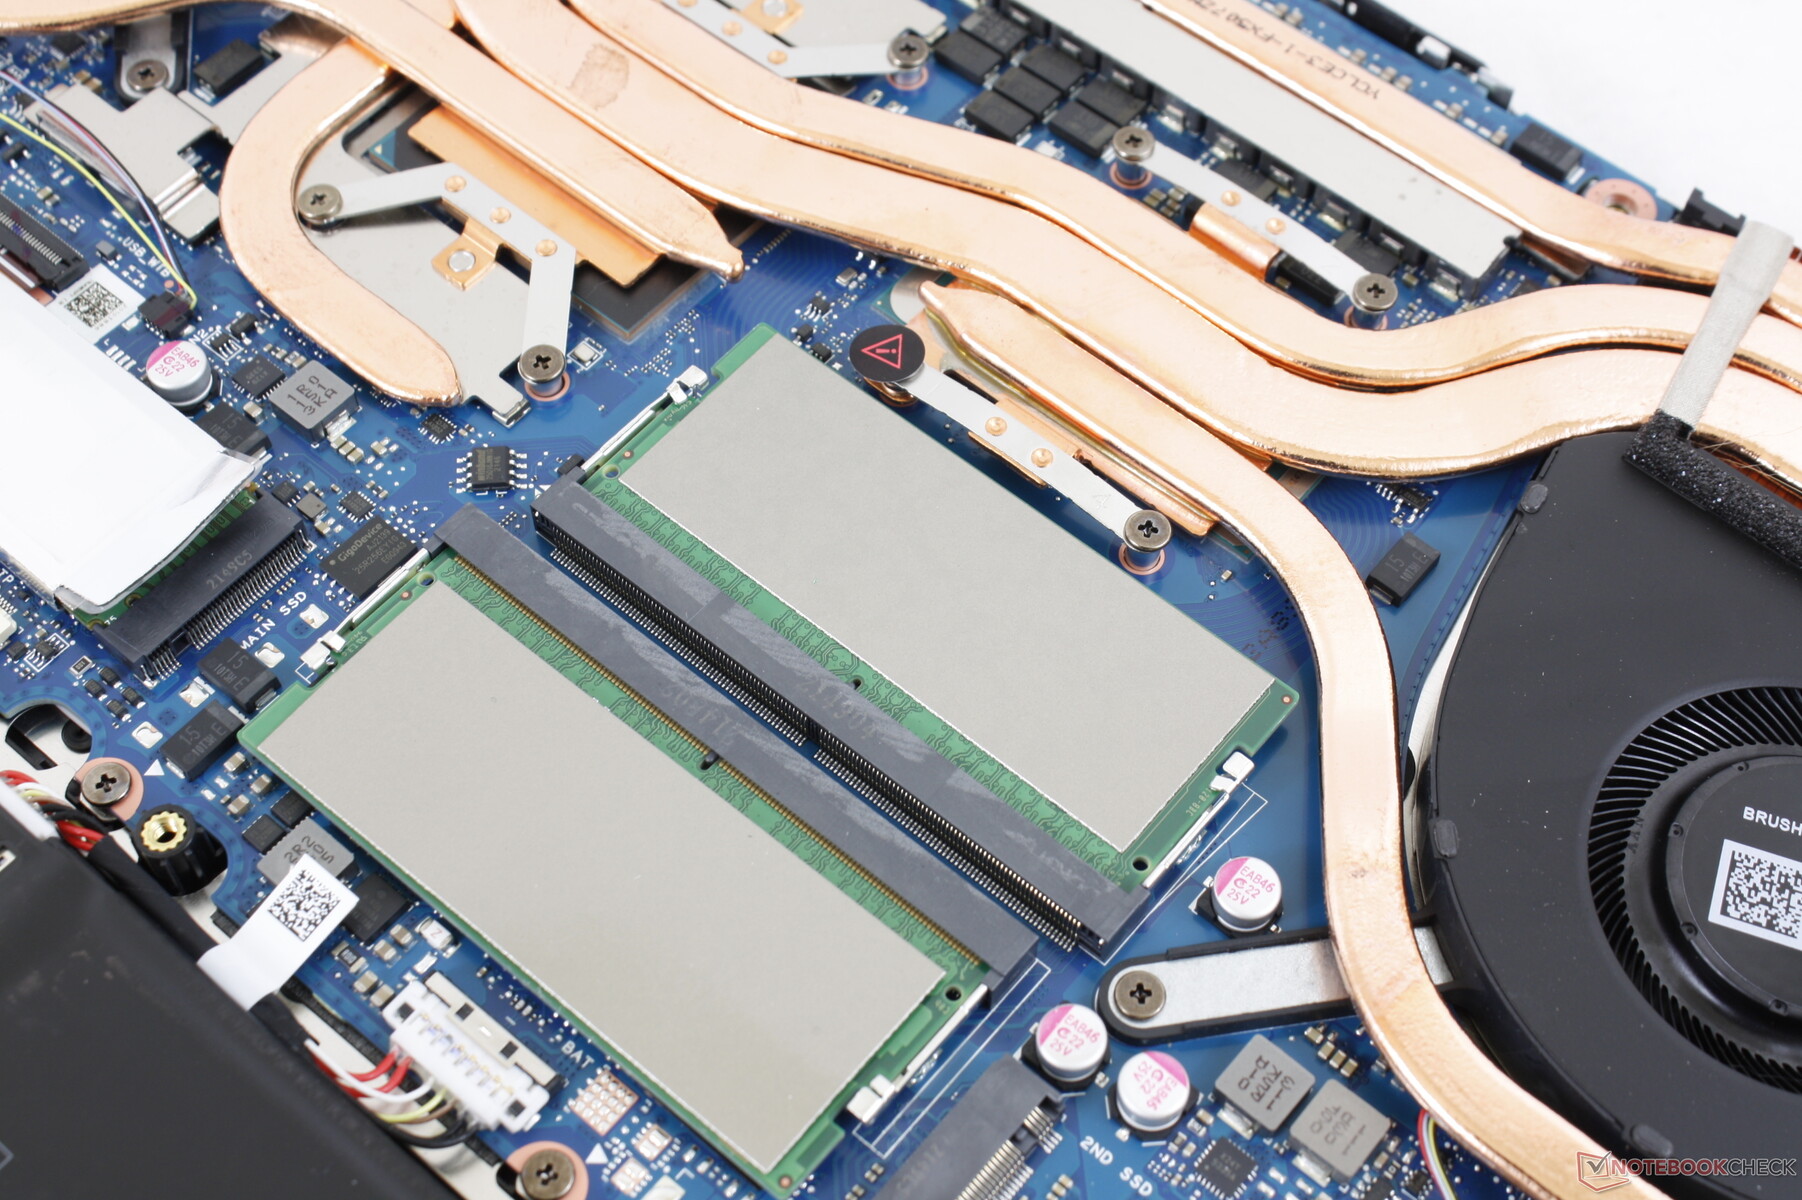
存储设备 - 多达两个M.2 PCIe4 x4驱动器
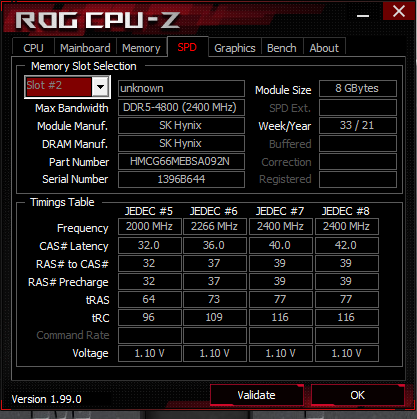
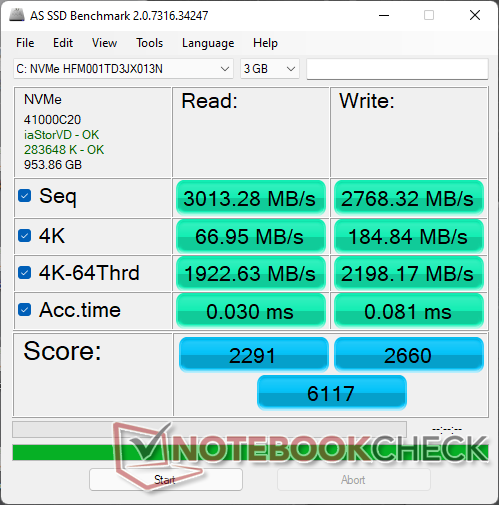
我们的设备发货时使用的是相同的SK Hynix HFM001TD3JX013NPCIe3 x4 NVMe SSD,与去年的型号相同。然而,请记住,FX507支持PCIe4 x4固态硬盘,这意味着如果需要,最终用户可以安装更快的驱动器。由于两个M.2插槽顶部没有散热器,性能的可持续性可能会受到限制。

| Drive Performance rating - Percent | |
| Asus TUF Gaming F15 FX507ZM | |
| Average SK Hynix HFM001TD3JX013N | |
| Asus TUF Gaming F15 FX506HM | |
| Asus Zephyrus S15 GX502L | |
| Asus ZenBook Pro Duo UX582 LR-1BH2 | |
| Asus TUF Dash F15 FX516PR | |
| Asus ROG Strix Scar 15 G533QS | |
* ... smaller is better
Disk Throttling: DiskSpd Read Loop, Queue Depth 8
GPU性能 - 140 W TGP图形
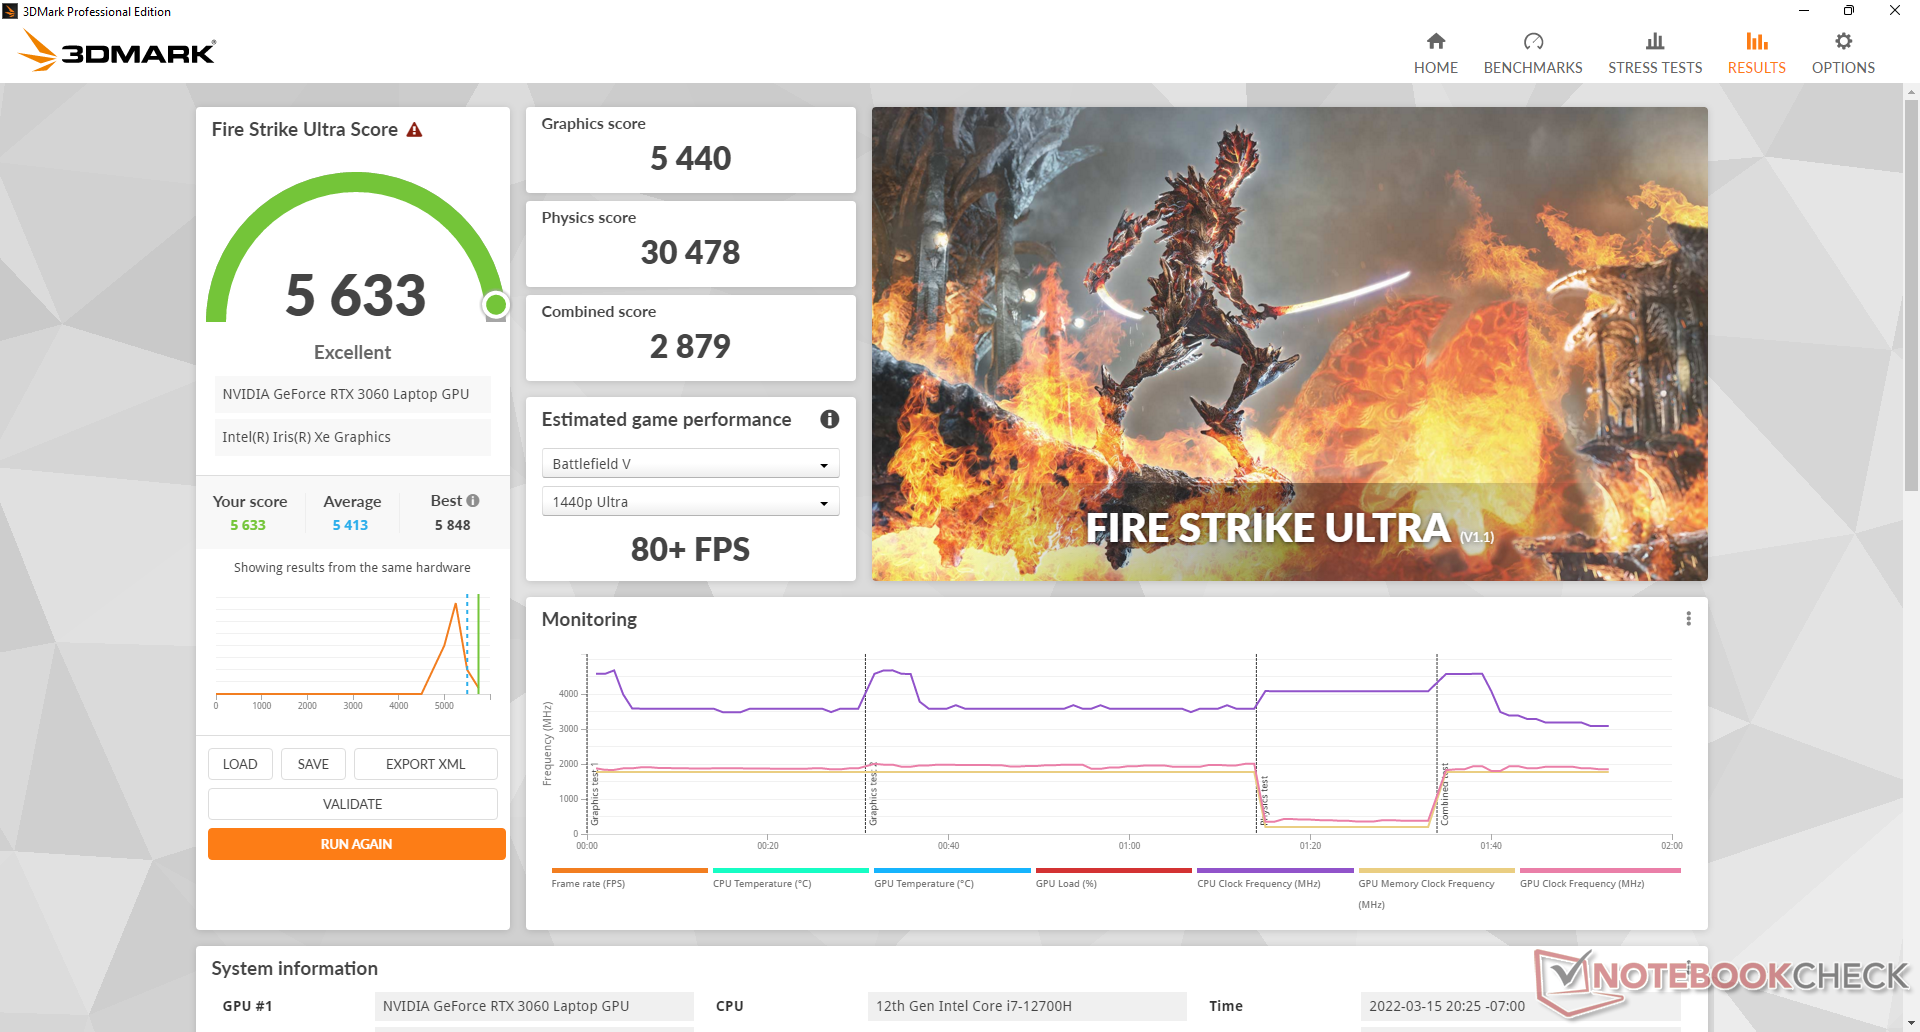
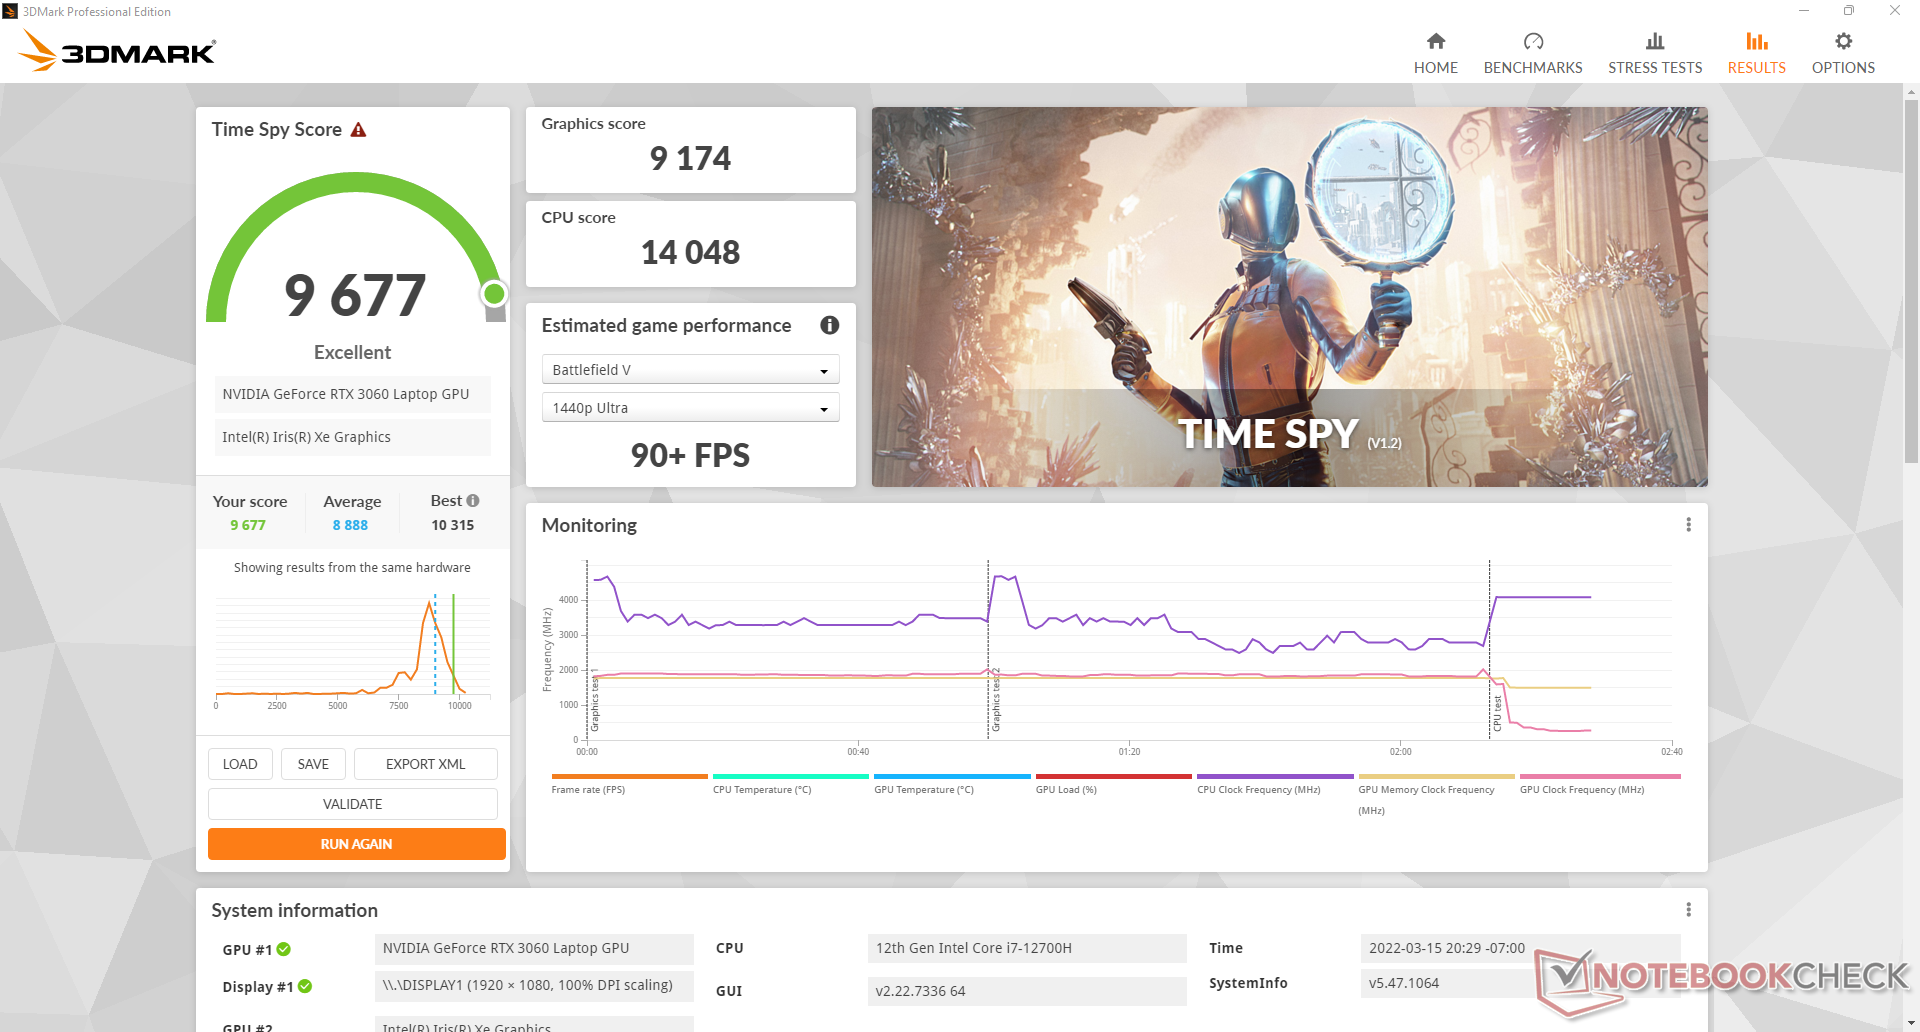
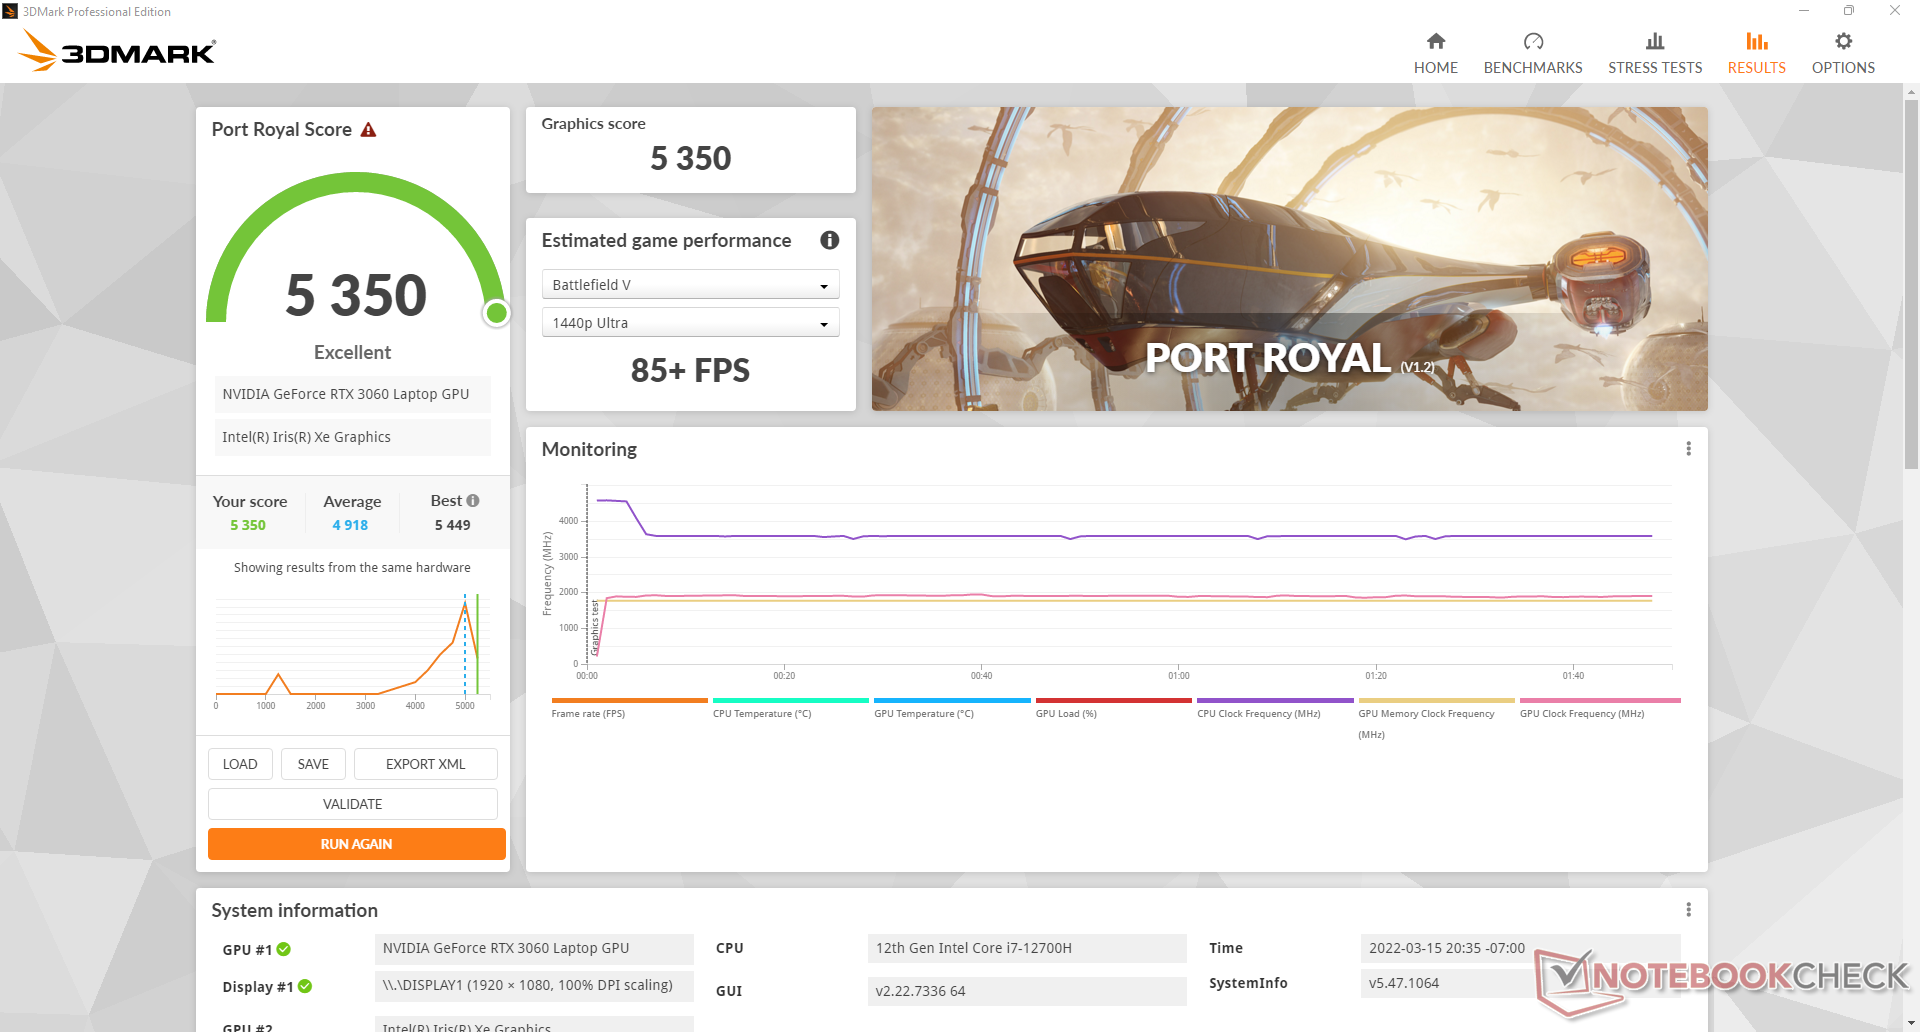
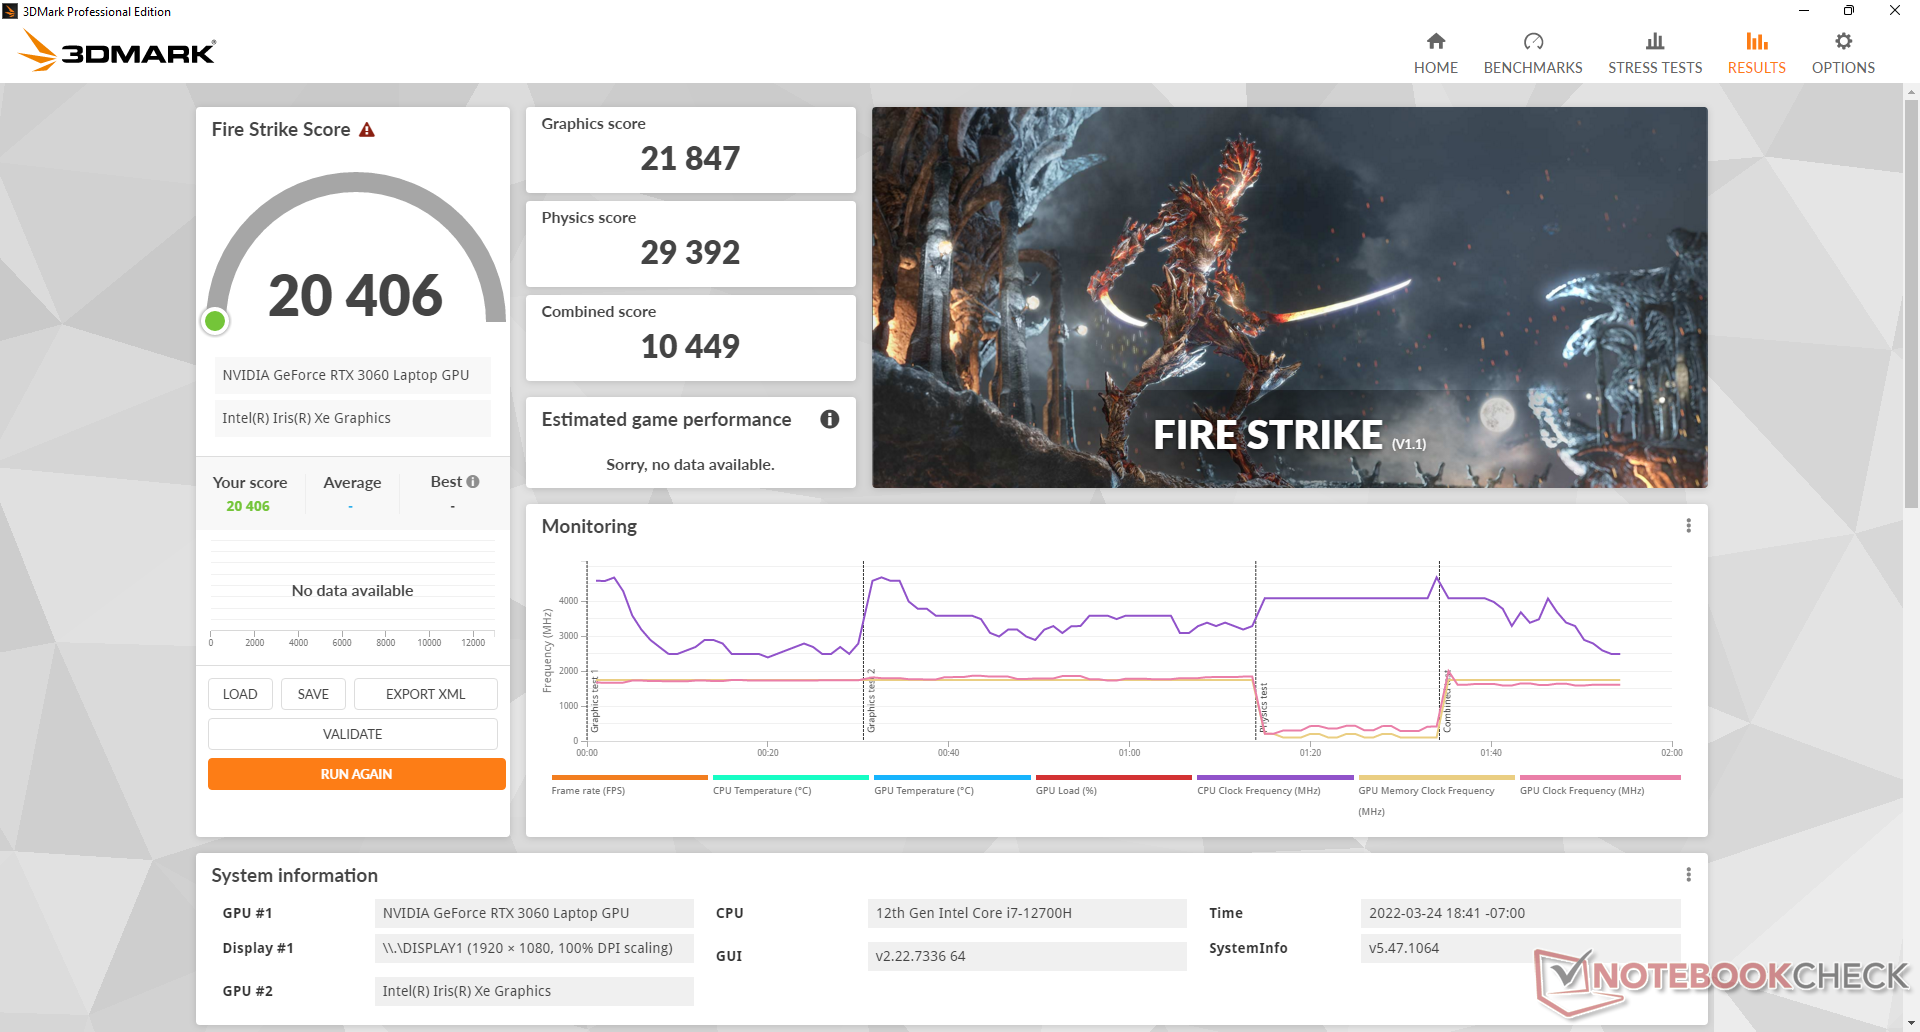
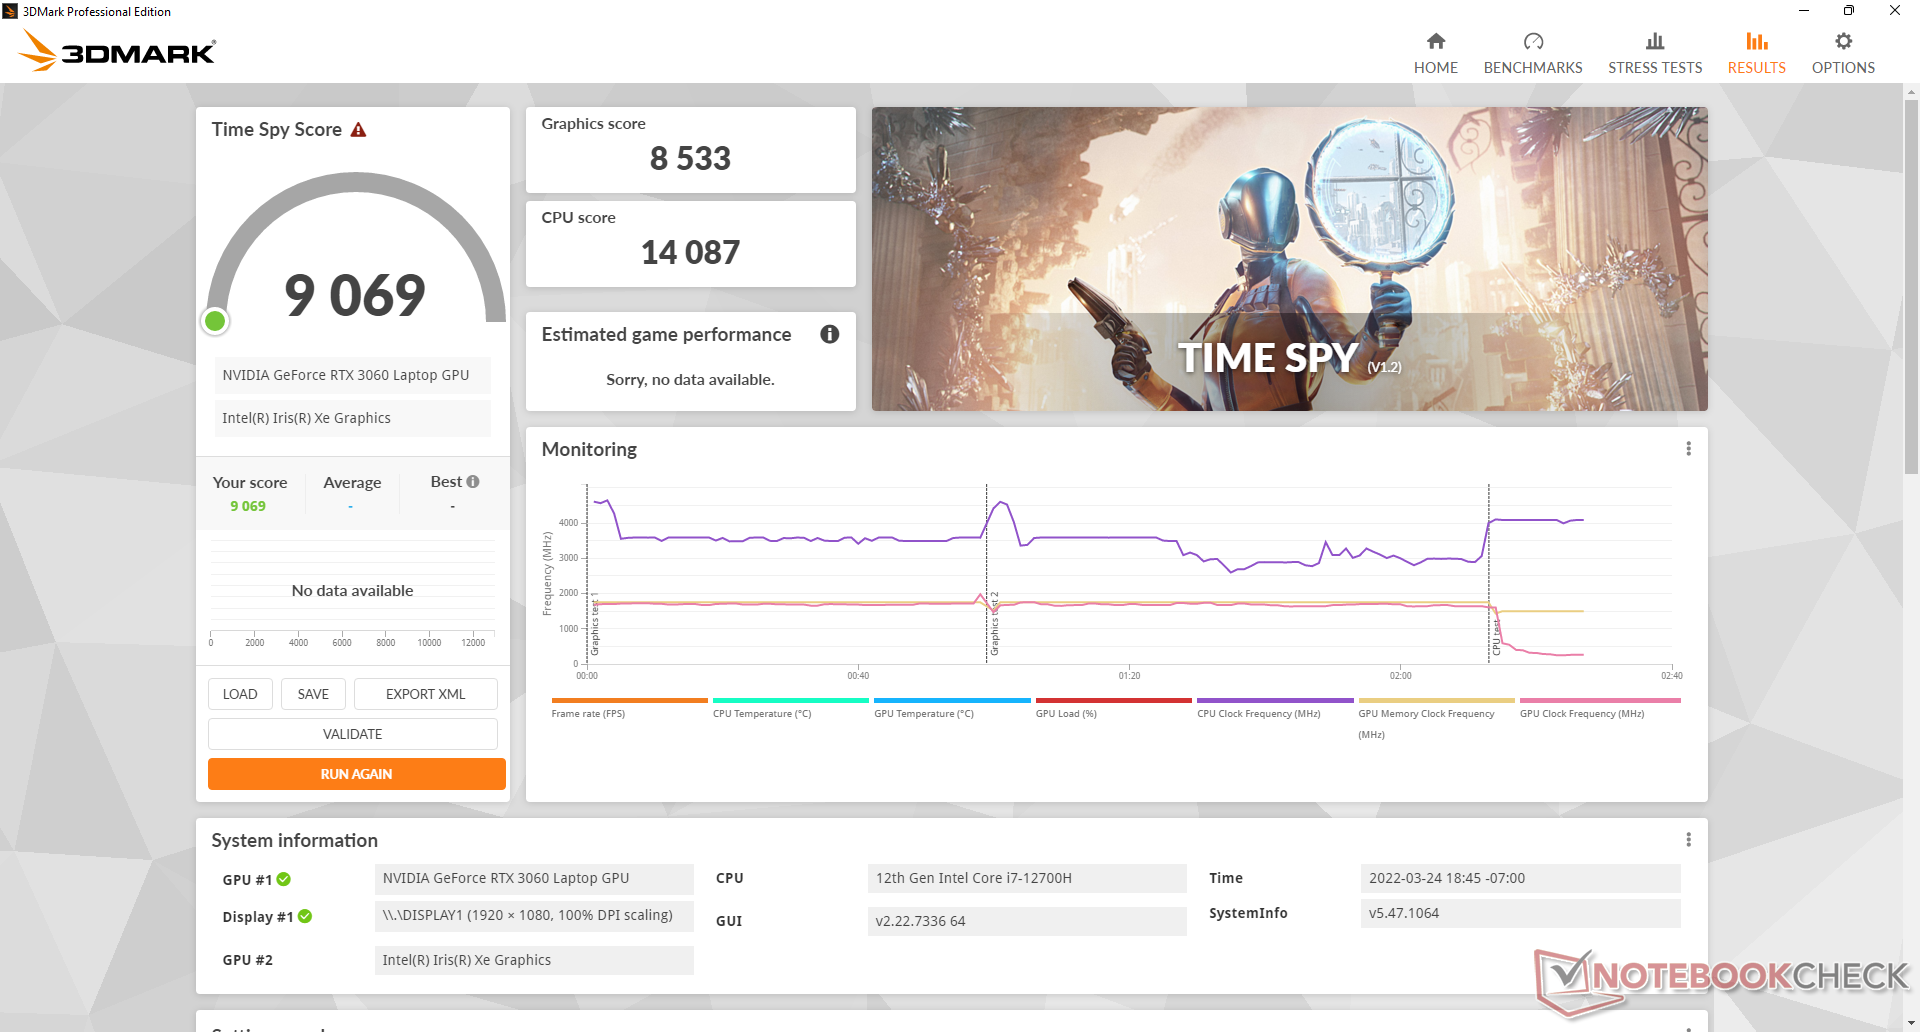
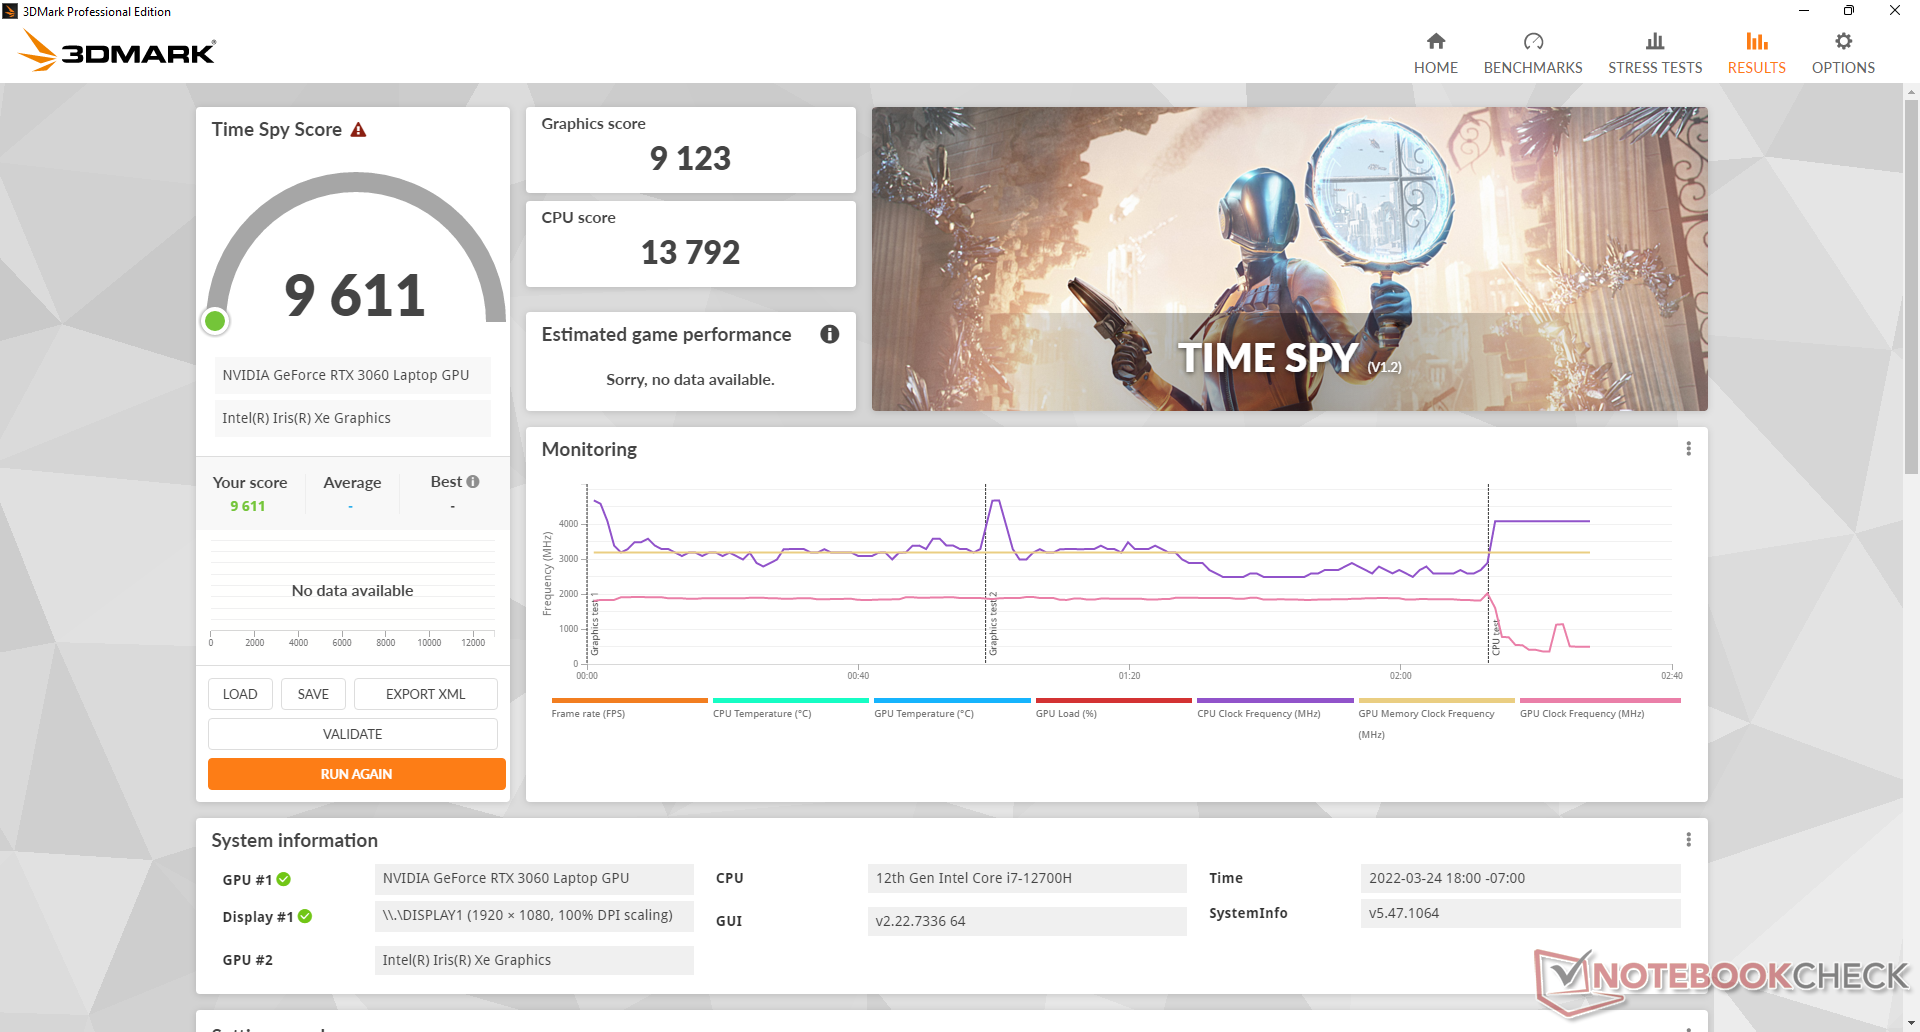
与去年的型号相比,GeForce RTX 3060 TGP目标更高(140 W对95 W),自然导致了更高的图形性能。用户可以期待比配备相同RTX 3060 GPU的FX506有10%到20%的性能提升。事实上,FX507是目前你能买到的最快的GeForce RTX 3060笔记本电脑之一,其结果比配备相同GPU的普通笔记本电脑高出约15%。 同样的GPU.
在MSHybrid模式而不是独立GPU模式下运行,将导致只有非常小的性能赤字或几乎没有赤字。两种模式的3DMark结果几乎相同,而在我们的测试中,游戏时的帧率只慢了几个百分点。
在dGPU性能模式下运行,而不是dGPU Turbo模式,将导致5-10%的GPU性能下降。
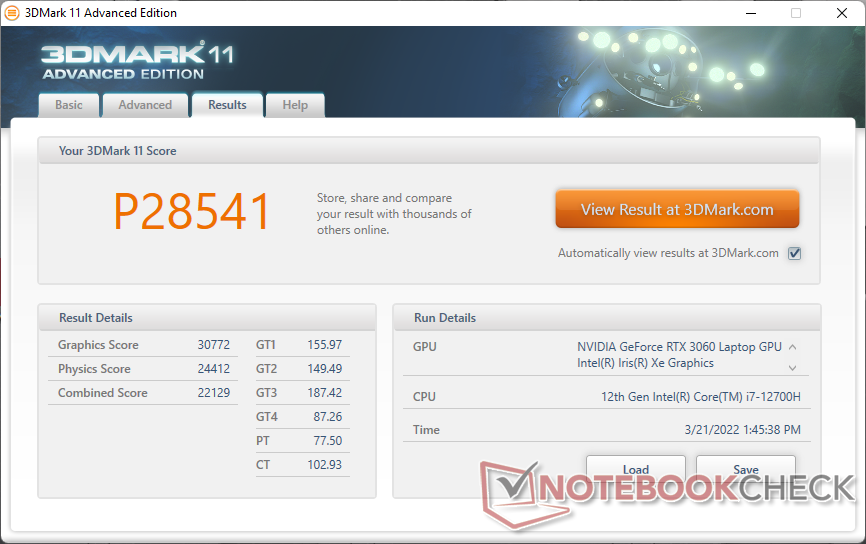
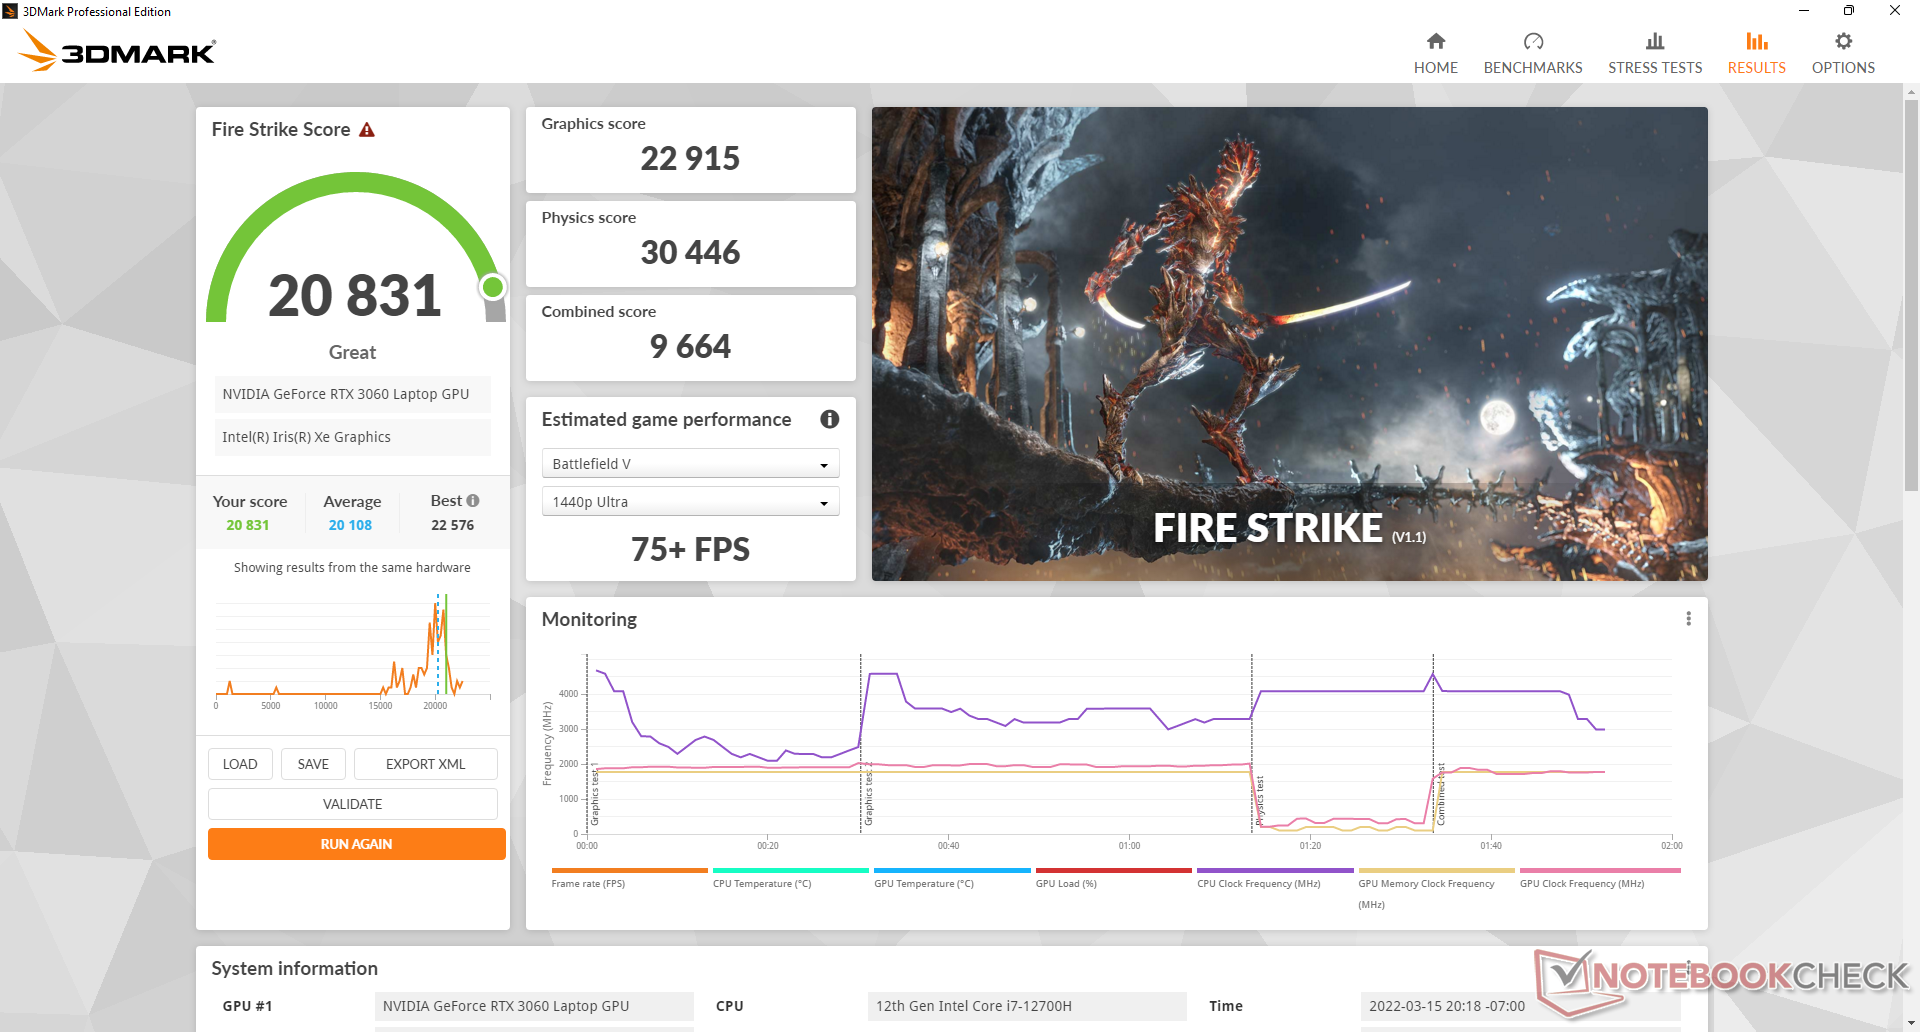

| 3DMark 11 Performance | 28541 points | |
| 3DMark Cloud Gate Standard Score | 58475 points | |
| 3DMark Fire Strike Score | 20831 points | |
| 3DMark Time Spy Score | 9677 points | |
Help | ||
| Final Fantasy XV Benchmark | |
| 1280x720 Lite Quality | |
| Inno3D GeForce RTX 3060 Twin X2 | |
| MSI Vector GP66 12UGS | |
| Schenker XMG Neo 15 Tiger Lake | |
| Razer Blade 15 2022 | |
| Eurocom RX315 NH57AF1 | |
| Asus TUF Gaming F15 FX507ZM | |
| Average NVIDIA GeForce RTX 3060 Laptop GPU (122.5 - 214, n=33) | |
| Asus TUF Gaming F15 FX506HM | |
| Asus ROG Zephyrus M15 GU502LU-BI7N4 | |
| 1920x1080 Standard Quality | |
| MSI Vector GP66 12UGS | |
| Razer Blade 15 2022 | |
| Schenker XMG Neo 15 Tiger Lake | |
| Asus TUF Gaming F15 FX507ZM | |
| Inno3D GeForce RTX 3060 Twin X2 | |
| Eurocom RX315 NH57AF1 | |
| MSI Delta 15 A5EFK | |
| Average NVIDIA GeForce RTX 3060 Laptop GPU (70.4 - 133.5, n=37) | |
| Asus TUF Gaming F15 FX506HM | |
| Asus ROG Zephyrus M15 GU502LU-BI7N4 | |
| 1920x1080 High Quality | |
| MSI Vector GP66 12UGS | |
| Razer Blade 15 2022 | |
| Schenker XMG Neo 15 Tiger Lake | |
| Asus TUF Gaming F15 FX507ZM | |
| Eurocom RX315 NH57AF1 | |
| Inno3D GeForce RTX 3060 Twin X2 | |
| MSI Delta 15 A5EFK | |
| Average NVIDIA GeForce RTX 3060 Laptop GPU (55 - 100.9, n=42) | |
| Asus TUF Gaming F15 FX506HM | |
| Asus ROG Zephyrus M15 GU502LU-BI7N4 | |
Witcher 3 FPS Chart
| low | med. | high | ultra | |
|---|---|---|---|---|
| GTA V (2015) | 186 | 182 | 162 | 97.9 |
| The Witcher 3 (2015) | 395.4 | 291.8 | 186.8 | 91.5 |
| Dota 2 Reborn (2015) | 172 | 161 | 154 | 148 |
| Final Fantasy XV Benchmark (2018) | 161 | 122 | 91.9 | |
| X-Plane 11.11 (2018) | 153 | 136 | 107 | |
| Far Cry 5 (2018) | 156 | 123 | 114 | 114 |
| Strange Brigade (2018) | 345 | 232 | 185 | 160 |
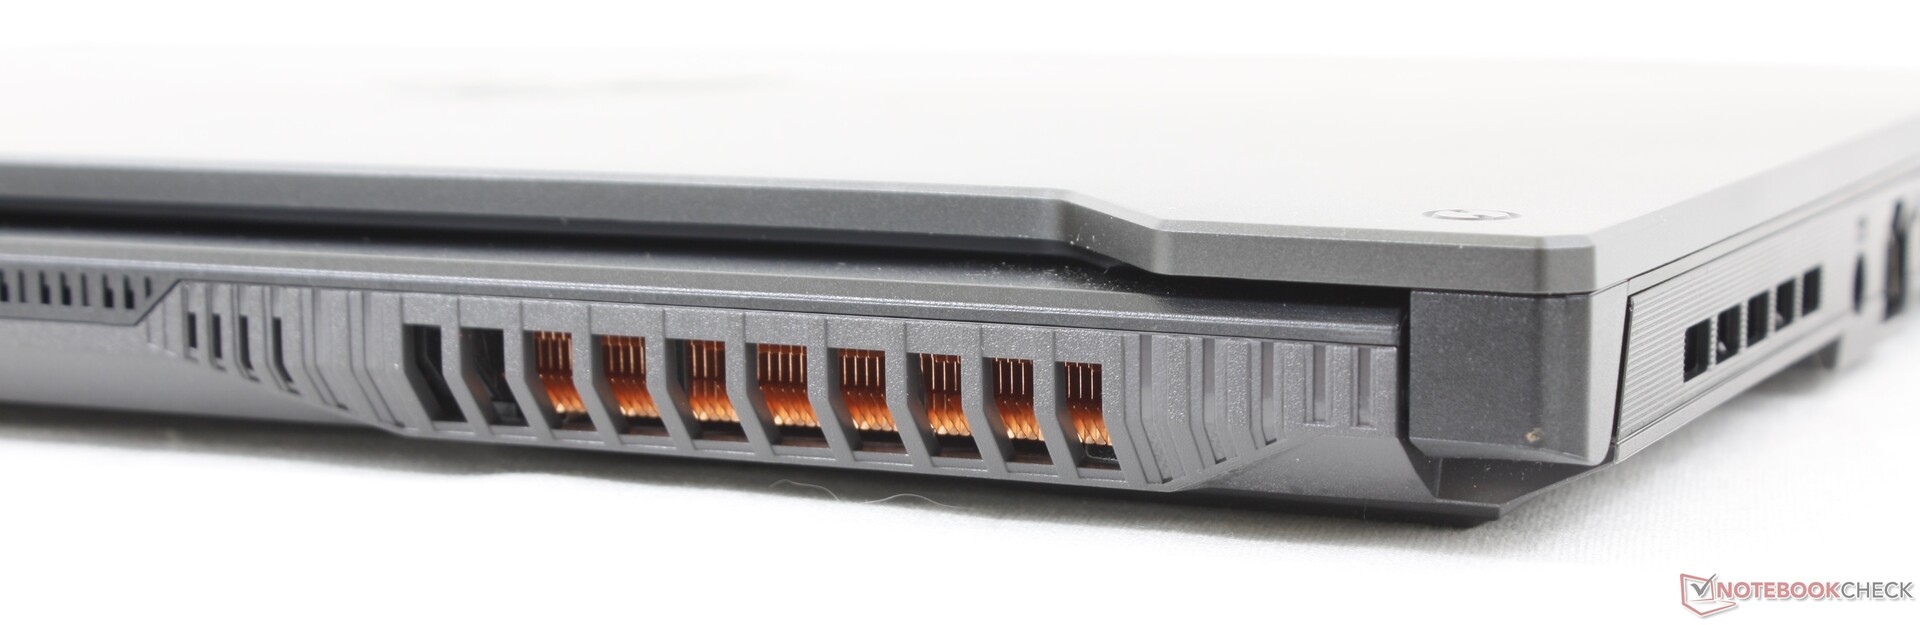
排放
系统噪音
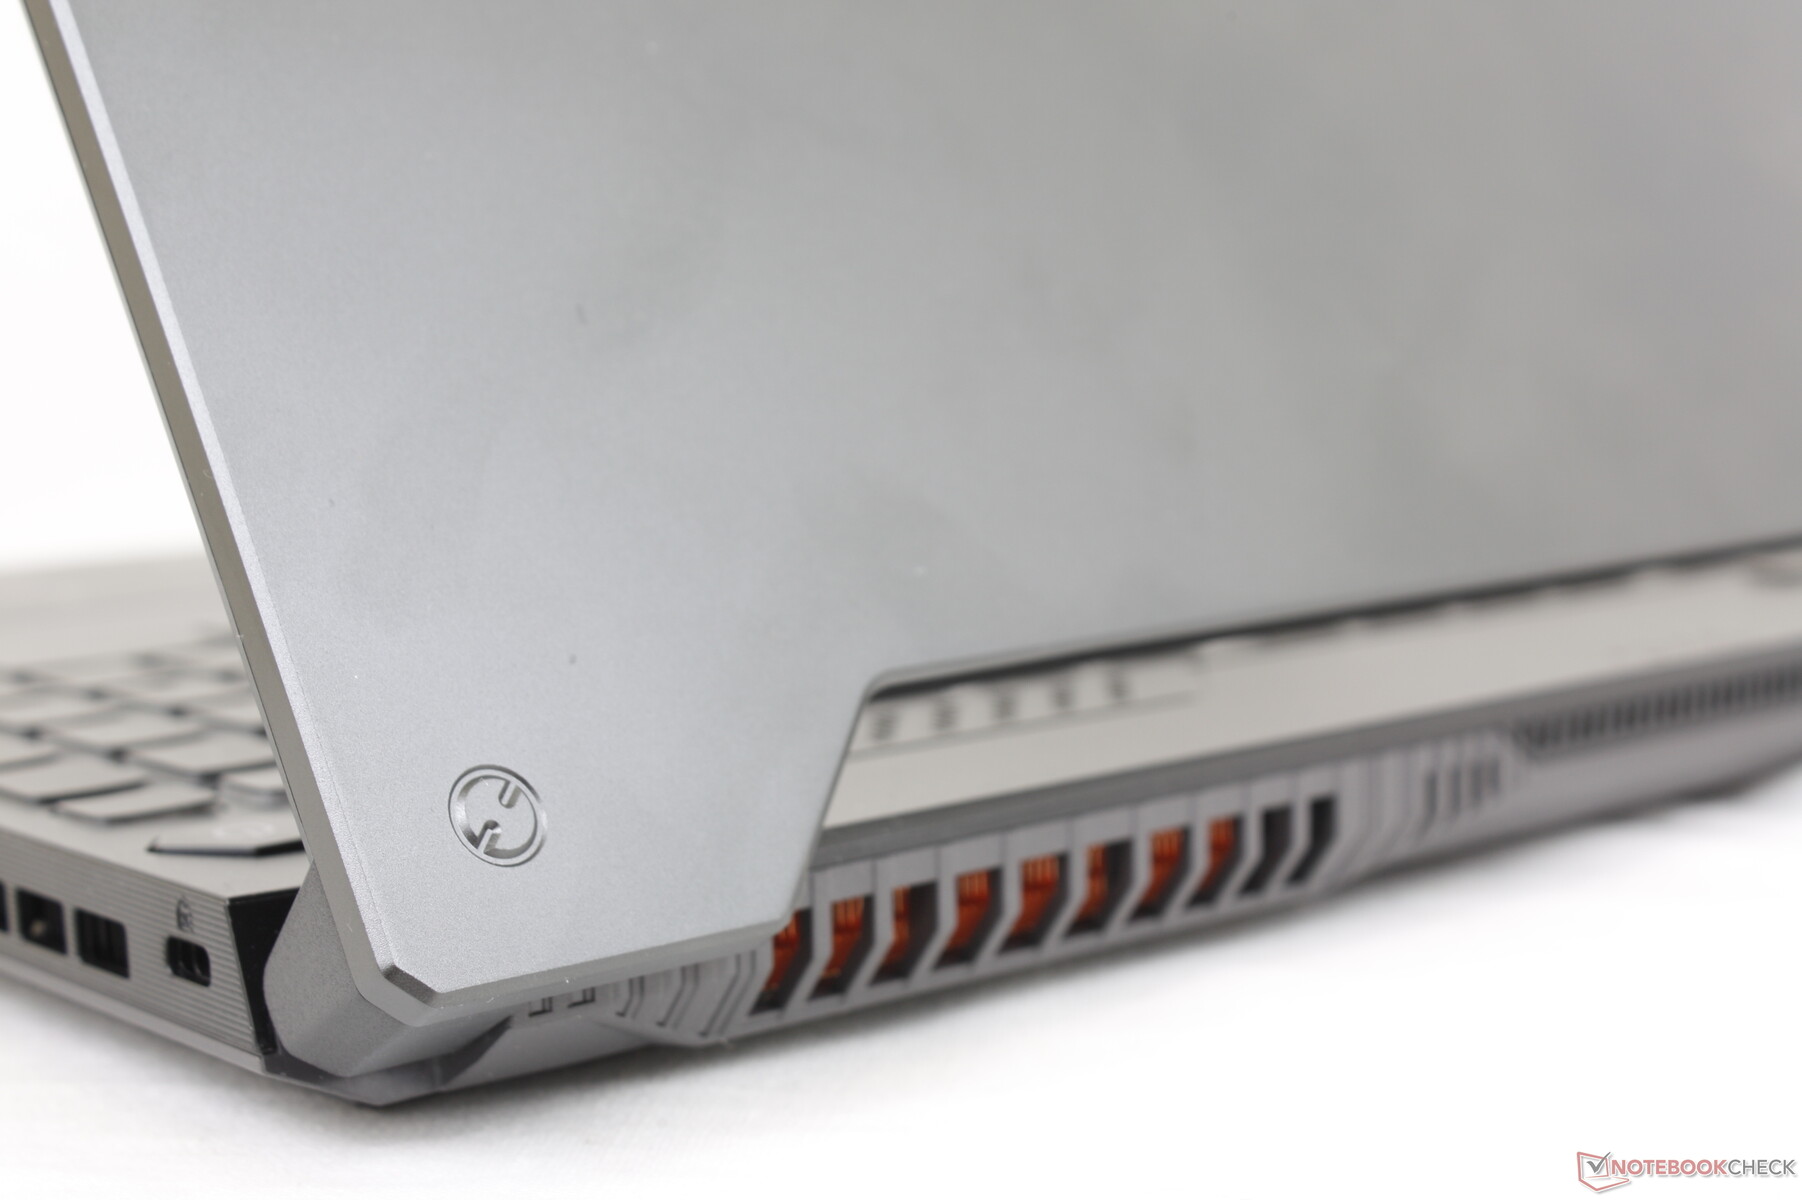
尽管与FX506相比,FX507的整体重量更轻,但华硕还是升级了其散热方案。通过Armoury Crate有五种风扇模式可供选择。Windows, Silent, Performance, Turbo, 和 Manual。在浏览或处理文字时,建议使用Windows或静音模式,以避免风扇的脉动。
在性能模式和涡轮模式下运行Witcher 3 ,将导致风扇噪音分别为45.8 dB(A)和54.1 dB(A)。与Turbo模式相比,性能模式下较低的风扇噪音是很重要的,因为图形性能会有5%到10%的小幅下降。因此,如果用户担心风扇噪音问题,可以考虑在性能模式下进行游戏。
Noise level
| Idle |
| 23.6 / 23.6 / 25.4 dB(A) |
| Load |
| 38 / 57.2 dB(A) |
 | ||
30 dB silent 40 dB(A) audible 50 dB(A) loud |
||
min: | ||
| Asus TUF Gaming F15 FX507ZM GeForce RTX 3060 Laptop GPU, i7-12700H, SK Hynix HFM001TD3JX013N | Asus TUF Gaming F15 FX506HM GeForce RTX 3060 Laptop GPU, i7-11800H, SK Hynix HFM001TD3JX013N | Asus TUF Dash F15 FX516PR GeForce RTX 3070 Laptop GPU, i7-11370H, SK Hynix HFM001TD3JX013N | Asus ROG Strix Scar 15 G533QS GeForce RTX 3080 Laptop GPU, R9 5900HX, ADATA Swordfish 2 TB | Asus Zephyrus S15 GX502L GeForce RTX 2070 Super Mobile, i7-10875H, WDC PC SN730 SDBPNTY-1T00 | Asus ZenBook Pro Duo UX582 LR-1BH2 GeForce RTX 3070 Laptop GPU, i7-10870H, Samsung PM981a MZVLB1T0HBLR | |
|---|---|---|---|---|---|---|
| Noise | 6% | -14% | -8% | -21% | -1% | |
| off / environment * (dB) | 23.2 | 24.8 -7% | 24 -3% | 25.5 -10% | 25 -8% | 24.6 -6% |
| Idle Minimum * (dB) | 23.6 | 24.6 -4% | 25 -6% | 25.5 -8% | 28 -19% | 24.6 -4% |
| Idle Average * (dB) | 23.6 | 24.9 -6% | 30 -27% | 25.5 -8% | 31 -31% | 24.6 -4% |
| Idle Maximum * (dB) | 25.4 | 24.9 2% | 35 -38% | 37.1 -46% | 36 -42% | 25.9 -2% |
| Load Average * (dB) | 38 | 27.1 29% | 53 -39% | 39.2 -3% | 56 -47% | 39.6 -4% |
| Witcher 3 ultra * (dB) | 54.1 | 46.4 14% | 48 11% | 50.5 7% | 55 -2% | 49.8 8% |
| Load Maximum * (dB) | 57.2 | 49 14% | 54 6% | 51.8 9% | 57 -0% | 54.2 5% |
* ... smaller is better
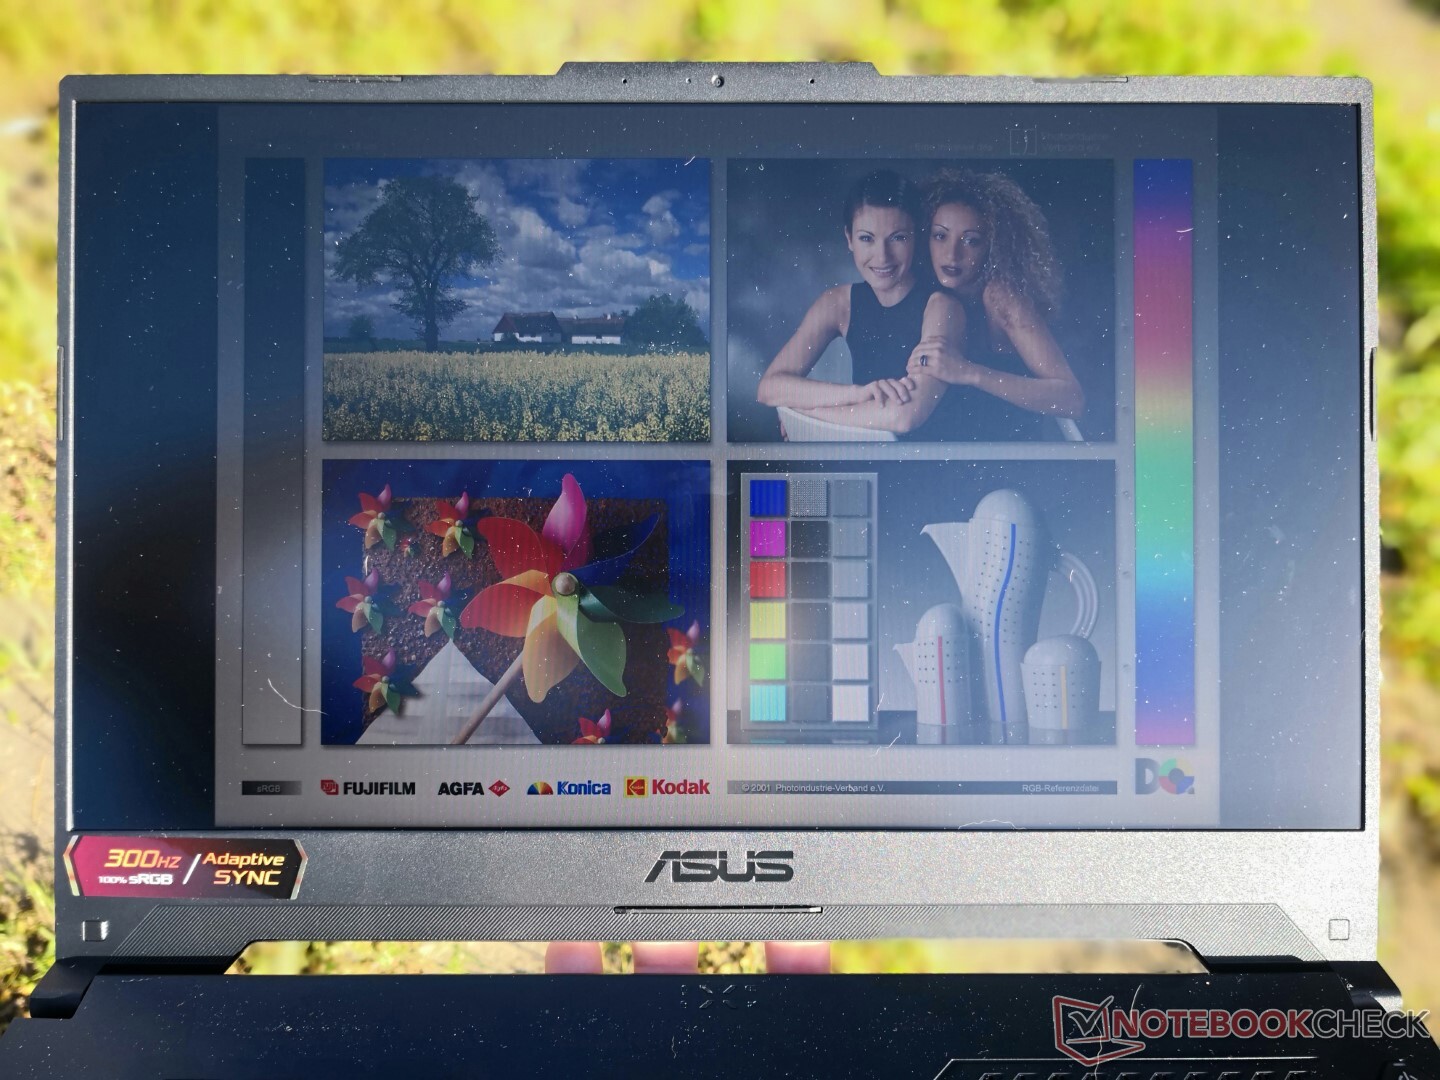
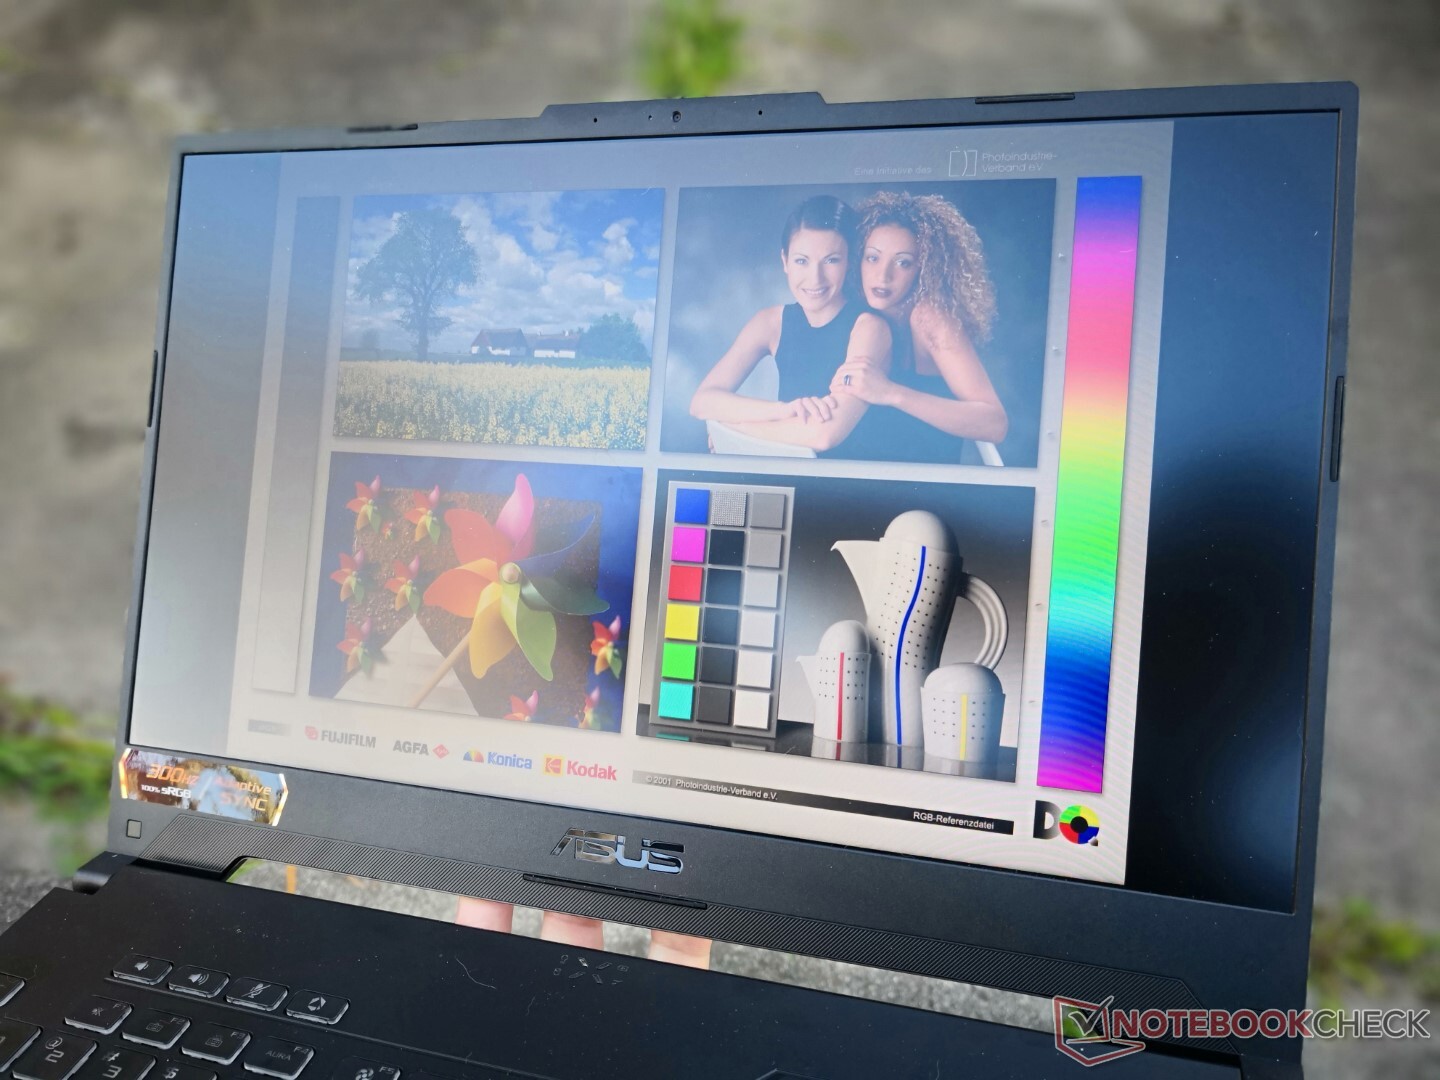
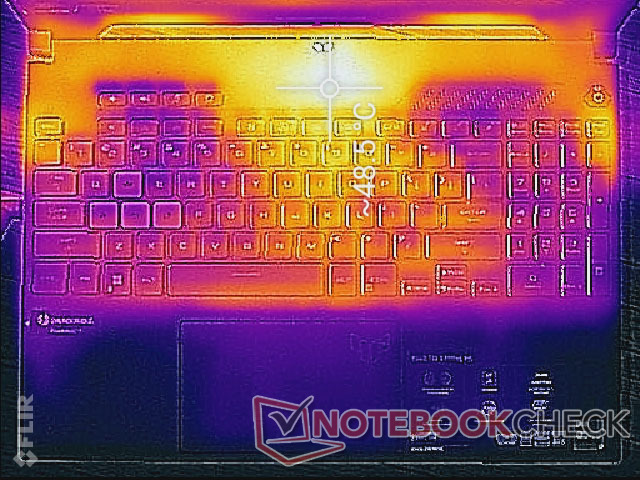
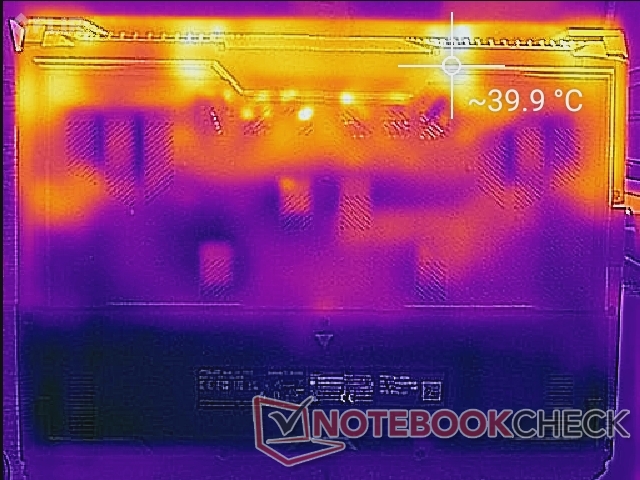
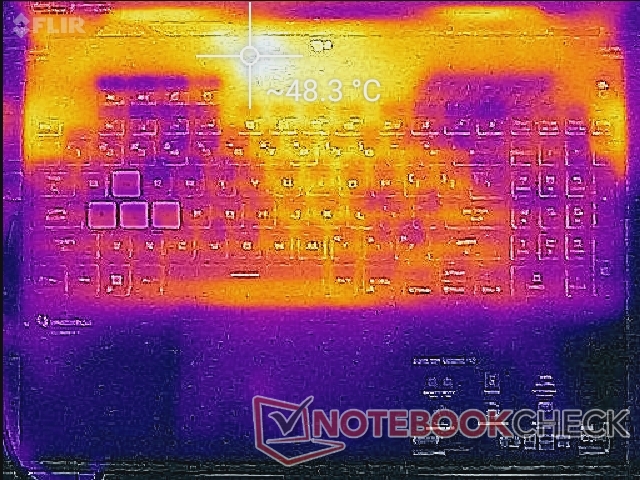
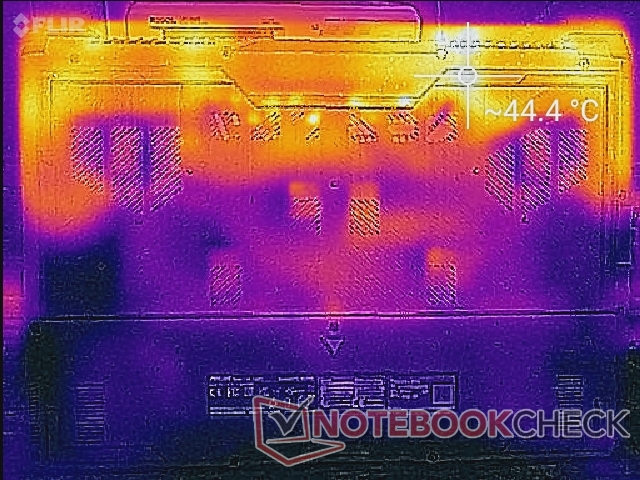
温度
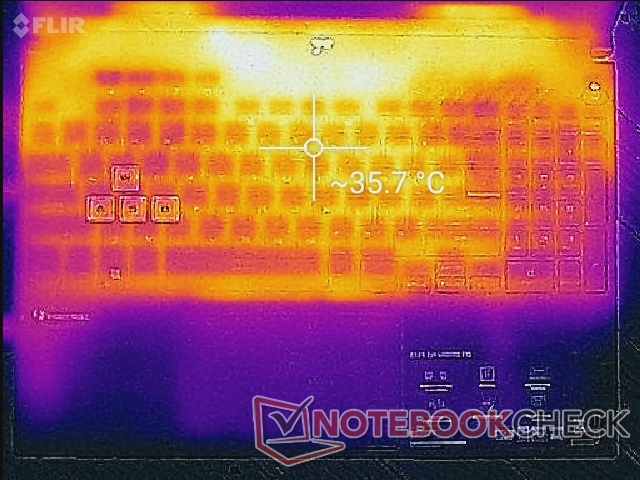
地表温度热点比我们在去年的模型上记录的要高。当运行 Witcher 3例如,FX507的顶部热点温度可以达到49℃,而FX506只有37℃。然而,FX507改进后的冷却解决方案将热点从键盘按键上移开,使手掌和手指无论在屏幕上的负载如何都能保持凉爽。
即使在桌面上空闲时,表面温度也比预期的要高,但这是因为当活动较少时,风扇往往会空闲或以非常低的速度运行。我们发现这是一个可以接受的权衡,特别是在教室或播放视频或音乐的时候。
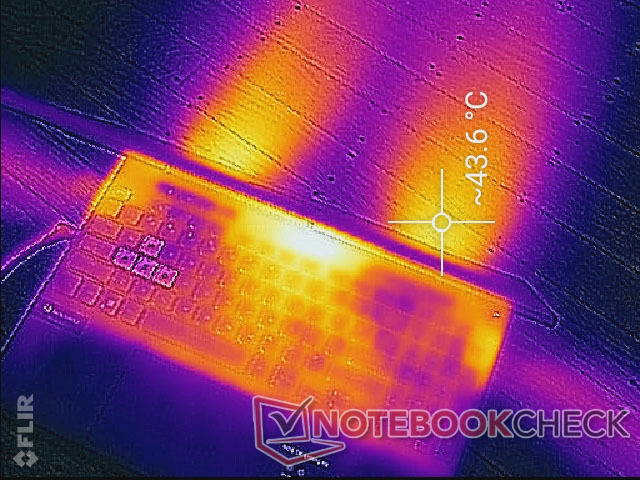
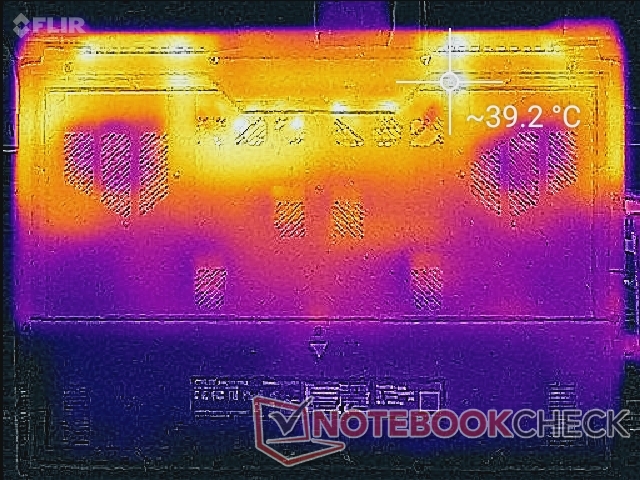
(±) The maximum temperature on the upper side is 44.4 °C / 112 F, compared to the average of 40.4 °C / 105 F, ranging from 21.2 to 68.8 °C for the class Gaming.
(-) The bottom heats up to a maximum of 48.8 °C / 120 F, compared to the average of 43.2 °C / 110 F
(+) In idle usage, the average temperature for the upper side is 30.2 °C / 86 F, compared to the device average of 33.9 °C / 93 F.
(+) Playing The Witcher 3, the average temperature for the upper side is 31.4 °C / 89 F, compared to the device average of 33.9 °C / 93 F.
(+) The palmrests and touchpad are cooler than skin temperature with a maximum of 28 °C / 82.4 F and are therefore cool to the touch.
(±) The average temperature of the palmrest area of similar devices was 28.8 °C / 83.8 F (+0.8 °C / 1.4 F).
| Asus TUF Gaming F15 FX507ZM Intel Core i7-12700H, NVIDIA GeForce RTX 3060 Laptop GPU | Asus TUF Gaming F15 FX506HM Intel Core i7-11800H, NVIDIA GeForce RTX 3060 Laptop GPU | Asus TUF Dash F15 FX516PR Intel Core i7-11370H, NVIDIA GeForce RTX 3070 Laptop GPU | Asus ROG Strix Scar 15 G533QS AMD Ryzen 9 5900HX, NVIDIA GeForce RTX 3080 Laptop GPU | Asus Zephyrus S15 GX502L Intel Core i7-10875H, NVIDIA GeForce RTX 2070 Super Mobile | Asus ZenBook Pro Duo UX582 LR-1BH2 Intel Core i7-10870H, NVIDIA GeForce RTX 3070 Laptop GPU | |
|---|---|---|---|---|---|---|
| Heat | 16% | 1% | 4% | 11% | 14% | |
| Maximum Upper Side * (°C) | 44.4 | 46.4 -5% | 55 -24% | 43.4 2% | 51 -15% | 47.7 -7% |
| Maximum Bottom * (°C) | 48.8 | 45.4 7% | 56 -15% | 48.2 1% | 44 10% | 53.8 -10% |
| Idle Upper Side * (°C) | 37.8 | 26 31% | 29 23% | 35.2 7% | 29 23% | 24.4 35% |
| Idle Bottom * (°C) | 39.6 | 27.4 31% | 32 19% | 37 7% | 30 24% | 24.7 38% |
* ... smaller is better
压力测试
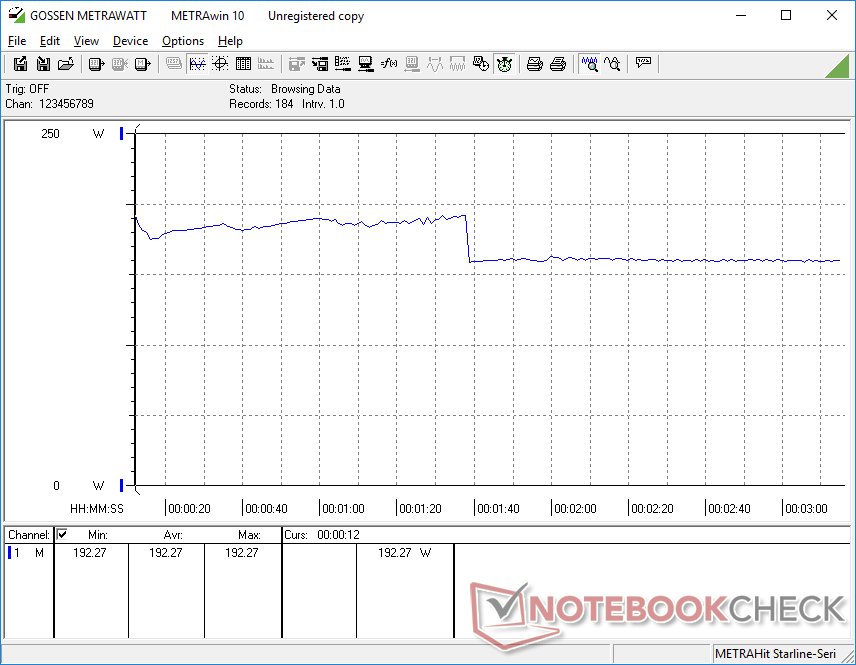
当运行Prime95时,CPU在最初的100秒左右会提升到3.8GHz,核心温度为95℃。时钟频率和温度最终会下降,并分别稳定在3.1GHz和83℃。根据WiNFO的数据,在此期间,封装功率也将从115W下降到90W。
当运行 Witcher 3在FX506上运行同样的测试,CPU和GPU的温度将分别稳定在69摄氏度和77摄氏度,GPU的频率为1927 MHz,主板功耗为133.4 W。
使用电池电源运行限制了性能。在电池上进行的Fire Strike 测试将返回物理和图形分数,分别为21169和15715分,而在电源上则为30446和22915分。
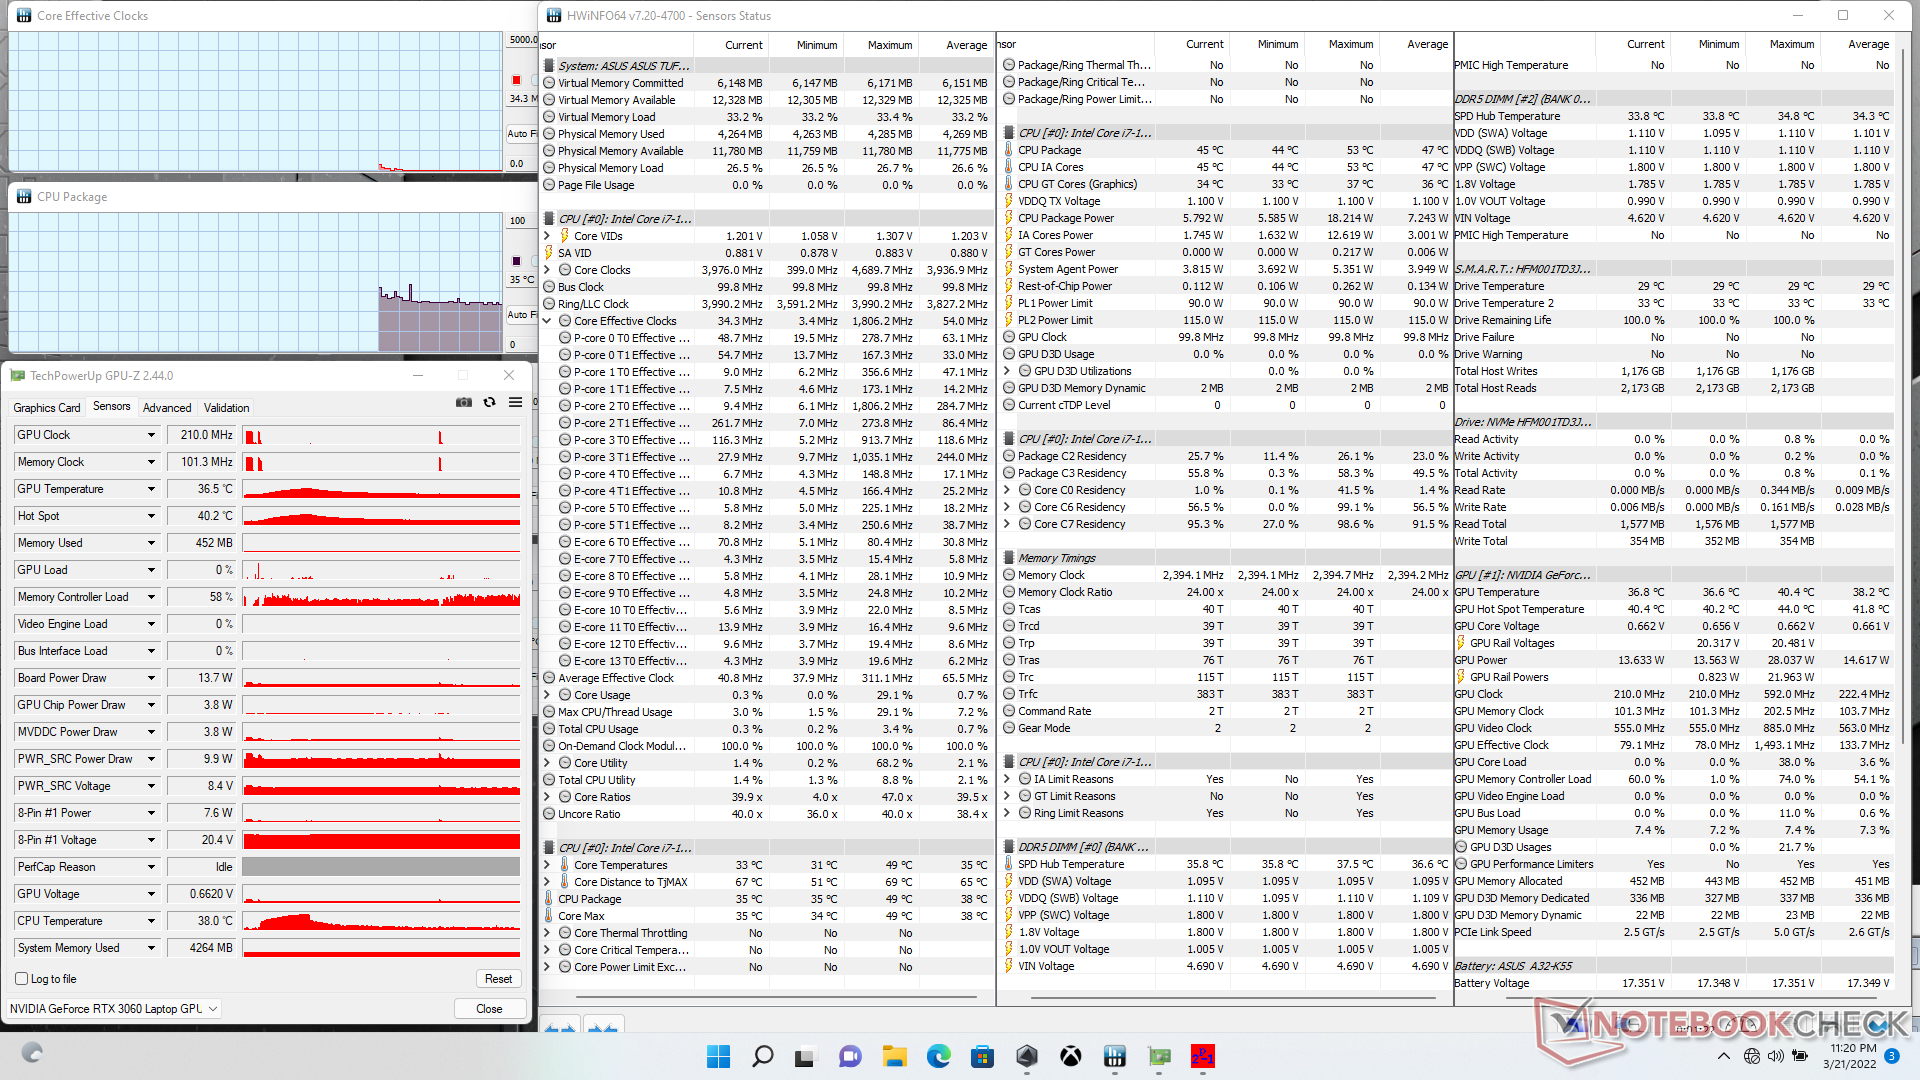
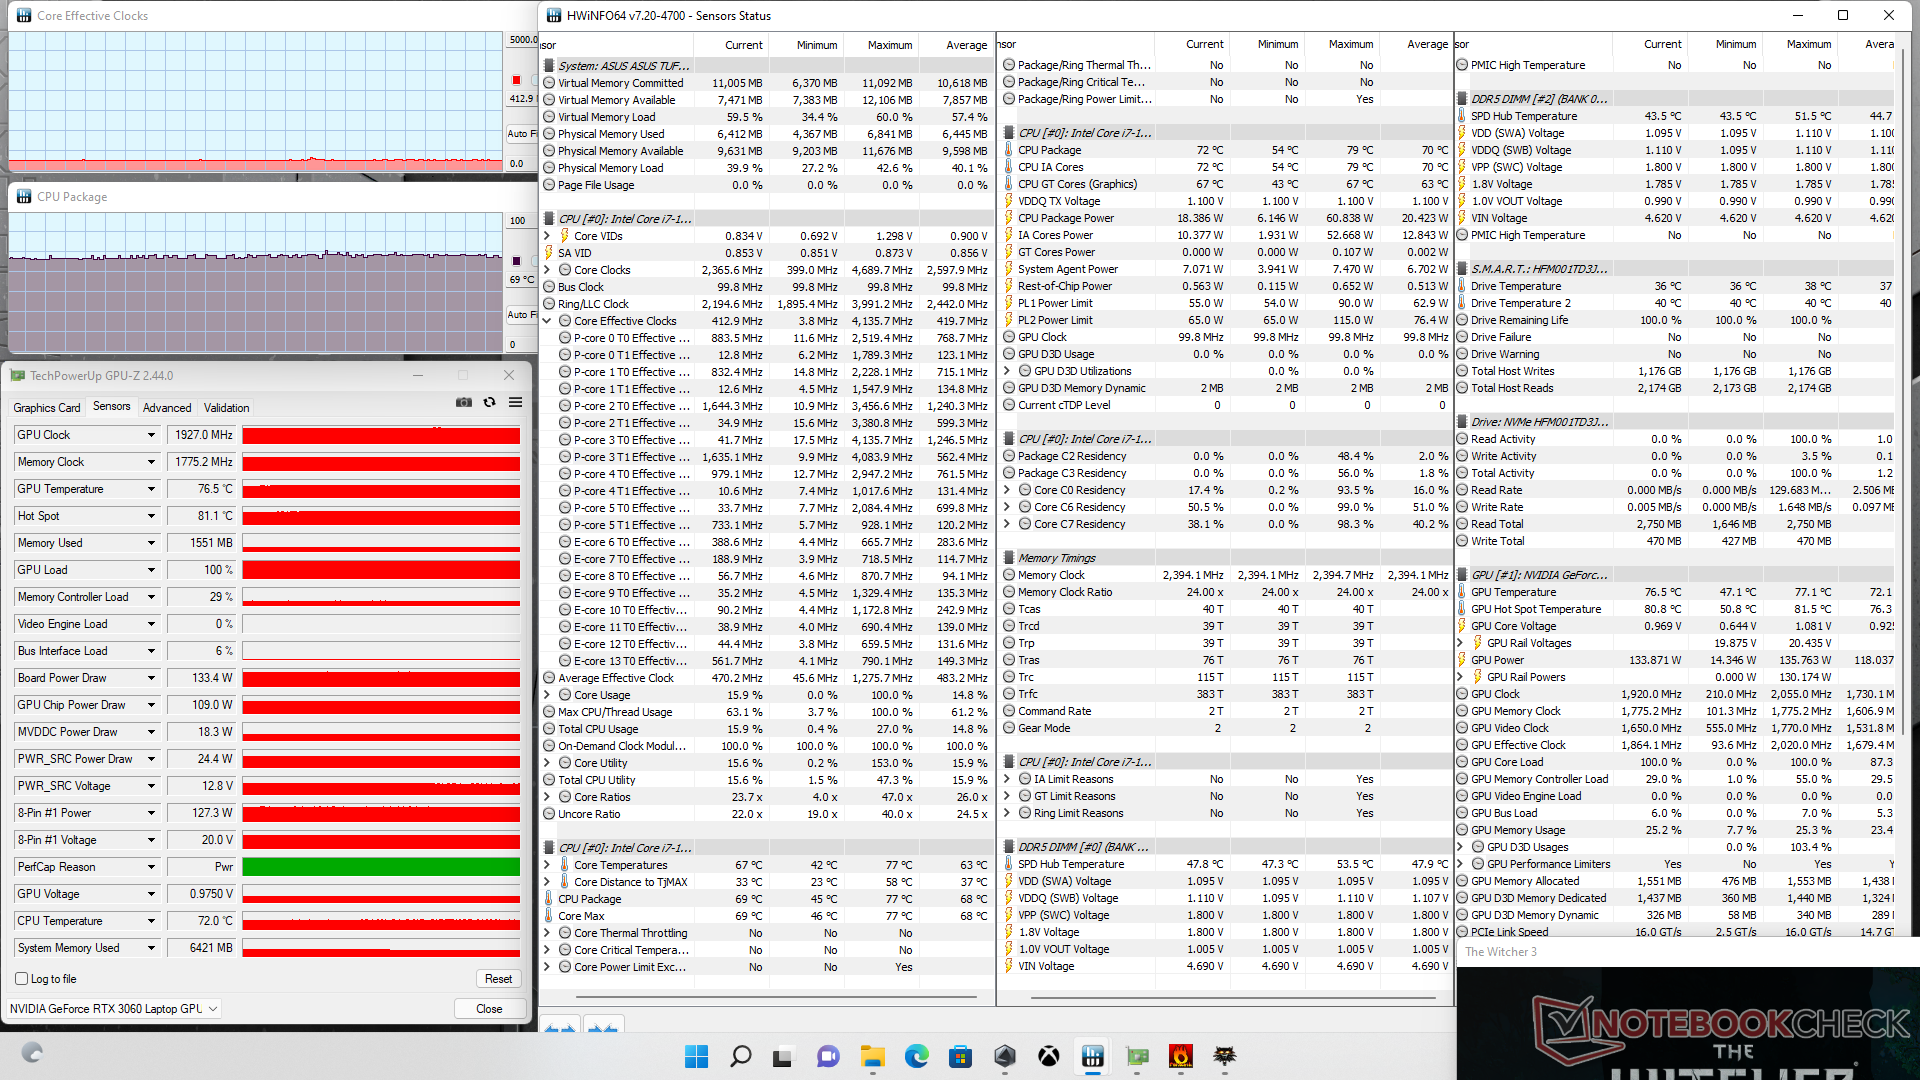
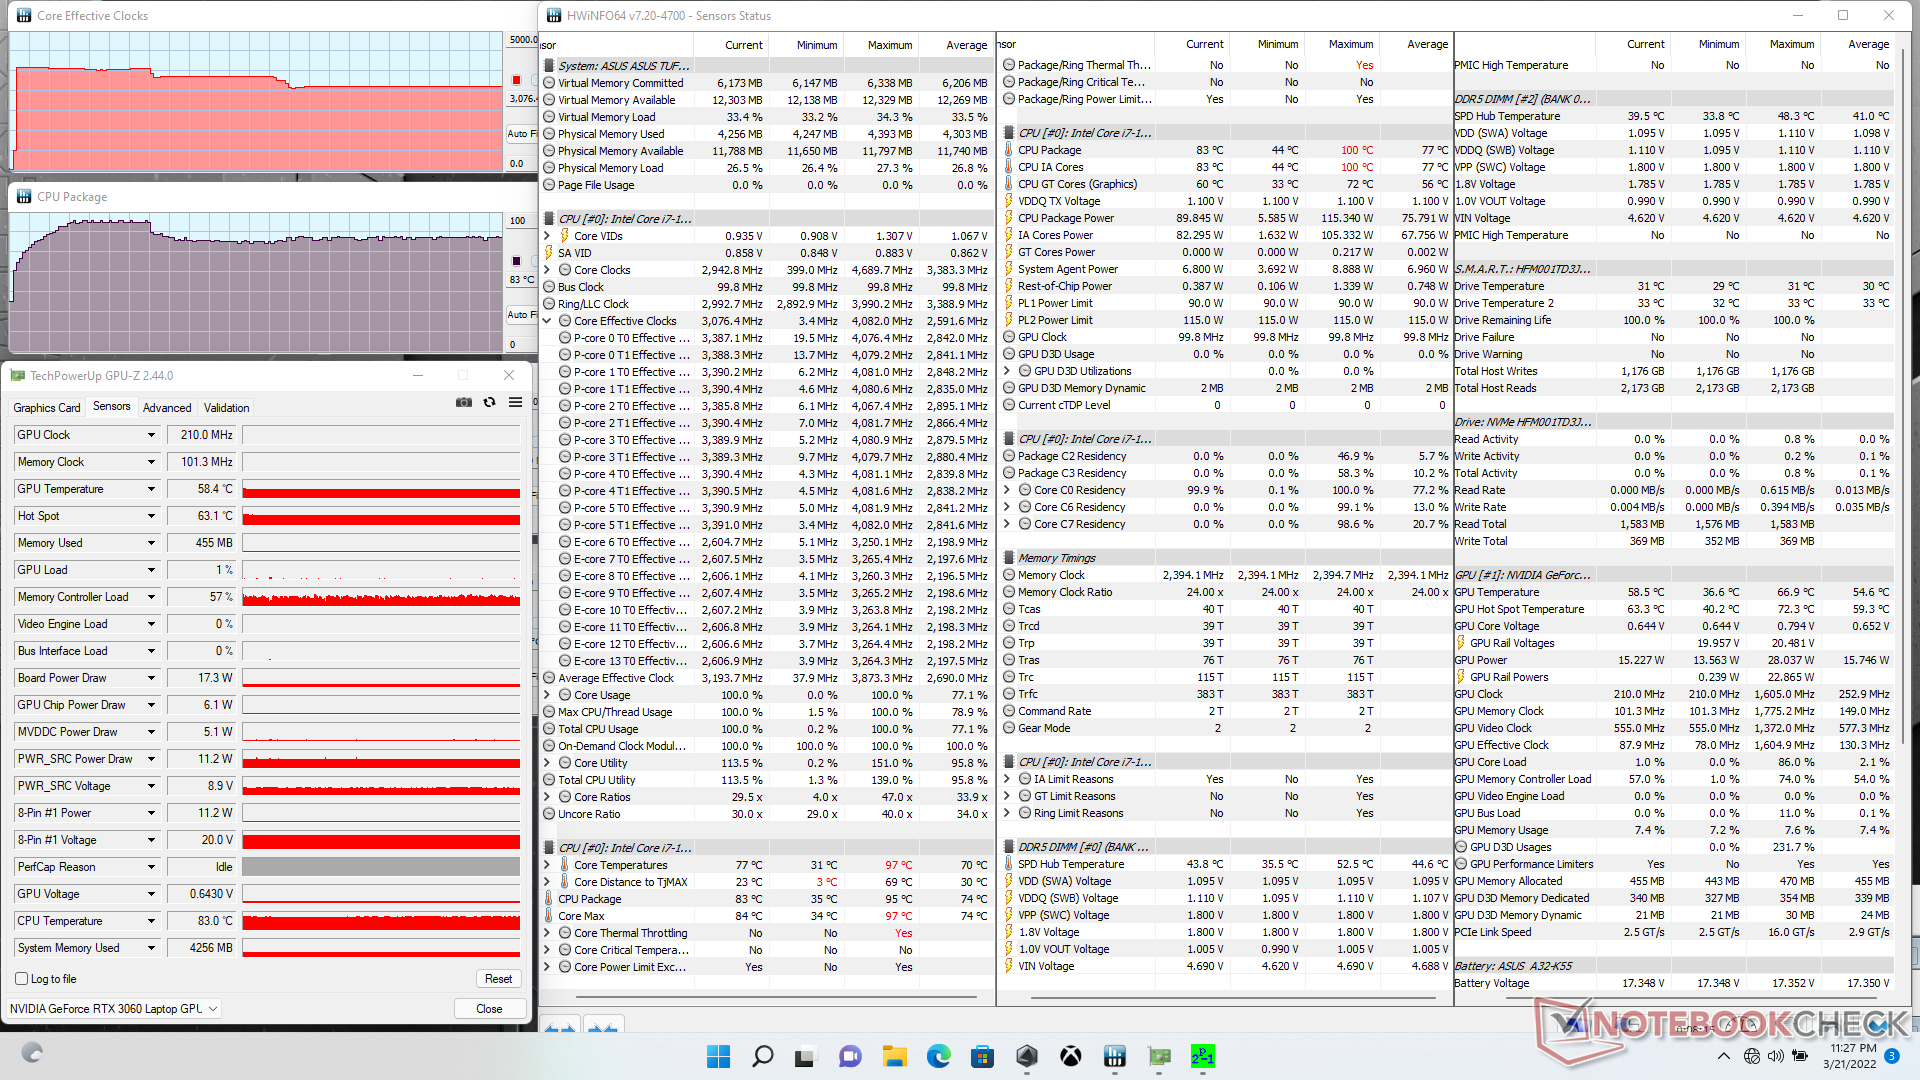
| CPU时钟(GHz) | GPU时钟(MHz) | CPU平均温度(℃) | GPU平均温度(℃) | |
| 系统空闲 | -- | -- | 35 | 37 |
| Prime95压力 | 3.1 | -- | 83 | 58 |
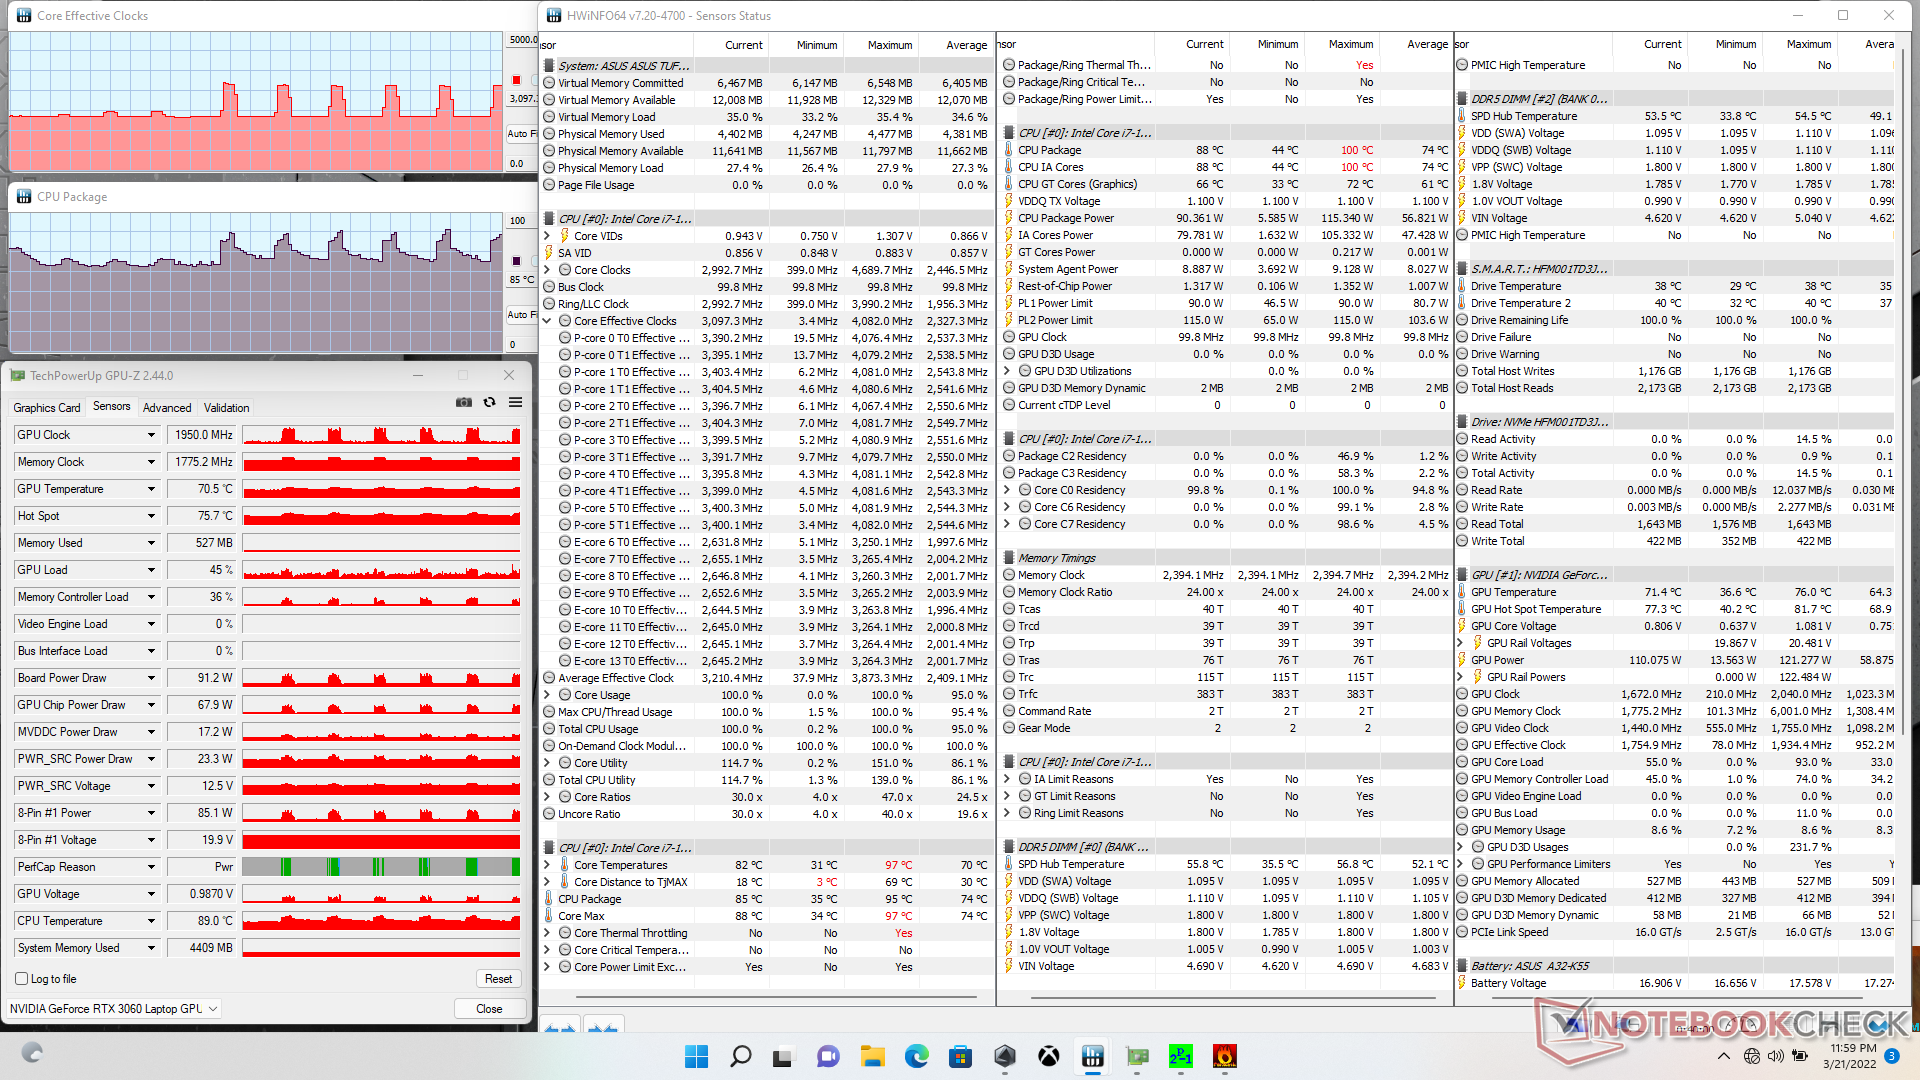
| Prime95 + FurMark 压力 | 2.0 - 3.0 | 450 - 2000 | 66 - 89 | 58 - 72 |
| Witcher 3 应力 | 0.412 | 1927 | 69 | 77 |
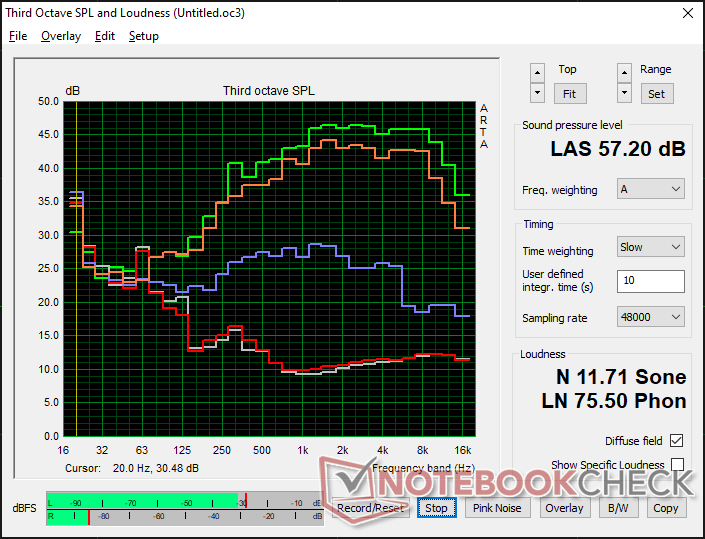
发言人
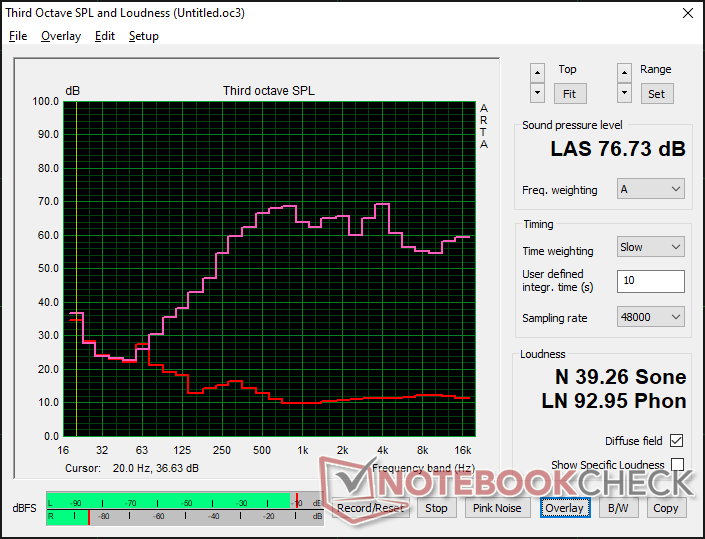
Asus TUF Gaming F15 FX507ZM audio analysis
(±) | speaker loudness is average but good (76.7 dB)
Bass 100 - 315 Hz
(±) | reduced bass - on average 13.7% lower than median
(±) | linearity of bass is average (10.1% delta to prev. frequency)
Mids 400 - 2000 Hz
(±) | higher mids - on average 5.2% higher than median
(+) | mids are linear (4.9% delta to prev. frequency)
Highs 2 - 16 kHz
(+) | balanced highs - only 4.1% away from median
(±) | linearity of highs is average (8.6% delta to prev. frequency)
Overall 100 - 16.000 Hz
(±) | linearity of overall sound is average (15.9% difference to median)
Compared to same class
» 38% of all tested devices in this class were better, 7% similar, 56% worse
» The best had a delta of 6%, average was 18%, worst was 132%
Compared to all devices tested
» 25% of all tested devices were better, 5% similar, 70% worse
» The best had a delta of 4%, average was 23%, worst was 134%
Apple MacBook Pro 16 2021 M1 Pro audio analysis
(+) | speakers can play relatively loud (84.7 dB)
Bass 100 - 315 Hz
(+) | good bass - only 3.8% away from median
(+) | bass is linear (5.2% delta to prev. frequency)
Mids 400 - 2000 Hz
(+) | balanced mids - only 1.3% away from median
(+) | mids are linear (2.1% delta to prev. frequency)
Highs 2 - 16 kHz
(+) | balanced highs - only 1.9% away from median
(+) | highs are linear (2.7% delta to prev. frequency)
Overall 100 - 16.000 Hz
(+) | overall sound is linear (4.6% difference to median)
Compared to same class
» 0% of all tested devices in this class were better, 0% similar, 100% worse
» The best had a delta of 5%, average was 17%, worst was 45%
Compared to all devices tested
» 0% of all tested devices were better, 0% similar, 100% worse
» The best had a delta of 4%, average was 23%, worst was 134%
能源管理--对硬件的全面要求更高
消耗功率
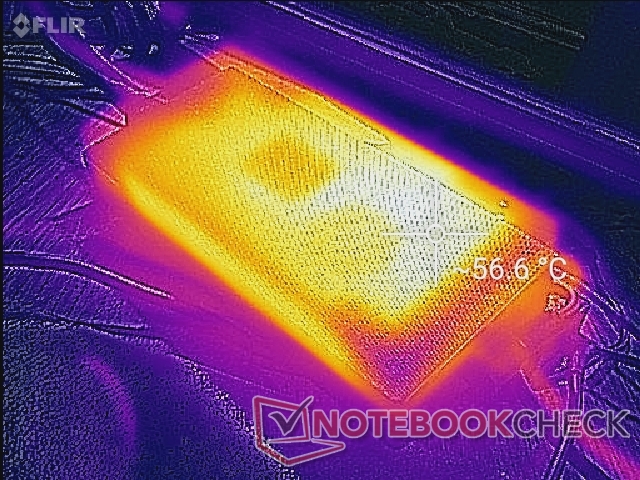
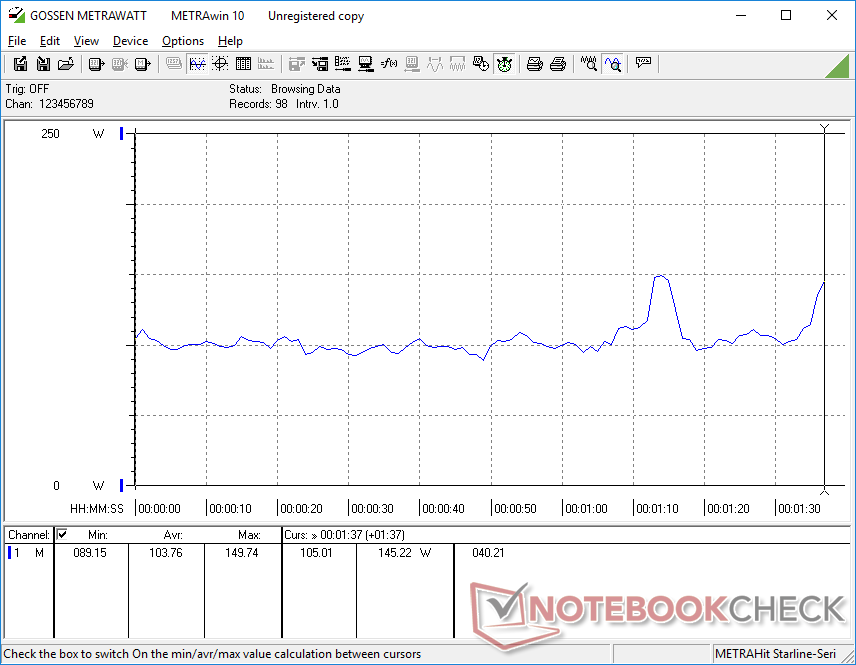
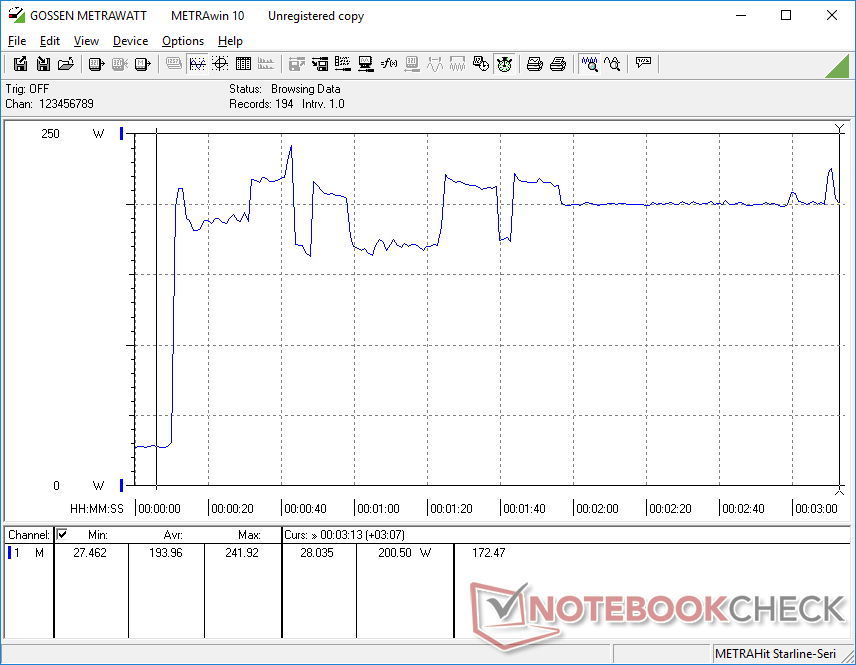
总体消耗量比前一年的模型记录的要高。这是可以预期的,因为英特尔新的第12代CPU有更高的功率需求,更高的RTX 3060 TGP,以及FX507更大的内部冷却方案。运行 Witcher 3与2021年的华硕FX506相比,耗电量同比增加约20%,图形性能提升10%至20%。
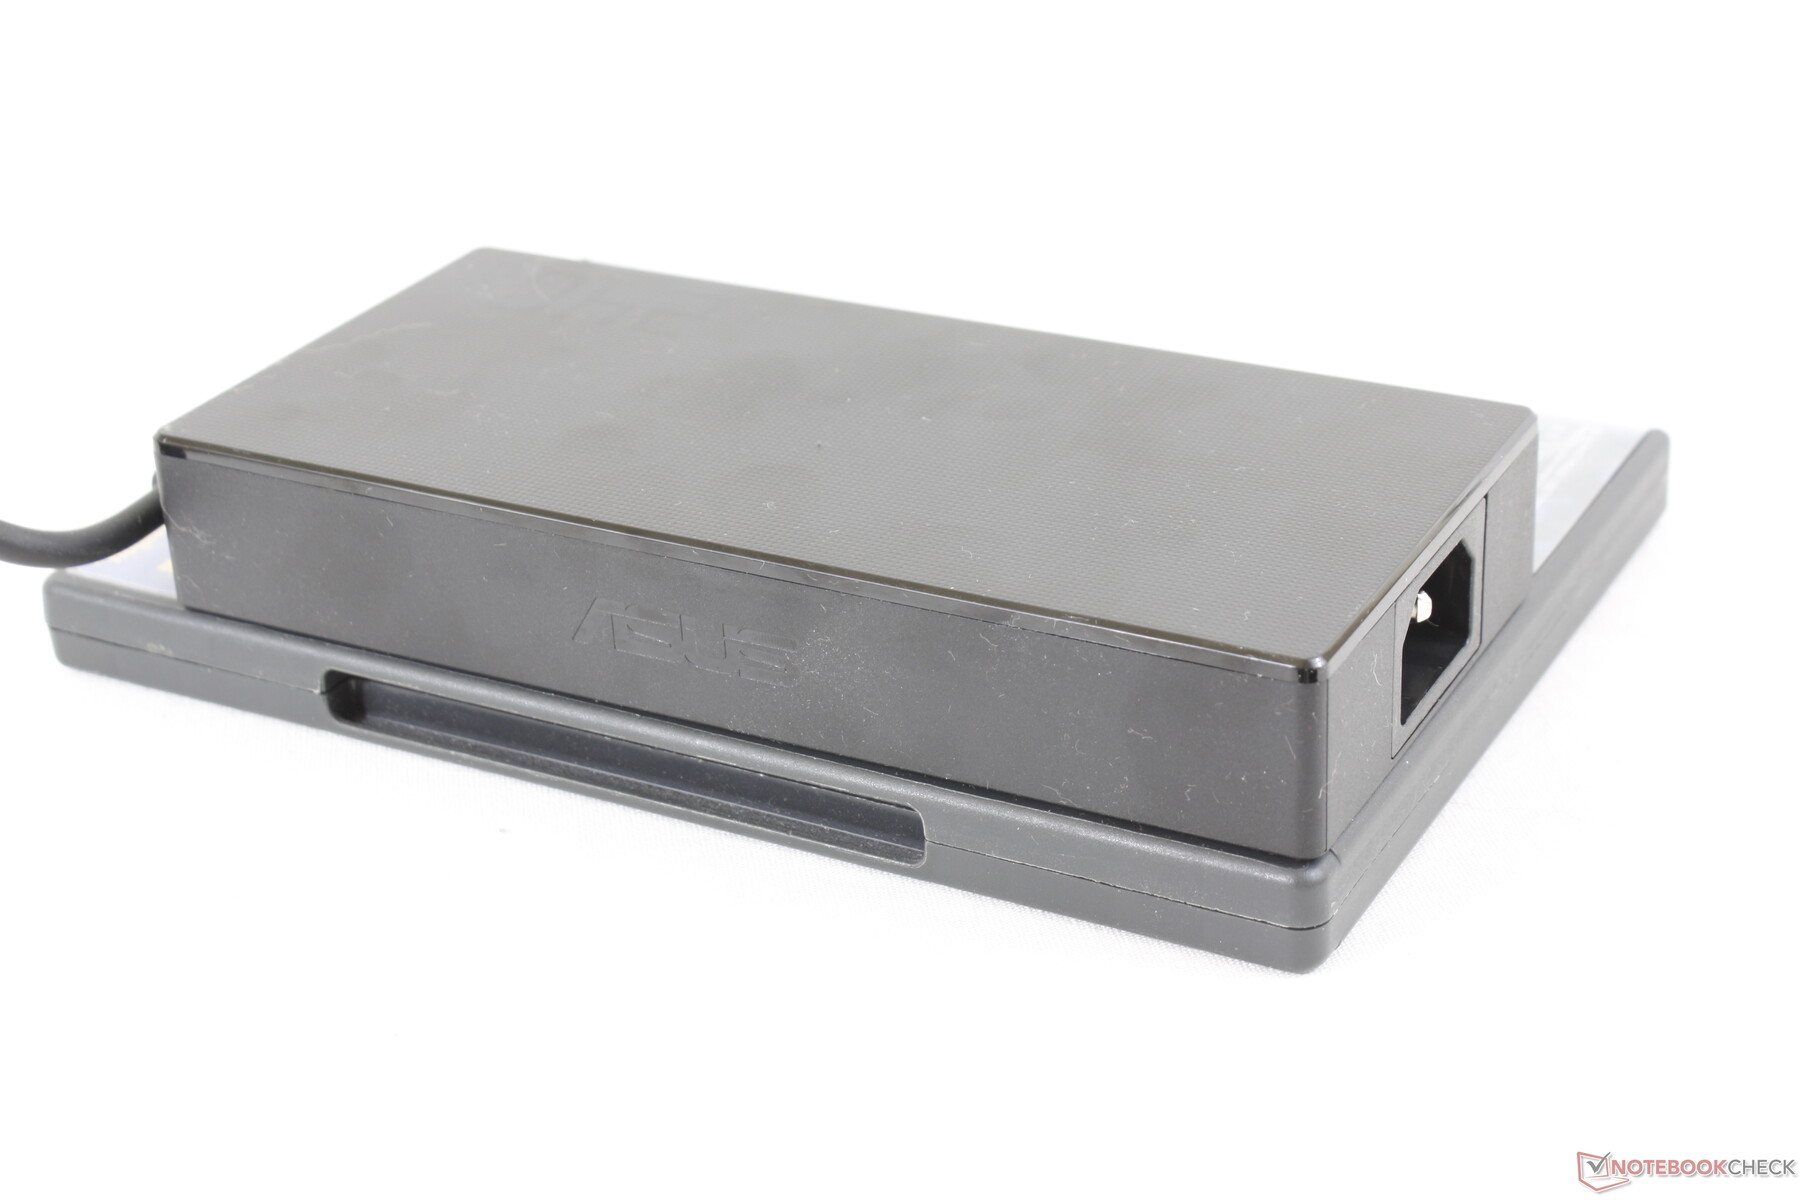
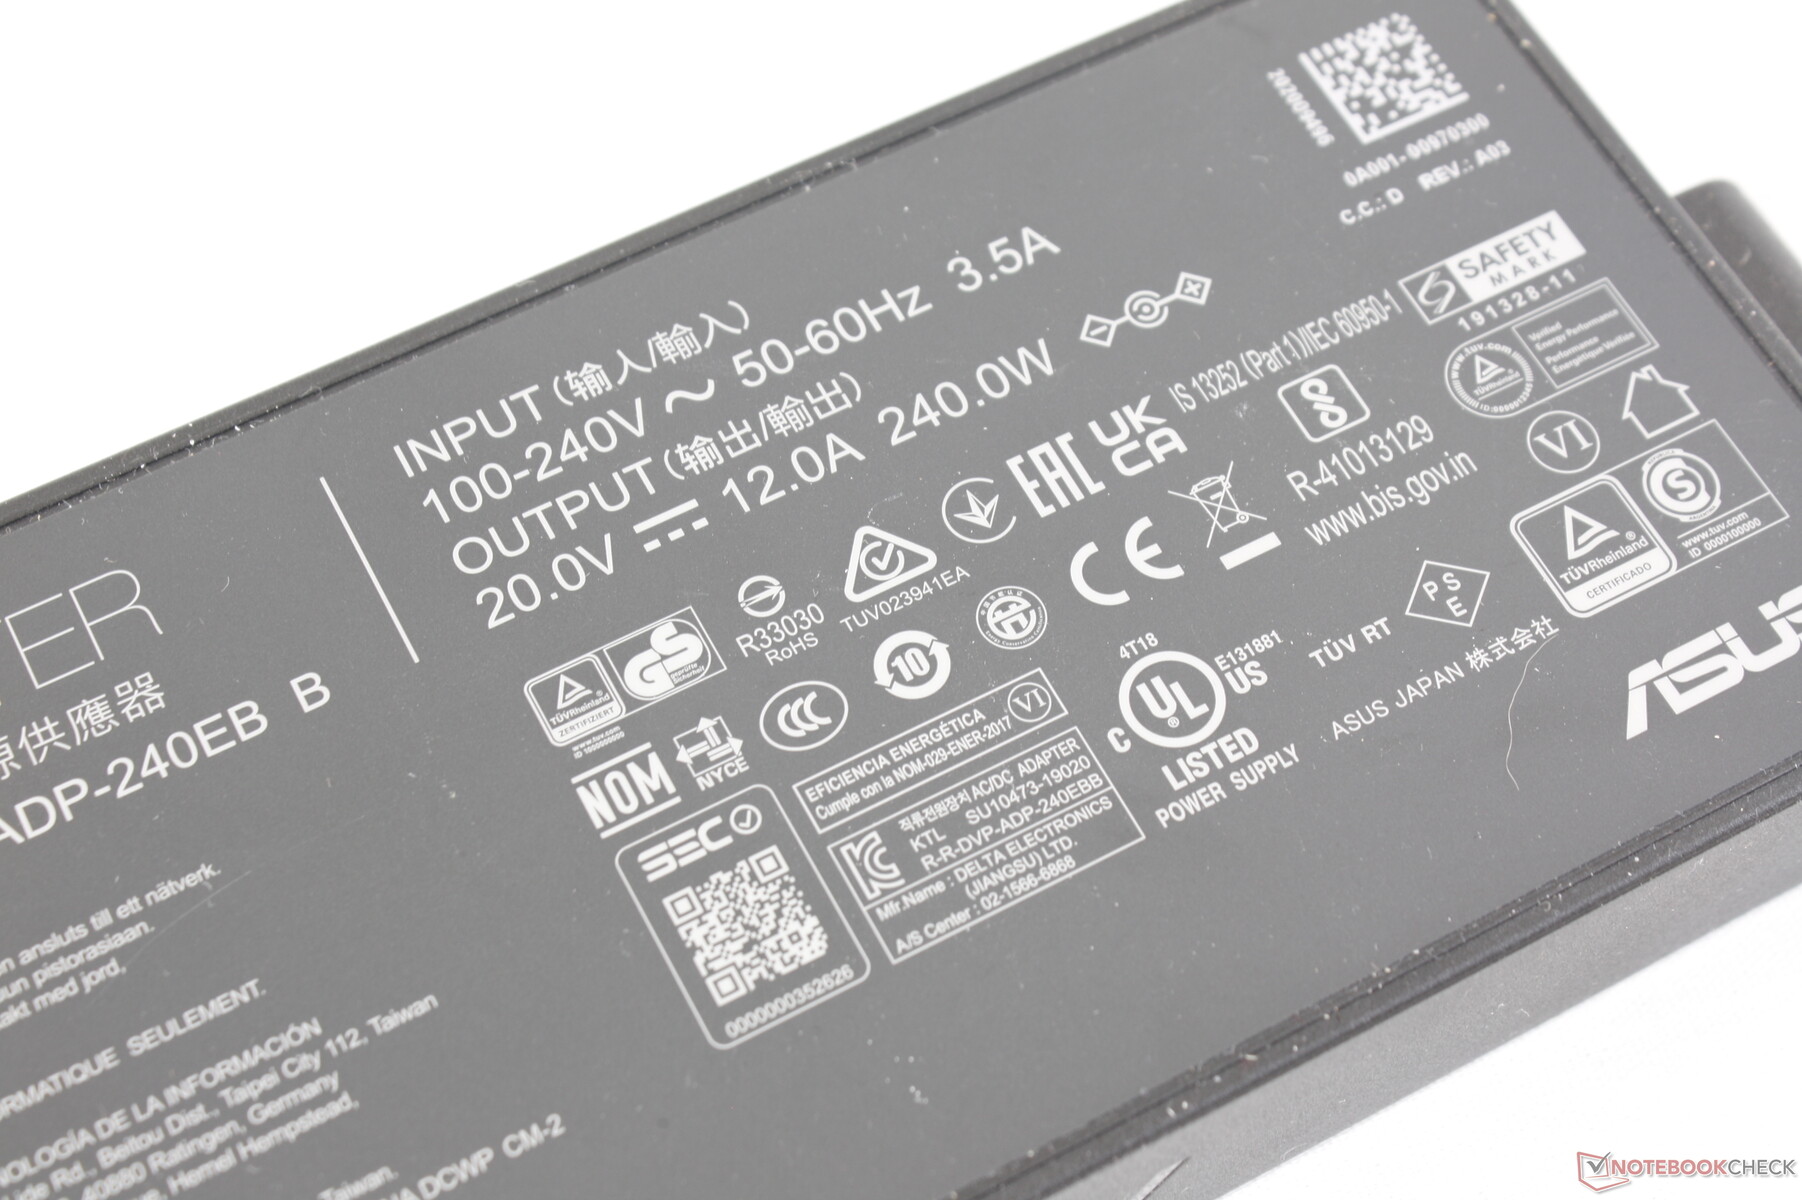
与FX506配备的200W交流适配器相比,FX507配备了更高功率的240W交流适配器,以更好地适应更耗电的内部设备。新的适配器随后比旧的适配器更大(约16.5 x 7.6 x 2.6厘米,而约15.1 x 7.2 x 2.3厘米)。
| Off / Standby | |
| Idle | |
| Load |
|
Key:
min: | |
| Asus TUF Gaming F15 FX507ZM i7-12700H, GeForce RTX 3060 Laptop GPU, SK Hynix HFM001TD3JX013N, IPS, 1920x1080, 15.6" | Asus TUF Gaming F15 FX506HM i7-11800H, GeForce RTX 3060 Laptop GPU, SK Hynix HFM001TD3JX013N, IPS, 1920x1080, 15.6" | Asus TUF Dash F15 FX516PR i7-11370H, GeForce RTX 3070 Laptop GPU, SK Hynix HFM001TD3JX013N, IPS, 1920x1080, 15.6" | Asus ROG Strix Scar 15 G533QS R9 5900HX, GeForce RTX 3080 Laptop GPU, ADATA Swordfish 2 TB, IPS, 2560x1440, 15.6" | Asus Zephyrus S15 GX502L i7-10875H, GeForce RTX 2070 Super Mobile, WDC PC SN730 SDBPNTY-1T00, IPS, 1920x1080, 15.6" | Asus ZenBook Pro Duo UX582 LR-1BH2 i7-10870H, GeForce RTX 3070 Laptop GPU, Samsung PM981a MZVLB1T0HBLR, OLED + IPS, 3840x2160, 15.6" | |
|---|---|---|---|---|---|---|
| Power Consumption | -2% | 9% | -24% | -12% | -4% | |
| Idle Minimum * (Watt) | 6.3 | 9.5 -51% | 9 -43% | 11.2 -78% | 7 -11% | 9 -43% |
| Idle Average * (Watt) | 9.8 | 12.1 -23% | 11 -12% | 16.4 -67% | 13 -33% | 14 -43% |
| Idle Maximum * (Watt) | 26.5 | 22.5 15% | 16 40% | 29.4 -11% | 25 6% | 15 43% |
| Load Average * (Watt) | 103.8 | 99.5 4% | 107 -3% | 106.2 -2% | 148 -43% | 107.2 -3% |
| Witcher 3 ultra * (Watt) | 189 | 157 17% | 121 36% | 189 -0% | 175 7% | 156 17% |
| Load Maximum * (Watt) | 241.9 | 173.5 28% | 162 33% | 213.6 12% | 232 4% | 235 3% |
* ... smaller is better
Power Consumption Witcher 3 / Stresstest
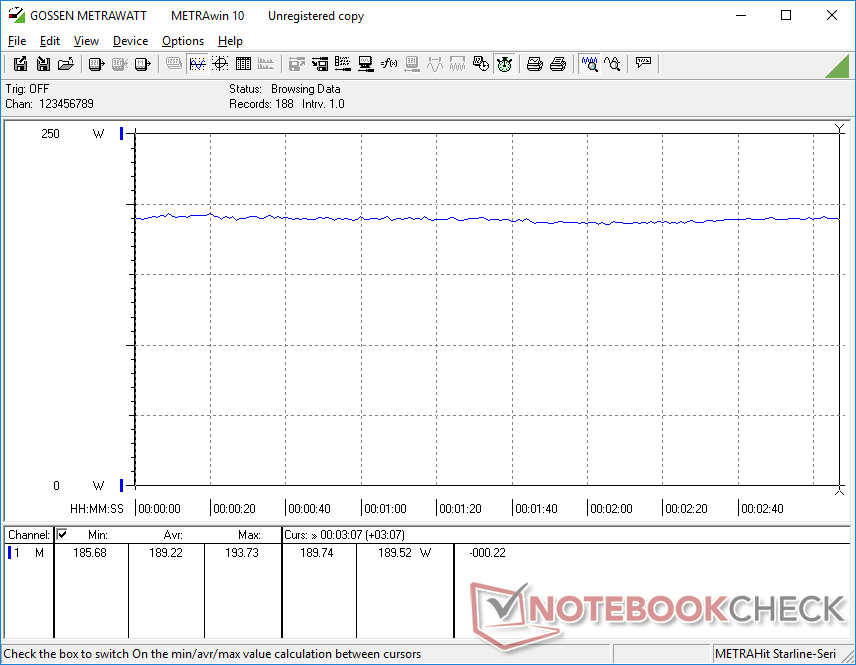
Power Consumption external Monitor
电池寿命--比上一代机型更短
WLAN运行时间比我们在去年的型号上记录的时间短了几个小时,尽管它们之间携带相同的90Wh容量的电池。我们在MSHybrid激活的平衡电源配置文件上测试了两次,取得了相同的结果。年复一年的较短的WLAN运行时间与我们观察到的两款机型之间的情况一致。 2021年Razer Blade 15和 2022年的Razer Blade 15.
用附带的交流适配器从空到满的充电需要大约90分钟。不幸的是,这个模型不支持USB-C充电,这与Razer Blade系列或MSI GS系列不同。
| Asus TUF Gaming F15 FX507ZM i7-12700H, GeForce RTX 3060 Laptop GPU, 90 Wh | Asus TUF Gaming F15 FX506HM i7-11800H, GeForce RTX 3060 Laptop GPU, 90 Wh | Asus TUF Dash F15 FX516PR i7-11370H, GeForce RTX 3070 Laptop GPU, 76 Wh | Asus ROG Strix Scar 15 G533QS R9 5900HX, GeForce RTX 3080 Laptop GPU, 90 Wh | Asus Zephyrus S15 GX502L i7-10875H, GeForce RTX 2070 Super Mobile, 76 Wh | Asus ZenBook Pro Duo UX582 LR-1BH2 i7-10870H, GeForce RTX 3070 Laptop GPU, 92 Wh | |
|---|---|---|---|---|---|---|
| Battery runtime | 39% | 46% | 16% | -15% | 36% | |
| Reader / Idle (h) | 15.8 | 11 -30% | 16 1% | 11.1 -30% | 8.7 -45% | |
| WiFi v1.3 (h) | 4.8 | 7.9 65% | 9.1 90% | 7.3 52% | 3 -37% | 7.4 54% |
| Load (h) | 1.1 | 2 82% | 1.4 27% | 1.5 36% | 1.3 18% | |
| H.264 (h) | 8.2 |
Pros
Cons
结论 - 140 WGeForce RTX 3060图形
除了所有的机箱更新外,FX507最引人注目的是其更高的TGP目标,即140W,而上一代产品只有95W。 而FX506.由于Nvidia尚未推出移动RTX 3000系列的继任者,今年各地的PC制造商都在使用相同的GeForce GPU。因此,为了从相同的GPU提供更好的图形性能,FX507必须比FX506消耗更多的电力。其结果是 GeForce RTX 3060笔记本电脑比目前配备相同GPU的大多数其他笔记本电脑更快。
为了减轻更耗电的系统所带来的一些后果,华硕升级了散热方案,以控制温度和风扇噪音。随后,尽管FX507的整体重量较轻,但其温度和噪音并没有明显高于前代产品。
FX507的处理器要求更高,这直接影响了电池寿命和AC适配器的尺寸。在大多数情况下,不要指望运行时间会比FX506更长,而且要准备好携带比以前更大的交流电适配器。不幸的是,该系统不能通过第三方USB-C适配器进行充电。
键盘和点击板的变化是一个混合包,考虑到深灰色字体与深色键帽的对比度很差。拖放操作在上一代机型上更容易,因为它有专用的鼠标按钮。
价格和可用性
华硕TUF游戏机F15 FX507ZM的评测是,现在在亚马逊上有售。为1750美元。
Asus TUF Gaming F15 FX507ZM
- 03/26/2022 v7 (old)
Allen Ngo
Price comparison

