Eurocom Raptor X15回顾。笔记本电脑中的LGA1700酷睿i7-12700K
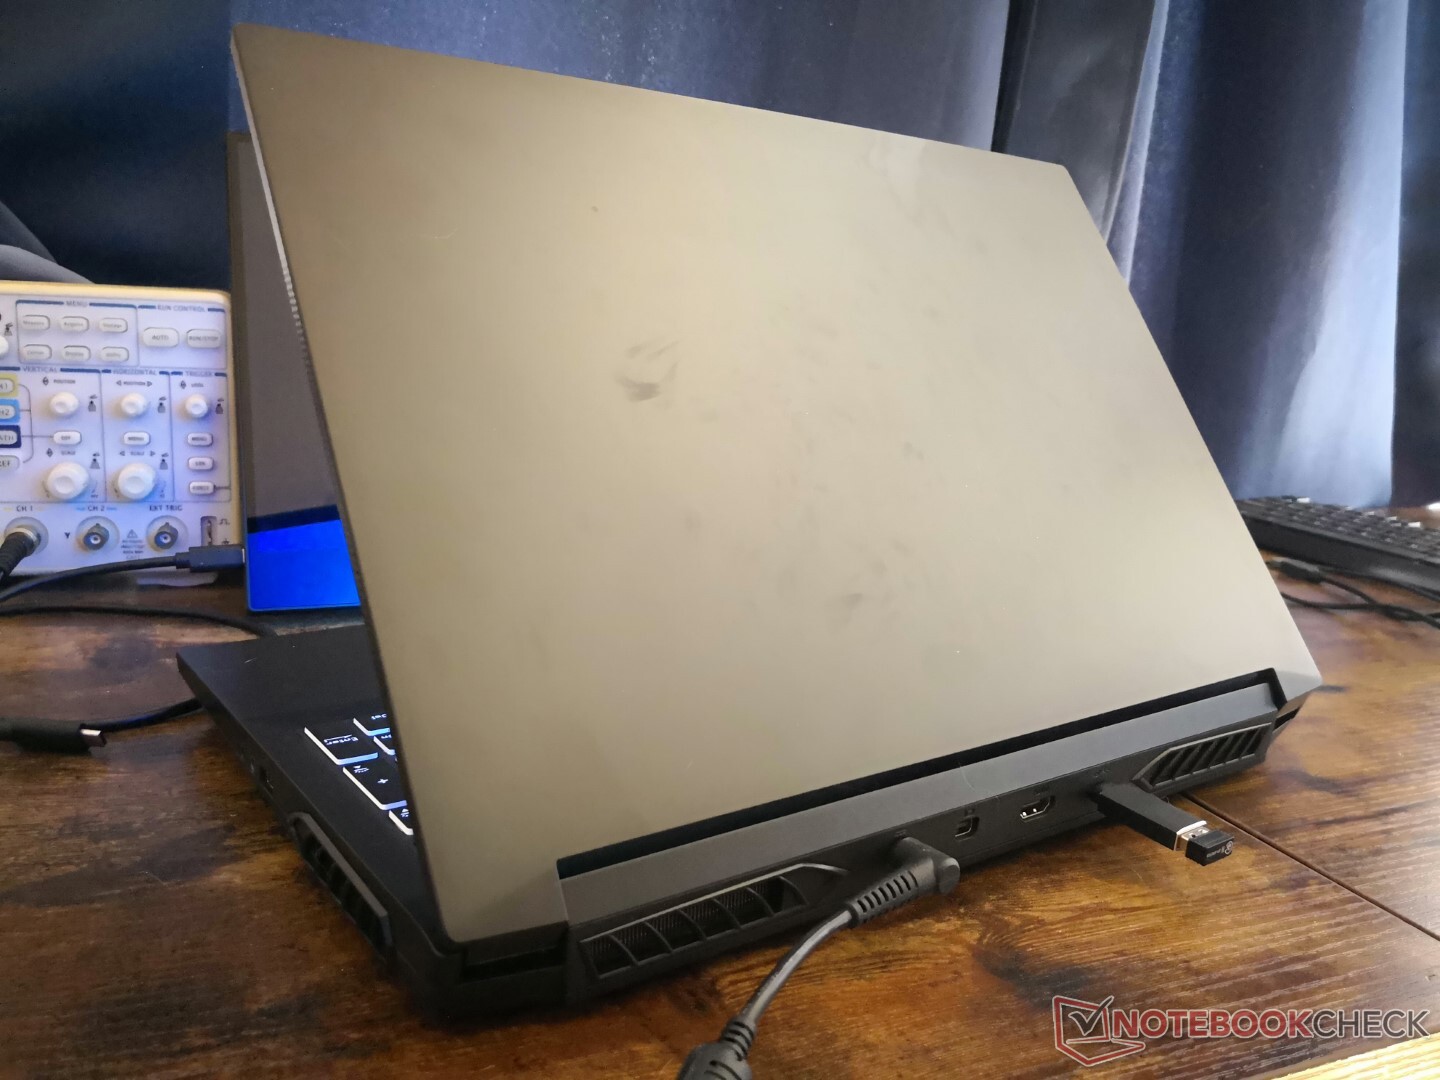
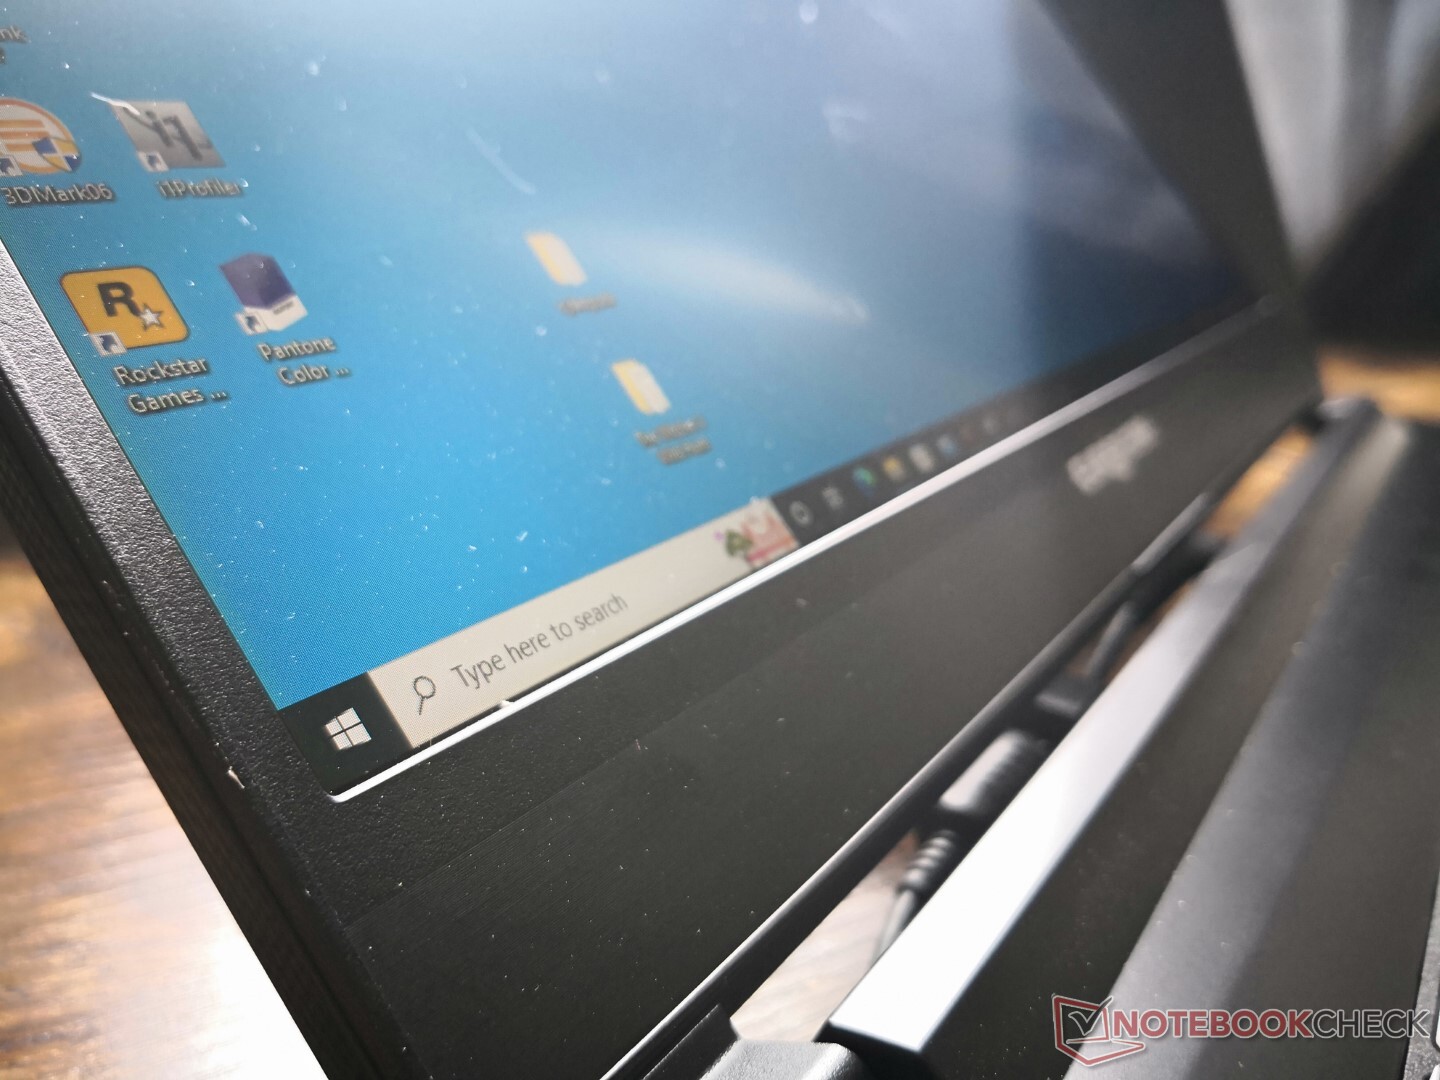
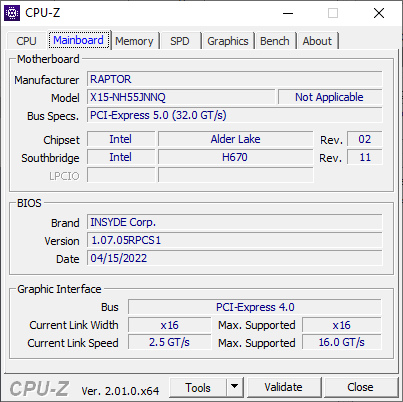
猛禽X15的机箱是Clevo NH57AF1,Schenker也将其用于XMG Apex 15笔记本电脑。因此,我们建议查看我们的 我们建议查看我们的 "Schenker评论 "页面因为我们对该型号的端口和整体设计的评论都适用于Raptor X15。本页将专注于Raptor X15的性能,以及当应用于笔记本电脑外形时,用户可以从12代酷睿i7-12700K CPU中获得什么。
Raptor X15与其他非超薄发烧级15.6英寸游戏笔记本竞争,如 微星GE66, 技嘉A5 X1, 华硕TUF游戏A15, 或 联想Legion 5 15.然而,一个关键的区别因素是它使用了一个LGA1700插座的台式机CPU,而不是典型的移动H系列处理器。
更多欧洲通信公司的评论。
潜在的竞争对手比较
Rating | Date | Model | Weight | Height | Size | Resolution | Price |
|---|---|---|---|---|---|---|---|
| 86.1 % v7 (old) | 06 / 2022 | Eurocom Raptor X15 i7-12700K, GeForce RTX 3070 Ti Laptop GPU | 2.7 kg | 32.5 mm | 15.60" | 1920x1080 | |
| 87.4 % v7 (old) | 06 / 2022 | MSI Raider GE66 12UHS i9-12900HK, GeForce RTX 3080 Ti Laptop GPU | 2.4 kg | 23.4 mm | 15.60" | 3840x2160 | |
| 88.3 % v7 (old) | 05 / 2022 | Razer Blade 15 Advanced Model Early 2022 i7-12800H, GeForce RTX 3080 Ti Laptop GPU | 2.1 kg | 16.99 mm | 15.60" | 1920x1080 | |
| 85.2 % v7 (old) | 03 / 2022 | Eurocom RX315 NH57AF1 i7-11800H, GeForce RTX 3070 Laptop GPU | 2 kg | 20 mm | 15.60" | 1920x1080 | |
| 84.1 % v7 (old) | 01 / 2022 | Gigabyte A5 X1 R9 5900HX, GeForce RTX 3070 Laptop GPU | 2.2 kg | 25.3 mm | 15.60" | 1920x1080 | |
| 85 % v7 (old) | Asus TUF Gaming A15 FA506QR-AZ061T R7 5800H, GeForce RTX 3070 Laptop GPU | 2.3 kg | 24 mm | 15.60" | 1920x1080 |
案例
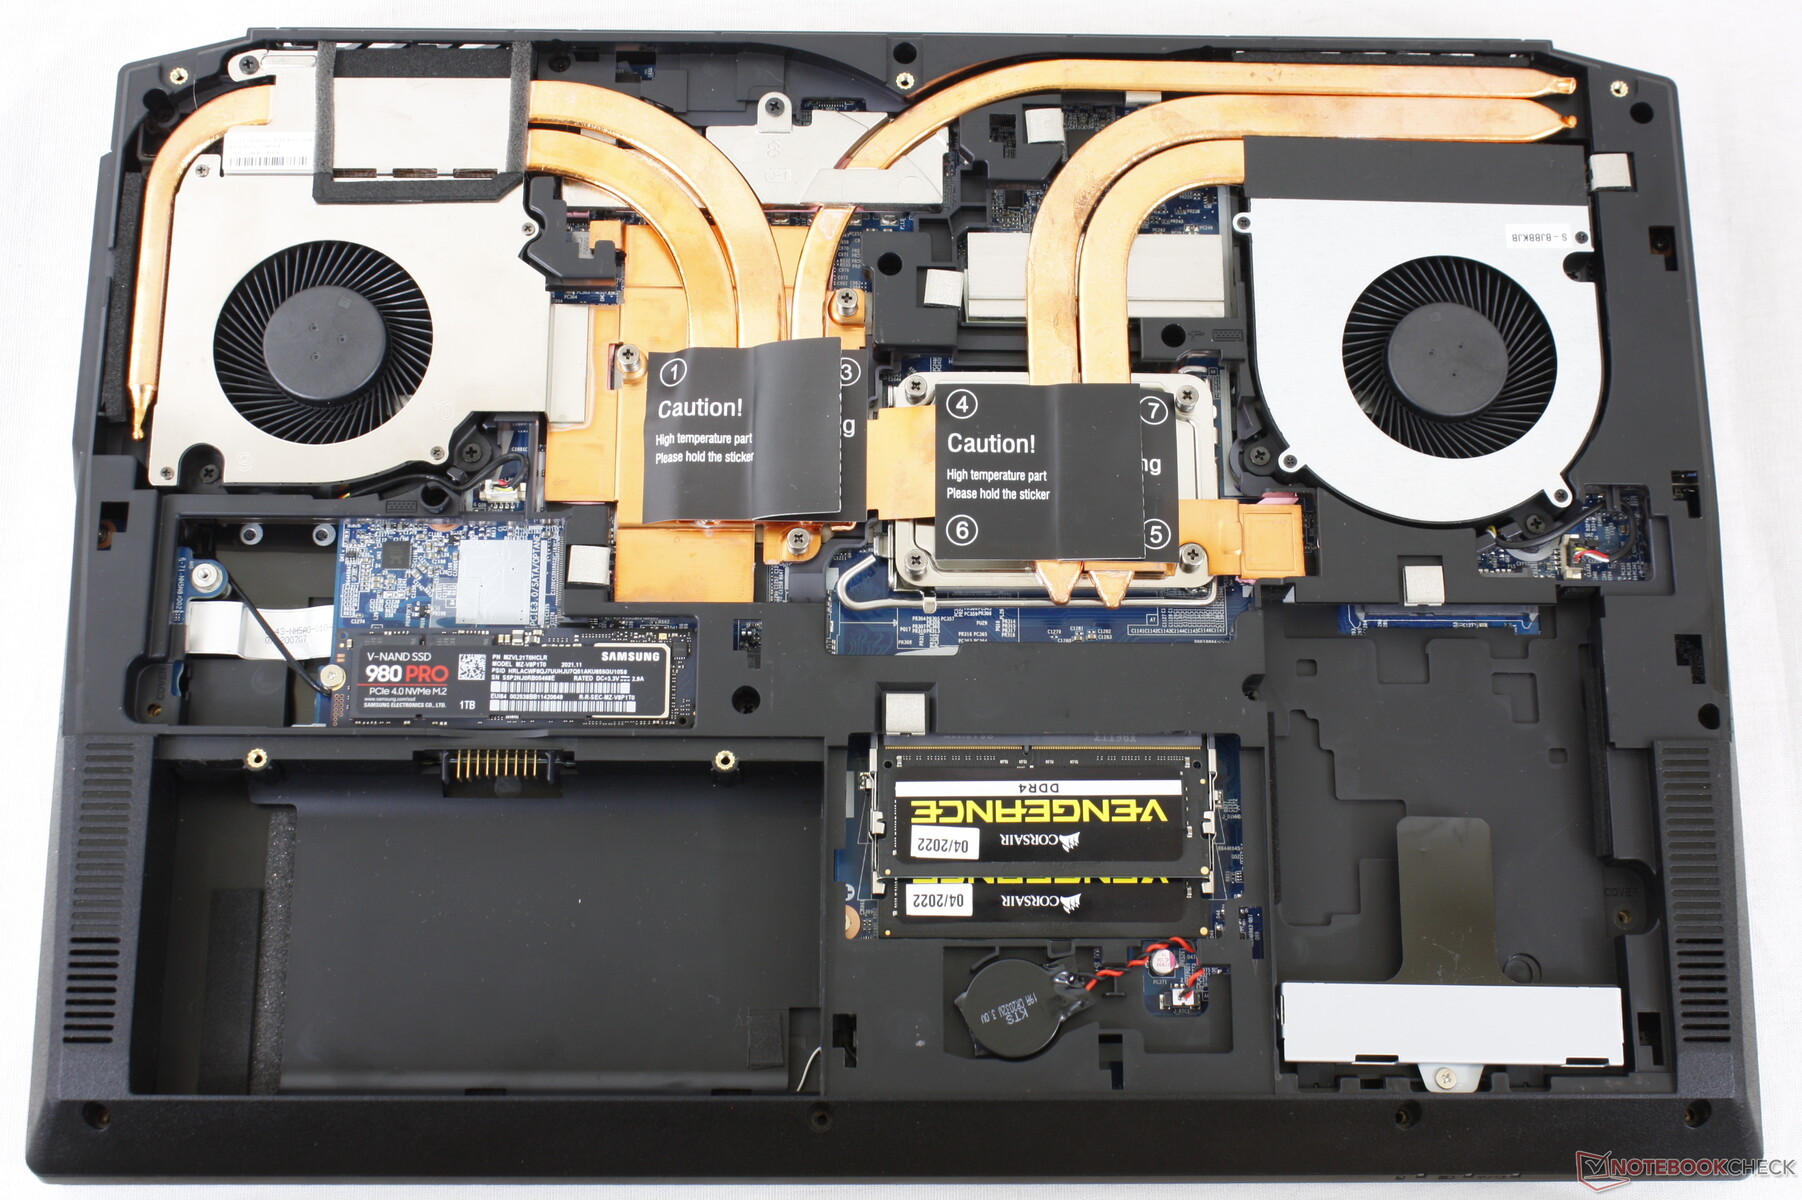
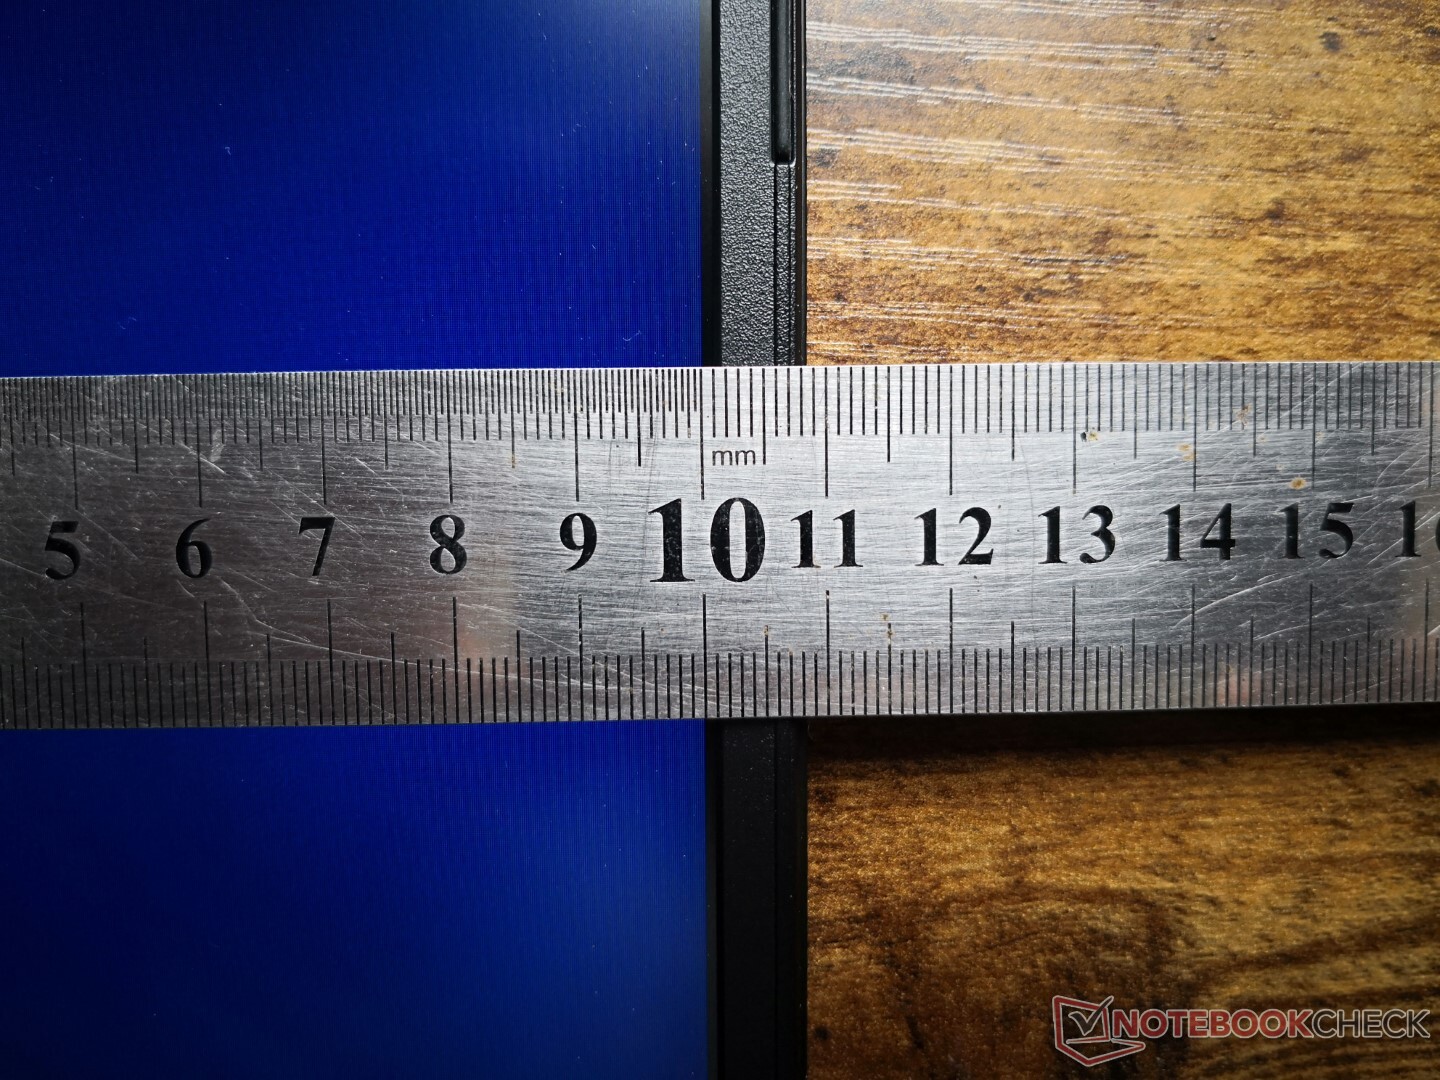
猛禽X15的重量为2.7公斤,厚度为32.5毫米,比大多数其他15.6英寸的游戏笔记本(包括微星GE66或华硕TUF游戏A15)更重、更厚。额外的重量可以部分归因于需要更庞大的冷却解决方案来充分容纳和冷却LGA1700插座和处理器。
连接性
端口选项是多样的,与Schenker XMG Apex 15相同。请注意,只有一个USB-C端口,支持DisplayPort,但不像许多其他英特尔供电的游戏笔记本电脑,如Razer Blade系列或MSI GS系列,支持Thunderbolt或Power Delivery。
SD卡阅读器
奇怪的是,尽管该模型集成了一个microSD读卡器,而不是一个全尺寸的读卡器,但它的外形尺寸大且相对较厚。传输速度只是平均水平,不到戴尔XPS 15上读卡器速度的一半。 戴尔XPS 15.
| SD Card Reader | |
| average JPG Copy Test (av. of 3 runs) | |
| Dell XPS 15 9510 i5 11400H FHD (AV Pro V60) | |
| Asus ZenBook Flip 14 UN5401QA-KN085W (AV Pro SD microSD 128 GB V60) | |
| Asus Zenbook Pro 15 OLED UM535Q (Toshiba Exceria Pro SDXC 64 GB UHS-II) | |
| Eurocom Raptor X15 (AV Pro V60) | |
| Asus ZenBook 14X OLED UX5400EA-L7154W | |
| maximum AS SSD Seq Read Test (1GB) | |
| Dell XPS 15 9510 i5 11400H FHD (AV Pro V60) | |
| Eurocom Raptor X15 (AV Pro V60) | |
| Asus ZenBook Flip 14 UN5401QA-KN085W (AV Pro SD microSD 128 GB V60) | |
| Asus Zenbook Pro 15 OLED UM535Q (Toshiba Exceria Pro SDXC 64 GB UHS-II) | |
| Asus ZenBook 14X OLED UX5400EA-L7154W | |
沟通
英特尔AX200/201可作为Wi-Fi 6和蓝牙5.2连接的最高端选择。在与我们的华硕GT-AXE11000测试路由器配对时,我们没有遇到任何问题。
不幸的是,Wi-Fi 6E是不兼容的。
| Networking | |
| iperf3 transmit AX12 | |
| Gigabyte A5 X1 | |
| Asus TUF Gaming A15 FA506QR-AZ061T | |
| Eurocom RX315 NH57AF1 | |
| iperf3 receive AX12 | |
| Asus TUF Gaming A15 FA506QR-AZ061T | |
| Gigabyte A5 X1 | |
| Eurocom RX315 NH57AF1 | |
| iperf3 receive AXE11000 | |
| Razer Blade 15 Advanced Model Early 2022 | |
| MSI Raider GE66 12UHS | |
| Eurocom Raptor X15 | |
| iperf3 transmit AXE11000 | |
| Razer Blade 15 Advanced Model Early 2022 | |
| MSI Raider GE66 12UHS | |
| Eurocom Raptor X15 | |
网络摄像头
网络摄像头很差,只有720p,而其他一些游戏笔记本的摄像头是1080p,如 雷蛇刀片15.也不支持Windows Hello。摄像头可以通过F10键以电子方式禁用,以取代物理快门。


维护
配件和保修
零售包装盒包括用于安装额外固态硬盘的螺丝和垫子以及一张驱动光盘。不包括CPU散热膏。
在美国购买时适用标准的一年有限保修,可选择两年和三年的延长保修。
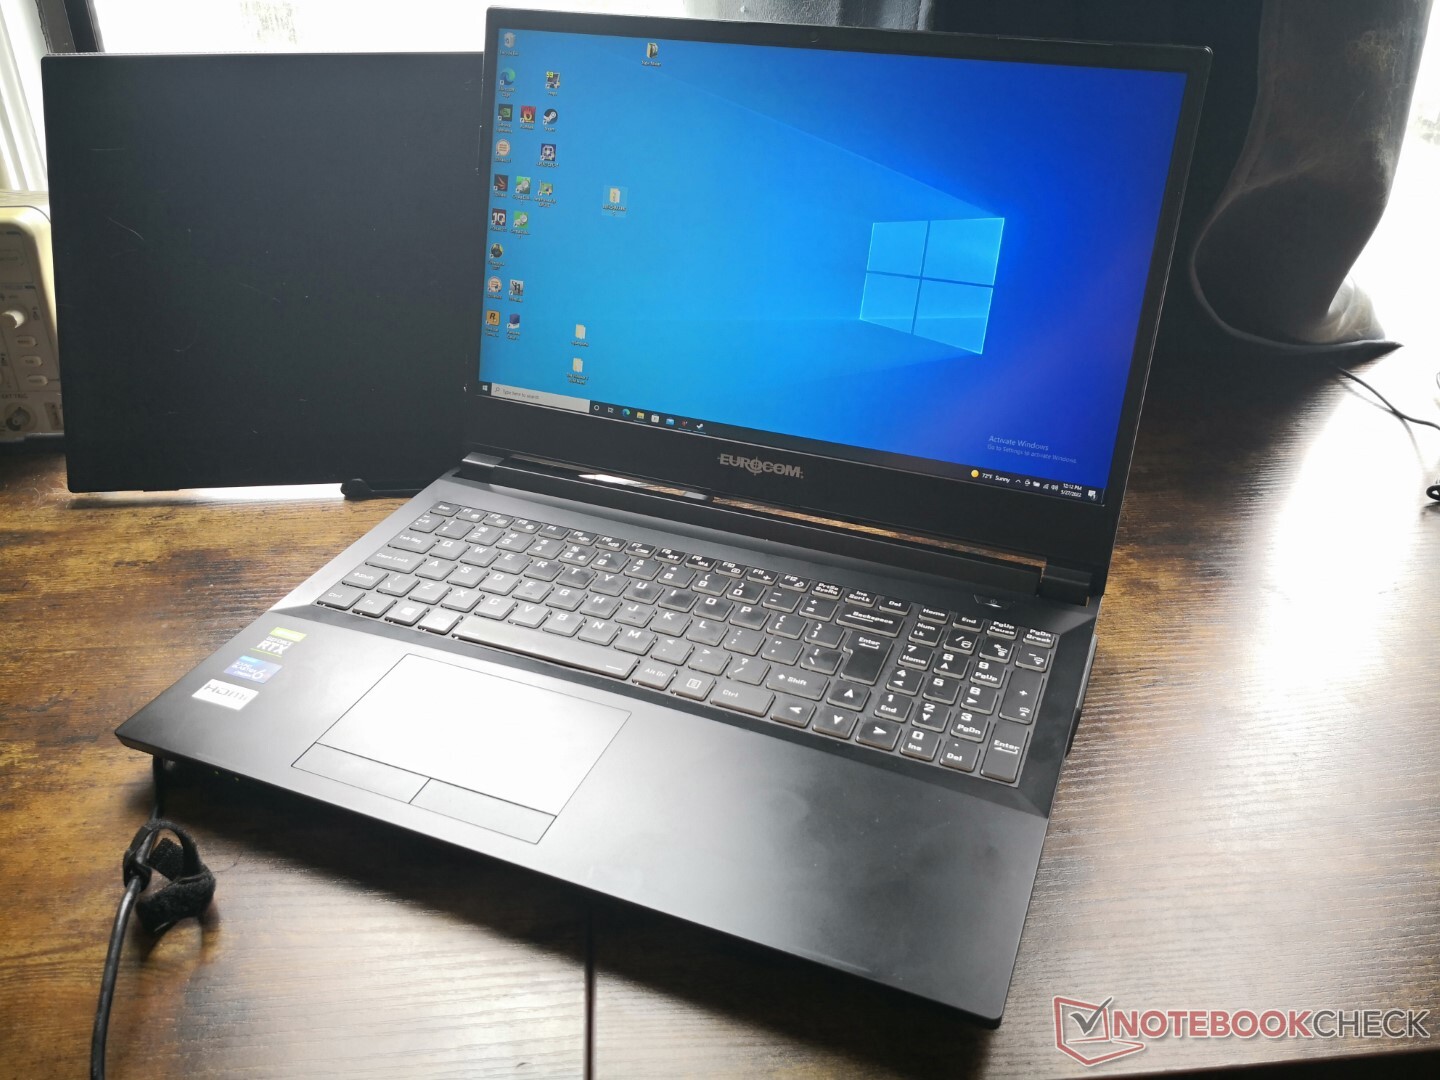
输入设备
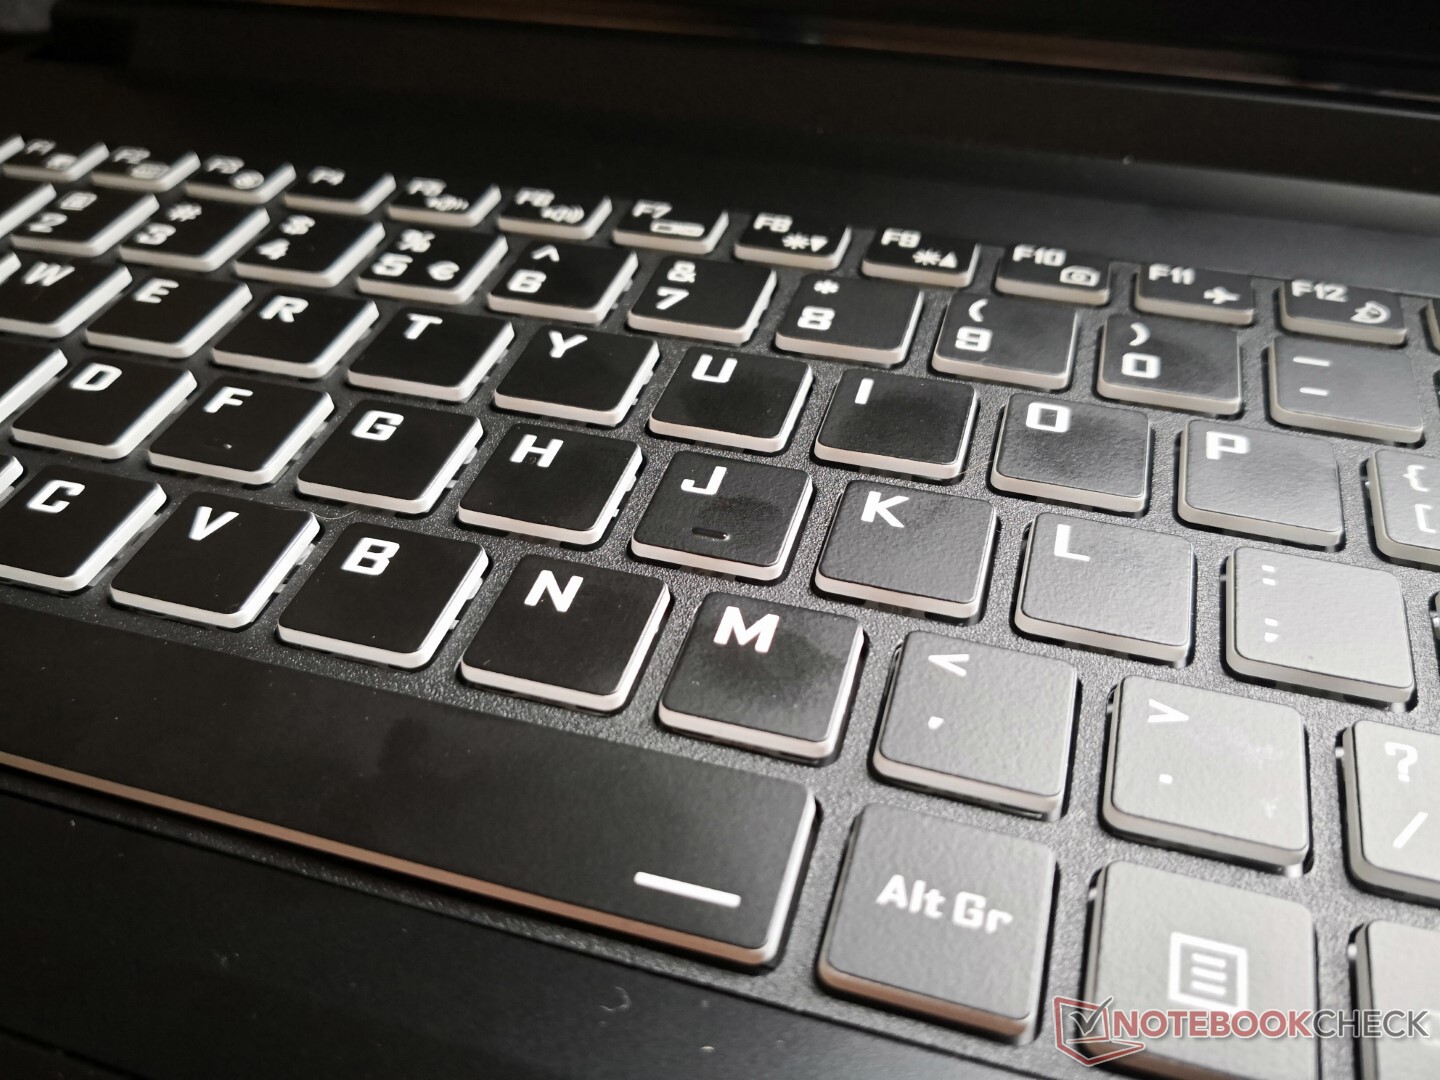
打字的体验很舒适,反馈更有力,但比我们在其他游戏笔记本上习惯的更大的响声。
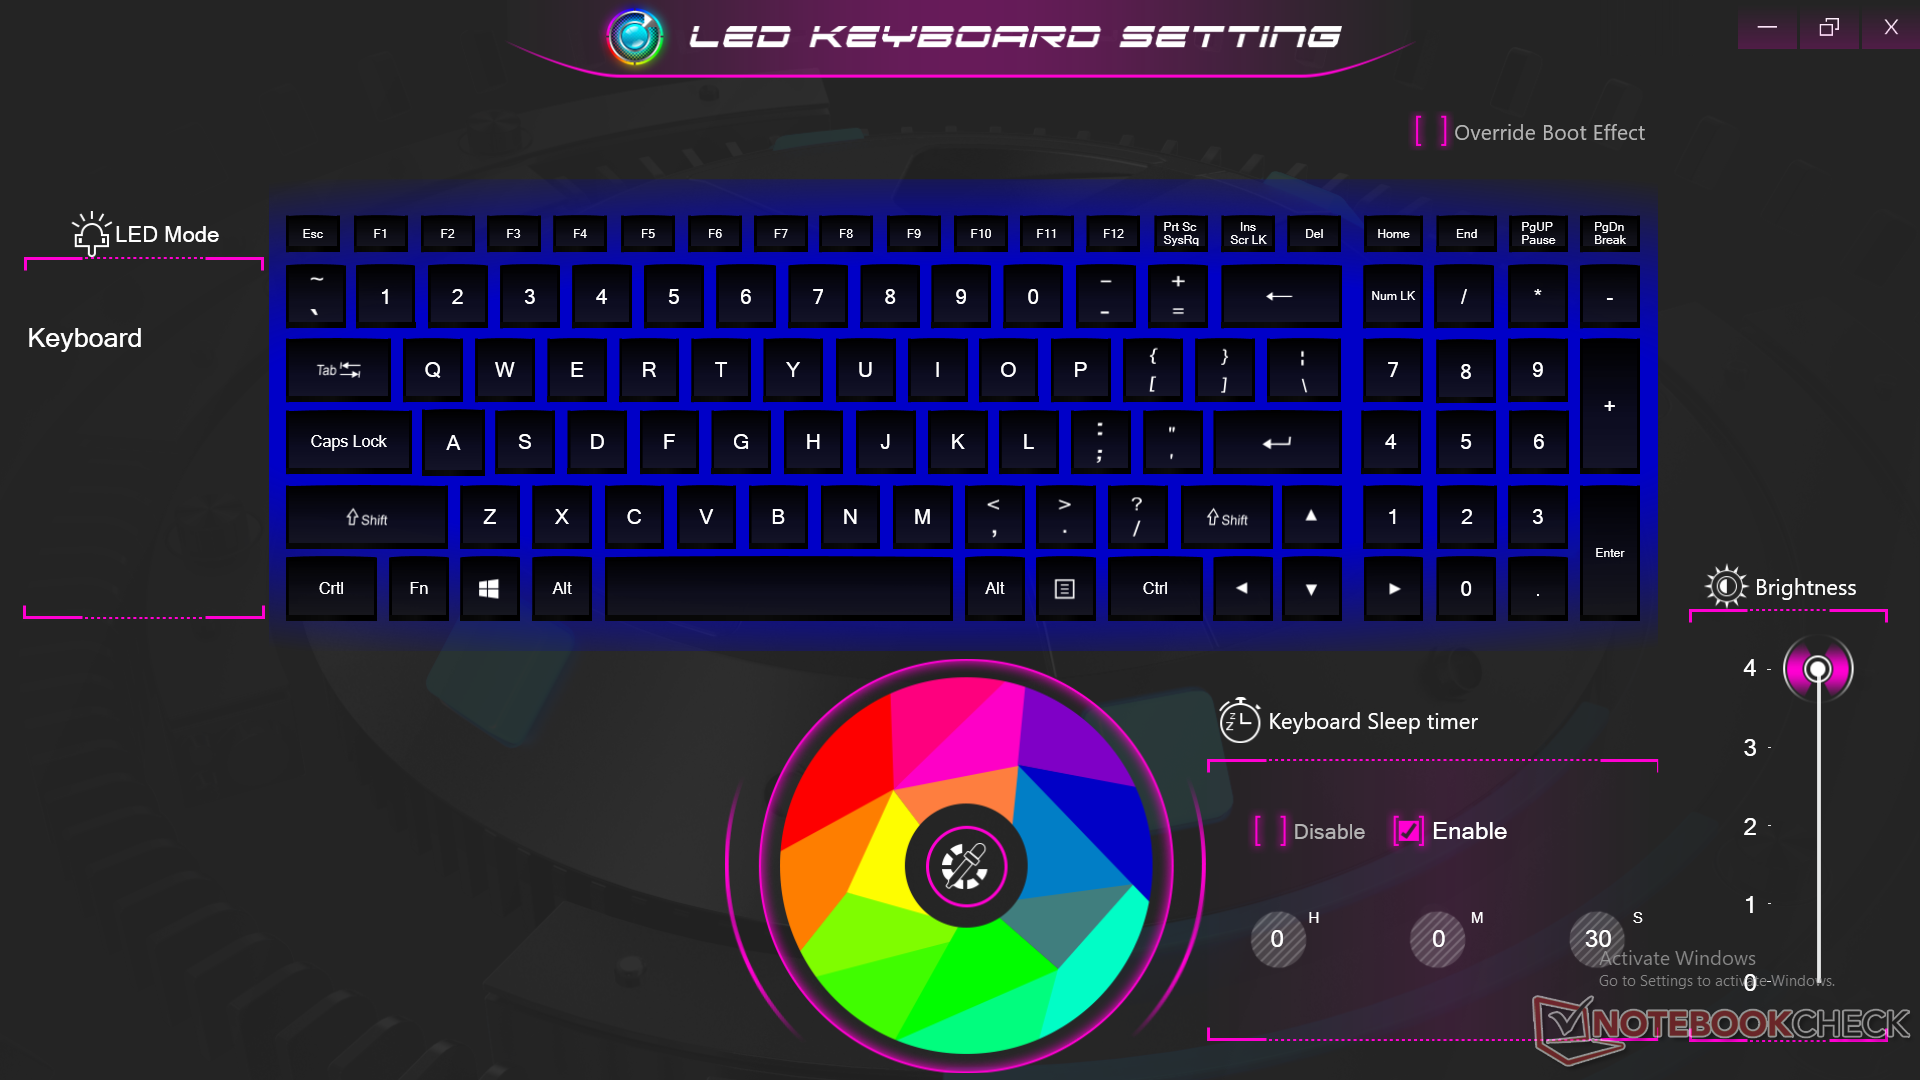
不幸的是,与大多数其他高性能笔记本电脑上的四区或每键RGB照明相比,键盘照明只有单区。然而,我们确实很欣赏专用的鼠标按钮,可以更容易地进行多点触摸输入。
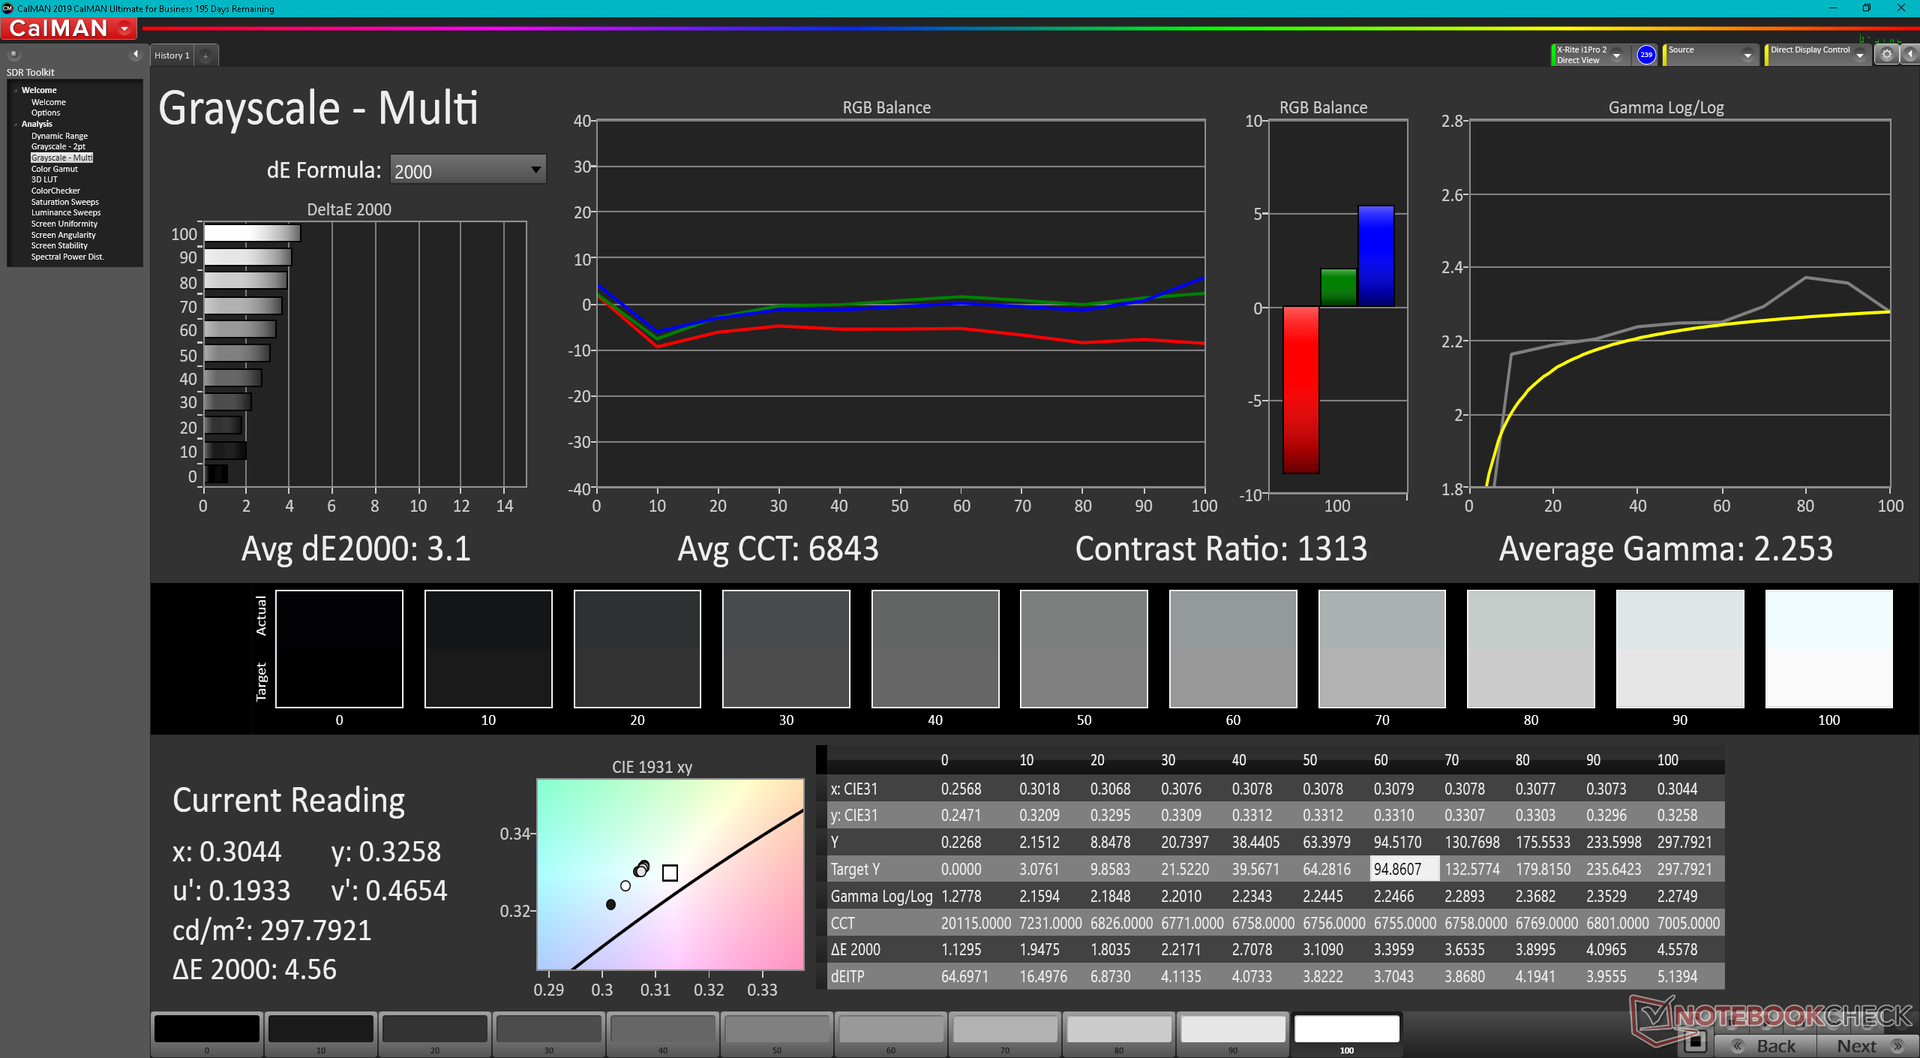
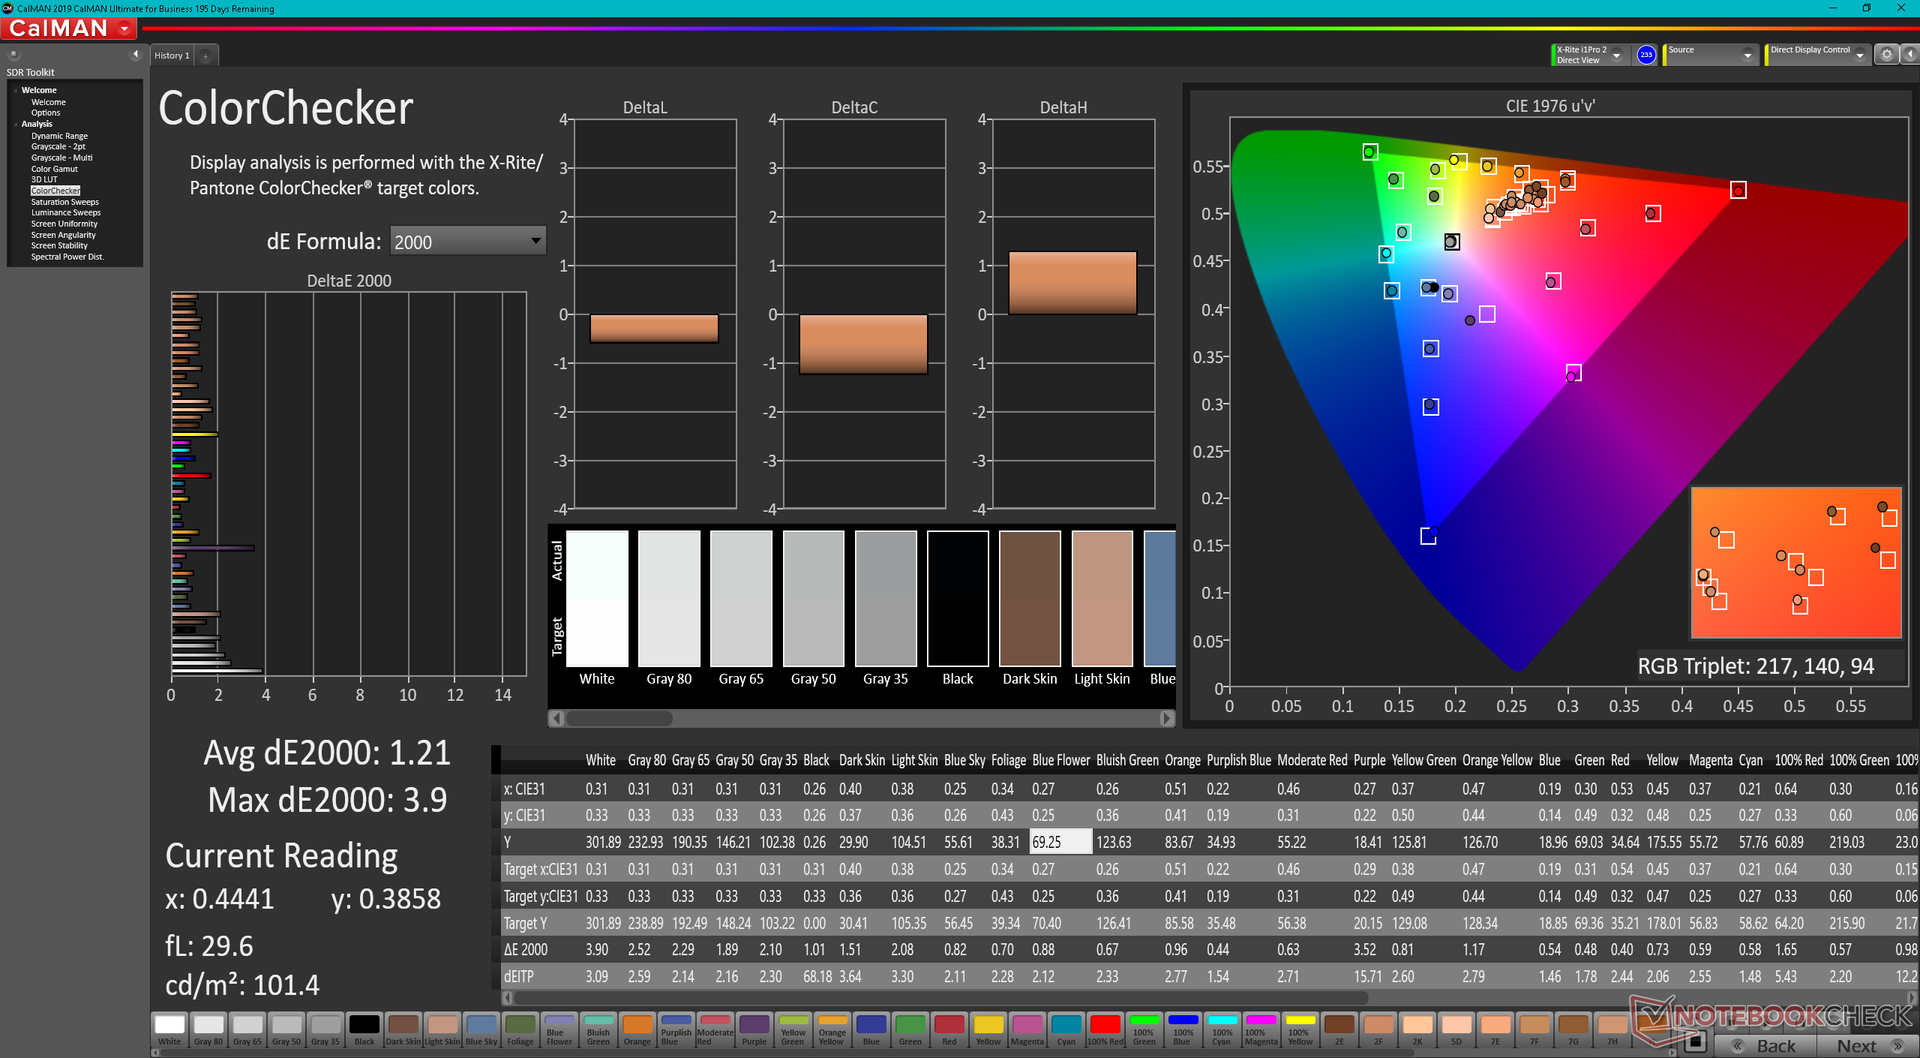
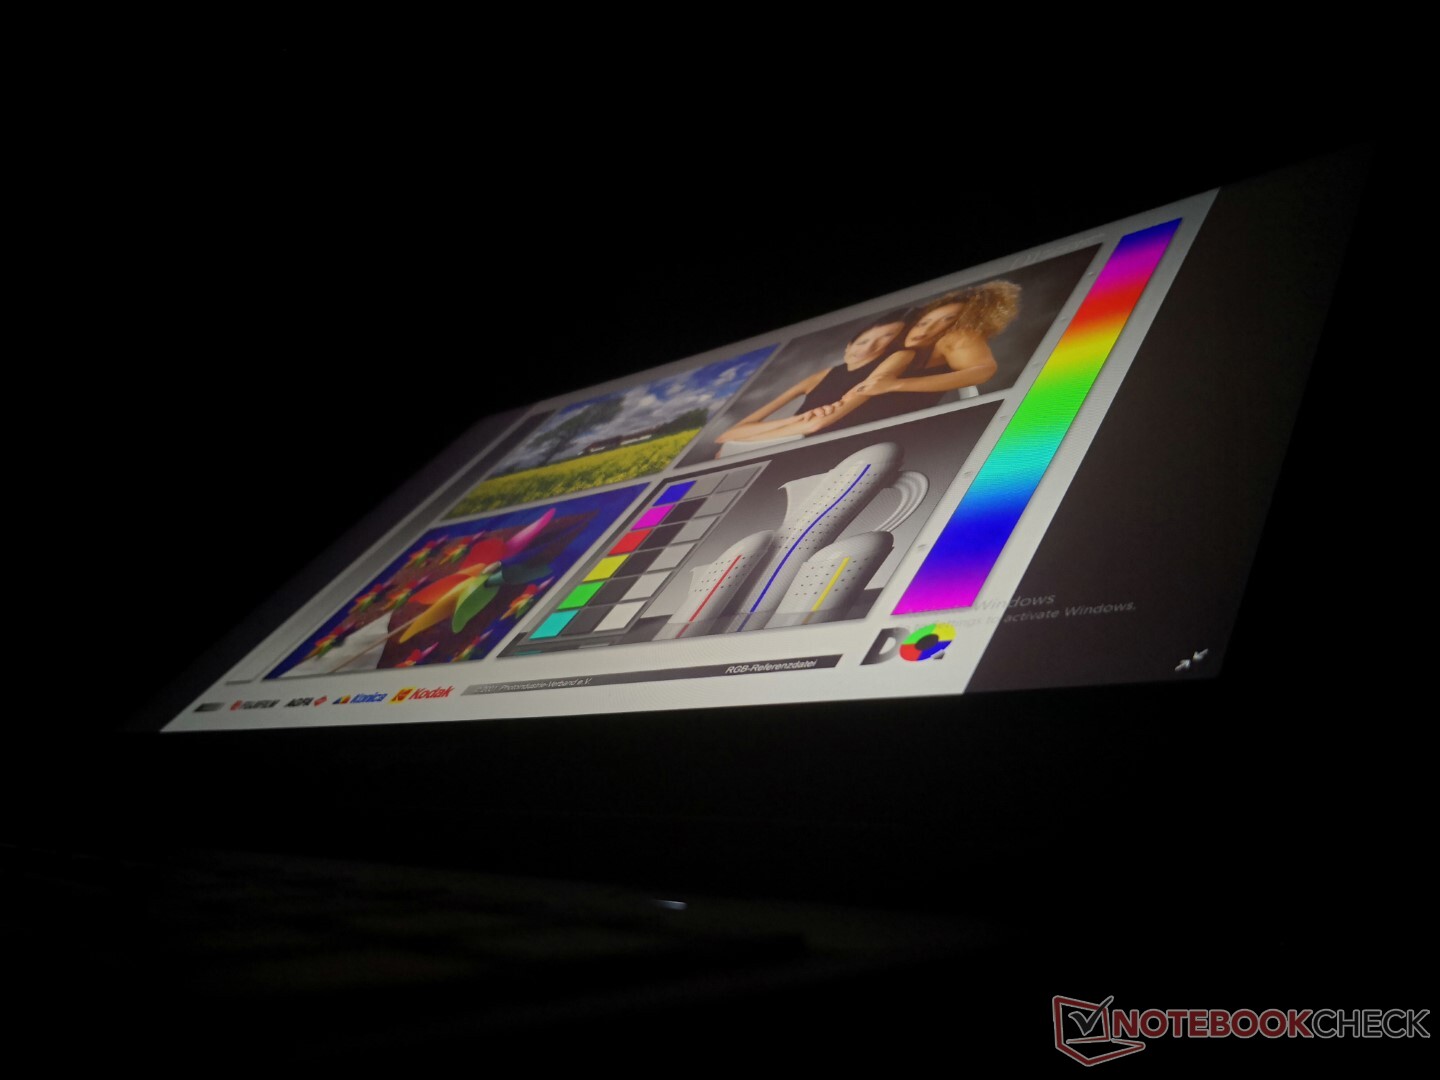
显示
我们的设备配置了与夏普LQ156M1JW03相同的IPS面板。欧通RX315.这块面板以其非常快的240赫兹刷新率、快速响应时间和全sRGB覆盖率而闻名,适合游戏和大多数图形编辑。一个更高分辨率的QHD面板也是可用的,尽管刷新率较慢为165赫兹,但有望完全覆盖DCI-P3。

| |||||||||||||||||||||||||
Brightness Distribution: 91 %
Center on Battery: 299.2 cd/m²
Contrast: 997:1 (Black: 0.3 cd/m²)
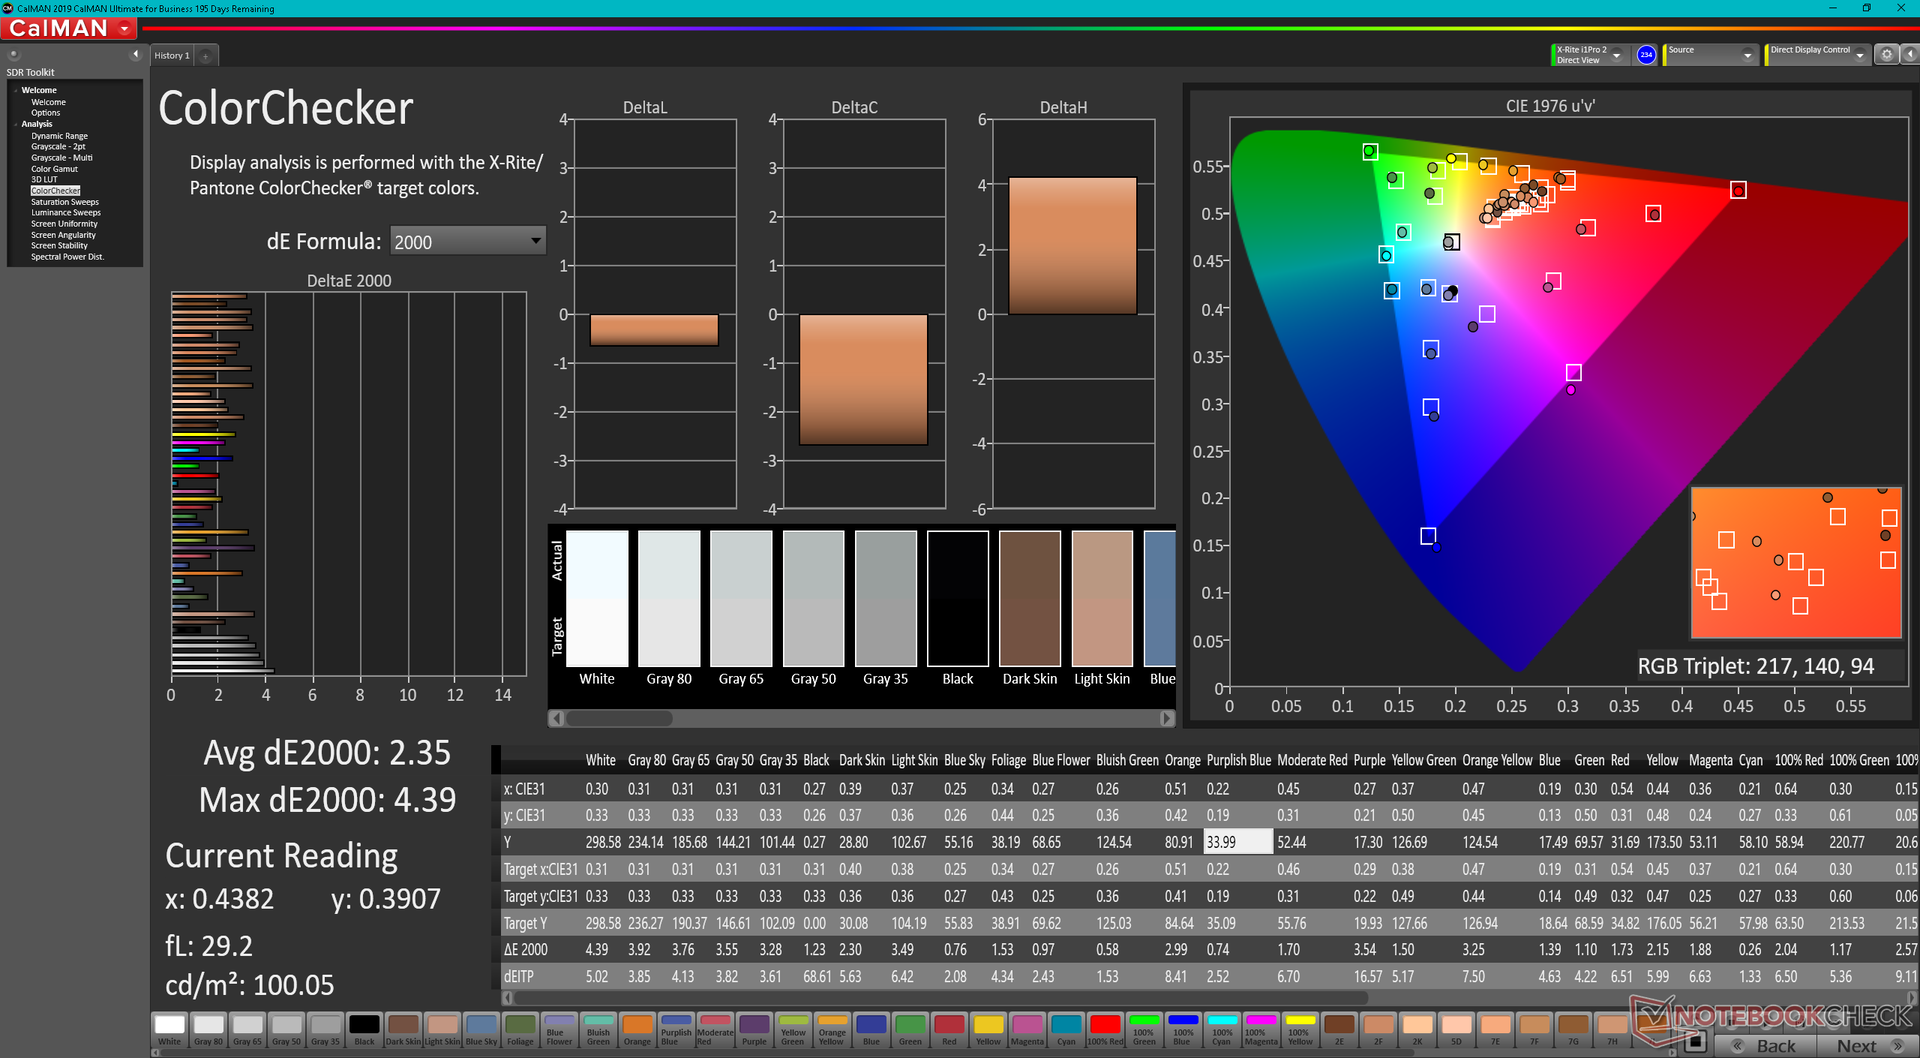
ΔE ColorChecker Calman: 2.35 | ∀{0.5-29.43 Ø4.72}
calibrated: 1.21
ΔE Greyscale Calman: 3.1 | ∀{0.09-98 Ø4.97}
67.7% AdobeRGB 1998 (Argyll 3D)
97.3% sRGB (Argyll 3D)
66.5% Display P3 (Argyll 3D)
Gamma: 2.25
CCT: 6843 K
| Eurocom Raptor X15 Sharp LQ156M1JW03, IPS, 1920x1080, 15.6" | MSI Raider GE66 12UHS AUO51EB, IPS, 3840x2160, 15.6" | Razer Blade 15 Advanced Model Early 2022 TL156VDXP02-0, IPS, 1920x1080, 15.6" | Eurocom RX315 NH57AF1 Sharp LQ156M1JW03, IPS, 1920x1080, 15.6" | Gigabyte A5 X1 AU Optronics B156HAN12.0, IPS, 1920x1080, 15.6" | Asus TUF Gaming A15 FA506QR-AZ061T Sharp SHP1532, IPS, 1920x1080, 15.6" | |
|---|---|---|---|---|---|---|
| Display | 21% | -5% | 1% | 4% | ||
| Display P3 Coverage (%) | 66.5 | 80.4 21% | 65.3 -2% | 67.5 2% | 69.6 5% | |
| sRGB Coverage (%) | 97.3 | 98.4 1% | 85.1 -13% | 98 1% | 98.6 1% | |
| AdobeRGB 1998 Coverage (%) | 67.7 | 94.7 40% | 67.4 0% | 68.5 1% | 70.8 5% | |
| Response Times | -35% | 33% | 4% | 28% | 15% | |
| Response Time Grey 50% / Grey 80% * (ms) | 12.8 ? | 18.8 ? -47% | 4.3 ? 66% | 10.4 ? 19% | 4.8 ? 63% | 12 ? 6% |
| Response Time Black / White * (ms) | 10.4 ? | 12.8 ? -23% | 10.5 ? -1% | 11.6 ? -12% | 11.2 ? -8% | 8 ? 23% |
| PWM Frequency (Hz) | 23810 ? | 22730 ? | 1250 ? | |||
| Screen | -7% | 27% | -23% | -13% | 18% | |
| Brightness middle (cd/m²) | 299.2 | 351 17% | 330 10% | 291.3 -3% | 335 12% | 297 -1% |
| Brightness (cd/m²) | 282 | 347 23% | 315 12% | 273 -3% | 325 15% | 268 -5% |
| Brightness Distribution (%) | 91 | 90 -1% | 89 -2% | 91 0% | 90 -1% | 84 -8% |
| Black Level * (cd/m²) | 0.3 | 0.35 -17% | 0.24 20% | 0.35 -17% | 0.4 -33% | 0.22 27% |
| Contrast (:1) | 997 | 1003 1% | 1375 38% | 832 -17% | 838 -16% | 1350 35% |
| Colorchecker dE 2000 * | 2.35 | 2.54 -8% | 1.47 37% | 2.39 -2% | 2.63 -12% | 1.36 42% |
| Colorchecker dE 2000 max. * | 4.39 | 8.36 -90% | 2.73 38% | 8.05 -83% | 7.71 -76% | 3.82 13% |
| Colorchecker dE 2000 calibrated * | 1.21 | 0.67 45% | 0.63 48% | 1.49 -23% | 0.97 20% | |
| Greyscale dE 2000 * | 3.1 | 4.1 -32% | 1.8 42% | 4.8 -55% | 4 -29% | 1.88 39% |
| Gamma | 2.25 98% | 2.089 105% | 2.282 96% | 2.25 98% | 2.129 103% | 2.48 89% |
| CCT | 6843 95% | 7036 92% | 6499 100% | 7124 91% | 7434 87% | 6768 96% |
| Color Space (Percent of AdobeRGB 1998) (%) | 63 | |||||
| Color Space (Percent of sRGB) (%) | 99 | |||||
| Total Average (Program / Settings) | -7% /
-5% | 18% /
21% | -6% /
-14% | 6% /
-4% | 17% /
17% |
* ... smaller is better
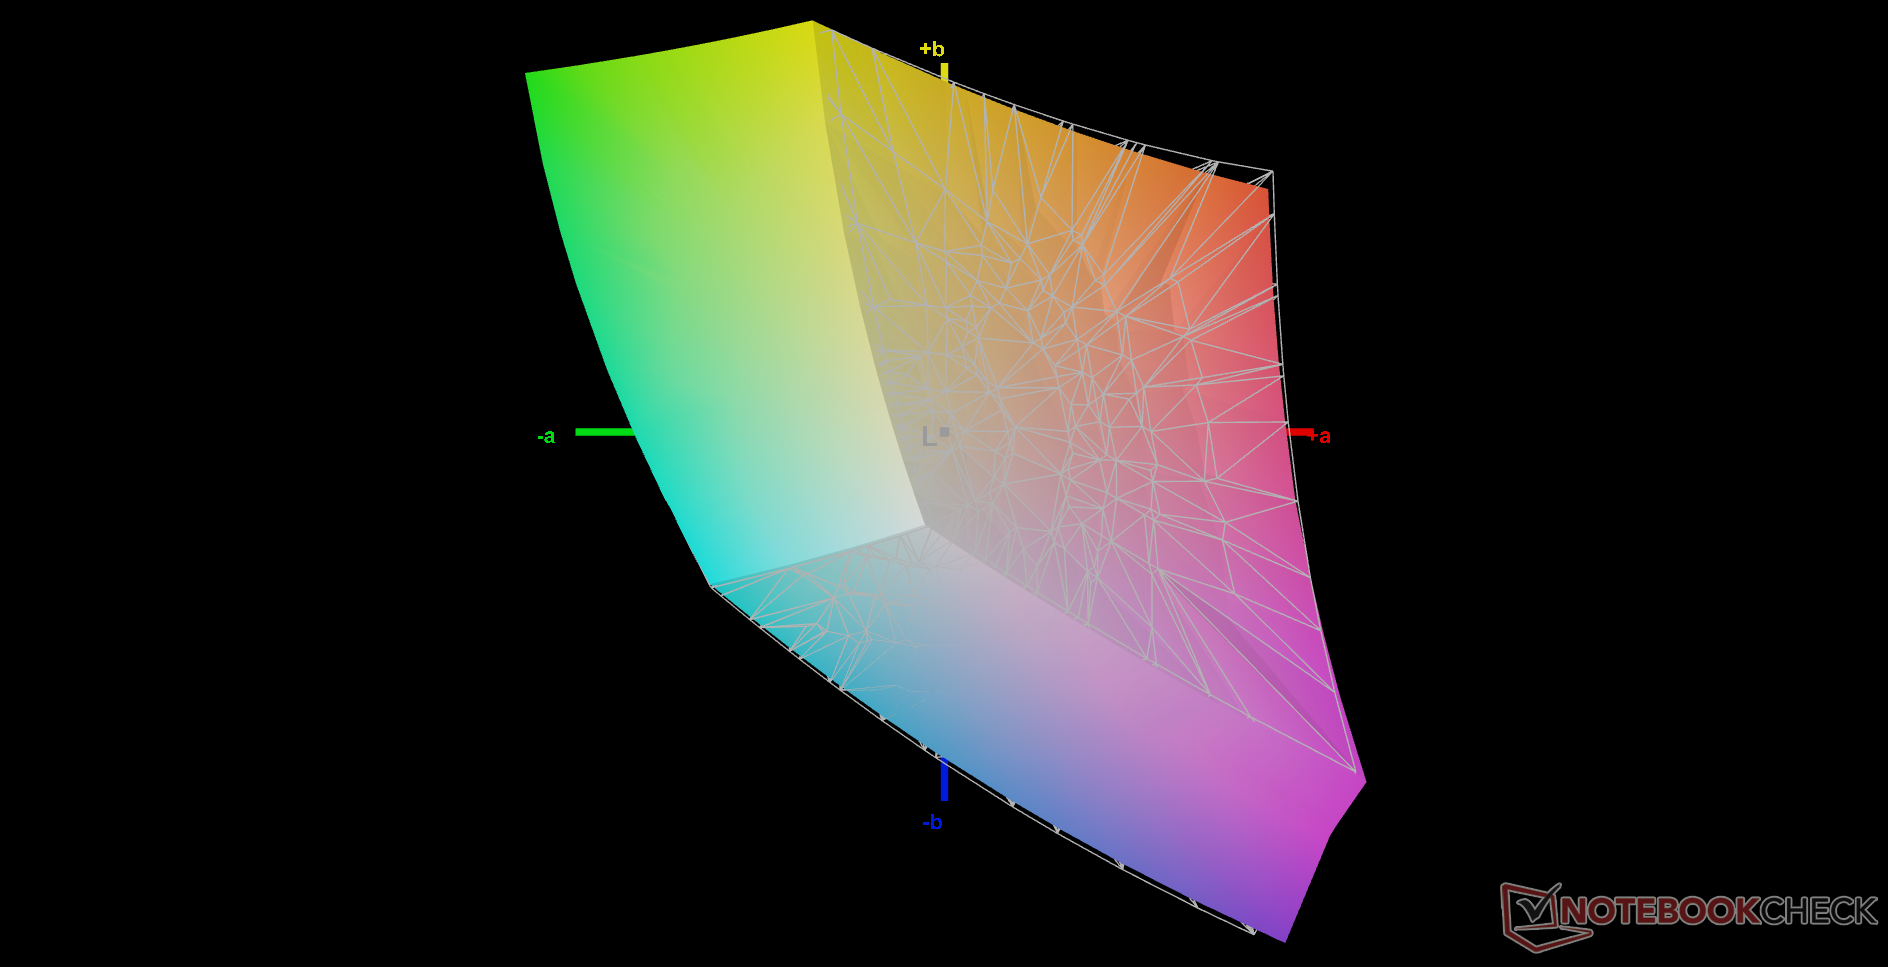
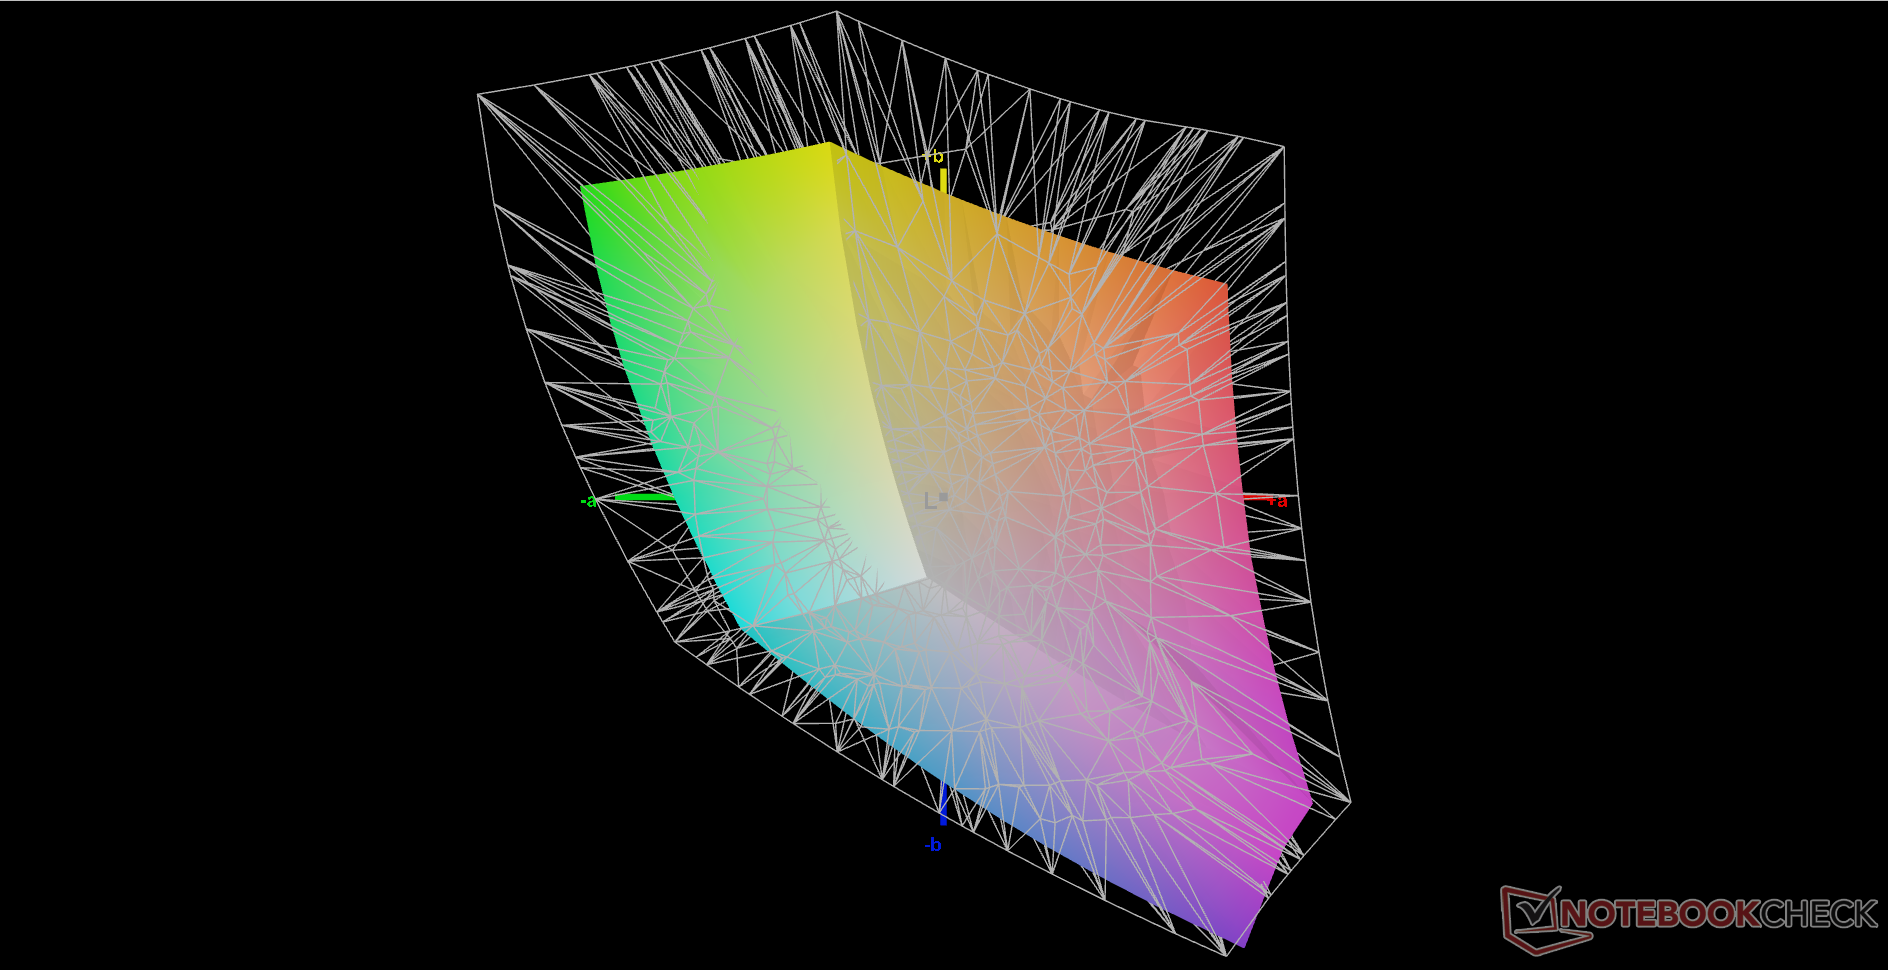
这台显示器开箱后就被校准得很好,灰度和ColorChecker的平均DeltaE值分别只有3.1和2.35。我们能够用X-Rite色度计进一步改善DeltaE,正如我们下面的截图所示。

Display Response Times
| ↔ Response Time Black to White | ||
|---|---|---|
| 10.4 ms ... rise ↗ and fall ↘ combined | ↗ 5.2 ms rise | 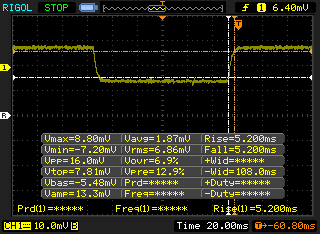 |
| ↘ 5.2 ms fall | ||
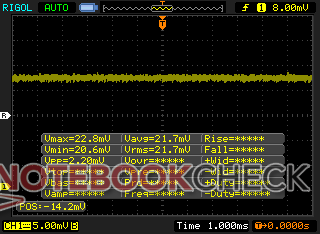
| The screen shows good response rates in our tests, but may be too slow for competitive gamers. In comparison, all tested devices range from 0.1 (minimum) to 240 (maximum) ms. » 28 % of all devices are better. This means that the measured response time is better than the average of all tested devices (19.8 ms). | ||
| ↔ Response Time 50% Grey to 80% Grey | ||
| 12.8 ms ... rise ↗ and fall ↘ combined | ↗ 4.8 ms rise | 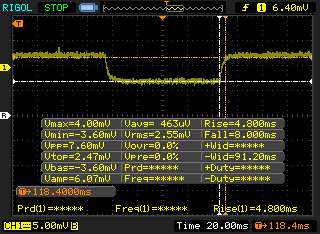 |
| ↘ 8 ms fall | ||
| The screen shows good response rates in our tests, but may be too slow for competitive gamers. In comparison, all tested devices range from 0.165 (minimum) to 636 (maximum) ms. » 26 % of all devices are better. This means that the measured response time is better than the average of all tested devices (31 ms). | ||
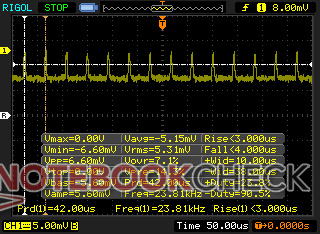
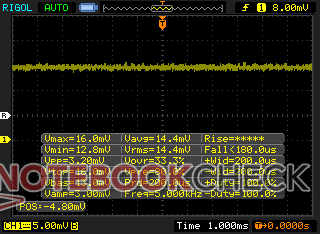
Screen Flickering / PWM (Pulse-Width Modulation)
| Screen flickering / PWM detected | 23810 Hz | ≤ 25 % brightness setting | 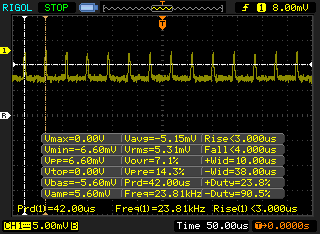 |
The display backlight flickers at 23810 Hz (worst case, e.g., utilizing PWM) Flickering detected at a brightness setting of 25 % and below. There should be no flickering or PWM above this brightness setting. The frequency of 23810 Hz is quite high, so most users sensitive to PWM should not notice any flickering. In comparison: 52 % of all tested devices do not use PWM to dim the display. If PWM was detected, an average of 7763 (minimum: 5 - maximum: 343500) Hz was measured. | |||

业绩
测试条件
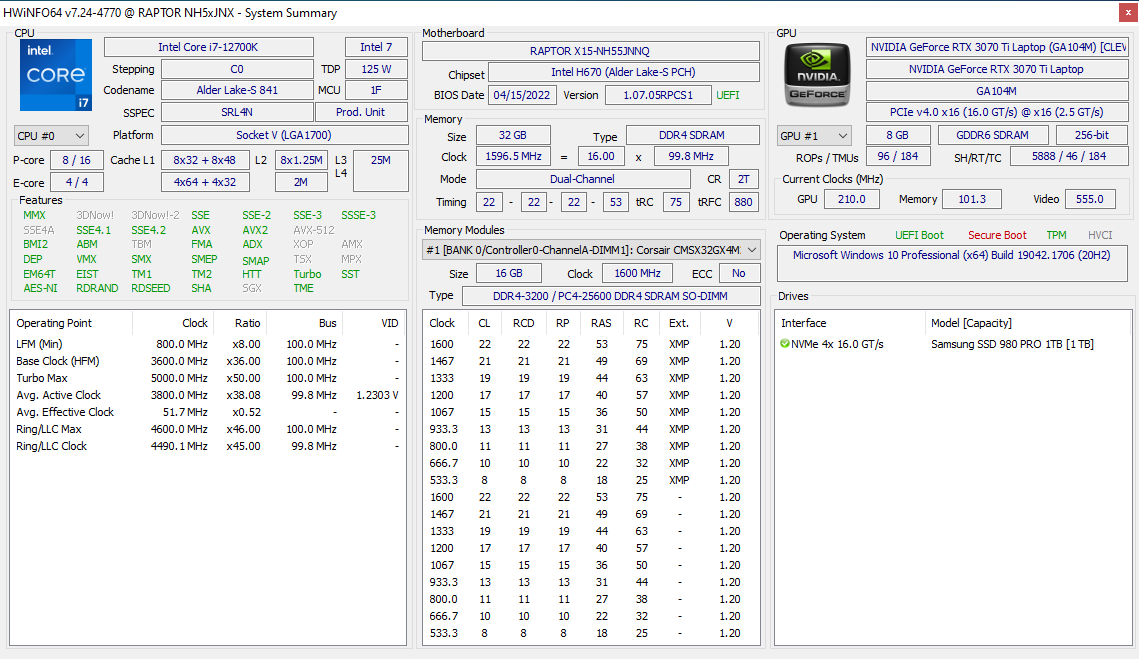
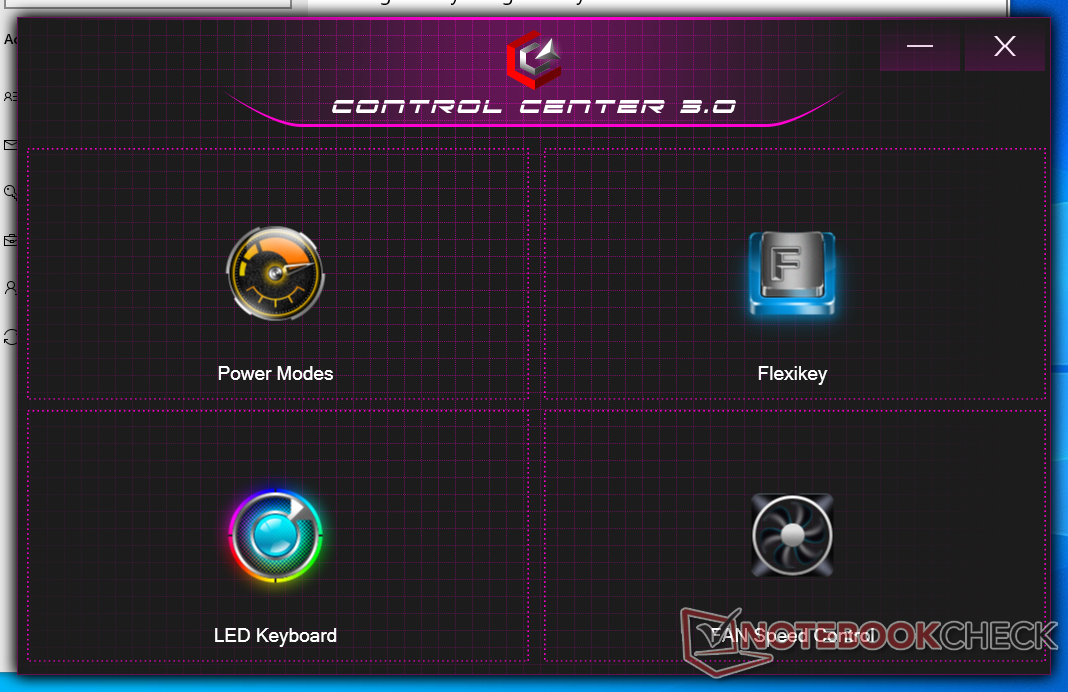
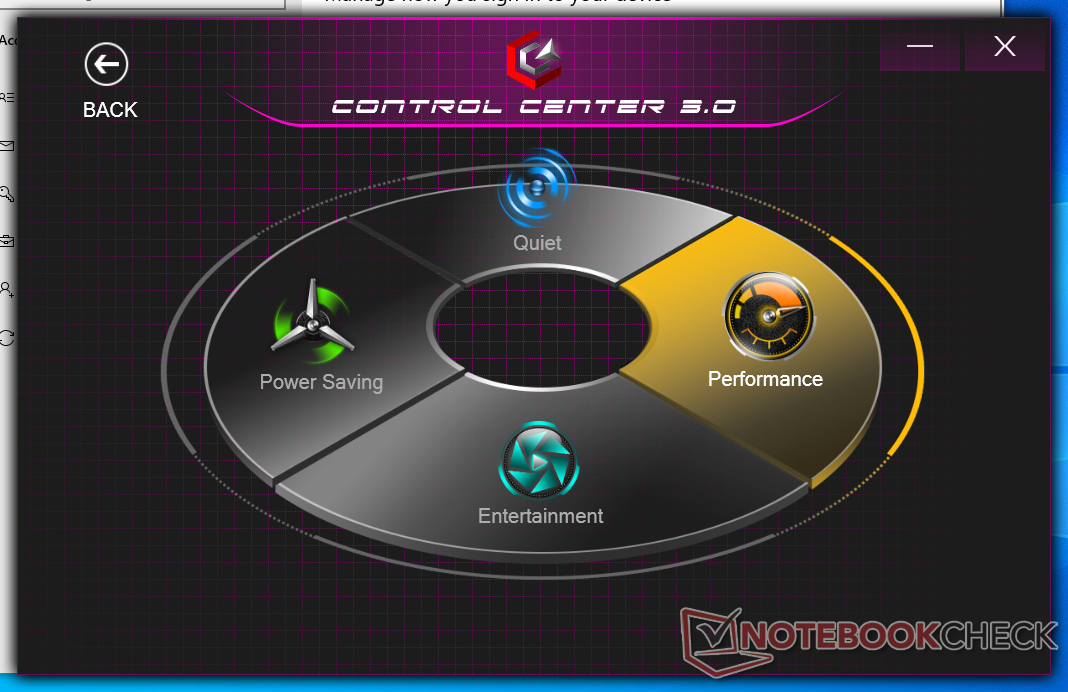
在运行以下任何性能基准测试之前,我们的设备通过Windows和控制中心3.0软件被设置为性能模式,以便在没有最终用户超频的情况下获得可能的最高分数。建议用户熟悉控制中心3.0,因为风扇控制、电源模式和LED/宏功能都是在这里切换的。
没有MUX开关,因此只有Optimus 1.0支持。Eurocom说Raptor X15在设计时没有考虑到MUX开关。
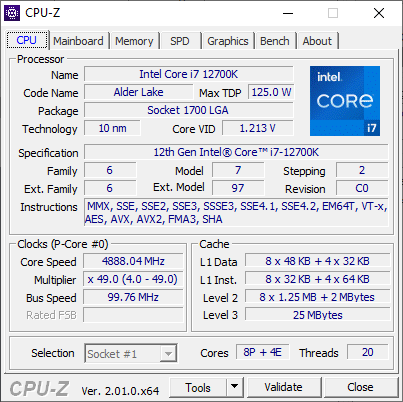
处理器
不幸的是,我们的设备在运行CineBench R15时,会出现性能错误,使我们无法在基准测试中记录正确的分数。Eurocom已经向我们确认,这个错误在多个Raptor X15设备上是可以重现的。幸运的是,所有其他基准测试的运行都没有任何问题。当与我们的参考台式机相比,同样的 Core i7-12700KCPU相比,我们的Eurocom中的i7-12700K在多线程工作负载中会慢20%到25%,总体性能水平与移动的 酷睿i7-12700H.
Cinebench R15 Multi Loop
Cinebench R23: Multi Core | Single Core
Cinebench R15: CPU Multi 64Bit | CPU Single 64Bit
Blender: v2.79 BMW27 CPU
7-Zip 18.03: 7z b 4 | 7z b 4 -mmt1
Geekbench 5.5: Multi-Core | Single-Core
HWBOT x265 Benchmark v2.2: 4k Preset
LibreOffice : 20 Documents To PDF
R Benchmark 2.5: Overall mean
| Cinebench R20 / CPU (Multi Core) | |
| Intel Core i7-12700K | |
| Average Intel Core i7-12700K (6953 - 8648, n=2) | |
| Eurocom Raptor X15 | |
| MSI Vector GP76 12UGS-434 | |
| Schenker XMG Apex 15 NH57AF1 | |
| MSI Raider GE66 12UHS | |
| Razer Blade 15 2022 | |
| Razer Blade 14 Ryzen 9 6900HX | |
| Gigabyte A5 X1 | |
| Eurocom Nightsky ARX315 | |
| Schenker XMG Apex 15 NH57E PS | |
| Eurocom RX315 NH57AF1 | |
| Aorus 15P XC | |
| Lenovo Legion C7 15IMH05 82EH0030GE | |
| Cinebench R20 / CPU (Single Core) | |
| Eurocom Raptor X15 | |
| Average Intel Core i7-12700K (731 - 740, n=2) | |
| Intel Core i7-12700K | |
| MSI Raider GE66 12UHS | |
| Razer Blade 15 2022 | |
| MSI Vector GP76 12UGS-434 | |
| Razer Blade 14 Ryzen 9 6900HX | |
| Eurocom Nightsky ARX315 | |
| Gigabyte A5 X1 | |
| Eurocom RX315 NH57AF1 | |
| Schenker XMG Apex 15 NH57E PS | |
| Schenker XMG Apex 15 NH57AF1 | |
| Lenovo Legion C7 15IMH05 82EH0030GE | |
| Aorus 15P XC | |
| Cinebench R23 / Multi Core | |
| Intel Core i7-12700K | |
| Average Intel Core i7-12700K (17003 - 22565, n=2) | |
| MSI Vector GP76 12UGS-434 | |
| Eurocom Raptor X15 | |
| MSI Raider GE66 12UHS | |
| Razer Blade 15 2022 | |
| Razer Blade 14 Ryzen 9 6900HX | |
| Gigabyte A5 X1 | |
| Eurocom Nightsky ARX315 | |
| Schenker XMG Apex 15 NH57E PS | |
| Eurocom RX315 NH57AF1 | |
| Aorus 15P XC | |
| Lenovo Legion C7 15IMH05 82EH0030GE | |
| Cinebench R23 / Single Core | |
| Intel Core i7-12700K | |
| MSI Raider GE66 12UHS | |
| Average Intel Core i7-12700K (1806 - 1895, n=2) | |
| Eurocom Raptor X15 | |
| Razer Blade 15 2022 | |
| MSI Vector GP76 12UGS-434 | |
| Eurocom Nightsky ARX315 | |
| Razer Blade 14 Ryzen 9 6900HX | |
| Eurocom RX315 NH57AF1 | |
| Gigabyte A5 X1 | |
| Schenker XMG Apex 15 NH57E PS | |
| Lenovo Legion C7 15IMH05 82EH0030GE | |
| Aorus 15P XC | |
| Cinebench R15 / CPU Multi 64Bit | |
| Intel Core i7-12700K | |
| Average Intel Core i7-12700K (n=1) | |
| MSI Vector GP76 12UGS-434 | |
| Schenker XMG Apex 15 NH57AF1 | |
| MSI Raider GE66 12UHS | |
| Razer Blade 14 Ryzen 9 6900HX | |
| Eurocom Nightsky ARX315 | |
| Razer Blade 15 2022 | |
| Gigabyte A5 X1 | |
| Schenker XMG Apex 15 NH57E PS | |
| Eurocom RX315 NH57AF1 | |
| Aorus 15P XC | |
| Lenovo Legion C7 15IMH05 82EH0030GE | |
| Cinebench R15 / CPU Single 64Bit | |
| Intel Core i7-12700K | |
| Average Intel Core i7-12700K (n=1) | |
| MSI Raider GE66 12UHS | |
| Razer Blade 15 2022 | |
| MSI Vector GP76 12UGS-434 | |
| Eurocom Nightsky ARX315 | |
| Razer Blade 14 Ryzen 9 6900HX | |
| Gigabyte A5 X1 | |
| Schenker XMG Apex 15 NH57E PS | |
| Eurocom RX315 NH57AF1 | |
| Lenovo Legion C7 15IMH05 82EH0030GE | |
| Aorus 15P XC | |
| Schenker XMG Apex 15 NH57AF1 | |
| Blender / v2.79 BMW27 CPU | |
| Lenovo Legion C7 15IMH05 82EH0030GE | |
| Aorus 15P XC | |
| Eurocom RX315 NH57AF1 | |
| Schenker XMG Apex 15 NH57E PS | |
| Gigabyte A5 X1 | |
| Razer Blade 15 2022 | |
| Razer Blade 14 Ryzen 9 6900HX | |
| Eurocom Nightsky ARX315 | |
| MSI Vector GP76 12UGS-434 | |
| MSI Raider GE66 12UHS | |
| Eurocom Raptor X15 | |
| Schenker XMG Apex 15 NH57AF1 | |
| Average Intel Core i7-12700K (152.3 - 193.9, n=2) | |
| Intel Core i7-12700K | |
| 7-Zip 18.03 / 7z b 4 | |
| Intel Core i7-12700K | |
| Eurocom Nightsky ARX315 | |
| Schenker XMG Apex 15 NH57AF1 | |
| Average Intel Core i7-12700K (65508 - 81369, n=2) | |
| MSI Raider GE66 12UHS | |
| Eurocom Raptor X15 | |
| MSI Vector GP76 12UGS-434 | |
| Razer Blade 14 Ryzen 9 6900HX | |
| Razer Blade 15 2022 | |
| Gigabyte A5 X1 | |
| Schenker XMG Apex 15 NH57E PS | |
| Aorus 15P XC | |
| Lenovo Legion C7 15IMH05 82EH0030GE | |
| Eurocom RX315 NH57AF1 | |
| 7-Zip 18.03 / 7z b 4 -mmt1 | |
| Eurocom Nightsky ARX315 | |
| Eurocom Raptor X15 | |
| Average Intel Core i7-12700K (6117 - 6422, n=2) | |
| Intel Core i7-12700K | |
| MSI Raider GE66 12UHS | |
| Razer Blade 14 Ryzen 9 6900HX | |
| Razer Blade 15 2022 | |
| Gigabyte A5 X1 | |
| Schenker XMG Apex 15 NH57E PS | |
| MSI Vector GP76 12UGS-434 | |
| Lenovo Legion C7 15IMH05 82EH0030GE | |
| Eurocom RX315 NH57AF1 | |
| Aorus 15P XC | |
| Schenker XMG Apex 15 NH57AF1 | |
| Geekbench 5.5 / Multi-Core | |
| Intel Core i7-12700K | |
| Average Intel Core i7-12700K (12475 - 15557, n=2) | |
| MSI Raider GE66 12UHS | |
| Eurocom Raptor X15 | |
| Razer Blade 15 2022 | |
| MSI Vector GP76 12UGS-434 | |
| Schenker XMG Apex 15 NH57AF1 | |
| Eurocom Nightsky ARX315 | |
| Razer Blade 14 Ryzen 9 6900HX | |
| Eurocom RX315 NH57AF1 | |
| Gigabyte A5 X1 | |
| Schenker XMG Apex 15 NH57E PS | |
| Lenovo Legion C7 15IMH05 82EH0030GE | |
| Aorus 15P XC | |
| Geekbench 5.5 / Single-Core | |
| Eurocom Raptor X15 | |
| Average Intel Core i7-12700K (1890 - 1933, n=2) | |
| Intel Core i7-12700K | |
| MSI Raider GE66 12UHS | |
| MSI Vector GP76 12UGS-434 | |
| Razer Blade 15 2022 | |
| Eurocom Nightsky ARX315 | |
| Razer Blade 14 Ryzen 9 6900HX | |
| Eurocom RX315 NH57AF1 | |
| Gigabyte A5 X1 | |
| Schenker XMG Apex 15 NH57E PS | |
| Lenovo Legion C7 15IMH05 82EH0030GE | |
| Aorus 15P XC | |
| Schenker XMG Apex 15 NH57AF1 | |
| HWBOT x265 Benchmark v2.2 / 4k Preset | |
| Intel Core i7-12700K | |
| Average Intel Core i7-12700K (14.9 - 26.1, n=2) | |
| MSI Vector GP76 12UGS-434 | |
| Schenker XMG Apex 15 NH57AF1 | |
| MSI Raider GE66 12UHS | |
| Razer Blade 14 Ryzen 9 6900HX | |
| Eurocom Nightsky ARX315 | |
| Razer Blade 15 2022 | |
| Gigabyte A5 X1 | |
| Schenker XMG Apex 15 NH57E PS | |
| Eurocom RX315 NH57AF1 | |
| Eurocom Raptor X15 | |
| Aorus 15P XC | |
| Lenovo Legion C7 15IMH05 82EH0030GE | |
| LibreOffice / 20 Documents To PDF | |
| Gigabyte A5 X1 | |
| Schenker XMG Apex 15 NH57AF1 | |
| Lenovo Legion C7 15IMH05 82EH0030GE | |
| Schenker XMG Apex 15 NH57E PS | |
| Aorus 15P XC | |
| Razer Blade 15 2022 | |
| Razer Blade 14 Ryzen 9 6900HX | |
| Eurocom RX315 NH57AF1 | |
| Eurocom Nightsky ARX315 | |
| MSI Vector GP76 12UGS-434 | |
| Intel Core i7-12700K | |
| Average Intel Core i7-12700K (37.8 - 39.8, n=2) | |
| Eurocom Raptor X15 | |
| MSI Raider GE66 12UHS | |
| R Benchmark 2.5 / Overall mean | |
| Aorus 15P XC | |
| Lenovo Legion C7 15IMH05 82EH0030GE | |
| Eurocom RX315 NH57AF1 | |
| Schenker XMG Apex 15 NH57AF1 | |
| Schenker XMG Apex 15 NH57E PS | |
| Gigabyte A5 X1 | |
| Eurocom Nightsky ARX315 | |
| Razer Blade 14 Ryzen 9 6900HX | |
| Razer Blade 15 2022 | |
| MSI Vector GP76 12UGS-434 | |
| MSI Raider GE66 12UHS | |
| Intel Core i7-12700K | |
| Average Intel Core i7-12700K (0.412 - 0.423, n=2) | |
| Eurocom Raptor X15 | |
Cinebench R23: Multi Core | Single Core
Cinebench R15: CPU Multi 64Bit | CPU Single 64Bit
Blender: v2.79 BMW27 CPU
7-Zip 18.03: 7z b 4 | 7z b 4 -mmt1
Geekbench 5.5: Multi-Core | Single-Core
HWBOT x265 Benchmark v2.2: 4k Preset
LibreOffice : 20 Documents To PDF
R Benchmark 2.5: Overall mean
* ... smaller is better
AIDA64: FP32 Ray-Trace | FPU Julia | CPU SHA3 | CPU Queen | FPU SinJulia | FPU Mandel | CPU AES | CPU ZLib | FP64 Ray-Trace | CPU PhotoWorxx
| Performance rating | |
| Gigabyte A5 X1 | |
| Eurocom RX315 NH57AF1 | |
| Asus TUF Gaming A15 FA506QR-AZ061T | |
| MSI Raider GE66 12UHS | |
| Eurocom Raptor X15 | |
| Average Intel Core i7-12700K | |
| Razer Blade 15 Advanced Model Early 2022 | |
| AIDA64 / FP32 Ray-Trace | |
| Gigabyte A5 X1 | |
| Eurocom RX315 NH57AF1 | |
| Asus TUF Gaming A15 FA506QR-AZ061T | |
| MSI Raider GE66 12UHS | |
| Eurocom Raptor X15 | |
| Average Intel Core i7-12700K (n=1) | |
| Razer Blade 15 Advanced Model Early 2022 | |
| AIDA64 / FPU Julia | |
| Gigabyte A5 X1 | |
| Asus TUF Gaming A15 FA506QR-AZ061T | |
| Eurocom RX315 NH57AF1 | |
| Eurocom Raptor X15 | |
| Average Intel Core i7-12700K (n=1) | |
| MSI Raider GE66 12UHS | |
| Razer Blade 15 Advanced Model Early 2022 | |
| AIDA64 / CPU SHA3 | |
| Eurocom RX315 NH57AF1 | |
| Gigabyte A5 X1 | |
| Eurocom Raptor X15 | |
| Average Intel Core i7-12700K (n=1) | |
| MSI Raider GE66 12UHS | |
| Asus TUF Gaming A15 FA506QR-AZ061T | |
| Razer Blade 15 Advanced Model Early 2022 | |
| AIDA64 / CPU Queen | |
| MSI Raider GE66 12UHS | |
| Gigabyte A5 X1 | |
| Eurocom Raptor X15 | |
| Average Intel Core i7-12700K (n=1) | |
| Asus TUF Gaming A15 FA506QR-AZ061T | |
| Eurocom RX315 NH57AF1 | |
| Razer Blade 15 Advanced Model Early 2022 | |
| AIDA64 / FPU SinJulia | |
| Gigabyte A5 X1 | |
| Asus TUF Gaming A15 FA506QR-AZ061T | |
| Eurocom Raptor X15 | |
| Average Intel Core i7-12700K (n=1) | |
| Eurocom RX315 NH57AF1 | |
| MSI Raider GE66 12UHS | |
| Razer Blade 15 Advanced Model Early 2022 | |
| AIDA64 / FPU Mandel | |
| Gigabyte A5 X1 | |
| Eurocom RX315 NH57AF1 | |
| Asus TUF Gaming A15 FA506QR-AZ061T | |
| MSI Raider GE66 12UHS | |
| Eurocom Raptor X15 | |
| Average Intel Core i7-12700K (n=1) | |
| Razer Blade 15 Advanced Model Early 2022 | |
| AIDA64 / CPU AES | |
| Eurocom RX315 NH57AF1 | |
| Gigabyte A5 X1 | |
| MSI Raider GE66 12UHS | |
| Eurocom Raptor X15 | |
| Average Intel Core i7-12700K (n=1) | |
| Asus TUF Gaming A15 FA506QR-AZ061T | |
| Razer Blade 15 Advanced Model Early 2022 | |
| AIDA64 / CPU ZLib | |
| Eurocom Raptor X15 | |
| Average Intel Core i7-12700K (n=1) | |
| MSI Raider GE66 12UHS | |
| Gigabyte A5 X1 | |
| Eurocom RX315 NH57AF1 | |
| Asus TUF Gaming A15 FA506QR-AZ061T | |
| Razer Blade 15 Advanced Model Early 2022 | |
| AIDA64 / FP64 Ray-Trace | |
| Eurocom RX315 NH57AF1 | |
| Gigabyte A5 X1 | |
| Asus TUF Gaming A15 FA506QR-AZ061T | |
| MSI Raider GE66 12UHS | |
| Eurocom Raptor X15 | |
| Average Intel Core i7-12700K (n=1) | |
| Razer Blade 15 Advanced Model Early 2022 | |
| AIDA64 / CPU PhotoWorxx | |
| MSI Raider GE66 12UHS | |
| Razer Blade 15 Advanced Model Early 2022 | |
| Eurocom Raptor X15 | |
| Average Intel Core i7-12700K (n=1) | |
| Eurocom RX315 NH57AF1 | |
| Gigabyte A5 X1 | |
| Asus TUF Gaming A15 FA506QR-AZ061T | |
系统性能
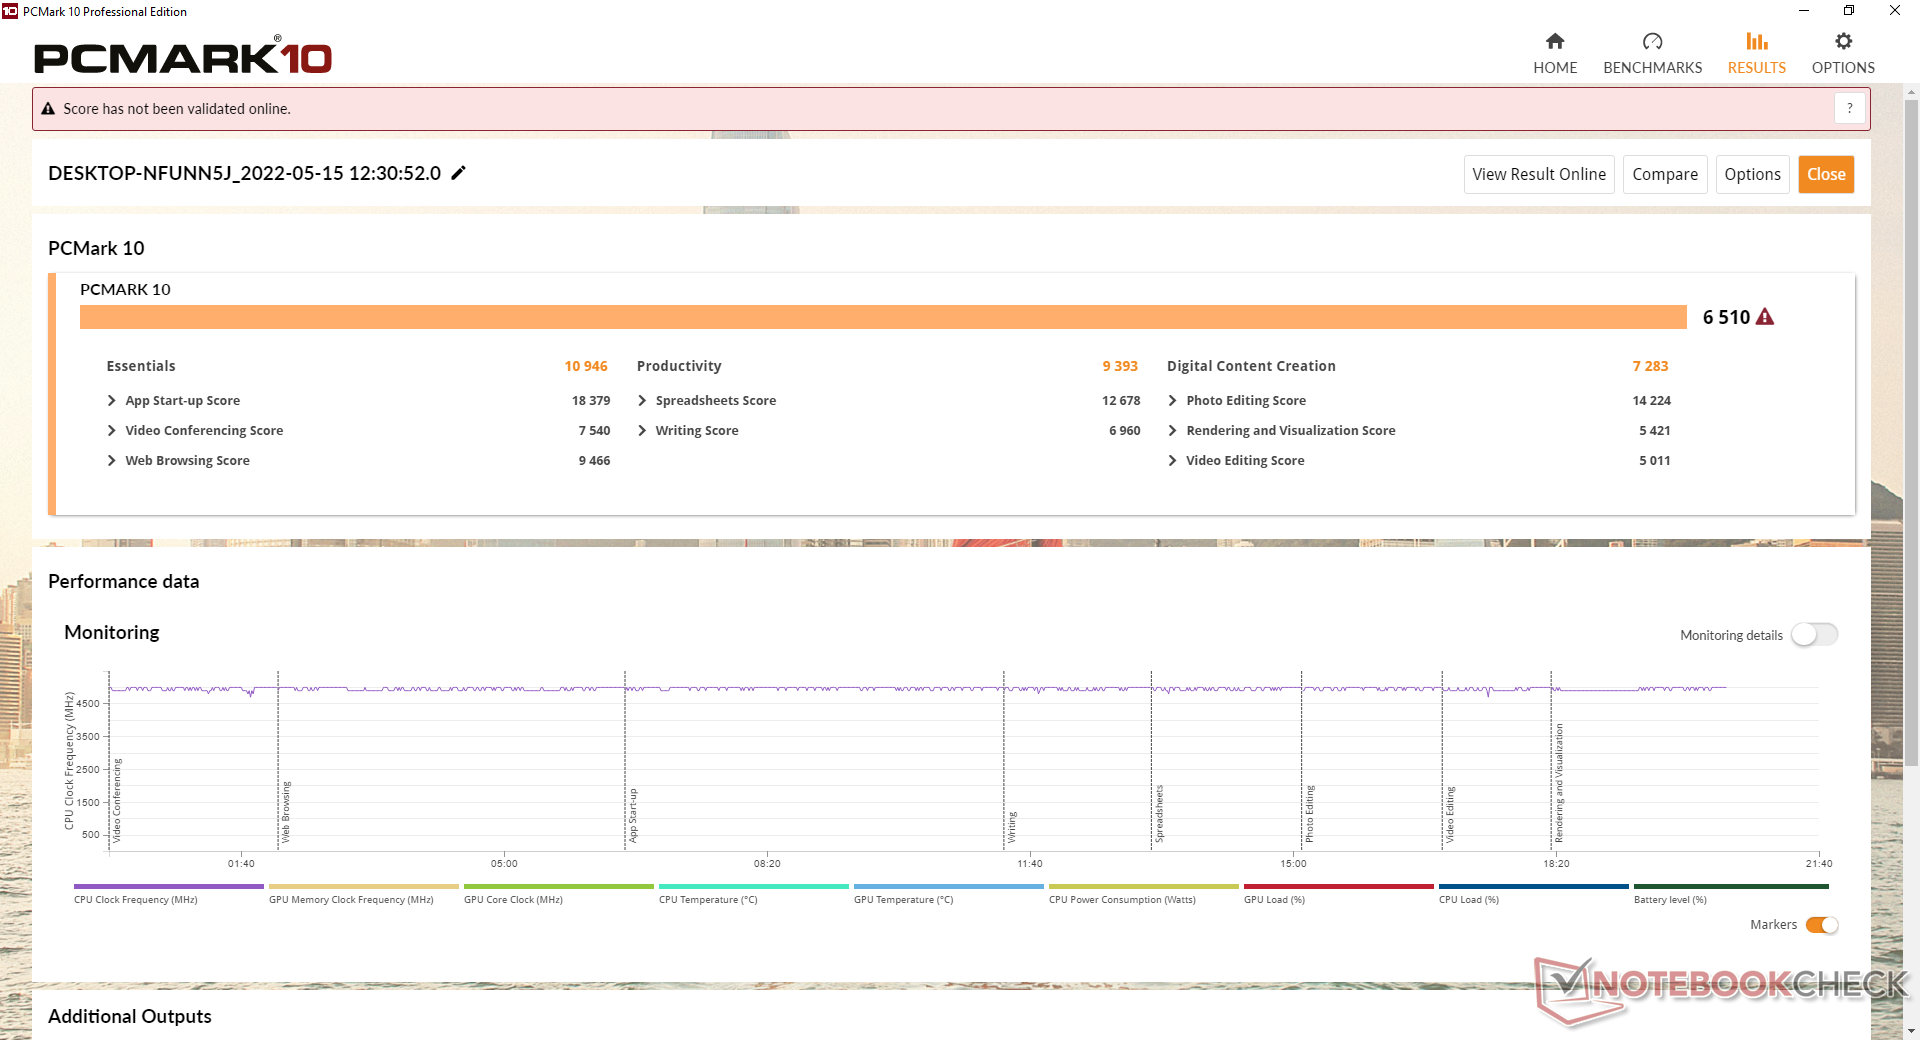
PCMark 10的分数与配备 "普通 "移动CPU的高端游戏笔记本电脑相当,如 微星GE66 i9-12900HK或Razer Blade 15 i7-12800H。然而,数字内容创作分测试的分数比预期的要低。
CrossMark: Overall | Productivity | Creativity | Responsiveness
| PCMark 10 / Score | |
| MSI Raider GE66 12UHS | |
| Razer Blade 15 Advanced Model Early 2022 | |
| Eurocom RX315 NH57AF1 | |
| Asus TUF Gaming A15 FA506QR-AZ061T | |
| Gigabyte A5 X1 | |
| Eurocom Raptor X15 | |
| Average Intel Core i7-12700K, NVIDIA GeForce RTX 3070 Ti Laptop GPU (n=1) | |
| PCMark 10 / Essentials | |
| MSI Raider GE66 12UHS | |
| Eurocom Raptor X15 | |
| Average Intel Core i7-12700K, NVIDIA GeForce RTX 3070 Ti Laptop GPU (n=1) | |
| Razer Blade 15 Advanced Model Early 2022 | |
| Eurocom RX315 NH57AF1 | |
| Asus TUF Gaming A15 FA506QR-AZ061T | |
| Gigabyte A5 X1 | |
| PCMark 10 / Productivity | |
| MSI Raider GE66 12UHS | |
| Razer Blade 15 Advanced Model Early 2022 | |
| Asus TUF Gaming A15 FA506QR-AZ061T | |
| Eurocom Raptor X15 | |
| Average Intel Core i7-12700K, NVIDIA GeForce RTX 3070 Ti Laptop GPU (n=1) | |
| Gigabyte A5 X1 | |
| Eurocom RX315 NH57AF1 | |
| PCMark 10 / Digital Content Creation | |
| MSI Raider GE66 12UHS | |
| Razer Blade 15 Advanced Model Early 2022 | |
| Eurocom RX315 NH57AF1 | |
| Gigabyte A5 X1 | |
| Asus TUF Gaming A15 FA506QR-AZ061T | |
| Eurocom Raptor X15 | |
| Average Intel Core i7-12700K, NVIDIA GeForce RTX 3070 Ti Laptop GPU (n=1) | |
| CrossMark / Overall | |
| Eurocom Raptor X15 | |
| Average Intel Core i7-12700K, NVIDIA GeForce RTX 3070 Ti Laptop GPU (n=1) | |
| Razer Blade 15 Advanced Model Early 2022 | |
| CrossMark / Productivity | |
| Eurocom Raptor X15 | |
| Average Intel Core i7-12700K, NVIDIA GeForce RTX 3070 Ti Laptop GPU (n=1) | |
| Razer Blade 15 Advanced Model Early 2022 | |
| CrossMark / Creativity | |
| Eurocom Raptor X15 | |
| Average Intel Core i7-12700K, NVIDIA GeForce RTX 3070 Ti Laptop GPU (n=1) | |
| Razer Blade 15 Advanced Model Early 2022 | |
| CrossMark / Responsiveness | |
| Eurocom Raptor X15 | |
| Average Intel Core i7-12700K, NVIDIA GeForce RTX 3070 Ti Laptop GPU (n=1) | |
| Razer Blade 15 Advanced Model Early 2022 | |
| PCMark 10 Score | 6510 points | |
Help | ||
| AIDA64 / Memory Copy | |
| MSI Raider GE66 12UHS | |
| Razer Blade 15 Advanced Model Early 2022 | |
| Eurocom Raptor X15 | |
| Average Intel Core i7-12700K (n=1) | |
| Eurocom RX315 NH57AF1 | |
| Gigabyte A5 X1 | |
| Asus TUF Gaming A15 FA506QR-AZ061T | |
| AIDA64 / Memory Read | |
| MSI Raider GE66 12UHS | |
| Razer Blade 15 Advanced Model Early 2022 | |
| Eurocom Raptor X15 | |
| Average Intel Core i7-12700K (n=1) | |
| Eurocom RX315 NH57AF1 | |
| Gigabyte A5 X1 | |
| Asus TUF Gaming A15 FA506QR-AZ061T | |
| AIDA64 / Memory Write | |
| Razer Blade 15 Advanced Model Early 2022 | |
| MSI Raider GE66 12UHS | |
| Eurocom Raptor X15 | |
| Average Intel Core i7-12700K (n=1) | |
| Eurocom RX315 NH57AF1 | |
| Gigabyte A5 X1 | |
| Asus TUF Gaming A15 FA506QR-AZ061T | |
| AIDA64 / Memory Latency | |
| Razer Blade 15 Advanced Model Early 2022 | |
| MSI Raider GE66 12UHS | |
| Eurocom RX315 NH57AF1 | |
| Asus TUF Gaming A15 FA506QR-AZ061T | |
| Gigabyte A5 X1 | |
| Eurocom Raptor X15 | |
| Average Intel Core i7-12700K (n=1) | |
* ... smaller is better
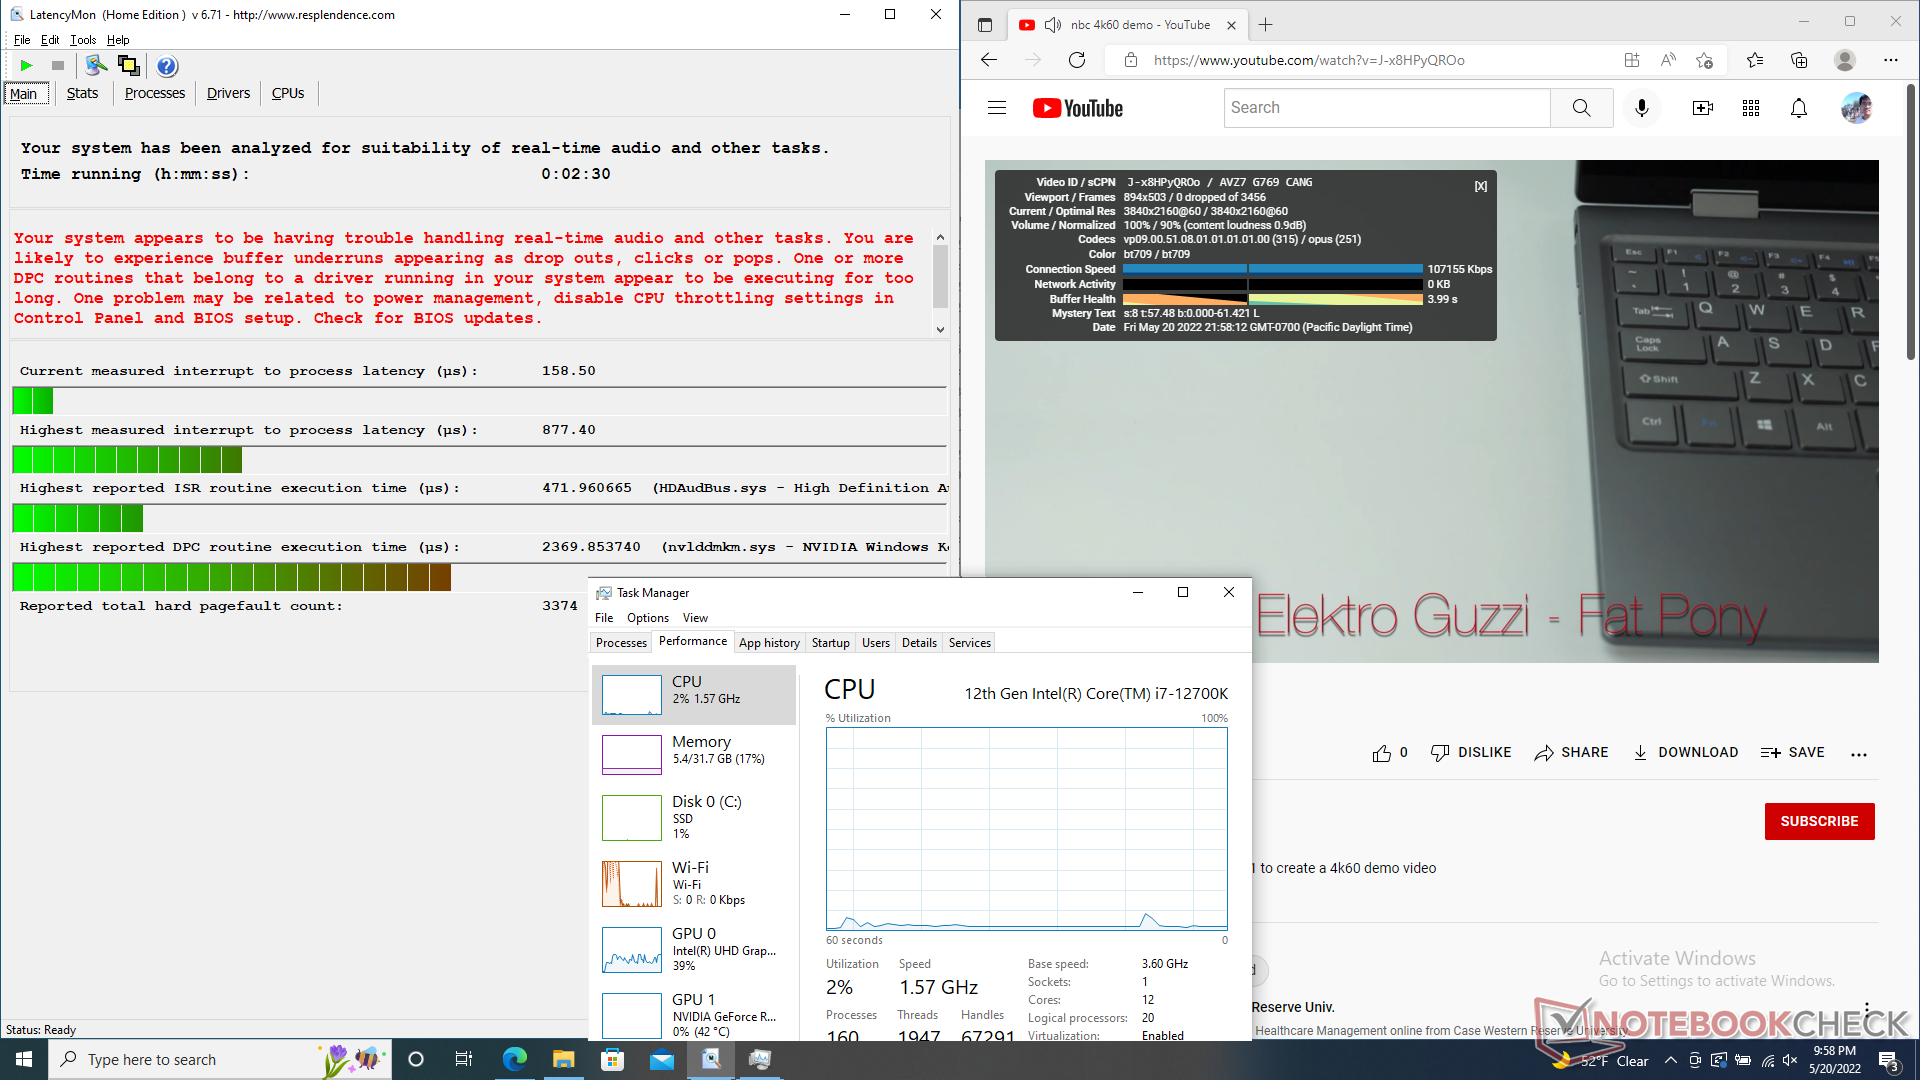
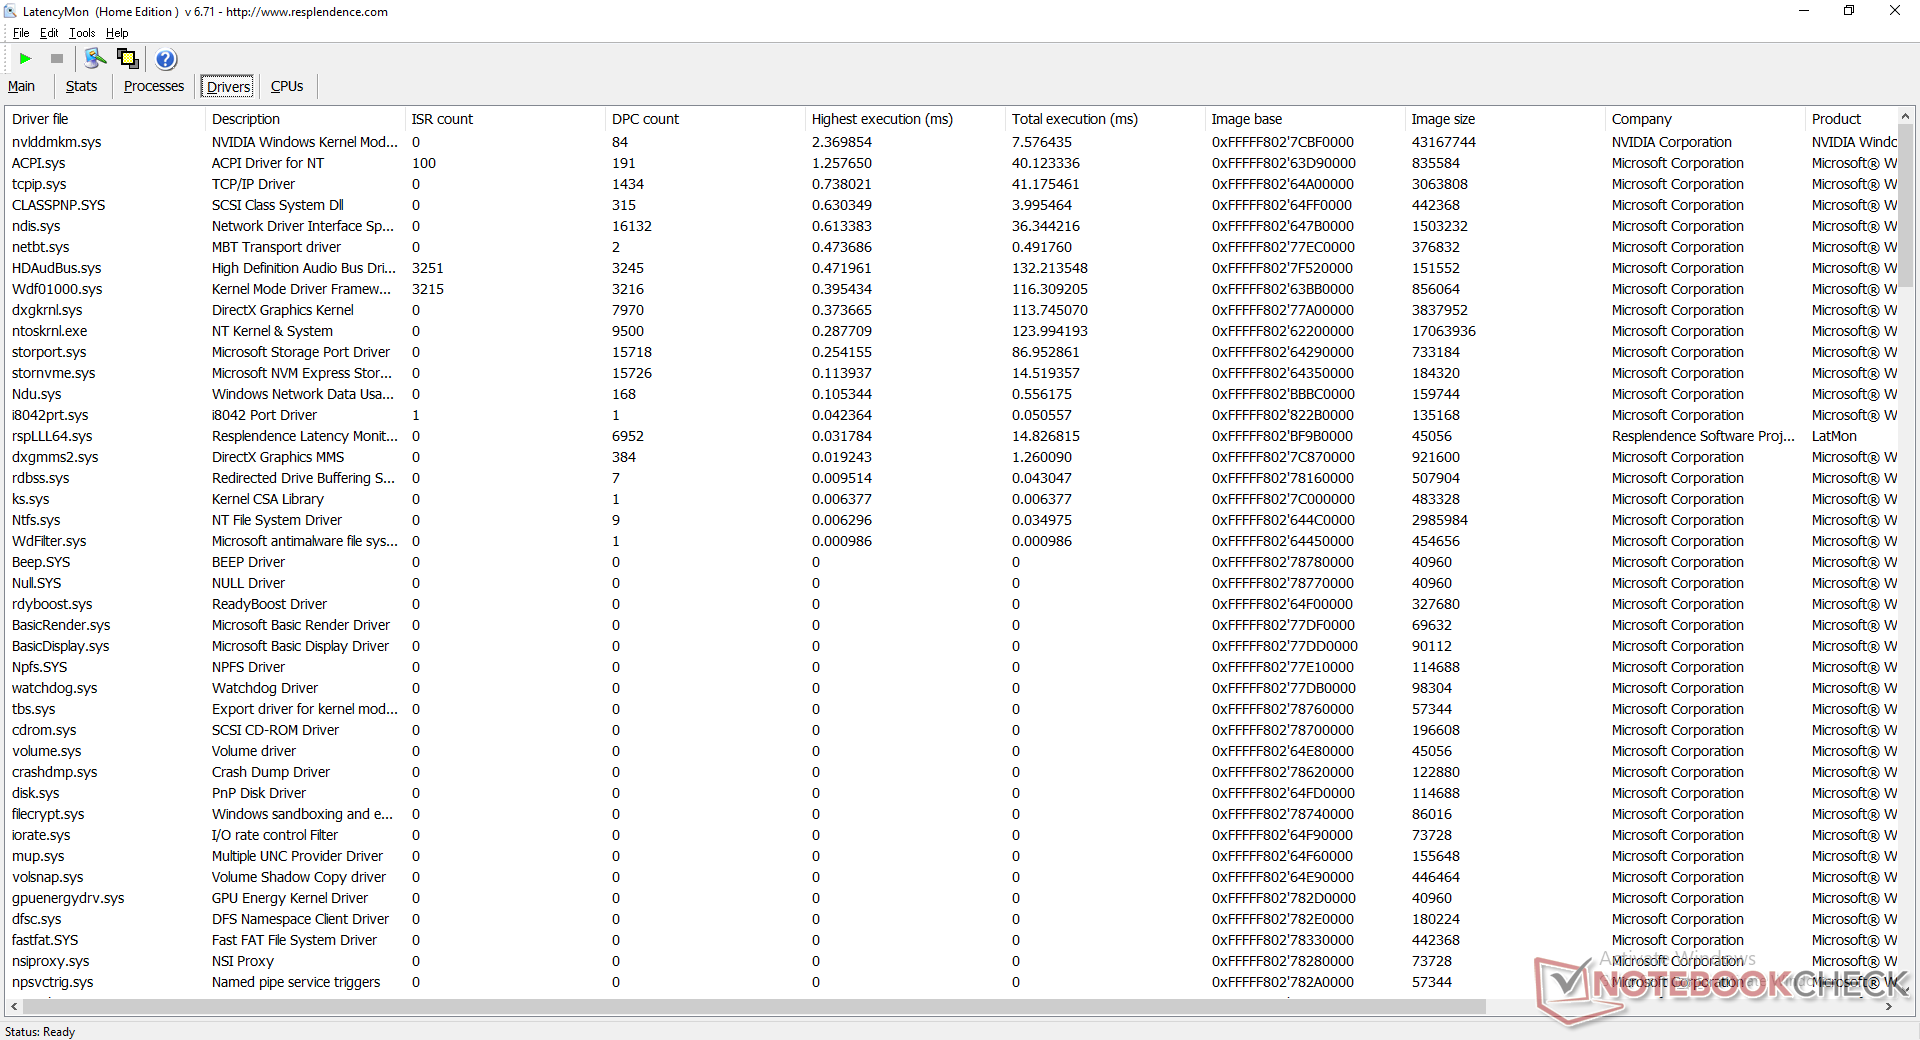
DPC延时
LatencyMon显示了在打开我们的主页的多个浏览器标签时的DPC问题。在其他方面,当设置为集成GPU时,在60FPS下的4K视频播放是完美的,没有丢帧。
| DPC Latencies / LatencyMon - interrupt to process latency (max), Web, Youtube, Prime95 | |
| MSI Raider GE66 12UHS | |
| Razer Blade 15 Advanced Model Early 2022 | |
| Eurocom RX315 NH57AF1 | |
| Asus TUF Gaming A15 FA506QR-AZ061T | |
| Eurocom Raptor X15 | |
| Gigabyte A5 X1 | |
* ... smaller is better
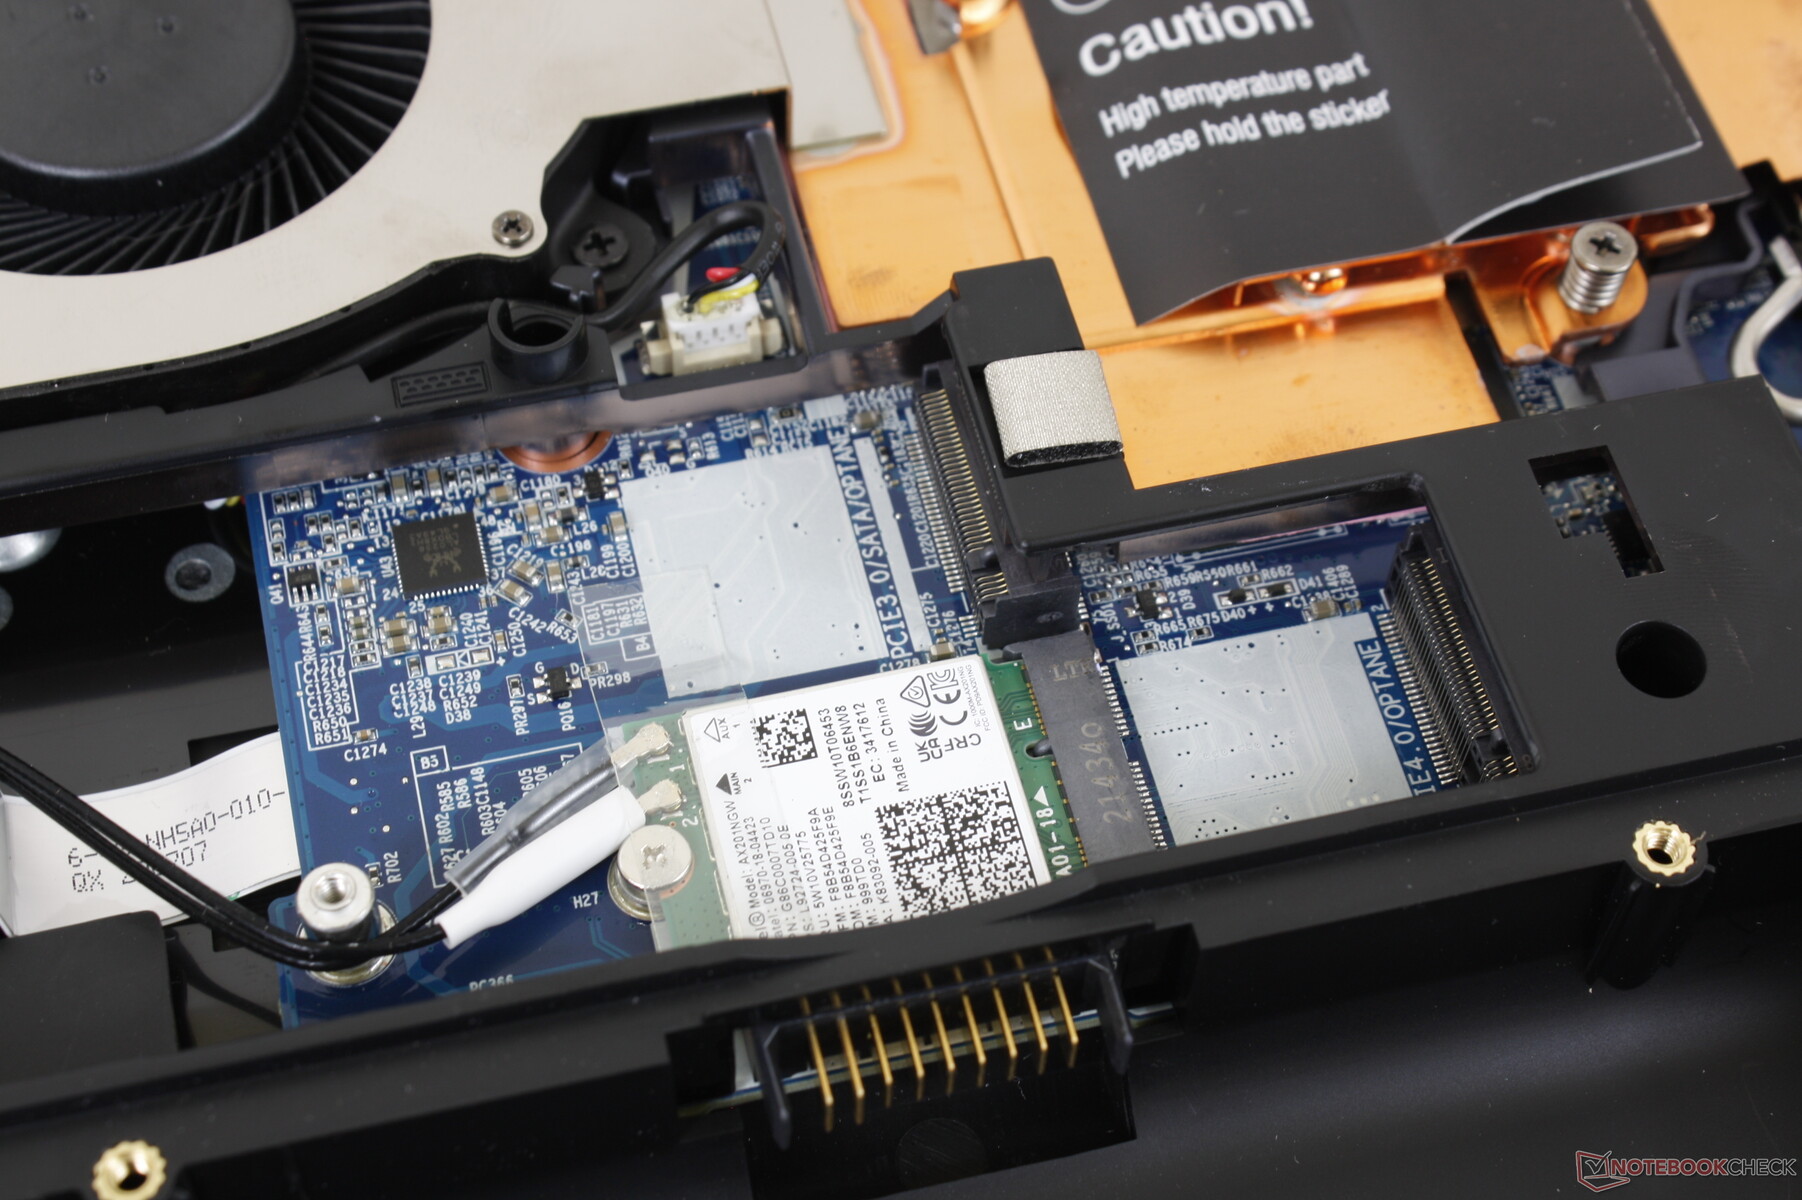
存储设备
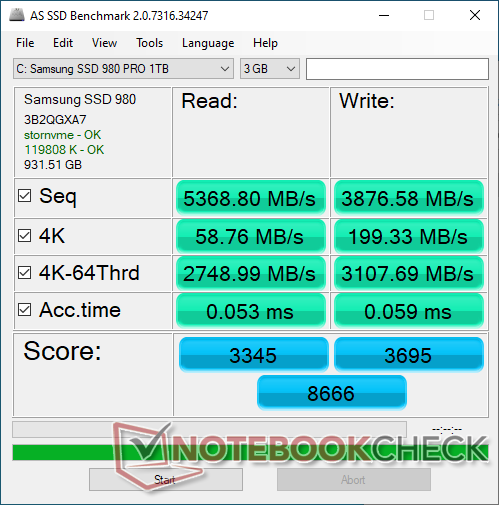
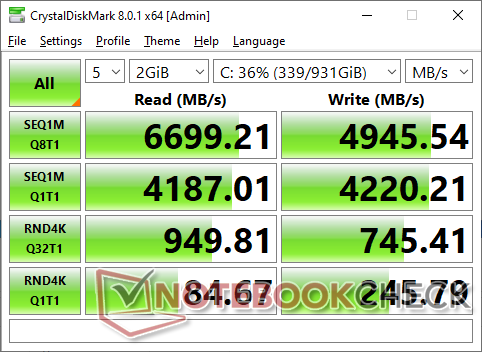
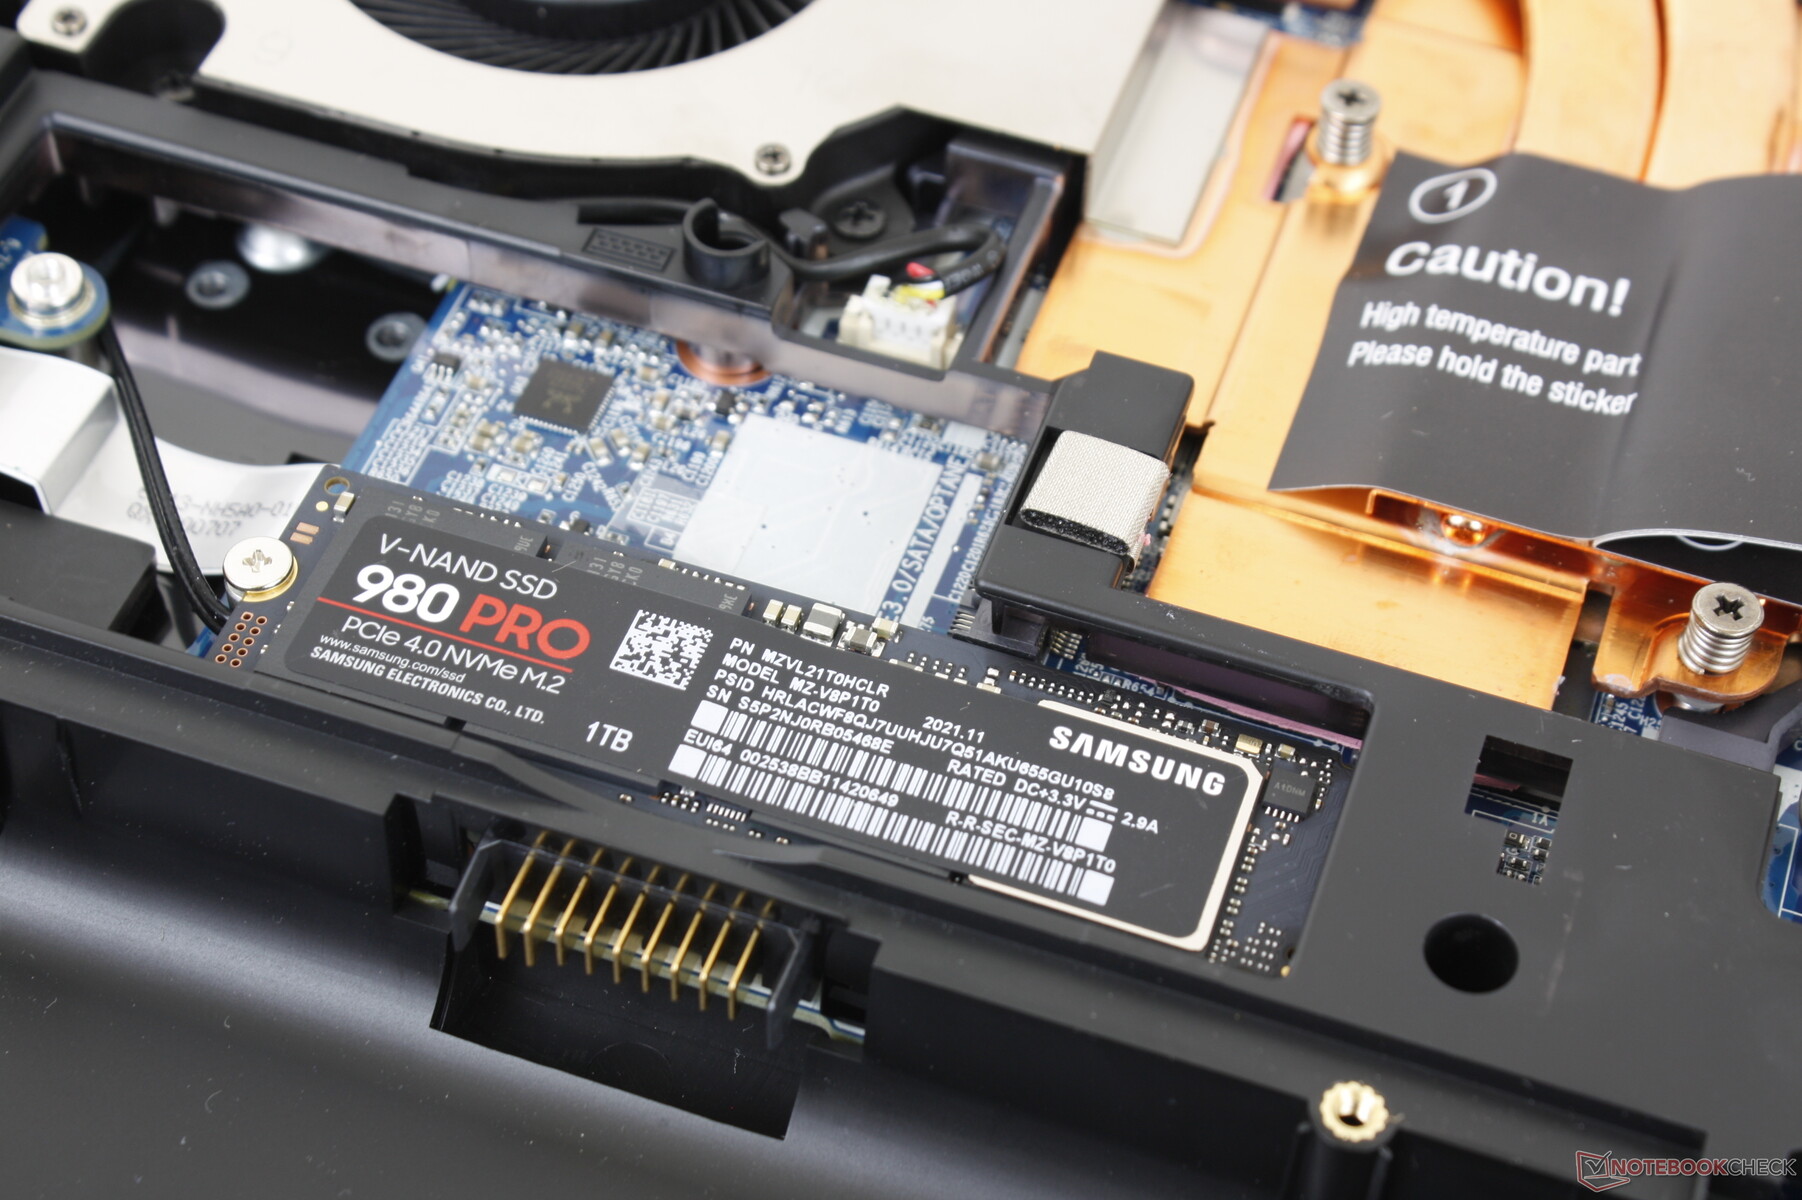
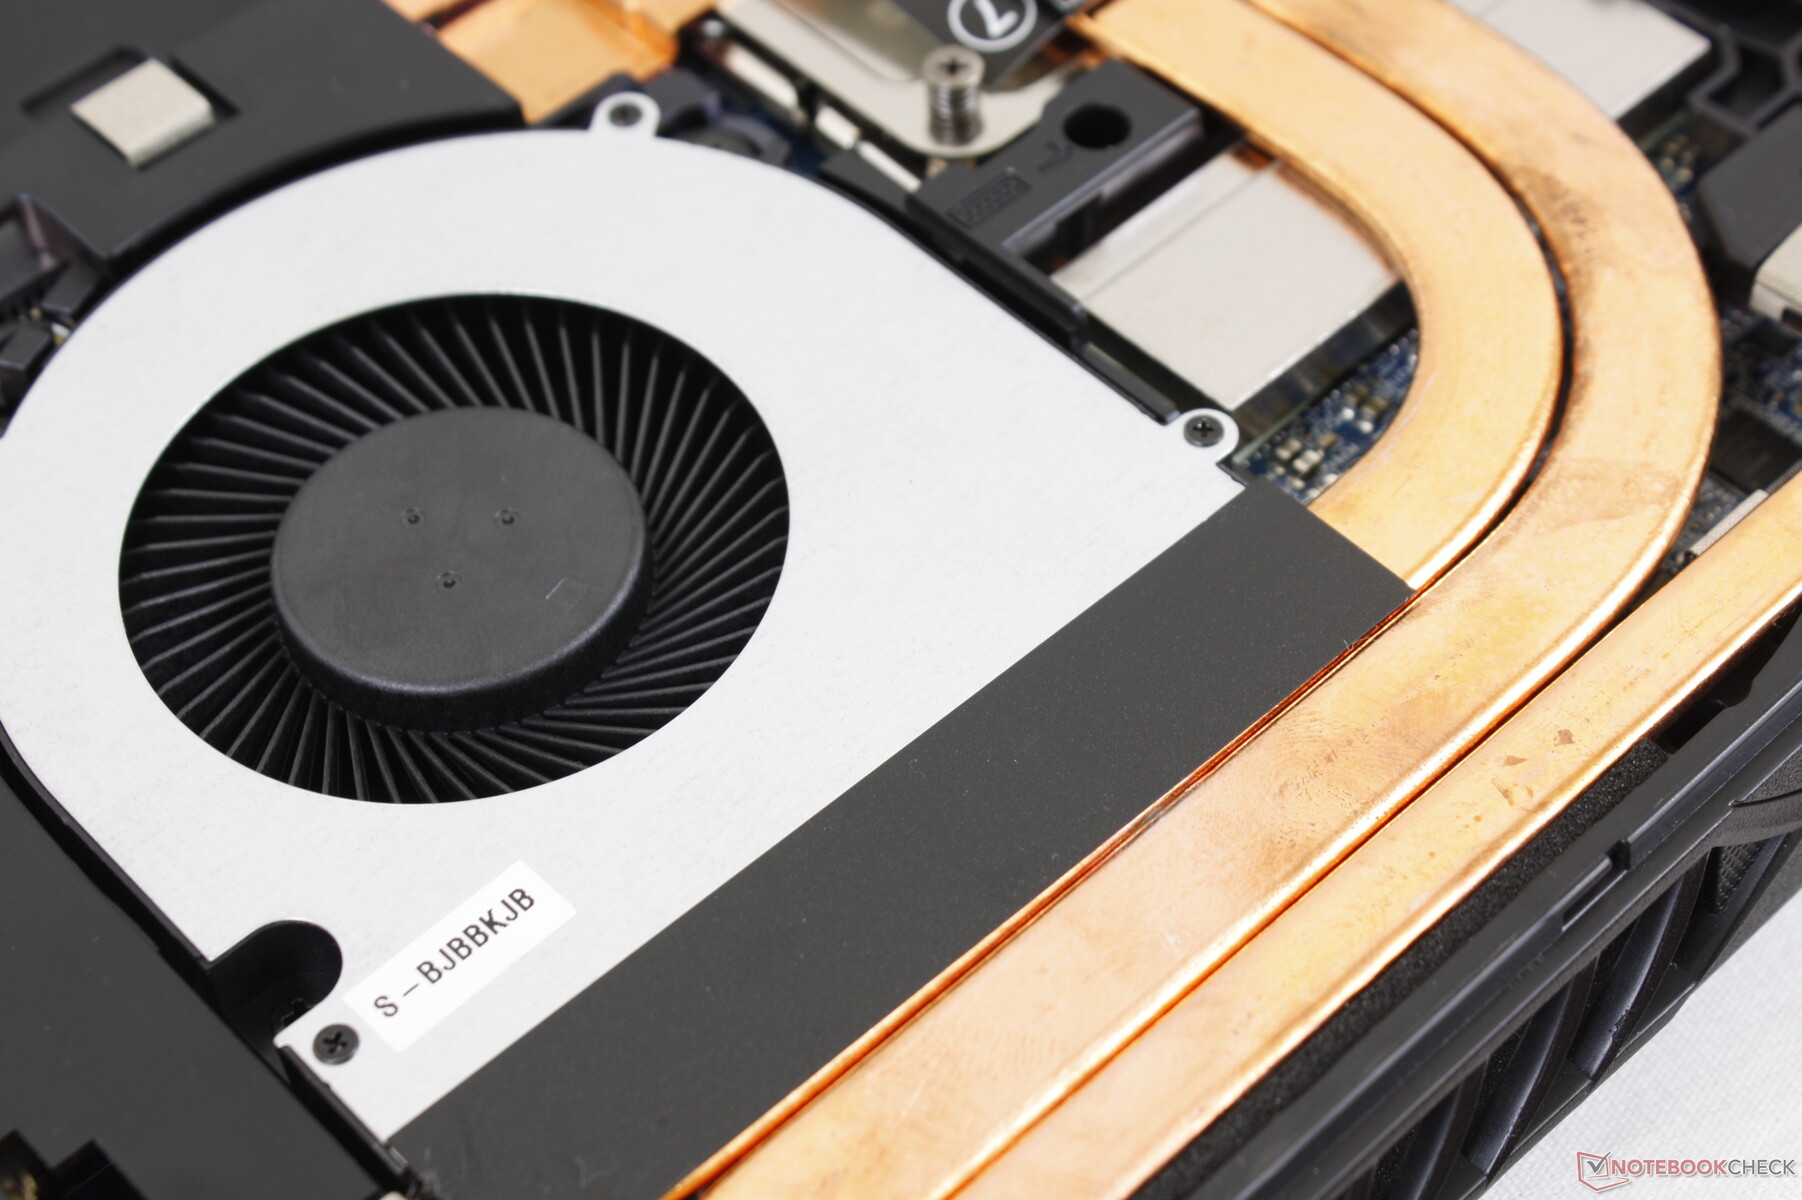
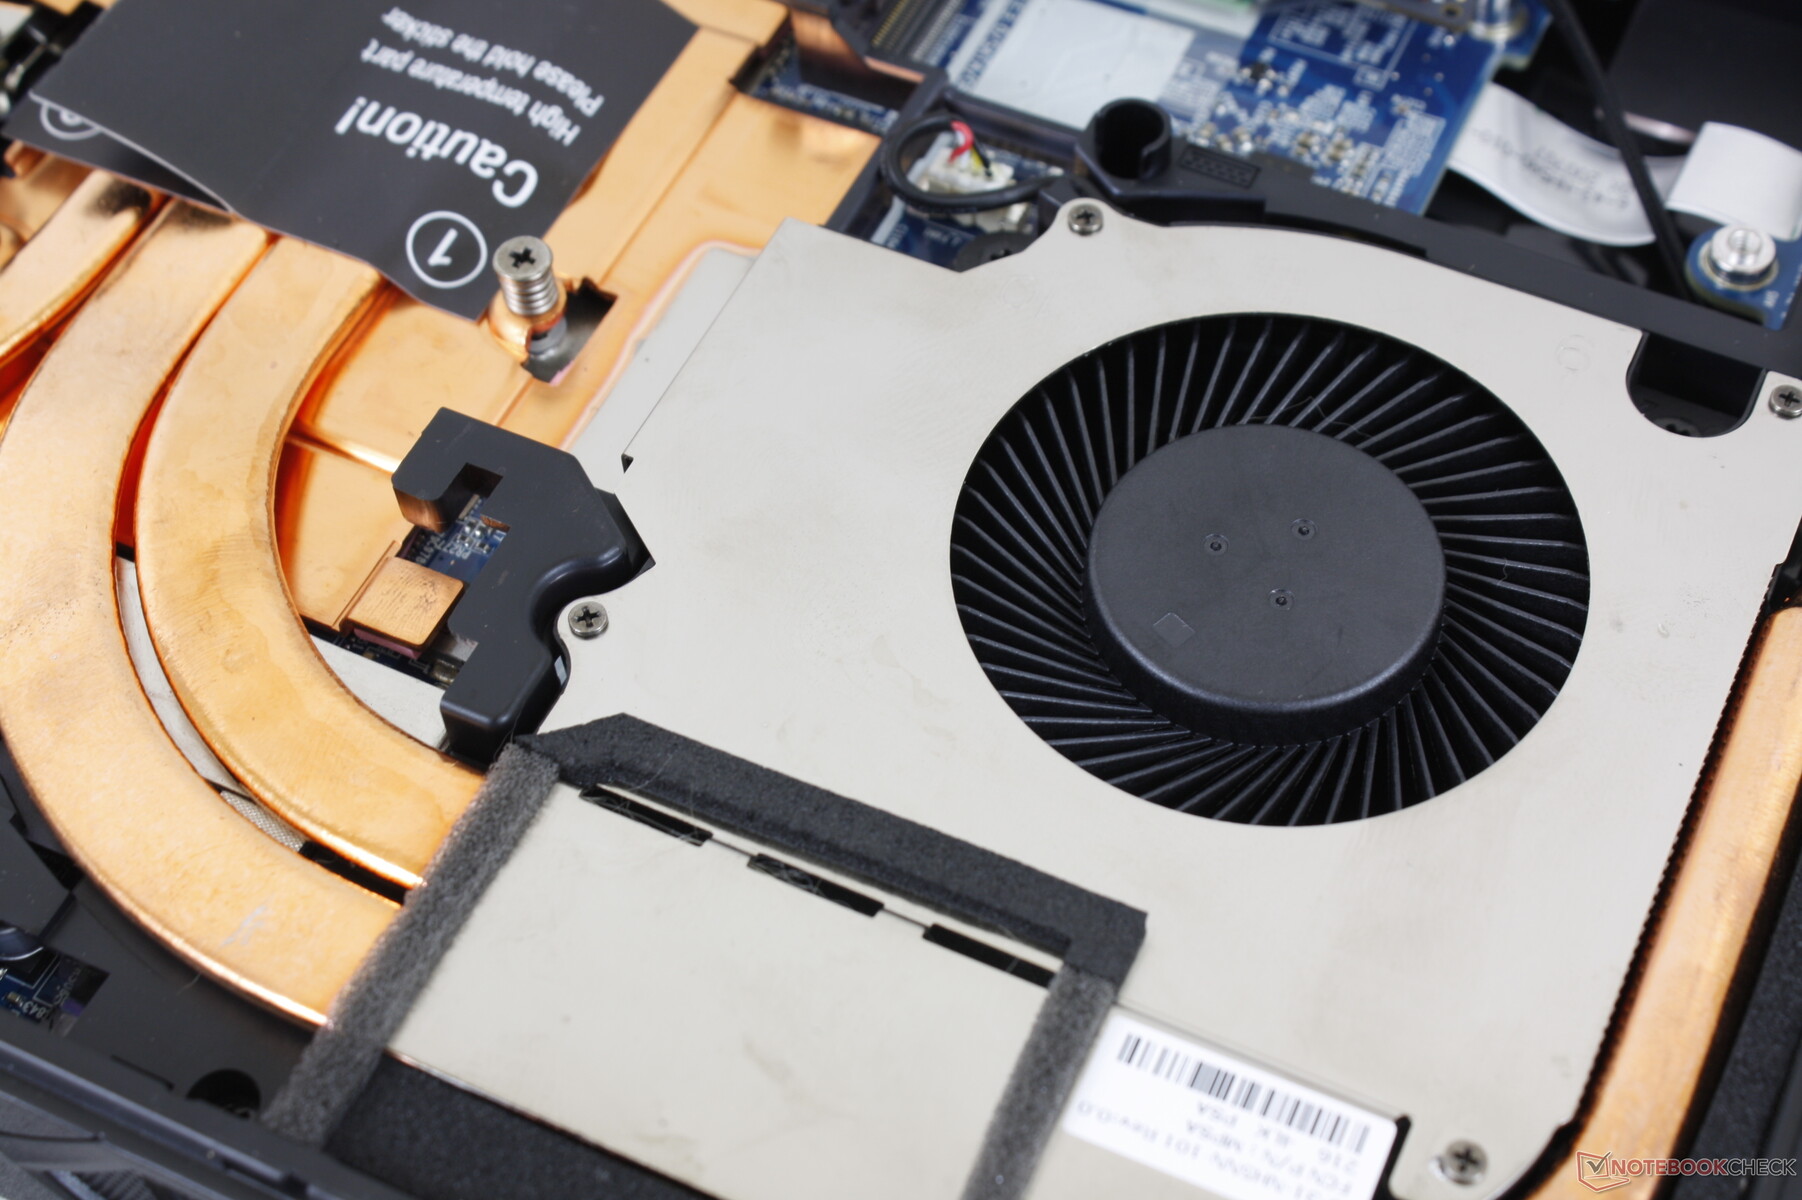
安装PCIe4硬盘时,性能的可持续性很差。正如我们下面的图表所示,三星SSD 980 Pro有问题,甚至在短时间内都无法维持其最大传输率。由于缺乏附带的散热器而产生的热限制,性能节流提前启动。

| Drive Performance rating - Percent | |
| MSI Raider GE66 12UHS | |
| Razer Blade 15 Advanced Model Early 2022 | |
| Eurocom Raptor X15 | |
| Eurocom RX315 NH57AF1 | |
| Asus TUF Gaming A15 FA506QR-AZ061T | |
| Gigabyte A5 X1 | |
* ... smaller is better
Disk Throttling: DiskSpd Read Loop, Queue Depth 8
GPU性能
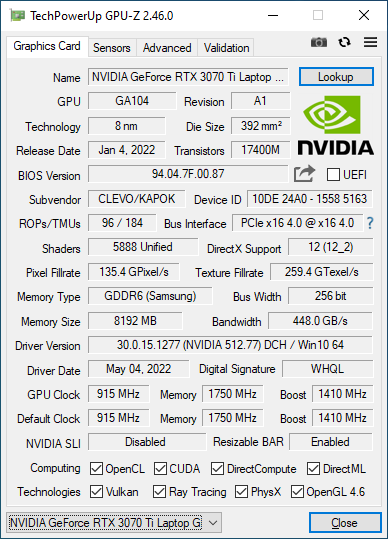
图形性能很好,比我们数据库中配备相同的笔记本电脑快10%。 GeForce RTX 3070 TiGPU。相对较厚的机箱允许高于平均水平的140W的TGP目标,相比之下,只有105W或更少,如在 微星GS66.性能仅次于 GeForce RTX 3070台式机的性能。
| 3DMark 11 - 1280x720 Performance GPU | |
| MSI GeForce RTX 3070 Ventus 3X | |
| MSI Raider GE66 12UHS | |
| MSI GP66 Leopard 11UH-028 | |
| Eurocom Raptor X15 | |
| Average NVIDIA GeForce RTX 3070 Ti Laptop GPU (13799 - 42569, n=36) | |
| Gigabyte A5 X1 | |
| MSI Stealth GS66 12UGS | |
| Asus TUF Gaming F15 FX507ZM | |
| Asus ROG Zephyrus M15 GU502LU-BI7N4 | |
| Dell G15 5510-43NHT | |
| Asus Zephyrus S GX531GM | |
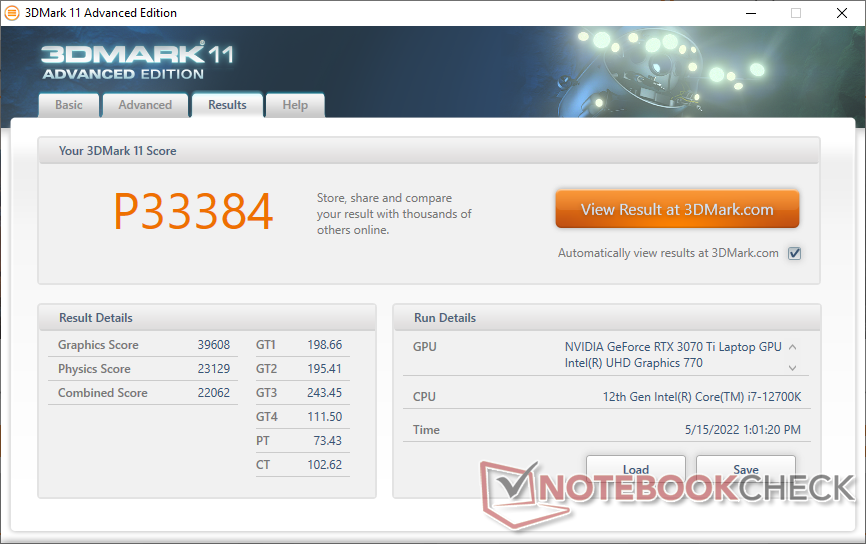
| 3DMark 11 Performance | 33384 points | |
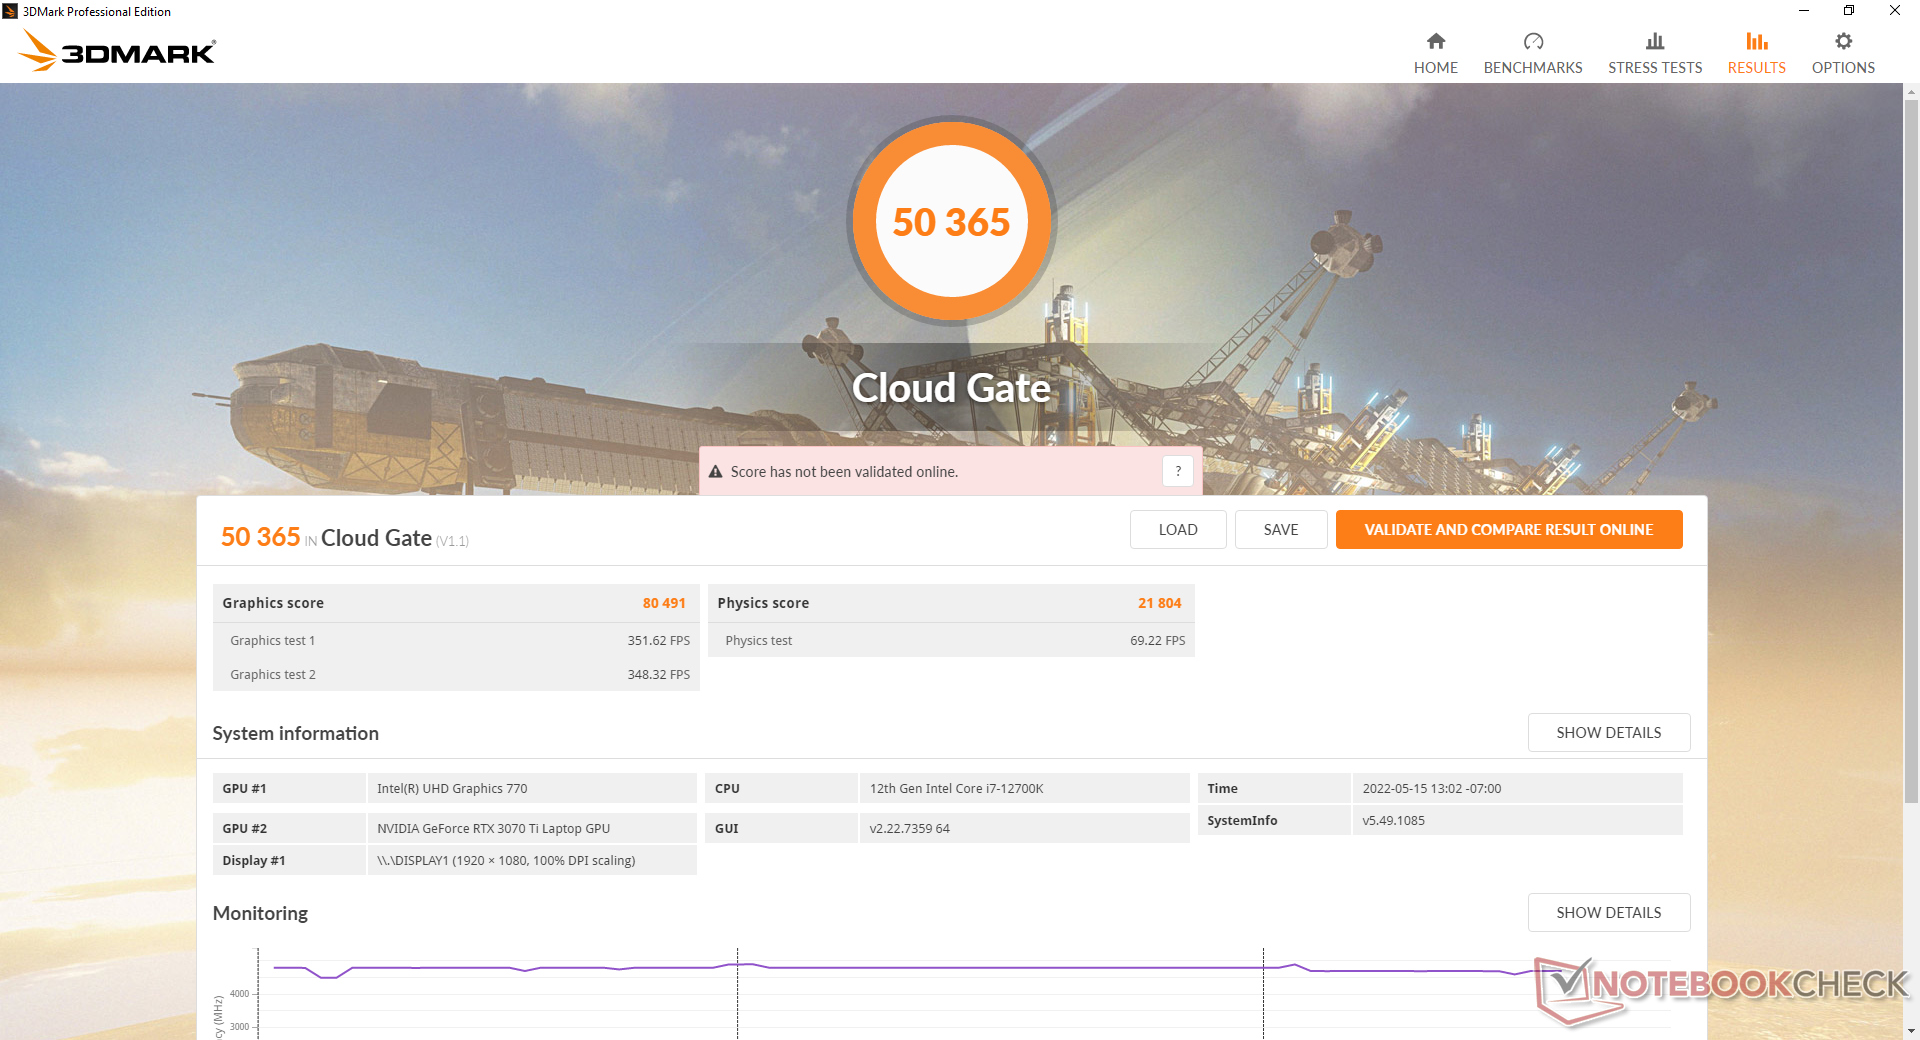
| 3DMark Cloud Gate Standard Score | 50365 points | |
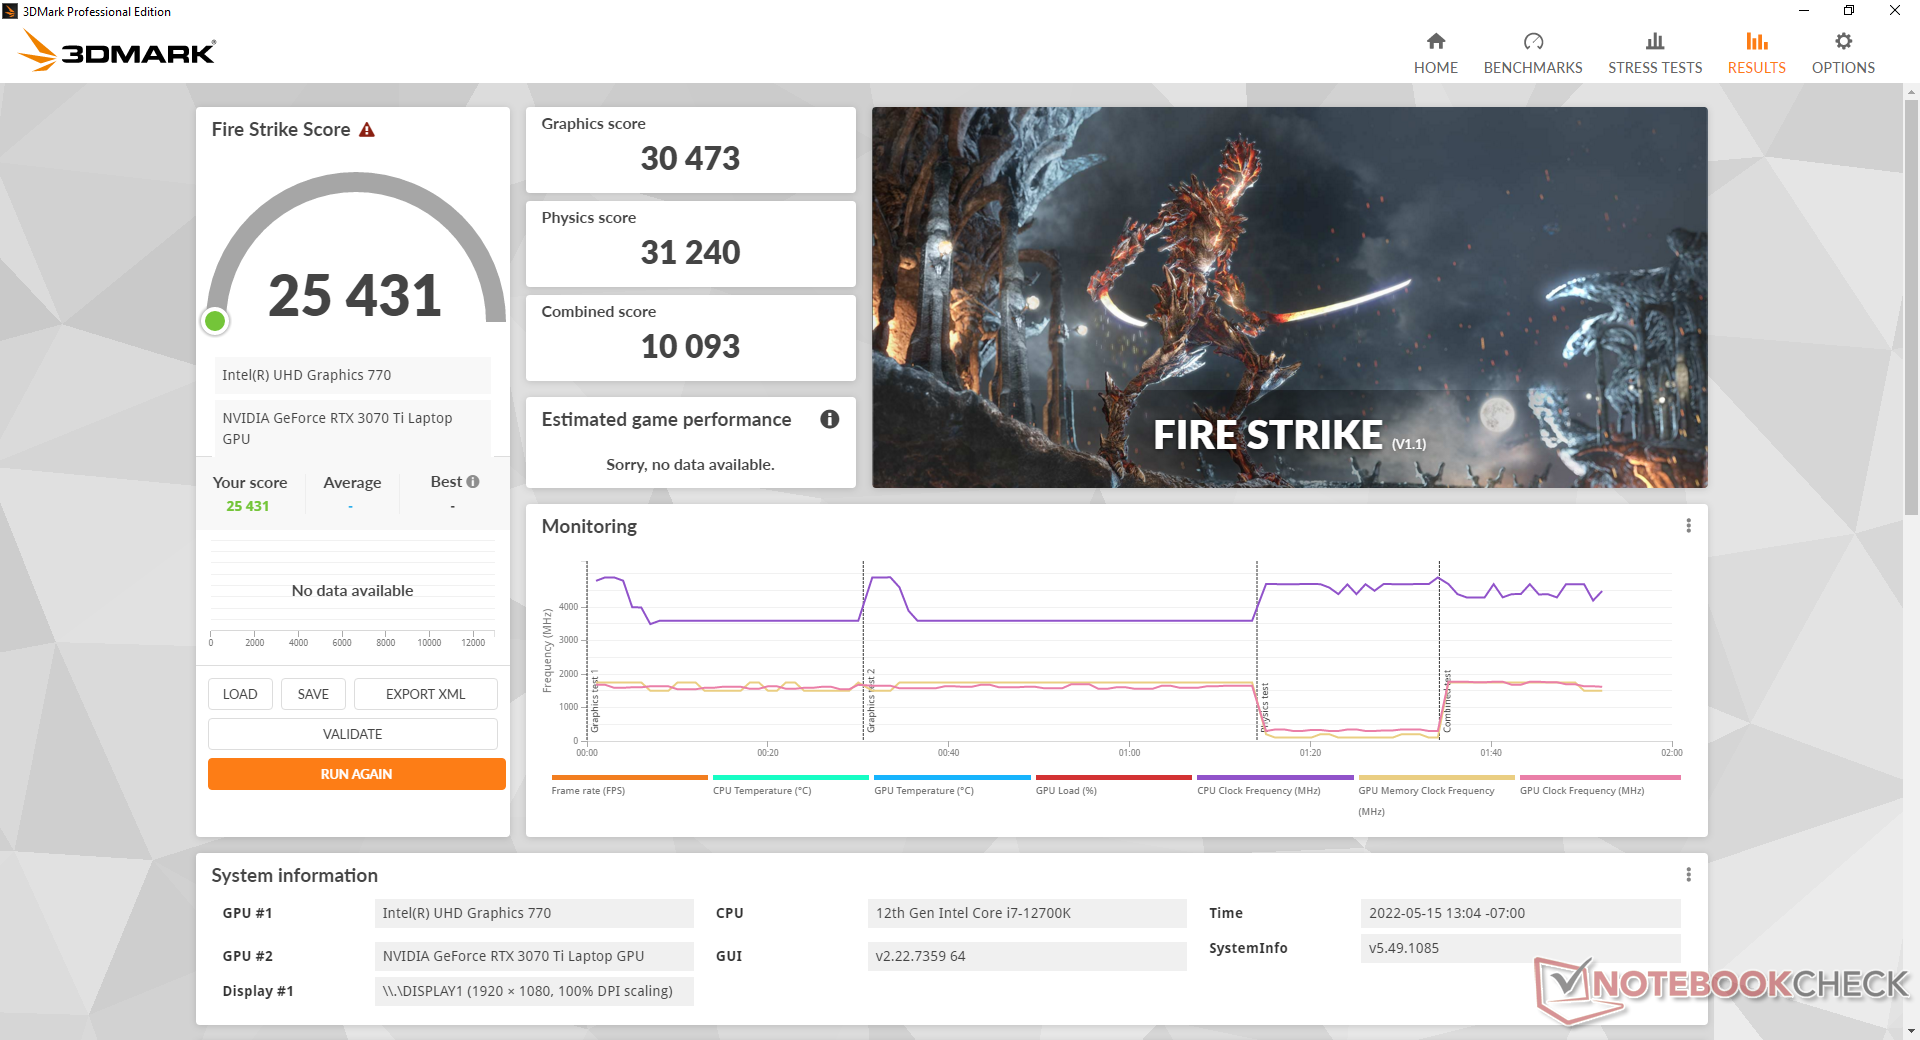
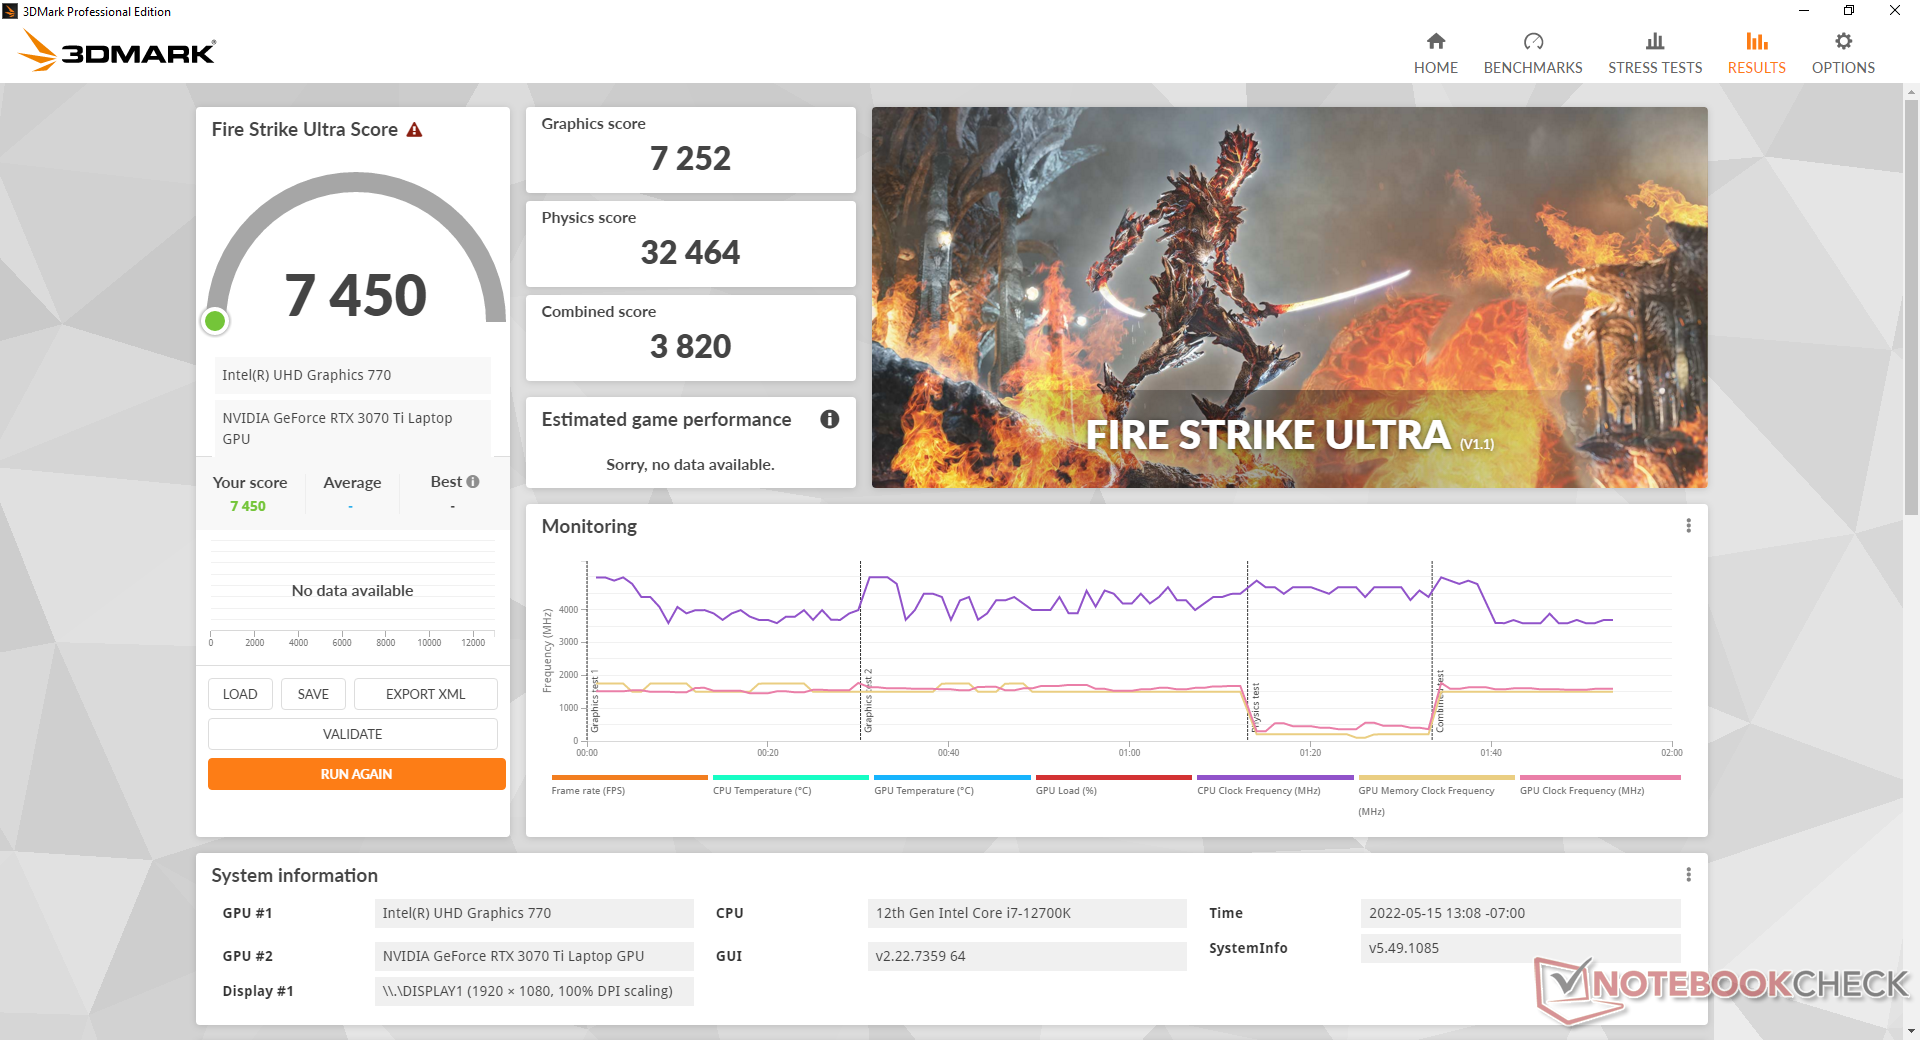
| 3DMark Fire Strike Score | 25431 points | |
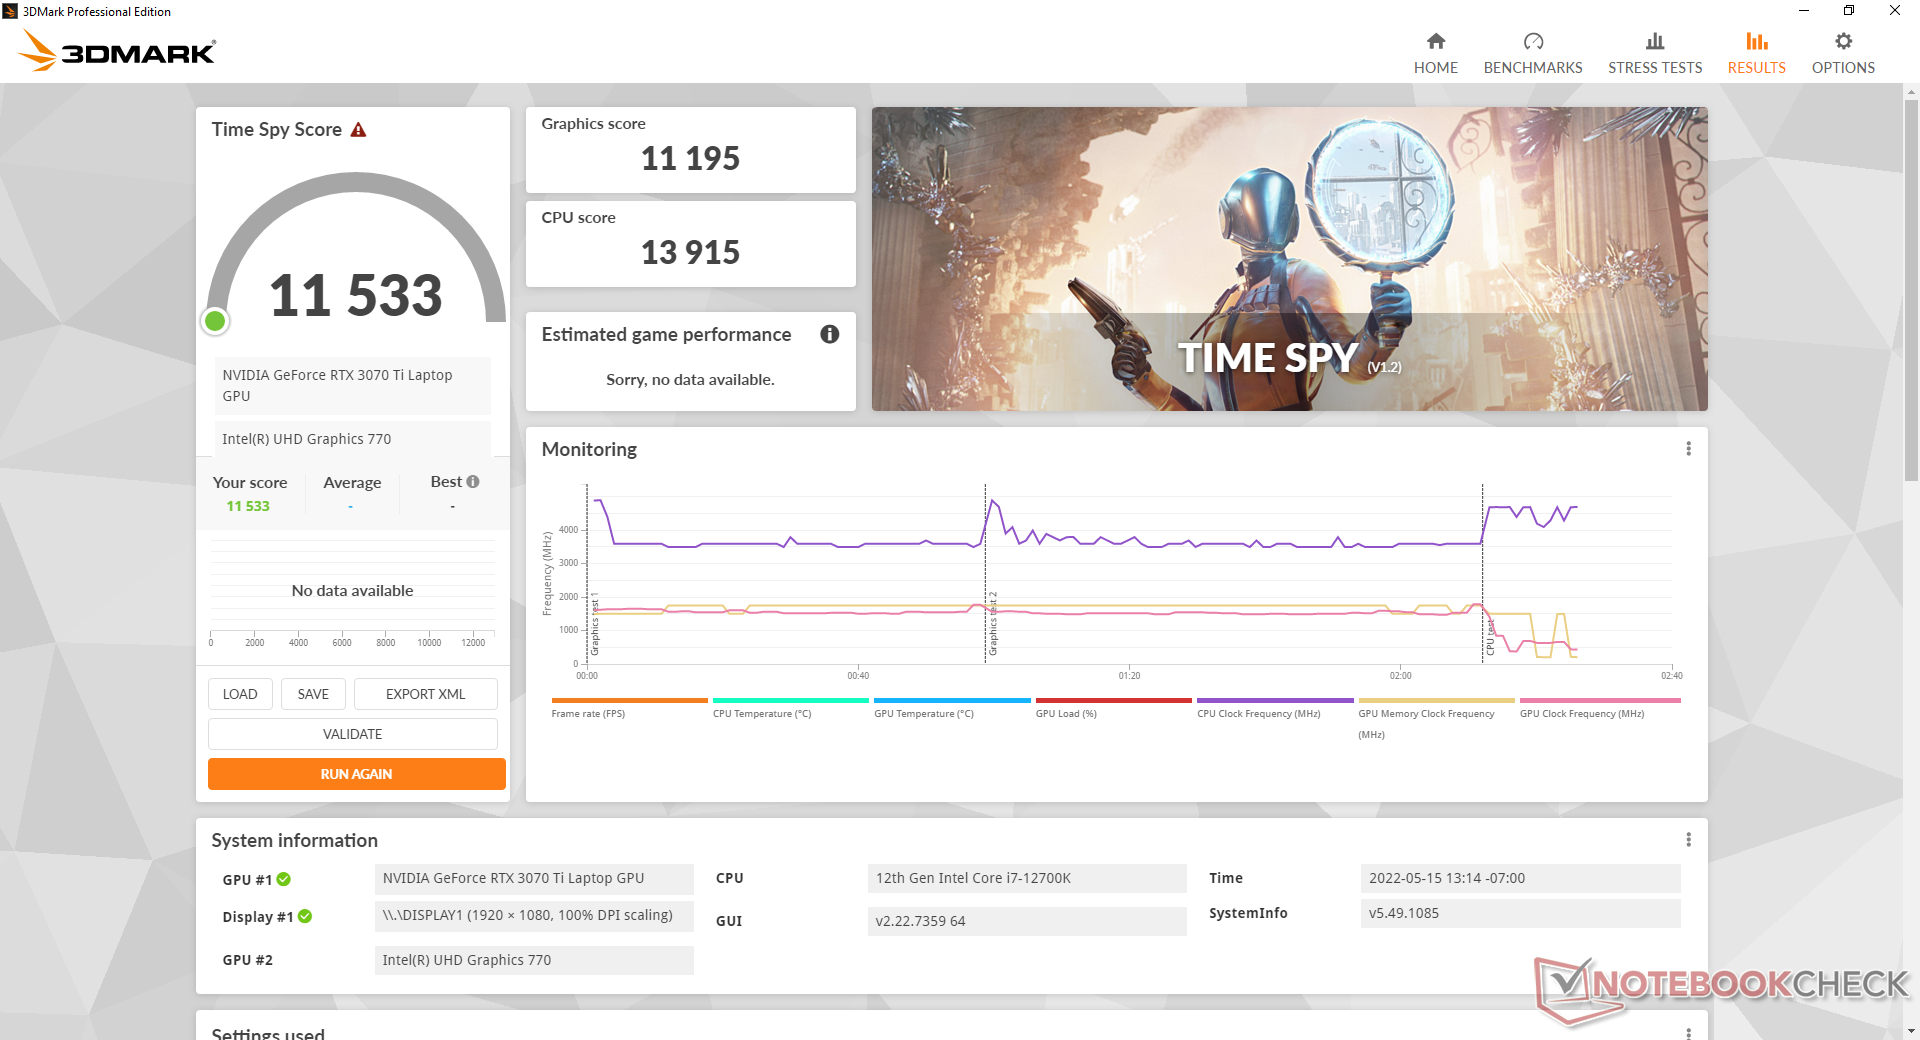
| 3DMark Time Spy Score | 11533 points | |
Help | ||
| Final Fantasy XV Benchmark | |
| 1280x720 Lite Quality | |
| MSI Raider GE66 12UHS | |
| MSI GeForce RTX 3070 Ventus 3X | |
| Eurocom Raptor X15 | |
| Average NVIDIA GeForce RTX 3070 Ti Laptop GPU (141.1 - 211, n=20) | |
| Gigabyte A5 X1 | |
| Asus TUF Gaming F15 FX507ZM | |
| Asus ROG Zephyrus M15 GU502LU-BI7N4 | |
| Dell G15 5510-43NHT | |
| 1920x1080 Standard Quality | |
| MSI Raider GE66 12UHS | |
| MSI GeForce RTX 3070 Ventus 3X | |
| Eurocom Raptor X15 | |
| MSI GP66 Leopard 11UH-028 | |
| Average NVIDIA GeForce RTX 3070 Ti Laptop GPU (113.9 - 162.6, n=24) | |
| Gigabyte A5 X1 | |
| Asus TUF Gaming F15 FX507ZM | |
| MSI Stealth GS66 12UGS | |
| Asus ROG Zephyrus M15 GU502LU-BI7N4 | |
| Dell G15 5510-43NHT | |
| 1920x1080 High Quality | |
| MSI GeForce RTX 3070 Ventus 3X | |
| MSI Raider GE66 12UHS | |
| Eurocom Raptor X15 | |
| Average NVIDIA GeForce RTX 3070 Ti Laptop GPU (49.5 - 122.4, n=35) | |
| Gigabyte A5 X1 | |
| Asus TUF Gaming F15 FX507ZM | |
| MSI Stealth GS66 12UGS | |
| Asus ROG Zephyrus M15 GU502LU-BI7N4 | |
| Dell G15 5510-43NHT | |
Witcher 3 FPS Chart
| low | med. | high | ultra | |
|---|---|---|---|---|
| GTA V (2015) | 186.6 | 182.8 | 174.6 | 116.5 |
| The Witcher 3 (2015) | 429 | 329.2 | 213.9 | 111.4 |
| Dota 2 Reborn (2015) | 199 | 178.4 | 166.3 | 155.6 |
| Final Fantasy XV Benchmark (2018) | 202 | 145.8 | 109.5 | |
| X-Plane 11.11 (2018) | 160.9 | 137.6 | 109.9 | |
| Strange Brigade (2018) | 490 | 271 | 223 | 194 |
| Cyberpunk 2077 1.6 (2022) | 140.4 | 124.6 | 132.3 | 81.8 |
排放
系统噪音
风扇噪音取决于五个控制中心的电源模式设置。省电、安静、娱乐、性能和最大风扇模式。在简单的浏览或视频流时,建议使用安静或省电模式,以使风扇噪音保持在最低水平。否则,在娱乐或性能模式下运行要求不高的应用程序时,风扇会更频繁地跳动。
预计在游戏时,风扇噪音将在50 dB(A)的范围内,比许多其他游戏笔记本在类似条件下的噪音要大。如果性能模式和最大风扇模式都处于激活状态,那么风扇噪音可高达55 dB(A)。
Noise level
| Idle |
| 23.8 / 23.8 / 30.1 dB(A) |
| Load |
| 31.1 / 55.1 dB(A) |
 | ||
30 dB silent 40 dB(A) audible 50 dB(A) loud |
||
min: | ||
| Eurocom Raptor X15 GeForce RTX 3070 Ti Laptop GPU, i7-12700K, Samsung SSD 980 Pro 1TB MZ-V8P1T0BW | MSI Raider GE66 12UHS GeForce RTX 3080 Ti Laptop GPU, i9-12900HK, Samsung PM9A1 MZVL22T0HBLB | Razer Blade 15 Advanced Model Early 2022 GeForce RTX 3080 Ti Laptop GPU, i7-12800H, Samsung PM9A1 MZVL21T0HCLR | Eurocom RX315 NH57AF1 GeForce RTX 3070 Laptop GPU, i7-11800H, Samsung SSD 980 Pro 1TB MZ-V8P1T0BW | Gigabyte A5 X1 GeForce RTX 3070 Laptop GPU, R9 5900HX, ADATA XPG SX8200 Pro (ASX8200PNP-512GT) | Asus TUF Gaming A15 FA506QR-AZ061T GeForce RTX 3070 Laptop GPU, R7 5800H, SK Hynix HFM001TD3JX013N | |
|---|---|---|---|---|---|---|
| Noise | -14% | -2% | -18% | -21% | -10% | |
| off / environment * (dB) | 23.3 | 26 -12% | 26 -12% | 26.3 -13% | 25 -7% | 26 -12% |
| Idle Minimum * (dB) | 23.8 | 27 -13% | 26 -9% | 26.4 -11% | 27 -13% | 26 -9% |
| Idle Average * (dB) | 23.8 | 30 -26% | 27 -13% | 31 -30% | 29 -22% | 26 -9% |
| Idle Maximum * (dB) | 30.1 | 39 -30% | 29 4% | 34 -13% | 32 -6% | 27.4 9% |
| Load Average * (dB) | 31.1 | 45 -45% | 37 -19% | 47.8 -54% | 57 -83% | 46.6 -50% |
| Witcher 3 ultra * (dB) | 51.3 | 45 12% | 44 14% | 51.7 -1% | 56 -9% | |
| Load Maximum * (dB) | 55.1 | 47 15% | 45 18% | 57.1 -4% | 58 -5% | 49.3 11% |
* ... smaller is better
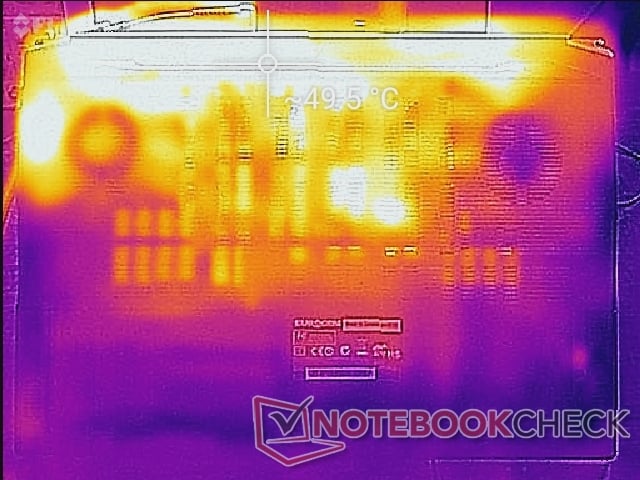
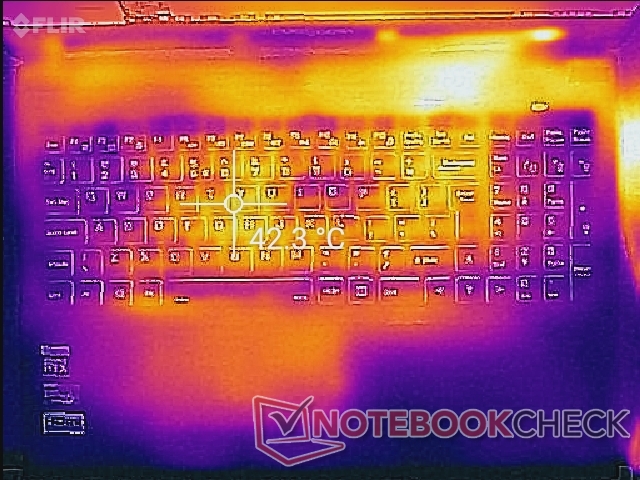
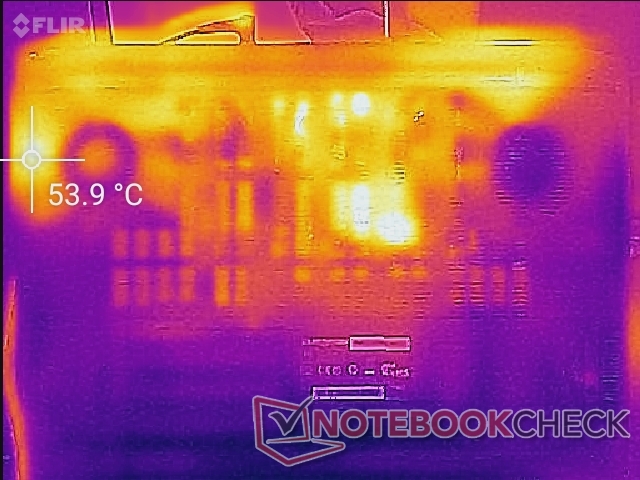
温度
在运行高要求的应用程序时,表面温度热点离左手掌托和键盘中心最近。由于PCIe4 NVMe固态硬盘被放置在下面,所以左边的掌托通常比右边的掌托更热。如下面的温度图所示,顶部和底部区域的热点可以达到约50℃。
(-) The maximum temperature on the upper side is 48.8 °C / 120 F, compared to the average of 40.4 °C / 105 F, ranging from 21.2 to 68.8 °C for the class Gaming.
(-) The bottom heats up to a maximum of 57.8 °C / 136 F, compared to the average of 43.2 °C / 110 F
(+) In idle usage, the average temperature for the upper side is 30.2 °C / 86 F, compared to the device average of 33.9 °C / 93 F.
(±) Playing The Witcher 3, the average temperature for the upper side is 34.3 °C / 94 F, compared to the device average of 33.9 °C / 93 F.
(±) The palmrests and touchpad can get very hot to the touch with a maximum of 37.2 °C / 99 F.
(-) The average temperature of the palmrest area of similar devices was 28.8 °C / 83.8 F (-8.4 °C / -15.2 F).
| Eurocom Raptor X15 Intel Core i7-12700K, NVIDIA GeForce RTX 3070 Ti Laptop GPU | MSI Raider GE66 12UHS Intel Core i9-12900HK, NVIDIA GeForce RTX 3080 Ti Laptop GPU | Razer Blade 15 Advanced Model Early 2022 Intel Core i7-12800H, NVIDIA GeForce RTX 3080 Ti Laptop GPU | Eurocom RX315 NH57AF1 Intel Core i7-11800H, NVIDIA GeForce RTX 3070 Laptop GPU | Gigabyte A5 X1 AMD Ryzen 9 5900HX, NVIDIA GeForce RTX 3070 Laptop GPU | Asus TUF Gaming A15 FA506QR-AZ061T AMD Ryzen 7 5800H, NVIDIA GeForce RTX 3070 Laptop GPU | |
|---|---|---|---|---|---|---|
| Heat | 2% | 2% | 14% | 17% | 3% | |
| Maximum Upper Side * (°C) | 48.8 | 54 -11% | 53 -9% | 36 26% | 47 4% | 46.7 4% |
| Maximum Bottom * (°C) | 57.8 | 65 -12% | 53 8% | 46 20% | 51 12% | 55.9 3% |
| Idle Upper Side * (°C) | 36.6 | 30 18% | 36 2% | 35.6 3% | 27 26% | 37.1 -1% |
| Idle Bottom * (°C) | 40.2 | 35 13% | 38 5% | 36.8 8% | 30 25% | 38.1 5% |
* ... smaller is better
压力测试
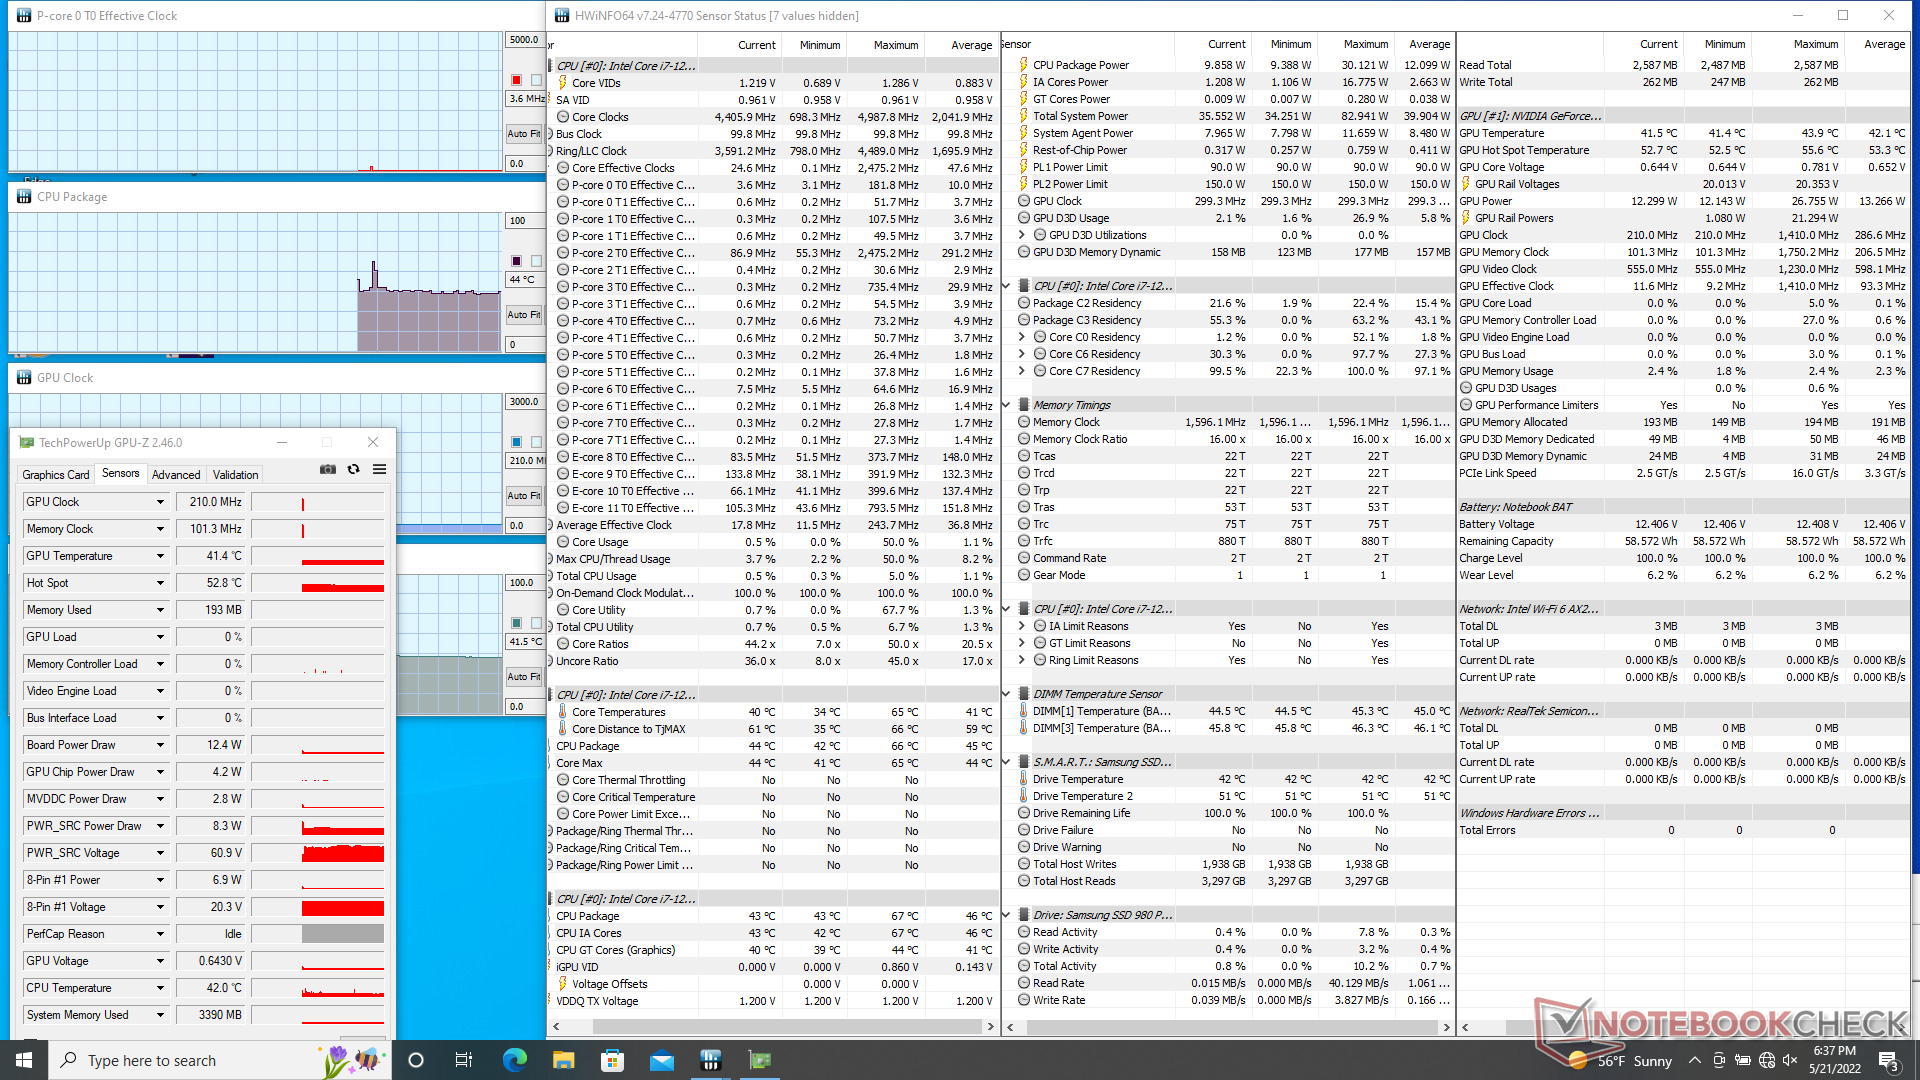
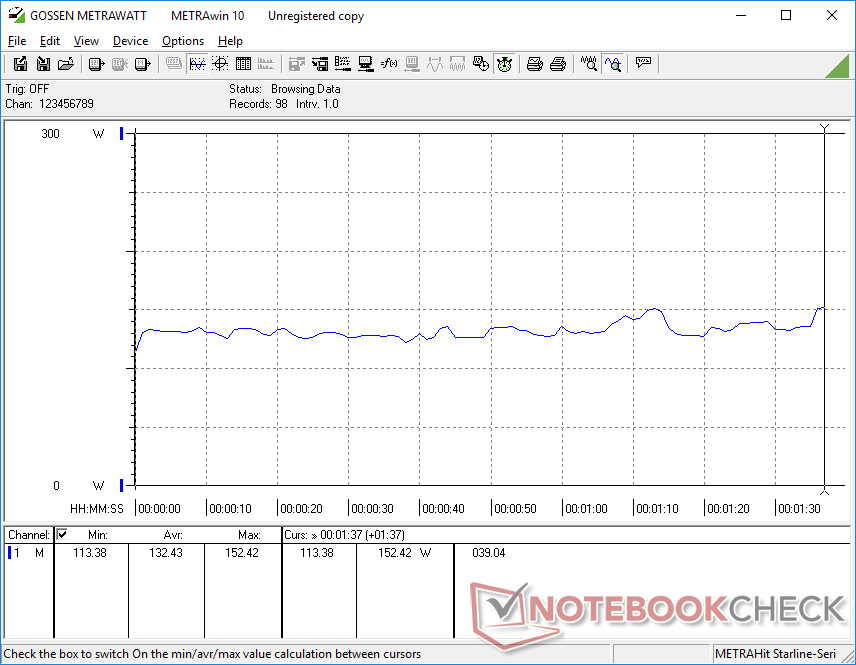
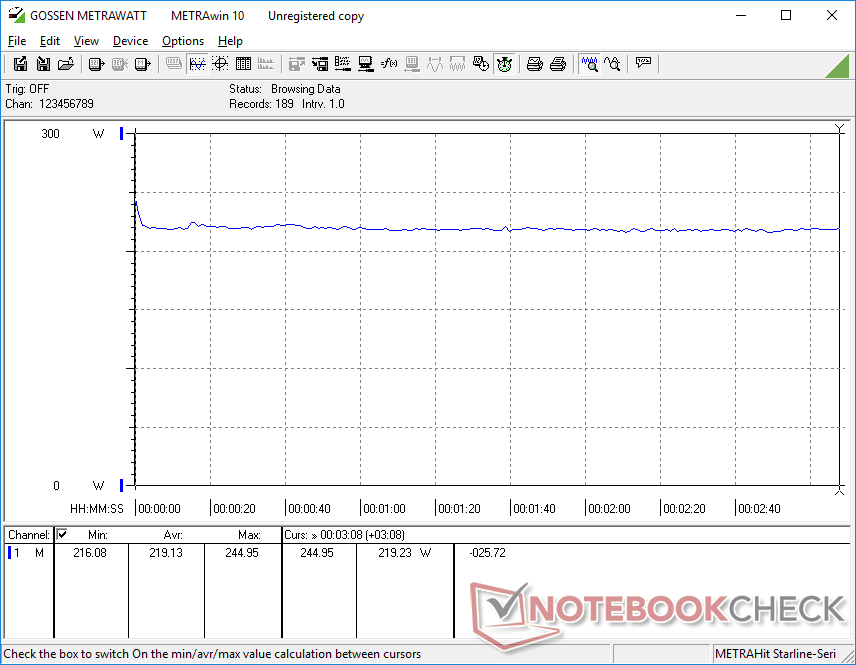
当在Prime95下受压时,CPU在达到86C的核心温度之前,会提升到3.8GHz和100W,几乎整整一分钟。此后,时钟频率会稳步下降,然后稳定在2.6GHz和70W,以达到75C的更稳定的核心温度。
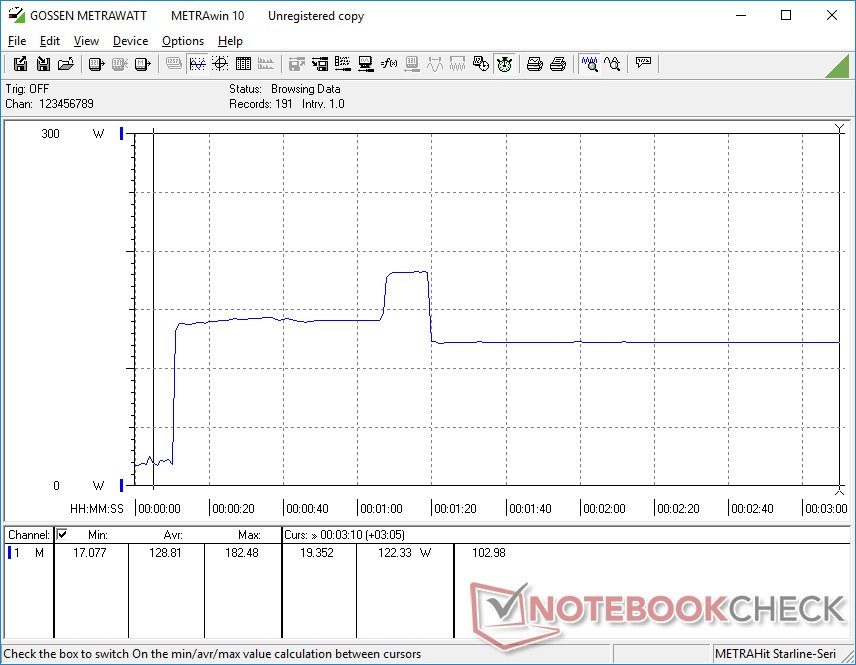
从娱乐模式切换到性能模式时,图形性能有轻微提升。在性能模式下运行Witcher 3 ,GPU板功耗和时钟速率将分别稳定在118瓦和1620兆赫,而在娱乐模式下运行同一游戏,则为113瓦和1530兆赫。如果激活最大风扇模式,GPU时钟速率和主板功耗将稳定在更高的数值,分别为1725 MHz和130 W。令人失望的是,GPU无法达到Nvidia控制面板上声称的140W目标,用户必须打开最大风扇模式,才能从GPU中榨取预期的性能水平。
用电池供电运行限制了性能。在电池上进行的Fire Strike 测试将返回物理和图形分数,分别为12708和3419分,而在主电源上则为31240和30473分。
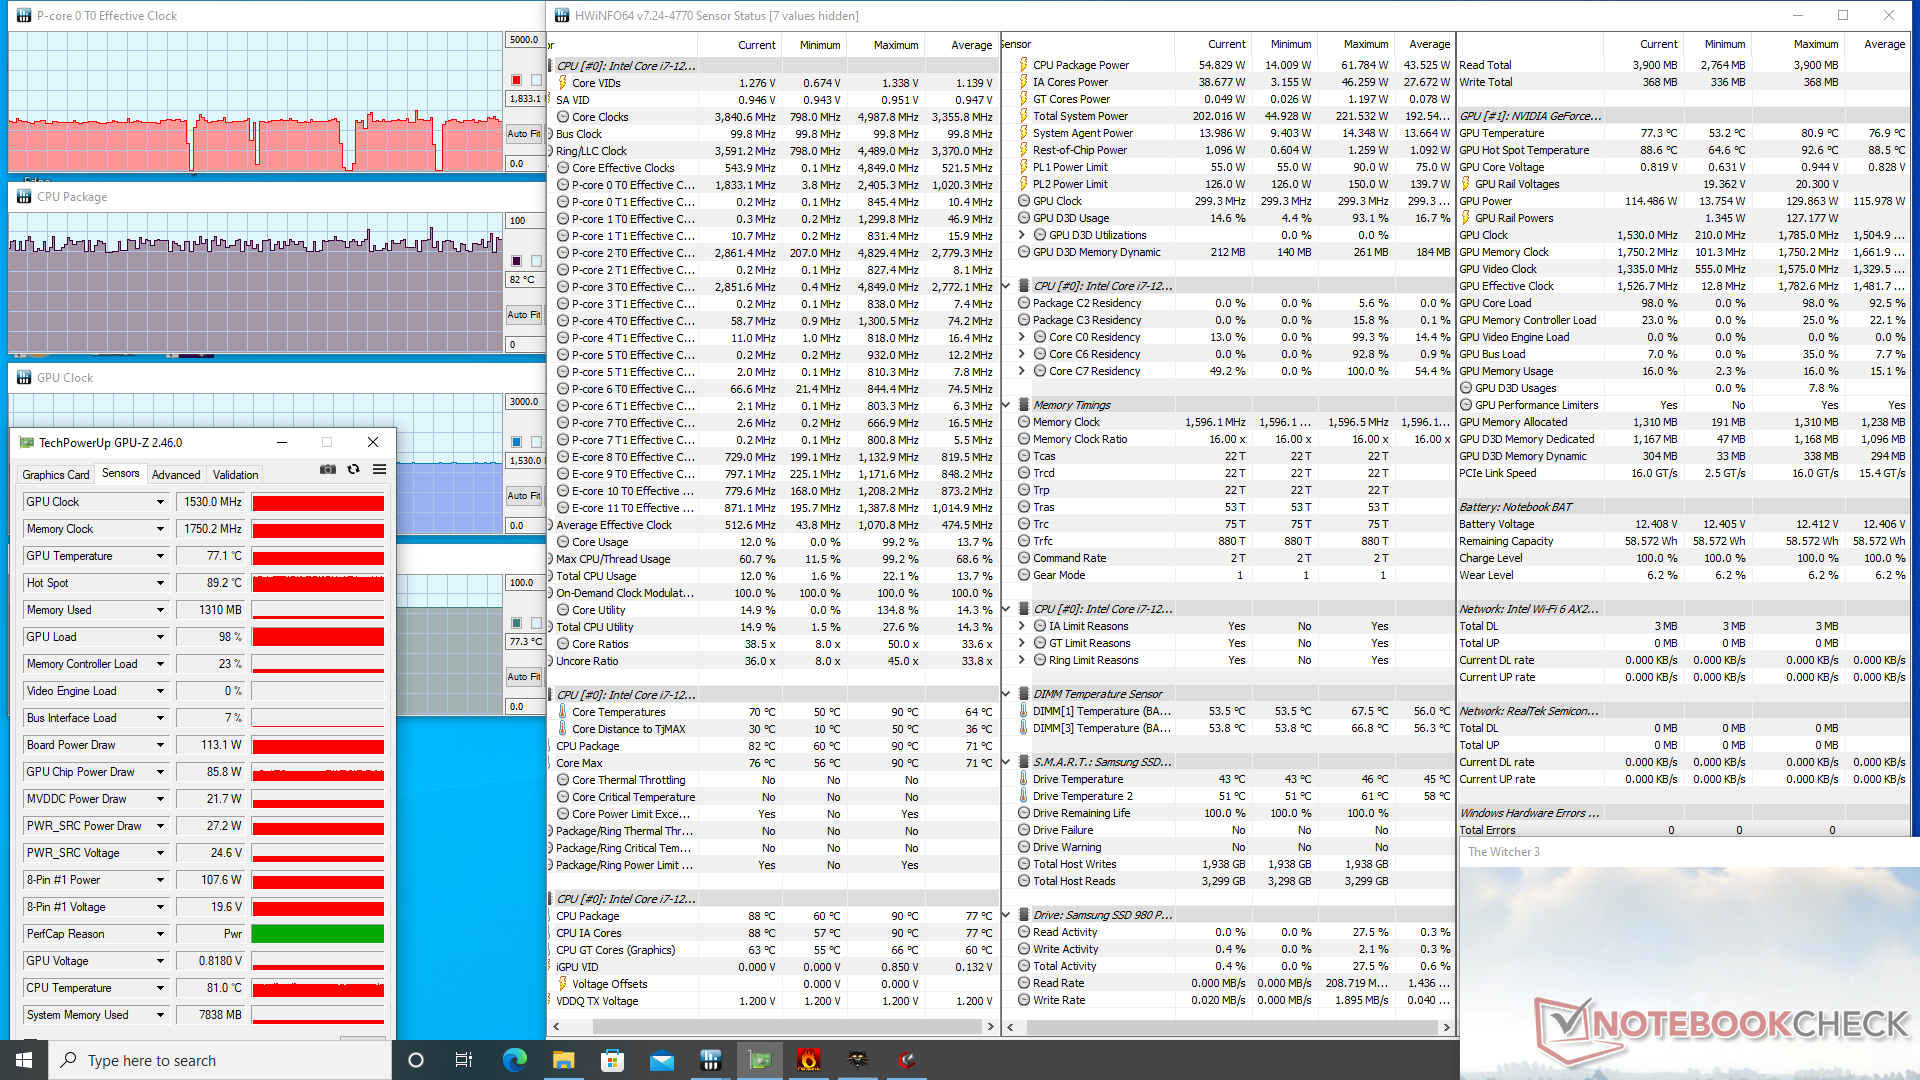
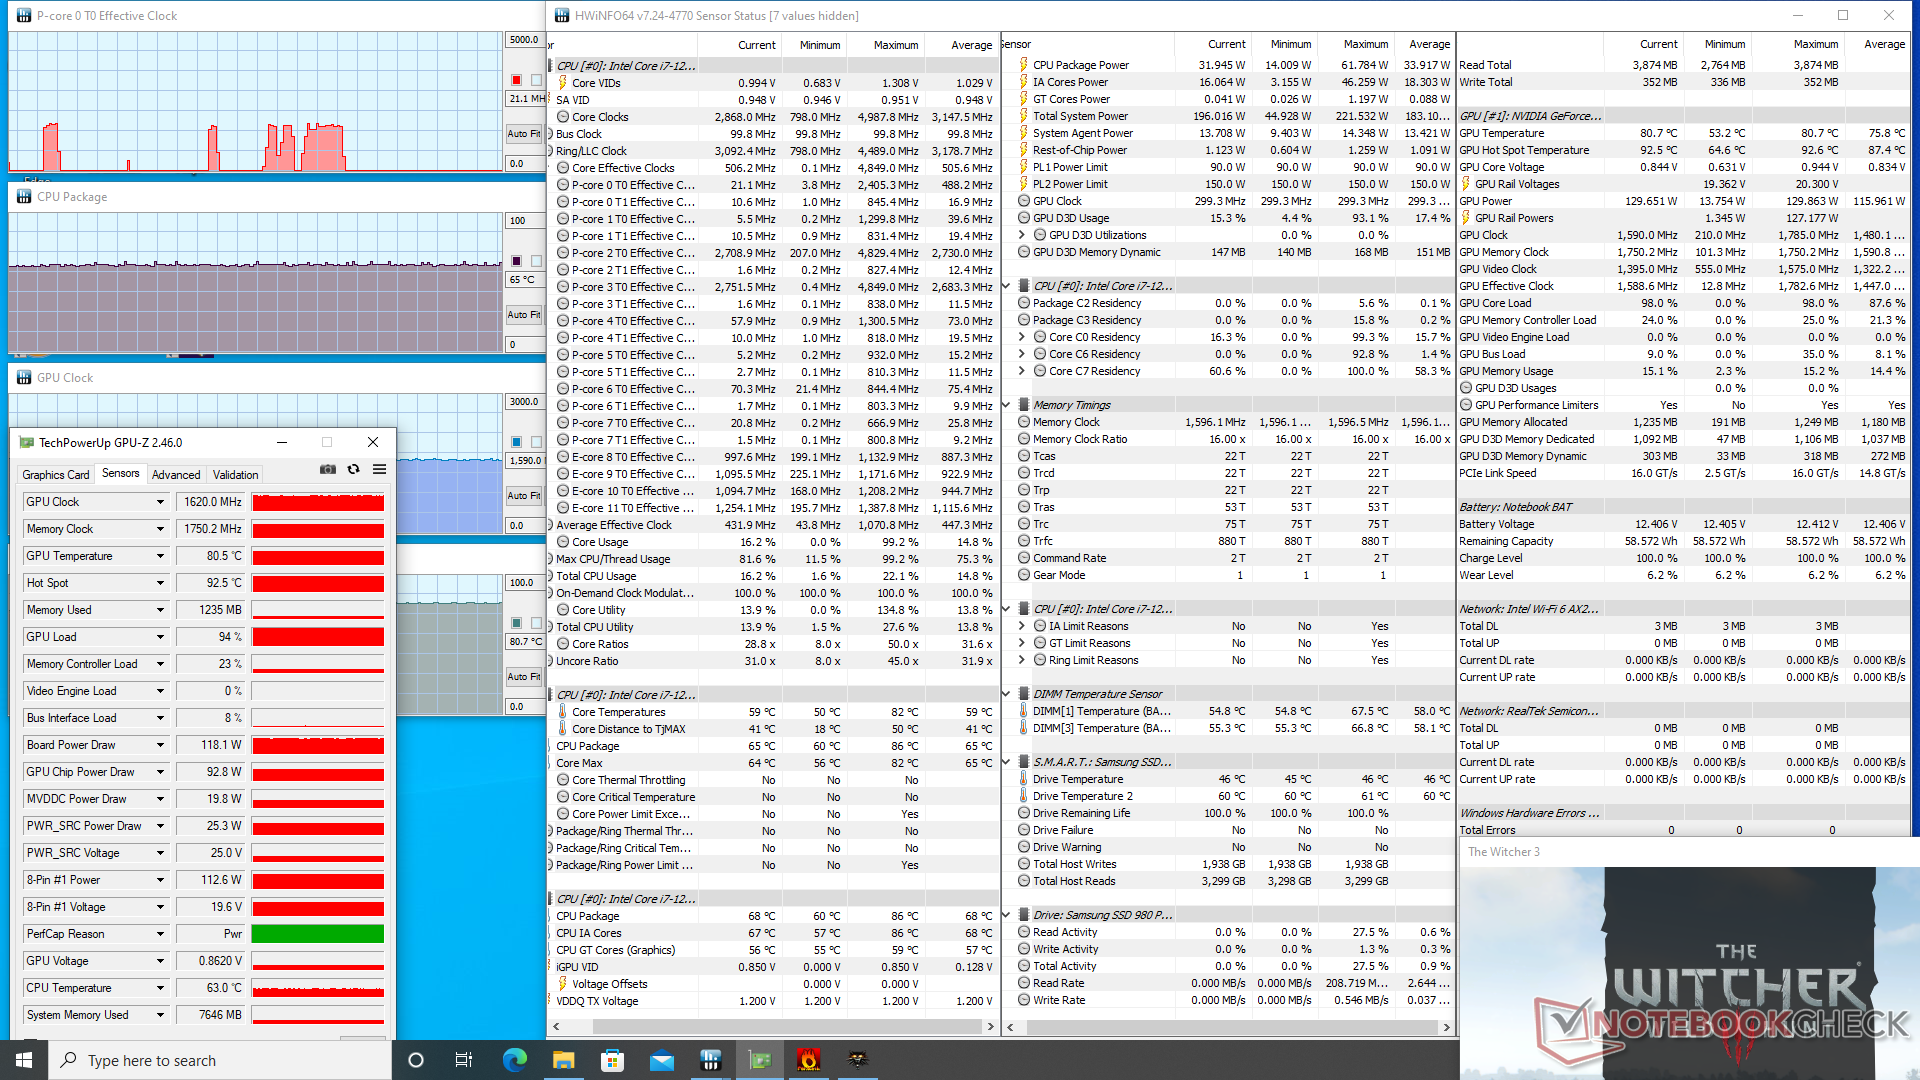
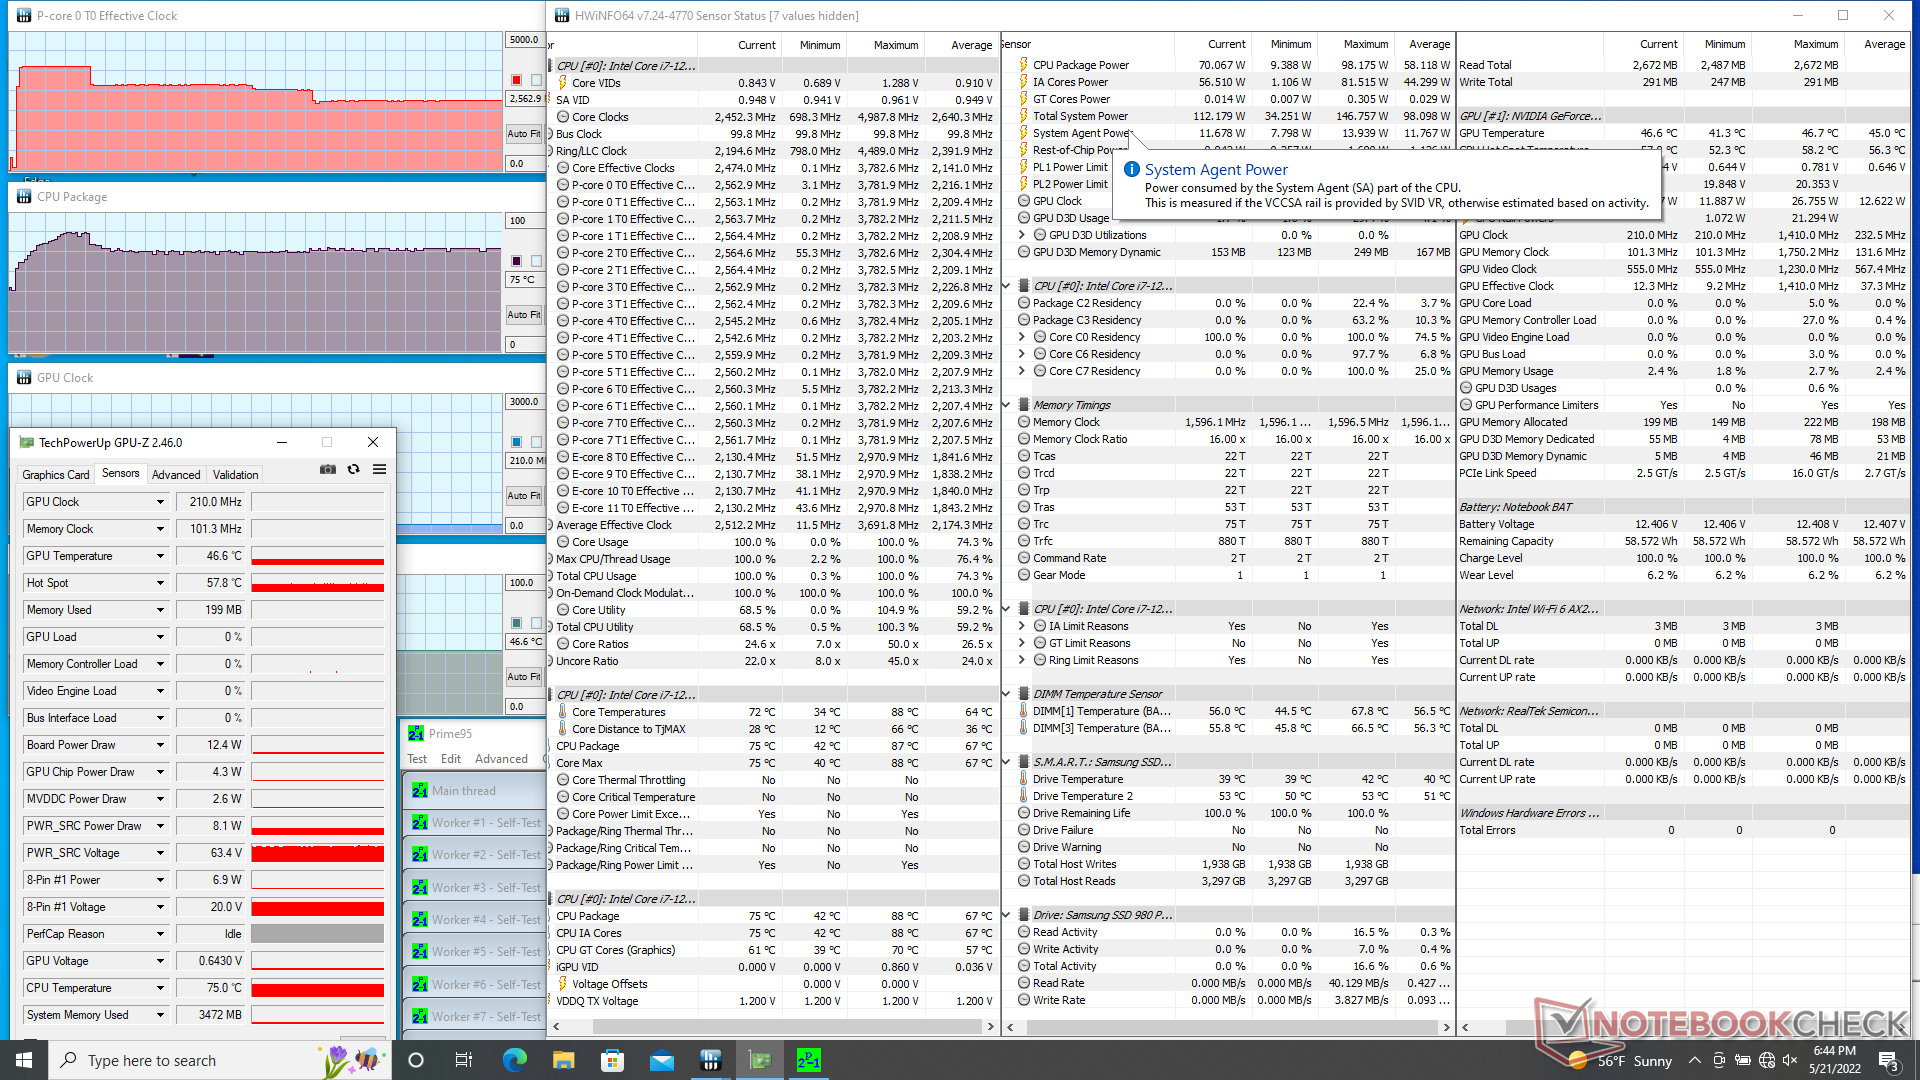
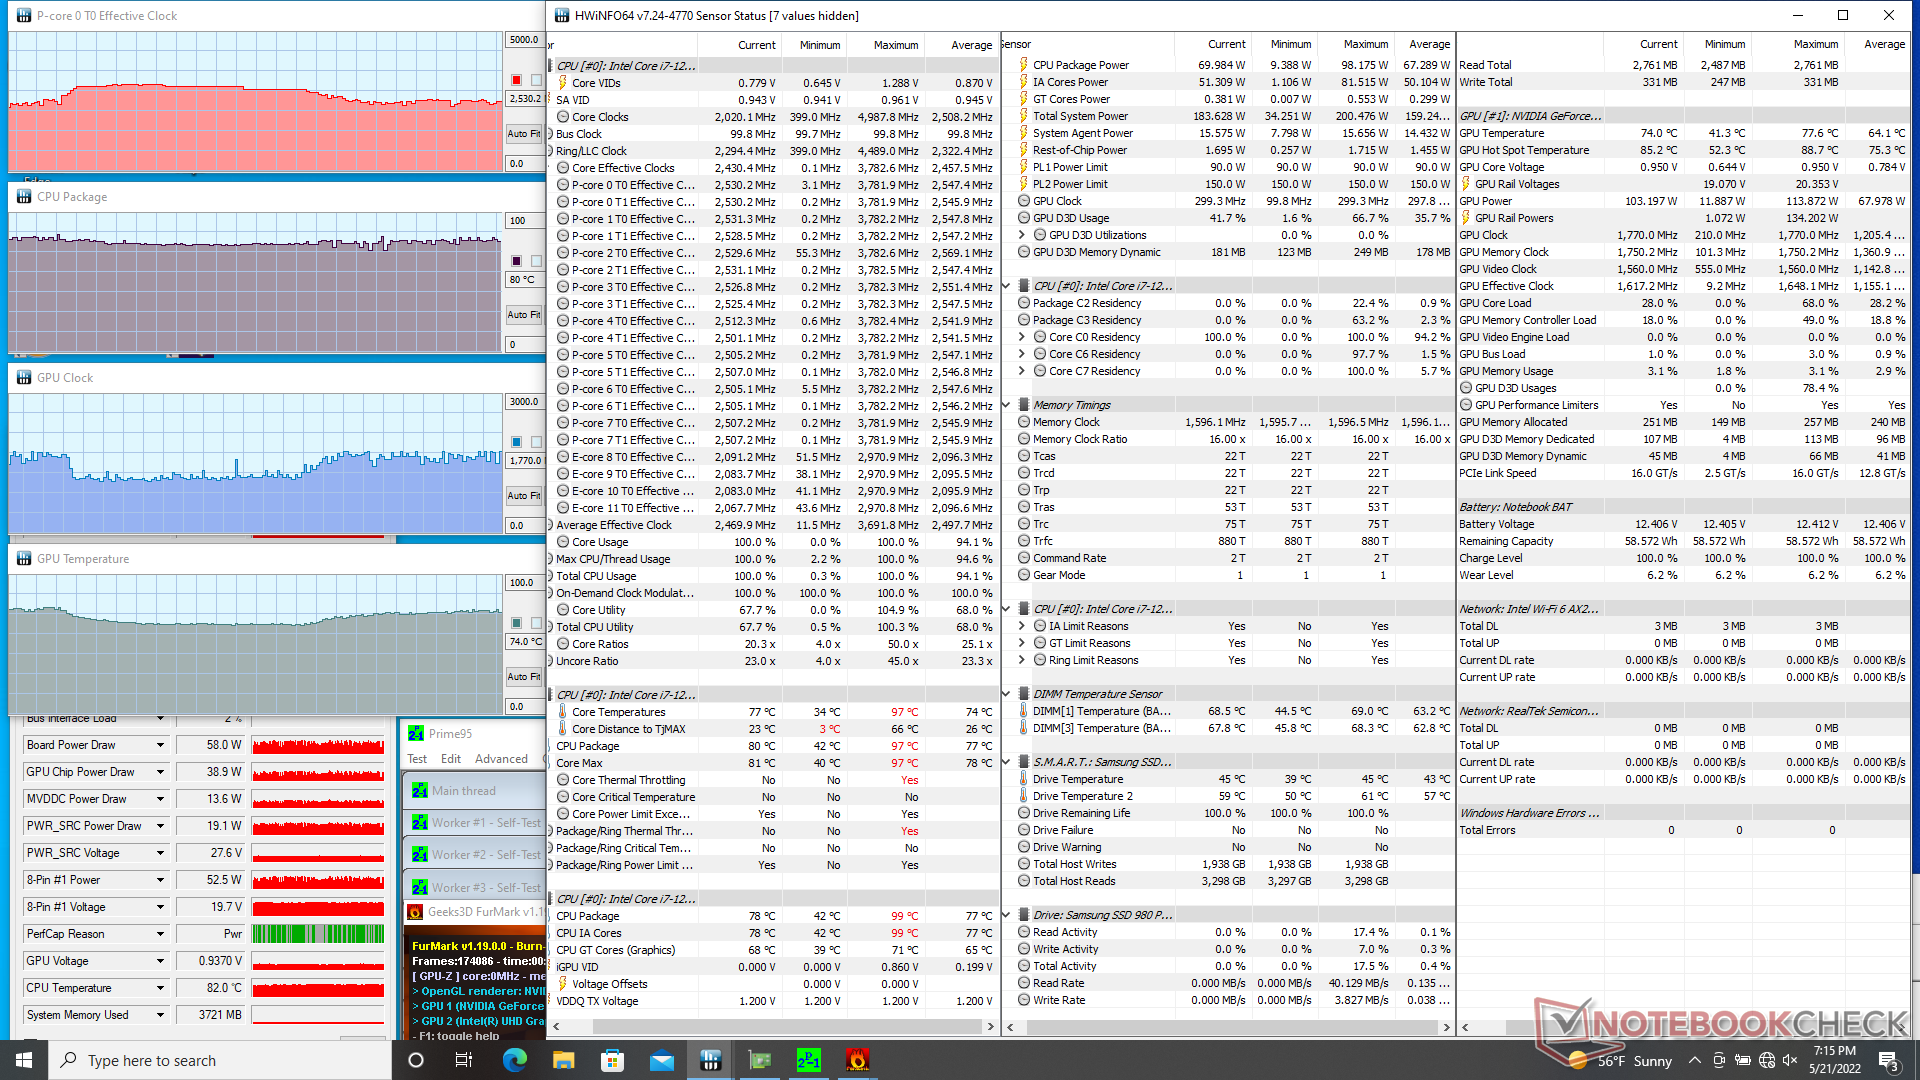
| CPU时钟(GHz) | GPU时钟(MHz) | CPU平均温度(℃) | GPU平均温度(℃) | |
| 系统空闲 | -- | -- | 44 | 41 |
| Prime95压力 | 2.6 | -- | 75 | 47 |
| Prime95 + FurMark 压力 | ~2.5 | ~1770 | 80 | 74 |
| Witcher 3 压力(娱乐模式) | -- | 1530 | ~82 | 77 |
| Witcher 3 压力(性能模式) | -- | 1620 | 65 | 81 |
发言人
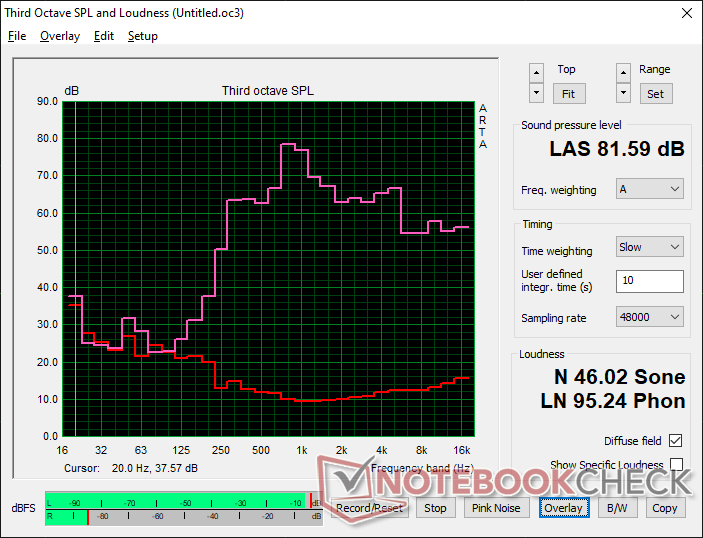
Eurocom Raptor X15 audio analysis
(±) | speaker loudness is average but good (81.6 dB)
Bass 100 - 315 Hz
(-) | nearly no bass - on average 24.6% lower than median
(±) | linearity of bass is average (13.4% delta to prev. frequency)
Mids 400 - 2000 Hz
(±) | higher mids - on average 5.6% higher than median
(±) | linearity of mids is average (8.1% delta to prev. frequency)
Highs 2 - 16 kHz
(+) | balanced highs - only 4.2% away from median
(+) | highs are linear (6% delta to prev. frequency)
Overall 100 - 16.000 Hz
(±) | linearity of overall sound is average (21.5% difference to median)
Compared to same class
» 77% of all tested devices in this class were better, 5% similar, 18% worse
» The best had a delta of 6%, average was 18%, worst was 132%
Compared to all devices tested
» 61% of all tested devices were better, 7% similar, 32% worse
» The best had a delta of 4%, average was 23%, worst was 134%
Apple MacBook Pro 16 2021 M1 Pro audio analysis
(+) | speakers can play relatively loud (84.7 dB)
Bass 100 - 315 Hz
(+) | good bass - only 3.8% away from median
(+) | bass is linear (5.2% delta to prev. frequency)
Mids 400 - 2000 Hz
(+) | balanced mids - only 1.3% away from median
(+) | mids are linear (2.1% delta to prev. frequency)
Highs 2 - 16 kHz
(+) | balanced highs - only 1.9% away from median
(+) | highs are linear (2.7% delta to prev. frequency)
Overall 100 - 16.000 Hz
(+) | overall sound is linear (4.6% difference to median)
Compared to same class
» 0% of all tested devices in this class were better, 0% similar, 100% worse
» The best had a delta of 5%, average was 17%, worst was 45%
Compared to all devices tested
» 0% of all tested devices were better, 0% similar, 100% worse
» The best had a delta of 4%, average was 23%, worst was 134%
能源管理
消耗功率
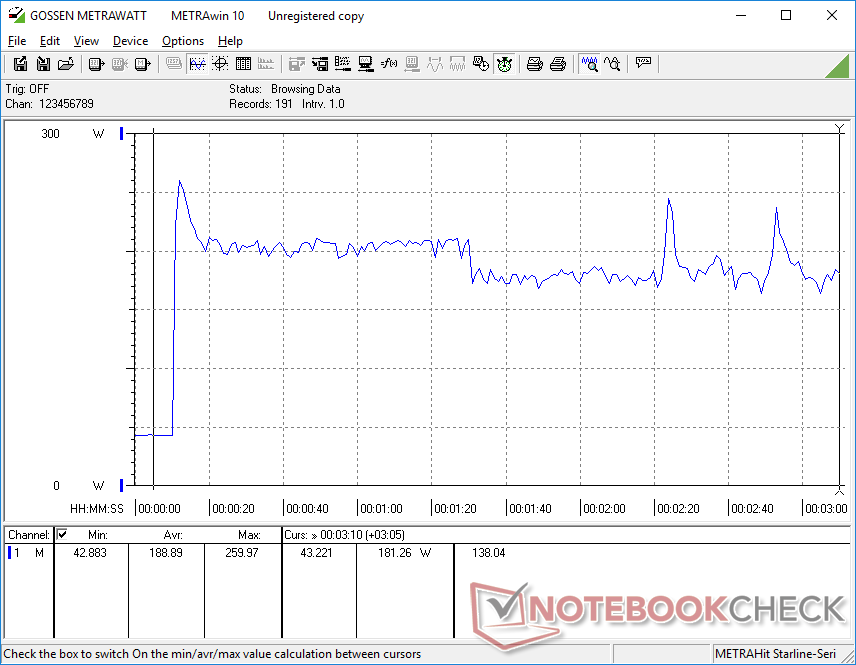
在桌面上空转时,耗电量相当低。我们的设备在台式机上空转时的功耗在12瓦到22瓦之间,而使用英特尔第九代台式机CPU的更老的Eurocom Sky X4C的功耗是33瓦到44瓦。尽管如此,在运行要求更高的应用程序时,消耗量仍然很高。运行 Witcher 3比如说,运行 "Dreamer",需要的功率比任何配备英特尔或AMD H系列CPU和类似GeForce RTX 3070级GPU的笔记本电脑都要大。
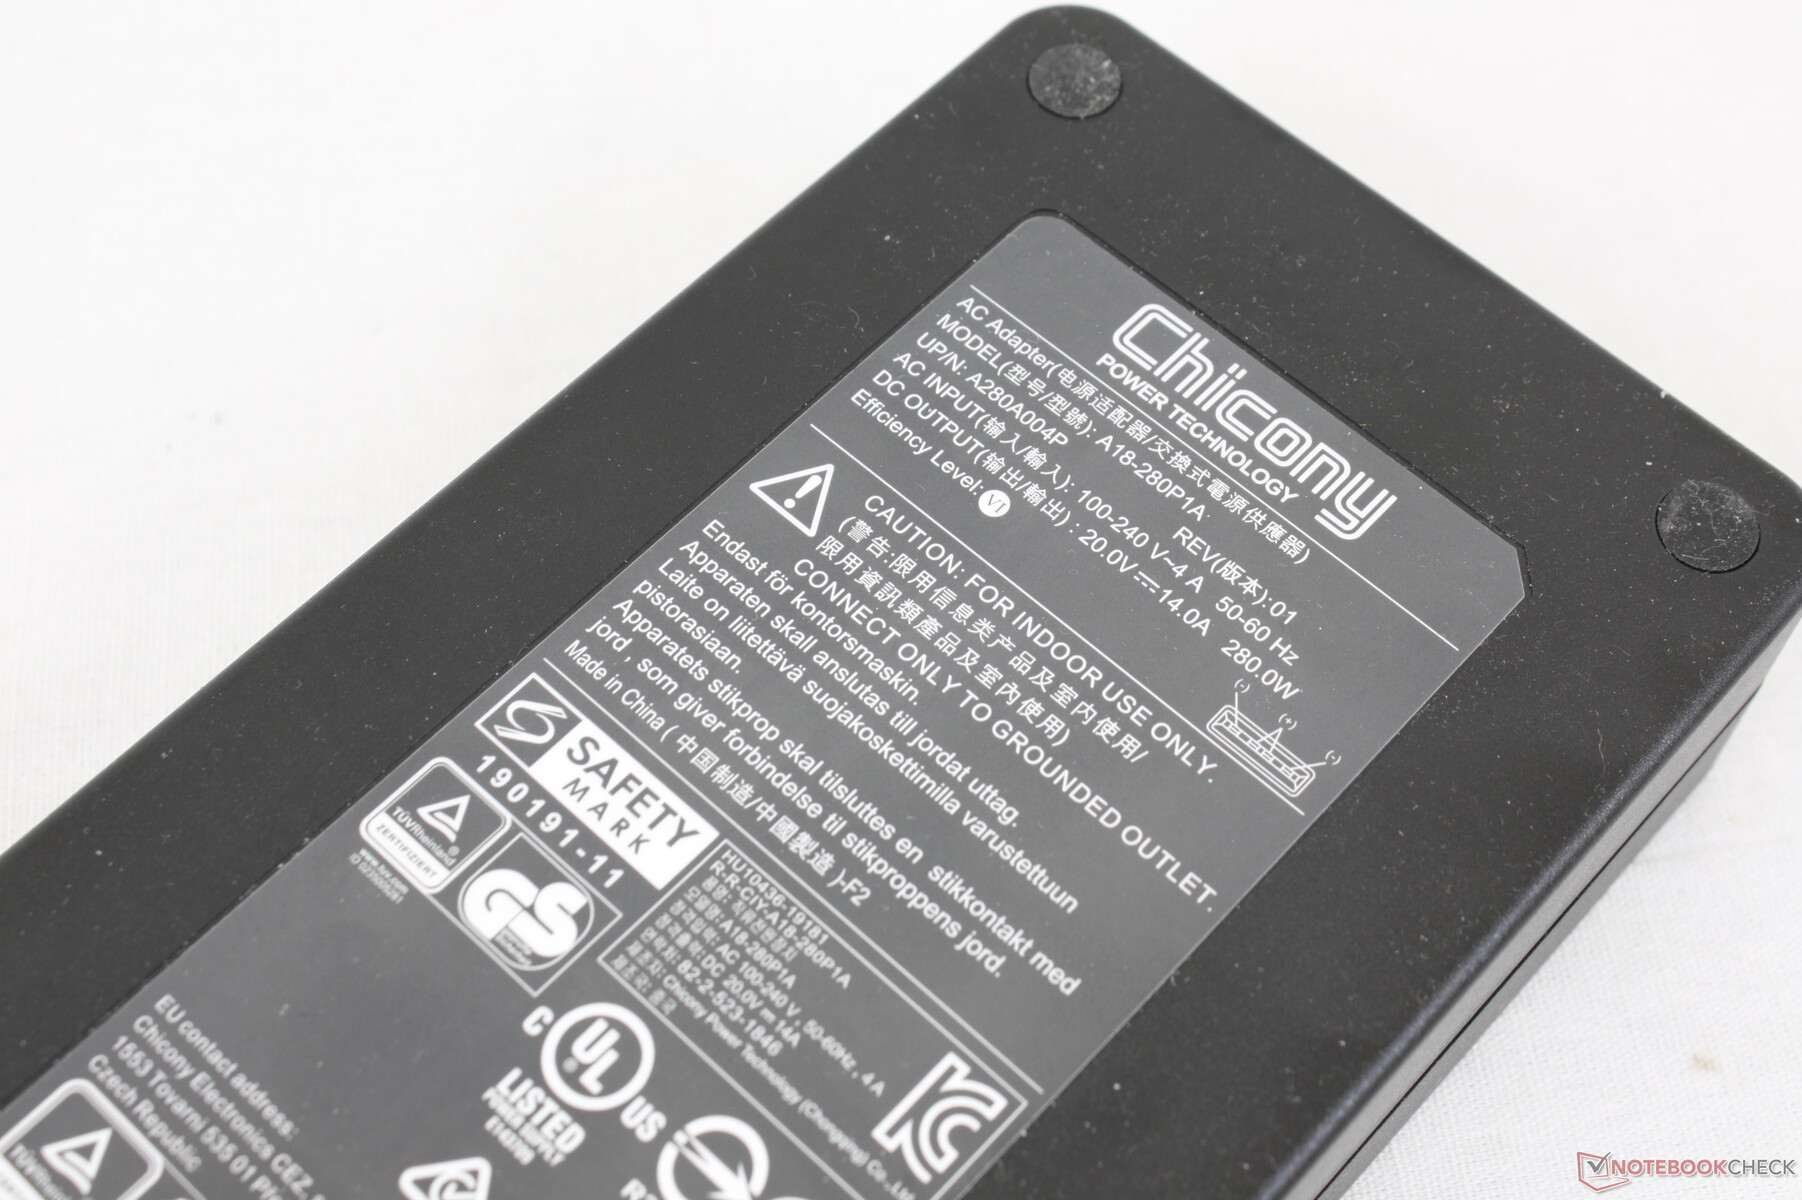
280瓦的交流适配器可能很大,但它对于全功率运行系统是必要的。当CPU和GPU都处于最大利用率时,我们能够达到260瓦的功耗。
| Off / Standby | |
| Idle | |
| Load |
|
Key:
min: | |
| Eurocom Raptor X15 i7-12700K, GeForce RTX 3070 Ti Laptop GPU, Samsung SSD 980 Pro 1TB MZ-V8P1T0BW, IPS, 1920x1080, 15.6" | MSI Raider GE66 12UHS i9-12900HK, GeForce RTX 3080 Ti Laptop GPU, Samsung PM9A1 MZVL22T0HBLB, IPS, 3840x2160, 15.6" | Razer Blade 15 Advanced Model Early 2022 i7-12800H, GeForce RTX 3080 Ti Laptop GPU, Samsung PM9A1 MZVL21T0HCLR, IPS, 1920x1080, 15.6" | Eurocom RX315 NH57AF1 i7-11800H, GeForce RTX 3070 Laptop GPU, Samsung SSD 980 Pro 1TB MZ-V8P1T0BW, IPS, 1920x1080, 15.6" | Gigabyte A5 X1 R9 5900HX, GeForce RTX 3070 Laptop GPU, ADATA XPG SX8200 Pro (ASX8200PNP-512GT), IPS, 1920x1080, 15.6" | Asus TUF Gaming A15 FA506QR-AZ061T R7 5800H, GeForce RTX 3070 Laptop GPU, SK Hynix HFM001TD3JX013N, IPS, 1920x1080, 15.6" | |
|---|---|---|---|---|---|---|
| Power Consumption | 0% | 8% | 3% | 17% | 27% | |
| Idle Minimum * (Watt) | 12.8 | 16 -25% | 17 -33% | 12.7 1% | 10 22% | 10.2 20% |
| Idle Average * (Watt) | 21.7 | 19 12% | 19 12% | 16.4 24% | 12 45% | 12.8 41% |
| Idle Maximum * (Watt) | 21.8 | 26 -19% | 25 -15% | 36.1 -66% | 16 27% | 15 31% |
| Load Average * (Watt) | 132.4 | 110 17% | 108 18% | 101.5 23% | 124 6% | 130 2% |
| Witcher 3 ultra * (Watt) | 219 | 202 8% | 150 32% | 197 10% | 204 7% | 137 37% |
| Load Maximum * (Watt) | 260 | 242 7% | 179 31% | 196.1 25% | 272 -5% | 184 29% |
* ... smaller is better
Power Consumption Witcher 3 / Stresstest
Power Consumption external Monitor
电池寿命
运行时间很短,在平衡电源配置和集成GPU激活的情况下,实际使用WLAN的时间不到4小时。充电速度还不错,从空电到满电需要2到2.5小时。然而,我们很欣赏电池可以轻松拆卸,这与大多数其他笔记本电脑不同。
| Eurocom Raptor X15 i7-12700K, GeForce RTX 3070 Ti Laptop GPU, 62 Wh | MSI Raider GE66 12UHS i9-12900HK, GeForce RTX 3080 Ti Laptop GPU, 99 Wh | Razer Blade 15 Advanced Model Early 2022 i7-12800H, GeForce RTX 3080 Ti Laptop GPU, 80 Wh | Eurocom RX315 NH57AF1 i7-11800H, GeForce RTX 3070 Laptop GPU, 71 Wh | Gigabyte A5 X1 R9 5900HX, GeForce RTX 3070 Laptop GPU, 48.96 Wh | Asus TUF Gaming A15 FA506QR-AZ061T R7 5800H, GeForce RTX 3070 Laptop GPU, 90 Wh | |
|---|---|---|---|---|---|---|
| Battery runtime | 43% | 23% | 20% | 60% | 185% | |
| WiFi v1.3 (h) | 4 | 5.7 43% | 4.9 23% | 4.8 20% | 6.4 60% | 11.4 185% |
| H.264 (h) | 7.1 | 5.9 | 7.3 | |||
| Load (h) | 1.7 | 2 | 1.3 | 2.4 | ||
| Reader / Idle (h) | 8.1 | 10.1 | 17.4 |
Pros
Cons
判决书

猛禽X15使用最新的英特尔CPU和Nvidia GPU,被困在一个老化的机箱中。该模型缺少其他高端15.6英寸游戏笔记本电脑上常见的功能,如每键RGB照明、DisplayPort-over-USB、Thunderbolt、Wi-Fi 6E支持,以及更好的NVMe SSD冷却。当竞争机型如 微星GE66或 技嘉A5 X1竞争机型,如微星GE66或技嘉A5 X1,在提供与猛禽相似的TGP目标的同时,很难推荐Eurocom超过这些替代品。
请记住,最大性能是与最大风扇模式相联系的。因此,用户必须手动将系统配置文件设置为最大风扇模式,并忍受响亮的风扇,以便从系统中获得最大性能。
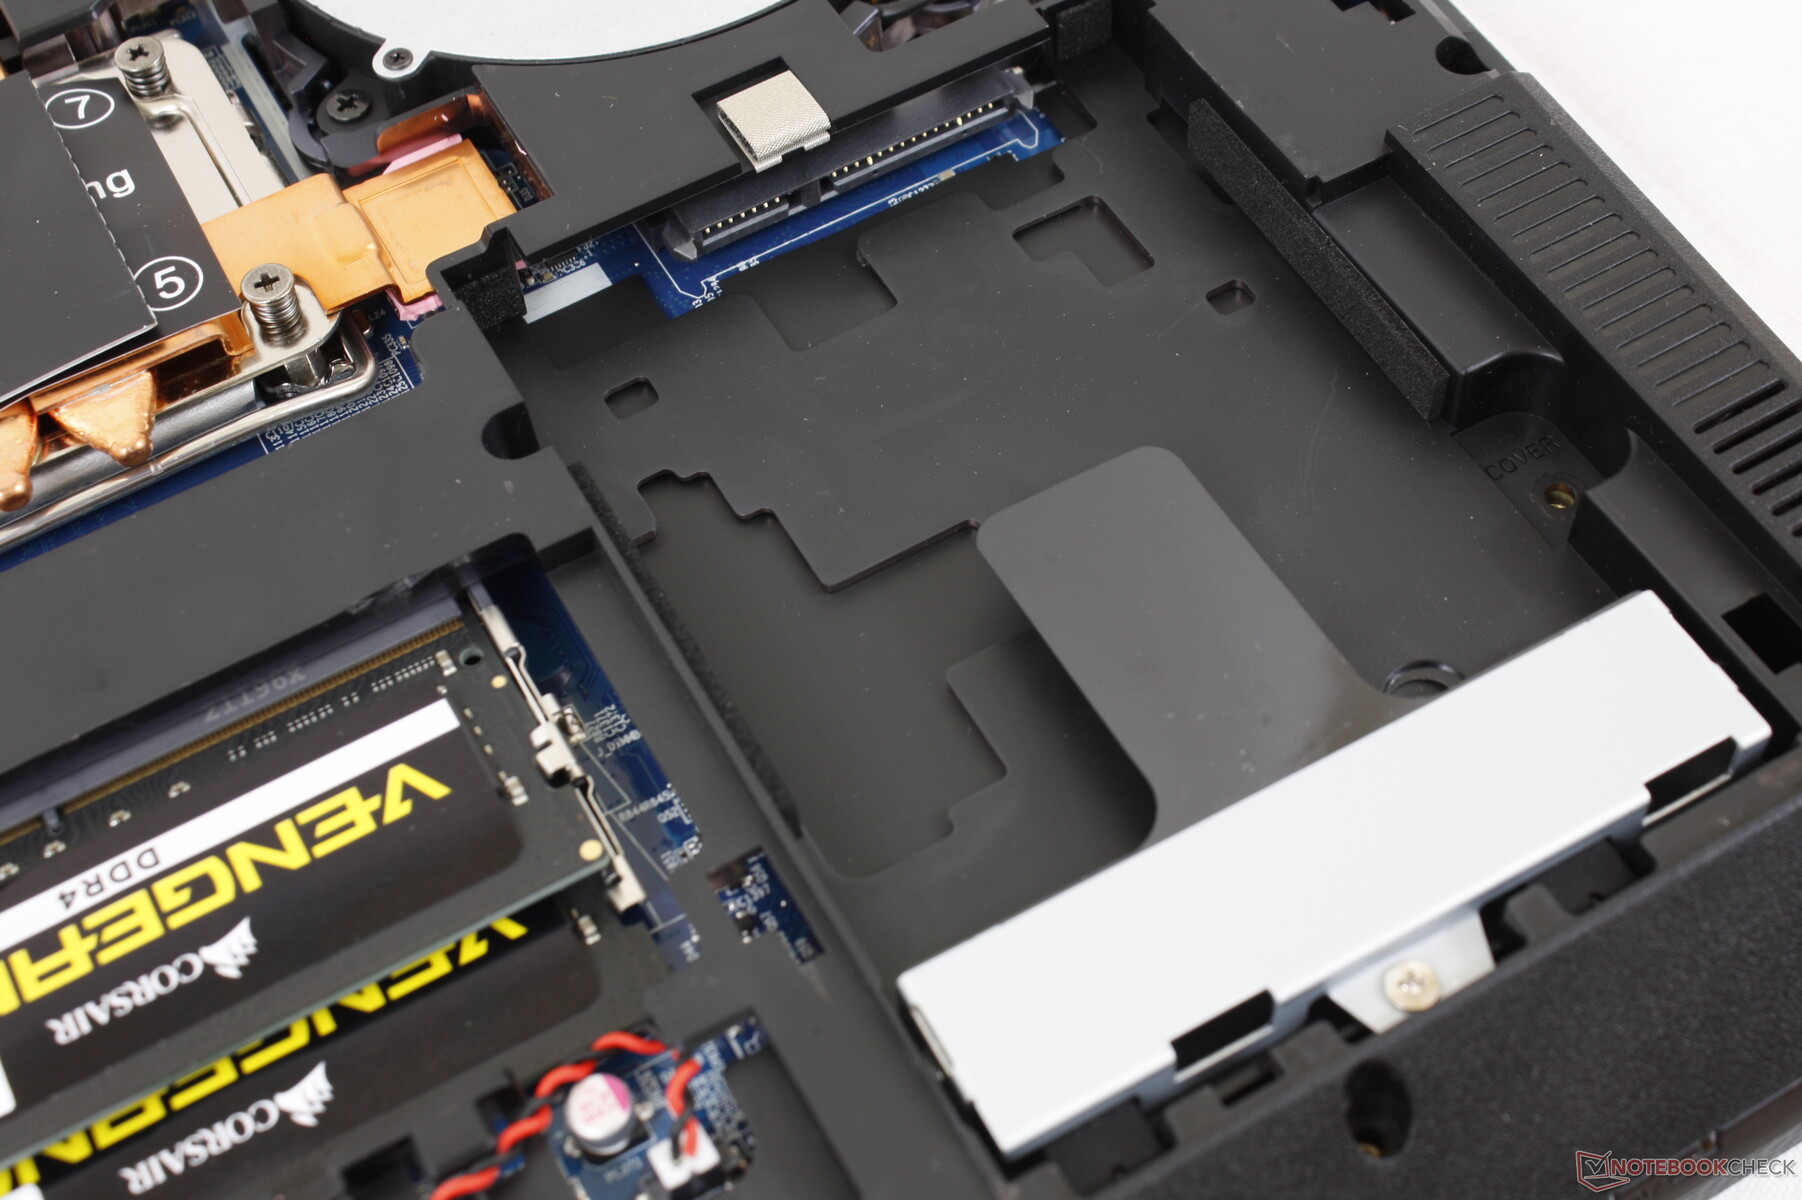
Raptor X15有一个可拆卸的LGA1700 CPU,有很多存储选项,但它的整体机箱设计可以使用整容。
仍然有一些值得称赞的显著特点。例如,该模型支持2.5英寸SATA III驱动器和一个易于拆卸的电池组,这在现代游戏笔记本电脑上是罕见的。然而,如果你不认为你会利用其LGA1700插座,那么猛禽X15的最大卖点就变得毫无意义。
价格和可用性
Eurocom现在正在发货Raptor X15的基本配置起价为2000美元,在我们的评论中配置为3500美元左右。
Eurocom Raptor X15
- 06/09/2022 v7 (old)
Allen Ngo
Price comparison

