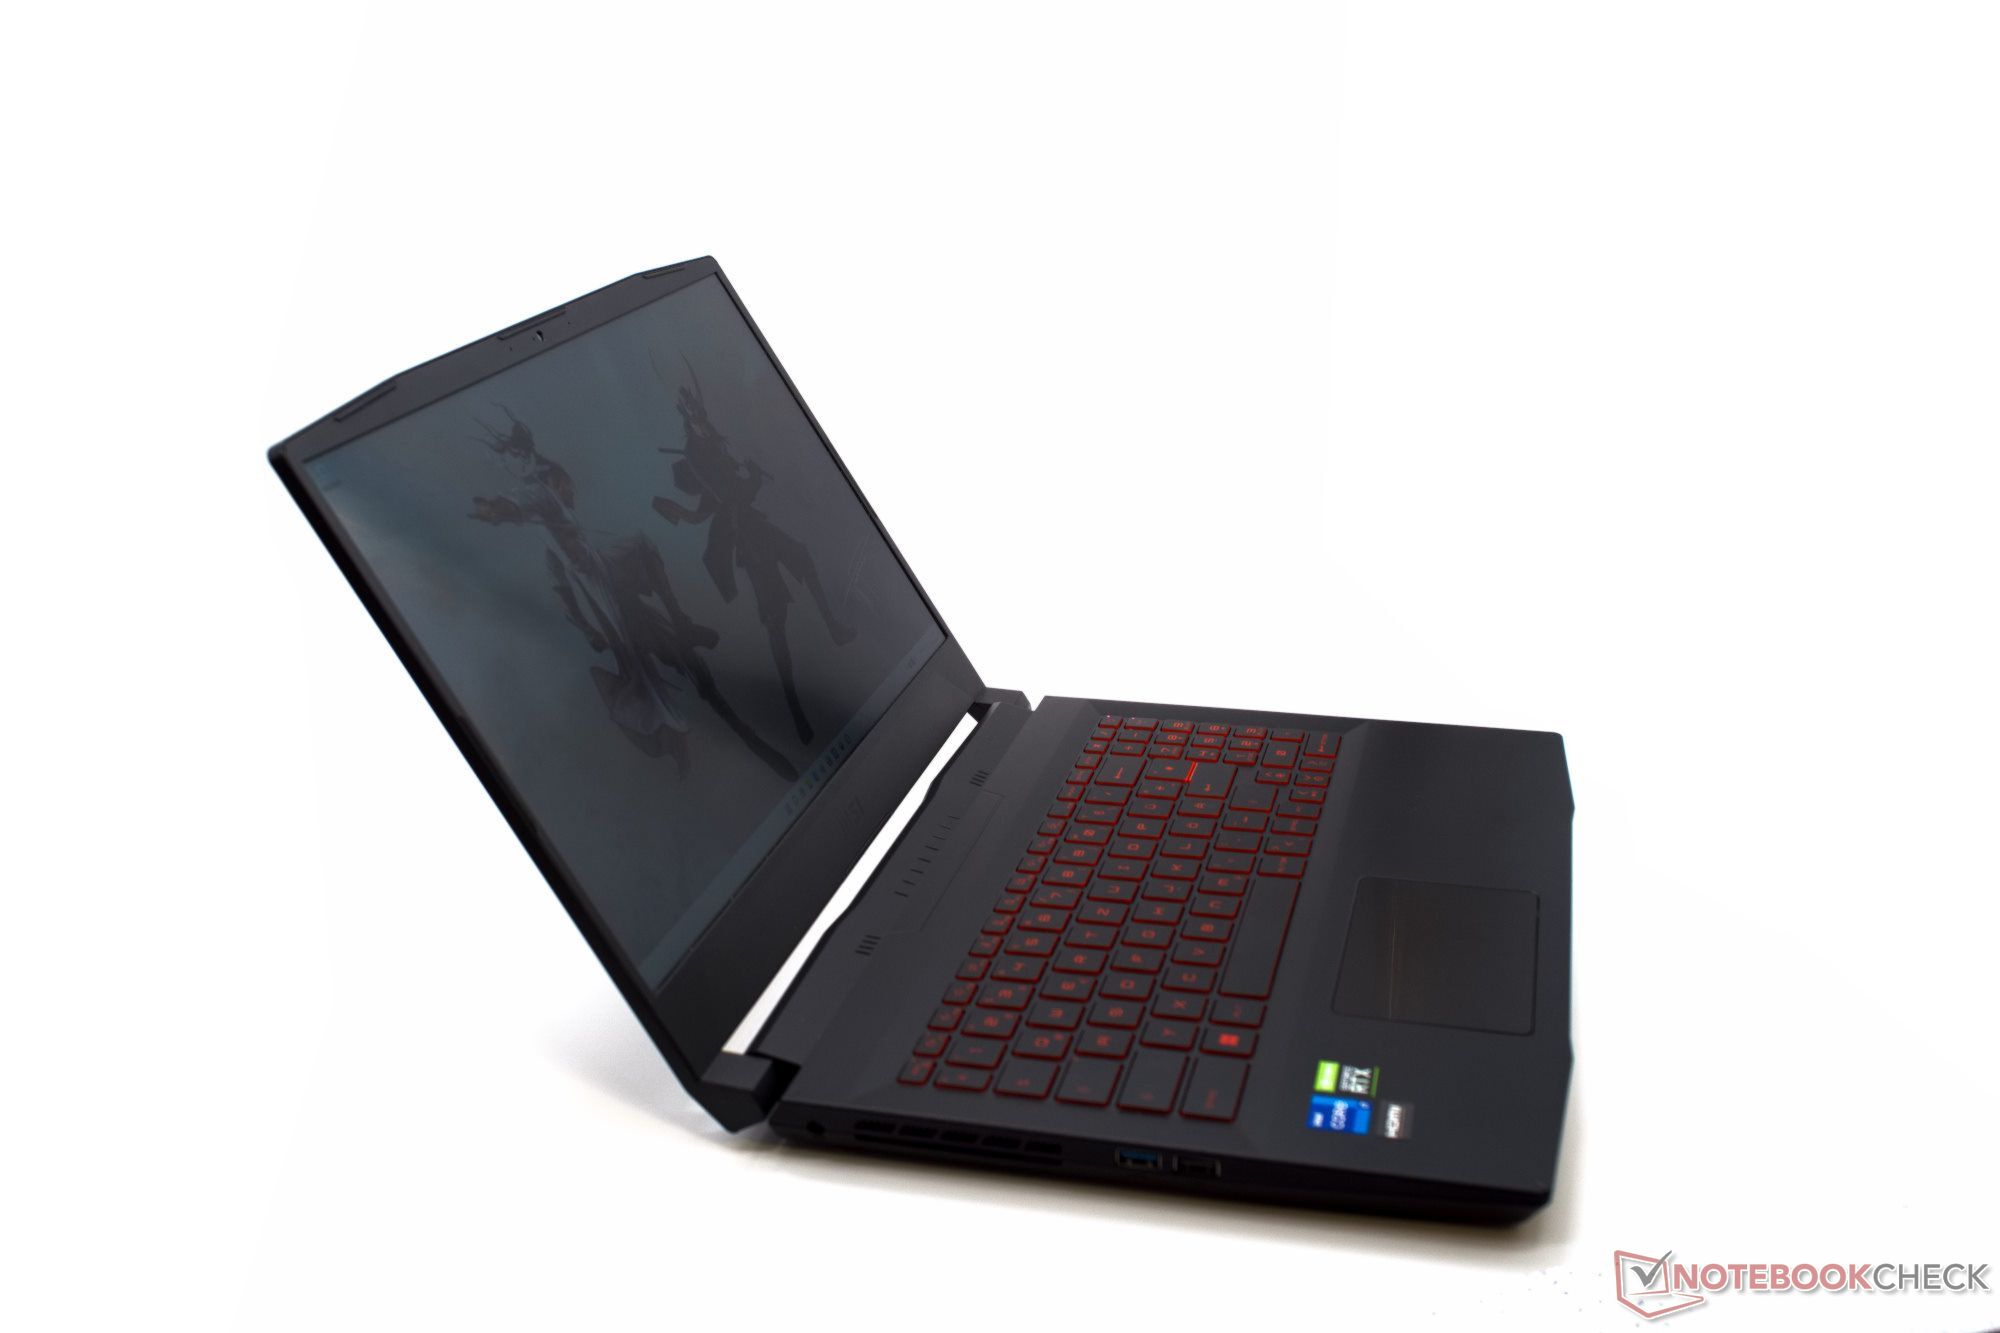
微星Katana GF66 12UGS笔记本电脑评测。桤木湖的更新带来了明显的性能提升
在计算性能方面,微星已经显著升级了 我们去年测试的Katana GF66.英特尔酷睿i7-11800H和NvidiaGeForce RTX 3070被更先进的芯片所取代,在这一点上,酷睿i7-12700H和RTX 3070 Ti构成了计算性能。这款优雅的游戏笔记本电脑的外观没有任何变化,长野刚的设计被保留下来,没有任何改变。
除了硬件的升级之外,显示屏也被另一块面板取代。然而,这似乎更像是一种降级而不是升级,GF66 12UGS的显示屏评估结果明显比 GF66 11UG.
对于配备强大的NvidiaGeForce RTX 3070 Ti的笔记本电脑来说,Katana是相对实惠的,约为2000欧元(约2142美元)。在这个价格上,我们也看到在我们的对比设备中,有几款游戏笔记本的配置应该比较弱。然而,我们再一次看到TDP和TGP值对计算性能的强大影响。在一些基准测试中,一些笔记本电脑,如 华硕TUF游戏机F15或 联想Legion 5能够明显超过目前的Katana GF66和它的大型兄弟姐妹,即 GF76.
潜在的竞争对手比较
Rating | Date | Model | Weight | Height | Size | Resolution | Price |
|---|---|---|---|---|---|---|---|
| 80.3 % v7 (old) | 06 / 2022 | MSI Katana GF66 12UGS i7-12700H, GeForce RTX 3070 Ti Laptop GPU | 2.3 kg | 27.5 mm | 15.60" | 1920x1080 | |
| 79.2 % v7 (old) | 09 / 2021 | MSI Katana GF66 11UG-220 i7-11800H, GeForce RTX 3070 Laptop GPU | 2.3 kg | 25 mm | 15.60" | 1920x1080 | |
| 82.6 % v7 (old) | 05 / 2022 | MSI Katana GF76 12UGS i7-12700H, GeForce RTX 3070 Ti Laptop GPU | 2.7 kg | 25.2 mm | 17.30" | 1920x1080 | |
| 87.2 % v7 (old) | 03 / 2022 | Asus TUF Gaming F15 FX507ZM i7-12700H, GeForce RTX 3060 Laptop GPU | 2.1 kg | 24.95 mm | 15.60" | 1920x1080 | |
| 85 % v7 (old) | Asus TUF Gaming A15 FA506QR-AZ061T R7 5800H, GeForce RTX 3070 Laptop GPU | 2.3 kg | 24 mm | 15.60" | 1920x1080 | ||
| 84 % v7 (old) | 06 / 2022 | Acer Nitro 5 AN515-58-72QR i7-12700H, GeForce RTX 3070 Ti Laptop GPU | 2.5 kg | 26.8 mm | 15.60" | 2560x1440 | |
| 82.6 % v7 (old) | 05 / 2022 | Lenovo Legion 5 15ACH6A-82NW0010GE R5 5600H, Radeon RX 6600M | 2.5 kg | 25.75 mm | 15.60" | 1920x1080 |
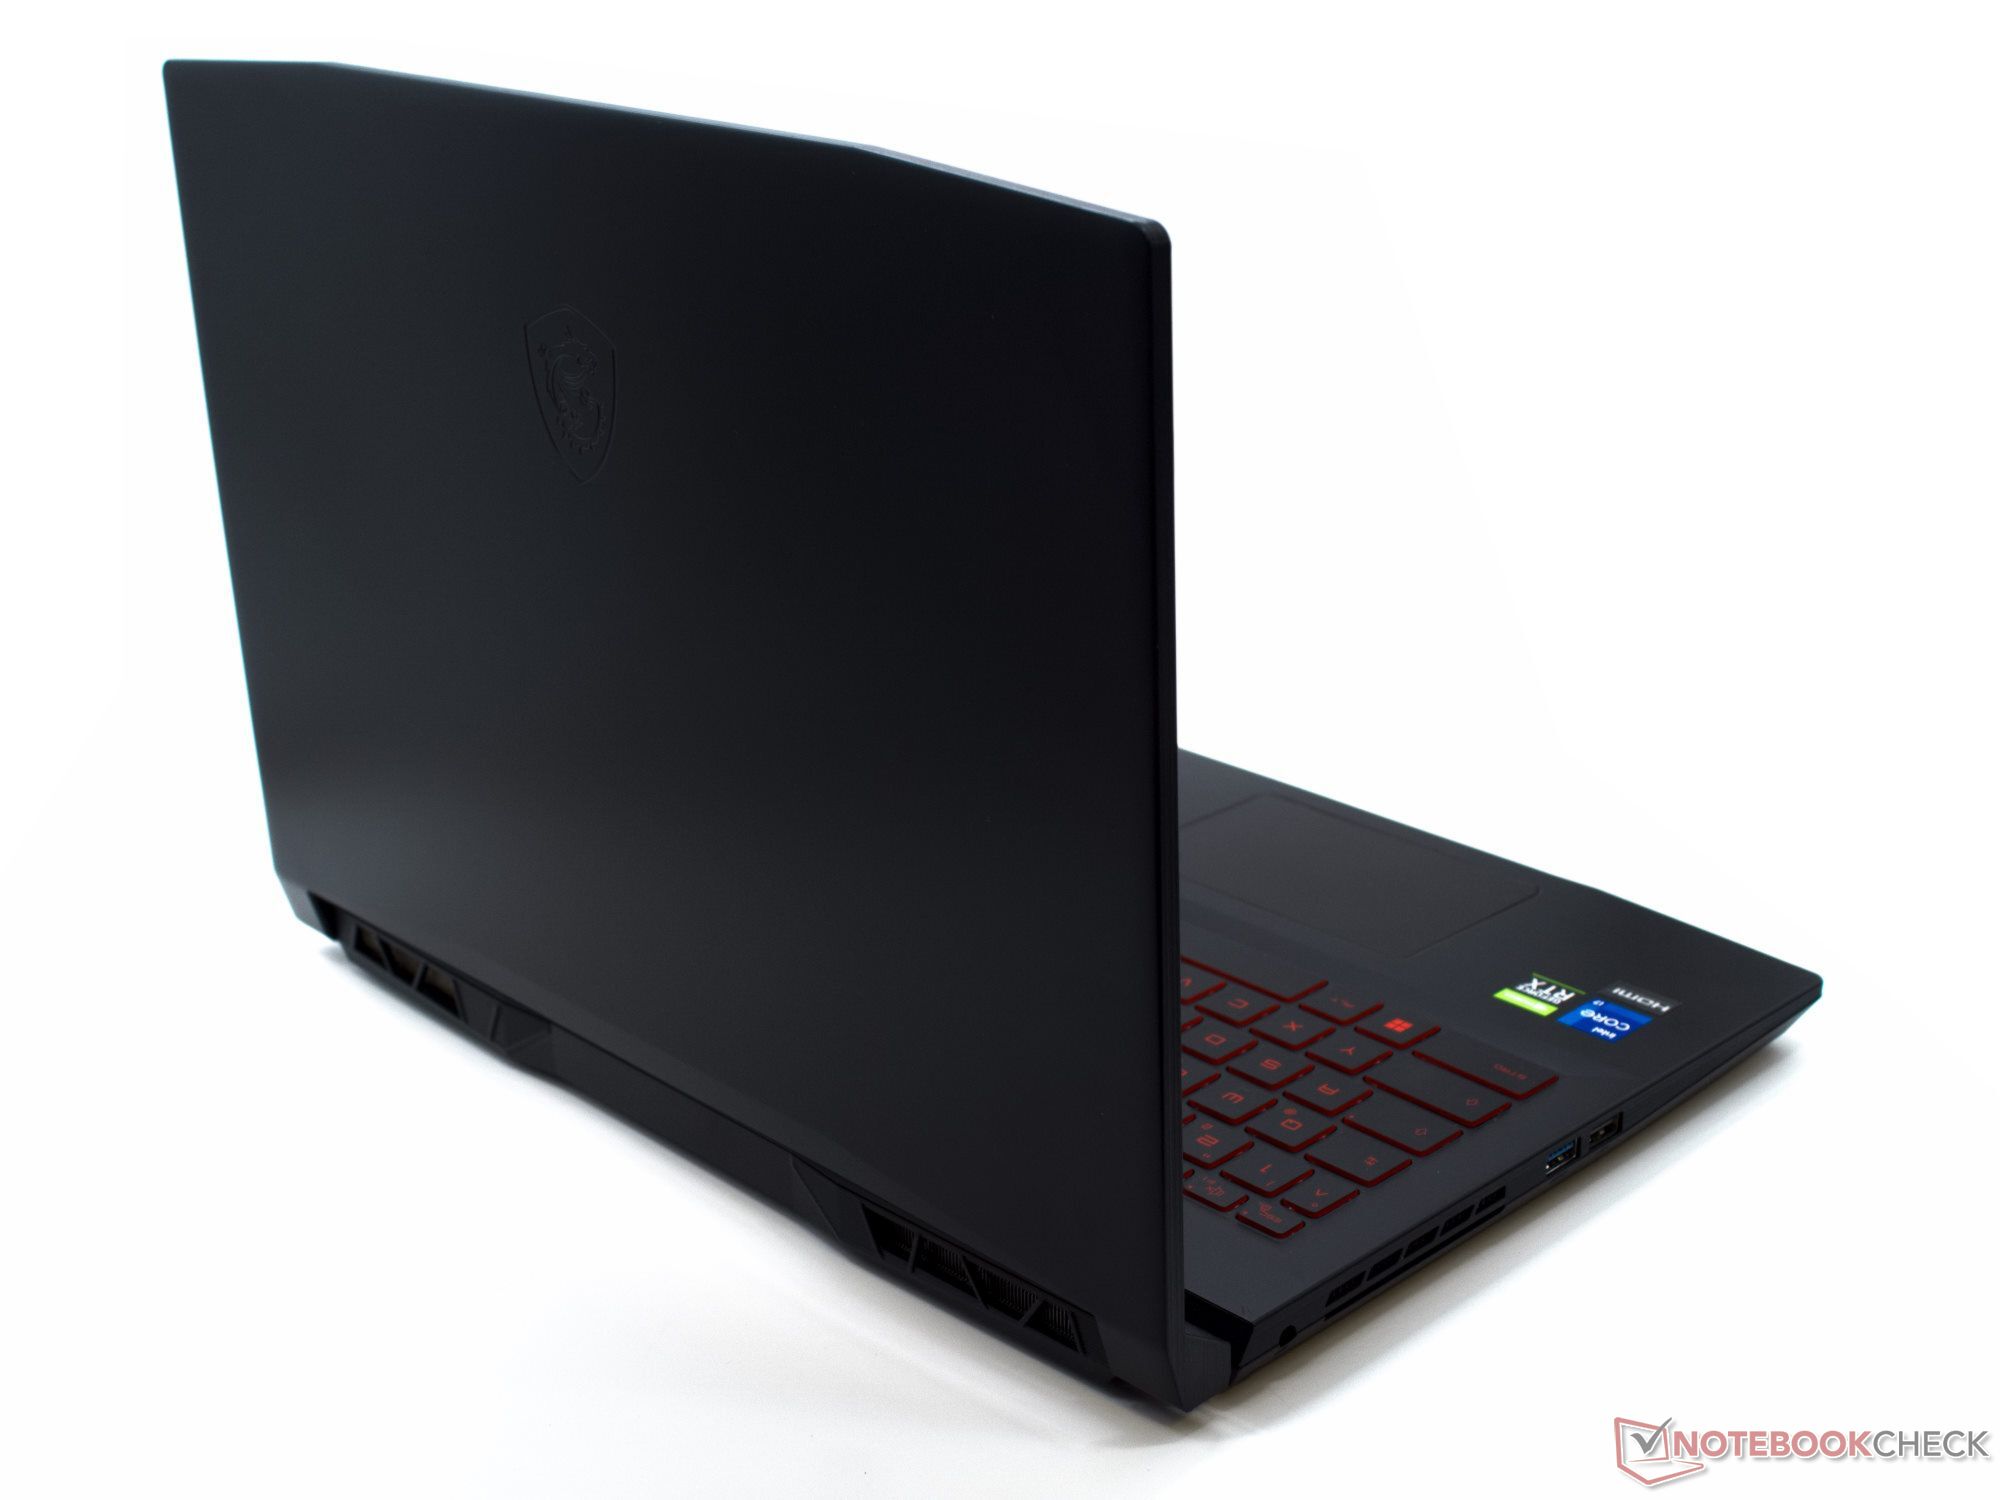
案例和设备 - 这里缺乏升级改造
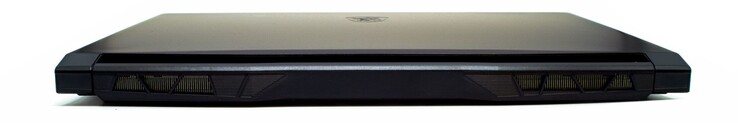
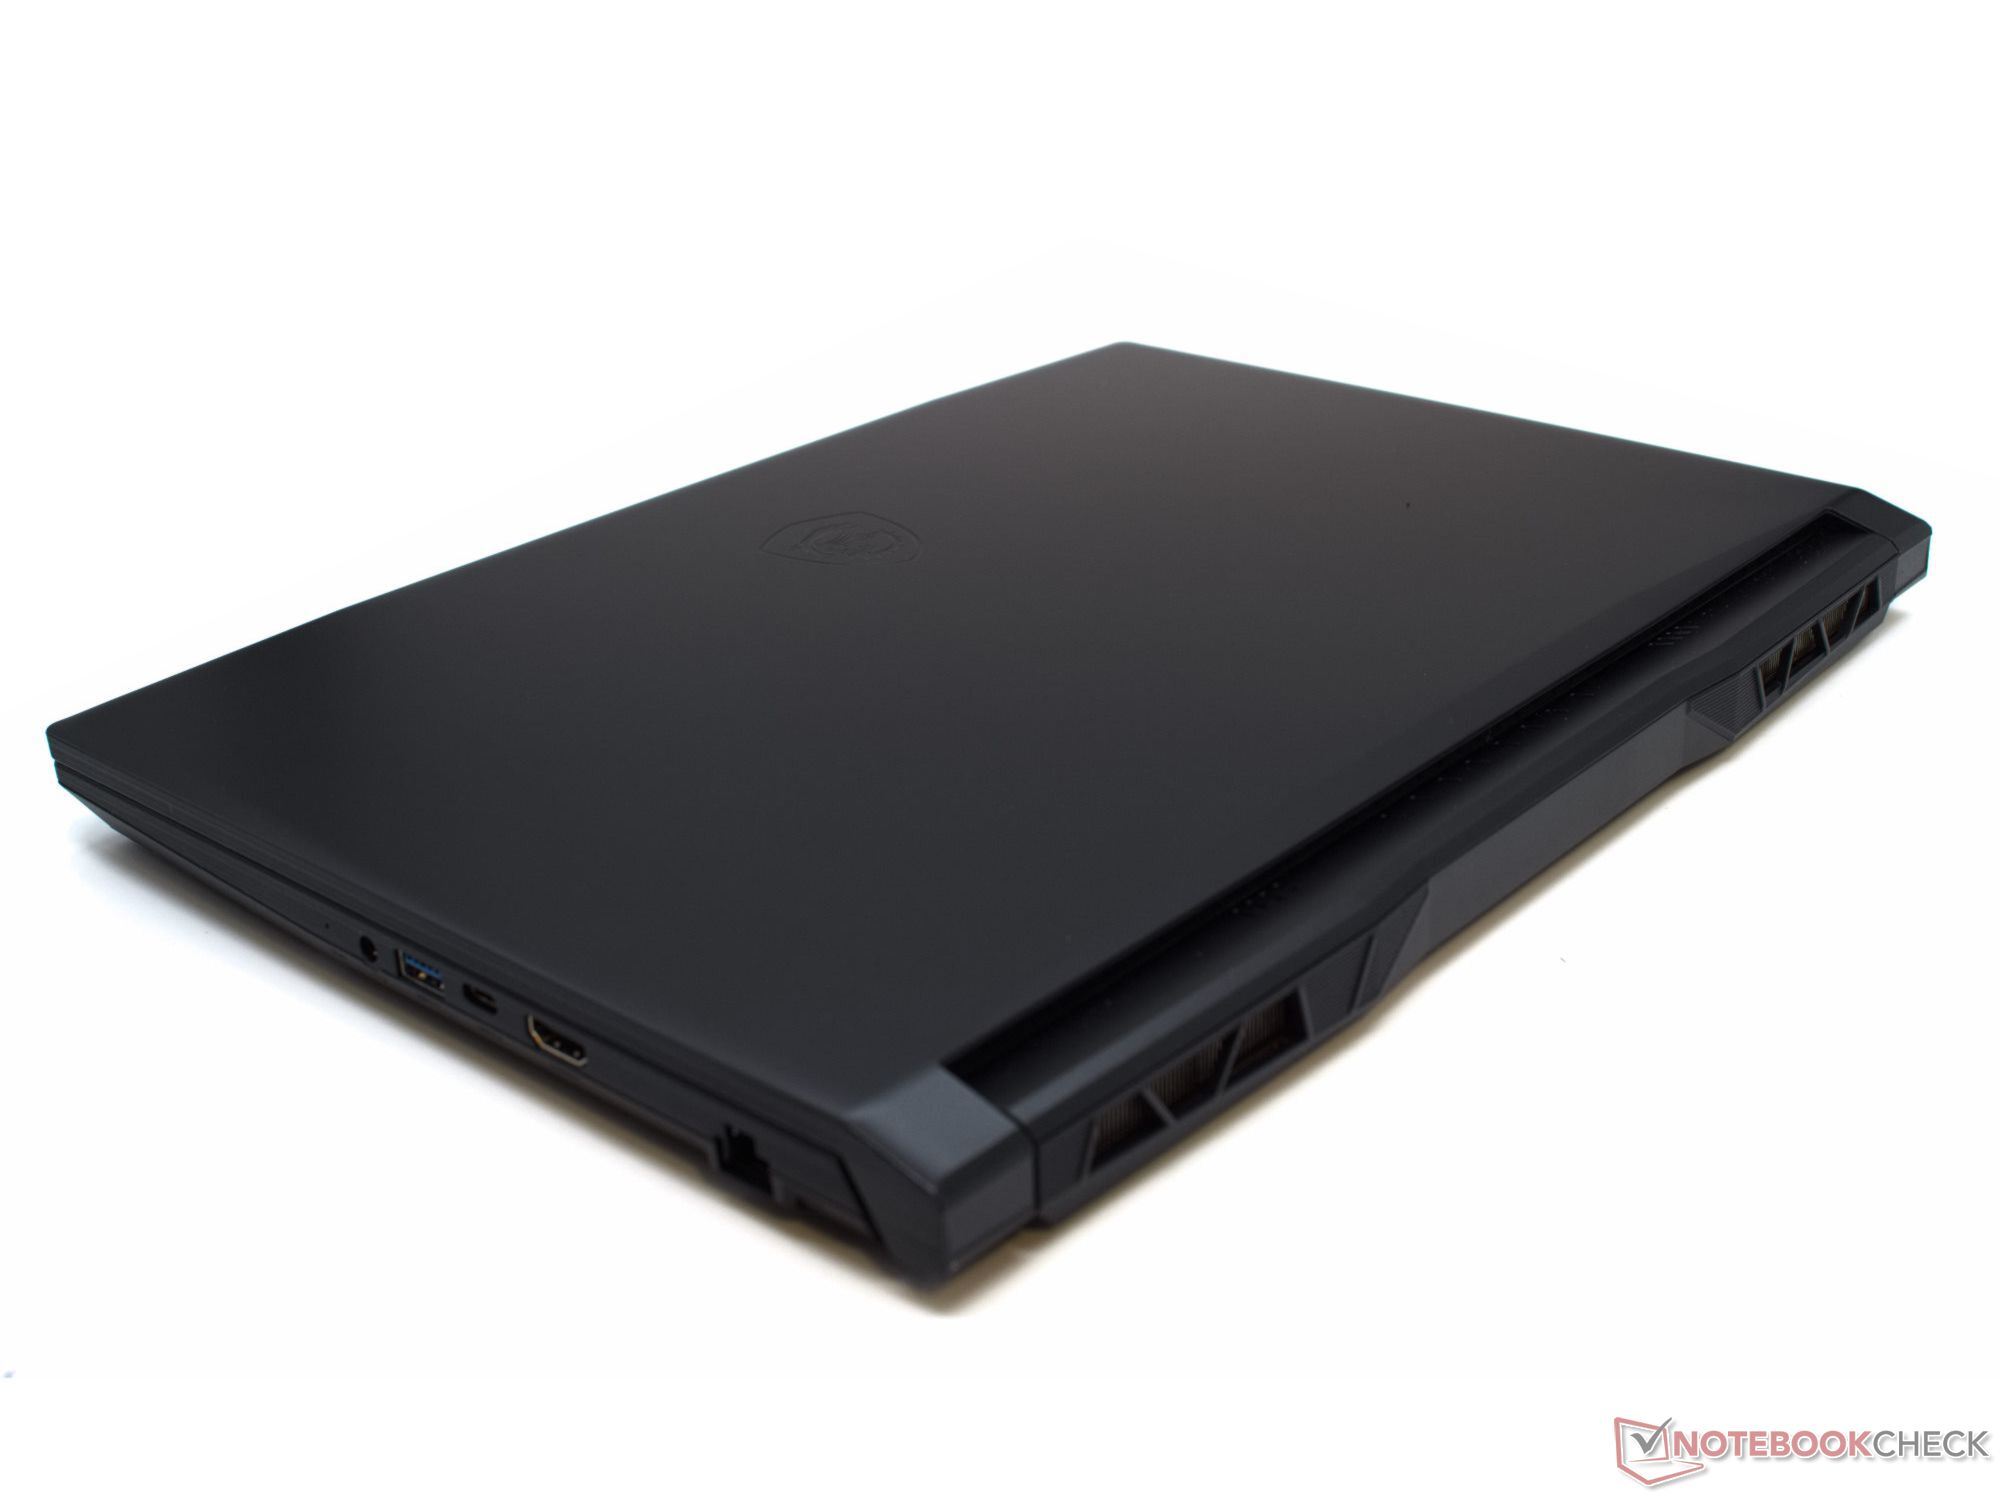
与之相比 GF66 11UG相比,外壳和连接设备都没有变化。设计仍然优雅而不显眼,连接的数量、位置和类型也保持不变。这意味着我们在游戏笔记本的USB-C连接中继续错过了Thunderbolt和DisplayPort。你可以在我们的评测中找到关于机箱和连接设备的更详细的描述。 MSI Katana GF66 11UG.
在更好的网络摄像头和显示器铰链的稳定性方面有一些轻微的改进,现在比上一代产品有更多的阻力,可以更好地固定显示器。
在尺寸和重量方面,Katana GF66 12UGS处于竞争对手的中间位置。作为典型的游戏笔记本电脑,其重量超过了2公斤(约4.4磅)。
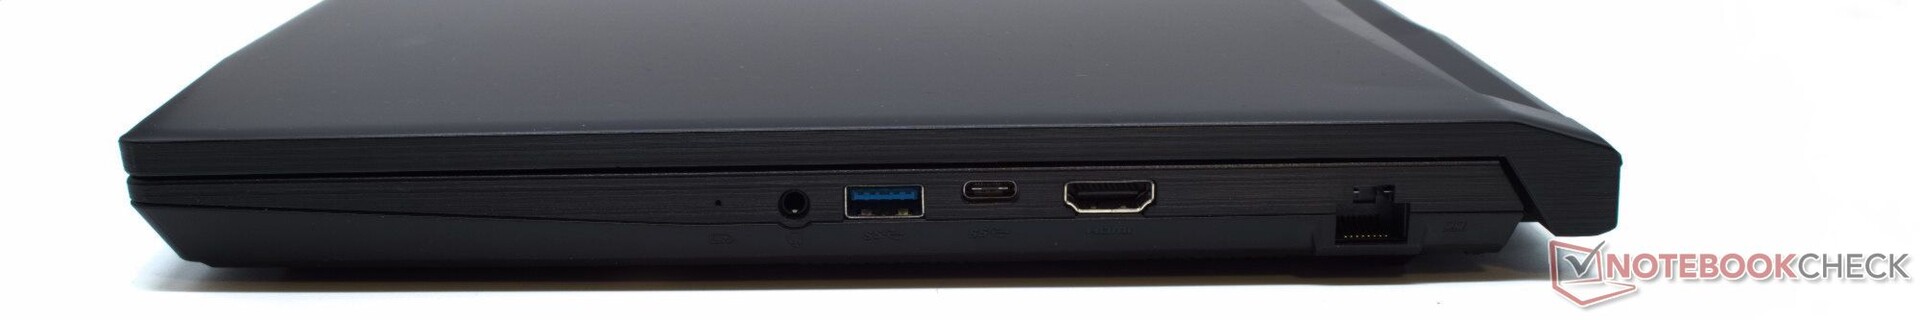
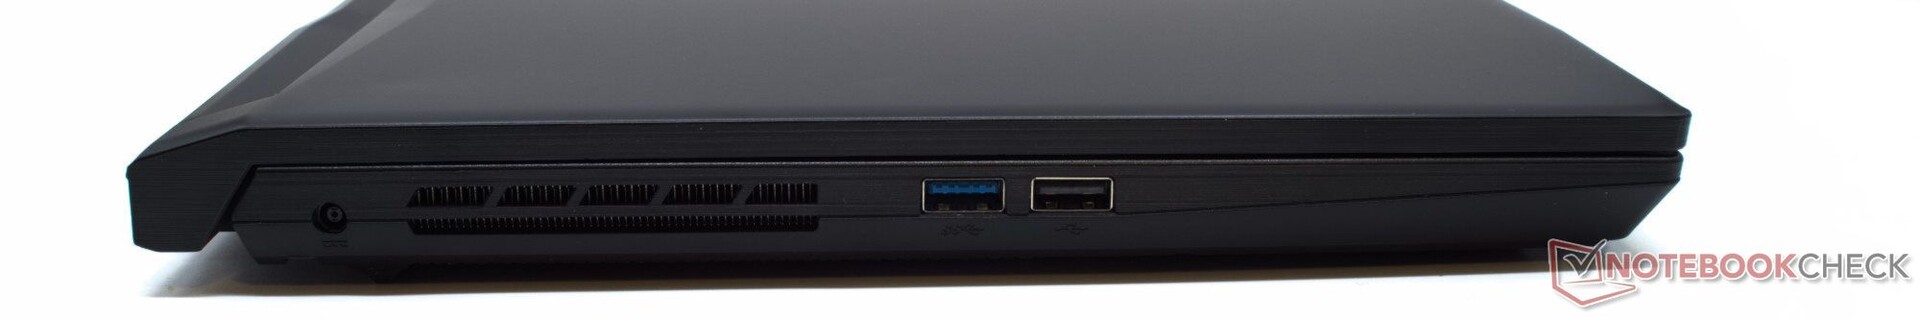
连接设备
微星Katana在连接方面并没有真正提供很多东西。左侧的USB-2.0端口清楚地表明,微星在连接方面走了一些弯路。它所缺乏的其他设备是读卡器或装备齐全的USB-C端口。
沟通
英特尔AX201模块继续提供WLAN-ax和蓝牙5.2功能。我们在ROG Rapture GT-AXE11000的测试中测得的高传输率表明,该游戏笔记本电脑的天线很强大。
网络摄像头
即使网络摄像头的质量仍然有待改进,但GF66的摄像头与去年相比还是略有改进。例如,现在的颜色偏差略低,对比度和清晰度也略有提高。


维护
虽然微星Katana GF66确实应该很容易打开,但微星在大多数时候都将至少一颗螺丝藏在密封贴纸下面。尽管这个封条应该很容易去除,但我们并没有这样做,因为我们的测试设备是借来的。在底盖下面,工作内存、WLAN模块和M.2-NVMe固态硬盘可以被替换或扩展,因为该游戏笔记本还提供了一个免费的M.2插槽。

担保
微星在欧洲为GF66提供了24个月的制造商保修。有缺陷的设备将在一个中心地点被取走和修理,从那里运回给客户。顺便说一下,移除密封贴纸不会影响设备的保修。封条只是为了向客户展示设备是否处于原始状态。
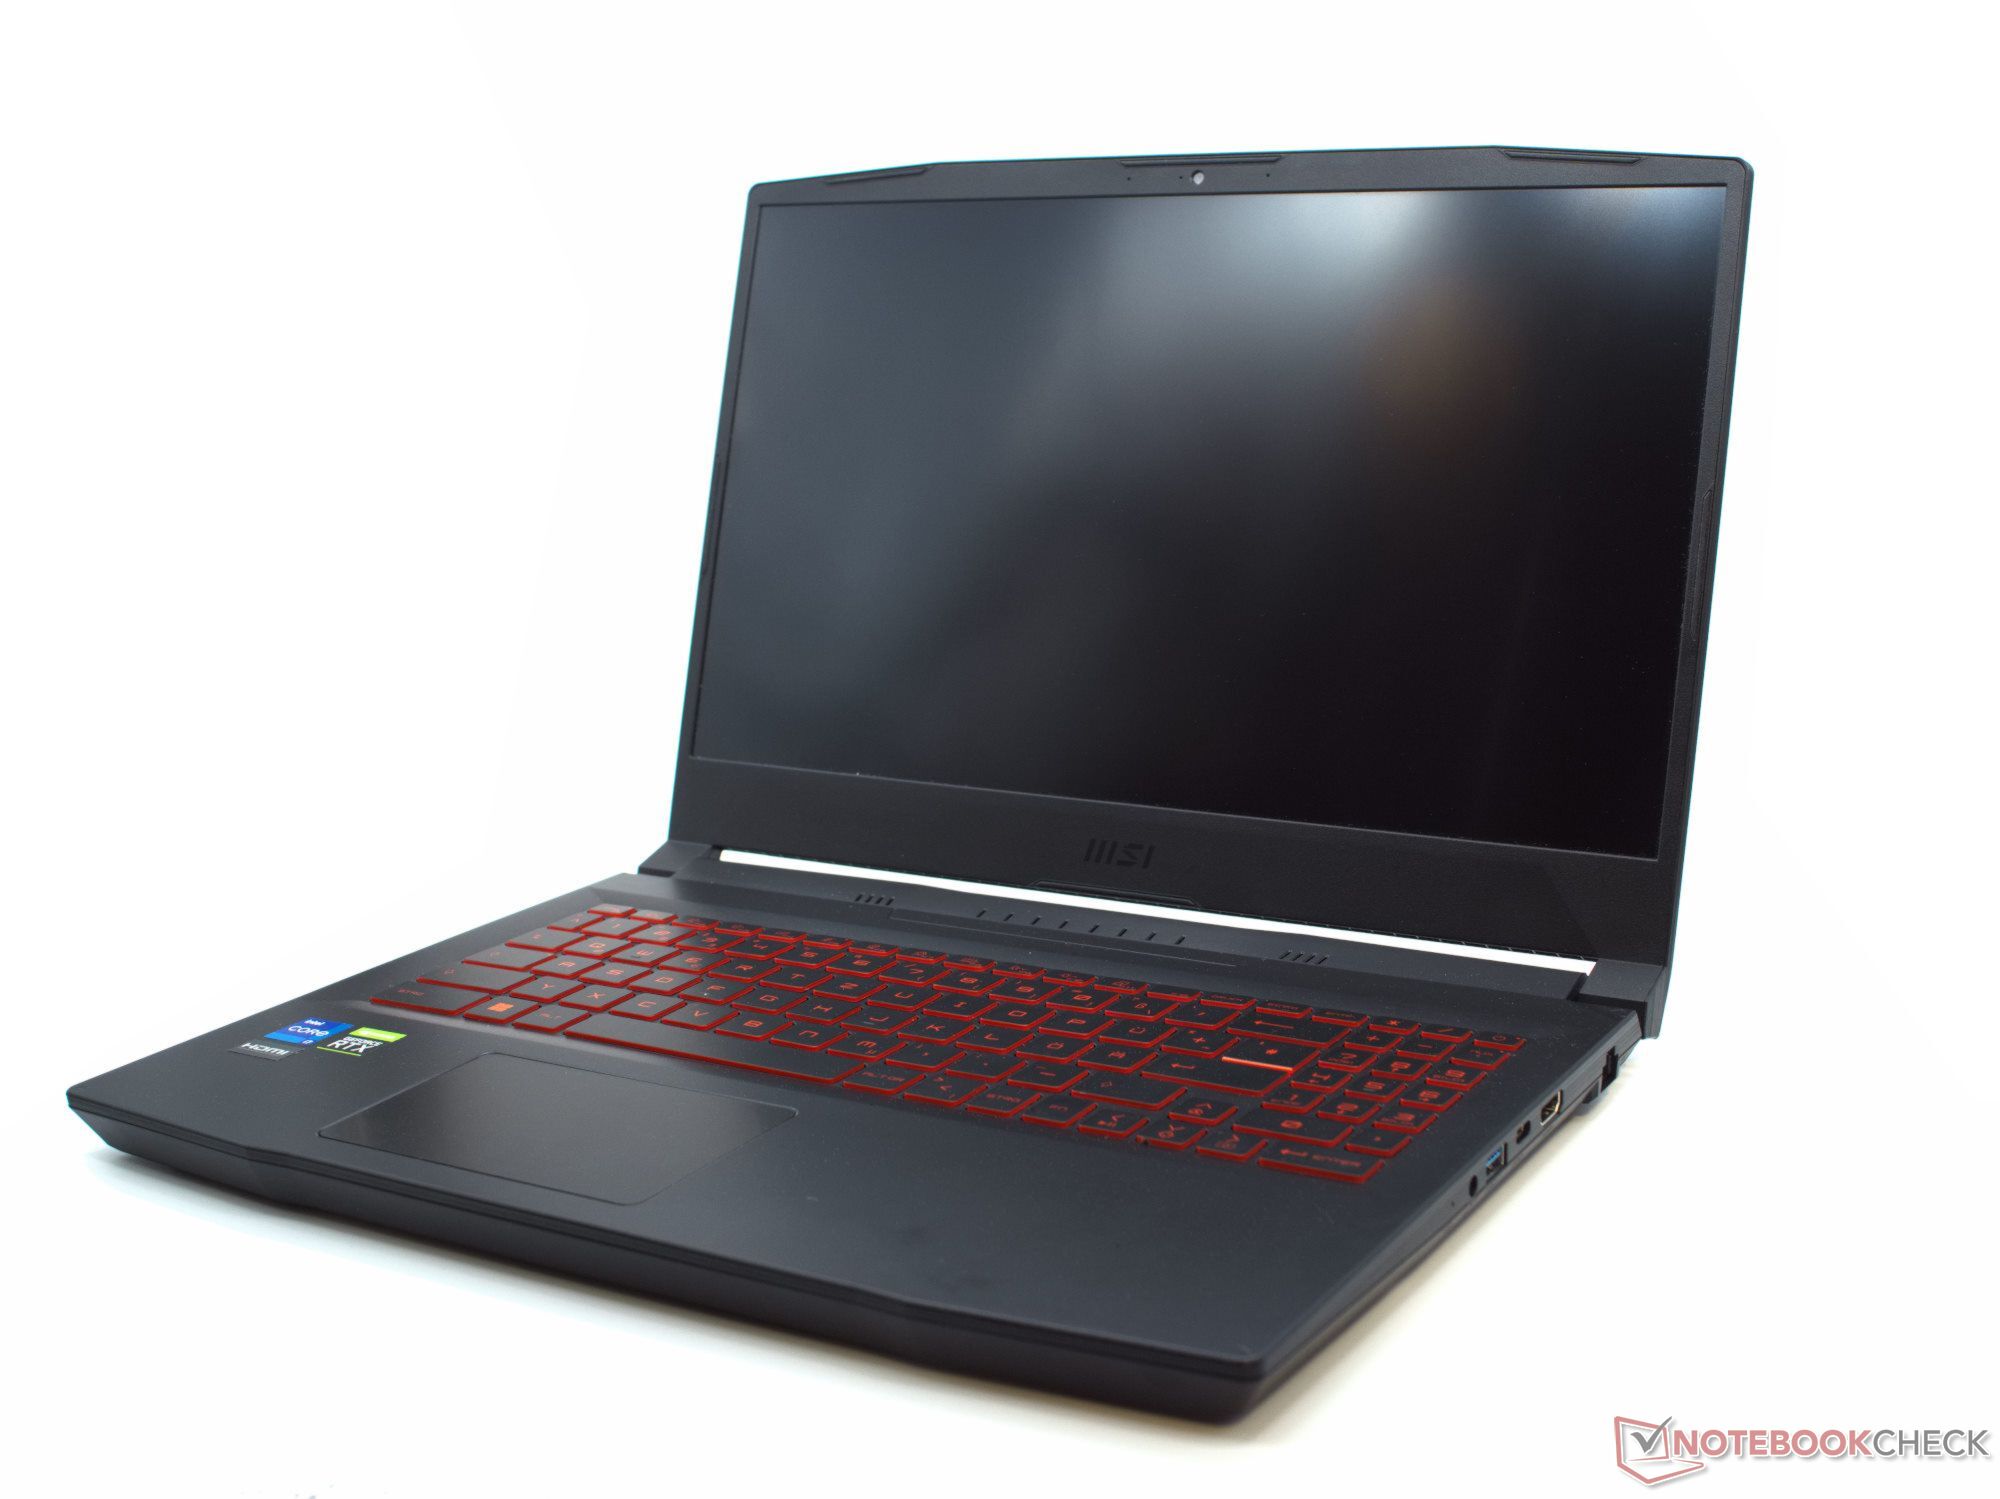
输入设备 - 这里没有什么新东西
与竞争对手相比,这款游戏笔记本的键盘和触摸板没有任何变化。键盘的尺寸很舒适,键盘的红色背景照明可以调整,没有刺眼的感觉。 不幸的是,相当小的触摸板的尺寸没有增加,但触摸板对输入的反应是完美无缺的。
在这一点上,所有的功能键都有工作驱动,所以你可以通过按键来控制网络摄像头、麦克风和微星中心,而且目标交叉覆盖现在也可以工作,便于在许多游戏中进行瞄准。
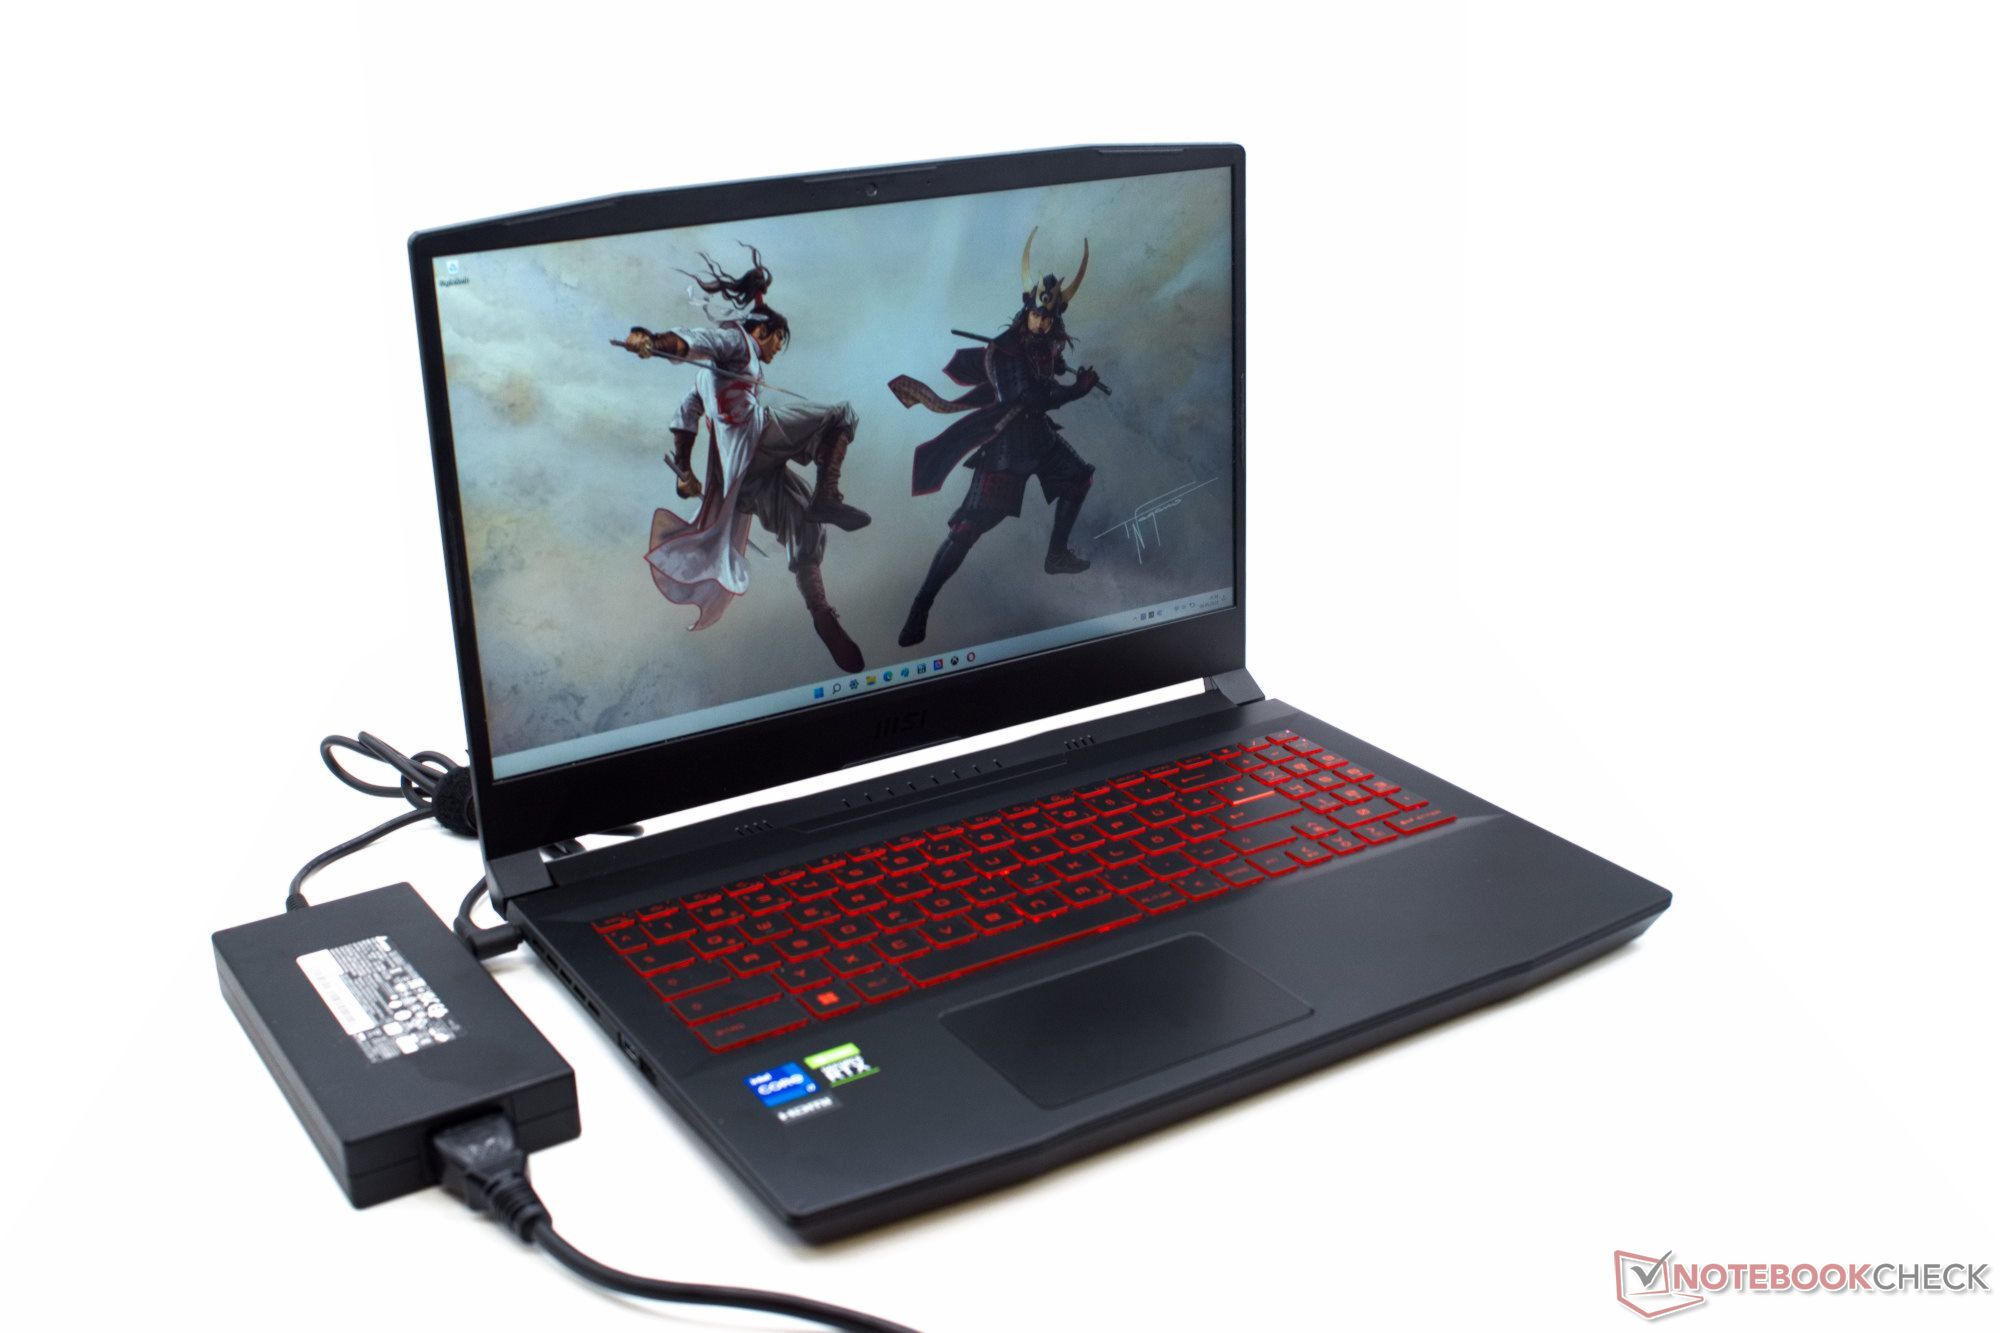
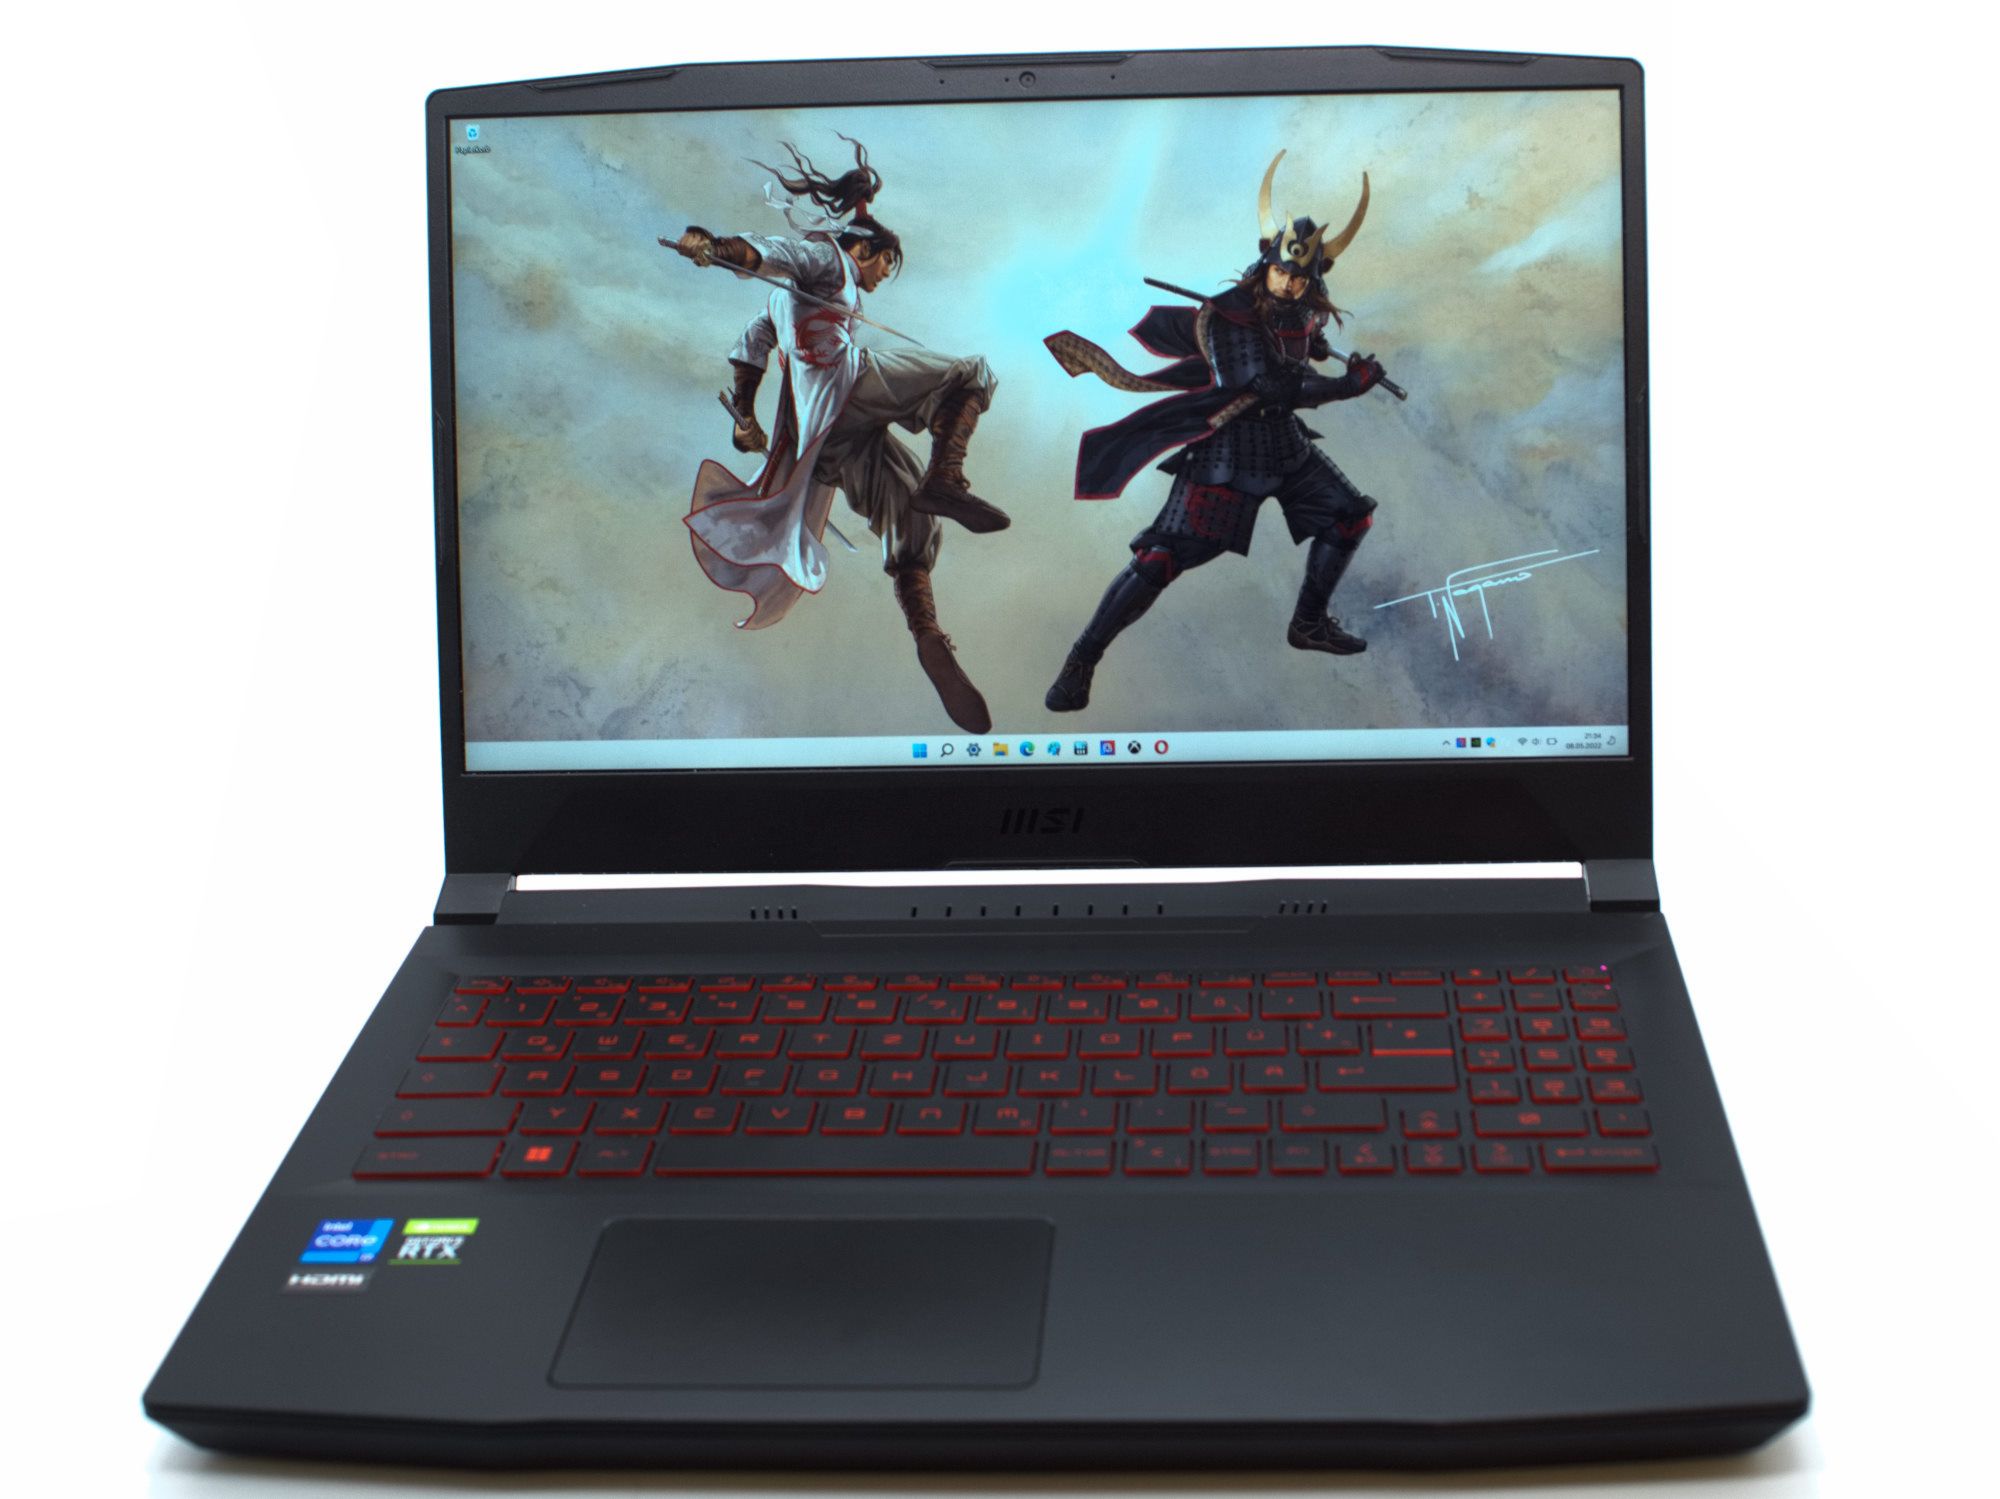
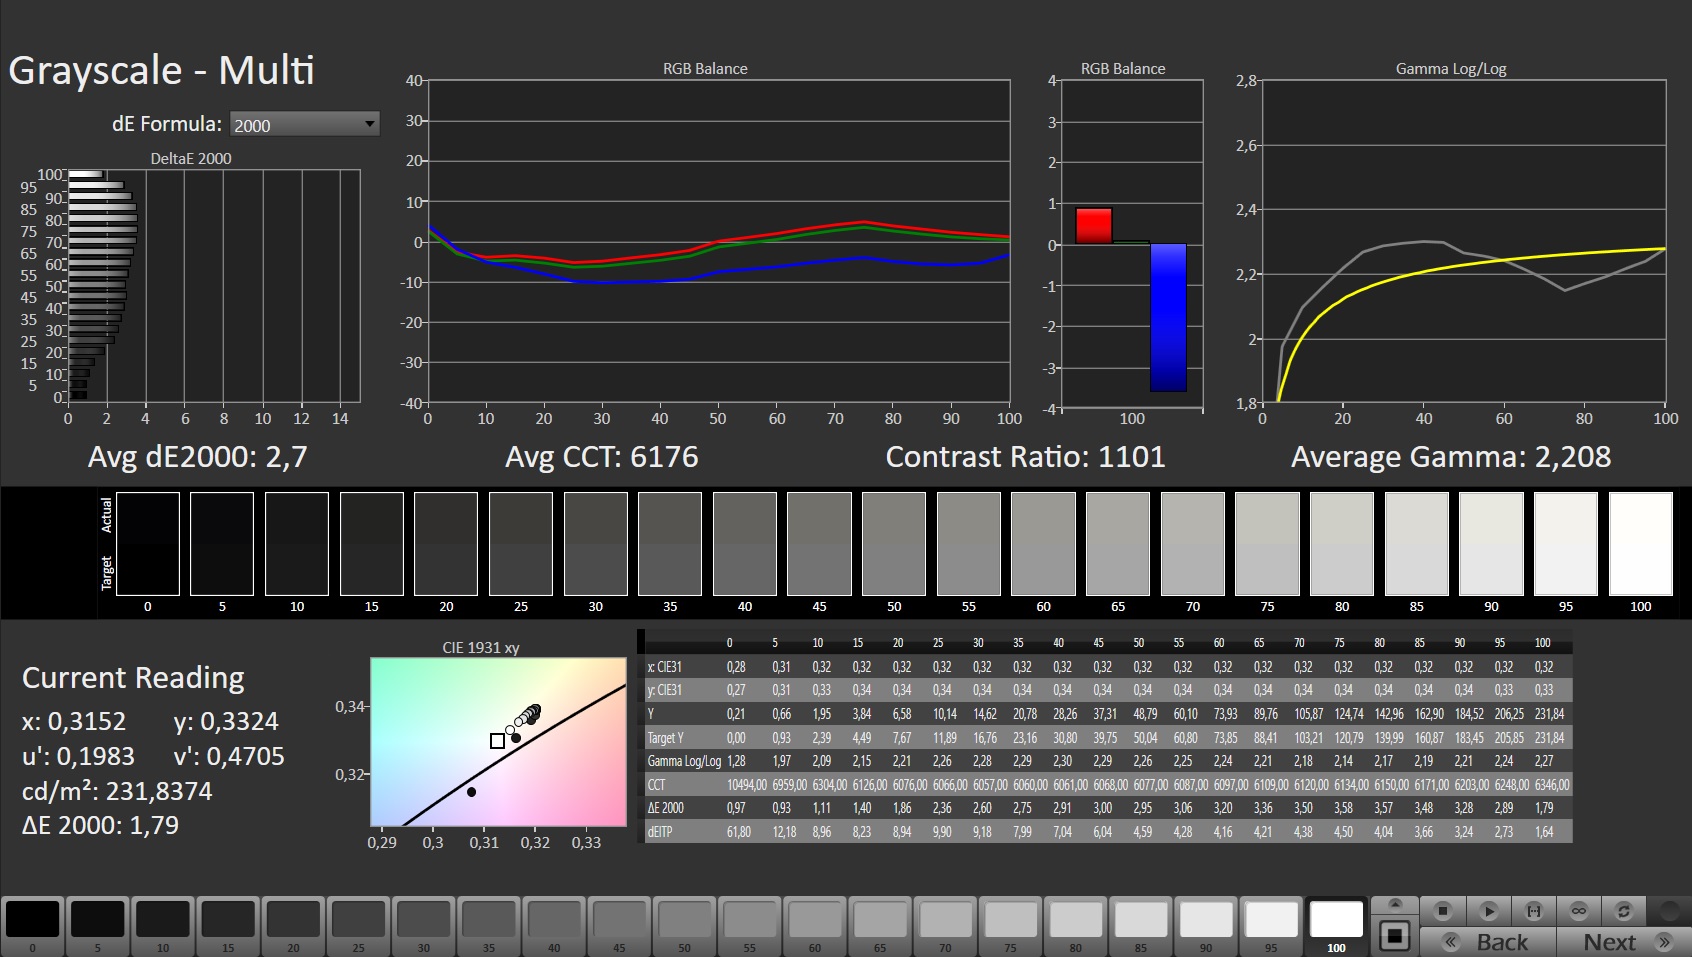
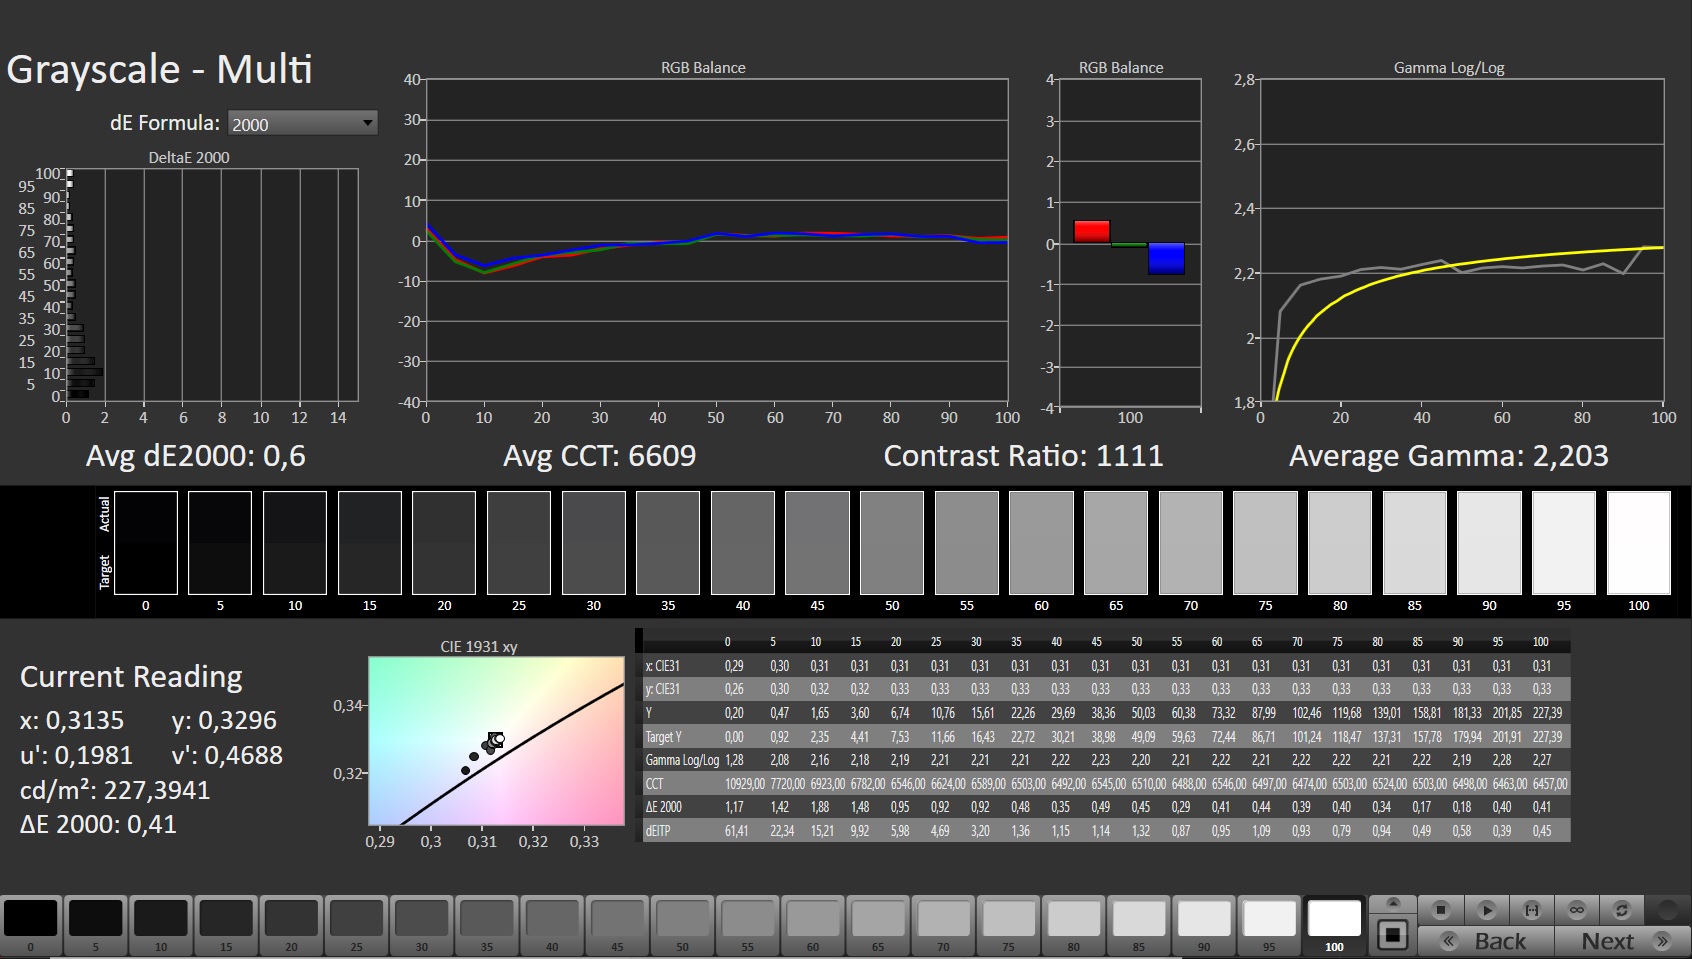
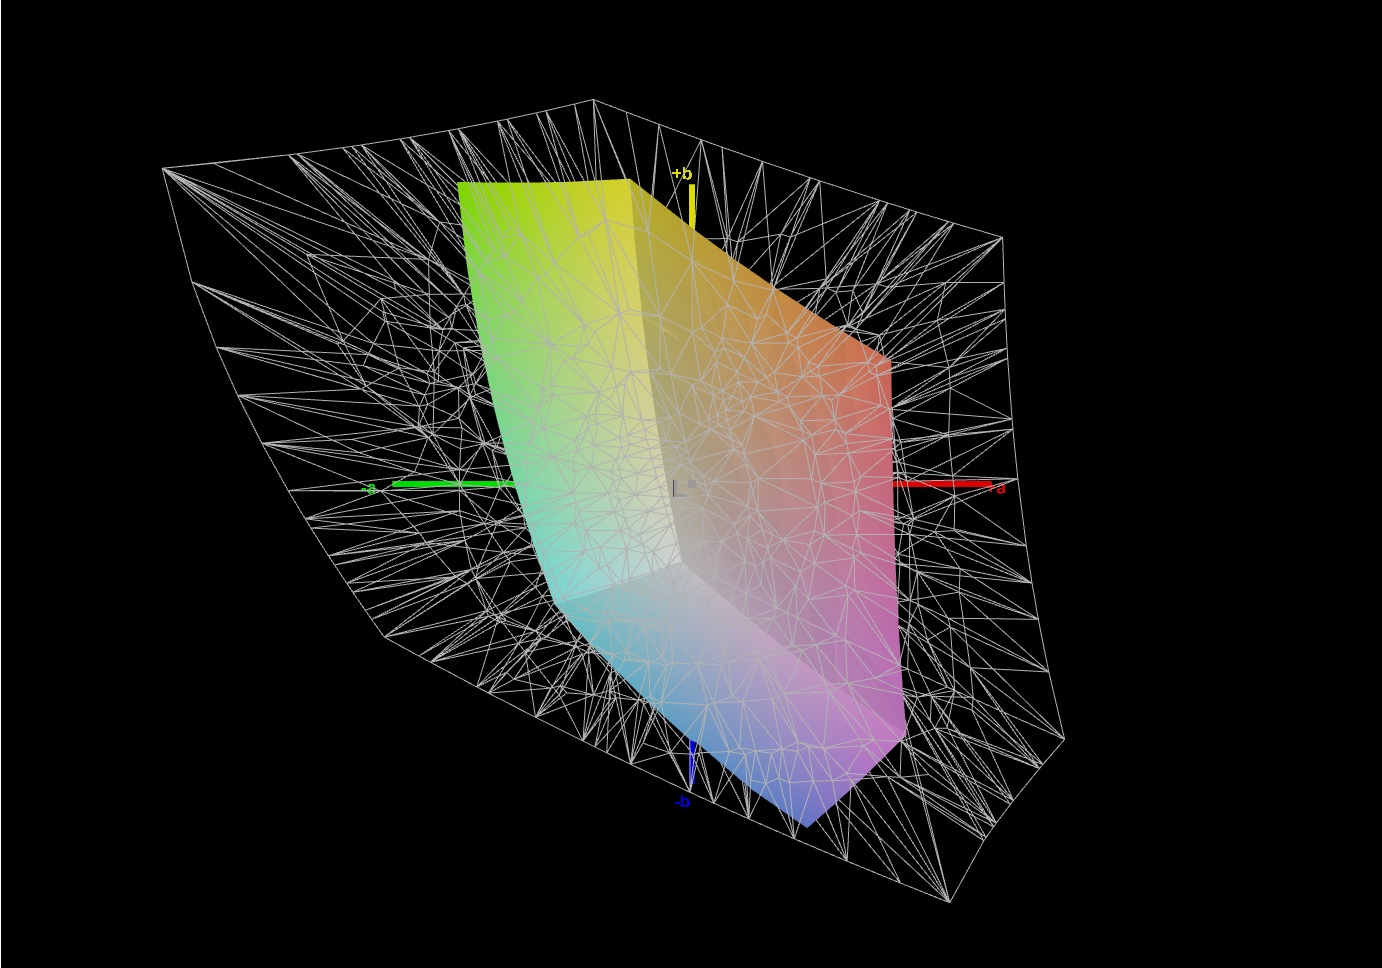
显示 - 微星在这里进行了明显的降级

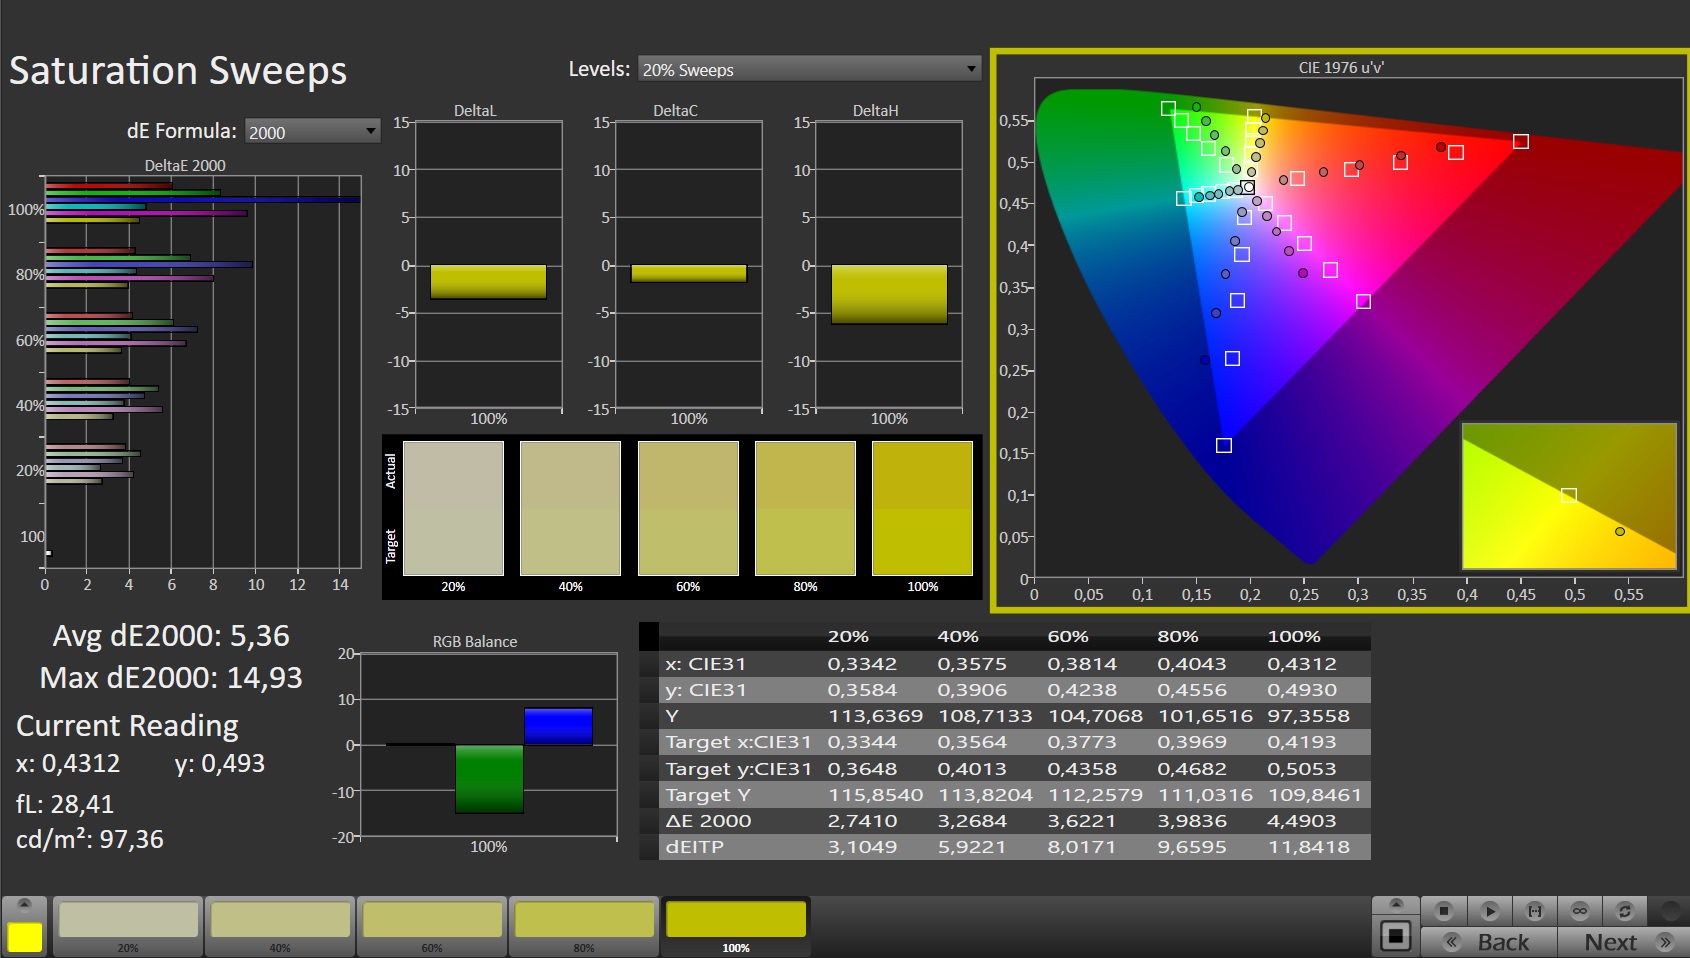
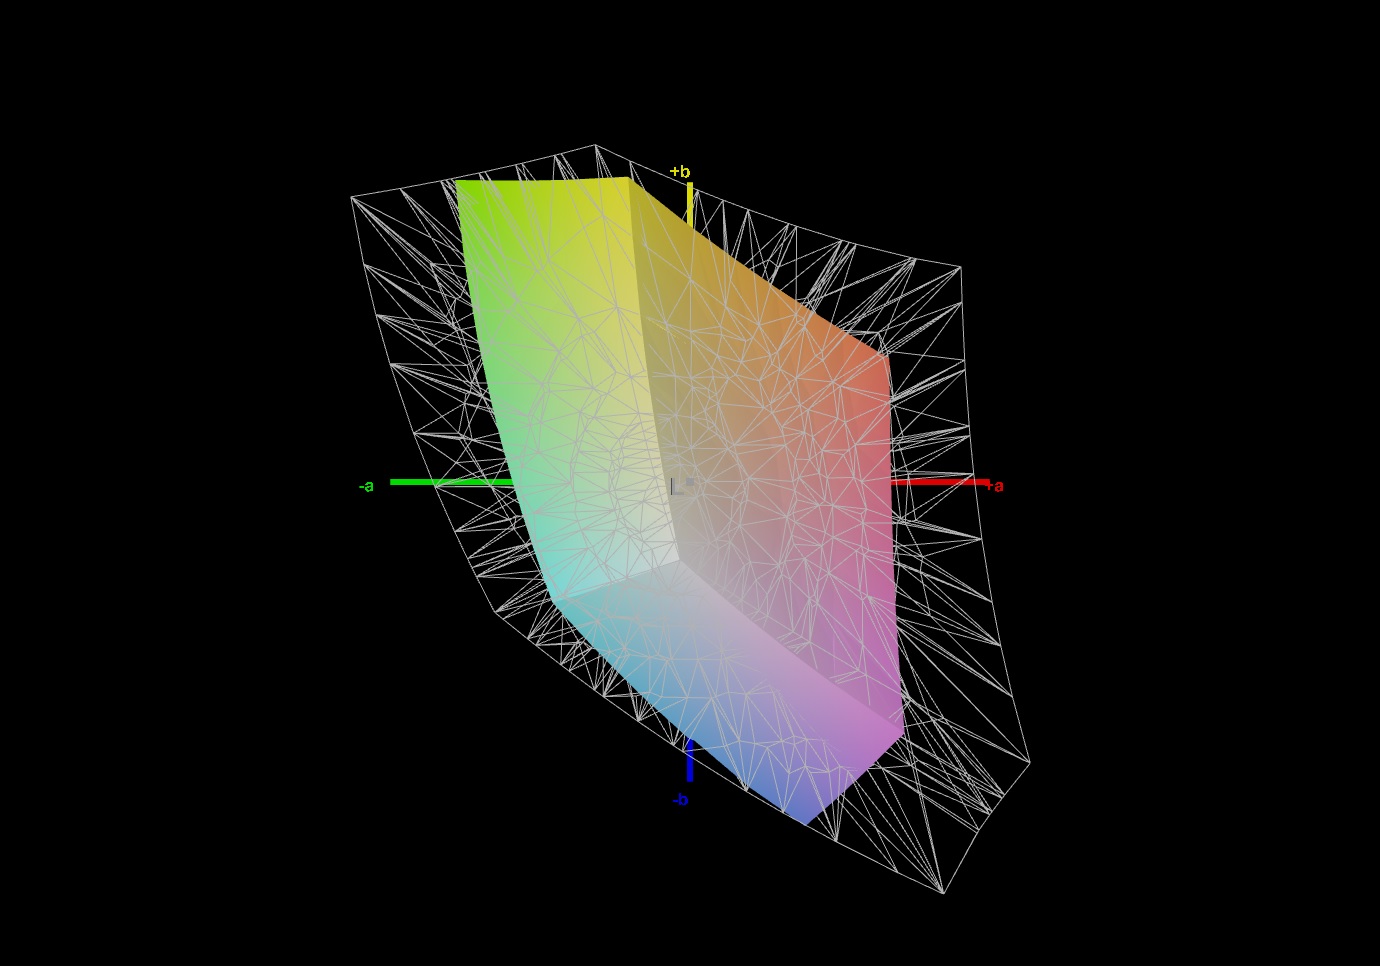
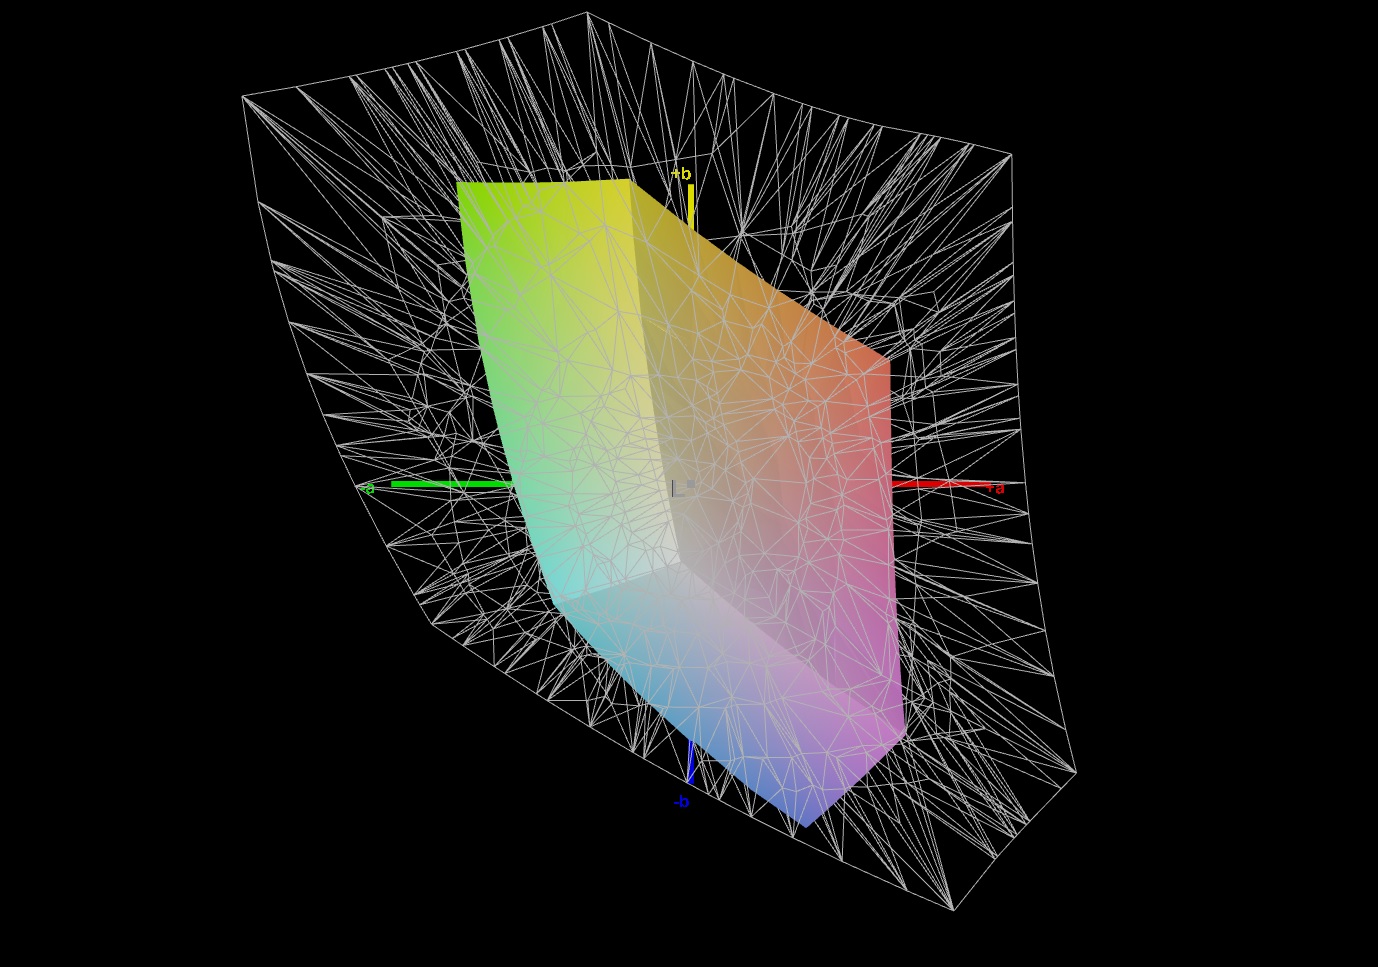
GF66 12UGS的显示屏明显比GF66 11UG的显示屏差。虽然144赫兹和全高清分辨率对于装有GeForce RTX 3070 Ti的游戏笔记本来说是足够的,但面板的其他数值并不支持将其作为游戏显示器使用。新的友达光电面板的sRGB色彩空间覆盖率为58.3%,比前代型号的面板要差;平均亮度为225cd/m²,亮度更差;响应时间也更差。微星公司在这里进行了明显的降级。
1081:1的对比度是不错的,但在我们的比较领域中,只有华硕TUF Gaming A15的数值更低。除了144赫兹之外,游戏笔记本的显示屏提供的数值更适合于办公笔记本。
| |||||||||||||||||||||||||
Brightness Distribution: 90 %
Center on Battery: 227 cd/m²
Contrast: 1081:1 (Black: 0.21 cd/m²)
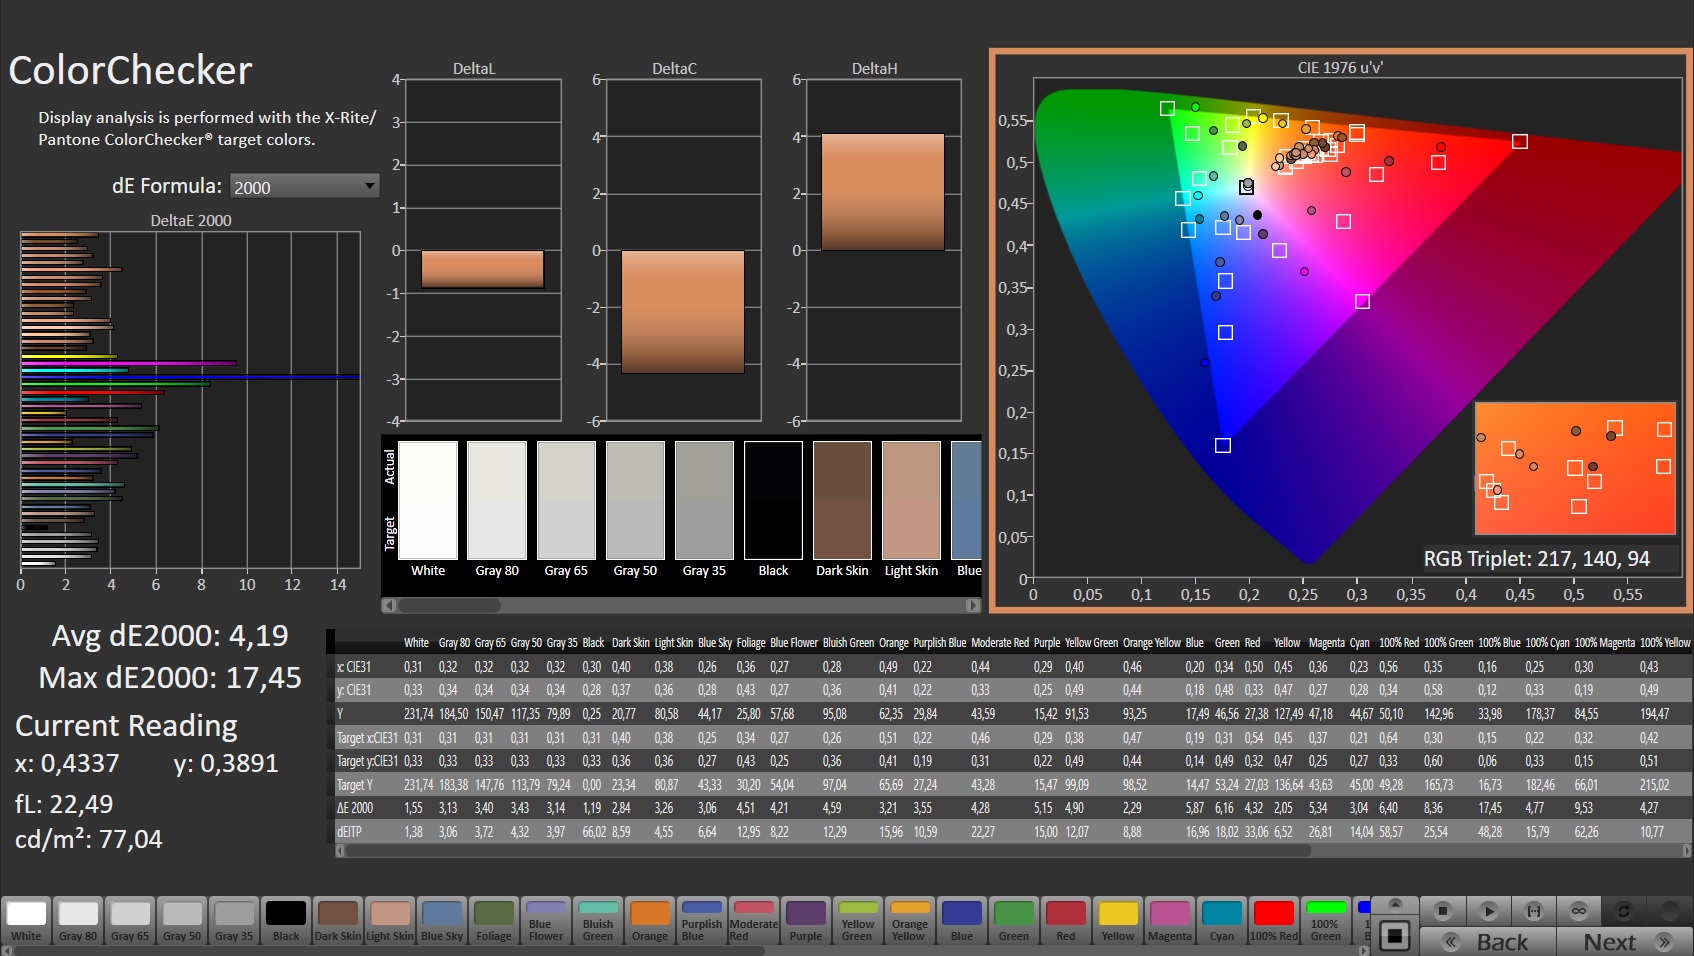
ΔE ColorChecker Calman: 4.19 | ∀{0.5-29.43 Ø4.73}
calibrated: 3.81
ΔE Greyscale Calman: 2.7 | ∀{0.09-98 Ø4.97}
40.4% AdobeRGB 1998 (Argyll 3D)
58.3% sRGB (Argyll 3D)
39.1% Display P3 (Argyll 3D)
Gamma: 2.208
CCT: 6176 K
| MSI Katana GF66 12UGS AU Optronics AUOAF90, IPS, 1920x1080, 15.6" | MSI Katana GF66 11UG-220 AU Optronics B156HAN08.0, IPS, 1920x1080, 15.6" | MSI Katana GF76 12UGS AU Optronics B173HAN04.9, IPS, 1920x1080, 17.3" | Asus TUF Gaming F15 FX507ZM TL156VDXP0101, IPS, 1920x1080, 15.6" | Asus TUF Gaming A15 FA506QR-AZ061T Sharp SHP1532, IPS, 1920x1080, 15.6" | Acer Nitro 5 AN515-58-72QR Chi Mei N156KME-GNA, IPS, 2560x1440, 15.6" | Lenovo Legion 5 15ACH6A-82NW0010GE LGD06A5, IPS, 1920x1080, 15.6" | |
|---|---|---|---|---|---|---|---|
| Display | 63% | -1% | 69% | 109% | 77% | ||
| Display P3 Coverage (%) | 39.1 | 65.4 67% | 38.5 -2% | 66.4 70% | 95.6 145% | 71.1 82% | |
| sRGB Coverage (%) | 58.3 | 91.3 57% | 57.8 -1% | 97 66% | 99.8 71% | 99.1 70% | |
| AdobeRGB 1998 Coverage (%) | 40.4 | 66.7 65% | 39.8 -1% | 68.5 70% | 85.2 111% | 72.3 79% | |
| Response Times | 71% | 3% | 71% | 71% | 63% | 71% | |
| Response Time Grey 50% / Grey 80% * (ms) | 40 ? | 7.4 ? 81% | 40.6 ? -2% | 5.6 ? 86% | 12 ? 70% | 15.7 ? 61% | 15 ? 62% |
| Response Time Black / White * (ms) | 28.4 ? | 11.2 ? 61% | 26.4 ? 7% | 12.8 ? 55% | 8 ? 72% | 10.2 ? 64% | 6 ? 79% |
| PWM Frequency (Hz) | 1250 ? | ||||||
| Screen | 7% | 23% | 32% | 30% | 12% | 15% | |
| Brightness middle (cd/m²) | 227 | 307 35% | 281 24% | 353.7 56% | 297 31% | 332 46% | 371 63% |
| Brightness (cd/m²) | 225 | 321 43% | 264 17% | 340 51% | 268 19% | 303 35% | 328 46% |
| Brightness Distribution (%) | 90 | 83 -8% | 88 -2% | 89 -1% | 84 -7% | 86 -4% | 85 -6% |
| Black Level * (cd/m²) | 0.21 | 0.27 -29% | 0.2 5% | 0.34 -62% | 0.22 -5% | 0.29 -38% | 0.32 -52% |
| Contrast (:1) | 1081 | 1137 5% | 1405 30% | 1040 -4% | 1350 25% | 1145 6% | 1159 7% |
| Colorchecker dE 2000 * | 4.19 | 4.67 -11% | 3.69 12% | 1.74 58% | 1.36 68% | 3.61 14% | 3.25 22% |
| Colorchecker dE 2000 max. * | 17.45 | 7.53 57% | 8.46 52% | 3.63 79% | 3.82 78% | 7.71 56% | 6.33 64% |
| Colorchecker dE 2000 calibrated * | 3.81 | 2.41 37% | 3.61 5% | 0.5 87% | 0.59 85% | 1.11 71% | |
| Greyscale dE 2000 * | 2.7 | 4.5 -67% | 0.94 65% | 2.1 22% | 1.88 30% | 5.2 -93% | 4.94 -83% |
| Gamma | 2.208 100% | 2.276 97% | 2.42 91% | 2.3 96% | 2.48 89% | 2.155 102% | 2.45 90% |
| CCT | 6176 105% | 6824 95% | 6443 101% | 6257 104% | 6768 96% | 6724 97% | 6064 107% |
| Color Space (Percent of AdobeRGB 1998) (%) | 63 | ||||||
| Color Space (Percent of sRGB) (%) | 99 | ||||||
| Total Average (Program / Settings) | 47% /
28% | 8% /
15% | 57% /
45% | 51% /
38% | 61% /
40% | 54% /
36% |
* ... smaller is better
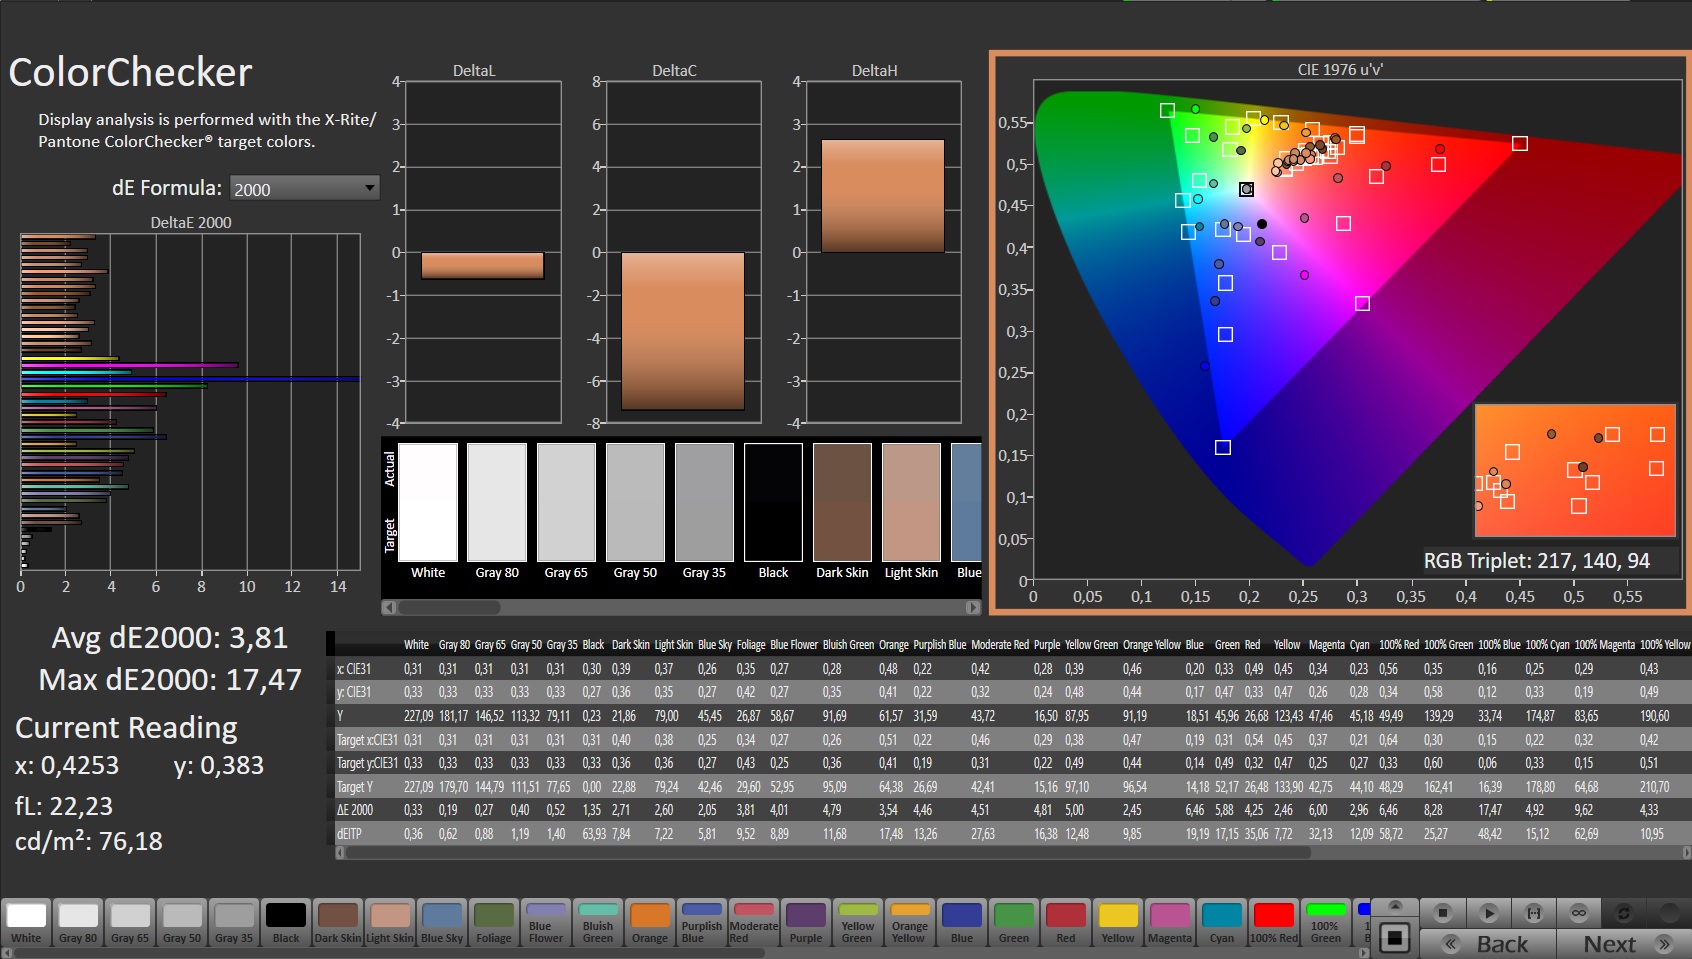
微星Katana GF66 12UGS的色彩空间覆盖率和色彩还原度是没有说服力的。几乎所有的颜色都超出了自然色彩再现的范围,你甚至可以用眼睛注意到颜色的偏差。由于色彩空间覆盖率低,即使使用CalMan和X-Rite i1色度计进行校准,也很难带来任何改善。

Display Response Times
| ↔ Response Time Black to White | ||
|---|---|---|
| 28.4 ms ... rise ↗ and fall ↘ combined | ↗ 15.2 ms rise | 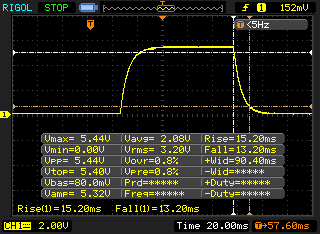 |
| ↘ 13.2 ms fall | ||
| The screen shows relatively slow response rates in our tests and may be too slow for gamers. In comparison, all tested devices range from 0.1 (minimum) to 240 (maximum) ms. » 75 % of all devices are better. This means that the measured response time is worse than the average of all tested devices (19.9 ms). | ||
| ↔ Response Time 50% Grey to 80% Grey | ||
| 40 ms ... rise ↗ and fall ↘ combined | ↗ 18.8 ms rise | 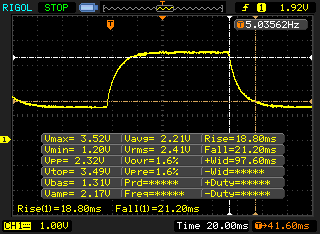 |
| ↘ 21.2 ms fall | ||
| The screen shows slow response rates in our tests and will be unsatisfactory for gamers. In comparison, all tested devices range from 0.165 (minimum) to 636 (maximum) ms. » 61 % of all devices are better. This means that the measured response time is worse than the average of all tested devices (31.1 ms). | ||
Screen Flickering / PWM (Pulse-Width Modulation)
| Screen flickering / PWM not detected | 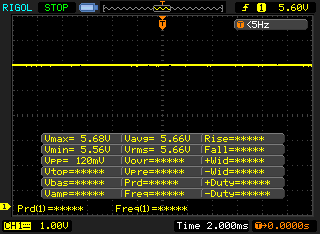 | ||
In comparison: 52 % of all tested devices do not use PWM to dim the display. If PWM was detected, an average of 7784 (minimum: 5 - maximum: 343500) Hz was measured. | |||
在明亮的阳光下,图像内容只能在有限的范围内被阅读。为了能够轻松阅读,显示屏必须提供更高的亮度。
在可视角度的分析中,微星GF66 12UGS对数据表上的宽视角(IPS级别)规格做到了公正。从所有的视角来看,颜色和对比度都只有很小的偏差。另一方面,感知的亮度下降相对较快,但这在相机图像中看起来很夸张,虽然。

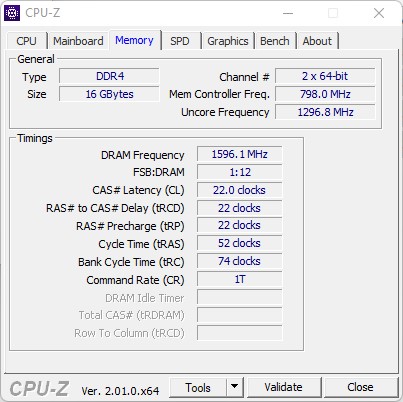
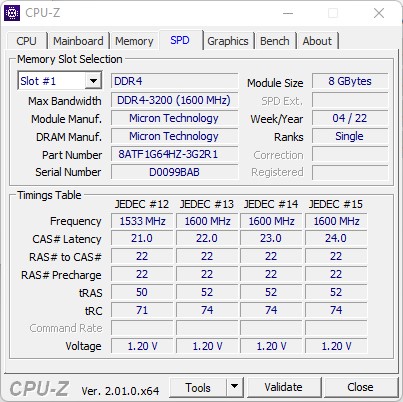
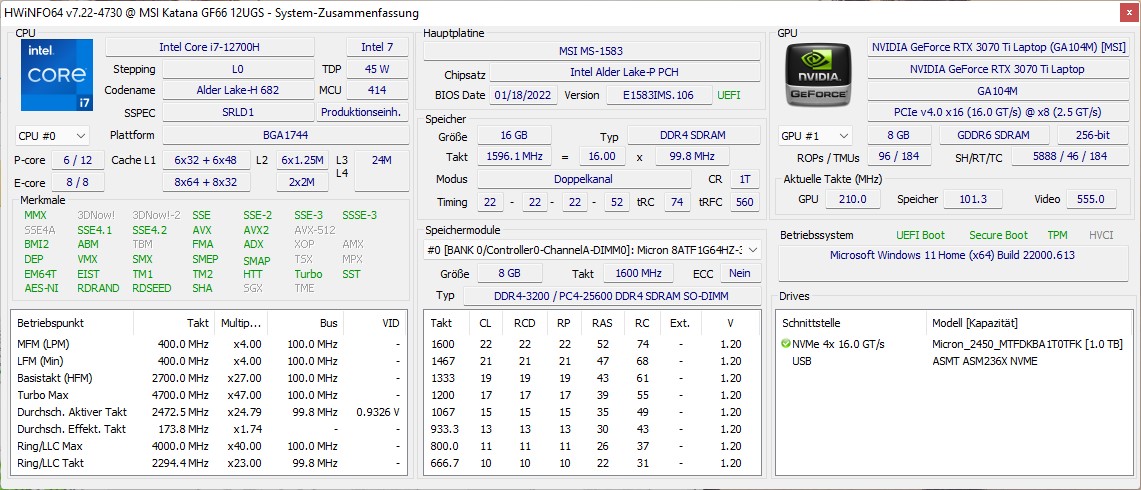
性能 - 当前的CPU一代
微星Katana GF66 12U游戏笔记本有多种配置。无论是英特尔酷睿i5-12500H或i7-12700H以及8或16GB的DDR4-3200工作内存都可以使用。微星还提供各种配置的图形芯片,从NvidiaGeForce RTX 3050开始,直到RTX 3070 Ti。在预装的操作系统中,你还可以选择FreeDos或Windows 11 Home。
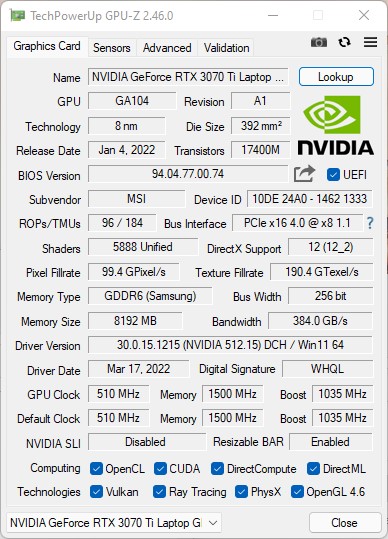
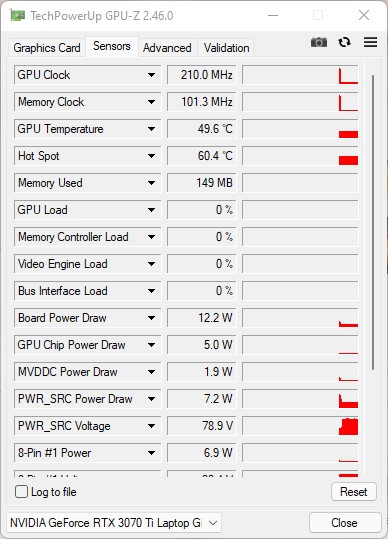
我们的测试装置提供了一个强大的配置,其中包括 NvidiaGeForce RTX 3070 Ti, 英特尔酷睿i7-12700H,以及16GB的内存。有了这些,这台笔记本电脑显然是针对游戏的。由于强大的显卡,即使是图形要求高的游戏也能以高帧率进行。
测试条件
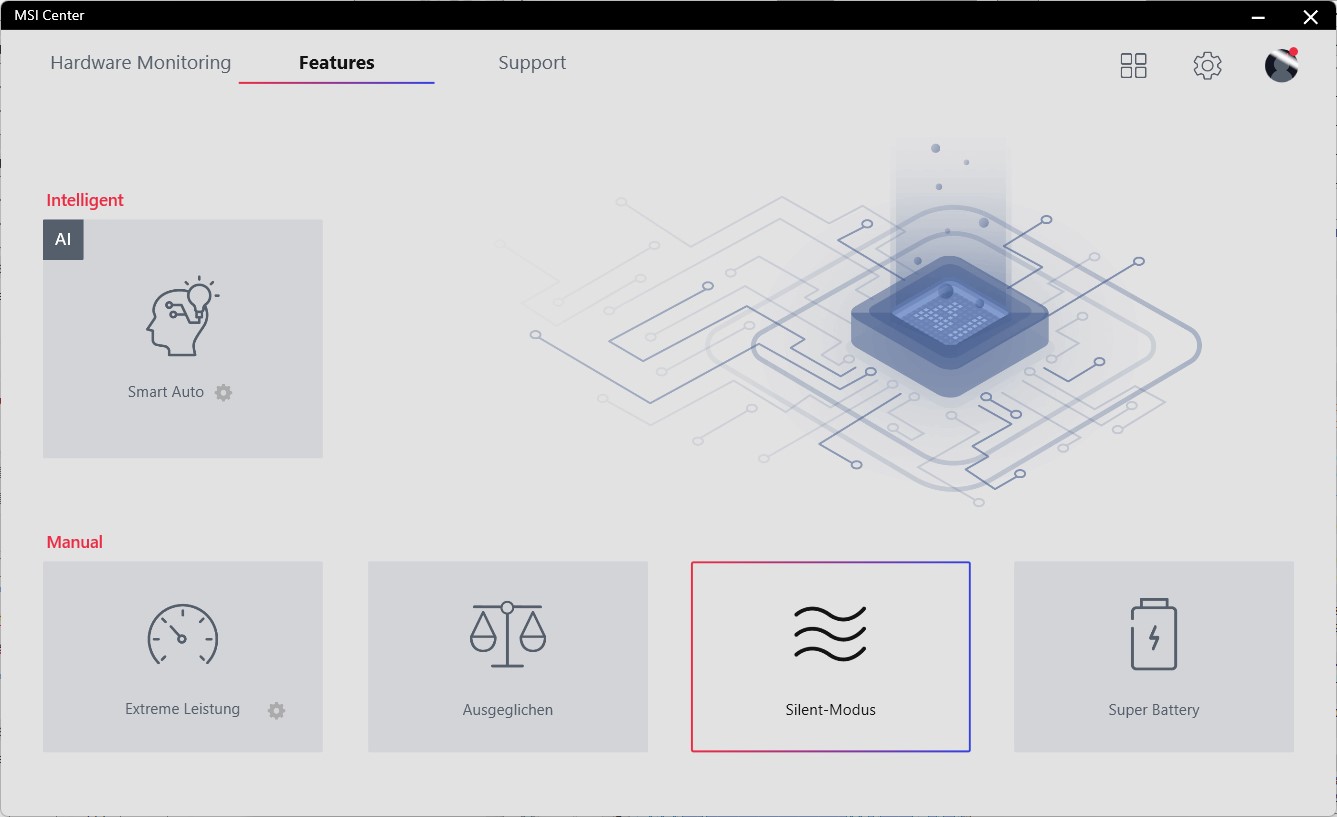
由于智能性能控制,你基本上不需要真的在微星Katana GF66中手动配置什么。在这种性能模式下,笔记本电脑会自动切换到静音和极限性能之间的一个预装模式。
PL1的性能限制在85瓦和23瓦之间。在电池操作中,PL1也可以在超级电池模式下降低到13瓦。
所有的测试都是在智能自动性能模式下进行的。这里的长期处理器消耗在于约38瓦,但在游戏或其他情况下,笔记本电脑也能大幅提高这一性能。
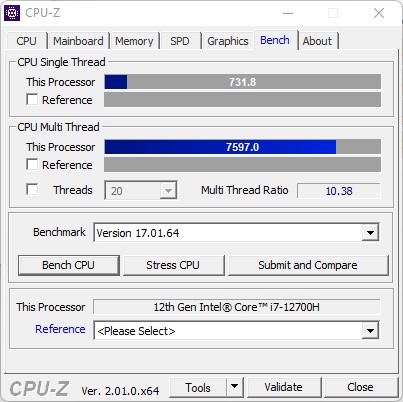
处理器
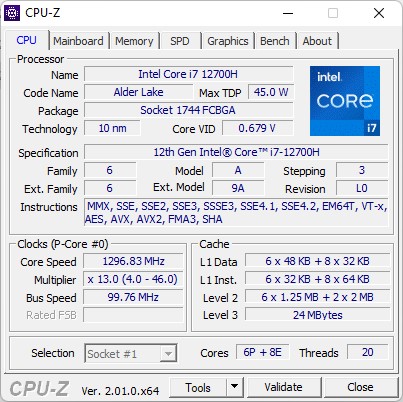
英特尔酷睿i7-12700H属于新Alder Lake一代的高端CPU。该处理器提供六个性能和八个效率核心。这样一来,该CPU就能在20个线程上运行。该处理器的TDP在PL1中可配置到45瓦,适合于具有强大冷却系统的大型笔记本电脑。
在我们的测试中,Katana GF66能够在某些方面显示出明显高于其前辈的性能。即使在人工智能性能模式下,它在大多数通用处理器基准测试中都超过了它的老兄弟姐妹。我们测试了 MSI Katana GF76,它配备了相同的硬件,在极限性能模式下。虽然那台笔记本电脑在这种方式下显示了更高的性能,但在短期负载的基准测试中,它的表现与眼睛持平。GF66 11U和GF66 12UGS之间的比较更为有趣。在相当平衡的人工智能模式下,GF66中的英特尔酷睿i7-12700H在极限性能模式下达到与它的前辈差不多的性能。
Cinebench R15 Multi Constant Load Test
| CPU Performance rating - Percent | |
| Average of class Gaming | |
| Acer Nitro 5 AN515-58-72QR | |
| MSI Katana GF76 12UGS | |
| MSI Katana GF66 12UGS | |
| Average Intel Core i7-12700H | |
| Asus TUF Gaming A15 FA506QR-AZ061T -2! | |
| Lenovo Legion 5 15ACH6A-82NW0010GE | |
| MSI Katana GF66 11UG-220 | |
| Cinebench R20 | |
| CPU (Multi Core) | |
| Average of class Gaming (4029 - 16108, n=109, last 2 years) | |
| Acer Nitro 5 AN515-58-72QR | |
| MSI Katana GF66 12UGS | |
| MSI Katana GF76 12UGS | |
| Average Intel Core i7-12700H (1576 - 7407, n=64) | |
| Asus TUF Gaming A15 FA506QR-AZ061T | |
| Lenovo Legion 5 15ACH6A-82NW0010GE | |
| MSI Katana GF66 11UG-220 | |
| CPU (Single Core) | |
| Average of class Gaming (442 - 895, n=109, last 2 years) | |
| MSI Katana GF66 12UGS | |
| MSI Katana GF76 12UGS | |
| Acer Nitro 5 AN515-58-72QR | |
| Average Intel Core i7-12700H (300 - 704, n=64) | |
| MSI Katana GF66 11UG-220 | |
| Asus TUF Gaming A15 FA506QR-AZ061T | |
| Lenovo Legion 5 15ACH6A-82NW0010GE | |
| Blender - v2.79 BMW27 CPU | |
| MSI Katana GF66 11UG-220 | |
| Lenovo Legion 5 15ACH6A-82NW0010GE | |
| MSI Katana GF66 12UGS | |
| Asus TUF Gaming A15 FA506QR-AZ061T | |
| Average Intel Core i7-12700H (168 - 732, n=63) | |
| Acer Nitro 5 AN515-58-72QR | |
| MSI Katana GF76 12UGS | |
| Average of class Gaming (80 - 330, n=107, last 2 years) | |
| Geekbench 5.5 | |
| Multi-Core | |
| Average of class Gaming (6460 - 27010, n=108, last 2 years) | |
| MSI Katana GF66 12UGS | |
| Average Intel Core i7-12700H (5144 - 13745, n=64) | |
| MSI Katana GF76 12UGS | |
| Acer Nitro 5 AN515-58-72QR | |
| Asus TUF Gaming A15 FA506QR-AZ061T | |
| MSI Katana GF66 11UG-220 | |
| Lenovo Legion 5 15ACH6A-82NW0010GE | |
| Single-Core | |
| Average of class Gaming (986 - 2474, n=108, last 2 years) | |
| MSI Katana GF76 12UGS | |
| Acer Nitro 5 AN515-58-72QR | |
| MSI Katana GF66 12UGS | |
| Average Intel Core i7-12700H (803 - 1851, n=64) | |
| MSI Katana GF66 11UG-220 | |
| Asus TUF Gaming A15 FA506QR-AZ061T | |
| Lenovo Legion 5 15ACH6A-82NW0010GE | |
| HWBOT x265 Benchmark v2.2 - 4k Preset | |
| Average of class Gaming (11.5 - 44.3, n=108, last 2 years) | |
| Acer Nitro 5 AN515-58-72QR | |
| Average Intel Core i7-12700H (4.67 - 21.8, n=64) | |
| MSI Katana GF76 12UGS | |
| Asus TUF Gaming A15 FA506QR-AZ061T | |
| MSI Katana GF66 12UGS | |
| Lenovo Legion 5 15ACH6A-82NW0010GE | |
| MSI Katana GF66 11UG-220 | |
| LibreOffice - 20 Documents To PDF | |
| Lenovo Legion 5 15ACH6A-82NW0010GE | |
| MSI Katana GF66 11UG-220 | |
| Average of class Gaming (19 - 88.8, n=108, last 2 years) | |
| Asus TUF Gaming A15 FA506QR-AZ061T | |
| Average Intel Core i7-12700H (34.2 - 95.3, n=63) | |
| Acer Nitro 5 AN515-58-72QR | |
| MSI Katana GF76 12UGS | |
| MSI Katana GF66 12UGS | |
| R Benchmark 2.5 - Overall mean | |
| MSI Katana GF66 11UG-220 | |
| Lenovo Legion 5 15ACH6A-82NW0010GE | |
| Asus TUF Gaming A15 FA506QR-AZ061T | |
| Average Intel Core i7-12700H (0.4441 - 1.052, n=63) | |
| Acer Nitro 5 AN515-58-72QR | |
| MSI Katana GF66 12UGS | |
| MSI Katana GF76 12UGS | |
| Average of class Gaming (0.3439 - 0.759, n=109, last 2 years) | |
* ... smaller is better
AIDA64: FP32 Ray-Trace | FPU Julia | CPU SHA3 | CPU Queen | FPU SinJulia | FPU Mandel | CPU AES | CPU ZLib | FP64 Ray-Trace | CPU PhotoWorxx
| Performance rating | |
| Average of class Gaming | |
| Average Intel Core i7-12700H | |
| MSI Katana GF76 12UGS | |
| Asus TUF Gaming A15 FA506QR-AZ061T | |
| MSI Katana GF66 12UGS | |
| Lenovo Legion 5 15ACH6A-82NW0010GE | |
| Acer Nitro 5 AN515-58-72QR | |
| MSI Katana GF66 11UG-220 -9! | |
| AIDA64 / FP32 Ray-Trace | |
| Average of class Gaming (10227 - 85542, n=107, last 2 years) | |
| Asus TUF Gaming A15 FA506QR-AZ061T | |
| Lenovo Legion 5 15ACH6A-82NW0010GE | |
| Average Intel Core i7-12700H (2585 - 17957, n=64) | |
| MSI Katana GF66 12UGS | |
| MSI Katana GF76 12UGS | |
| Acer Nitro 5 AN515-58-72QR | |
| AIDA64 / FPU Julia | |
| Average of class Gaming (51376 - 238426, n=107, last 2 years) | |
| Lenovo Legion 5 15ACH6A-82NW0010GE | |
| Asus TUF Gaming A15 FA506QR-AZ061T | |
| Average Intel Core i7-12700H (12439 - 90760, n=64) | |
| Acer Nitro 5 AN515-58-72QR | |
| MSI Katana GF66 12UGS | |
| MSI Katana GF76 12UGS | |
| AIDA64 / CPU SHA3 | |
| Average of class Gaming (2180 - 9817, n=107, last 2 years) | |
| MSI Katana GF76 12UGS | |
| Average Intel Core i7-12700H (833 - 4242, n=64) | |
| MSI Katana GF66 12UGS | |
| Acer Nitro 5 AN515-58-72QR | |
| Lenovo Legion 5 15ACH6A-82NW0010GE | |
| Asus TUF Gaming A15 FA506QR-AZ061T | |
| AIDA64 / CPU Queen | |
| Average of class Gaming (49785 - 173351, n=98, last 2 years) | |
| MSI Katana GF76 12UGS | |
| MSI Katana GF66 12UGS | |
| Acer Nitro 5 AN515-58-72QR | |
| Average Intel Core i7-12700H (57923 - 103202, n=63) | |
| Asus TUF Gaming A15 FA506QR-AZ061T | |
| Lenovo Legion 5 15ACH6A-82NW0010GE | |
| AIDA64 / FPU SinJulia | |
| Average of class Gaming (4424 - 33636, n=107, last 2 years) | |
| Asus TUF Gaming A15 FA506QR-AZ061T | |
| Acer Nitro 5 AN515-58-72QR | |
| MSI Katana GF66 12UGS | |
| MSI Katana GF76 12UGS | |
| Average Intel Core i7-12700H (3249 - 9939, n=64) | |
| Lenovo Legion 5 15ACH6A-82NW0010GE | |
| AIDA64 / FPU Mandel | |
| Average of class Gaming (25115 - 128721, n=107, last 2 years) | |
| Lenovo Legion 5 15ACH6A-82NW0010GE | |
| Asus TUF Gaming A15 FA506QR-AZ061T | |
| Average Intel Core i7-12700H (7135 - 44760, n=64) | |
| Acer Nitro 5 AN515-58-72QR | |
| MSI Katana GF66 12UGS | |
| MSI Katana GF76 12UGS | |
| AIDA64 / CPU AES | |
| Average of class Gaming (39258 - 247074, n=107, last 2 years) | |
| Lenovo Legion 5 15ACH6A-82NW0010GE | |
| MSI Katana GF76 12UGS | |
| MSI Katana GF66 12UGS | |
| Average Intel Core i7-12700H (31839 - 144360, n=64) | |
| Asus TUF Gaming A15 FA506QR-AZ061T | |
| Acer Nitro 5 AN515-58-72QR | |
| AIDA64 / CPU ZLib | |
| Average of class Gaming (574 - 2531, n=107, last 2 years) | |
| Acer Nitro 5 AN515-58-72QR | |
| MSI Katana GF76 12UGS | |
| MSI Katana GF66 12UGS | |
| Average Intel Core i7-12700H (305 - 1171, n=64) | |
| Asus TUF Gaming A15 FA506QR-AZ061T | |
| Lenovo Legion 5 15ACH6A-82NW0010GE | |
| MSI Katana GF66 11UG-220 | |
| AIDA64 / FP64 Ray-Trace | |
| Average of class Gaming (5509 - 45446, n=107, last 2 years) | |
| Asus TUF Gaming A15 FA506QR-AZ061T | |
| Lenovo Legion 5 15ACH6A-82NW0010GE | |
| Average Intel Core i7-12700H (1437 - 9692, n=64) | |
| Acer Nitro 5 AN515-58-72QR | |
| MSI Katana GF76 12UGS | |
| MSI Katana GF66 12UGS | |
| AIDA64 / CPU PhotoWorxx | |
| Average of class Gaming (12271 - 89891, n=107, last 2 years) | |
| Average Intel Core i7-12700H (12863 - 52207, n=64) | |
| MSI Katana GF66 12UGS | |
| MSI Katana GF76 12UGS | |
| Acer Nitro 5 AN515-58-72QR | |
| Asus TUF Gaming A15 FA506QR-AZ061T | |
| Lenovo Legion 5 15ACH6A-82NW0010GE | |
系统性能
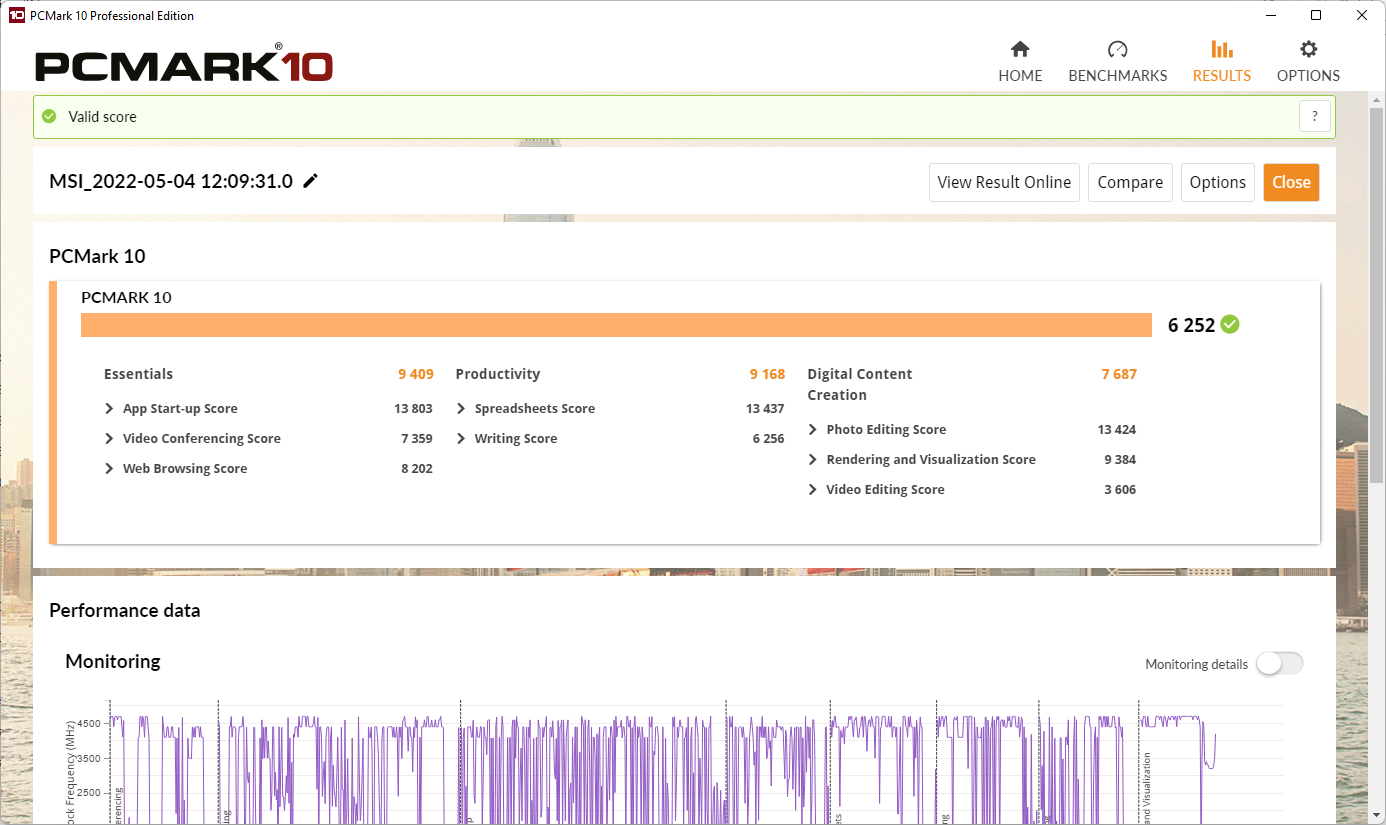
尽管Katana GF66能够在PCMark10和CrossMark基准测试中提供稳定的性能,但它无法超越所有的竞争对手。这方面的责任应该主要在于相对较慢的工作内存和略微有限的TDP/TGP。工作存储器的测量延迟为95.7ns,非常高。
尽管有电池操作,微星Katana GF66还是能够在PCMark 10中达到一个相对较好的数值,正如一个额外的基准测试所显示的。在基本要素和生产力部分分别为9409和9168分,即使在电池运行的情况下,这款游戏笔记本也能达到很高的分数。
CrossMark: Overall | Productivity | Creativity | Responsiveness
| PCMark 10 / Score | |
| Average of class Gaming (5828 - 11574, n=94, last 2 years) | |
| MSI Katana GF76 12UGS | |
| Average Intel Core i7-12700H, NVIDIA GeForce RTX 3070 Ti Laptop GPU (6941 - 7947, n=11) | |
| MSI Katana GF66 12UGS | |
| Asus TUF Gaming F15 FX507ZM | |
| Lenovo Legion 5 15ACH6A-82NW0010GE | |
| Acer Nitro 5 AN515-58-72QR | |
| Asus TUF Gaming A15 FA506QR-AZ061T | |
| MSI Katana GF66 11UG-220 | |
| PCMark 10 / Essentials | |
| MSI Katana GF76 12UGS | |
| Average of class Gaming (8810 - 12600, n=98, last 2 years) | |
| Average Intel Core i7-12700H, NVIDIA GeForce RTX 3070 Ti Laptop GPU (9892 - 10935, n=11) | |
| Lenovo Legion 5 15ACH6A-82NW0010GE | |
| Asus TUF Gaming F15 FX507ZM | |
| MSI Katana GF66 12UGS | |
| Asus TUF Gaming A15 FA506QR-AZ061T | |
| Acer Nitro 5 AN515-58-72QR | |
| MSI Katana GF66 11UG-220 | |
| PCMark 10 / Productivity | |
| Average of class Gaming (6845 - 18766, n=96, last 2 years) | |
| MSI Katana GF76 12UGS | |
| MSI Katana GF66 12UGS | |
| Average Intel Core i7-12700H, NVIDIA GeForce RTX 3070 Ti Laptop GPU (9024 - 10638, n=11) | |
| Asus TUF Gaming A15 FA506QR-AZ061T | |
| Lenovo Legion 5 15ACH6A-82NW0010GE | |
| MSI Katana GF66 11UG-220 | |
| Asus TUF Gaming F15 FX507ZM | |
| Acer Nitro 5 AN515-58-72QR | |
| PCMark 10 / Digital Content Creation | |
| Average of class Gaming (7602 - 19657, n=96, last 2 years) | |
| Asus TUF Gaming F15 FX507ZM | |
| Average Intel Core i7-12700H, NVIDIA GeForce RTX 3070 Ti Laptop GPU (10165 - 12546, n=11) | |
| MSI Katana GF66 12UGS | |
| MSI Katana GF76 12UGS | |
| Acer Nitro 5 AN515-58-72QR | |
| Lenovo Legion 5 15ACH6A-82NW0010GE | |
| MSI Katana GF66 11UG-220 | |
| Asus TUF Gaming A15 FA506QR-AZ061T | |
| CrossMark / Overall | |
| Average of class Gaming (1366 - 2409, n=96, last 2 years) | |
| MSI Katana GF66 12UGS | |
| MSI Katana GF76 12UGS | |
| Average Intel Core i7-12700H, NVIDIA GeForce RTX 3070 Ti Laptop GPU (974 - 2000, n=12) | |
| Acer Nitro 5 AN515-58-72QR | |
| CrossMark / Productivity | |
| MSI Katana GF66 12UGS | |
| MSI Katana GF76 12UGS | |
| Average of class Gaming (1386 - 2254, n=96, last 2 years) | |
| Average Intel Core i7-12700H, NVIDIA GeForce RTX 3070 Ti Laptop GPU (907 - 1962, n=12) | |
| Acer Nitro 5 AN515-58-72QR | |
| CrossMark / Creativity | |
| Average of class Gaming (1343 - 2729, n=96, last 2 years) | |
| MSI Katana GF66 12UGS | |
| Average Intel Core i7-12700H, NVIDIA GeForce RTX 3070 Ti Laptop GPU (1027 - 2057, n=12) | |
| Acer Nitro 5 AN515-58-72QR | |
| MSI Katana GF76 12UGS | |
| CrossMark / Responsiveness | |
| MSI Katana GF66 12UGS | |
| MSI Katana GF76 12UGS | |
| Average Intel Core i7-12700H, NVIDIA GeForce RTX 3070 Ti Laptop GPU (1029 - 2142, n=12) | |
| Average of class Gaming (1226 - 2334, n=96, last 2 years) | |
| Acer Nitro 5 AN515-58-72QR | |
| PCMark 10 Score | 7458 points | |
Help | ||
| AIDA64 / Memory Copy | |
| Average of class Gaming (21750 - 129946, n=107, last 2 years) | |
| Average Intel Core i7-12700H (25615 - 80511, n=64) | |
| Asus TUF Gaming F15 FX507ZM | |
| MSI Katana GF76 12UGS | |
| MSI Katana GF66 12UGS | |
| Acer Nitro 5 AN515-58-72QR | |
| Asus TUF Gaming A15 FA506QR-AZ061T | |
| Lenovo Legion 5 15ACH6A-82NW0010GE | |
| AIDA64 / Memory Read | |
| Average of class Gaming (22956 - 118858, n=107, last 2 years) | |
| Asus TUF Gaming F15 FX507ZM | |
| Average Intel Core i7-12700H (25586 - 79442, n=64) | |
| MSI Katana GF76 12UGS | |
| MSI Katana GF66 12UGS | |
| Asus TUF Gaming A15 FA506QR-AZ061T | |
| Acer Nitro 5 AN515-58-72QR | |
| Lenovo Legion 5 15ACH6A-82NW0010GE | |
| AIDA64 / Memory Write | |
| Average of class Gaming (22297 - 135096, n=107, last 2 years) | |
| Asus TUF Gaming F15 FX507ZM | |
| Average Intel Core i7-12700H (23679 - 88660, n=64) | |
| MSI Katana GF76 12UGS | |
| MSI Katana GF66 12UGS | |
| Acer Nitro 5 AN515-58-72QR | |
| Asus TUF Gaming A15 FA506QR-AZ061T | |
| Lenovo Legion 5 15ACH6A-82NW0010GE | |
| AIDA64 / Memory Latency | |
| Average of class Gaming (75.3 - 259, n=107, last 2 years) | |
| MSI Katana GF66 12UGS | |
| MSI Katana GF76 12UGS | |
| Lenovo Legion 5 15ACH6A-82NW0010GE | |
| Asus TUF Gaming A15 FA506QR-AZ061T | |
| Average Intel Core i7-12700H (76.2 - 133.9, n=62) | |
| MSI Katana GF66 11UG-220 | |
| MSI Katana GF66 11UG-220 | |
| Asus TUF Gaming F15 FX507ZM | |
| Acer Nitro 5 AN515-58-72QR | |
| Acer Nitro 5 AN515-58-72QR | |
* ... smaller is better
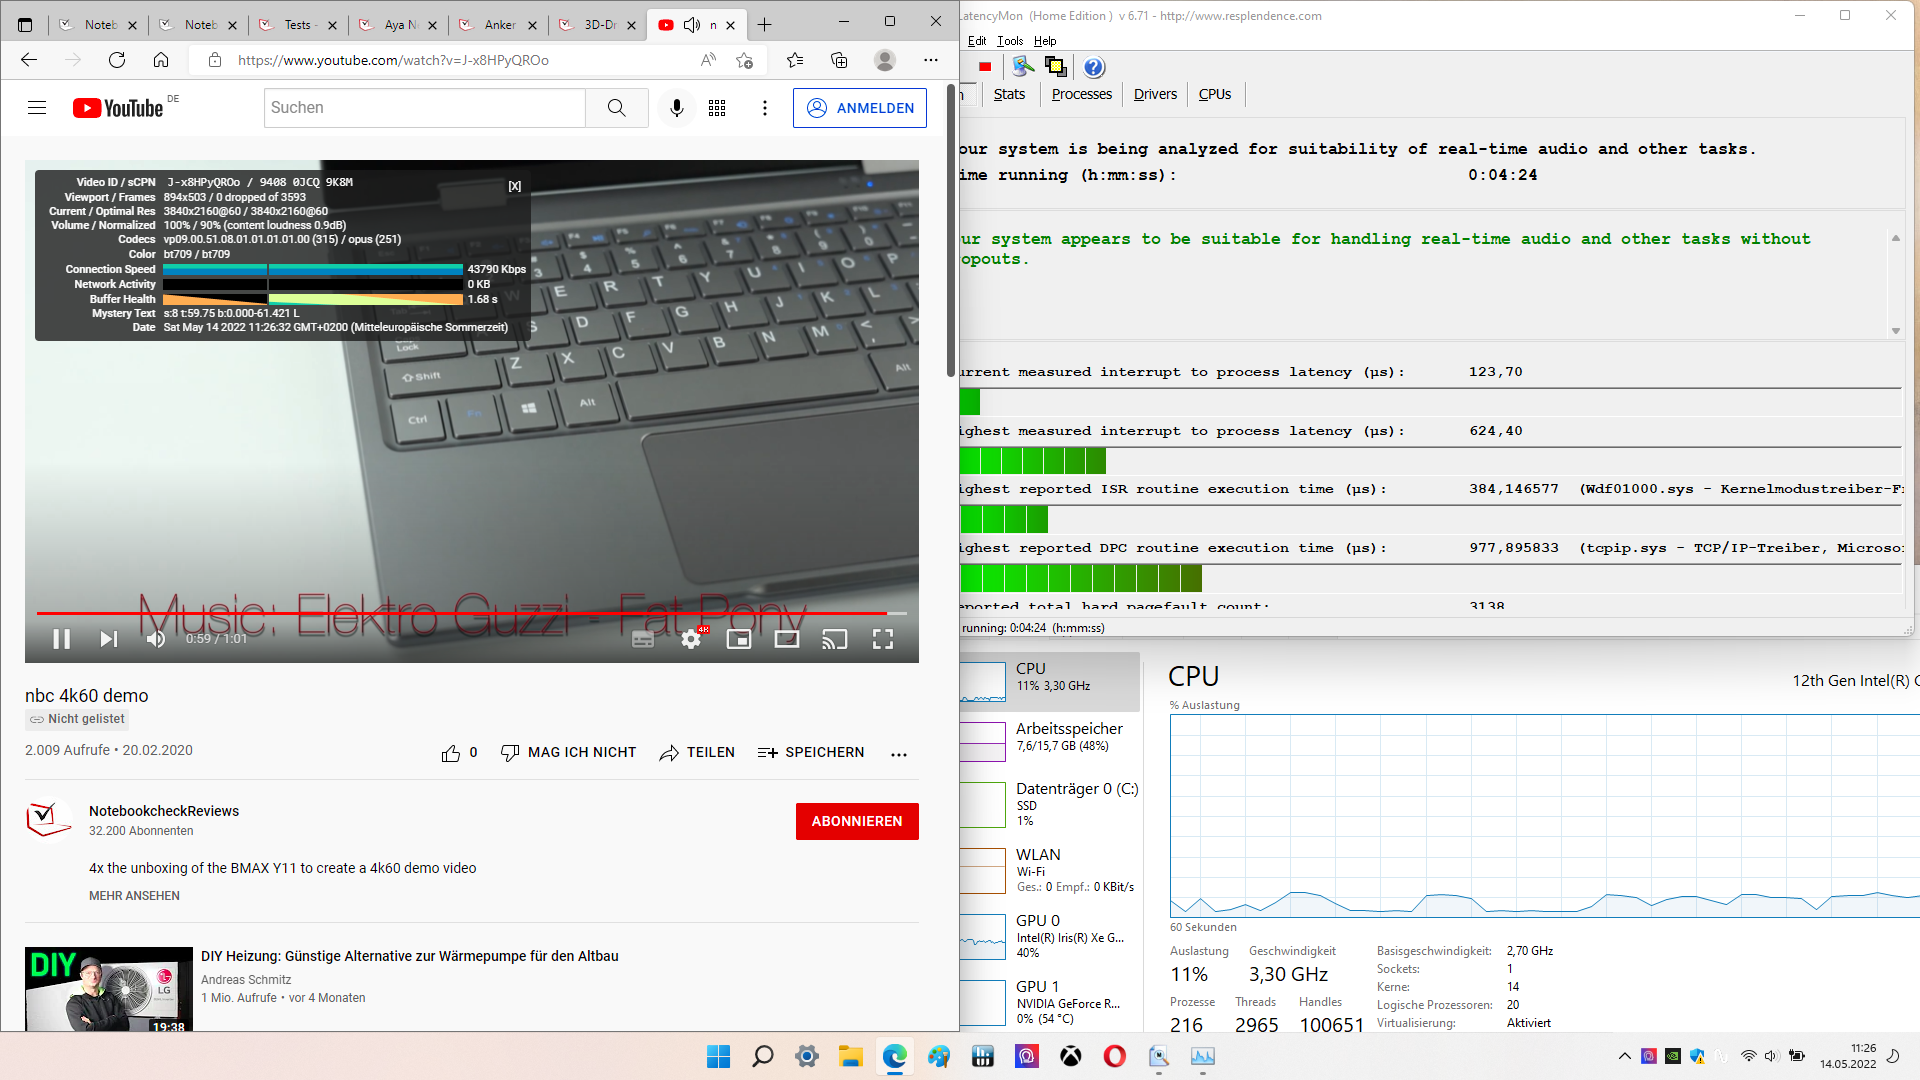
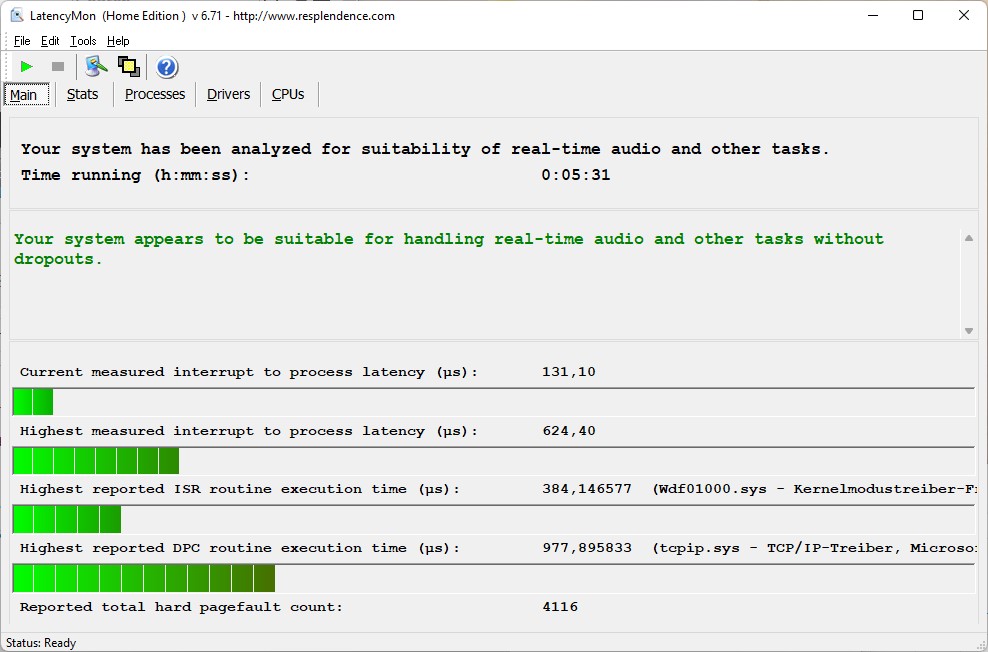
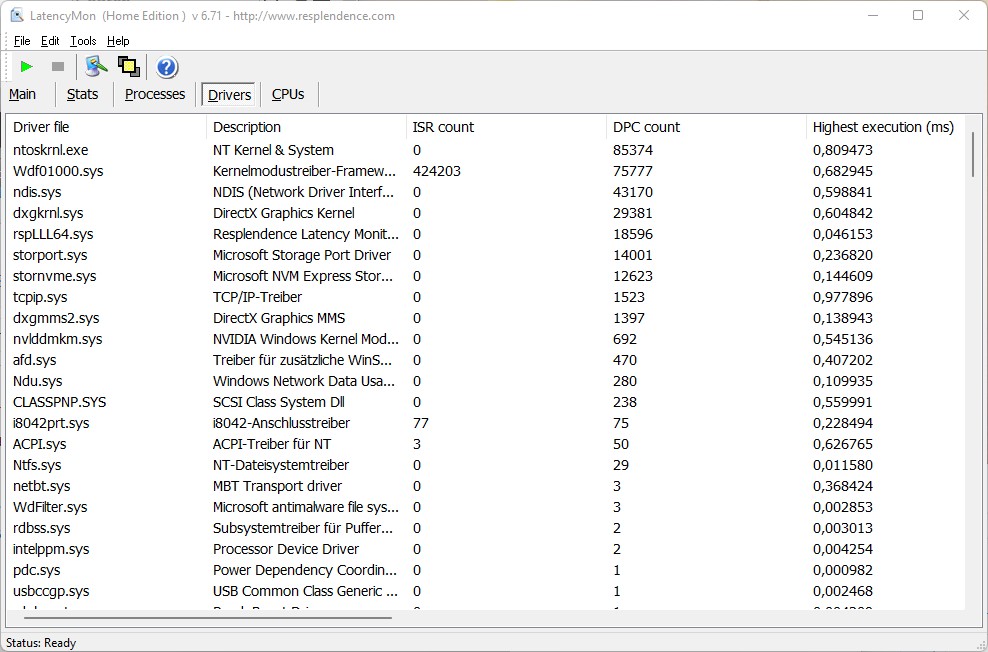
DPC延迟
运行时间关键程序时的延迟相对较低,因此,在我们测试装置的配置中,Katana GF66也应该适合实时应用。在4K 60Hz的Youtube测试视频中,没有出现掉帧。驱动程序更新和其他因素可能会显著影响这里的数值。
| DPC Latencies / LatencyMon - interrupt to process latency (max), Web, Youtube, Prime95 | |
| MSI Katana GF76 12UGS | |
| Asus TUF Gaming A15 FA506QR-AZ061T | |
| MSI Katana GF66 11UG-220 | |
| Lenovo Legion 5 15ACH6A-82NW0010GE | |
| Acer Nitro 5 AN515-58-72QR | |
| MSI Katana GF66 12UGS | |
* ... smaller is better
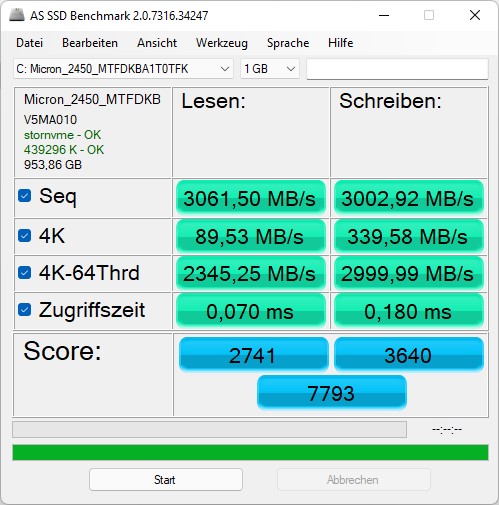
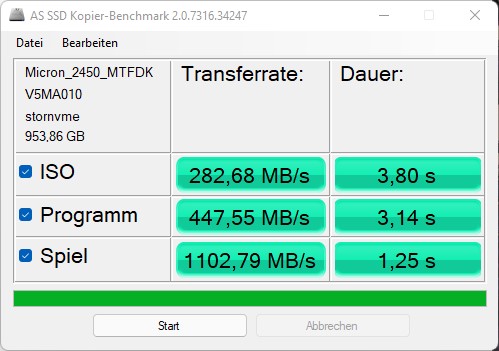
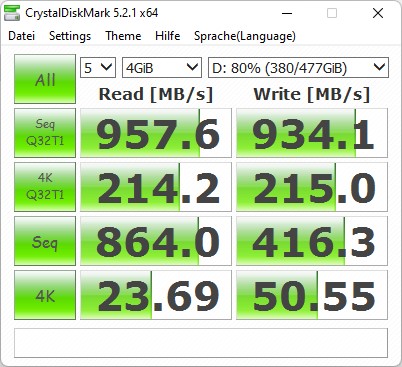
存储解决方案
尽管这里使用的美光2450 NVMe固态硬盘的1TB存储量能够在我们的比较领域中取得顶尖位置,但它在我们的固态硬盘和HDD表格中更多地处于中间位置。 SSDs和HDDs的表格中,它更多地处于中间位置。.虽然单一存储基准的结果很好,但它们并不突出。

| Drive Performance rating - Percent | |
| Acer Nitro 5 AN515-58-72QR | |
| Average of class Gaming | |
| MSI Katana GF66 12UGS | |
| MSI Katana GF76 12UGS | |
| Average Micron 2450 1TB MTFDKBA1T0TFK | |
| Asus TUF Gaming F15 FX507ZM | |
| Asus TUF Gaming A15 FA506QR-AZ061T | |
| Lenovo Legion 5 15ACH6A-82NW0010GE | |
| MSI Katana GF66 11UG-220 | |
* ... smaller is better
Constant Performance Reading: DiskSpd Read Loop, Queue Depth 8
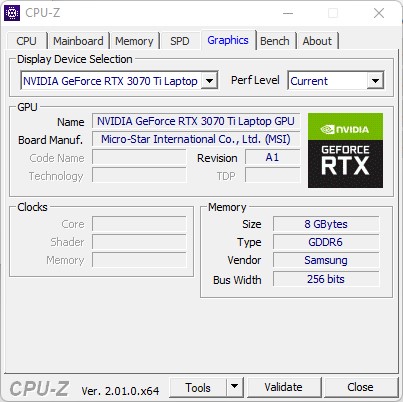
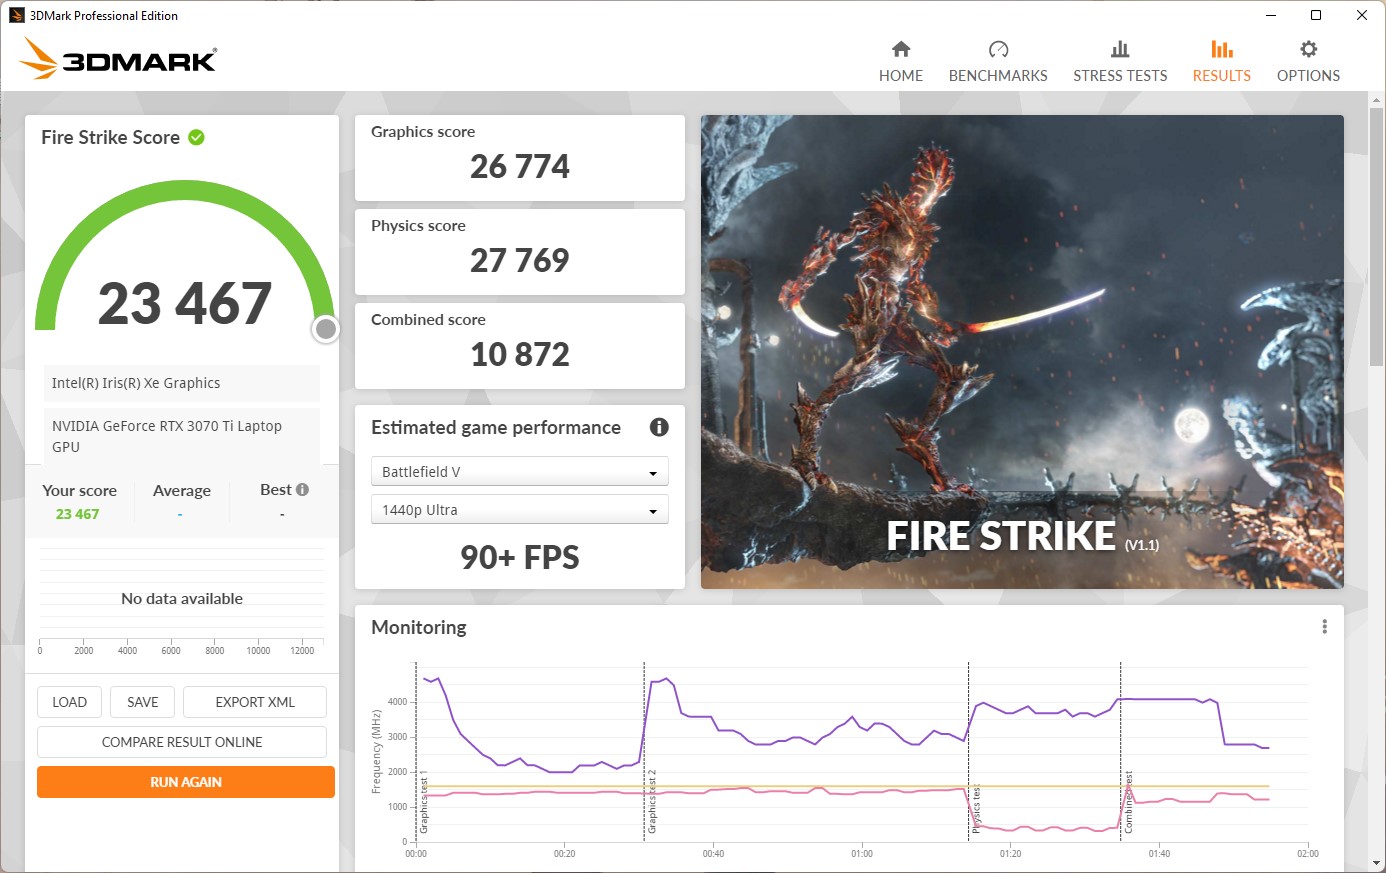
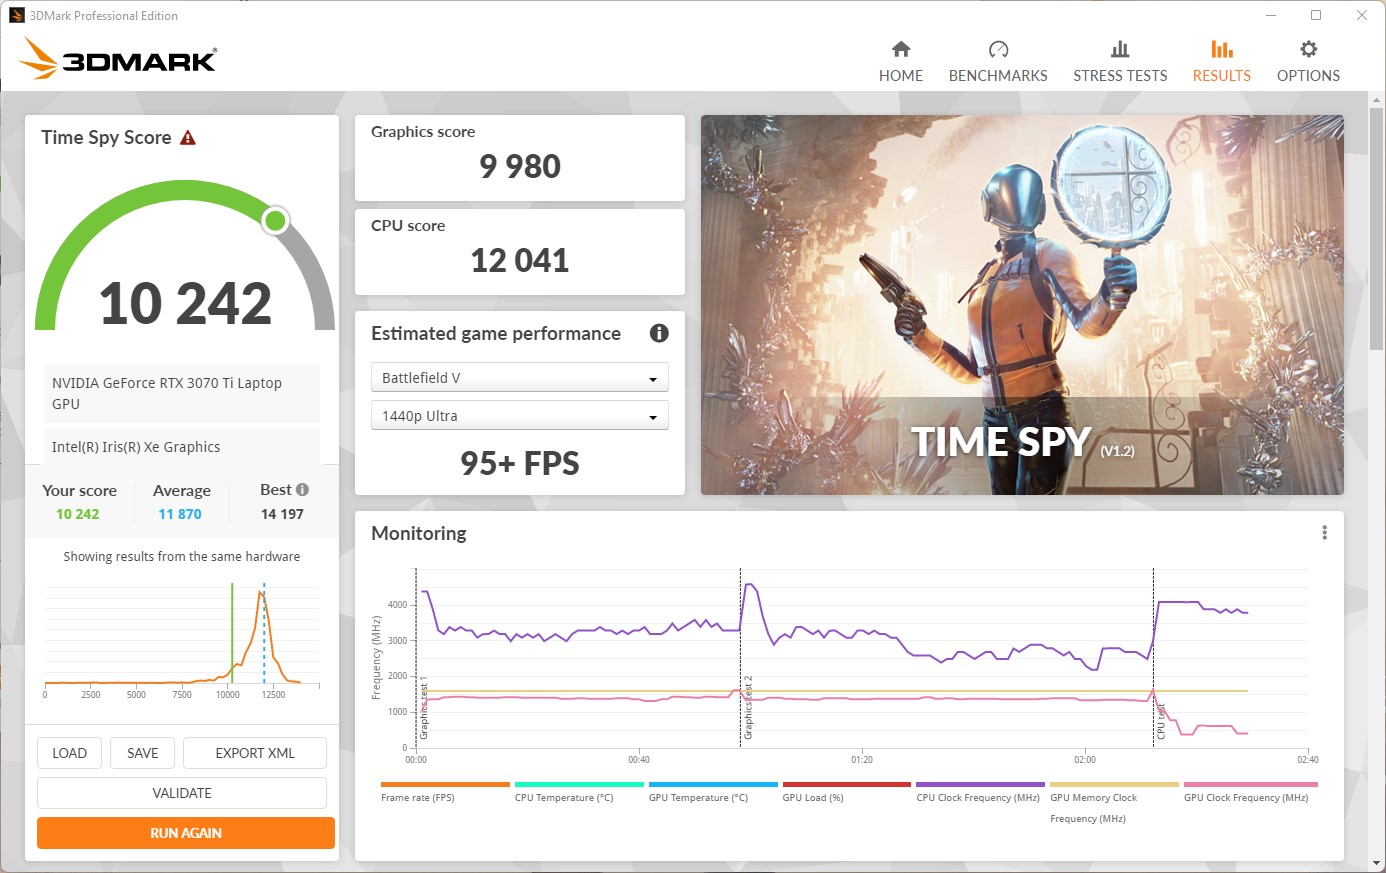
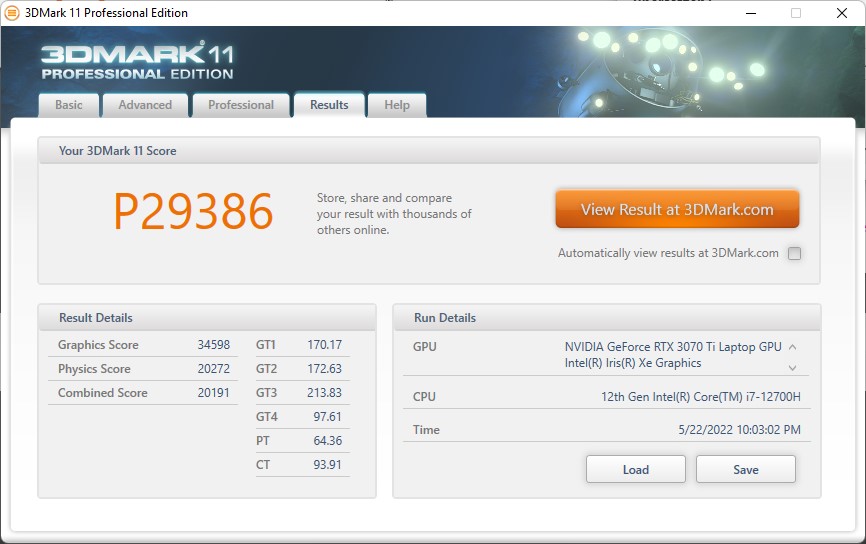
图形卡
作为最强大的笔记本电脑显卡之一,... 笔记本电脑显卡之一。能够在许多游戏中实现高帧率。然而,在我们的测试装置中,显卡的性能受到严重限制,因为RTX 3070 Ti在较长时间内只能以约90瓦的功率运行。这在Time Spy 基准中变得尤为明显,其性能比所有具有类似硬件的设备的平均水平低约600分。但在我们与相同价格段的竞争对手的比较中,微星游戏笔记本仍然提供了强大的结果。
| 3DMark Performance rating - Percent | |
| Average of class Gaming | |
| Acer Nitro 5 AN515-58-72QR | |
| Average NVIDIA GeForce RTX 3070 Ti Laptop GPU | |
| MSI Katana GF66 12UGS | |
| Lenovo Legion 5 15ACH6A-82NW0010GE | |
| Asus TUF Gaming F15 FX507ZM | |
| MSI Katana GF66 11UG-220 -1! | |
| Asus TUF Gaming A15 FA506QR-AZ061T | |
| MSI Katana GF76 12UGS | |
| 3DMark 11 - 1280x720 Performance GPU | |
| Average of class Gaming (21841 - 80022, n=106, last 2 years) | |
| Acer Nitro 5 AN515-58-72QR | |
| Average NVIDIA GeForce RTX 3070 Ti Laptop GPU (13799 - 42569, n=36) | |
| MSI Katana GF66 12UGS | |
| Lenovo Legion 5 15ACH6A-82NW0010GE | |
| Asus TUF Gaming F15 FX507ZM | |
| MSI Katana GF66 11UG-220 | |
| Asus TUF Gaming A15 FA506QR-AZ061T | |
| MSI Katana GF76 12UGS | |
| 3DMark | |
| 1920x1080 Fire Strike Graphics | |
| Average of class Gaming (12242 - 62849, n=118, last 2 years) | |
| Average NVIDIA GeForce RTX 3070 Ti Laptop GPU (22612 - 32550, n=37) | |
| Acer Nitro 5 AN515-58-72QR | |
| MSI Katana GF66 12UGS | |
| MSI Katana GF76 12UGS | |
| Lenovo Legion 5 15ACH6A-82NW0010GE | |
| Asus TUF Gaming F15 FX507ZM | |
| Asus TUF Gaming A15 FA506QR-AZ061T | |
| 2560x1440 Time Spy Graphics | |
| Average of class Gaming (5012 - 26212, n=117, last 2 years) | |
| Average NVIDIA GeForce RTX 3070 Ti Laptop GPU (8142 - 12324, n=37) | |
| Acer Nitro 5 AN515-58-72QR | |
| MSI Katana GF66 12UGS | |
| MSI Katana GF76 12UGS | |
| Asus TUF Gaming F15 FX507ZM | |
| MSI Katana GF66 11UG-220 | |
| Asus TUF Gaming A15 FA506QR-AZ061T | |
| Lenovo Legion 5 15ACH6A-82NW0010GE | |
| 3DMark 11 Performance | 29386 points | |
| 3DMark Fire Strike Score | 23467 points | |
| 3DMark Time Spy Score | 10242 points | |
Help | ||
游戏性能
微星Katana GF66 11UGS能够将我们测试的几乎所有游戏在所有质量级别和全高清分辨率下以超过100 FPS的速度呈现在屏幕上。这使得它成为一个非常通用的游戏笔记本电脑。
| The Witcher 3 | |
| 1920x1080 High Graphics & Postprocessing (Nvidia HairWorks Off) | |
| Average of class Gaming (181 - 341, n=3, last 2 years) | |
| Average NVIDIA GeForce RTX 3070 Ti Laptop GPU (139.7 - 226, n=27) | |
| Asus TUF Gaming F15 FX507ZM | |
| MSI Katana GF76 12UGS | |
| Acer Nitro 5 AN515-58-72QR | |
| Lenovo Legion 5 15ACH6A-82NW0010GE | |
| MSI Katana GF66 12UGS | |
| MSI Katana GF66 11UG-220 | |
| 1920x1080 Ultra Graphics & Postprocessing (HBAO+) | |
| Average of class Gaming (95 - 240, n=8, last 2 years) | |
| Average NVIDIA GeForce RTX 3070 Ti Laptop GPU (76.8 - 124.1, n=39) | |
| Acer Nitro 5 AN515-58-72QR | |
| MSI Katana GF66 12UGS | |
| Asus TUF Gaming F15 FX507ZM | |
| MSI Katana GF76 12UGS | |
| Lenovo Legion 5 15ACH6A-82NW0010GE | |
| MSI Katana GF66 11UG-220 | |
| Asus TUF Gaming A15 FA506QR-AZ061T | |
| GTA V | |
| 1920x1080 High/On (Advanced Graphics Off) AA:2xMSAA + FX AF:8x | |
| Average of class Gaming (110.7 - 189, n=70, last 2 years) | |
| MSI Katana GF66 12UGS | |
| Average NVIDIA GeForce RTX 3070 Ti Laptop GPU (80 - 181.9, n=28) | |
| MSI Katana GF66 11UG-220 | |
| Asus TUF Gaming F15 FX507ZM | |
| MSI Katana GF76 12UGS | |
| Acer Nitro 5 AN515-58-72QR | |
| Asus TUF Gaming A15 FA506QR-AZ061T | |
| Lenovo Legion 5 15ACH6A-82NW0010GE | |
| 1920x1080 Highest AA:4xMSAA + FX AF:16x | |
| Average of class Gaming (48.3 - 186.9, n=100, last 2 years) | |
| Average NVIDIA GeForce RTX 3070 Ti Laptop GPU (44 - 123.9, n=36) | |
| MSI Katana GF66 12UGS | |
| Asus TUF Gaming F15 FX507ZM | |
| MSI Katana GF76 12UGS | |
| Acer Nitro 5 AN515-58-72QR | |
| MSI Katana GF66 11UG-220 | |
| Asus TUF Gaming A15 FA506QR-AZ061T | |
| Lenovo Legion 5 15ACH6A-82NW0010GE | |
| Dota 2 Reborn | |
| 1920x1080 high (2/3) | |
| Average of class Gaming (82.8 - 275, n=109, last 2 years) | |
| Asus TUF Gaming F15 FX507ZM | |
| MSI Katana GF66 12UGS | |
| Average NVIDIA GeForce RTX 3070 Ti Laptop GPU (75.4 - 170.2, n=38) | |
| MSI Katana GF76 12UGS | |
| Acer Nitro 5 AN515-58-72QR | |
| MSI Katana GF66 11UG-220 | |
| MSI Katana GF66 11UG-220 | |
| Asus TUF Gaming A15 FA506QR-AZ061T | |
| Lenovo Legion 5 15ACH6A-82NW0010GE | |
| 1920x1080 ultra (3/3) best looking | |
| Average of class Gaming (84.8 - 248, n=110, last 2 years) | |
| Asus TUF Gaming F15 FX507ZM | |
| MSI Katana GF66 12UGS | |
| MSI Katana GF76 12UGS | |
| Average NVIDIA GeForce RTX 3070 Ti Laptop GPU (68.7 - 160.5, n=38) | |
| Acer Nitro 5 AN515-58-72QR | |
| MSI Katana GF66 11UG-220 | |
| Asus TUF Gaming A15 FA506QR-AZ061T | |
| Lenovo Legion 5 15ACH6A-82NW0010GE | |
| Final Fantasy XV Benchmark | |
| 1920x1080 High Quality | |
| Average of class Gaming (41 - 215, n=101, last 2 years) | |
| Average NVIDIA GeForce RTX 3070 Ti Laptop GPU (49.5 - 122.4, n=35) | |
| Asus TUF Gaming F15 FX507ZM | |
| MSI Katana GF76 12UGS | |
| MSI Katana GF66 12UGS | |
| Acer Nitro 5 AN515-58-72QR | |
| Asus TUF Gaming A15 FA506QR-AZ061T | |
| Lenovo Legion 5 15ACH6A-82NW0010GE | |
| MSI Katana GF66 11UG-220 | |
| 2560x1440 High Quality | |
| Average of class Gaming (32.5 - 184.3, n=88, last 2 years) | |
| Average NVIDIA GeForce RTX 3070 Ti Laptop GPU (57.9 - 93, n=24) | |
| Acer Nitro 5 AN515-58-72QR | |
| MSI Katana GF66 12UGS | |
| MSI Katana GF66 11UG-220 | |
| Far Cry 5 | |
| 1920x1080 High Preset AA:T | |
| Average NVIDIA GeForce RTX 3070 Ti Laptop GPU (99 - 147, n=23) | |
| Average of class Gaming (82 - 163, n=10, last 2 years) | |
| MSI Katana GF66 12UGS | |
| MSI Katana GF76 12UGS | |
| Asus TUF Gaming F15 FX507ZM | |
| MSI Katana GF66 11UG-220 | |
| Asus TUF Gaming A15 FA506QR-AZ061T | |
| Acer Nitro 5 AN515-58-72QR | |
| Lenovo Legion 5 15ACH6A-82NW0010GE | |
| 1920x1080 Ultra Preset AA:T | |
| Average NVIDIA GeForce RTX 3070 Ti Laptop GPU (91 - 138, n=25) | |
| Average of class Gaming (70 - 151, n=10, last 2 years) | |
| MSI Katana GF66 12UGS | |
| Asus TUF Gaming F15 FX507ZM | |
| MSI Katana GF76 12UGS | |
| MSI Katana GF66 11UG-220 | |
| Asus TUF Gaming A15 FA506QR-AZ061T | |
| Acer Nitro 5 AN515-58-72QR | |
| Lenovo Legion 5 15ACH6A-82NW0010GE | |
| Far Cry 6 | |
| 1920x1080 High Graphics Quality AA:T | |
| Average of class Gaming (120.8 - 136, n=2, last 2 years) | |
| Average NVIDIA GeForce RTX 3070 Ti Laptop GPU (89 - 108, n=3) | |
| MSI Katana GF66 12UGS | |
| Lenovo Legion 5 15ACH6A-82NW0010GE | |
| Lenovo Legion 5 15ACH6A-82NW0010GE | |
| 1920x1080 Ultra Graphics Quality + HD Textures AA:T | |
| Average of class Gaming (96.3 - 135.7, n=3, last 2 years) | |
| Average NVIDIA GeForce RTX 3070 Ti Laptop GPU (82 - 95.3, n=4) | |
| MSI Katana GF66 12UGS | |
| Lenovo Legion 5 15ACH6A-82NW0010GE | |
| Lenovo Legion 5 15ACH6A-82NW0010GE | |
| Strange Brigade | |
| 1920x1080 high AA:high AF:8 | |
| Average of class Gaming (129.5 - 485, n=78, last 2 years) | |
| Average NVIDIA GeForce RTX 3070 Ti Laptop GPU (112 - 248, n=27) | |
| Acer Nitro 5 AN515-58-72QR | |
| MSI Katana GF66 12UGS | |
| Asus TUF Gaming F15 FX507ZM | |
| MSI Katana GF76 12UGS | |
| Lenovo Legion 5 15ACH6A-82NW0010GE | |
| MSI Katana GF66 11UG-220 | |
| Asus TUF Gaming A15 FA506QR-AZ061T | |
| 1920x1080 ultra AA:ultra AF:16 | |
| Average of class Gaming (76.3 - 456, n=91, last 2 years) | |
| Average NVIDIA GeForce RTX 3070 Ti Laptop GPU (109 - 221, n=37) | |
| Acer Nitro 5 AN515-58-72QR | |
| MSI Katana GF66 12UGS | |
| Asus TUF Gaming F15 FX507ZM | |
| MSI Katana GF76 12UGS | |
| Lenovo Legion 5 15ACH6A-82NW0010GE | |
| MSI Katana GF66 11UG-220 | |
| Asus TUF Gaming A15 FA506QR-AZ061T | |
| Ghostwire Tokyo | |
| 1920x1080 High Settings | |
| Average NVIDIA GeForce RTX 3070 Ti Laptop GPU (123.9 - 152, n=4) | |
| MSI Katana GF66 12UGS | |
| 1920x1080 Highest Settings | |
| Average NVIDIA GeForce RTX 3070 Ti Laptop GPU (115.4 - 145.1, n=4) | |
| MSI Katana GF66 12UGS | |
尽管在使用"TheWitcher 3"(FHD/Ultra)的持续负载测试中,帧率在一段时间后略有下降,但随后仍相当稳定地保持在相对较高的80至90 FPS。
The Witcher 3 FPS Chart
| low | med. | high | ultra | QHD | 4K | |
|---|---|---|---|---|---|---|
| GTA V (2015) | 180.7 | 175.2 | 168 | 102.5 | ||
| The Witcher 3 (2015) | 403 | 139.7 | 96.8 | |||
| Dota 2 Reborn (2015) | 180.4 | 165.1 | 148.1 | 138.1 | ||
| Final Fantasy XV Benchmark (2018) | 174.3 | 120.6 | 89.5 | 68.2 | 39.6 | |
| X-Plane 11.11 (2018) | 139 | 126.4 | 102.5 | |||
| Far Cry 5 (2018) | 131 | 124 | 117 | |||
| Strange Brigade (2018) | 435 | 232 | 193.4 | 171.2 | ||
| Far Cry 6 (2021) | 99 | 89 | 82 | |||
| Ghostwire Tokyo (2022) | 127 | 124 | 123.9 | 115.4 |
排放 - 一个相当安静的游戏笔记本电脑
噪声排放
在人工智能模式下,Katana GF66保持明显的安静,比你对游戏笔记本的期望要低。在最高45 dB(A)的情况下,这款笔记本电脑的噪音水平几乎不令人讨厌。
Noise level
| Idle |
| 27 / 28 / 31 dB(A) |
| Load |
| 44 / 45 dB(A) |
 | ||
30 dB silent 40 dB(A) audible 50 dB(A) loud |
||
min: | ||
| MSI Katana GF66 12UGS i7-12700H, GeForce RTX 3070 Ti Laptop GPU | MSI Katana GF76 12UGS i7-12700H, GeForce RTX 3070 Ti Laptop GPU | Asus TUF Gaming F15 FX507ZM i7-12700H, GeForce RTX 3060 Laptop GPU | Asus TUF Gaming A15 FA506QR-AZ061T R7 5800H, GeForce RTX 3070 Laptop GPU | Acer Nitro 5 AN515-58-72QR i7-12700H, GeForce RTX 3070 Ti Laptop GPU | Lenovo Legion 5 15ACH6A-82NW0010GE R5 5600H, Radeon RX 6600M | |
|---|---|---|---|---|---|---|
| Noise | -11% | 3% | 1% | -7% | -3% | |
| off / environment * (dB) | 26 | 23 12% | 23.2 11% | 26 -0% | 26 -0% | 25 4% |
| Idle Minimum * (dB) | 27 | 28.41 -5% | 23.6 13% | 26 4% | 26 4% | 25 7% |
| Idle Average * (dB) | 28 | 28.41 -1% | 23.6 16% | 26 7% | 29 -4% | 25 11% |
| Idle Maximum * (dB) | 31 | 36.71 -18% | 25.4 18% | 27.4 12% | 33 -6% | 34.5 -11% |
| Load Average * (dB) | 44 | 53.04 -21% | 38 14% | 46.6 -6% | 47 -7% | 51.1 -16% |
| Witcher 3 ultra * (dB) | 44 | 54.22 -23% | 54.1 -23% | 53 -20% | ||
| Load Maximum * (dB) | 45 | 54.38 -21% | 57.2 -27% | 49.3 -10% | 53 -18% | 51.3 -14% |
* ... smaller is better
温度
至少,在压力测试中,WASD键没有达到设备的最高温度,即使我们在这里测得的超过50°C(122°F)的温度对长时间游戏来说并不是很诱人。另一方面,表面温度高是许多游戏笔记本的问题。所以对于微星Katana GF66来说,建议使用外部键盘。
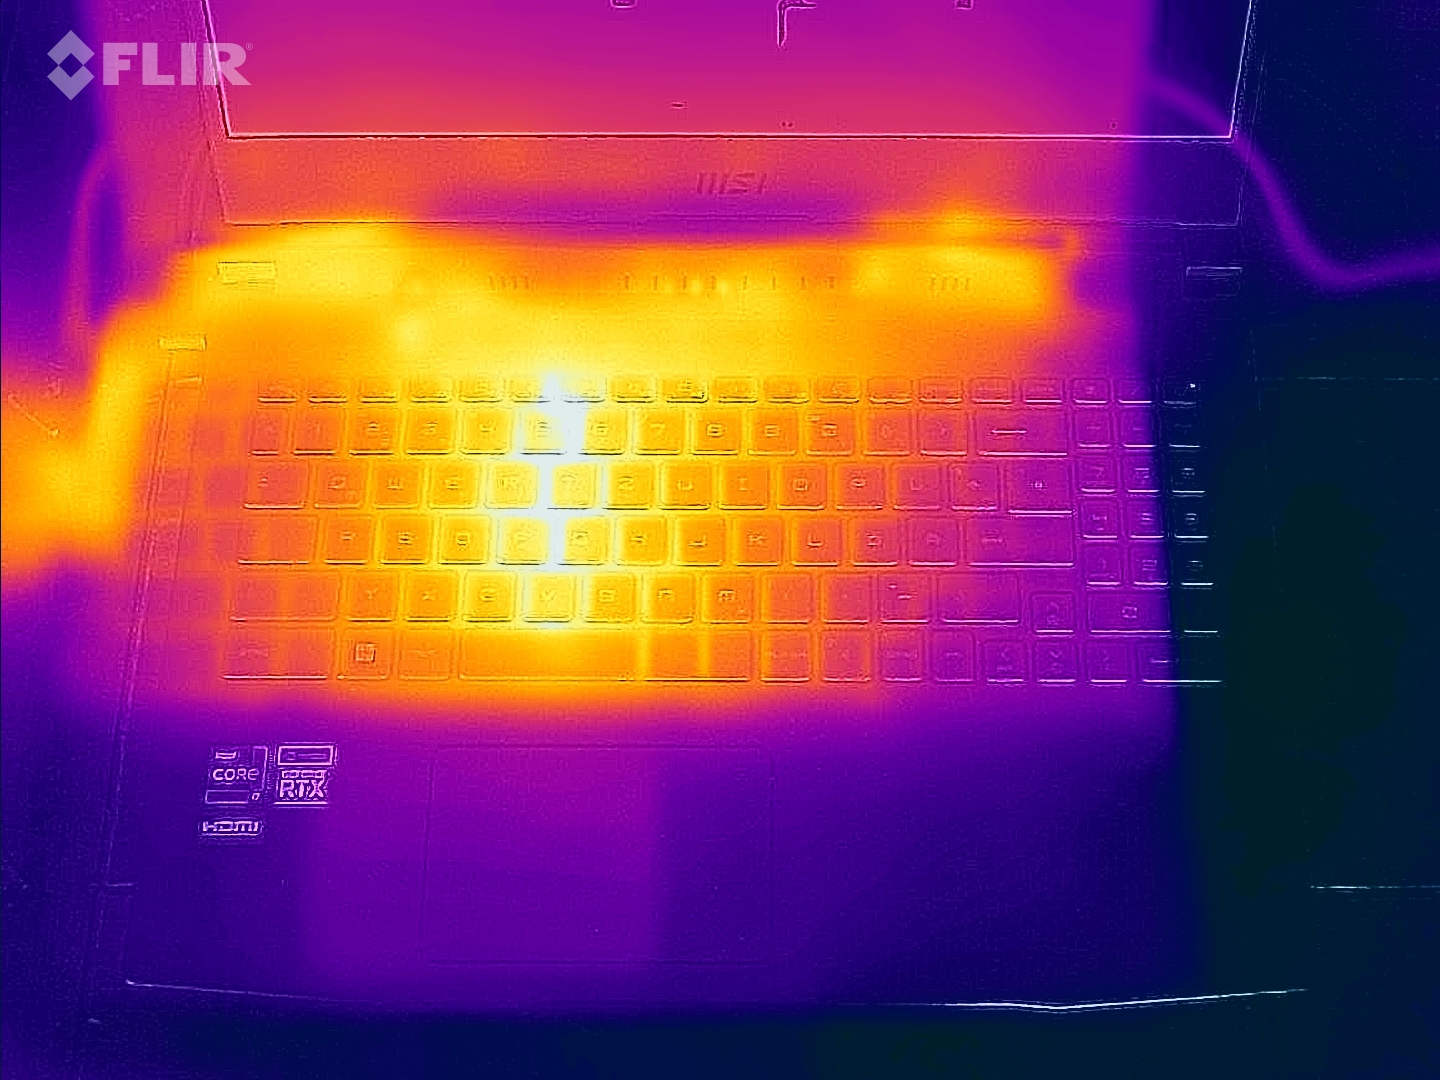
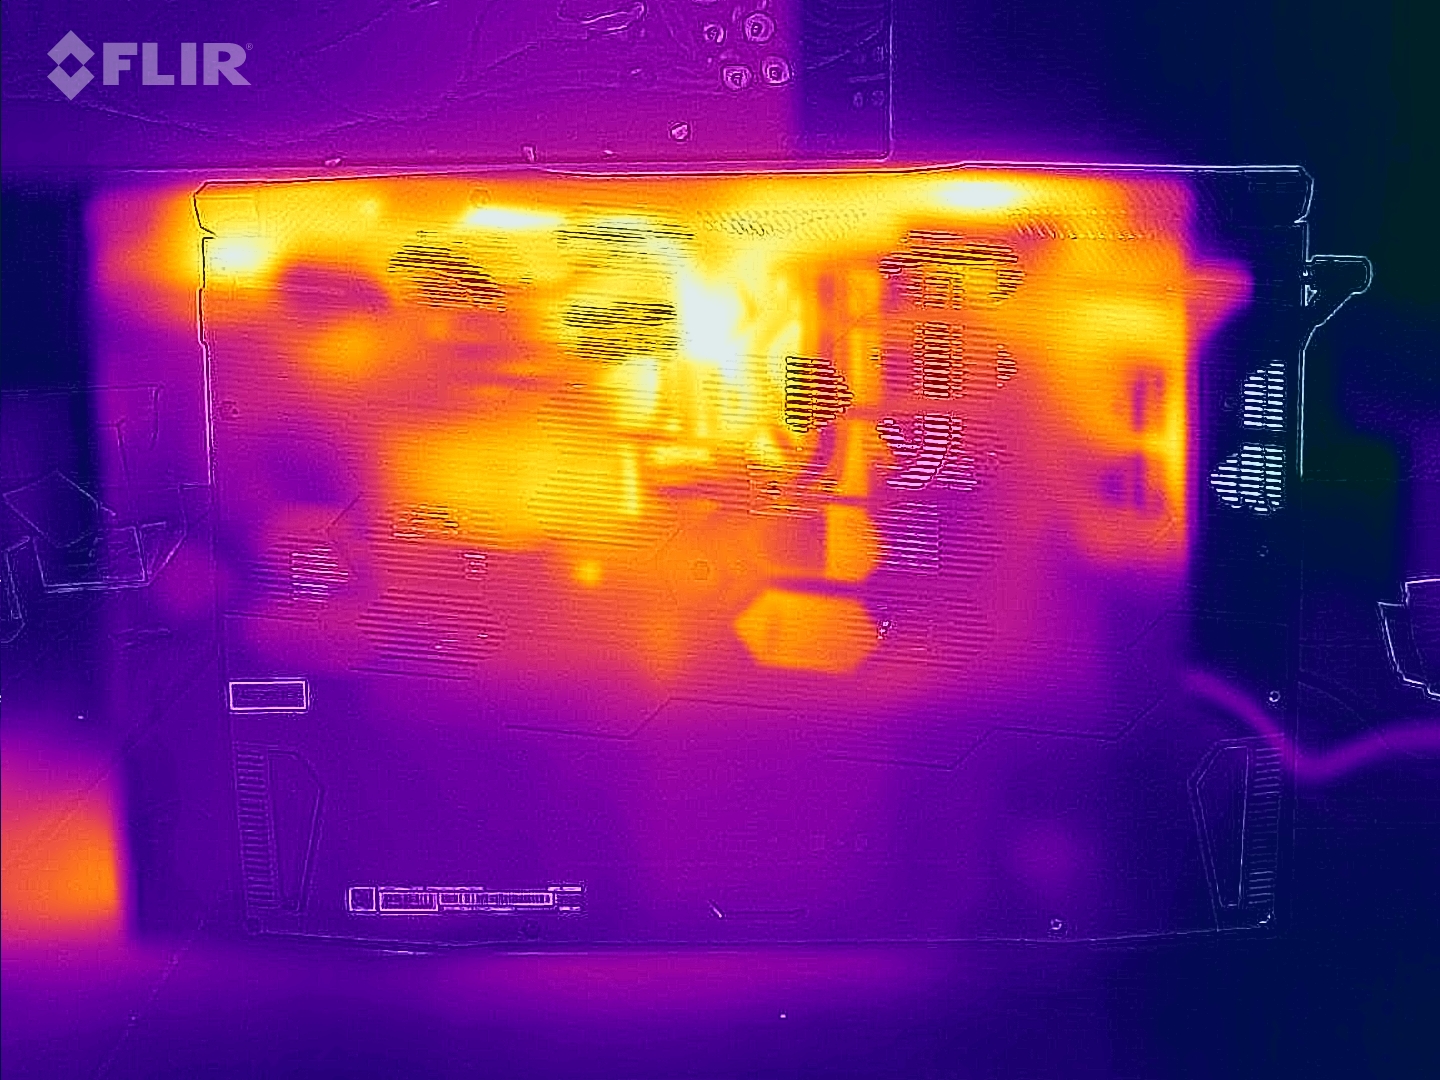
(-) The maximum temperature on the upper side is 61 °C / 142 F, compared to the average of 40.4 °C / 105 F, ranging from 21.2 to 68.8 °C for the class Gaming.
(-) The bottom heats up to a maximum of 55 °C / 131 F, compared to the average of 43.2 °C / 110 F
(±) In idle usage, the average temperature for the upper side is 33.9 °C / 93 F, compared to the device average of 33.9 °C / 93 F.
(-) Playing The Witcher 3, the average temperature for the upper side is 46.8 °C / 116 F, compared to the device average of 33.9 °C / 93 F.
(-) The palmrests and touchpad can get very hot to the touch with a maximum of 43 °C / 109.4 F.
(-) The average temperature of the palmrest area of similar devices was 28.8 °C / 83.8 F (-14.2 °C / -25.6 F).
| MSI Katana GF66 12UGS i7-12700H, GeForce RTX 3070 Ti Laptop GPU | MSI Katana GF66 11UG-220 i7-11800H, GeForce RTX 3070 Laptop GPU | MSI Katana GF76 12UGS i7-12700H, GeForce RTX 3070 Ti Laptop GPU | Asus TUF Gaming F15 FX507ZM i7-12700H, GeForce RTX 3060 Laptop GPU | Asus TUF Gaming A15 FA506QR-AZ061T R7 5800H, GeForce RTX 3070 Laptop GPU | Acer Nitro 5 AN515-58-72QR i7-12700H, GeForce RTX 3070 Ti Laptop GPU | Lenovo Legion 5 15ACH6A-82NW0010GE R5 5600H, Radeon RX 6600M | |
|---|---|---|---|---|---|---|---|
| Heat | 15% | 8% | 12% | 9% | 16% | 23% | |
| Maximum Upper Side * (°C) | 61 | 56 8% | 51 16% | 44.4 27% | 46.7 23% | 48 21% | 39.9 35% |
| Maximum Bottom * (°C) | 55 | 49 11% | 55 -0% | 48.8 11% | 55.9 -2% | 51 7% | 43.8 20% |
| Idle Upper Side * (°C) | 43 | 36 16% | 37 14% | 37.8 12% | 37.1 14% | 34 21% | 34.1 21% |
| Idle Bottom * (°C) | 38 | 28 26% | 38 -0% | 39.6 -4% | 38.1 -0% | 33 13% | 31.7 17% |
* ... smaller is better
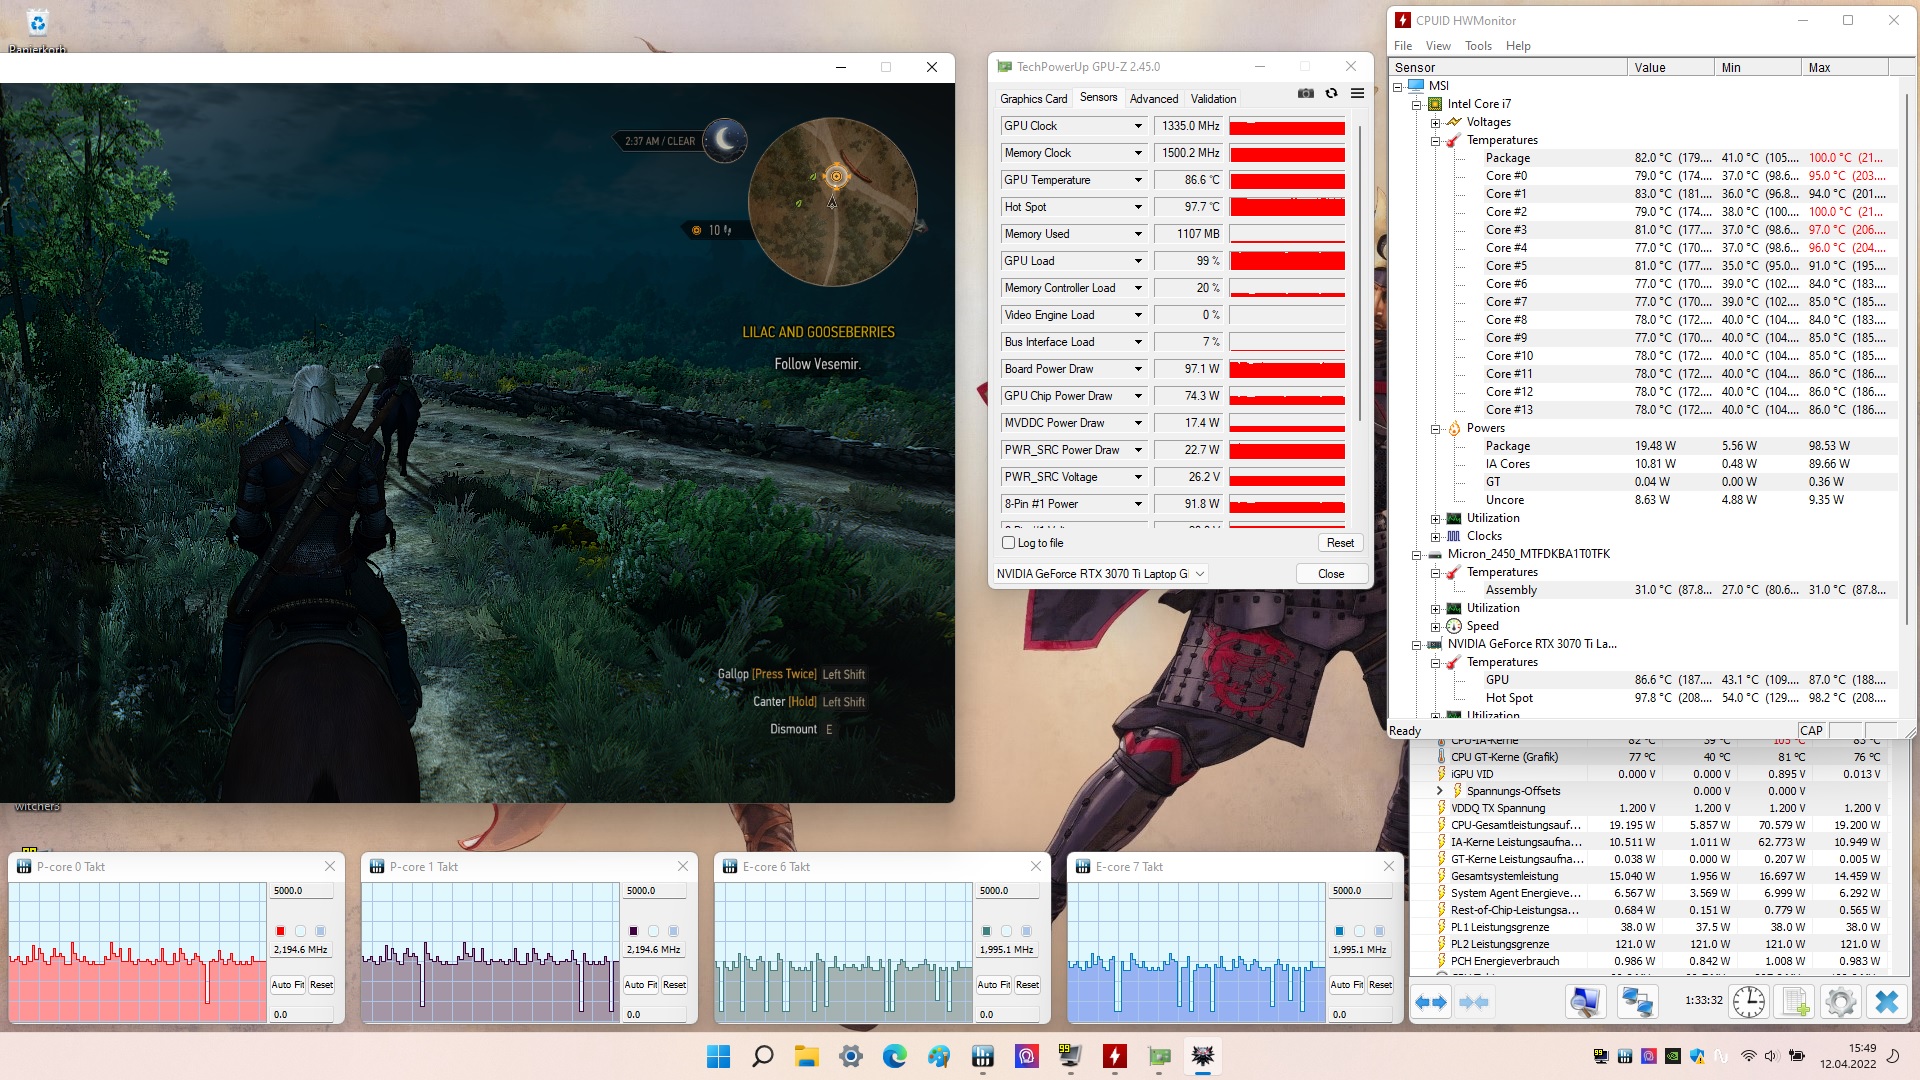
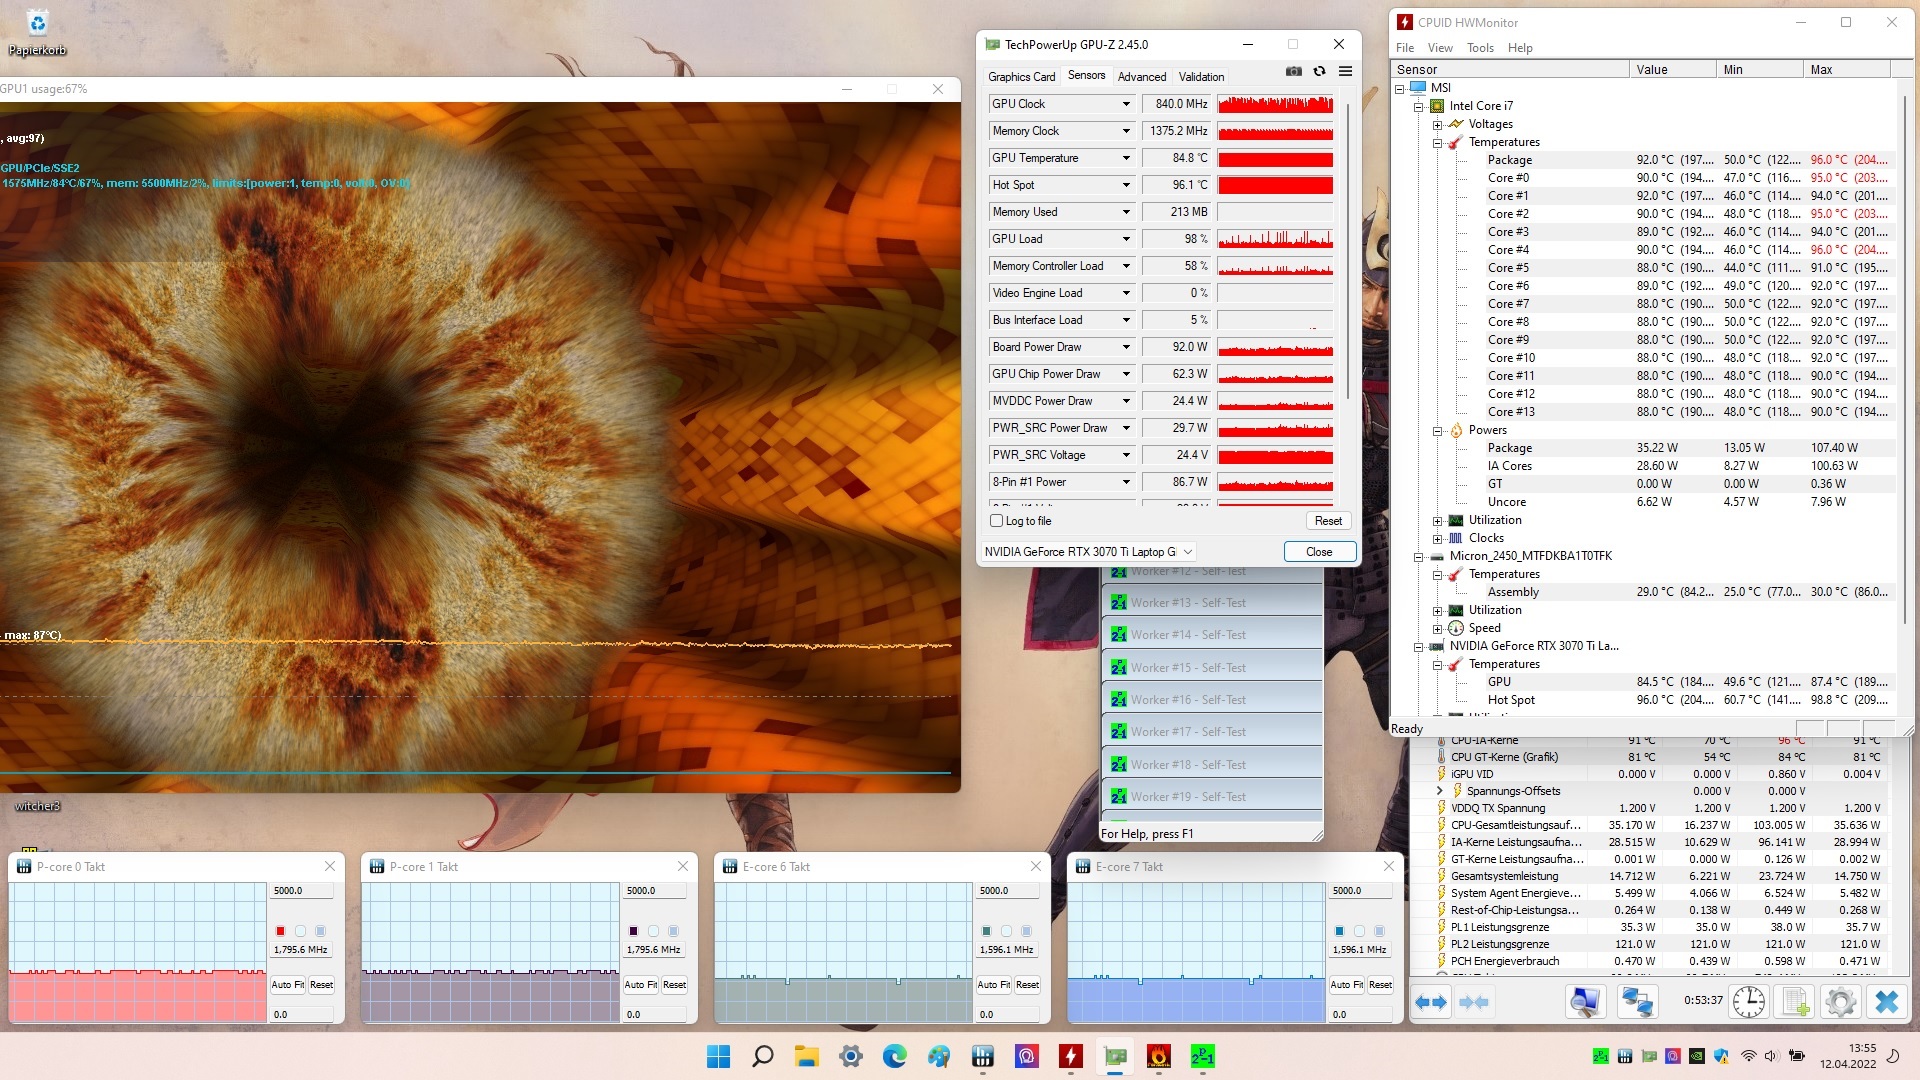
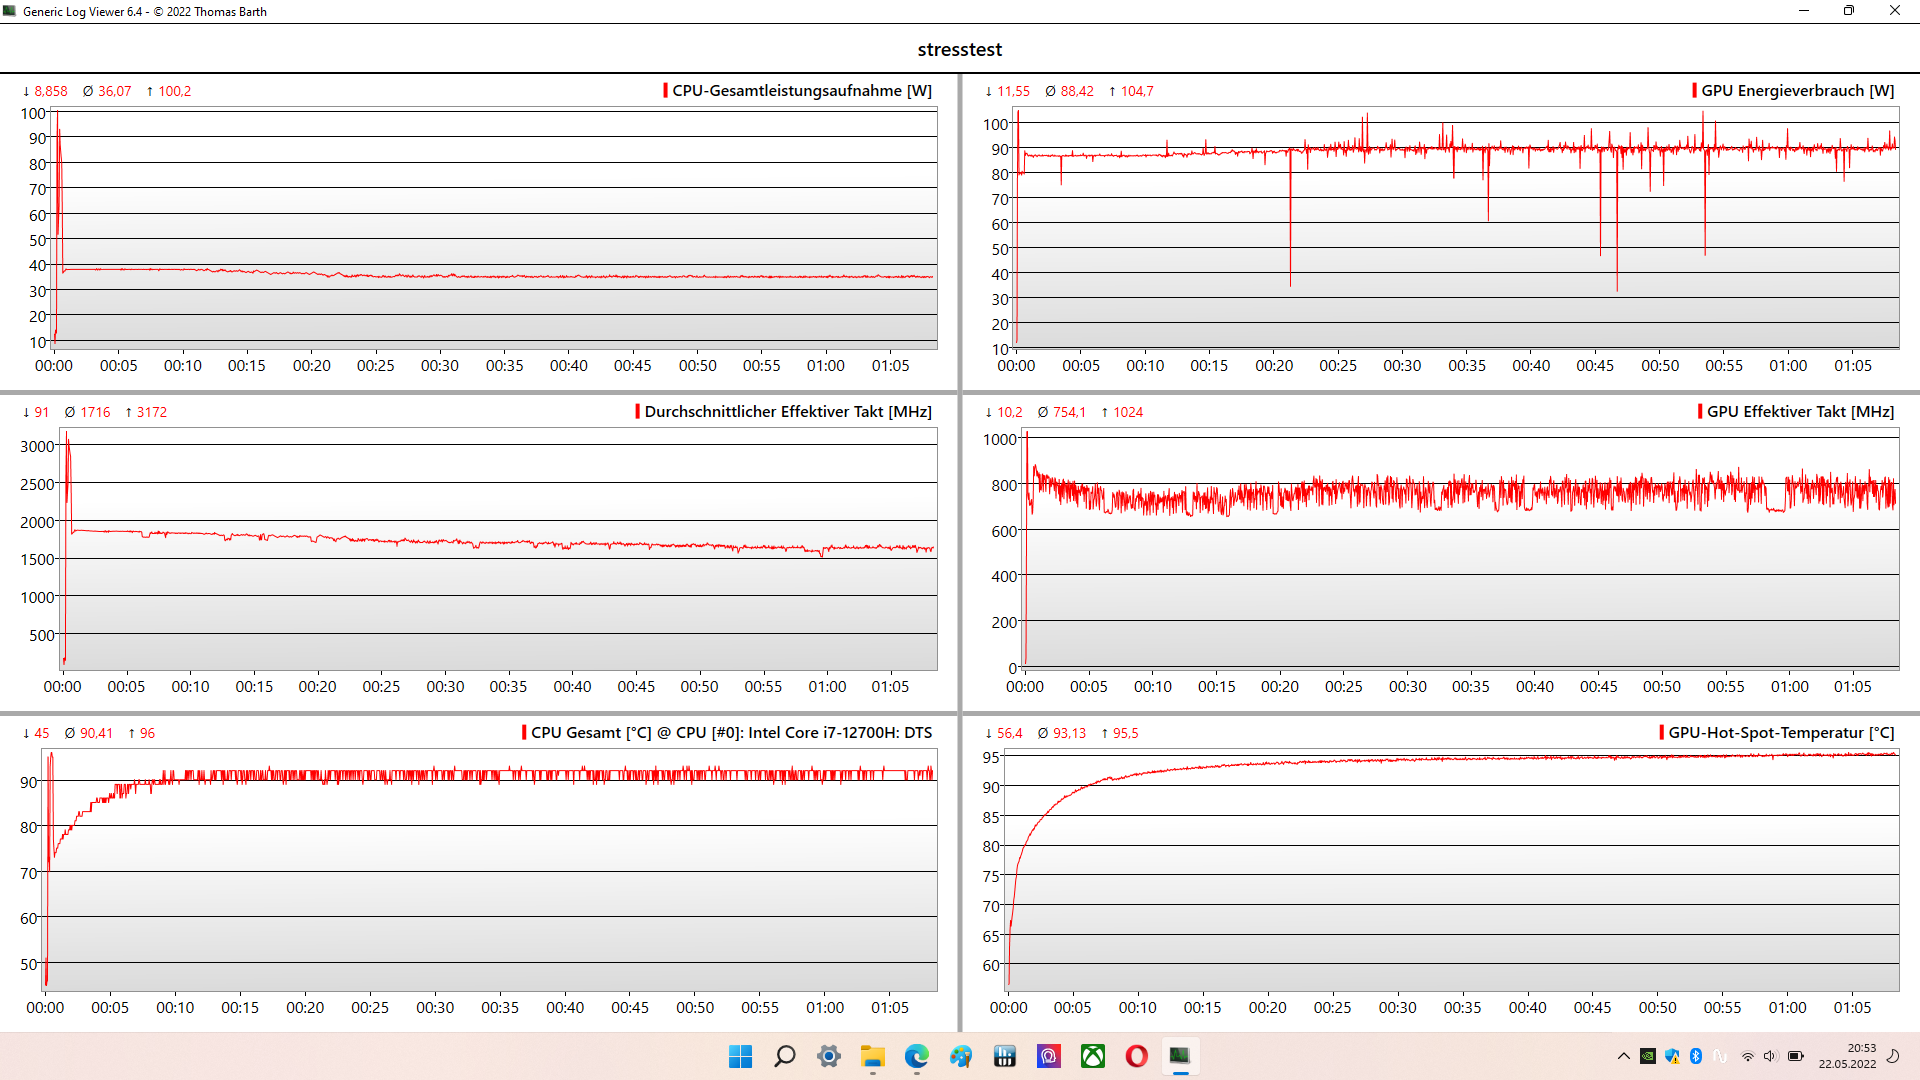
压力测试
在更长的时间内,压力测试期间CPU的消耗为33瓦,而在压力测试的前10分钟,它仍然能够使用45瓦。然而,CPU和GPU只是在共享的共同消耗中转换一下,其消耗量在120瓦左右。我们没有注意到两个芯片的温度有任何重大问题。在90和95°C(194和203°F)的温度下,两者都属于较高但仍非关键的范围,可以稳定地保持。
发言人
高的最大音量和良好的音乐和声音的总体再现确保了坚实的声音图像。我们可以原谅笔记本电脑在低音方面的轻微弱点。降低音量可以确保更平衡的声音。
MSI Katana GF66 12UGS audio analysis
(±) | speaker loudness is average but good (80 dB)
Bass 100 - 315 Hz
(-) | nearly no bass - on average 17.3% lower than median
(±) | linearity of bass is average (9.9% delta to prev. frequency)
Mids 400 - 2000 Hz
(±) | higher mids - on average 6.8% higher than median
(±) | linearity of mids is average (8.3% delta to prev. frequency)
Highs 2 - 16 kHz
(+) | balanced highs - only 1.1% away from median
(+) | highs are linear (4.2% delta to prev. frequency)
Overall 100 - 16.000 Hz
(±) | linearity of overall sound is average (16.5% difference to median)
Compared to same class
» 42% of all tested devices in this class were better, 7% similar, 51% worse
» The best had a delta of 6%, average was 18%, worst was 132%
Compared to all devices tested
» 28% of all tested devices were better, 6% similar, 66% worse
» The best had a delta of 4%, average was 24%, worst was 134%
Apple MacBook Pro 16 2021 M1 Pro audio analysis
(+) | speakers can play relatively loud (84.7 dB)
Bass 100 - 315 Hz
(+) | good bass - only 3.8% away from median
(+) | bass is linear (5.2% delta to prev. frequency)
Mids 400 - 2000 Hz
(+) | balanced mids - only 1.3% away from median
(+) | mids are linear (2.1% delta to prev. frequency)
Highs 2 - 16 kHz
(+) | balanced highs - only 1.9% away from median
(+) | highs are linear (2.7% delta to prev. frequency)
Overall 100 - 16.000 Hz
(+) | overall sound is linear (4.6% difference to median)
Compared to same class
» 0% of all tested devices in this class were better, 0% similar, 100% worse
» The best had a delta of 5%, average was 17%, worst was 45%
Compared to all devices tested
» 0% of all tested devices were better, 0% similar, 100% worse
» The best had a delta of 4%, average was 24%, worst was 134%
电源管理--微薄的电池寿命
消耗功率
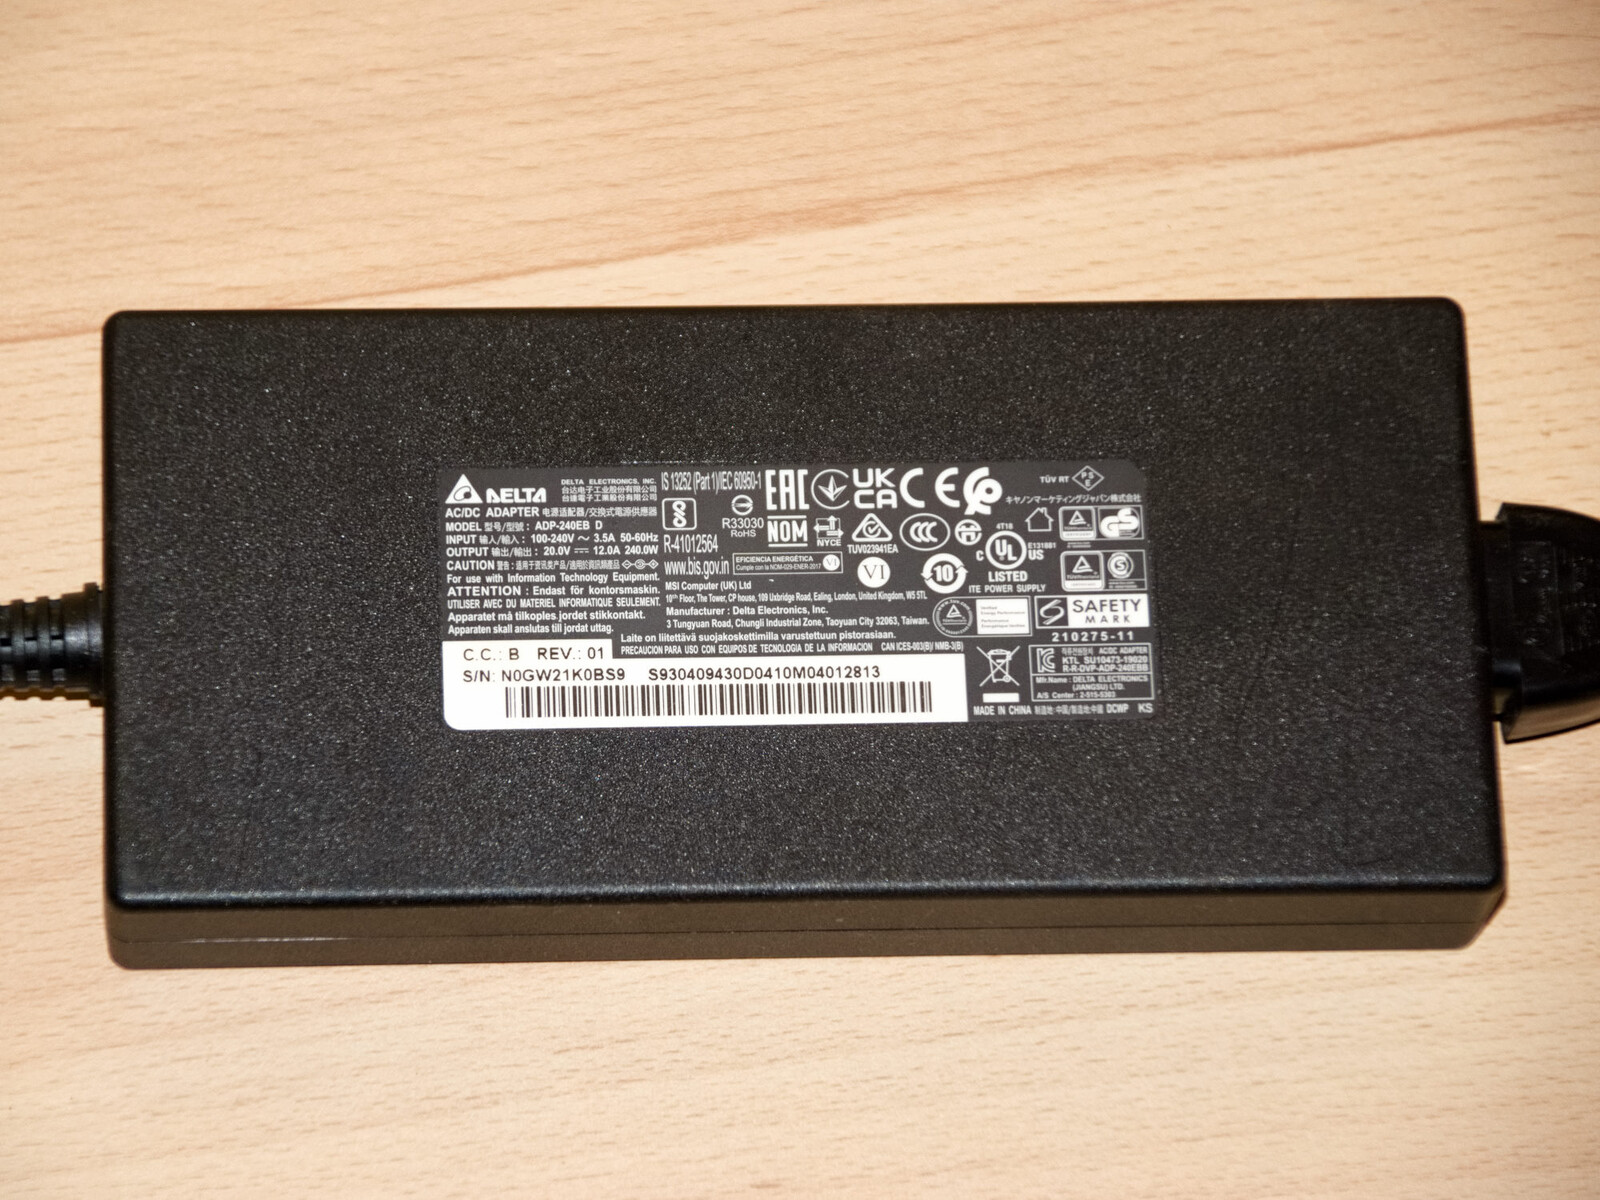
虽然在前代产品中,电源的尺寸仍然非常紧凑,但微星在这里大大增加了这一尺寸,并包括一个具有240瓦的适当性能的电源。这意味着,即使在最大负荷下,这台游戏笔记本也不会达到电源的极限。
在功耗方面,这款笔记本的水平低于游戏笔记本的平均水平。
| Off / Standby | |
| Idle | |
| Load |
|
Key:
min: | |
| MSI Katana GF66 12UGS i7-12700H, GeForce RTX 3070 Ti Laptop GPU | MSI Katana GF76 12UGS i7-12700H, GeForce RTX 3070 Ti Laptop GPU | Asus TUF Gaming F15 FX507ZM i7-12700H, GeForce RTX 3060 Laptop GPU | Asus TUF Gaming A15 FA506QR-AZ061T R7 5800H, GeForce RTX 3070 Laptop GPU | Acer Nitro 5 AN515-58-72QR i7-12700H, GeForce RTX 3070 Ti Laptop GPU | Lenovo Legion 5 15ACH6A-82NW0010GE R5 5600H, Radeon RX 6600M | Average of class Gaming | |
|---|---|---|---|---|---|---|---|
| Power Consumption | -19% | -4% | 1% | -12% | -13% | -28% | |
| Idle Minimum * (Watt) | 9 | 14.2 -58% | 6.3 30% | 10.2 -13% | 7 22% | 10 -11% | 13.2 ? -47% |
| Idle Average * (Watt) | 13 | 18 -38% | 9.8 25% | 12.8 2% | 15 -15% | 13.2 -2% | 18.9 ? -45% |
| Idle Maximum * (Watt) | 20 | 22 -10% | 26.5 -33% | 15 25% | 24 -20% | 15.6 22% | 24.3 ? -22% |
| Load Average * (Watt) | 100 | 98 2% | 103.8 -4% | 130 -30% | 124 -24% | 178 -78% | 108.3 ? -8% |
| Witcher 3 ultra * (Watt) | 149 | 159 -7% | 189 -27% | 137 8% | 195.1 -31% | 181 -21% | |
| Load Maximum * (Watt) | 212 | 219 -3% | 241.9 -14% | 184 13% | 220 -4% | 180 15% | 254 ? -20% |
* ... smaller is better
Power Consumption The Witcher 3 / Stress Test
{
电池寿命
另一方面,微星Katana GF66 12UGS也不是真的高效。因此,这款游戏笔记本只提供较短的电池寿命也就不足为奇了。然而,电池寿命仍然保持在游戏笔记本竞争对手的正常范围内。
| MSI Katana GF66 12UGS i7-12700H, GeForce RTX 3070 Ti Laptop GPU, 52 Wh | MSI Katana GF76 12UGS i7-12700H, GeForce RTX 3070 Ti Laptop GPU, 53.5 Wh | Asus TUF Gaming F15 FX507ZM i7-12700H, GeForce RTX 3060 Laptop GPU, 90 Wh | Asus TUF Gaming A15 FA506QR-AZ061T R7 5800H, GeForce RTX 3070 Laptop GPU, 90 Wh | Acer Nitro 5 AN515-58-72QR i7-12700H, GeForce RTX 3070 Ti Laptop GPU, 57.5 Wh | Lenovo Legion 5 15ACH6A-82NW0010GE R5 5600H, Radeon RX 6600M, 80 Wh | Average of class Gaming | |
|---|---|---|---|---|---|---|---|
| Battery runtime | 34% | 40% | 223% | 25% | 163% | 99% | |
| Reader / Idle (h) | 15.8 | 17.4 | 5.7 | 12.8 | 8.71 ? | ||
| WiFi v1.3 (h) | 2.4 | 3.7 54% | 4.8 100% | 11.4 375% | 3.9 63% | 9.2 283% | 7.04 ? 193% |
| Load (h) | 1.4 | 1.6 14% | 1.1 -21% | 2.4 71% | 1.2 -14% | 2 43% | 1.47 ? 5% |
| H.264 (h) | 3.3 | 4.7 | 8.26 ? |
Pros
Cons
判决书

微星在Katana GF66的许多方面都做了改进,显示即使没有配置的TDP限制中的最高值,游戏也可以做得相对实惠。然而,Nvidia RTX 3070 Ti和英特尔酷睿i7-12700H仍然是一个有点虚假的。这是另一种情况,我们真的希望制造商提供更明确的TDP规格。但是对于要求高的游戏玩家来说,真正的问题是糟糕的显示屏。由于其缓慢的响应时间和糟糕的色彩还原,该显示器并不真正100%适合游戏。
微星Katana GF66 12UGS是一款具有平衡性价比的笔记本电脑,提供了一个相当实惠的进入顶级移动游戏的机会。
尽管这把 "塑料剑 "无法在最好的设备上大放异彩,但它基本上是坚实的。那些对游戏笔记本没有太高要求的人将在这个设备中找到一个好伙伴。尽管TGP/TDP稍有限制,但显卡和处理器都非常强大,使Katana GF66 12UGS能够完成其作为游戏笔记本电脑的主要任务。
价格和可用性
微星Katana GF66在美国有很多配置,其中大部分仍然是11代处理器。带有12代i7处理器和RTX 3050 Ti的配置目前在亚马逊上售价为1150美元而使用i5处理器的配置为1130美元.例如,GF76的更高端配置可从亚马逊,价格为1960美元.
MSI Katana GF66 12UGS
- 05/31/2022 v7 (old)
Marc Herter
Price comparison

