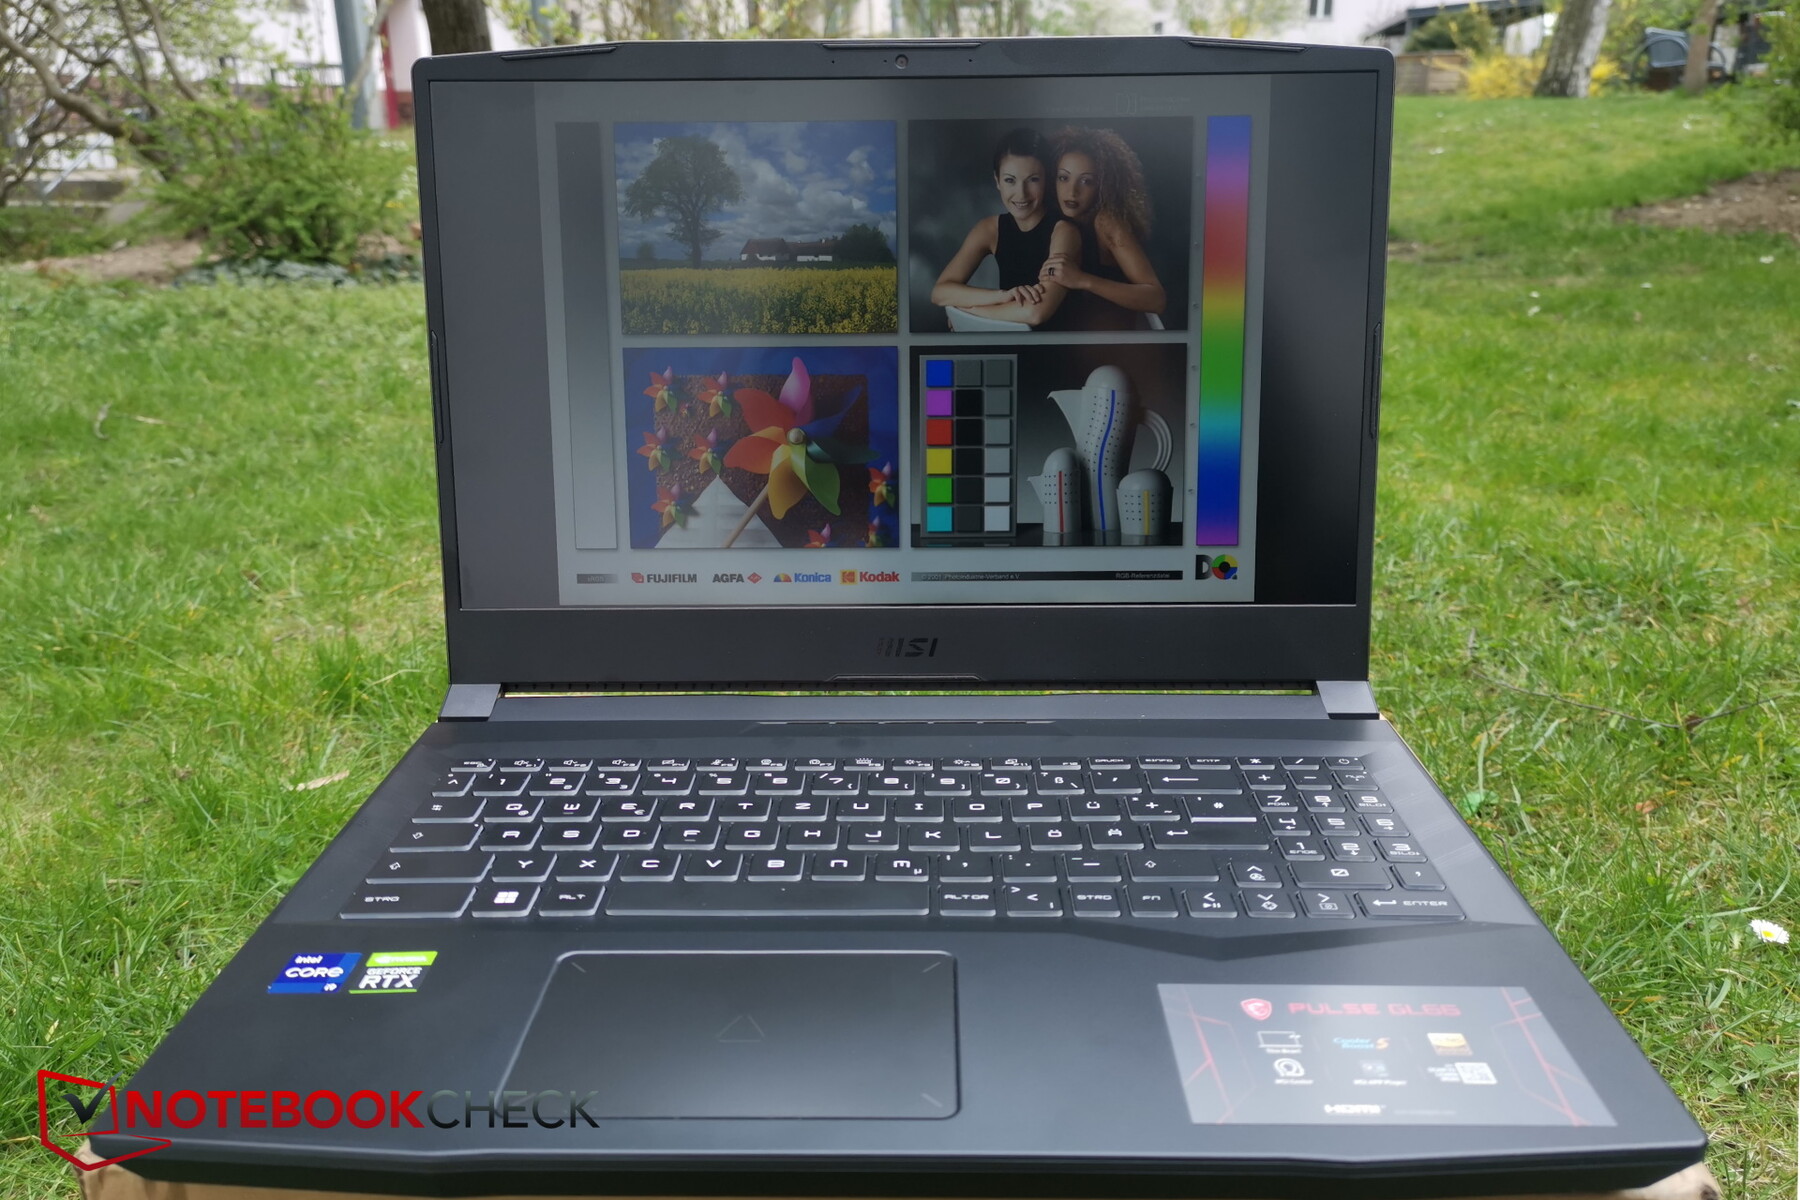
微星Pulse GL66评论。i9-12900H是在改进RTX-3060游戏笔记本,还是只让它更贵?
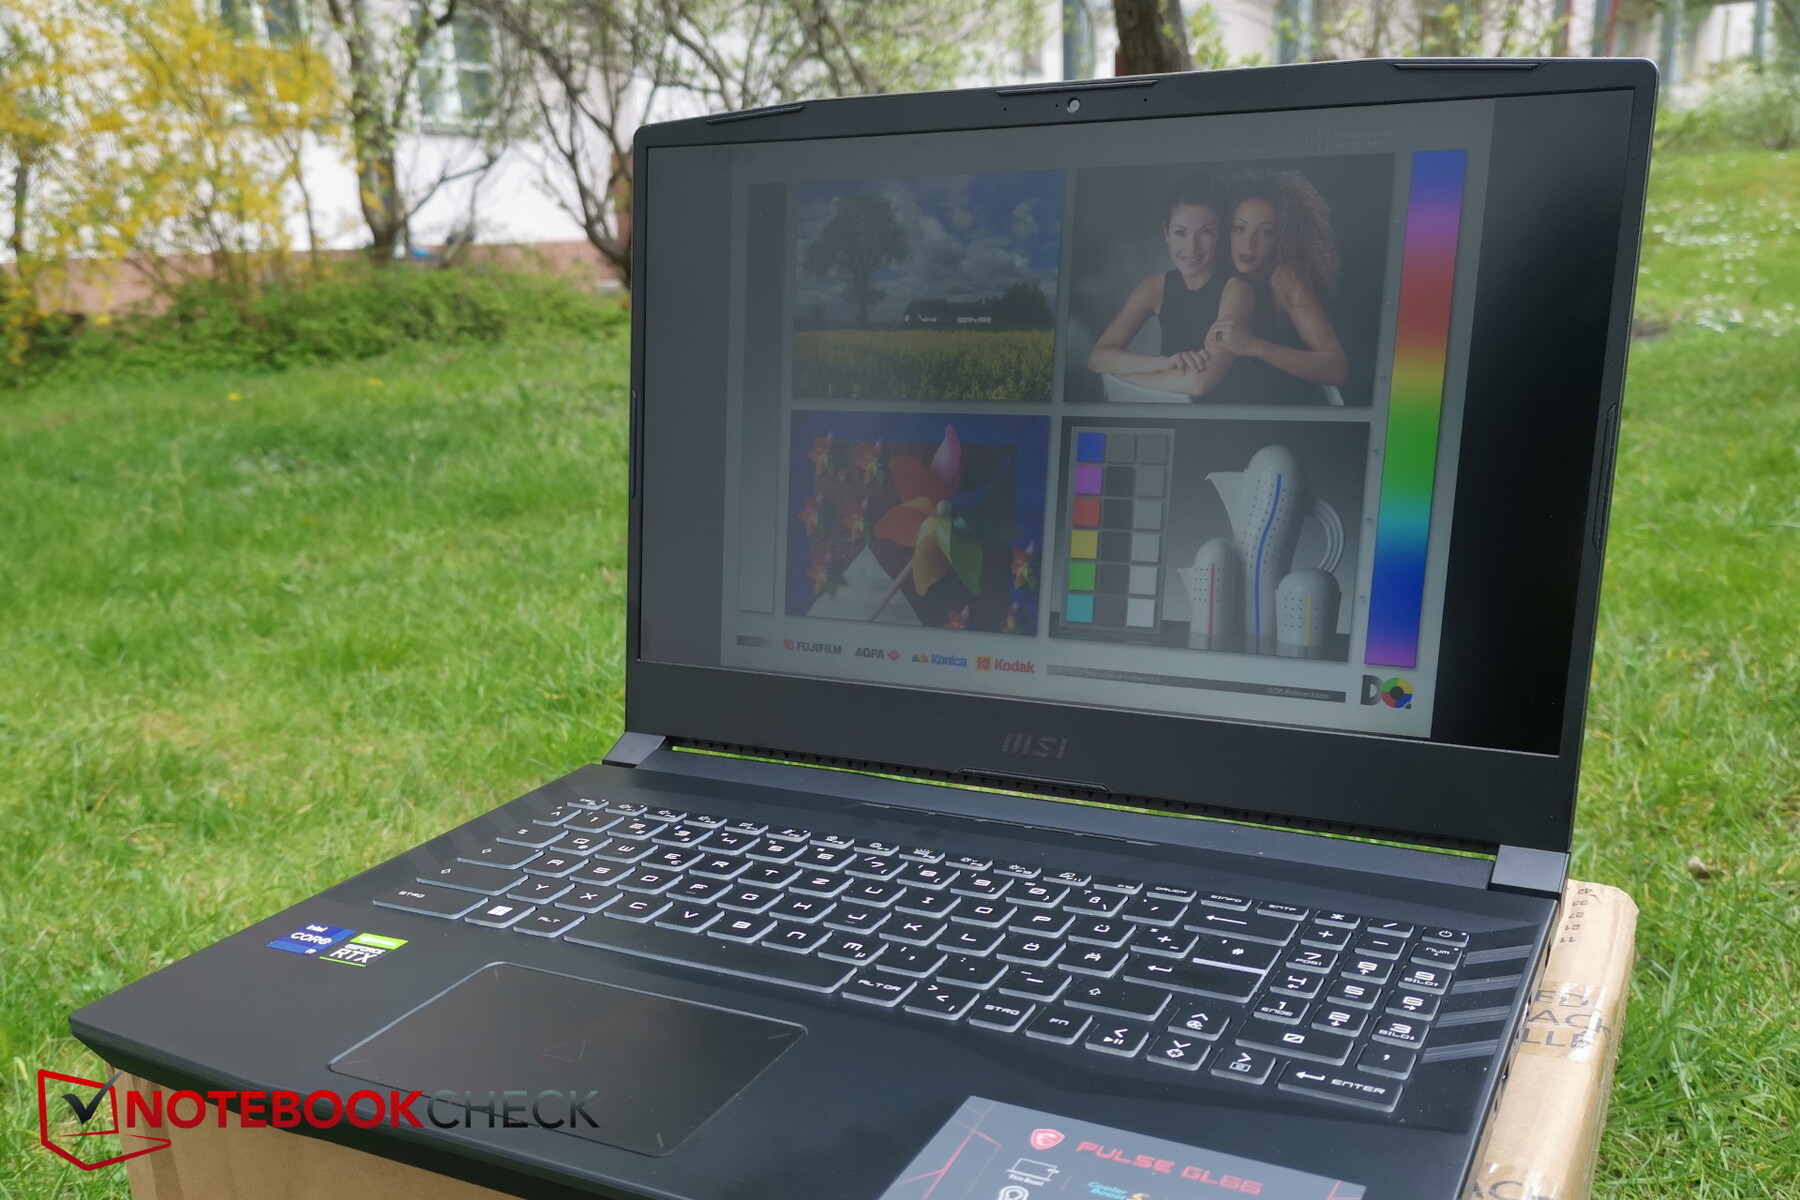
去年,Pulse游戏系列新推出了GL66和GL76两款产品,今年又更新到了Alder Lake。由于我们去年没有测试这些设备,所以对这个系列的测试对我们来说是新的。我们审查了15英寸GL66的第二次迭代,它配备了一个RTX 3060和 酷睿i9-12900H这款产品售价约为1900欧元(约2057美元)。
我们已经在Alder Lake和RTX 3060的组合中测试了 Alienware x14(14英寸)和 华硕TUF游戏机F15作为额外的比较设备,我们使用其他15英寸的游戏笔记本电脑与相同的GPU,如 申克XMG Apex 15,以及联想Legion S7,以及 Alienware m15 R5.
潜在的竞争对手比较
Rating | Date | Model | Weight | Height | Size | Resolution | Price |
|---|---|---|---|---|---|---|---|
| 80.7 % v7 (old) | 04 / 2022 | MSI Pulse GL66 12UEK i9-12900H, GeForce RTX 3060 Laptop GPU | 2.3 kg | 25 mm | 15.60" | 1920x1080 | |
| 87.2 % v7 (old) | 03 / 2022 | Asus TUF Gaming F15 FX507ZM i7-12700H, GeForce RTX 3060 Laptop GPU | 2.1 kg | 24.95 mm | 15.60" | 1920x1080 | |
| 86.7 % v7 (old) | 03 / 2022 | Alienware x14 i7 RTX 3060 i7-12700H, GeForce RTX 3060 Laptop GPU | 1.8 kg | 14.5 mm | 14.00" | 1920x1080 | |
| 84.4 % v7 (old) | 11 / 2021 | Schenker XMG Apex 15 NH57E PS R7 5800H, GeForce RTX 3060 Laptop GPU | 2.1 kg | 29 mm | 15.60" | 1920x1080 | |
| 87.9 % v7 (old) | 11 / 2021 | Lenovo Legion S7 15ACH6 82K80030GE R9 5900HX, GeForce RTX 3060 Laptop GPU | 2 kg | 18.9 mm | 15.60" | 3840x2160 | |
| 84.7 % v7 (old) | 08 / 2025 | Alienware m15 R5 Ryzen Edition R7 5800H, GeForce RTX 3060 Laptop GPU | 2.5 kg | 22.85 mm | 15.60" | 1920x1080 |
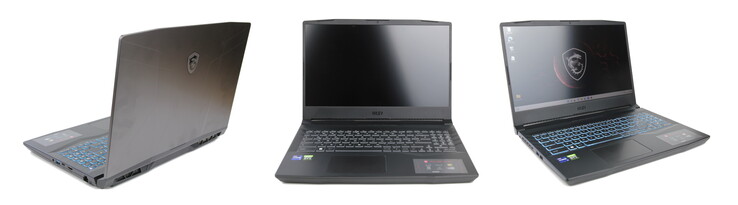
案例
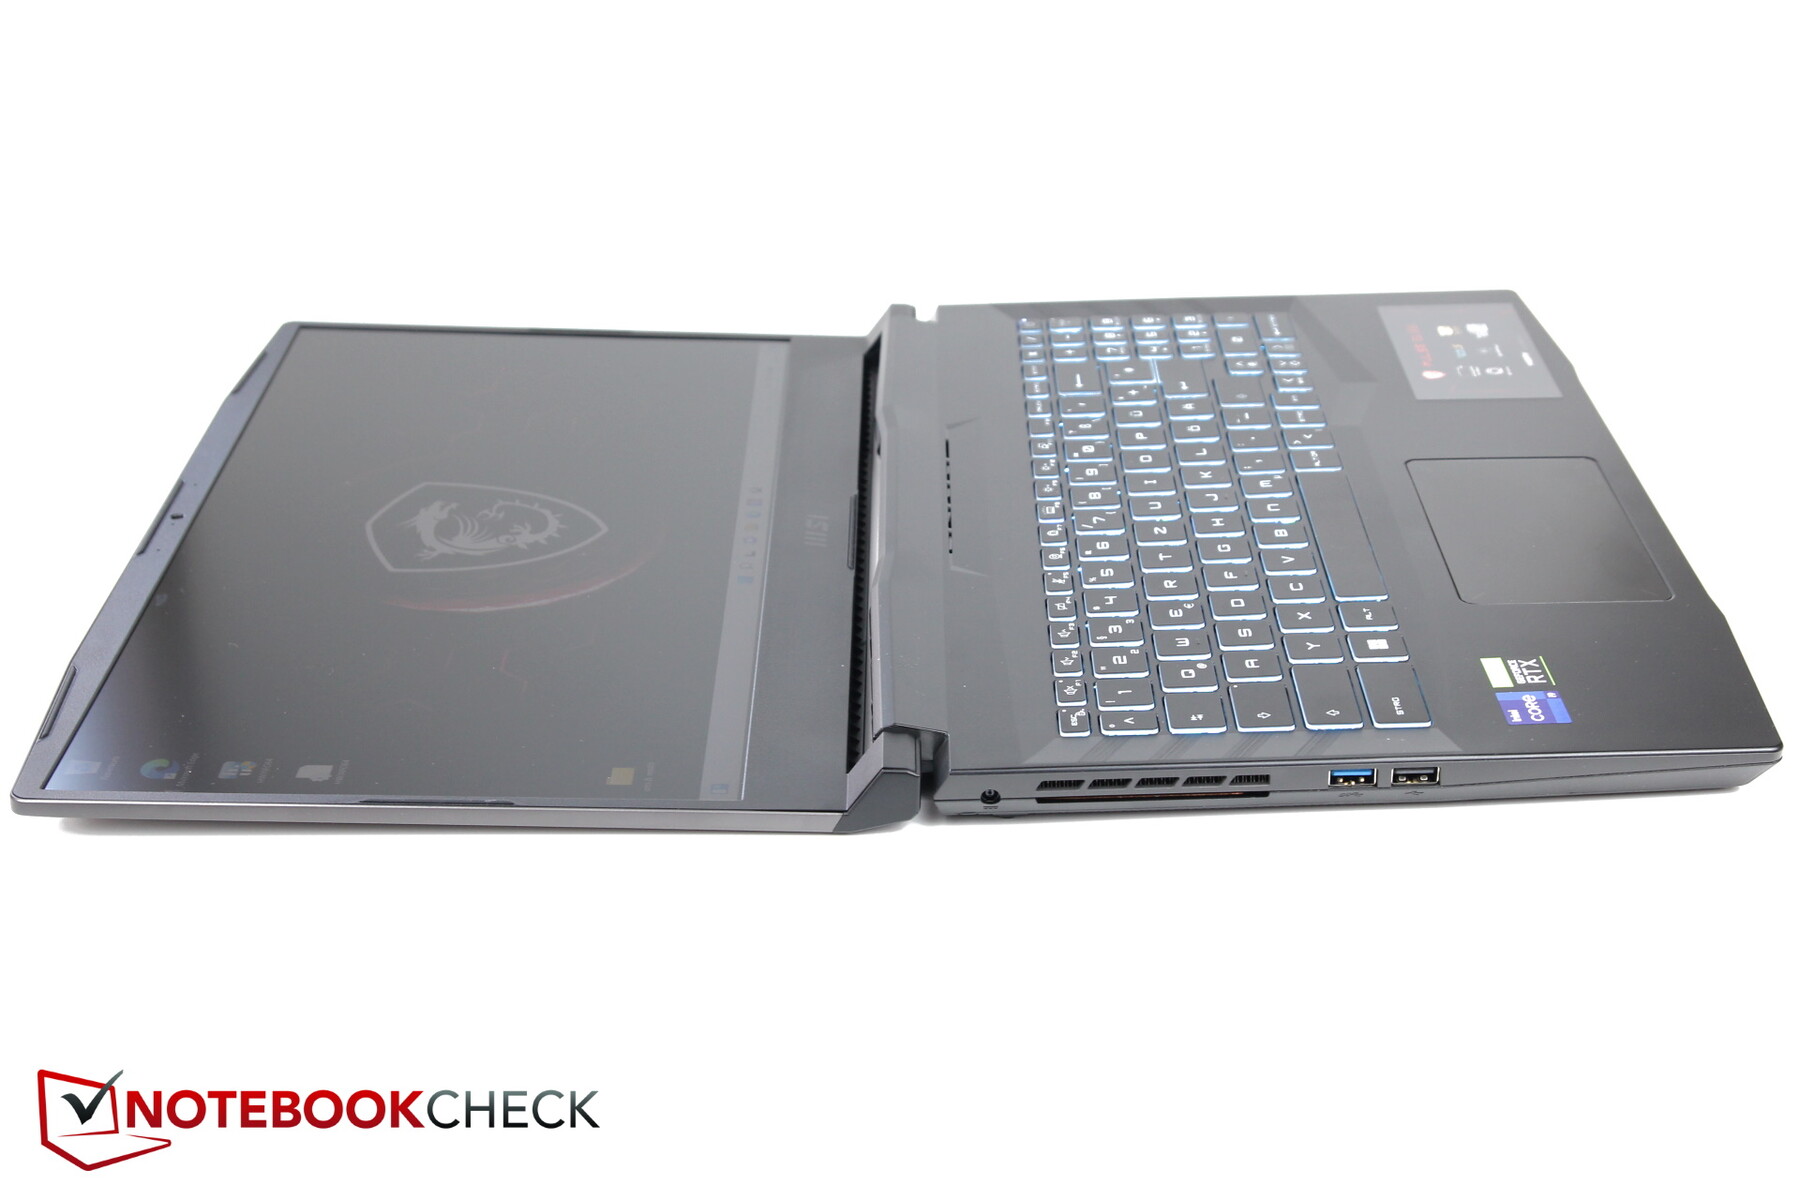
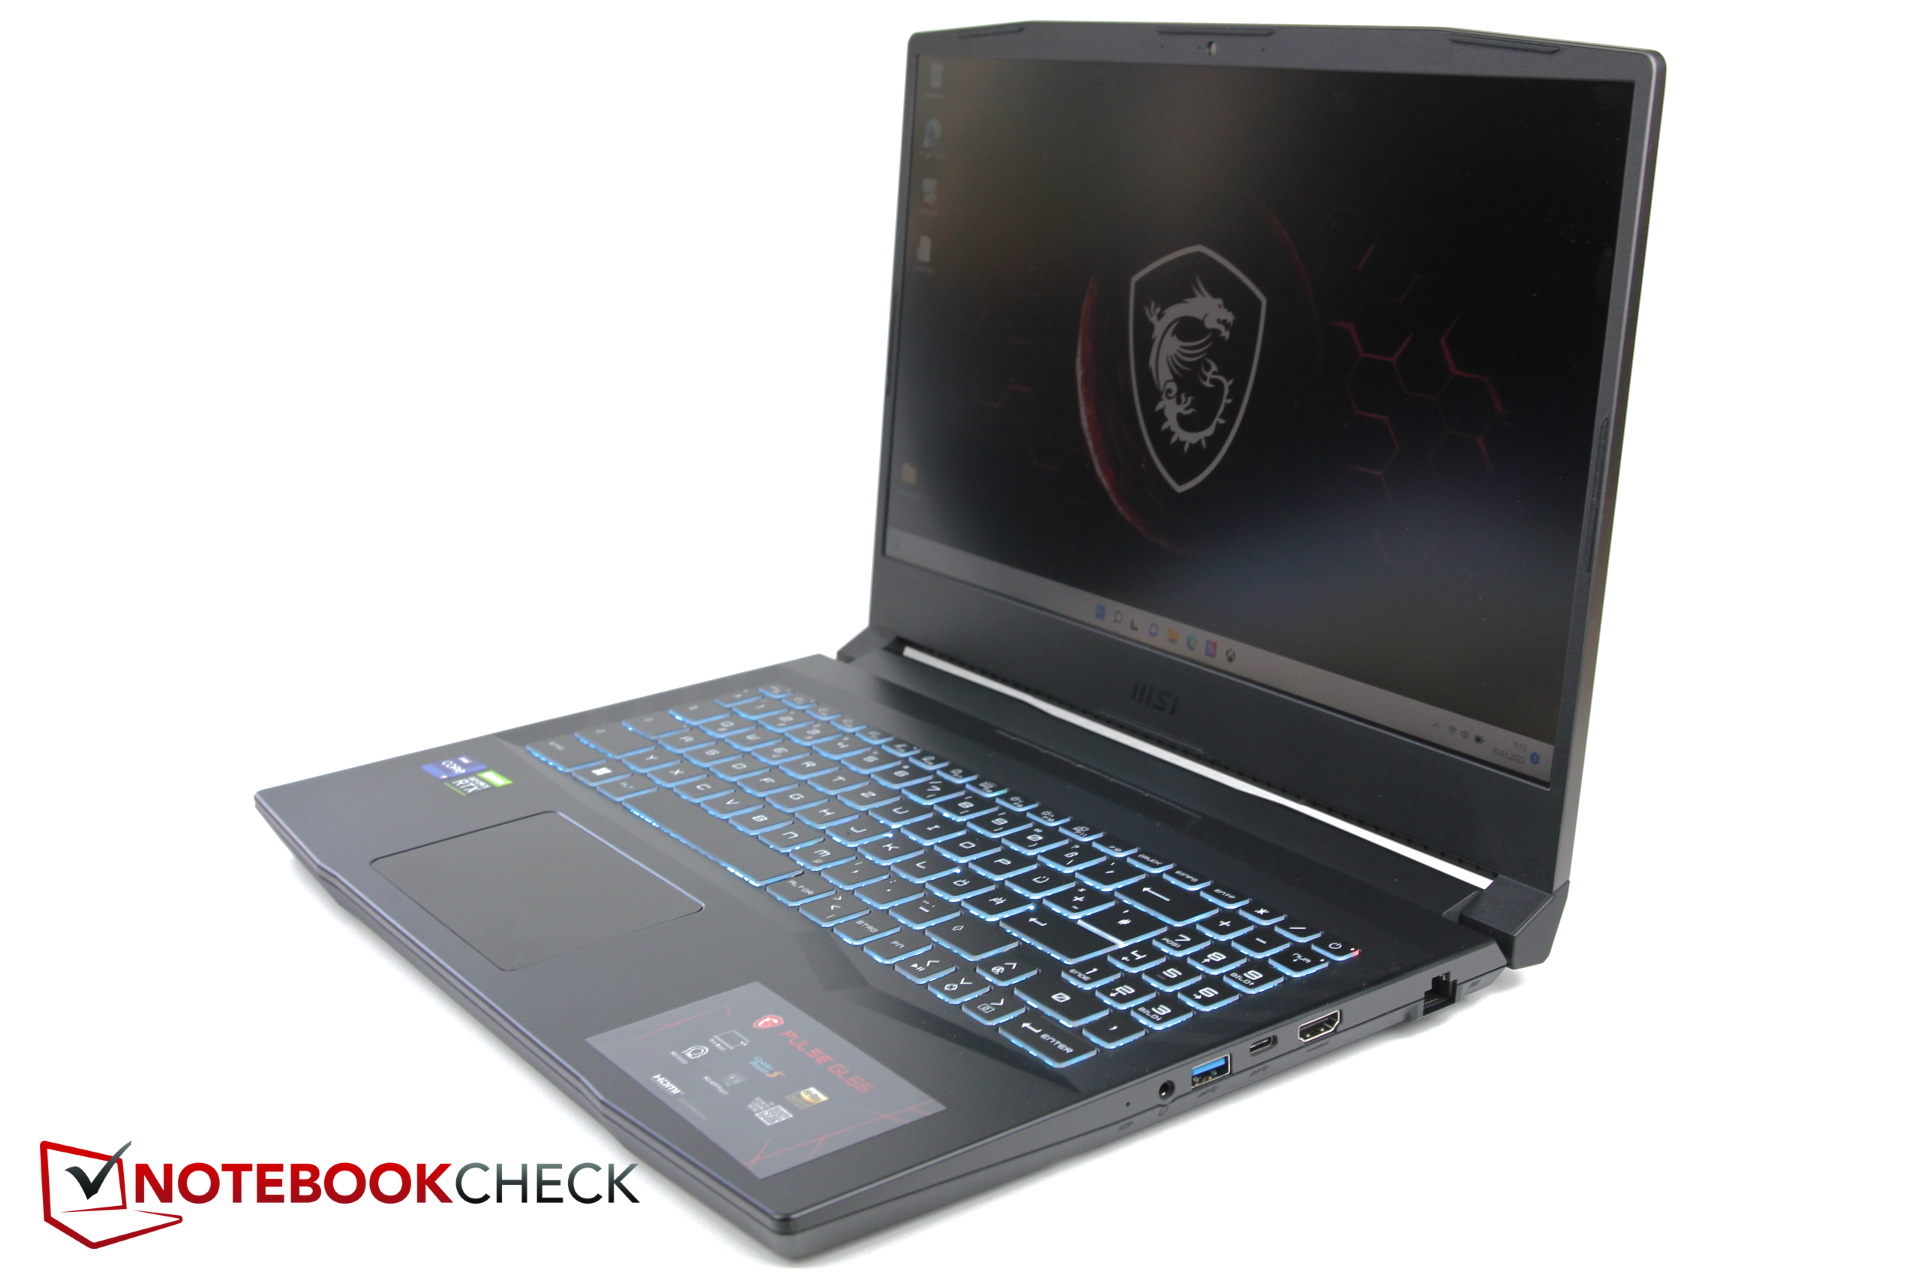
只有Pulse的显示盖子是由金属制成的,而笔记本的其他部分是由塑料制成的。这使得盖子相当耐翘。它的最大打开角度几乎为180度。侧面的两个铰链做得很好,但由于其金属结构,盖子不是特别轻,当你移动笔记本电脑时,它可能会意外地完全打开,特别是当它被打开超过三分之二的时候。
底座上的一个凹槽可以让你用一只手轻松打开笔记本电脑。虽然底座也相当稳定,但试图翘起它有时也会产生一些吱吱嘎嘎的声音。
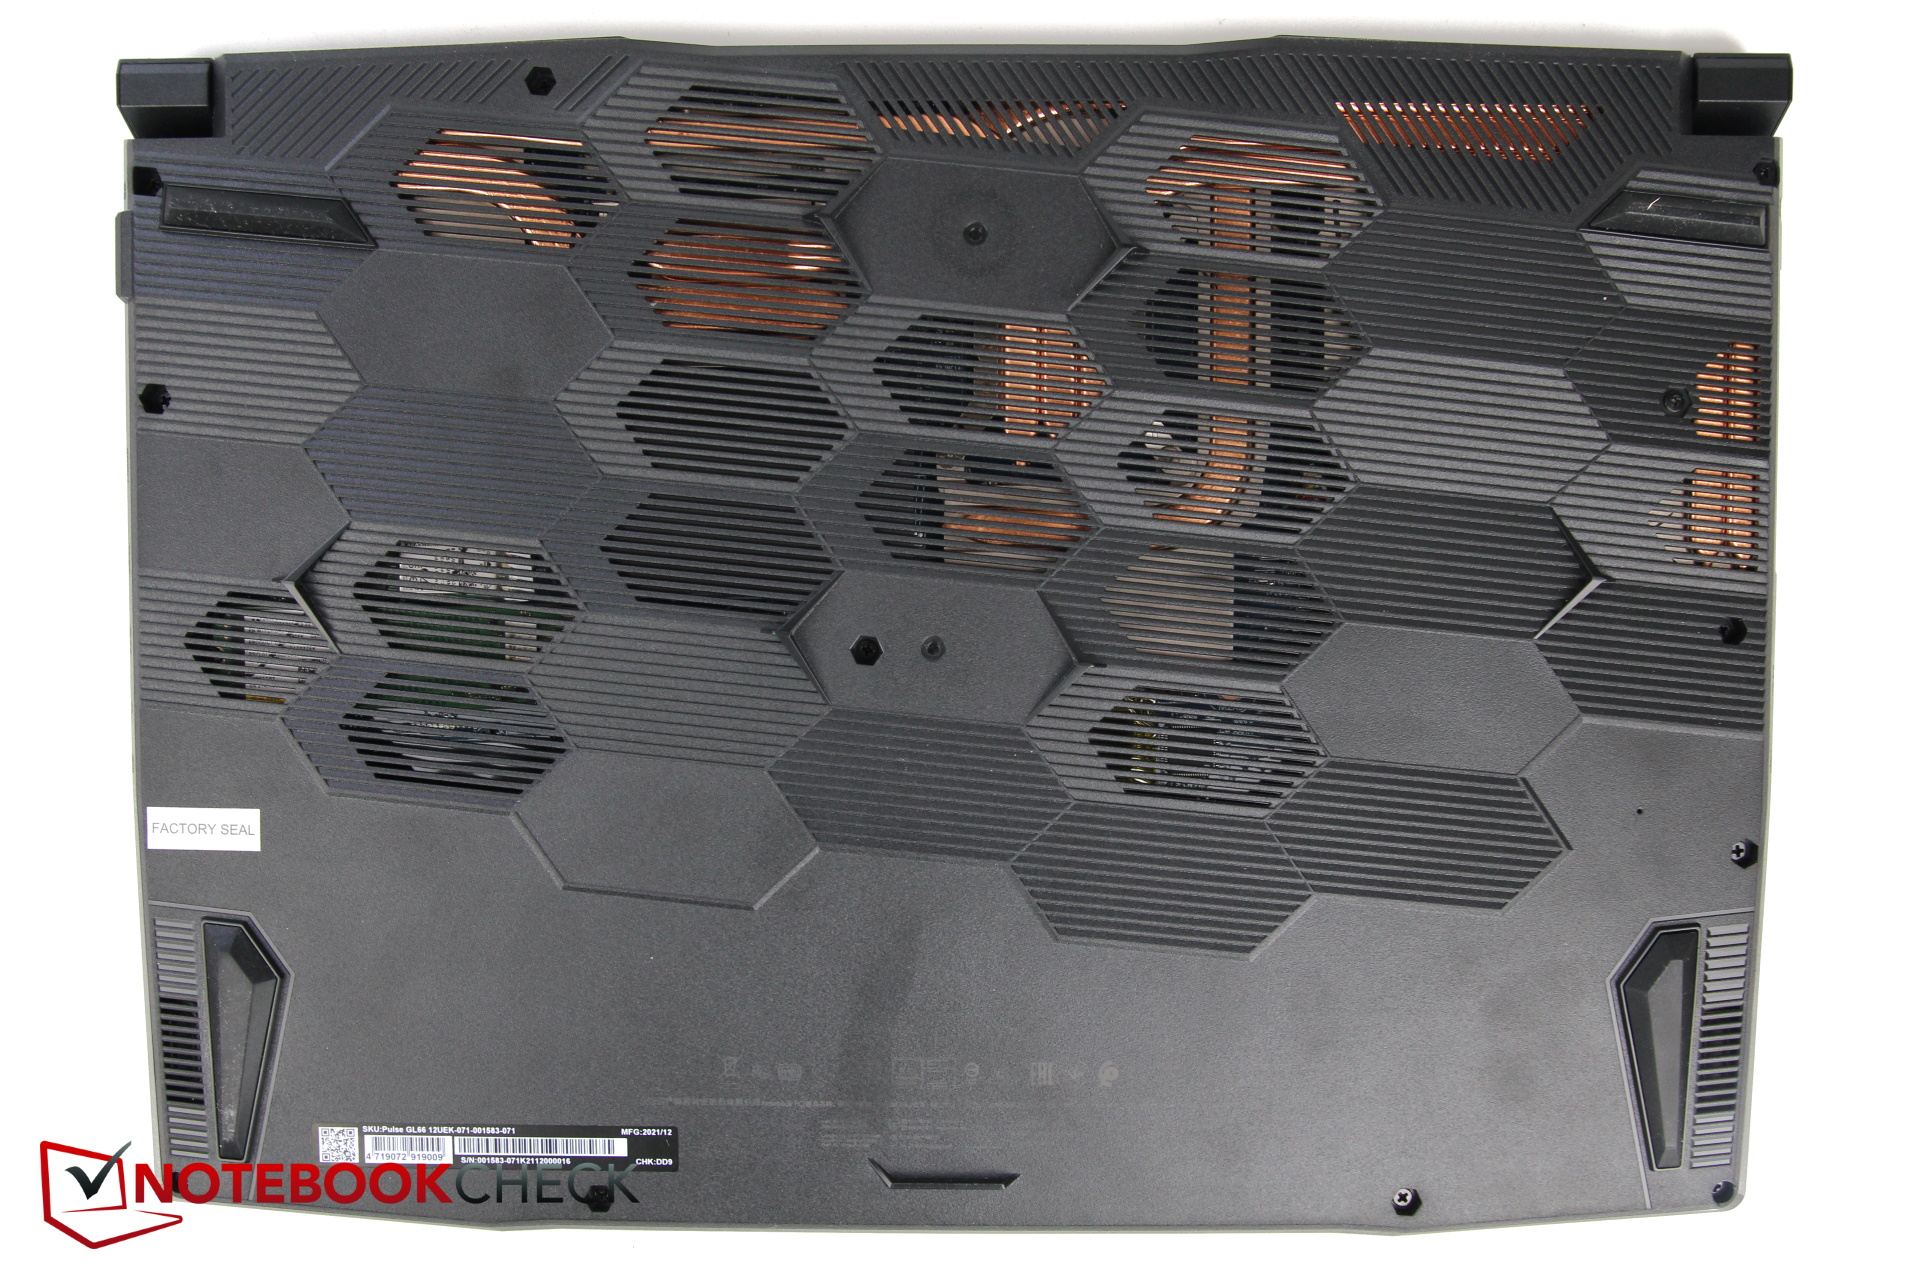
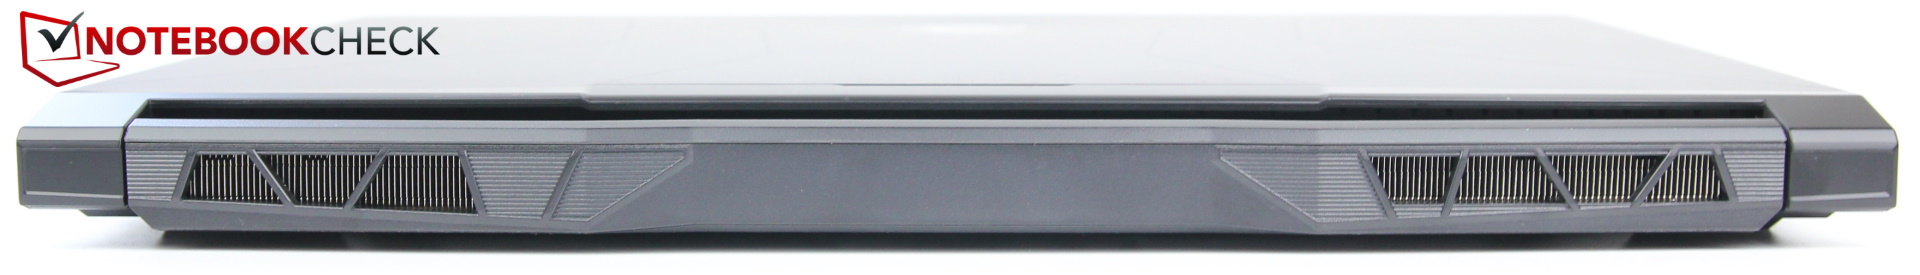
键盘略微凹陷,所以掌托被抬高的幅度很小。机箱底部由薄塑料制成,并由许多大的、类似蜂窝的结构覆盖,其中一些是风扇通风口。排气口在背面和左侧向后方排出。
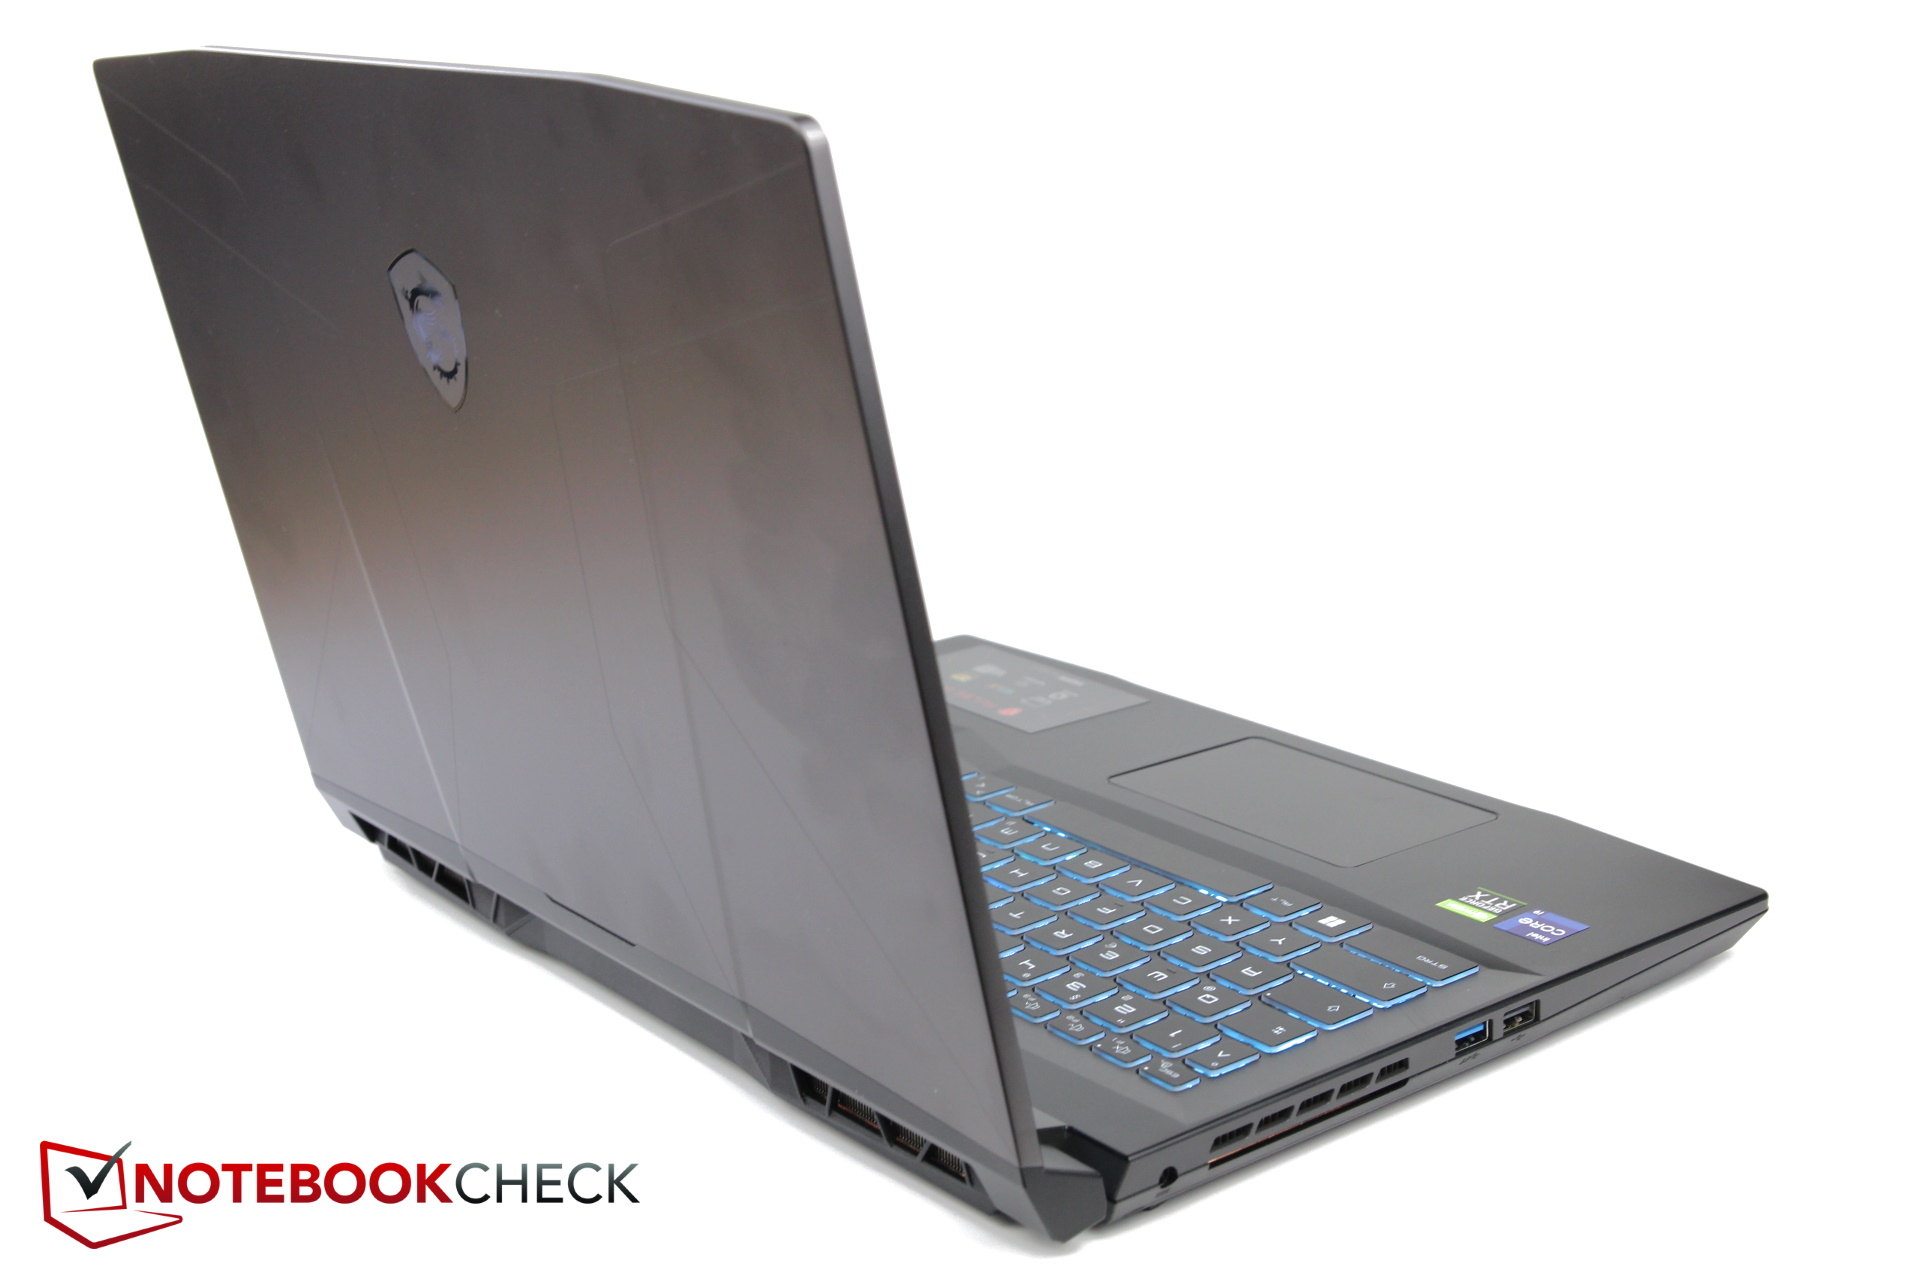
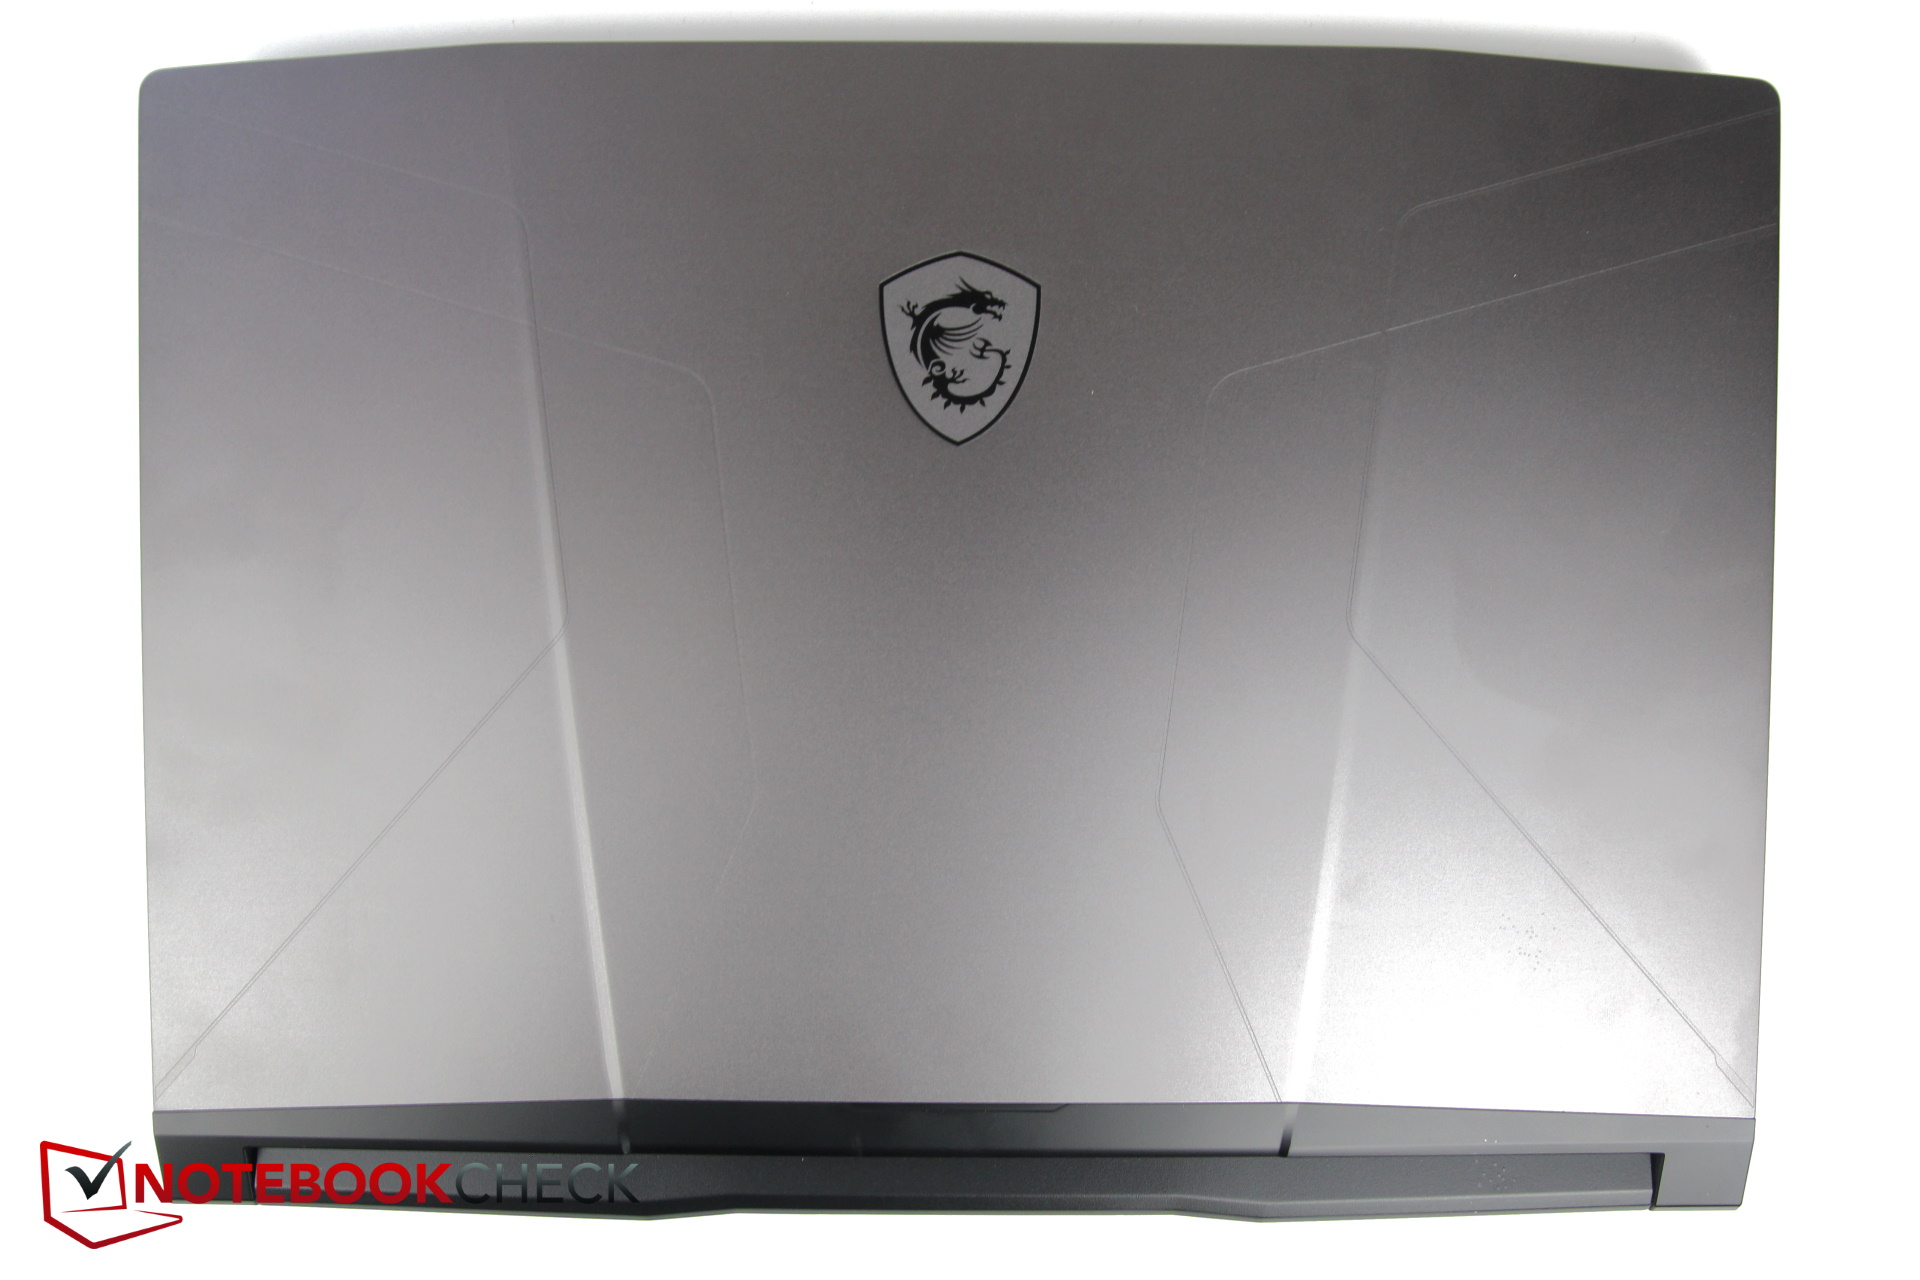
该设计针对的是游戏玩家,没有过多的装饰。银灰色的顶部突出显示了类似于保时捷的盾牌标志与龙,底部与底部则保持了深黑色。做工似乎不错,我们没有发现任何不均匀的缝隙。
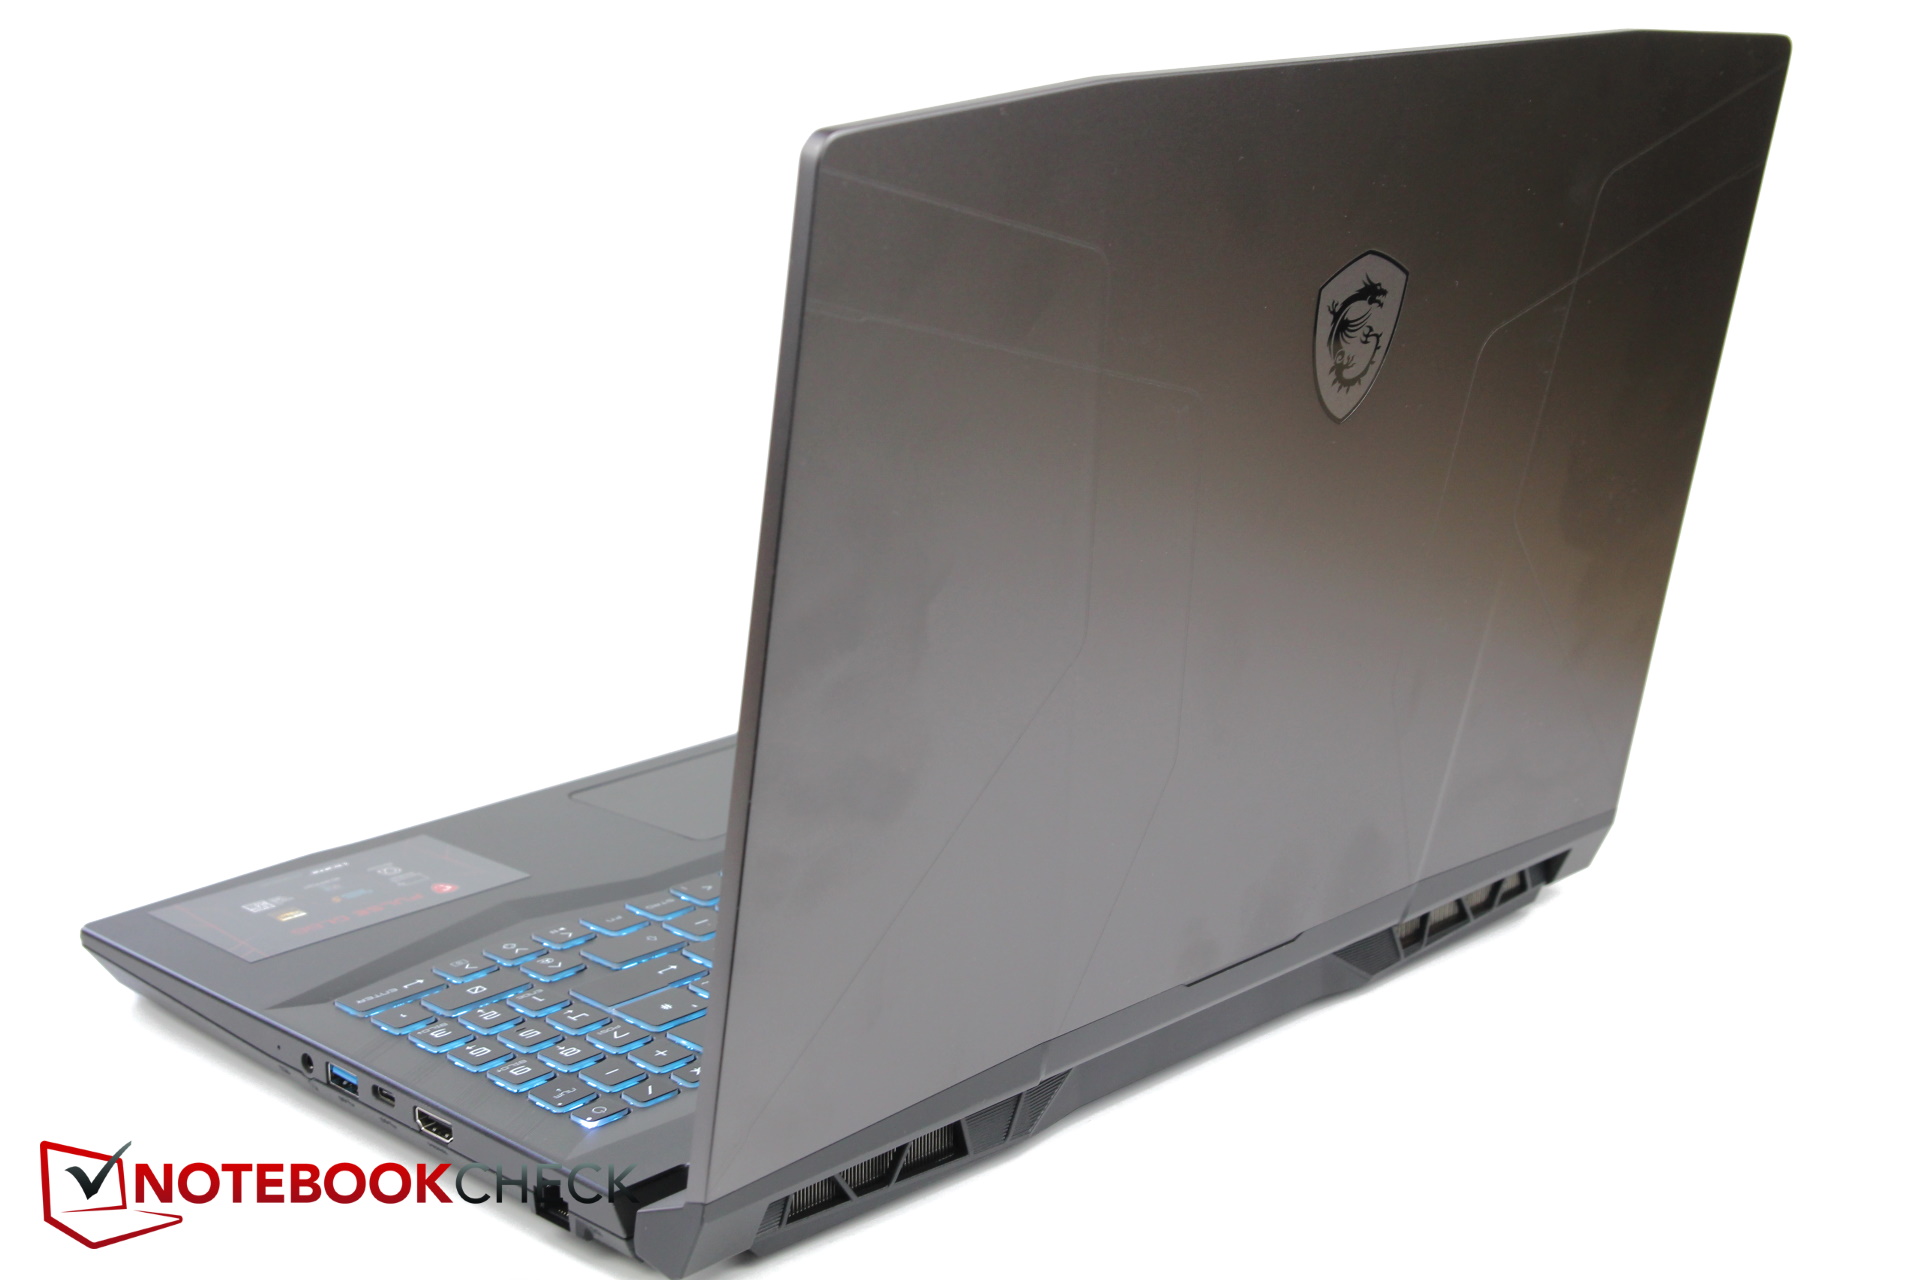
除了较大的Alienware m5,我们测试领域中的大多数笔记本电脑的长度和宽度大致相同。微星的厚度使其处于该领域的中间位置。然而,微星指定的23.4毫米(约0.92英寸)的厚度更有可能是指最薄的地方,而该笔记本向后的尺寸更像是25毫米(约0.98英寸)。
Legion S7和Alienware x14表明,游戏笔记本电脑也可以更薄,但XMG Apex和TUG Gaming F15都比较厚。在重量方面,微星是较重的机型之一,只有Alienware m5更重。
装备
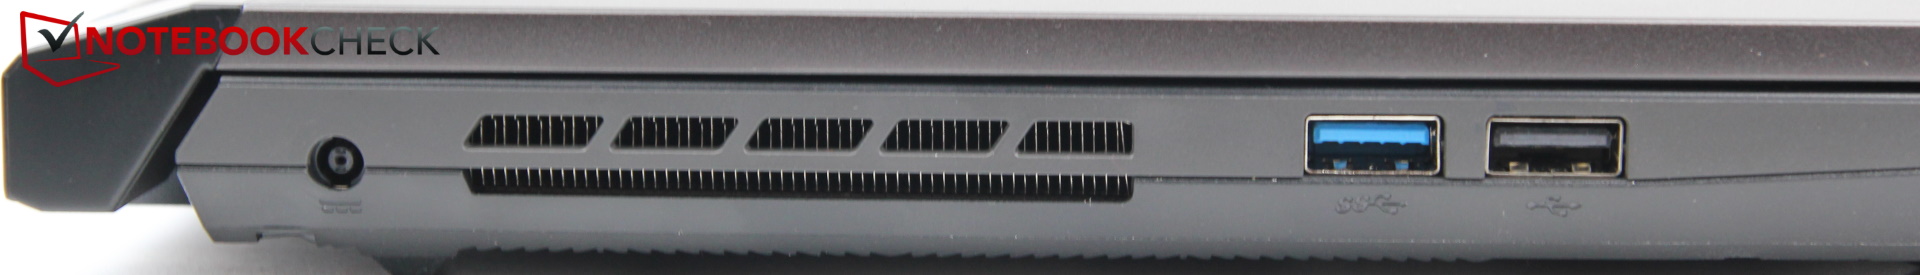
只有最必要的连接是存在的,但没有别的。总共有四个USB端口,其中一个是USB-C格式。不幸的是,这也只是3.2 Gen 1,几乎与USB 3.0(5Gb/s)相同。Thunderbolt是缺乏的,只是作为一个SD卡读卡器。三个USB-A端口中的一个甚至只支持2.0的速度,这已经不符合当前的标准。
但更糟糕的是,USB-C端口没有正常工作。我们装在M.2盒子里的外部固态硬盘不断地在USB-C端口上重新公布自己的信息。虽然固态硬盘的灯一直亮着,但操作系统却一直在注册和取消注册它。重启也无济于事,我们不得不改用USB-C转A的适配器。之后,这个问题就不再发生了。我们在微星Katana上遇到了同样的问题,但我们同时测试的华硕TUF Gaming F17或ROG Strix Scar却没有出现这个问题。也许我们的USB-C插头不能插入微星的端口足够深。
端口的分布也不是很理想。大多数端口都在右侧,包括HDMI端口,其潜在的大插头和僵硬的电缆。这对右撇子用户来说是个烦恼。此外,端口之间的距离相当近,特别是左侧的两个USB-A端口,否则就没有任何连接。
我们还应该提到,电源插头不是很紧。在我们的测试中,有好几次,它在我们没有注意到的情况下滑出了一半。

沟通
Pulse通过英特尔AX201模块连接到WLAN。它的潜力没有得到充分利用,在我们的比较中,传输率处于底端。
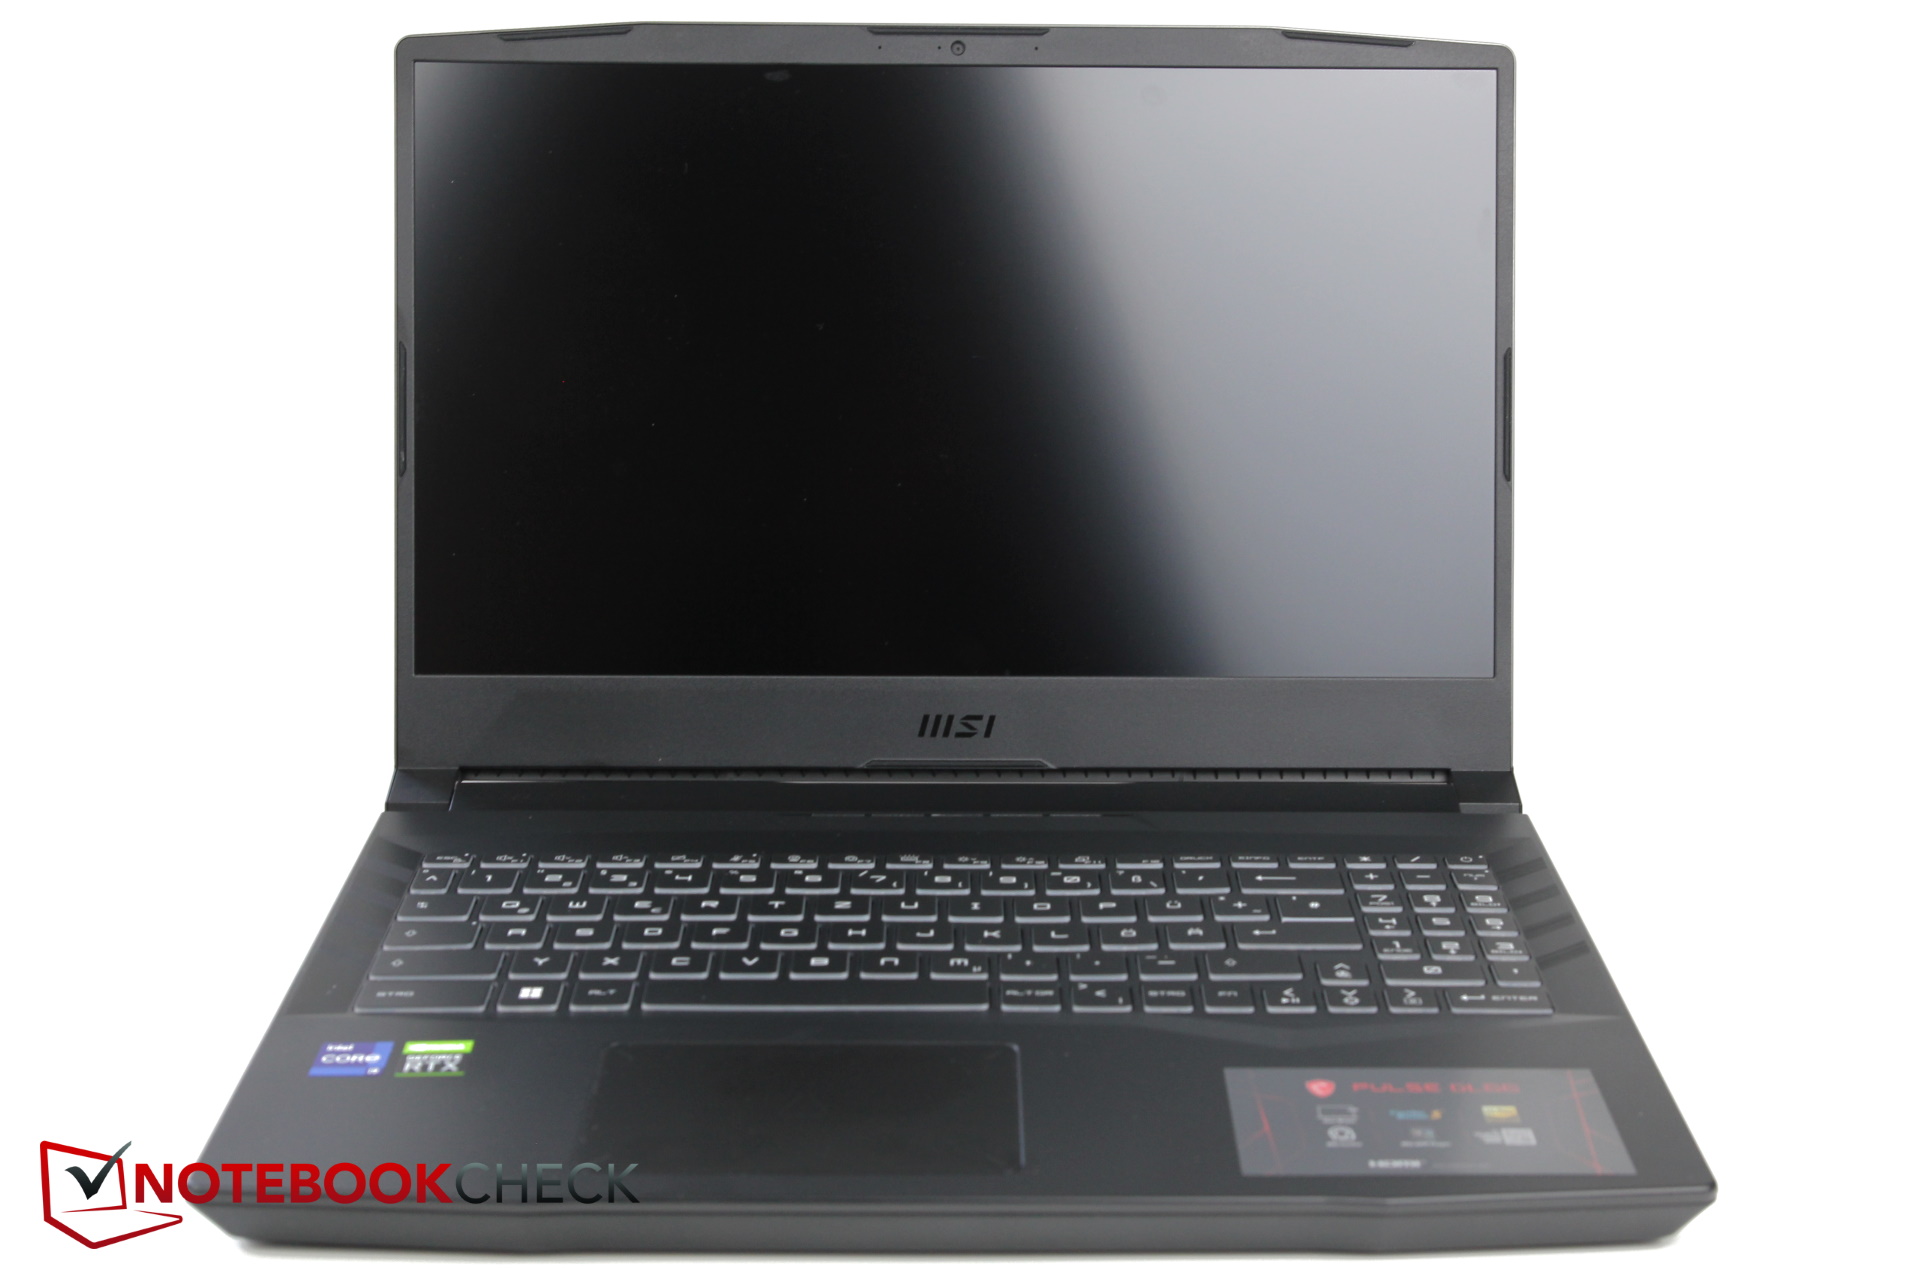
网络摄像头
使用了一个标准的720p网络摄像头。多年来,许多笔记本电脑在这方面没有真正的重大升级,不管这是否与科罗纳的短缺有关。但至少颜色偏差仍在限制范围内。


安全问题
对于安全纯粹主义者来说,Pulse并没有什么可提供的,既没有指纹传感器,也没有Kensington连接。不过,当然也包括TPM 2.0。
配件和保修
除了一些 "酷 "的贴纸和240瓦的电源外,微星没有包括任何其他值得一提的笔记本电脑。保修期包括24个月的提货和退货服务。
维护
微星将其中一颗螺丝藏在贴纸后面。我们的测试设备是由数码港商店提供的借用设备,所以我们不想破坏贴纸的密封性来打开设备。然而,根据微星公司的说法,客户也可以打开设备进行维护工作。只要这样做是 "专业的",设备的保修应该不会受到影响。
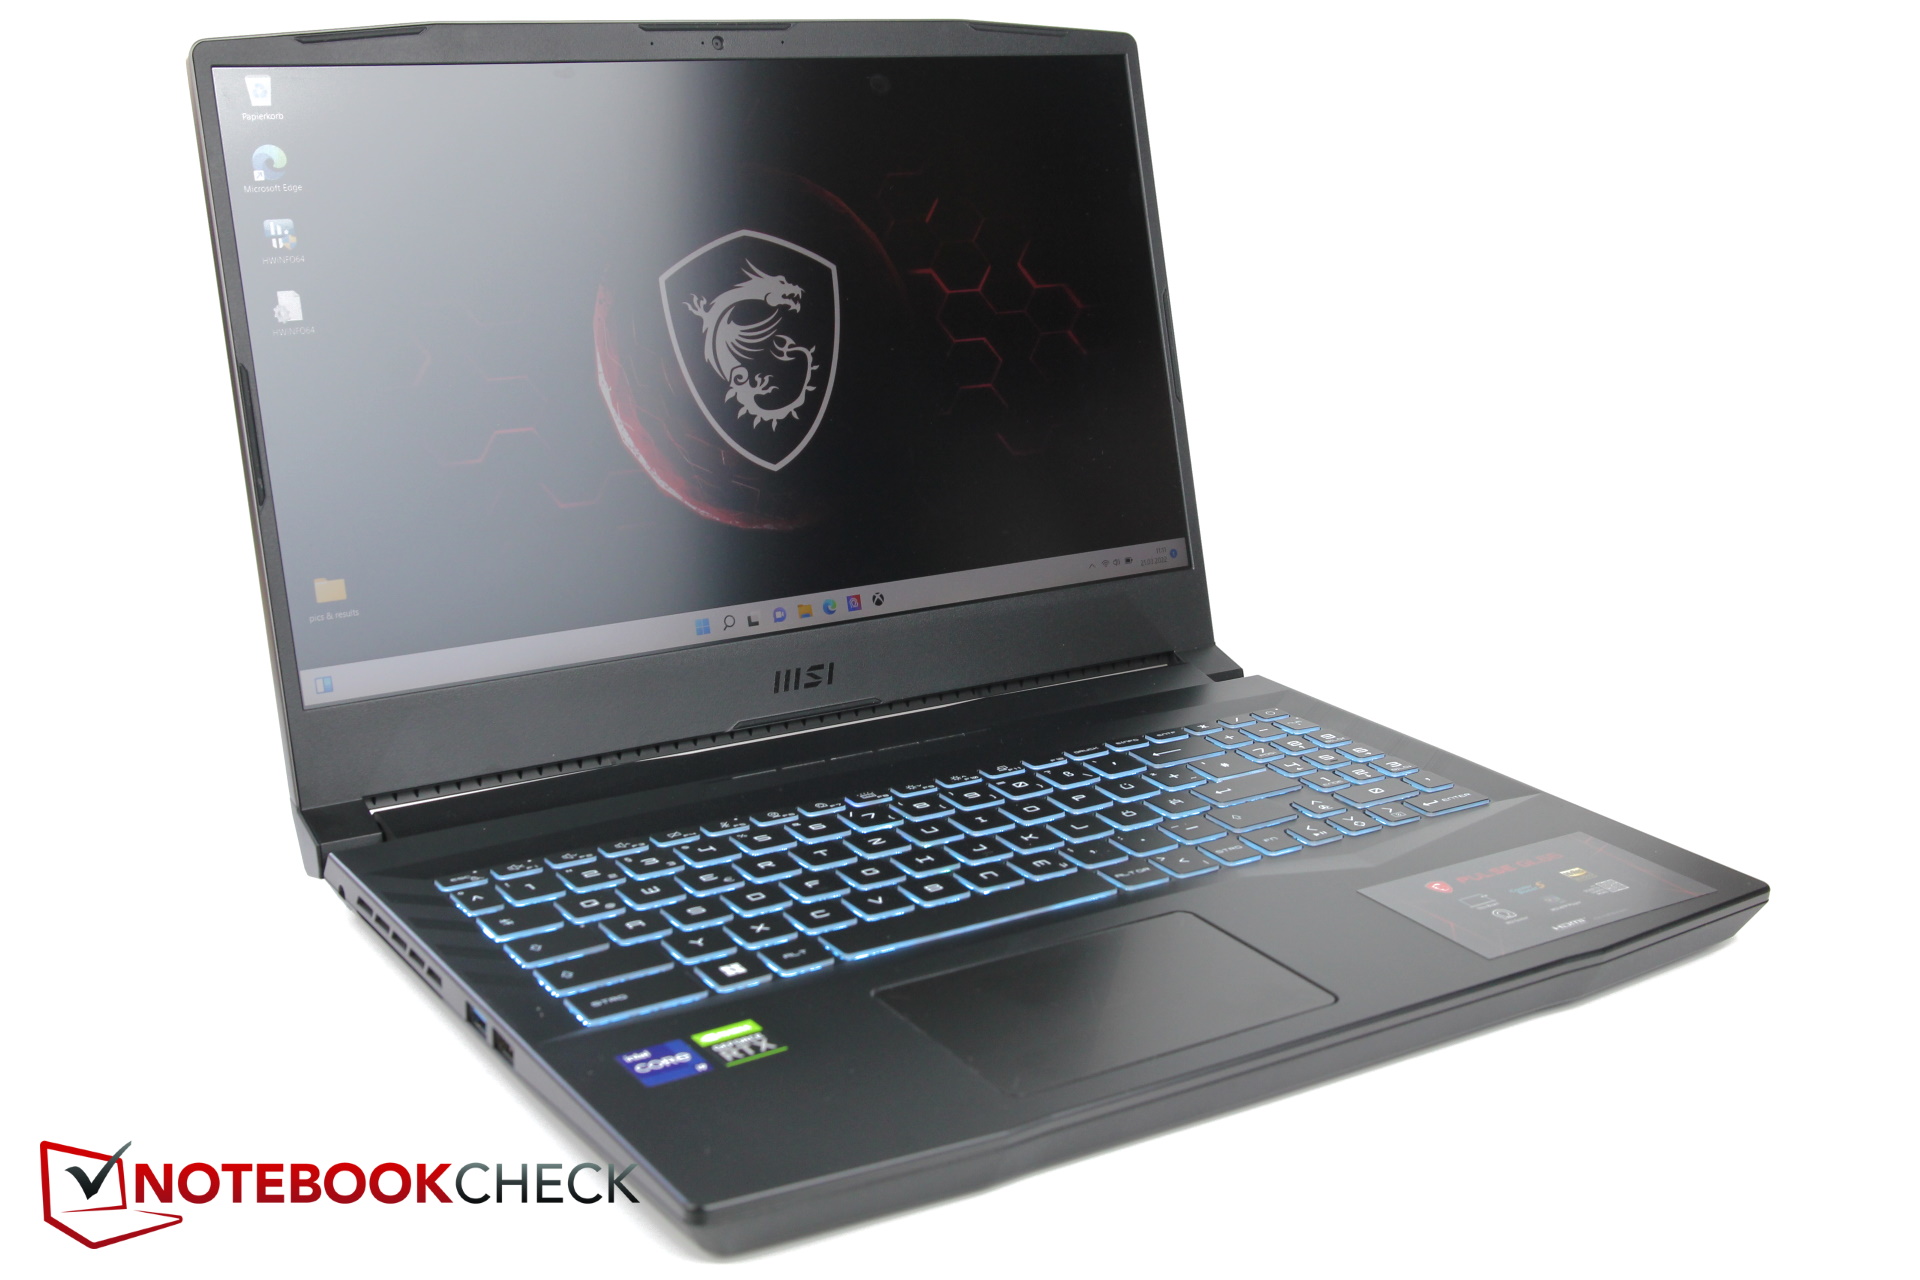
输入设备
键盘
键盘显示出与其他微星笔记本电脑(如Katana系列)的极大相似性。它的布局看起来很合理,但是由于它的按键紧挨着,而且有些按键还非常小,看起来有点拥挤。特别是F键和挤在它们旁边的数字键盘,都显得非常小。
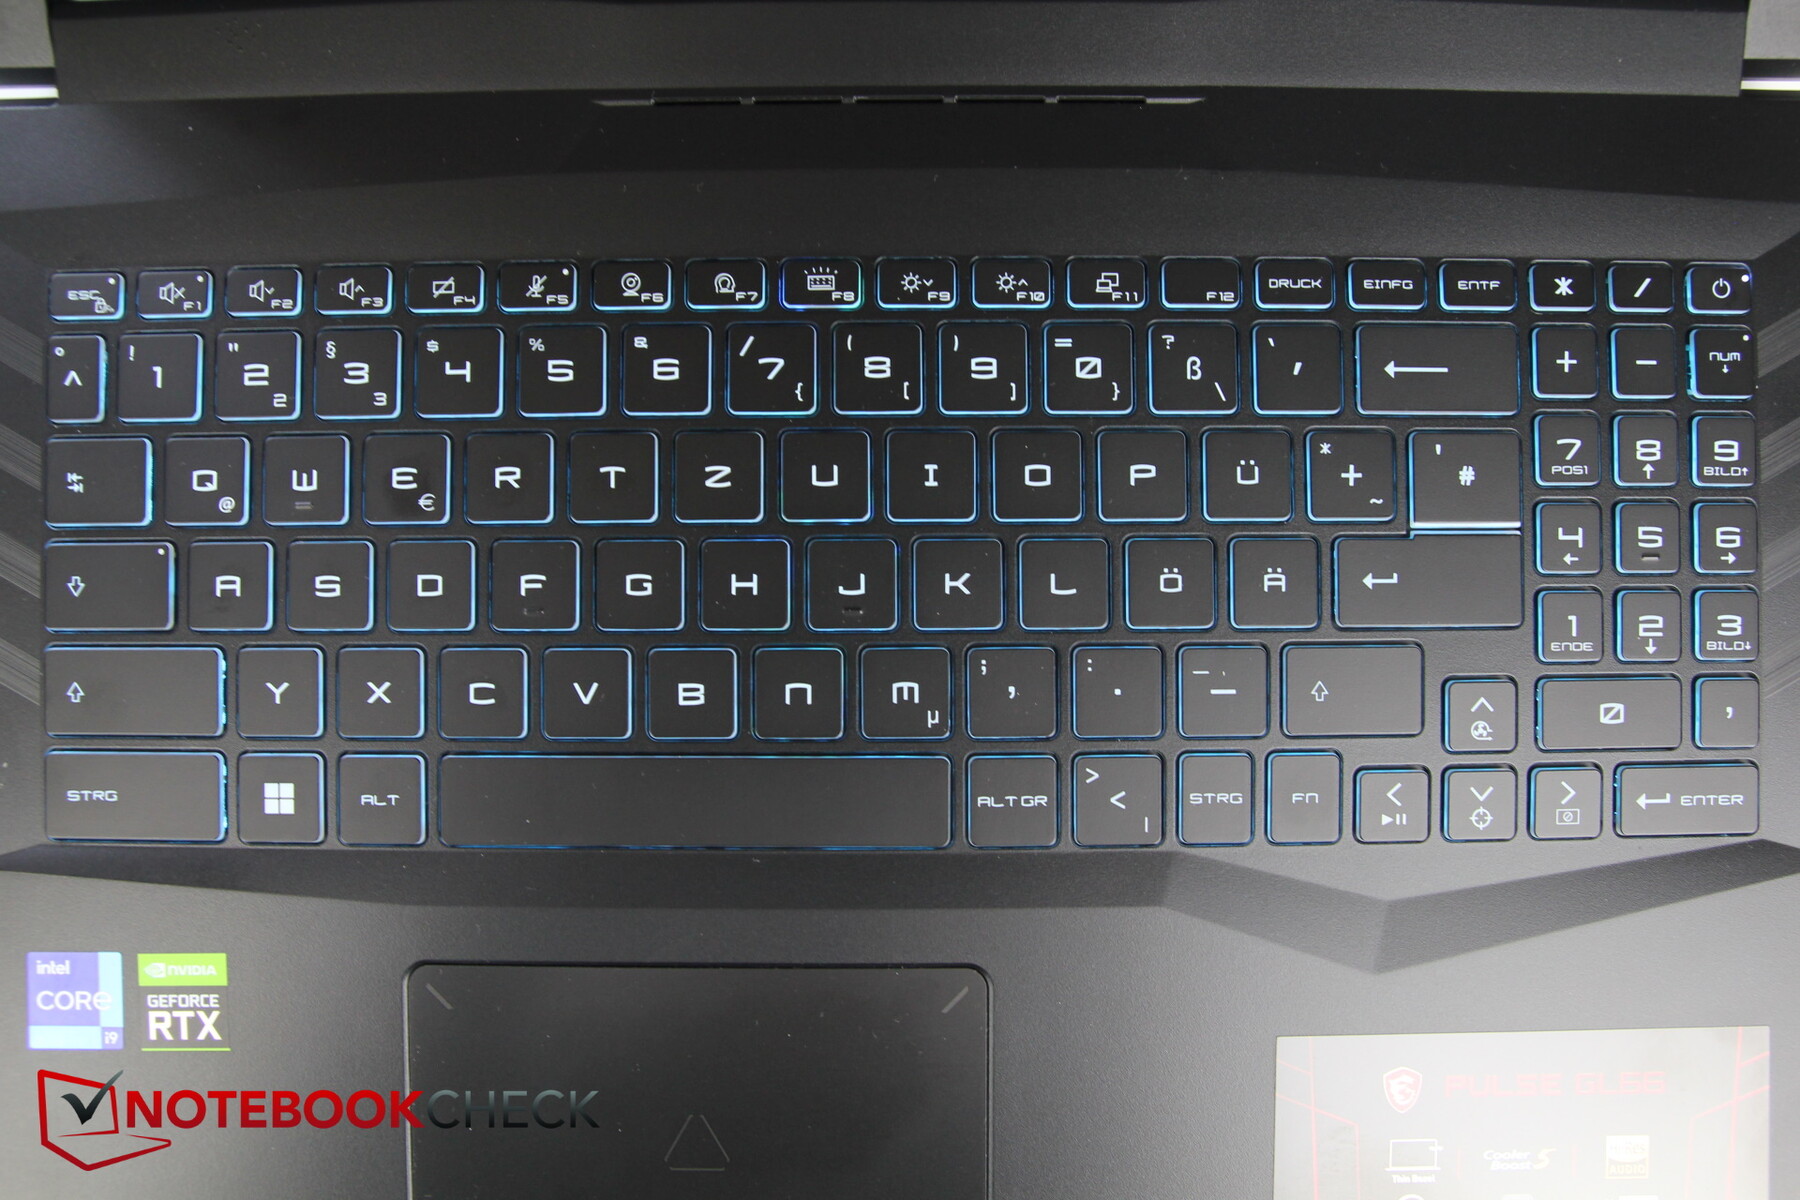
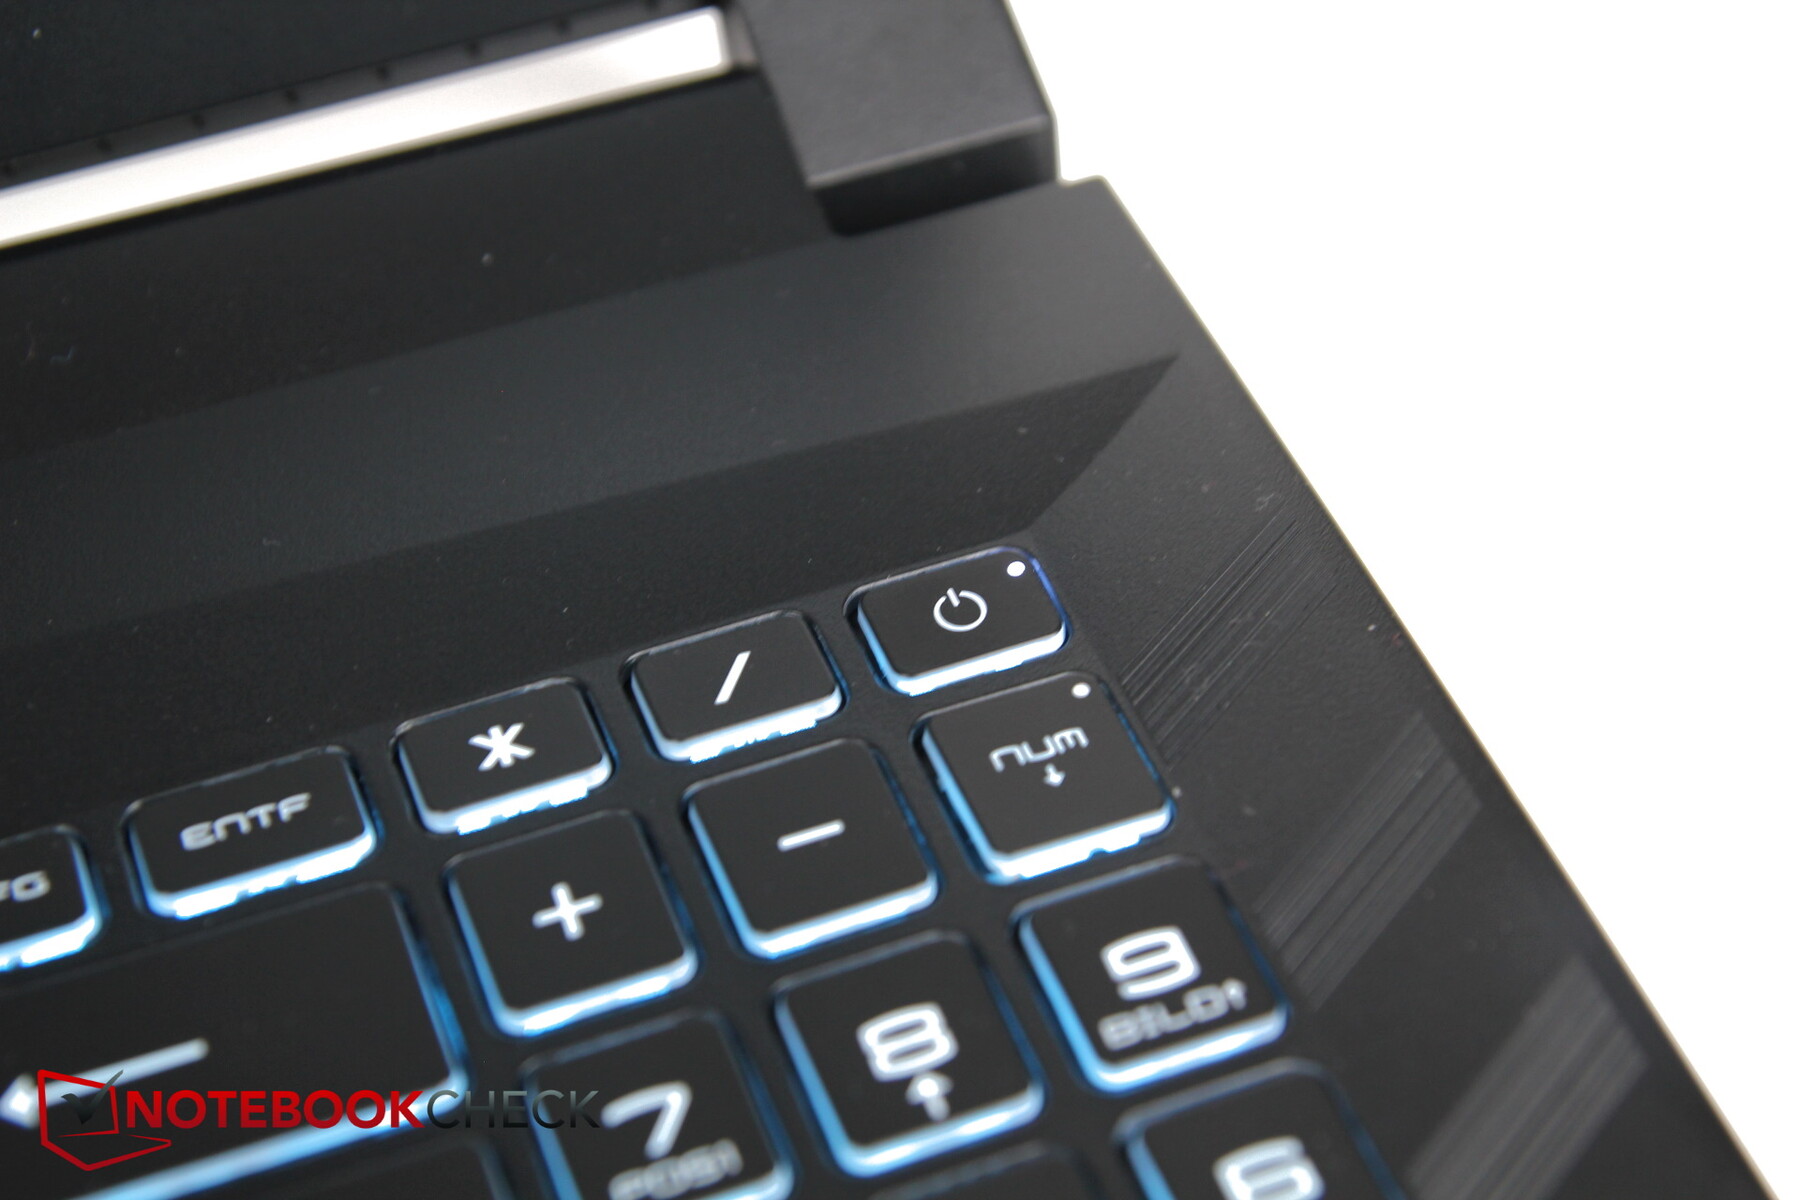
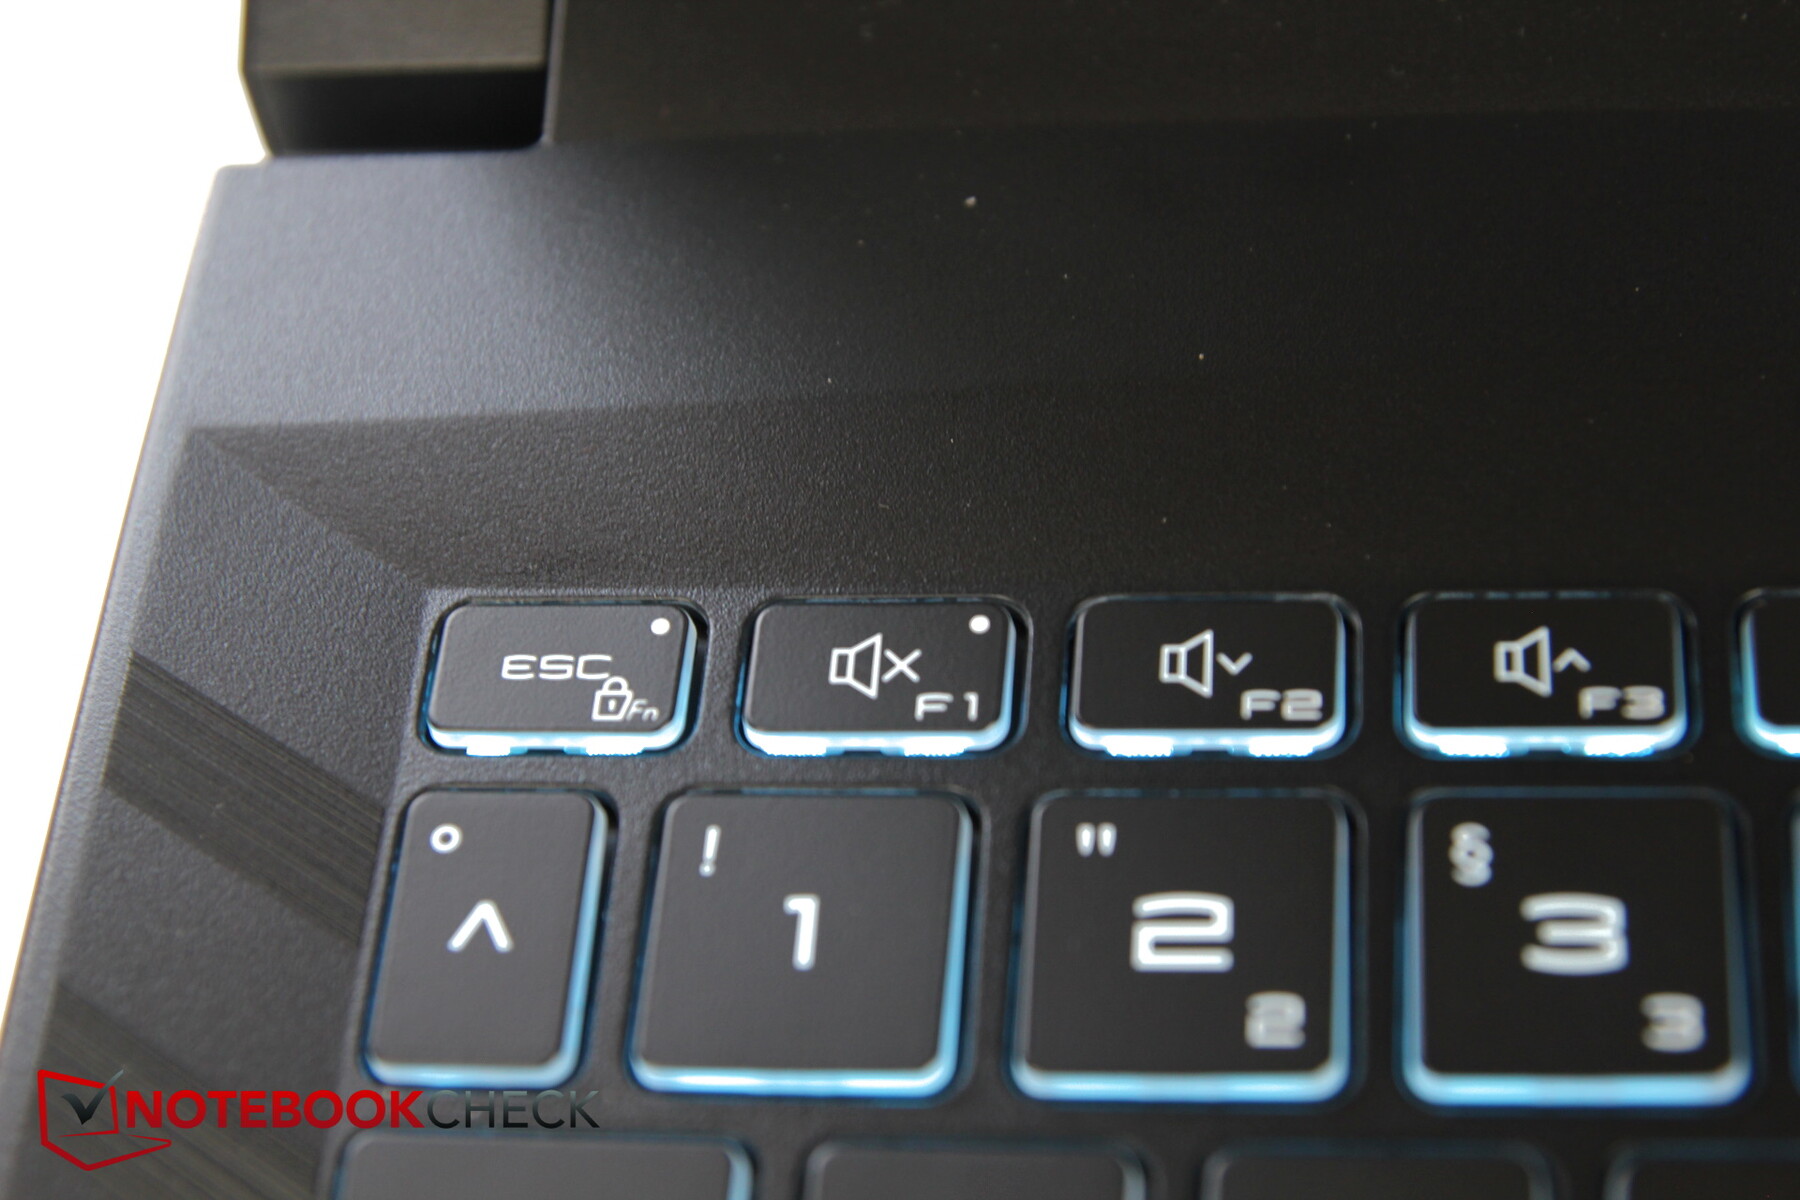
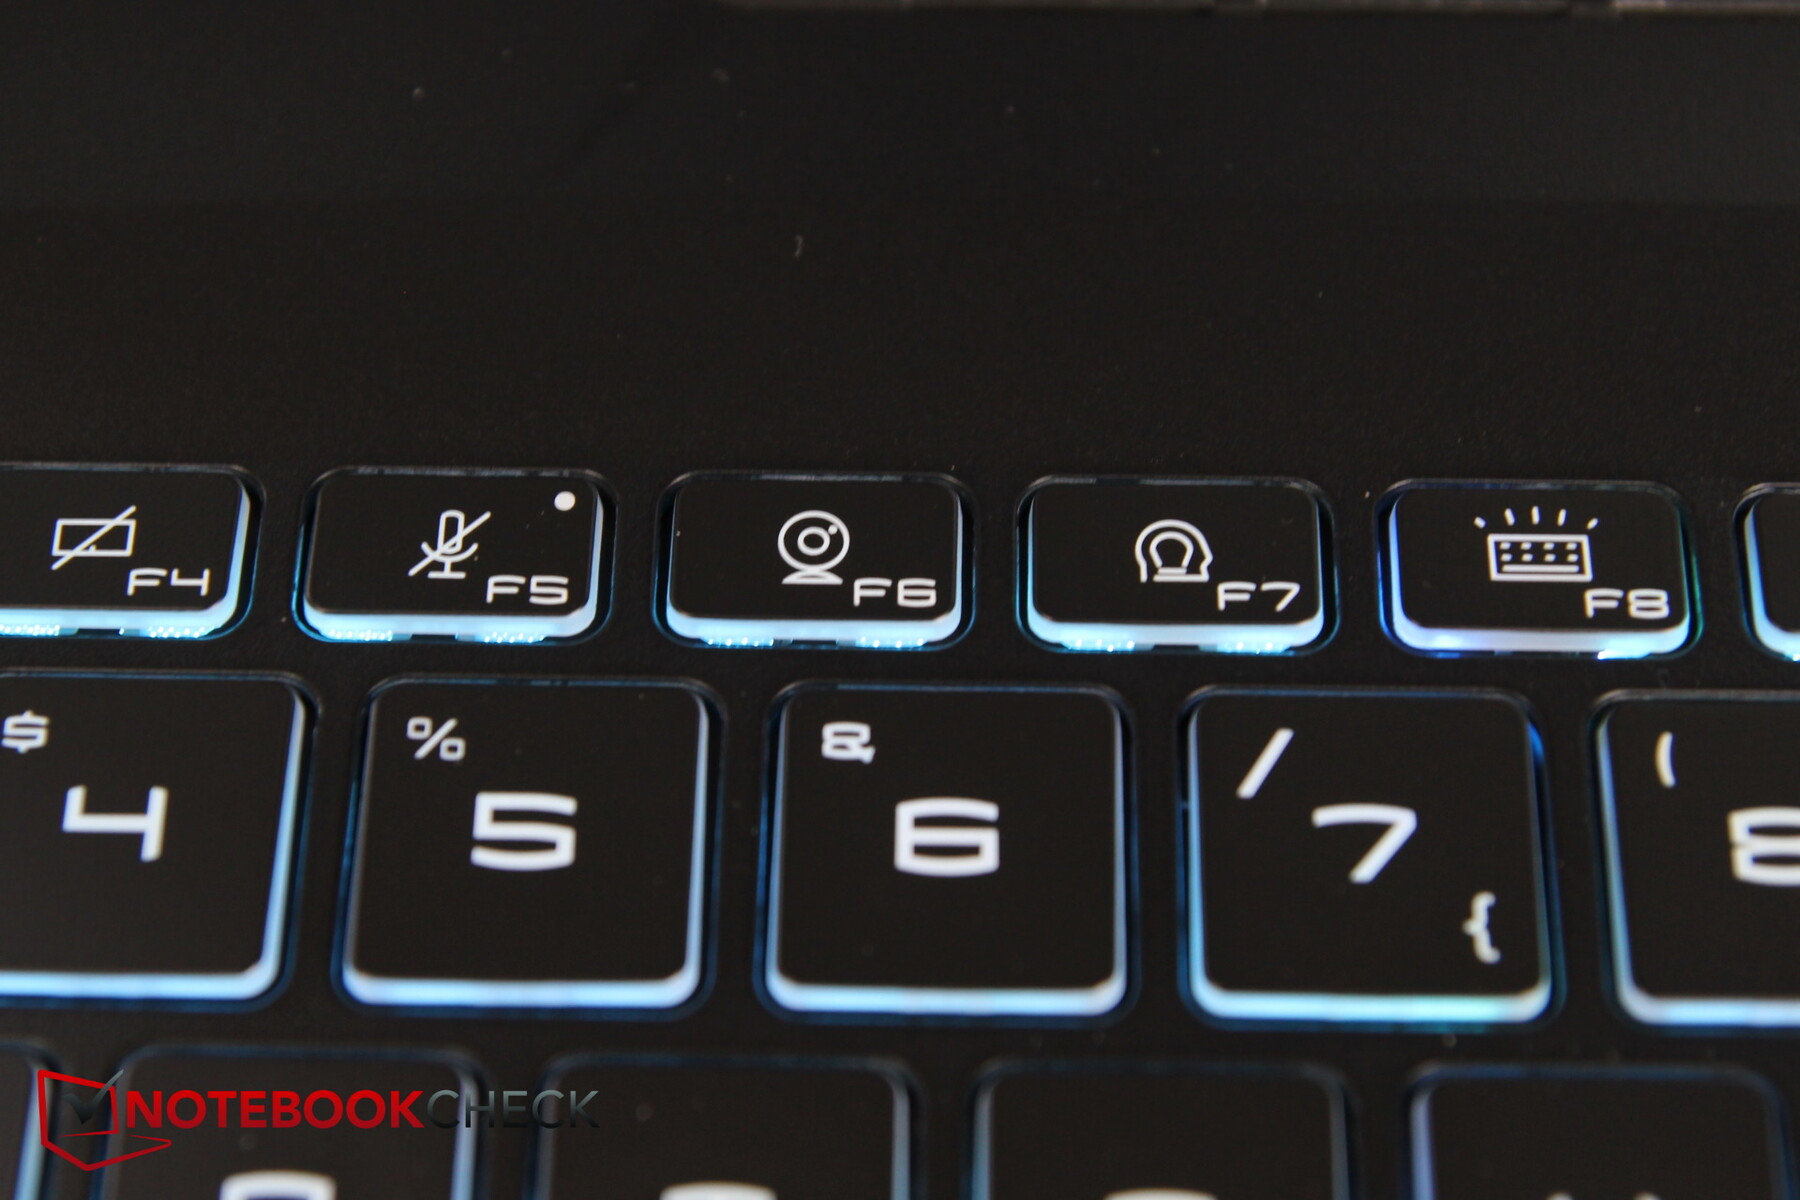
作为微星的典型,Fn键被放在右边而不是左边,但它可以与左边的Windows键切换功能。方向键还容纳了一些特殊的功能,如打开风扇助推器,关闭显示器,或叠加十字线等。
键的标签很容易阅读,并使用了未来主义的字体风格,可能是为了吸引游戏玩家。
虽然有一个短的行程,但反馈还可以,让你轻松快速地打字。键盘在压力下不会出现恼人的弯曲,而且打字的噪音也适中。
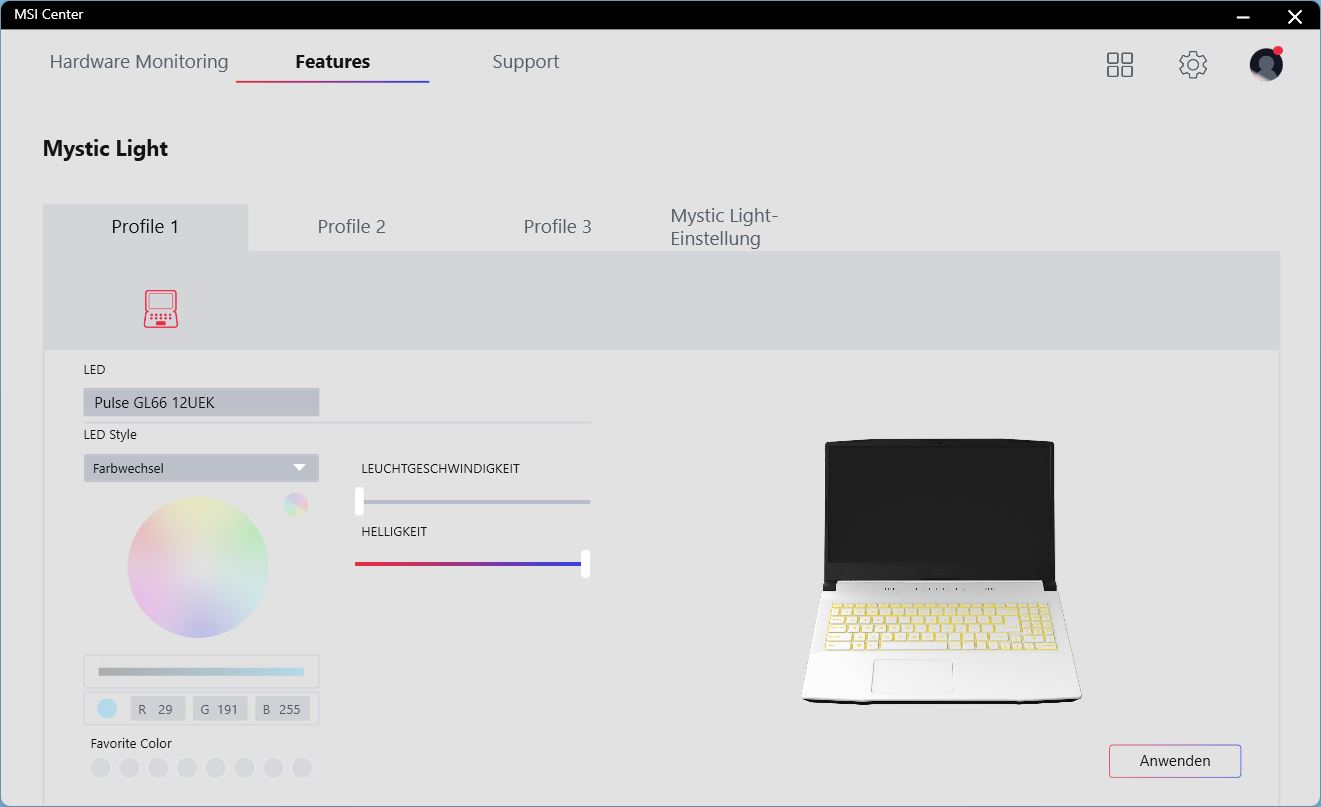
虽然有键盘照明,但它只有一个区域。你可以在微星中心调整颜色和许多其他设置。
触摸板
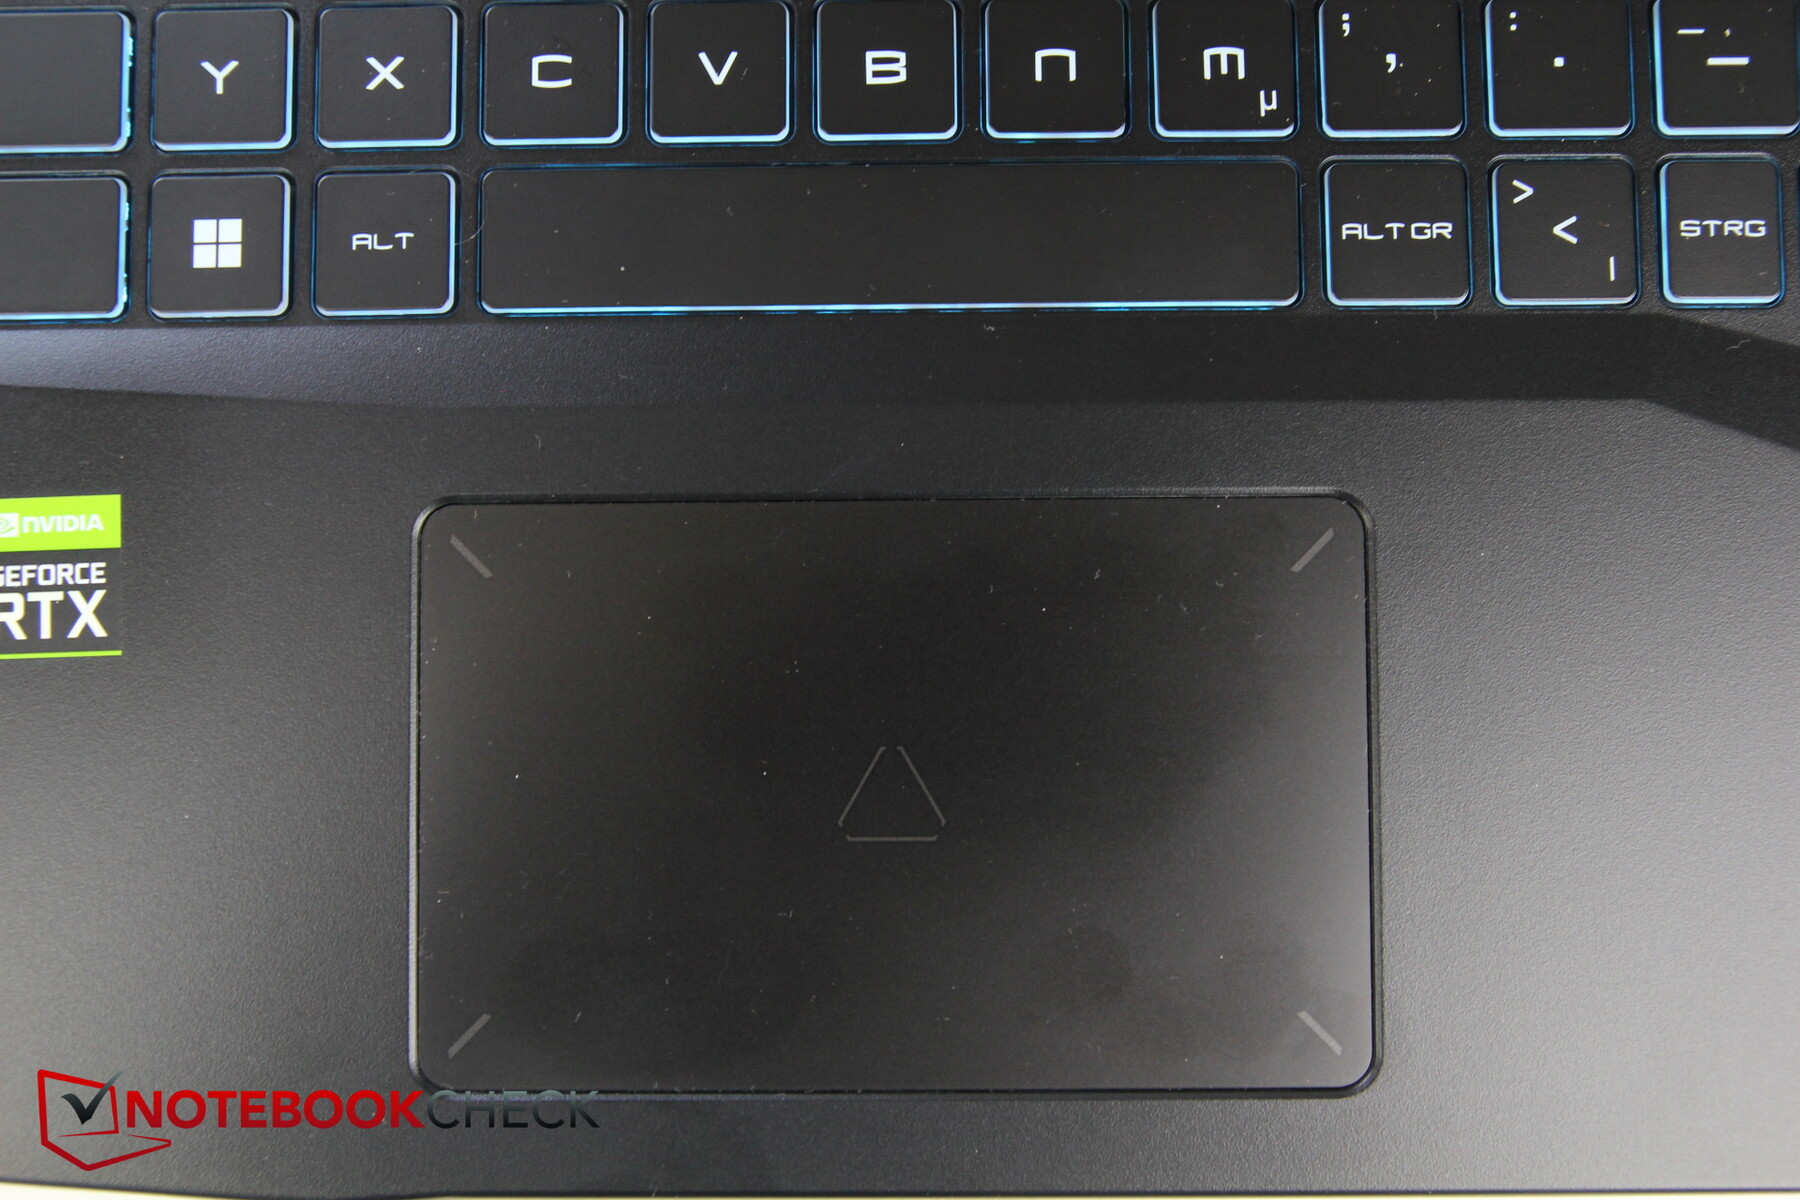
触摸板看起来不是很大,约10.5 x 6.5厘米(约4.1 x 2.6英寸)。虽然表面很光滑,但手指只是稍微湿润就已经有点粘连了。多点触摸输入仍然工作得非常好。
集成的鼠标键有一个清晰的、非常短的、清晰的压力点。它们比键盘的声音略大,但没有达到特别令人讨厌的程度。
显示

微星使用了来自友达光电的144赫兹的哑光全高清IPS显示屏。微星去年已经使用了这种模式,例如在 GF65 Thin.该面板的一个很大的缺点是它的亮度很弱,不到250尼特。亮度分布仍在可接受的范围内,为86%。
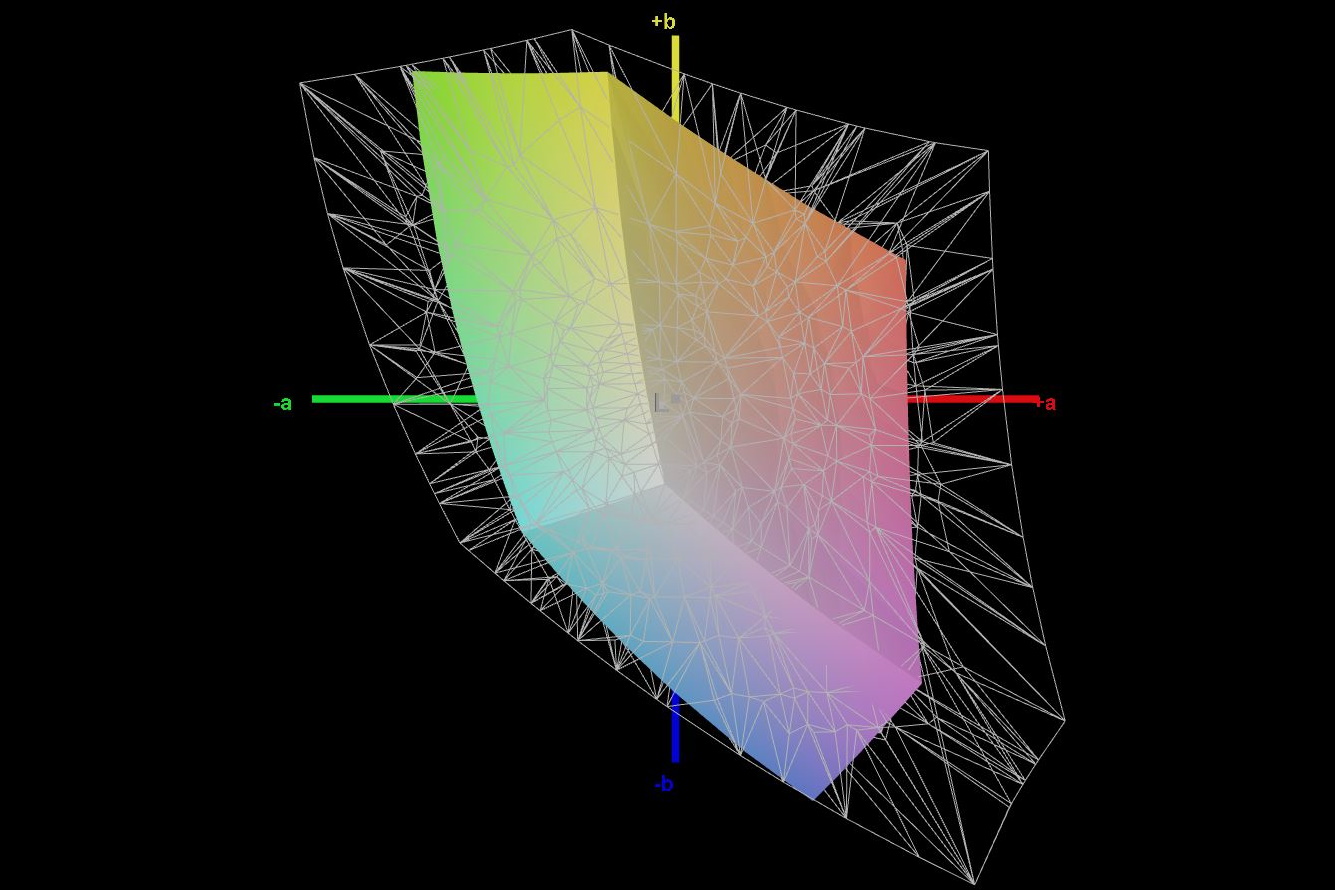
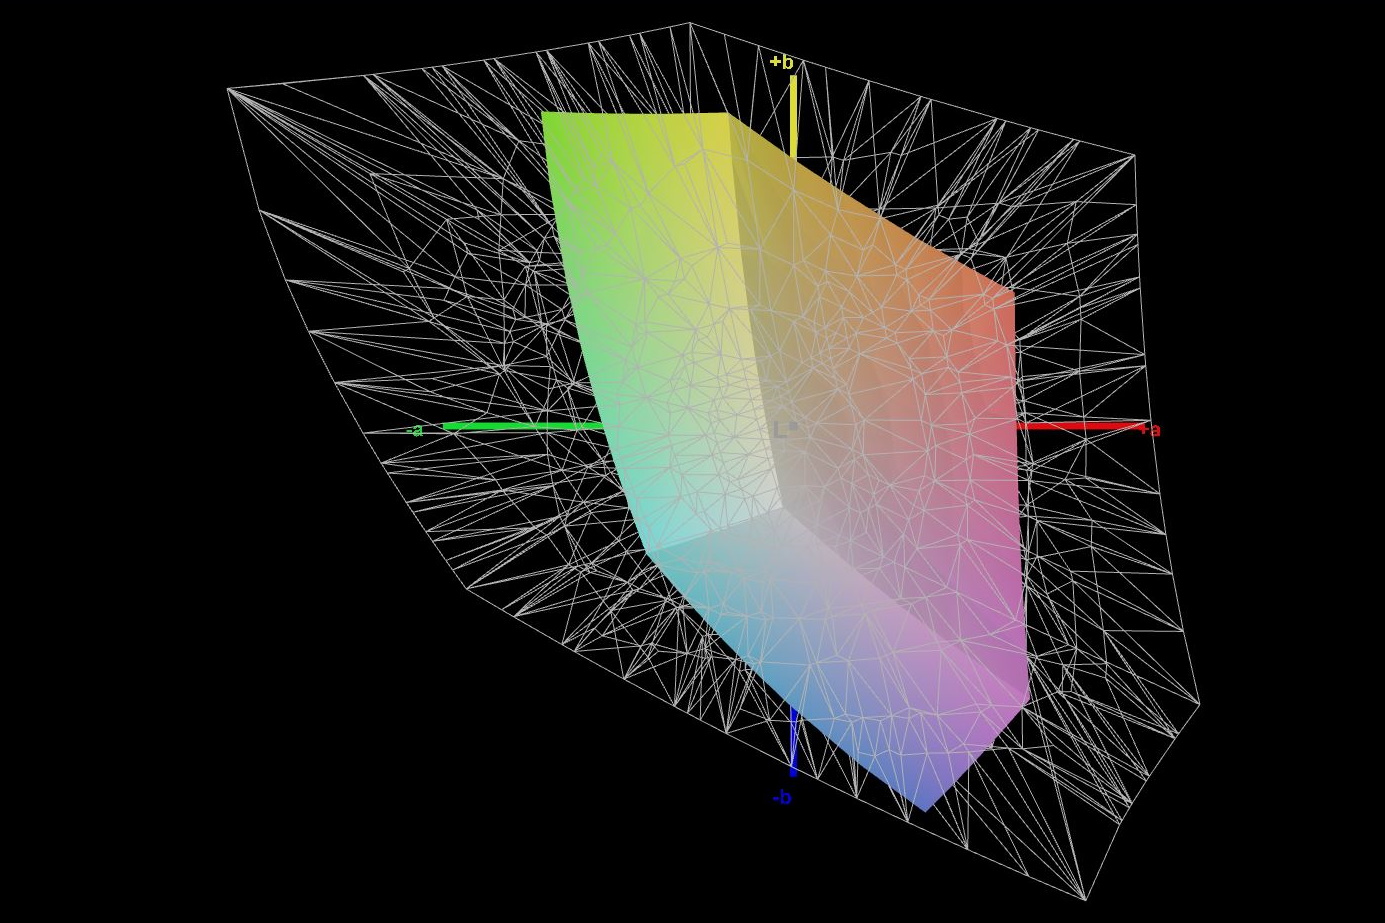
至少黑值很低,对比度很高,但只有58%的sRGB,色彩空间覆盖率变弱。对于一台游戏笔记本电脑来说,响应时间也相当弱。
不幸的是,看起来没有任何其他显示选项。至少17英寸的Pulse提供了一个360赫兹的面板,希望它也能更亮。
虽然在左边的顶部边缘有一些屏幕渗漏,但几乎不明显。
| |||||||||||||||||||||||||
Brightness Distribution: 86 %
Center on Battery: 247 cd/m²
Contrast: 1908:1 (Black: 0.13 cd/m²)
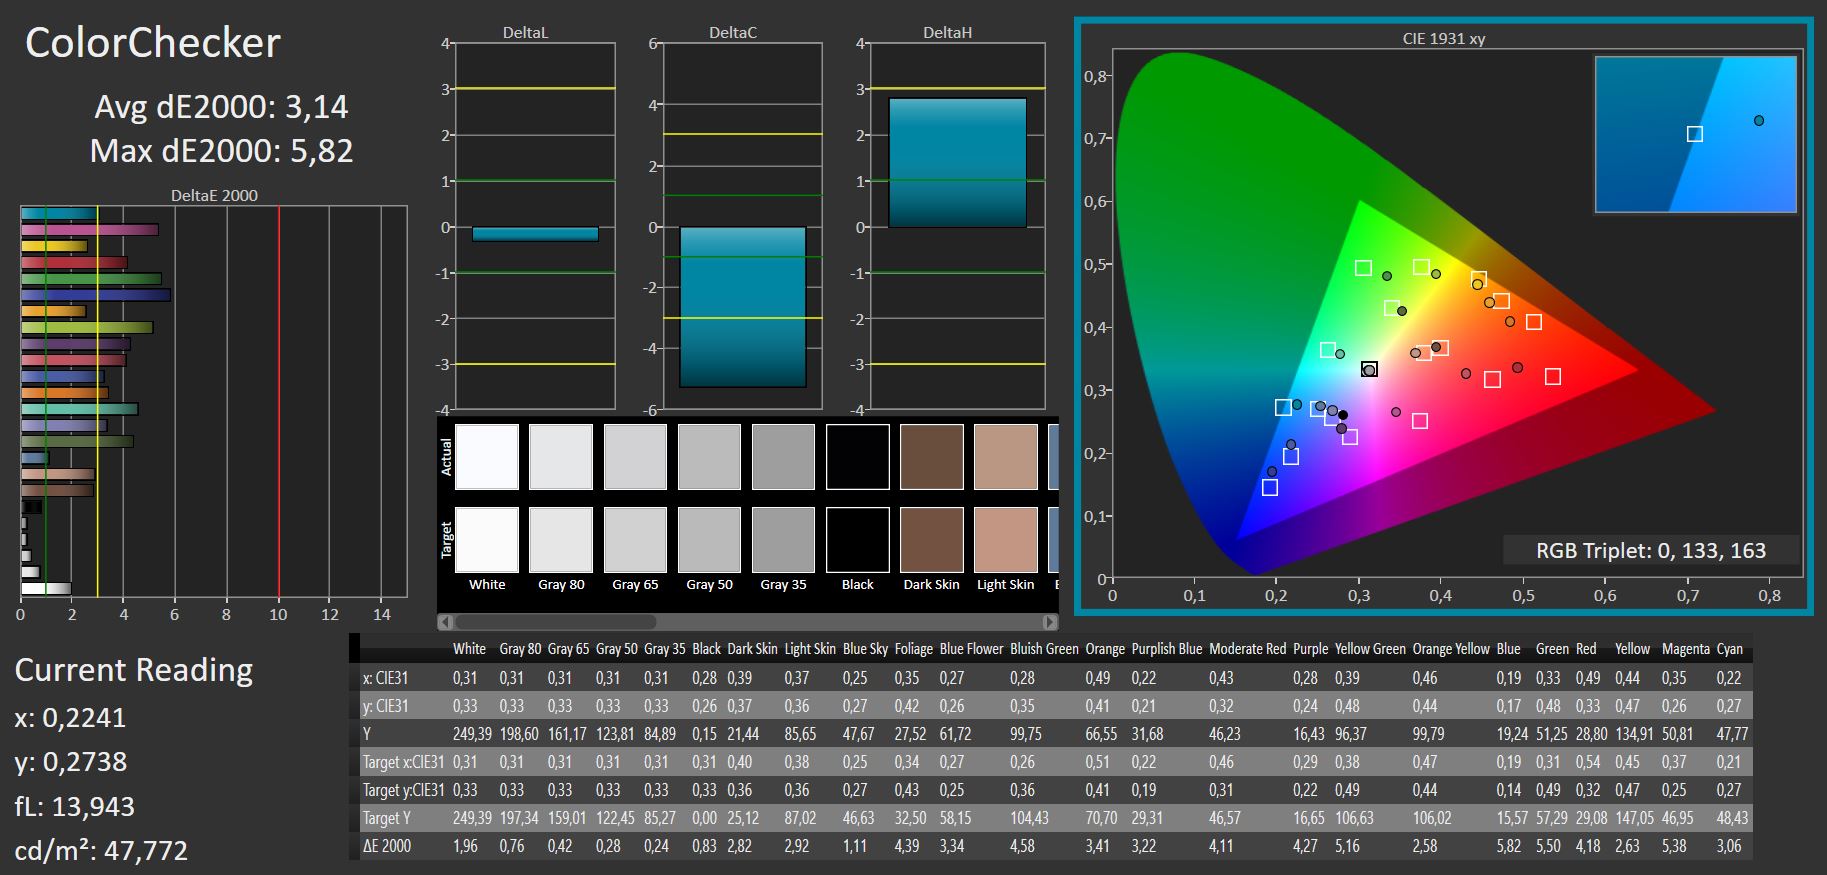
ΔE ColorChecker Calman: 3.14 | ∀{0.5-29.43 Ø4.71}
calibrated: 3.14
ΔE Greyscale Calman: 1.2 | ∀{0.09-98 Ø4.96}
40.3% AdobeRGB 1998 (Argyll 3D)
58.4% sRGB (Argyll 3D)
39% Display P3 (Argyll 3D)
Gamma: 2.49
CCT: 6468 K
| MSI Pulse GL66 12UEK AU Optronics B156HAN08.4 (AUOAF90), IPS, 1920x1080, 15.6" | Asus TUF Gaming F15 FX507ZM TL156VDXP0101, IPS, 1920x1080, 15.6" | Alienware x14 i7 RTX 3060 SHP154D, IPS, 1920x1080, 14" | Schenker XMG Apex 15 NH57E PS LG Philips LGD0625 (LP156WFG-SPB3), IPS, 1920x1080, 15.6" | Lenovo Legion S7 15ACH6 82K80030GE CSOT T3 MNF601EA1-6, IPS, 3840x2160, 15.6" | Alienware m15 R5 Ryzen Edition B156HAN, IPS, 1920x1080, 15.6" | |
|---|---|---|---|---|---|---|
| Display | 69% | 114% | 64% | 110% | ||
| Display P3 Coverage (%) | 39 | 66.4 70% | 99.6 155% | 64.5 65% | 85.2 118% | |
| sRGB Coverage (%) | 58.4 | 97 66% | 100 71% | 95.9 64% | 98.8 69% | |
| AdobeRGB 1998 Coverage (%) | 40.3 | 68.5 70% | 87.6 117% | 65.8 63% | 98.2 144% | |
| Response Times | 70% | 74% | 60% | 31% | 80% | |
| Response Time Grey 50% / Grey 80% * (ms) | 38.8 ? | 5.6 ? 86% | 9.6 ? 75% | 15 61% | 31.6 ? 19% | 4 ? 90% |
| Response Time Black / White * (ms) | 28 ? | 12.8 ? 54% | 7.6 ? 73% | 11.6 59% | 16 ? 43% | 8.4 ? 70% |
| PWM Frequency (Hz) | ||||||
| Screen | -3% | -24% | -40% | 30% | -12% | |
| Brightness middle (cd/m²) | 248 | 353.7 43% | 434 75% | 393 58% | 607 145% | 329 33% |
| Brightness (cd/m²) | 245 | 340 39% | 411 68% | 353 44% | 605 147% | 321 31% |
| Brightness Distribution (%) | 86 | 89 3% | 89 3% | 83 -3% | 93 8% | 92 7% |
| Black Level * (cd/m²) | 0.13 | 0.34 -162% | 0.25 -92% | 0.47 -262% | 0.41 -215% | 0.27 -108% |
| Contrast (:1) | 1908 | 1040 -45% | 1736 -9% | 836 -56% | 1480 -22% | 1219 -36% |
| Colorchecker dE 2000 * | 3.14 | 1.74 45% | 3 4% | 2.84 10% | 0.84 73% | 2.78 11% |
| Colorchecker dE 2000 max. * | 5.82 | 3.63 38% | 7.1 -22% | 7.15 -23% | 3.02 48% | 4.88 16% |
| Colorchecker dE 2000 calibrated * | 3.14 | 0.5 84% | 0.7 78% | 0.67 79% | 0.69 78% | 1.63 48% |
| Greyscale dE 2000 * | 1.2 | 2.1 -75% | 5.1 -325% | 3.73 -211% | 1.1 8% | 2.5 -108% |
| Gamma | 2.49 88% | 2.3 96% | 2.19 100% | 2.53 87% | 2.131 103% | 2.106 104% |
| CCT | 6468 100% | 6257 104% | 6204 105% | 7312 89% | 6648 98% | 6201 105% |
| Color Space (Percent of AdobeRGB 1998) (%) | 76 | |||||
| Color Space (Percent of sRGB) (%) | 99 | |||||
| Total Average (Program / Settings) | 45% /
23% | 55% /
19% | 28% /
-4% | 57% /
47% | 34% /
5% |
* ... smaller is better
至少在交付状态下,面板已经被很好地校准了。灰度的偏差只有1.2。因此,你很难再通过手动校准获得任何改进。


Display Response Times
| ↔ Response Time Black to White | ||
|---|---|---|
| 28 ms ... rise ↗ and fall ↘ combined | ↗ 14.6 ms rise | 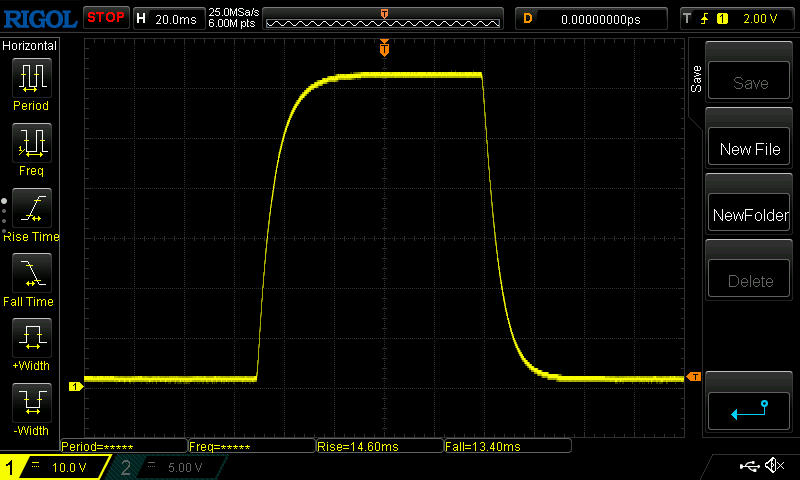 |
| ↘ 13.4 ms fall | ||
| The screen shows relatively slow response rates in our tests and may be too slow for gamers. In comparison, all tested devices range from 0.1 (minimum) to 240 (maximum) ms. » 71 % of all devices are better. This means that the measured response time is worse than the average of all tested devices (19.8 ms). | ||
| ↔ Response Time 50% Grey to 80% Grey | ||
| 38.8 ms ... rise ↗ and fall ↘ combined | ↗ 18.2 ms rise | 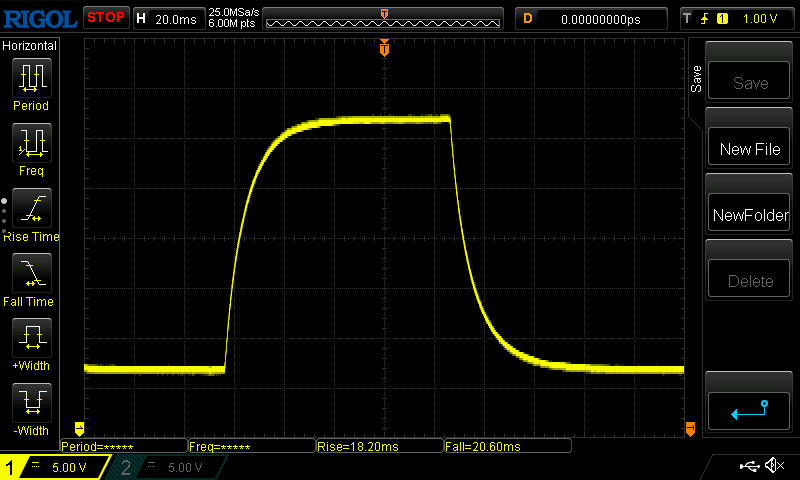 |
| ↘ 20.6 ms fall | ||
| The screen shows slow response rates in our tests and will be unsatisfactory for gamers. In comparison, all tested devices range from 0.165 (minimum) to 636 (maximum) ms. » 58 % of all devices are better. This means that the measured response time is worse than the average of all tested devices (30.9 ms). | ||
Screen Flickering / PWM (Pulse-Width Modulation)
| Screen flickering / PWM not detected | 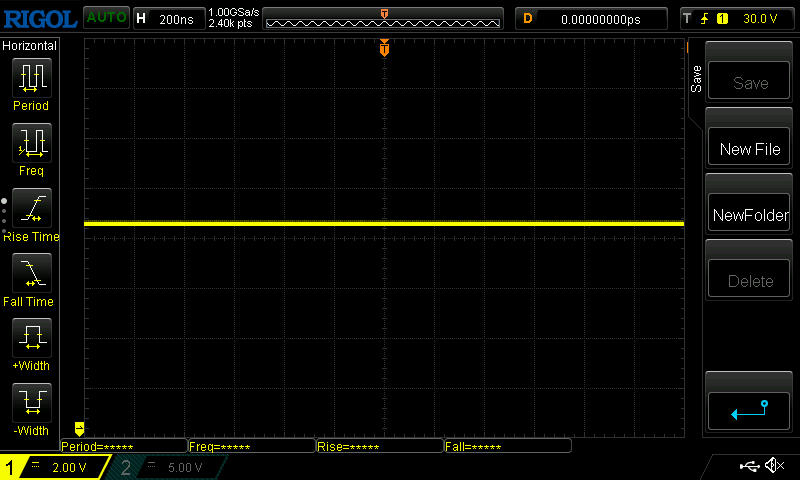 | ||
In comparison: 52 % of all tested devices do not use PWM to dim the display. If PWM was detected, an average of 7741 (minimum: 5 - maximum: 343500) Hz was measured. | |||
在户外,特别是低亮度会使事情变得困难,因此,寻找不那么明亮的环境就成为必须的。
即使IPS显示屏通常具有相当稳定的视角,当从极端的视角看我们的测试设备时,你仍然可以注意到亮度的明显下降。

业绩
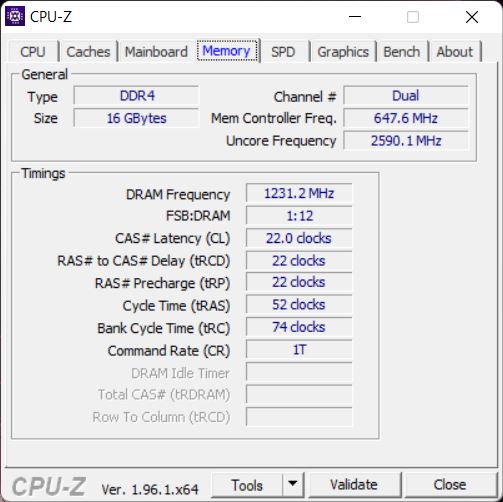
由于它结合了英特尔酷睿i9-12900H和 RTX 3060,Pulse显然是针对游戏玩家的。此外,还有16GB的内存,微星在这里仍然使用DDR4-RAM。虽然价格约为1900欧元(约2057美元),但该设备仍属于较低的中档产品。

测试条件
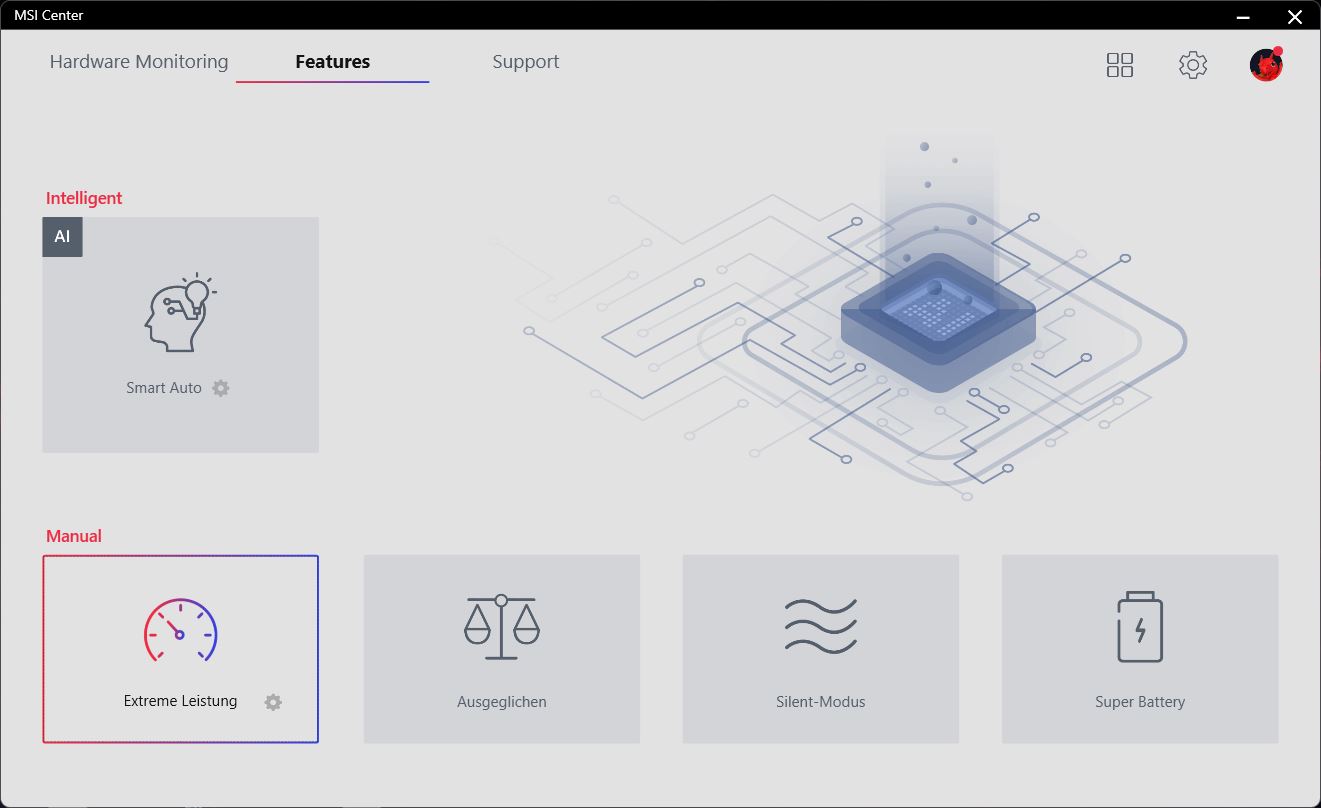
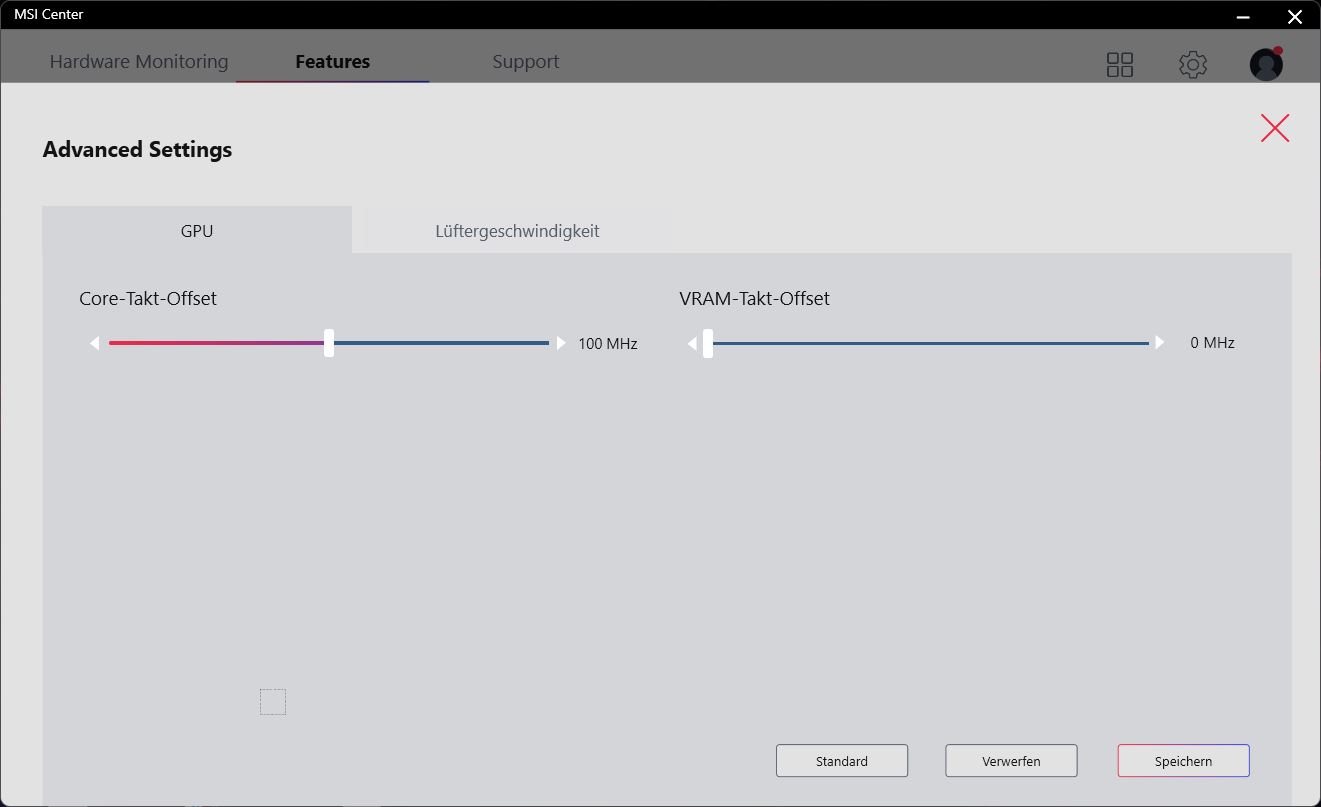
为了获得最佳的基准测试结果,我们在微星软件中选择 "极限性能 "模式。在 "高级设置 "中,我们使用 "标准"。
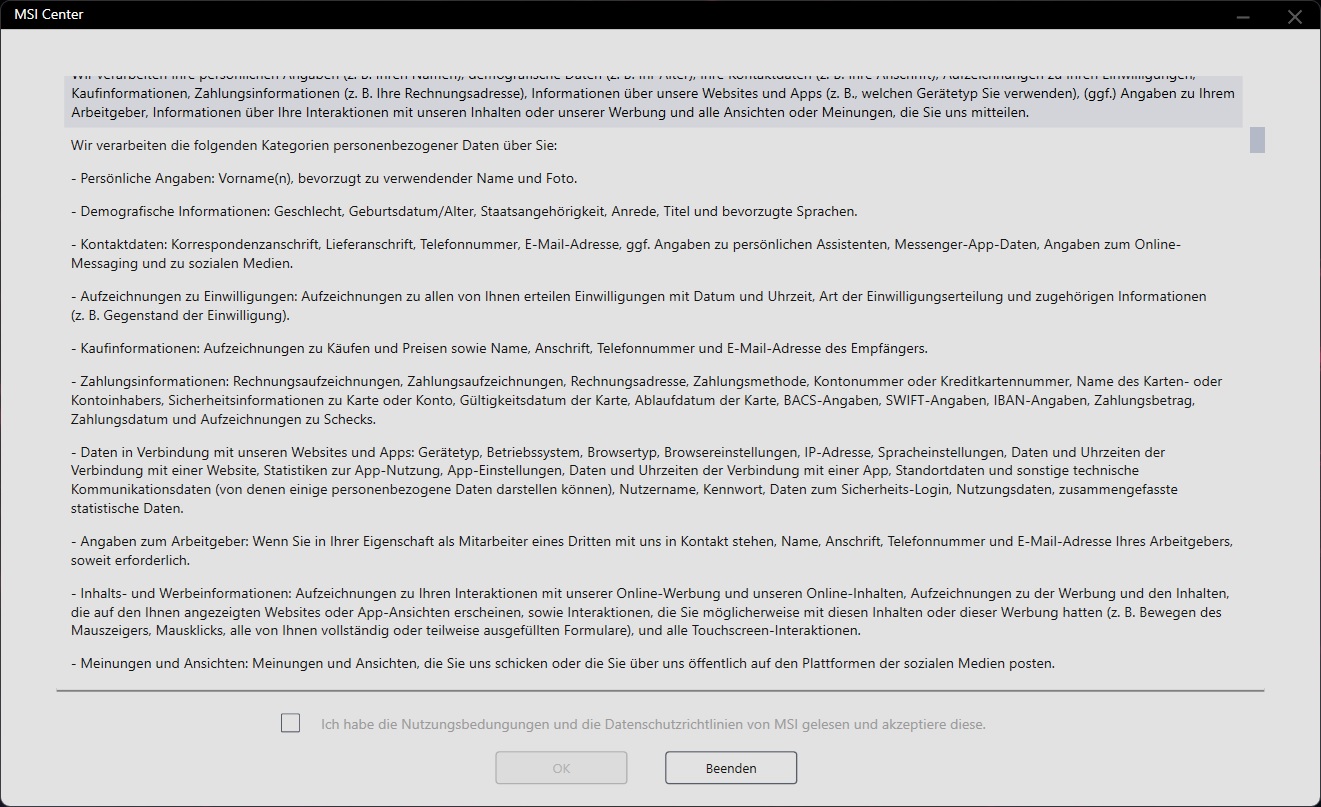
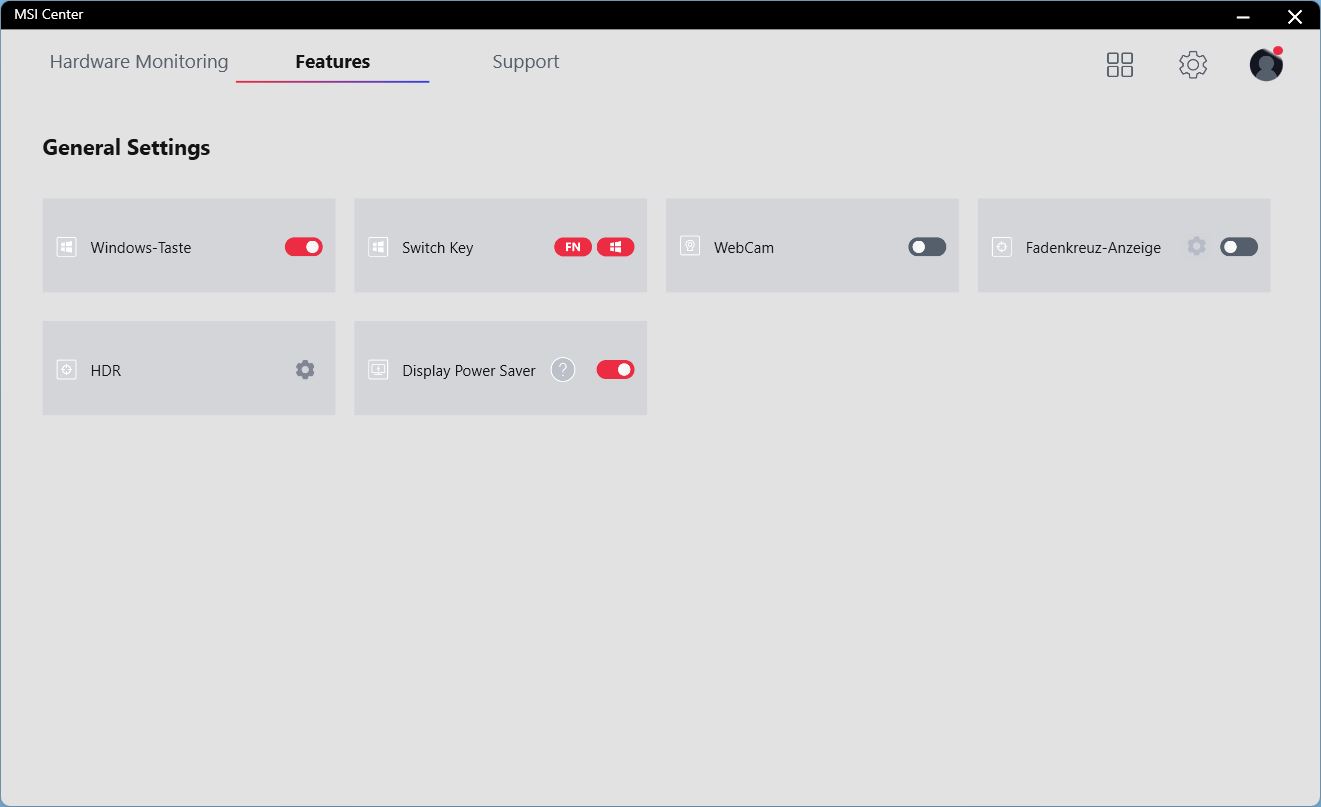
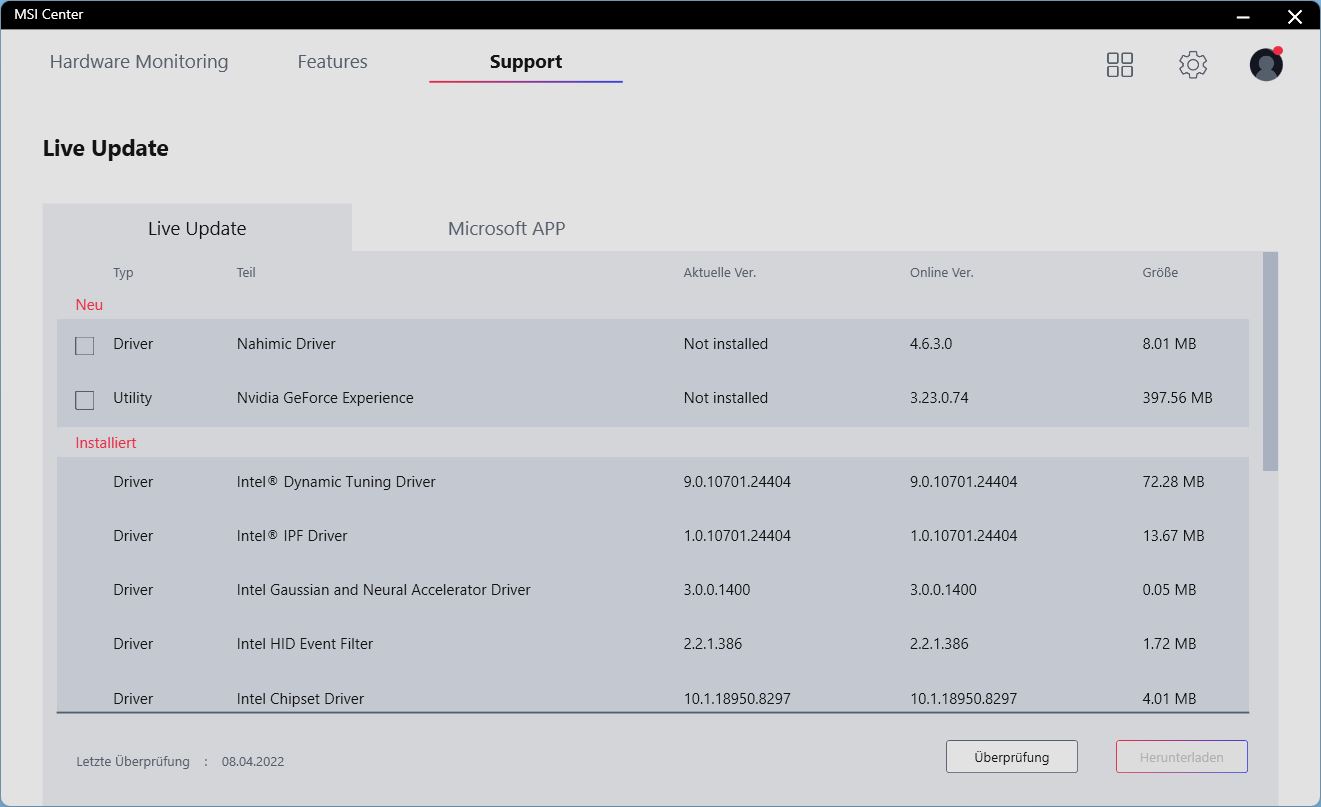
用户应该熟悉微星中心,因为除了设置风扇配置文件之外,你还可以在这里检查系统的更新,配置键盘照明,调整一般设置等等。 当然,制造商也在这里收集一些用户数据。
处理器
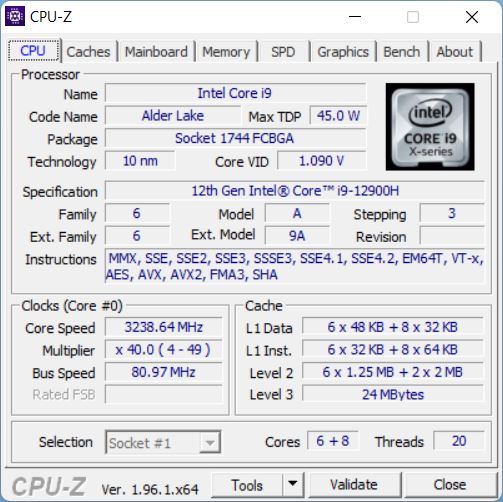
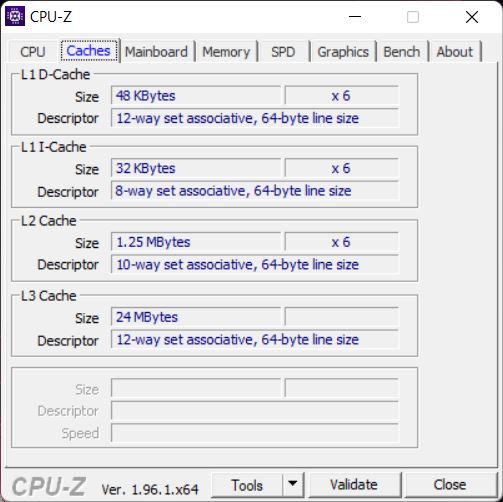
这款酷睿i9-12900H该CPU结合了6个性能核心和8个效率核心,能够同时运行多达20个线程。涡轮增压时钟速度高达5GHz。
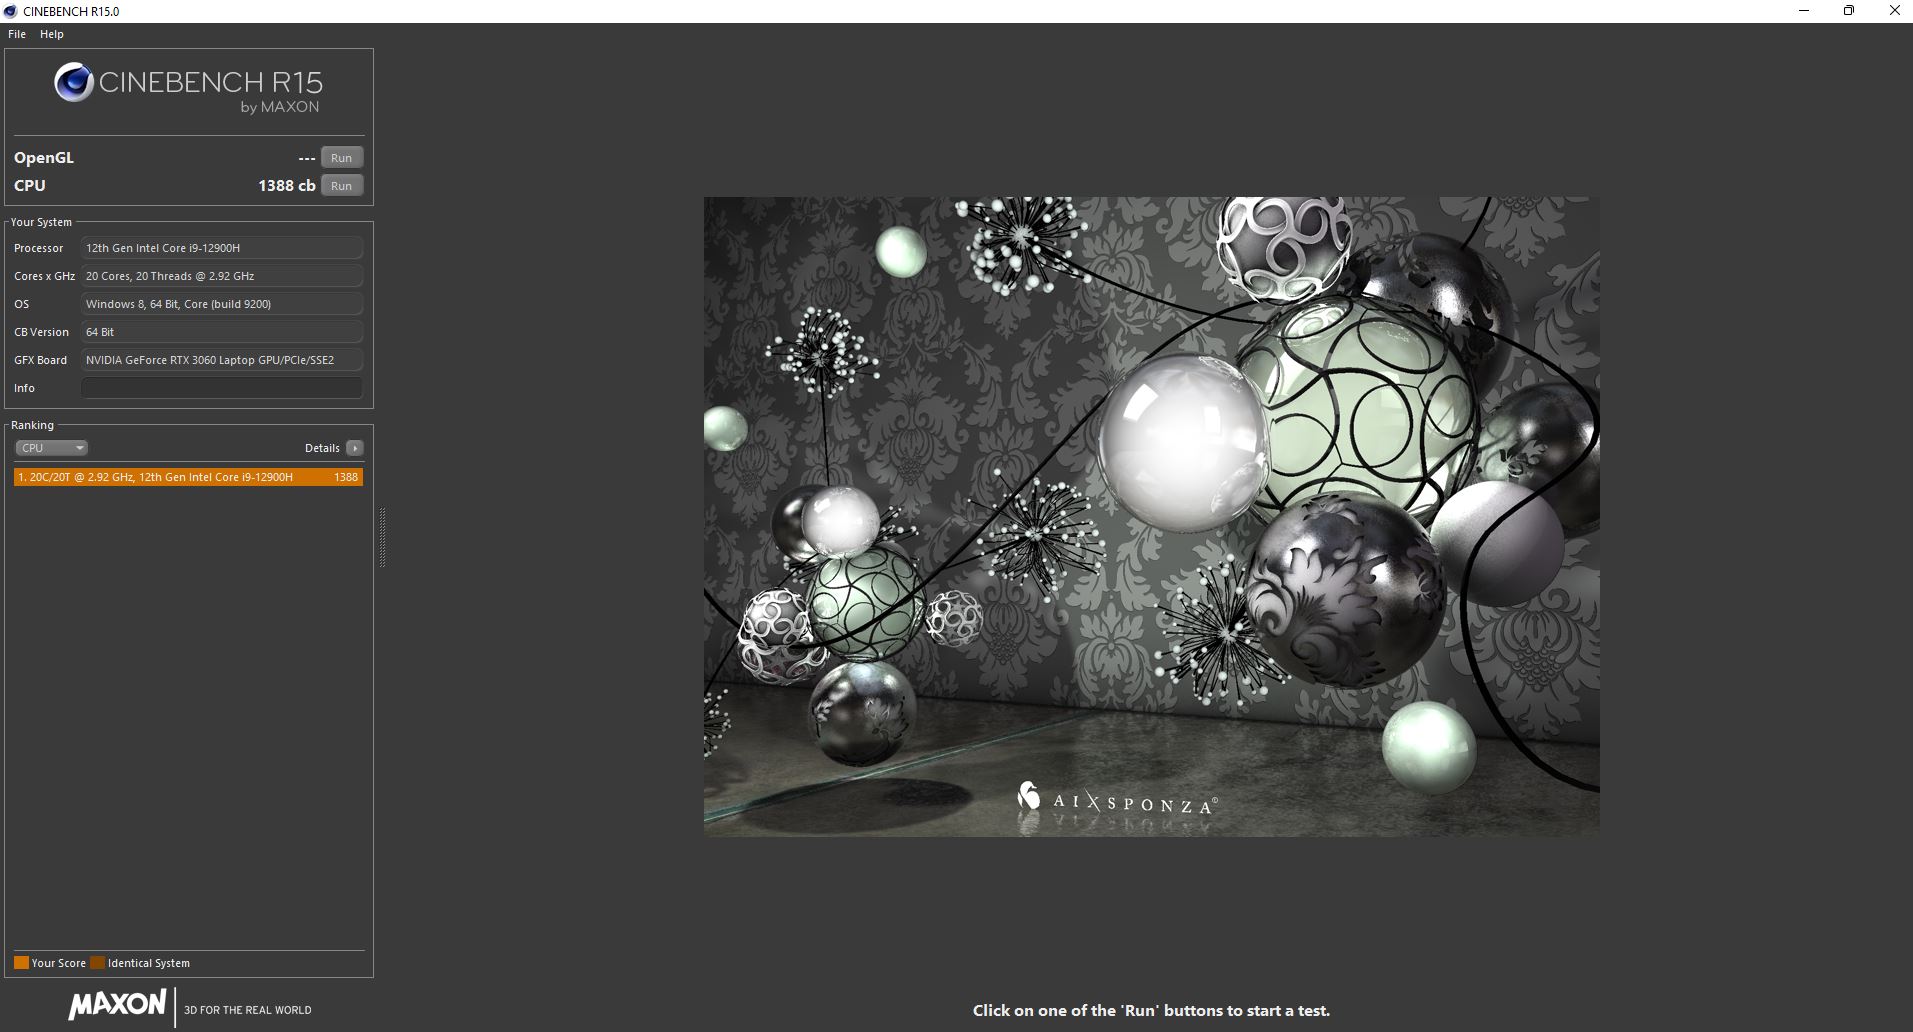
在Cinebench循环中的表现很好,而且该CPU能够毫无问题地击败带有AMD处理器的前一代产品。然而,Pulse中的i9并没有明显快于 i7-12700H在一些竞争性笔记本电脑中的速度。特别是 华硕TUF F15的表现至少在眼睛的水平上,在某些方面甚至略快。微星本可以为自己和客户节省额外的溢价,购买明显更昂贵的i9-12900H。另一方面,超薄的 纤薄的Alienware x14配有i7-12700H的Alienware x14则慢了大约6%到7%。
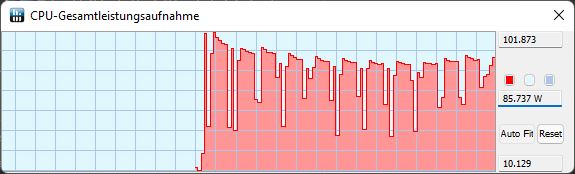
在第一次运行开始时,TDP在100瓦左右,然后开始下降,最后在85瓦左右趋于平稳。然而,它很少下降到标称的45瓦。
在电池操作中,极限性能模式不再可用,它变为平衡模式。在Cinebench中,性能下降了整整45%,只达到了1388分!这说明了什么?
Cinebench R15 Multi Constant Load Test
Cinebench R23: Multi Core | Single Core
Cinebench R20: CPU (Multi Core) | CPU (Single Core)
Cinebench R15: CPU Multi 64Bit | CPU Single 64Bit
Blender: v2.79 BMW27 CPU
7-Zip 18.03: 7z b 4 | 7z b 4 -mmt1
Geekbench 5.5: Multi-Core | Single-Core
HWBOT x265 Benchmark v2.2: 4k Preset
LibreOffice : 20 Documents To PDF
R Benchmark 2.5: Overall mean
| CPU Performance rating | |
| Average of class Gaming | |
| MSI Pulse GL66 12UEK | |
| Asus TUF Gaming F15 FX507ZM | |
| Alienware x14 i7 RTX 3060 | |
| Average Intel Core i9-12900H | |
| Schenker XMG Apex 15 NH57E PS | |
| Lenovo Legion S7 15ACH6 82K80030GE | |
| Alienware m15 R5 Ryzen Edition | |
| Cinebench R23 / Multi Core | |
| Average of class Gaming (10488 - 42661, n=104, last 2 years) | |
| Asus TUF Gaming F15 FX507ZM | |
| MSI Pulse GL66 12UEK | |
| Alienware x14 i7 RTX 3060 | |
| Average Intel Core i9-12900H (7359 - 19648, n=28) | |
| Lenovo Legion S7 15ACH6 82K80030GE | |
| Schenker XMG Apex 15 NH57E PS | |
| Alienware m15 R5 Ryzen Edition | |
| Cinebench R23 / Single Core | |
| Average of class Gaming (1601 - 2415, n=104, last 2 years) | |
| MSI Pulse GL66 12UEK | |
| Average Intel Core i9-12900H (1634 - 1930, n=28) | |
| Asus TUF Gaming F15 FX507ZM | |
| Alienware x14 i7 RTX 3060 | |
| Lenovo Legion S7 15ACH6 82K80030GE | |
| Alienware m15 R5 Ryzen Edition | |
| Schenker XMG Apex 15 NH57E PS | |
| Cinebench R20 / CPU (Multi Core) | |
| Average of class Gaming (4029 - 16433, n=103, last 2 years) | |
| Asus TUF Gaming F15 FX507ZM | |
| MSI Pulse GL66 12UEK | |
| Alienware x14 i7 RTX 3060 | |
| Average Intel Core i9-12900H (2681 - 7471, n=28) | |
| Lenovo Legion S7 15ACH6 82K80030GE | |
| Schenker XMG Apex 15 NH57E PS | |
| Alienware m15 R5 Ryzen Edition | |
| Cinebench R20 / CPU (Single Core) | |
| Average of class Gaming (622 - 913, n=103, last 2 years) | |
| MSI Pulse GL66 12UEK | |
| Average Intel Core i9-12900H (624 - 738, n=28) | |
| Alienware x14 i7 RTX 3060 | |
| Asus TUF Gaming F15 FX507ZM | |
| Lenovo Legion S7 15ACH6 82K80030GE | |
| Alienware m15 R5 Ryzen Edition | |
| Schenker XMG Apex 15 NH57E PS | |
| Cinebench R15 / CPU Multi 64Bit | |
| Average of class Gaming (1578 - 6330, n=102, last 2 years) | |
| Asus TUF Gaming F15 FX507ZM | |
| MSI Pulse GL66 12UEK | |
| Alienware x14 i7 RTX 3060 | |
| Average Intel Core i9-12900H (1395 - 3077, n=28) | |
| Lenovo Legion S7 15ACH6 82K80030GE | |
| Schenker XMG Apex 15 NH57E PS | |
| Alienware m15 R5 Ryzen Edition | |
| Cinebench R15 / CPU Single 64Bit | |
| Average of class Gaming (188.8 - 350, n=103, last 2 years) | |
| MSI Pulse GL66 12UEK | |
| Average Intel Core i9-12900H (235 - 277, n=29) | |
| Asus TUF Gaming F15 FX507ZM | |
| Alienware x14 i7 RTX 3060 | |
| Lenovo Legion S7 15ACH6 82K80030GE | |
| Alienware m15 R5 Ryzen Edition | |
| Schenker XMG Apex 15 NH57E PS | |
| Blender / v2.79 BMW27 CPU | |
| Alienware m15 R5 Ryzen Edition | |
| Schenker XMG Apex 15 NH57E PS | |
| Average Intel Core i9-12900H (160 - 451, n=28) | |
| Lenovo Legion S7 15ACH6 82K80030GE | |
| Alienware x14 i7 RTX 3060 | |
| MSI Pulse GL66 12UEK | |
| Asus TUF Gaming F15 FX507ZM | |
| Average of class Gaming (79 - 330, n=101, last 2 years) | |
| 7-Zip 18.03 / 7z b 4 | |
| Average of class Gaming (33491 - 148086, n=102, last 2 years) | |
| Asus TUF Gaming F15 FX507ZM | |
| Alienware x14 i7 RTX 3060 | |
| MSI Pulse GL66 12UEK | |
| Average Intel Core i9-12900H (34684 - 76677, n=28) | |
| Lenovo Legion S7 15ACH6 82K80030GE | |
| Schenker XMG Apex 15 NH57E PS | |
| Alienware m15 R5 Ryzen Edition | |
| 7-Zip 18.03 / 7z b 4 -mmt1 | |
| Average of class Gaming (4824 - 7436, n=102, last 2 years) | |
| MSI Pulse GL66 12UEK | |
| Average Intel Core i9-12900H (5302 - 6289, n=28) | |
| Lenovo Legion S7 15ACH6 82K80030GE | |
| Alienware x14 i7 RTX 3060 | |
| Alienware m15 R5 Ryzen Edition | |
| Schenker XMG Apex 15 NH57E PS | |
| Asus TUF Gaming F15 FX507ZM | |
| Geekbench 5.5 / Multi-Core | |
| Average of class Gaming (6460 - 28263, n=102, last 2 years) | |
| Alienware x14 i7 RTX 3060 | |
| Asus TUF Gaming F15 FX507ZM | |
| Average Intel Core i9-12900H (8519 - 14376, n=31) | |
| MSI Pulse GL66 12UEK | |
| Lenovo Legion S7 15ACH6 82K80030GE | |
| Schenker XMG Apex 15 NH57E PS | |
| Alienware m15 R5 Ryzen Edition | |
| Geekbench 5.5 / Single-Core | |
| Average of class Gaming (1403 - 2474, n=102, last 2 years) | |
| MSI Pulse GL66 12UEK | |
| Average Intel Core i9-12900H (1631 - 1897, n=31) | |
| Alienware x14 i7 RTX 3060 | |
| Asus TUF Gaming F15 FX507ZM | |
| Lenovo Legion S7 15ACH6 82K80030GE | |
| Schenker XMG Apex 15 NH57E PS | |
| Alienware m15 R5 Ryzen Edition | |
| HWBOT x265 Benchmark v2.2 / 4k Preset | |
| Average of class Gaming (11.5 - 44.4, n=102, last 2 years) | |
| Asus TUF Gaming F15 FX507ZM | |
| MSI Pulse GL66 12UEK | |
| Alienware x14 i7 RTX 3060 | |
| Average Intel Core i9-12900H (8.05 - 22.5, n=28) | |
| Lenovo Legion S7 15ACH6 82K80030GE | |
| Schenker XMG Apex 15 NH57E PS | |
| Alienware m15 R5 Ryzen Edition | |
| LibreOffice / 20 Documents To PDF | |
| Lenovo Legion S7 15ACH6 82K80030GE | |
| Alienware m15 R5 Ryzen Edition | |
| Schenker XMG Apex 15 NH57E PS | |
| Average of class Gaming (33.2 - 88.8, n=102, last 2 years) | |
| Asus TUF Gaming F15 FX507ZM | |
| Average Intel Core i9-12900H (36.8 - 59.8, n=28) | |
| MSI Pulse GL66 12UEK | |
| Alienware x14 i7 RTX 3060 | |
| R Benchmark 2.5 / Overall mean | |
| Alienware m15 R5 Ryzen Edition | |
| Schenker XMG Apex 15 NH57E PS | |
| Lenovo Legion S7 15ACH6 82K80030GE | |
| Asus TUF Gaming F15 FX507ZM | |
| Alienware x14 i7 RTX 3060 | |
| Average Intel Core i9-12900H (0.4218 - 0.506, n=28) | |
| MSI Pulse GL66 12UEK | |
| Average of class Gaming (0.3439 - 0.59, n=102, last 2 years) | |
* ... smaller is better
AIDA64: FP32 Ray-Trace | FPU Julia | CPU SHA3 | CPU Queen | FPU SinJulia | FPU Mandel | CPU AES | CPU ZLib | FP64 Ray-Trace | CPU PhotoWorxx
| Performance rating | |
| Average of class Gaming | |
| Lenovo Legion S7 15ACH6 82K80030GE | |
| Schenker XMG Apex 15 NH57E PS | |
| Alienware m15 R5 Ryzen Edition | |
| Average Intel Core i9-12900H | |
| Alienware x14 i7 RTX 3060 | |
| MSI Pulse GL66 12UEK | |
| Asus TUF Gaming F15 FX507ZM | |
| AIDA64 / FP32 Ray-Trace | |
| Average of class Gaming (10227 - 85542, n=102, last 2 years) | |
| Lenovo Legion S7 15ACH6 82K80030GE | |
| Schenker XMG Apex 15 NH57E PS | |
| Alienware m15 R5 Ryzen Edition | |
| Average Intel Core i9-12900H (4074 - 18289, n=29) | |
| Asus TUF Gaming F15 FX507ZM | |
| MSI Pulse GL66 12UEK | |
| Alienware x14 i7 RTX 3060 | |
| AIDA64 / FPU Julia | |
| Average of class Gaming (51376 - 372155, n=102, last 2 years) | |
| Lenovo Legion S7 15ACH6 82K80030GE | |
| Schenker XMG Apex 15 NH57E PS | |
| Alienware m15 R5 Ryzen Edition | |
| Average Intel Core i9-12900H (22307 - 93236, n=29) | |
| Asus TUF Gaming F15 FX507ZM | |
| MSI Pulse GL66 12UEK | |
| Alienware x14 i7 RTX 3060 | |
| AIDA64 / CPU SHA3 | |
| Average of class Gaming (2180 - 10115, n=102, last 2 years) | |
| Lenovo Legion S7 15ACH6 82K80030GE | |
| Asus TUF Gaming F15 FX507ZM | |
| Schenker XMG Apex 15 NH57E PS | |
| MSI Pulse GL66 12UEK | |
| Alienware m15 R5 Ryzen Edition | |
| Average Intel Core i9-12900H (1378 - 4215, n=29) | |
| Alienware x14 i7 RTX 3060 | |
| AIDA64 / CPU Queen | |
| Average of class Gaming (49785 - 173351, n=86, last 2 years) | |
| MSI Pulse GL66 12UEK | |
| Lenovo Legion S7 15ACH6 82K80030GE | |
| Average Intel Core i9-12900H (78172 - 111241, n=28) | |
| Alienware x14 i7 RTX 3060 | |
| Asus TUF Gaming F15 FX507ZM | |
| Schenker XMG Apex 15 NH57E PS | |
| Alienware m15 R5 Ryzen Edition | |
| AIDA64 / FPU SinJulia | |
| Average of class Gaming (4424 - 33636, n=102, last 2 years) | |
| Lenovo Legion S7 15ACH6 82K80030GE | |
| Schenker XMG Apex 15 NH57E PS | |
| Alienware m15 R5 Ryzen Edition | |
| MSI Pulse GL66 12UEK | |
| Asus TUF Gaming F15 FX507ZM | |
| Alienware x14 i7 RTX 3060 | |
| Average Intel Core i9-12900H (5709 - 10410, n=29) | |
| AIDA64 / FPU Mandel | |
| Average of class Gaming (25115 - 196829, n=102, last 2 years) | |
| Lenovo Legion S7 15ACH6 82K80030GE | |
| Schenker XMG Apex 15 NH57E PS | |
| Alienware m15 R5 Ryzen Edition | |
| Average Intel Core i9-12900H (11257 - 45581, n=29) | |
| Asus TUF Gaming F15 FX507ZM | |
| MSI Pulse GL66 12UEK | |
| Alienware x14 i7 RTX 3060 | |
| AIDA64 / CPU AES | |
| Lenovo Legion S7 15ACH6 82K80030GE | |
| Schenker XMG Apex 15 NH57E PS | |
| Alienware m15 R5 Ryzen Edition | |
| Average of class Gaming (39258 - 247074, n=102, last 2 years) | |
| MSI Pulse GL66 12UEK | |
| Alienware x14 i7 RTX 3060 | |
| Average Intel Core i9-12900H (31935 - 151546, n=29) | |
| Asus TUF Gaming F15 FX507ZM | |
| AIDA64 / CPU ZLib | |
| Average of class Gaming (574 - 2531, n=102, last 2 years) | |
| Asus TUF Gaming F15 FX507ZM | |
| MSI Pulse GL66 12UEK | |
| Alienware x14 i7 RTX 3060 | |
| Average Intel Core i9-12900H (449 - 1193, n=29) | |
| Lenovo Legion S7 15ACH6 82K80030GE | |
| Schenker XMG Apex 15 NH57E PS | |
| Alienware m15 R5 Ryzen Edition | |
| AIDA64 / FP64 Ray-Trace | |
| Average of class Gaming (5509 - 45446, n=102, last 2 years) | |
| Lenovo Legion S7 15ACH6 82K80030GE | |
| Schenker XMG Apex 15 NH57E PS | |
| Alienware m15 R5 Ryzen Edition | |
| Average Intel Core i9-12900H (2235 - 10511, n=29) | |
| Asus TUF Gaming F15 FX507ZM | |
| MSI Pulse GL66 12UEK | |
| Alienware x14 i7 RTX 3060 | |
| AIDA64 / CPU PhotoWorxx | |
| Alienware x14 i7 RTX 3060 | |
| Average of class Gaming (12271 - 89891, n=102, last 2 years) | |
| Average Intel Core i9-12900H (20960 - 48269, n=30) | |
| Asus TUF Gaming F15 FX507ZM | |
| MSI Pulse GL66 12UEK | |
| Schenker XMG Apex 15 NH57E PS | |
| Lenovo Legion S7 15ACH6 82K80030GE | |
| Alienware m15 R5 Ryzen Edition | |
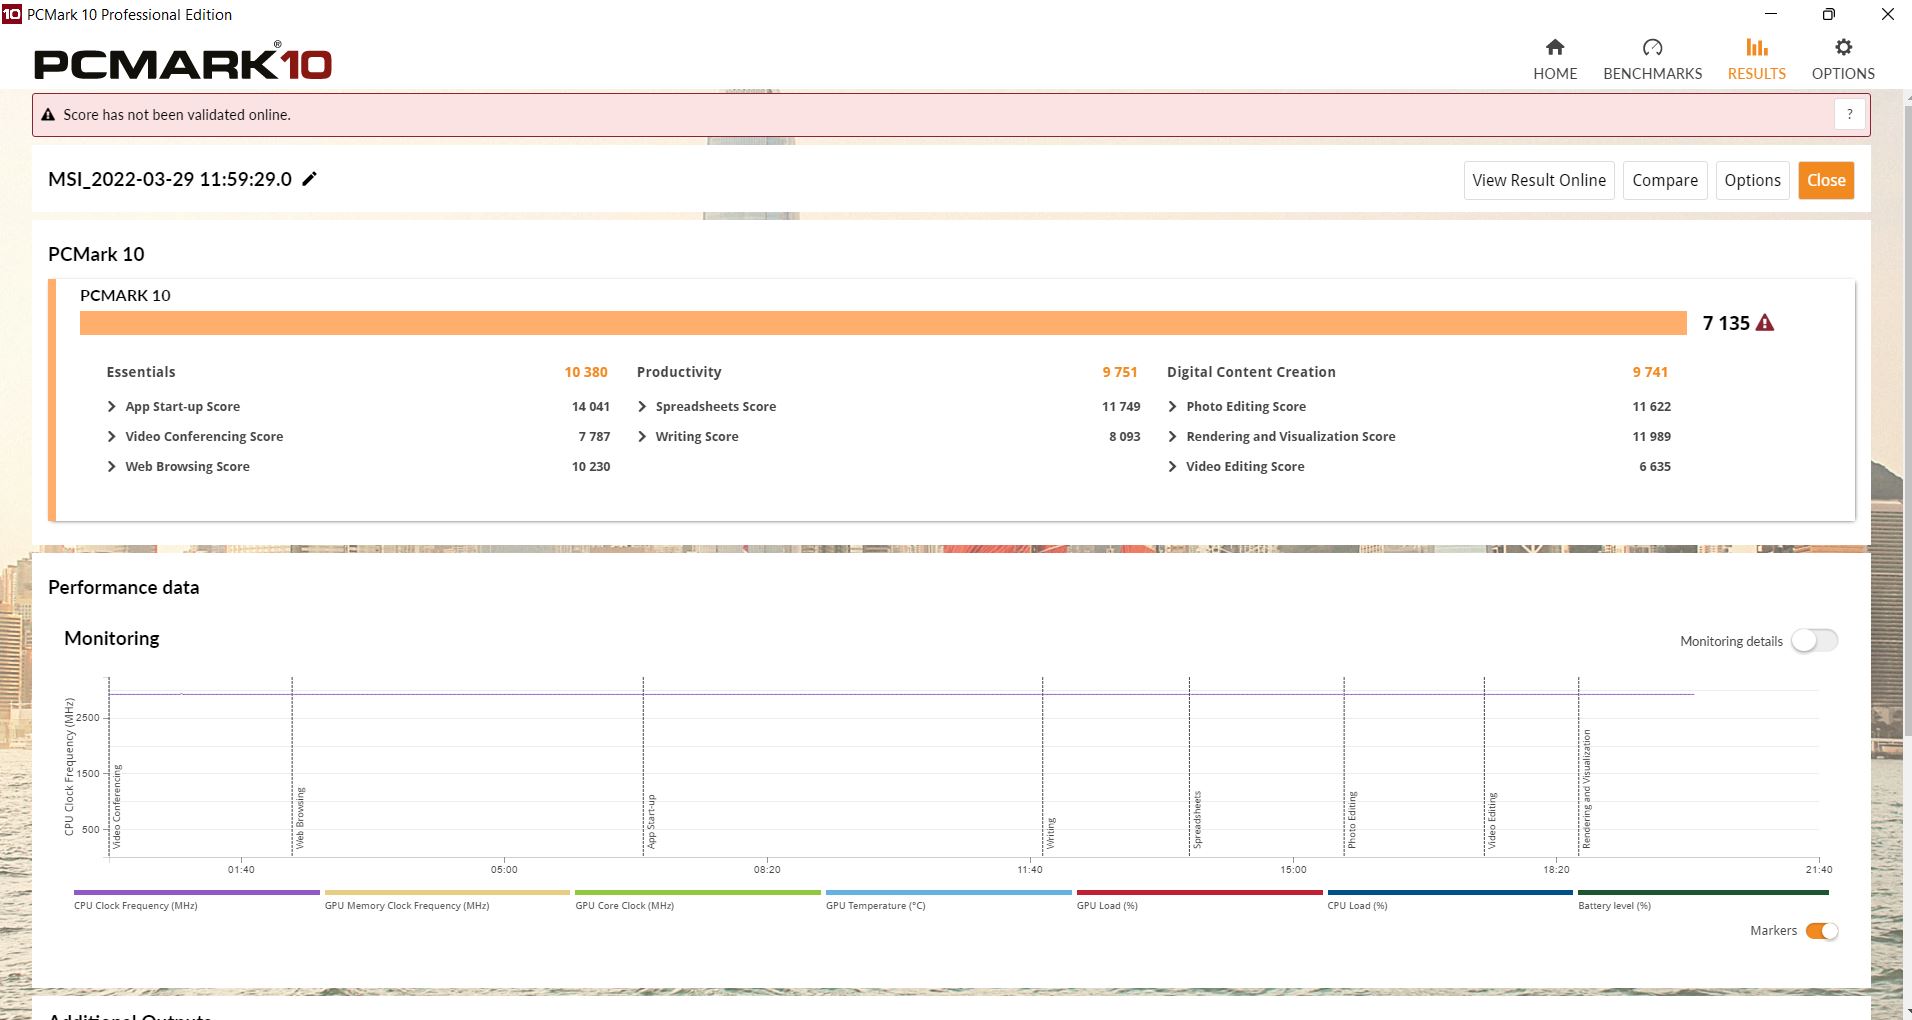
系统性能
在PCMark 10生产力基准测试中,Pulse排名第一,但在其他领域,它被华硕TUF Gaming 15略微超过,有时也被Alienware X14超越。另一方面,在CrossMark中,我们的测试设备也在X14之前完成了。
CrossMark: Overall | Productivity | Creativity | Responsiveness
| PCMark 10 / Score | |
| Average of class Gaming (5828 - 12414, n=93, last 2 years) | |
| Average Intel Core i9-12900H, NVIDIA GeForce RTX 3060 Laptop GPU (7135 - 7861, n=4) | |
| Asus TUF Gaming F15 FX507ZM | |
| Alienware x14 i7 RTX 3060 | |
| MSI Pulse GL66 12UEK | |
| Schenker XMG Apex 15 NH57E PS | |
| Lenovo Legion S7 15ACH6 82K80030GE | |
| Alienware m15 R5 Ryzen Edition | |
| PCMark 10 / Essentials | |
| Average Intel Core i9-12900H, NVIDIA GeForce RTX 3060 Laptop GPU (10380 - 11198, n=4) | |
| Average of class Gaming (8810 - 11935, n=97, last 2 years) | |
| Asus TUF Gaming F15 FX507ZM | |
| MSI Pulse GL66 12UEK | |
| Alienware x14 i7 RTX 3060 | |
| Schenker XMG Apex 15 NH57E PS | |
| Lenovo Legion S7 15ACH6 82K80030GE | |
| Alienware m15 R5 Ryzen Edition | |
| PCMark 10 / Productivity | |
| Average of class Gaming (6845 - 25323, n=95, last 2 years) | |
| Average Intel Core i9-12900H, NVIDIA GeForce RTX 3060 Laptop GPU (9751 - 10486, n=4) | |
| MSI Pulse GL66 12UEK | |
| Alienware x14 i7 RTX 3060 | |
| Asus TUF Gaming F15 FX507ZM | |
| Alienware m15 R5 Ryzen Edition | |
| Lenovo Legion S7 15ACH6 82K80030GE | |
| Schenker XMG Apex 15 NH57E PS | |
| PCMark 10 / Digital Content Creation | |
| Average of class Gaming (7602 - 19954, n=95, last 2 years) | |
| Asus TUF Gaming F15 FX507ZM | |
| Average Intel Core i9-12900H, NVIDIA GeForce RTX 3060 Laptop GPU (9741 - 11226, n=4) | |
| Alienware x14 i7 RTX 3060 | |
| MSI Pulse GL66 12UEK | |
| Schenker XMG Apex 15 NH57E PS | |
| Lenovo Legion S7 15ACH6 82K80030GE | |
| Alienware m15 R5 Ryzen Edition | |
| CrossMark / Overall | |
| MSI Pulse GL66 12UEK | |
| Average of class Gaming (1366 - 2409, n=94, last 2 years) | |
| Average Intel Core i9-12900H, NVIDIA GeForce RTX 3060 Laptop GPU (1789 - 2096, n=4) | |
| Alienware x14 i7 RTX 3060 | |
| CrossMark / Productivity | |
| MSI Pulse GL66 12UEK | |
| Average Intel Core i9-12900H, NVIDIA GeForce RTX 3060 Laptop GPU (1677 - 2062, n=4) | |
| Average of class Gaming (1386 - 2254, n=94, last 2 years) | |
| Alienware x14 i7 RTX 3060 | |
| CrossMark / Creativity | |
| Average of class Gaming (1343 - 2786, n=94, last 2 years) | |
| Average Intel Core i9-12900H, NVIDIA GeForce RTX 3060 Laptop GPU (2032 - 2125, n=4) | |
| MSI Pulse GL66 12UEK | |
| Alienware x14 i7 RTX 3060 | |
| CrossMark / Responsiveness | |
| MSI Pulse GL66 12UEK | |
| Average Intel Core i9-12900H, NVIDIA GeForce RTX 3060 Laptop GPU (1486 - 2230, n=4) | |
| Alienware x14 i7 RTX 3060 | |
| Average of class Gaming (1226 - 2334, n=94, last 2 years) | |
| PCMark 10 Score | 7135 points | |
Help | ||
| AIDA64 / Memory Copy | |
| Alienware x14 i7 RTX 3060 | |
| Average of class Gaming (21750 - 129946, n=102, last 2 years) | |
| Average Intel Core i9-12900H (34438 - 74264, n=29) | |
| Asus TUF Gaming F15 FX507ZM | |
| MSI Pulse GL66 12UEK | |
| Schenker XMG Apex 15 NH57E PS | |
| Lenovo Legion S7 15ACH6 82K80030GE | |
| Alienware m15 R5 Ryzen Edition | |
| AIDA64 / Memory Read | |
| Alienware x14 i7 RTX 3060 | |
| Average of class Gaming (22956 - 118858, n=102, last 2 years) | |
| Average Intel Core i9-12900H (36365 - 74642, n=29) | |
| Asus TUF Gaming F15 FX507ZM | |
| MSI Pulse GL66 12UEK | |
| Schenker XMG Apex 15 NH57E PS | |
| Lenovo Legion S7 15ACH6 82K80030GE | |
| Alienware m15 R5 Ryzen Edition | |
| AIDA64 / Memory Write | |
| Average of class Gaming (22297 - 135096, n=102, last 2 years) | |
| Alienware x14 i7 RTX 3060 | |
| Average Intel Core i9-12900H (32276 - 67858, n=29) | |
| Asus TUF Gaming F15 FX507ZM | |
| MSI Pulse GL66 12UEK | |
| Schenker XMG Apex 15 NH57E PS | |
| Lenovo Legion S7 15ACH6 82K80030GE | |
| Alienware m15 R5 Ryzen Edition | |
| AIDA64 / Memory Latency | |
| Alienware x14 i7 RTX 3060 | |
| Average of class Gaming (75.3 - 165.4, n=102, last 2 years) | |
| MSI Pulse GL66 12UEK | |
| Average Intel Core i9-12900H (74.7 - 118.1, n=28) | |
| Lenovo Legion S7 15ACH6 82K80030GE | |
| Alienware m15 R5 Ryzen Edition | |
| Schenker XMG Apex 15 NH57E PS | |
| Asus TUF Gaming F15 FX507ZM | |
* ... smaller is better
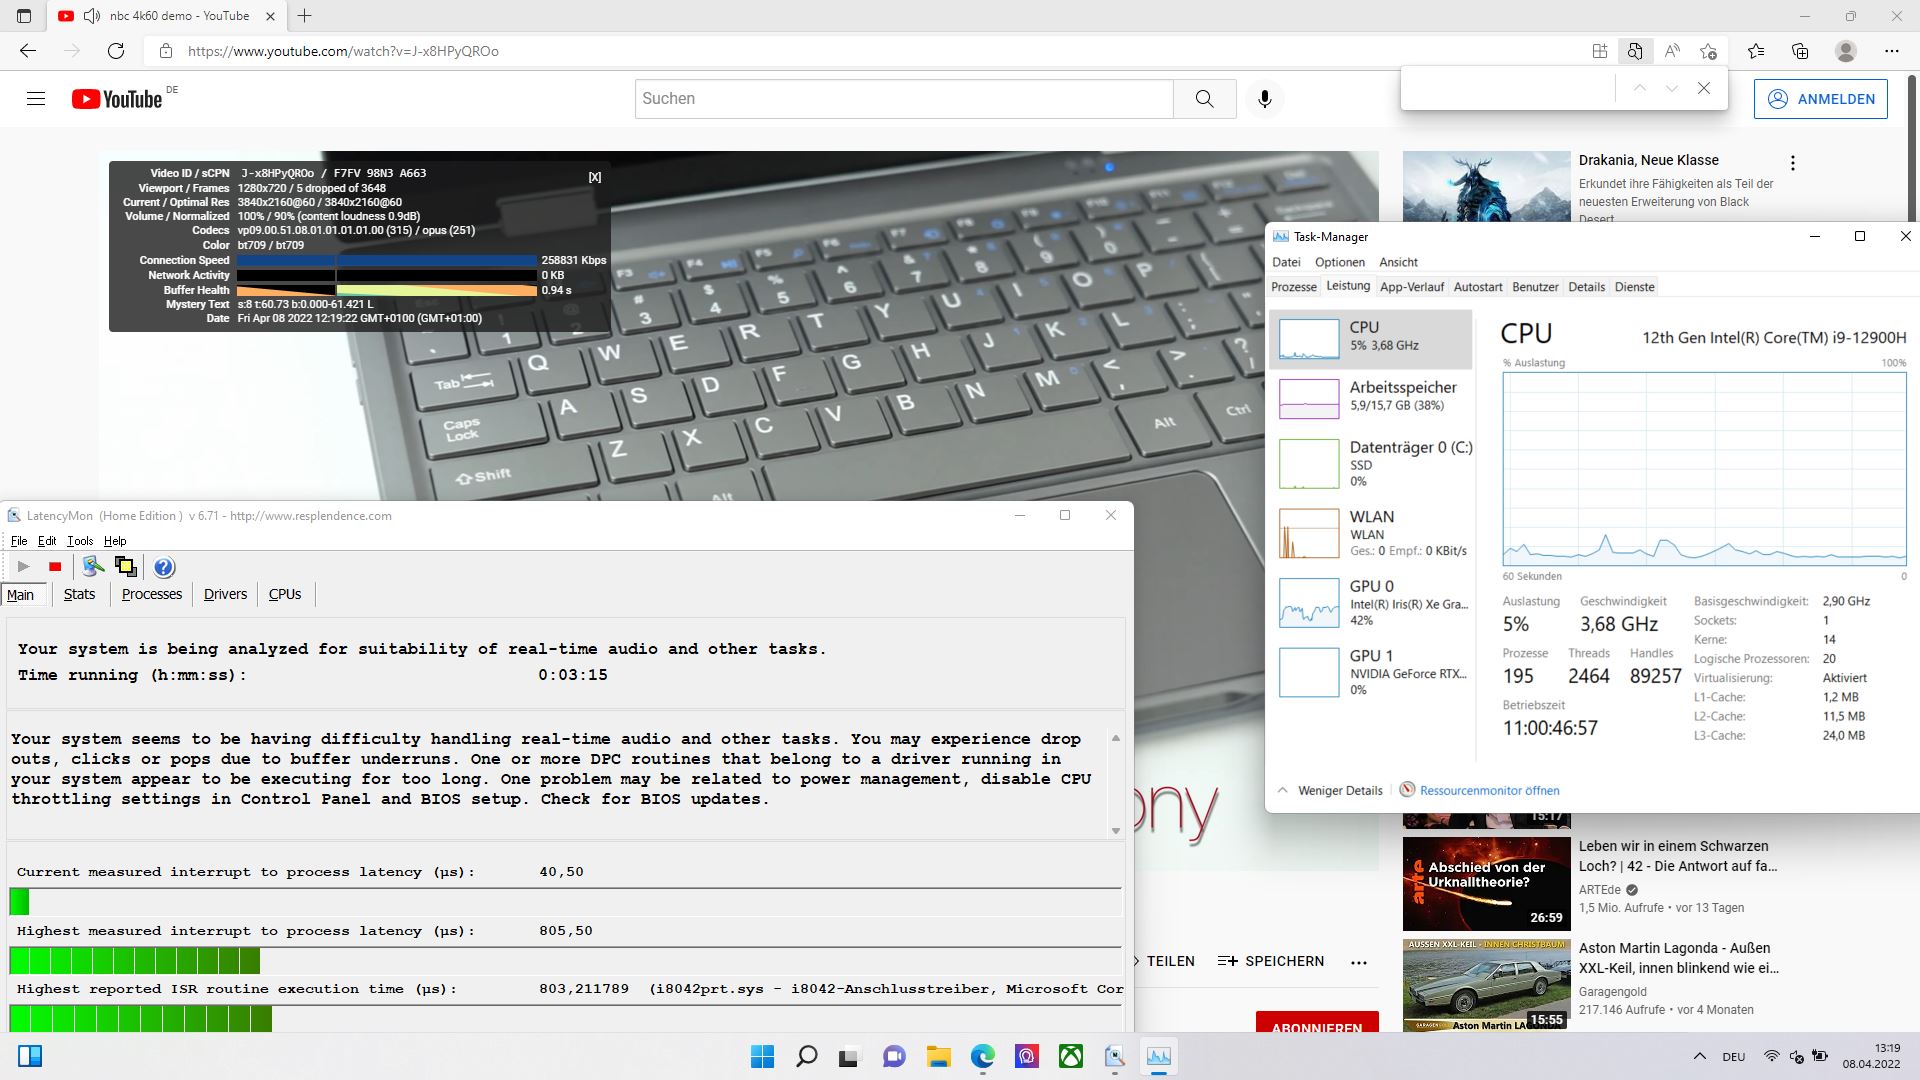
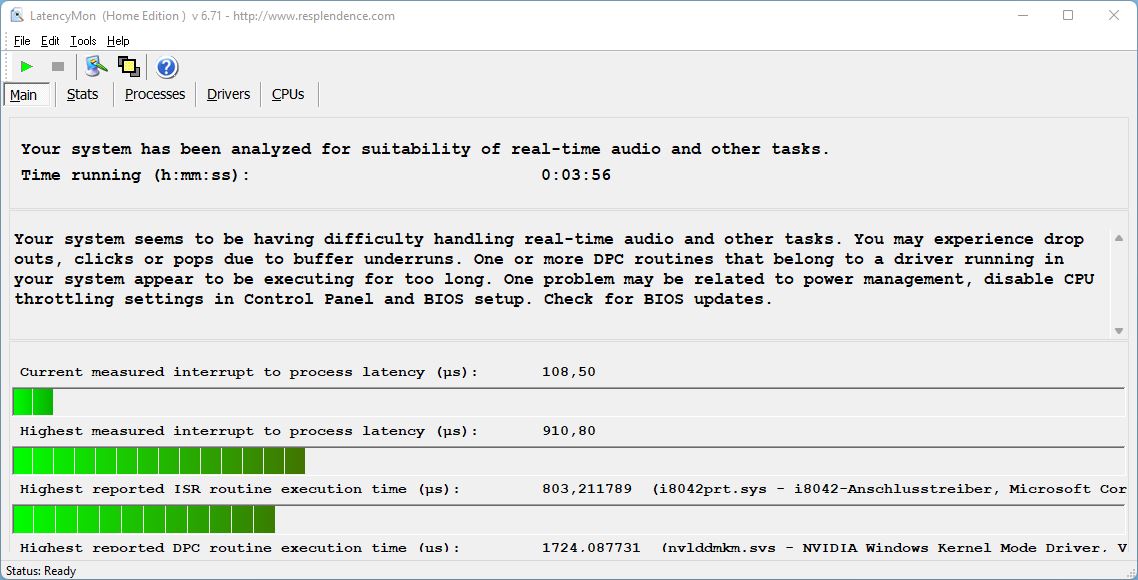
DPC延迟
不幸的是,LatencyMon在打开浏览器时已经显示出一些小问题。打开几个标签并没有显示任何进一步的影响。在播放我们的4K/60帧的YouTube视频时,有五个丢帧。紧接着的10秒Prime95会进一步增加延迟值。

| DPC Latencies / LatencyMon - interrupt to process latency (max), Web, Youtube, Prime95 | |
| Schenker XMG Apex 15 NH57E PS | |
| Alienware x14 i7 RTX 3060 | |
| MSI Pulse GL66 12UEK | |
| Asus TUF Gaming F15 FX507ZM | |
| Lenovo Legion S7 15ACH6 82K80030GE | |
| Alienware m15 R5 Ryzen Edition | |
* ... smaller is better
存储解决方案
微星使用的是美光的512-GB NVMe固态硬盘。它的恒定性能仍然非常均匀,在连续读写中达到3000MB/s左右,这还算可以。

* ... smaller is better
Constant Performance Reading: DiskSpd Read Loop, Queue Depth 8
图形性能
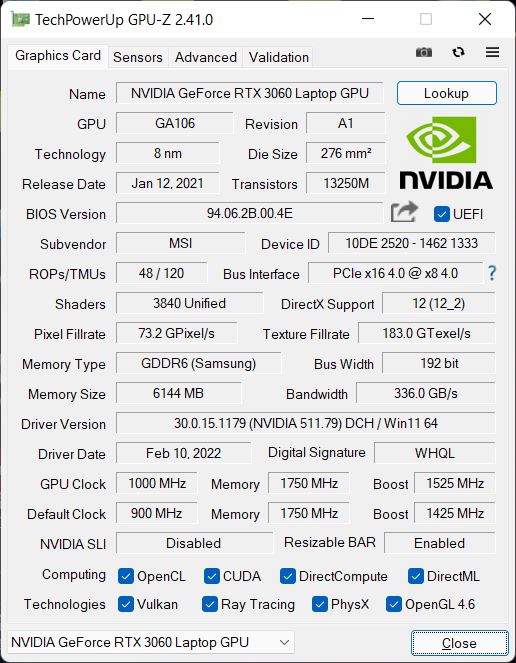
Nvidia Geforce RTX 3060有6GB的VRAM,被用作GPU。然而,它的最大功率不是可能的140瓦,而是只能使用高达105瓦,包括动态提升。这可能会导致一些在纯3D性能方面更快的竞争对手。
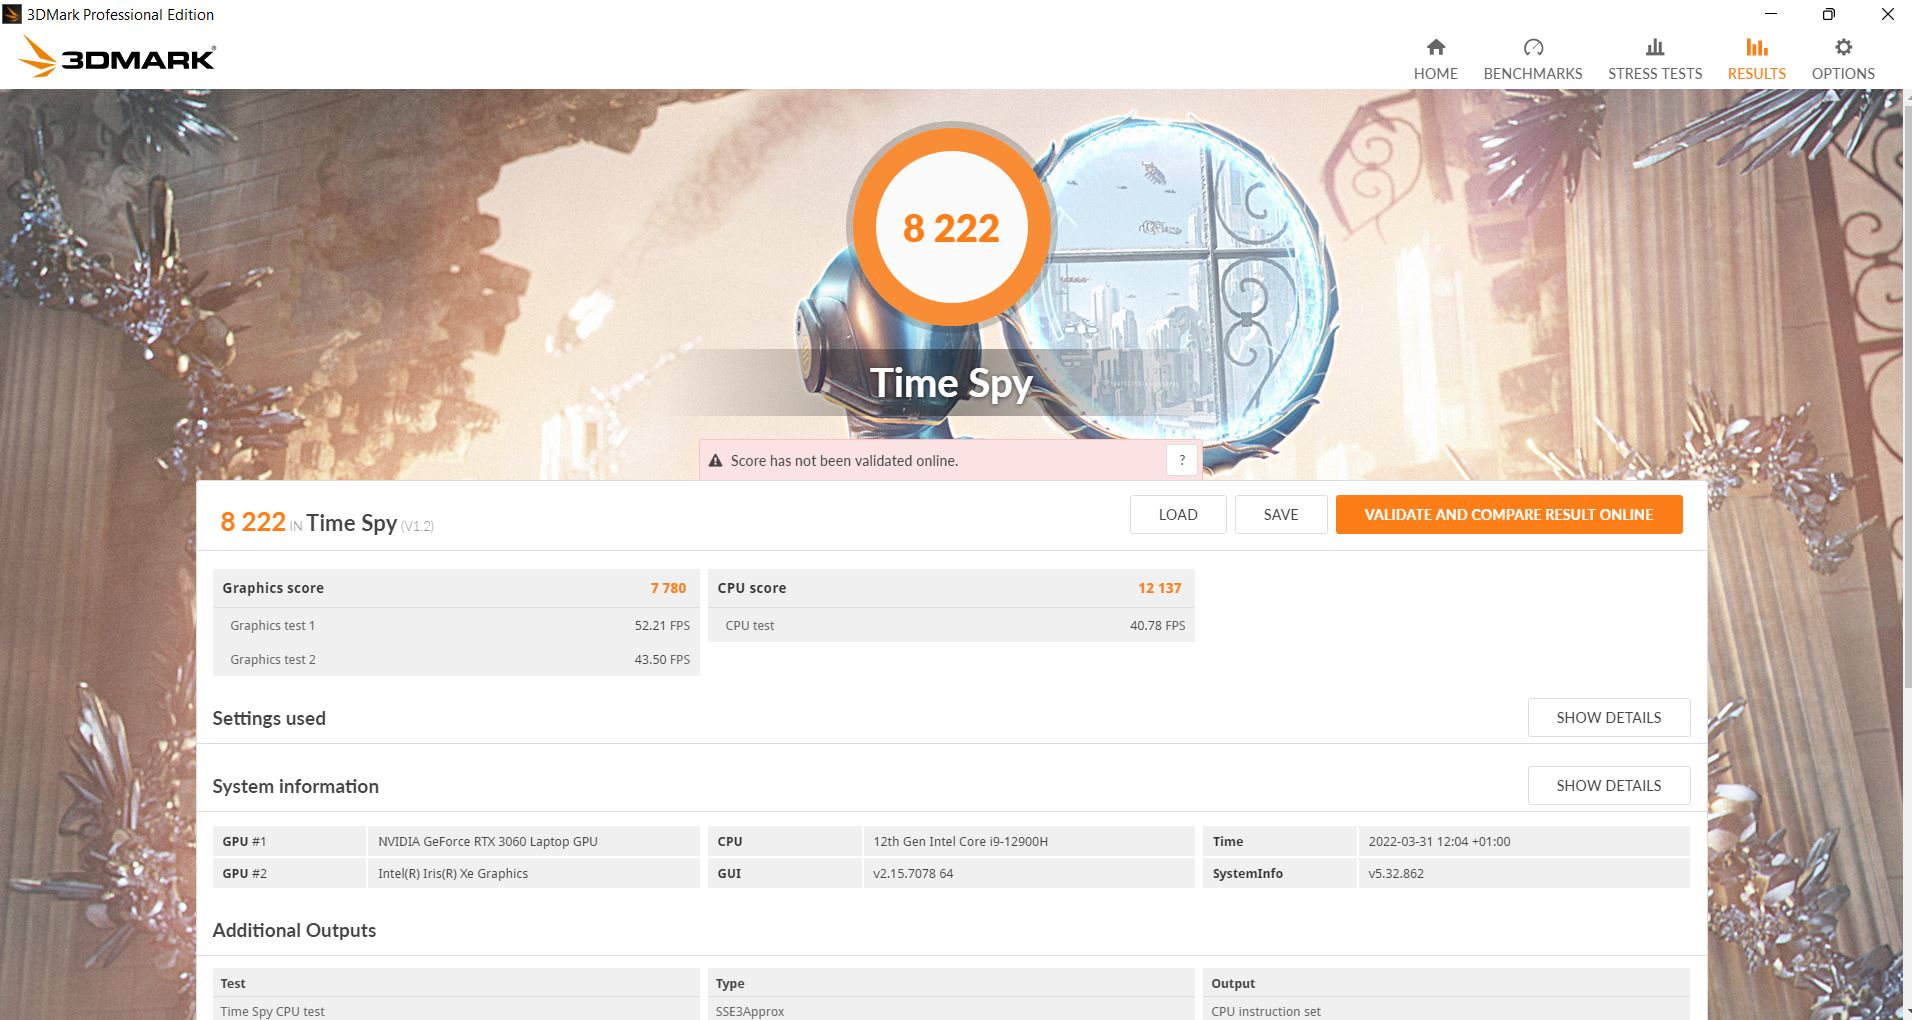
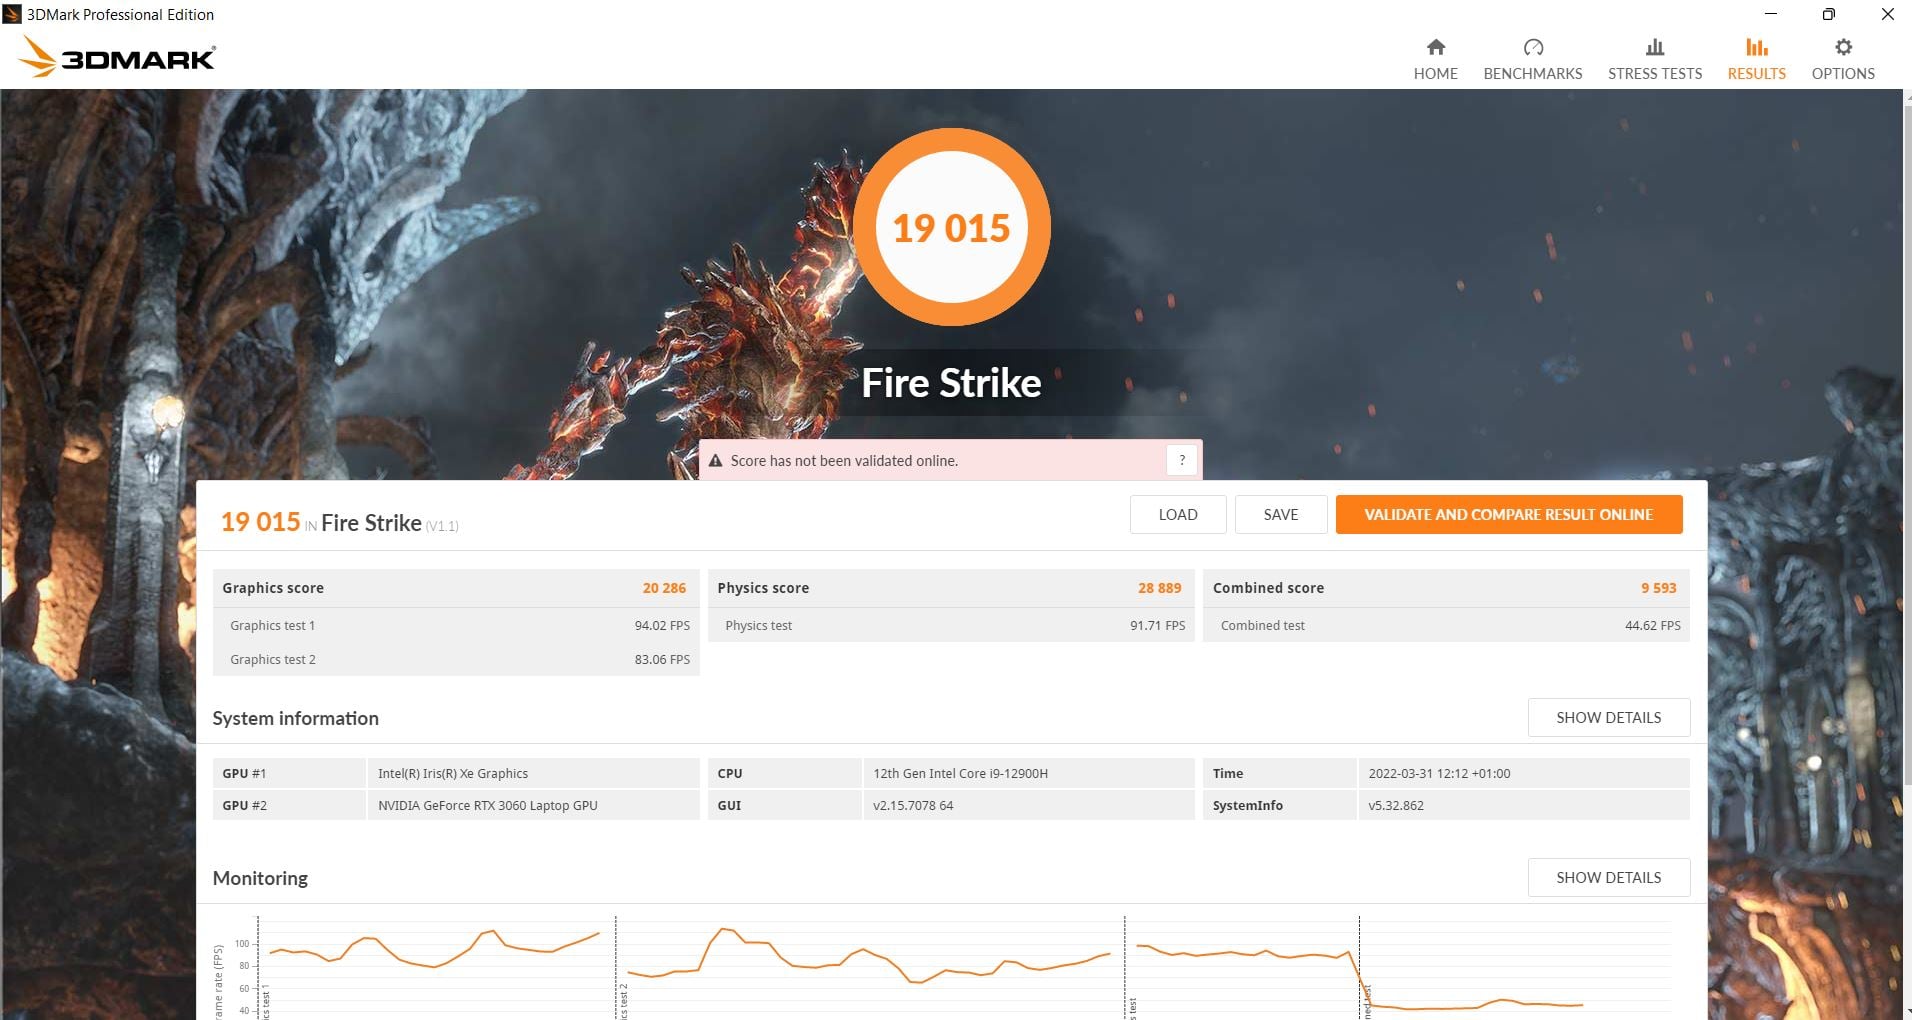
在合成3DMark测试中,Pulse能够在Time Spy 和Fire Strike 测试中达到普通RTX 3060的预期水平。几个竞争对手的速度更快,包括华硕TUF Gaming F15,但有些也略微慢一些,如Alienware X4。然而,与表现最好的人的距离要大于与表现最差的人的距离。
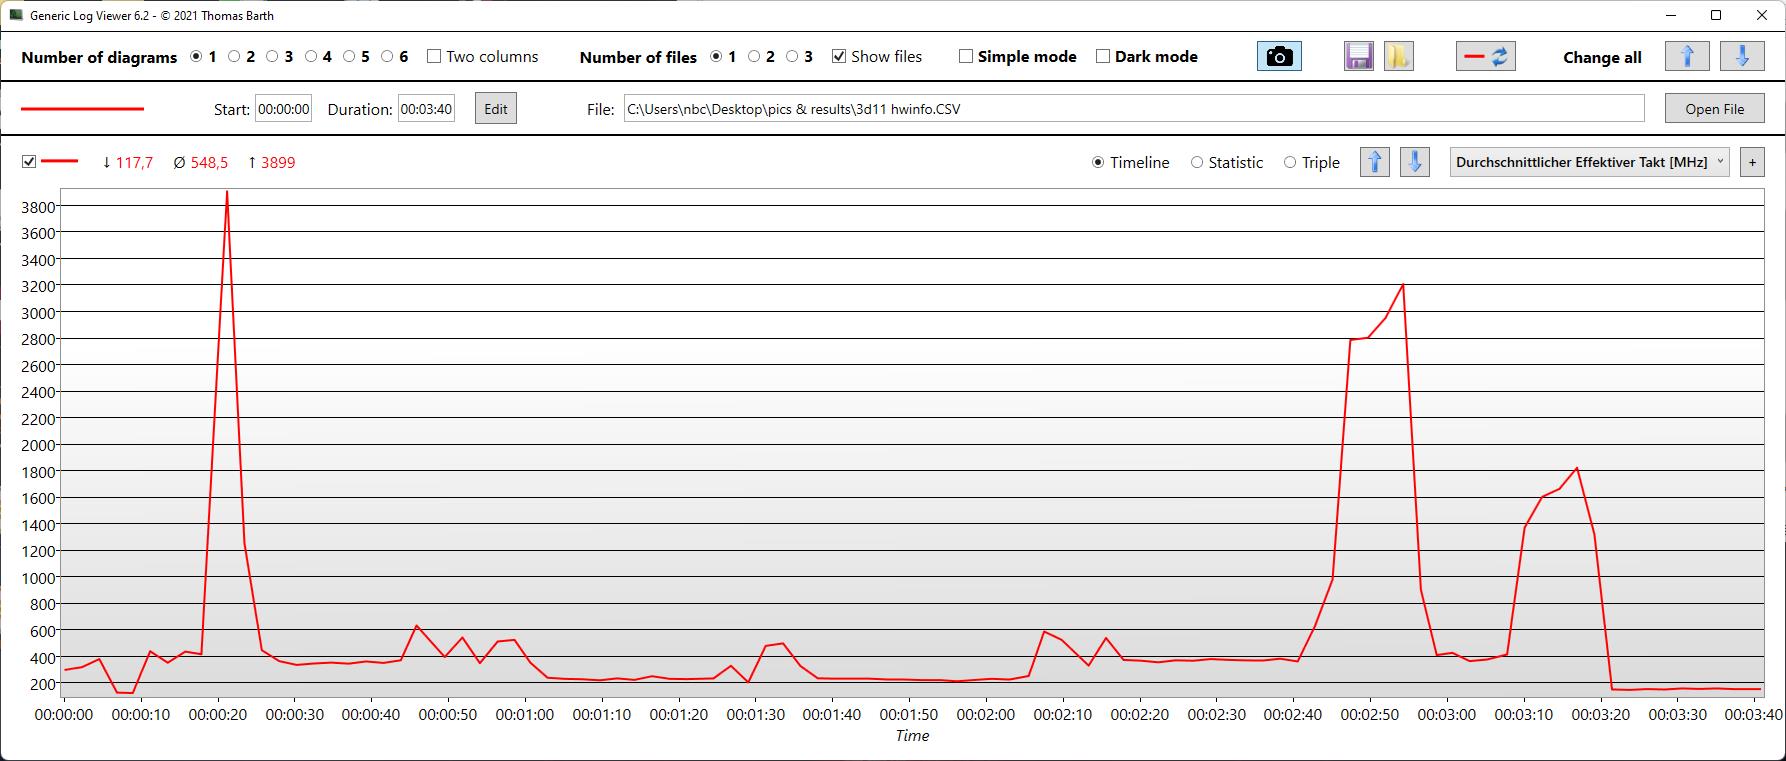
另一方面,笔记本电脑在3DMark 11中的表现非常令人失望。即使经过4次以上的运行,包括中间的一些重启,奇怪的、底层的结果还是重复出现。来自HWinfo的日志显示,CPU的时钟速度奇怪地很低(见右边的图表)。我们在Cloud-Gate基准测试中观察到类似的行为。
在电池运行中,帧率从75帧下降到相当稳定的30帧,在
"TheWitcher 3。"此外,冷却系统很晚才被激活。
| 3DMark 11 Performance | 14164 points | |
| 3DMark Cloud Gate Standard Score | 28859 points | |
| 3DMark Fire Strike Score | 19015 points | |
| 3DMark Time Spy Score | 8222 points | |
Help | ||
游戏性能
"Witcher 3"在原生分辨率和Ultra设置下运行,速度约为75 fps。这符合预期水平,但以华硕TUF为首的几个竞争对手仍然更快。在"赛博朋克2077 1.5"中,该系统在相同设置下仅达到约40 fps。虽然这仍然可以流畅地玩,但对于光线追踪效果来说是不够的。
在"Far Cry 5"和"X-Plane 11.11"中,Pulse甚至能够在华硕TUF之后取得第二名。尽管TGP相对较低,否则你可以在原生分辨率和高细节水平下流畅地玩几乎任何游戏。
| Cyberpunk 2077 1.6 | |
| 1920x1080 Medium Preset | |
| Average NVIDIA GeForce RTX 3060 Laptop GPU (68 - 118, n=14) | |
| MSI Pulse GL66 12UEK | |
| Alienware x14 i7 RTX 3060 | |
| 1920x1080 High Preset | |
| Average NVIDIA GeForce RTX 3060 Laptop GPU (42.2 - 87.7, n=14) | |
| Alienware x14 i7 RTX 3060 | |
| MSI Pulse GL66 12UEK | |
| 1920x1080 Ultra Preset | |
| Alienware x14 i7 RTX 3060 | |
| Average NVIDIA GeForce RTX 3060 Laptop GPU (40 - 78.8, n=16) | |
| MSI Pulse GL66 12UEK | |
| 1920x1080 Ray Tracing Ultra Preset (DLSS off) | |
| Average NVIDIA GeForce RTX 3060 Laptop GPU (12.6 - 28.9, n=7) | |
| MSI Pulse GL66 12UEK | |
脉冲没有先进的擎天柱,机上也没有MUX开关。然而,"TheWitcher 3" 的帧率在一个小时内仍然相当稳定。
The Witcher 3 FPS Chart
| low | med. | high | ultra | |
|---|---|---|---|---|
| The Witcher 3 (2015) | 368.5 | 247.2 | 139.6 | 78 |
| Dota 2 Reborn (2015) | 179 | 161 | 151 | 144 |
| X-Plane 11.11 (2018) | 142 | 123 | 100 | |
| Far Cry 5 (2018) | 168 | 128 | 120 | 112 |
| Cyberpunk 2077 1.6 (2022) | 88.1 | 87.1 | 42.2 | 40.7 |
排放
噪声排放
虽然我们在极限性能模式下运行大多数基准测试,但微星推荐使用平衡模式。在极限模式下,风扇甚至在空闲运行时短暂启动,但在平衡模式下,它们甚至在电池运行期间经过5分钟的"TheWitcher 3"后保持沉默。
即使在平衡模式下,风扇也可以在常规工作任务(如写这篇评论)中打开,但这时它们会悄悄地呼啸而过,几乎看不出来。
在极端模式下,只有Schenker Core在负载下会变得更响亮。速度更快的华硕TUF产生类似的噪音水平。
Noise level
| Idle |
| 23 / 27 / 27 dB(A) |
| Load |
| 48.2 / 56.94 dB(A) |
 | ||
30 dB silent 40 dB(A) audible 50 dB(A) loud |
||
min: | ||
| MSI Pulse GL66 12UEK GeForce RTX 3060 Laptop GPU, i9-12900H, Micron 2450 512GB MTFDKBA512TFK | Asus TUF Gaming F15 FX507ZM GeForce RTX 3060 Laptop GPU, i7-12700H, SK Hynix HFM001TD3JX013N | Alienware x14 i7 RTX 3060 GeForce RTX 3060 Laptop GPU, i7-12700H, WDC PC SN810 1TB | Schenker XMG Apex 15 NH57E PS GeForce RTX 3060 Laptop GPU, R7 5800H, Samsung SSD 980 500GB (MZ-V8V500BW) | Lenovo Legion S7 15ACH6 82K80030GE GeForce RTX 3060 Laptop GPU, R9 5900HX, Samsung PM981a MZVLB1T0HBLR | Alienware m15 R5 Ryzen Edition GeForce RTX 3060 Laptop GPU, R7 5800H, Toshiba KBG40ZNS512G NVMe | |
|---|---|---|---|---|---|---|
| Noise | 6% | 2% | 6% | -5% | 1% | |
| off / environment * (dB) | 23 | 23.2 -1% | 24.7 -7% | 23 -0% | 25 -9% | 24 -4% |
| Idle Minimum * (dB) | 23 | 23.6 -3% | 24.7 -7% | 23 -0% | 25 -9% | 24 -4% |
| Idle Average * (dB) | 27 | 23.6 13% | 24.7 9% | 23 15% | 30 -11% | 25 7% |
| Idle Maximum * (dB) | 27 | 25.4 6% | 30.9 -14% | 26.4 2% | 36 -33% | 35 -30% |
| Load Average * (dB) | 48.2 | 38 21% | 40 17% | 34.25 29% | 42 13% | 44 9% |
| Witcher 3 ultra * (dB) | 56.9 | 54.1 5% | 51.5 9% | 58.4 -3% | 53 7% | 48 16% |
| Load Maximum * (dB) | 56.94 | 57.2 -0% | 51.5 10% | 58.42 -3% | 54 5% | 50 12% |
* ... smaller is better
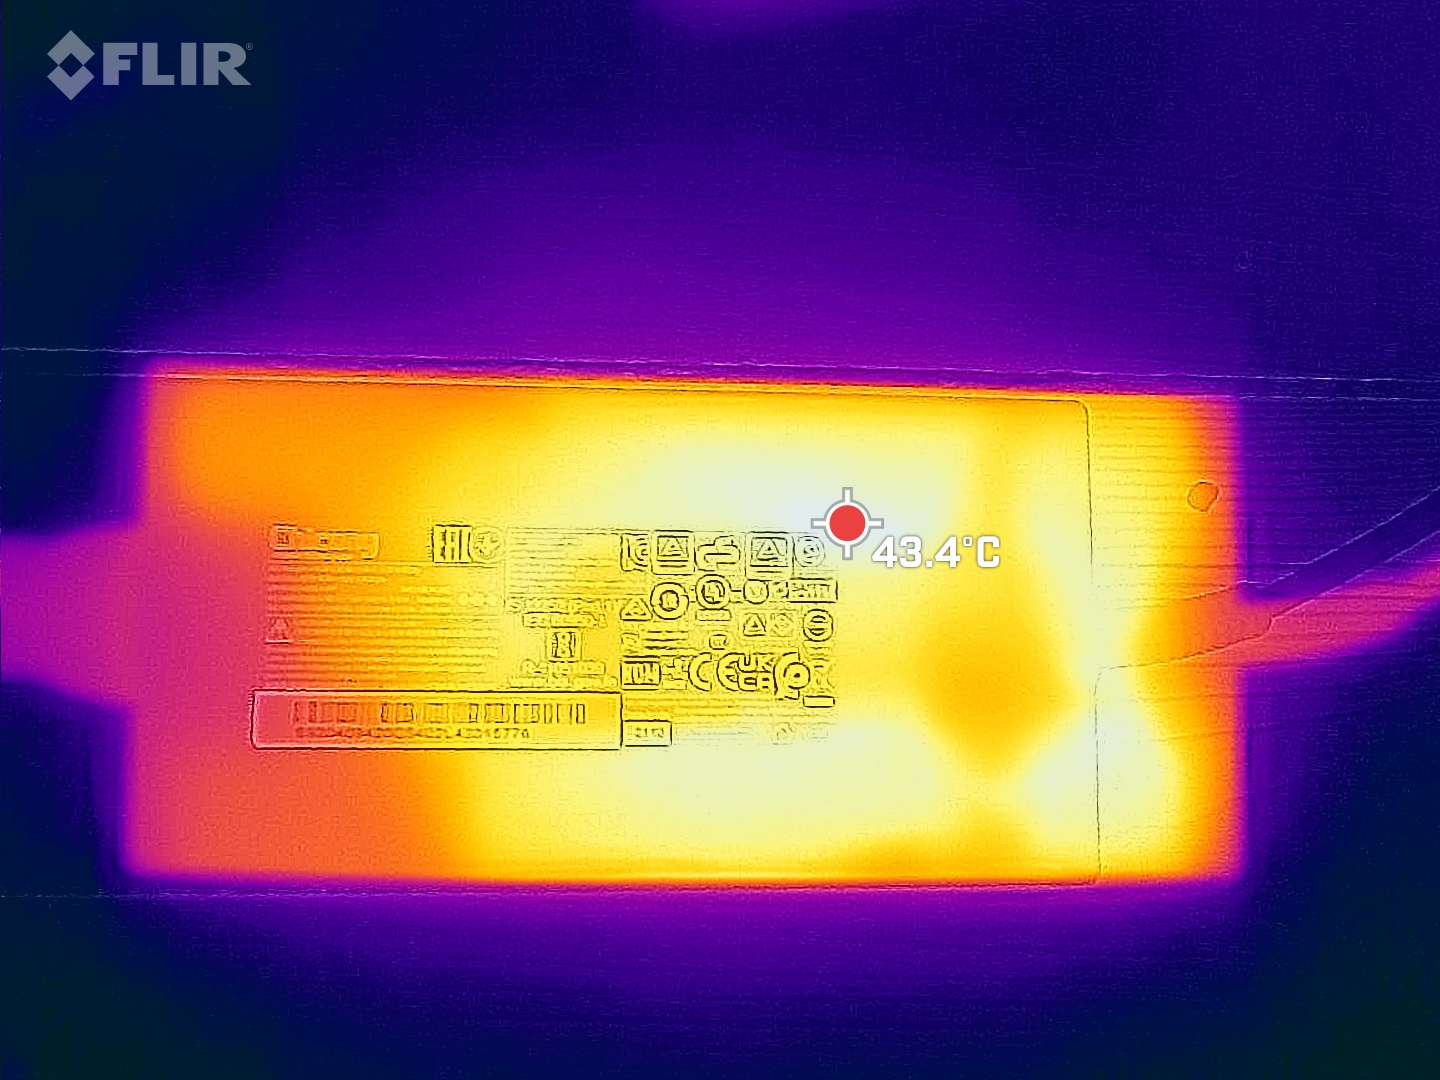
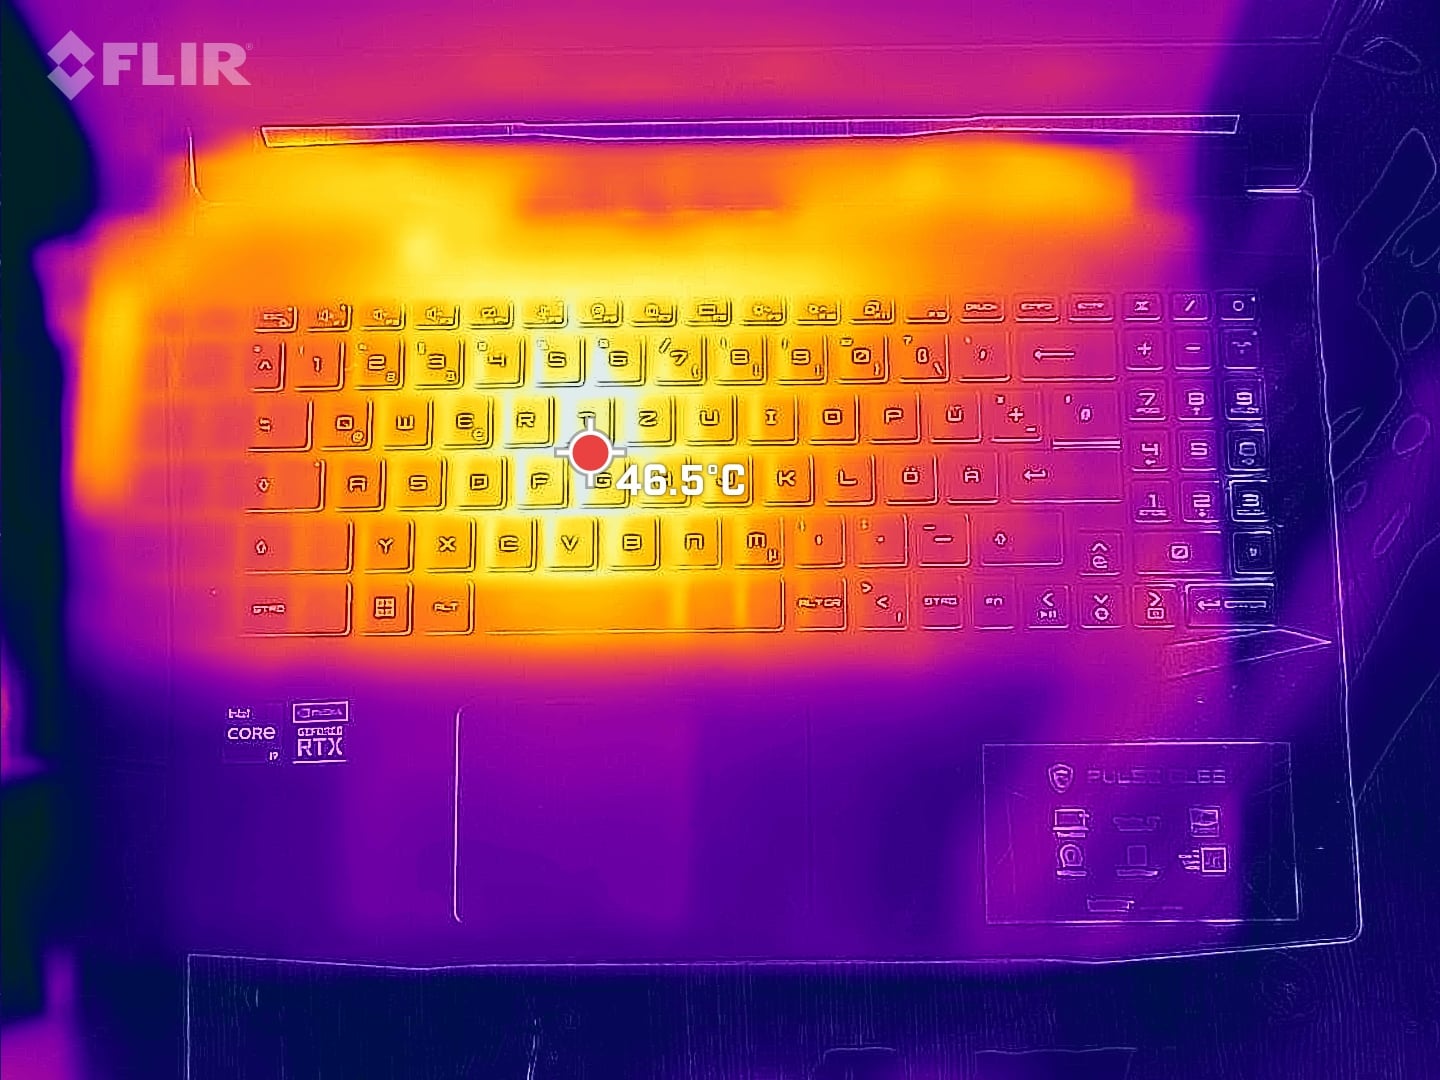
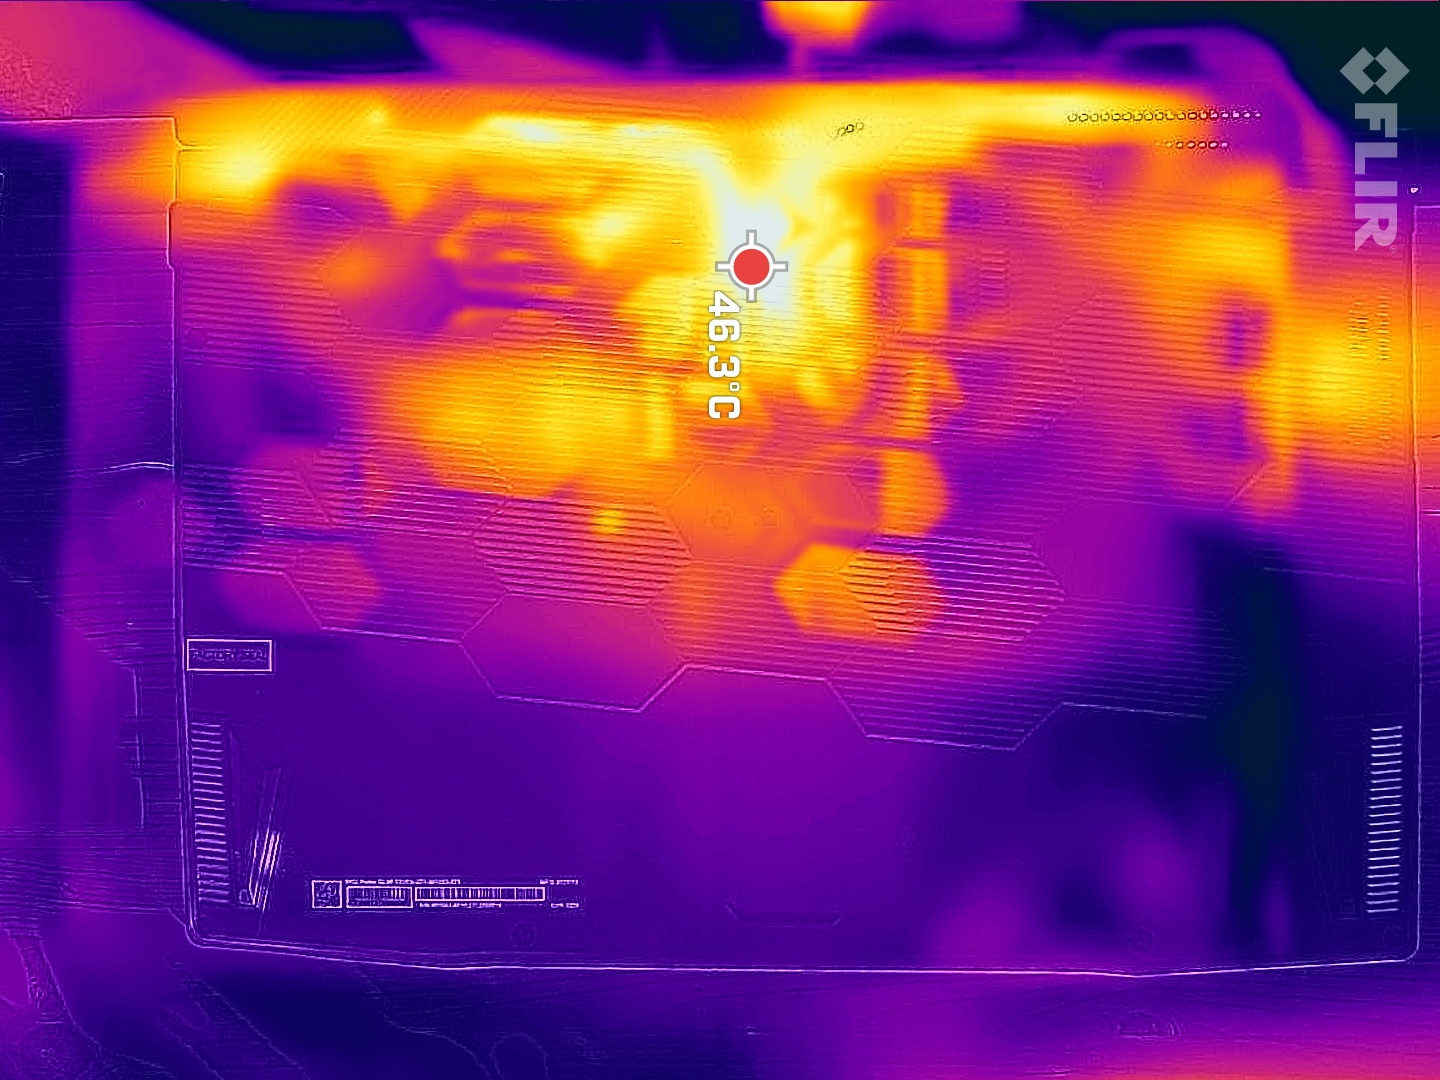
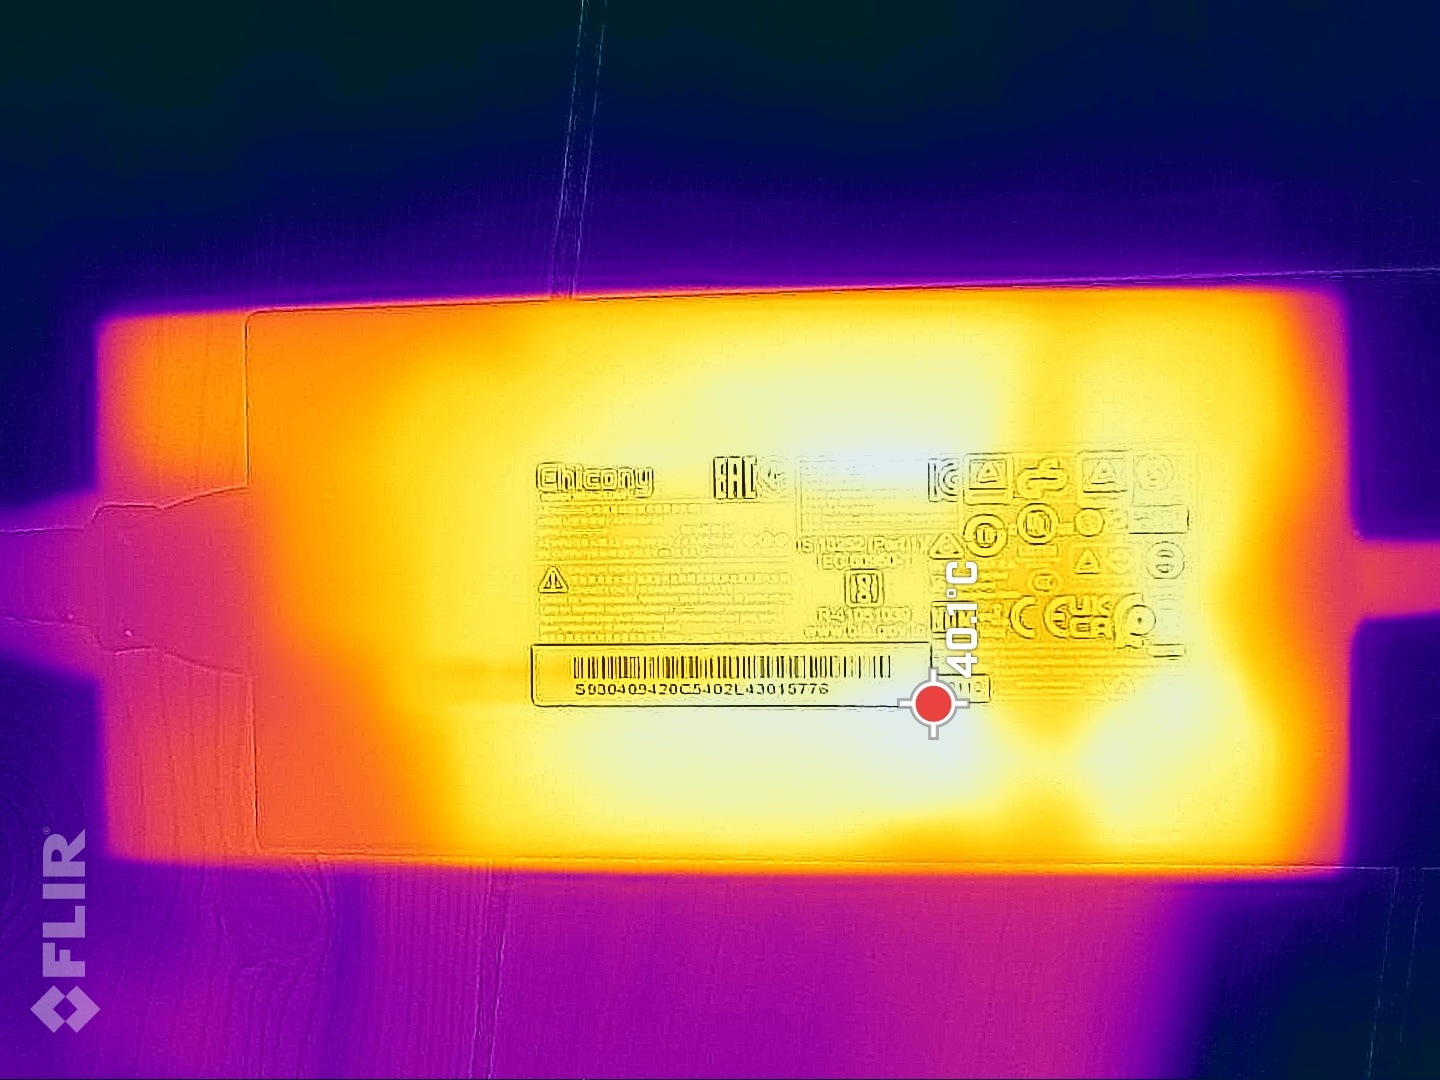
温度
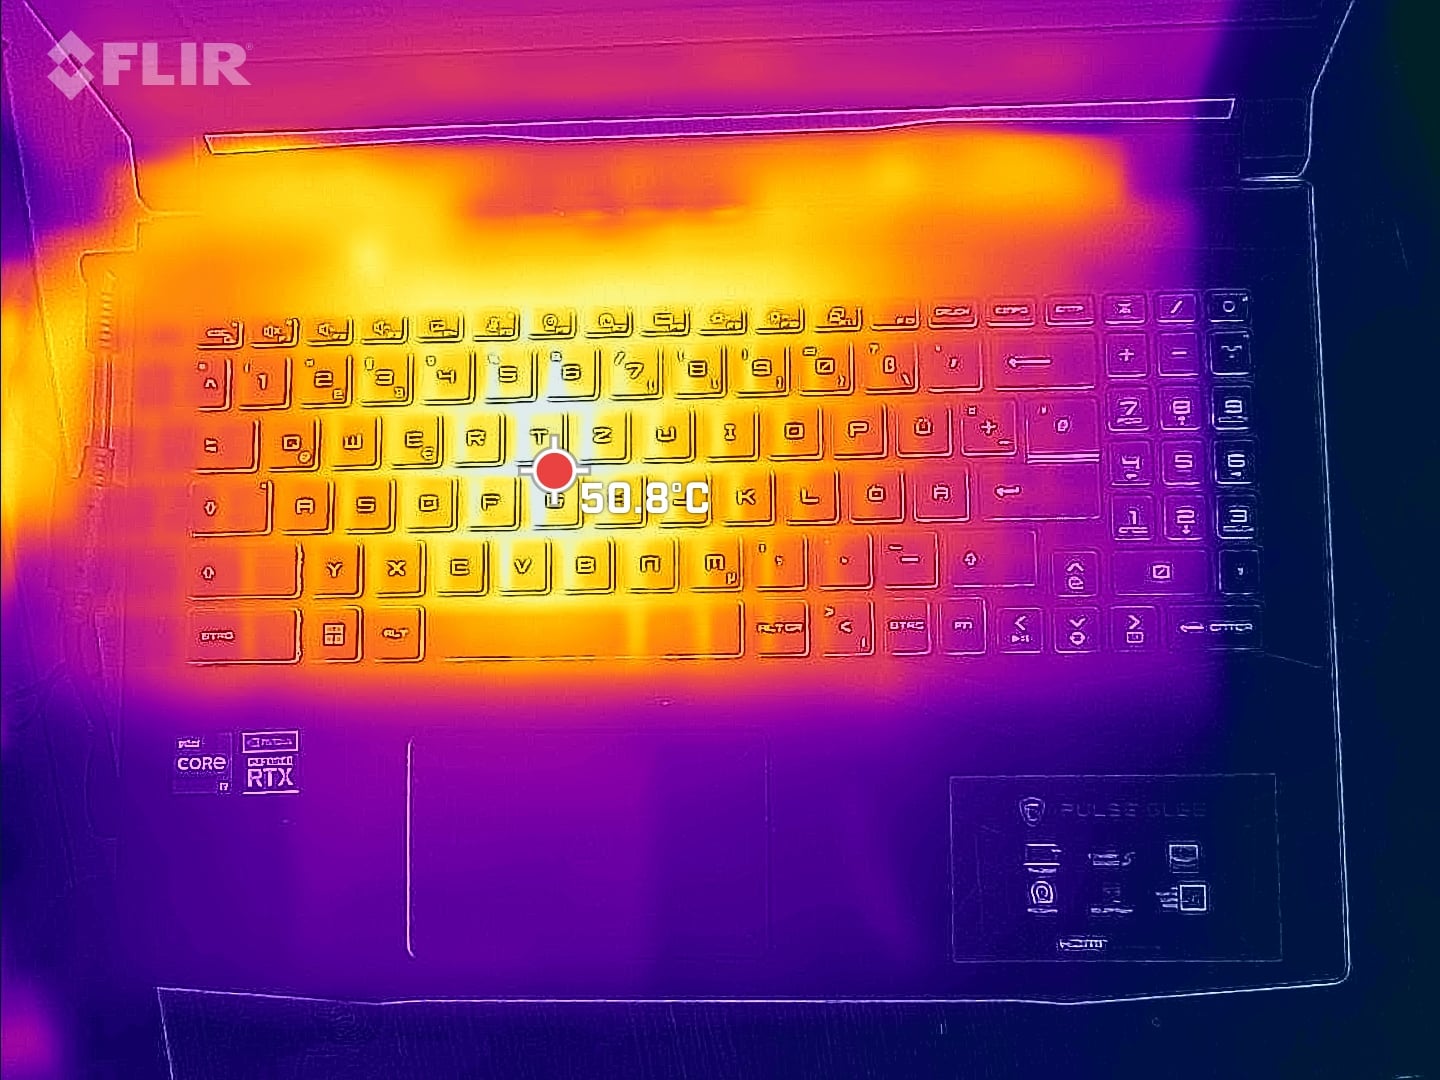
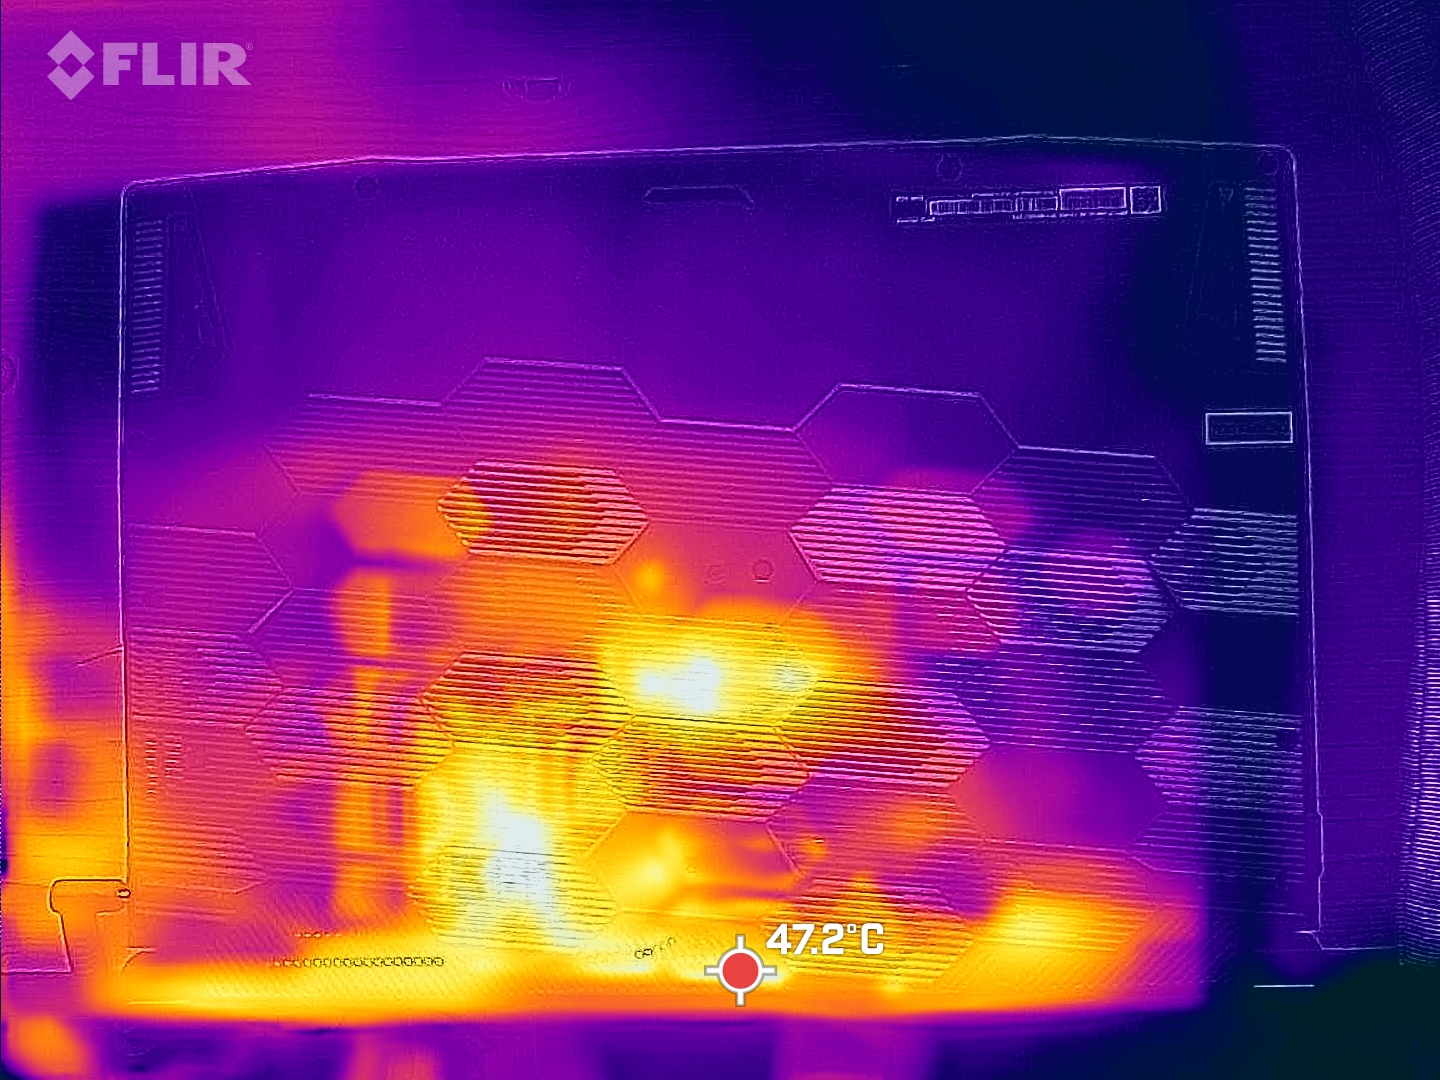
在空闲运行期间,约37°C(99°F),笔记本电脑的温度比竞争对手略高。只有华硕TUF在这里得到类似的温度。在负载情况下,这种情况持续到50°C(122°F),几个竞争对手达到了类似的温度(联想Legion S7)或变得更热(Alienware m5)。
幸运的是,掌托始终保持凉爽。热点在中心或更接近显示屏的地方。
(-) The maximum temperature on the upper side is 50 °C / 122 F, compared to the average of 40.4 °C / 105 F, ranging from 21.2 to 68.8 °C for the class Gaming.
(-) The bottom heats up to a maximum of 47 °C / 117 F, compared to the average of 43.2 °C / 110 F
(+) In idle usage, the average temperature for the upper side is 30.8 °C / 87 F, compared to the device average of 33.9 °C / 93 F.
(-) Playing The Witcher 3, the average temperature for the upper side is 39.6 °C / 103 F, compared to the device average of 33.9 °C / 93 F.
(+) The palmrests and touchpad are cooler than skin temperature with a maximum of 26 °C / 78.8 F and are therefore cool to the touch.
(+) The average temperature of the palmrest area of similar devices was 28.8 °C / 83.8 F (+2.8 °C / 5 F).
| MSI Pulse GL66 12UEK Intel Core i9-12900H, NVIDIA GeForce RTX 3060 Laptop GPU | Asus TUF Gaming F15 FX507ZM Intel Core i7-12700H, NVIDIA GeForce RTX 3060 Laptop GPU | Alienware x14 i7 RTX 3060 Intel Core i7-12700H, NVIDIA GeForce RTX 3060 Laptop GPU | Schenker XMG Apex 15 NH57E PS AMD Ryzen 7 5800H, NVIDIA GeForce RTX 3060 Laptop GPU | Lenovo Legion S7 15ACH6 82K80030GE AMD Ryzen 9 5900HX, NVIDIA GeForce RTX 3060 Laptop GPU | Alienware m15 R5 Ryzen Edition AMD Ryzen 7 5800H, NVIDIA GeForce RTX 3060 Laptop GPU | |
|---|---|---|---|---|---|---|
| Heat | -1% | 14% | 19% | 9% | -10% | |
| Maximum Upper Side * (°C) | 50 | 44.4 11% | 51.3 -3% | 36 28% | 49 2% | 62 -24% |
| Maximum Bottom * (°C) | 47 | 48.8 -4% | 44.4 6% | 38 19% | 50 -6% | 61 -30% |
| Idle Upper Side * (°C) | 36 | 37.8 -5% | 27.2 24% | 31 14% | 29 19% | 36 -0% |
| Idle Bottom * (°C) | 38 | 39.6 -4% | 26.6 30% | 33 13% | 30 21% | 33 13% |
* ... smaller is better
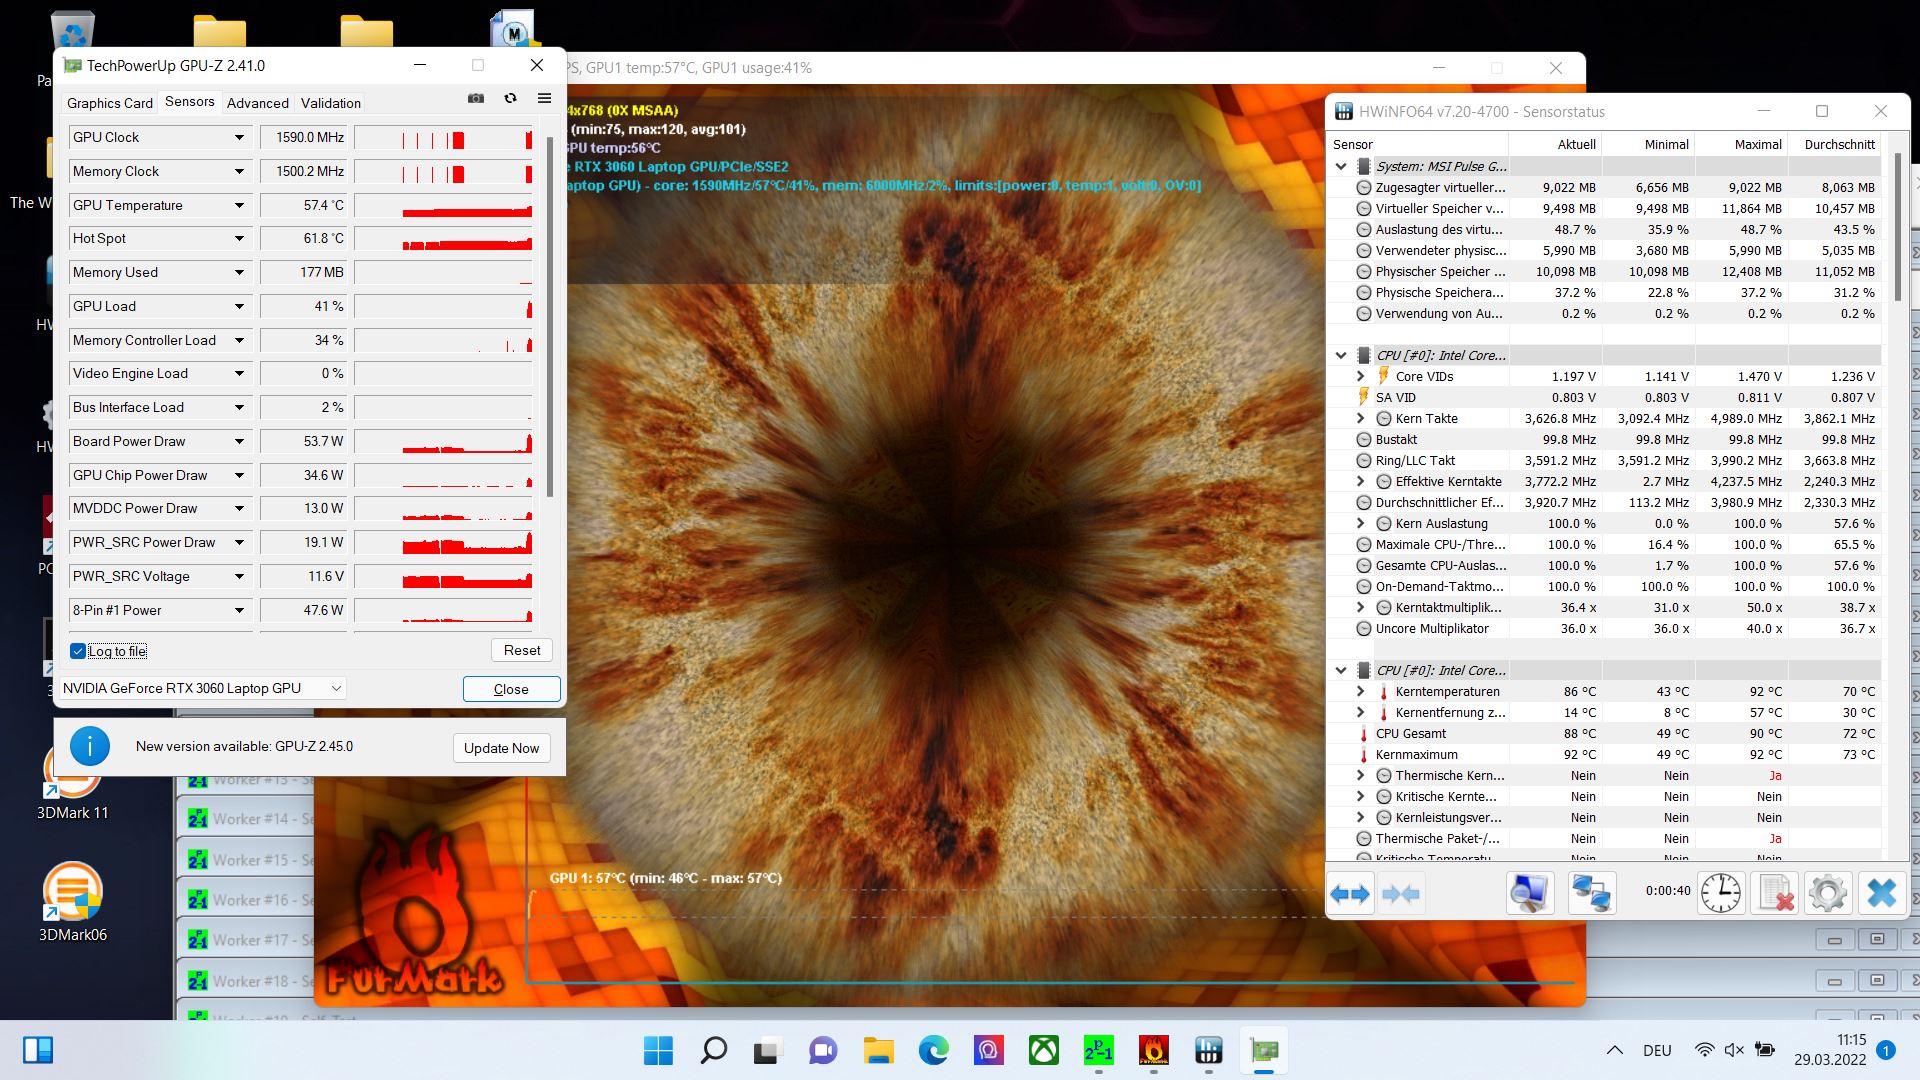
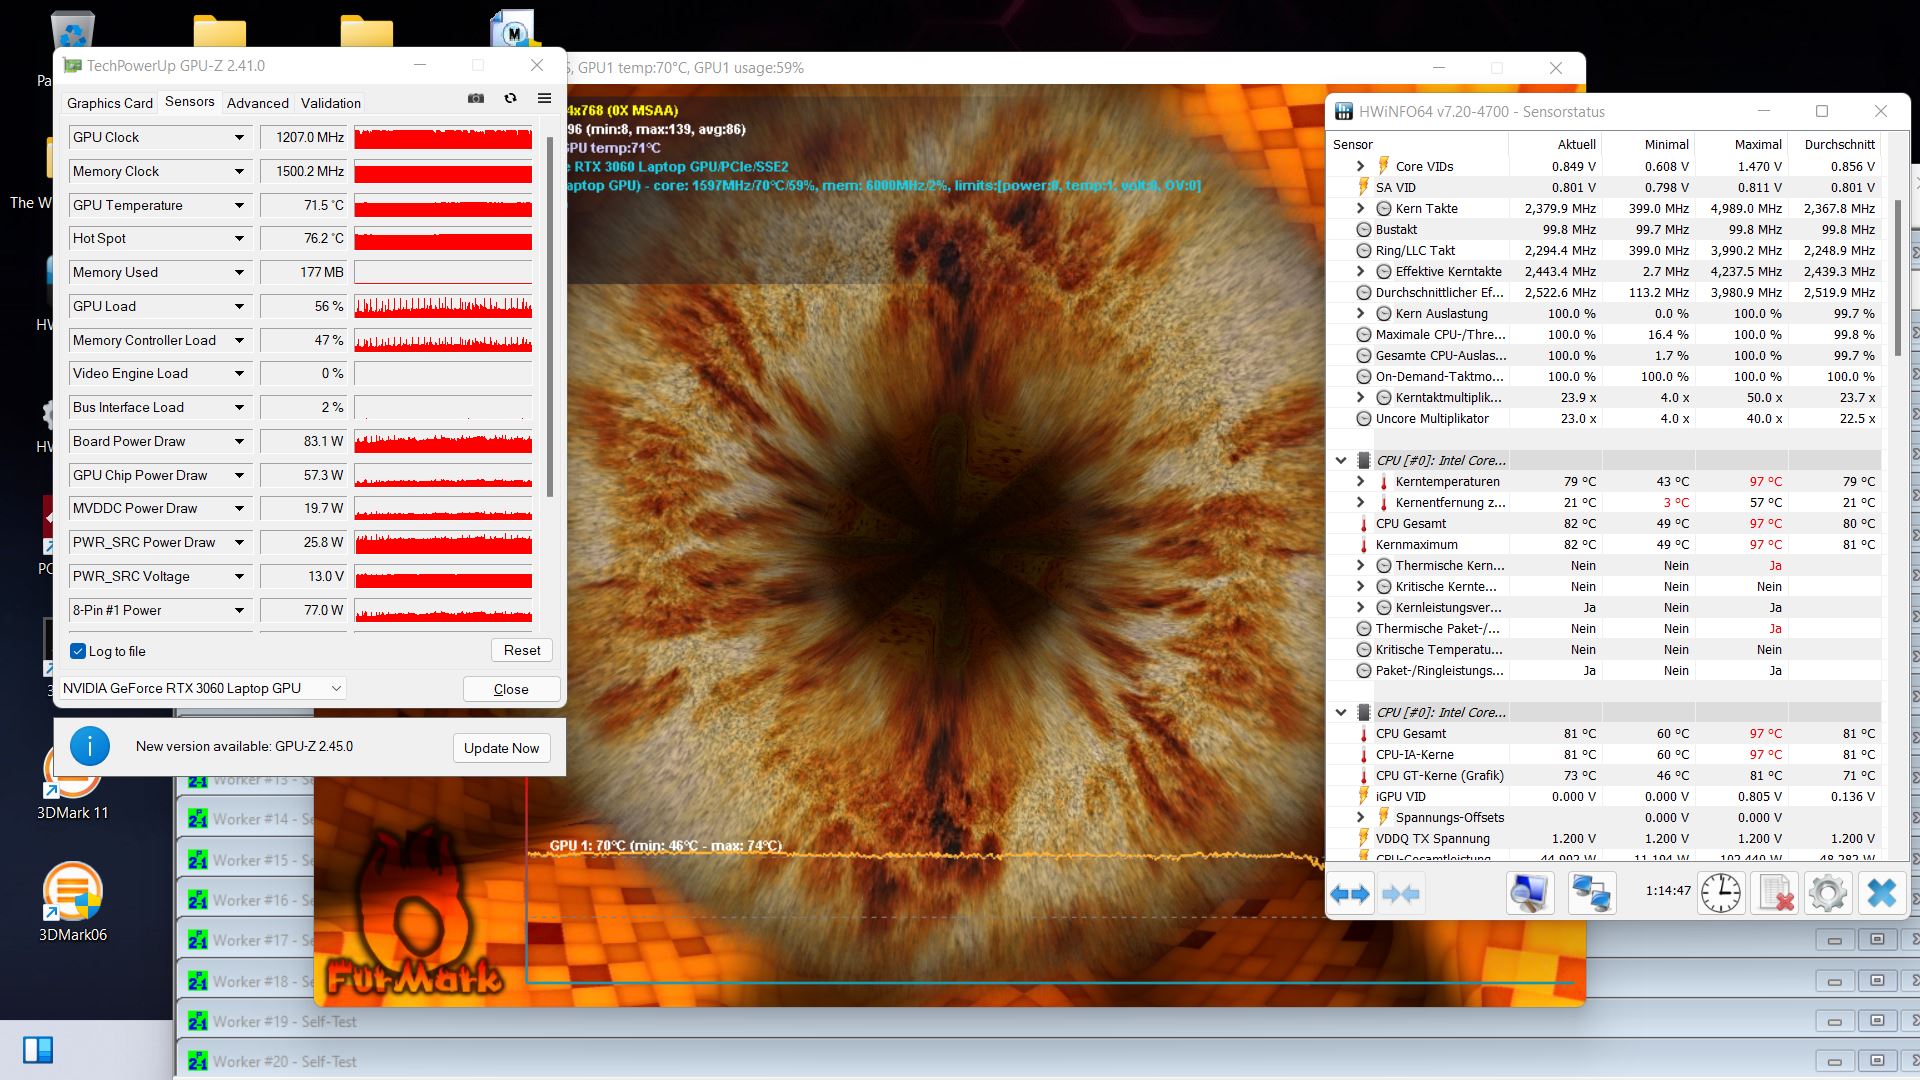
压力测试
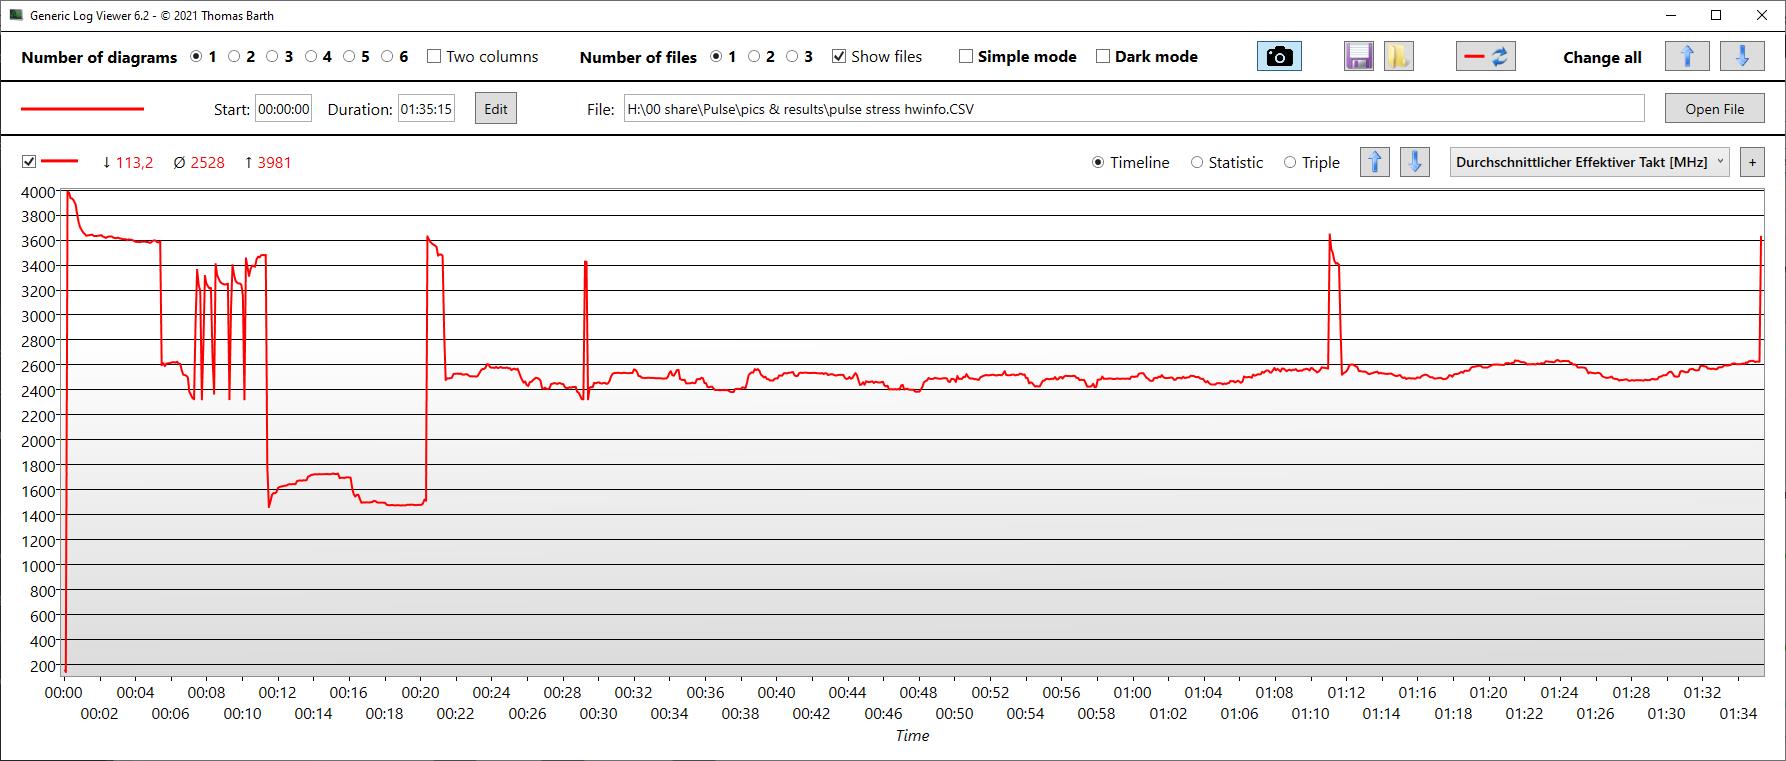
在我们的压力测试开始时,核心最初加速到3.6GHz,这与可能的最高5GHz相差甚远。在最初的一分钟后,时钟速度不断下降。我们在10分钟后只测到2.9GHz,1小时后约为2.3GHz。这意味着,尽管有极限性能模式,但CPU在这里被节流了。一小时后,核心温度约为80℃(176°F)。在测试过程中,最高温度上升到97°C(207°F),这就是时钟速度被节流的原因。
我们看到在第12分钟和第20分钟之间出现了奇怪的性能下降,也许有一些其他进程在这里干扰了。
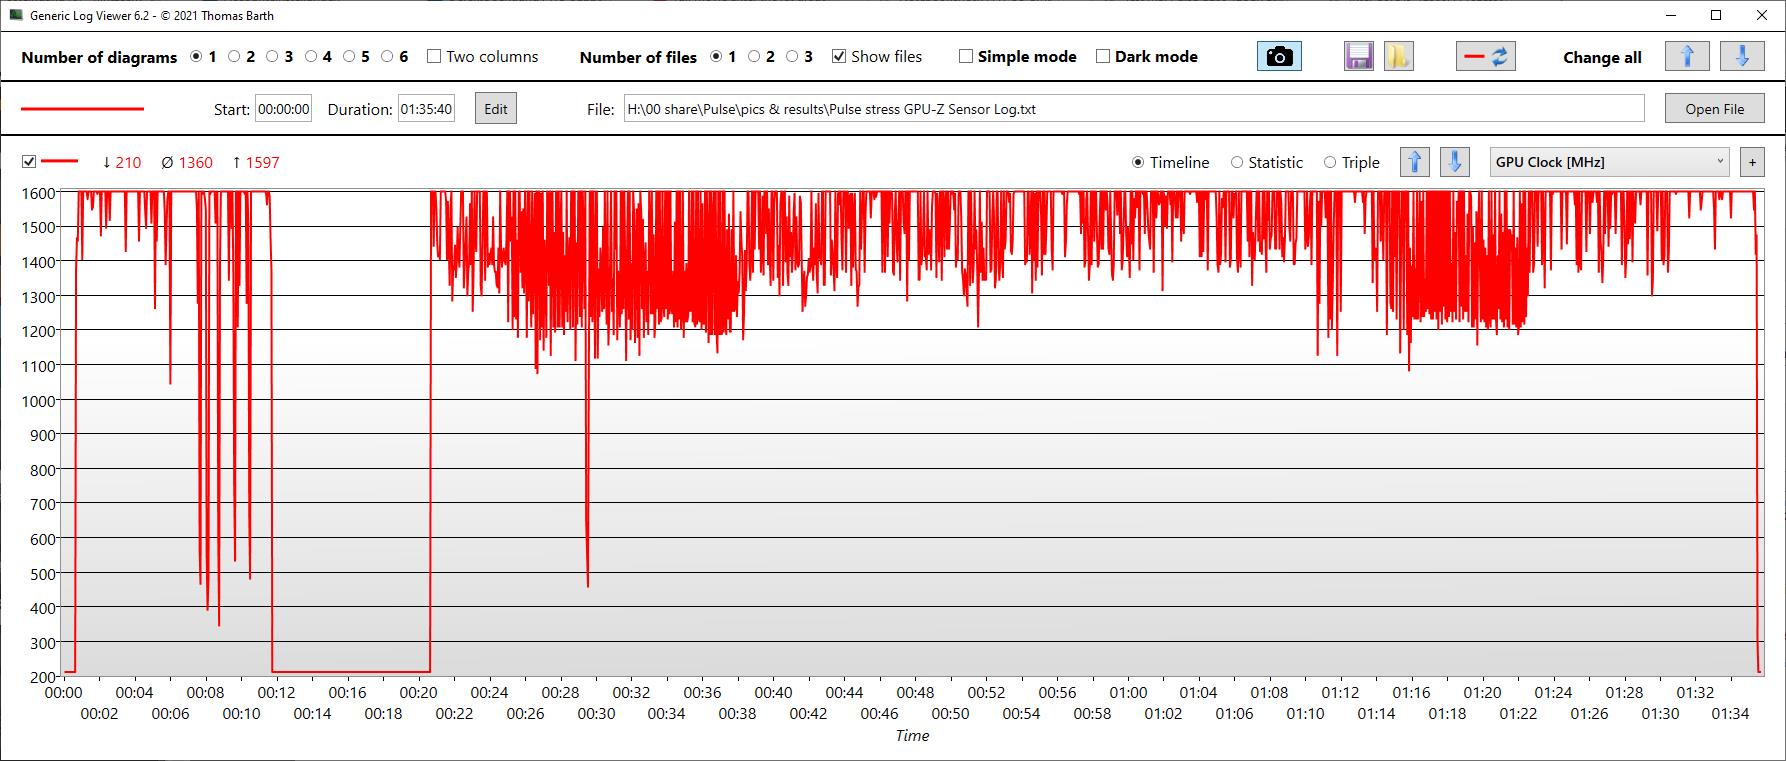
GPU的时钟速度变化很大,一小时内大约在1.6和1.2GHz之间,温度在70 °C(158 °F)左右。在GPU时钟速度方面有一些较大的性能下降,在存储速度方面也是如此。至少后者应该保持相当稳定,但根据GPU-Z的日志,在测试过程中,这两个值都下降到了200MHz。
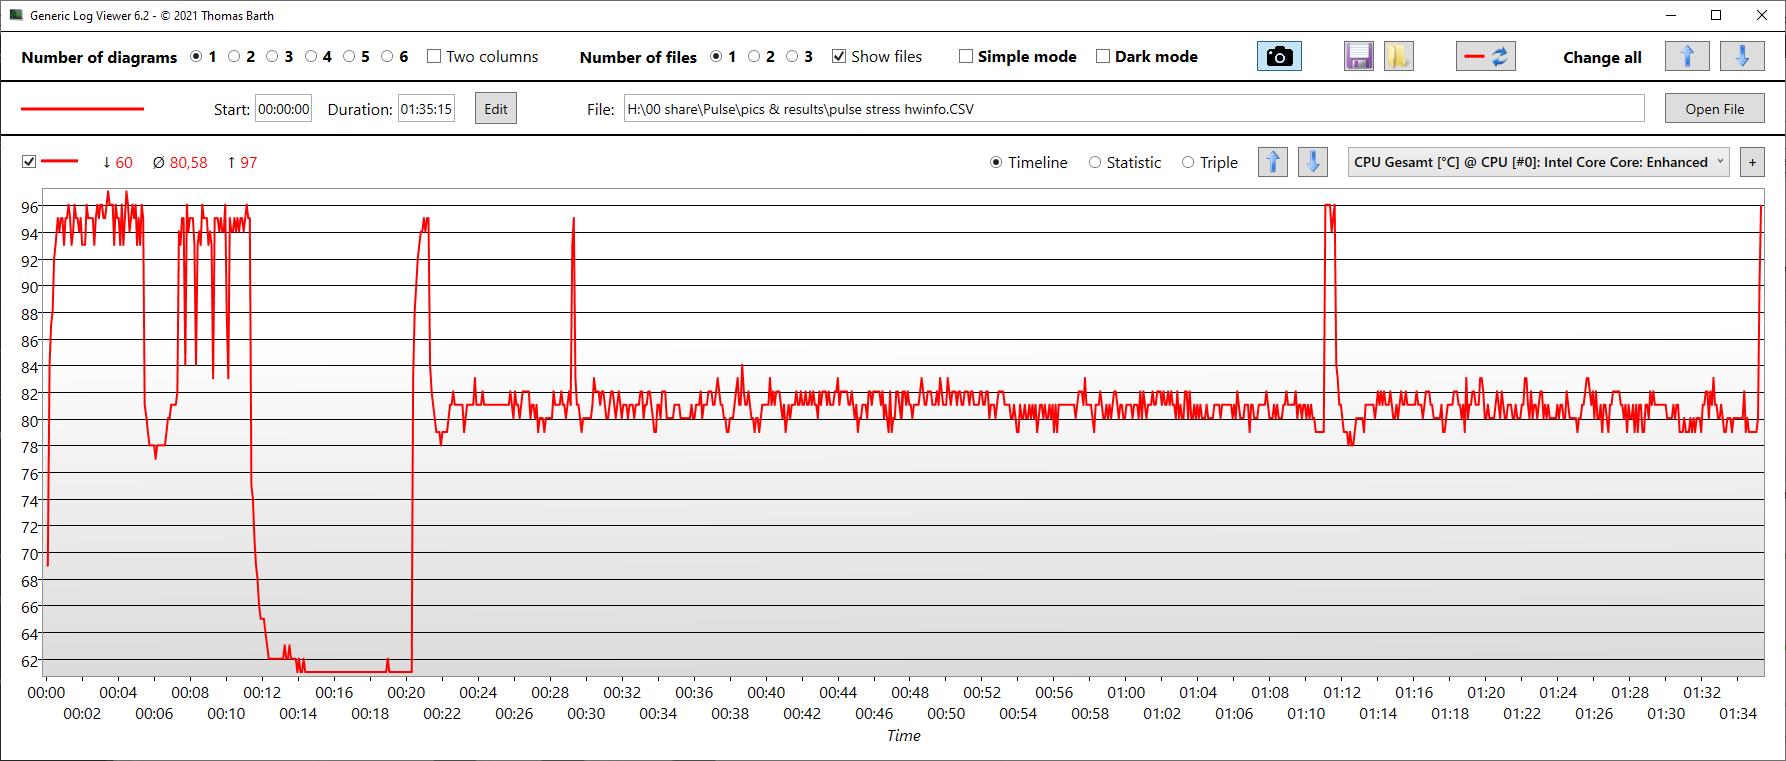
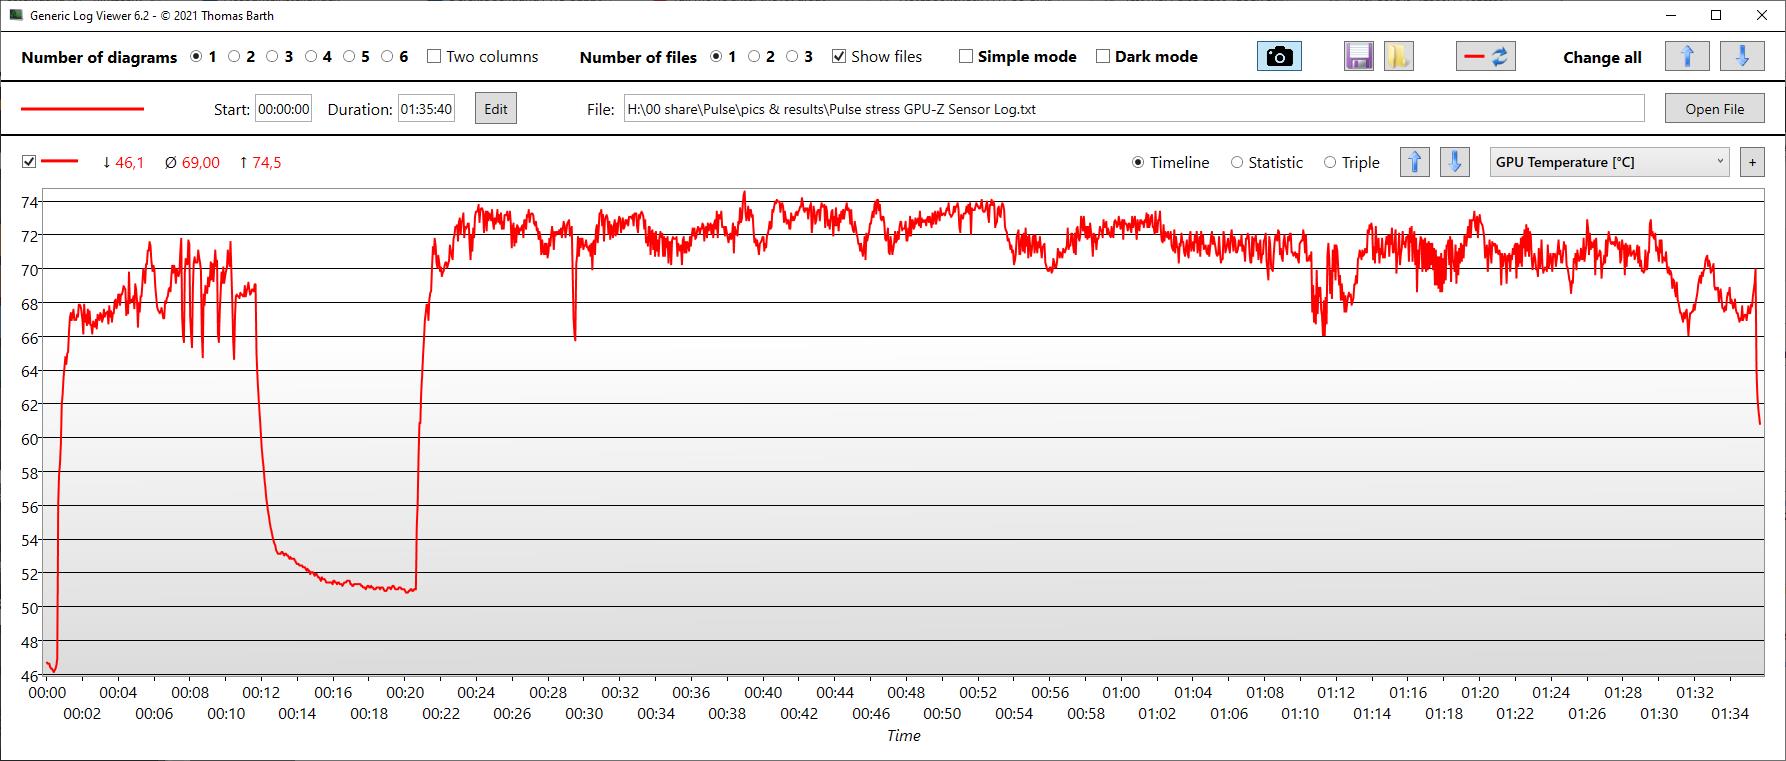
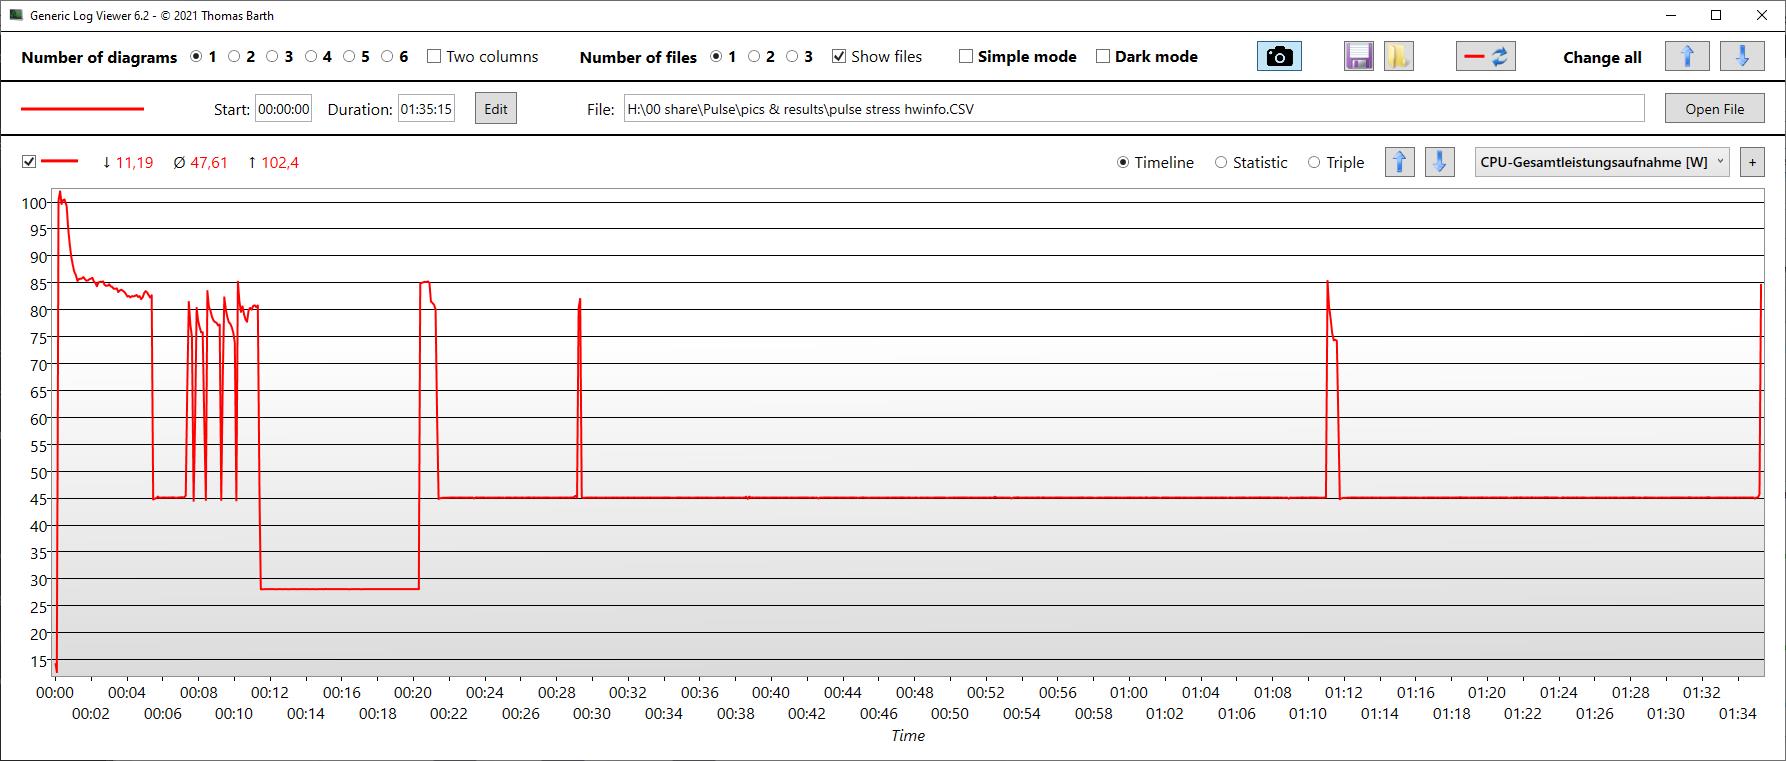
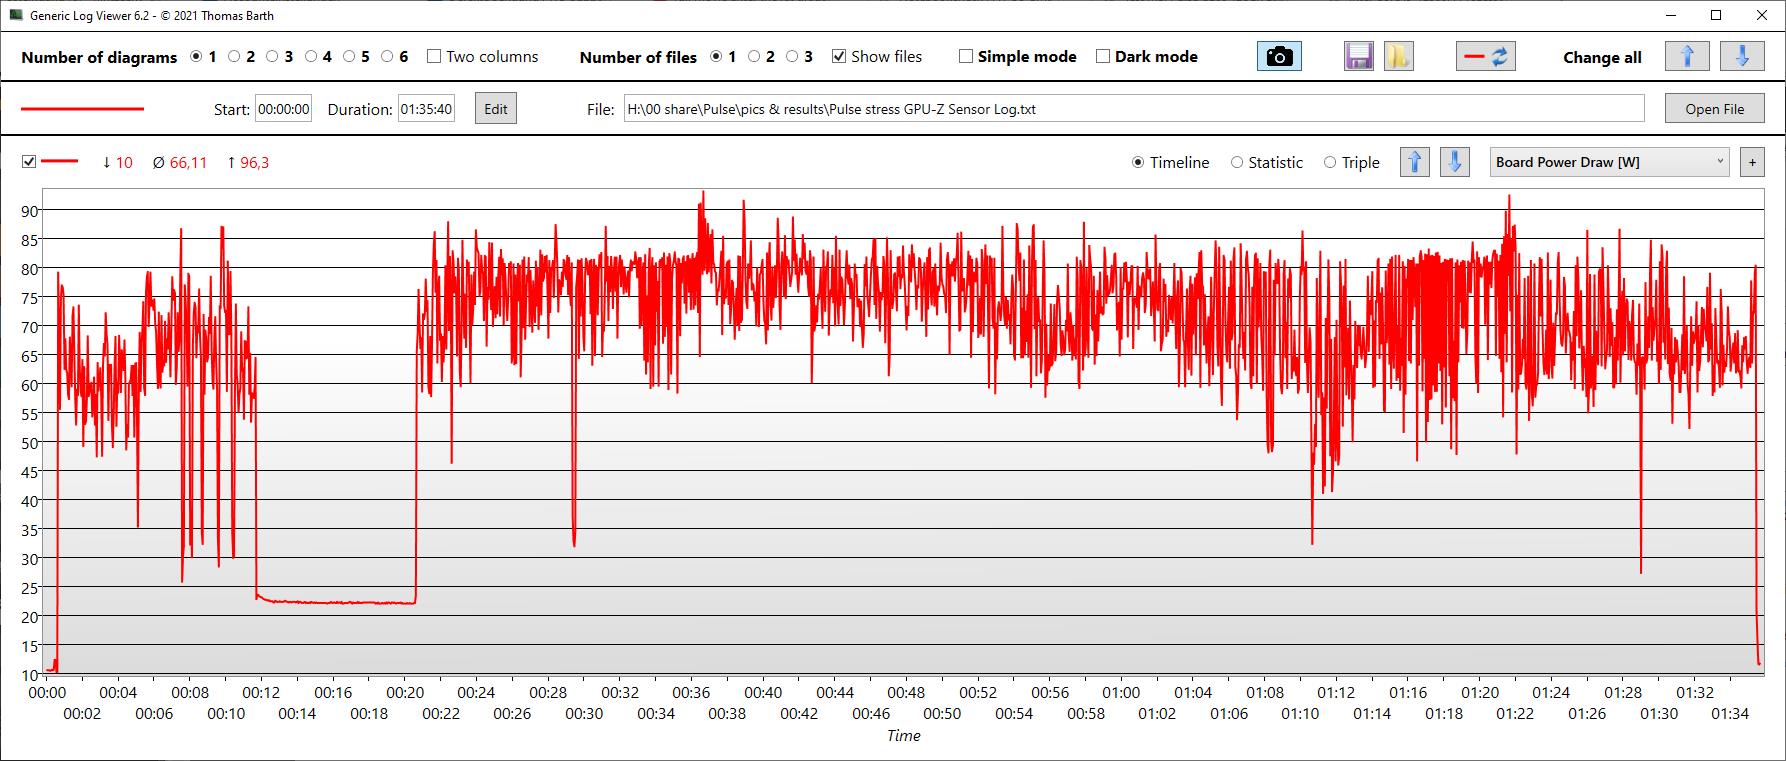
| CPU时钟(GHz) | GPU时钟(MHz) | CPU平均温度(℃) | GPU平均温度(℃) | |
| Prime95 + FurMark Stress | 2,5 | 1.360 | 81 | 69 |
发言人
扬声器的声音可以更大,而且明显缺乏一些低音。但至少中音和高音是相当平衡的。有一个组合音频端口,可以连接模拟外部音频设备。
MSI Pulse GL66 12UEK audio analysis
(±) | speaker loudness is average but good (79.8 dB)
Bass 100 - 315 Hz
(-) | nearly no bass - on average 16.2% lower than median
(±) | linearity of bass is average (10.4% delta to prev. frequency)
Mids 400 - 2000 Hz
(±) | higher mids - on average 7.6% higher than median
(+) | mids are linear (6.8% delta to prev. frequency)
Highs 2 - 16 kHz
(+) | balanced highs - only 4.1% away from median
(±) | linearity of highs is average (8.1% delta to prev. frequency)
Overall 100 - 16.000 Hz
(±) | linearity of overall sound is average (18.8% difference to median)
Compared to same class
» 62% of all tested devices in this class were better, 8% similar, 30% worse
» The best had a delta of 6%, average was 18%, worst was 132%
Compared to all devices tested
» 44% of all tested devices were better, 8% similar, 49% worse
» The best had a delta of 4%, average was 23%, worst was 134%
Asus TUF Gaming F15 FX507ZM audio analysis
(±) | speaker loudness is average but good (76.7 dB)
Bass 100 - 315 Hz
(±) | reduced bass - on average 13.7% lower than median
(±) | linearity of bass is average (10.1% delta to prev. frequency)
Mids 400 - 2000 Hz
(±) | higher mids - on average 5.2% higher than median
(+) | mids are linear (4.9% delta to prev. frequency)
Highs 2 - 16 kHz
(+) | balanced highs - only 4.1% away from median
(±) | linearity of highs is average (8.6% delta to prev. frequency)
Overall 100 - 16.000 Hz
(±) | linearity of overall sound is average (15.9% difference to median)
Compared to same class
» 38% of all tested devices in this class were better, 7% similar, 56% worse
» The best had a delta of 6%, average was 18%, worst was 132%
Compared to all devices tested
» 25% of all tested devices were better, 5% similar, 70% worse
» The best had a delta of 4%, average was 23%, worst was 134%
电源管理
消耗功率
在空闲运行时,特别是在平均负载下(3DMark06),功耗非常低。在游戏时,功耗位于该领域的中间位置,但至少它也是最快的设备之一。在我们的压力测试中,消耗量是最高的,达到了与华硕TUF相同的水平,它确实更快。然而,总体而言,消耗量是低的或适当的。
| Idle | |
| Load |
|
Key:
min: | |
| MSI Pulse GL66 12UEK i9-12900H, GeForce RTX 3060 Laptop GPU, Micron 2450 512GB MTFDKBA512TFK, IPS, 1920x1080, 15.6" | Asus TUF Gaming F15 FX507ZM i7-12700H, GeForce RTX 3060 Laptop GPU, SK Hynix HFM001TD3JX013N, IPS, 1920x1080, 15.6" | Alienware x14 i7 RTX 3060 i7-12700H, GeForce RTX 3060 Laptop GPU, WDC PC SN810 1TB, IPS, 1920x1080, 14" | Schenker XMG Apex 15 NH57E PS R7 5800H, GeForce RTX 3060 Laptop GPU, Samsung SSD 980 500GB (MZ-V8V500BW), IPS, 1920x1080, 15.6" | Lenovo Legion S7 15ACH6 82K80030GE R9 5900HX, GeForce RTX 3060 Laptop GPU, Samsung PM981a MZVLB1T0HBLR, IPS, 3840x2160, 15.6" | Alienware m15 R5 Ryzen Edition R7 5800H, GeForce RTX 3060 Laptop GPU, Toshiba KBG40ZNS512G NVMe, IPS, 1920x1080, 15.6" | Average NVIDIA GeForce RTX 3060 Laptop GPU | Average of class Gaming | |
|---|---|---|---|---|---|---|---|---|
| Power Consumption | -33% | -7% | -36% | -43% | -52% | -45% | -70% | |
| Idle Minimum * (Watt) | 7 | 6.3 10% | 7.9 -13% | 10.5 -50% | 13 -86% | 11 -57% | 10.4 ? -49% | 13.1 ? -87% |
| Idle Average * (Watt) | 13 | 9.8 25% | 11.1 15% | 15 -15% | 16 -23% | 14 -8% | 14.5 ? -12% | 19 ? -46% |
| Idle Maximum * (Watt) | 13.7 | 26.5 -93% | 11.8 14% | 17 -24% | 23 -68% | 25 -82% | 21.4 ? -56% | 24.6 ? -80% |
| Load Average * (Watt) | 48.4 | 103.8 -114% | 107.4 -122% | 109 -125% | 95 -96% | 123 -154% | 109.3 ? -126% | 111.3 ? -130% |
| Witcher 3 ultra * (Watt) | 148 | 189 -28% | 111 25% | 186 -26% | 156 -5% | 176 -19% | ||
| Load Maximum * (Watt) | 244 | 241.9 1% | 140.4 42% | 186 24% | 191 22% | 226 7% | 206 ? 16% | 260 ? -7% |
* ... smaller is better
Power Consumption The Witcher 3 / Stress Test
Power Consumption With External Monitor
电池寿命
微星使用了相当小的电池,容量只有53-Wh,游戏笔记本的电池寿命也相应较低。 只有申克有类似的小电池,但其他竞争对手都有80(Alienware)甚至90-Wh(华硕TUF)的容量。
这意味着,在全亮度(即相当平庸)的情况下,勉强够看4小时的视频或4.5小时的冲浪。
| MSI Pulse GL66 12UEK i9-12900H, GeForce RTX 3060 Laptop GPU, 53.5 Wh | Asus TUF Gaming F15 FX507ZM i7-12700H, GeForce RTX 3060 Laptop GPU, 90 Wh | Alienware x14 i7 RTX 3060 i7-12700H, GeForce RTX 3060 Laptop GPU, 80 Wh | Schenker XMG Apex 15 NH57E PS R7 5800H, GeForce RTX 3060 Laptop GPU, 49 Wh | Lenovo Legion S7 15ACH6 82K80030GE R9 5900HX, GeForce RTX 3060 Laptop GPU, 71 Wh | Alienware m15 R5 Ryzen Edition R7 5800H, GeForce RTX 3060 Laptop GPU, 86 Wh | Average of class Gaming | |
|---|---|---|---|---|---|---|---|
| Battery runtime | -42% | 39% | -6% | 26% | 34% | 43% | |
| H.264 (h) | 4 | 9.4 135% | 4.6 15% | 7.5 88% | 8.8 120% | 8.27 ? 107% | |
| Load (h) | 1.9 | 1.1 -42% | 0.8 -58% | 1.4 -26% | 1.2 -37% | 0.9 -53% | 1.496 ? -21% |
| Reader / Idle (h) | 15.8 | 14 | 14.7 | 7.84 ? | |||
| WiFi v1.3 (h) | 4.8 | 8.9 | 6.5 | 7 | 5.1 | 7.08 ? | |
| Witcher 3 ultra (h) | 0.8 | 1.6 |
Pros
Cons
评语 - 有很大的改进潜力
虽然RTX 3060只能使用105瓦,但我们仍然喜欢其游戏性能,特别是这也使Pulse的效率舒适,但无论如何也不会慢。
无论是响应时间蹩脚的暗色显示屏,还是USB 2.0或缺乏Thunderbolt,都不会让真正的游戏玩家满意。使用贴纸的工厂封条,至少是有问题的,也不会激发任何热情。
很明显,这款笔记本确实是为价格敏感的游戏玩家设计的,尽管目前约1900欧元(约2057美元)的价格并没有真正使其成为一种偷窃。如果制造商像大多数竞争对手一样使用i7-12700H或i7-12800H处理器,而不是昂贵的i9-12900H,微星可以毫无问题地降低价格。在Pulse中,性能差异并不明显,并不能证明额外的价格溢价是合理的。
通过Pulse GL66,微星相当新的游戏系列仍然暴露出一些调整问题。昂贵的CPU并没有发挥出它的全部水平,一个更实惠的型号会将系统的价格降低到一个更合适的水平。
从性能上看,华硕TUF游戏机F15推荐自己作为替代品。它速度更快,提供更好的屏幕,而且价格更实惠,约为1,600欧元(约1,732美元)。联想Legion S7的价格与Pulse差不多,它也能以良好的显示屏而大放异彩。
价格和可用性
在美国,配备i7-12700H的Pulse GL66 12UEK的各种配置可从亚马逊起价1549美元。.
MSI Pulse GL66 12UEK
- 04/11/2022 v7 (old)
Christian Hintze
Price comparison

