Apple MacBook Pro 16 2023回顾--M2最大挑战 RTX 3080 TiGeForce
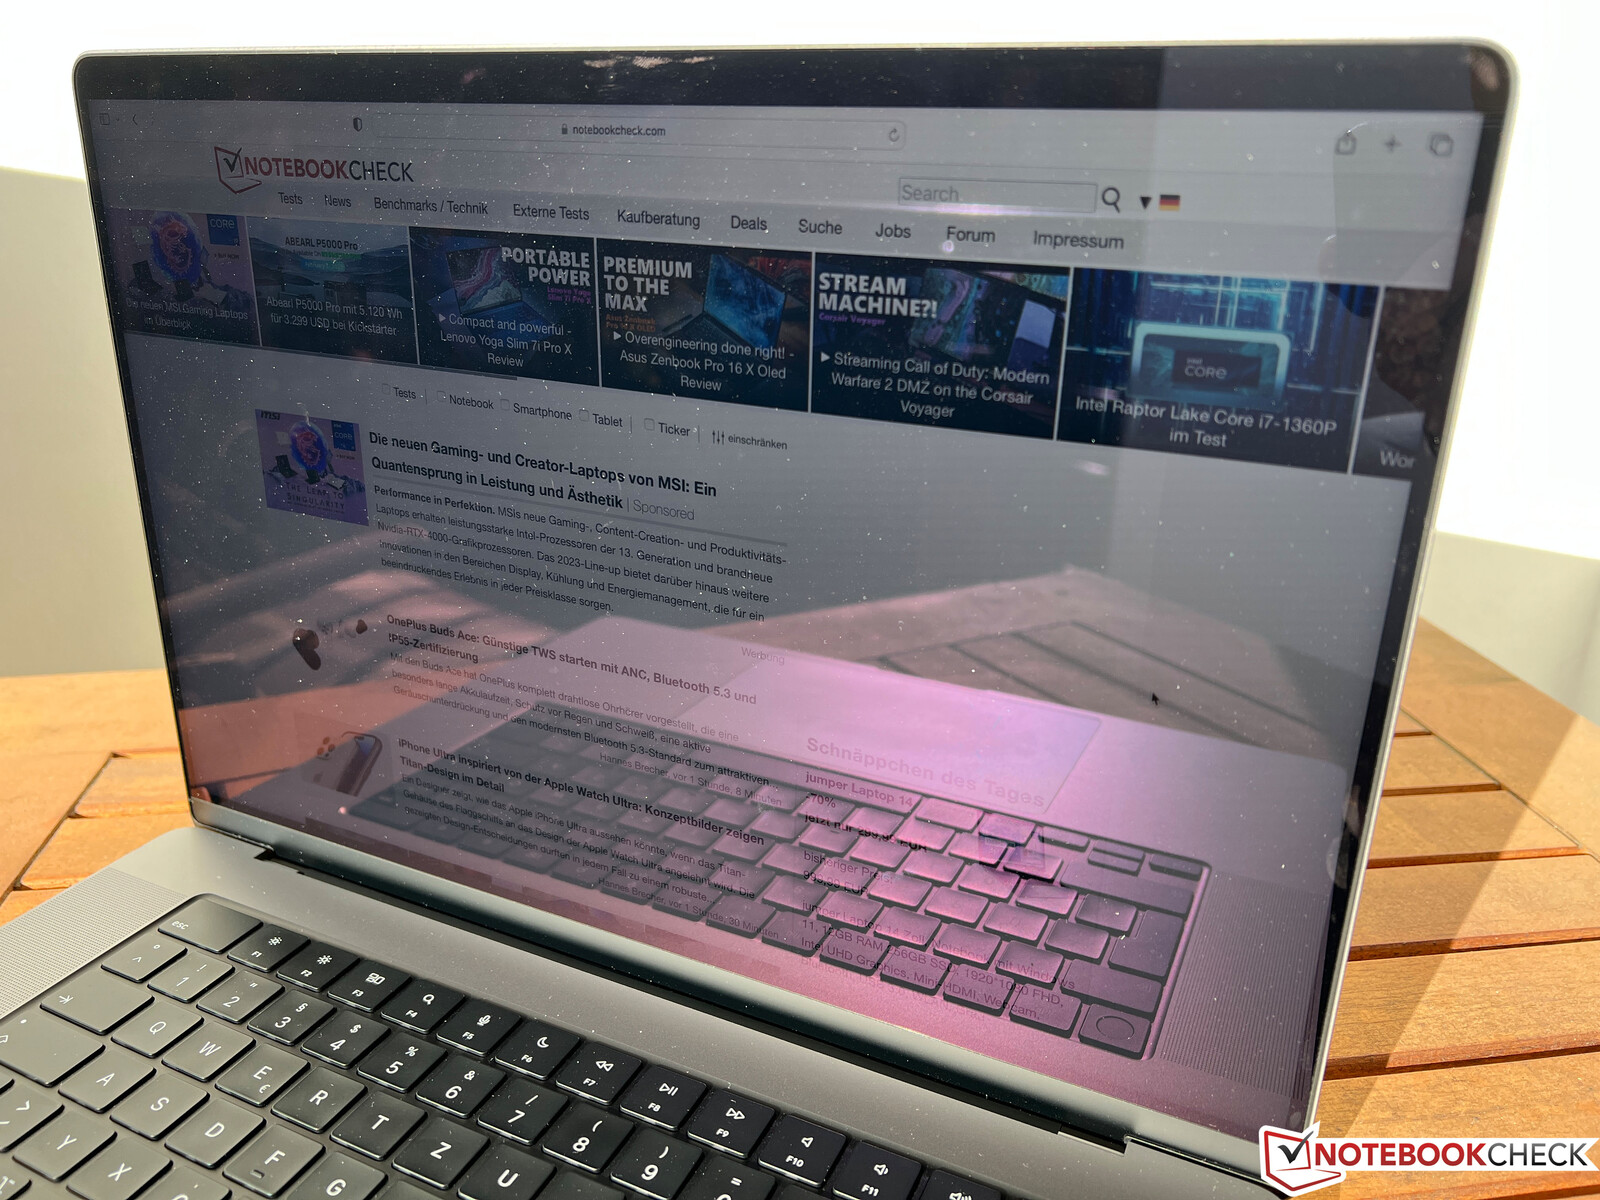
我们已经回顾了新的MacBook Pro 14配备新的M2 Pro SoC,现在我们仔细看看更大的MacBook Pro 16。你可以得到同样的M2 Pro以及M2 Max,但我们从上一代产品中知道,只有更大的MBP 16可以利用M2 Pro的全部潜力。M1 Max,而Apple ,承诺新的M2 Max的性能更强。我们对新的MBP 16的高端型号与M2 Max(38个GPU核心),64GB内存和2TB SSD存储。价格很高,为5069欧元,MBP 16中的M2 Max至少要3919欧元(配备32GB内存,512GB SSD存储)。如果你勾选所有的选项(M2 Max,96GB内存,8TB SSD存储),Apple ,将收取7599欧元。与2021年的模型相比,机箱的设计没有变化,所以我们将在某些部分保持简短。更多信息也请参见我们之前的评论。
潜在的竞争对手比较
Rating | Date | Model | Weight | Height | Size | Resolution | Price |
|---|---|---|---|---|---|---|---|
| 93.7 % v7 (old) | 03 / 2023 | Apple MacBook Pro 16 2023 M2 Max M2 Max, M2 Max 38-Core GPU | 2.2 kg | 16.8 mm | 16.20" | 3456x2234 | |
| 92.5 % v7 (old) | 11 / 2021 | Apple MacBook Pro 16 2021 M1 Max M1 Max, M1 Max 32-Core GPU | 2.2 kg | 16.8 mm | 16.20" | 3456x2234 | |
| 88.7 % v7 (old) | 12 / 2022 | Lenovo ThinkPad X1 Extreme G5-21DE003RGE i7-12700H, GeForce RTX 3060 Laptop GPU | 2.1 kg | 17.9 mm | 16.00" | 3840x2400 | |
| 88.4 % v7 (old) | 12 / 2022 | Asus ZenBook Pro 16X OLED UX7602ZM-ME115W i9-12900H, GeForce RTX 3060 Laptop GPU | 2.4 kg | 19.5 mm | 16.00" | 3840x2400 | |
| 87.8 % v7 (old) | 11 / 2022 | Schenker Vision 16 Pro RTX 3070 Ti i7-12700H, GeForce RTX 3070 Ti Laptop GPU | 1.7 kg | 17.1 mm | 16.00" | 2560x1600 | |
| 89.1 % v7 (old) | 12 / 2022 | Dell Precision 7000 7670 Performance i9-12950HX, RTX A5500 Laptop GPU | 2.8 kg | 25.95 mm | 16.00" | 3840x2400 |
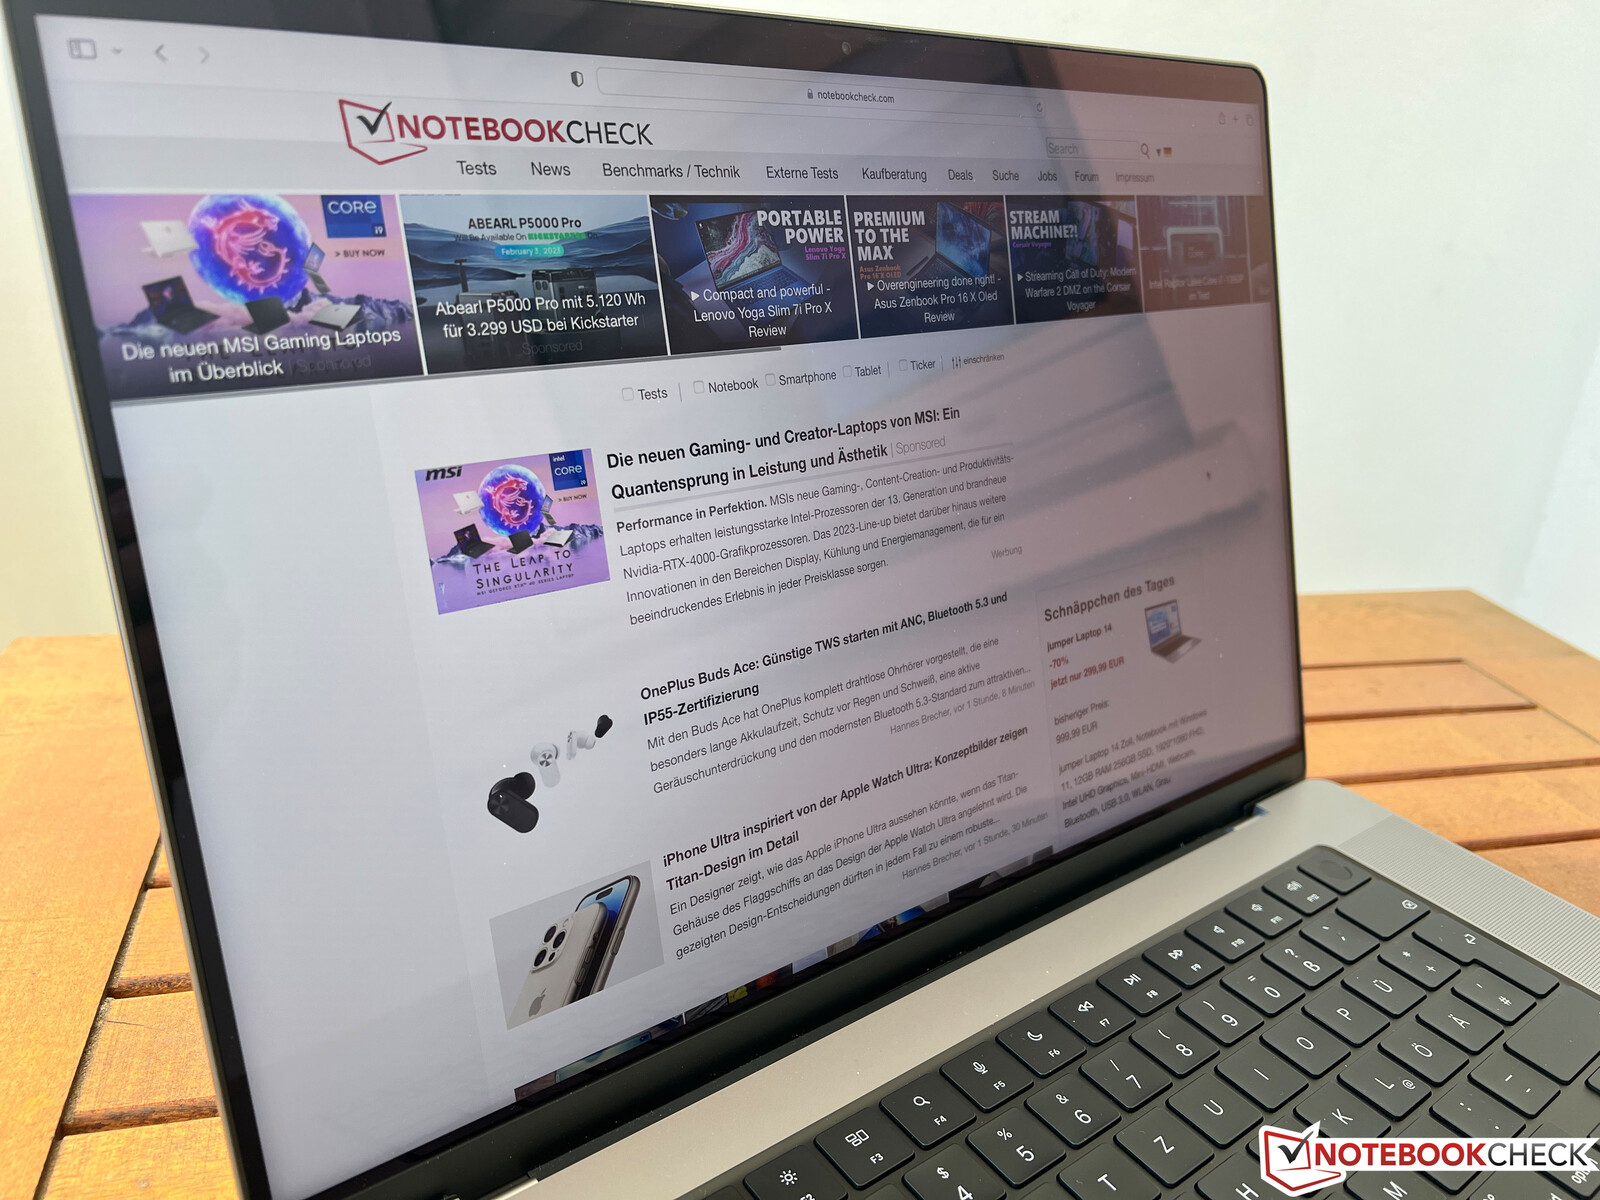
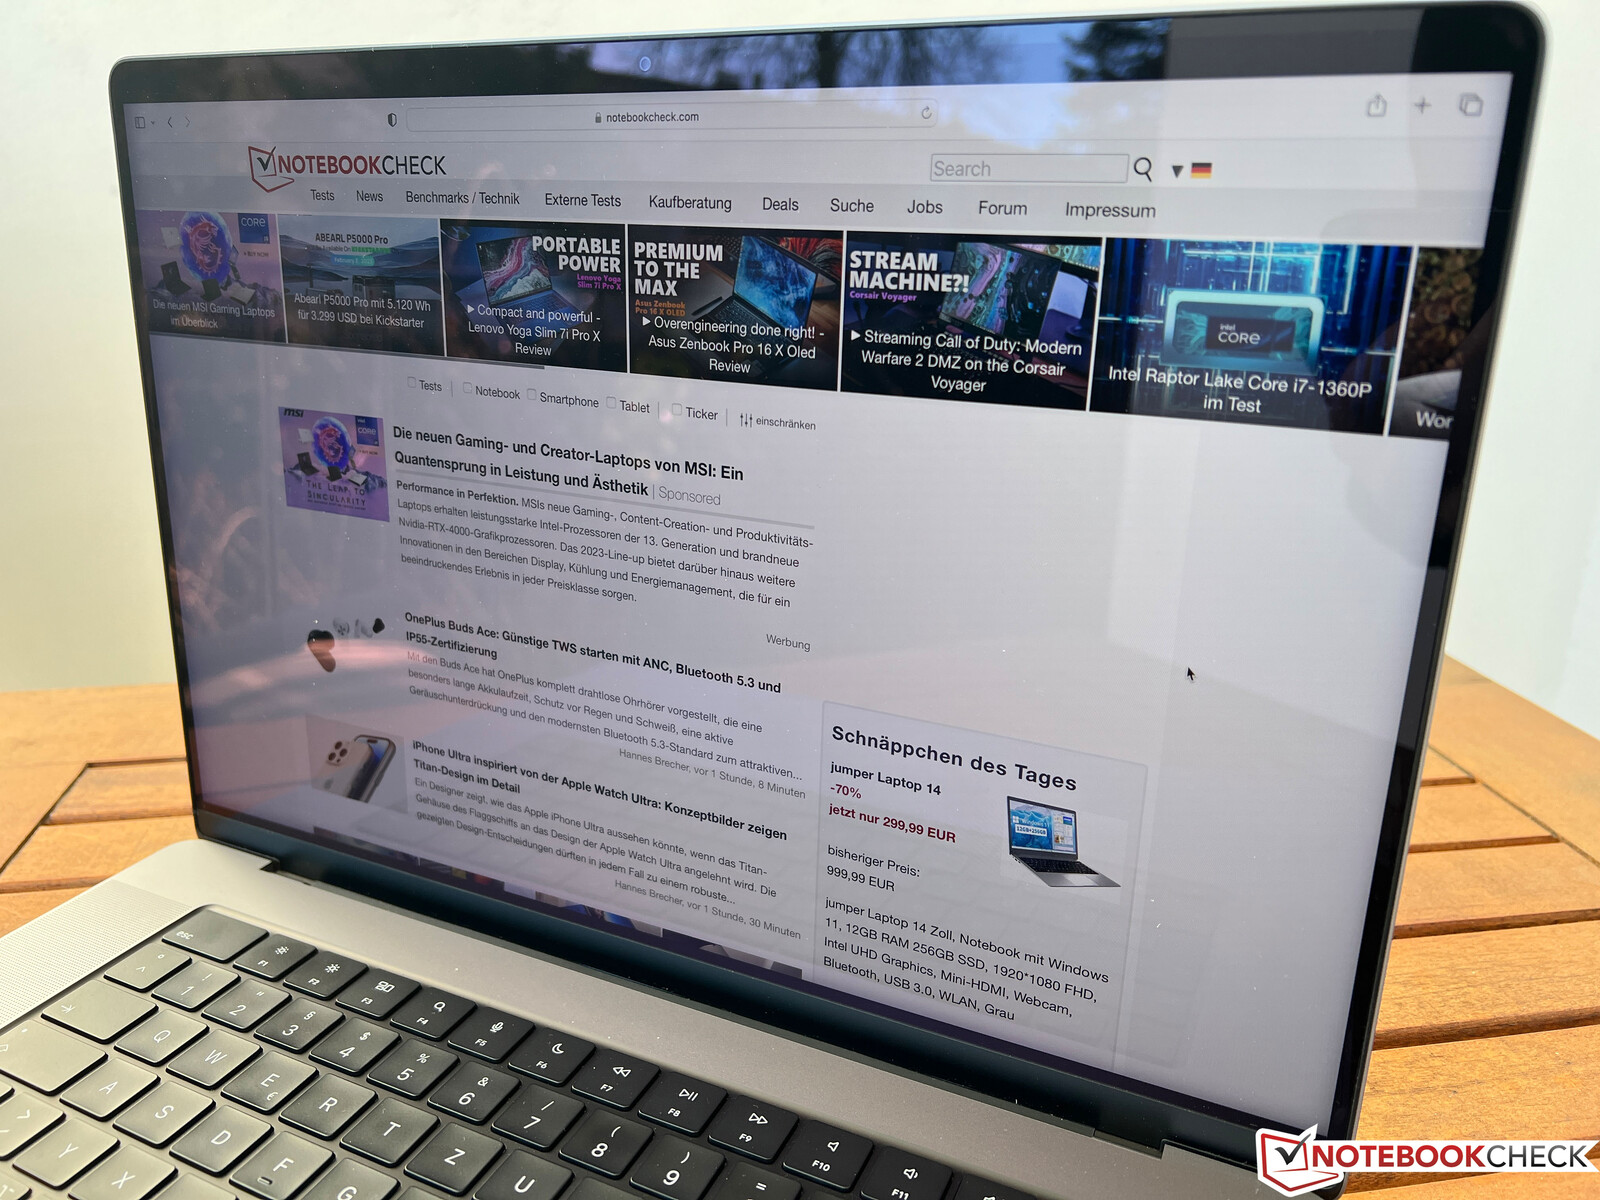
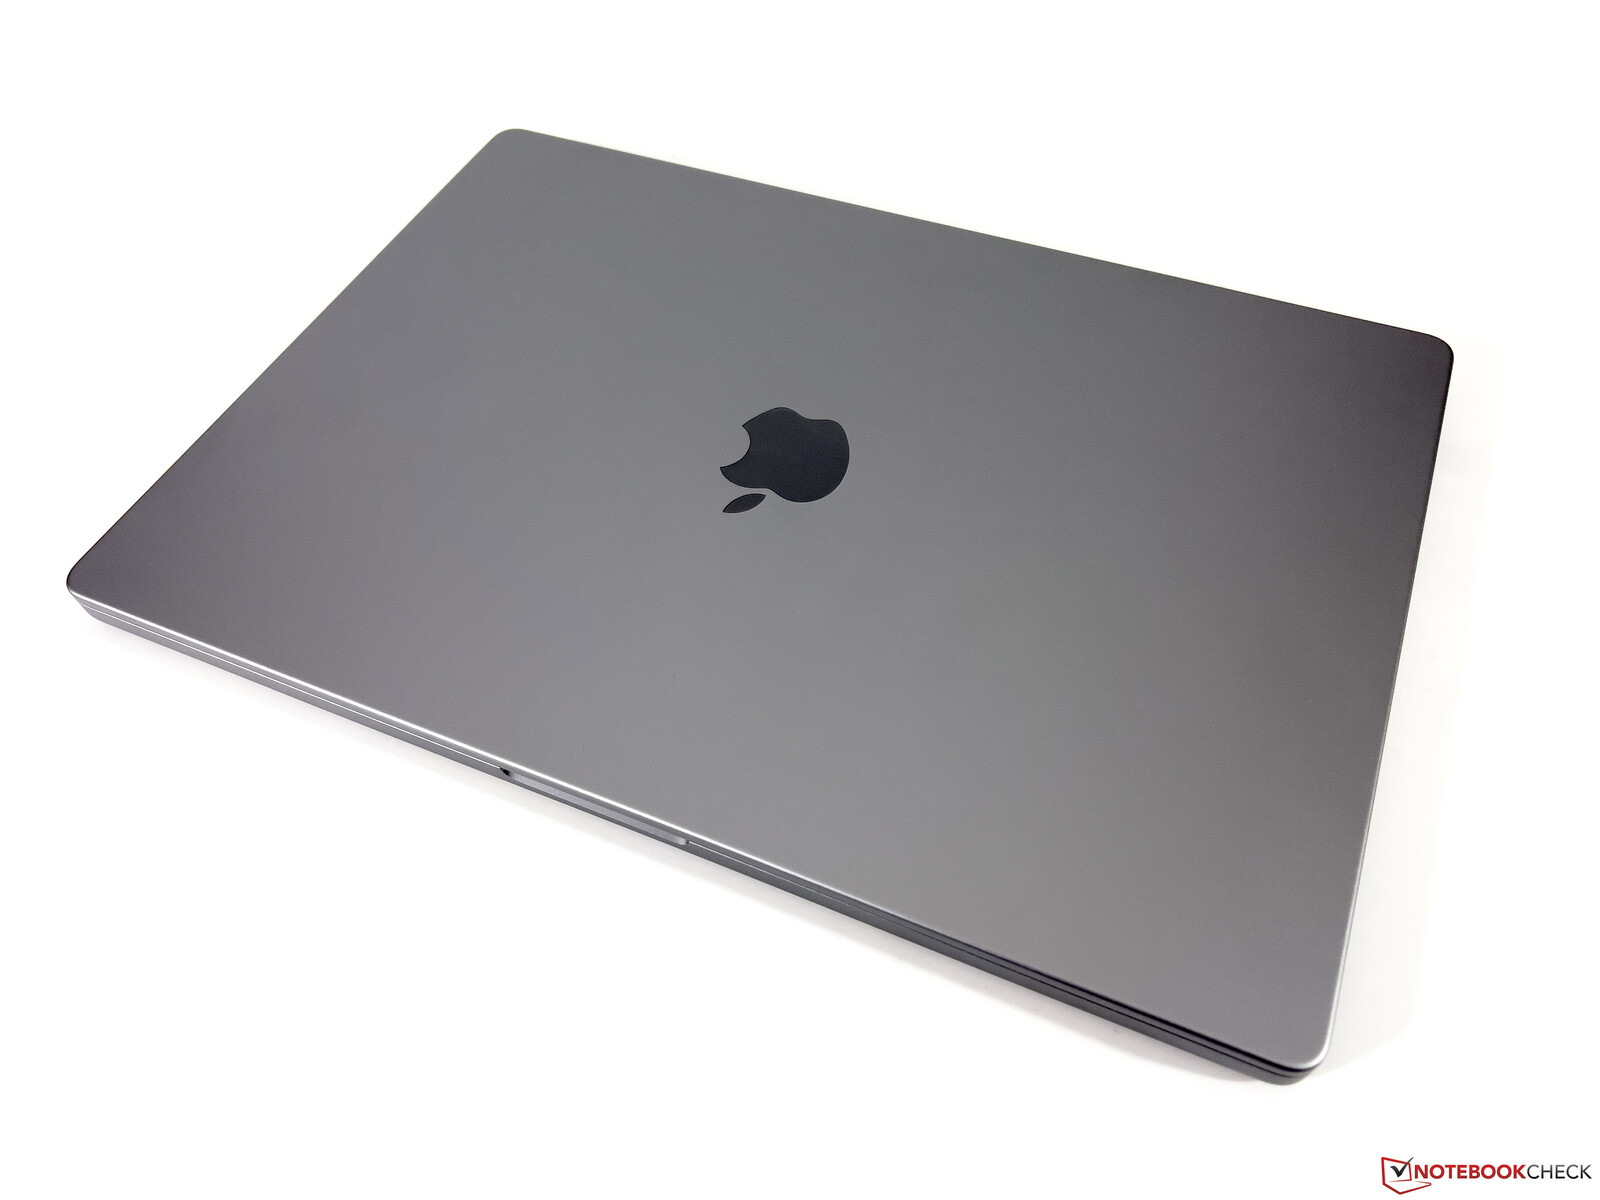
案例 - MBP,无变化
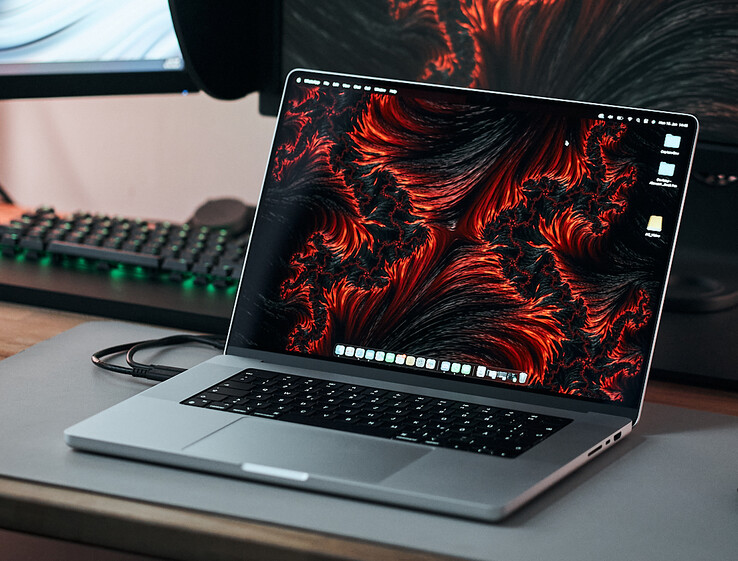
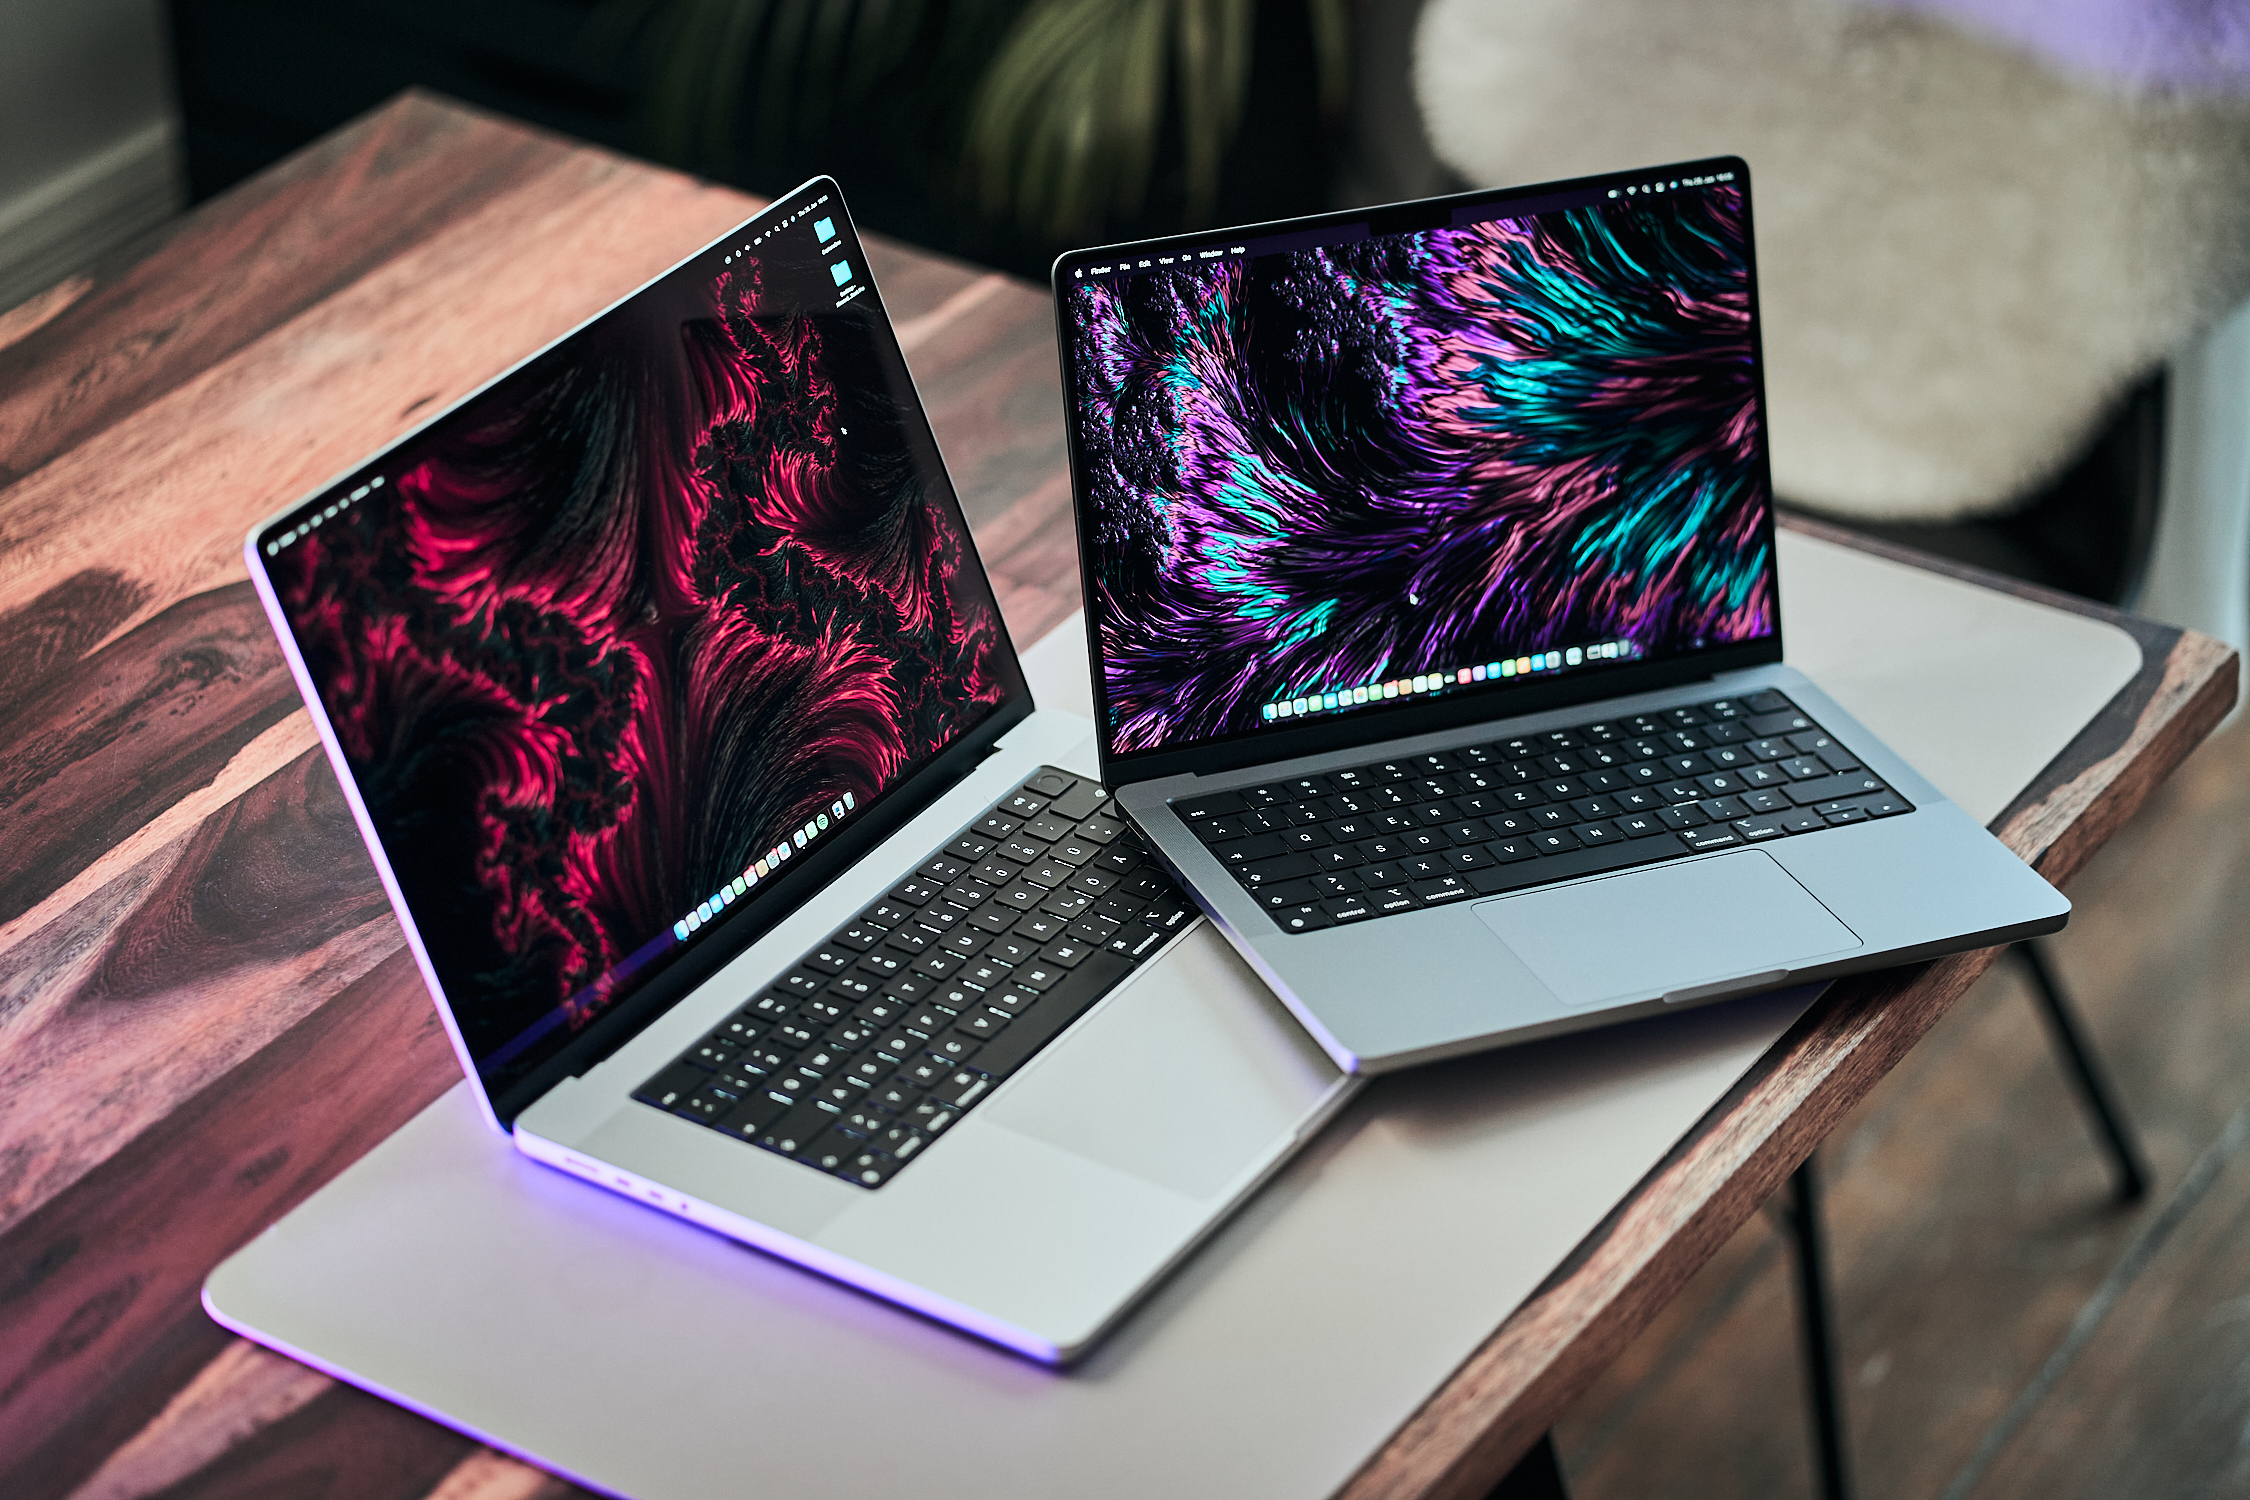
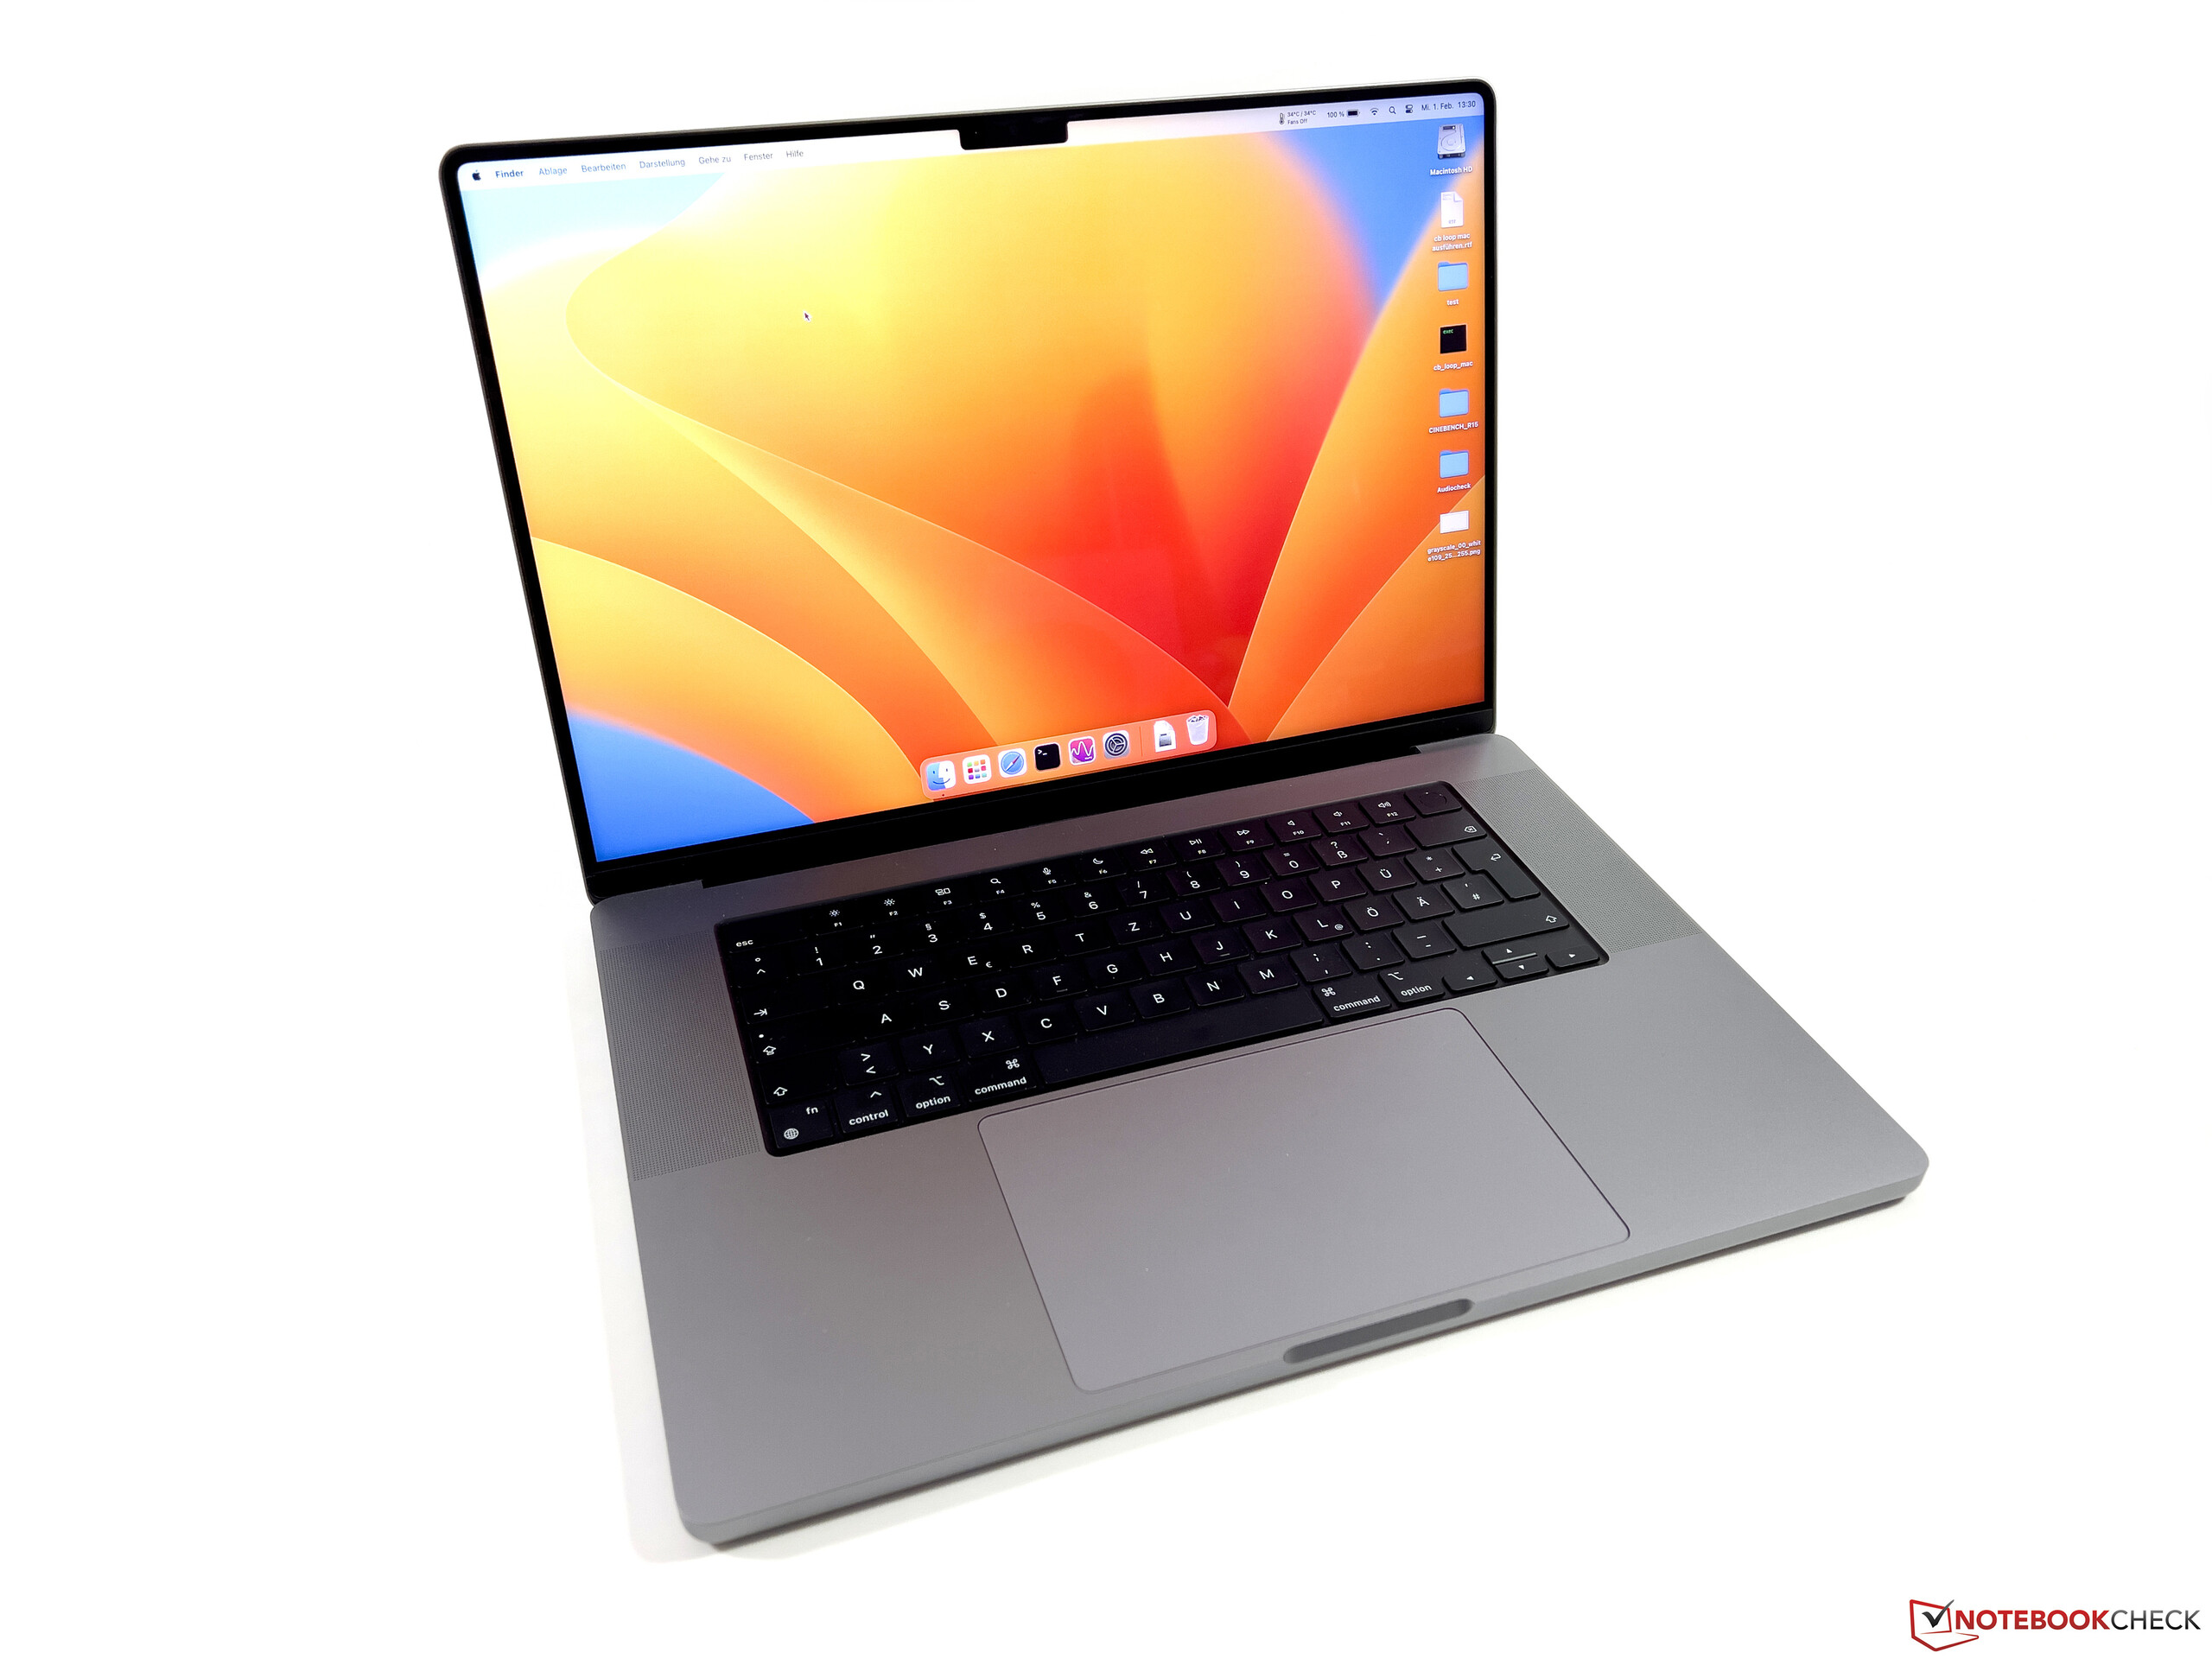
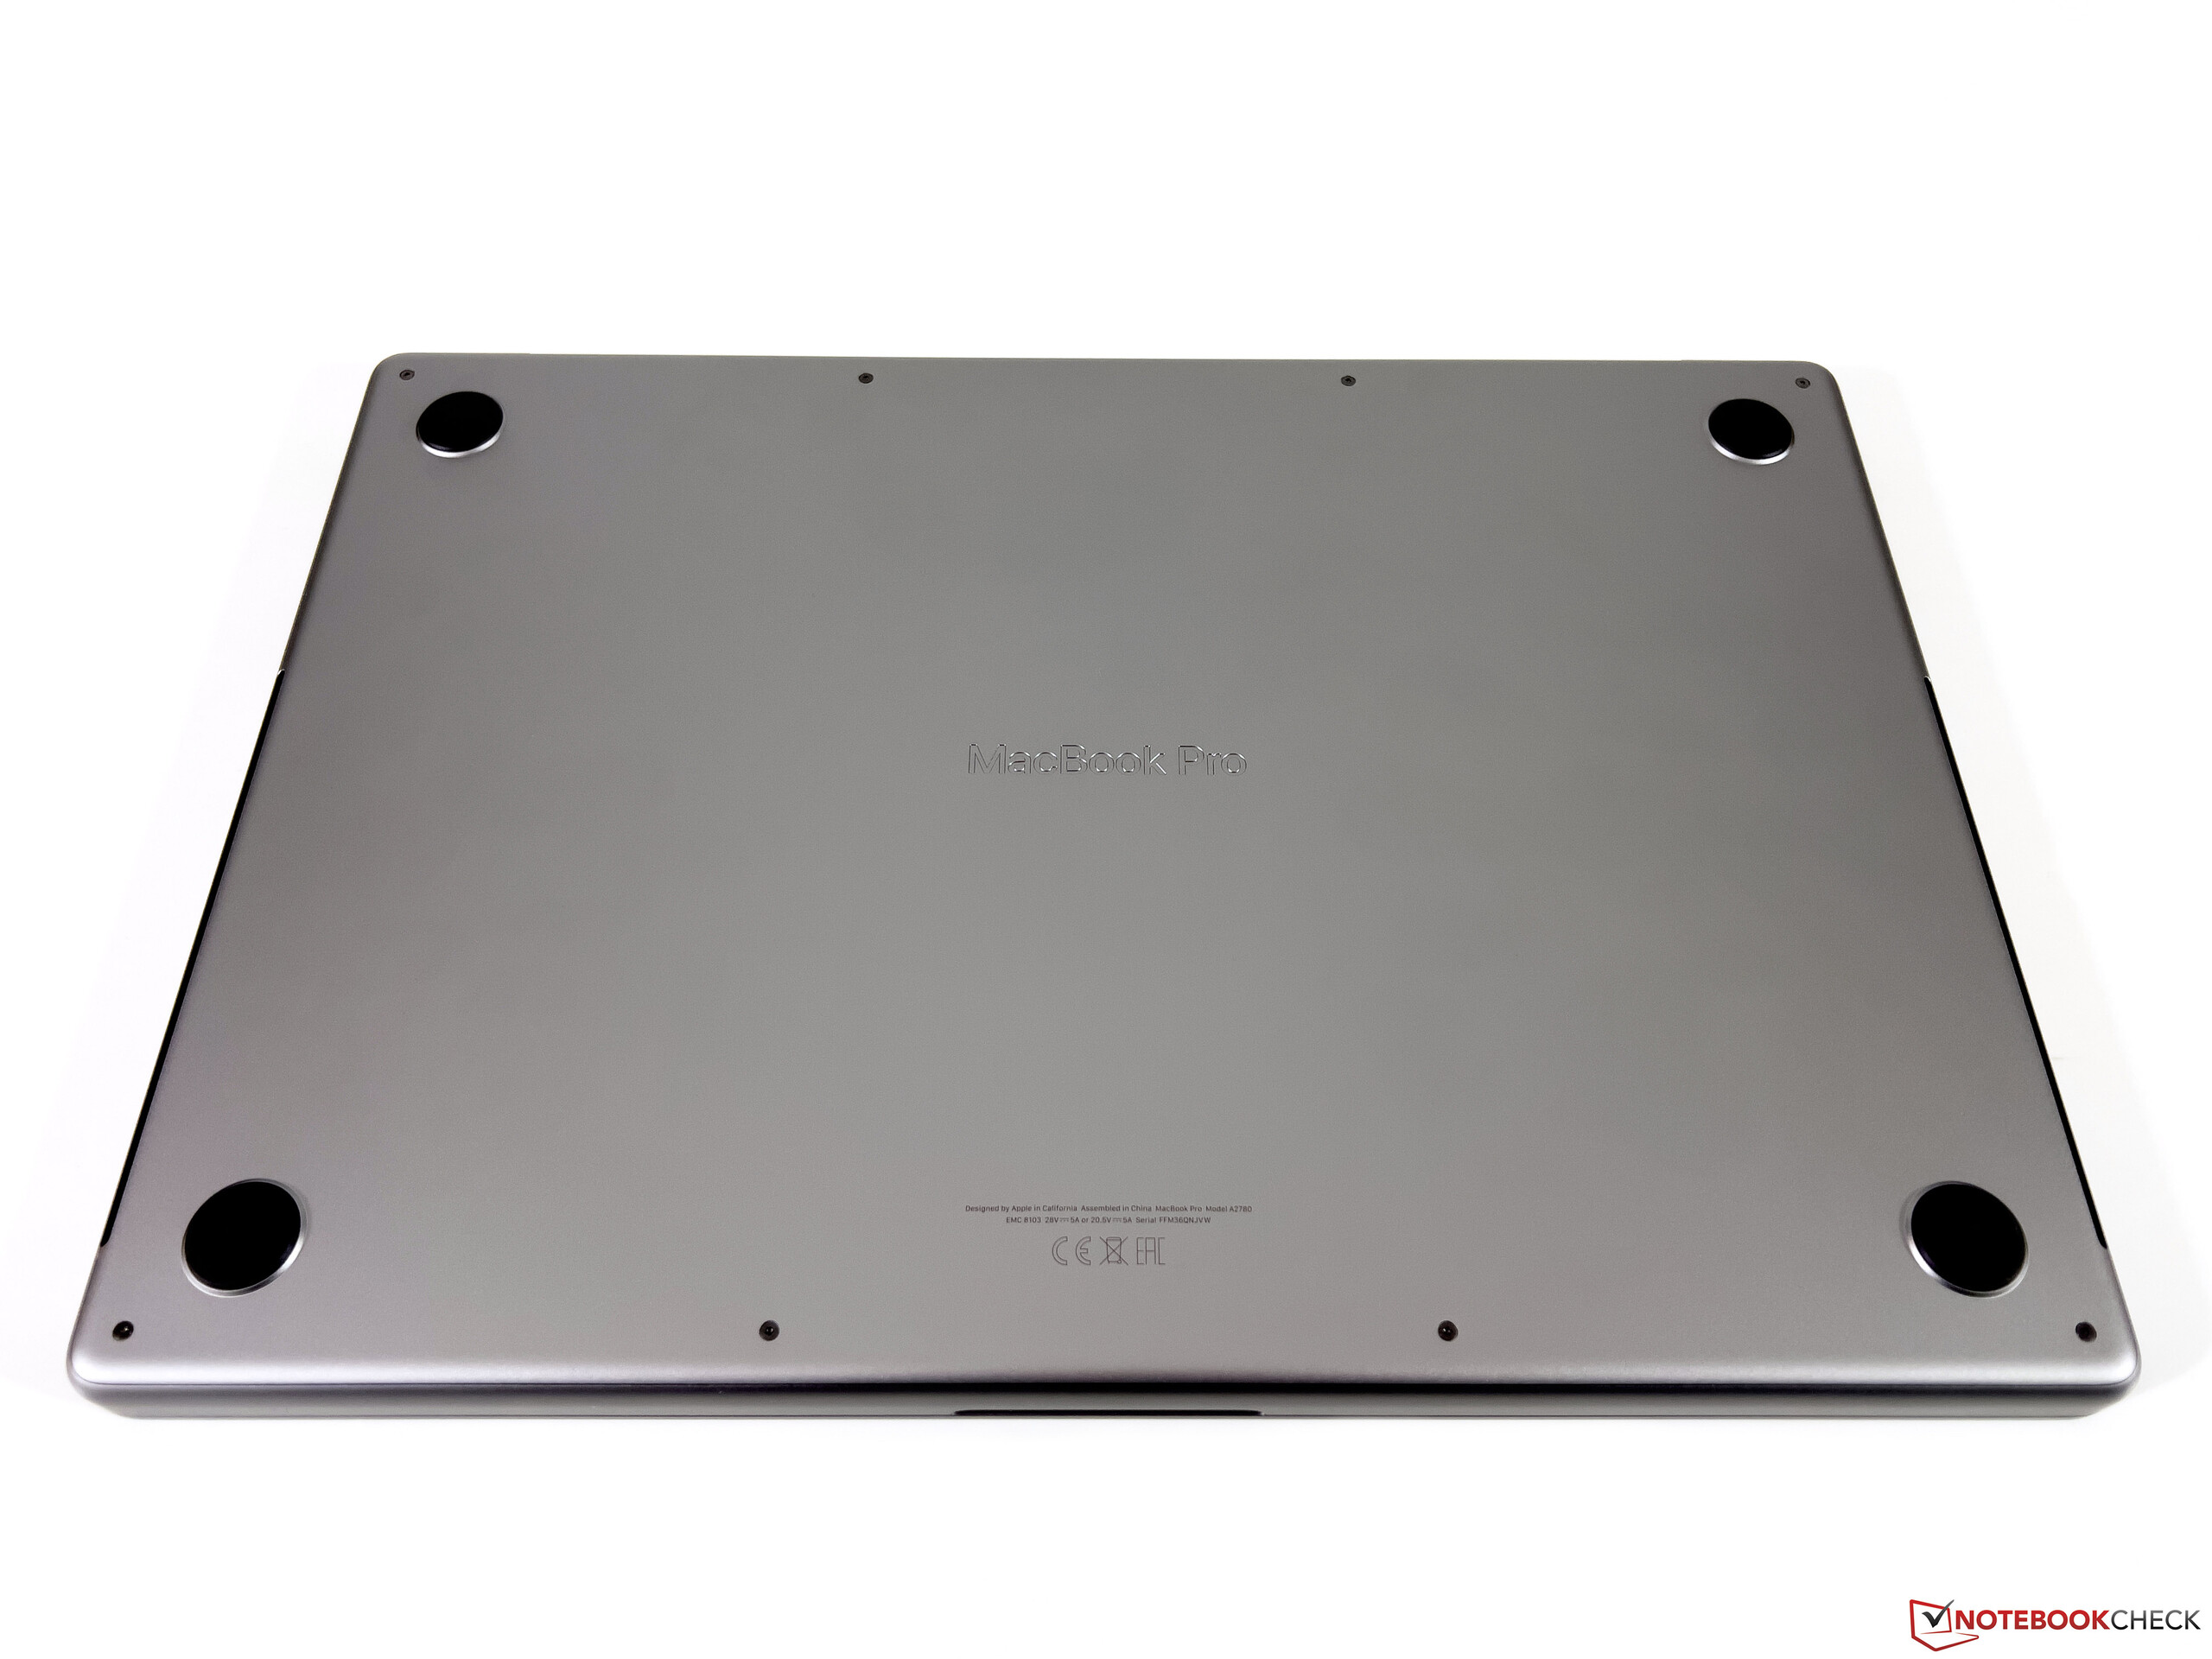
就像我们对新的MacBook Pro 14 2023,我们在这里可以保持很短的时间,因为新的MacBook Pro 16仍然使用与以前相同的机箱。由于其设计,基本单元仍然显得非常笨重,但16英寸机型的整体比例是平衡的。在制造质量或稳定性方面,没有什么可抱怨的。颜色仍然是银色或太空灰,表面不大容易留下指纹或灰尘。
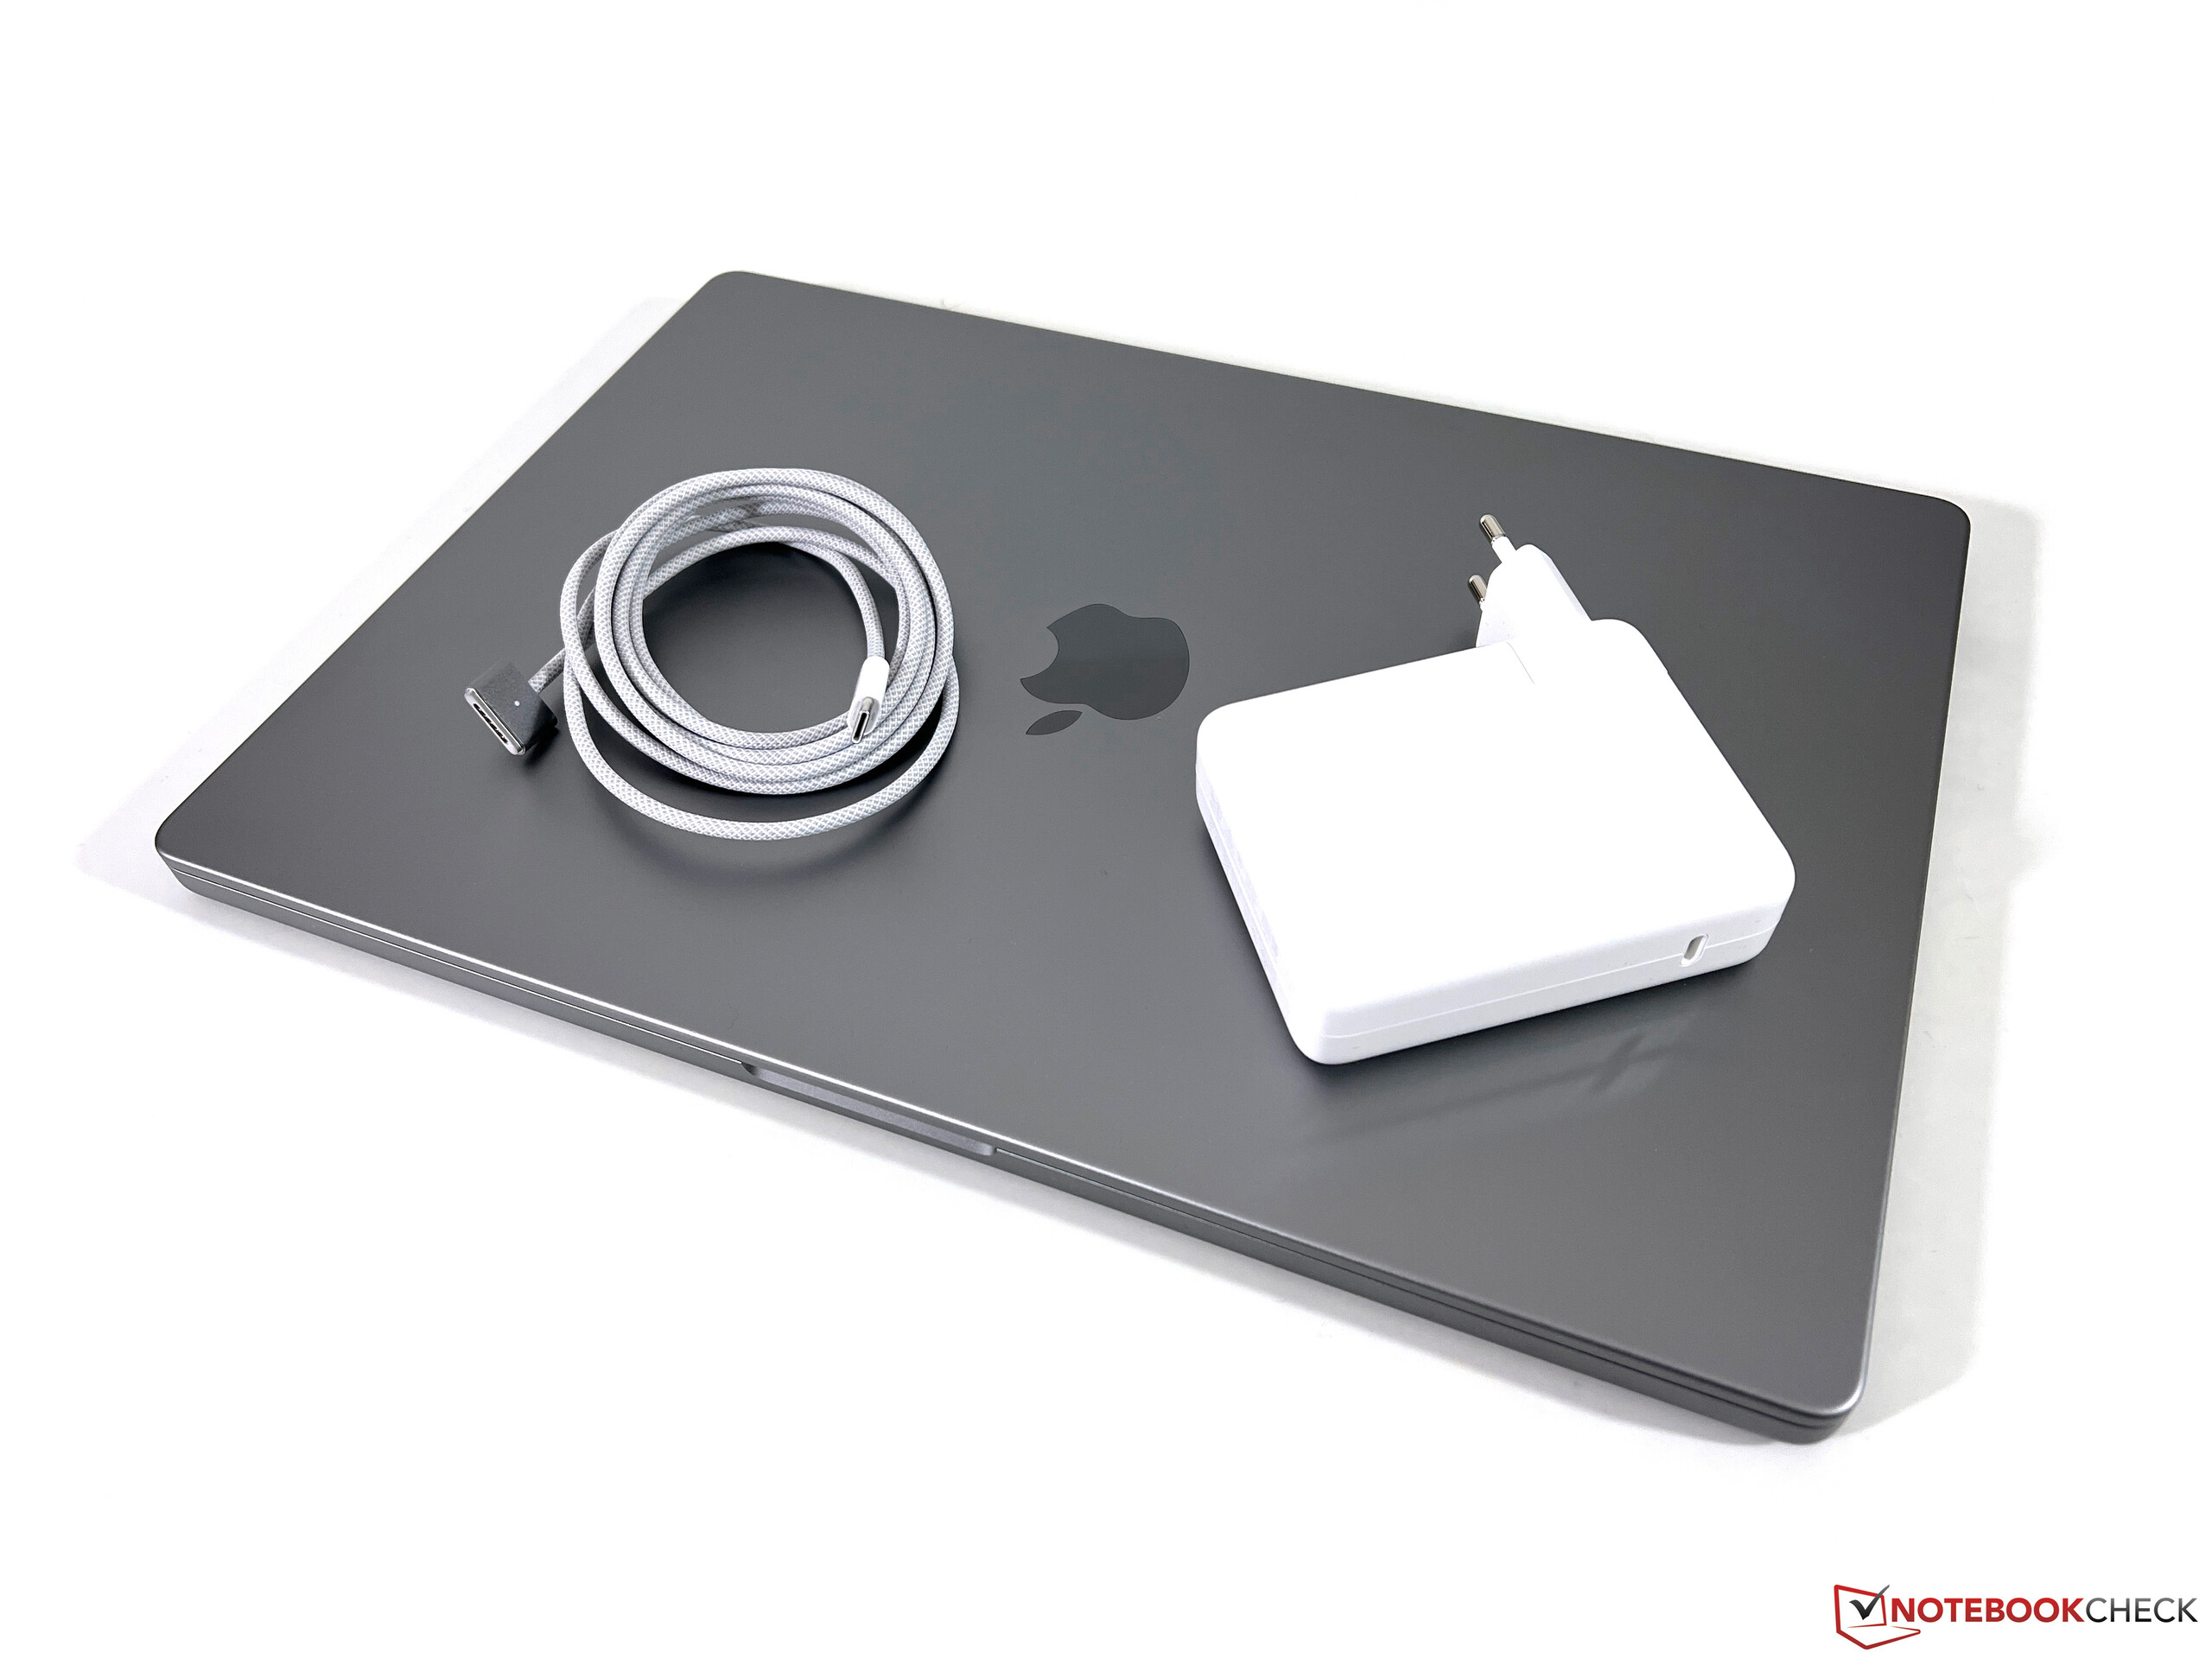
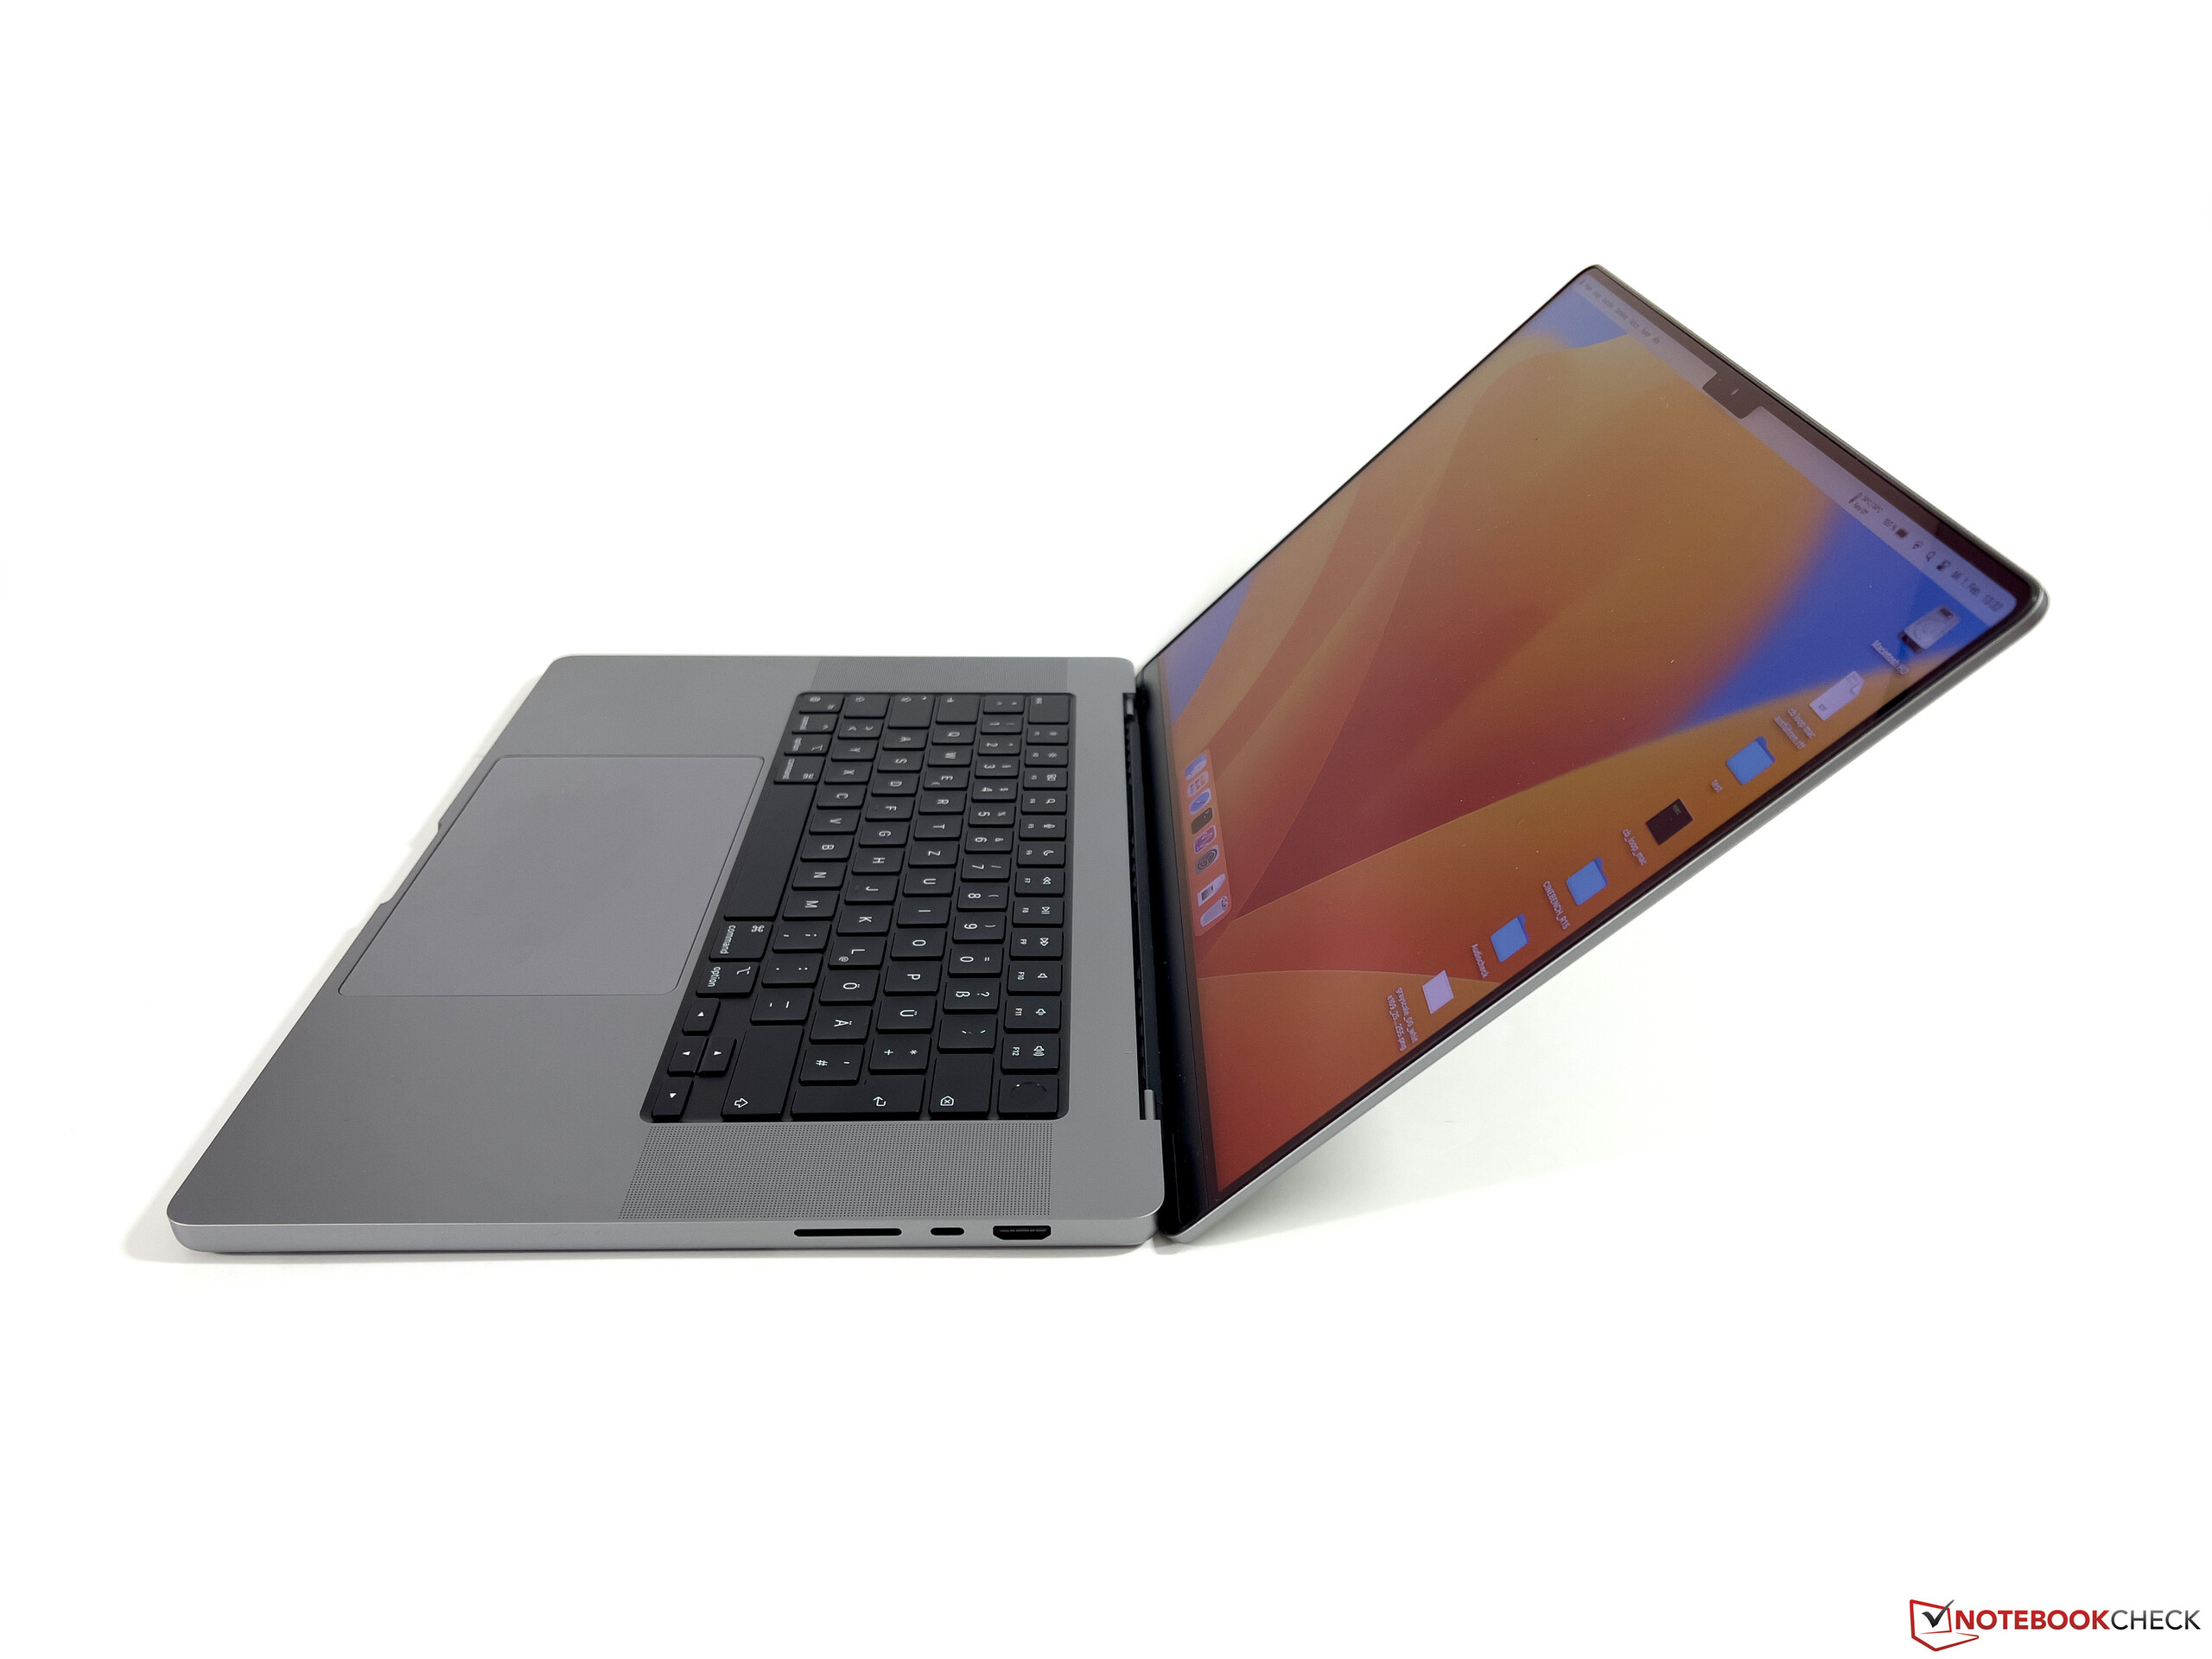
MBP 16最初可能看起来相当笨重,但它实际上是我们的对比组中最薄的设备,只有16.8毫米。约2.2公斤的重量也符合要求,只有Schenker Vision 16 Pro明显更轻,只有1.7公斤,而移动工作站戴尔Precision 7670则重得多,为2.8公斤。140W电源适配器的重量为345克,包括MagSafe电缆。
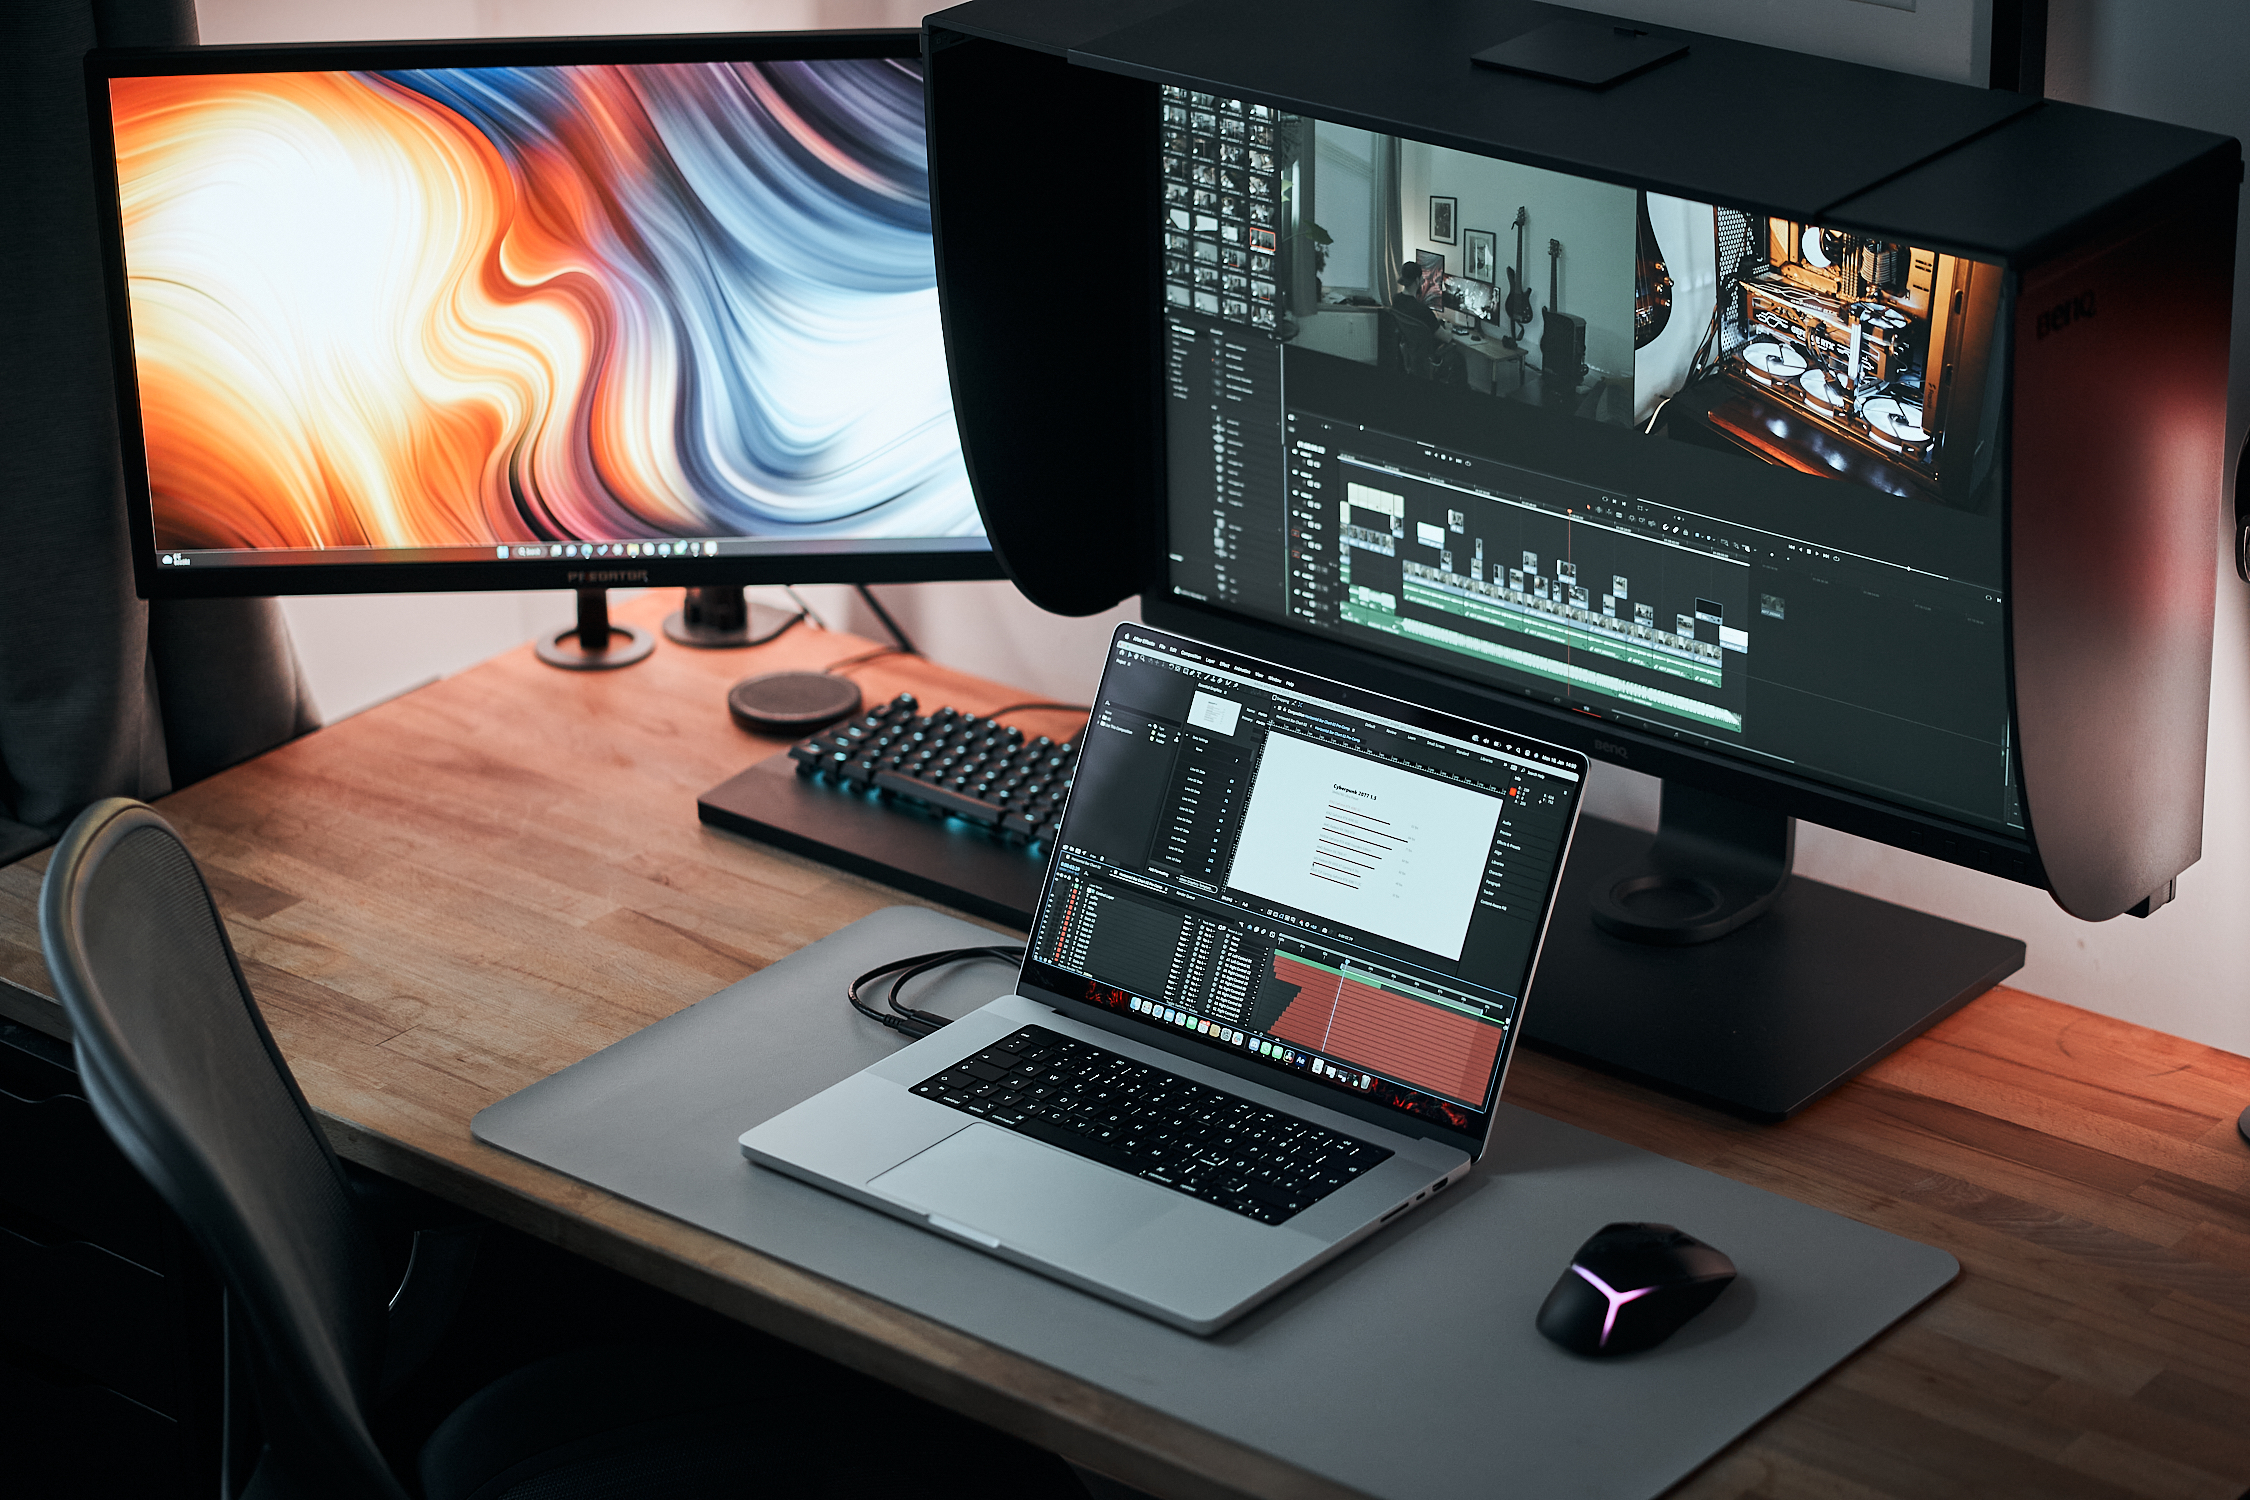
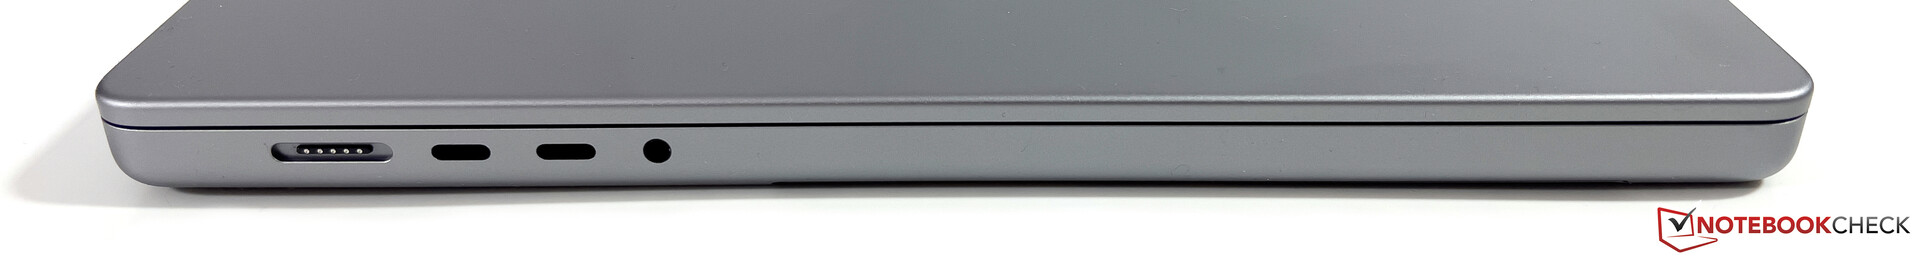
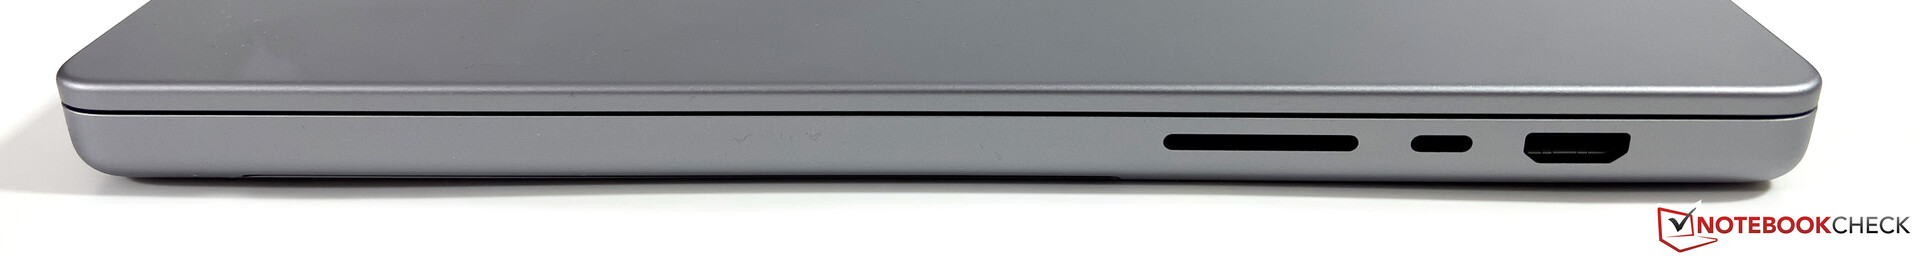
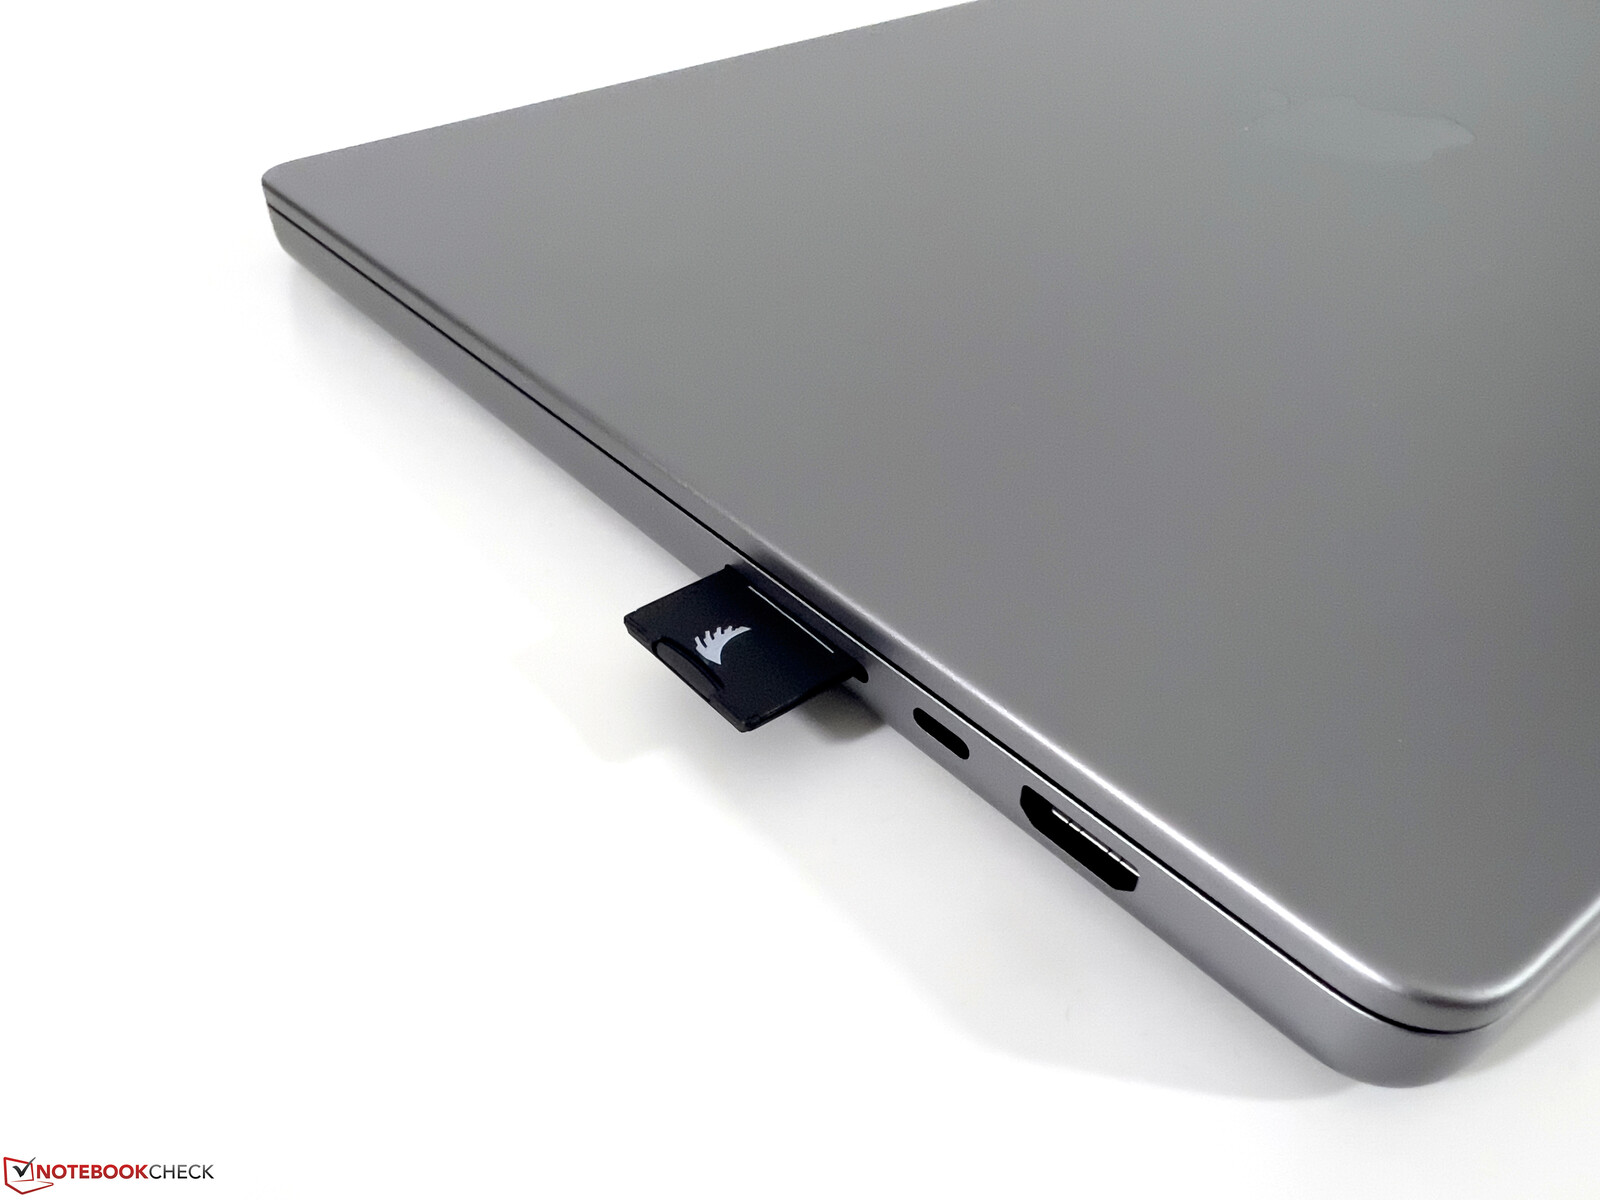
连接性 - MacBook现在配备了HDMI 2.1
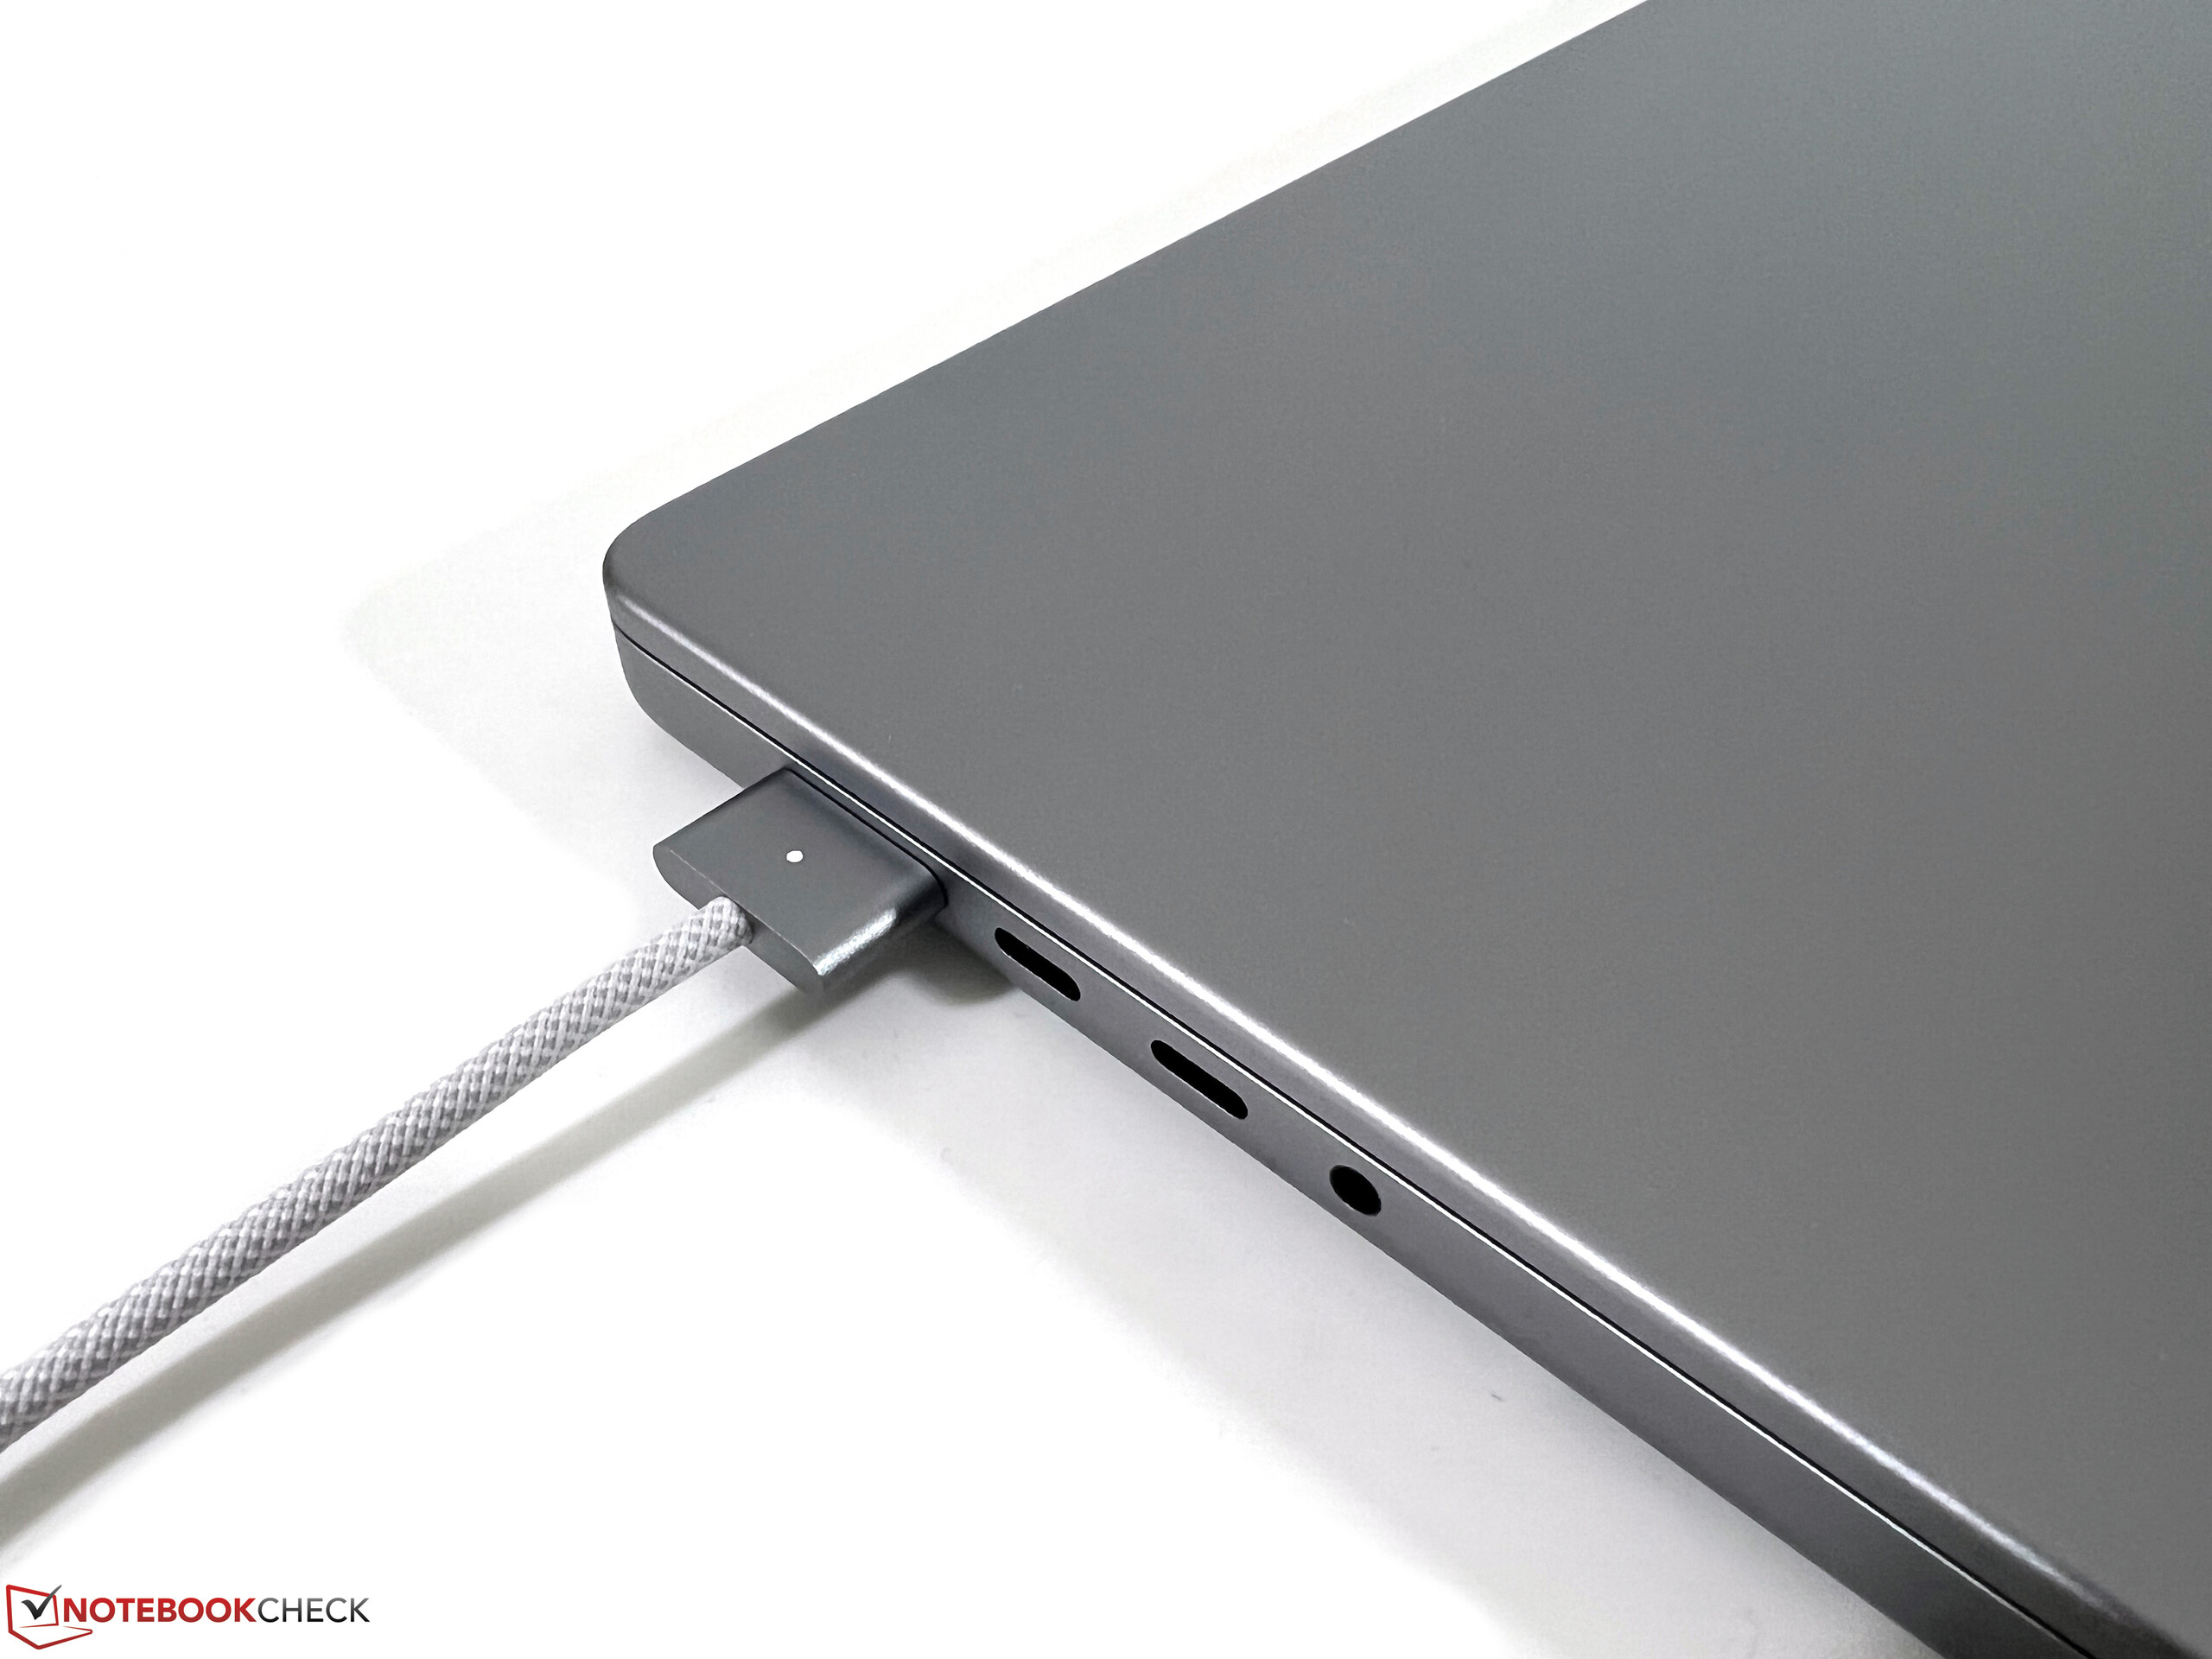
端口布局没有改变,你仍然得到了用于充电的MagSafe连接器以及三个USB-C/Thunderbolt端口,这也可以用来为设备充电。Apple ,升级了HDMI端口,它现在支持HDMI 2.1标准。除了集成面板,带有M2 Max的型号可以分别驱动四个(通过Thunderbolt驱动3x 6K@60Hz,通过HDMI驱动1x 4K@144 Hz)或三个外部显示器(通过Thunderbolt驱动2x 6K@60 Hz,通过HDMI驱动1x 8K@60 Hz bzw. 4K@240 Hz)。
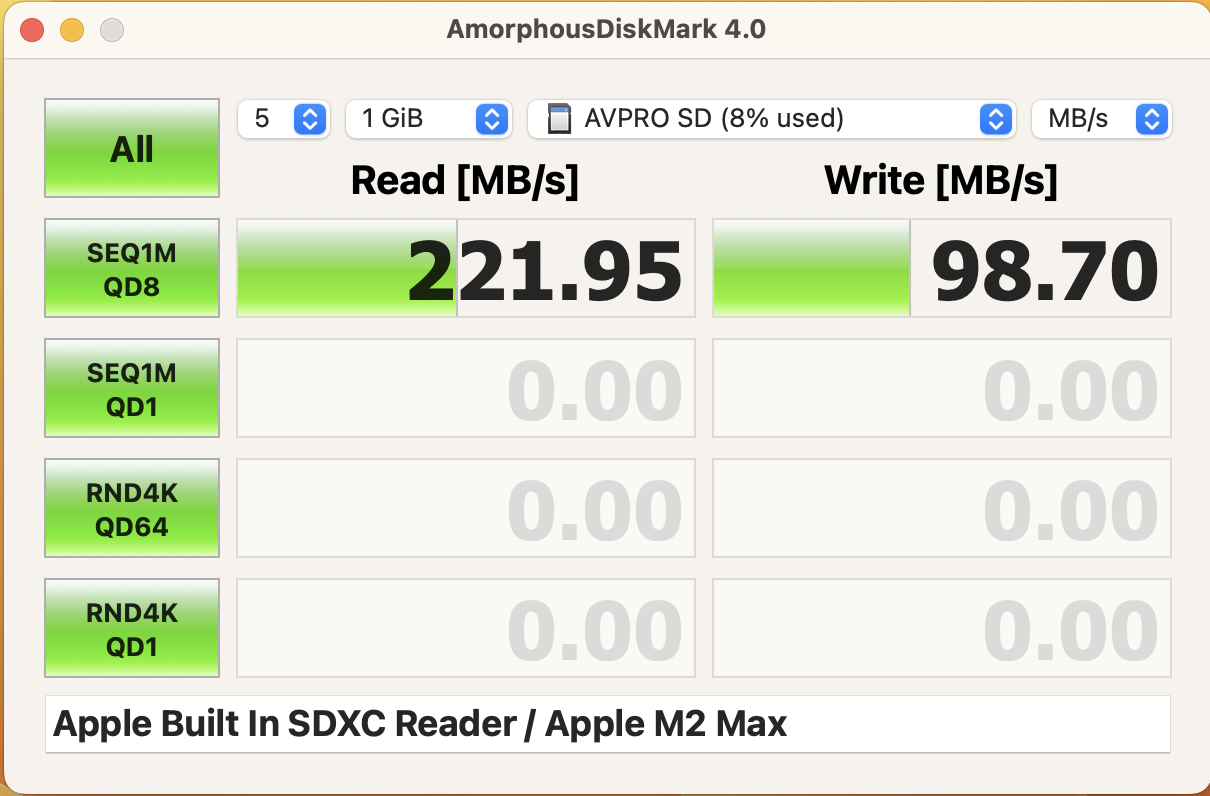
SD卡阅读器
与以前的型号相比,我们测量了集成读卡器更好的传输率。我们的参考卡(Angelbird AV Pro V60)管理的最大传输速率为222 MB/s,当我们从卡上复制图像时,传输速率为196 MB/s。
| SD Card Reader | |
| average JPG Copy Test (av. of 3 runs) | |
| Apple MacBook Pro 16 2023 M2 Max (Angelbird AV Pro V60) | |
| Apple MacBook Pro 14 2023 M2 Pro (AV Pro V60) | |
| Dell Precision 7000 7670 Performance (Toshiba Exceria Pro SDXC 64 GB UHS-II) | |
| Average of class Multimedia (23 - 531, n=39, last 2 years) | |
| Apple MacBook Pro 16 2021 M1 Pro (Angelbird AV Pro V60) | |
| Schenker Vision 16 Pro RTX 3070 Ti (AV Pro V60) | |
| Asus ZenBook Pro 16X OLED UX7602ZM-ME115W (AV Pro SD microSD 128 GB V60) | |
| Lenovo ThinkPad X1 Extreme G5-21DE003RGE (AV Pro V60) | |
| maximum AS SSD Seq Read Test (1GB) | |
| Apple MacBook Pro 16 2023 M2 Max (Angelbird AV Pro V60) | |
| Apple MacBook Pro 14 2023 M2 Pro (AV Pro V60) | |
| Average of class Multimedia (37.3 - 1455, n=38, last 2 years) | |
| Dell Precision 7000 7670 Performance (Toshiba Exceria Pro SDXC 64 GB UHS-II) | |
| Schenker Vision 16 Pro RTX 3070 Ti (AV Pro V60) | |
| Asus ZenBook Pro 16X OLED UX7602ZM-ME115W (AV Pro SD microSD 128 GB V60) | |
| Lenovo ThinkPad X1 Extreme G5-21DE003RGE (AV Pro V60) | |
沟通
以前的MacBook Pro机型的一个缺点是,Wi-Fi 6网络的连接被限制在80MHz,因此最大传输速率比一些Windows笔记本电脑低得多。Apple ,2023年的机型解决了这个问题,博通Wi-Fi模块现在支持Wi-Fi 6E标准。我们使用6GHz的Wi-Fi网络(华硕参考路由器)没有问题,传输速率和信号强度都很好。
| Networking | |
| Apple MacBook Pro 16 2023 M2 Max | |
| iperf3 receive AXE11000 6GHz | |
| iperf3 transmit AXE11000 6GHz | |
| Lenovo ThinkPad X1 Extreme G5-21DE003RGE | |
| iperf3 receive AXE11000 6GHz | |
| iperf3 transmit AXE11000 6GHz | |
| Asus ZenBook Pro 16X OLED UX7602ZM-ME115W | |
| iperf3 receive AXE11000 | |
| iperf3 transmit AXE11000 | |
| Schenker Vision 16 Pro RTX 3070 Ti | |
| iperf3 receive AXE11000 | |
| iperf3 transmit AXE11000 | |
| Dell Precision 7000 7670 Performance | |
| iperf3 receive AXE11000 6GHz | |
| iperf3 receive AXE11000 | |
| iperf3 transmit AXE11000 6GHz | |
| iperf3 transmit AXE11000 | |
| Apple MacBook Pro 16 2021 M1 Pro | |
| iperf3 transmit AX12 | |
| iperf3 receive AX12 | |
| iperf3 receive AXE11000 | |
| iperf3 transmit AXE11000 | |
网络摄像头
Apple 仍然使用与前一型号相同的1080p传感器。 前一型号,但新的M2芯片的图像处理得到了改进,因此在某些情况下,图片质量可以更好。然而,考虑到大的显示屏缺口,我们对该相机仍然不支持Face-ID或Center Stage感到有点失望。iPhone的用户至少可以把他们的智能手机当作网络摄像头使用,甚至还有俯视功能,所以你可以使用笔记本电脑前面的区域(非常适合动手制作视频或产品演示)。


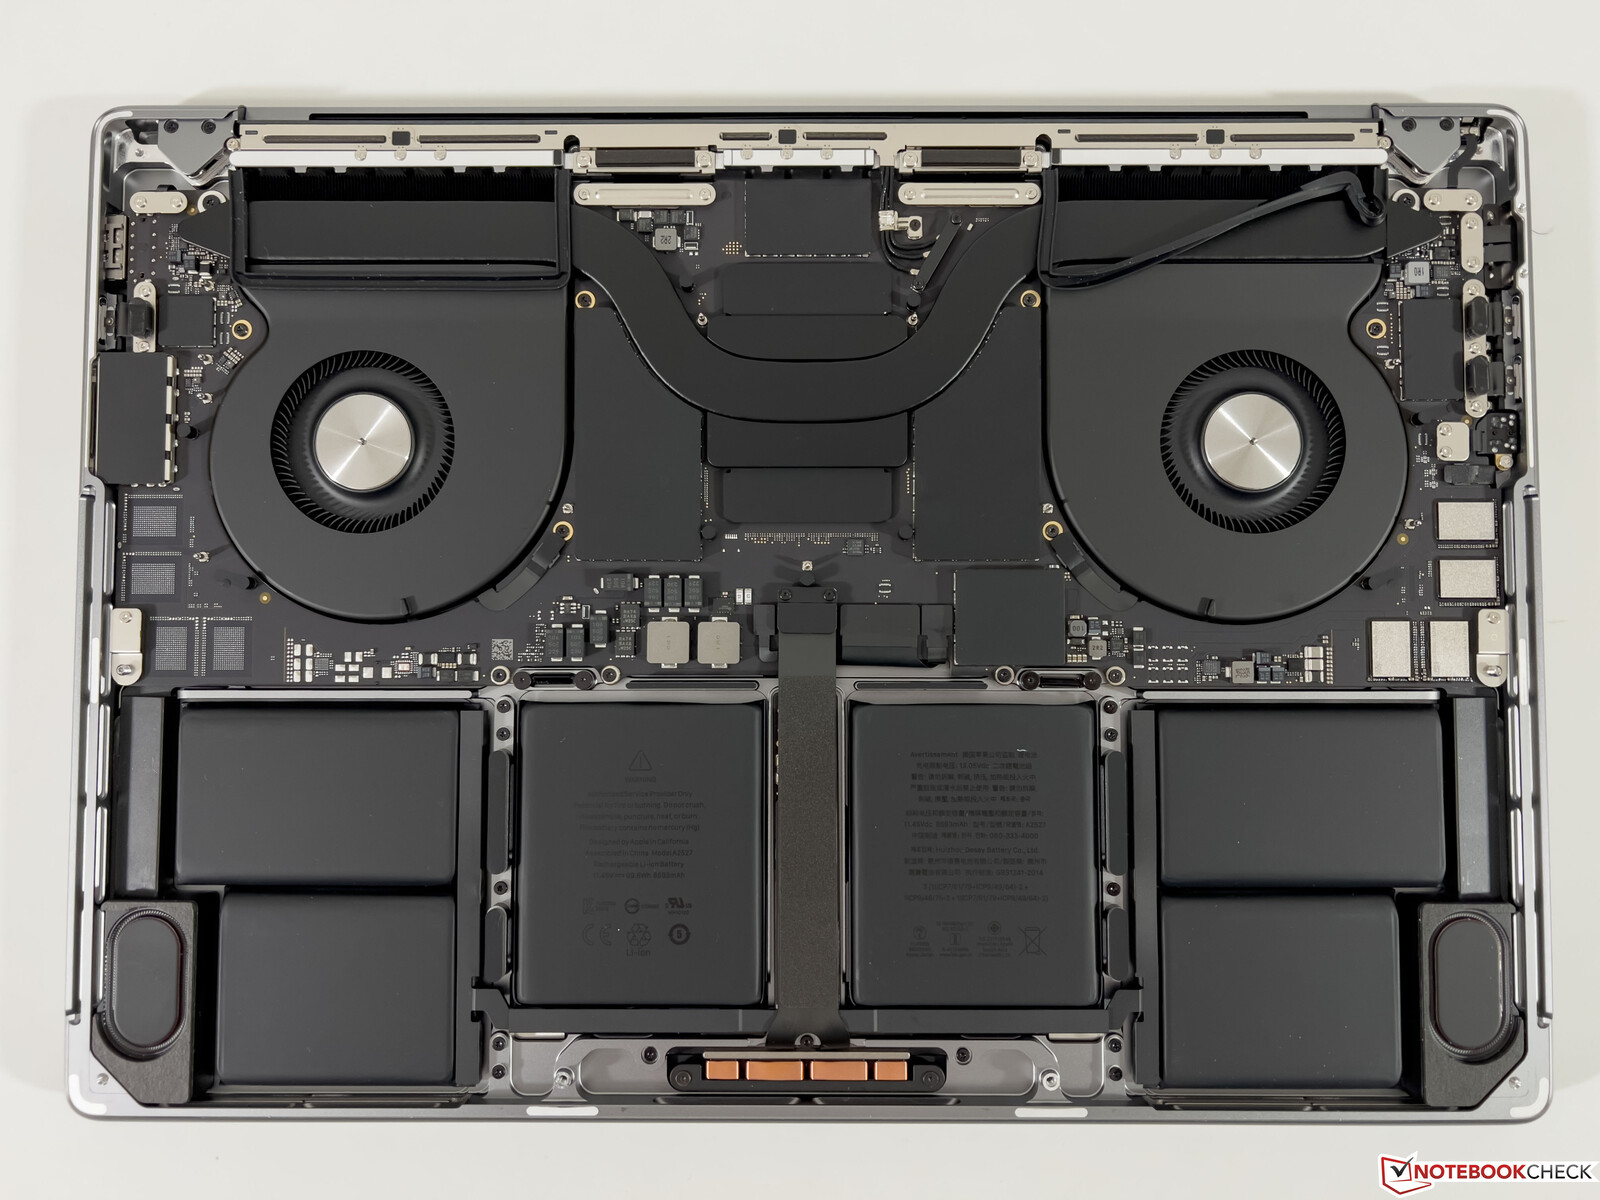
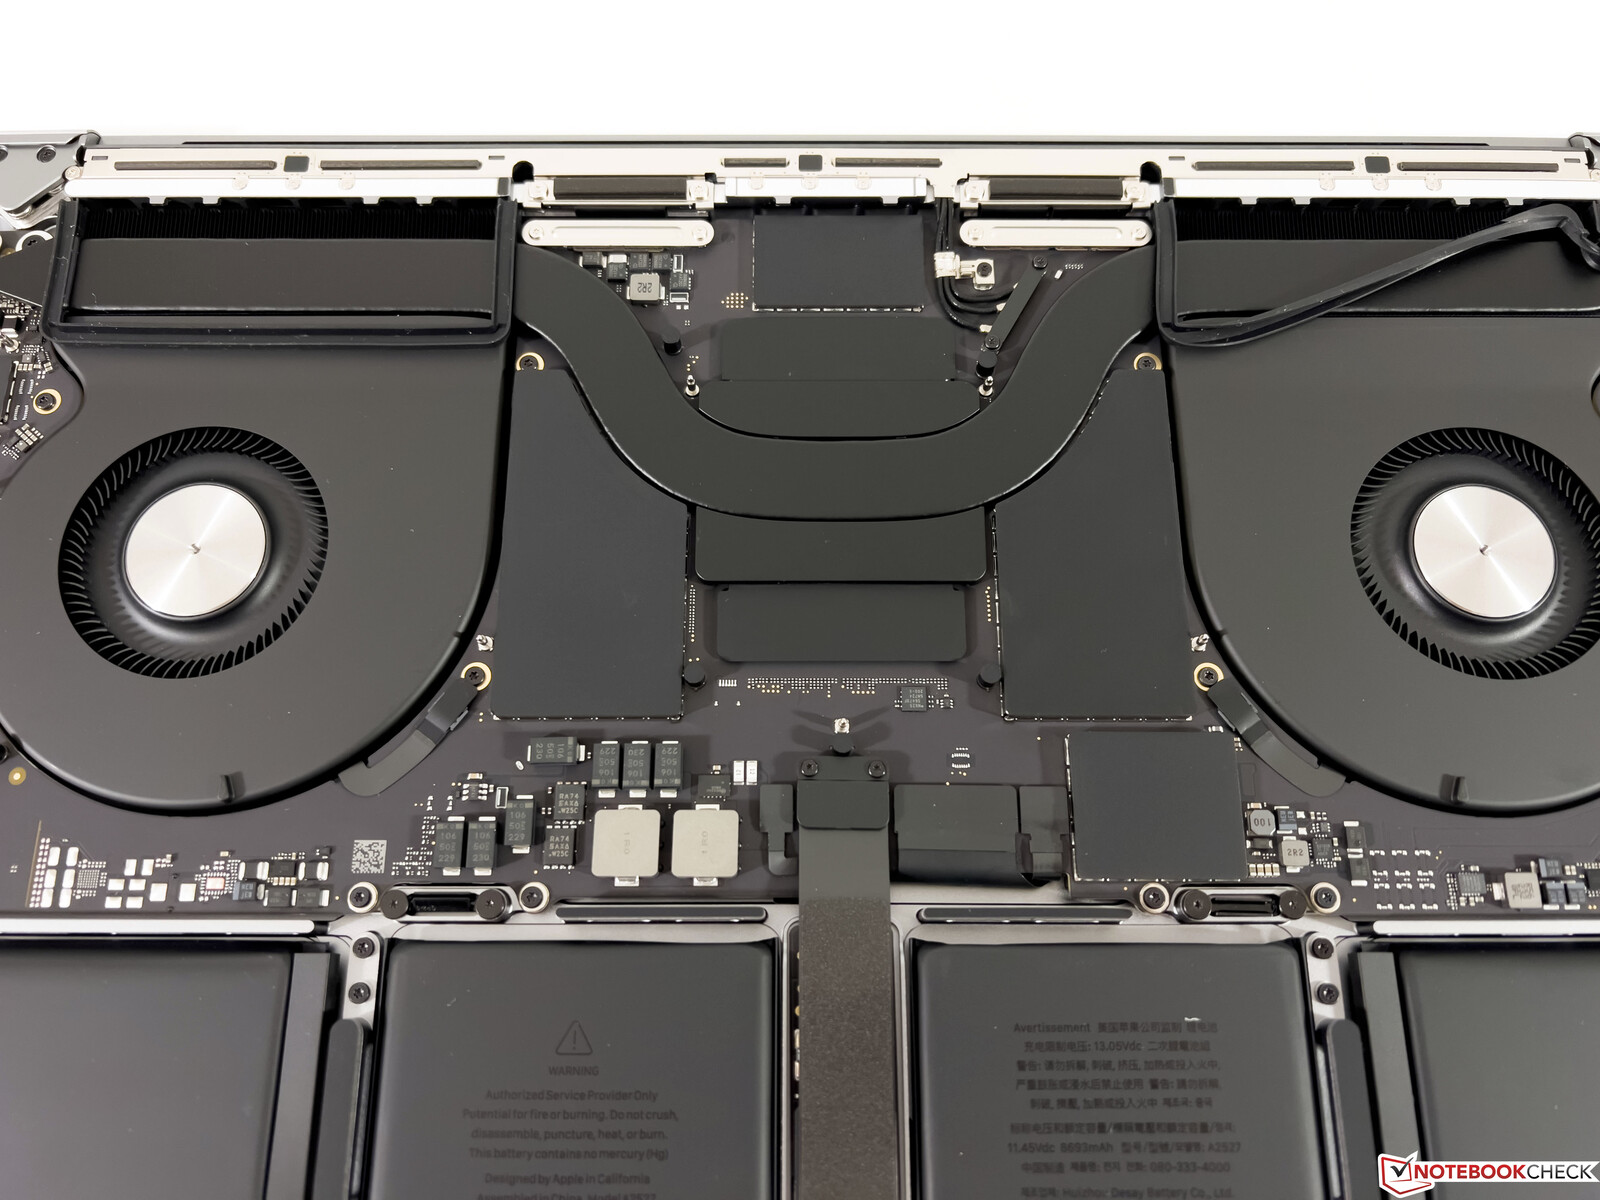
维护
用相应的工具卸下五角螺丝很简单,然后你必须把底板推向前面,然后才能抬起它。你可以清洁两个风扇,但其他组件不能被替换或升级。
担保
Apple 2023年的MacBook Pro 16仍然以一年的保修期发货。可以通过 Care+来延长这个期限,可以是399欧元的三年,也可以是每年149欧元(没有时间限制),这意味着费用比起Apple MBP 14(分别为299欧元或109欧元)。
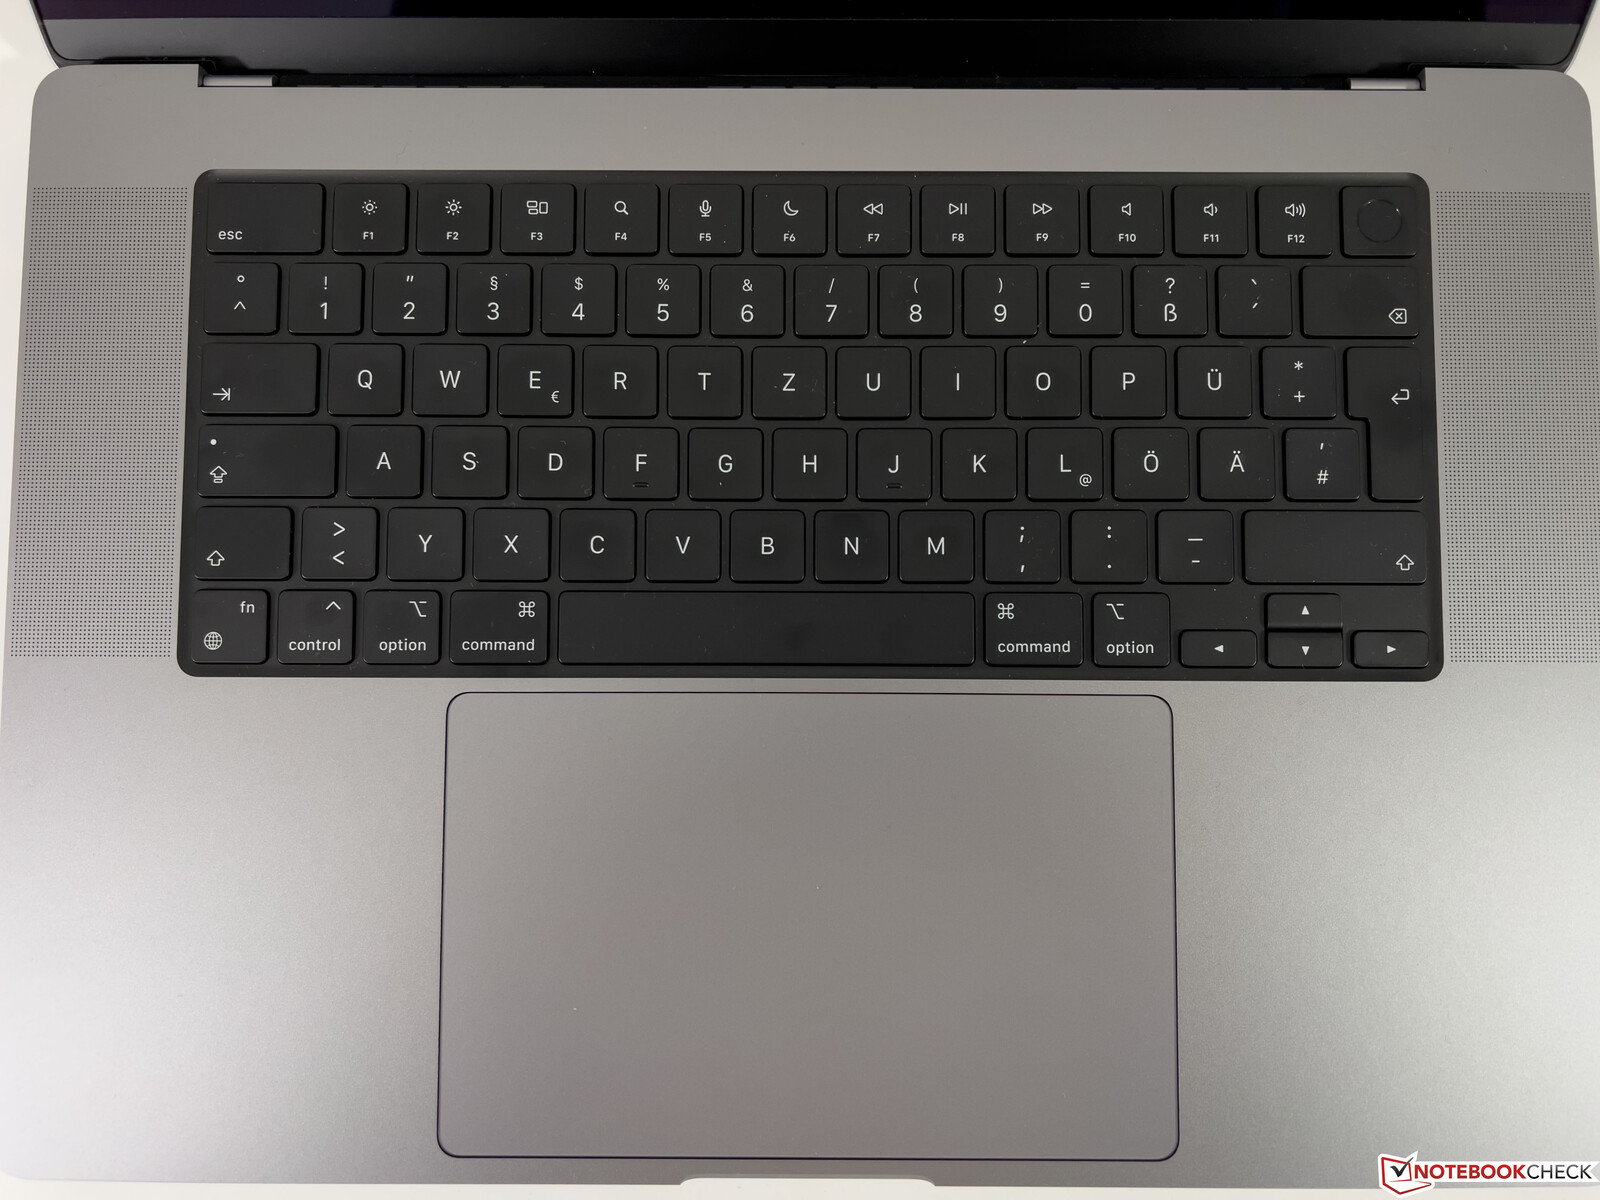
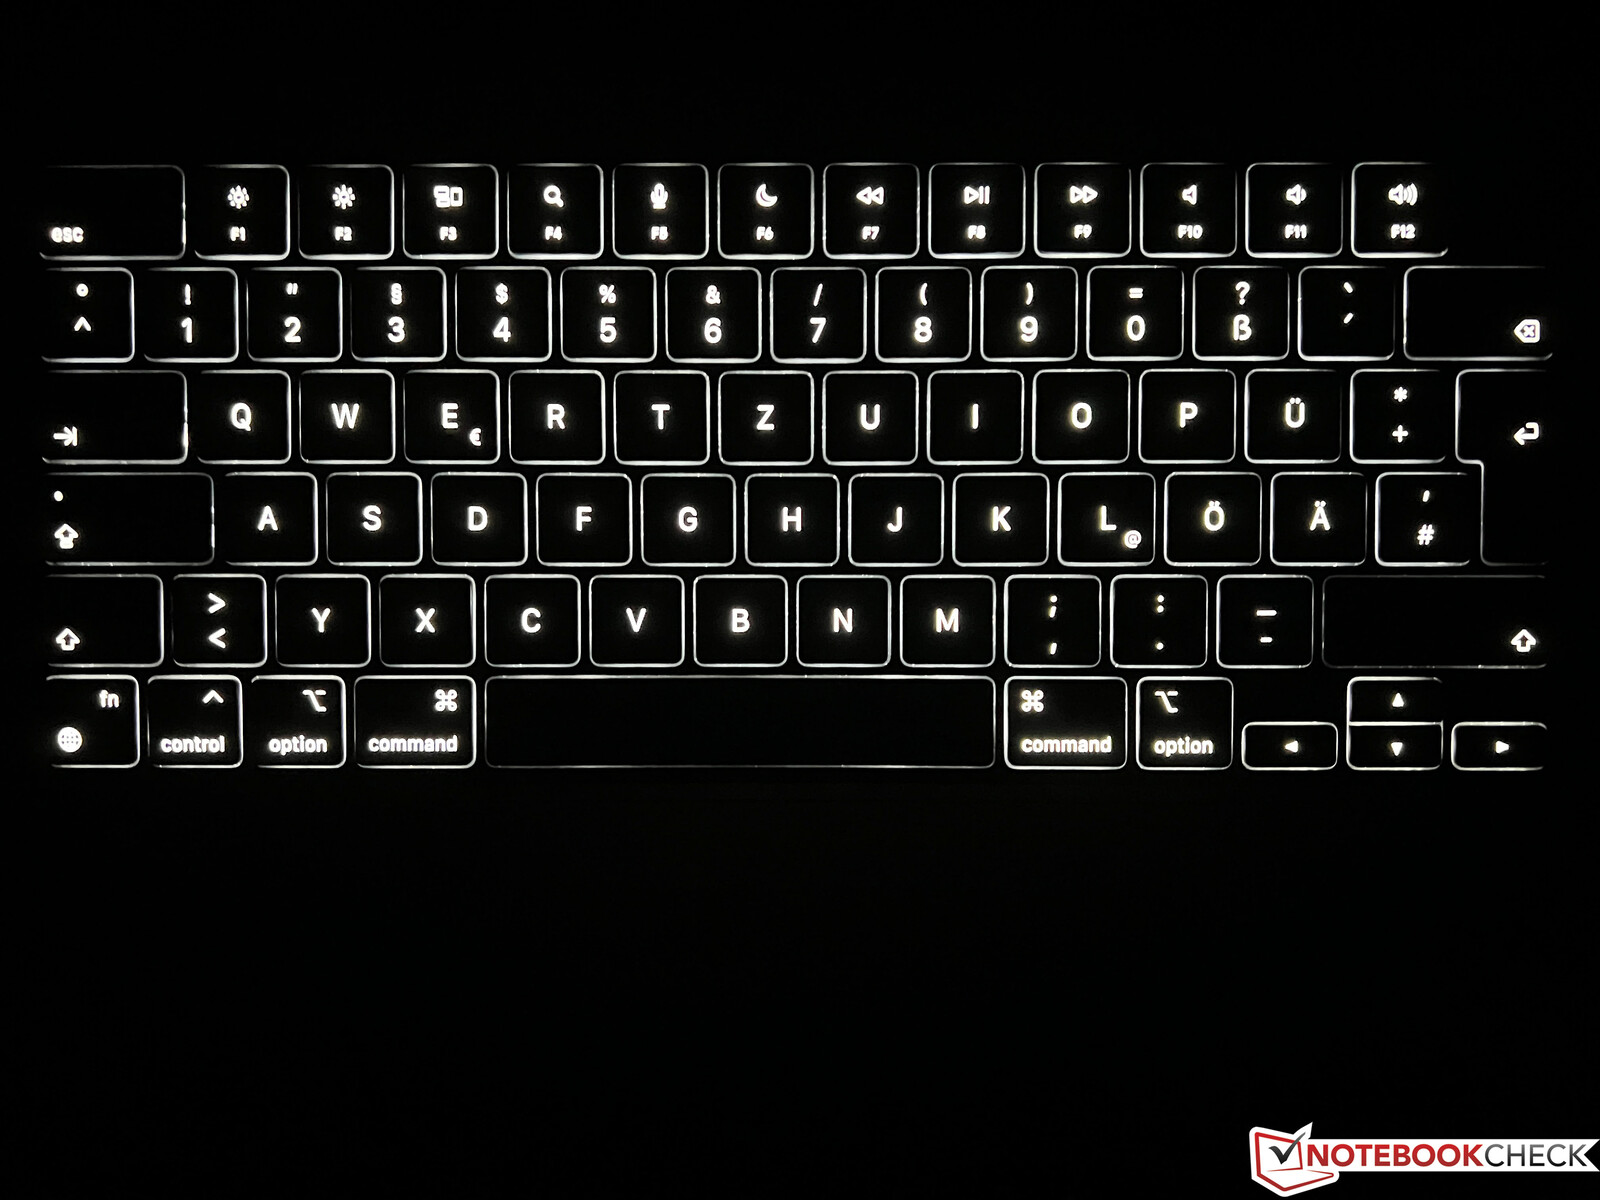
输入设备 - 良好的键盘,完美的触控板
我们可以参考 之前的模型的输入设备。键盘提供了一个体面的打字体验,但与昂贵的商务笔记本电脑相比,仍有改进的余地。然而,Apple ,仍然提供最好的键盘照明,它通过亮度传感器以非常精细的步骤自动调整。有一些Windows笔记本电脑可以根据环境照明来激活照明,但通常只有两到三个强度级别。
大尺寸的触控板在功能和操作方面仍然是基准,因为与macOS一起实现的效果就是非常好。
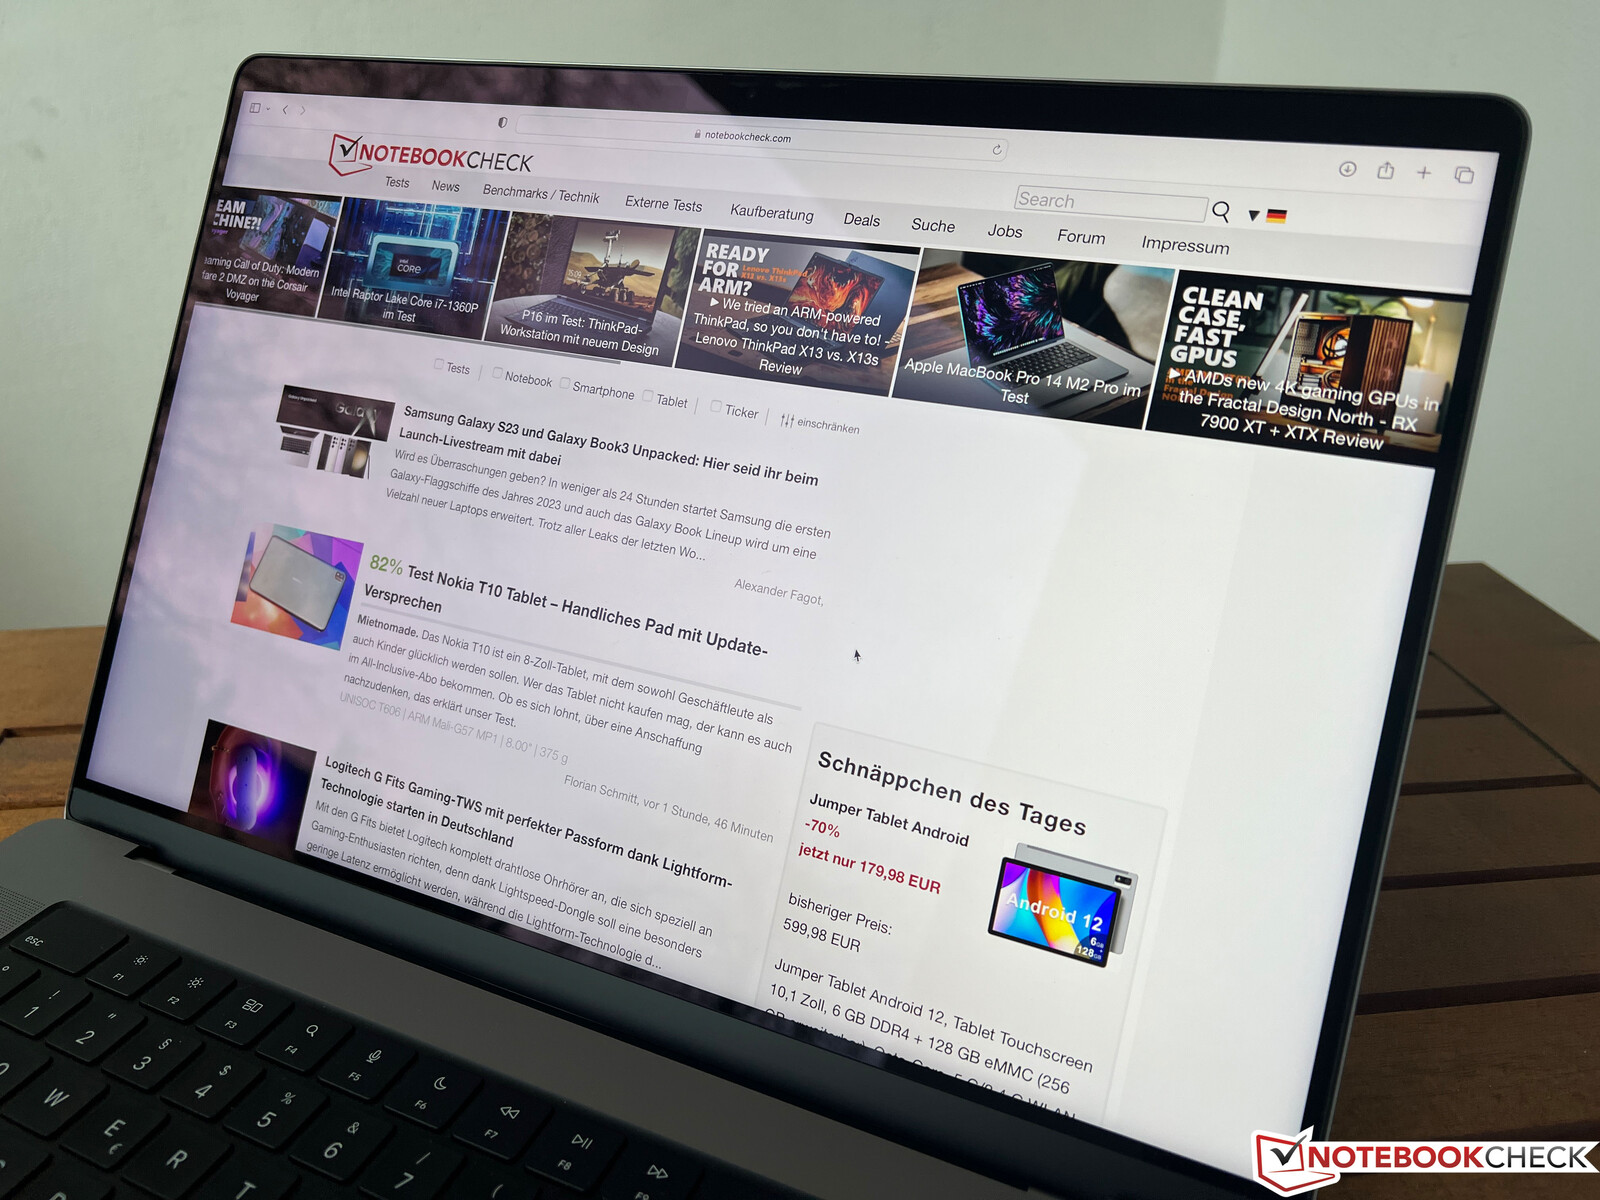
显示屏 - 120赫兹迷你LED

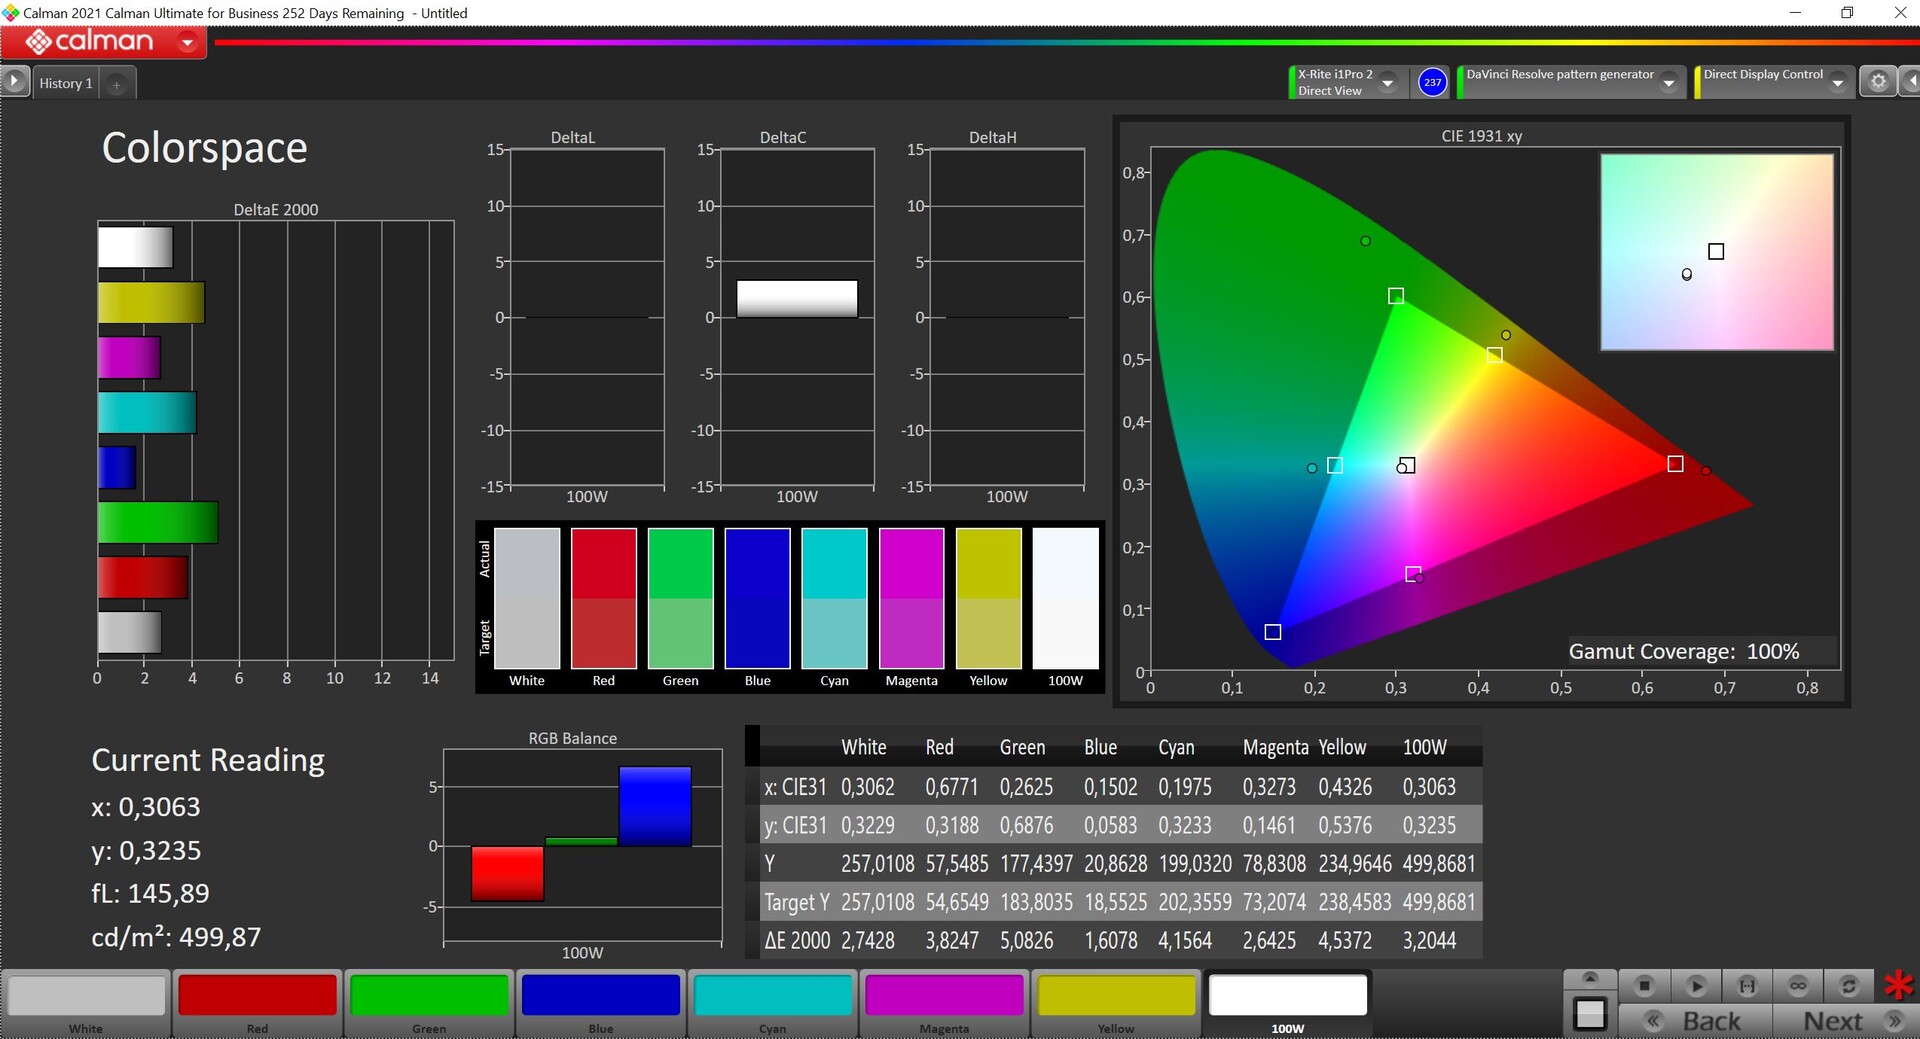
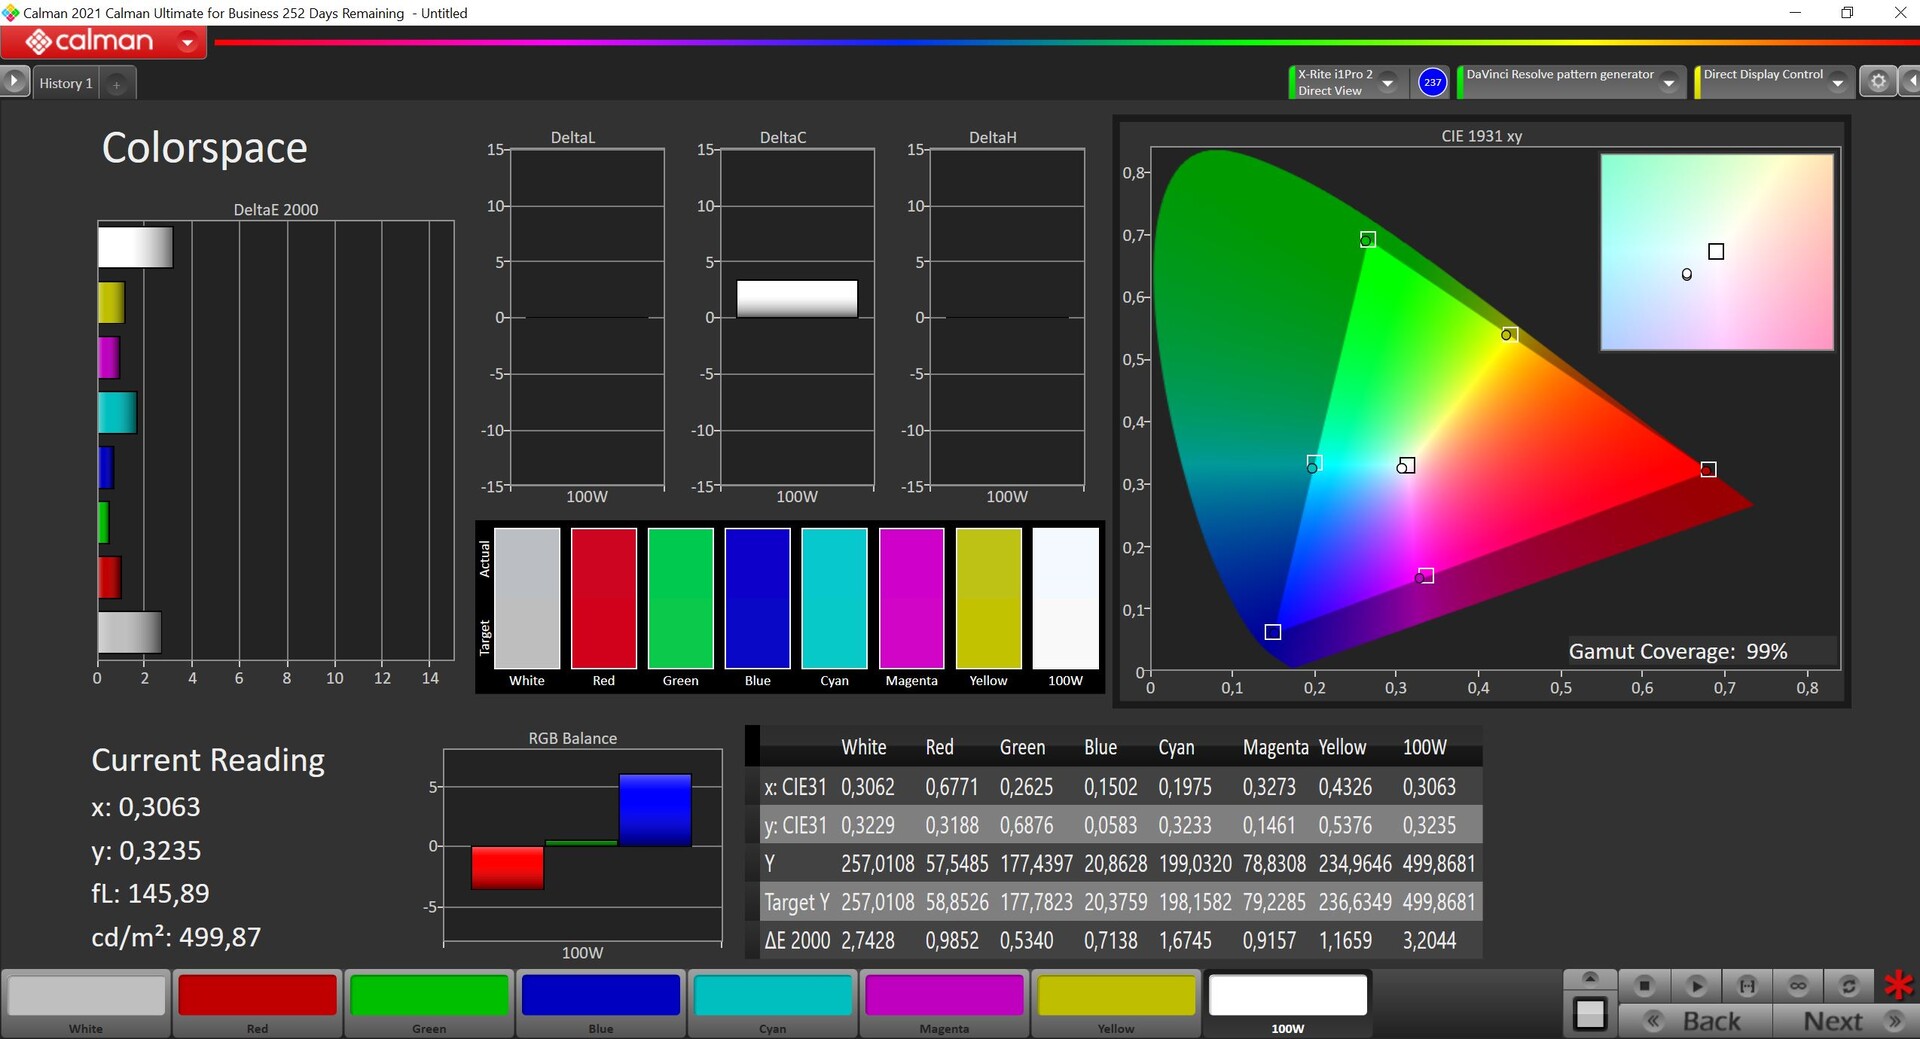
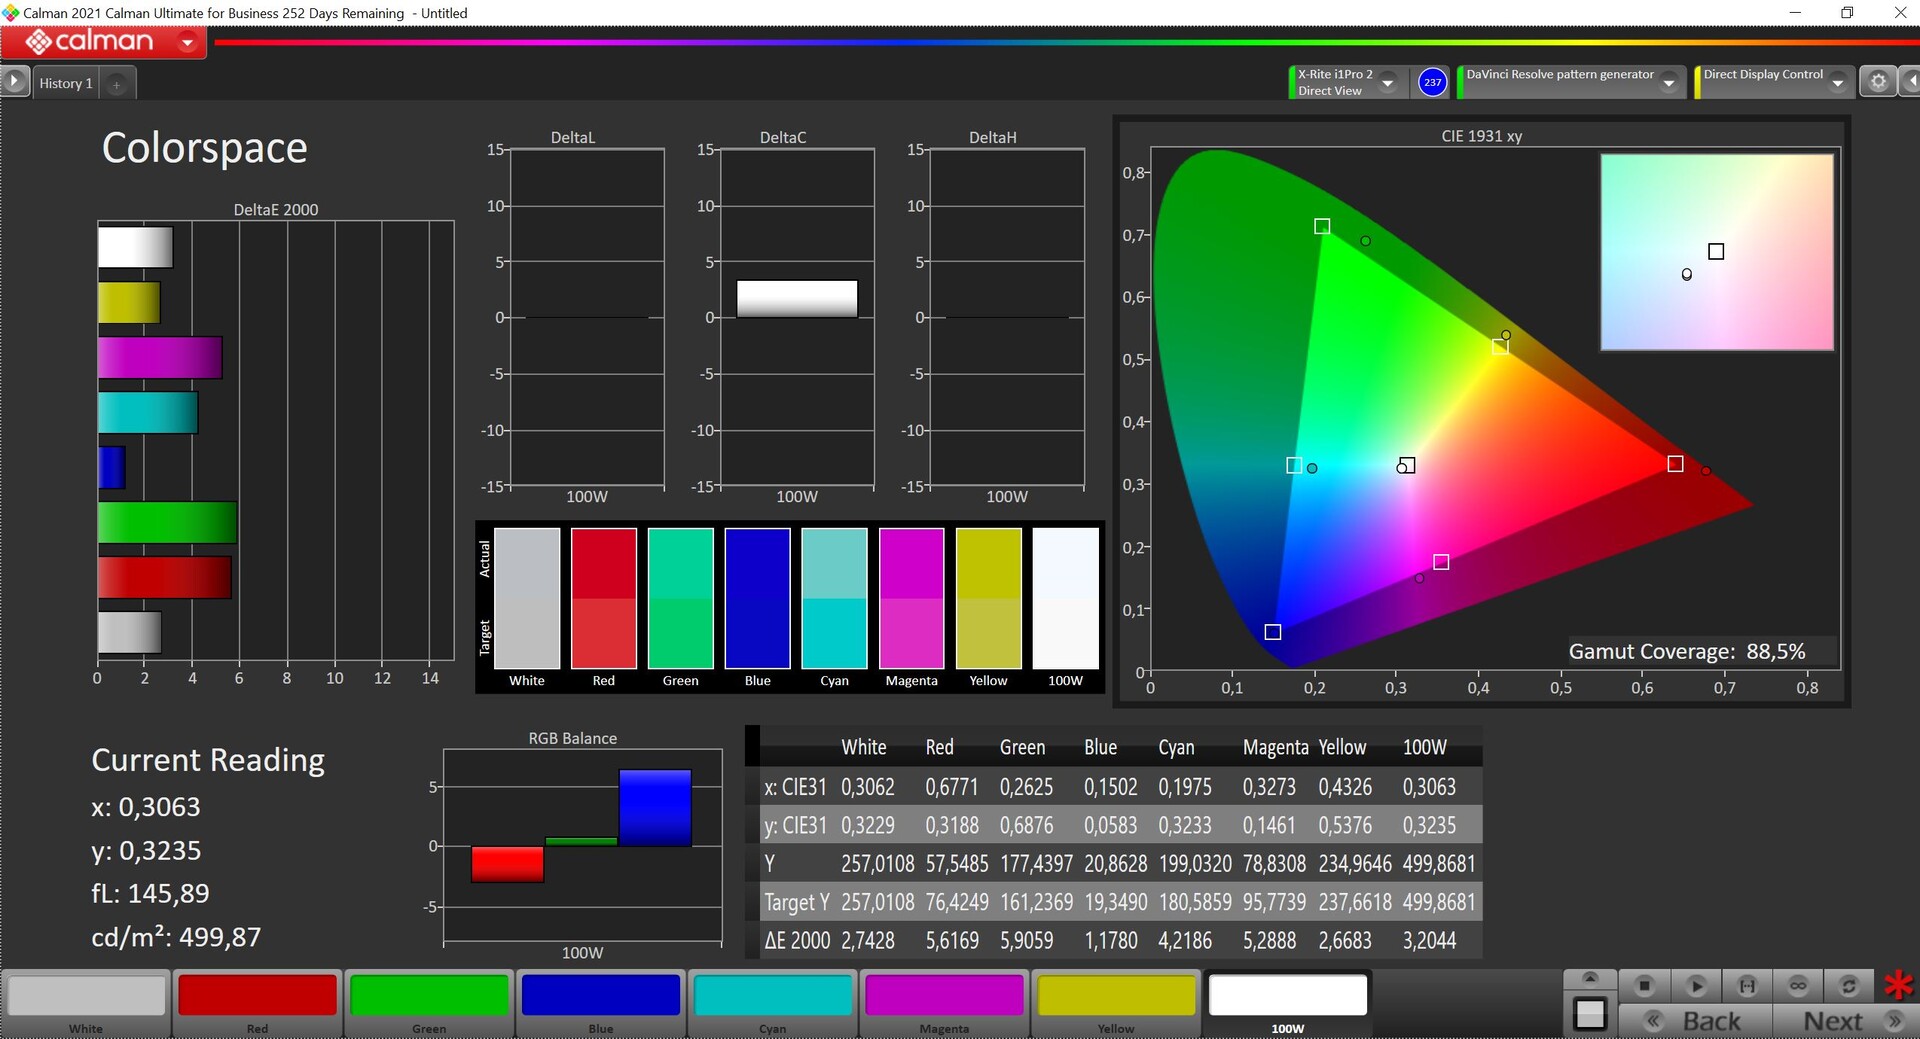
Apple 虽没有改变MacBook Pro 16的Mini-LED面板的规格,但我们高兴地看到, ,现在宣传的最大SDR亮度为500尼特。16.2英寸屏幕的分辨率为3456 x 2234像素(254 ppi),它基本上是一个16:10长宽比的屏幕,显示缺口旁边有额外的垂直像素。凹槽看起来仍然不是很好,但我们没有遇到任何功能问题。主观的图片印象仍然令人印象深刻,内容完全是黑色的,沿边缘没有背光渗出。然而,由于面板的整个调光区都被照亮,所以在黑暗背景上的明亮物体周围会出现绽放现象(如标志)。这在演示视频或前面提到的有标志的屏幕中非常明显,但在实际使用中并不是一个问题,由于120赫兹的刷新率,你可以享受丰富的色彩和流畅的运动。Apple
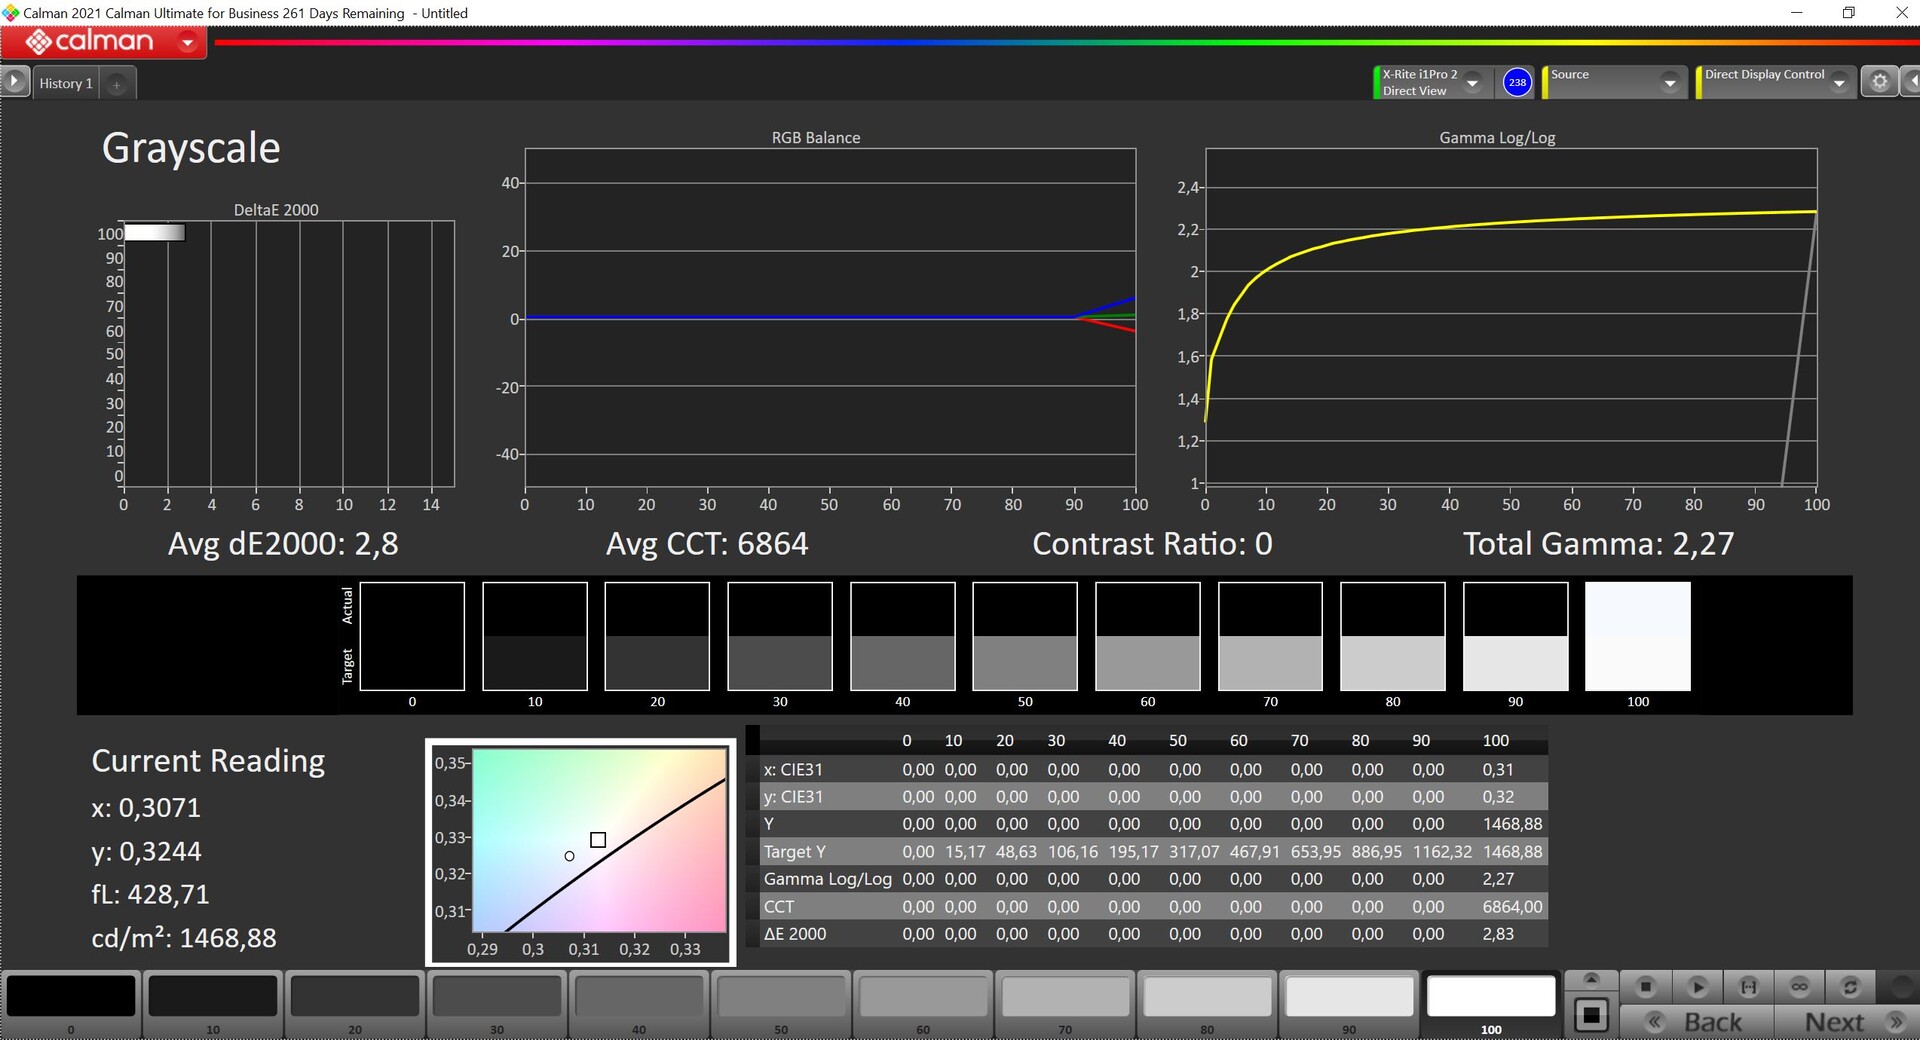
正如宣传的那样,我们测量的最大SDR亮度为500尼特;更高的数值是为HDR内容保留的。然而,我们的测试设备并没有达到宣传的最高1600尼特,因为我们只在一个小的明亮区域测量到1470尼特,在几乎完全白色的画面上仍然比1100尼特多一点。我们最近测试了微星泰坦GT77配备了4K迷你LED屏幕,我们不得不提到MacOS中伟大的HDR实现。当你在屏幕上有相应的内容时,显示器会直接增加亮度。它不需要改变任何设置,也不存在颜色配置文件的问题--没有比这更舒适的了。其他舒适功能包括精确自动调节显示器亮度和自动调节色温(True Tone)。
| |||||||||||||||||||||||||
Brightness Distribution: 94 %
Center on Battery: 504 cd/m²
Contrast: 504000:1 (Black: 0.001 cd/m²)
ΔE ColorChecker Calman: 1.5 | ∀{0.5-29.43 Ø4.71}
ΔE Greyscale Calman: 2.1 | ∀{0.09-98 Ø4.96}
88.5% AdobeRGB 1998 (Argyll 3D)
100% sRGB (Argyll 3D)
99% Display P3 (Argyll 3D)
Gamma: 2.25
CCT: 6882 K
| Apple MacBook Pro 16 2023 M2 Max Mini-LED, 3456x2234, 16.2" | Apple MacBook Pro 16 2021 M1 Pro Liquid Retina XDR, Mini-LED, 3456x2234, 16.2" | Lenovo ThinkPad X1 Extreme G5-21DE003RGE LP160UQ1-SPB1, IPS, 3840x2400, 16" | Asus ZenBook Pro 16X OLED UX7602ZM-ME115W Samsung SDC415D, OLED, 3840x2400, 16" | Schenker Vision 16 Pro RTX 3070 Ti N160QDM-NZ1, IPS, 2560x1600, 16" | Dell Precision 7000 7670 Performance Samsung 160YV03, OLED, 3840x2400, 16" | |
|---|---|---|---|---|---|---|
| Display | -0% | -2% | 0% | -18% | 4% | |
| Display P3 Coverage (%) | 99 | 99.1 0% | 84.6 -15% | 99.84 1% | 68.7 -31% | 99.9 1% |
| sRGB Coverage (%) | 100 | 100 0% | 99.2 -1% | 99.99 0% | 96.7 -3% | 100 0% |
| AdobeRGB 1998 Coverage (%) | 88.5 | 88 -1% | 97.7 10% | 88.9 0% | 70 -21% | 98.1 11% |
| Response Times | -24% | 51% | 97% | 82% | 97% | |
| Response Time Grey 50% / Grey 80% * (ms) | 80.5 ? | 42.8 ? 47% | 46 ? 43% | 2 ? 98% | 14.3 ? 82% | 1.84 ? 98% |
| Response Time Black / White * (ms) | 47.2 ? | 91.6 ? -94% | 19.2 ? 59% | 2 ? 96% | 8.6 ? 82% | 1.92 ? 96% |
| PWM Frequency (Hz) | 14880 ? | 14880 | 59 ? | 59.52 ? | ||
| Screen | -247% | -4387% | -23% | -3804% | -70% | |
| Brightness middle (cd/m²) | 504 | 514 2% | 476 -6% | 346 -31% | 364 -28% | 325.2 -35% |
| Brightness (cd/m²) | 487 | 497 2% | 470 -3% | 354 -27% | 347 -29% | 328 -33% |
| Brightness Distribution (%) | 94 | 95 1% | 90 -4% | 96 2% | 89 -5% | 97 3% |
| Black Level * (cd/m²) | 0.001 | 0.02 -1900% | 0.35 -34900% | 0.3 -29900% | ||
| Contrast (:1) | 504000 | 25700 -95% | 1360 -100% | 1213 -100% | ||
| Colorchecker dE 2000 * | 1.5 | 1.4 7% | 1.9 -27% | 2.28 -52% | 3.3 -120% | 4.59 -206% |
| Colorchecker dE 2000 max. * | 3.3 | 2.8 15% | 4.7 -42% | 4.94 -50% | 6.6 -100% | 7.65 -132% |
| Greyscale dE 2000 * | 2.1 | 2.3 -10% | 2.4 -14% | 1.64 22% | 5.2 -148% | 2.5 -19% |
| Gamma | 2.25 98% | 2.27 97% | 2.24 98% | 2.37 93% | 2.14 103% | 2.1 105% |
| CCT | 6882 94% | 6792 96% | 6377 102% | 6384 102% | 6331 103% | 6541 99% |
| Colorchecker dE 2000 calibrated * | 1.3 | 2.16 | 2.5 | |||
| Total Average (Program / Settings) | -90% /
-156% | -1446% /
-2692% | 25% /
5% | -1247% /
-2332% | 10% /
-20% |
* ... smaller is better
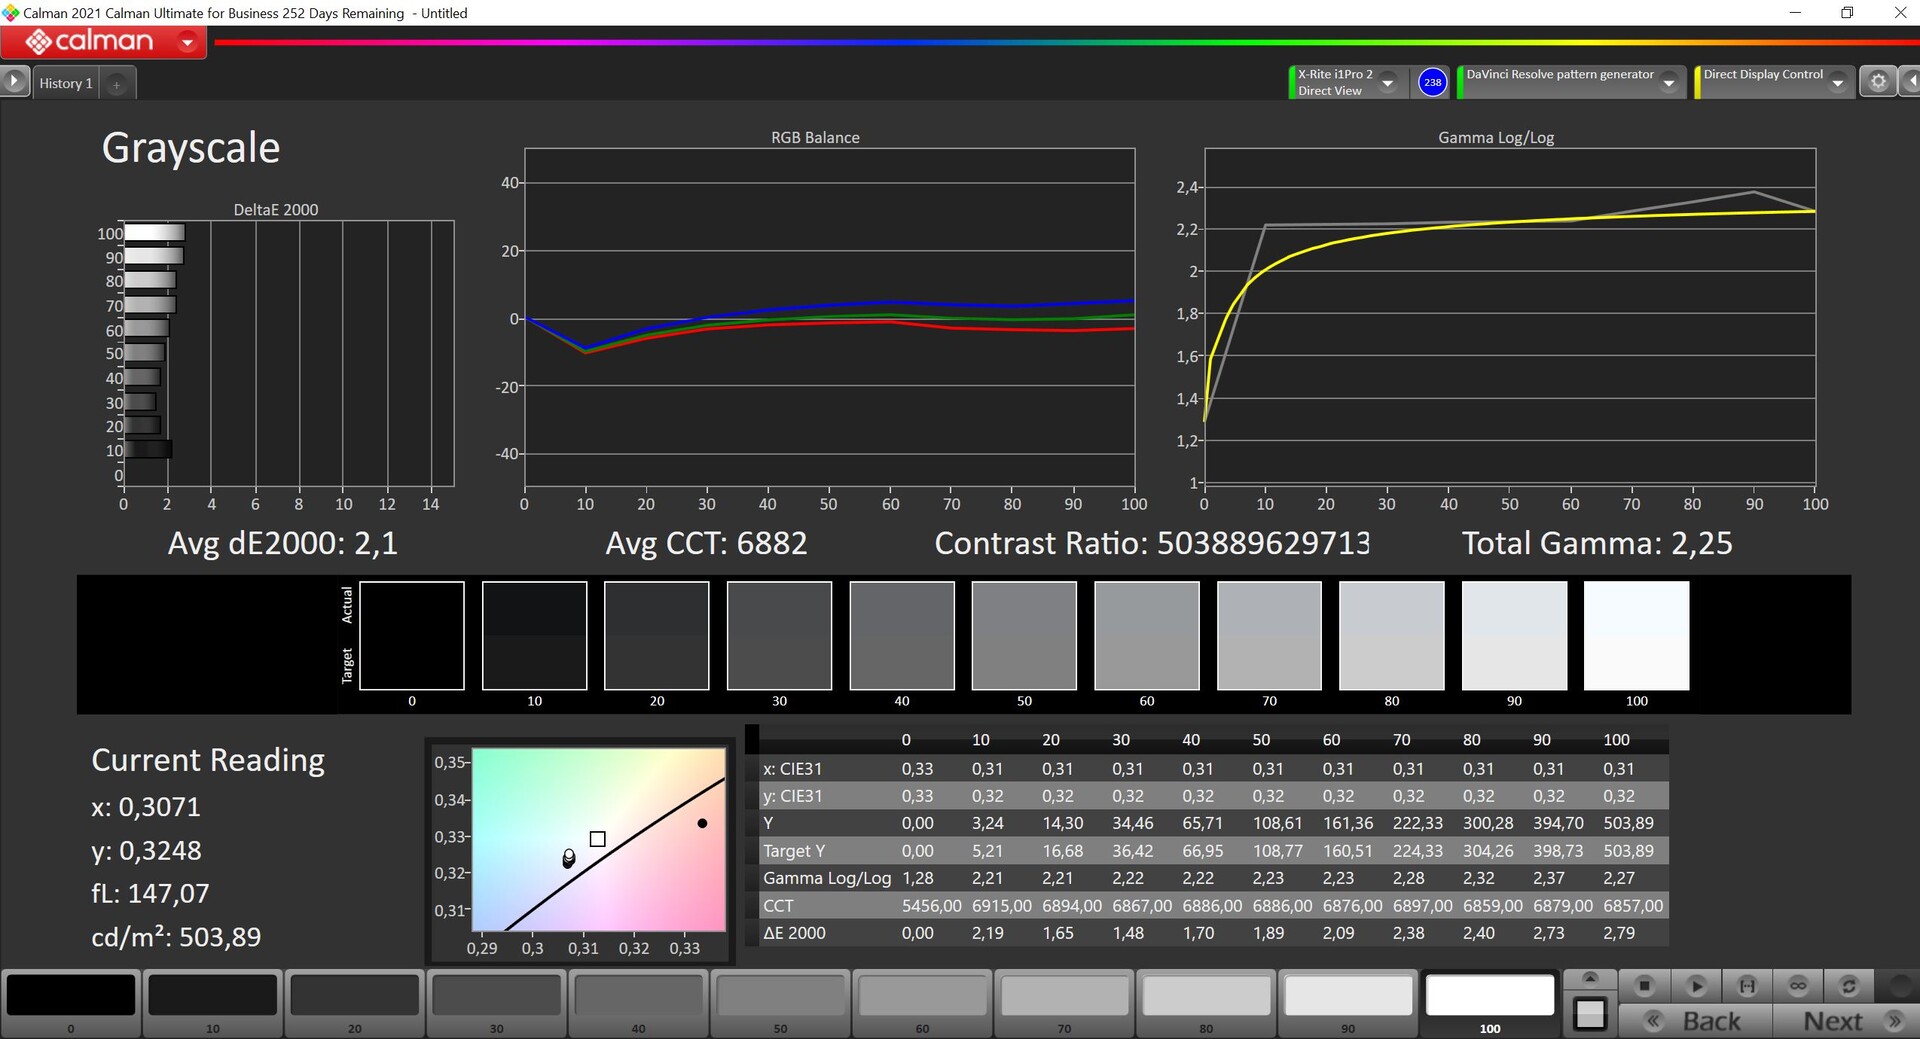
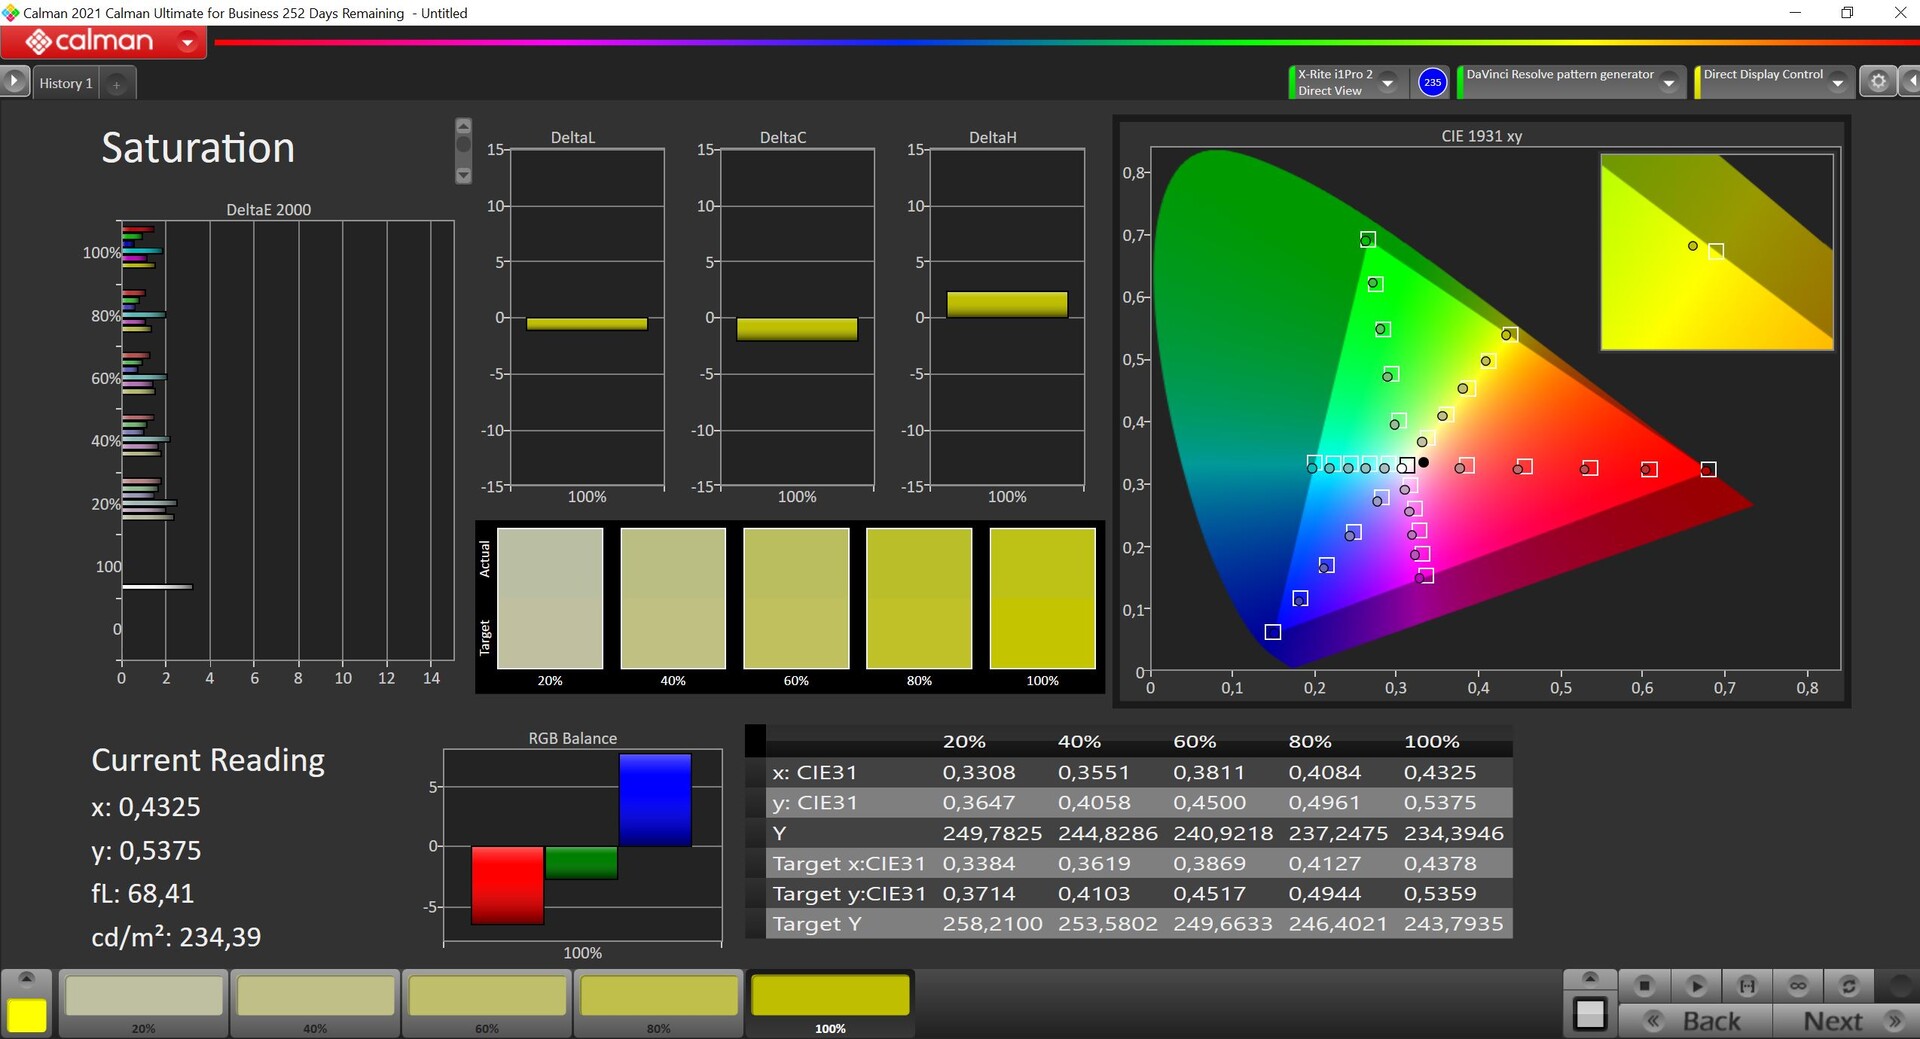
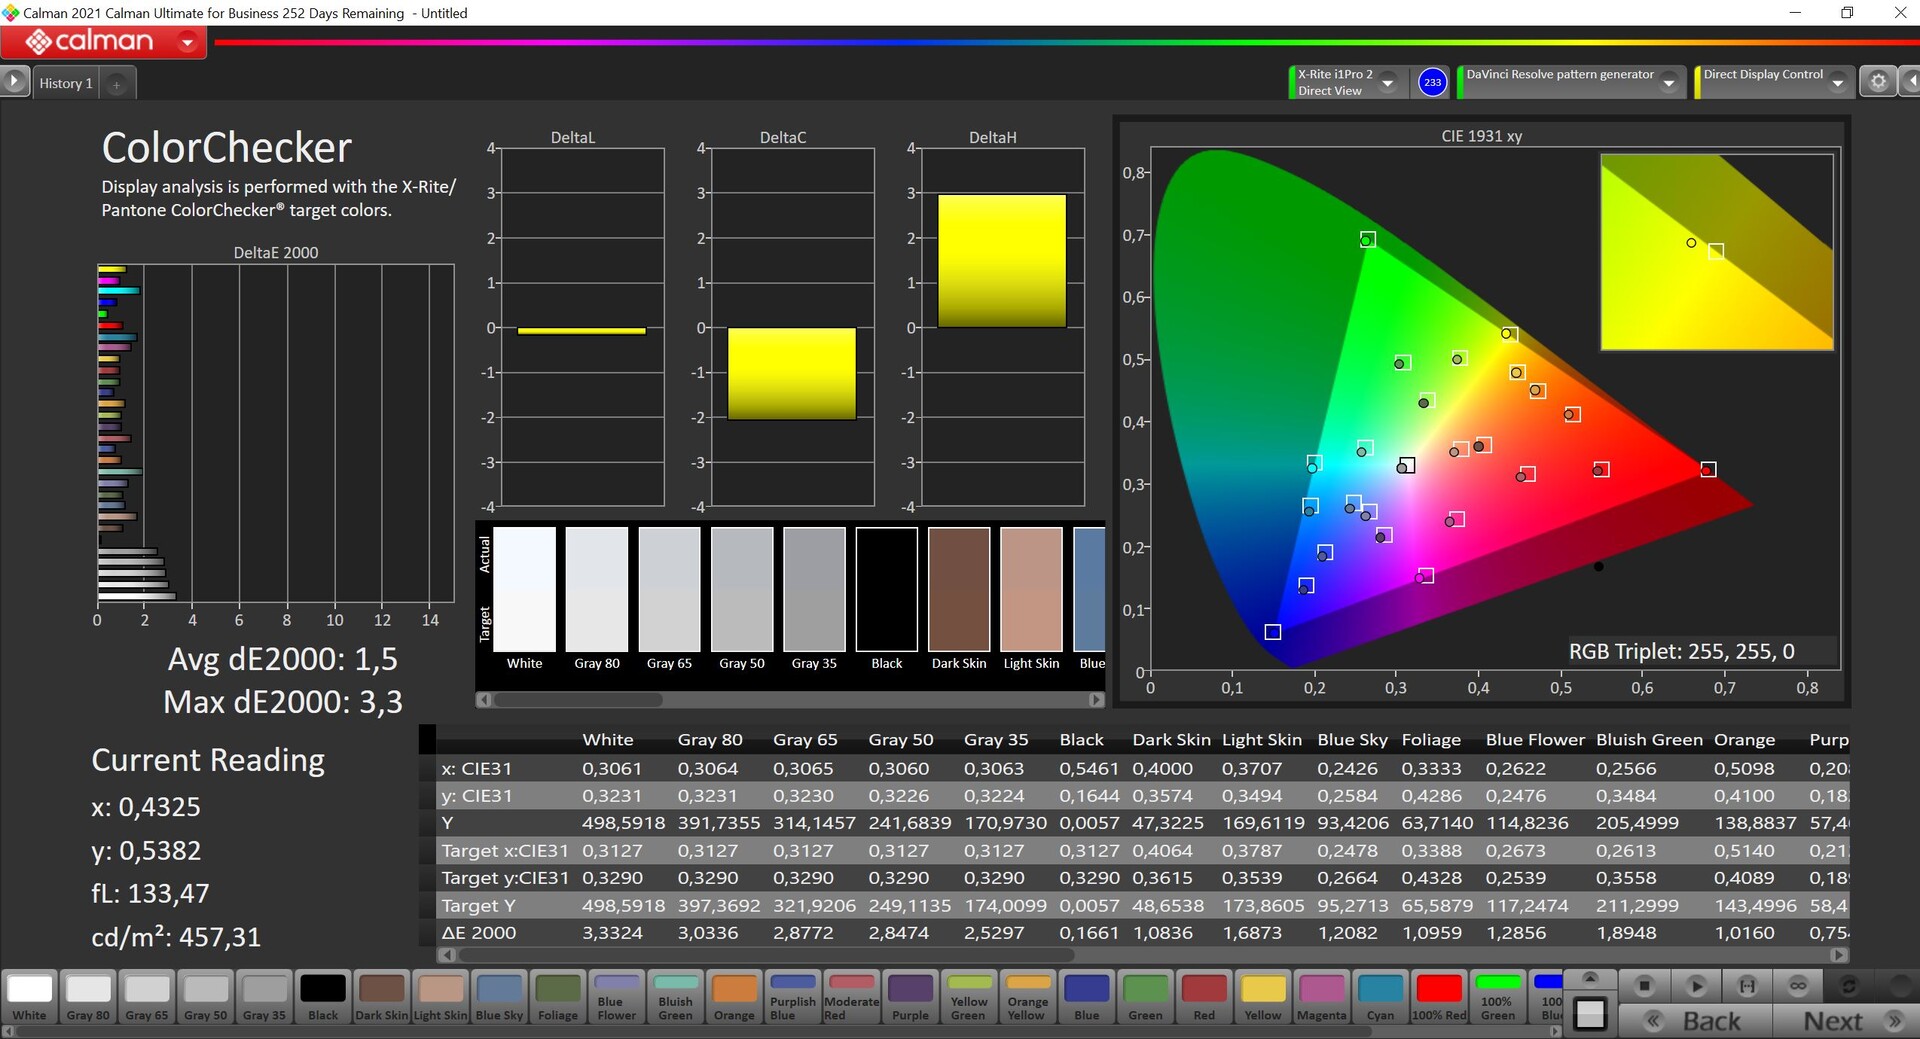
我们用专业的CalMAN软件(X-Rite i1 Pro 2)进行的显示分析表明,该面板在开箱时就已经校准得非常好。与P3参考色彩空间相比,灰度和色彩都没有显示出超过3的DeltaE 2000偏差,完全覆盖。只有色温略微过冷,而且有一个最小的蓝色偏移,但这几乎是肉眼看不到的。我们无法用我们的工具校准面板,这意味着我们无法提供相应的显示配置文件,色彩空间的测量结果来自CalMAN。
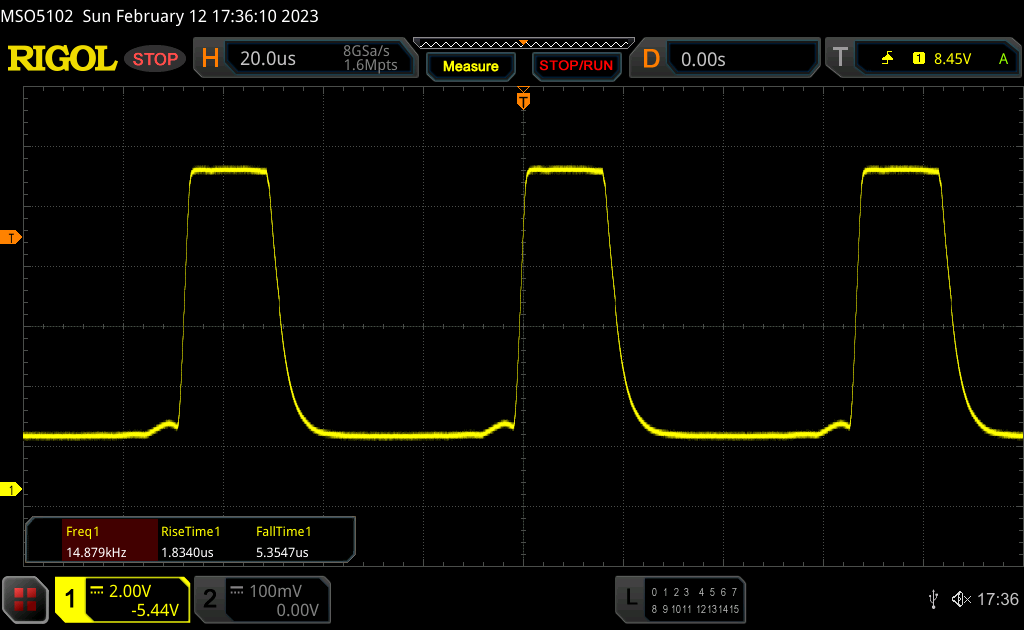
Display Response Times
| ↔ Response Time Black to White | ||
|---|---|---|
| 47.2 ms ... rise ↗ and fall ↘ combined | ↗ 20.6 ms rise | 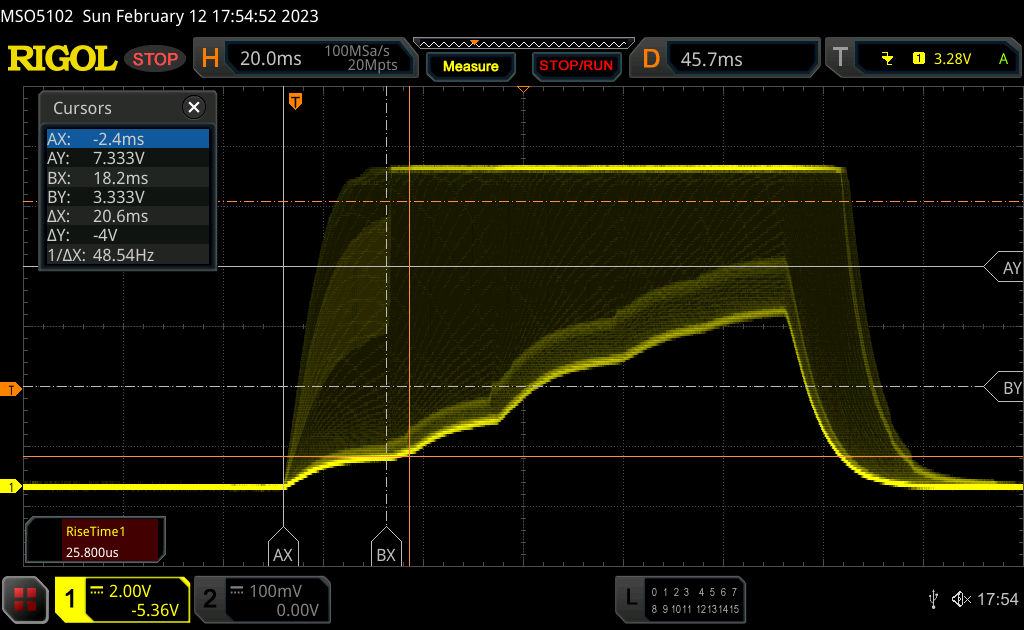 |
| ↘ 26.6 ms fall | ||
| The screen shows slow response rates in our tests and will be unsatisfactory for gamers. In comparison, all tested devices range from 0.1 (minimum) to 240 (maximum) ms. » 99 % of all devices are better. This means that the measured response time is worse than the average of all tested devices (19.8 ms). | ||
| ↔ Response Time 50% Grey to 80% Grey | ||
| 80.5 ms ... rise ↗ and fall ↘ combined | ↗ 38.5 ms rise | 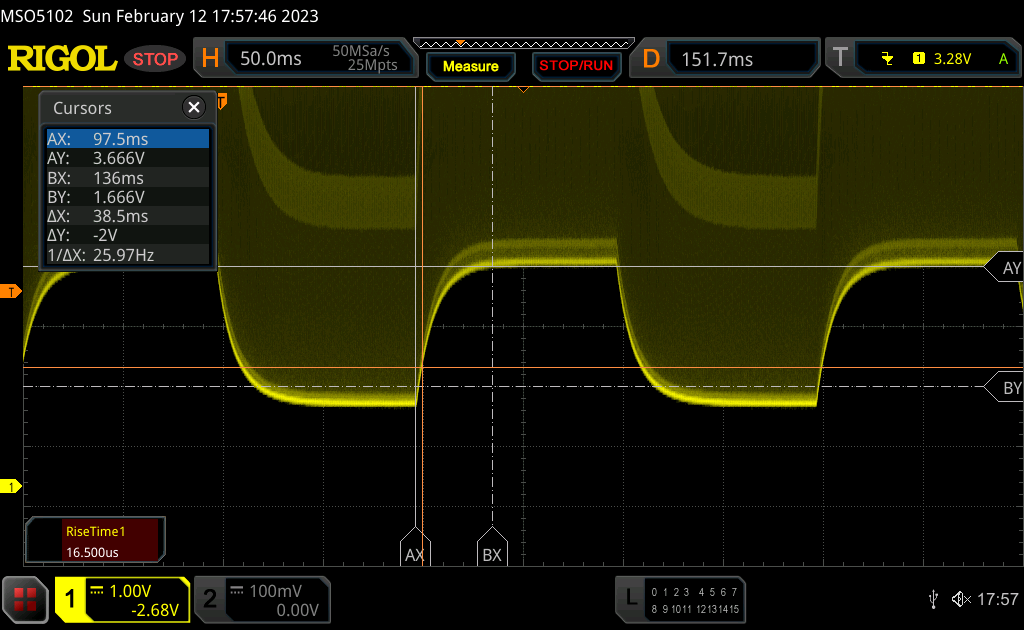 |
| ↘ 42 ms fall | ||
| The screen shows slow response rates in our tests and will be unsatisfactory for gamers. In comparison, all tested devices range from 0.165 (minimum) to 636 (maximum) ms. » 99 % of all devices are better. This means that the measured response time is worse than the average of all tested devices (31 ms). | ||
Screen Flickering / PWM (Pulse-Width Modulation)
| Screen flickering / PWM detected | 14880 Hz | ≤ 100 % brightness setting | 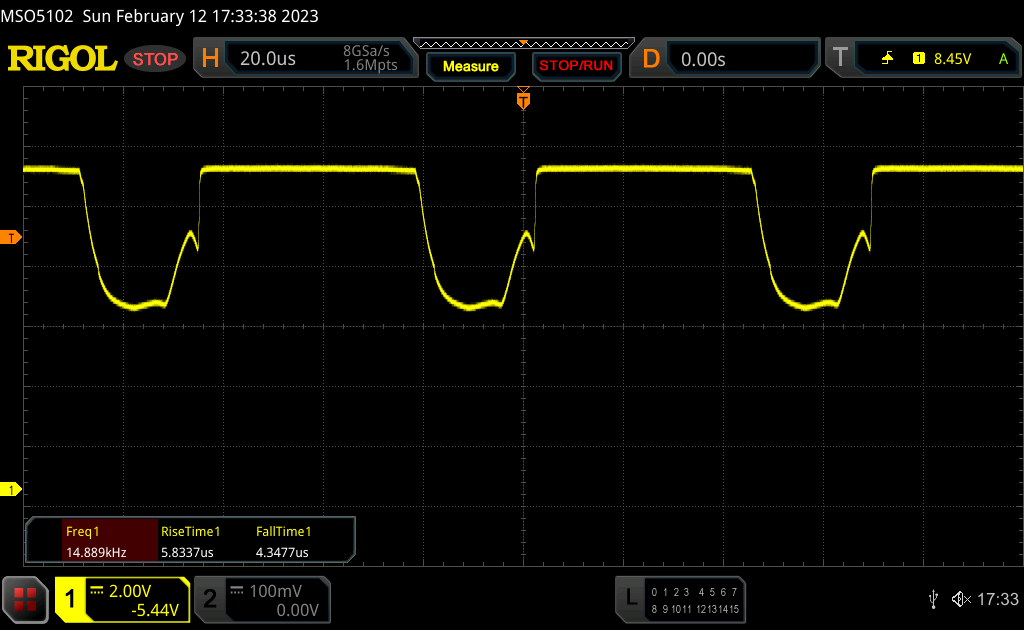 |
| ≤ 500 cd/m² brightness | |||
The display backlight flickers at 14880 Hz (worst case, e.g., utilizing PWM) Flickering detected at a brightness setting of 100 % (500 cd/m²) and below. There should be no flickering or PWM above this brightness setting. The frequency of 14880 Hz is quite high, so most users sensitive to PWM should not notice any flickering. Flickering occurs even at high brightness setting and may have an effect on the user during everyday use. In comparison: 52 % of all tested devices do not use PWM to dim the display. If PWM was detected, an average of 7757 (minimum: 5 - maximum: 343500) Hz was measured. | |||
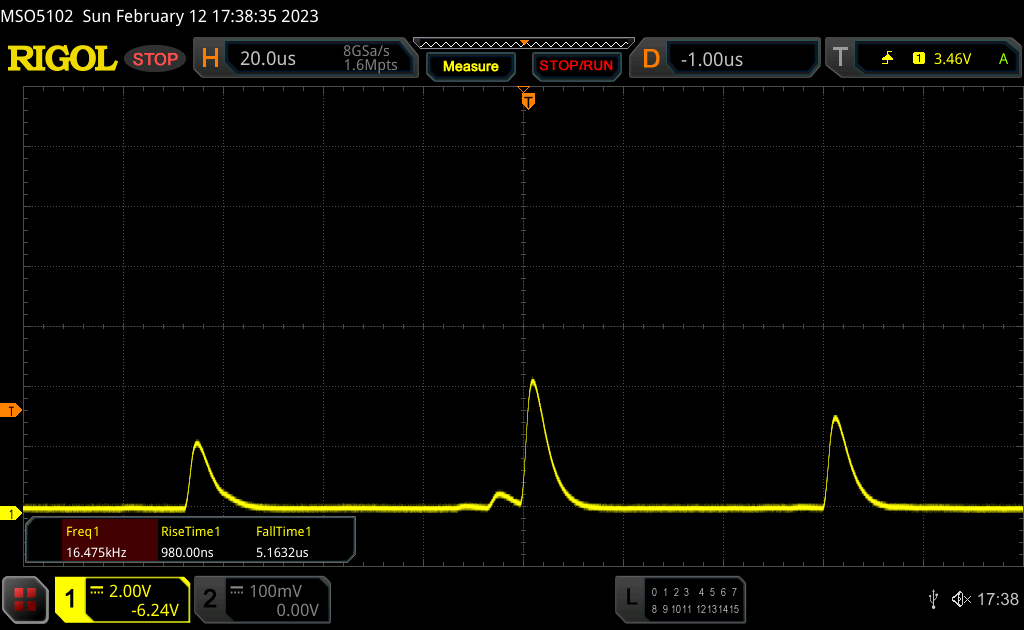
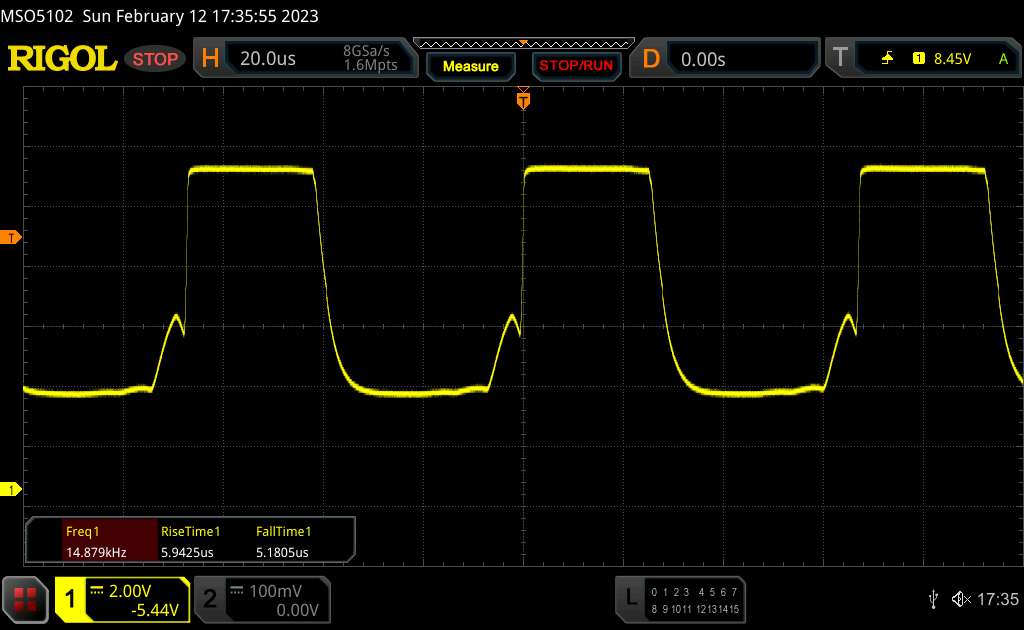
与较小的MBP 14类似,我们可以测量到频率为14.88KHz的PWM,甚至在最大的SDR亮度下。然而,这个频率非常高,对大多数用户来说应该不会造成问题。PWM的闪烁使得确定响应时间变得很棘手,响应时间也显得非常缓慢。在实践中,你可以注意到轻微的重影(例如,当你移动光标时),但120赫兹的较高刷新率有助于获得流畅的印象。
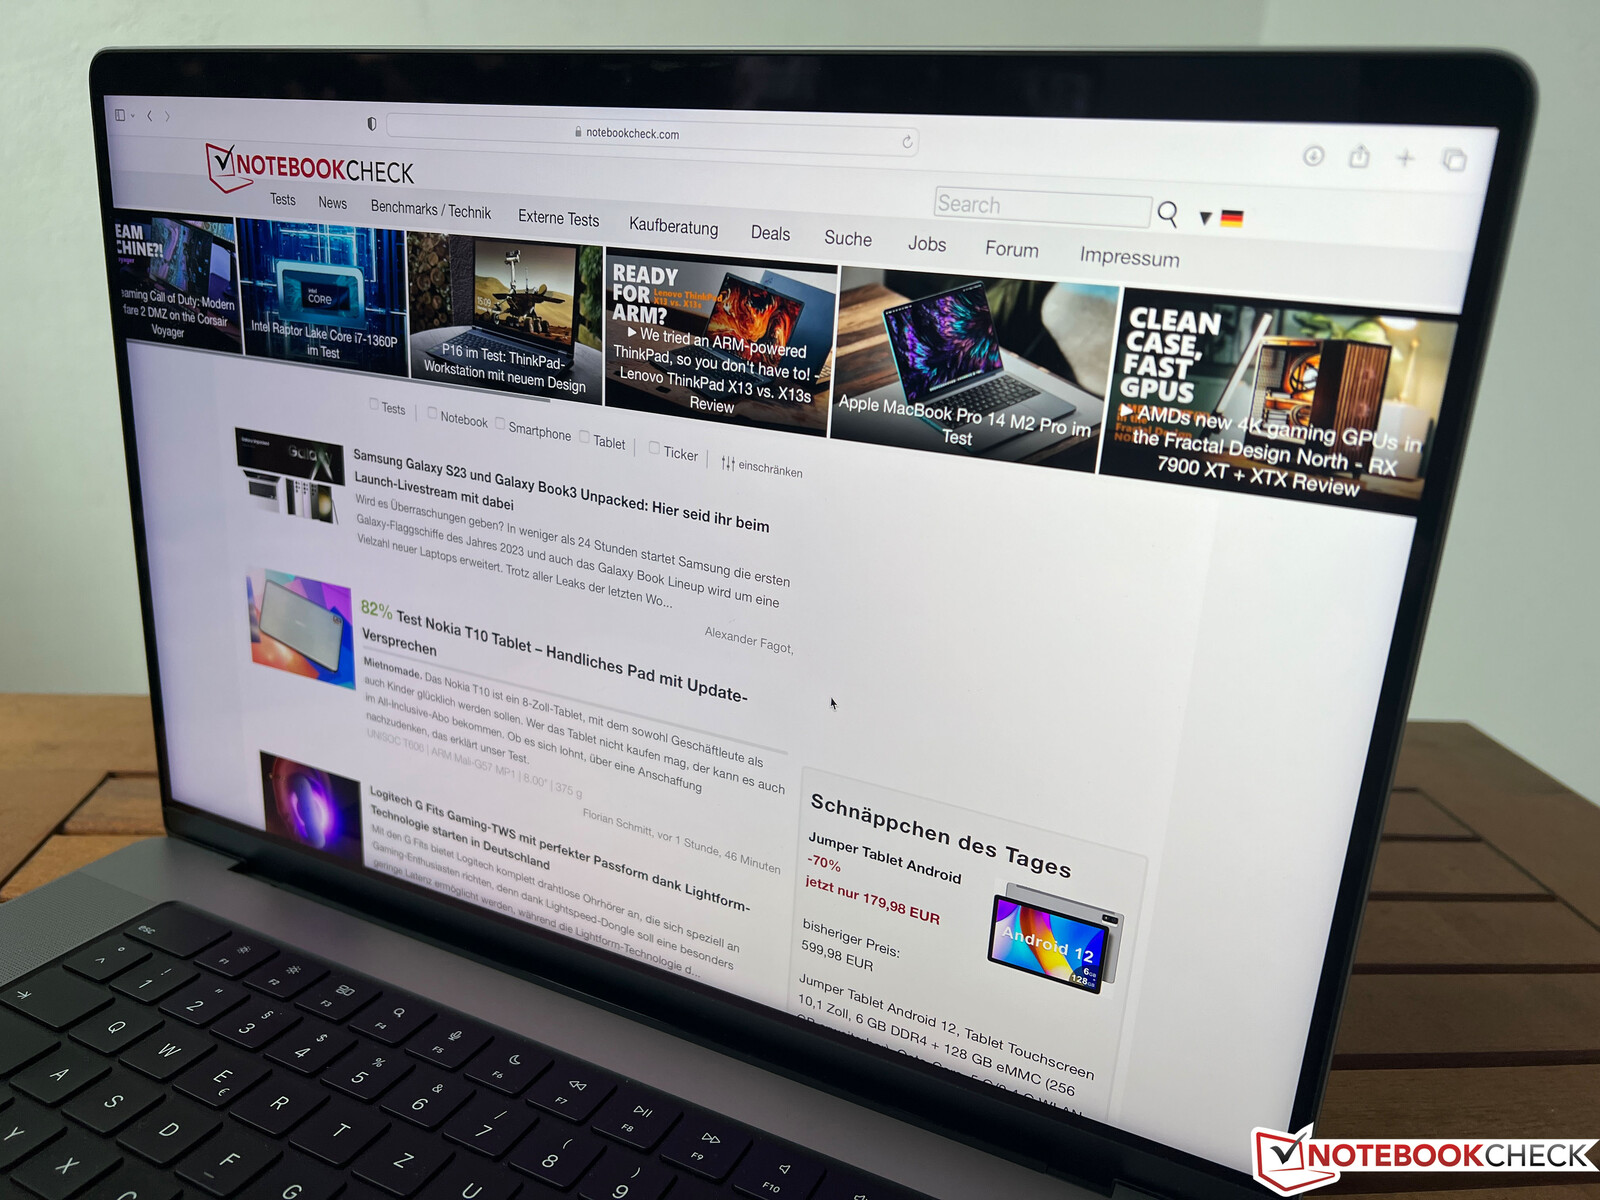
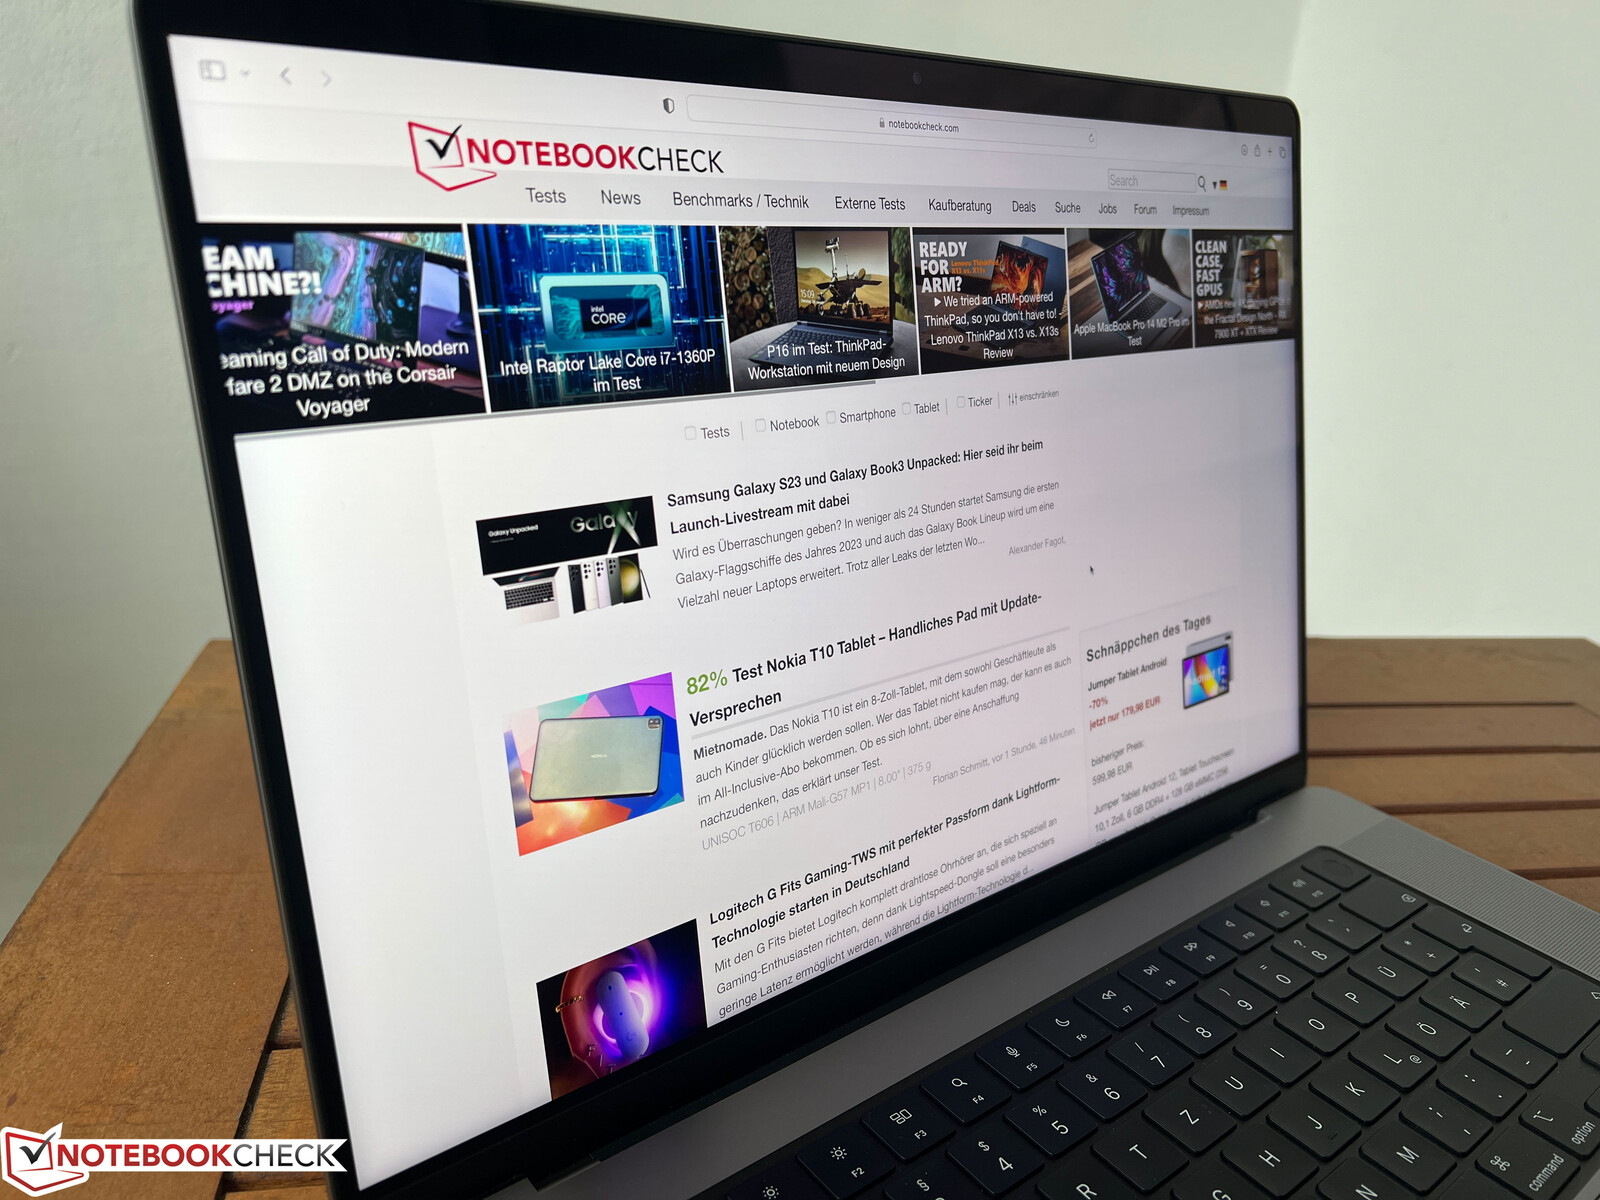

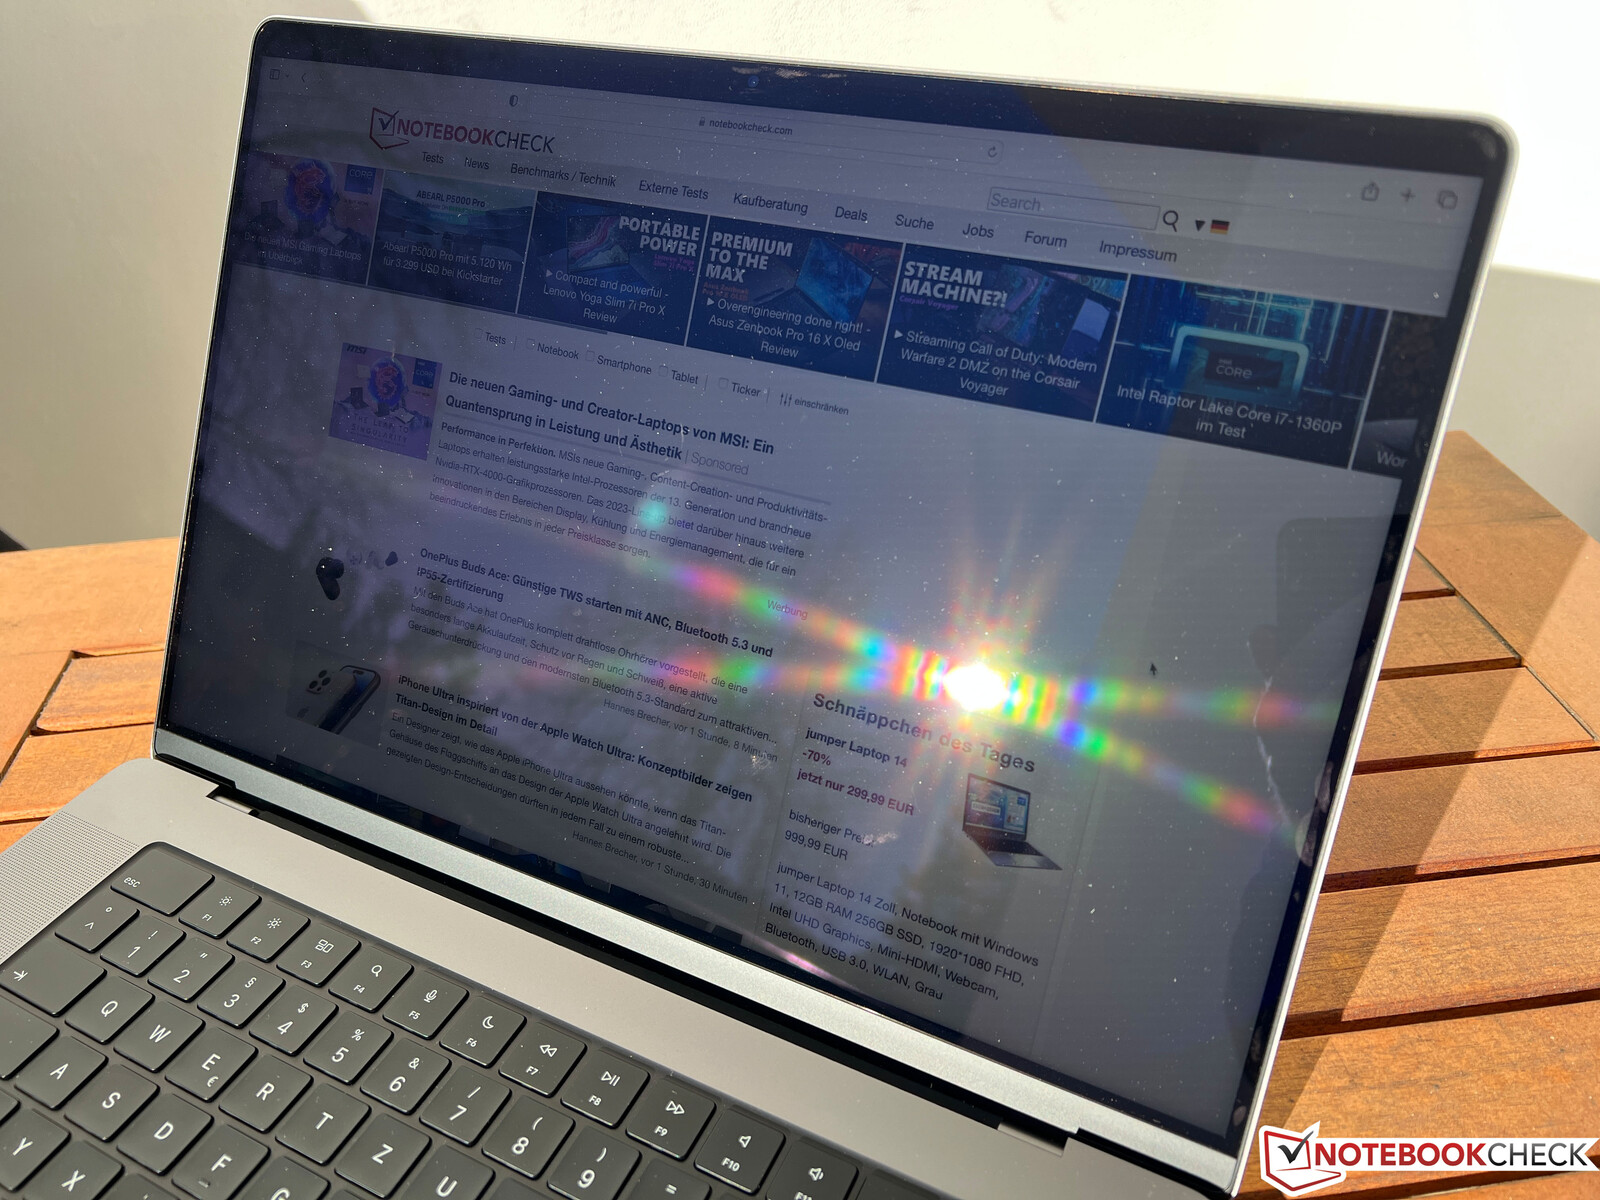
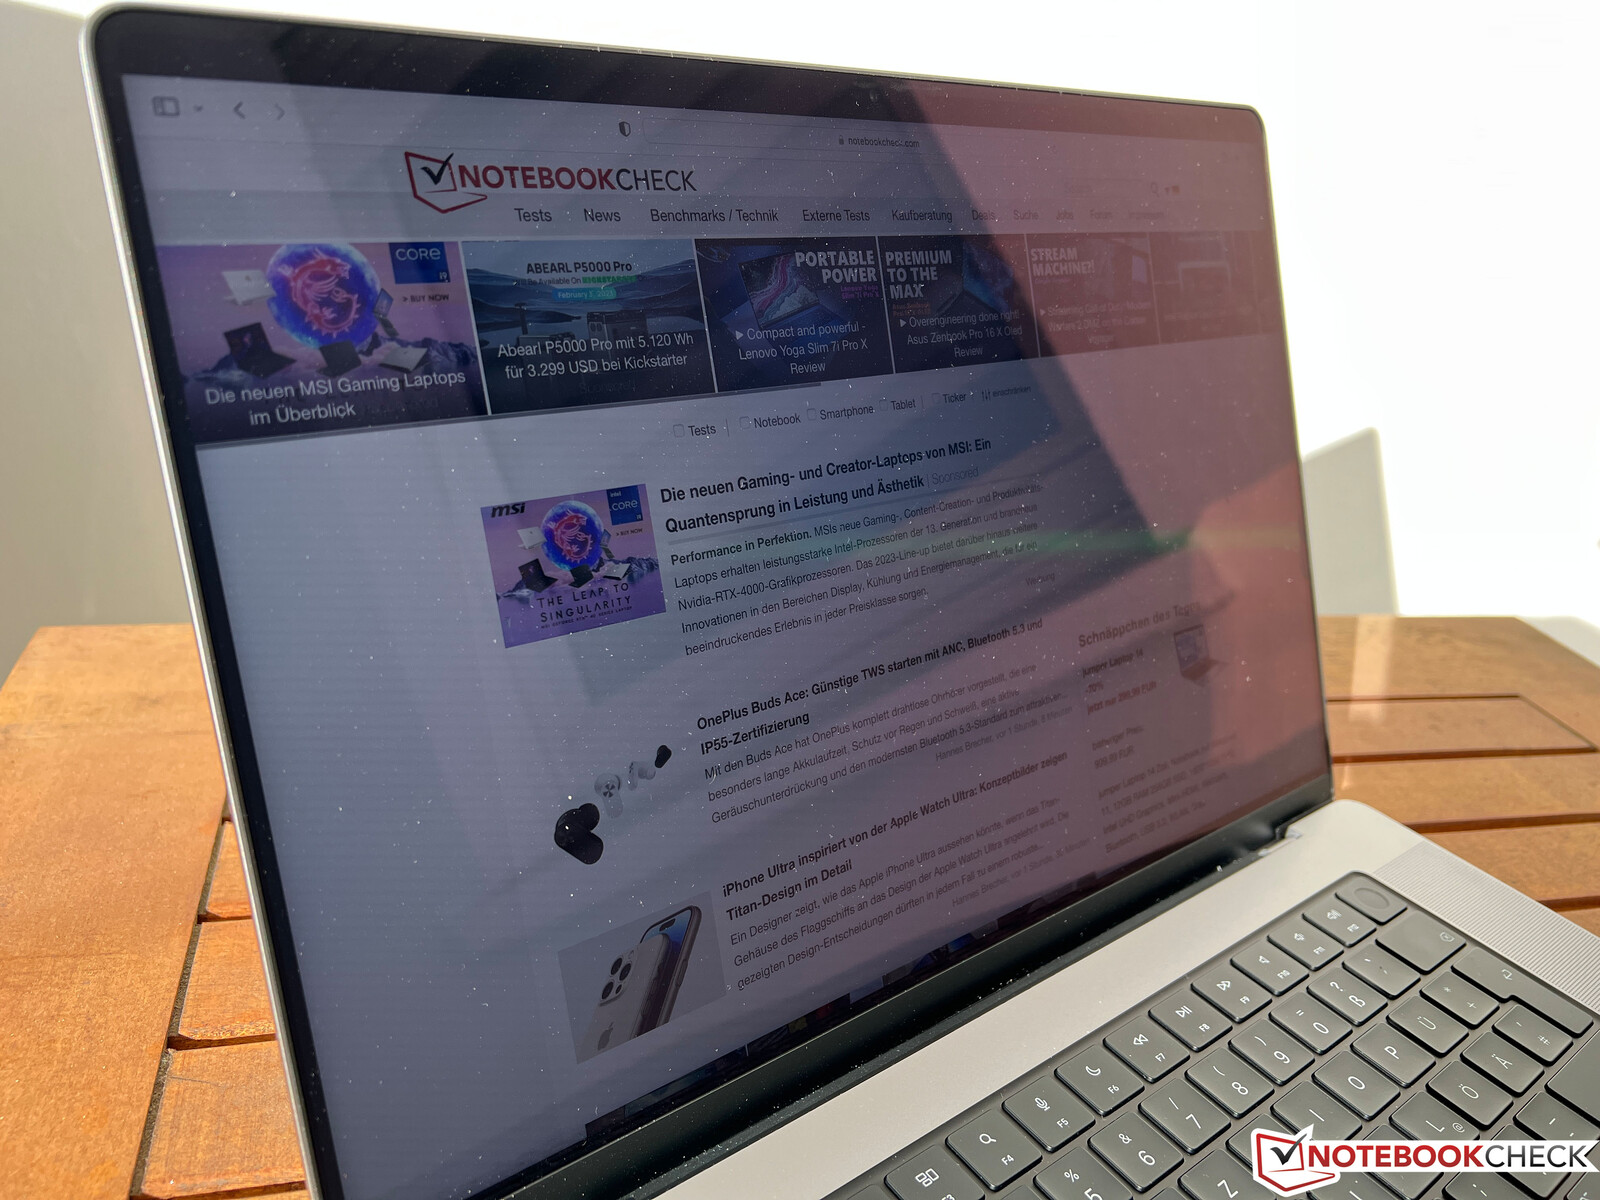
MacBook Pro 16使用的是光面屏幕,但它不像许多使用光面面板的Windows笔记本电脑那样会反光。只要你能避免光源或明亮物体的直接反射,你也可以在较亮的环境中非常舒适地看到显示内容。还有一些第三方应用程序,如Vivid,让你在使用SDR内容时也能使用最大的面板亮度,这在户外也有帮助。Mini-LED面板的可视角度稳定性非常好。

性能 - M2 Max有38个GPU内核
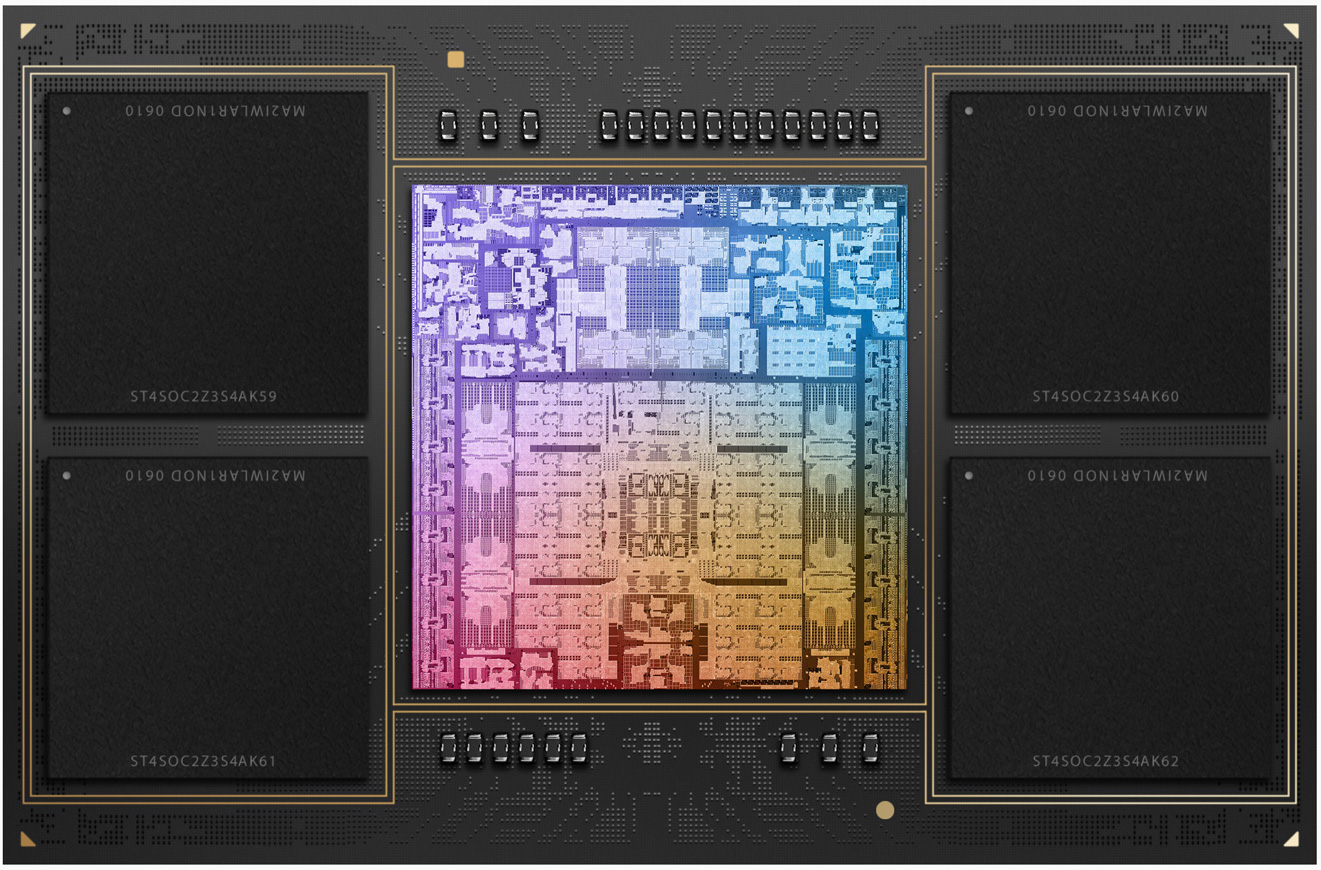
新的 M2 Pro和 M2 Max SoCs仍然基于与以前相同的架构,芯片采用改进的5纳米工艺(N5P)制造。普通的 M2芯片去年随新的MacBook Air已经显示了新SoC的总体方向。性能核心的数量是相同的,但效率核心的数量从2个增加到4个。 更大的MacBook Pro 16只提供完整版的M2 Pro(12个CPU核心和19个GPU核心),而基础型号的MacBook Pro 14使用较慢的芯片,少了两个P核。
| SoC | CPU内核 | GPU内核 | RAM | 额外价格 |
|---|---|---|---|---|
| M2 Pro | 4个效率核心和8个性能核心 | 19 | 16或32 GB | |
| M2 Max | 4个效率核心和8个性能核心 | 30 | 32、64或96 GB | 230欧元 |
| M2 Max | 4个效率核心和8个性能核心 | 38 | 32、64或96 GB | 460欧元 |
审查设置
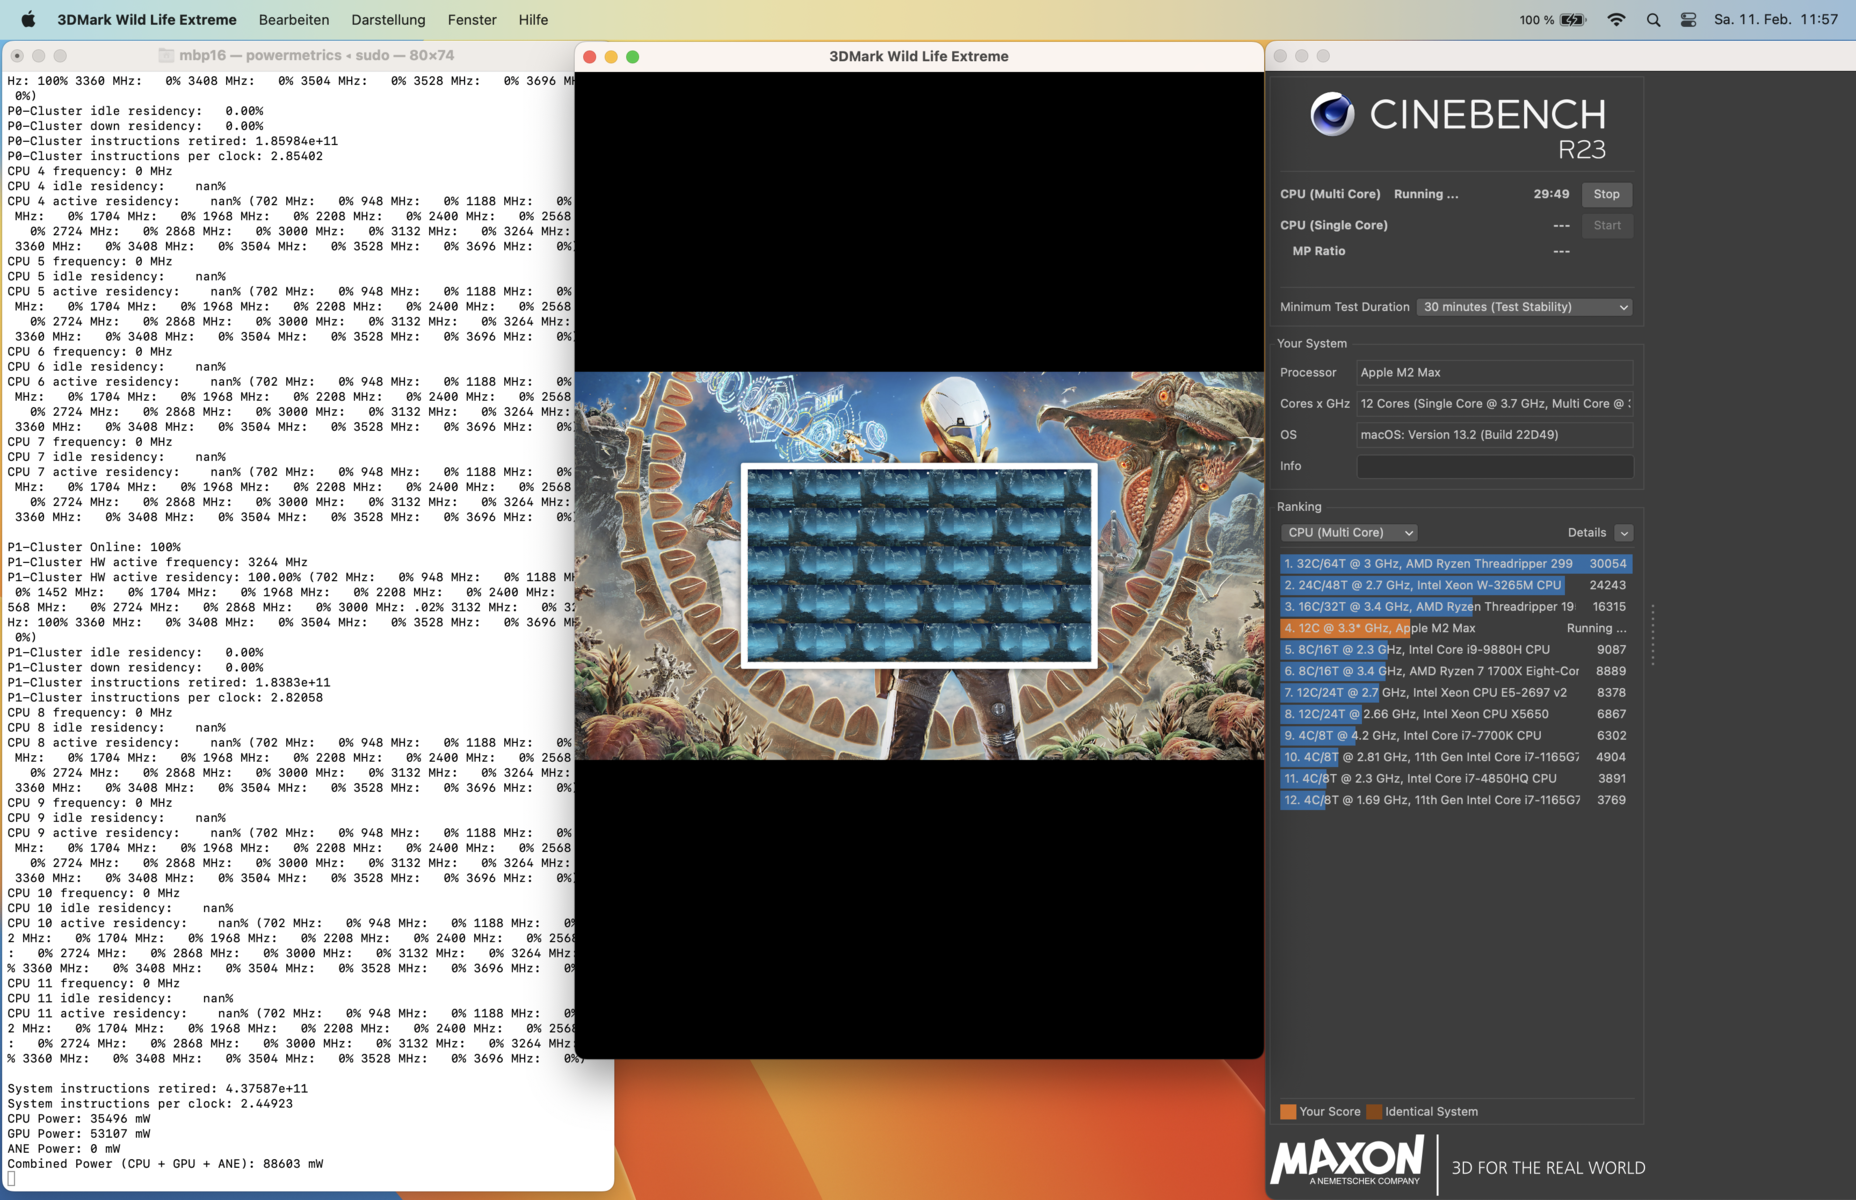
配备M2 Max SoC的MacBook Pro机型再次提供了一个额外的高性能模式,但它并没有增加性能,而只是增加了风扇速度。然而,温度绝不是关键,所以我们用默认的自动模式进行了以下所有的基准测试和测量。低充电模式将SoC的性能限制在22瓦,但风扇将保持关闭。
处理器 - 12个CPU核心
我们已经提到过,新的CPU性能M2 Max与M2 Pro我们已经审查了较小的MacBook Pro 14.然而,我们可以观察到功耗略高,为35-36瓦(M2 Pro为34瓦)。Apple ,在Cinebench R15等模拟测试和Cinebench R23等原生基准测试中都设法提高了性能。我们看到在R23单项测试中提高了6%,在多项测试中提高了20%。
与具有相对较低TDP值的AMD和英特尔竞争对手相比,较小的MBP 14表现良好,但由于更高的功率限制,16英寸的竞争对手通常提供更多的CPU性能。Geekbench是个例外,M2 Max在这个基准测试中实际上比竞争对手更快。
Cinebench R15 Multi Loop
我们的Cinebench R15多循环是模拟的,但测试仍然表明,当你给所有核心施加压力时,性能是完全稳定的。与Windows对手相比,最大的优势是CPU性能在电池供电时不会降低(直到电池电量下降到3%)。更多的CPU基准测试被列在 我们的技术部分.
Cinebench R23: Multi Core | Single Core
Cinebench R20: CPU (Multi Core) | CPU (Single Core)
Cinebench R15: CPU Multi 64Bit | CPU Single 64Bit
Geekbench 5.5: Multi-Core | Single-Core
| CPU Performance rating | |
| Average of class Multimedia | |
| Lenovo ThinkPad X1 Extreme G5-21DE003RGE | |
| Dell Precision 7000 7670 Performance | |
| Asus ZenBook Pro 16X OLED UX7602ZM-ME115W | |
| Schenker Vision 16 Pro RTX 3070 Ti | |
| Apple MacBook Pro 16 2023 M2 Max | |
| Average Apple M2 Max | |
| Apple MacBook Pro 14 2023 M2 Pro | |
| Apple MacBook Pro 16 2021 M1 Max | |
| Cinebench R23 / Multi Core | |
| Lenovo ThinkPad X1 Extreme G5-21DE003RGE | |
| Average of class Multimedia (4861 - 33362, n=75, last 2 years) | |
| Asus ZenBook Pro 16X OLED UX7602ZM-ME115W | |
| Dell Precision 7000 7670 Performance | |
| Apple MacBook Pro 14 2023 M2 Pro | |
| Apple MacBook Pro 16 2023 M2 Max | |
| Average Apple M2 Max (14738 - 14767, n=2) | |
| Schenker Vision 16 Pro RTX 3070 Ti | |
| Apple MacBook Pro 16 2021 M1 Max | |
| Cinebench R23 / Single Core | |
| Average of class Multimedia (1128 - 2459, n=67, last 2 years) | |
| Lenovo ThinkPad X1 Extreme G5-21DE003RGE | |
| Schenker Vision 16 Pro RTX 3070 Ti | |
| Asus ZenBook Pro 16X OLED UX7602ZM-ME115W | |
| Apple MacBook Pro 14 2023 M2 Pro | |
| Average Apple M2 Max (1625 - 1662, n=2) | |
| Apple MacBook Pro 16 2023 M2 Max | |
| Apple MacBook Pro 16 2021 M1 Max | |
| Dell Precision 7000 7670 Performance | |
| Cinebench R20 / CPU (Multi Core) | |
| Lenovo ThinkPad X1 Extreme G5-21DE003RGE | |
| Dell Precision 7000 7670 Performance | |
| Average of class Multimedia (1887 - 12912, n=58, last 2 years) | |
| Asus ZenBook Pro 16X OLED UX7602ZM-ME115W | |
| Schenker Vision 16 Pro RTX 3070 Ti | |
| Average Apple M2 Max (4044 - 4085, n=2) | |
| Apple MacBook Pro 14 2023 M2 Pro | |
| Apple MacBook Pro 16 2023 M2 Max | |
| Apple MacBook Pro 16 2021 M1 Max | |
| Cinebench R20 / CPU (Single Core) | |
| Average of class Multimedia (425 - 853, n=58, last 2 years) | |
| Lenovo ThinkPad X1 Extreme G5-21DE003RGE | |
| Dell Precision 7000 7670 Performance | |
| Schenker Vision 16 Pro RTX 3070 Ti | |
| Asus ZenBook Pro 16X OLED UX7602ZM-ME115W | |
| Apple MacBook Pro 16 2023 M2 Max | |
| Average Apple M2 Max (451 - 460, n=2) | |
| Apple MacBook Pro 14 2023 M2 Pro | |
| Apple MacBook Pro 16 2021 M1 Max | |
| Cinebench R15 / CPU Multi 64Bit | |
| Lenovo ThinkPad X1 Extreme G5-21DE003RGE | |
| Dell Precision 7000 7670 Performance | |
| Schenker Vision 16 Pro RTX 3070 Ti | |
| Schenker Vision 16 Pro RTX 3070 Ti | |
| Asus ZenBook Pro 16X OLED UX7602ZM-ME115W | |
| Average of class Multimedia (856 - 5224, n=62, last 2 years) | |
| Average Apple M2 Max (2074 - 2094, n=2) | |
| Apple MacBook Pro 16 2023 M2 Max | |
| Apple MacBook Pro 14 2023 M2 Pro | |
| Apple MacBook Pro 16 2021 M1 Max | |
| Cinebench R15 / CPU Single 64Bit | |
| Average of class Multimedia (184.8 - 326, n=60, last 2 years) | |
| Dell Precision 7000 7670 Performance | |
| Asus ZenBook Pro 16X OLED UX7602ZM-ME115W | |
| Asus ZenBook Pro 16X OLED UX7602ZM-ME115W | |
| Schenker Vision 16 Pro RTX 3070 Ti | |
| Lenovo ThinkPad X1 Extreme G5-21DE003RGE | |
| Apple MacBook Pro 16 2023 M2 Max | |
| Average Apple M2 Max (233 - 239, n=2) | |
| Apple MacBook Pro 14 2023 M2 Pro | |
| Apple MacBook Pro 16 2021 M1 Max | |
| Geekbench 5.5 / Multi-Core | |
| Average Apple M2 Max (15348 - 15444, n=3) | |
| Apple MacBook Pro 16 2023 M2 Max | |
| Apple MacBook Pro 14 2023 M2 Pro | |
| Dell Precision 7000 7670 Performance | |
| Asus ZenBook Pro 16X OLED UX7602ZM-ME115W | |
| Average of class Multimedia (4652 - 20422, n=57, last 2 years) | |
| Apple MacBook Pro 16 2021 M1 Max | |
| Lenovo ThinkPad X1 Extreme G5-21DE003RGE | |
| Schenker Vision 16 Pro RTX 3070 Ti | |
| Geekbench 5.5 / Single-Core | |
| Apple MacBook Pro 16 2023 M2 Max | |
| Average Apple M2 Max (1965 - 1978, n=3) | |
| Average of class Multimedia (805 - 2974, n=57, last 2 years) | |
| Apple MacBook Pro 14 2023 M2 Pro | |
| Dell Precision 7000 7670 Performance | |
| Schenker Vision 16 Pro RTX 3070 Ti | |
| Asus ZenBook Pro 16X OLED UX7602ZM-ME115W | |
| Lenovo ThinkPad X1 Extreme G5-21DE003RGE | |
| Apple MacBook Pro 16 2021 M1 Max | |
系统性能
带有M2 Max的新MacBook Pro 16 2023再次成为一台反应极为迅速的笔记本电脑,良好的性能也通过基准测试显示出来。仿真应用程序的运行通常也没有任何问题,尽管许多应用程序(包括完整的Adobe套件、DaVinci Resolve、Microsoft Office)现在已经可以作为原生应用程序使用,而且它们真的很快。主观上,Photoshop在MBP上的运行甚至比目前的微星Titan GT77搭配的酷睿i9-13950HX和GeForce RTX 4090 Laptop这几乎是你目前能得到的最好的移动硬件。下面的PugetBench结果不能代表实际性能,因为它们只适用于模拟的英特尔版本的应用程序,但我们仍然包括这些结果用于比较。
Blackmagic RAW Speed Test: 12:1 8K Metal | 12:1 8K CPU
Photoshop PugetBench: Overall Score
Premiere Pro PugetBench: Overall Score 0.9
Jetstream 2: 2.0 Total
Speedometer 2.0: Result 2.0
Mozilla Kraken 1.1: Total
WebXPRT 3: Overall
WebXPRT 4: Overall
| CrossMark / Overall | |
| Apple MacBook Pro 16 2023 M2 Max | |
| Average Apple M2 Max, Apple M2 Max 38-Core GPU (n=1) | |
| Average of class Multimedia (866 - 2728, n=61, last 2 years) | |
| Dell Precision 7000 7670 Performance | |
| Asus ZenBook Pro 16X OLED UX7602ZM-ME115W | |
| Lenovo ThinkPad X1 Extreme G5-21DE003RGE | |
| Schenker Vision 16 Pro RTX 3070 Ti | |
| Apple MacBook Pro 16 2021 M1 Max | |
| CrossMark / Productivity | |
| Average of class Multimedia (931 - 2489, n=61, last 2 years) | |
| Dell Precision 7000 7670 Performance | |
| Asus ZenBook Pro 16X OLED UX7602ZM-ME115W | |
| Lenovo ThinkPad X1 Extreme G5-21DE003RGE | |
| Apple MacBook Pro 16 2023 M2 Max | |
| Average Apple M2 Max, Apple M2 Max 38-Core GPU (n=1) | |
| Schenker Vision 16 Pro RTX 3070 Ti | |
| Apple MacBook Pro 16 2021 M1 Max | |
| CrossMark / Creativity | |
| Apple MacBook Pro 16 2023 M2 Max | |
| Average Apple M2 Max, Apple M2 Max 38-Core GPU (n=1) | |
| Average of class Multimedia (907 - 3465, n=61, last 2 years) | |
| Apple MacBook Pro 16 2021 M1 Max | |
| Dell Precision 7000 7670 Performance | |
| Asus ZenBook Pro 16X OLED UX7602ZM-ME115W | |
| Lenovo ThinkPad X1 Extreme G5-21DE003RGE | |
| Schenker Vision 16 Pro RTX 3070 Ti | |
| CrossMark / Responsiveness | |
| Average of class Multimedia (605 - 2024, n=61, last 2 years) | |
| Dell Precision 7000 7670 Performance | |
| Asus ZenBook Pro 16X OLED UX7602ZM-ME115W | |
| Lenovo ThinkPad X1 Extreme G5-21DE003RGE | |
| Apple MacBook Pro 16 2023 M2 Max | |
| Average Apple M2 Max, Apple M2 Max 38-Core GPU (n=1) | |
| Schenker Vision 16 Pro RTX 3070 Ti | |
| Apple MacBook Pro 16 2021 M1 Max | |
| Blackmagic RAW Speed Test / 12:1 8K Metal | |
| Average of class Multimedia (78 - 430, n=7, last 2 years) | |
| Apple MacBook Pro 16 2023 M2 Max | |
| Average Apple M2 Max, Apple M2 Max 38-Core GPU (n=1) | |
| Apple MacBook Pro 16 2021 M1 Max | |
| Blackmagic RAW Speed Test / 12:1 8K CPU | |
| Average of class Multimedia (44 - 102, n=7, last 2 years) | |
| Apple MacBook Pro 16 2023 M2 Max | |
| Average Apple M2 Max, Apple M2 Max 38-Core GPU (n=1) | |
| Apple MacBook Pro 16 2021 M1 Max | |
| Photoshop PugetBench / Overall Score | |
| Apple MacBook Pro 16 2023 M2 Max | |
| Average Apple M2 Max, Apple M2 Max 38-Core GPU (n=1) | |
| Apple MacBook Pro 16 2021 M1 Max | |
| Premiere Pro PugetBench / Overall Score 0.9 | |
| Apple MacBook Pro 16 2023 M2 Max | |
| Average Apple M2 Max, Apple M2 Max 38-Core GPU (n=1) | |
| Apple MacBook Pro 16 2021 M1 Max | |
| Jetstream 2 / 2.0 Total | |
| Average of class Multimedia (287 - 481, n=32, last 2 years) | |
| Dell Precision 7000 7670 Performance | |
| Schenker Vision 16 Pro RTX 3070 Ti | |
| Apple MacBook Pro 16 2023 M2 Max | |
| Average Apple M2 Max, Apple M2 Max 38-Core GPU (n=1) | |
| Lenovo ThinkPad X1 Extreme G5-21DE003RGE | |
| Apple MacBook Pro 16 2021 M1 Max | |
| Speedometer 2.0 / Result 2.0 | |
| Average of class Multimedia (337 - 946, n=31, last 2 years) | |
| Apple MacBook Pro 16 2023 M2 Max | |
| Average Apple M2 Max, Apple M2 Max 38-Core GPU (n=1) | |
| Schenker Vision 16 Pro RTX 3070 Ti | |
| Apple MacBook Pro 16 2021 M1 Max | |
| Lenovo ThinkPad X1 Extreme G5-21DE003RGE | |
| Mozilla Kraken 1.1 / Total | |
| Schenker Vision 16 Pro RTX 3070 Ti | |
| Lenovo ThinkPad X1 Extreme G5-21DE003RGE | |
| Asus ZenBook Pro 16X OLED UX7602ZM-ME115W | |
| Dell Precision 7000 7670 Performance | |
| Average of class Multimedia (228 - 835, n=67, last 2 years) | |
| Apple MacBook Pro 16 2023 M2 Max | |
| Average Apple M2 Max, Apple M2 Max 38-Core GPU (n=1) | |
| Apple MacBook Pro 16 2021 M1 Max | |
| WebXPRT 3 / Overall | |
| Apple MacBook Pro 16 2023 M2 Max | |
| Average Apple M2 Max, Apple M2 Max 38-Core GPU (n=1) | |
| Apple MacBook Pro 16 2021 M1 Max | |
| Average of class Multimedia (136.4 - 596, n=64, last 2 years) | |
| Dell Precision 7000 7670 Performance | |
| Asus ZenBook Pro 16X OLED UX7602ZM-ME115W | |
| Schenker Vision 16 Pro RTX 3070 Ti | |
| Lenovo ThinkPad X1 Extreme G5-21DE003RGE | |
| WebXPRT 4 / Overall | |
| Average of class Multimedia (167.3 - 402, n=66, last 2 years) | |
| Dell Precision 7000 7670 Performance | |
| Asus ZenBook Pro 16X OLED UX7602ZM-ME115W | |
| Schenker Vision 16 Pro RTX 3070 Ti | |
| Apple MacBook Pro 16 2023 M2 Max | |
| Average Apple M2 Max, Apple M2 Max 38-Core GPU (n=1) | |
| Lenovo ThinkPad X1 Extreme G5-21DE003RGE | |
* ... smaller is better
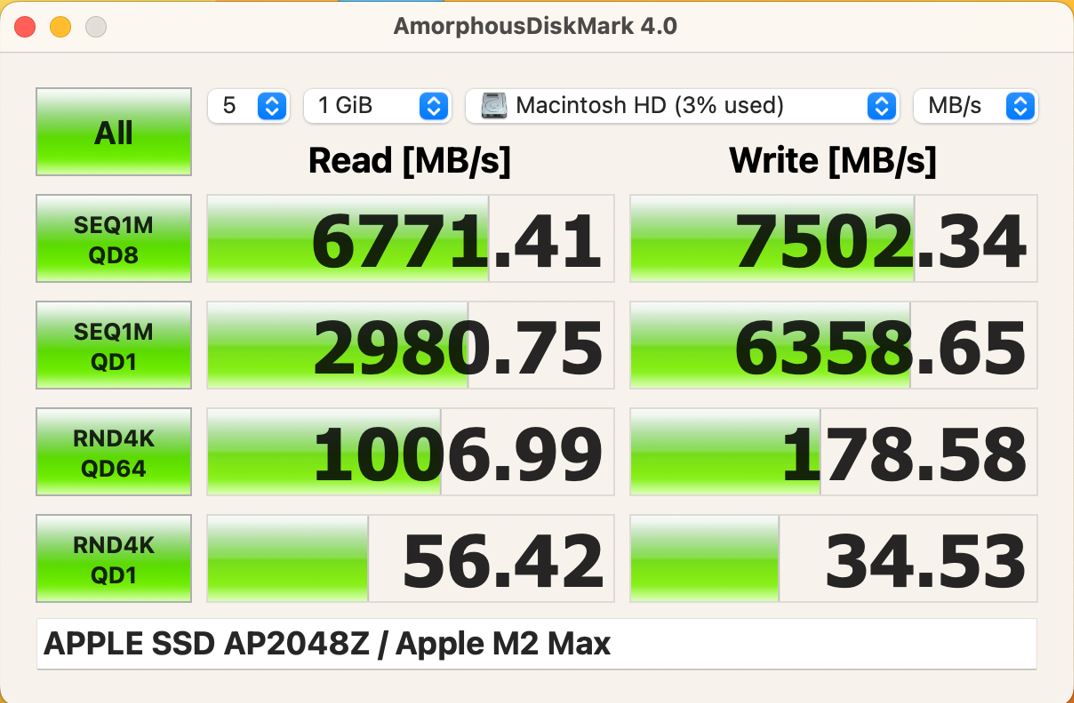
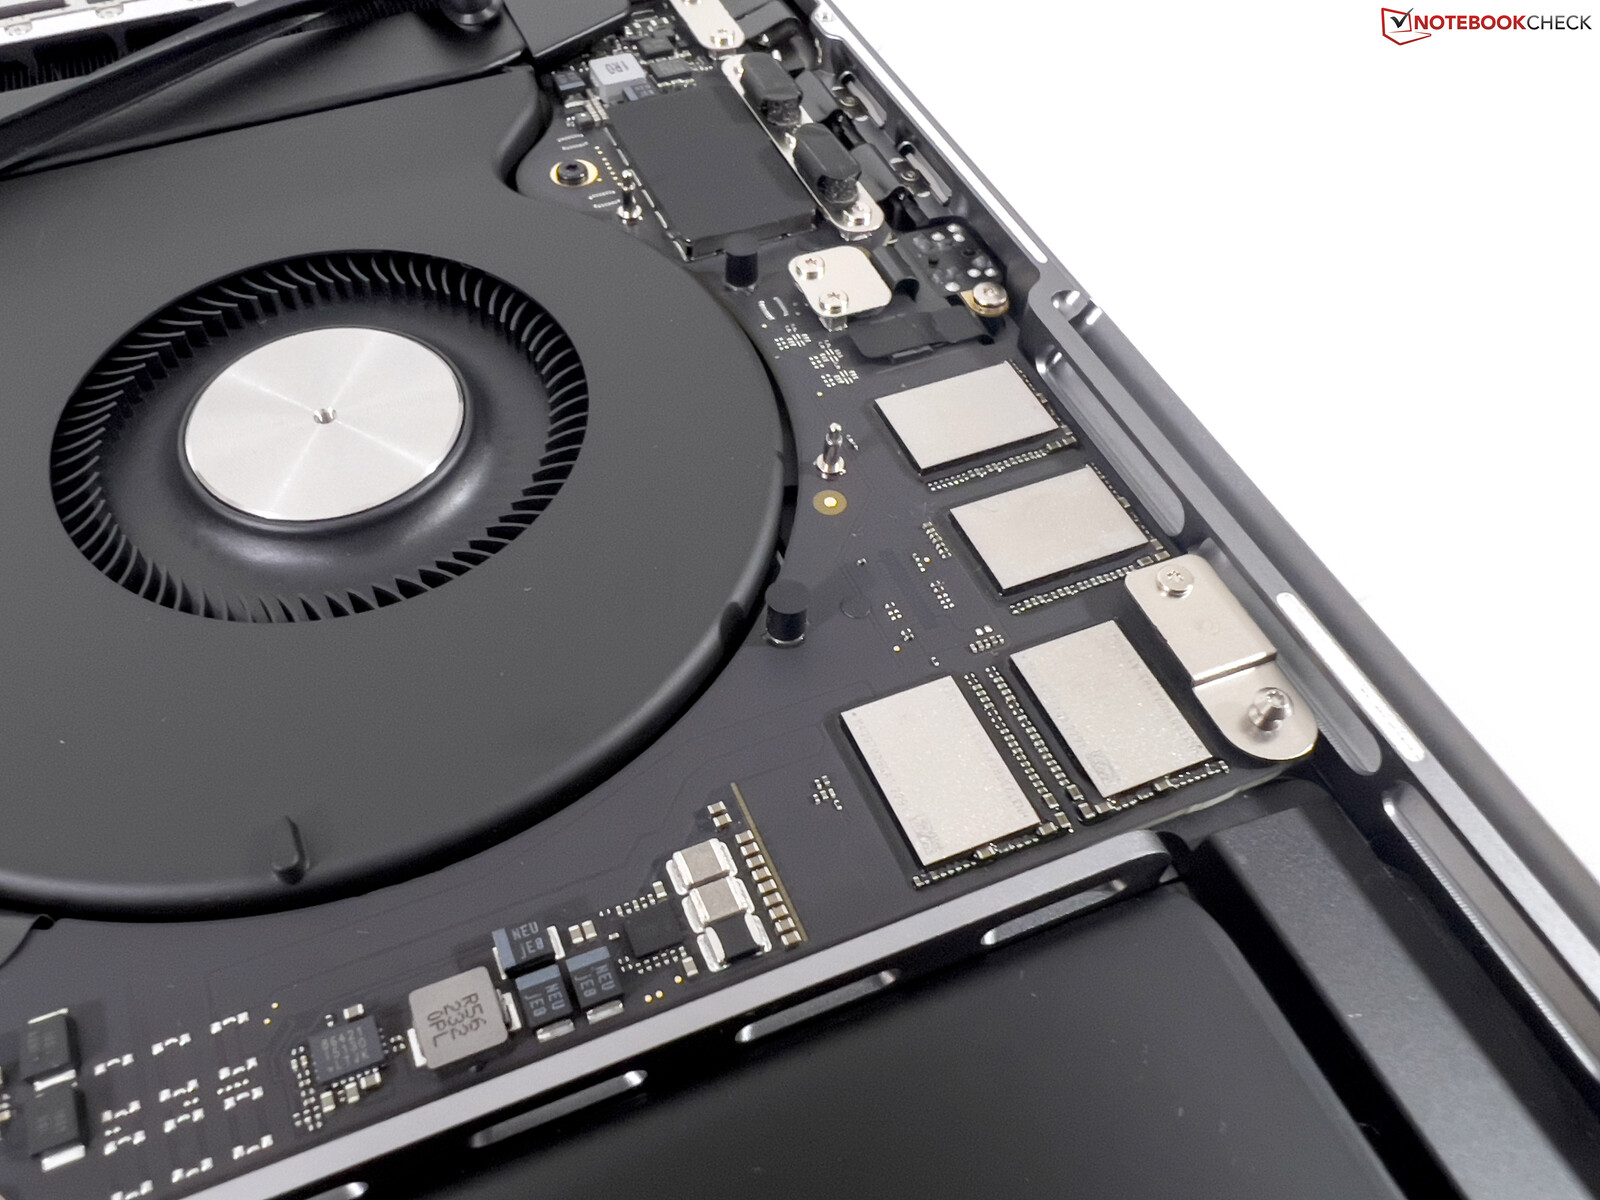
存储设备
我们的评测单元配备了2TB的固态硬盘,用四个512GB的芯片实现。主板的另一侧还有四个固态硬盘芯片的空间,可以用512GB芯片实现4TB。只有8TB型号的MacBook Pro将利用1TB芯片。PCIe 4.0固态硬盘的性能非常好;更多固态硬盘基准测试列在 这里.
GPU性能
Apple 改变了处理器以及GPU的核心配置,增加了核心的数量。该M2 MaxSoC有30或38个GPU核心,时钟频率高达1.4GHz。我们可以看到,与旧的M2 Max相比,改进了24-28%。M1 Max在大多数基准测试中,我们可以看到比带有32个GPU核心的旧M1 Max提高了24-28%,但功耗也从44瓦增加到64瓦。然而,我们只在Novabench GPU测试中记录了这一GPU消耗,所有其他基准测试的最高功率为54W,我们通常在大多数测试中看到46-48W之间,所以整体效率比以前好。但这也表明,利用GPU的全部潜力并不容易。
3DMark Wildlife Extreme Unlimited等原生基准测试表明,M2 Max GPU甚至可以与RTX 3080(联想Legion 7 16)或RTX 3080 Ti笔记本电脑 (Alienware x15),而Geekbench的性能则大致与RTX 3060.
在持续的工作负荷下,甚至在电池供电的情况下,图形性能都很稳定,这绝对是带有独立GPU的Windows笔记本电脑的优势。
| GFXBench | |
| 3840x2160 4K Aztec Ruins High Tier Offscreen | |
| Apple MacBook Pro 16 2023 M2 Max | |
| Average Apple M2 Max 38-Core GPU (n=1) | |
| Apple MacBook Pro 16 2021 M1 Max | |
| Average of class Multimedia (36.4 - 232, n=12, last 2 years) | |
| 2560x1440 Aztec Ruins High Tier Offscreen | |
| Average Apple M2 Max 38-Core GPU (n=1) | |
| Apple MacBook Pro 16 2023 M2 Max | |
| Apple MacBook Pro 16 2021 M1 Max | |
| Average of class Multimedia (73.3 - 516, n=11, last 2 years) | |
| 1920x1080 Aztec Ruins Normal Tier Offscreen | |
| Apple MacBook Pro 16 2023 M2 Max | |
| Average Apple M2 Max 38-Core GPU (n=1) | |
| Apple MacBook Pro 16 2021 M1 Max | |
| Average of class Multimedia (178.3 - 1302, n=11, last 2 years) | |
| 1920x1080 Car Chase Offscreen | |
| Apple MacBook Pro 16 2023 M2 Max | |
| Average Apple M2 Max 38-Core GPU (n=1) | |
| Average of class Multimedia (174.6 - 941, n=9, last 2 years) | |
| Apple MacBook Pro 16 2021 M1 Max | |
| Blender / v3.3 Classroom METAL | |
| Apple MacBook Pro 14 2023 M2 Pro | |
| Apple MacBook Pro 16 2023 M2 Max | |
| Average Apple M2 Max 38-Core GPU (n=1) | |
| Average of class Multimedia (17.8 - 68, n=5, last 2 years) | |
| Blender / v3.3 Classroom OPTIX/RTX | |
| Lenovo ThinkPad X1 Extreme G5-21DE003RGE | |
| Asus ZenBook Pro 16X OLED UX7602ZM-ME115W | |
| Average of class Multimedia (12 - 105, n=22, last 2 years) | |
| Schenker Vision 16 Pro RTX 3070 Ti | |
| Dell Precision 7000 7670 Performance | |
| Blender / v3.3 Classroom CUDA | |
| Lenovo ThinkPad X1 Extreme G5-21DE003RGE | |
| Asus ZenBook Pro 16X OLED UX7602ZM-ME115W | |
| Average of class Multimedia (20 - 186, n=22, last 2 years) | |
| Schenker Vision 16 Pro RTX 3070 Ti | |
| Dell Precision 7000 7670 Performance | |
| Blender / v3.3 Classroom CPU | |
| Schenker Vision 16 Pro RTX 3070 Ti | |
| Average of class Multimedia (134.5 - 1042, n=63, last 2 years) | |
| Dell Precision 7000 7670 Performance | |
| Apple MacBook Pro 14 2023 M2 Pro | |
| Lenovo ThinkPad X1 Extreme G5-21DE003RGE | |
| Apple MacBook Pro 16 2023 M2 Max | |
| Average Apple M2 Max 38-Core GPU (n=1) | |
| Asus ZenBook Pro 16X OLED UX7602ZM-ME115W | |
* ... smaller is better
游戏性能
拥有38个GPU核心的新M2 Max的游戏性能非常好,但最大的限制仍然是针对Apple'自己的M1/M2芯片的原生游戏数量很少,而且与其他通过Rosetta 2模拟的游戏或通过CrossWare等额外应用程序运行的游戏的兼容性有限,这使你可以玩一些Windows游戏。
生化危机村无疑是目前原生Apple 硅标题的最好例子,它在1080p和最大细节(100-140帧)下运行完全流畅,性能大致与GeForce RTX 3060移动版.Apple 还宣传了相当长一段时间的《无人区》的优化版本,但仍然没有发布日期。
像《侠盗猎车手》或《Witcher 3 》等流行的Windows游戏也能以高细节顺利运行,但你必须对一些设置加以注意。例如,我们无法对《GTA V》使用我们的超预设,同样的情况也适用于Witcher 3 ,因为当Nvidia HairWorks激活时,游戏就会崩溃。HBAO也会产生一个问题,即区域太暗,所以你只能使用SSAO。一旦你关闭了这两个设置,游戏在70-80帧时运行得非常好,而且性能非常稳定。我们无法记录fps数字,而且有集成基准的标题数量有限,所以我们只有少量的结果。
| GTA V - 1920x1080 High/On (Advanced Graphics Off) AA:2xMSAA + FX AF:8x | |
| Schenker Vision 16 Pro RTX 3070 Ti | |
| Asus ZenBook Pro 16X OLED UX7602ZM-ME115W | |
| Dell Precision 7000 7670 Performance | |
| Lenovo ThinkPad X1 Extreme G5-21DE003RGE | |
| Average of class Multimedia (19.5 - 186.1, n=48, last 2 years) | |
| Apple MacBook Pro 16 2023 M2 Max | |
| Average Apple M2 Max 38-Core GPU (n=1) | |
| The Witcher 3 - 1920x1080 High Graphics & Postprocessing (Nvidia HairWorks Off) | |
| Dell Precision 7000 7670 Performance | |
| Schenker Vision 16 Pro RTX 3070 Ti | |
| Lenovo ThinkPad X1 Extreme G5-21DE003RGE | |
| Asus ZenBook Pro 16X OLED UX7602ZM-ME115W | |
| Average of class Multimedia (22 - 224, n=8, last 2 years) | |
| Apple MacBook Pro 16 2023 M2 Max | |
| Average Apple M2 Max 38-Core GPU (n=1) | |
| Apple MacBook Pro 14 2023 M2 Pro | |
| Borderlands 3 - 1920x1080 High Overall Quality (DX11) | |
| Dell Precision 7000 7670 Performance | |
| Apple MacBook Pro 16 2023 M2 Max | |
| Average Apple M2 Max 38-Core GPU (n=1) | |
| Apple MacBook Pro 16 2021 M1 Max | |
| Apple MacBook Pro 14 2023 M2 Pro | |
| Apple MacBook Pro 16 2021 M1 Pro | |
相较于具备32个GPU核心的M1 Max有32个GPU核心,新的M2 Max在仿真游戏中的速度约为25%。你可以玩GTA V和Witcher 3 等游戏,但你明显注意到它们没有被优化。它们运行得很好(尤其是Witcher 3 ),但GeForce GPU只是更出色。
对功耗的观察表明M2 Max是非常有效的,因为在Witcher 3 ,CPU只消耗大约6W,而GPU消耗19-24W。这意味着MacBook Pro 16的效率比两个对比设备高65-79%。Schenker Vision 16 Pro和联想ThinkPad X1 Extreme G5.(注:由于设置略有改变,结果并不完全可比,在相同的设置下,MBP的优势会小一点,但它仍然让我们对效率有一个很好的概念)。
| Power Consumption - Witcher 3 ultra Efficiency (external Monitor) | |
| Apple MacBook Pro 14 2023 M2 Pro | |
| Apple MacBook Pro 16 2023 M2 Max | |
| Schenker Vision 16 Pro RTX 3070 Ti | |
| Lenovo ThinkPad X1 Extreme G5-21DE003RGE | |
| low | med. | high | ultra | QHD | |
|---|---|---|---|---|---|
| GTA V (2015) | 84 | 81 | 57 | ||
| The Witcher 3 (2015) | 83 | 76 | |||
| Shadow of the Tomb Raider (2018) | 182 | 131 | 122 | 109 | 78 |
| Total War: Three Kingdoms (2019) | 330 | 147 | 96 | 71 | 47 |
| Borderlands 3 (2019) | 72 | 60.2 | 48.6 |
排放 - 负载下的温暖键盘
系统噪音
当你只执行日常任务时,这两个风扇通常是停用的,而且Apple ,仍然使用非常防御性的风扇曲线,所以短的峰值负载情况也不会导致风扇活动。只要你给笔记本施加较长时间的压力,风扇就会逐渐开始加速旋转,但在最低的风扇速度下,风扇的杂音几乎不明显。与较小的MacBook Pro 14相比,整体风扇速度也较低。在2800转/分的情况下,CPU满负荷将导致28分贝(A),而我们的压力测试在3600转/分时为43.2分贝(A)。游戏时有差异,我们在Witcher 3 ,在《生化危机村》和《古墓丽影》中测得35.1 dB(A)和43.2 dB(A)之间。最大的风扇转速是5570转/分,结果是56.2分贝(A),但我们只设法手动触发这个水平,而不是在我们的基准和测试中。这意味着冷却解决方案对于更强大的组件仍有一些空间。
总而言之,风扇的噪音可以与 旧型号而Windows的竞争产品在负载下往往噪音更大。我们的测试装置没有任何其他电子噪音的问题,如线圈啸叫。
Noise level
| Idle |
| 23.9 / 23.9 / 23.9 dB(A) |
| Load |
| 36.6 / 43.2 dB(A) |
 | ||
30 dB silent 40 dB(A) audible 50 dB(A) loud |
||
min: | ||
| Apple MacBook Pro 16 2023 M2 Max M2 Max 38-Core GPU, M2 Max, Apple SSD AP2048Z | Apple MacBook Pro 16 2021 M1 Max M1 Max 32-Core GPU, M1 Max, Apple SSD AP2048R | Lenovo ThinkPad X1 Extreme G5-21DE003RGE GeForce RTX 3060 Laptop GPU, i7-12700H, Micron 3400 1TB MTFDKBA1T0TFH | Asus ZenBook Pro 16X OLED UX7602ZM-ME115W GeForce RTX 3060 Laptop GPU, i9-12900H, Samsung PM9A1 MZVL21T0HCLR | Schenker Vision 16 Pro RTX 3070 Ti GeForce RTX 3070 Ti Laptop GPU, i7-12700H, Samsung SSD 980 Pro 1TB MZ-V8P1T0BW | Dell Precision 7000 7670 Performance RTX A5500 Laptop GPU, i9-12950HX | |
|---|---|---|---|---|---|---|
| Noise | -5% | -7% | -16% | -10% | -17% | |
| off / environment * (dB) | 23.9 | 24.2 -1% | 23.2 3% | 26 -9% | 22.9 4% | 23.9 -0% |
| Idle Minimum * (dB) | 23.9 | 24.2 -1% | 23.2 3% | 26 -9% | 24.3 -2% | 24 -0% |
| Idle Average * (dB) | 23.9 | 24.2 -1% | 23.2 3% | 26 -9% | 24.3 -2% | 24 -0% |
| Idle Maximum * (dB) | 23.9 | 24.2 -1% | 23.2 3% | 26 -9% | 24.3 -2% | 38 -59% |
| Load Average * (dB) | 36.6 | 42.9 -17% | 45.5 -24% | 48 -31% | 38.5 -5% | 46.3 -27% |
| Witcher 3 ultra * (dB) | 35.1 | 39.5 -13% | 45.5 -30% | 51 -45% | 41.9 -19% | |
| Load Maximum * (dB) | 43.2 | 42.9 1% | 45.5 -5% | 54.6 -26% | 51 -18% | 47.9 -11% |
* ... smaller is better
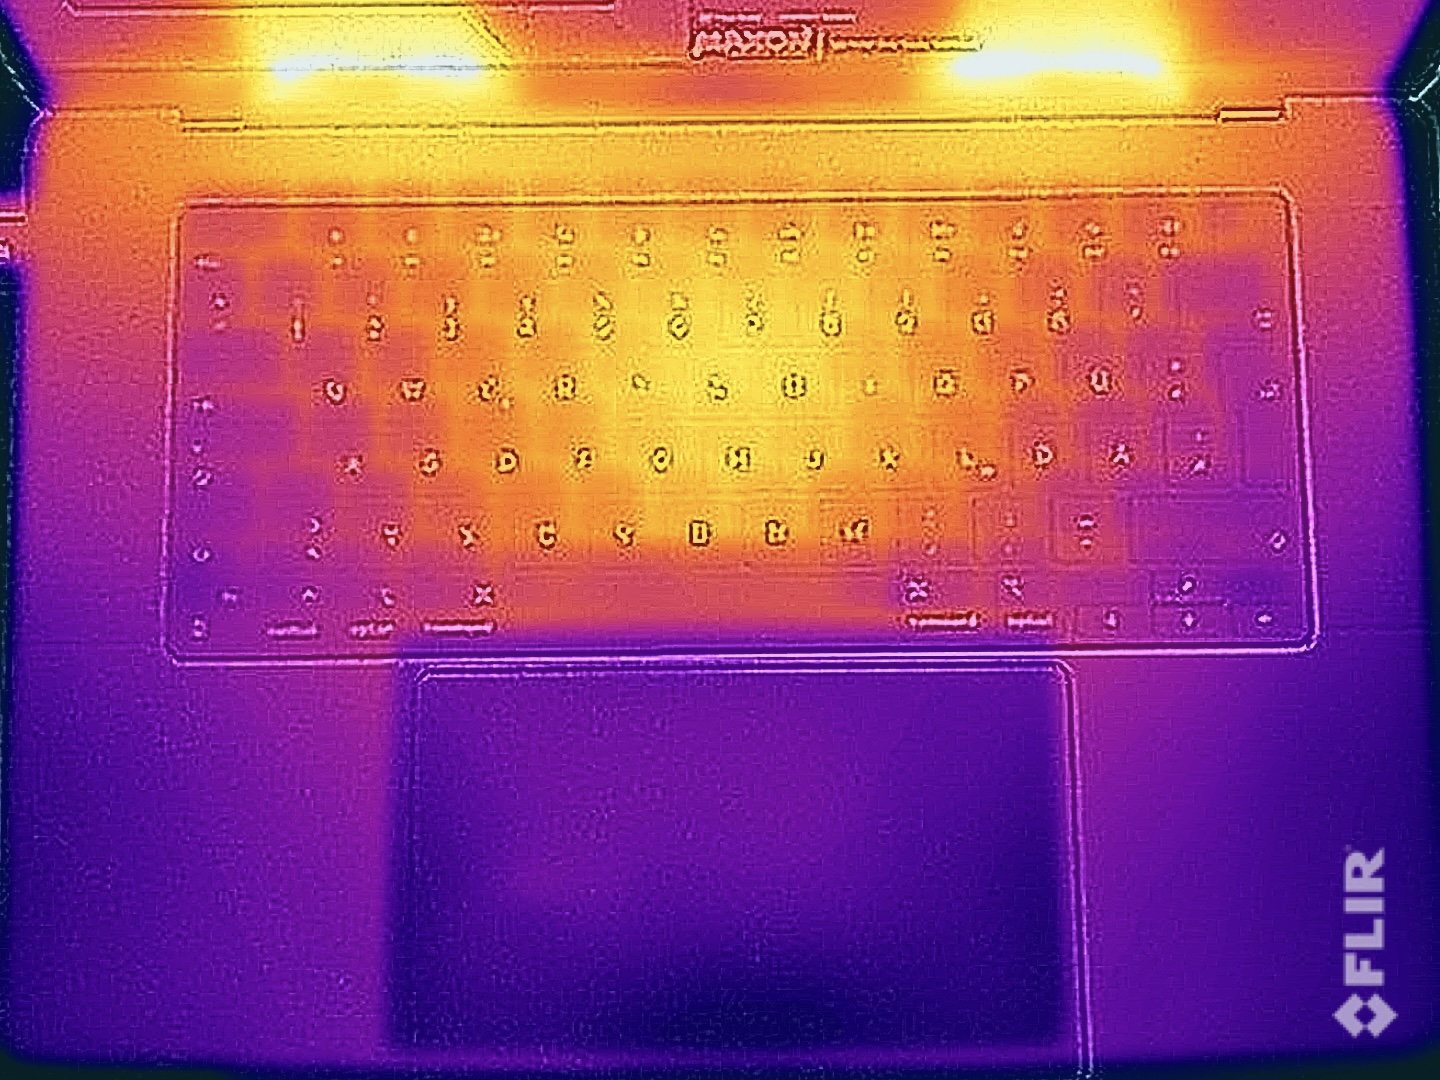
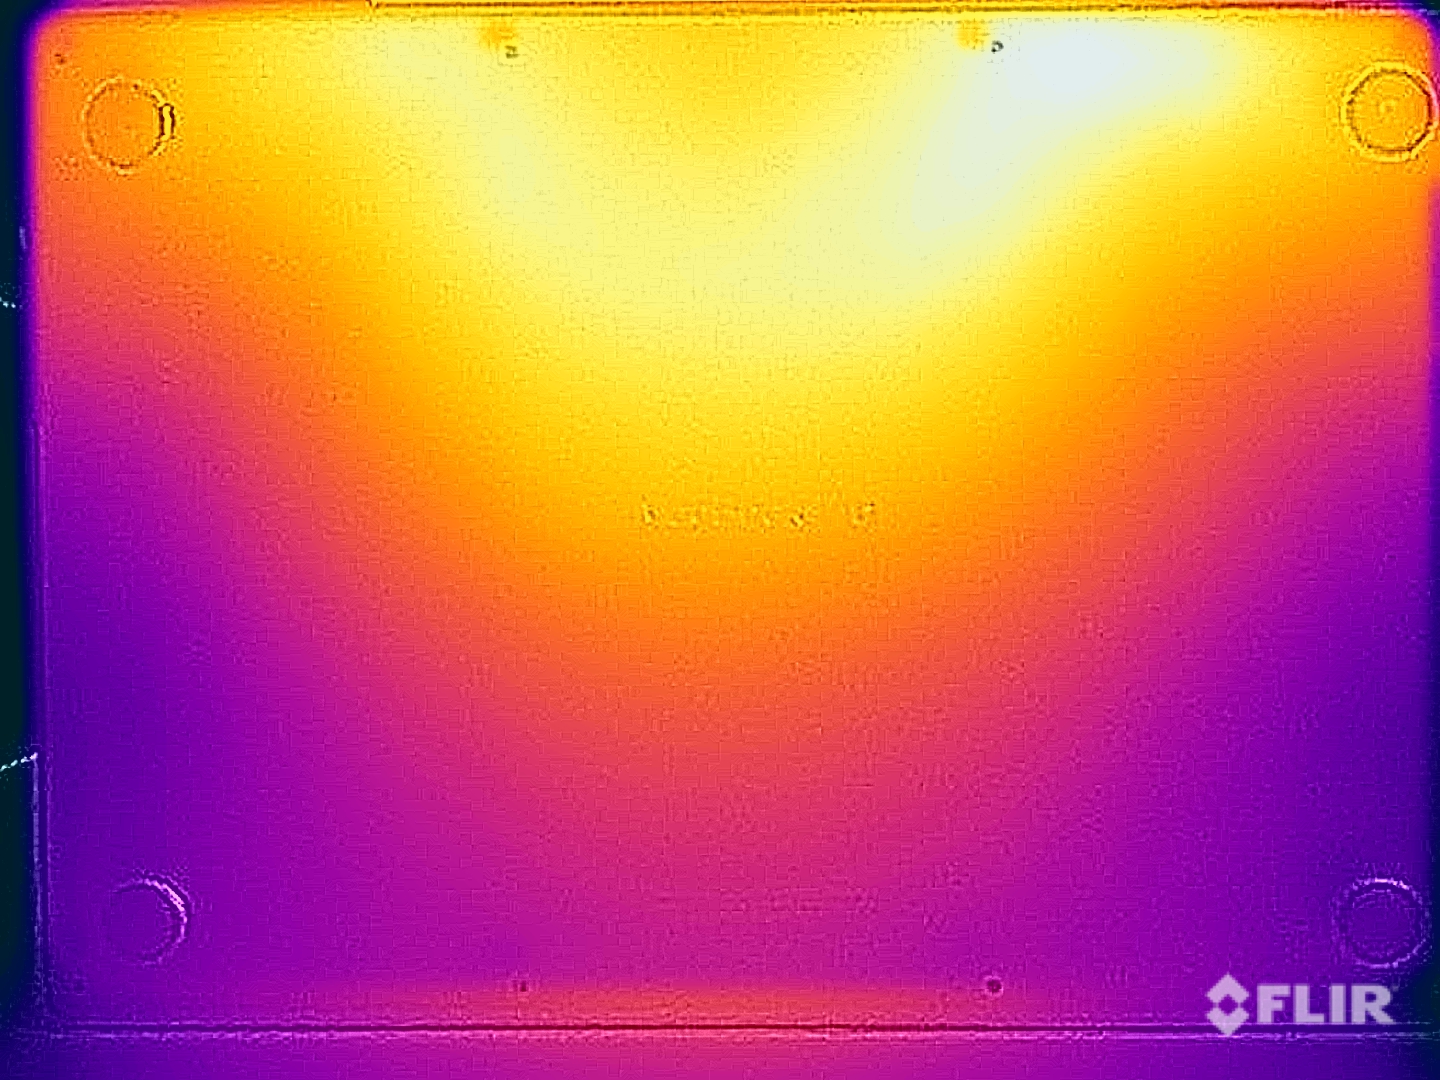
温度
表面温度没有问题,在轻度工作负荷下,机箱根本没有真正升温。我们可以测量到底部在负载下高达42℃,这意味着你仍然可以把它放在你的腿上。底座顶部的温度会高一点,中间的键盘区域会升温到~44℃,这很明显,特别是在你玩游戏的时候。旧的MacBook Pro 16 M1 Max稍微凉一些,但其他Windows对手在负载下通常会更热。
(±) The maximum temperature on the upper side is 44.2 °C / 112 F, compared to the average of 36.8 °C / 98 F, ranging from 21 to 71 °C for the class Multimedia.
(±) The bottom heats up to a maximum of 42.9 °C / 109 F, compared to the average of 39.1 °C / 102 F
(+) In idle usage, the average temperature for the upper side is 22.1 °C / 72 F, compared to the device average of 31.3 °C / 88 F.
(±) Playing The Witcher 3, the average temperature for the upper side is 36.5 °C / 98 F, compared to the device average of 31.3 °C / 88 F.
(+) The palmrests and touchpad are cooler than skin temperature with a maximum of 30.1 °C / 86.2 F and are therefore cool to the touch.
(±) The average temperature of the palmrest area of similar devices was 28.7 °C / 83.7 F (-1.4 °C / -2.5 F).
| Apple MacBook Pro 16 2023 M2 Max Apple M2 Max, Apple M2 Max 38-Core GPU | Apple MacBook Pro 16 2021 M1 Max Apple M1 Max, Apple M1 Max 32-Core GPU | Lenovo ThinkPad X1 Extreme G5-21DE003RGE Intel Core i7-12700H, NVIDIA GeForce RTX 3060 Laptop GPU | Asus ZenBook Pro 16X OLED UX7602ZM-ME115W Intel Core i9-12900H, NVIDIA GeForce RTX 3060 Laptop GPU | Schenker Vision 16 Pro RTX 3070 Ti Intel Core i7-12700H, NVIDIA GeForce RTX 3070 Ti Laptop GPU | Dell Precision 7000 7670 Performance Intel Core i9-12950HX, NVIDIA RTX A5500 Laptop GPU | |
|---|---|---|---|---|---|---|
| Heat | -2% | -22% | -19% | -16% | -34% | |
| Maximum Upper Side * (°C) | 44.2 | 42.3 4% | 52 -18% | 32 28% | 50.8 -15% | 53 -20% |
| Maximum Bottom * (°C) | 42.9 | 41.7 3% | 56.4 -31% | 41.6 3% | 46.3 -8% | 43.2 -1% |
| Idle Upper Side * (°C) | 22.4 | 23.9 -7% | 26.4 -18% | 32.6 -46% | 27.2 -21% | 36.8 -64% |
| Idle Bottom * (°C) | 22.3 | 23.9 -7% | 27.2 -22% | 36 -61% | 26.6 -19% | 33.8 -52% |
* ... smaller is better
压力测试
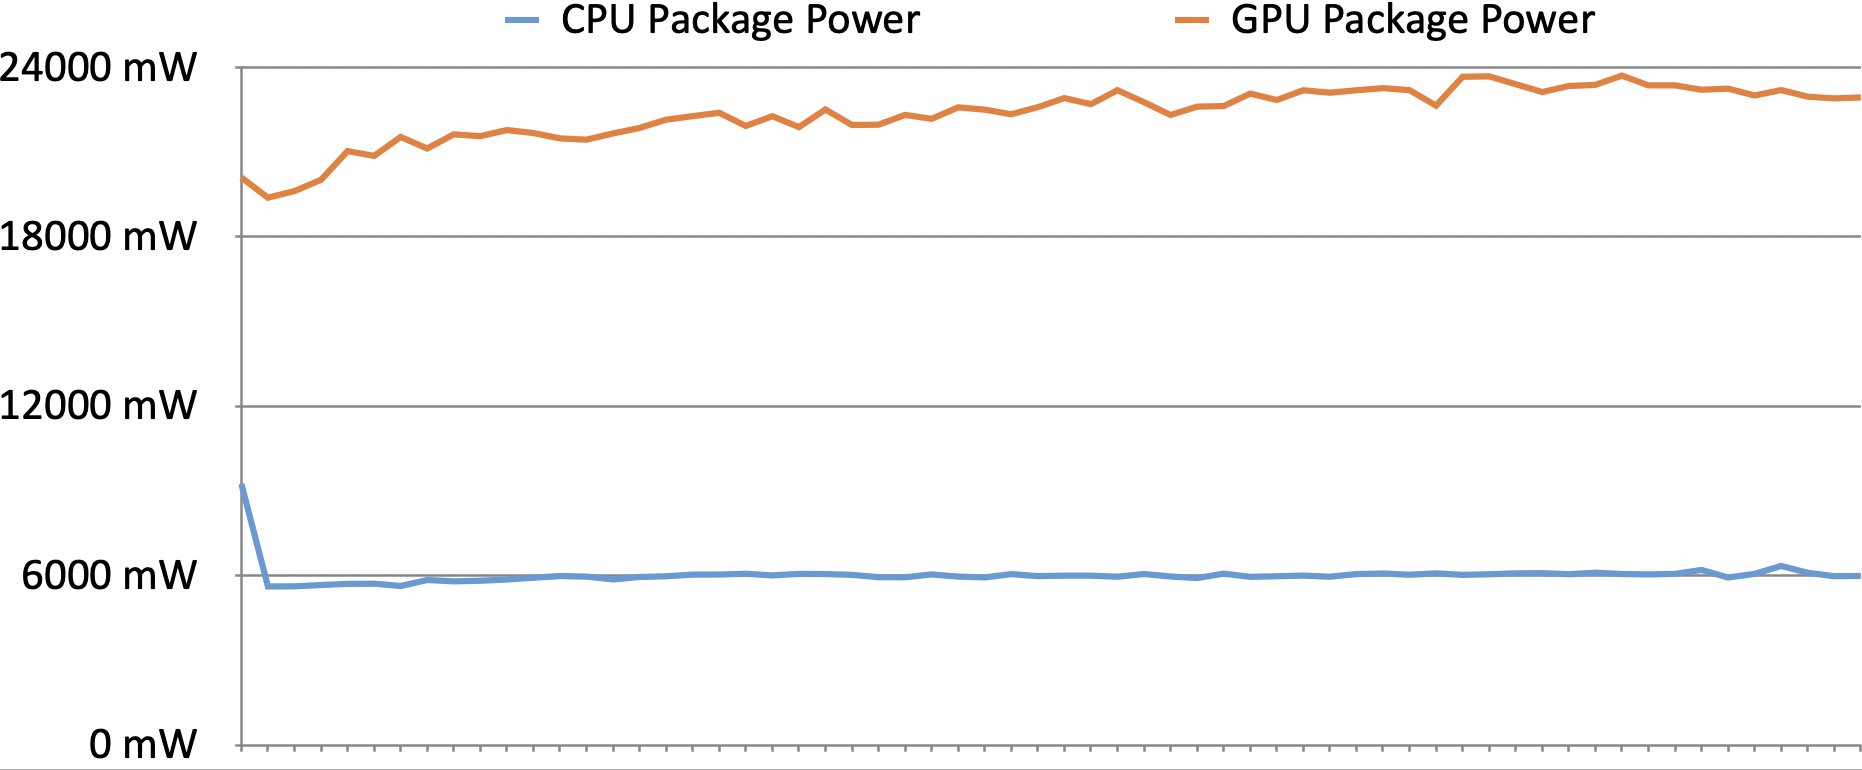
类似于 以前的模式它,正如我们在GPU部分所显示的那样,要在较长时间内充分利用M2 Max GPU的潜力并不容易。这意味着在我们的压力测试中也有周期性的波动,因为CPU功率与GPU功率相关。在我们所有的基准测试中,我们看到的最大值是CPU和GPU加起来的88W,但消耗量很快就平息在65-70W。再次有不同的可能解释:Apple ,可能是想避免更大声的风扇(因为我们看到仍有足够的空间),或者制造商想确保你可以在电池电源上使用相同的CPU/GPU组合性能。
发言人
我们的扬声器分析只显示了与前代产品的微小偏差MacBook Pro 16 2021,但结果仍在测量公差范围内。由6个扬声器和低音炮组成的音响系统仍然是你目前在笔记本电脑中能得到的最好的系统,与较小的MacBook Pro 14相比,它也稍好一些。MacBook Pro 14.
Apple MacBook Pro 16 2023 M2 Max audio analysis
(+) | speakers can play relatively loud (86.1 dB)
Bass 100 - 315 Hz
(+) | good bass - only 3.9% away from median
(+) | bass is linear (5.7% delta to prev. frequency)
Mids 400 - 2000 Hz
(+) | balanced mids - only 1.2% away from median
(+) | mids are linear (1.5% delta to prev. frequency)
Highs 2 - 16 kHz
(+) | balanced highs - only 2.5% away from median
(+) | highs are linear (1.7% delta to prev. frequency)
Overall 100 - 16.000 Hz
(+) | overall sound is linear (4.9% difference to median)
Compared to same class
» 0% of all tested devices in this class were better, 0% similar, 99% worse
» The best had a delta of 5%, average was 17%, worst was 45%
Compared to all devices tested
» 0% of all tested devices were better, 0% similar, 100% worse
» The best had a delta of 4%, average was 23%, worst was 134%
Apple MacBook Pro 16 2021 M1 Pro audio analysis
(+) | speakers can play relatively loud (84.7 dB)
Bass 100 - 315 Hz
(+) | good bass - only 3.8% away from median
(+) | bass is linear (5.2% delta to prev. frequency)
Mids 400 - 2000 Hz
(+) | balanced mids - only 1.3% away from median
(+) | mids are linear (2.1% delta to prev. frequency)
Highs 2 - 16 kHz
(+) | balanced highs - only 1.9% away from median
(+) | highs are linear (2.7% delta to prev. frequency)
Overall 100 - 16.000 Hz
(+) | overall sound is linear (4.6% difference to median)
Compared to same class
» 0% of all tested devices in this class were better, 0% similar, 100% worse
» The best had a delta of 5%, average was 17%, worst was 45%
Compared to all devices tested
» 0% of all tested devices were better, 0% similar, 100% worse
» The best had a delta of 4%, average was 23%, worst was 134%
能源管理 - MBP 16具有较长的运行时间
消耗功率
闲置消耗几乎与前一型号相同,明亮的16英寸屏幕再次成为最大的消耗者。我们可以测量出在最大SDR亮度下几乎为17W,在全HDR亮度约1100尼特下甚至高达34W。负载下的结果也很相似。在我们的压力测试开始时,我们可以测量到145W,后来是~130W,所以附带的140W电源适配器仍然足够。
| Off / Standby | |
| Idle | |
| Load |
|
Key:
min: | |
| Apple MacBook Pro 16 2023 M2 Max M2 Max, M2 Max 38-Core GPU, Apple SSD AP2048Z, Mini-LED, 3456x2234, 16.2" | Apple MacBook Pro 16 2021 M1 Max M1 Max, M1 Max 32-Core GPU, Apple SSD AP2048R, Mini-LED, 3456x2234, 16.2" | Lenovo ThinkPad X1 Extreme G5-21DE003RGE i7-12700H, GeForce RTX 3060 Laptop GPU, Micron 3400 1TB MTFDKBA1T0TFH, IPS, 3840x2400, 16" | Asus ZenBook Pro 16X OLED UX7602ZM-ME115W i9-12900H, GeForce RTX 3060 Laptop GPU, Samsung PM9A1 MZVL21T0HCLR, OLED, 3840x2400, 16" | Schenker Vision 16 Pro RTX 3070 Ti i7-12700H, GeForce RTX 3070 Ti Laptop GPU, Samsung SSD 980 Pro 1TB MZ-V8P1T0BW, IPS, 2560x1600, 16" | Dell Precision 7000 7670 Performance i9-12950HX, RTX A5500 Laptop GPU, , OLED, 3840x2400, 16" | Average Apple M2 Max 38-Core GPU | Average of class Multimedia | |
|---|---|---|---|---|---|---|---|---|
| Power Consumption | 2% | -53% | -29% | -20% | -122% | 0% | 24% | |
| Idle Minimum * (Watt) | 5.2 | 5.4 -4% | 11.8 -127% | 11.1 -113% | 9 -73% | 16.4 -215% | 5.2 ? -0% | 5.69 ? -9% |
| Idle Average * (Watt) | 16.5 | 16.4 1% | 22.4 -36% | 11.4 31% | 13.3 19% | 35.9 -118% | 16.5 ? -0% | 10.2 ? 38% |
| Idle Maximum * (Watt) | 16.8 | 16.7 1% | 23.1 -38% | 14.4 14% | 14.3 15% | 47 -180% | 16.8 ? -0% | 12.5 ? 26% |
| Load Average * (Watt) | 113 | 94 17% | 138 -22% | 137.4 -22% | 107 5% | 147.1 -30% | 113 ? -0% | 65.4 ? 42% |
| Witcher 3 ultra * (Watt) | 92 | 104 -13% | 129.9 -41% | 136 -48% | 155.2 -69% | 158.8 -73% | ||
| Load Maximum * (Watt) | 145 | 135 7% | 225.6 -56% | 197 -36% | 172 -19% | 311 -114% | 145 ? -0% | 112.9 ? 22% |
* ... smaller is better
Power consumption Witcher 3 / Stress test
Power consumption external screen
电池运行时间
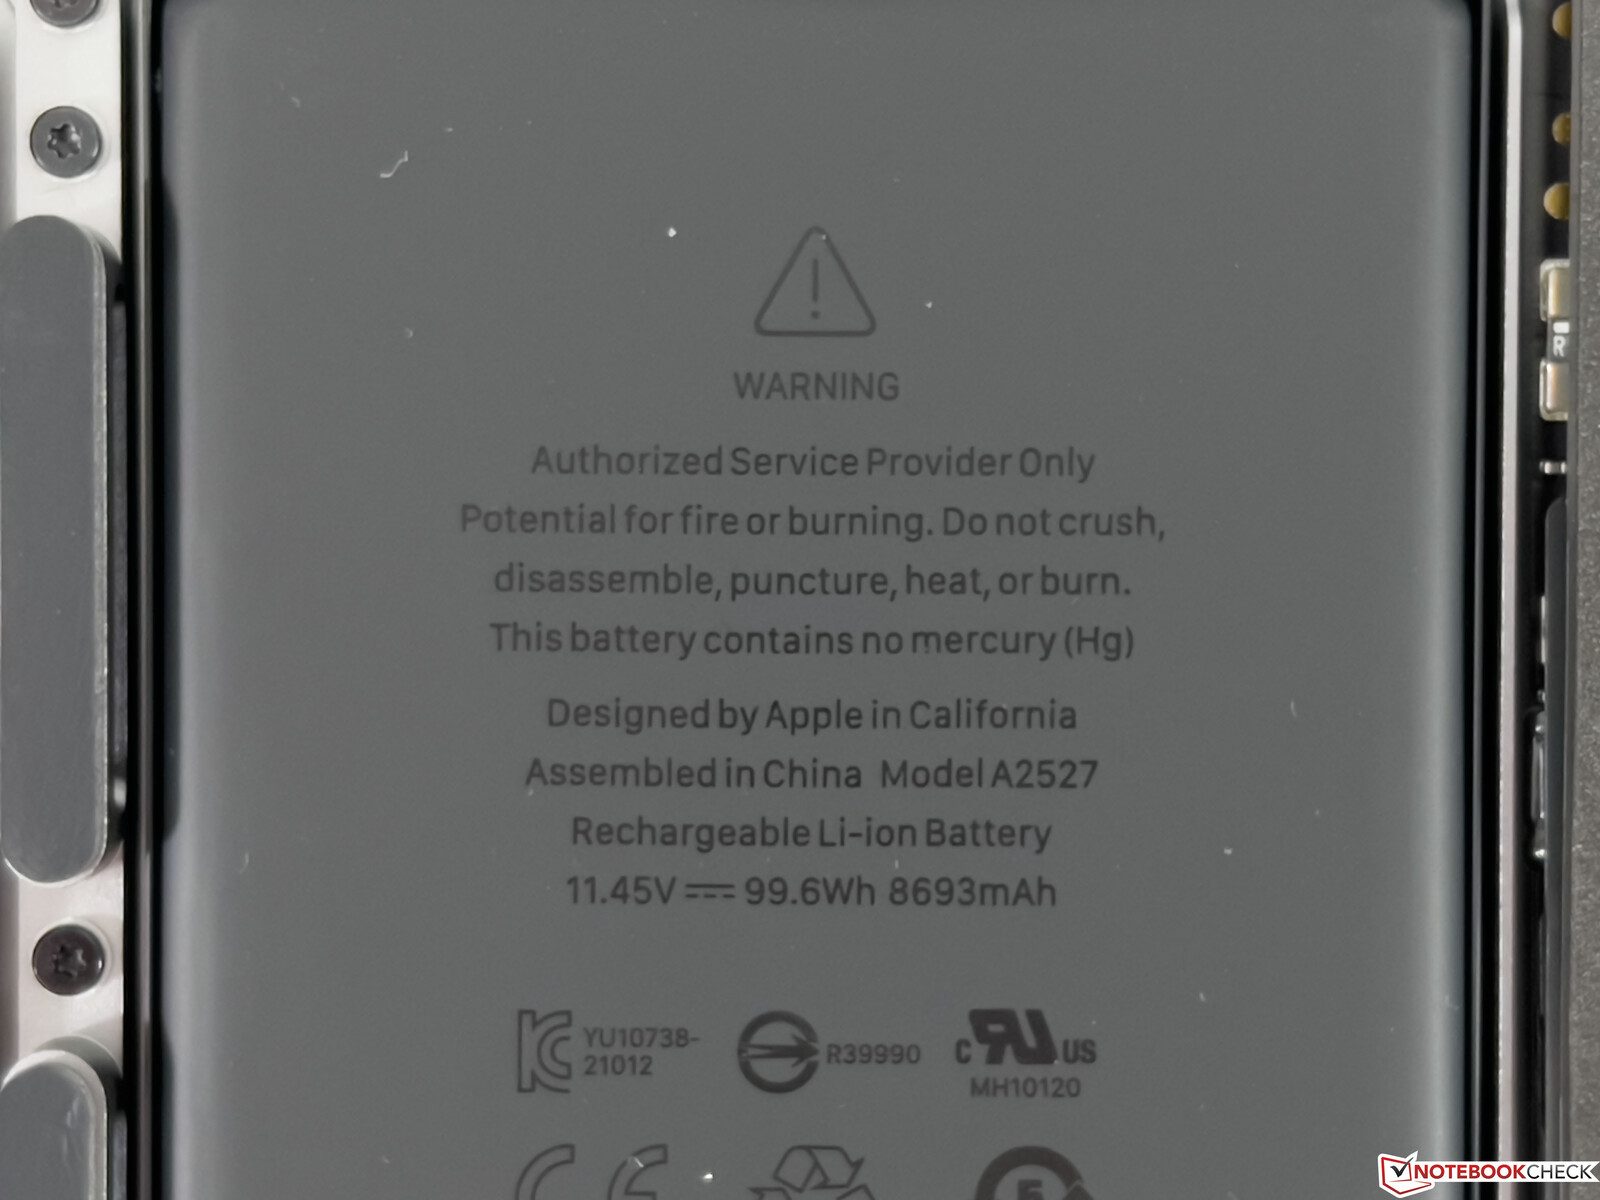
电池容量仍然是99.6Wh,在我们的视频测试中,我们可以看到在150尼特(从最大亮度开始的-7大步和2小步)下的运行时间有所改善。虽然以前的机型能够运行17小时左右,但我们现在能够记录近19小时的视频播放。另一方面,我们的Wi-Fi测试结果几乎是相同的,在150尼特下约15小时,在最大SDR亮度下略多于7小时。与Windows的竞争对手相比,这些结果要好得多,特别是当他们配备了高分辨率屏幕时。
另一方面,在我们的比较组中,负载运行时间是最短的,但MBP 16并没有降低其性能。电池电量在50分钟后下降到仅为3%,此时性能将受到限制。Windows的竞争对手能够管理更长的最低运行时间,但是一旦你拔掉设备的插头,就会有明显的性能损失。
一段HDR视频(YouTube 4K)在最大HDR亮度下运行了4:47小时,与之前的型号相比正好多了10分钟。当设备打开时,完全充电需要100分钟;仅28分钟后就可获得50%的电量,51分钟后可获得80%的电量。
| Apple MacBook Pro 16 2023 M2 Max M2 Max, M2 Max 38-Core GPU, 99.6 Wh | Apple MacBook Pro 16 2021 M1 Max M1 Max, M1 Max 32-Core GPU, 99.6 Wh | Lenovo ThinkPad X1 Extreme G5-21DE003RGE i7-12700H, GeForce RTX 3060 Laptop GPU, 90 Wh | Asus ZenBook Pro 16X OLED UX7602ZM-ME115W i9-12900H, GeForce RTX 3060 Laptop GPU, 96 Wh | Schenker Vision 16 Pro RTX 3070 Ti i7-12700H, GeForce RTX 3070 Ti Laptop GPU, 80 Wh | Dell Precision 7000 7670 Performance i9-12950HX, RTX A5500 Laptop GPU, 93 Wh | Average of class Multimedia | |
|---|---|---|---|---|---|---|---|
| Battery runtime | -3% | -20% | 48% | -36% | -68% | 9% | |
| H.264 (h) | 18.7 | 17 -9% | 7.3 -61% | 6.1 -67% | 16.8 ? -10% | ||
| WiFi v1.3 (h) | 14.8 | 14.9 1% | 6.7 -55% | 8.9 -40% | 6 -59% | 4.7 -68% | 12.2 ? -18% |
| Load (h) | 1.1 | 1.1 0% | 1.7 55% | 2.6 136% | 1.3 18% | 1.7 ? 55% |
Pros
Cons
结论 - MacBook Pro 16 2023再次成为最佳多媒体笔记本电脑之一
采用M2 Max SoC的新MacBook Pro 16 2023是目前在售的最强大的笔记本电脑Apple 。虽然我们没有从完全新的3纳米芯片中获得预期的性能和效率改进,这是我们在发布前所期望的,但2023型仍然是一个坚实的更新。M2 Max的CPUM2 Max比旧型号快20%,我们还看到38个内核的GPU有25-30%的优势。然而,这两个组件也会消耗更多的能量,所以在最大负荷下,效率并没有改变那么多。由于增加了效率核心,在实践中效率仍然更好,因为更快的P核没有像以前那样被利用。总而言之,性能非常好,你也可以在电池电量下使用全部性能,这在同类Windows笔记本电脑上是不可能的。
我们的压力测试显示,这两个组件不能利用其全部潜力,肯定有一个限制。我们非常肯定M2 Max可以更快,但这也需要一个更强大的PSU,更响亮的风扇,而且在电池供电的情况下,性能可能会更低。我们认为Apple ,不希望出现这些妥协。
由于新的M2 Max,Apple MacBook Pro 16 2023比以前更加强大。Mini-LED面板仍然很出色,MBP 16再次成为内容创作者的最佳笔记本电脑之一。然而,伟大的整体包装要付出高昂的代价,配备M2 Max的新MBP 16起价3900欧元。
新的SoC是最大的变化,否则2023型号终于支持更快的Wi-Fi 6E以及蓝牙5.3,HDMI端口现在支持2.1标准,4K输出频率高达240 Hz。电池运行时间通常与前一型号相当,只是视频运行时间现在更好,几乎达到19小时。迷你LED面板仍然提供出色的图像质量和HDR能力,在macOS中实现了非常舒适的HDR。Apple ,还使用了你现在可以在笔记本电脑中得到的最好的声音系统。
也有缺点,最大的缺点是缺乏维护和升级选项。你必须确保在购买笔记本电脑时得到一个有足够内存和固态硬盘存储的型号,这就给我们带来了下一个缺点,即内存和固态硬盘的升级价格高昂。显示屏的缺口也不是很美观。
在其他16英寸笔记本中,MacBook肯定要与提供更多CPU和GPU性能的强大对手竞争,而Nvidia的新RTX 40 GPU这些天刚刚到货。然而,这些系统也将消耗更多的电力。即使是竞争对手的高亮度屏幕也很难跟上Apple'的Mini-LED面板,尤其是HDR功能。大多数Windows笔记本电脑提供一些升级选项作为回报,你通常可以更换内存、固态硬盘,有时还可以更换Wi-Fi模块。
我们认为从2021年的模型升级没有什么意义,当你从旧的英特尔MacBook或其他系统升级时,我们建议你查看 2021年的旧型号也是如此,目前M1 Max的价格要低700-800欧元(起价约为3100欧元)。你还应该考虑你真正需要多少GPU性能,分别采用M1 Pro或M2 Pro的系统,可能会给大多数用户提供足够的性能。
价格和可用性
Apple MacBook Pro 16 2023 M2 Max
- 02/14/2023 v7 (old)
Andreas Osthoff
Transparency
The selection of devices to be reviewed is made by our editorial team. The test sample was provided to the author as a loan by the manufacturer or retailer for the purpose of this review. The lender had no influence on this review, nor did the manufacturer receive a copy of this review before publication. There was no obligation to publish this review. As an independent media company, Notebookcheck is not subjected to the authority of manufacturers, retailers or publishers.
This is how Notebookcheck is testing
Every year, Notebookcheck independently reviews hundreds of laptops and smartphones using standardized procedures to ensure that all results are comparable. We have continuously developed our test methods for around 20 years and set industry standards in the process. In our test labs, high-quality measuring equipment is utilized by experienced technicians and editors. These tests involve a multi-stage validation process. Our complex rating system is based on hundreds of well-founded measurements and benchmarks, which maintains objectivity. Further information on our test methods can be found here.
Price comparison

