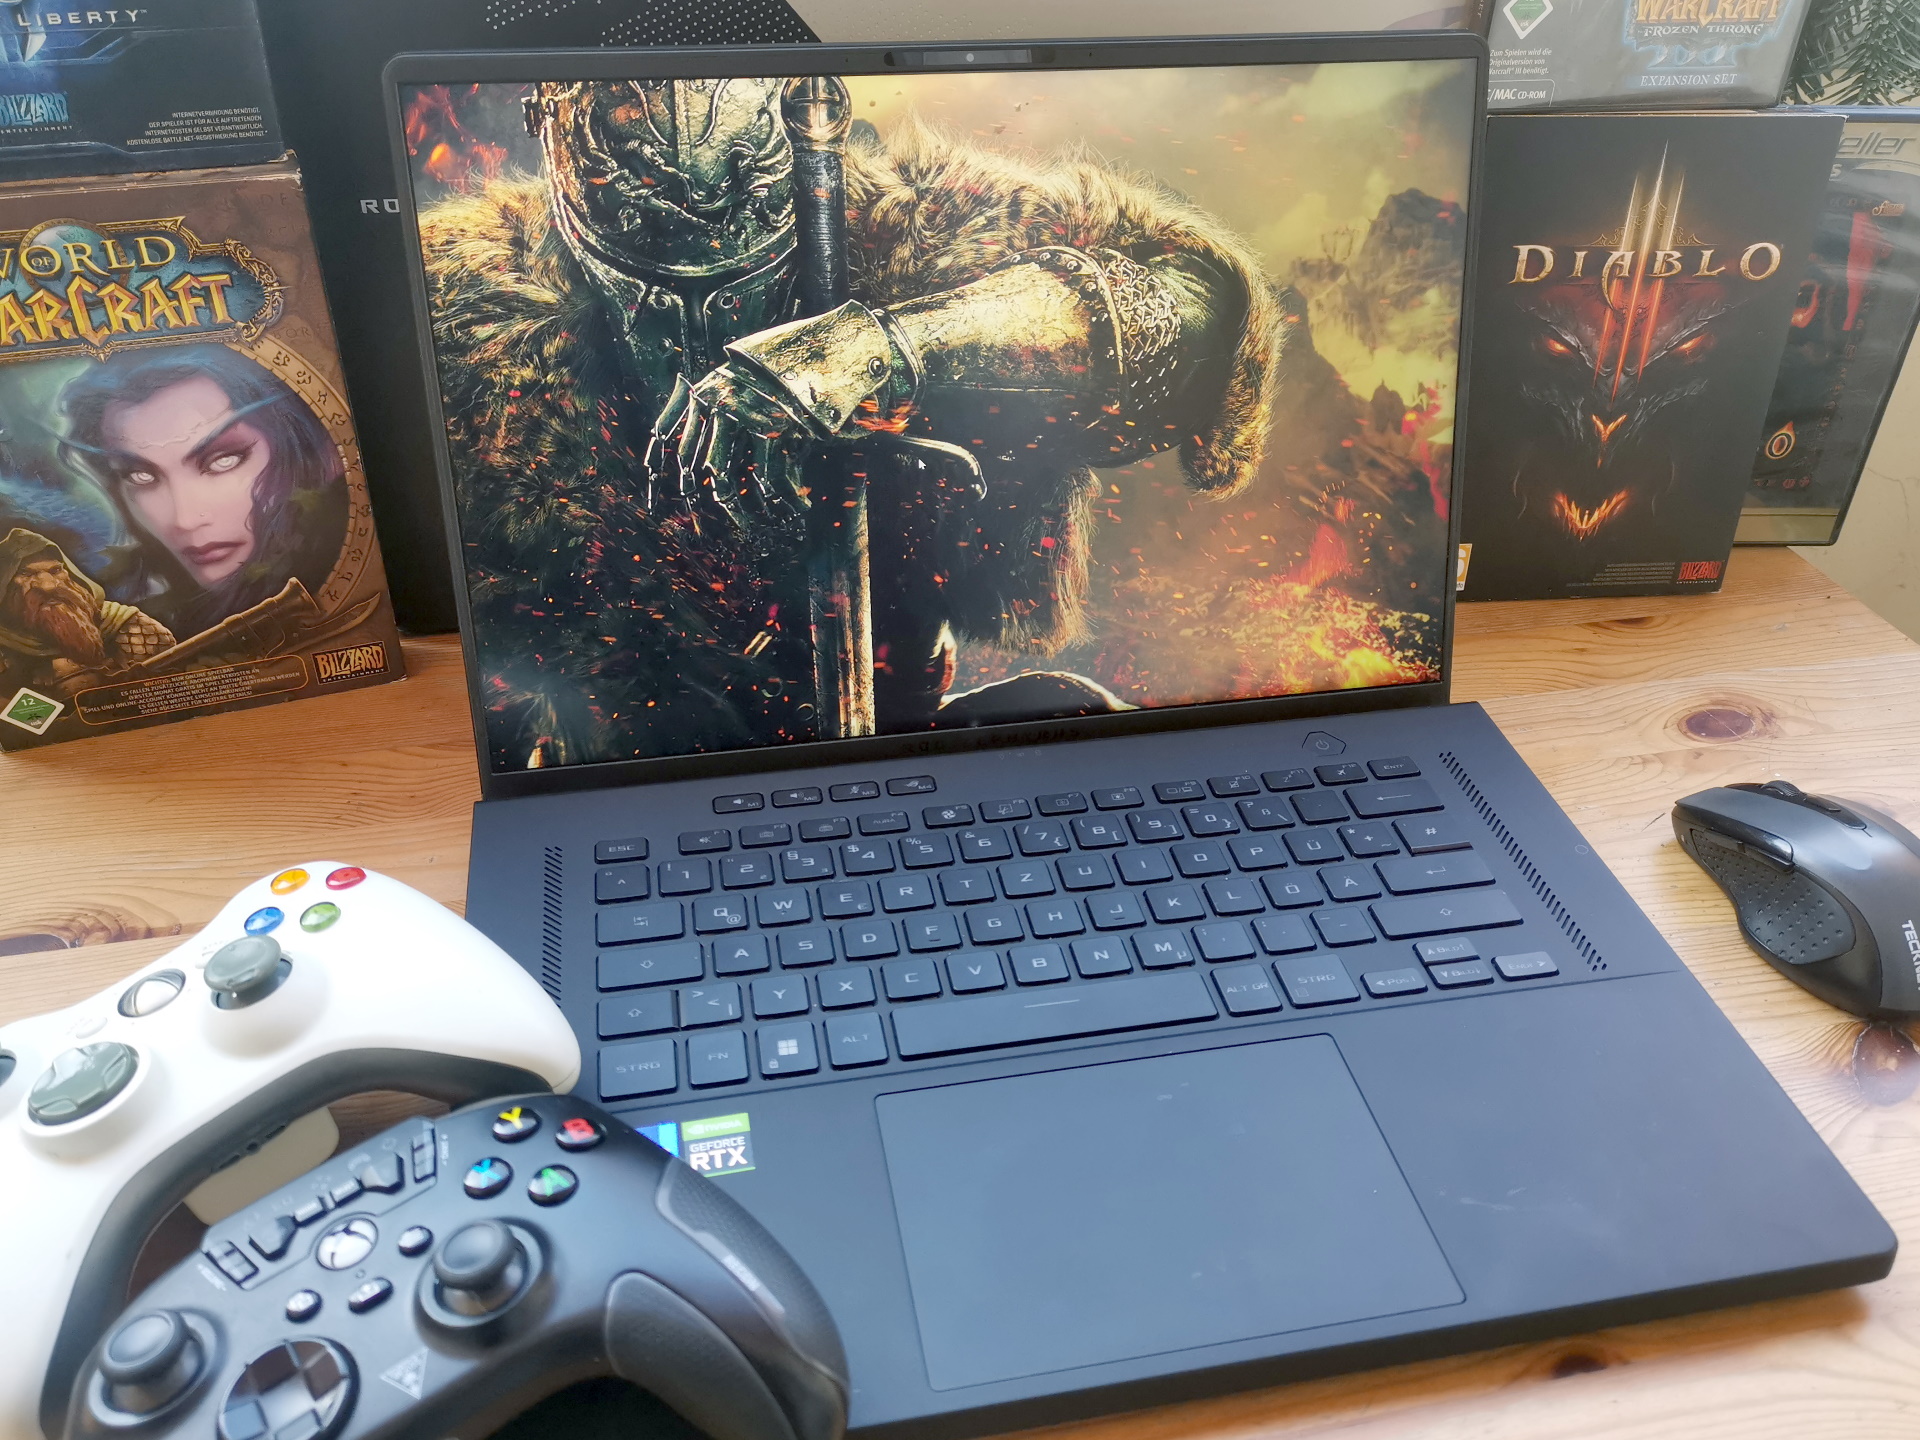
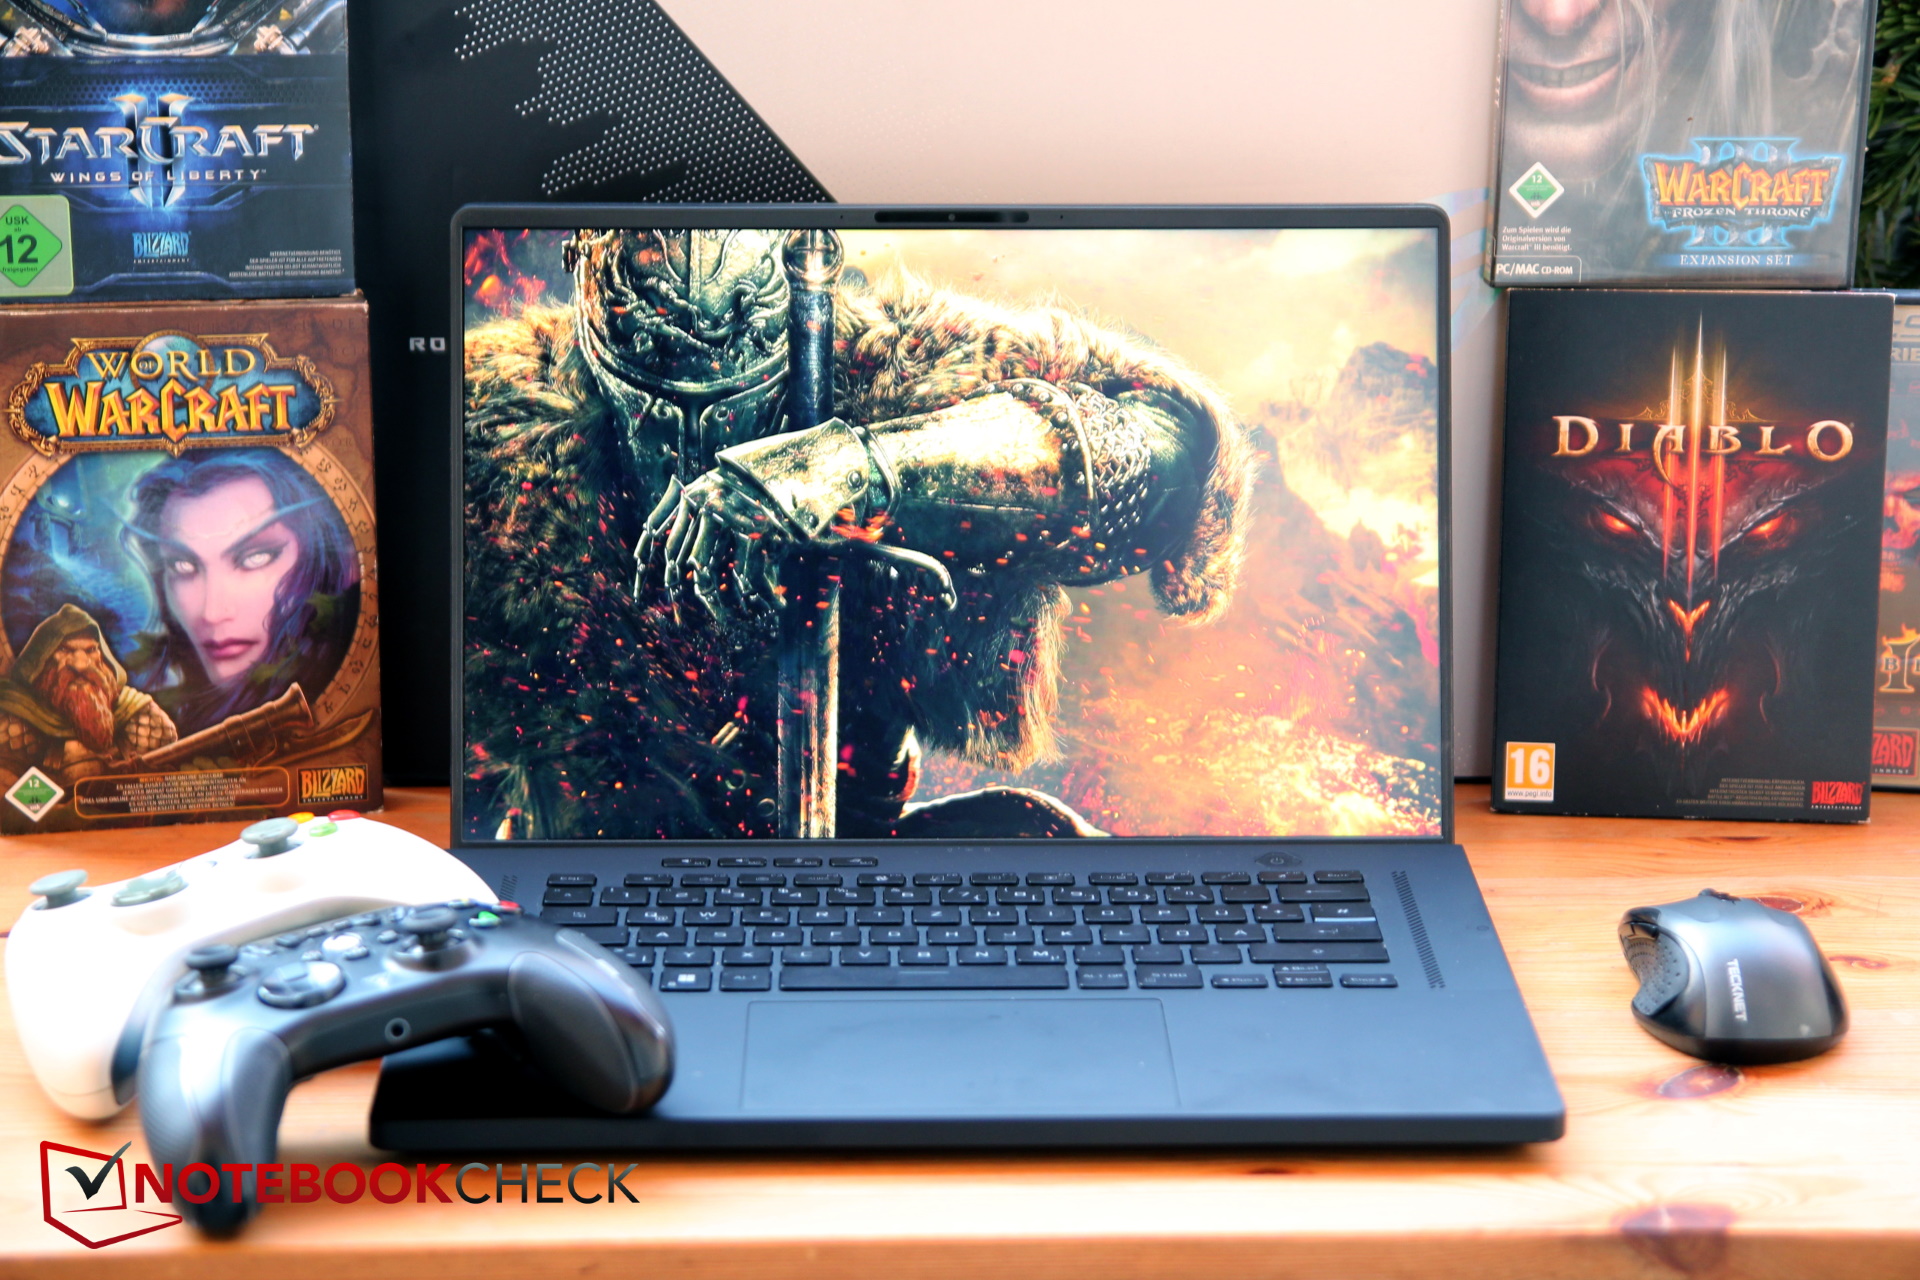
华硕ROG Zephyrus M16笔记本电脑评测。一个全面的游戏包

M16(2022)GU603zw继承了其同名的前辈,用一个强大的i9 Alder Lake CPU和RTX 3070 Ti,升级了包装。 RTX 3070 Ti.所有这些都是在一个相当苗条和紧凑的16英寸外形尺寸,16:10显示屏(2,560 x 1,500像素),只是勉强错过了我们的最佳移动游戏笔记本电脑名单,因为它的重量只有75克(约2.6盎司)太多(>2公斤=4.4磅)。这本来是列表中的第一个16英寸设备。
由于采用16:10显示屏的16英寸游戏笔记本电脑仍然是少数,我们在比较中也包括具有类似硬件的 "传统 "16:9设备。除了前辈外,这些设备特别是申克视界16 Pro和联想Legion 5 Pro,但也有 申克XMG Focus 16和 Corsair Voyager a1600.
潜在的竞争对手比较
Rating | Date | Model | Weight | Height | Size | Resolution | Price |
|---|---|---|---|---|---|---|---|
| 87.8 % v7 (old) | 02 / 2023 | Asus ROG Zephyrus M16 GU603Z i9-12900H, GeForce RTX 3070 Ti Laptop GPU | 2.1 kg | 19.9 mm | 16.00" | 2560x1600 | |
| 85.6 % v7 (old) | 06 / 2021 | Asus ROG Zephyrus M16 GU603H i9-11900H, GeForce RTX 3070 Laptop GPU | 2 kg | 20 mm | 16.00" | 2560x1600 | |
| 87.8 % v7 (old) | 11 / 2022 | Schenker Vision 16 Pro RTX 3070 Ti i7-12700H, GeForce RTX 3070 Ti Laptop GPU | 1.7 kg | 17.1 mm | 16.00" | 2560x1600 | |
| 87.7 % v7 (old) | 10 / 2022 | Lenovo Legion 5 Pro 16ARH7H RTX 3070 Ti R7 6800H, GeForce RTX 3070 Ti Laptop GPU | 2.6 kg | 26.6 mm | 16.00" | 2560x1600 | |
| 87 % v7 (old) | 01 / 2023 | Schenker XMG Focus 16 (i7-12700H, RTX 3060) i7-12700H, GeForce RTX 3060 Laptop GPU | 2.2 kg | 24.3 mm | 16.00" | 2560x1600 | |
| 86.6 % v7 (old) | 12 / 2022 | Corsair Voyager a1600 R9 6900HS, Radeon RX 6800M | 2.4 kg | 19.9 mm | 16.00" | 2560x1600 |
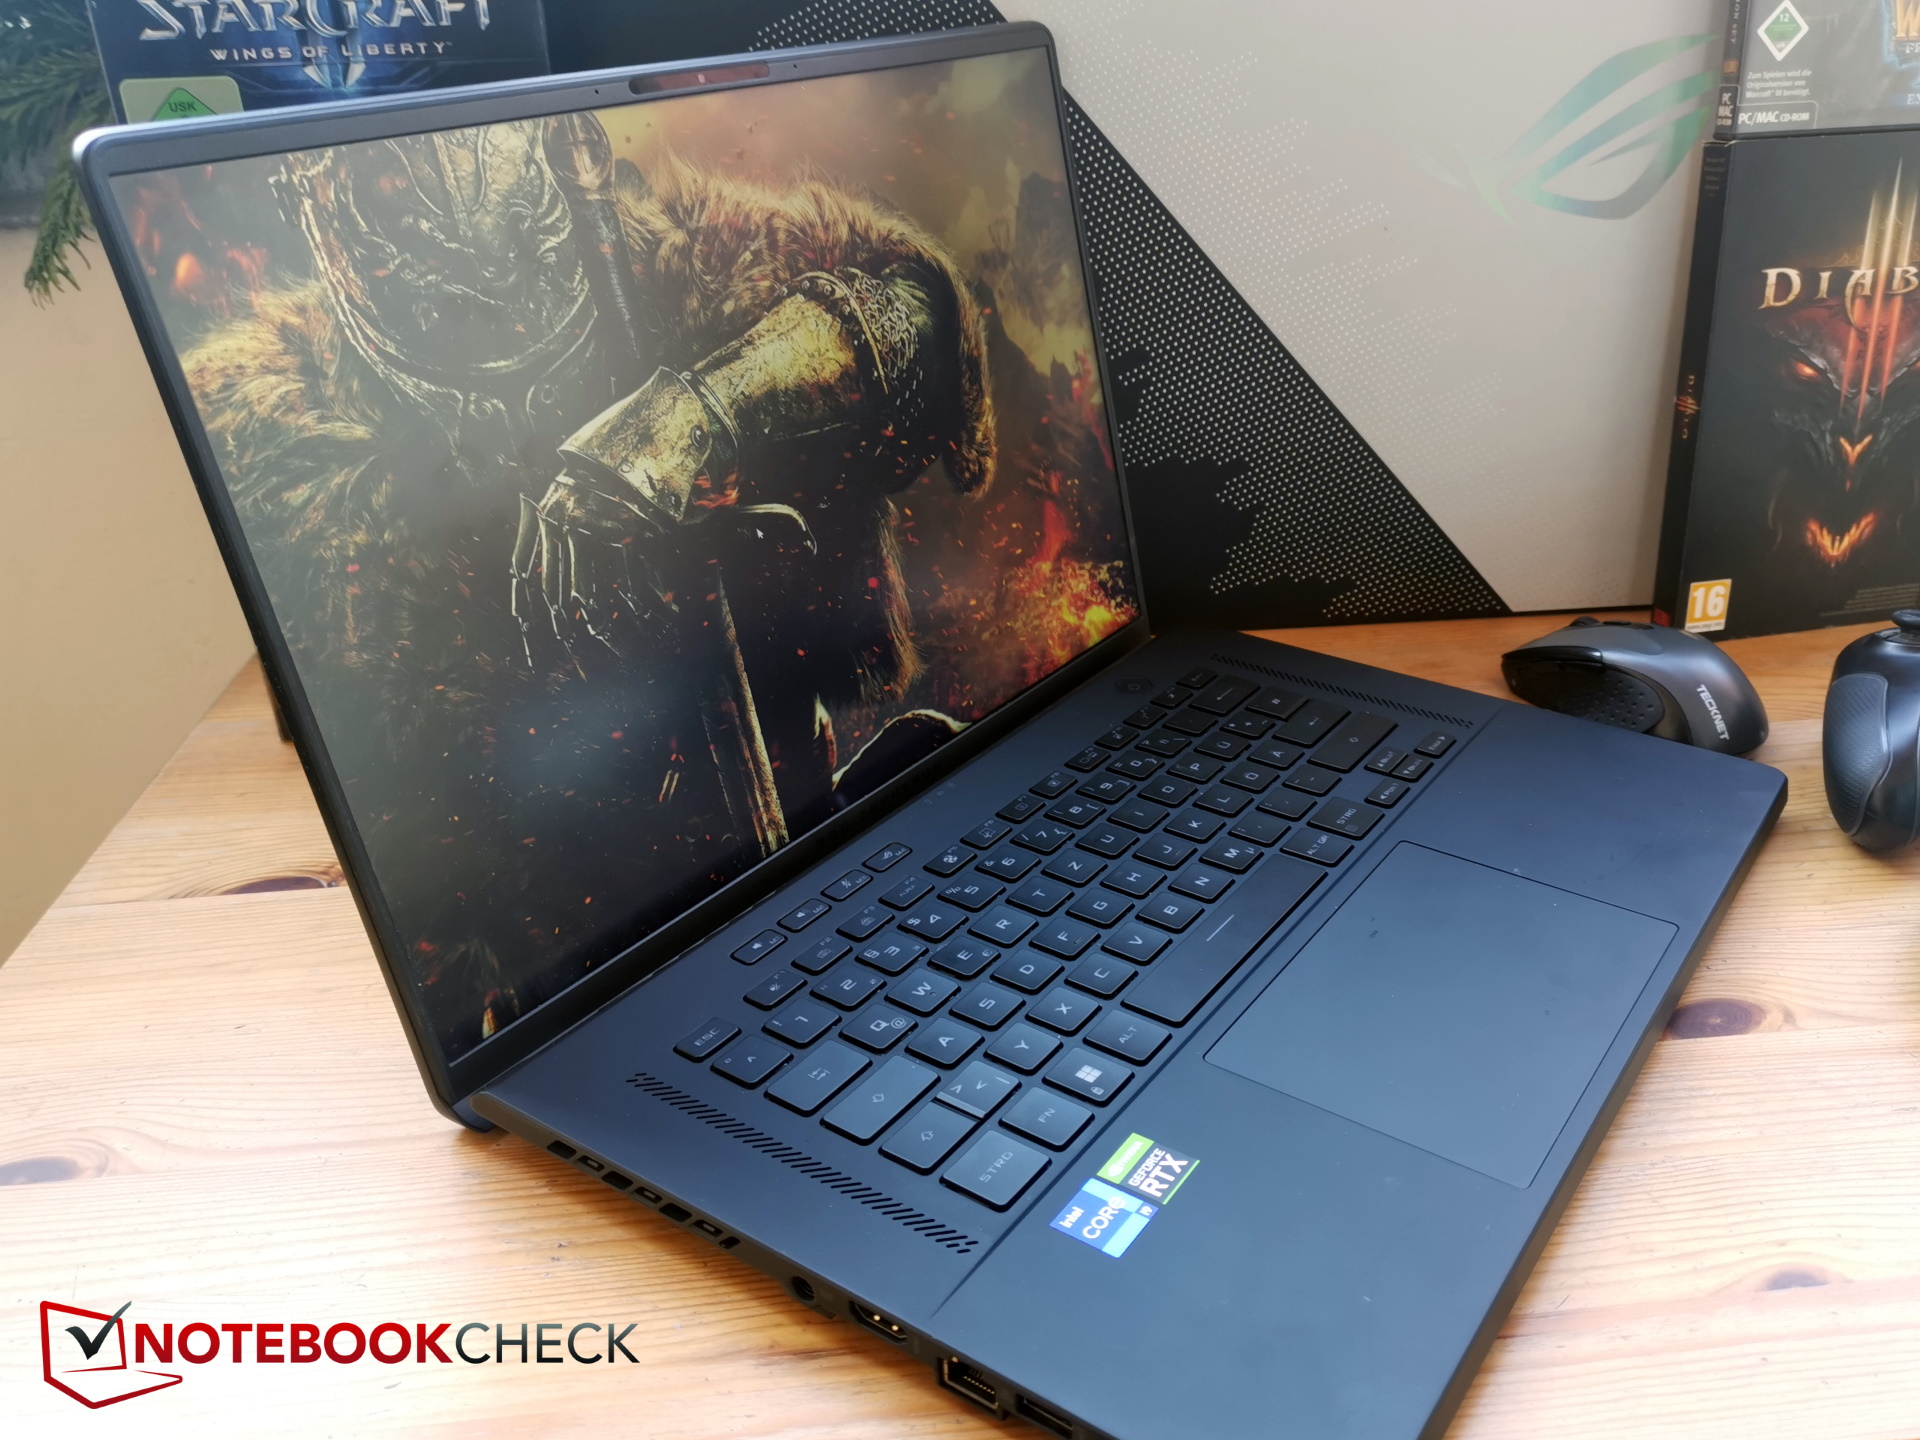
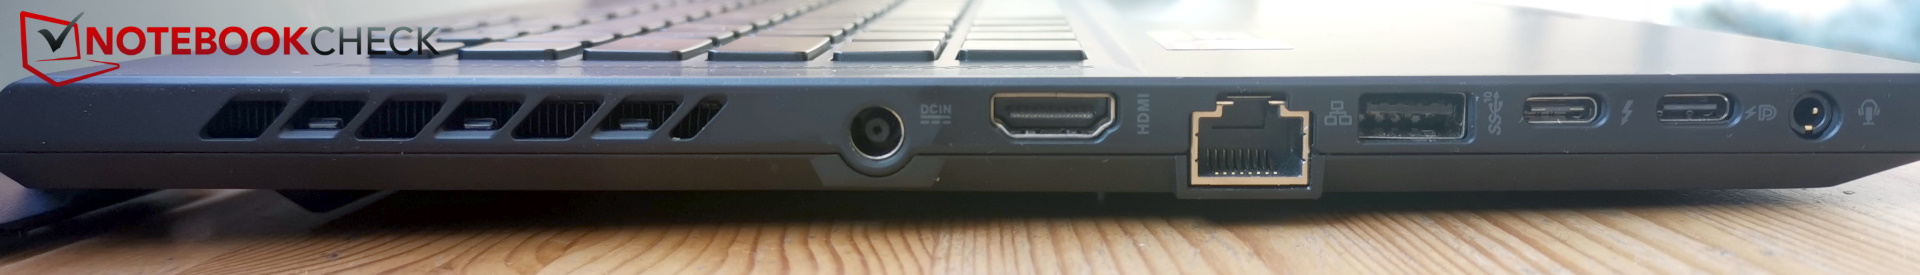
连接设备 - HDMI 2.1和Thunderbolt 4

SD卡阅读器
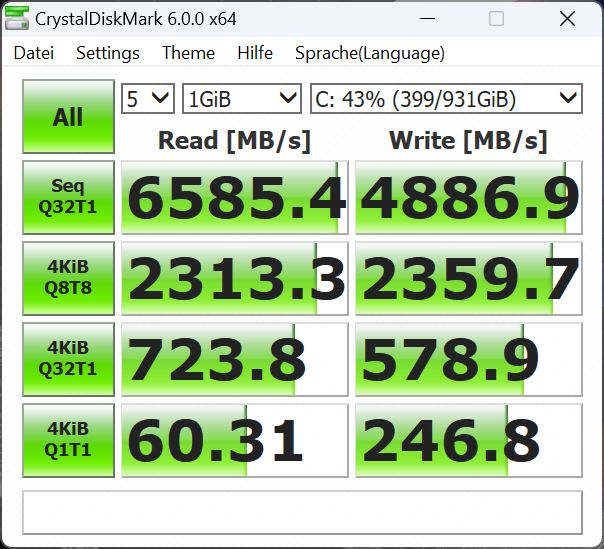
SC读卡器仅限于microSD卡,但至少我们的AV PRO microSD 128 GB V60可以紧紧地贴在一起,而不会伸出来。与已经表现良好的前代产品相比,速度又有了小幅提升。
| SD Card Reader | |
| average JPG Copy Test (av. of 3 runs) | |
| Asus ROG Zephyrus M16 GU603Z | |
| Average of class Gaming (20.9 - 210, n=54, last 2 years) | |
| Asus ROG Zephyrus M16 GU603H (AV PRO microSD 128 GB V60) | |
| Corsair Voyager a1600 (AV Pro SD microSD 128 GB V60) | |
| Schenker Vision 16 Pro RTX 3070 Ti (AV Pro V60) | |
| Schenker XMG Focus 16 (i7-12700H, RTX 3060) (AV Pro SD microSD 128 GB V60) | |
| maximum AS SSD Seq Read Test (1GB) | |
| Asus ROG Zephyrus M16 GU603Z | |
| Asus ROG Zephyrus M16 GU603H (AV PRO microSD 128 GB V60) | |
| Average of class Gaming (25.5 - 261, n=51, last 2 years) | |
| Corsair Voyager a1600 (AV Pro SD microSD 128 GB V60) | |
| Schenker XMG Focus 16 (i7-12700H, RTX 3060) (AV Pro SD microSD 128 GB V60) | |
| Schenker Vision 16 Pro RTX 3070 Ti (AV Pro V60) | |
沟通
华硕使用英特尔AX211模块,它也支持6-Ghz网络。与前代的联发科模块相比,传输速率明显增加。性能非常稳定。
网络摄像头


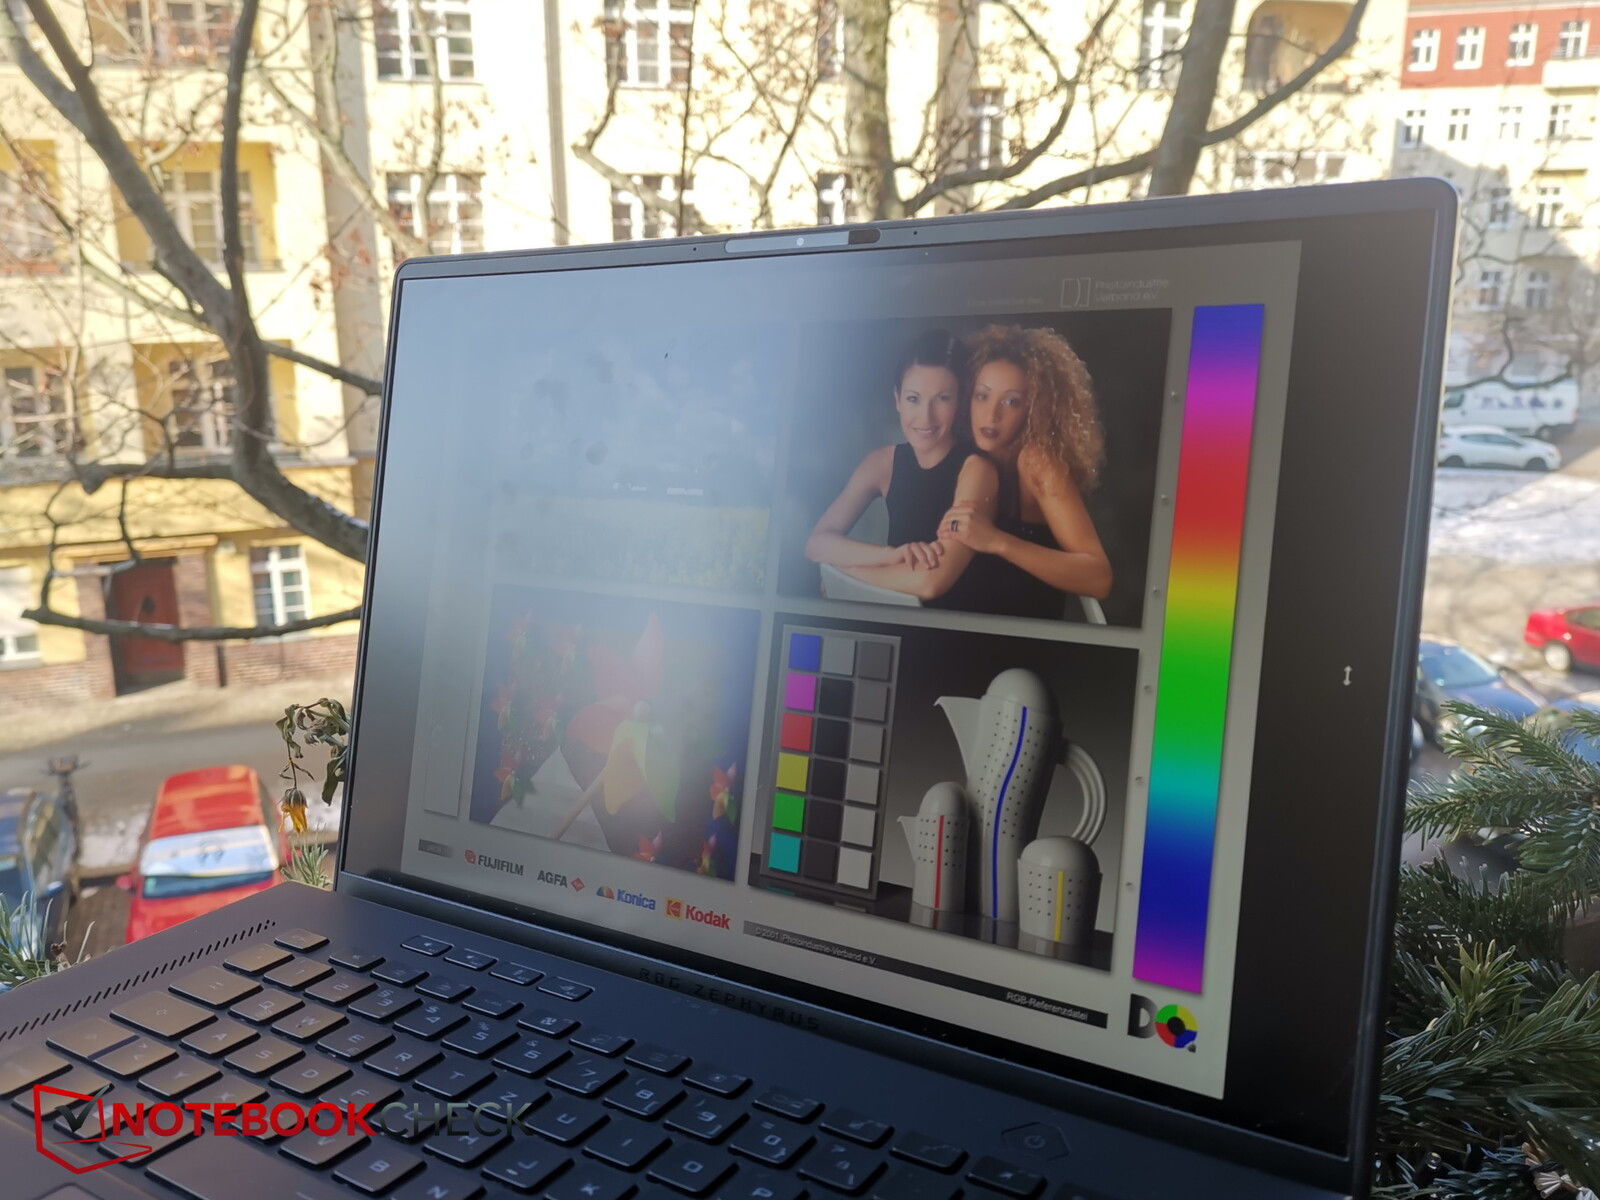
显示屏 - 16英寸,QHD+,165赫兹
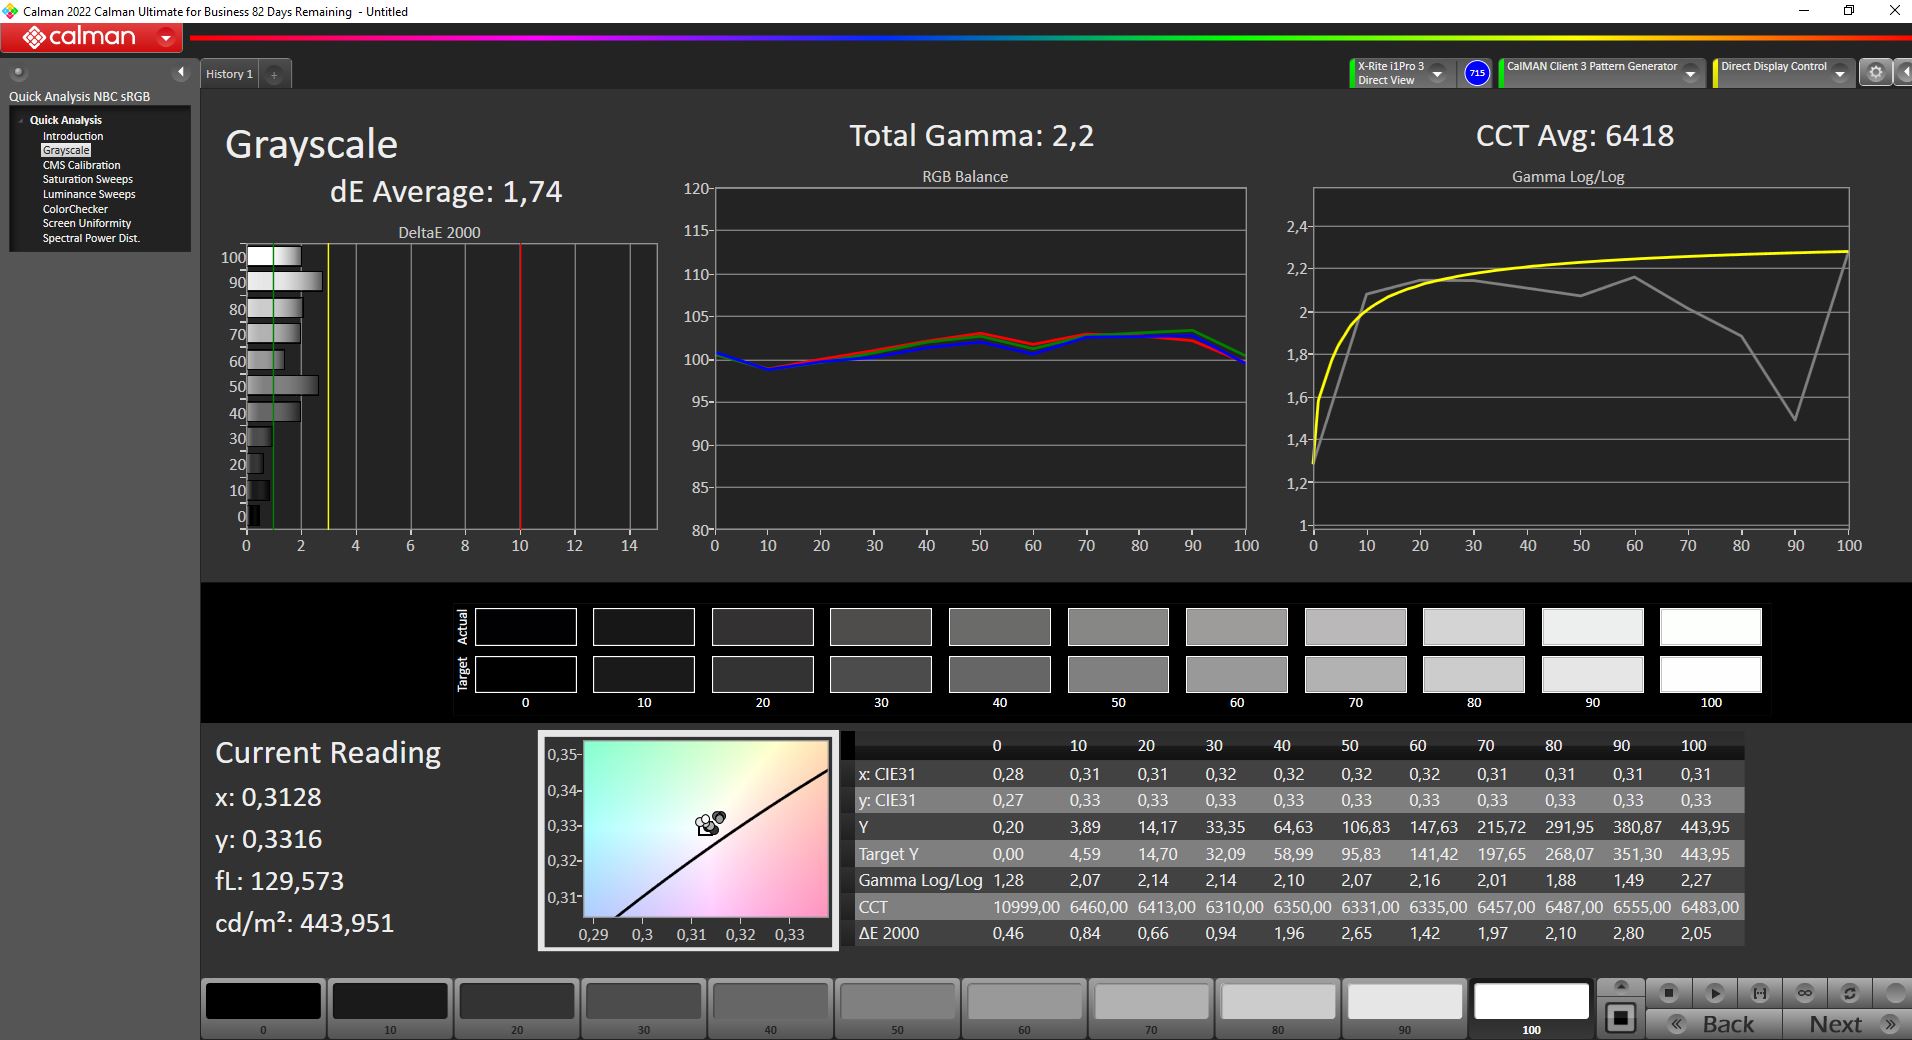
尽管它与前代产品的基本规格相同(16英寸,IPS,16:10,2,560 x 1,600,165 Hz),但华硕现在使用了不同的面板。这次没有使用来自友达光电的面板,而是来自京东方。虽然面板甚至略微更亮(481尼特),但亮度分布更不均匀,尤其是左下角的亮度大大降低。由于黑值的明显改善,对比度值有了积极的增加。
响应时间相对较快,尽管前代产品在这里的响应速度更快。PWM不用于亮度控制,一些轻微的屏幕渗漏只在黑暗场景中明显。

| |||||||||||||||||||||||||
Brightness Distribution: 82 %
Center on Battery: 484 cd/m²
Contrast: 2367:1 (Black: 0.21 cd/m²)
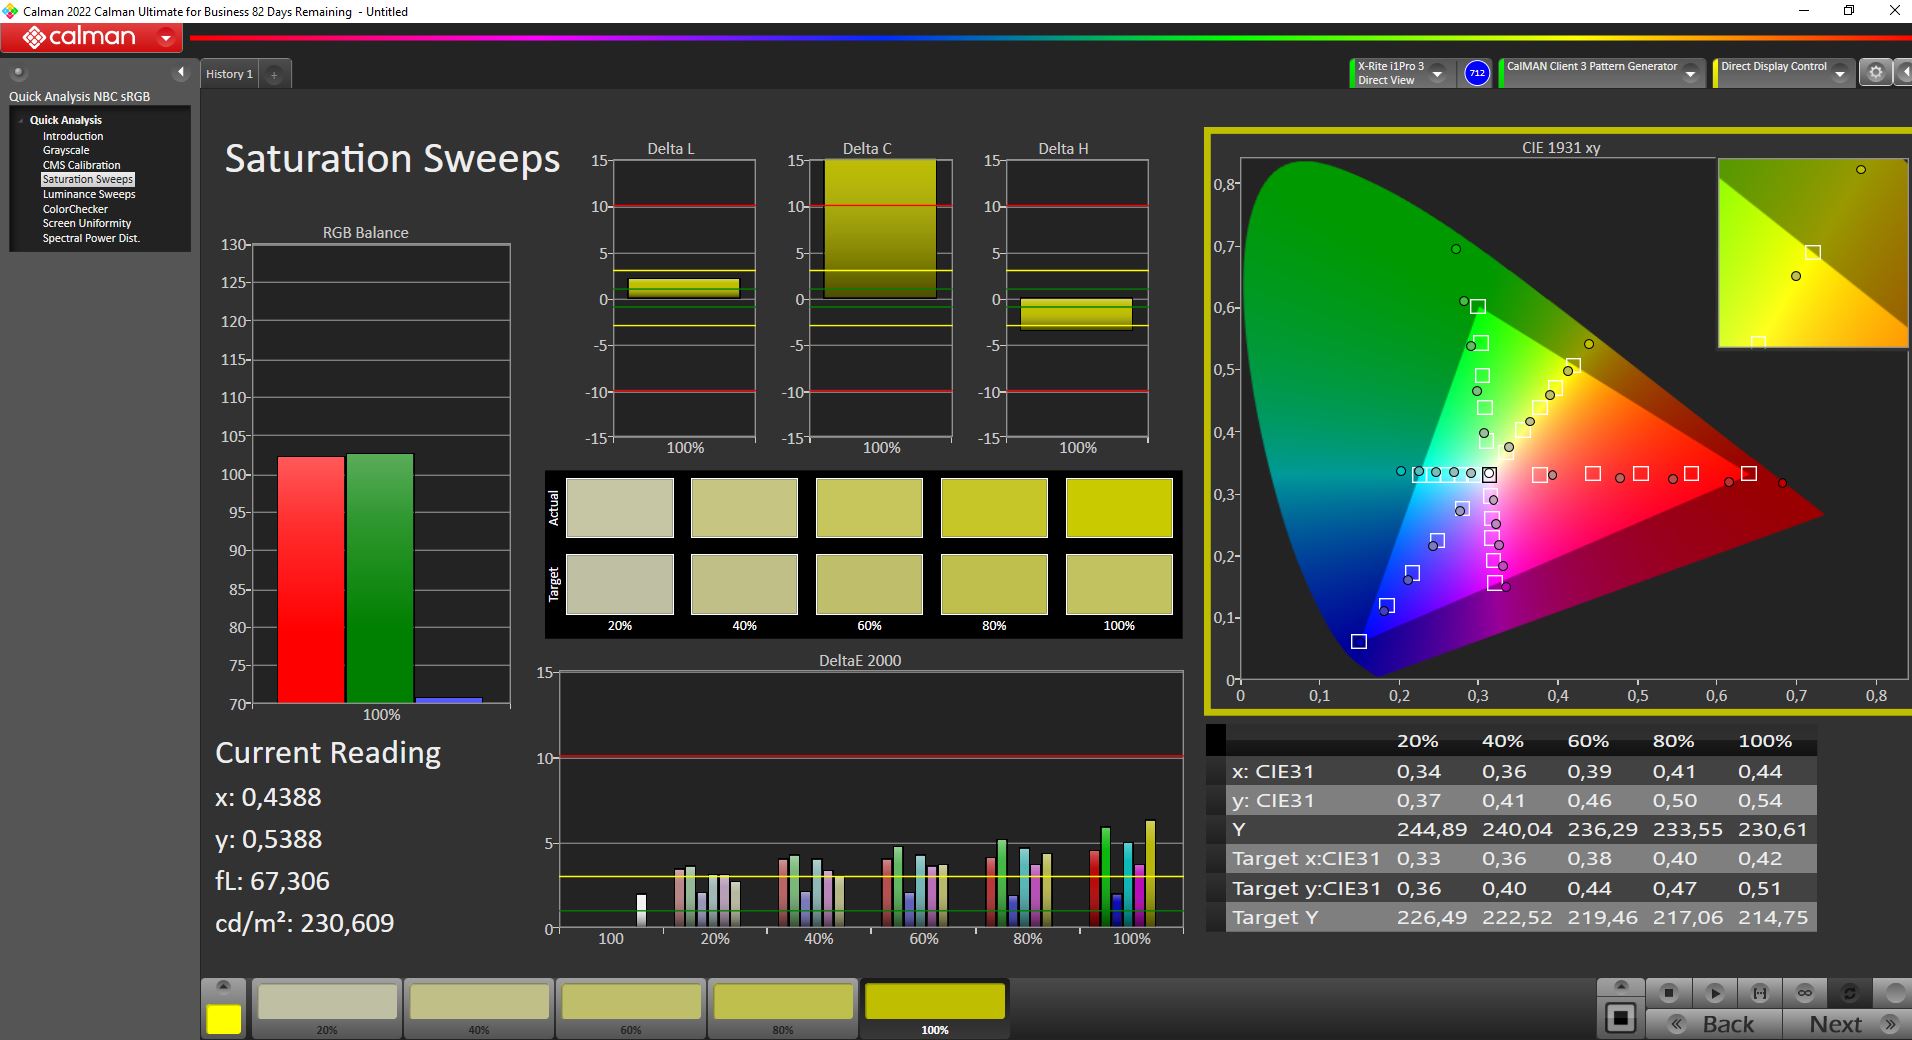
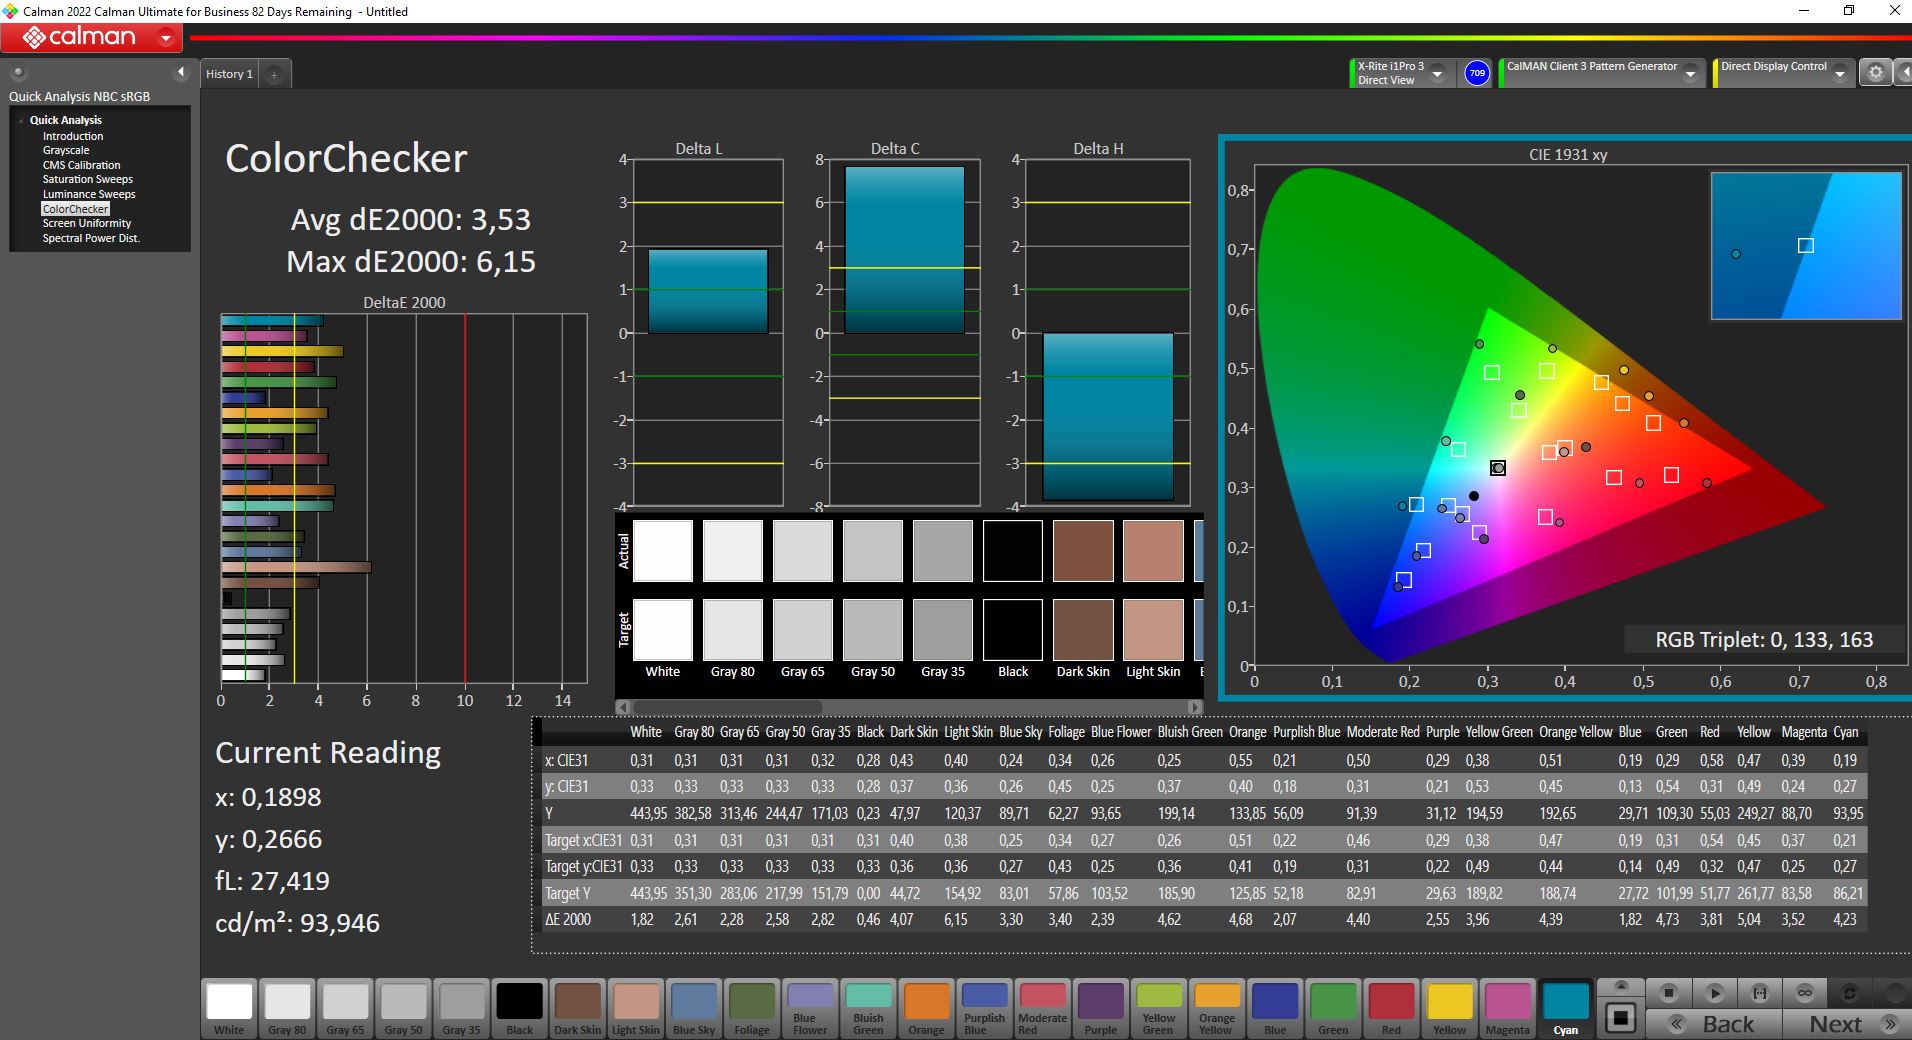
ΔE ColorChecker Calman: 3.53 | ∀{0.5-29.43 Ø4.71}
calibrated: 3.53
ΔE Greyscale Calman: 1.74 | ∀{0.09-98 Ø4.96}
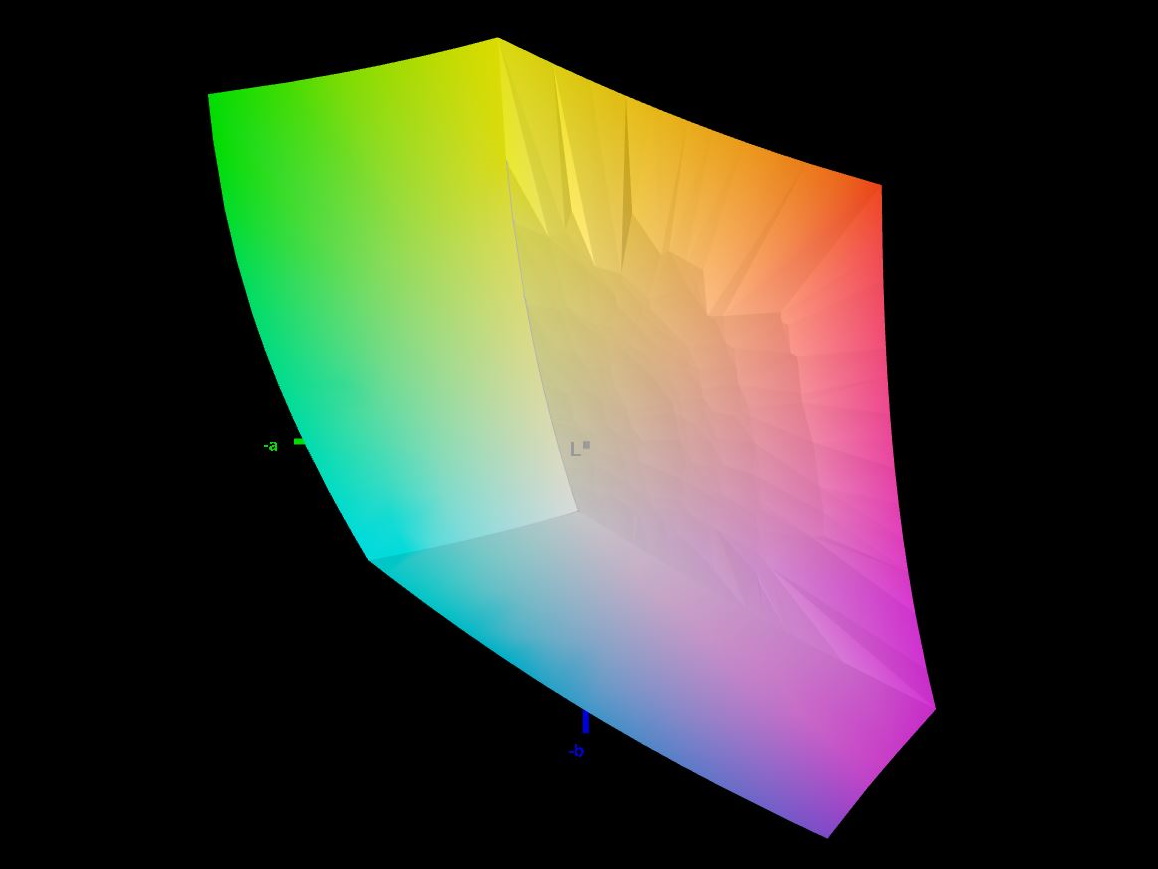
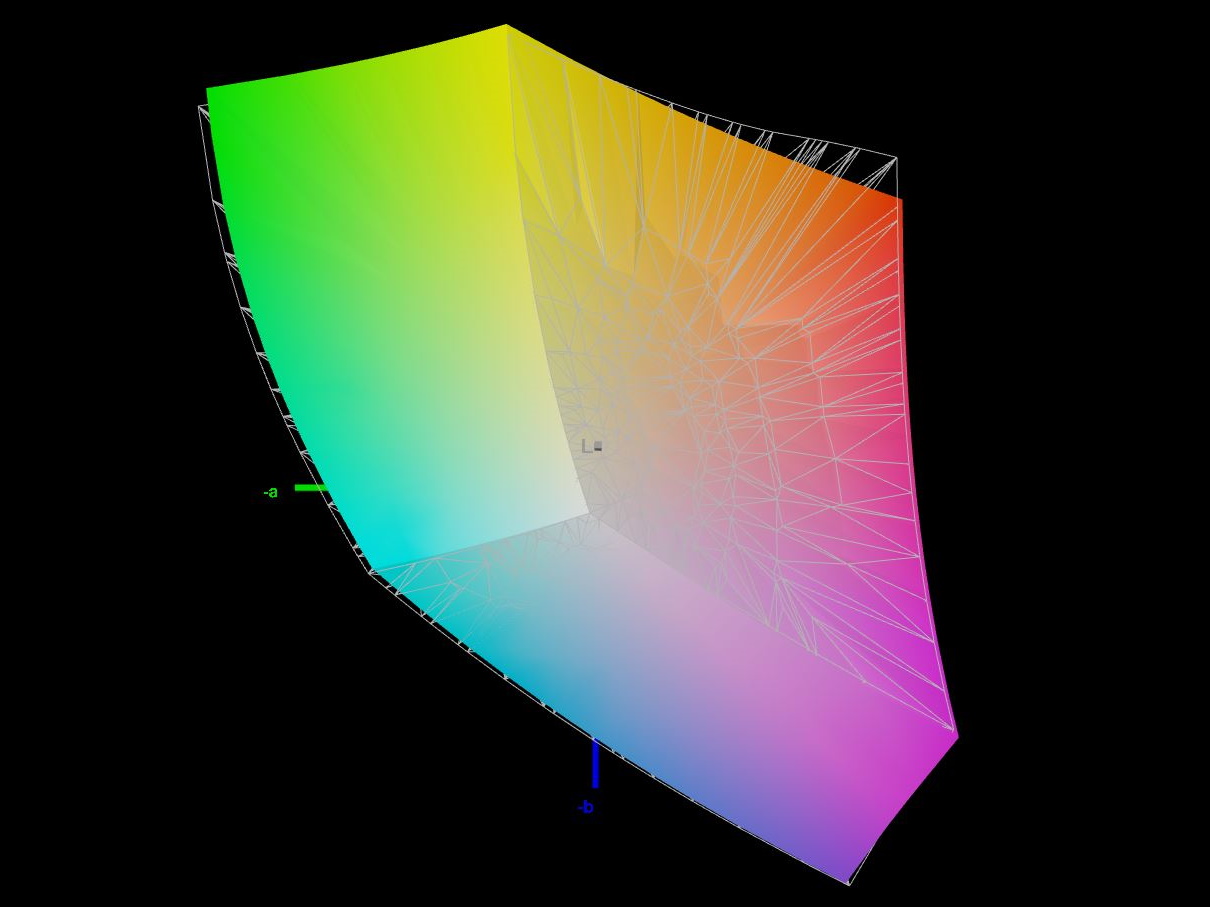
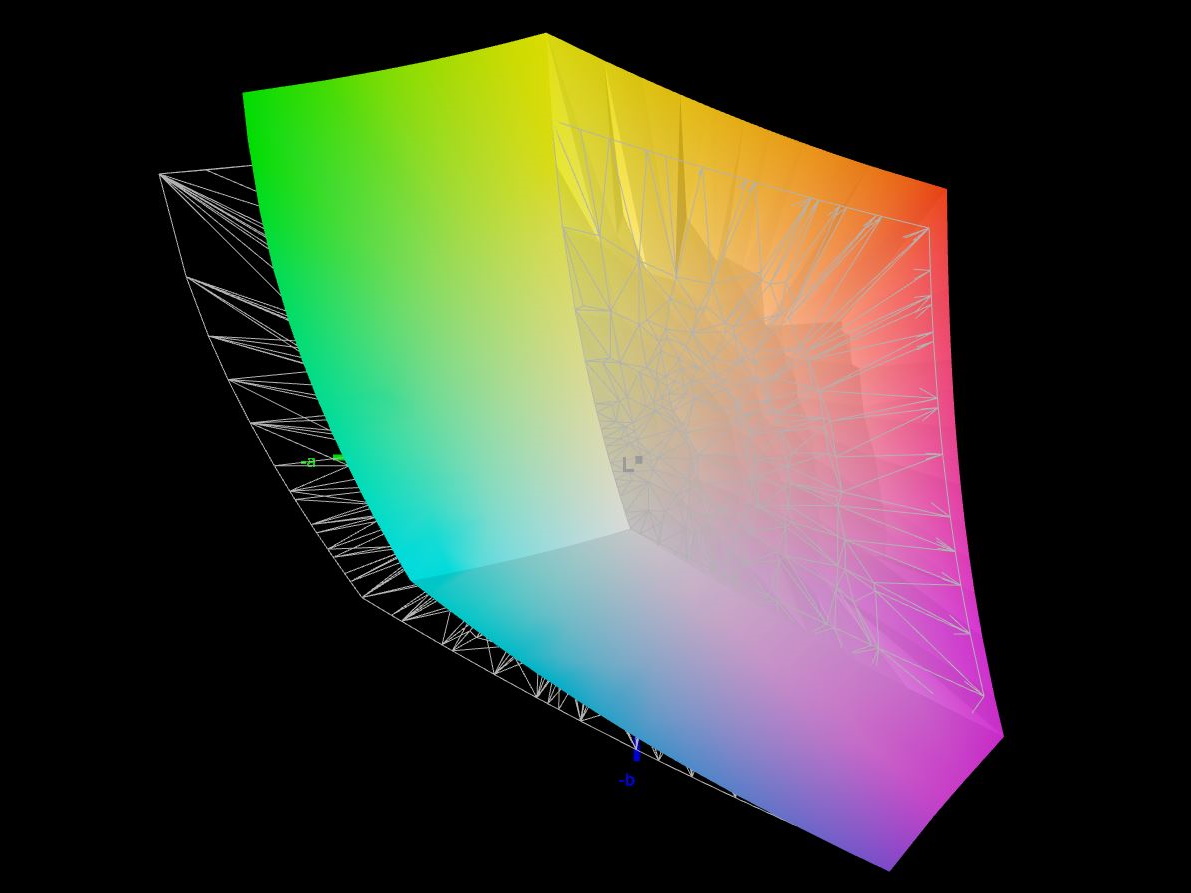
83.1% AdobeRGB 1998 (Argyll 3D)
98.5% sRGB (Argyll 3D)
92.8% Display P3 (Argyll 3D)
Gamma: 2.2
CCT: 6418 K
| Asus ROG Zephyrus M16 GU603Z BOE0A0B (BOE CQ NE160QDM-NY3), IPS, 2560x1600, 16" | Asus ROG Zephyrus M16 GU603H AU Optronics AUOC199, IPS, 2560x1600, 16" | Schenker Vision 16 Pro RTX 3070 Ti N160QDM-NZ1, IPS, 2560x1600, 16" | Lenovo Legion 5 Pro 16ARH7H RTX 3070 Ti BOE CQ NE160QDM-NY1, IPS, 2560x1600, 16" | Schenker XMG Focus 16 (i7-12700H, RTX 3060) BOE NE16oQDM-NY1, IPS, 2560x1600, 16" | Corsair Voyager a1600 BOE0A3B, IPS, 2560x1600, 16" | |
|---|---|---|---|---|---|---|
| Display | -15% | -15% | -14% | -14% | ||
| Display P3 Coverage (%) | 92.8 | 68.7 -26% | 67.3 -27% | 68.3 -26% | 68.7 -26% | |
| sRGB Coverage (%) | 98.5 | 96.7 -2% | 96.1 -2% | 96.6 -2% | 98.2 0% | |
| AdobeRGB 1998 Coverage (%) | 83.1 | 70 -16% | 69.5 -16% | 70.6 -15% | 70.1 -16% | |
| Response Times | 39% | -37% | -51% | -62% | -36% | |
| Response Time Grey 50% / Grey 80% * (ms) | 7.6 ? | 4.8 ? 37% | 14.3 ? -88% | 14.4 ? -89% | 16.4 ? -116% | 13 ? -71% |
| Response Time Black / White * (ms) | 10 ? | 6 ? 40% | 8.6 ? 14% | 11.2 ? -12% | 10.8 ? -8% | 10 ? -0% |
| PWM Frequency (Hz) | ||||||
| Screen | -28% | -34% | -11% | -40% | -21% | |
| Brightness middle (cd/m²) | 497 | 448 -10% | 364 -27% | 522.8 5% | 460 -7% | 355 -29% |
| Brightness (cd/m²) | 481 | 446 -7% | 347 -28% | 503 5% | 442 -8% | 340 -29% |
| Brightness Distribution (%) | 82 | 86 5% | 89 9% | 84 2% | 89 9% | 91 11% |
| Black Level * (cd/m²) | 0.21 | 0.48 -129% | 0.3 -43% | 0.41 -95% | 0.32 -52% | 0.53 -152% |
| Contrast (:1) | 2367 | 933 -61% | 1213 -49% | 1275 -46% | 1438 -39% | 670 -72% |
| Colorchecker dE 2000 * | 3.53 | 2.76 22% | 3.3 7% | 2.47 30% | 3.65 -3% | 2.43 31% |
| Colorchecker dE 2000 max. * | 6.15 | 7.09 -15% | 6.6 -7% | 6.56 -7% | 7.49 -22% | 4.31 30% |
| Colorchecker dE 2000 calibrated * | 3.53 | 2.86 19% | 2.5 29% | 0.61 83% | 3.65 -3% | 1.14 68% |
| Greyscale dE 2000 * | 1.74 | 3.1 -78% | 5.2 -199% | 3 -72% | 5.87 -237% | 2.62 -51% |
| Gamma | 2.2 100% | 2.153 102% | 2.14 103% | 2.27 97% | 2.42 91% | 2.28 96% |
| CCT | 6418 101% | 6826 95% | 6331 103% | 6719 97% | 6711 97% | 6909 94% |
| Color Space (Percent of AdobeRGB 1998) (%) | 87 | |||||
| Color Space (Percent of sRGB) (%) | 100 | |||||
| Total Average (Program / Settings) | 6% /
-16% | -29% /
-30% | -26% /
-17% | -39% /
-38% | -24% /
-22% |
* ... smaller is better
华硕宣传100%覆盖DCI-P3色彩空间,但我们测得 "只有 "92.8%。AdobeRGB色彩空间的覆盖率仍为83%。至少在我们选定的竞争对手的测试领域中,这仍然导致了顶级的位置。总的来说,这款显示器也适合于图片和视频的专业编辑。
在交付状态下,面板已经被很好地校准了。只有1.74,灰度的DeltaE值特别低。在ColorChecker中,我们的Portrait Display Calman色彩校准工具测得的偏差略高。额外的校准并没有进一步改善这些数值,而是把已经非常好的灰度弄得一团糟。
Display Response Times
| ↔ Response Time Black to White | ||
|---|---|---|
| 10 ms ... rise ↗ and fall ↘ combined | ↗ 4.6 ms rise | 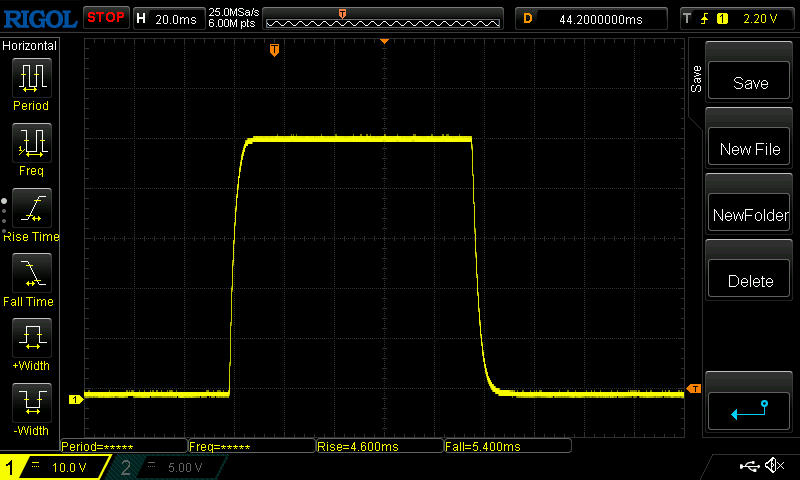 |
| ↘ 5.4 ms fall | ||
| The screen shows good response rates in our tests, but may be too slow for competitive gamers. In comparison, all tested devices range from 0.1 (minimum) to 240 (maximum) ms. » 27 % of all devices are better. This means that the measured response time is better than the average of all tested devices (19.8 ms). | ||
| ↔ Response Time 50% Grey to 80% Grey | ||
| 7.6 ms ... rise ↗ and fall ↘ combined | ↗ 3.4 ms rise | 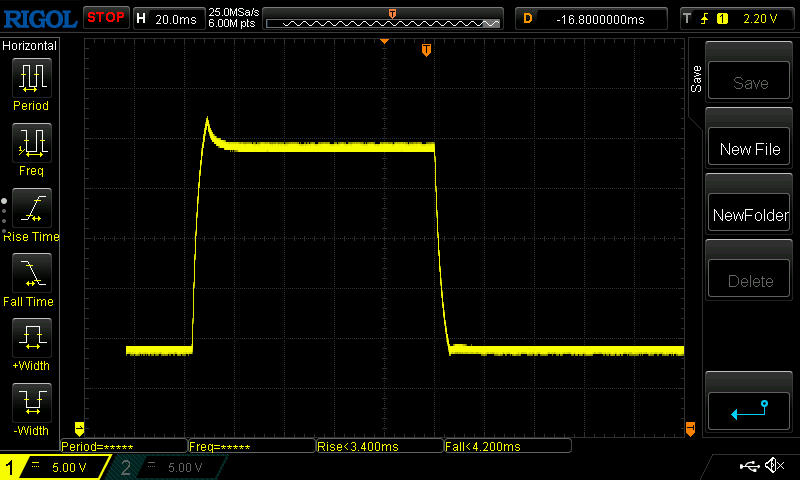 |
| ↘ 4.2 ms fall | ||
| The screen shows very fast response rates in our tests and should be very well suited for fast-paced gaming. In comparison, all tested devices range from 0.165 (minimum) to 636 (maximum) ms. » 20 % of all devices are better. This means that the measured response time is better than the average of all tested devices (31 ms). | ||
Screen Flickering / PWM (Pulse-Width Modulation)
| Screen flickering / PWM not detected | 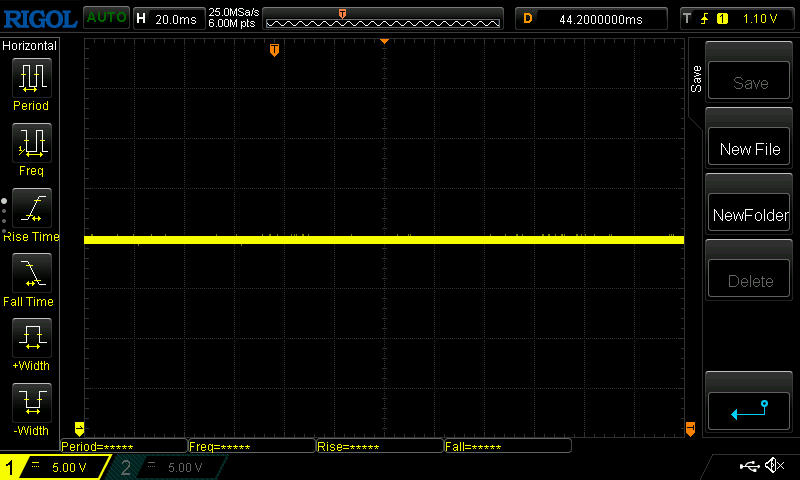 | ||
In comparison: 52 % of all tested devices do not use PWM to dim the display. If PWM was detected, an average of 7754 (minimum: 5 - maximum: 343500) Hz was measured. | |||
尽管显示屏的亮度很好,但你仍应避免在户外被阳光直射,并确保你从正面直视屏幕,因为否则能见度会迅速下降。

即使从极端的视角看,也能轻松阅读显示内容。当从侧面看屏幕时,亮度比从顶部或底部观察角度看时要低。

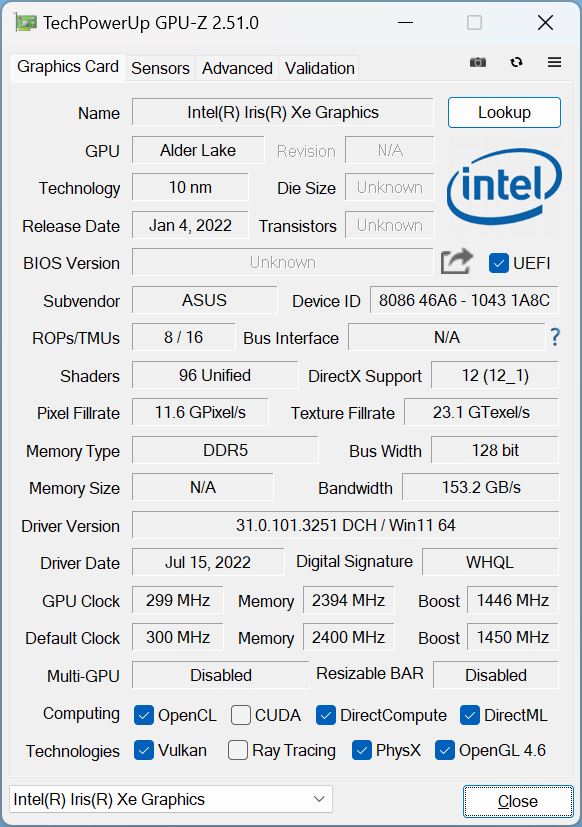
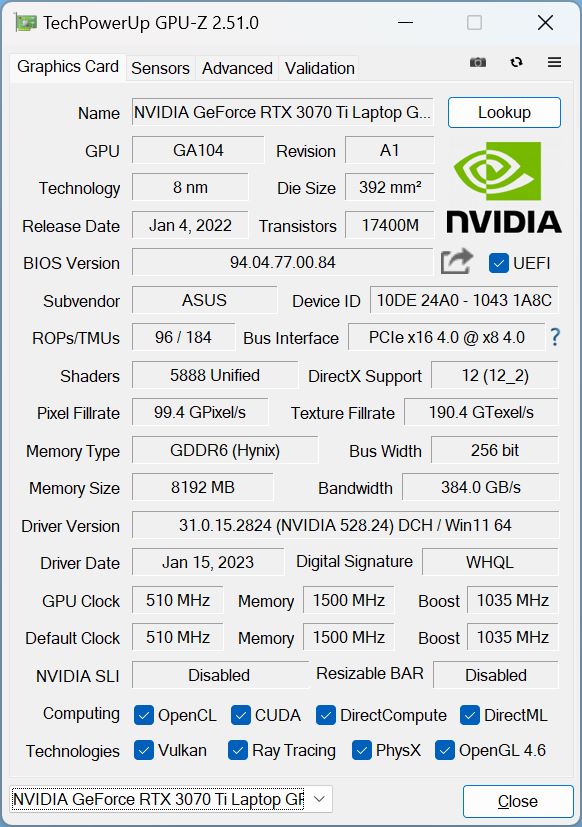
性能 - 120瓦的RTX 3070-Ti略低于平均水平
ROG Zephyrus有各种设备配置。据称,M16也将很快配备英特尔第13代CPU和RTX 40xx,而我们的测试设备仍然使用了一个酷睿i9-12900H和RTX 3070 Ti.
另外,几乎任何东西都有可能从RTX 3050 Ti到 RTX 3080 Ti.在处理器方面,你目前有以下选择 i7-12700H和我们的顶级型号。该设备由32GB内存完成,但这里也有许多选择。

测试条件
华硕Armoury Crate软件允许你调整笔记本电脑的各种设置,所以用户应该熟悉这个。它提供了寻找设备更新的选项,选择多彩和动态的Aura壁纸,或控制性能。
制造商提供了三种性能模式(安静、性能和涡轮),还提供了使用Windows性能模式控制性能的选项,甚至可以在手动模式下自己设置几个功率限制--这些选项是许多其他制造商所缺乏的。
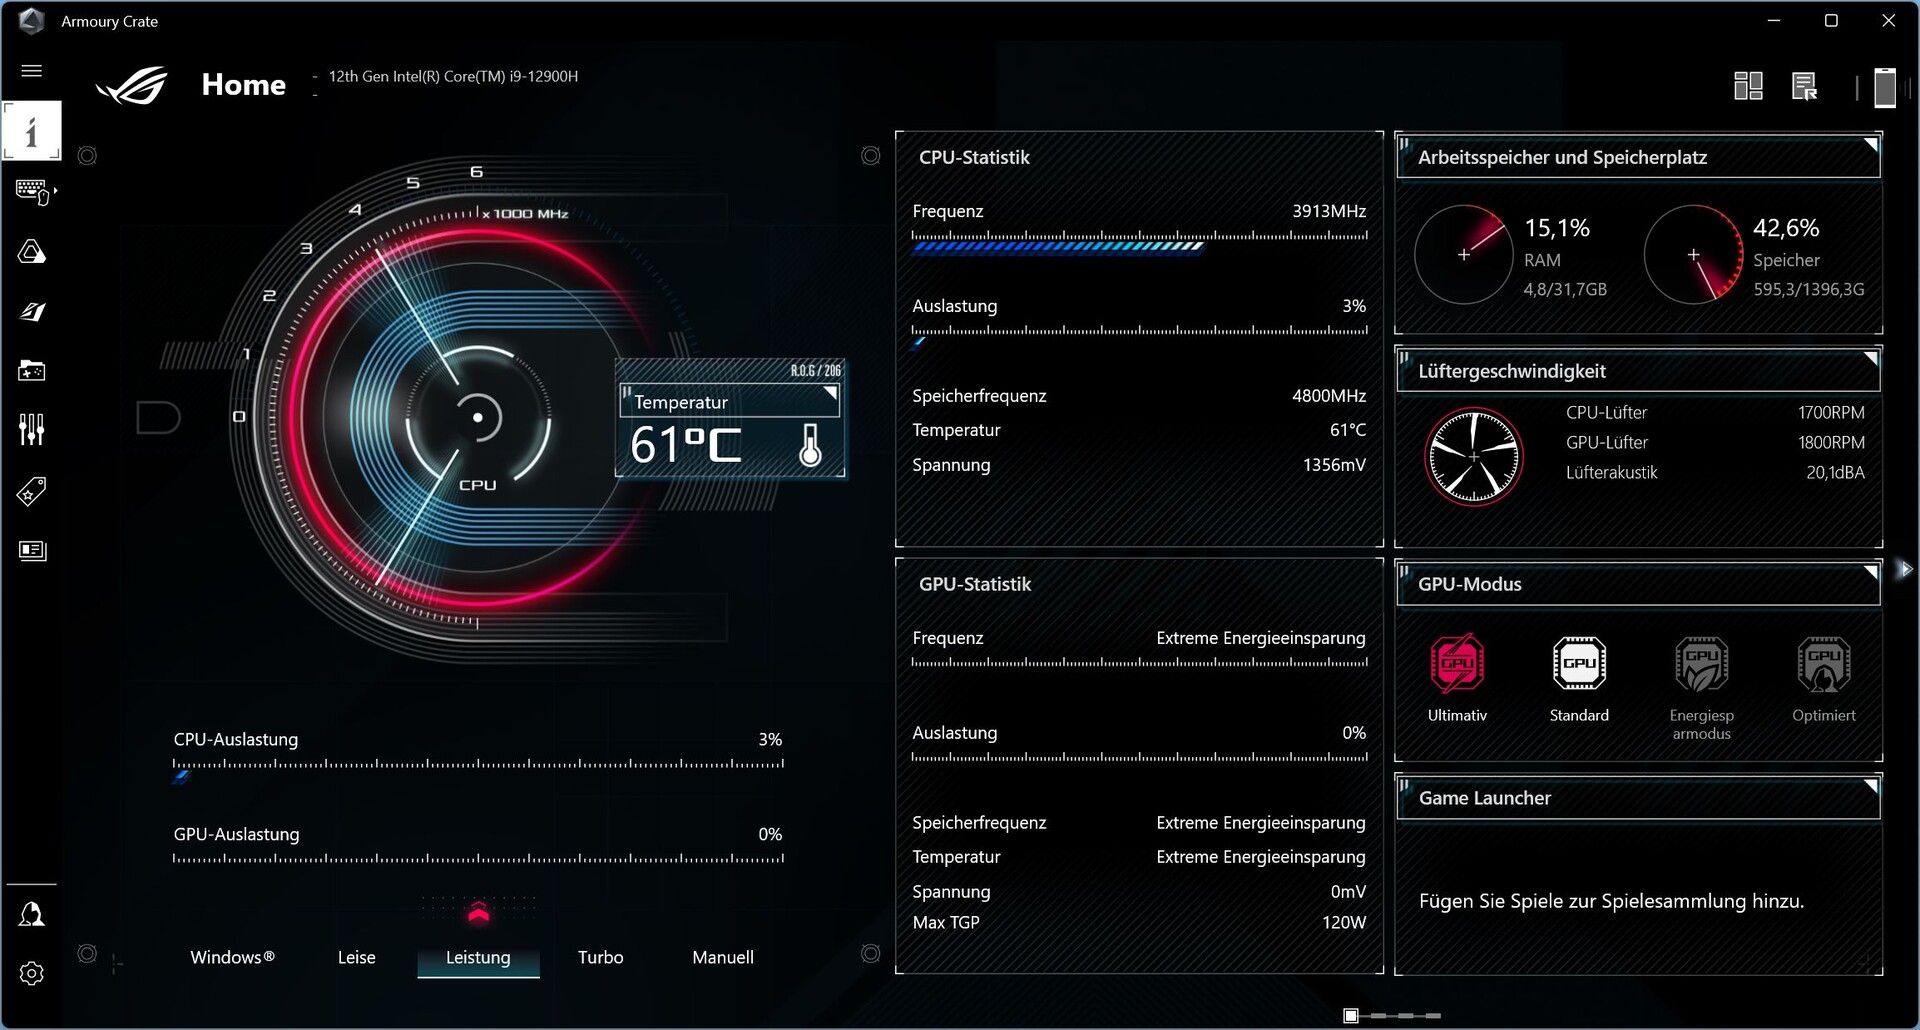
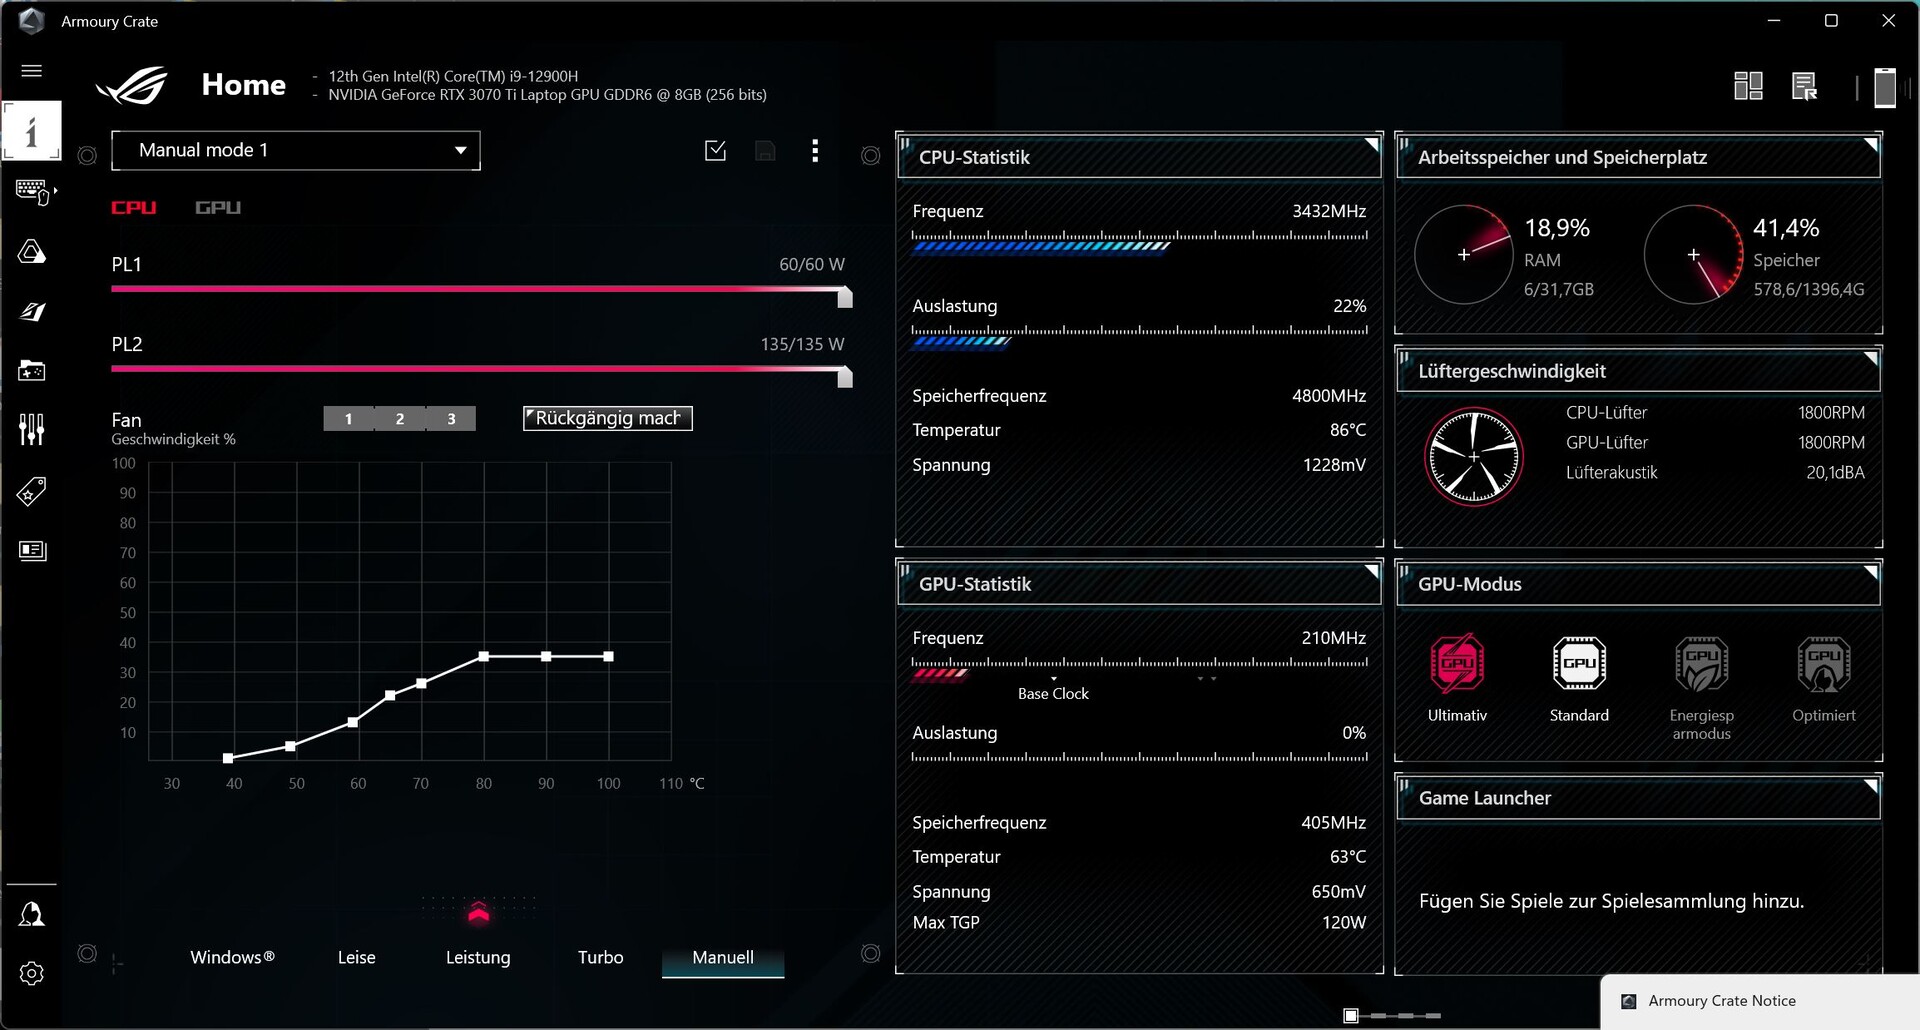
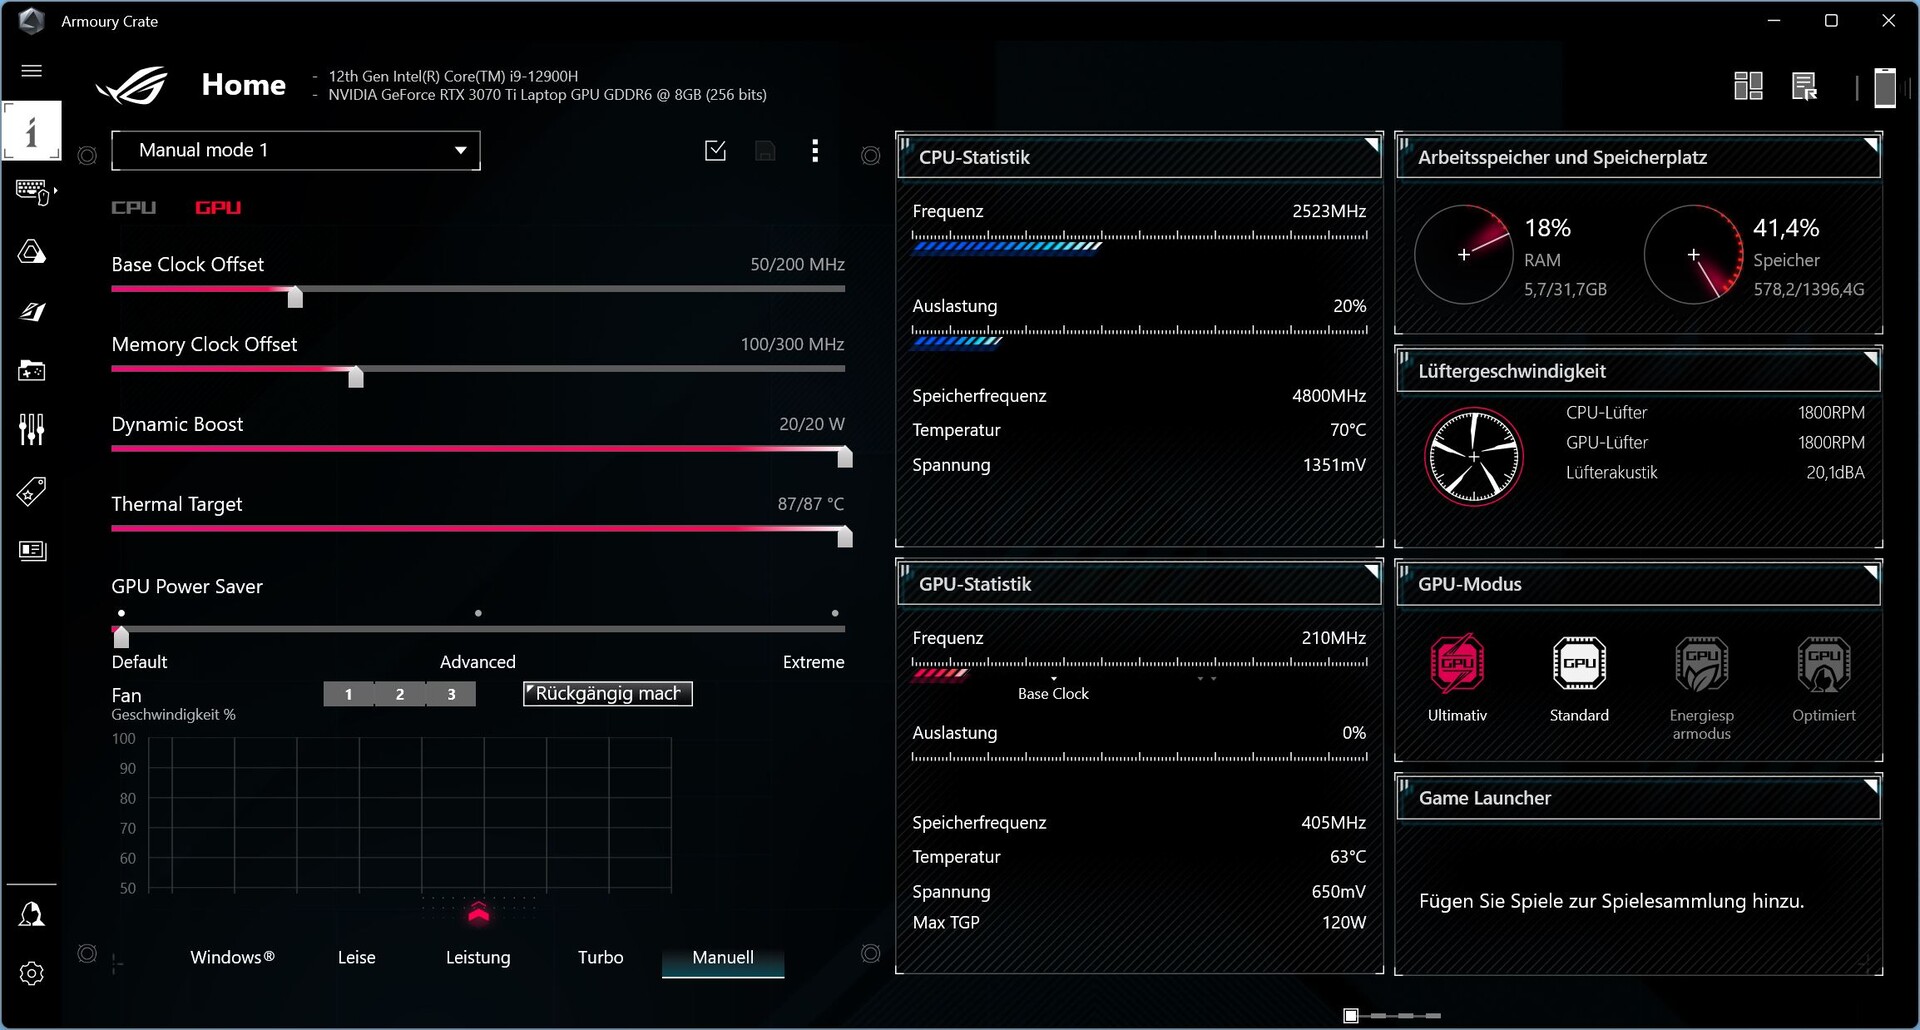
由于在Turbo模式下,笔记本电脑在空闲运行时已经非常响亮,我们在 "性能 "模式下运行所有基准测试。安静 "模式只用于电池测试--没有单独的省电模式。
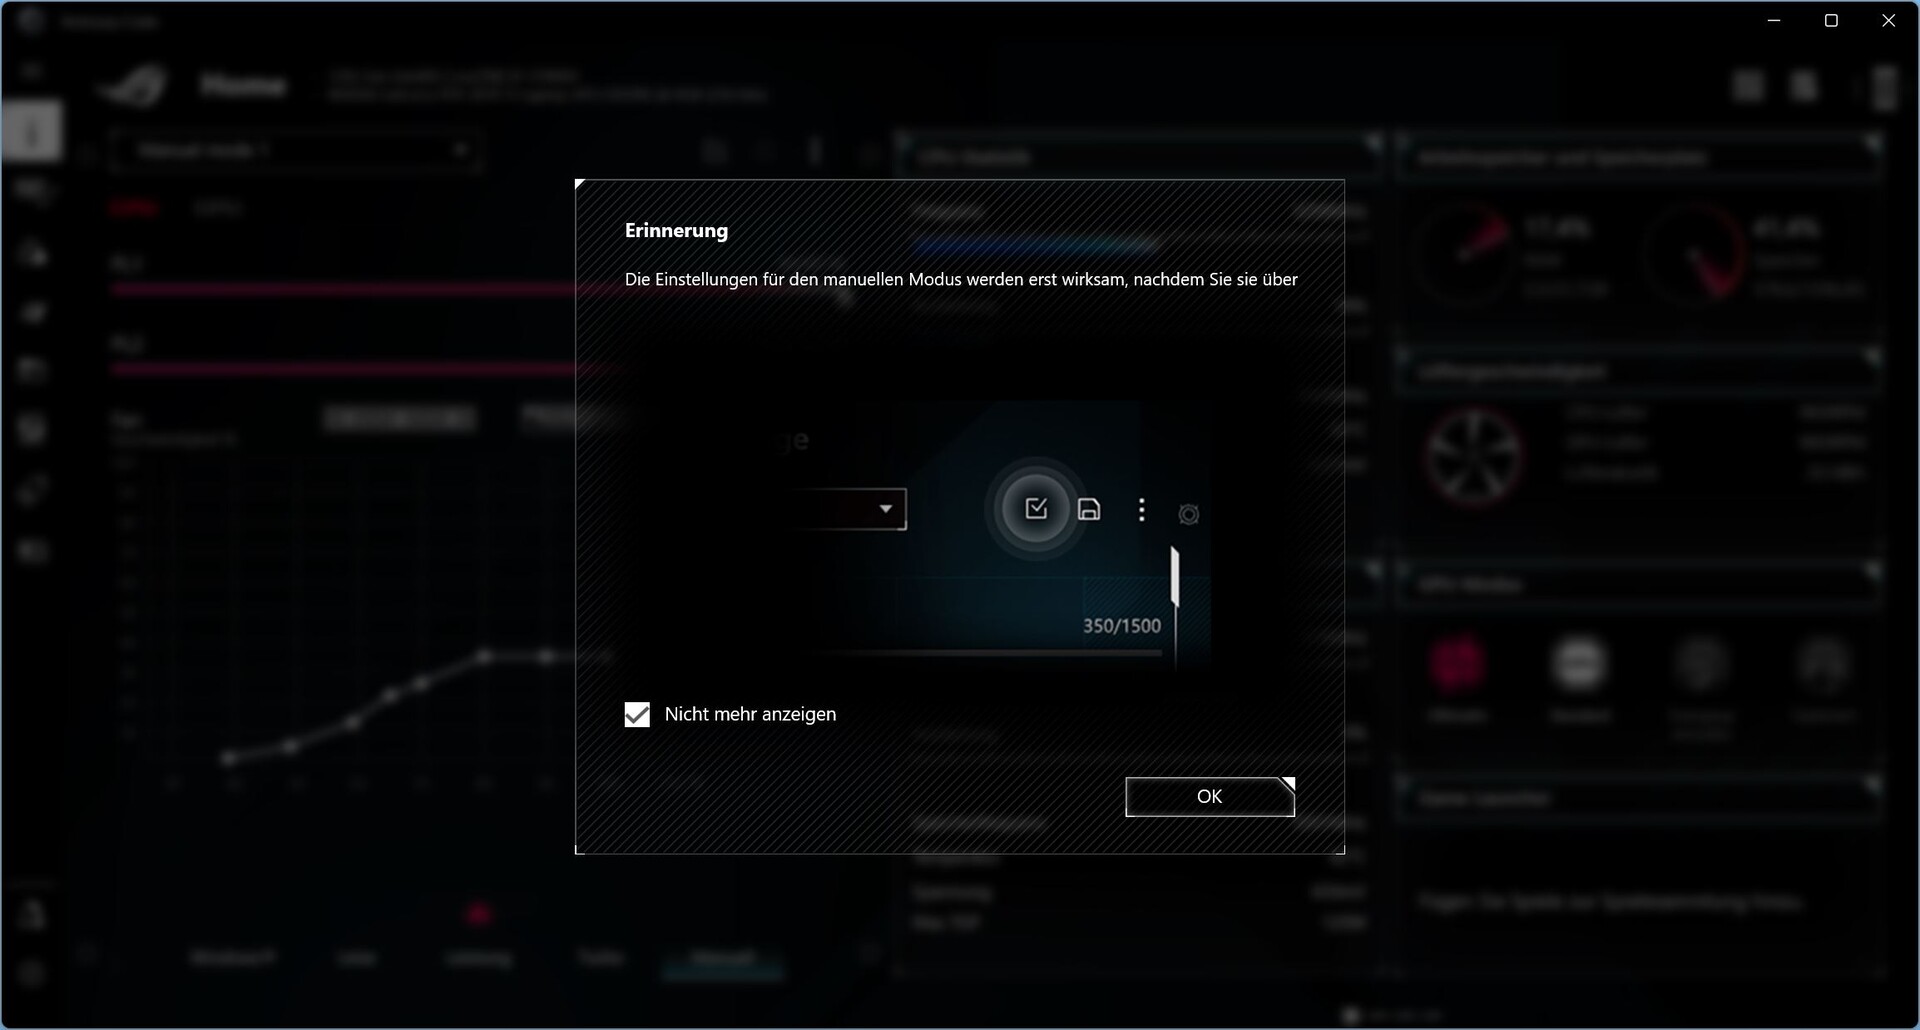
尽管软件本身组织得很好,但各种翻译错误或不完整的句子(在德语版本中)仍然妨碍了一个良好的整体印象。


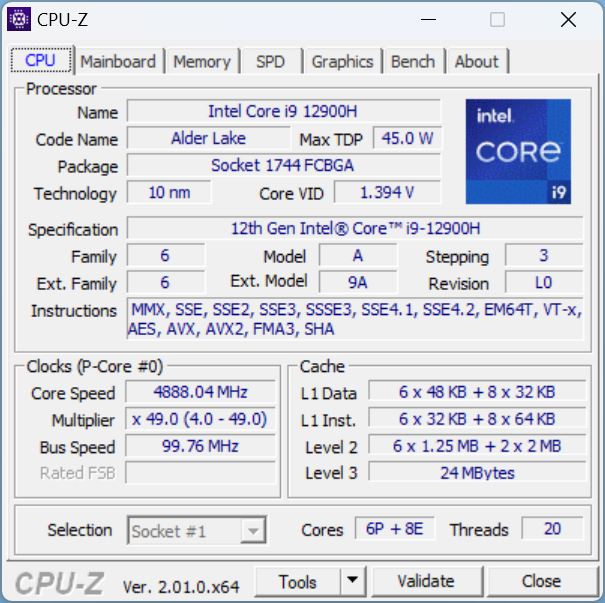
处理器
华硕已经宣布M16采用英特尔Gen13。在这之前,我们目前仍在使用Intel Core i9-12900H在我们的测试单元中。该高端CPU提供6个性能核心和8个效率核心。性能核心的时钟速度高达5GHz,而效率核心的基本时钟速度为1.8GHz。由于只有P核心支持超线程,我们总共得到12个线程。
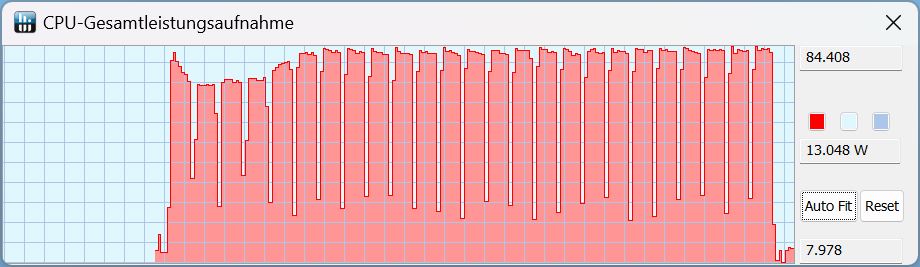
在Cinebench循环中,恒定性能非常稳定,在性能模式下最大TDP达到约84瓦。的性能i7-12700H在非常强大的XMG Focus 16在开始的时候甚至略胜一筹。但在最新的第4次运行后,它的性能下降到我们的M16以下,它也击败了Ryzen 7 6800在Legion 5.
顺便说一下,而不是84瓦,在Turbo模式下有强大的99瓦!在电池运行期间,这只有大约40瓦,性能也相应下降。
在所有的测试中,2022年的M16比前代的i9-11900H快20%左右。i9-11900H.
Cinebench R15 Multi Constant Load Test
Cinebench R23: Multi Core | Single Core
Cinebench R20: CPU (Multi Core) | CPU (Single Core)
Cinebench R15: CPU Multi 64Bit | CPU Single 64Bit
Blender: v2.79 BMW27 CPU
7-Zip 18.03: 7z b 4 | 7z b 4 -mmt1
Geekbench 5.5: Multi-Core | Single-Core
HWBOT x265 Benchmark v2.2: 4k Preset
LibreOffice : 20 Documents To PDF
R Benchmark 2.5: Overall mean
| CPU Performance rating | |
| Average of class Gaming | |
| Asus ROG Zephyrus M16 GU603Z | |
| Schenker XMG Focus 16 (i7-12700H, RTX 3060) | |
| Average Intel Core i9-12900H | |
| Schenker Vision 16 Pro RTX 3070 Ti | |
| Lenovo Legion 5 Pro 16ARH7H RTX 3070 Ti | |
| Corsair Voyager a1600 | |
| Asus ROG Zephyrus M16 GU603H -2! | |
| Cinebench R23 / Multi Core | |
| Average of class Gaming (10488 - 42661, n=107, last 2 years) | |
| Schenker XMG Focus 16 (i7-12700H, RTX 3060) | |
| Asus ROG Zephyrus M16 GU603Z | |
| Average Intel Core i9-12900H (7359 - 19648, n=28) | |
| Lenovo Legion 5 Pro 16ARH7H RTX 3070 Ti | |
| Corsair Voyager a1600 | |
| Schenker Vision 16 Pro RTX 3070 Ti | |
| Cinebench R23 / Single Core | |
| Average of class Gaming (1166 - 2415, n=107, last 2 years) | |
| Asus ROG Zephyrus M16 GU603Z | |
| Average Intel Core i9-12900H (1634 - 1930, n=28) | |
| Schenker Vision 16 Pro RTX 3070 Ti | |
| Schenker XMG Focus 16 (i7-12700H, RTX 3060) | |
| Corsair Voyager a1600 | |
| Lenovo Legion 5 Pro 16ARH7H RTX 3070 Ti | |
| Cinebench R20 / CPU (Multi Core) | |
| Average of class Gaming (4029 - 16433, n=106, last 2 years) | |
| Schenker XMG Focus 16 (i7-12700H, RTX 3060) | |
| Asus ROG Zephyrus M16 GU603Z | |
| Average Intel Core i9-12900H (2681 - 7471, n=28) | |
| Lenovo Legion 5 Pro 16ARH7H RTX 3070 Ti | |
| Asus ROG Zephyrus M16 GU603H | |
| Corsair Voyager a1600 | |
| Schenker Vision 16 Pro RTX 3070 Ti | |
| Cinebench R20 / CPU (Single Core) | |
| Average of class Gaming (442 - 913, n=106, last 2 years) | |
| Asus ROG Zephyrus M16 GU603Z | |
| Average Intel Core i9-12900H (624 - 738, n=28) | |
| Schenker Vision 16 Pro RTX 3070 Ti | |
| Schenker XMG Focus 16 (i7-12700H, RTX 3060) | |
| Asus ROG Zephyrus M16 GU603H | |
| Lenovo Legion 5 Pro 16ARH7H RTX 3070 Ti | |
| Corsair Voyager a1600 | |
| Cinebench R15 / CPU Multi 64Bit | |
| Average of class Gaming (1578 - 6330, n=105, last 2 years) | |
| Schenker Vision 16 Pro RTX 3070 Ti | |
| Schenker Vision 16 Pro RTX 3070 Ti | |
| Schenker XMG Focus 16 (i7-12700H, RTX 3060) | |
| Asus ROG Zephyrus M16 GU603Z | |
| Average Intel Core i9-12900H (1395 - 3077, n=28) | |
| Lenovo Legion 5 Pro 16ARH7H RTX 3070 Ti | |
| Asus ROG Zephyrus M16 GU603H | |
| Corsair Voyager a1600 | |
| Cinebench R15 / CPU Single 64Bit | |
| Average of class Gaming (188.8 - 350, n=106, last 2 years) | |
| Asus ROG Zephyrus M16 GU603Z | |
| Average Intel Core i9-12900H (235 - 277, n=29) | |
| Schenker Vision 16 Pro RTX 3070 Ti | |
| Schenker XMG Focus 16 (i7-12700H, RTX 3060) | |
| Lenovo Legion 5 Pro 16ARH7H RTX 3070 Ti | |
| Corsair Voyager a1600 | |
| Asus ROG Zephyrus M16 GU603H | |
| Blender / v2.79 BMW27 CPU | |
| Schenker Vision 16 Pro RTX 3070 Ti | |
| Asus ROG Zephyrus M16 GU603H | |
| Average Intel Core i9-12900H (160 - 451, n=28) | |
| Corsair Voyager a1600 | |
| Lenovo Legion 5 Pro 16ARH7H RTX 3070 Ti | |
| Schenker XMG Focus 16 (i7-12700H, RTX 3060) | |
| Asus ROG Zephyrus M16 GU603Z | |
| Average of class Gaming (79 - 330, n=104, last 2 years) | |
| 7-Zip 18.03 / 7z b 4 | |
| Average of class Gaming (33491 - 148086, n=105, last 2 years) | |
| Asus ROG Zephyrus M16 GU603Z | |
| Lenovo Legion 5 Pro 16ARH7H RTX 3070 Ti | |
| Schenker XMG Focus 16 (i7-12700H, RTX 3060) | |
| Corsair Voyager a1600 | |
| Average Intel Core i9-12900H (34684 - 76677, n=28) | |
| Asus ROG Zephyrus M16 GU603H | |
| Schenker Vision 16 Pro RTX 3070 Ti | |
| 7-Zip 18.03 / 7z b 4 -mmt1 | |
| Average of class Gaming (4199 - 7436, n=105, last 2 years) | |
| Asus ROG Zephyrus M16 GU603Z | |
| Schenker Vision 16 Pro RTX 3070 Ti | |
| Average Intel Core i9-12900H (5302 - 6289, n=28) | |
| Corsair Voyager a1600 | |
| Lenovo Legion 5 Pro 16ARH7H RTX 3070 Ti | |
| Schenker XMG Focus 16 (i7-12700H, RTX 3060) | |
| Asus ROG Zephyrus M16 GU603H | |
| Geekbench 5.5 / Multi-Core | |
| Average of class Gaming (6460 - 28263, n=105, last 2 years) | |
| Asus ROG Zephyrus M16 GU603Z | |
| Schenker XMG Focus 16 (i7-12700H, RTX 3060) | |
| Average Intel Core i9-12900H (8519 - 14376, n=31) | |
| Schenker Vision 16 Pro RTX 3070 Ti | |
| Lenovo Legion 5 Pro 16ARH7H RTX 3070 Ti | |
| Corsair Voyager a1600 | |
| Asus ROG Zephyrus M16 GU603H | |
| Geekbench 5.5 / Single-Core | |
| Average of class Gaming (986 - 2474, n=105, last 2 years) | |
| Asus ROG Zephyrus M16 GU603Z | |
| Schenker Vision 16 Pro RTX 3070 Ti | |
| Average Intel Core i9-12900H (1631 - 1897, n=31) | |
| Schenker XMG Focus 16 (i7-12700H, RTX 3060) | |
| Asus ROG Zephyrus M16 GU603H | |
| Lenovo Legion 5 Pro 16ARH7H RTX 3070 Ti | |
| Corsair Voyager a1600 | |
| HWBOT x265 Benchmark v2.2 / 4k Preset | |
| Average of class Gaming (11.5 - 44.4, n=105, last 2 years) | |
| Asus ROG Zephyrus M16 GU603Z | |
| Lenovo Legion 5 Pro 16ARH7H RTX 3070 Ti | |
| Schenker XMG Focus 16 (i7-12700H, RTX 3060) | |
| Average Intel Core i9-12900H (8.05 - 22.5, n=28) | |
| Corsair Voyager a1600 | |
| Asus ROG Zephyrus M16 GU603H | |
| Schenker Vision 16 Pro RTX 3070 Ti | |
| LibreOffice / 20 Documents To PDF | |
| Corsair Voyager a1600 | |
| Lenovo Legion 5 Pro 16ARH7H RTX 3070 Ti | |
| Average of class Gaming (33.2 - 88.8, n=105, last 2 years) | |
| Schenker XMG Focus 16 (i7-12700H, RTX 3060) | |
| Schenker Vision 16 Pro RTX 3070 Ti | |
| Average Intel Core i9-12900H (36.8 - 59.8, n=28) | |
| Asus ROG Zephyrus M16 GU603Z | |
| Asus ROG Zephyrus M16 GU603H | |
| R Benchmark 2.5 / Overall mean | |
| Asus ROG Zephyrus M16 GU603H | |
| Corsair Voyager a1600 | |
| Lenovo Legion 5 Pro 16ARH7H RTX 3070 Ti | |
| Schenker XMG Focus 16 (i7-12700H, RTX 3060) | |
| Schenker Vision 16 Pro RTX 3070 Ti | |
| Average Intel Core i9-12900H (0.4218 - 0.506, n=28) | |
| Asus ROG Zephyrus M16 GU603Z | |
| Average of class Gaming (0.3439 - 0.759, n=106, last 2 years) | |
* ... smaller is better
AIDA64: FP32 Ray-Trace | FPU Julia | CPU SHA3 | CPU Queen | FPU SinJulia | FPU Mandel | CPU AES | CPU ZLib | FP64 Ray-Trace | CPU PhotoWorxx
| Performance rating | |
| Average of class Gaming | |
| Lenovo Legion 5 Pro 16ARH7H RTX 3070 Ti | |
| Corsair Voyager a1600 | |
| Asus ROG Zephyrus M16 GU603Z | |
| Schenker XMG Focus 16 (i7-12700H, RTX 3060) | |
| Average Intel Core i9-12900H | |
| Schenker Vision 16 Pro RTX 3070 Ti | |
| Asus ROG Zephyrus M16 GU603H -9! | |
| AIDA64 / FP32 Ray-Trace | |
| Average of class Gaming (10227 - 85542, n=105, last 2 years) | |
| Lenovo Legion 5 Pro 16ARH7H RTX 3070 Ti | |
| Corsair Voyager a1600 | |
| Asus ROG Zephyrus M16 GU603Z | |
| Schenker XMG Focus 16 (i7-12700H, RTX 3060) | |
| Schenker Vision 16 Pro RTX 3070 Ti | |
| Average Intel Core i9-12900H (4074 - 18289, n=29) | |
| AIDA64 / FPU Julia | |
| Average of class Gaming (51376 - 238426, n=105, last 2 years) | |
| Lenovo Legion 5 Pro 16ARH7H RTX 3070 Ti | |
| Corsair Voyager a1600 | |
| Schenker XMG Focus 16 (i7-12700H, RTX 3060) | |
| Asus ROG Zephyrus M16 GU603Z | |
| Schenker Vision 16 Pro RTX 3070 Ti | |
| Average Intel Core i9-12900H (22307 - 93236, n=29) | |
| AIDA64 / CPU SHA3 | |
| Average of class Gaming (2180 - 10115, n=105, last 2 years) | |
| Schenker XMG Focus 16 (i7-12700H, RTX 3060) | |
| Lenovo Legion 5 Pro 16ARH7H RTX 3070 Ti | |
| Asus ROG Zephyrus M16 GU603Z | |
| Corsair Voyager a1600 | |
| Average Intel Core i9-12900H (1378 - 4215, n=29) | |
| Schenker Vision 16 Pro RTX 3070 Ti | |
| AIDA64 / CPU Queen | |
| Average of class Gaming (49785 - 173351, n=90, last 2 years) | |
| Lenovo Legion 5 Pro 16ARH7H RTX 3070 Ti | |
| Asus ROG Zephyrus M16 GU603Z | |
| Corsair Voyager a1600 | |
| Schenker XMG Focus 16 (i7-12700H, RTX 3060) | |
| Average Intel Core i9-12900H (78172 - 111241, n=28) | |
| Schenker Vision 16 Pro RTX 3070 Ti | |
| AIDA64 / FPU SinJulia | |
| Average of class Gaming (4424 - 33636, n=105, last 2 years) | |
| Corsair Voyager a1600 | |
| Lenovo Legion 5 Pro 16ARH7H RTX 3070 Ti | |
| Schenker XMG Focus 16 (i7-12700H, RTX 3060) | |
| Asus ROG Zephyrus M16 GU603Z | |
| Average Intel Core i9-12900H (5709 - 10410, n=29) | |
| Schenker Vision 16 Pro RTX 3070 Ti | |
| AIDA64 / FPU Mandel | |
| Average of class Gaming (25115 - 128721, n=105, last 2 years) | |
| Lenovo Legion 5 Pro 16ARH7H RTX 3070 Ti | |
| Corsair Voyager a1600 | |
| Schenker XMG Focus 16 (i7-12700H, RTX 3060) | |
| Asus ROG Zephyrus M16 GU603Z | |
| Schenker Vision 16 Pro RTX 3070 Ti | |
| Average Intel Core i9-12900H (11257 - 45581, n=29) | |
| AIDA64 / CPU AES | |
| Lenovo Legion 5 Pro 16ARH7H RTX 3070 Ti | |
| Corsair Voyager a1600 | |
| Asus ROG Zephyrus M16 GU603Z | |
| Average of class Gaming (39258 - 247074, n=105, last 2 years) | |
| Average Intel Core i9-12900H (31935 - 151546, n=29) | |
| Schenker XMG Focus 16 (i7-12700H, RTX 3060) | |
| Schenker Vision 16 Pro RTX 3070 Ti | |
| AIDA64 / CPU ZLib | |
| Average of class Gaming (574 - 2531, n=105, last 2 years) | |
| Schenker XMG Focus 16 (i7-12700H, RTX 3060) | |
| Asus ROG Zephyrus M16 GU603Z | |
| Average Intel Core i9-12900H (449 - 1193, n=29) | |
| Lenovo Legion 5 Pro 16ARH7H RTX 3070 Ti | |
| Corsair Voyager a1600 | |
| Schenker Vision 16 Pro RTX 3070 Ti | |
| Asus ROG Zephyrus M16 GU603H | |
| AIDA64 / FP64 Ray-Trace | |
| Average of class Gaming (5509 - 45446, n=105, last 2 years) | |
| Lenovo Legion 5 Pro 16ARH7H RTX 3070 Ti | |
| Corsair Voyager a1600 | |
| Asus ROG Zephyrus M16 GU603Z | |
| Schenker XMG Focus 16 (i7-12700H, RTX 3060) | |
| Schenker Vision 16 Pro RTX 3070 Ti | |
| Average Intel Core i9-12900H (2235 - 10511, n=29) | |
| AIDA64 / CPU PhotoWorxx | |
| Average of class Gaming (12271 - 89891, n=105, last 2 years) | |
| Schenker Vision 16 Pro RTX 3070 Ti | |
| Asus ROG Zephyrus M16 GU603Z | |
| Average Intel Core i9-12900H (20960 - 48269, n=30) | |
| Lenovo Legion 5 Pro 16ARH7H RTX 3070 Ti | |
| Schenker XMG Focus 16 (i7-12700H, RTX 3060) | |
| Corsair Voyager a1600 | |
系统性能
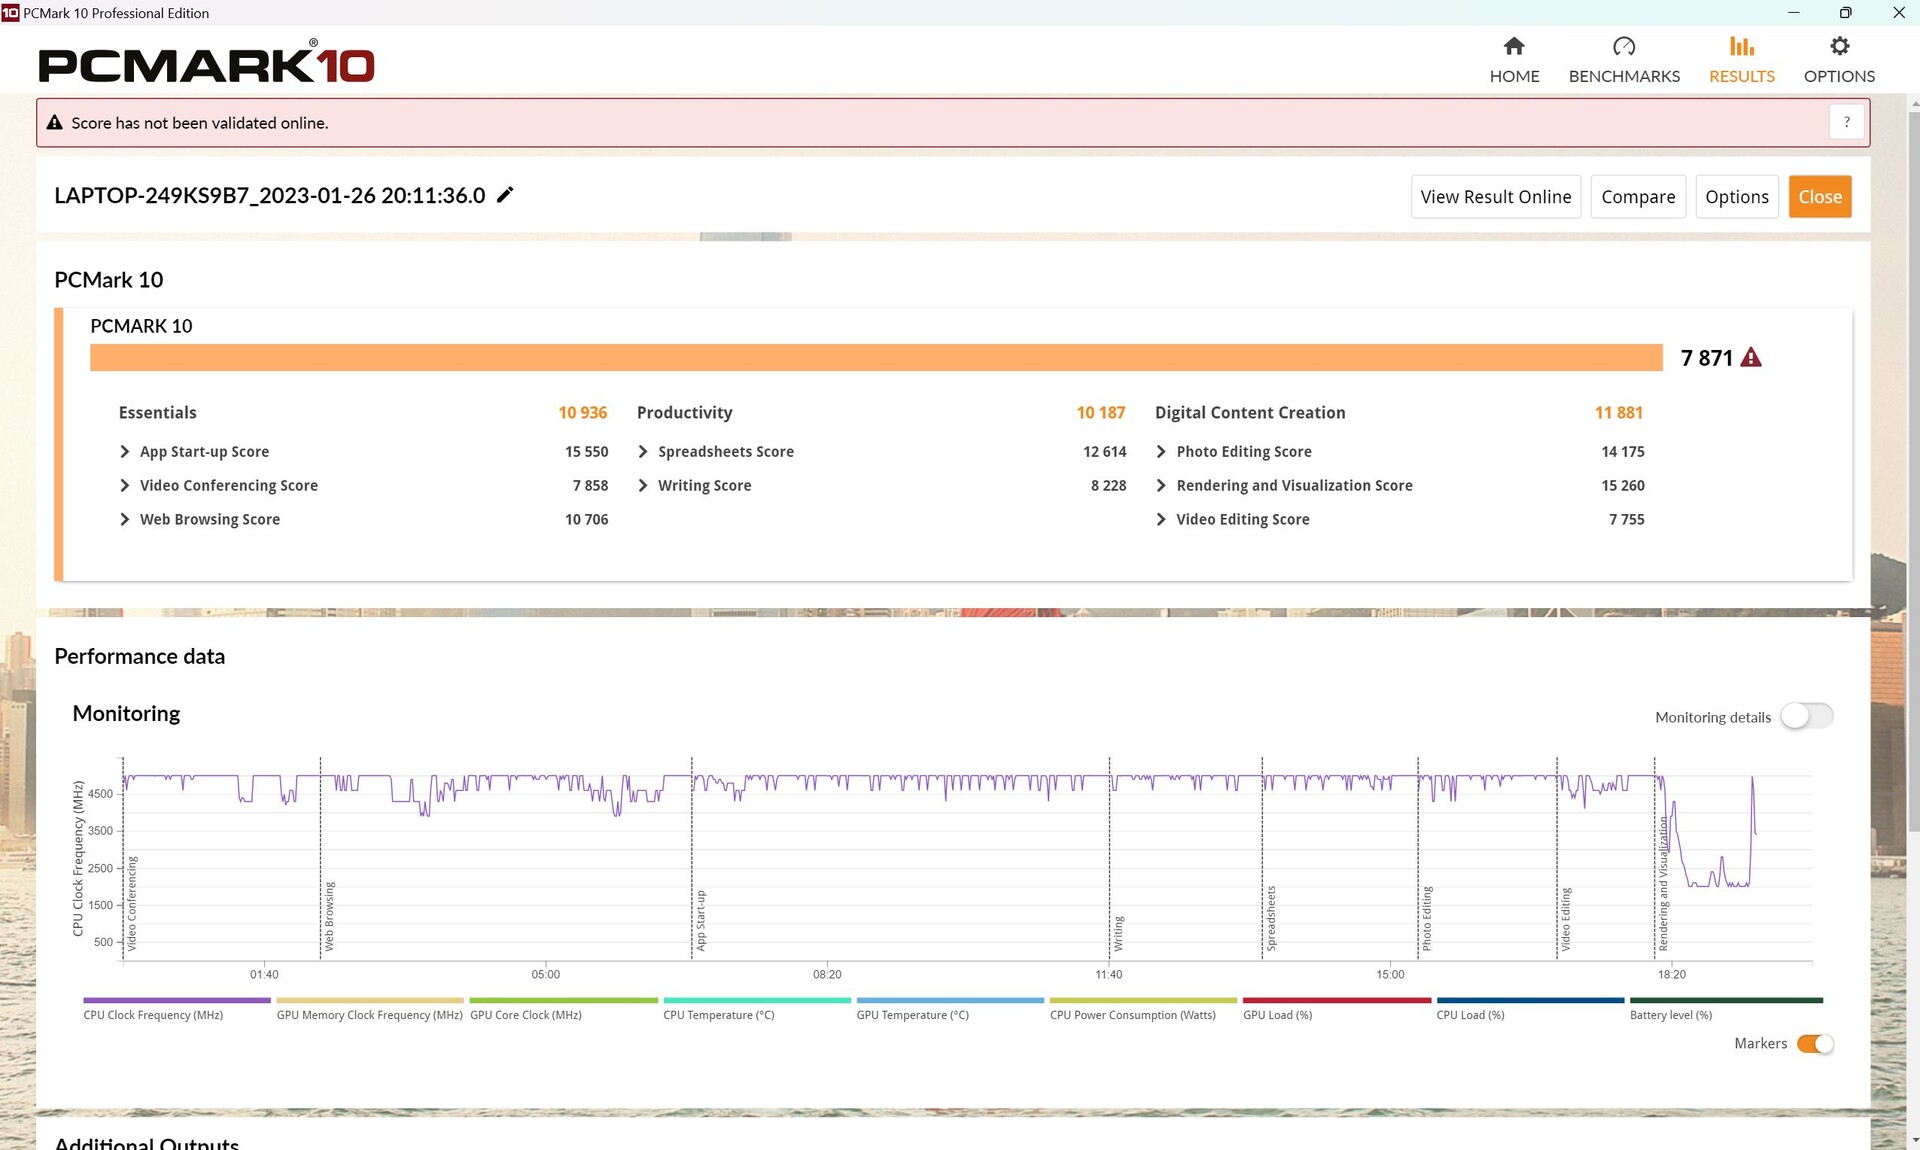
在PCMark中,i9和RTX 3070 Ti的组合为 RTX 3070 Ti在所有基准测试中都处于领先地位,但这也是预期的性能水平。CrossMark基准测试的情况也是如此。
CrossMark: Overall | Productivity | Creativity | Responsiveness
| PCMark 10 / Score | |
| Average of class Gaming (5828 - 12414, n=93, last 2 years) | |
| Asus ROG Zephyrus M16 GU603Z | |
| Average Intel Core i9-12900H, NVIDIA GeForce RTX 3070 Ti Laptop GPU (7087 - 8072, n=6) | |
| Lenovo Legion 5 Pro 16ARH7H RTX 3070 Ti | |
| Corsair Voyager a1600 | |
| Schenker XMG Focus 16 (i7-12700H, RTX 3060) | |
| Asus ROG Zephyrus M16 GU603H | |
| PCMark 10 / Essentials | |
| Asus ROG Zephyrus M16 GU603Z | |
| Average Intel Core i9-12900H, NVIDIA GeForce RTX 3070 Ti Laptop GPU (10266 - 11663, n=6) | |
| Average of class Gaming (8810 - 11935, n=97, last 2 years) | |
| Asus ROG Zephyrus M16 GU603H | |
| Lenovo Legion 5 Pro 16ARH7H RTX 3070 Ti | |
| Schenker XMG Focus 16 (i7-12700H, RTX 3060) | |
| Corsair Voyager a1600 | |
| PCMark 10 / Productivity | |
| Average of class Gaming (6845 - 25323, n=95, last 2 years) | |
| Asus ROG Zephyrus M16 GU603Z | |
| Average Intel Core i9-12900H, NVIDIA GeForce RTX 3070 Ti Laptop GPU (9402 - 10742, n=6) | |
| Schenker XMG Focus 16 (i7-12700H, RTX 3060) | |
| Lenovo Legion 5 Pro 16ARH7H RTX 3070 Ti | |
| Asus ROG Zephyrus M16 GU603H | |
| Corsair Voyager a1600 | |
| PCMark 10 / Digital Content Creation | |
| Average of class Gaming (7602 - 19954, n=95, last 2 years) | |
| Asus ROG Zephyrus M16 GU603Z | |
| Lenovo Legion 5 Pro 16ARH7H RTX 3070 Ti | |
| Average Intel Core i9-12900H, NVIDIA GeForce RTX 3070 Ti Laptop GPU (10009 - 12541, n=6) | |
| Corsair Voyager a1600 | |
| Asus ROG Zephyrus M16 GU603H | |
| Schenker XMG Focus 16 (i7-12700H, RTX 3060) | |
| CrossMark / Overall | |
| Average of class Gaming (1366 - 2409, n=94, last 2 years) | |
| Asus ROG Zephyrus M16 GU603Z | |
| Average Intel Core i9-12900H, NVIDIA GeForce RTX 3070 Ti Laptop GPU (1664 - 2044, n=6) | |
| Schenker XMG Focus 16 (i7-12700H, RTX 3060) | |
| Schenker Vision 16 Pro RTX 3070 Ti | |
| Lenovo Legion 5 Pro 16ARH7H RTX 3070 Ti | |
| Corsair Voyager a1600 | |
| CrossMark / Productivity | |
| Average of class Gaming (1386 - 2254, n=94, last 2 years) | |
| Asus ROG Zephyrus M16 GU603Z | |
| Average Intel Core i9-12900H, NVIDIA GeForce RTX 3070 Ti Laptop GPU (1591 - 1968, n=6) | |
| Lenovo Legion 5 Pro 16ARH7H RTX 3070 Ti | |
| Schenker XMG Focus 16 (i7-12700H, RTX 3060) | |
| Schenker Vision 16 Pro RTX 3070 Ti | |
| Corsair Voyager a1600 | |
| CrossMark / Creativity | |
| Average of class Gaming (1343 - 2786, n=94, last 2 years) | |
| Asus ROG Zephyrus M16 GU603Z | |
| Average Intel Core i9-12900H, NVIDIA GeForce RTX 3070 Ti Laptop GPU (1797 - 2148, n=6) | |
| Schenker Vision 16 Pro RTX 3070 Ti | |
| Schenker XMG Focus 16 (i7-12700H, RTX 3060) | |
| Lenovo Legion 5 Pro 16ARH7H RTX 3070 Ti | |
| Corsair Voyager a1600 | |
| CrossMark / Responsiveness | |
| Asus ROG Zephyrus M16 GU603Z | |
| Average Intel Core i9-12900H, NVIDIA GeForce RTX 3070 Ti Laptop GPU (1514 - 2069, n=6) | |
| Average of class Gaming (1226 - 2334, n=94, last 2 years) | |
| Lenovo Legion 5 Pro 16ARH7H RTX 3070 Ti | |
| Schenker XMG Focus 16 (i7-12700H, RTX 3060) | |
| Schenker Vision 16 Pro RTX 3070 Ti | |
| Corsair Voyager a1600 | |
| PCMark 10 Score | 7871 points | |
Help | ||
| AIDA64 / Memory Copy | |
| Average of class Gaming (21750 - 129946, n=105, last 2 years) | |
| Asus ROG Zephyrus M16 GU603Z | |
| Schenker Vision 16 Pro RTX 3070 Ti | |
| Average Intel Core i9-12900H (34438 - 74264, n=29) | |
| Lenovo Legion 5 Pro 16ARH7H RTX 3070 Ti | |
| Corsair Voyager a1600 | |
| Schenker XMG Focus 16 (i7-12700H, RTX 3060) | |
| AIDA64 / Memory Read | |
| Average of class Gaming (22956 - 118858, n=105, last 2 years) | |
| Asus ROG Zephyrus M16 GU603Z | |
| Schenker Vision 16 Pro RTX 3070 Ti | |
| Average Intel Core i9-12900H (36365 - 74642, n=29) | |
| Lenovo Legion 5 Pro 16ARH7H RTX 3070 Ti | |
| Corsair Voyager a1600 | |
| Schenker XMG Focus 16 (i7-12700H, RTX 3060) | |
| AIDA64 / Memory Write | |
| Average of class Gaming (22297 - 135096, n=105, last 2 years) | |
| Asus ROG Zephyrus M16 GU603Z | |
| Schenker Vision 16 Pro RTX 3070 Ti | |
| Average Intel Core i9-12900H (32276 - 67858, n=29) | |
| Lenovo Legion 5 Pro 16ARH7H RTX 3070 Ti | |
| Corsair Voyager a1600 | |
| Schenker XMG Focus 16 (i7-12700H, RTX 3060) | |
| AIDA64 / Memory Latency | |
| Average of class Gaming (75.3 - 259, n=105, last 2 years) | |
| Corsair Voyager a1600 | |
| Schenker Vision 16 Pro RTX 3070 Ti | |
| Schenker XMG Focus 16 (i7-12700H, RTX 3060) | |
| Asus ROG Zephyrus M16 GU603Z | |
| Lenovo Legion 5 Pro 16ARH7H RTX 3070 Ti | |
| Average Intel Core i9-12900H (74.7 - 118.1, n=28) | |
| Asus ROG Zephyrus M16 GU603H | |
* ... smaller is better
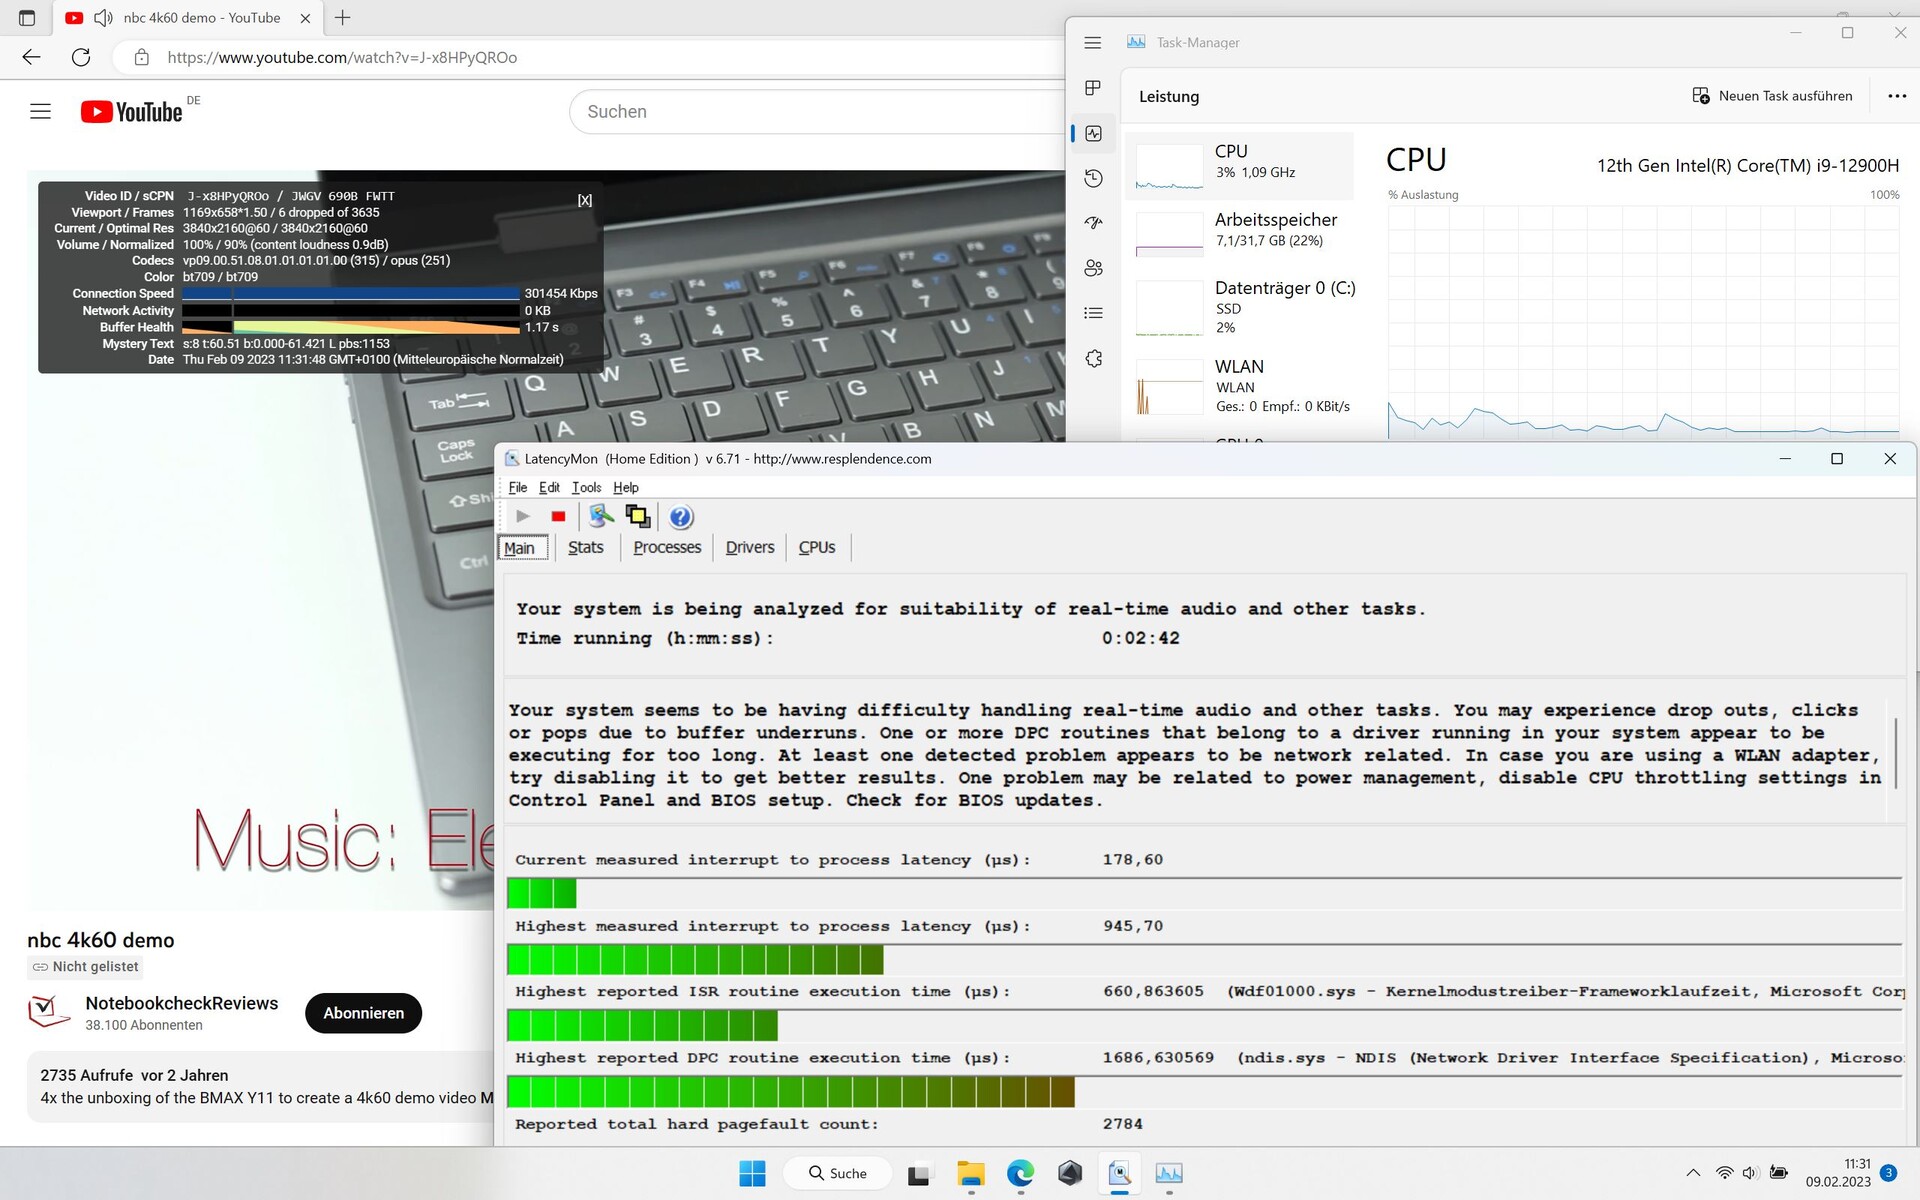
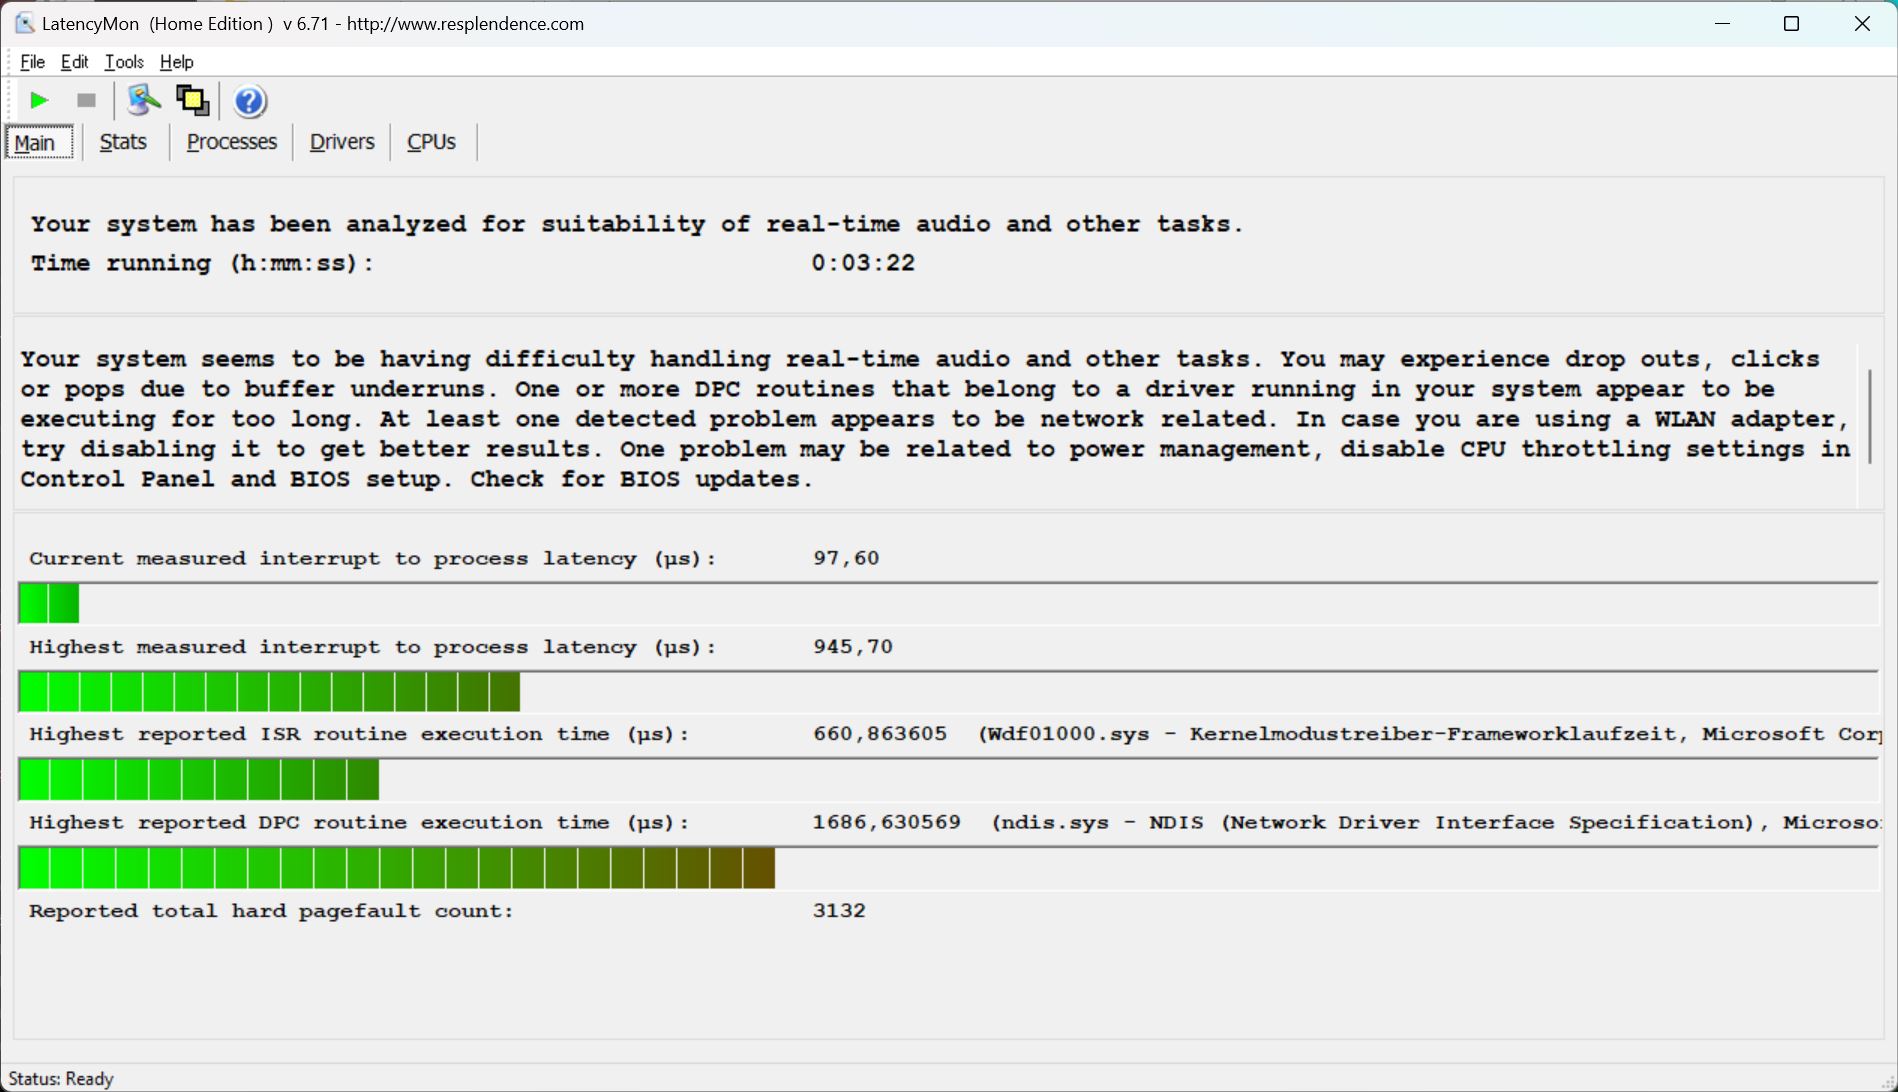
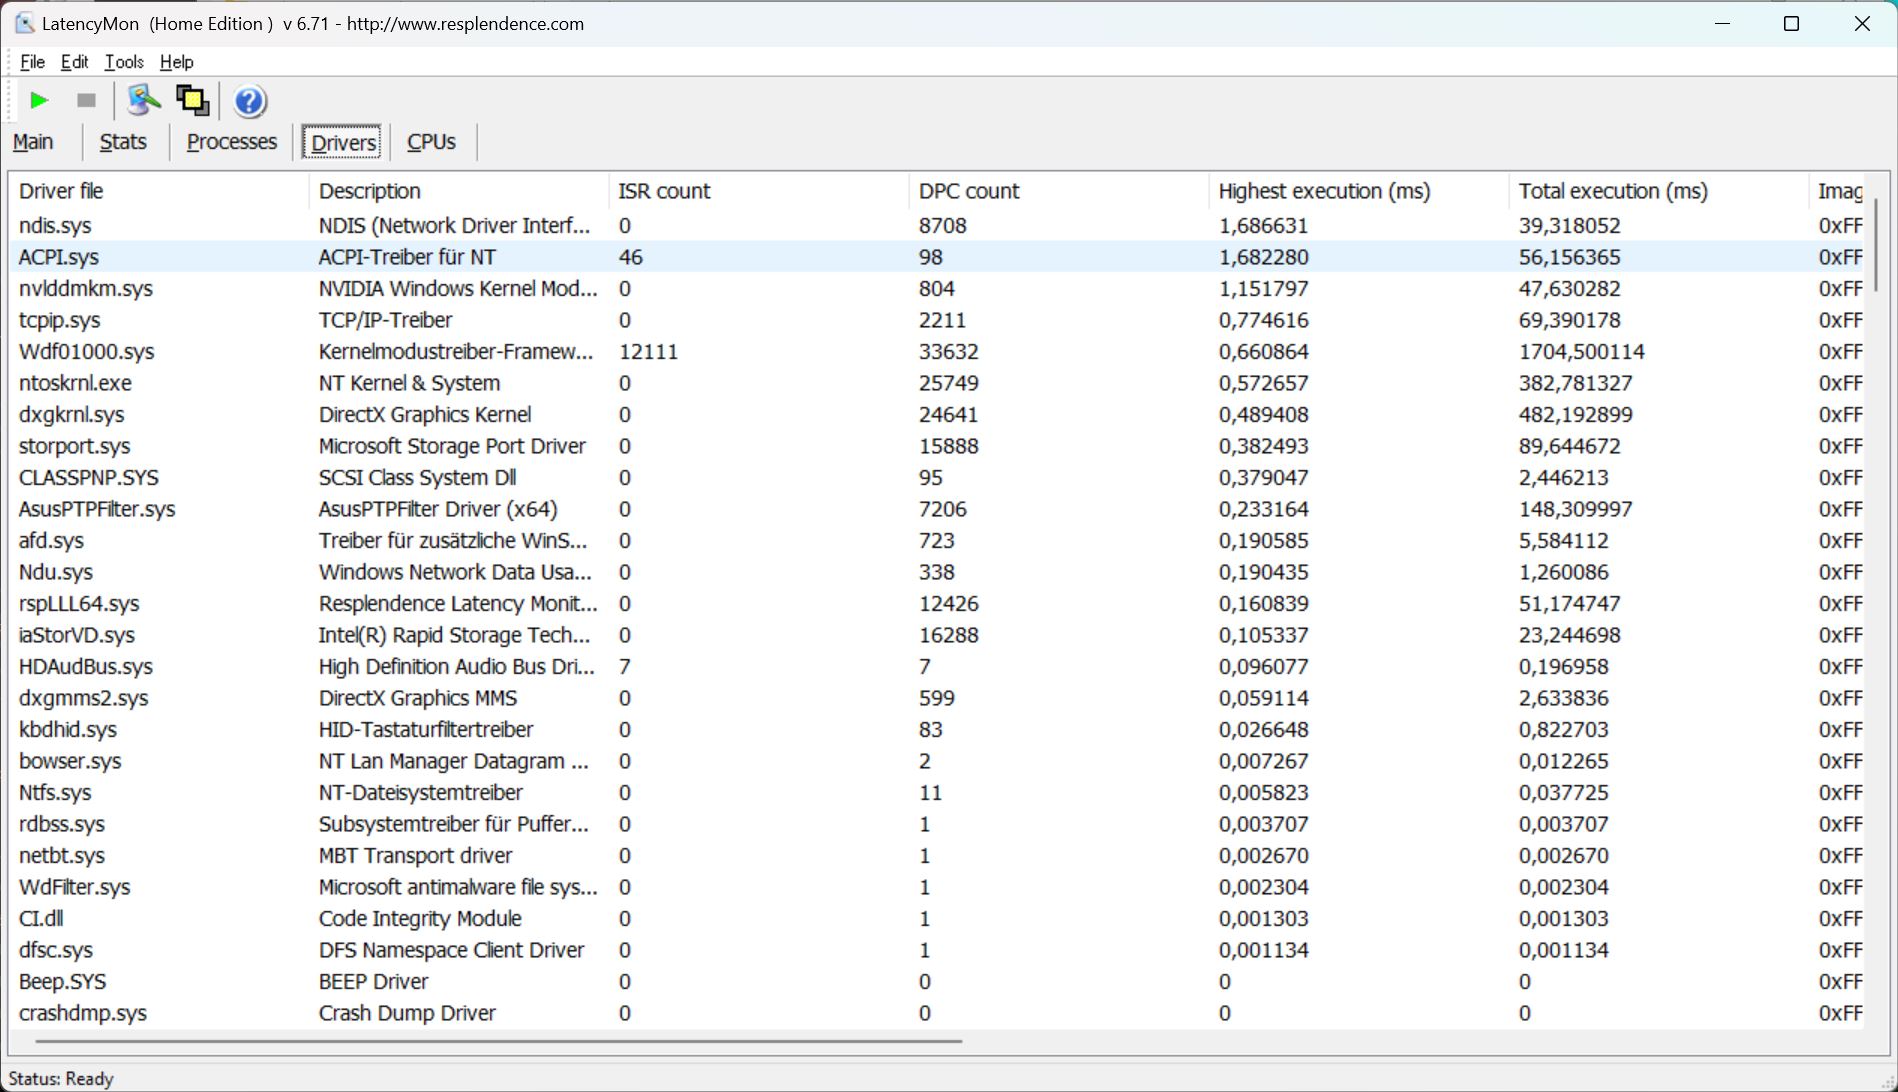
DPC延迟
不幸的是,LatencyMon在启动软件时已经发现了第一个延迟,即使没有额外的操作。当用多个标签打开浏览器时,延迟会进一步增加。
我们的4K/60-fps YouTube视频也不能在没有任何丢帧的情况下再现(6)。然而,延迟值总体上并不是特别高,而且低于在 XMG Focus 16,比如说。另一方面,它们变得很明显。
| DPC Latencies / LatencyMon - interrupt to process latency (max), Web, Youtube, Prime95 | |
| Schenker XMG Focus 16 (i7-12700H, RTX 3060) | |
| Asus ROG Zephyrus M16 GU603H | |
| Asus ROG Zephyrus M16 GU603Z | |
| Lenovo Legion 5 Pro 16ARH7H RTX 3070 Ti | |
| Corsair Voyager a1600 | |
| Schenker Vision 16 Pro RTX 3070 Ti | |
* ... smaller is better
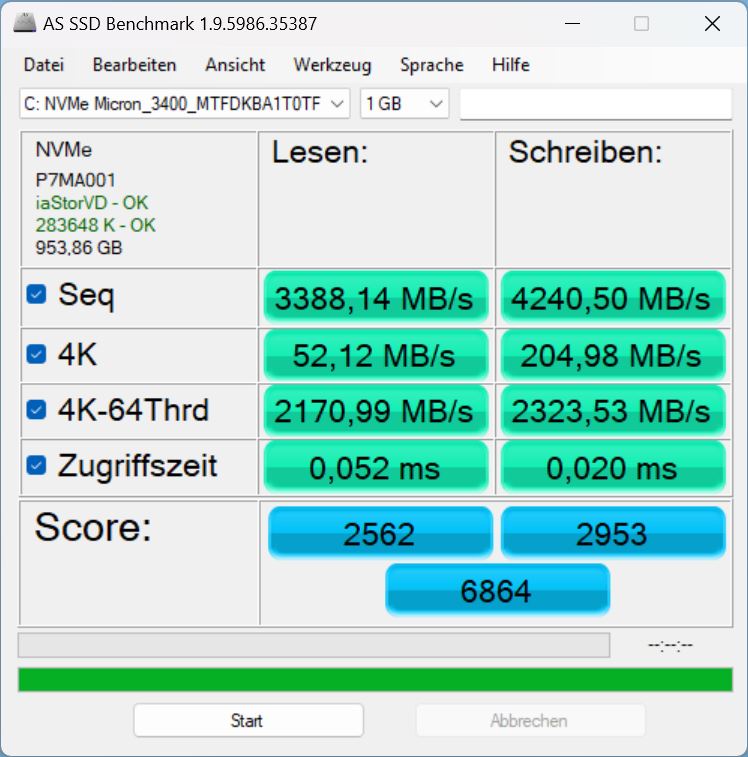
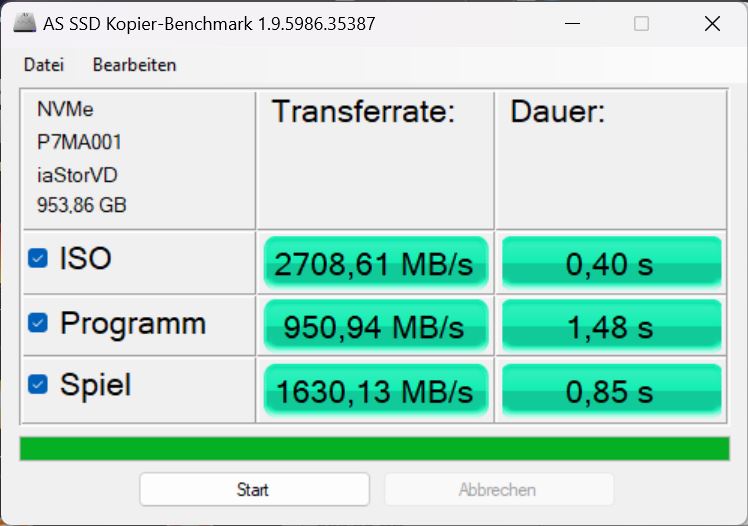
存储解决方案
我们的测试模型使用美光公司的PCIe Gen4固态硬盘,存储量为1TB。在我们的 最佳固态硬盘列表中,它排在第74位。基准测试证实了该存储解决方案的体面价值。然而,三星存储的测量值在前辈或 Legion 5,则更快。
这款固态硬盘不太能够长期保持其性能,但性能下降的幅度很小。

* ... smaller is better
Disk Throttling: DiskSpd Read Loop, Queue Depth 8
图形卡
我们的测试系统使用了一个RTX 3070 Ti。尽管它确实是最强大的笔记本电脑GPU之一,但它 "只 "被允许在M16中使用100W和20W动态提升。当允许使用150瓦时, 同样的GPU在M16系统中更快 ,这并不令人惊讶。Legion 5 Pro的速度,甚至高达27%!
至少,前辈的 RTX 3070(没有 "Ti")超过了38%。这款XMG Vision 16 Pro只允许最大95W的GPU,所以也仍然大大落后于M16。
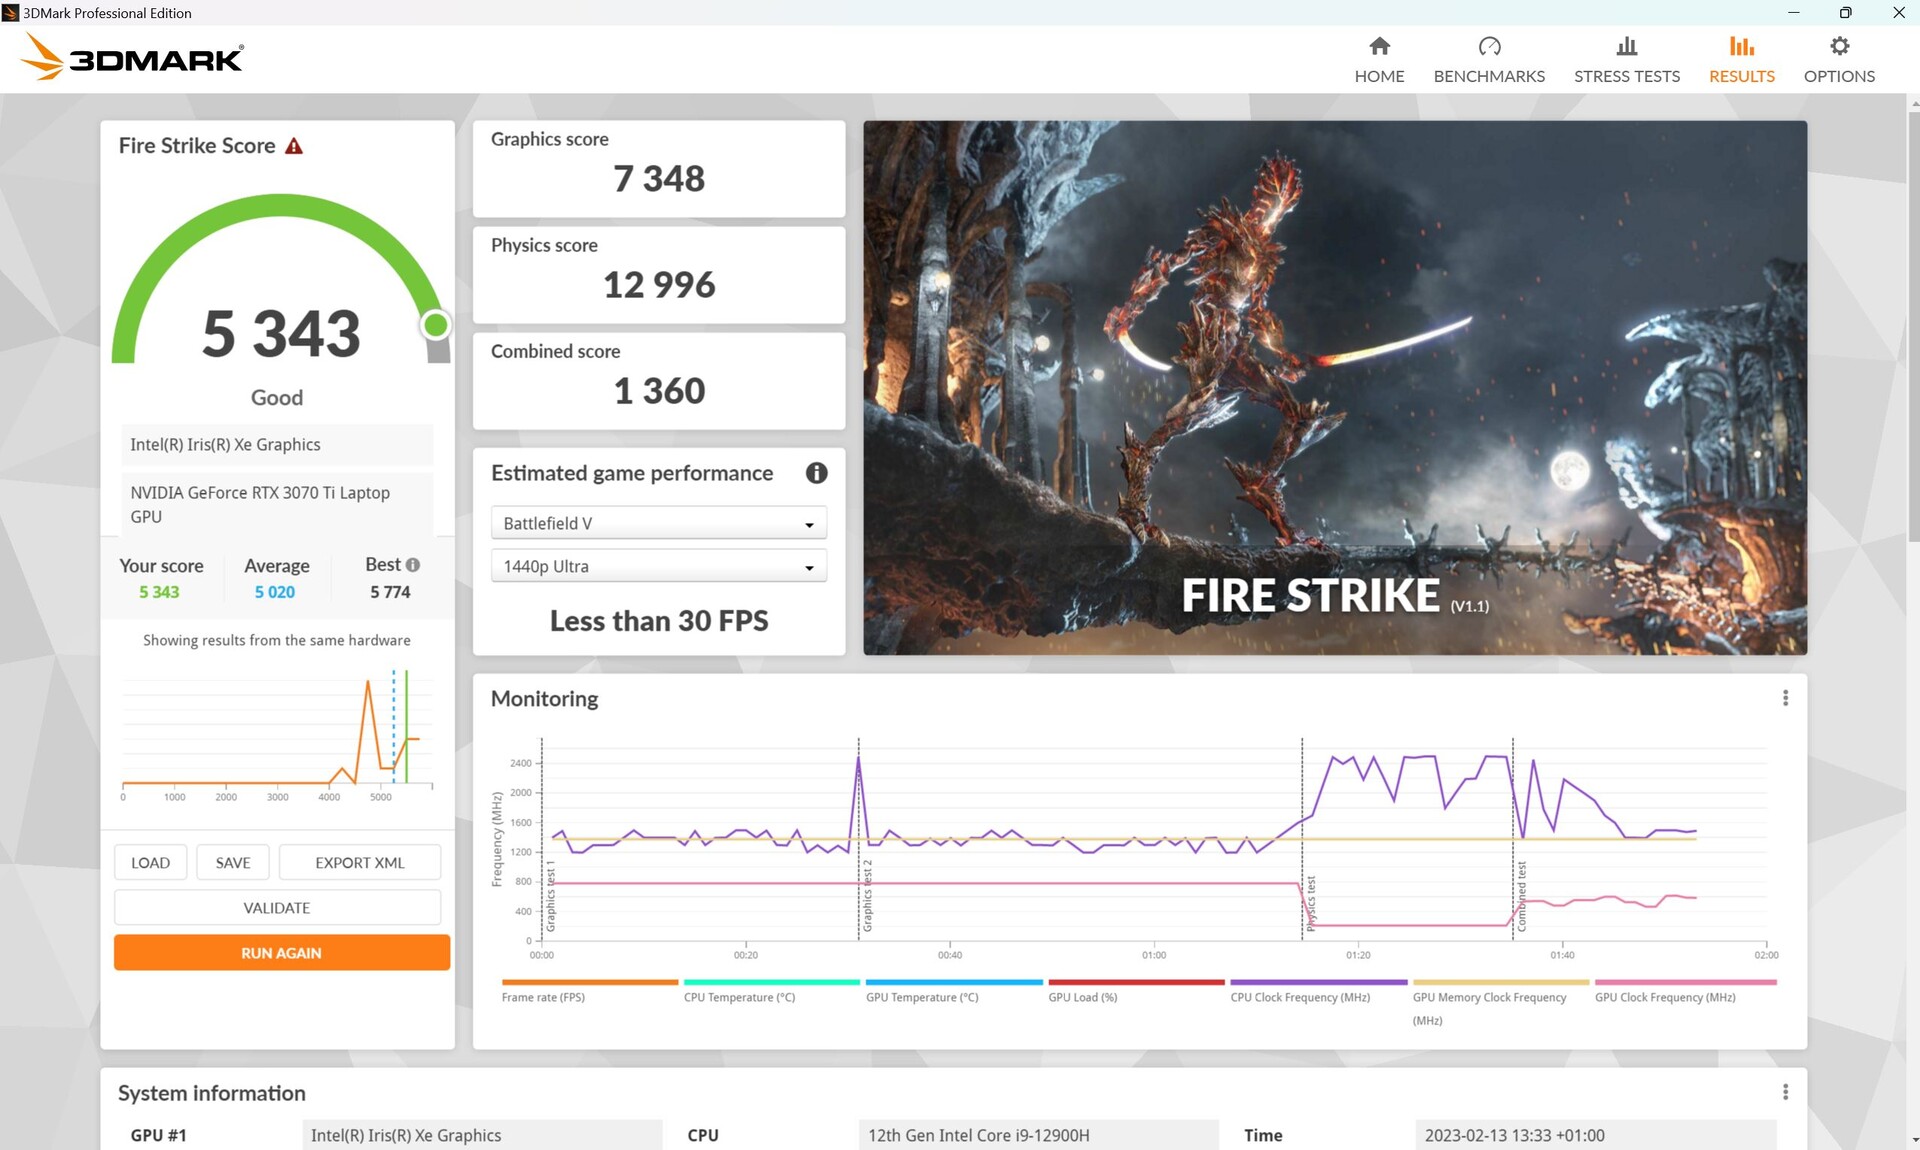
总的来说,120-W显卡的速度比我们数据库中的平均RTX 3070 Ti慢了约7至12%。
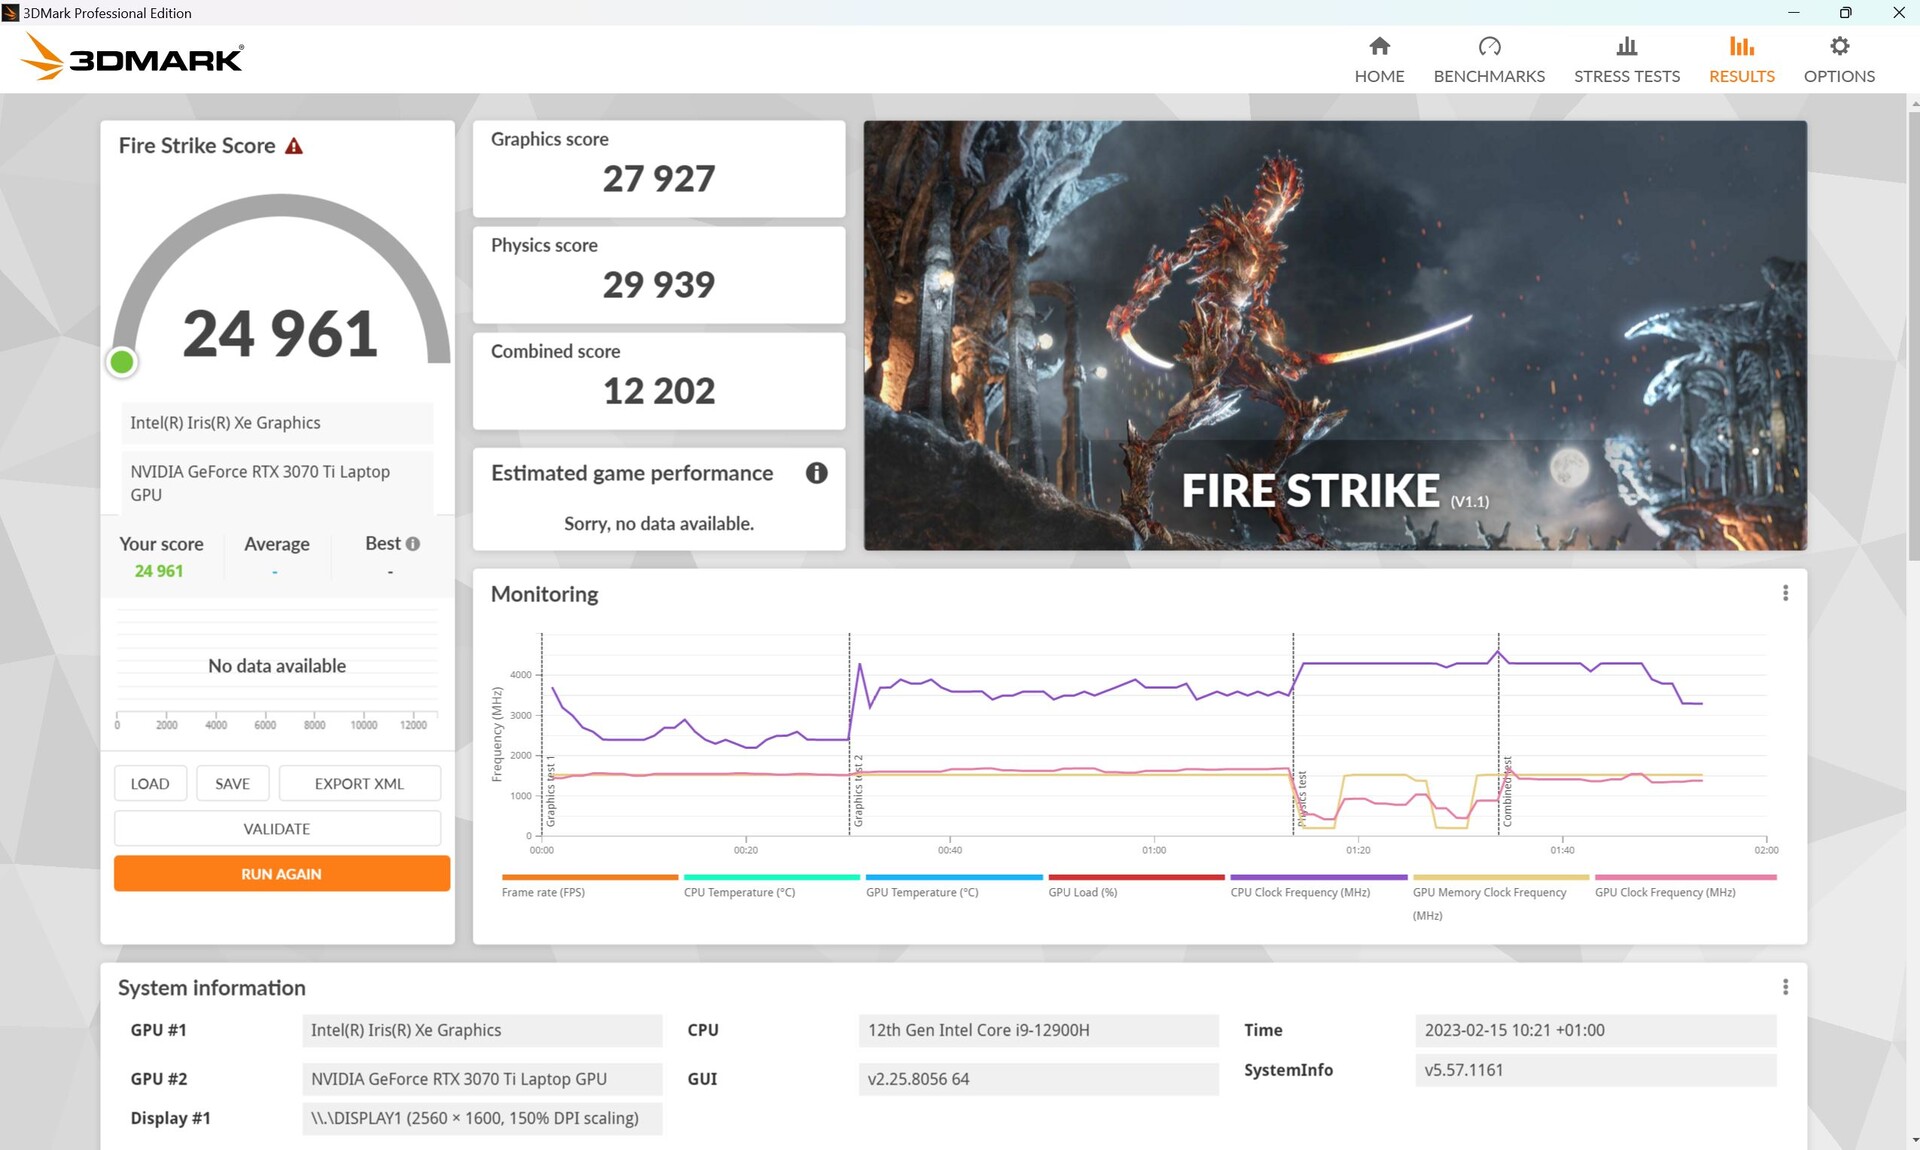
在Turbo模式下,性能和消耗略有增加,另一个Fire-Strike测试的结果是图形得分高出约13%。
在电池运行期间,3D性能明显下降。与主电源运行时Fire Strike 的24,618个图形点相比,在电池运行时只剩下7,348个3D点,这相当于下降了70%!
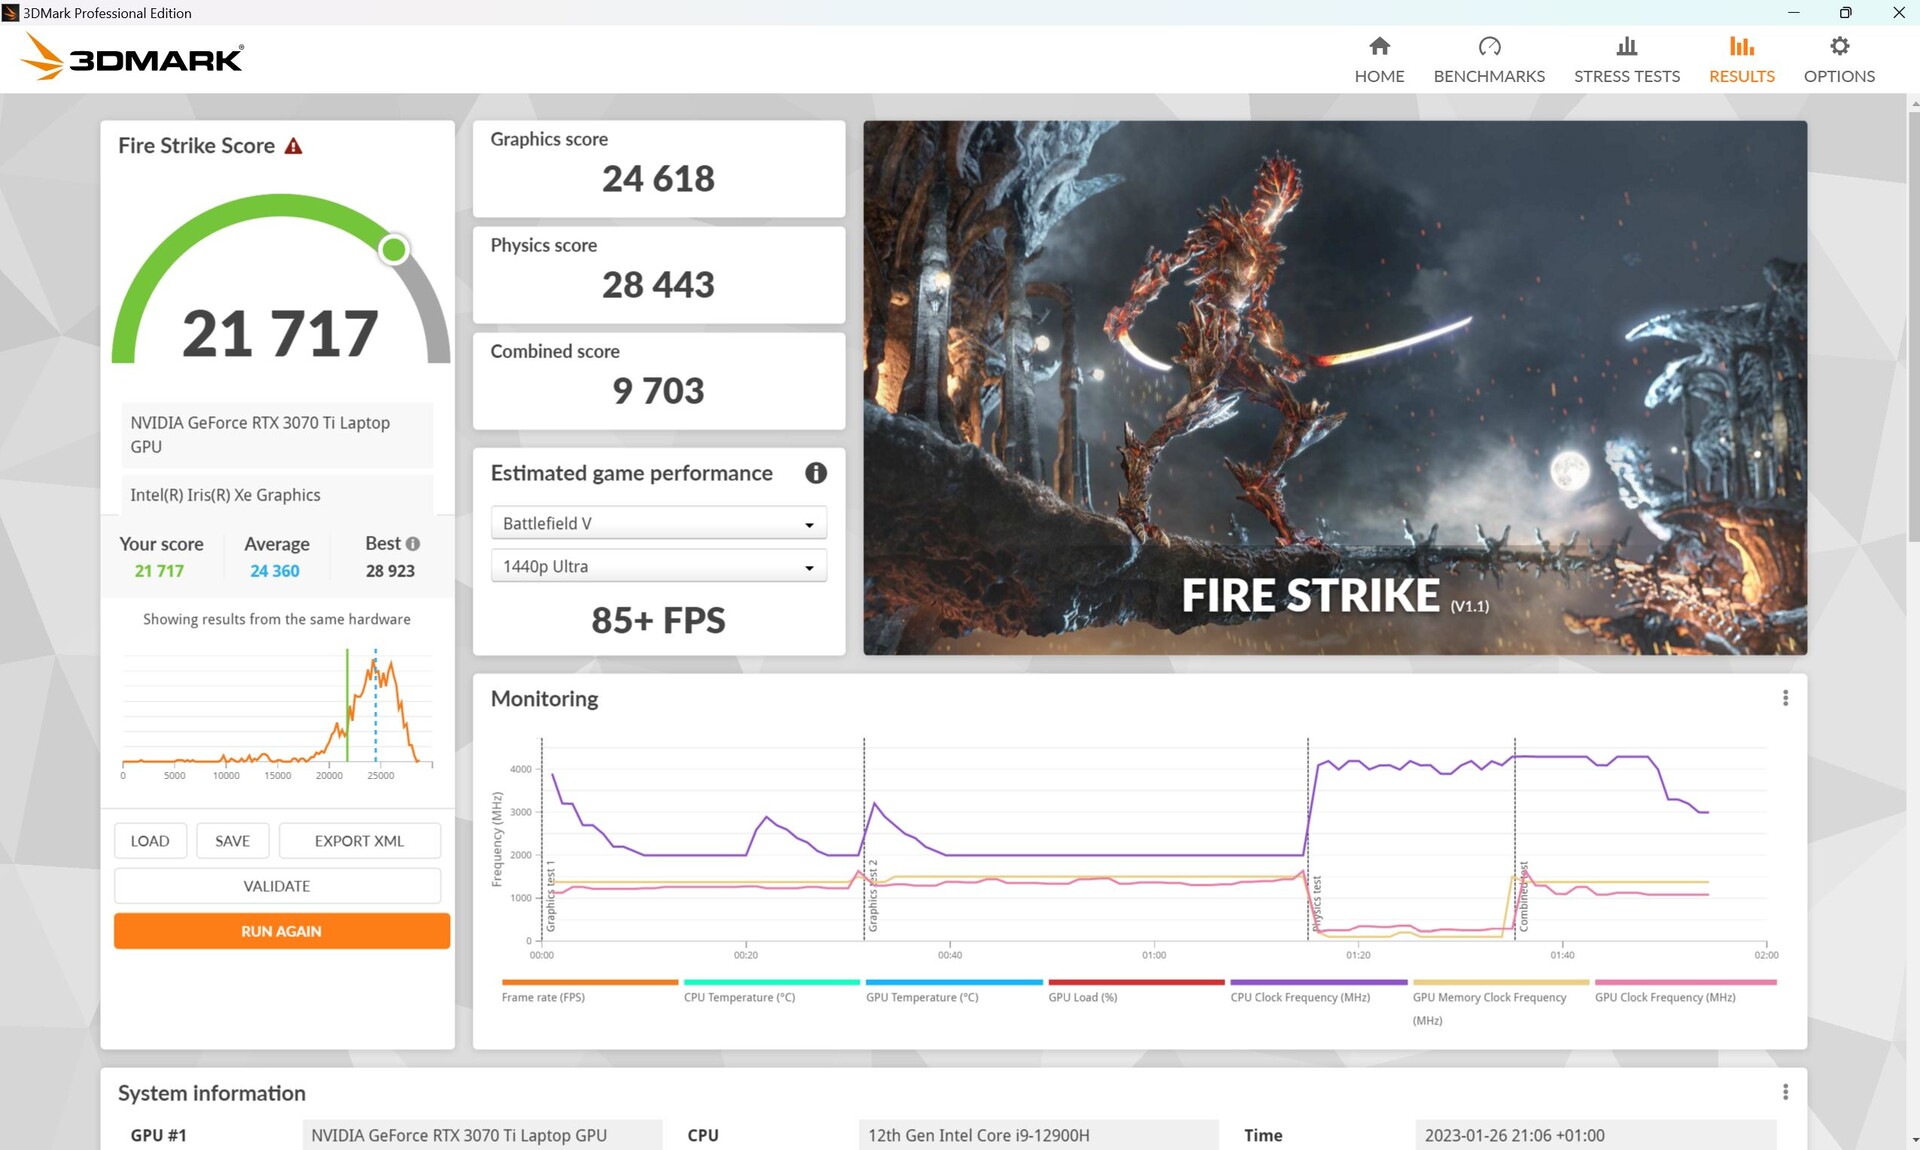


| 3DMark 11 Performance | 29169 points | |
| 3DMark Cloud Gate Standard Score | 59794 points | |
| 3DMark Fire Strike Score | 21717 points | |
| 3DMark Time Spy Score | 9841 points | |
Help | ||
* ... smaller is better
游戏性能
在游戏时,整体上的差异并不是很大,这也是因为在相应的CPU重度游戏中,强大的CPU能够赶上。在GPU重的游戏中,如《Witcher 3 》或《奇异旅》,5Pro的性能是最强的。Legion 5 Pro与其150-W RTX 3070-Ti明显领先。在DOTA 2 Reborn或X-Plane 11.11中,M16能够名列前茅。
| The Witcher 3 - 1920x1080 Ultra Graphics & Postprocessing (HBAO+) | |
| Average of class Gaming (104.7 - 240, n=7, last 2 years) | |
| Lenovo Legion 5 Pro 16ARH7H RTX 3070 Ti | |
| Corsair Voyager a1600 | |
| Asus ROG Zephyrus M16 GU603Z | |
| Asus ROG Zephyrus M16 GU603H | |
| Schenker Vision 16 Pro RTX 3070 Ti | |
| Schenker XMG Focus 16 (i7-12700H, RTX 3060) | |
这款笔记本电脑不支持高级优化,而是支持普通的优化,它还提供一个MUX开关,允许你在集成(或混合模式)和专用GPU之间主动切换。
我们的Witcher 3 循环导致了相对稳定的帧率。竞争对手之间的性能差异在这里变得很明显:虽然Legion 5 Pro的速度要快得多,而 申克视讯16专业版几乎没有被超越。
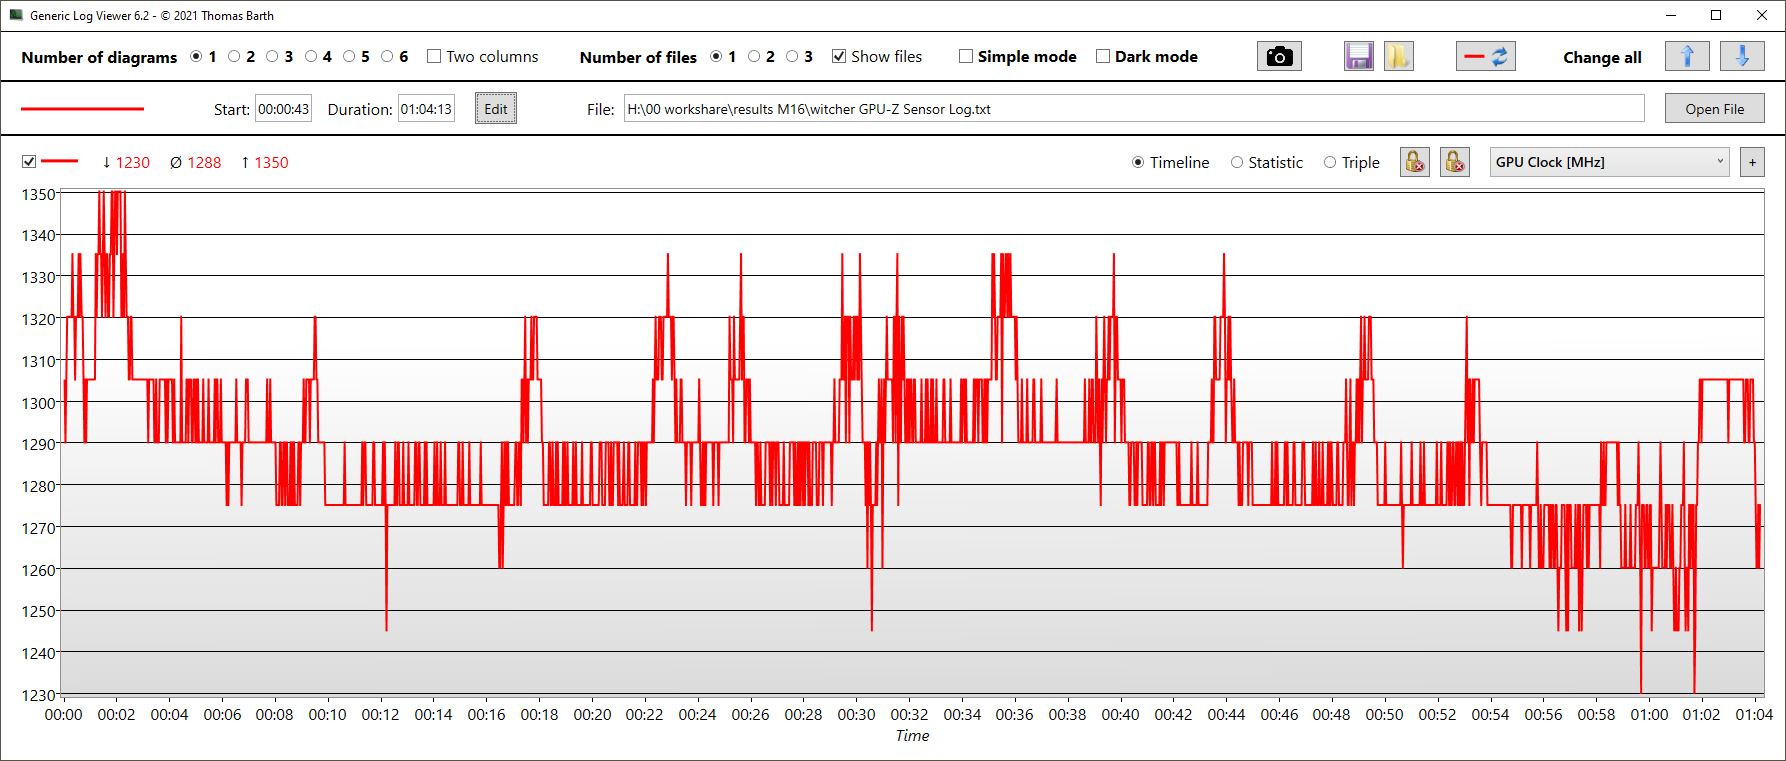
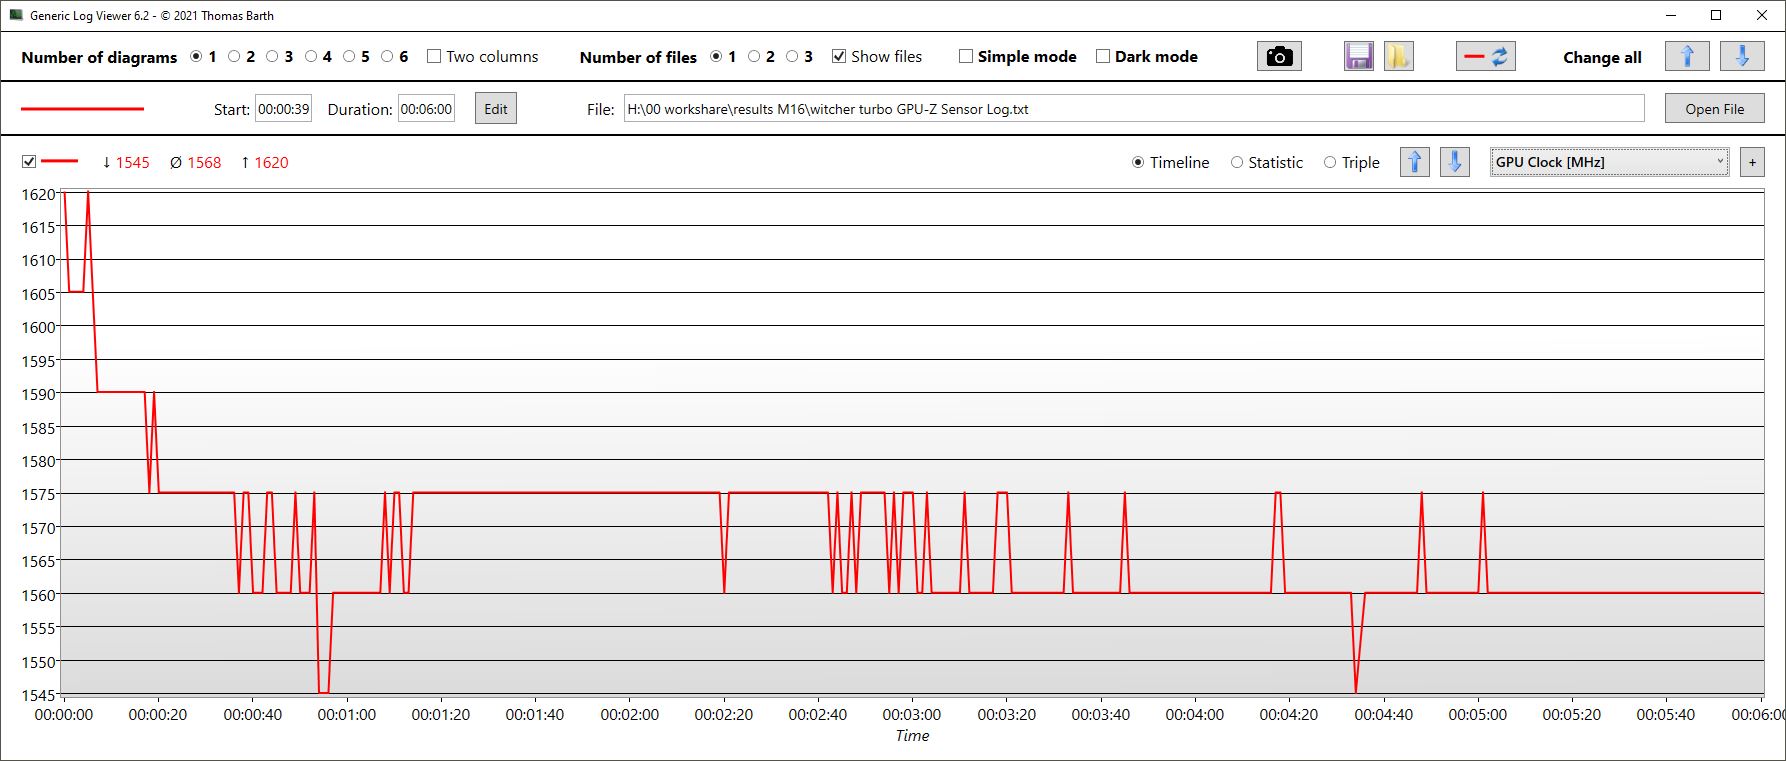
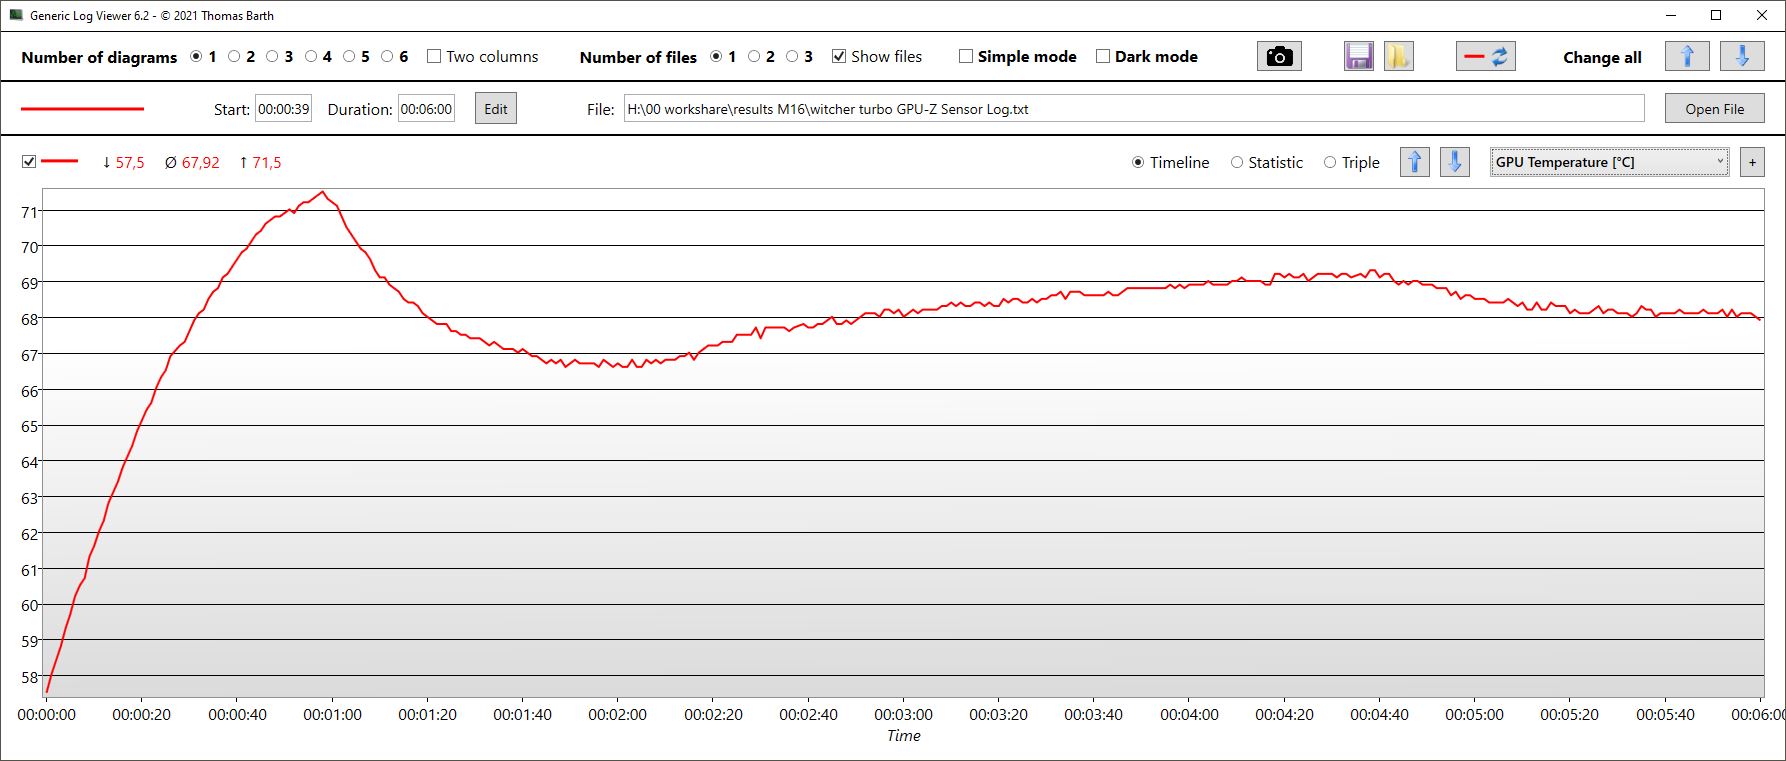
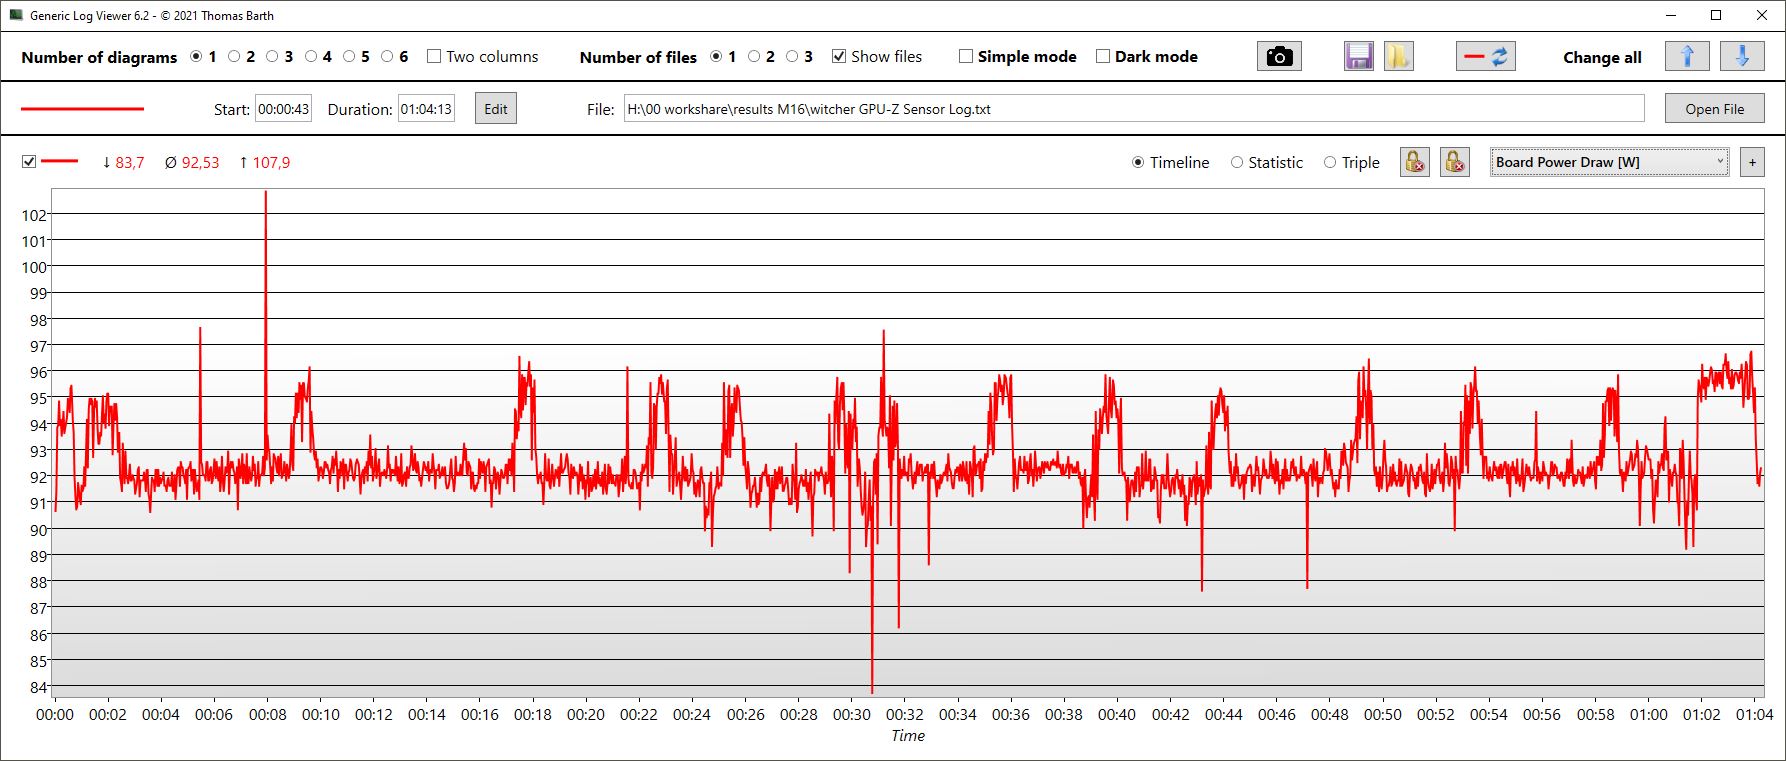
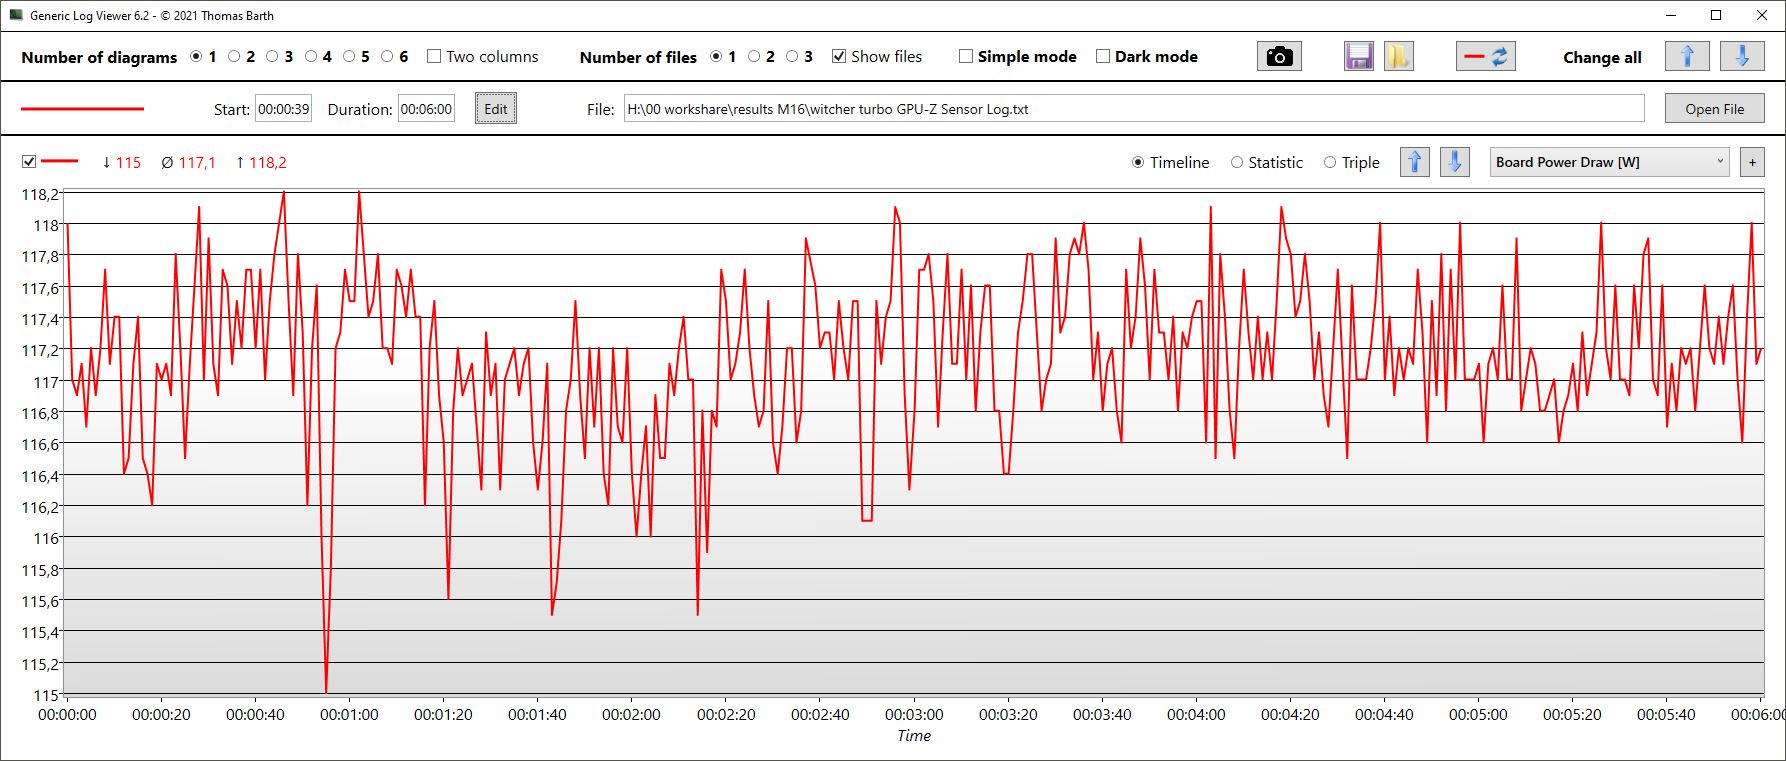
在涡轮模式下(蓝图,测量时间为6分钟),性能大大增加,在某些部分接近Legion 5 Pro的性能。然后,笔记本产生的噪音也同样响亮,你也可以在下面的排放物部分看到。GPU和存储速度增加,功耗也增加到近120W。
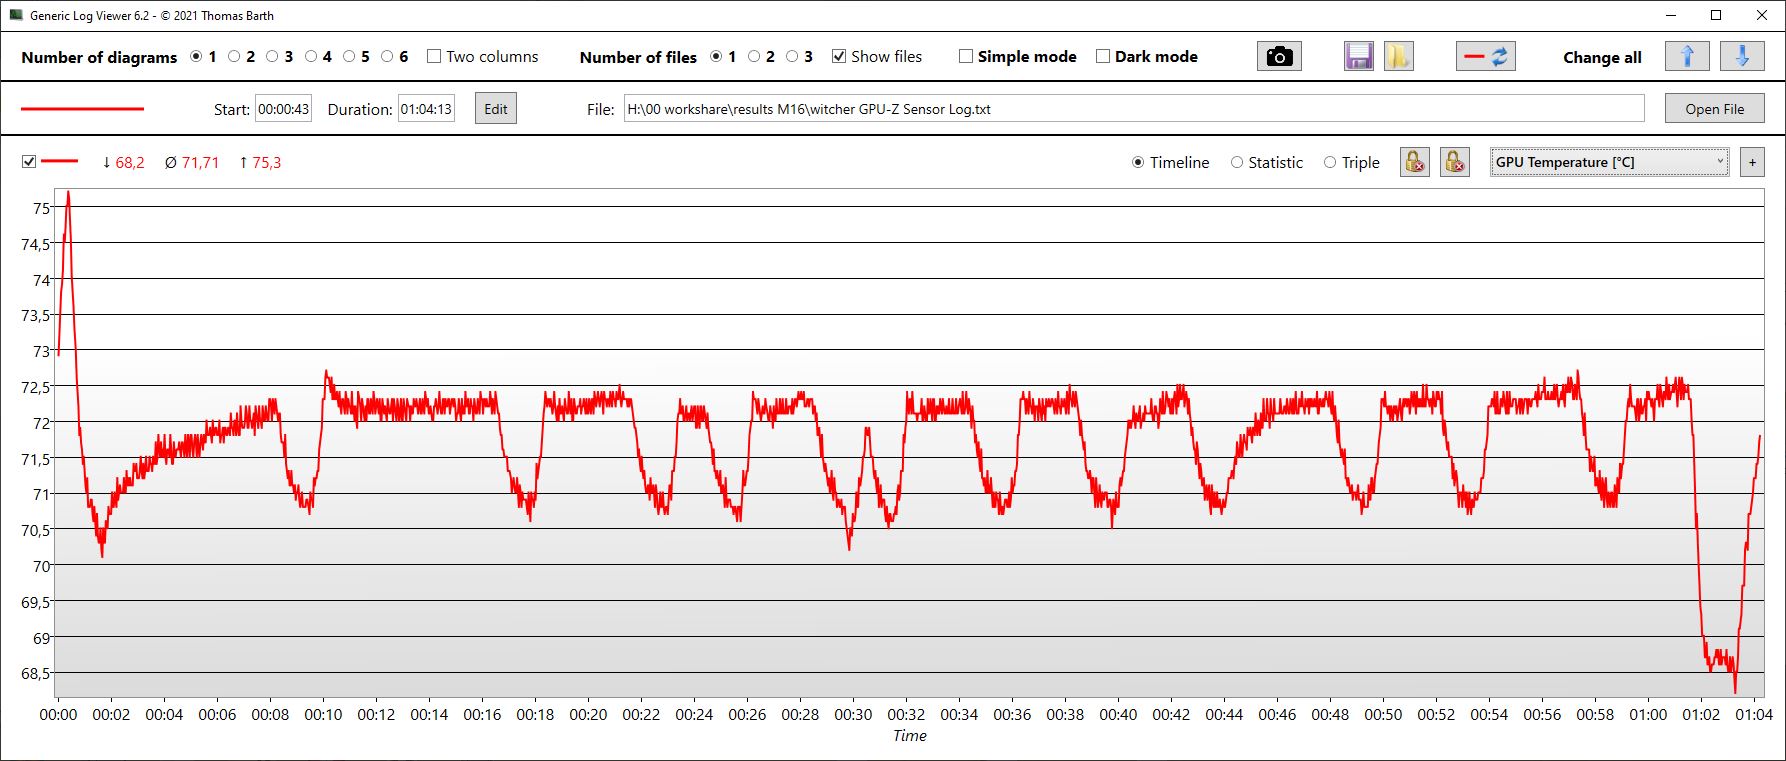
随着时间的推移,GPU的时钟速度仍然略有下降,最后平均为1,288 MHz。显卡的温度上升到72 °C (162°F) 左右,而显卡 的平均 功耗只有 93 W,这与TGP的目标值还有很大差距。
The Witcher 3 FPS Chart
| low | med. | high | ultra | QHD | 4K | |
|---|---|---|---|---|---|---|
| GTA V (2015) | 184.6 | 171.4 | 108.1 | |||
| The Witcher 3 (2015) | 370.2 | 273.2 | 171 | 99.5 | ||
| Dota 2 Reborn (2015) | 195.2 | 174.7 | 170.2 | 160.5 | ||
| Final Fantasy XV Benchmark (2018) | 123.8 | 94.8 | 72.1 | 43 | ||
| X-Plane 11.11 (2018) | 166.8 | 145.7 | 115 | |||
| Far Cry 5 (2018) | 174 | 128 | 128 | 124 | 90 | |
| Strange Brigade (2018) | 376 | 227 | 187.9 | 163.8 | ||
| Dying Light 2 (2022) | 98.5 | 79 | 66 | 46.7 |
排放 - 适度的华硕M16
噪声水平
在空闲运行期间,风扇经常被关闭--但不是持续的。不时地,它们可以很容易地转速到47分贝,例如在重启后,当Windows启动时。
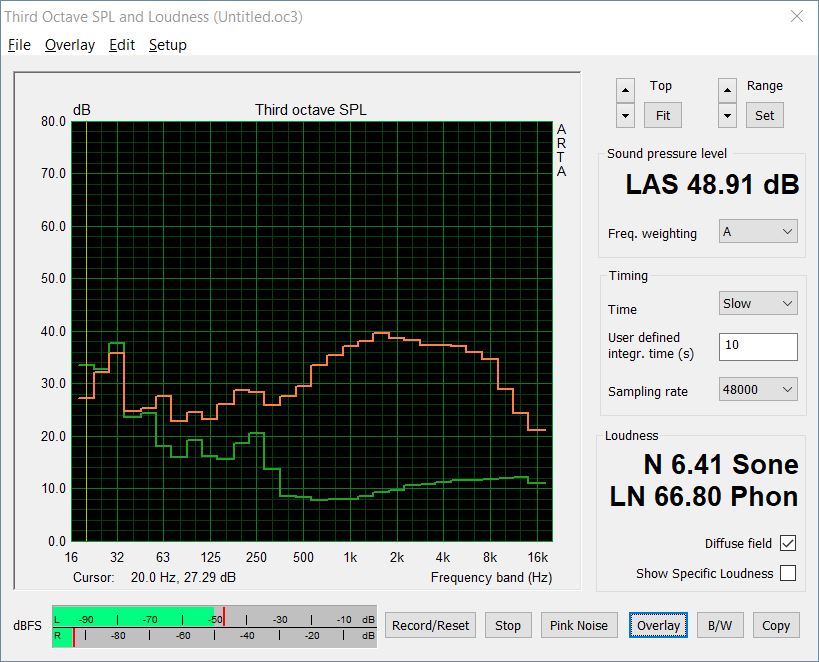
在3DMark 06基准测试的第一个场景中,风扇基本保持安静,只有34分贝,而在结束前风扇噪音才增加到47分贝。Schenker Vision 16 Pro 和Legion 5 Pro 能够保持更长时间的安静。
在游戏时,与竞争对手相比,M16的操作仍然相当安静,其中一些产品的噪音水平明显高于50分贝,而M16的噪音水平仍然低于这一水平。然而,这只适用于性能模式。如果你使用Turbo模式,风扇转速几乎达到55分贝,这与Legion 5 Pro的水平相同,并明显高于Vision 16 Pro的声音。
Noise level
| Idle |
| 23 / 24 / 47 dB(A) |
| Load |
| 47.91 / 50.25 dB(A) |
 | ||
30 dB silent 40 dB(A) audible 50 dB(A) loud |
||
min: | ||
| Asus ROG Zephyrus M16 GU603Z GeForce RTX 3070 Ti Laptop GPU, i9-12900H, Micron 3400 1TB MTFDKBA1T0TFH | Asus ROG Zephyrus M16 GU603H GeForce RTX 3070 Laptop GPU, i9-11900H, Samsung PM9A1 MZVL22T0HBLB | Schenker Vision 16 Pro RTX 3070 Ti GeForce RTX 3070 Ti Laptop GPU, i7-12700H, Samsung SSD 980 Pro 1TB MZ-V8P1T0BW | Lenovo Legion 5 Pro 16ARH7H RTX 3070 Ti GeForce RTX 3070 Ti Laptop GPU, R7 6800H, Samsung PM9A1 MZVL21T0HCLR | Schenker XMG Focus 16 (i7-12700H, RTX 3060) GeForce RTX 3060 Laptop GPU, i7-12700H, Samsung SSD 980 Pro 1TB MZ-V8P1T0BW | Corsair Voyager a1600 Radeon RX 6800M, R9 6900HS, Samsung PM9A1 MZVL22T0HBLB | |
|---|---|---|---|---|---|---|
| Noise | -8% | 8% | -1% | 0% | -9% | |
| off / environment * (dB) | 23 | 25 -9% | 22.9 -0% | 23.5 -2% | 23 -0% | 29.9 -30% |
| Idle Minimum * (dB) | 23 | 25 -9% | 24.3 -6% | 23.7 -3% | 23 -0% | 30.5 -33% |
| Idle Average * (dB) | 24 | 31 -29% | 24.3 -1% | 31.1 -30% | 23 4% | 30.6 -28% |
| Idle Maximum * (dB) | 47 | 42 11% | 24.3 48% | 32.2 31% | 32.07 32% | 30.7 35% |
| Load Average * (dB) | 47.91 | 48 -0% | 38.5 20% | 38.4 20% | 53.7 -12% | 44.5 7% |
| Witcher 3 ultra * (dB) | 48.91 | 52 -6% | 51 -4% | 54.8 -12% | 54.58 -12% | |
| Load Maximum * (dB) | 50.25 | 56 -11% | 51 -1% | 54.8 -9% | 54.58 -9% | 51.1 -2% |
* ... smaller is better
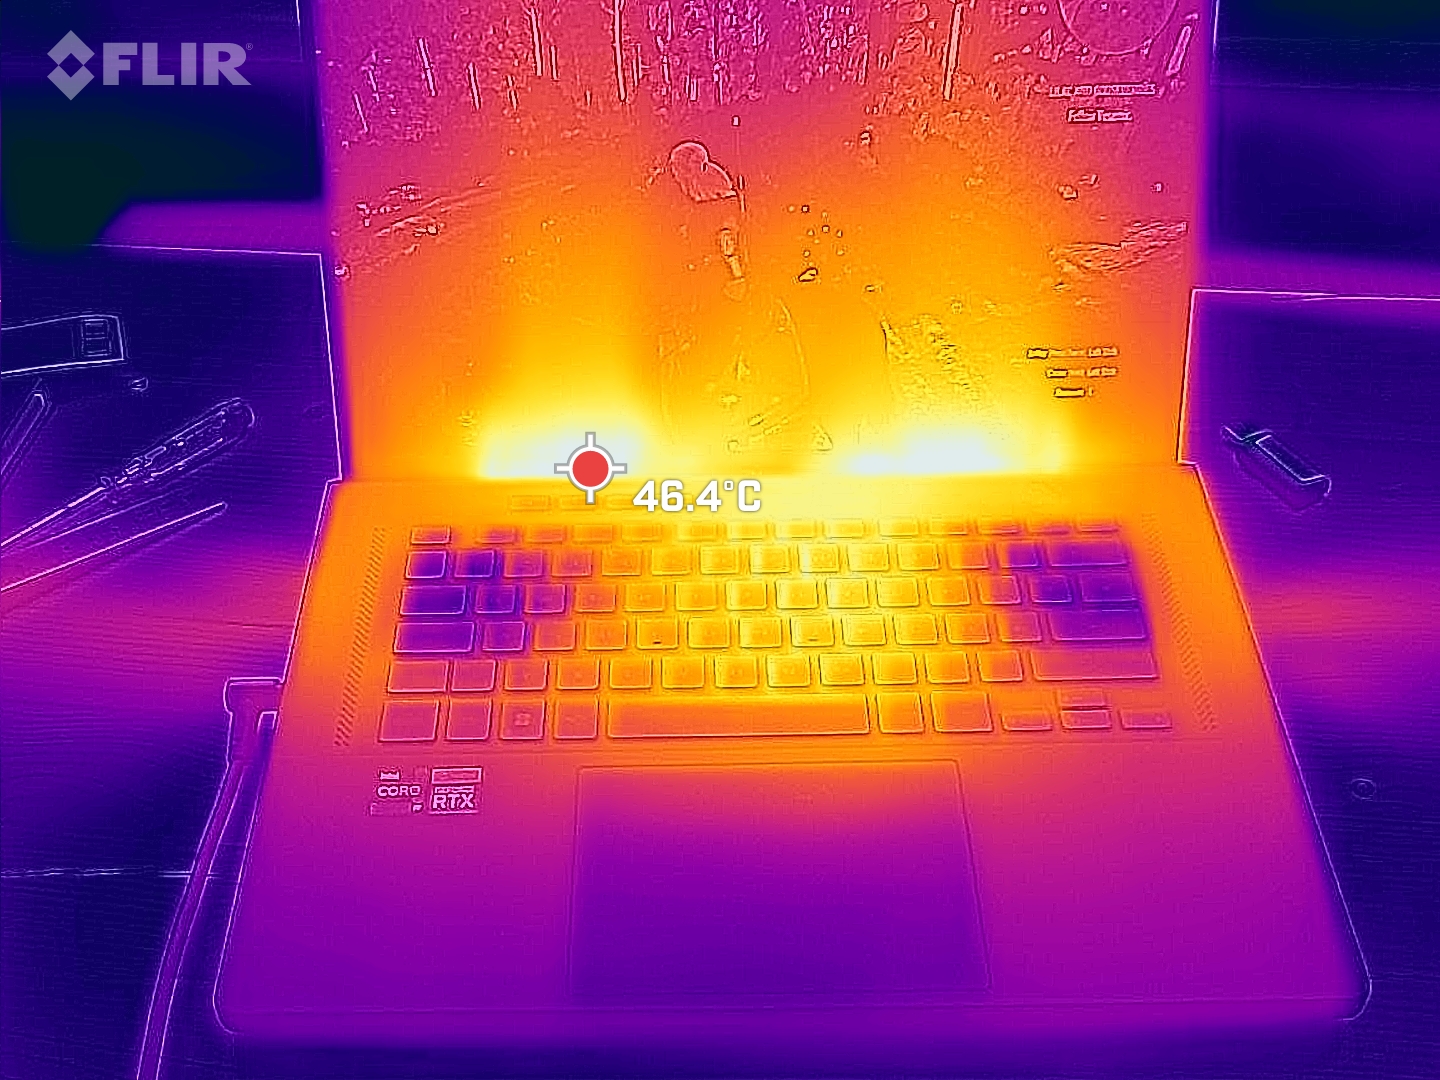
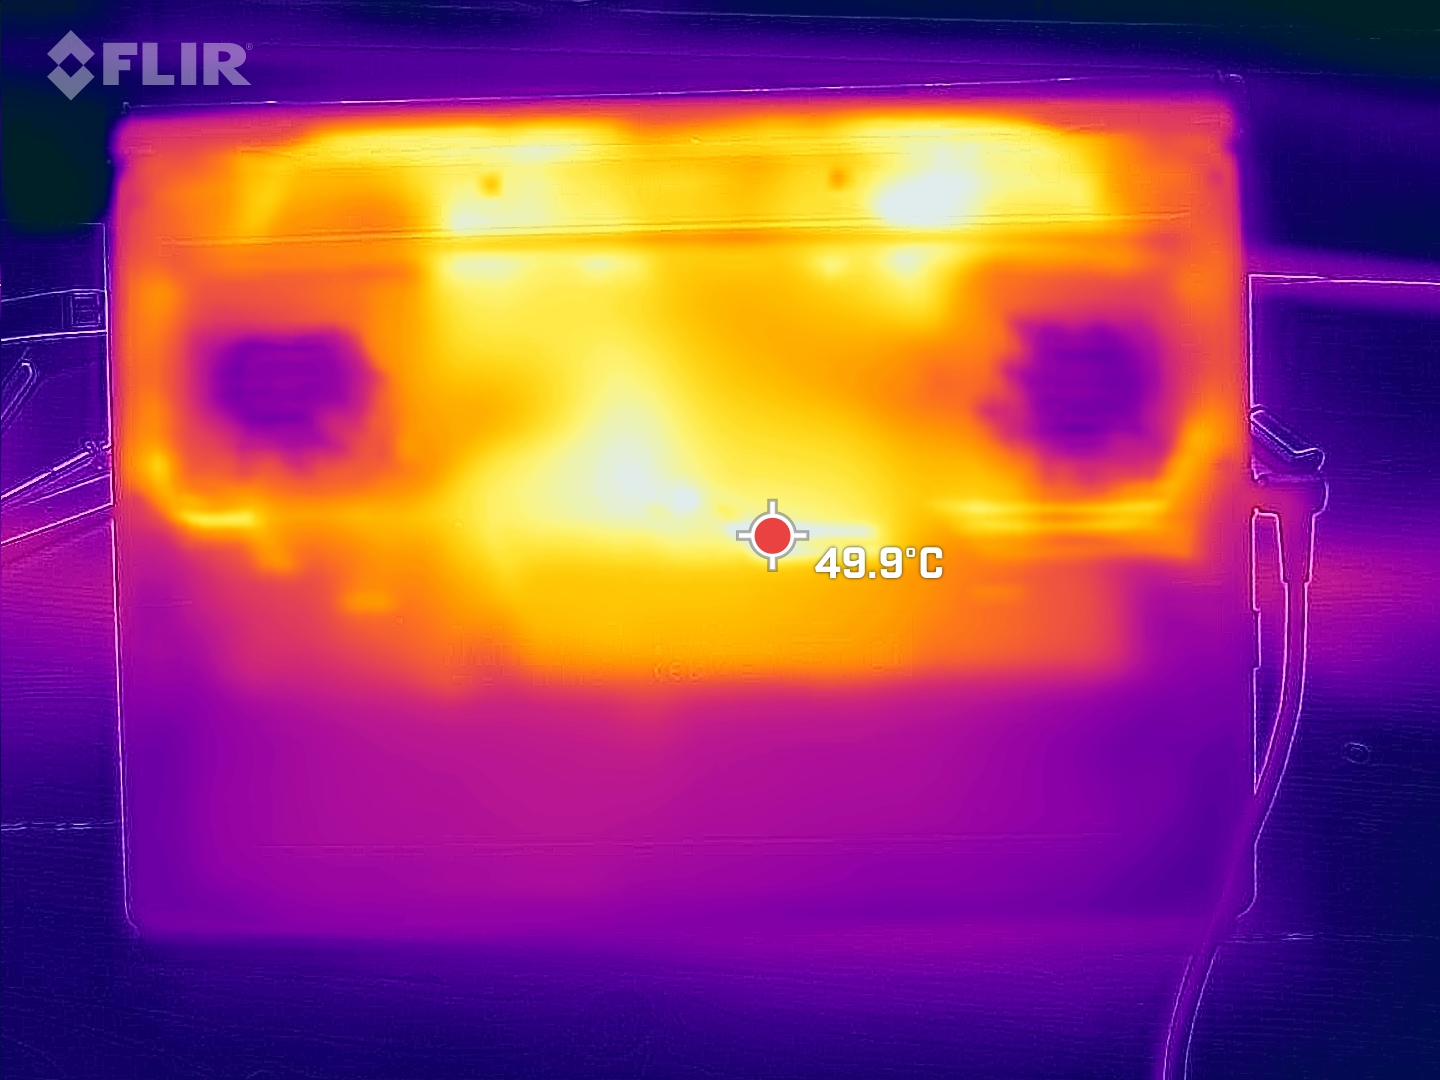
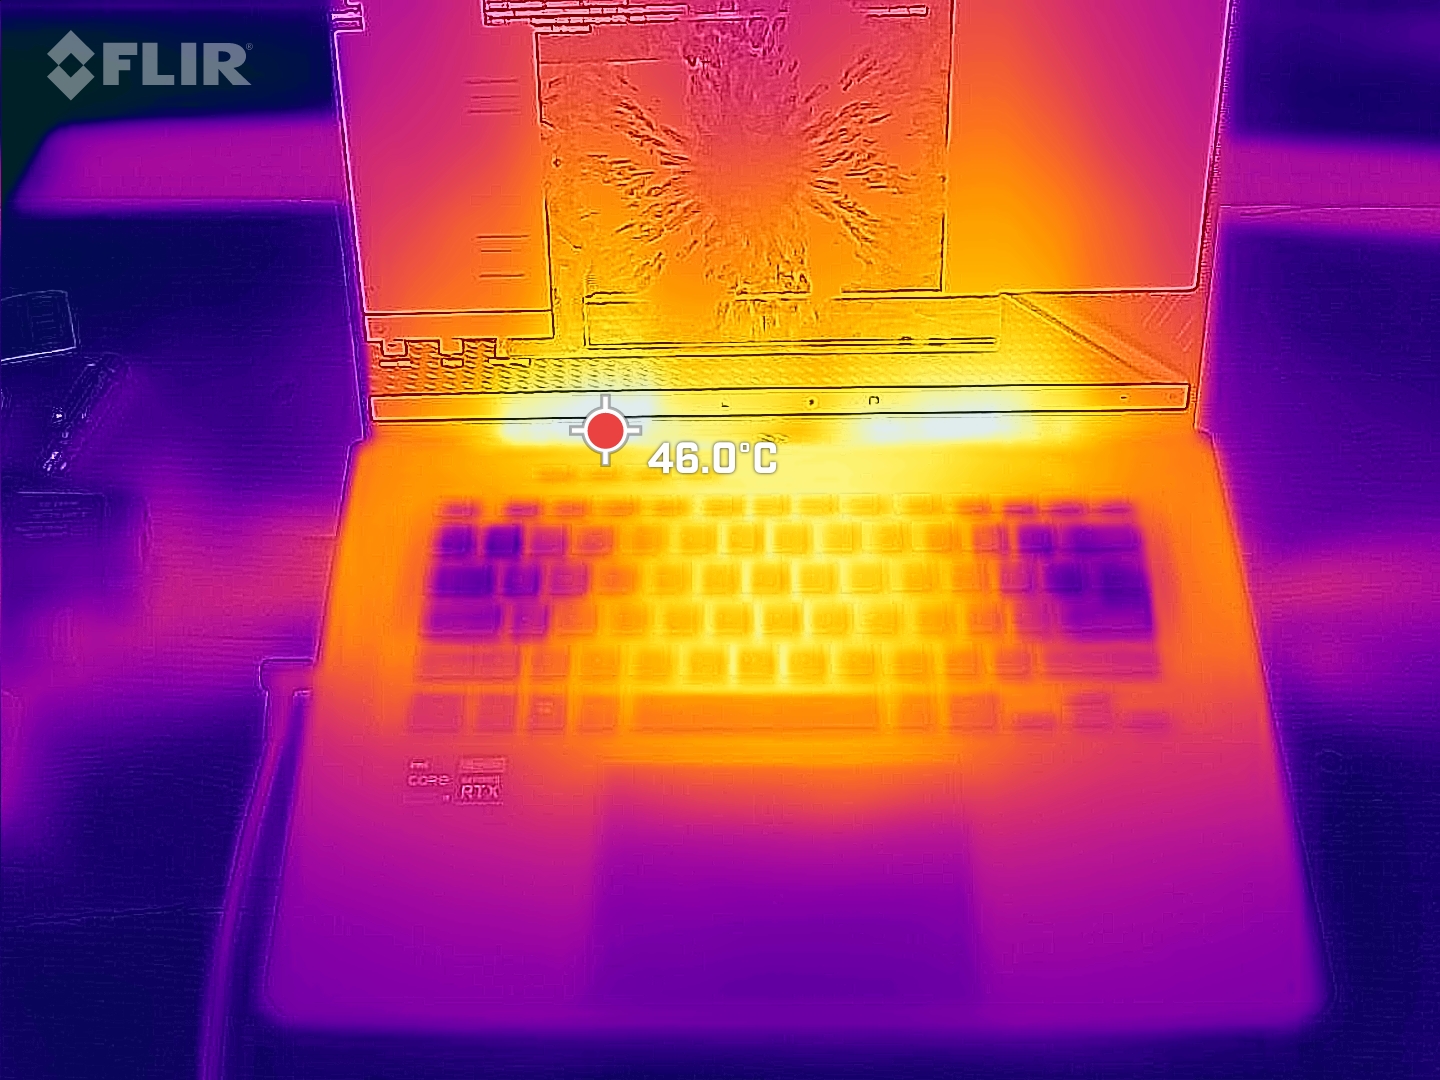
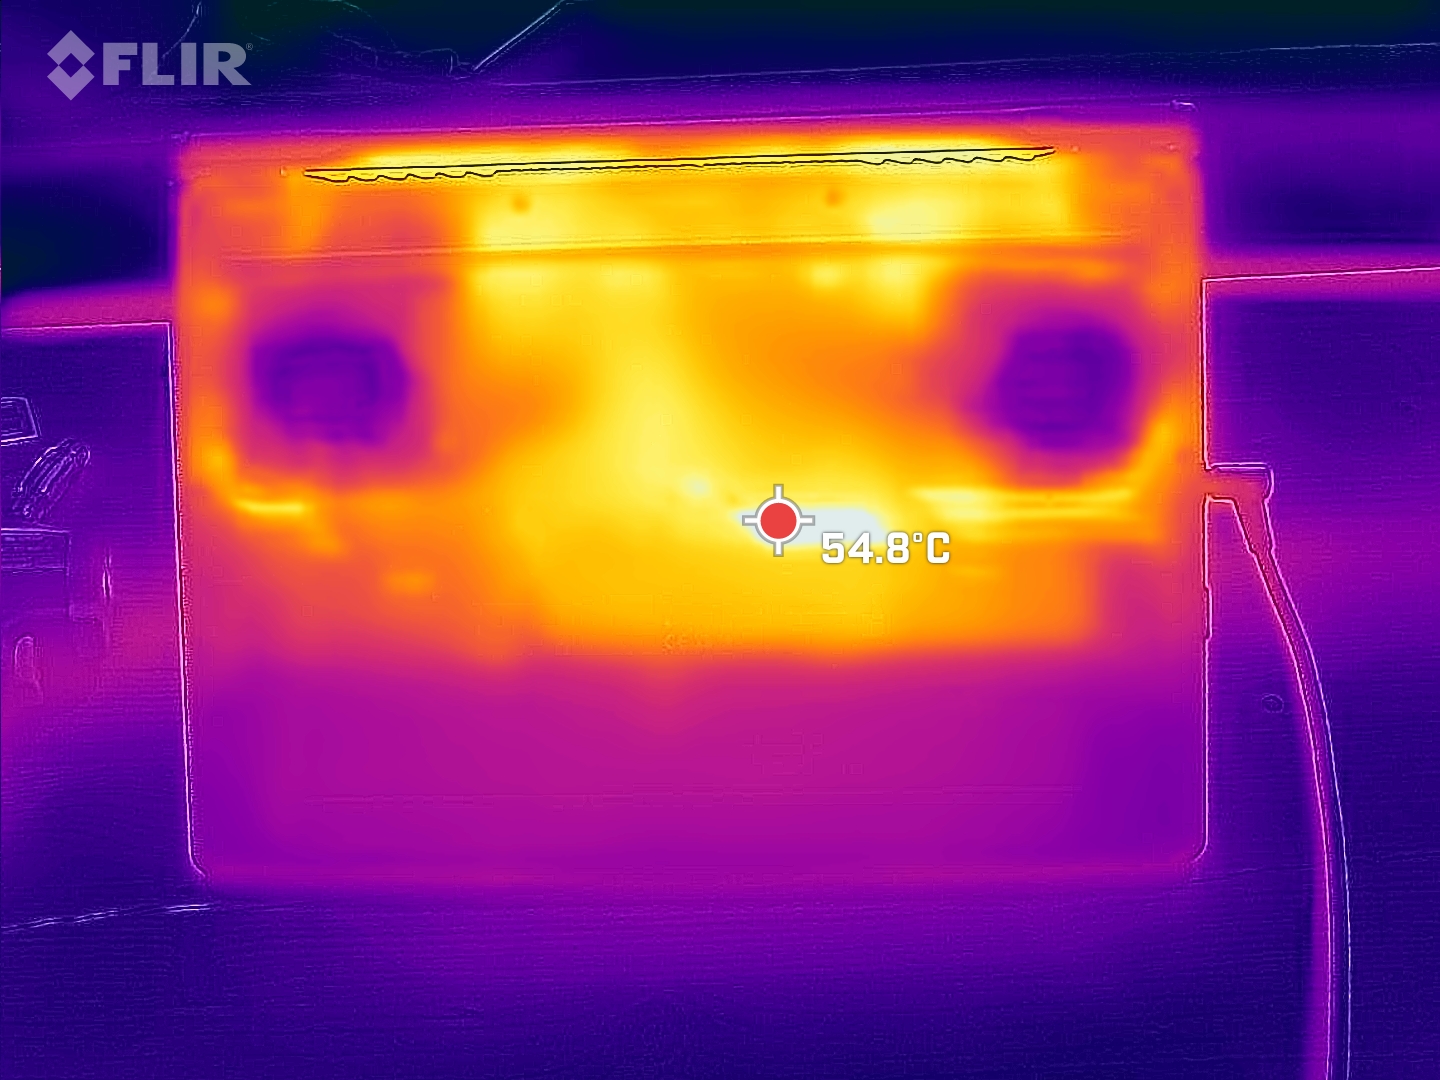
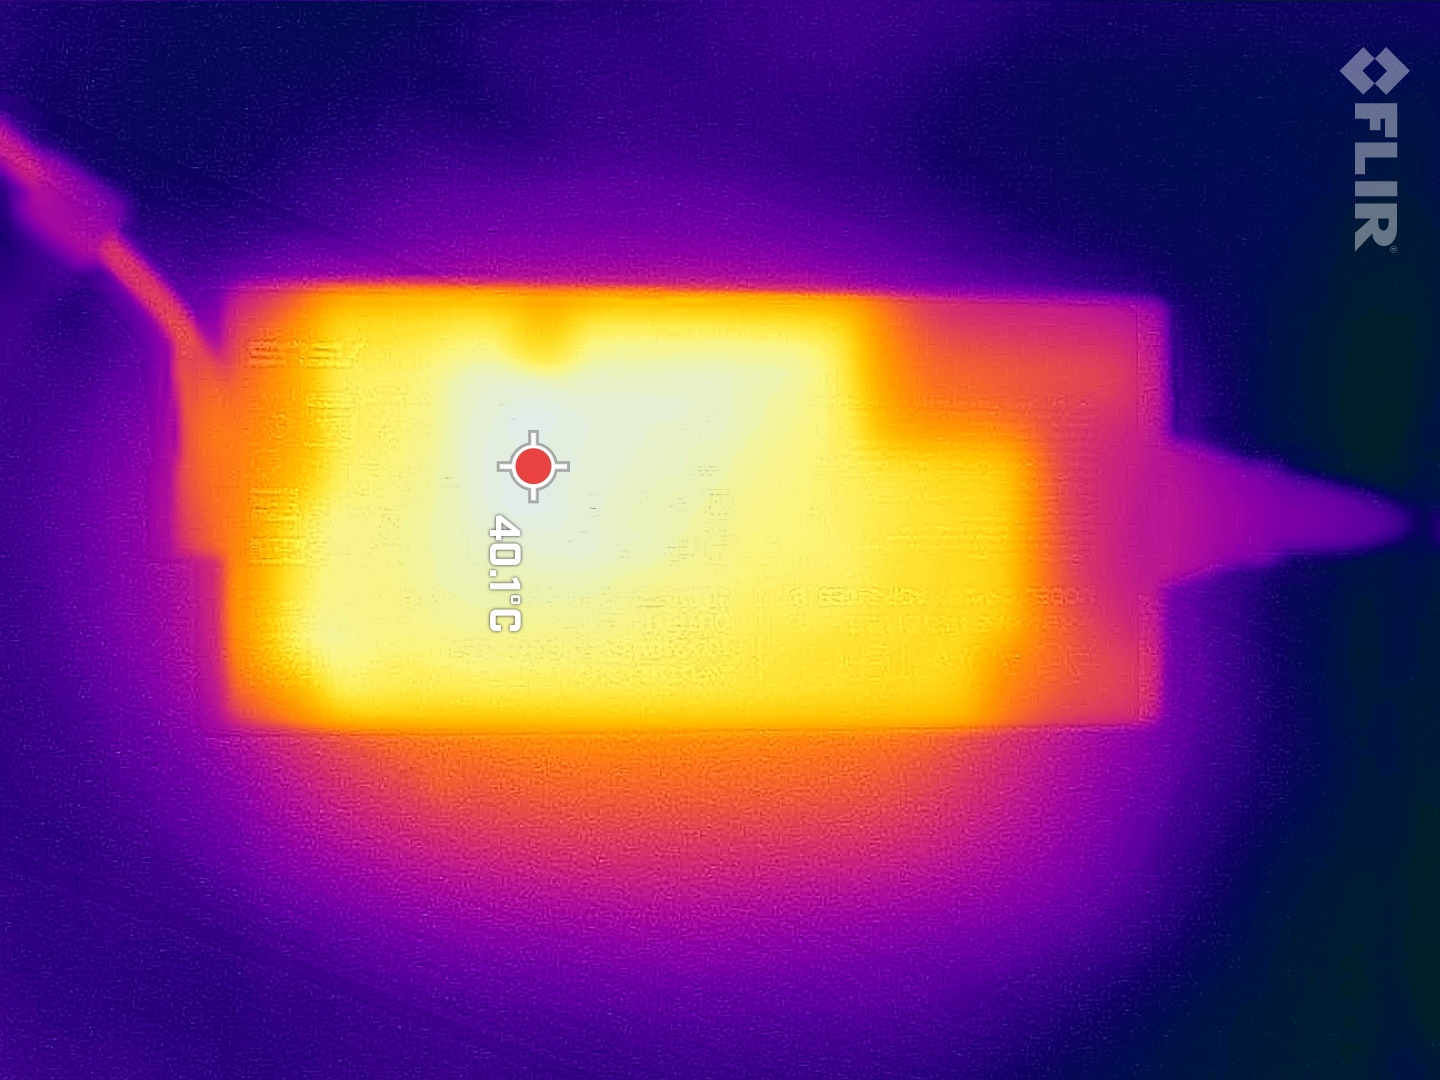
温度
在重载的情况下,机箱的顶部和底部会发热到略高于50°C(122°F)。这仍然在通常的范围内,甚至比前代产品略好。的 Legion 5 Pro 在顶部仍然略微凉爽,而 Vision 16 Pro 在底部略微凉一些。
(-) The maximum temperature on the upper side is 52 °C / 126 F, compared to the average of 40.4 °C / 105 F, ranging from 21.2 to 68.8 °C for the class Gaming.
(-) The bottom heats up to a maximum of 51 °C / 124 F, compared to the average of 43.2 °C / 110 F
(+) In idle usage, the average temperature for the upper side is 26.4 °C / 80 F, compared to the device average of 33.9 °C / 93 F.
(-) Playing The Witcher 3, the average temperature for the upper side is 40.2 °C / 104 F, compared to the device average of 33.9 °C / 93 F.
(+) The palmrests and touchpad are reaching skin temperature as a maximum (32 °C / 89.6 F) and are therefore not hot.
(-) The average temperature of the palmrest area of similar devices was 28.8 °C / 83.8 F (-3.2 °C / -5.8 F).
| Asus ROG Zephyrus M16 GU603Z Intel Core i9-12900H, NVIDIA GeForce RTX 3070 Ti Laptop GPU | Asus ROG Zephyrus M16 GU603H Intel Core i9-11900H, NVIDIA GeForce RTX 3070 Laptop GPU | Schenker Vision 16 Pro RTX 3070 Ti Intel Core i7-12700H, NVIDIA GeForce RTX 3070 Ti Laptop GPU | Lenovo Legion 5 Pro 16ARH7H RTX 3070 Ti AMD Ryzen 7 6800H, NVIDIA GeForce RTX 3070 Ti Laptop GPU | Schenker XMG Focus 16 (i7-12700H, RTX 3060) Intel Core i7-12700H, NVIDIA GeForce RTX 3060 Laptop GPU | Corsair Voyager a1600 AMD Ryzen 9 6900HS, AMD Radeon RX 6800M | |
|---|---|---|---|---|---|---|
| Heat | -15% | 9% | 3% | 4% | -7% | |
| Maximum Upper Side * (°C) | 52 | 52 -0% | 50.8 2% | 43.8 16% | 50 4% | 50.7 2% |
| Maximum Bottom * (°C) | 51 | 53 -4% | 46.3 9% | 53 -4% | 48 6% | 54.2 -6% |
| Idle Upper Side * (°C) | 29 | 38 -31% | 27.2 6% | 30 -3% | 28 3% | 35.8 -23% |
| Idle Bottom * (°C) | 33 | 41 -24% | 26.6 19% | 31.8 4% | 32 3% | 33 -0% |
* ... smaller is better
压力测试
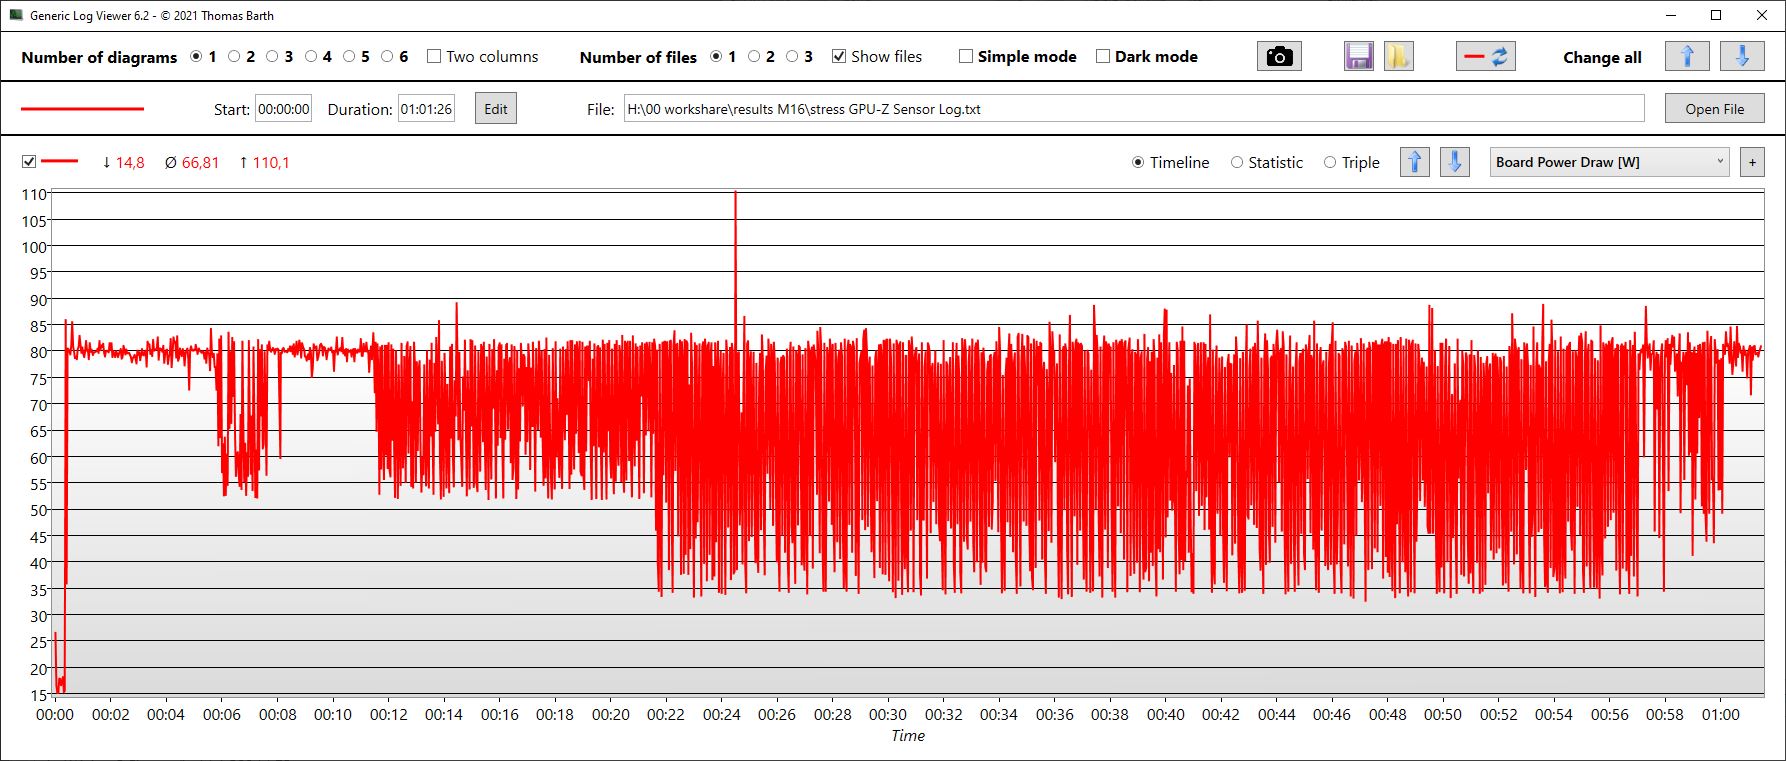
CPU核心以3.5GHz的频率开始我们的压力测试。几秒钟后,时钟速度开始下降,在2.4GHz左右趋于平缓。温度有所变化,最高为97℃(207°F), 平均为83℃(181 °F)。CPU的TDP平均为44W。
显卡速度在500至1600兆赫之间变化很大,平均为838兆赫。存储速度在1.4GHz左右,GPU加热到约70°C(158°F)。我们测量的功耗约为66瓦。
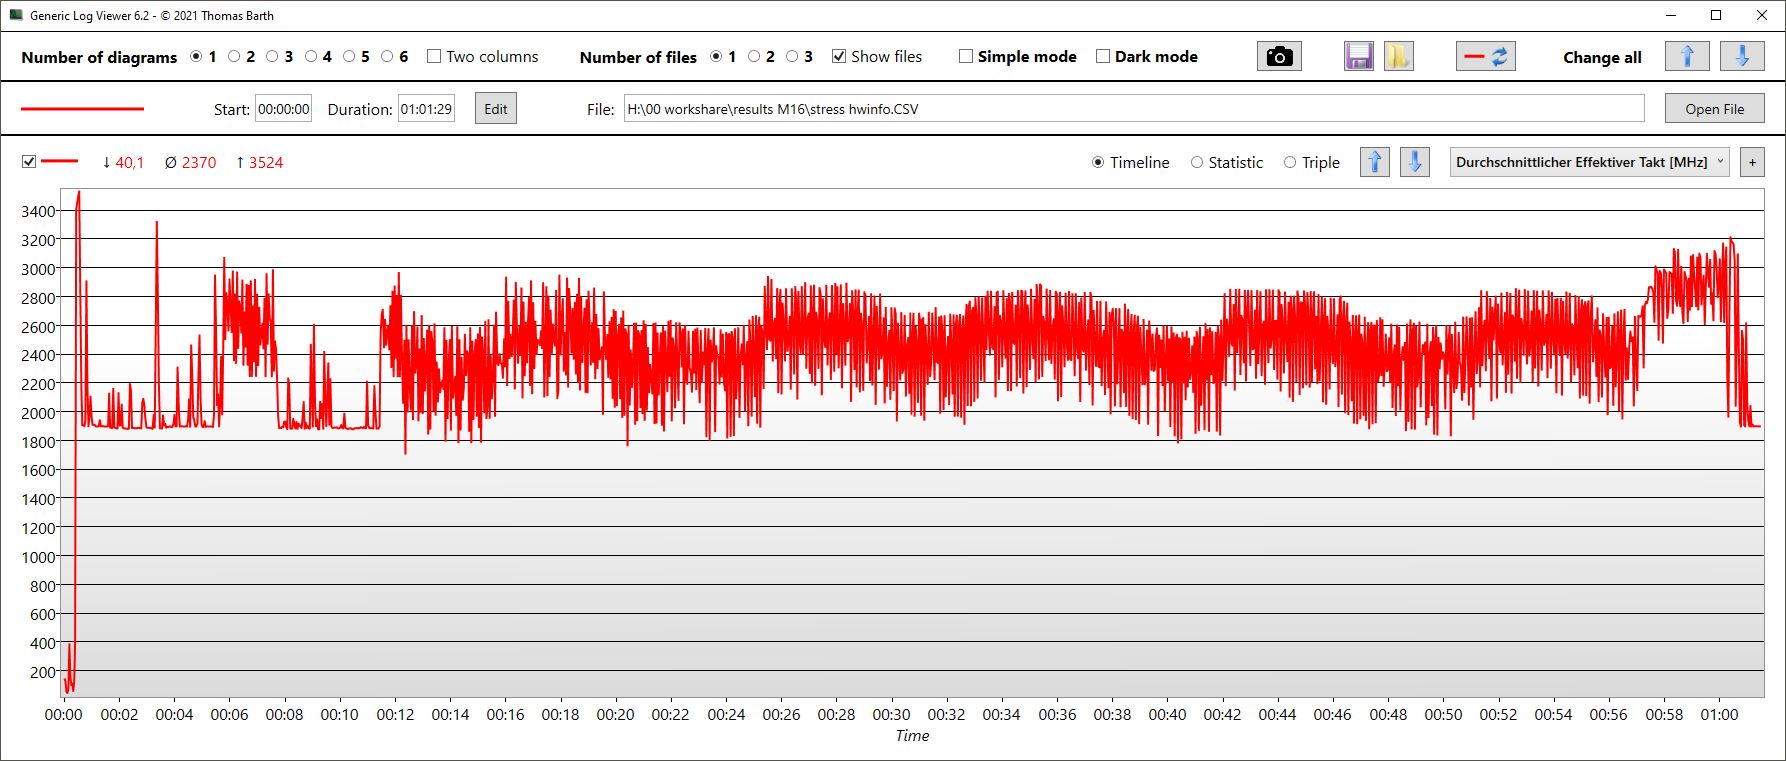
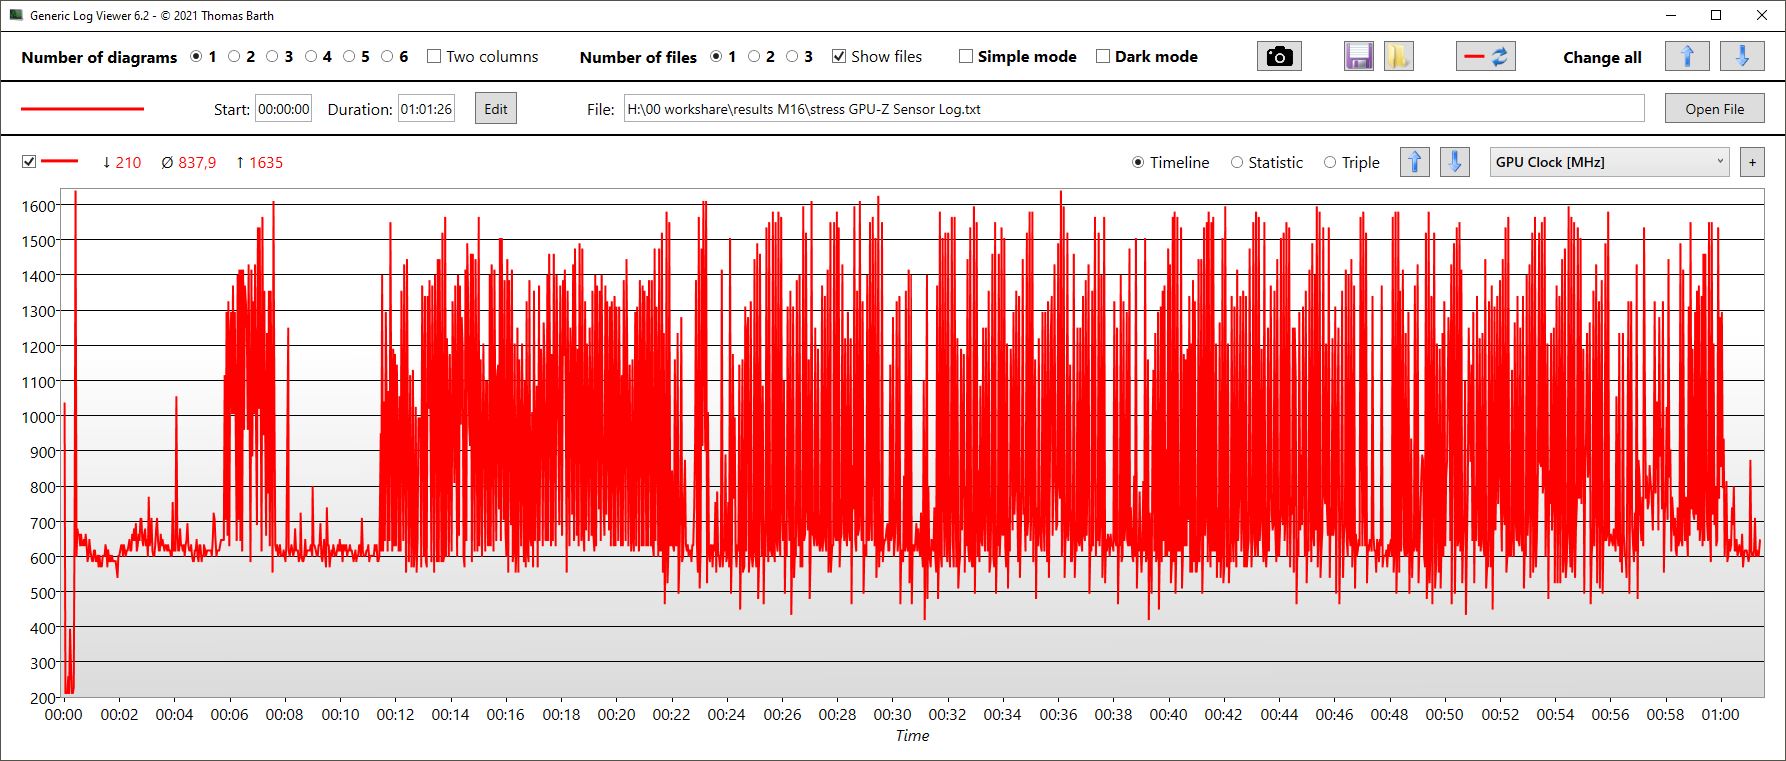

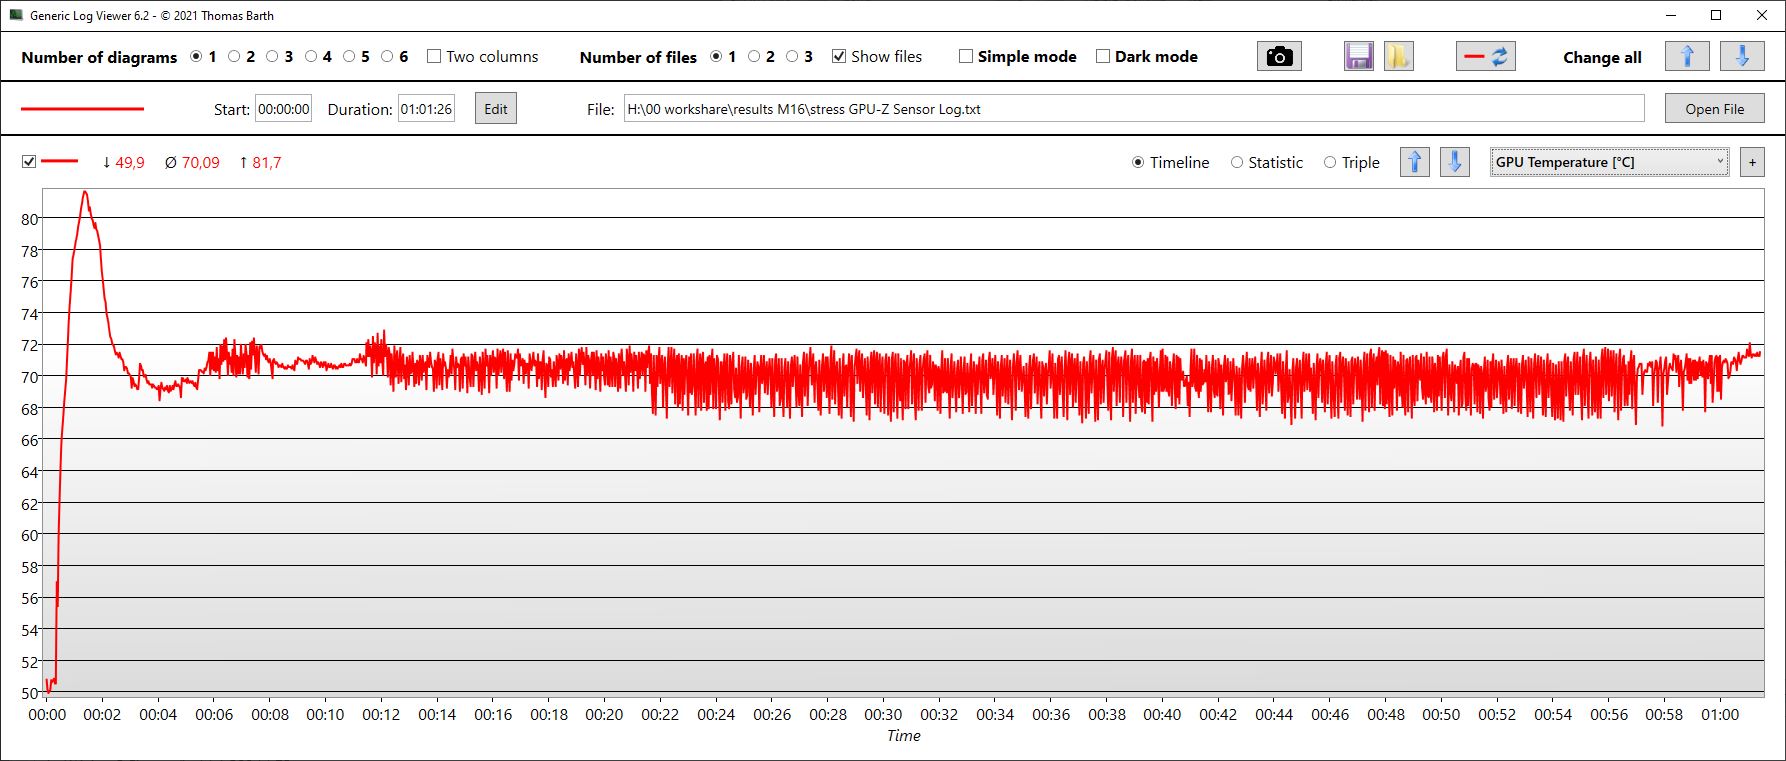
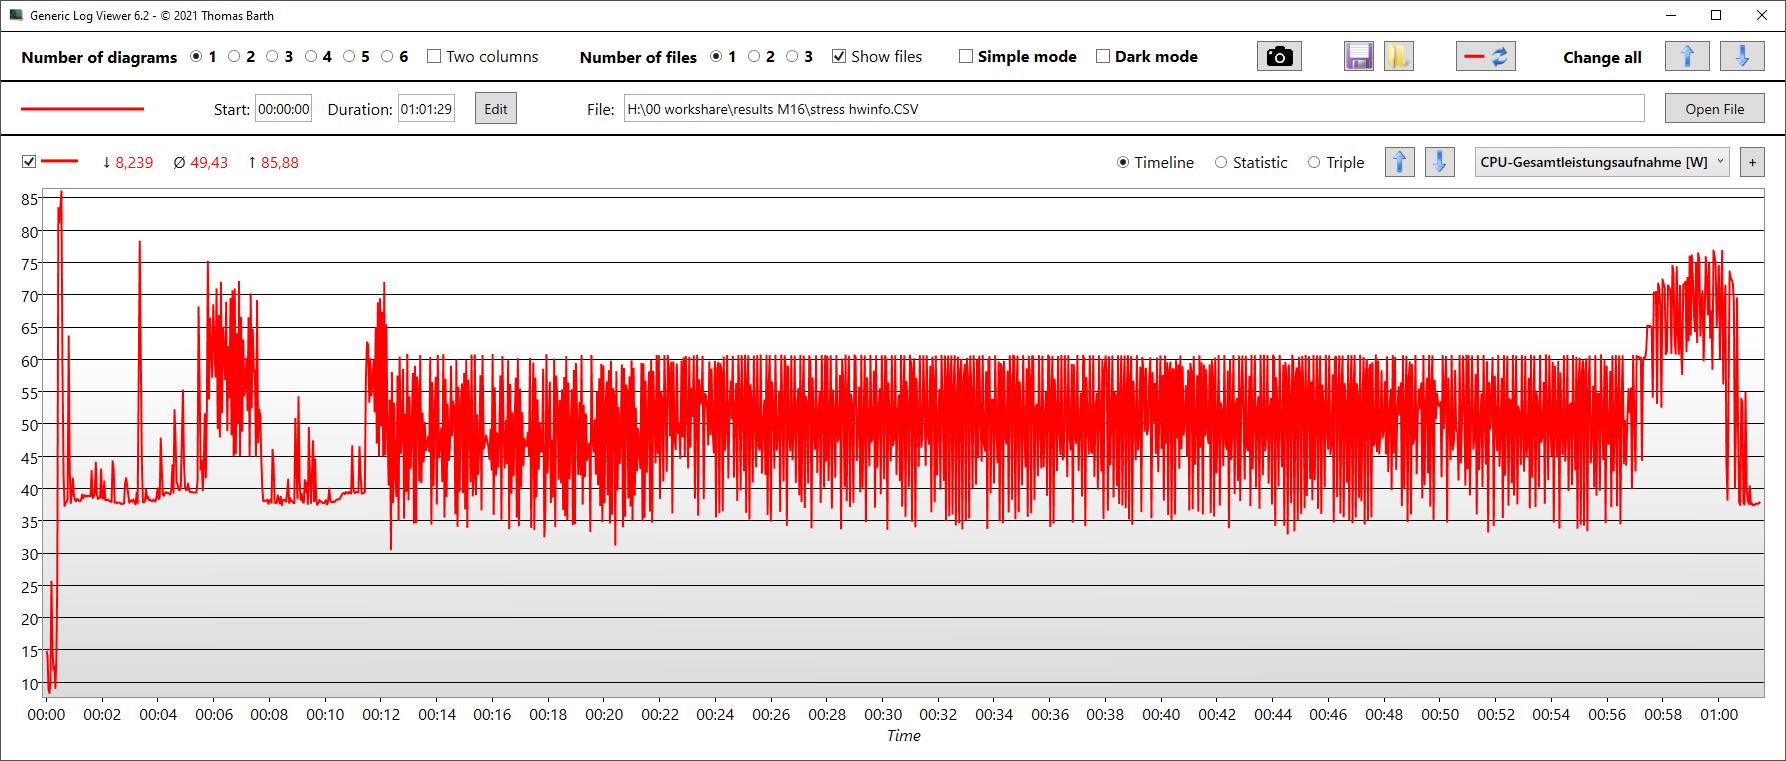
| CPU时钟(GHz) | GPU时钟(MHz) | CPU平均温度(℃) | GPU平均温度(℃) | |
| Prime95 + FurMark压力 | 2,4 | 838 | 83 | 70 |
| Witcher 3 压力 | 1.1 | 1,288 | 68 | 72 |
发言人
华硕在M16的扬声器方面采取了特殊的做法:制造商没有使用通常的立体声扬声器,而是使用了四个扬声器,每个2W,两个用于高频,两个用于低频。这一点变得相当明显,扬声器不仅相对响亮,而且还提供平衡的中音和高音,甚至低音也不像许多竞争对手那样表现不足。
然而,它们仍然不能取代半途而废的外部扬声器。对于模拟音频设备的连接,你可以使用一个组合音频端口。
Asus ROG Zephyrus M16 GU603Z audio analysis
(+) | speakers can play relatively loud (82.96 dB)
Bass 100 - 315 Hz
(±) | reduced bass - on average 11.6% lower than median
(±) | linearity of bass is average (9.2% delta to prev. frequency)
Mids 400 - 2000 Hz
(+) | balanced mids - only 4.3% away from median
(+) | mids are linear (5.7% delta to prev. frequency)
Highs 2 - 16 kHz
(+) | balanced highs - only 1.6% away from median
(+) | highs are linear (3.9% delta to prev. frequency)
Overall 100 - 16.000 Hz
(+) | overall sound is linear (10.1% difference to median)
Compared to same class
» 5% of all tested devices in this class were better, 2% similar, 93% worse
» The best had a delta of 6%, average was 18%, worst was 132%
Compared to all devices tested
» 5% of all tested devices were better, 2% similar, 94% worse
» The best had a delta of 4%, average was 23%, worst was 134%
Lenovo Legion 5 Pro 16ARH7H RTX 3070 Ti audio analysis
(±) | speaker loudness is average but good (72.5 dB)
Bass 100 - 315 Hz
(-) | nearly no bass - on average 22.3% lower than median
(-) | bass is not linear (15.4% delta to prev. frequency)
Mids 400 - 2000 Hz
(±) | higher mids - on average 7.1% higher than median
(±) | linearity of mids is average (9.5% delta to prev. frequency)
Highs 2 - 16 kHz
(+) | balanced highs - only 1.9% away from median
(+) | highs are linear (3.6% delta to prev. frequency)
Overall 100 - 16.000 Hz
(-) | overall sound is not linear (30.3% difference to median)
Compared to same class
» 96% of all tested devices in this class were better, 2% similar, 3% worse
» The best had a delta of 6%, average was 18%, worst was 132%
Compared to all devices tested
» 89% of all tested devices were better, 3% similar, 9% worse
» The best had a delta of 4%, average was 23%, worst was 134%
电源管理--游戏时效率高,但空闲时不稳定
消耗功率
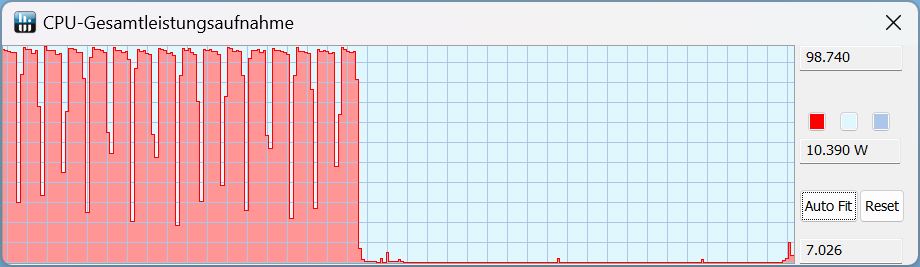
不幸的是,尽管任务管理器没有显示任何阻碍性进程,但空闲时的消耗量变化很大,变得相当高。即使在长时间运行后,情况也是如此。我们欢迎华硕在这方面进行一些驱动更新。
在游戏时,M16的消耗量出奇的低(144W)。Vision 16 Pro 的消耗量多出8%,而更强大的Legion 5 Pro 甚至多出45%!考虑到Legion 5 的额外性能,这并不十分令人惊讶,但差异的程度却令人惊讶,因为即使是明显较弱的前辈 在游戏时也会消耗更多的电力。
如果我们为M16选择Turbo模式,它在游戏 时消耗175瓦(《Witcher 3 》 )而不是144瓦(蓝图)。这就比Vision 16 Pro略高,但仍低于Legion 5 Pro的209瓦。
我们测量了240W电源的临时负载峰值高达220W,因此这应该足以满足所有的使用场景。
| Off / Standby | |
| Idle | |
| Load |
|
Key:
min: | |
| Asus ROG Zephyrus M16 GU603Z i9-12900H, GeForce RTX 3070 Ti Laptop GPU, Micron 3400 1TB MTFDKBA1T0TFH, IPS, 2560x1600, 16" | Asus ROG Zephyrus M16 GU603H i9-11900H, GeForce RTX 3070 Laptop GPU, Samsung PM9A1 MZVL22T0HBLB, IPS, 2560x1600, 16" | Schenker Vision 16 Pro RTX 3070 Ti i7-12700H, GeForce RTX 3070 Ti Laptop GPU, Samsung SSD 980 Pro 1TB MZ-V8P1T0BW, IPS, 2560x1600, 16" | Lenovo Legion 5 Pro 16ARH7H RTX 3070 Ti R7 6800H, GeForce RTX 3070 Ti Laptop GPU, Samsung PM9A1 MZVL21T0HCLR, IPS, 2560x1600, 16" | Schenker XMG Focus 16 (i7-12700H, RTX 3060) i7-12700H, GeForce RTX 3060 Laptop GPU, Samsung SSD 980 Pro 1TB MZ-V8P1T0BW, IPS, 2560x1600, 16" | Corsair Voyager a1600 R9 6900HS, Radeon RX 6800M, Samsung PM9A1 MZVL22T0HBLB, IPS, 2560x1600, 16" | Average NVIDIA GeForce RTX 3070 Ti Laptop GPU | Average of class Gaming | |
|---|---|---|---|---|---|---|---|---|
| Power Consumption | -14% | 14% | -30% | -16% | -32% | -23% | -17% | |
| Idle Minimum * (Watt) | 10.8 | 11 -2% | 9 17% | 9.7 10% | 14.7 -36% | 16.9 -56% | 14.2 ? -31% | 13 ? -20% |
| Idle Average * (Watt) | 17 | 20 -18% | 13.3 22% | 14.8 13% | 18.6 -9% | 20.3 -19% | 19.9 ? -17% | 19 ? -12% |
| Idle Maximum * (Watt) | 17.8 | 30 -69% | 14.3 20% | 45.8 -157% | 21.2 -19% | 22.2 -25% | 26.2 ? -47% | 24.6 ? -38% |
| Load Average * (Watt) | 116 | 111 4% | 107 8% | 87.2 25% | 121 -4% | 133.4 -15% | 125.8 ? -8% | 110.7 ? 5% |
| Witcher 3 ultra * (Watt) | 144 | 156 -8% | 155.2 -8% | 209 -45% | 174 -21% | 206 -43% | ||
| Load Maximum * (Watt) | 220 | 197 10% | 172 22% | 275.3 -25% | 235 -7% | 248 ? -13% | 259 ? -18% |
* ... smaller is better
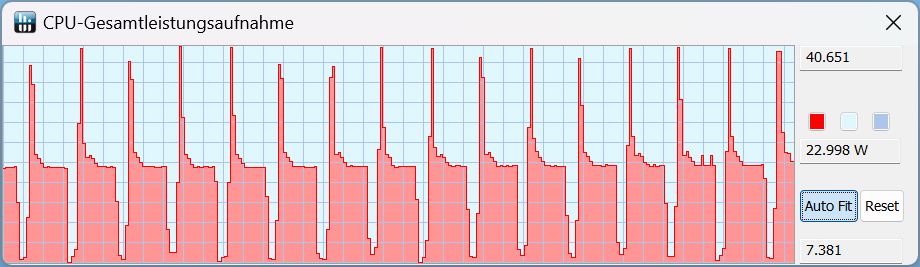
Power Consumption The Witcher 3 / Stress Test
Power Consumption with External Monitor
电池寿命
华硕在性能选项中并没有列出任何真正的省电模式。如果你拔掉插头,M16会自动切换到静音模式。
电池容量为90Wh,相比之下还算不错。Vision 16 Pro和Legion 5只提供80Wh的容量。这导致M16的持续时间相应地更长。
根据显示亮度的不同,运行时间也有很大差异。在我们的WiFi测试中,M16的持续时间在5小时(全亮度)和约7.5小时(150尼特)之间。
在看电影时,你可以期待差不多的时间。
| Asus ROG Zephyrus M16 GU603Z i9-12900H, GeForce RTX 3070 Ti Laptop GPU, 90 Wh | Asus ROG Zephyrus M16 GU603H i9-11900H, GeForce RTX 3070 Laptop GPU, 90 Wh | Schenker Vision 16 Pro RTX 3070 Ti i7-12700H, GeForce RTX 3070 Ti Laptop GPU, 80 Wh | Lenovo Legion 5 Pro 16ARH7H RTX 3070 Ti R7 6800H, GeForce RTX 3070 Ti Laptop GPU, 80 Wh | Schenker XMG Focus 16 (i7-12700H, RTX 3060) i7-12700H, GeForce RTX 3060 Laptop GPU, 54 Wh | Corsair Voyager a1600 R9 6900HS, Radeon RX 6800M, 99 Wh | Average of class Gaming | |
|---|---|---|---|---|---|---|---|
| Battery runtime | 9% | -14% | -41% | -18% | 3% | 6% | |
| H.264 (h) | 7.3 | 6.1 -16% | 6 -18% | 8.32 ? 14% | |||
| WiFi v1.3 (h) | 7.4 | 7.7 4% | 6 -19% | 4.4 -41% | 4.8 -35% | 5.8 -22% | 7.11 ? -4% |
| Load (h) | 1.4 | 1.6 14% | 1.3 -7% | 1.4 0% | 2.1 50% | 1.502 ? 7% | |
| Reader / Idle (h) | 13.3 | 7 | 8.27 ? |
Pros
Cons
结论 - 一个全面的游戏笔记本电脑,拥有16:10的显示屏

华硕ROG Zephyrus M16是一款整体优化良好的游戏笔记本电脑,没有任何明显的问题领域。除了非常好的CPU性能和体面的电池寿命外,16:10格式的大型16英寸QHD+显示屏也知道如何以其强大的对比度和相当高的色彩空间覆盖率来取悦。
考虑到许多竞争对手完全没有任何SD卡读卡器的事实,我们可以原谅华硕只使用了一个microSD读卡器,特别是因为这里使用的设备相当快。 RTX 3070 TiRTX 3070 Ti只有120W的TGP,但这也意味着笔记本电脑不会变得太热,噪音水平也保持在限制范围内。另一方面,华硕可以优化风扇控制,因为不时地,即使在空闲运行时,风扇也会突然转速达到47分贝。
M16主要是作为一个全面的游戏包来展示自己。尽管它没有提供最大的性能,但该套装的温度和噪音水平都很适中。
那些需要更高的性能的人可以看一下 联想Legion 5 Pro或者你可以直接打开M16中同样响亮的Turbo模式,导致这里的性能也有明显的、可测量的提高。
价格和可用性
亚马逊列出了2022年华硕ROG Zephyrus M16的各种配置,起价2249美元。
Asus ROG Zephyrus M16 GU603Z
- 02/14/2023 v7 (old)
Christian Hintze
Transparency
The selection of devices to be reviewed is made by our editorial team. The test sample was provided to the author as a loan by the manufacturer or retailer for the purpose of this review. The lender had no influence on this review, nor did the manufacturer receive a copy of this review before publication. There was no obligation to publish this review. As an independent media company, Notebookcheck is not subjected to the authority of manufacturers, retailers or publishers.
This is how Notebookcheck is testing
Every year, Notebookcheck independently reviews hundreds of laptops and smartphones using standardized procedures to ensure that all results are comparable. We have continuously developed our test methods for around 20 years and set industry standards in the process. In our test labs, high-quality measuring equipment is utilized by experienced technicians and editors. These tests involve a multi-stage validation process. Our complex rating system is based on hundreds of well-founded measurements and benchmarks, which maintains objectivity. Further information on our test methods can be found here.
Price comparison

