结论 - 强大的力量伴随着巨大的体积
游戏笔记本电脑的流行趋势是越做越薄,但发烧友们都很清楚,减掉几毫米也就意味着减掉了性能。与许多竞争对手相比,Alienware 18 Area-51 可能更大更重,但它却能同时运行得更冷、更快,有时还更安静。希望尽可能提高性能的发烧友们无需再考虑 Alienware 18 了。
大尺寸带来的不仅仅是性能的提升。该机型提供了大多数较薄或较小的竞争对手所不具备的优质功能,包括双 PCIe5 SSD 插槽、舒适的 CherryMX 机械按键、更高品质的扬声器以及更坚固、更灵活的机箱。如果购物者只是简单地比较竞争对手笔记本电脑的规格,可能会忽略 Alienware 的一些最佳功能。
除了庞大的体积和重量外,该系统最大的缺点是电池续航时间短,而且没有任何显示屏可供选择。1600p 300 Hz IPS 显示屏对于游戏而言可以说是非常出色,但考虑到 Alienware 18 的零售价,不支持 HDR 和 4K 有点令人费解。无论设置如何,功耗都非常高,这可能会让注重效率的用户望而却步。戴尔可以在这些方面加以改进,从而在效率略高于采用 AMD 技术的 微星 Raider A18 HX和 4K mini-LED。与此同时,那些不介意为更薄(和更响)的设计而降低 10% 至 15% 性能的用户有很多选择,如 雷蛇刀锋 18或华硕 ROG Strix G18.
Pros
Cons
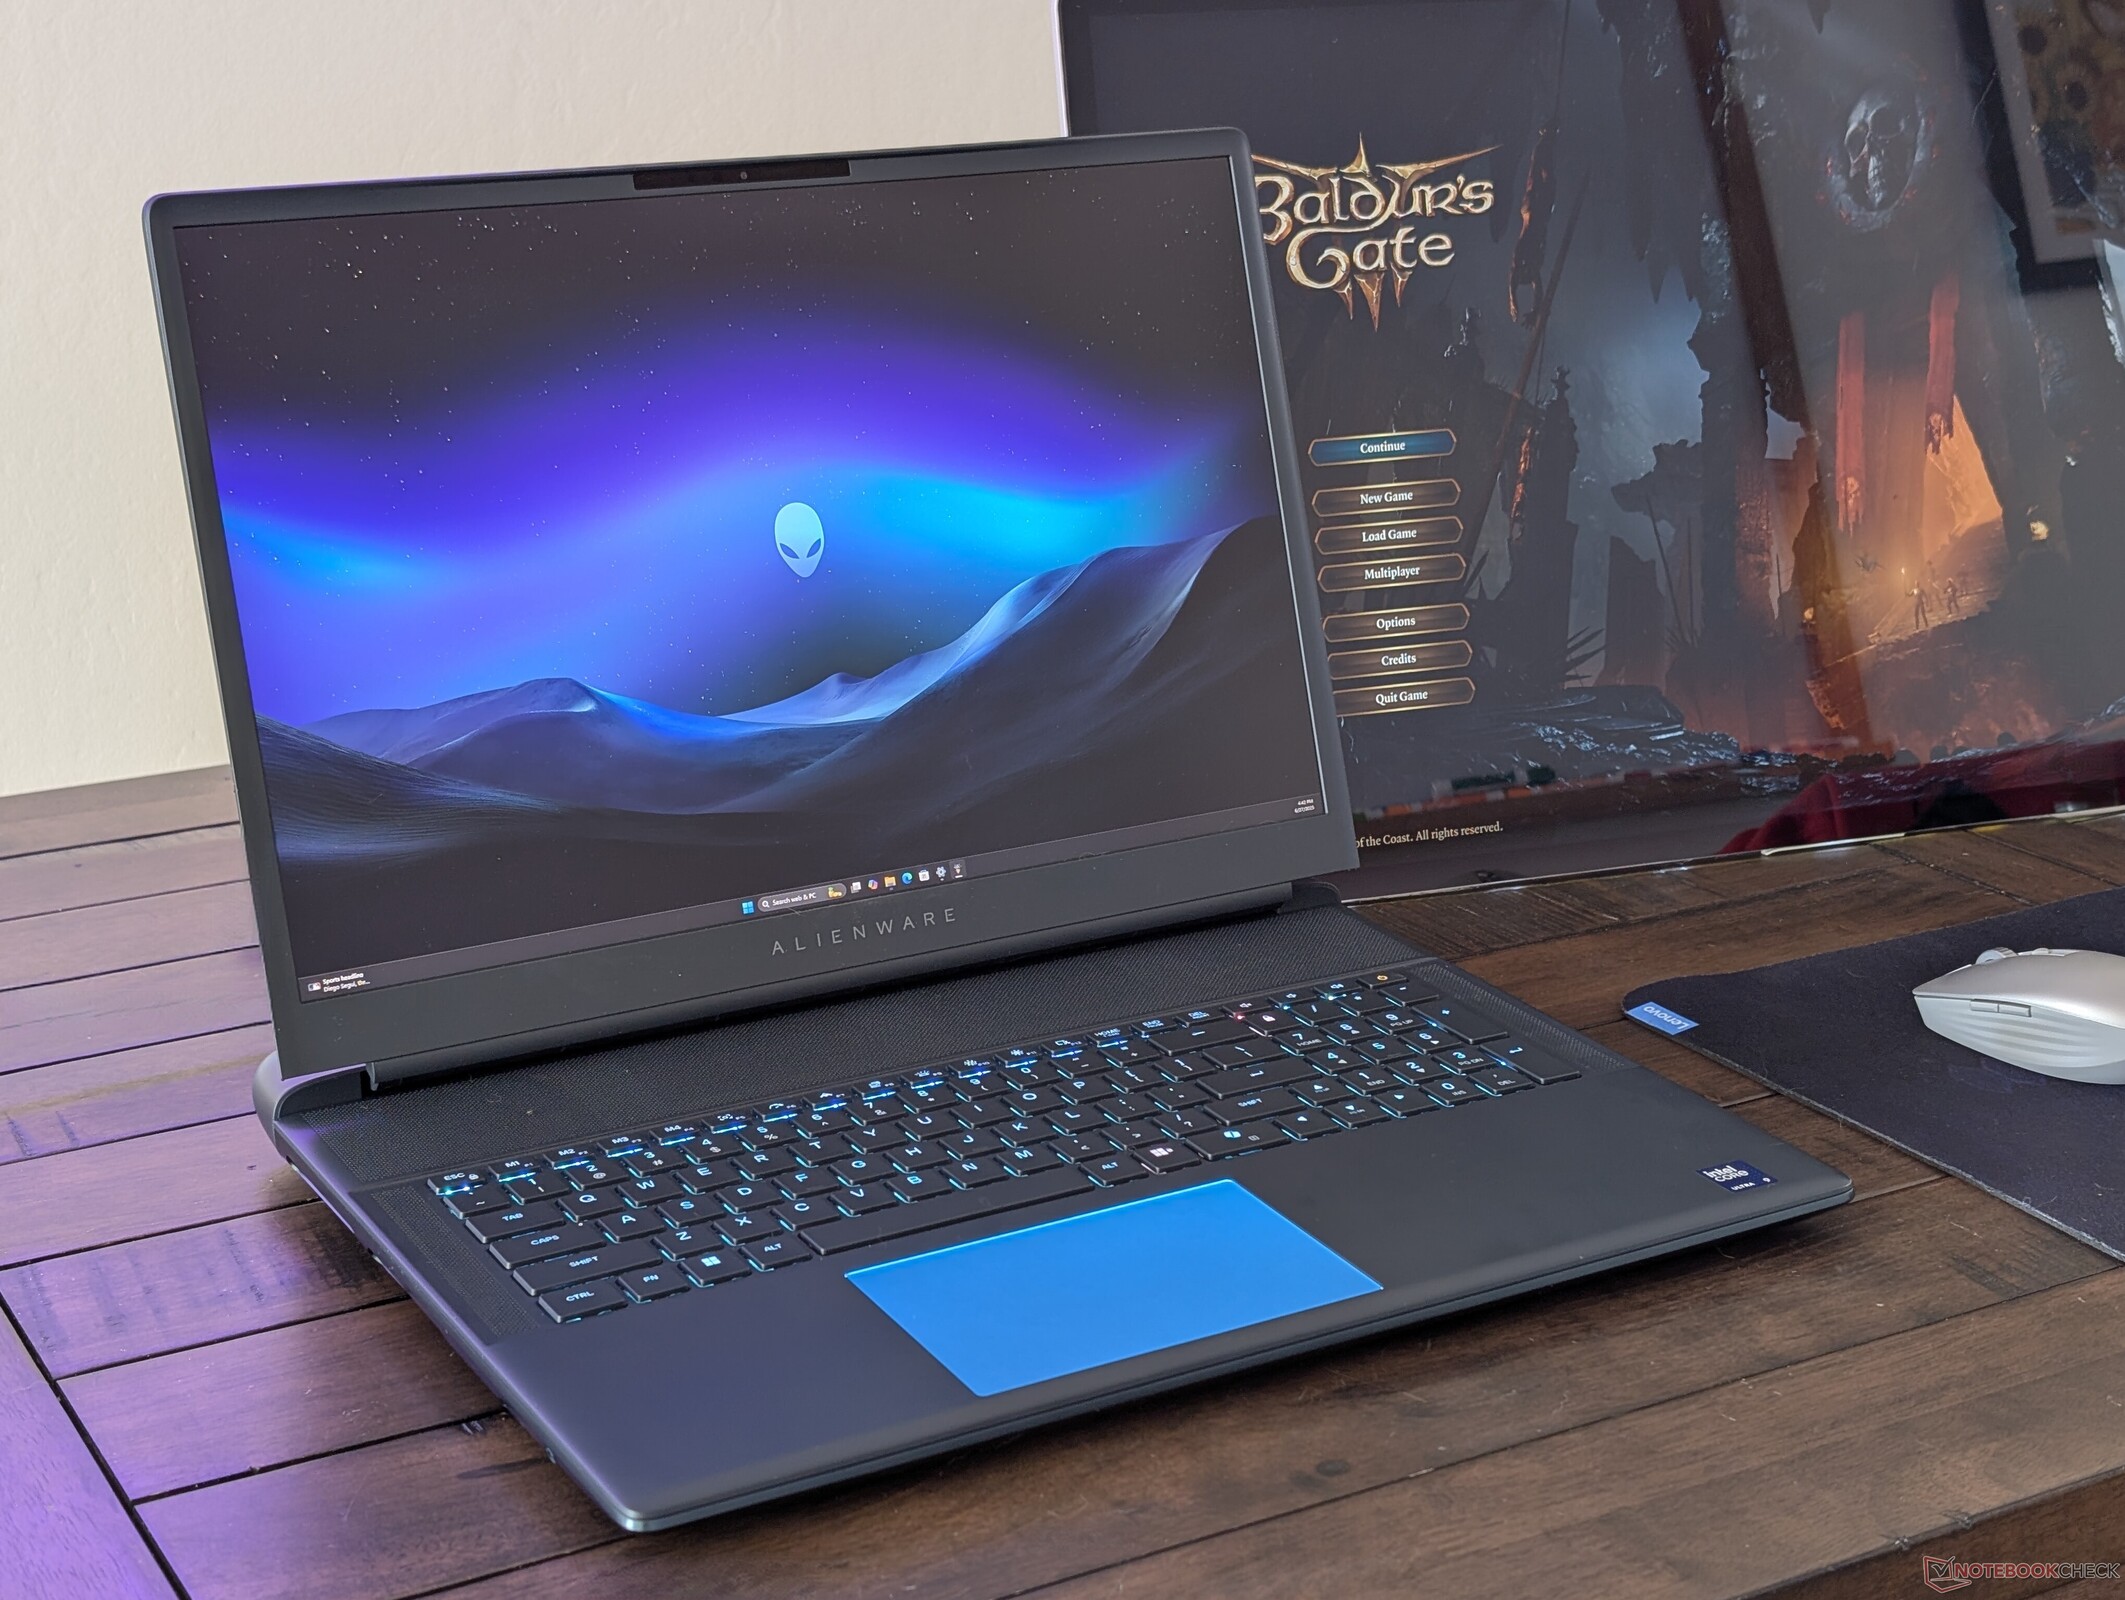
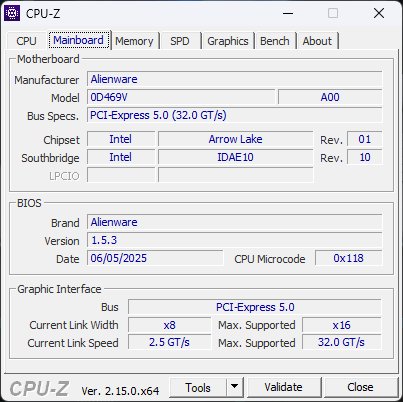
Alienware 18 Area-51 是戴尔最新推出的顶级游戏笔记本电脑,与尺寸更小的 16 英寸 Alienware 16 相比,它拥有更强的性能和更大的开销。它直接接替了去年的 m18 R2直接接替了去年的 Alienware m18 R2,对内外部设计进行了全面革新。Raptor Lake-HX CPU 和 Ada LoveLace GPU 已不复存在,取而代之的分别是更新的 Arrow Lake-HX 和 Blackwell 选项。
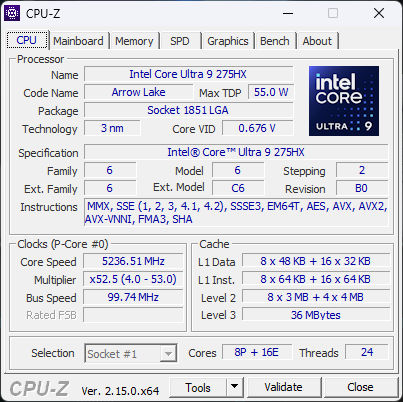
我们的测试机是最高配置,配备酷睿至尊 9 275HX CPU、175 WGeForce RTX 5090 GPU 和 1600p300 IPS 显示屏,售价约 4400 美元。较低的 SKU 从 RTX 5070 Ti 开始,价格为 3300 美元,但目前没有其他处理器或显示器可供选择。
该领域的竞争对手包括其他 18 英寸大型游戏笔记本电脑,如 微星 Titan 18 HX, Aorus Master 18或 华硕 ROG Strix Scar 18.我们对 Alienware 16的许多评论也适用于 Alienware 18,因为它们采用了相同的 AW30 设计语言。
更多戴尔评论:
规格
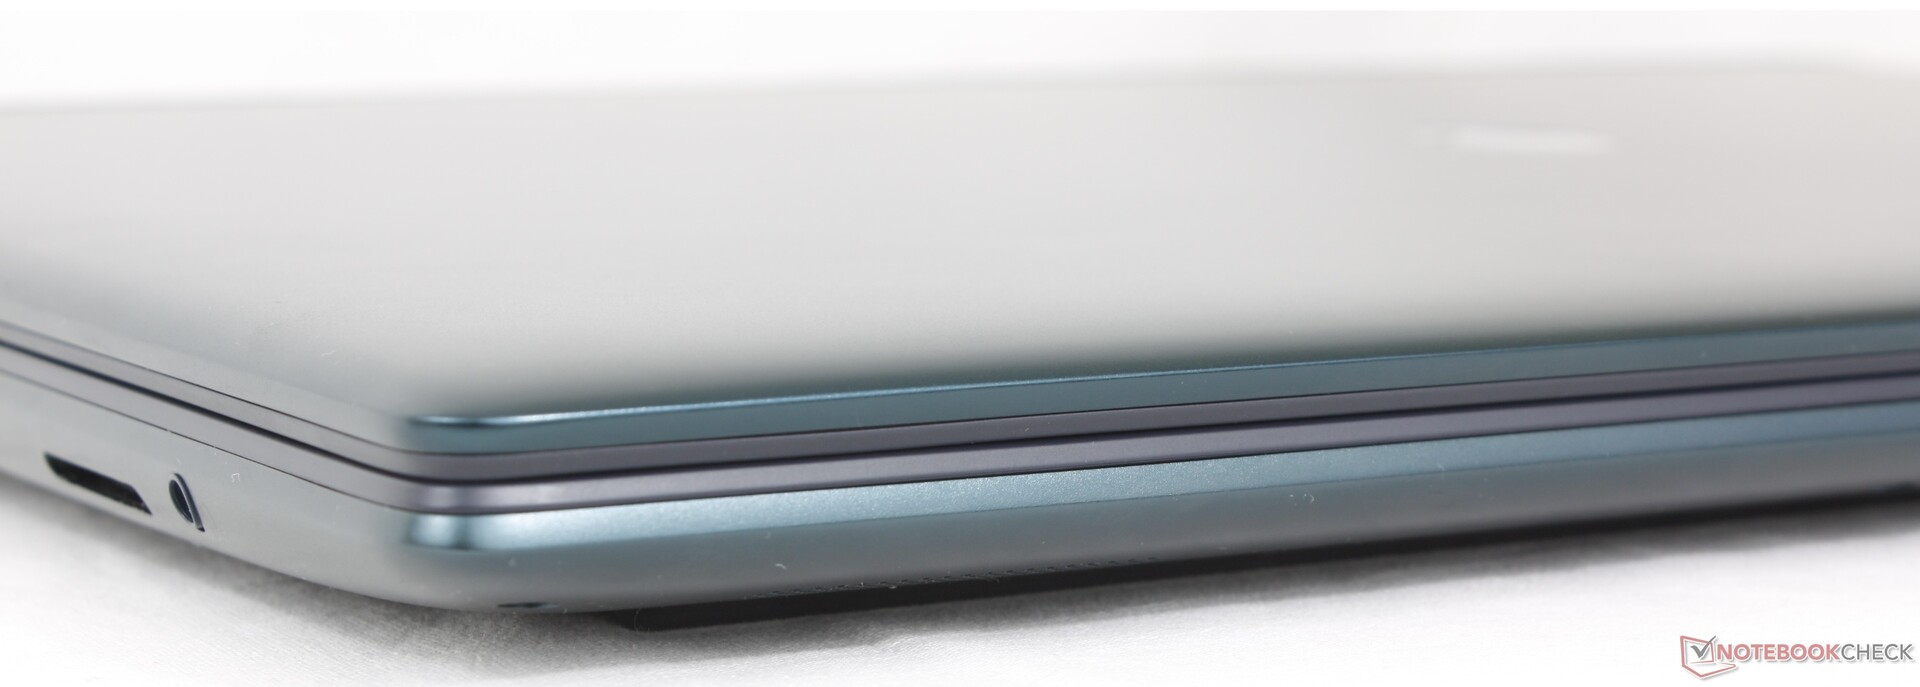
案例 - 远离六角形
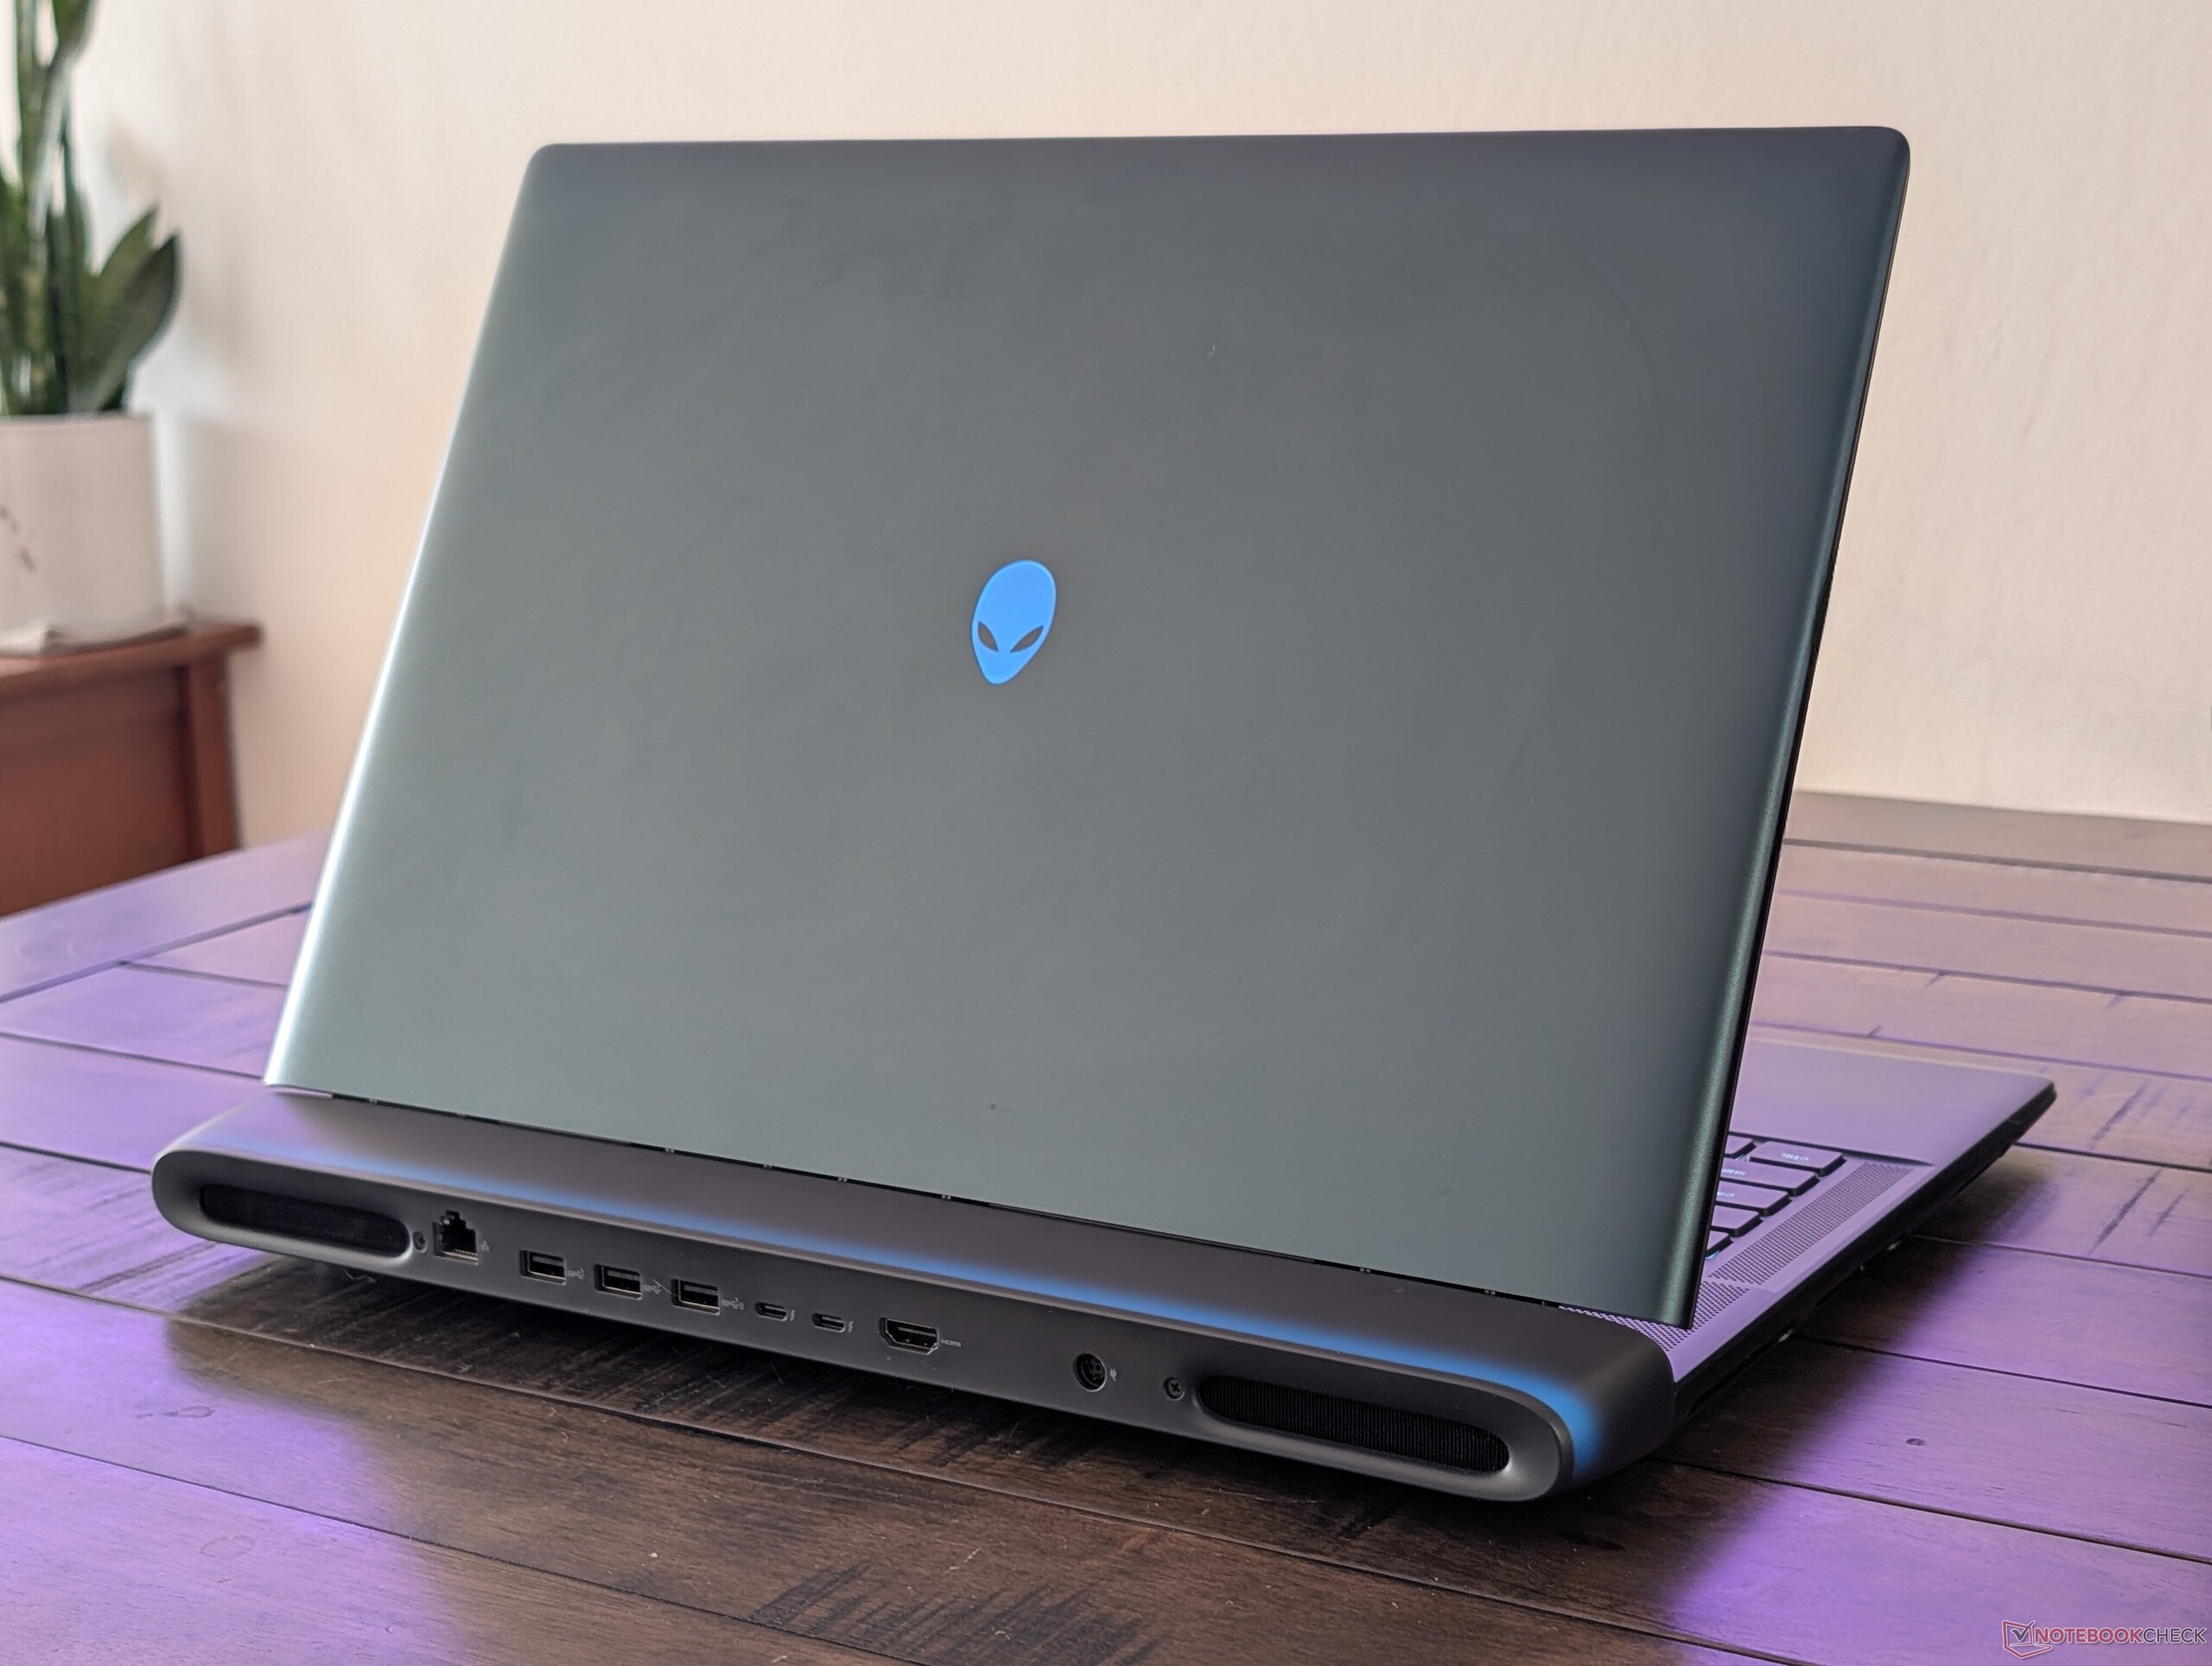
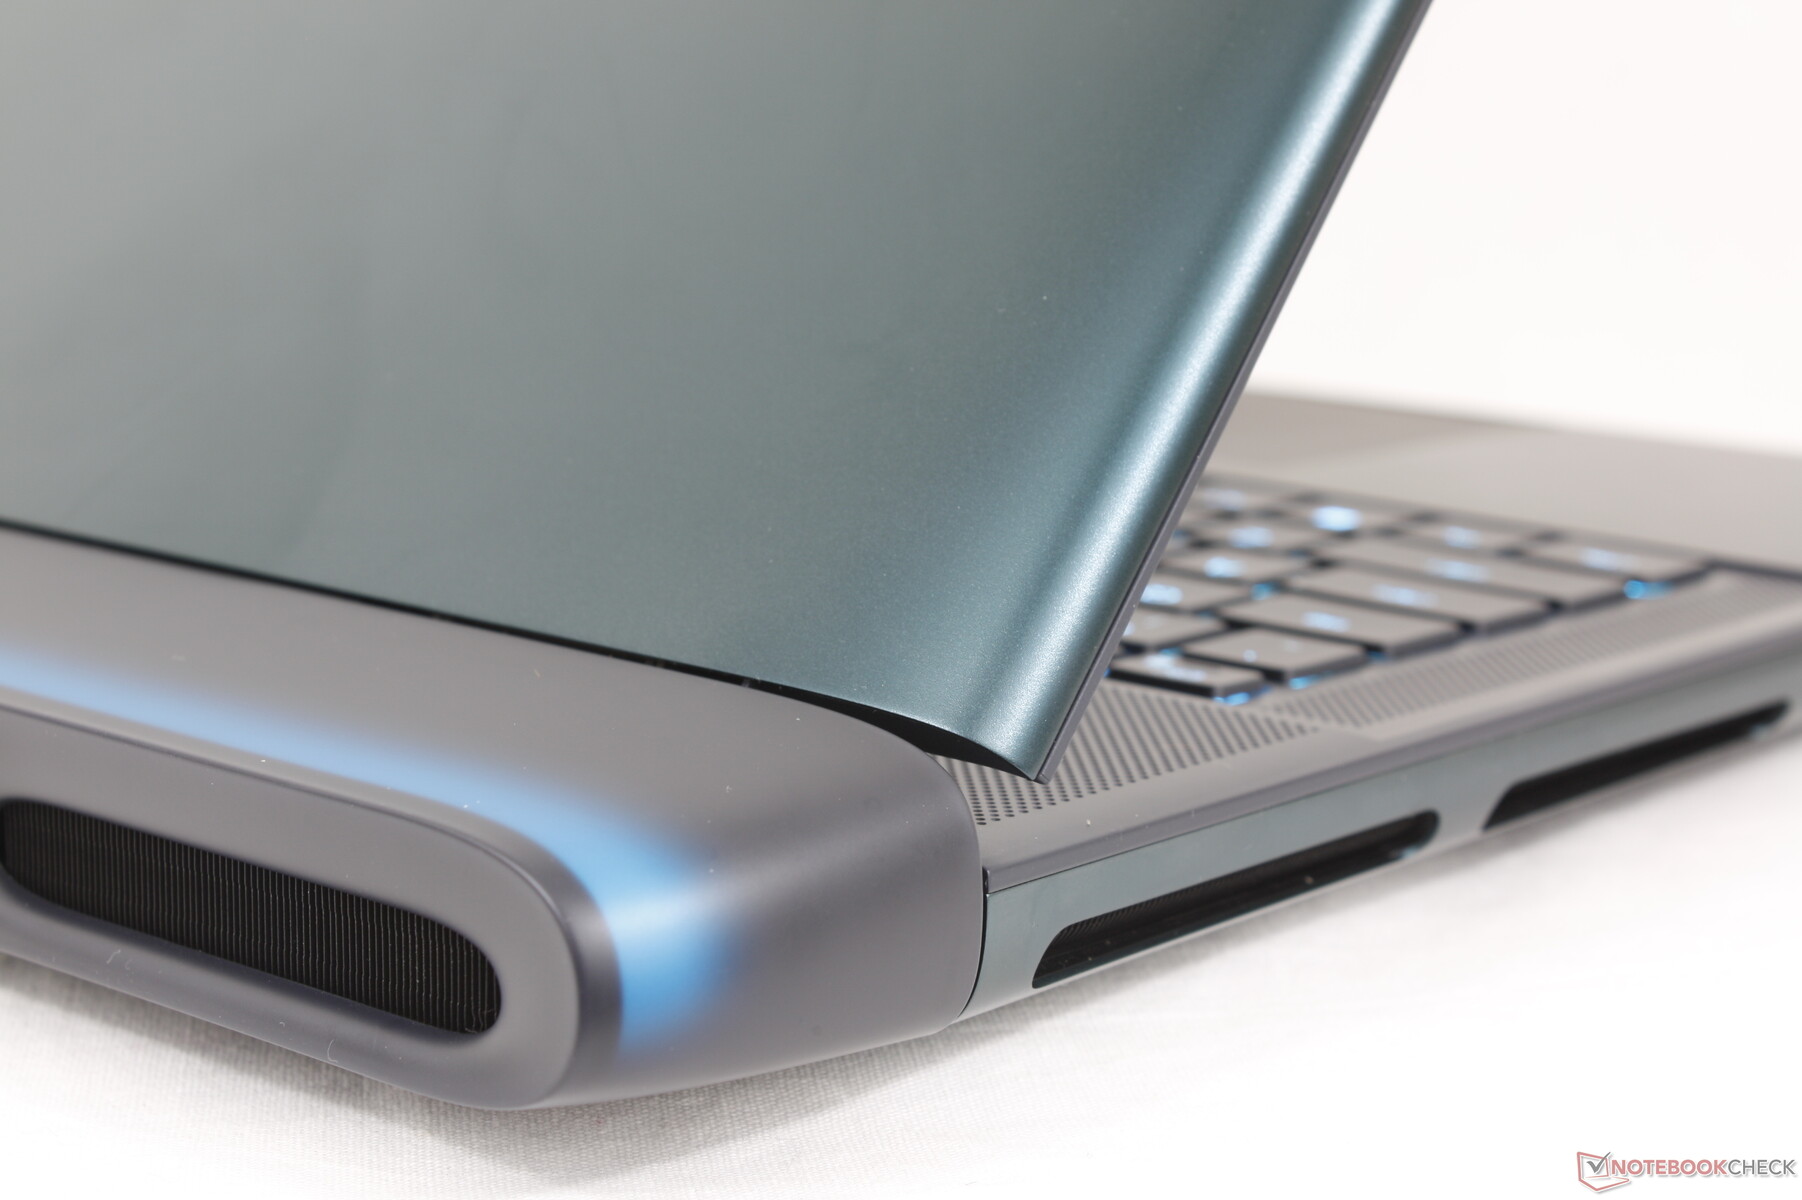
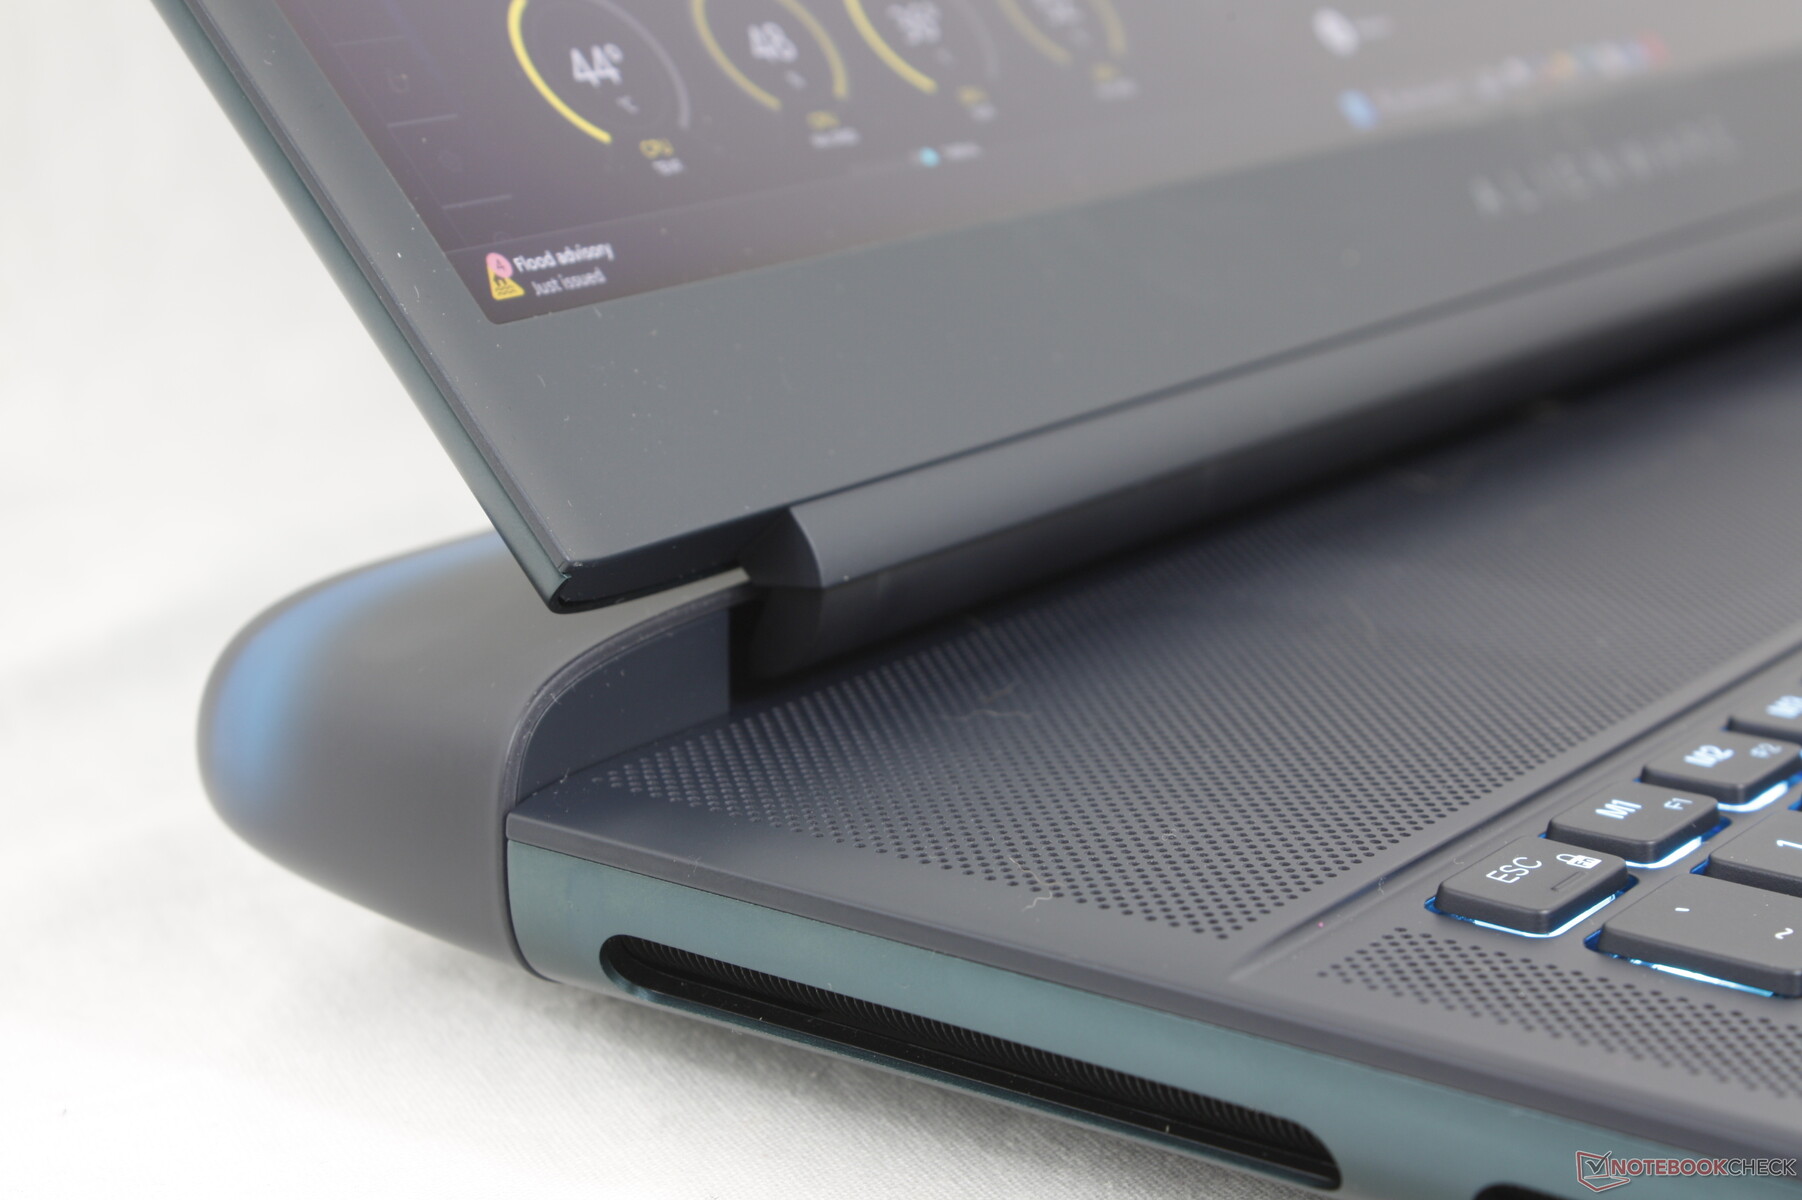
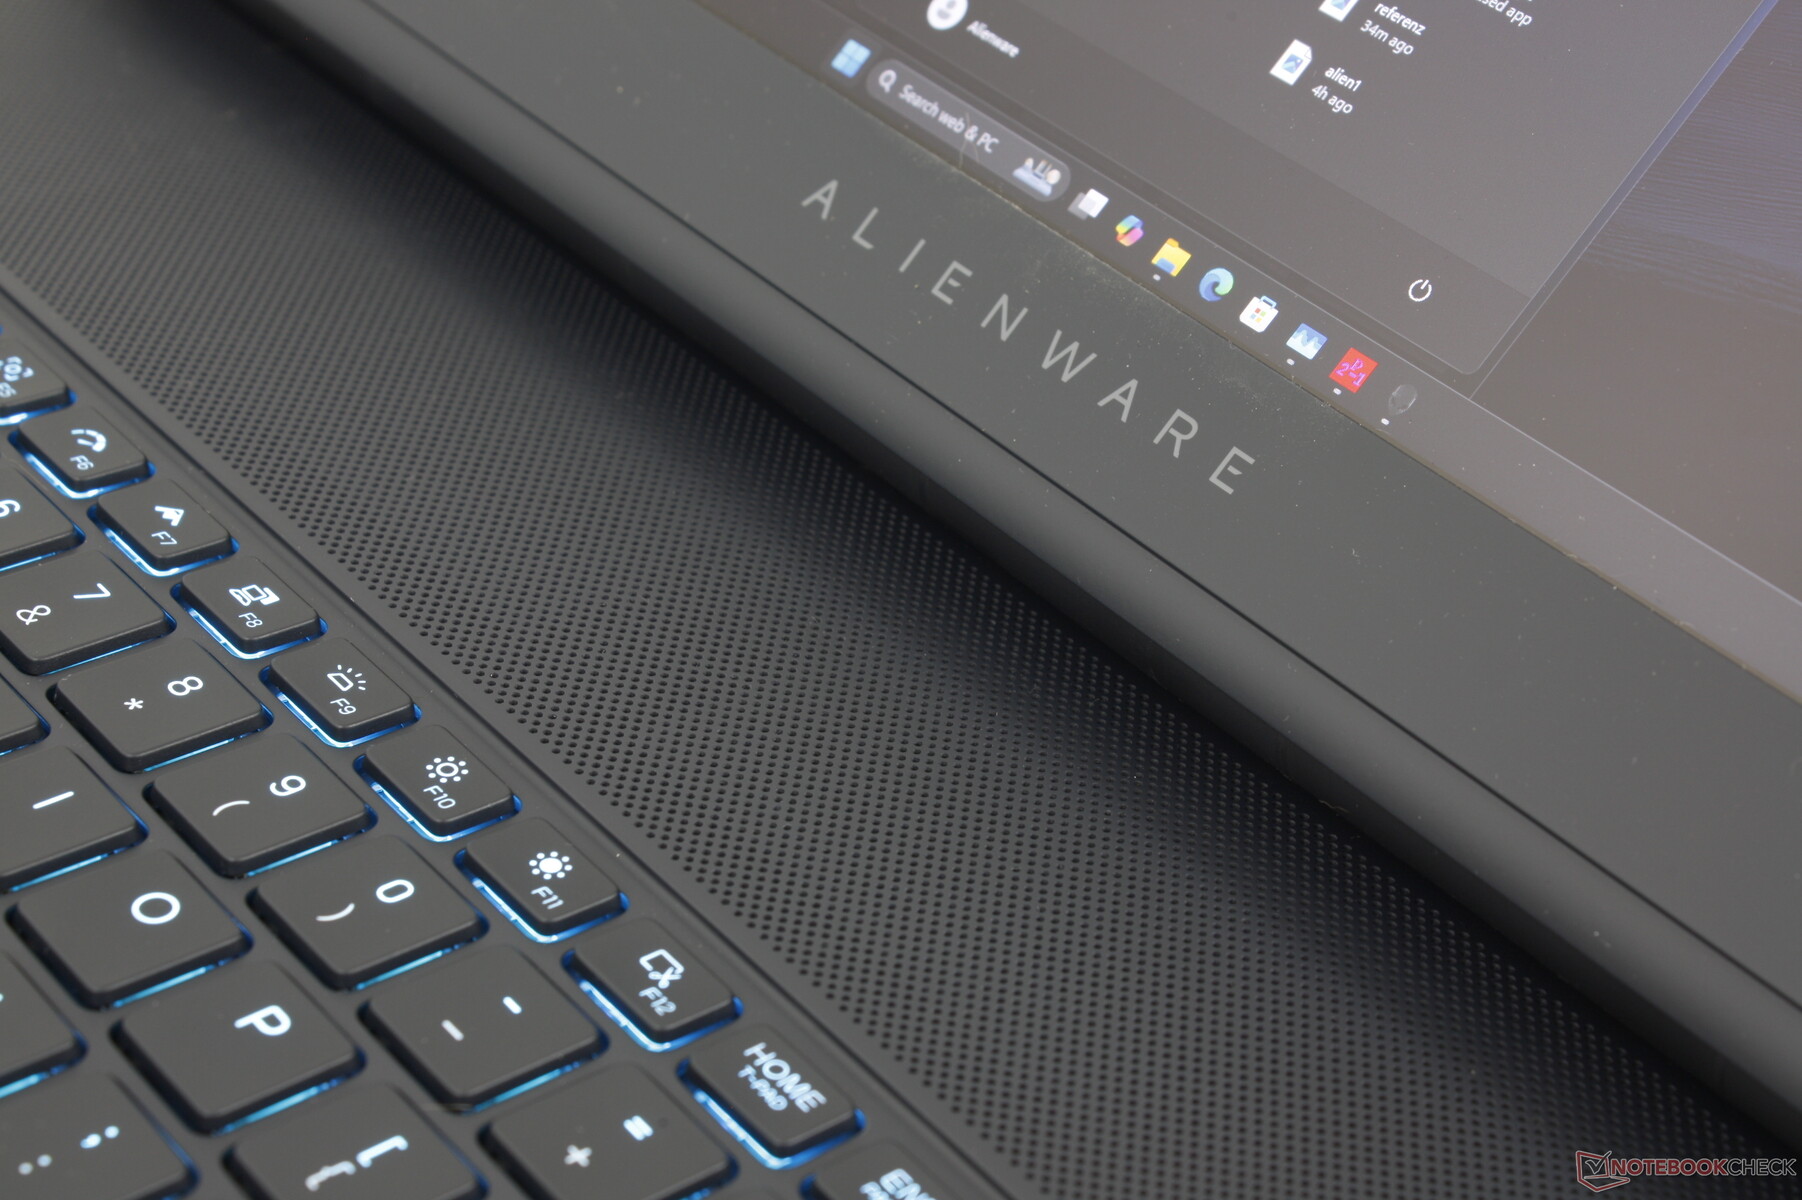
可以说,Alienware 16 上的 AW30 设计对于更大的 18 英寸机型来说效果更好。其显著的视觉特征,如圆润的边缘、光滑的外盖表面、背面柔和的 RGB LED 以及底部的大猩猩玻璃窗,都比 16 英寸的小机型更大,因此更具视觉冲击力。尽管占地面积大得惊人,但该系统看起来却相当专业。
我们对设计的主要不满并不在于它的硬度或质量,而是触感柔软的黑色键盘面板,上面很快就会积累难看的指纹。零售包装盒中应该附带一块抹布,因为你需要经常擦去按键和掌托上的油脂。
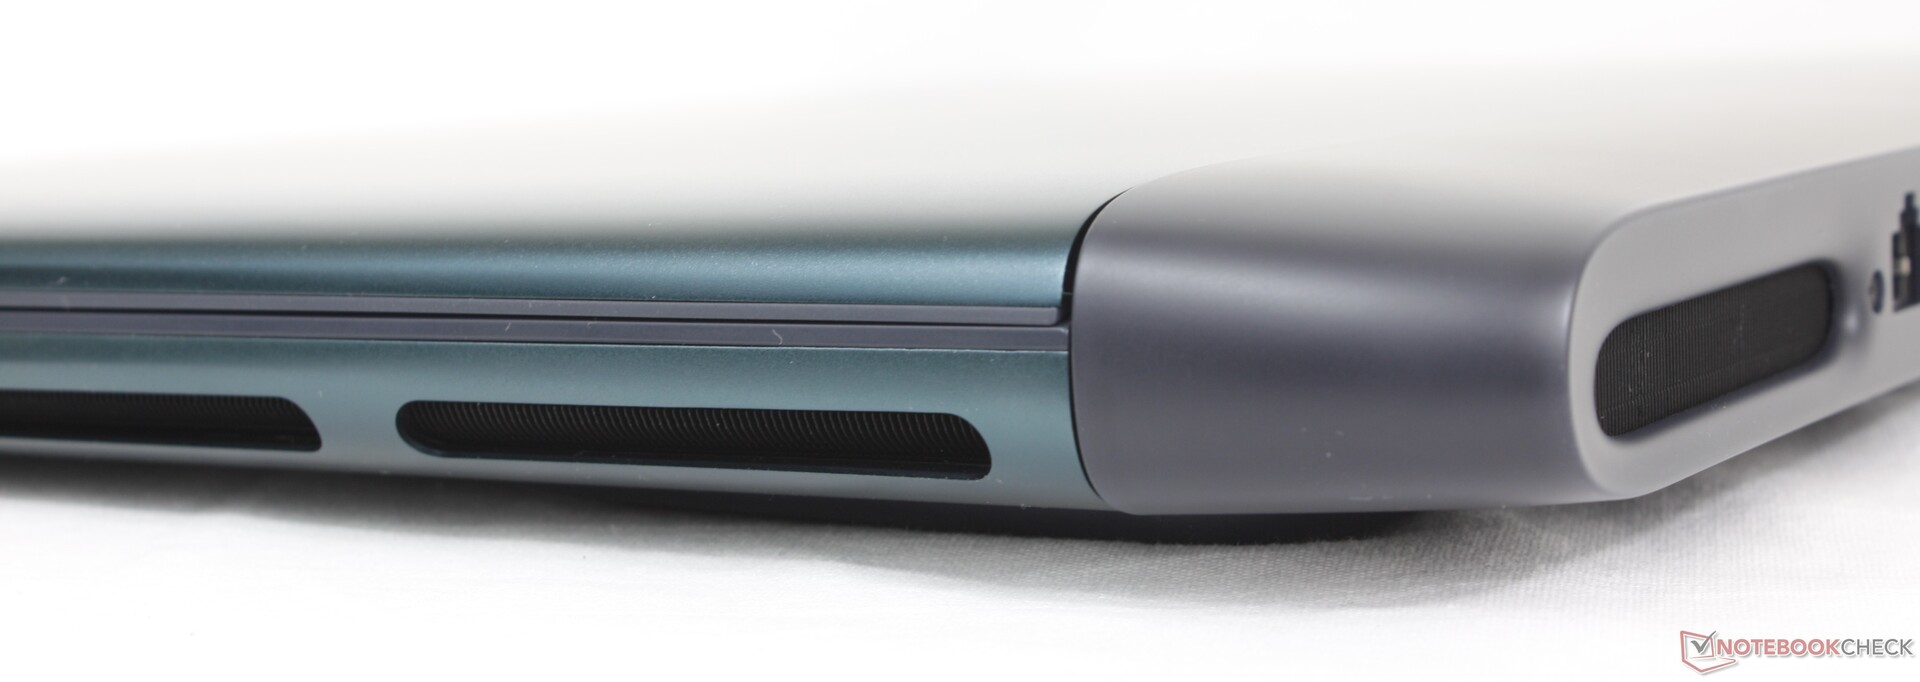
相对而言,Alienware 18 是市场上最大、最重的 18 英寸游戏笔记本电脑之一。它甚至比微星 Titan 18 还重 600 克,虽然厚度不如微星 Titan 18,但更大的占地面积弥补了这一点。
连接性
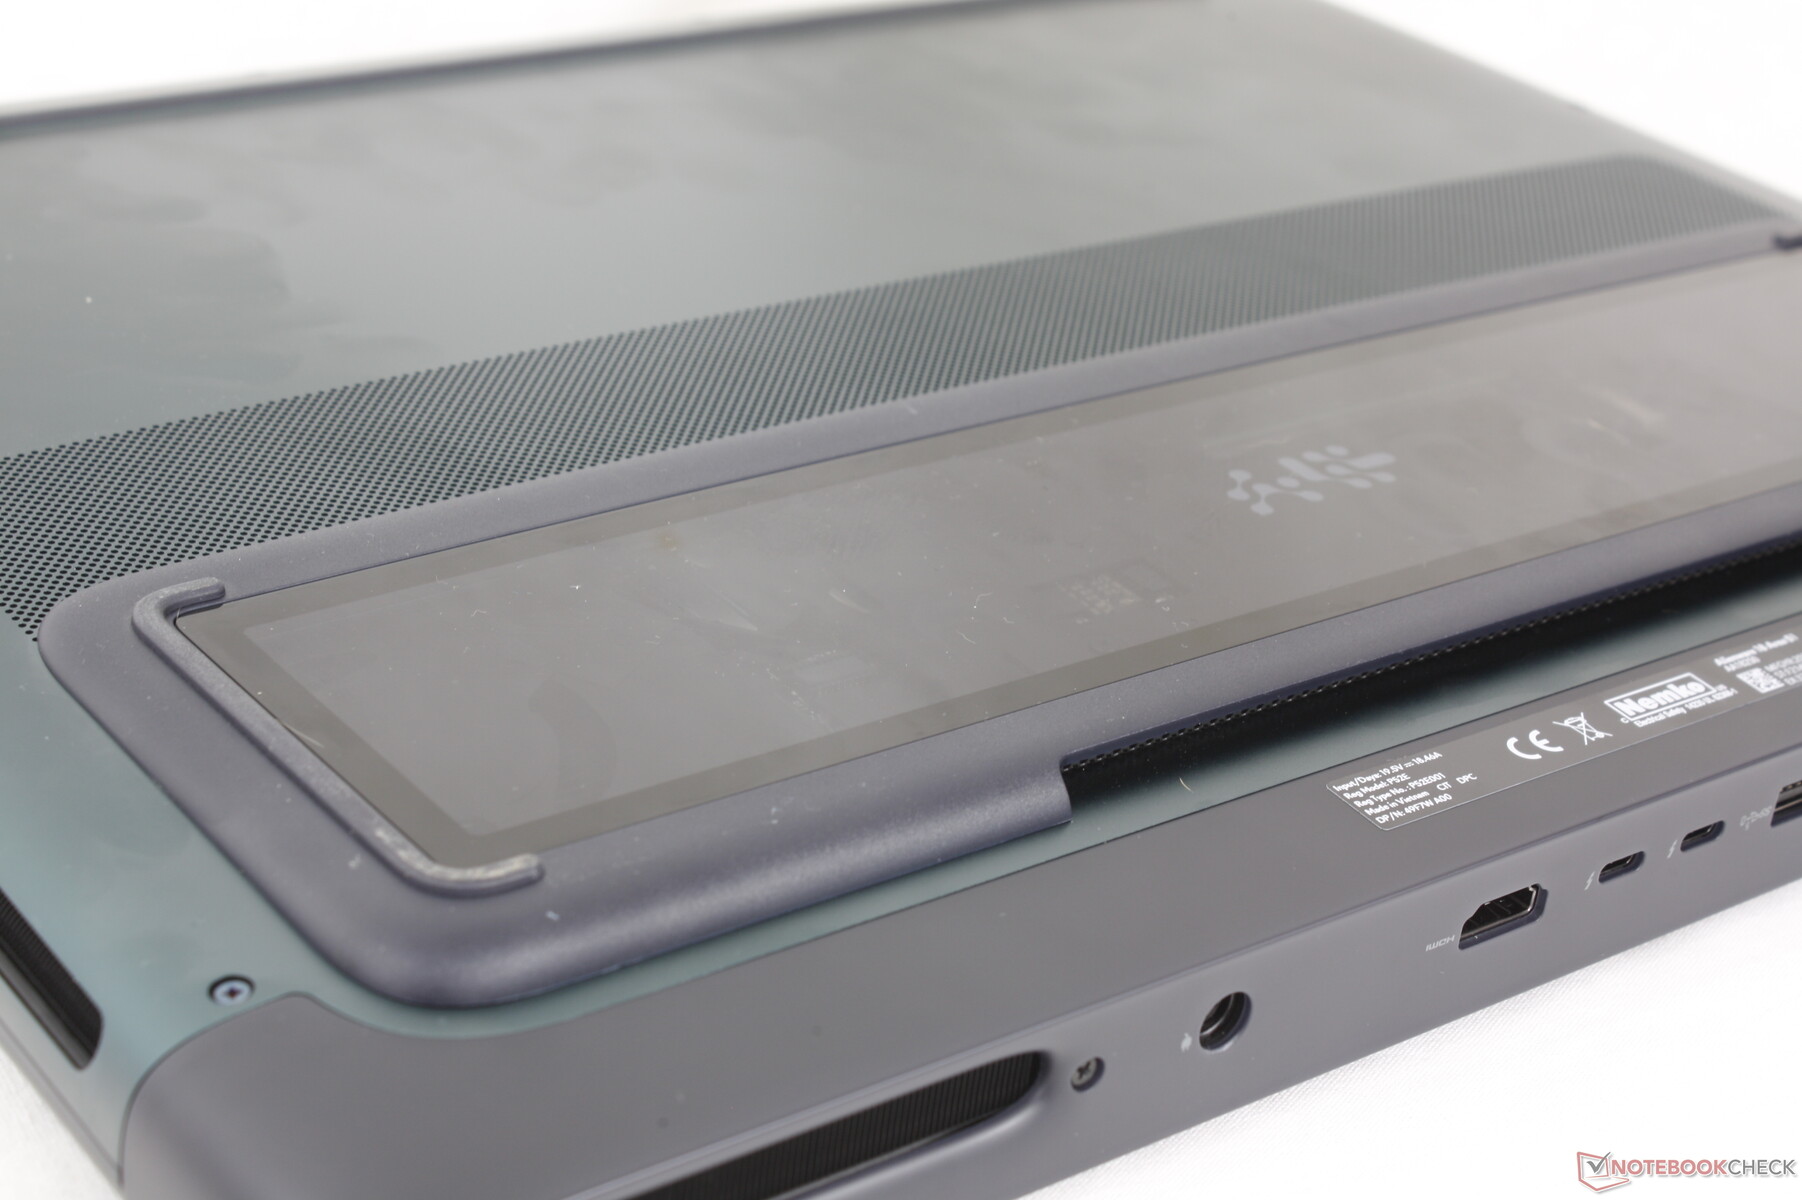
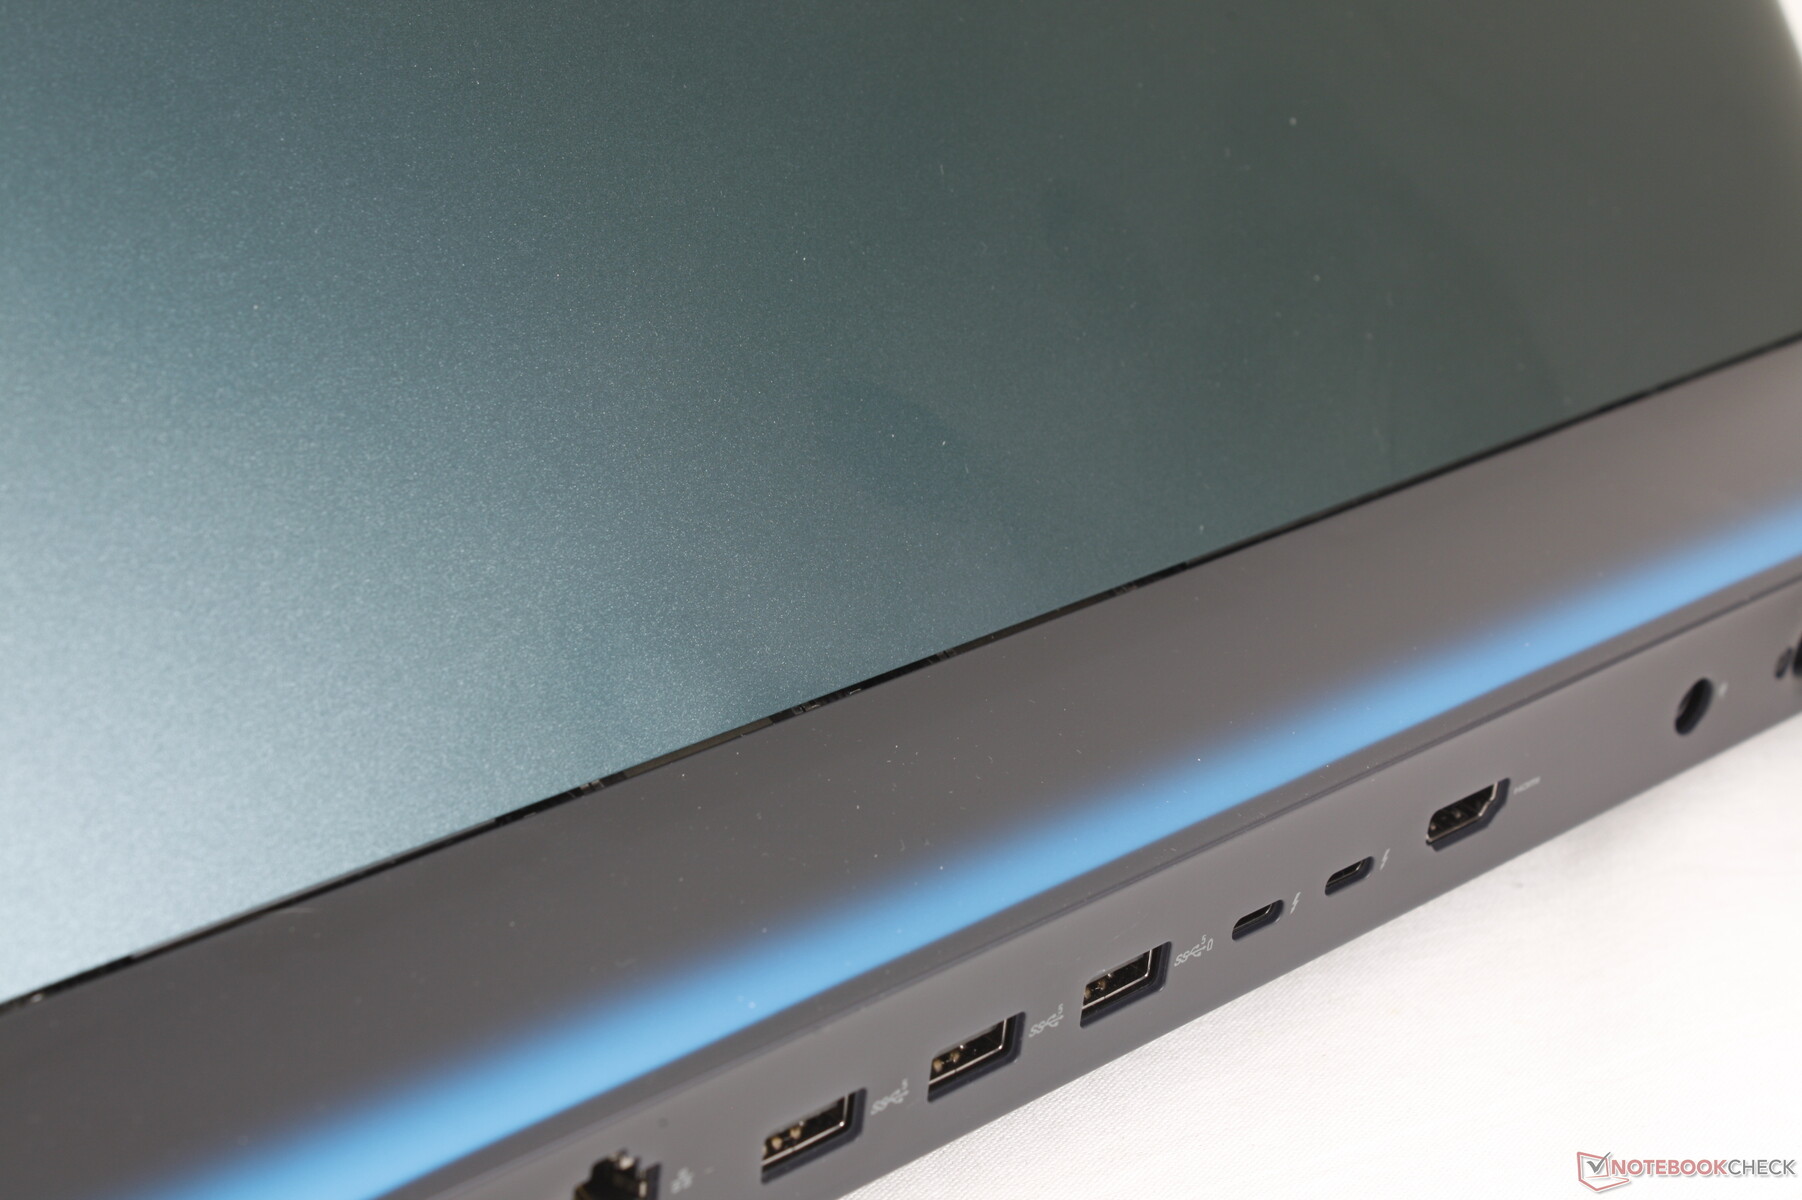
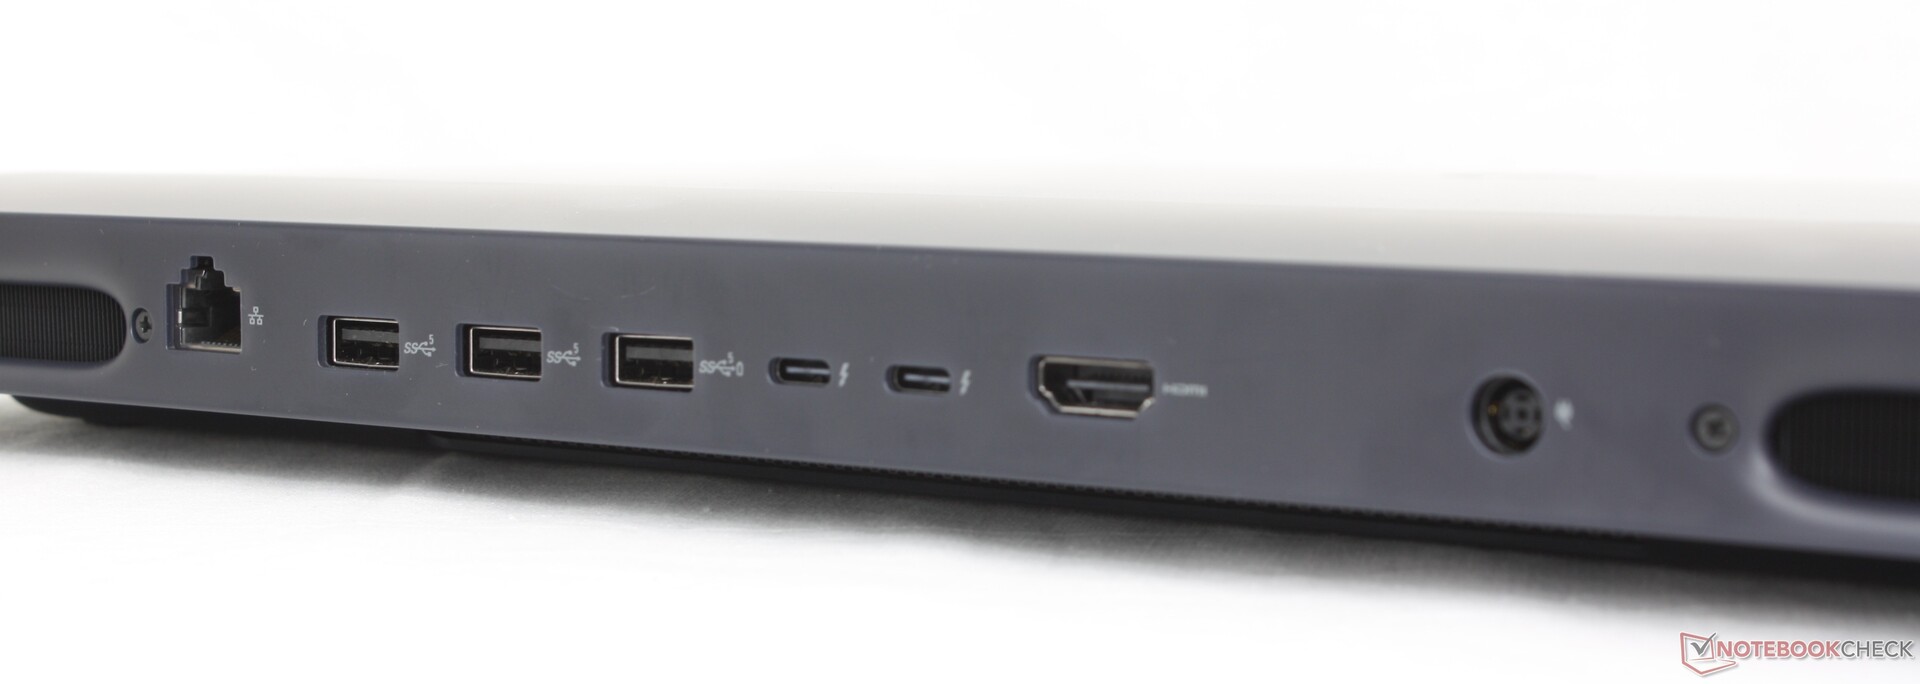
Alienware 16 上的所有端口在 Alienware 18 上都有,另外还有一个值得注意的额外端口:5 Gbps RJ-45 端口。去年 m18 R2 上的迷你 DisplayPort 现在已不复存在,幸好 SD 卡读卡器被移到了更方便的位置。
请记住,配置 RTX 5070 显卡只能获得 Thunderbolt 4,而没有 Thunderbolt 5。
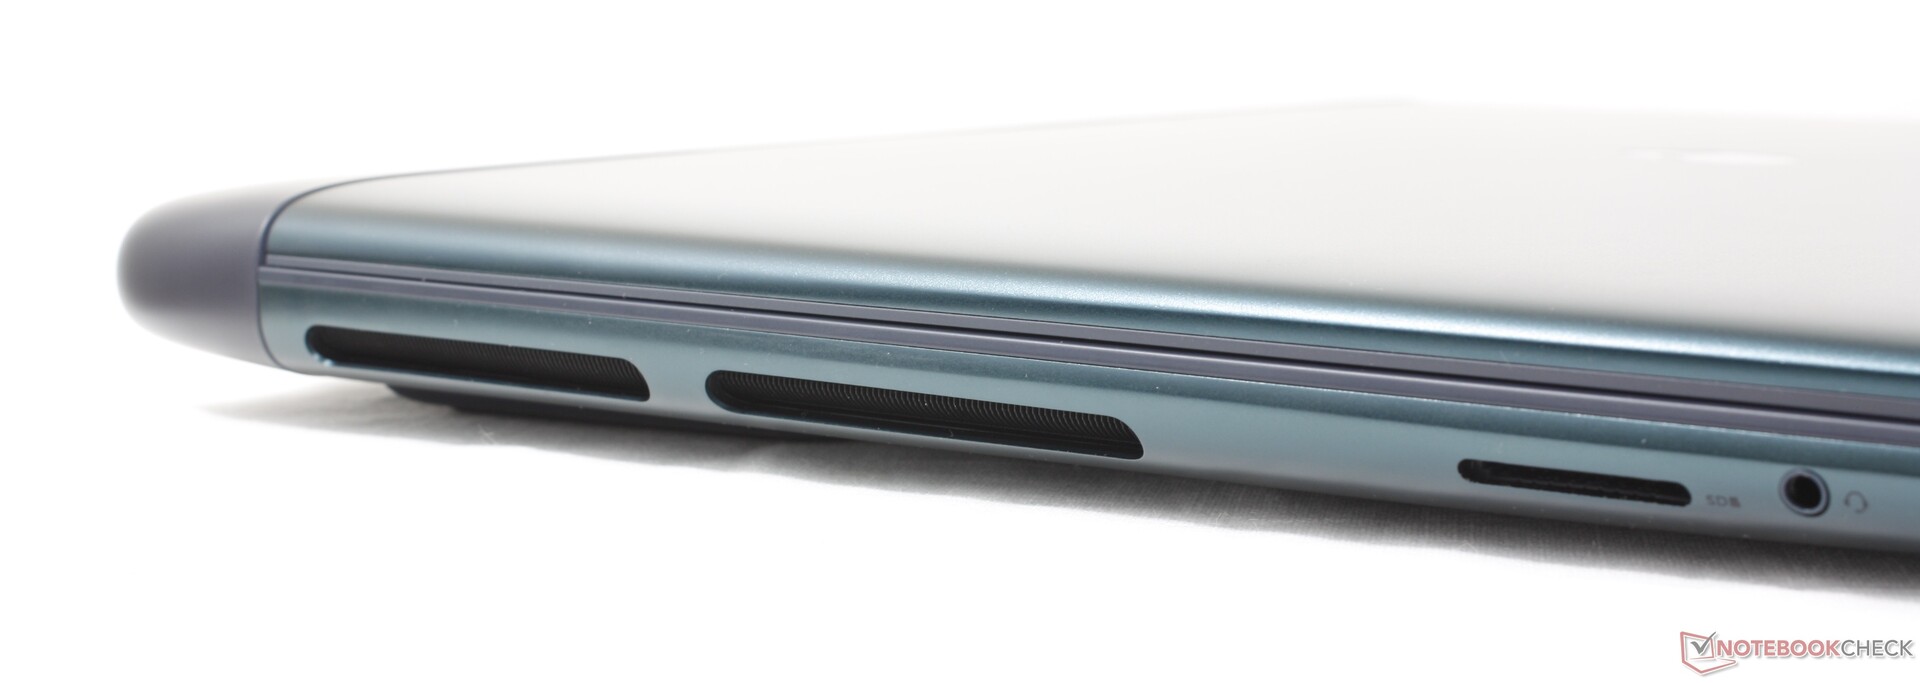
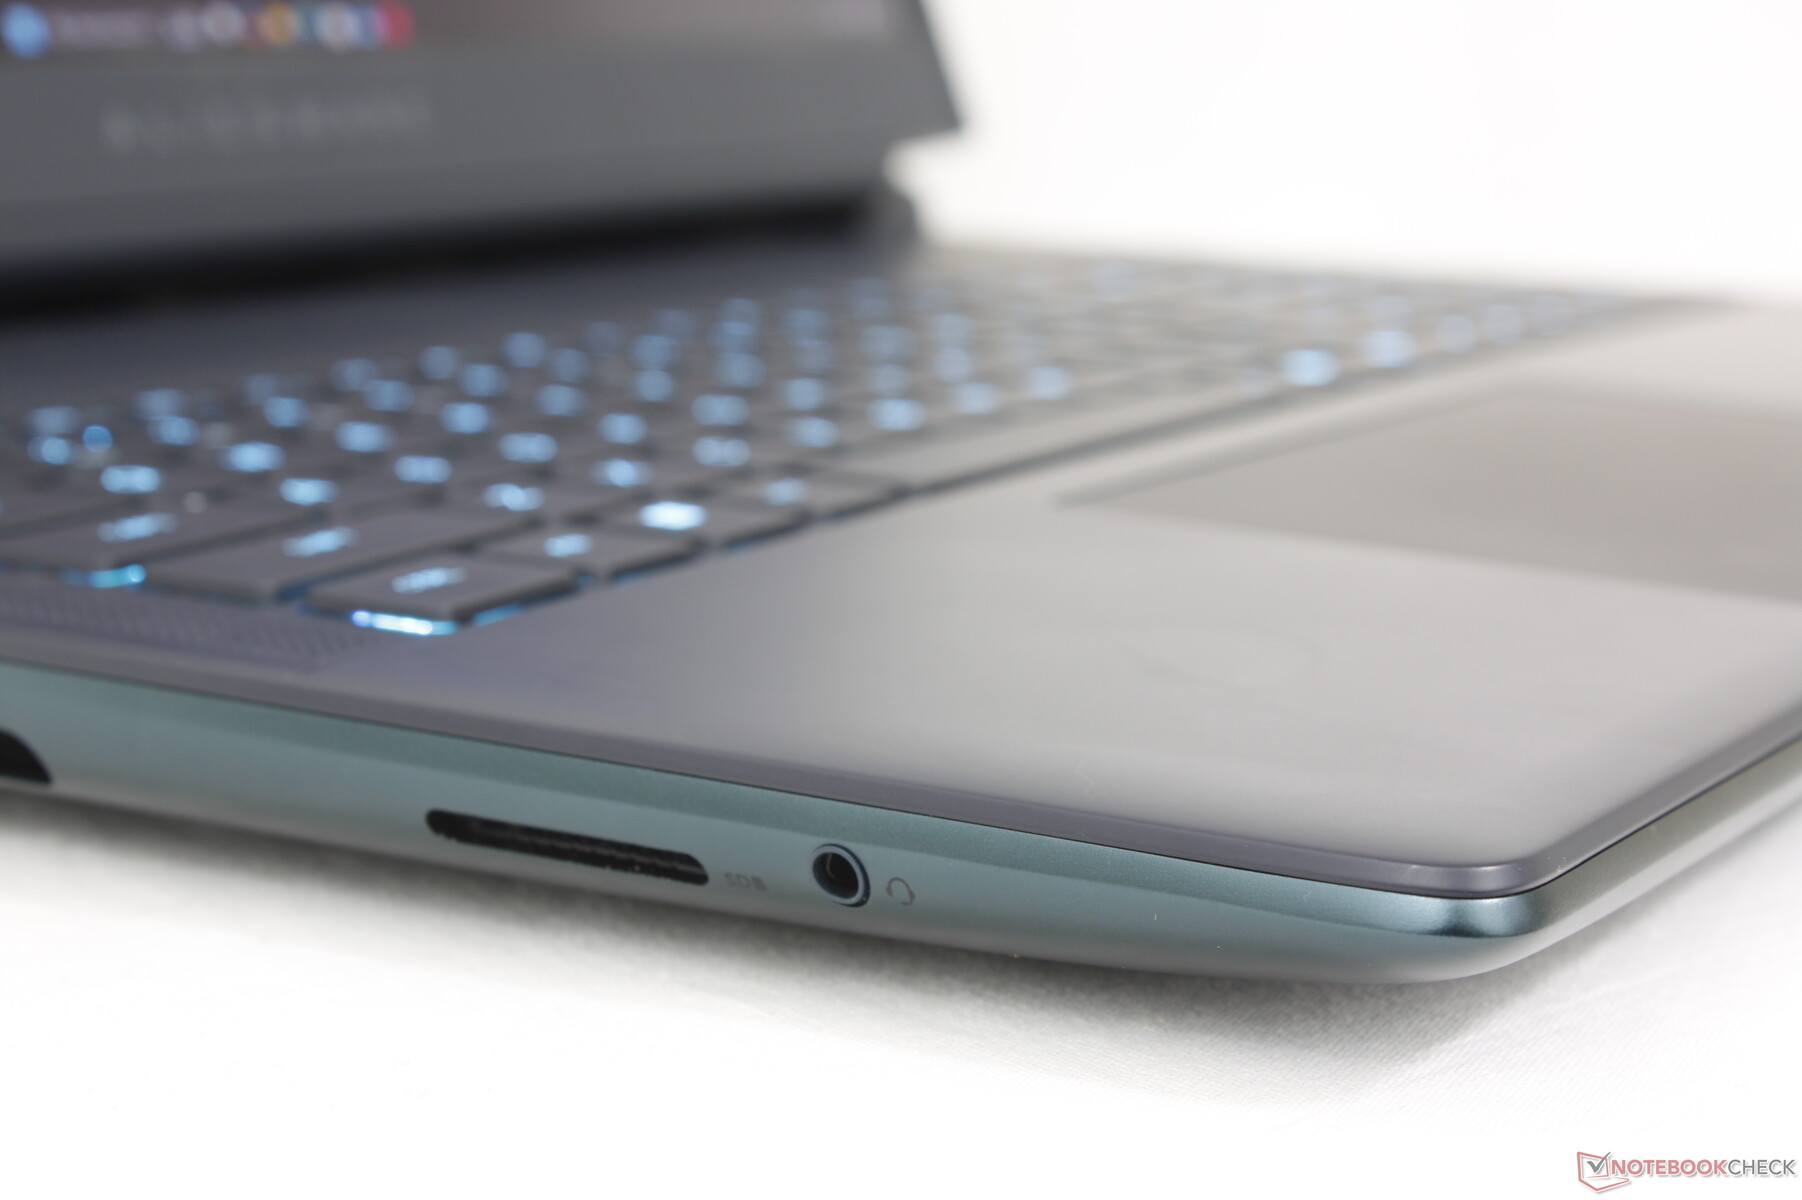
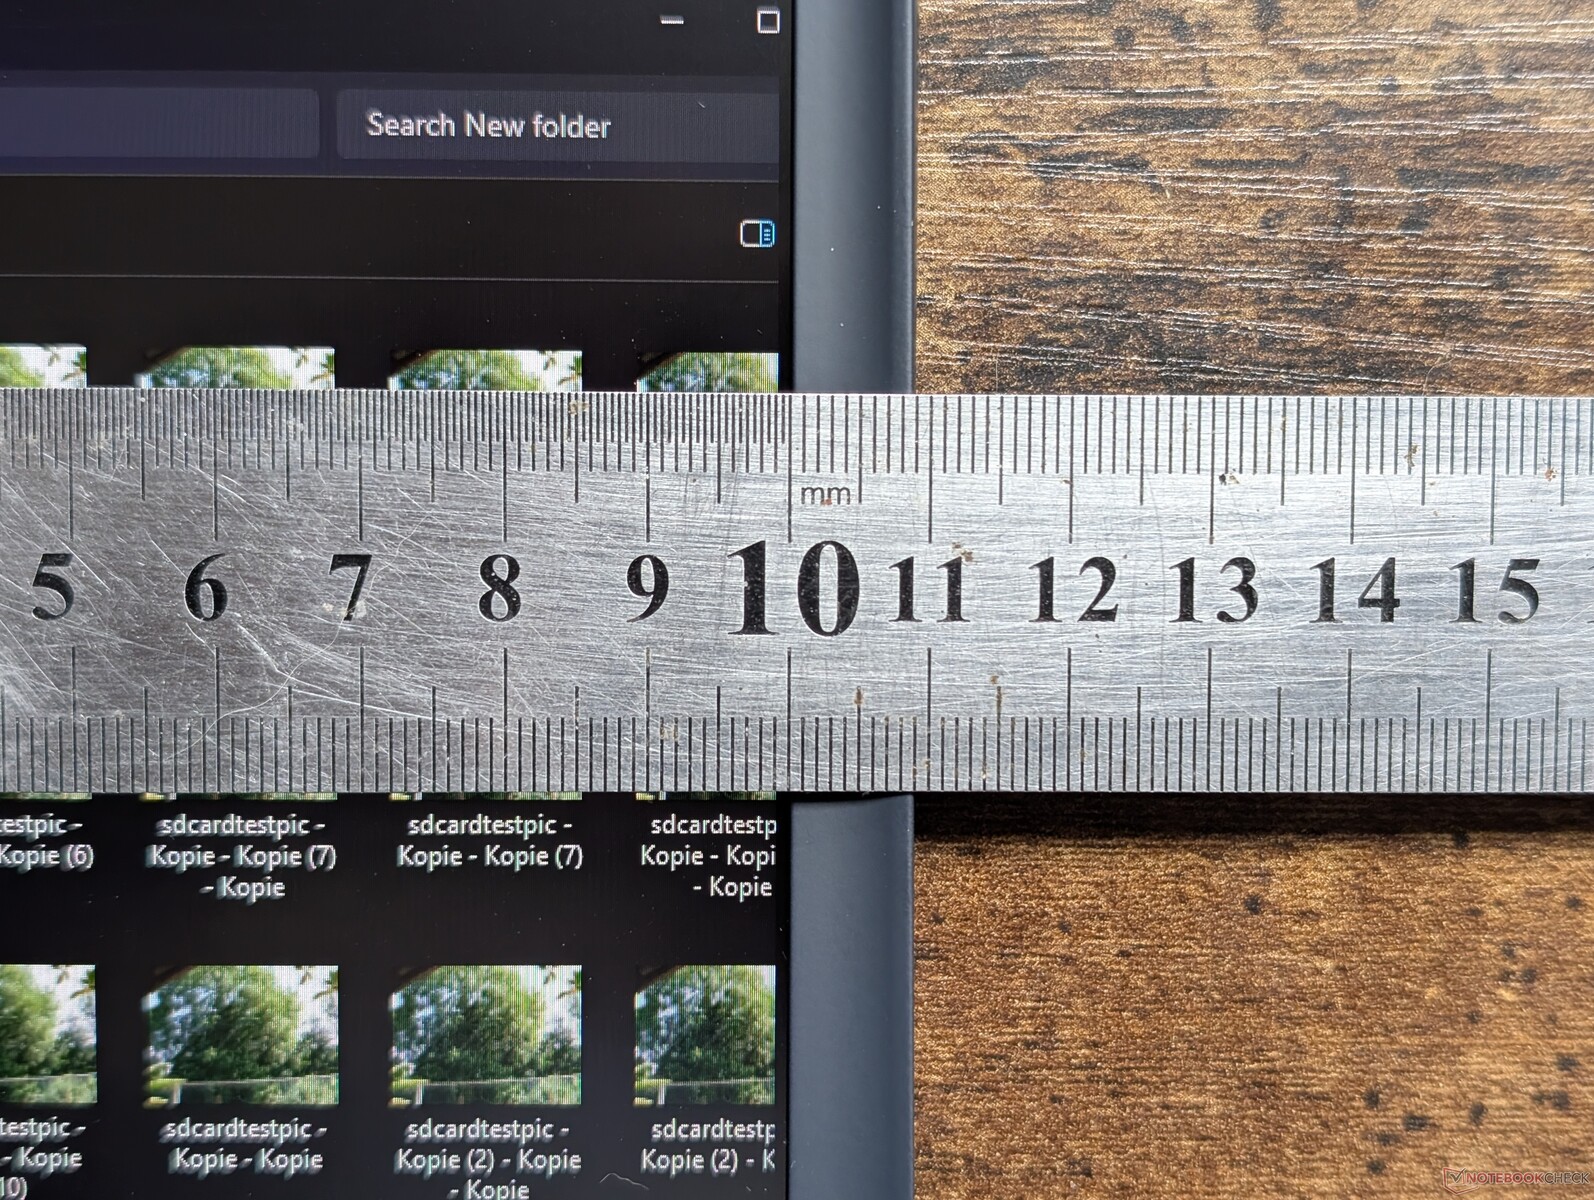
SD 读卡器
虽然读卡速度很快,但由于读卡器没有弹簧加载,插入的 SD 卡仍会突出近一半长度,运输时很不安全。

| SD Card Reader | |
| average JPG Copy Test (av. of 3 runs) | |
| Alienware 18 Area-51 (Toshiba Exceria Pro SDXC 64 GB UHS-II) | |
| Alienware m18 R2 (Toshiba Exceria Pro SDXC 64 GB UHS-II) | |
| Razer Blade 18 2024 RZ09-0509 (Toshiba Exceria Pro SDXC 64 GB UHS-II) | |
| Alienware 16 Area-51 (Toshiba Exceria Pro SDXC 64 GB UHS-II) | |
| Acer Predator Helios 18 PH18-72-98MW (AV PRO microSD 128 GB V60) | |
| MSI Titan 18 HX AI A2XWJG (AV PRO microSD 128 GB V60) | |
| MSI Raider A18 HX A9WIG-080 | |
| maximum AS SSD Seq Read Test (1GB) | |
| Alienware 18 Area-51 (Toshiba Exceria Pro SDXC 64 GB UHS-II) | |
| Alienware 16 Area-51 (Toshiba Exceria Pro SDXC 64 GB UHS-II) | |
| Razer Blade 18 2024 RZ09-0509 (Toshiba Exceria Pro SDXC 64 GB UHS-II) | |
| Alienware m18 R2 (Toshiba Exceria Pro SDXC 64 GB UHS-II) | |
| MSI Raider A18 HX A9WIG-080 | |
| MSI Titan 18 HX AI A2XWJG (AV PRO microSD 128 GB V60) | |
| Acer Predator Helios 18 PH18-72-98MW (AV PRO microSD 128 GB V60) | |
交流
英特尔杀手 BE1750W 标配 Wi-Fi 7 和蓝牙 5.4 连接。根据英特尔的说法,其核心规格与 Alienware 16中的 BE1750x 相同。.
网络摄像头
用户可以配置 200 万像素或 800 万像素网络摄像头,每个摄像头都支持红外功能。对于如此昂贵的系统来说,没有物理快门选项是一个疏忽。


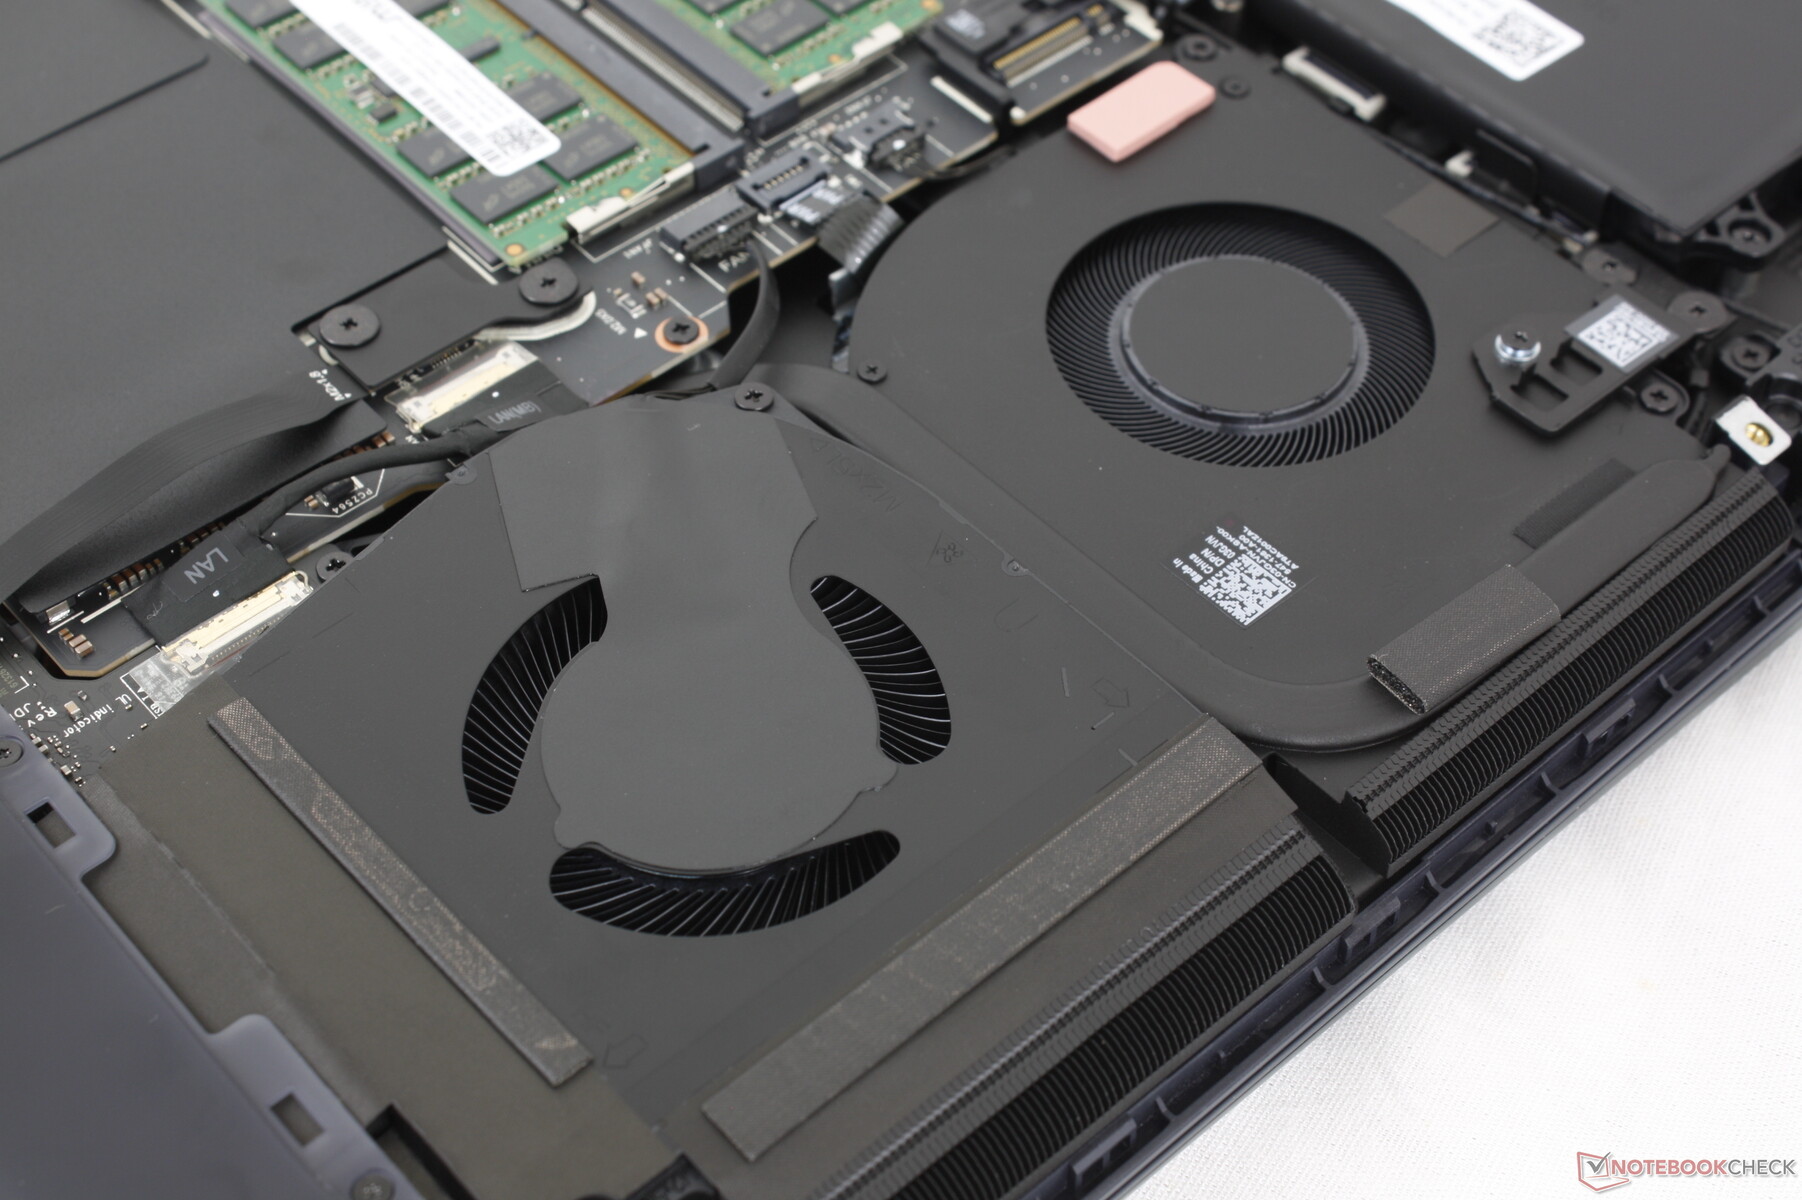
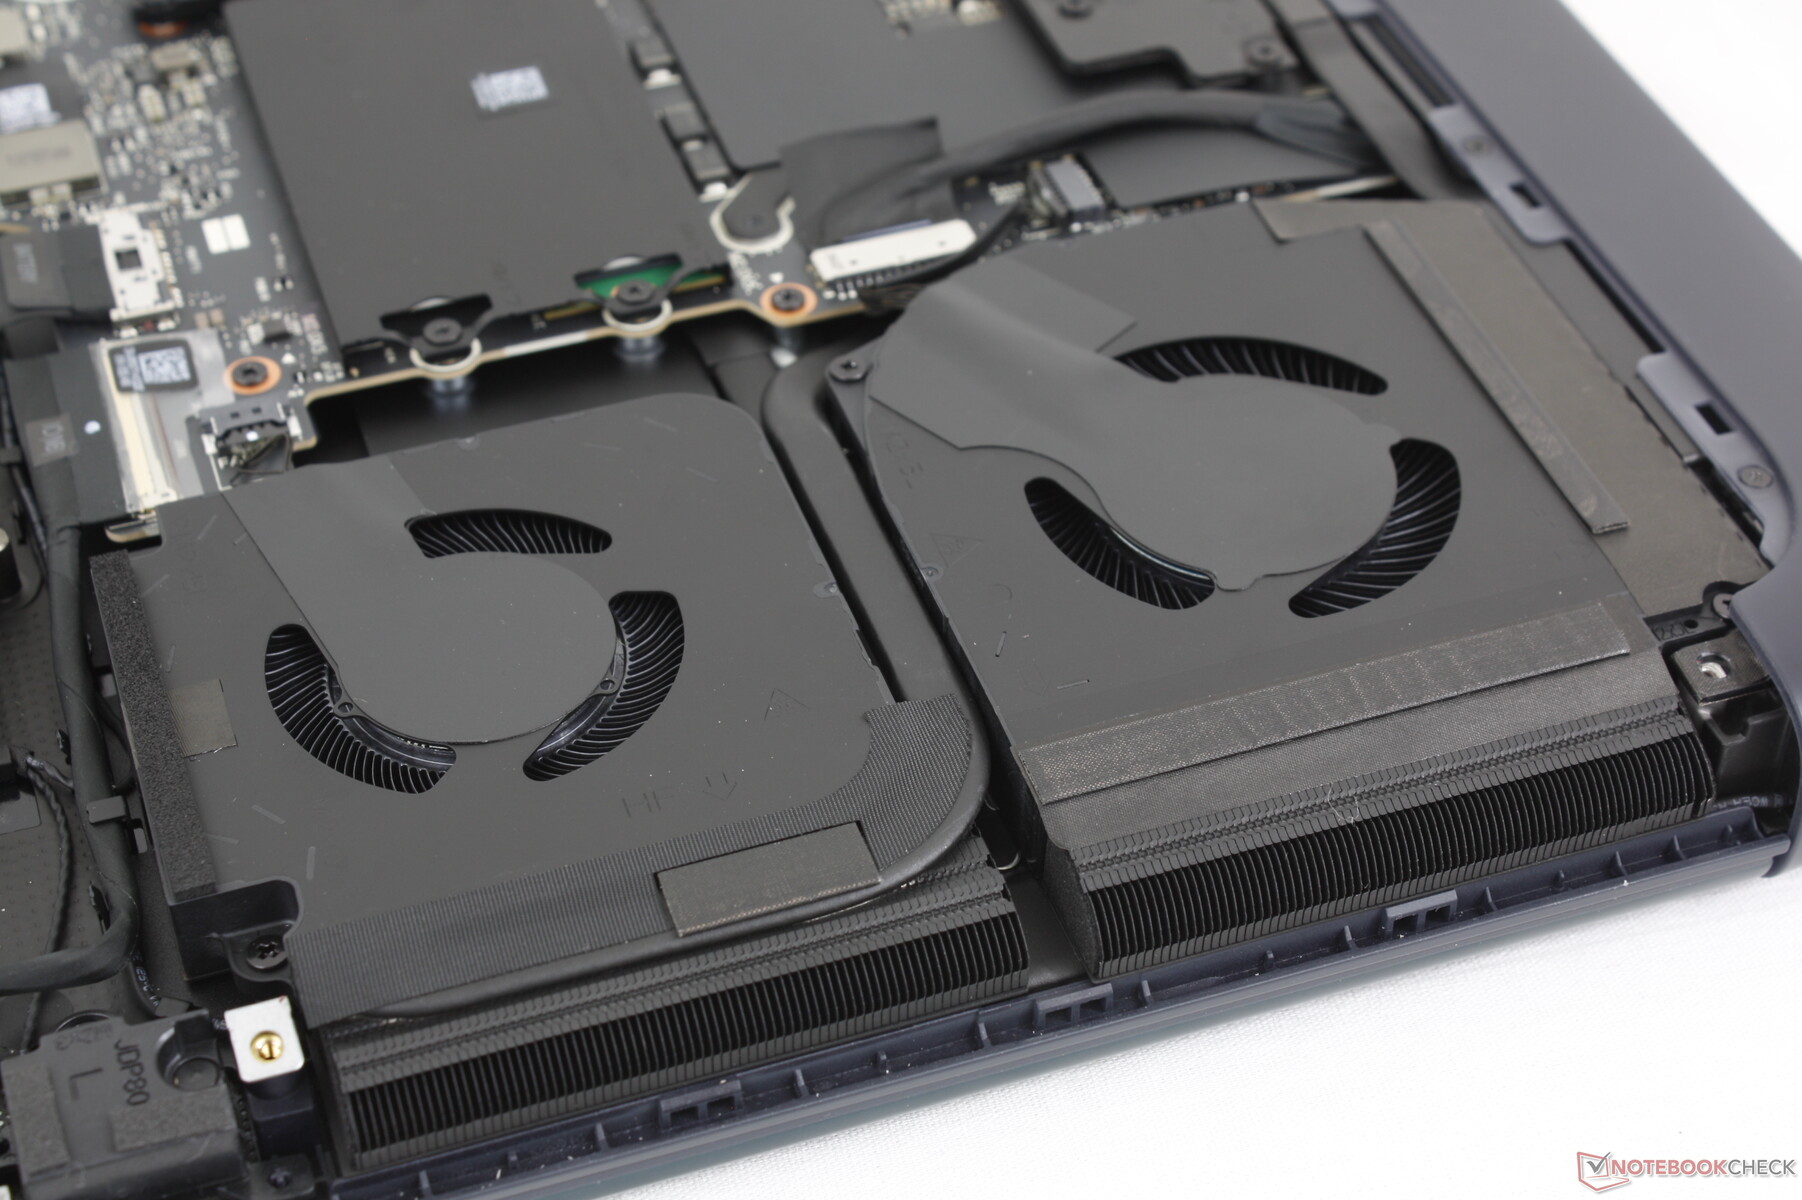
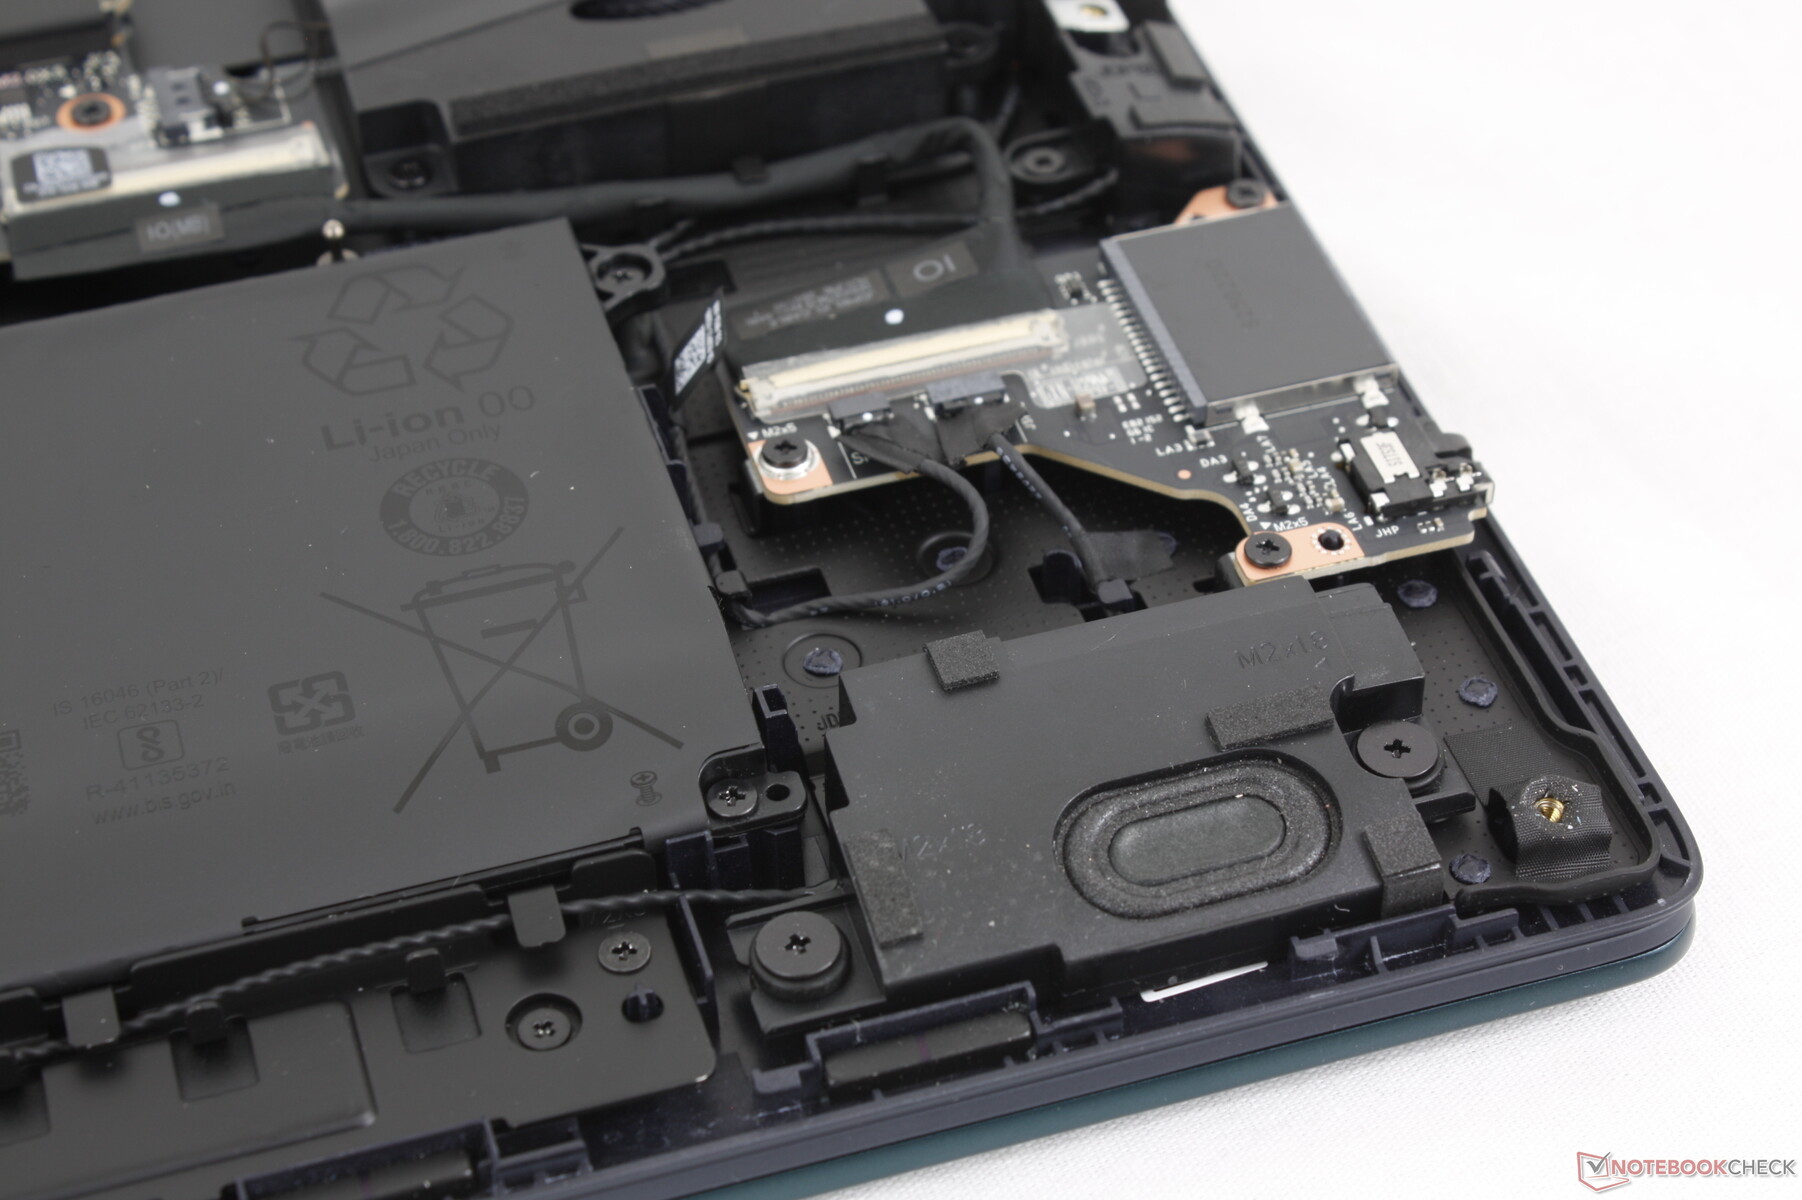
维护
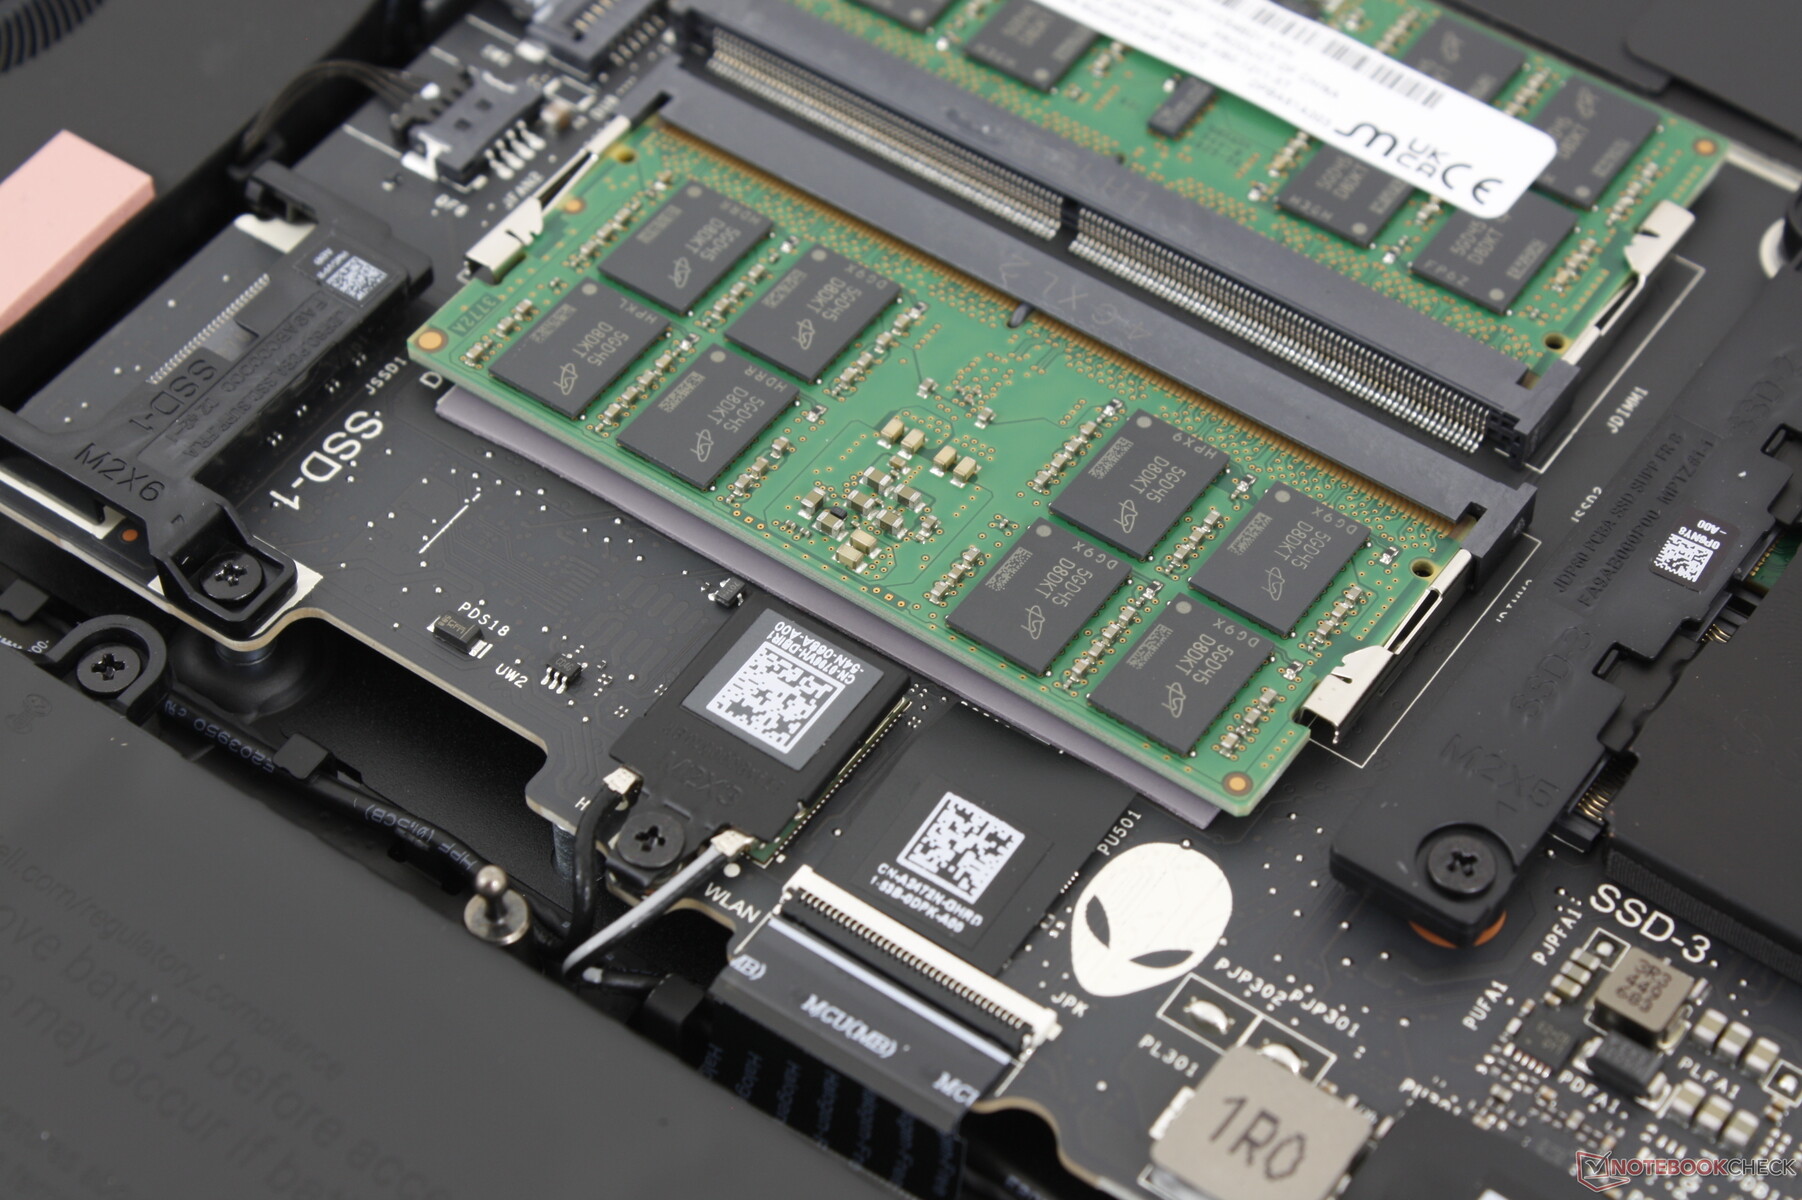
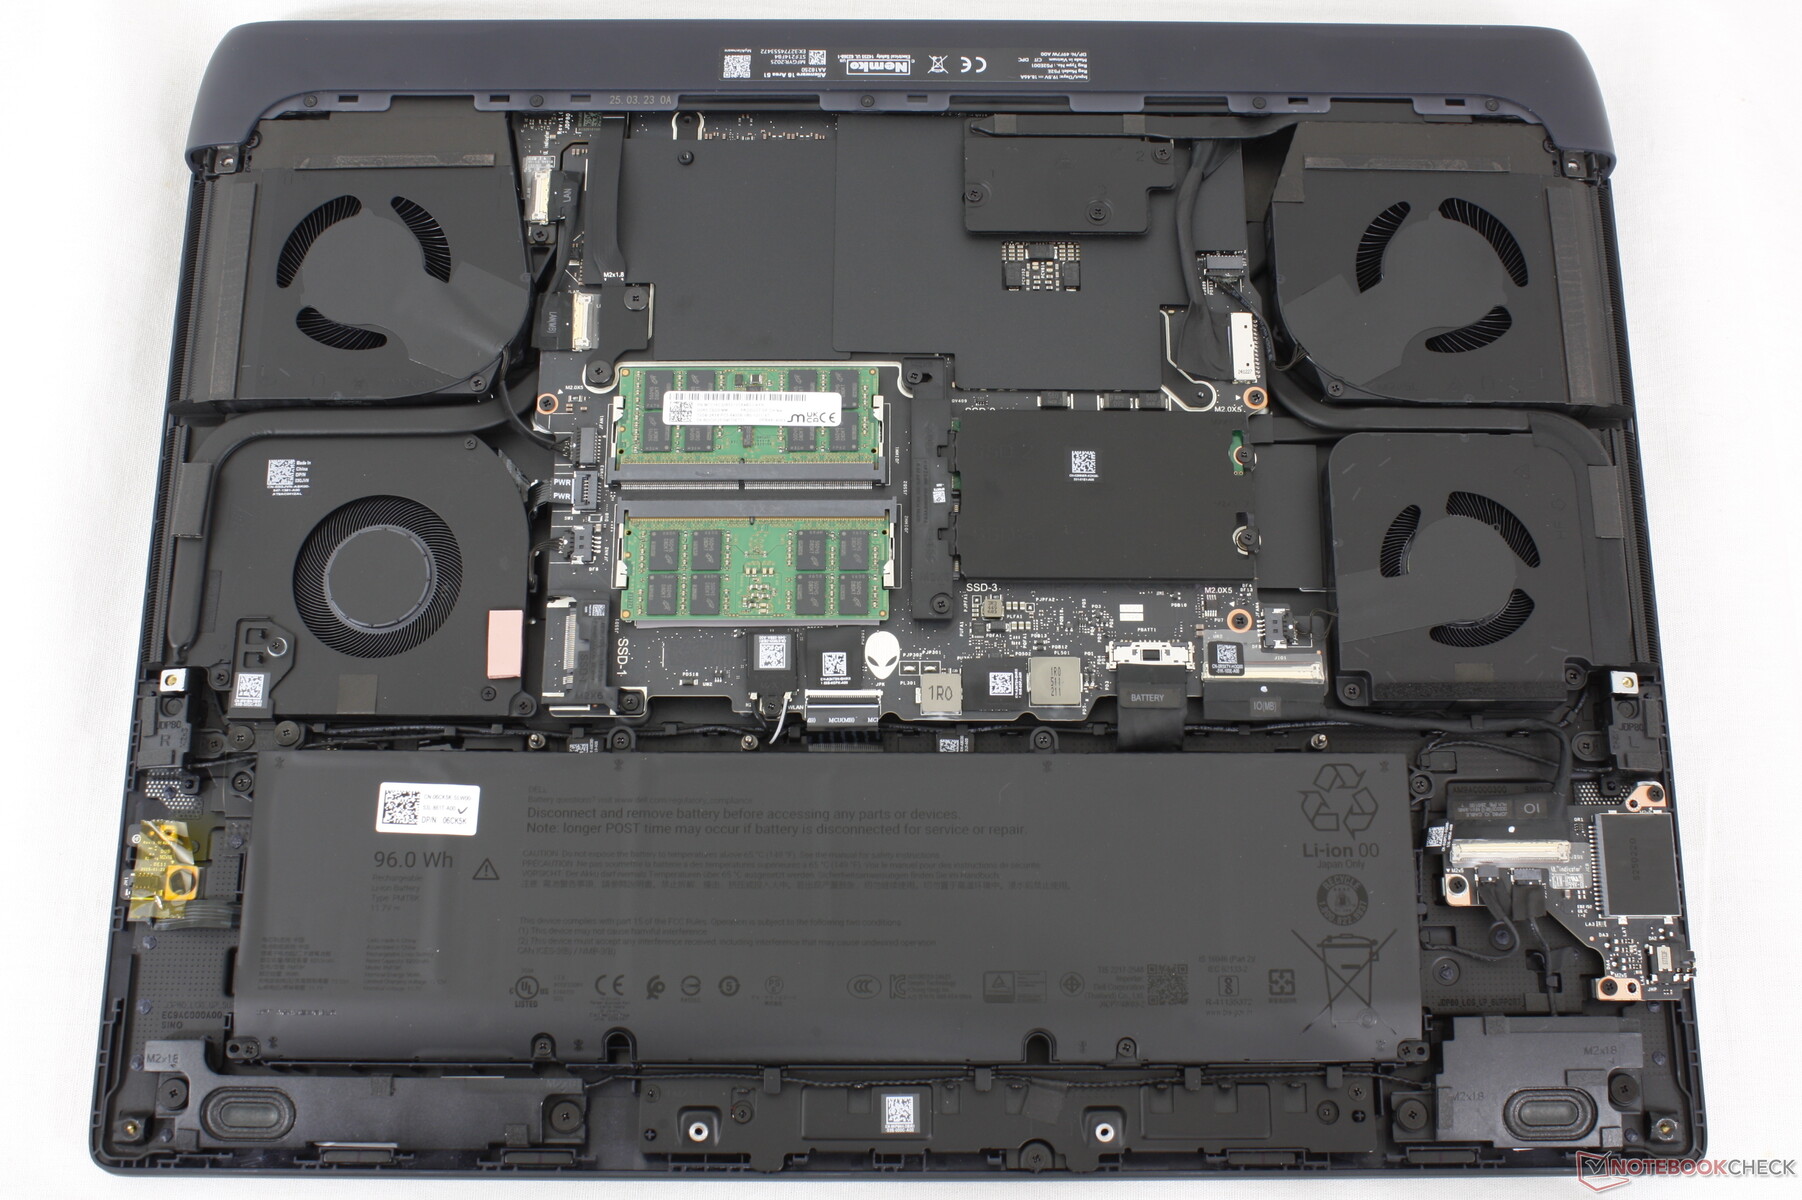
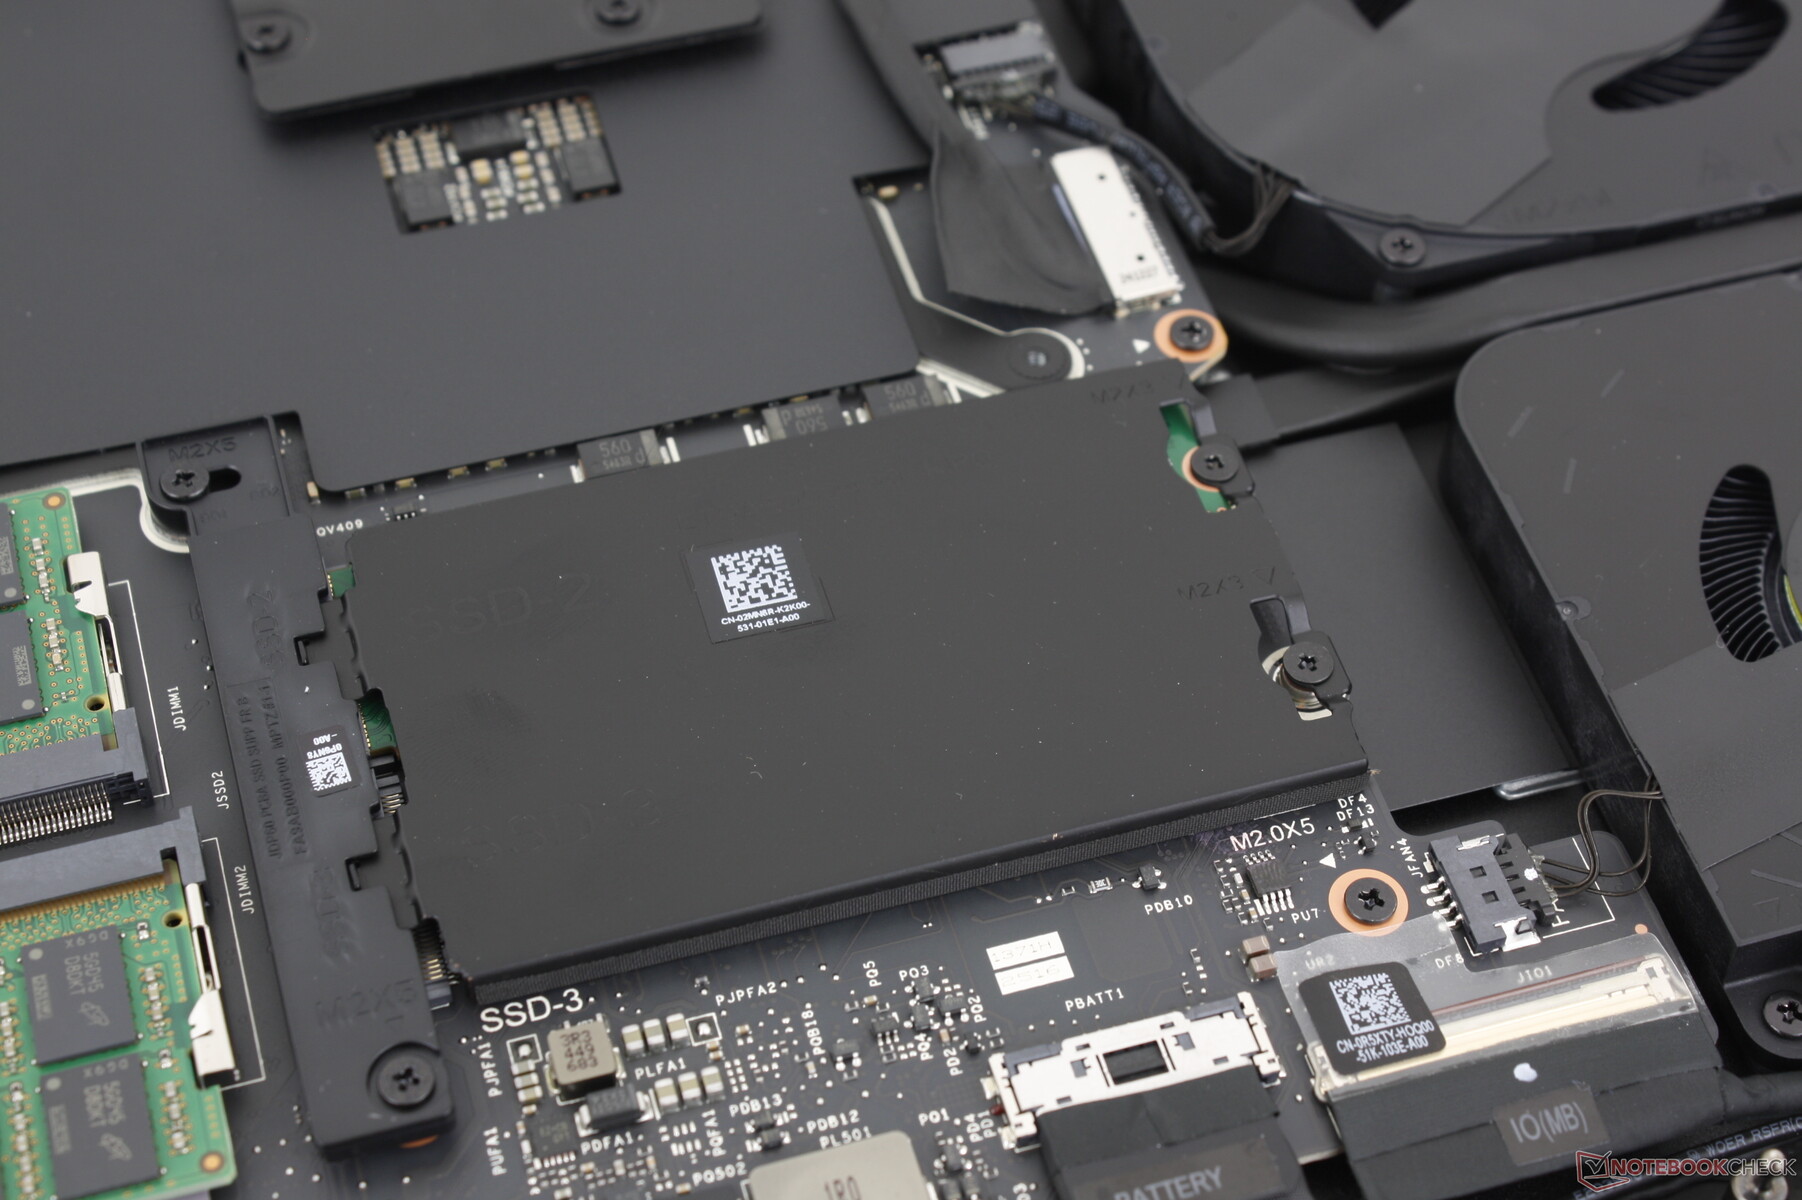
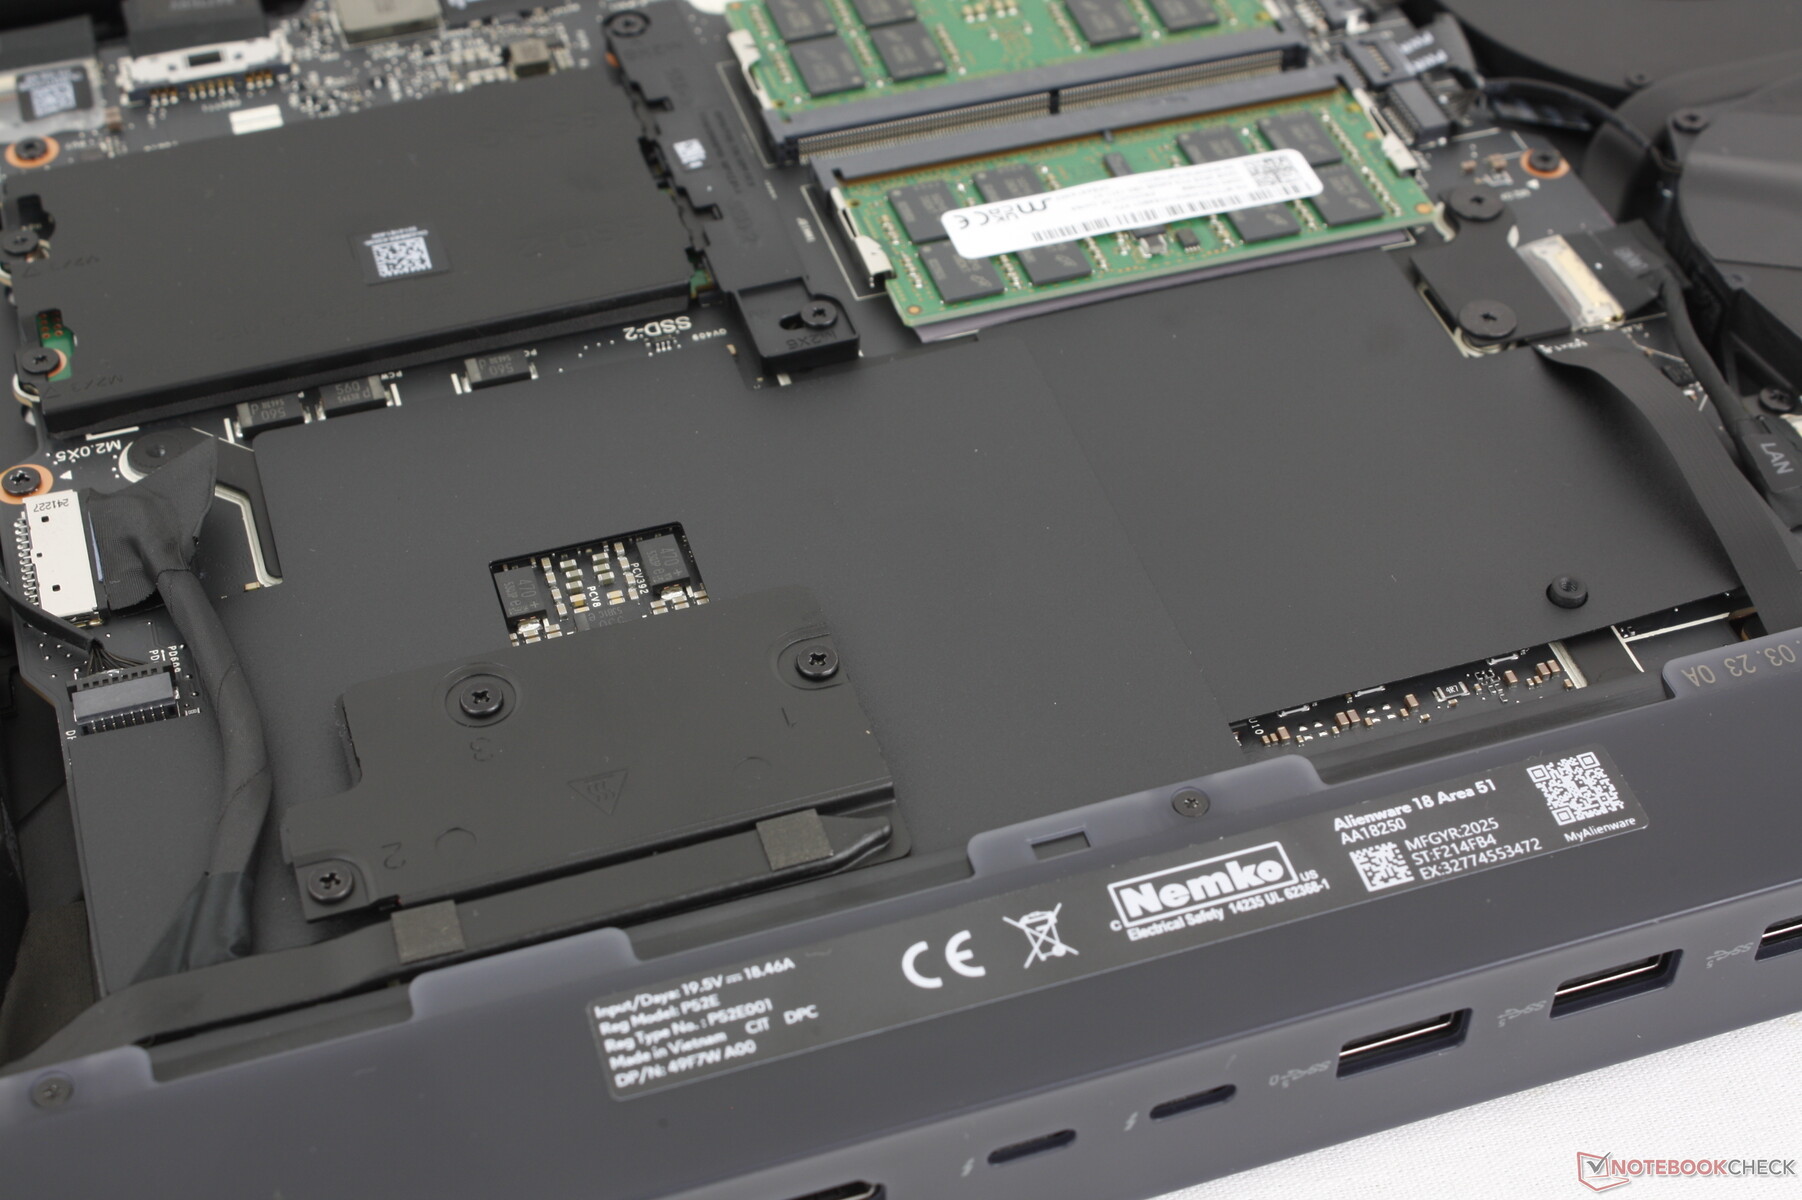
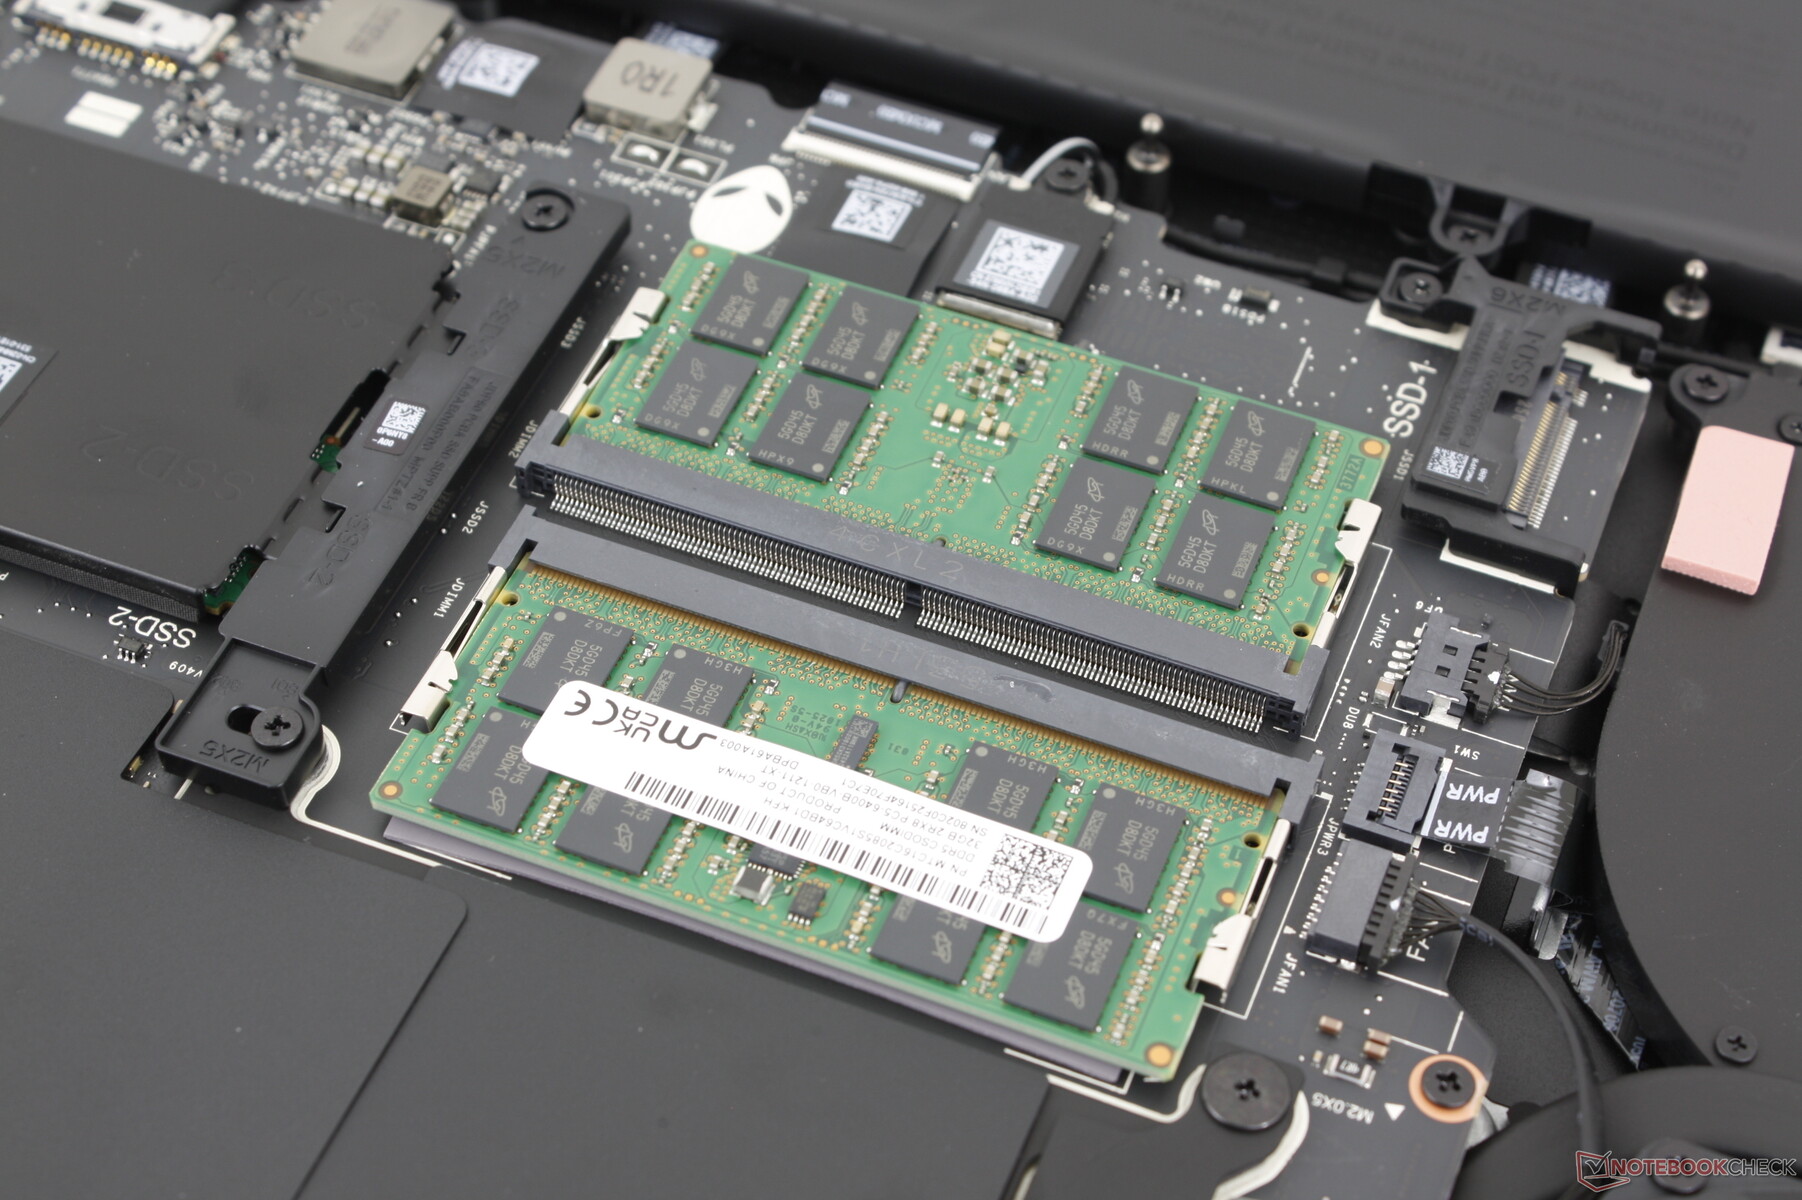
底部面板由 8 颗十字螺丝固定,维修相对方便。内部结构与 Alienware 16 相似,但风扇更大,散热效果更好,固态硬盘插槽的位置也有所调整。
可持续性
我们找不到任何关于 Alienware 18 在制造过程中使用回收塑料或金属的信息。同时,为了不使用塑料,包装大多采用纸张和纸板。
配件和保修
零售包装盒内除了交流适配器和文件外,没有任何其他附件。如果在美国购买,制造商通常提供一年有限保修。
输入设备--点击舒适
键盘
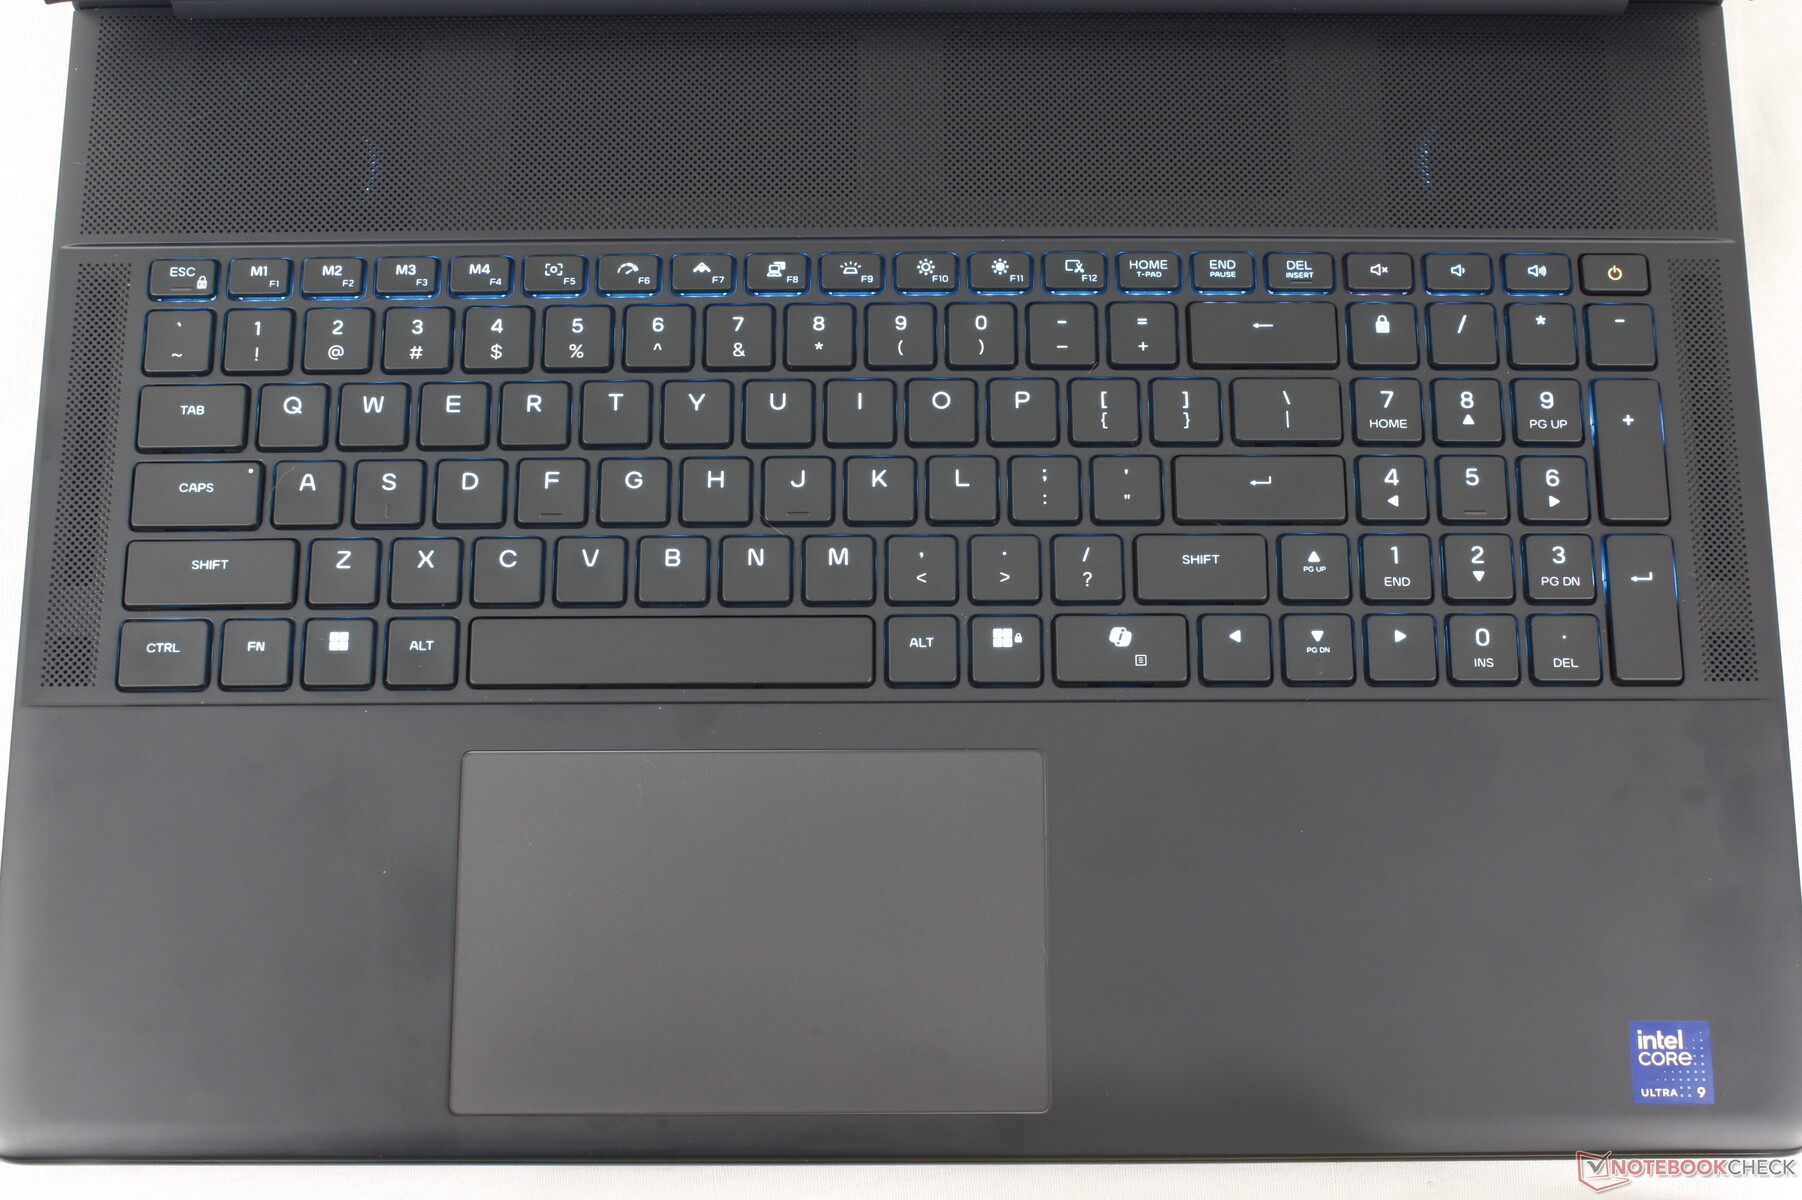
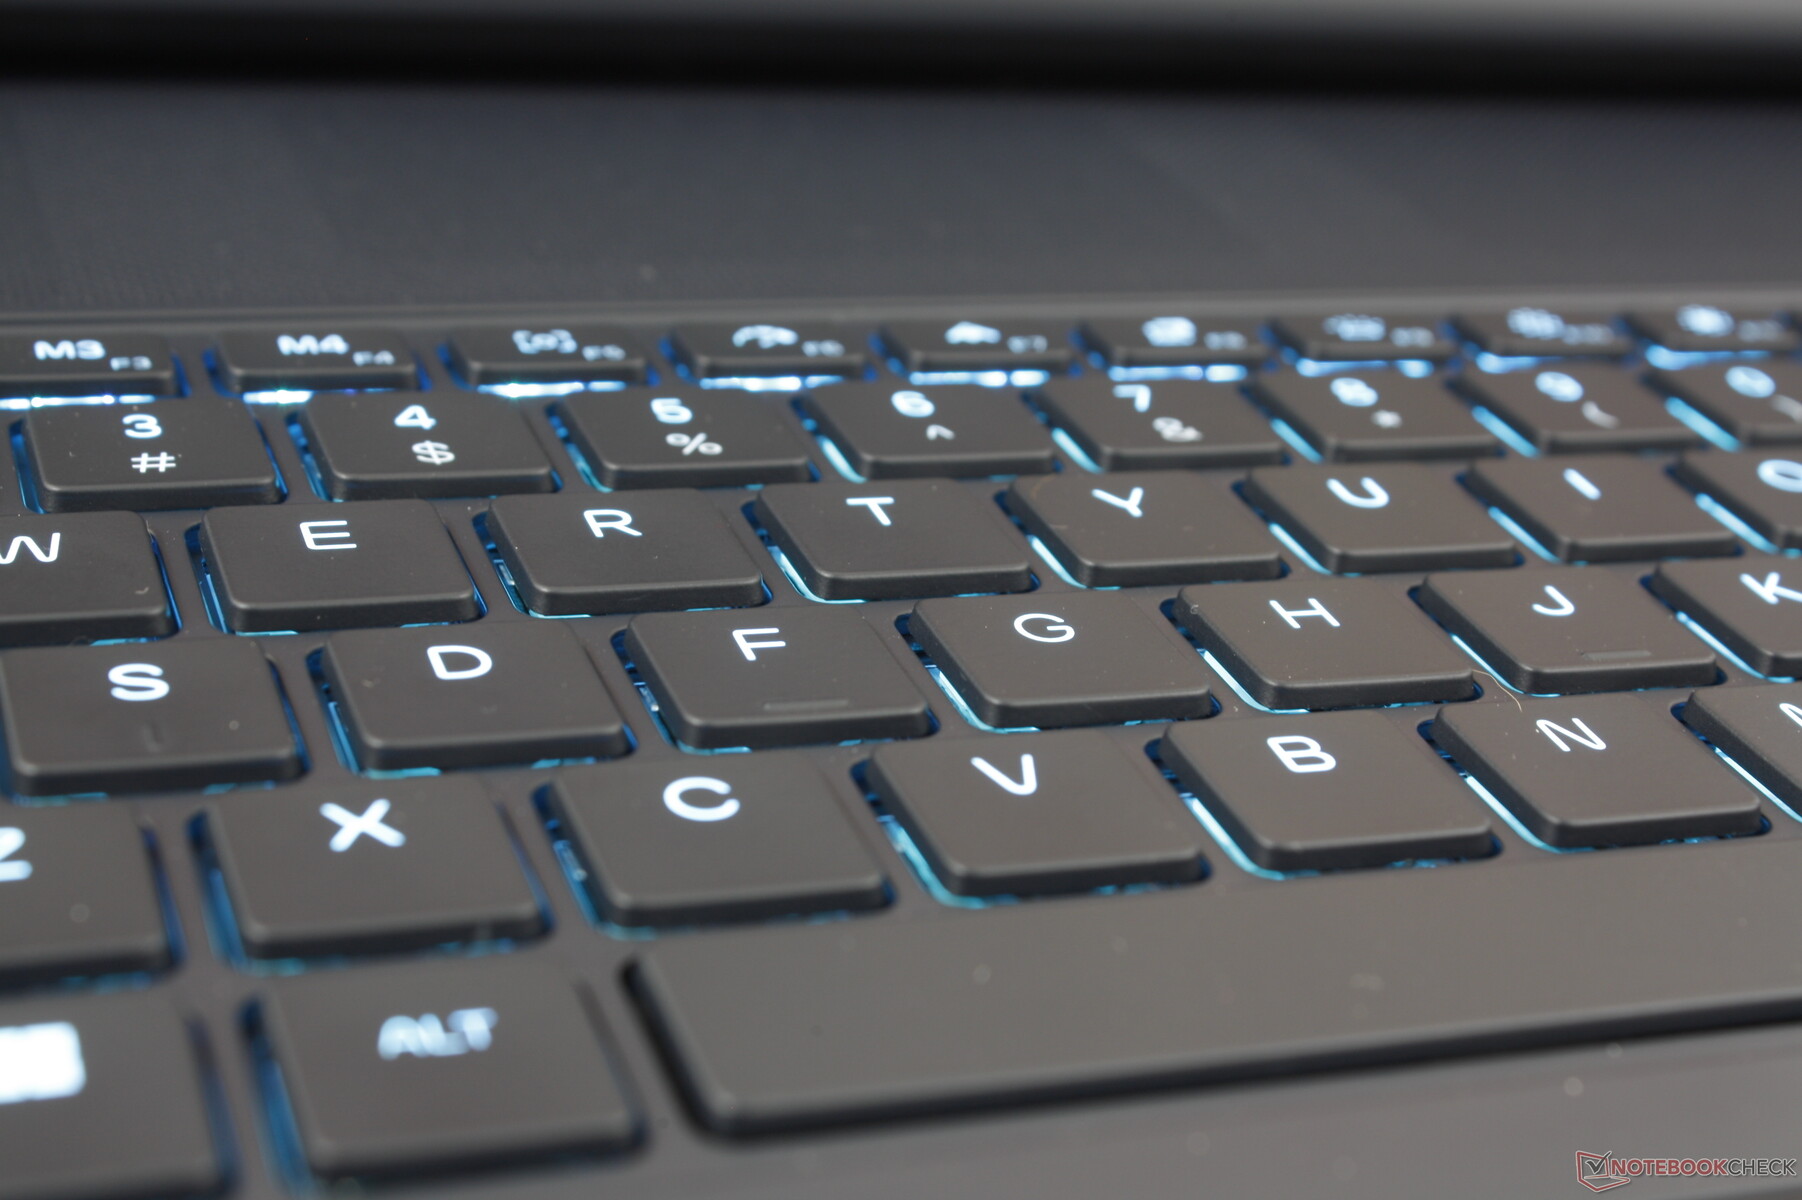
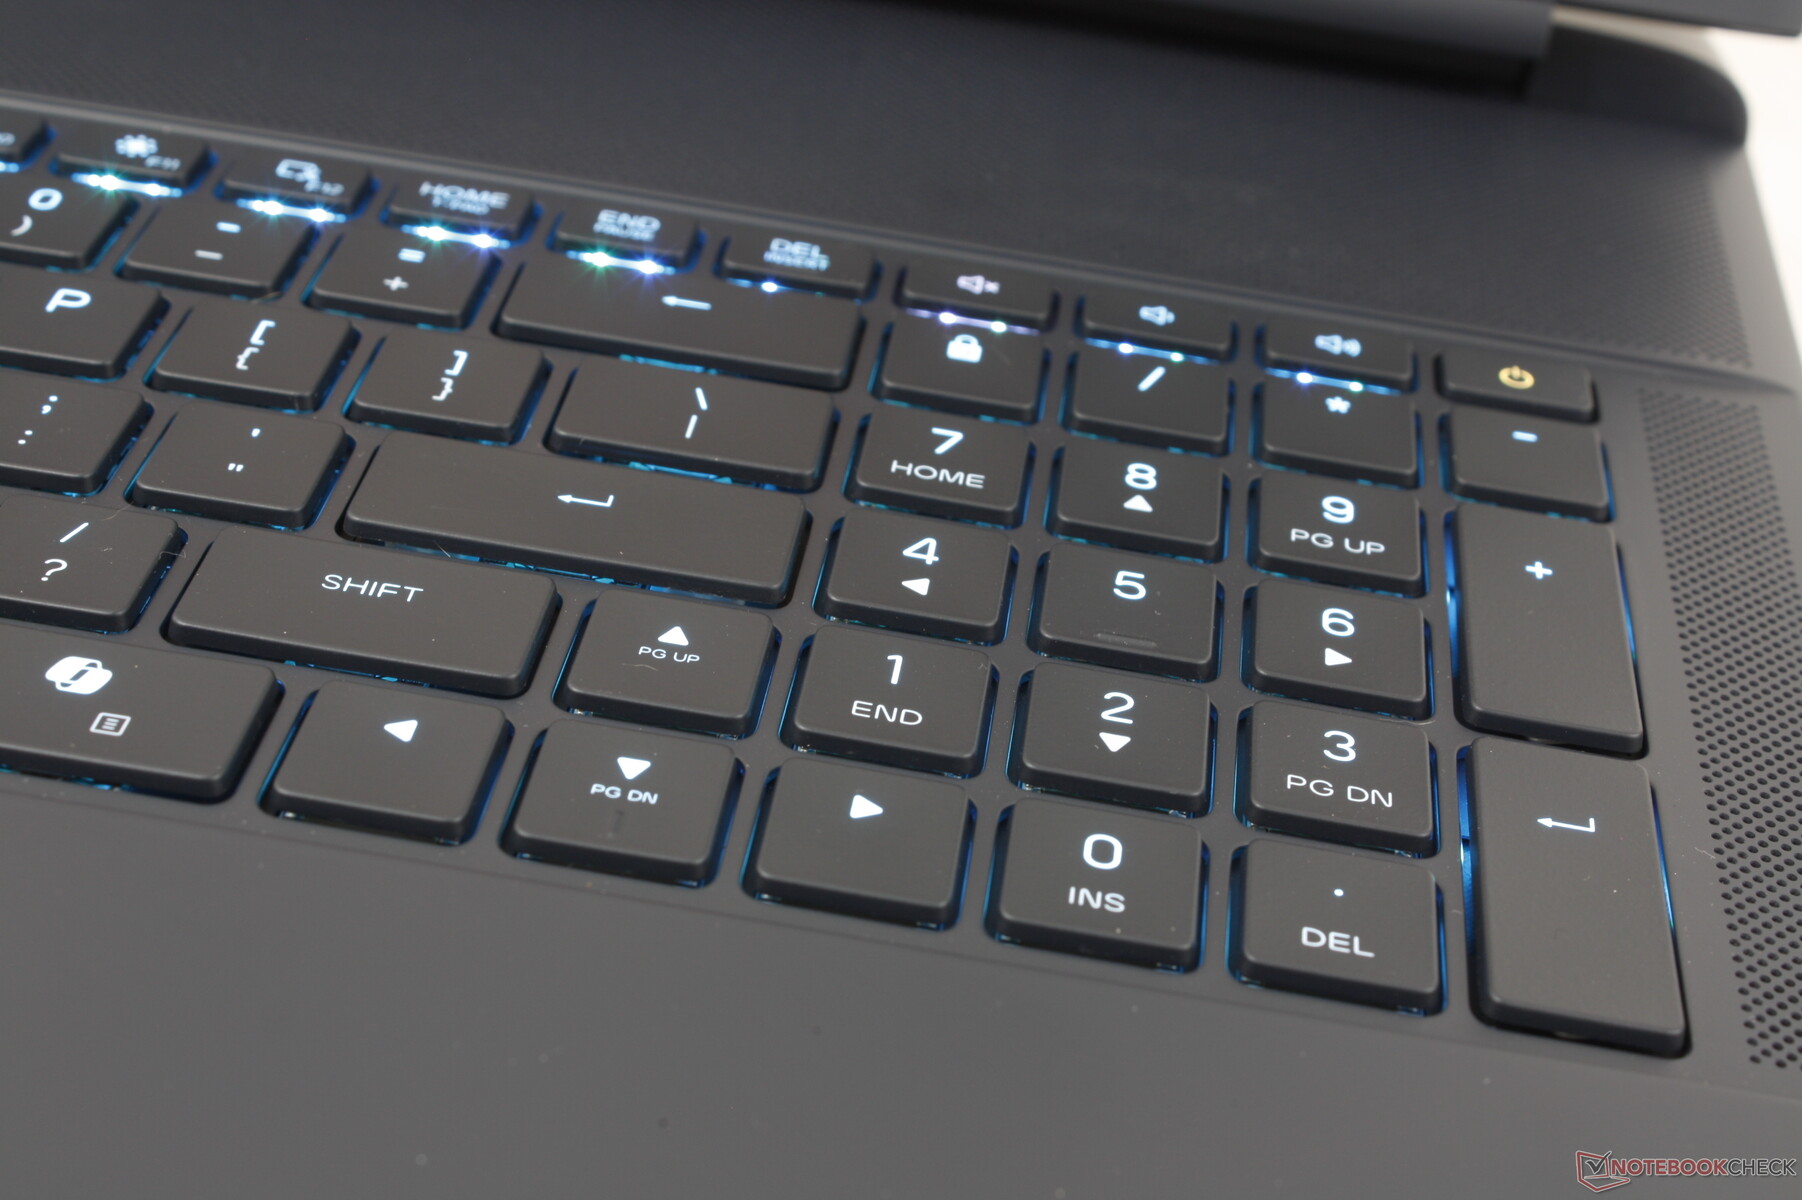
低调的 Cherry 机械键盘从 Alienware 16 和去年的 m18系列。事实上,键盘的布局和按键功能与 Alienware m18 系列几乎完全相同,打字体验基本相同。这些低调的 CherryMX 按键是我们在游戏笔记本电脑上体验过的最宽敞、最舒适的按键,因为它们铿锵有力、键程深、反馈响亮。不过,用户可能还是希望配置标准的薄膜式按键,因为响亮而高亢的机械按键可能不适合对噪音敏感的环境。
触摸板
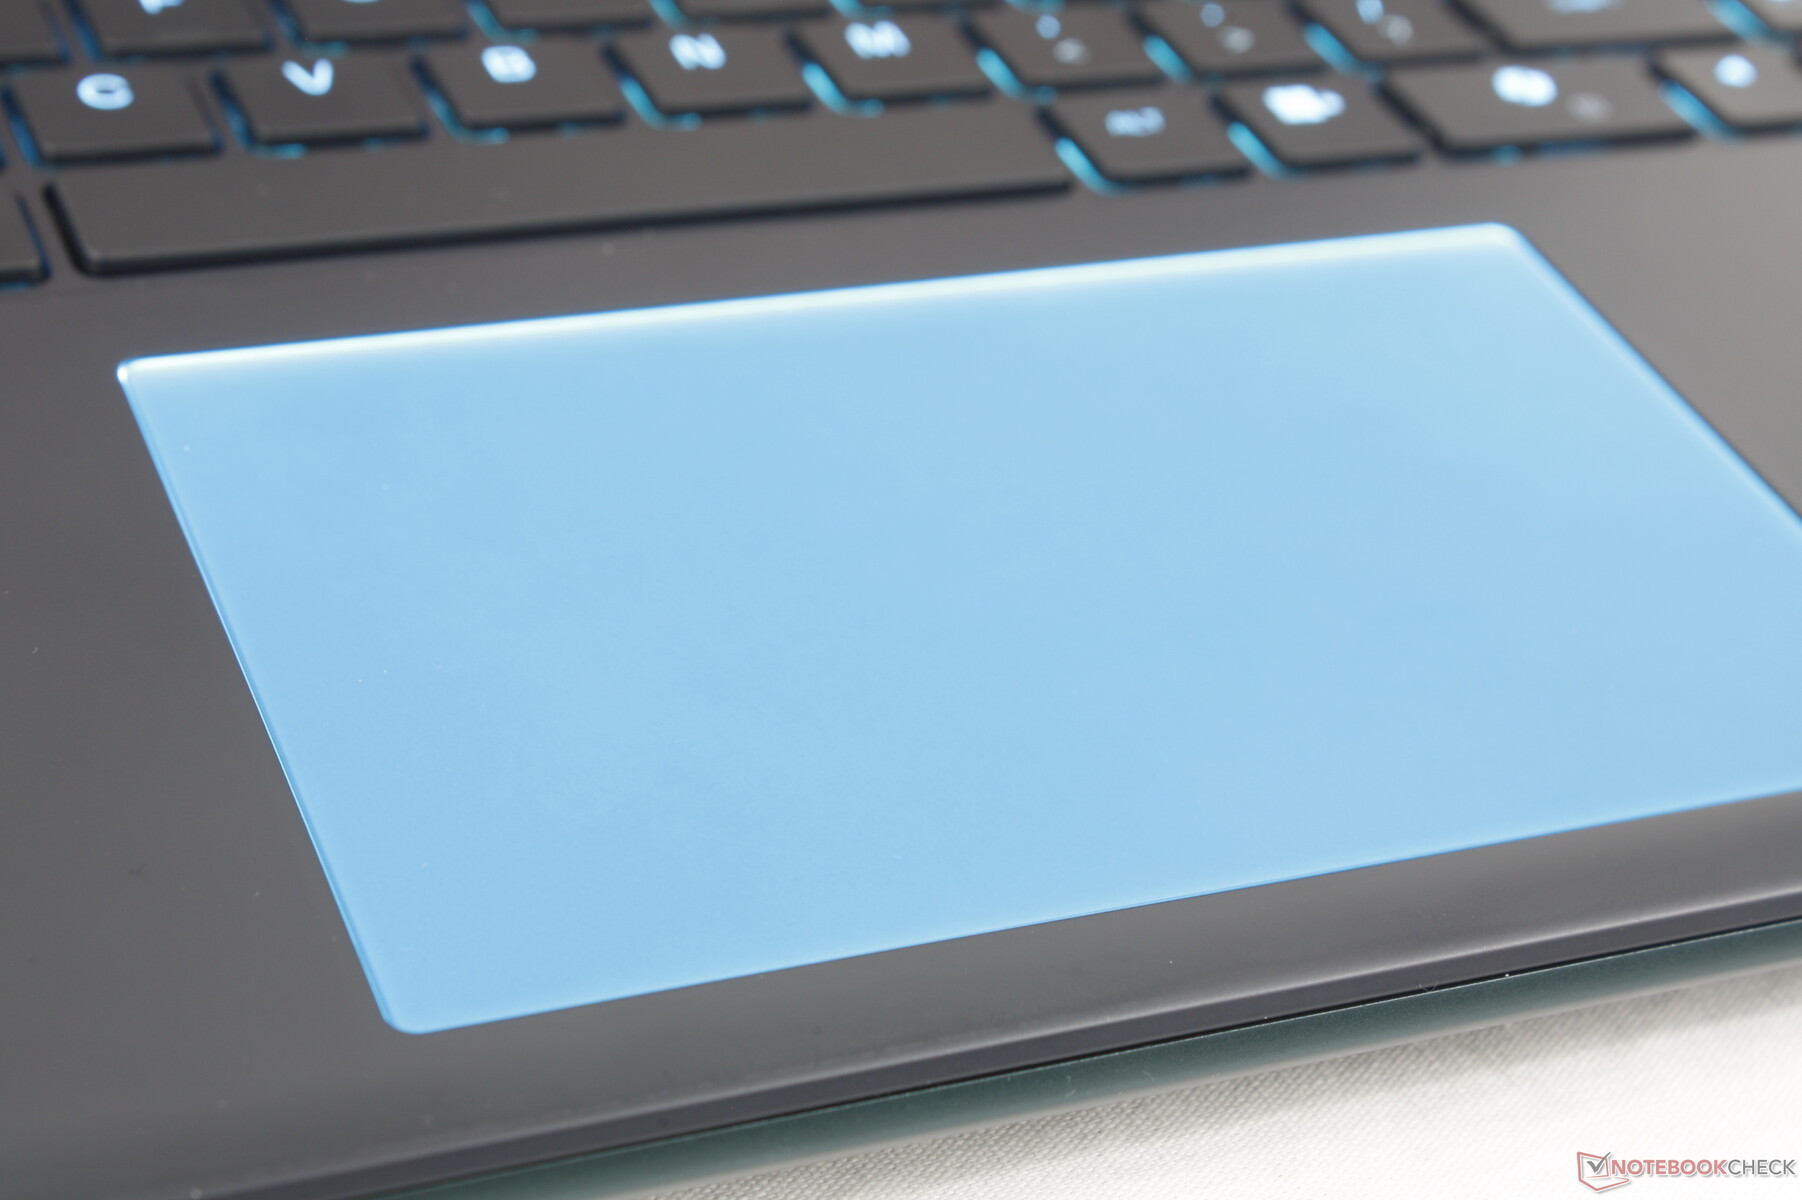
与 Alienware 16 的点击板相比,Alienware 18 的点击板稍大(13.2 x 8 厘米对 11.2 x 6.5 厘米)。除此之外,两款机型的平滑牵引和响亮的 "咔哒 "反馈感觉完全相同。
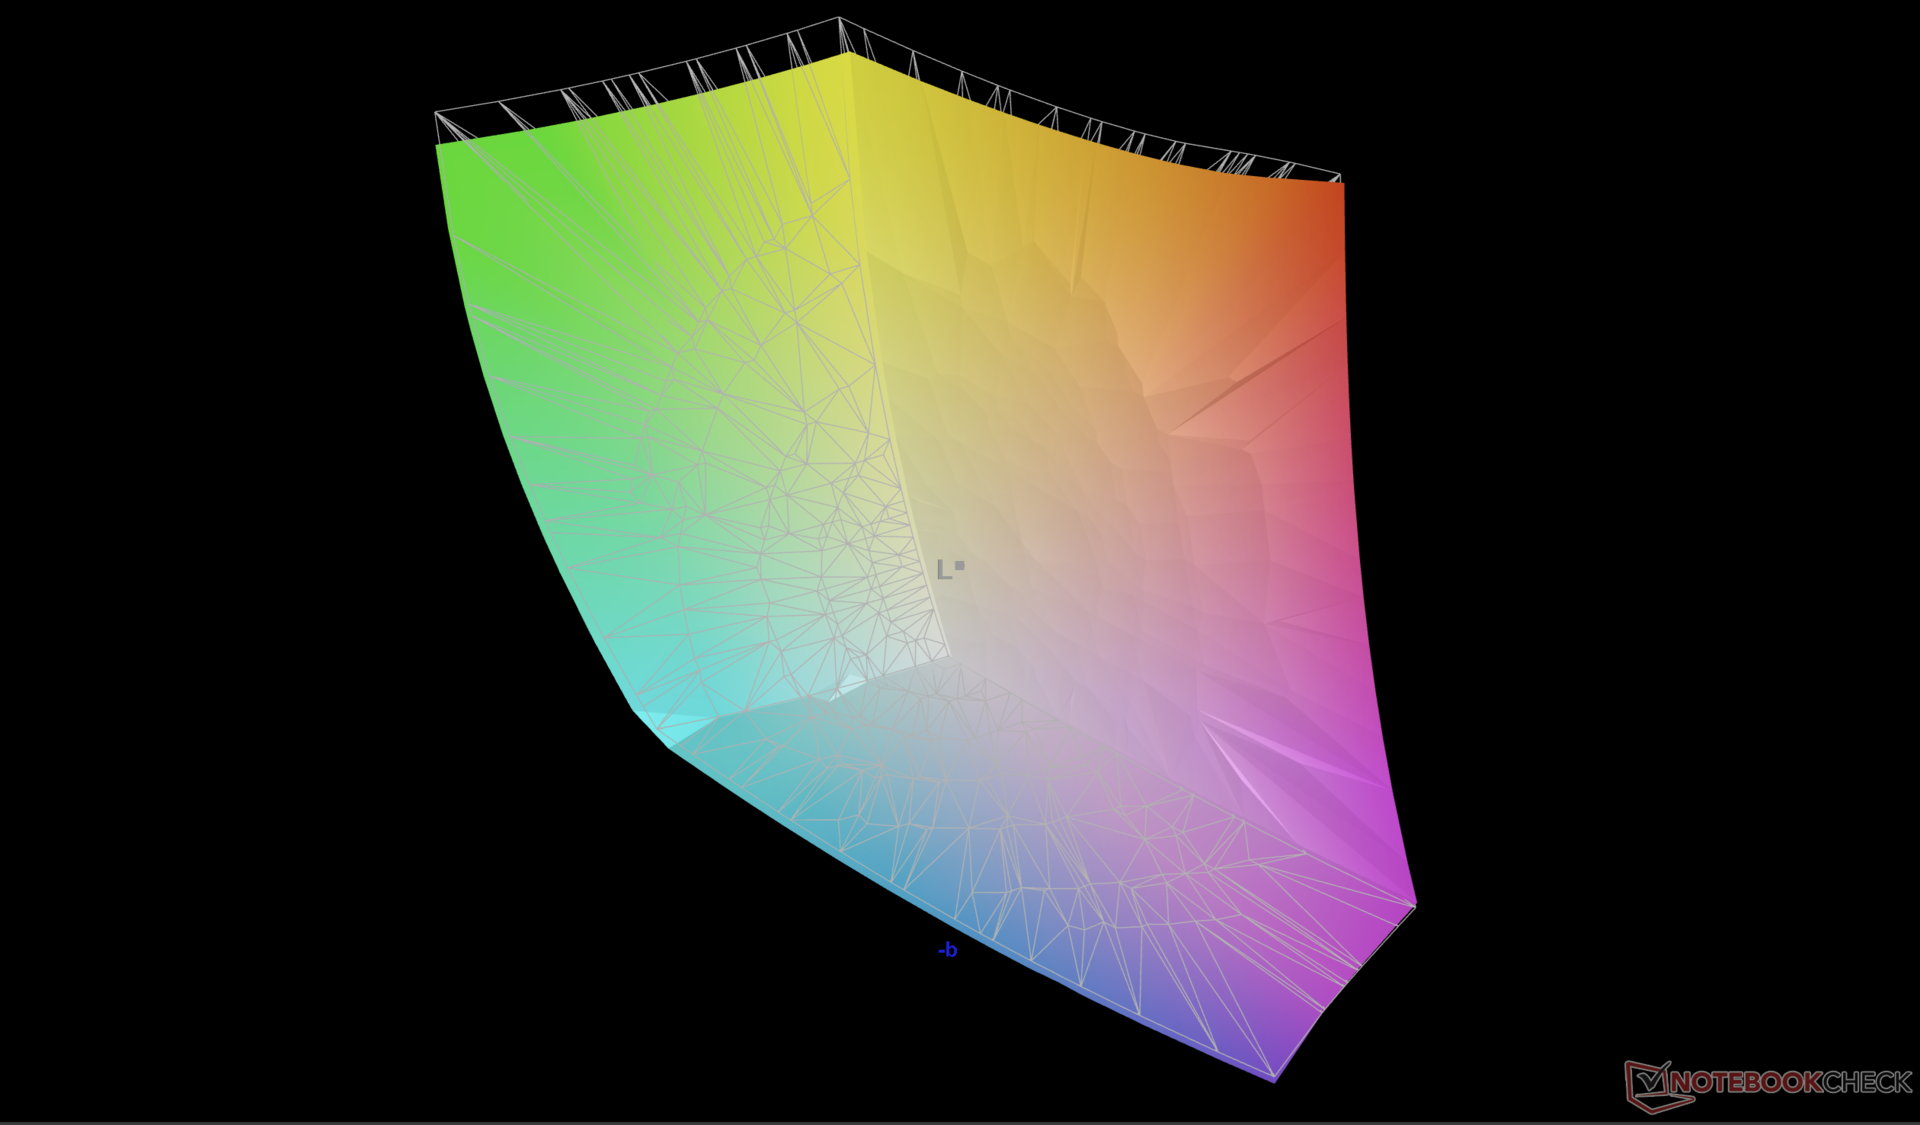
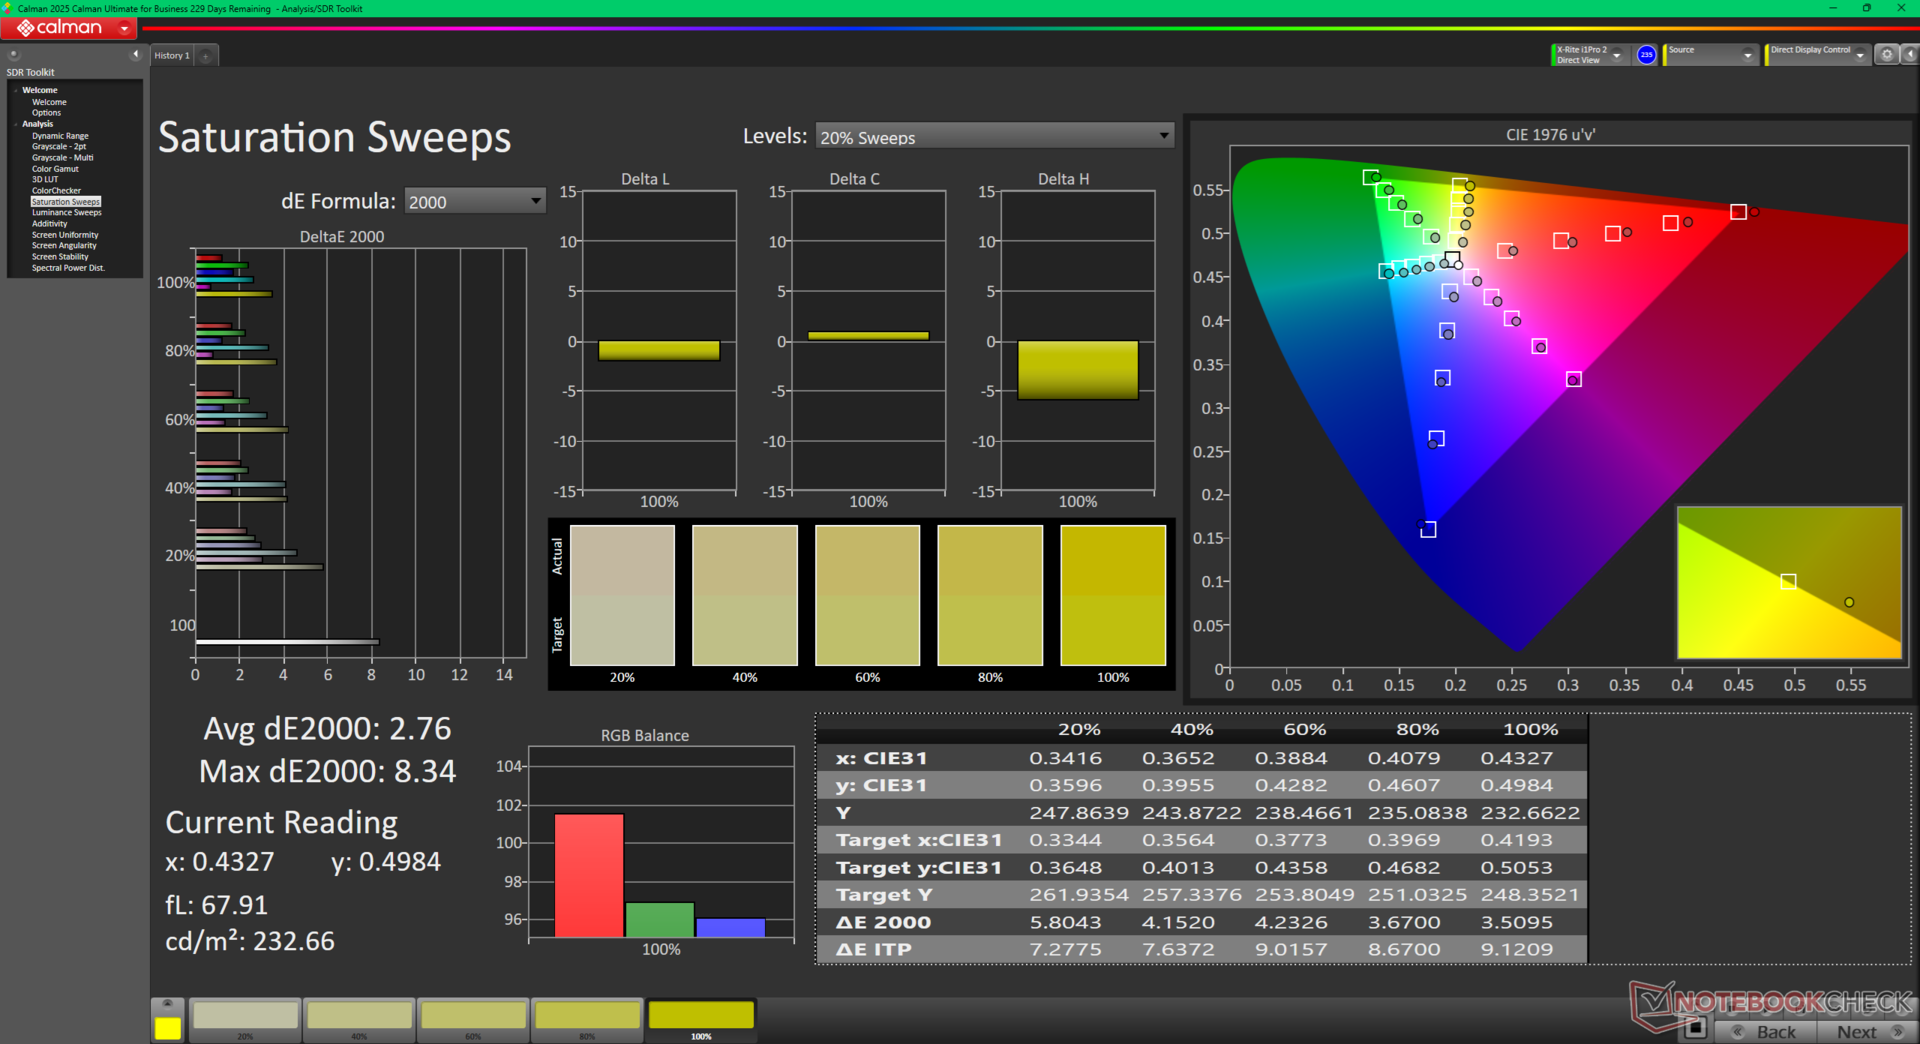
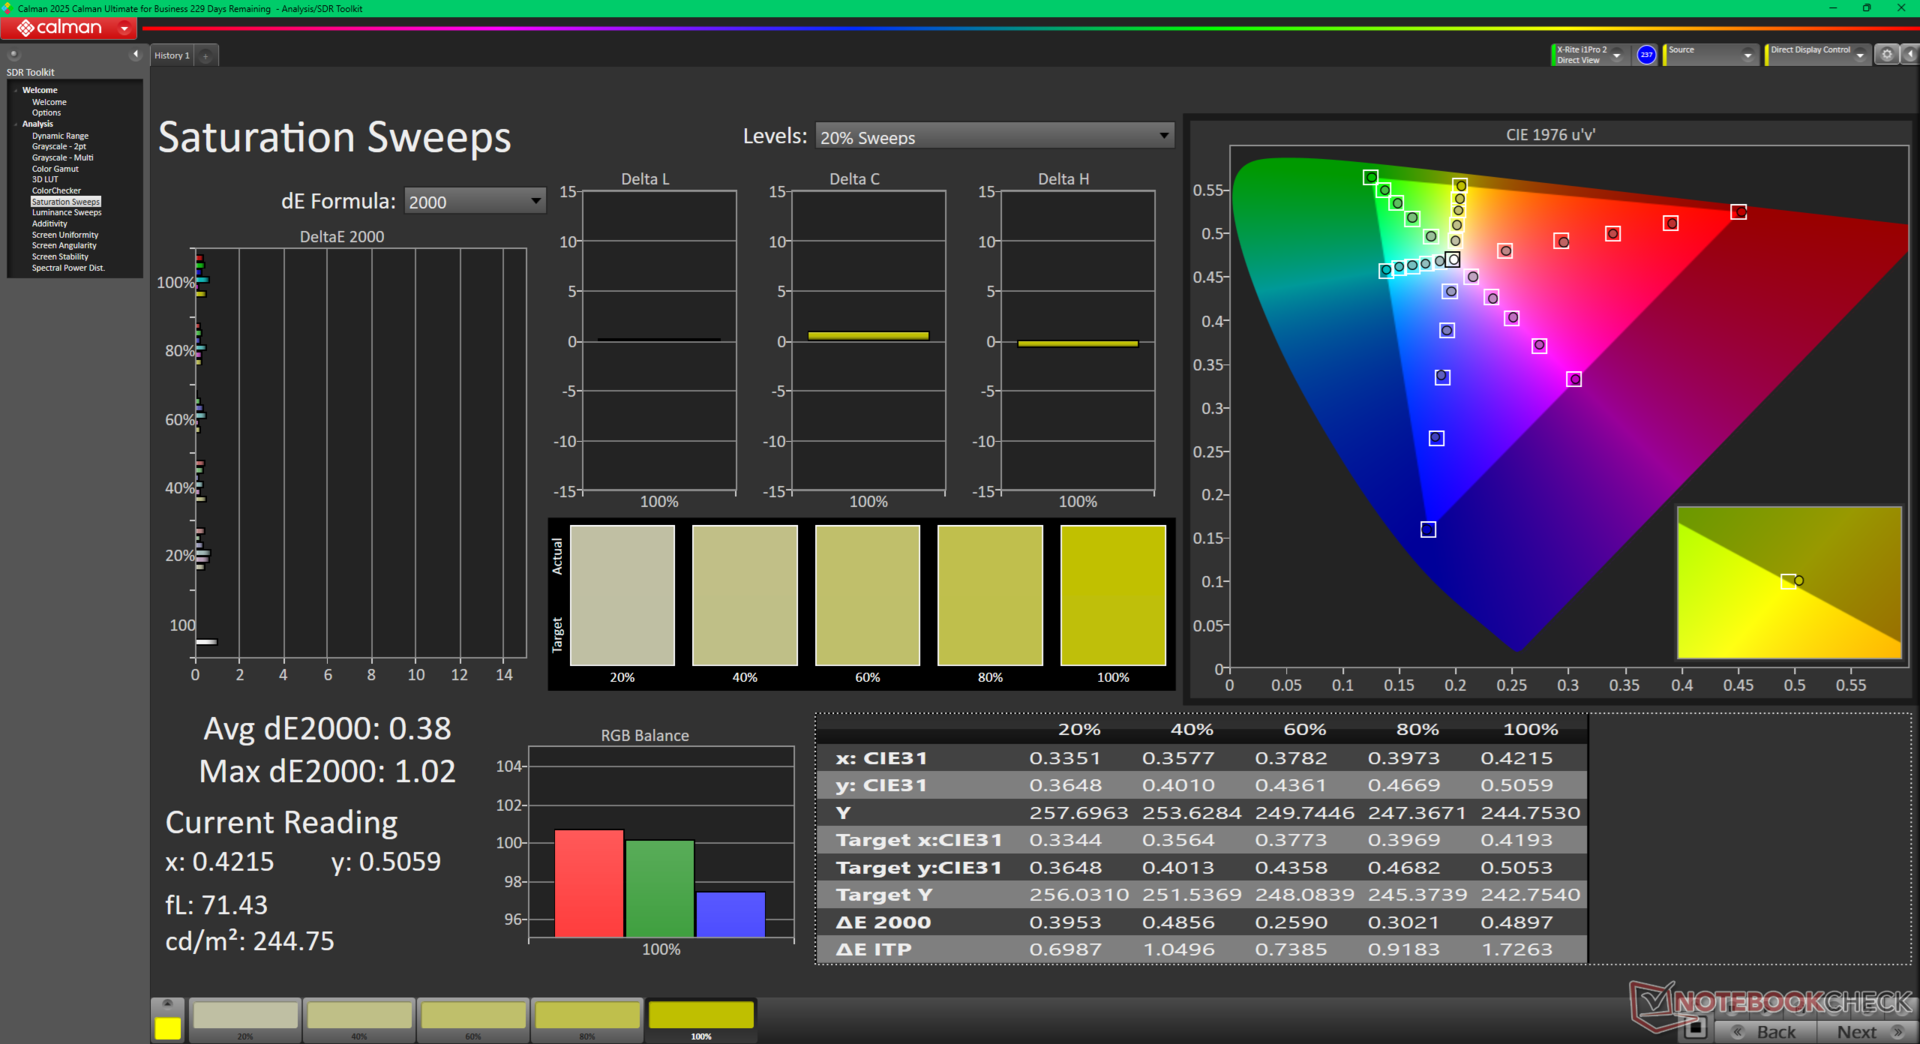
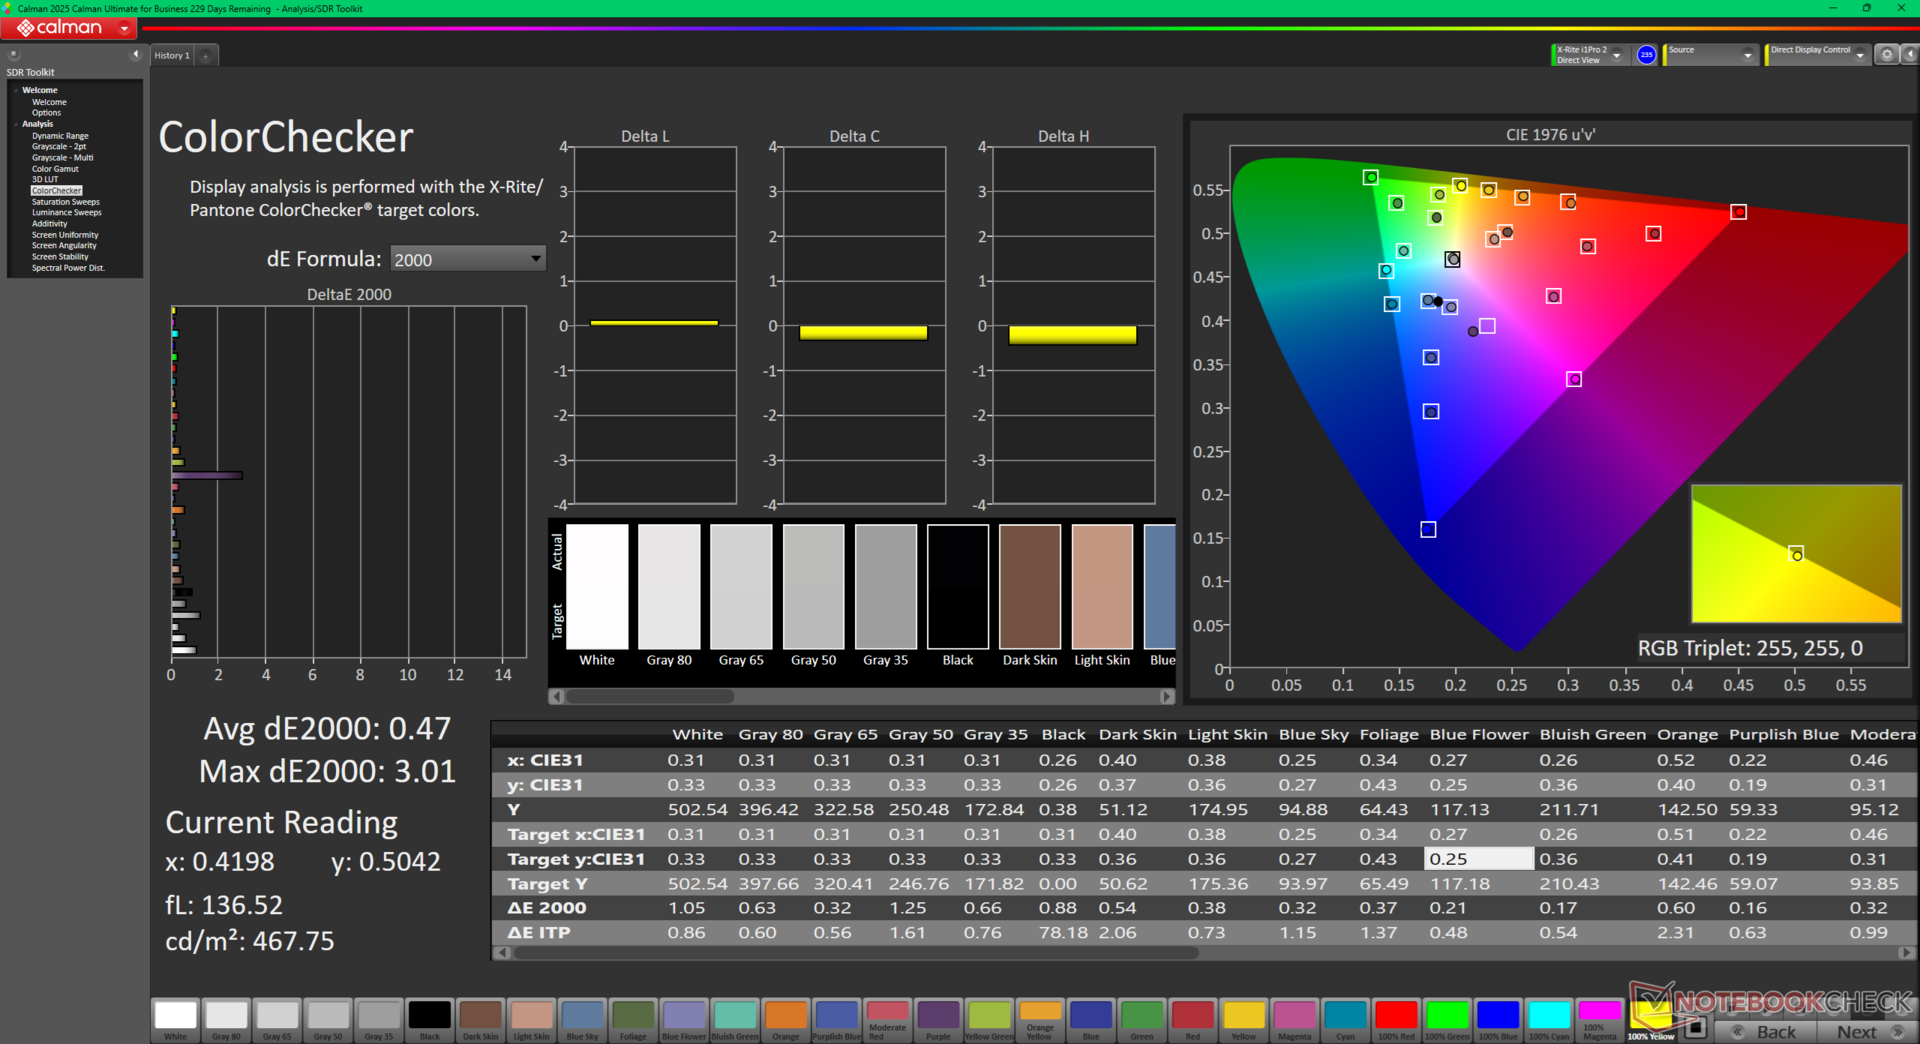
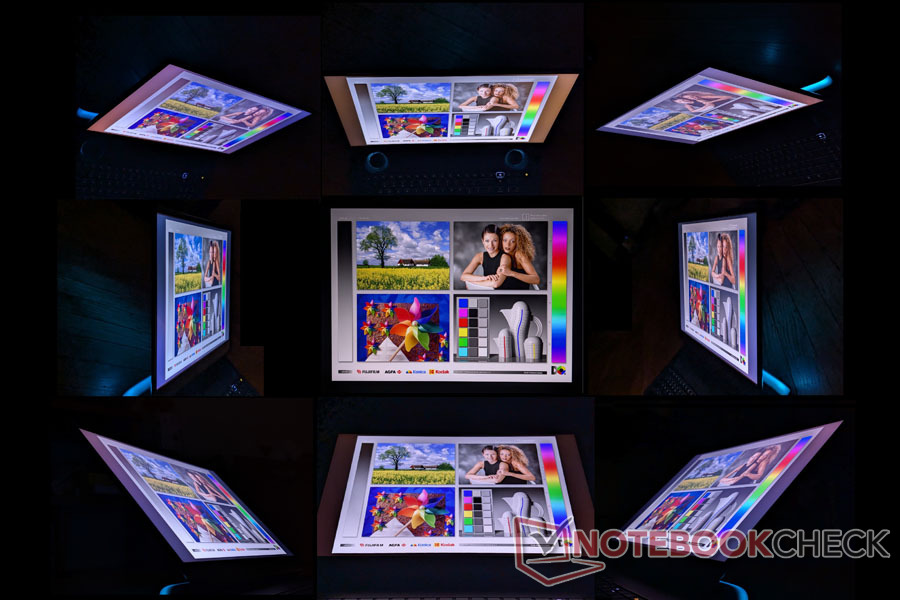
显示屏 - 没有 4K
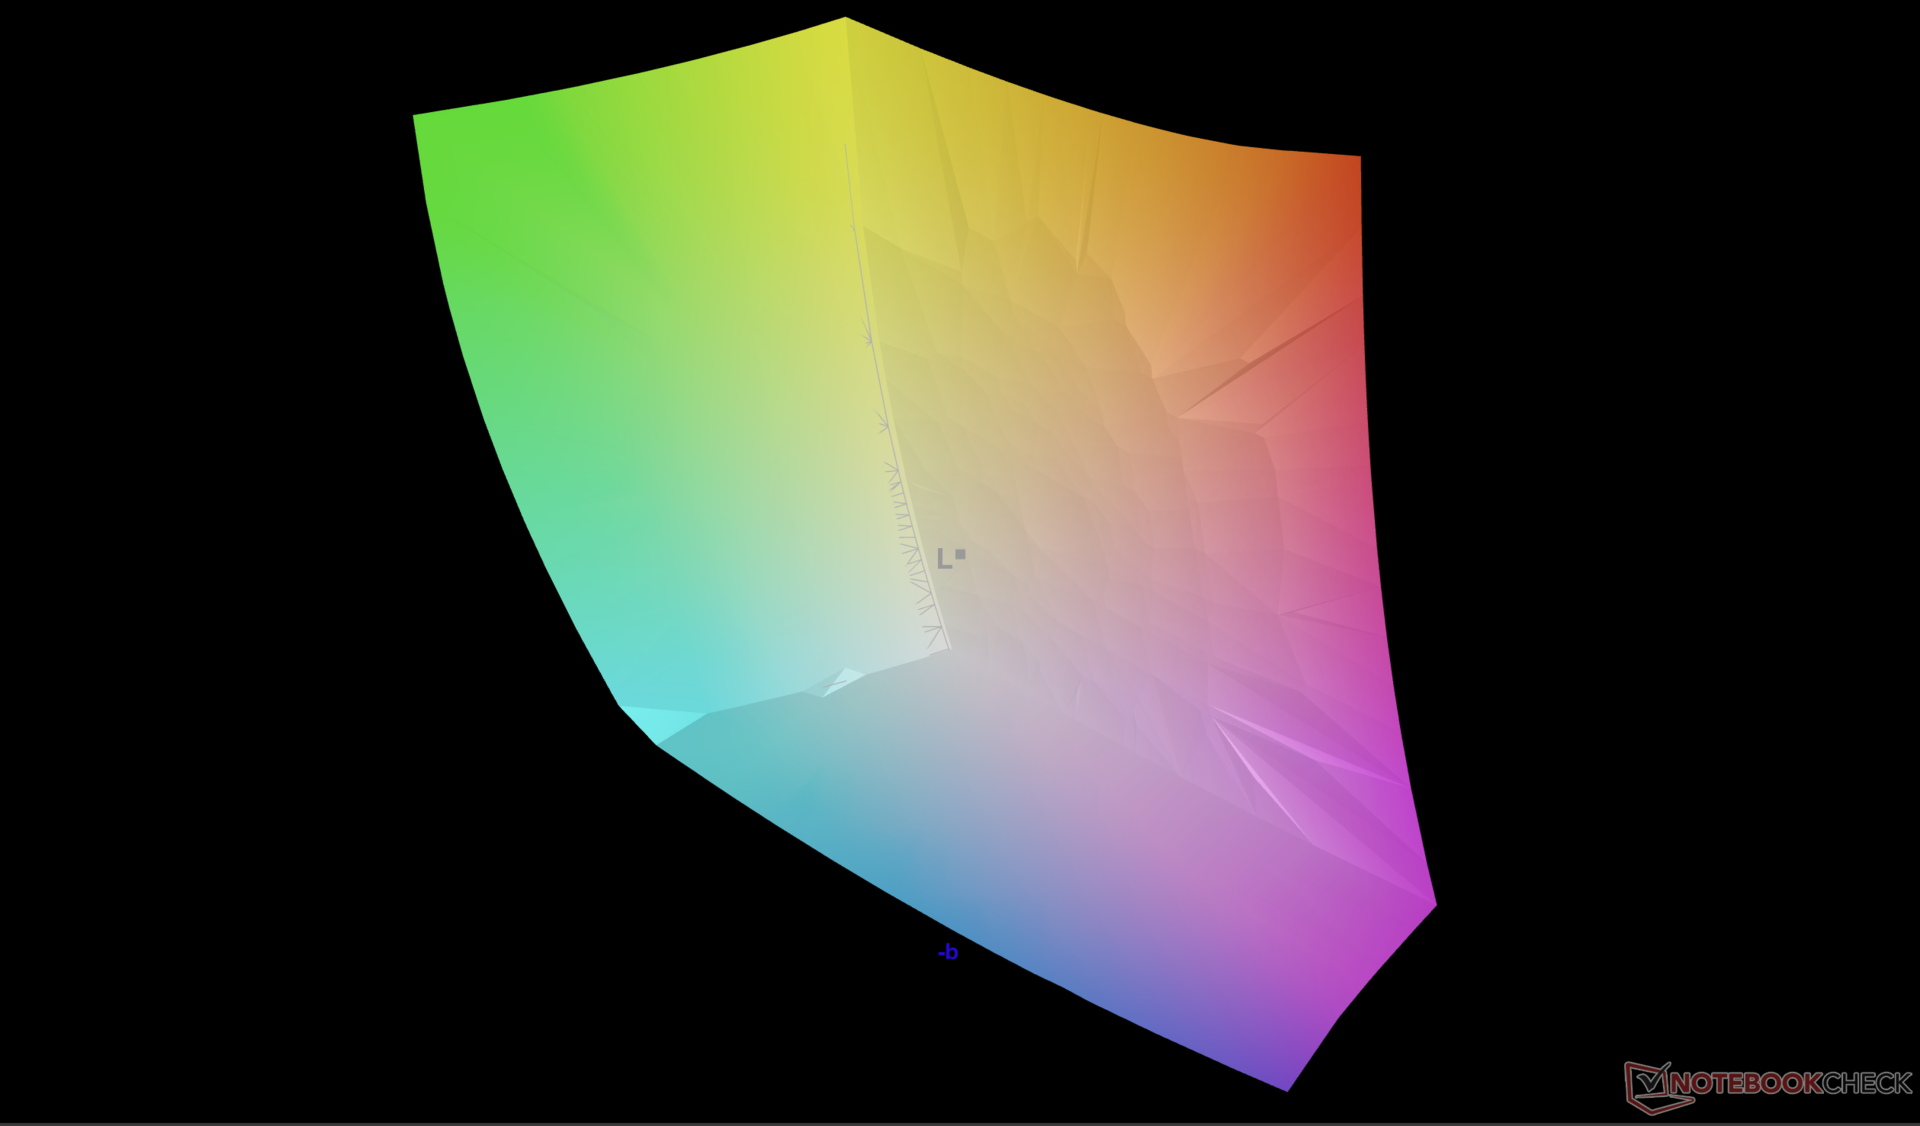
无论好坏,目前只有一种显示器可供选择。好的方面包括极高的 300 Hz 刷新率和支持高级 Optimus 的全 DCI-P3 色彩。另一方面,IPS 显示屏不支持 HDR,也不具备迷你 LED 或 OLED 的所有优势,如深黑色和高最大亮度水平。此外,考虑到 18 英寸的大屏幕尺寸,没有 4K 选项也令人遗憾。微星 微星 Raider A18 HX在这些特定场景中略胜一筹。


| |||||||||||||||||||||||||
Brightness Distribution: 94 %
Center on Battery: 512.5 cd/m²
Contrast: 1250:1 (Black: 0.41 cd/m²)
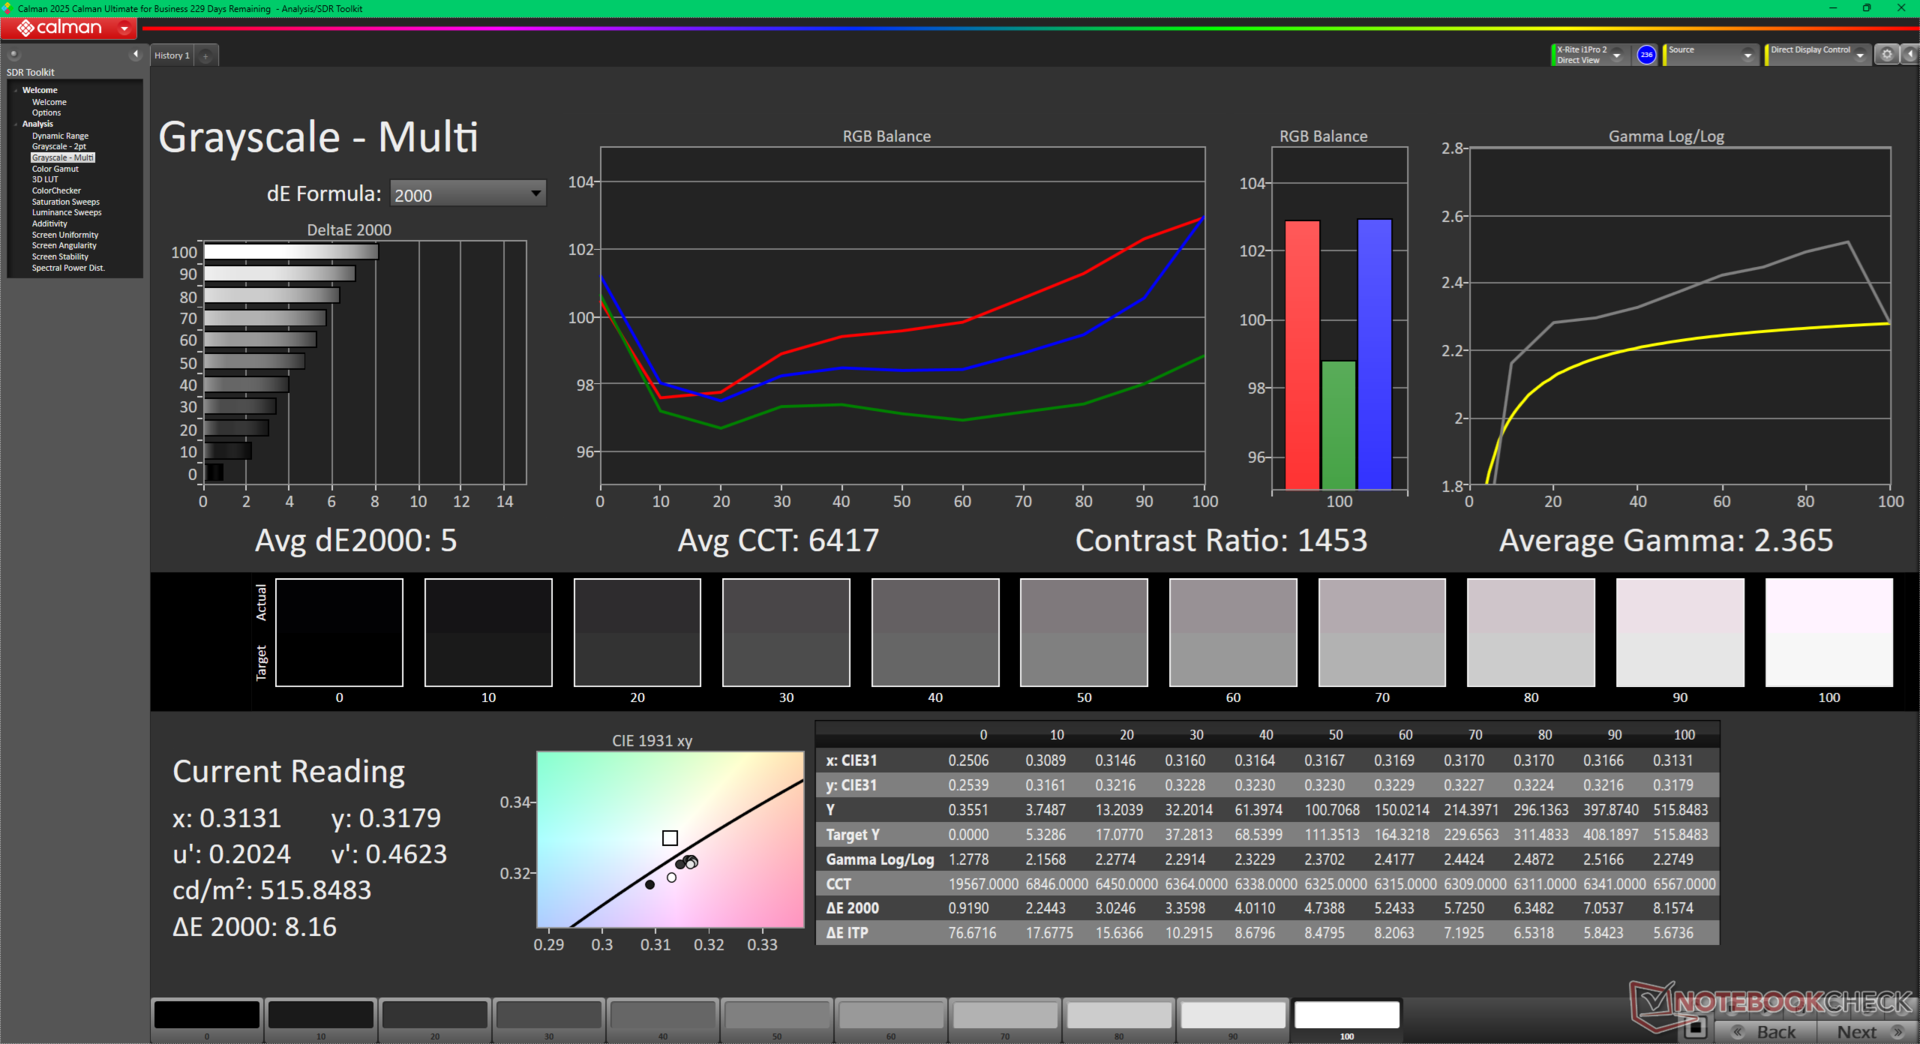
ΔE ColorChecker Calman: 3.24 | ∀{0.5-29.43 Ø4.72}
calibrated: 0.47
ΔE Greyscale Calman: 5 | ∀{0.09-98 Ø4.97}
89.7% AdobeRGB 1998 (Argyll 3D)
100% sRGB (Argyll 3D)
96.1% Display P3 (Argyll 3D)
Gamma: 2.37
CCT: 6417 K
| Alienware 18 Area-51 AU Optronics B180QAN, IPS, 2560x1600, 18", 300 Hz | Alienware 16 Area-51 AU Optronics B160QAN, IPS, 2560x1600, 16", 240 Hz | Alienware m18 R2 BOE NE18NZ1, IPS, 2560x1600, 18", 165 Hz | MSI Raider A18 HX A9WIG-080 B180ZAN01.0, MiniLED IPS, 3840x2400, 18", 120 Hz | Razer Blade 18 2024 RZ09-0509 BOE NE180QDM-NM1, Mini-LED, 2560x1600, 18", 300 Hz | Asus ROG Strix G18 G814JI NE180QDM-NZ2 (BOE0B35), IPS, 2560x1600, 18", 240 Hz | Acer Predator Helios 18 PH18-72-98MW B180QAN01.2 (AUO45A8), Mini-LED, 2560x1600, 18", 250 Hz | |
|---|---|---|---|---|---|---|---|
| Display | -0% | 0% | 3% | 0% | -1% | 2% | |
| Display P3 Coverage (%) | 96.1 | 96 0% | 97.8 2% | 99.9 4% | 99 3% | 98.1 2% | 99.7 4% |
| sRGB Coverage (%) | 100 | 100 0% | 99.5 0% | 100 0% | 100 0% | 99.9 0% | 100 0% |
| AdobeRGB 1998 Coverage (%) | 89.7 | 89.2 -1% | 88.9 -1% | 93.9 5% | 86.9 -3% | 85.6 -5% | 91.6 2% |
| Response Times | 40% | 20% | -76% | -10% | 27% | -32% | |
| Response Time Grey 50% / Grey 80% * (ms) | 13 ? | 4.8 ? 63% | 5.3 ? 59% | 23 ? -77% | 7.6 ? 42% | 5.6 ? 57% | 8 ? 38% |
| Response Time Black / White * (ms) | 8.7 ? | 7.2 ? 17% | 10.4 ? -20% | 15.1 ? -74% | 14 ? -61% | 9 ? -3% | 17.6 ? -102% |
| PWM Frequency (Hz) | 15203 | 26444 ? | 4832 ? | ||||
| PWM Amplitude * (%) | 100 | ||||||
| Screen | -6% | -3% | 331% | 15% | -1% | 148% | |
| Brightness middle (cd/m²) | 512.5 | 554 8% | 271.8 -47% | 510 0% | 605.4 18% | 471 -8% | 722 41% |
| Brightness (cd/m²) | 496 | 532 7% | 275 -45% | 470 -5% | 600 21% | 422 -15% | 724 46% |
| Brightness Distribution (%) | 94 | 88 -6% | 78 -17% | 85 -10% | 97 3% | 83 -12% | 93 -1% |
| Black Level * (cd/m²) | 0.41 | 0.52 -27% | 0.27 34% | 0.01 98% | 0.62 -51% | 0.47 -15% | 0.04 90% |
| Contrast (:1) | 1250 | 1065 -15% | 1007 -19% | 51000 3980% | 976 -22% | 1002 -20% | 18050 1344% |
| Colorchecker dE 2000 * | 3.24 | 2.81 13% | 2.48 23% | 4.5 -39% | 1.53 53% | 2.05 37% | 3.4 -5% |
| Colorchecker dE 2000 max. * | 8.4 | 8.32 1% | 5.59 33% | 7.3 13% | 4.15 51% | 4.15 51% | 5.32 37% |
| Colorchecker dE 2000 calibrated * | 0.47 | 0.65 -38% | 0.56 -19% | 5.7 -1113% | 0.8 -70% | 1.6 -240% | |
| Greyscale dE 2000 * | 5 | 4.7 6% | 3.7 26% | 2.3 54% | 2.6 48% | 2.8 44% | 3.8 24% |
| Gamma | 2.37 93% | 2.3 96% | 2.2 100% | 2.08 106% | 2.22 99% | 2.204 100% | 2.383 92% |
| CCT | 6417 101% | 6476 100% | 6355 102% | 6648 98% | 6843 95% | 7122 91% | 7051 92% |
| Total Average (Program / Settings) | 11% /
2% | 6% /
1% | 86% /
203% | 2% /
8% | 8% /
3% | 39% /
91% |
* ... smaller is better
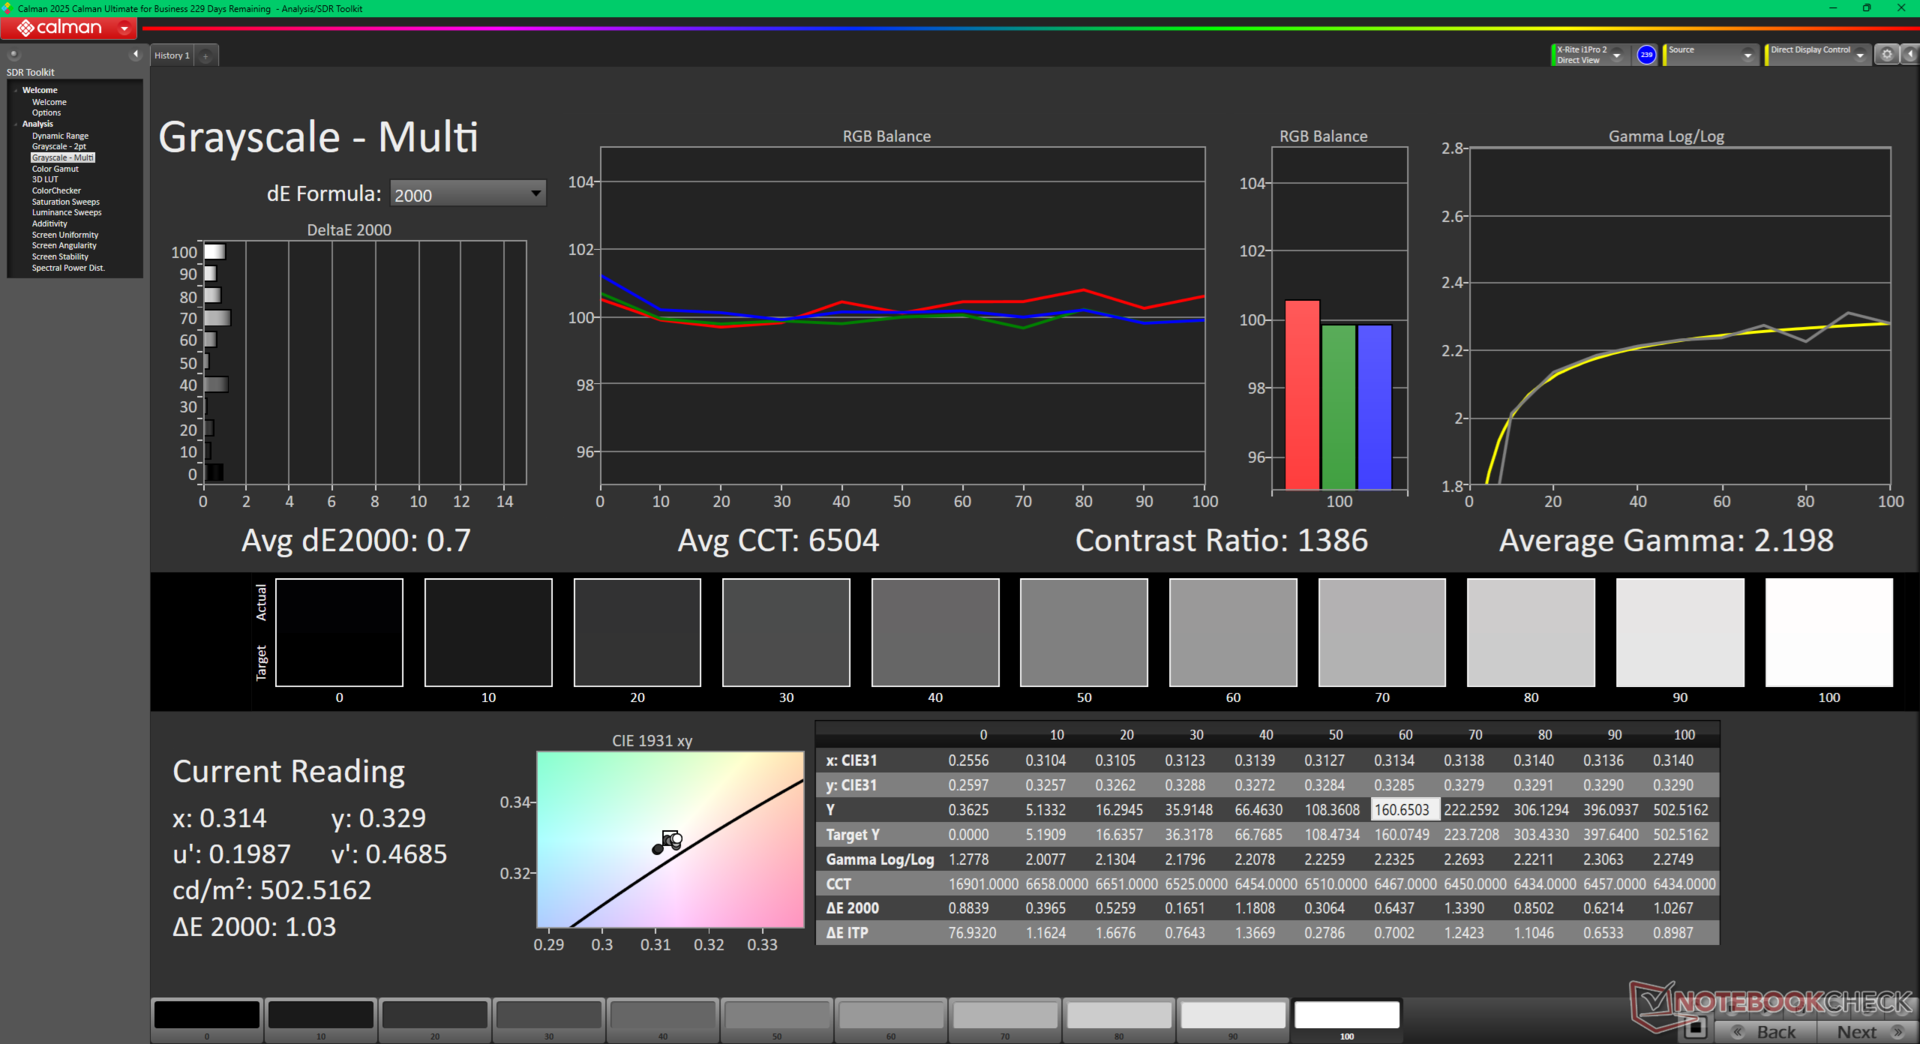
显示器在开箱时默认按照 sRGB 标准进行了适当的校准。使用 X-Rite 色差计进行校准后,平均灰度和色彩 DeltaE 值分别降至 0.7 和 0.47。

Display Response Times
| ↔ Response Time Black to White | ||
|---|---|---|
| 8.7 ms ... rise ↗ and fall ↘ combined | ↗ 4.4 ms rise | 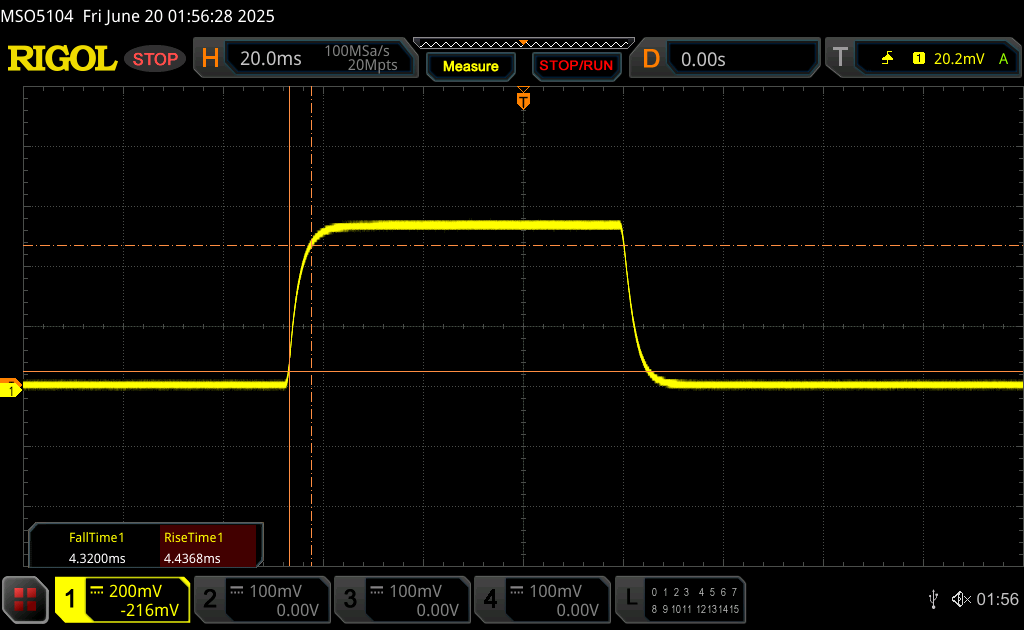 |
| ↘ 4.3 ms fall | ||
| The screen shows fast response rates in our tests and should be suited for gaming. In comparison, all tested devices range from 0.1 (minimum) to 240 (maximum) ms. » 24 % of all devices are better. This means that the measured response time is better than the average of all tested devices (19.8 ms). | ||
| ↔ Response Time 50% Grey to 80% Grey | ||
| 13 ms ... rise ↗ and fall ↘ combined | ↗ 5.8 ms rise | 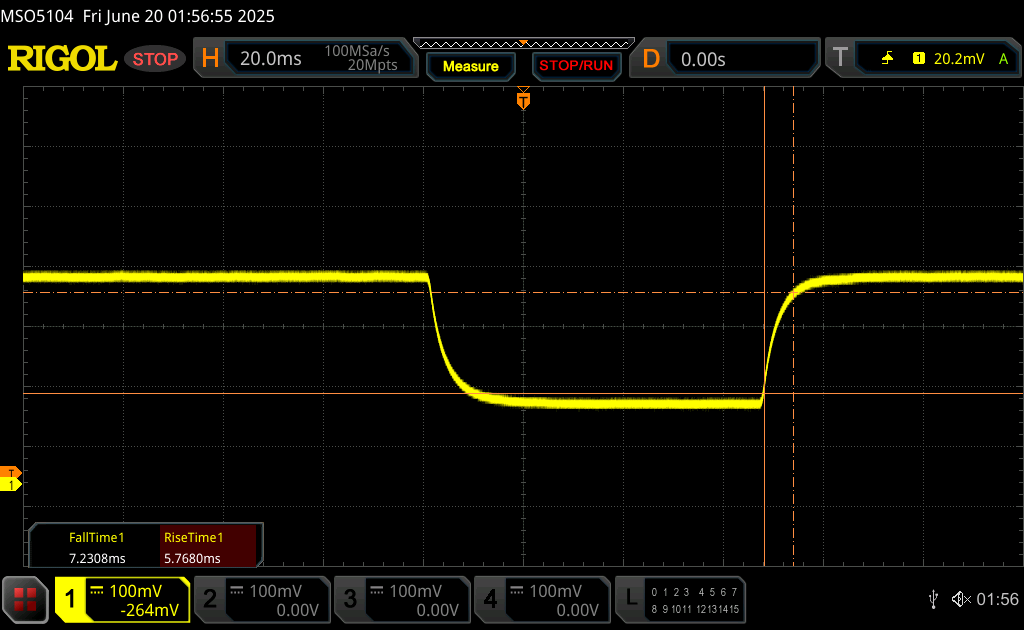 |
| ↘ 7.2 ms fall | ||
| The screen shows good response rates in our tests, but may be too slow for competitive gamers. In comparison, all tested devices range from 0.165 (minimum) to 636 (maximum) ms. » 27 % of all devices are better. This means that the measured response time is better than the average of all tested devices (31 ms). | ||
Screen Flickering / PWM (Pulse-Width Modulation)
| Screen flickering / PWM not detected |  | ||
In comparison: 52 % of all tested devices do not use PWM to dim the display. If PWM was detected, an average of 7753 (minimum: 5 - maximum: 343500) Hz was measured. | |||
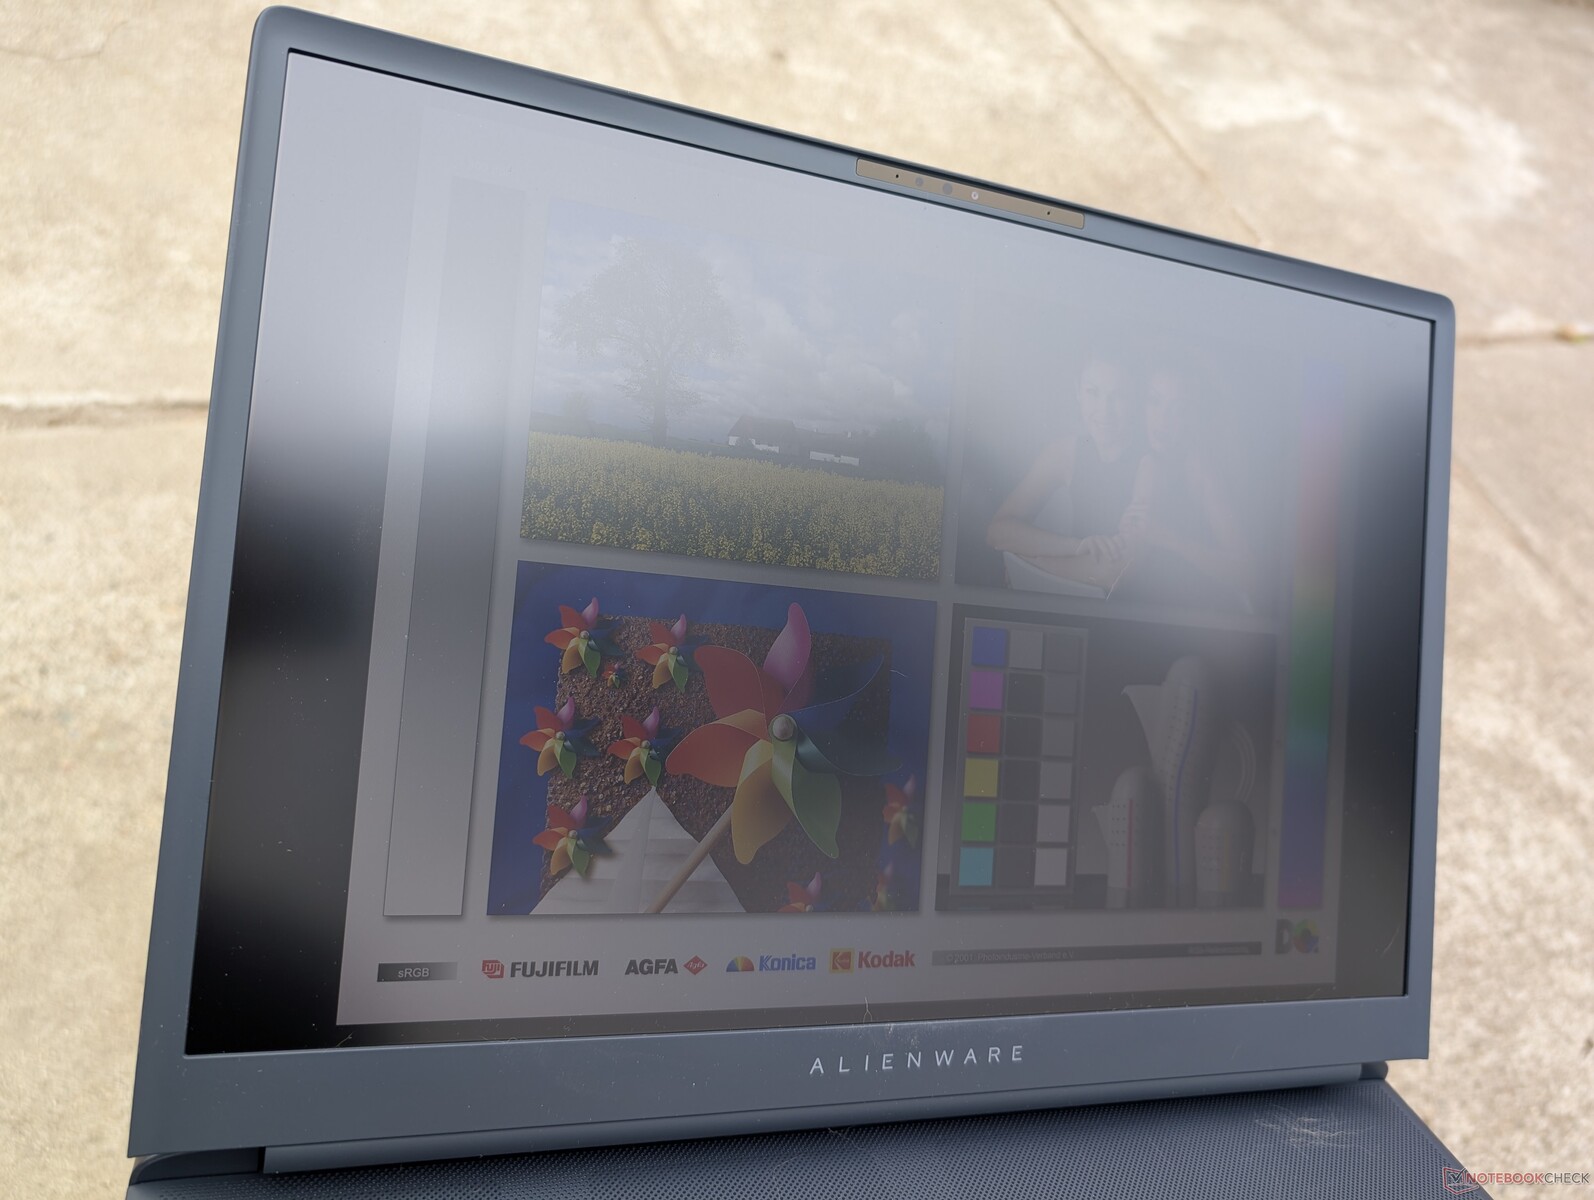
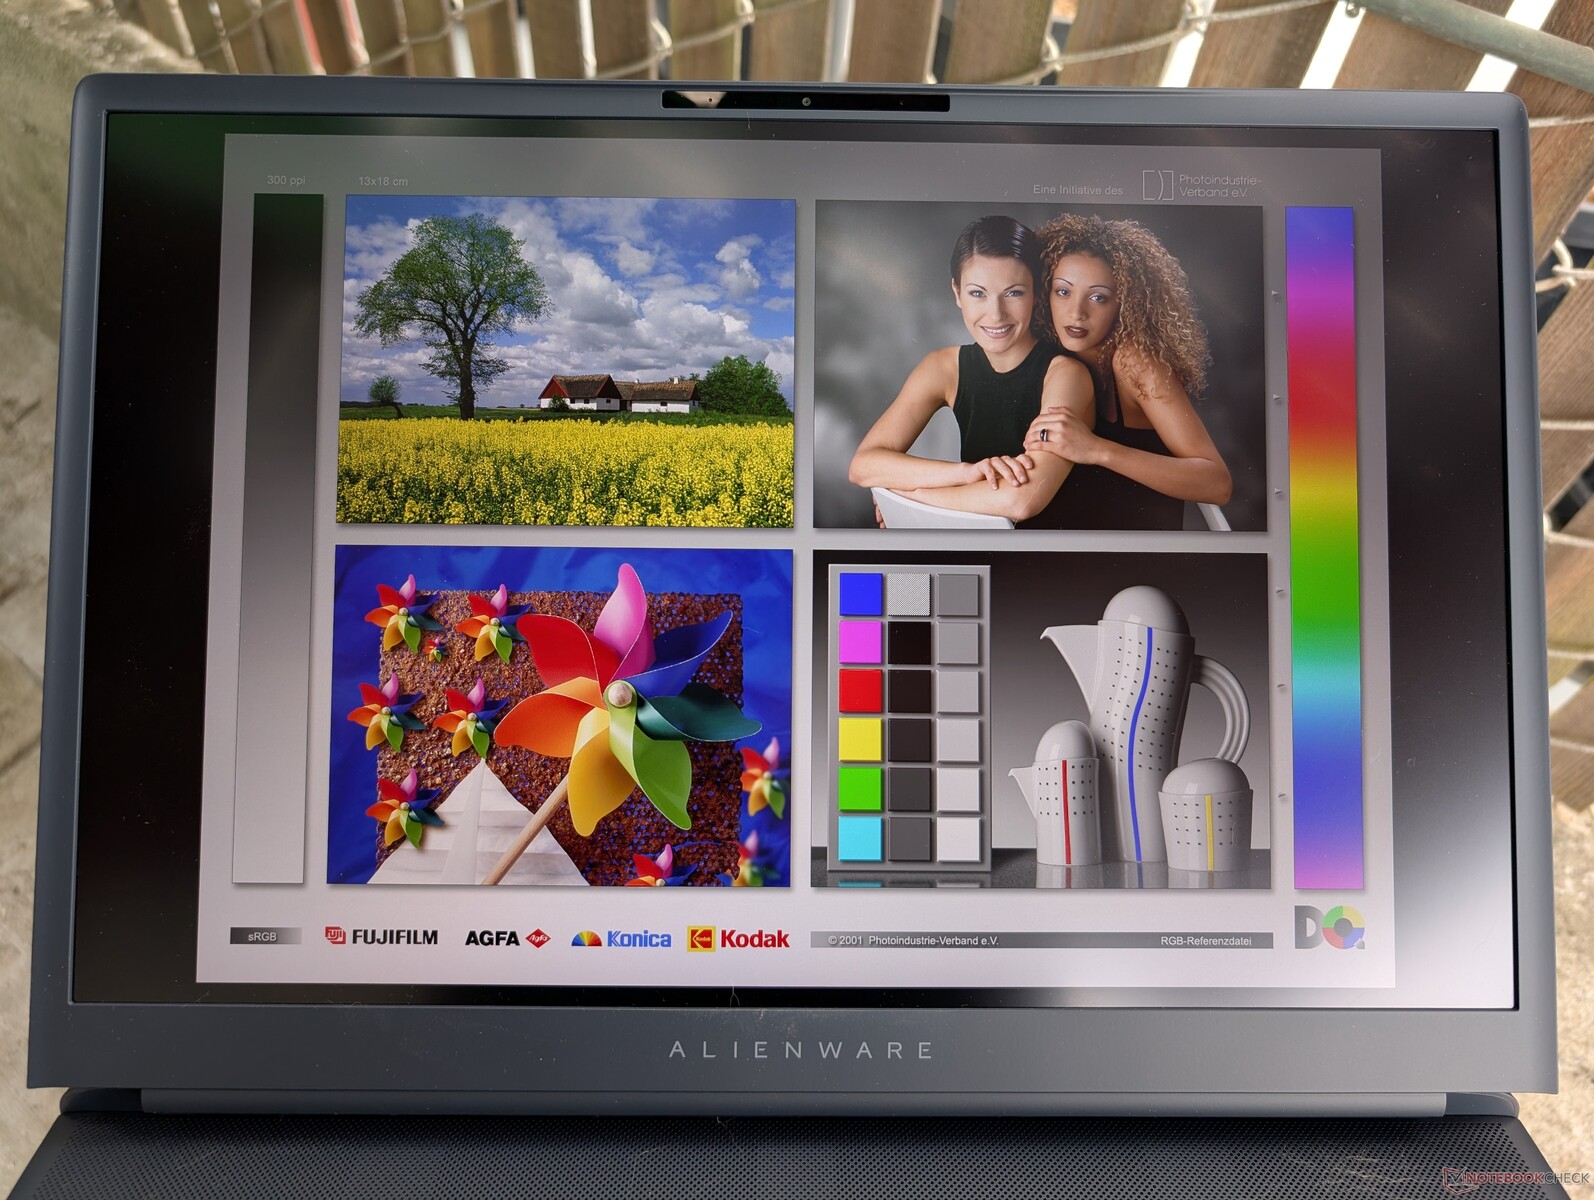
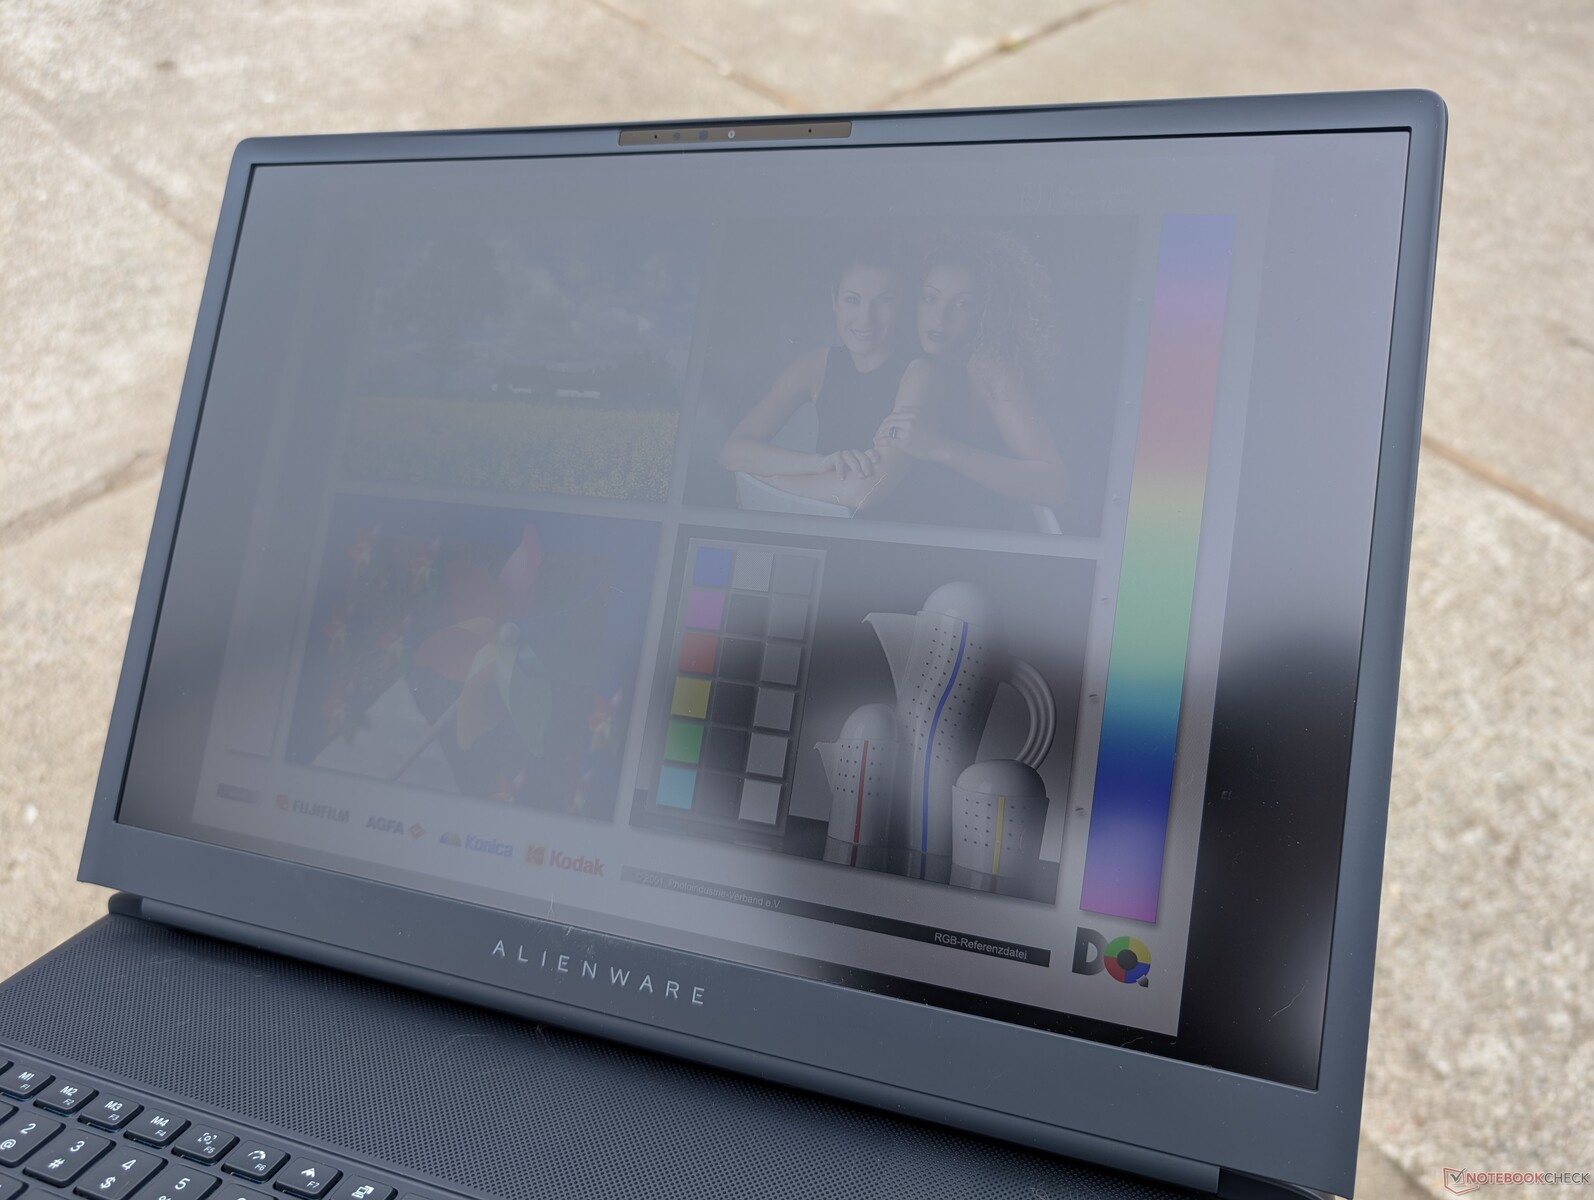
500 尼特的面板亮度是相对较暗的 Alienware m18 R2 面板的 2 倍,户外可视性更好。即便如此,您还是要尽可能在阴凉处使用,以避免色彩失真。总之,有限的电池寿命和沉重的重量使该系统只能在室内使用。
性能
测试条件
在运行以下基准测试之前,我们将 Alienware Command Center 设置为 "性能 "模式。性能模式和超频模式(即 Turbo 模式)之间的任何差异都会被记录下来。Alienware Command Center 对于控制系统的大部分方面(包括 LED 灯和电源配置文件)都至关重要,但它有时会在启动时无缘无故挂起。
处理器
多线程性能比 Alienware 16相同的 酷睿至尊 9 275HXCPU 的多线程性能要快 20%。在更高的 "Overdrive "电源配置文件下运行,Alienware 18 的 CPU 性能似乎并没有提高多少,而 Alienware 16 的性能则提升了 10%。这意味着,Alienware 18 的用户并不一定要在超频模式下运行系统才能获得最高性能。
整体性能与竞争对手的 Ryzen 9 9955HX3D微星 Raider A18 HX。
从仅使用两年的流星湖-H 系列升级的用户,如 酷睿至尊 7 155H多线程性能将大幅提升约 2 倍。
Cinebench R15 Multi Loop
Cinebench R23: Multi Core | Single Core
Cinebench R20: CPU (Multi Core) | CPU (Single Core)
Cinebench R15: CPU Multi 64Bit | CPU Single 64Bit
Blender: v2.79 BMW27 CPU
7-Zip 18.03: 7z b 4 | 7z b 4 -mmt1
Geekbench 6.7: Multi-Core | Single-Core
Geekbench 5.5: Multi-Core | Single-Core
HWBOT x265 Benchmark v2.2: 4k Preset
LibreOffice : 20 Documents To PDF
R Benchmark 2.5: Overall mean
* ... smaller is better
AIDA64: FP32 Ray-Trace | FPU Julia | CPU SHA3 | CPU Queen | FPU SinJulia | FPU Mandel | CPU AES | CPU ZLib | FP64 Ray-Trace | CPU PhotoWorxx
| Performance rating | |
| MSI Raider A18 HX A9WIG-080 | |
| Alienware 18 Area-51 | |
| Average Intel Core Ultra 9 275HX | |
| Alienware 16 Area-51 | |
| Alienware m18 R2 | |
| Razer Blade 18 2024 RZ09-0509 | |
| Acer Predator Helios 18 PH18-72-98MW | |
| Asus ROG Strix G18 G814JI | |
| AIDA64 / FP32 Ray-Trace | |
| MSI Raider A18 HX A9WIG-080 | |
| Alienware 18 Area-51 | |
| Average Intel Core Ultra 9 275HX (28039 - 39895, n=30) | |
| Alienware 16 Area-51 | |
| Alienware m18 R2 | |
| Razer Blade 18 2024 RZ09-0509 | |
| Acer Predator Helios 18 PH18-72-98MW | |
| Asus ROG Strix G18 G814JI | |
| AIDA64 / FPU Julia | |
| MSI Raider A18 HX A9WIG-080 | |
| Alienware 18 Area-51 | |
| Average Intel Core Ultra 9 275HX (140254 - 200744, n=30) | |
| Alienware 16 Area-51 | |
| Alienware m18 R2 | |
| Razer Blade 18 2024 RZ09-0509 | |
| Acer Predator Helios 18 PH18-72-98MW | |
| Asus ROG Strix G18 G814JI | |
| AIDA64 / CPU SHA3 | |
| MSI Raider A18 HX A9WIG-080 | |
| Alienware 18 Area-51 | |
| Average Intel Core Ultra 9 275HX (6710 - 9817, n=30) | |
| Alienware 16 Area-51 | |
| Alienware m18 R2 | |
| Razer Blade 18 2024 RZ09-0509 | |
| Acer Predator Helios 18 PH18-72-98MW | |
| Asus ROG Strix G18 G814JI | |
| AIDA64 / CPU Queen | |
| MSI Raider A18 HX A9WIG-080 | |
| Alienware 18 Area-51 | |
| Alienware m18 R2 | |
| Acer Predator Helios 18 PH18-72-98MW | |
| Razer Blade 18 2024 RZ09-0509 | |
| Average Intel Core Ultra 9 275HX (113887 - 140937, n=30) | |
| Alienware 16 Area-51 | |
| Asus ROG Strix G18 G814JI | |
| AIDA64 / FPU SinJulia | |
| MSI Raider A18 HX A9WIG-080 | |
| Alienware m18 R2 | |
| Razer Blade 18 2024 RZ09-0509 | |
| Acer Predator Helios 18 PH18-72-98MW | |
| Alienware 18 Area-51 | |
| Alienware 16 Area-51 | |
| Average Intel Core Ultra 9 275HX (11172 - 14425, n=30) | |
| Asus ROG Strix G18 G814JI | |
| AIDA64 / FPU Mandel | |
| MSI Raider A18 HX A9WIG-080 | |
| Alienware 18 Area-51 | |
| Average Intel Core Ultra 9 275HX (72596 - 104508, n=30) | |
| Alienware 16 Area-51 | |
| Alienware m18 R2 | |
| Razer Blade 18 2024 RZ09-0509 | |
| Acer Predator Helios 18 PH18-72-98MW | |
| Asus ROG Strix G18 G814JI | |
| AIDA64 / CPU AES | |
| MSI Raider A18 HX A9WIG-080 | |
| Alienware 18 Area-51 | |
| Alienware m18 R2 | |
| Average Intel Core Ultra 9 275HX (105608 - 247074, n=30) | |
| Alienware 16 Area-51 | |
| Razer Blade 18 2024 RZ09-0509 | |
| Acer Predator Helios 18 PH18-72-98MW | |
| Asus ROG Strix G18 G814JI | |
| AIDA64 / CPU ZLib | |
| MSI Raider A18 HX A9WIG-080 | |
| Alienware 18 Area-51 | |
| Alienware m18 R2 | |
| Average Intel Core Ultra 9 275HX (1582 - 2263, n=30) | |
| Alienware 16 Area-51 | |
| Razer Blade 18 2024 RZ09-0509 | |
| Acer Predator Helios 18 PH18-72-98MW | |
| Asus ROG Strix G18 G814JI | |
| AIDA64 / FP64 Ray-Trace | |
| MSI Raider A18 HX A9WIG-080 | |
| Alienware 18 Area-51 | |
| Average Intel Core Ultra 9 275HX (14847 - 21854, n=30) | |
| Alienware 16 Area-51 | |
| Alienware m18 R2 | |
| Razer Blade 18 2024 RZ09-0509 | |
| Acer Predator Helios 18 PH18-72-98MW | |
| Asus ROG Strix G18 G814JI | |
| AIDA64 / CPU PhotoWorxx | |
| Alienware 18 Area-51 | |
| Alienware 16 Area-51 | |
| Average Intel Core Ultra 9 275HX (37482 - 62916, n=30) | |
| Alienware m18 R2 | |
| Razer Blade 18 2024 RZ09-0509 | |
| Acer Predator Helios 18 PH18-72-98MW | |
| Asus ROG Strix G18 G814JI | |
| MSI Raider A18 HX A9WIG-080 | |
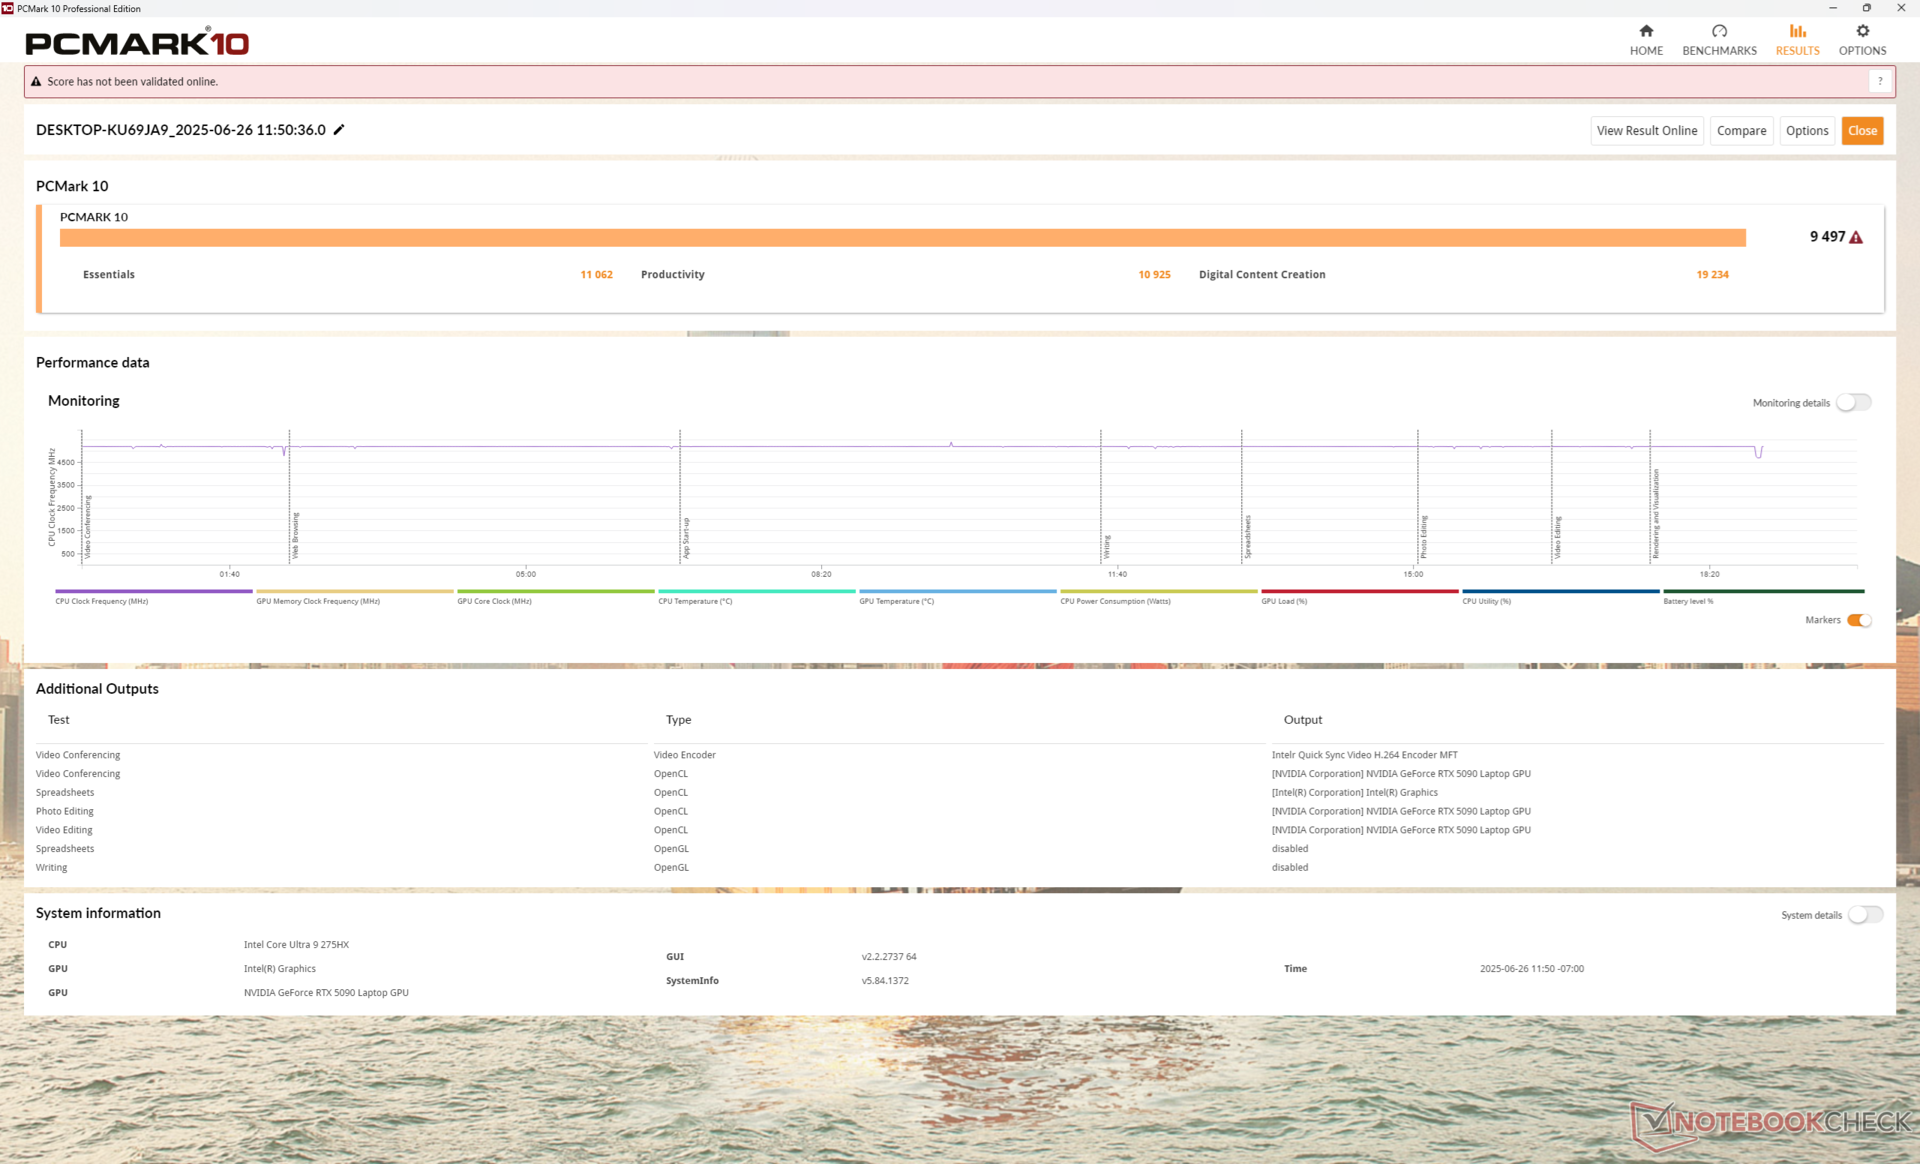
系统性能
PCMark 的平均分数是所有 18 英寸游戏笔记本电脑中最高的,包括 微星 Raider A18 HX搭载 Ryzen 9 9955HX3D。这部分归功于 Alienware 测试设备上的 PCIe5 固态硬盘。
PCMark 10: Score | Essentials | Productivity | Digital Content Creation
CrossMark: Overall | Productivity | Creativity | Responsiveness
WebXPRT 3: Overall
WebXPRT 4: Overall
Mozilla Kraken 1.1: Total
| Performance rating | |
| Alienware 18 Area-51 | |
| MSI Raider A18 HX A9WIG-080 | |
| Alienware 16 Area-51 | |
| Average Intel Core Ultra 9 275HX, NVIDIA GeForce RTX 5090 Laptop | |
| Alienware m18 R2 | |
| Razer Blade 18 2024 RZ09-0509 -1! | |
| Acer Predator Helios 18 PH18-72-98MW -6! | |
| Asus ROG Strix G18 G814JI -4! | |
| PCMark 10 / Score | |
| Alienware 18 Area-51 | |
| Alienware m18 R2 | |
| MSI Raider A18 HX A9WIG-080 | |
| Razer Blade 18 2024 RZ09-0509 | |
| Alienware 16 Area-51 | |
| Average Intel Core Ultra 9 275HX, NVIDIA GeForce RTX 5090 Laptop (7474 - 9497, n=11) | |
| Acer Predator Helios 18 PH18-72-98MW | |
| Asus ROG Strix G18 G814JI | |
| PCMark 10 / Essentials | |
| MSI Raider A18 HX A9WIG-080 | |
| Alienware m18 R2 | |
| Razer Blade 18 2024 RZ09-0509 | |
| Alienware 16 Area-51 | |
| Alienware 18 Area-51 | |
| Acer Predator Helios 18 PH18-72-98MW | |
| Average Intel Core Ultra 9 275HX, NVIDIA GeForce RTX 5090 Laptop (9994 - 11369, n=12) | |
| Asus ROG Strix G18 G814JI | |
| PCMark 10 / Productivity | |
| Alienware m18 R2 | |
| Alienware 18 Area-51 | |
| MSI Raider A18 HX A9WIG-080 | |
| Razer Blade 18 2024 RZ09-0509 | |
| Acer Predator Helios 18 PH18-72-98MW | |
| Average Intel Core Ultra 9 275HX, NVIDIA GeForce RTX 5090 Laptop (9122 - 10925, n=11) | |
| Alienware 16 Area-51 | |
| Asus ROG Strix G18 G814JI | |
| PCMark 10 / Digital Content Creation | |
| Alienware 18 Area-51 | |
| Alienware 16 Area-51 | |
| Average Intel Core Ultra 9 275HX, NVIDIA GeForce RTX 5090 Laptop (9952 - 19234, n=11) | |
| Alienware m18 R2 | |
| Razer Blade 18 2024 RZ09-0509 | |
| MSI Raider A18 HX A9WIG-080 | |
| Acer Predator Helios 18 PH18-72-98MW | |
| Asus ROG Strix G18 G814JI | |
| CrossMark / Overall | |
| Alienware 18 Area-51 | |
| MSI Raider A18 HX A9WIG-080 | |
| Average Intel Core Ultra 9 275HX, NVIDIA GeForce RTX 5090 Laptop (1995 - 2339, n=12) | |
| Alienware 16 Area-51 | |
| Alienware m18 R2 | |
| Razer Blade 18 2024 RZ09-0509 | |
| CrossMark / Productivity | |
| Alienware 18 Area-51 | |
| Average Intel Core Ultra 9 275HX, NVIDIA GeForce RTX 5090 Laptop (1847 - 2211, n=12) | |
| Alienware 16 Area-51 | |
| MSI Raider A18 HX A9WIG-080 | |
| Razer Blade 18 2024 RZ09-0509 | |
| Alienware m18 R2 | |
| CrossMark / Creativity | |
| MSI Raider A18 HX A9WIG-080 | |
| Alienware 18 Area-51 | |
| Average Intel Core Ultra 9 275HX, NVIDIA GeForce RTX 5090 Laptop (2170 - 2642, n=12) | |
| Alienware 16 Area-51 | |
| Alienware m18 R2 | |
| Razer Blade 18 2024 RZ09-0509 | |
| CrossMark / Responsiveness | |
| Alienware 18 Area-51 | |
| Alienware 16 Area-51 | |
| Average Intel Core Ultra 9 275HX, NVIDIA GeForce RTX 5090 Laptop (1673 - 2217, n=12) | |
| MSI Raider A18 HX A9WIG-080 | |
| Alienware m18 R2 | |
| Razer Blade 18 2024 RZ09-0509 | |
| WebXPRT 3 / Overall | |
| MSI Raider A18 HX A9WIG-080 | |
| Alienware 18 Area-51 | |
| Alienware 16 Area-51 | |
| Average Intel Core Ultra 9 275HX, NVIDIA GeForce RTX 5090 Laptop (315 - 372, n=12) | |
| Razer Blade 18 2024 RZ09-0509 | |
| Alienware m18 R2 | |
| Asus ROG Strix G18 G814JI | |
| Asus ROG Strix G18 G814JI | |
| WebXPRT 4 / Overall | |
| Alienware 18 Area-51 | |
| MSI Raider A18 HX A9WIG-080 | |
| Alienware 16 Area-51 | |
| Average Intel Core Ultra 9 275HX, NVIDIA GeForce RTX 5090 Laptop (301 - 341, n=11) | |
| Alienware m18 R2 | |
| Asus ROG Strix G18 G814JI | |
| Asus ROG Strix G18 G814JI | |
| Mozilla Kraken 1.1 / Total | |
| Asus ROG Strix G18 G814JI | |
| Asus ROG Strix G18 G814JI | |
| Razer Blade 18 2024 RZ09-0509 | |
| Acer Predator Helios 18 PH18-72-98MW | |
| Alienware m18 R2 | |
| Average Intel Core Ultra 9 275HX, NVIDIA GeForce RTX 5090 Laptop (402 - 424, n=12) | |
| Alienware 16 Area-51 | |
| Alienware 18 Area-51 | |
| MSI Raider A18 HX A9WIG-080 | |
* ... smaller is better
| PCMark 10 Score | 9497 points | |
Help | ||
| AIDA64 / Memory Copy | |
| Alienware 18 Area-51 | |
| Alienware 16 Area-51 | |
| Average Intel Core Ultra 9 275HX (56003 - 94460, n=30) | |
| Alienware m18 R2 | |
| Acer Predator Helios 18 PH18-72-98MW | |
| Razer Blade 18 2024 RZ09-0509 | |
| Asus ROG Strix G18 G814JI | |
| MSI Raider A18 HX A9WIG-080 | |
| AIDA64 / Memory Read | |
| Alienware 18 Area-51 | |
| Alienware 16 Area-51 | |
| Alienware m18 R2 | |
| Acer Predator Helios 18 PH18-72-98MW | |
| Average Intel Core Ultra 9 275HX (55795 - 97151, n=30) | |
| Razer Blade 18 2024 RZ09-0509 | |
| Asus ROG Strix G18 G814JI | |
| MSI Raider A18 HX A9WIG-080 | |
| AIDA64 / Memory Write | |
| Alienware 18 Area-51 | |
| Alienware 16 Area-51 | |
| Average Intel Core Ultra 9 275HX (55663 - 116129, n=30) | |
| Alienware m18 R2 | |
| Acer Predator Helios 18 PH18-72-98MW | |
| Razer Blade 18 2024 RZ09-0509 | |
| Asus ROG Strix G18 G814JI | |
| MSI Raider A18 HX A9WIG-080 | |
| AIDA64 / Memory Latency | |
| Alienware 16 Area-51 | |
| Average Intel Core Ultra 9 275HX (105.8 - 161.6, n=30) | |
| Alienware 18 Area-51 | |
| MSI Raider A18 HX A9WIG-080 | |
| Razer Blade 18 2024 RZ09-0509 | |
| Alienware m18 R2 | |
| Asus ROG Strix G18 G814JI | |
| Acer Predator Helios 18 PH18-72-98MW | |
* ... smaller is better
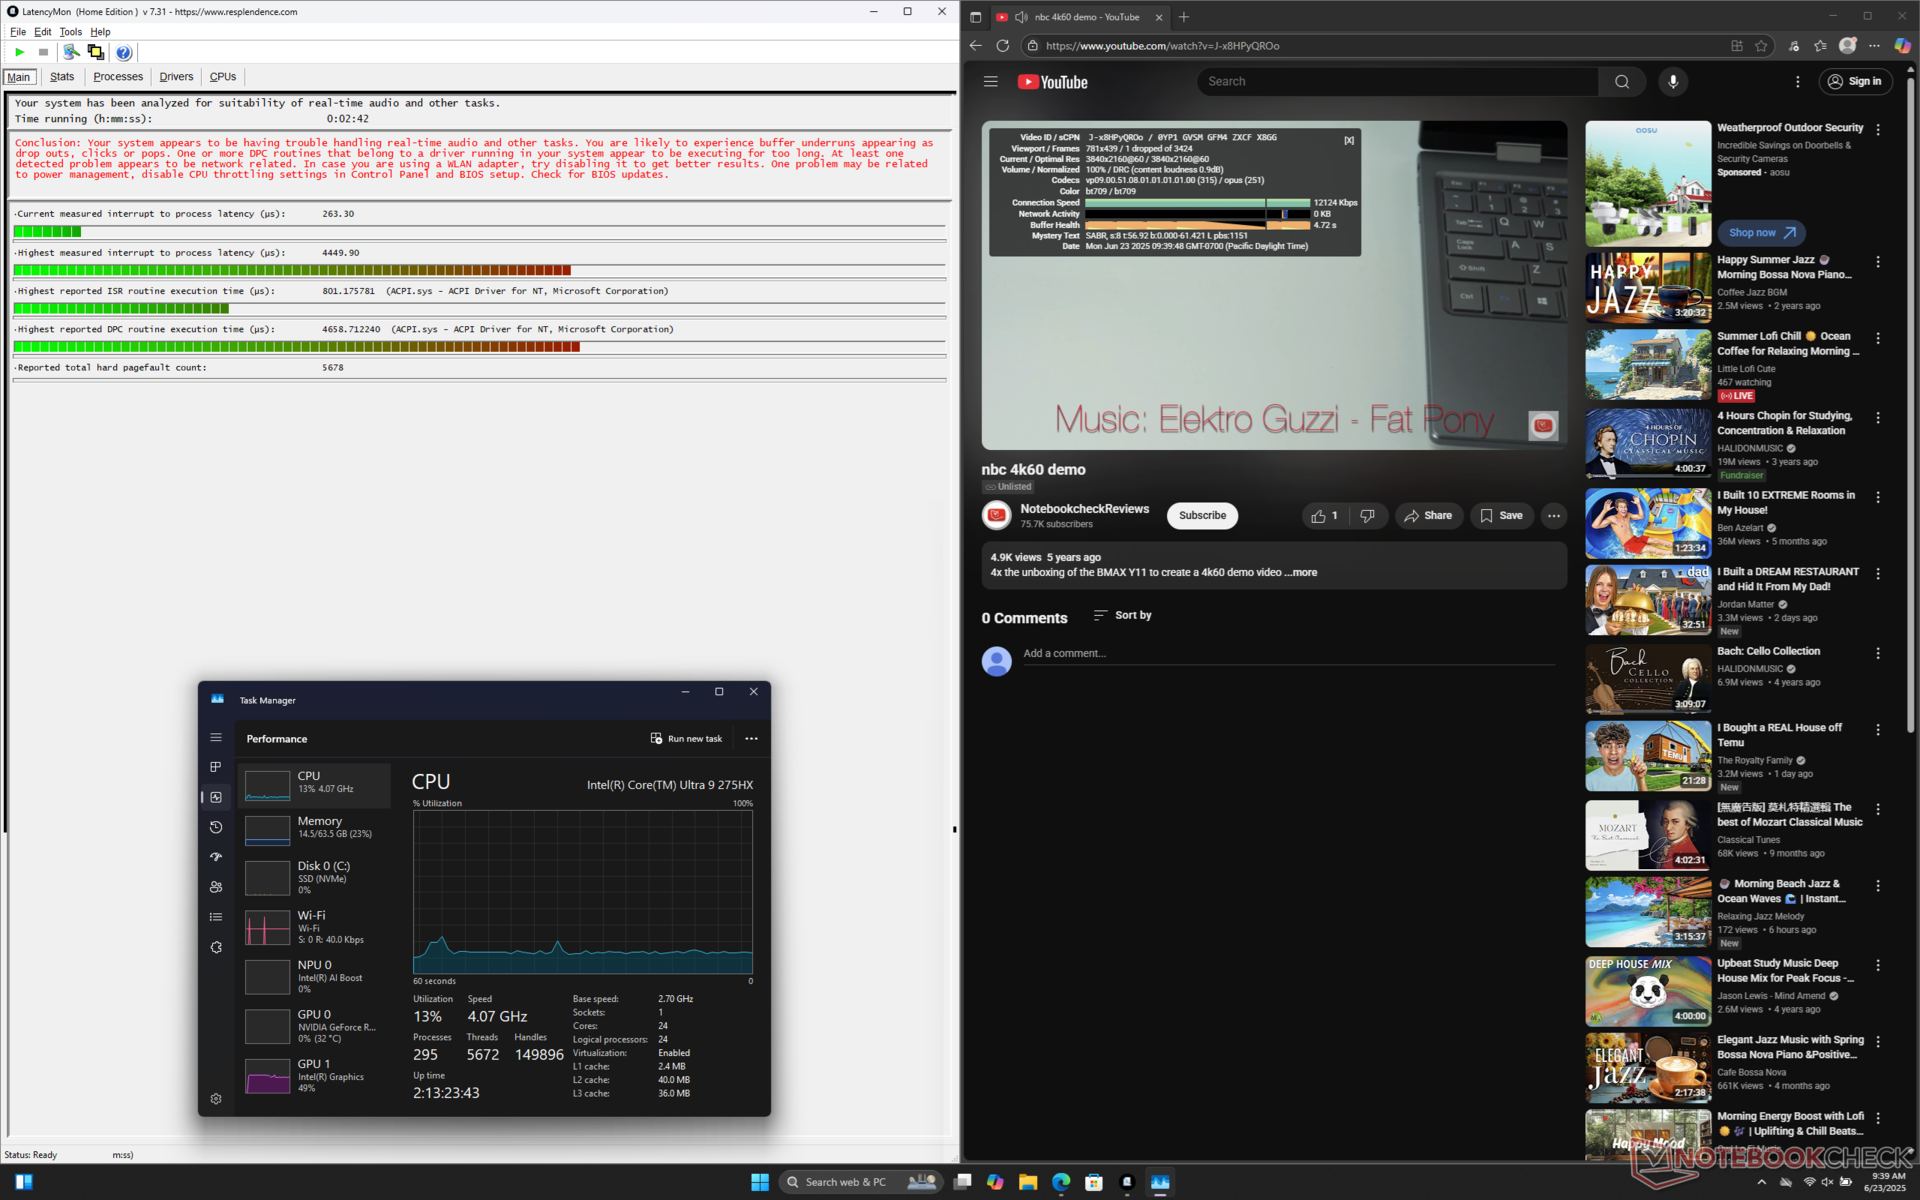
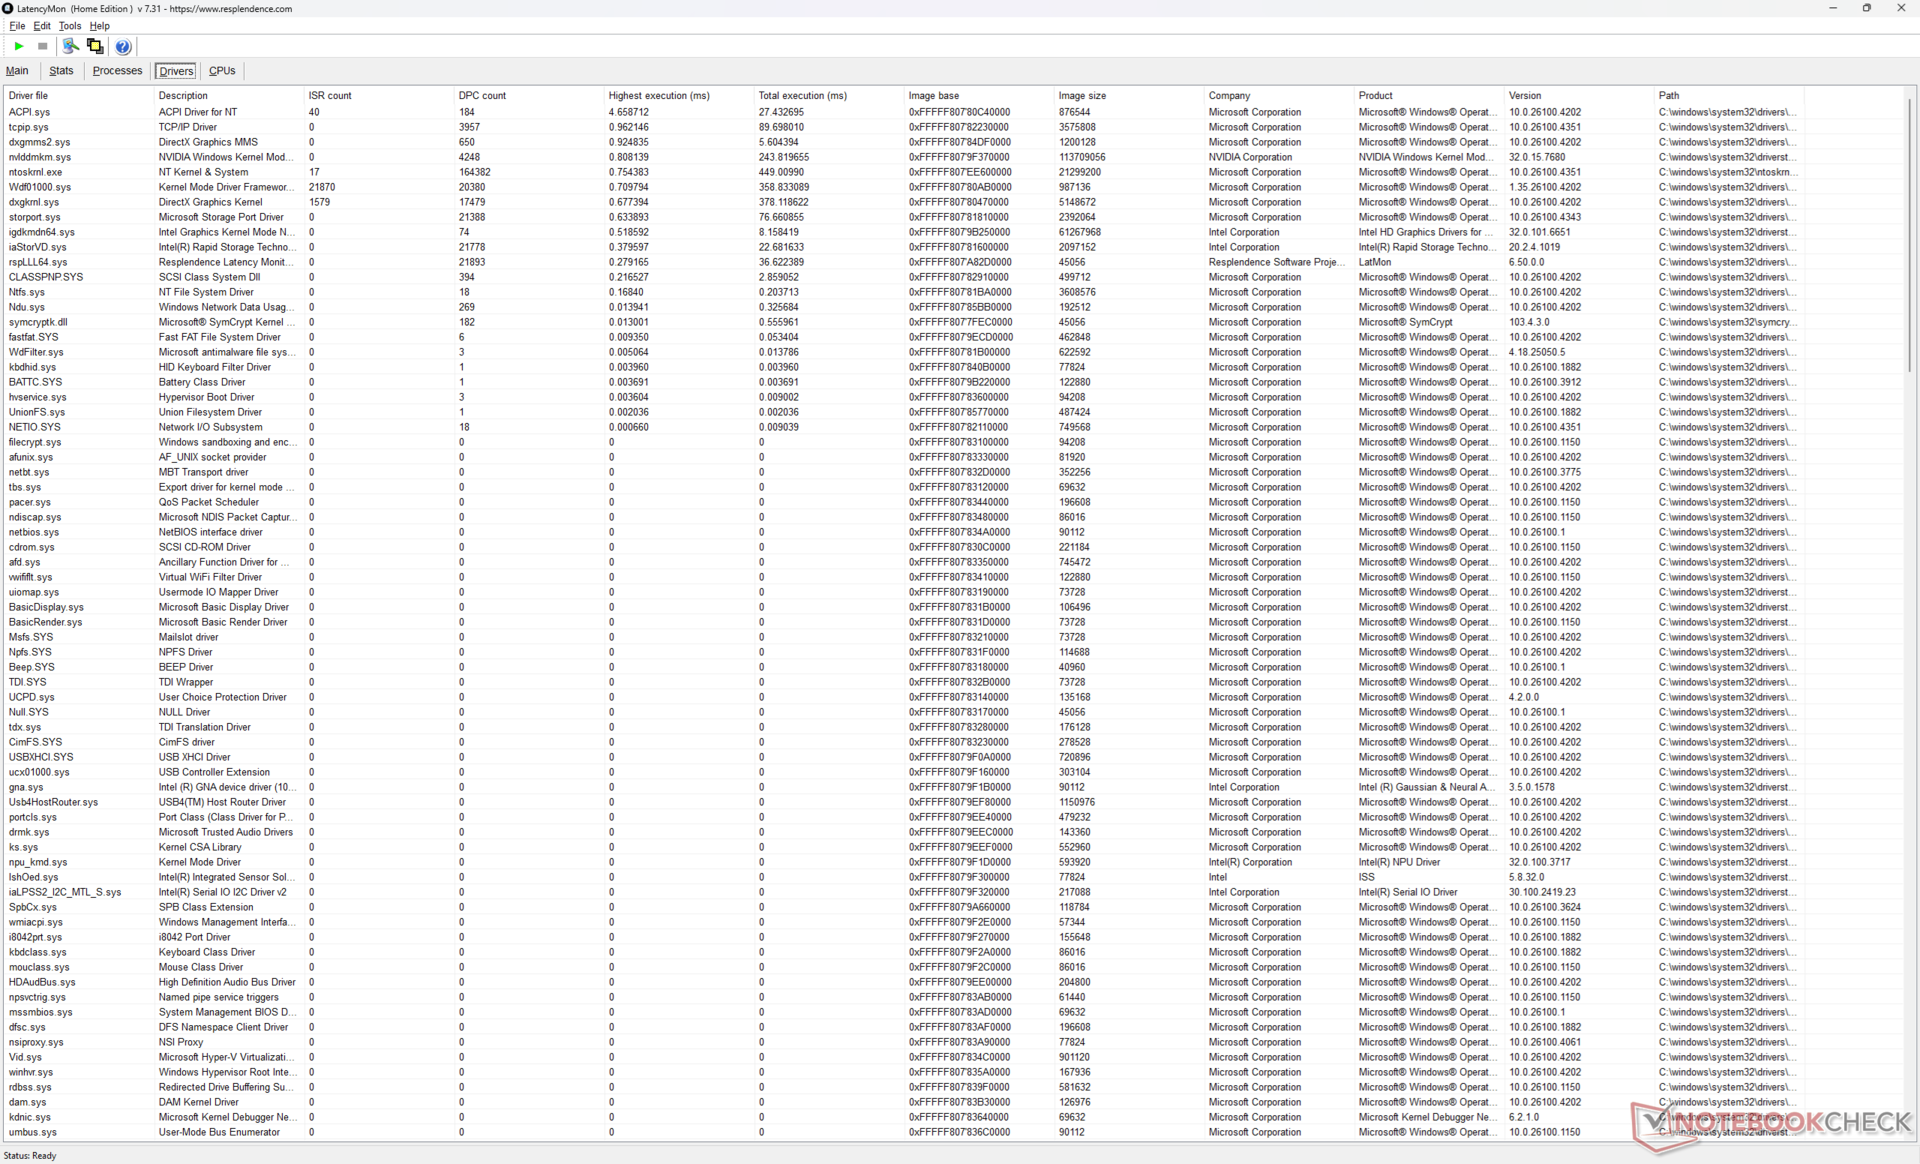
DPC 延迟
LatencyMon 显示了 DPC 问题,但在播放 4K60 视频内容时没有明显掉帧。
| DPC Latencies / LatencyMon - interrupt to process latency (max), Web, Youtube, Prime95 | |
| Alienware 18 Area-51 | |
| Alienware 16 Area-51 | |
| Acer Predator Helios 18 PH18-72-98MW | |
| Alienware m18 R2 | |
| Razer Blade 18 2024 RZ09-0509 | |
| Asus ROG Strix G18 G814JI | |
| MSI Raider A18 HX A9WIG-080 | |
* ... smaller is better
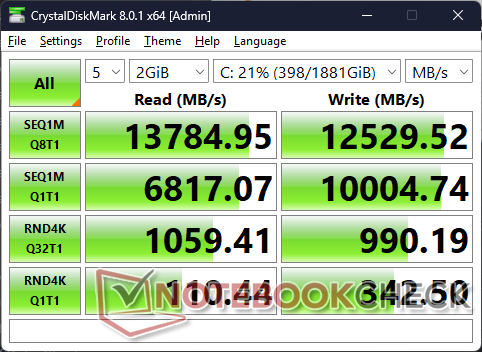
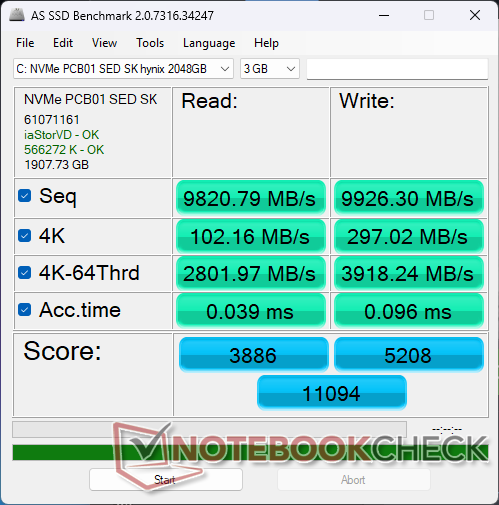
存储设备
我们的测试装置配备了 SK Hynix PCB01 SEDPCIe5 NVMe 固态硬盘,即使在压力下也能提供约 14000 MB/s 的稳定传输速率,如下所示的 DiskSpd 循环测试结果。与去年的 Alienware m18 R2 所使用的 PCie4 SK Hynix PC811 SSD 相比,性能最多可提高 2 倍。值得一提的是,如下图所示,两个 PCIe5 M.2 2280 插槽配有散热器,而第三个 PCIe4 2280 插槽则直接位于四个风扇之一的上方。
如果配置 RTX 5070 Ti 或更低显卡,三个固态硬盘插槽中只有一个支持 PCIe5。


* ... smaller is better
Disk Throttling: DiskSpd Read Loop, Queue Depth 8
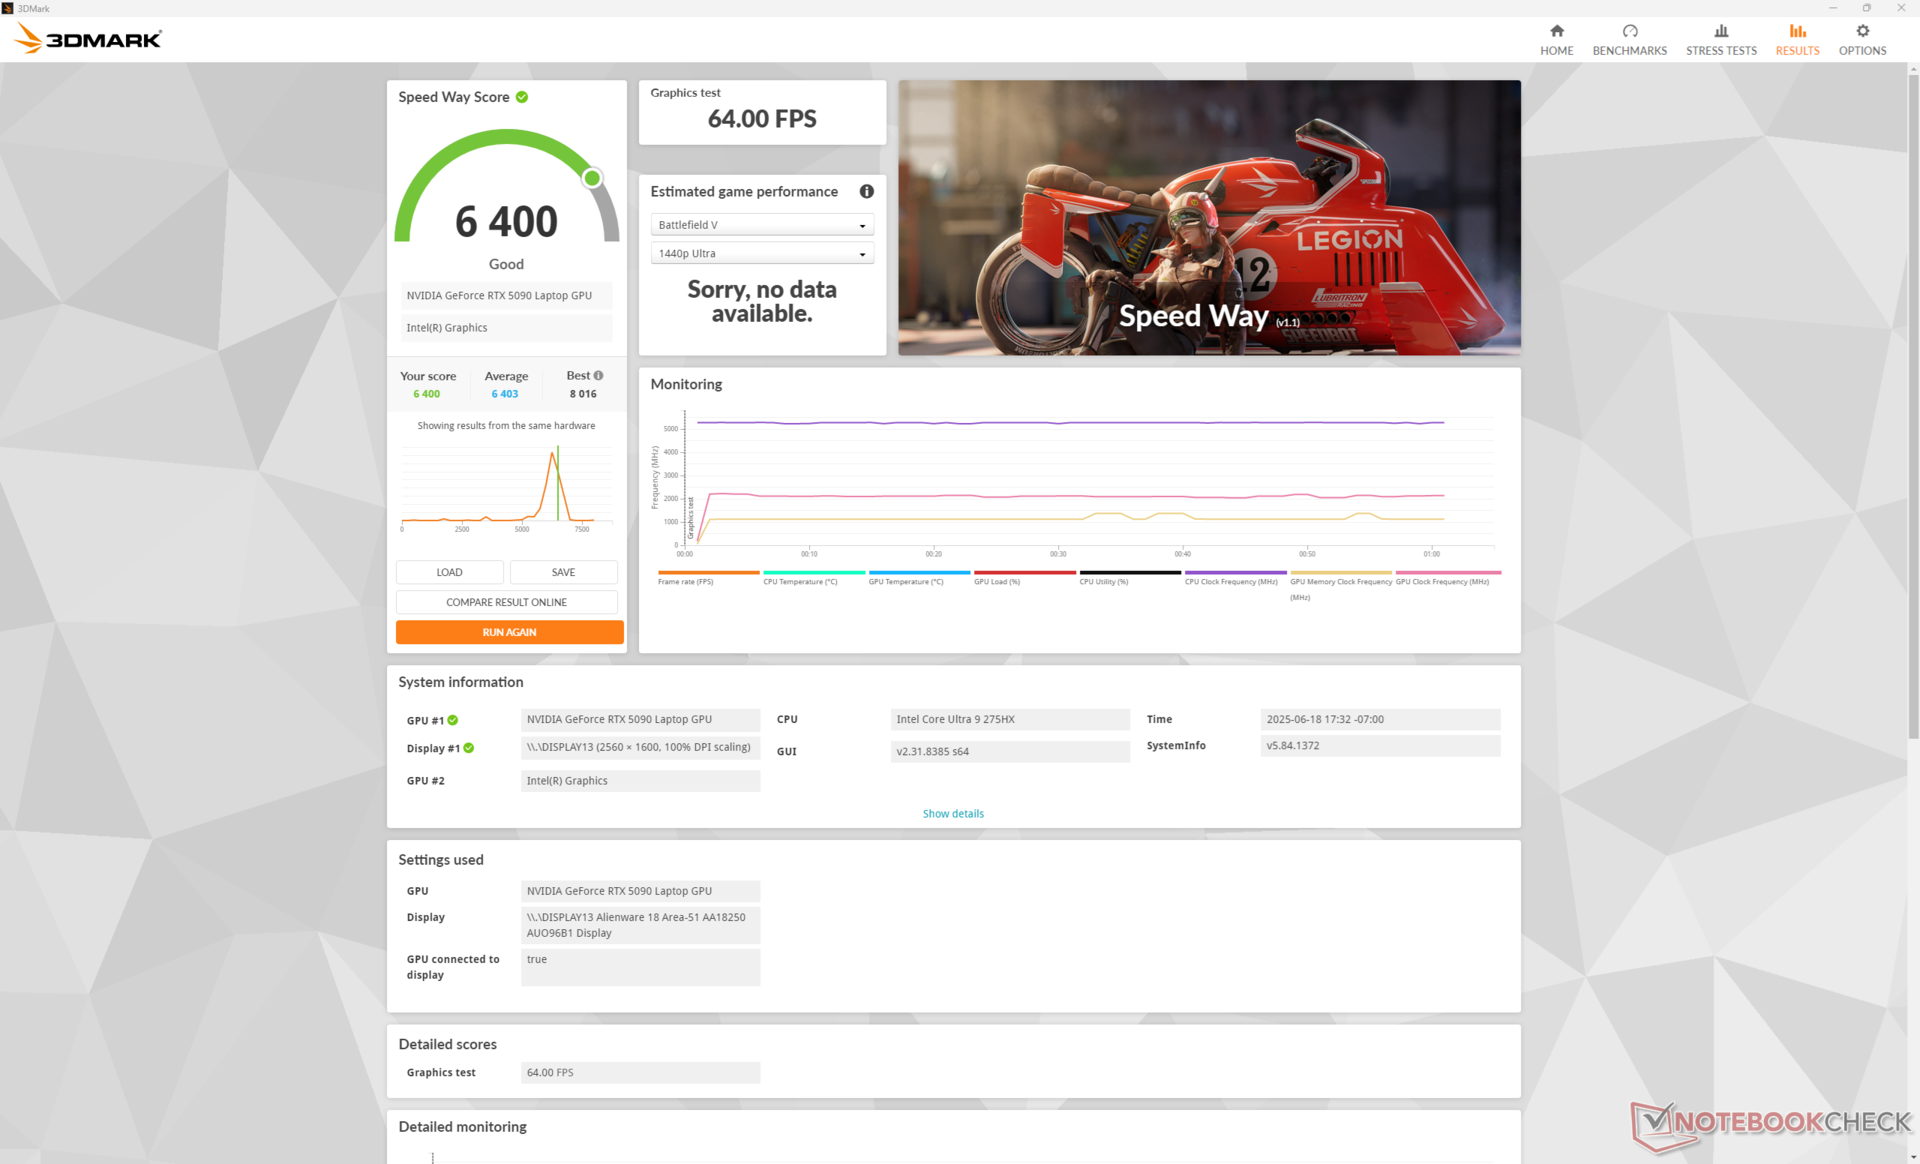
图形处理器性能
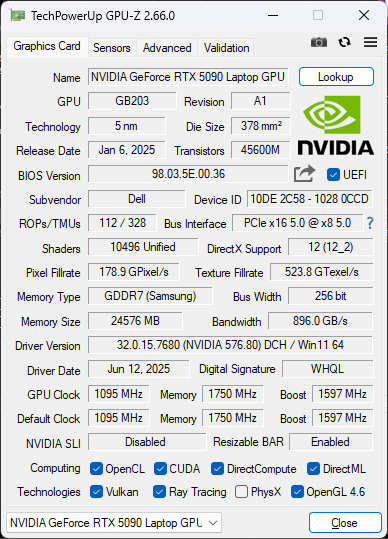
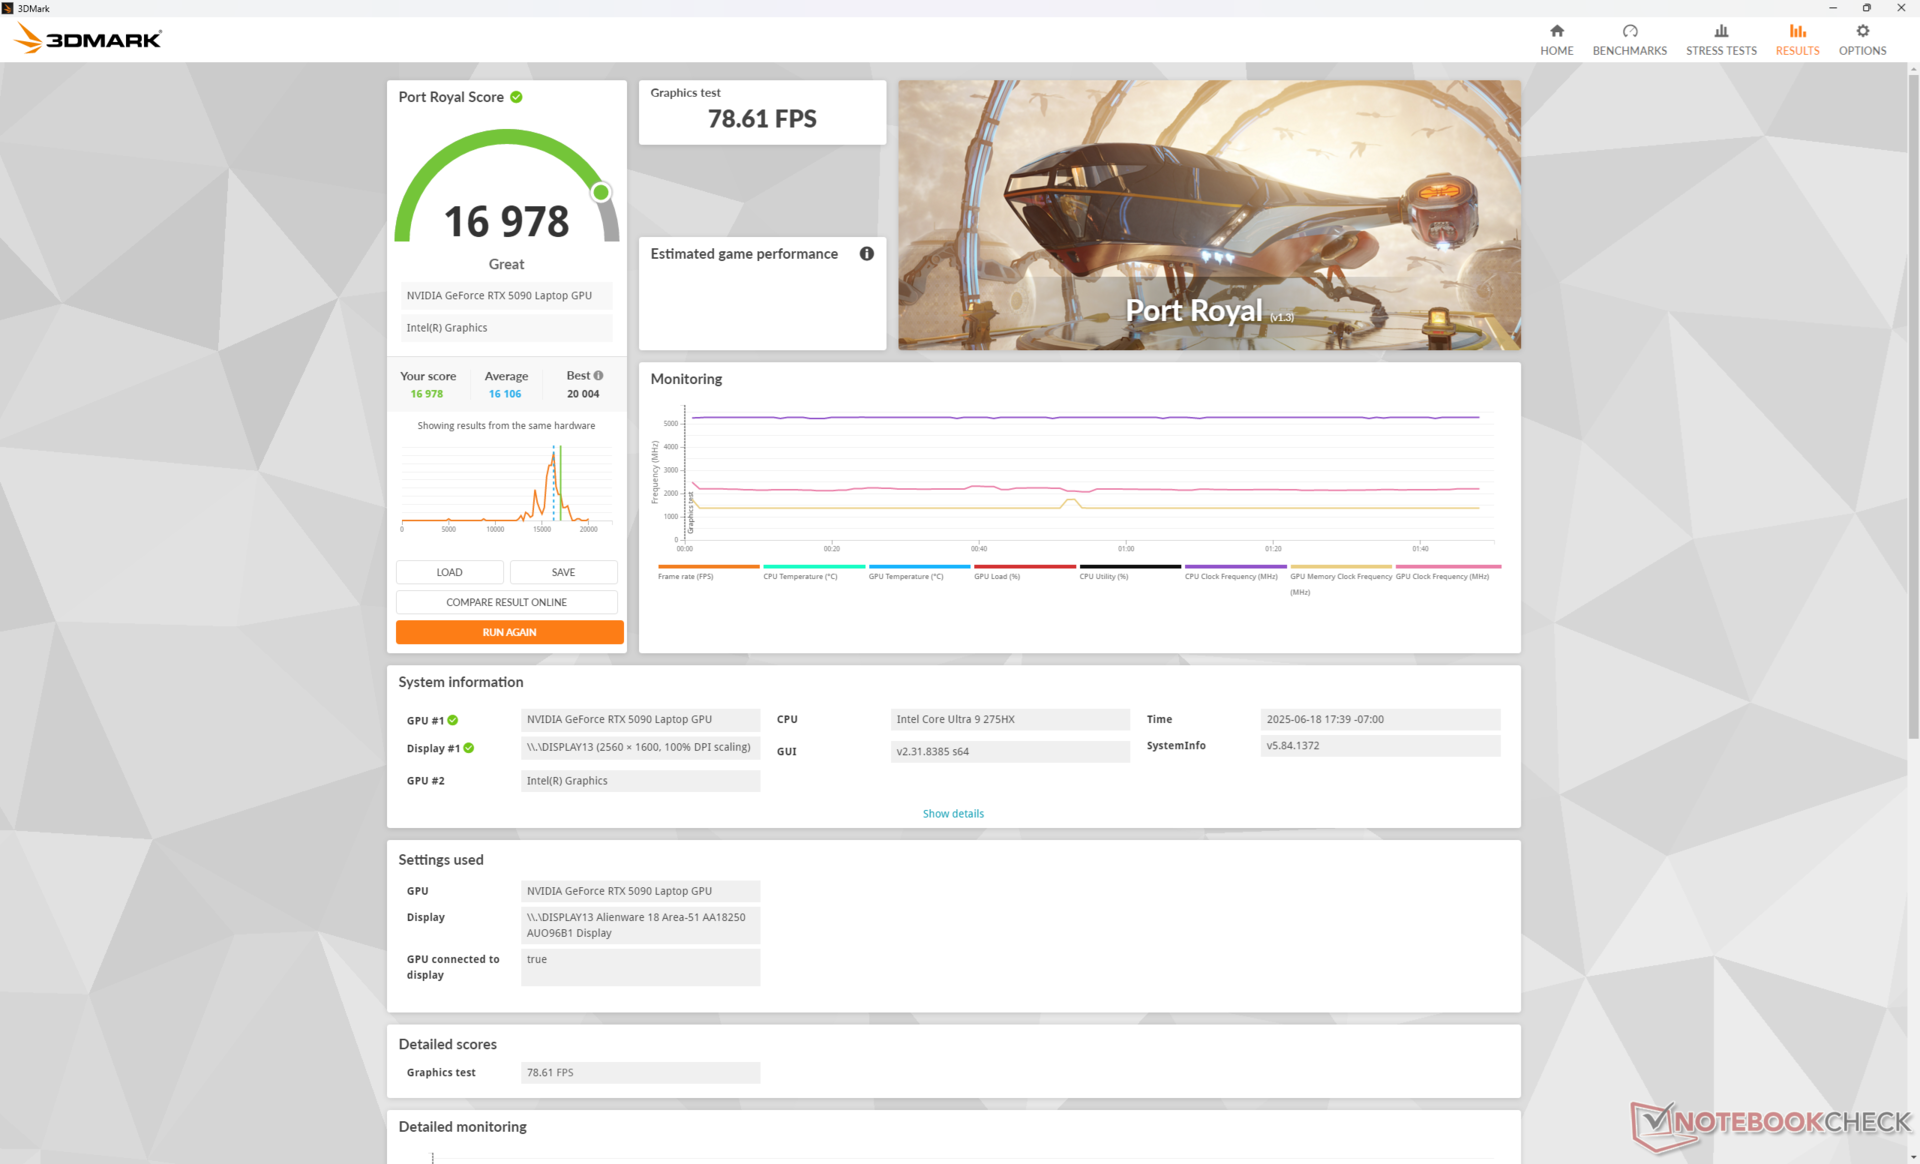
......(英文 GeForce RTX 5090Alienware 18 中的 GPU 运行速度略快于我们数据库中配备相同 RTX 5090 图形处理器的大多数其他笔记本电脑,因为 Alienware 中的 GPU 可以承受更高的功率极限,更接近 175 W TGP 目标值。较小的 华硕 ROG Strix Scar 16为例,其运行速度比 Alienware 18 慢约 8%。
降至 RTX 5080或 RTX 5070 Ti配置的图形性能预计将比 RTX 5090 系统分别降低 10% 至 15% 和 30% 至 45%。
与性能模式相比,在超频模式下运行最多只能带来极小的性能优势,如下表Fire Strike 结果所示。如果设置为 "平衡 "模式,性能降低的幅度会比预期的小得多。
| 电源配置文件 | 图形分数 | 物理得分 | 综合得分 |
| 超速模式 | 49289 | 48120 | 13445 |
| 性能模式 | 50772 (+3%) | 47552 (-1%) | 13217 (-2%) |
| 平衡模式 | 46380 (-6%) | 48198 (-0%) | 11235 (-16%) |
| 电池模式 | 33485 (-32%) | 29896 (-38%) | 8165 (-39%) |
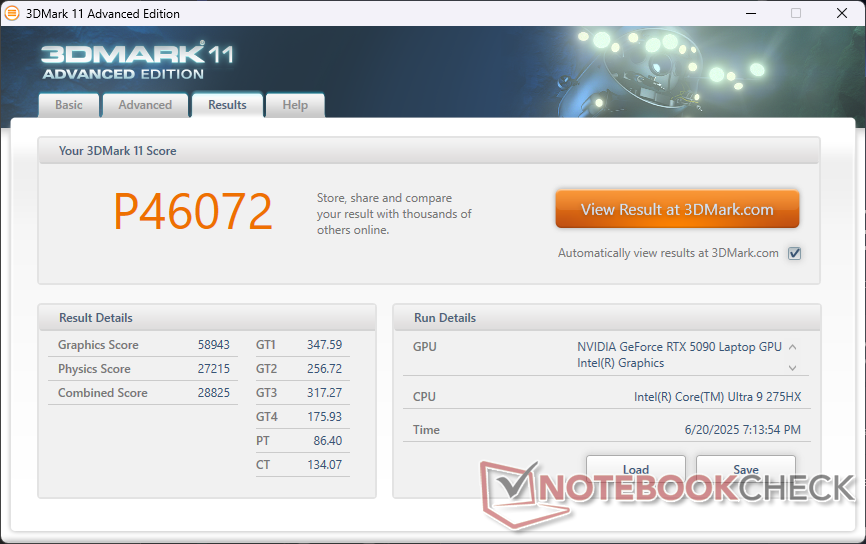

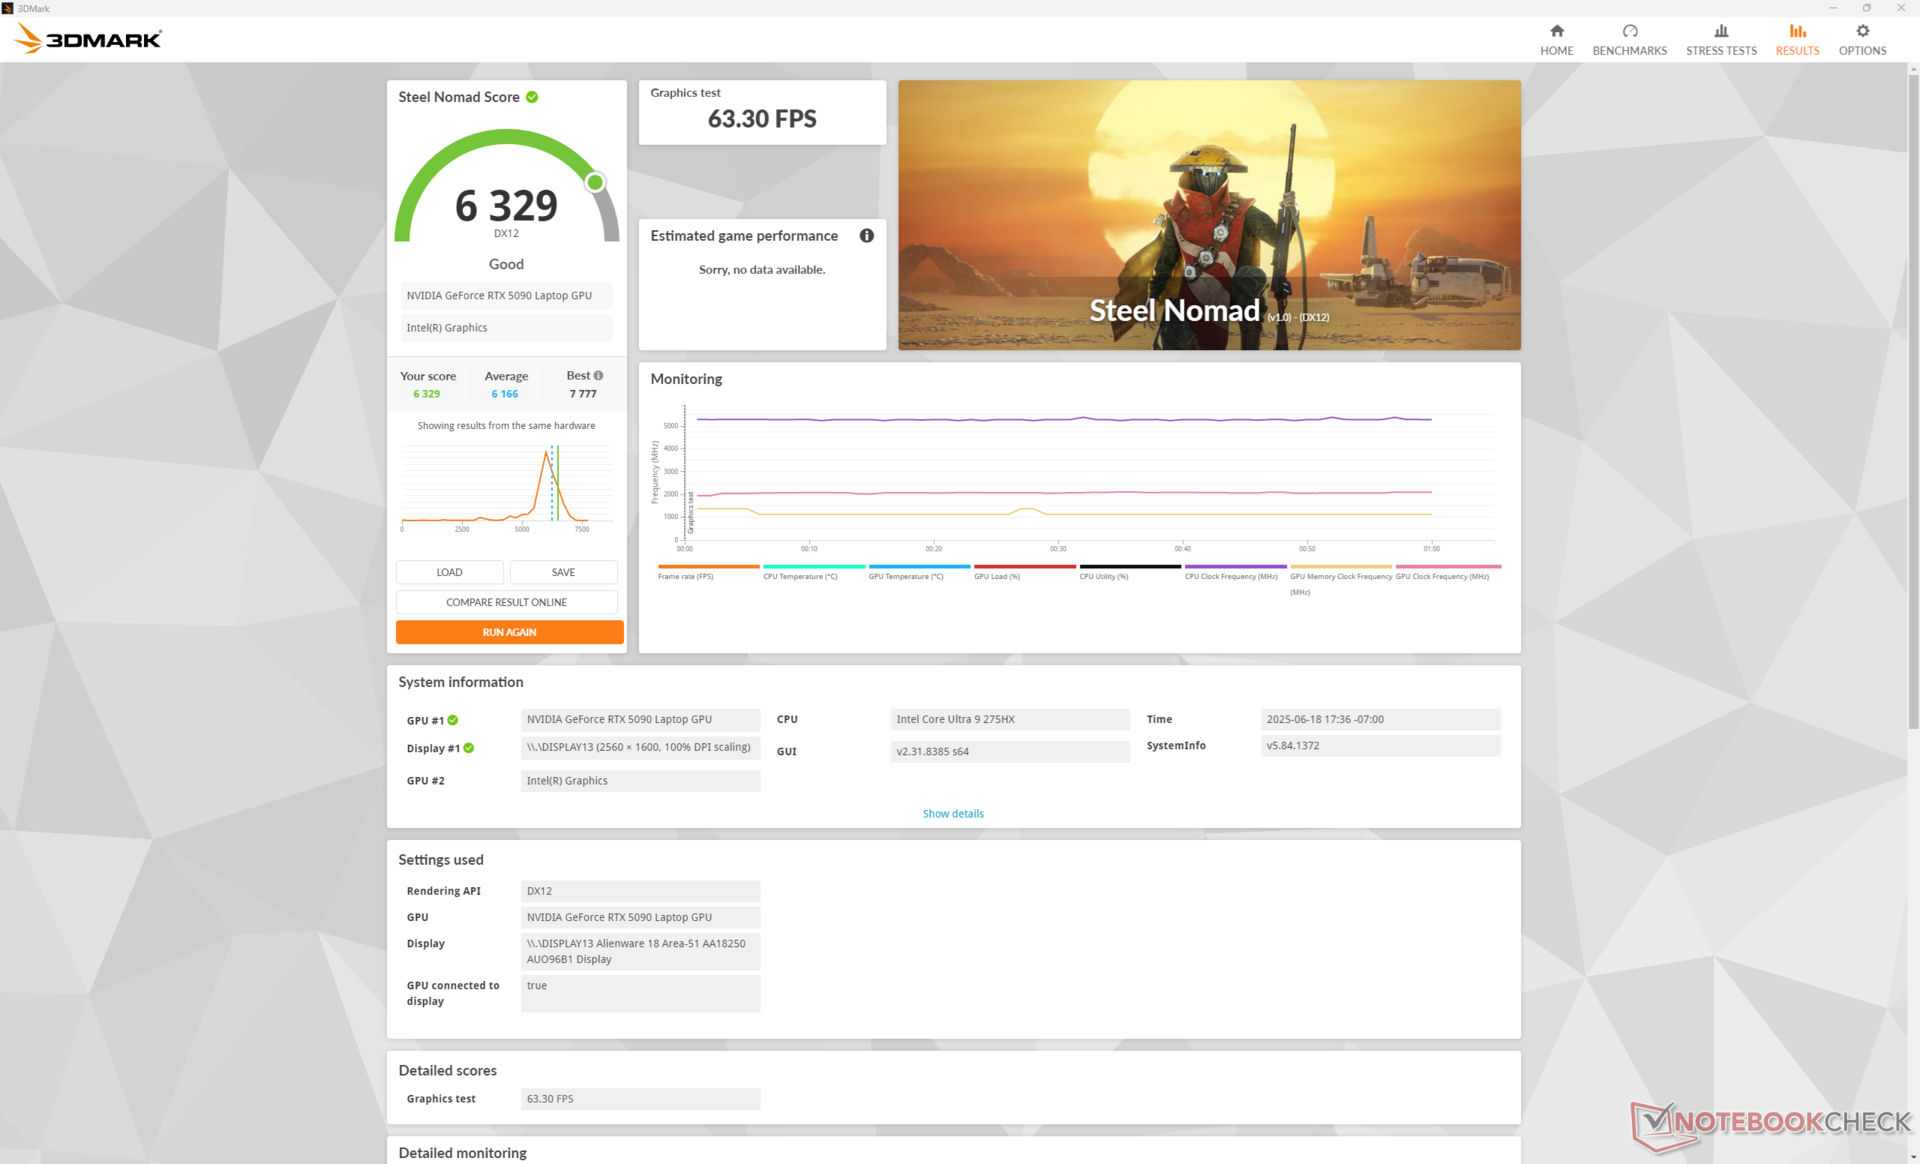
| 3DMark 11 Performance | 46072 points | |
| 3DMark Fire Strike Score | 39227 points | |
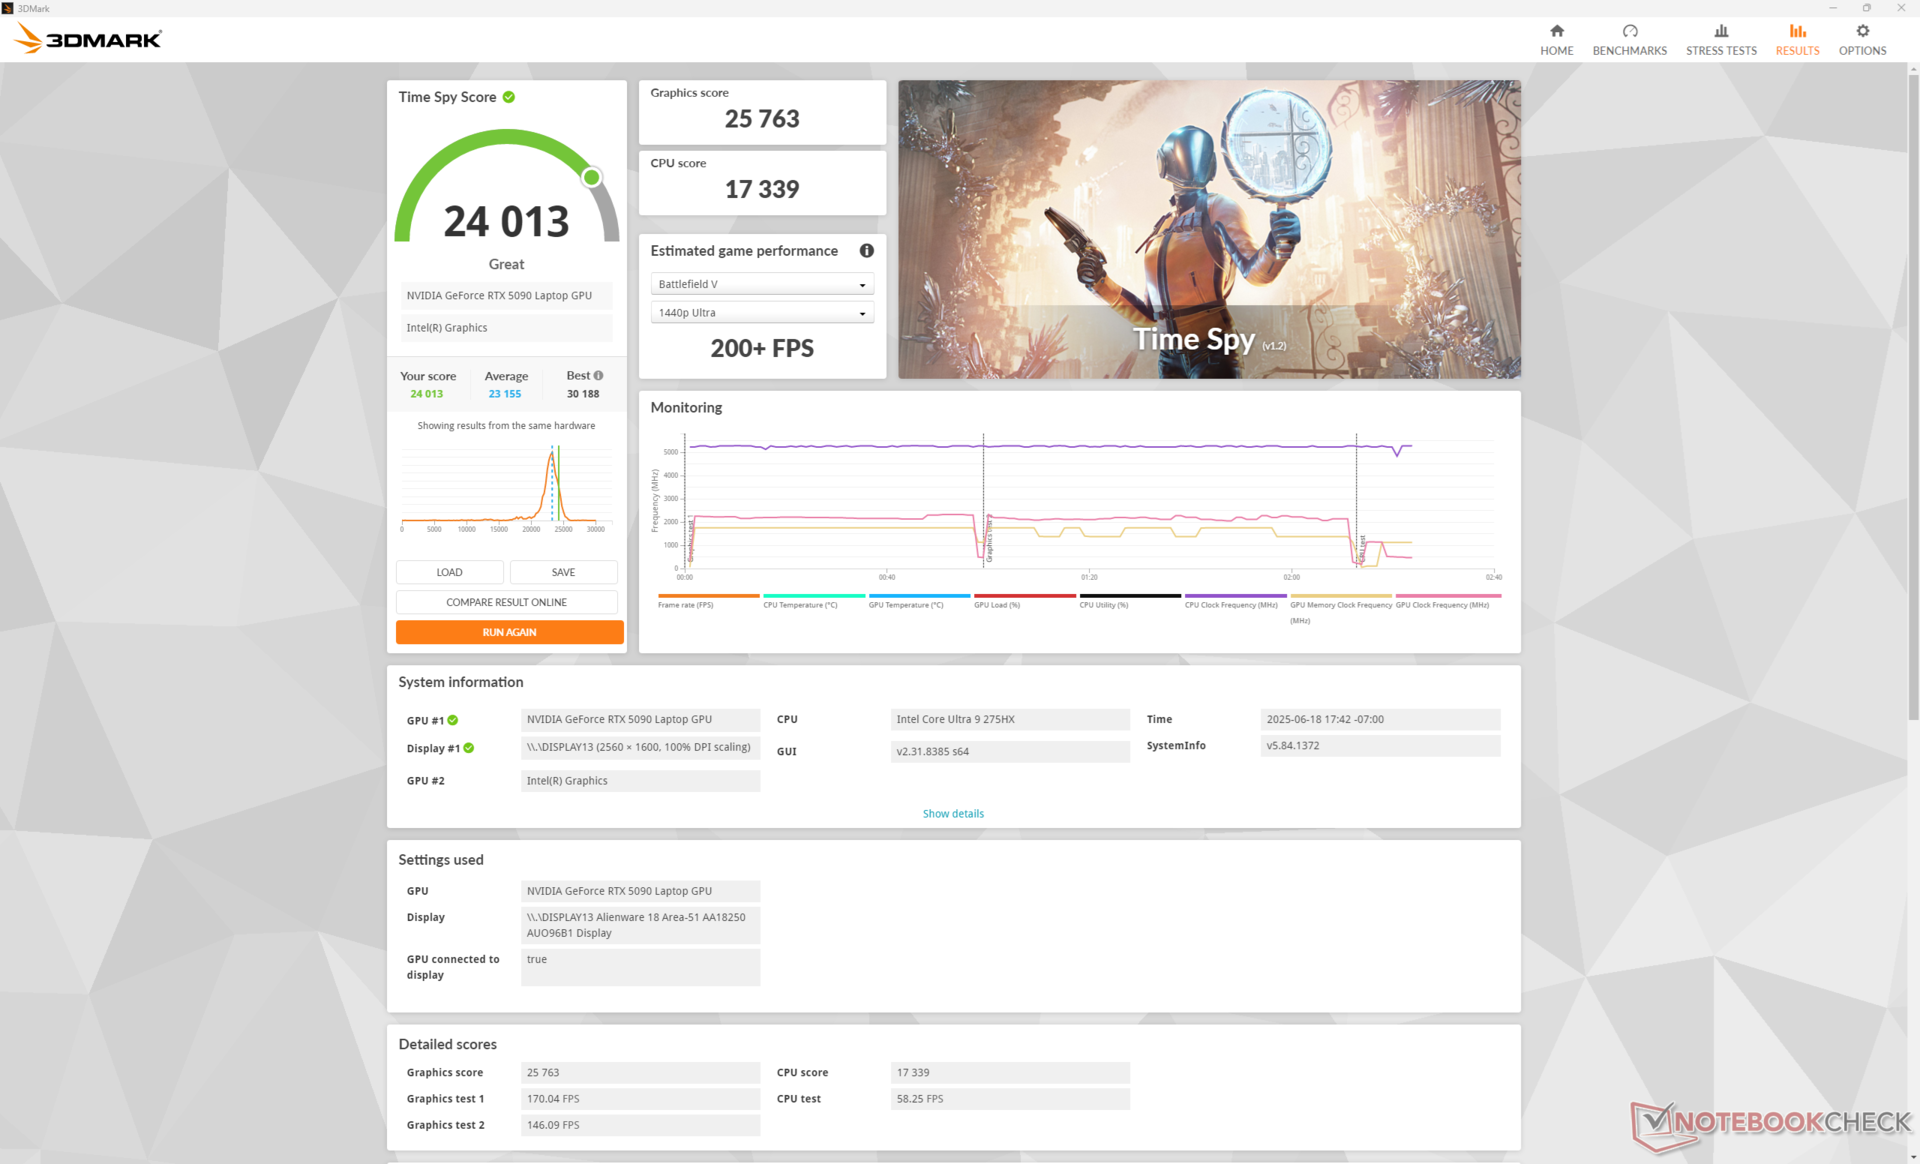
| 3DMark Time Spy Score | 24013 points | |
| 3DMark Steel Nomad Score | 6329 points | |
Help | ||
* ... smaller is better
游戏性能
我们的 Alienware 18 运行游戏的速度始终比我们数据库中采用相同 RTX 5090 GPU 的普通笔记本电脑快 5% 到 15%。由于 Nvidia 将多帧生成作为 RTX 50 Blackwell 系列的主要卖点之一,因此在笔记本电脑 GPU 领域,性能提升基本上是渐进式的。例如,我们的系统在最大 4K RT 设置下使用 MFG x4 能够以 125 FPS 的速度运行《艾伦-觉醒 2》,而上一代 RTX 4090 笔记本电脑只能以远低于平均帧率一半的速度进行 x2 帧生成。如果你最喜欢的游戏不支持 MFG,比如《F1 24》,那么与 RTX 40 笔记本电脑相比,性能提升就没有那么明显了。对于希望利用原生面板 300 Hz 快速刷新率的玩家来说,MFG 是关键。
Cyberpunk 2077 ultra FPS Chart
| low | med. | high | ultra | QHD DLSS | QHD | 4K DLSS | 4K | |
|---|---|---|---|---|---|---|---|---|
| Dota 2 Reborn (2015) | 217 | 193.8 | 188.3 | 171.5 | 165.3 | |||
| Final Fantasy XV Benchmark (2018) | 212 | 183.6 | 109.4 | |||||
| X-Plane 11.11 (2018) | 153.7 | 143.6 | 122.9 | 100.2 | ||||
| Strange Brigade (2018) | 456 | 350 | 185.5 | |||||
| Baldur's Gate 3 (2023) | 236.5 | 237.3 | 174.8 | 149.3 | 94 | |||
| Cyberpunk 2077 (2023) | 179.1 | 166.5 | 136.6 | 120.5 | 55 | |||
| Alan Wake 2 (2023) | 133.2 | 88.1 | 75.4 | 49.3 | ||||
| F1 24 (2024) | 155.4 | 156.3 | 106.4 | 90.6 | 52.2 | |||
| Black Myth: Wukong (2024) | 109 | 65 | 73 | 50 | 52 | 30 | ||
| Indiana Jones and the Great Circle (2024) | 140.3 | 133.7 | 112.6 | 73 | ||||
| Monster Hunter Wilds (2025) | 95.34 | 92.77 | 80.51 | 69.17 | 50.77 | |||
| Assassin's Creed Shadows (2025) | 75 | 76 | 64 | 61 | 46 | |||
| Battlefield 6 (2025) | 159.4 | 143.4 | 109.3 | 83.6 | 59.4 |
排放量
系统噪音
在运行浏览器或视频流等要求不高的负载时,风扇噪音徘徊在 31 分贝(A)左右。直到引入要求更高的负载时,噪音才会增大,从而将脉动降到最低。噪音始终可闻,但在不玩游戏时一般不会造成干扰。
当设置为平衡模式、性能模式和超频模式时,游戏时的风扇噪音分别稳定在 45.9 dB(A)、48.9 dB(A) 和 55.9 dB(A)。性能模式和超速模式之间的噪音差异很大,尤其是与超速模式带来的微小性能提升相比。在性能模式下,风扇噪音比去年的 Alienware m18 R2.

Noise level
| Idle |
| 30.2 / 30.6 / 30.6 dB(A) |
| Load |
| 38 / 55.9 dB(A) |
 | ||
30 dB silent 40 dB(A) audible 50 dB(A) loud |
||
min: | ||
| Alienware 18 Area-51 GeForce RTX 5090 Laptop, Ultra 9 275HX | Alienware 16 Area-51 GeForce RTX 5080 Laptop, Ultra 9 275HX, Samsung PM9C1a MZ9L81T0HDLB | Alienware m18 R2 GeForce RTX 4090 Laptop GPU, i9-14900HX, SK Hynix PC811 HFS002TEM9X152N | MSI Raider A18 HX A9WIG-080 GeForce RTX 5080 Laptop, R9 9955HX3D, Samsung PM9E1 MZVLC2T0HBLD | Razer Blade 18 2024 RZ09-0509 GeForce RTX 4090 Laptop GPU, i9-14900HX | Asus ROG Strix G18 G814JI GeForce RTX 4070 Laptop GPU, i7-13650HX, Micron 2400 MTFDKBA1T0QFM | Acer Predator Helios 18 PH18-72-98MW GeForce RTX 4090 Laptop GPU, i9-14900HX, 2x SK Hynix HFS001TEJ9X115N (RAID 0) | |
|---|---|---|---|---|---|---|---|
| Noise | 7% | 8% | -1% | 5% | 5% | -14% | |
| off / environment * (dB) | 23.4 | 23.6 -1% | 23.6 -1% | 25.1 -7% | 23.4 -0% | 25 -7% | 25 -7% |
| Idle Minimum * (dB) | 30.2 | 25.4 16% | 23.8 21% | 28.6 5% | 23.9 21% | 26 14% | 30 1% |
| Idle Average * (dB) | 30.6 | 27.8 9% | 26.1 15% | 28.9 6% | 28.2 8% | 28 8% | 36 -18% |
| Idle Maximum * (dB) | 30.6 | 28.1 8% | 31.5 -3% | 29.2 5% | 29 5% | 29 5% | 44 -44% |
| Load Average * (dB) | 38 | 28.8 24% | 31.5 17% | 45.6 -20% | 36.8 3% | 41 -8% | 48 -26% |
| Cyberpunk 2077 ultra * (dB) | 48.9 | 50.4 -3% | 55.6 -14% | ||||
| Load Maximum * (dB) | 55.9 | 56.4 -1% | 56.6 -1% | 45.8 18% | 61.1 -9% | 46 18% | 51 9% |
| Witcher 3 ultra * (dB) | 52.1 | 54.1 | 44 | 49 |
* ... smaller is better
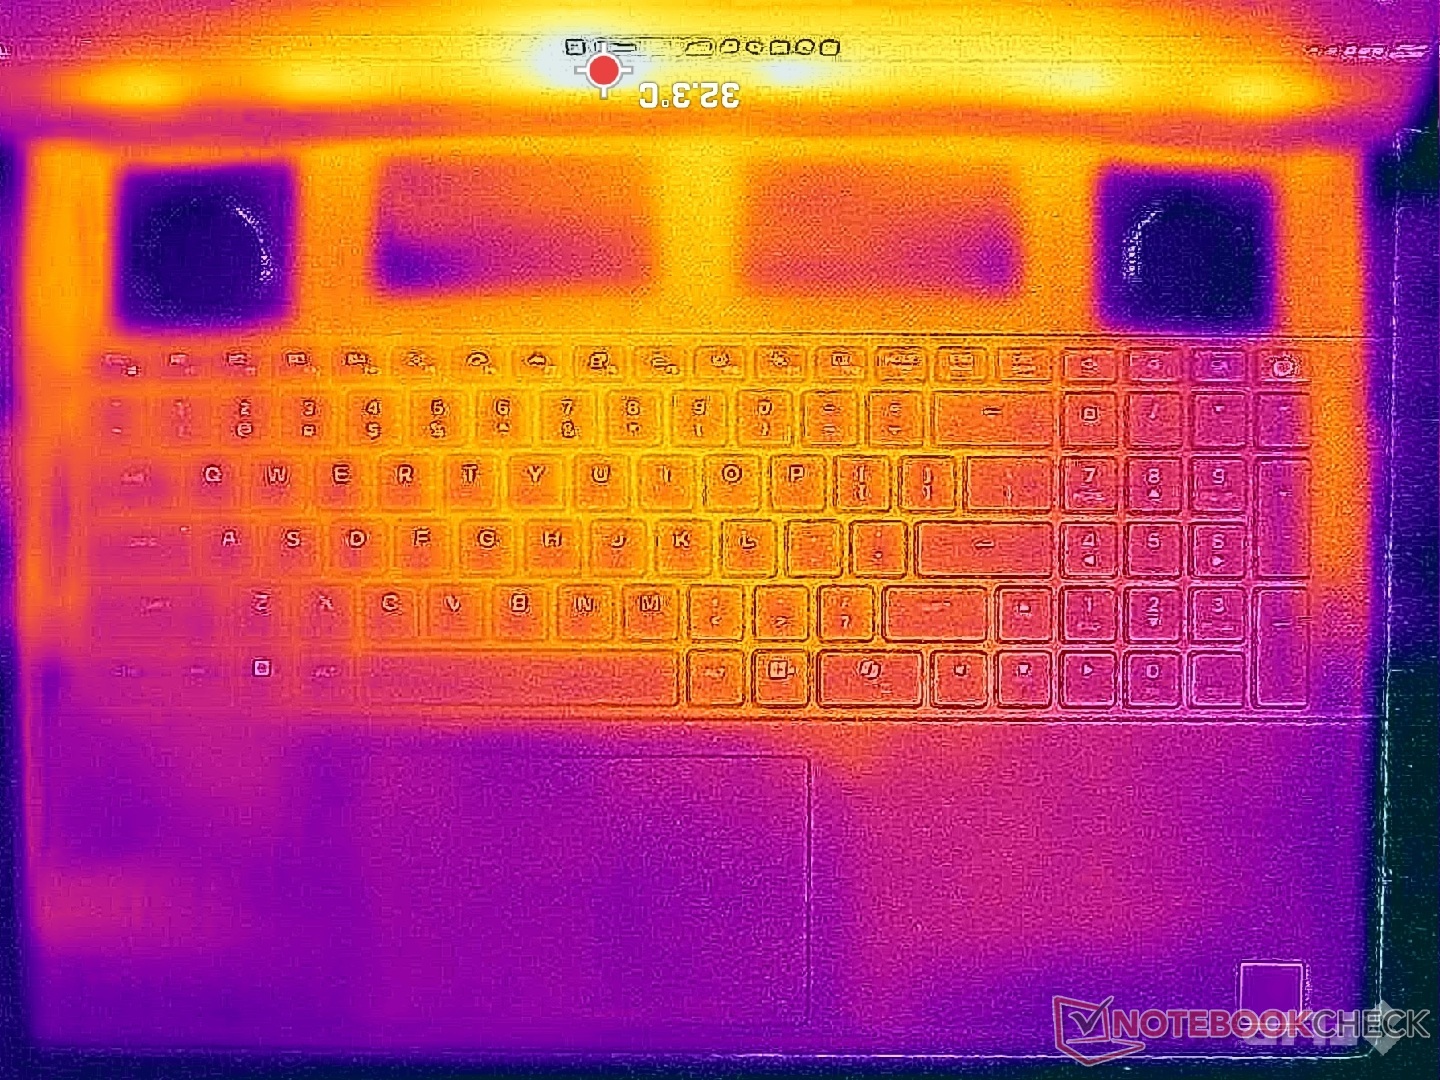
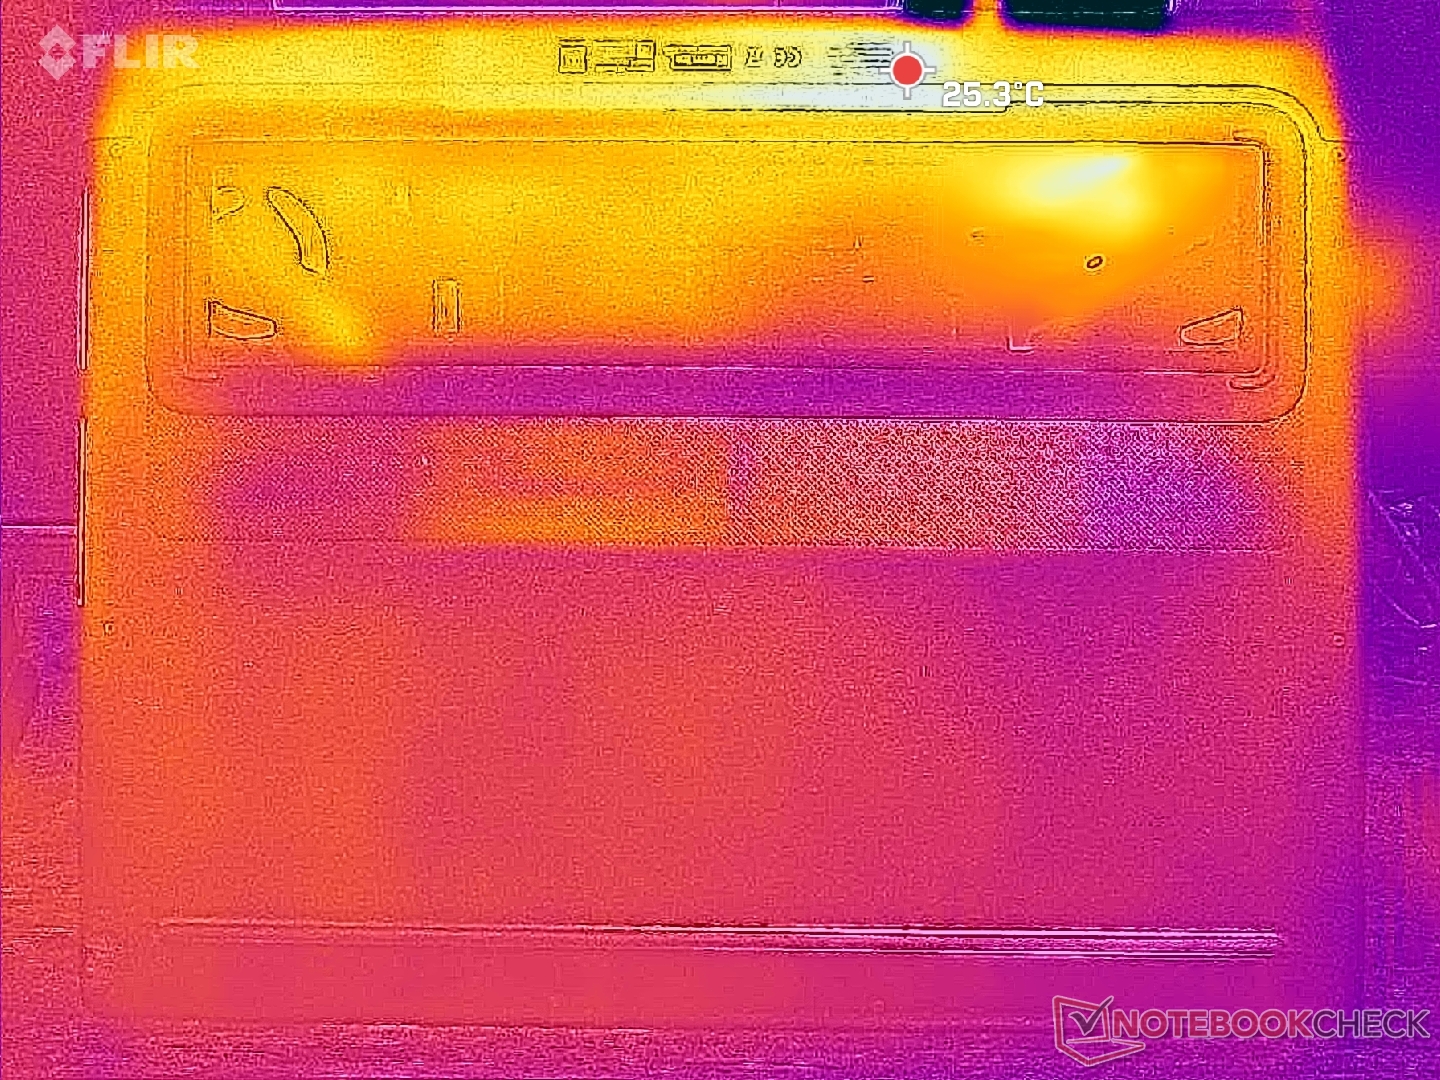
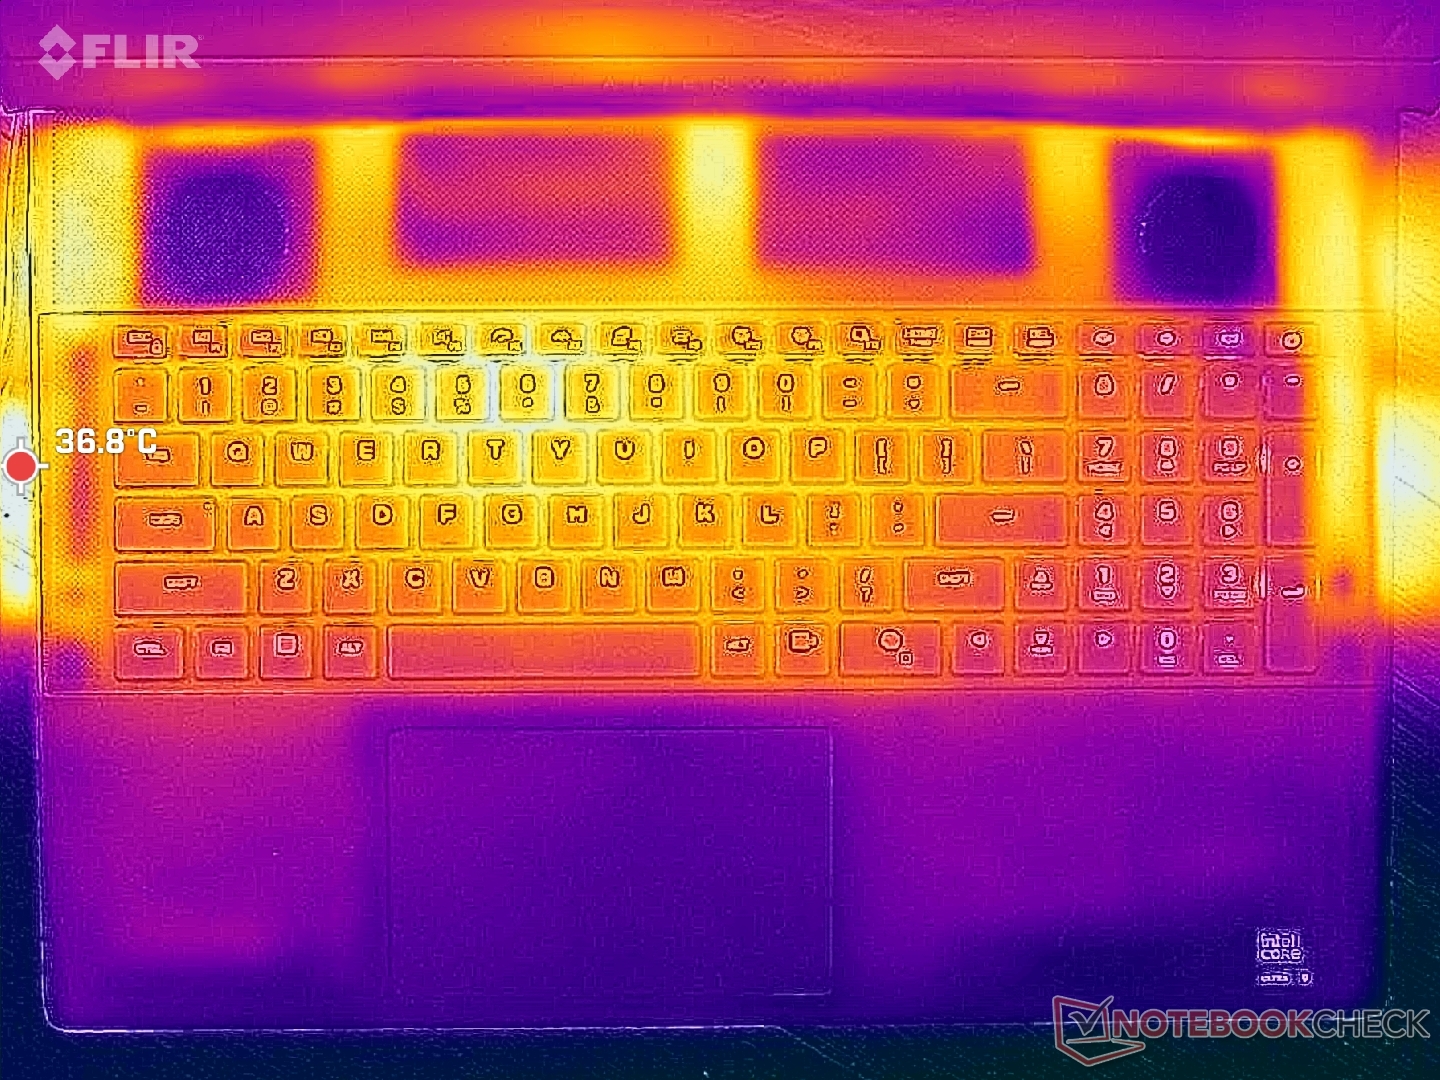
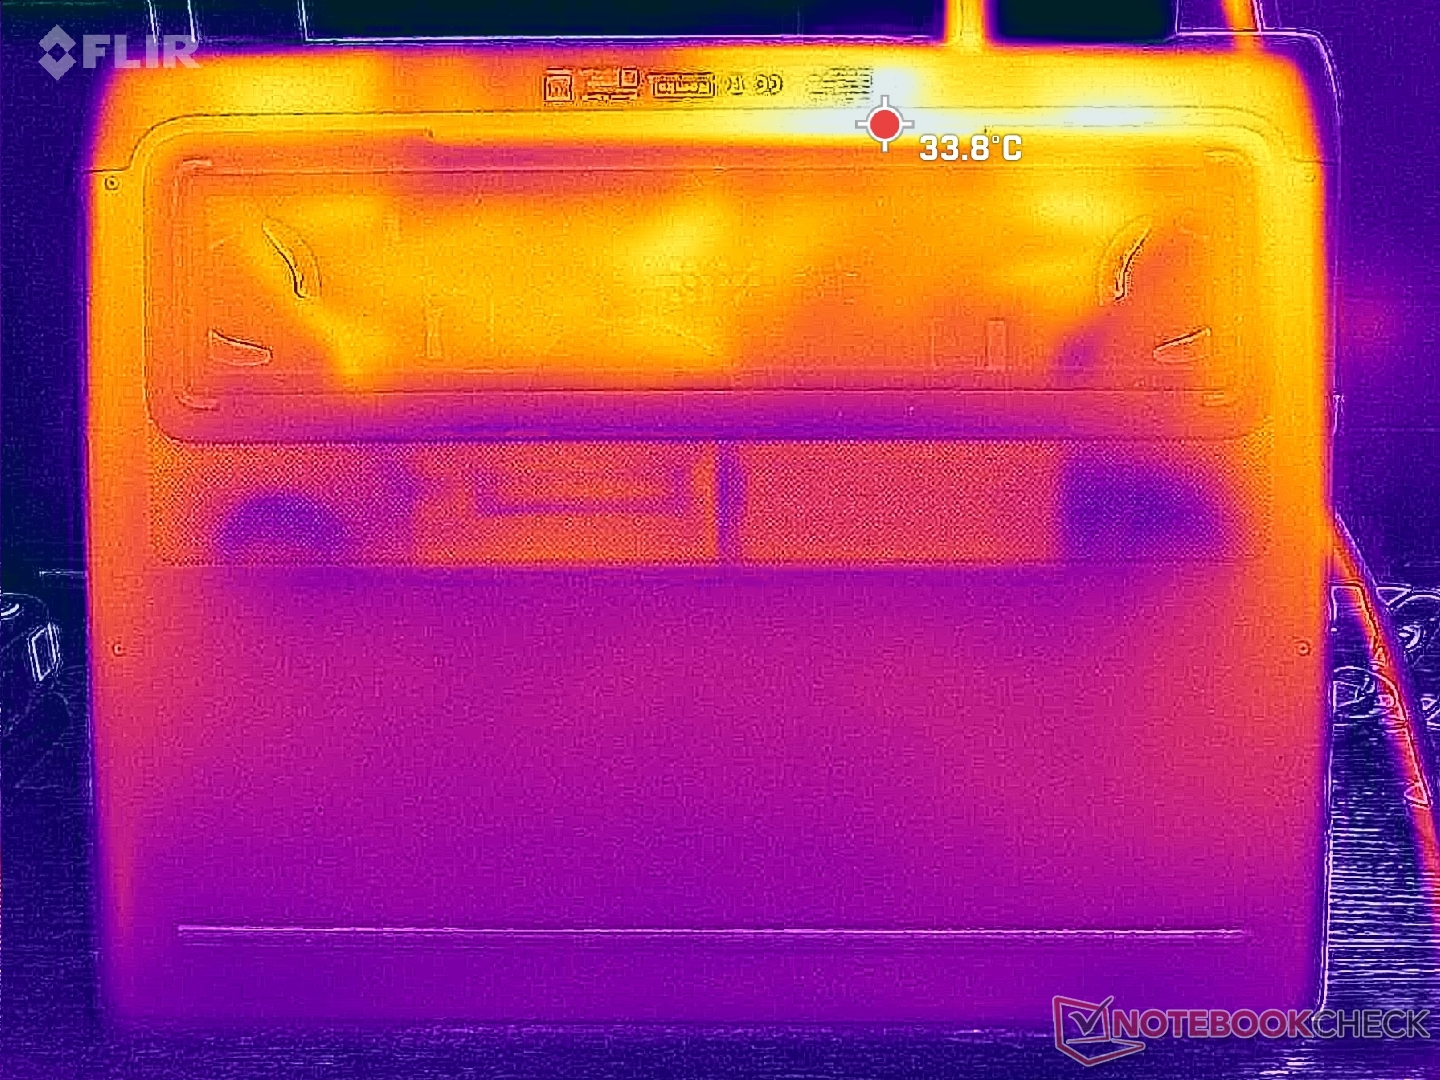
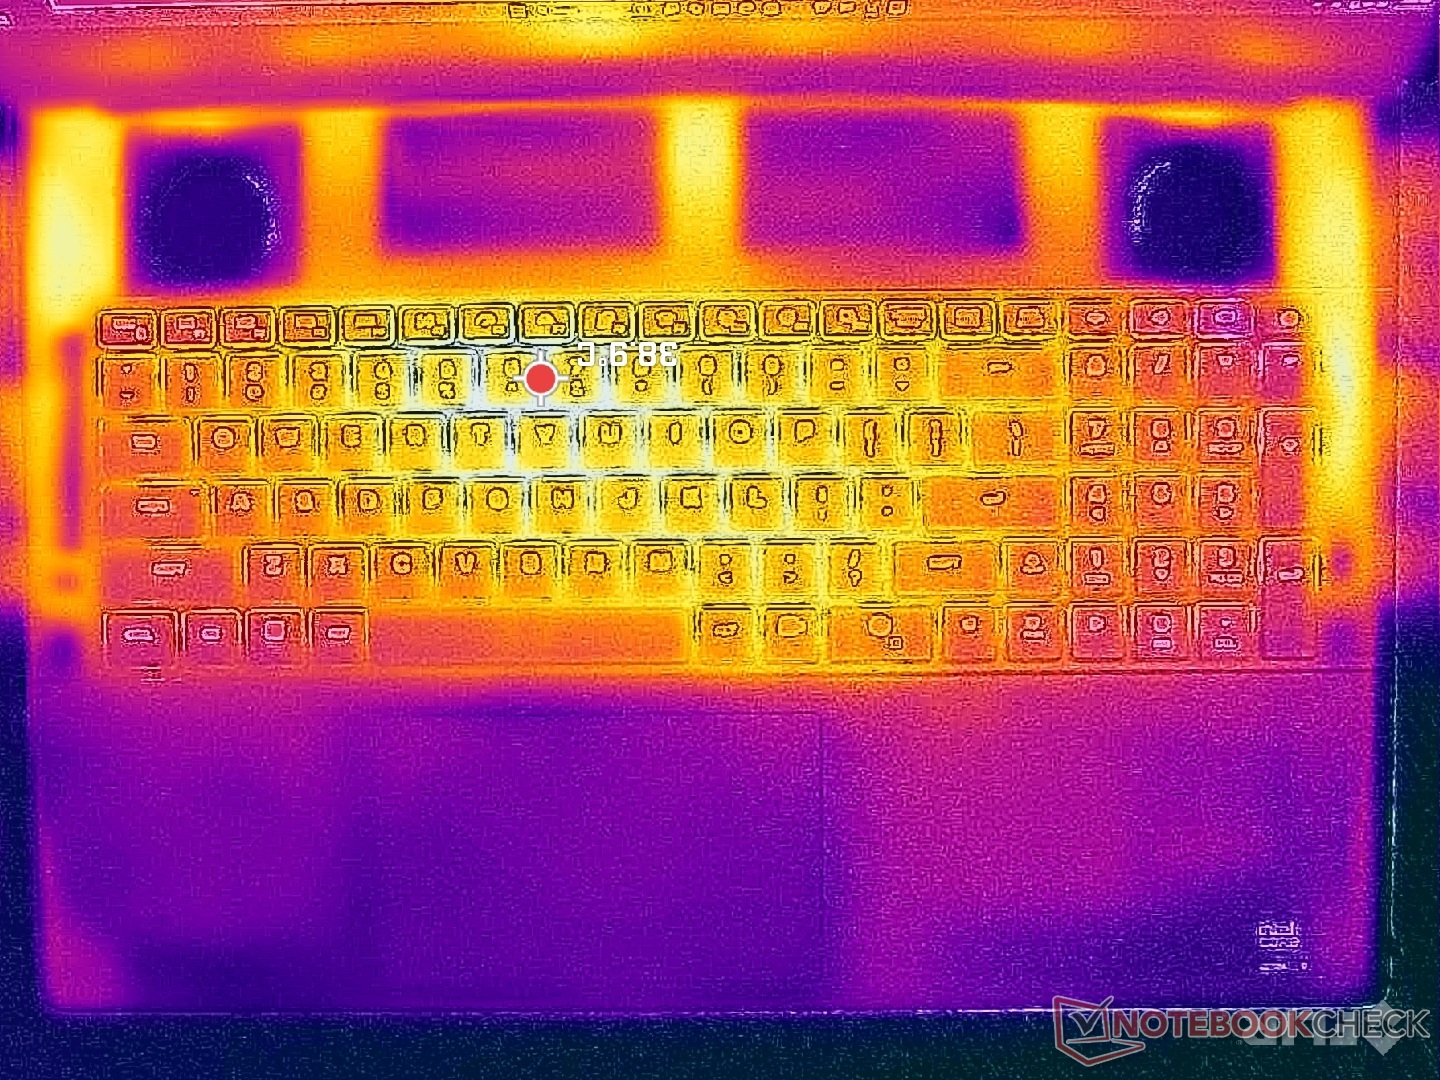
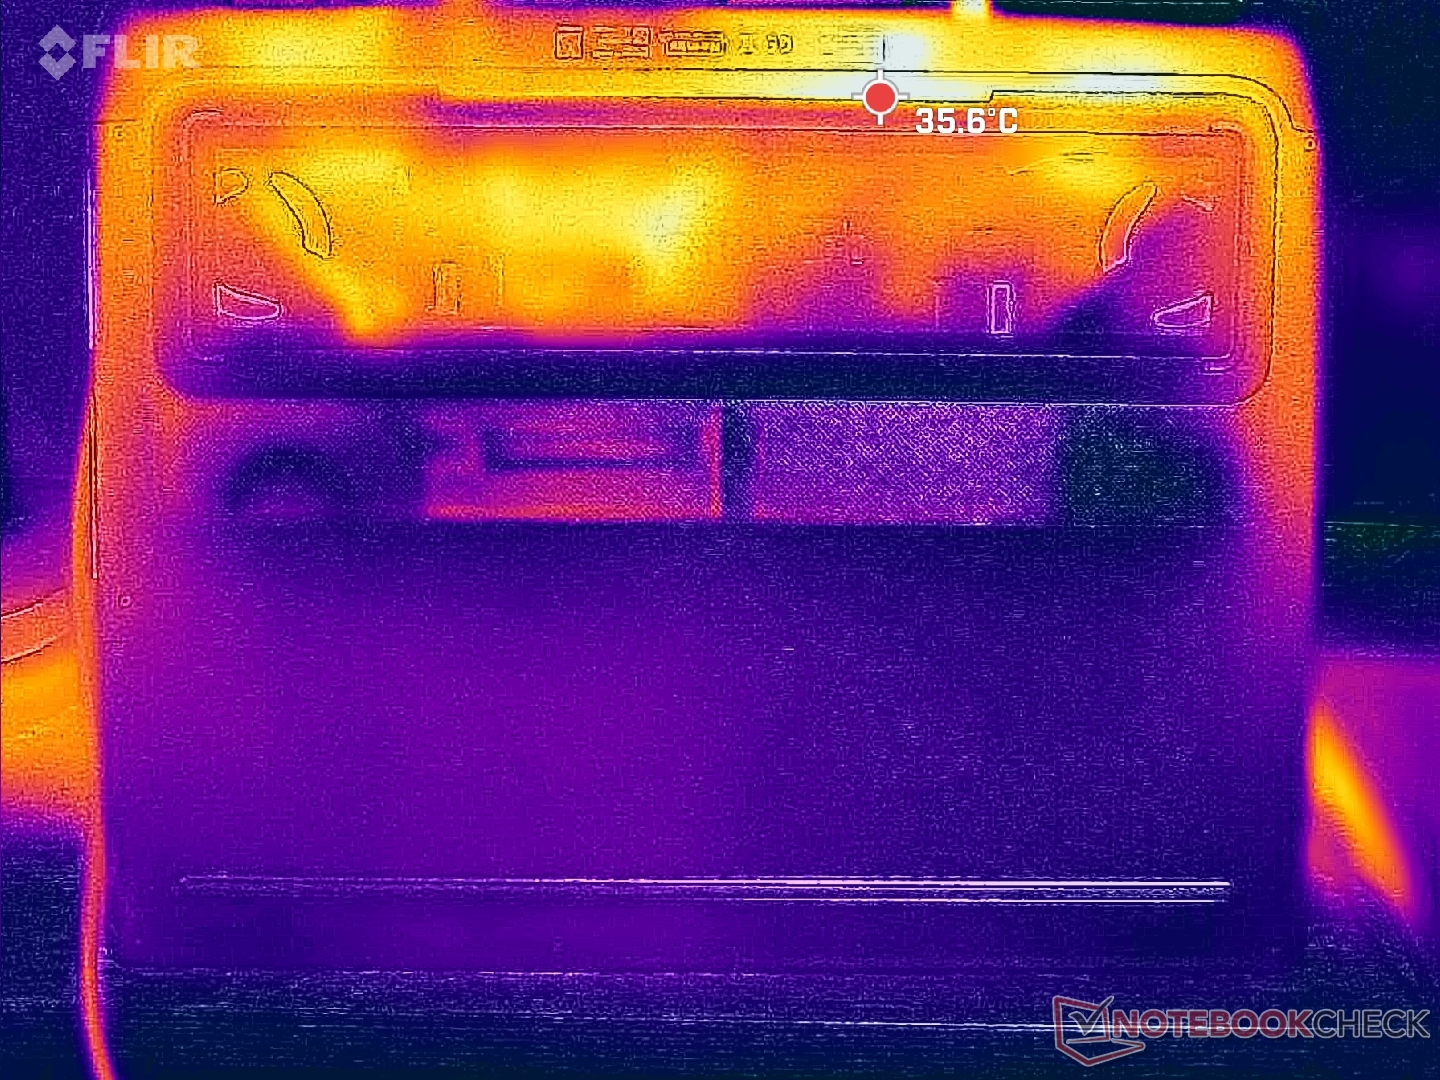
温度
平均表面温度与 Alienware m18 R2 大致相同,但热区温度较低,尽管整体通风栅较少。游戏时,微星 Raider A18 某些区域的温度高达 50 摄氏度,而 Alienware 只有 36 摄氏度。鉴于 Alienware 机器如此笨重,我们对它的期望值也不低。
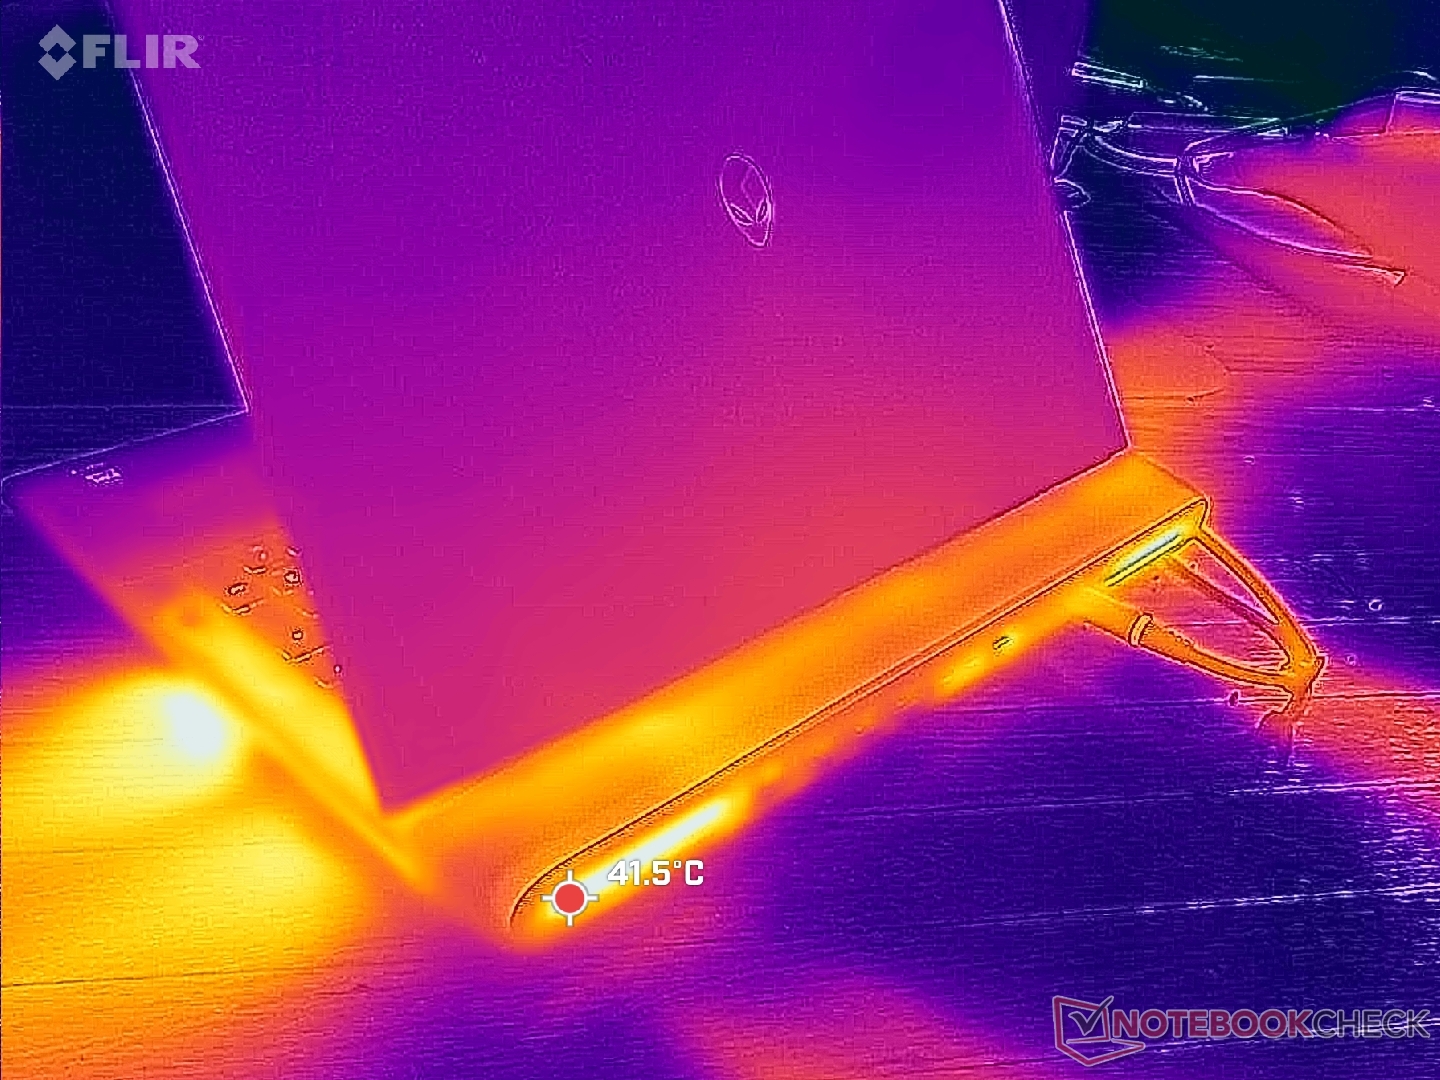
(+) The maximum temperature on the upper side is 36.8 °C / 98 F, compared to the average of 40.4 °C / 105 F, ranging from 21.2 to 68.8 °C for the class Gaming.
(+) The bottom heats up to a maximum of 35.8 °C / 96 F, compared to the average of 43.2 °C / 110 F
(+) In idle usage, the average temperature for the upper side is 28.5 °C / 83 F, compared to the device average of 33.9 °C / 93 F.
(+) 3: The average temperature for the upper side is 31.2 °C / 88 F, compared to the average of 33.9 °C / 93 F for the class Gaming.
(+) The palmrests and touchpad are cooler than skin temperature with a maximum of 26.8 °C / 80.2 F and are therefore cool to the touch.
(±) The average temperature of the palmrest area of similar devices was 28.8 °C / 83.8 F (+2 °C / 3.6 F).
| Alienware 18 Area-51 Intel Core Ultra 9 275HX, NVIDIA GeForce RTX 5090 Laptop | Alienware 16 Area-51 Intel Core Ultra 9 275HX, NVIDIA GeForce RTX 5080 Laptop | Alienware m18 R2 Intel Core i9-14900HX, NVIDIA GeForce RTX 4090 Laptop GPU | MSI Raider A18 HX A9WIG-080 AMD Ryzen 9 9955HX3D, NVIDIA GeForce RTX 5080 Laptop | Razer Blade 18 2024 RZ09-0509 Intel Core i9-14900HX, NVIDIA GeForce RTX 4090 Laptop GPU | Asus ROG Strix G18 G814JI Intel Core i7-13650HX, NVIDIA GeForce RTX 4070 Laptop GPU | Acer Predator Helios 18 PH18-72-98MW Intel Core i9-14900HX, NVIDIA GeForce RTX 4090 Laptop GPU | |
|---|---|---|---|---|---|---|---|
| Heat | -16% | -23% | -25% | -18% | -12% | -24% | |
| Maximum Upper Side * (°C) | 36.8 | 43.8 -19% | 41.2 -12% | 49.3 -34% | 43.2 -17% | 45 -22% | 43 -17% |
| Maximum Bottom * (°C) | 35.8 | 40 -12% | 34.6 3% | 50.9 -42% | 42.6 -19% | 47 -31% | 59 -65% |
| Idle Upper Side * (°C) | 30.6 | 35.8 -17% | 42.8 -40% | 35.2 -15% | 36 -18% | 28 8% | 32 -5% |
| Idle Bottom * (°C) | 30.8 | 35.2 -14% | 43.6 -42% | 33.5 -9% | 36.4 -18% | 31 -1% | 34 -10% |
* ... smaller is better
压力测试
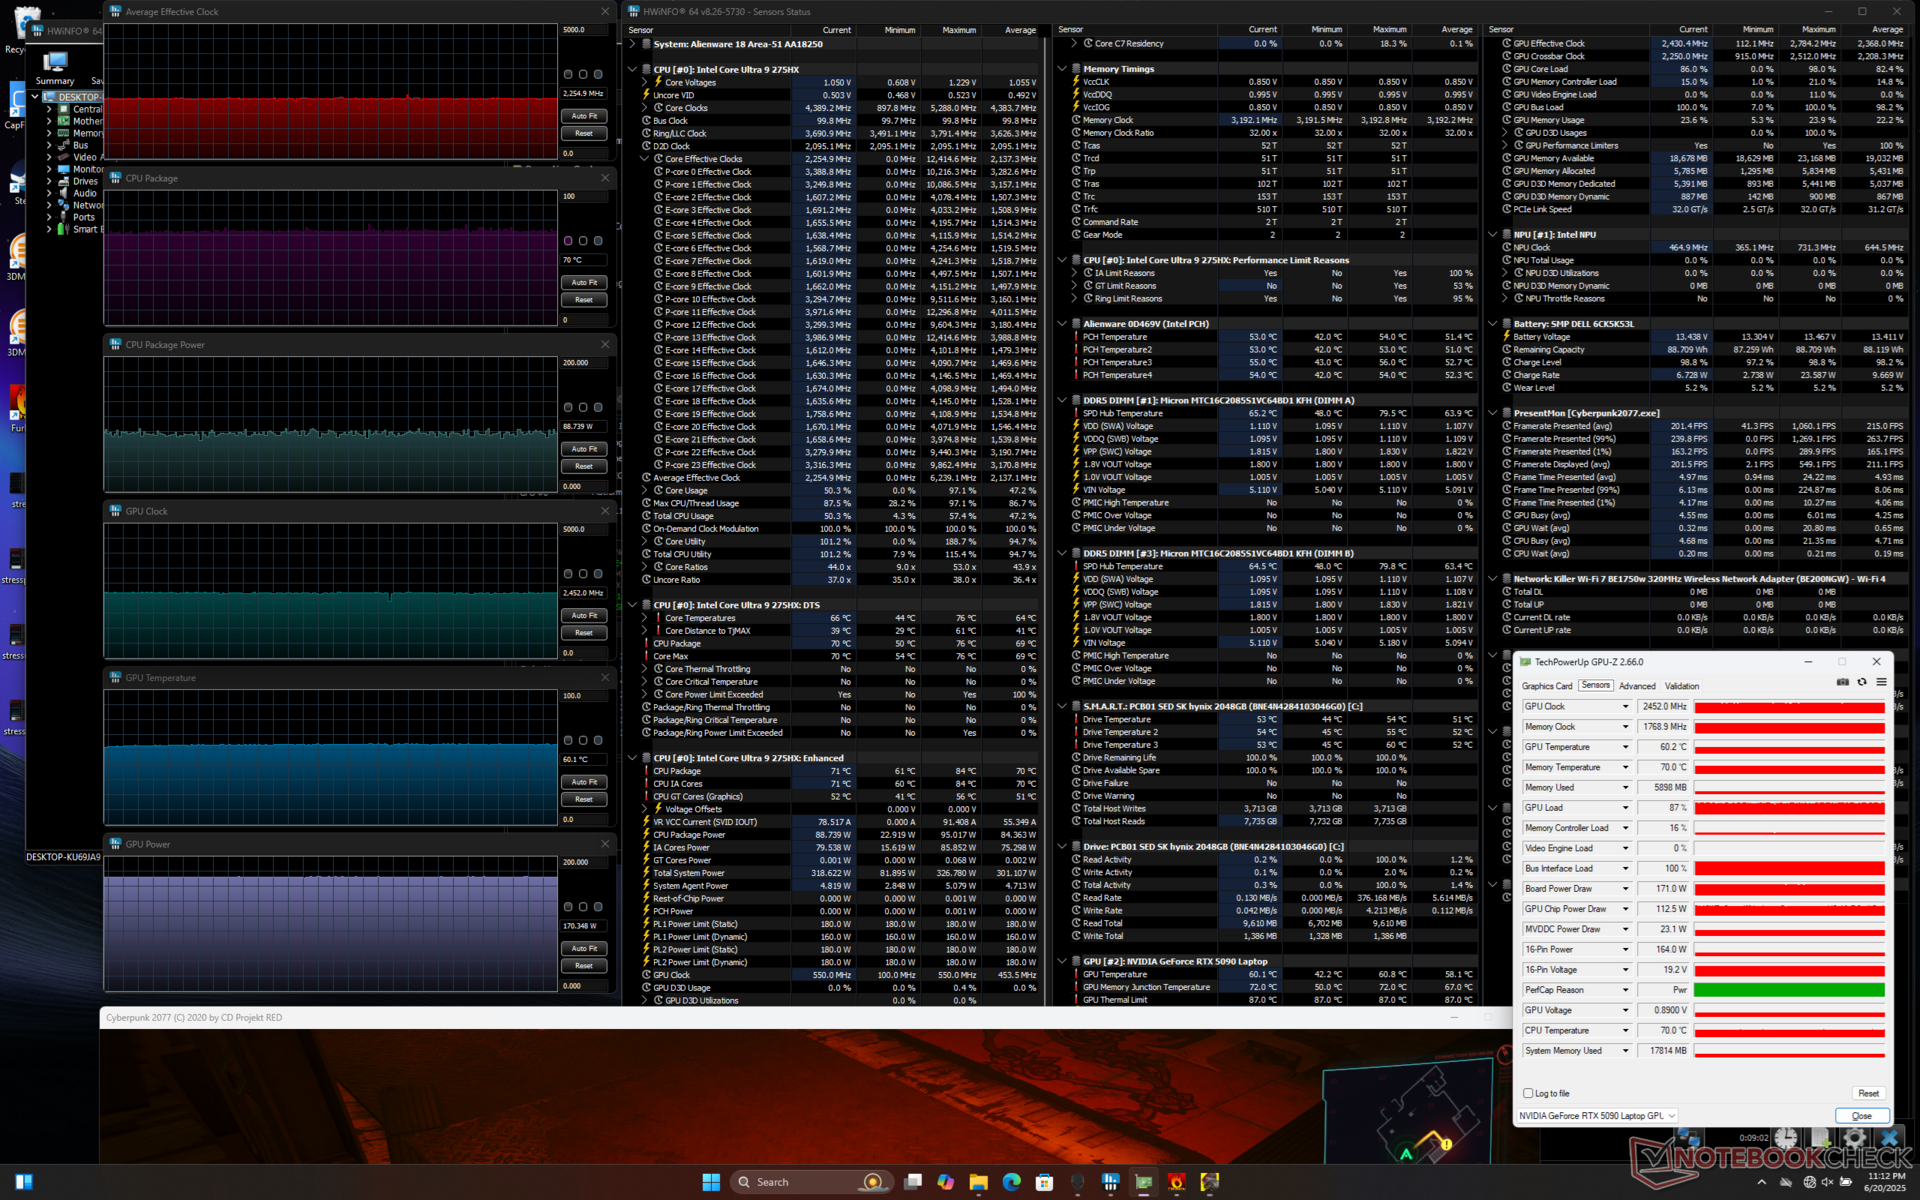
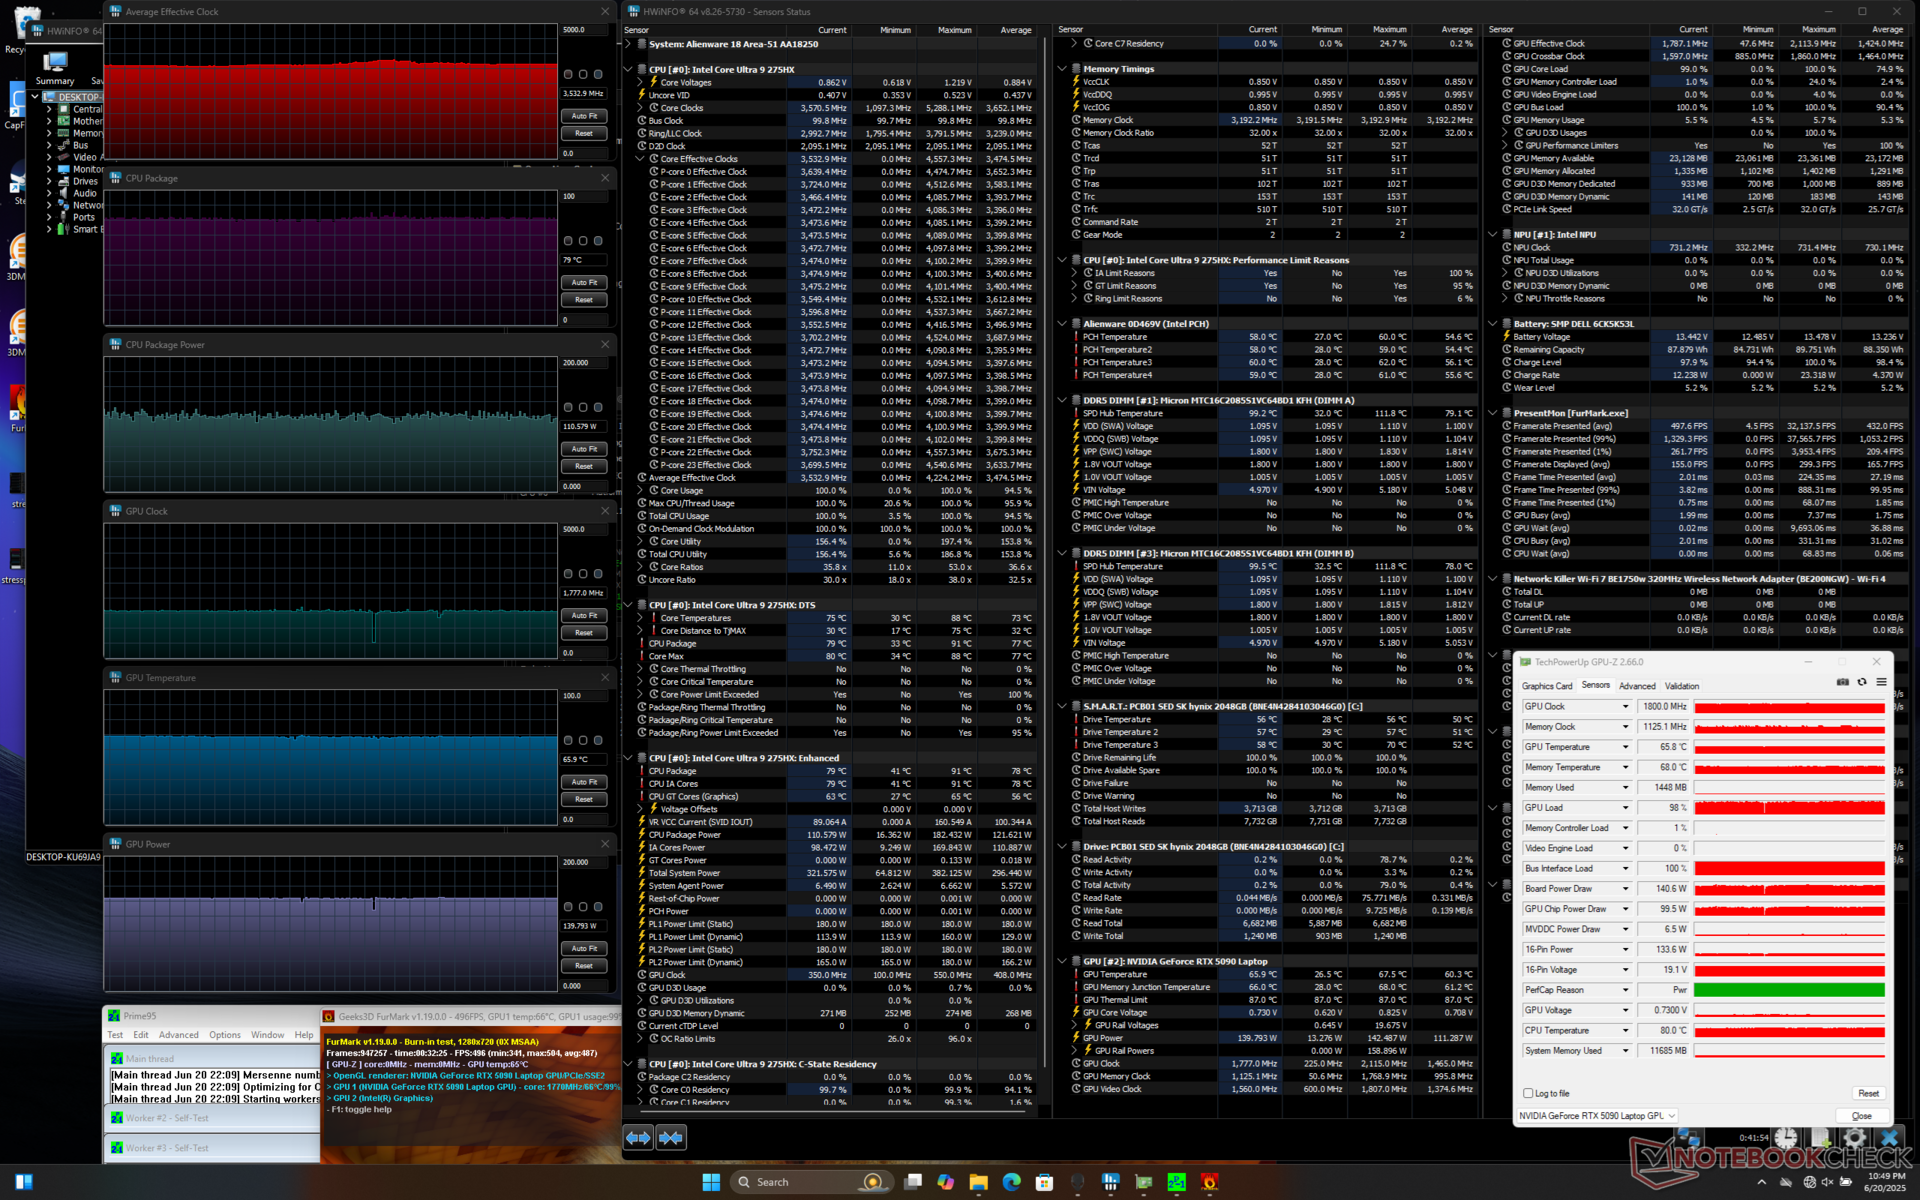
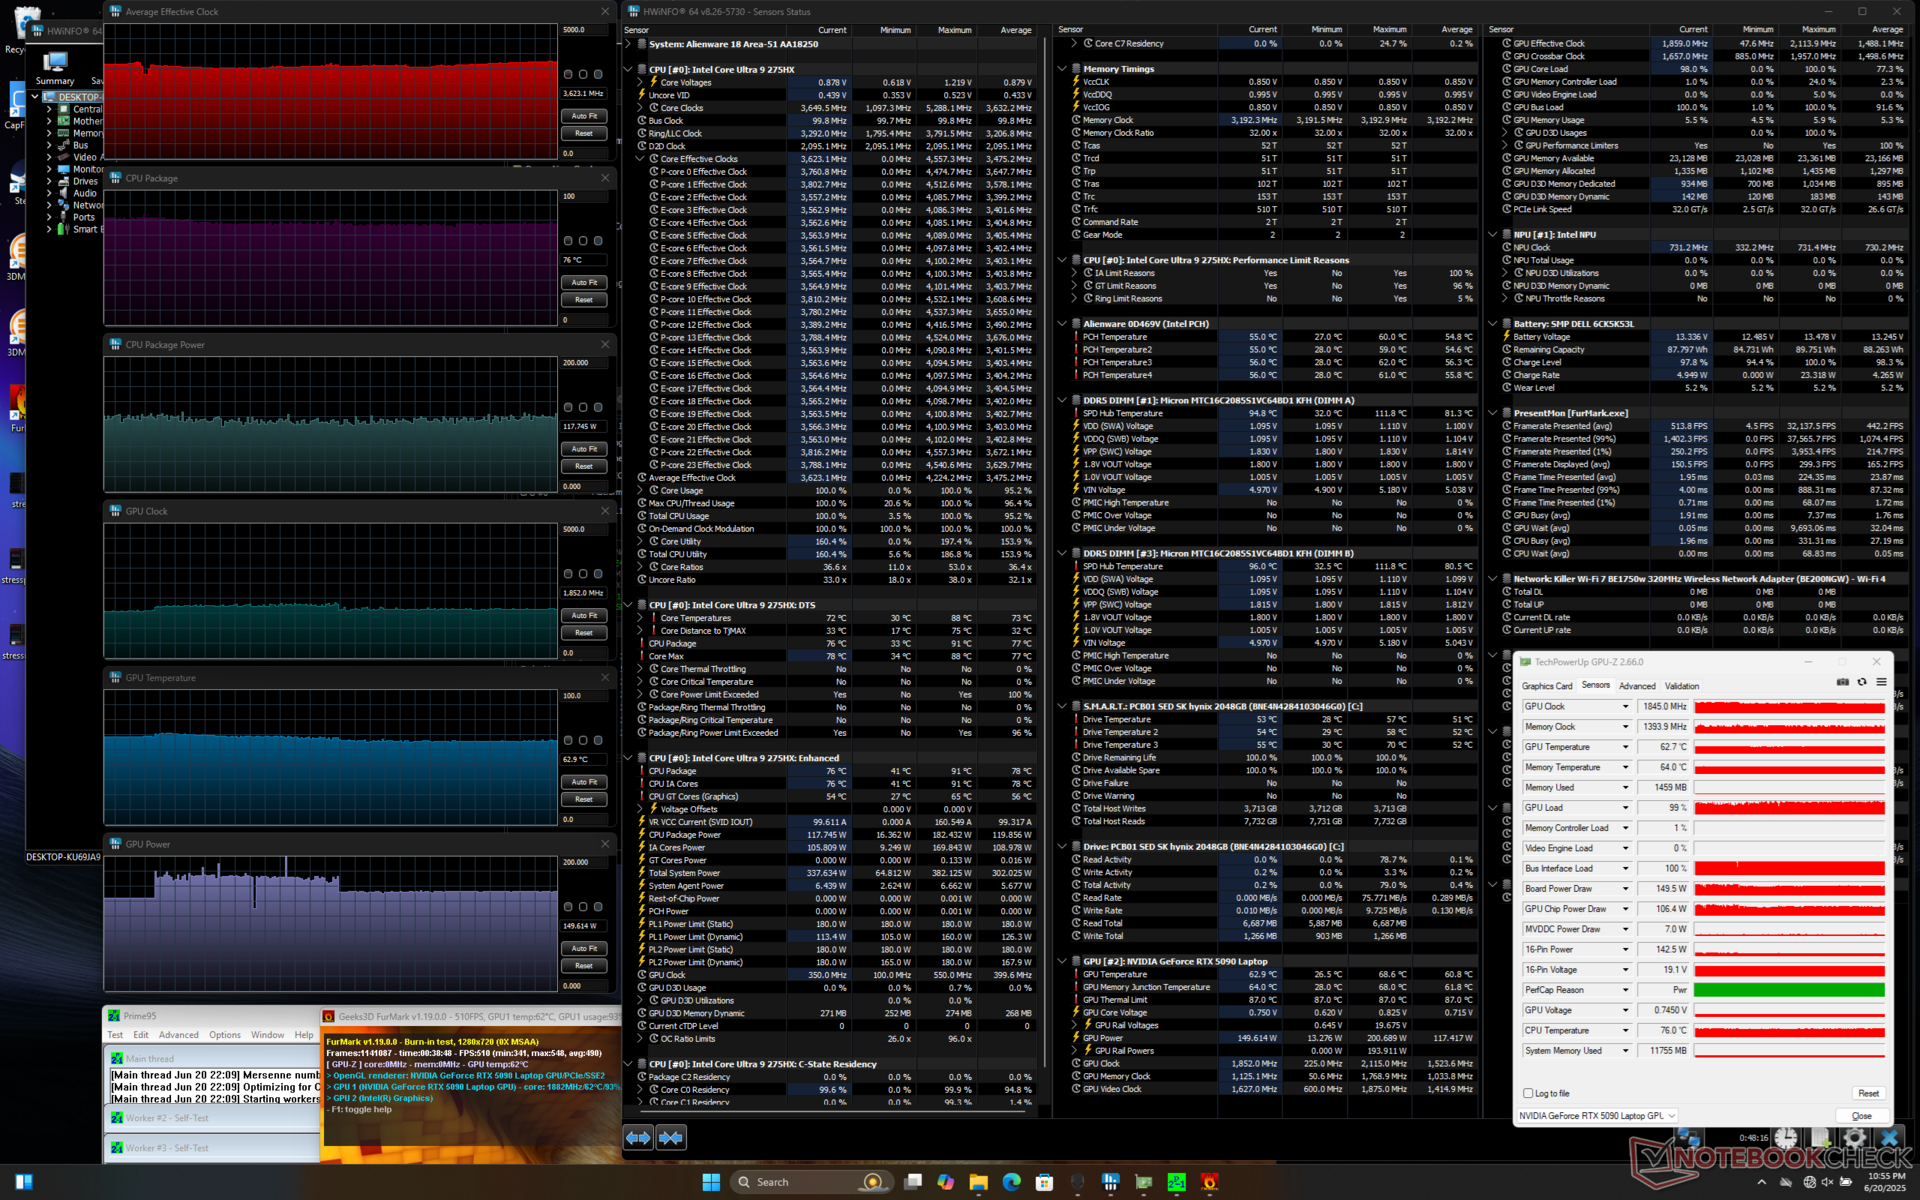
对于游戏笔记本电脑来说,负载情况下的平均核心温度相对较低。例如,在运行 Prime95 和 FurMark 时,CPU 和 GPU 的温度分别稳定在 79 C 和 66 C,而微星 Vector A18 HX 的温度则分别为 83 C 和 77 C。 微星 Vector A18 HX.在运行《赛博朋克 2077》时,Alienware 18 的温度也比其他大多数游戏笔记本电脑低。
将电源配置文件更改为超频模式后,CPU 会恢复到 4.0 GHz 和 165 W。
在性能模式下运行《赛博朋克 2077》时,GPU 板功耗略低于 160 W,而在超频模式下运行同一游戏时则为 171 W。在 Overdrive 模式下,风扇的声音更大,因此 GPU 时钟频率可以稍快一些,而核心温度却基本保持不变。
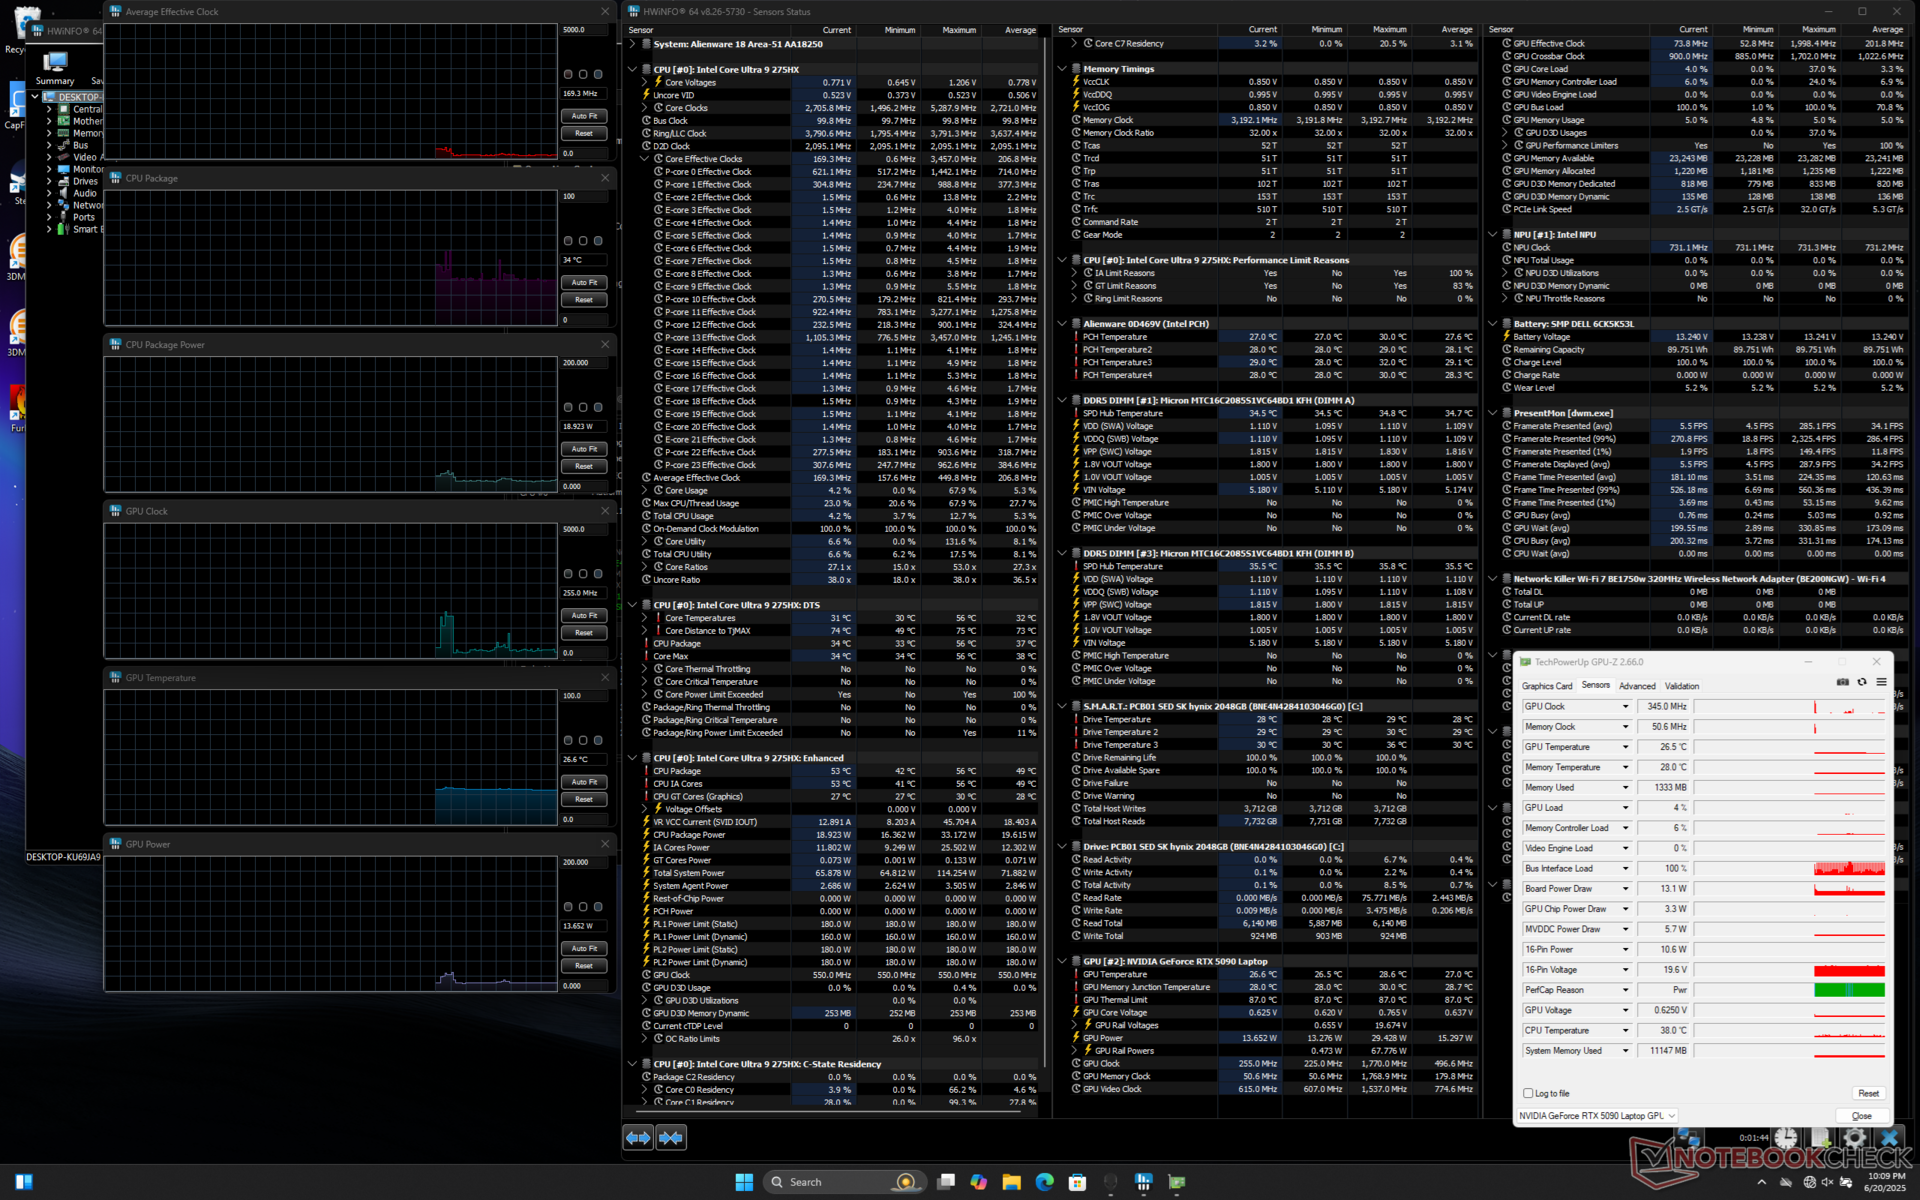
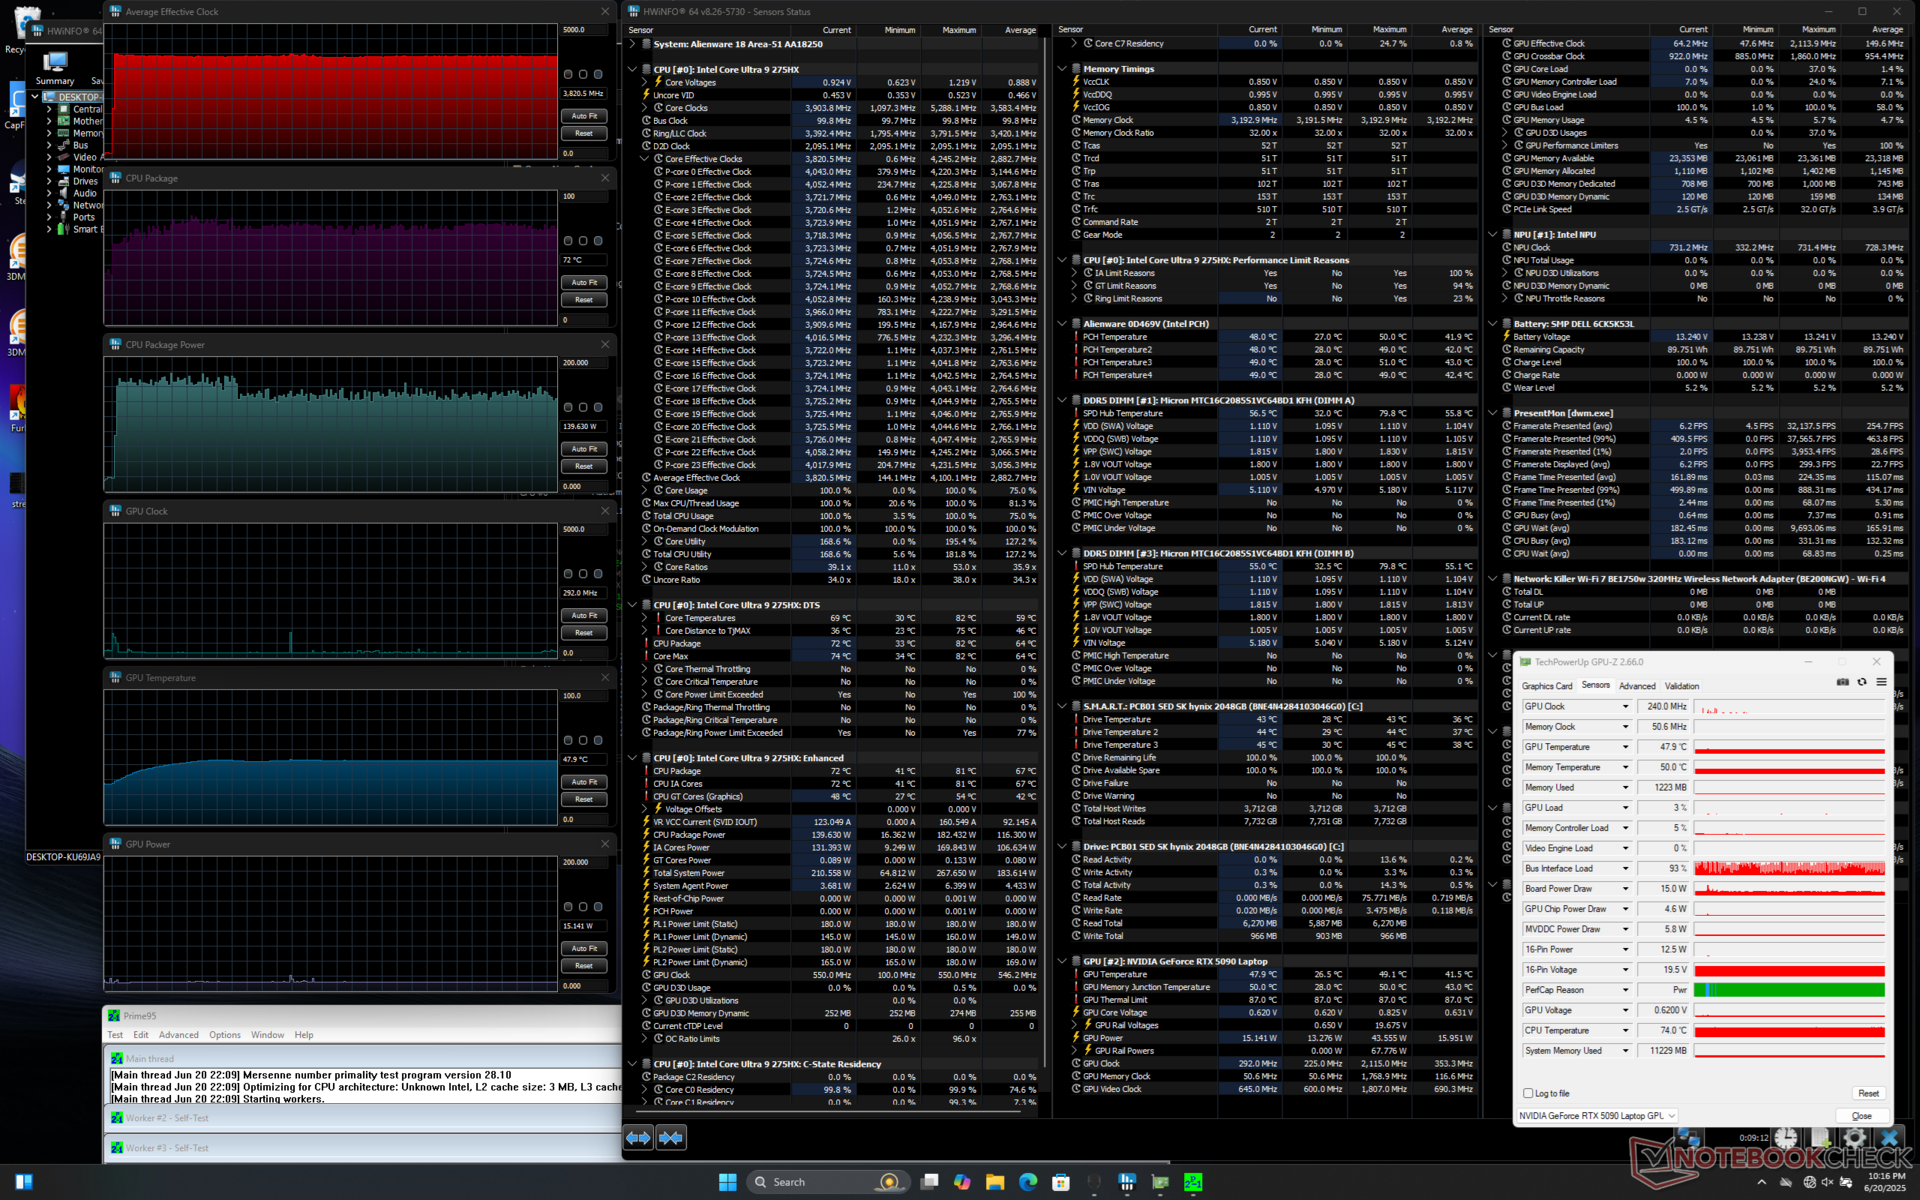
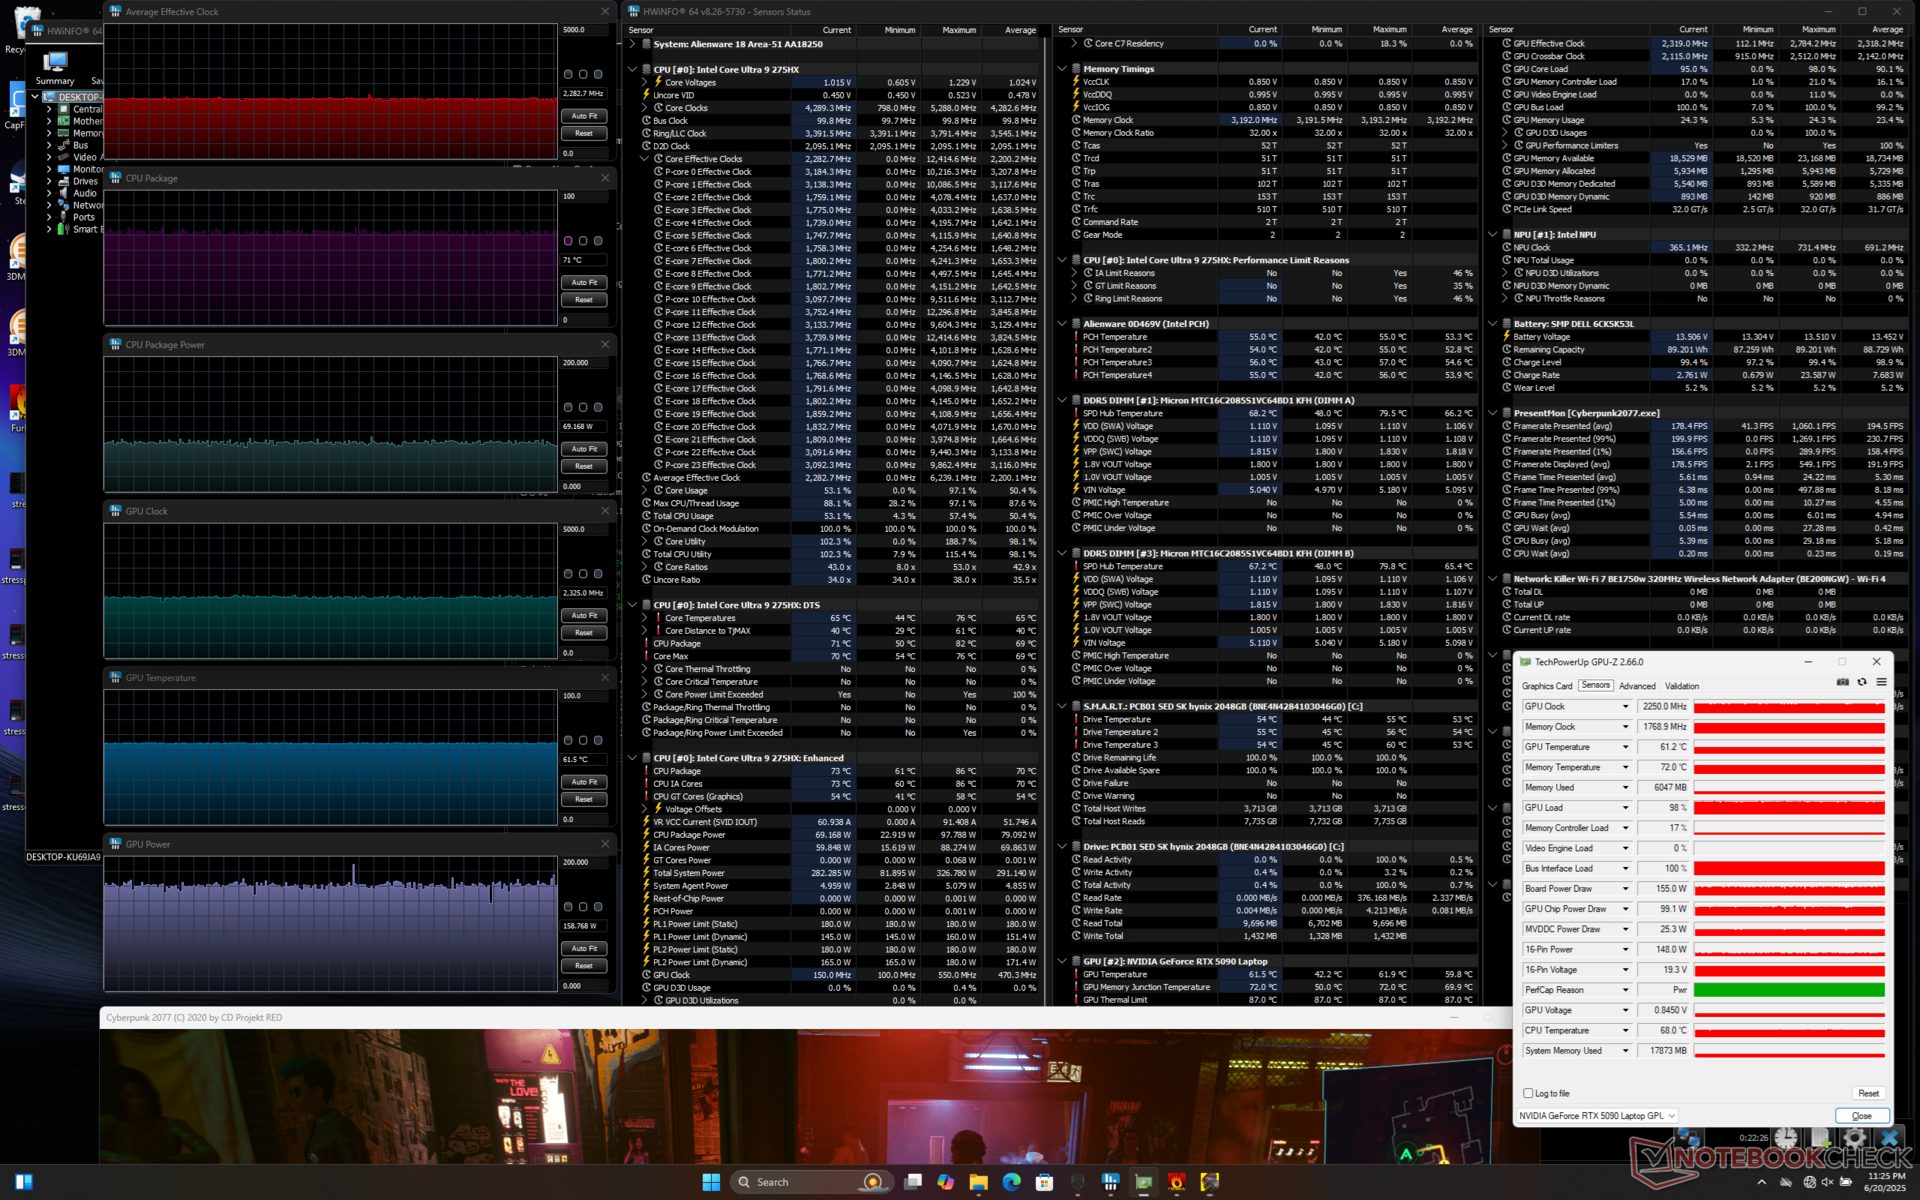
| 平均 CPU 时钟 (GHz) | GPU 时钟 (MHz) | 平均 CPU 温度 (°C) | 平均 GPU 温度 (°C) | |
| 系统闲置 | -- | -- | 34 | 27 |
| Prime95 压力 | 3.8 | -- | 72 | 48 |
| Prime95 + FurMark 压力(超速模式) | 3.6 | 1852 | 76 | 63 |
| Prime95 + FurMark Stress(性能模式) | 3.5 | 1777 | 79 | 66 |
| 赛博朋克 2077》压力(超速模式) | 2.3 | 2452 | 70 | 60 |
| 赛博朋克 2077》压力(性能模式) | 2.3 | 2325 | 71 | 62 |
发言人
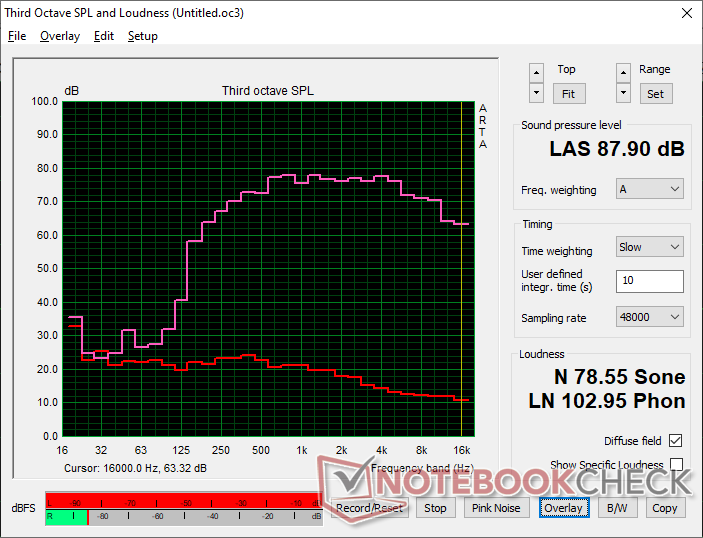
Alienware 18 Area-51 audio analysis
(+) | speakers can play relatively loud (87.9 dB)
Bass 100 - 315 Hz
(-) | nearly no bass - on average 17.5% lower than median
(±) | linearity of bass is average (13.4% delta to prev. frequency)
Mids 400 - 2000 Hz
(+) | balanced mids - only 3.1% away from median
(+) | mids are linear (3.6% delta to prev. frequency)
Highs 2 - 16 kHz
(+) | balanced highs - only 2.9% away from median
(+) | highs are linear (2.9% delta to prev. frequency)
Overall 100 - 16.000 Hz
(+) | overall sound is linear (14.2% difference to median)
Compared to same class
» 25% of all tested devices in this class were better, 7% similar, 68% worse
» The best had a delta of 6%, average was 18%, worst was 132%
Compared to all devices tested
» 17% of all tested devices were better, 4% similar, 79% worse
» The best had a delta of 4%, average was 23%, worst was 134%
Apple MacBook Pro 16 2021 M1 Pro audio analysis
(+) | speakers can play relatively loud (84.7 dB)
Bass 100 - 315 Hz
(+) | good bass - only 3.8% away from median
(+) | bass is linear (5.2% delta to prev. frequency)
Mids 400 - 2000 Hz
(+) | balanced mids - only 1.3% away from median
(+) | mids are linear (2.1% delta to prev. frequency)
Highs 2 - 16 kHz
(+) | balanced highs - only 1.9% away from median
(+) | highs are linear (2.7% delta to prev. frequency)
Overall 100 - 16.000 Hz
(+) | overall sound is linear (4.6% difference to median)
Compared to same class
» 0% of all tested devices in this class were better, 0% similar, 100% worse
» The best had a delta of 5%, average was 17%, worst was 45%
Compared to all devices tested
» 0% of all tested devices were better, 0% similar, 100% worse
» The best had a delta of 4%, average was 23%, worst was 134%
能源管理
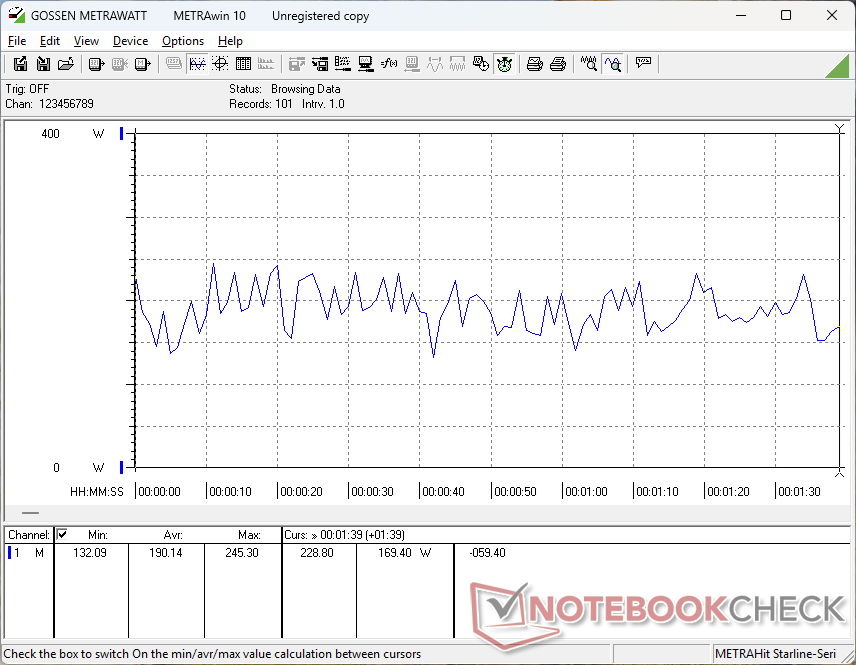
耗电量
即使以最低亮度和功率设置在桌面上空闲运行,系统的要求也非常高。因此,无论屏幕负载如何,电池寿命都很短,这一点我们将在下文中加以说明。
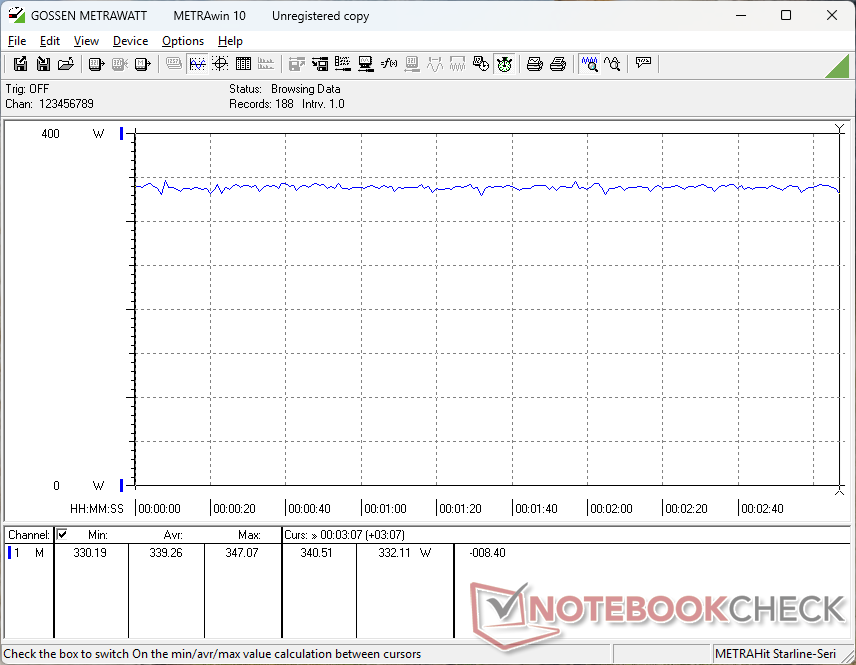
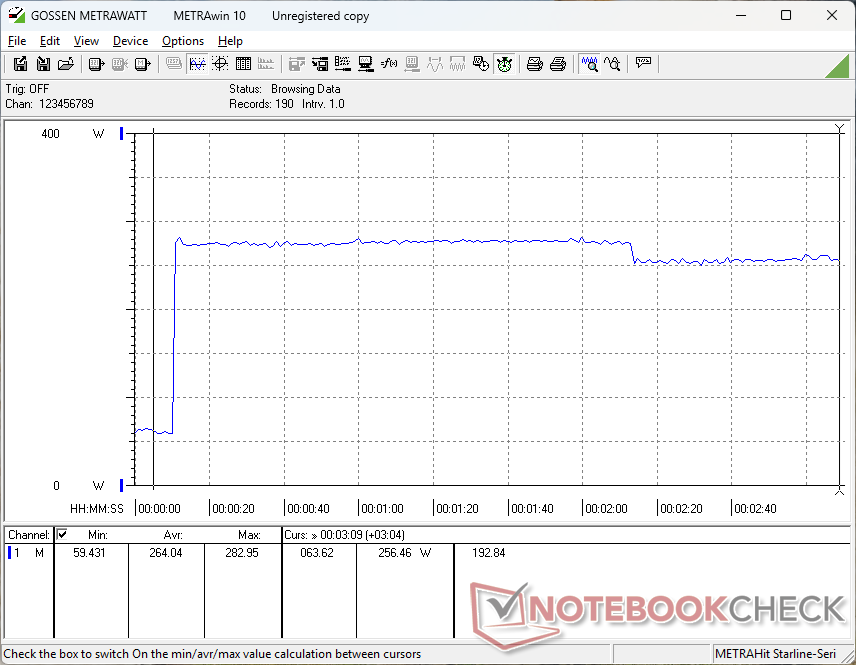
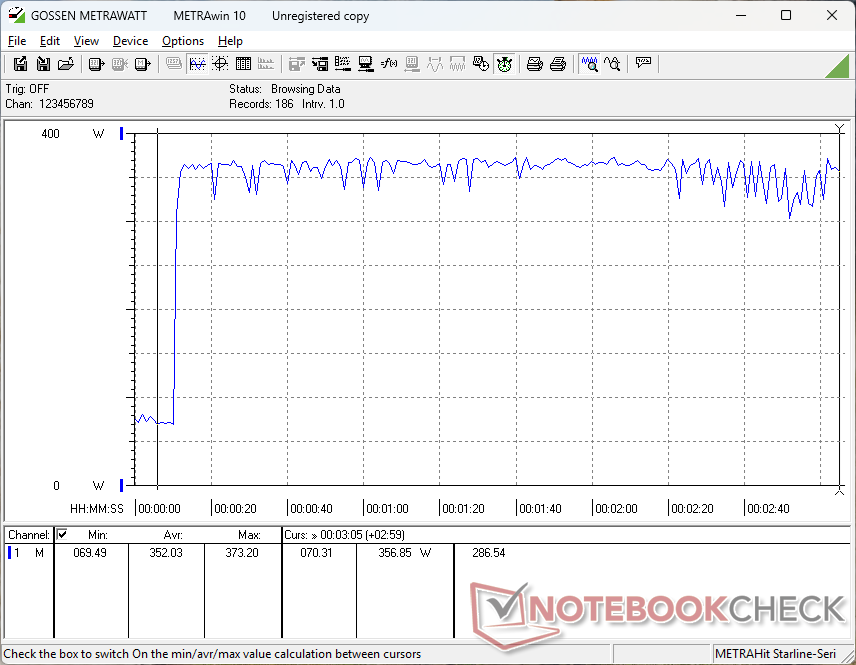
运行《 赛博朋克 2077》 来代表典型的游戏负载,如果在超频模式下,功耗约为 340 瓦;如果在性能模式下,功耗约为 300 瓦,这是因为 CPU 和 GPU 功耗降低,如上文压力测试部分所述。结果仍明显高于我们在 Alienware 16 上记录的结果,但低于去年的 Alienware m18 R2.尽管 Alienware 18 并不是最高效的游戏笔记本电脑,但其每瓦性能却逐年提高。
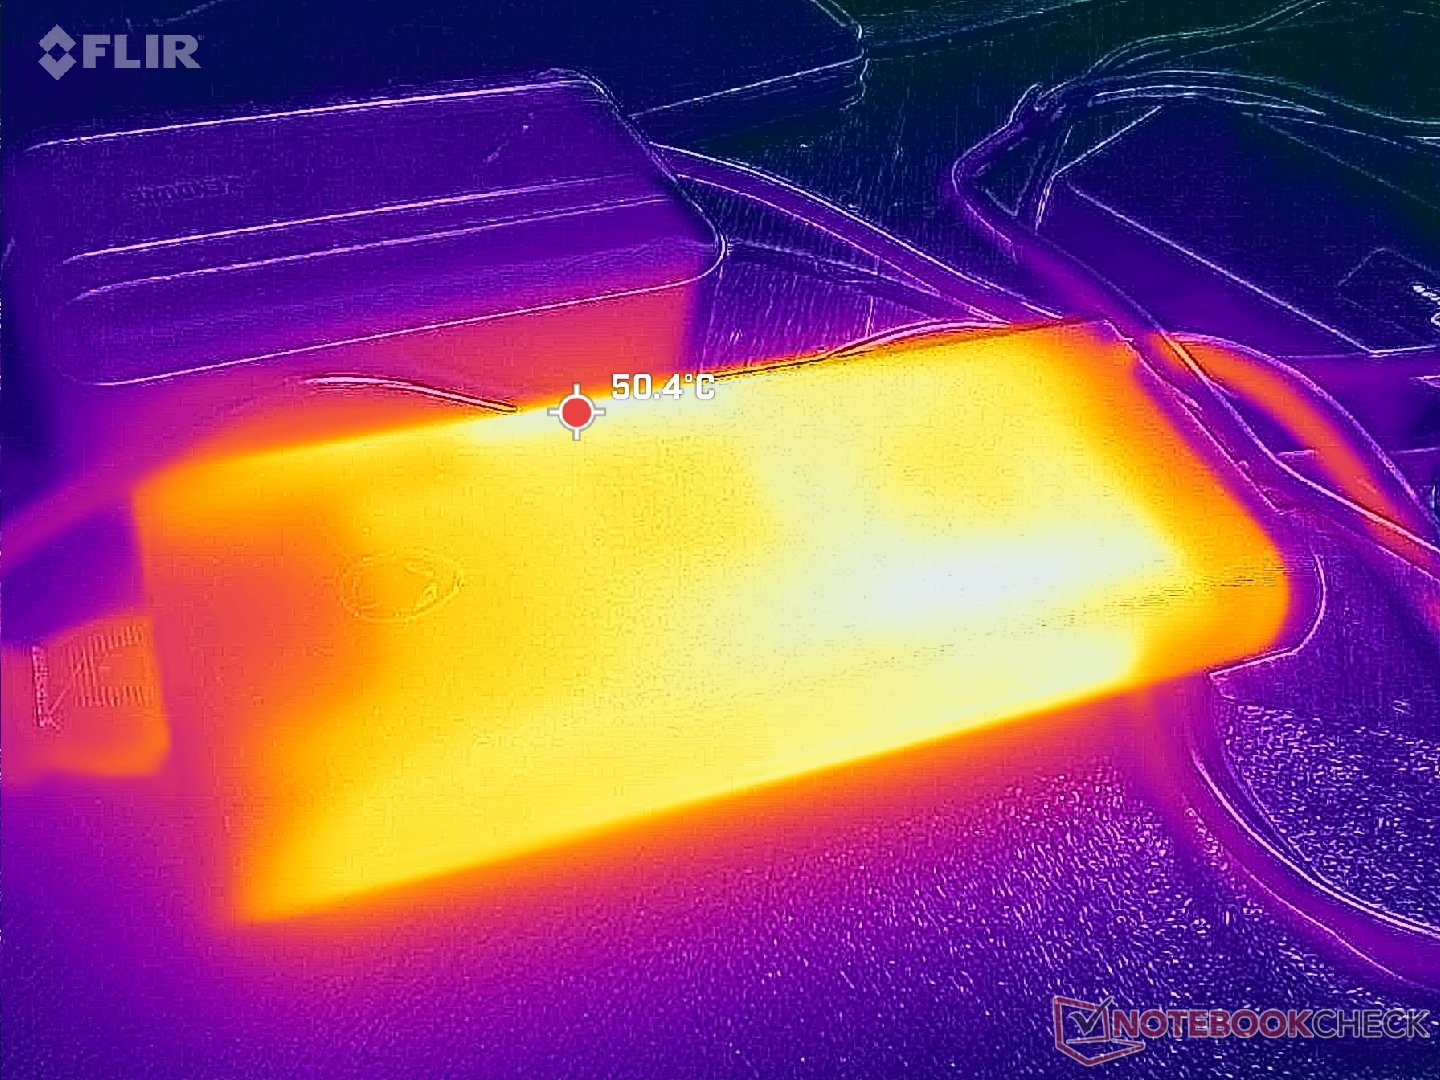
在运行 Prime95 和 FurMark 时,我们可以从大尺寸(约 18.9 x 8.7 x 2.5 厘米)360 W AC 适配器记录到 373 W 的最大功耗。由于游戏对功率的要求已经在 300 W 到 340 W 之间,因此如果同时进行游戏,充电速度可能会减慢。竞争产品 联想Legion Pro 7i 16 G10相比之下,联想 Pro 7i 16 G10 配备了功率更大的 400 W AC 适配器。
| Off / Standby | |
| Idle | |
| Load |
|
Key:
min: | |
| Alienware 18 Area-51 Ultra 9 275HX, GeForce RTX 5090 Laptop, , IPS, 2560x1600, 18" | Alienware 16 Area-51 Ultra 9 275HX, GeForce RTX 5080 Laptop, Samsung PM9C1a MZ9L81T0HDLB, IPS, 2560x1600, 16" | Alienware m18 R2 i9-14900HX, GeForce RTX 4090 Laptop GPU, SK Hynix PC811 HFS002TEM9X152N, IPS, 2560x1600, 18" | MSI Raider A18 HX A9WIG-080 R9 9955HX3D, GeForce RTX 5080 Laptop, Samsung PM9E1 MZVLC2T0HBLD, MiniLED IPS, 3840x2400, 18" | Razer Blade 18 2024 RZ09-0509 i9-14900HX, GeForce RTX 4090 Laptop GPU, , Mini-LED, 2560x1600, 18" | Asus ROG Strix G18 G814JI i7-13650HX, GeForce RTX 4070 Laptop GPU, Micron 2400 MTFDKBA1T0QFM, IPS, 2560x1600, 18" | Acer Predator Helios 18 PH18-72-98MW i9-14900HX, GeForce RTX 4090 Laptop GPU, 2x SK Hynix HFS001TEJ9X115N (RAID 0), Mini-LED, 2560x1600, 18" | MSI Titan 18 HX AI A2XWJG Ultra 9 285HX, GeForce RTX 5090 Laptop, 1x Samsung PM9E1 MZVLC2T0HBLD-00BT7 + 2x Samsung PM9A1 MZVL22T0HDLB-00BT7 (RAID 0), Mini-LED, 3840x2160, 18" | |
|---|---|---|---|---|---|---|---|---|
| Power Consumption | 24% | 30% | 4% | 20% | 55% | 21% | 25% | |
| Idle Minimum * (Watt) | 38.4 | 27 30% | 10.6 72% | 41.5 -8% | 25.4 34% | 8 79% | 31 19% | 19.01 50% |
| Idle Average * (Watt) | 45.6 | 33.5 27% | 20.9 54% | 53.5 -17% | 37.7 17% | 15 67% | 35 23% | 30.92 32% |
| Idle Maximum * (Watt) | 57.5 | 41.4 28% | 40 30% | 53.8 6% | 57.9 -1% | 26 55% | 43 25% | 33.84 41% |
| Load Average * (Watt) | 190.1 | 124.7 34% | 201.1 -6% | 168.5 11% | 128.4 32% | 102 46% | 144 24% | 105.4 45% |
| Cyberpunk 2077 ultra external monitor * (Watt) | 333 | 249 25% | 295 11% | 330 1% | ||||
| Cyberpunk 2077 ultra * (Watt) | 340 | 256 25% | 298 12% | 343 -1% | ||||
| Load Maximum * (Watt) | 373.2 | 367.2 2% | 378.9 -2% | 323.7 13% | 297.9 20% | 267 28% | 318 15% | 354 5% |
| Witcher 3 ultra * (Watt) | 358 | 273.1 | 178.6 | 228 |
* ... smaller is better
Power Consumption Cyberpunk / Stress Test
Power Consumption external Monitor
电池寿命
即使设置为 iGPU 模式、60 赫兹刷新率和电池电量配置文件,运行时间也比我们在 Alienware 16 上记录的时间短,实际浏览时间不到 2 小时。而其他大多数游戏笔记本电脑尽管拥有 18 英寸的超大屏幕,却能提供更长的运行时间。
使用随附的交流适配器,从空电到满电只需不到 2 小时。也支持通过 USB-C 接口充电,但充电速度要慢得多。
| Alienware 18 Area-51 Ultra 9 275HX, GeForce RTX 5090 Laptop, 96 Wh | Alienware 16 Area-51 Ultra 9 275HX, GeForce RTX 5080 Laptop, 96 Wh | Alienware m18 R2 i9-14900HX, GeForce RTX 4090 Laptop GPU, 97 Wh | MSI Raider A18 HX A9WIG-080 R9 9955HX3D, GeForce RTX 5080 Laptop, 99 Wh | Razer Blade 18 2024 RZ09-0509 i9-14900HX, GeForce RTX 4090 Laptop GPU, 91.7 Wh | Asus ROG Strix G18 G814JI i7-13650HX, GeForce RTX 4070 Laptop GPU, 90 Wh | Acer Predator Helios 18 PH18-72-98MW i9-14900HX, GeForce RTX 4090 Laptop GPU, 90 Wh | MSI Titan 18 HX AI A2XWJG Ultra 9 285HX, GeForce RTX 5090 Laptop, 99 Wh | |
|---|---|---|---|---|---|---|---|---|
| Battery runtime | 40% | 140% | 5% | 120% | 305% | 60% | 115% | |
| WiFi v1.3 (h) | 2 | 2.8 40% | 4.8 140% | 2.1 5% | 4.4 120% | 8.1 305% | 3.2 60% | 4.3 115% |
| Reader / Idle (h) | 3.1 | 6.6 | 11.7 | |||||
| Load (h) | 1.1 | 1 | 1.2 | 1.1 | 1.5 | |||
| H.264 (h) | 3 | |||||||
| Cyberpunk 2077 ultra 150cd (h) | 1.2 |
笔记本检查评级
Alienware 18 Area-51
- 07/01/2025 v8
Allen Ngo
 Total Sustainability Score:
 Potential Competitors in Comparison
Image | Model / Review | Price | Weight | Height | Display |
|---|---|---|---|---|---|
1. 86.2%  | Alienware 18 Area-51 Intel Core Ultra 9 275HX ⎘ NVIDIA GeForce RTX 5090 Laptop ⎘ 64 GB Memory | Amazon: 1. $3,805.46 Alienware 18 Area-51 Gaming ... 2. $4,199.00 Alienware 18 Area-51 Gaming ... 3. $3,799.00 Dell Alienware 18 Area-51 Ga... List Price: 4400 USD | 4.2 kg | 24.32 mm | 18.00" 2560x1600 168 PPI IPS |
2. 85.7%  | Alienware 16 Area-51 Intel Core Ultra 9 275HX ⎘ NVIDIA GeForce RTX 5080 Laptop ⎘ 32 GB Memory, 1024 GB SSD | Amazon: 1. $2,350.67 Alienware 16 Area-51 Gaming ... 2. $3,899.99 Alienware 16 Area-51 Gaming ... 3. $3,799.99 Alienware 16 Area-51 Gaming ... List Price: 3500 USD | 3.3 kg | 28.5 mm | 16.00" 2560x1600 189 PPI IPS |
3. 89.5% v7 (old)  | Alienware m18 R2 Intel Core i9-14900HX ⎘ NVIDIA GeForce RTX 4090 Laptop GPU ⎘ 32 GB Memory, 2048 GB SSD | Amazon: 1. $2,460.15 Alienware M18 R2 Gaming Lapt... 2. $1,527.86 Alienware M18 Gaming Laptop ... 3. $3,999.99 Dell Alienware m18 R2 Gaming... List Price: 3300 USD | 4 kg | 26.7 mm | 18.00" 2560x1600 168 PPI IPS |
4. 85.1%  | MSI Raider A18 HX A9WIG-080 AMD Ryzen 9 9955HX3D ⎘ NVIDIA GeForce RTX 5080 Laptop ⎘ 64 GB Memory, 2048 GB SSD | Amazon: List Price: 4350 Euro | 3.6 kg | 34 mm | 18.00" 3840x2400 252 PPI MiniLED IPS |
5. 90.5% v7 (old)  | Razer Blade 18 2024 RZ09-0509 Intel Core i9-14900HX ⎘ NVIDIA GeForce RTX 4090 Laptop GPU ⎘ 32 GB Memory | Amazon: List Price: 4500 USD | 3.1 kg | 21.9 mm | 18.00" 2560x1600 168 PPI Mini-LED |
6. 87.4% v7 (old)  | Asus ROG Strix G18 G814JI Intel Core i7-13650HX ⎘ NVIDIA GeForce RTX 4070 Laptop GPU ⎘ 32 GB Memory, 1024 GB SSD | Amazon: 1. $3,449.00 ASUS ROG Strix G18 G814 Gami... 2. $169.00 18" 2560x1600 240hz LCD Scre... 3. $2,749.00 ASUS ROG Strix G18 G815 Gami... List Price: 2699 EUR | 3 kg | 31 mm | 18.00" 2560x1600 168 PPI IPS |
7. 87.1% v7 (old)  | Acer Predator Helios 18 PH18-72-98MW Intel Core i9-14900HX ⎘ NVIDIA GeForce RTX 4090 Laptop GPU ⎘ 32 GB Memory, 2048 GB SSD | Amazon: 1. $23.99 DC Power Jack Charging Port ... 2. $69.00 330W 19.5V 16.92A AC Charger... 3. $2,849.00 Acer Predator Helios Neo 18i... | 3.3 kg | 29.5 mm | 18.00" 2560x1600 168 PPI Mini-LED |
Transparency
The selection of devices to be reviewed is made by our editorial team. The test sample was provided to the author as a loan by the manufacturer or retailer for the purpose of this review. The lender had no influence on this review, nor did the manufacturer receive a copy of this review before publication. There was no obligation to publish this review. As an independent media company, Notebookcheck is not subjected to the authority of manufacturers, retailers or publishers.
This is how Notebookcheck is testing
Every year, Notebookcheck independently reviews hundreds of laptops and smartphones using standardized procedures to ensure that all results are comparable. We have continuously developed our test methods for around 20 years and set industry standards in the process. In our test labs, high-quality measuring equipment is utilized by experienced technicians and editors. These tests involve a multi-stage validation process. Our complex rating system is based on hundreds of well-founded measurements and benchmarks, which maintains objectivity. Further information on our test methods can be found here.

