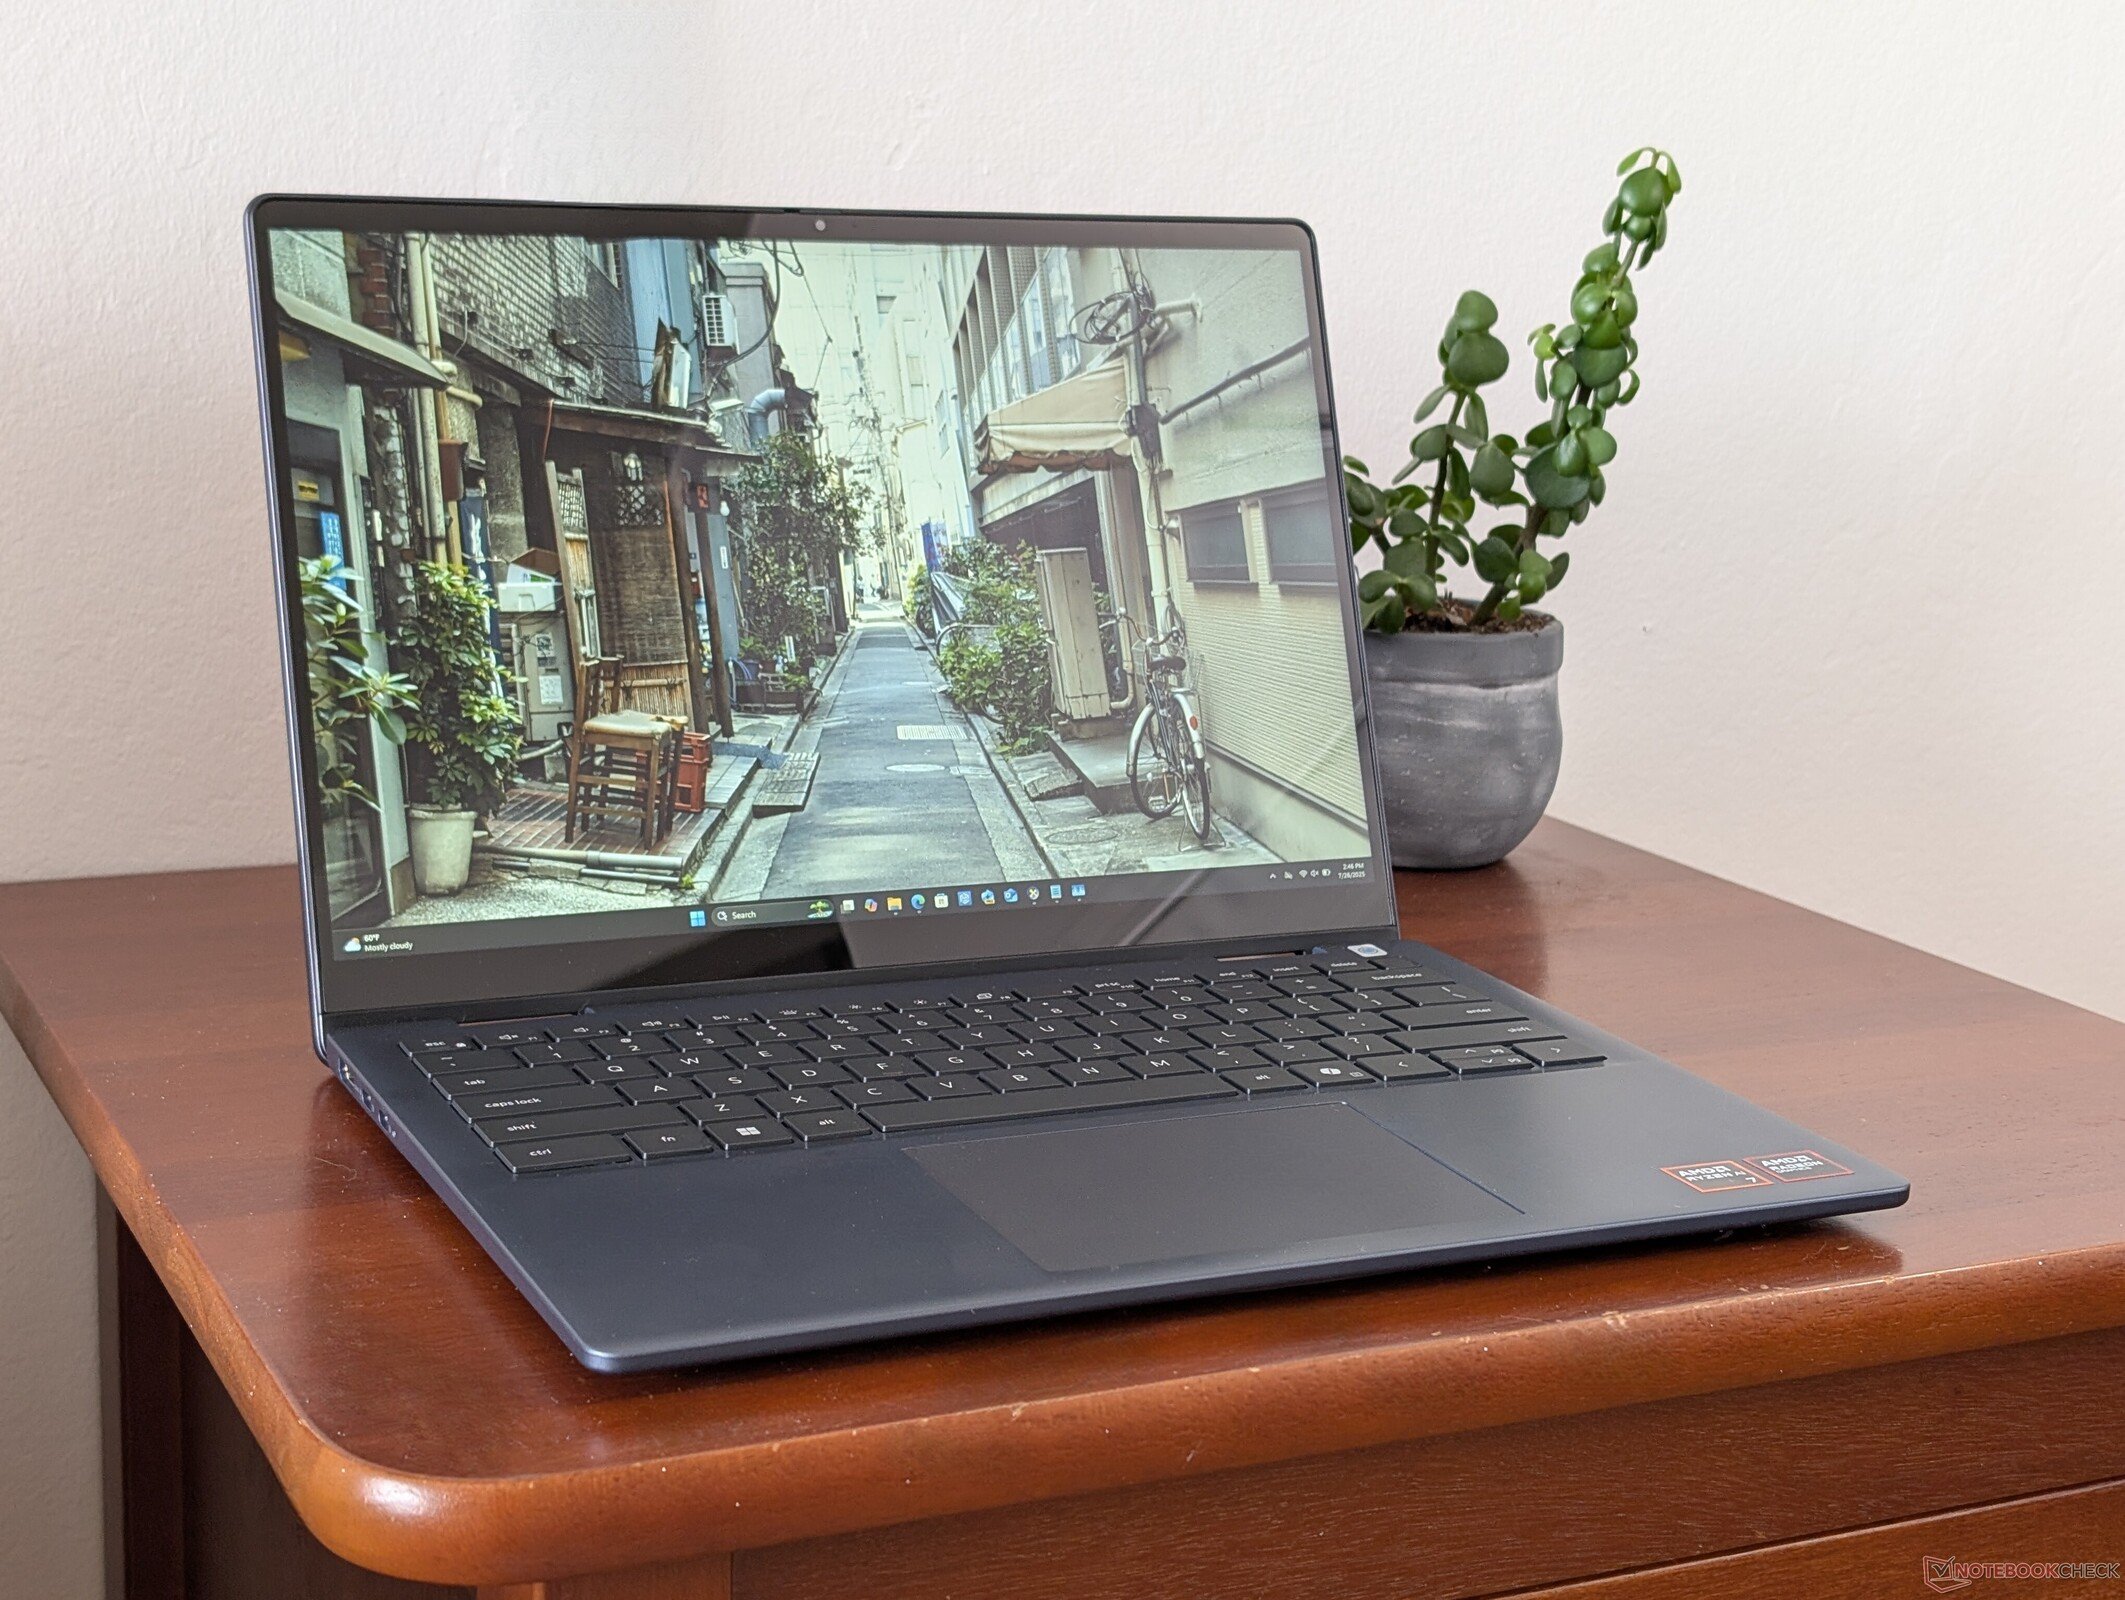
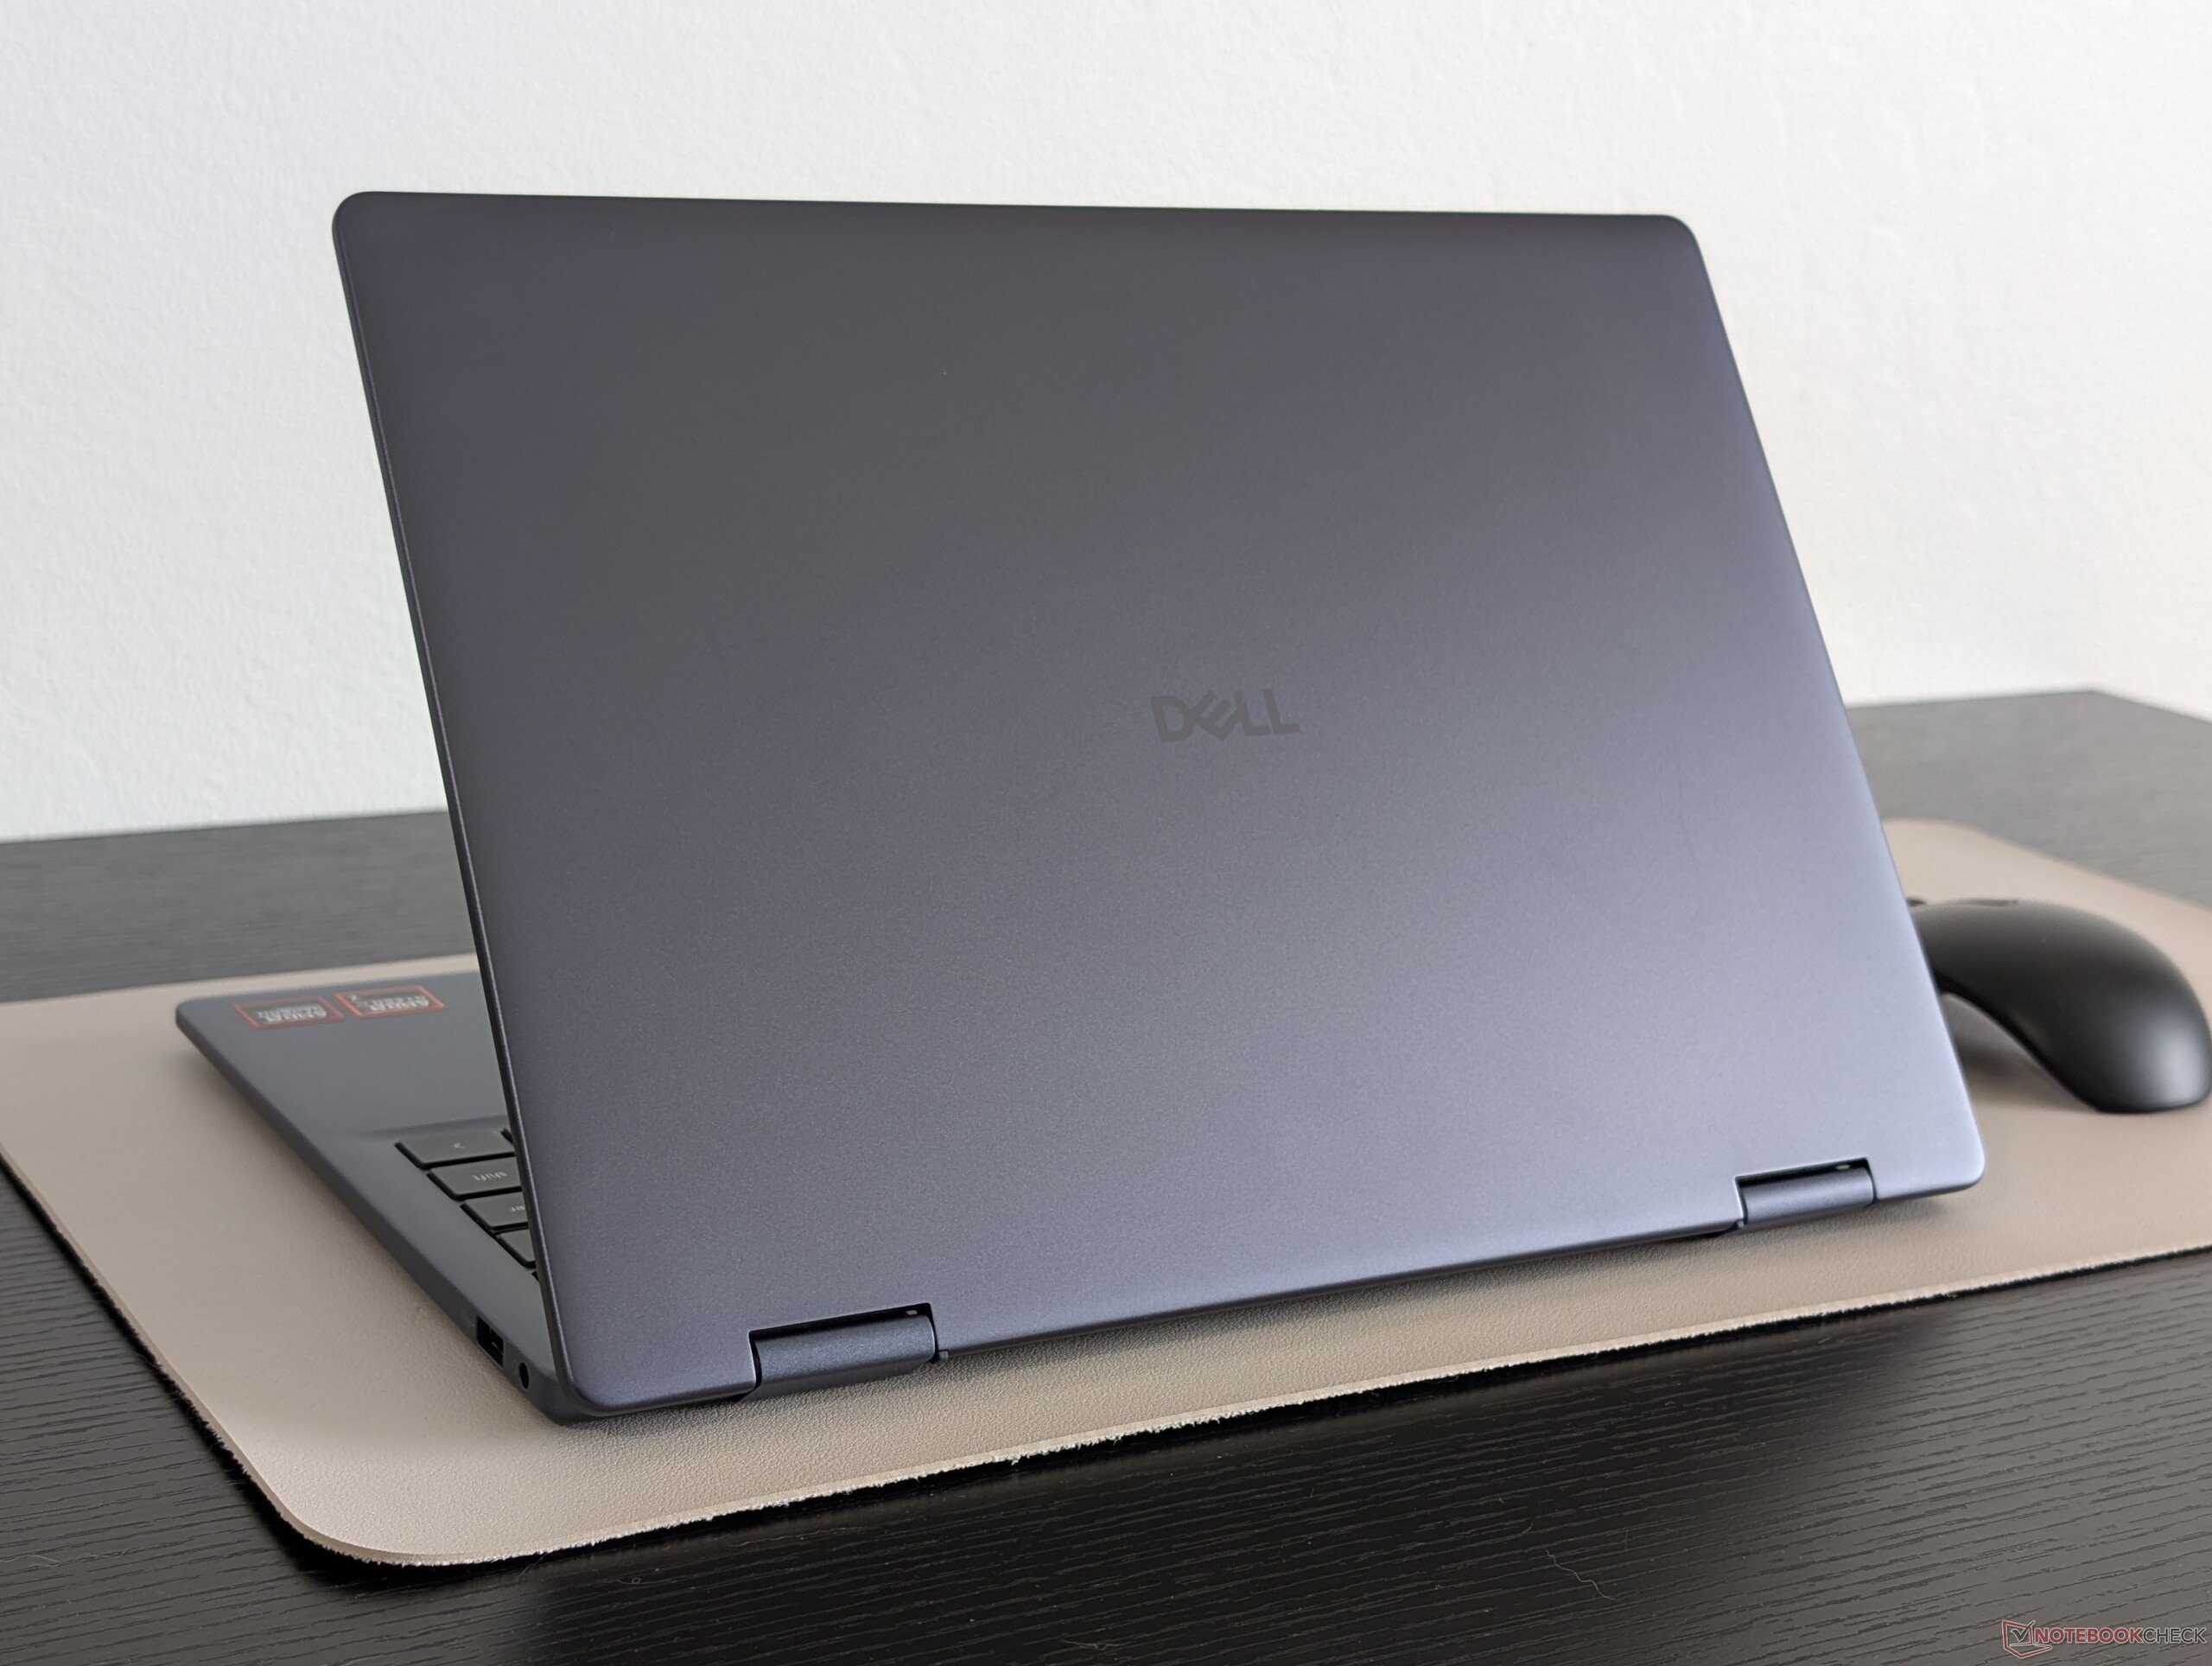
结论--新名称,熟悉的感觉
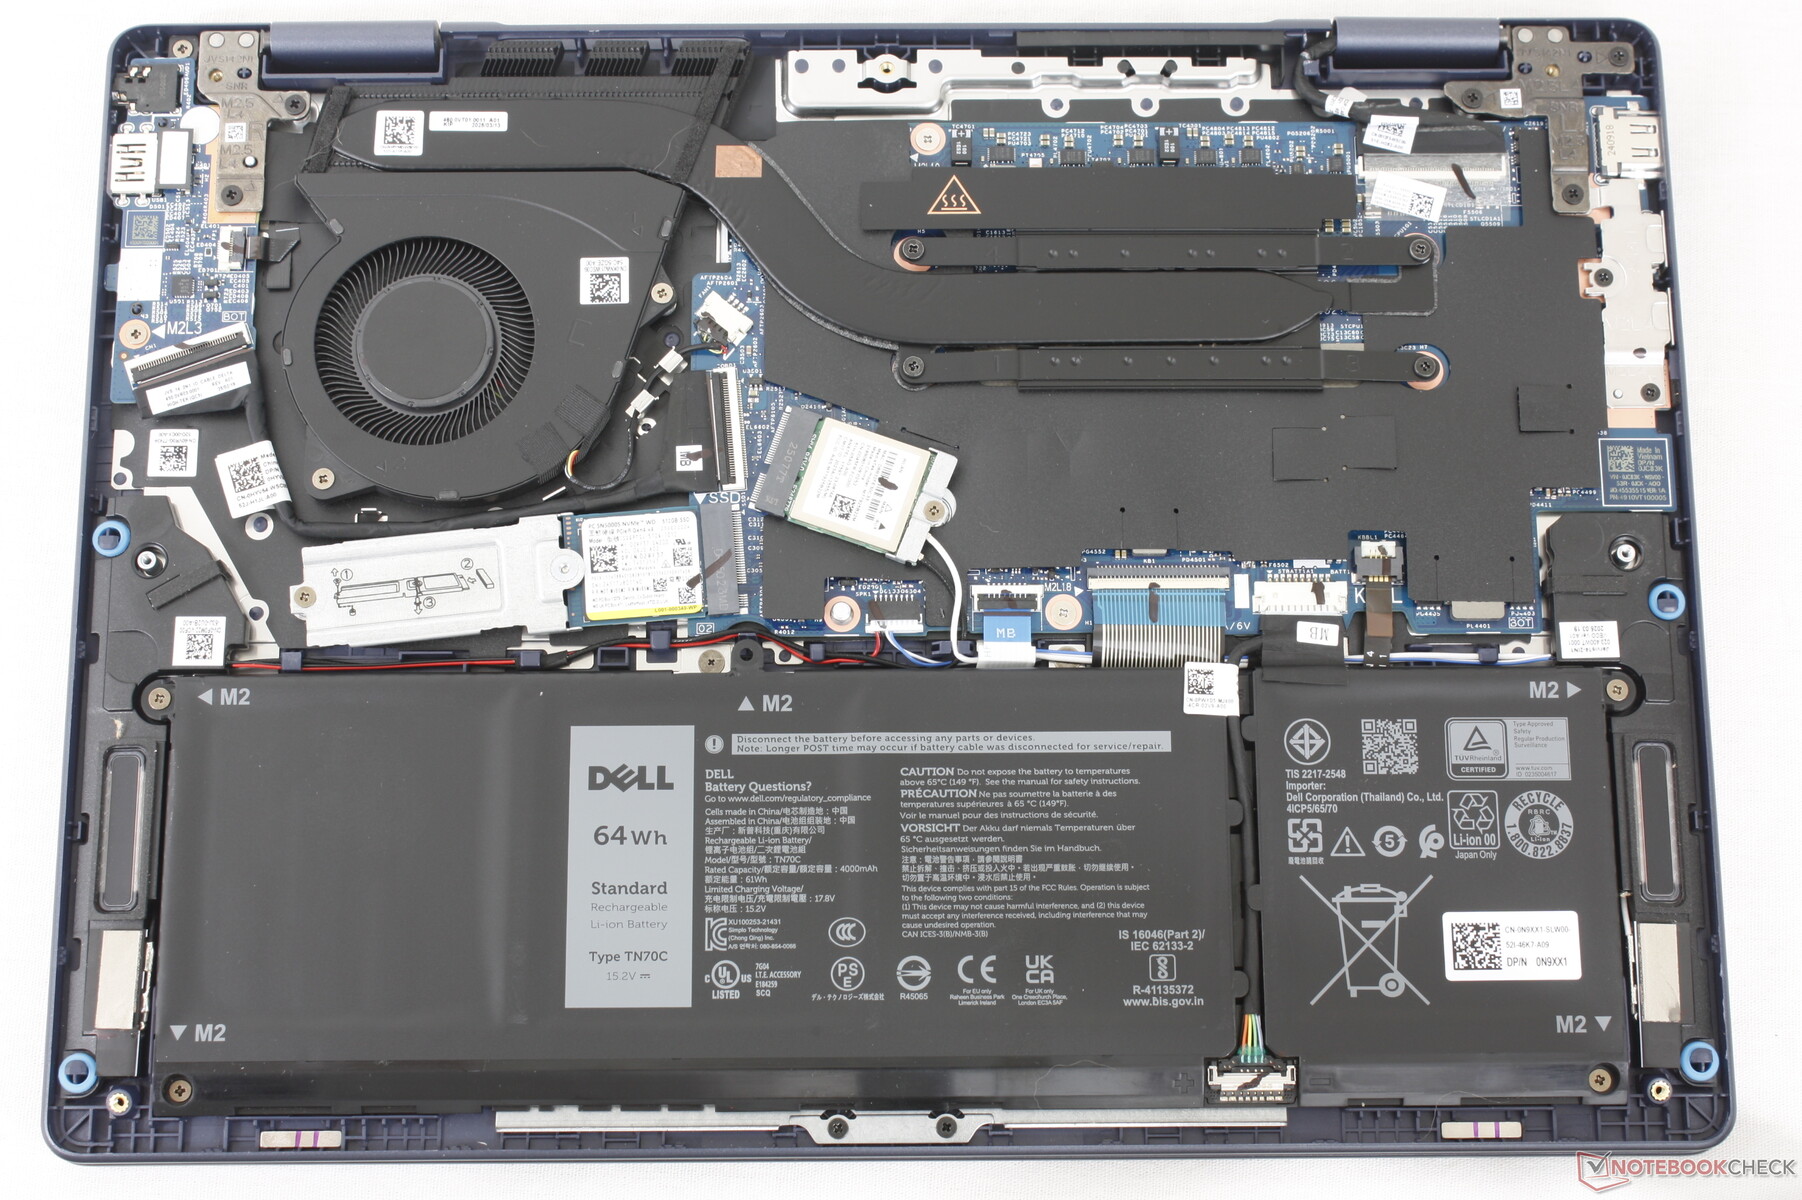
比如面向预算的 戴尔 14 Plus Clamshell对于现有的 Inspiron 用户来说,戴尔 14 Plus 2 合 1 不会感到陌生,因为它的物理特性与去年的 Inspiron 14 7440 2 合 1 系列相比没有太大变化。尽管内存采用了焊接式设计,端口数量也比以前少了,但整体重量仍基本保持不变。因此,对人工智能加速没有需求的买家会发现,去年的 Inspiron 14 7445 2-in-1 以更低的价格提供了几乎相同的用户体验。
对戴尔 14 Plus 2 合 1 感兴趣的买家应谨慎选择英特尔或 AMD 配置。前者提供 Thunderbolt 4、更快的图形处理性能和更长的电池续航时间,而后者则在原始多线程处理器性能方面表现出色。不过,所有选项都仅限于 1200p IPS 触摸屏,没有完整的 sRGB 选项。
Pros
Cons
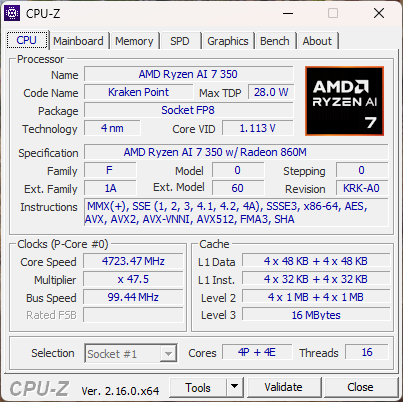
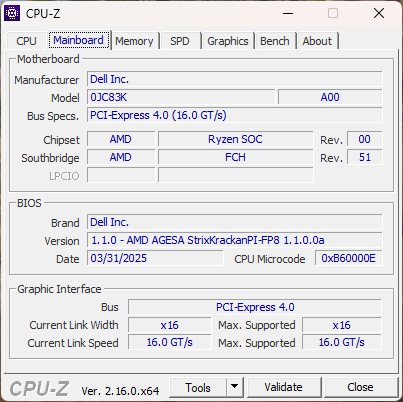
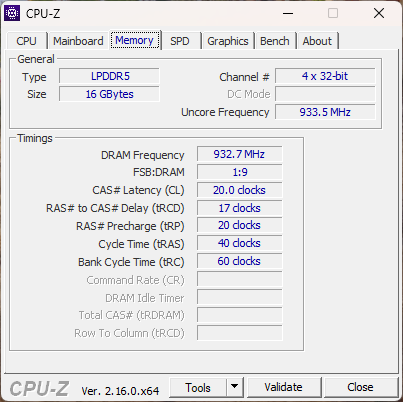
戴尔 14 Plus 2 合 1 继承了老一代经济型 Inspiron 14 2 合 1 产品线。我们的测试机是搭载 Ryzen AI 7 350 的高端配置,价格约为 1100 美元,但 Ryzen AI 5 340 配置的起价为 950 美元。1200p 触摸屏在 AMD 产品系列中保持不变。
该机型还有更贵的英特尔版本,从酷睿Ultra 5 226V到酷睿Ultra 9 288V。
戴尔 14 Plus 2 合 1 的替代产品包括其他可负担得起的 14 英寸可转换机型,如 联想 IdeaPad 5 2 合 1或 华硕 VivoBook Flip.
更多戴尔评论:
规格
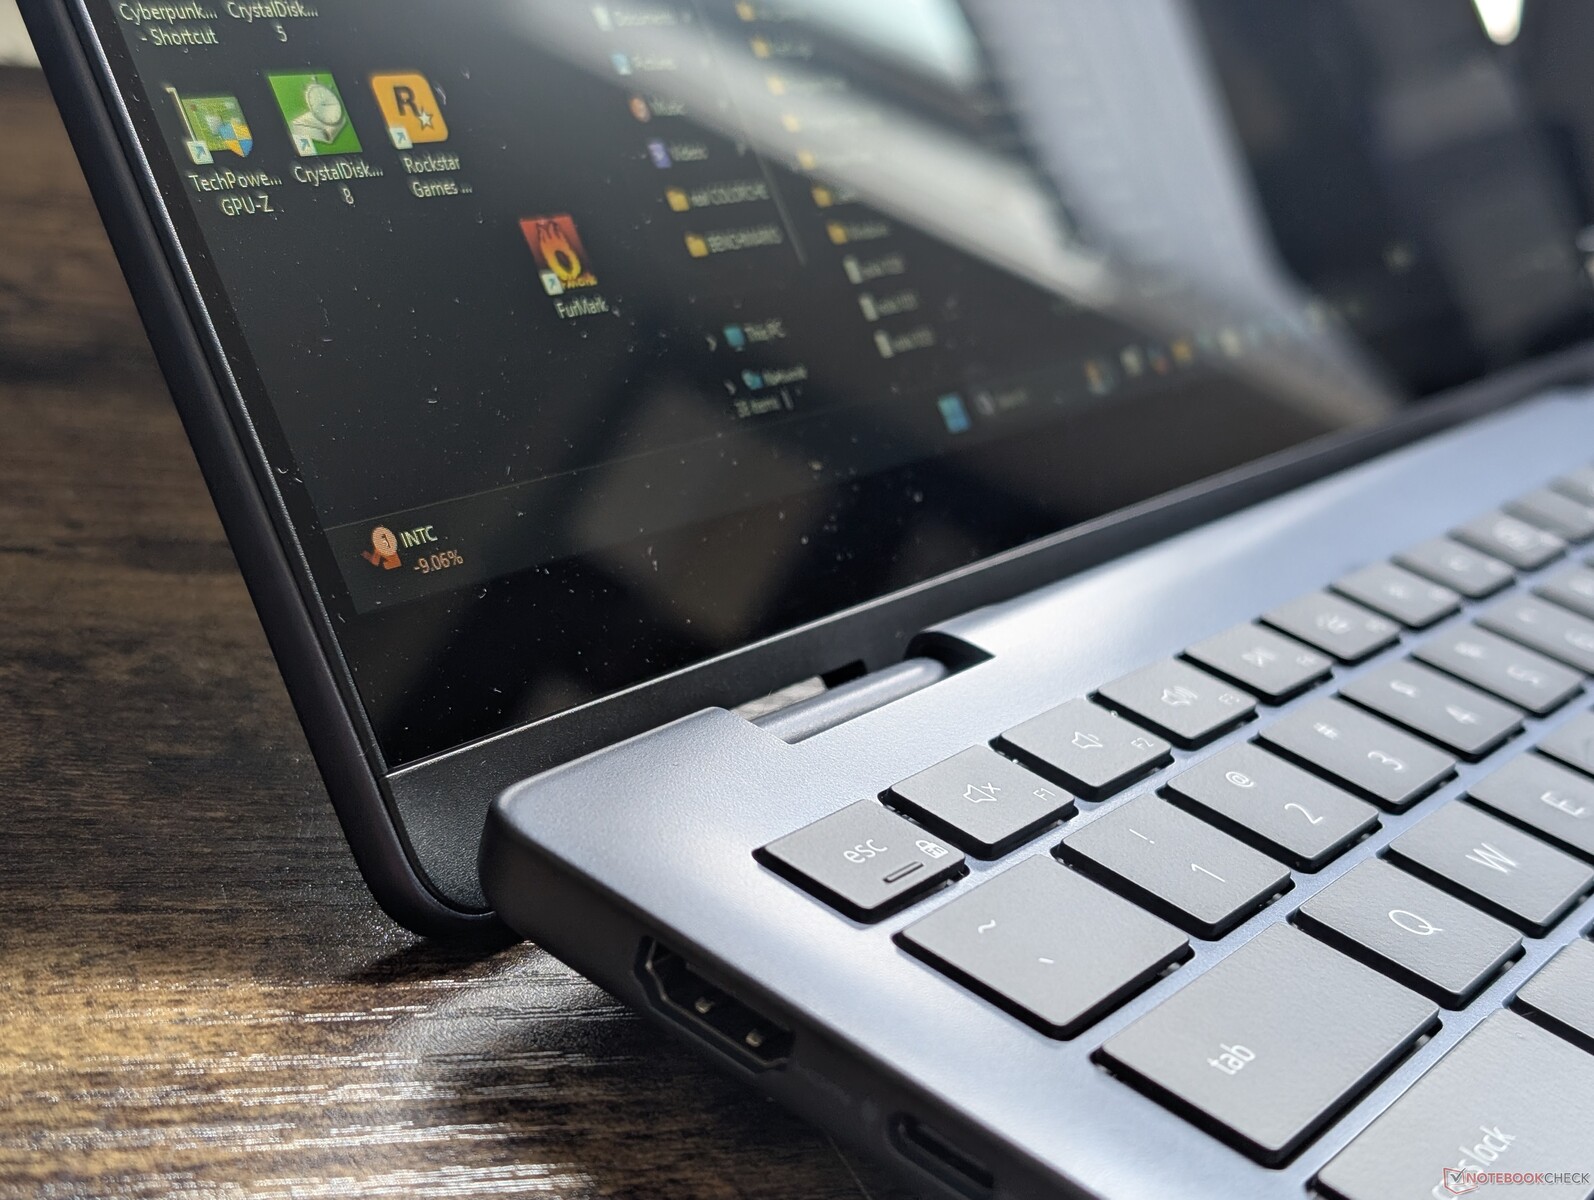
案例
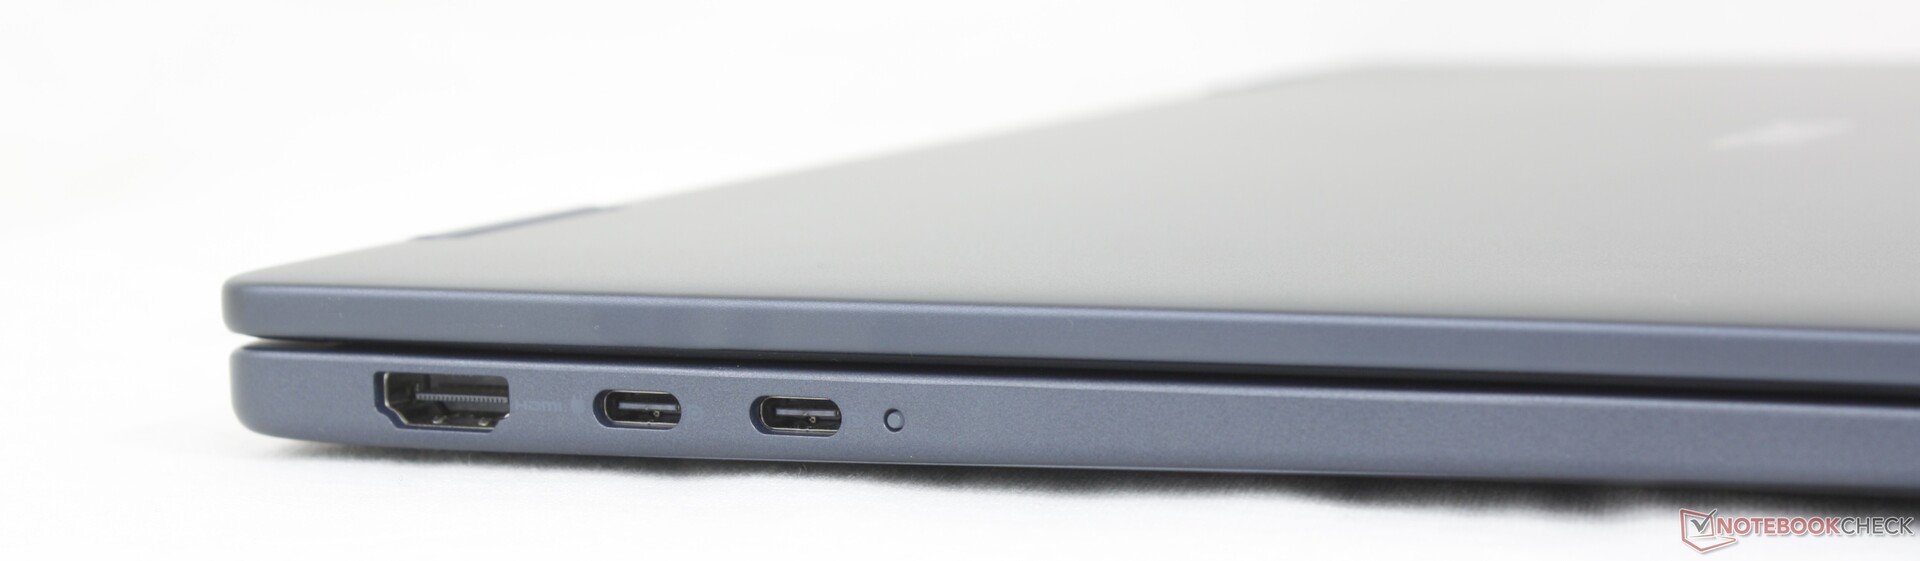
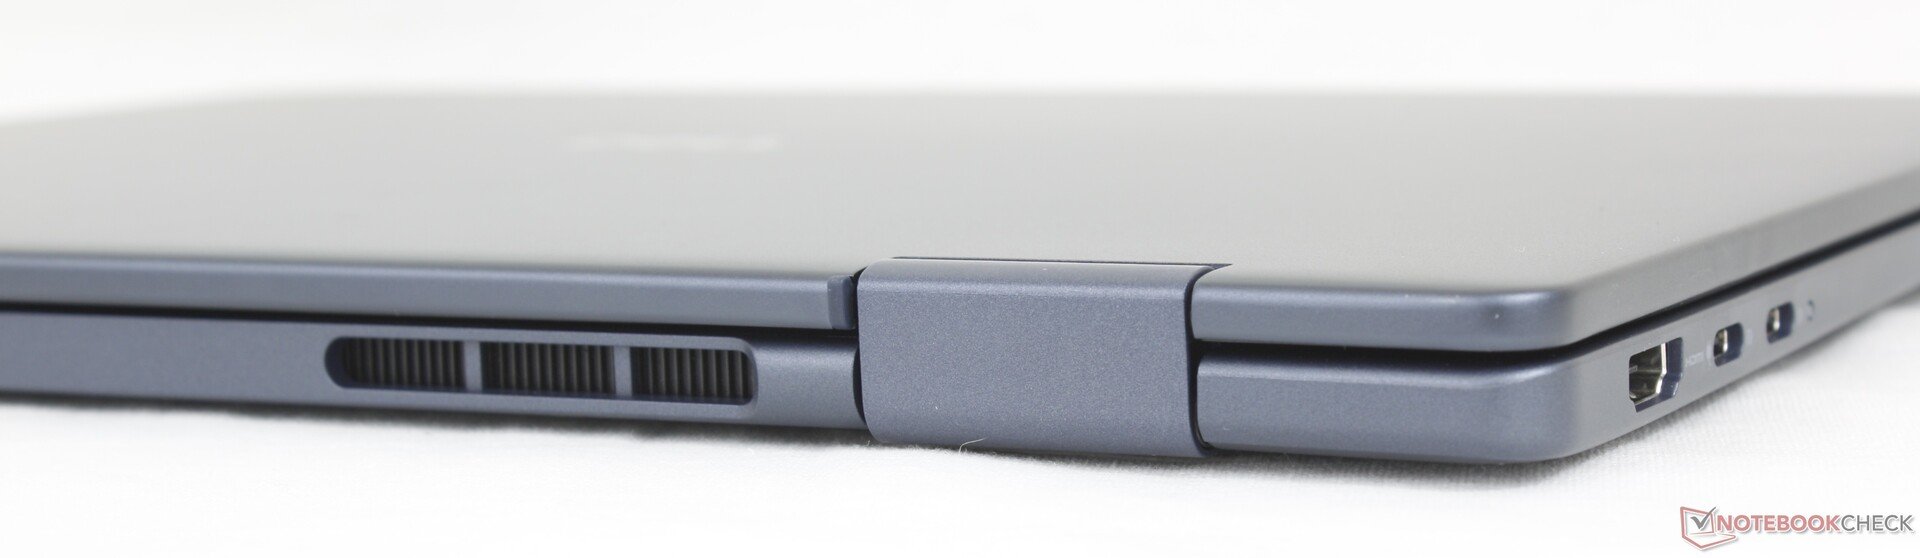
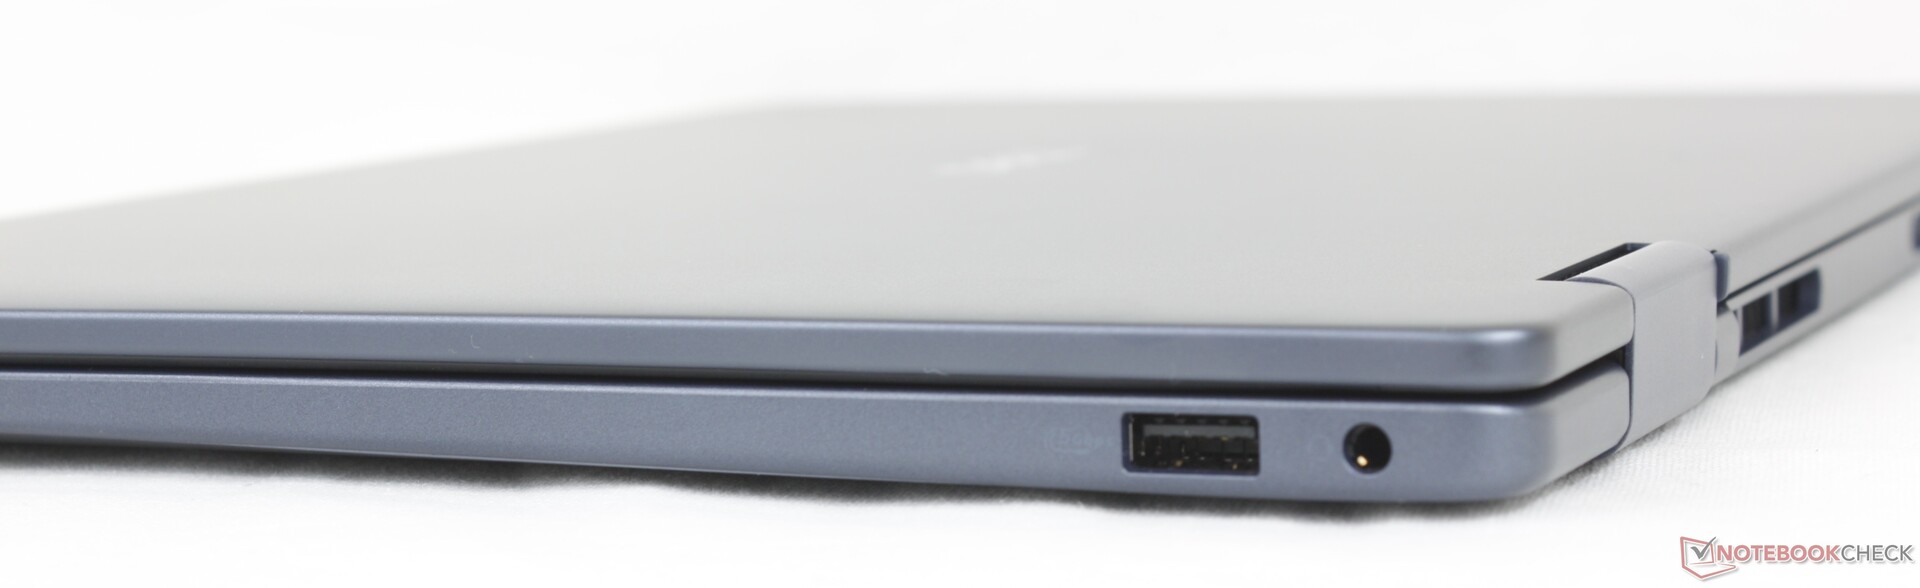
连接性
请记住,英特尔版本的该机型支持 HDMI 2.1 和 Thunderbolt 4(40 Gbps)设备,而我们的 AMD 版本仅支持 HDMI 1.4 和 USB-C(10 Gbps)。
交流
| Networking | |
| iperf3 transmit AX12 | |
| Asus ZenBook Flip 14 UN5401QA-KN085W | |
| iperf3 receive AX12 | |
| Asus ZenBook Flip 14 UN5401QA-KN085W | |
| iperf3 transmit AXE11000 | |
| Lenovo Yoga 7 2-in-1 14AHP9 Arctic Grey | |
| Acer Aspire Spin 14 ASP14-52MTN-51V5 | |
| Dell Inspiron 14 7445 2-in-1 | |
| Dell 14 Plus 2-in-1 | |
| iperf3 receive AXE11000 | |
| Lenovo Yoga 7 2-in-1 14AHP9 Arctic Grey | |
| Acer Aspire Spin 14 ASP14-52MTN-51V5 | |
| Lenovo IdeaPad 5 2-in-1 14AKP10 83KT0033GE | |
| Dell 14 Plus 2-in-1 | |
| Dell Inspiron 14 7445 2-in-1 | |
| iperf3 transmit AXE11000 6GHz | |
| Dell 14 Plus 2-in-1 | |
| Dell Inspiron 14 7445 2-in-1 | |
| iperf3 receive AXE11000 6GHz | |
| Lenovo IdeaPad 5 2-in-1 14AKP10 83KT0033GE | |
| Dell 14 Plus 2-in-1 | |
| Dell Inspiron 14 7445 2-in-1 | |
网络摄像头


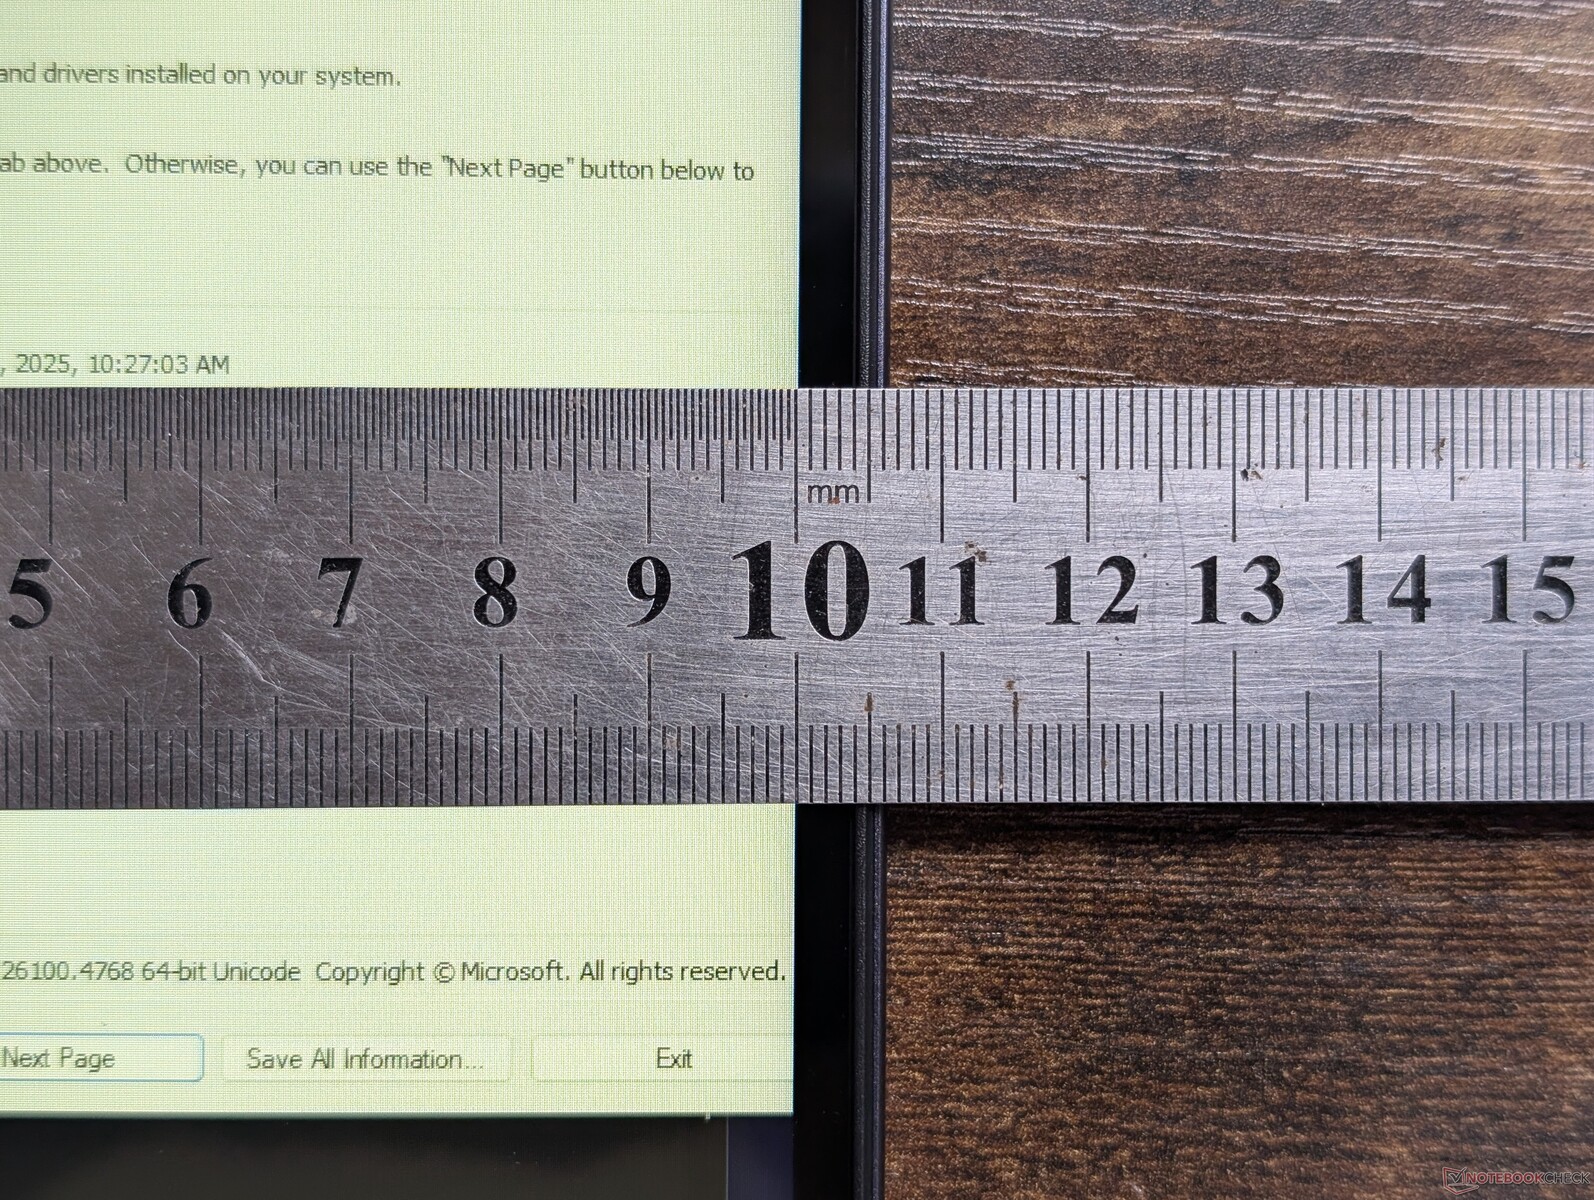
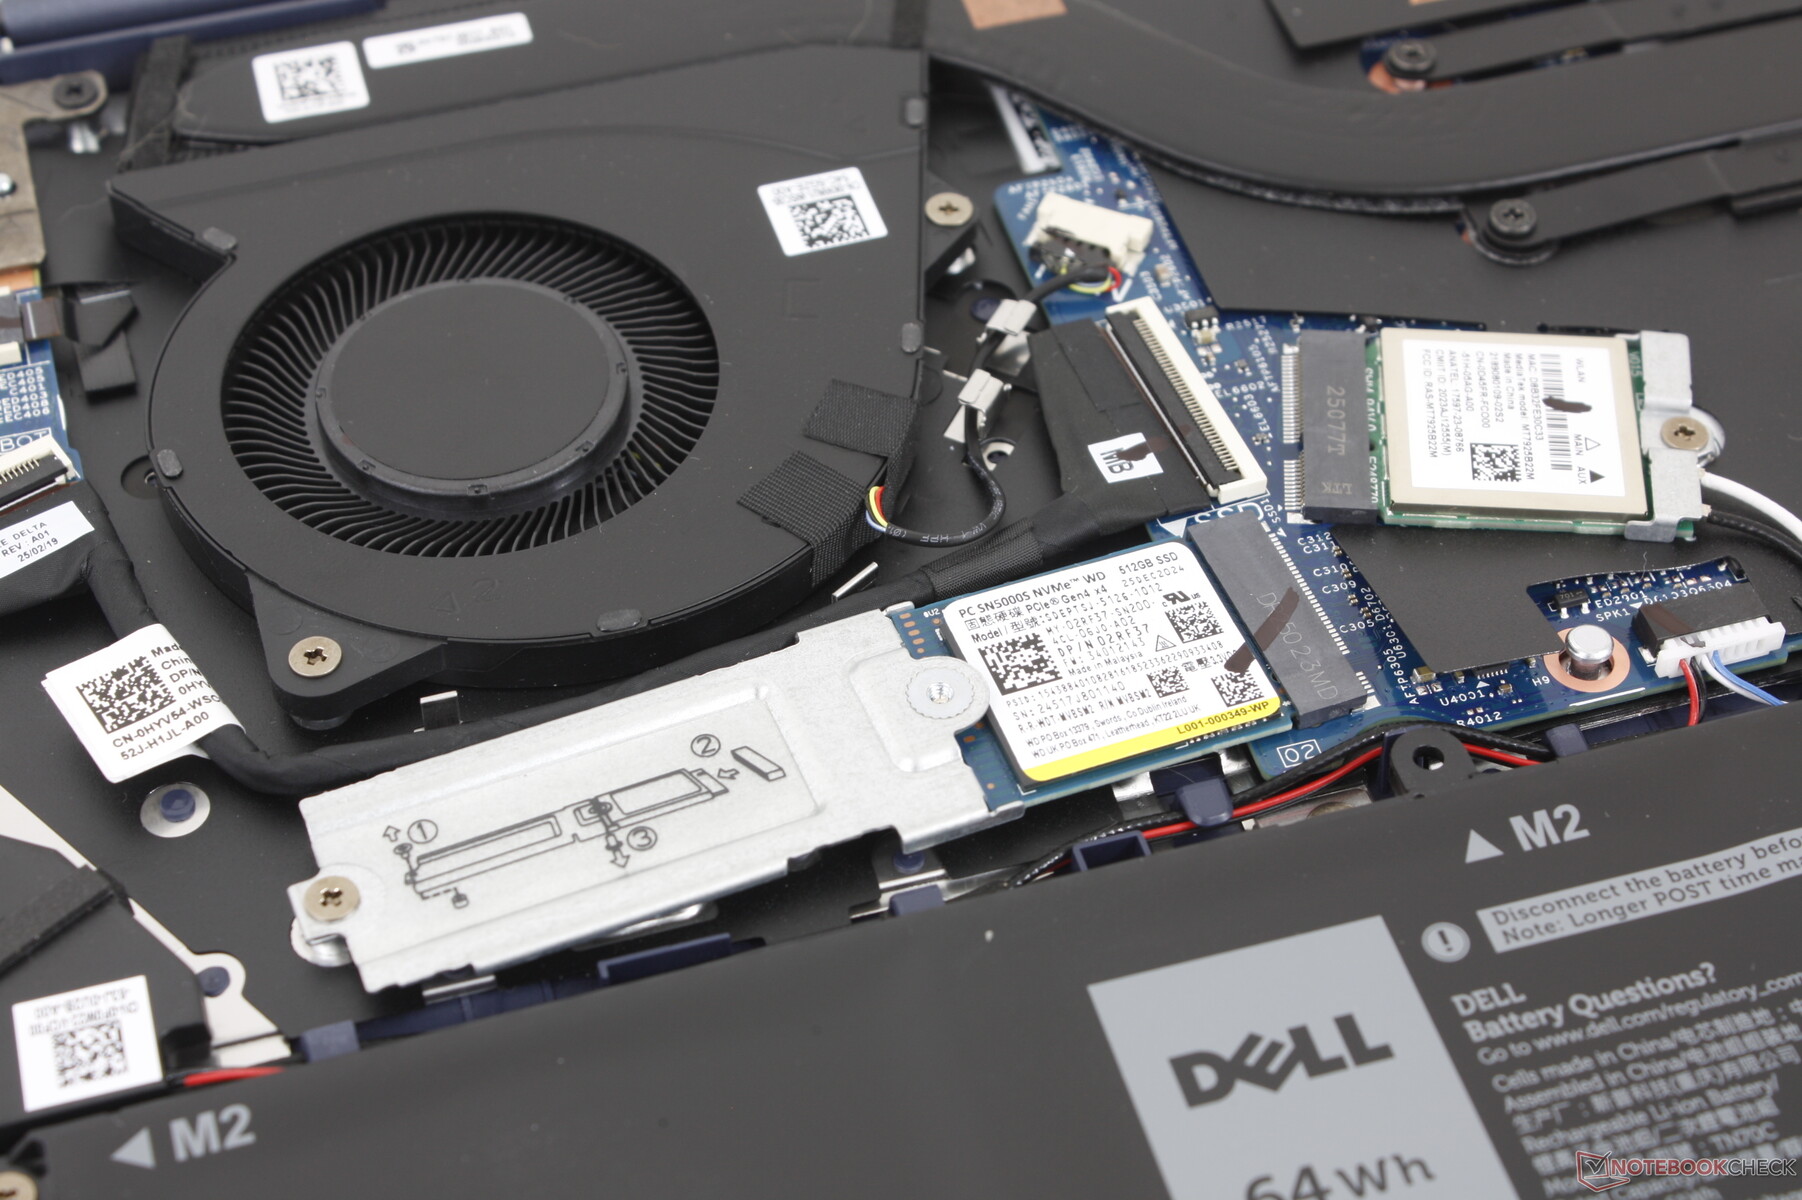
维护
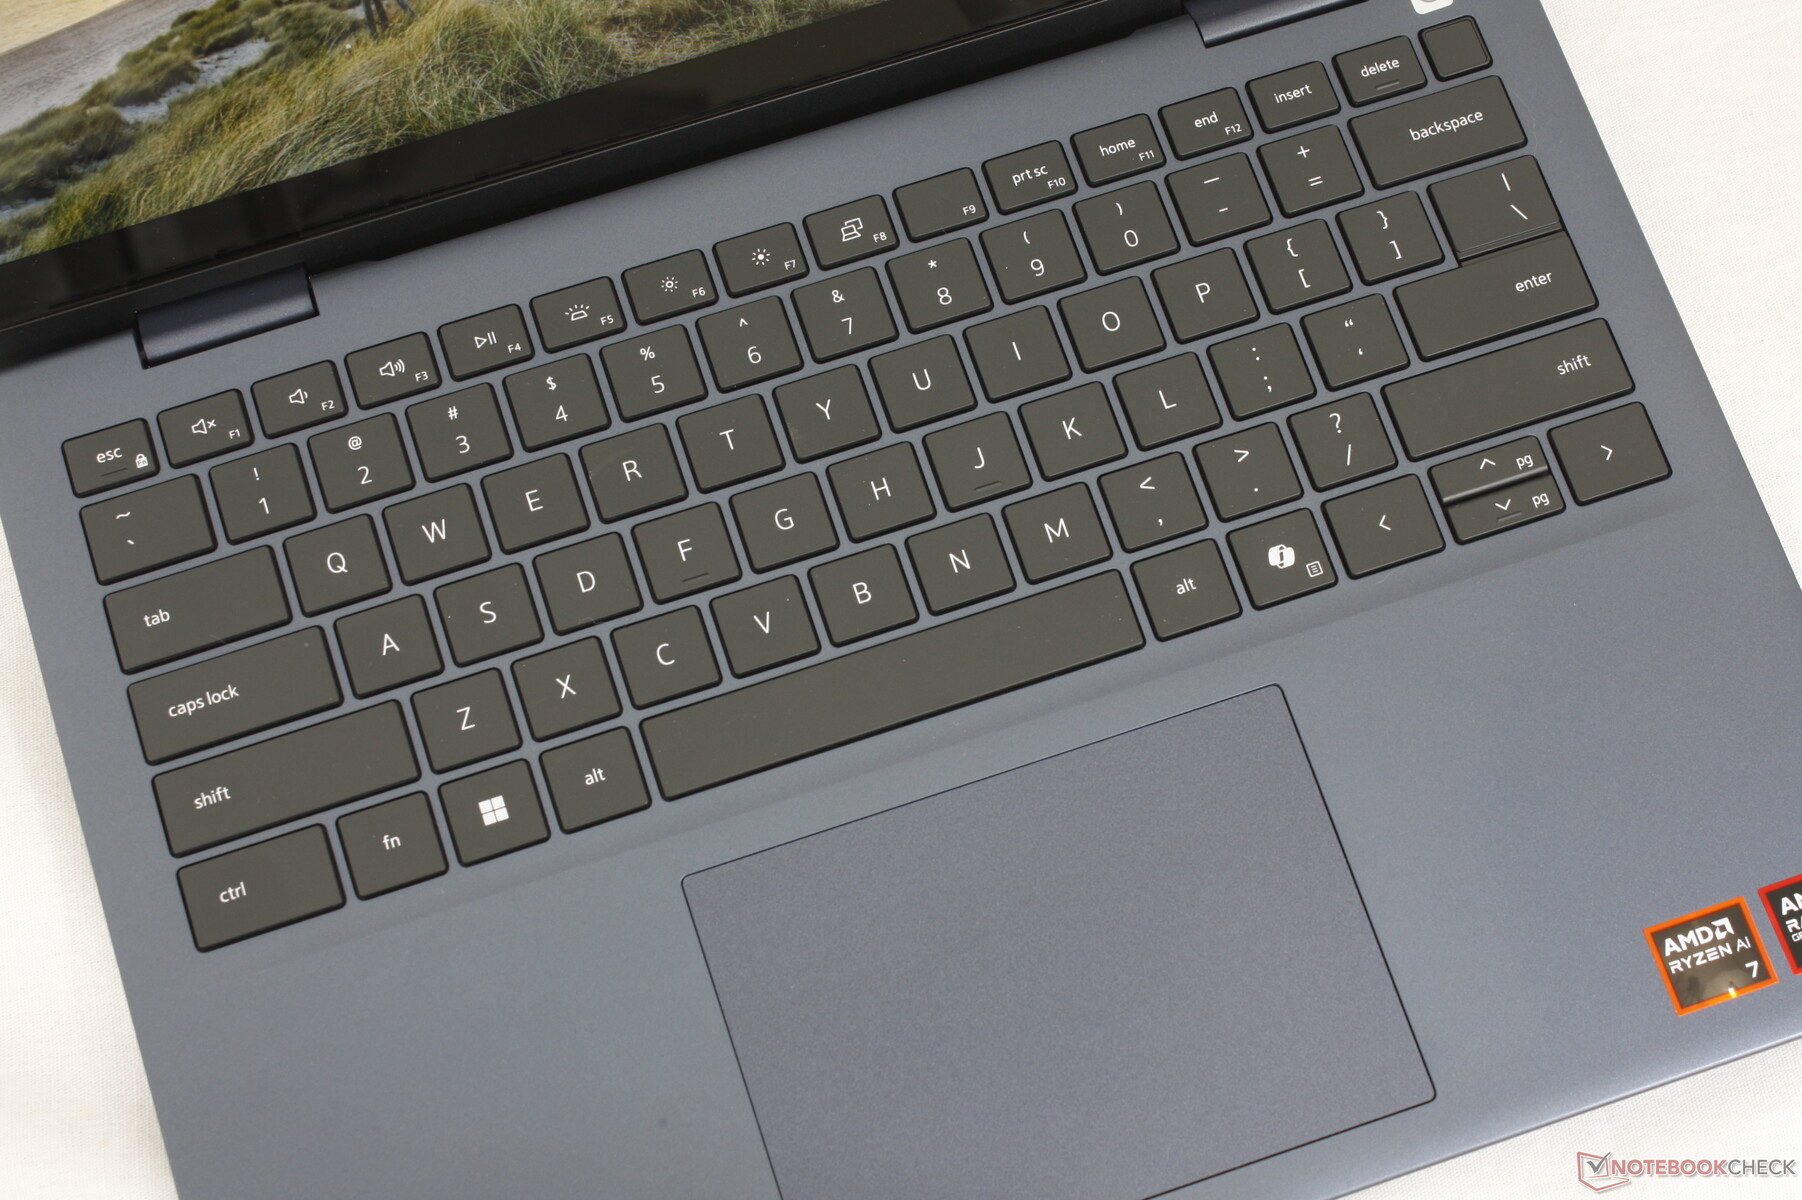
输入设备
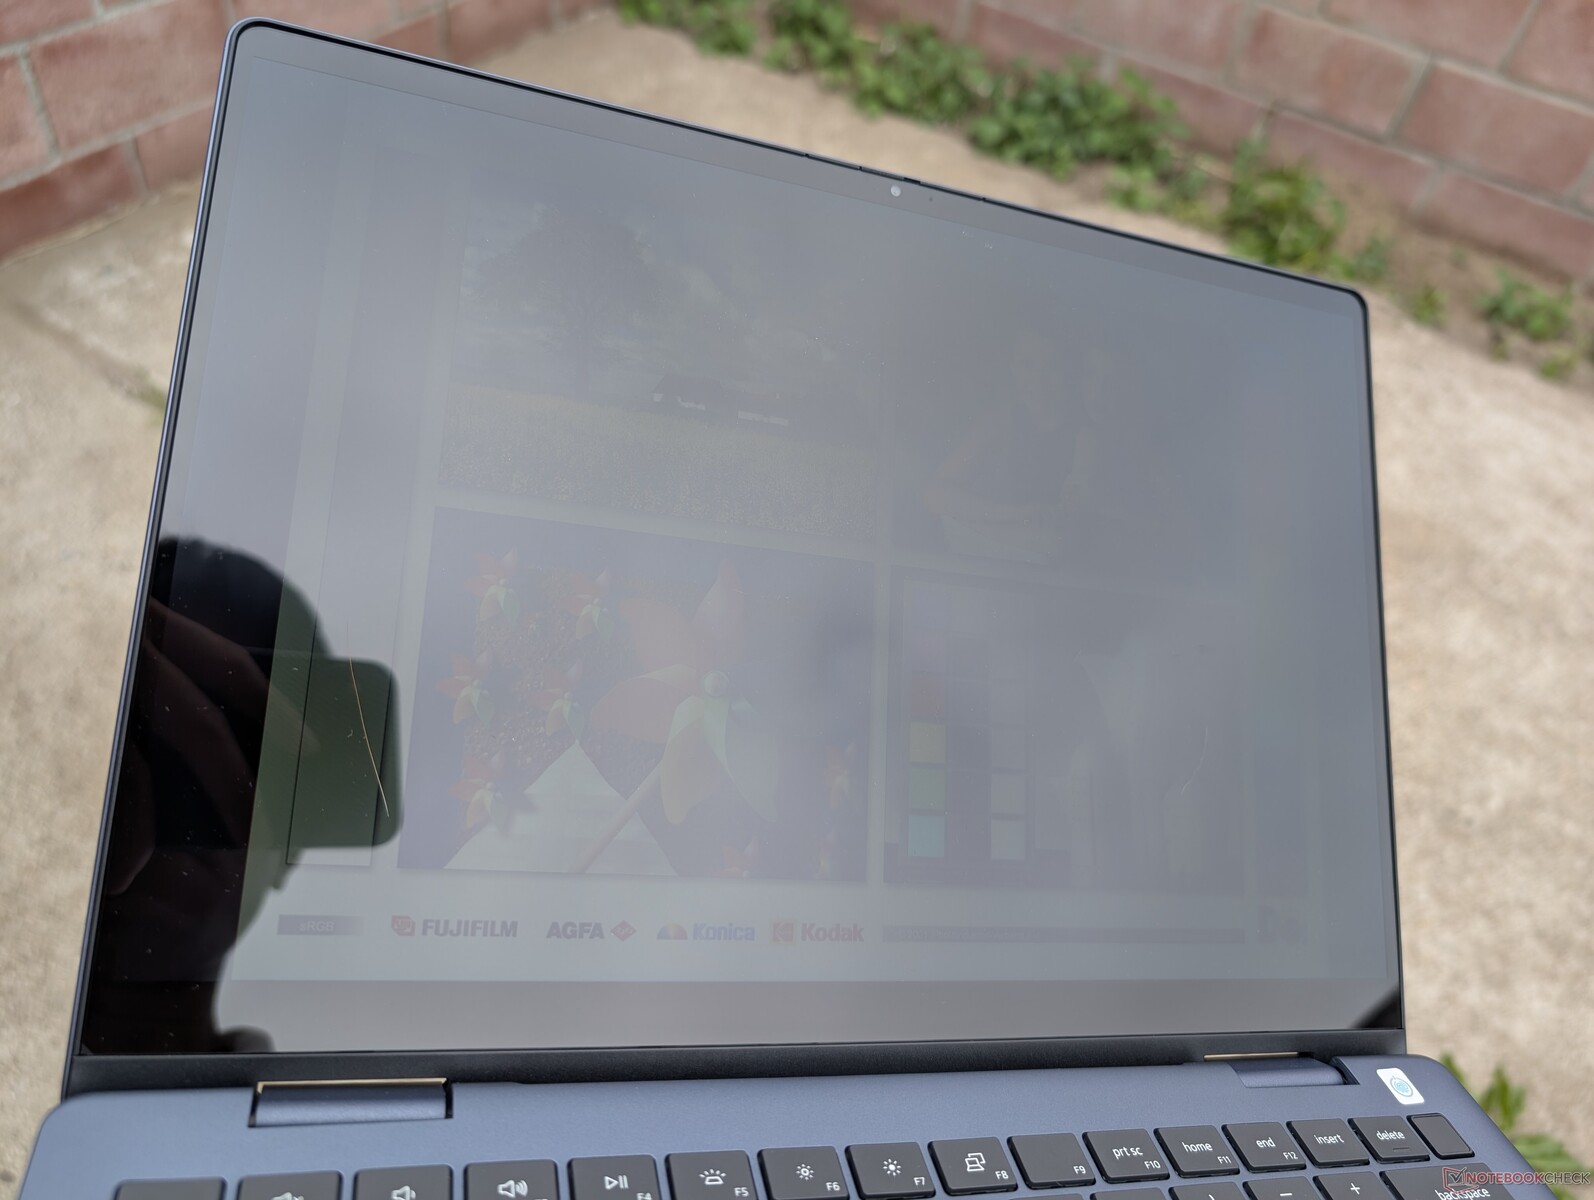
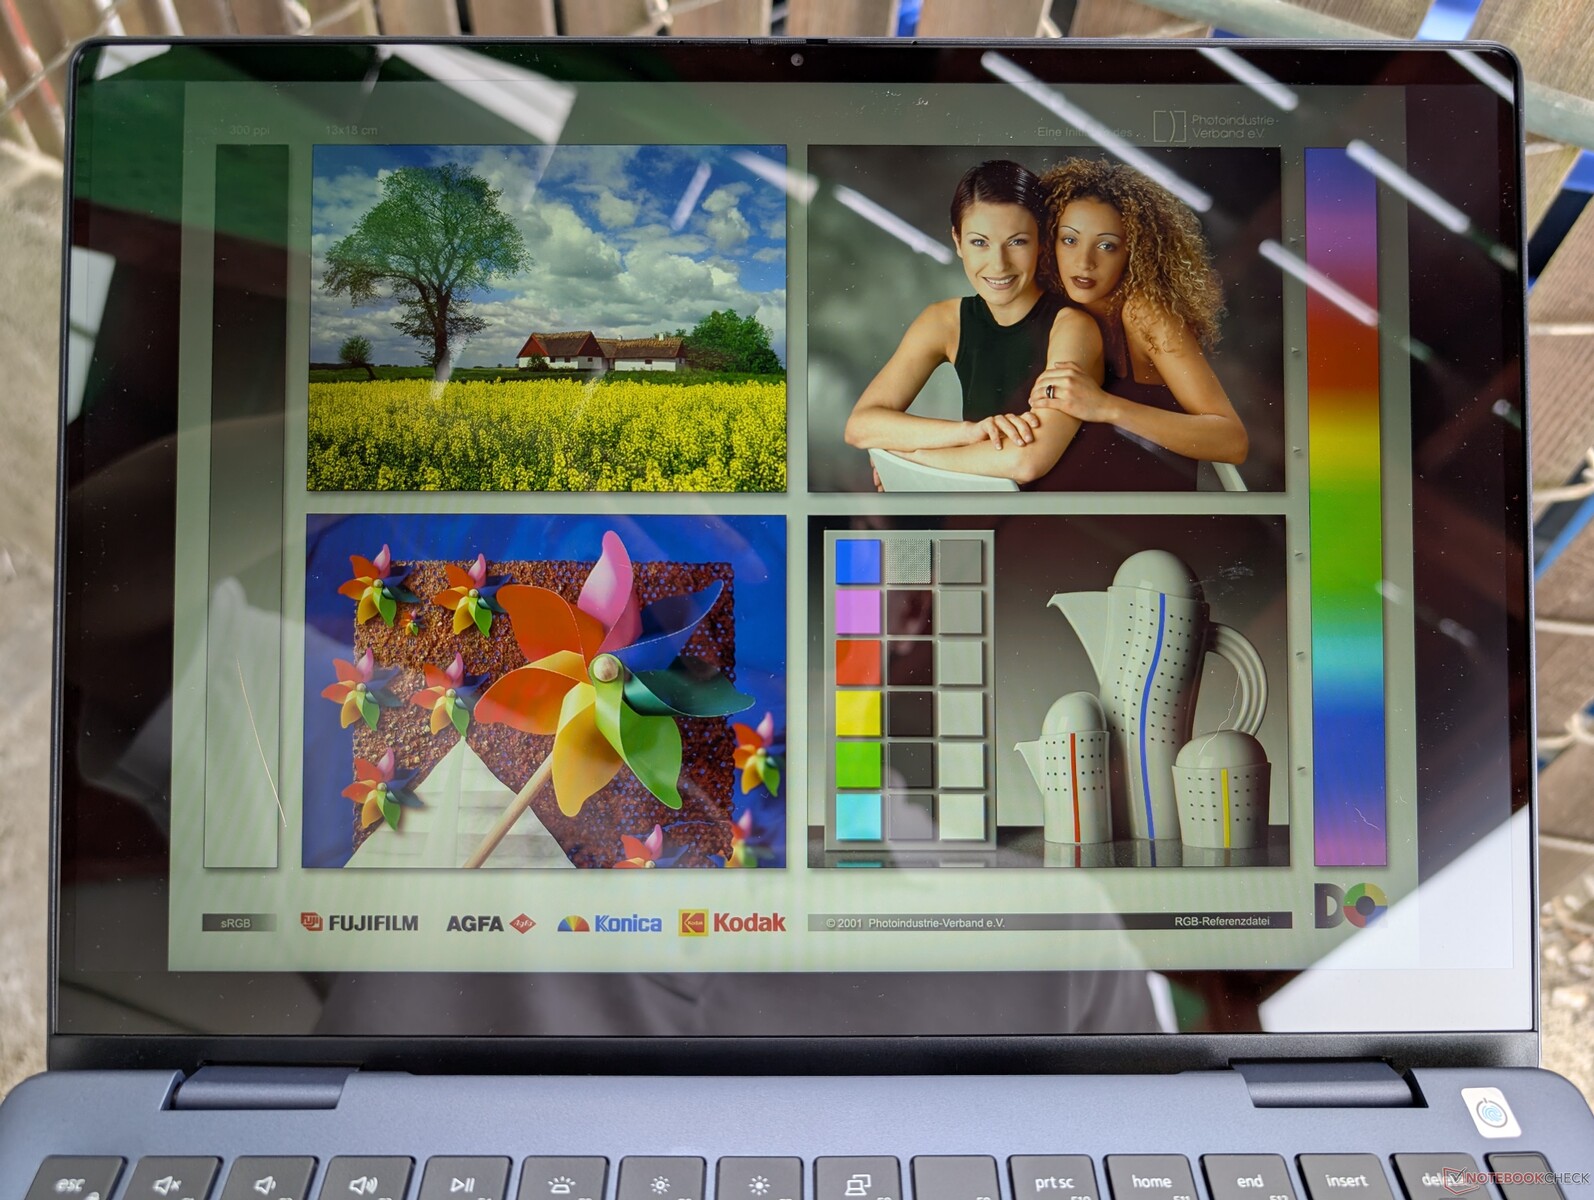
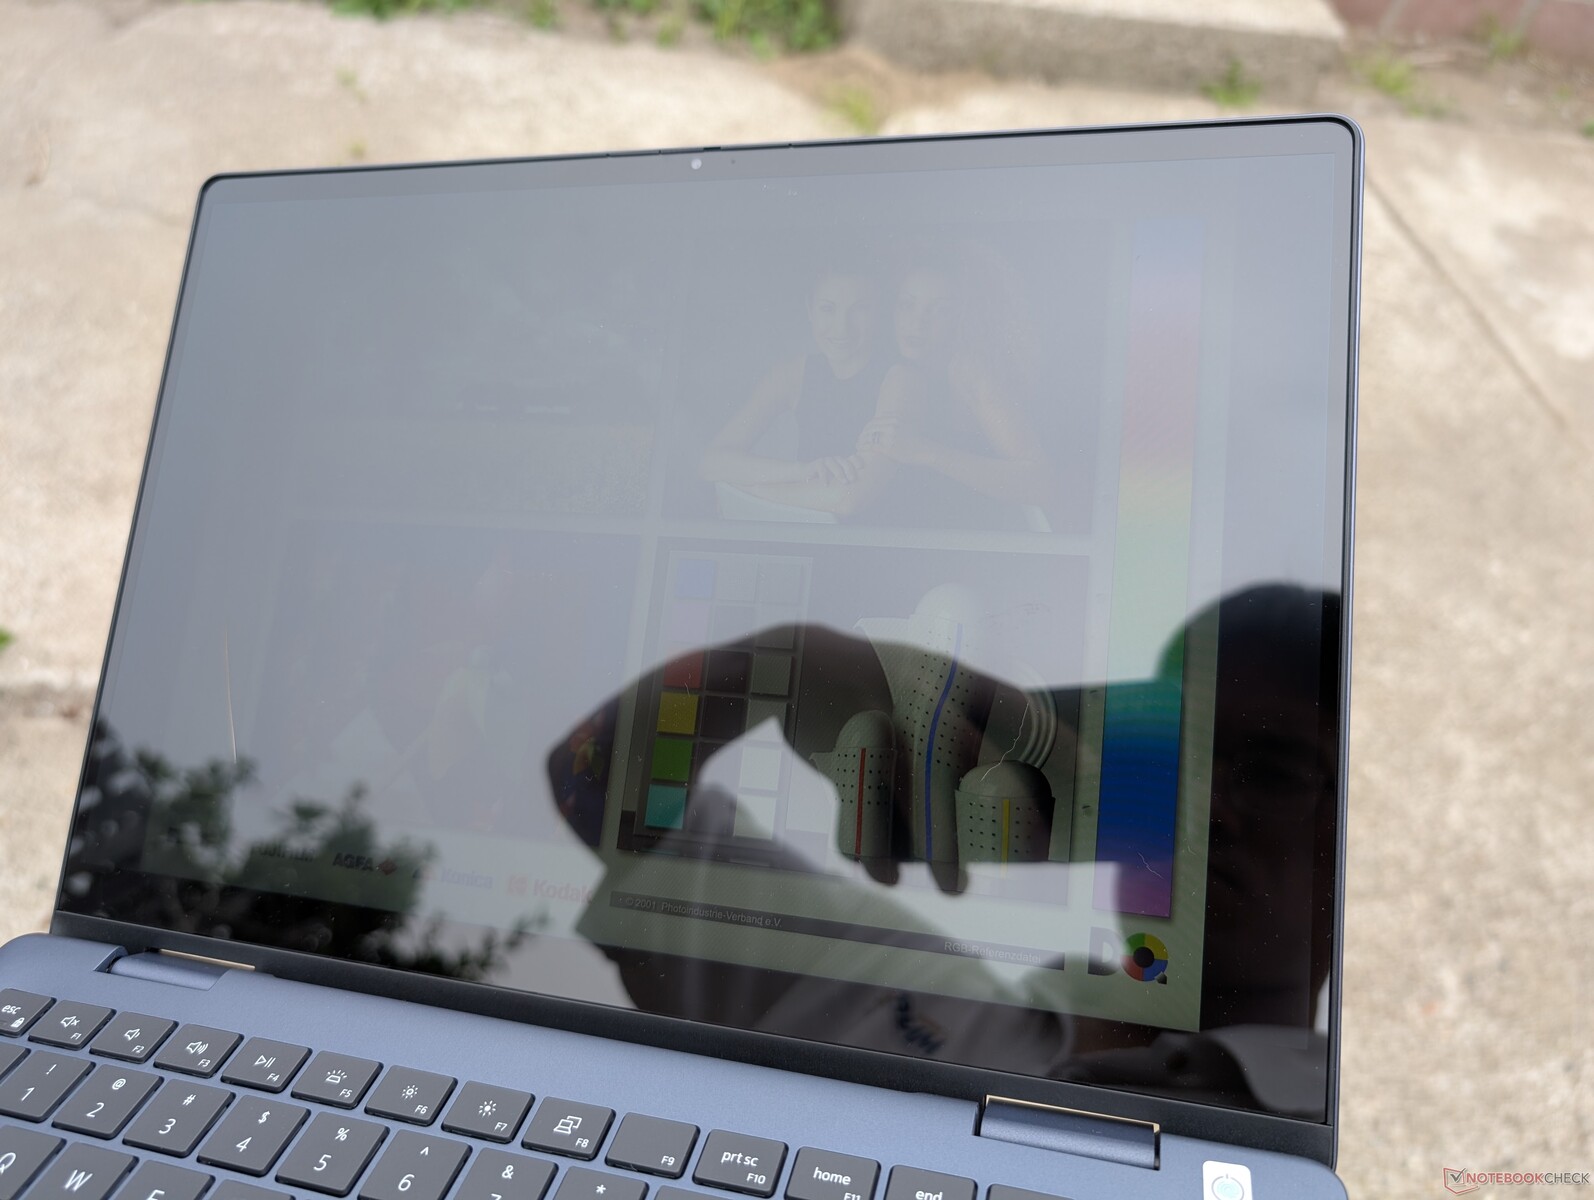
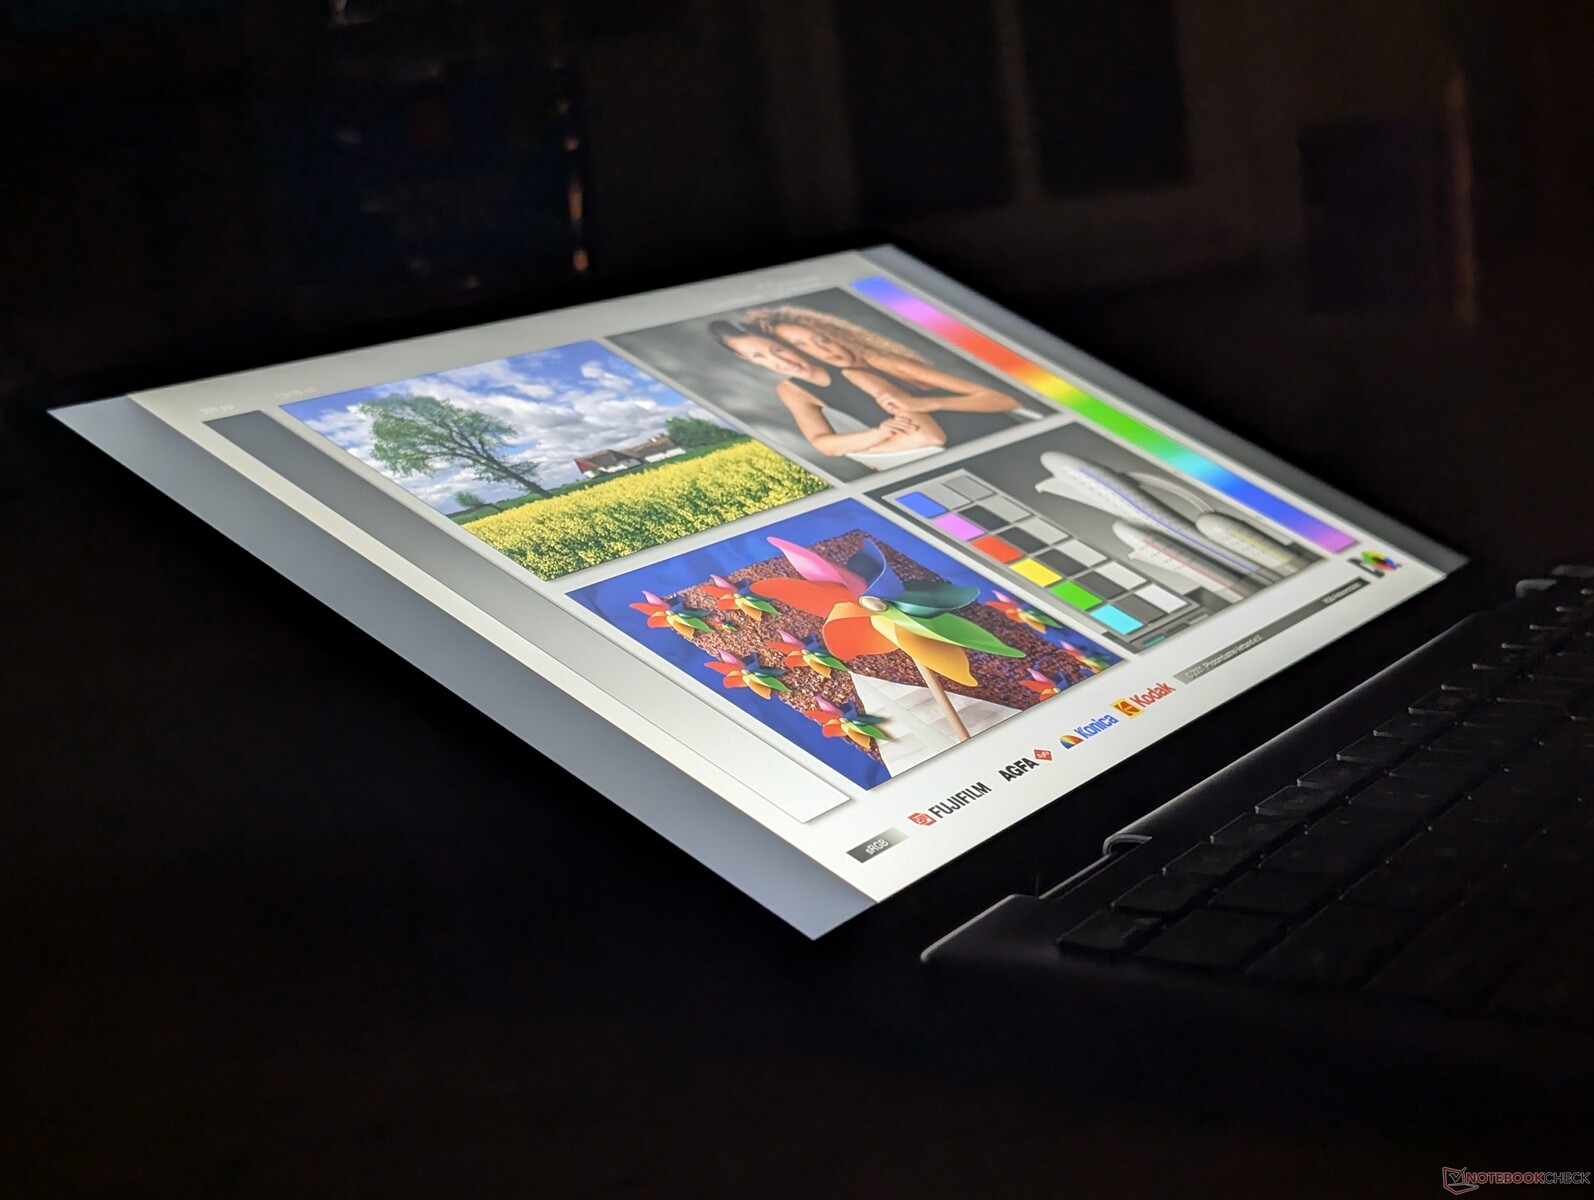
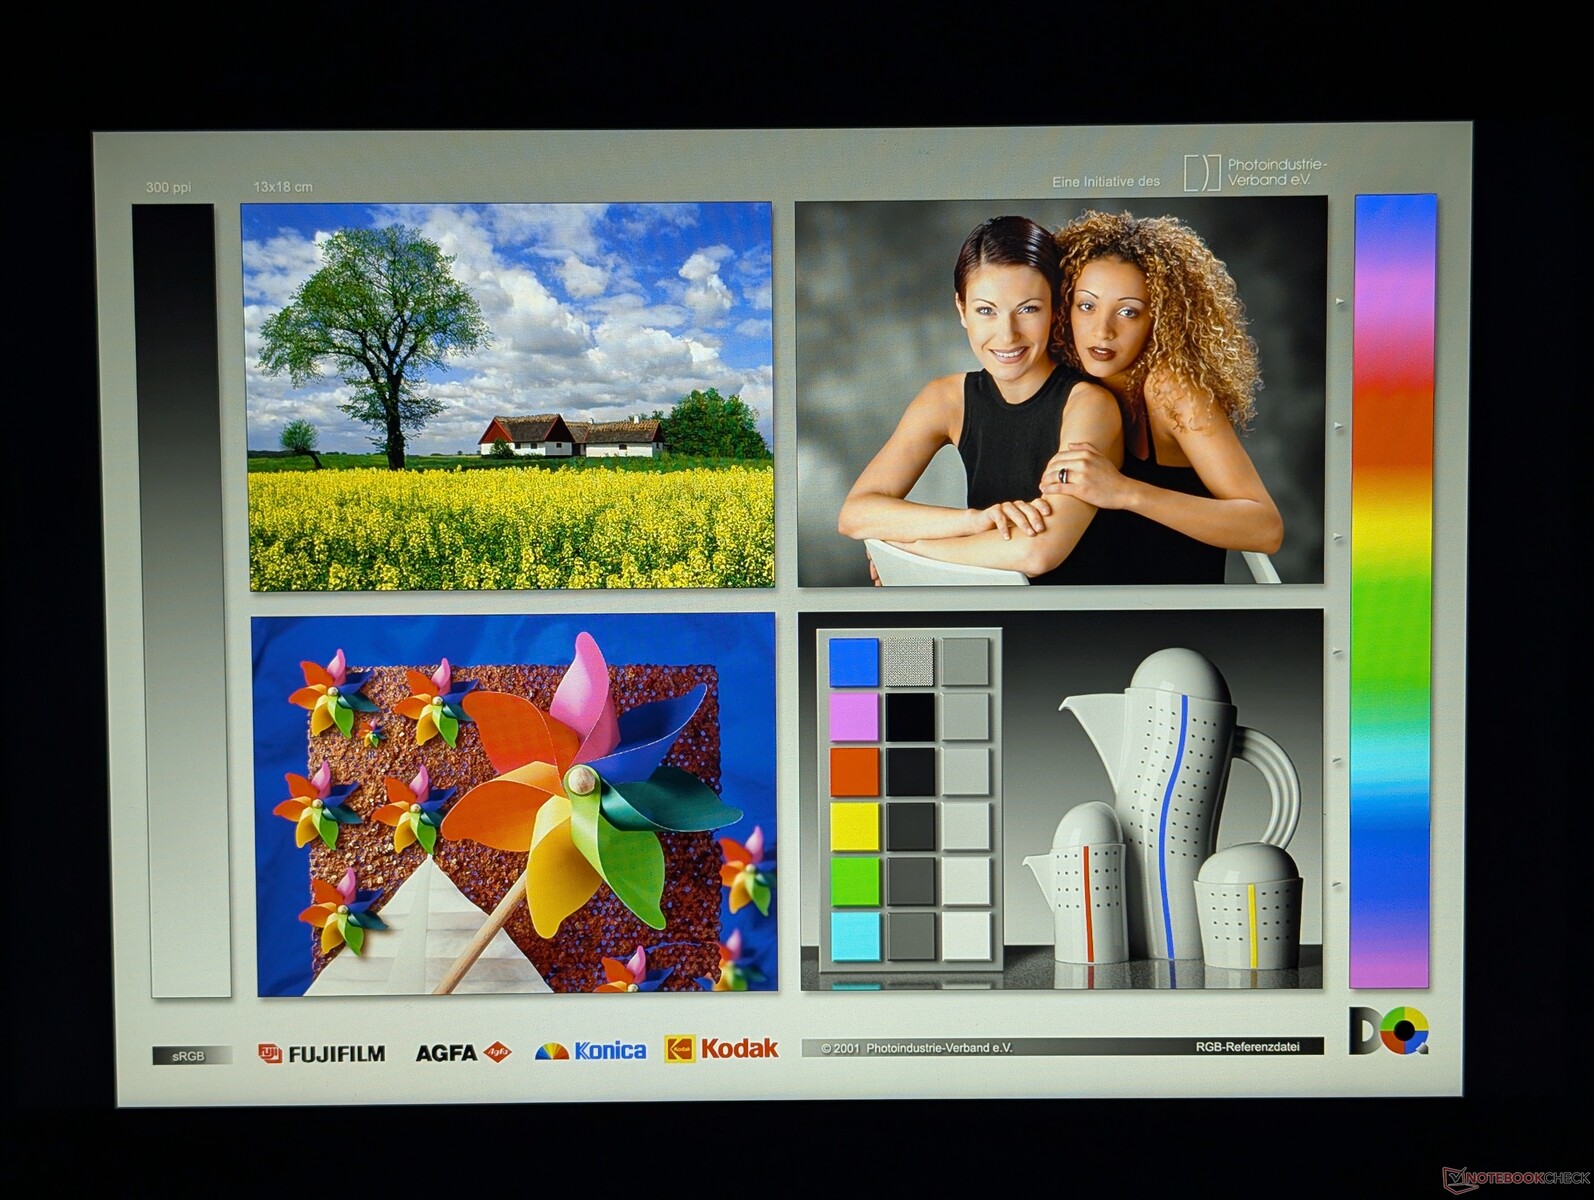
显示屏


| |||||||||||||||||||||||||
Brightness Distribution: 93 %
Center on Battery: 317.2 cd/m²
Contrast: 1269:1 (Black: 0.25 cd/m²)
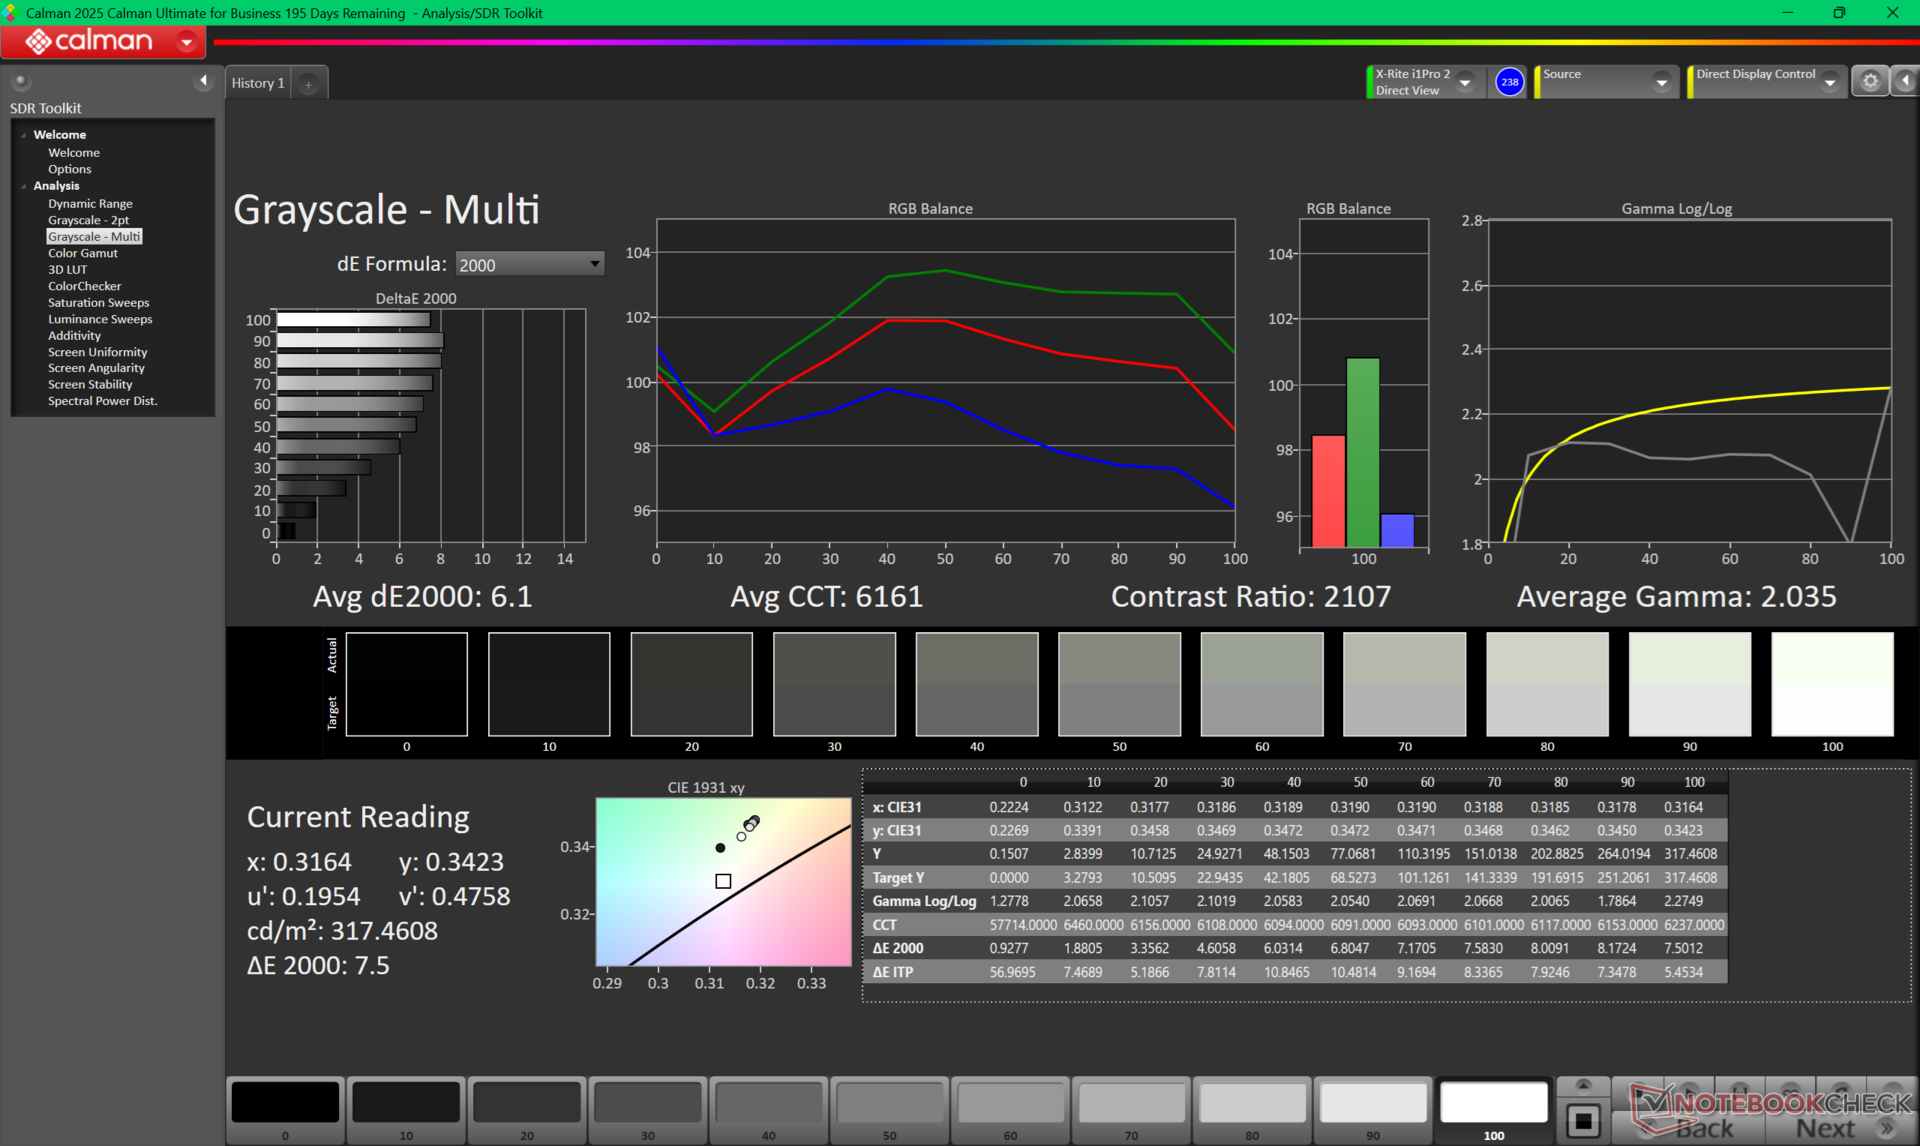
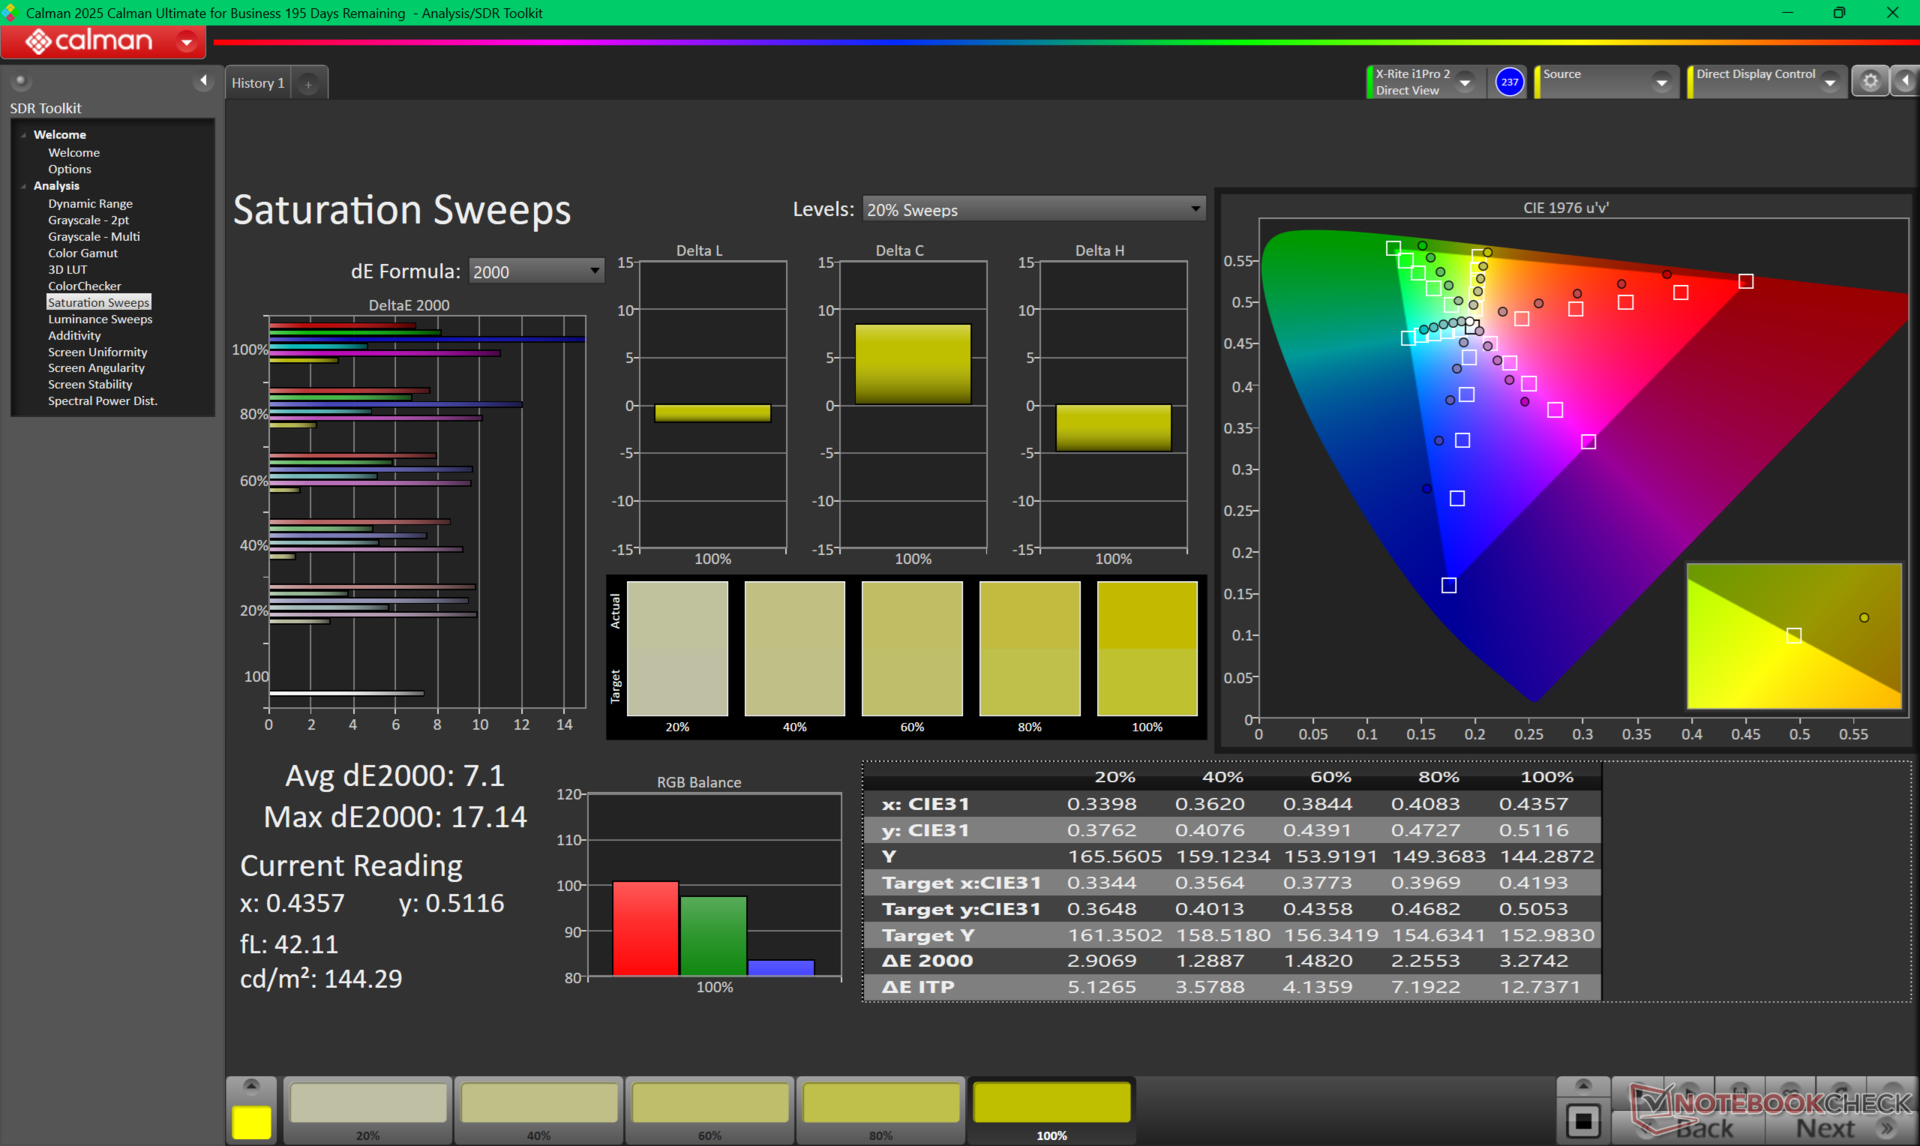
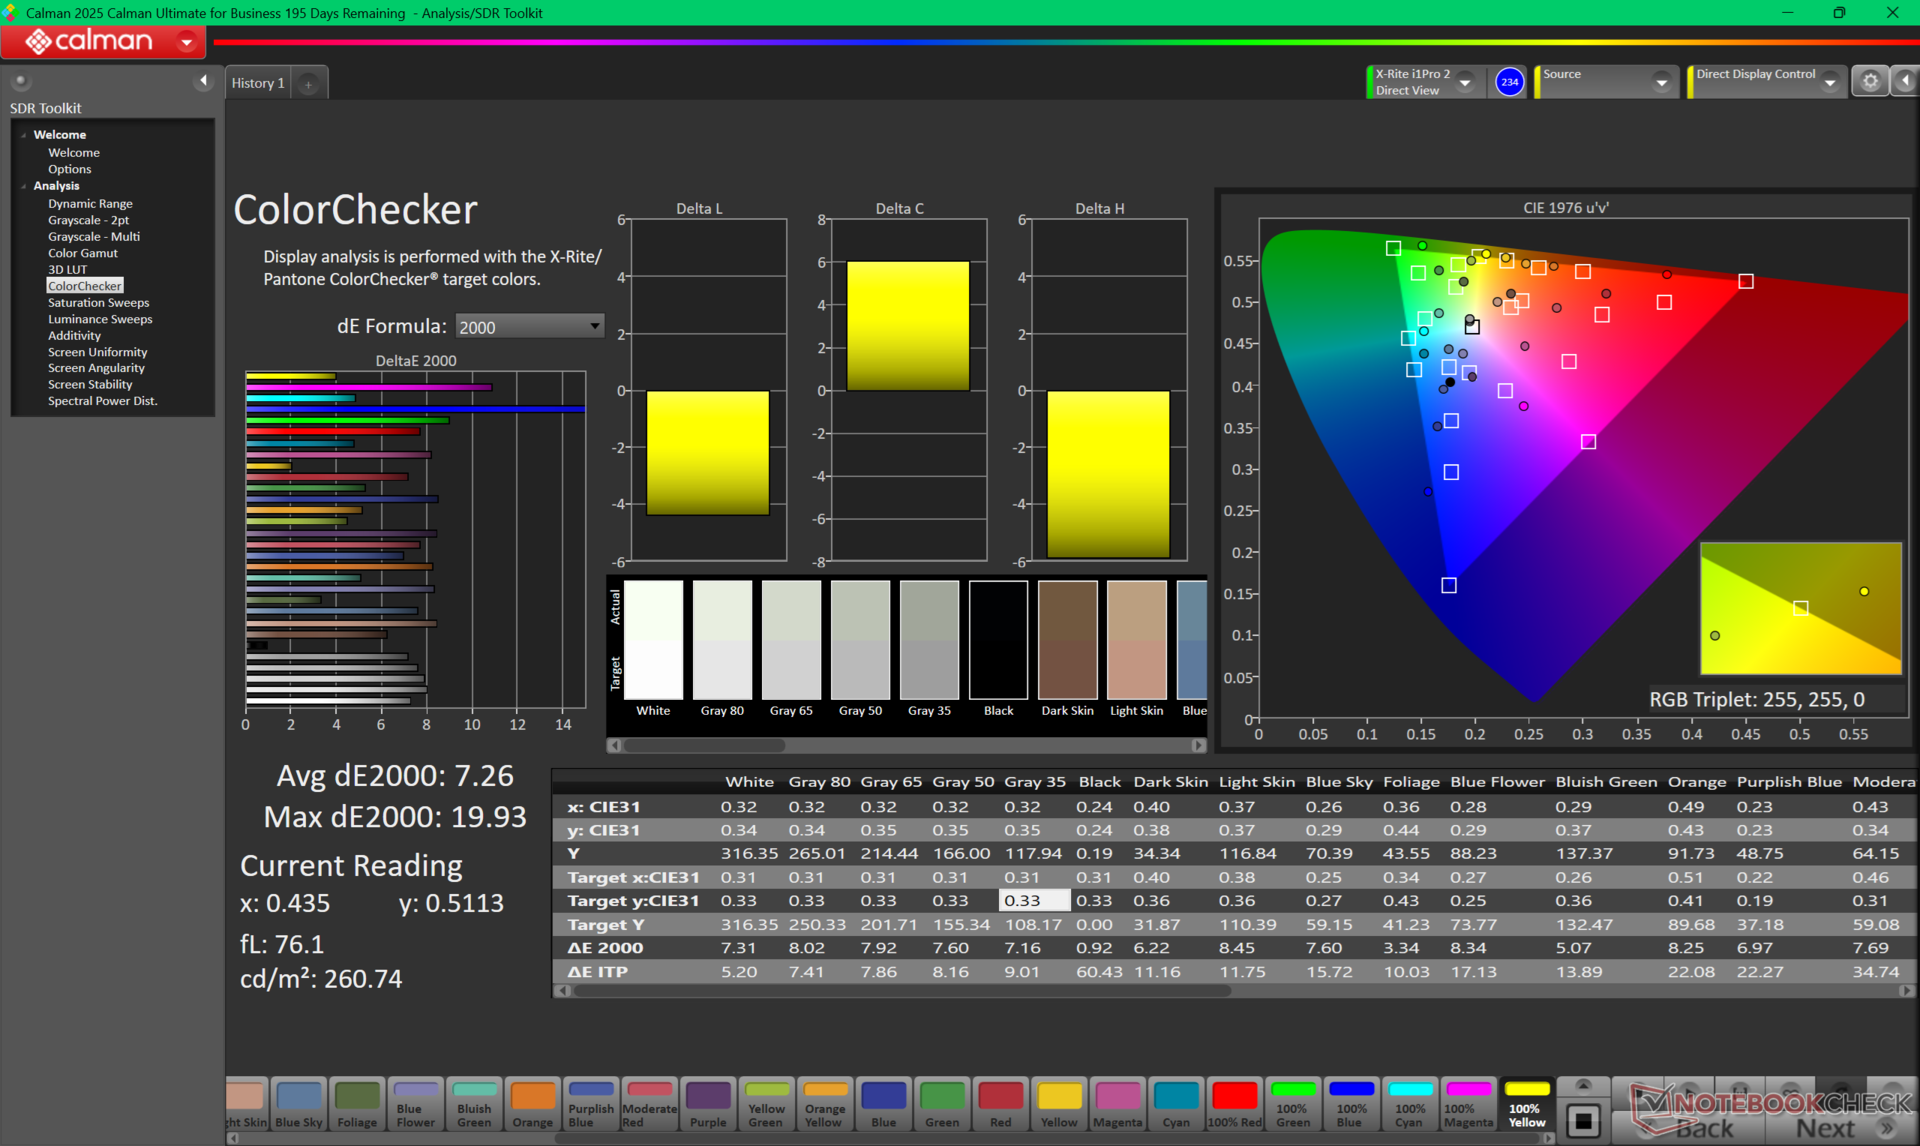
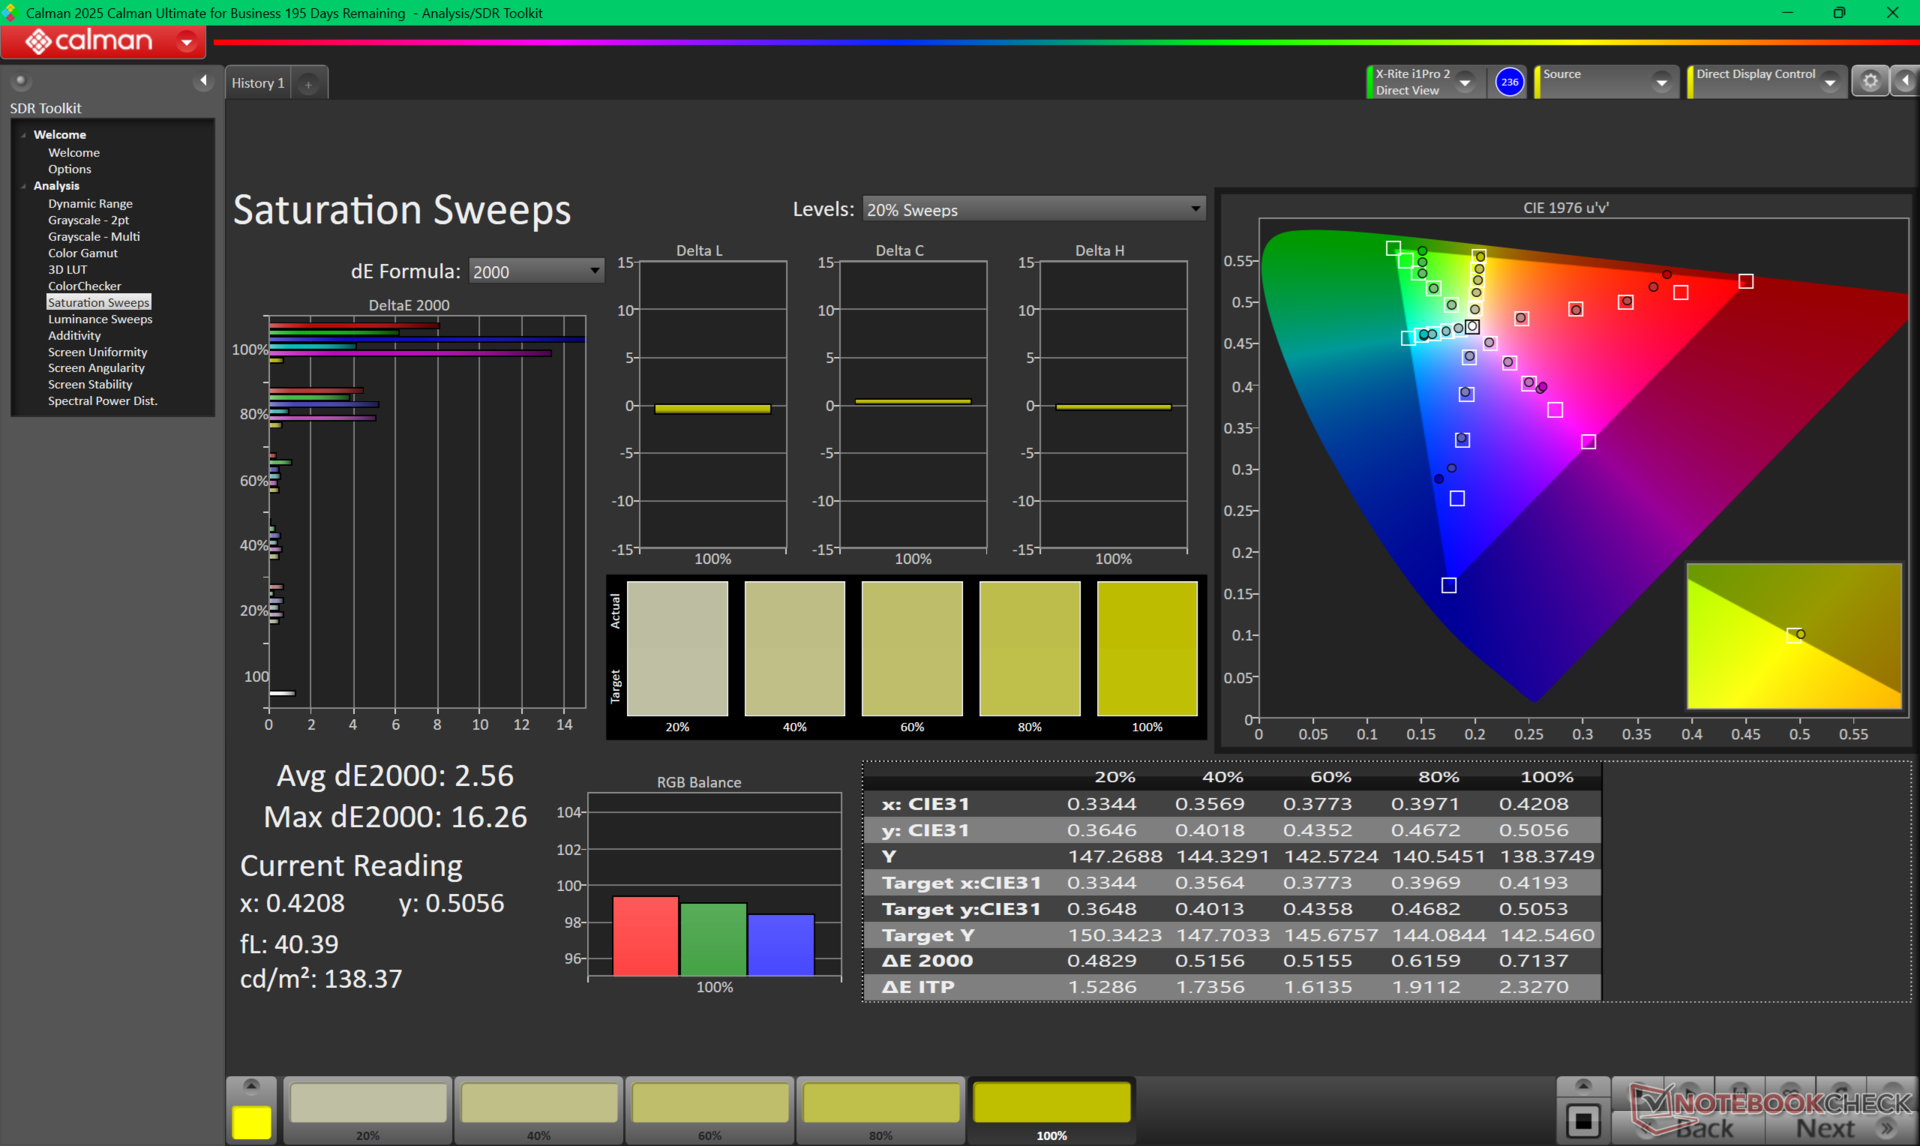
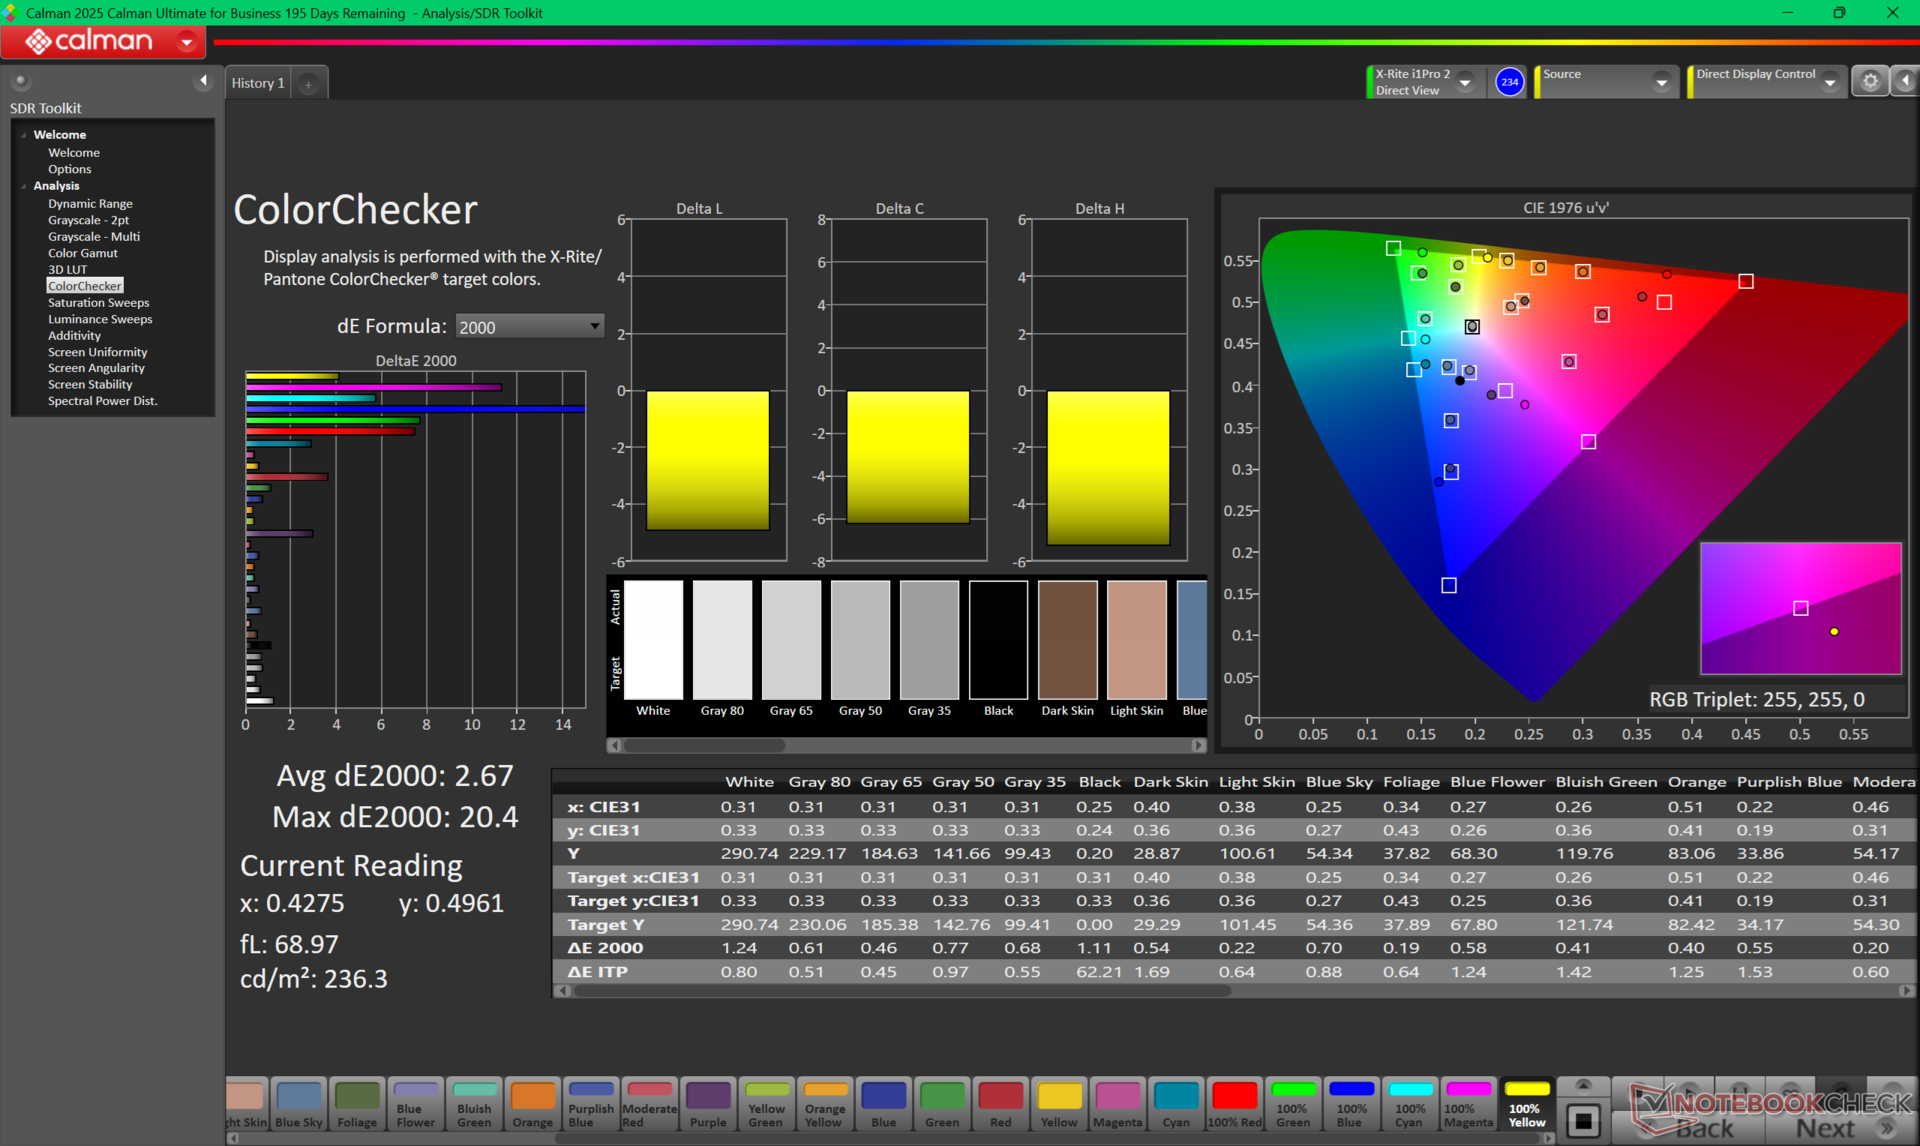
ΔE ColorChecker Calman: 7.26 | ∀{0.5-29.43 Ø4.71}
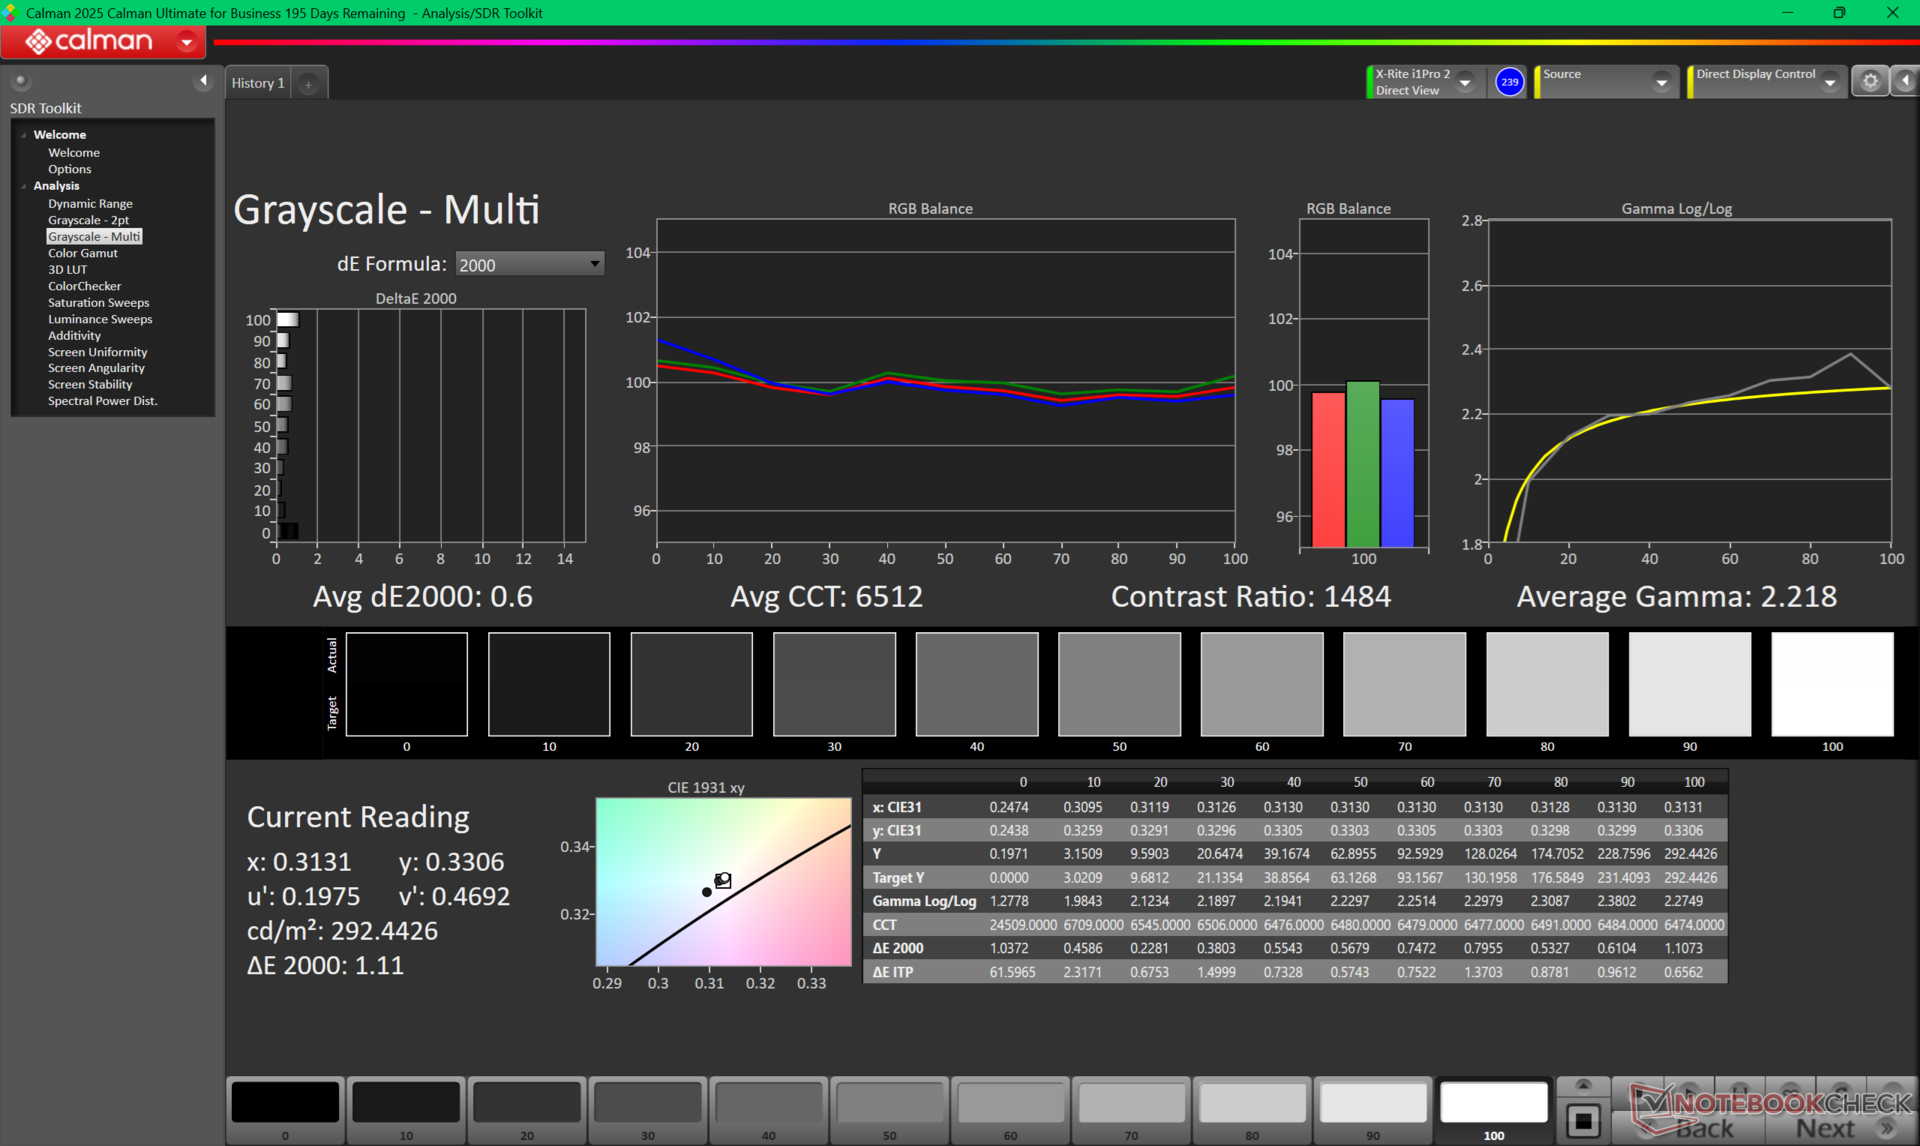
calibrated: 2.67
ΔE Greyscale Calman: 6.1 | ∀{0.09-98 Ø4.96}
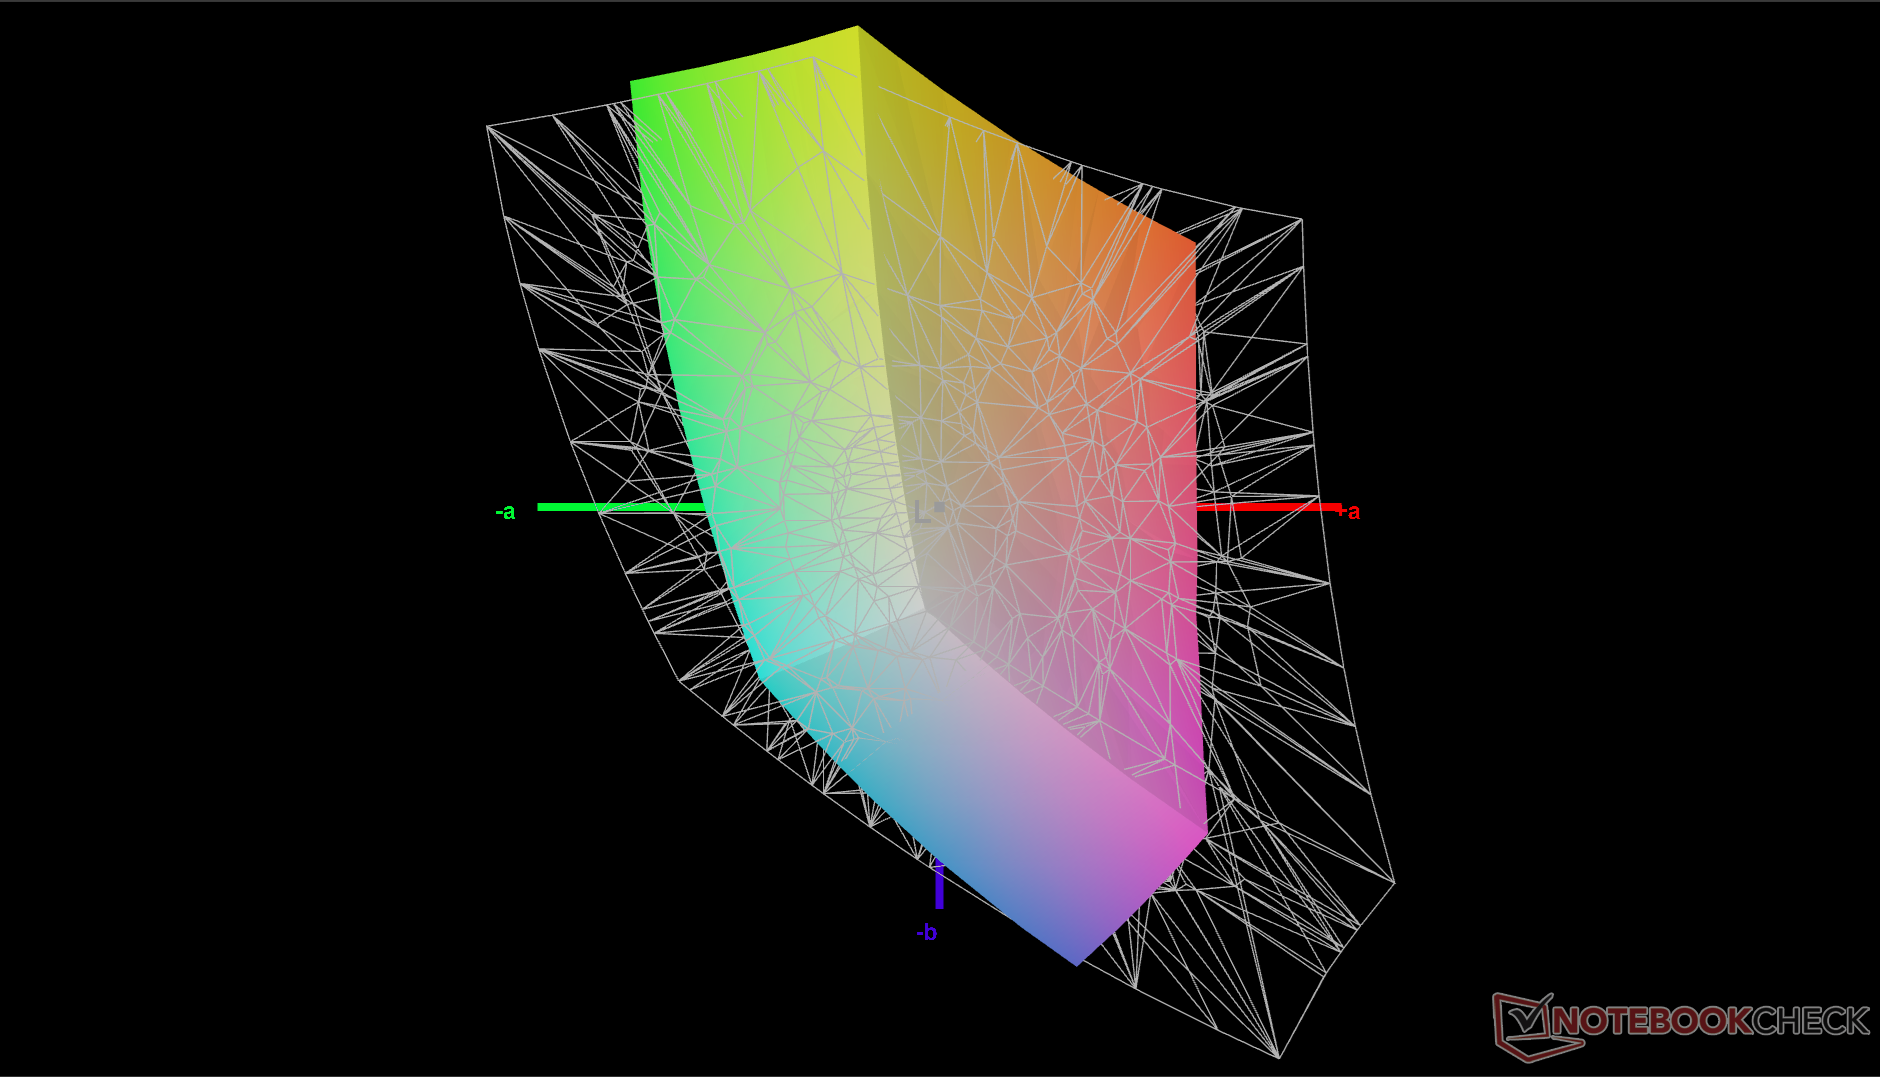
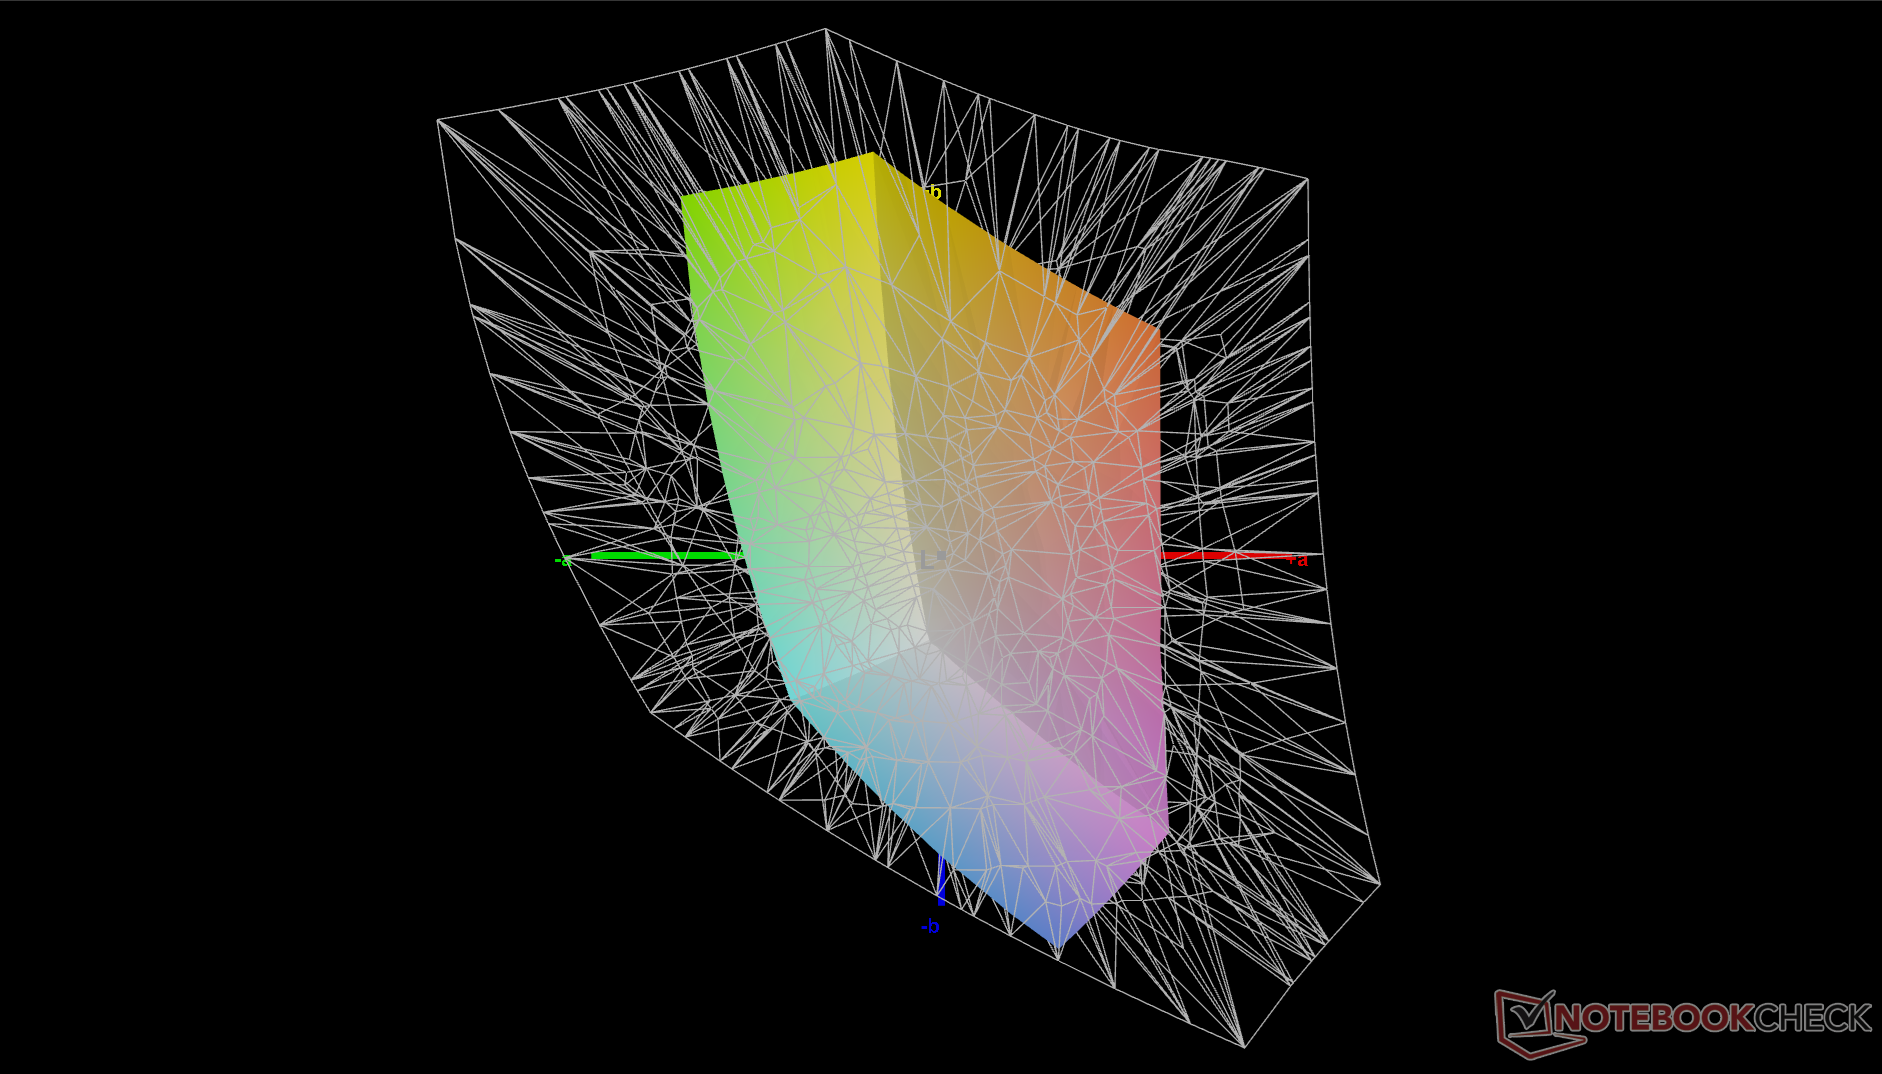
43.3% AdobeRGB 1998 (Argyll 3D)
59.8% sRGB (Argyll 3D)
41.9% Display P3 (Argyll 3D)
Gamma: 2.04
CCT: 6161 K
| Dell 14 Plus 2-in-1 BOE NV14A16, IPS, 1920x1200, 14", 60 Hz | Lenovo IdeaPad 5 2-in-1 14AKP10 83KT0033GE LEN140WUXGA , OLED, 1920x1200, 14", 60 Hz | Lenovo Yoga 7 2-in-1 14AHP9 Arctic Grey Lenovo LEN140WUXGA (LEN88AC), OLED, 1920x1200, 14", 60 Hz | Acer Aspire Spin 14 ASP14-52MTN-51V5 NV140WUM-N41 (BOE0C63), IPS, 1920x1200, 14", 60 Hz | Dell Inspiron 14 7445 2-in-1 AU Optronics B14UAT, IPS, 1920x1200, 14", 60 Hz | Asus ZenBook Flip 14 UN5401QA-KN085W SDC4154, OLED, 2880x1800, 14", 90 Hz | |
|---|---|---|---|---|---|---|
| Display | 110% | 111% | -5% | -13% | 111% | |
| Display P3 Coverage (%) | 41.9 | 99.5 137% | 99.9 138% | 39.1 -7% | 35.7 -15% | 99.7 138% |
| sRGB Coverage (%) | 59.8 | 100 67% | 100 67% | 57.9 -3% | 53.6 -10% | 100 67% |
| AdobeRGB 1998 Coverage (%) | 43.3 | 97.5 125% | 98.1 127% | 40.5 -6% | 36.9 -15% | 98.6 128% |
| Response Times | 85% | 85% | -23% | 3% | 90% | |
| Response Time Grey 50% / Grey 80% * (ms) | 24.1 ? | 2.72 ? 89% | 1.6 ? 93% | 28.8 ? -20% | 23 ? 5% | 2 ? 92% |
| Response Time Black / White * (ms) | 15.8 ? | 3.9 ? 75% | 1.4 ? 91% | 19.7 ? -25% | 15.8 ? -0% | 2 ? 87% |
| PWM Frequency (Hz) | 480 ? | 240 ? | ||||
| PWM Amplitude * (%) | 100 | 9.5 90% | 30 70% | |||
| Screen | 347% | 1598% | -0% | 2% | 32% | |
| Brightness middle (cd/m²) | 317.2 | 382 20% | 358 13% | 357 13% | 267.6 -16% | 366 15% |
| Brightness (cd/m²) | 314 | 384 22% | 354 13% | 344 10% | 240 -24% | 369 18% |
| Brightness Distribution (%) | 93 | 98 5% | 96 3% | 87 -6% | 84 -10% | 96 3% |
| Black Level * (cd/m²) | 0.25 | 0.01 96% | 0.002 99% | 0.26 -4% | 0.31 -24% | |
| Contrast (:1) | 1269 | 38200 2910% | 179000 14006% | 1373 8% | 863 -32% | |
| Colorchecker dE 2000 * | 7.26 | 4.7 35% | 2.37 67% | 6 17% | 4.67 36% | 2.84 61% |
| Colorchecker dE 2000 max. * | 19.93 | 8.9 55% | 5.11 74% | 22.87 -15% | 17.52 12% | 5.29 73% |
| Colorchecker dE 2000 calibrated * | 2.67 | 4.8 -80% | 1.9 29% | 4.46 -67% | 2.49 7% | 2.81 -5% |
| Greyscale dE 2000 * | 6.1 | 2.3 62% | 1.5 75% | 3.5 43% | 2 67% | 2.32 62% |
| Gamma | 2.04 108% | 2.1 105% | 2.249 98% | 1.992 110% | 2.15 102% | 2.44 90% |
| CCT | 6161 106% | 6400 102% | 6282 103% | 6585 99% | 6585 99% | 6170 105% |
| Total Average (Program / Settings) | 181% /
247% | 598% /
998% | -9% /
-4% | -3% /
-1% | 78% /
62% |
* ... smaller is better
Display Response Times
| ↔ Response Time Black to White | ||
|---|---|---|
| 15.8 ms ... rise ↗ and fall ↘ combined | ↗ 8.3 ms rise | 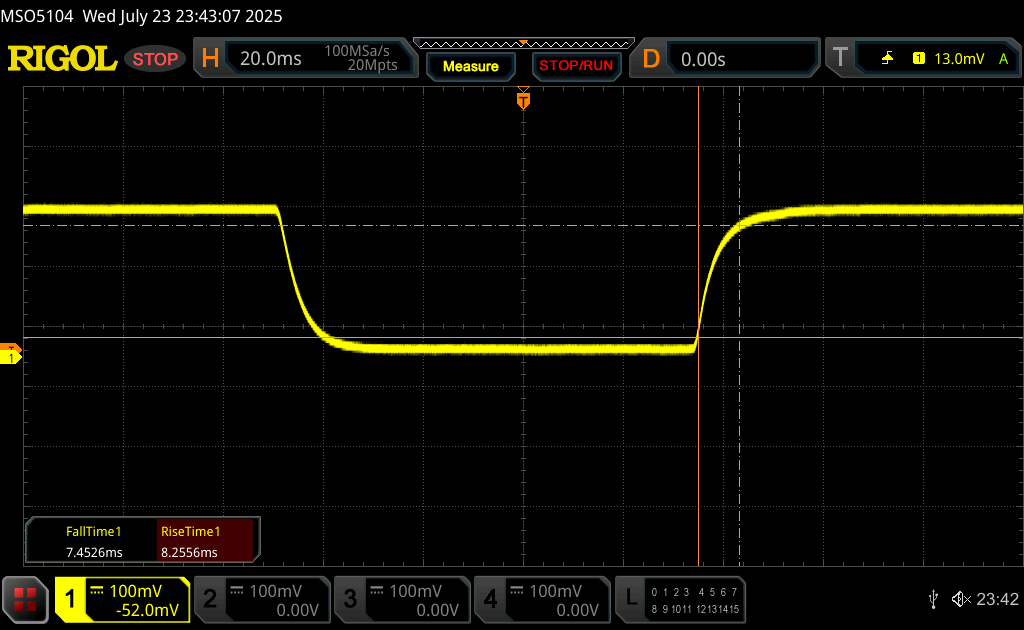 |
| ↘ 7.5 ms fall | ||
| The screen shows good response rates in our tests, but may be too slow for competitive gamers. In comparison, all tested devices range from 0.1 (minimum) to 240 (maximum) ms. » 37 % of all devices are better. This means that the measured response time is better than the average of all tested devices (19.8 ms). | ||
| ↔ Response Time 50% Grey to 80% Grey | ||
| 24.1 ms ... rise ↗ and fall ↘ combined | ↗ 10.9 ms rise | 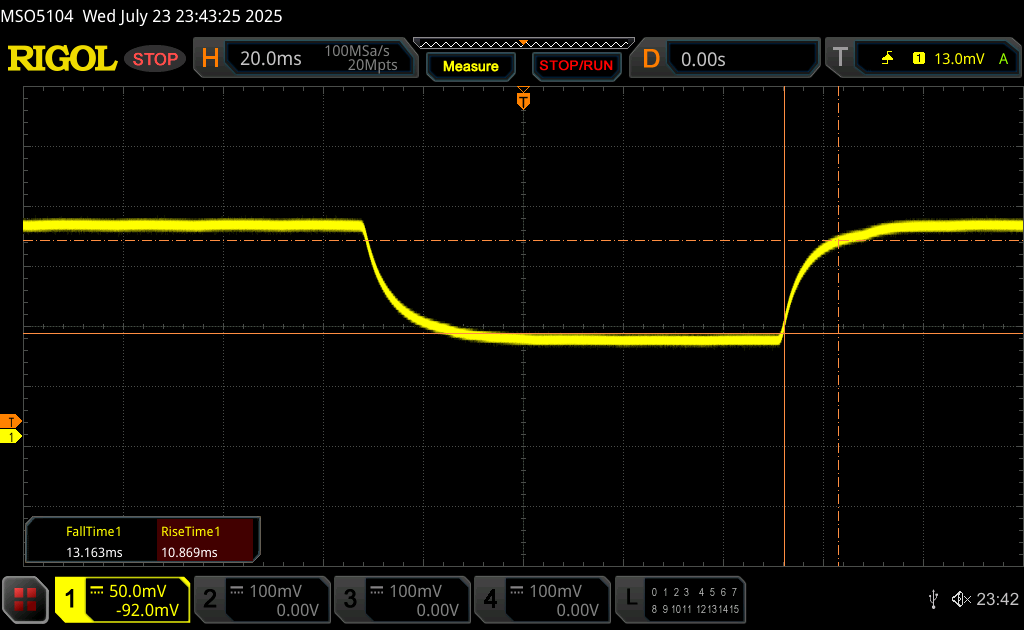 |
| ↘ 13.2 ms fall | ||
| The screen shows good response rates in our tests, but may be too slow for competitive gamers. In comparison, all tested devices range from 0.165 (minimum) to 636 (maximum) ms. » 35 % of all devices are better. This means that the measured response time is better than the average of all tested devices (30.9 ms). | ||
Screen Flickering / PWM (Pulse-Width Modulation)
| Screen flickering / PWM not detected | 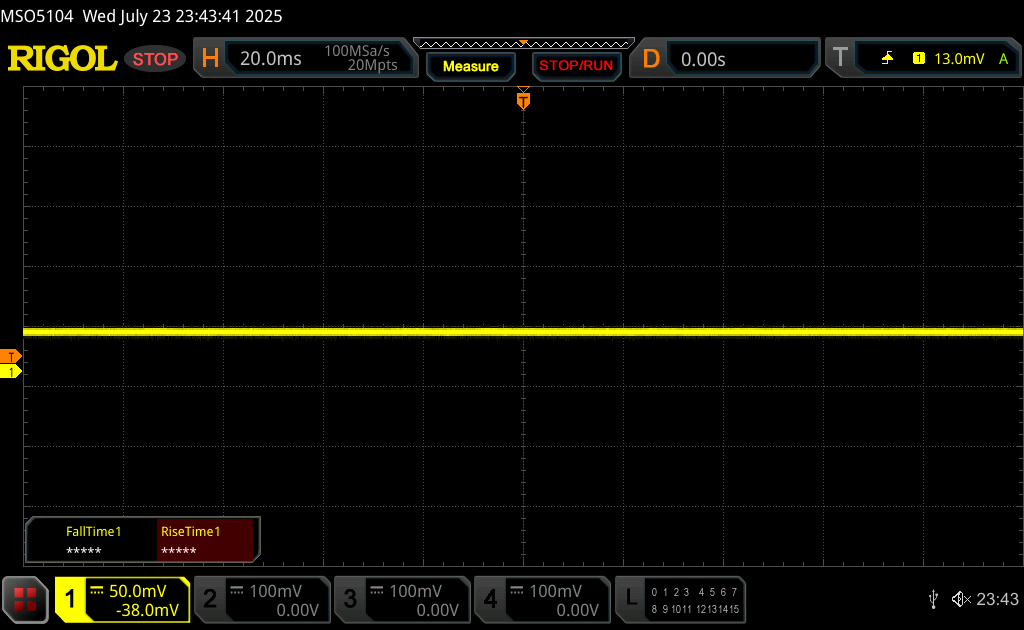 | ||
In comparison: 52 % of all tested devices do not use PWM to dim the display. If PWM was detected, an average of 7748 (minimum: 5 - maximum: 343500) Hz was measured. | |||

性能
测试条件
在运行以下基准测试之前,我们将 Windows 设置为性能模式。
处理器
Cinebench R15 Multi Loop
Cinebench R23: Multi Core | Single Core
Cinebench R20: CPU (Multi Core) | CPU (Single Core)
Cinebench R15: CPU Multi 64Bit | CPU Single 64Bit
Blender: v2.79 BMW27 CPU
7-Zip 18.03: 7z b 4 | 7z b 4 -mmt1
Geekbench 6.7: Multi-Core | Single-Core
Geekbench 5.5: Multi-Core | Single-Core
HWBOT x265 Benchmark v2.2: 4k Preset
LibreOffice : 20 Documents To PDF
R Benchmark 2.5: Overall mean
* ... smaller is better
AIDA64: FP32 Ray-Trace | FPU Julia | CPU SHA3 | CPU Queen | FPU SinJulia | FPU Mandel | CPU AES | CPU ZLib | FP64 Ray-Trace | CPU PhotoWorxx
压力测试
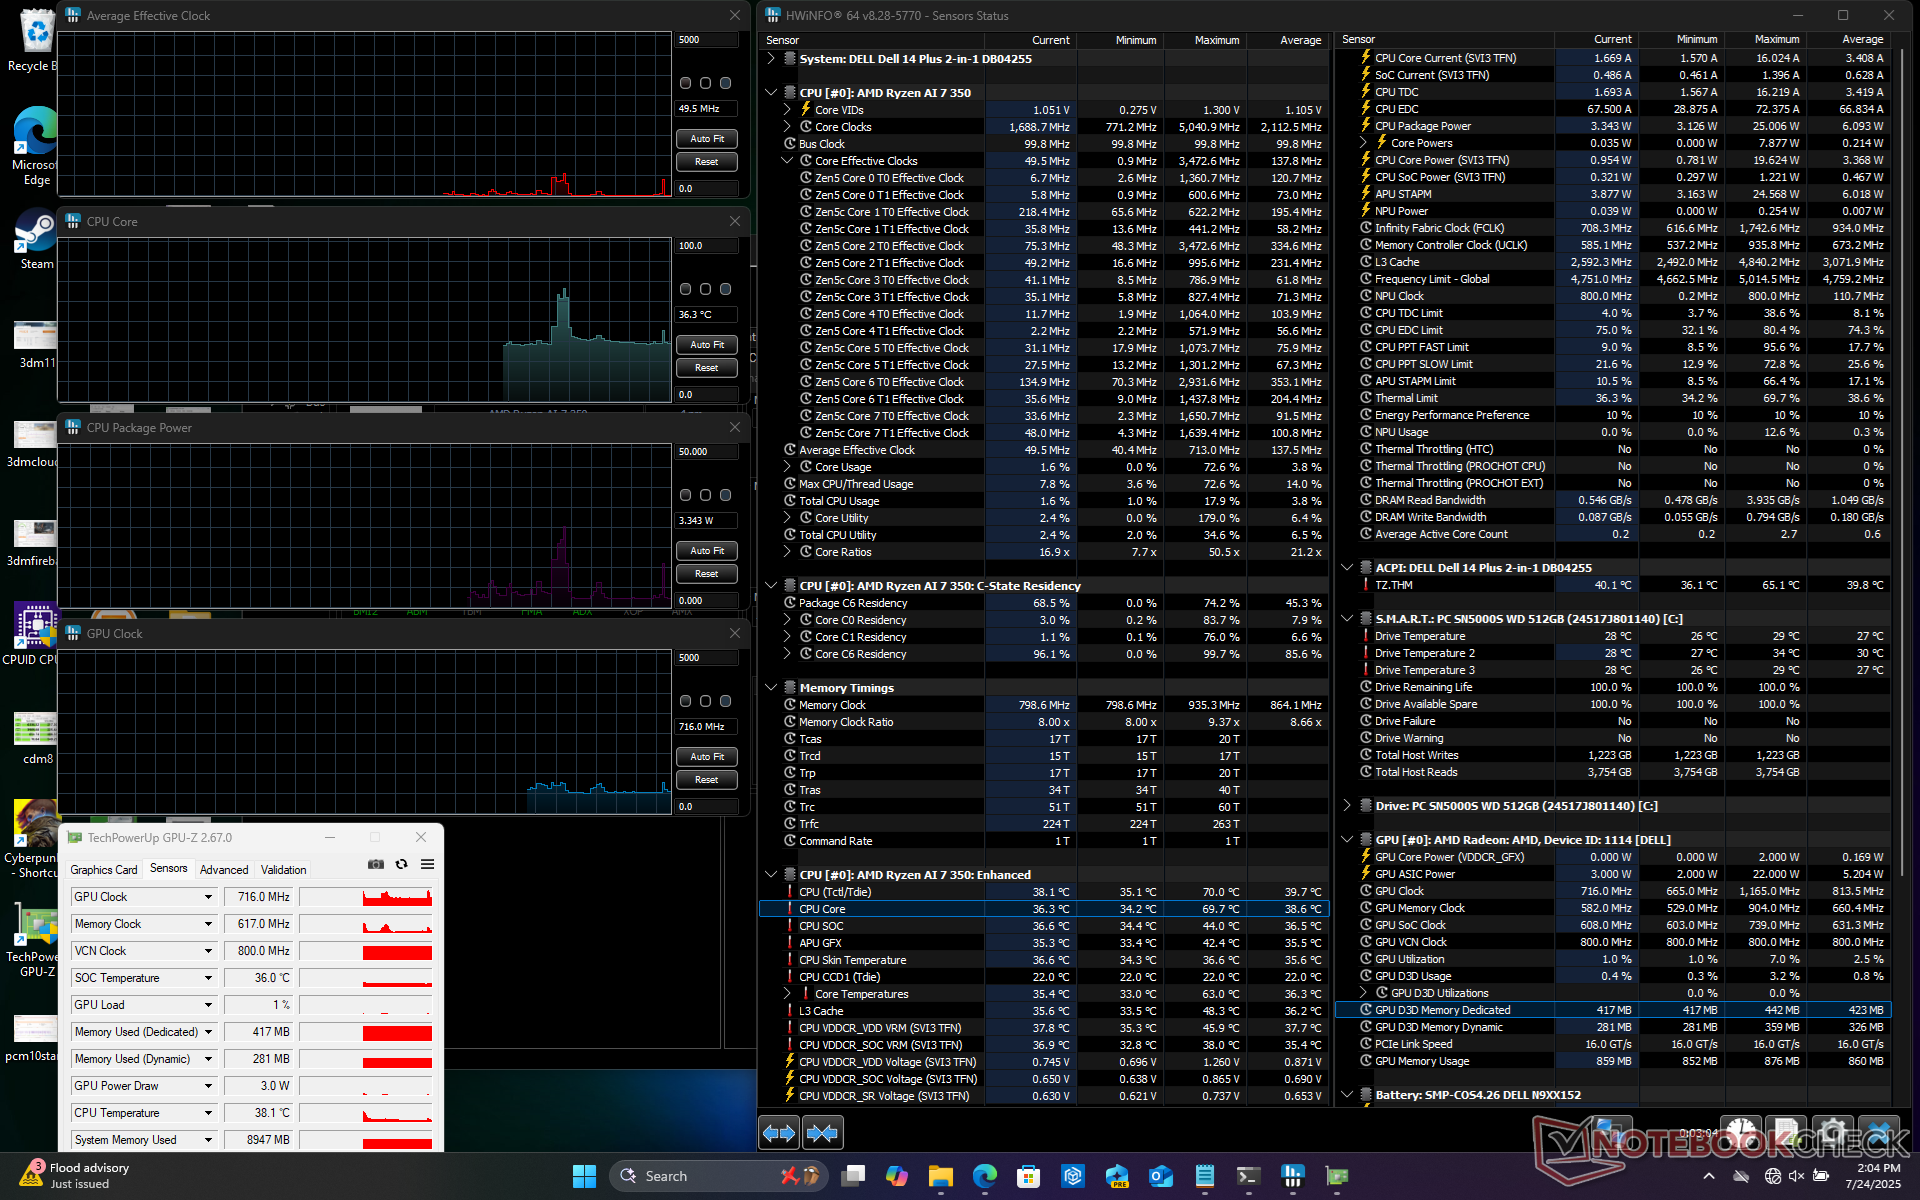
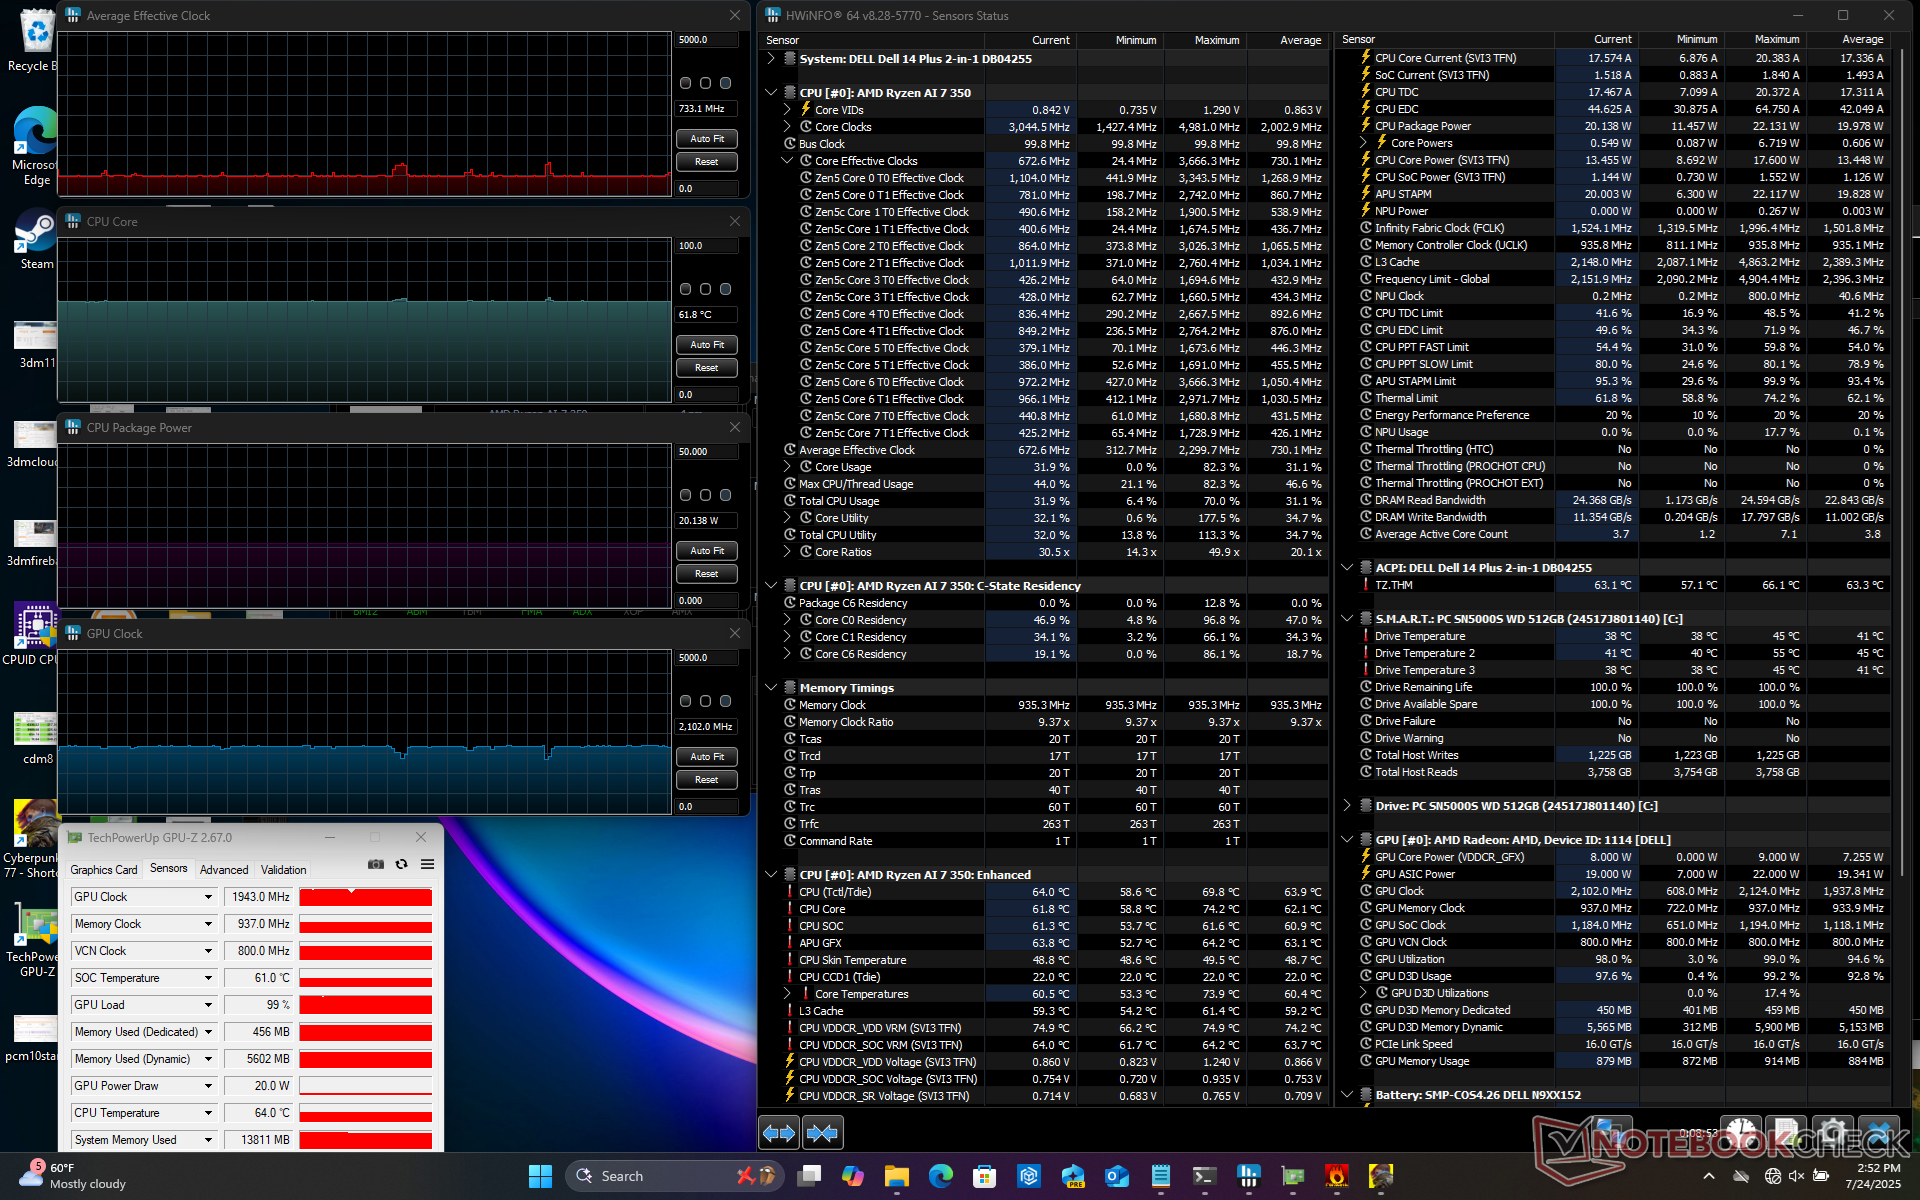
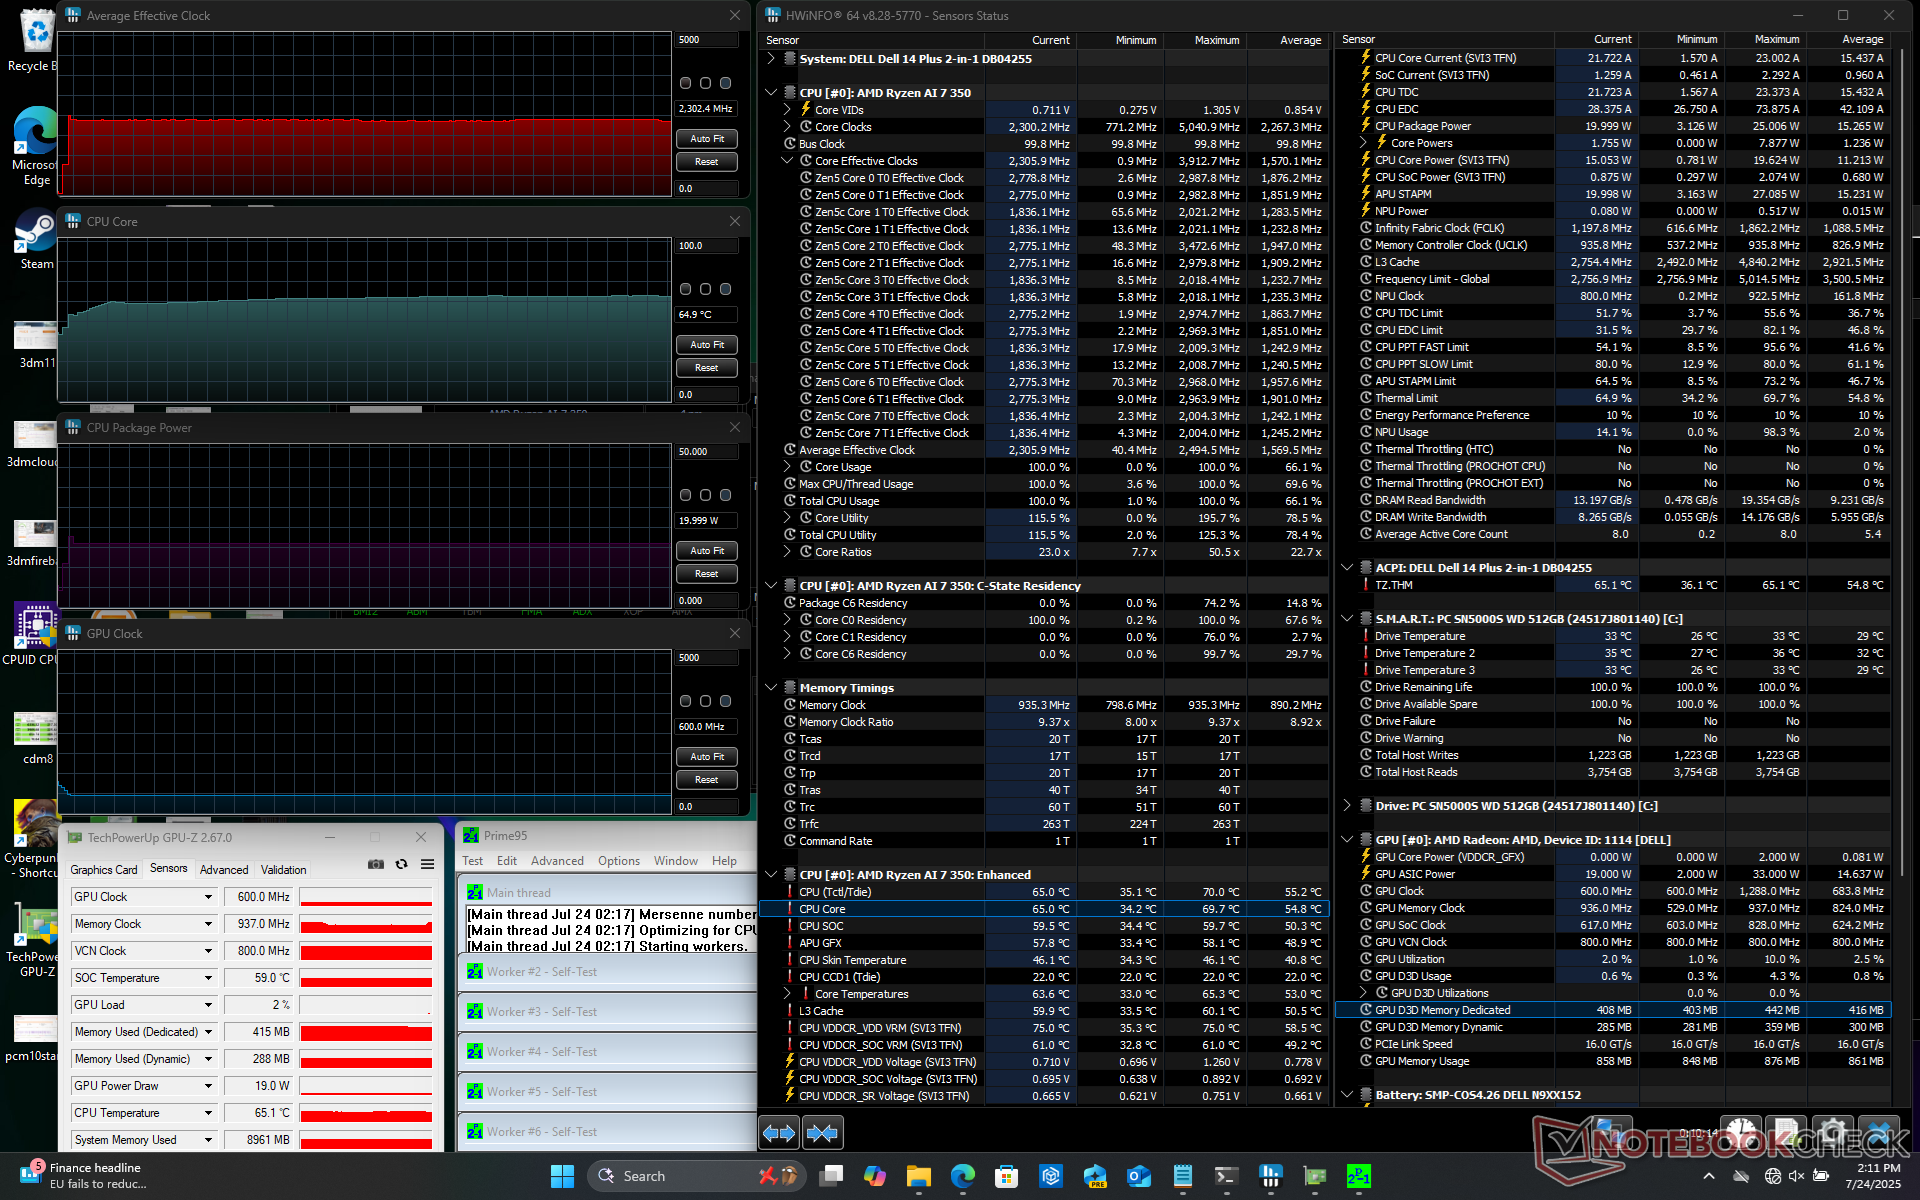
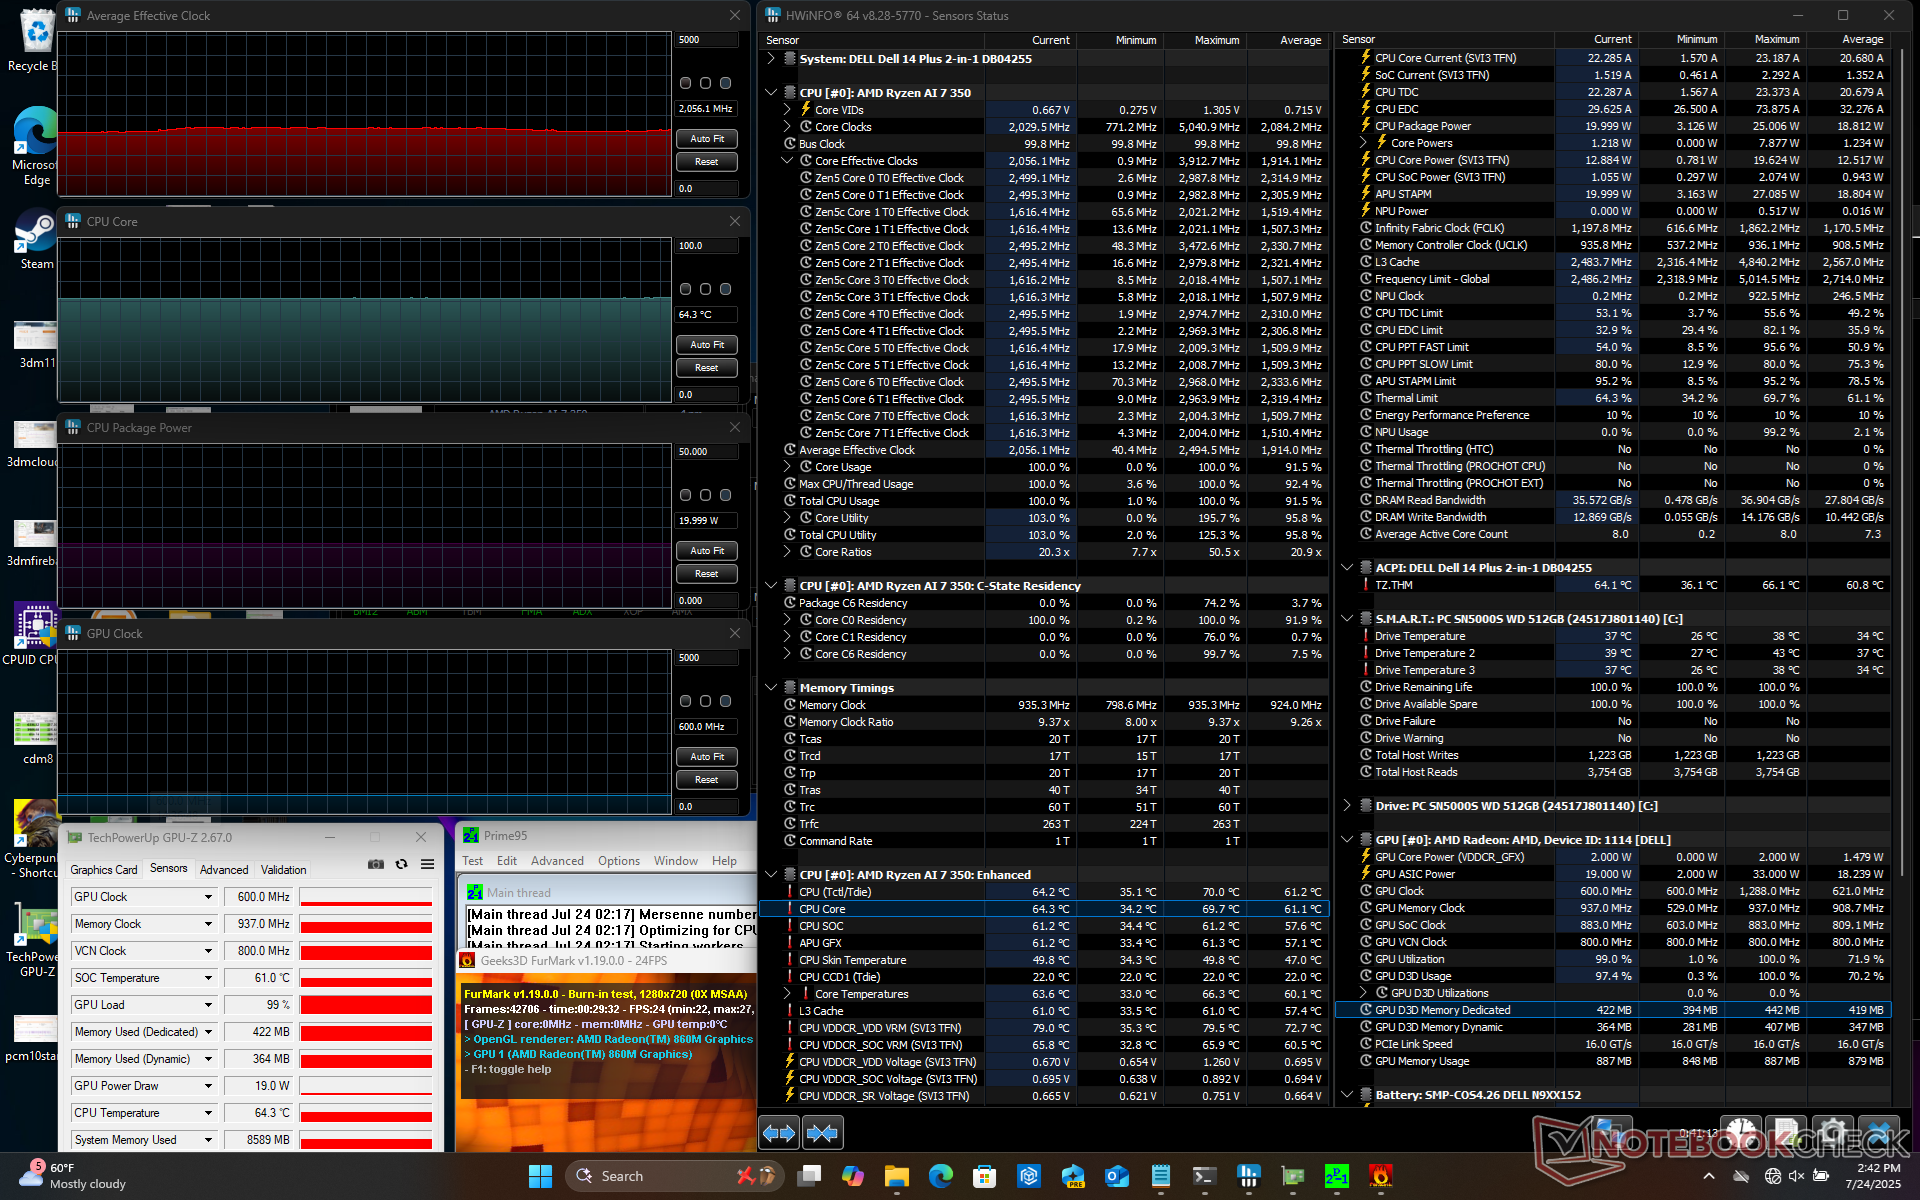
| CPU 平均时钟 (GHz) | GPU 时钟 (MHz) | CPU 平均温度 (°C) | |
| 系统闲置 | -- | -- | 36 |
| Prime95 压力 | 2.3 | -- | 65 |
| Prime95 + FurMark Stress | 2.1 | 600 | 64 |
| 赛博朋克 2077》压力 | 0.73 | 2102 | 62 |
系统性能
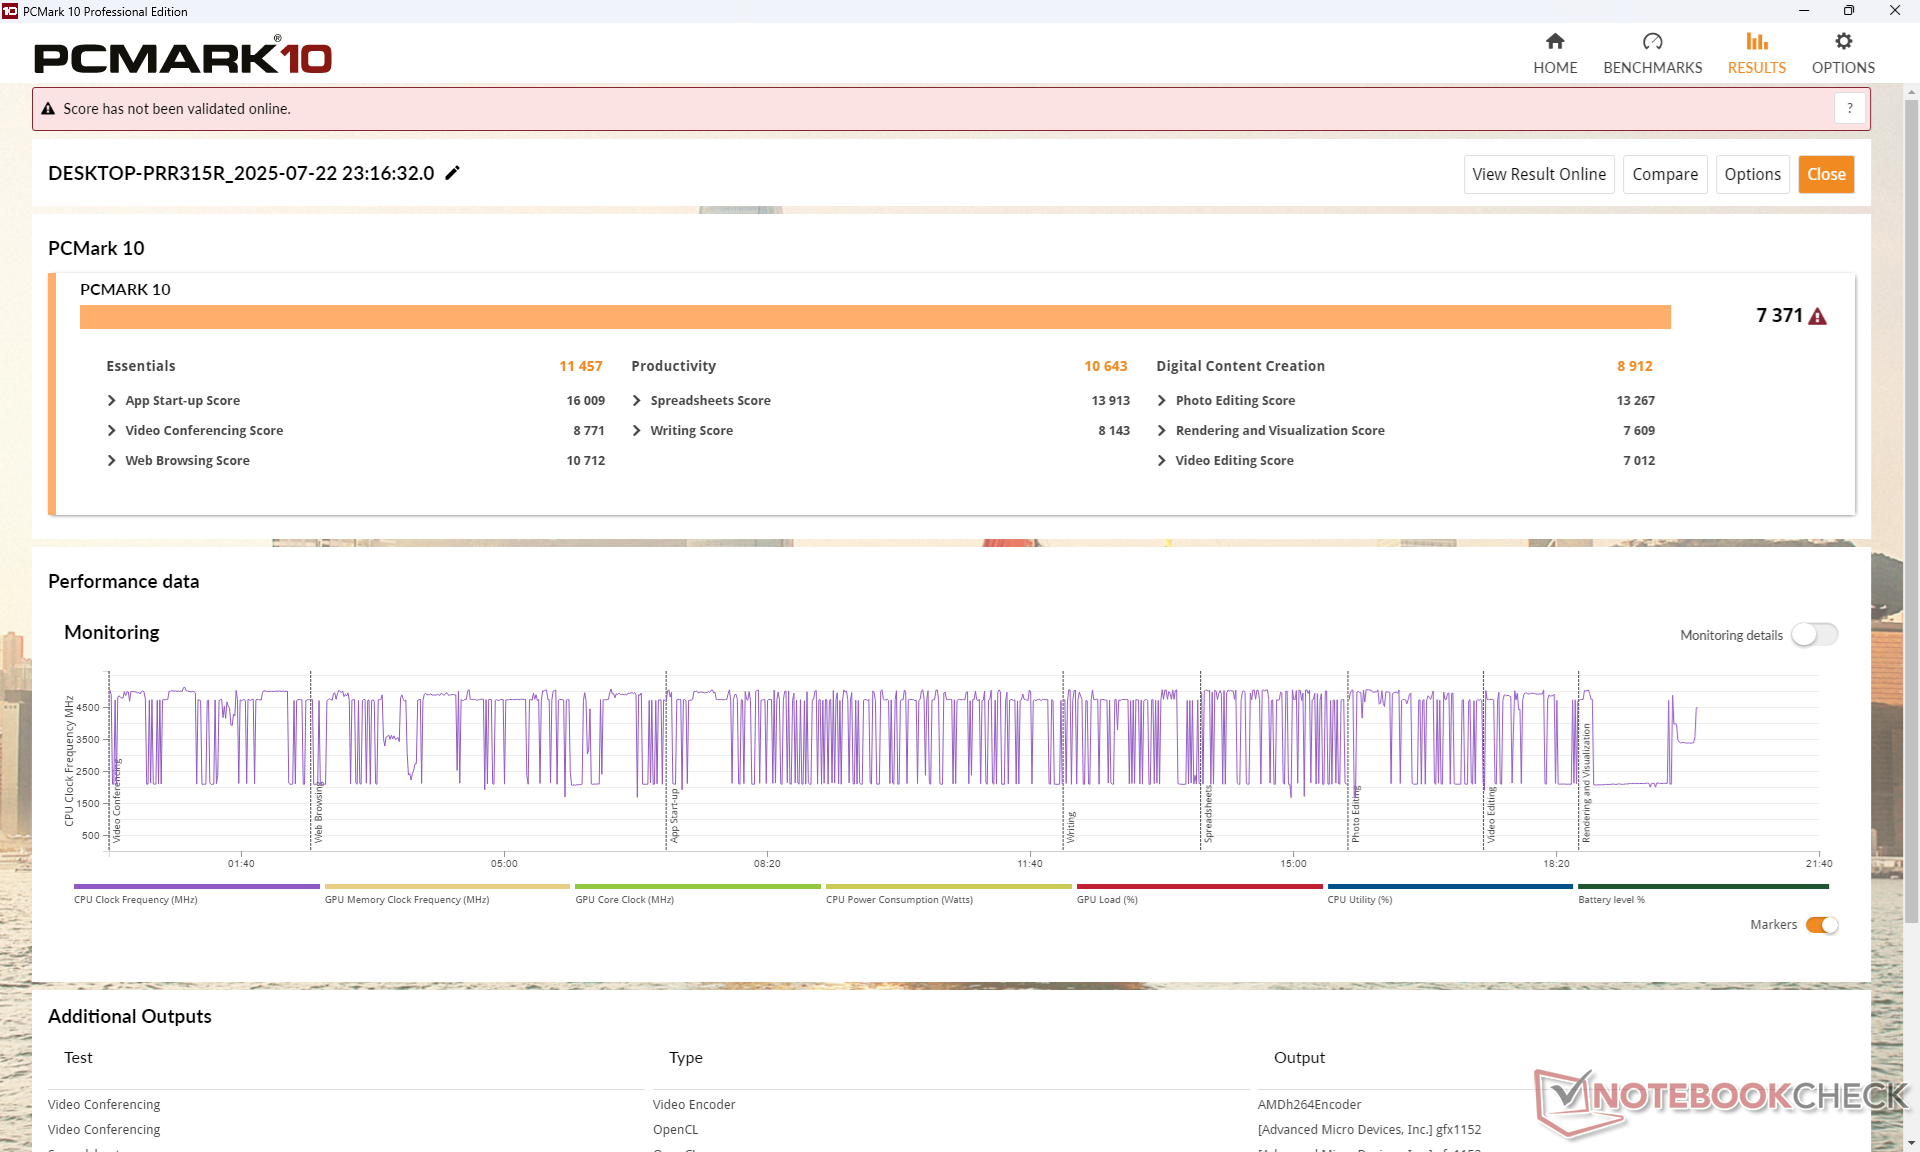
PCMark 10: Score | Essentials | Productivity | Digital Content Creation
CrossMark: Overall | Productivity | Creativity | Responsiveness
WebXPRT 3: Overall
WebXPRT 4: Overall
Mozilla Kraken 1.1: Total
| Performance rating | |
| Lenovo IdeaPad 5 2-in-1 14AKP10 83KT0033GE | |
| Average AMD Ryzen AI 7 350, AMD Radeon 860M | |
| Dell Inspiron 14 7445 2-in-1 | |
| Dell 14 Plus 2-in-1 | |
| Lenovo Yoga 7 2-in-1 14AHP9 Arctic Grey -4! | |
| Asus ZenBook Flip 14 UN5401QA-KN085W -5! | |
| Acer Aspire Spin 14 ASP14-52MTN-51V5 -4! | |
| PCMark 10 / Score | |
| Lenovo IdeaPad 5 2-in-1 14AKP10 83KT0033GE | |
| Average AMD Ryzen AI 7 350, AMD Radeon 860M (6982 - 8588, n=12) | |
| Dell 14 Plus 2-in-1 | |
| Dell Inspiron 14 7445 2-in-1 | |
| Lenovo Yoga 7 2-in-1 14AHP9 Arctic Grey | |
| Asus ZenBook Flip 14 UN5401QA-KN085W | |
| Acer Aspire Spin 14 ASP14-52MTN-51V5 | |
| PCMark 10 / Essentials | |
| Lenovo IdeaPad 5 2-in-1 14AKP10 83KT0033GE | |
| Dell 14 Plus 2-in-1 | |
| Average AMD Ryzen AI 7 350, AMD Radeon 860M (10801 - 12383, n=12) | |
| Dell Inspiron 14 7445 2-in-1 | |
| Lenovo Yoga 7 2-in-1 14AHP9 Arctic Grey | |
| Asus ZenBook Flip 14 UN5401QA-KN085W | |
| Acer Aspire Spin 14 ASP14-52MTN-51V5 | |
| PCMark 10 / Productivity | |
| Average AMD Ryzen AI 7 350, AMD Radeon 860M (9674 - 17243, n=12) | |
| Dell 14 Plus 2-in-1 | |
| Lenovo IdeaPad 5 2-in-1 14AKP10 83KT0033GE | |
| Dell Inspiron 14 7445 2-in-1 | |
| Asus ZenBook Flip 14 UN5401QA-KN085W | |
| Lenovo Yoga 7 2-in-1 14AHP9 Arctic Grey | |
| Acer Aspire Spin 14 ASP14-52MTN-51V5 | |
| PCMark 10 / Digital Content Creation | |
| Lenovo IdeaPad 5 2-in-1 14AKP10 83KT0033GE | |
| Average AMD Ryzen AI 7 350, AMD Radeon 860M (8746 - 10028, n=12) | |
| Dell 14 Plus 2-in-1 | |
| Dell Inspiron 14 7445 2-in-1 | |
| Lenovo Yoga 7 2-in-1 14AHP9 Arctic Grey | |
| Asus ZenBook Flip 14 UN5401QA-KN085W | |
| Acer Aspire Spin 14 ASP14-52MTN-51V5 | |
| CrossMark / Overall | |
| Lenovo IdeaPad 5 2-in-1 14AKP10 83KT0033GE | |
| Average AMD Ryzen AI 7 350, AMD Radeon 860M (1301 - 2005, n=12) | |
| Dell Inspiron 14 7445 2-in-1 | |
| Dell 14 Plus 2-in-1 | |
| CrossMark / Productivity | |
| Lenovo IdeaPad 5 2-in-1 14AKP10 83KT0033GE | |
| Dell Inspiron 14 7445 2-in-1 | |
| Dell 14 Plus 2-in-1 | |
| Average AMD Ryzen AI 7 350, AMD Radeon 860M (1199 - 1869, n=12) | |
| CrossMark / Creativity | |
| Lenovo IdeaPad 5 2-in-1 14AKP10 83KT0033GE | |
| Average AMD Ryzen AI 7 350, AMD Radeon 860M (1514 - 2236, n=12) | |
| Dell 14 Plus 2-in-1 | |
| Dell Inspiron 14 7445 2-in-1 | |
| CrossMark / Responsiveness | |
| Lenovo IdeaPad 5 2-in-1 14AKP10 83KT0033GE | |
| Average AMD Ryzen AI 7 350, AMD Radeon 860M (1052 - 1784, n=12) | |
| Dell 14 Plus 2-in-1 | |
| Dell Inspiron 14 7445 2-in-1 | |
| WebXPRT 3 / Overall | |
| Lenovo IdeaPad 5 2-in-1 14AKP10 83KT0033GE | |
| Dell Inspiron 14 7445 2-in-1 | |
| Average AMD Ryzen AI 7 350, AMD Radeon 860M (255 - 328, n=12) | |
| Lenovo Yoga 7 2-in-1 14AHP9 Arctic Grey | |
| Lenovo Yoga 7 2-in-1 14AHP9 Arctic Grey | |
| Dell 14 Plus 2-in-1 | |
| Asus ZenBook Flip 14 UN5401QA-KN085W | |
| Acer Aspire Spin 14 ASP14-52MTN-51V5 | |
| WebXPRT 4 / Overall | |
| Lenovo IdeaPad 5 2-in-1 14AKP10 83KT0033GE | |
| Dell 14 Plus 2-in-1 | |
| Dell Inspiron 14 7445 2-in-1 | |
| Average AMD Ryzen AI 7 350, AMD Radeon 860M (199.1 - 275, n=12) | |
| Lenovo Yoga 7 2-in-1 14AHP9 Arctic Grey | |
| Acer Aspire Spin 14 ASP14-52MTN-51V5 | |
| Mozilla Kraken 1.1 / Total | |
| Dell 14 Plus 2-in-1 | |
| Asus ZenBook Flip 14 UN5401QA-KN085W | |
| Acer Aspire Spin 14 ASP14-52MTN-51V5 | |
| Lenovo Yoga 7 2-in-1 14AHP9 Arctic Grey | |
| Lenovo Yoga 7 2-in-1 14AHP9 Arctic Grey | |
| Average AMD Ryzen AI 7 350, AMD Radeon 860M (434 - 702, n=12) | |
| Dell Inspiron 14 7445 2-in-1 | |
| Lenovo IdeaPad 5 2-in-1 14AKP10 83KT0033GE | |
* ... smaller is better
| PCMark 10 Score | 7371 points | |
Help | ||
* ... smaller is better
DPC 延迟
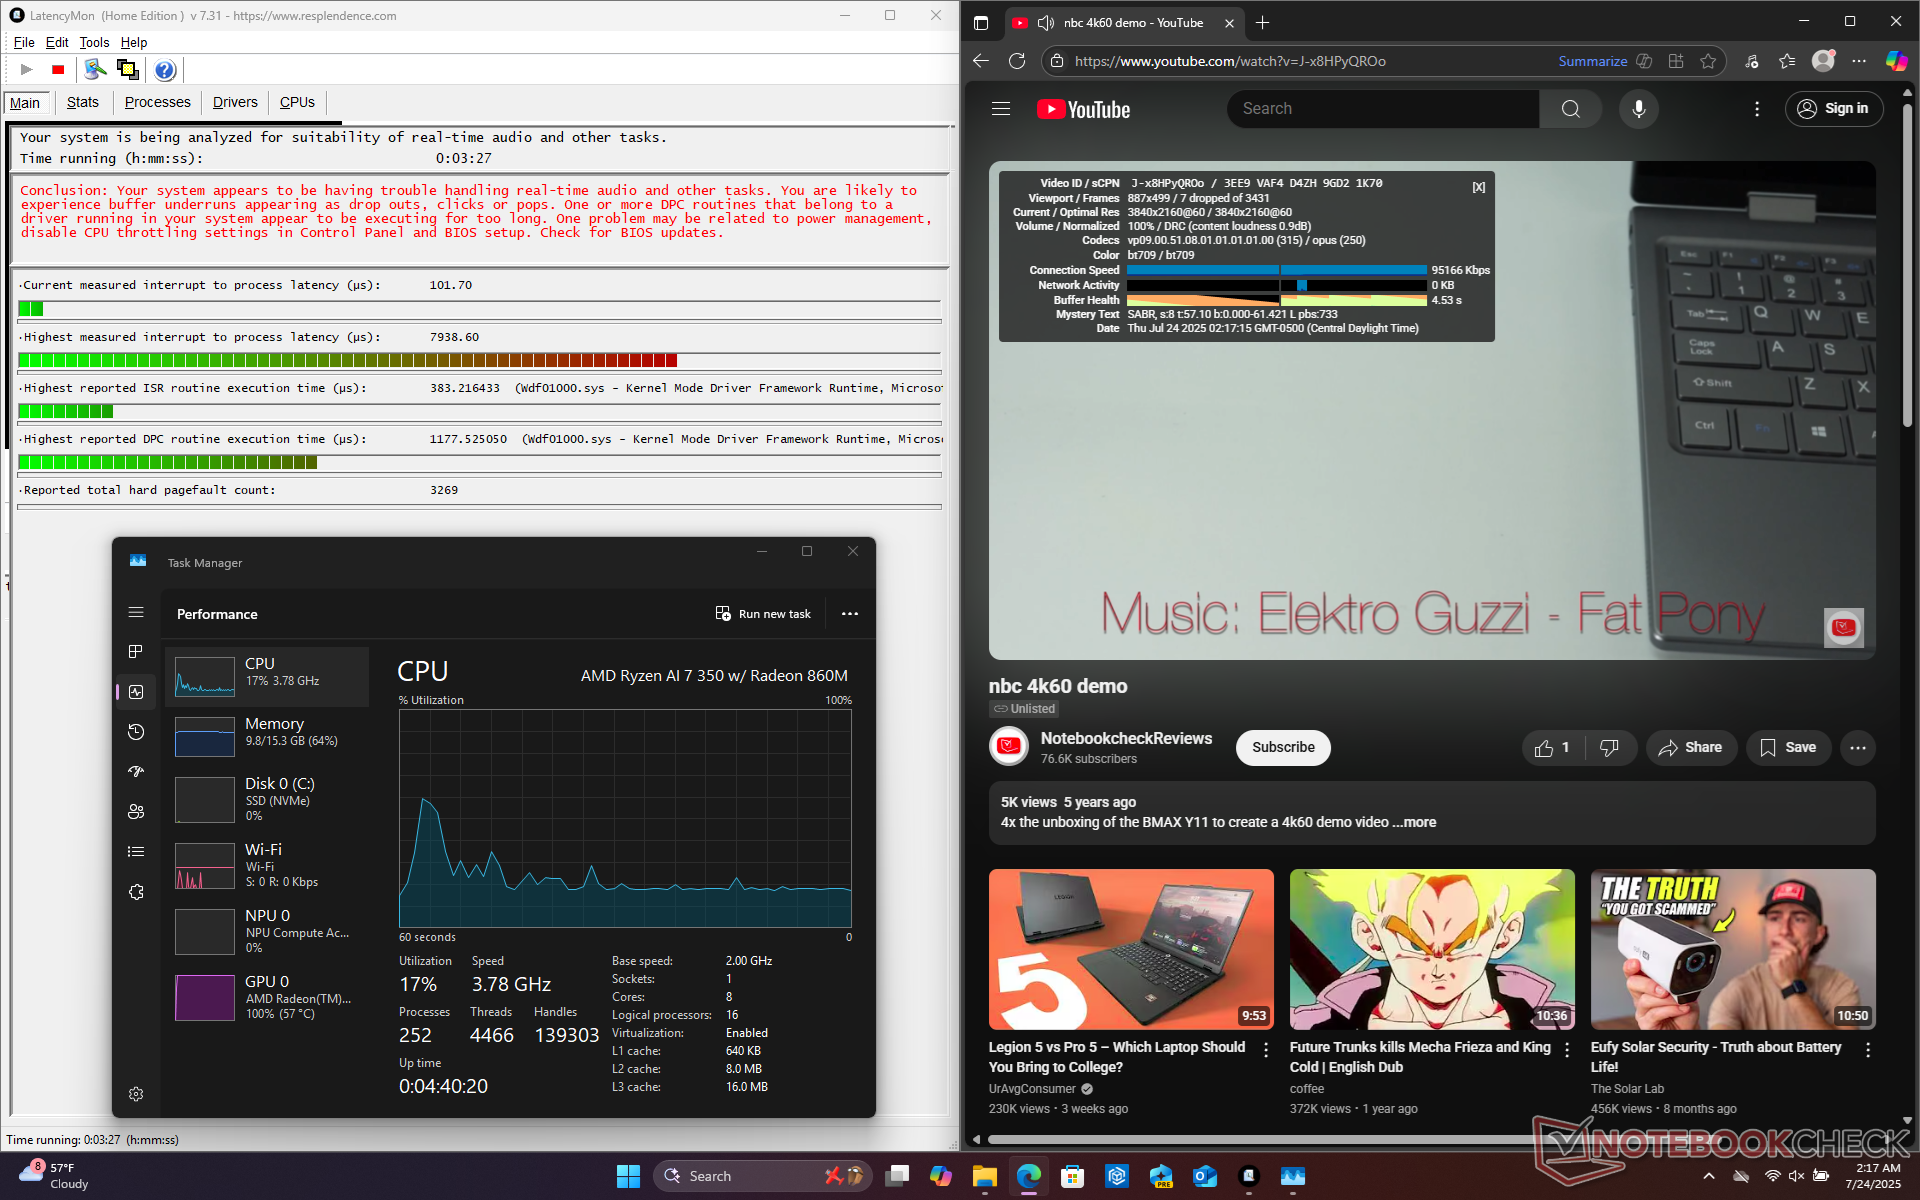
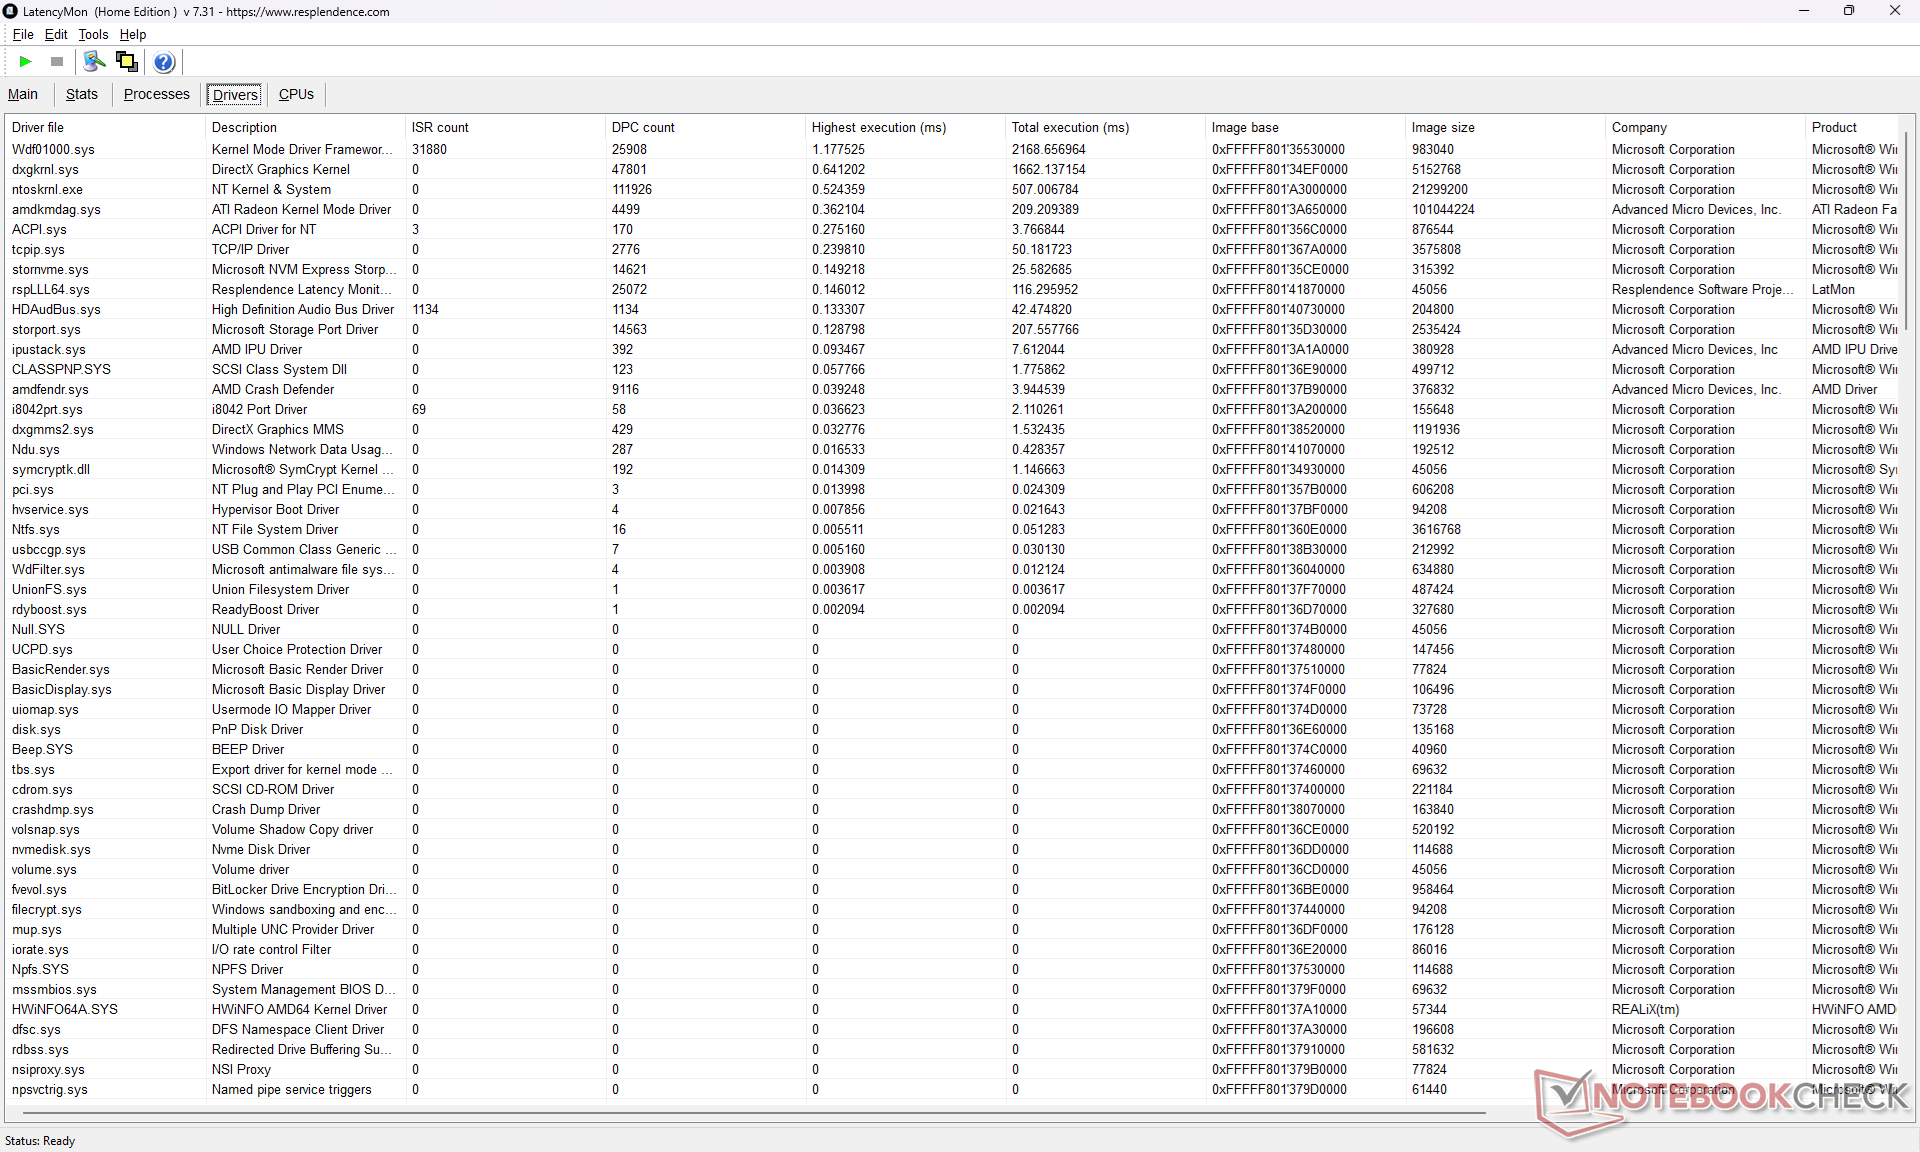
| DPC Latencies / LatencyMon - interrupt to process latency (max), Web, Youtube, Prime95 | |
| Dell 14 Plus 2-in-1 | |
| Lenovo IdeaPad 5 2-in-1 14AKP10 83KT0033GE | |
| Lenovo Yoga 7 2-in-1 14AHP9 Arctic Grey | |
| Acer Aspire Spin 14 ASP14-52MTN-51V5 | |
| Asus ZenBook Flip 14 UN5401QA-KN085W | |
| Dell Inspiron 14 7445 2-in-1 | |
* ... smaller is better
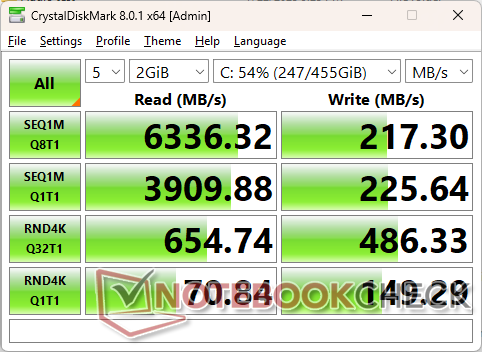
存储设备
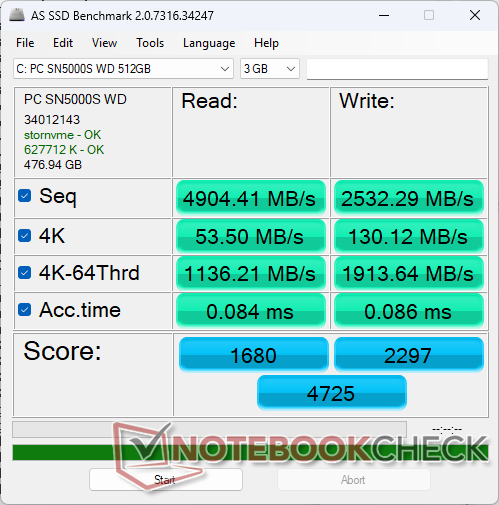

* ... smaller is better
Disk Throttling: DiskSpd Read Loop, Queue Depth 8
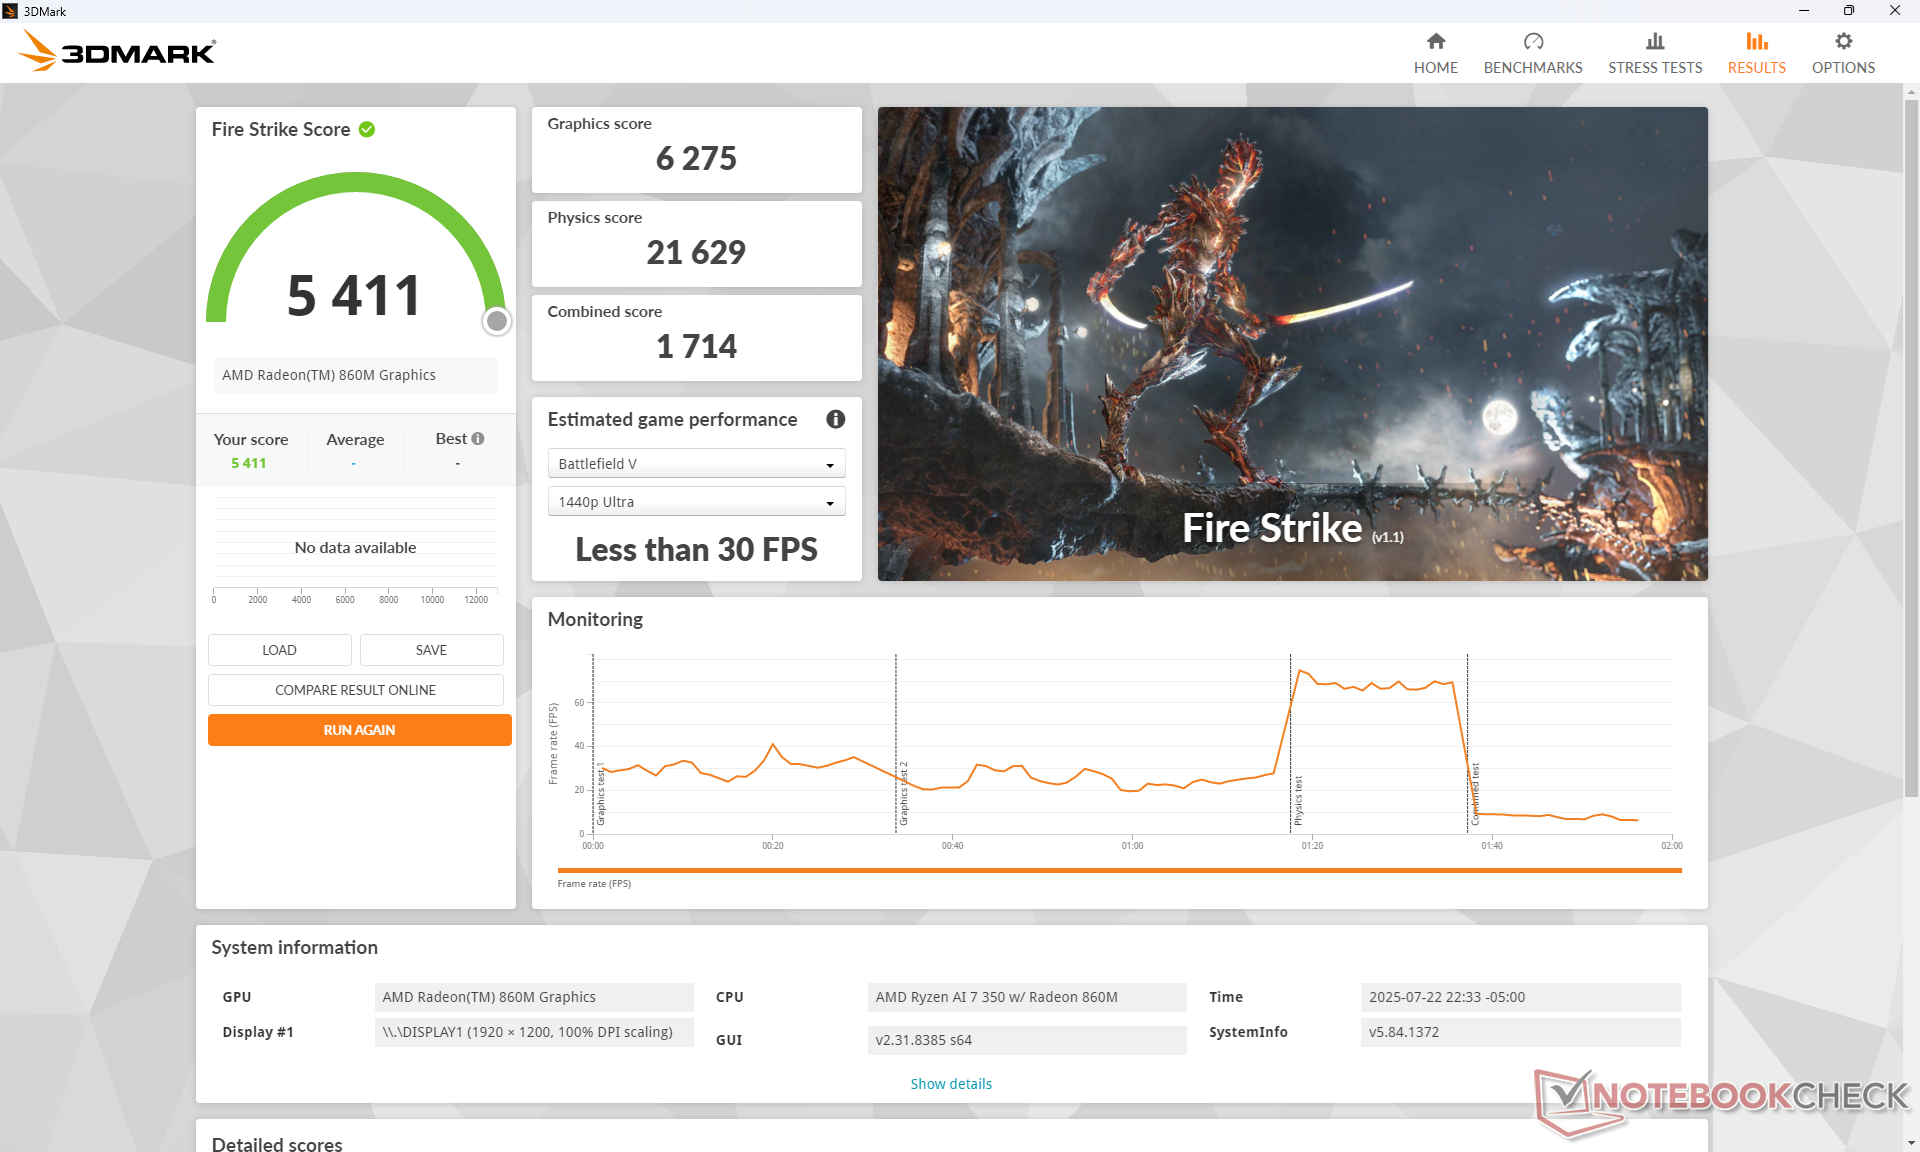
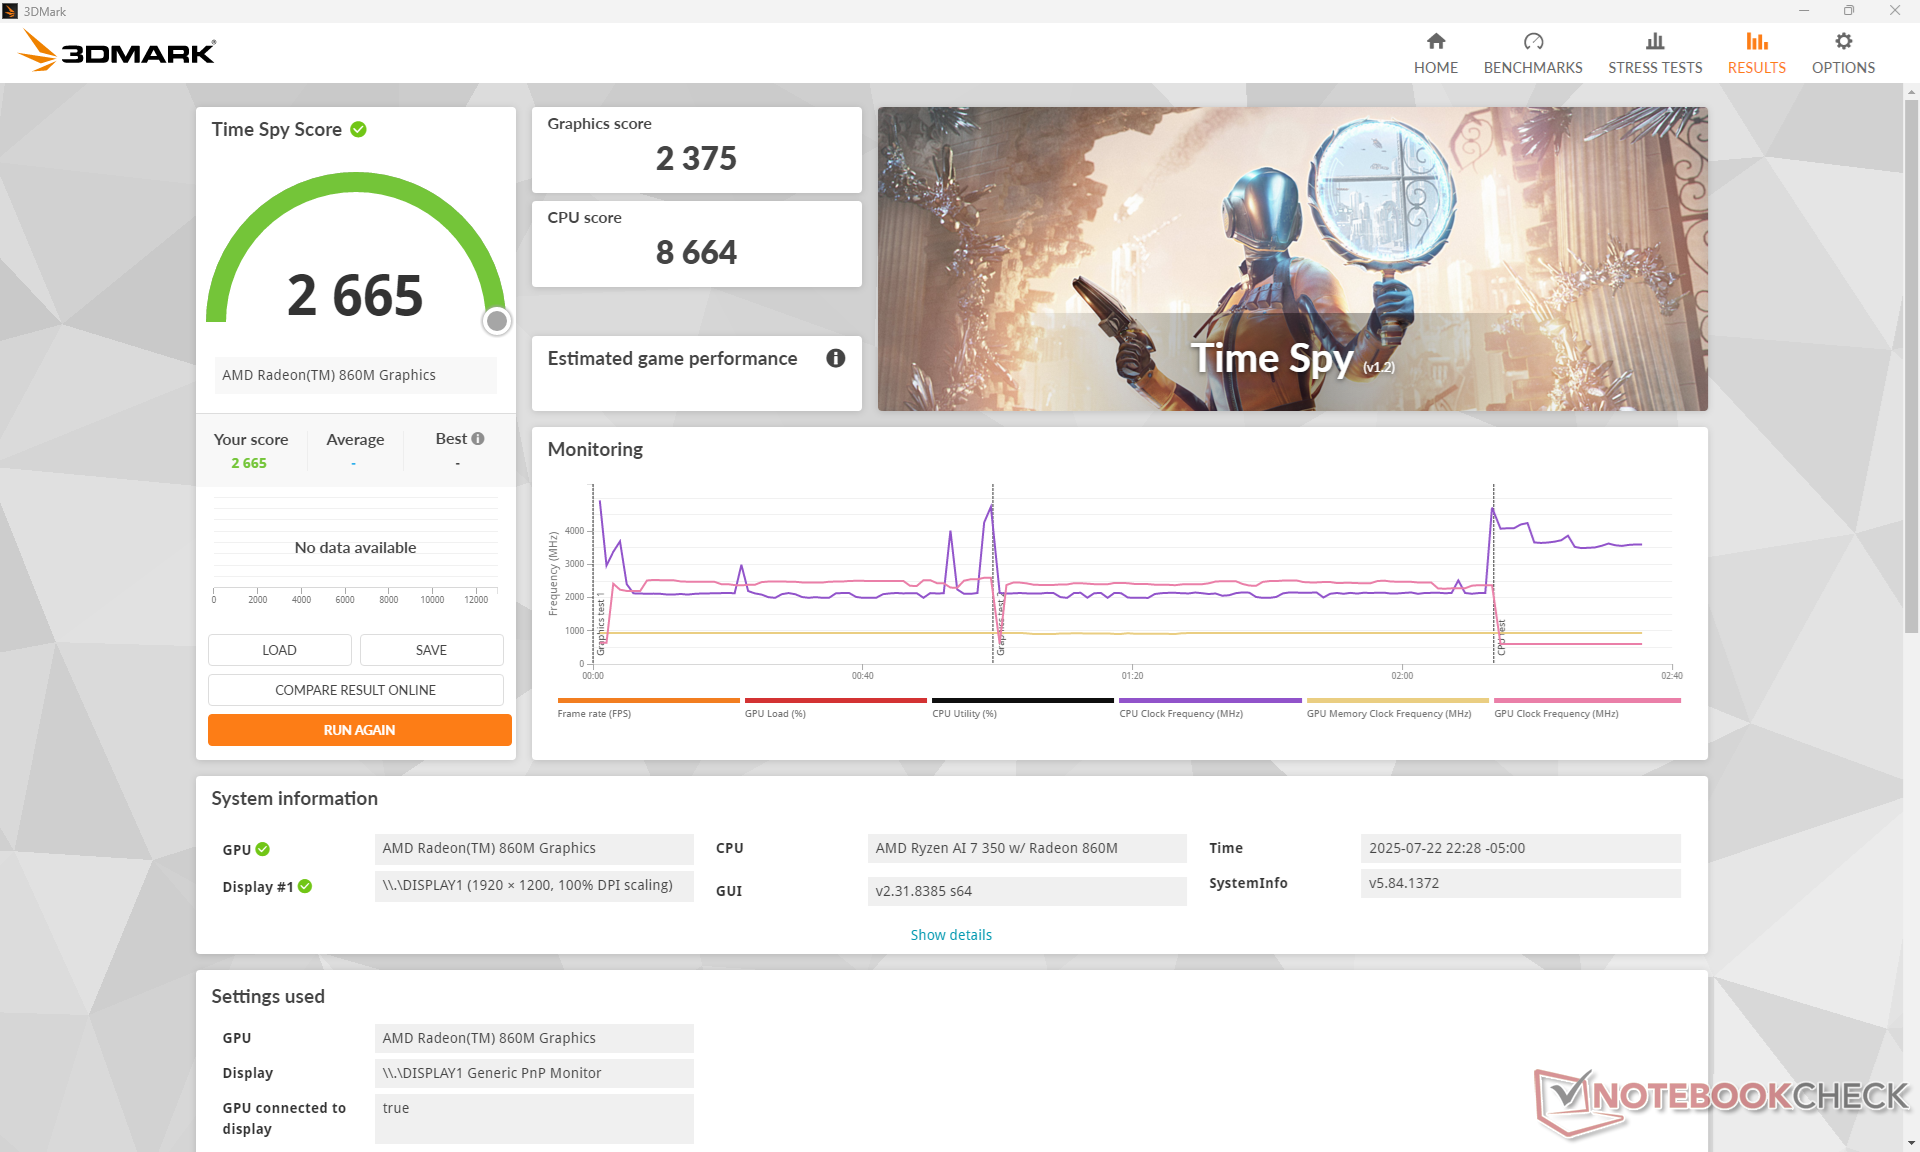
图形处理器性能
无论设置如何,F1 24 基准测试 每次都会崩溃。
| 电源配置文件 | 图形分数 | 物理得分 | 综合得分 |
| 性能模式 | 6275 | 21629 | 1714 |
| 均衡模式 | 4240 (-32%) | 19580 (-10%) | 1361 (-21%) |
| 电池电量 | 2837 (-55%) | 17122 (-21%) | 784 (-54%) |
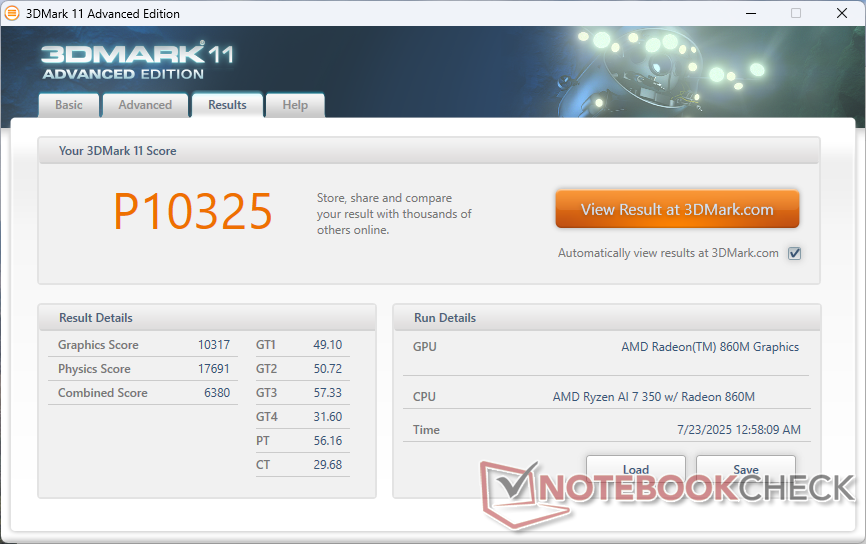
| 3DMark 11 Performance | 10325 points | |
| 3DMark Cloud Gate Standard Score | 29649 points | |
| 3DMark Fire Strike Score | 5411 points | |
| 3DMark Time Spy Score | 2665 points | |
Help | ||
* ... smaller is better
| F1 24 | |
| 1920x1080 Low Preset AA:T AF:16x | |
| Asus ZenBook Duo OLED UX8406CA | |
| Lenovo Yoga Book 9 14IAH10 | |
| Average AMD Radeon 860M (44.4 - 77.2, n=11) | |
| Lenovo IdeaPad 5 2-in-1 14AKP10 83KT0033GE | |
| 1920x1080 Medium Preset AA:T AF:16x | |
| Asus ZenBook Duo OLED UX8406CA | |
| Lenovo Yoga Book 9 14IAH10 | |
| Average AMD Radeon 860M (50.2 - 69.6, n=10) | |
| Lenovo IdeaPad 5 2-in-1 14AKP10 83KT0033GE | |
| 1920x1080 High Preset AA:T AF:16x | |
| Asus ZenBook Duo OLED UX8406CA | |
| Average AMD Radeon 860M (37.7 - 51.8, n=9) | |
| 1920x1080 Ultra High Preset AA:T AF:16x | |
| Asus ZenBook Duo OLED UX8406CA | |
| Average AMD Radeon 860M (7.94 - 11.4, n=8) | |
Cyberpunk 2077 ultra FPS Chart
| low | med. | high | ultra | |
|---|---|---|---|---|
| GTA V (2015) | 163.1 | 52.1 | 20.6 | |
| Dota 2 Reborn (2015) | 131.7 | 119.1 | 74.1 | 66.6 |
| Final Fantasy XV Benchmark (2018) | 65 | 32.3 | 22.4 | |
| X-Plane 11.11 (2018) | 57.6 | 44.7 | 38.7 | |
| Strange Brigade (2018) | 141.5 | 54.6 | 44.4 | 37.3 |
| Baldur's Gate 3 (2023) | 28.4 | 23.6 | 19.2 | 18.9 |
| Cyberpunk 2077 (2023) | 30.4 | 21.9 | 17.1 | 11 |
排放量
系统噪音
Noise level
| Idle |
| 29.7 / 33.1 / 33.1 dB(A) |
| Load |
| 33.4 / 48.5 dB(A) |
 | ||
30 dB silent 40 dB(A) audible 50 dB(A) loud |
||
min: | ||
| Dell 14 Plus 2-in-1 Radeon 860M, Ryzen AI 7 350 | Lenovo IdeaPad 5 2-in-1 14AKP10 83KT0033GE Radeon 860M, Ryzen AI 7 350, WD PC SN7100S SDFPMSL-512G-1101 | Lenovo Yoga 7 2-in-1 14AHP9 Arctic Grey Radeon 760M, R5 8640HS, Micron 2450 512GB MTFDKCD512TFK | Acer Aspire Spin 14 ASP14-52MTN-51V5 Graphics 4-Core iGPU (Arrow Lake), Ultra 5 115U, Kingston OM8PGP4512Q-A0 | Dell Inspiron 14 7445 2-in-1 Radeon 780M, R7 8840HS, Micron 2400 MTFDKBK1T0QFM | Asus ZenBook Flip 14 UN5401QA-KN085W Vega 8, R7 5800H, Intel SSD 600p SSDPEKKW512G7 | |
|---|---|---|---|---|---|---|
| Noise | 9% | 3% | 1% | 13% | 5% | |
| off / environment * (dB) | 23.1 | 24.8 -7% | 25 -8% | 25 -8% | 23.6 -2% | 26 -13% |
| Idle Minimum * (dB) | 29.7 | 24.8 16% | 25 16% | 25 16% | 24.3 18% | 26 12% |
| Idle Average * (dB) | 33.1 | 24.8 25% | 26 21% | 28 15% | 24.3 27% | 26 21% |
| Idle Maximum * (dB) | 33.1 | 24.8 25% | 30 9% | 29 12% | 24.8 25% | 27.3 18% |
| Load Average * (dB) | 33.4 | 41.2 -23% | 43 -29% | 37 -11% | 33.5 -0% | 39.8 -19% |
| Cyberpunk 2077 ultra * (dB) | 43.2 | 35.9 17% | 42 3% | 47 -9% | ||
| Load Maximum * (dB) | 48.5 | 43.3 11% | 43 11% | 51 -5% | 43.8 10% | 42.4 13% |
| Witcher 3 ultra * (dB) | 43.8 |
* ... smaller is better
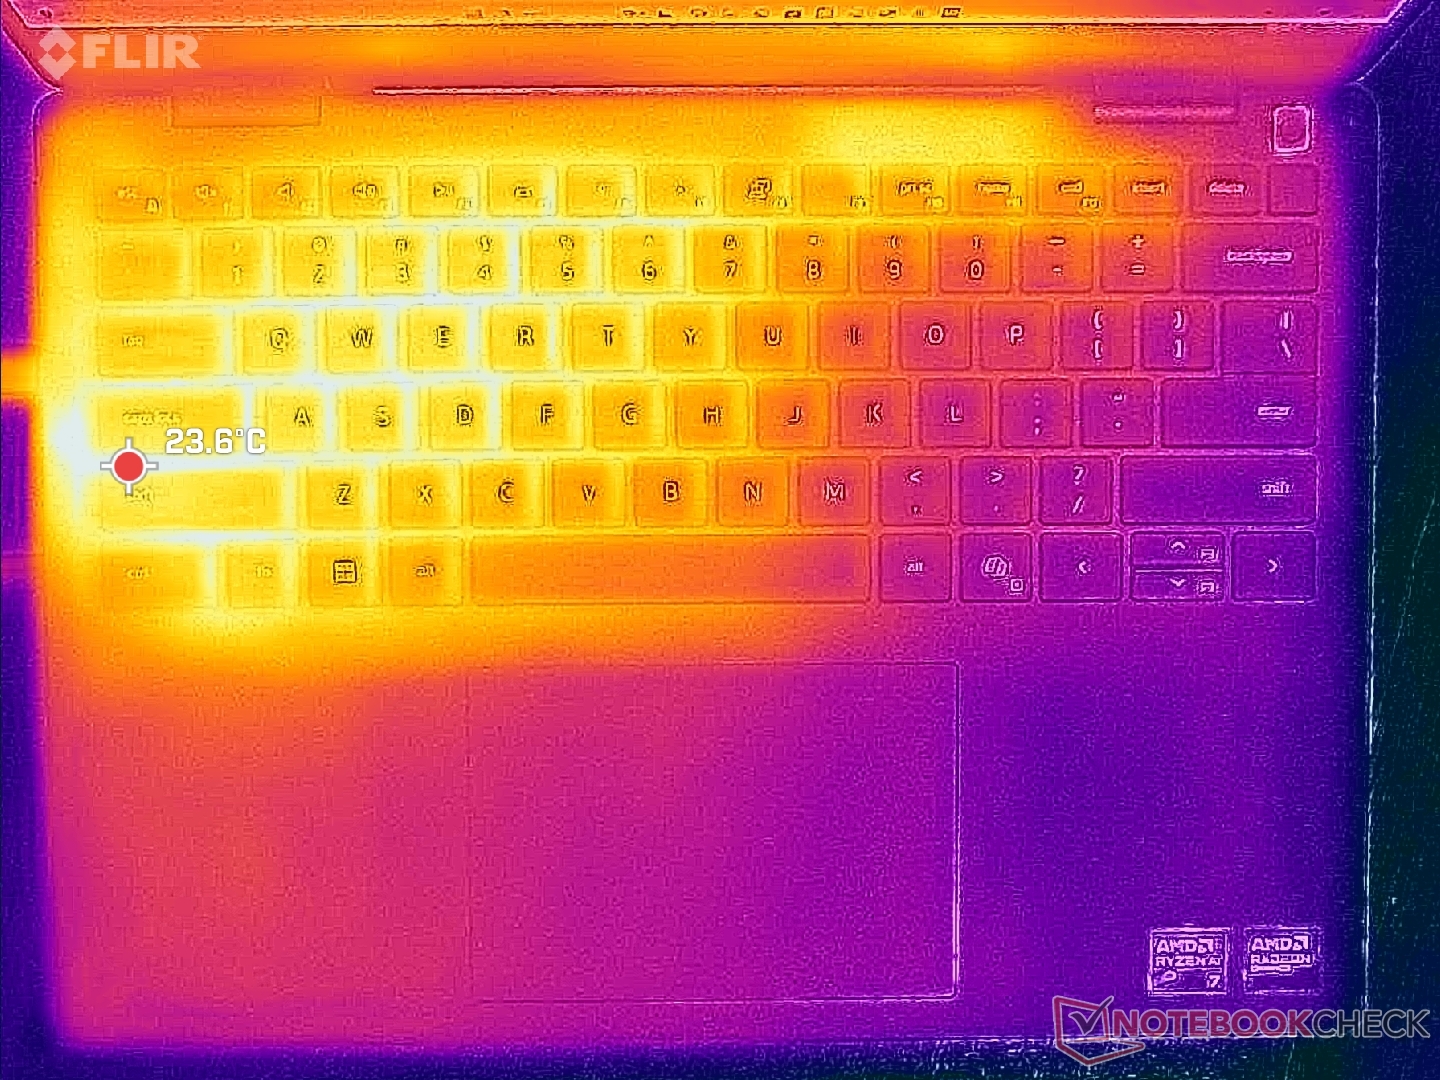
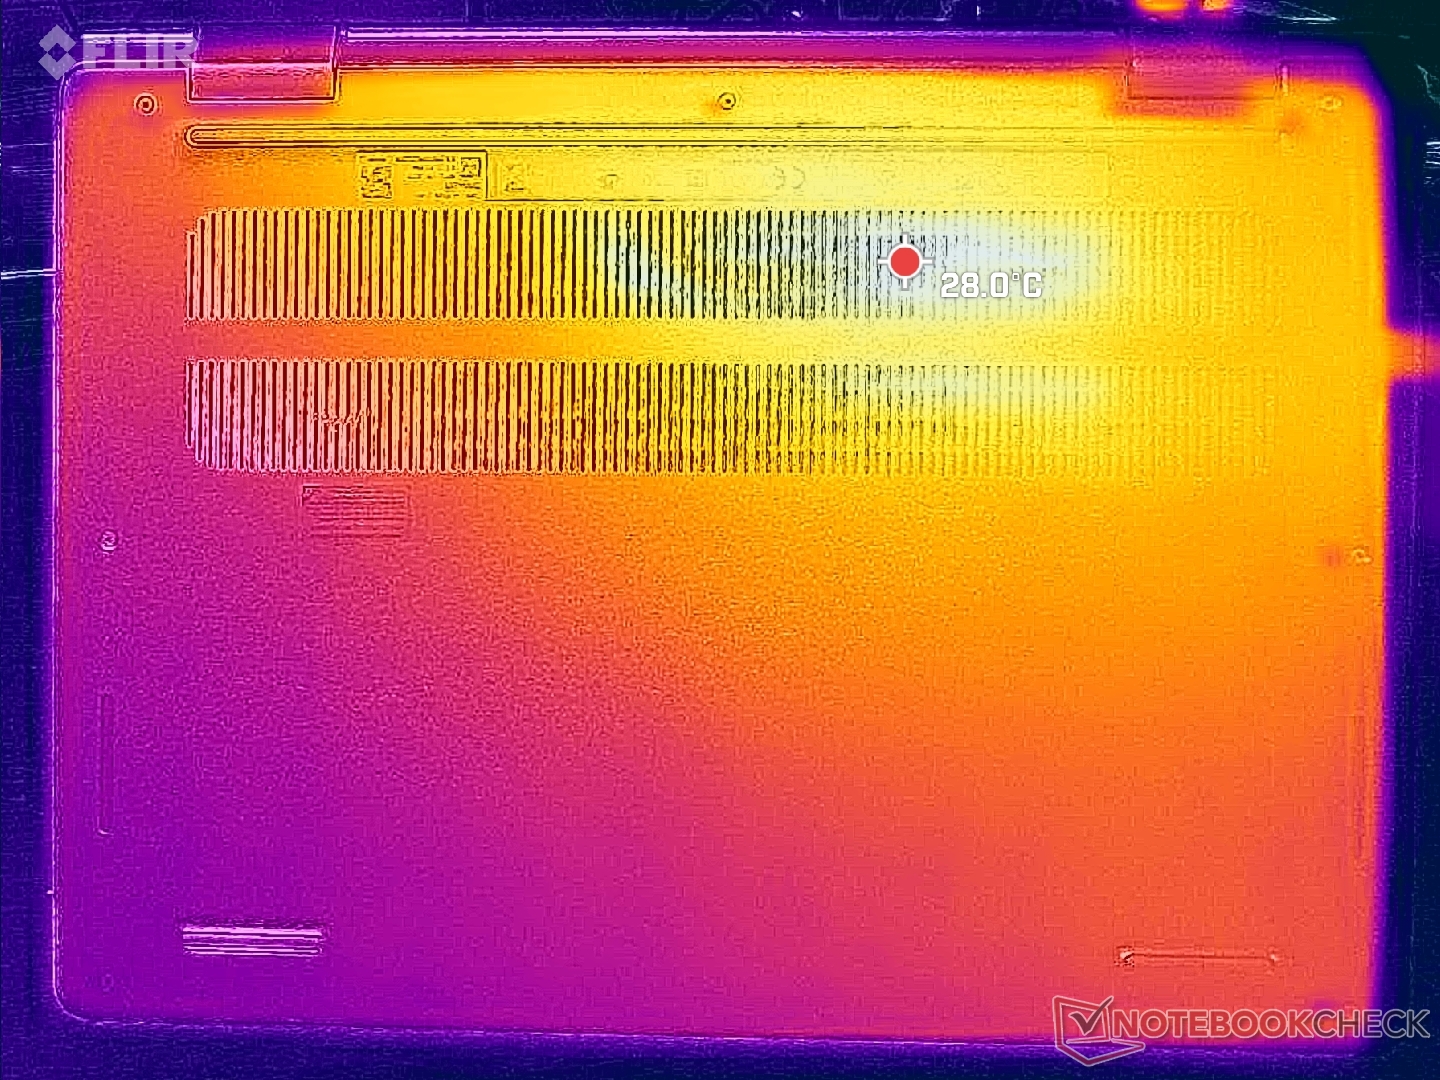
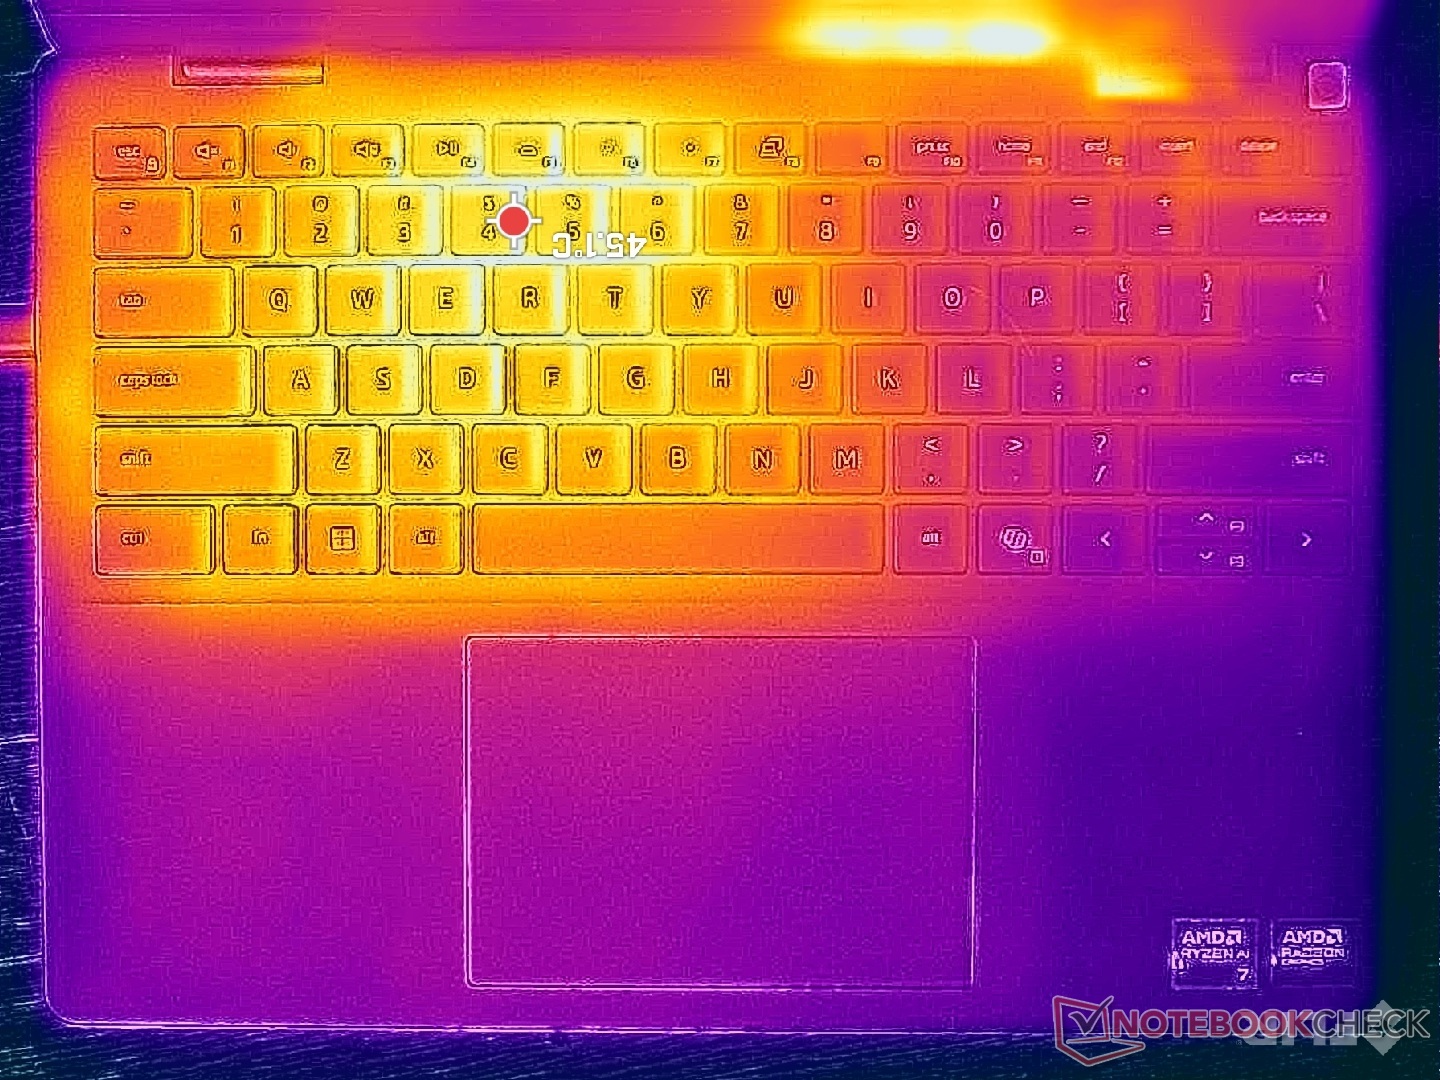
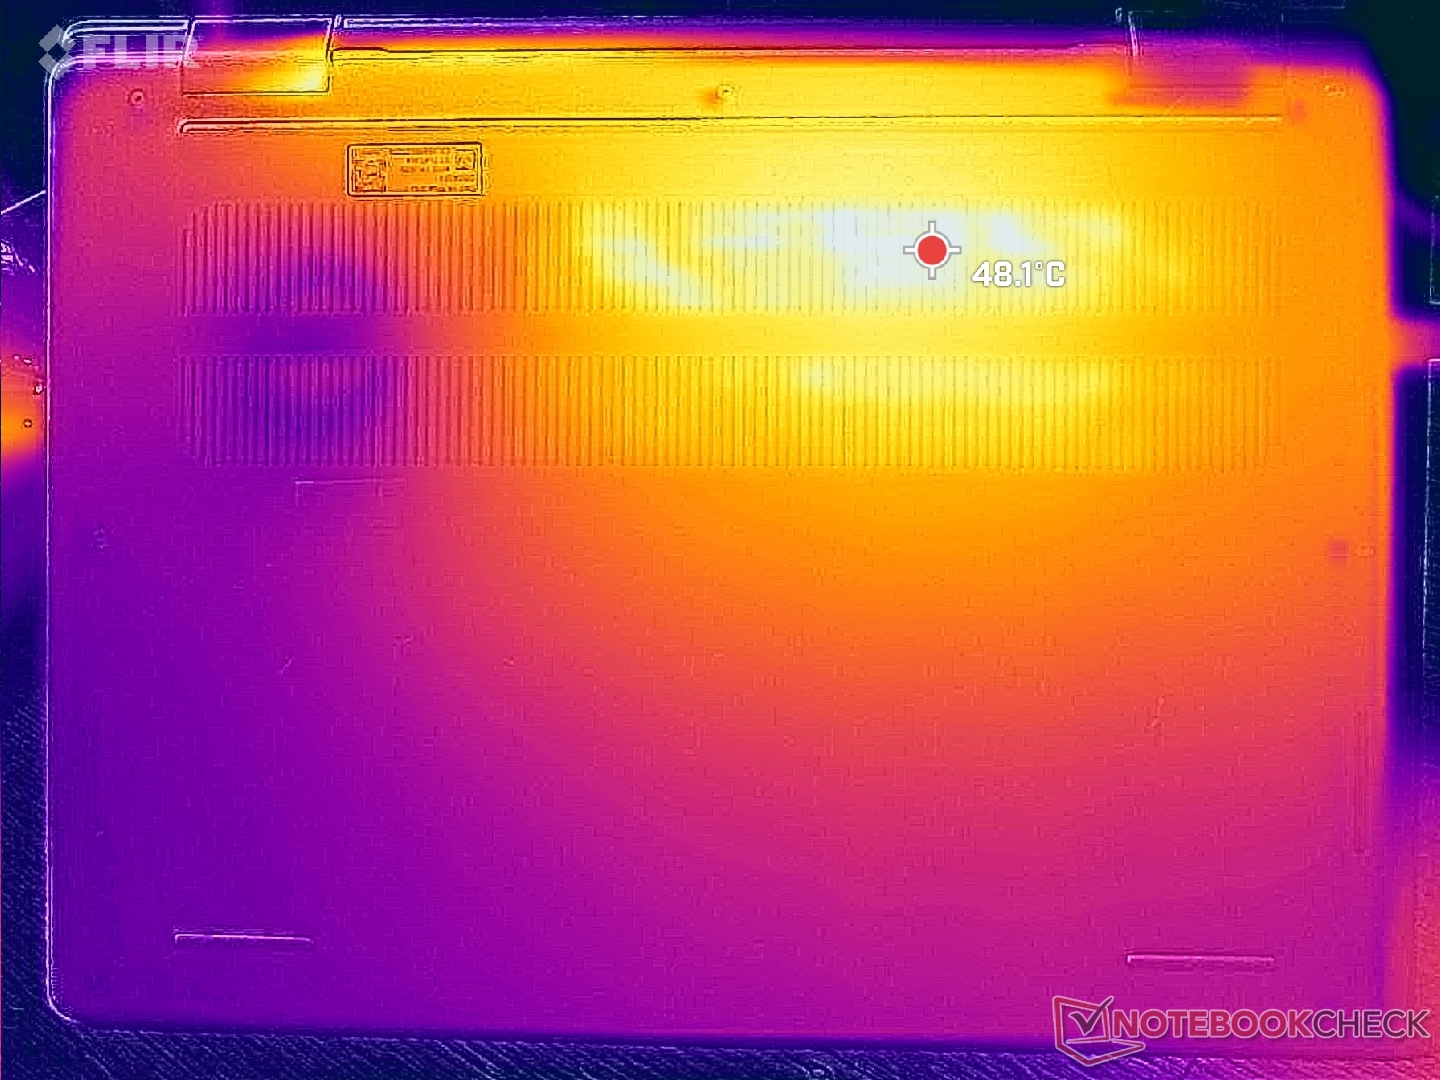
温度
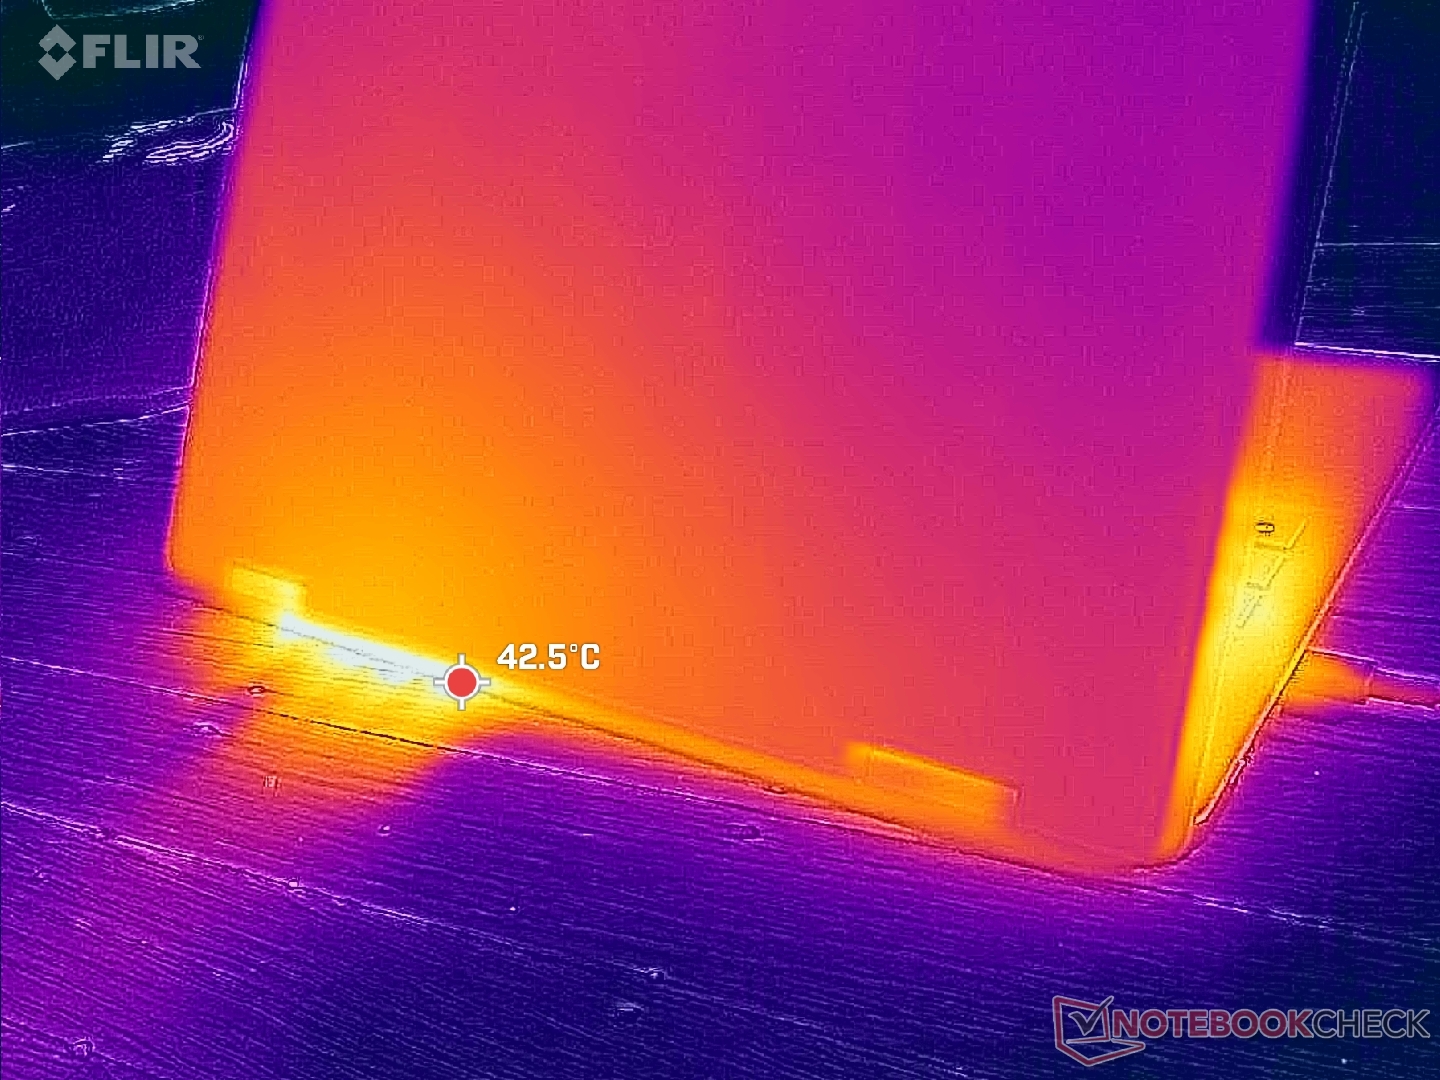
(±) The maximum temperature on the upper side is 43.2 °C / 110 F, compared to the average of 35.4 °C / 96 F, ranging from 19.6 to 60 °C for the class Convertible.
(±) The bottom heats up to a maximum of 42.8 °C / 109 F, compared to the average of 36.9 °C / 98 F
(+) In idle usage, the average temperature for the upper side is 28.2 °C / 83 F, compared to the device average of 30.3 °C / 87 F.
(+) The palmrests and touchpad are cooler than skin temperature with a maximum of 31 °C / 87.8 F and are therefore cool to the touch.
(-) The average temperature of the palmrest area of similar devices was 28 °C / 82.4 F (-3 °C / -5.4 F).
| Dell 14 Plus 2-in-1 AMD Ryzen AI 7 350, AMD Radeon 860M | Lenovo IdeaPad 5 2-in-1 14AKP10 83KT0033GE AMD Ryzen AI 7 350, AMD Radeon 860M | Lenovo Yoga 7 2-in-1 14AHP9 Arctic Grey AMD Ryzen 5 8640HS, AMD Radeon 760M | Acer Aspire Spin 14 ASP14-52MTN-51V5 Intel Core Ultra 5 115U, Intel Graphics 4-Core iGPU (Meteor / Arrow Lake) | Dell Inspiron 14 7445 2-in-1 AMD Ryzen 7 8840HS, AMD Radeon 780M | Asus ZenBook Flip 14 UN5401QA-KN085W AMD Ryzen 7 5800H, AMD Radeon RX Vega 8 (Ryzen 4000/5000) | |
|---|---|---|---|---|---|---|
| Heat | -3% | 5% | 3% | -3% | -9% | |
| Maximum Upper Side * (°C) | 43.2 | 45 -4% | 44 -2% | 41 5% | 41.2 5% | 42.7 1% |
| Maximum Bottom * (°C) | 42.8 | 47.5 -11% | 47 -10% | 47 -10% | 48.4 -13% | 53.1 -24% |
| Idle Upper Side * (°C) | 32.2 | 31.1 3% | 27 16% | 27 16% | 29.4 9% | 32.9 -2% |
| Idle Bottom * (°C) | 31.6 | 31.5 -0% | 27 15% | 31 2% | 35.2 -11% | 35.2 -11% |
* ... smaller is better
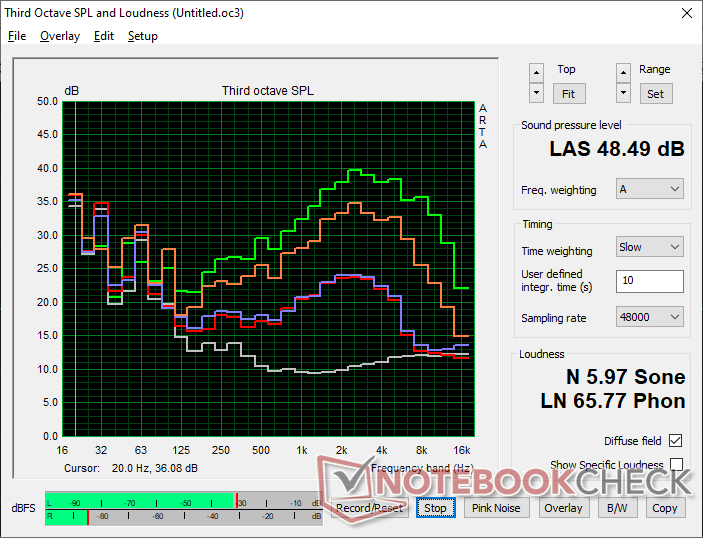
发言人
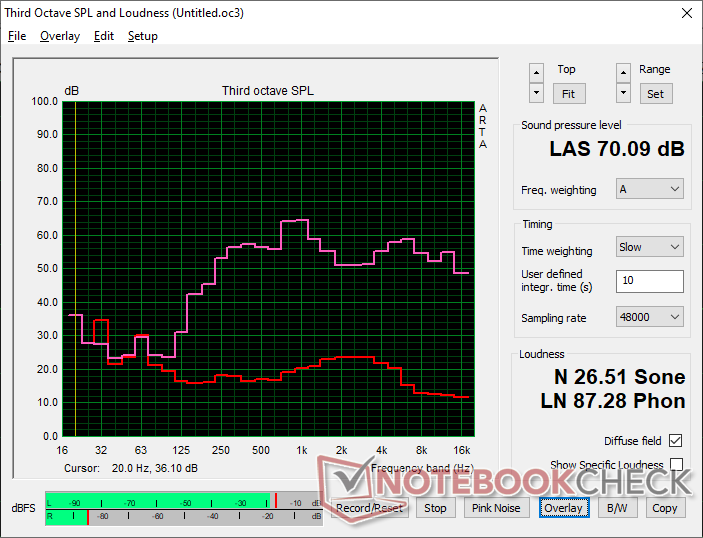
Dell 14 Plus 2-in-1 audio analysis
(-) | not very loud speakers (70.1 dB)
Bass 100 - 315 Hz
(±) | reduced bass - on average 13.4% lower than median
(-) | bass is not linear (15.1% delta to prev. frequency)
Mids 400 - 2000 Hz
(+) | balanced mids - only 4% away from median
(±) | linearity of mids is average (8.4% delta to prev. frequency)
Highs 2 - 16 kHz
(+) | balanced highs - only 2.5% away from median
(+) | highs are linear (5.6% delta to prev. frequency)
Overall 100 - 16.000 Hz
(±) | linearity of overall sound is average (19.4% difference to median)
Compared to same class
» 48% of all tested devices in this class were better, 6% similar, 47% worse
» The best had a delta of 6%, average was 20%, worst was 57%
Compared to all devices tested
» 48% of all tested devices were better, 7% similar, 45% worse
» The best had a delta of 4%, average was 23%, worst was 134%
Apple MacBook Pro 16 2021 M1 Pro audio analysis
(+) | speakers can play relatively loud (84.7 dB)
Bass 100 - 315 Hz
(+) | good bass - only 3.8% away from median
(+) | bass is linear (5.2% delta to prev. frequency)
Mids 400 - 2000 Hz
(+) | balanced mids - only 1.3% away from median
(+) | mids are linear (2.1% delta to prev. frequency)
Highs 2 - 16 kHz
(+) | balanced highs - only 1.9% away from median
(+) | highs are linear (2.7% delta to prev. frequency)
Overall 100 - 16.000 Hz
(+) | overall sound is linear (4.6% difference to median)
Compared to same class
» 0% of all tested devices in this class were better, 0% similar, 100% worse
» The best had a delta of 5%, average was 17%, worst was 45%
Compared to all devices tested
» 0% of all tested devices were better, 0% similar, 100% worse
» The best had a delta of 4%, average was 23%, worst was 134%
能源管理
耗电量
| Off / Standby | |
| Idle | |
| Load |
|
Key:
min: | |
| Dell 14 Plus 2-in-1 Ryzen AI 7 350, Radeon 860M, , IPS, 1920x1200, 14" | Lenovo IdeaPad 5 2-in-1 14AKP10 83KT0033GE Ryzen AI 7 350, Radeon 860M, WD PC SN7100S SDFPMSL-512G-1101, OLED, 1920x1200, 14" | Lenovo Yoga 7 2-in-1 14AHP9 Arctic Grey R5 8640HS, Radeon 760M, Micron 2450 512GB MTFDKCD512TFK, OLED, 1920x1200, 14" | Acer Aspire Spin 14 ASP14-52MTN-51V5 Ultra 5 115U, Graphics 4-Core iGPU (Arrow Lake), Kingston OM8PGP4512Q-A0, IPS, 1920x1200, 14" | Dell Inspiron 14 7445 2-in-1 R7 8840HS, Radeon 780M, Micron 2400 MTFDKBK1T0QFM, IPS, 1920x1200, 14" | Asus ZenBook Flip 14 UN5401QA-KN085W R7 5800H, Vega 8, Intel SSD 600p SSDPEKKW512G7, OLED, 2880x1800, 14" | |
|---|---|---|---|---|---|---|
| Power Consumption | -33% | -29% | -6% | -22% | -44% | |
| Idle Minimum * (Watt) | 3.5 | 5.3 -51% | 4.4 -26% | 5 -43% | 4.5 -29% | 6.4 -83% |
| Idle Average * (Watt) | 6.8 | 5.6 18% | 5.2 24% | 6 12% | 8.4 -24% | 9.4 -38% |
| Idle Maximum * (Watt) | 6.9 | 6.8 1% | 9.9 -43% | 9 -30% | 8.9 -29% | 10.7 -55% |
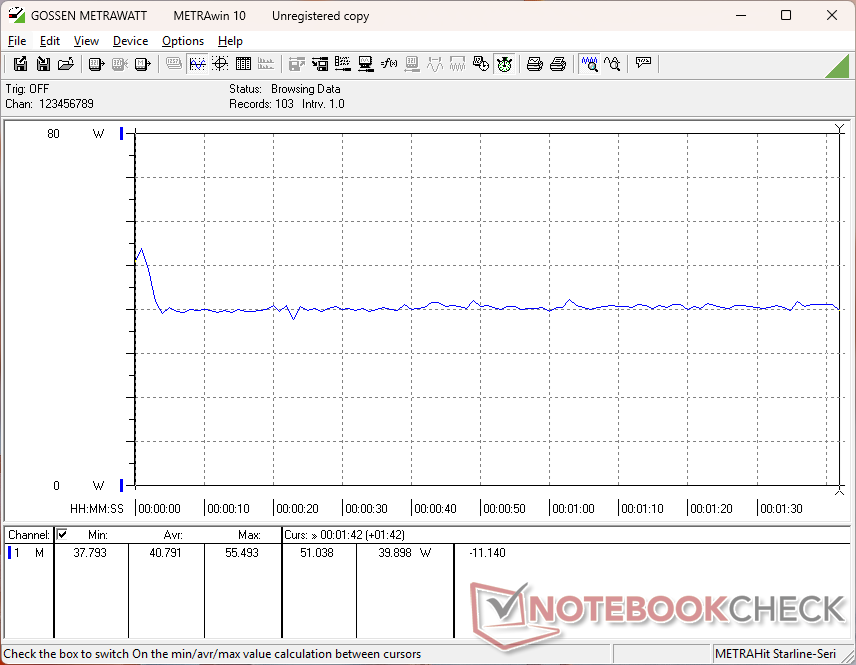
| Load Average * (Watt) | 40.8 | 56.2 -38% | 52.5 -29% | 32 22% | 50.7 -24% | 52.2 -28% |
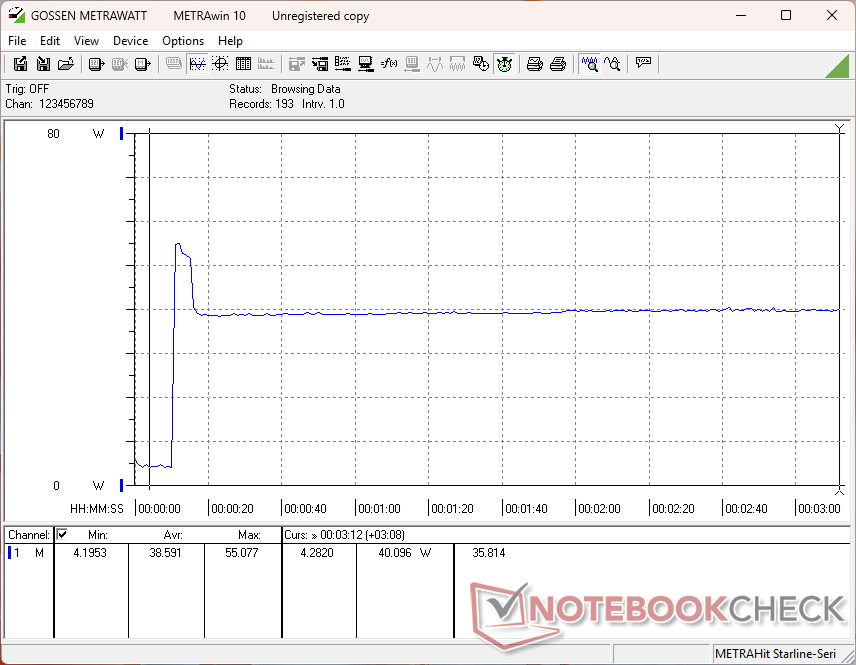
| Cyberpunk 2077 ultra external monitor * (Watt) | 32.8 | 65.7 -100% | 52.7 -61% | 32 2% | ||
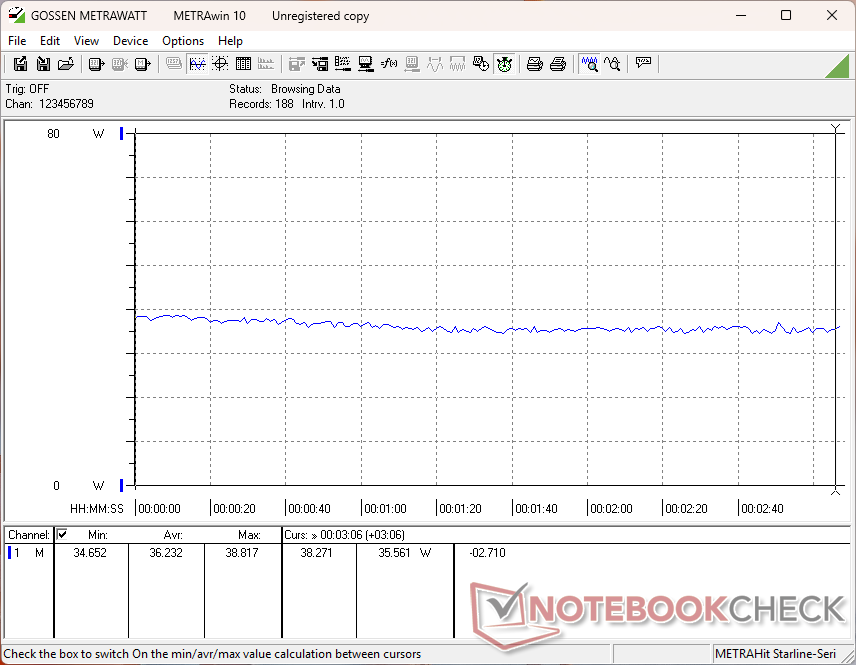
| Cyberpunk 2077 ultra * (Watt) | 36.2 | 54.5 -51% | 55.4 -53% | 34.4 5% | ||
| Load Maximum * (Watt) | 59.3 | 65.8 -11% | 67 -13% | 67 -13% | 62.4 -5% | 69 -16% |
| Witcher 3 ultra * (Watt) | 50.8 | 53 |
* ... smaller is better
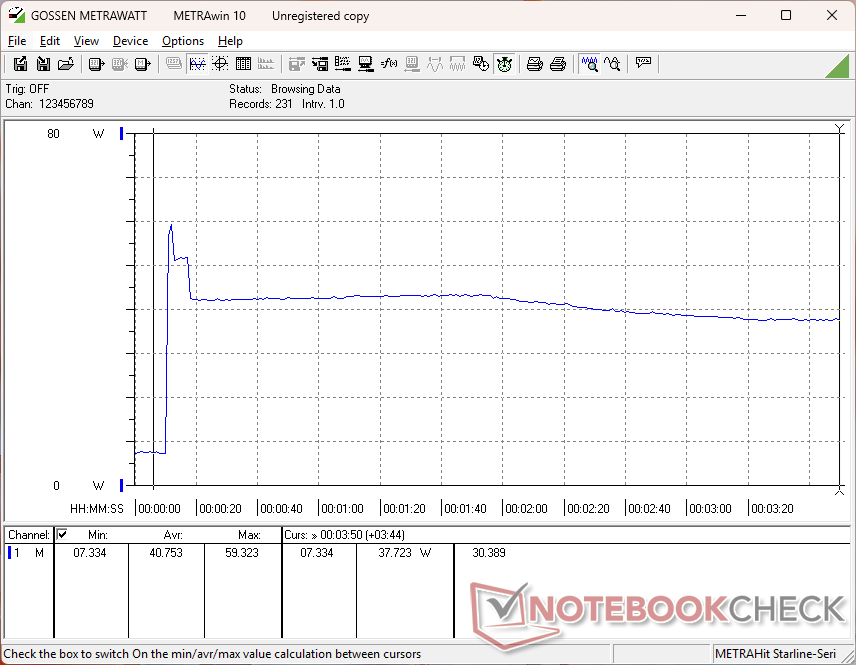
Power Consumption Cyberpunk / Stress Test
Power Consumption external Monitor
电池寿命
| Dell 14 Plus 2-in-1 Ryzen AI 7 350, Radeon 860M, 64 Wh | Lenovo IdeaPad 5 2-in-1 14AKP10 83KT0033GE Ryzen AI 7 350, Radeon 860M, 57 Wh | Lenovo Yoga 7 2-in-1 14AHP9 Arctic Grey R5 8640HS, Radeon 760M, 71 Wh | Acer Aspire Spin 14 ASP14-52MTN-51V5 Ultra 5 115U, Graphics 4-Core iGPU (Arrow Lake), 50 Wh | Dell Inspiron 14 7445 2-in-1 R7 8840HS, Radeon 780M, 54 Wh | Asus ZenBook Flip 14 UN5401QA-KN085W R7 5800H, Vega 8, 63 Wh | |
|---|---|---|---|---|---|---|
| Battery runtime | -44% | -10% | 1% | 6% | -30% | |
| WiFi v1.3 (h) | 12.4 | 7 -44% | 11.1 -10% | 12.5 1% | 13.1 6% | 8.7 -30% |
| Load (h) | 1.1 | 2.2 | 2.1 | |||
| Reader / Idle (h) | 22.2 | |||||
| H.264 (h) | 9 |
笔记本检查评级
Dell 14 Plus 2-in-1
- 07/29/2025 v8
Allen Ngo
 Total Sustainability Score:
 潜在竞争对手比较
Transparency
The selection of devices to be reviewed is made by our editorial team. The test sample was provided to the author as a loan by the manufacturer or retailer for the purpose of this review. The lender had no influence on this review, nor did the manufacturer receive a copy of this review before publication. There was no obligation to publish this review. As an independent media company, Notebookcheck is not subjected to the authority of manufacturers, retailers or publishers.
This is how Notebookcheck is testing
Every year, Notebookcheck independently reviews hundreds of laptops and smartphones using standardized procedures to ensure that all results are comparable. We have continuously developed our test methods for around 20 years and set industry standards in the process. In our test labs, high-quality measuring equipment is utilized by experienced technicians and editors. These tests involve a multi-stage validation process. Our complex rating system is based on hundreds of well-founded measurements and benchmarks, which maintains objectivity. Further information on our test methods can be found here.

