Notebookcheck Logo

回顾 Palworld:笔记本电脑和台式机基准测试

令人兴奋的流派组合 在短短几天内,《Palworld》迅速在 Steam 上取得了惊人的成功。这款早期进入的游戏融合了《口袋妖怪》、《方舟》和《塞尔达》等多款游戏的元素。我们深入了解了这款对视觉要求极高的游戏。
Gaming Laptop / Notebook Desktop Gamecheck
Palworld

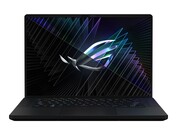
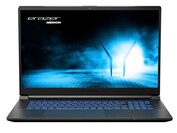
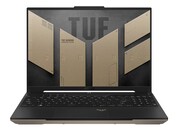
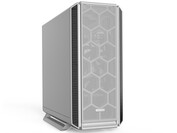
我们在这些设备上进行了游戏基准测试。点击各种图片可进入相应生产商的网站。有关设备规格的更多详情,请参阅文章末尾。

技术

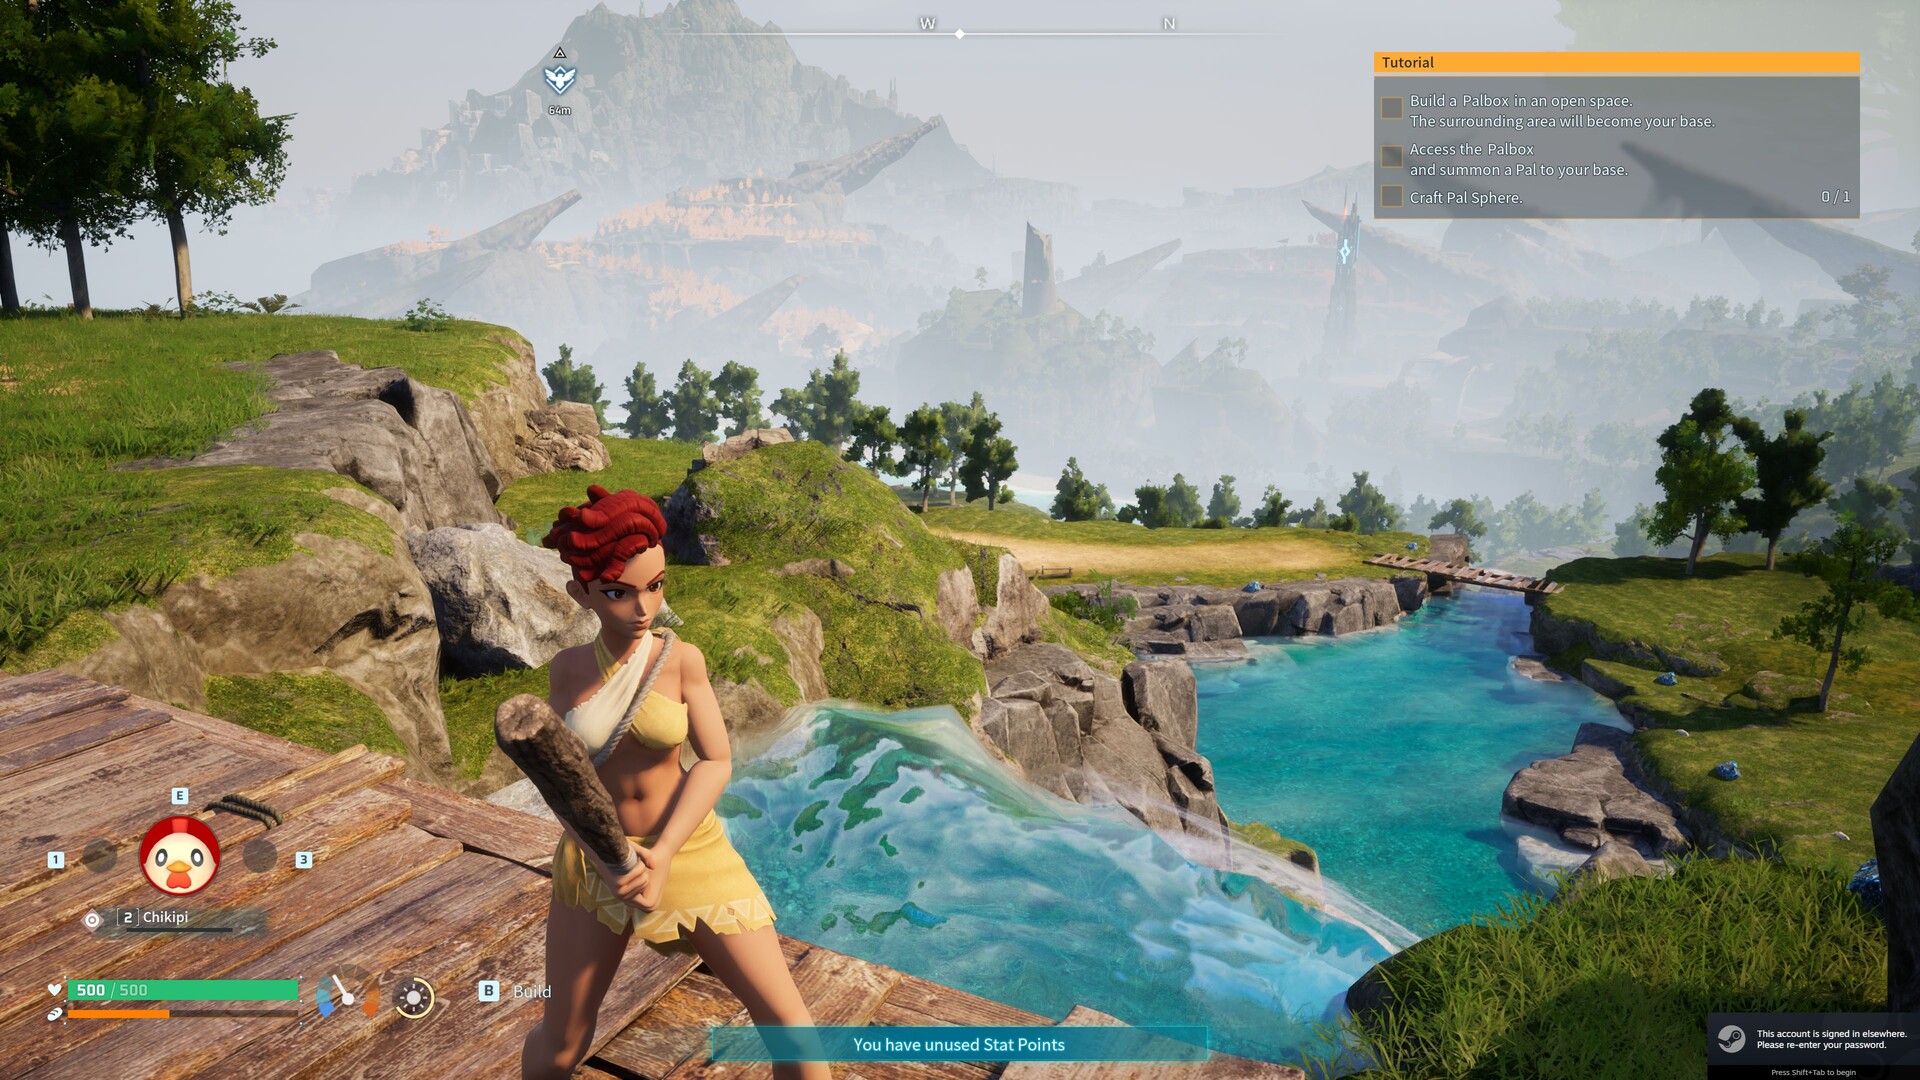
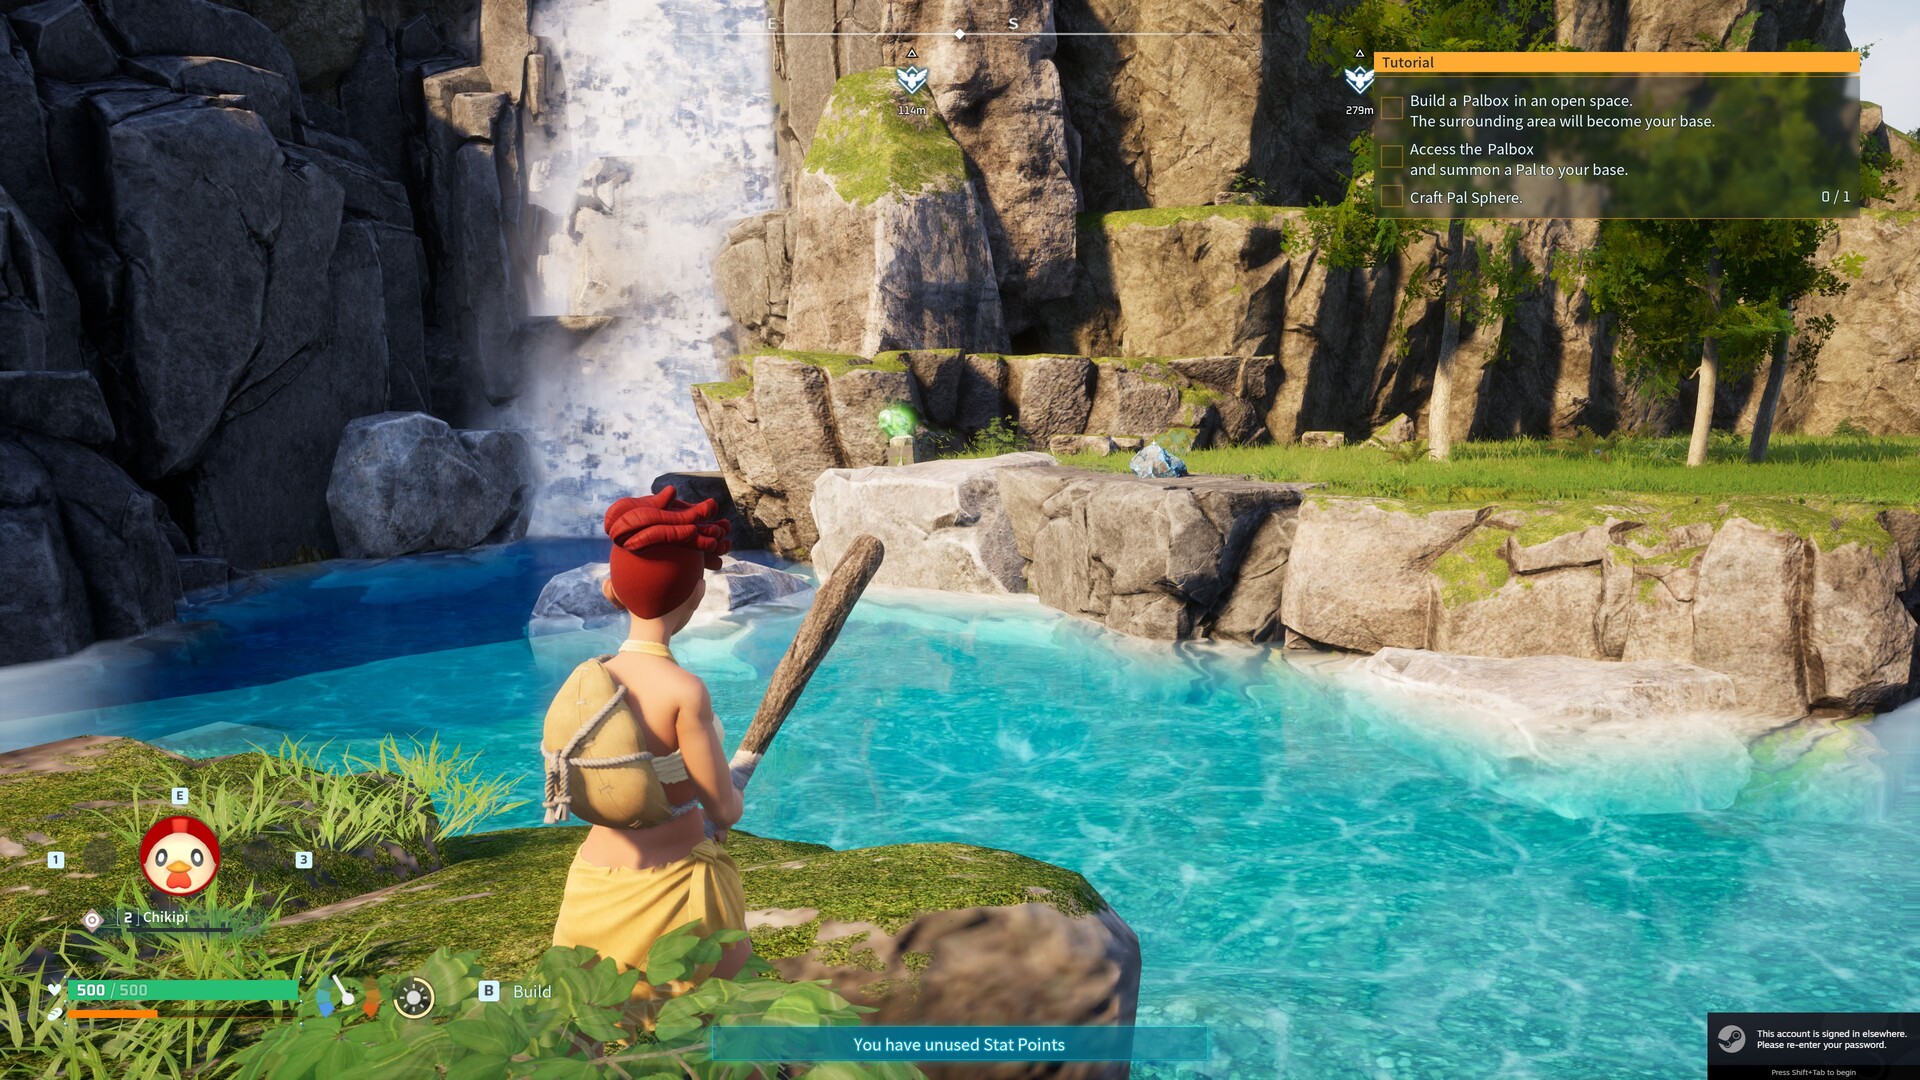
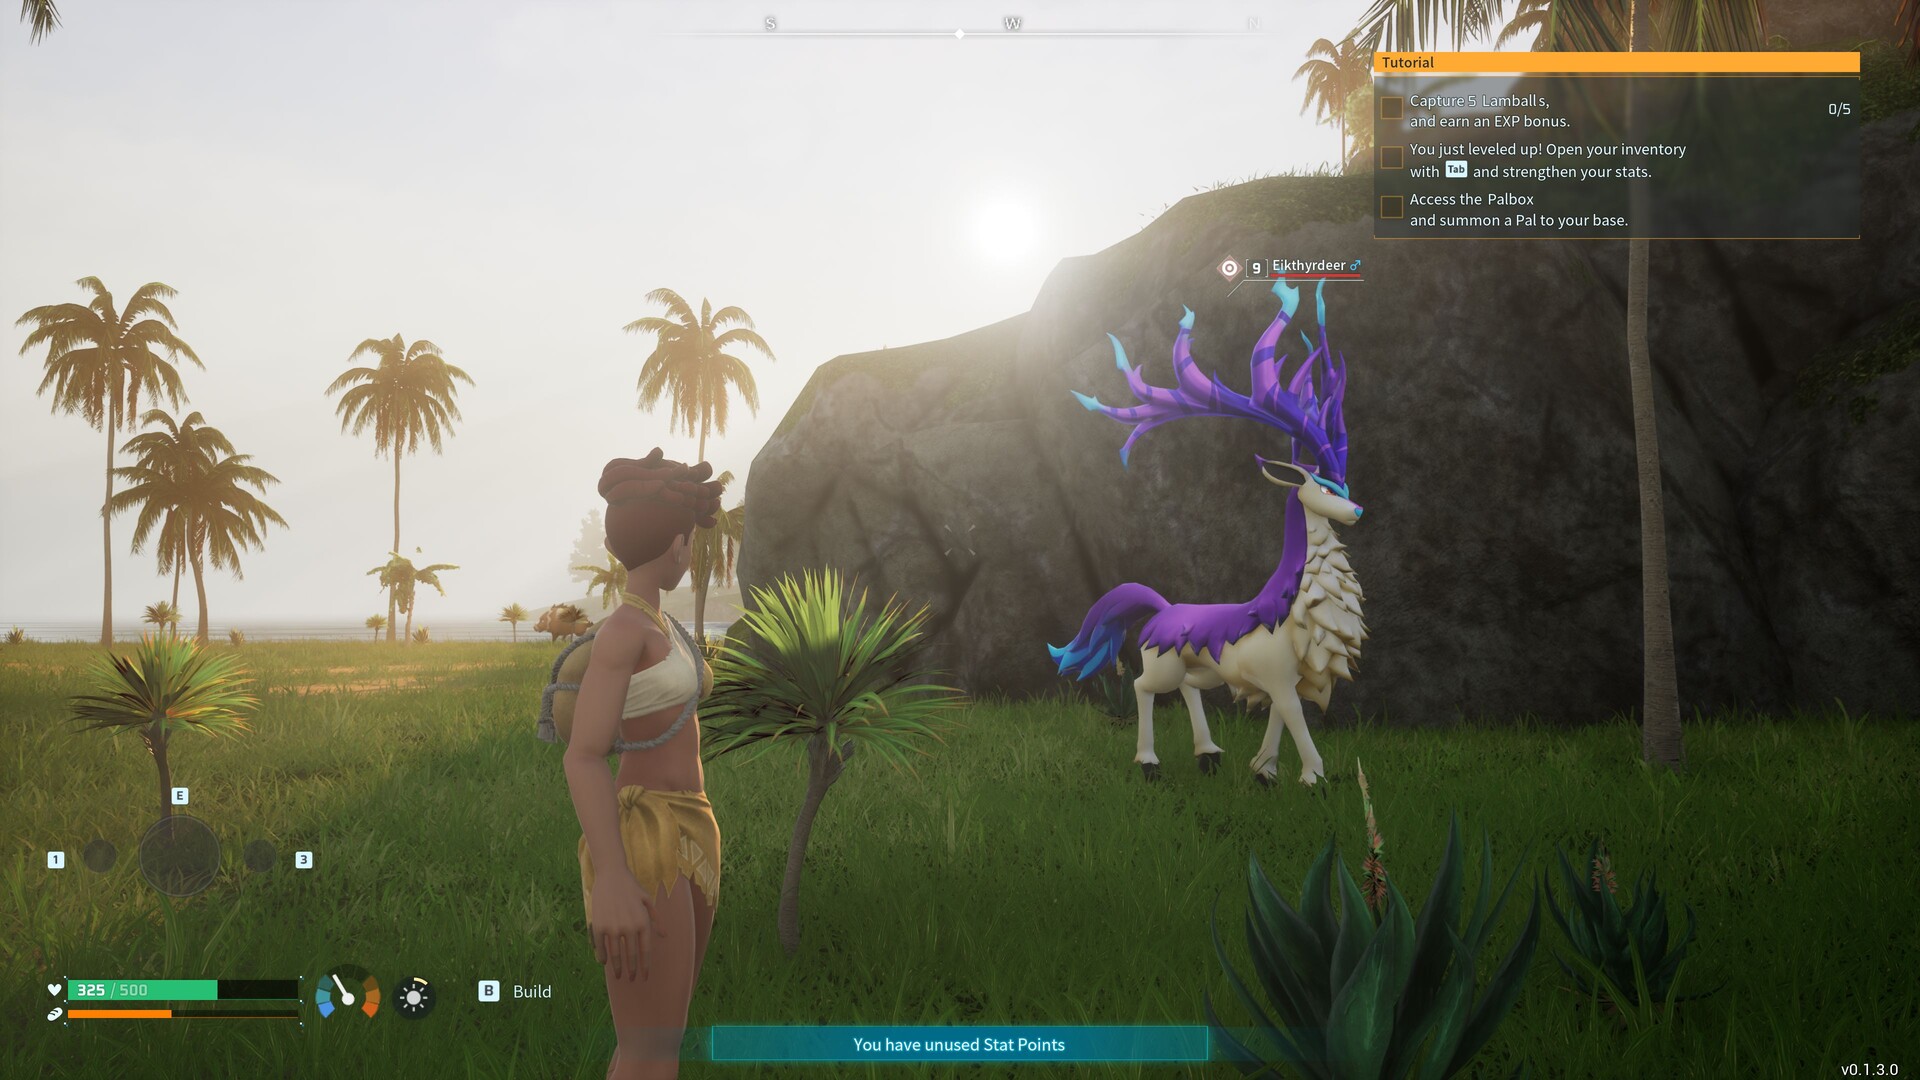
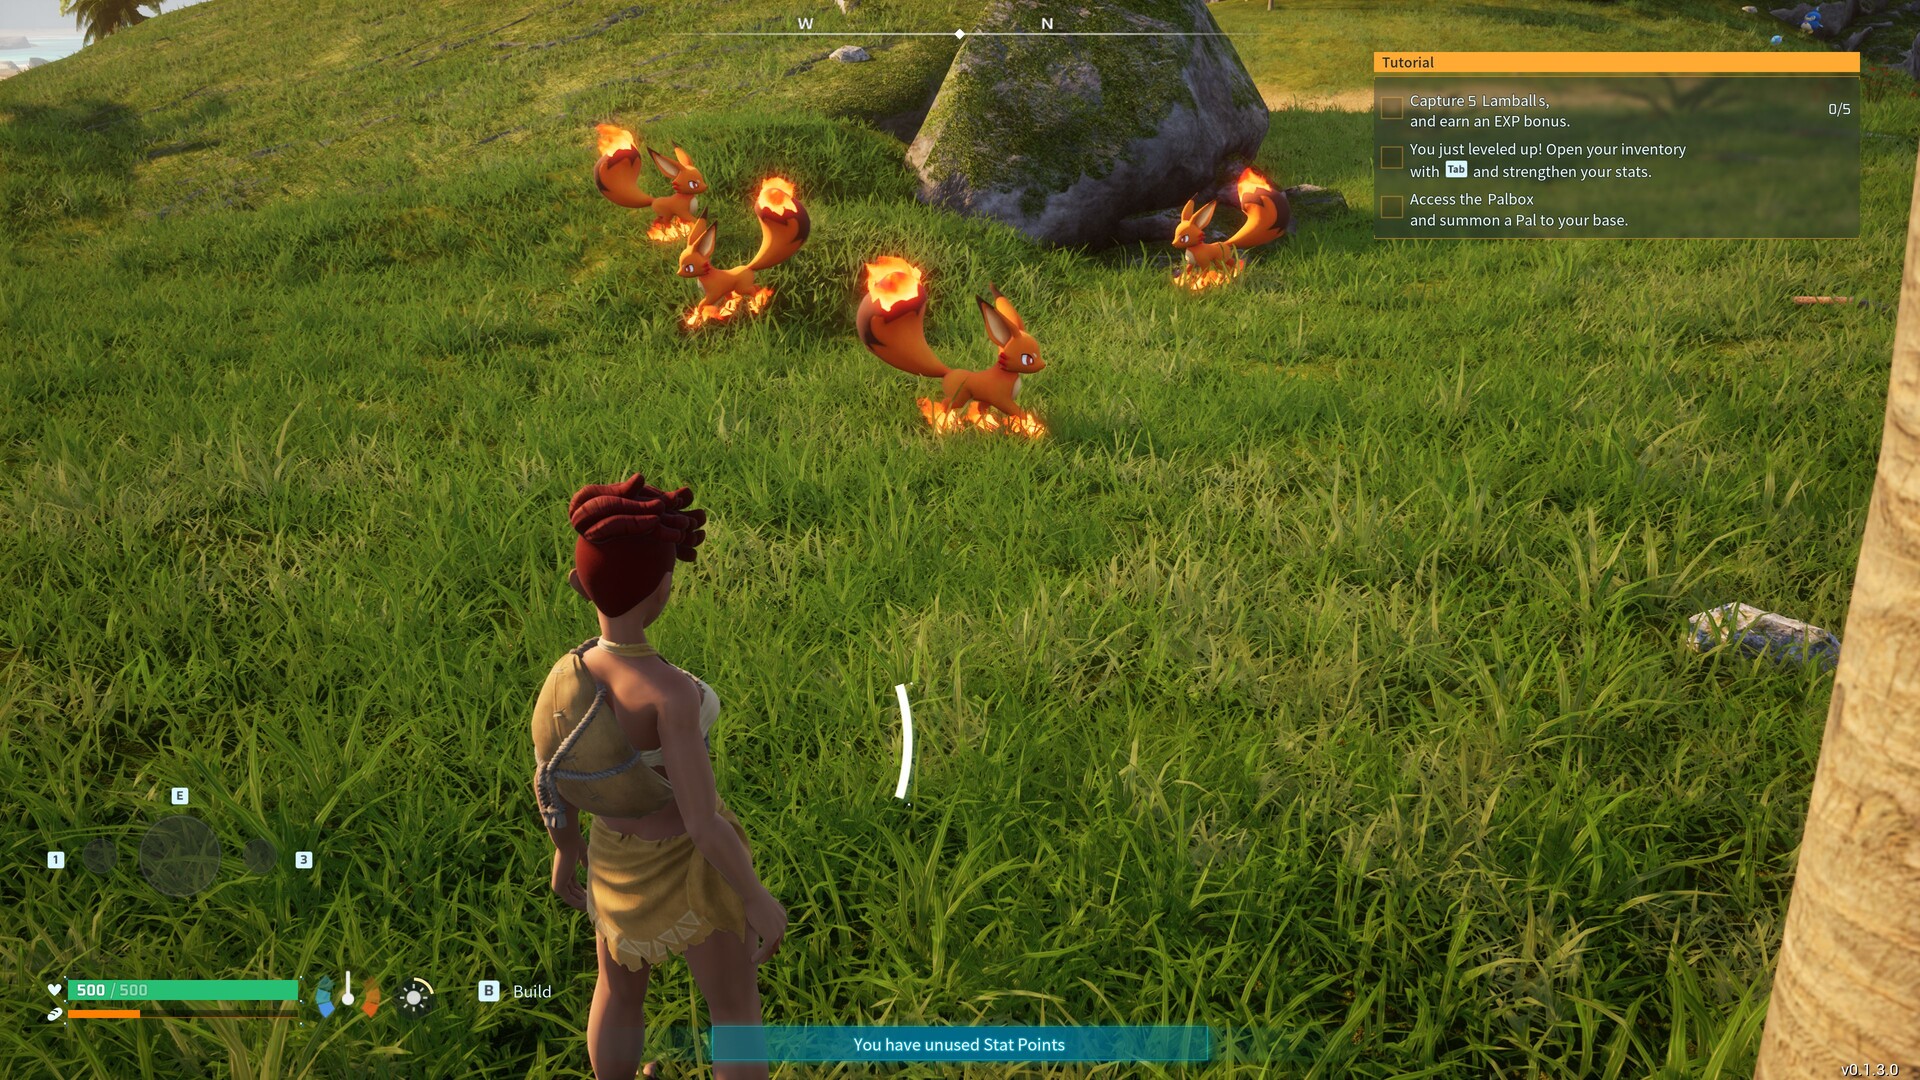
Palworld 几乎凭空迅速登上了 Steam 排行榜的榜首。这款开放世界游戏由日本工作室 Pocket Pair 开发,采用了强大的虚幻引擎 5,确保了令人印象深刻的视觉效果。尽管这款游戏色彩鲜艳,整体画面风格卡通,但其底层技术无疑是值得一提的。除了扎实的纹理(尤其是在较高的级别)之外,该游戏的积极特点还包括茂密的植被、出色的可视性和美丽的光照氛围。

Palworld
Palworld
Palworld
Palworld
Palworld
Palworld

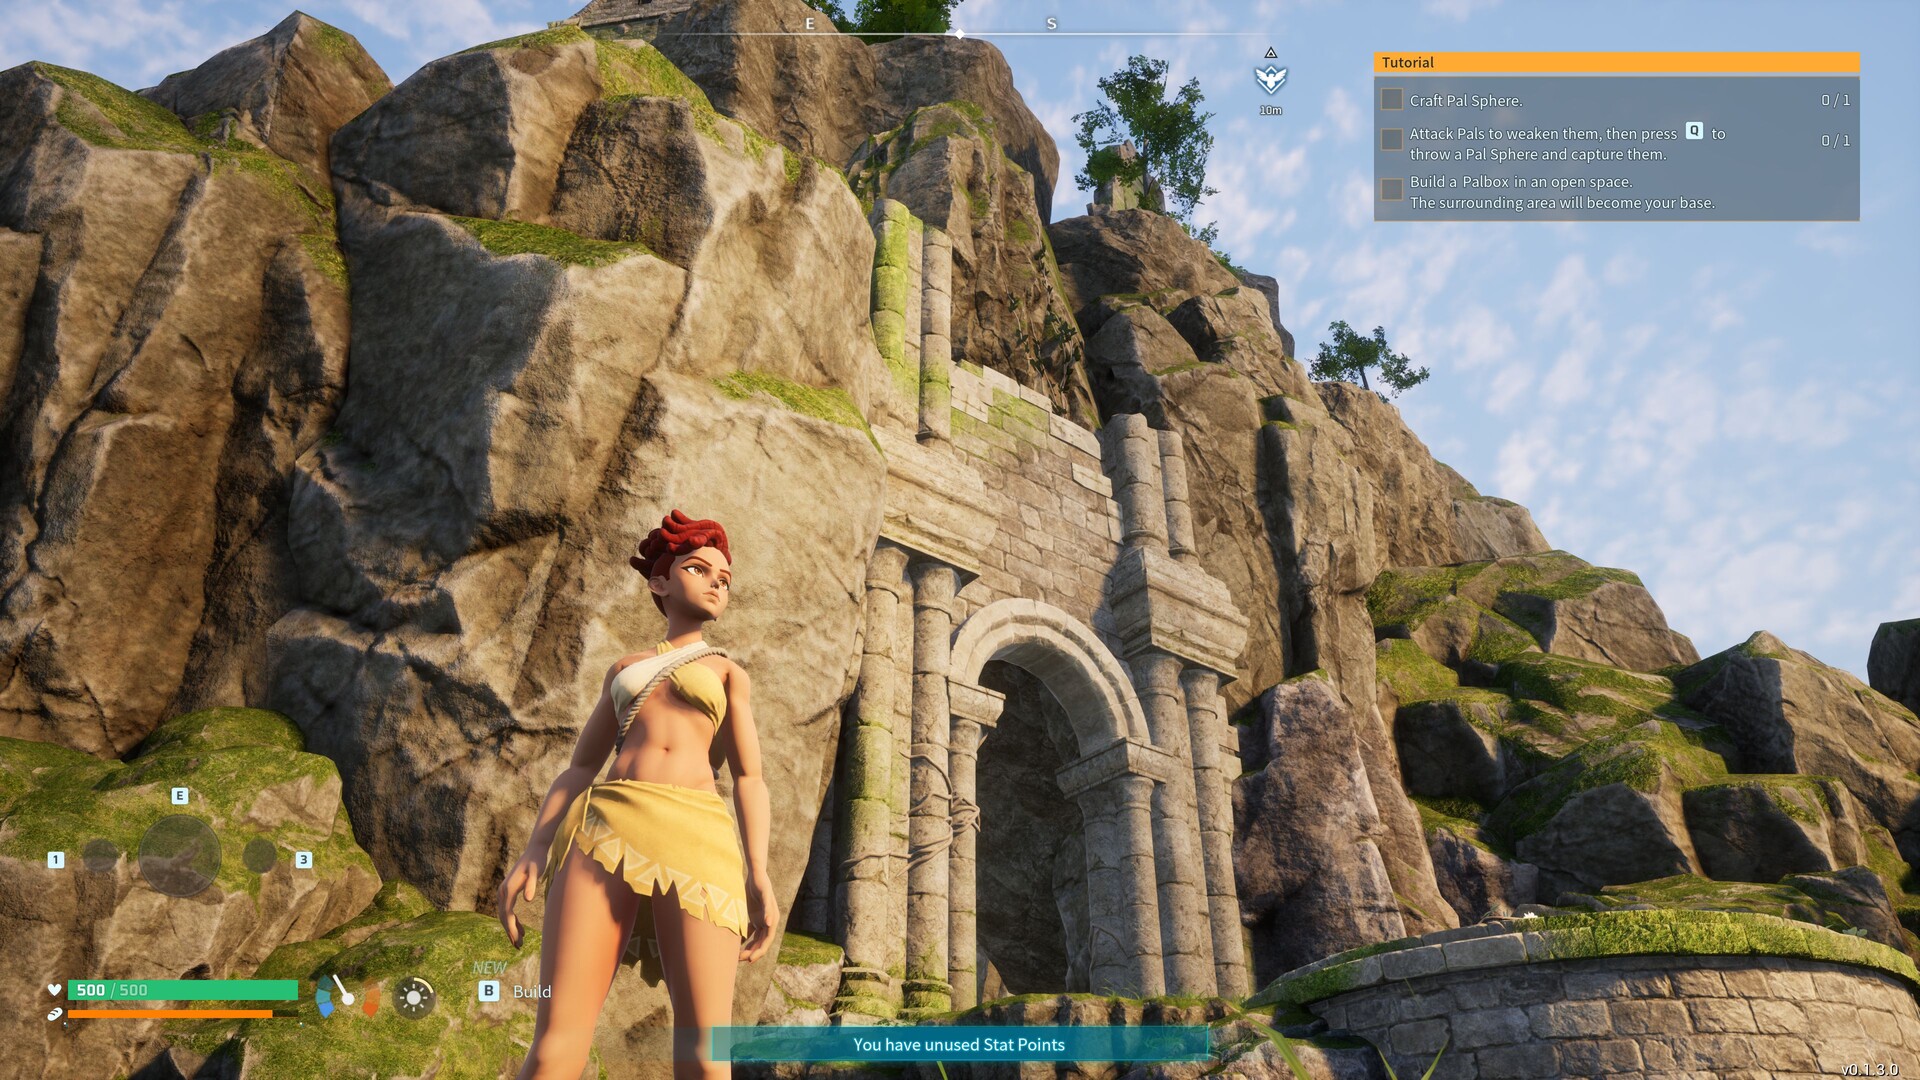
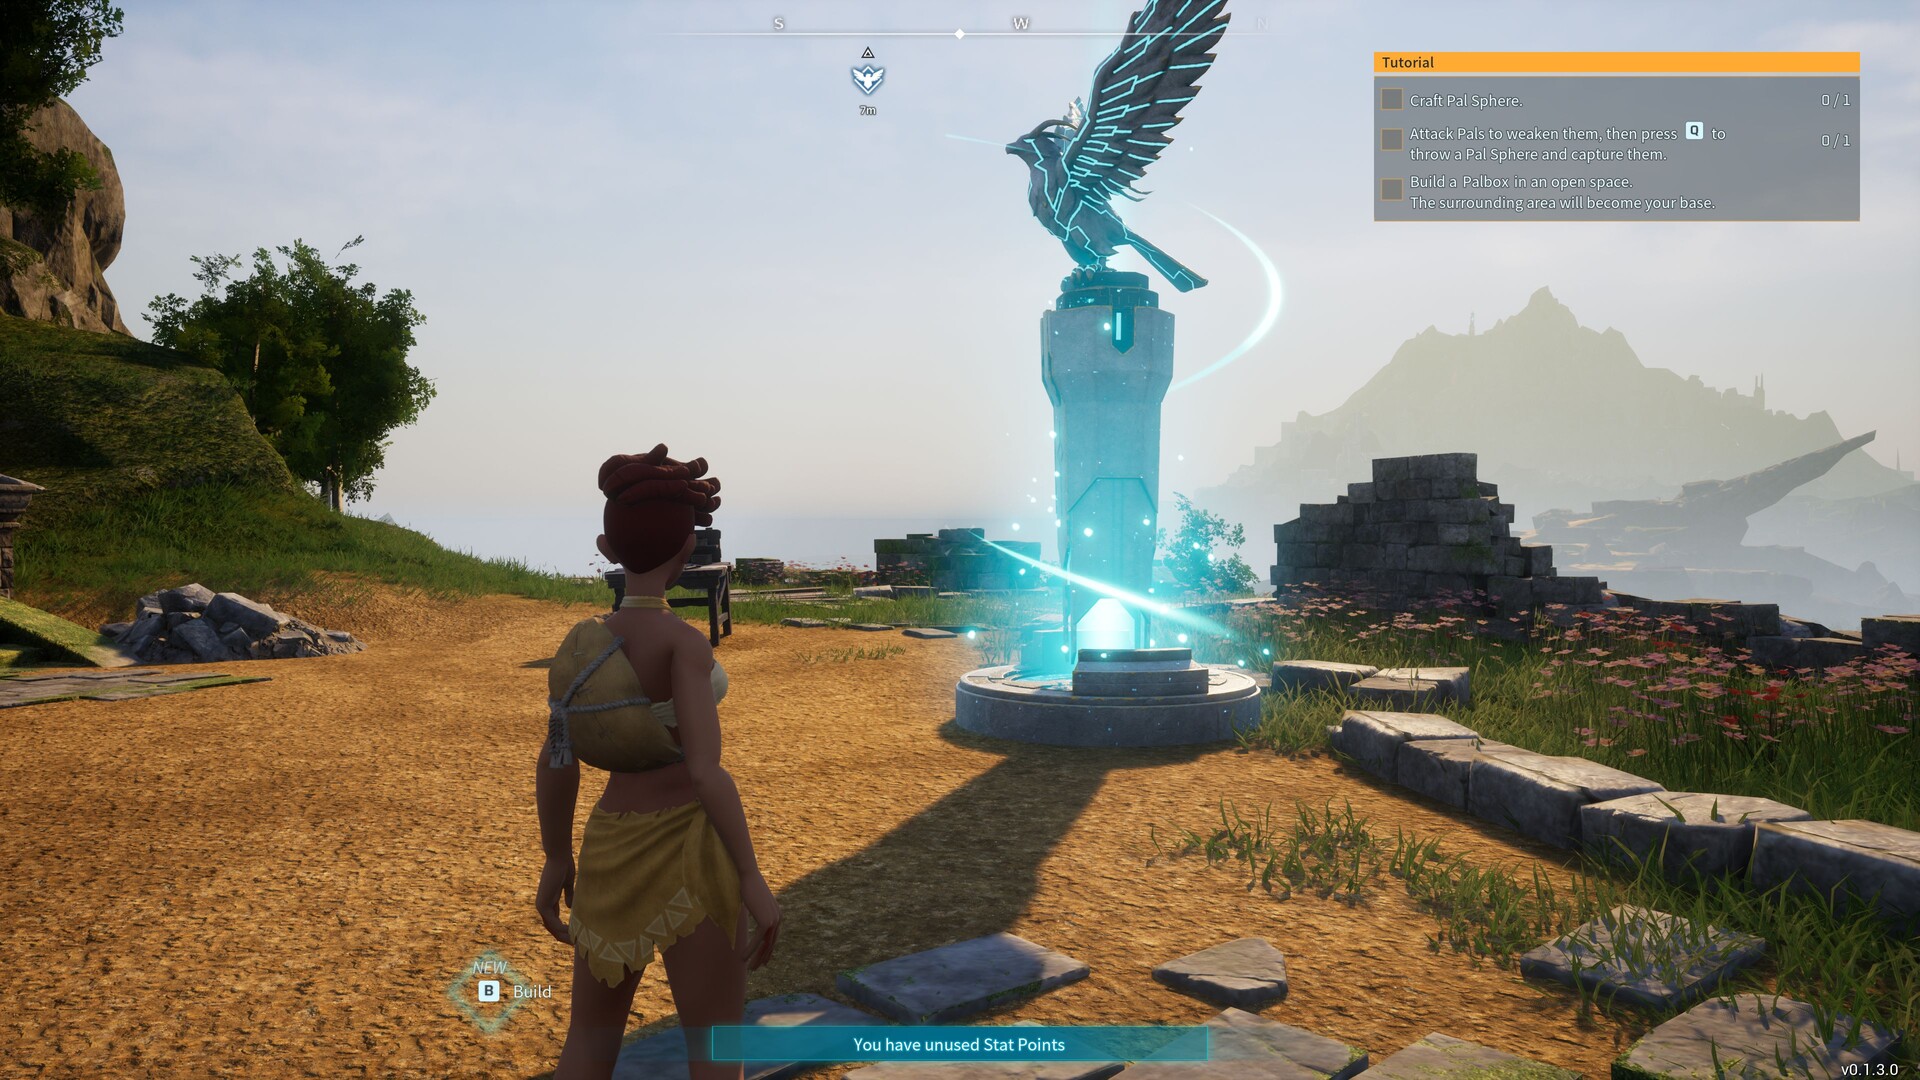
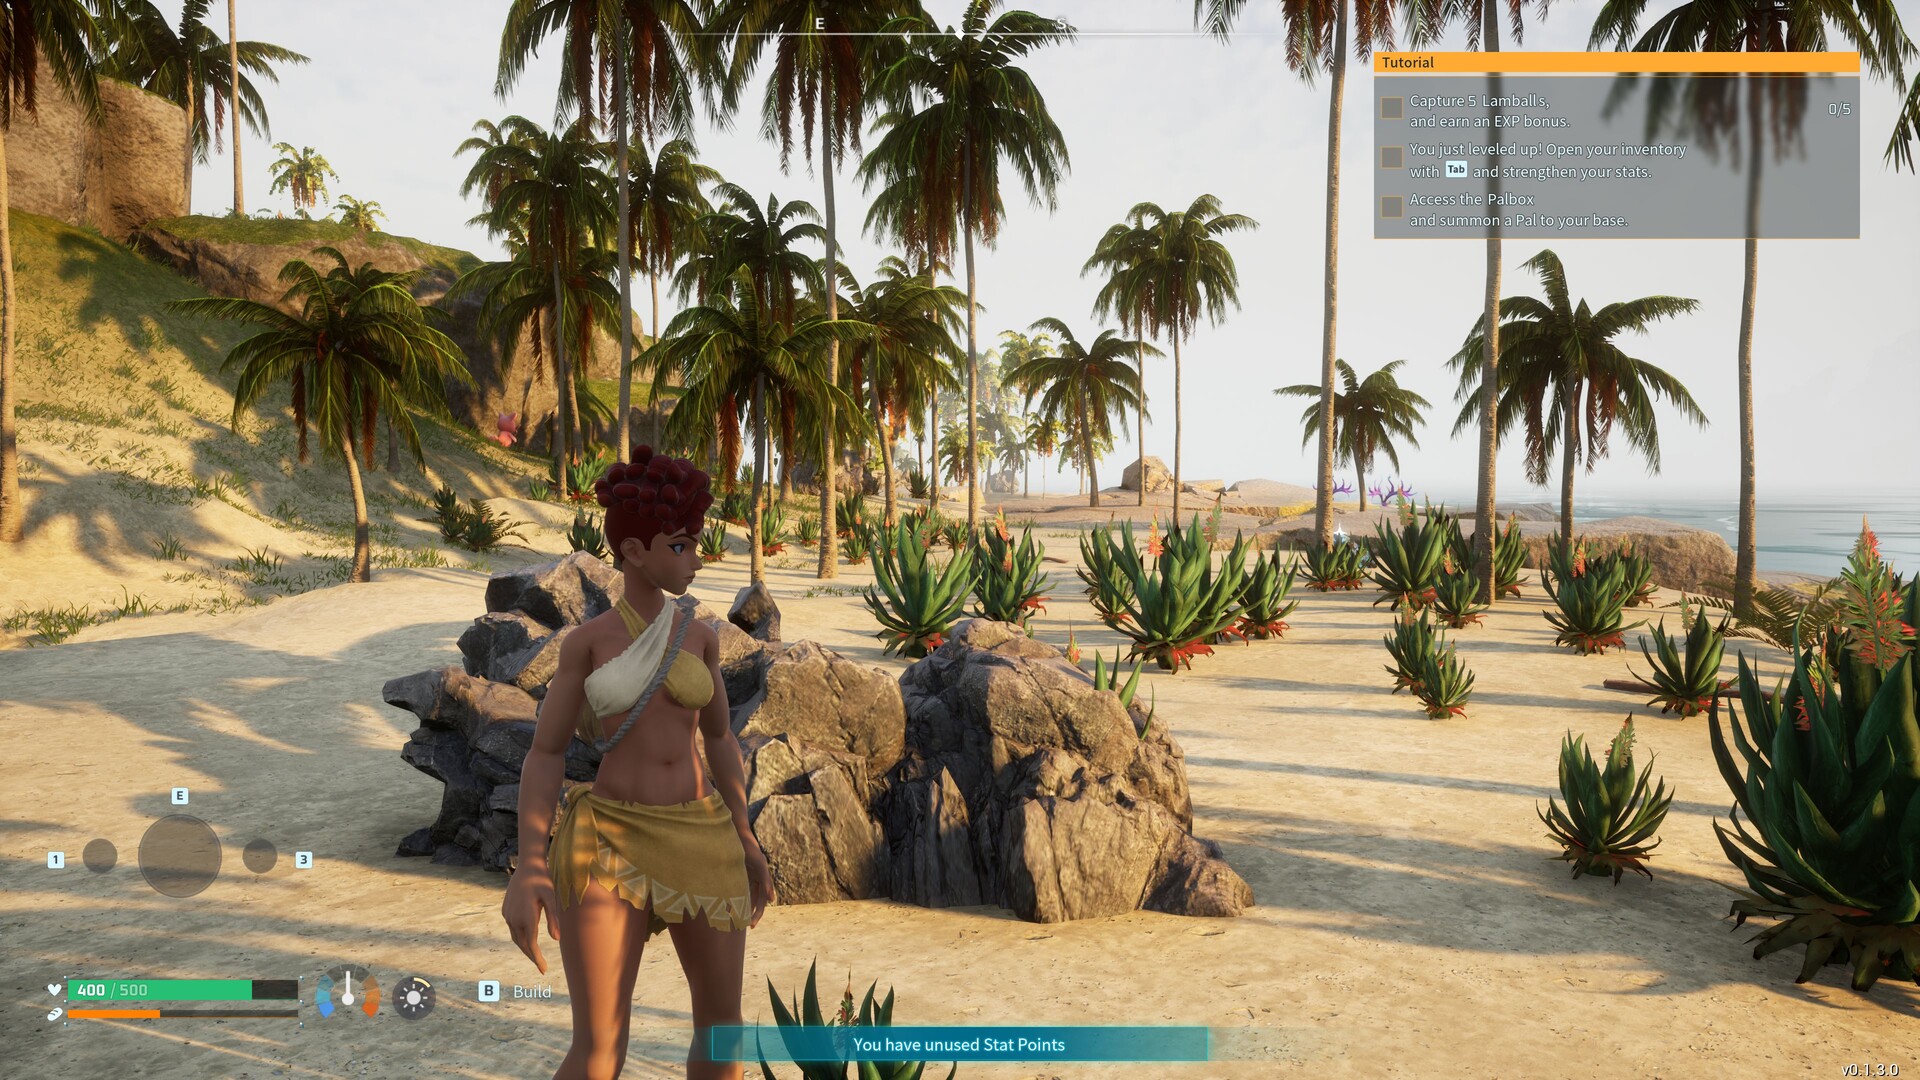
游戏还提供了多样的气候区和迷人的昼夜循环。虽然偶尔也能看到与《口袋妖怪》十分相似的地方,但游戏中众多生物的设计都很有爱。作为一款早期进入的游戏,《Palworld》的精良程度令人印象深刻。不过,问题更多地表现在细节上。物体有时会突兀地弹出,剪切和碰撞检测偶尔也会出现问题。

Palworld
Palworld
Palworld
Palworld
Palworld
Palworld

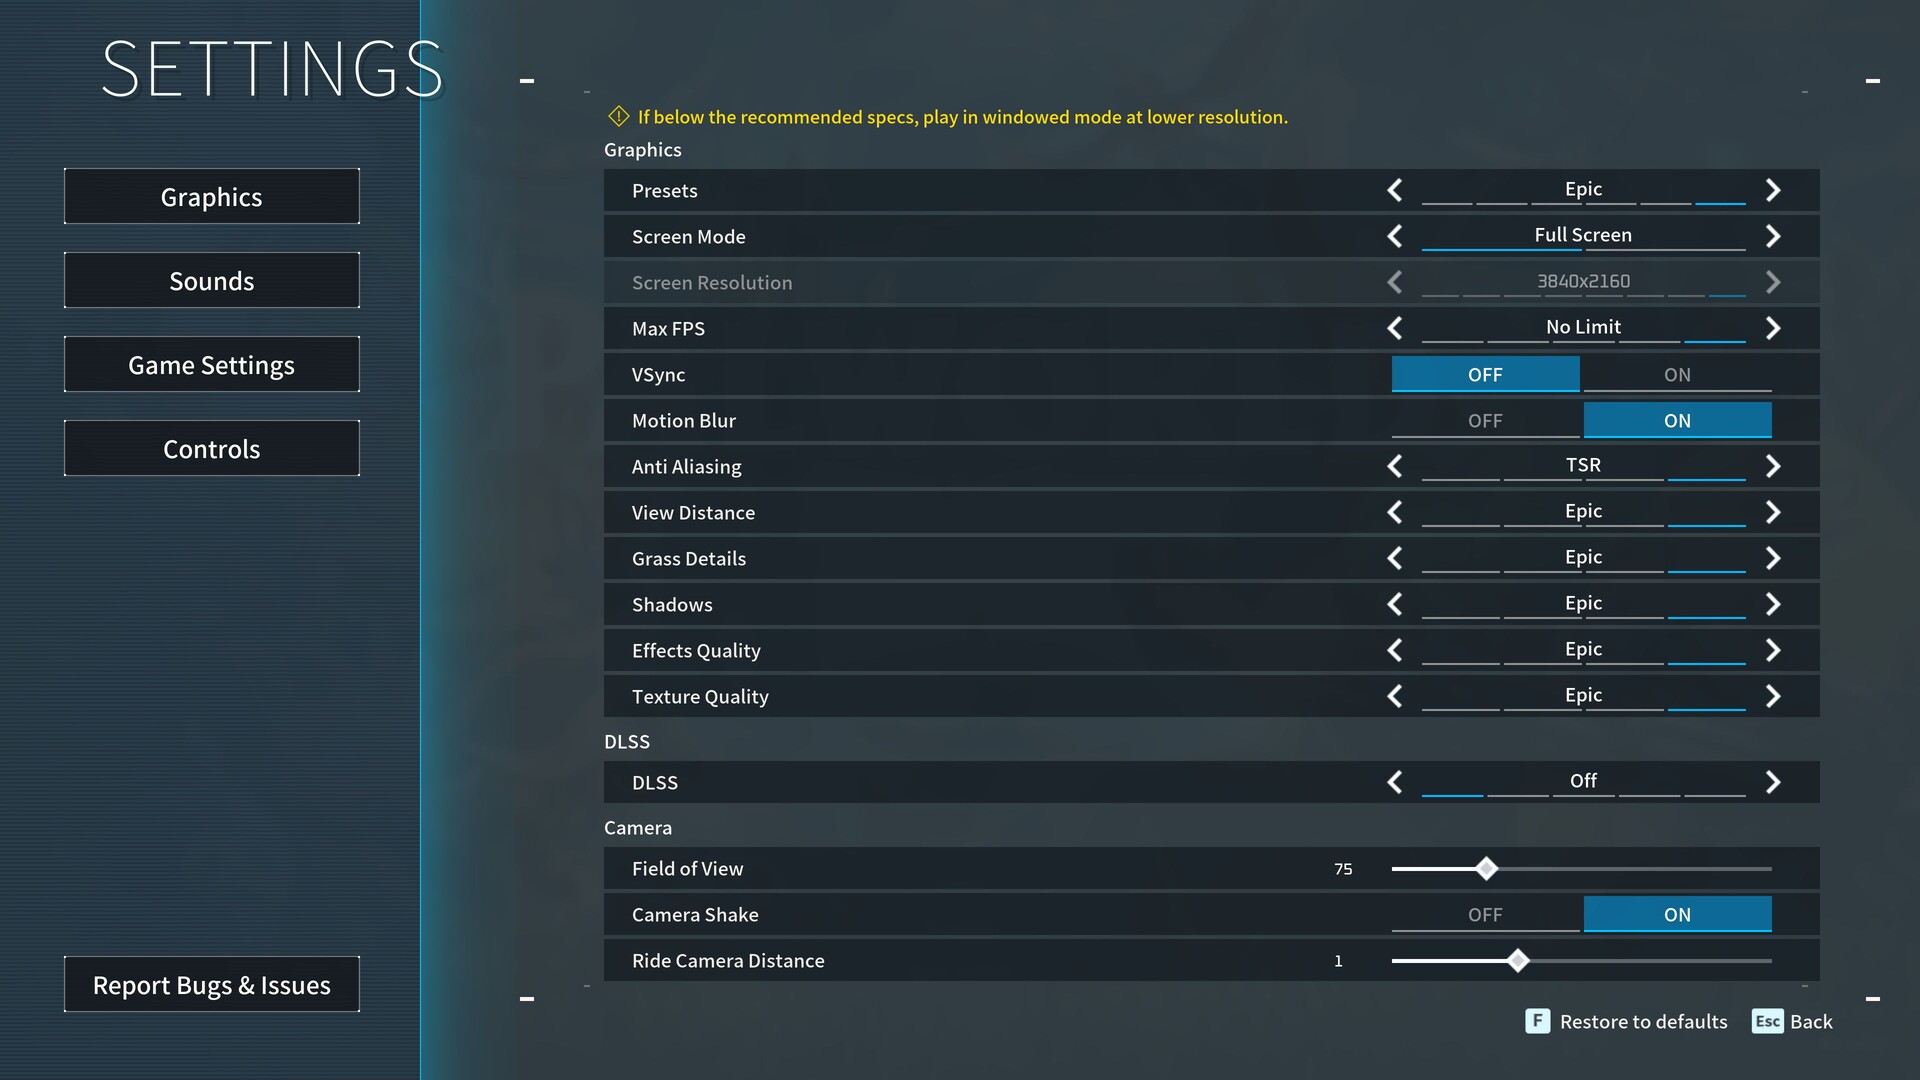
图形界面需要考虑一些因素。例如,我们不得不重新运行某些基准测试,因为 "最大每秒帧数"(Max FPS)开关无法始终正常工作,尽管设置了 "无限制"(No Limit),但偶尔还是会将帧数限制在 120 FPS。此外,简单的更改就会显示 "Restart due"(重新启动)信息,而且全屏模式仅适用于原始分辨率,这些都不是最佳选择。不过,选项菜单还是值得称赞的。除了五项画质和细节控制外,还有五项实用的预设(我们将其评为 "不错")。

Palworld
Palworld
Palworld
Palworld
Palworld
Palworld

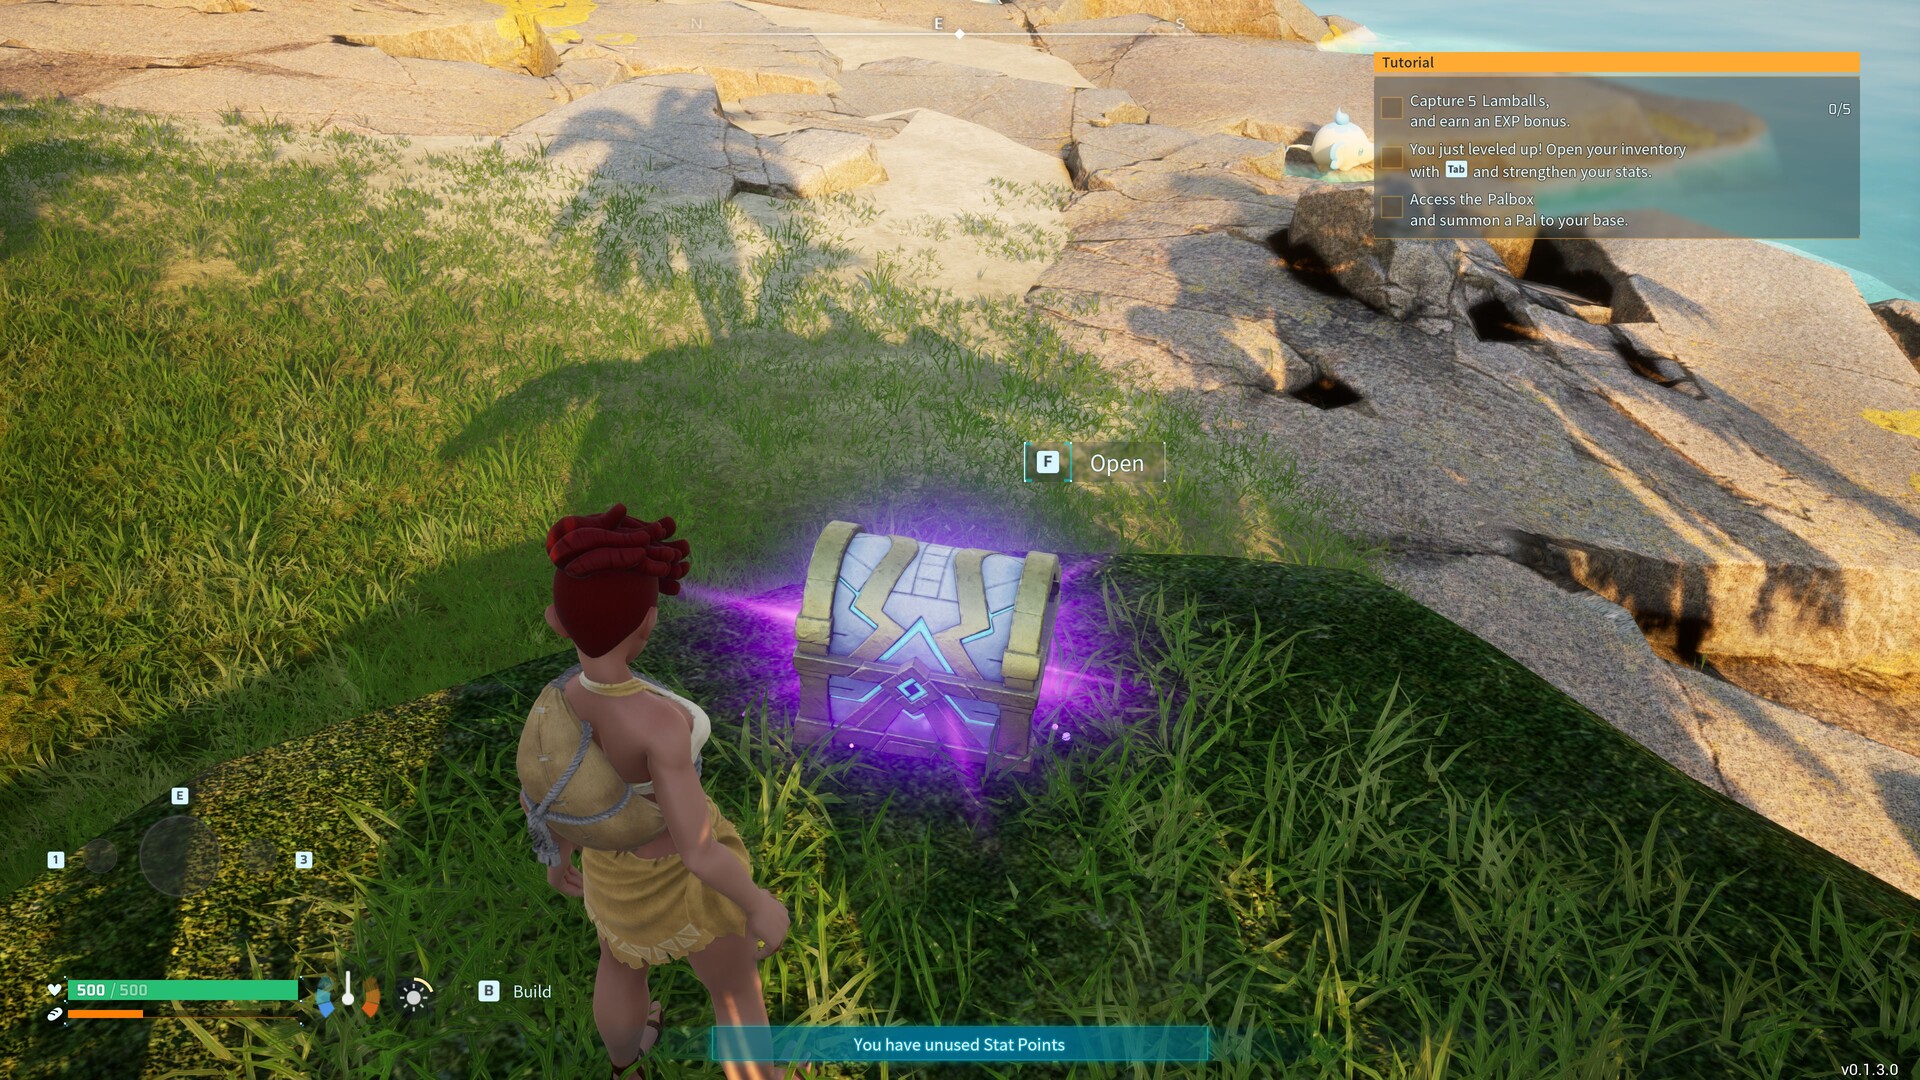
VSync、运动模糊和 DLSS 也是可选项,但目前玩家只能使用 FSR。在边缘平滑方面,有 FXAA、TAA 和 TSR 可供选择,后者在大多数预设中都是默认激活的。希望开发人员能对各项设置做出更多解释。同时,游戏的启动和加载时间也令人满意。从本质上讲,《Palworld》运行相当流畅,这对于一款早期接入游戏来说并非必然。Palworld 的游戏范围也同样令人瞩目,不可否认,它在游戏性方面有其魅力,能激励玩家进行探索和尝试。

Palworld

基准

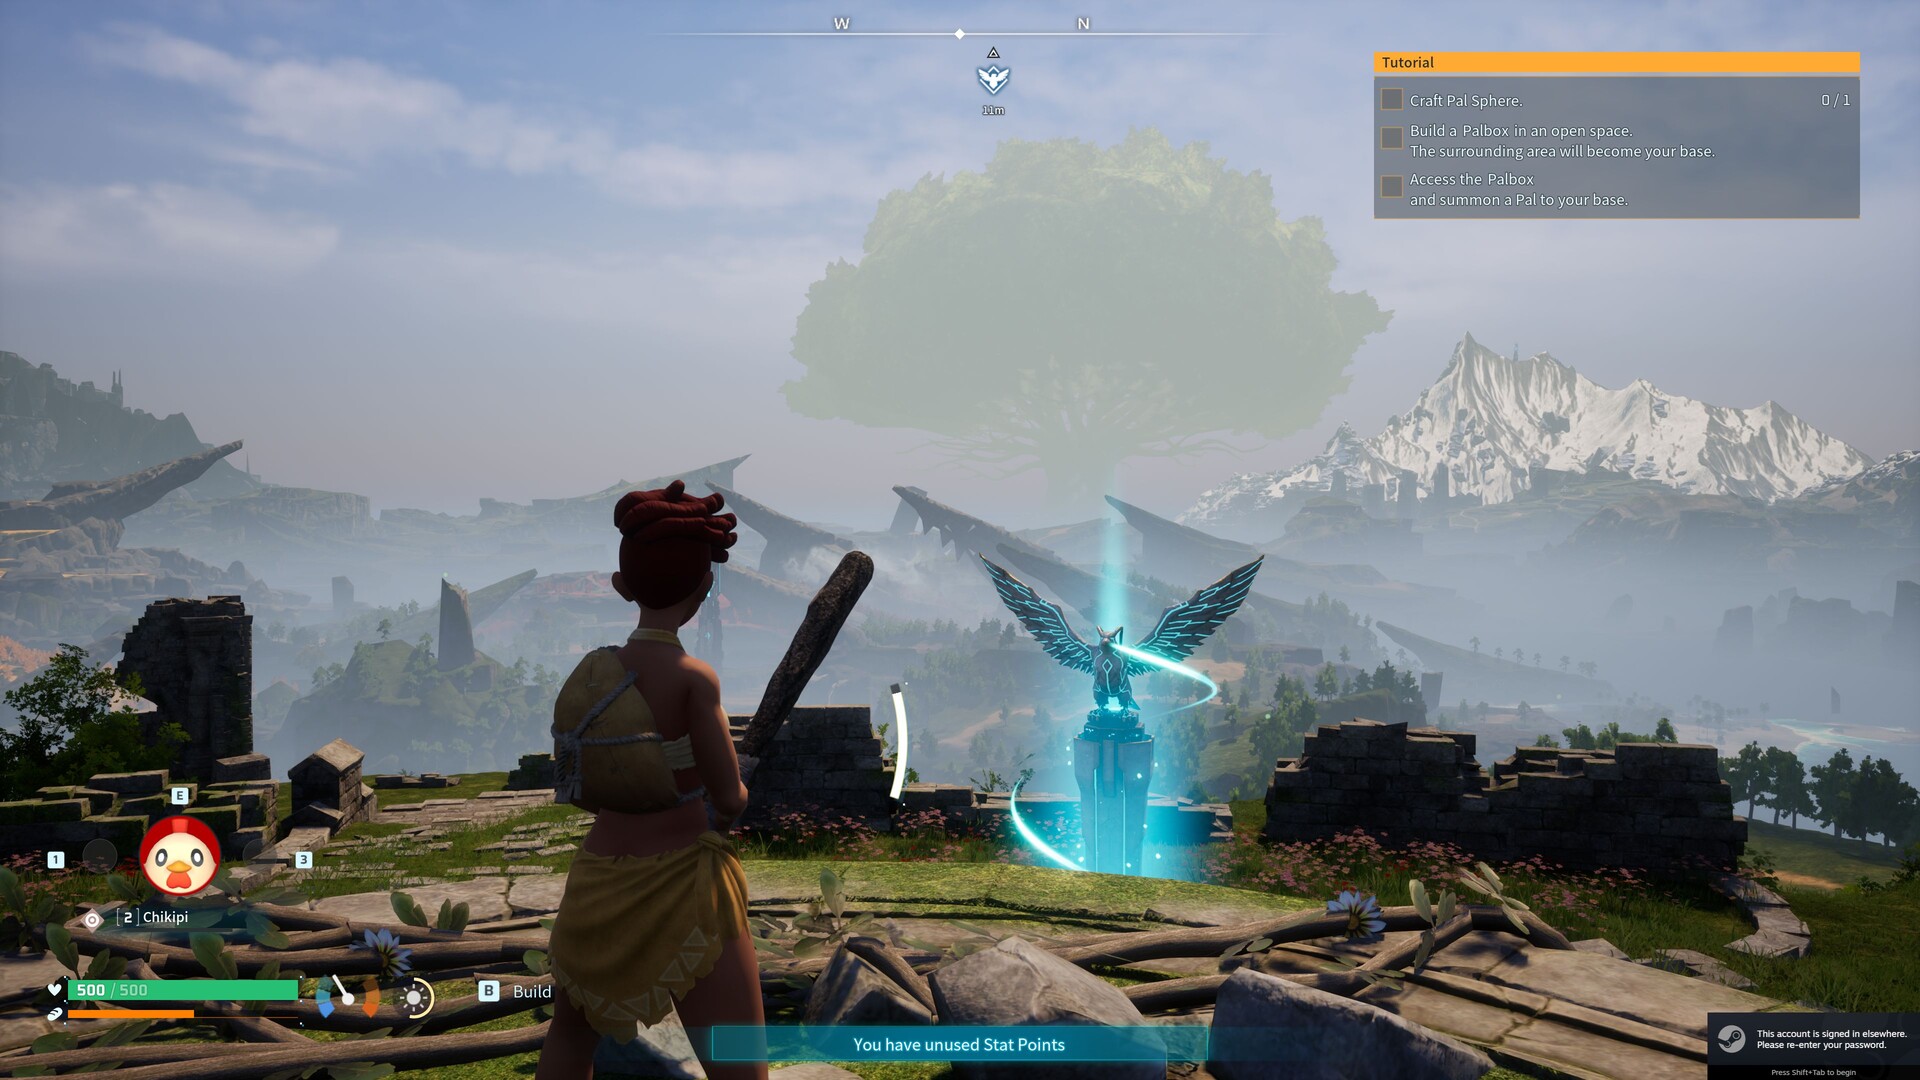
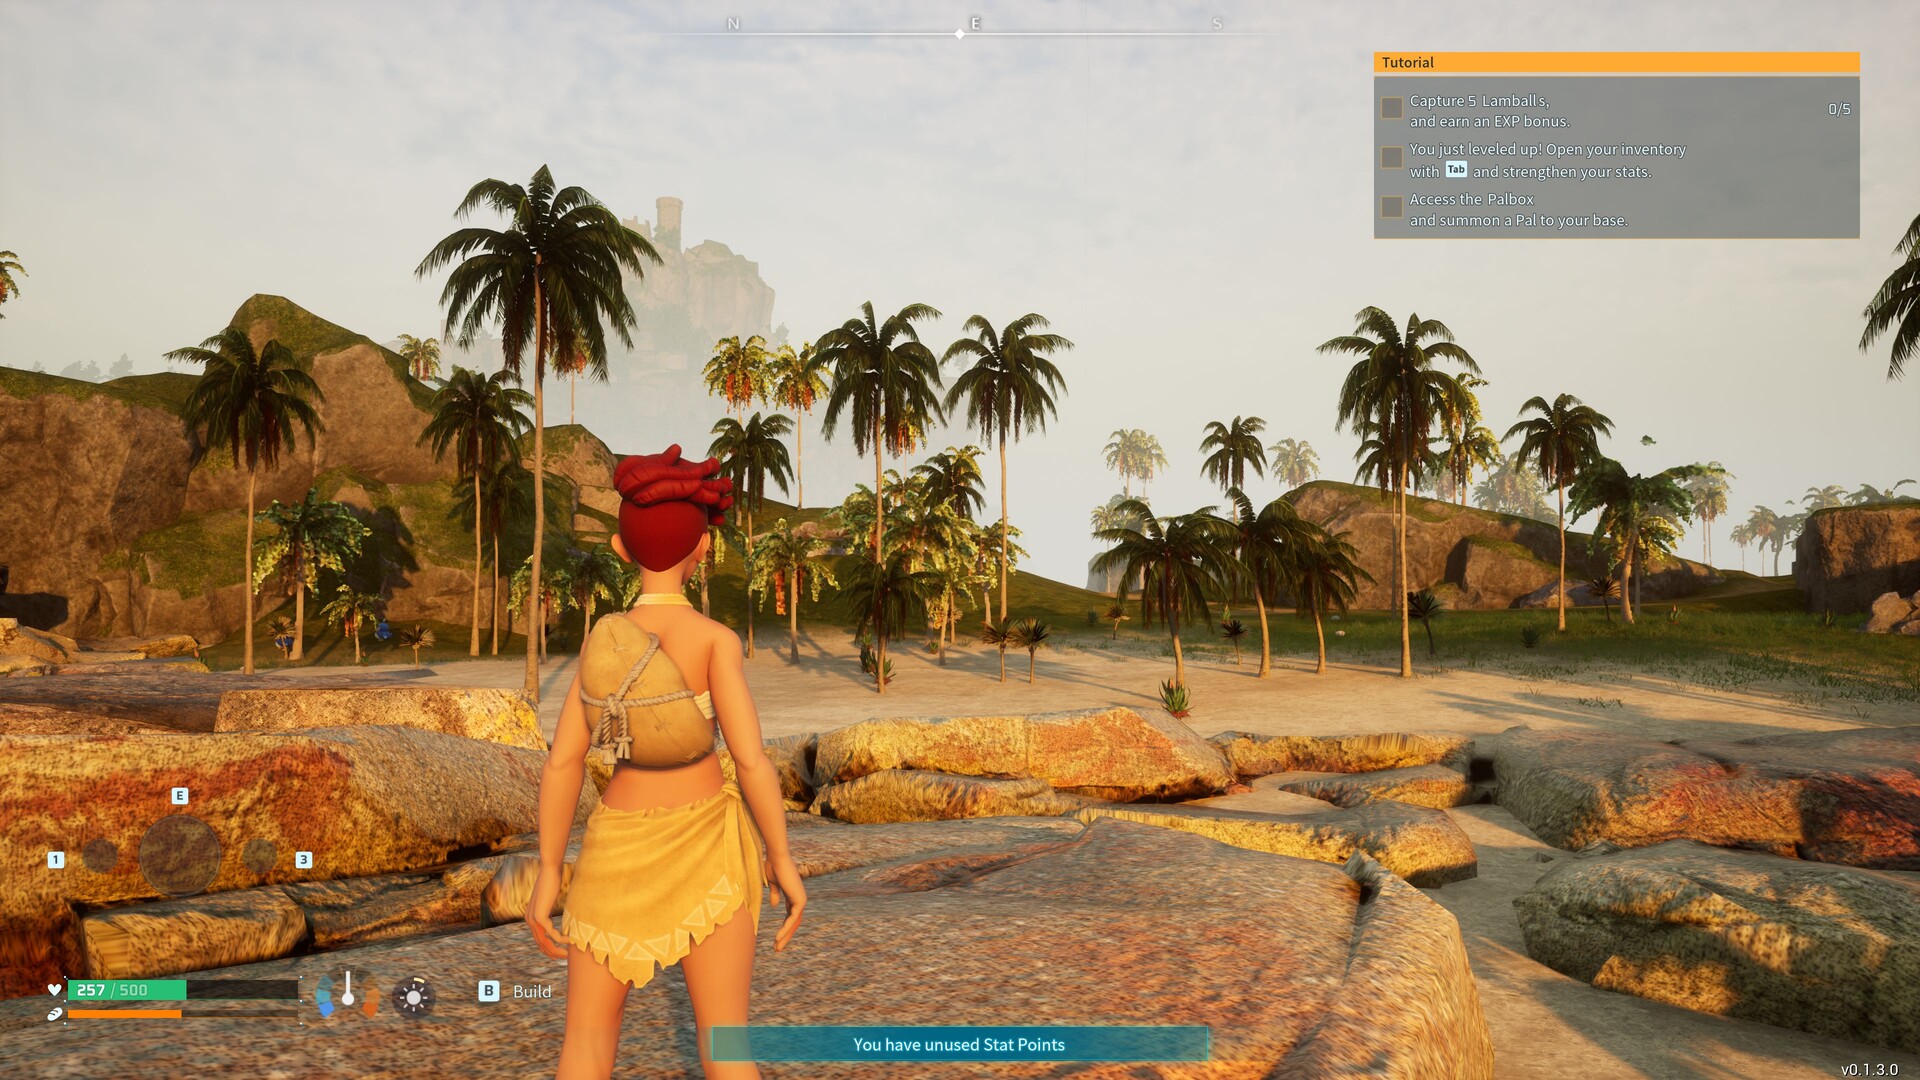
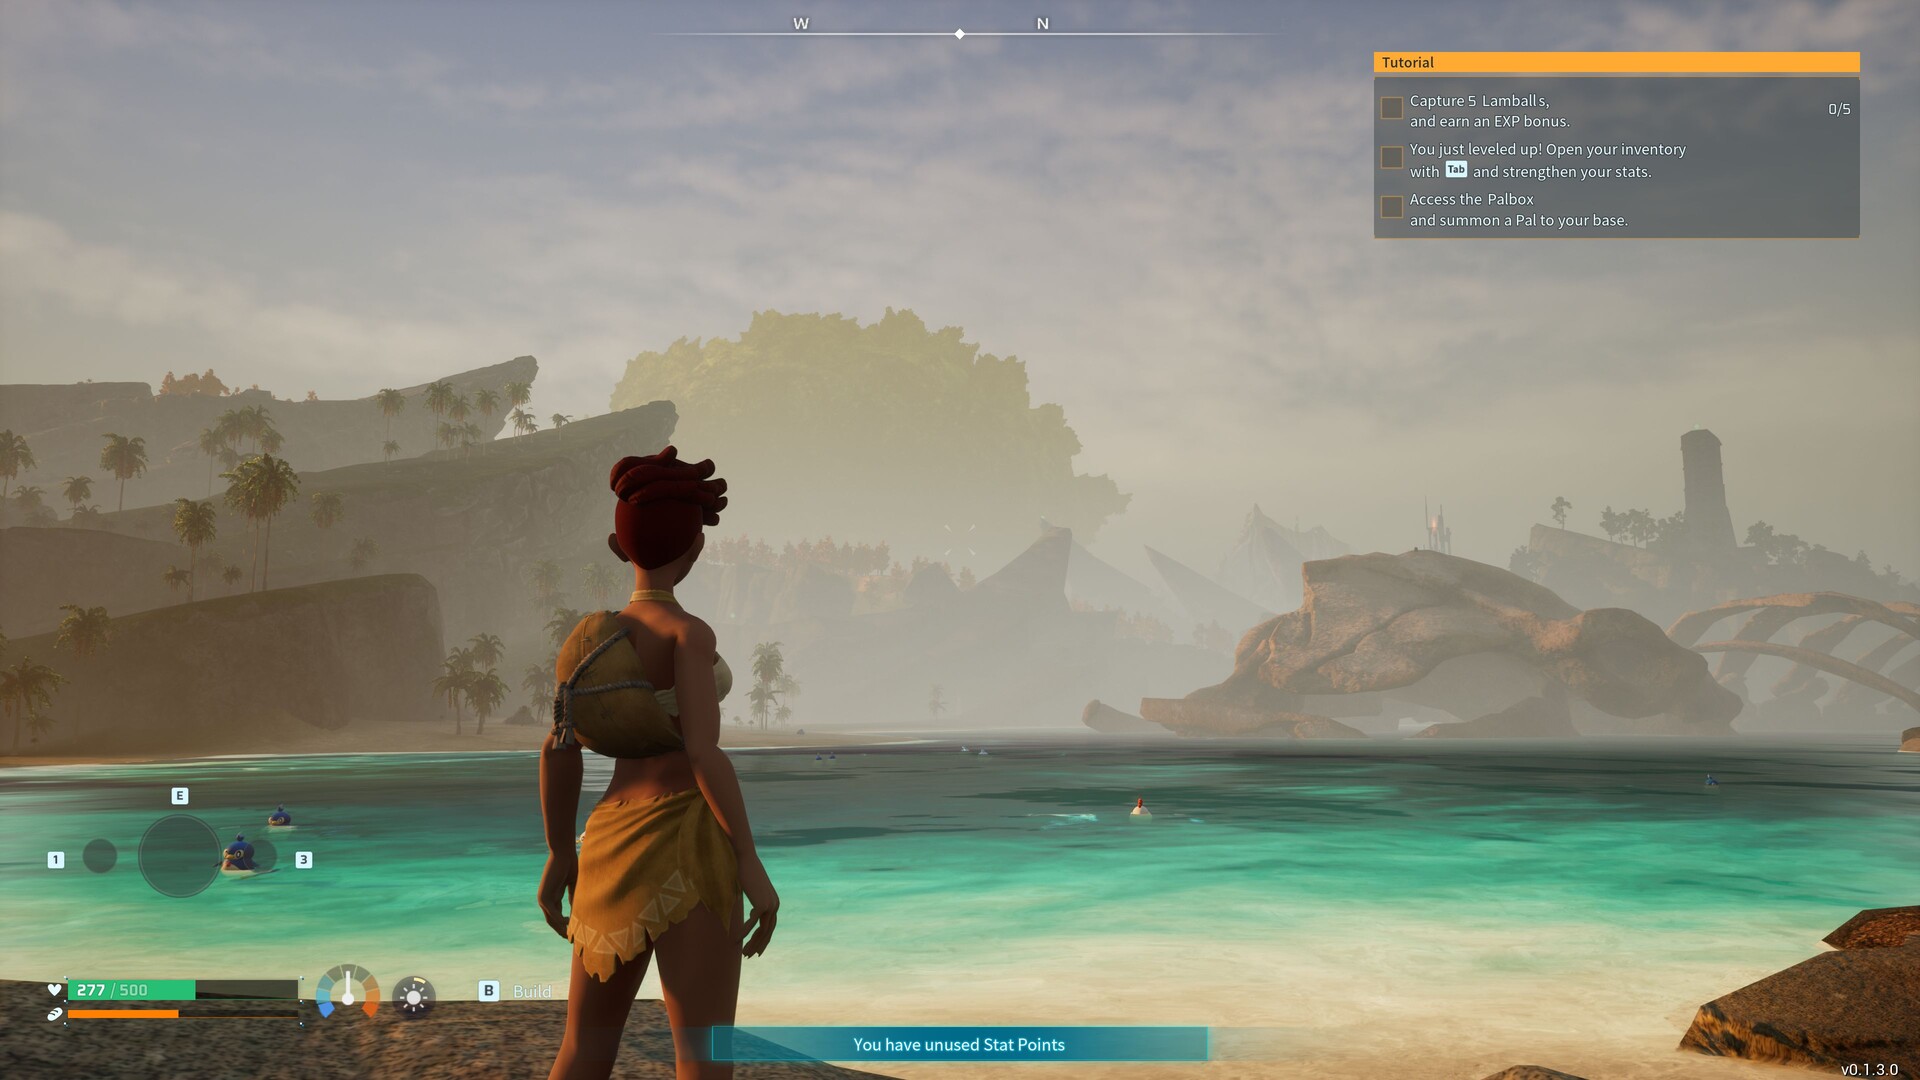
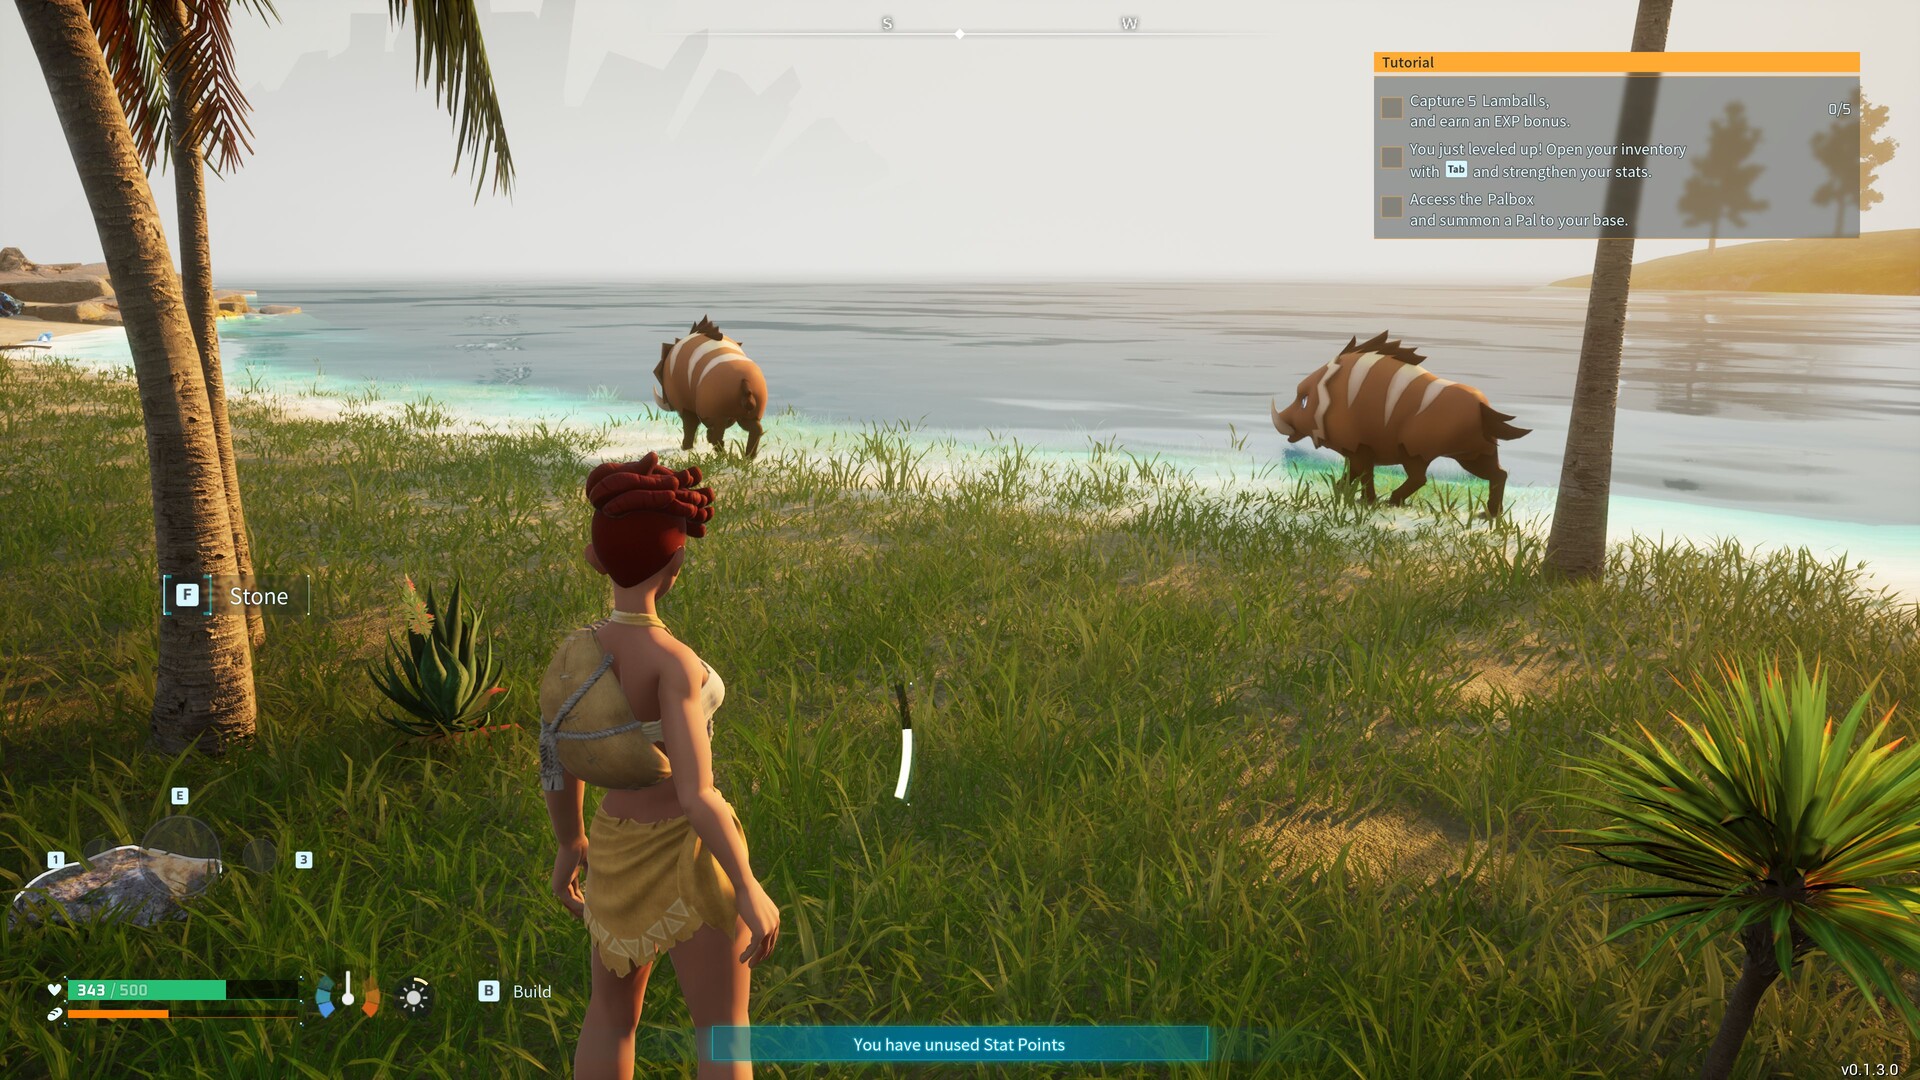
在测量过程中,我们使用了游戏的初始阶段,特别是当主角自由进入开放世界时。我们使用 CapFrameX 工具记录了一条预定路线,时间不到 20 秒。

成果


全高清(1,920 x 1,080)

Palworld 对硬件的要求属于中等水平,不高也不低。iGPU Radeon 780M可以在全高清条件下流畅处理低预设值。与此同时,当前的中端显卡在处理较高预设值时也没有问题,如表所示。

Palworld
    1920x1080 Low Preset AA:TSR     1920x1080 Medium Preset AA:TSR     1920x1080 High Preset AA:TSR     1920x1080 Epic Preset AA:TSR
NVIDIA GeForce RTX 4080, i9-13900K
Desktop-PC Asus ROG Strix Z790-F
237 (51min, 91.8P0.1, 159.1P1) fps ∼100%
219 (55.4min, 110.5P0.1, 165.4P1) fps ∼100%
218 (75.5min, 95.5P0.1, 145.3P1) fps ∼100%
AMD Radeon RX 7900 XT, i9-13900K
Desktop-PC Asus ROG Strix Z790-F
173.9 (72.6min, 98.7P0.1, 135.2P1) fps ∼73%
153.9 (50.3min, 57.5P0.1, 108.6P1) fps ∼70%
149.9 (47min, 55.3P0.1, 98P1) fps ∼69%
NVIDIA GeForce RTX 4090 Laptop GPU, i9-13900H
Asus ROG Zephyrus M16
171.6 (48min, 69.4P0.1, 98.7P1) fps ∼72%
139.3 (26.8min, 48P0.1, 85.2P1) fps ∼64%
138.8 (26.3min, 42.5P0.1, 86.9P1) fps ∼64%
NVIDIA GeForce RTX 4080 Laptop GPU, i9-13950HX
Razer Blade 16 Mid 23
162.3 (33.9min, 57.9P0.1, 95.5P1) fps ∼68%
133.5 (32.2min, 39.3P0.1, 77.7P1) fps ∼61%
130.8 (23.6min, 34.4P0.1, 73.8P1) fps ∼60%
NVIDIA GeForce RTX 4070 Laptop GPU, i9-13900HX
XMG Pro 15 E23
118.4 (7.9min, 42.5P0.1, 73.7P1) fps ∼50%
111 (29.1min, 46.7P0.1, 73P1) fps ∼51%
108.5 (34.6min, 46.6P0.1, 70.2P1) fps ∼50%
NVIDIA GeForce RTX 4060 Laptop GPU, R9 7940HS
Razer Blade 14 Mid 23
110.7 (31.6min, 34.9P0.1, 54.4P1) fps ∼47%
91.9 (13.2min, 23.2P0.1, 53.7P1) fps ∼42%
87.8 (13.4min, 18.4P0.1, 44.8P1) fps ∼40%
NVIDIA GeForce RTX 4050 Laptop GPU, i7-13700H
Medion Erazer Scout E20
99.1 (25.7min, 37.4P0.1, 68.1P1) fps ∼42%
76.3 (31.8min, 36.1P0.1, 58.9P1) fps ∼35%
74.9 (28.8min, 39.1P0.1, 61P1) fps ∼34%
AMD Radeon RX 7600S, R9 7940HS
Asus TUF Gaming Advantage A16
117 (59.9min, 75.4P0.1, 90.1P1) fps ∼100%
97.7 (25.5min, 41P0.1, 67.6P1) fps ∼41%
71.9 (32.2min, 39.2P0.1, 51.8P1) fps ∼33%
69.5 (29.4min, 35.7P0.1, 50.6P1) fps ∼32%
AMD Radeon 780M, R9 7940HS
Asus TUF Gaming Advantage A16
37.9 (6.67min, 8.65P0.1, 25P1) fps ∼32%
30.3 (13.1min, 14P0.1, 19.8P1) fps ∼13%
20.5 (4.68min, 5.5P0.1, 11.8P1) fps ∼9%
20.2 (10.6min, 10.9P0.1, 12.5P1) fps ∼9%

QHD (2,560 x 1,440)

即使是 QHD 分辨率,也不需要高端显卡。A GeForce RTX 4050Radeon RX 7600S就能满足 2560 x 1440 像素和史诗预设的要求。

Palworld
    2560x1440 Epic Preset AA:TSR
NVIDIA GeForce RTX 4080, i9-13900K
Desktop-PC Asus ROG Strix Z790-F
178.1 (64.7min, 112.8P0.1, 147.1P1) fps ∼100%
AMD Radeon RX 7900 XT, i9-13900K
Desktop-PC Asus ROG Strix Z790-F
135.2 (14.2min, 49.8P0.1, 85.1P1) fps ∼76%
NVIDIA GeForce RTX 4090 Laptop GPU, i9-13900H
Asus ROG Zephyrus M16
110.5 (31min, 40.3P0.1, 61.9P1) fps ∼62%
NVIDIA GeForce RTX 4080 Laptop GPU, i9-13950HX
Razer Blade 16 Mid 23
106.7 (25.6min, 31.6P0.1, 53.9P1) fps ∼60%
NVIDIA GeForce RTX 4070 Laptop GPU, i9-13900HX
XMG Pro 15 E23
81.3 (33.5min, 35.1P0.1, 56.1P1) fps ∼46%
NVIDIA GeForce RTX 4060 Laptop GPU, R9 7940HS
Razer Blade 14 Mid 23
65.6 (7.31min, 12.6P0.1, 39.2P1) fps ∼37%
NVIDIA GeForce RTX 4050 Laptop GPU, i7-13700H
Medion Erazer Scout E20
50.6 (21.2min, 27.7P0.1, 40.2P1) fps ∼28%
AMD Radeon RX 7600S, R9 7940HS
Asus TUF Gaming Advantage A16
48.9 (14.9min, 17P0.1, 35.8P1) fps ∼27%

超高清(3,840 x 2,160)

实际测试结果为 3,840 x 2,160 像素,尤其是在不使用升频的情况下。史诗预设仅在使用 GeForce RTX 4070 或更高。在包含 DLSS 的情况下 GeForce RTX 4060 就足够了。

Palworld
    3840x2160 Epic Preset AA:TSR     3840x2160 Epic Preset + Quality DLSS AA:TSR
NVIDIA GeForce RTX 4080, i9-13900K
Desktop-PC Asus ROG Strix Z790-F
101.6 (46.1min, 58.5P0.1, 82.9P1) fps ∼100%
139.8 (9.18min, 61.1P0.1, 105.5P1) fps ∼100%
AMD Radeon RX 7900 XT, i9-13900K
Desktop-PC Asus ROG Strix Z790-F
71.3 (10.3min, 12.3P0.1, 46.3P1) fps ∼70%
NVIDIA GeForce RTX 4090 Laptop GPU, i9-13900H
Asus ROG Zephyrus M16
66.5 (23.9min, 26.1P0.1, 38.8P1) fps ∼65%
86.2 (11.9min, 21.2P0.1, 40.8P1) fps ∼62%
NVIDIA GeForce RTX 4080 Laptop GPU, i9-13950HX
Razer Blade 16 Mid 23
61 (20.7min, 22.8P0.1, 35.8P1) fps ∼60%
83 (16.5min, 20.7P0.1, 39.4P1) fps ∼59%
NVIDIA GeForce RTX 4070 Laptop GPU, i9-13900HX
XMG Pro 15 E23
42.7 (16.8min, 19.5P0.1, 33.4P1) fps ∼42%
58.1 (24.4min, 29P0.1, 43.4P1) fps ∼42%
NVIDIA GeForce RTX 4060 Laptop GPU, R9 7940HS
Razer Blade 14 Mid 23
34.8 (14.7min, 14.9P0.1, 24.3P1) fps ∼34%
49.9 (17.6min, 20.9P0.1, 30.6P1) fps ∼36%
NVIDIA GeForce RTX 4050 Laptop GPU, i7-13700H
Medion Erazer Scout E20
26 (11.6min, 12.4P0.1, 15.1P1) fps ∼26%
36.3 (15.5min, 20.4P0.1, 31.7P1) fps ∼26%
AMD Radeon RX 7600S, R9 7940HS
Asus TUF Gaming Advantage A16
25.2 (9.17min, 9.74P0.1, 12.2P1) fps ∼25%

Overview

Show Restrictions
PosModel< PrevNext >Palworld
 Palworld (2024)
low
1920x1080
Low Preset
TSRAA
med.
1920x1080
Medium Preset
TSRAA
high
1920x1080
High Preset
TSRAA
ultra
1920x1080
Epic Preset
TSRAA
QHD
2560x1440
Epic Preset
TSRAA
4K
3840x2160
Epic Preset
TSRAA

3840x2160
Epic Preset + Quality DLSS
TSRAA
NVIDIA GeForce RTX 4090
240
239
234
232
211
138.7
198.3
AMD Radeon RX 7900 XTX
236
223
187.3
184.1
154.5
92.2
NVIDIA GeForce RTX 4080 Super
240n2
238n2
225.5n2
224n2
181.05n2
103.95n2
140.4n2
NVIDIA GeForce RTX 4080
237
219
218
178.1
101.6
139.8
AMD Radeon RX 7900 XT
173.9
153.9
149.9
135.2
71.3
AMD Radeon RX 6950 XT
236
219
172.8
165.3
121.1
67.3
NVIDIA GeForce RTX 4090 Laptop GPU
211
176.25n2
145.3n2
144.85n2
115.15n2
66.5
86.2
NVIDIA GeForce RTX 3090
239
233
208
157.3
120.4
71.5
96.4
NVIDIA GeForce RTX 4080 Laptop GPU
162.3
133.5
130.8
106.7
61
83
NVIDIA GeForce RTX 3080 12 GB
209
165.5
152.7
113.4
66.5
AMD Radeon RX 6800
209
167.8
124
117.4
86.4
46.5
NVIDIA Titan RTX
146.6
123.8
98.7
91.4
65.8
36.3
70.9
NVIDIA GeForce RTX 3080 Ti Laptop GPU
115.6
86.6
47.1
NVIDIA GeForce RTX 4070 Laptop GPU
118.4
106.6n2
102.55n2
75.2n2
42.7
58.1
NVIDIA GeForce RTX 3070
173.9
138.8
124.6
91.4
51.8
AMD Radeon RX 6750 XT
184.2
148.3
110.7
100.9
71.8
38.4
AMD Radeon RX 6700 XT
172.2
140.6
99.9
93.1
67.1
36.3
NVIDIA GeForce RTX 3080 Laptop GPU
119.9
116.4
102.5
96.8n2
70.95n2
40.15n2
54.6n2
NVIDIA GeForce RTX 3060 Ti
185.7
156.9
121.6
109.3
81.5
43.7
61.1
PosModel< PrevNext >Palworld
low med. high ultra QHD 4K
Intel Arc A770
127.4
105.8
82
78.8
60.2
33.5
AMD Radeon RX 7600
158.3
131.5
96.9
85.7
59.6
28.3
NVIDIA GeForce RTX 4060 Laptop GPU
110.7
91.9
87.8
65.6
34.8
49.9
AMD Radeon RX 6650 XT
145.7
115.7
80.9
74.8
52.2
27.4
NVIDIA GeForce RTX 3070 Laptop GPU
116.7
106.1
103
102.1
72.9
38.7
54.9
Intel Arc A750
125.2
112.2
89.5
81.7
59.3
32.3
NVIDIA Titan X Pascal
133.5
112.2
90.3
83.7
57.8
32.2
NVIDIA GeForce RTX 2070 Super (Desktop)
143.7
120.1
94.4
86.3
58.4
31.2
45
AMD Radeon RX 5700 XT (Desktop)
125.7
100.7
73
68.2
47.1
25.9
AMD Radeon RX 7600S
117
97.7
71.9
69.5
48.9
25.2
Intel Arc A580
111.9
94.8
73.5
67.9
48.5
26.7
NVIDIA GeForce RTX 2060 Super (Desktop)
124.7
105
82
75.1
51.5
25.9
40.2
AMD Radeon RX 6600
119.4
104
78.4
70.7
47.2
22.1
AMD Radeon RX 5700 (Desktop)
112.5
89
67.1
62.9
42.7
23.3
AMD Radeon RX 5600 XT (Desktop)
109.8
89.2
66.5
62.4
42.8
21.7
NVIDIA GeForce GTX 1660 Super (Desktop)
86n2
70.75n2
54.15n2
49.65n2
34n2
17.35n2
AMD Radeon RX 6500 XT
68.7
43.7
30.1
21.7
AMD Radeon RX 5500 XT (Desktop)
71.8
60.7
43.4
40.8
28
14.9
NVIDIA GeForce RTX 4050 Laptop GPU
96.2n2
74.4n2
73.4n2
50.6
26
36.3
Intel Arc A730M
80.1
67.4
53.8
50.7
36.5
18.9
PosModel< PrevNext >Palworld
low med. high ultra QHD 4K
NVIDIA GeForce GTX 1660 Ti Mobile
80.5
69.9
55.3
50.7
NVIDIA GeForce GTX 1650 Super (Desktop)
70.9
53.4
51.3
47.4
26
11.8
AMD Radeon RX 6500M
59.5
47.9
26.8
21.1
NVIDIA GeForce RTX 2050 Mobile
57.2
48
37.5
35
NVIDIA GeForce GTX 1650 Mobile
50.6
43.8
33.6
31
Intel Arc A380
46.3
37.4
27.4
24.4
Intel Arc A310
38.3
33.2
23.2
20.9
Intel Arc 8-Cores iGPU
40.6
37.1
29.5
27.3
Intel Arc 7-Cores iGPU
34.8
32.6
25.2
23.4
AMD Radeon 780M
42.4n2
35.1n2
24.95n2
23.1n2
17.7
8.9
Intel UHD Graphics Xe 32EUs (Tiger Lake-H)
11.1
Intel UHD Graphics 630
5.96
AMD Radeon RX Vega 3
6.28
(-) * Smaller values are better. / n123 Number of benchmarks for this median value / * Approximate position


Legend
5Stutters – This game is very likely to stutter and have poor frame rates. Based on all known benchmarks using the specified graphical settings, average frame rates are expected to fall below 25fps
May Stutter – This graphics card has not been explicitly tested on this game. Based on interpolated information from surrounding graphics cards of similar performance levels, stutters and poor frame rates are expected.
30Fluent – Based on all known benchmarks using the specified graphical settings, this game should run at or above 25fps
40Fluent – Based on all known benchmarks using the specified graphical settings, this game should run at or above 35fps
60Fluent – Based on all known benchmarks using the specified graphical settings, this game should run at or above 58fps
May Run Fluently – This graphics card has not been explicitly tested on this game. Based on interpolated information from surrounding graphics cards of similar performance levels, fluent frame rates are expected.
?Uncertain – This graphics card experienced unexpected performance issues during testing for this game. A slower card may be able to achieve better and more consistent frame rates than this particular GPU running the same benchmark scene.
Uncertain – This graphics card has not been explicitly tested on this game and no reliable interpolation can be made based on the performances of surrounding cards of the same class or family.
The value in the fields displays the average frame rate of all values in the database. Move your cursor over the value to see individual results.

Test system details

笔记本 显卡 处理器 内存
华硕 ROG Zephyrus M16 NvidiaGeForce RTX 4090 @150 W TGP (16 GB GDDR6X) Intel Core i9-13900H 2 x 16 GB DDR5
Razer Blade 16 Mid 23 NvidiaGeForce RTX 4080 @175 W TGP (12 GB GDDR6X) Intel Core i9-13950HX 2 x 16 GB DDR5
XMG Pro 15 E23 NvidiaGeForce RTX 4070 @140 W TGP (8 GB GDDR6) Intel Core i9-13900HX 2 x 16 GB DDR5
Razer Blade 14 Mid 23 NvidiaGeForce RTX 4060 @140 W TGP (8 GB GDDR6) AMD Ryzen 9 7940HS 2 x 8 GB DDR5
Medion Erazer Scout E20 NvidiaGeForce RTX 4050 @100 W TGP (6 GB GDDR6) Intel Core i7-13700H 2 x 8 GB DDR5
华硕 TUF Gaming Advantage A16 AMD Radeon RX 7600S (8 GB GDDR6) & AMD Radeon 780M AMD Ryzen 9 7940HS 2 x 8 GB DDR5
塔式电脑 显卡 处理器 内存
华硕 ROG Strix Z790-F NvidiaGeForce RTX 4080 (16 GB GDDR6X)
AMD Radeon RX 7900 XT (20 GB GDDR6)
Intel Core i9-13900K 2 x 24 GB DDR5 G.Skill
4K 显示器 操作系统 Nvidia 驱动程序 AMD 驱动程序
Philips Evnia 42M2N8900 Windows 11 ForceWare 546.65 Adrenalin 23.12.1
Please share our article, every link counts!
> Notebookcheck中文版(NBC中国) > 评测 > 回顾 Palworld:笔记本电脑和台式机基准测试
Florian Glaser, 2024-01-27 (Update: 2024-01-27)