结论 - MacBook Pro 14 无法应对 M5 Max
配备 M5 Max SoC 的全新 MacBook Pro 14 问题重重,虽然你可以获得熟悉的优势,如出色的机身设计、现代化的端口、出色的扬声器、出色的 Mini-LED 面板(有哑光选项)和较长的电池续航时间,但 14 英寸的机身和散热根本无法充分处理 M5 Max。这导致了严重的热节流现象,而且我们还体验到了非常不稳定的 CPU 性能,而我们的 MacBook Pro 16 和 M5 Pro 却没有出现这种情况。对于较大的 16 英寸机型,我们认为 M5 Max 绝对是更好的选择。
功率限制过高还会导致风扇噪音过大,电源适配器的功率也不足。在压力测试开始时,仅 M5 Max 就能消耗 96 瓦的功率,96 瓦的电源适配器可能会很吃力,这一点大家应该不会感到惊讶。Apple 还将输入功率限制在 97 瓦,即使使用 140 瓦的 PSU 或普通的 180 瓦 USB-C 充电器也是如此。考虑到我们在较大的 MacBook Pro 16 和 M5 Pro 的测量结果。的 MacBook Pro 14 在峰值负载情况下的实际功耗将超过 140 瓦,因此它也必须使用电池。
不过,即使存在这些问题,MBP 14 仍是功能最强大的 14 英寸笔记本电脑之一,其两个主要竞争对手是 华硕 ROG Zephyrus G14配备了移动 RTX 5080 或 华硕 ProArt PX13配备 AMD Strix Halo Ryzen AI Max+ 395 和 Radeon 8060S(也是 128 GB 内存),但这两款机型的屏幕都无法与 MacBook Pro 14 出色的 Mini-LED 面板相比,而且这两款替代品在 CPU 性能方面也不占优势。
总而言之,这仍然是一款非常出色的多媒体笔记本电脑,只是新款 M5 Pro 更适合 14 英寸机身。如果你想要或需要 M5 Max,你应该知道 14 英寸机型的性能会低于 MacBook Pro 16。
Pros
Cons
Apple新的旗舰芯片名为 M5 Max,我们在最新迭代的小巧 MacBook Pro 14 中对它进行了测试。2026 型号年的其他更新包括 Wi-Fi 7 和蓝牙 6(通过Apple 自己的 N1 芯片),以及更快的 PCIe 5.0 固态硬盘。我们这次评测的是最高配置,包括所有可能的升级,因此它是 M5 Max 的最快版本,配备 40 核 GPU、128 GB LPDDR5x-9600 内存、8 TB SSD 存储器和哑光 Mini-LED 面板,售价高达 7049 美元,令人瞠目。在我们的分析文章中,我们已经介绍了配备 M5 Pro 芯片的新 MacBook Pro 16,并检查了新 M5 Pro 和 M5 Max 芯片的 CPU 和 GPU 性能,这些文章的链接如下:
规格
与之前的 MacBook Pro 14 M4 Pro 相比的变化
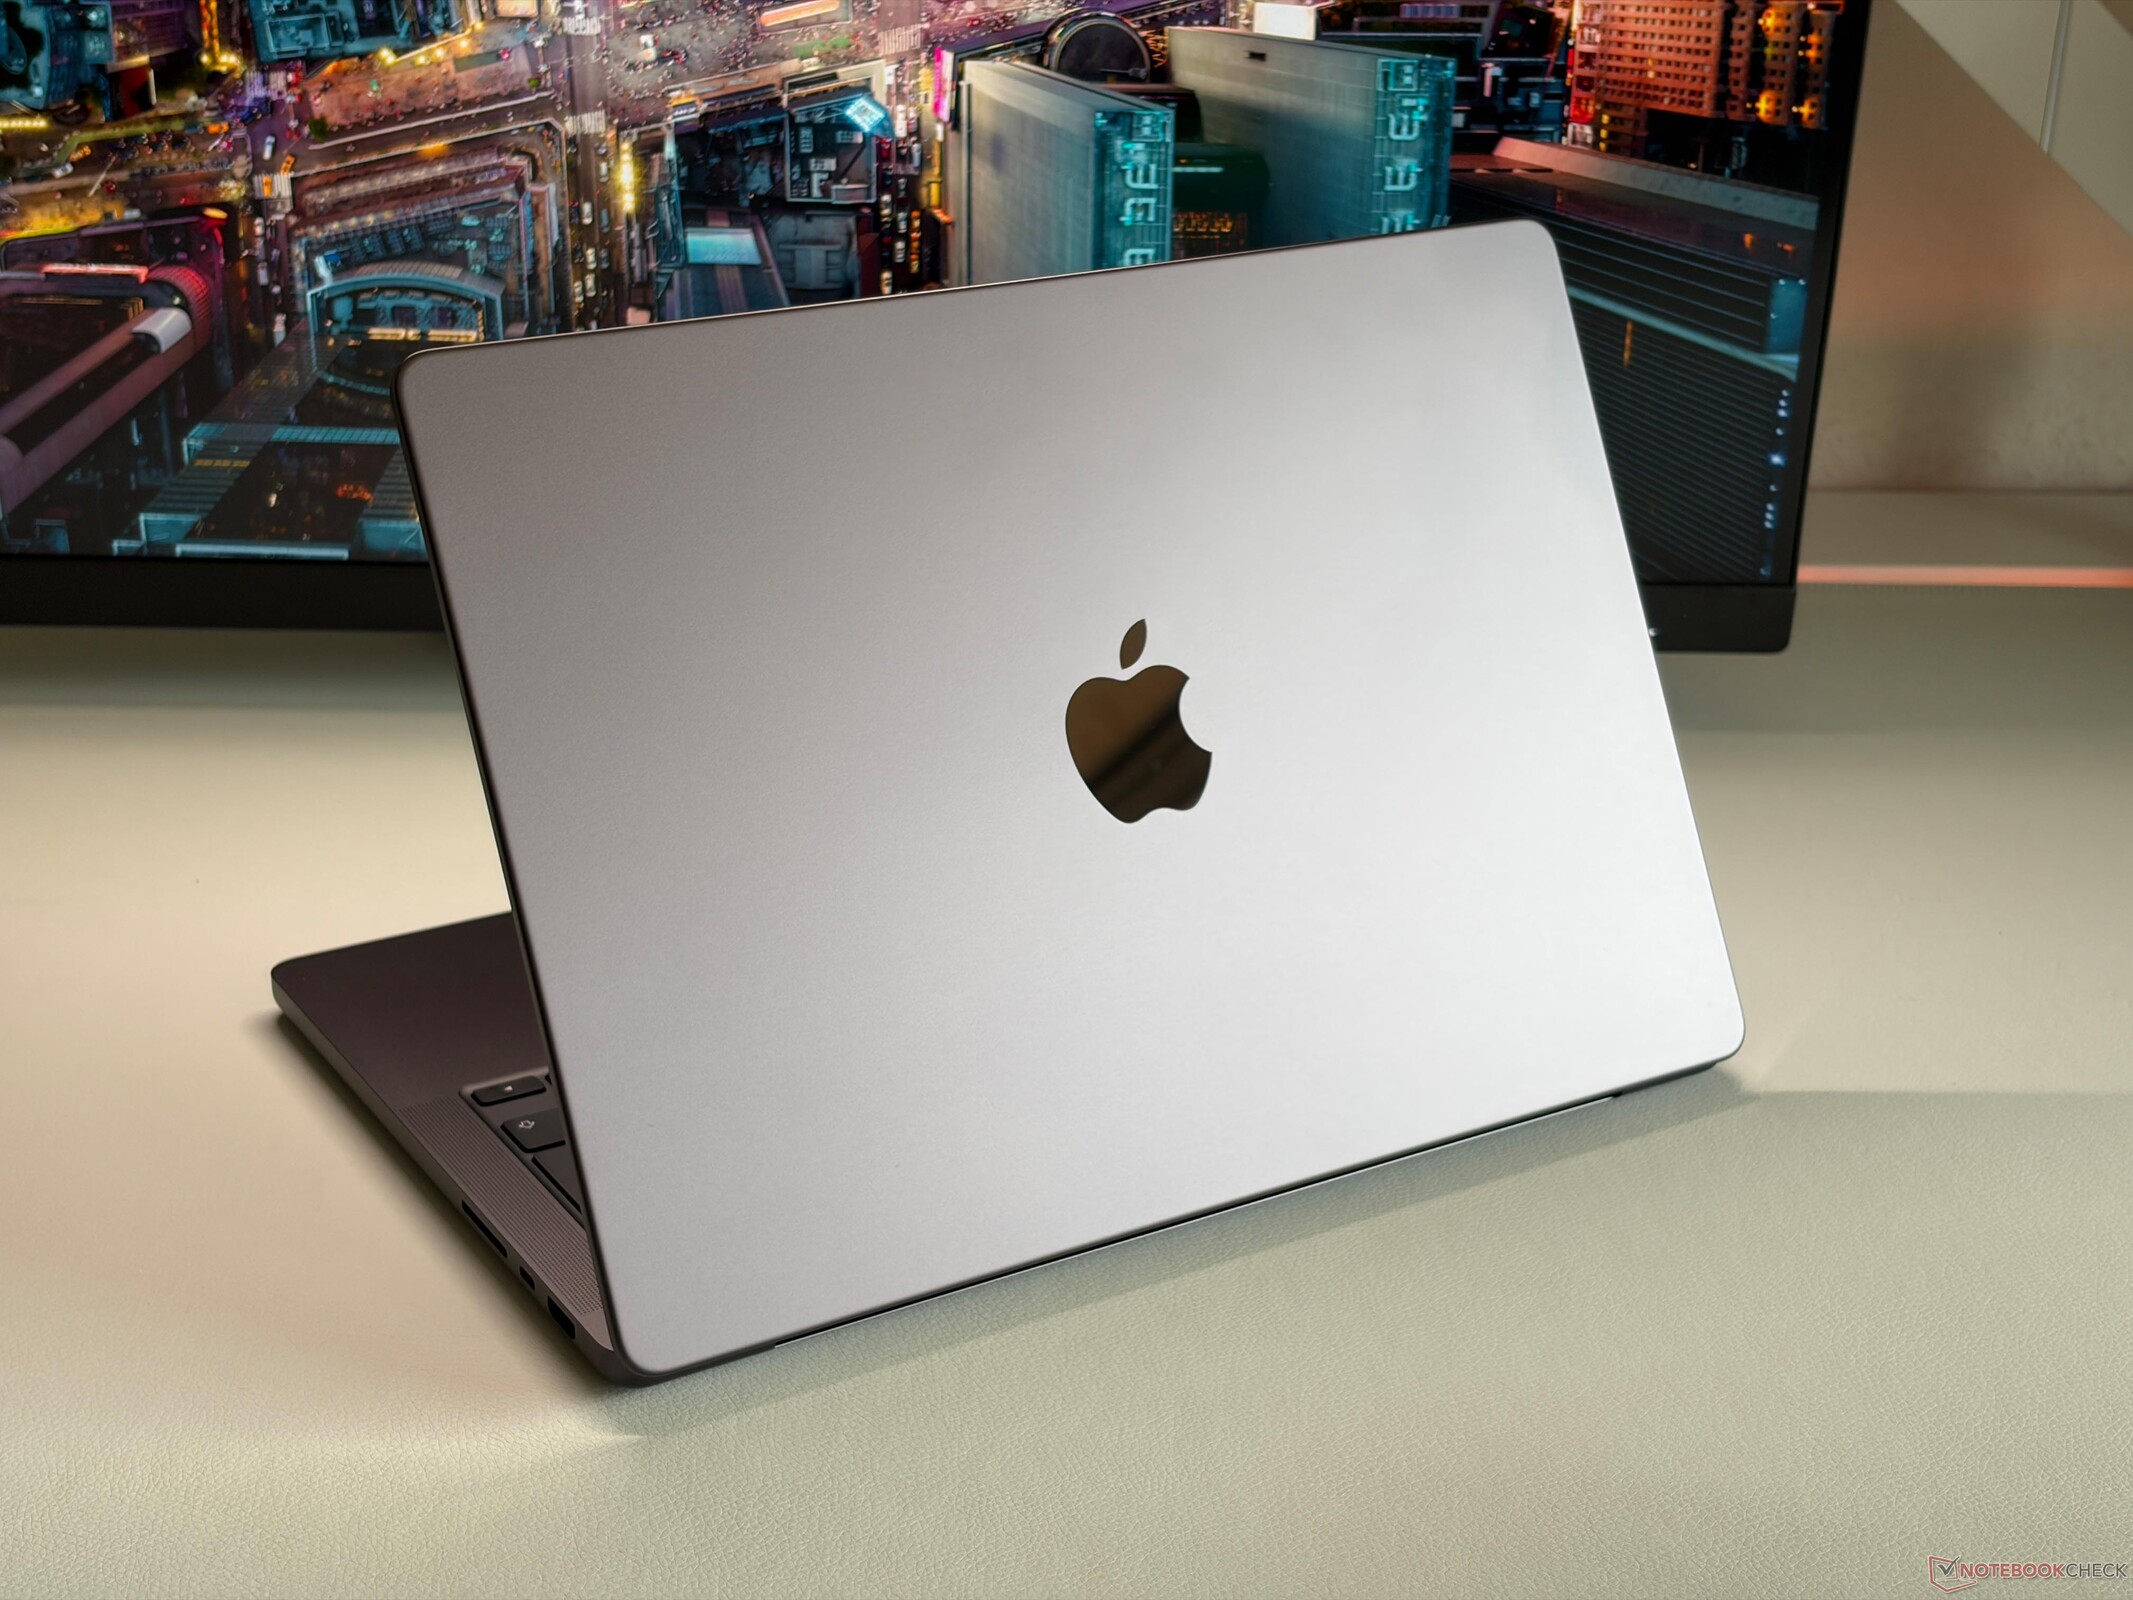
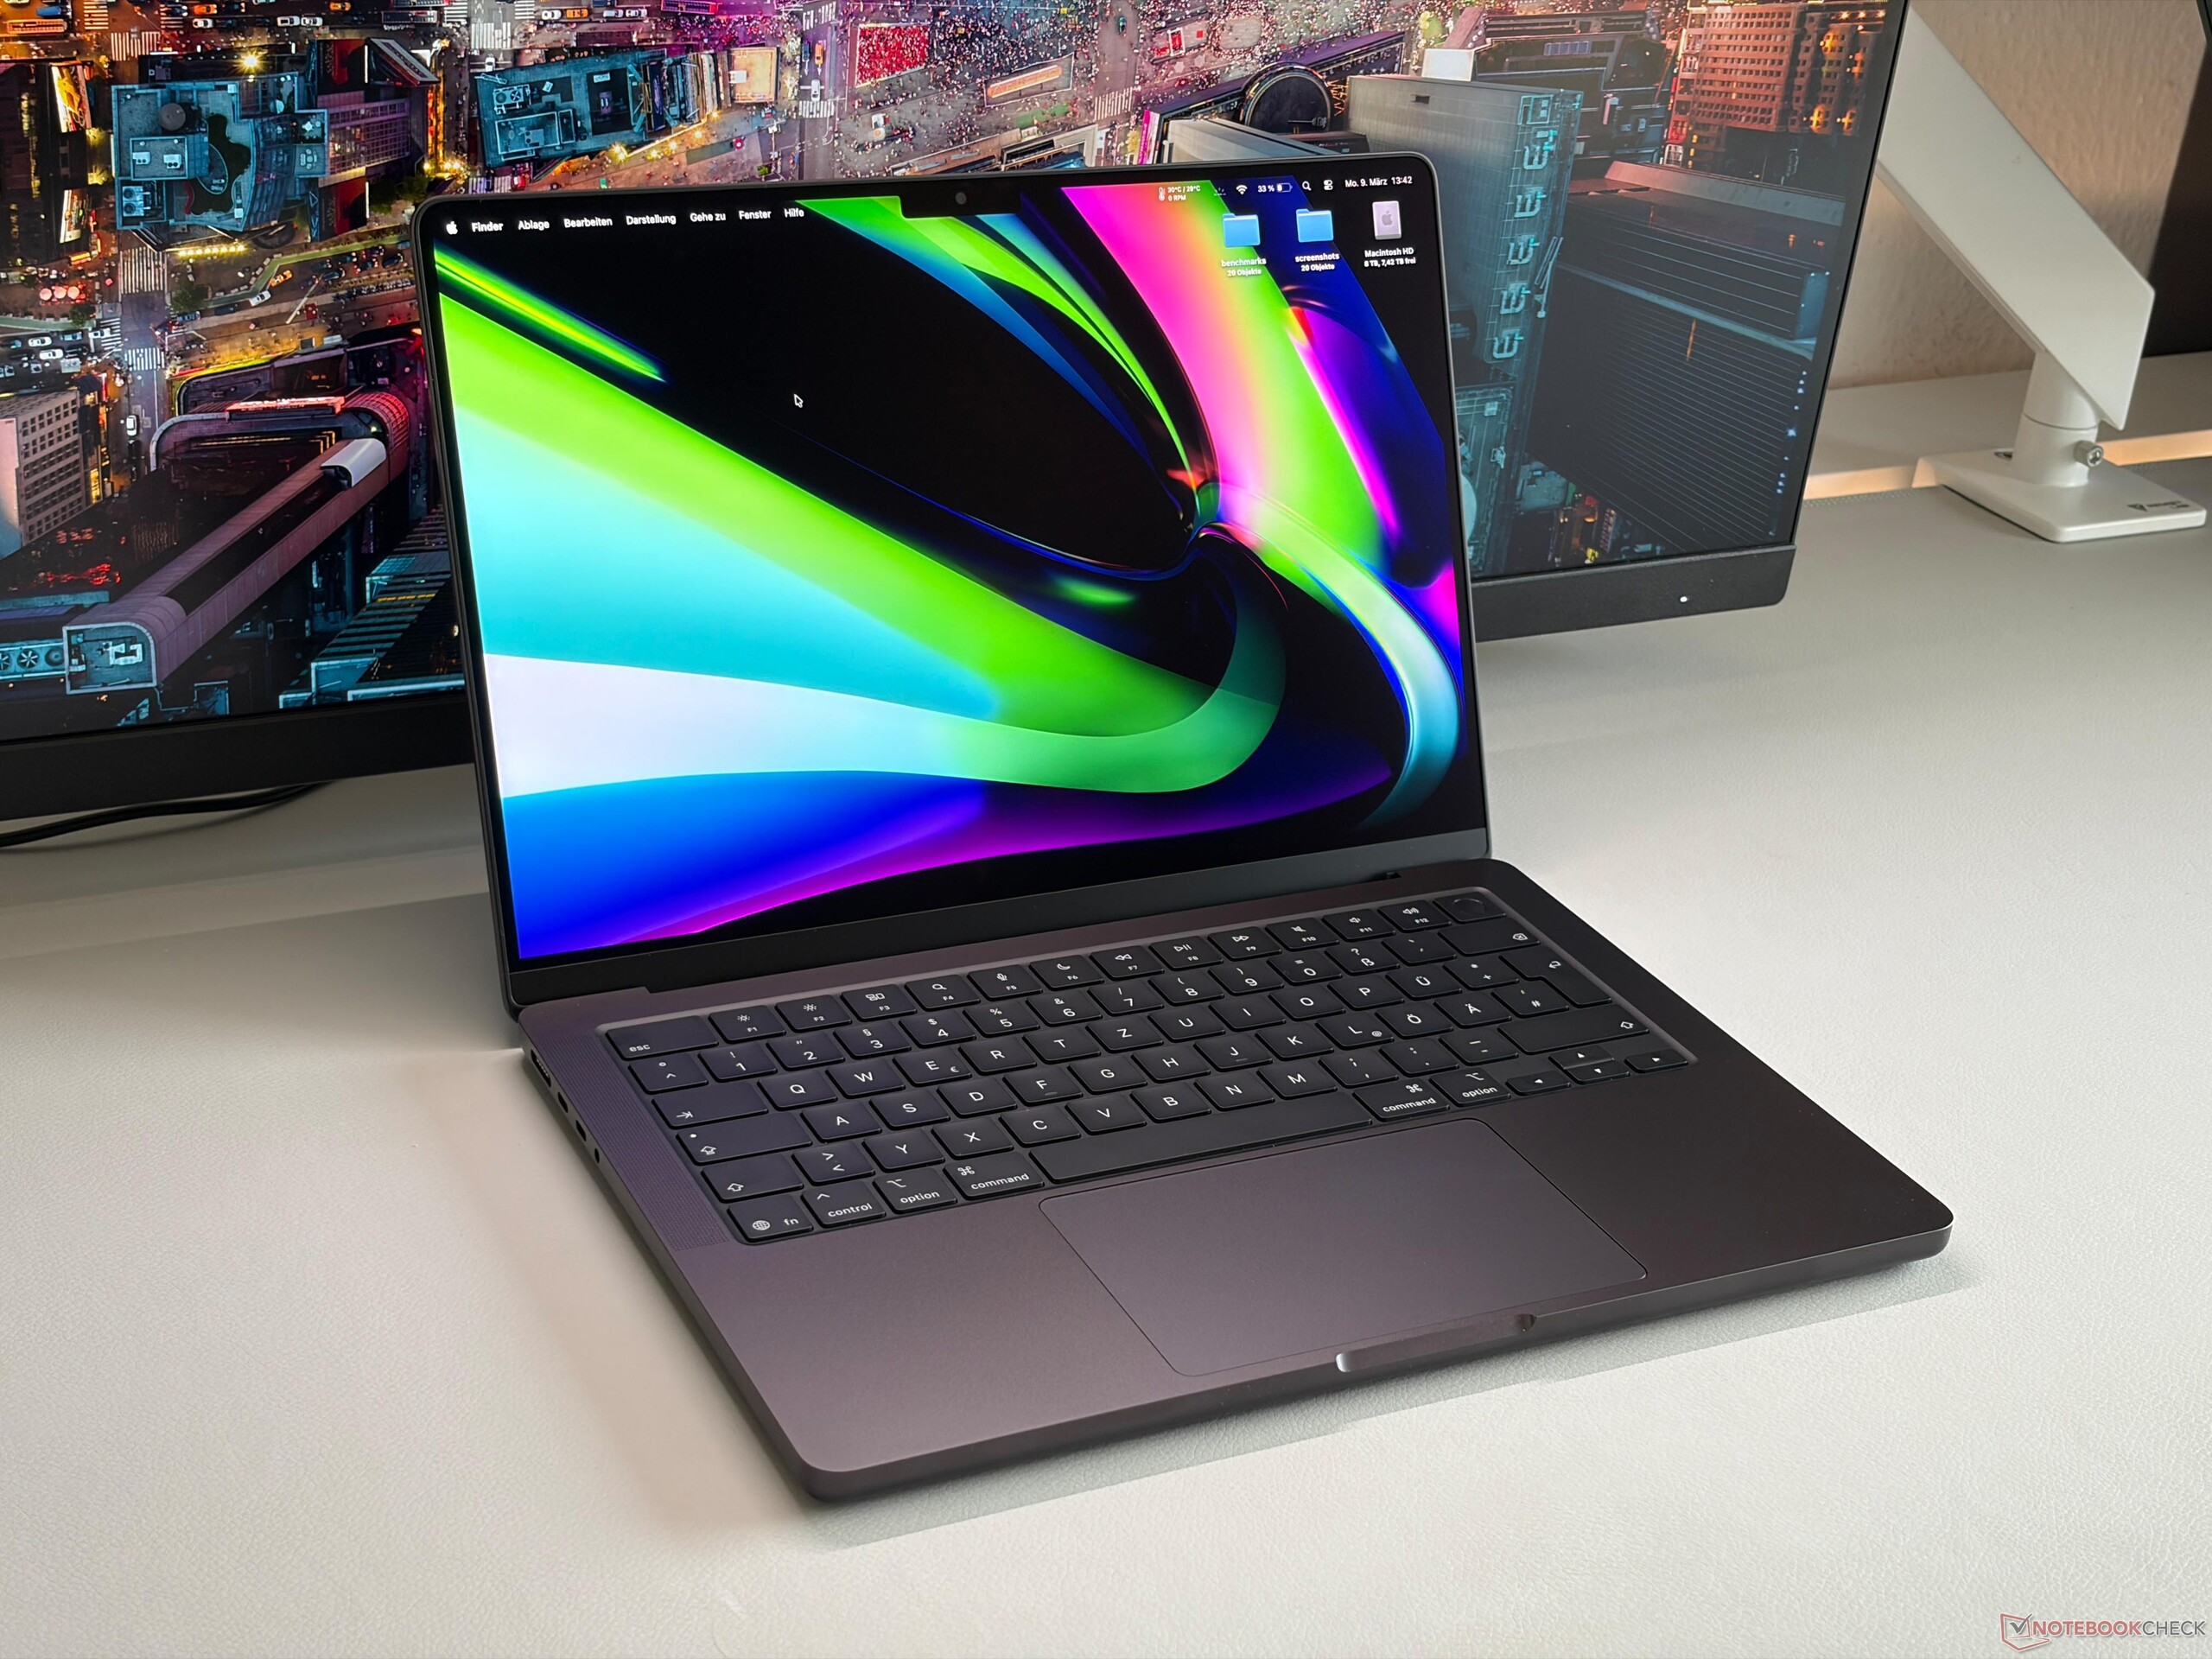
Apple 我们没有改变机箱,其中包括连接(3x Thunderbolt 5)以及 1200 万像素中心舞台网络摄像头、输入设备和 Mini-LED 面板。请参阅我们对 M4 Pro MacBook Pro 14了解有关这些主题的更多信息。维护选项仍然仅限于风扇和电池,而所有其他组件都是焊接的。
SD 卡读卡器也保持不变,这意味着 UHS 标准的性能良好,但不支持最新的 SD Express 标准。新的Apple N1 芯片提供 Wi-Fi 7 和蓝牙 6,在我们的测试中传输速率非常高且稳定。不过,新的Apple N1 芯片仅支持 160 MHz 的 Wi-Fi 7,而不是大多数 Windows 笔记本电脑上的 320 MHz。我们目前正在期待 Wi-Fi 7 路由器的到来,并将尽快测试 Wi-Fi 7 的性能。


| SD Card Reader | |
| average JPG Copy Test (av. of 3 runs) | |
| Razer Blade 14 2025 (Angelbird AV Pro V60) | |
| Asus ROG Zephyrus G14 2025 GA403WW (Angelbird AV Pro V60) | |
| Apple MacBook Pro 14 2024 M4 Pro (Angelbird AV Pro V60) | |
| Apple MacBook Pro 14 2026 M5 Max (Angelbird AV Pro V60) | |
| Average of class Multimedia (23 - 531, n=40, last 2 years) | |
| Schenker Key 14 (M24) (Angelbird AV Pro V60) | |
| Acer Predator Triton 14 AI PT14-52 (Angelbird AV Pro V60) | |
| maximum AS SSD Seq Read Test (1GB) | |
| Apple MacBook Pro 14 2024 M4 Pro (Angelbird AV Pro V60) | |
| Apple MacBook Pro 14 2026 M5 Max (Angelbird AV Pro V60) | |
| Razer Blade 14 2025 (Angelbird AV Pro V60) | |
| Asus ROG Zephyrus G14 2025 GA403WW (Angelbird AV Pro V60) | |
| Average of class Multimedia (37.3 - 1455, n=39, last 2 years) | |
| Schenker Key 14 (M24) (Angelbird AV Pro V60) | |
| Acer Predator Triton 14 AI PT14-52 (Angelbird AV Pro V60) | |
| Networking | |
| Apple MacBook Pro 14 2026 M5 Max | |
| iperf3 transmit AXE11000 | |
| iperf3 receive AXE11000 | |
| Apple MacBook Pro 14 2024 M4 Pro | |
| iperf3 transmit AXE11000 | |
| iperf3 receive AXE11000 | |
| Acer Predator Triton 14 AI PT14-52 | |
| iperf3 transmit AXE11000 | |
| iperf3 receive AXE11000 | |
| Razer Blade 14 2025 | |
| iperf3 transmit AXE11000 | |
| iperf3 receive AXE11000 | |
| HP ZBook Ultra G1a A3ZQ0ET | |
| iperf3 transmit AXE11000 | |
| iperf3 receive AXE11000 | |
| iperf3 transmit AXE11000 6GHz | |
| iperf3 receive AXE11000 6GHz | |
| Asus ROG Zephyrus G14 2025 GA403WW | |
| iperf3 transmit AXE11000 | |
| iperf3 receive AXE11000 | |
| Schenker Key 14 (M24) | |
| iperf3 transmit AXE11000 | |
| iperf3 receive AXE11000 | |
可持续性

性能 - M5 Max 性能不稳定


测试条件
MacBook Pro 提供三种不同的性能模式:我们在下表中总结了三种不同模式的效果。所有三种模式在电池供电时也可使用,性能数据相同。如果你想获得最高的 CPU 和 GPU 性能,就必须使用高功率模式,因此我们在测试中也使用了该模式。不过,在 14 英寸机型上,显示的最大功率极限仅能达到一到两秒钟,然后几乎会立即减速。虽然 GPU 性能是可重复的,但我们在 CPU 性能方面遇到了问题,Cinebench 2024 Multi 分数介于约 1400 分和最高 2073 分之间,消耗功率有时低于 40 瓦,尽管运行的测试条件基本相同。我们真的不清楚这是怎么回事,也许Apple 会通过软件更新修复这种行为。目前,在持续工作负载下,CPU 性能不会非常稳定。
| CPU (瓦特) | CB2024 Multi (分) |
GPU (瓦特) | Steel Nomad (分) |
赛博朋克 2077 1080p Ultra (fps) |
TDP 压力测试 CPU&GPU (瓦特) |
最大风扇噪音 (dB(A)) | |
|---|---|---|---|---|---|---|---|
| 低功耗 | 13 | 897 | 8.2 | 1654 | 23.4 | 12 | 24.1 (2400 rpm) |
| 自动 | 75/36 | 1407 | 60/32 | 3698 | 54.1 | 84/30 | 41.4 (5150 rpm) |
| 大功率 | 75/52 | 2073 | 72/44 | 3947 | 54.6 | 96/42 | 53.2 (7500 rpm) |
处理器
新款 M5 Max 提供 18 个处理器内核,我们已经在我们的 我们的 CPU 分析.单核性能非常出色,我们在单核测试中看到了约 12% 的优势,与所有其他 M5 SoC 相似。但多核性能则不同。是的,在 Geekbench 测试中,峰值负载阶段的性能比 M4 Max 高出 14%,但如果我们看一下 Cinebench 2024 多核测试(只需几分钟),其性能与 M4 Max 几乎完全相同。如前所述,CPU 的多核性能也不稳定,尽管情况类似,但每次运行的分数都在 1400 到 2000 多分之间(包括中间的所有分数)。我们不清楚 M5 Max 为何会有这样的表现,而且我们在配备 M5 Max 的全新 配备 M5 Pro 的 MacBook Pro 16.在 Cinebench 2024 Multi 的 30 分钟压力测试中,性能下降了 24%。
Cinebench 2024: CPU Multi Core | CPU Single Core
Geekbench 6.7: Multi-Core | Single-Core
| CPU Performance rating | |
| Average Apple M5 Max | |
| Apple MacBook Pro 14 2026 M5 Max | |
| Apple MacBook Pro 16 M4 Max | |
| Apple MacBook Pro 14 2024 M4 Pro | |
| Asus ProArt PX13 HN7306EA | |
| Asus ROG Zephyrus G14 2025 GA403WW | |
| Average of class Multimedia | |
| HP ZBook Ultra G1a A3ZQ0ET | |
| Razer Blade 14 2025 | |
| Acer Predator Triton 14 AI PT14-52 | |
| Schenker Key 14 (M24) | |
| Cinebench 2024 / CPU Multi Core | |
| Average Apple M5 Max (2073 - 2437, n=2) | |
| Apple MacBook Pro 14 2026 M5 Max | |
| Apple MacBook Pro 16 M4 Max | |
| Apple MacBook Pro 16 M4 Max | |
| Asus ProArt PX13 HN7306EA | |
| Apple MacBook Pro 14 2024 M4 Pro | |
| HP ZBook Ultra G1a A3ZQ0ET | |
| Asus ROG Zephyrus G14 2025 GA403WW | |
| Razer Blade 14 2025 | |
| Average of class Multimedia (327 - 2437, n=75, last 2 years) | |
| Schenker Key 14 (M24) | |
| Acer Predator Triton 14 AI PT14-52 | |
| Cinebench 2024 / CPU Single Core | |
| Average Apple M5 Max (200 - 201, n=2) | |
| Apple MacBook Pro 14 2026 M5 Max | |
| Apple MacBook Pro 16 M4 Max | |
| Apple MacBook Pro 14 2024 M4 Pro | |
| Acer Predator Triton 14 AI PT14-52 | |
| Average of class Multimedia (72.5 - 201, n=60, last 2 years) | |
| Asus ROG Zephyrus G14 2025 GA403WW | |
| Asus ProArt PX13 HN7306EA | |
| Razer Blade 14 2025 | |
| HP ZBook Ultra G1a A3ZQ0ET | |
| Schenker Key 14 (M24) | |
| Geekbench 6.7 / Multi-Core | |
| Apple MacBook Pro 14 2026 M5 Max | |
| Average Apple M5 Max (29000 - 29415, n=4) | |
| Apple MacBook Pro 16 M4 Max | |
| Apple MacBook Pro 14 2024 M4 Pro | |
| Asus ProArt PX13 HN7306EA | |
| Asus ROG Zephyrus G14 2025 GA403WW | |
| HP ZBook Ultra G1a A3ZQ0ET | |
| Razer Blade 14 2025 | |
| Average of class Multimedia (4983 - 29415, n=71, last 2 years) | |
| Schenker Key 14 (M24) | |
| Acer Predator Triton 14 AI PT14-52 | |
| Geekbench 6.7 / Single-Core | |
| Apple MacBook Pro 14 2026 M5 Max | |
| Average Apple M5 Max (4200 - 4335, n=4) | |
| Apple MacBook Pro 14 2024 M4 Pro | |
| Apple MacBook Pro 16 M4 Max | |
| Asus ProArt PX13 HN7306EA | |
| Asus ROG Zephyrus G14 2025 GA403WW | |
| Average of class Multimedia (1534 - 4335, n=70, last 2 years) | |
| Razer Blade 14 2025 | |
| Acer Predator Triton 14 AI PT14-52 | |
| HP ZBook Ultra G1a A3ZQ0ET | |
| Schenker Key 14 (M24) | |
系统性能
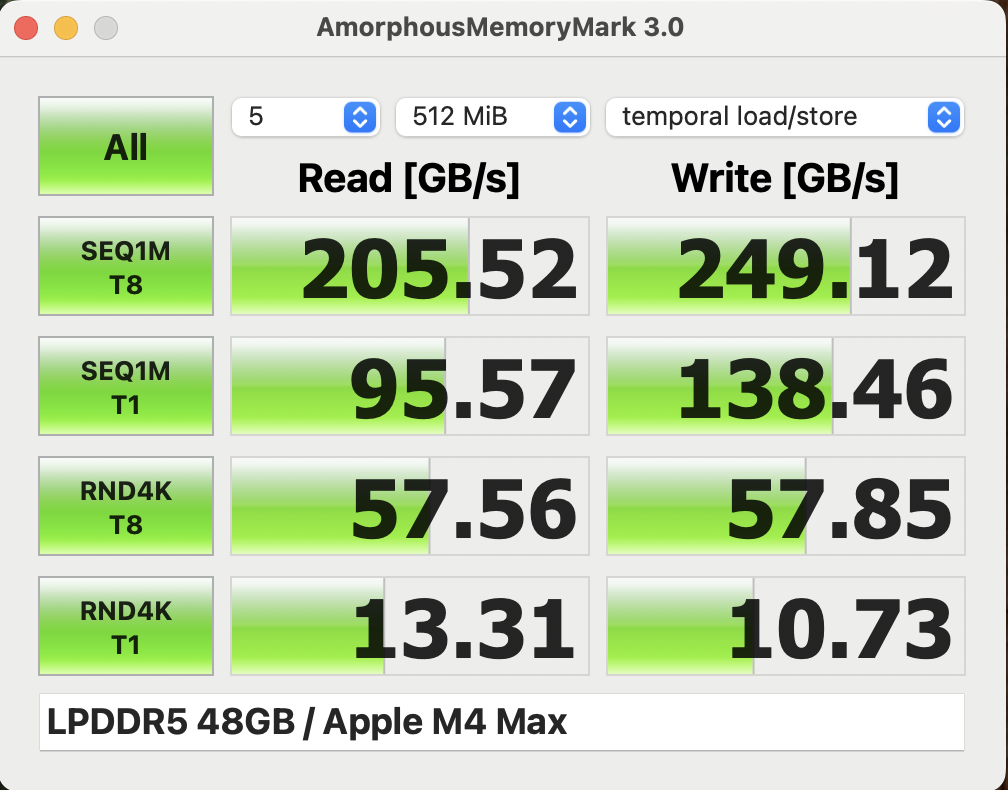
主观性能给人的印象非常出色,但公平地说,每台配备 M5 芯片的现代 MacBook 都是如此,因为高单核性能(与快速固态硬盘存储相结合)是日常工作负载的关键因素。我们的评测机(128 GB 内存)已达到最大值,您在执行繁重的多任务时不会遇到任何问题,而且拥有如此大内存的设备并不多,通常只有 AMD Strix Halo 系统,如 华硕 ProArt PX13.与之前的 M4 Max SoC 相比,内存性能基本保持不变。

CrossMark: Overall | Productivity | Creativity | Responsiveness
WebXPRT 3: Overall
WebXPRT 4: Overall
Mozilla Kraken 1.1: Total
| Performance rating | |
| Apple MacBook Pro 14 2026 M5 Max | |
| Average Apple M5 Max, Apple M5 Max 40-Core GPU | |
| Apple MacBook Pro 14 2024 M4 Pro | |
| Asus ProArt PX13 HN7306EA | |
| Asus ROG Zephyrus G14 2025 GA403WW | |
| Razer Blade 14 2025 | |
| Average of class Multimedia | |
| HP ZBook Ultra G1a A3ZQ0ET | |
| Acer Predator Triton 14 AI PT14-52 | |
| Schenker Key 14 (M24) | |
| CrossMark / Overall | |
| Apple MacBook Pro 14 2026 M5 Max | |
| Average Apple M5 Max, Apple M5 Max 40-Core GPU (n=1) | |
| Apple MacBook Pro 14 2024 M4 Pro | |
| Asus ProArt PX13 HN7306EA | |
| Asus ROG Zephyrus G14 2025 GA403WW | |
| Razer Blade 14 2025 | |
| Average of class Multimedia (866 - 2728, n=62, last 2 years) | |
| HP ZBook Ultra G1a A3ZQ0ET | |
| Schenker Key 14 (M24) | |
| Acer Predator Triton 14 AI PT14-52 | |
| CrossMark / Productivity | |
| Apple MacBook Pro 14 2026 M5 Max | |
| Average Apple M5 Max, Apple M5 Max 40-Core GPU (n=1) | |
| Apple MacBook Pro 14 2024 M4 Pro | |
| Asus ProArt PX13 HN7306EA | |
| Razer Blade 14 2025 | |
| Asus ROG Zephyrus G14 2025 GA403WW | |
| Average of class Multimedia (931 - 2489, n=62, last 2 years) | |
| Schenker Key 14 (M24) | |
| Acer Predator Triton 14 AI PT14-52 | |
| HP ZBook Ultra G1a A3ZQ0ET | |
| CrossMark / Creativity | |
| Apple MacBook Pro 14 2026 M5 Max | |
| Average Apple M5 Max, Apple M5 Max 40-Core GPU (n=1) | |
| Asus ProArt PX13 HN7306EA | |
| Apple MacBook Pro 14 2024 M4 Pro | |
| Asus ROG Zephyrus G14 2025 GA403WW | |
| HP ZBook Ultra G1a A3ZQ0ET | |
| Razer Blade 14 2025 | |
| Average of class Multimedia (907 - 3465, n=62, last 2 years) | |
| Acer Predator Triton 14 AI PT14-52 | |
| Schenker Key 14 (M24) | |
| CrossMark / Responsiveness | |
| Apple MacBook Pro 14 2026 M5 Max | |
| Average Apple M5 Max, Apple M5 Max 40-Core GPU (n=1) | |
| Razer Blade 14 2025 | |
| Schenker Key 14 (M24) | |
| Asus ProArt PX13 HN7306EA | |
| Apple MacBook Pro 14 2024 M4 Pro | |
| Asus ROG Zephyrus G14 2025 GA403WW | |
| Average of class Multimedia (605 - 2024, n=62, last 2 years) | |
| HP ZBook Ultra G1a A3ZQ0ET | |
| Acer Predator Triton 14 AI PT14-52 | |
| WebXPRT 3 / Overall | |
| Apple MacBook Pro 14 2026 M5 Max | |
| Average Apple M5 Max, Apple M5 Max 40-Core GPU (n=1) | |
| Apple MacBook Pro 14 2024 M4 Pro | |
| Asus ROG Zephyrus G14 2025 GA403WW | |
| Average of class Multimedia (136.4 - 596, n=65, last 2 years) | |
| Asus ProArt PX13 HN7306EA | |
| Acer Predator Triton 14 AI PT14-52 | |
| Razer Blade 14 2025 | |
| Schenker Key 14 (M24) | |
| HP ZBook Ultra G1a A3ZQ0ET | |
| WebXPRT 4 / Overall | |
| Apple MacBook Pro 14 2026 M5 Max | |
| Average Apple M5 Max, Apple M5 Max 40-Core GPU (n=1) | |
| Apple MacBook Pro 14 2024 M4 Pro | |
| HP ZBook Ultra G1a A3ZQ0ET | |
| Average of class Multimedia (167.3 - 402, n=67, last 2 years) | |
| Acer Predator Triton 14 AI PT14-52 | |
| Asus ROG Zephyrus G14 2025 GA403WW | |
| Razer Blade 14 2025 | |
| Asus ProArt PX13 HN7306EA | |
| Schenker Key 14 (M24) | |
| Mozilla Kraken 1.1 / Total | |
| Schenker Key 14 (M24) | |
| Acer Predator Triton 14 AI PT14-52 | |
| Asus ProArt PX13 HN7306EA | |
| Average of class Multimedia (228 - 835, n=68, last 2 years) | |
| Razer Blade 14 2025 | |
| HP ZBook Ultra G1a A3ZQ0ET | |
| Asus ROG Zephyrus G14 2025 GA403WW | |
| Apple MacBook Pro 14 2024 M4 Pro | |
| Apple MacBook Pro 14 2026 M5 Max | |
| Average Apple M5 Max, Apple M5 Max 40-Core GPU (n=1) | |
* ... smaller is better
存储设备
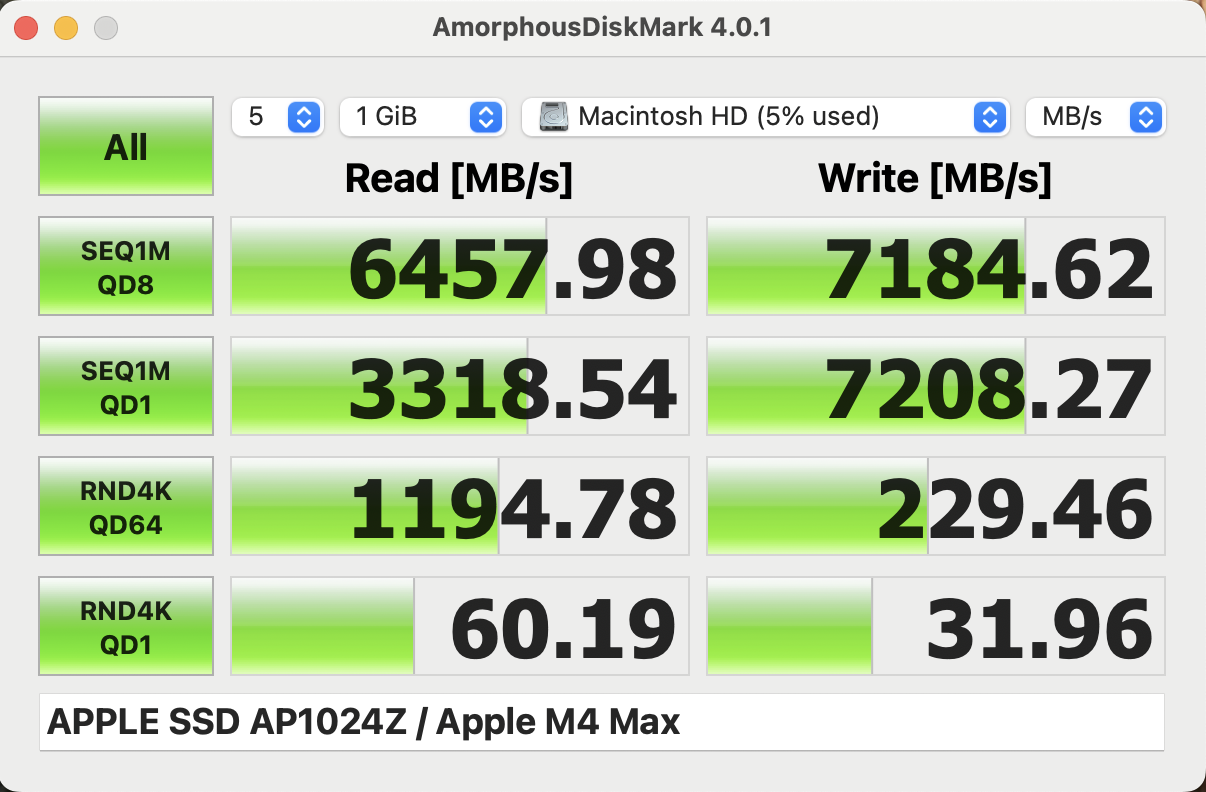
Apple 现在,它使用 PCIe 5.0 固态硬盘,我们评测的 8 TB 版本性能非常出色,传输速率高达 20 GB/s。它也是为数不多的存储容量高达 8 TB 的 14 英寸笔记本电脑之一。

图形处理器性能
我们的评测机配备了最快的 40 核 M5 Max GPU,我们在我们的 GPU 分析.GPU 在负载情况下的功耗高达 72 瓦,但仅在 1-2 秒钟内就降至 55 瓦,随后在高功率模式下降至仅 44 瓦(自动模式下为 60/32瓦)。在 3DMark 测试中,我们看到 M5 Max 与旧版 M4 Max 相比有 8-14% 的优势,也接近 ROG Zephyrus G14 中的移动 RTX 5080。在 Cinebench 2024 或 Geekbench 等较短的基准测试中,M5 Max 的性能优势比 M4 Max 更大。配备 M5 Max 的大型 MacBook Pro 16 在 GPU 测试中的表现应该会更好。
持续的工作负载会导致一些节流,即使在高功率模式下也会达到 92.6%(自动模式下为 74.99%),如下图所示。


| 3DMark Steel Nomad Score | 3924 points | |
| 3DMark Steel Nomad Light Score | 16191 points | |
Help | ||
| Blender / v4.3 Barbershop Metal | |
| Apple MacBook Pro 14 2026 M5 Max | |
| Average Apple M5 Max 40-Core GPU (n=1) | |
| Average of class Multimedia (83.2 - 100, n=2, last 2 years) | |
| Apple MacBook Pro 16 M4 Max | |
| Blender / v4.3 Barbershop OPTIX | |
| Average of class Multimedia (58 - 305, n=6, last 2 years) | |
| HP ZBook X G1i 16 | |
| Zotac GeForce RTX 5060 Low Profile | |
| MSI Crosshair 18 HX AI A2XW | |
| HP Omen 17z-db100 | |
| Asus ROG NUC 15-90AS00I1 | |
| Lenovo Legion 9 18IAX10 | |
| HP ZBook Fury G1i 18 | |
| MSI Stealth 18 HX AI A2XW | |
| Blender / v4.3 Barbershop CPU | |
| Average of class Multimedia (722 - 5186, n=25, last 2 years) | |
| HP Omen 17z-db100 | |
| HP ZBook X G1i 16 | |
| Zotac GeForce RTX 5060 Low Profile | |
| HP ZBook Fury G1i 18 | |
| MSI Stealth 18 HX AI A2XW | |
| MSI Crosshair 18 HX AI A2XW | |
| Apple MacBook Pro 16 M4 Max | |
| Asus ROG NUC 15-90AS00I1 | |
| Apple MacBook Pro 14 2026 M5 Max | |
| Average Apple M5 Max 40-Core GPU (n=1) | |
| Lenovo Legion 9 18IAX10 | |
| Blender / v3.3 Classroom METAL | |
| Average of class Multimedia (17.8 - 68, n=5, last 2 years) | |
| Apple MacBook Pro 14 2026 M5 Max | |
| Average Apple M5 Max 40-Core GPU (n=1) | |
| Apple MacBook Pro 16 M4 Max | |
* ... smaller is better
游戏性能
我们主要针对原生游戏进行性能测试,结果相当不错。在所有三款测试游戏(《赛博朋克 2077》、《博德之门 3》和《刺客信条暗影》)中,M5 Max SoC 都能赶上移动版GeForce RTX 5070,并明显优于 Radeon 8060S(Strix Halo)。不过,性能再次不完全稳定,尽管下降速度很快。在《赛博朋克 2077》节流测试中,初始帧数为 86,但几秒钟后迅速降至 80,这与Steel Nomad 压力测试的结果如出一辙。
| low | med. | high | ultra | QHD | 4K | |
|---|---|---|---|---|---|---|
| Baldur's Gate 3 (2023) | 184.6 | 149.2 | 123.6 | 122.1 | 83.3 | 46.8 |
| Cyberpunk 2077 (2023) | 136.4 | 120.4 | 103.1 | 91.3 | 54.6 | 23.8 |
| Total War Pharaoh (2023) | 55.2 | 55 | 50.1 | |||
| Assassin's Creed Shadows (2025) | 69 | 65 | 58 | 41 | 35 | 24 |
排放 - 负载时声音很大
系统噪音
在日常使用中,MacBook Pro 14 又是一款非常安静的设备,第一阶段风扇转速为 2400 rpm 时,风扇的杂音几乎听不到。不过,如果对部件(单独或单独)施加压力,这台 14 英寸的小型笔记本电脑就会发出很大的声音,尤其是在高功率模式下。我们在压力测试中测得的噪音高达 53.2 dB(A) (~7500 rpm),游戏时为 47.8 dB(A) (~6200 rpm)。在自动模式下,风扇的噪音更低,最高为 41.4 dB(A) (~5150 rpm),在低功耗模式下几乎听不到噪音,仅为 24.1 dB(A) (~2400 rpm)。我们的评测设备未发出任何其他电子噪音。
Noise level
| Idle |
| 23.1 / 23.1 / 23.1 dB(A) |
| Load |
| 36.8 / 53.2 dB(A) |
 | ||
30 dB silent 40 dB(A) audible 50 dB(A) loud |
||
min: | ||
| Apple MacBook Pro 14 2026 M5 Max M5 Max, M5 Max 40-Core GPU | Apple MacBook Pro 14 2024 M4 Pro M4 Pro 14-Core, M4 Pro 20-Core GPU | Acer Predator Triton 14 AI PT14-52 Core Ultra 9 288V, GeForce RTX 5070 Laptop | Razer Blade 14 2025 Ryzen AI 9 365, GeForce RTX 5070 Laptop | HP ZBook Ultra G1a A3ZQ0ET Ryzen AI Max PRO 390, Radeon 8050S | Asus ROG Zephyrus G14 2025 GA403WW Ryzen AI 9 HX 370, GeForce RTX 5080 Laptop | Schenker Key 14 (M24) Ultra 7 155H, GeForce RTX 4060 Laptop GPU | |
|---|---|---|---|---|---|---|---|
| Noise | 4% | -12% | -9% | -2% | -20% | -19% | |
| off / environment * (dB) | 23.1 | 23.9 -3% | 24.9 -8% | 23.7 -3% | 24.6 -6% | 23.3 -1% | 25.5 -10% |
| Idle Minimum * (dB) | 23.1 | 23.9 -3% | 24.9 -8% | 23.7 -3% | 24.6 -6% | 29.1 -26% | 25.5 -10% |
| Idle Average * (dB) | 23.1 | 23.9 -3% | 24.9 -8% | 23.7 -3% | 24.6 -6% | 29.1 -26% | 26.5 -15% |
| Idle Maximum * (dB) | 23.1 | 23.9 -3% | 30.5 -32% | 27 -17% | 24.6 -6% | 29.1 -26% | 30.3 -31% |
| Load Average * (dB) | 36.8 | 30.2 18% | 36.1 2% | 44.9 -22% | 40.7 -11% | 54.4 -48% | 49.3 -34% |
| Cyberpunk 2077 ultra * (dB) | 47.8 | 44.5 7% | 57.9 -21% | 54.6 -14% | 45.4 5% | 54.4 -14% | 57.8 -21% |
| Load Maximum * (dB) | 53.2 | 44.5 16% | 57.9 -9% | 54.6 -3% | 45.4 15% | 54.4 -2% | 57.8 -9% |
* ... smaller is better
温度
在空载或轻度工作时,铝制表面保持非常凉爽。不过,如果你真的对系统施加压力,键盘中心区域的温度会超过 47 °C,这绝对是显而易见的,但你仍然可以打字。底部面板的温度仅为 40 °C,因此在膝上使用 MBP 14 完全没有问题,即使你非常紧张。96W 电源适配器的温度超过 50 °C。
在压力测试中,M5 Max SoC 在高功率模式下的功耗高达 96 瓦,但很快降至 46 瓦,随后又降至 42 瓦(约 85 °C)。在自动模式下,数值更低,为 84/46/30 瓦特(80 °C),而在低功耗模式下仅为 12 瓦特(66 °C)。
(-) The maximum temperature on the upper side is 47 °C / 117 F, compared to the average of 36.8 °C / 98 F, ranging from 21 to 71 °C for the class Multimedia.
(±) The bottom heats up to a maximum of 40.5 °C / 105 F, compared to the average of 39.1 °C / 102 F
(+) In idle usage, the average temperature for the upper side is 22.9 °C / 73 F, compared to the device average of 31.3 °C / 88 F.
(-) 3: The average temperature for the upper side is 39 °C / 102 F, compared to the average of 31.3 °C / 88 F for the class Multimedia.
(+) The palmrests and touchpad are cooler than skin temperature with a maximum of 30.7 °C / 87.3 F and are therefore cool to the touch.
(±) The average temperature of the palmrest area of similar devices was 28.7 °C / 83.7 F (-2 °C / -3.6 F).


| Apple MacBook Pro 14 2026 M5 Max M5 Max, M5 Max 40-Core GPU | Apple MacBook Pro 14 2024 M4 Pro M4 Pro 14-Core, M4 Pro 20-Core GPU | Acer Predator Triton 14 AI PT14-52 Core Ultra 9 288V, GeForce RTX 5070 Laptop | Razer Blade 14 2025 Ryzen AI 9 365, GeForce RTX 5070 Laptop | HP ZBook Ultra G1a A3ZQ0ET Ryzen AI Max PRO 390, Radeon 8050S | Asus ROG Zephyrus G14 2025 GA403WW Ryzen AI 9 HX 370, GeForce RTX 5080 Laptop | Schenker Key 14 (M24) Ultra 7 155H, GeForce RTX 4060 Laptop GPU | |
|---|---|---|---|---|---|---|---|
| Heat | 0% | -11% | -20% | -16% | -24% | -31% | |
| Maximum Upper Side * (°C) | 47 | 47.3 -1% | 42.9 9% | 47 -0% | 43 9% | 51.2 -9% | 43.1 8% |
| Maximum Bottom * (°C) | 40.5 | 44.2 -9% | 47.4 -17% | 49.6 -22% | 40.4 -0% | 50.3 -24% | 51.3 -27% |
| Idle Upper Side * (°C) | 23.3 | 22.1 5% | 27.3 -17% | 29.8 -28% | 31.2 -34% | 30.2 -30% | 33.2 -42% |
| Idle Bottom * (°C) | 23.4 | 22.1 6% | 28.1 -20% | 30.7 -31% | 32.5 -39% | 30.9 -32% | 38.3 -64% |
* ... smaller is better
发言人
六扬声器音响系统不如较大的 16 英寸 MacBook Pro 较大的 16 英寸 MacBook Pro但也相差不远,甚至仍胜过最好的 Windows 竞争对手,如 ROG Zephyrus G14.
Apple MacBook Pro 14 2026 M5 Max audio analysis
(+) | speakers can play relatively loud (83.1 dB)
Bass 100 - 315 Hz
(+) | good bass - only 4.5% away from median
(±) | linearity of bass is average (7.1% delta to prev. frequency)
Mids 400 - 2000 Hz
(+) | balanced mids - only 1.3% away from median
(+) | mids are linear (2.5% delta to prev. frequency)
Highs 2 - 16 kHz
(+) | balanced highs - only 3.3% away from median
(+) | highs are linear (3.7% delta to prev. frequency)
Overall 100 - 16.000 Hz
(+) | overall sound is linear (6.5% difference to median)
Compared to same class
» 4% of all tested devices in this class were better, 1% similar, 95% worse
» The best had a delta of 5%, average was 17%, worst was 45%
Compared to all devices tested
» 1% of all tested devices were better, 0% similar, 99% worse
» The best had a delta of 4%, average was 23%, worst was 134%
Acer Predator Triton 14 AI PT14-52 audio analysis
(+) | speakers can play relatively loud (90.7 dB)
Bass 100 - 315 Hz
(±) | reduced bass - on average 11.9% lower than median
(±) | linearity of bass is average (10.3% delta to prev. frequency)
Mids 400 - 2000 Hz
(±) | higher mids - on average 10.1% higher than median
(+) | mids are linear (6.9% delta to prev. frequency)
Highs 2 - 16 kHz
(±) | reduced highs - on average 5.2% lower than median
(+) | highs are linear (4.4% delta to prev. frequency)
Overall 100 - 16.000 Hz
(±) | linearity of overall sound is average (17.9% difference to median)
Compared to same class
» 55% of all tested devices in this class were better, 9% similar, 37% worse
» The best had a delta of 6%, average was 18%, worst was 132%
Compared to all devices tested
» 37% of all tested devices were better, 8% similar, 55% worse
» The best had a delta of 4%, average was 23%, worst was 134%
Razer Blade 14 2025 audio analysis
(±) | speaker loudness is average but good (79.6 dB)
Bass 100 - 315 Hz
(±) | reduced bass - on average 9% lower than median
(±) | linearity of bass is average (7.4% delta to prev. frequency)
Mids 400 - 2000 Hz
(±) | higher mids - on average 9% higher than median
(+) | mids are linear (5.4% delta to prev. frequency)
Highs 2 - 16 kHz
(+) | balanced highs - only 3.2% away from median
(+) | highs are linear (5% delta to prev. frequency)
Overall 100 - 16.000 Hz
(±) | linearity of overall sound is average (15.1% difference to median)
Compared to same class
» 32% of all tested devices in this class were better, 6% similar, 62% worse
» The best had a delta of 6%, average was 18%, worst was 132%
Compared to all devices tested
» 21% of all tested devices were better, 4% similar, 75% worse
» The best had a delta of 4%, average was 23%, worst was 134%
HP ZBook Ultra G1a A3ZQ0ET audio analysis
(+) | speakers can play relatively loud (85.3 dB)
Bass 100 - 315 Hz
(±) | reduced bass - on average 11.2% lower than median
(±) | linearity of bass is average (11.5% delta to prev. frequency)
Mids 400 - 2000 Hz
(±) | higher mids - on average 5.7% higher than median
(+) | mids are linear (5.6% delta to prev. frequency)
Highs 2 - 16 kHz
(+) | balanced highs - only 3.3% away from median
(+) | highs are linear (5.6% delta to prev. frequency)
Overall 100 - 16.000 Hz
(+) | overall sound is linear (11.5% difference to median)
Compared to same class
» 14% of all tested devices in this class were better, 4% similar, 82% worse
» The best had a delta of 7%, average was 17%, worst was 35%
Compared to all devices tested
» 8% of all tested devices were better, 2% similar, 90% worse
» The best had a delta of 4%, average was 23%, worst was 134%
Asus ROG Zephyrus G14 2025 GA403WW audio analysis
(±) | speaker loudness is average but good (81.2 dB)
Bass 100 - 315 Hz
(+) | good bass - only 2.8% away from median
(±) | linearity of bass is average (8.1% delta to prev. frequency)
Mids 400 - 2000 Hz
(+) | balanced mids - only 3.9% away from median
(+) | mids are linear (5.6% delta to prev. frequency)
Highs 2 - 16 kHz
(±) | reduced highs - on average 5.9% lower than median
(+) | highs are linear (4.3% delta to prev. frequency)
Overall 100 - 16.000 Hz
(+) | overall sound is linear (10.4% difference to median)
Compared to same class
» 6% of all tested devices in this class were better, 2% similar, 92% worse
» The best had a delta of 6%, average was 18%, worst was 132%
Compared to all devices tested
» 5% of all tested devices were better, 1% similar, 93% worse
» The best had a delta of 4%, average was 23%, worst was 134%
Schenker Key 14 (M24) audio analysis
(±) | speaker loudness is average but good (81.5 dB)
Bass 100 - 315 Hz
(-) | nearly no bass - on average 29.9% lower than median
(±) | linearity of bass is average (7.9% delta to prev. frequency)
Mids 400 - 2000 Hz
(±) | higher mids - on average 5.3% higher than median
(+) | mids are linear (5.9% delta to prev. frequency)
Highs 2 - 16 kHz
(+) | balanced highs - only 2.1% away from median
(+) | highs are linear (2.8% delta to prev. frequency)
Overall 100 - 16.000 Hz
(±) | linearity of overall sound is average (20.9% difference to median)
Compared to same class
» 71% of all tested devices in this class were better, 8% similar, 21% worse
» The best had a delta of 5%, average was 17%, worst was 45%
Compared to all devices tested
» 57% of all tested devices were better, 8% similar, 35% worse
» The best had a delta of 4%, average was 23%, worst was 134%
能源管理 - 电源适配器不足
耗电量

对于 M5 Max 机型来说,功耗是个大问题,因为 96 瓦的电源根本不够用。在 "高功率 "模式下(这是获得最佳和最稳定性能的必要条件),当我们玩原生版《赛博朋克 2077》时,电池耗电量约为 10%,在压力测试中甚至达到了 15%。有两个问题尤其突出:首先,Apple 将输入功率限制在约 97 瓦,因此无论使用附带的 96W PSU、MacBook Pro 16 的 140W PSU 还是功率更大的 180W USB-C 充电器都没有区别。其次,Apple 试图掩盖电池在负载情况下必须尽可能长时间耗尽的事实,因为电池指示灯仍然显示 100%,MagSafe LED 保持绿色,而我们的测量设备清楚地显示电池必须充电。在短时间的峰值负载情况下(这种情况比较常见),这会让用户觉得一切正常,96 瓦 PSU 足够使用。当负载持续时,电池百分比最终会下降几个百分点(例如从 100 降至 97)。根据我们对配备 M5 Pro 的大型 MacBook Pro 16 的功耗测量,我们怀疑负载下的实际功耗超过 140 瓦。
| Off / Standby | |
| Idle | |
| Load |
|
Key:
min: | |
| Apple MacBook Pro 14 2026 M5 Max M5 Max, M5 Max 40-Core GPU, Apple SSD AP8192Z, Mini-LED, 3024x1964, 14.2" | Apple MacBook Pro 14 2024 M4 Pro M4 Pro 14-Core, M4 Pro 20-Core GPU, Apple SSD AP2048Z, MiniLED, 3024x1964, 14.2" | Acer Predator Triton 14 AI PT14-52 Core Ultra 9 288V, GeForce RTX 5070 Laptop, Micron 3400 1TB MTFDKBA1T0TFH, OLED, 2880x1800, 14.5" | Razer Blade 14 2025 Ryzen AI 9 365, GeForce RTX 5070 Laptop, Samsung PM9A1 MZVL21T0HCLR, OLED, 2880x1800, 14" | HP ZBook Ultra G1a A3ZQ0ET Ryzen AI Max PRO 390, Radeon 8050S, SK hynix PC801 HFS001TEJ9X101N, IPS LED, 1920x1200, 14" | Asus ROG Zephyrus G14 2025 GA403WW Ryzen AI 9 HX 370, GeForce RTX 5080 Laptop, WD PC SN740 SDDPNQE-2T00, OLED, 2880x1800, 14" | Schenker Key 14 (M24) Ultra 7 155H, GeForce RTX 4060 Laptop GPU, Samsung 990 Pro 1 TB, IPS, 2880x1800, 14" | Average Apple M5 Max 40-Core GPU | Average of class Multimedia | |
|---|---|---|---|---|---|---|---|---|---|
| Power Consumption | 9% | -58% | -78% | -9% | -61% | -55% | 0% | -21% | |
| Idle Minimum * (Watt) | 2.5 | 2.17 13% | 9.3 -272% | 9.3 -272% | 4.5 -80% | 6.7 -168% | 5.8 -132% | 2.5 ? -0% | 5.72 ? -129% |
| Idle Average * (Watt) | 11.6 | 10.9 6% | 12.2 -5% | 11.1 4% | 7.5 35% | 8.8 24% | 10.8 7% | 11.6 ? -0% | 10.2 ? 12% |
| Idle Maximum * (Watt) | 11.8 | 11 7% | 12.5 -6% | 11.2 5% | 8.3 30% | 9.3 21% | 11.1 6% | 11.8 ? -0% | 12.4 ? -5% |
| Load Average * (Watt) | 95.6 | 74.3 22% | 68.4 28% | 91.9 4% | 80.7 16% | 121.5 -27% | 87.4 9% | 95.6 ? -0% | 65.5 ? 31% |
| Cyberpunk 2077 ultra external monitor * (Watt) | 86.4 | 80.5 7% | 132.2 -53% | 168.6 -95% | 104.1 -20% | 155.5 -80% | 169.1 -96% | ||
| Cyberpunk 2077 ultra * (Watt) | 89.4 | 134 -50% | 171.5 -92% | 106.5 -19% | 157.4 -76% | 175.3 -96% | |||
| Load Maximum * (Watt) | 98.8 | 98.1 1% | 145.4 -47% | 195 -97% | 125.1 -27% | 218.1 -121% | 183 -85% | 98.8 ? -0% | 114 ? -15% |
* ... smaller is better
功耗 赛博朋克/压力测试
外部显示器功耗
电池寿命
72.4 Wh 的电池仍能提供出色的续航时间,尤其是在较低的 150 尼特面板亮度下。我们在 Wi-Fi 测试中记录的续航时间超过 15 小时,在视频测试中甚至略高于 20 小时。这些结果远远优于任何配备强大组件的 Windows 竞争对手。不过,如果提高面板亮度,运行时间将大幅缩短,我们的 Wi-Fi 测试在最大亮度下仅运行了 6 小时。我们的 Wi-Fi 测试在最大 SDR 亮度(约 640 尼特,不含环境光传感器)下仅运行了 6 小时。如果你真的要推动系统,你可以在一小时内耗尽电池,而实际上你只需 49 分钟就能从 100 % 电量达到 3 % 电量(此时系统会大幅降低性能,但仍能运行几分钟)。充电时间约为 1.5 小时(28 分钟后达到 50%)。
| Apple MacBook Pro 14 2026 M5 Max M5 Max, M5 Max 40-Core GPU, 72.4 Wh | Apple MacBook Pro 14 2024 M4 Pro M4 Pro 14-Core, M4 Pro 20-Core GPU, 72.6 Wh | Acer Predator Triton 14 AI PT14-52 Core Ultra 9 288V, GeForce RTX 5070 Laptop, 76 Wh | Razer Blade 14 2025 Ryzen AI 9 365, GeForce RTX 5070 Laptop, 72 Wh | HP ZBook Ultra G1a A3ZQ0ET Ryzen AI Max PRO 390, Radeon 8050S, 74.5 Wh | Asus ROG Zephyrus G14 2025 GA403WW Ryzen AI 9 HX 370, GeForce RTX 5080 Laptop, 73 Wh | Schenker Key 14 (M24) Ultra 7 155H, GeForce RTX 4060 Laptop GPU, 80 Wh | Average of class Multimedia | |
|---|---|---|---|---|---|---|---|---|
| Battery runtime | 1% | -41% | -22% | -6% | -6% | -50% | 9% | |
| H.264 (h) | 20.2 | 19.8 -2% | 10.9 -46% | 15 -26% | 16.4 ? -19% | |||
| WiFi v1.3 (h) | 15.2 | 15.8 4% | 9 -41% | 8.9 -41% | 10.5 -31% | 10.5 -31% | 7.6 -50% | 12.2 ? -20% |
| Load (h) | 1 | 1.2 20% | 1.2 20% | 1.4 40% | 1.668 ? 67% |
笔记本检查评级
Apple MacBook Pro 14 2026 M5 Max
- 03/11/2026 v8
Andreas Osthoff
 Total Sustainability Score:
 潜在竞争对手比较
Image | Model / Review | Price | Weight | Height | Display |
|---|---|---|---|---|---|
1. 90.2%  | Apple MacBook Pro 14 2026 M5 Max Apple M5 Max ⎘ Apple M5 Max 40-Core GPU ⎘ 128 GB Memory, 8192 GB SSD | Amazon: List Price: 8589€ | 1.6 kg | 15.5 mm | 14.20" 3024x1964 254 PPI Mini-LED |
2. 91.8%  | Apple MacBook Pro 14 2024 M4 Pro Apple M4 Pro 14-Core ⎘ Apple M4 Pro 20-Core GPU ⎘ 48 GB Memory, 2048 GB SSD | Amazon: List Price: 3989 Euro | 1.6 kg | 15.5 mm | 14.20" 3024x1964 254 PPI MiniLED |
3. 82.3%  | Acer Predator Triton 14 AI PT14-52 Intel Core Ultra 9 288V ⎘ NVIDIA GeForce RTX 5070 Laptop ⎘ 32 GB Memory, 1024 GB SSD | Amazon: List Price: 2999€ | 1.6 kg | 17.31 mm | 14.50" 2880x1800 234 PPI OLED |
4. 87.2%  | Razer Blade 14 2025 AMD Ryzen AI 9 365 ⎘ NVIDIA GeForce RTX 5070 Laptop ⎘ 32 GB Memory, 1024 GB SSD | Amazon: List Price: 2399€ | 1.6 kg | 16.2 mm | 14.00" 2880x1800 243 PPI OLED |
5. 85.4%  | HP ZBook Ultra G1a A3ZQ0ET AMD Ryzen AI Max PRO 390 ⎘ AMD Radeon 8050S ⎘ 32 GB Memory, 1024 GB SSD | Amazon: List Price: 2545 Euro | 1.6 kg | 19 mm | 14.00" 1920x1200 162 PPI IPS LED |
6. 88.9%  | Asus ROG Zephyrus G14 2025 GA403WW AMD Ryzen AI 9 HX 370 ⎘ NVIDIA GeForce RTX 5080 Laptop ⎘ 64 GB Memory, 2048 GB SSD | Amazon: List Price: 3899€ | 1.6 kg | 18.3 mm | 14.00" 2880x1800 243 PPI OLED |
7. 82.8%  | Schenker Key 14 (M24) Intel Core Ultra 7 155H ⎘ NVIDIA GeForce RTX 4060 Laptop GPU ⎘ 32 GB Memory, 1024 GB SSD | Amazon: 1. $68.79 PowerHOOD 20V AC/DC Adapter ... 2. $71.28 duskhoot 20V AC/DC Adapter f... 3. $72.78 Onerbl AC-DC Adapter for Cha... List Price: 1890€ | 1.7 kg | 19.9 mm | 14.00" 2880x1800 243 PPI IPS |
Transparency
The selection of devices to be reviewed is made by our editorial team. The test sample was provided to the author as a loan by the manufacturer or retailer for the purpose of this review. The lender had no influence on this review, nor did the manufacturer receive a copy of this review before publication. There was no obligation to publish this review. As an independent media company, Notebookcheck is not subjected to the authority of manufacturers, retailers or publishers.
This is how Notebookcheck is testing
Every year, Notebookcheck independently reviews hundreds of laptops and smartphones using standardized procedures to ensure that all results are comparable. We have continuously developed our test methods for around 20 years and set industry standards in the process. In our test labs, high-quality measuring equipment is utilized by experienced technicians and editors. These tests involve a multi-stage validation process. Our complex rating system is based on hundreds of well-founded measurements and benchmarks, which maintains objectivity. Further information on our test methods can be found here.

