英特尔NUC 11 Beast Canyon与Core i9和RTX 3060的评测

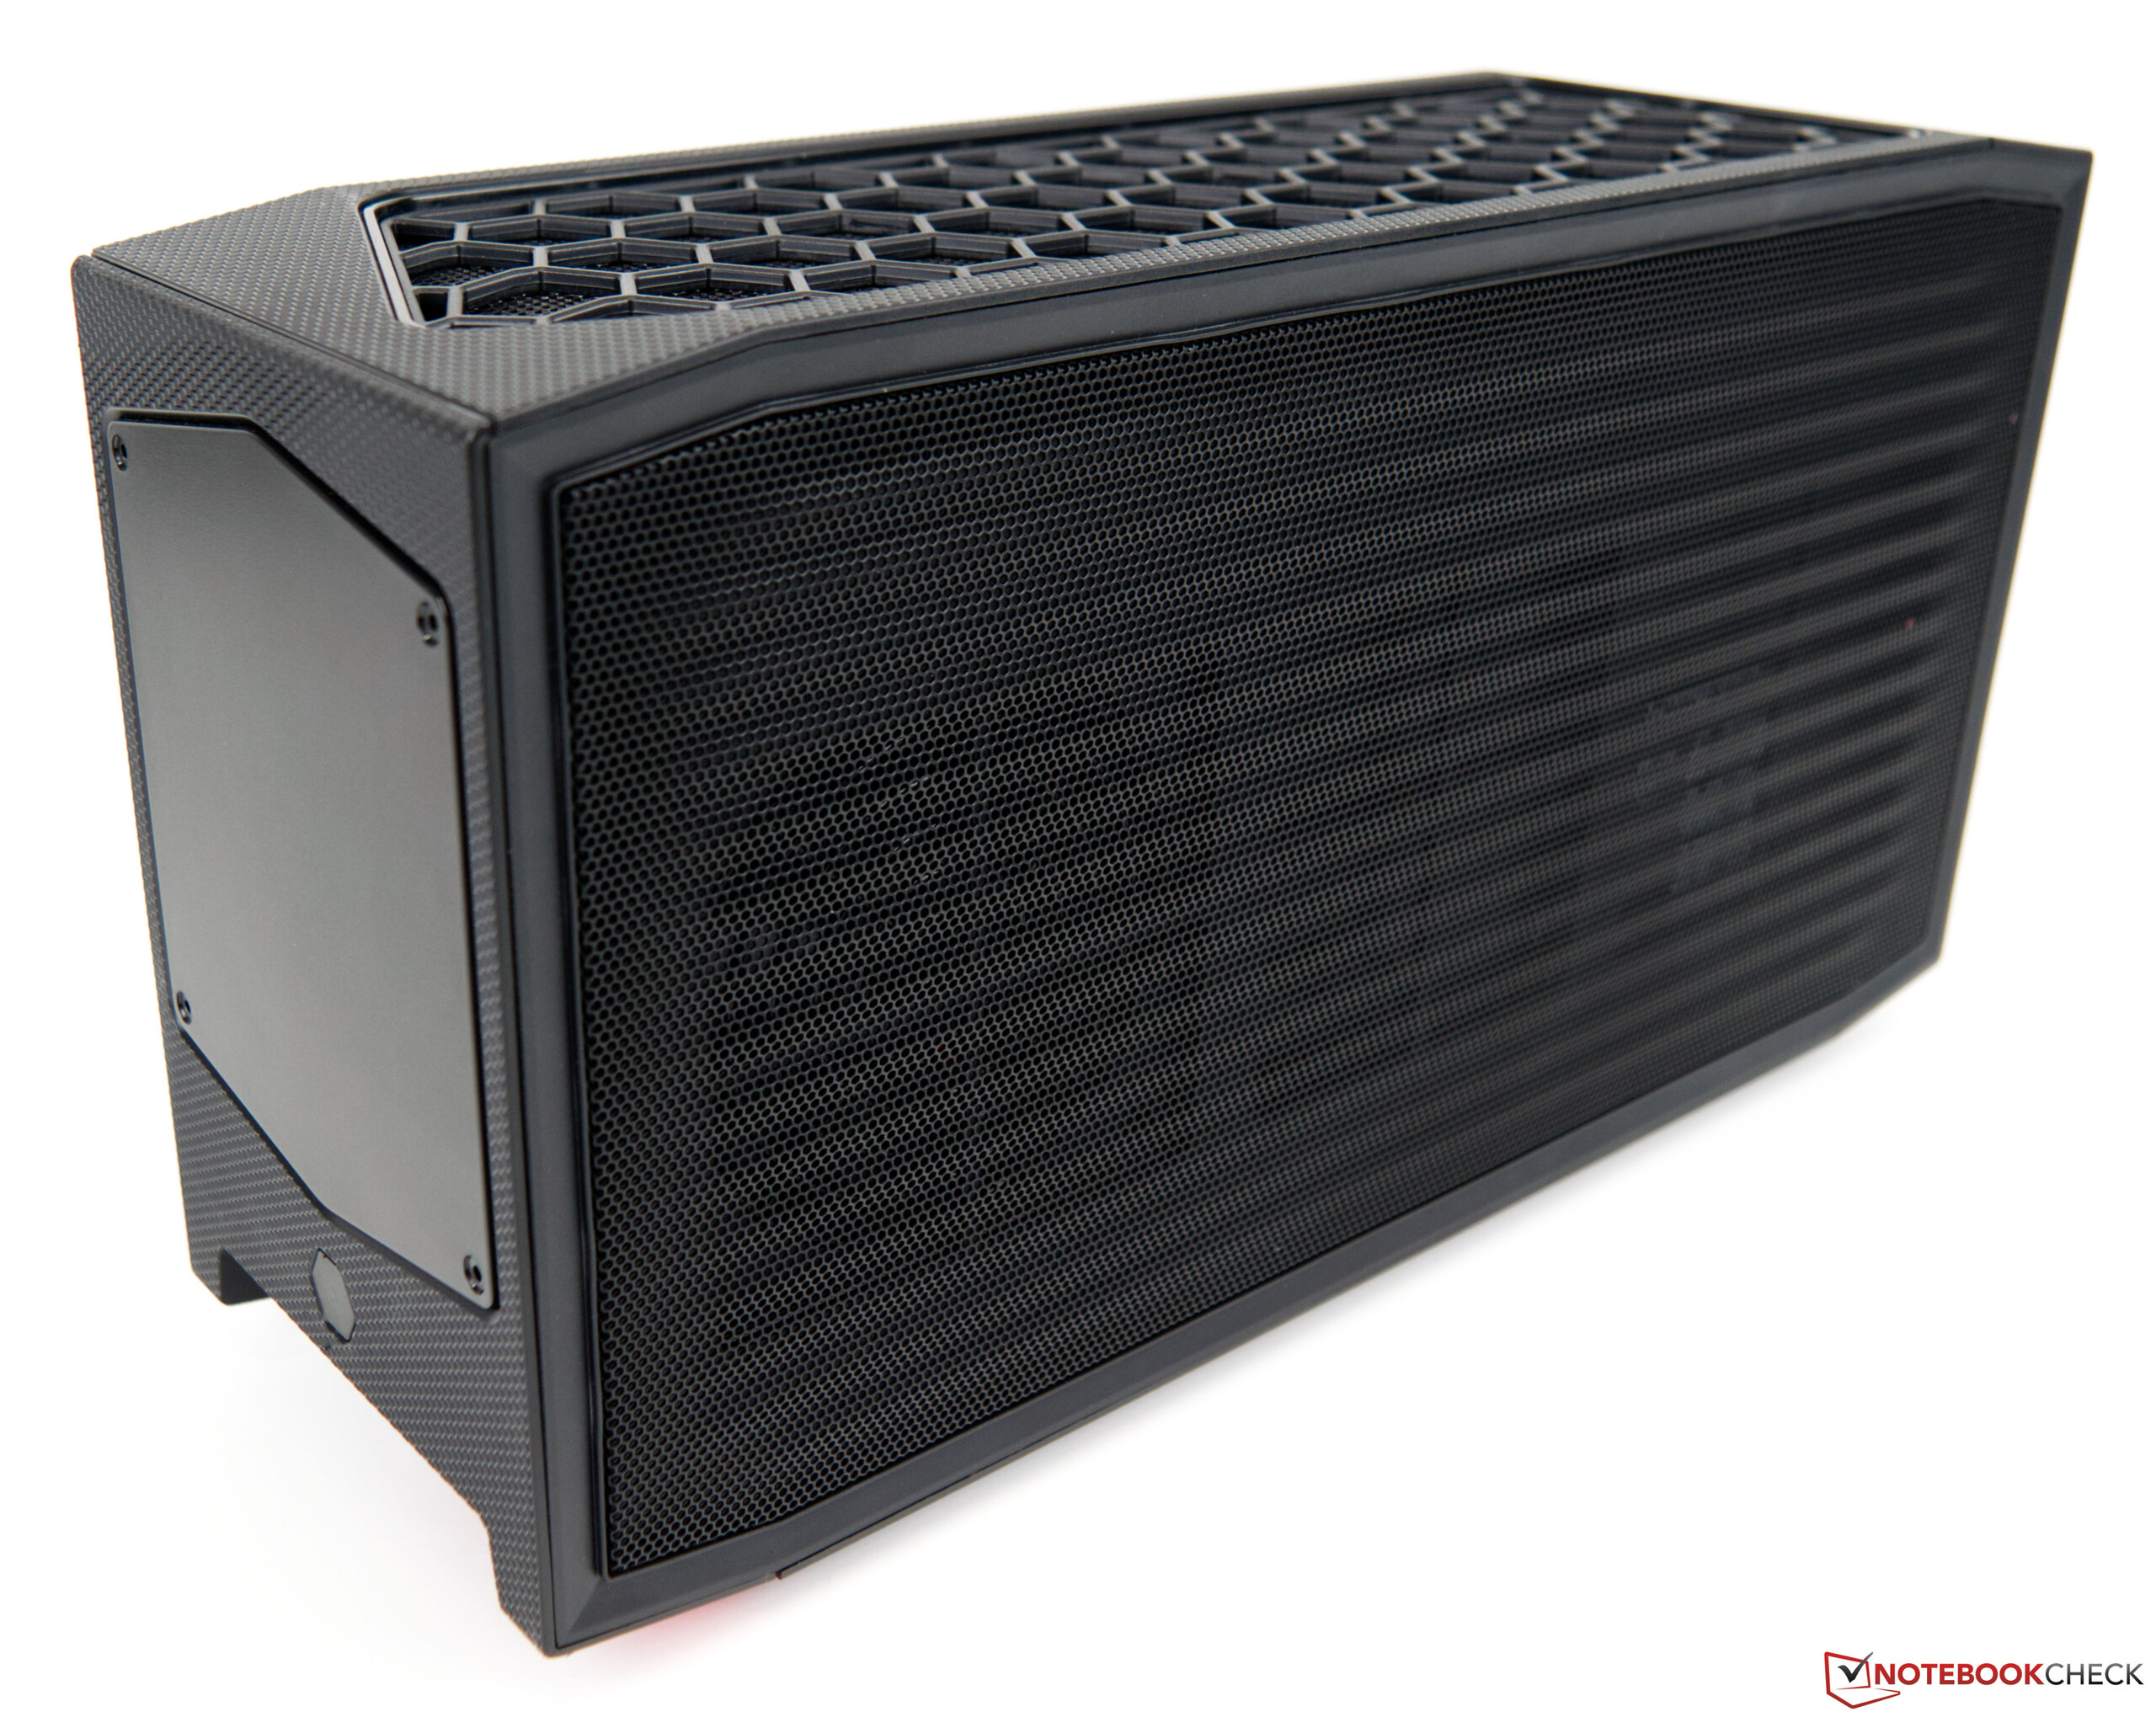
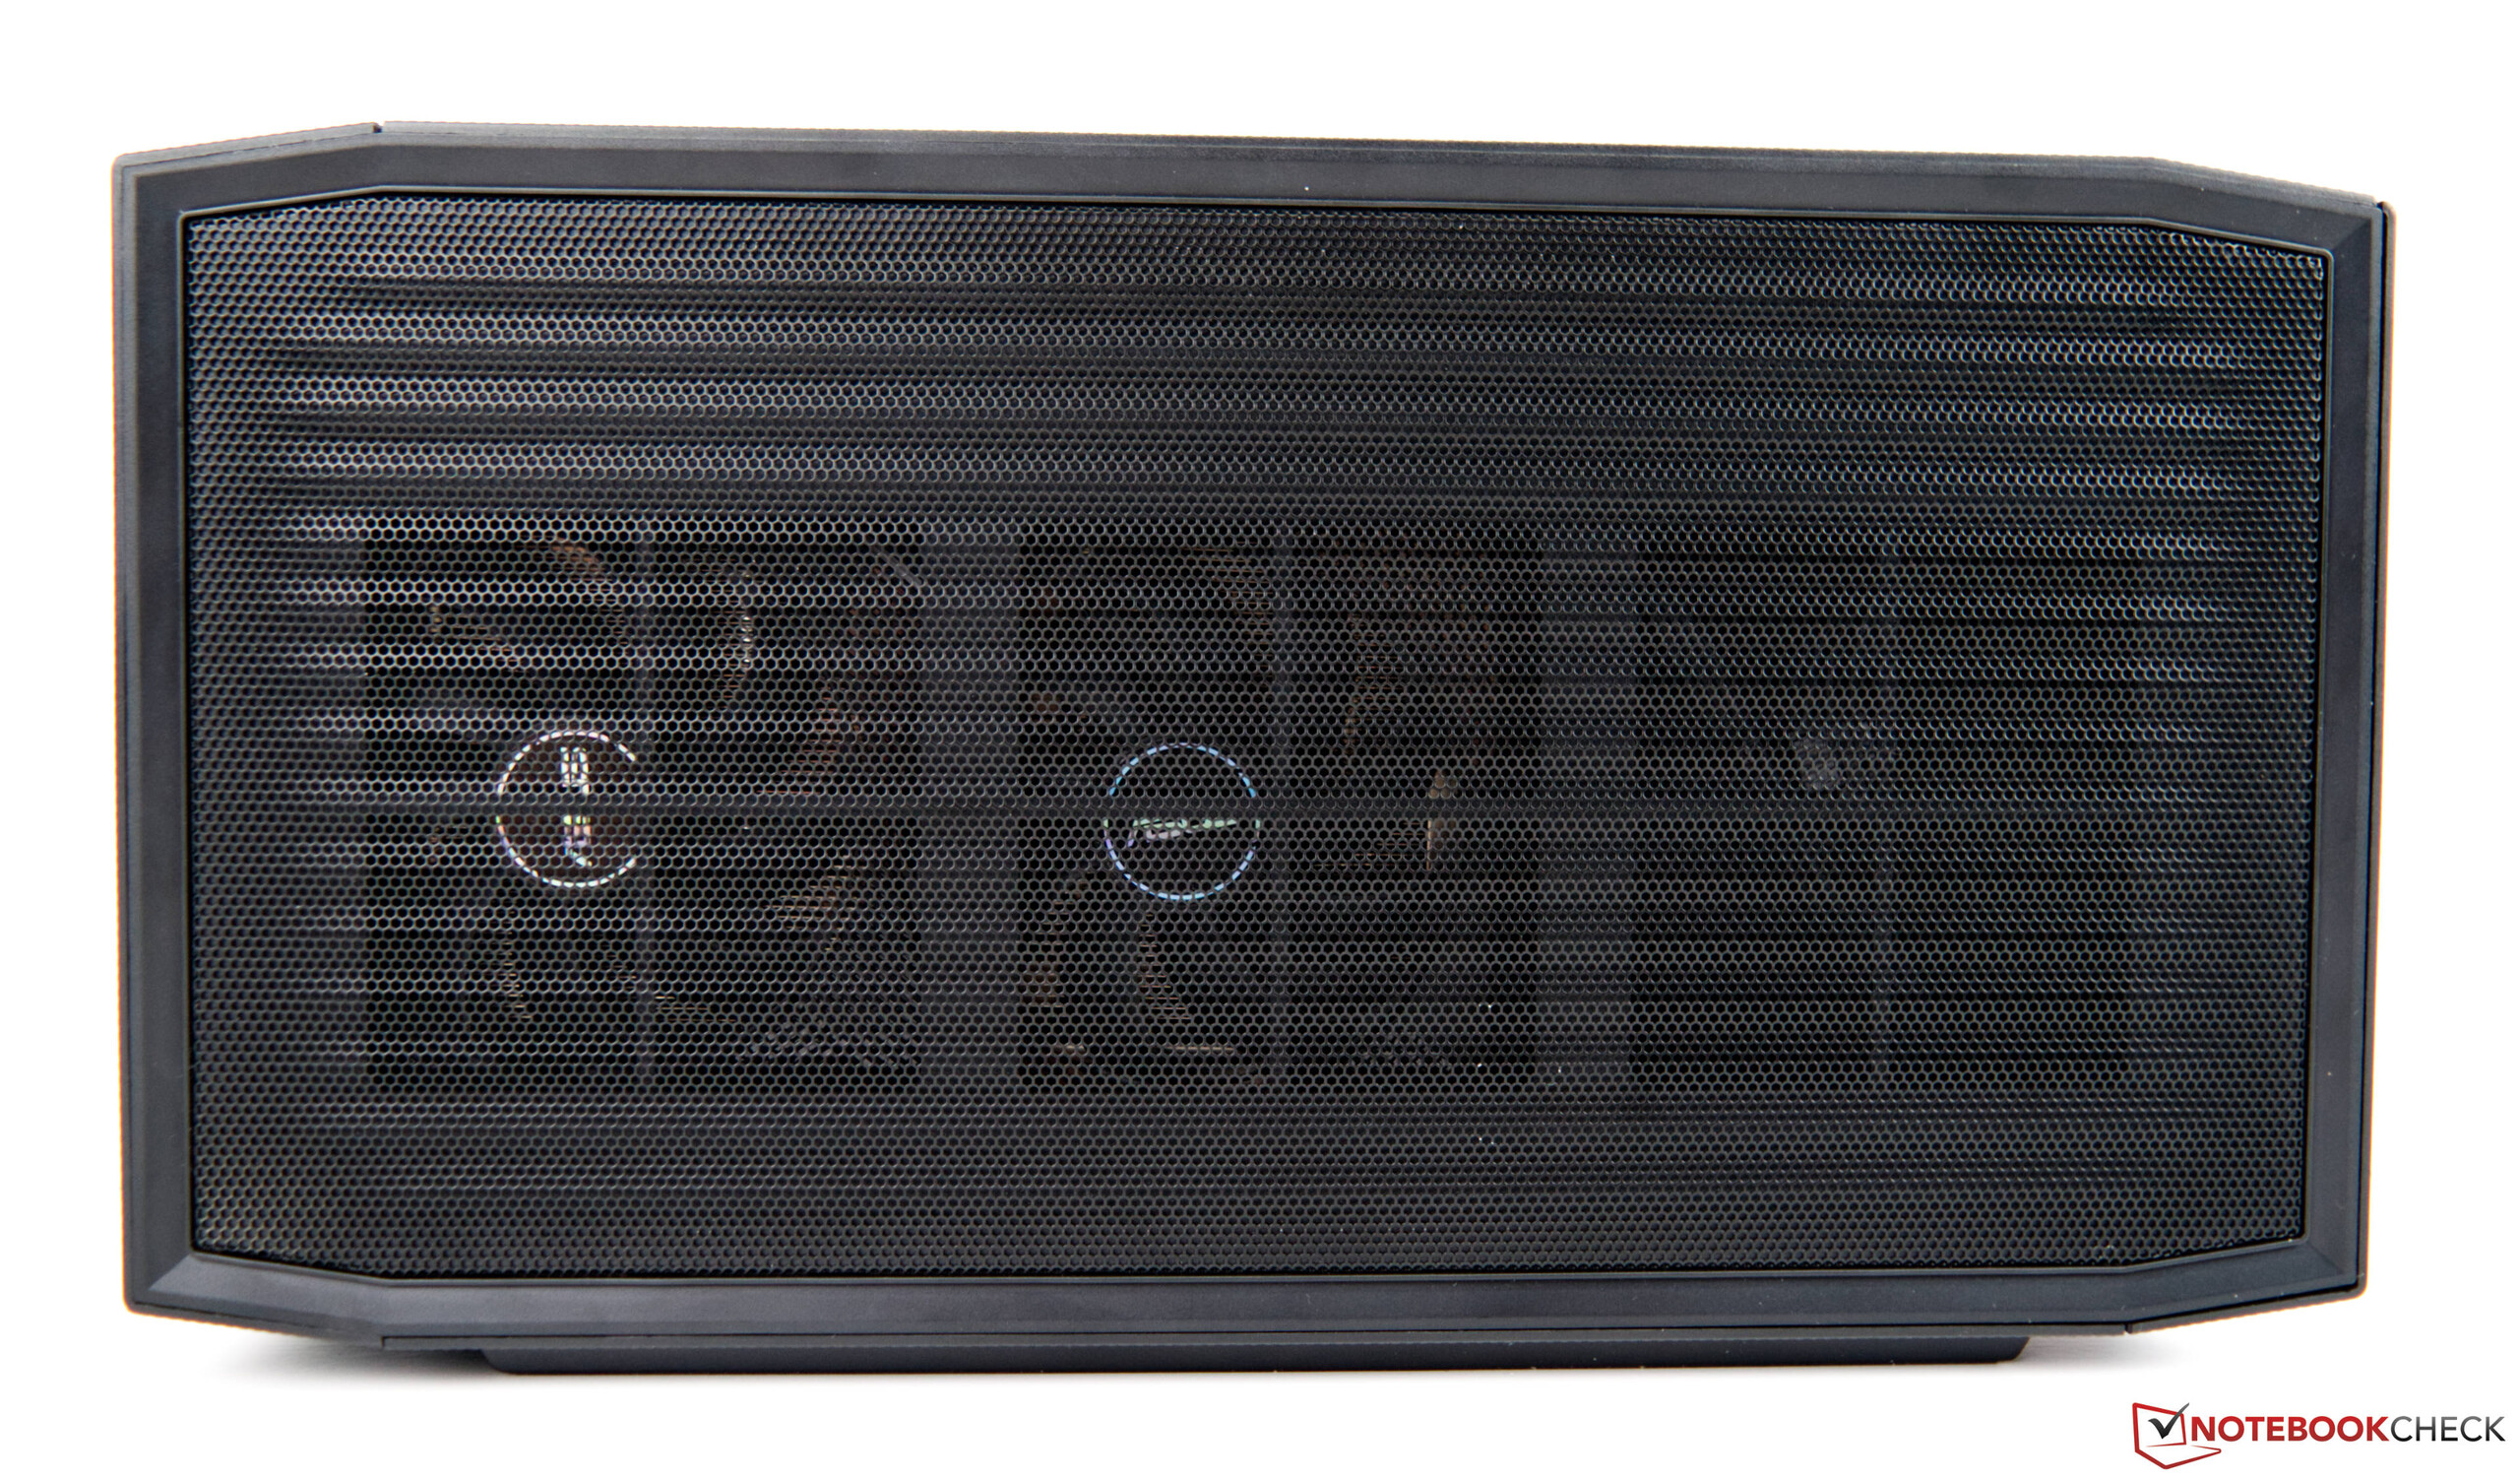
英特尔主要提供NUC品牌下的紧凑型办公系统。尽管如此,英特尔也有游戏系统,其名称中也带有NUC。例如,去年,我们对以下产品的性能印象深刻 英特尔鬼谷子NUC.今年,英特尔又推出了另一个基于专门开发的计算元件的游戏系统--野兽峡谷NUC,采取的方式略有不同。
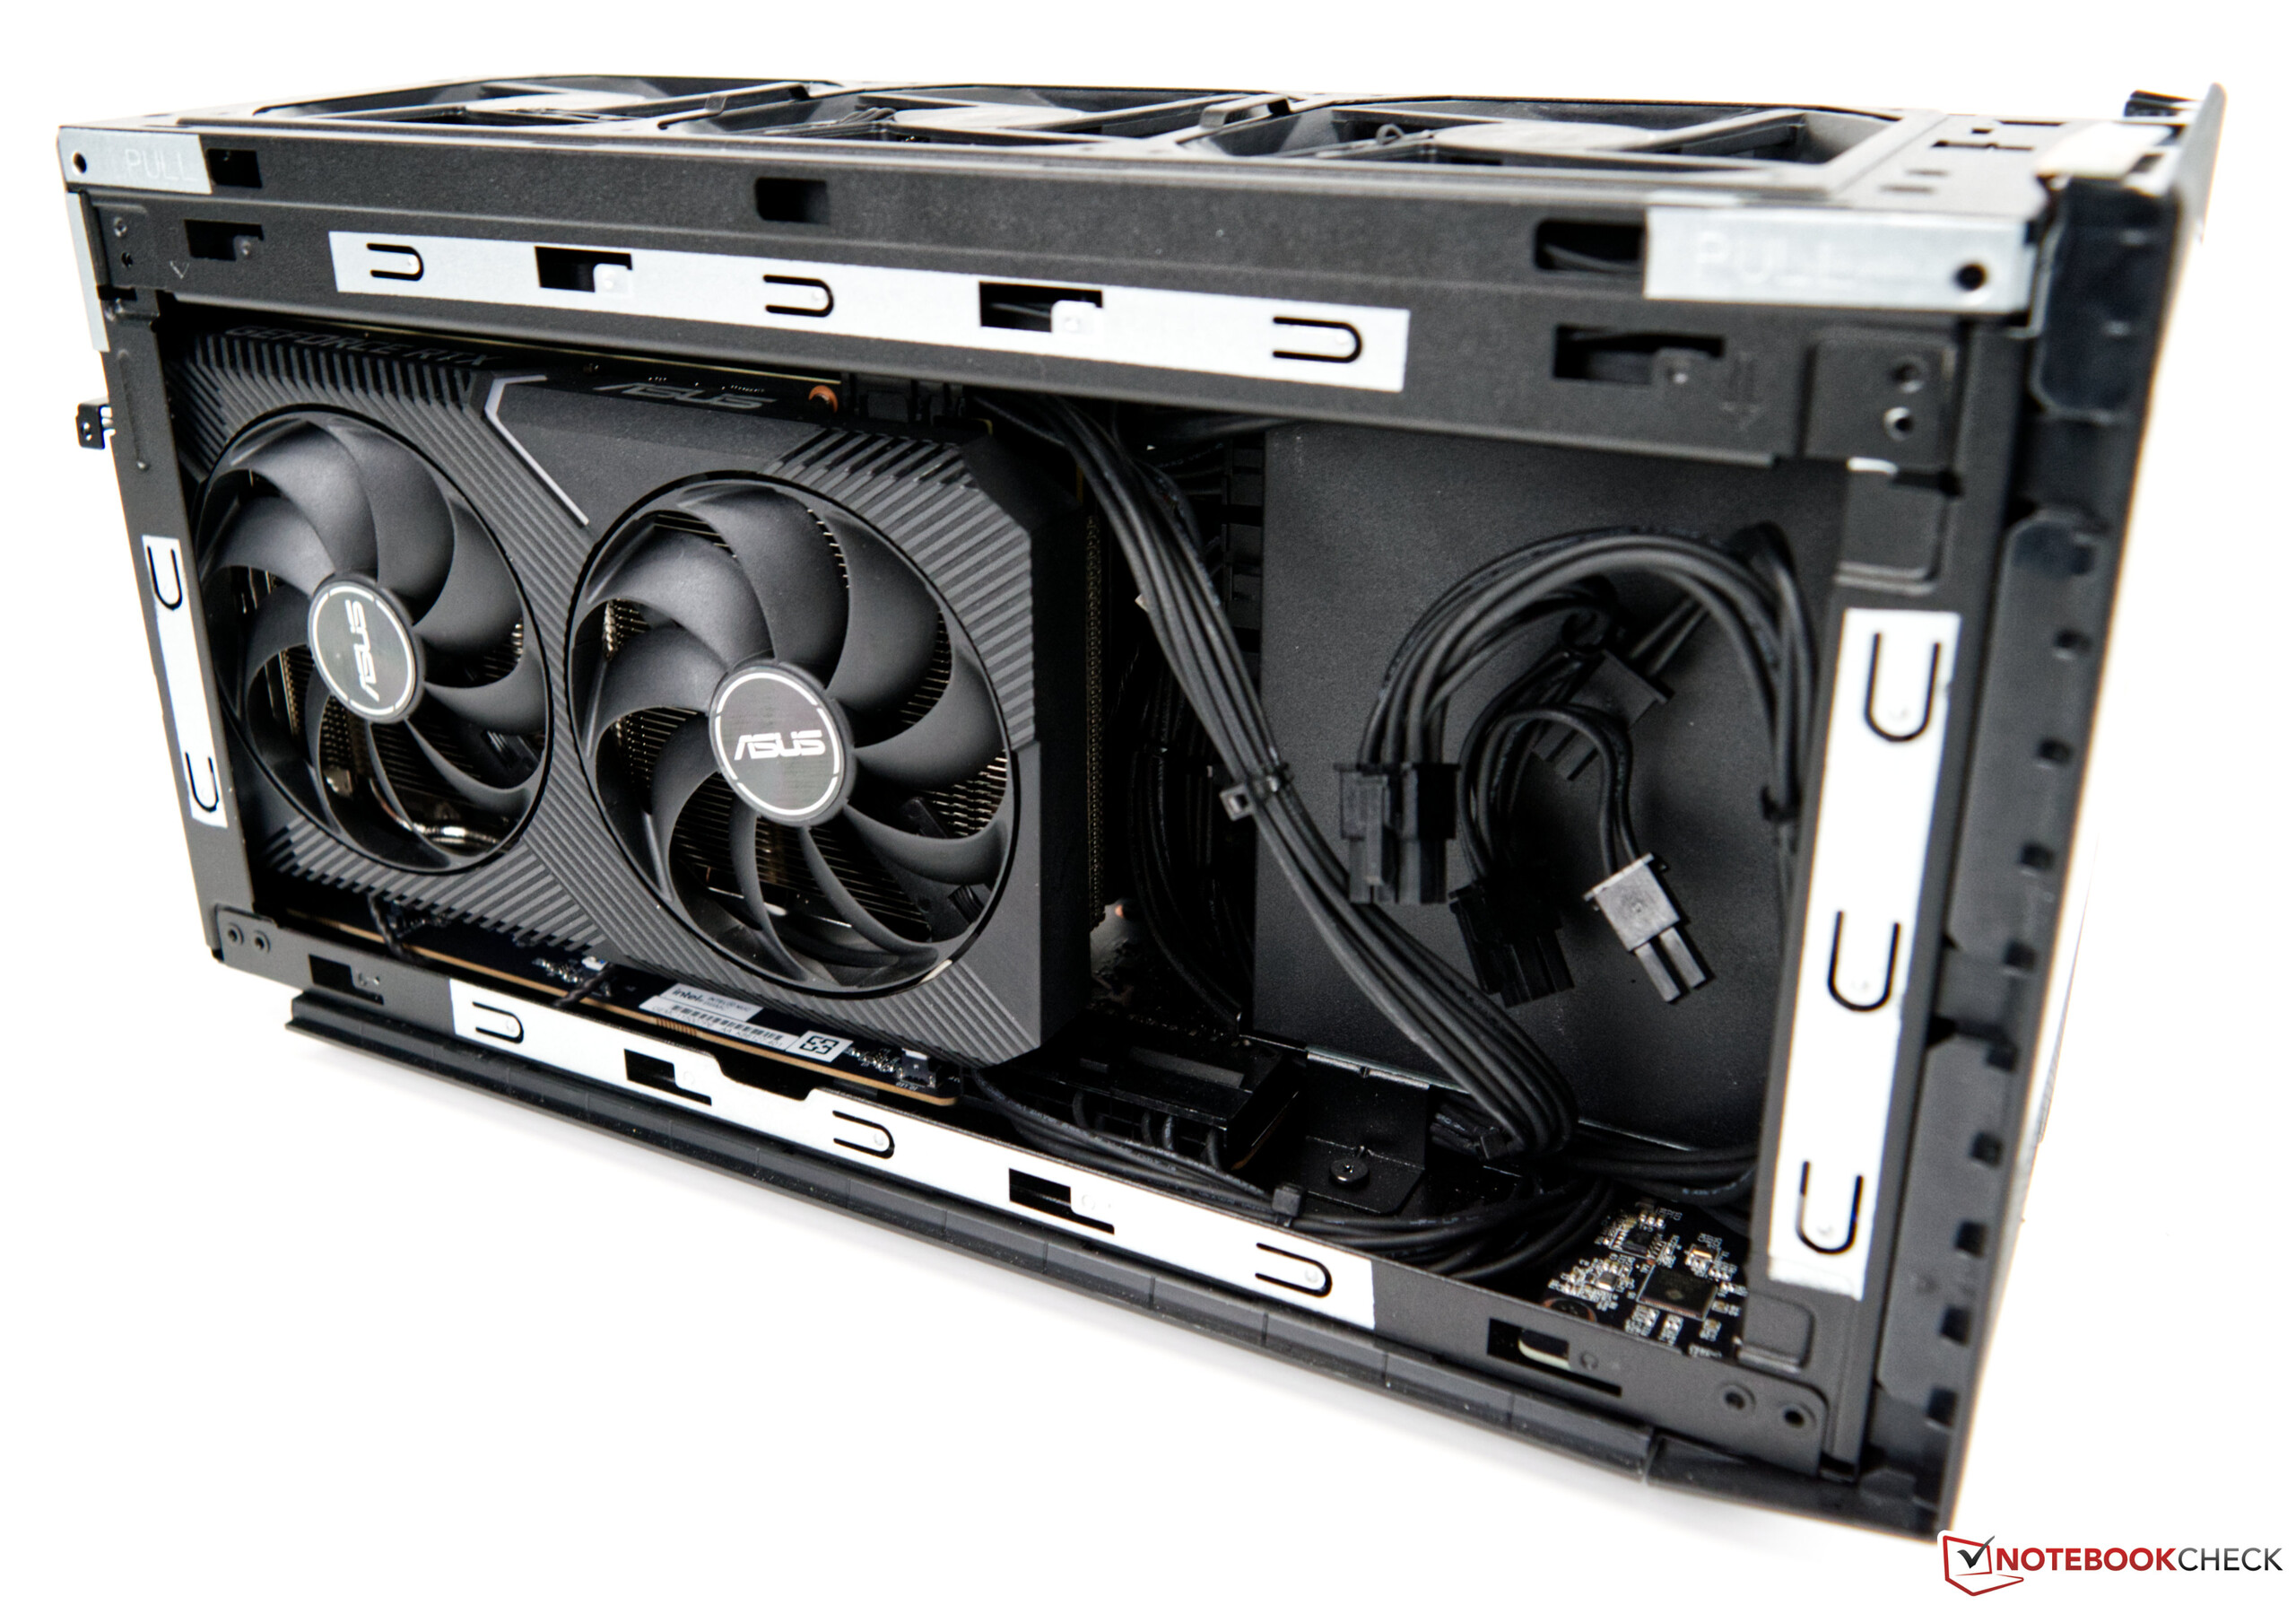
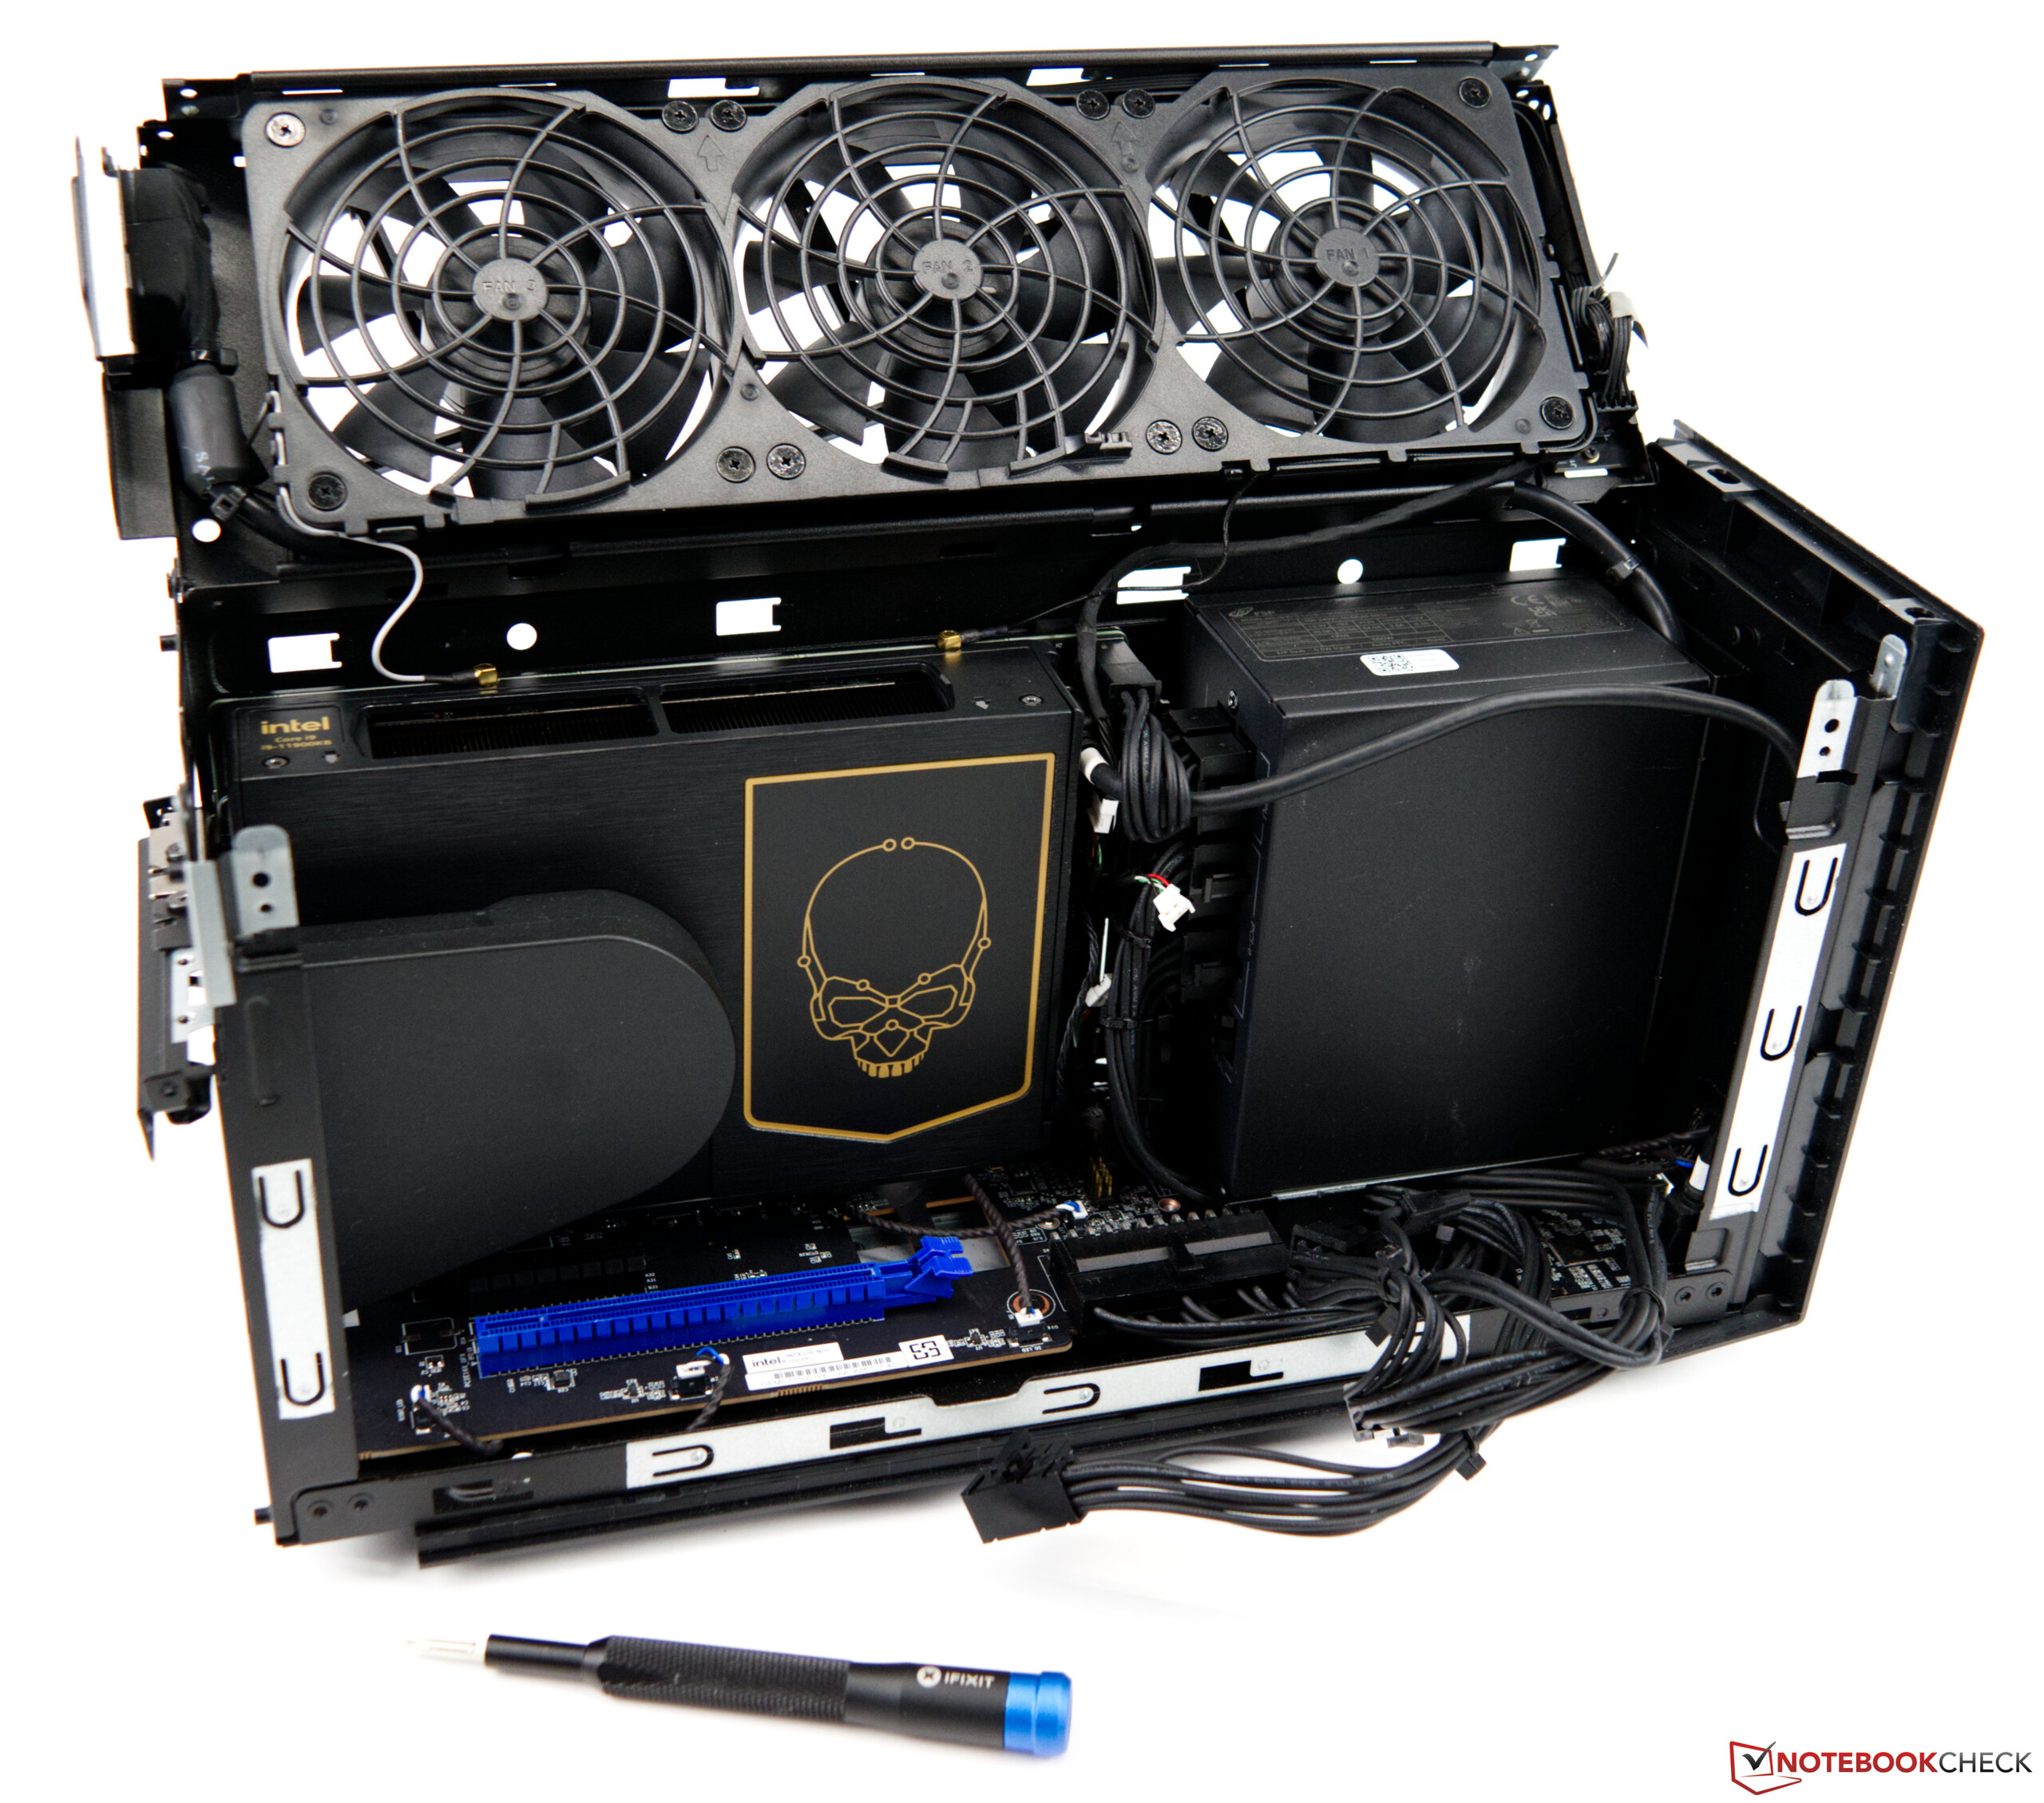
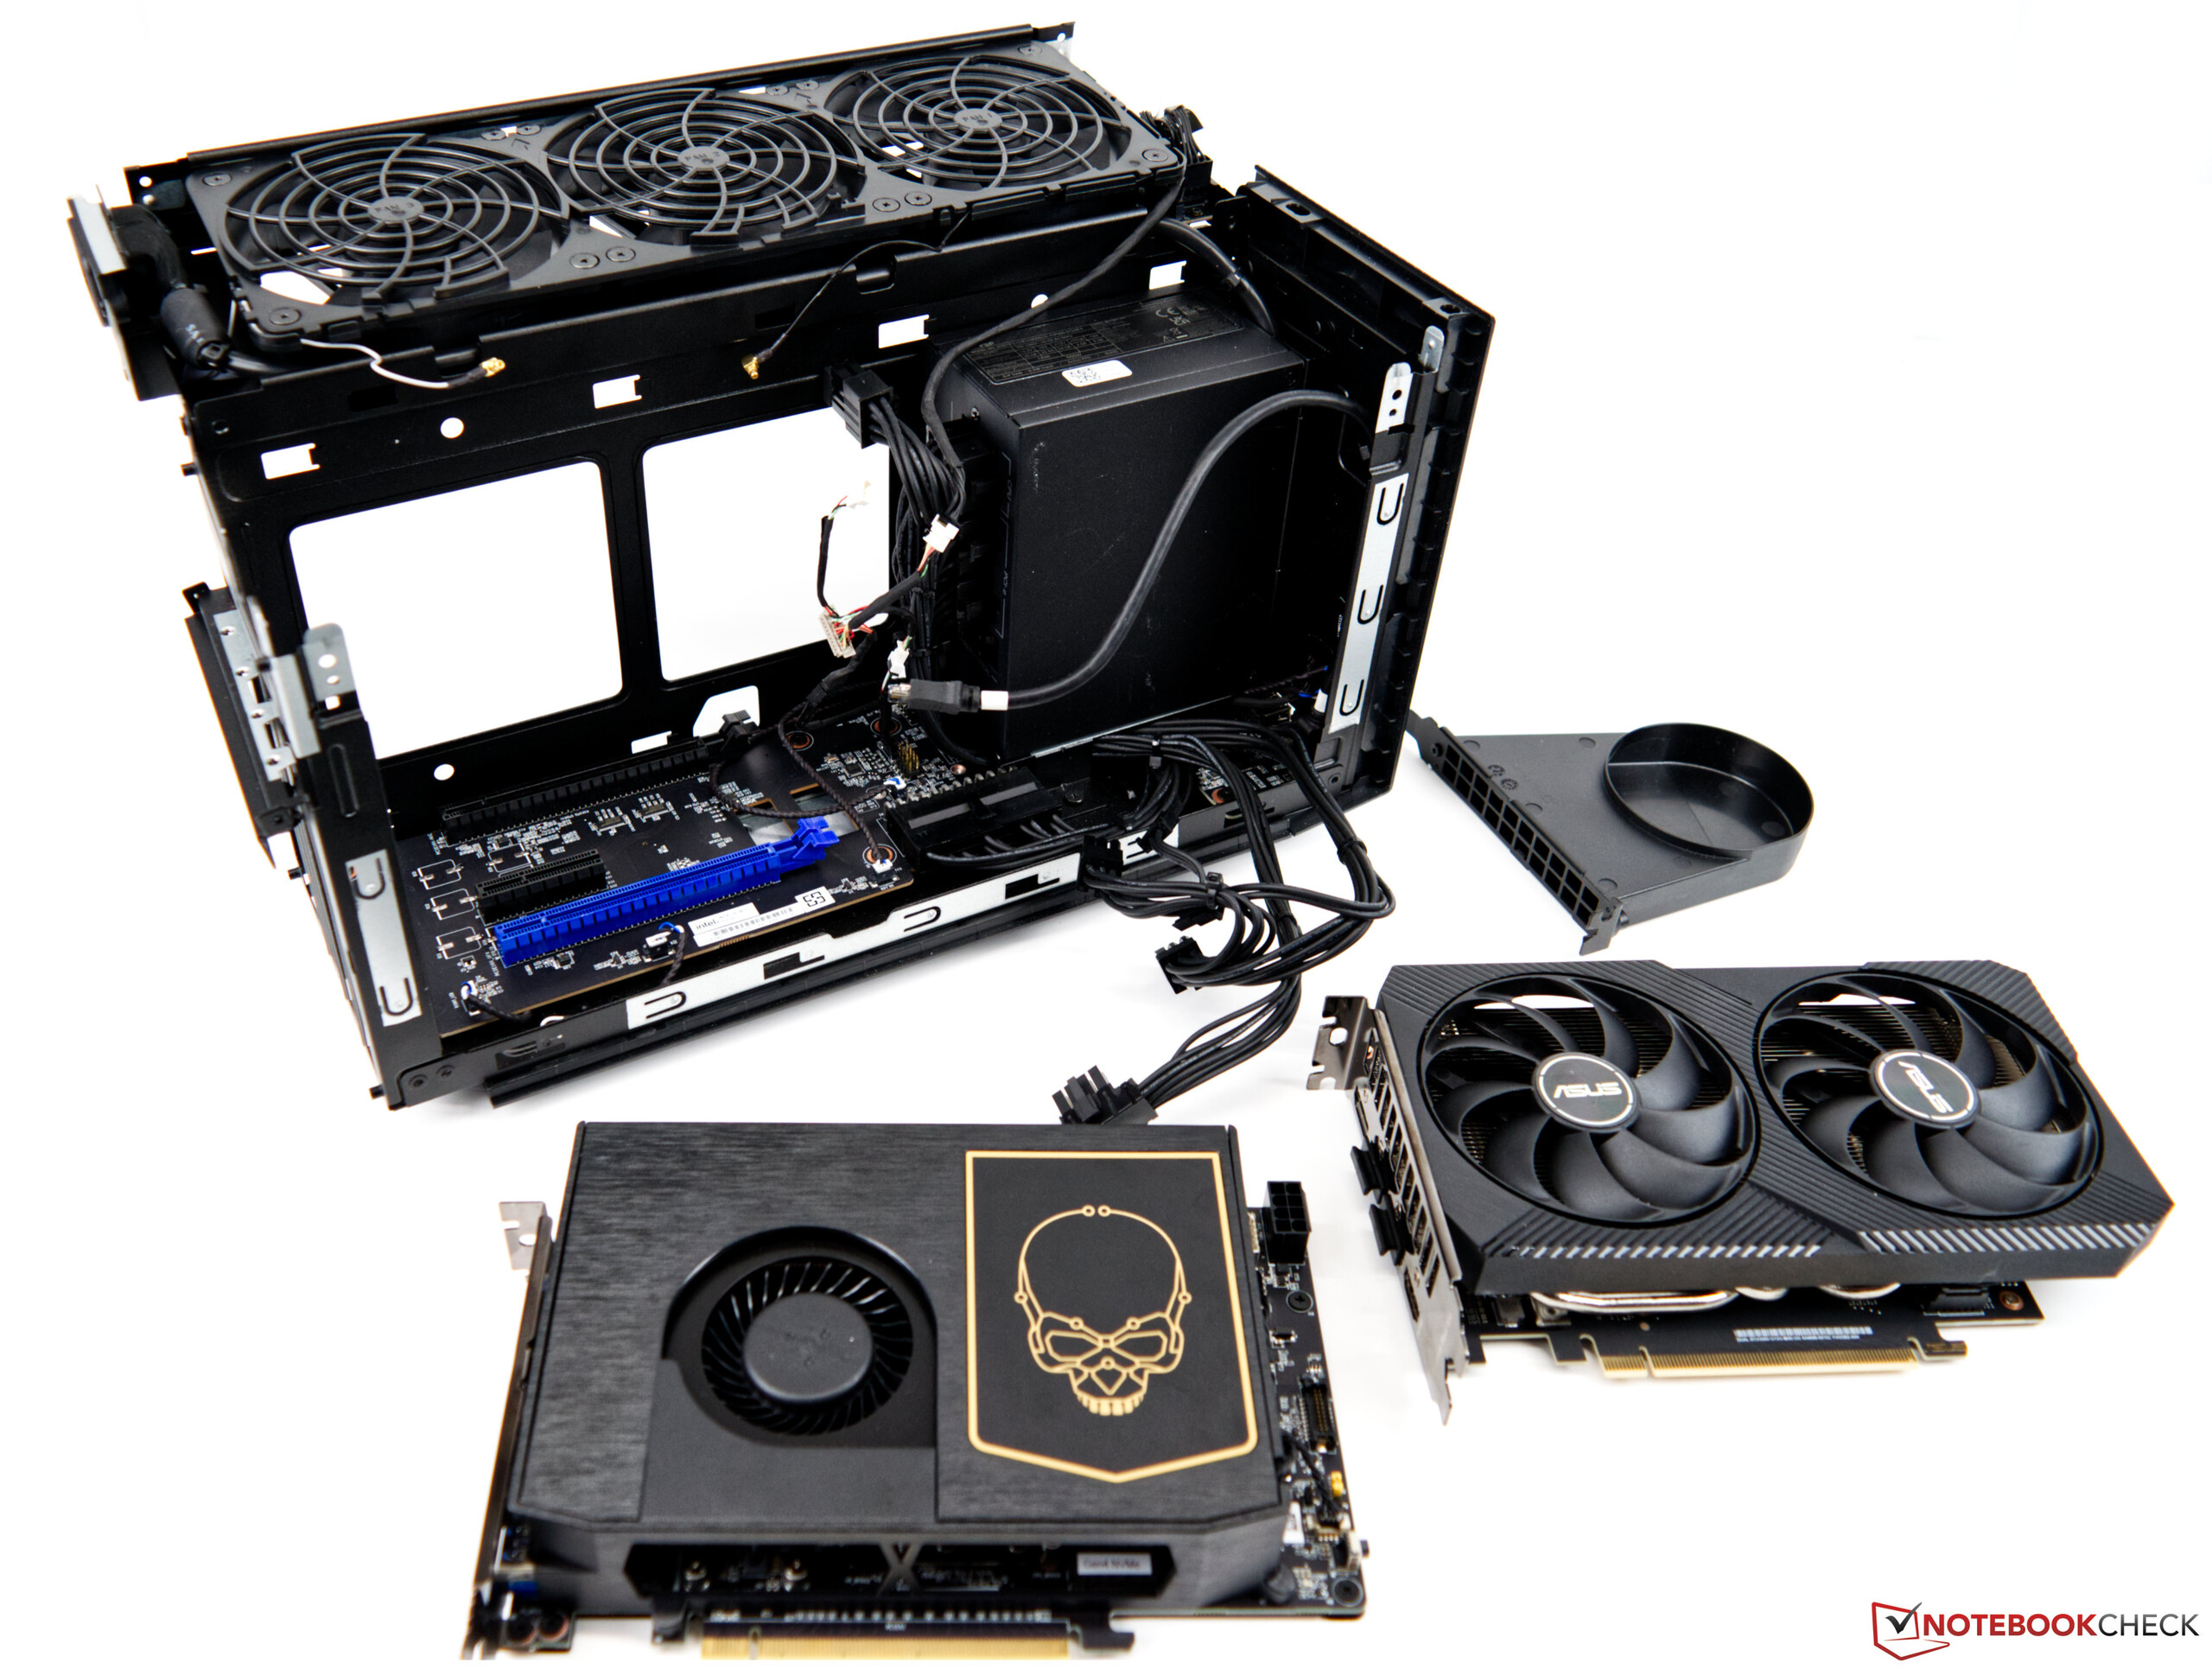
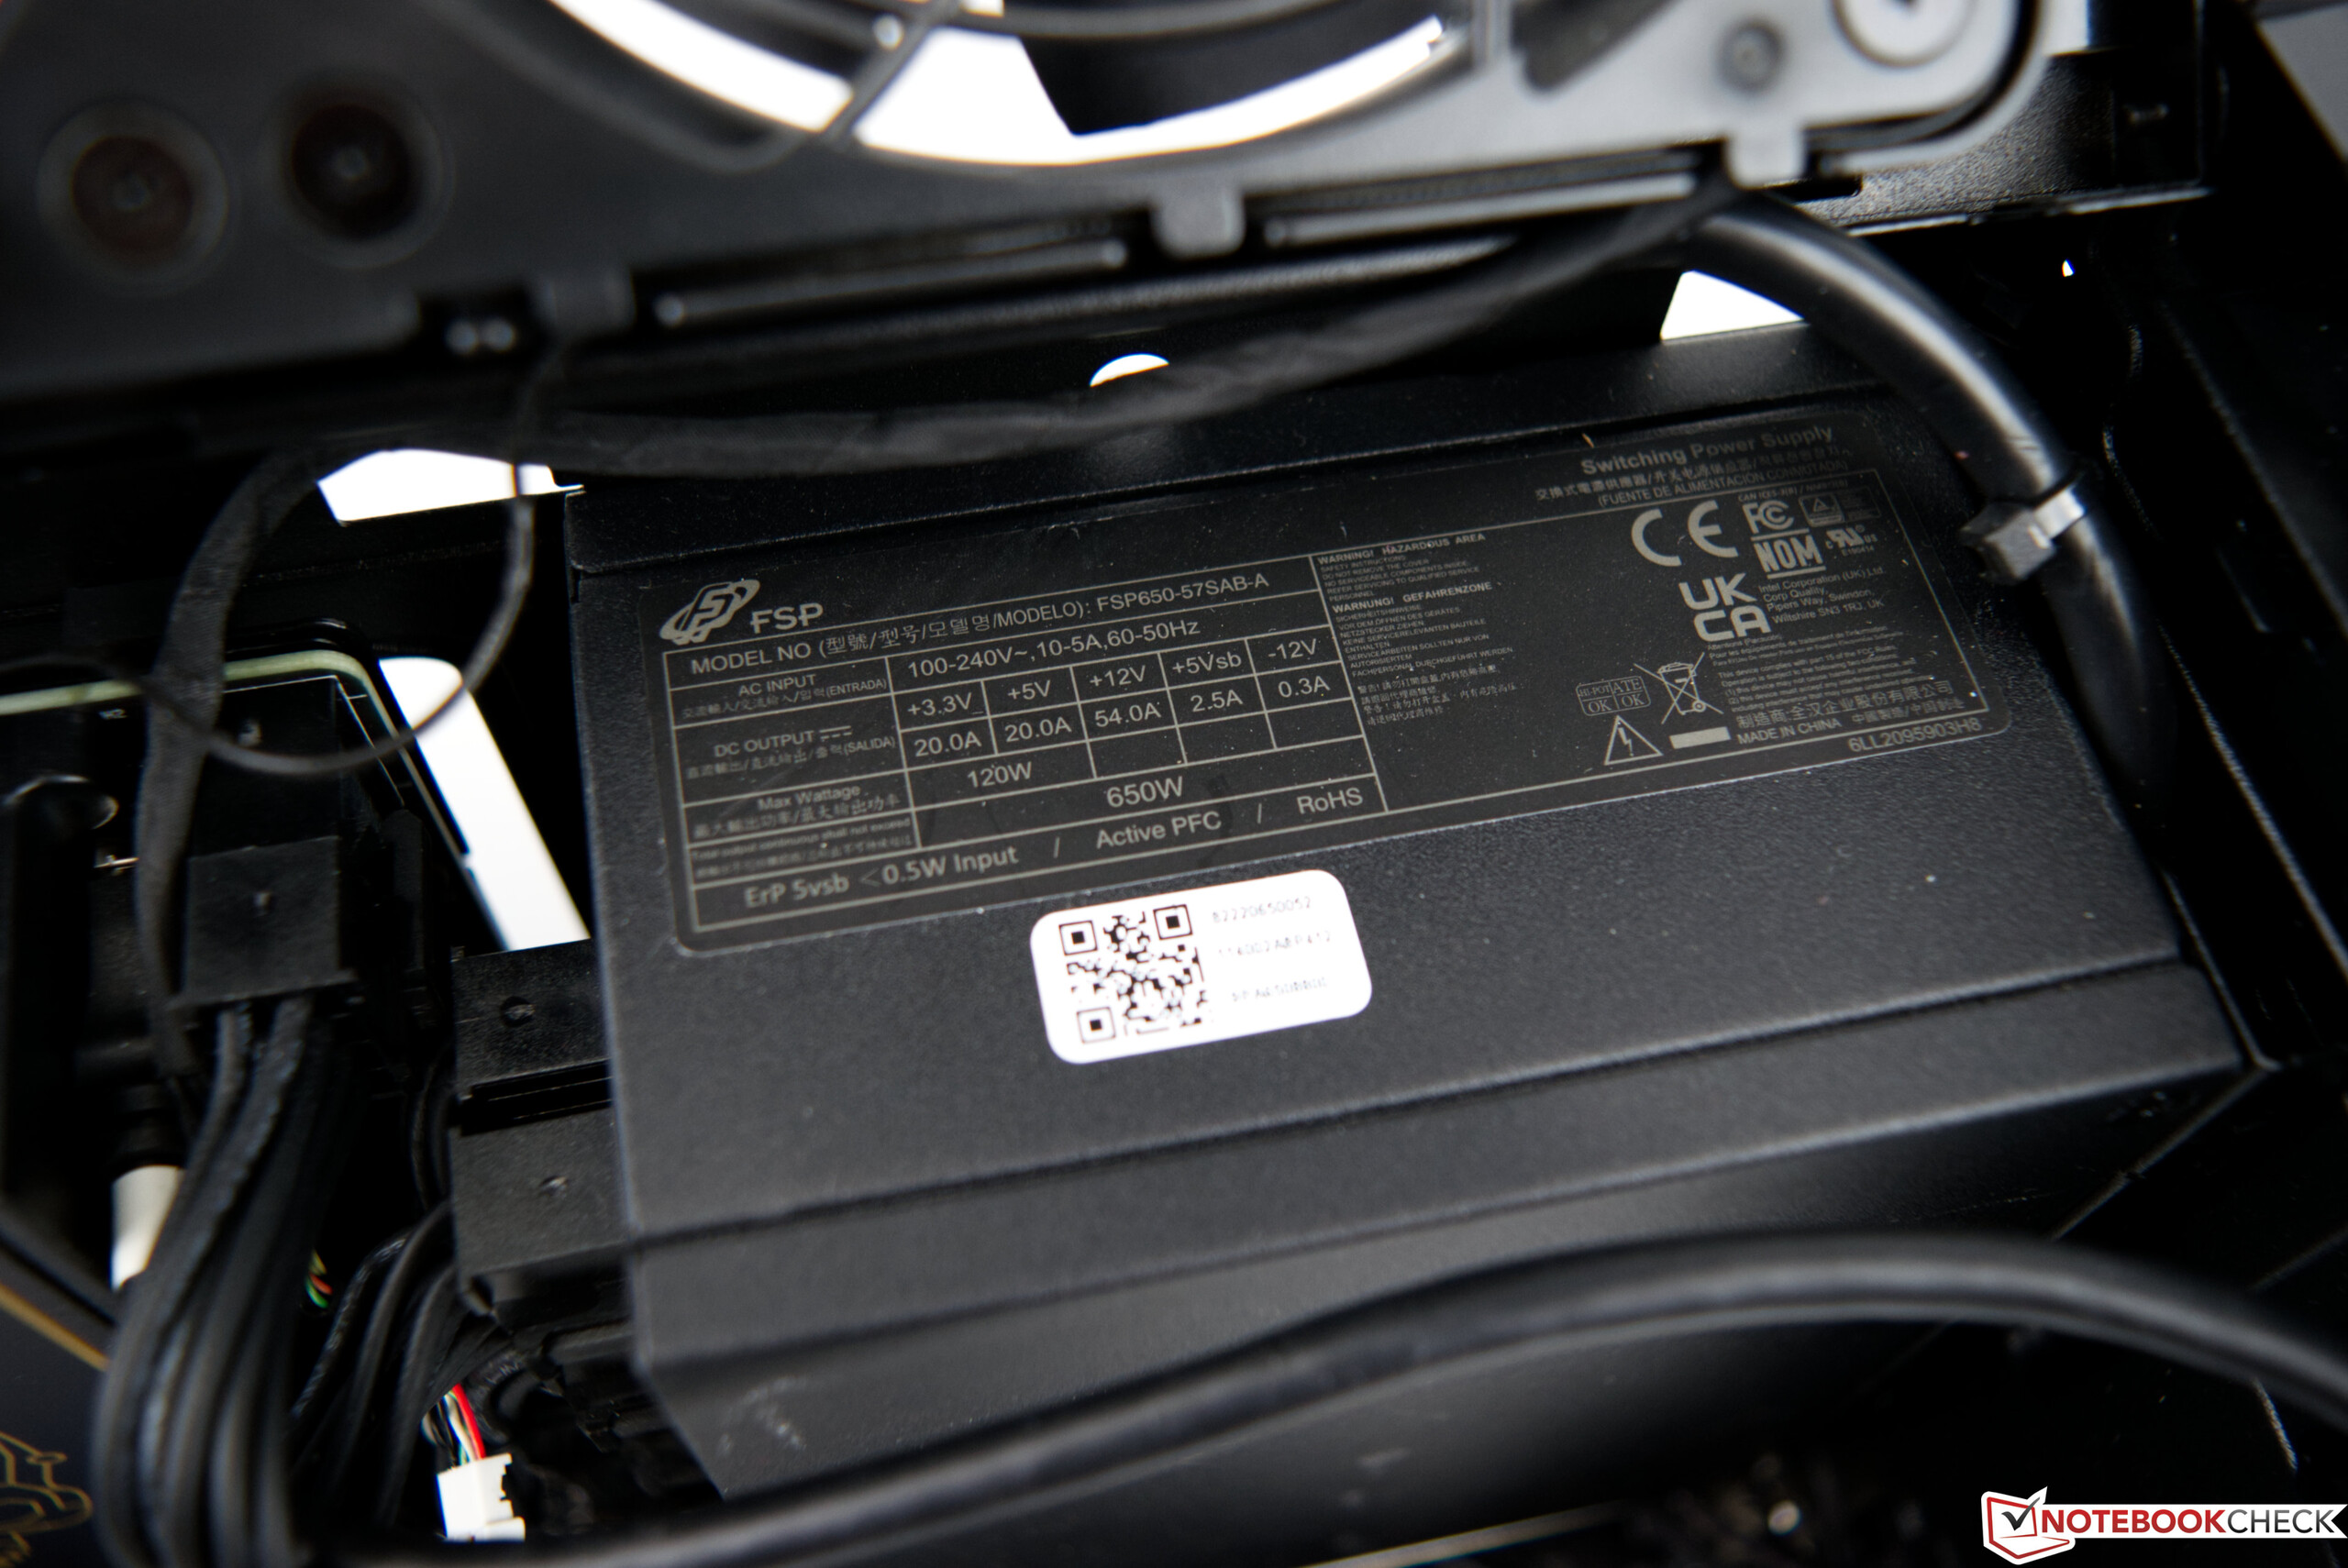
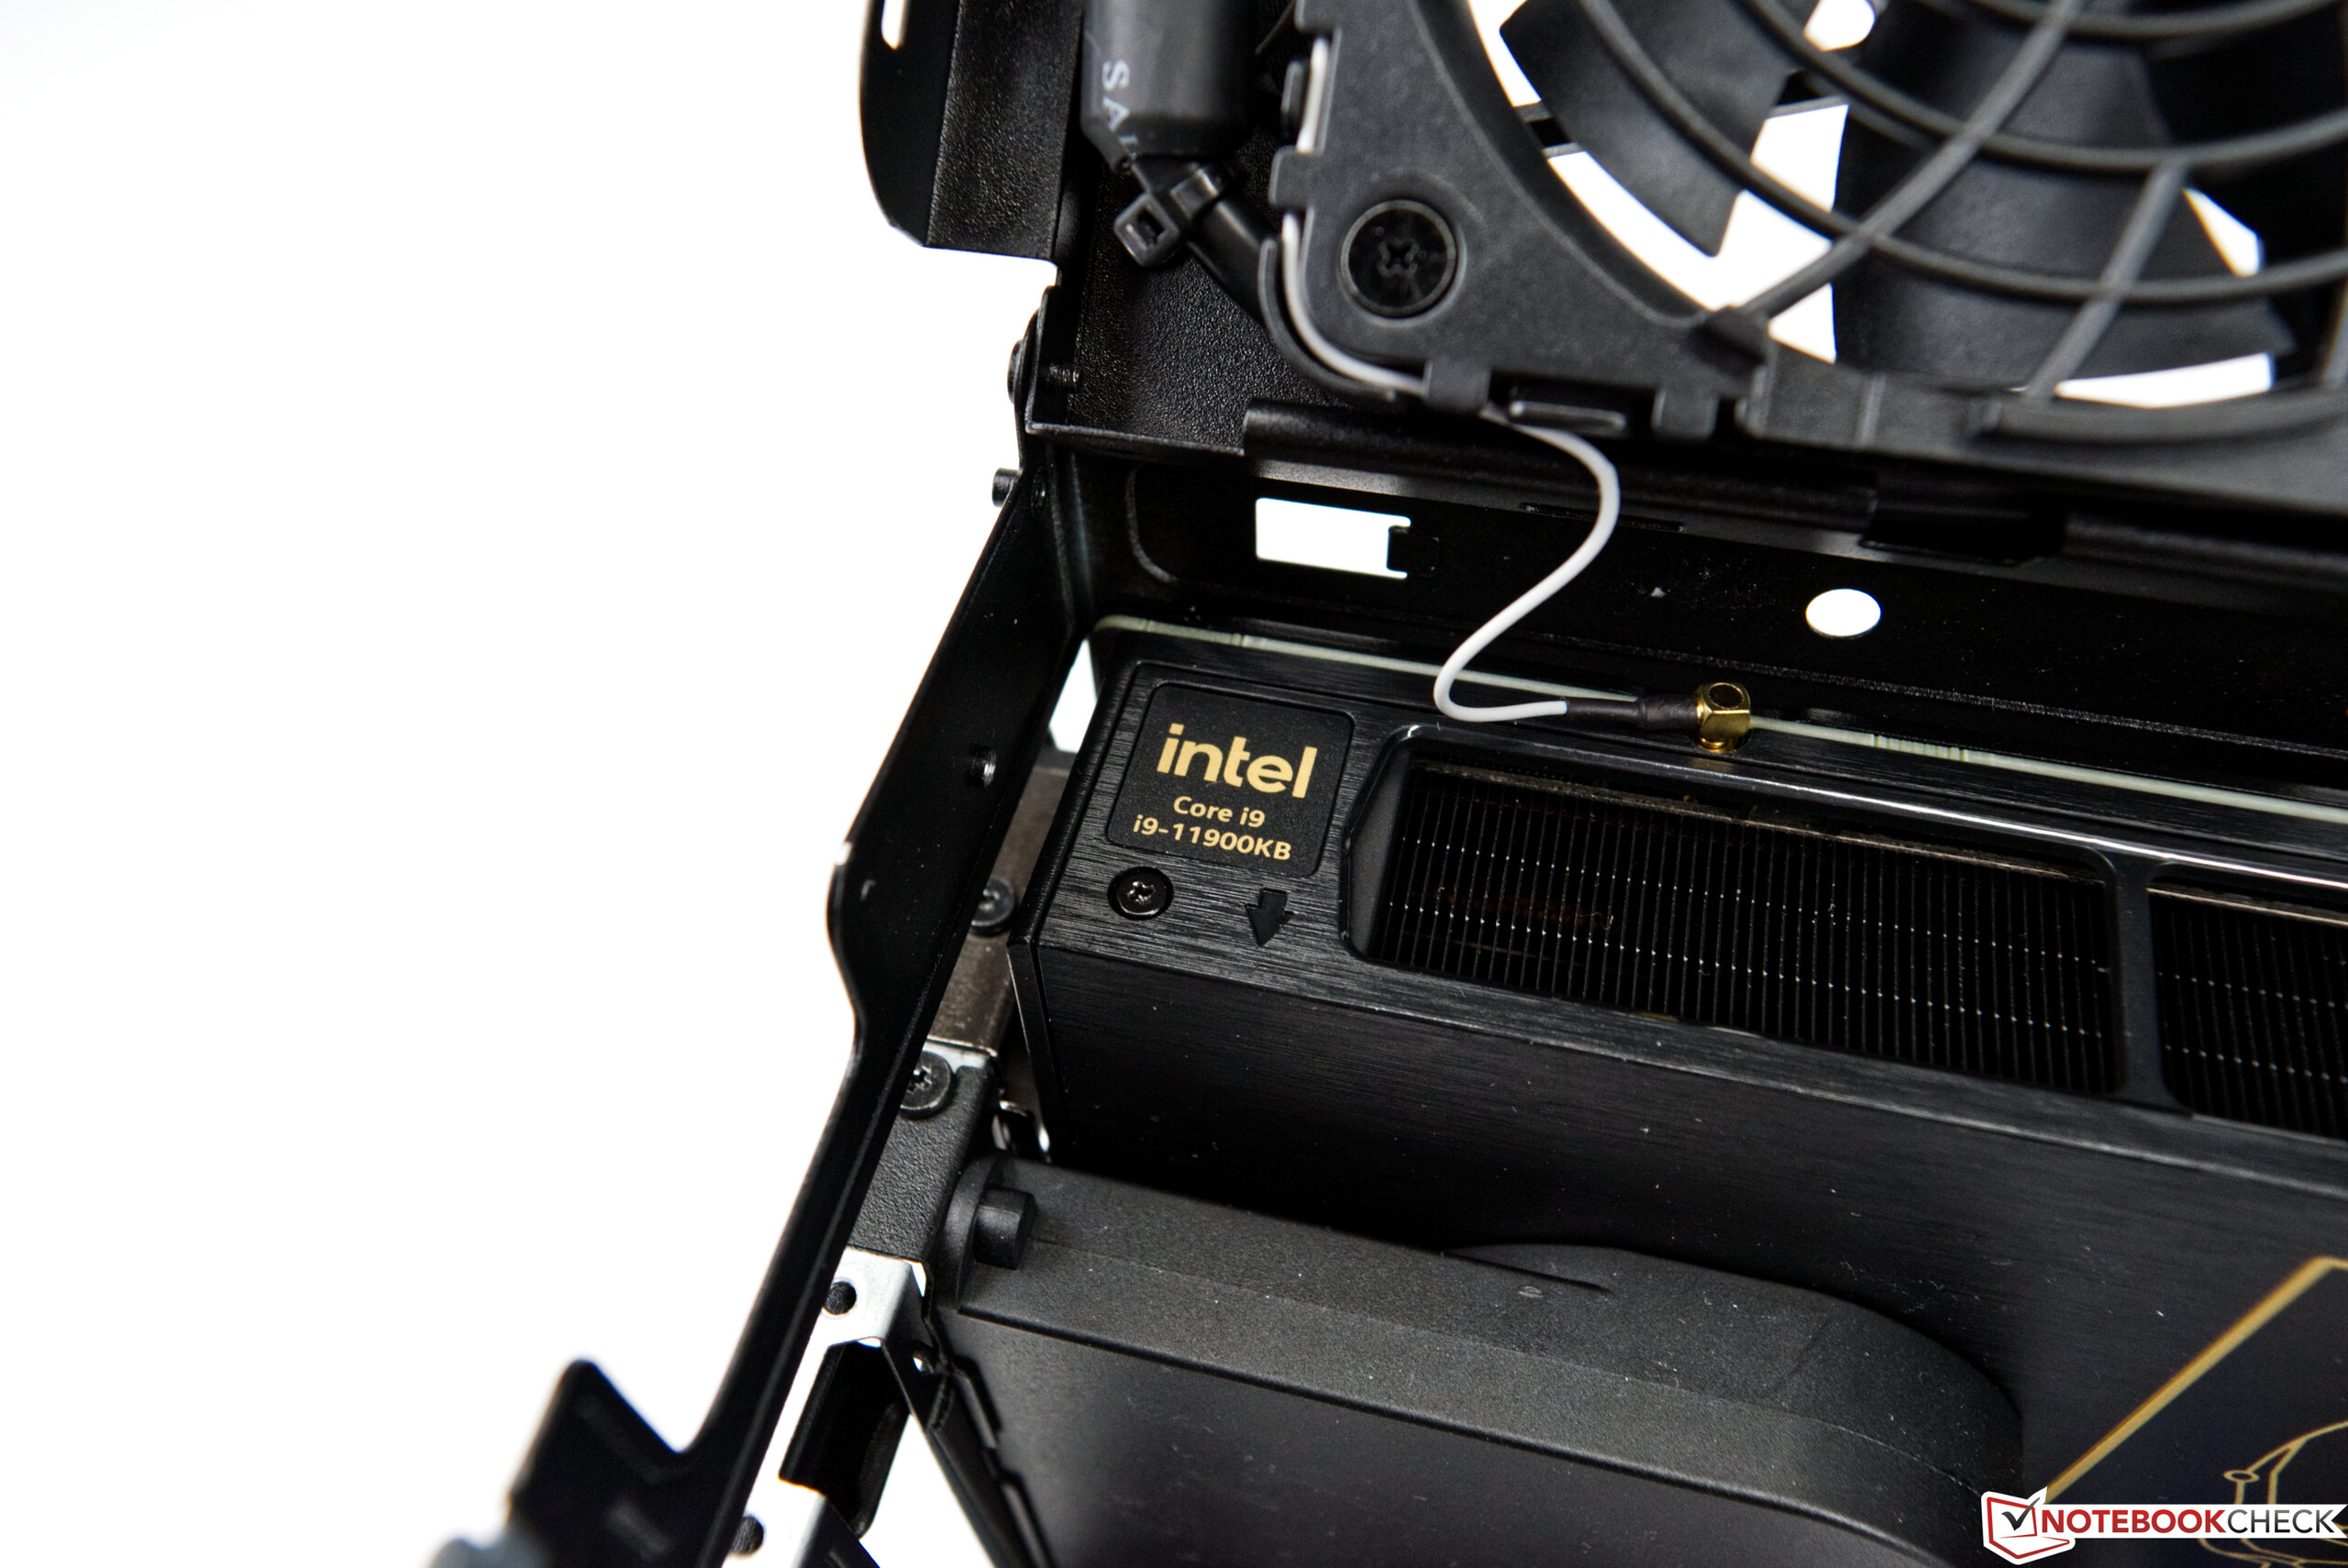
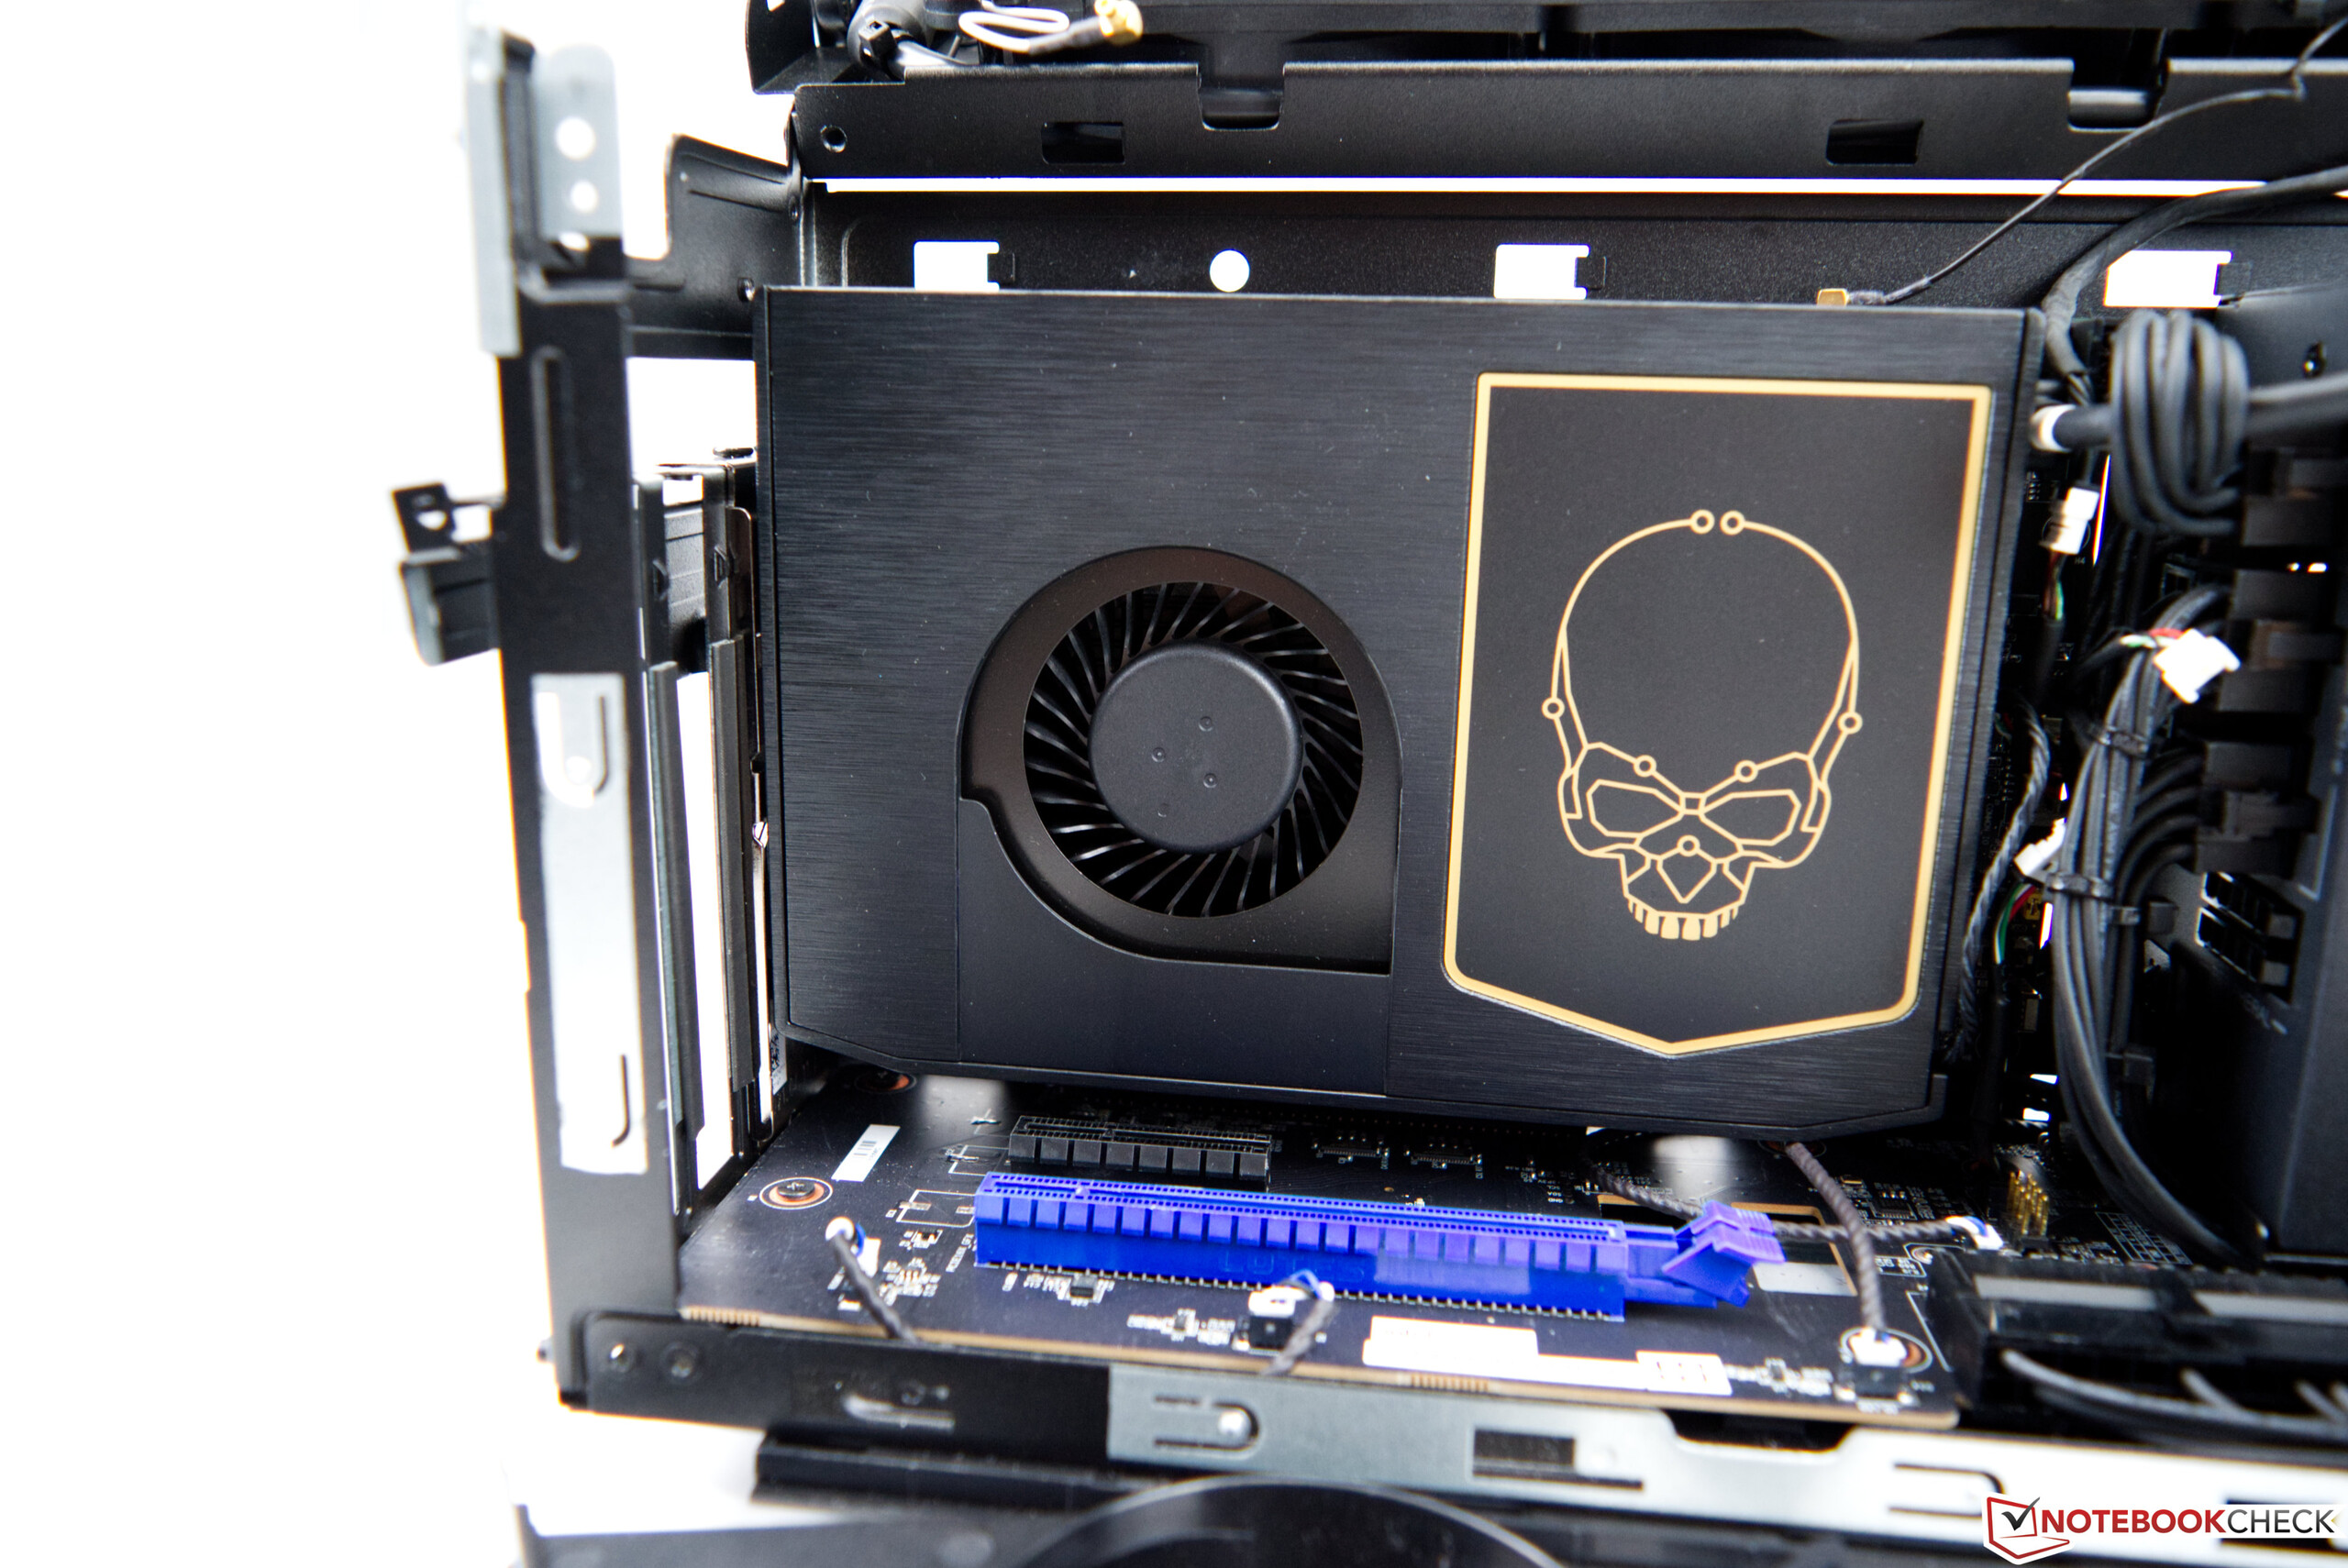
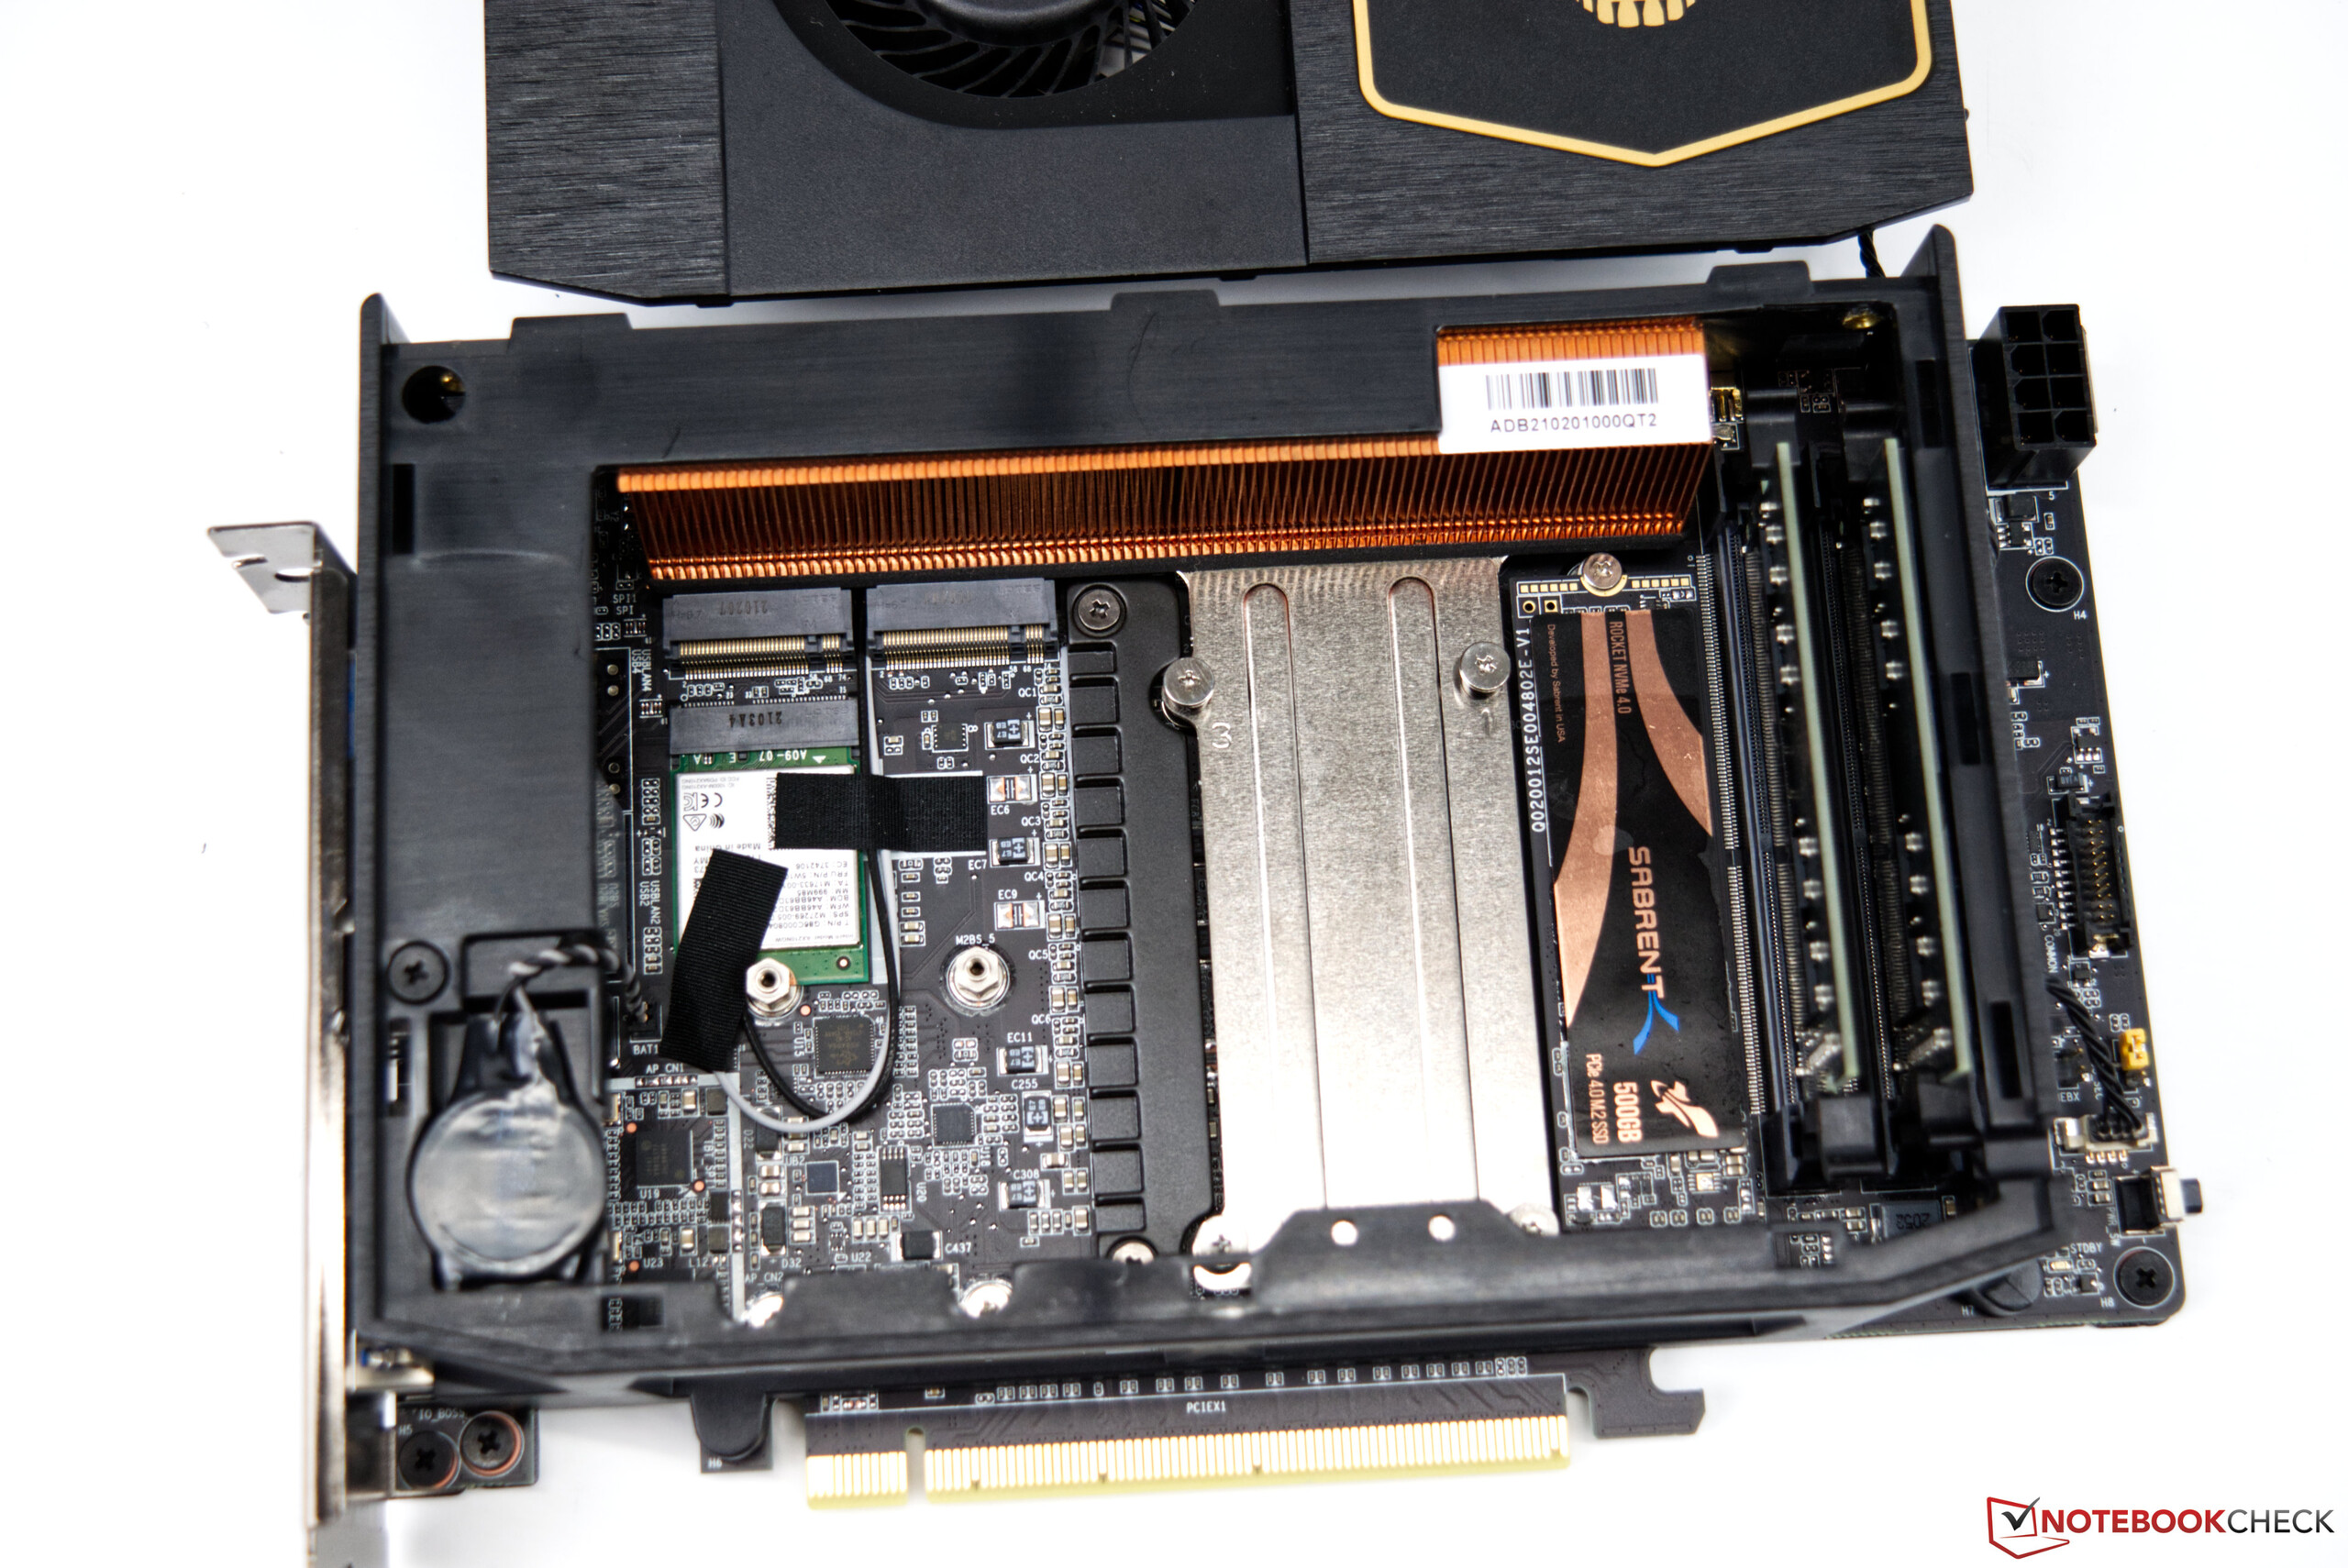
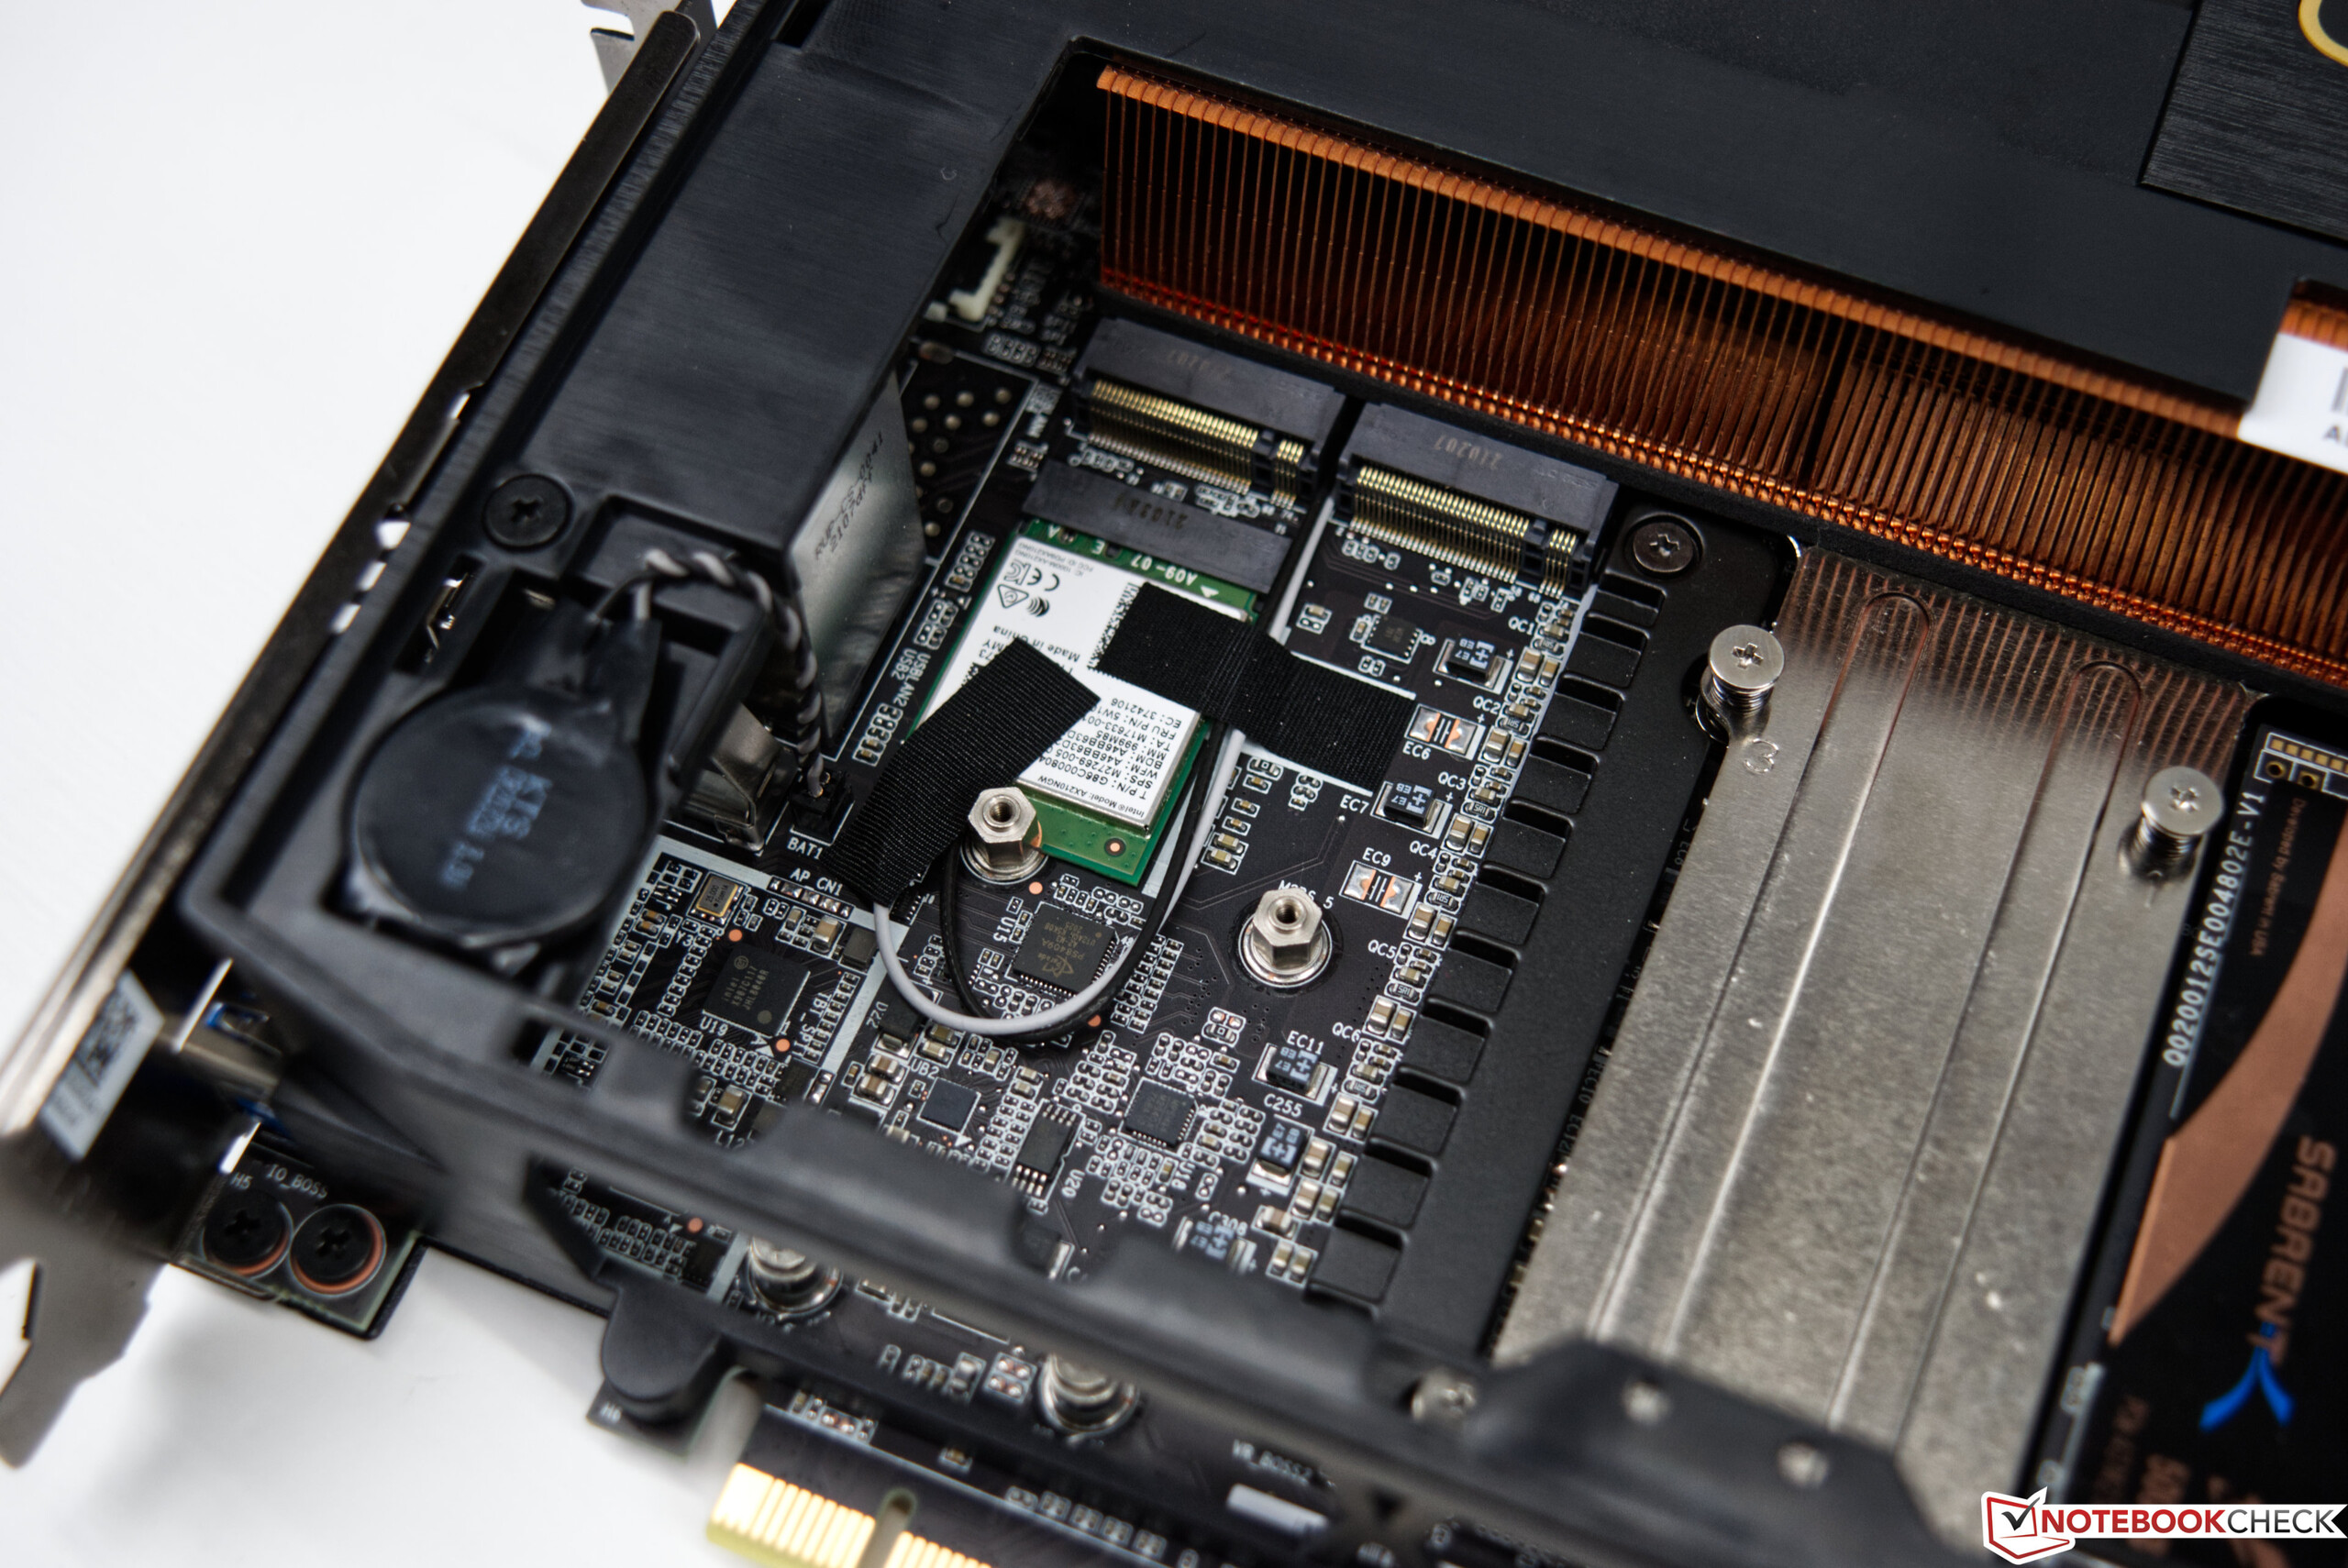
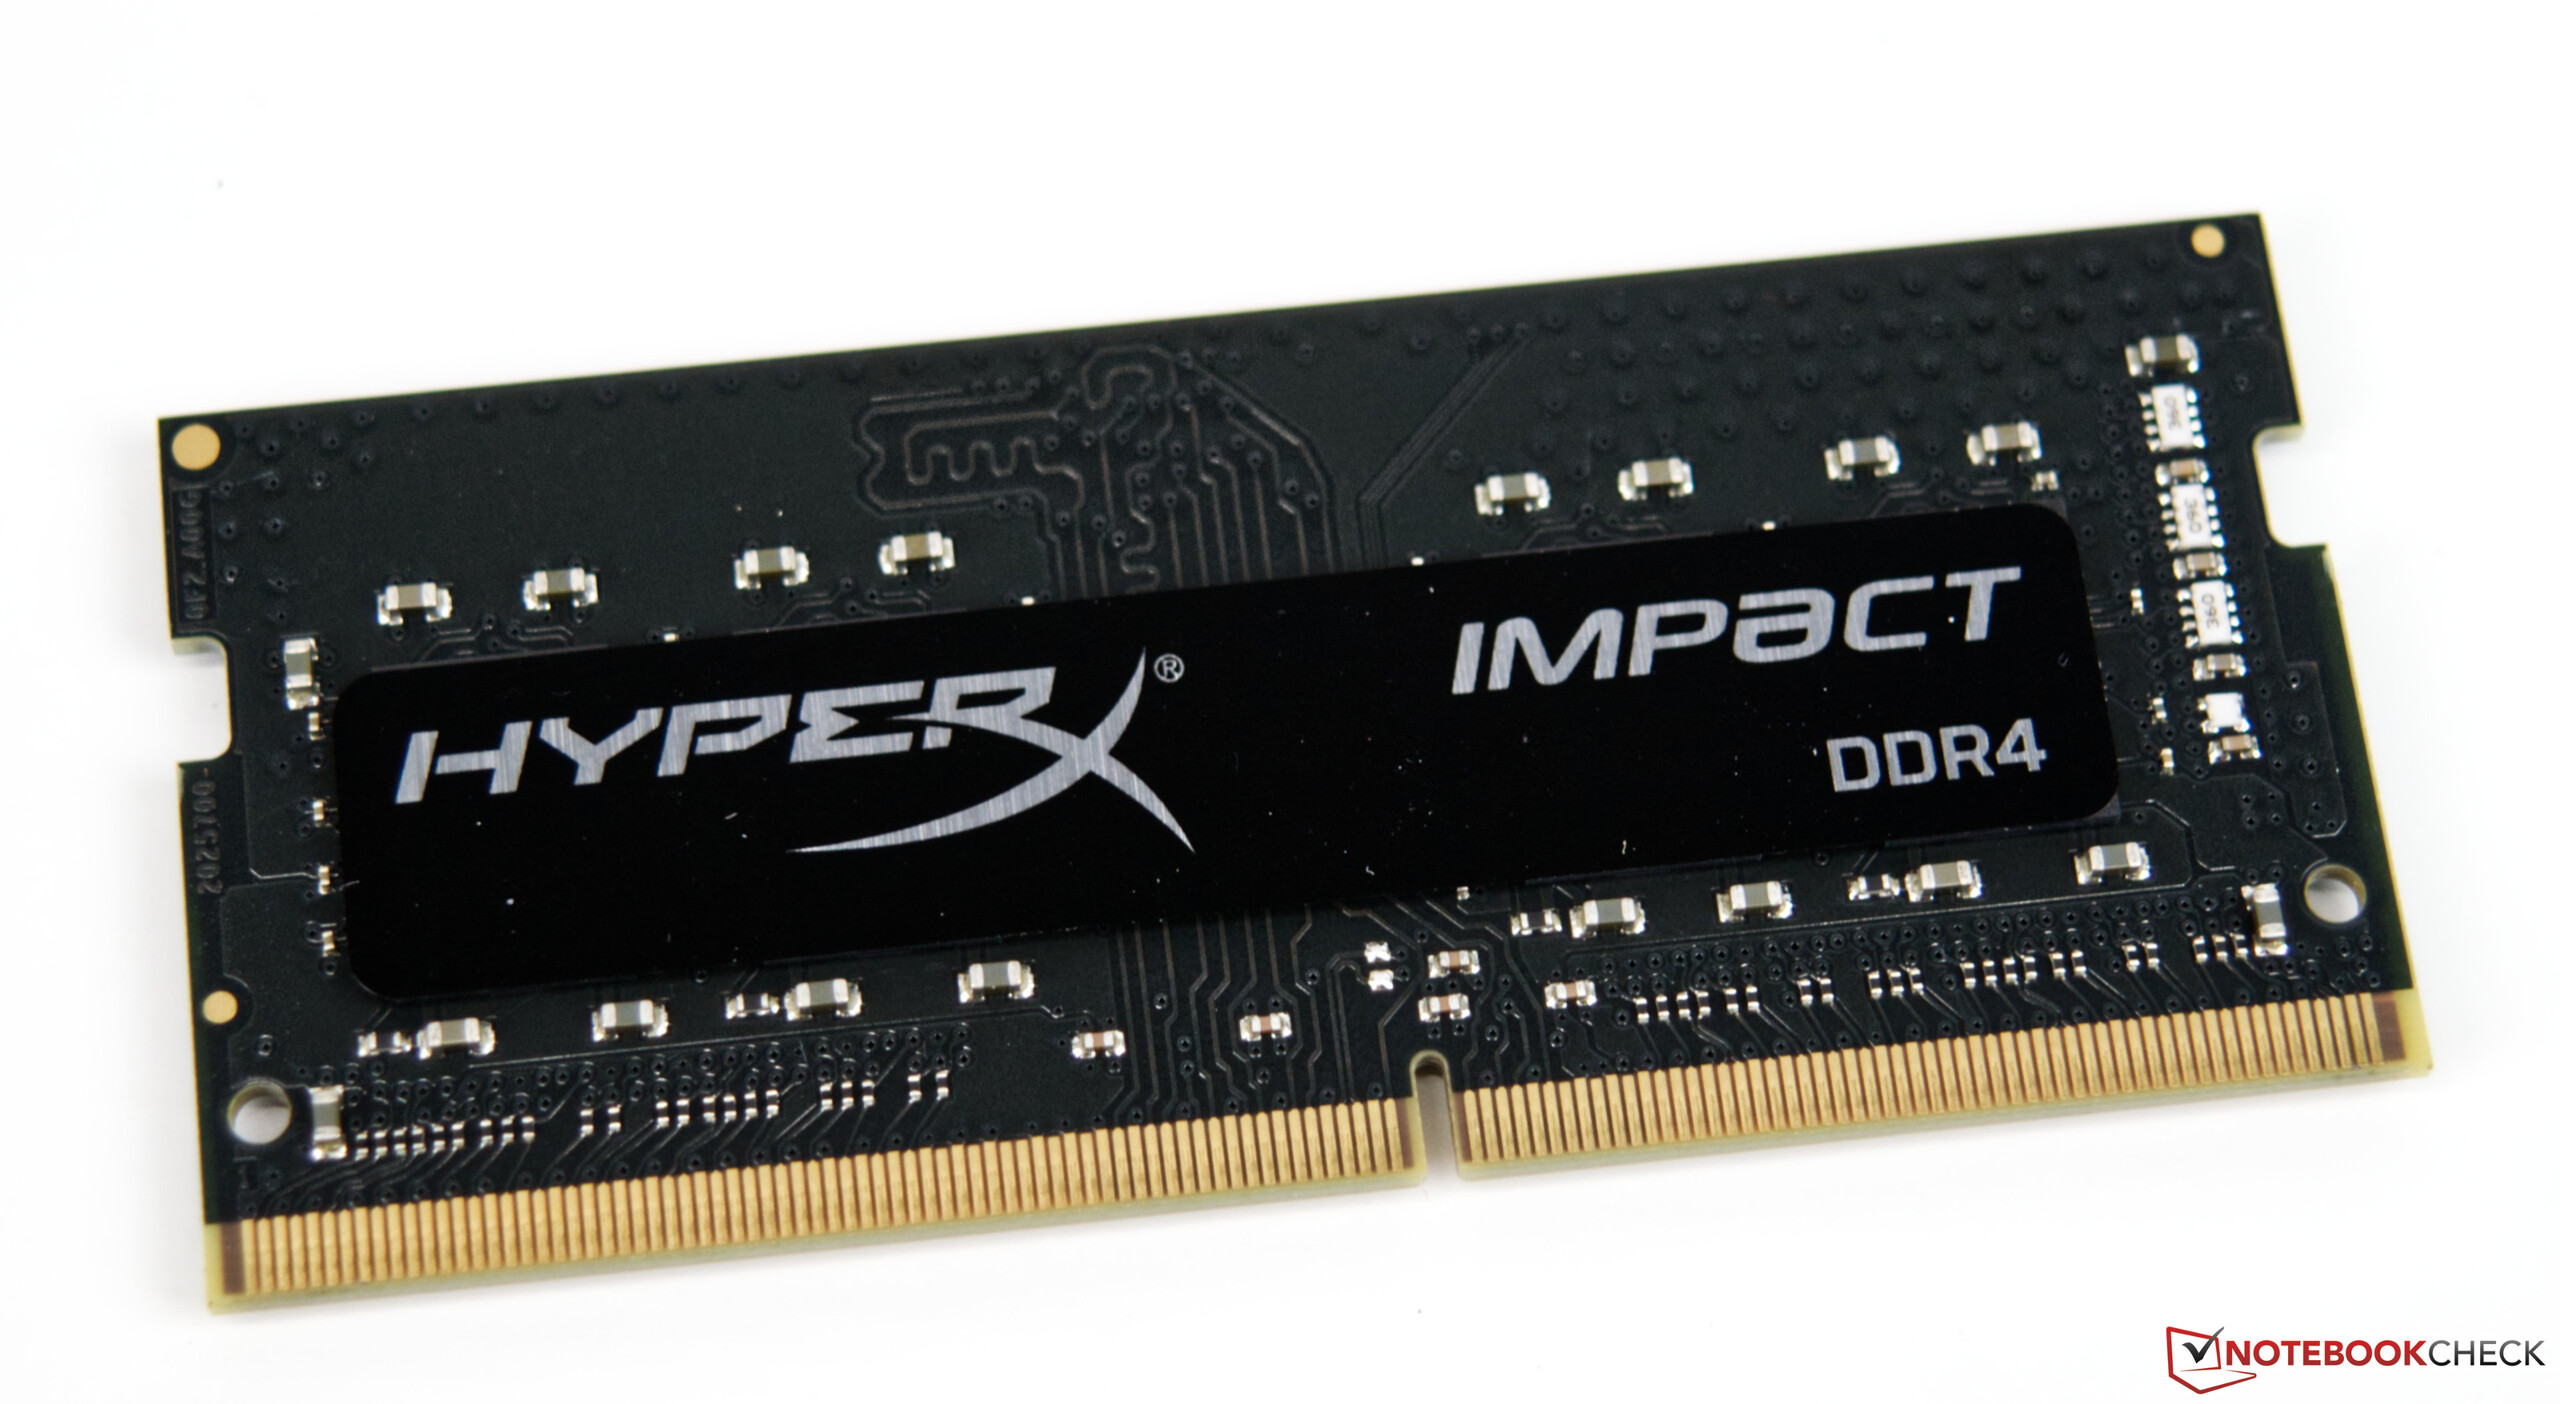
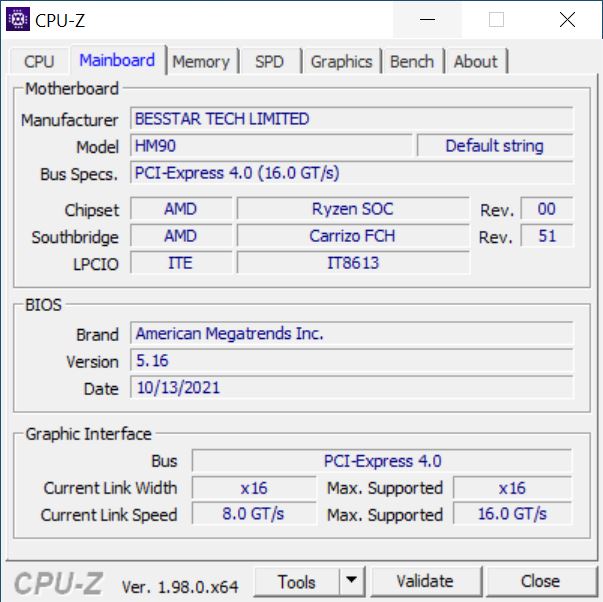
从视觉上看,这两个系统差别很大,尽管粗略的内部布局只在元件的安排上有差别。电源仍然隐藏在机箱内,这次使用了SFX外形,这使得在出现缺陷时更容易更换。新的计算元件仍然作为插卡藏在PCI Express插槽中,包含有 英特尔酷睿i9-11900KB- 一个具有8个内核和16个线程的非常快速的SoC。此外,NUC 11 Extreme计算元件为两个SO-DIMM模块提供了空间,除了WLAN模块外,还可存储多达三个M.2 SSD2。
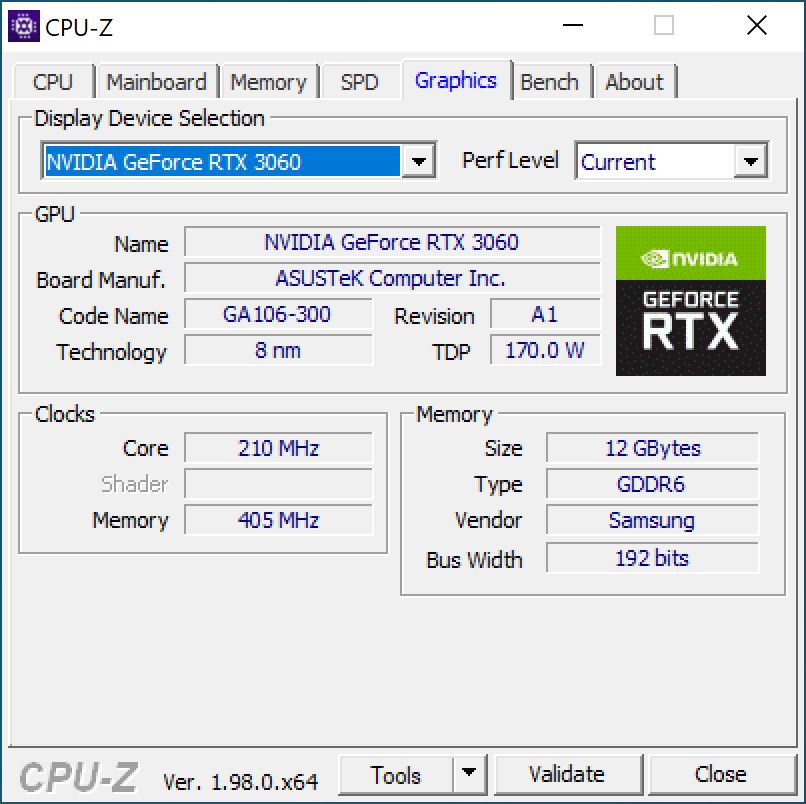
该SoC有自己的iGPU,只在有限程度上适用于游戏。相反,在 NvidiaGeForce RTX 3060安装在野兽峡谷中的Nvidia RTX 3060与快速的SoC相结合,提供了一个体面的游戏性能。
野兽峡谷的定价不是很直接。英特尔本身对酷睿i9模型的建议零售价略低于1,200美元,我们在此对其进行了审查。酷睿i7型号(英特尔酷睿i9-11700B)的价格约为1,000美元。应该注意的是,这些是裸机系统的价格,这意味着内存、SSD和GPU的额外成本。以我们的测试系统为基础进行的粗略估计表明,成本远远超过2,000美元。显卡的现状是造成额外成本的最大因素。华硕公司安装的GeForce RTX 3060目前的成本约为1,000美元。如果你选择更便宜的替代品或自行选择合适的型号,成本可以降低一些。
然而,那些想使用带有专用显卡的英特尔NUC 11极端套件的人应该注意显卡的尺寸。冷却装置不应占用超过两个PCIe插槽。显卡的长度被限制在最大12英寸。


英特尔NUC 11极限计算元件的详细介绍
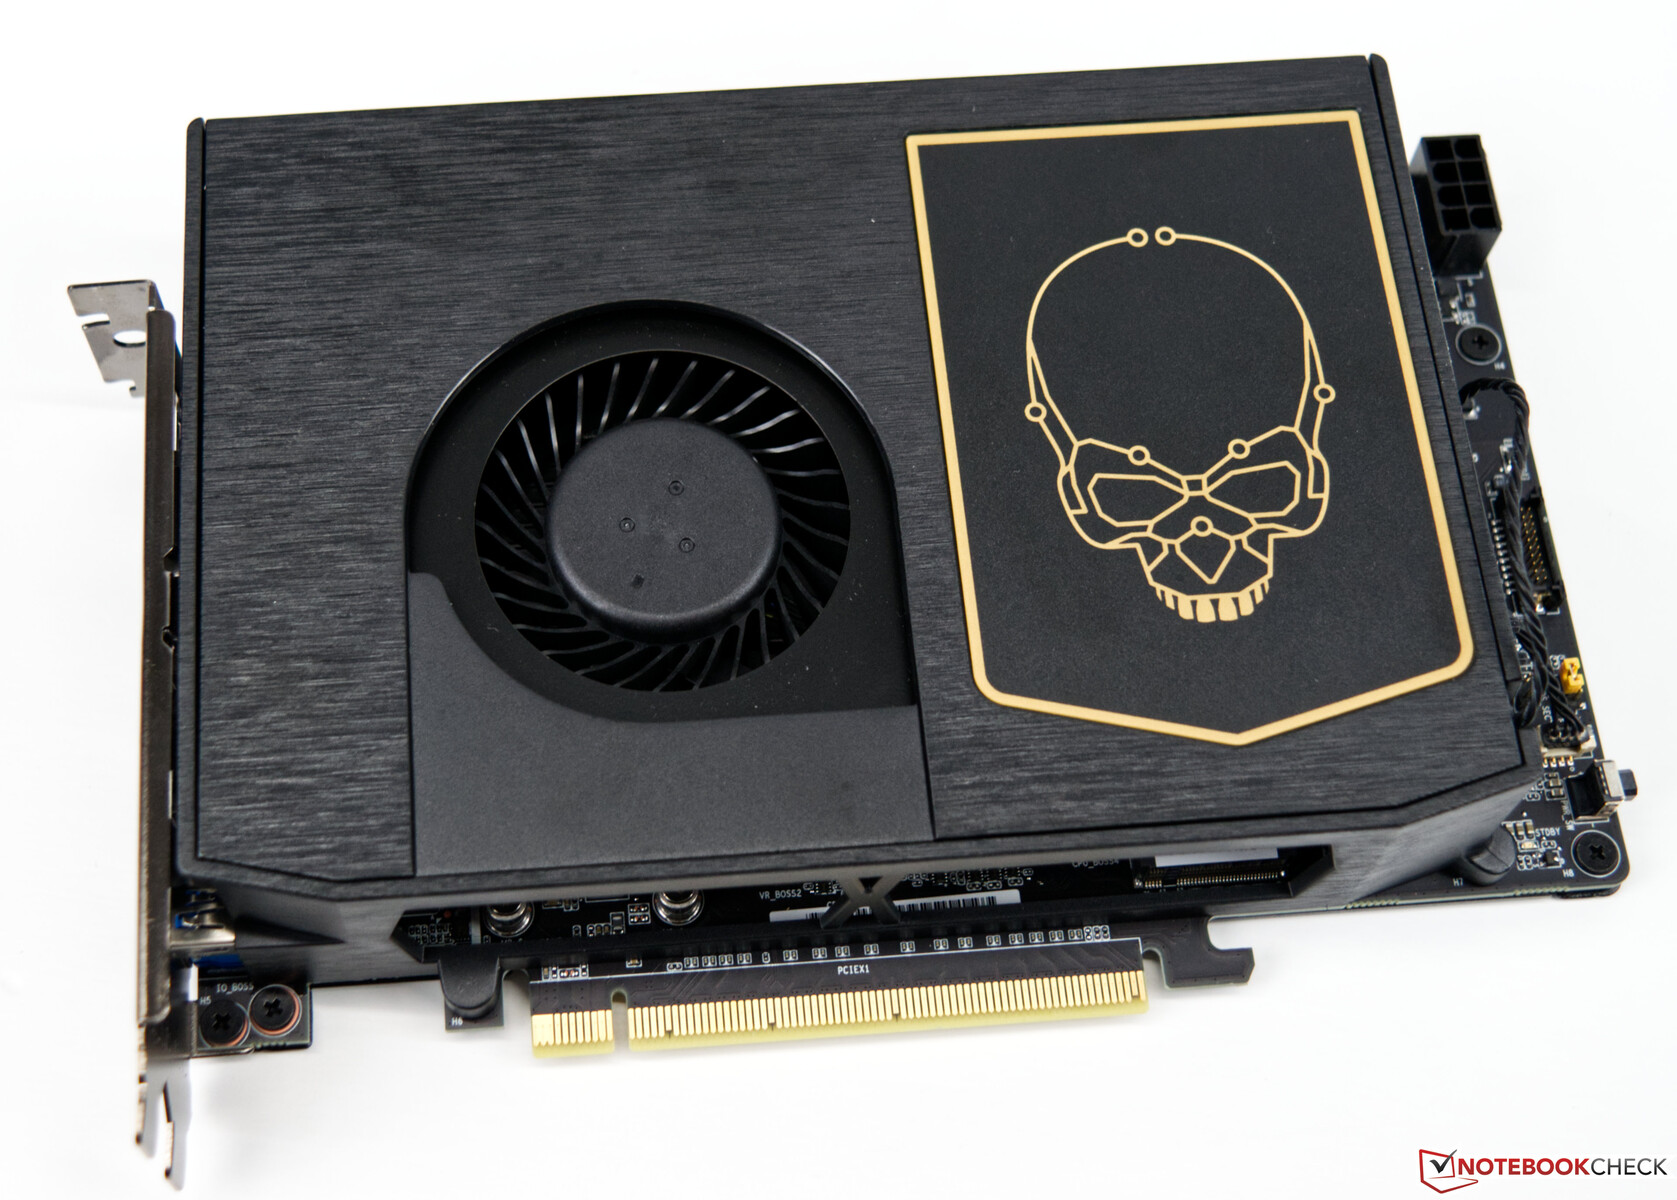
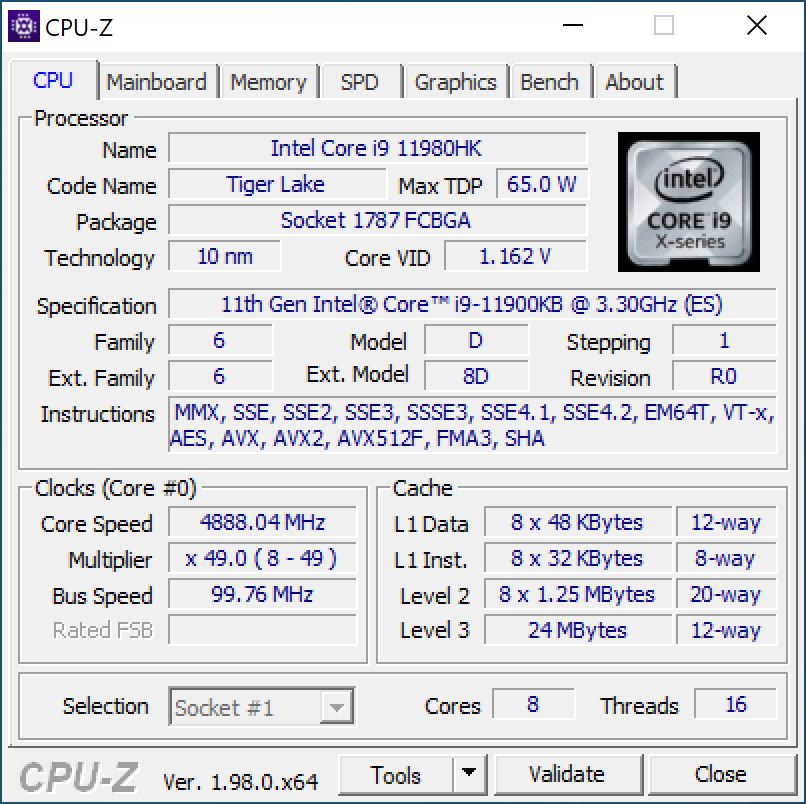
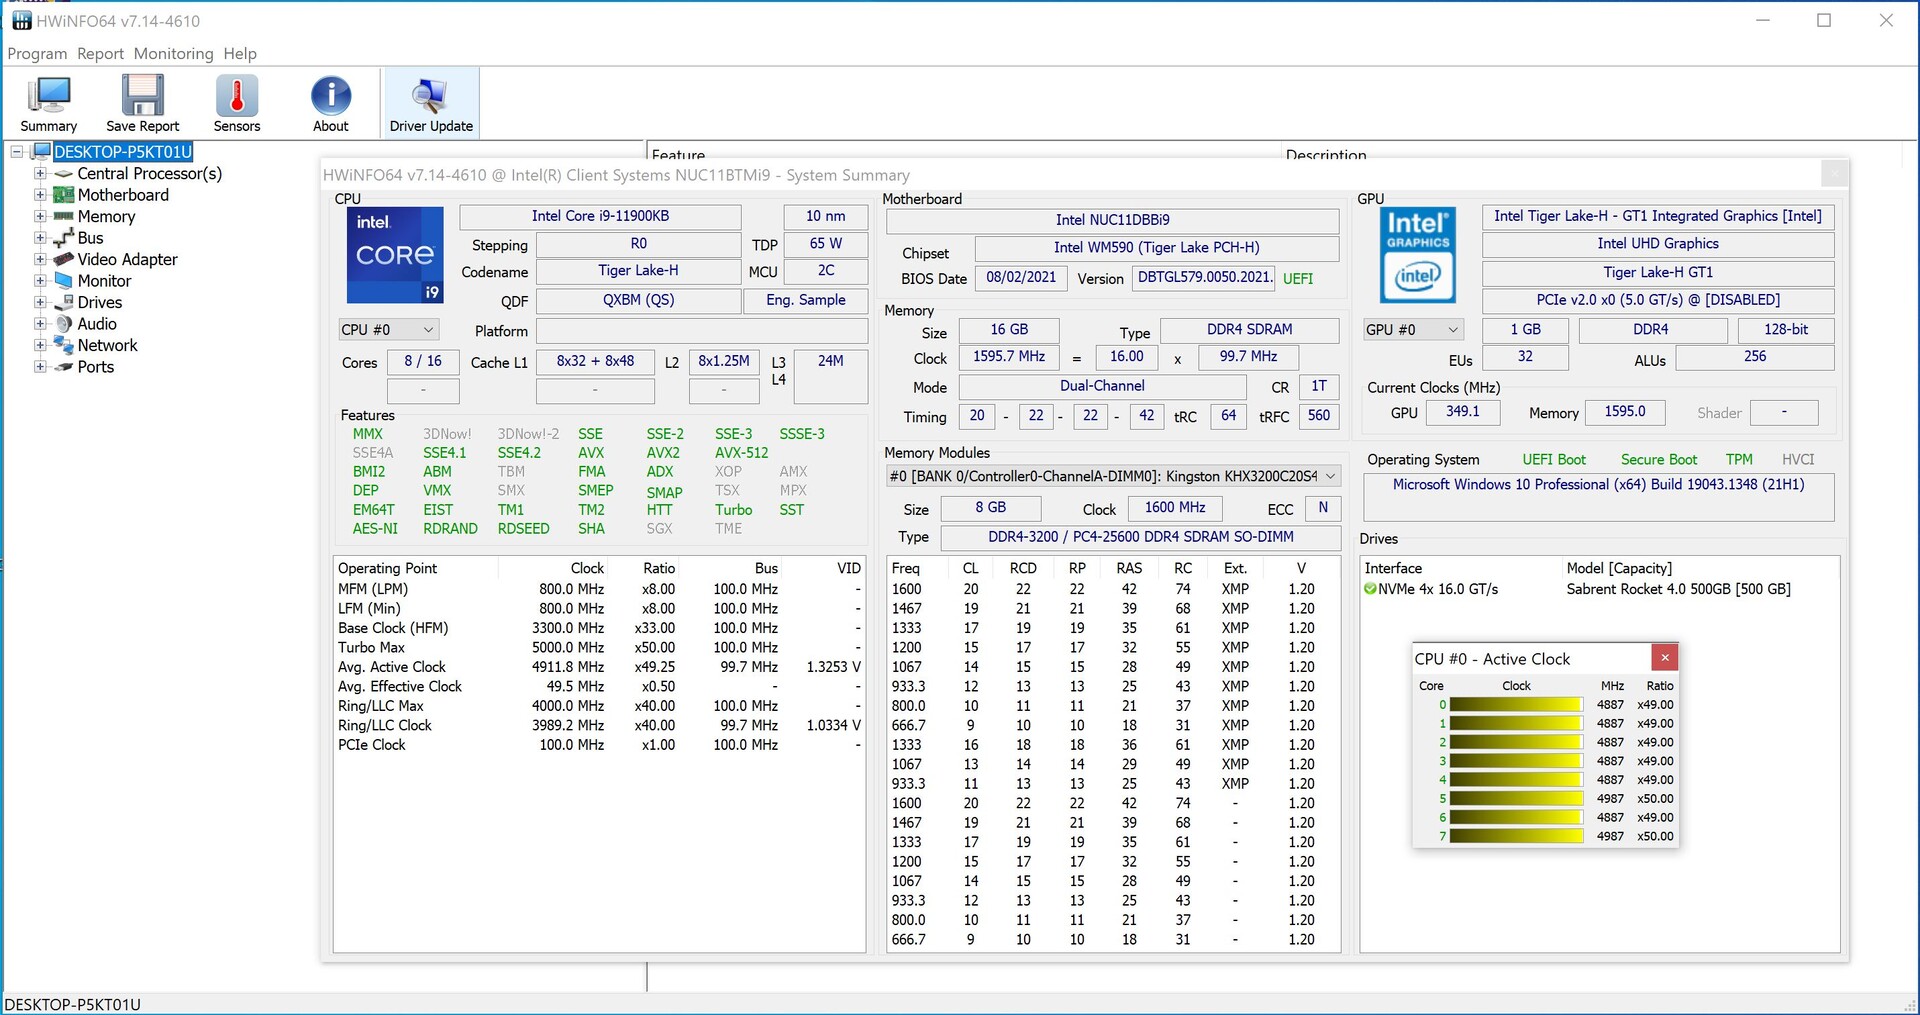
英特尔NUC 11 Extreme提供了与 英特尔酷睿i9-11900KB基于Tiger Lake 系列的具有16个线程的8核SoC。该SoC起源于移动外形,由于功耗低,是小型和紧凑型系统的一个很好的选择。此外,所有的外部接口都在计算元素上,它在系统中是PCI Express插件卡的形式。一切重要的东西都在板上,你不需要做任何事情。
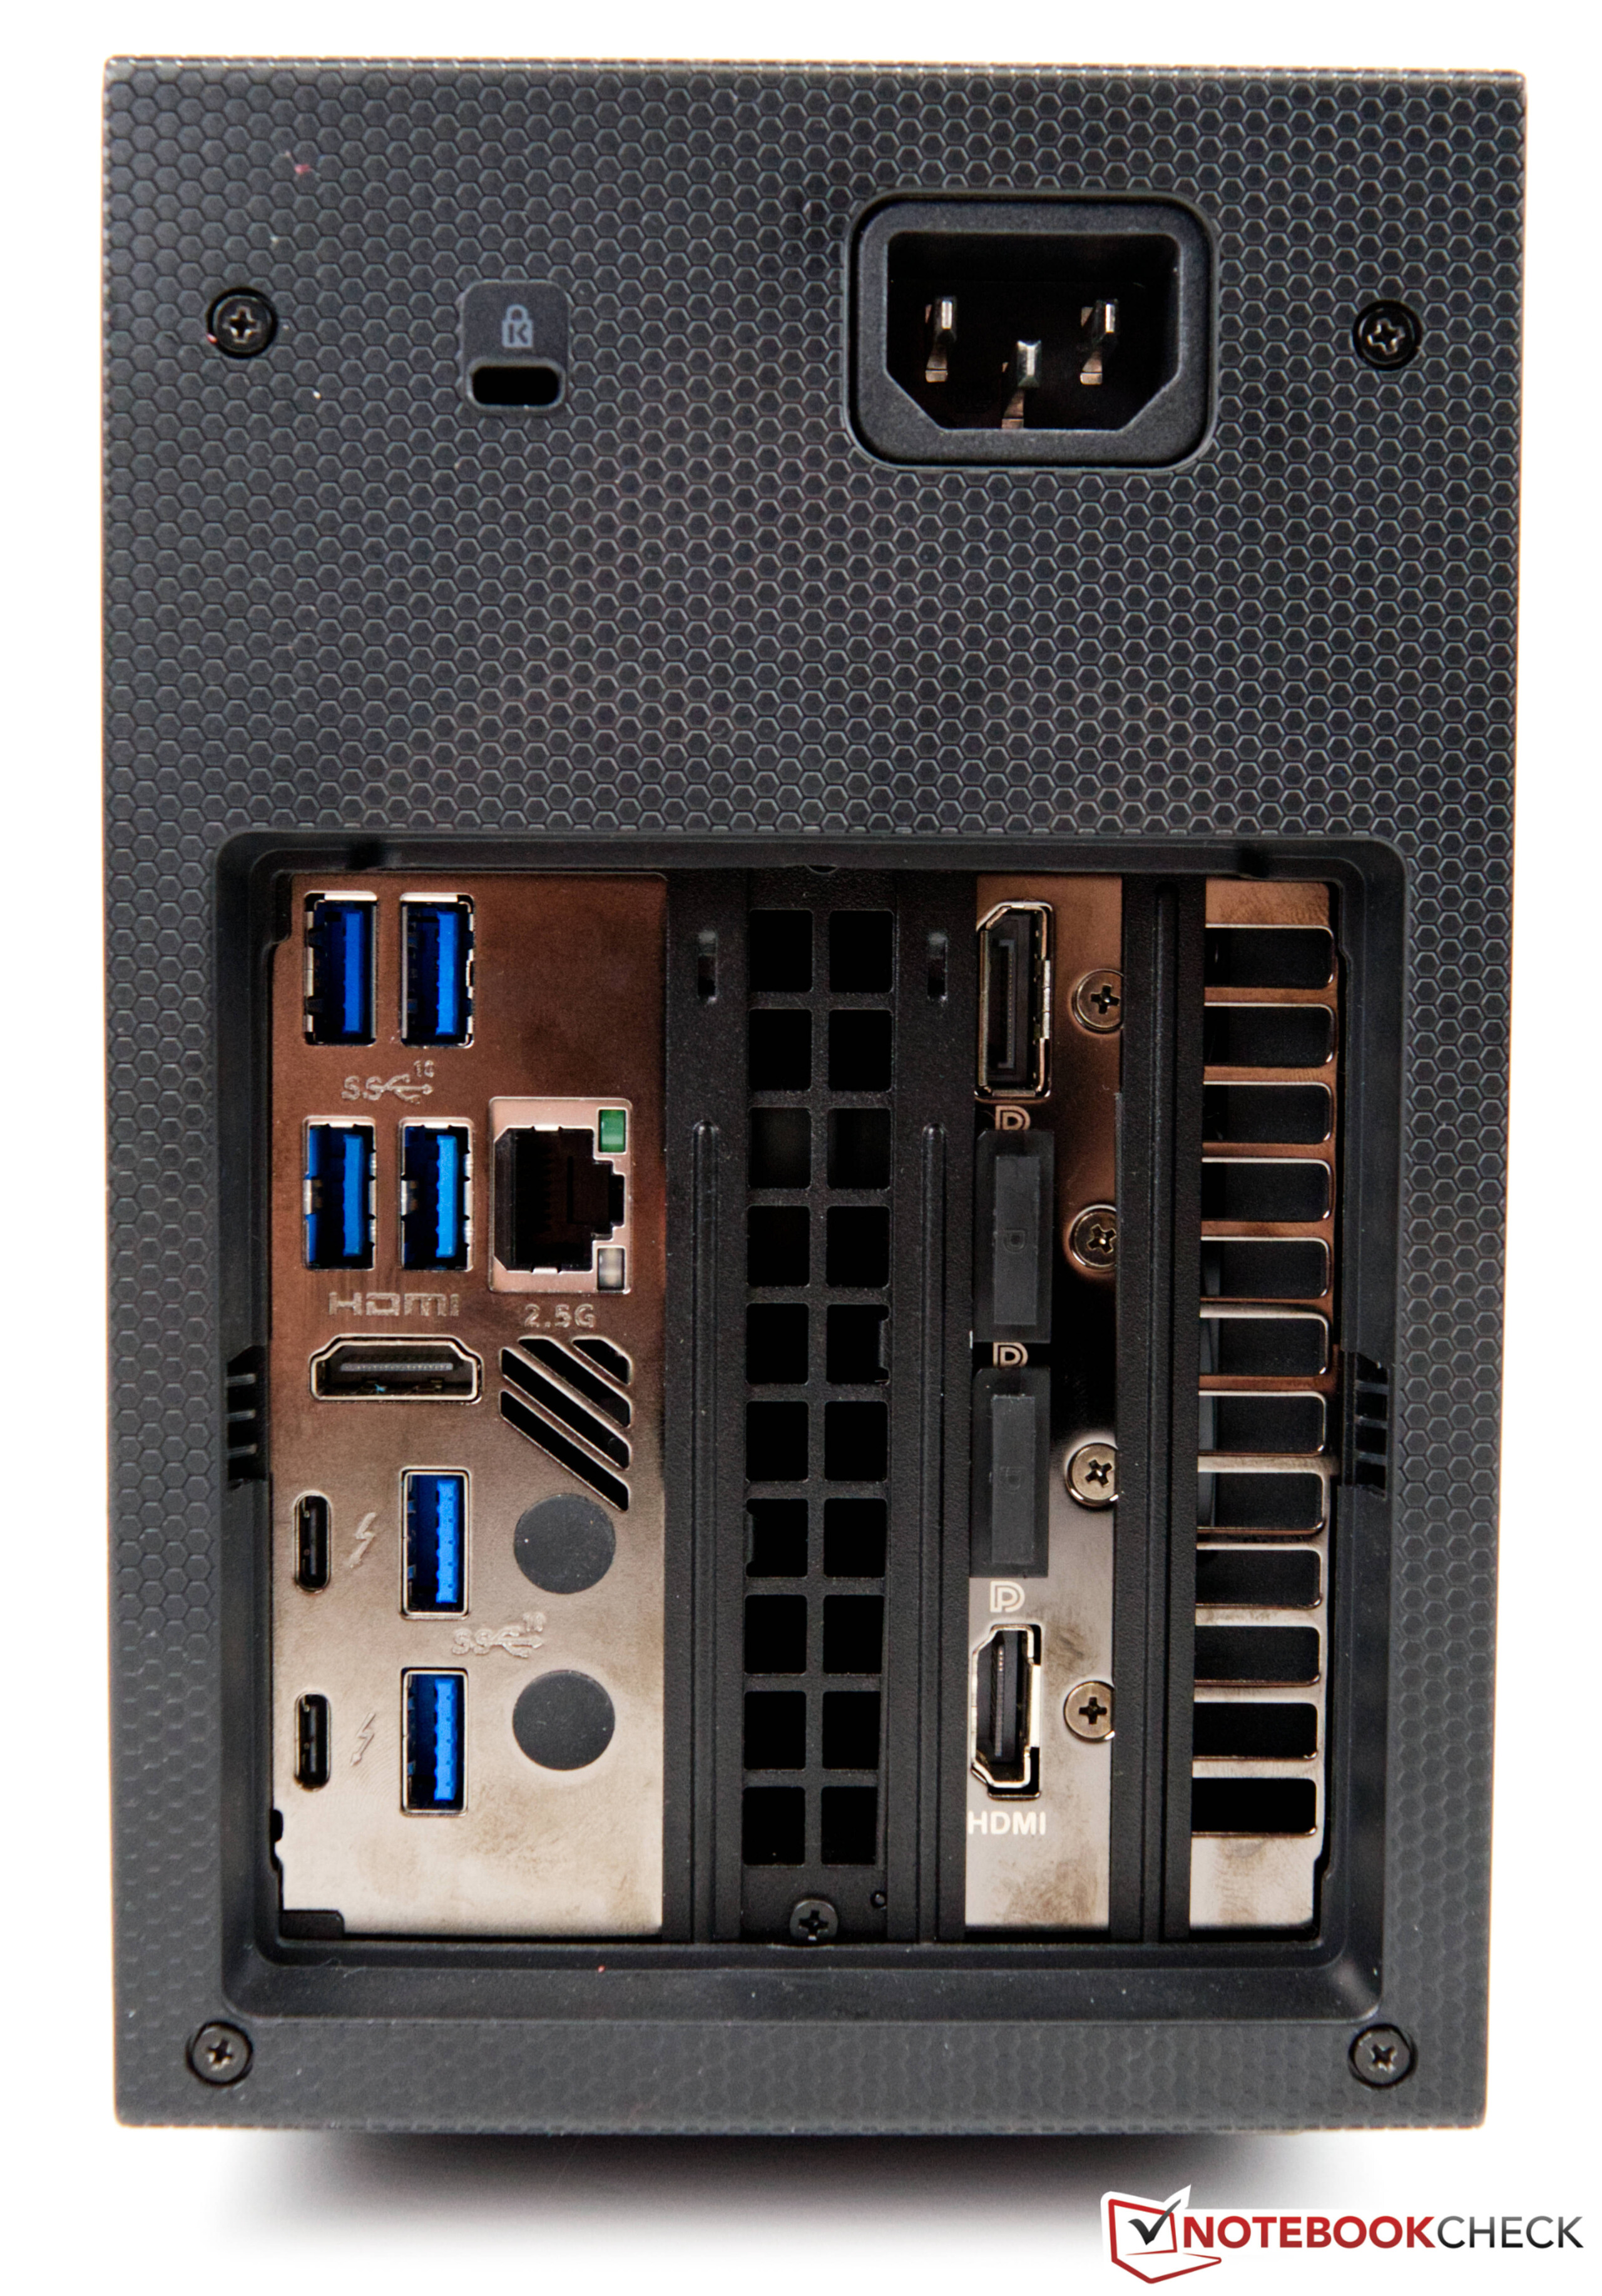
在背面,有6个USB 3.1 Gen2 Type-A和两个USB-C端口,包括Thunderbolt 4。通过HDMI或USB-C最多可同时操作三个显示器,有两种不同的方式将系统连接到网络--WiFi 6E或2.5Gbit LAN。计算元件本身可以安装两个SO-DIMM内存模块,每个模块最大容量为32GB。此外,还有空间容纳三个M.2固态硬盘。
处理器基准测试
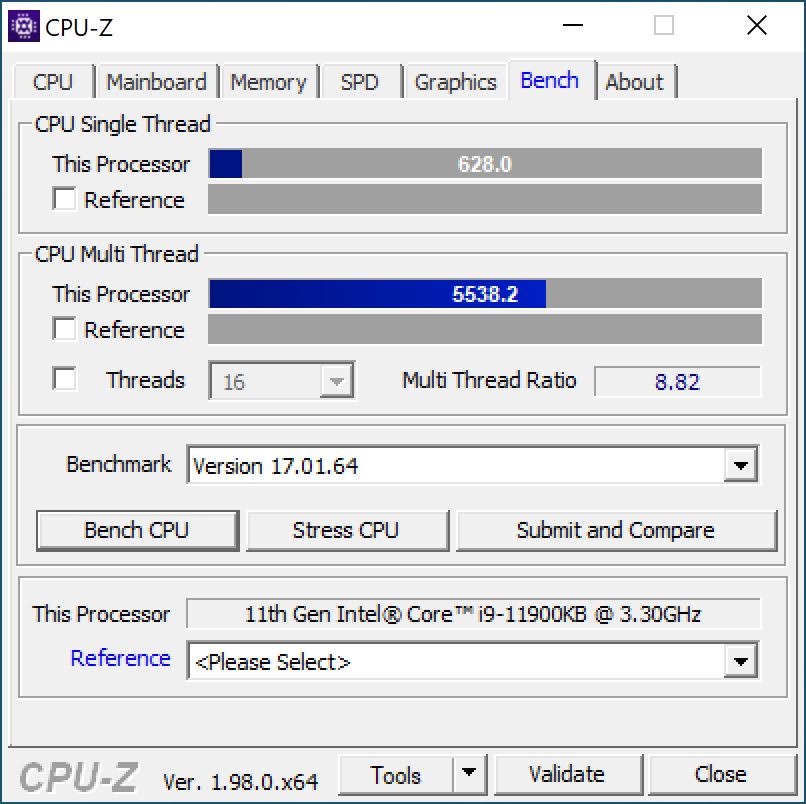
的 英特尔酷睿i9-11900KB是一款从笔记本电脑到台式机都能找到的SoC。英特尔将该SoC安装在计算元素中,并受益于65W的低功耗。然而,CPU的最大封装功率在短时间内被限制在90W。
在测试中,该SoC显示出坚实的性能,表现与英特尔酷睿i5-11600K有些相似。由于有两个额外的计算单元,英特尔酷睿i9-11900KB在多线程应用中优于酷睿i5-11600K。如果我们比较两个8核CPU,我们的测试样本不得不承认在与 英特尔酷睿i9-11900K.尽管如此,当你看到这些CPU的能耗时,这个差距是可控的。
对于进一步的比较和基准测试,我们建议你参考我们的CPU比较表.
| Performance rating - Percent | |
| AMD Ryzen 7 5800X, NVIDIA Titan RTX | |
| AMD Ryzen 9 3950X, NVIDIA Titan RTX | |
| Intel Core i9-11900K, NVIDIA Titan RTX | |
| Intel Core i9-10900K, NVIDIA Titan RTX | |
| Intel Core i9-11900KB, NVIDIA GeForce RTX 3060 | |
| Intel Core i5-11600K, NVIDIA Titan RTX | |
| AMD Ryzen 7 3800XT, NVIDIA Titan RTX | |
| Intel Core i9-9980HK, NVIDIA GeForce RTX 2070 (Desktop) | |
| Intel Core i5-10600K, NVIDIA Titan RTX | |
| Cinebench R15 | |
| CPU Single 64Bit | |
| AMD Ryzen 7 5800X, NVIDIA Titan RTX | |
| Intel Core i9-11900K, NVIDIA Titan RTX | |
| Intel Core i9-11900KB, NVIDIA GeForce RTX 3060 | |
| Intel Core i5-11600K, NVIDIA Titan RTX | |
| Intel Core i9-10900K, NVIDIA Titan RTX | |
| AMD Ryzen 7 3800XT, NVIDIA Titan RTX | |
| Intel Core i9-9980HK, NVIDIA GeForce RTX 2070 (Desktop) | |
| AMD Ryzen 9 3950X, NVIDIA Titan RTX | |
| Intel Core i5-10600K, NVIDIA Titan RTX | |
| CPU Multi 64Bit | |
| AMD Ryzen 9 3950X, NVIDIA Titan RTX | |
| Intel Core i9-10900K, NVIDIA Titan RTX | |
| AMD Ryzen 7 5800X, NVIDIA Titan RTX | |
| Intel Core i9-11900K, NVIDIA Titan RTX | |
| AMD Ryzen 7 3800XT, NVIDIA Titan RTX | |
| Intel Core i9-11900KB, NVIDIA GeForce RTX 3060 | |
| Intel Core i5-11600K, NVIDIA Titan RTX | |
| Intel Core i9-9980HK, NVIDIA GeForce RTX 2070 (Desktop) | |
| Intel Core i5-10600K, NVIDIA Titan RTX | |
| Cinebench R20 | |
| CPU (Single Core) | |
| Intel Core i9-11900K, NVIDIA Titan RTX | |
| Intel Core i9-11900KB, NVIDIA GeForce RTX 3060 | |
| AMD Ryzen 7 5800X, NVIDIA Titan RTX | |
| Intel Core i5-11600K, NVIDIA Titan RTX | |
| AMD Ryzen 7 3800XT, NVIDIA Titan RTX | |
| Intel Core i9-10900K, NVIDIA Titan RTX | |
| AMD Ryzen 9 3950X, NVIDIA Titan RTX | |
| Intel Core i9-9980HK, NVIDIA GeForce RTX 2070 (Desktop) | |
| Intel Core i5-10600K, NVIDIA Titan RTX | |
| CPU (Multi Core) | |
| AMD Ryzen 9 3950X, NVIDIA Titan RTX | |
| Intel Core i9-10900K, NVIDIA Titan RTX | |
| AMD Ryzen 7 5800X, NVIDIA Titan RTX | |
| Intel Core i9-11900K, NVIDIA Titan RTX | |
| AMD Ryzen 7 3800XT, NVIDIA Titan RTX | |
| Intel Core i9-11900KB, NVIDIA GeForce RTX 3060 | |
| Intel Core i5-11600K, NVIDIA Titan RTX | |
| Intel Core i5-10600K, NVIDIA Titan RTX | |
| Intel Core i9-9980HK, NVIDIA GeForce RTX 2070 (Desktop) | |
| Cinebench R11.5 | |
| CPU Single 64Bit | |
| Intel Core i9-11900K, NVIDIA Titan RTX | |
| AMD Ryzen 7 5800X, NVIDIA Titan RTX | |
| Intel Core i5-11600K, NVIDIA Titan RTX | |
| Intel Core i9-11900KB, NVIDIA GeForce RTX 3060 | |
| Intel Core i9-10900K, NVIDIA Titan RTX | |
| Intel Core i9-9980HK, NVIDIA GeForce RTX 2070 (Desktop) | |
| AMD Ryzen 9 3950X, NVIDIA Titan RTX | |
| AMD Ryzen 7 3800XT, NVIDIA Titan RTX | |
| Intel Core i5-10600K, NVIDIA Titan RTX | |
| CPU Multi 64Bit | |
| AMD Ryzen 9 3950X, NVIDIA Titan RTX | |
| AMD Ryzen 7 5800X, NVIDIA Titan RTX | |
| Intel Core i9-10900K, NVIDIA Titan RTX | |
| Intel Core i9-11900K, NVIDIA Titan RTX | |
| AMD Ryzen 7 3800XT, NVIDIA Titan RTX | |
| Intel Core i9-11900KB, NVIDIA GeForce RTX 3060 | |
| Intel Core i5-11600K, NVIDIA Titan RTX | |
| Intel Core i9-9980HK, NVIDIA GeForce RTX 2070 (Desktop) | |
| Intel Core i5-10600K, NVIDIA Titan RTX | |
| Cinebench R10 | |
| Rendering Single CPUs 64Bit | |
| Intel Core i9-11900K, NVIDIA Titan RTX | |
| AMD Ryzen 7 5800X, NVIDIA Titan RTX | |
| Intel Core i5-11600K, NVIDIA Titan RTX | |
| Intel Core i9-11900KB, NVIDIA GeForce RTX 3060 | |
| Intel Core i9-10900K, NVIDIA Titan RTX | |
| AMD Ryzen 9 3950X, NVIDIA Titan RTX | |
| AMD Ryzen 7 3800XT, NVIDIA Titan RTX | |
| Intel Core i9-9980HK, NVIDIA GeForce RTX 2070 (Desktop) | |
| Intel Core i5-10600K, NVIDIA Titan RTX | |
| Rendering Multiple CPUs 64Bit | |
| AMD Ryzen 9 3950X, NVIDIA Titan RTX | |
| AMD Ryzen 7 5800X, NVIDIA Titan RTX | |
| Intel Core i9-11900K, NVIDIA Titan RTX | |
| Intel Core i9-10900K, NVIDIA Titan RTX | |
| AMD Ryzen 7 3800XT, NVIDIA Titan RTX | |
| Intel Core i9-11900KB, NVIDIA GeForce RTX 3060 | |
| Intel Core i5-11600K, NVIDIA Titan RTX | |
| Intel Core i9-9980HK, NVIDIA GeForce RTX 2070 (Desktop) | |
| Intel Core i5-10600K, NVIDIA Titan RTX | |
| Blender - v2.79 BMW27 CPU | |
| Intel Core i9-9980HK, NVIDIA GeForce RTX 2070 (Desktop) | |
| Intel Core i5-10600K, NVIDIA Titan RTX | |
| Intel Core i5-11600K, NVIDIA Titan RTX | |
| Intel Core i9-11900KB, NVIDIA GeForce RTX 3060 | |
| AMD Ryzen 7 3800XT, NVIDIA Titan RTX | |
| AMD Ryzen 7 5800X, NVIDIA Titan RTX | |
| Intel Core i9-11900K, NVIDIA Titan RTX | |
| Intel Core i9-10900K, NVIDIA Titan RTX | |
| AMD Ryzen 9 3950X, NVIDIA Titan RTX | |
| wPrime 2.10 | |
| 32m | |
| Intel Core i5-11600K, NVIDIA Titan RTX | |
| Intel Core i5-10600K, NVIDIA Titan RTX | |
| AMD Ryzen 9 3950X, NVIDIA Titan RTX | |
| Intel Core i9-11900K, NVIDIA Titan RTX | |
| Intel Core i9-9980HK, NVIDIA GeForce RTX 2070 (Desktop) | |
| AMD Ryzen 7 3800XT, NVIDIA Titan RTX | |
| Intel Core i9-10900K, NVIDIA Titan RTX | |
| Intel Core i9-11900KB, NVIDIA GeForce RTX 3060 | |
| AMD Ryzen 7 5800X, NVIDIA Titan RTX | |
| 1024m | |
| Intel Core i9-9980HK, NVIDIA GeForce RTX 2070 (Desktop) | |
| Intel Core i5-10600K, NVIDIA Titan RTX | |
| Intel Core i5-11600K, NVIDIA Titan RTX | |
| Intel Core i9-11900KB, NVIDIA GeForce RTX 3060 | |
| AMD Ryzen 7 5800X, NVIDIA Titan RTX | |
| AMD Ryzen 7 3800XT, NVIDIA Titan RTX | |
| Intel Core i9-11900K, NVIDIA Titan RTX | |
| Intel Core i9-10900K, NVIDIA Titan RTX | |
| AMD Ryzen 9 3950X, NVIDIA Titan RTX | |
| X264 HD Benchmark 4.0 | |
| Pass 1 | |
| AMD Ryzen 7 5800X, NVIDIA Titan RTX | |
| Intel Core i9-11900K, NVIDIA Titan RTX | |
| Intel Core i5-11600K, NVIDIA Titan RTX | |
| Intel Core i9-10900K, NVIDIA Titan RTX | |
| Intel Core i9-11900KB, NVIDIA GeForce RTX 3060 | |
| AMD Ryzen 7 3800XT, NVIDIA Titan RTX | |
| AMD Ryzen 9 3950X, NVIDIA Titan RTX | |
| Intel Core i5-10600K, NVIDIA Titan RTX | |
| Intel Core i9-9980HK, NVIDIA GeForce RTX 2070 (Desktop) | |
| Pass 2 | |
| AMD Ryzen 9 3950X, NVIDIA Titan RTX | |
| AMD Ryzen 7 5800X, NVIDIA Titan RTX | |
| Intel Core i9-10900K, NVIDIA Titan RTX | |
| Intel Core i9-11900K, NVIDIA Titan RTX | |
| AMD Ryzen 7 3800XT, NVIDIA Titan RTX | |
| Intel Core i9-11900KB, NVIDIA GeForce RTX 3060 | |
| Intel Core i5-11600K, NVIDIA Titan RTX | |
| Intel Core i9-9980HK, NVIDIA GeForce RTX 2070 (Desktop) | |
| Intel Core i5-10600K, NVIDIA Titan RTX | |
| WinRAR - Result | |
| AMD Ryzen 7 5800X, NVIDIA Titan RTX | |
| Intel Core i9-10900K, NVIDIA Titan RTX | |
| Intel Core i9-11900KB, NVIDIA GeForce RTX 3060 | |
| Intel Core i9-11900K, NVIDIA Titan RTX | |
| Intel Core i5-11600K, NVIDIA Titan RTX | |
| AMD Ryzen 7 3800XT, NVIDIA Titan RTX | |
| AMD Ryzen 9 3950X, NVIDIA Titan RTX | |
| Intel Core i9-9980HK, NVIDIA GeForce RTX 2070 (Desktop) | |
| Intel Core i5-10600K, NVIDIA Titan RTX | |
| TrueCrypt | |
| AES Mean 100MB | |
| AMD Ryzen 7 5800X, NVIDIA Titan RTX | |
| Intel Core i9-10900K, NVIDIA Titan RTX | |
| Intel Core i9-11900K, NVIDIA Titan RTX | |
| Intel Core i9-11900KB, NVIDIA GeForce RTX 3060 | |
| AMD Ryzen 7 3800XT, NVIDIA Titan RTX | |
| AMD Ryzen 9 3950X, NVIDIA Titan RTX | |
| Intel Core i9-9980HK, NVIDIA GeForce RTX 2070 (Desktop) | |
| Intel Core i5-11600K, NVIDIA Titan RTX | |
| Intel Core i5-10600K, NVIDIA Titan RTX | |
| Twofish Mean 100MB | |
| AMD Ryzen 9 3950X, NVIDIA Titan RTX | |
| Intel Core i9-10900K, NVIDIA Titan RTX | |
| AMD Ryzen 7 3800XT, NVIDIA Titan RTX | |
| AMD Ryzen 7 5800X, NVIDIA Titan RTX | |
| Intel Core i9-11900K, NVIDIA Titan RTX | |
| Intel Core i9-9980HK, NVIDIA GeForce RTX 2070 (Desktop) | |
| Intel Core i9-11900KB, NVIDIA GeForce RTX 3060 | |
| Intel Core i5-11600K, NVIDIA Titan RTX | |
| Intel Core i5-10600K, NVIDIA Titan RTX | |
| Serpent Mean 100MB | |
| AMD Ryzen 9 3950X, NVIDIA Titan RTX | |
| Intel Core i9-10900K, NVIDIA Titan RTX | |
| AMD Ryzen 7 5800X, NVIDIA Titan RTX | |
| AMD Ryzen 7 3800XT, NVIDIA Titan RTX | |
| Intel Core i9-11900K, NVIDIA Titan RTX | |
| Intel Core i9-11900KB, NVIDIA GeForce RTX 3060 | |
| Intel Core i9-9980HK, NVIDIA GeForce RTX 2070 (Desktop) | |
| Intel Core i5-11600K, NVIDIA Titan RTX | |
| Intel Core i5-10600K, NVIDIA Titan RTX | |
| Geekbench 5.5 | |
| Multi-Core | |
| AMD Ryzen 9 3950X, NVIDIA Titan RTX | |
| Intel Core i9-10900K, NVIDIA Titan RTX | |
| AMD Ryzen 7 5800X, NVIDIA Titan RTX | |
| Intel Core i9-11900K, NVIDIA Titan RTX | |
| AMD Ryzen 7 3800XT, NVIDIA Titan RTX | |
| Intel Core i9-11900KB, NVIDIA GeForce RTX 3060 | |
| Intel Core i5-11600K, NVIDIA Titan RTX | |
| Intel Core i9-9980HK, NVIDIA GeForce RTX 2070 (Desktop) | |
| Intel Core i5-10600K, NVIDIA Titan RTX | |
| Single-Core | |
| Intel Core i9-11900K, NVIDIA Titan RTX | |
| Intel Core i5-11600K, NVIDIA Titan RTX | |
| AMD Ryzen 7 5800X, NVIDIA Titan RTX | |
| Intel Core i9-11900KB, NVIDIA GeForce RTX 3060 | |
| Intel Core i9-10900K, NVIDIA Titan RTX | |
| Intel Core i9-9980HK, NVIDIA GeForce RTX 2070 (Desktop) | |
| AMD Ryzen 7 3800XT, NVIDIA Titan RTX | |
| AMD Ryzen 9 3950X, NVIDIA Titan RTX | |
| Intel Core i5-10600K, NVIDIA Titan RTX | |
| Geekbench 5.0 | |
| 5.0 Multi-Core | |
| AMD Ryzen 9 3950X, NVIDIA Titan RTX | |
| Intel Core i9-10900K, NVIDIA Titan RTX | |
| AMD Ryzen 7 5800X, NVIDIA Titan RTX | |
| Intel Core i9-11900K, NVIDIA Titan RTX | |
| AMD Ryzen 7 3800XT, NVIDIA Titan RTX | |
| Intel Core i9-11900KB, NVIDIA GeForce RTX 3060 | |
| Intel Core i5-11600K, NVIDIA Titan RTX | |
| Intel Core i9-9980HK, NVIDIA GeForce RTX 2070 (Desktop) | |
| Intel Core i5-10600K, NVIDIA Titan RTX | |
| 5.0 Single-Core | |
| Intel Core i9-11900K, NVIDIA Titan RTX | |
| Intel Core i5-11600K, NVIDIA Titan RTX | |
| AMD Ryzen 7 5800X, NVIDIA Titan RTX | |
| Intel Core i9-11900KB, NVIDIA GeForce RTX 3060 | |
| Intel Core i9-10900K, NVIDIA Titan RTX | |
| AMD Ryzen 7 3800XT, NVIDIA Titan RTX | |
| Intel Core i9-9980HK, NVIDIA GeForce RTX 2070 (Desktop) | |
| AMD Ryzen 9 3950X, NVIDIA Titan RTX | |
| Intel Core i5-10600K, NVIDIA Titan RTX | |
| Geekbench 4.4 | |
| 64 Bit Single-Core Score | |
| Intel Core i9-11900K, NVIDIA Titan RTX | |
| Intel Core i5-11600K, NVIDIA Titan RTX | |
| AMD Ryzen 7 5800X, NVIDIA Titan RTX | |
| Intel Core i9-11900KB, NVIDIA GeForce RTX 3060 | |
| Intel Core i9-10900K, NVIDIA Titan RTX | |
| Intel Core i9-9980HK, NVIDIA GeForce RTX 2070 (Desktop) | |
| AMD Ryzen 7 3800XT, NVIDIA Titan RTX | |
| Intel Core i5-10600K, NVIDIA Titan RTX | |
| AMD Ryzen 9 3950X, NVIDIA Titan RTX | |
| 64 Bit Multi-Core Score | |
| AMD Ryzen 9 3950X, NVIDIA Titan RTX | |
| AMD Ryzen 7 5800X, NVIDIA Titan RTX | |
| Intel Core i9-10900K, NVIDIA Titan RTX | |
| Intel Core i9-11900K, NVIDIA Titan RTX | |
| Intel Core i9-11900KB, NVIDIA GeForce RTX 3060 | |
| AMD Ryzen 7 3800XT, NVIDIA Titan RTX | |
| Intel Core i5-11600K, NVIDIA Titan RTX | |
| Intel Core i9-9980HK, NVIDIA GeForce RTX 2070 (Desktop) | |
| Intel Core i5-10600K, NVIDIA Titan RTX | |
| 3DMark 11 - 1280x720 Performance Physics | |
| AMD Ryzen 7 5800X, NVIDIA Titan RTX | |
| Intel Core i9-10900K, NVIDIA Titan RTX | |
| Intel Core i9-11900K, NVIDIA Titan RTX | |
| AMD Ryzen 9 3950X, NVIDIA Titan RTX | |
| AMD Ryzen 7 3800XT, NVIDIA Titan RTX | |
| Intel Core i9-11900KB, NVIDIA GeForce RTX 3060 | |
| Intel Core i5-11600K, NVIDIA Titan RTX | |
| Intel Core i9-9980HK, NVIDIA GeForce RTX 2070 (Desktop) | |
| Intel Core i5-10600K, NVIDIA Titan RTX | |
| 7-Zip 18.03 | |
| 7z b 4 | |
| AMD Ryzen 9 3950X, NVIDIA Titan RTX | |
| AMD Ryzen 7 5800X, NVIDIA Titan RTX | |
| Intel Core i9-10900K, NVIDIA Titan RTX | |
| Intel Core i9-11900K, NVIDIA Titan RTX | |
| AMD Ryzen 7 3800XT, NVIDIA Titan RTX | |
| Intel Core i9-11900KB, NVIDIA GeForce RTX 3060 | |
| Intel Core i5-11600K, NVIDIA Titan RTX | |
| Intel Core i9-9980HK, NVIDIA GeForce RTX 2070 (Desktop) | |
| Intel Core i5-10600K, NVIDIA Titan RTX | |
| 7z b 4 -mmt1 | |
| AMD Ryzen 7 5800X, NVIDIA Titan RTX | |
| Intel Core i9-11900K, NVIDIA Titan RTX | |
| Intel Core i5-11600K, NVIDIA Titan RTX | |
| Intel Core i9-11900KB, NVIDIA GeForce RTX 3060 | |
| Intel Core i9-10900K, NVIDIA Titan RTX | |
| Intel Core i9-9980HK, NVIDIA GeForce RTX 2070 (Desktop) | |
| AMD Ryzen 7 3800XT, NVIDIA Titan RTX | |
| AMD Ryzen 9 3950X, NVIDIA Titan RTX | |
| Intel Core i5-10600K, NVIDIA Titan RTX | |
| HWBOT x265 Benchmark v2.2 - 4k Preset | |
| Intel Core i9-10900K, NVIDIA Titan RTX | |
| AMD Ryzen 7 5800X, NVIDIA Titan RTX | |
| Intel Core i9-11900K, NVIDIA Titan RTX | |
| AMD Ryzen 7 3800XT, NVIDIA Titan RTX | |
| AMD Ryzen 9 3950X, NVIDIA Titan RTX | |
| Intel Core i5-11600K, NVIDIA Titan RTX | |
| Intel Core i9-11900KB, NVIDIA GeForce RTX 3060 | |
| Intel Core i5-10600K, NVIDIA Titan RTX | |
| Intel Core i9-9980HK, NVIDIA GeForce RTX 2070 (Desktop) | |
| R Benchmark 2.5 - Overall mean | |
| Intel Core i5-10600K, NVIDIA Titan RTX | |
| Intel Core i9-9980HK, NVIDIA GeForce RTX 2070 (Desktop) | |
| Intel Core i9-11900KB, NVIDIA GeForce RTX 3060 | |
| Intel Core i9-10900K, NVIDIA Titan RTX | |
| AMD Ryzen 9 3950X, NVIDIA Titan RTX | |
| AMD Ryzen 7 3800XT, NVIDIA Titan RTX | |
| Intel Core i5-11600K, NVIDIA Titan RTX | |
| Intel Core i9-11900K, NVIDIA Titan RTX | |
| AMD Ryzen 7 5800X, NVIDIA Titan RTX | |
| LibreOffice - 20 Documents To PDF | |
| Intel Core i9-10900K, NVIDIA Titan RTX | |
| Intel Core i9-11900K, NVIDIA Titan RTX | |
| AMD Ryzen 9 3950X, NVIDIA Titan RTX | |
| Intel Core i5-10600K, NVIDIA Titan RTX | |
| Intel Core i9-9980HK, NVIDIA GeForce RTX 2070 (Desktop) | |
| Intel Core i9-11900KB, NVIDIA GeForce RTX 3060 | |
| AMD Ryzen 7 3800XT, NVIDIA Titan RTX | |
| AMD Ryzen 7 5800X, NVIDIA Titan RTX | |
| Intel Core i5-11600K, NVIDIA Titan RTX | |
| WebXPRT 3 - Overall | |
| AMD Ryzen 7 5800X, NVIDIA Titan RTX | |
| Intel Core i5-11600K, NVIDIA Titan RTX | |
| Intel Core i9-11900KB, NVIDIA GeForce RTX 3060 | |
| Intel Core i9-10900K, NVIDIA Titan RTX | |
| AMD Ryzen 7 3800XT, NVIDIA Titan RTX | |
| AMD Ryzen 9 3950X, NVIDIA Titan RTX | |
| Intel Core i5-10600K, NVIDIA Titan RTX | |
| Intel Core i9-9980HK, NVIDIA GeForce RTX 2070 (Desktop) | |
| Intel Core i9-11900K, NVIDIA Titan RTX | |
| Mozilla Kraken 1.1 - Total | |
| Intel Core i5-10600K, NVIDIA Titan RTX | |
| Intel Core i9-9980HK, NVIDIA GeForce RTX 2070 (Desktop) | |
| Intel Core i9-10900K, NVIDIA Titan RTX | |
| AMD Ryzen 9 3950X, NVIDIA Titan RTX | |
| AMD Ryzen 7 3800XT, NVIDIA Titan RTX | |
| Intel Core i9-11900KB, NVIDIA GeForce RTX 3060 | |
| Intel Core i5-11600K, NVIDIA Titan RTX | |
| AMD Ryzen 7 5800X, NVIDIA Titan RTX | |
| Intel Core i9-11900K, NVIDIA Titan RTX | |
| 3DMark | |
| 3840x2160 Fire Strike Ultra Physics | |
| AMD Ryzen 9 3950X, NVIDIA Titan RTX | |
| AMD Ryzen 7 5800X, NVIDIA Titan RTX | |
| Intel Core i9-10900K, NVIDIA Titan RTX | |
| Intel Core i9-11900K, NVIDIA Titan RTX | |
| AMD Ryzen 7 3800XT, NVIDIA Titan RTX | |
| Intel Core i9-11900KB, NVIDIA GeForce RTX 3060 | |
| Intel Core i5-11600K, NVIDIA Titan RTX | |
| Intel Core i9-9980HK, NVIDIA GeForce RTX 2070 (Desktop) | |
| Intel Core i5-10600K, NVIDIA Titan RTX | |
| 1920x1080 Fire Strike Physics | |
| AMD Ryzen 9 3950X, NVIDIA Titan RTX | |
| AMD Ryzen 7 5800X, NVIDIA Titan RTX | |
| Intel Core i9-10900K, NVIDIA Titan RTX | |
| Intel Core i9-11900K, NVIDIA Titan RTX | |
| AMD Ryzen 7 3800XT, NVIDIA Titan RTX | |
| Intel Core i9-11900KB, NVIDIA GeForce RTX 3060 | |
| Intel Core i5-11600K, NVIDIA Titan RTX | |
| Intel Core i9-9980HK, NVIDIA GeForce RTX 2070 (Desktop) | |
| Intel Core i5-10600K, NVIDIA Titan RTX | |
| 2560x1440 Time Spy CPU | |
| Intel Core i9-10900K, NVIDIA Titan RTX | |
| Intel Core i9-11900K, NVIDIA Titan RTX | |
| AMD Ryzen 9 3950X, NVIDIA Titan RTX | |
| AMD Ryzen 7 5800X, NVIDIA Titan RTX | |
| AMD Ryzen 7 3800XT, NVIDIA Titan RTX | |
| Intel Core i9-11900KB, NVIDIA GeForce RTX 3060 | |
| Intel Core i5-11600K, NVIDIA Titan RTX | |
| Intel Core i9-9980HK, NVIDIA GeForce RTX 2070 (Desktop) | |
| Intel Core i5-10600K, NVIDIA Titan RTX | |
* ... smaller is better
英特尔NUC 11极端套件在Cinebench R15多循环中的表现
用Cinebench R15多循环进行的第一次负载测试显示了稳定的性能。在1800分的情况下,英特尔酷睿i9-11900KB提供了一个持续的高性能,没有性能下降。尽管如此,在前两次运行后,可以注意到轻微的性能下降。
应用性能
在应用基准测试中,我们的测试样本只是非常轻微地领先于Ghost Canyon NUC。总的来说,较新的硬件不能提供一个体面的性能增益。然而,主观上,我们可以说Ghost Canyon NUC和Beast Canyon NUC在日常使用中都相当快。只有在下载大型游戏时才会出现较长的等待时间,但这是由于网络供应商的带宽限制造成的。我们的测试样本在面对当前的测试系统时也表现得相当好,从下面的PCMark 10结果可以看出。
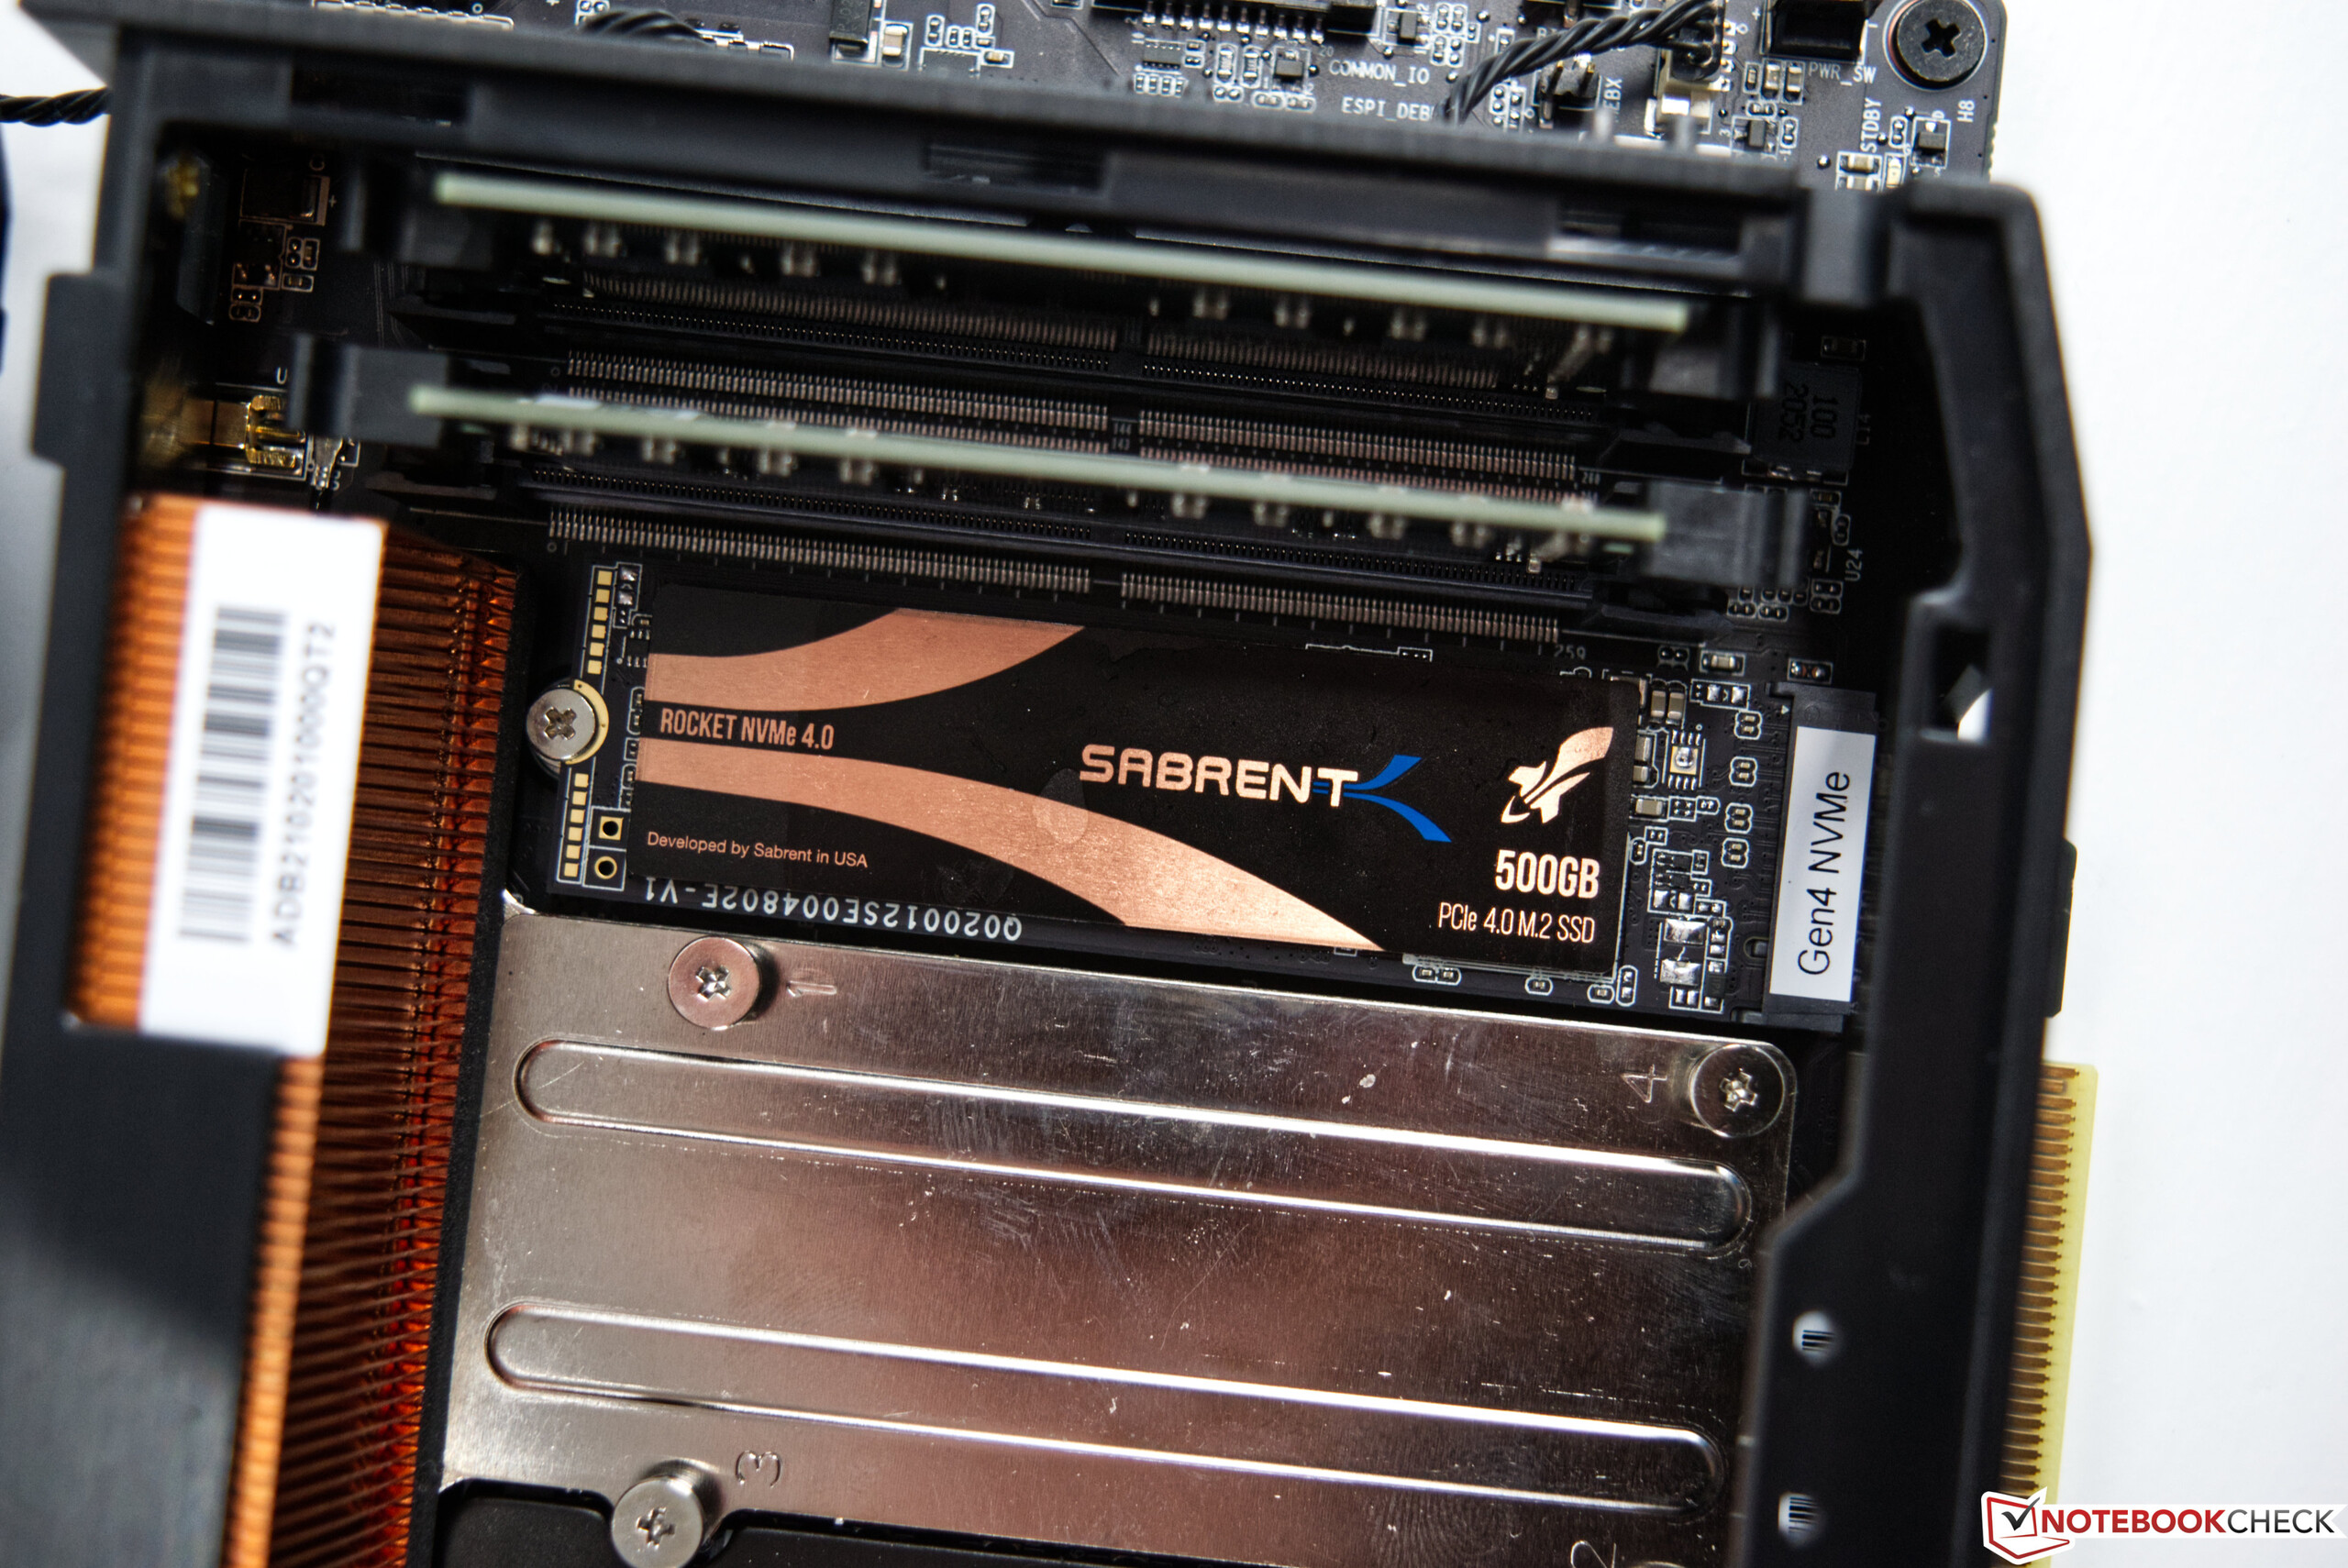
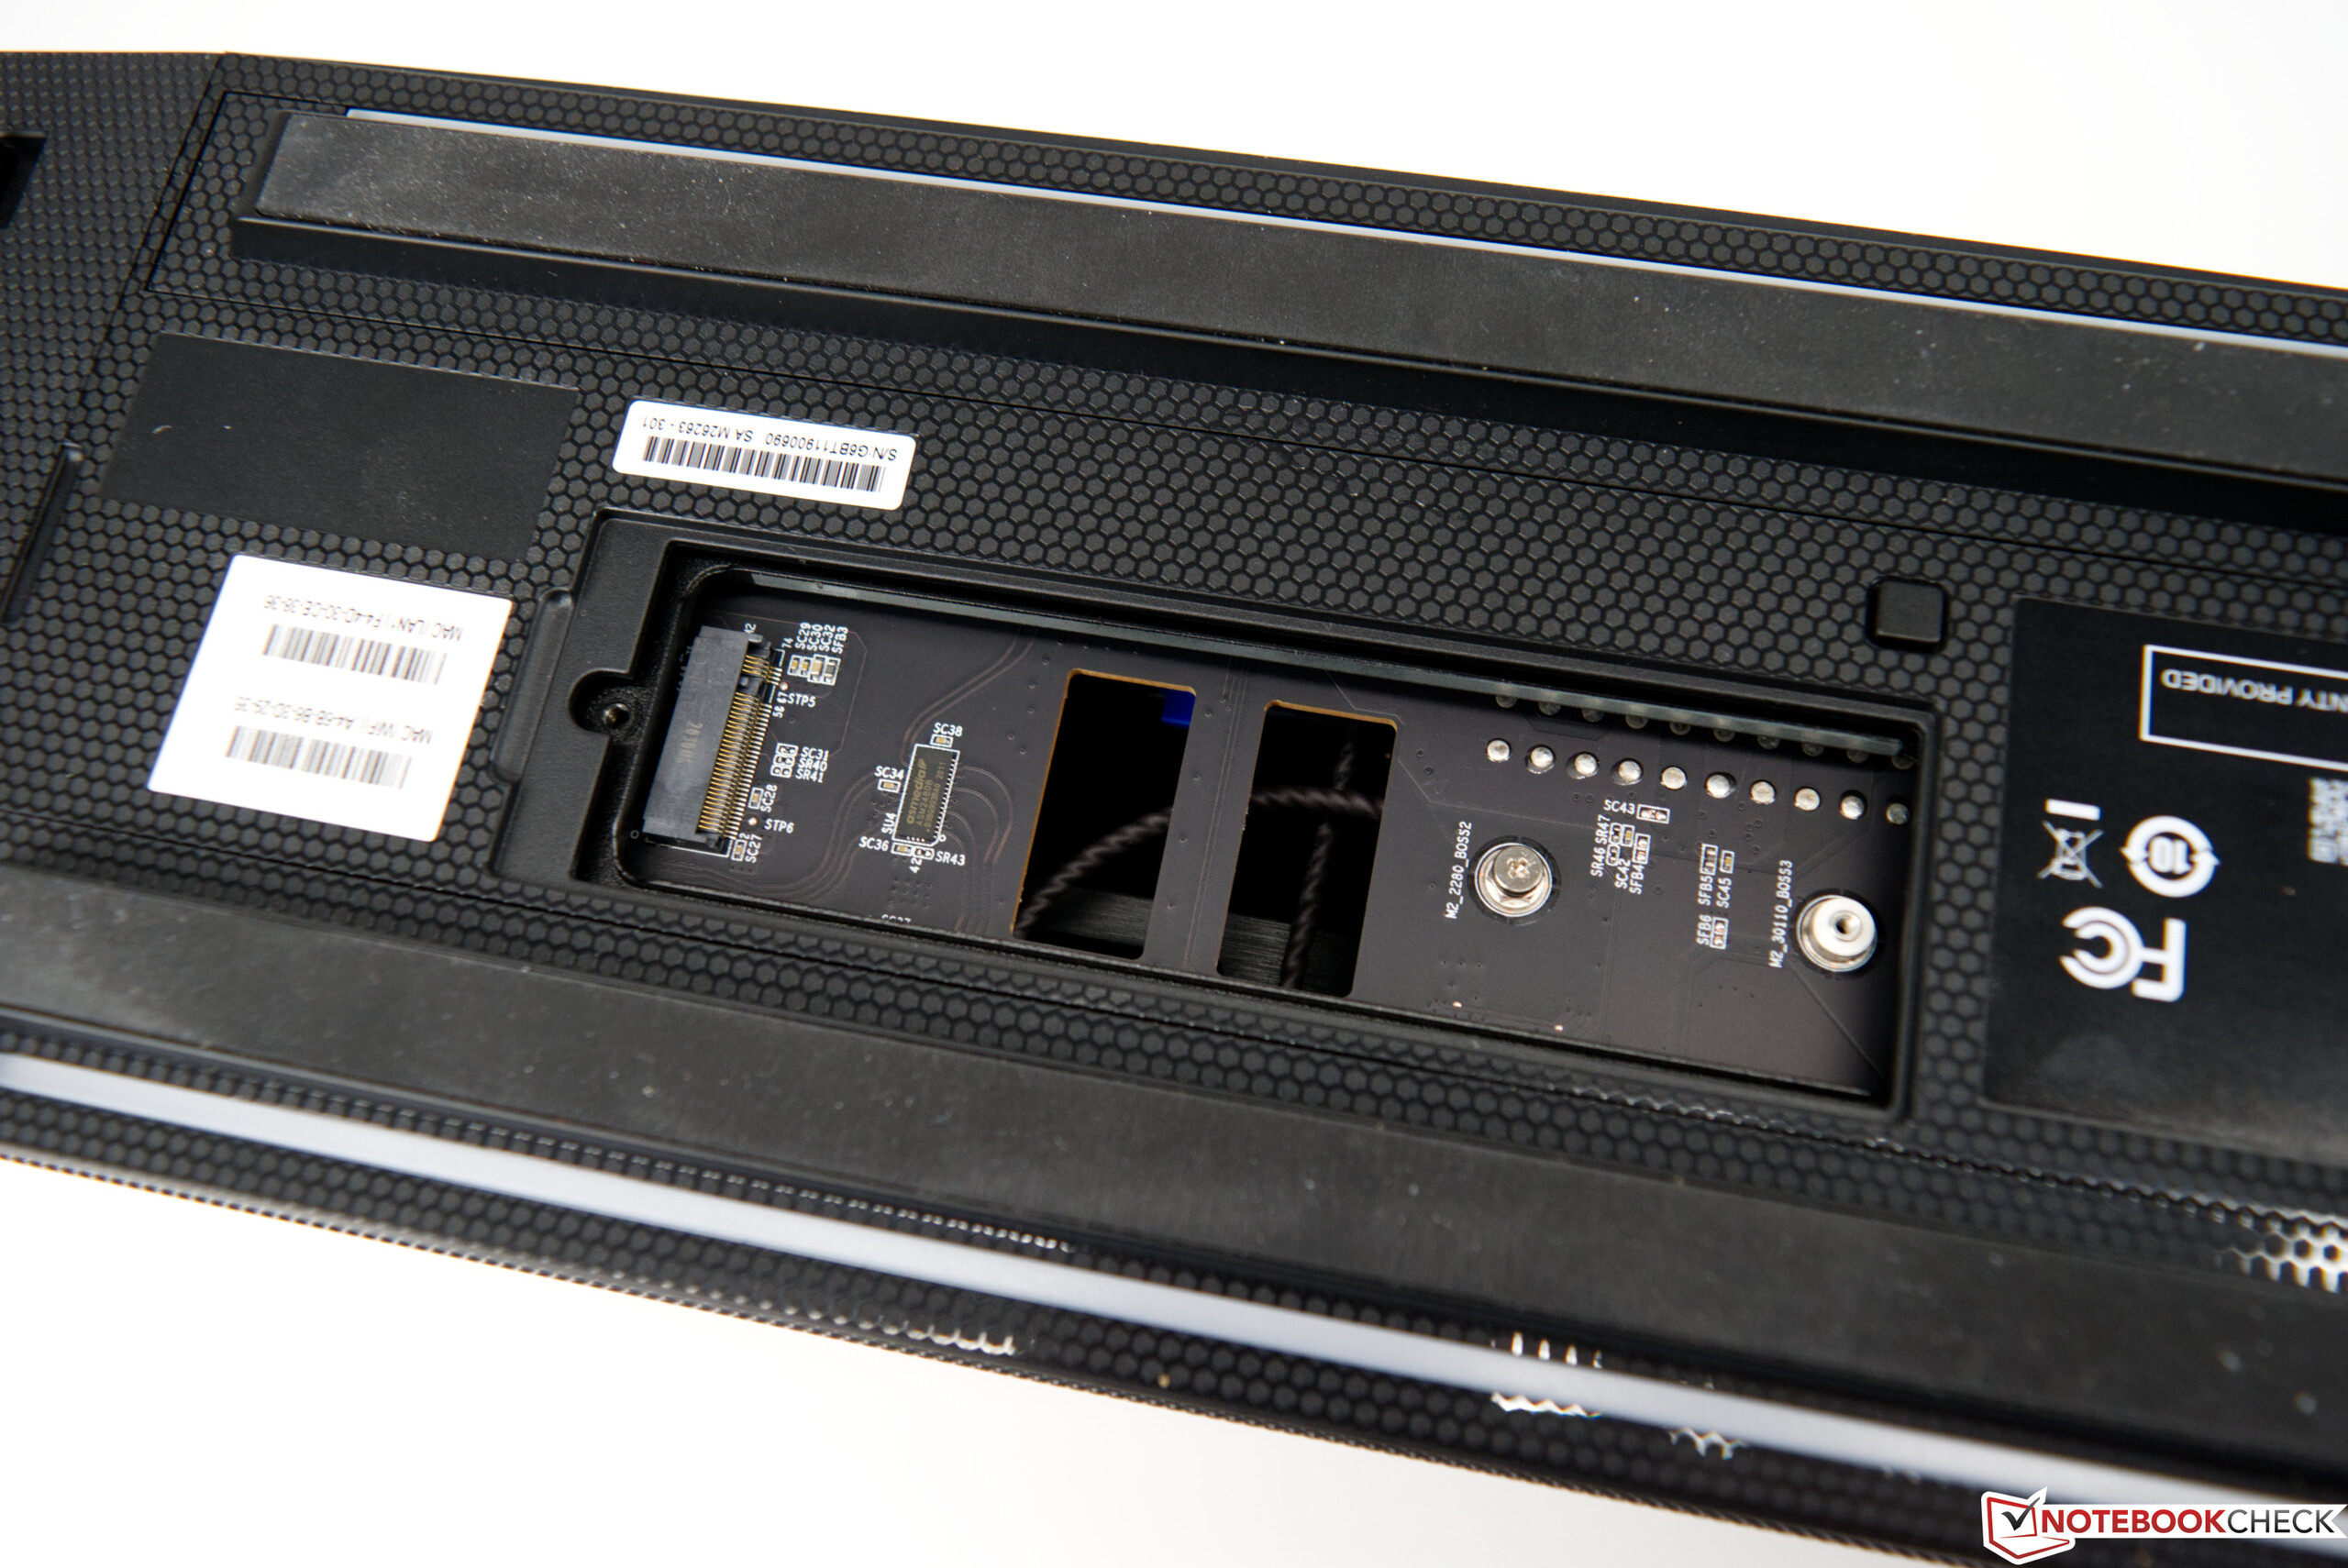
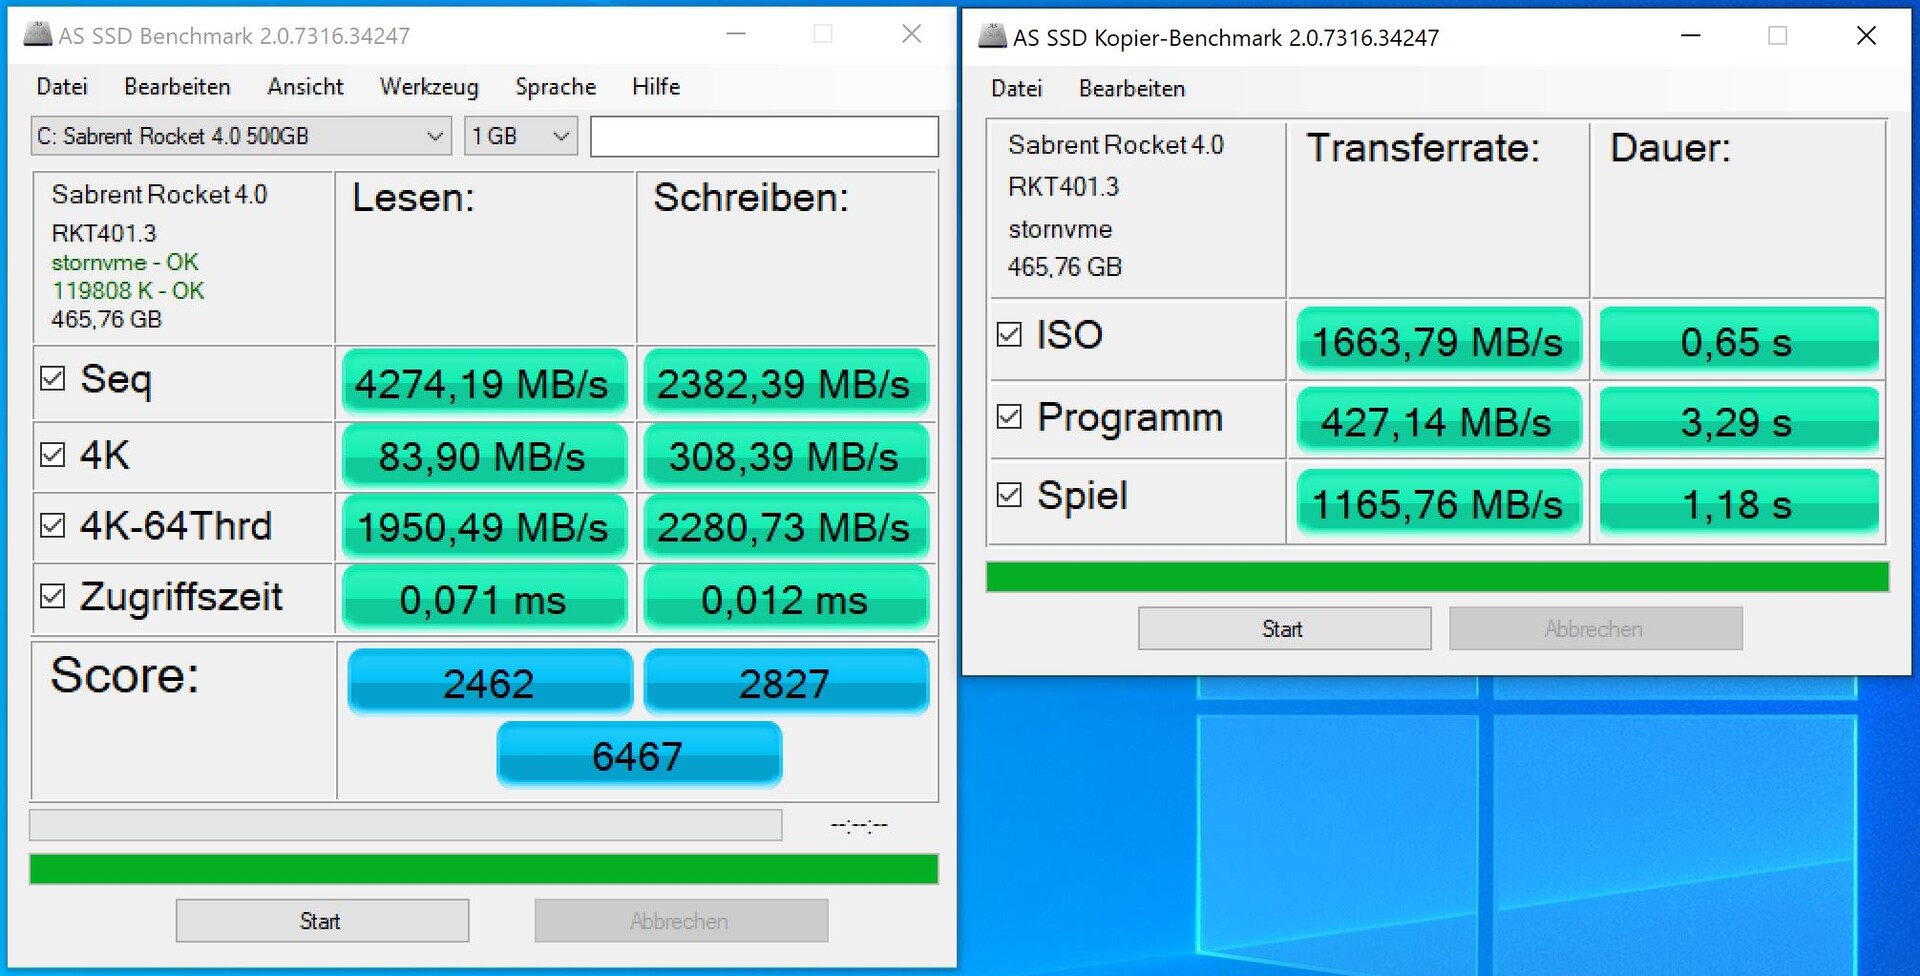
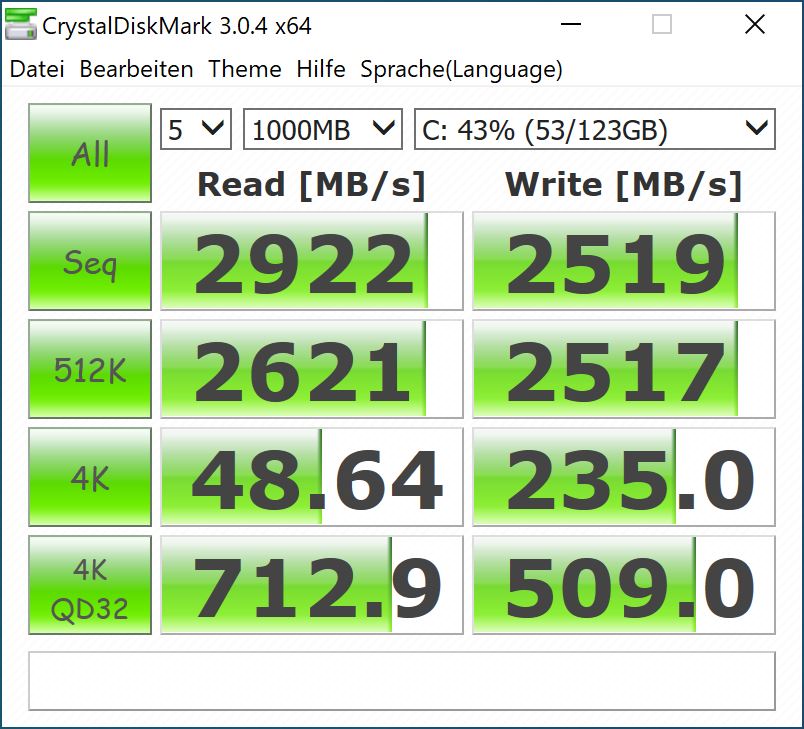
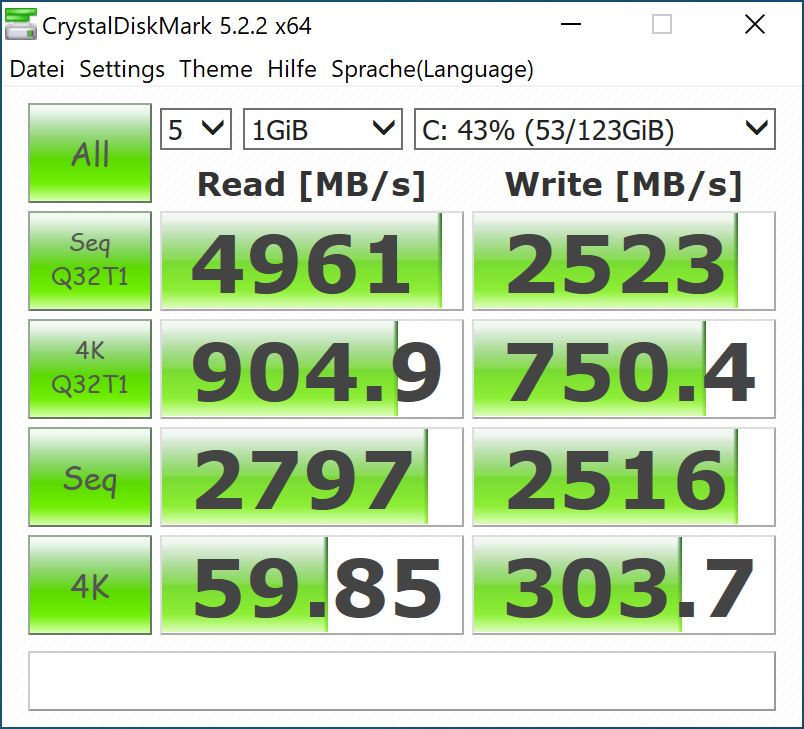
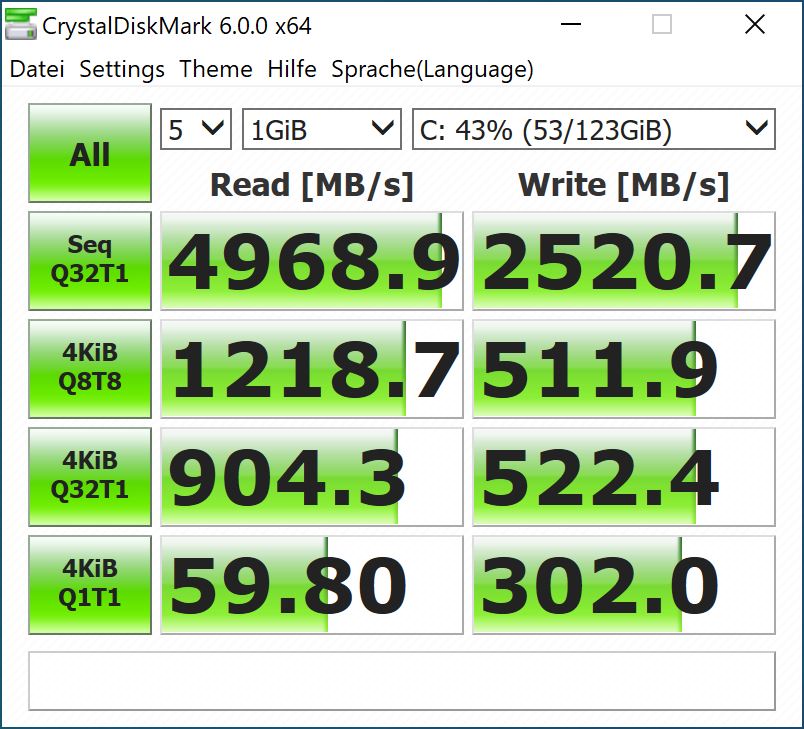
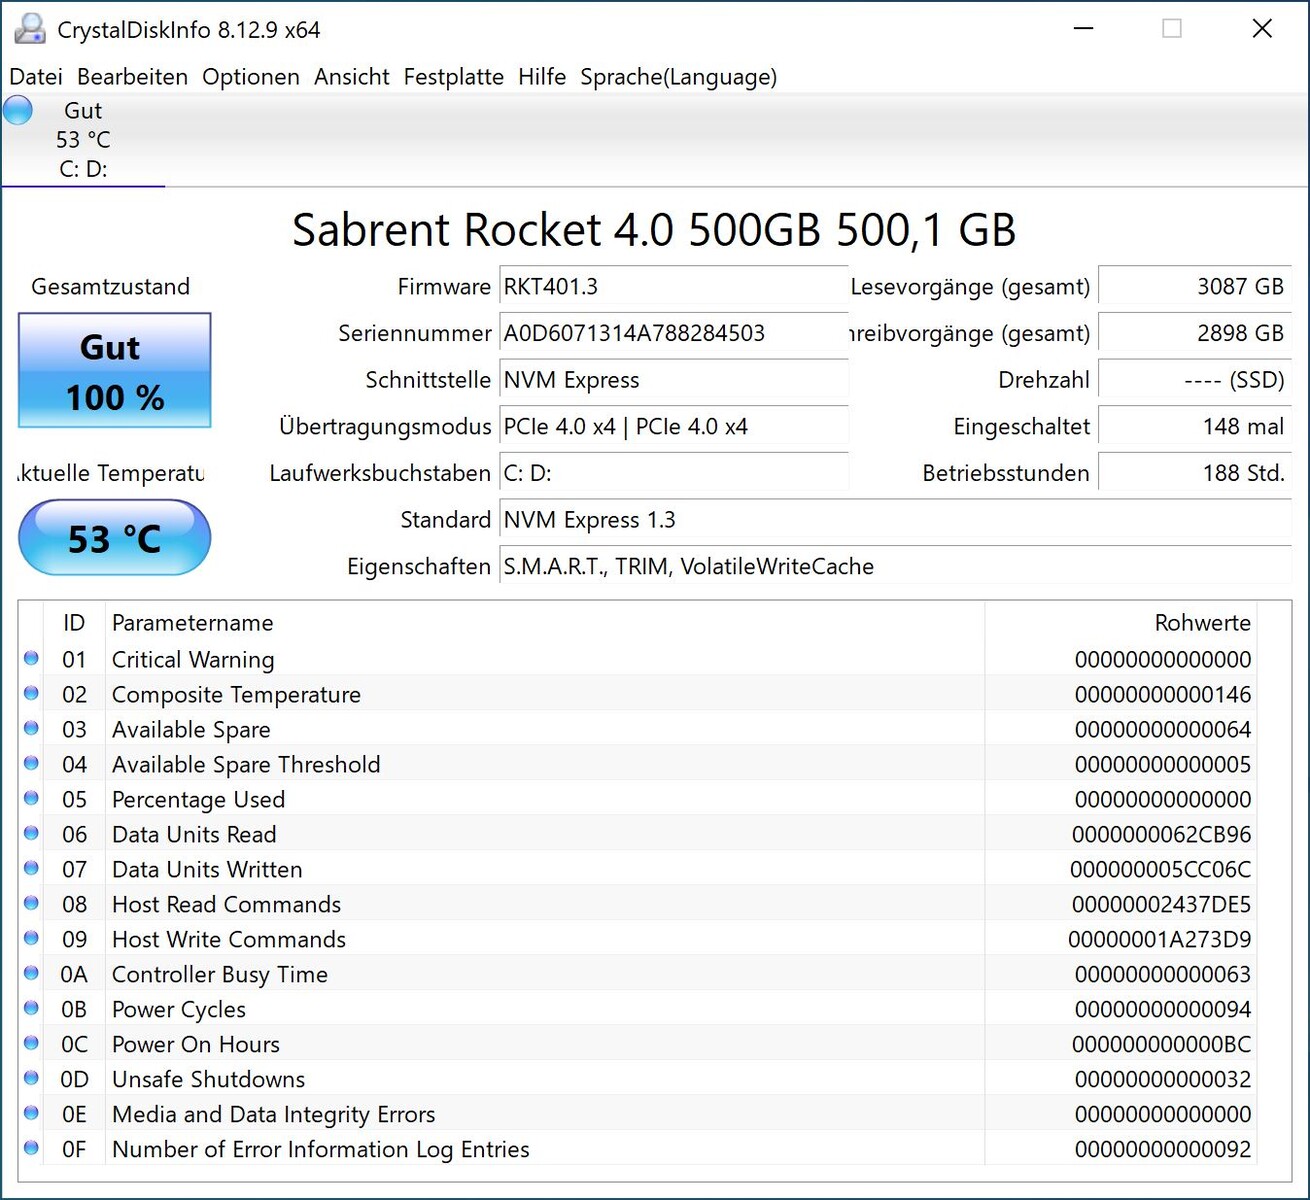
英特尔为测试样本配备了一个500GB的固态硬盘,在测试中表现非常好。由于构造的原因,只能在野兽峡谷NUC中安装SSD。计算元素有三个M.2-2280插槽,另一个模块可以安装在机箱的底面。
| Performance rating - Percent | |
| Intel Core i9-11900K, Intel Core i9-11900K | |
| Intel Core i5-11600K, Intel Core i5-11600K | |
| Intel Core i9-10900K, Intel Core i9-10900K | |
| Intel Core i5-10600K, Intel Core i5-10600K | |
| AMD Ryzen 9 3950X, AMD Ryzen 9 3950X | |
| Corsair One i160, Intel Core i9-9900K | |
| Intel Beast Canyon NUC, Intel Core i9-11900KB | |
| Intel Ghost Canyon NUC (RTX 2070), Intel Core i9-9980HK | |
| PCMark 10 - Score | |
| AMD Ryzen 9 3950X, AMD Ryzen 9 3950X | |
| Intel Core i9-11900K, Intel Core i9-11900K | |
| Intel Core i5-11600K, Intel Core i5-11600K | |
| Intel Core i9-10900K, Intel Core i9-10900K | |
| Corsair One i160, Intel Core i9-9900K | |
| Intel Beast Canyon NUC, Intel Core i9-11900KB | |
| Intel Core i5-10600K, Intel Core i5-10600K | |
| Intel Ghost Canyon NUC (RTX 2070), Intel Core i9-9980HK | |
| SPECviewperf 12 | |
| 1900x1060 Solidworks (sw-03) | |
| Intel Core i9-11900K, Intel Core i9-11900K | |
| Intel Core i9-10900K, Intel Core i9-10900K | |
| Intel Core i5-11600K, Intel Core i5-11600K | |
| Intel Core i5-10600K, Intel Core i5-10600K | |
| AMD Ryzen 9 3950X, AMD Ryzen 9 3950X | |
| Corsair One i160, Intel Core i9-9900K | |
| Intel Beast Canyon NUC, Intel Core i9-11900KB | |
| Intel Ghost Canyon NUC (RTX 2070), Intel Core i9-9980HK | |
| 1900x1060 Siemens NX (snx-02) | |
| Intel Core i9-10900K, Intel Core i9-10900K | |
| Intel Core i5-10600K, Intel Core i5-10600K | |
| AMD Ryzen 9 3950X, AMD Ryzen 9 3950X | |
| Intel Core i5-11600K, Intel Core i5-11600K | |
| Intel Core i9-11900K, Intel Core i9-11900K | |
| Corsair One i160, Intel Core i9-9900K | |
| Intel Ghost Canyon NUC (RTX 2070), Intel Core i9-9980HK | |
| Intel Beast Canyon NUC, Intel Core i9-11900KB | |
| 1900x1060 Showcase (showcase-01) | |
| Intel Core i9-11900K, Intel Core i9-11900K | |
| Intel Core i5-11600K, Intel Core i5-11600K | |
| Intel Core i5-10600K, Intel Core i5-10600K | |
| Intel Core i9-10900K, Intel Core i9-10900K | |
| AMD Ryzen 9 3950X, AMD Ryzen 9 3950X | |
| Corsair One i160, Intel Core i9-9900K | |
| Intel Ghost Canyon NUC (RTX 2070), Intel Core i9-9980HK | |
| Intel Beast Canyon NUC, Intel Core i9-11900KB | |
| 1900x1060 Medical (medical-01) | |
| Intel Core i5-10600K, Intel Core i5-10600K | |
| Intel Core i9-10900K, Intel Core i9-10900K | |
| Intel Core i5-11600K, Intel Core i5-11600K | |
| AMD Ryzen 9 3950X, AMD Ryzen 9 3950X | |
| Intel Core i9-11900K, Intel Core i9-11900K | |
| Corsair One i160, Intel Core i9-9900K | |
| Intel Beast Canyon NUC, Intel Core i9-11900KB | |
| Intel Ghost Canyon NUC (RTX 2070), Intel Core i9-9980HK | |
| 1900x1060 Maya (maya-04) | |
| Intel Core i9-11900K, Intel Core i9-11900K | |
| Intel Beast Canyon NUC, Intel Core i9-11900KB | |
| Corsair One i160, Intel Core i9-9900K | |
| Intel Core i9-10900K, Intel Core i9-10900K | |
| Intel Core i5-11600K, Intel Core i5-11600K | |
| AMD Ryzen 9 3950X, AMD Ryzen 9 3950X | |
| Intel Ghost Canyon NUC (RTX 2070), Intel Core i9-9980HK | |
| Intel Core i5-10600K, Intel Core i5-10600K | |
| 1900x1060 Energy (energy-01) | |
| Intel Core i5-10600K, Intel Core i5-10600K | |
| Intel Core i9-10900K, Intel Core i9-10900K | |
| Intel Core i5-11600K, Intel Core i5-11600K | |
| Intel Core i9-11900K, Intel Core i9-11900K | |
| AMD Ryzen 9 3950X, AMD Ryzen 9 3950X | |
| Corsair One i160, Intel Core i9-9900K | |
| Intel Ghost Canyon NUC (RTX 2070), Intel Core i9-9980HK | |
| Intel Beast Canyon NUC, Intel Core i9-11900KB | |
| 1900x1060 Creo (creo-01) | |
| Intel Core i9-11900K, Intel Core i9-11900K | |
| Intel Core i5-11600K, Intel Core i5-11600K | |
| Intel Core i9-10900K, Intel Core i9-10900K | |
| Intel Core i5-10600K, Intel Core i5-10600K | |
| AMD Ryzen 9 3950X, AMD Ryzen 9 3950X | |
| Corsair One i160, Intel Core i9-9900K | |
| Intel Ghost Canyon NUC (RTX 2070), Intel Core i9-9980HK | |
| Intel Beast Canyon NUC, Intel Core i9-11900KB | |
| 1900x1060 Catia (catia-04) | |
| Intel Core i9-11900K, Intel Core i9-11900K | |
| Intel Core i5-11600K, Intel Core i5-11600K | |
| Intel Core i9-10900K, Intel Core i9-10900K | |
| AMD Ryzen 9 3950X, AMD Ryzen 9 3950X | |
| Intel Core i5-10600K, Intel Core i5-10600K | |
| Corsair One i160, Intel Core i9-9900K | |
| Intel Ghost Canyon NUC (RTX 2070), Intel Core i9-9980HK | |
| Intel Beast Canyon NUC, Intel Core i9-11900KB | |
| 1900x1060 3ds Max (3dsmax-05) | |
| Intel Core i9-10900K, Intel Core i9-10900K | |
| Intel Core i5-10600K, Intel Core i5-10600K | |
| Intel Core i9-11900K, Intel Core i9-11900K | |
| Intel Core i5-11600K, Intel Core i5-11600K | |
| AMD Ryzen 9 3950X, AMD Ryzen 9 3950X | |
| Corsair One i160, Intel Core i9-9900K | |
| Intel Beast Canyon NUC, Intel Core i9-11900KB | |
| Intel Ghost Canyon NUC (RTX 2070), Intel Core i9-9980HK | |
| SPECviewperf 13 | |
| Solidworks (sw-04) | |
| Intel Core i9-11900K, Intel Core i9-11900K | |
| Intel Core i5-11600K, Intel Core i5-11600K | |
| Intel Core i9-10900K, Intel Core i9-10900K | |
| Intel Core i5-10600K, Intel Core i5-10600K | |
| AMD Ryzen 9 3950X, AMD Ryzen 9 3950X | |
| Corsair One i160, Intel Core i9-9900K | |
| Intel Beast Canyon NUC, Intel Core i9-11900KB | |
| Intel Ghost Canyon NUC (RTX 2070), Intel Core i9-9980HK | |
| Siemens NX (snx-03) | |
| Intel Core i9-10900K, Intel Core i9-10900K | |
| Intel Core i5-10600K, Intel Core i5-10600K | |
| AMD Ryzen 9 3950X, AMD Ryzen 9 3950X | |
| Intel Core i5-11600K, Intel Core i5-11600K | |
| Intel Core i9-11900K, Intel Core i9-11900K | |
| Corsair One i160, Intel Core i9-9900K | |
| Intel Ghost Canyon NUC (RTX 2070), Intel Core i9-9980HK | |
| Intel Beast Canyon NUC, Intel Core i9-11900KB | |
| Showcase (showcase-02) | |
| Intel Core i5-10600K, Intel Core i5-10600K | |
| Intel Core i9-10900K, Intel Core i9-10900K | |
| Intel Core i9-11900K, Intel Core i9-11900K | |
| Intel Core i5-11600K, Intel Core i5-11600K | |
| AMD Ryzen 9 3950X, AMD Ryzen 9 3950X | |
| Corsair One i160, Intel Core i9-9900K | |
| Intel Ghost Canyon NUC (RTX 2070), Intel Core i9-9980HK | |
| Intel Beast Canyon NUC, Intel Core i9-11900KB | |
| Medical (medical-02) | |
| AMD Ryzen 9 3950X, AMD Ryzen 9 3950X | |
| Intel Core i9-11900K, Intel Core i9-11900K | |
| Intel Core i5-11600K, Intel Core i5-11600K | |
| Intel Core i5-10600K, Intel Core i5-10600K | |
| Intel Core i9-10900K, Intel Core i9-10900K | |
| Corsair One i160, Intel Core i9-9900K | |
| Intel Ghost Canyon NUC (RTX 2070), Intel Core i9-9980HK | |
| Intel Beast Canyon NUC, Intel Core i9-11900KB | |
| Maya (maya-05) | |
| Intel Core i9-11900K, Intel Core i9-11900K | |
| Intel Core i5-11600K, Intel Core i5-11600K | |
| Intel Core i9-10900K, Intel Core i9-10900K | |
| Corsair One i160, Intel Core i9-9900K | |
| AMD Ryzen 9 3950X, AMD Ryzen 9 3950X | |
| Intel Core i5-10600K, Intel Core i5-10600K | |
| Intel Ghost Canyon NUC (RTX 2070), Intel Core i9-9980HK | |
| Intel Beast Canyon NUC, Intel Core i9-11900KB | |
| Energy (energy-02) | |
| Intel Core i5-11600K, Intel Core i5-11600K | |
| Intel Core i9-11900K, Intel Core i9-11900K | |
| Intel Core i5-10600K, Intel Core i5-10600K | |
| Intel Core i9-10900K, Intel Core i9-10900K | |
| AMD Ryzen 9 3950X, AMD Ryzen 9 3950X | |
| Corsair One i160, Intel Core i9-9900K | |
| Intel Ghost Canyon NUC (RTX 2070), Intel Core i9-9980HK | |
| Intel Beast Canyon NUC, Intel Core i9-11900KB | |
| Creo (creo-02) | |
| Intel Core i9-11900K, Intel Core i9-11900K | |
| Intel Core i5-11600K, Intel Core i5-11600K | |
| Intel Core i9-10900K, Intel Core i9-10900K | |
| Intel Core i5-10600K, Intel Core i5-10600K | |
| AMD Ryzen 9 3950X, AMD Ryzen 9 3950X | |
| Corsair One i160, Intel Core i9-9900K | |
| Intel Ghost Canyon NUC (RTX 2070), Intel Core i9-9980HK | |
| Intel Beast Canyon NUC, Intel Core i9-11900KB | |
| Catia (catia-05) | |
| Intel Core i9-11900K, Intel Core i9-11900K | |
| Intel Core i5-11600K, Intel Core i5-11600K | |
| Intel Core i9-10900K, Intel Core i9-10900K | |
| AMD Ryzen 9 3950X, AMD Ryzen 9 3950X | |
| Intel Core i5-10600K, Intel Core i5-10600K | |
| Corsair One i160, Intel Core i9-9900K | |
| Intel Ghost Canyon NUC (RTX 2070), Intel Core i9-9980HK | |
| Intel Beast Canyon NUC, Intel Core i9-11900KB | |
| 3ds Max (3dsmax-06) | |
| Intel Core i5-10600K, Intel Core i5-10600K | |
| Intel Core i9-10900K, Intel Core i9-10900K | |
| Intel Core i5-11600K, Intel Core i5-11600K | |
| Intel Core i9-11900K, Intel Core i9-11900K | |
| AMD Ryzen 9 3950X, AMD Ryzen 9 3950X | |
| Corsair One i160, Intel Core i9-9900K | |
| Intel Beast Canyon NUC, Intel Core i9-11900KB | |
| Intel Ghost Canyon NUC (RTX 2070), Intel Core i9-9980HK | |
3D性能和游戏性能
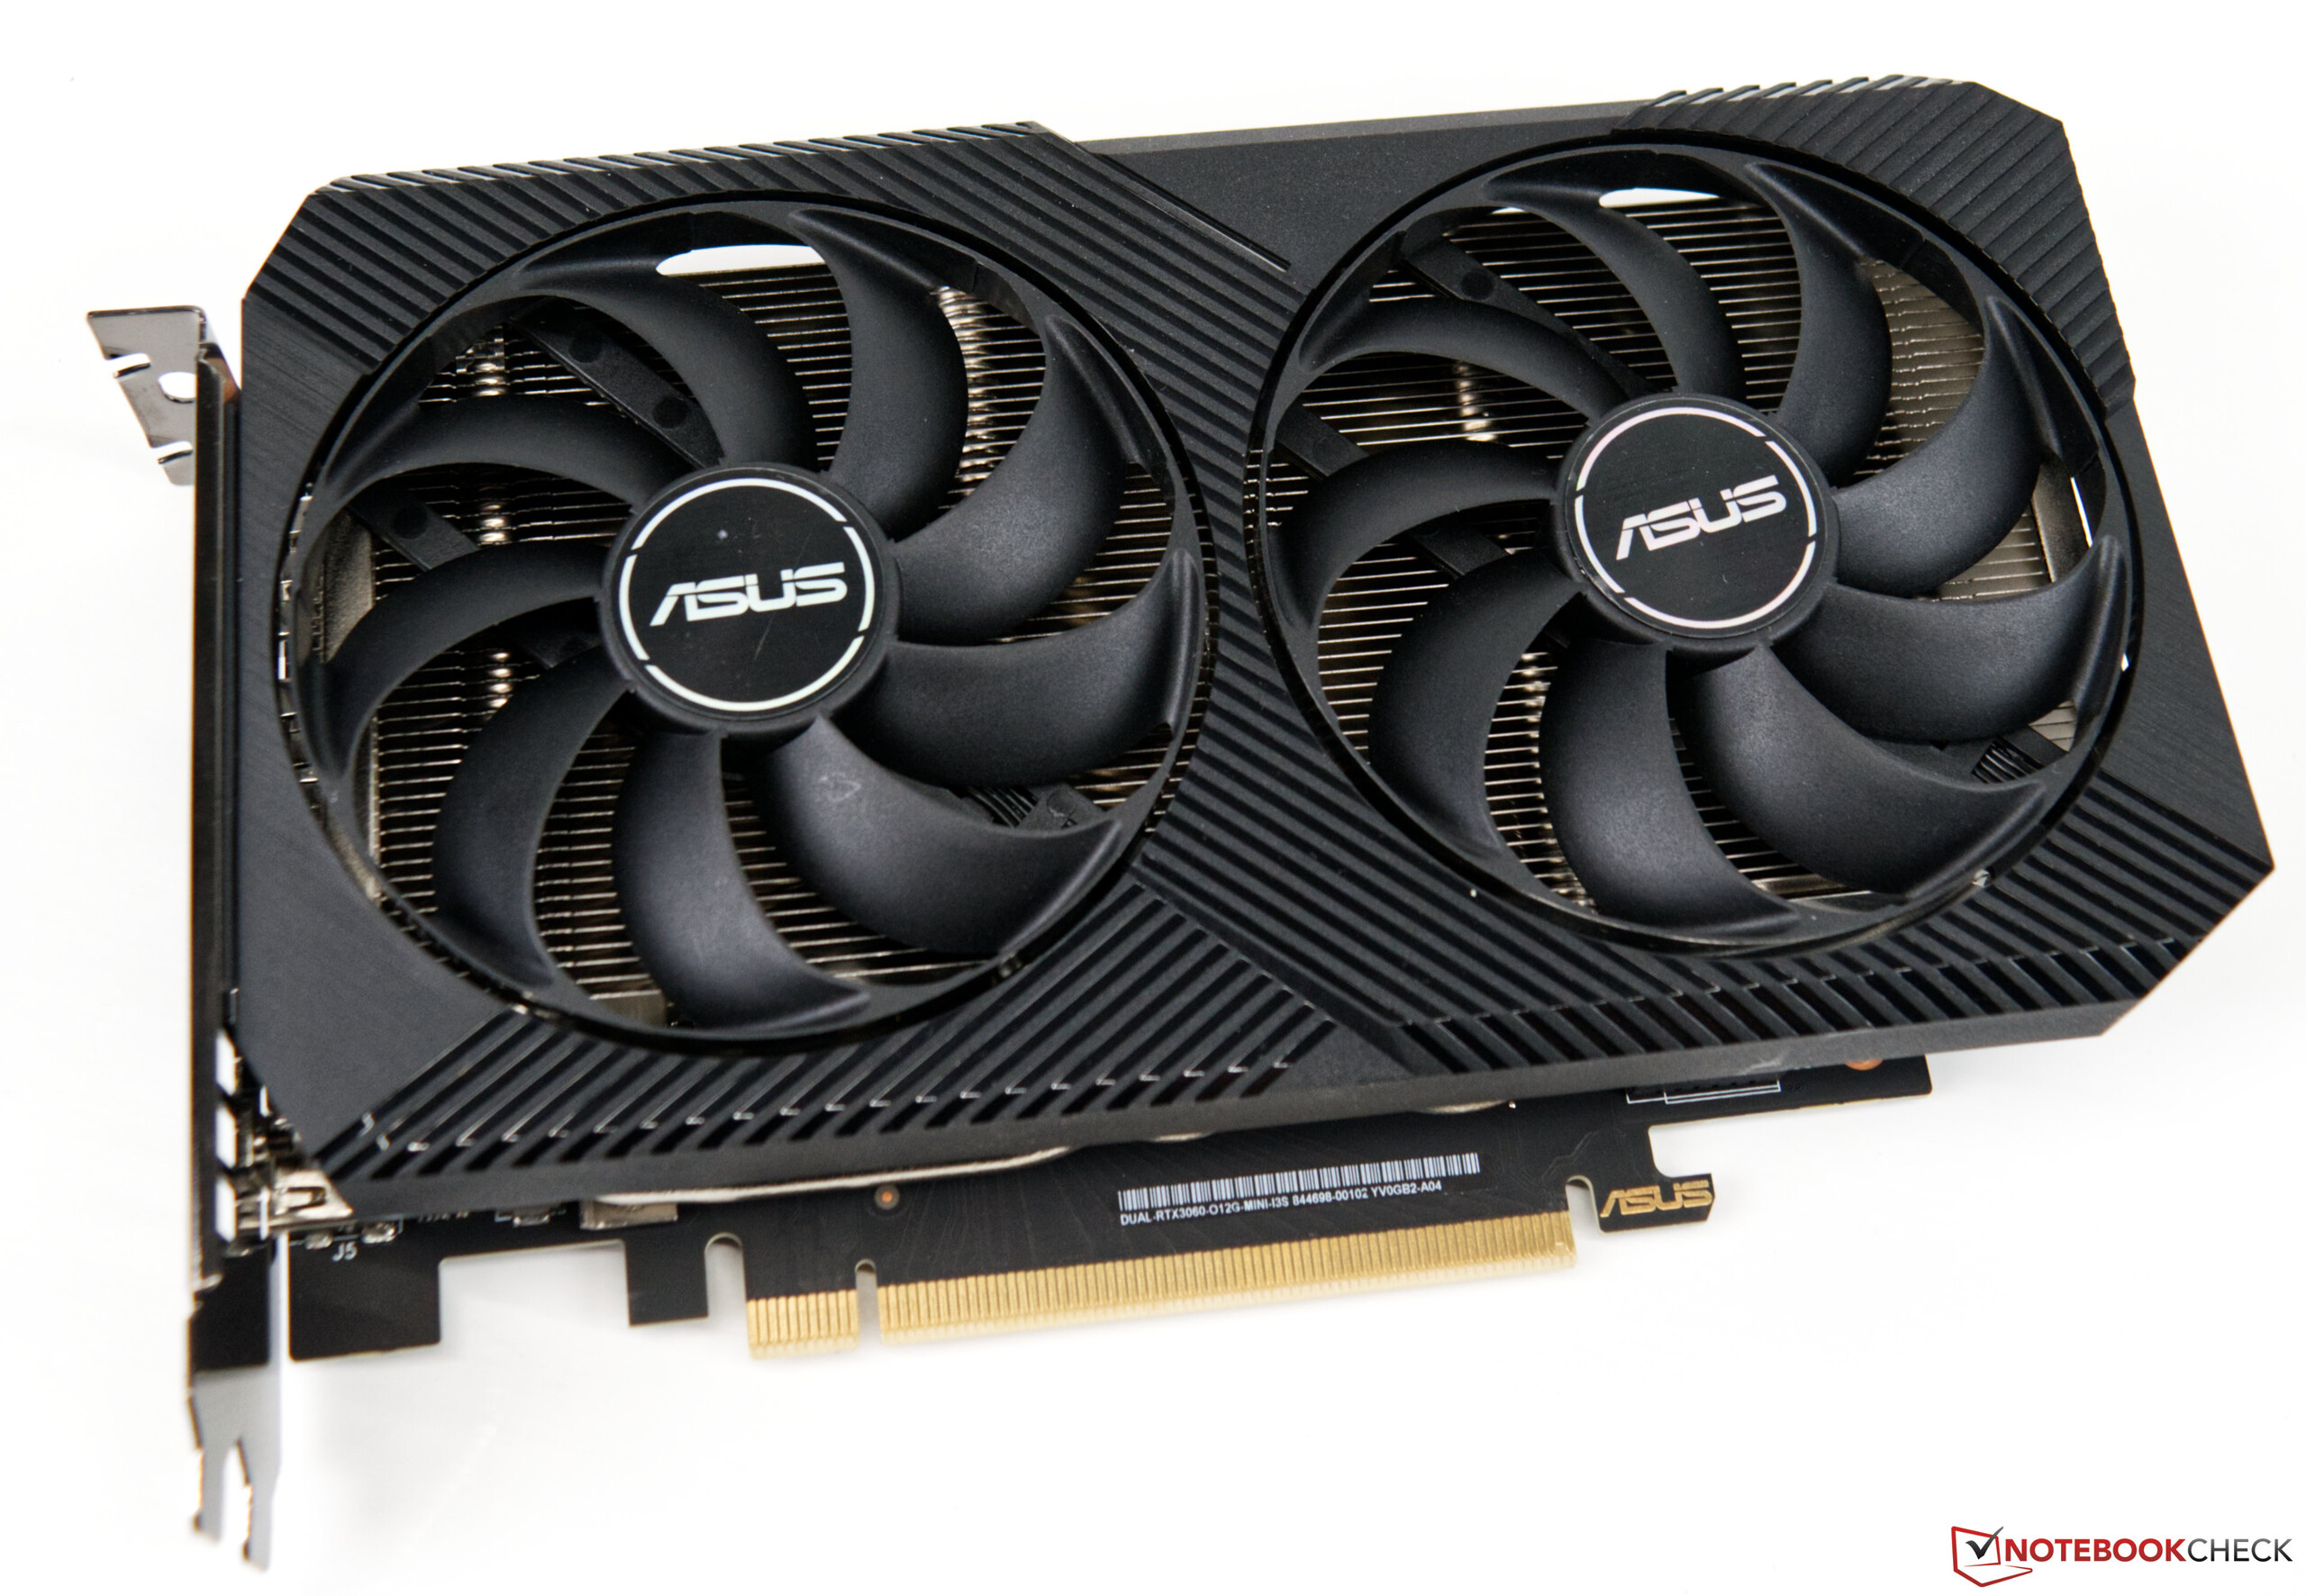
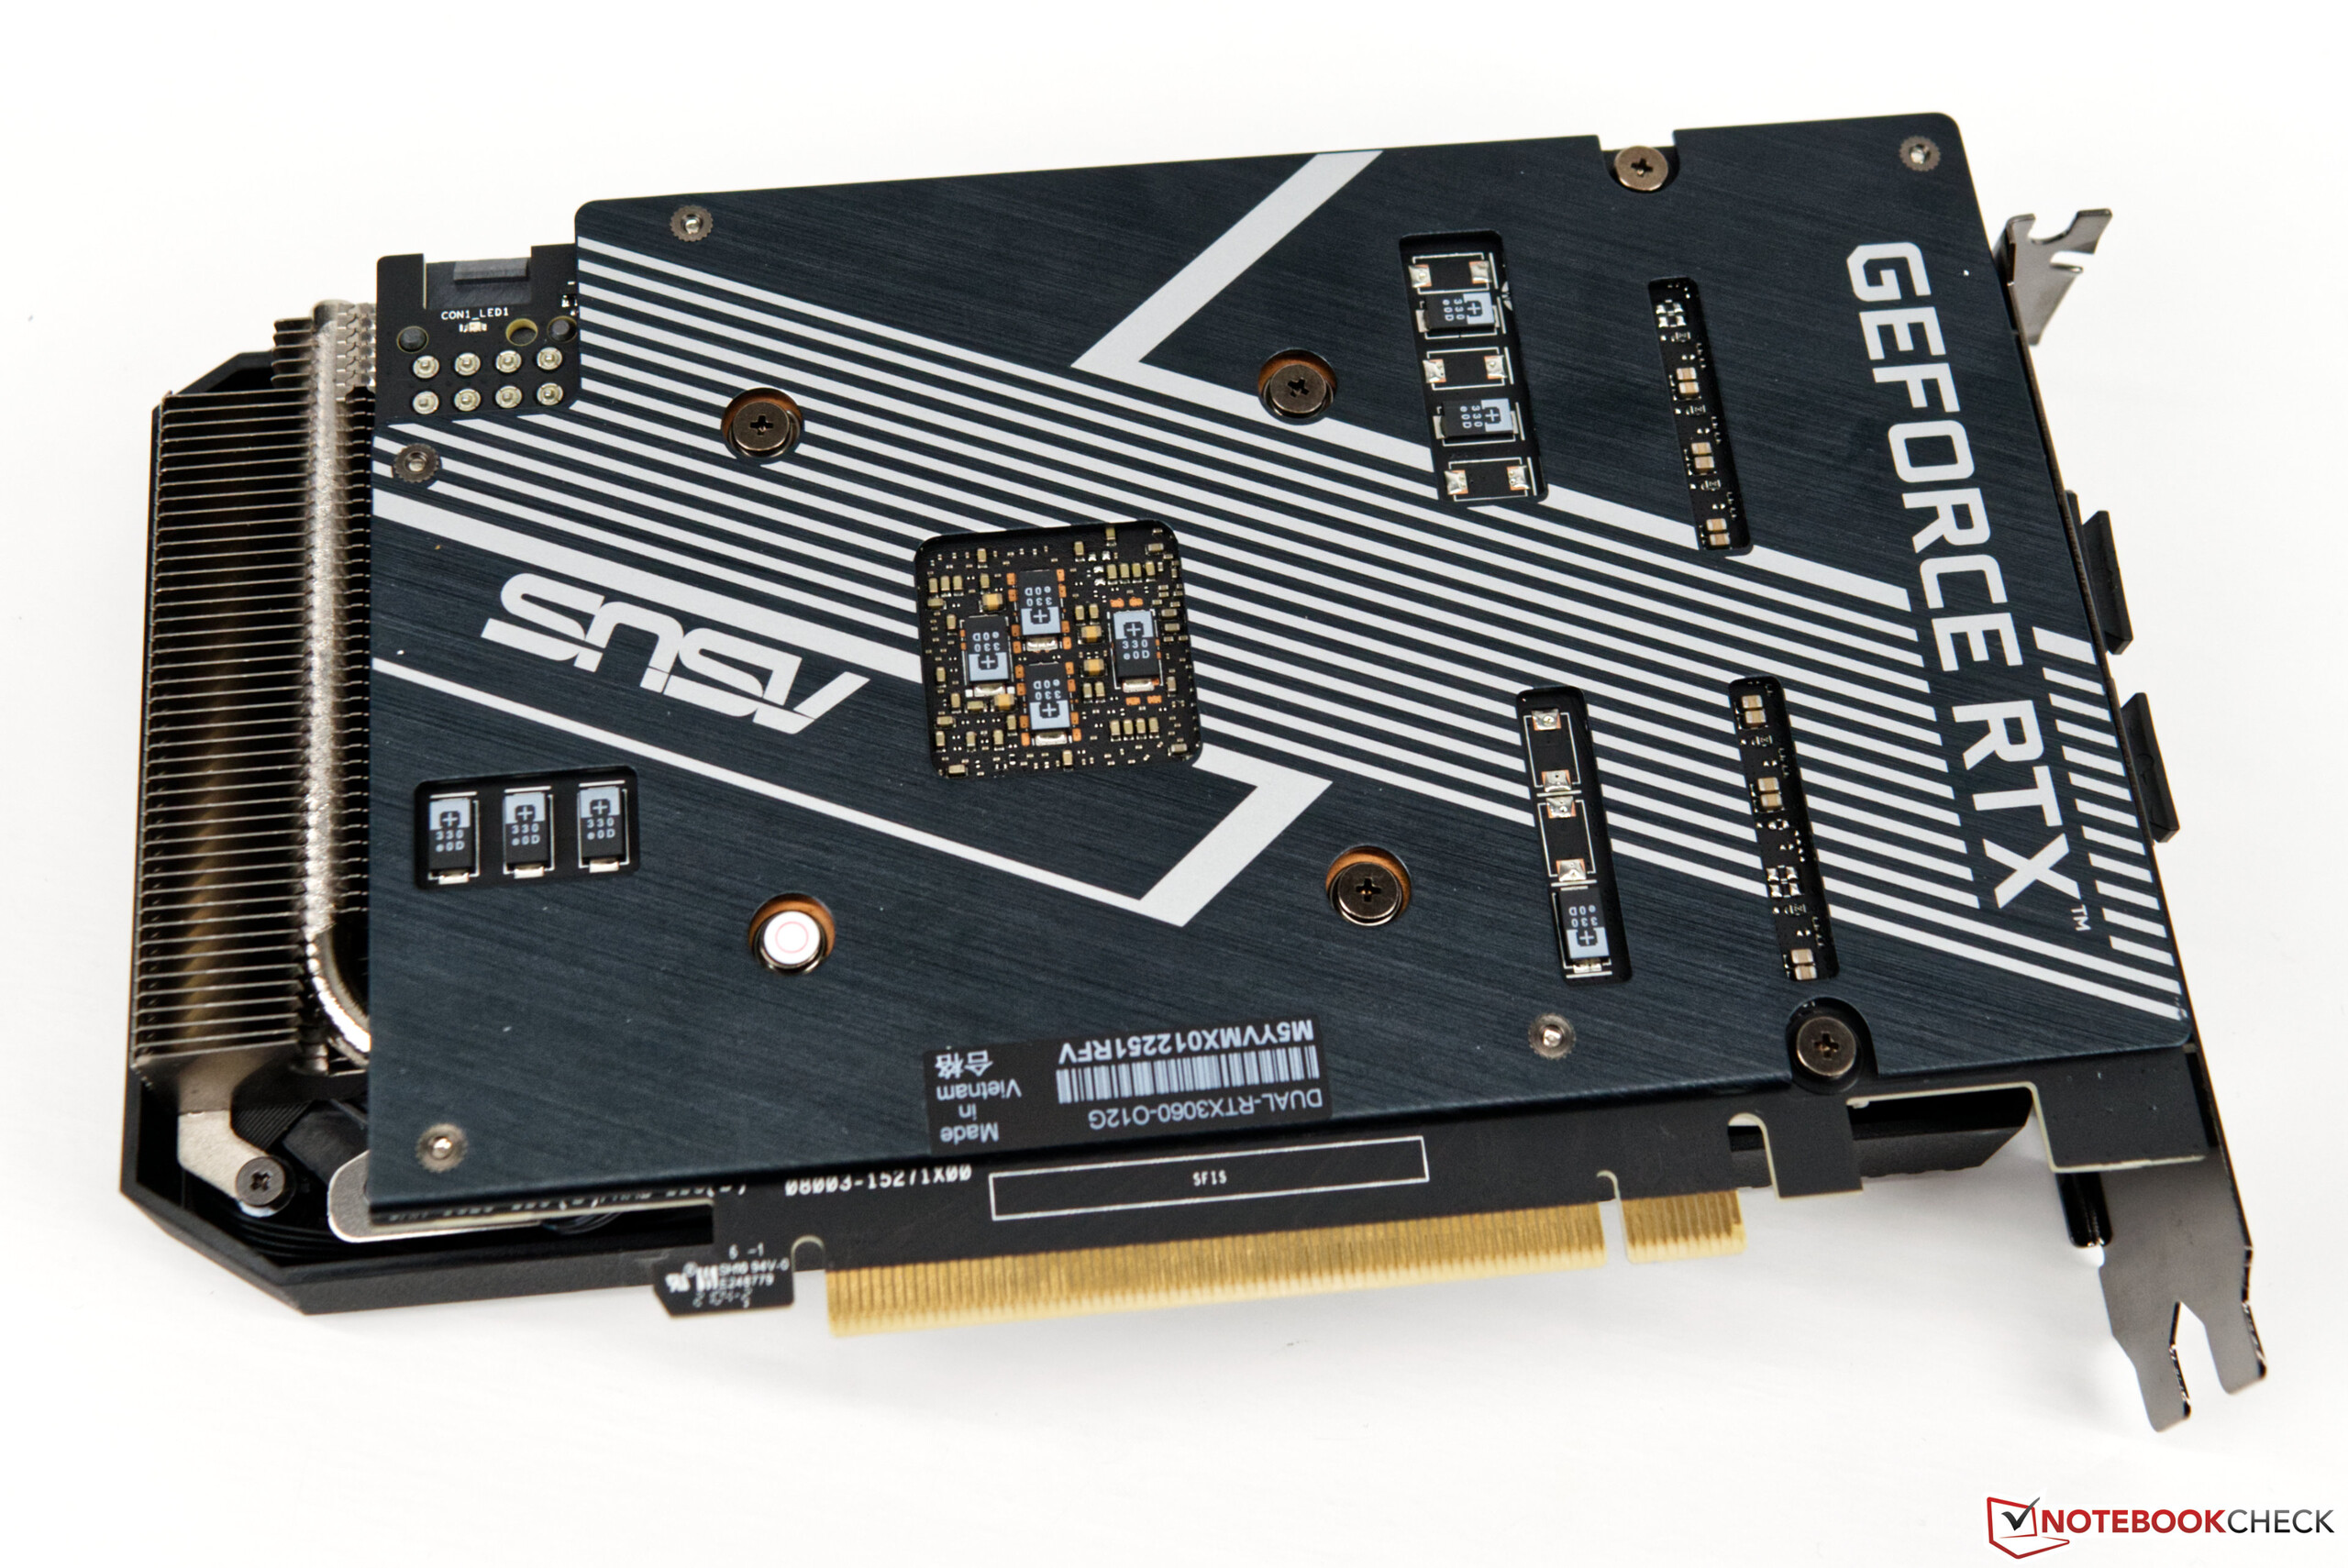
为了获得良好的游戏性能,我们的测试系统配备了一个 NvidiaGeForce RTX 3060华硕的。由于野兽峡谷NUC在出售时没有专用显卡,用户可以自行决定他们想安装什么。的集成GPU。 英特尔酷睿i9-11900KB不建议用于游戏。这里安装的GeForce RTX 3060提供了坚实的性能,基本满足1080p以及1440p游戏的需要。不过,对于持续流畅的4K游戏来说,它还不太够用。尽管如此,旧版游戏可以在高分辨率下流畅地呈现。
如果你想在Beast Canyon NUC中安装不同的显卡,你应该事先了解GPU的尺寸。显卡的散热设计不能超过两槽,最大长度应该是12英寸。
| Performance rating - Percent | |
| Zotac Magnus One (ECM73070C) | |
| Inno3D GeForce RTX 3060 Twin X2 | |
| Intel Beast Canyon NUC -2! | |
| Intel Ghost Canyon NUC (RTX 2070) | |
| Borderlands 3 | |
| 1280x720 Very Low Overall Quality (DX11) | |
| Inno3D GeForce RTX 3060 Twin X2 | |
| Intel Beast Canyon NUC | |
| Intel Ghost Canyon NUC (RTX 2070) | |
| Zotac Magnus One (ECM73070C) | |
| 1920x1080 Badass Overall Quality (DX11) | |
| Intel Beast Canyon NUC | |
| Zotac Magnus One (ECM73070C) | |
| Inno3D GeForce RTX 3060 Twin X2 | |
| Intel Ghost Canyon NUC (RTX 2070) | |
| Metro Exodus | |
| 1280x720 Low Quality AF:4x | |
| Inno3D GeForce RTX 3060 Twin X2 | |
| Intel Beast Canyon NUC | |
| Intel Ghost Canyon NUC (RTX 2070) | |
| Zotac Magnus One (ECM73070C) | |
| 1920x1080 Ultra Quality AF:16x | |
| Zotac Magnus One (ECM73070C) | |
| Intel Ghost Canyon NUC (RTX 2070) | |
| Intel Beast Canyon NUC | |
| Inno3D GeForce RTX 3060 Twin X2 | |
| Far Cry New Dawn | |
| 1280x720 Low Preset | |
| Inno3D GeForce RTX 3060 Twin X2 | |
| Intel Beast Canyon NUC | |
| Intel Ghost Canyon NUC (RTX 2070) | |
| Zotac Magnus One (ECM73070C) | |
| 1920x1080 Ultra Preset | |
| Inno3D GeForce RTX 3060 Twin X2 | |
| Intel Beast Canyon NUC | |
| Zotac Magnus One (ECM73070C) | |
| Intel Ghost Canyon NUC (RTX 2070) | |
| Far Cry 5 | |
| 1280x720 Low Preset AA:T | |
| Inno3D GeForce RTX 3060 Twin X2 | |
| Intel Beast Canyon NUC | |
| Zotac Magnus One (ECM73070C) | |
| Intel Ghost Canyon NUC (RTX 2070) | |
| 1920x1080 Ultra Preset AA:T | |
| Inno3D GeForce RTX 3060 Twin X2 | |
| Intel Beast Canyon NUC | |
| Zotac Magnus One (ECM73070C) | |
| Intel Ghost Canyon NUC (RTX 2070) | |
| X-Plane 11.11 | |
| 1280x720 low (fps_test=1) | |
| Inno3D GeForce RTX 3060 Twin X2 | |
| Intel Beast Canyon NUC | |
| Intel Ghost Canyon NUC (RTX 2070) | |
| Zotac Magnus One (ECM73070C) | |
| 1920x1080 high (fps_test=3) | |
| Inno3D GeForce RTX 3060 Twin X2 | |
| Intel Beast Canyon NUC | |
| Intel Ghost Canyon NUC (RTX 2070) | |
| Zotac Magnus One (ECM73070C) | |
| Final Fantasy XV Benchmark | |
| 1280x720 Lite Quality | |
| Inno3D GeForce RTX 3060 Twin X2 | |
| Intel Beast Canyon NUC | |
| Intel Ghost Canyon NUC (RTX 2070) | |
| Zotac Magnus One (ECM73070C) | |
| 1920x1080 High Quality | |
| Zotac Magnus One (ECM73070C) | |
| Intel Ghost Canyon NUC (RTX 2070) | |
| Inno3D GeForce RTX 3060 Twin X2 | |
| Intel Beast Canyon NUC | |
| Dota 2 Reborn | |
| 1280x720 min (0/3) fastest | |
| Inno3D GeForce RTX 3060 Twin X2 | |
| Intel Beast Canyon NUC | |
| Zotac Magnus One (ECM73070C) | |
| Intel Ghost Canyon NUC (RTX 2070) | |
| 1920x1080 ultra (3/3) best looking | |
| Inno3D GeForce RTX 3060 Twin X2 | |
| Intel Beast Canyon NUC | |
| Intel Ghost Canyon NUC (RTX 2070) | |
| Zotac Magnus One (ECM73070C) | |
| The Witcher 3 | |
| 1024x768 Low Graphics & Postprocessing | |
| Inno3D GeForce RTX 3060 Twin X2 | |
| Zotac Magnus One (ECM73070C) | |
| Intel Ghost Canyon NUC (RTX 2070) | |
| 1920x1080 Ultra Graphics & Postprocessing (HBAO+) | |
| Zotac Magnus One (ECM73070C) | |
| Intel Ghost Canyon NUC (RTX 2070) | |
| Inno3D GeForce RTX 3060 Twin X2 | |
| 3DMark | |
| Fire Strike Extreme Graphics | |
| Zotac Magnus One (ECM73070C) | |
| Inno3D GeForce RTX 3060 Twin X2 | |
| Intel Beast Canyon NUC | |
| Intel Ghost Canyon NUC (RTX 2070) | |
| 1920x1080 Fire Strike Graphics | |
| Zotac Magnus One (ECM73070C) | |
| Inno3D GeForce RTX 3060 Twin X2 | |
| Intel Beast Canyon NUC | |
| Intel Ghost Canyon NUC (RTX 2070) | |
| 2560x1440 Time Spy Graphics | |
| Zotac Magnus One (ECM73070C) | |
| Intel Ghost Canyon NUC (RTX 2070) | |
| Inno3D GeForce RTX 3060 Twin X2 | |
| Intel Beast Canyon NUC | |
| 3DMark 11 | |
| 1280x720 Performance GPU | |
| Zotac Magnus One (ECM73070C) | |
| Intel Beast Canyon NUC | |
| Intel Ghost Canyon NUC (RTX 2070) | |
| Inno3D GeForce RTX 3060 Twin X2 | |
| 1280x720 Performance | |
| Zotac Magnus One (ECM73070C) | |
| Inno3D GeForce RTX 3060 Twin X2 | |
| Intel Beast Canyon NUC | |
| Intel Ghost Canyon NUC (RTX 2070) | |
| low | med. | high | ultra | QHD DLSS | QHD | 4K DLSS | 4K | |
|---|---|---|---|---|---|---|---|---|
| GTA V (2015) | 186 | 181 | 177 | 104 | 81.4 | 82.3 | ||
| Dota 2 Reborn (2015) | 178.3 | 161.7 | 155.6 | 147.1 | 116.1 | |||
| Final Fantasy XV Benchmark (2018) | 196 | 123 | 88.6 | 64.8 | 38 | |||
| X-Plane 11.11 (2018) | 151 | 133 | 105 | 88.5 | ||||
| Far Cry 5 (2018) | 170 | 140 | 131 | 122 | 94 | 49 | ||
| Strange Brigade (2018) | 491 | 230 | 180 | 154 | 116 | 66.8 | ||
| Far Cry New Dawn (2019) | 144 | 120 | 115 | 102 | 88 | 50 | ||
| Metro Exodus (2019) | 198 | 105 | 77.4 | 59.8 | 48.6 | 31.3 | ||
| Borderlands 3 (2019) | 156 | 152 | 133 | 100 | 70.2 | 36.8 | ||
| F1 2020 (2020) | 355 | 259 | 208 | 142 | 106 | 60.2 | ||
| F1 2021 (2021) | 419 | 261 | 206 | 96.9 | 72 | 40.9 | ||
| Far Cry 6 (2021) | 136 | 116 | 103 | 90.8 | 68.8 | 38.8 | ||
| Baldur's Gate 3 (2023) | 131 | 100 | 86.7 | 86 | 59 | 30.8 | ||
| Kingdom Come Deliverance 2 (2025) | 81.7 | 66.5 | 46.8 | |||||
| F1 25 (2025) | 209 | 174.7 | 131.4 | 11.5 | 12 | 6.63 | 5.61 | 3.08 |
| Borderlands 4 (2025) | 42.5 | 34.6 | 26.8 | 19.6 |
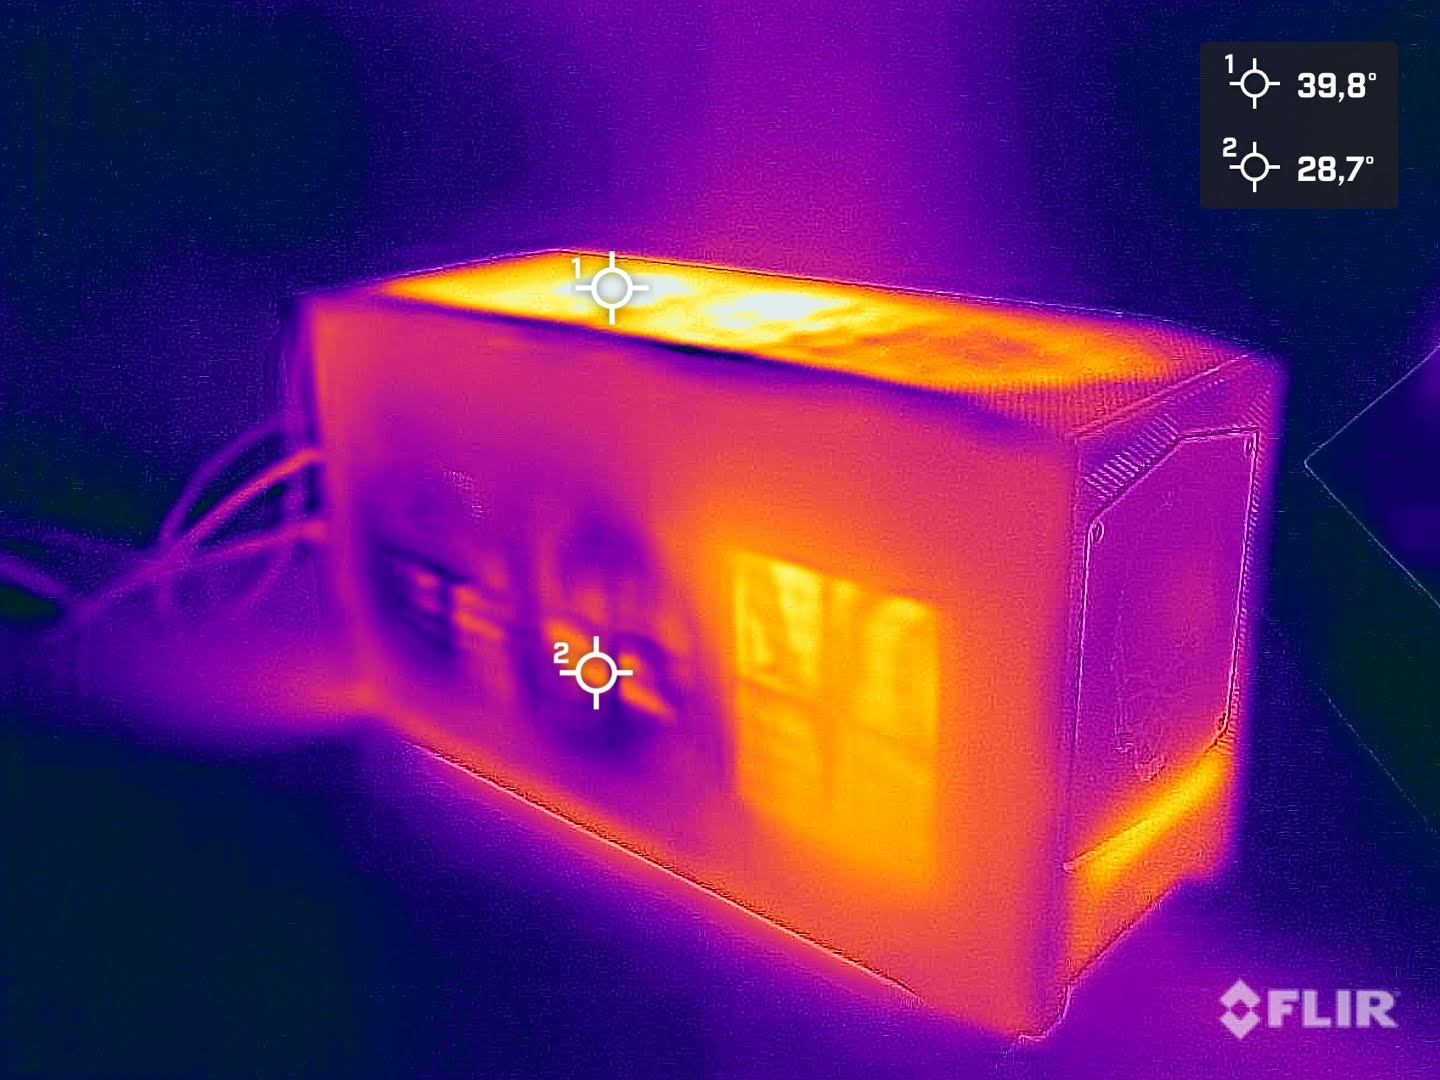
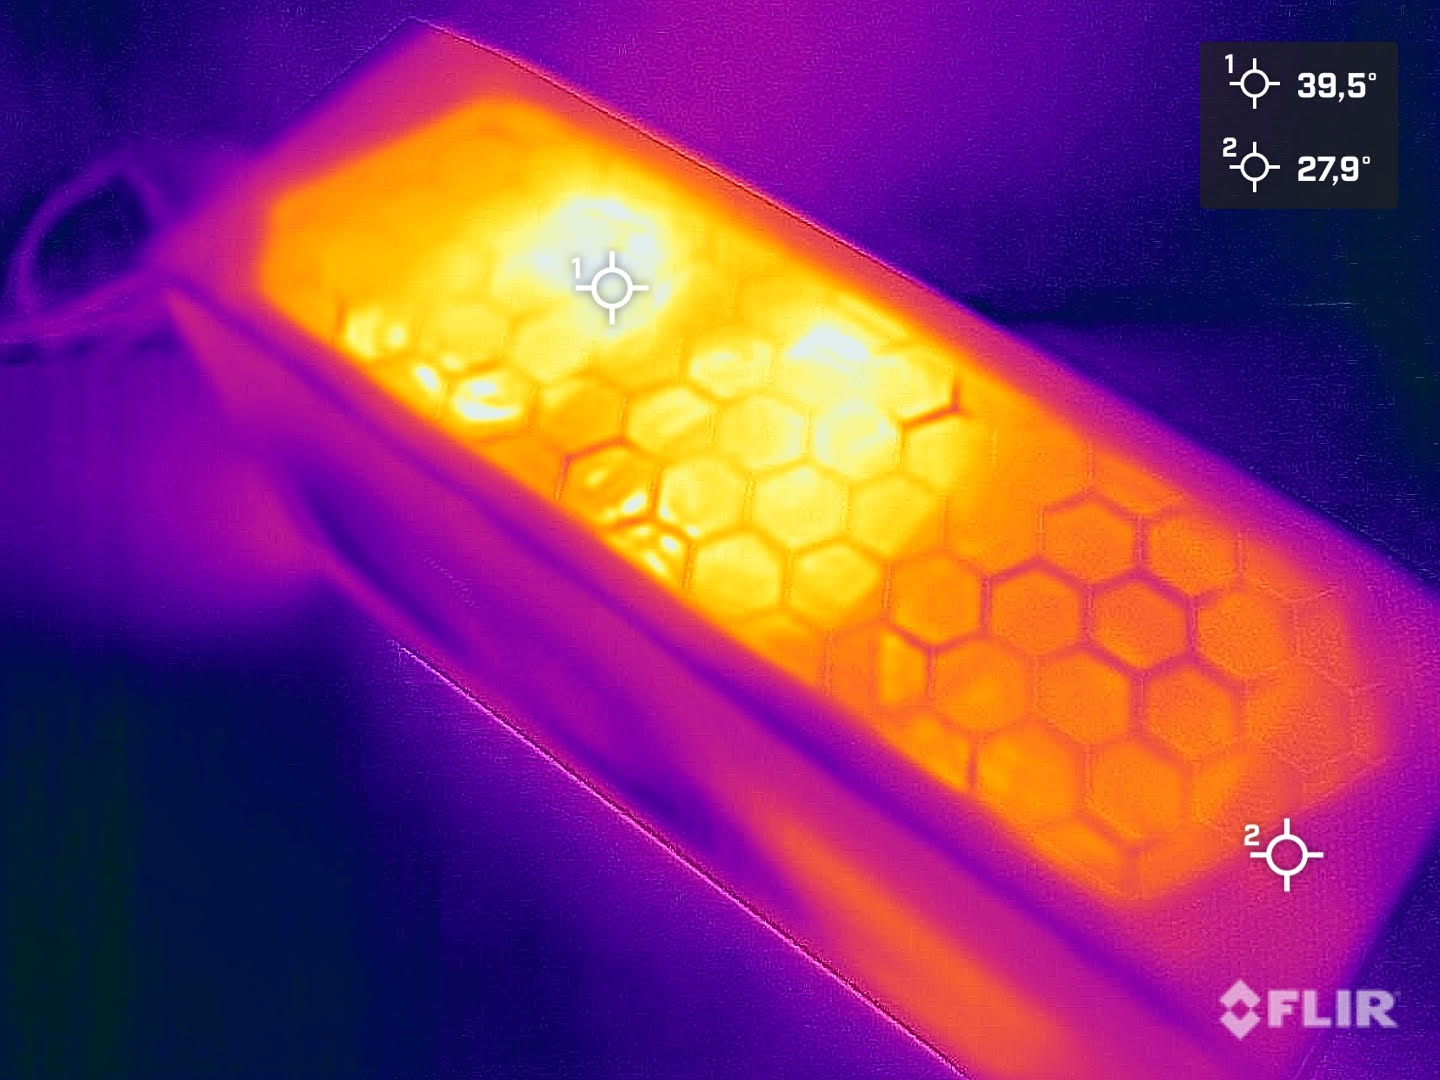
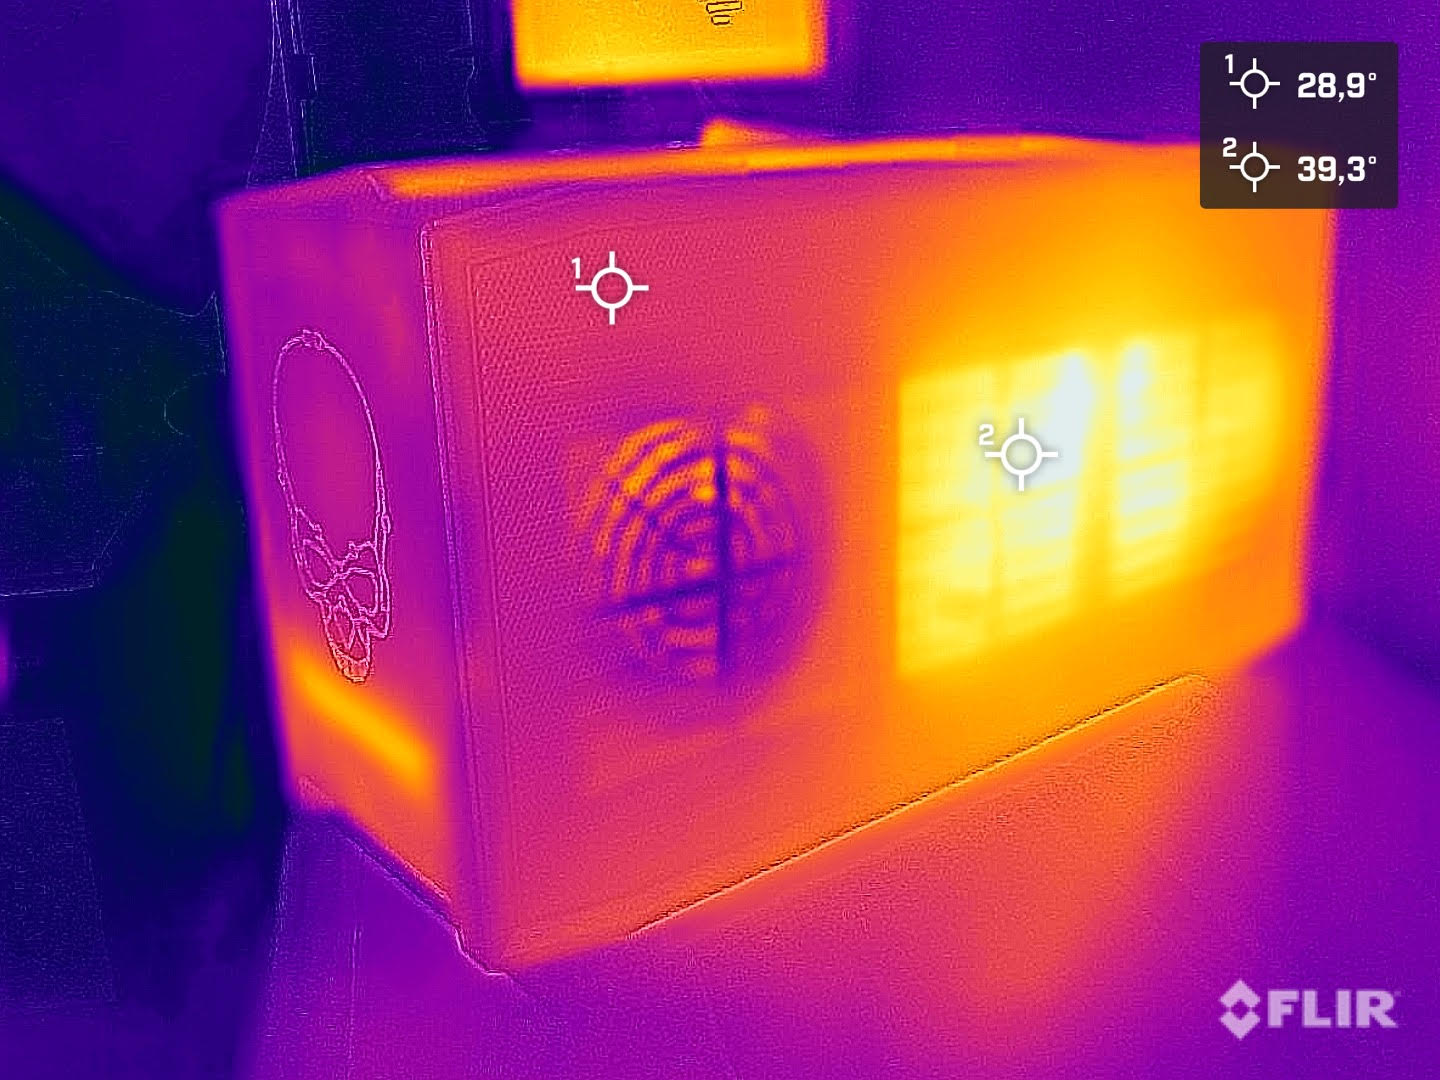
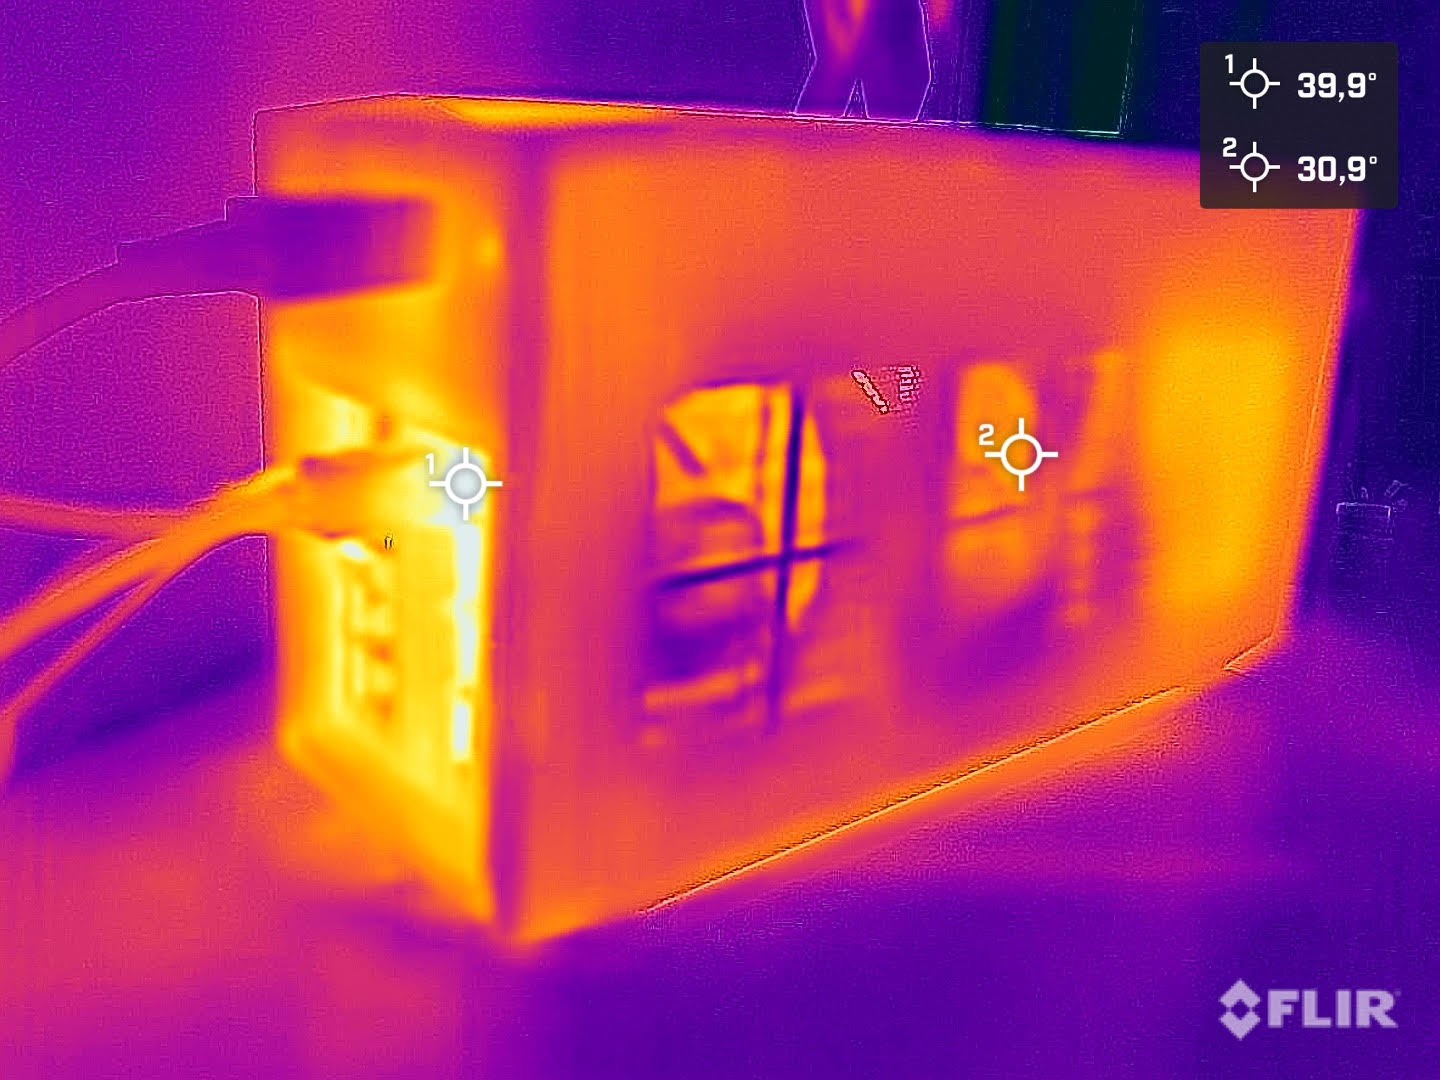
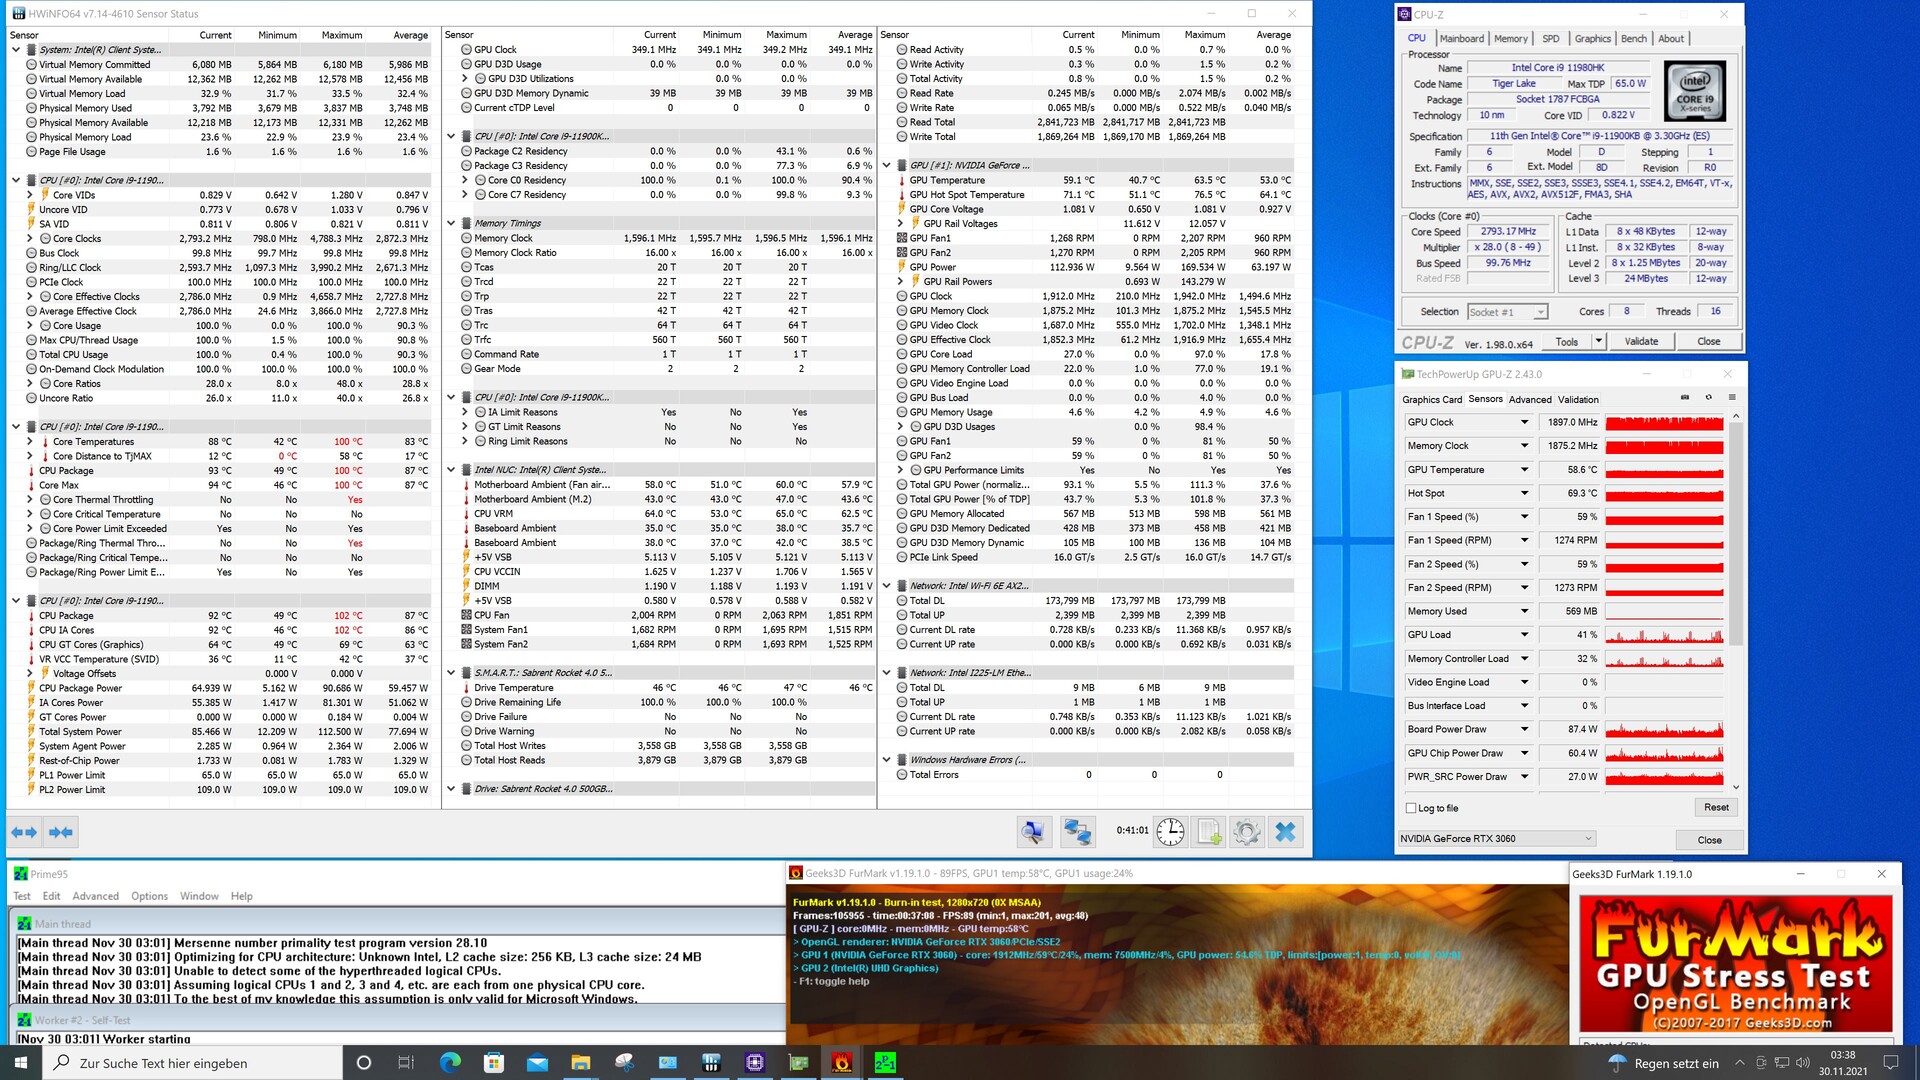
英特尔NUC 11 Beast Canyon的能源消耗和热量开发
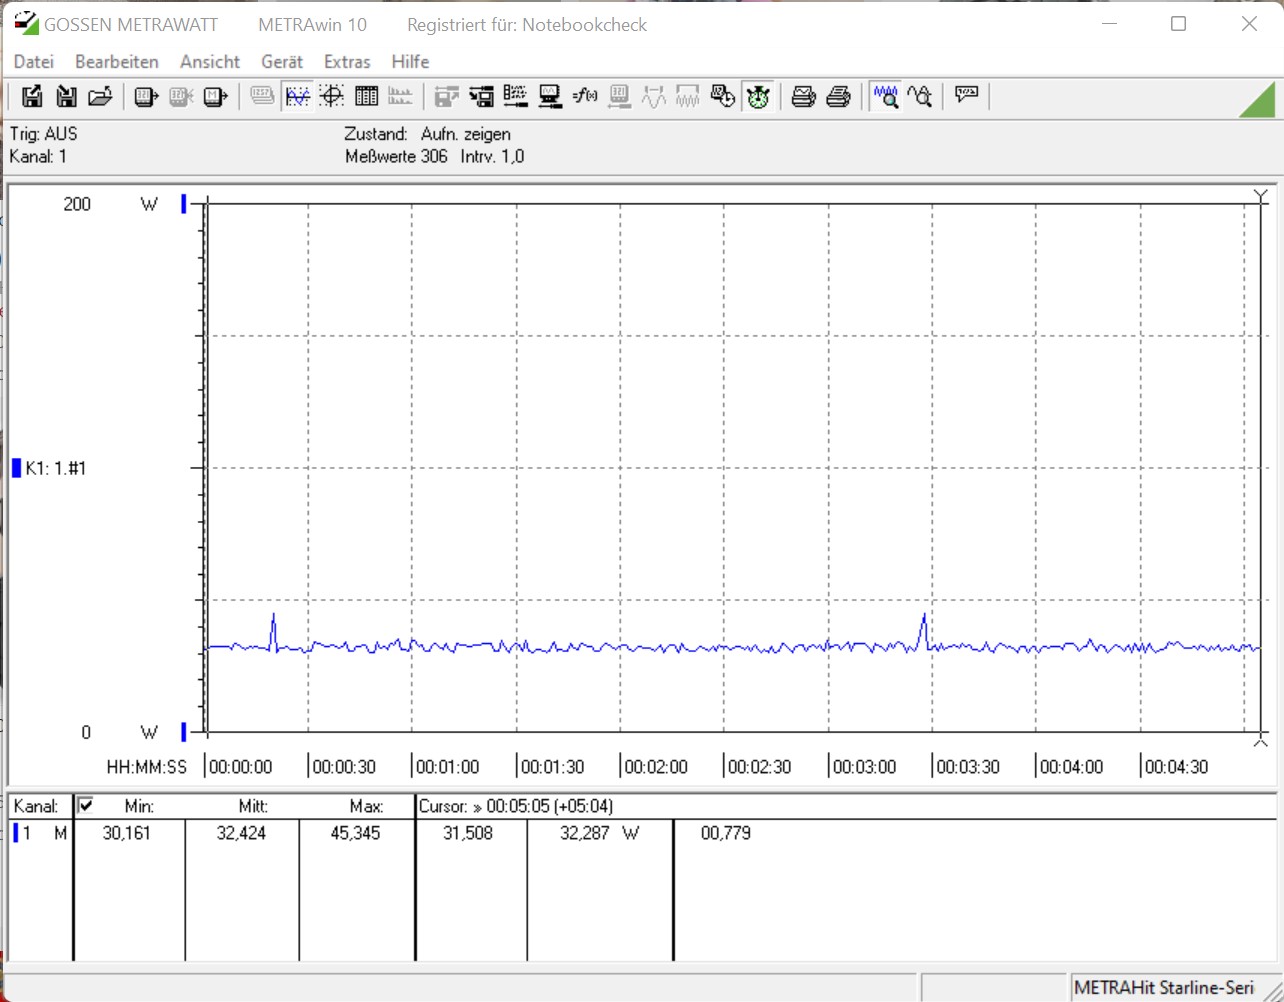
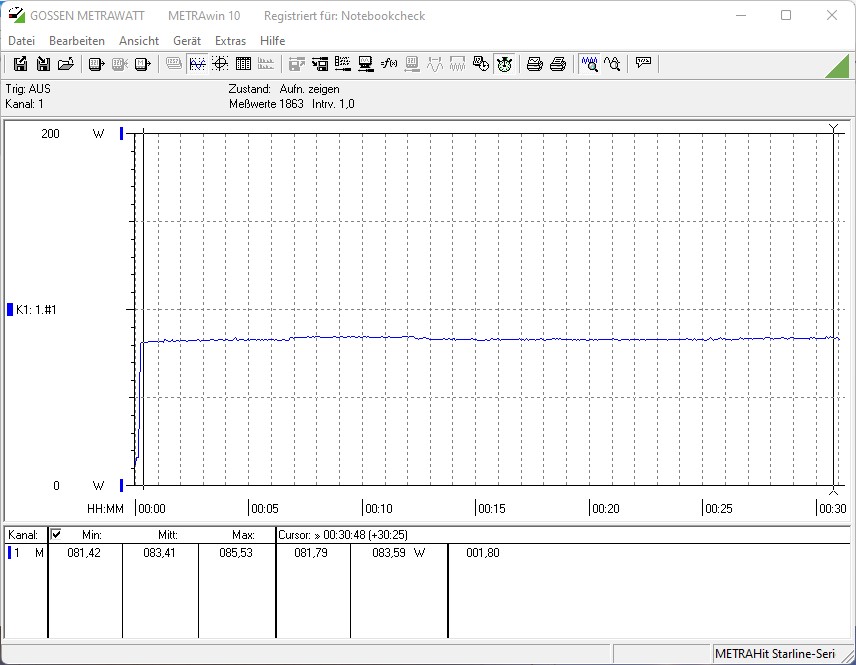
英特尔NUC 11 Extreme的低能耗是快乐的源泉。由于节俭的SoC,在Cinebench R15 Multi测试中,我们只注意到系统在负载下的124W。一个基于以下设备的台式机系统 英特尔酷睿i5-10600K平均需要172.5瓦。采用英特尔酷睿i9-10900K的测试系统,也需要消耗~100W。
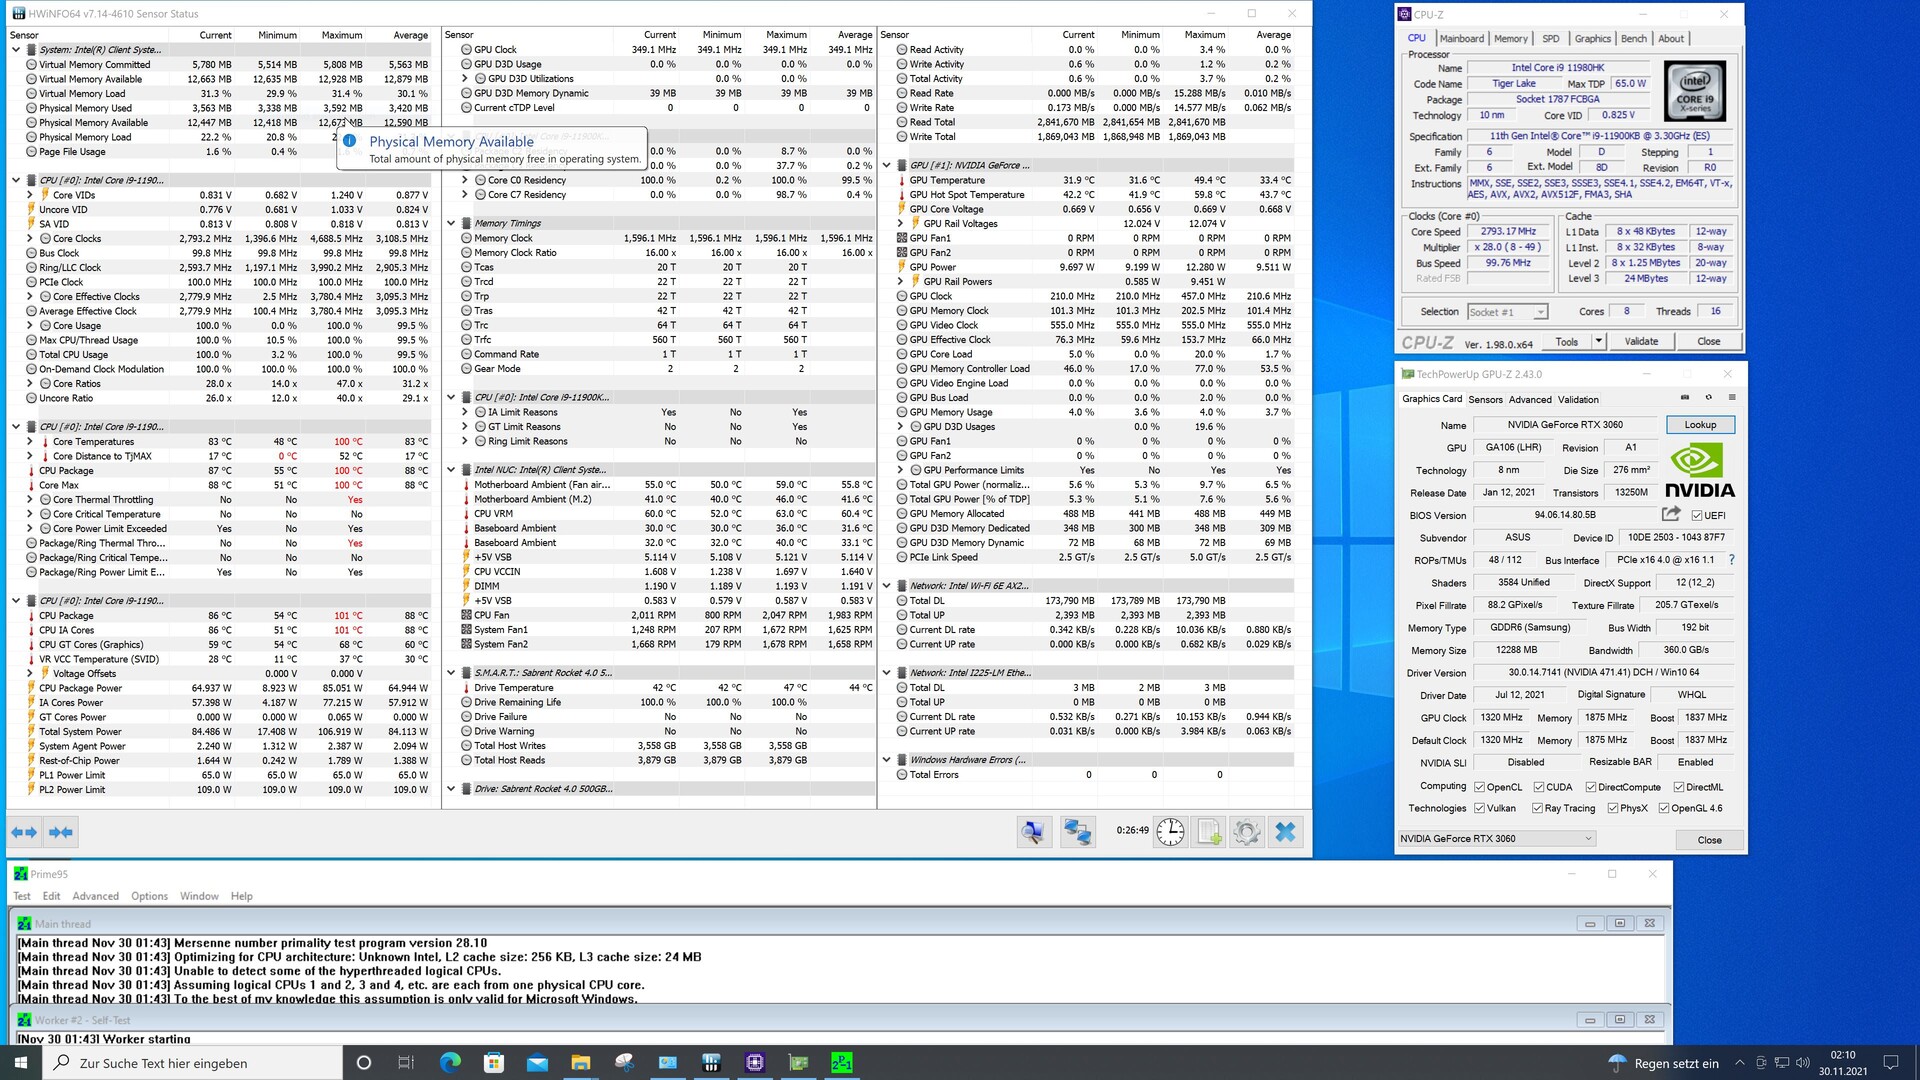
在压力测试中,英特尔酷睿i9-11900KB在功耗方面要比 英特尔酷睿i9-9980HK.然而,只有3%的额外需求是可控的,而且113瓦的底线也相当不错。
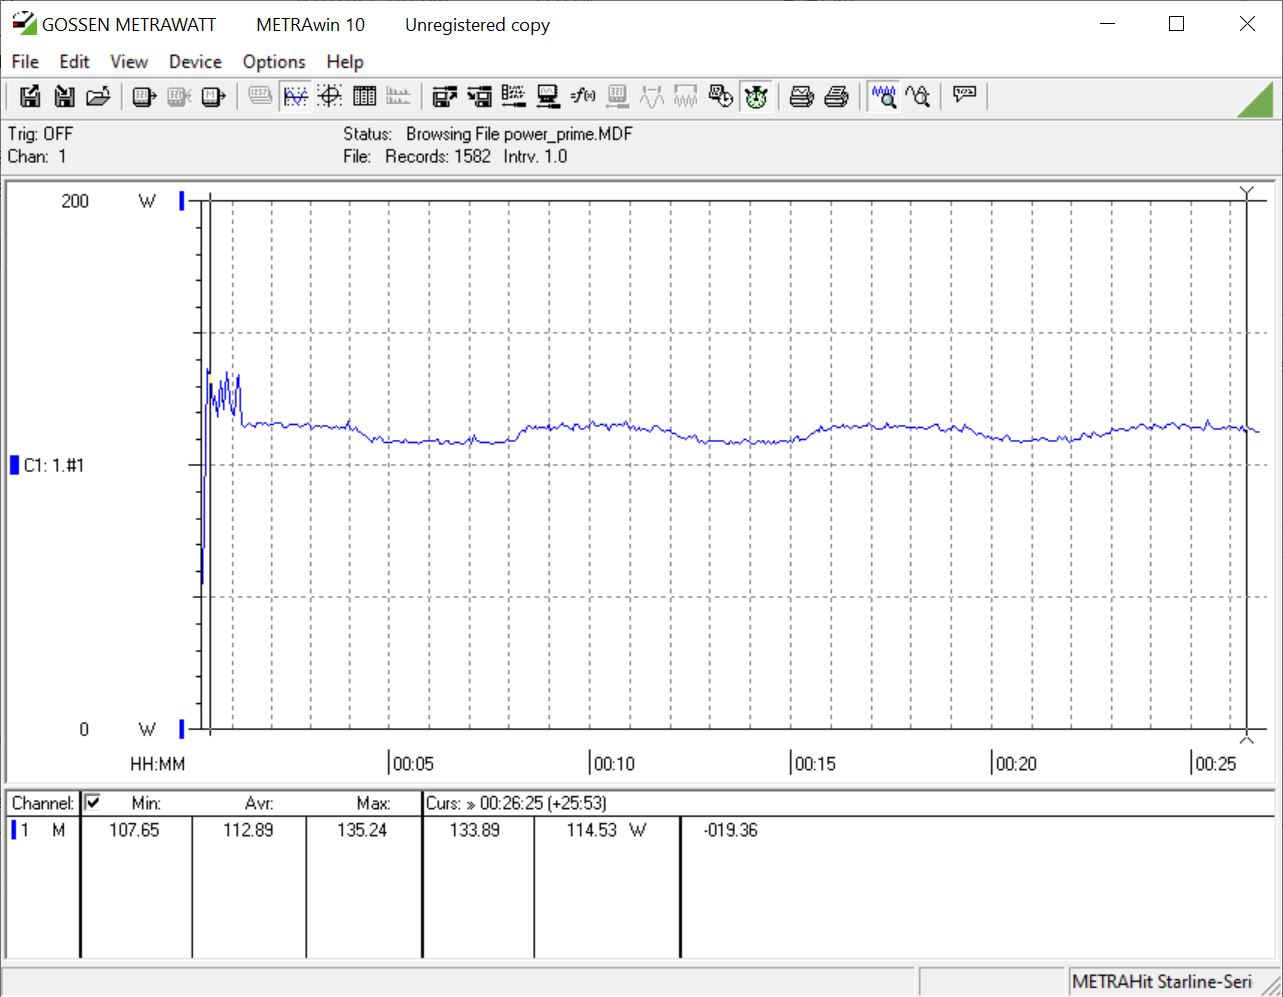
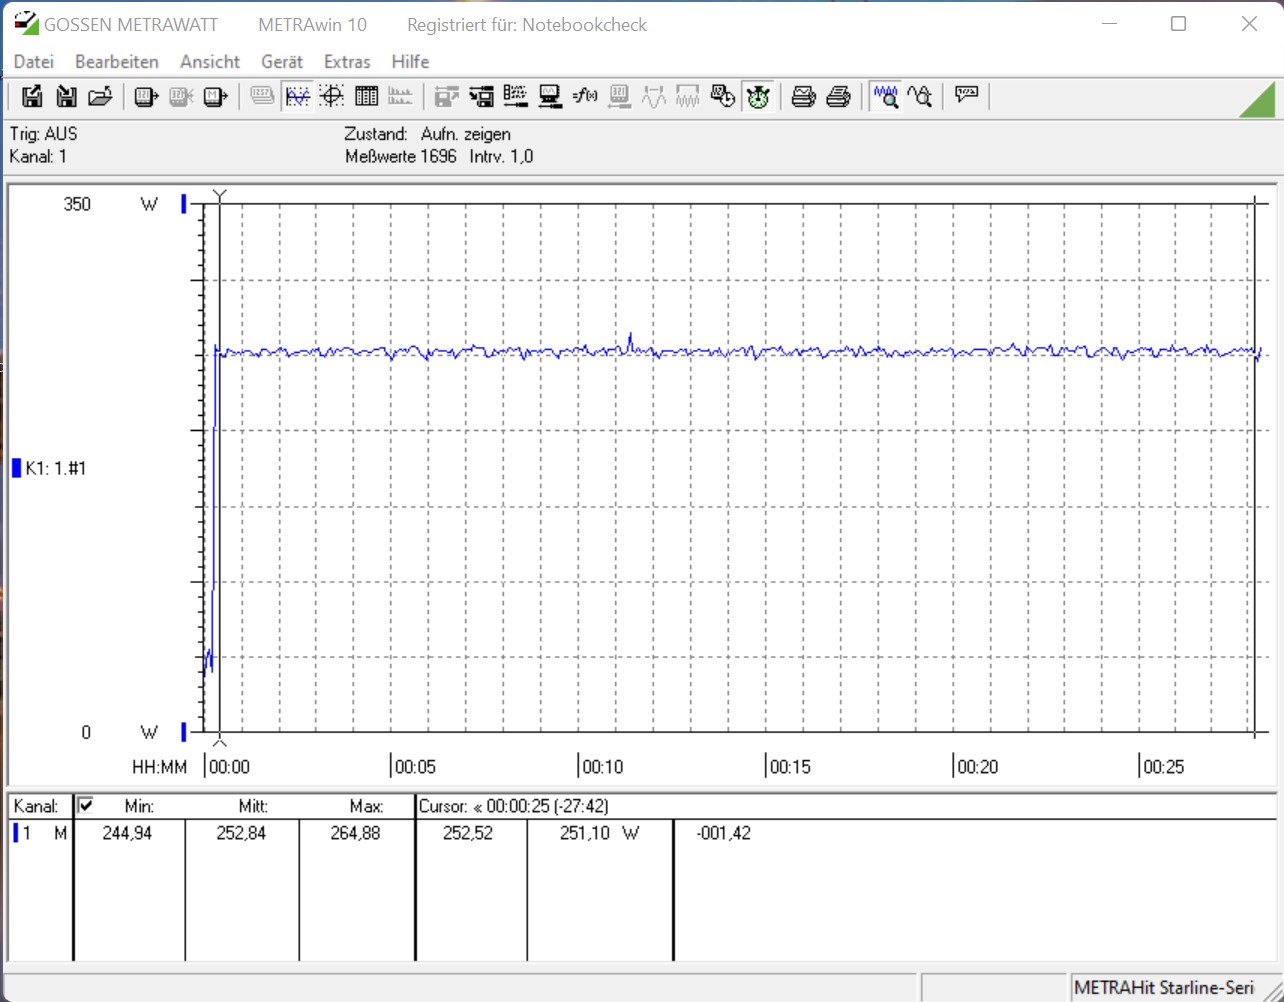
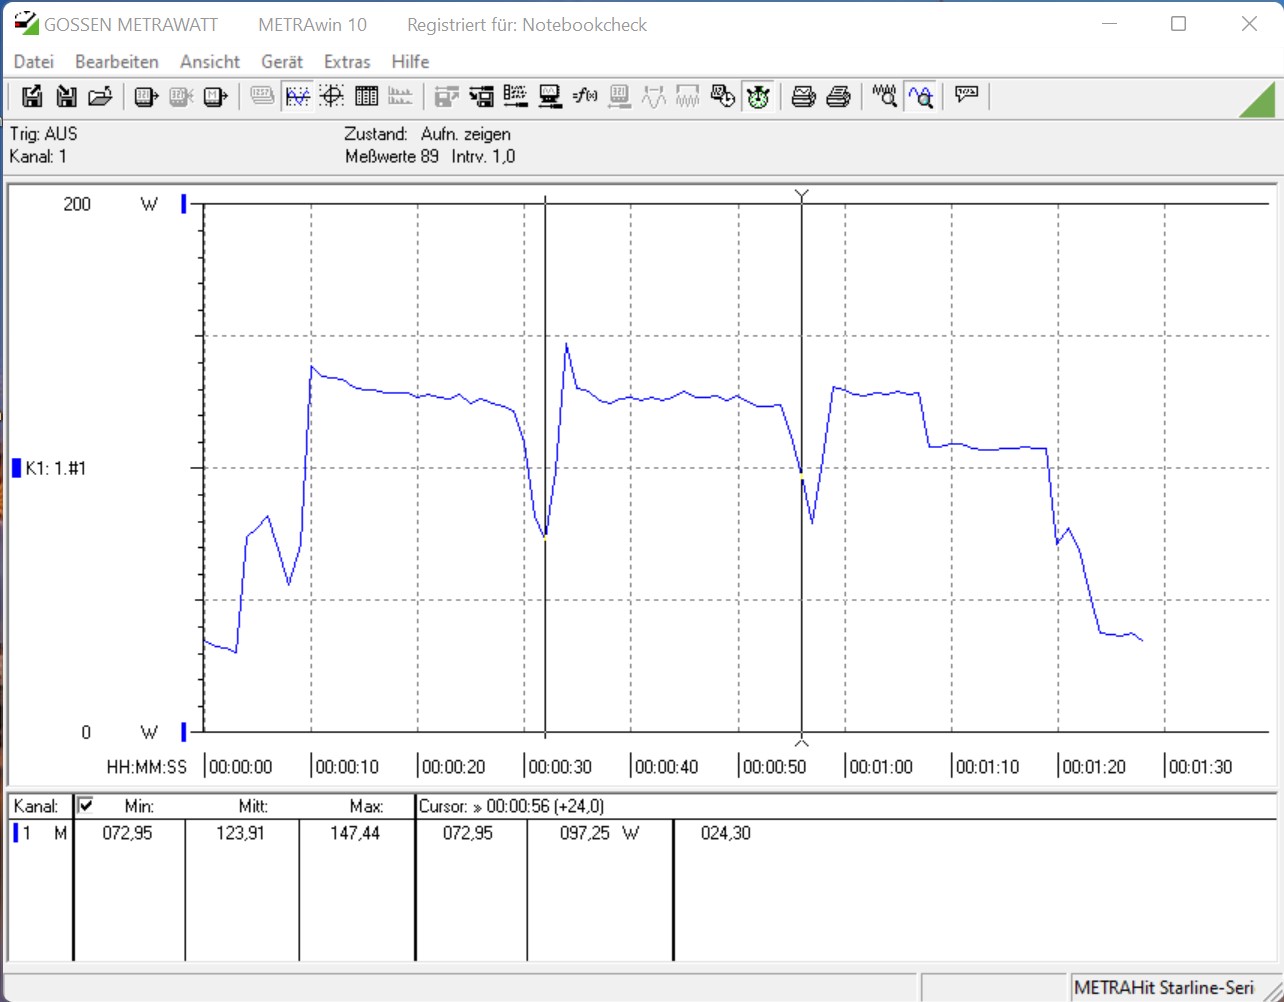
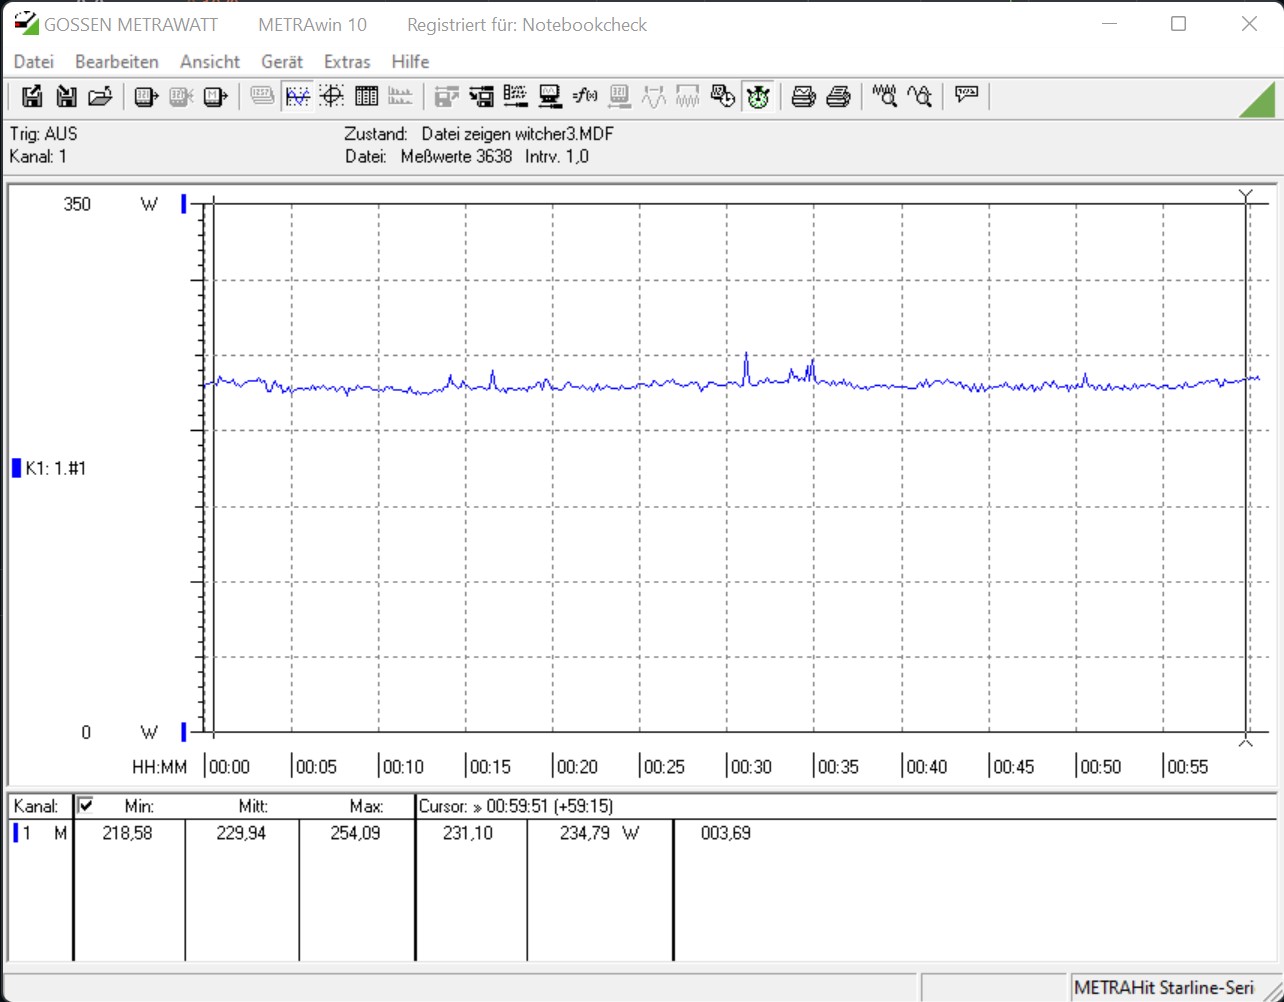
在游戏时,安装的显卡在很大程度上决定了系统的能量需求。野兽峡谷NUC在与幽灵峡谷NUC的比较中以微弱的优势胜出,即使是TDP的 GeForce RTX 3060的TDP为170W,但却大大低于 GeForce RTX 2070超级(215 W).
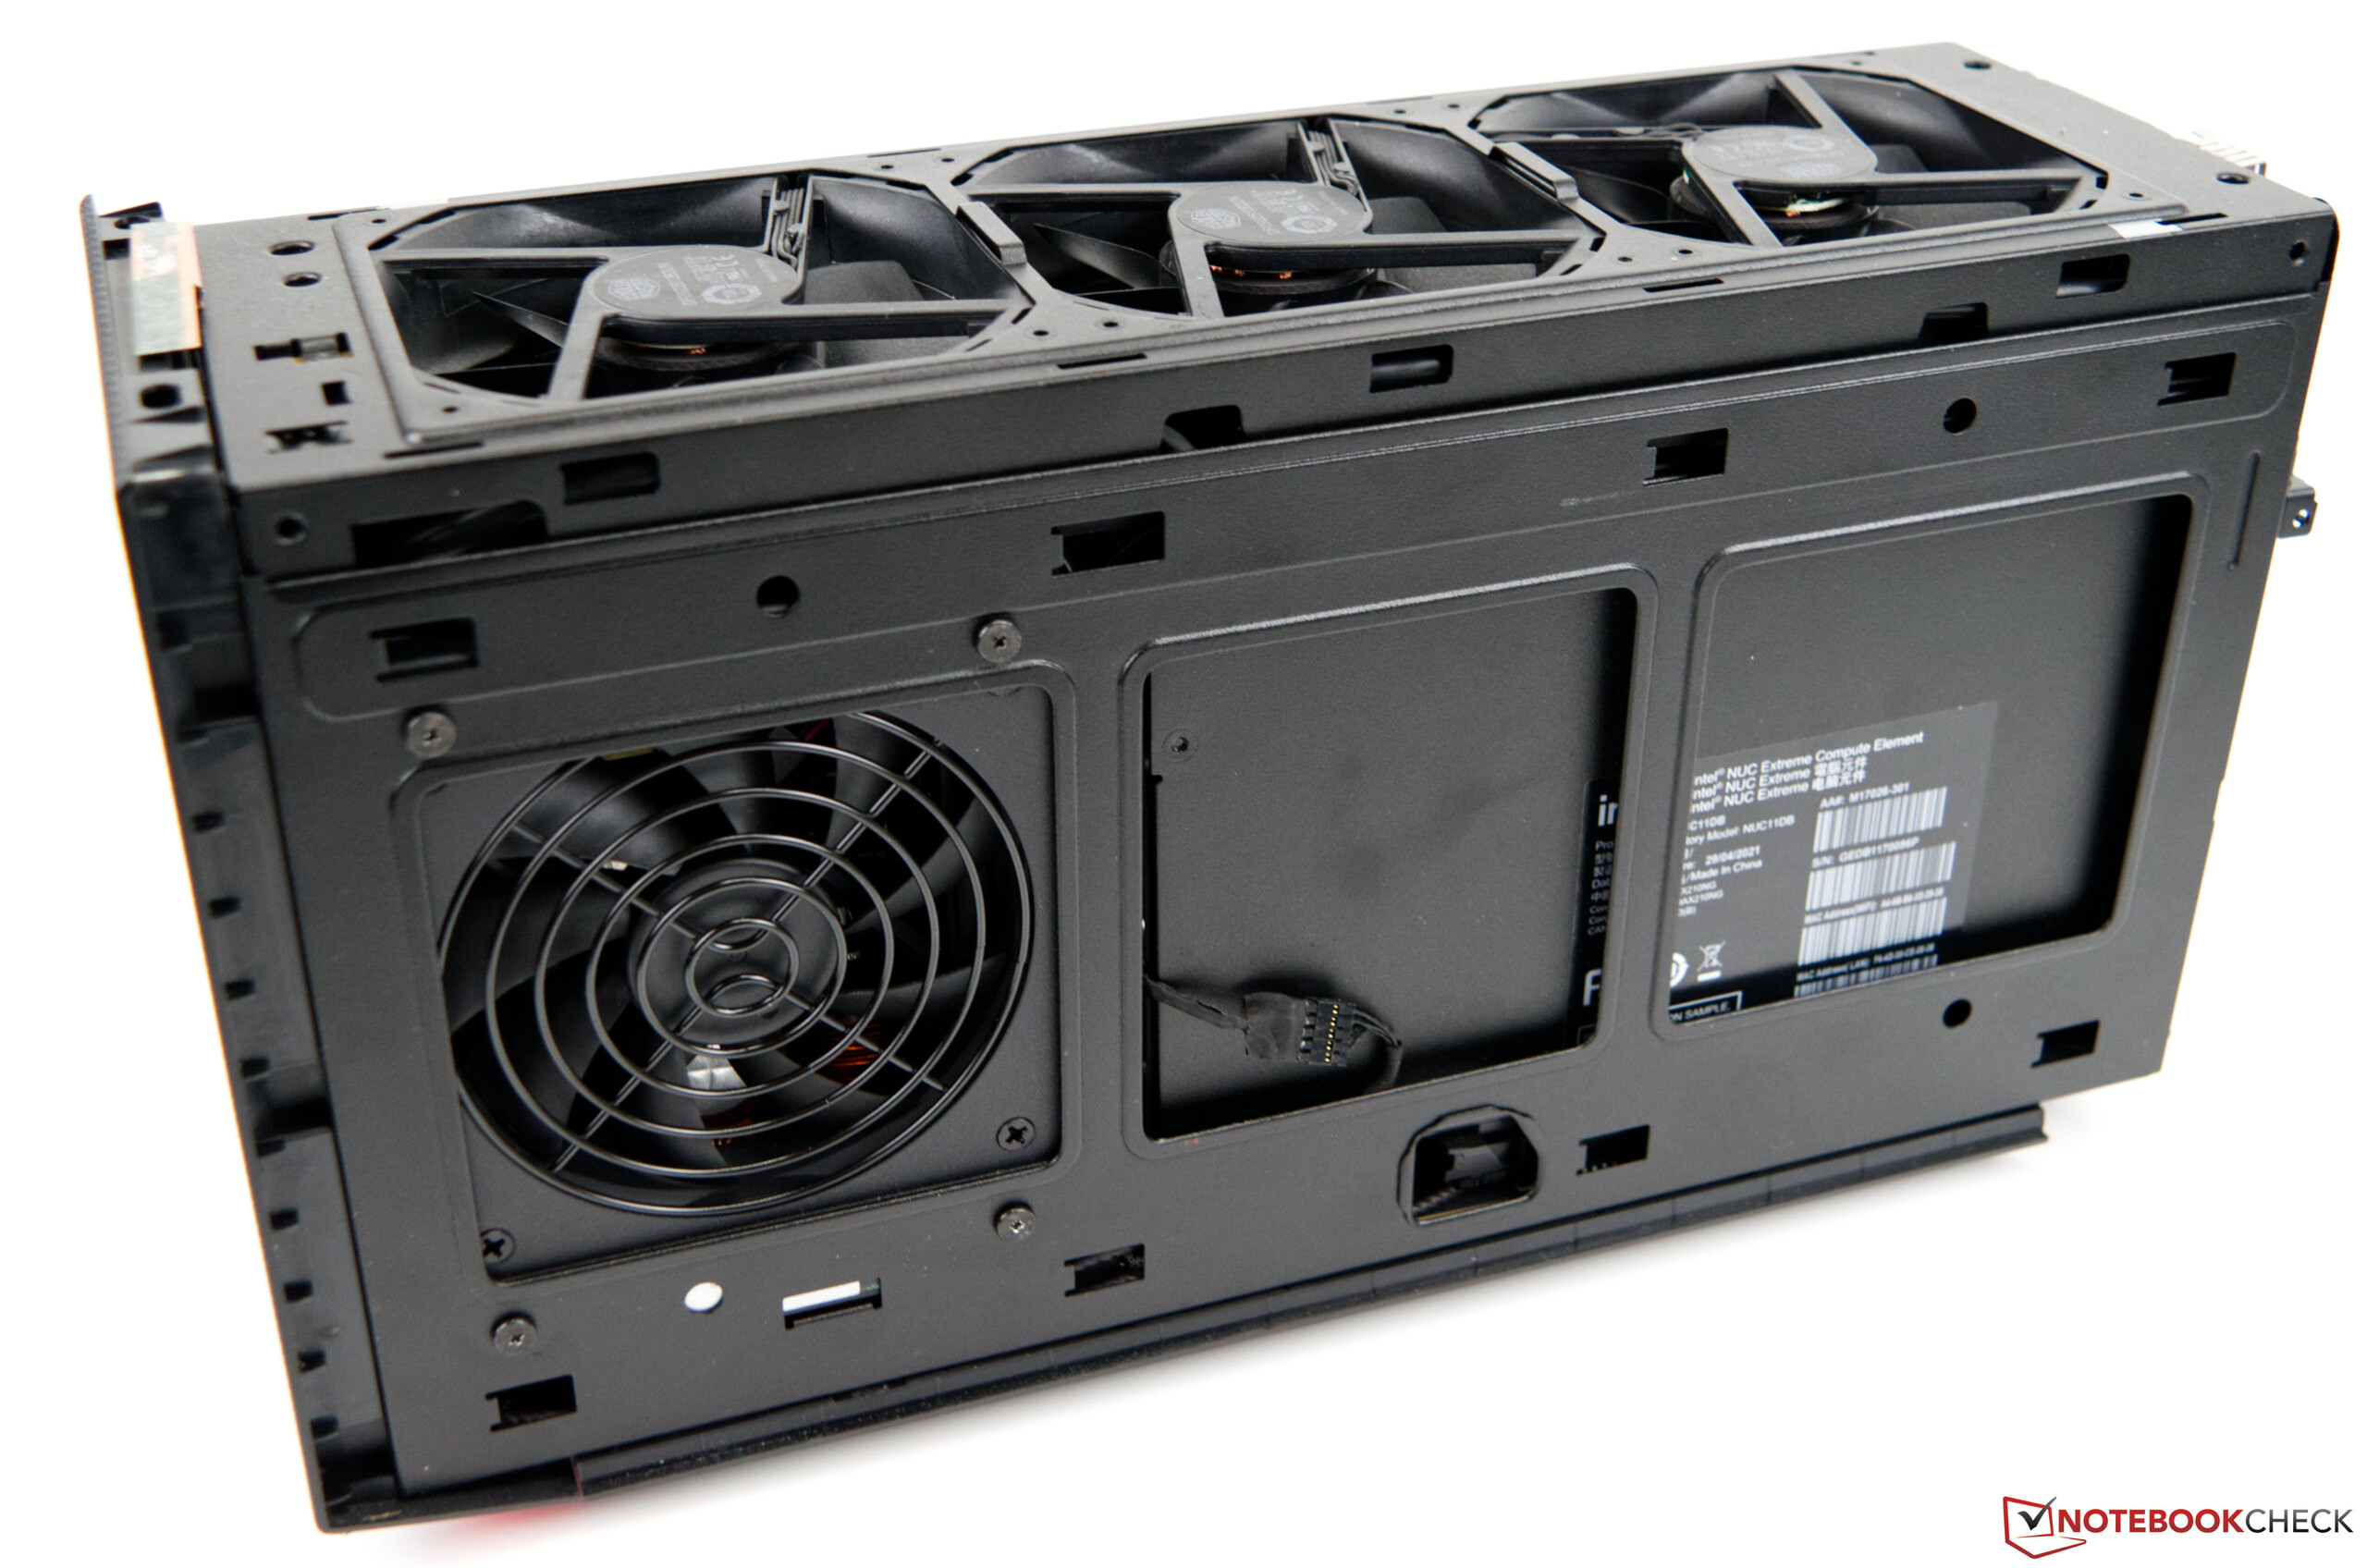
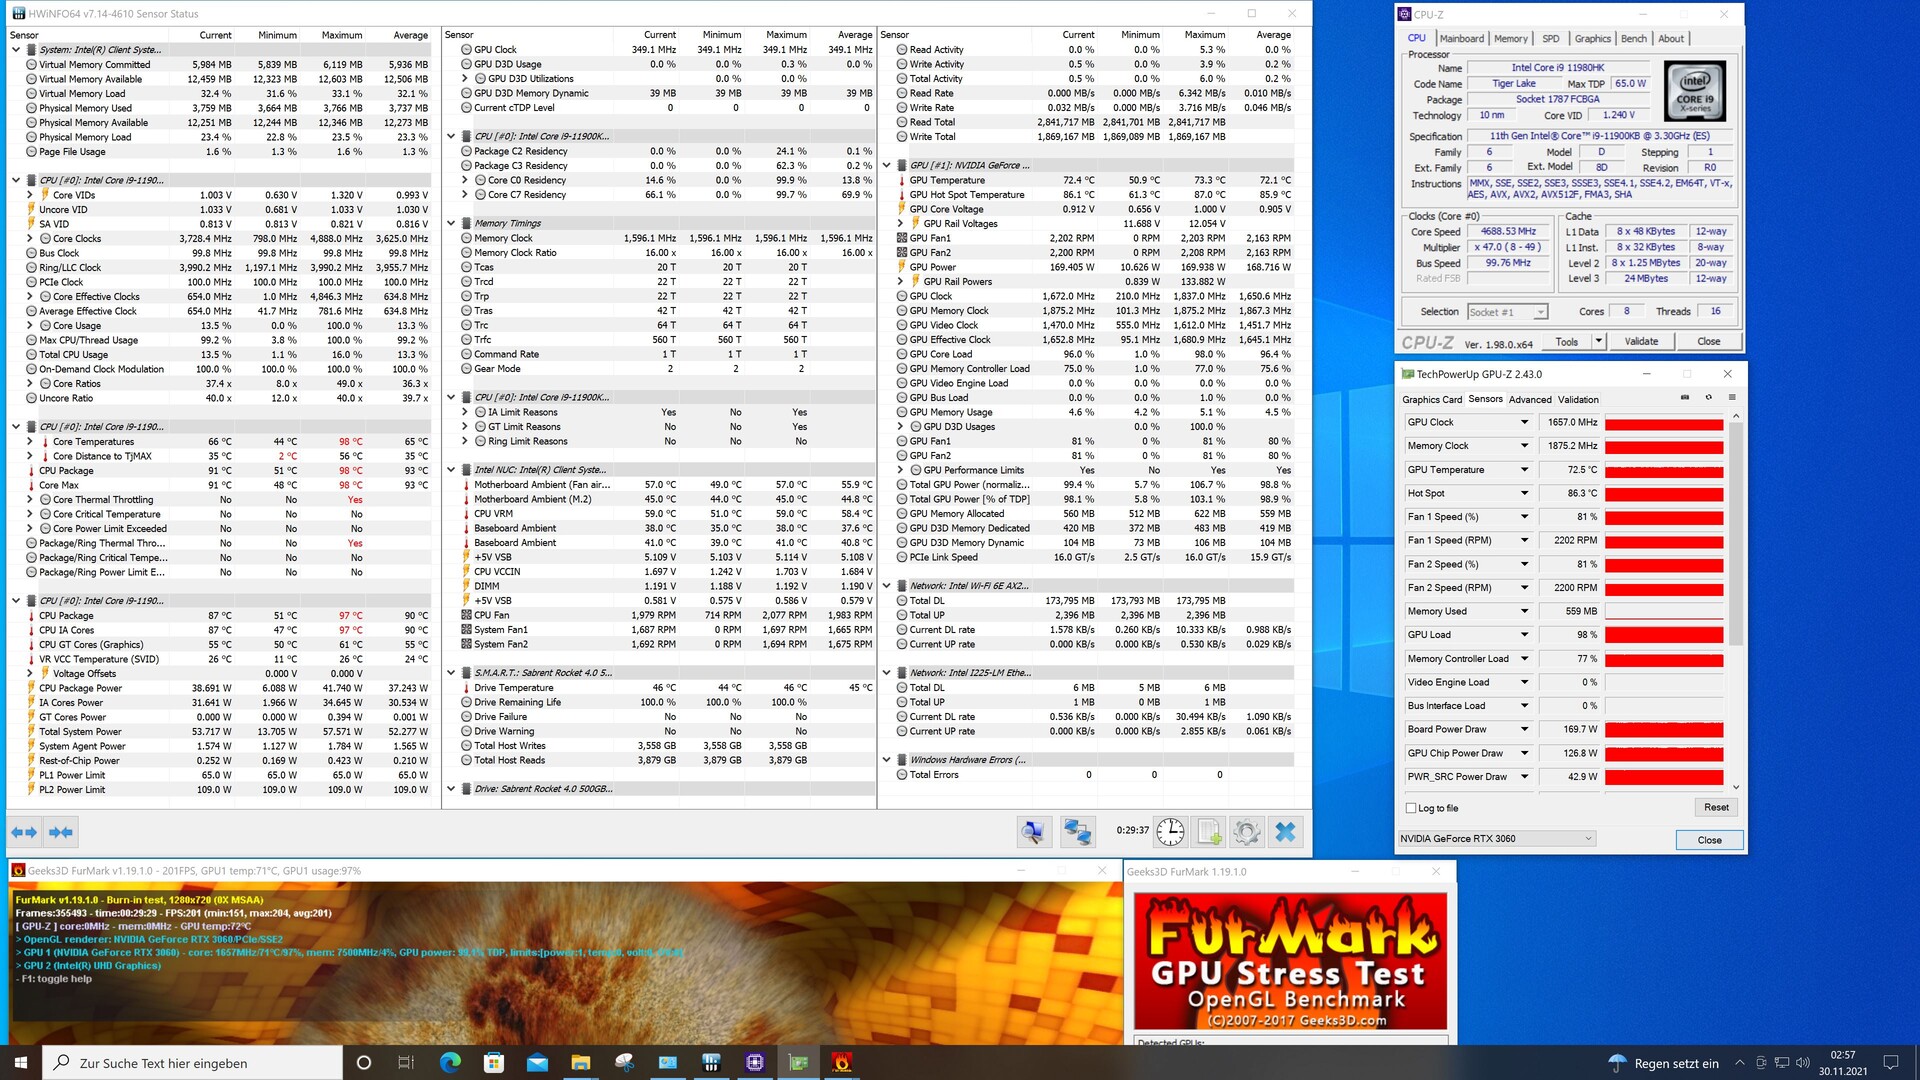
英特尔并没有过度调节英特尔酷睿i9-11900KB的性能,这一点可以从温度读数中看出,只要对性能有要求。没有什么问题就可以达到100°C大关。然而,这不能与性能测试中明显下降的性能联系起来。计算元素的冷却是由一个小风扇保证的,它由机箱上部的三个额外的机箱风扇支持。紧凑的设计自然在组件的温度方面有其份额。相应地,这也取决于系统中的专用显卡。如果你只想使用iGPU而不使用专用图形适配器,你可以期望SoC的性能略高。然而,不应期望有大幅度的性能提升。
不过,这种紧凑的设计仍然有一个很大的缺点,那就是噪音水平。英特尔NUC 11 Extreme Kit - Beast Canyon有明显的声音,在36 dB(A),即使在空转时系统也不是很安静。因此,我们在游戏过程中能测到50.5 dB(A)也就不奇怪了。我们在距离设备15厘米(约6英寸)的地方测定了噪音水平。只要你不把英特尔NUC 11 Extreme Kit - Beast Canyon直接放在你旁边,你应该注意到背景噪音会少一点。
| Power Consumption | |
| 1920x1080 The Witcher 3 ultra (external Monitor) | |
| AMD Ryzen 9 3950X (Idle: 95 W) | |
| Intel Core i9-10900K (Idle: 52.3 W) | |
| Intel Core i5-10600K (Idle: 52.2 W) | |
| Corsair One i160 (Idle: 51.5 W) | |
| Intel Ghost Canyon NUC (RTX 2070) (Idle: 33.1 W) | |
| Intel Beast Canyon NUC (Idle: 32 W) | |
| Prime95 V2810 Stress (external Monitor) | |
| Intel Core i9-10900K (Idle: 52.3 W) | |
| Intel Core i5-10600K (Idle: 52.2 W) | |
| AMD Ryzen 9 3950X (Idle: 95 W) | |
| Intel Beast Canyon NUC (Idle: 34 W) | |
| Intel Ghost Canyon NUC (RTX 2070) (Idle: 33.1 W) | |
| Cinebench R15 Multi (external Monitor) | |
| Intel Core i9-10900K (Idle: 52.3 W) | |
| AMD Ryzen 9 3950X (Idle: 95 W) | |
| Intel Core i5-10600K (Idle: 52.2 W) | |
| Intel Beast Canyon NUC (Idle: 32 W) | |
| Temperatures - CPU Temperature Prime95 | |
| Intel Core i9-10900K | |
| AMD Ryzen 9 3950X | |
| Intel Core i5-10600K | |
* ... smaller is better
Pros
Cons
结论 - 紧凑、现代和快速
英特尔NUC 11 Extreme Kit - Beast Canyon在一个小机箱中提供了非常好的性能。有了基于英特尔酷睿i9-11900KB的新计算元素,就有了一个来自笔记本电脑领域的经济型SoC。由于高IPC,8个核心和16个线程在游戏和生产力方面提供了非常好的性能。然而,1200美元的最低价格并不划算。在此基础上还需要增加专用显卡、工作内存、大容量存储和操作系统,因此你很快就会达到2000美元以上。可比的台式机系统目前也同样昂贵,所以你绝对可以考虑购买英特尔NUC 11 Extreme Kit - Beast Canyon。
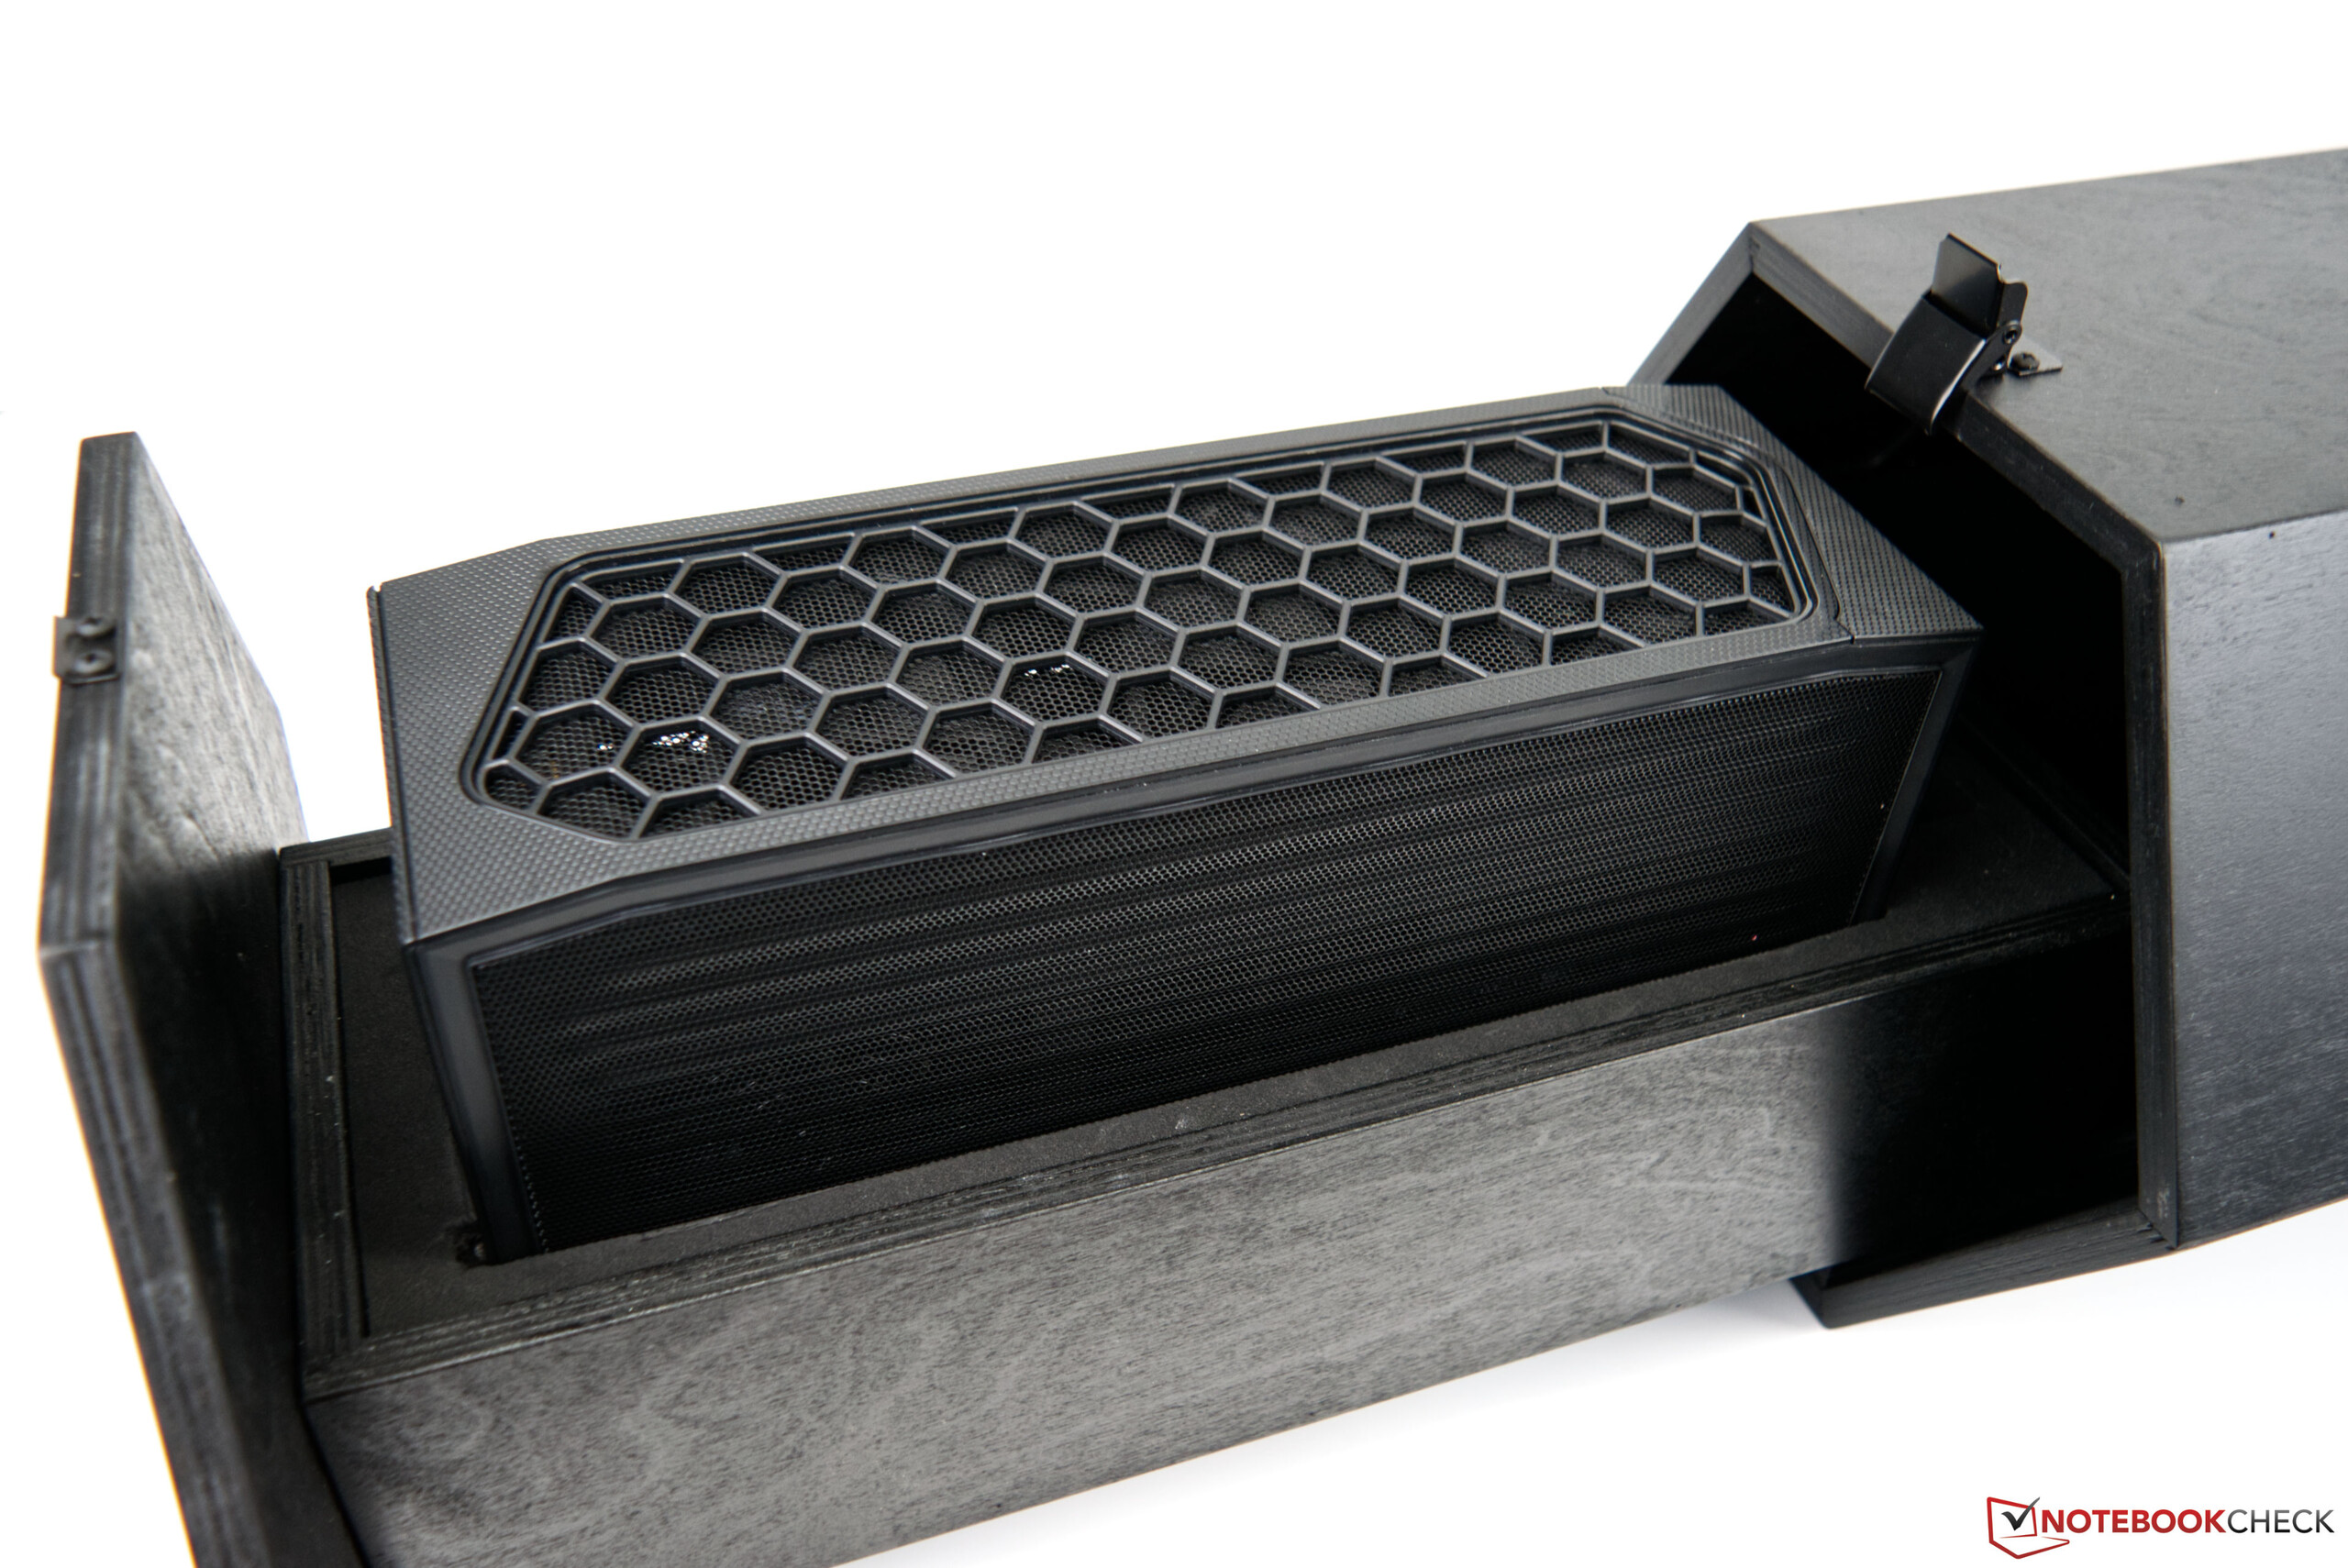
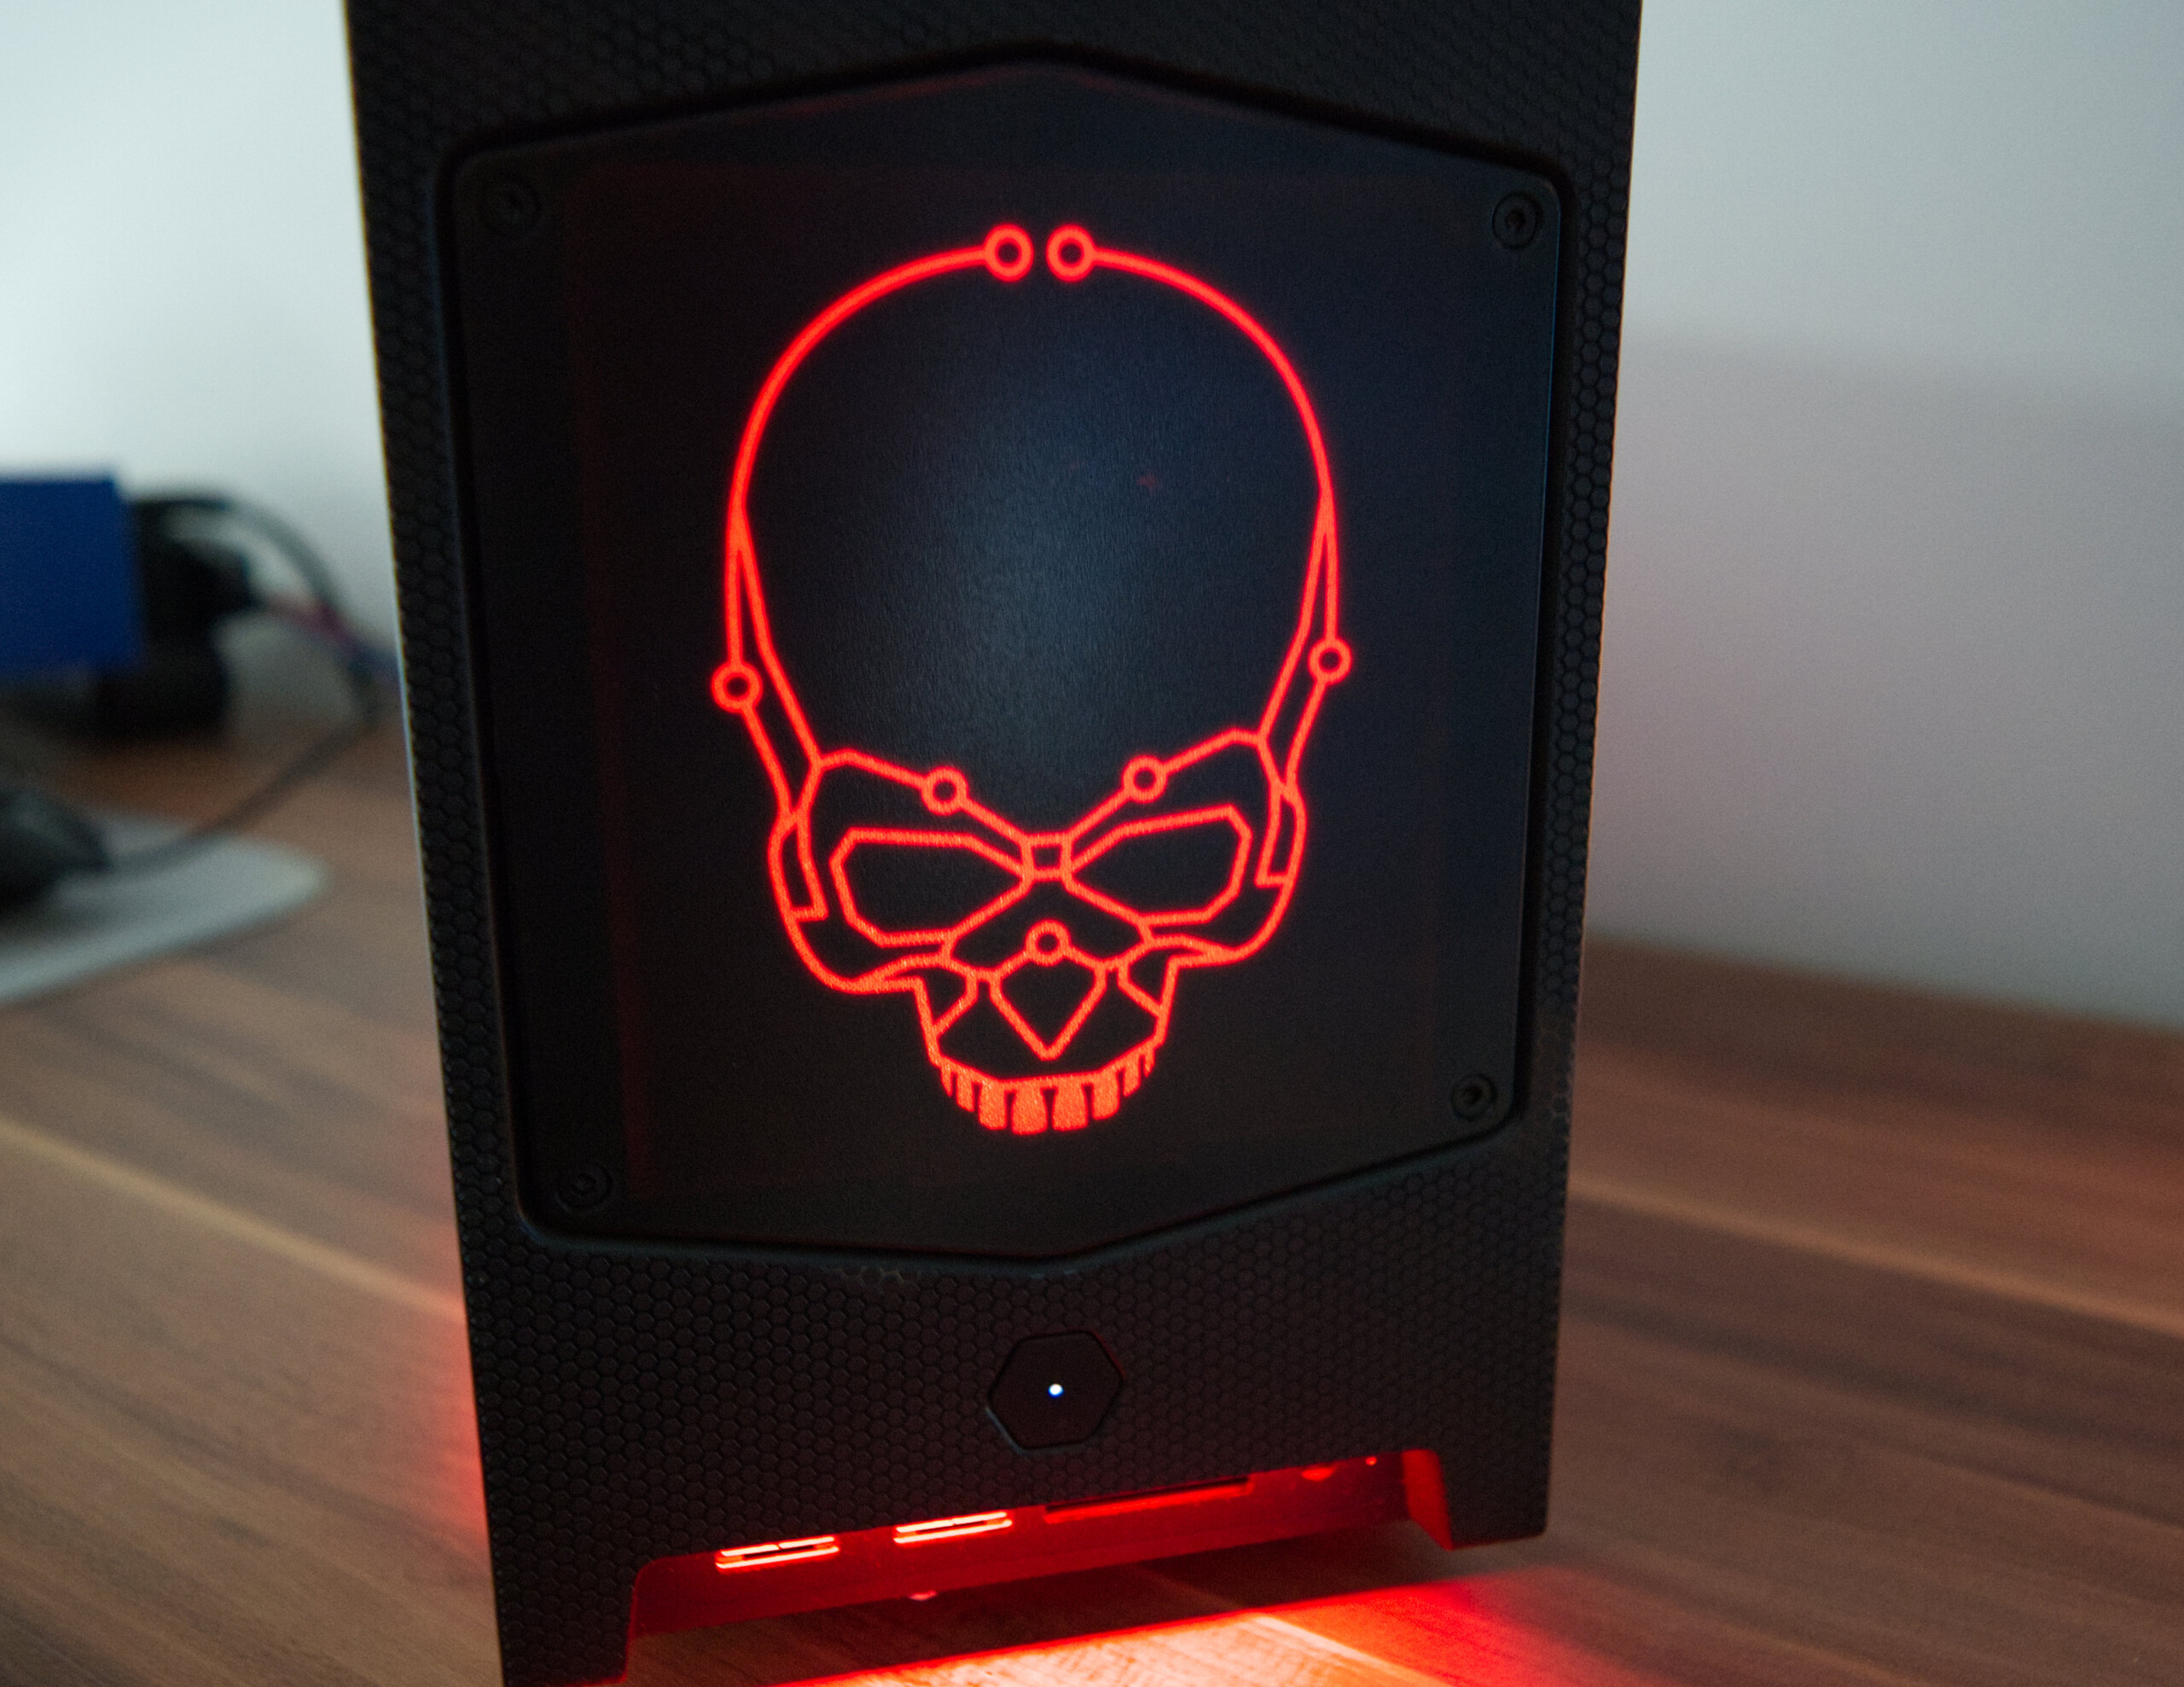
最大的缺点可能是高噪音水平,在负载下可以明显听到。如果你能接受该系统的缺点,并且不想安装最大的显卡,那么你将通过英特尔NUC 11 Extreme Kit - Beast Canyon获得一个具有稀有价值的紧凑型系统。该机箱不单独提供,是一个带有光学装饰的抢眼之作。
英特尔通过英特尔NUC 11 Extreme Kit - Beast Canyon进一步推动了其紧凑型设备的性能。
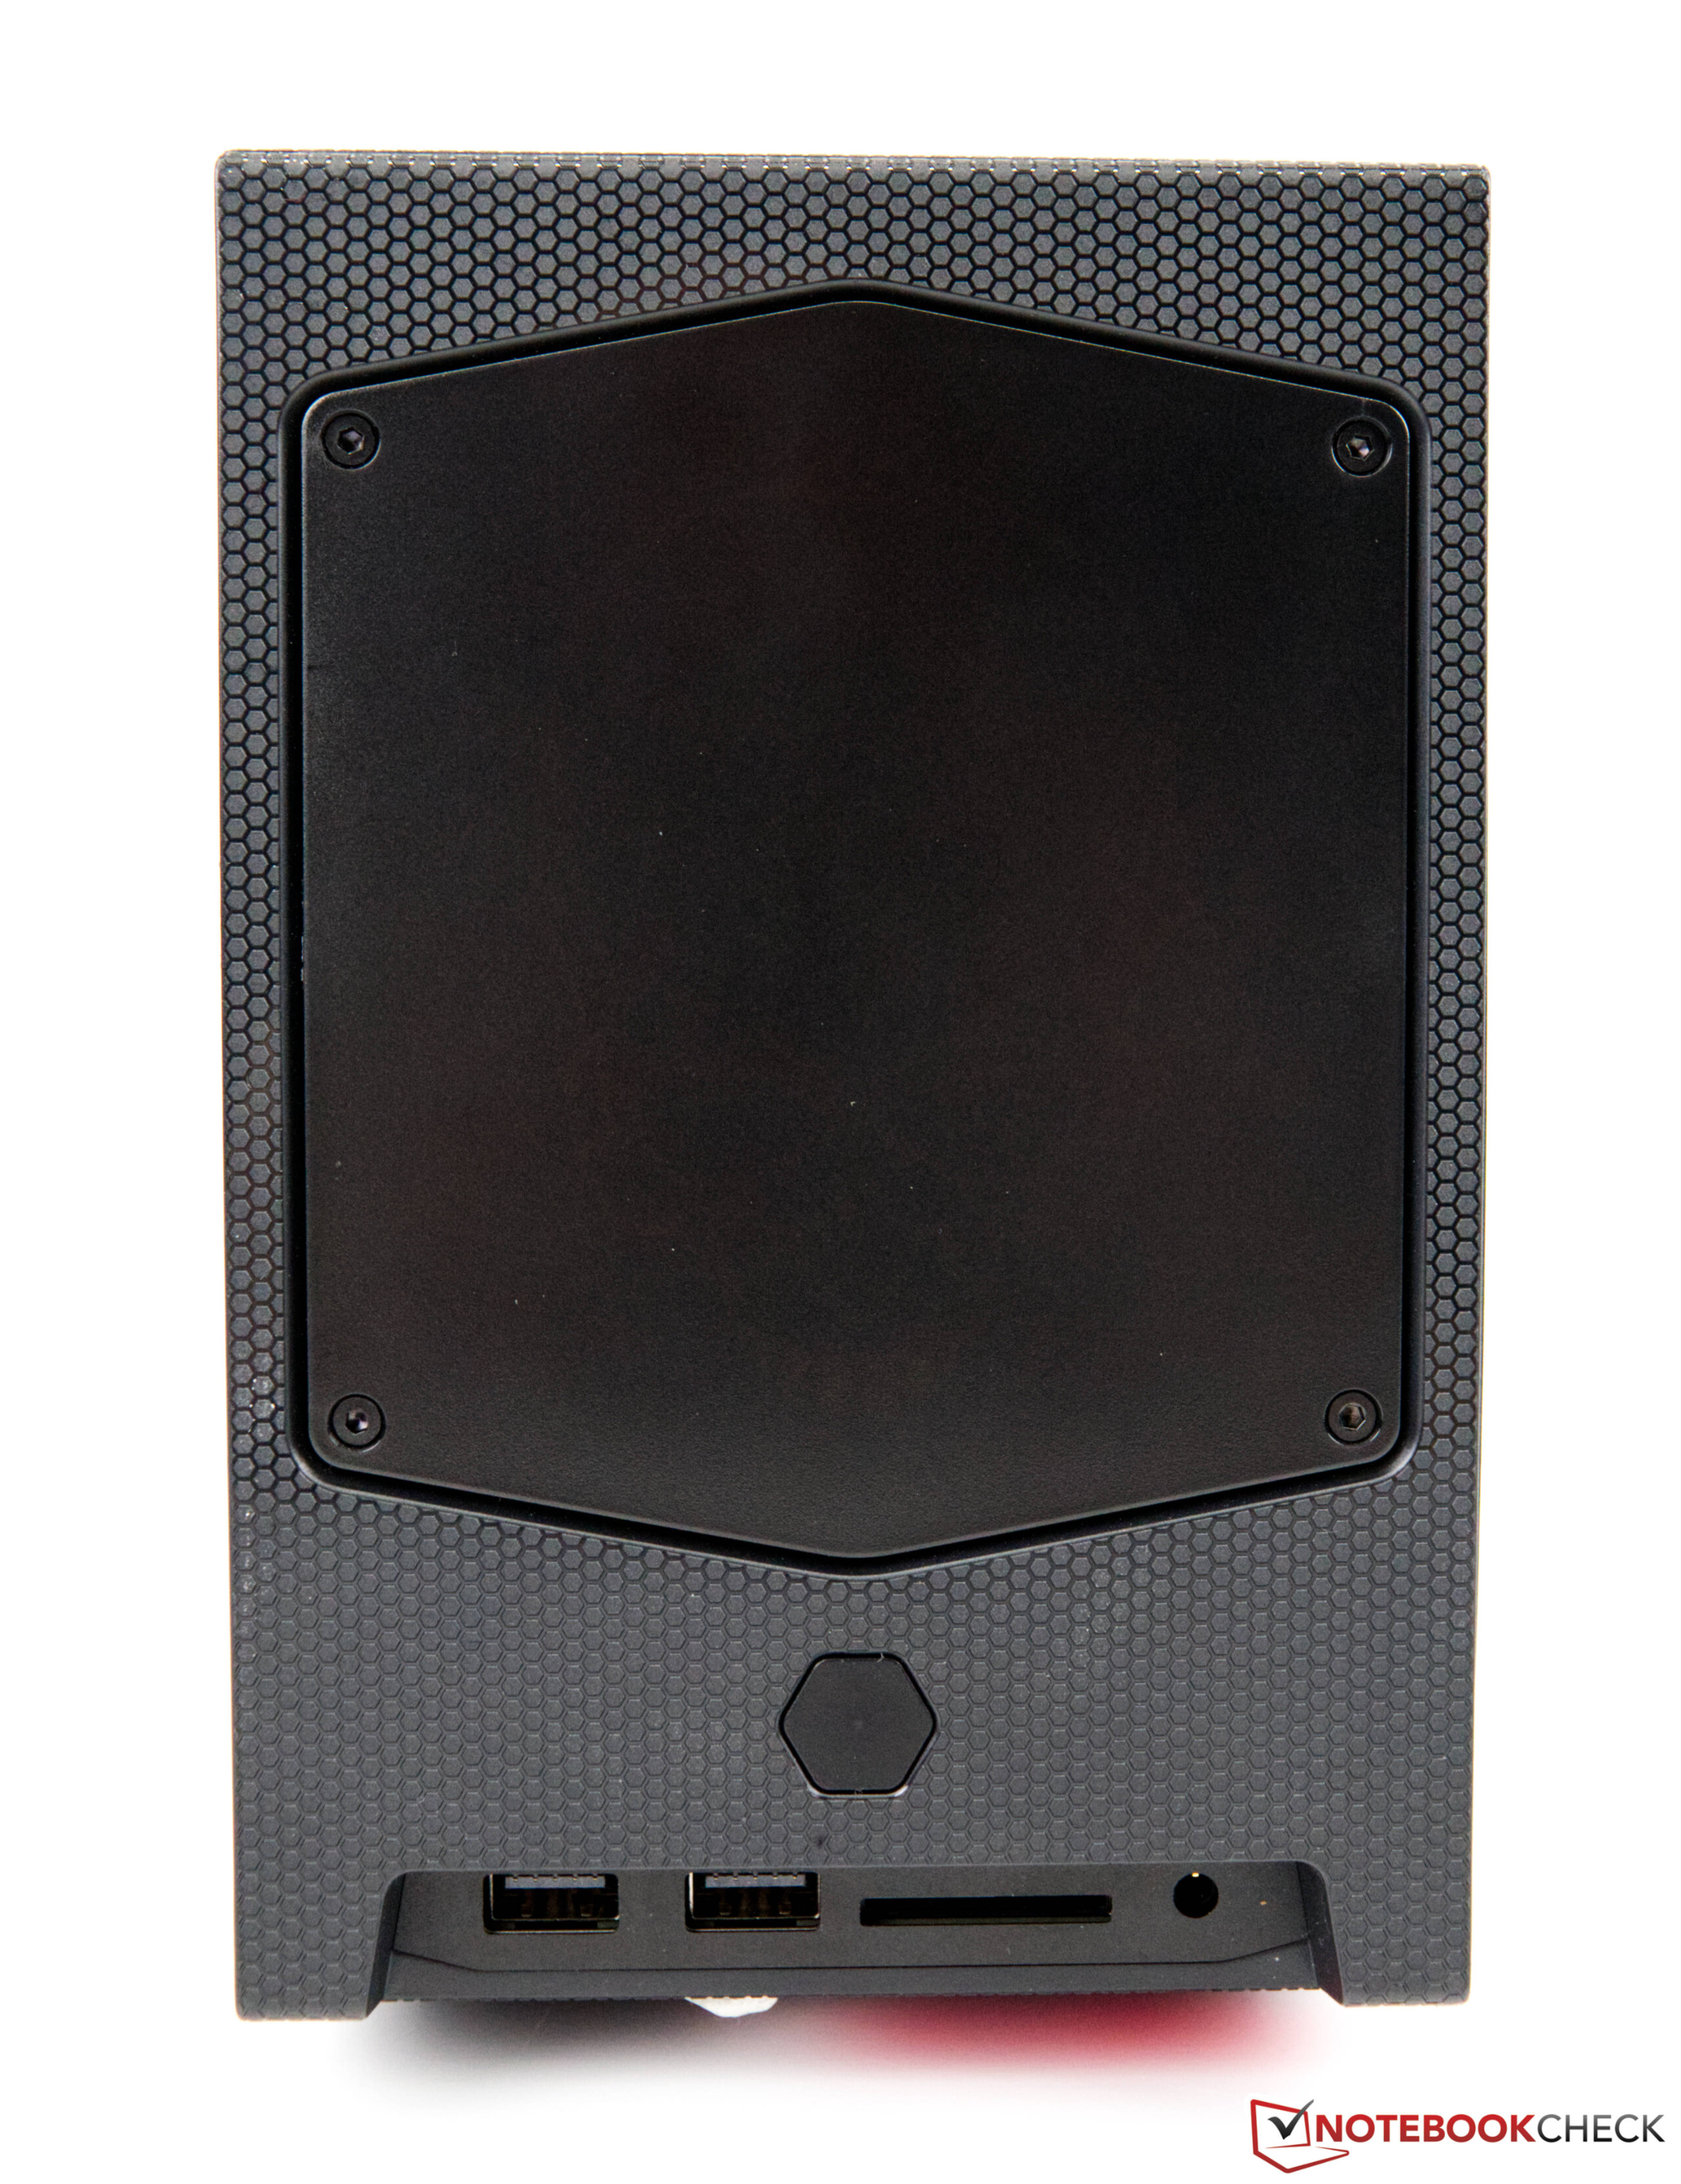
接口的选择和数量都非常好。有两个Thunderbolt 4端口,它甚至拥有最快和最现代的面向未来的标准。还有许多USB端口用于连接外围设备,甚至还有一个符合UHS-II标准的快速SD读卡器。只有缺乏第二个以太网端口可以批评,尽管这将是高层次的抱怨。
英特尔NUC 11 Extreme Kit - Beast Canyon的替代方案是自己组装一个系统,这可能花费相同。这款 Zotac Magnus One也是一个不错的选择,当涉及到非常紧凑的游戏PC时。
