联想 ThinkPad P70 工作站简短评测
| |||||||||||||||||||||||||
Brightness Distribution: 85 %
Center on Battery: 361 cd/m²
Contrast: 913:1 (Black: 0.4 cd/m²)
ΔE ColorChecker Calman: 3.8 | ∀{0.5-29.43 Ø4.72}
ΔE Greyscale Calman: 6.09 | ∀{0.09-98 Ø4.97}
99.97% sRGB (Argyll 1.6.3 3D)
76.01% AdobeRGB 1998 (Argyll 1.6.3 3D)
85.4% AdobeRGB 1998 (Argyll 3D)
100% sRGB (Argyll 3D)
90.8% Display P3 (Argyll 3D)
Gamma: 2.3
CCT: 6332 K
| Lenovo ThinkPad P70 Quadro M3000M, 6820HQ, Samsung SSD PM871 MZNLN512HCJH | Dell Precision 7710 FirePro W7170M, E3-1535M v5, Samsung SM951 MZVPV256HDGL m.2 PCI-e | HP ZBook 17 E9X11AA-ABA Quadro K610M, 4900MQ, Micron RealSSD C400 MTFDDAK128MAM | MSI WT72-2OL32SR311BW Quadro K4100M, 4980HQ, 4x Toshiba HG6 THNSNJ256G8NU (RAID 0) | Bullman E-Klasse 5 Quadro K3100M, 4790K, Samsung SSD SM951 256GB MZHPV256HDGL | |
|---|---|---|---|---|---|
| Display | -17% | 3% | -24% | -23% | |
| Display P3 Coverage (%) | 90.8 | 66.6 -27% | 85.7 -6% | 66.5 -27% | 66.5 -27% |
| sRGB Coverage (%) | 100 | 96.9 -3% | 100 0% | 84.3 -16% | 84.5 -15% |
| AdobeRGB 1998 Coverage (%) | 85.4 | 68.6 -20% | 99.2 16% | 61.7 -28% | 61.8 -28% |
| Response Times | -22% | ||||
| Response Time Grey 50% / Grey 80% * (ms) | 44 ? | 50 ? -14% | |||
| Response Time Black / White * (ms) | 27.6 ? | 36 ? -30% | |||
| PWM Frequency (Hz) | 228 ? | 198 ? | |||
| Screen | 4% | 13% | -9% | -1% | |
| Brightness middle (cd/m²) | 365 | 332 -9% | 320 -12% | 303 -17% | 355 -3% |
| Brightness (cd/m²) | 341 | 307 -10% | 311 -9% | 276 -19% | 335 -2% |
| Brightness Distribution (%) | 85 | 83 -2% | 88 4% | 83 -2% | 89 5% |
| Black Level * (cd/m²) | 0.4 | 0.33 17% | 0.359 10% | 0.34 15% | 0.44 -10% |
| Contrast (:1) | 913 | 1006 10% | 891 -2% | 891 -2% | 807 -12% |
| Colorchecker dE 2000 * | 3.8 | 3 21% | 2.04 46% | 5.57 -47% | 3.73 2% |
| Greyscale dE 2000 * | 6.09 | 4 34% | 2.45 60% | 4.08 33% | 2.84 53% |
| Gamma | 2.3 96% | 2 110% | 2.28 96% | 2.19 100% | 2.12 104% |
| CCT | 6332 103% | 7089 92% | 6518 100% | 7362 88% | 6457 101% |
| Color Space (Percent of AdobeRGB 1998) (%) | 76.01 | 62 -18% | 93 22% | 55.34 -27% | 55.45 -27% |
| Color Space (Percent of sRGB) (%) | 99.97 | 97 -3% | 100 0% | 84.21 -16% | 84.39 -16% |
| Total Average (Program / Settings) | -12% /
-4% | 8% /
11% | -17% /
-13% | -12% /
-7% |
* ... smaller is better
Display Response Times
| ↔ Response Time Black to White | ||
|---|---|---|
| 27.6 ms ... rise ↗ and fall ↘ combined | ↗ 4.8 ms rise | 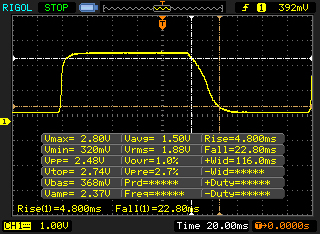 |
| ↘ 22.8 ms fall | ||
| The screen shows relatively slow response rates in our tests and may be too slow for gamers. In comparison, all tested devices range from 0.1 (minimum) to 240 (maximum) ms. » 70 % of all devices are better. This means that the measured response time is worse than the average of all tested devices (19.8 ms). | ||
| ↔ Response Time 50% Grey to 80% Grey | ||
| 44 ms ... rise ↗ and fall ↘ combined | ↗ 17.2 ms rise | 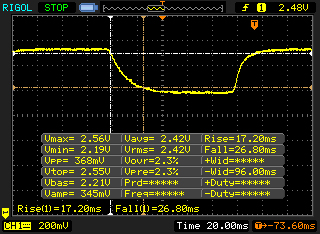 |
| ↘ 26.8 ms fall | ||
| The screen shows slow response rates in our tests and will be unsatisfactory for gamers. In comparison, all tested devices range from 0.165 (minimum) to 636 (maximum) ms. » 73 % of all devices are better. This means that the measured response time is worse than the average of all tested devices (31 ms). | ||
Screen Flickering / PWM (Pulse-Width Modulation)
| Screen flickering / PWM detected | 228 Hz | ≤ 95 % brightness setting | 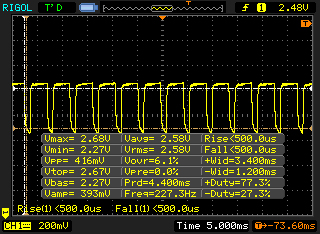 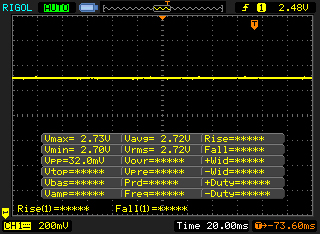 |
The display backlight flickers at 228 Hz (worst case, e.g., utilizing PWM) Flickering detected at a brightness setting of 95 % and below. There should be no flickering or PWM above this brightness setting. The frequency of 228 Hz is relatively low, so sensitive users will likely notice flickering and experience eyestrain at the stated brightness setting and below. In comparison: 52 % of all tested devices do not use PWM to dim the display. If PWM was detected, an average of 7747 (minimum: 5 - maximum: 343500) Hz was measured. | |||
| Cinebench R15 | |
| CPU Multi 64Bit (sort by value) | |
| Lenovo ThinkPad P70 | |
| Dell Precision 7710 | |
| HP ZBook 17 G2 J8Z55ET | |
| MSI WT72-2OL32SR311BW | |
| Bullman E-Klasse 5 | |
| Dell Precision 5510 | |
| MSI GE62-6QD16H11 | |
| CPU Single 64Bit (sort by value) | |
| Lenovo ThinkPad P70 | |
| Dell Precision 7710 | |
| HP ZBook 17 G2 J8Z55ET | |
| MSI WT72-2OL32SR311BW | |
| Bullman E-Klasse 5 | |
| Dell Precision 5510 | |
| MSI GE62-6QD16H11 | |
| Cinebench R11.5 | |
| CPU Multi 64Bit (sort by value) | |
| Lenovo ThinkPad P70 | |
| Dell Precision 7710 | |
| HP ZBook 17 G2 J8Z55ET | |
| MSI WT72-2OL32SR311BW | |
| Bullman E-Klasse 5 | |
| Dell Precision 5510 | |
| MSI GE62-6QD16H11 | |
| CPU Single 64Bit (sort by value) | |
| Lenovo ThinkPad P70 | |
| Dell Precision 7710 | |
| HP ZBook 17 G2 J8Z55ET | |
| MSI WT72-2OL32SR311BW | |
| Bullman E-Klasse 5 | |
| Dell Precision 5510 | |
| MSI GE62-6QD16H11 | |
| Cinebench R10 | |
| Rendering Multiple CPUs 64Bit (sort by value) | |
| Lenovo ThinkPad P70 | |
| Dell Precision 7710 | |
| HP ZBook 17 G2 J8Z55ET | |
| Bullman E-Klasse 5 | |
| Dell Precision 5510 | |
| MSI GE62-6QD16H11 | |
| Rendering Single CPUs 64Bit (sort by value) | |
| Lenovo ThinkPad P70 | |
| Dell Precision 7710 | |
| HP ZBook 17 G2 J8Z55ET | |
| Bullman E-Klasse 5 | |
| Dell Precision 5510 | |
| MSI GE62-6QD16H11 | |
| PCMark 7 Score | 5003 points | |
| PCMark 8 Home Score Accelerated v2 | 3345 points | |
| PCMark 8 Work Score Accelerated v2 | 4411 points | |
Help | ||
| PCMark 7 - Score (sort by value) | |
| Lenovo ThinkPad P70 | |
| Dell Precision 7710 | |
| HP ZBook 17 G2 J8Z55ET | |
| Bullman E-Klasse 5 | |
| Dell Precision 5510 | |
| MSI GE62-6QD16H11 | |
| PCMark 8 | |
| Home Score Accelerated v2 (sort by value) | |
| Lenovo ThinkPad P70 | |
| Dell Precision 7710 | |
| HP ZBook 17 G2 J8Z55ET | |
| MSI WT72-2OL32SR311BW | |
| Bullman E-Klasse 5 | |
| Dell Precision 5510 | |
| MSI GE62-6QD16H11 | |
| Work Score Accelerated v2 (sort by value) | |
| Lenovo ThinkPad P70 | |
| Dell Precision 7710 | |
| HP ZBook 17 G2 J8Z55ET | |
| MSI WT72-2OL32SR311BW | |
| Bullman E-Klasse 5 | |
| Dell Precision 5510 | |
| MSI GE62-6QD16H11 | |

| LuxMark v2.0 64Bit | |
| Room GPUs-only (sort by value) | |
| Lenovo ThinkPad P70 | |
| Dell Precision 7710 | |
| HP ZBook 17 G2 J8Z55ET | |
| MSI WT72-2OL32SR311BW | |
| Bullman E-Klasse 5 | |
| Dell Precision 5510 | |
| Schenker W706 | |
| Sala GPUs-only (sort by value) | |
| Lenovo ThinkPad P70 | |
| Dell Precision 7710 | |
| HP ZBook 17 G2 J8Z55ET | |
| MSI WT72-2OL32SR311BW | |
| Bullman E-Klasse 5 | |
| Dell Precision 5510 | |
| Schenker W706 | |
| SiSoft Sandra 2016 | |
| Image Processing (sort by value) | |
| Lenovo ThinkPad P70 | |
| Dell Precision 7710 | |
| Dell Precision 5510 | |
| Schenker W706 | |
| GP Cryptography (Higher Security AES256+SHA2-512) (sort by value) | |
| Lenovo ThinkPad P70 | |
| Dell Precision 7710 | |
| Dell Precision 5510 | |
| Schenker W706 | |
| GP Financial Analysis (FP High/Double Precision) (sort by value) | |
| Lenovo ThinkPad P70 | |
| Dell Precision 7710 | |
| Dell Precision 5510 | |
| Schenker W706 | |
| 3DMark 06 Standard Score | 26746 points | |
| 3DMark Vantage P Result | 27405 points | |
| 3DMark 11 Performance | 8493 points | |
| 3DMark Ice Storm Standard Score | 42156 points | |
| 3DMark Cloud Gate Standard Score | 19732 points | |
| 3DMark Fire Strike Score | 5835 points | |
Help | ||
| Unigine Heaven 3.0 | |
| 1920x1080 OpenGL, Normal Tessellation, High Shaders AA:Off AF:Off (sort by value) | |
| Lenovo ThinkPad P70 | |
| Dell Precision 7710 | |
| HP ZBook 17 G2 J8Z55ET | |
| Bullman E-Klasse 5 | |
| Schenker W706 | |
| 1920x1080 DX 11, Normal Tessellation, High Shaders AA:Off AF:Off (sort by value) | |
| Lenovo ThinkPad P70 | |
| Dell Precision 7710 | |
| HP ZBook 17 G2 J8Z55ET | |
| Bullman E-Klasse 5 | |
| Schenker W706 | |
| Unigine Valley 1.0 | |
| 1920x1080 Extreme HD DirectX AA:x8 (sort by value) | |
| Lenovo ThinkPad P70 | |
| Dell Precision 7710 | |
| Schenker W706 | |
| 1920x1080 Extreme HD Preset OpenGL AA:x8 (sort by value) | |
| Lenovo ThinkPad P70 | |
| Dell Precision 7710 | |
| Schenker W706 | |
| Tomb Raider | |
| 1366x768 High Preset AA:FX AF:8x (sort by value) | |
| Lenovo ThinkPad P70 | |
| Dell Precision 7710 | |
| HP ZBook 17 G2 J8Z55ET | |
| Schenker W706 | |
| MSI GE72 965M Ti | |
| MSI GE62-2QEUi716H21BW | |
| 1920x1080 Ultra Preset AA:FX AF:16x (sort by value) | |
| Lenovo ThinkPad P70 | |
| Dell Precision 7710 | |
| HP ZBook 17 G2 J8Z55ET | |
| Schenker W706 | |
| MSI GE72 965M Ti | |
| MSI GE62-2QEUi716H21BW | |
| BioShock Infinite | |
| 1366x768 High Preset (sort by value) | |
| Lenovo ThinkPad P70 | |
| Dell Precision 7710 | |
| HP ZBook 17 G2 J8Z55ET | |
| Schenker W706 | |
| MSI GE72 965M Ti | |
| MSI GE62-2QEUi716H21BW | |
| 1920x1080 Ultra Preset, DX11 (DDOF) (sort by value) | |
| Lenovo ThinkPad P70 | |
| Dell Precision 7710 | |
| HP ZBook 17 G2 J8Z55ET | |
| Schenker W706 | |
| MSI GE72 965M Ti | |
| MSI GE62-2QEUi716H21BW | |
| Just Cause 3 | |
| 1920x1080 High / On AA:FX AF:8x (sort by value) | |
| Lenovo ThinkPad P70 | |
| MSI GE72 965M Ti | |
| 1920x1080 Very High / On AA:SM AF:16x (sort by value) | |
| Lenovo ThinkPad P70 | |
| MSI GE72 965M Ti | |
| 3840x2160 High / On AA:FX AF:8x (sort by value) | |
| Lenovo ThinkPad P70 | |
| Rainbow Six Siege | |
| 1920x1080 High Preset AA:T AF:4x (sort by value) | |
| Lenovo ThinkPad P70 | |
| MSI GE72 965M Ti | |
| 1920x1080 Ultra Preset AA:T AF:16x (sort by value) | |
| Lenovo ThinkPad P70 | |
| MSI GE72 965M Ti | |
| 3840x2160 High Preset AA:T AF:4x (sort by value) | |
| Lenovo ThinkPad P70 | |
| Star Wars Battlefront | |
| 1920x1080 High Preset AA:FX (sort by value) | |
| Lenovo ThinkPad P70 | |
| MSI GE72 965M Ti | |
| 1920x1080 Ultra Preset AA:FX (sort by value) | |
| Lenovo ThinkPad P70 | |
| MSI GE72 965M Ti | |
| 3840x2160 High Preset AA:FX (sort by value) | |
| Lenovo ThinkPad P70 | |
| MSI GE72 965M Ti | |
| The Witcher 3 | |
| 1920x1080 High Graphics & Postprocessing (Nvidia HairWorks Off) (sort by value) | |
| Lenovo ThinkPad P70 | |
| Dell Precision 7710 | |
| Schenker W706 | |
| MSI GE72 965M Ti | |
| Schenker XMG P506 | |
| 1920x1080 Ultra Graphics & Postprocessing (HBAO+) (sort by value) | |
| Lenovo ThinkPad P70 | |
| Dell Precision 7710 | |
| Schenker W706 | |
| MSI GE72 965M Ti | |
| Schenker XMG P506 | |
| 3840x2160 High Graphics & Postprocessing (Nvidia HairWorks Off) (sort by value) | |
| Lenovo ThinkPad P70 | |
| Dirt Rally | |
| 1920x1080 High Preset (sort by value) | |
| Lenovo ThinkPad P70 | |
| Dell Precision 7710 | |
| MSI WT72-2OL32SR311BW | |
| Bullman E-Klasse 5 | |
| Schenker W706 | |
| Schenker XMG P506 | |
| 1920x1080 Ultra Preset AA:4x MS (sort by value) | |
| Lenovo ThinkPad P70 | |
| Dell Precision 7710 | |
| MSI WT72-2OL32SR311BW | |
| Bullman E-Klasse 5 | |
| Schenker W706 | |
| Schenker XMG P506 | |
| 3840x2160 High Preset (sort by value) | |
| Lenovo ThinkPad P70 | |
| MSI WT72-2OL32SR311BW | |
| Bullman E-Klasse 5 | |
| GTA V | |
| 1920x1080 High/On (Advanced Graphics Off) AA:2xMSAA + FX AF:8x (sort by value) | |
| Lenovo ThinkPad P70 | |
| 1920x1080 Highest AA:4xMSAA + FX AF:16x (sort by value) | |
| Lenovo ThinkPad P70 | |
| 3840x2160 High/On (Advanced Graphics Off) AA:FX AF:8x (sort by value) | |
| Lenovo ThinkPad P70 | |
| Thief | |
| 1366x768 High Preset AA:FXAA & Low SS AF:4x (sort by value) | |
| Lenovo ThinkPad P70 | |
| Dell Precision 7710 | |
| HP ZBook 17 G2 J8Z55ET | |
| MSI WT72-2OL32SR311BW | |
| Bullman E-Klasse 5 | |
| Schenker W706 | |
| MSI GE72 965M Ti | |
| MSI GE62-2QEUi716H21BW | |
| 1920x1080 Very High Preset AA:FXAA & High SS AF:8x (sort by value) | |
| Lenovo ThinkPad P70 | |
| Dell Precision 7710 | |
| HP ZBook 17 G2 J8Z55ET | |
| MSI WT72-2OL32SR311BW | |
| Bullman E-Klasse 5 | |
| Schenker W706 | |
| MSI GE72 965M Ti | |
| MSI GE62-2QEUi716H21BW | |
| Metro: Last Light | |
| 1366x768 High (DX11) AF:16x (sort by value) | |
| Lenovo ThinkPad P70 | |
| Dell Precision 7710 | |
| HP ZBook 17 G2 J8Z55ET | |
| Schenker W706 | |
| MSI GE72 965M Ti | |
| 1920x1080 Very High (DX11) AF:16x (sort by value) | |
| Lenovo ThinkPad P70 | |
| Dell Precision 7710 | |
| HP ZBook 17 G2 J8Z55ET | |
| Schenker W706 | |
| MSI GE72 965M Ti | |
| low | med. | high | ultra | 4K | |
|---|---|---|---|---|---|
| Tomb Raider (2013) | 255.1 | 185 | 82.1 | ||
| BioShock Infinite (2013) | 176 | 163.8 | 69.7 | ||
| Metro: Last Light (2013) | 124.5 | 82.9 | 44.6 | ||
| Thief (2014) | 88.6 | 77.4 | 43.1 | ||
| GTA V (2015) | 136.1 | 69.1 | 29.7 | 35.3 | |
| Dirt Rally (2015) | 108.6 | 89.6 | 53.6 | 39.2 | |
| The Witcher 3 (2015) | 73.1 | 40.9 | 22.1 | 14.1 | |
| Star Wars Battlefront (2015) | 124.5 | 59.4 | 50.9 | 17.8 | |
| Rainbow Six Siege (2015) | 146.8 | 76.8 | 54.5 | 23.8 | |
| Just Cause 3 (2015) | 85.6 | 50.4 | 43.7 | 17.8 |
Noise level
| Idle |
| 30 / 30 / 30 dB(A) |
| Load |
| 36.5 / 40.8 dB(A) |
 | ||
30 dB silent 40 dB(A) audible 50 dB(A) loud |
||
min: | ||
(+) The maximum temperature on the upper side is 39 °C / 102 F, compared to the average of 38.2 °C / 101 F, ranging from 22.2 to 69.8 °C for the class Workstation.
(+) The bottom heats up to a maximum of 35.4 °C / 96 F, compared to the average of 41.1 °C / 106 F
(+) In idle usage, the average temperature for the upper side is 28.2 °C / 83 F, compared to the device average of 32 °C / 90 F.
(+) The palmrests and touchpad are cooler than skin temperature with a maximum of 28.1 °C / 82.6 F and are therefore cool to the touch.
(±) The average temperature of the palmrest area of similar devices was 27.8 °C / 82 F (-0.3 °C / -0.6 F).
| Off / Standby | |
| Idle | |
| Load |
|
Key:
min: | |
Pros
Cons
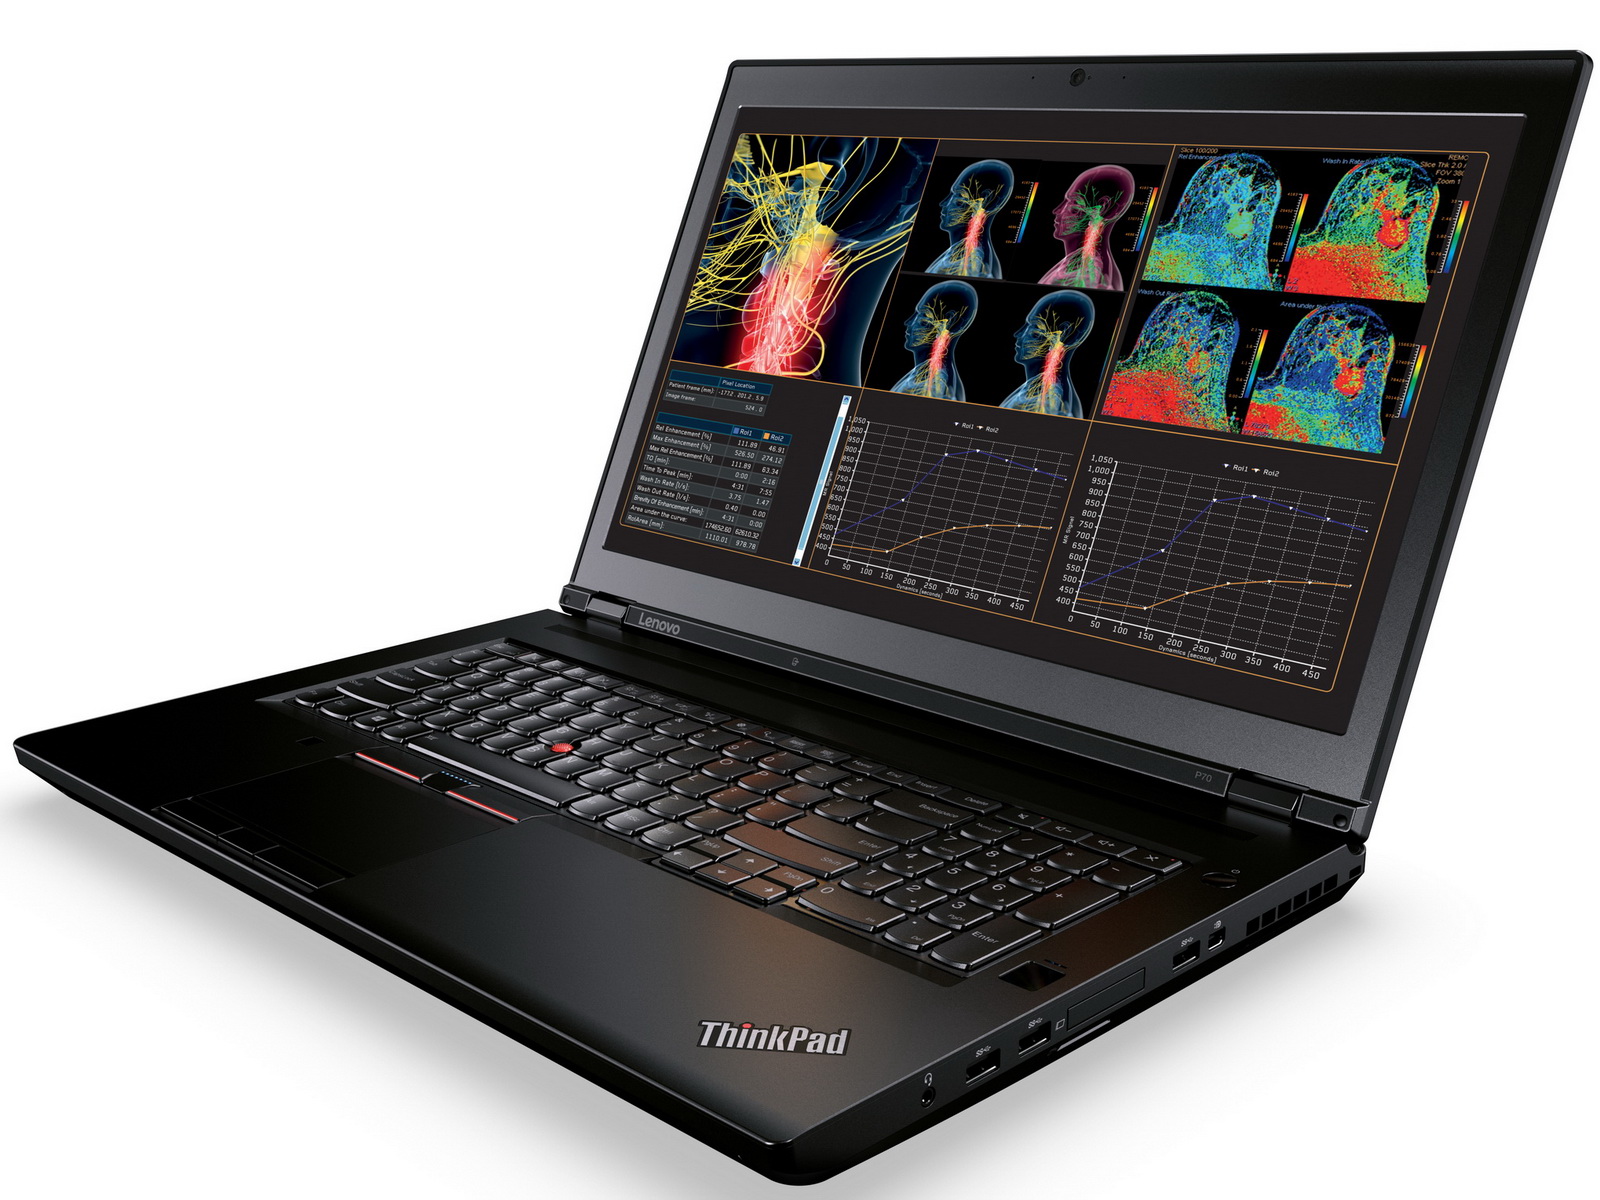
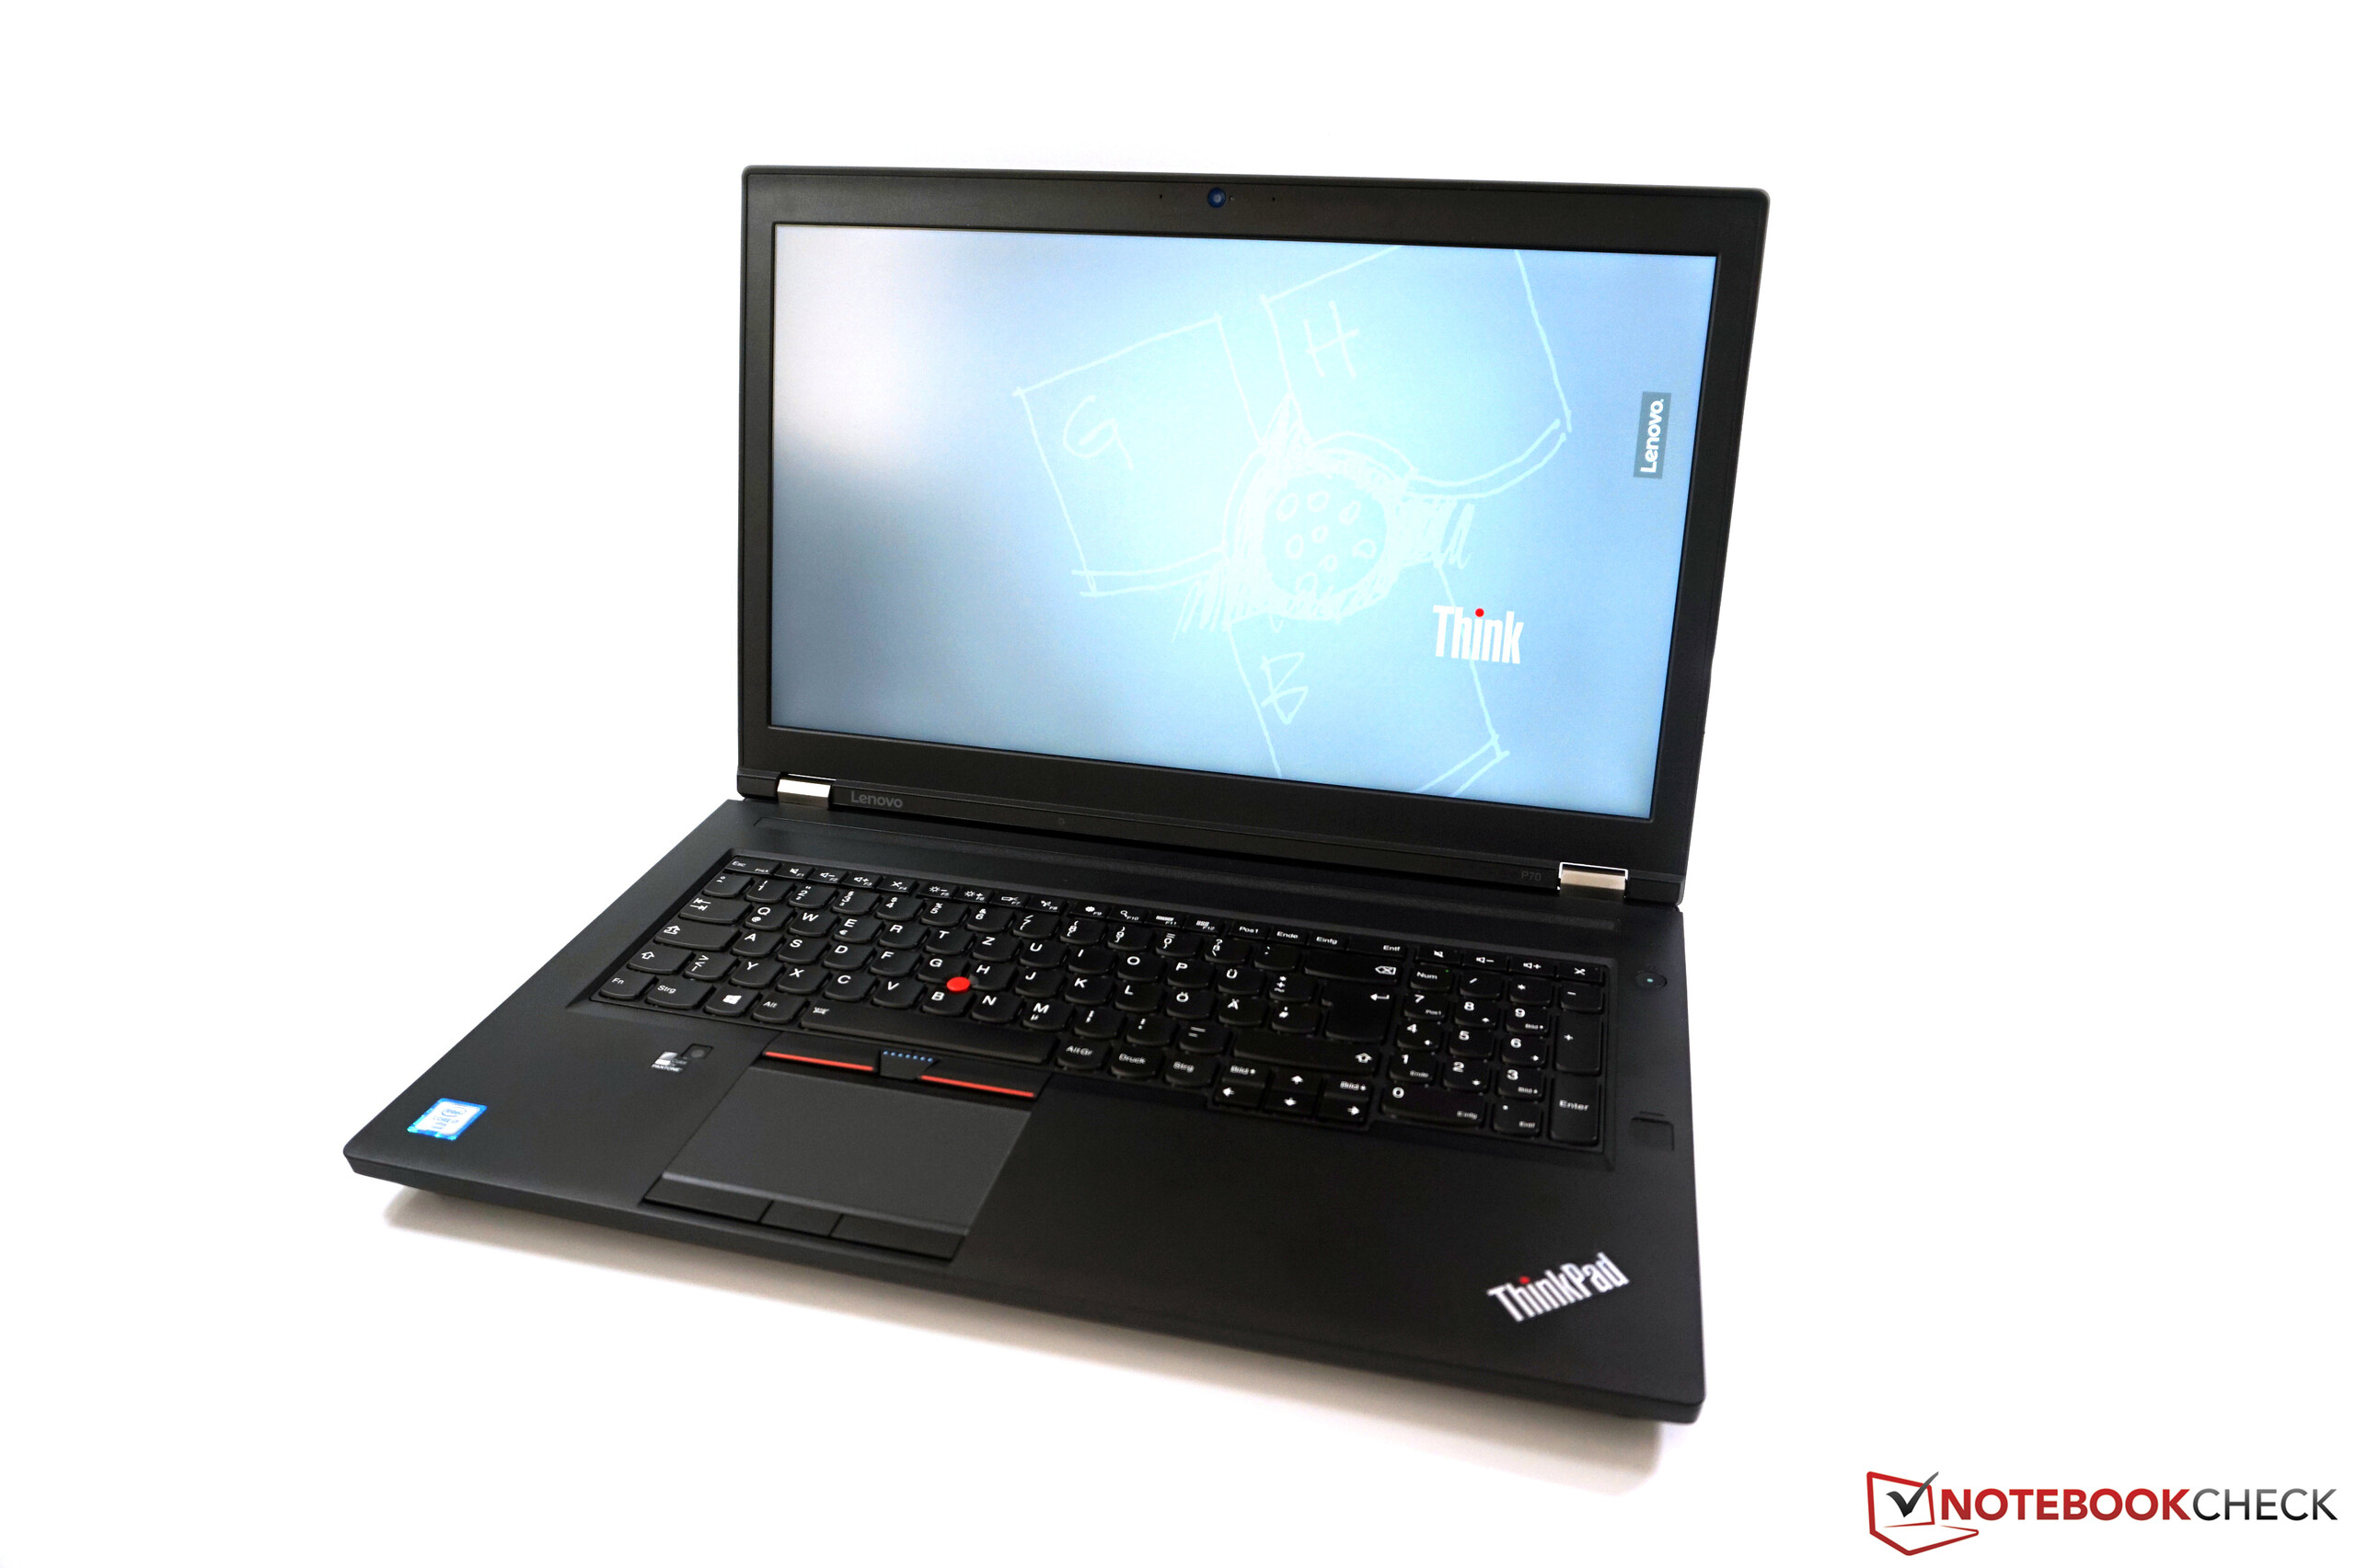
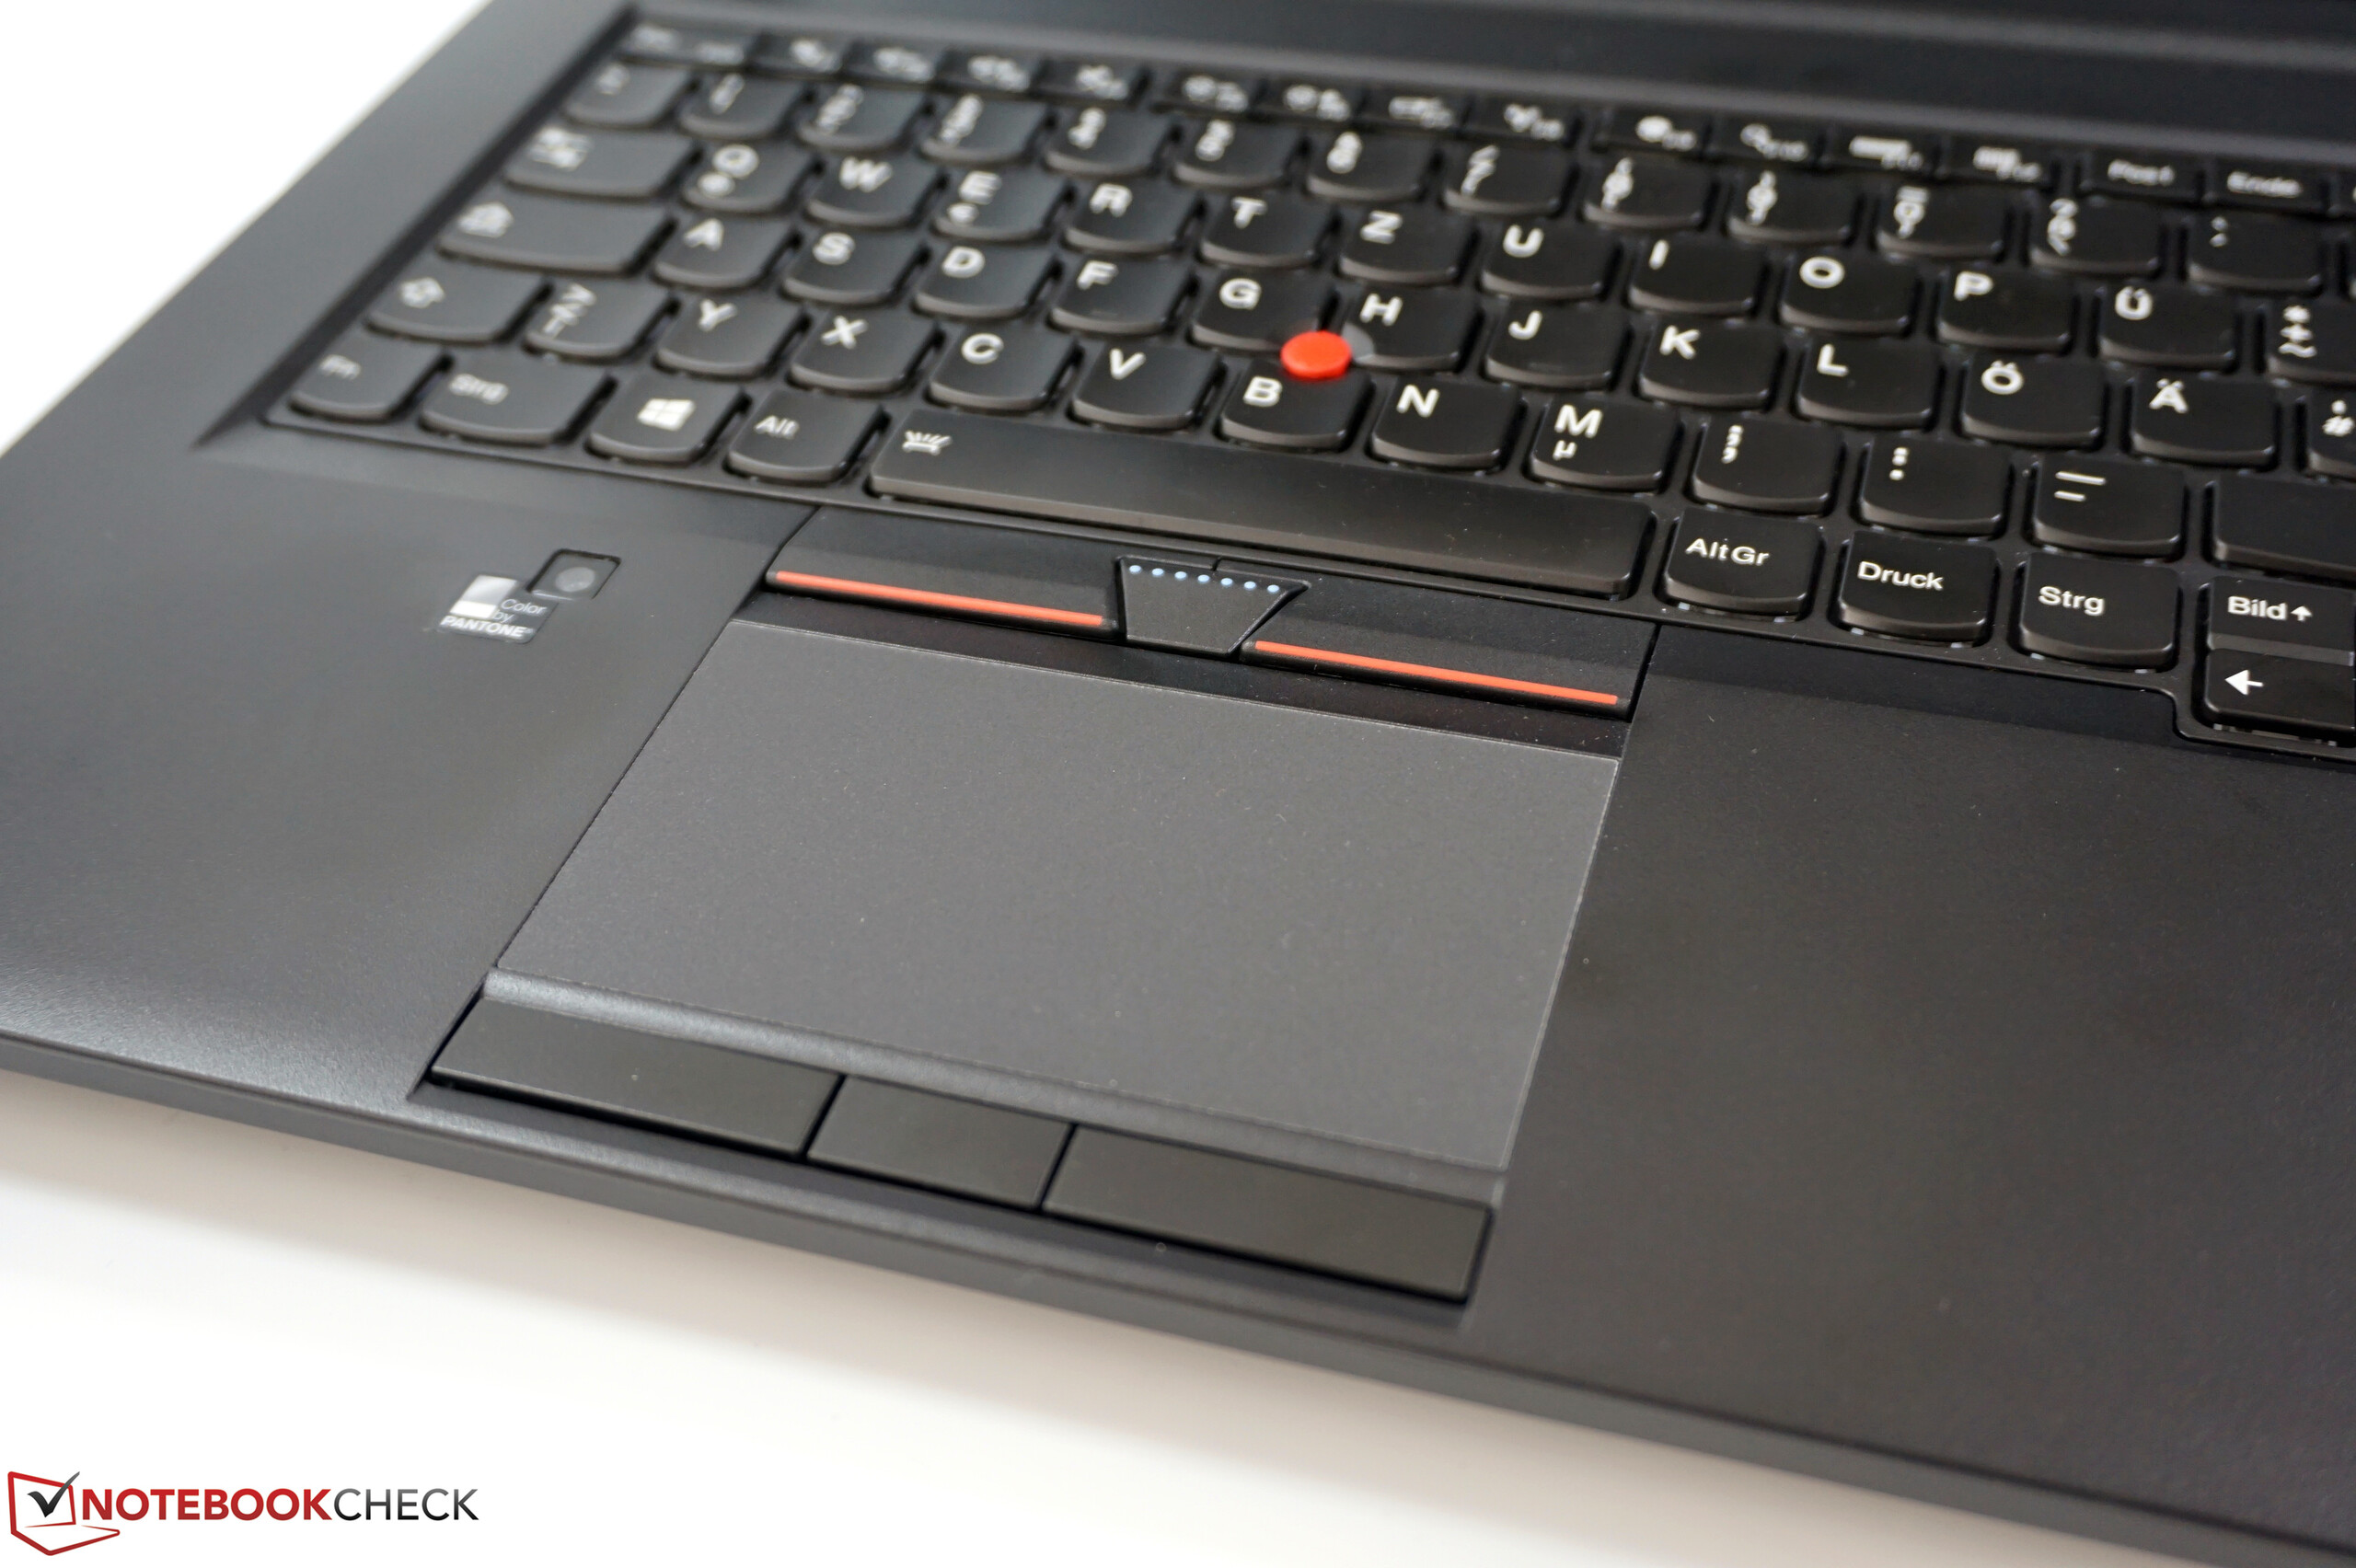
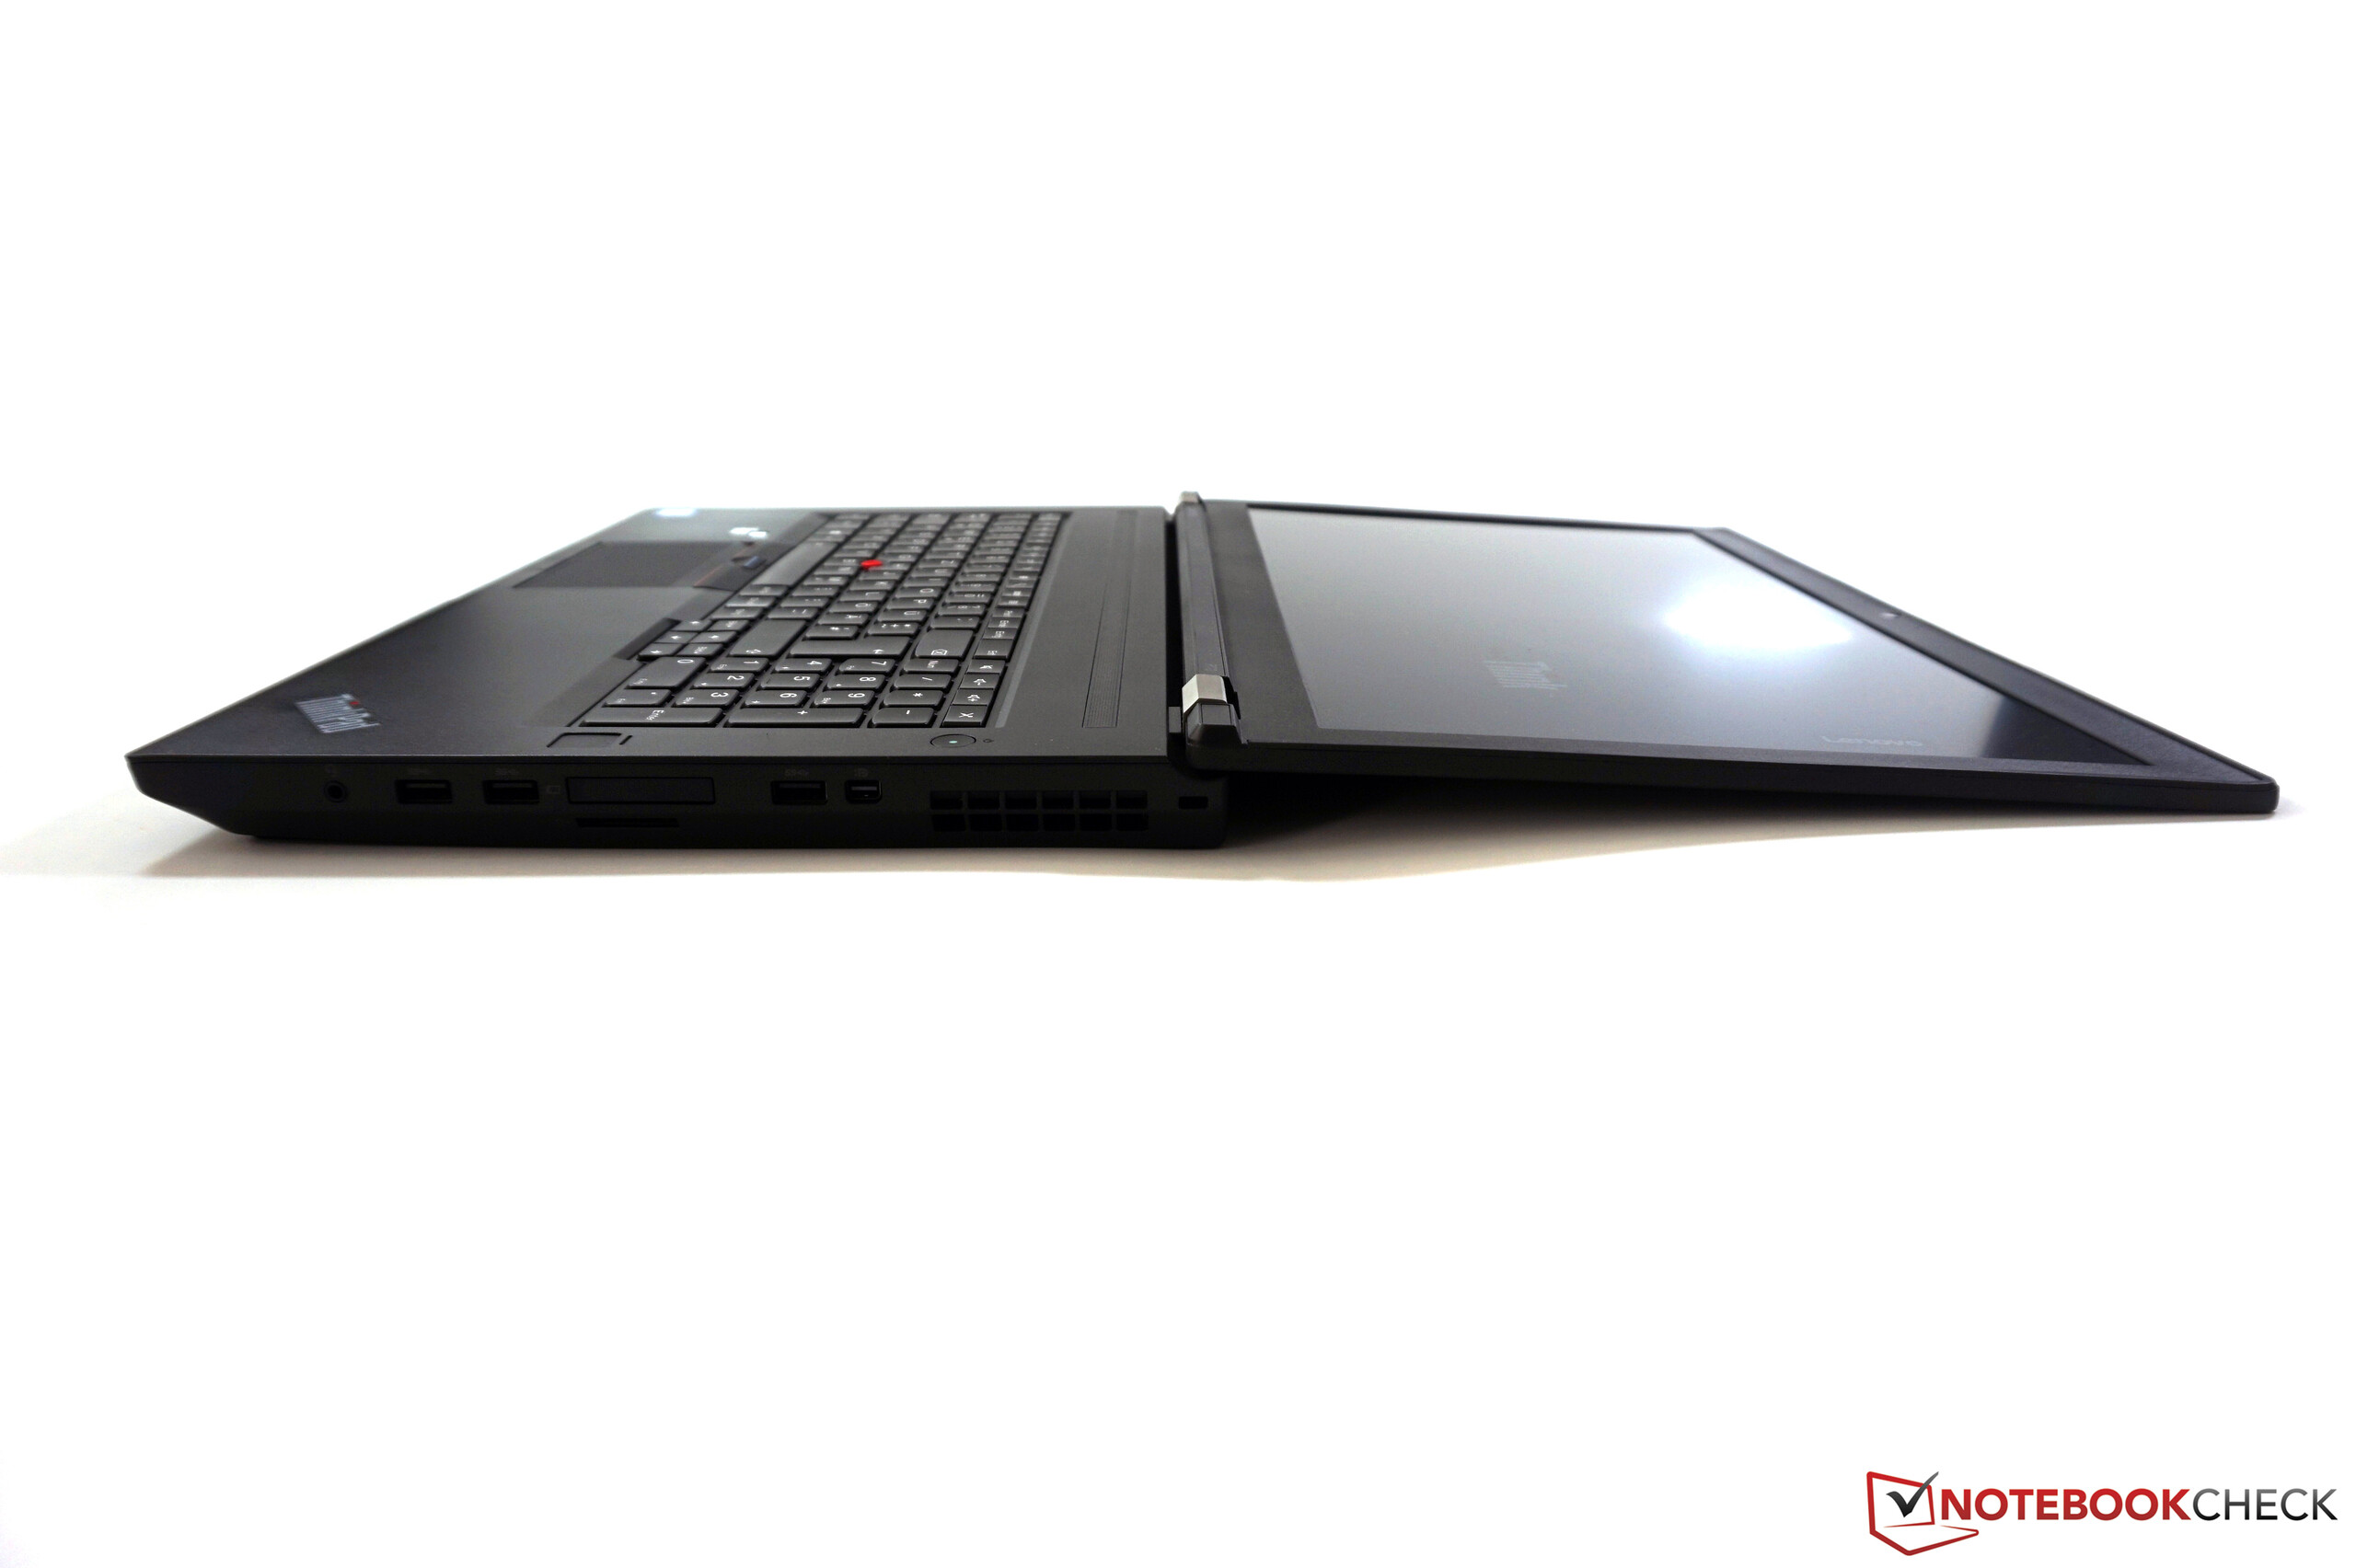
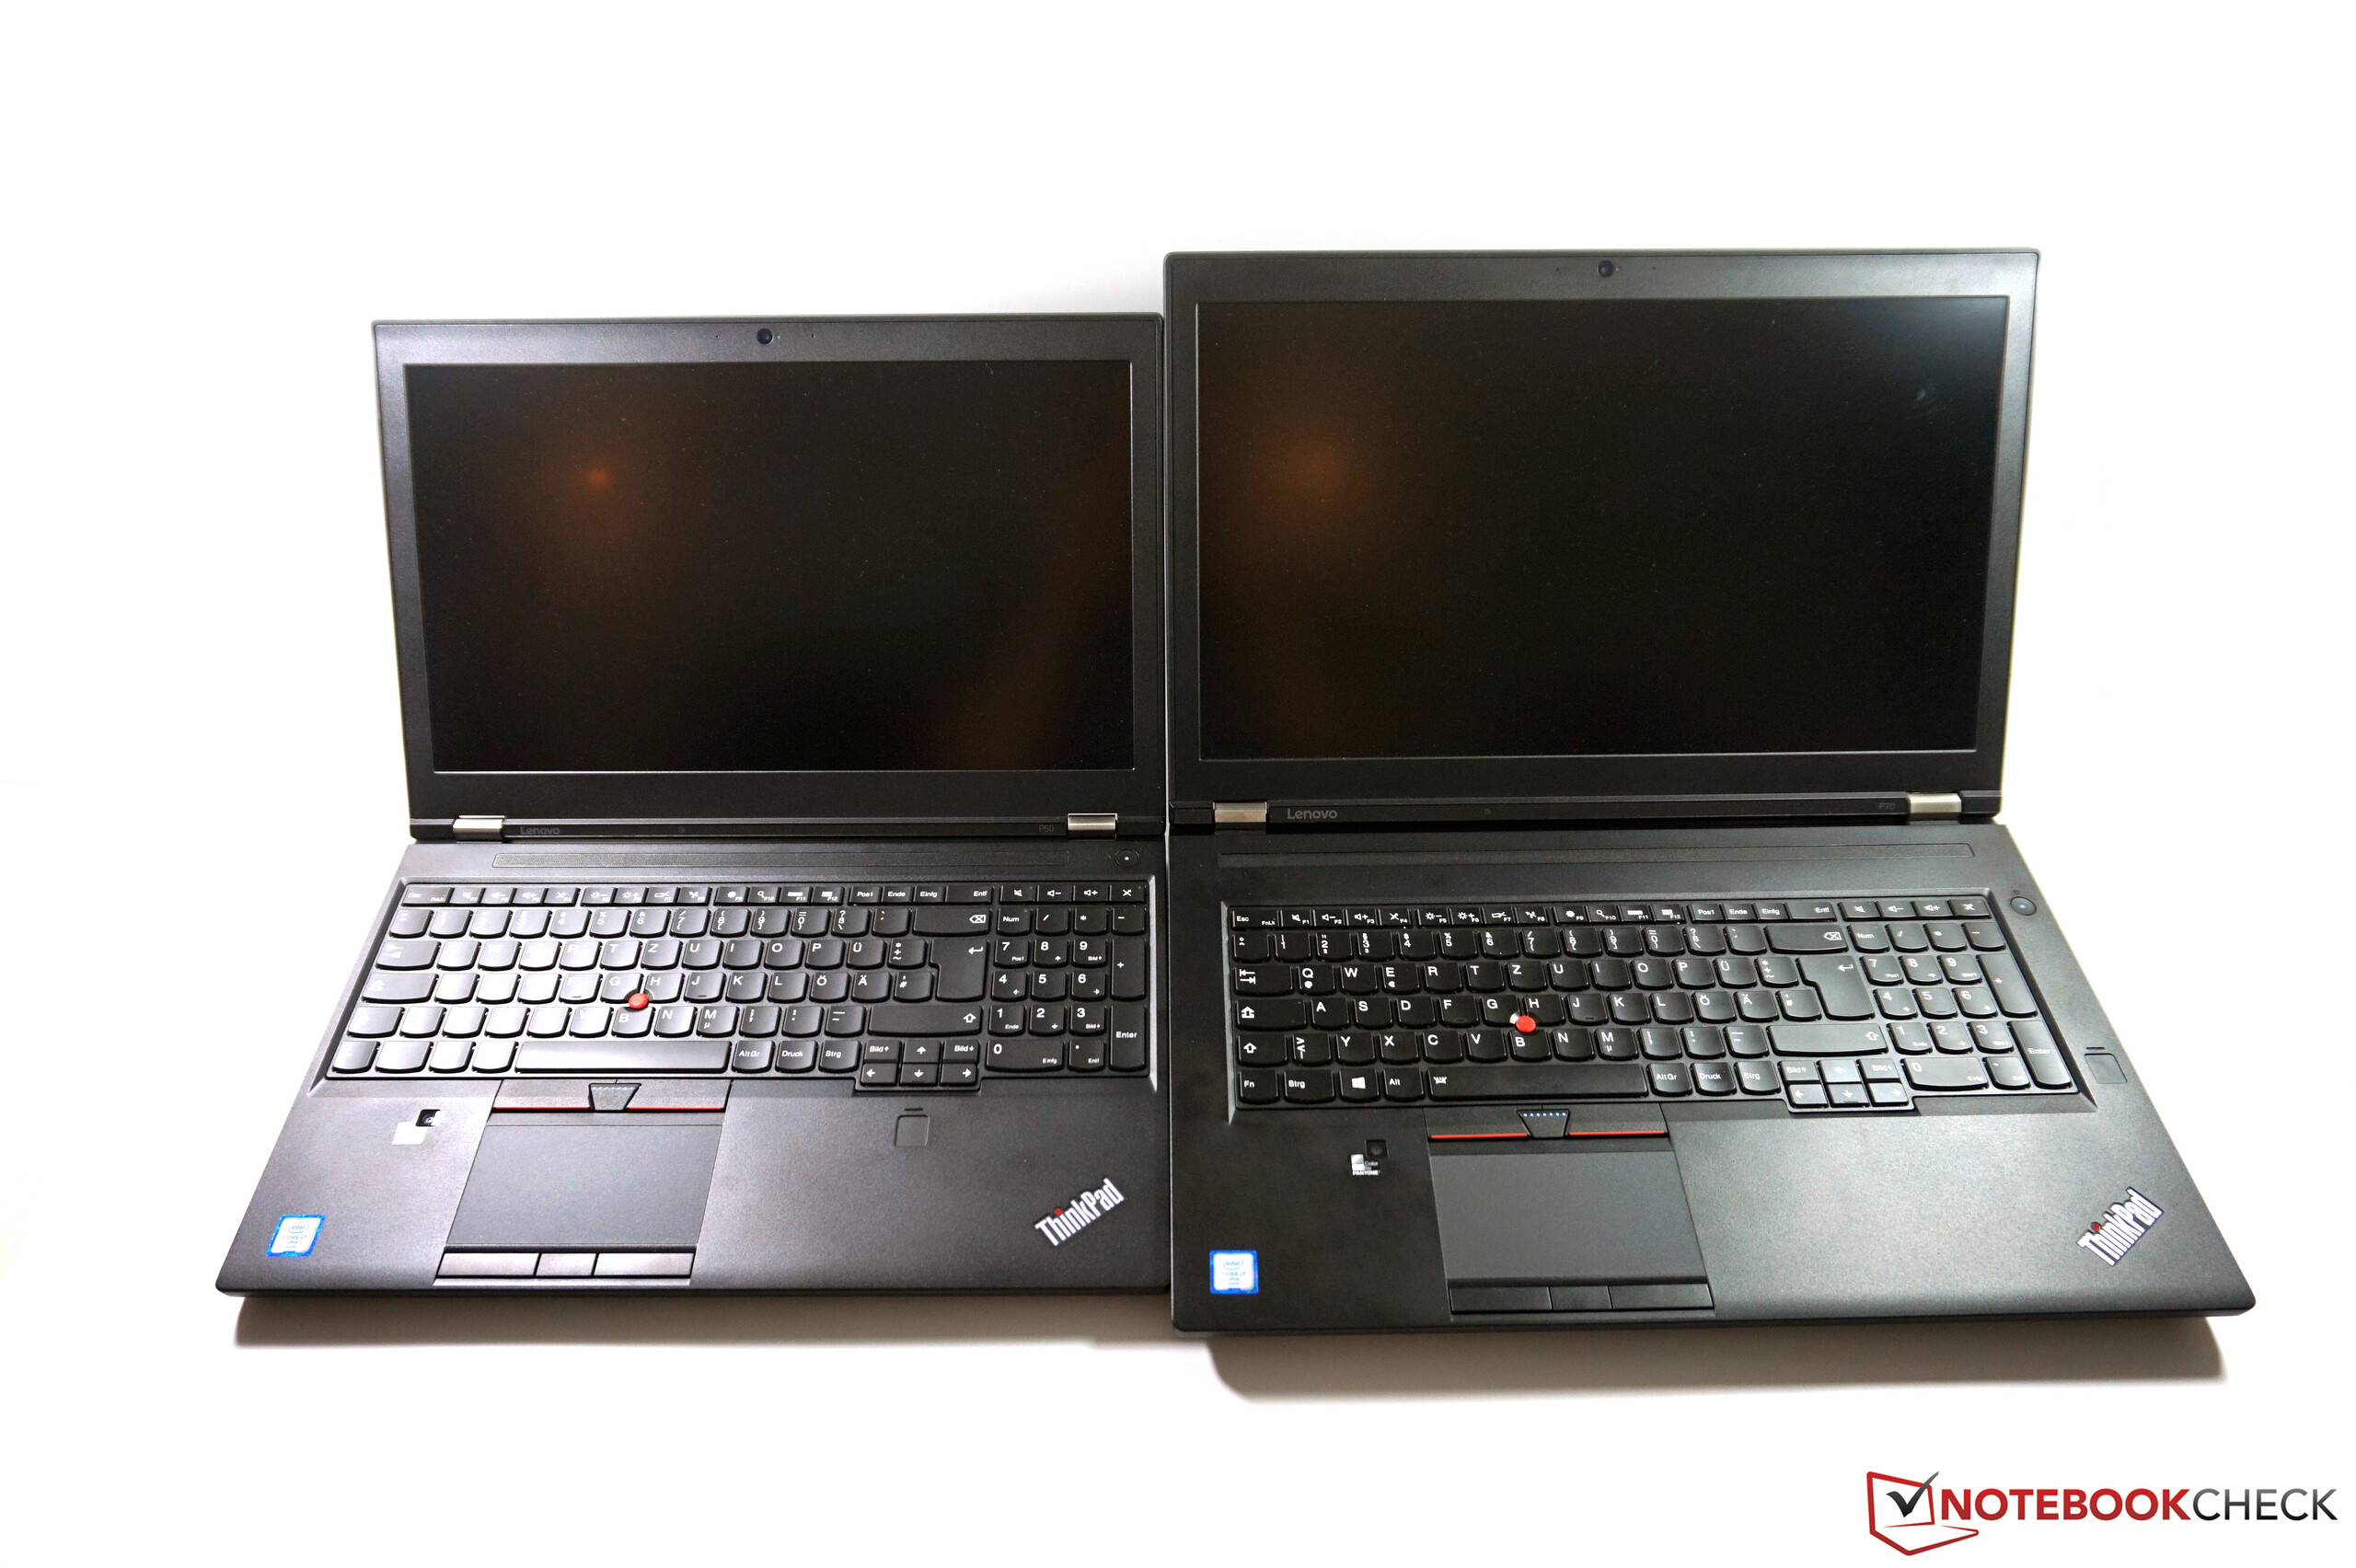
联想的ThinkPad P70是一台出色的17寸工作站。我们特别欣赏联想对于用户反馈的重视,他们改变了前几代产品中一些有争议的设计,进行了改进。其中特别是指点杆和触控板的设计,它们再次搭配了独立按键。
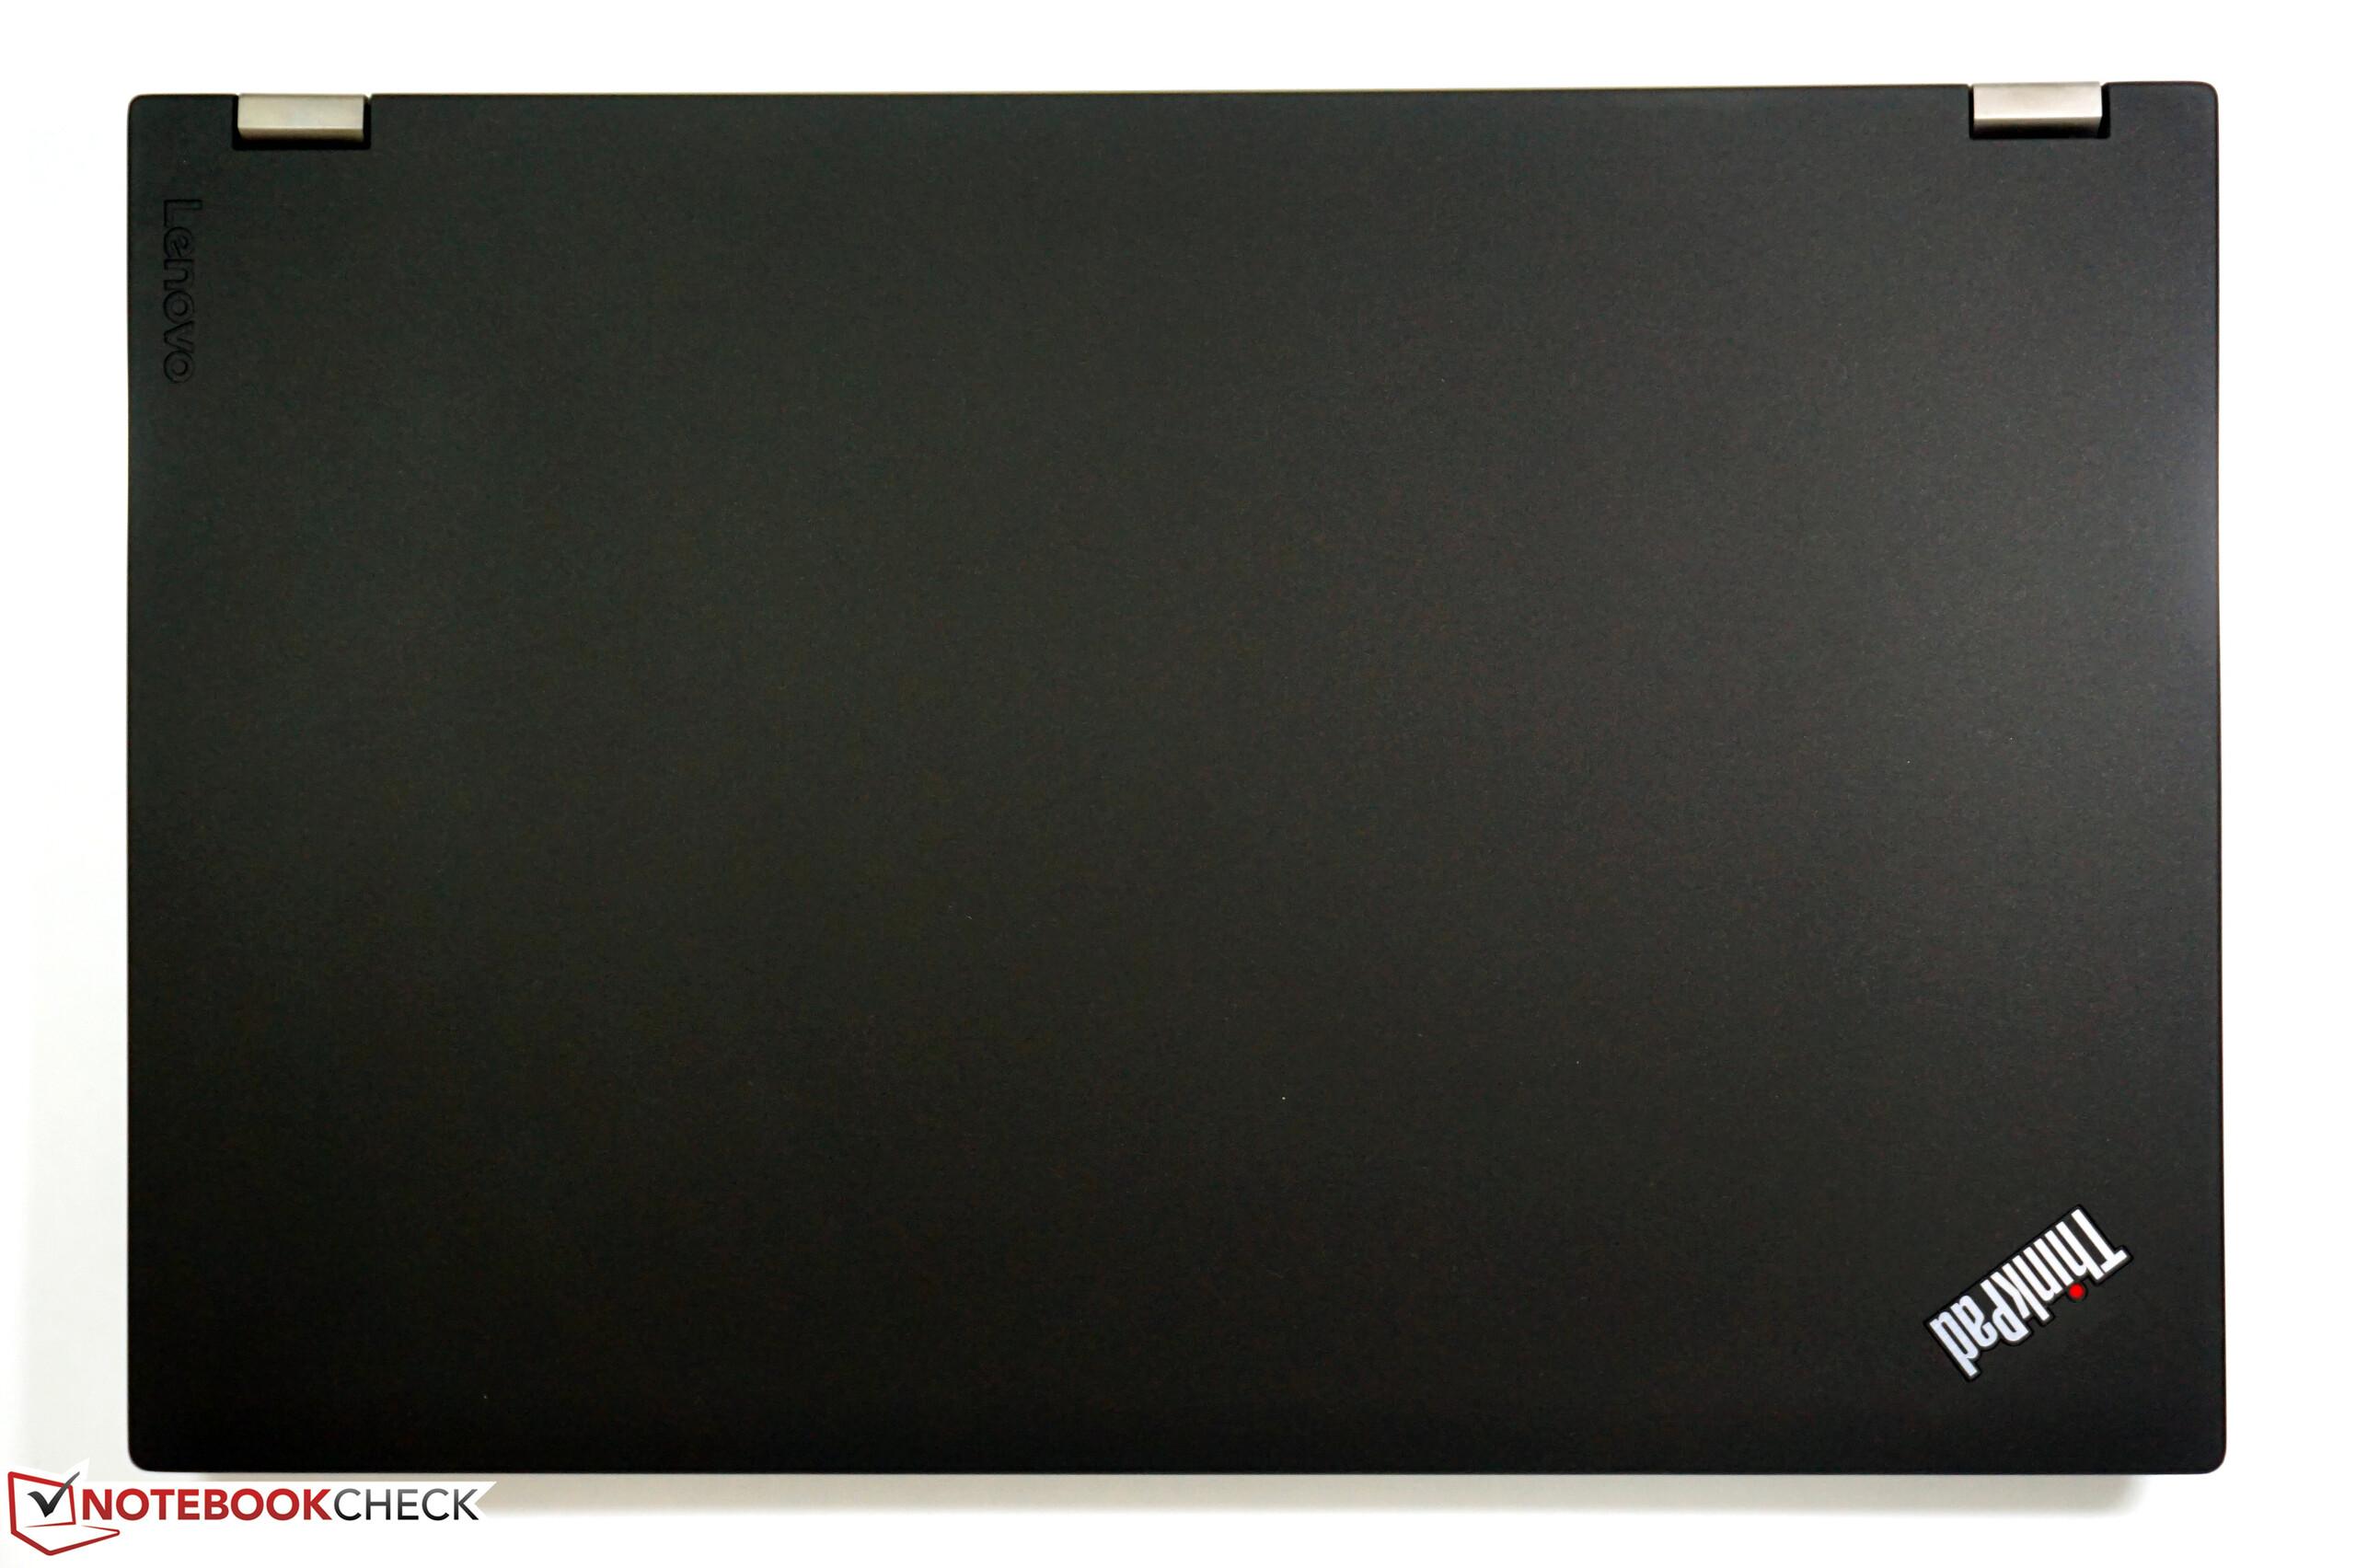
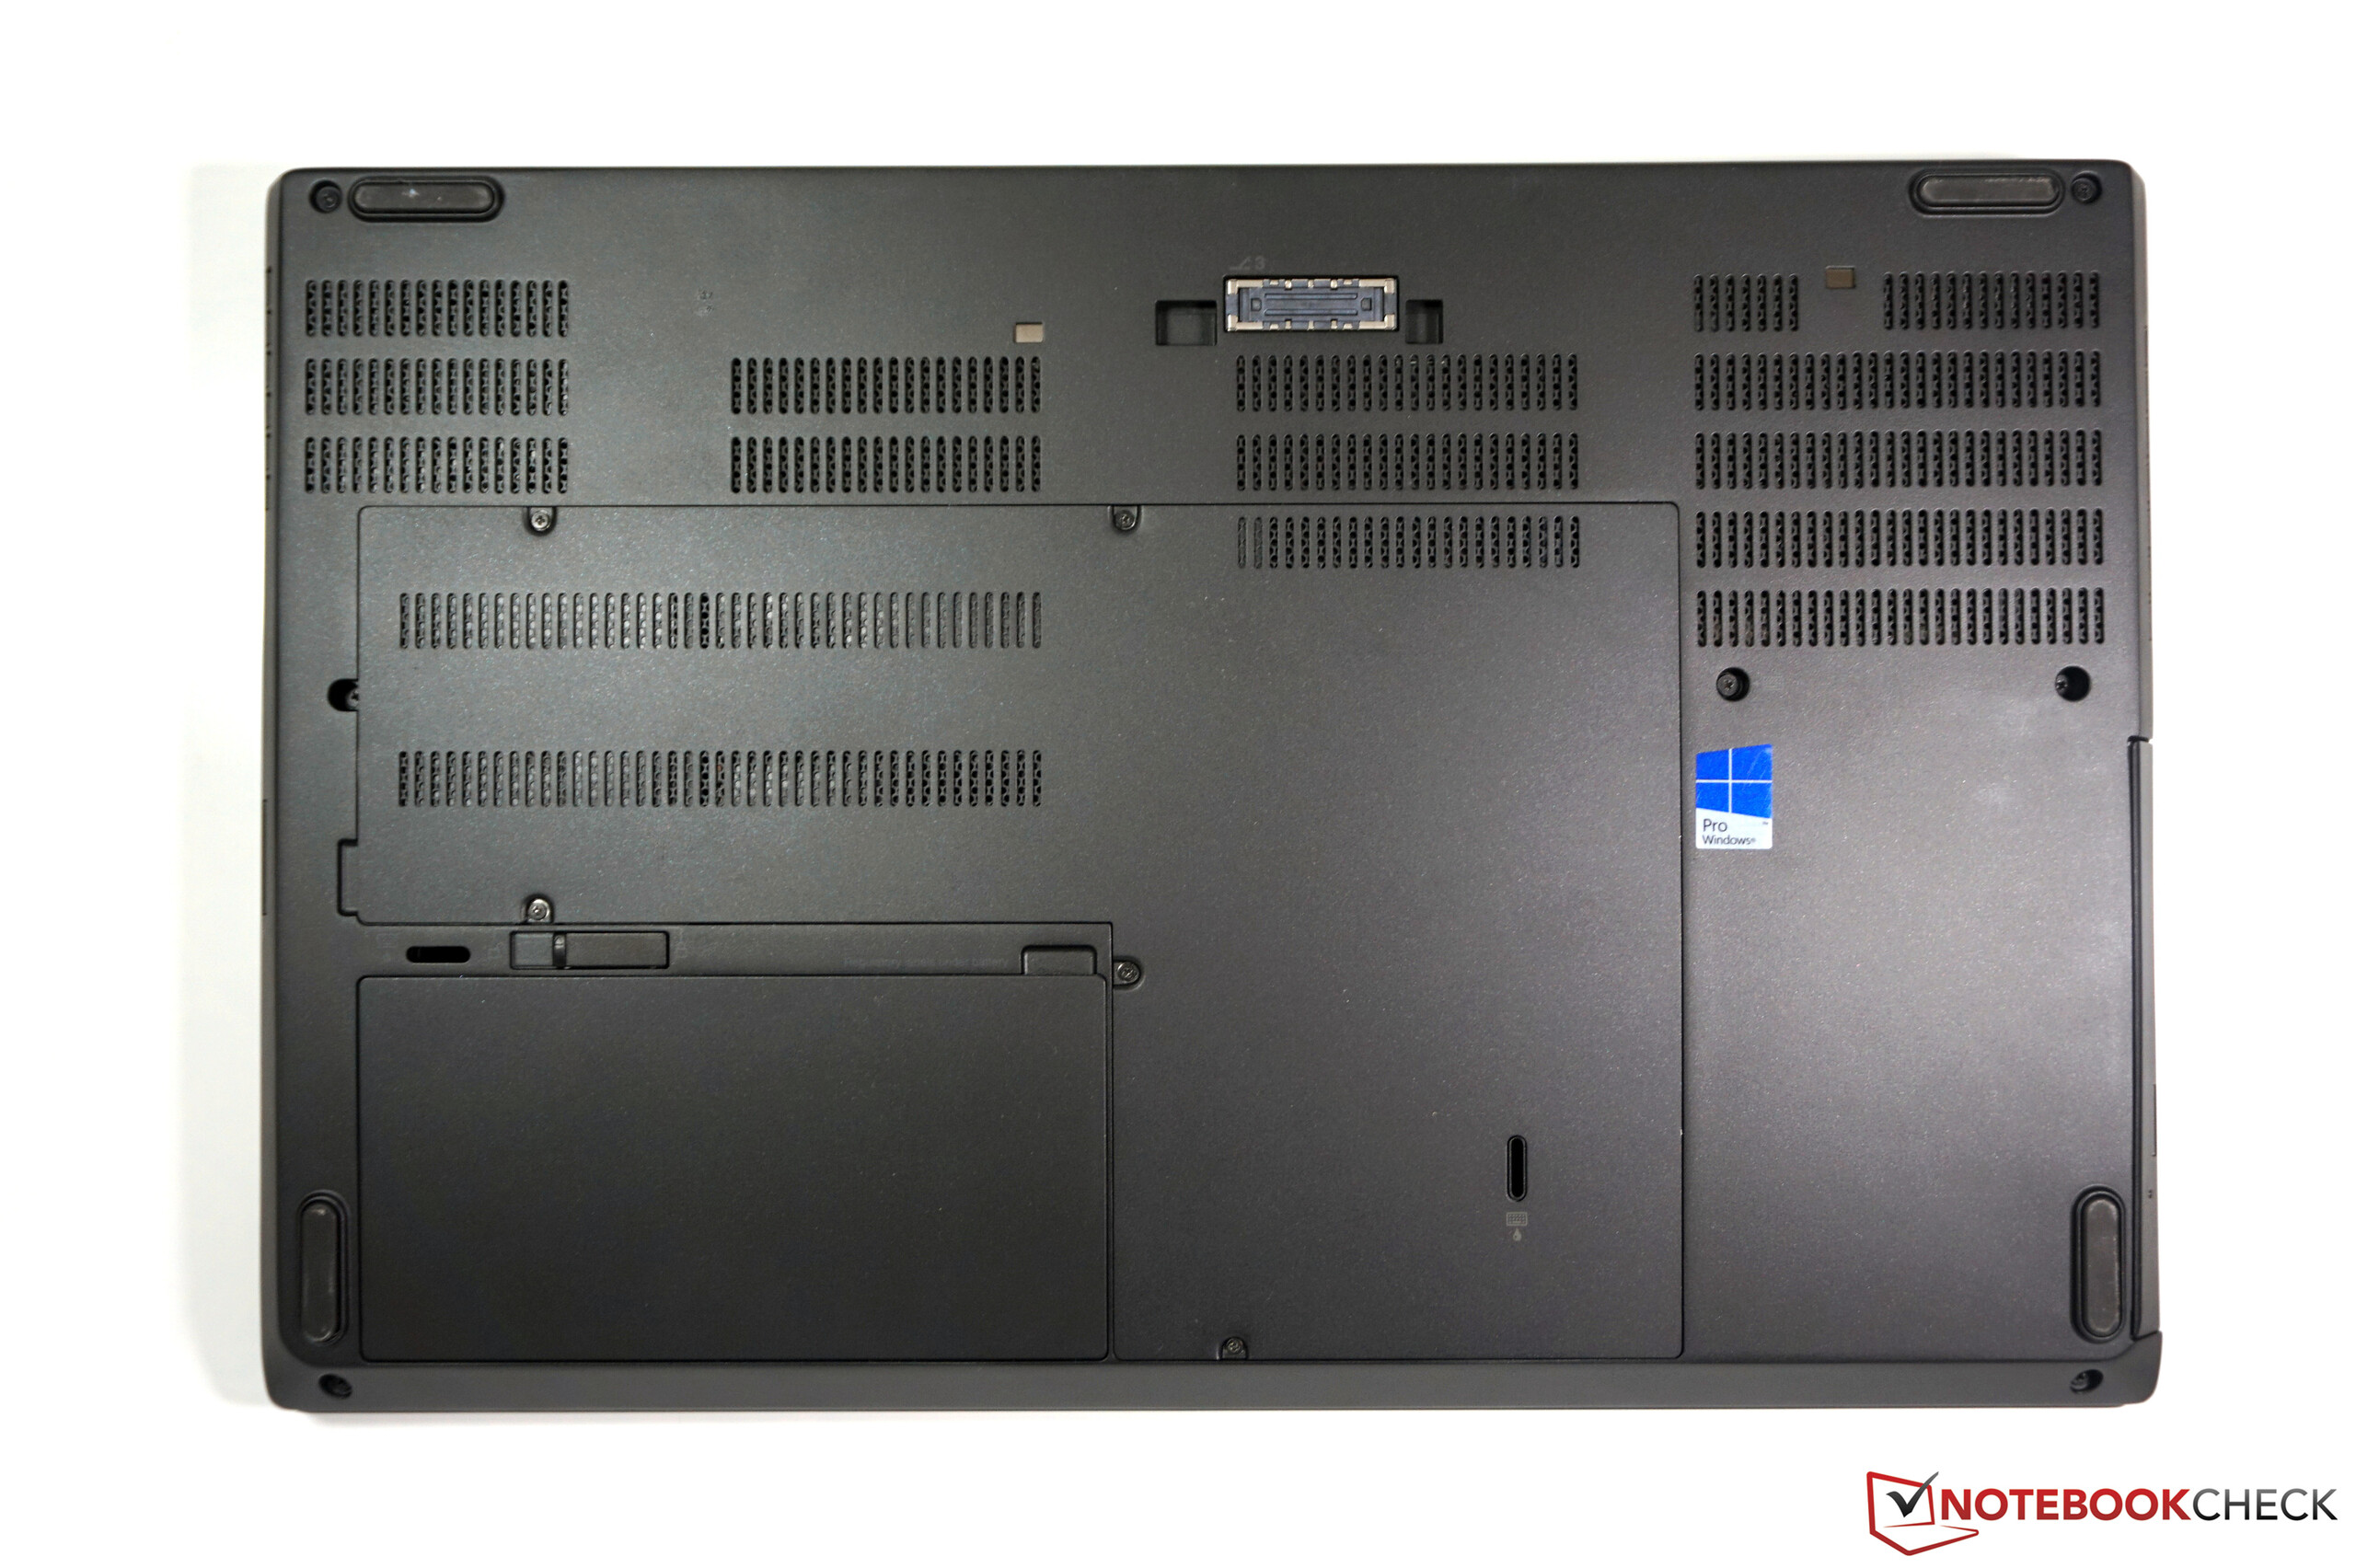
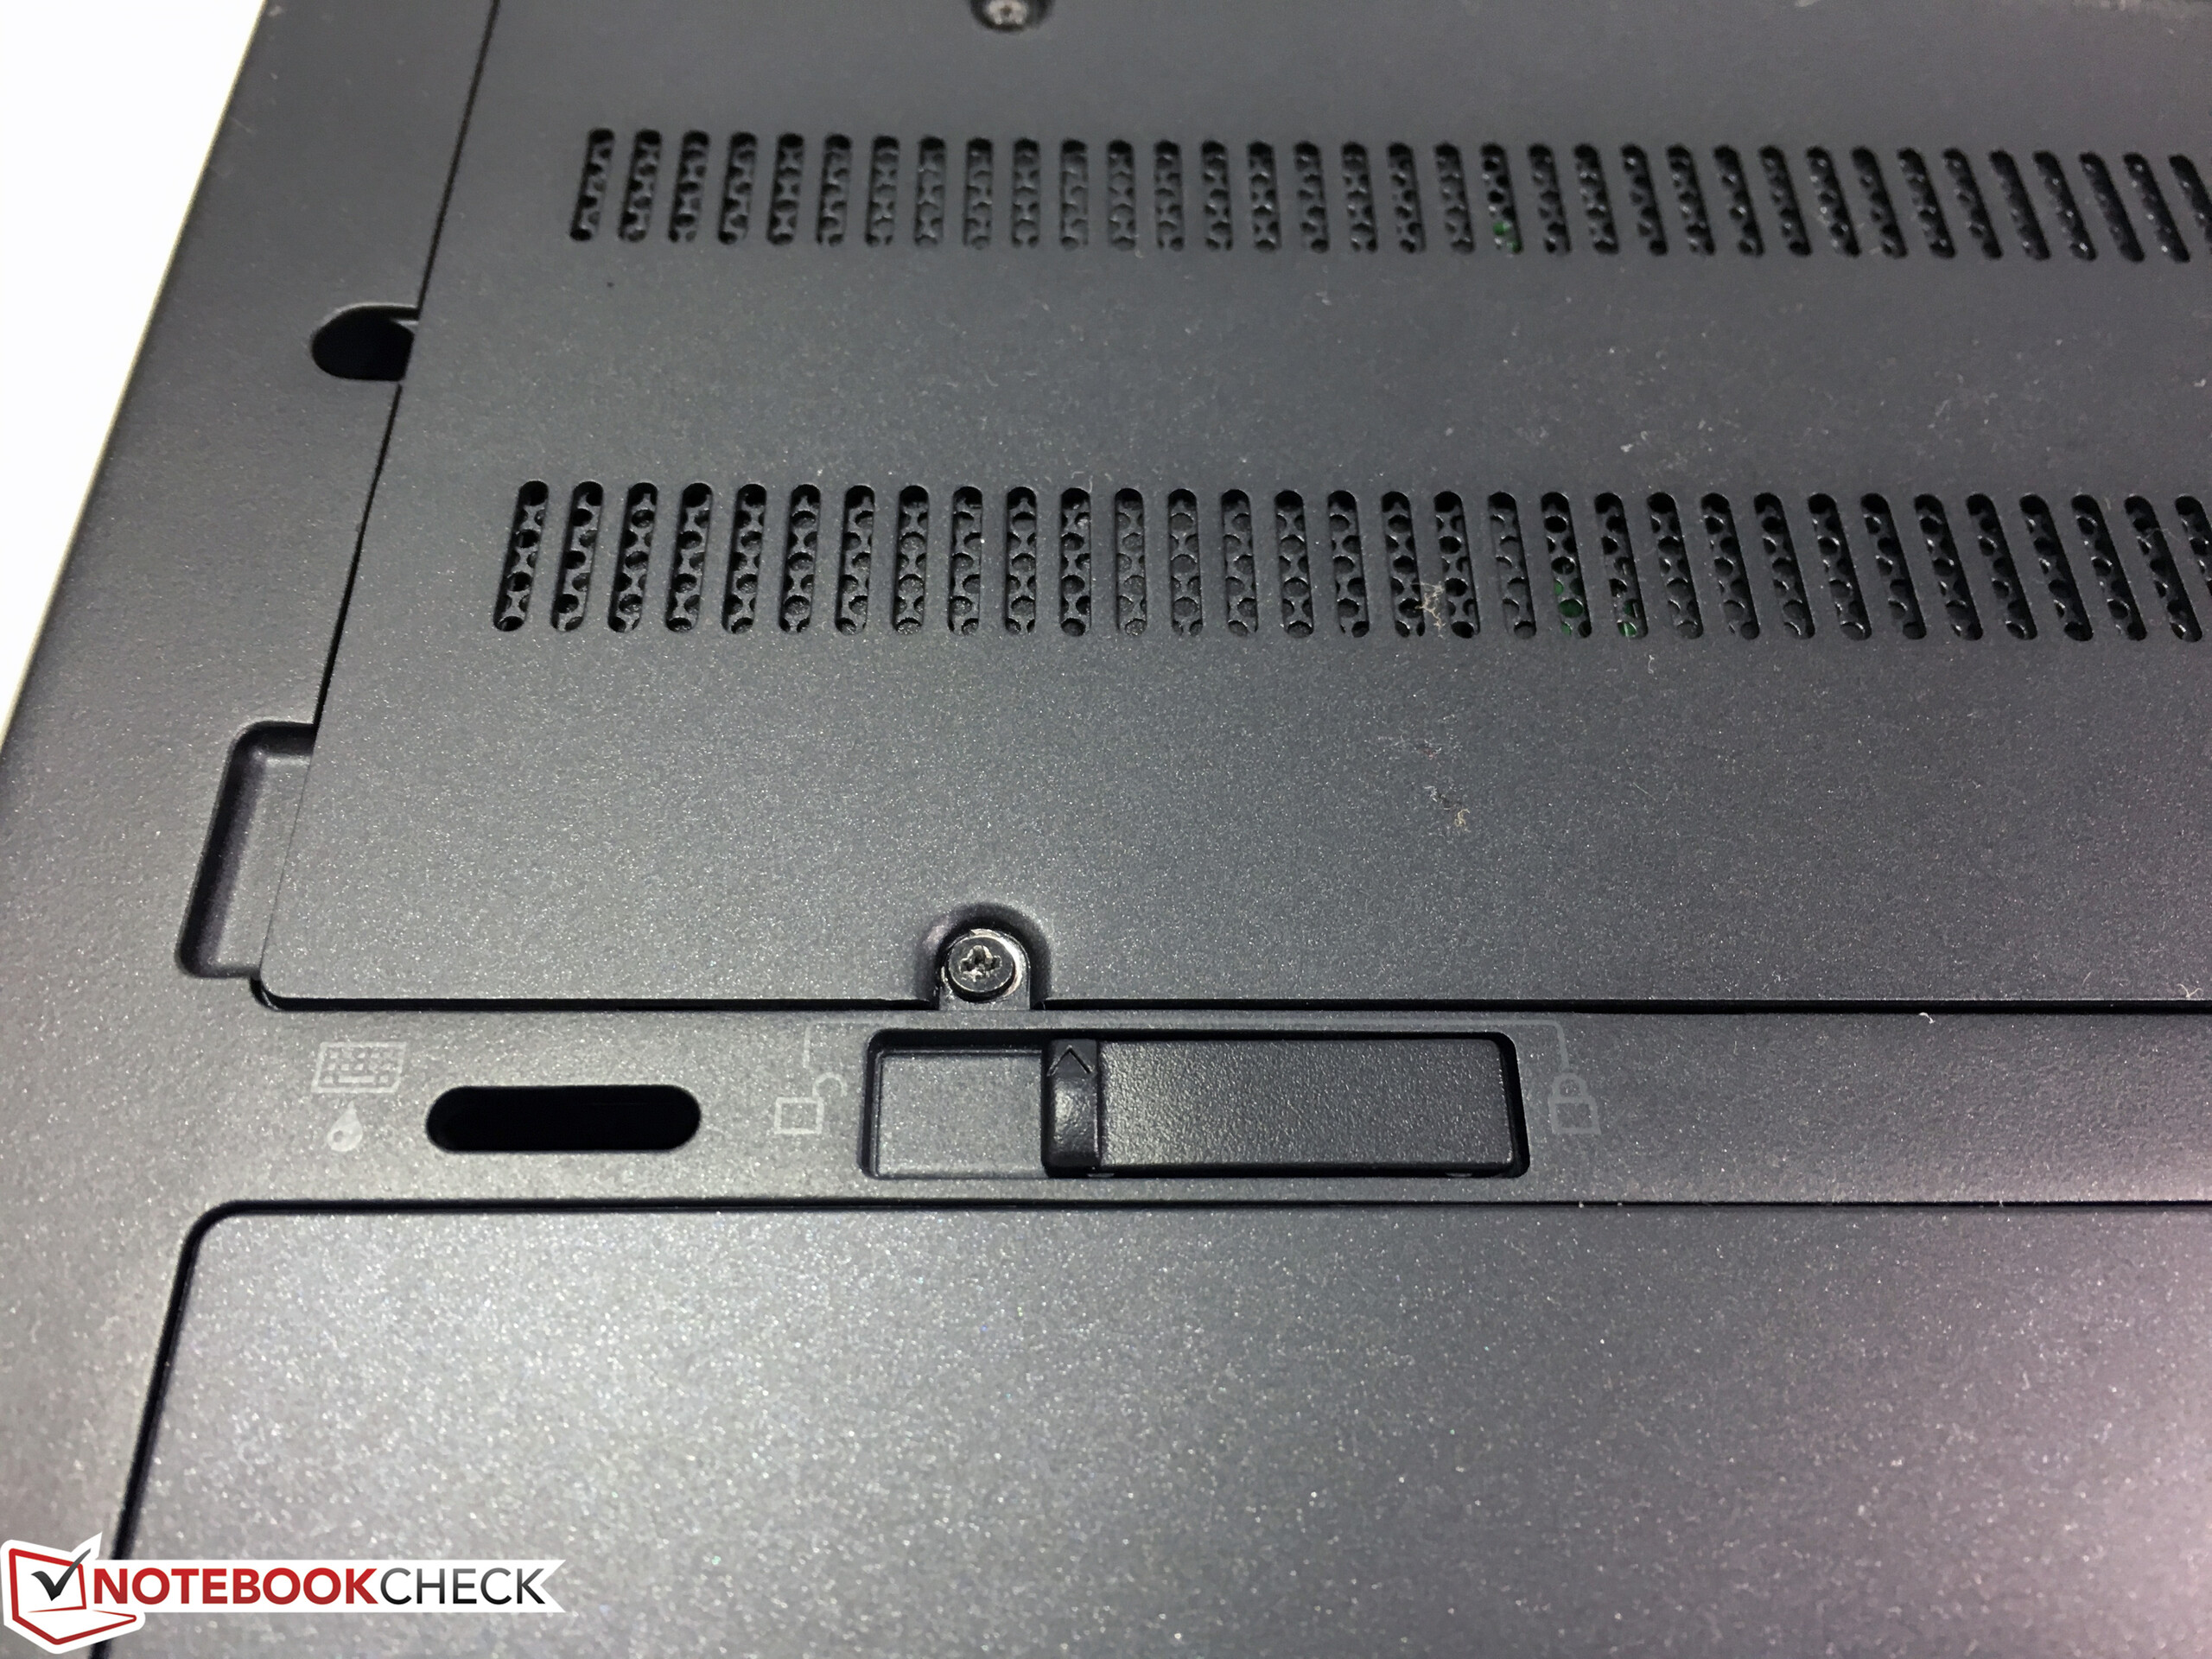
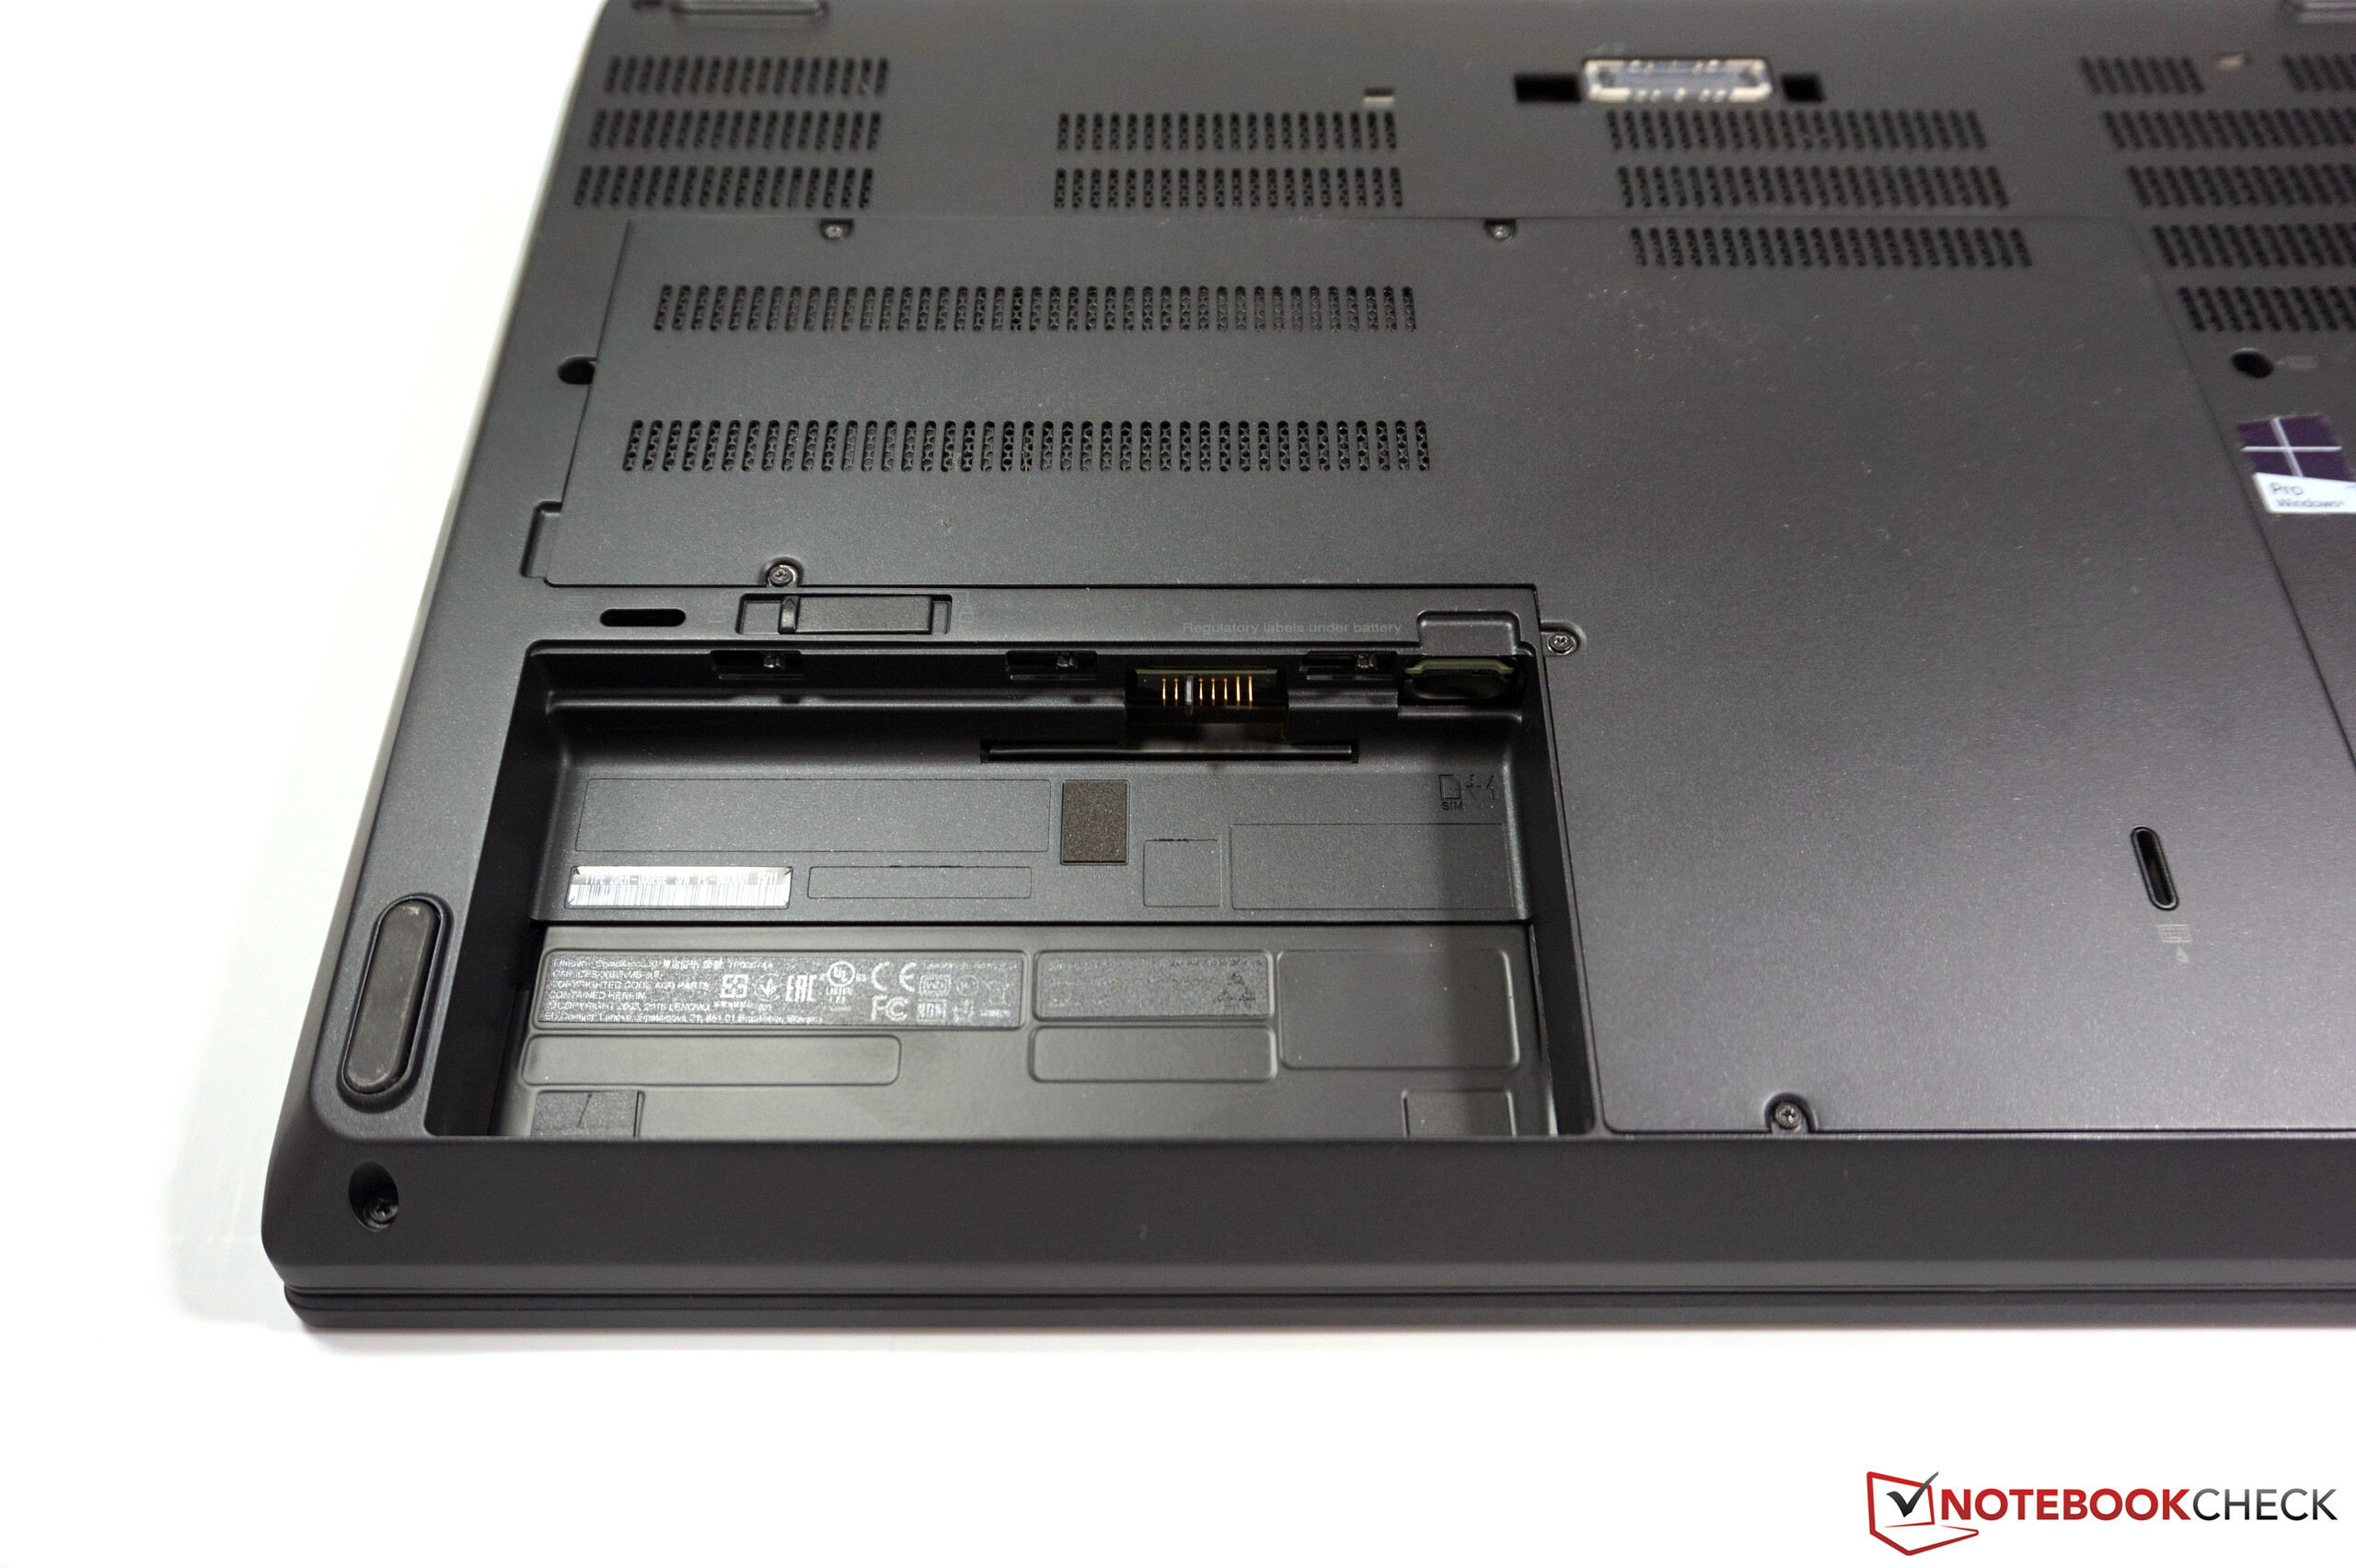
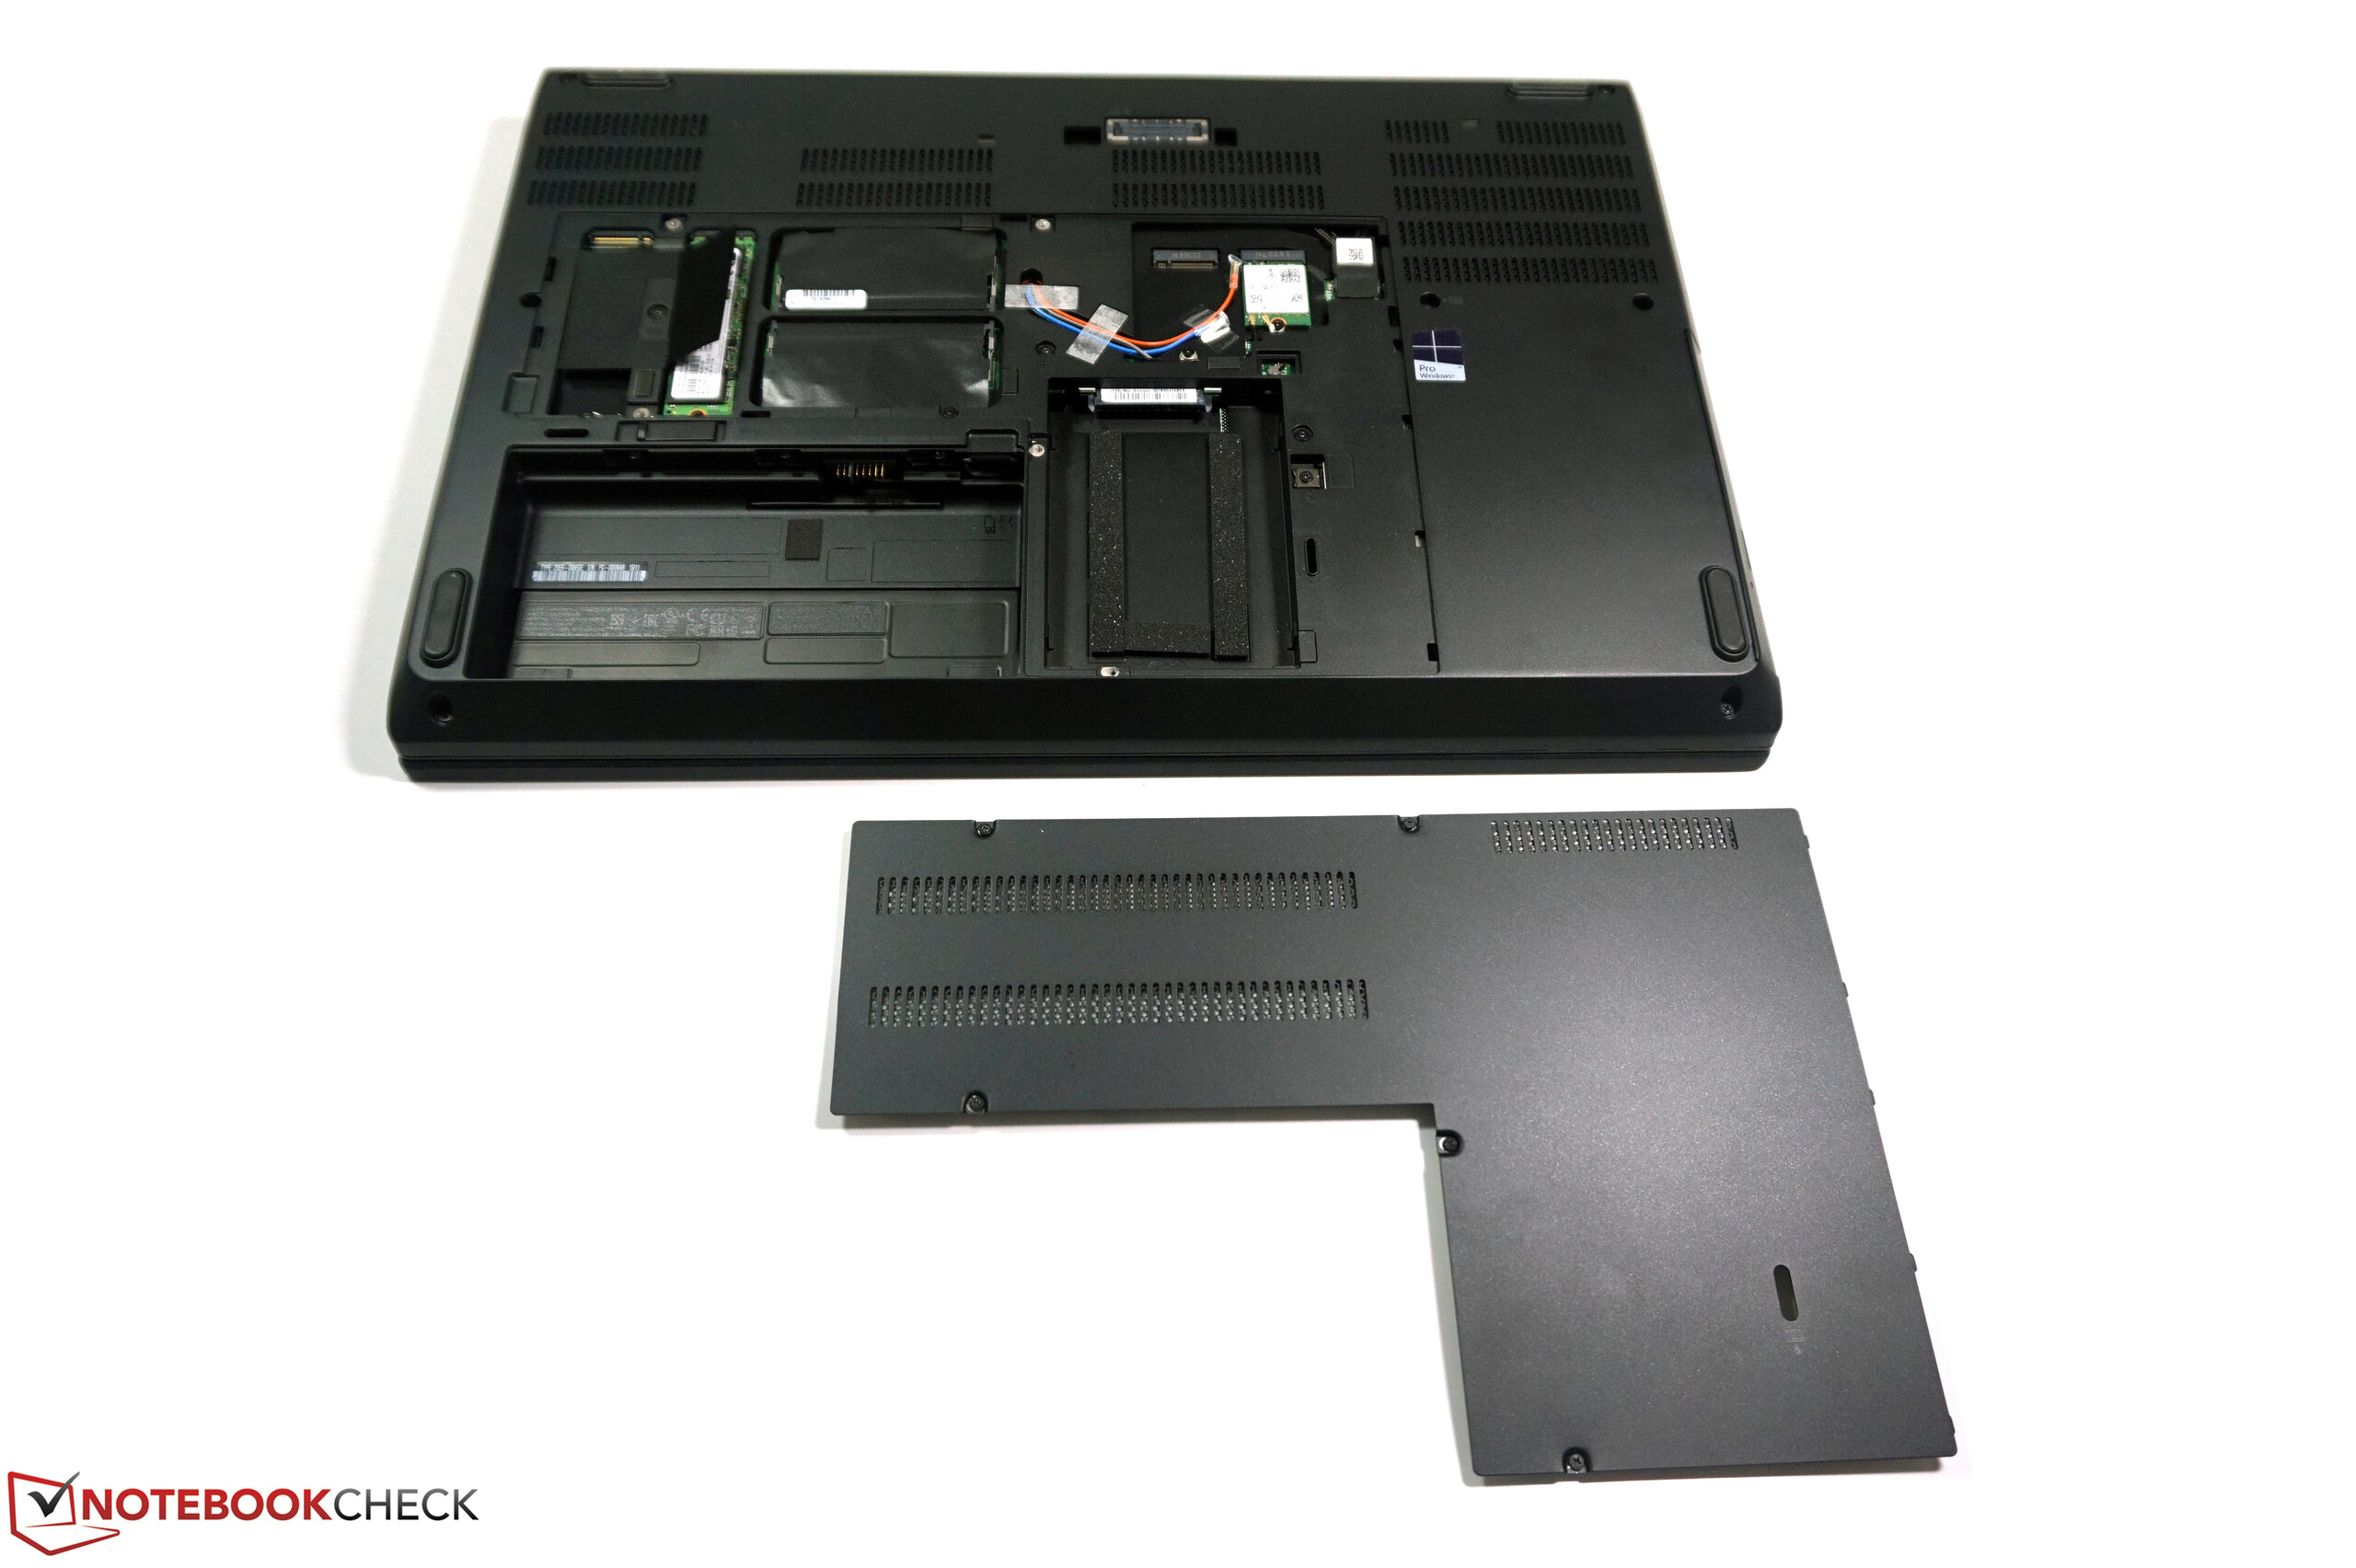
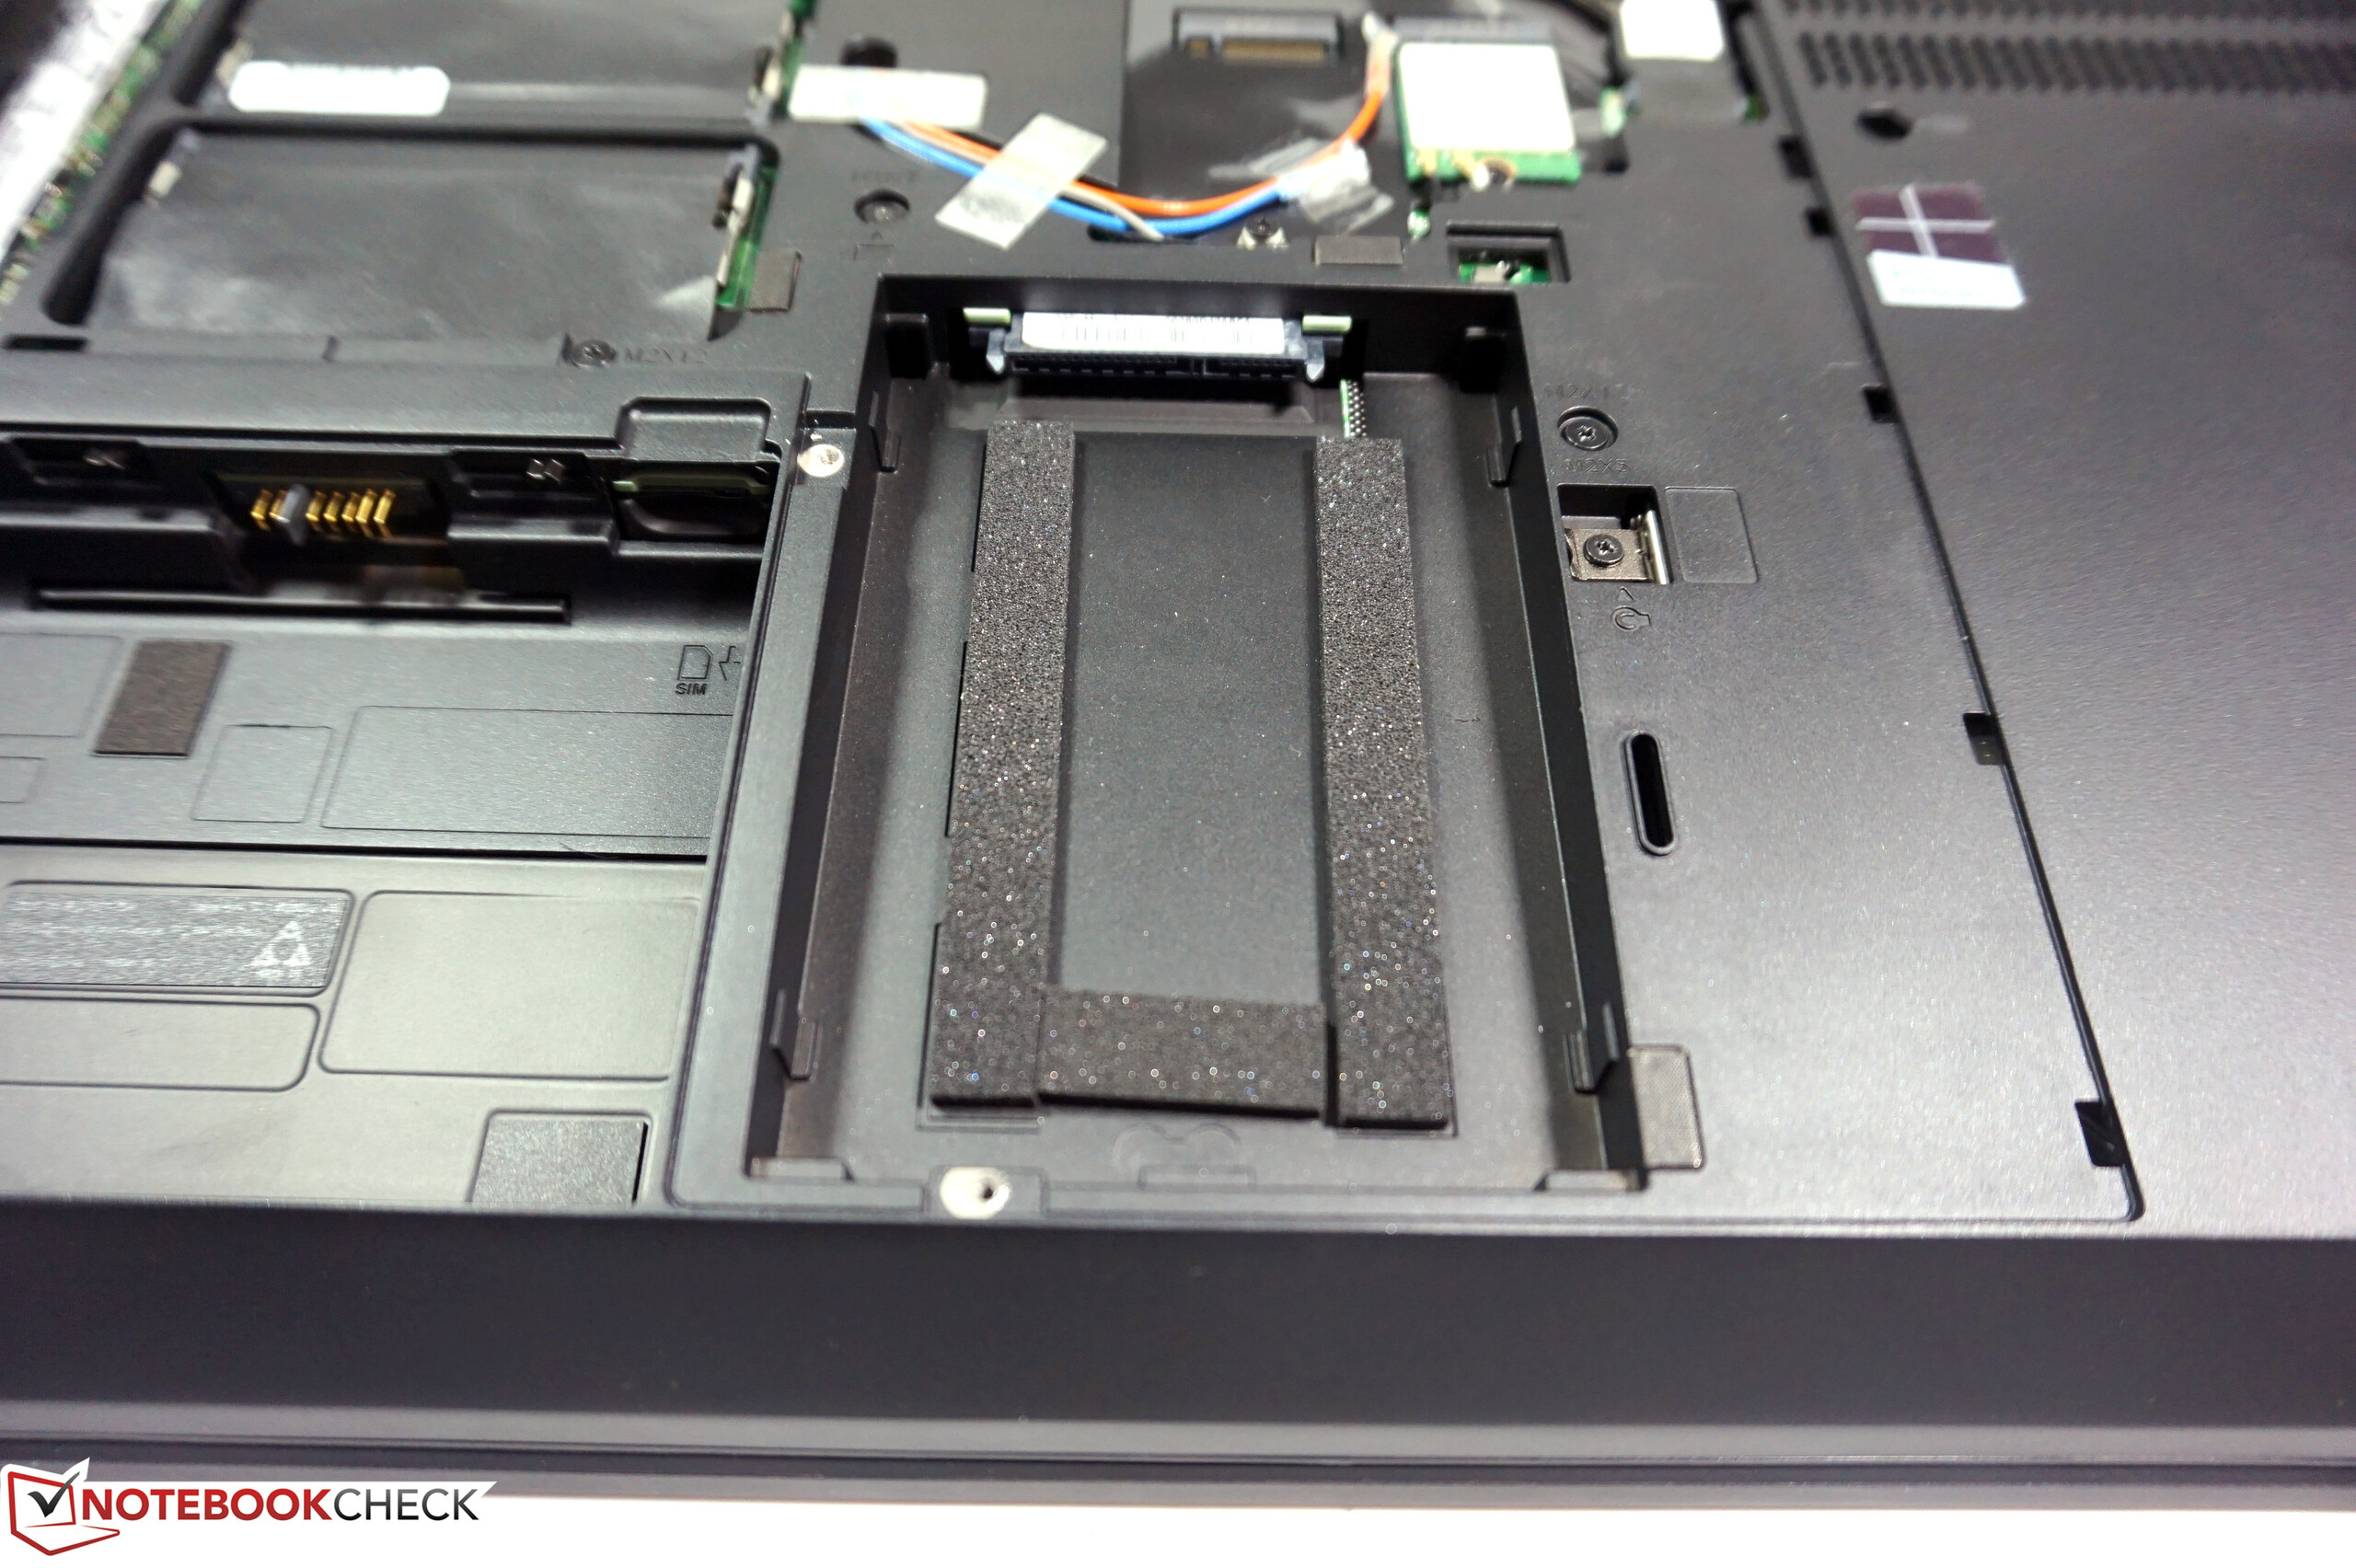
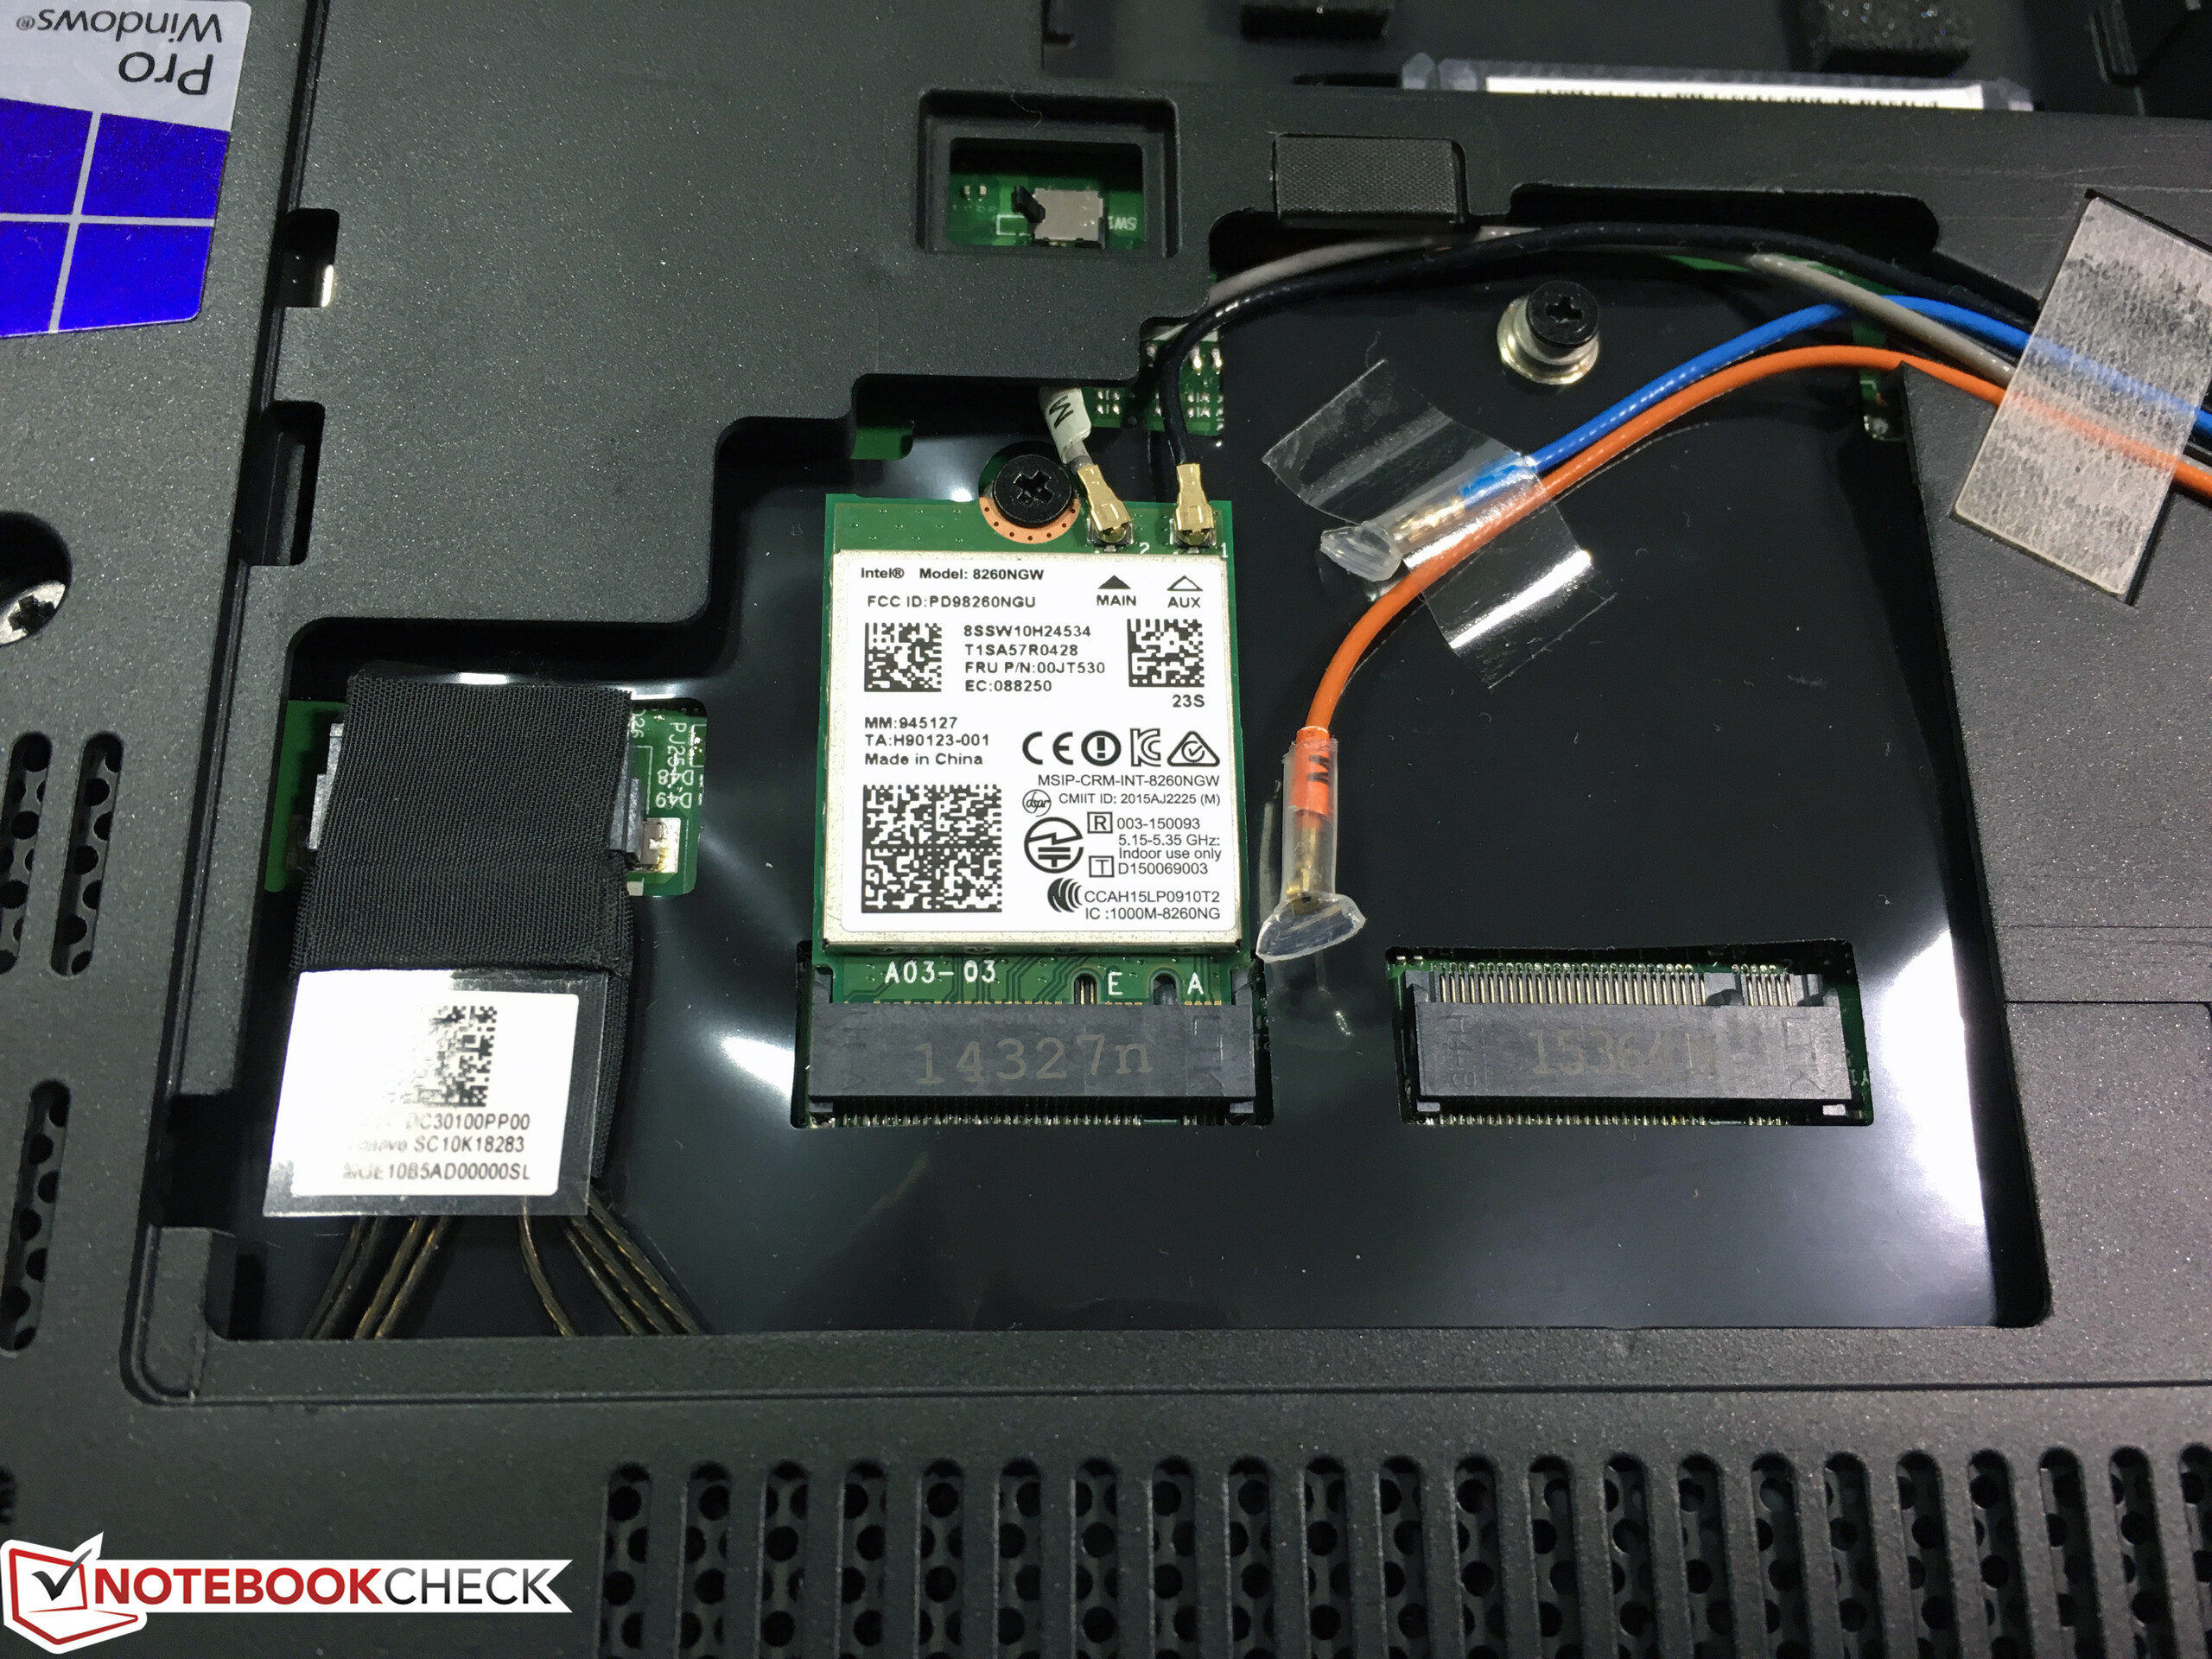
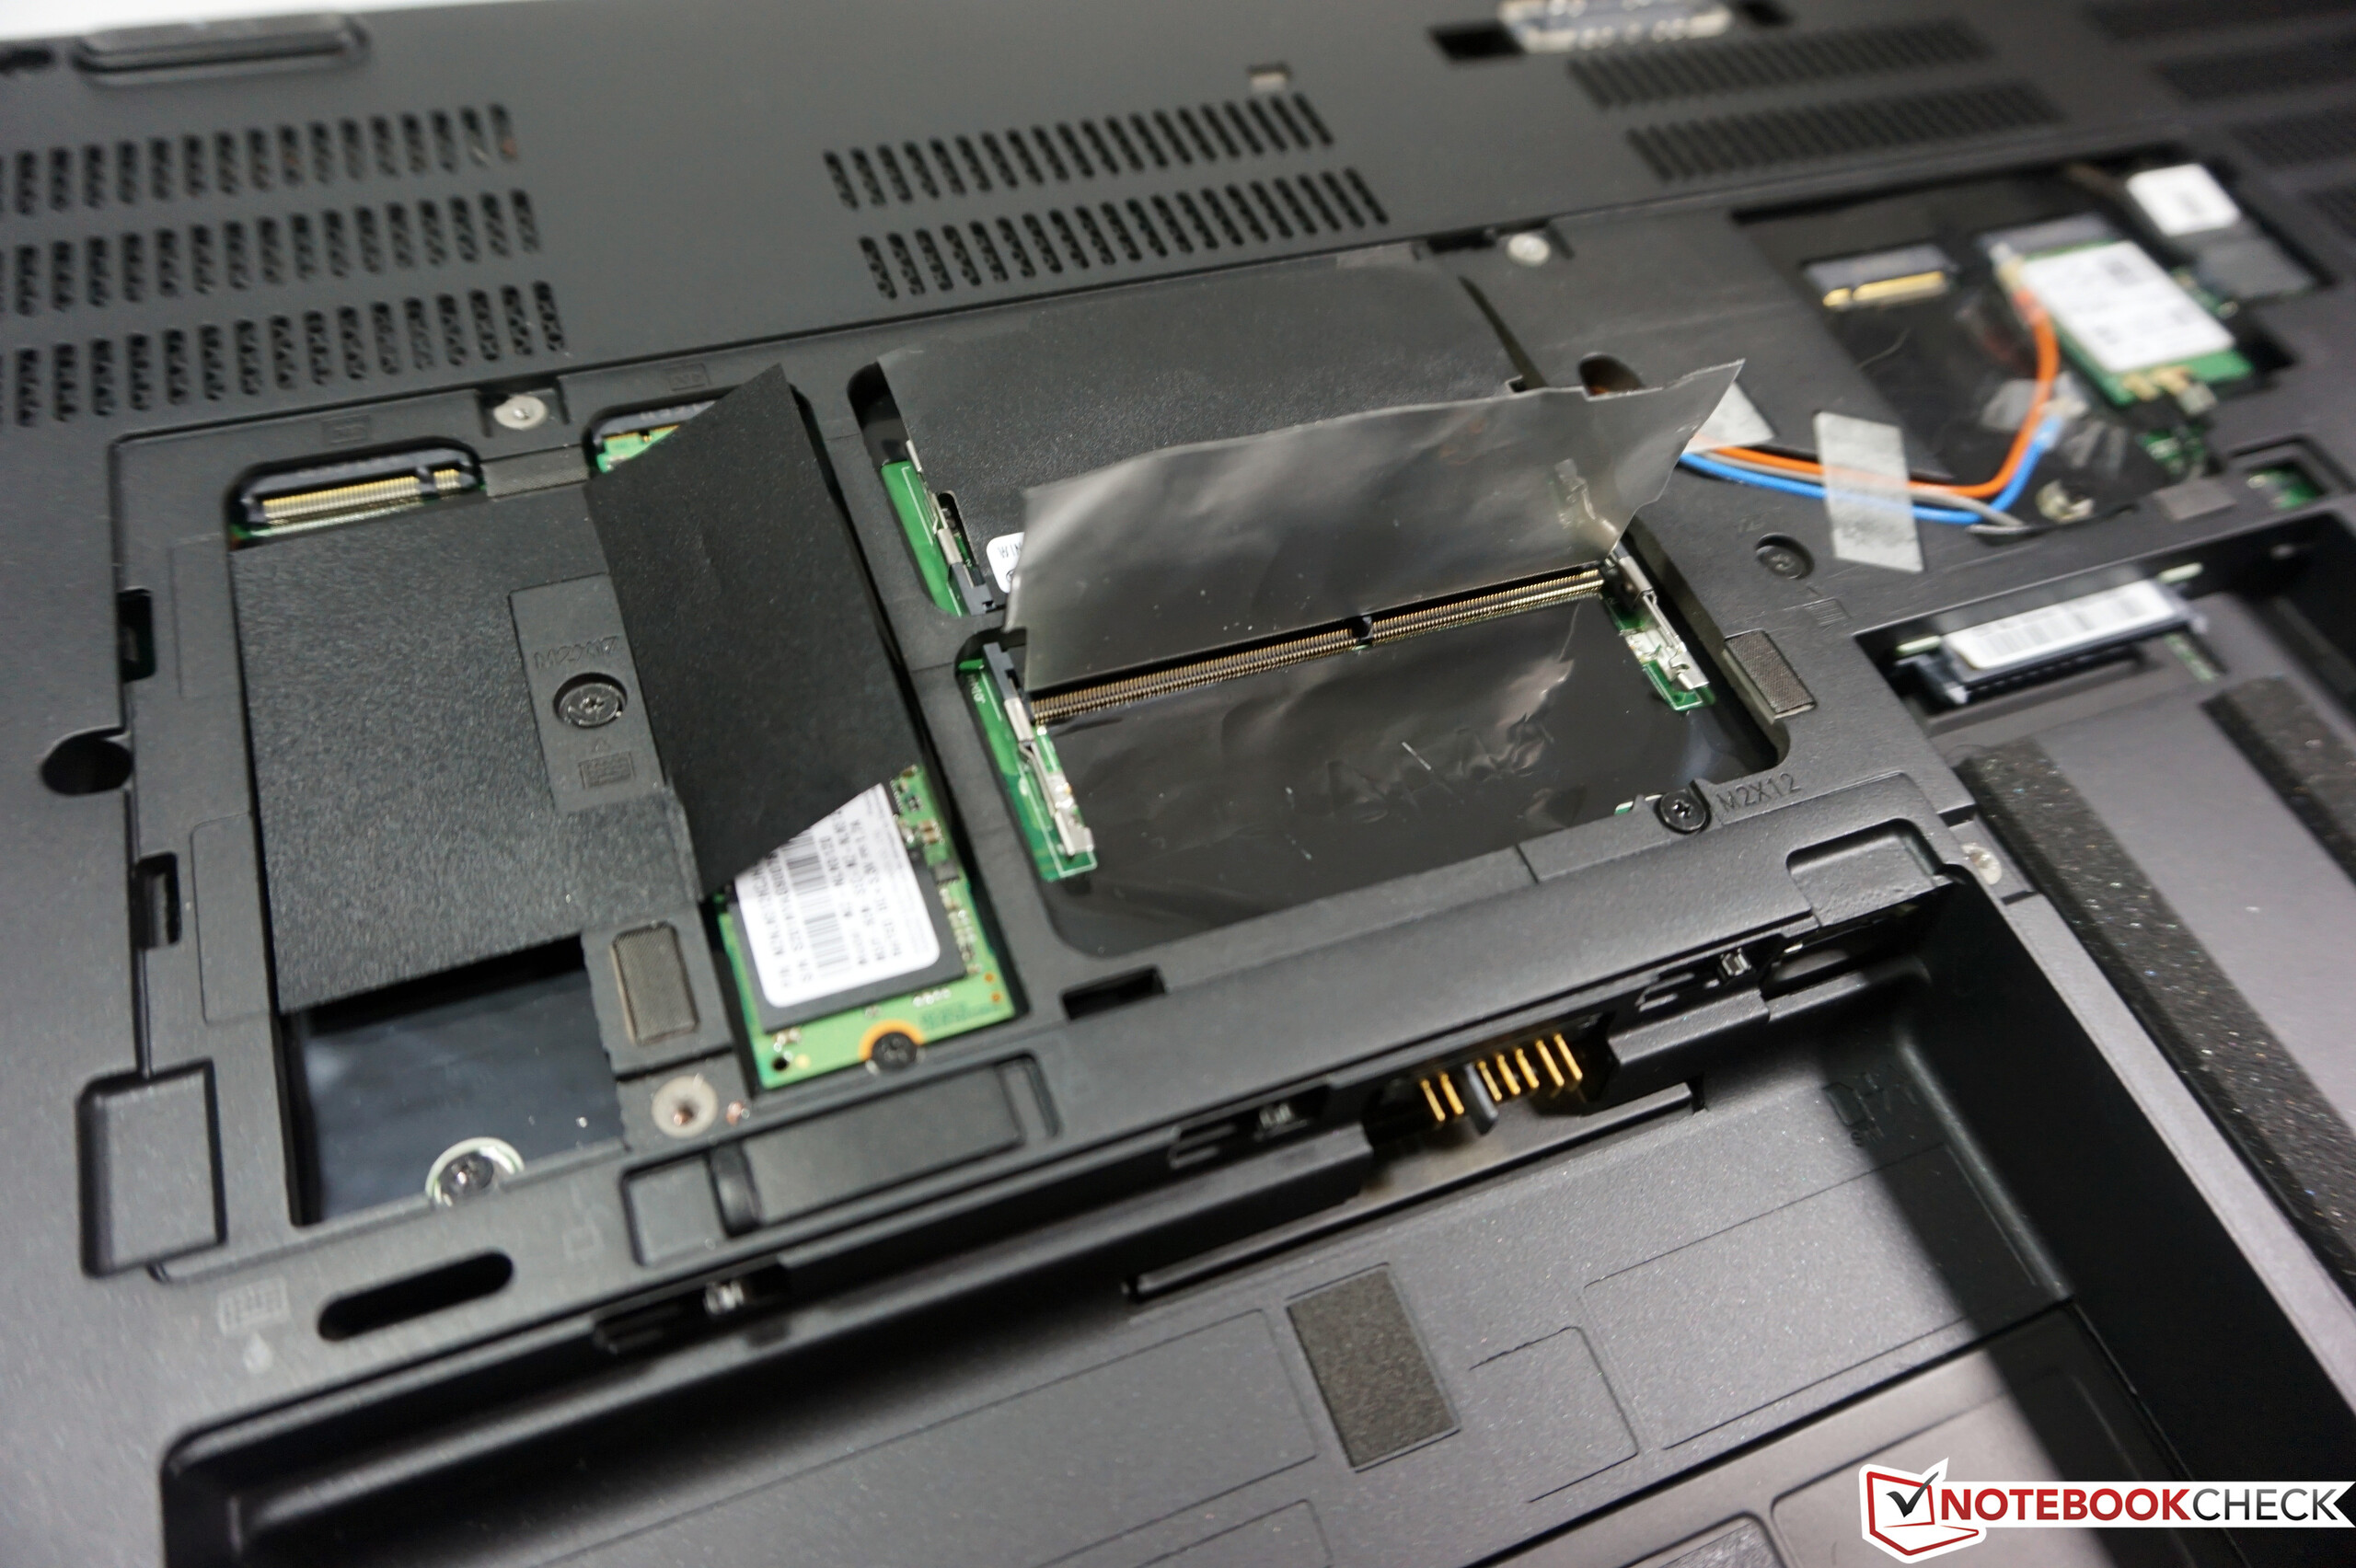
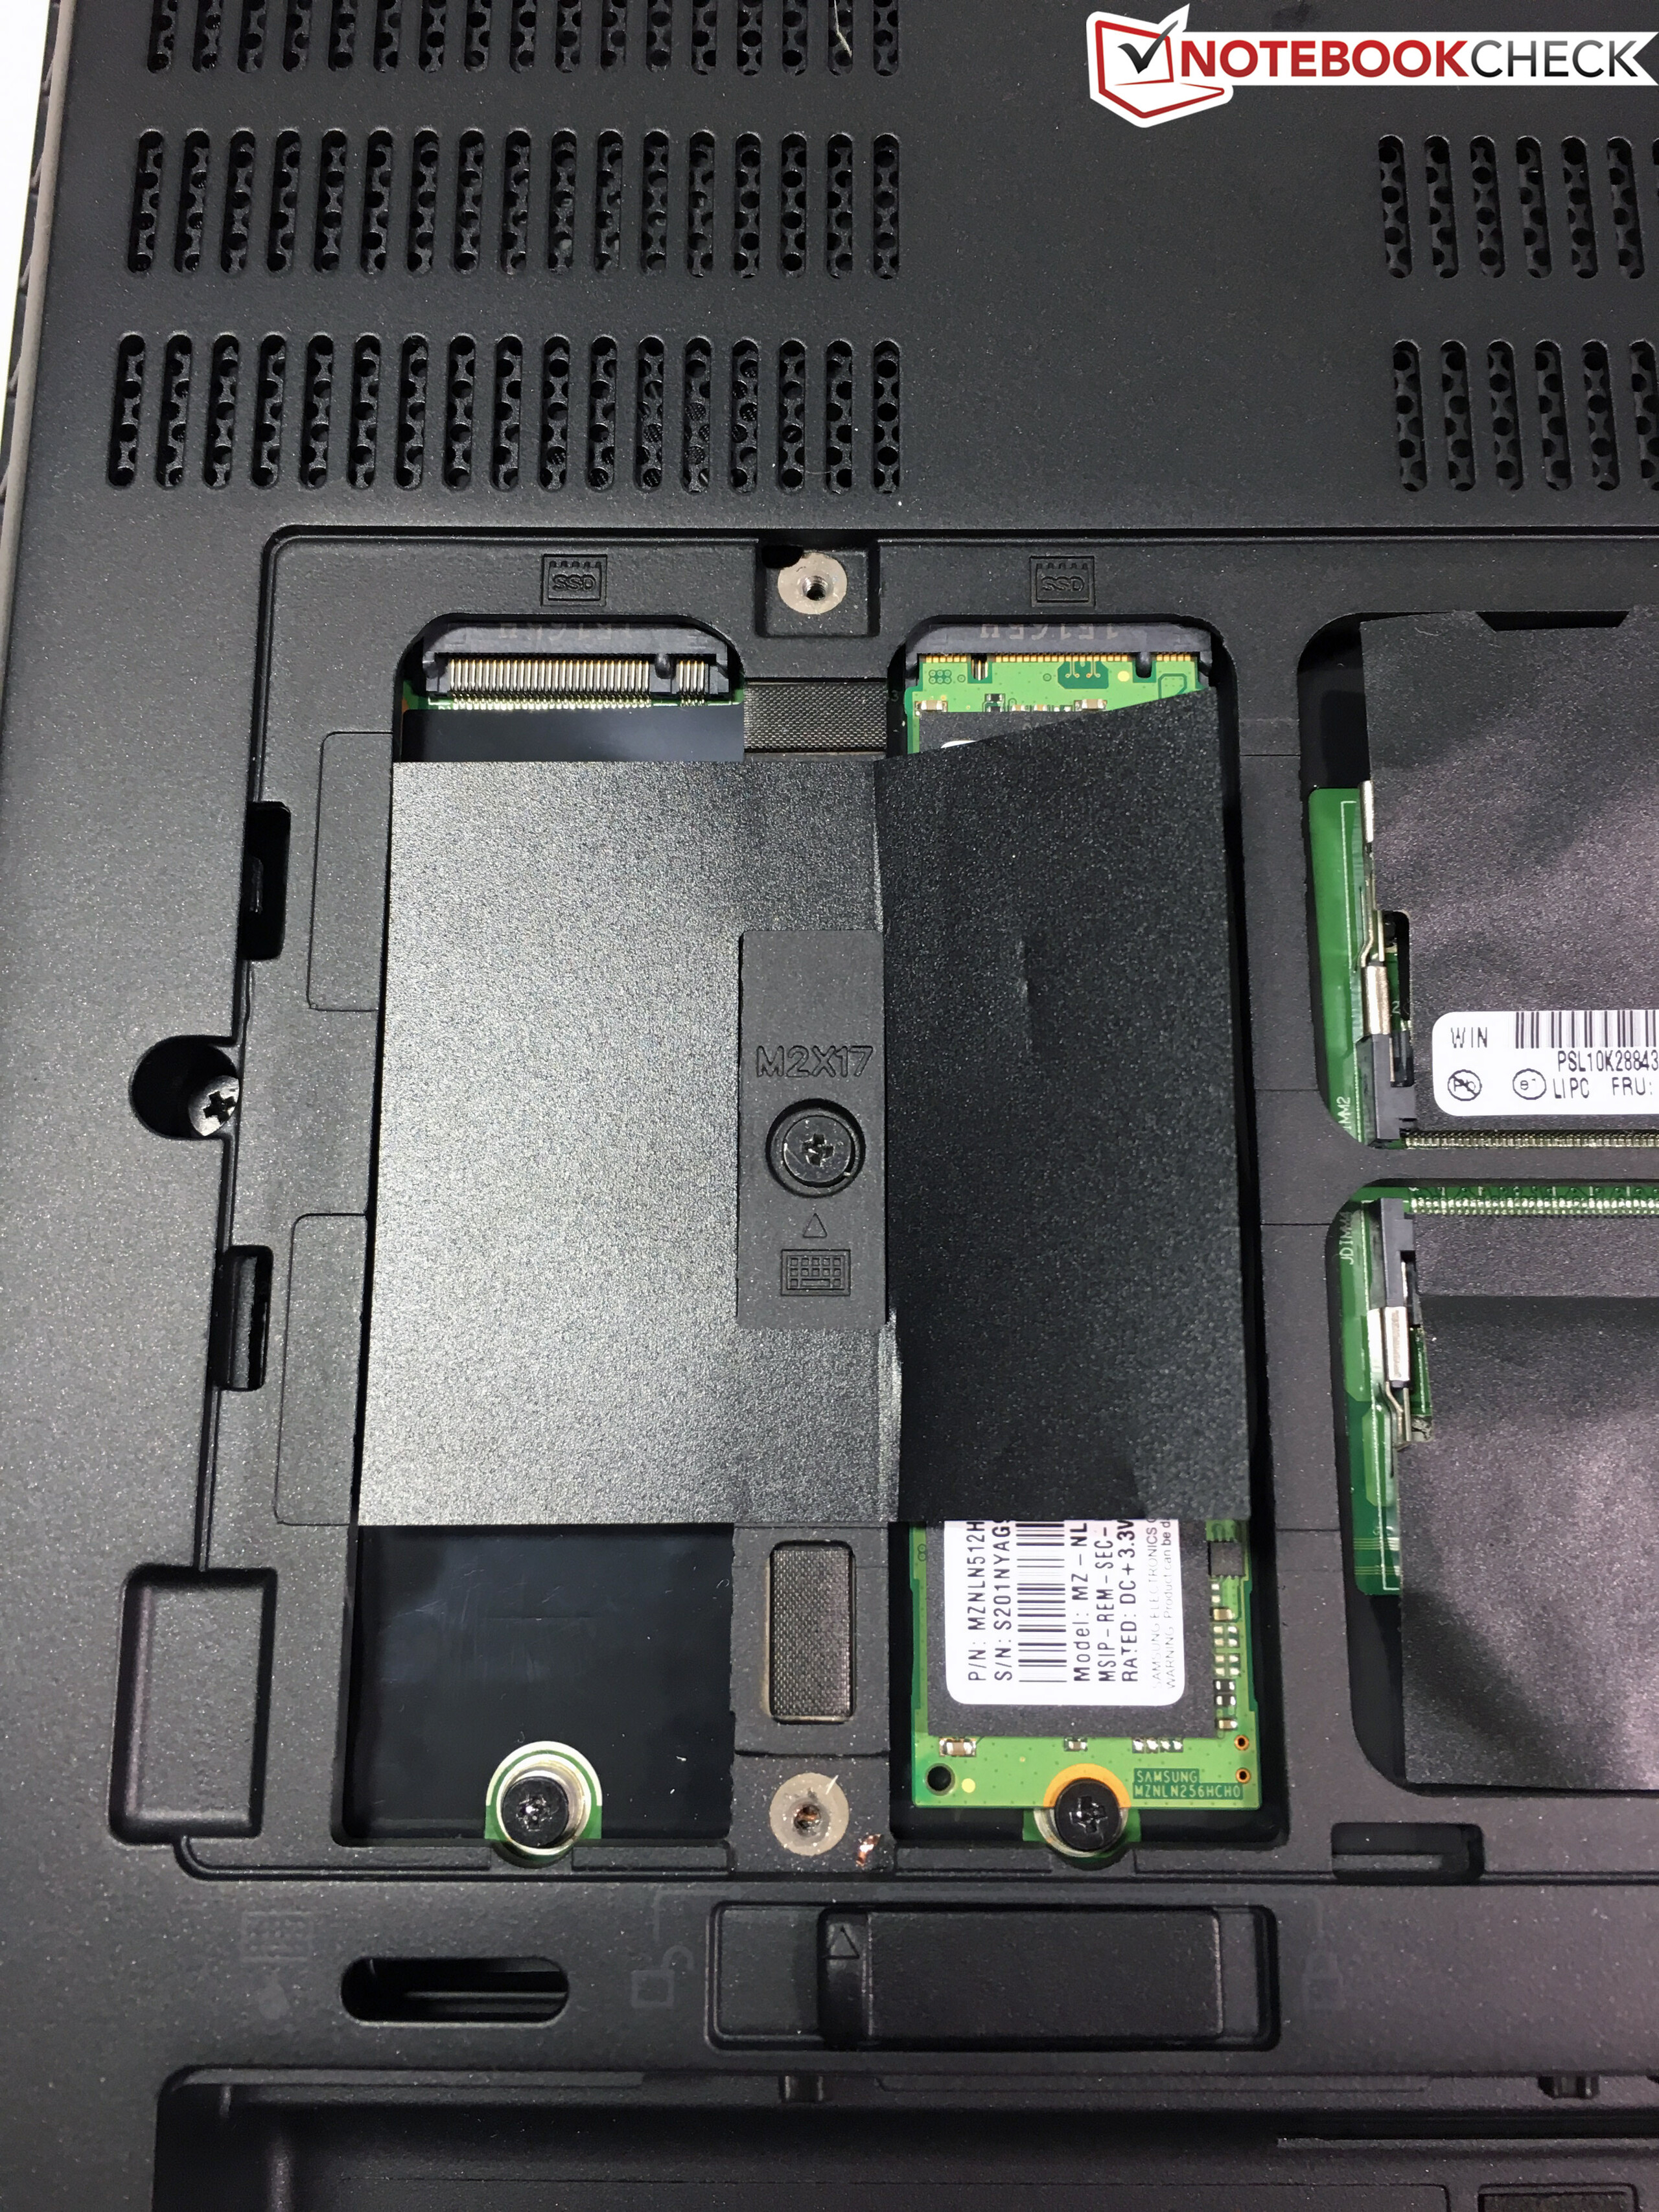
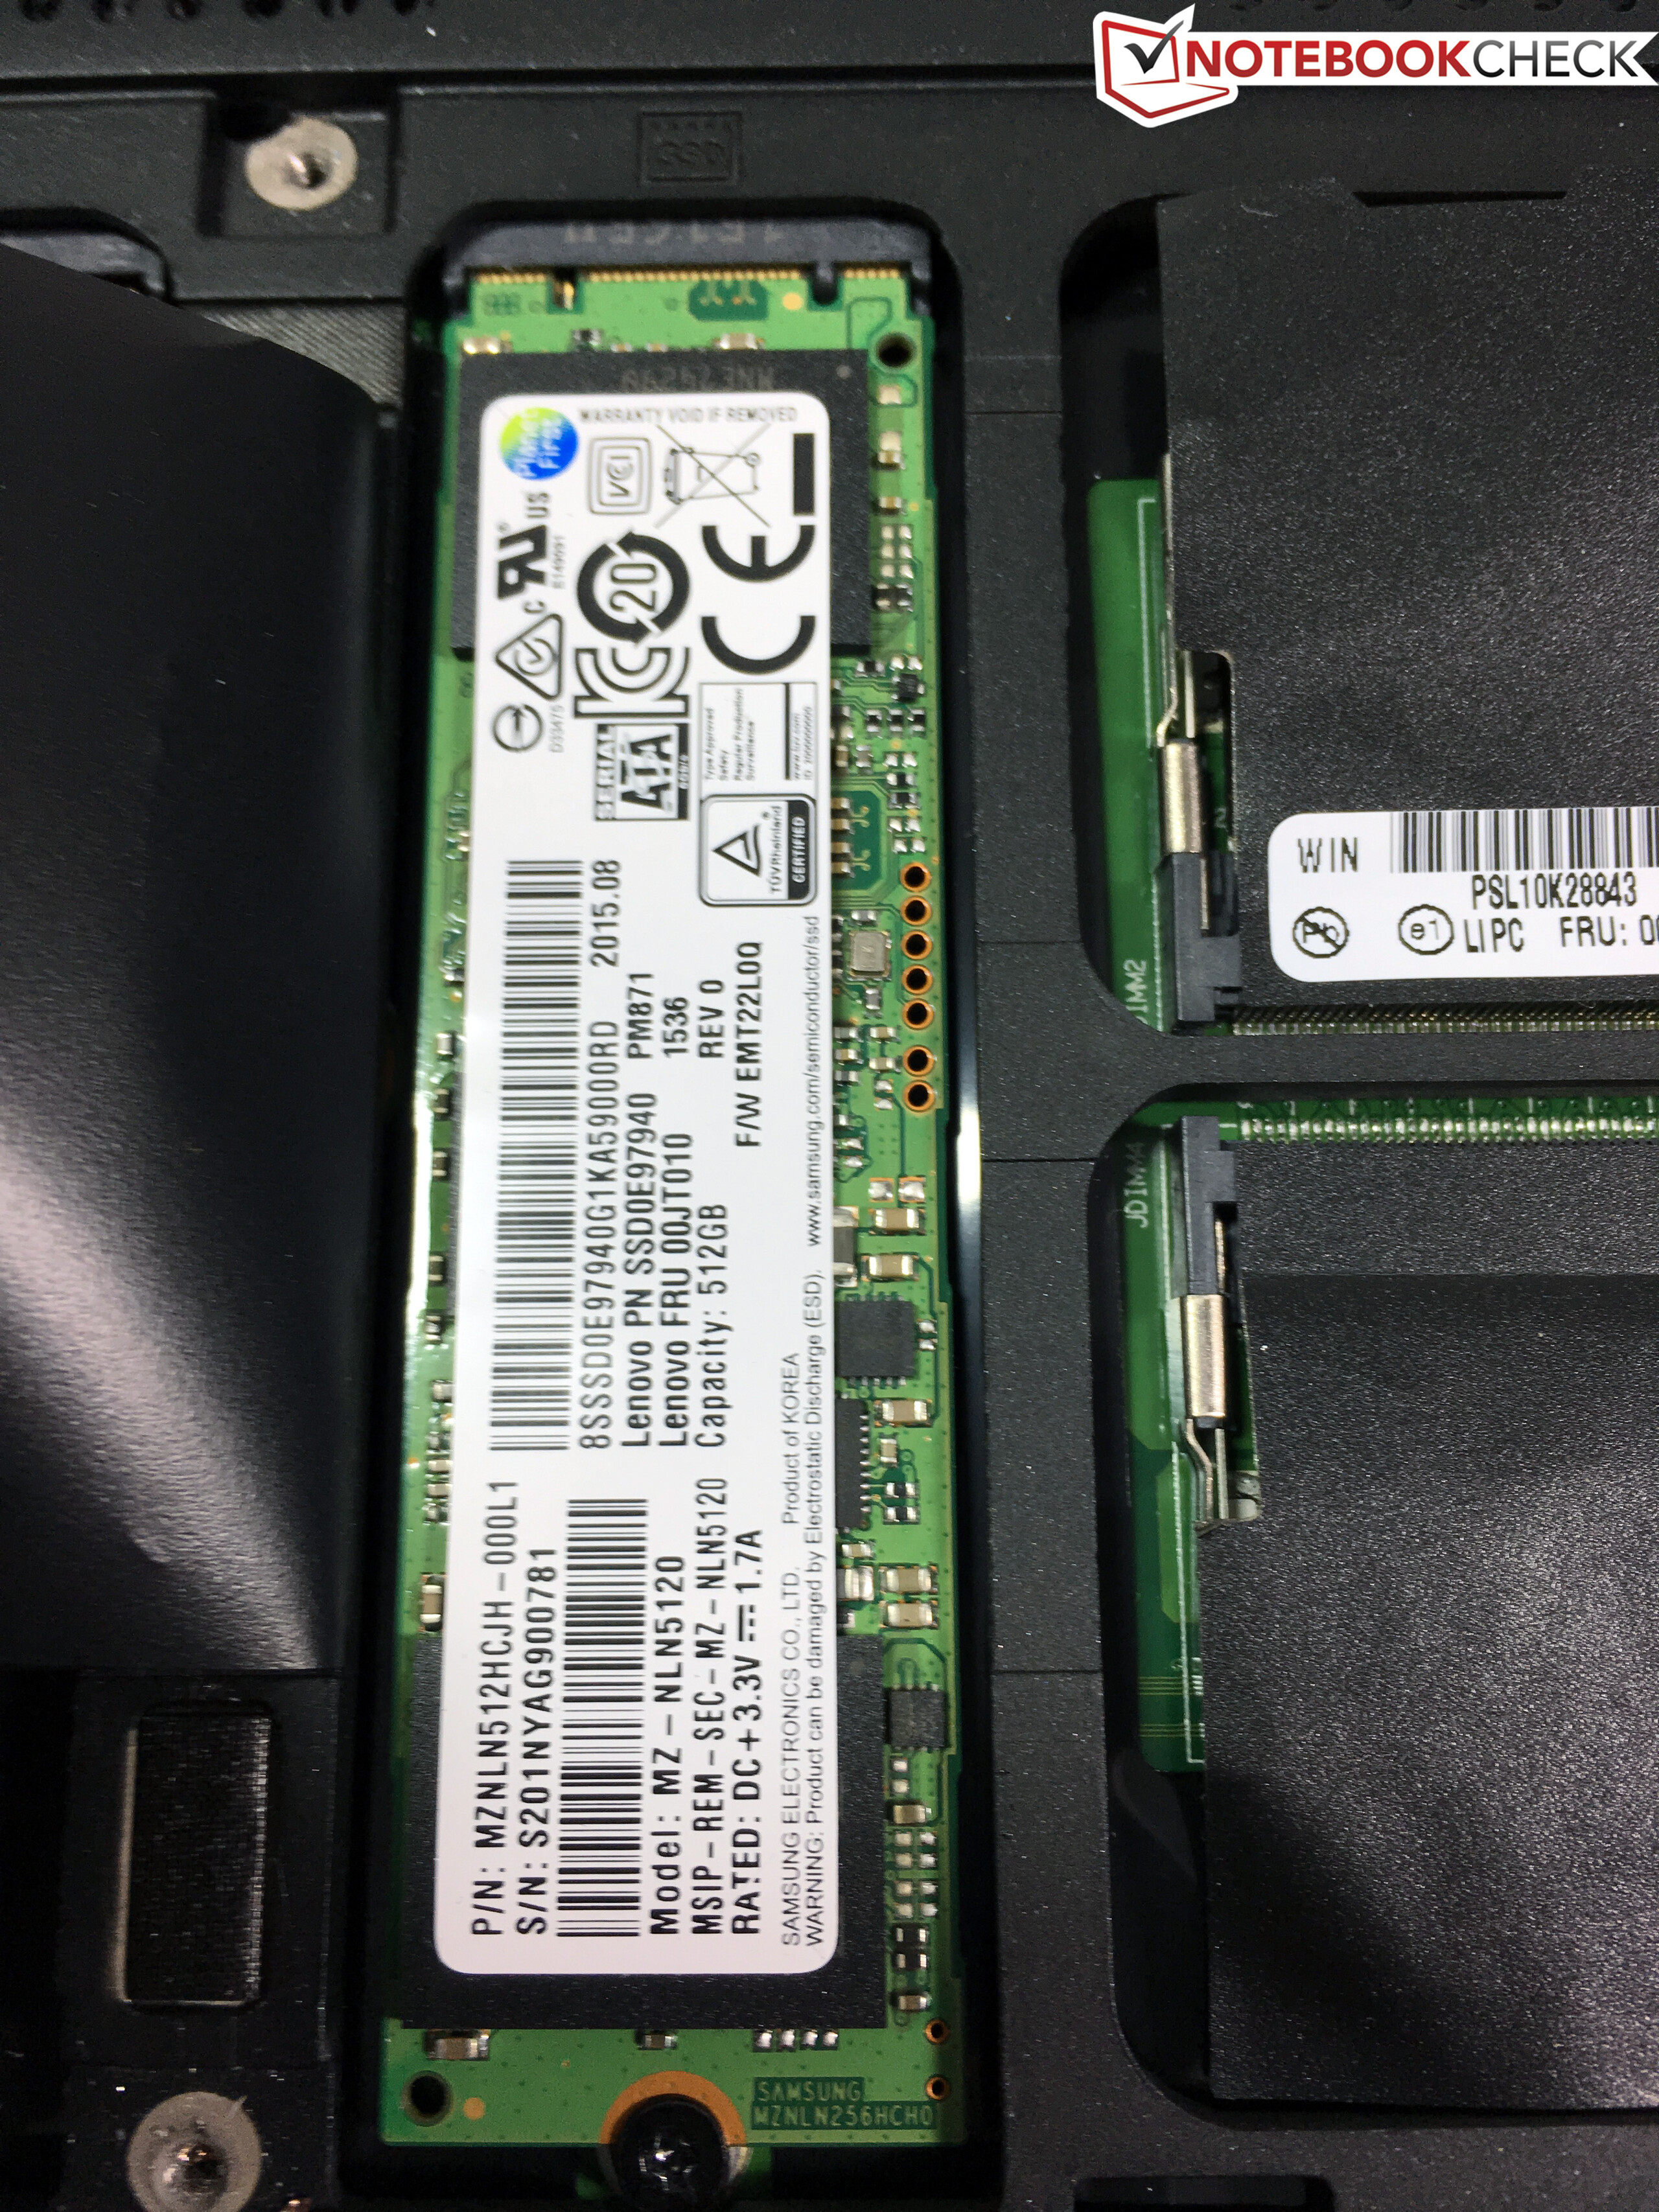
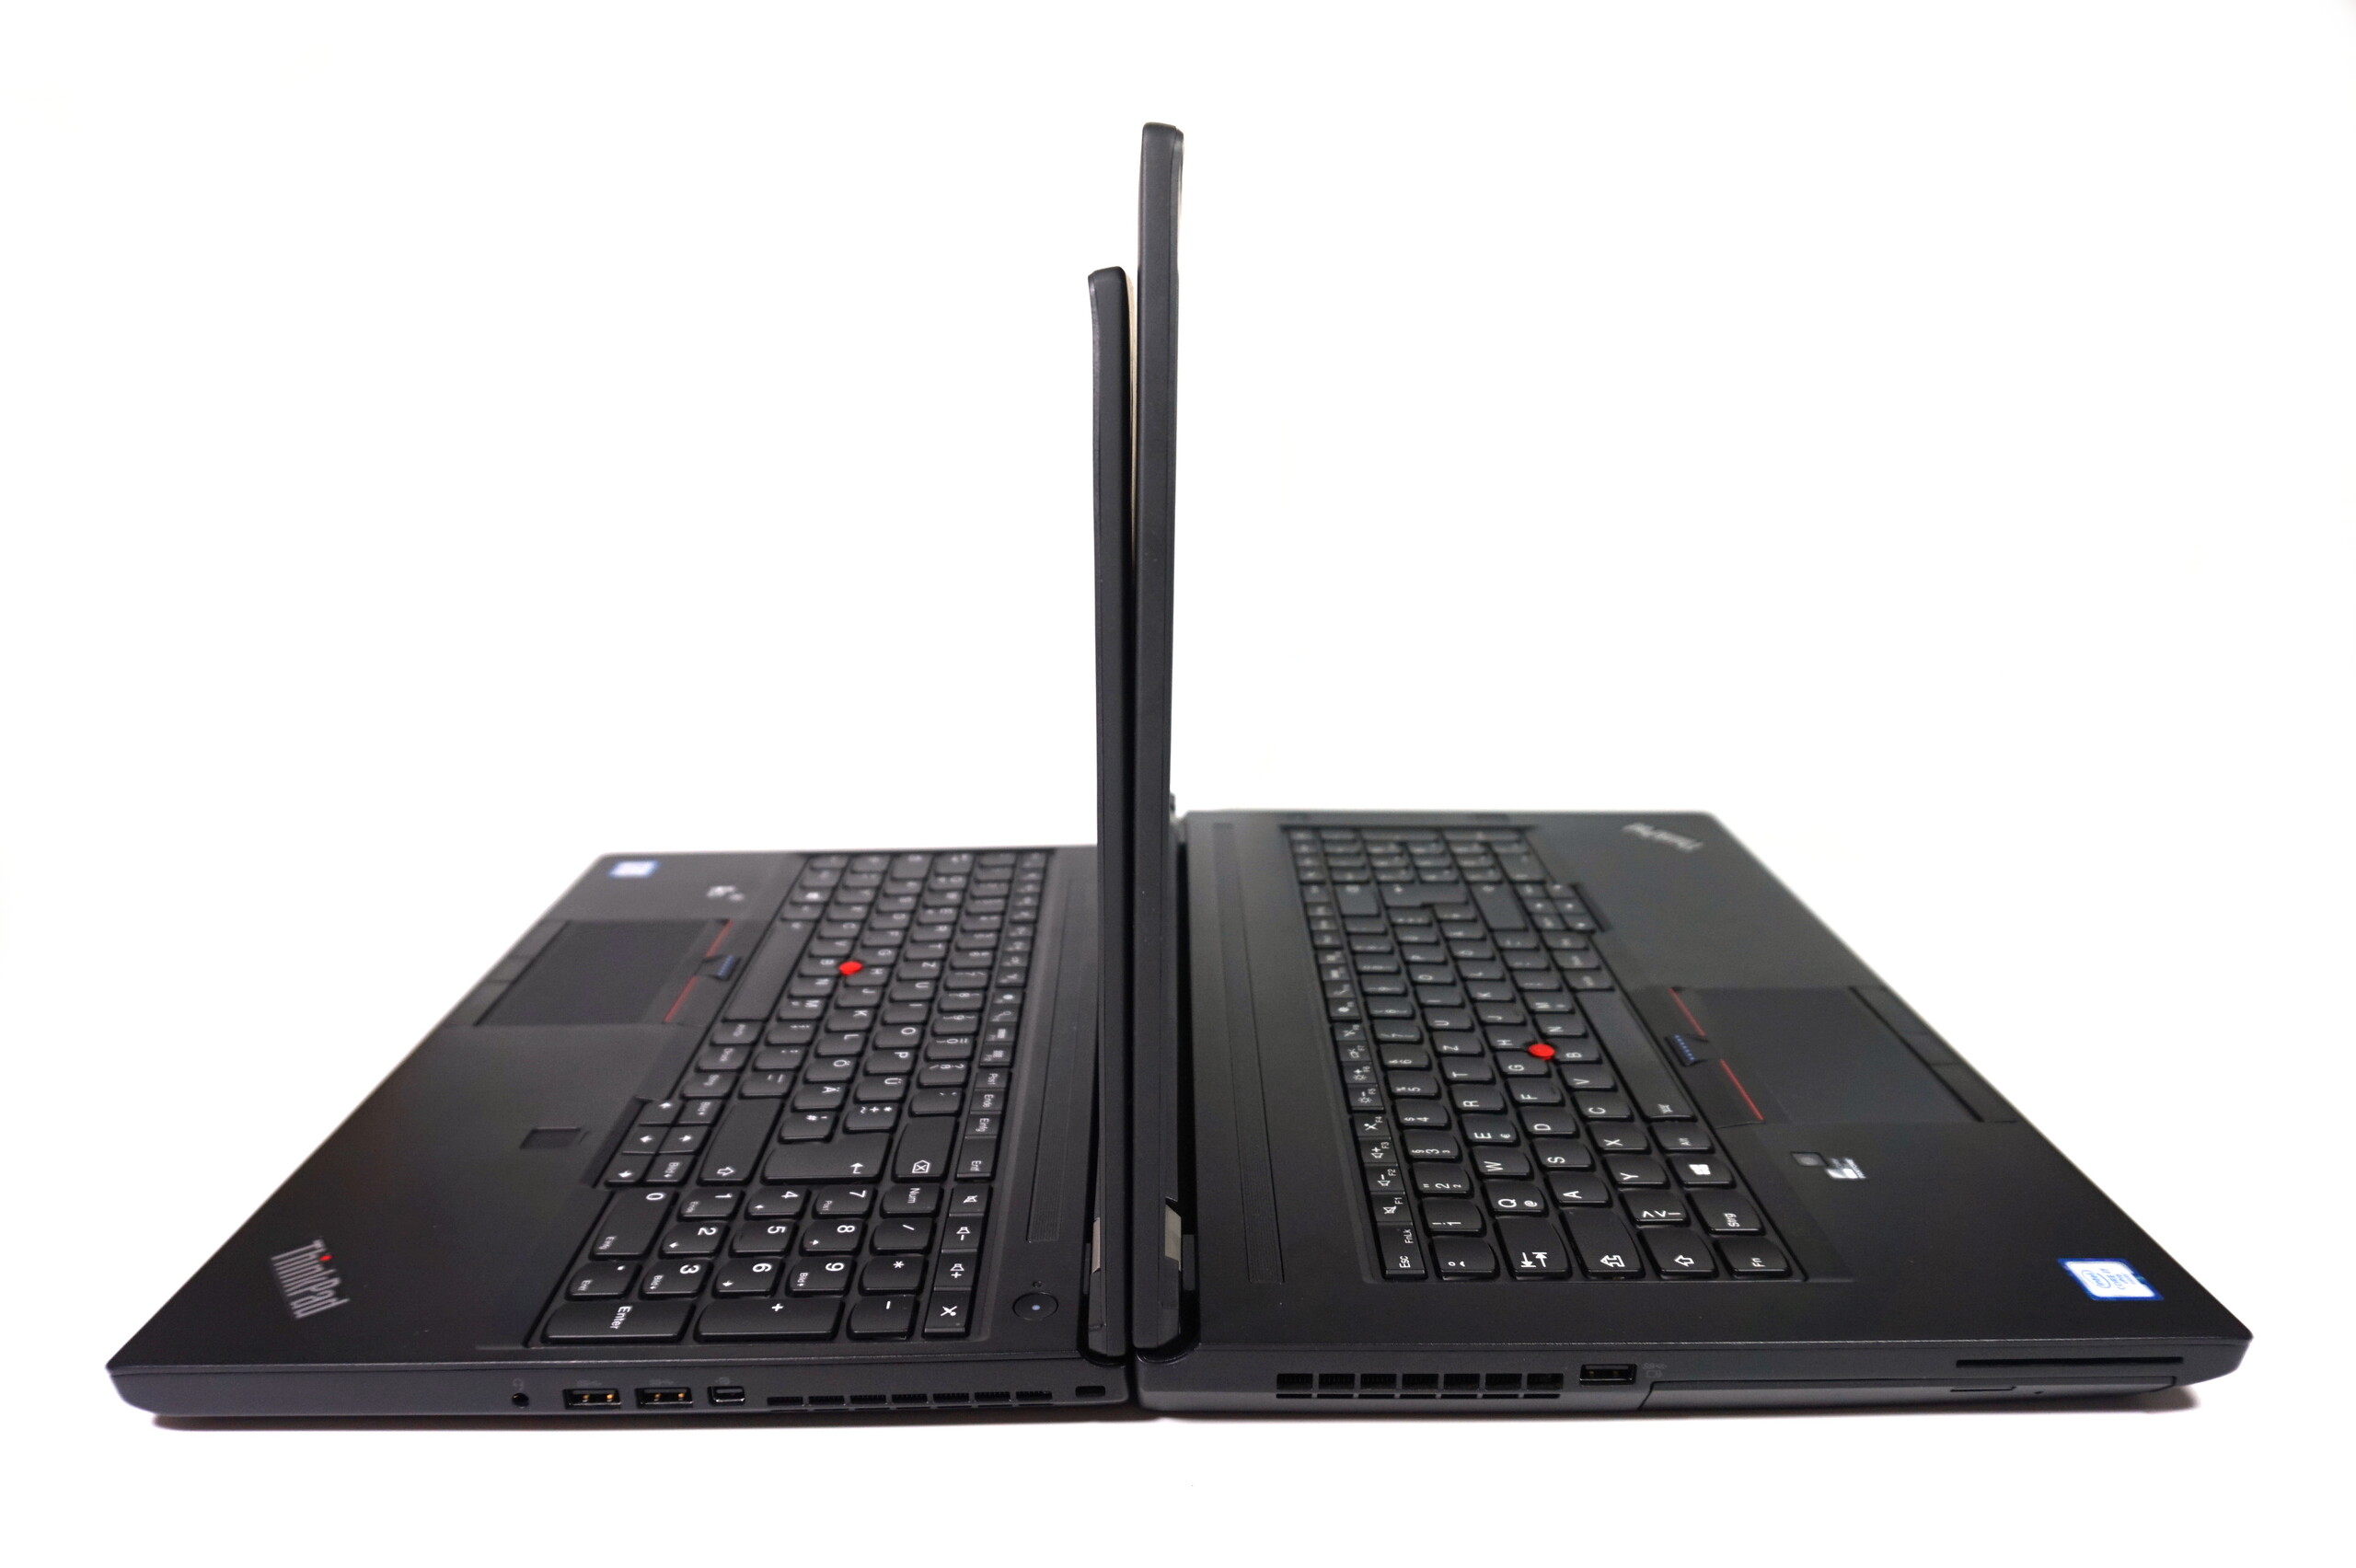
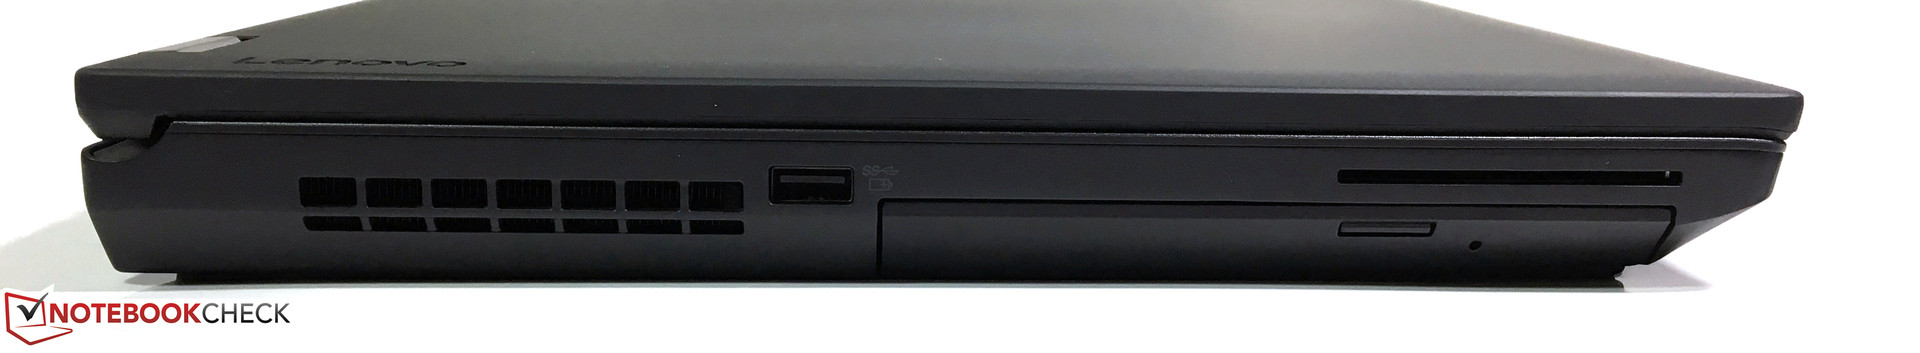
这台工作站的机身再次采用了黑色,它的机身和键盘都很坚固,品质堪称上乘。不过较薄的屏幕上盖和转轴在较大角度下有些难以支撑沉重的屏幕。它机身的另外一个优势在于完备的维护升级功能。
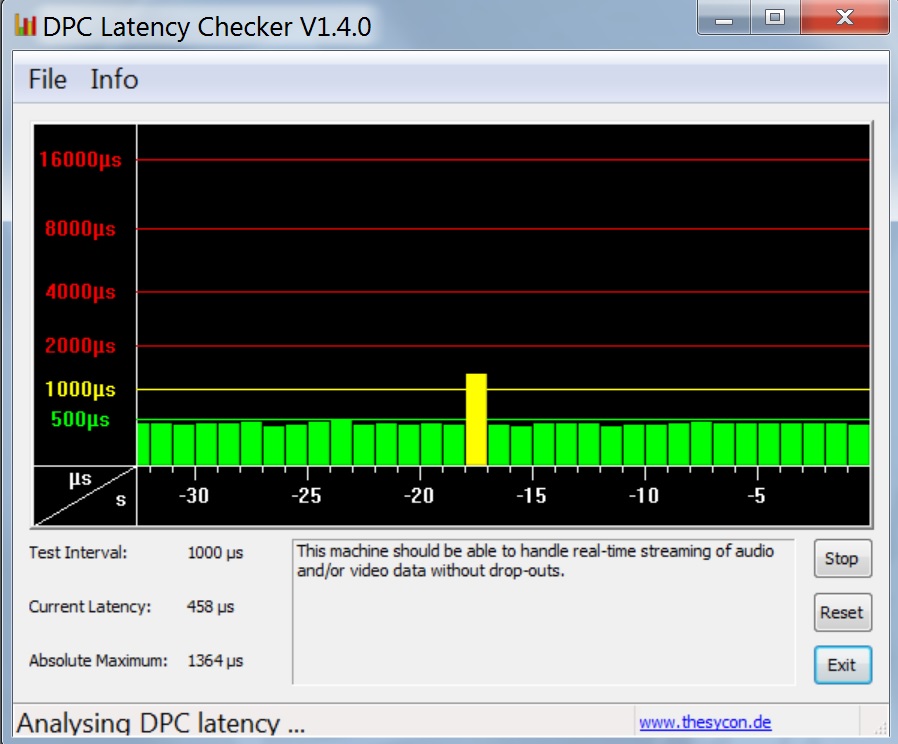
一台工作站最重要的特性显然是性能,而ThinkPad P70在这方面让我们心服口服。得利于优秀(且安静)的散热系统,它的部件在满负载下也可以发挥很高的性能。如果联想没有在控制温度上略显保守的话,它应该还可以跑的更快。只有显卡的性能在使用电池时会有所降低。
欢迎回来,联想!ThinkPad P70是这家中国生产商在五年之后重装登陆带来的出色工作站。联想参考了用户的反馈,改进了前代产品的一些问题。
我们在右边栏中列出了它的一些缺点,不过其中有一些只是因为测试机搭载了Windows 7。P70并没有什么大问题,不过你还是会发现一些小缺憾。其中最烦人应该是屏幕漏光,这不应该出现在这样价位的产品中。联想可能在摄像头和扬声器上也节省了一些成本。
如果选择4K屏幕的机型的话,应该考虑使用Windows 10。因为我们发现Windows 7存在一些屏幕缩放的问题。如果选择全高清屏幕的话,那么老板的系统就不会造成任何问题,同时还会对功耗有正面的影响,特别是在低负载的情况下。
注:本文是基于完整评测的缩减版本,阅读完整的英文评测,请点击这里。
Lenovo ThinkPad P70
- 03/17/2016 v5 (old)
Andreas Osthoff
Price comparison
