淘宝网上有很多卖家,他们都是在淘宝网上买的,但是淘宝网上有很多卖家,他们都是在淘宝网上买的。
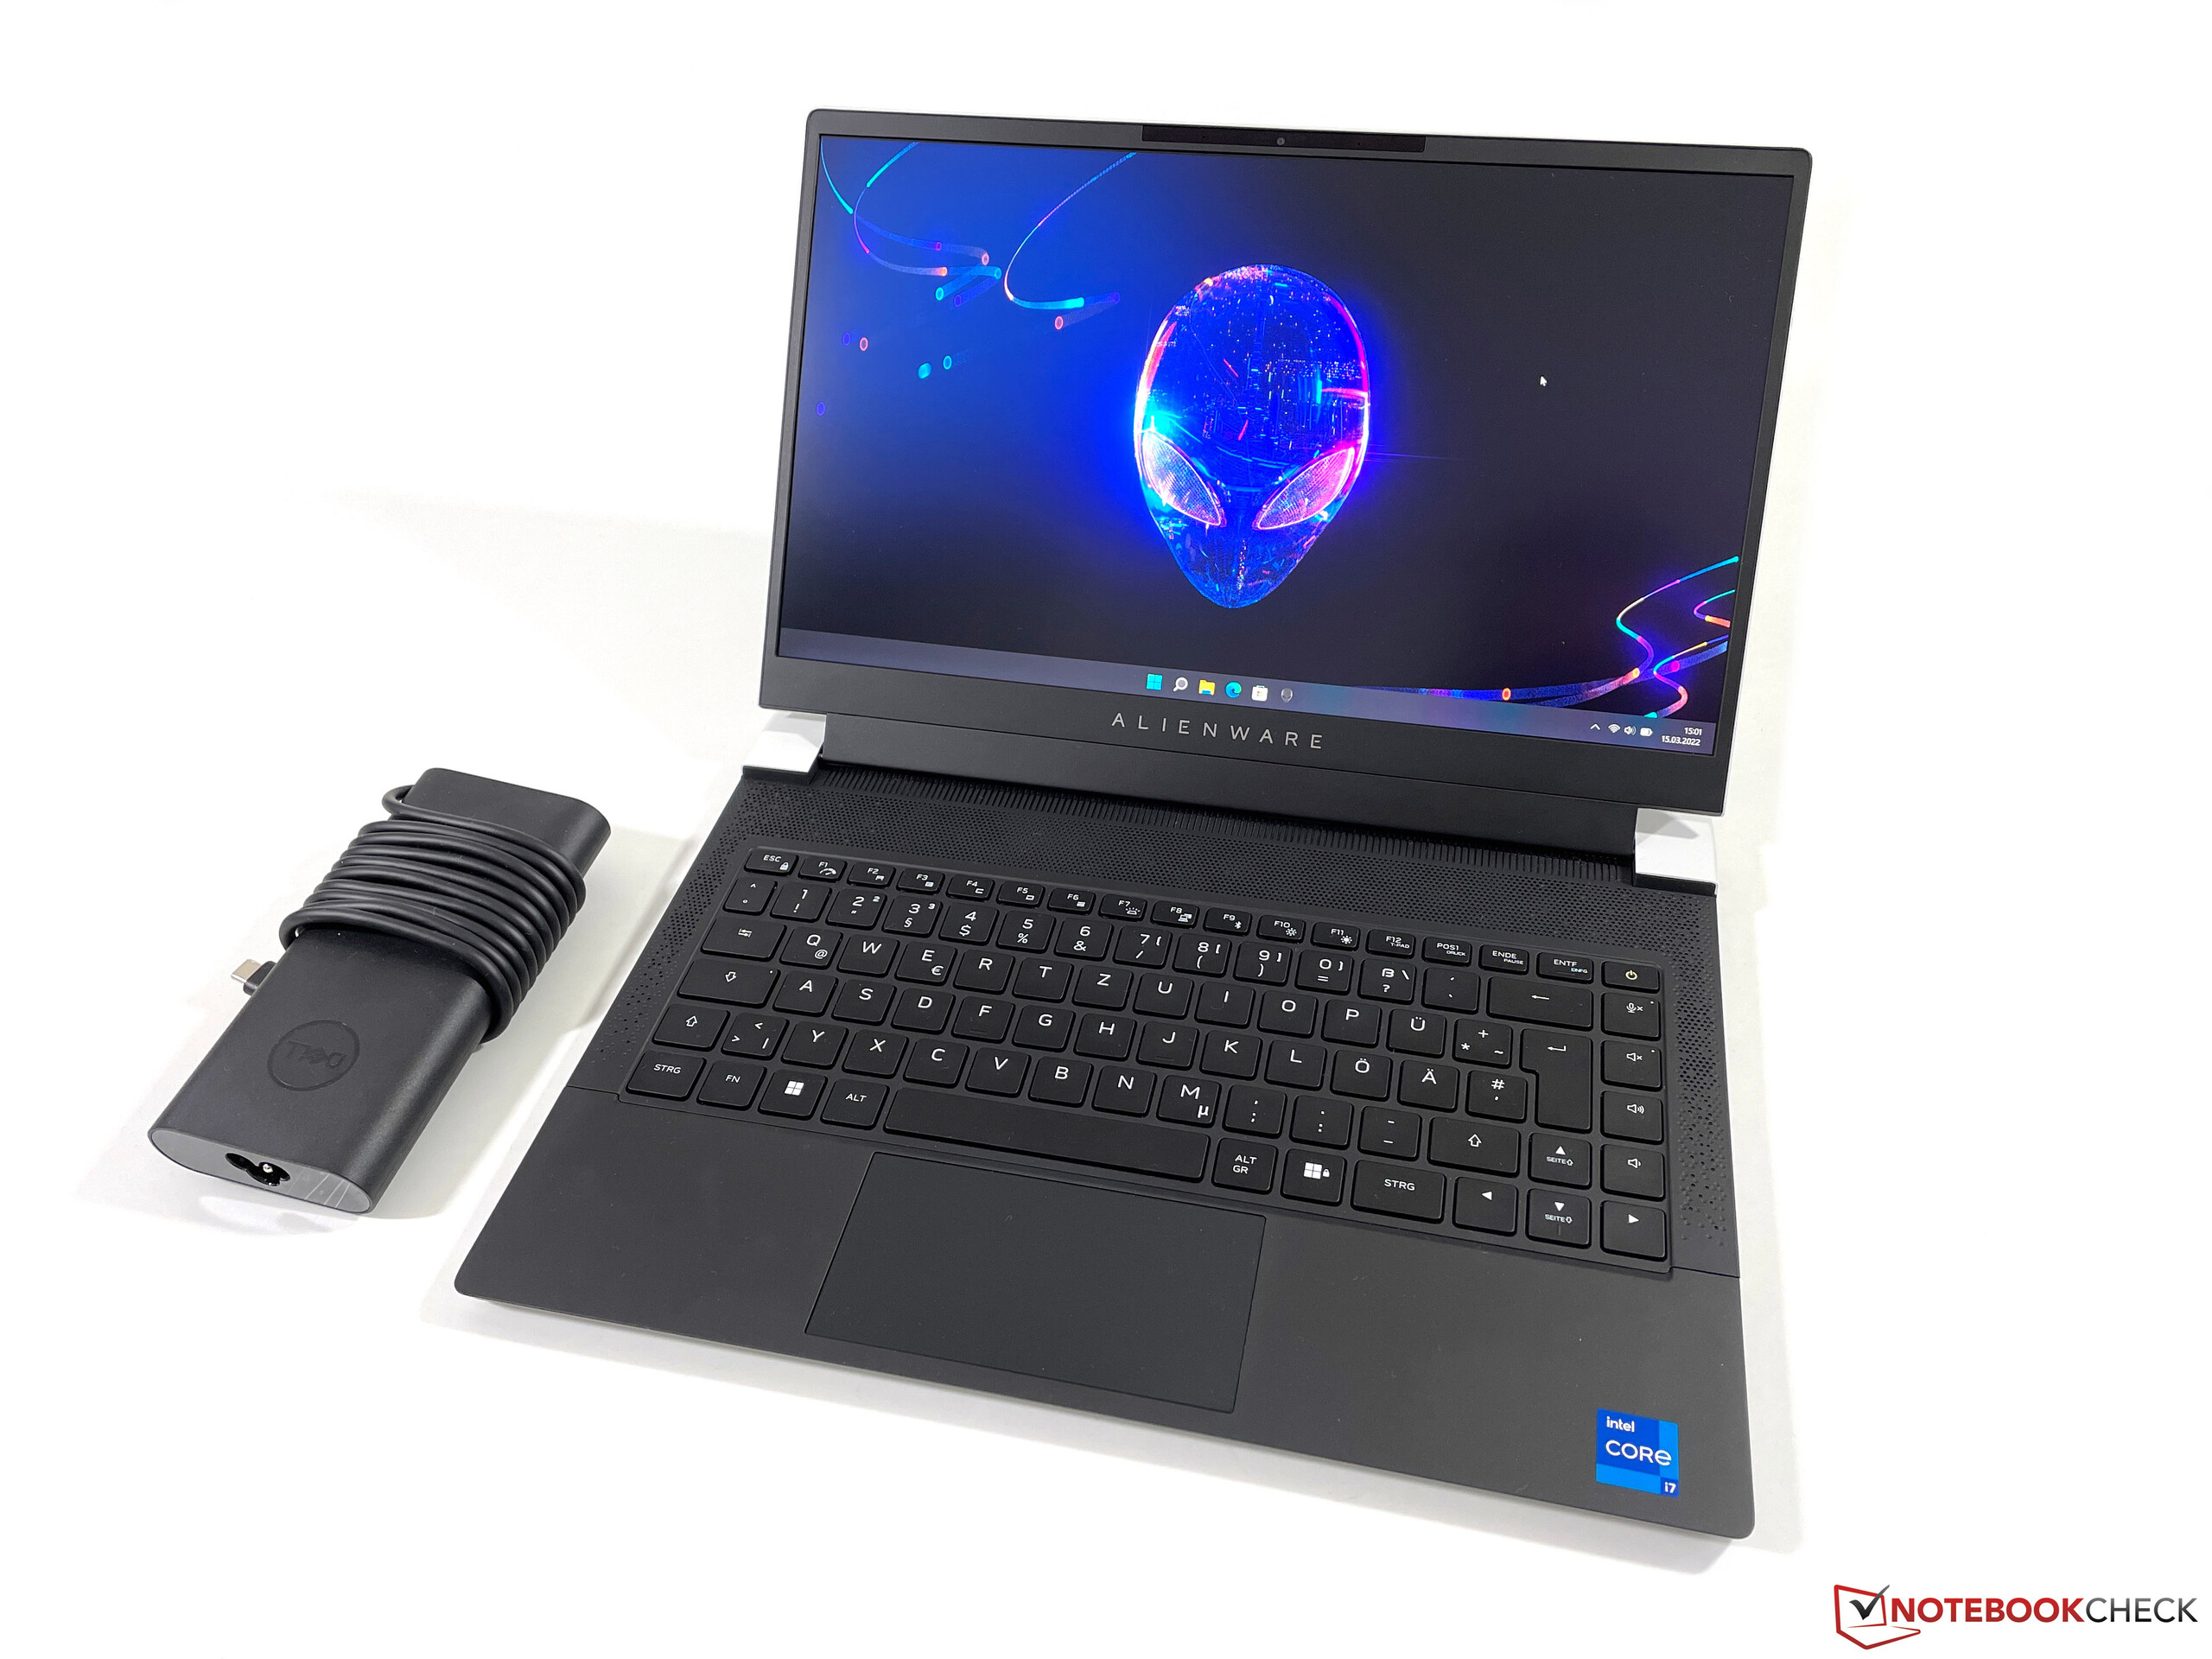
在Alienware发布两款新的游戏笔记本之后x15和x17去年,该制造商现在推出了一个14英寸的系统。新的Alienware x14沿用了相同的设计语言,希望通过非常纤薄的机箱吸引客户,它包含了英特尔全新的Alder Lake CPU以及Nvidia的RTX 3000 GPU,可以提供足够的游戏性能。目前只有一个1080p屏幕,具有144赫兹和P3色域。入门级的规格有一个酷睿i5和RTX 3050起价为1899欧元,但我们审查的是配有Core i7-12700H、16GB LPDDR5-RAM的高端型号。NvidiaGeForce RTX 3060以及1TB PCI-SSD,价格为2.399欧元。
潜在的竞争对手比较
Rating | Date | Model | Weight | Height | Size | Resolution | Price |
|---|---|---|---|---|---|---|---|
| 86.7 % v7 (old) | 03 / 2022 | Alienware x14 i7 RTX 3060 i7-12700H, GeForce RTX 3060 Laptop GPU | 1.8 kg | 14.5 mm | 14.00" | 1920x1080 | |
| 86.7 % v7 (old) | 03 / 2022 | Asus ROG Zephyrus G14 GA402RK R9 6900HS, Radeon RX 6800S | 1.7 kg | 19.5 mm | 14.00" | 2560x1600 | |
| 87.5 % v7 (old) | 07 / 2021 | Razer Blade 14 Ryzen 9 RTX 3070 R9 5900HX, GeForce RTX 3070 Laptop GPU | 1.8 kg | 16.8 mm | 14.00" | 2560x1440 | |
| 83.5 % v7 (old) | 02 / 2021 | Asus Zephyrus G14 GA401QM R9 5900HS, GeForce RTX 3060 Laptop GPU | 1.7 kg | 19.9 mm | 14.00" | 1920x1080 | |
| 87.2 % v7 (old) | 10 / 2021 | Alienware x15 RTX 3070 P111F i7-11800H, GeForce RTX 3070 Laptop GPU | 2.4 kg | 15.9 mm | 15.60" | 2560x1440 |
机箱--Alienware x15的一个小型版本
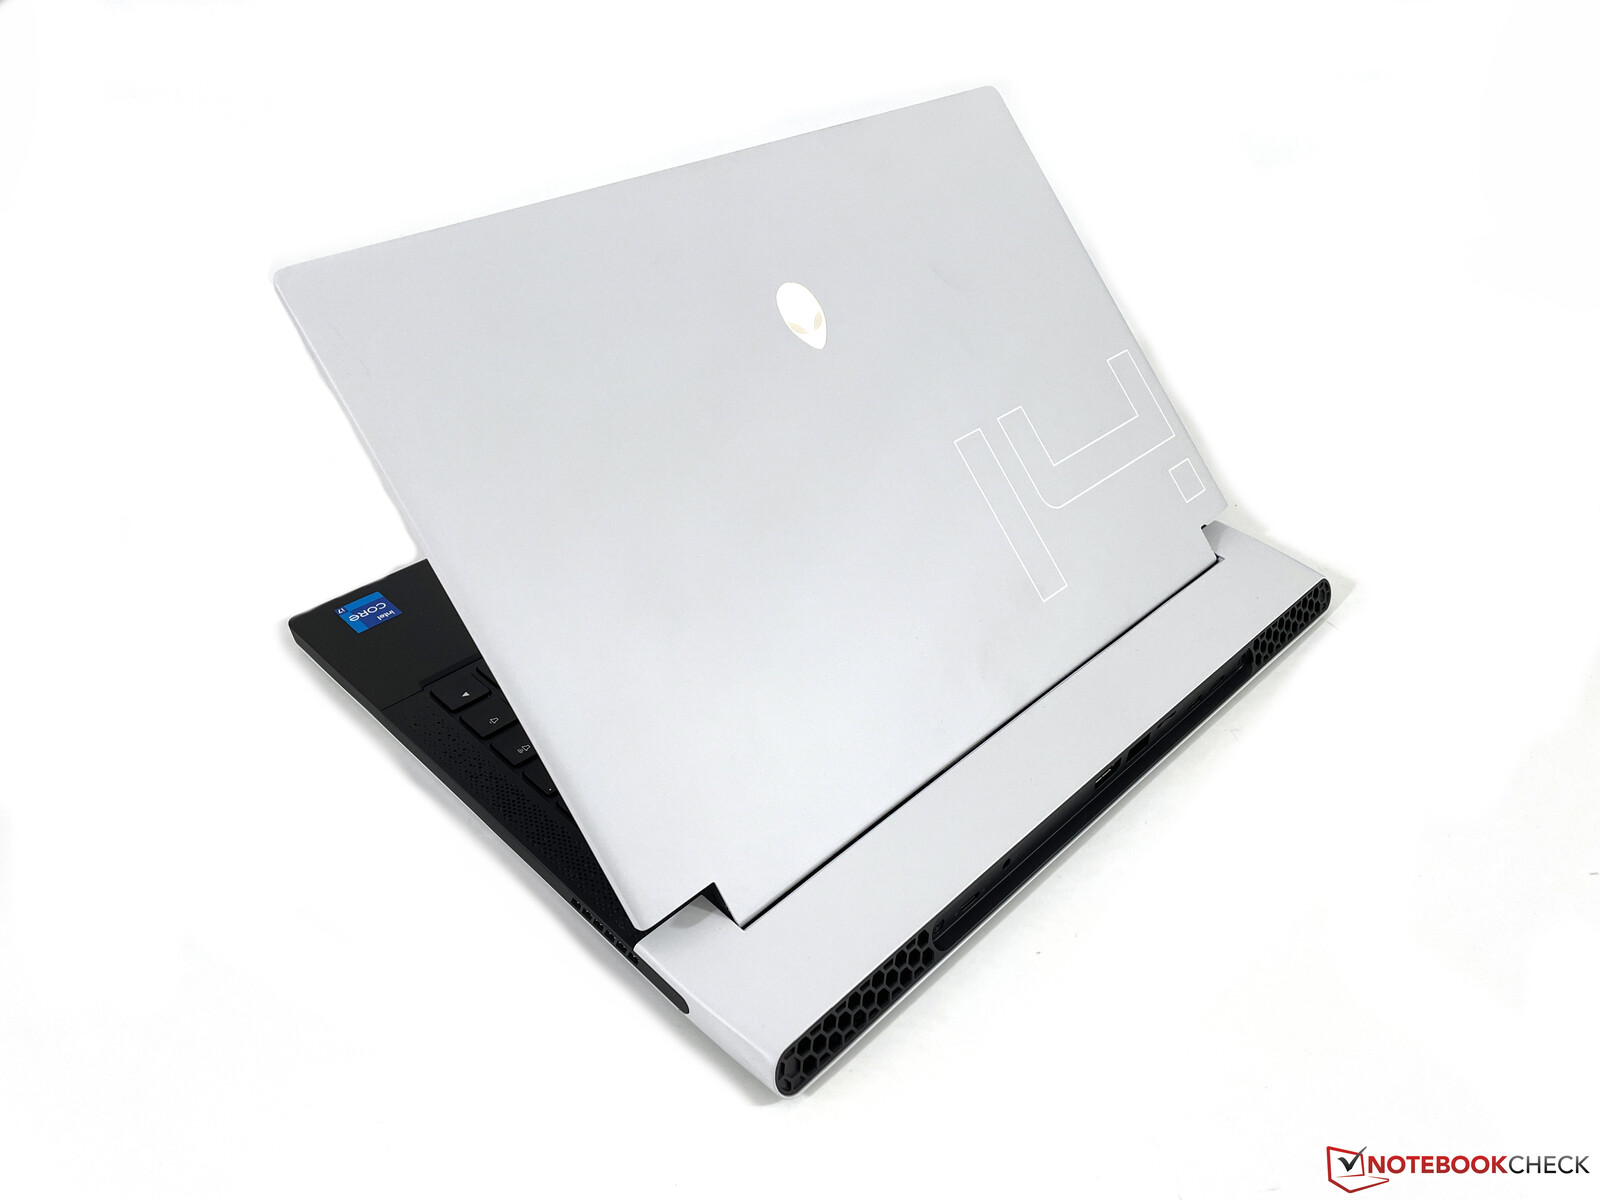
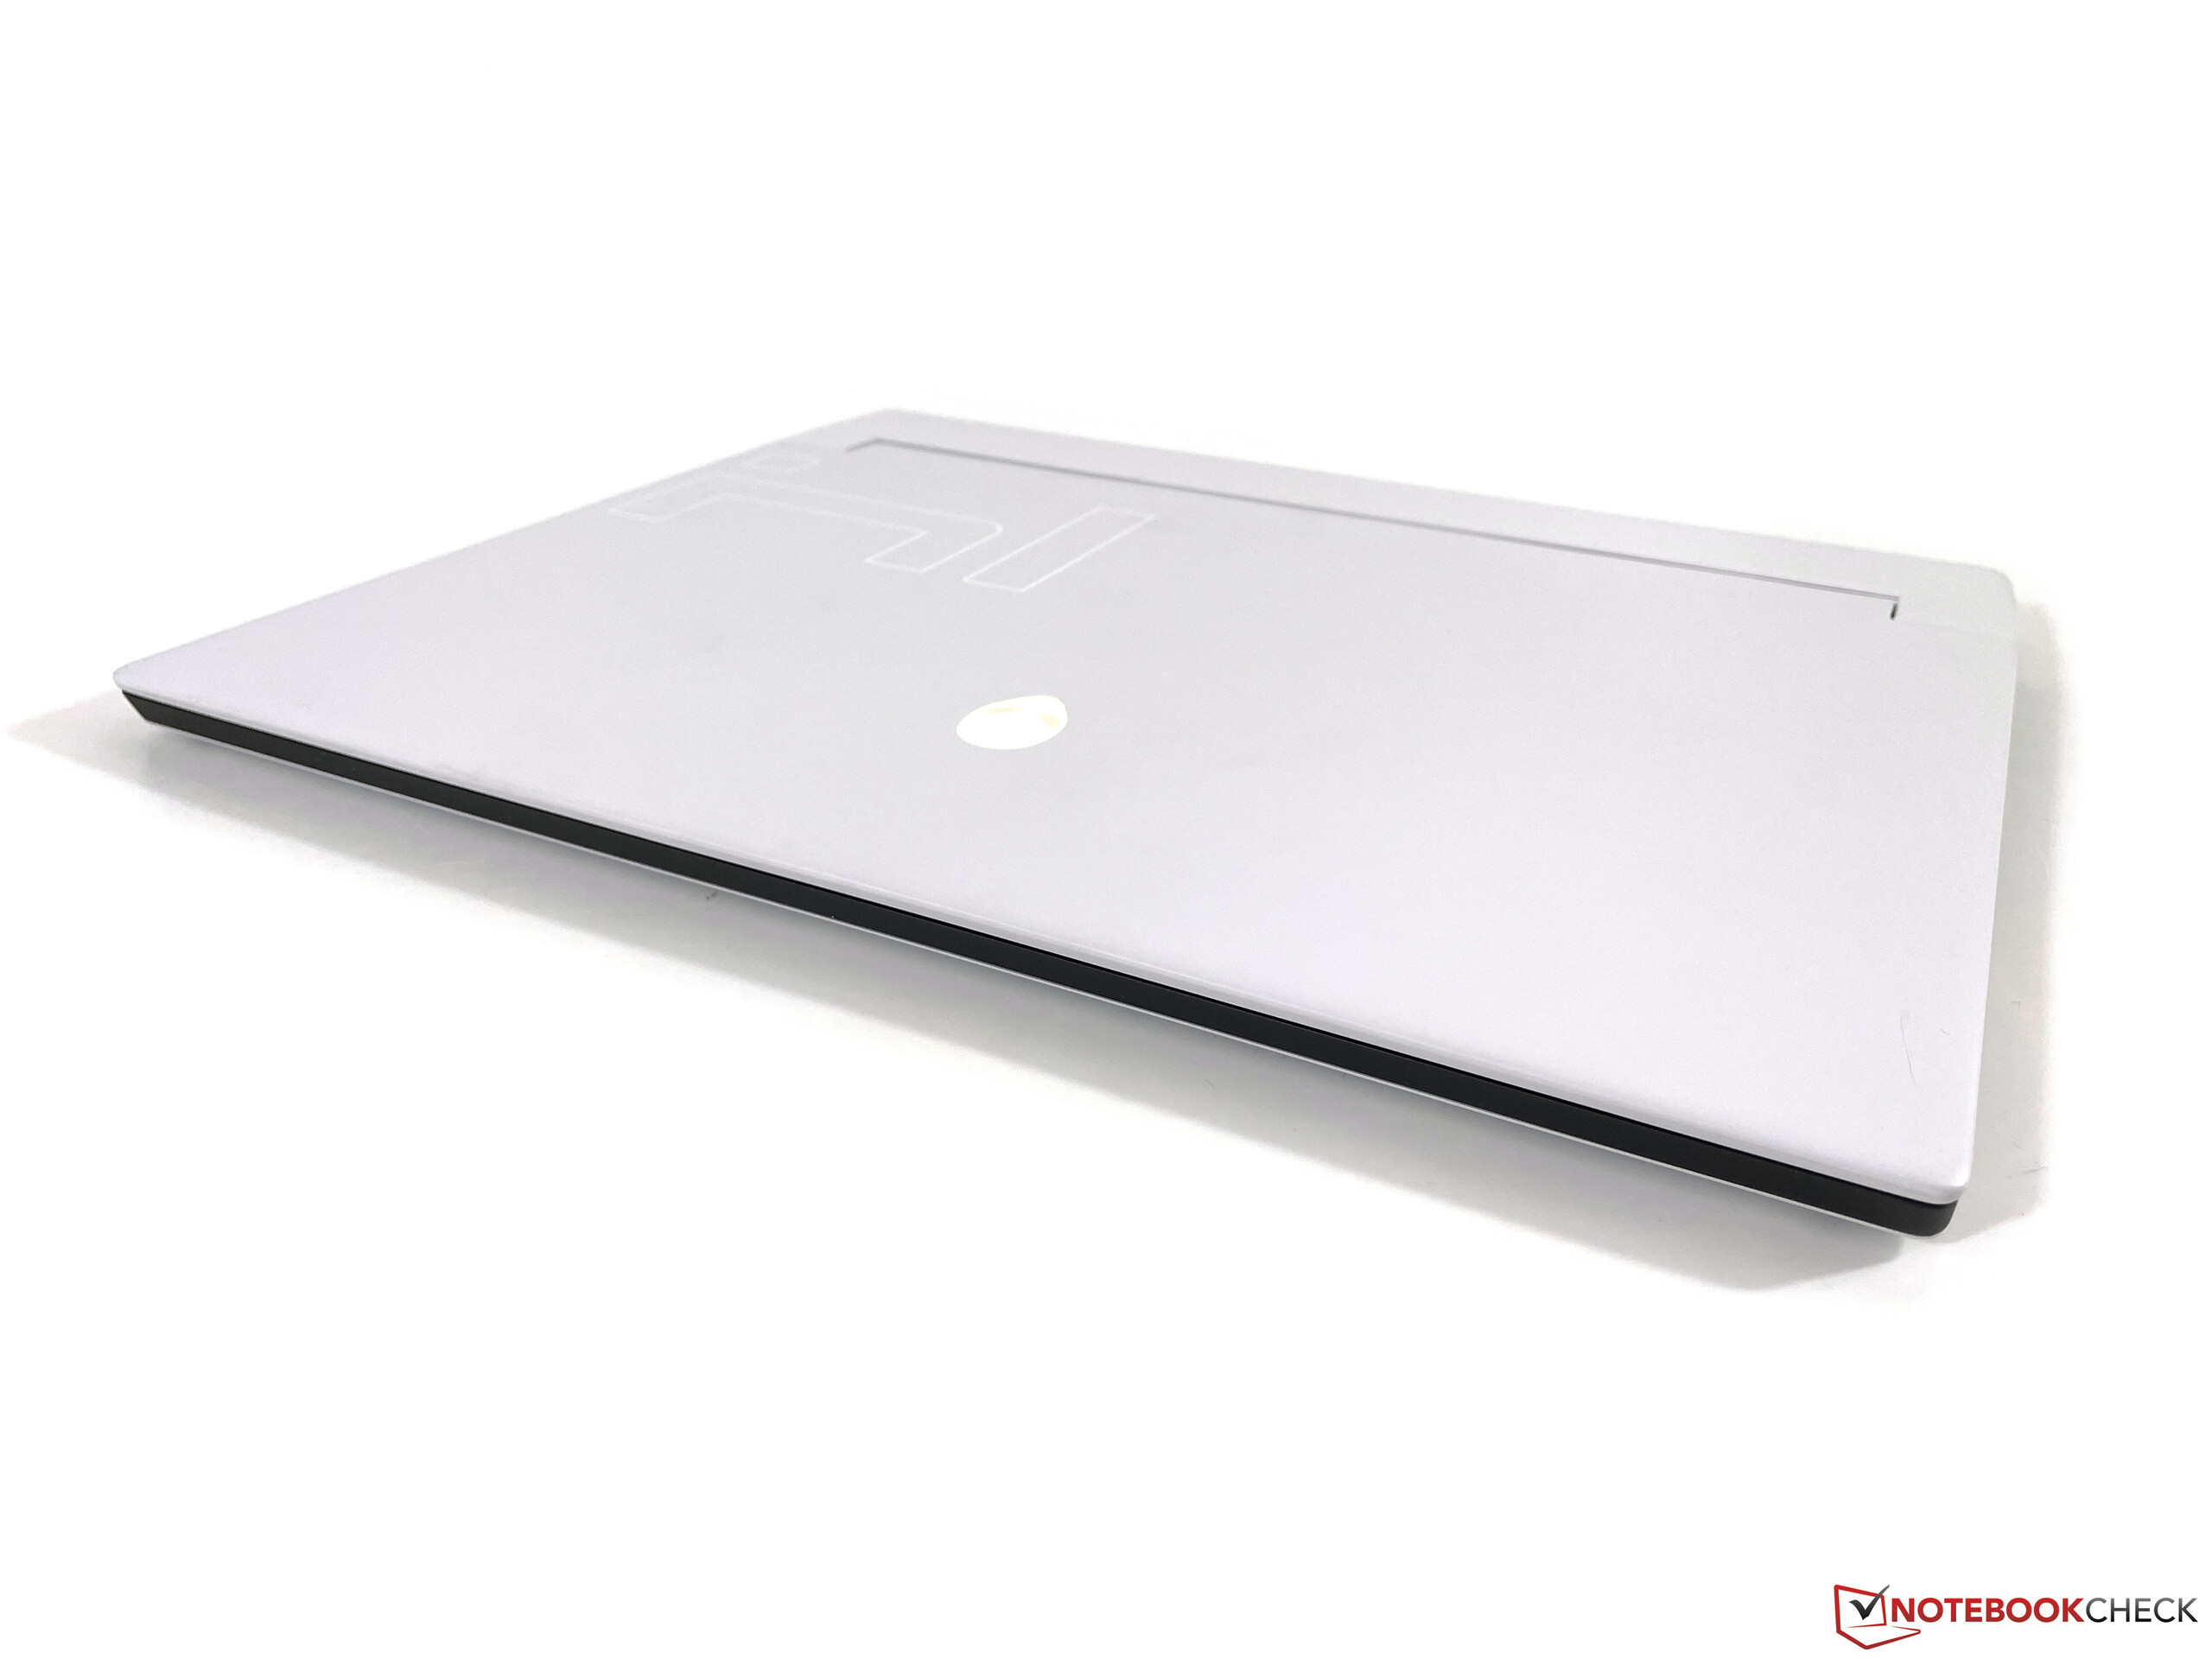
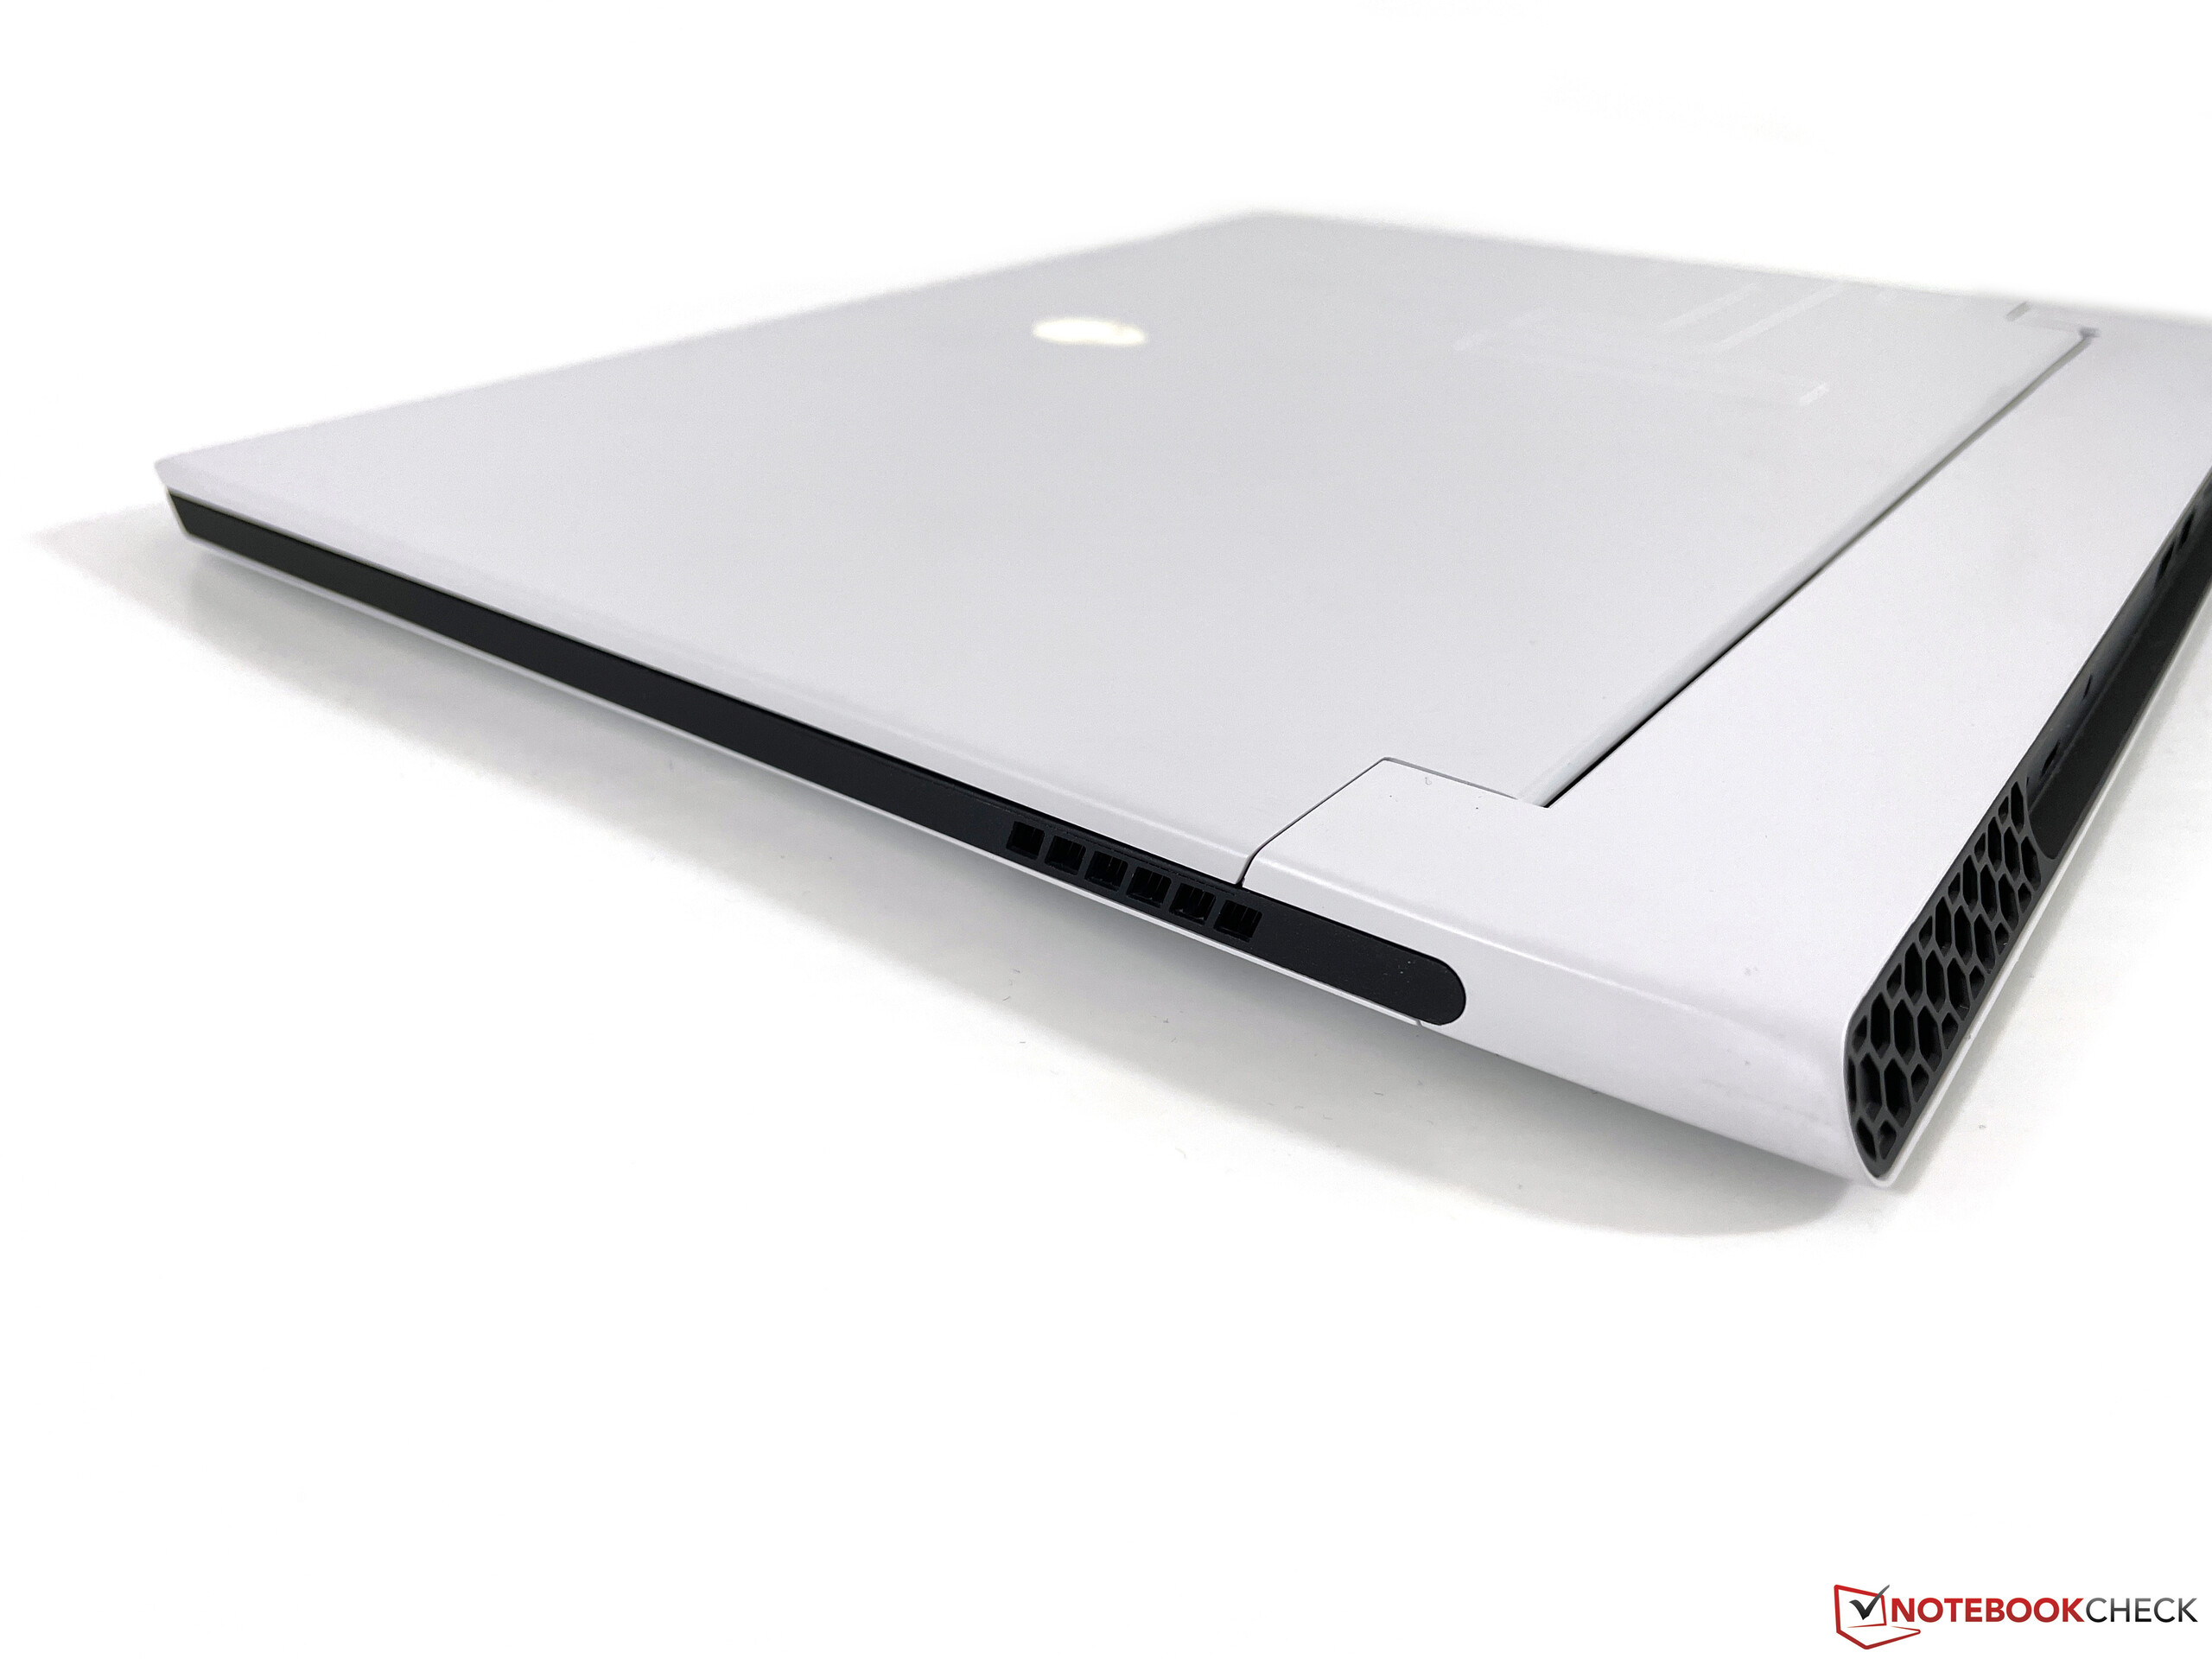
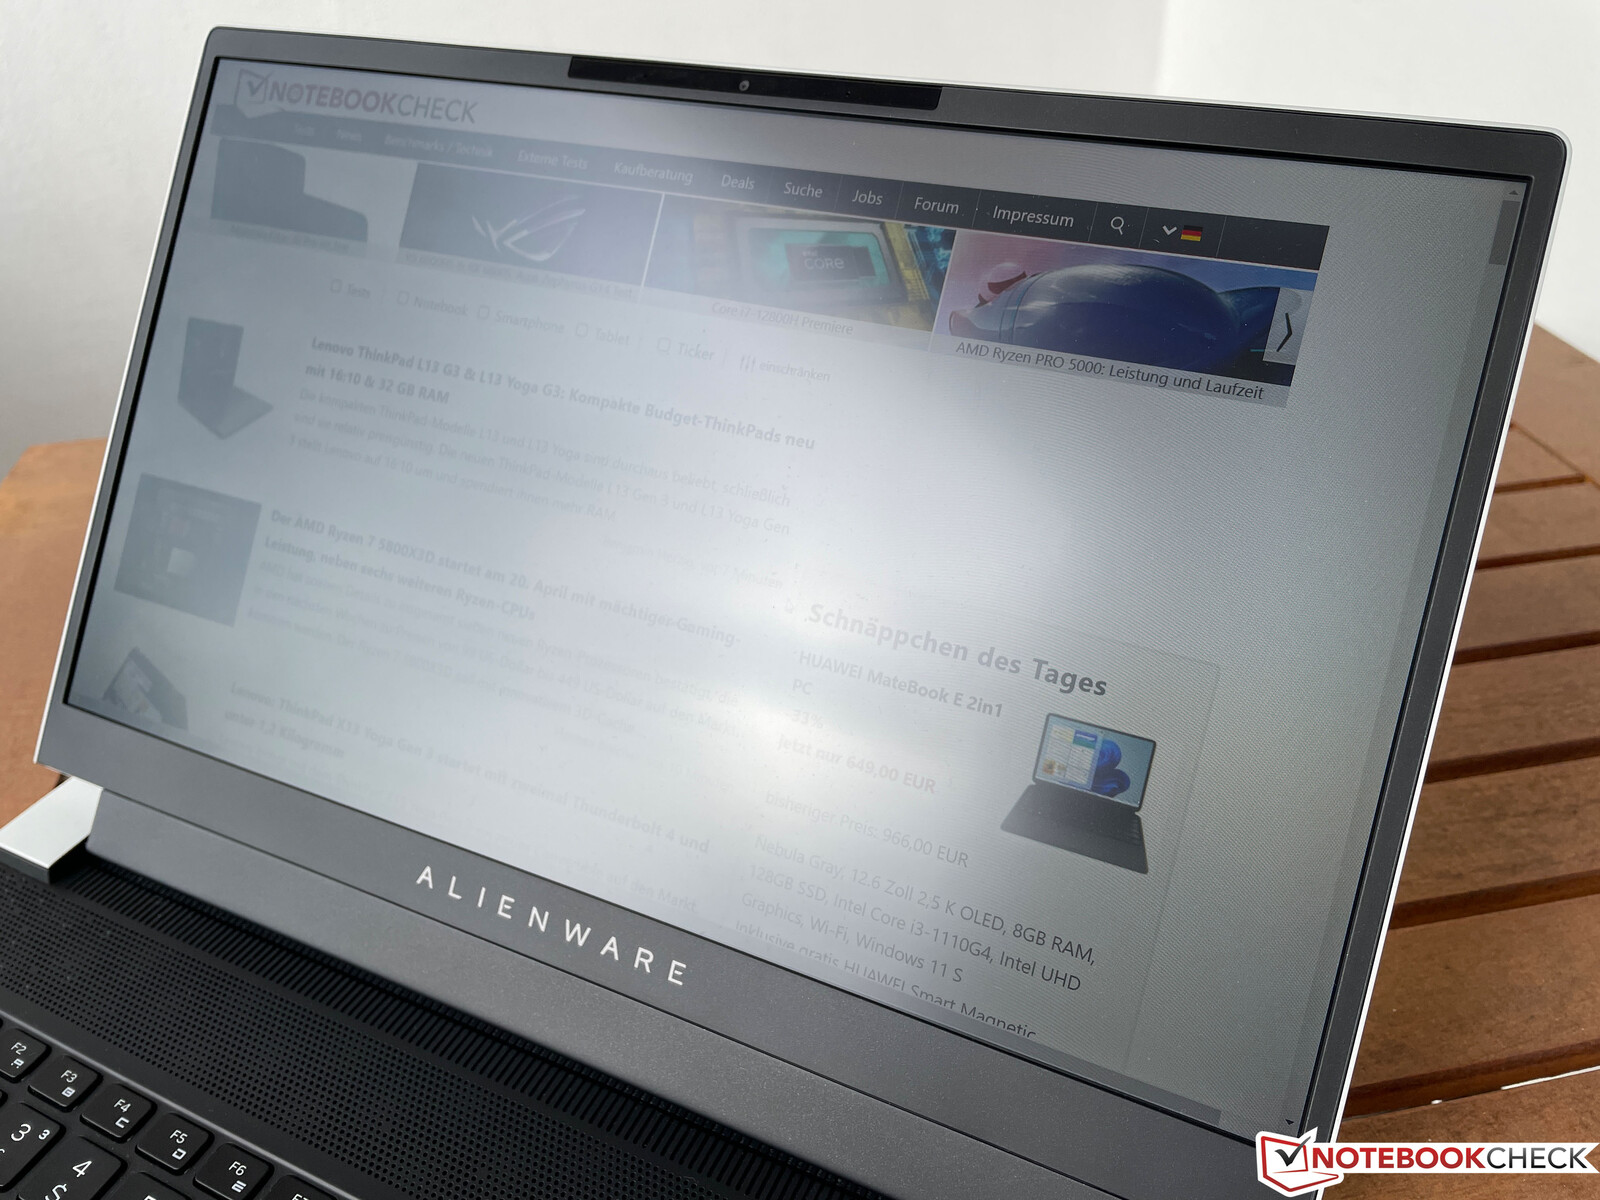
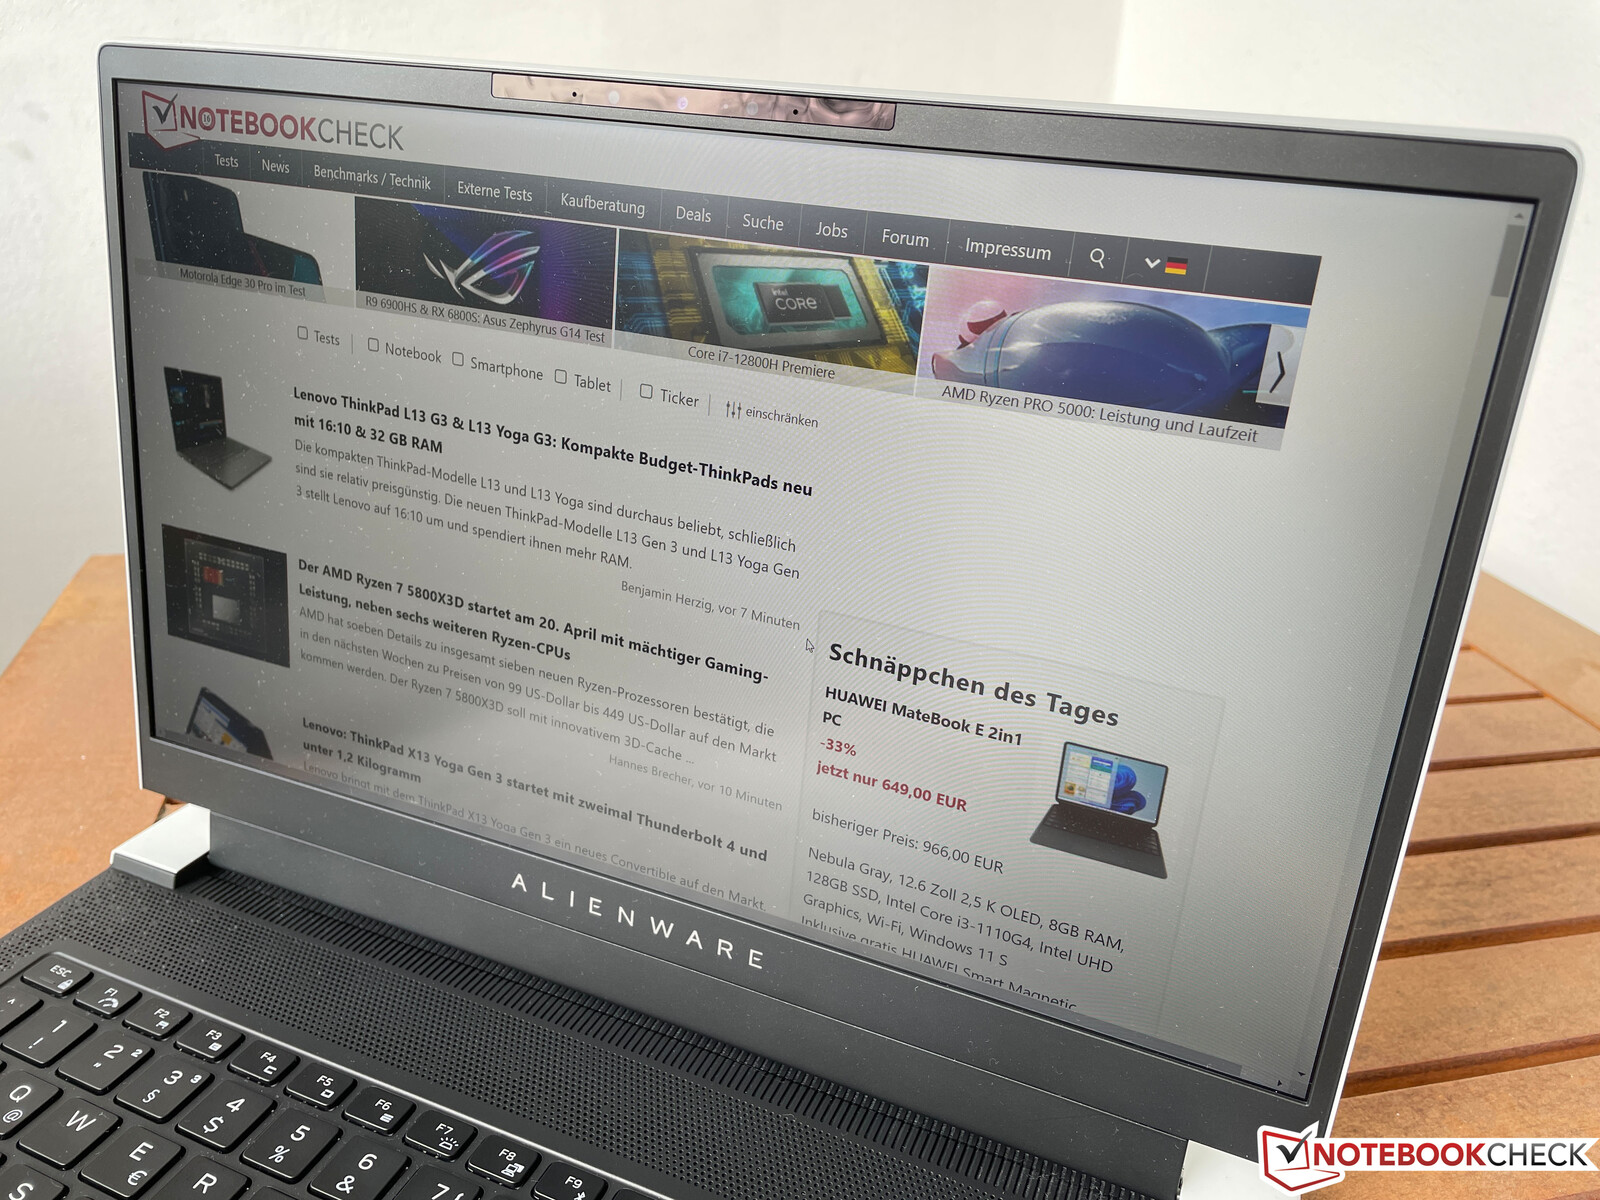
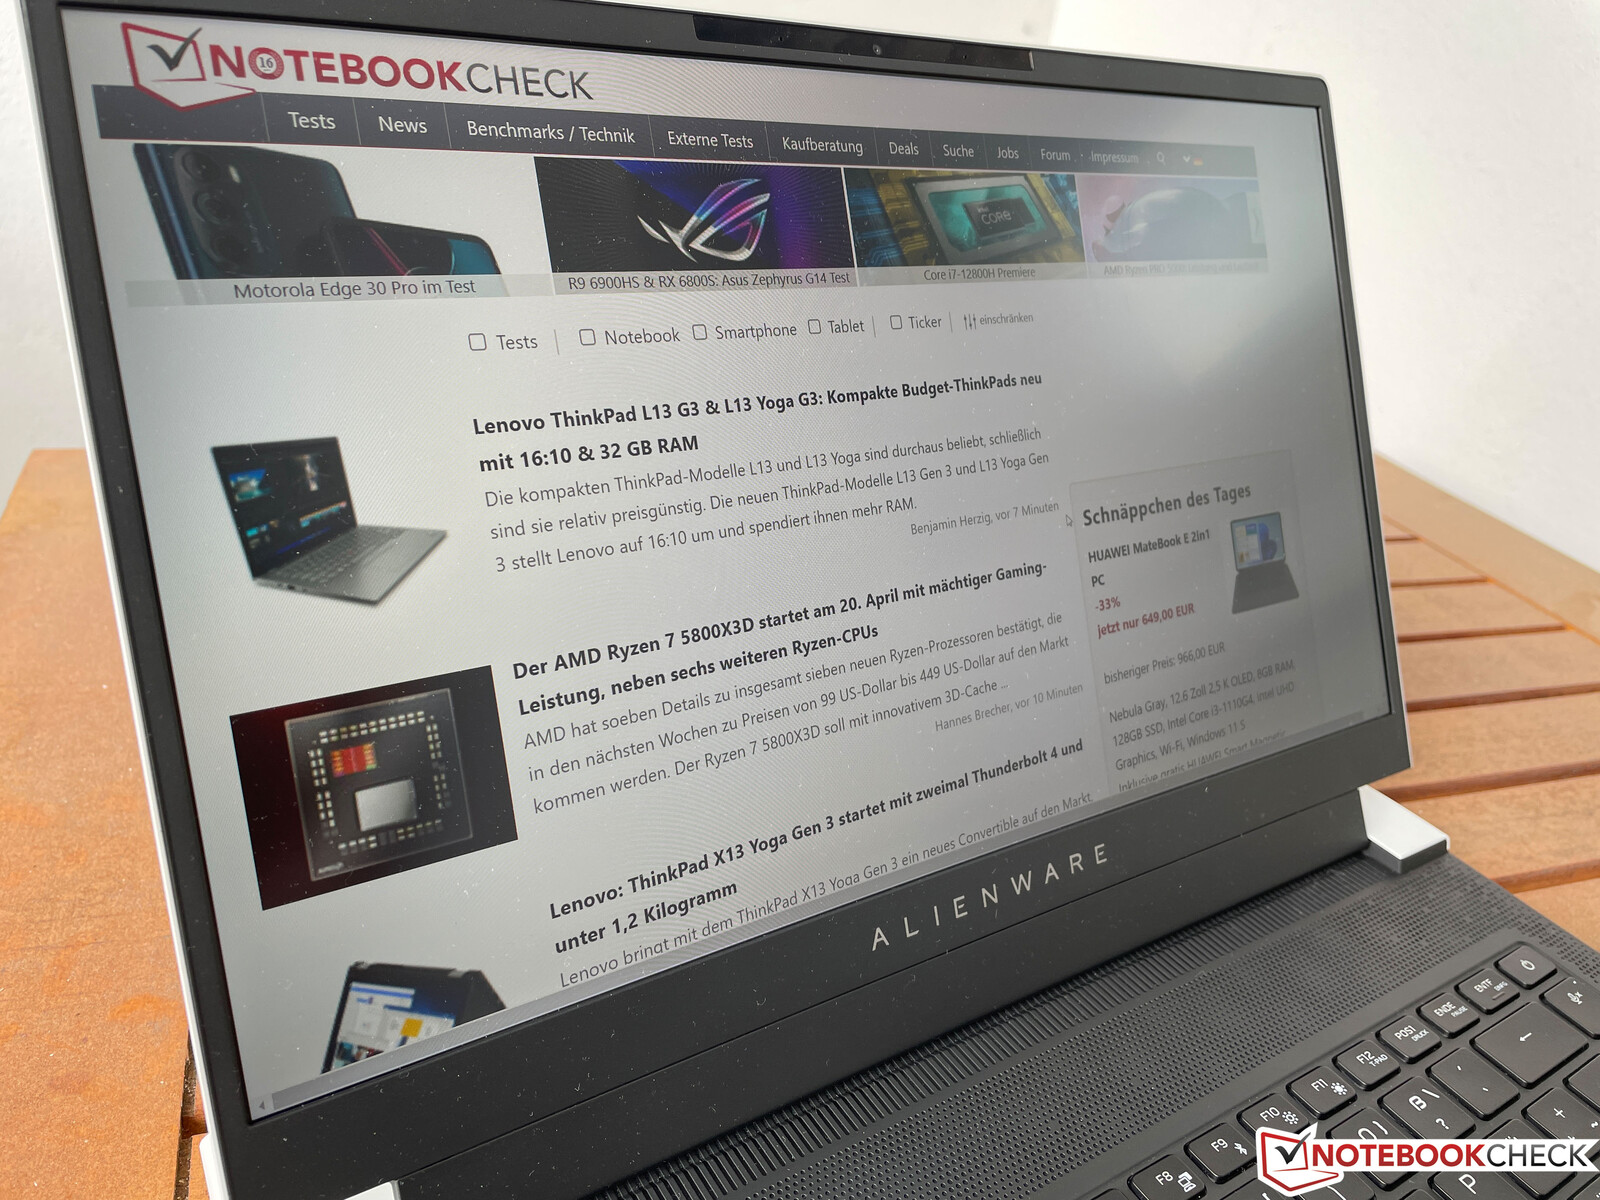
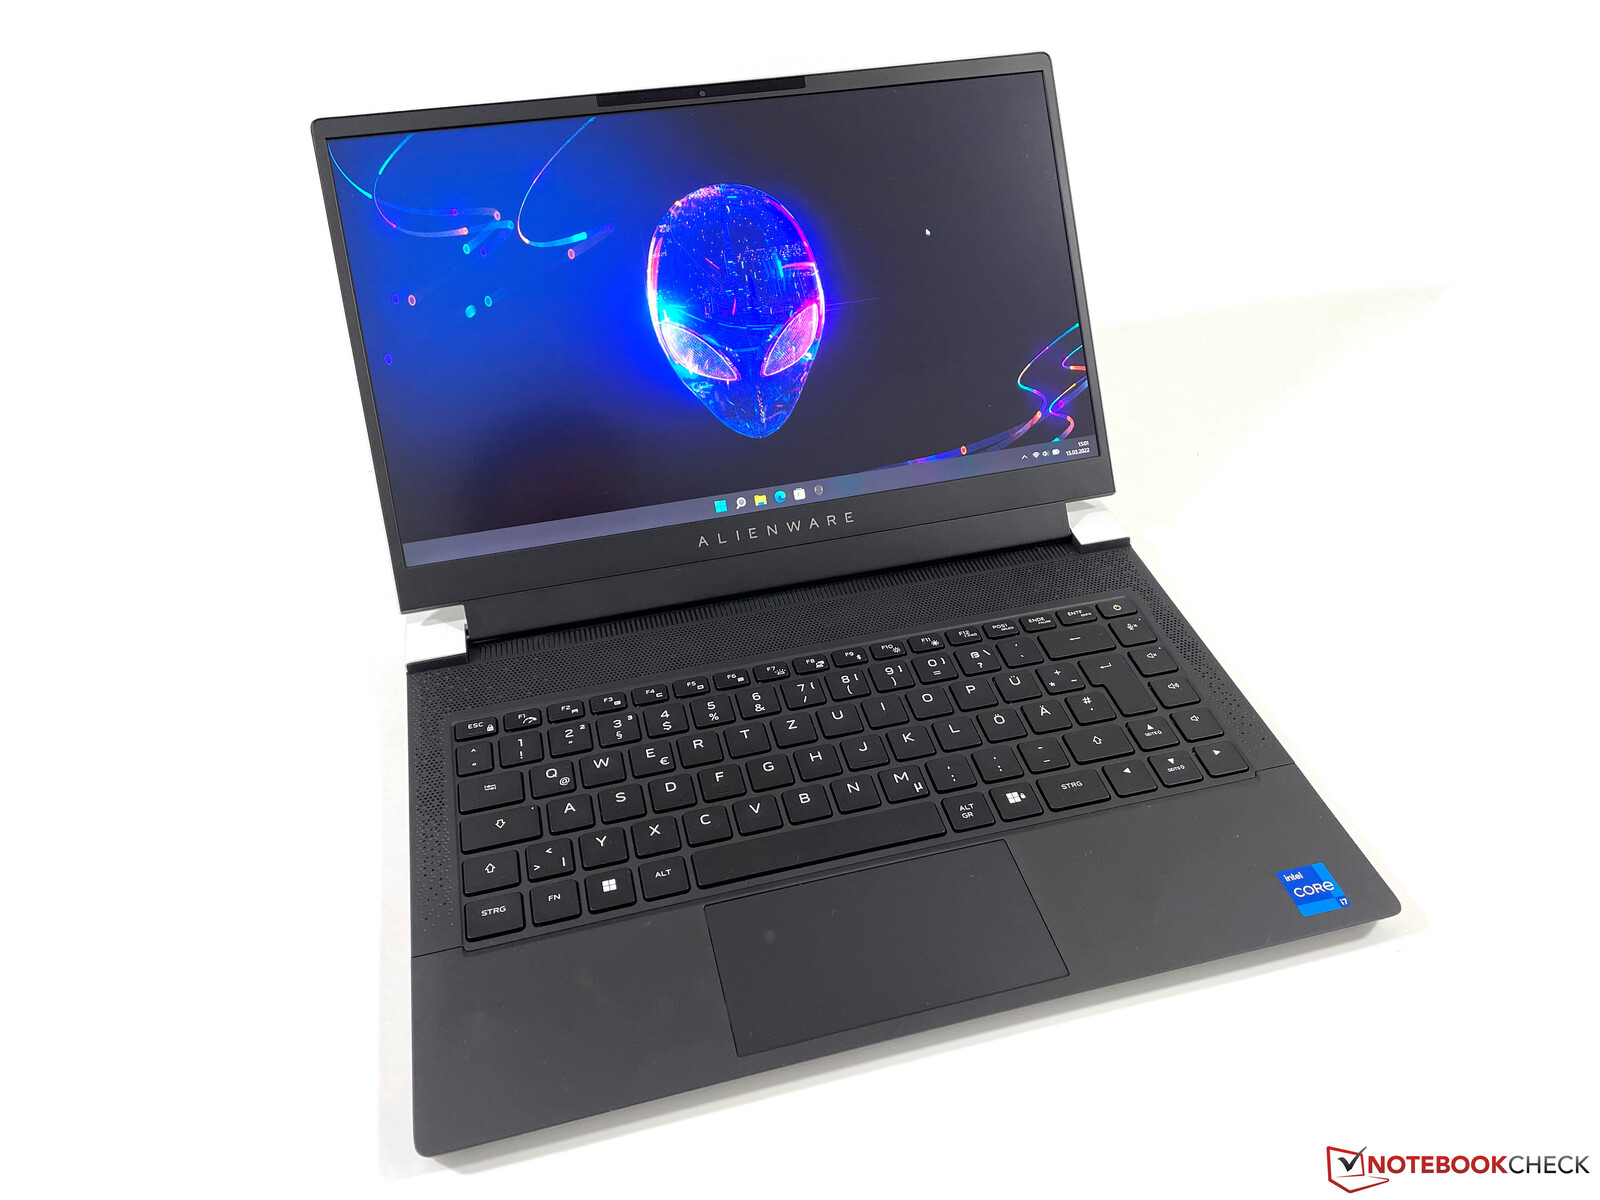
新的Alienware x14的设计与它的大型兄弟姐妹们几乎没有区别x15和x17.该设计应该是尽可能的苗条,但由于显示器铰链被移向前面的结构,笔记本电脑非常深。特别是对于14英寸的机型,这意味着键盘也被移到了底座的前面,而且掌托也相当小。与较大的兄弟姐妹相比,后部也没有照明,只有键盘和x14盖子上的外星人头可以被照亮。
你只能买到月光银颜色的新x14,在图片上看起来不错,但明亮的表面很快就会吸引灰尘,你必须经常清洁它们。底座的上部、后部以及显示屏边框都是黑色的,这创造了一个很好的对比。侧面的边框相当纤细,但特别是下边框非常宽,我们很确定16:10的面板也会适合。由于机箱结构的原因,新X14的屏幕与机身比例仅为64%。
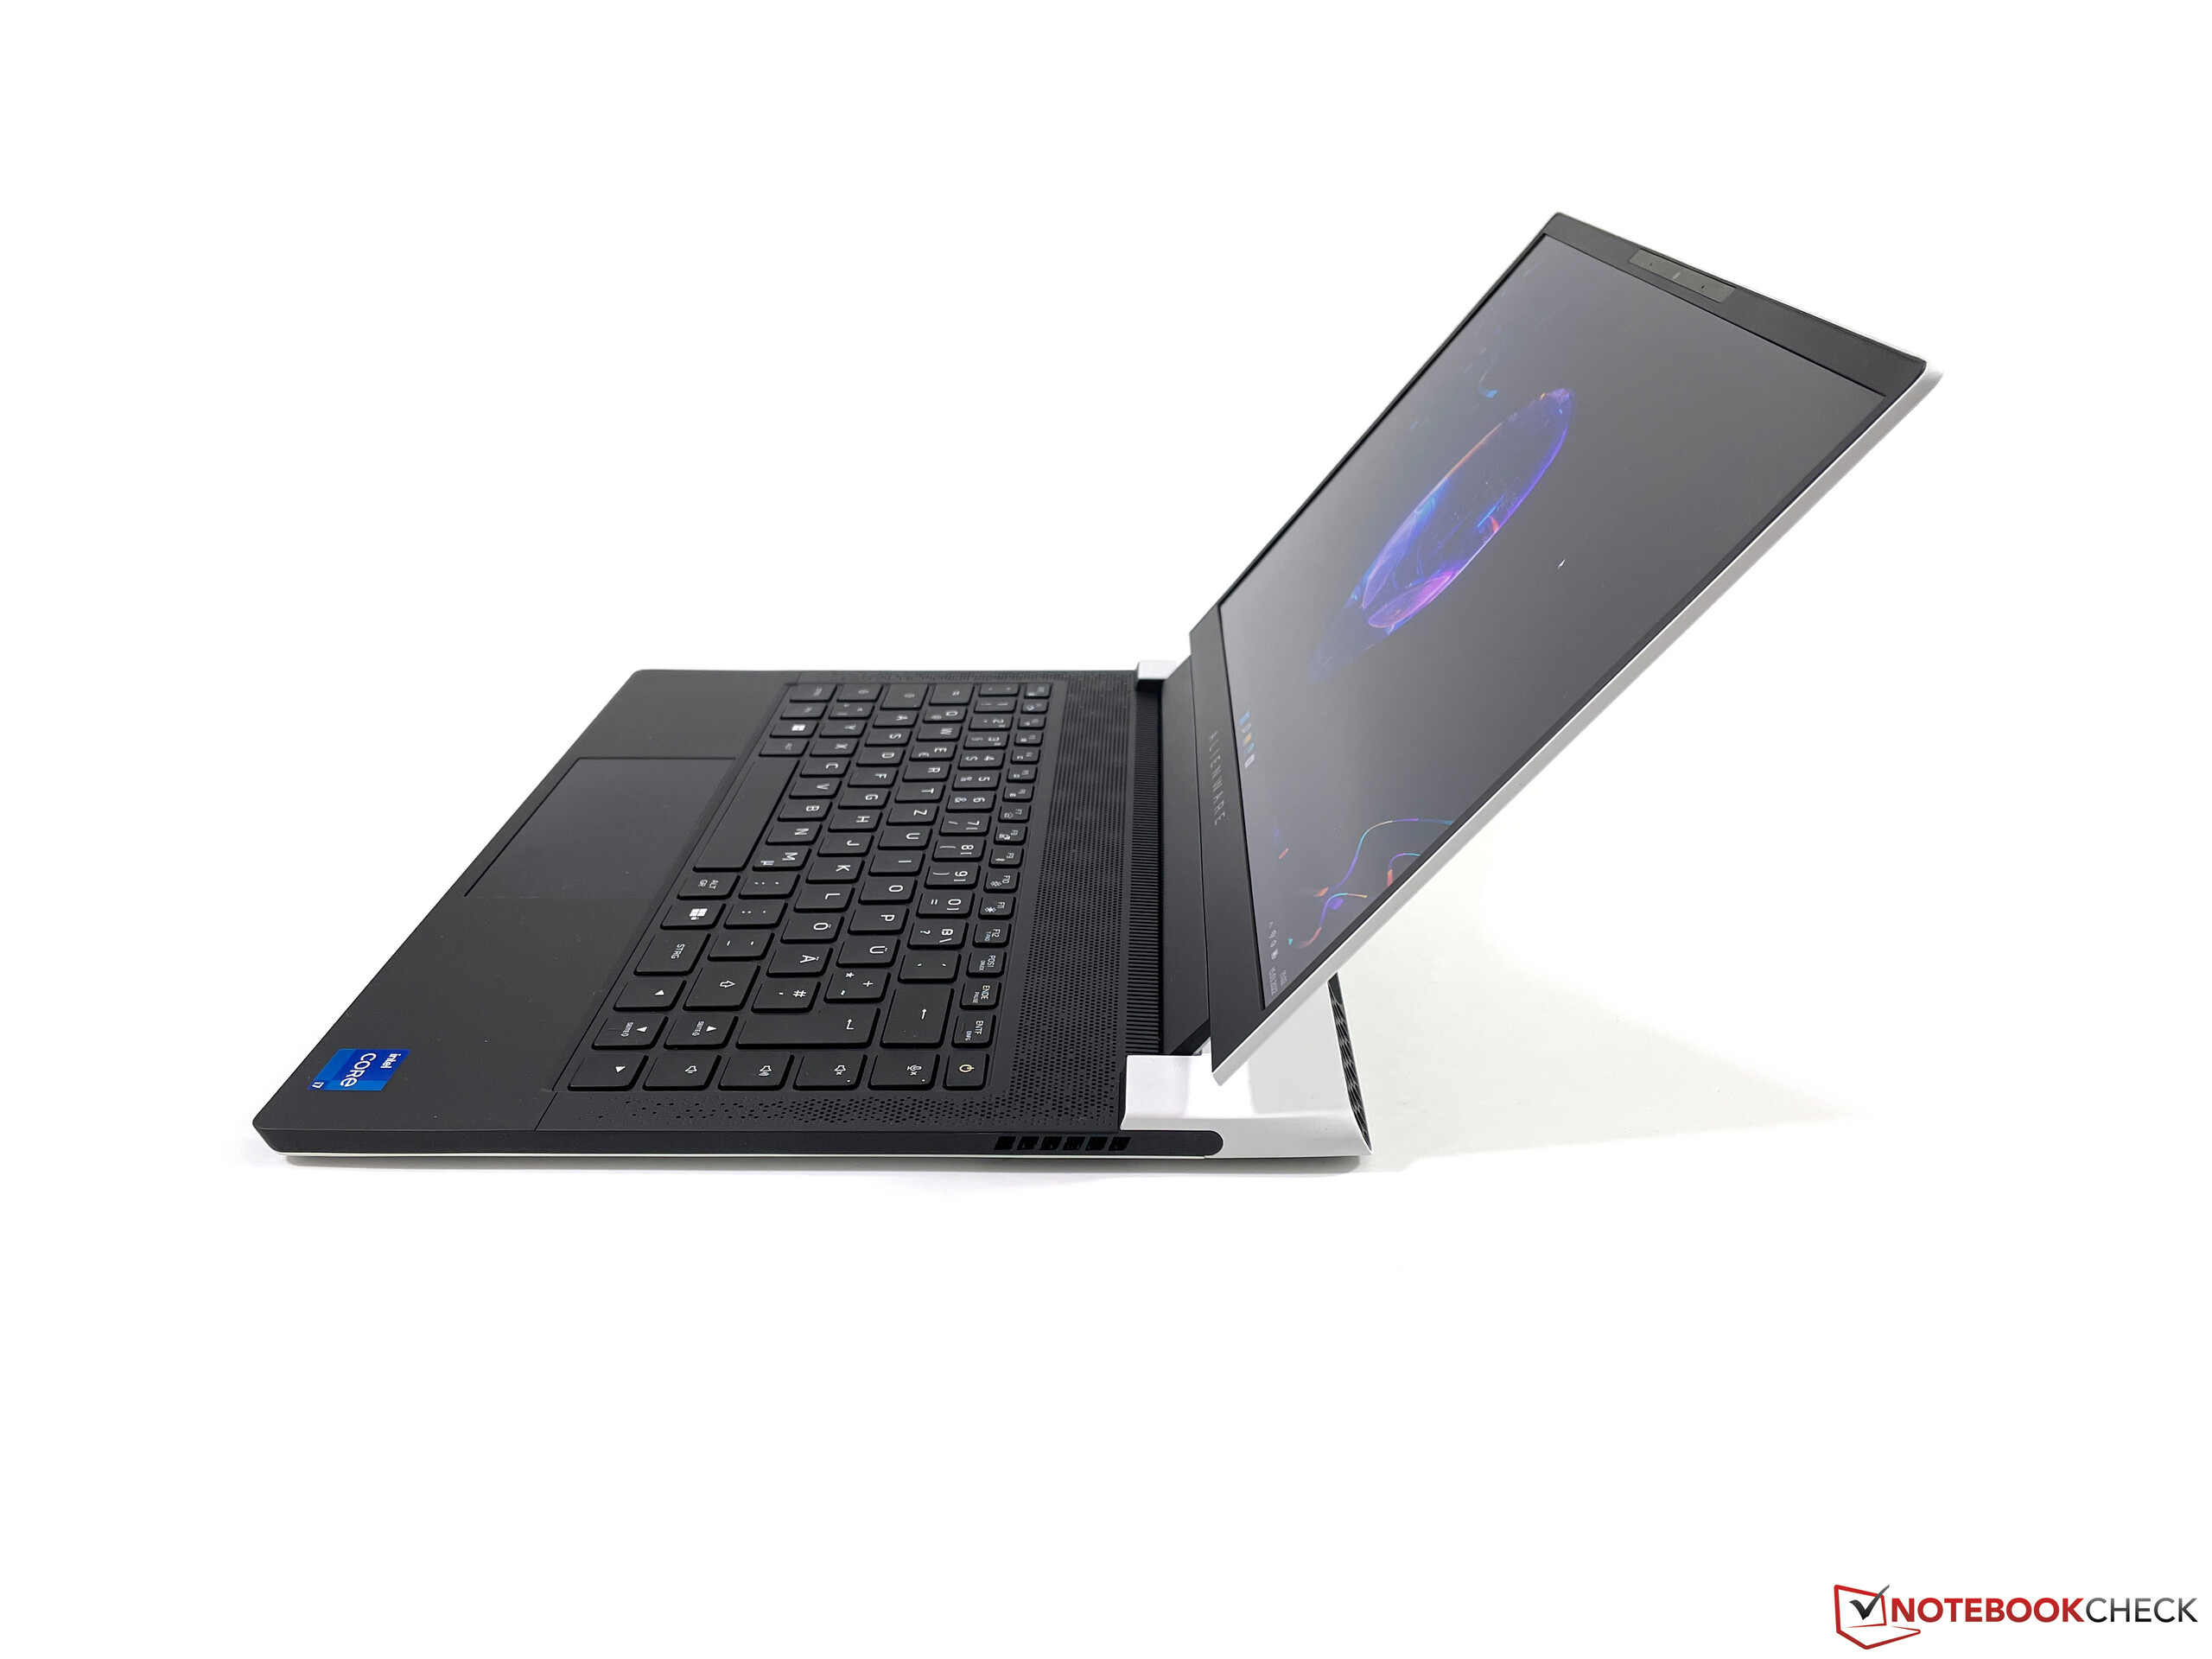
对质量没有太多的批评,因为戴尔使用了高质量的材料,我们的测试设备的建造质量是完美无缺的,稳定性也给人留下了良好的印象。我们总体上也喜欢显示器铰链,但在调整开启角度时仍有一些弹跳现象。由于屏幕的位置,最大开启角度也被限制在135度左右。
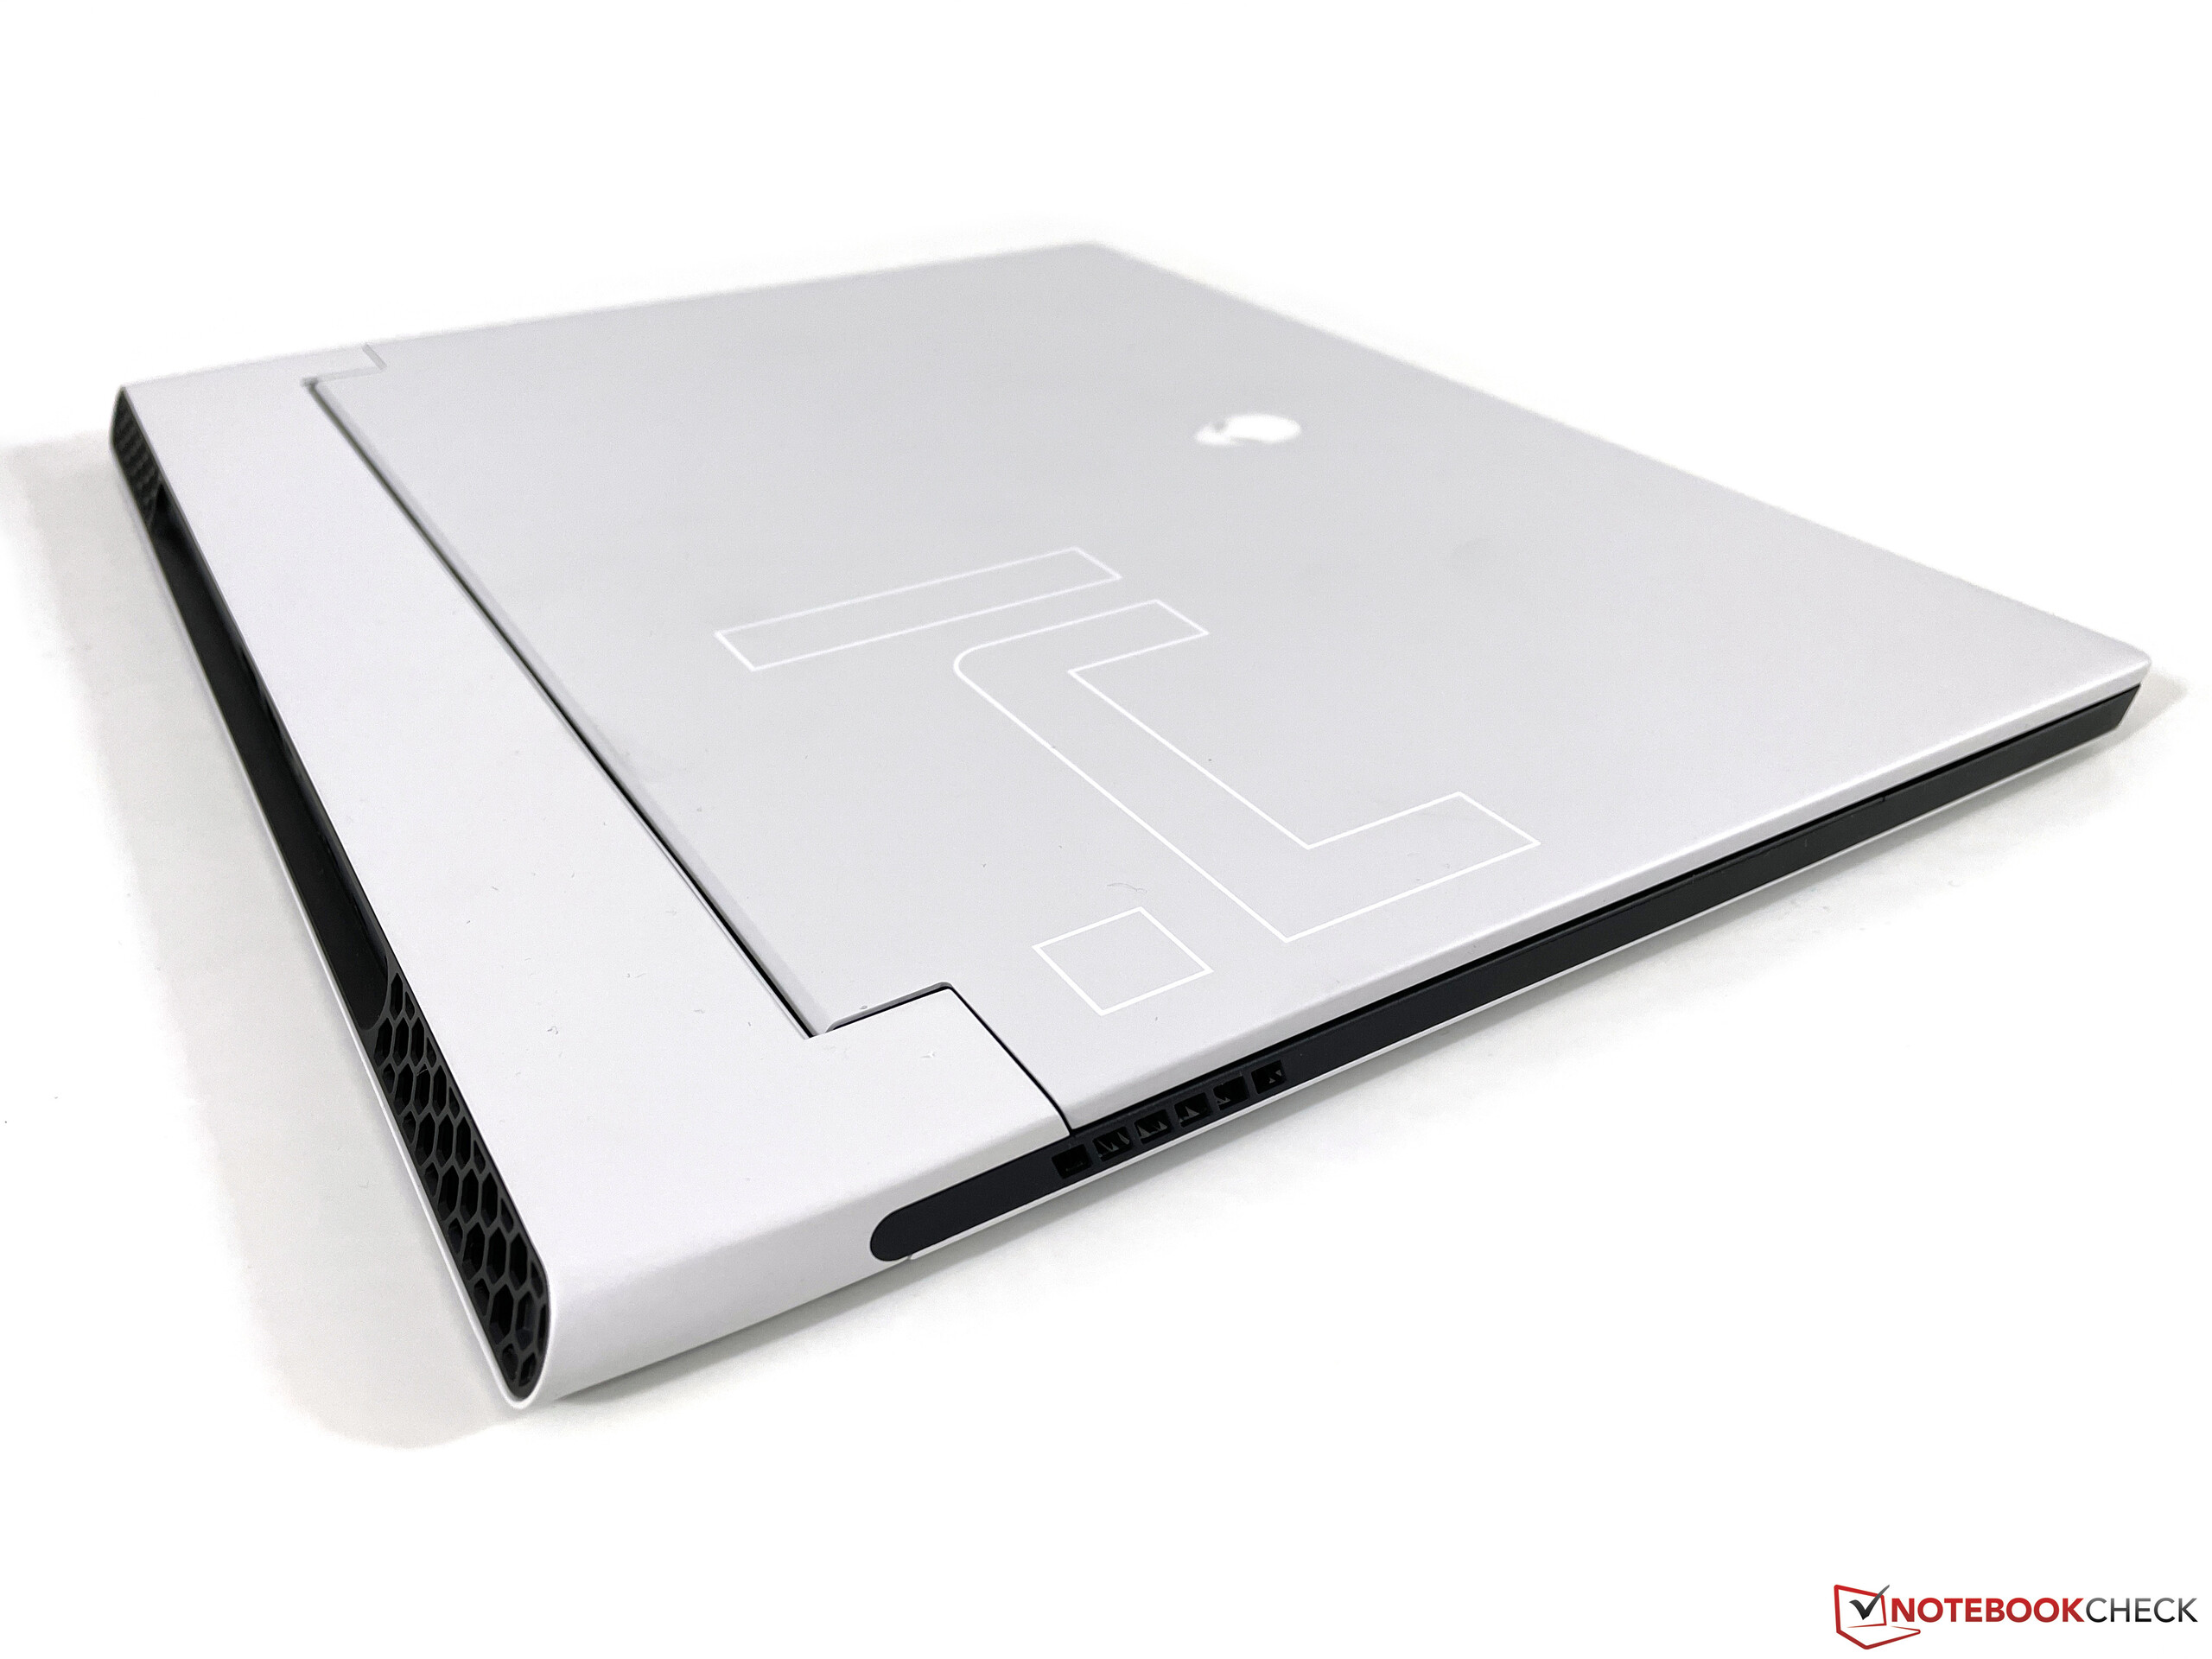
新的x14非常苗条,只有14.5毫米,但由于其机箱设计,这款游戏笔记本电脑非常深,与我们对比组中的其他14英寸笔记本电脑相比,它的占地面积最大。所有的对手在重量方面都相当接近,除了笔记本电脑本身的1.8公斤,你还必须为130W的电源适配器增加486克。
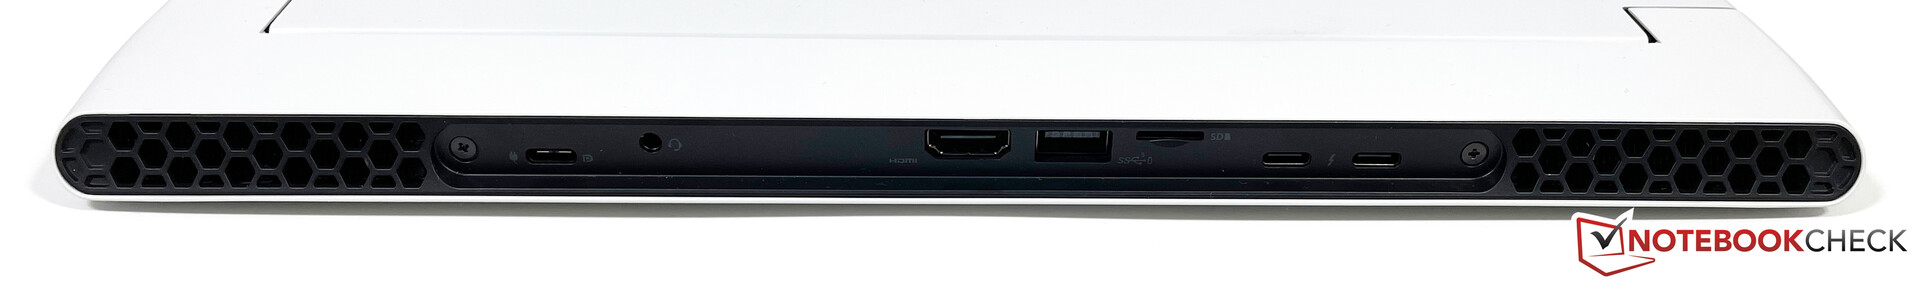
连接性 - 带有Thunderbolt 4和HDMI 2.1的Alienware
对于端口没有任何批评,因为戴尔使用了最新的标准,包括Thunderbolt 4和HDMI 2.1。除了三个USB-C端口(其中一个通常被电源适配器挡住)外,还有一个普通的USB-A端口。然而,问题是所有的端口都位于后部(甚至是立体声插孔),因此很难接近。
SD卡阅读器
x14在后面提供了一个microSD读卡器(弹簧式),它几乎完全容纳了SD卡。这是一个非常快的模块,我们确定的传输速率高达220 MB/s,当我们从参考卡(Angelbird AV Pro V60)复制文件时,仍然是190 MB/s。
| SD Card Reader | |
| average JPG Copy Test (av. of 3 runs) | |
| Alienware x15 RTX 3070 P111F (AV Pro V60) | |
| Alienware x14 i7 RTX 3060 (Angelbird AV Pro V60) | |
| Asus ROG Zephyrus G14 GA402RK (AV PRO microSD 128 GB V60) | |
| Average of class Gaming (20.9 - 210, n=54, last 2 years) | |
| maximum AS SSD Seq Read Test (1GB) | |
| Alienware x15 RTX 3070 P111F (AV Pro V60) | |
| Alienware x14 i7 RTX 3060 (Angelbird AV Pro V60) | |
| Asus ROG Zephyrus G14 GA402RK (AV PRO microSD 128 GB V60) | |
| Average of class Gaming (25.5 - 261, n=51, last 2 years) | |
沟通
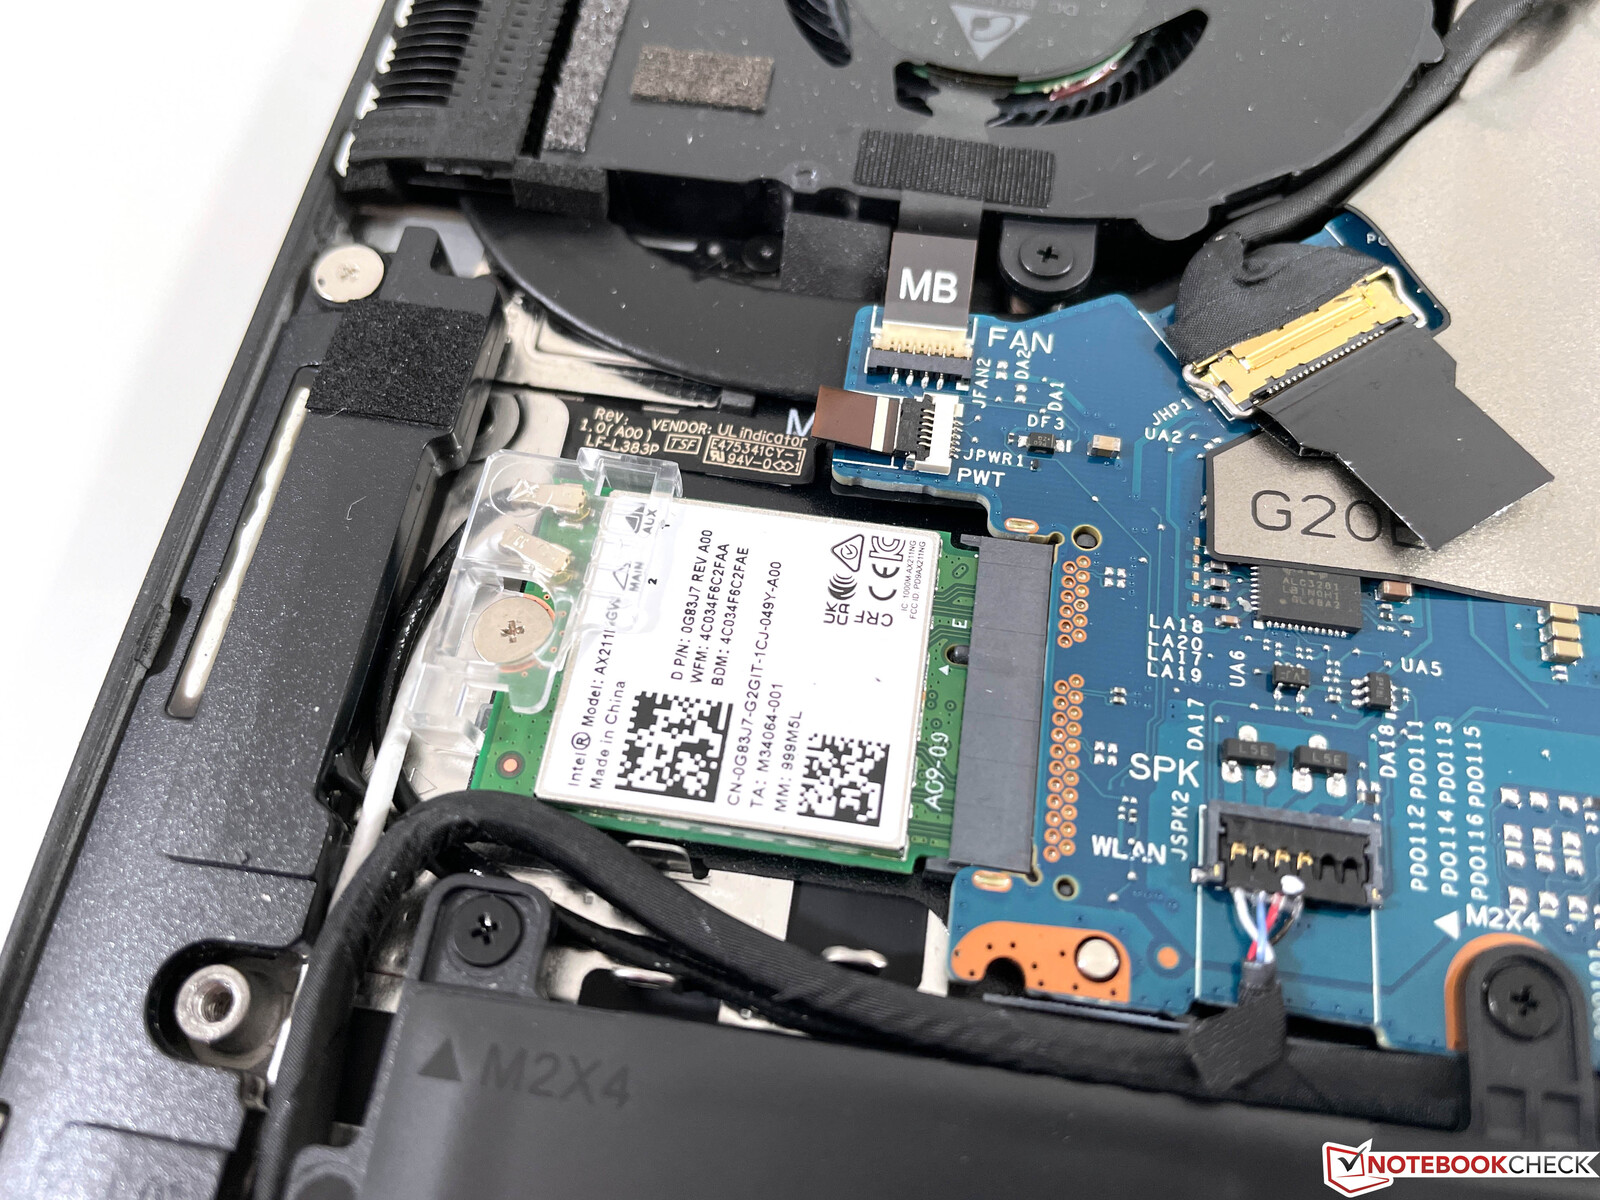
来自英特尔的Wi-Fi模块(AX211)也支持最新的Wi-Fi 6E标准(802.11ax),包括6GHz网络以及蓝牙5.2。我们确定与Netgear的参考路由器(Nighthawk AX12)结合使用的传输速率非常好,而且在我们的审查期间,我们也没有注意到信号质量方面的任何问题。没有专门的以太网模块,如果你想使用有线网络,你将不得不使用相应的雷电适配器。
网络摄像头
我们有点惊讶的是,Alienware x14只配备了一个720p的网络摄像头,尽管在顶部边框中似乎有足够的空间来安装更好的传感器。即使在良好的照明条件下,图片质量也不好,而且效果也不是很清晰。网络摄像头完成了它的工作,但也就这样了。还有一个红外摄像头用于通过Windows Hello进行面部识别。


辅料
Alienware x14的盒子里只包含130W电源适配器(USB-C)。戴尔提供大量带有Alienware品牌的配件,包括输入设备、耳机和显示器。
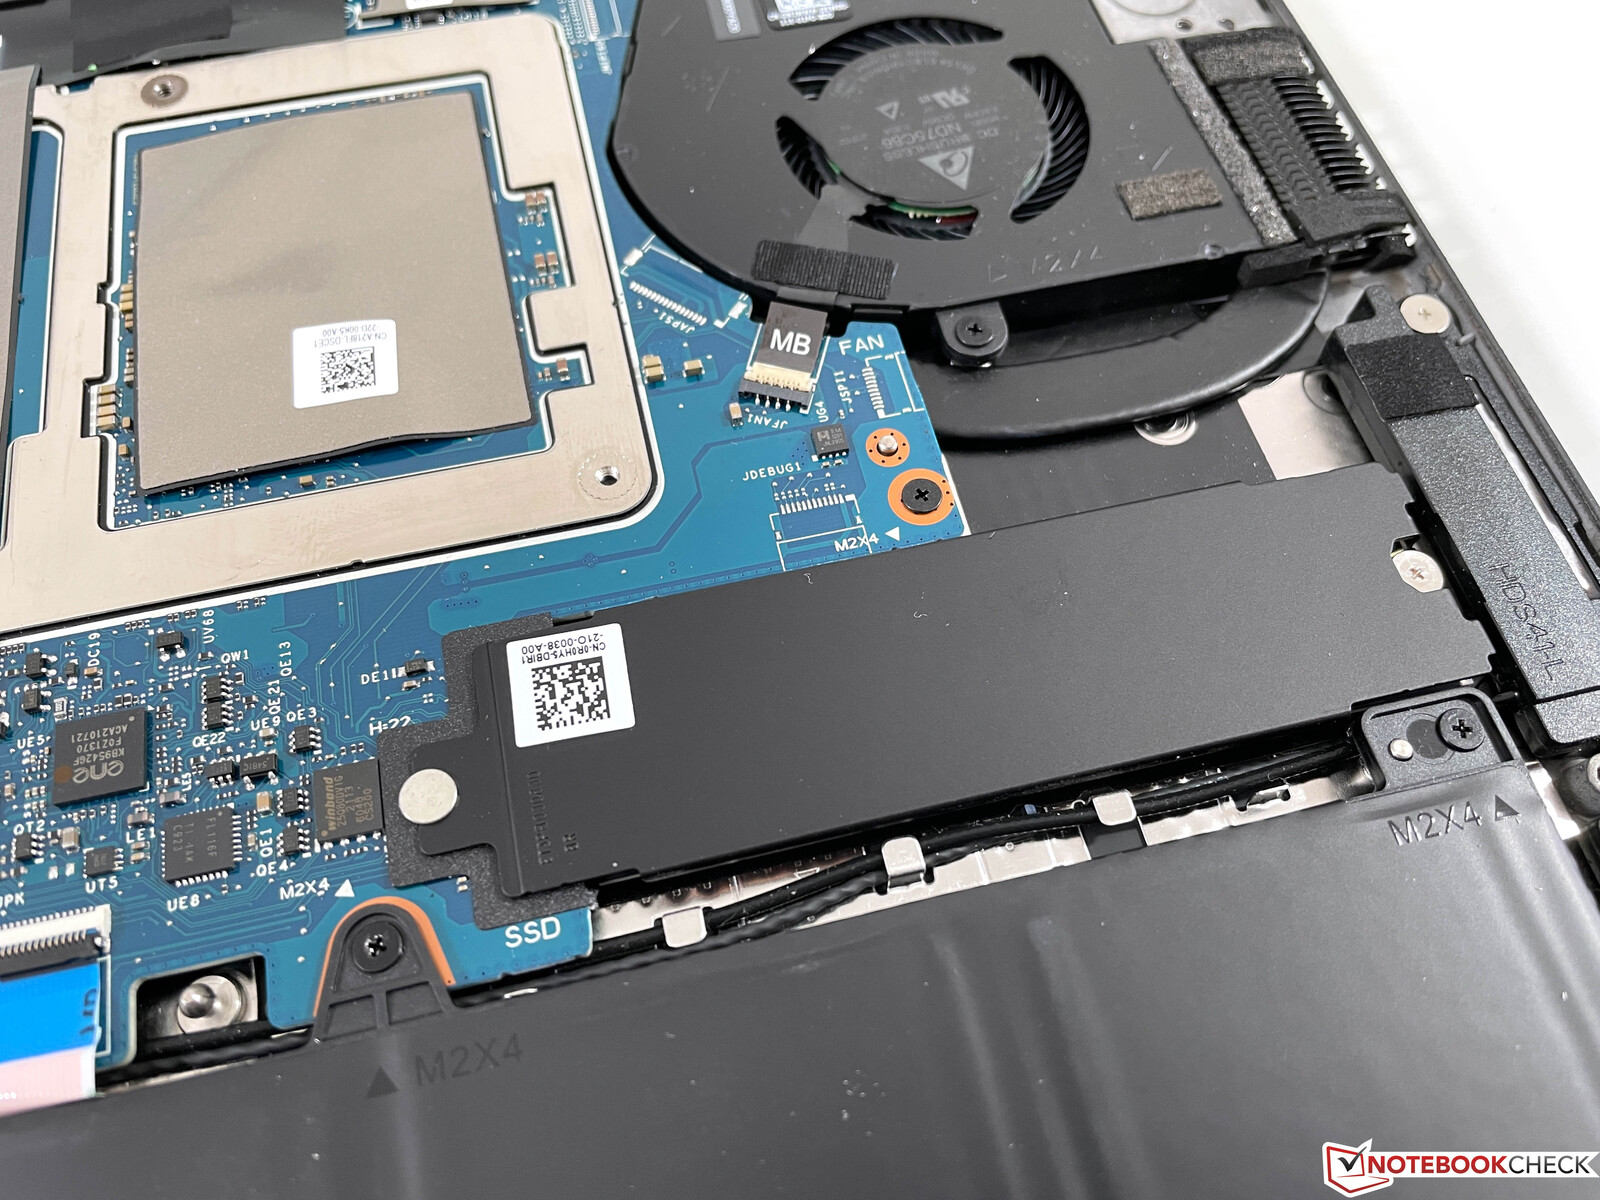
维护
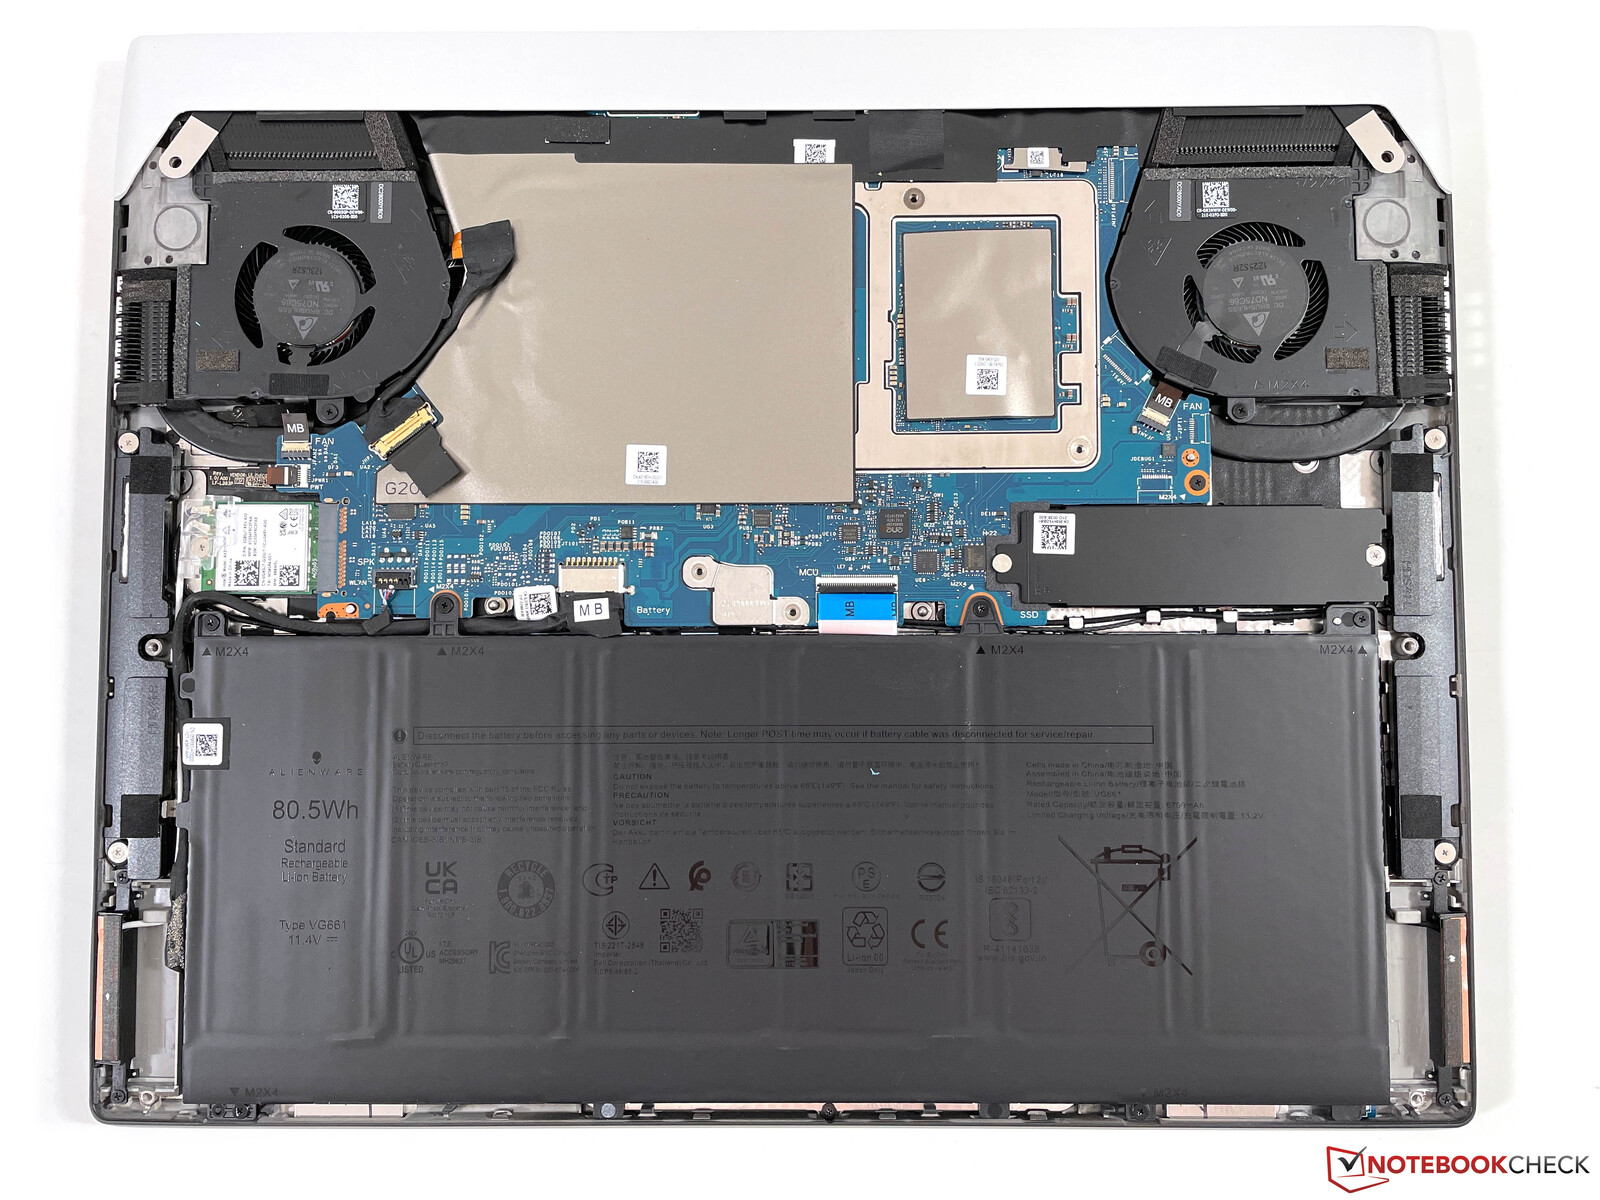
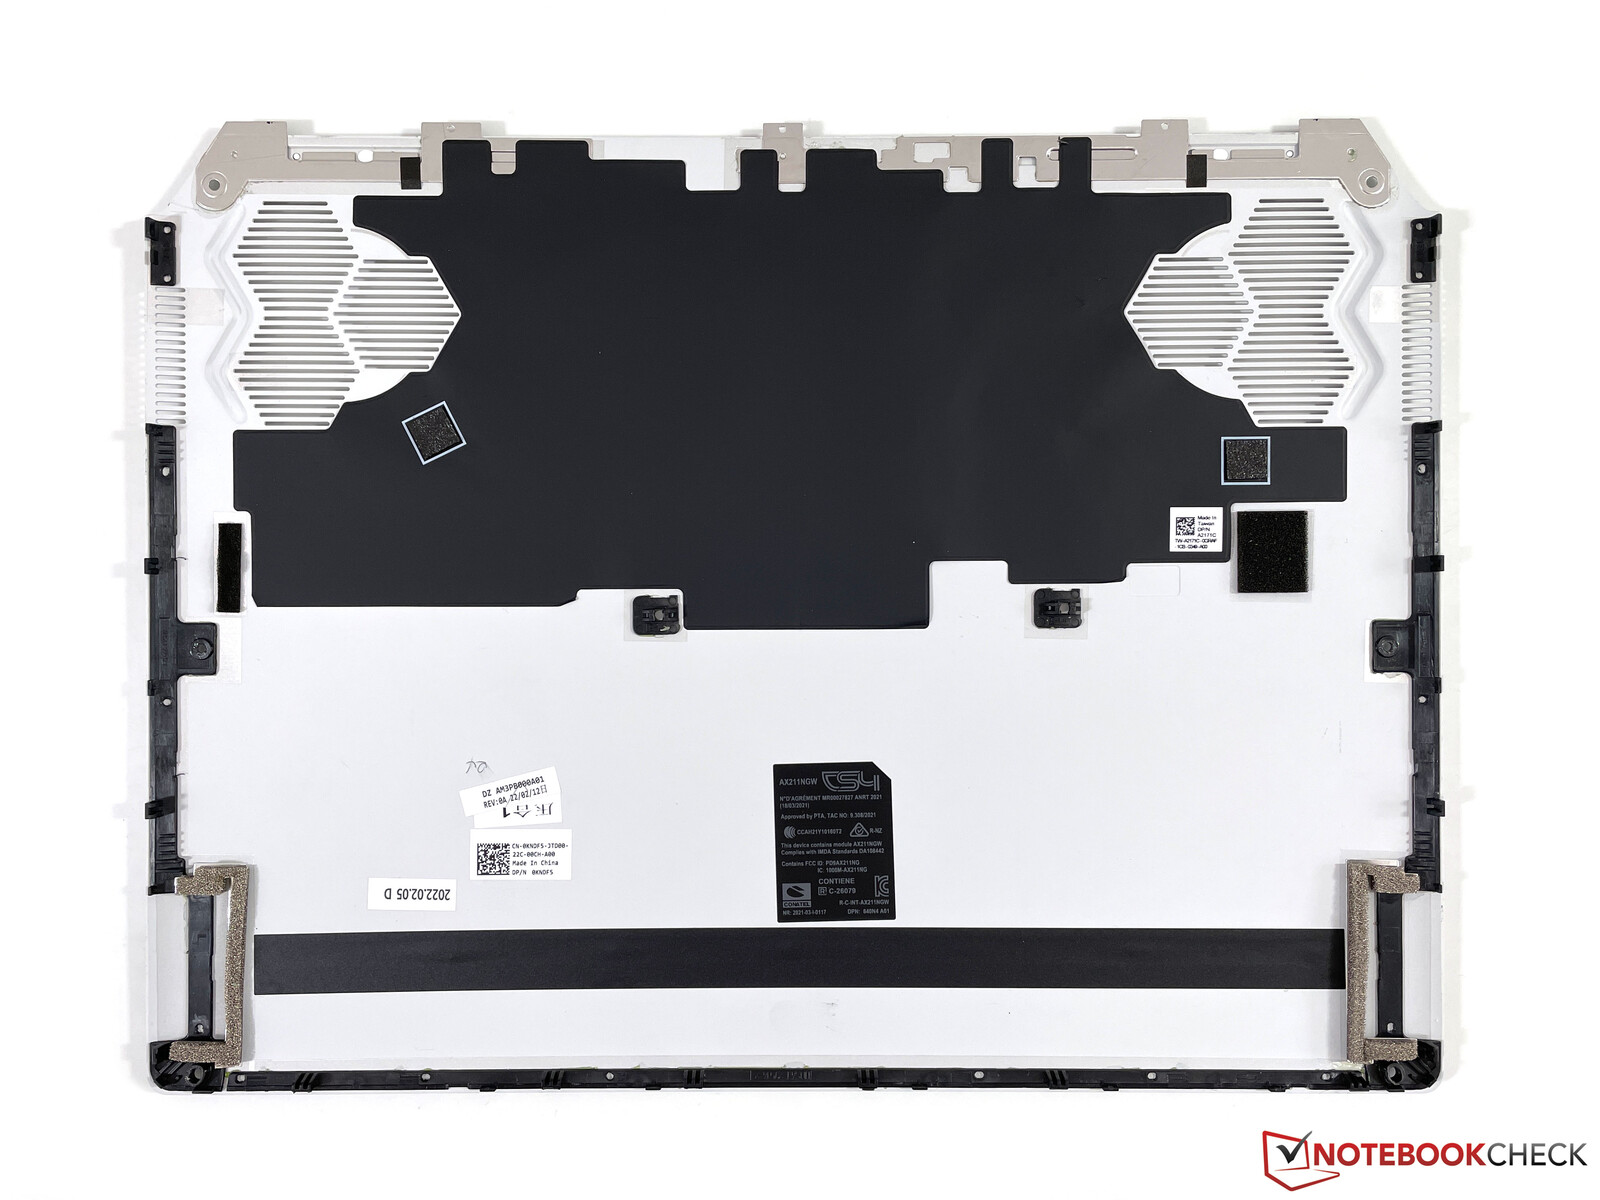
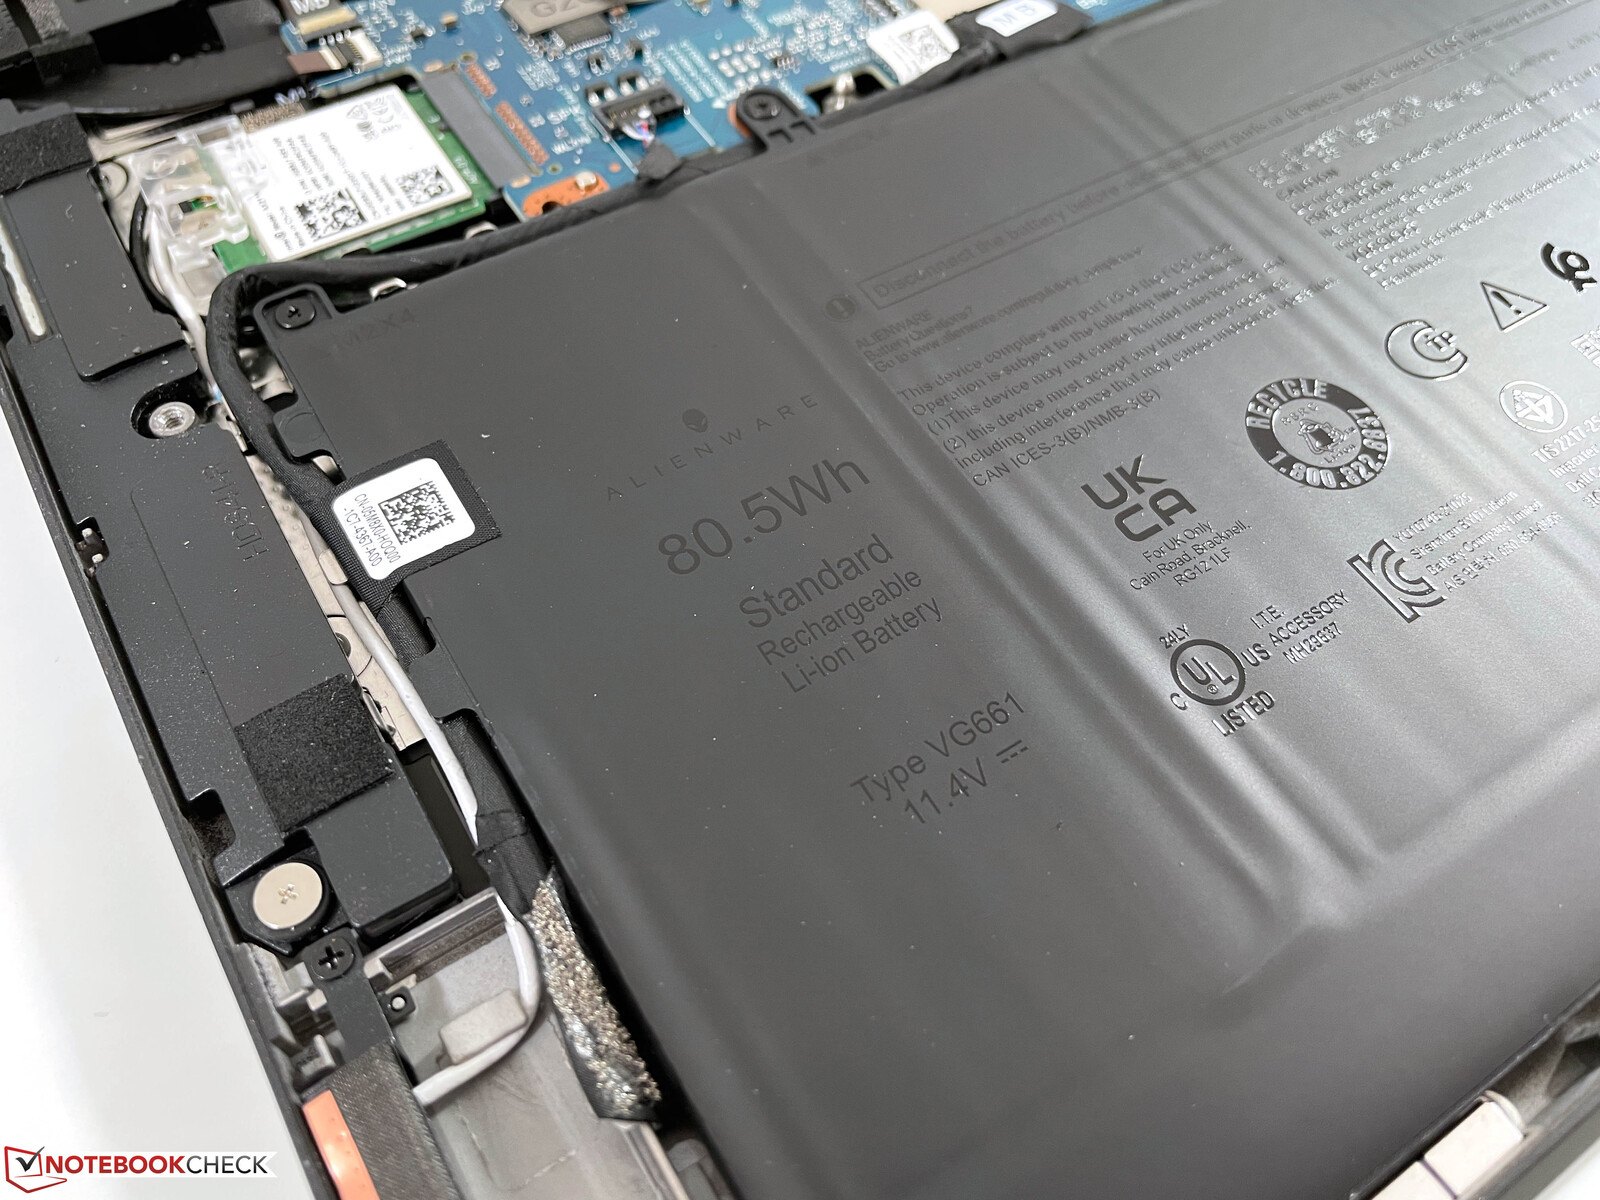
机箱底部的面板由六个标准的飞利浦螺钉固定,但还有额外的塑料夹子,这些夹子非常牢固,必须先松开。之后,你可以提起前面的部分,将整个面板拉向前面。你会注意到的第一件事是大电池,你的维护选项仅限于清洁风扇和更换Wi-Fi模块以及M.2-2280-SSD。
担保
新的x14出厂时默认带有高级支持,其中还包括现场服务。然而,该服务仅限于12个月,你必须支付323欧元才能延长到三年,或562欧元延长到四年。如果你想安全起见,还有高级支持服务,其中包括意外损坏(三年479欧元,四年657欧元)。
输入设备 - X14,键程减少
键盘
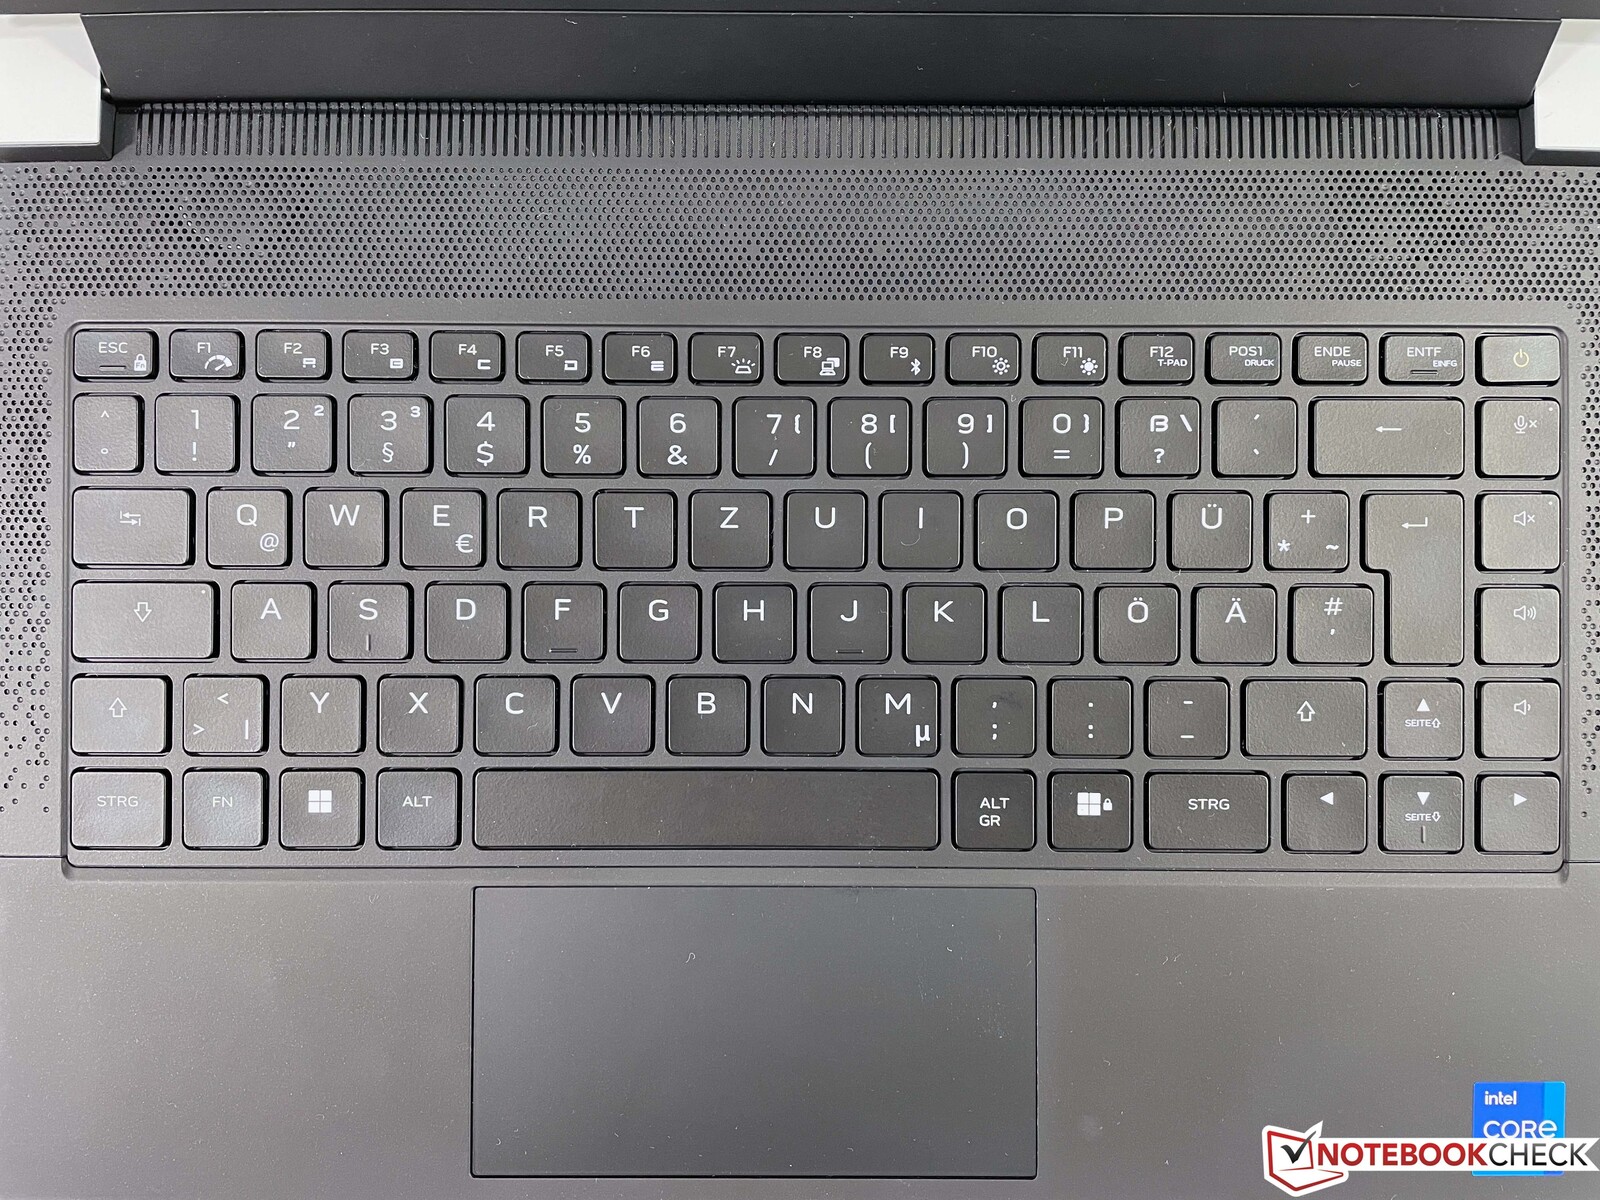
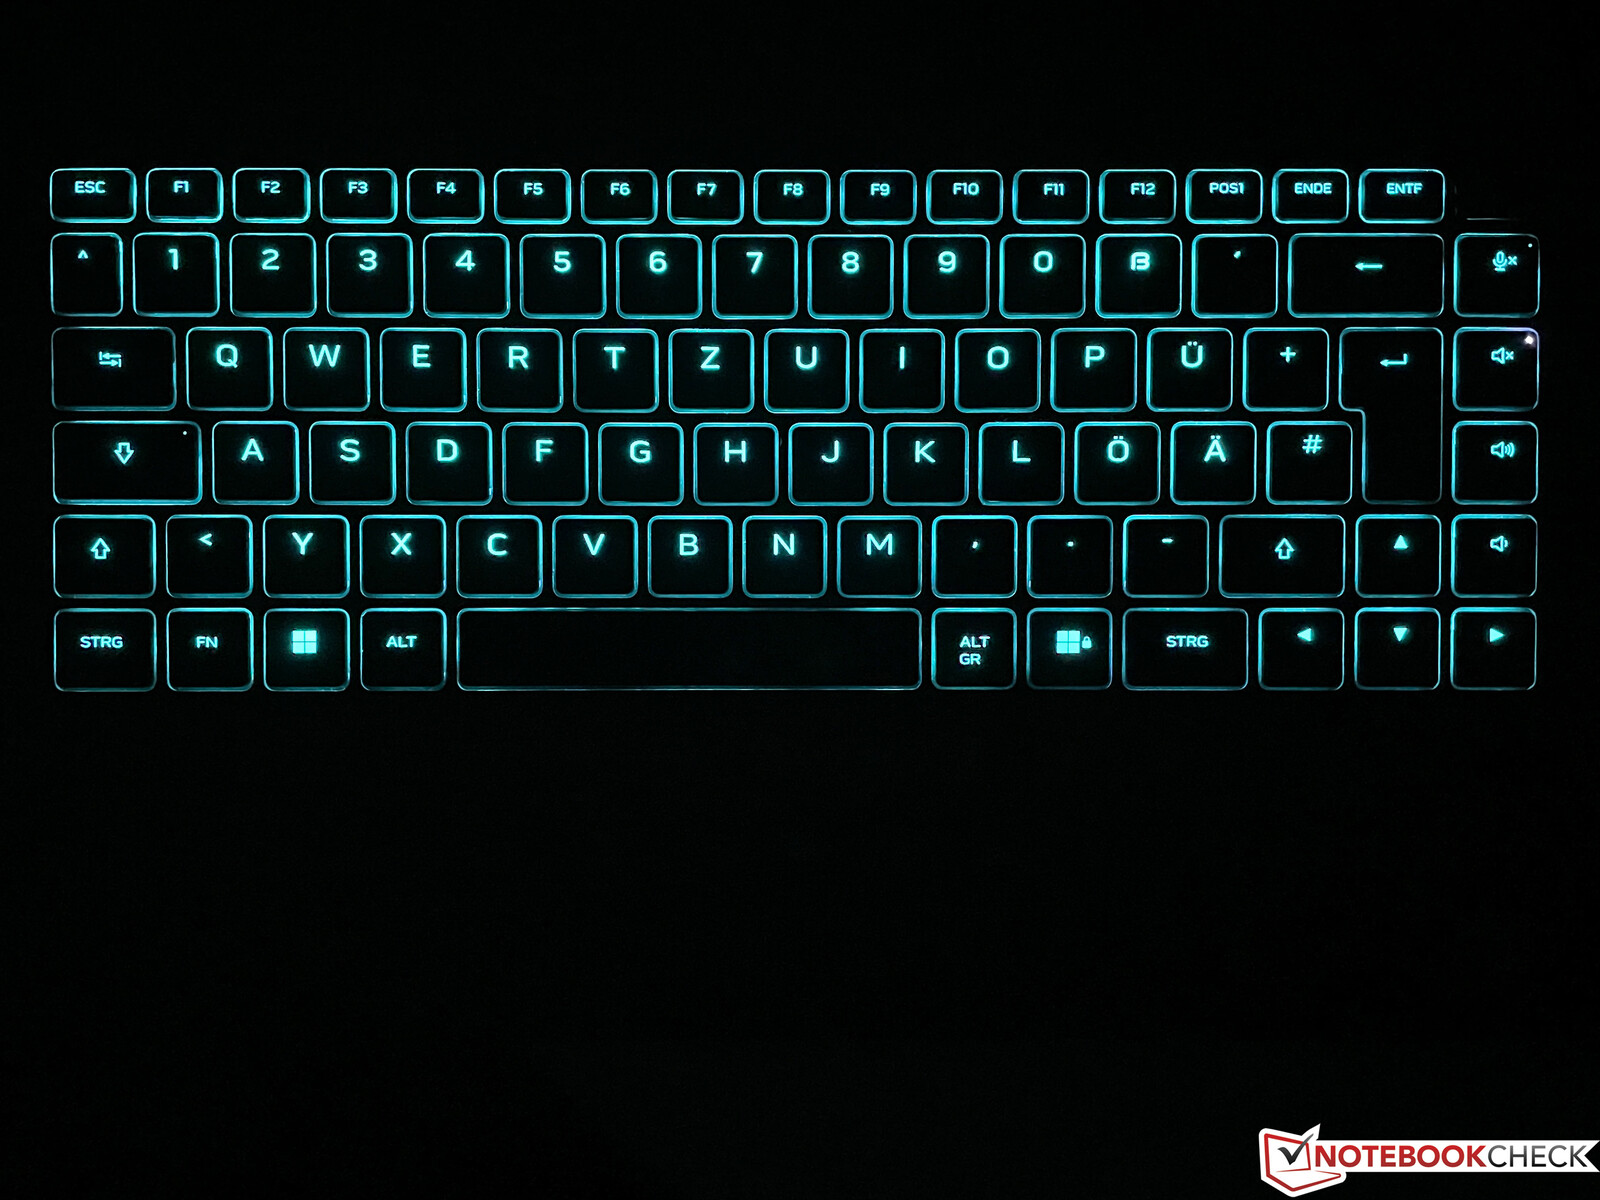
纤细的结构也影响到了键盘。基本布局(包括全尺寸的方向键)与较大的键盘的基本布局(包括全尺寸方向键)与较大的Alienware x15相同。但按键行程从1.5毫米减少到1.2毫米,这一点绝对是明显的。打字的体验并不差,按键仍然非常精确,而且比较安静,但与较大的x15相比,它就是不舒服。键盘支持N键翻转,可同时进行多个键盘输入。
你可以调整键盘照明的颜色,但只有一个区域。特殊功能再次不被照亮(如音量或亮度控制),这在较大的x15上已经很烦人了。只是在较暗的环境中很难看到小的象形图。如果你有一双大手,小的掌托也会成为一个问题,因为你的手掌必须放在底座的前缘上。
触摸板
由于键盘位置的偏移,也没有太多的空间容纳大型触摸板。Alienware x14的触摸板的高度非常有限,只有10.8 x 5.5厘米,你必须经常调整手指的位置,即使是在标准的光标移动中。触摸板本身运行良好,它位于基座的下方,因此很容易用手指找到它,但是点击它将导致非常响亮的声音,这显得很廉价。
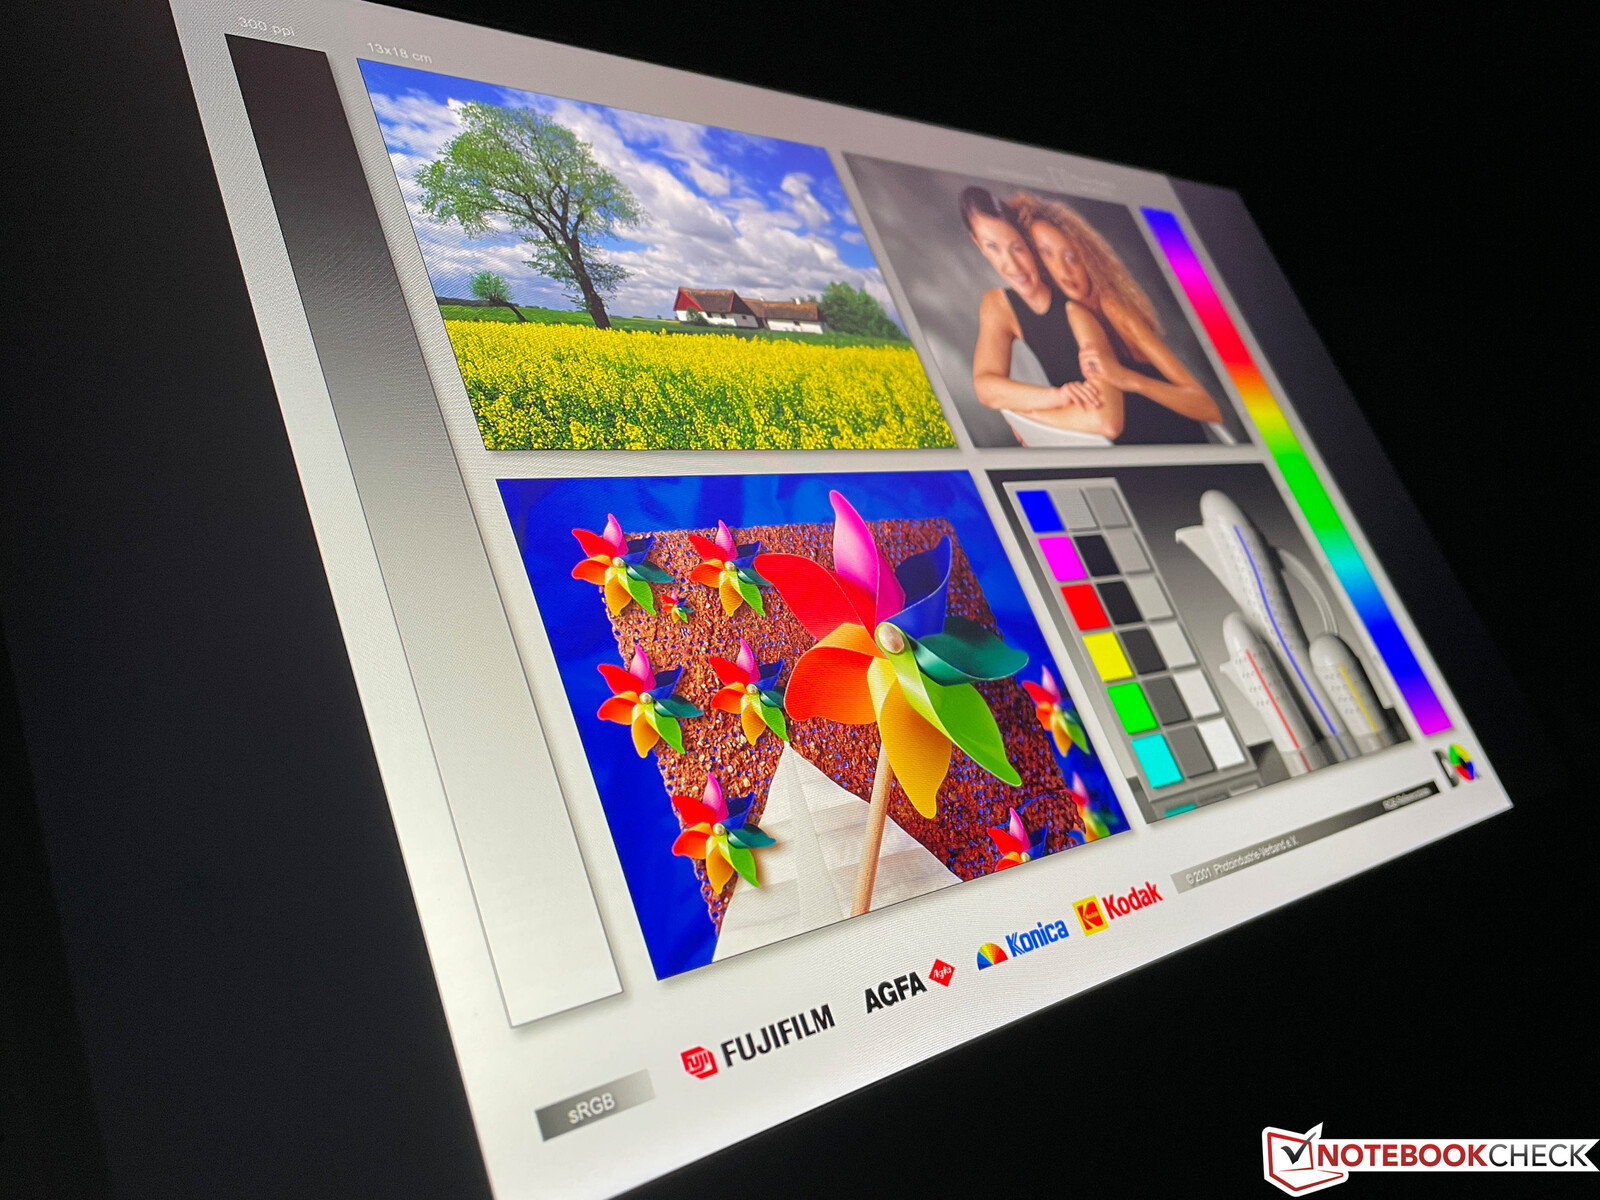
显示器 - X14,1080p和144Hz

戴尔只为新的Alienware x14提供了一个显示屏:哑光1080p IPS屏幕,1920 x 1080像素(16:9),包括快速响应时间和144 Hz的高刷新率。对于游戏笔记本来说,这当然是一个不错的选择,但有些用户可能更喜欢更高的分辨率选择。夏普的显示屏还支持Nvidia的G-Sync以及Advanced Optimus技术。
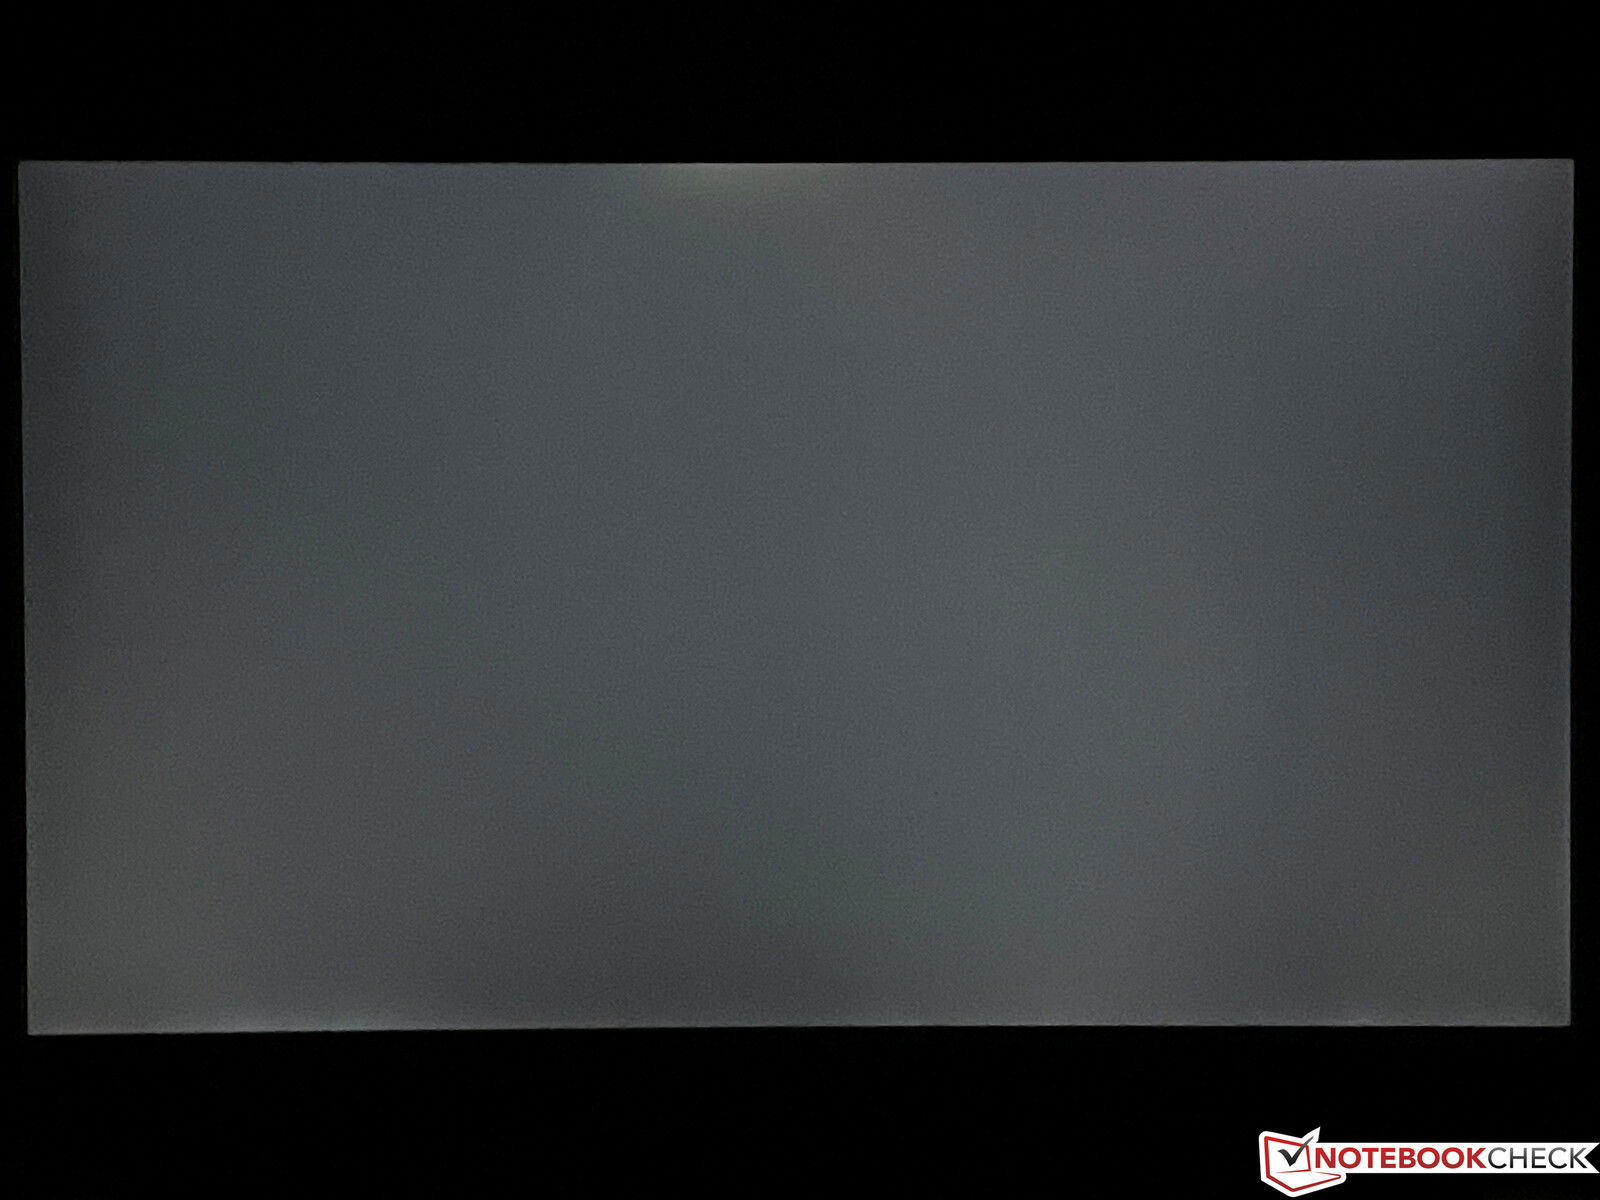
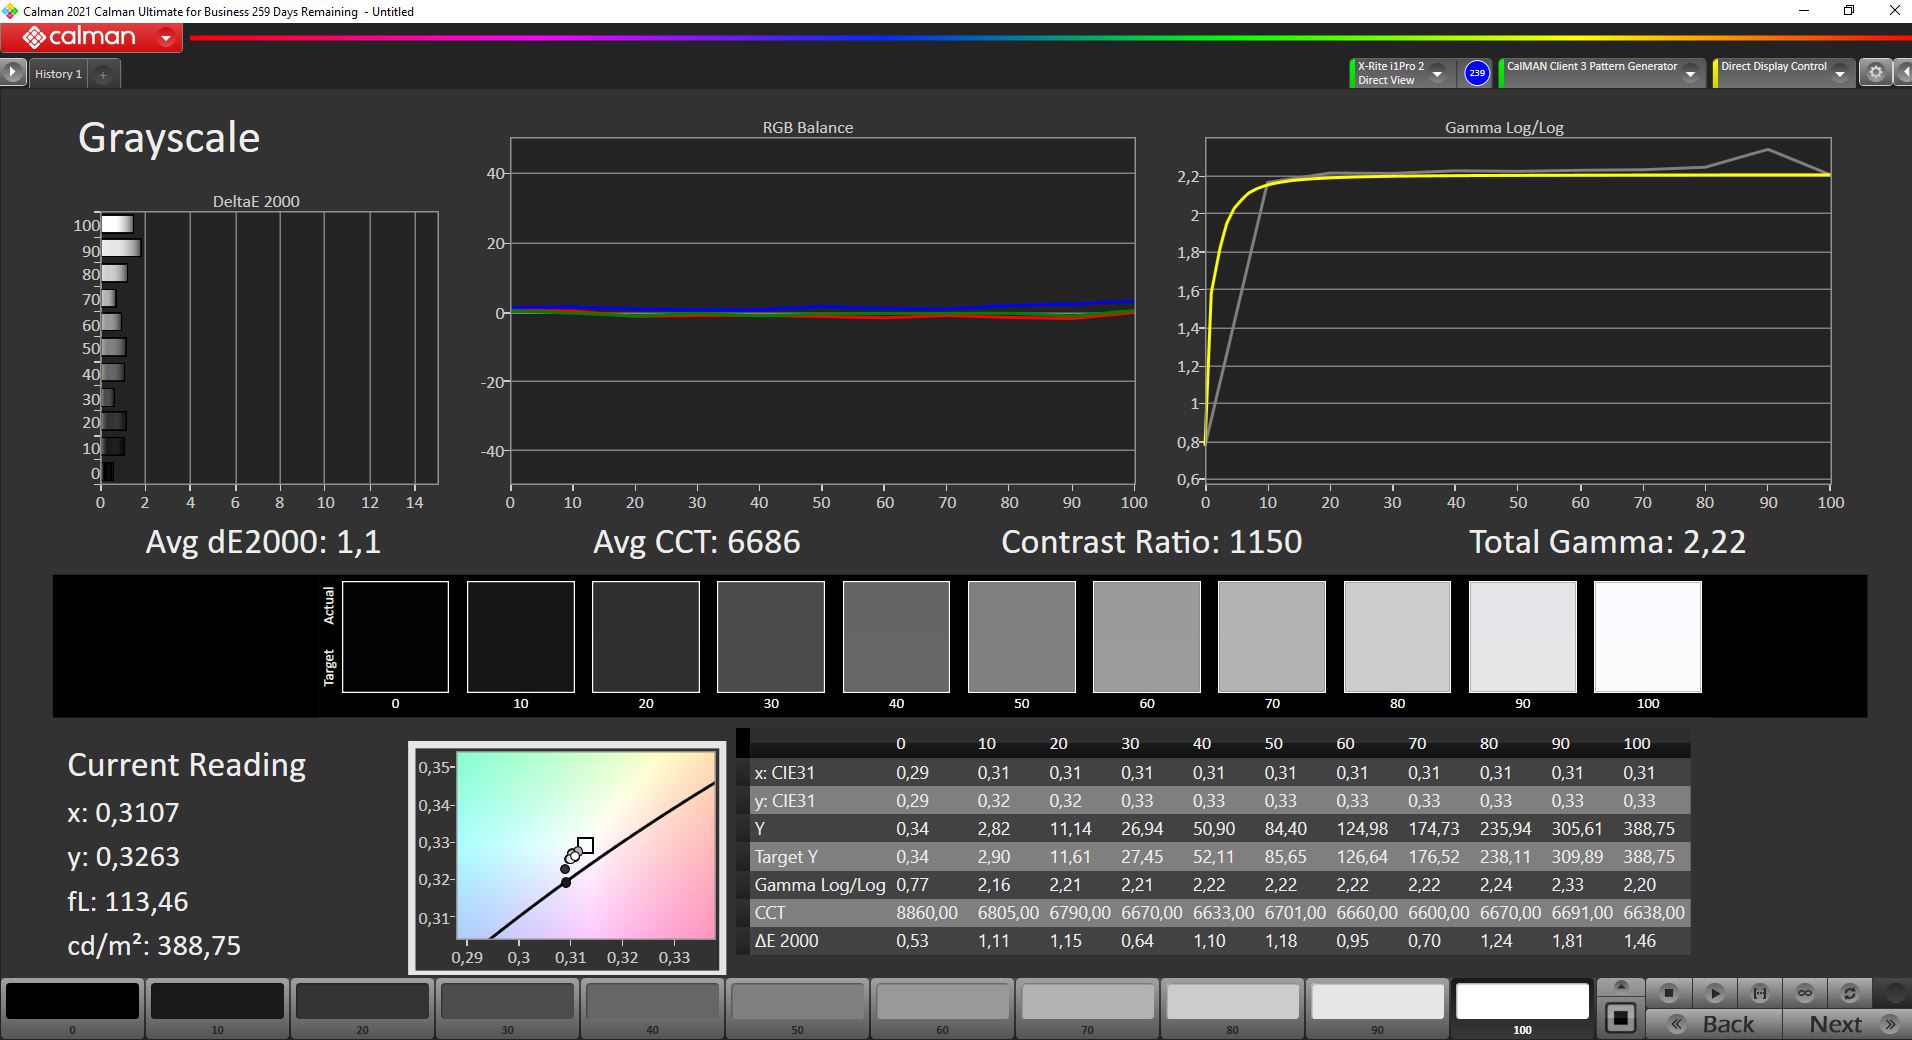
我们确定平均亮度略高于400尼特,体面的黑值为0.25,因此对比度非常好,超过1700:1。画面的主观印象也非常好,特别是动作非常流畅,这要归功于刷新率和快速响应时间。然而,与OLED屏幕相比,图片不是那么鲜艳和清晰。
你只能注意到在高亮度的黑暗背景下沿边缘的一些背光渗漏,但在日常场景中是看不到的。我们无法检测到PWM闪烁,测量的响应时间非常快。
| |||||||||||||||||||||||||
Brightness Distribution: 89 %
Center on Battery: 432 cd/m²
Contrast: 1736:1 (Black: 0.25 cd/m²)
ΔE ColorChecker Calman: 3 | ∀{0.5-29.43 Ø4.71}
calibrated: 0.7
ΔE Greyscale Calman: 5.1 | ∀{0.09-98 Ø4.96}
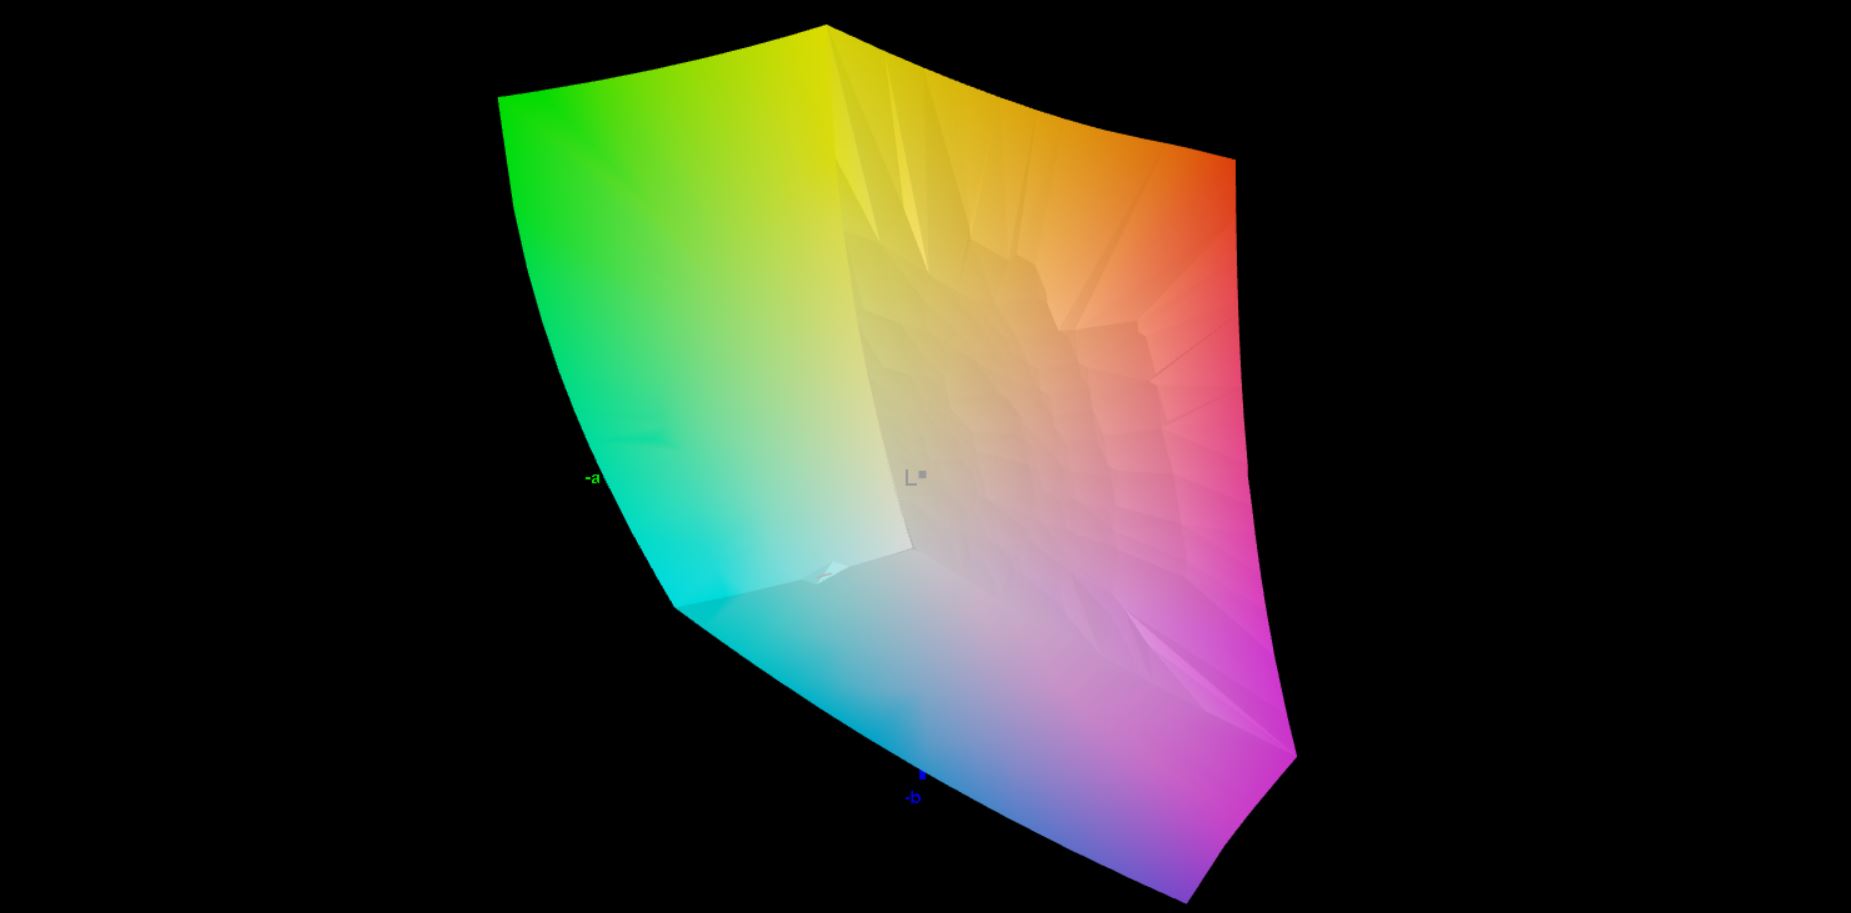
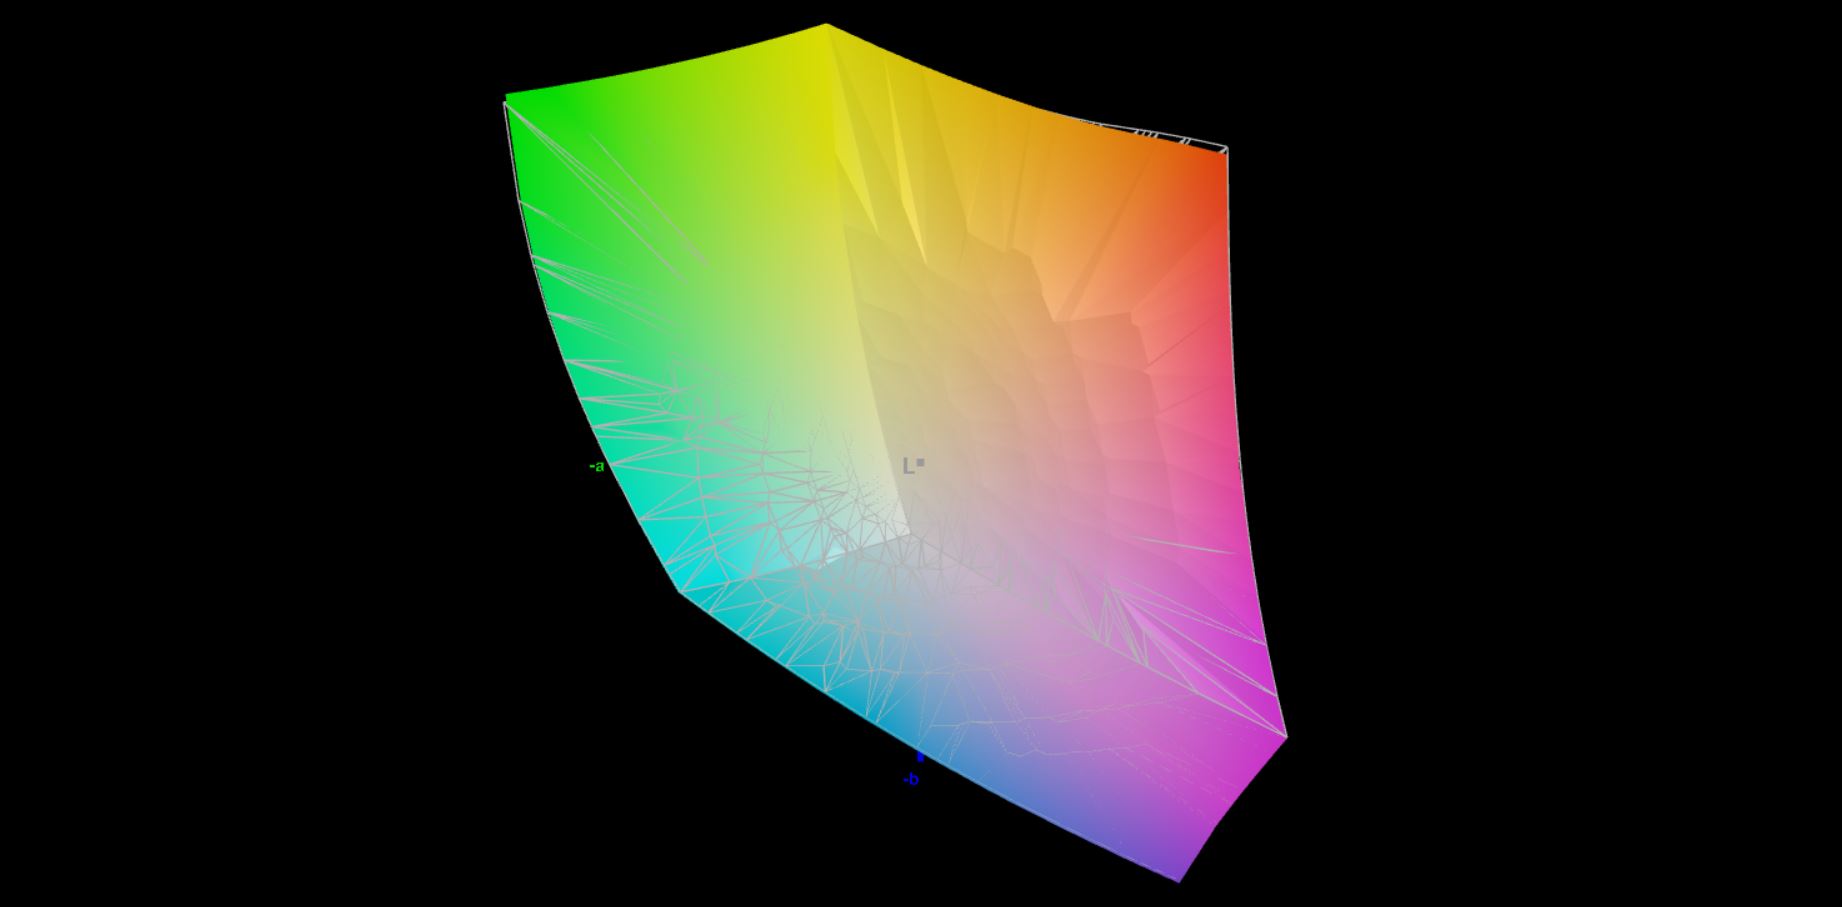
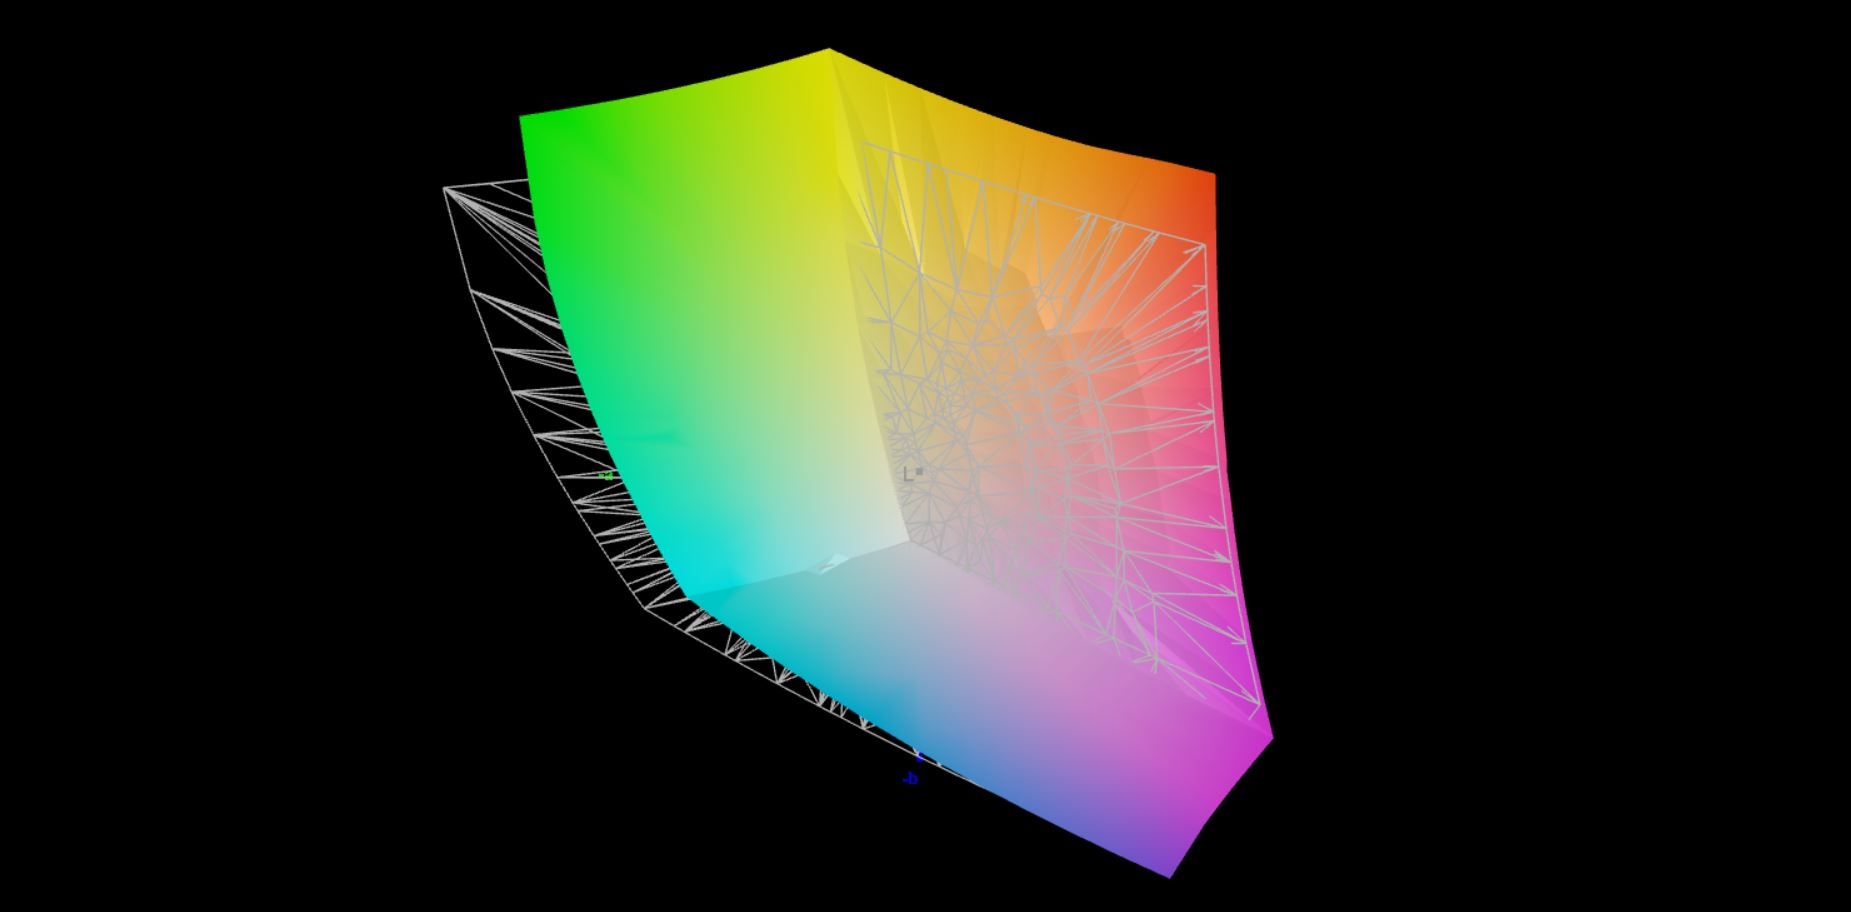
87.6% AdobeRGB 1998 (Argyll 3D)
100% sRGB (Argyll 3D)
99.6% Display P3 (Argyll 3D)
Gamma: 2.19
CCT: 6204 K
| Alienware x14 i7 RTX 3060 SHP154D, IPS, 1920x1080, 14" | Asus ROG Zephyrus G14 GA402RK NE140QDM-NX1 (BOE0A1D), IPS-Level, 2560x1600, 14" | Razer Blade 14 Ryzen 9 RTX 3070 TL140BDXP02-2, IPS, 2560x1440, 14" | Asus Zephyrus G14 GA401QM LM140LF-1F02, IPS, 1920x1080, 14" | Alienware x15 RTX 3070 P111F LG Philips 156QHG, IPS, 2560x1440, 15.6" | |
|---|---|---|---|---|---|
| Display | -1% | -2% | -21% | -1% | |
| Display P3 Coverage (%) | 99.6 | 97.4 -2% | 97.2 -2% | 68.1 -32% | 97.8 -2% |
| sRGB Coverage (%) | 100 | 99.9 0% | 99.9 0% | 92.4 -8% | 99.9 0% |
| AdobeRGB 1998 Coverage (%) | 87.6 | 85.5 -2% | 85.4 -3% | 67.7 -23% | |
| Response Times | 15% | -57% | -261% | -31% | |
| Response Time Grey 50% / Grey 80% * (ms) | 9.6 ? | 8.8 ? 8% | 16.4 ? -71% | 34.4 ? -258% | 12 ? -25% |
| Response Time Black / White * (ms) | 7.6 ? | 6 ? 21% | 10.8 ? -42% | 27.6 ? -263% | 10.4 ? -37% |
| PWM Frequency (Hz) | 27170 ? | ||||
| Screen | -16% | -1% | -69% | -20% | |
| Brightness middle (cd/m²) | 434 | 480 11% | 331.1 -24% | 329.4 -24% | 409.5 -6% |
| Brightness (cd/m²) | 411 | 456 11% | 318 -23% | 311 -24% | 390 -5% |
| Brightness Distribution (%) | 89 | 80 -10% | 91 2% | 90 1% | 88 -1% |
| Black Level * (cd/m²) | 0.25 | 0.48 -92% | 0.36 -44% | 0.39 -56% | 0.47 -88% |
| Contrast (:1) | 1736 | 1000 -42% | 920 -47% | 845 -51% | 871 -50% |
| Colorchecker dE 2000 * | 3 | 2.62 13% | 2.25 25% | 4.01 -34% | 3.48 -16% |
| Colorchecker dE 2000 max. * | 7.1 | 6.71 5% | 4.62 35% | 8.21 -16% | 6.31 11% |
| Colorchecker dE 2000 calibrated * | 0.7 | 1.12 -60% | 3.89 -456% | 0.89 -27% | |
| Greyscale dE 2000 * | 5.1 | 4.2 18% | 1.7 67% | 3.2 37% | 5 2% |
| Gamma | 2.19 100% | 2.16 102% | 2.3 96% | 2.2 100% | 2.16 102% |
| CCT | 6204 105% | 7122 91% | 6751 96% | 7070 92% | 6591 99% |
| Total Average (Program / Settings) | -1% /
-9% | -20% /
-10% | -117% /
-86% | -17% /
-19% |
* ... smaller is better
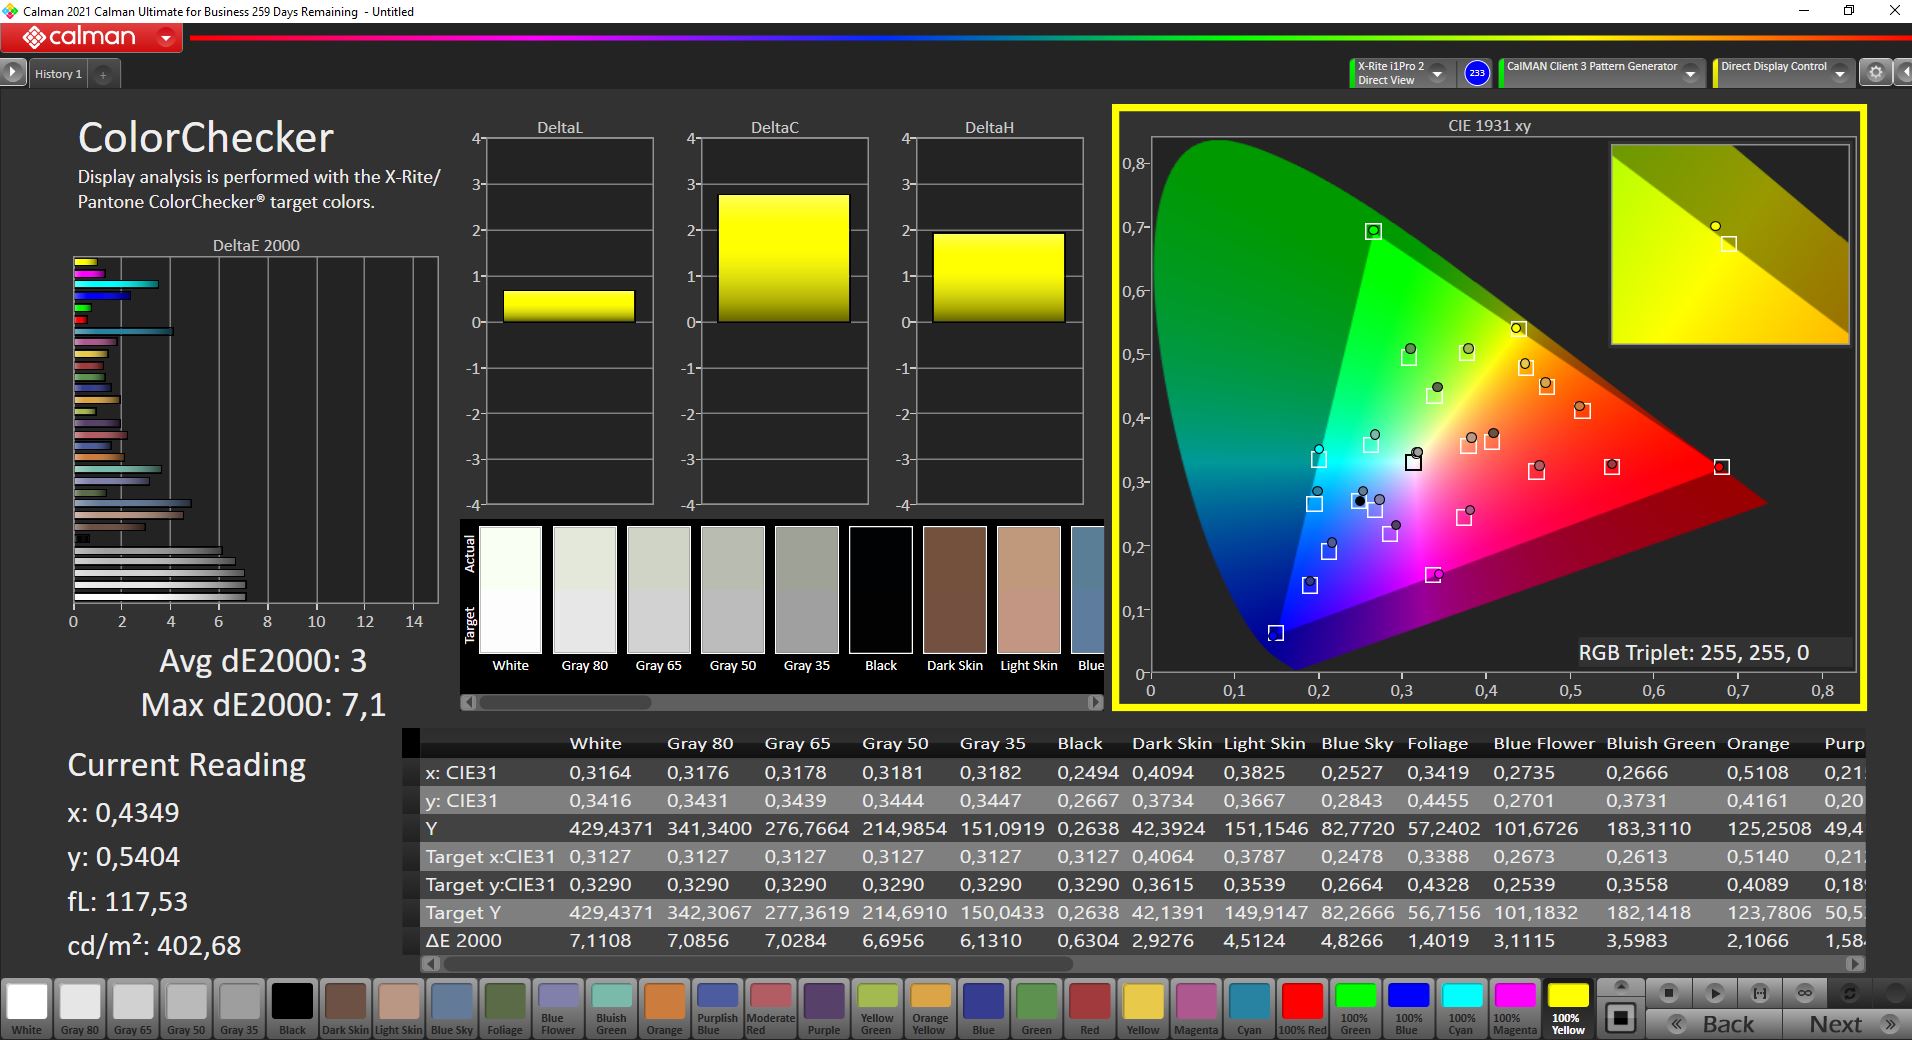
我们用专业的CalMAN软件和X-Rite i1 Pro 2分光光度计分析了显示器。开箱后的画质已经很不错了,但色温有点偏暖,你可以看到轻微的偏色,偏向黄色。色彩偏差也非常小,只是有一些离群值,DeltaE-2000偏差(与P3参考色彩空间相比)超过3。
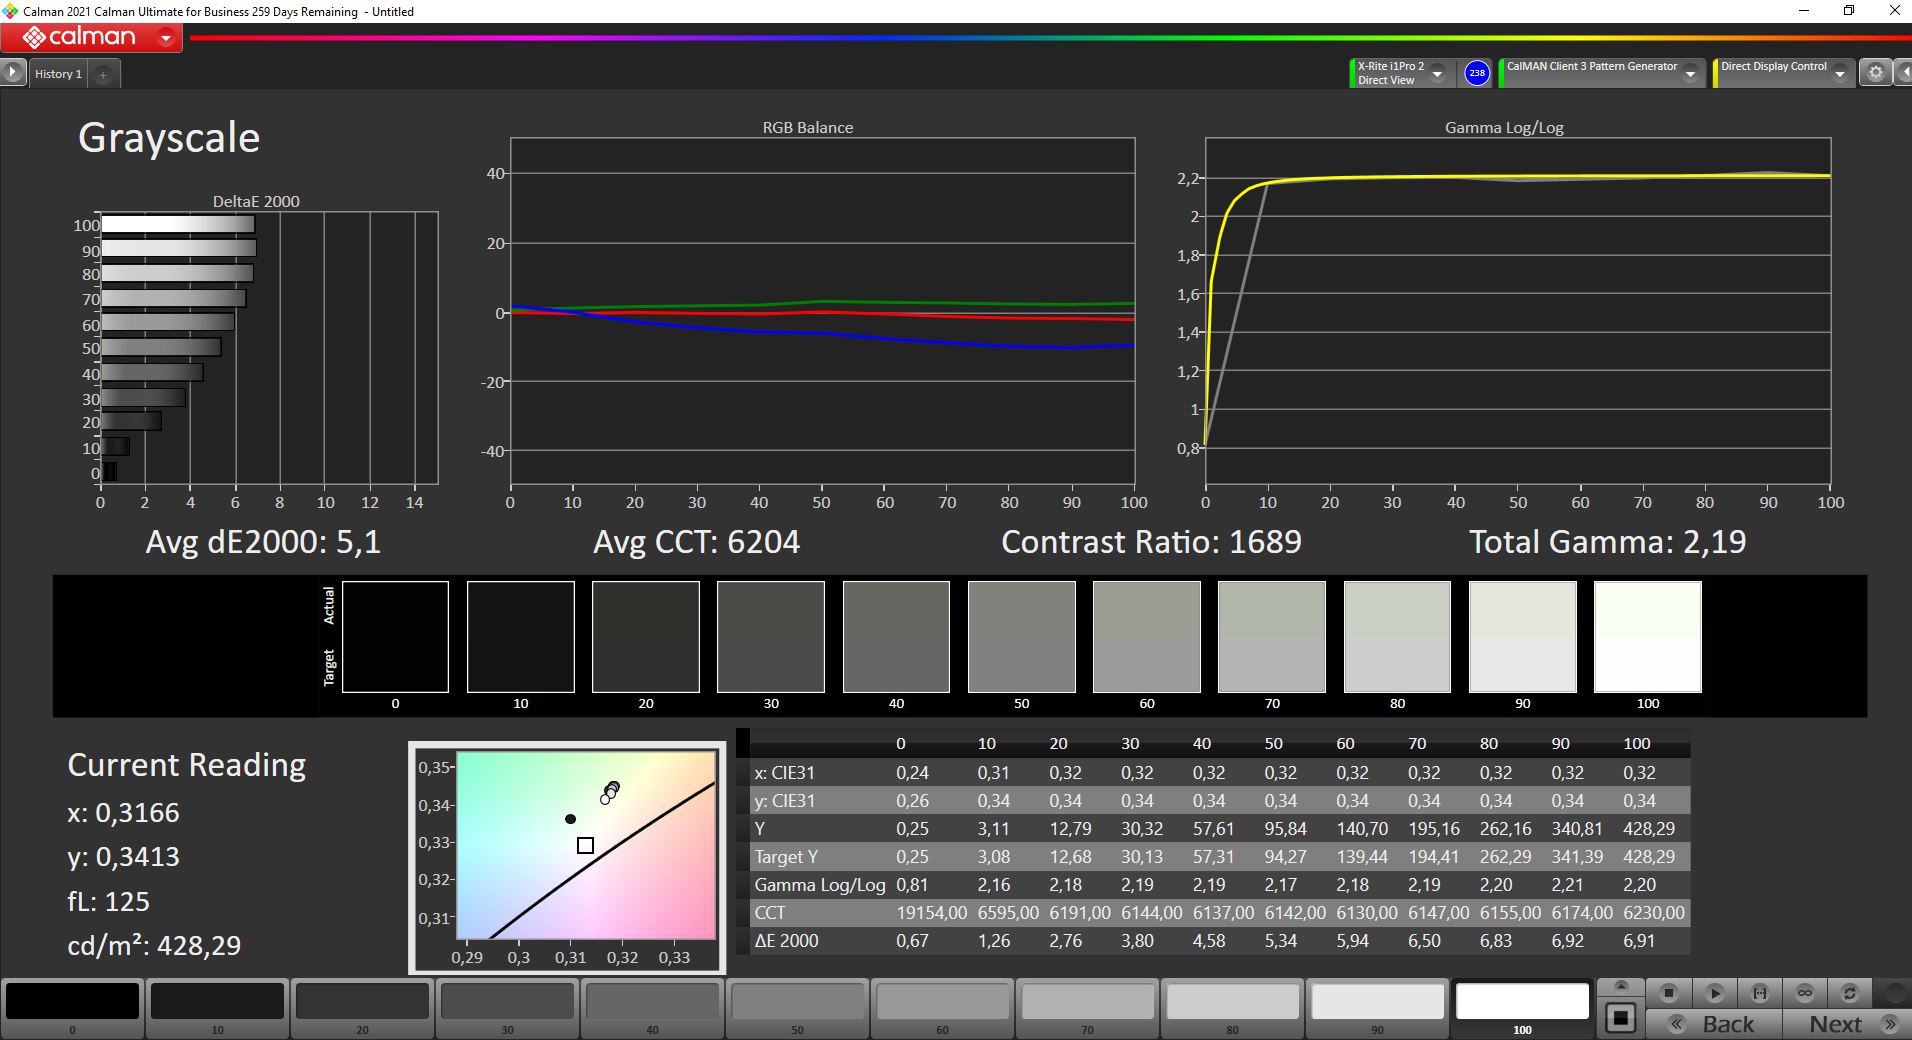
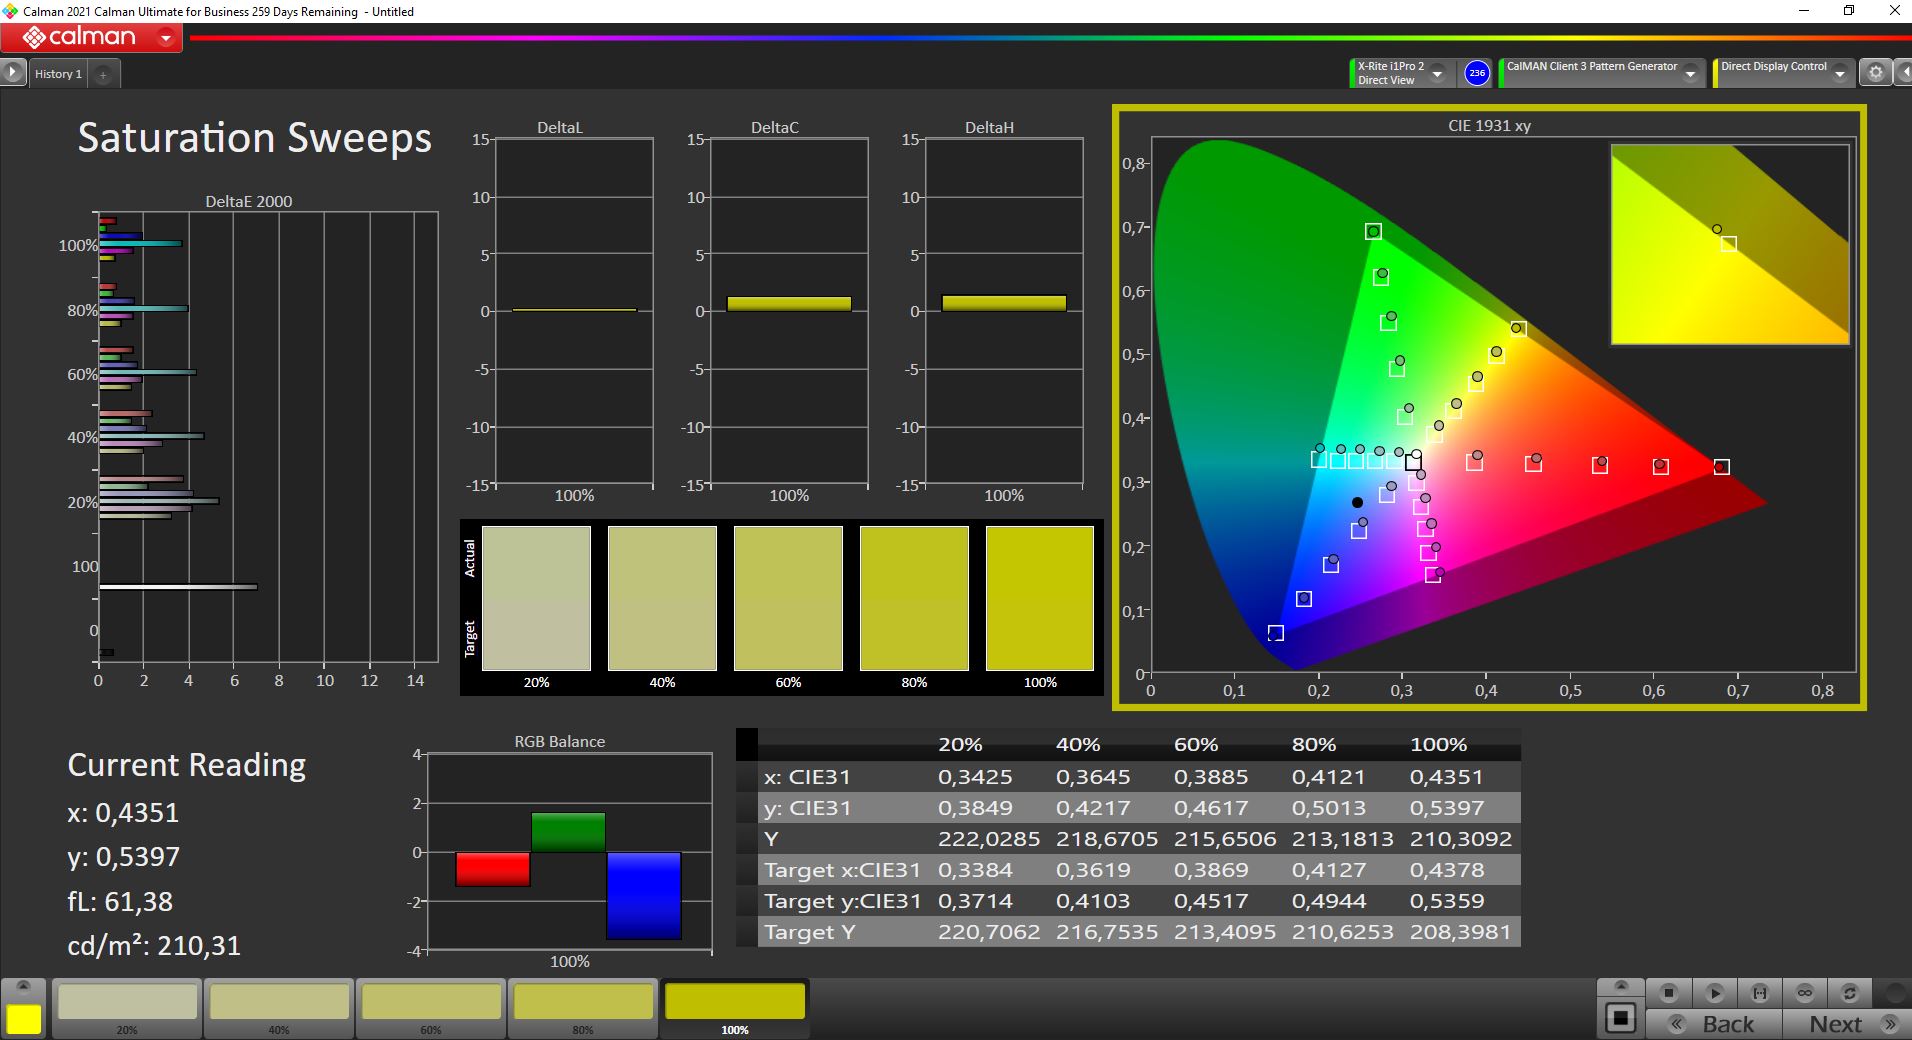
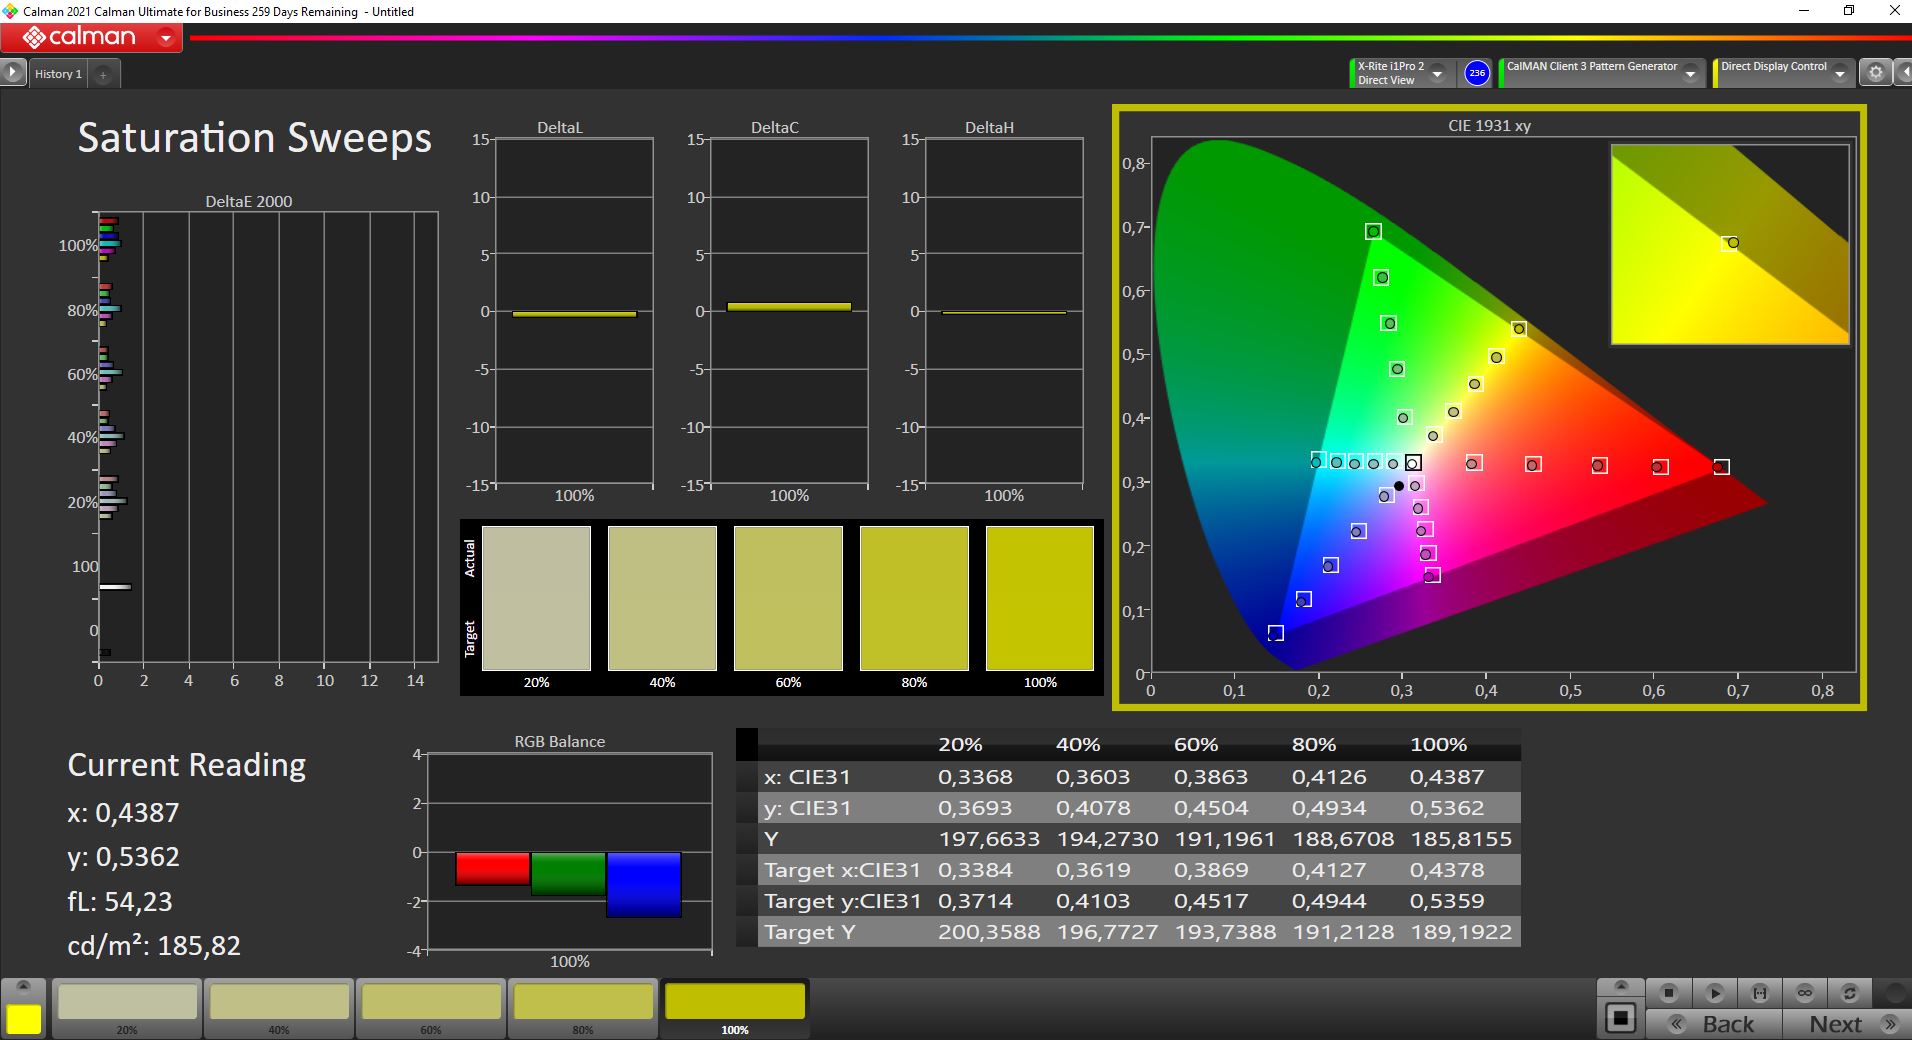
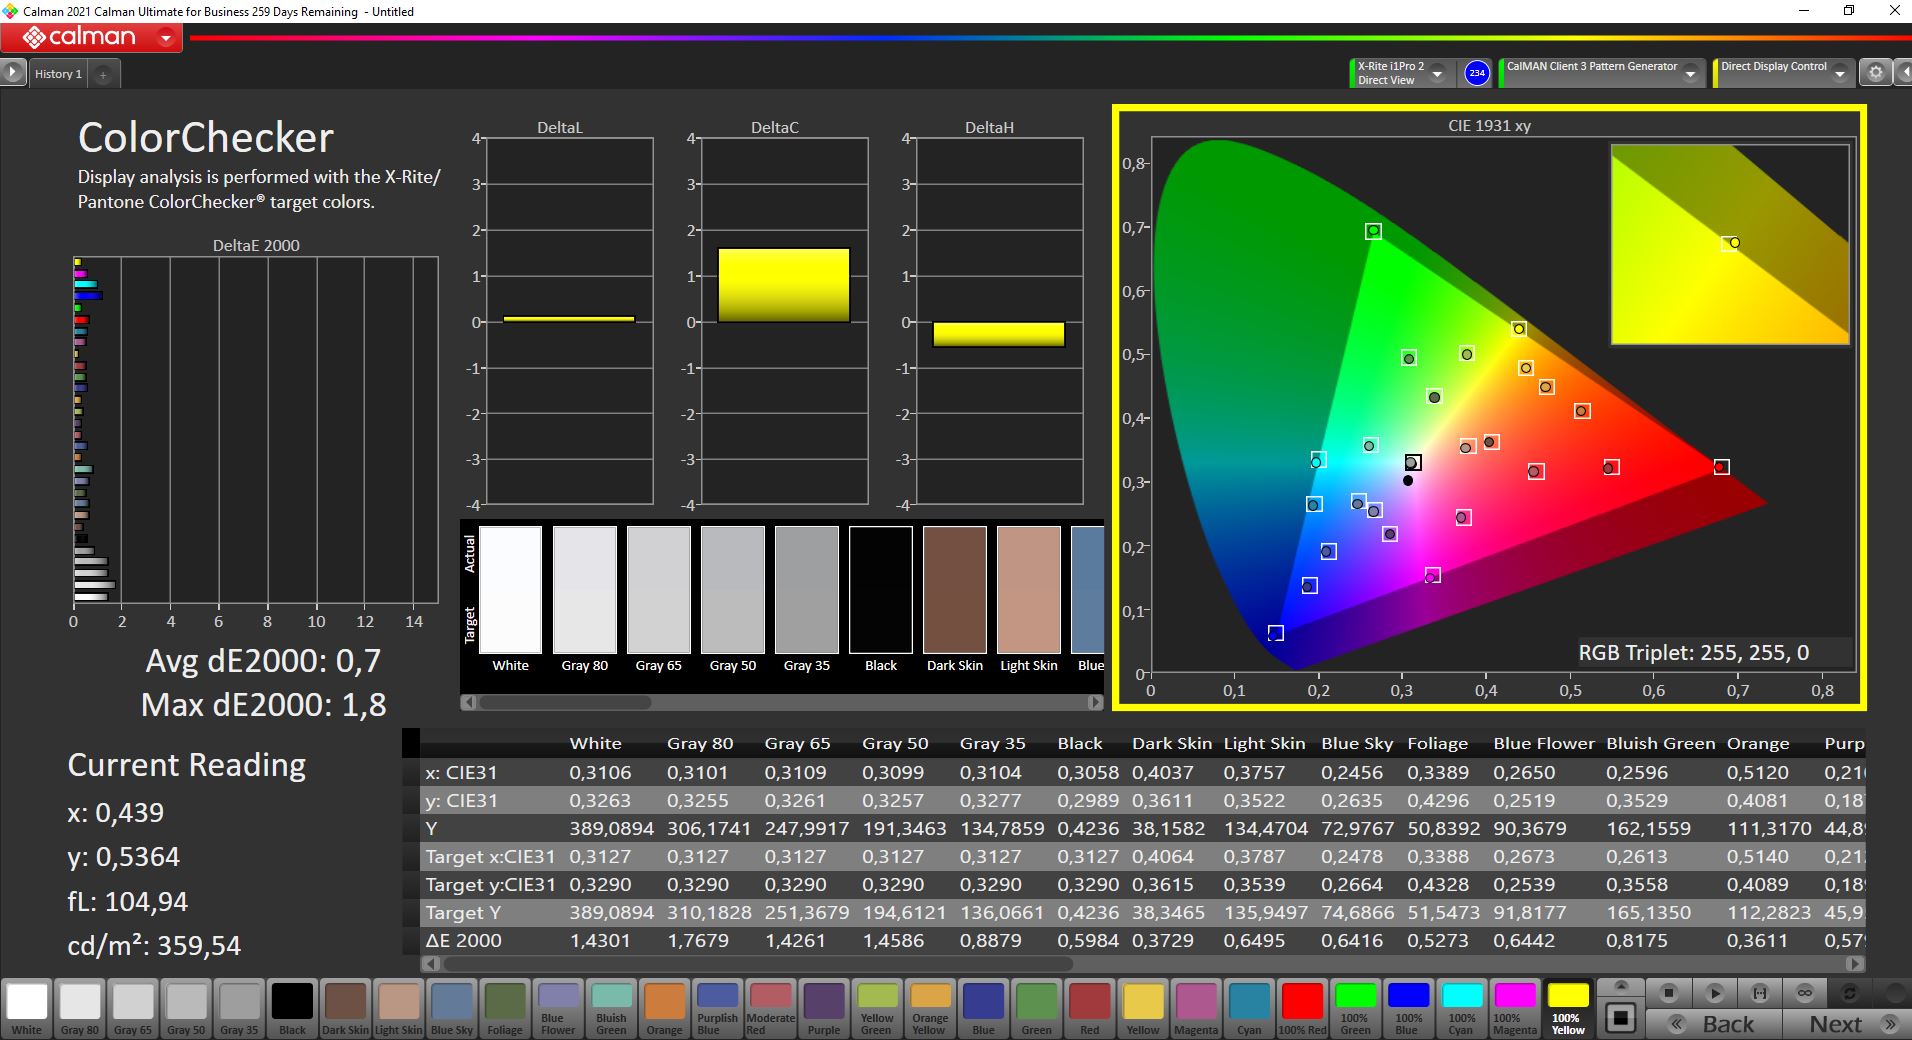
我们自己的校准(配置文件可在上面的方框中免费下载)将最大亮度降低了约40尼特,但它显示了屏幕的全部潜力。DeltaE-2000的平均偏差非常低,所有的颜色都非常准确。结合填充DCI-P3色域,该面板是图片和视频编辑的绝佳选择。
Display Response Times
| ↔ Response Time Black to White | ||
|---|---|---|
| 7.6 ms ... rise ↗ and fall ↘ combined | ↗ 2.8 ms rise |  |
| ↘ 4.8 ms fall | ||
| The screen shows very fast response rates in our tests and should be very well suited for fast-paced gaming. In comparison, all tested devices range from 0.1 (minimum) to 240 (maximum) ms. » 22 % of all devices are better. This means that the measured response time is better than the average of all tested devices (19.8 ms). | ||
| ↔ Response Time 50% Grey to 80% Grey | ||
| 9.6 ms ... rise ↗ and fall ↘ combined | ↗ 4.4 ms rise | 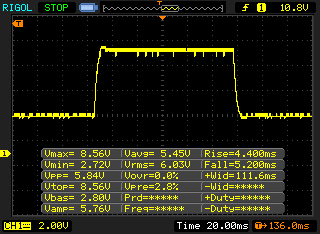 |
| ↘ 5.2 ms fall | ||
| The screen shows fast response rates in our tests and should be suited for gaming. In comparison, all tested devices range from 0.165 (minimum) to 636 (maximum) ms. » 23 % of all devices are better. This means that the measured response time is better than the average of all tested devices (30.9 ms). | ||
Screen Flickering / PWM (Pulse-Width Modulation)
| Screen flickering / PWM not detected | 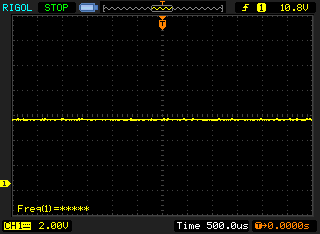 | ||
In comparison: 52 % of all tested devices do not use PWM to dim the display. If PWM was detected, an average of 7744 (minimum: 5 - maximum: 343500) Hz was measured. | |||
只要你能避免光源的直接反射,显示内容在户外仍然可见。IPS屏幕的可视角度稳定性非常好。
性能--戴尔的瘦身游戏机采用英特尔Alder Lake处理器
你可以选择酷睿i7-12700H和稍慢的酷睿i5-12500H,与i7相比,它的性能核心少了两个。你可以得到至少16GB的LPDDR5内存,但只有较慢的4800模块与RTX3050的组合。GeForce RTX 3050或RTX 3050 Ti(都有50W的TGP和15W的Dynamic Boost)。更快的5200内存只可与RTX 3060,就像升级到32GB一样。
审查设置
我们最初对该处理器的TDP配置感到惊讶,它被设定为45瓦。在我们的测试过程中,英特尔有一个更新(通过Windows Update),将TDP增加到115W。x14没有达到这个数值,但这意味着冷却方案是唯一的限制因素。因此,我们重复了所有的基准测试和测量,以显示更新后的TDP值的性能水平。
预装的命令中心为冷却提供了不同的设置,但它们对性能没有影响。还有一个额外的高性能模式,可以通过组合键Fn+F1激活。然而,对实际游戏性能的影响(即使在较长的会议期间)是可以忽略不计的,但它使用更积极的风扇曲线,笔记本只是更快地达到其最大风扇噪音(这也有点高)。我们在以下设置下进行了所有的基准测试和测量。正常模式,散热:平衡,Windows性能滑块。最佳性能。
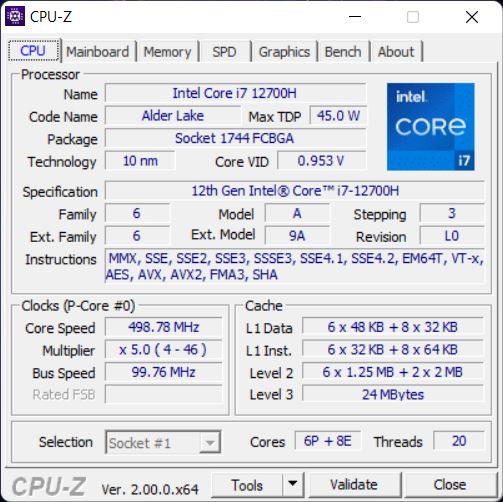
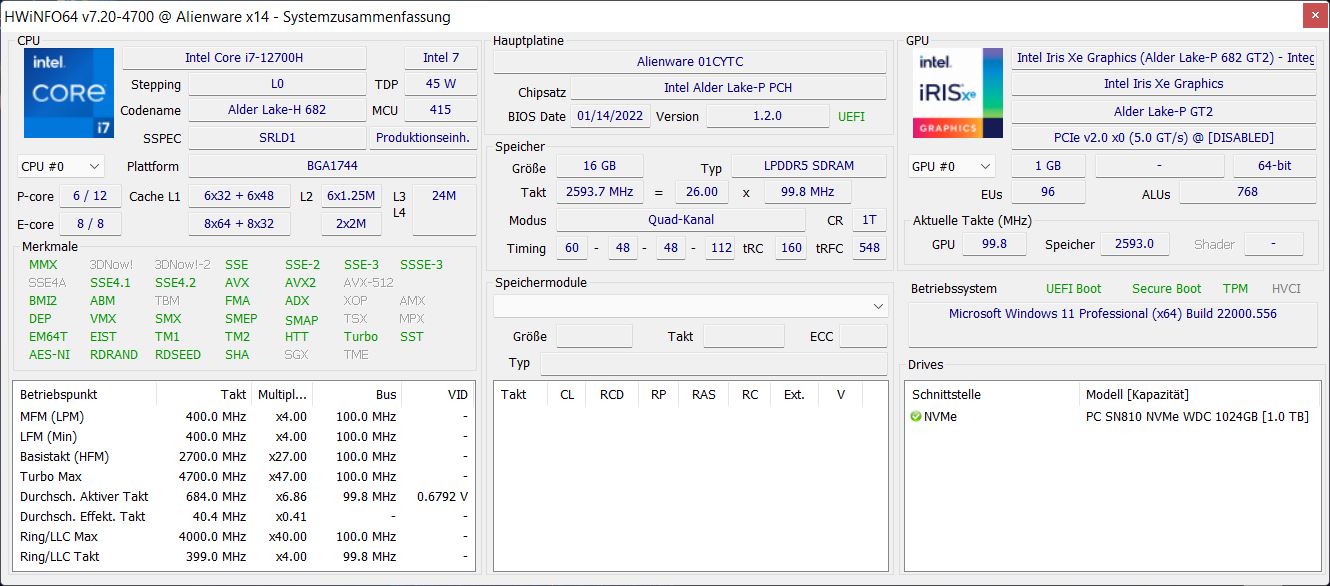
处理器 - 酷睿i7-12700H
芯片酷睿i7-12700H是英特尔新一代Alder Lake的芯片,采用混合架构。除了六个运行频率高达4.8 GHz(包括超线程)的性能核心外,它还使用了八个效率核心(高达3.7 GHz),因此i7-12700H可以同时执行多达20个线程。从理论上讲,这是一个45W的处理器,但CPU可以消耗更多的电力,特别是在峰值负载情况下。
我们记录到在基准测试开始时,有一段短暂的消耗量高达100W,它最终会平息在55W。你可以在我们下面的Cinebench R15多重循环的图表中非常清楚地看到这种行为,其中第二次运行已经被限制在80W。在最初的几分钟里,CPU的性能比竞争对手要好,但最终会下降到AMD Ryzen 5000芯片或Alienware x15的水平。酷睿i7-11800H在多核测试中。
Cinebench R15 Multi Loop
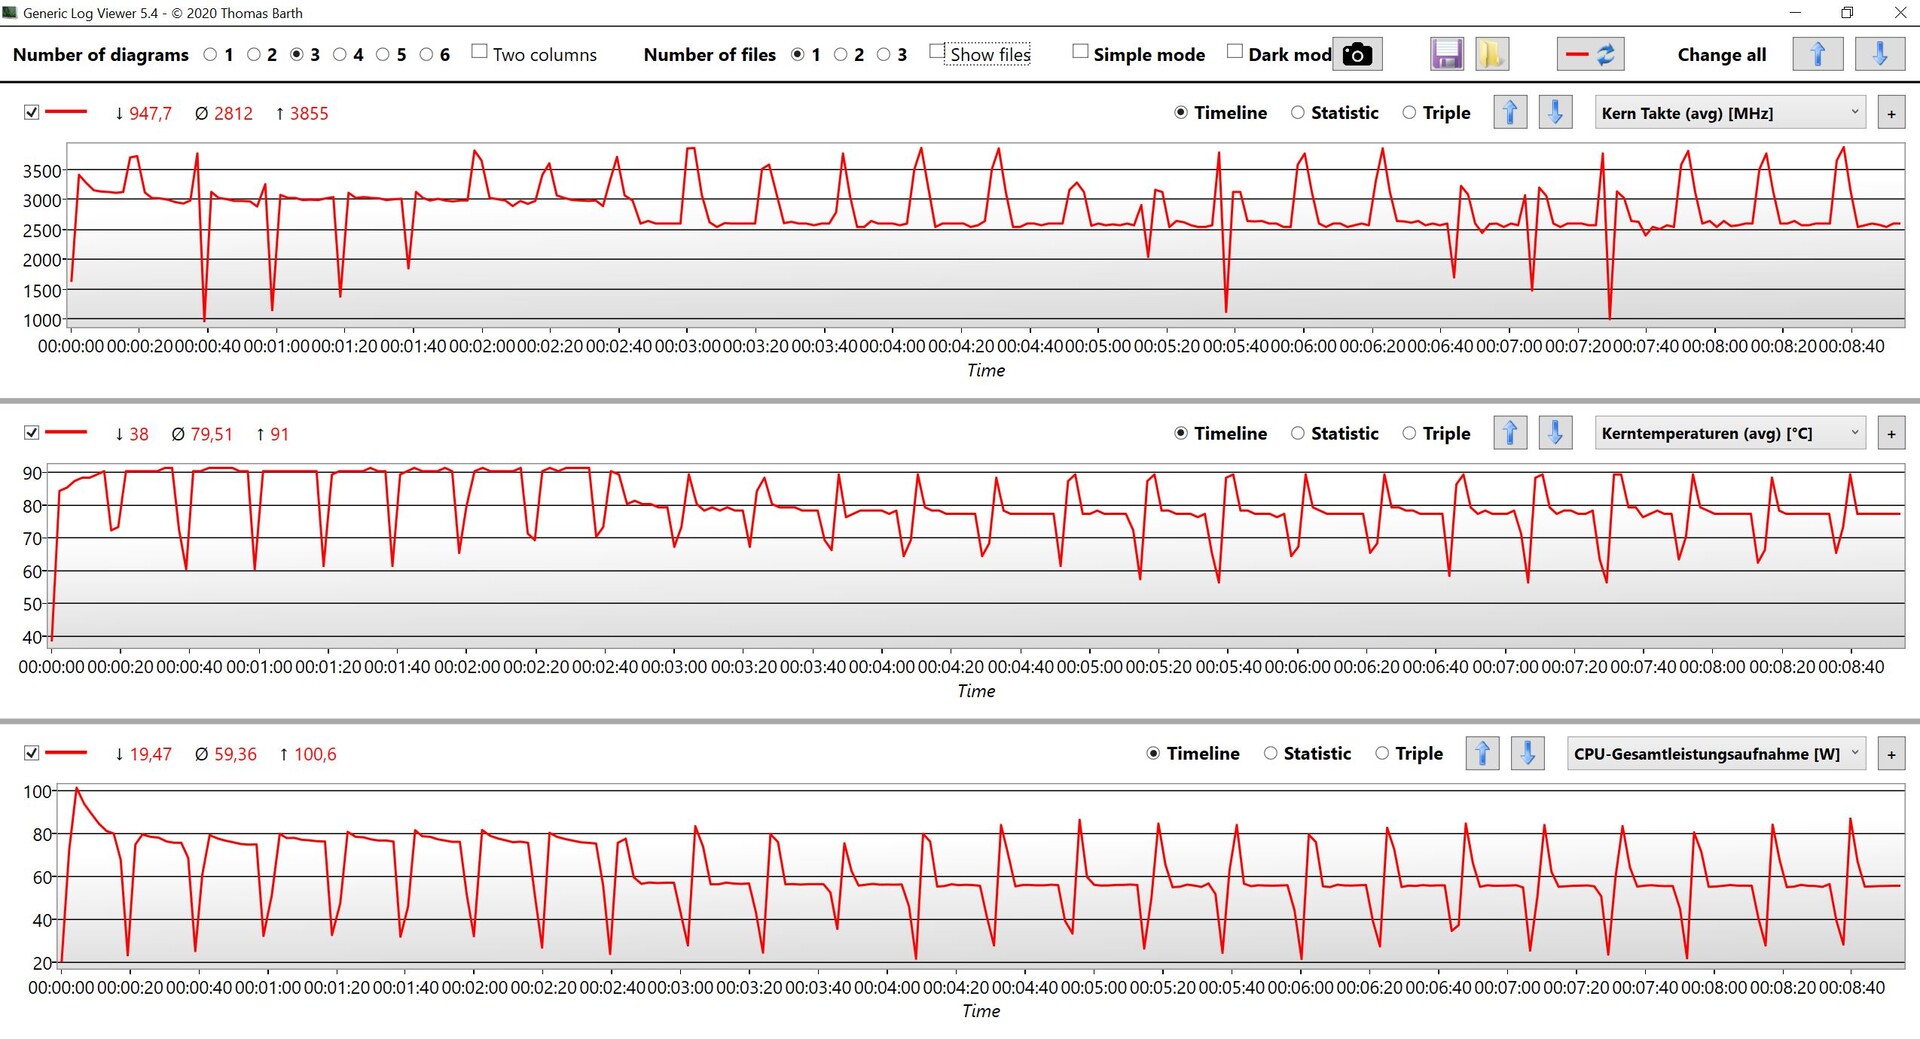
由于新的性能核心和高时钟,新的酷睿i7-12700H在单核测试中往往能确保领先。总而言之,对于一个紧凑的游戏笔记本电脑来说,结果是好的,但我们离酷睿i7-12700H的性能潜力仍然很远。这款芯片需要略高于120W的功率来实现所有核心的最大时钟(约3000点@CB R15 Multi)。
在电池供电的情况下,CPU的功耗被限制在80W,因此与主电源相比只是略低。更多的CPU基准测试可在 我们的技术部分.
Cinebench R23: Multi Core | Single Core
Cinebench R20: CPU (Multi Core) | CPU (Single Core)
Cinebench R15: CPU Multi 64Bit | CPU Single 64Bit
Blender: v2.79 BMW27 CPU
7-Zip 18.03: 7z b 4 | 7z b 4 -mmt1
Geekbench 5.5: Multi-Core | Single-Core
HWBOT x265 Benchmark v2.2: 4k Preset
LibreOffice : 20 Documents To PDF
R Benchmark 2.5: Overall mean
| CPU Performance rating | |
| Average of class Gaming | |
| Alienware x14 i7 RTX 3060 | |
| Average Intel Core i7-12700H | |
| Asus ROG Zephyrus G14 GA402RK | |
| Alienware x15 RTX 3070 P111F -2! | |
| Asus Zephyrus G14 GA401QM -2! | |
| Razer Blade 14 Ryzen 9 RTX 3070 -2! | |
| Cinebench R23 / Multi Core | |
| Average of class Gaming (10488 - 42661, n=104, last 2 years) | |
| Alienware x14 i7 RTX 3060 | |
| Average Intel Core i7-12700H (4032 - 19330, n=64) | |
| Alienware x15 RTX 3070 P111F | |
| Asus Zephyrus G14 GA401QM | |
| Razer Blade 14 Ryzen 9 RTX 3070 | |
| Asus ROG Zephyrus G14 GA402RK | |
| Cinebench R23 / Single Core | |
| Average of class Gaming (1601 - 2415, n=104, last 2 years) | |
| Alienware x14 i7 RTX 3060 | |
| Average Intel Core i7-12700H (778 - 1826, n=63) | |
| Asus ROG Zephyrus G14 GA402RK | |
| Alienware x15 RTX 3070 P111F | |
| Asus Zephyrus G14 GA401QM | |
| Razer Blade 14 Ryzen 9 RTX 3070 | |
| Cinebench R20 / CPU (Multi Core) | |
| Average of class Gaming (4029 - 16433, n=103, last 2 years) | |
| Alienware x14 i7 RTX 3060 | |
| Average Intel Core i7-12700H (1576 - 7407, n=64) | |
| Alienware x15 RTX 3070 P111F | |
| Asus Zephyrus G14 GA401QM | |
| Razer Blade 14 Ryzen 9 RTX 3070 | |
| Asus ROG Zephyrus G14 GA402RK | |
| Cinebench R20 / CPU (Single Core) | |
| Average of class Gaming (622 - 913, n=103, last 2 years) | |
| Alienware x14 i7 RTX 3060 | |
| Average Intel Core i7-12700H (300 - 704, n=64) | |
| Asus ROG Zephyrus G14 GA402RK | |
| Alienware x15 RTX 3070 P111F | |
| Asus Zephyrus G14 GA401QM | |
| Razer Blade 14 Ryzen 9 RTX 3070 | |
| Cinebench R15 / CPU Multi 64Bit | |
| Average of class Gaming (1578 - 6330, n=102, last 2 years) | |
| Alienware x14 i7 RTX 3060 | |
| Average Intel Core i7-12700H (1379 - 2916, n=70) | |
| Alienware x15 RTX 3070 P111F | |
| Asus Zephyrus G14 GA401QM | |
| Asus ROG Zephyrus G14 GA402RK | |
| Razer Blade 14 Ryzen 9 RTX 3070 | |
| Cinebench R15 / CPU Single 64Bit | |
| Average of class Gaming (188.8 - 350, n=103, last 2 years) | |
| Asus ROG Zephyrus G14 GA402RK | |
| Average Intel Core i7-12700H (113 - 263, n=65) | |
| Alienware x14 i7 RTX 3060 | |
| Asus Zephyrus G14 GA401QM | |
| Alienware x15 RTX 3070 P111F | |
| Razer Blade 14 Ryzen 9 RTX 3070 | |
| Blender / v2.79 BMW27 CPU | |
| Razer Blade 14 Ryzen 9 RTX 3070 | |
| Asus ROG Zephyrus G14 GA402RK | |
| Asus Zephyrus G14 GA401QM | |
| Average Intel Core i7-12700H (168 - 732, n=63) | |
| Alienware x14 i7 RTX 3060 | |
| Alienware x15 RTX 3070 P111F | |
| Average of class Gaming (79 - 330, n=101, last 2 years) | |
| 7-Zip 18.03 / 7z b 4 | |
| Average of class Gaming (33491 - 148086, n=102, last 2 years) | |
| Alienware x14 i7 RTX 3060 | |
| Average Intel Core i7-12700H (22844 - 73067, n=63) | |
| Asus ROG Zephyrus G14 GA402RK | |
| Asus Zephyrus G14 GA401QM | |
| Razer Blade 14 Ryzen 9 RTX 3070 | |
| Alienware x15 RTX 3070 P111F | |
| 7-Zip 18.03 / 7z b 4 -mmt1 | |
| Average of class Gaming (4824 - 7436, n=102, last 2 years) | |
| Asus ROG Zephyrus G14 GA402RK | |
| Average Intel Core i7-12700H (2743 - 5972, n=63) | |
| Asus Zephyrus G14 GA401QM | |
| Alienware x14 i7 RTX 3060 | |
| Alienware x15 RTX 3070 P111F | |
| Razer Blade 14 Ryzen 9 RTX 3070 | |
| Geekbench 5.5 / Multi-Core | |
| Average of class Gaming (6460 - 28263, n=102, last 2 years) | |
| Alienware x14 i7 RTX 3060 | |
| Average Intel Core i7-12700H (5144 - 13745, n=64) | |
| Asus ROG Zephyrus G14 GA402RK | |
| Geekbench 5.5 / Single-Core | |
| Average of class Gaming (1403 - 2474, n=102, last 2 years) | |
| Alienware x14 i7 RTX 3060 | |
| Average Intel Core i7-12700H (803 - 1851, n=64) | |
| Asus ROG Zephyrus G14 GA402RK | |
| HWBOT x265 Benchmark v2.2 / 4k Preset | |
| Average of class Gaming (11.5 - 44.4, n=102, last 2 years) | |
| Alienware x14 i7 RTX 3060 | |
| Average Intel Core i7-12700H (4.67 - 21.8, n=64) | |
| Alienware x15 RTX 3070 P111F | |
| Asus ROG Zephyrus G14 GA402RK | |
| Asus Zephyrus G14 GA401QM | |
| Razer Blade 14 Ryzen 9 RTX 3070 | |
| LibreOffice / 20 Documents To PDF | |
| Razer Blade 14 Ryzen 9 RTX 3070 | |
| Asus Zephyrus G14 GA401QM | |
| Average of class Gaming (33.2 - 88.8, n=102, last 2 years) | |
| Alienware x15 RTX 3070 P111F | |
| Asus ROG Zephyrus G14 GA402RK | |
| Average Intel Core i7-12700H (34.2 - 95.3, n=63) | |
| Alienware x14 i7 RTX 3060 | |
| R Benchmark 2.5 / Overall mean | |
| Razer Blade 14 Ryzen 9 RTX 3070 | |
| Alienware x15 RTX 3070 P111F | |
| Asus Zephyrus G14 GA401QM | |
| Asus ROG Zephyrus G14 GA402RK | |
| Average Intel Core i7-12700H (0.4441 - 1.052, n=63) | |
| Alienware x14 i7 RTX 3060 | |
| Average of class Gaming (0.3439 - 0.59, n=102, last 2 years) | |
* ... smaller is better
AIDA64: FP32 Ray-Trace | FPU Julia | CPU SHA3 | CPU Queen | FPU SinJulia | FPU Mandel | CPU AES | CPU ZLib | FP64 Ray-Trace | CPU PhotoWorxx
| Performance rating | |
| Average of class Gaming | |
| Asus ROG Zephyrus G14 GA402RK | |
| Asus Zephyrus G14 GA401QM | |
| Razer Blade 14 Ryzen 9 RTX 3070 | |
| Alienware x14 i7 RTX 3060 | |
| Average Intel Core i7-12700H | |
| Alienware x15 RTX 3070 P111F -9! | |
| AIDA64 / FP32 Ray-Trace | |
| Average of class Gaming (10227 - 85542, n=102, last 2 years) | |
| Asus Zephyrus G14 GA401QM | |
| Razer Blade 14 Ryzen 9 RTX 3070 | |
| Asus ROG Zephyrus G14 GA402RK | |
| Average Intel Core i7-12700H (2585 - 17957, n=64) | |
| Alienware x14 i7 RTX 3060 | |
| AIDA64 / FPU Julia | |
| Average of class Gaming (51376 - 372155, n=102, last 2 years) | |
| Asus Zephyrus G14 GA401QM | |
| Razer Blade 14 Ryzen 9 RTX 3070 | |
| Asus ROG Zephyrus G14 GA402RK | |
| Average Intel Core i7-12700H (12439 - 90760, n=64) | |
| Alienware x14 i7 RTX 3060 | |
| AIDA64 / CPU SHA3 | |
| Average of class Gaming (2180 - 10115, n=102, last 2 years) | |
| Asus Zephyrus G14 GA401QM | |
| Razer Blade 14 Ryzen 9 RTX 3070 | |
| Asus ROG Zephyrus G14 GA402RK | |
| Average Intel Core i7-12700H (833 - 4242, n=64) | |
| Alienware x14 i7 RTX 3060 | |
| AIDA64 / CPU Queen | |
| Average of class Gaming (49785 - 173351, n=86, last 2 years) | |
| Asus Zephyrus G14 GA401QM | |
| Asus ROG Zephyrus G14 GA402RK | |
| Alienware x14 i7 RTX 3060 | |
| Average Intel Core i7-12700H (57923 - 103202, n=63) | |
| Razer Blade 14 Ryzen 9 RTX 3070 | |
| AIDA64 / FPU SinJulia | |
| Average of class Gaming (4424 - 33636, n=102, last 2 years) | |
| Asus ROG Zephyrus G14 GA402RK | |
| Asus Zephyrus G14 GA401QM | |
| Razer Blade 14 Ryzen 9 RTX 3070 | |
| Alienware x14 i7 RTX 3060 | |
| Average Intel Core i7-12700H (3249 - 9939, n=64) | |
| AIDA64 / FPU Mandel | |
| Average of class Gaming (25115 - 196829, n=102, last 2 years) | |
| Asus Zephyrus G14 GA401QM | |
| Razer Blade 14 Ryzen 9 RTX 3070 | |
| Asus ROG Zephyrus G14 GA402RK | |
| Average Intel Core i7-12700H (7135 - 44760, n=64) | |
| Alienware x14 i7 RTX 3060 | |
| AIDA64 / CPU AES | |
| Asus Zephyrus G14 GA401QM | |
| Asus ROG Zephyrus G14 GA402RK | |
| Razer Blade 14 Ryzen 9 RTX 3070 | |
| Average of class Gaming (39258 - 247074, n=102, last 2 years) | |
| Alienware x14 i7 RTX 3060 | |
| Average Intel Core i7-12700H (31839 - 144360, n=64) | |
| AIDA64 / CPU ZLib | |
| Average of class Gaming (574 - 2531, n=102, last 2 years) | |
| Alienware x14 i7 RTX 3060 | |
| Average Intel Core i7-12700H (305 - 1171, n=64) | |
| Asus Zephyrus G14 GA401QM | |
| Asus ROG Zephyrus G14 GA402RK | |
| Razer Blade 14 Ryzen 9 RTX 3070 | |
| Alienware x15 RTX 3070 P111F | |
| AIDA64 / FP64 Ray-Trace | |
| Average of class Gaming (5509 - 45446, n=102, last 2 years) | |
| Razer Blade 14 Ryzen 9 RTX 3070 | |
| Asus Zephyrus G14 GA401QM | |
| Asus ROG Zephyrus G14 GA402RK | |
| Average Intel Core i7-12700H (1437 - 9692, n=64) | |
| Alienware x14 i7 RTX 3060 | |
| AIDA64 / CPU PhotoWorxx | |
| Alienware x14 i7 RTX 3060 | |
| Average of class Gaming (12271 - 89891, n=102, last 2 years) | |
| Average Intel Core i7-12700H (12863 - 52207, n=64) | |
| Asus ROG Zephyrus G14 GA402RK | |
| Razer Blade 14 Ryzen 9 RTX 3070 | |
| Asus Zephyrus G14 GA401QM | |
系统性能
由于采用了包括PCIe-4.0固态硬盘在内的现代组件,Alienware x14是一个反应非常灵敏的系统,主观性能印象非常好。这也得到了合成基准分数的支持,测试装置可以确保一个好的位置。然而,所有的对手在高水平上都非常接近,当你做日常工作时,你将无法注意到它们之间的差异。在我们审查期间,我们也没有遇到任何其他问题。
CrossMark: Overall | Productivity | Creativity | Responsiveness
| PCMark 10 / Score | |
| Average of class Gaming (5828 - 12414, n=93, last 2 years) | |
| Asus ROG Zephyrus G14 GA402RK | |
| Average Intel Core i7-12700H, NVIDIA GeForce RTX 3060 Laptop GPU (5986 - 8156, n=12) | |
| Alienware x15 RTX 3070 P111F | |
| Alienware x14 i7 RTX 3060 | |
| Razer Blade 14 Ryzen 9 RTX 3070 | |
| Asus Zephyrus G14 GA401QM | |
| PCMark 10 / Essentials | |
| Asus ROG Zephyrus G14 GA402RK | |
| Average of class Gaming (8810 - 11935, n=97, last 2 years) | |
| Average Intel Core i7-12700H, NVIDIA GeForce RTX 3060 Laptop GPU (9289 - 12144, n=12) | |
| Alienware x15 RTX 3070 P111F | |
| Asus Zephyrus G14 GA401QM | |
| Razer Blade 14 Ryzen 9 RTX 3070 | |
| Alienware x14 i7 RTX 3060 | |
| PCMark 10 / Productivity | |
| Average of class Gaming (6845 - 25323, n=95, last 2 years) | |
| Asus ROG Zephyrus G14 GA402RK | |
| Alienware x14 i7 RTX 3060 | |
| Asus Zephyrus G14 GA401QM | |
| Razer Blade 14 Ryzen 9 RTX 3070 | |
| Average Intel Core i7-12700H, NVIDIA GeForce RTX 3060 Laptop GPU (6161 - 10362, n=12) | |
| Alienware x15 RTX 3070 P111F | |
| PCMark 10 / Digital Content Creation | |
| Average of class Gaming (7602 - 19954, n=95, last 2 years) | |
| Asus ROG Zephyrus G14 GA402RK | |
| Alienware x15 RTX 3070 P111F | |
| Average Intel Core i7-12700H, NVIDIA GeForce RTX 3060 Laptop GPU (8950 - 12554, n=12) | |
| Alienware x14 i7 RTX 3060 | |
| Razer Blade 14 Ryzen 9 RTX 3070 | |
| Asus Zephyrus G14 GA401QM | |
| CrossMark / Overall | |
| Average of class Gaming (1366 - 2409, n=94, last 2 years) | |
| Alienware x14 i7 RTX 3060 | |
| Average Intel Core i7-12700H, NVIDIA GeForce RTX 3060 Laptop GPU (1649 - 2017, n=11) | |
| CrossMark / Productivity | |
| Average of class Gaming (1386 - 2254, n=94, last 2 years) | |
| Alienware x14 i7 RTX 3060 | |
| Average Intel Core i7-12700H, NVIDIA GeForce RTX 3060 Laptop GPU (1536 - 1958, n=11) | |
| CrossMark / Creativity | |
| Average of class Gaming (1343 - 2786, n=94, last 2 years) | |
| Alienware x14 i7 RTX 3060 | |
| Average Intel Core i7-12700H, NVIDIA GeForce RTX 3060 Laptop GPU (1816 - 2084, n=11) | |
| CrossMark / Responsiveness | |
| Alienware x14 i7 RTX 3060 | |
| Average of class Gaming (1226 - 2334, n=94, last 2 years) | |
| Average Intel Core i7-12700H, NVIDIA GeForce RTX 3060 Laptop GPU (1210 - 2207, n=11) | |
| PCMark 10 Score | 7170 points | |
Help | ||
| AIDA64 / Memory Copy | |
| Alienware x14 i7 RTX 3060 | |
| Average of class Gaming (21750 - 129946, n=102, last 2 years) | |
| Average Intel Core i7-12700H (25615 - 80511, n=64) | |
| Asus ROG Zephyrus G14 GA402RK | |
| Razer Blade 14 Ryzen 9 RTX 3070 | |
| Asus Zephyrus G14 GA401QM | |
| AIDA64 / Memory Read | |
| Alienware x14 i7 RTX 3060 | |
| Average of class Gaming (22956 - 118858, n=102, last 2 years) | |
| Average Intel Core i7-12700H (25586 - 79442, n=64) | |
| Asus ROG Zephyrus G14 GA402RK | |
| Razer Blade 14 Ryzen 9 RTX 3070 | |
| Asus Zephyrus G14 GA401QM | |
| AIDA64 / Memory Write | |
| Average of class Gaming (22297 - 135096, n=102, last 2 years) | |
| Alienware x14 i7 RTX 3060 | |
| Asus ROG Zephyrus G14 GA402RK | |
| Average Intel Core i7-12700H (23679 - 88660, n=64) | |
| Asus Zephyrus G14 GA401QM | |
| Razer Blade 14 Ryzen 9 RTX 3070 | |
| AIDA64 / Memory Latency | |
| Alienware x14 i7 RTX 3060 | |
| Average of class Gaming (75.3 - 165.4, n=102, last 2 years) | |
| Razer Blade 14 Ryzen 9 RTX 3070 | |
| Asus ROG Zephyrus G14 GA402RK | |
| Asus Zephyrus G14 GA401QM | |
| Average Intel Core i7-12700H (76.2 - 133.9, n=62) | |
| Alienware x15 RTX 3070 P111F | |
* ... smaller is better
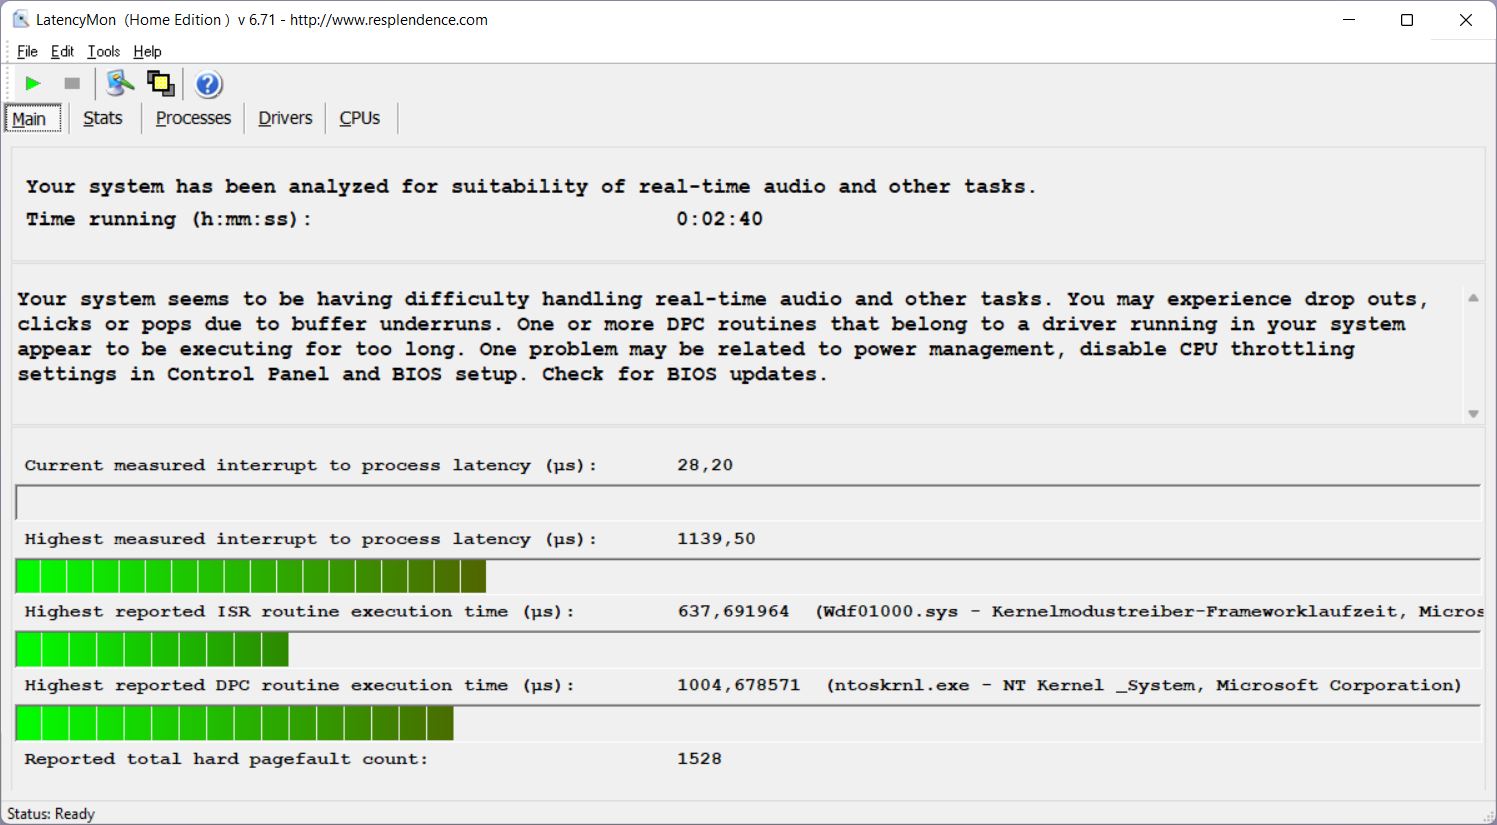
DPC延时
我们的标准化延迟测试包括不同的场景,如网页浏览、4K YouTube播放和CPU负载。我们的测试装置显示了一些问题,对于当前BIOS版本的实时音频应用来说并不理想,但未来的更新可以改善这种情况。
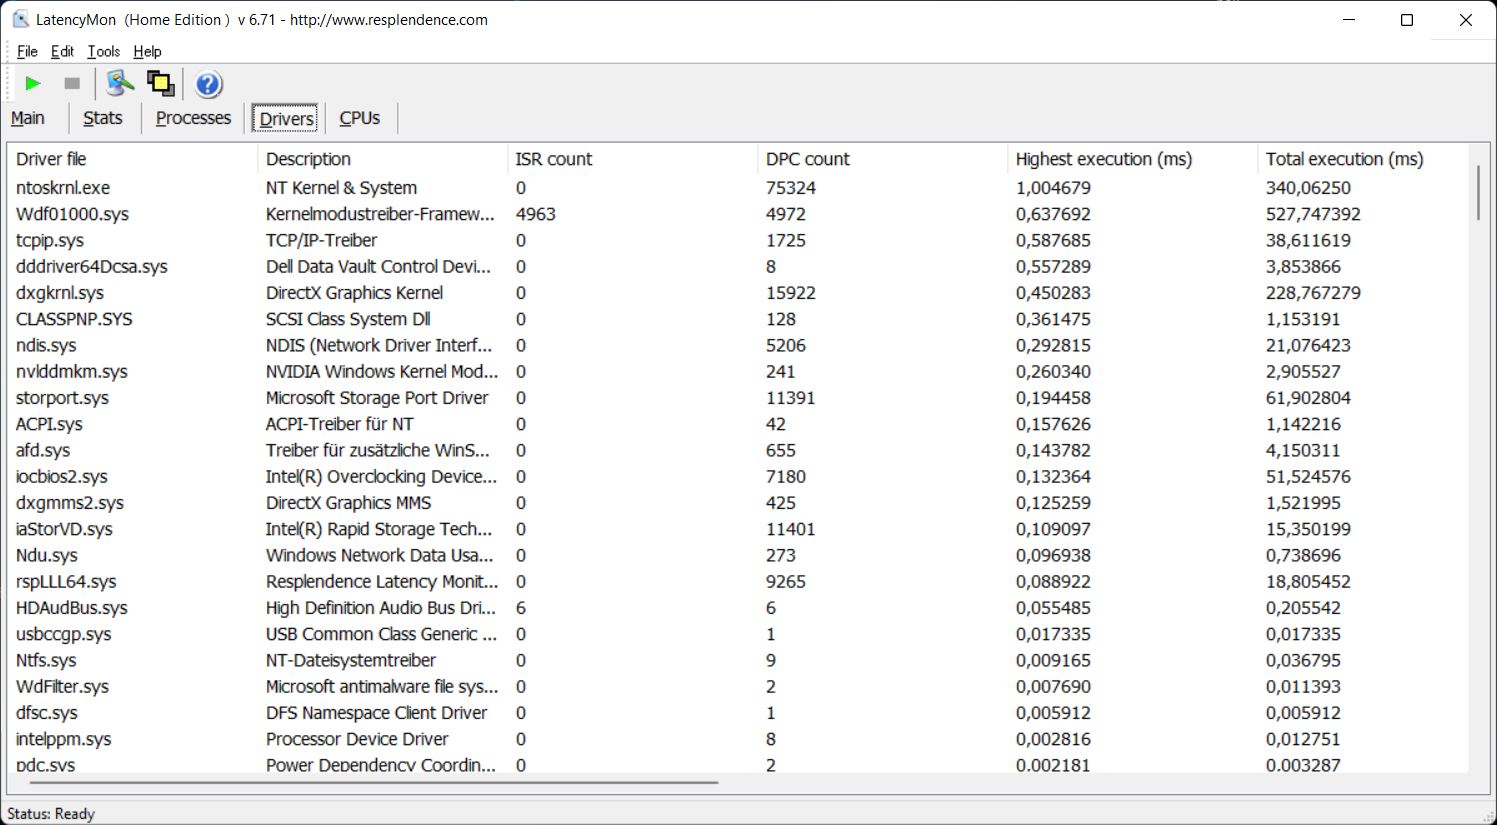
| DPC Latencies / LatencyMon - interrupt to process latency (max), Web, Youtube, Prime95 | |
| Asus Zephyrus G14 GA401QM | |
| Asus ROG Zephyrus G14 GA402RK | |
| Alienware x15 RTX 3070 P111F | |
| Alienware x14 i7 RTX 3060 | |
| Razer Blade 14 Ryzen 9 RTX 3070 | |
* ... smaller is better
存储设备
我们的评测设备配备了西部数据的1TB NVMe-SSD(SN810),它已经支持现代PCIe 4.0标准,在我们的基准测试中,它管理的传输速率超过6GB/s。在初始设置后,你可以将824GB用于自己的文件和应用程序。戴尔还在其网上商店提供2TB的固态硬盘,与1TB的硬盘相比,价格高出100欧元。更多的SSD基准测试可在 这里.

* ... smaller is better
Disk Throttling: DiskSpd Read Loop, Queue Depth 8
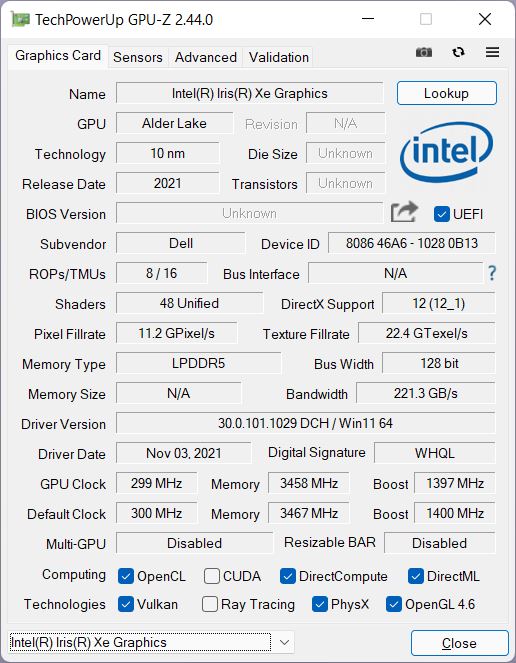
GPU性能 -GeForce RTX 3060,75W TGP
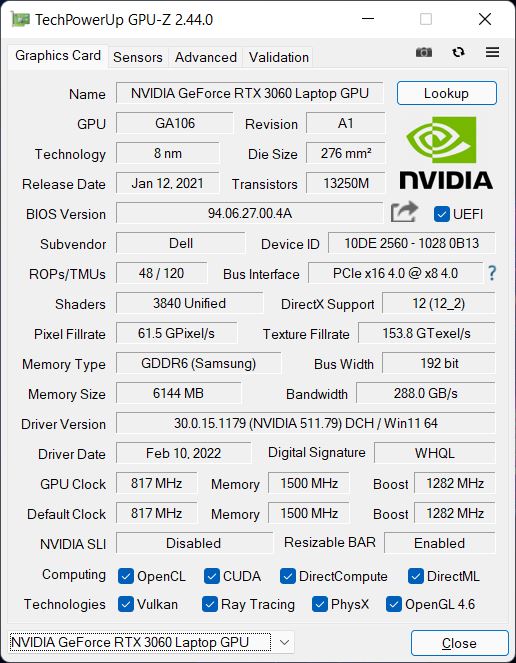
简单的工作负载通常由集成的Iris Xe Graphics G7和专用的NvidiaGeForce RTX 30606GB GDDR6-VRAM,在你需要更多性能时自动介入(Advanced Optimus - 结合G-Sync实现可切换图形)。它是RTX 3060最慢的版本之一,TGP为60W,但根据工作负载,它最多可以使用处理器的15W,这导致总TGP为75W。在GPU基准测试期间,我们也看到了这个数值,最大核心时钟为1687 MHz。
在合成3DMark基准测试中,新的x14比我们数据库中的平均RTX 3060要慢一些。无论是新的Zephyrus G14与Radeon RX 6800S以及刀片14配备了RTX 3070是相当快的,实际上更接近于较大的Alienware x15,后者也配备了RTX 3070。
在持续的工作负载下,性能是稳定的,系统轻松地通过了Time Spy ,压力测试为99.3 %。在电池供电的情况下,dGPU的功耗被限制在60W,这导致性能上的差距只有10%(6700分对7425分@Time Spy Graphics)。请参阅 我们的技术部分了解更多GPU基准测试。
| 3DMark Cloud Gate Standard Score | 53689 points | |
| 3DMark Fire Strike Score | 17786 points | |
| 3DMark Time Spy Score | 7915 points | |
Help | ||
游戏性能
整体游戏性能非常好,对于Alienware x14的原生1080p分辨率来说是足够的,但是RTX 3060只是没有提供像新的华硕ROG Zephyrus G14搭配Radeon RX 6800S或Razer Blade 14与RTX 3070尤其是在对GPU要求非常高的游戏中(如赛博朋克2077).不过,现在你仍然可以在新的X14上玩几乎所有的现代游戏,而且在较长的游戏时间内,性能也很稳定。
| The Witcher 3 | |
| 1920x1080 High Graphics & Postprocessing (Nvidia HairWorks Off) | |
| Average of class Gaming (341 - 404, n=2, last 2 years) | |
| Alienware x15 RTX 3070 P111F | |
| Razer Blade 14 Ryzen 9 RTX 3070 | |
| Asus ROG Zephyrus G14 GA402RK | |
| Average NVIDIA GeForce RTX 3060 Laptop GPU (81 - 186.8, n=41) | |
| Alienware x14 i7 RTX 3060 | |
| Asus Zephyrus G14 GA401QM | |
| 1920x1080 Ultra Graphics & Postprocessing (HBAO+) | |
| Average of class Gaming (104.7 - 240, n=7, last 2 years) | |
| Alienware x15 RTX 3070 P111F | |
| Asus ROG Zephyrus G14 GA402RK | |
| Razer Blade 14 Ryzen 9 RTX 3070 | |
| Average NVIDIA GeForce RTX 3060 Laptop GPU (58.2 - 91.5, n=48) | |
| Alienware x14 i7 RTX 3060 | |
| Alienware x14 i7 RTX 3060 (Battery) | |
| Asus Zephyrus G14 GA401QM | |
| Final Fantasy XV Benchmark | |
| 1920x1080 Standard Quality | |
| Average of class Gaming (85.7 - 236, n=81, last 2 years) | |
| Alienware x15 RTX 3070 P111F (1.3) | |
| Asus ROG Zephyrus G14 GA402RK | |
| Razer Blade 14 Ryzen 9 RTX 3070 (1.3) | |
| Average NVIDIA GeForce RTX 3060 Laptop GPU (70.4 - 133.5, n=37) | |
| Alienware x14 i7 RTX 3060 (1.3) | |
| Asus Zephyrus G14 GA401QM (1.3) | |
| 1920x1080 High Quality | |
| Average of class Gaming (64.2 - 215, n=91, last 2 years) | |
| Alienware x15 RTX 3070 P111F (1.3) | |
| Asus ROG Zephyrus G14 GA402RK | |
| Razer Blade 14 Ryzen 9 RTX 3070 (1.3) | |
| Average NVIDIA GeForce RTX 3060 Laptop GPU (55 - 100.9, n=42) | |
| Alienware x14 i7 RTX 3060 (1.3) | |
| Asus Zephyrus G14 GA401QM (1.3) | |
| Strange Brigade | |
| 1920x1080 high AA:high AF:8 | |
| Average of class Gaming (129.5 - 494, n=74, last 2 years) | |
| Alienware x15 RTX 3070 P111F (1.47.22.14 D3D12) | |
| Asus ROG Zephyrus G14 GA402RK (1.47.22.14 D3D12) | |
| Razer Blade 14 Ryzen 9 RTX 3070 (1.47.22.14 D3D12) | |
| Average NVIDIA GeForce RTX 3060 Laptop GPU (115.6 - 192.1, n=41) | |
| Alienware x14 i7 RTX 3060 | |
| Asus Zephyrus G14 GA401QM (1.47.22.14 D3D12) | |
| 1920x1080 ultra AA:ultra AF:16 | |
| Average of class Gaming (113.6 - 458, n=83, last 2 years) | |
| Alienware x15 RTX 3070 P111F (1.47.22.14 D3D12) | |
| Asus ROG Zephyrus G14 GA402RK (1.47.22.14 D3D12) | |
| Razer Blade 14 Ryzen 9 RTX 3070 (1.47.22.14 D3D12) | |
| Average NVIDIA GeForce RTX 3060 Laptop GPU (102.2 - 166.3, n=43) | |
| Alienware x14 i7 RTX 3060 | |
| Asus Zephyrus G14 GA401QM (1.47.22.14 D3D12) | |
| F1 2021 | |
| 1920x1080 High Preset AA:T AF:16x | |
| Asus ROG Zephyrus G14 GA402RK | |
| Average NVIDIA GeForce RTX 3060 Laptop GPU (119 - 227, n=9) | |
| Alienware x14 i7 RTX 3060 | |
| 1920x1080 Ultra High Preset + Raytracing AA:T AF:16x | |
| Asus ROG Zephyrus G14 GA402RK | |
| Alienware x14 i7 RTX 3060 | |
| Average NVIDIA GeForce RTX 3060 Laptop GPU (67 - 112.8, n=9) | |
在玩游戏时,GPU通常消耗约70W,但当游戏的CPU负担较重时,它也可以接近TGP的原始值60W。也可以用电池供电进行游戏,我们在Witcher 3 (Ultra预设)中仍然记录了60多帧,所以只是有一个类似于纯GPU性能的小缺陷。至少在电池容量下降到50%以下时,GPU的功耗开始有些波动,所以帧数也会波动。其他游戏基准测试可在 这里.
Witcher 3 FPS chart
| low | med. | high | ultra | |
|---|---|---|---|---|
| GTA V (2015) | 185 | 181 | 165 | 88.6 |
| The Witcher 3 (2015) | 267 | 239 | 144 | 58.2 |
| Dota 2 Reborn (2015) | 184 | 168 | 161 | 153 |
| Final Fantasy XV Benchmark (2018) | 151 | 96.5 | 74.1 | |
| Far Cry 5 (2018) | 141 | 113 | 105 | 98 |
| Strange Brigade (2018) | 367 | 182 | 145 | 127 |
| F1 2021 (2021) | 347 | 205 | 165 | 94 |
| GRID Legends (2022) | 178 | 149 | 131 | 94 |
| Cyberpunk 2077 1.6 (2022) | 97 | 84 | 65 | 64 |
排放--在X14上玩游戏需要戴耳机
系统噪音
就像更大的Alienware x15一样,x14也采用了蒸汽室冷却或特殊的镓硅热界面材料等现代技术来改善散热效果,但它只使用了两个较小的风扇。当你只是浏览网页或观看视频时,笔记本电脑通常是无声的,也没有其他电子声音,如线圈啸叫。
一旦你开始给处理器或显卡施加压力,它的声音就会大得多,当你玩游戏时,风扇噪音很快就会达到40多分贝(A),几分钟后就会达到51.5分贝(A),也是在电池供电的情况下。这意味着Alienware在游戏中的噪音甚至比Razer Blade 14和ROG Zephyrus还要大一些,尽管GPU性能较低。我们绝对建议你在游戏时戴上耳机。在可选的高性能模式下,风扇的声音甚至会更大,达到53 dB(A)。
Noise level
| Idle |
| 24.7 / 24.7 / 30.9 dB(A) |
| Load |
| 40 / 51.5 dB(A) |
 | ||
30 dB silent 40 dB(A) audible 50 dB(A) loud |
||
min: | ||
| Alienware x14 i7 RTX 3060 GeForce RTX 3060 Laptop GPU, i7-12700H, WDC PC SN810 1TB | Asus ROG Zephyrus G14 GA402RK Radeon RX 6800S, R9 6900HS, Micron 2450 1TB MTFDKBK1T0TFK | Razer Blade 14 Ryzen 9 RTX 3070 GeForce RTX 3070 Laptop GPU, R9 5900HX, Samsung PM981a MZVLB1T0HBLR | Asus Zephyrus G14 GA401QM GeForce RTX 3060 Laptop GPU, R9 5900HS, SK Hynix HFM001TD3JX013N | Alienware x15 RTX 3070 P111F GeForce RTX 3070 Laptop GPU, i7-11800H, WDC PC SN730 SDBPNTY-512G | |
|---|---|---|---|---|---|
| Noise | 3% | 7% | -7% | 3% | |
| off / environment * (dB) | 24.7 | 24 3% | 25.1 -2% | 24.8 -0% | 24.1 2% |
| Idle Minimum * (dB) | 24.7 | 24 3% | 25.2 -2% | 25.4 -3% | 26.6 -8% |
| Idle Average * (dB) | 24.7 | 26 -5% | 25.2 -2% | 34.5 -40% | 26.6 -8% |
| Idle Maximum * (dB) | 30.9 | 31 -0% | 25.2 18% | 34.5 -12% | 26.6 14% |
| Load Average * (dB) | 40 | 45 -13% | 31 22% | 35.4 11% | 30.9 23% |
| Witcher 3 ultra * (dB) | 51.5 | 43 17% | 44 15% | 52.7 -2% | 49.9 3% |
| Load Maximum * (dB) | 51.5 | 45 13% | 51.7 -0% | 52.3 -2% | 53.5 -4% |
* ... smaller is better
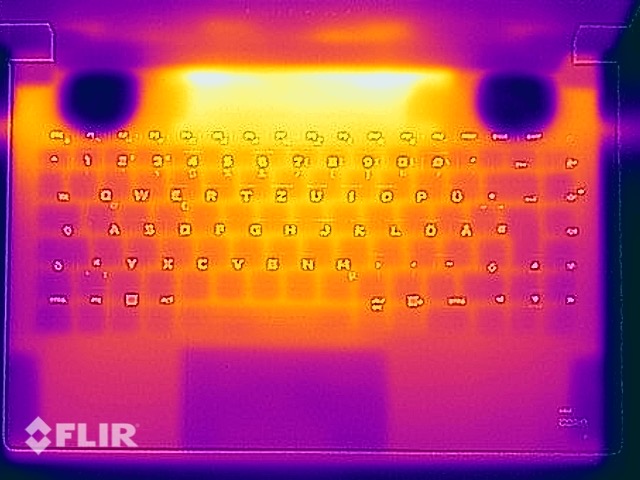
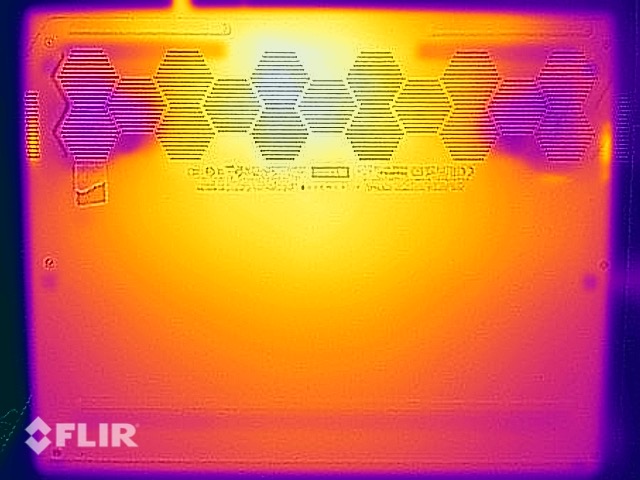
温度
我们对表面温度感到惊讶,因为底座的底部保持相对凉爽,即使在负载下(如游戏)也是如此,所以在这种情况下,你仍然可以把它放在你的腿上。我们记录了底座顶部的最高温度,但这是键盘上方的区域,你并没有真正接触到表面。键盘区域本身也明显升温到44℃,你会感到手指发热,但当你想打字时,没有任何限制。在轻度工作负荷下,机箱保持舒适的冷却。
(-) The maximum temperature on the upper side is 51.3 °C / 124 F, compared to the average of 40.4 °C / 105 F, ranging from 21.2 to 68.8 °C for the class Gaming.
(±) The bottom heats up to a maximum of 44.4 °C / 112 F, compared to the average of 43.2 °C / 110 F
(+) In idle usage, the average temperature for the upper side is 25.4 °C / 78 F, compared to the device average of 33.9 °C / 93 F.
(-) Playing The Witcher 3, the average temperature for the upper side is 42.5 °C / 109 F, compared to the device average of 33.9 °C / 93 F.
(±) The palmrests and touchpad can get very hot to the touch with a maximum of 39 °C / 102.2 F.
(-) The average temperature of the palmrest area of similar devices was 28.8 °C / 83.8 F (-10.2 °C / -18.4 F).
| Alienware x14 i7 RTX 3060 Intel Core i7-12700H, NVIDIA GeForce RTX 3060 Laptop GPU | Asus ROG Zephyrus G14 GA402RK AMD Ryzen 9 6900HS, AMD Radeon RX 6800S | Razer Blade 14 Ryzen 9 RTX 3070 AMD Ryzen 9 5900HX, NVIDIA GeForce RTX 3070 Laptop GPU | Asus Zephyrus G14 GA401QM AMD Ryzen 9 5900HS, NVIDIA GeForce RTX 3060 Laptop GPU | Alienware x15 RTX 3070 P111F Intel Core i7-11800H, NVIDIA GeForce RTX 3070 Laptop GPU | |
|---|---|---|---|---|---|
| Heat | -15% | -21% | -21% | -15% | |
| Maximum Upper Side * (°C) | 51.3 | 55 -7% | 45 12% | 55.4 -8% | 59.2 -15% |
| Maximum Bottom * (°C) | 44.4 | 55 -24% | 44.4 -0% | 62.2 -40% | 58 -31% |
| Idle Upper Side * (°C) | 27.2 | 30 -10% | 40.2 -48% | 31 -14% | 28.4 -4% |
| Idle Bottom * (°C) | 26.6 | 32 -20% | 39.2 -47% | 32.4 -22% | 29 -9% |
* ... smaller is better
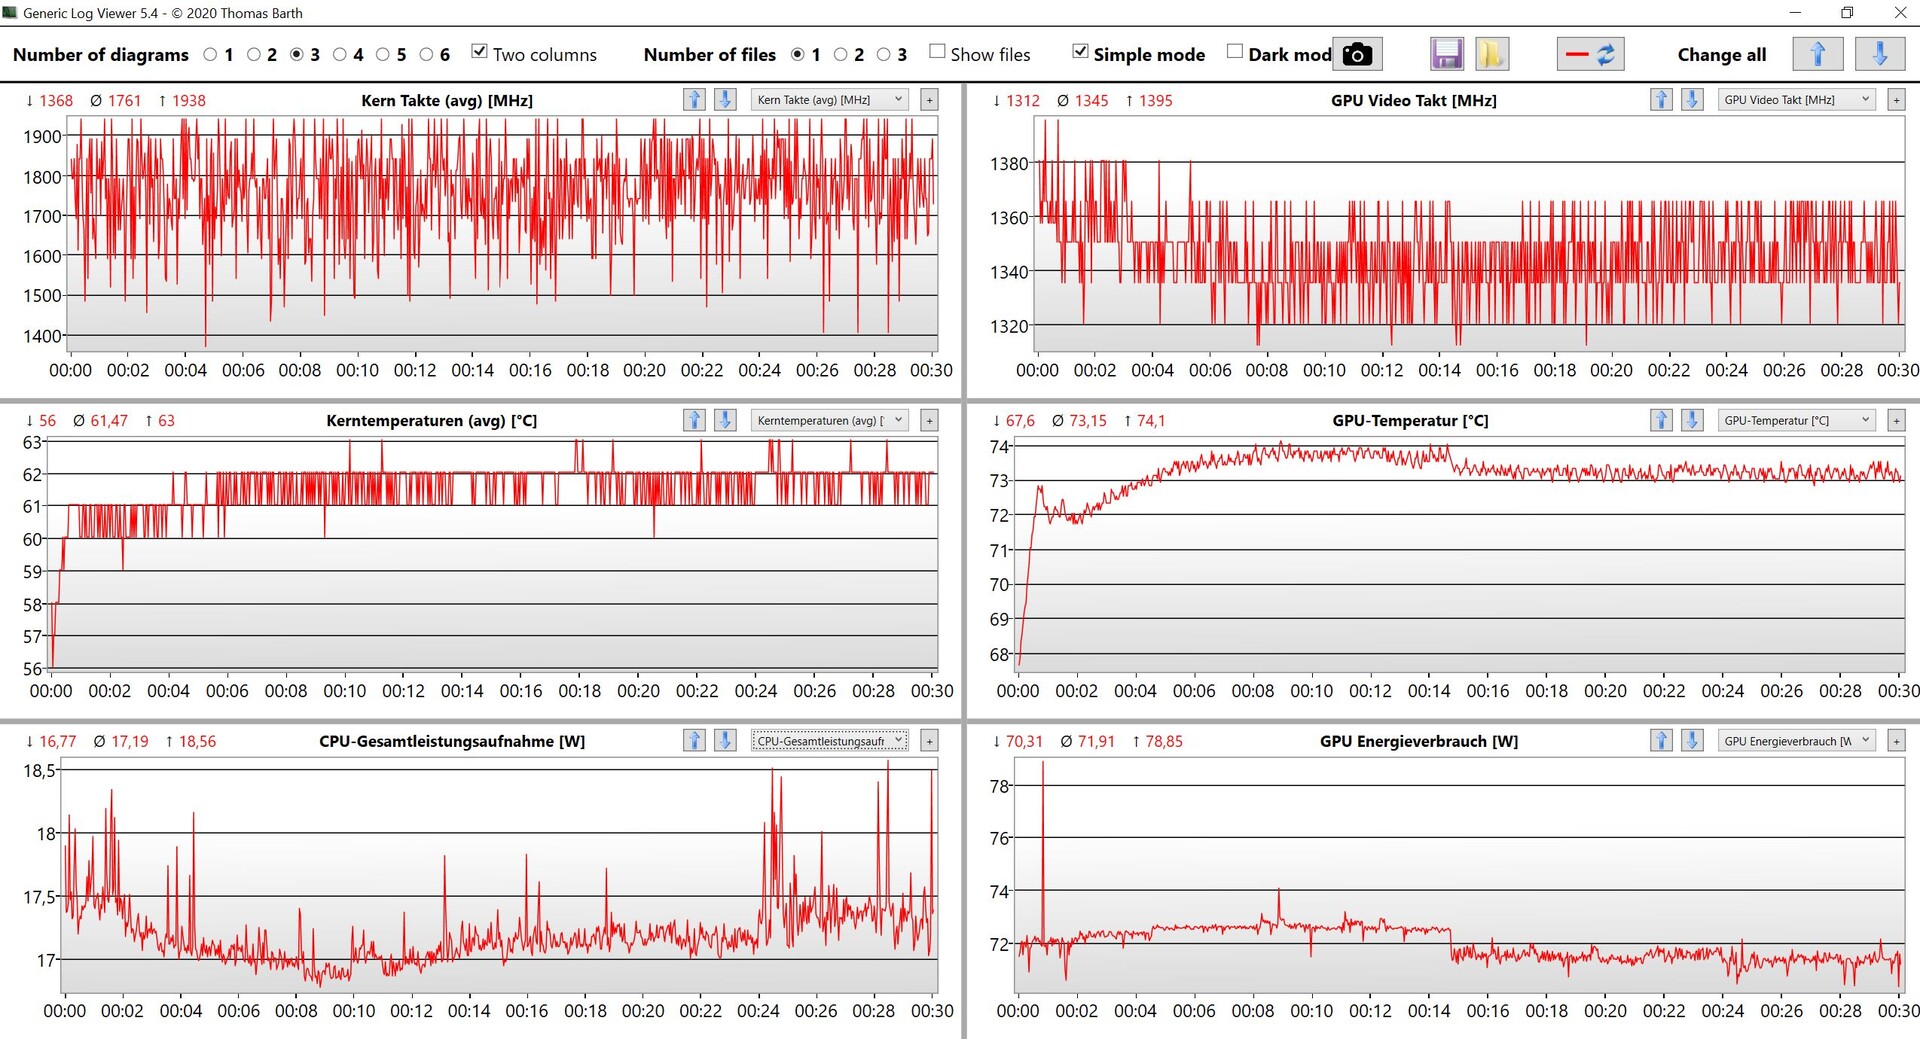
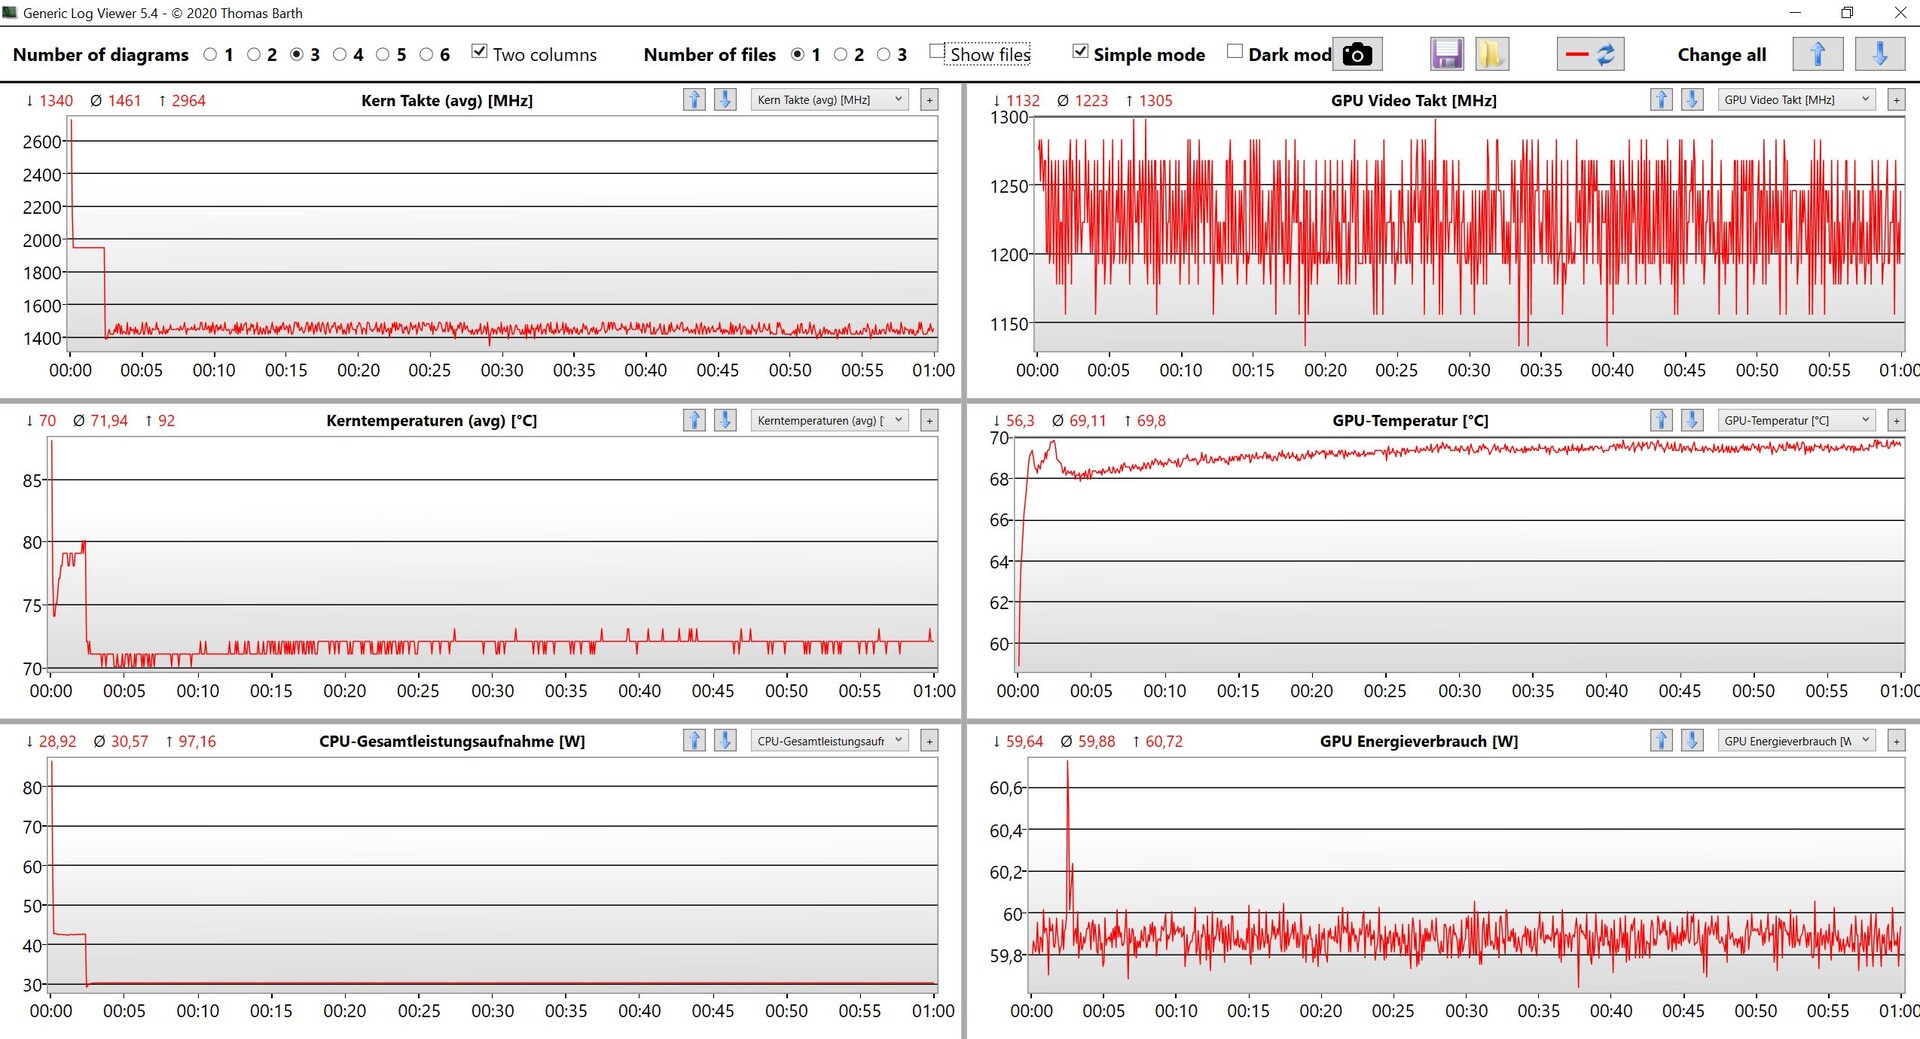
压力测试
在压力测试中,该系统偏向于专用显卡,这对游戏笔记本电脑来说是有意义的。该RTX 3060一直以60W的功率运行,而Core i7则下降到只有30W。在高性能模式下,其行为基本相同,唯一的区别是GPU多消耗了5W。总而言之,Alienware x14可以在较长时间内处理90-95W的功率。电池的压力测试是相同的,直到电池容量的50%,当消费数字开始有点波动(GPU:40-50W;CPU:30-35W)。
发言人
Alienware为x14配备了Dolby Access应用程序,它提供了不同的预设,它的结果是一个明显的更丰富的声音体验。当你停用该软件时,模块的声音相当尖锐,而且无力。整体性能还可以,听一些音乐或看视频都没有问题,但在玩游戏时,由于风扇声音太大,扬声器基本没有用。
Alienware x14 i7 RTX 3060 audio analysis
(±) | speaker loudness is average but good (79.5 dB)
Bass 100 - 315 Hz
(-) | nearly no bass - on average 18.3% lower than median
(±) | linearity of bass is average (10.9% delta to prev. frequency)
Mids 400 - 2000 Hz
(+) | balanced mids - only 2.9% away from median
(+) | mids are linear (4.2% delta to prev. frequency)
Highs 2 - 16 kHz
(+) | balanced highs - only 3.3% away from median
(+) | highs are linear (4.3% delta to prev. frequency)
Overall 100 - 16.000 Hz
(±) | linearity of overall sound is average (15.5% difference to median)
Compared to same class
» 35% of all tested devices in this class were better, 7% similar, 58% worse
» The best had a delta of 6%, average was 18%, worst was 132%
Compared to all devices tested
» 23% of all tested devices were better, 4% similar, 73% worse
» The best had a delta of 4%, average was 23%, worst was 134%
Razer Blade 14 Ryzen 9 RTX 3070 audio analysis
(±) | speaker loudness is average but good (78.1 dB)
Bass 100 - 315 Hz
(±) | reduced bass - on average 14.2% lower than median
(±) | linearity of bass is average (13.5% delta to prev. frequency)
Mids 400 - 2000 Hz
(±) | higher mids - on average 5.5% higher than median
(+) | mids are linear (6.6% delta to prev. frequency)
Highs 2 - 16 kHz
(+) | balanced highs - only 4.8% away from median
(±) | linearity of highs is average (8.9% delta to prev. frequency)
Overall 100 - 16.000 Hz
(±) | linearity of overall sound is average (18.6% difference to median)
Compared to same class
» 61% of all tested devices in this class were better, 9% similar, 31% worse
» The best had a delta of 6%, average was 18%, worst was 132%
Compared to all devices tested
» 42% of all tested devices were better, 8% similar, 50% worse
» The best had a delta of 4%, average was 23%, worst was 134%
能源管理--在电池上几乎发挥全部性能
消耗功率
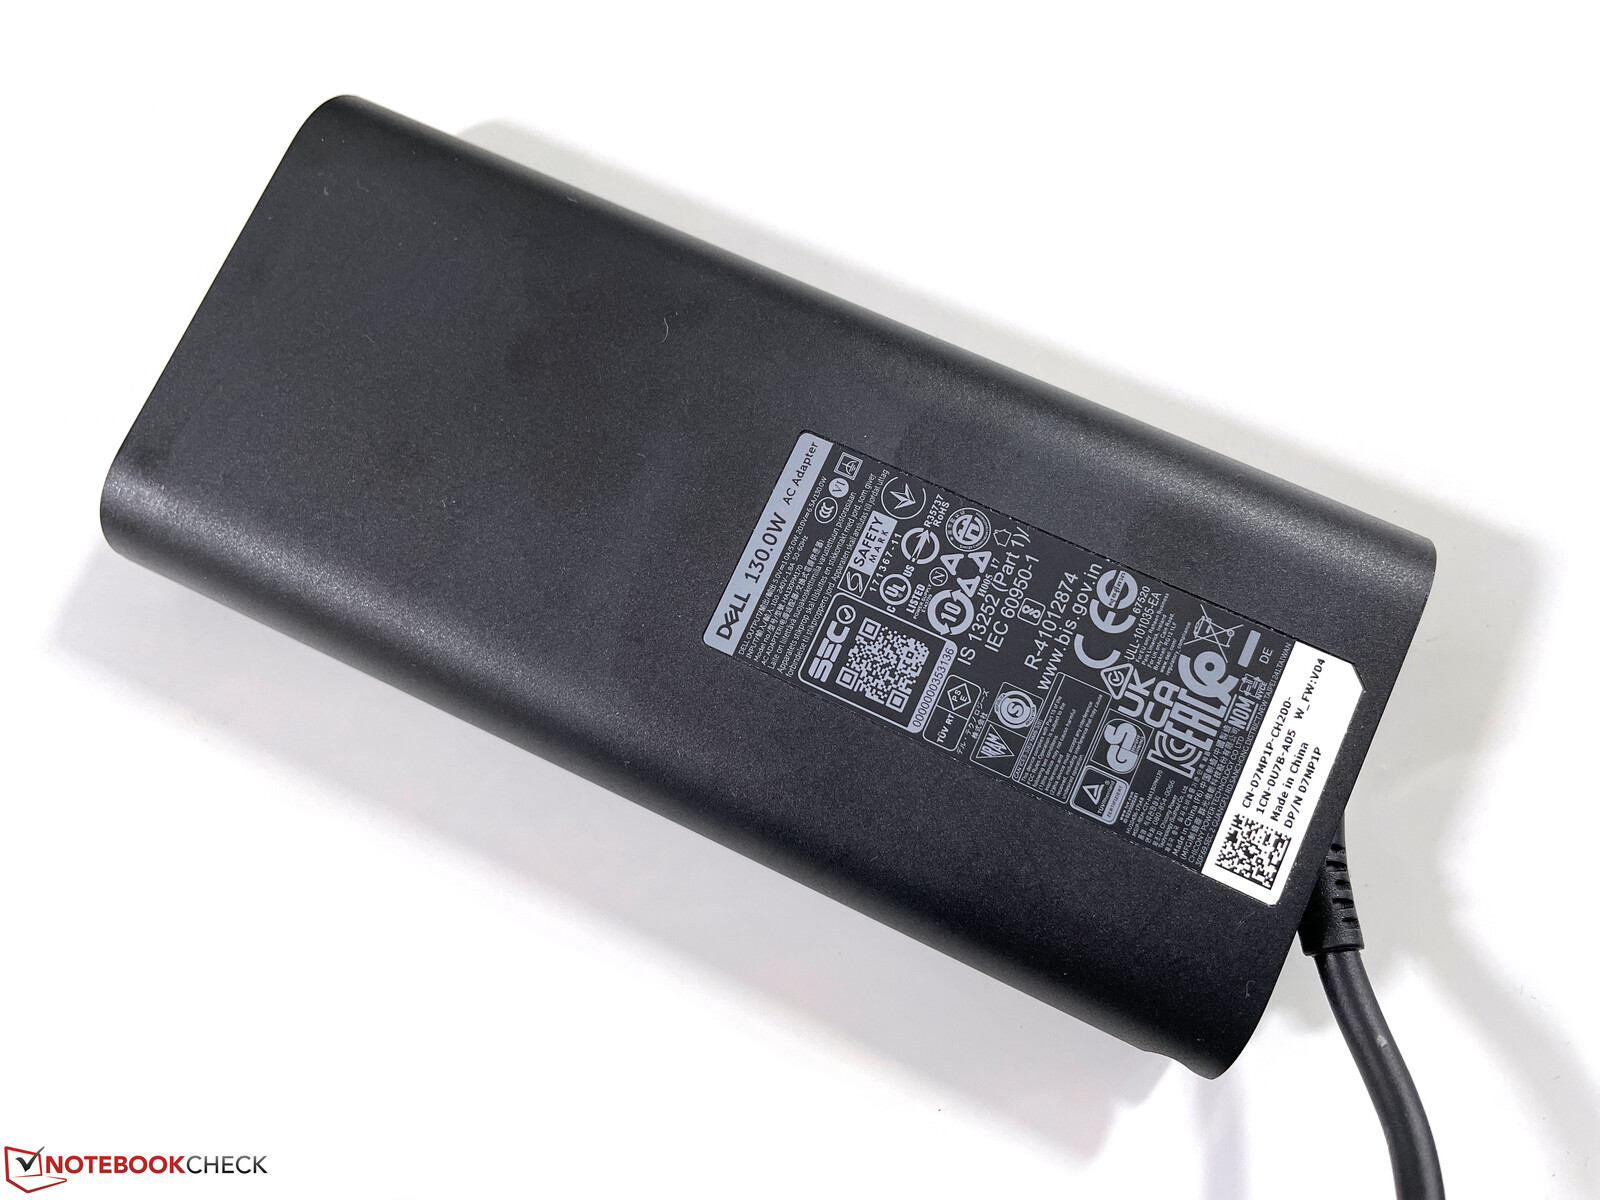
Alienware x14通过USB-C供电,由于采用了新的USB-C 2.1标准(最高240W),这没有问题。我们测量了在负载下高达140W的短暂峰值,这很快就稳定在130W,然后在几分钟后达到114W。在游戏过程中,你也可以期待这些数值,所以附带的130W电源适配器是足够的。
对于一台强大的游戏笔记本电脑来说,空闲时的消耗值相当低,我们在最大亮度下空闲时只测量到11.8W。设备关闭时的消耗也很低,但戴尔可以再看看待机值(1.3W)并对其进行优化。
| Off / Standby | |
| Idle | |
| Load |
|
Key:
min: | |
| Alienware x14 i7 RTX 3060 i7-12700H, GeForce RTX 3060 Laptop GPU, WDC PC SN810 1TB, IPS, 1920x1080, 14" | Asus ROG Zephyrus G14 GA402RK R9 6900HS, Radeon RX 6800S, Micron 2450 1TB MTFDKBK1T0TFK, IPS-Level, 2560x1600, 14" | Razer Blade 14 Ryzen 9 RTX 3070 R9 5900HX, GeForce RTX 3070 Laptop GPU, Samsung PM981a MZVLB1T0HBLR, IPS, 2560x1440, 14" | Asus Zephyrus G14 GA401QM R9 5900HS, GeForce RTX 3060 Laptop GPU, SK Hynix HFM001TD3JX013N, IPS, 1920x1080, 14" | Alienware x15 RTX 3070 P111F i7-11800H, GeForce RTX 3070 Laptop GPU, WDC PC SN730 SDBPNTY-512G, IPS, 2560x1440, 15.6" | Average NVIDIA GeForce RTX 3060 Laptop GPU | Average of class Gaming | |
|---|---|---|---|---|---|---|---|
| Power Consumption | -26% | -35% | 1% | -86% | -39% | -67% | |
| Idle Minimum * (Watt) | 7.9 | 7 11% | 9.4 -19% | 5.6 29% | 15.7 -99% | 10.4 ? -32% | 13.1 ? -66% |
| Idle Average * (Watt) | 11.1 | 14 -26% | 15.8 -42% | 10.4 6% | 20.3 -83% | 14.5 ? -31% | 19 ? -71% |
| Idle Maximum * (Watt) | 11.8 | 22 -86% | 24.1 -104% | 18 -53% | 43 -264% | 21.4 ? -81% | 24.6 ? -108% |
| Load Average * (Watt) | 107.4 | 98 9% | 76.8 28% | 68 37% | 94.4 12% | 109.3 ? -2% | 111.3 ? -4% |
| Witcher 3 ultra * (Watt) | 111 | 141 -27% | 154 -39% | 113 -2% | 167 -50% | ||
| Load Maximum * (Watt) | 140.4 | 188 -34% | 189.7 -35% | 158.2 -13% | 183.4 -31% | 206 ? -47% | 260 ? -85% |
* ... smaller is better
Power Consumption Witcher 3 / Stress test
Power Consumption external screen
电池运行时间
80瓦时的大电池提供了很长的运行时间。我们的实际Wi-Fi测试在150尼特(占我们测试设备最大亮度的57%)下运行了近9个小时,在最大亮度下仍有7小时。我们的视频测试在150尼特下确定了近9.5小时。这意味着紧凑的x14有更多的耐力比x15和Razer Blade 14,但这两个型号的华硕ROG Zephyrus G14管理更长的运行时间。
值得注意的是,在电池电量上,性能并没有真正降低那么多,因为在压力测试和游戏时,仅45分钟后就耗尽了全部的电量。前35%的充电速度确实不错(仅18分钟),然后就有点下降了(36分钟后为50%,72分钟后为80%)。当笔记本电脑打开时,充满电需要大约130分钟。
| Alienware x14 i7 RTX 3060 i7-12700H, GeForce RTX 3060 Laptop GPU, 80 Wh | Asus ROG Zephyrus G14 GA402RK R9 6900HS, Radeon RX 6800S, 76 Wh | Razer Blade 14 Ryzen 9 RTX 3070 R9 5900HX, GeForce RTX 3070 Laptop GPU, 62 Wh | Asus Zephyrus G14 GA401QM R9 5900HS, GeForce RTX 3060 Laptop GPU, 76 Wh | Alienware x15 RTX 3070 P111F i7-11800H, GeForce RTX 3070 Laptop GPU, 87 Wh | Average of class Gaming | |
|---|---|---|---|---|---|---|
| Battery runtime | 10% | 23% | 54% | -9% | 18% | |
| H.264 (h) | 9.4 | 8.27 ? -12% | ||||
| WiFi v1.3 (h) | 8.9 | 9.5 7% | 7.3 -18% | 11.8 33% | 6.1 -31% | 7.08 ? -20% |
| Witcher 3 ultra (h) | 0.8 | |||||
| Load (h) | 0.8 | 0.9 13% | 1.3 63% | 1.4 75% | 0.9 13% | 1.496 ? 87% |
| Reader / Idle (h) | 18.1 | 13.8 | 21 | 9.7 | 7.84 ? |
Pros
Cons
结论--Alienware x14更薄,但也比竞争对手慢。
新款Alienware x14与两款超薄游戏笔记本的产品阵容无缝整合在一起x15和x17并获得了大量的现代技术。英特尔Alder Lake CPU、GeForce RTX 3000 GPU、Thunderbolt 4、PCIe 4.0、Wi-Fi 6E、G-Sync和Advanced Optimus。然而,苗条的设计有一些缺点,就像它较大的兄弟姐妹一样。铰链位置的转移导致一个非常深的设备,与其他两个目前来自Razer和Asus的14英寸游戏系统相比,占地面积很大。所有的端口都位于后部,所以不可能在两侧连接USB驱动器甚至耳机。键盘也位于靠近前缘的位置,小的掌托对大手来说将是一个问题。戴尔还将键程从x15的1.5毫米减少到只有1.2毫米,这一点马上就能看出来。
第二个问题是性能。Ur评测单元采用Alder Lake Core i7-12700H和GeForce RTX 3060是目前Alienware x14最强大的版本,其性能利用率真的不差。在原生1080p分辨率下进行游戏是没有问题的,但对手们雷蛇刀片14和华硕ROG Zephyrus G14只是提供了更快的GPU,因此用同样的钱可以获得更多的游戏性能。当你玩游戏时,风扇的声音也非常大(即使在正常模式下),所以耳机或耳麦是必不可少的。"世界上最薄的游戏笔记本 "这一营销短语听起来不错,但我们非常肯定,如果机箱稍微厚一点,就会产生更好的产品。
新的Alienware x14提供了最新的技术和稳定的游戏性能,但超薄的机箱需要一些妥协。对许多客户来说,更厚的机箱可能会更好。
目前只有一个显示屏选项。哑光IPS屏幕,分辨率为1080p。主观的画质不如OLED屏幕,但毫无疑问,它是一个没有PWM闪烁的好显示屏。由于快速的响应时间和144赫兹的刷新率,我们特别喜欢其流畅的动作。这款显示器也有很大的潜力,因为在我们校准之后,颜色非常准确,而且屏幕覆盖了DCI-P3色域。这意味着在旅途中编辑图片或视频是没有问题的,摄影师以及无人机飞行员会对快速的microSD读取器感到高兴。
由于具有准确色彩和P3色域的哑光显示屏以及快速读卡器的组合,Alienware x14实际上是一个非常有趣的选择,适合那些想在旅途中编辑照片的摄影师。
最后,是价格问题。2400欧元的价格对于我们的评测单位来说并不便宜。这两个直接竞争对手的价格范围相似,但由于更快的GPU而提供更多的游戏性能。如果你能接受超薄机箱的缺点,新的Alienware x14绝对值得一看,特别是如果你能从准确的色彩和P3色域的显示器中受益。
价格和可用性
你可以从戴尔的在线商店订购新的Alienware x14起价1599.99美元,配备Core i7、RTX 3050、16GB内存和512GB SSD存储。我们的审查配置为1949.99美元。
Alienware x14 i7 RTX 3060
- 03/16/2022 v7 (old)
Andreas Osthoff
Price comparison

