RTX 5090 笔记本电脑和游戏笔记本电脑中的迷你 LED - 华硕 ROG Strix SCAR 16 2025 评测
华硕最快的 16 英寸处理器
ROG Strix SCAR 16 是华硕的 16 英寸游戏旗舰,配备酷睿 Ultra 275HX、GeForce RTX 5090 笔记本电脑、24 GB 显存和 240 Hz 迷你 LED 显示屏。Andreas Osthoff, 👁 Andreas Osthoff (translated by DeepL / Ninh Duy) Published 🇺🇸 🇩🇪 ...
结论 - 性能全面,显示效果出色
与较大的 Strix SCAR 18 一样,较小的 Strix SCAR 16 的游戏性能也非常出色,尤其是与 18 英寸机型相比没有性能损失。即便如此,与 RTX 5080 笔记本电脑相比,它的性能优势也不是很大,尤其是在笔记本电脑的原生 WQHD 分辨率下,如果你不能从其更大的 VRAM 中获得任何其他好处,那么我们建议你选择 RTX 5080 笔记本电脑的配置。该设备的迷你 LED 显示屏令人印象深刻,提供了丰富的功能和操作模式,在我们的测试中取得了非常好的数值,并具有开箱即用的精确色彩配置文件。
它的外壳质量很好,有大量照明元素,但遗憾的是,它完全由塑料制成,黑色表面很容易留下污痕。笔记本电脑的维护选项很好,你可以很容易地访问其组件,此外,它已经配备了 Thunderbolt 5。大部分端口都在设备的左侧,背面没有任何端口。
总而言之,新款 ROG Strix SCAR 16 是一款令人印象深刻的游戏笔记本电脑,配备了功能强大的组件。与普通的 ROG Strix G16相比,Strix SCAR 16 首先得益于其迷你 LED 面板,但价格却要高出约 550 美元。
Pros
Cons
价格和供应情况
截至发稿时,ROG Strix SCAR 16 G635 尚未在美国发售。其零售价约为 4300 美元。
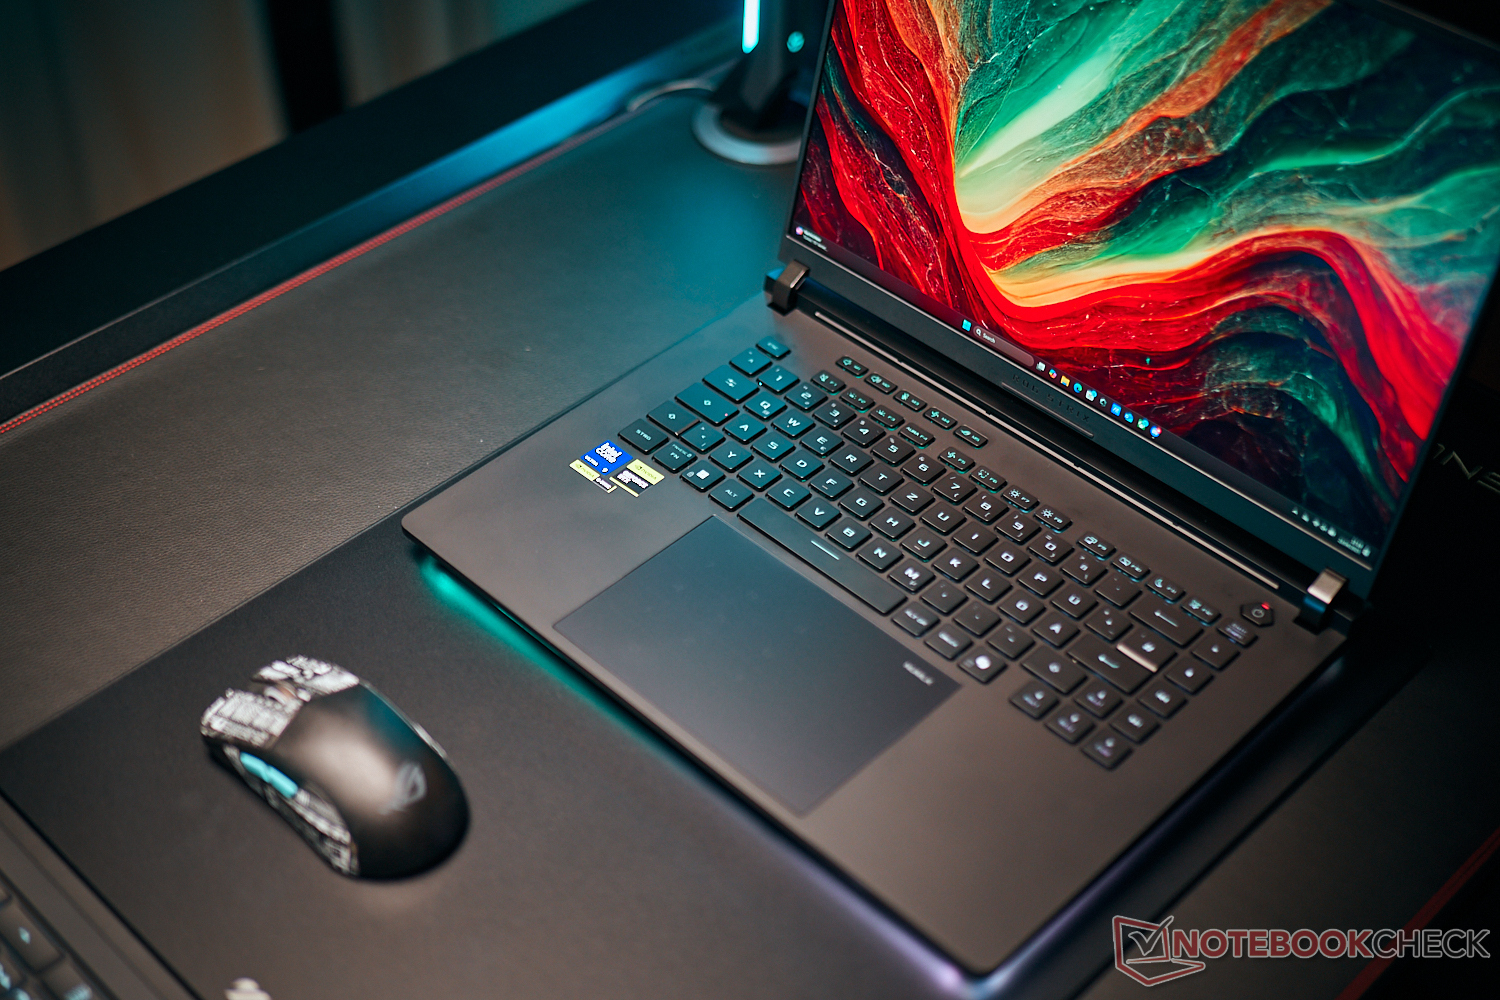
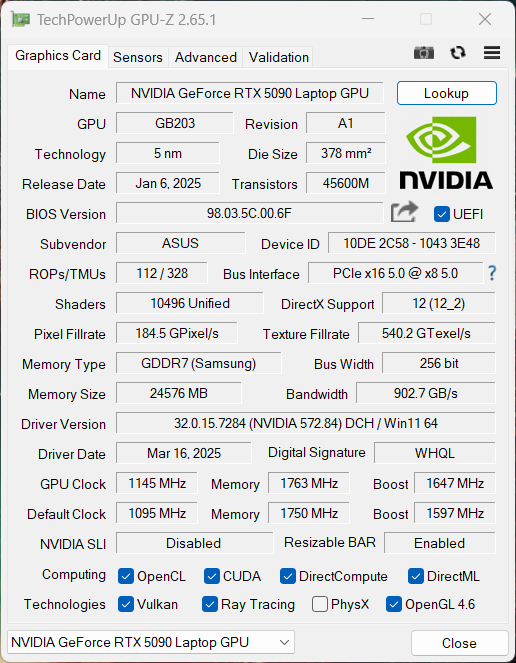
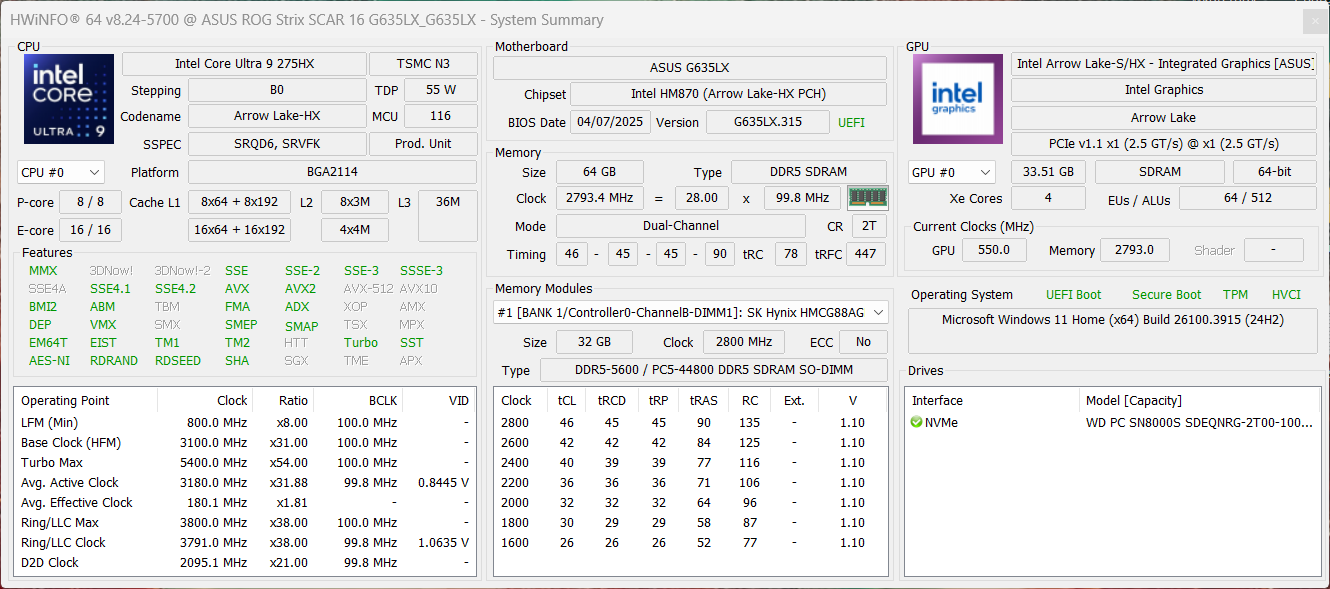
Strix SCAR 16 是华硕推出的速度最快的 16 英寸游戏机,集高端组件、迷你 LED 屏幕和丰富的照明元素于一身。我们测试了配备 酷睿至尊 9 275HX和 GeForce RTX 5090 笔记本电脑64 GB 内存、2 TB 固态硬盘和 240 Hz 迷你 LED 面板,售价约 5630 美元。
规格
外壳和连接
总体而言,这款笔记本电脑的外壳设计、黑色表面和盖子上的 AniME 视觉显示屏与较大的 SCAR 18.它的质量很好(包括制造和稳定性),但考虑到价位,你可能希望看到一些金属。此外,其黑色表面极易留下污痕。另一方面,它的照明选项非常丰富,新的环绕式 LED 灯带看起来令人印象深刻。
华硕安装了两个现代 Thunderbolt 5 端口和足够多的 USB 端口,不过所有端口都位于两侧(左侧较多)。该设备的 1080p 摄像头(无机械快门)可以正常工作,其 WLAN 模块已支持 Wi-Fi 7 标准。在我们的测试中,其传输速率稳定而快速。虽然不是 Copilot+ 笔记本电脑,但它支持网络摄像头的 Studio Effects 和实时字幕。


| Networking | |
| Asus ROG Strix Scar 16 2025 | |
| iperf3 transmit AXE11000 | |
| iperf3 receive AXE11000 | |
| Asus ROG Strix G16 G615 | |
| iperf3 transmit AXE11000 | |
| iperf3 receive AXE11000 | |
| Lenovo Legion Pro 7i 16 Gen 10 | |
| iperf3 transmit AXE11000 | |
| iperf3 receive AXE11000 | |
| iperf3 transmit AXE11000 6GHz | |
| iperf3 receive AXE11000 6GHz | |
| HP Omen Max 16 ah000 | |
| iperf3 transmit AXE11000 | |
| iperf3 receive AXE11000 | |
| iperf3 transmit AXE11000 6GHz | |
| iperf3 receive AXE11000 6GHz | |
| Aorus MASTER 16 AM6H | |
| iperf3 transmit AXE11000 | |
| iperf3 receive AXE11000 | |
| iperf3 transmit AXE11000 6GHz | |
| iperf3 receive AXE11000 6GHz | |
| Asus ROG Strix Scar 16 G634JZR | |
| iperf3 transmit AXE11000 | |
| iperf3 receive AXE11000 | |
| iperf3 transmit AXE11000 6GHz | |
| iperf3 receive AXE11000 6GHz | |


维护

要解锁底板,只需按下滑块即可。在内部,你可以看到两个内存插槽、两个 M.2 2280 固态硬盘、电池和风扇。不过,WLAN 模块是焊接上去的。


可持续性
华硕没有提供该设备的二氧化碳排放量或环保认证信息。其包装几乎全部由纸板组成。
输入设备 - 舒适的键盘
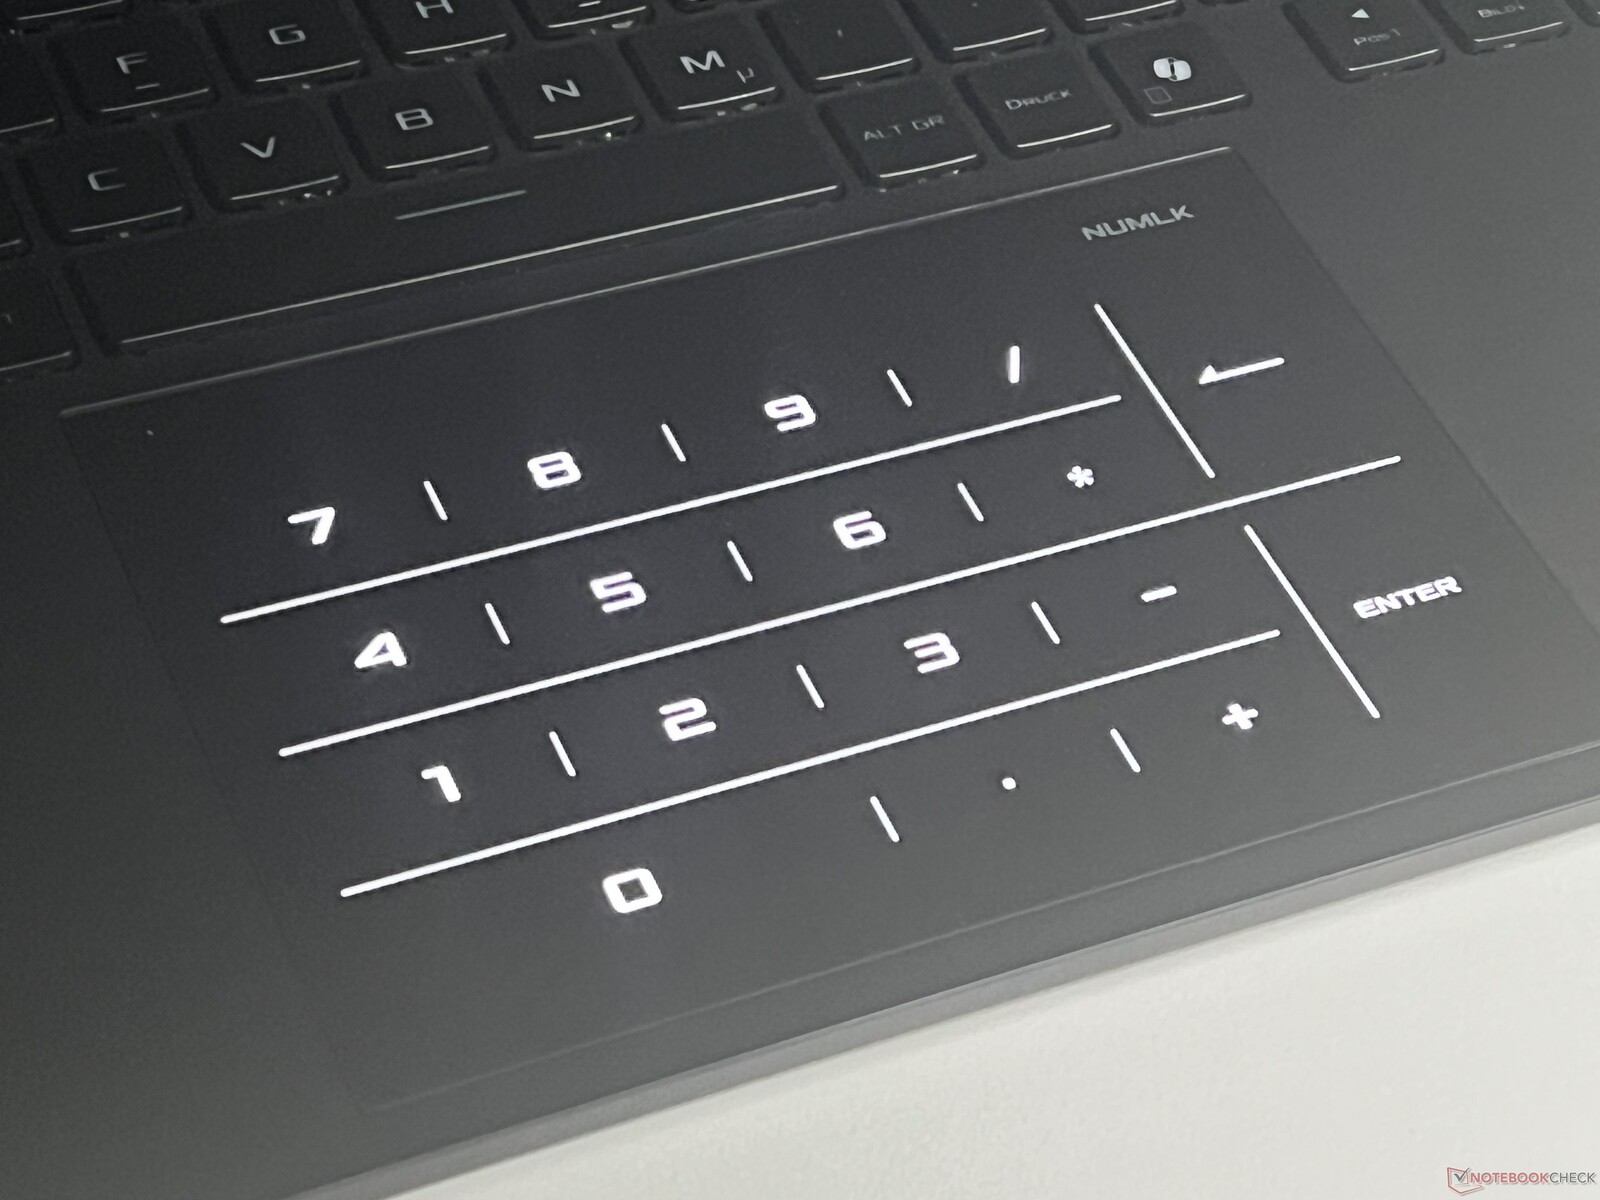
16 英寸版 Strix SCAR 没有数字键盘,但在其他方面与较大的 SCAR 18.作为替代,数字键盘可以显示在 ClickPad 上。手感舒适顺滑,并能发出低沉、高质量的机械咔哒声。键盘背光可针对每个按键单独调节,但无法通过传感器激活。


显示屏 - Mini LED,240 赫兹
Strix G16 配备的是 IPS 面板,而 Strix SCAR 16 配备的仍然是哑光微型 LED 面板(2560 x 1600 像素,240 Hz)。我们在评测较大的 较大的 SCAR 18总体而言,它的画质非常出色。它的响应速度很快,虽然存在 PWM 闪烁,但频率极高,为 20 kHz。
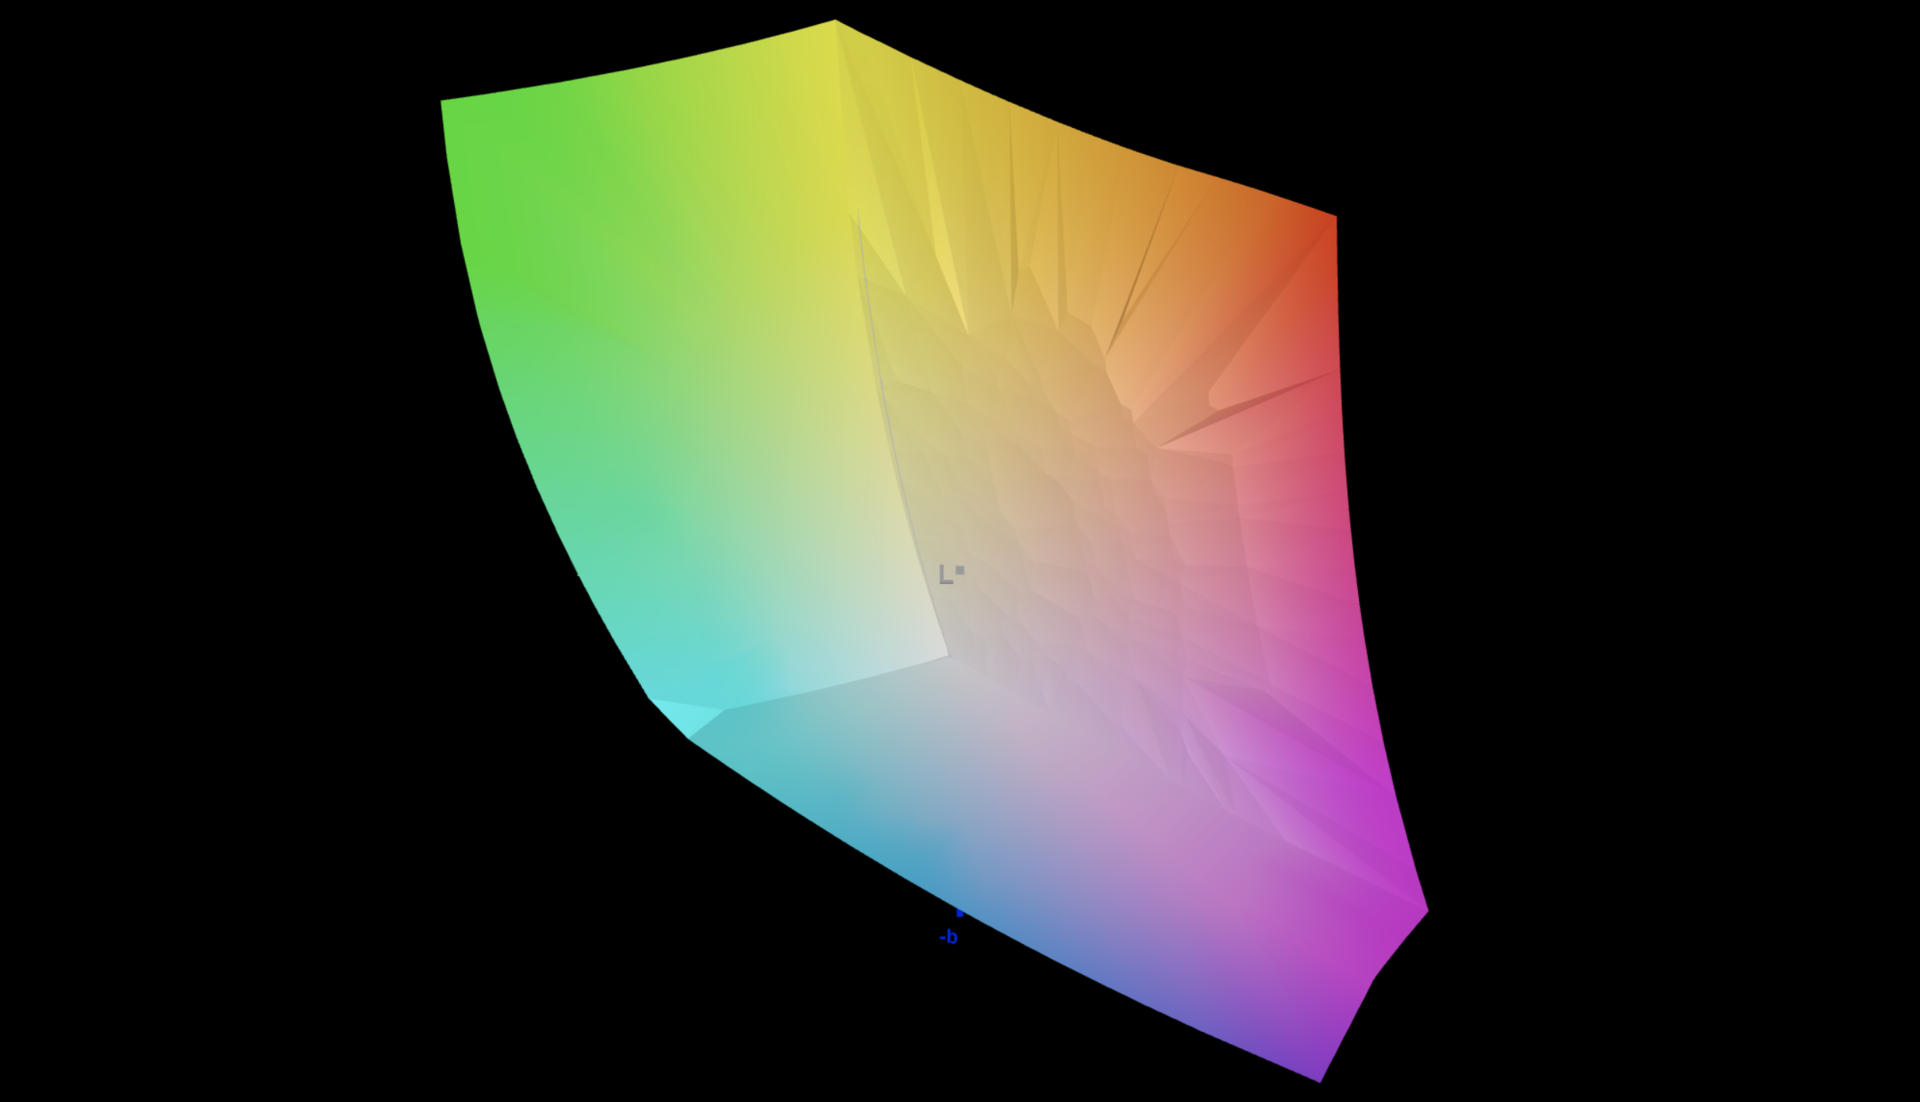
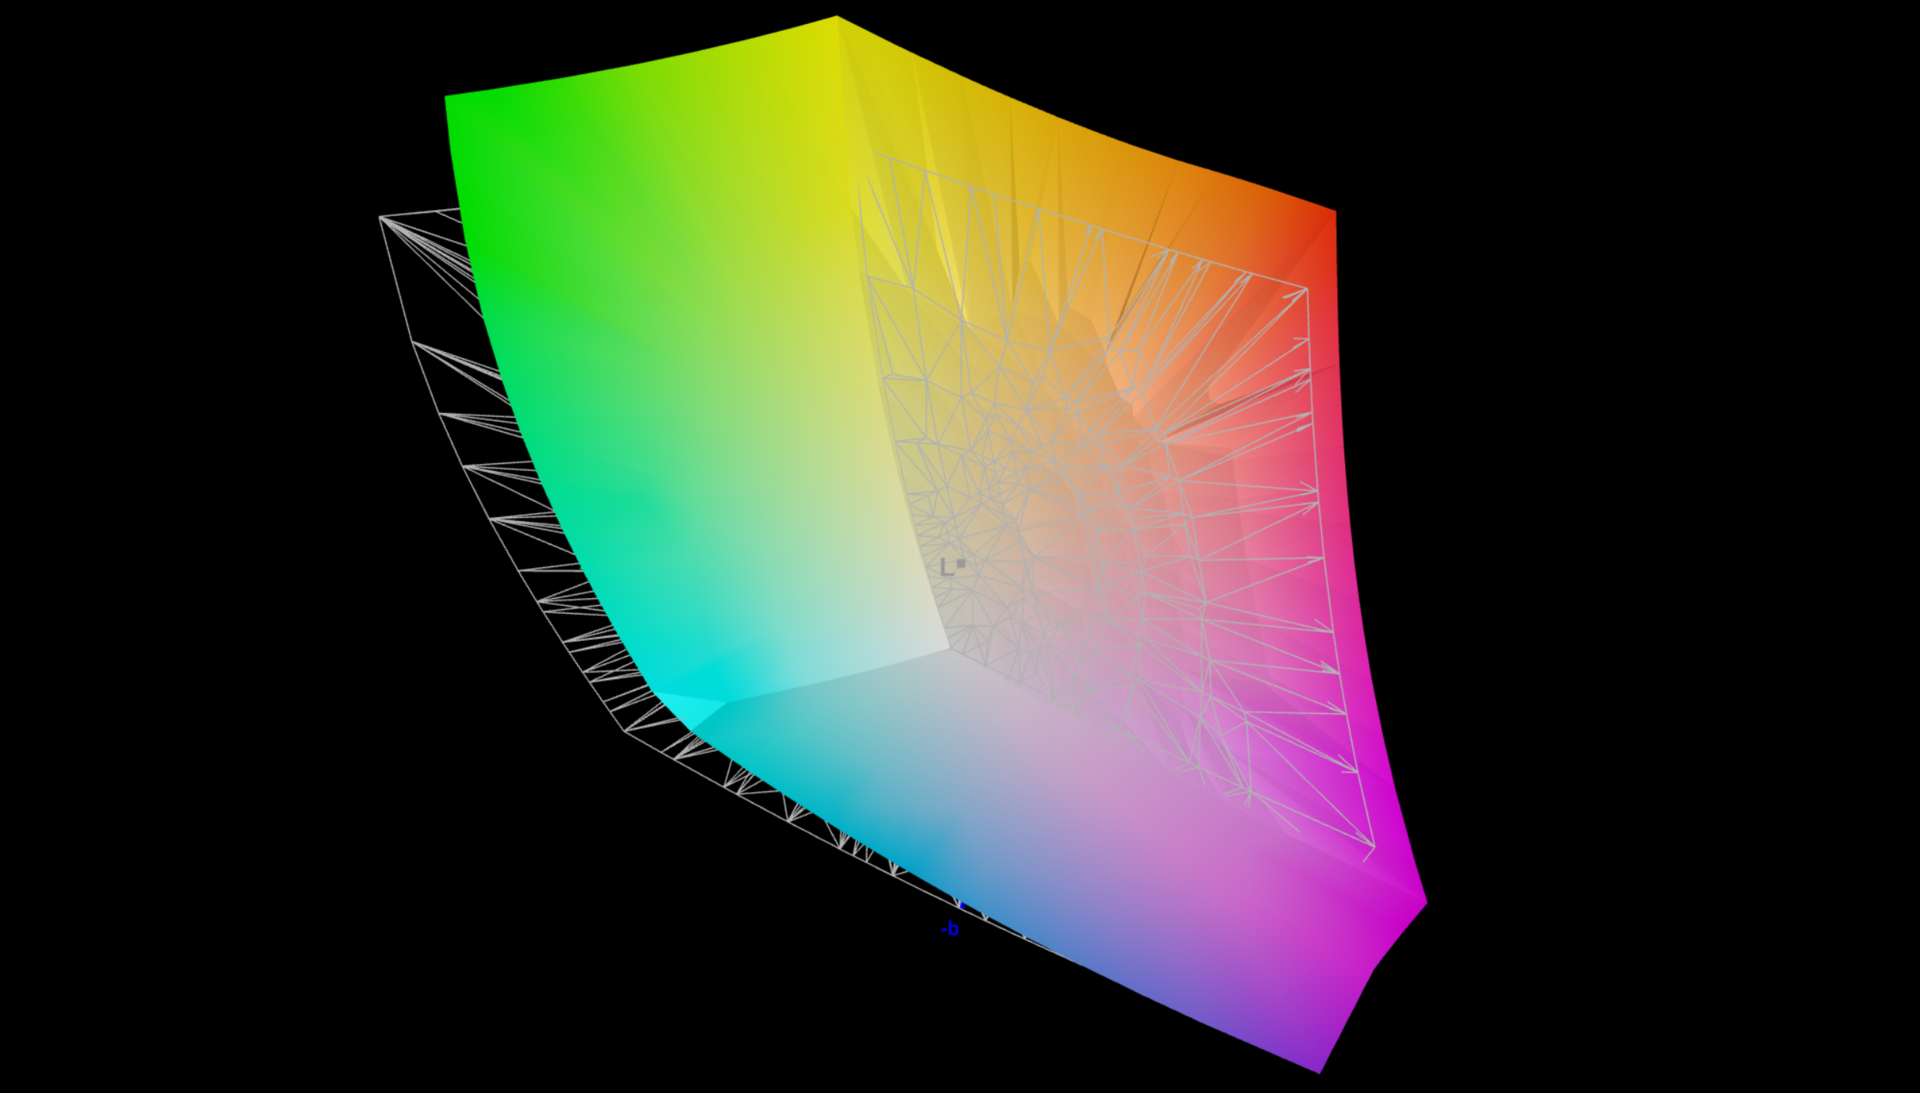
在 SDR 模式下,其亮度超过 770 cd/m²,而在 HDR 模式下,我们甚至注意到其亮度超过 1,400 cd/m²。不过,在 SDR 模式下,它的黑度不是 0(只有在 HDR 模式下才是),但对比度还是非常高。华硕还为 P3/sRGB 色彩空间直接提供了非常准确的色彩配置文件,而我们自己的校准却无法进一步减少显示器的偏差。本地调光功能可以关闭,因此该面板也适用于图像编辑,没有任何限制。


| |||||||||||||||||||||||||
Brightness Distribution: 91 %
Center on Battery: 719 cd/m²
Contrast: 10771:1 (Black: 0.07 cd/m²)
ΔE ColorChecker Calman: 1 | ∀{0.5-29.43 Ø4.72}
ΔE Greyscale Calman: 1 | ∀{0.09-98 Ø4.97}
88.4% AdobeRGB 1998 (Argyll 3D)
100% sRGB (Argyll 3D)
99.9% Display P3 (Argyll 3D)
Gamma: 2.14
CCT: 6493 K
| Asus ROG Strix Scar 16 2025 NE160QDM-NM8, Mini-LED, 2560x1600, 16", 240 Hz | Asus ROG Strix G16 G615 NE160QDM-NZC, IPS, 2560x1600, 16", 240 Hz | Lenovo Legion Pro 7i 16 Gen 10 Samsung ATNA60HU01-0, OLED, 2560x1600, 16", 240 Hz | HP Omen Max 16 ah000 Samsung ATNA60DL02-0, OLED, 2560x1600, 16", 240 Hz | Aorus MASTER 16 AM6H ATNA60DL03-0 (SDC41AB), OLED, 2560x1600, 16", 240 Hz | Asus ROG Strix Scar 16 G634JZR BOE NE160QDM-NM7, Mini LED, 2560x1600, 16", 240 Hz | |
|---|---|---|---|---|---|---|
| Display | 0% | 2% | 4% | 0% | 1% | |
| Display P3 Coverage (%) | 99.9 | 99.1 -1% | 99.5 0% | 99.7 0% | 95.3 -5% | 99.8 0% |
| sRGB Coverage (%) | 100 | 99.9 0% | 100 0% | 100 0% | 98.8 -1% | 100 0% |
| AdobeRGB 1998 Coverage (%) | 88.4 | 89.1 1% | 94.4 7% | 98.2 11% | 94.1 6% | 90.8 3% |
| Response Times | 31% | 96% | 95% | 96% | 3% | |
| Response Time Grey 50% / Grey 80% * (ms) | 7 ? | 4.6 ? 34% | 0.28 ? 96% | 0.29 ? 96% | 0.24 ? 97% | 5 ? 29% |
| Response Time Black / White * (ms) | 8.4 ? | 6.1 ? 27% | 0.43 ? 95% | 0.47 ? 94% | 0.43 ? 95% | 10.4 ? -24% |
| PWM Frequency (Hz) | 20555 ? | 1438 ? | 960 ? | 960 | 2040 ? | |
| PWM Amplitude * (%) | 29 | 31 | 47 | |||
| Screen | -117% | -81% | -106% | -80% | -83% | |
| Brightness middle (cd/m²) | 754 | 545 -28% | 490.4 -35% | 376.5 -50% | 435 -42% | 490 -35% |
| Brightness (cd/m²) | 773 | 536 -31% | 498 -36% | 382 -51% | 437 -43% | 487 -37% |
| Brightness Distribution (%) | 91 | 89 -2% | 97 7% | 96 5% | 96 5% | 94 3% |
| Black Level * (cd/m²) | 0.07 | 0.41 -486% | 0.08 -14% | 0.4 -471% | ||
| Contrast (:1) | 10771 | 1329 -88% | 5438 -50% | 1225 -89% | ||
| Colorchecker dE 2000 * | 1 | 1.6 -60% | 3.2 -220% | 3.67 -267% | 2.42 -142% | 1.08 -8% |
| Colorchecker dE 2000 max. * | 2 | 4 -100% | 6.04 -202% | 7.24 -262% | 4.81 -140% | 2.38 -19% |
| Greyscale dE 2000 * | 1 | 2.4 -140% | 1 -0% | 1.1 -10% | 3.11 -211% | 1.1 -10% |
| Gamma | 2.14 103% | 2.25 98% | 2.24 98% | 2.25 98% | 2.48 89% | 2.13 103% |
| CCT | 6493 100% | 6737 96% | 6373 102% | 6319 103% | 6270 104% | 6724 97% |
| Colorchecker dE 2000 calibrated * | 0.8 | 0.84 | 0.94 | 2.03 | 0.9 | |
| Total Average (Program / Settings) | -29% /
-67% | 6% /
-26% | -2% /
-39% | 5% /
-34% | -26% /
-51% |
* ... smaller is better


Display Response Times
| ↔ Response Time Black to White | ||
|---|---|---|
| 8.4 ms ... rise ↗ and fall ↘ combined | ↗ 4 ms rise | 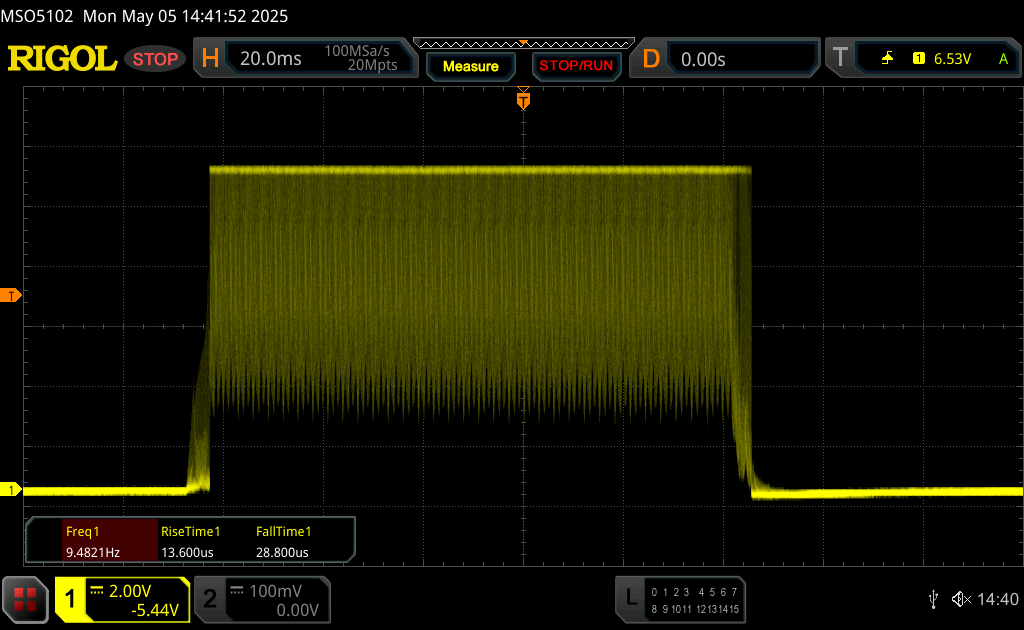 |
| ↘ 4.4 ms fall | ||
| The screen shows fast response rates in our tests and should be suited for gaming. In comparison, all tested devices range from 0.1 (minimum) to 240 (maximum) ms. » 24 % of all devices are better. This means that the measured response time is better than the average of all tested devices (19.8 ms). | ||
| ↔ Response Time 50% Grey to 80% Grey | ||
| 7 ms ... rise ↗ and fall ↘ combined | ↗ 5 ms rise | 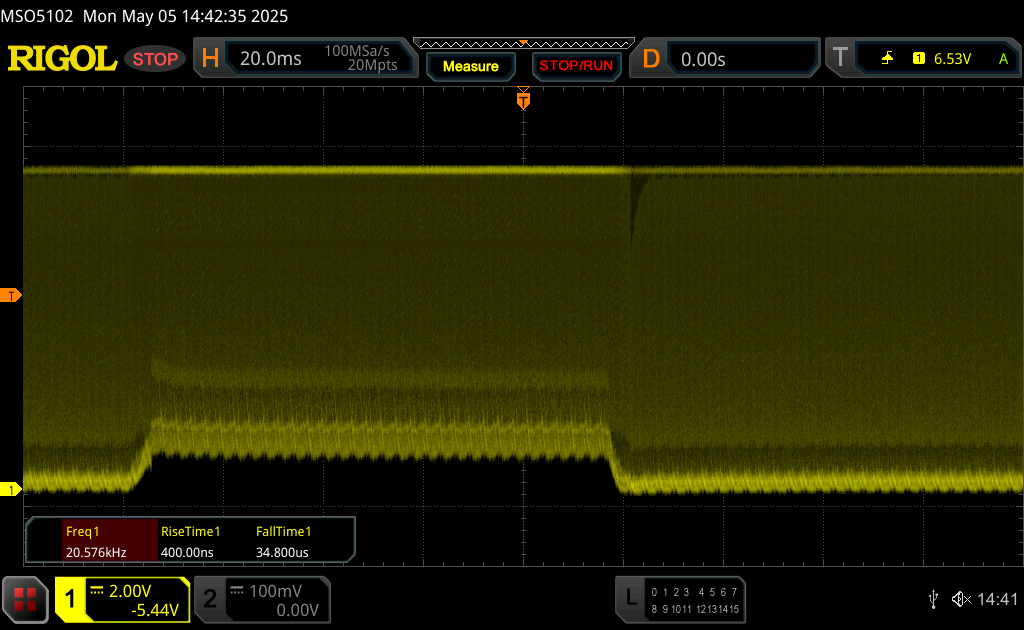 |
| ↘ 2 ms fall | ||
| The screen shows very fast response rates in our tests and should be very well suited for fast-paced gaming. In comparison, all tested devices range from 0.165 (minimum) to 636 (maximum) ms. » 20 % of all devices are better. This means that the measured response time is better than the average of all tested devices (31 ms). | ||
Screen Flickering / PWM (Pulse-Width Modulation)
| Screen flickering / PWM detected | 20555 Hz | ≤ 100 % brightness setting |  |
The display backlight flickers at 20555 Hz (worst case, e.g., utilizing PWM) Flickering detected at a brightness setting of 100 % and below. There should be no flickering or PWM above this brightness setting. The frequency of 20555 Hz is quite high, so most users sensitive to PWM should not notice any flickering. In comparison: 52 % of all tested devices do not use PWM to dim the display. If PWM was detected, an average of 7763 (minimum: 5 - maximum: 343500) Hz was measured. | |||


性能 - Arrow Lake-HX 和 RTX 5090 笔记本电脑


测试条件
ROG Strix SCAR 16 提供了所有常用的能量配置文件。我们在Turbo模式下进行了以下基准测试和测量。在电池模式下,最大可用模式为性能模式。
| 能源概况 | TDP | CB2024 Multi | TGP | Time Spy Graphics | CP 2077 QHD Ultra | 最大风扇噪音排放 |
|---|---|---|---|---|---|---|
| 静音 | 75/45 瓦 | 1,517 分 | 55 瓦 | 10,442 分 | 46.2fps | 35.3 dB(A) |
| 性能 | 165/100 瓦 | 1,972 分 | 160 瓦 | 22,787 分 | 99.9fps | 48.8 dB(A) |
| 涡轮 | 165/145 瓦 | 2,196 分 | 175 瓦 | 23,600 分 | 107.7fps | 53.6 dB(A) |
| 电池 | 65/50 瓦 | 1,584 分 | 55 瓦 | 9,712 分 | 46.5fps | 34.5 dB(A) |
处理器 - Core Ultra 9 275HX
英特尔新款高端 酷睿至尊 9 275HX处理器几乎可以在 Strix SCAR 16 上充分发挥其潜力,这要归功于它的高功率限制,在所有 CPU 基准测试中,它都仅领先于 16 英寸的竞争对手。它只比旧版 SCAR 16 领先 9%,而只有更大的 ROG Strix SCAR 18稍快一些。此外,它的性能仍然非常稳定。
Cinebench R15 Multi continuous test
Cinebench 2024: CPU Multi Core | CPU Single Core
Cinebench R23: Multi Core | Single Core
Cinebench R20: CPU (Multi Core) | CPU (Single Core)
Cinebench R15: CPU Multi 64Bit | CPU Single 64Bit
Blender: v2.79 BMW27 CPU
7-Zip 18.03: 7z b 4 | 7z b 4 -mmt1
Geekbench 6.7: Multi-Core | Single-Core
Geekbench 5.5: Multi-Core | Single-Core
HWBOT x265 Benchmark v2.2: 4k Preset
LibreOffice : 20 Documents To PDF
R Benchmark 2.5: Overall mean
| CPU Performance rating | |
| Asus Strix Scar 18 G835LX | |
| Asus ROG Strix Scar 16 2025 | |
| Asus ROG Strix G16 G615 | |
| Lenovo Legion Pro 7i 16 Gen 10 | |
| Average Intel Core Ultra 9 275HX | |
| Aorus MASTER 16 AM6H -2! | |
| Asus ROG Strix Scar 16 G634JZR | |
| HP Omen Max 16 ah000 | |
| Average of class Gaming | |
| Cinebench 2024 / CPU Multi Core | |
| Asus Strix Scar 18 G835LX | |
| Asus ROG Strix G16 G615 | |
| Asus ROG Strix Scar 16 2025 | |
| Lenovo Legion Pro 7i 16 Gen 10 | |
| Average Intel Core Ultra 9 275HX (1547 - 2288, n=27) | |
| HP Omen Max 16 ah000 | |
| Asus ROG Strix Scar 16 G634JZR | |
| Average of class Gaming (486 - 2298, n=91, last 2 years) | |
| Cinebench 2024 / CPU Single Core | |
| Asus Strix Scar 18 G835LX | |
| Asus ROG Strix G16 G615 | |
| Lenovo Legion Pro 7i 16 Gen 10 | |
| Average Intel Core Ultra 9 275HX (123.1 - 138.2, n=27) | |
| HP Omen Max 16 ah000 | |
| Asus ROG Strix Scar 16 2025 | |
| Asus ROG Strix Scar 16 G634JZR | |
| Average of class Gaming (95 - 138.2, n=91, last 2 years) | |
| Cinebench R23 / Multi Core | |
| Asus Strix Scar 18 G835LX | |
| Asus ROG Strix Scar 16 2025 | |
| Lenovo Legion Pro 7i 16 Gen 10 | |
| Aorus MASTER 16 AM6H | |
| Average Intel Core Ultra 9 275HX (30712 - 40970, n=31) | |
| Asus ROG Strix G16 G615 | |
| HP Omen Max 16 ah000 | |
| Asus ROG Strix Scar 16 G634JZR | |
| Average of class Gaming (10488 - 40970, n=110, last 2 years) | |
| Cinebench R23 / Single Core | |
| Asus Strix Scar 18 G835LX | |
| Aorus MASTER 16 AM6H | |
| Lenovo Legion Pro 7i 16 Gen 10 | |
| Average Intel Core Ultra 9 275HX (2009 - 2267, n=31) | |
| Asus ROG Strix Scar 16 G634JZR | |
| Asus ROG Strix G16 G615 | |
| Asus ROG Strix Scar 16 2025 | |
| HP Omen Max 16 ah000 | |
| Average of class Gaming (1166 - 2356, n=110, last 2 years) | |
| Cinebench R20 / CPU (Multi Core) | |
| Asus Strix Scar 18 G835LX | |
| Asus ROG Strix Scar 16 2025 | |
| Aorus MASTER 16 AM6H | |
| Lenovo Legion Pro 7i 16 Gen 10 | |
| Average Intel Core Ultra 9 275HX (12026 - 16108, n=30) | |
| Asus ROG Strix G16 G615 | |
| HP Omen Max 16 ah000 | |
| Asus ROG Strix Scar 16 G634JZR | |
| Average of class Gaming (4029 - 16108, n=109, last 2 years) | |
| Cinebench R20 / CPU (Single Core) | |
| Asus Strix Scar 18 G835LX | |
| Asus ROG Strix G16 G615 | |
| Aorus MASTER 16 AM6H | |
| Average Intel Core Ultra 9 275HX (774 - 870, n=30) | |
| Asus ROG Strix Scar 16 2025 | |
| Asus ROG Strix Scar 16 G634JZR | |
| Lenovo Legion Pro 7i 16 Gen 10 | |
| HP Omen Max 16 ah000 | |
| Average of class Gaming (442 - 895, n=109, last 2 years) | |
| Cinebench R15 / CPU Multi 64Bit | |
| Asus Strix Scar 18 G835LX | |
| Asus ROG Strix G16 G615 | |
| Asus ROG Strix Scar 16 2025 | |
| Lenovo Legion Pro 7i 16 Gen 10 | |
| Aorus MASTER 16 AM6H | |
| Average Intel Core Ultra 9 275HX (4737 - 6271, n=30) | |
| HP Omen Max 16 ah000 | |
| Asus ROG Strix Scar 16 G634JZR | |
| Average of class Gaming (1578 - 6271, n=108, last 2 years) | |
| Cinebench R15 / CPU Single 64Bit | |
| Asus Strix Scar 18 G835LX | |
| Asus ROG Strix Scar 16 2025 | |
| Asus ROG Strix G16 G615 | |
| Lenovo Legion Pro 7i 16 Gen 10 | |
| Aorus MASTER 16 AM6H | |
| Average Intel Core Ultra 9 275HX (306 - 343, n=31) | |
| HP Omen Max 16 ah000 | |
| Asus ROG Strix Scar 16 G634JZR | |
| Average of class Gaming (188.8 - 343, n=109, last 2 years) | |
| Blender / v2.79 BMW27 CPU | |
| Average of class Gaming (80 - 330, n=107, last 2 years) | |
| Asus ROG Strix Scar 16 G634JZR | |
| HP Omen Max 16 ah000 | |
| Average Intel Core Ultra 9 275HX (82 - 116, n=29) | |
| Aorus MASTER 16 AM6H | |
| Lenovo Legion Pro 7i 16 Gen 10 | |
| Asus Strix Scar 18 G835LX | |
| Asus ROG Strix Scar 16 2025 | |
| Asus ROG Strix G16 G615 | |
| 7-Zip 18.03 / 7z b 4 | |
| Asus Strix Scar 18 G835LX | |
| Asus ROG Strix Scar 16 G634JZR | |
| Asus ROG Strix Scar 16 2025 | |
| Asus ROG Strix G16 G615 | |
| Lenovo Legion Pro 7i 16 Gen 10 | |
| Average Intel Core Ultra 9 275HX (98236 - 124155, n=30) | |
| Aorus MASTER 16 AM6H | |
| HP Omen Max 16 ah000 | |
| Average of class Gaming (33491 - 148086, n=108, last 2 years) | |
| 7-Zip 18.03 / 7z b 4 -mmt1 | |
| Asus ROG Strix Scar 16 G634JZR | |
| Asus ROG Strix G16 G615 | |
| Asus Strix Scar 18 G835LX | |
| Average Intel Core Ultra 9 275HX (6026 - 7149, n=30) | |
| Aorus MASTER 16 AM6H | |
| Asus ROG Strix Scar 16 2025 | |
| Lenovo Legion Pro 7i 16 Gen 10 | |
| Average of class Gaming (4199 - 7436, n=108, last 2 years) | |
| HP Omen Max 16 ah000 | |
| Geekbench 6.7 / Multi-Core | |
| Asus Strix Scar 18 G835LX | |
| Asus ROG Strix Scar 16 2025 | |
| Asus ROG Strix G16 G615 | |
| Average Intel Core Ultra 9 275HX (16033 - 21668, n=33) | |
| Aorus MASTER 16 AM6H | |
| Lenovo Legion Pro 7i 16 Gen 10 | |
| Asus ROG Strix Scar 16 G634JZR | |
| HP Omen Max 16 ah000 | |
| Average of class Gaming (6625 - 22104, n=109, last 2 years) | |
| Geekbench 6.7 / Single-Core | |
| Asus Strix Scar 18 G835LX | |
| Asus ROG Strix Scar 16 2025 | |
| Lenovo Legion Pro 7i 16 Gen 10 | |
| Aorus MASTER 16 AM6H | |
| Average Intel Core Ultra 9 275HX (2843 - 3160, n=33) | |
| Asus ROG Strix Scar 16 G634JZR | |
| Asus ROG Strix G16 G615 | |
| HP Omen Max 16 ah000 | |
| Average of class Gaming (1490 - 3259, n=109, last 2 years) | |
| Geekbench 5.5 / Multi-Core | |
| Asus Strix Scar 18 G835LX | |
| Asus ROG Strix Scar 16 2025 | |
| Asus ROG Strix G16 G615 | |
| Average Intel Core Ultra 9 275HX (19105 - 25855, n=31) | |
| Lenovo Legion Pro 7i 16 Gen 10 | |
| Aorus MASTER 16 AM6H | |
| Asus ROG Strix Scar 16 G634JZR | |
| HP Omen Max 16 ah000 | |
| Average of class Gaming (6460 - 27010, n=108, last 2 years) | |
| Geekbench 5.5 / Single-Core | |
| Asus Strix Scar 18 G835LX | |
| Asus ROG Strix Scar 16 2025 | |
| Aorus MASTER 16 AM6H | |
| Asus ROG Strix Scar 16 G634JZR | |
| Average Intel Core Ultra 9 275HX (2033 - 2292, n=31) | |
| Lenovo Legion Pro 7i 16 Gen 10 | |
| Asus ROG Strix G16 G615 | |
| Average of class Gaming (986 - 2474, n=108, last 2 years) | |
| HP Omen Max 16 ah000 | |
| HWBOT x265 Benchmark v2.2 / 4k Preset | |
| Asus Strix Scar 18 G835LX | |
| Asus ROG Strix Scar 16 2025 | |
| Asus ROG Strix G16 G615 | |
| Lenovo Legion Pro 7i 16 Gen 10 | |
| Average Intel Core Ultra 9 275HX (30.7 - 43.8, n=30) | |
| Aorus MASTER 16 AM6H | |
| HP Omen Max 16 ah000 | |
| Asus ROG Strix Scar 16 G634JZR | |
| Average of class Gaming (11.5 - 44.3, n=108, last 2 years) | |
| LibreOffice / 20 Documents To PDF | |
| Average of class Gaming (19 - 88.8, n=108, last 2 years) | |
| Asus ROG Strix Scar 16 G634JZR | |
| Average Intel Core Ultra 9 275HX (33.2 - 62.1, n=30) | |
| HP Omen Max 16 ah000 | |
| Asus Strix Scar 18 G835LX | |
| Asus ROG Strix Scar 16 2025 | |
| Aorus MASTER 16 AM6H | |
| Asus ROG Strix G16 G615 | |
| Lenovo Legion Pro 7i 16 Gen 10 | |
| R Benchmark 2.5 / Overall mean | |
| HP Omen Max 16 ah000 | |
| Aorus MASTER 16 AM6H | |
| Average of class Gaming (0.3439 - 0.759, n=109, last 2 years) | |
| Average Intel Core Ultra 9 275HX (0.3943 - 0.4568, n=30) | |
| Asus ROG Strix Scar 16 2025 | |
| Lenovo Legion Pro 7i 16 Gen 10 | |
| Asus ROG Strix G16 G615 | |
| Asus Strix Scar 18 G835LX | |
| Asus ROG Strix Scar 16 G634JZR | |
* ... smaller is better
AIDA64: FP32 Ray-Trace | FPU Julia | CPU SHA3 | CPU Queen | FPU SinJulia | FPU Mandel | CPU AES | CPU ZLib | FP64 Ray-Trace | CPU PhotoWorxx
| Performance rating | |
| Asus ROG Strix Scar 16 2025 | |
| Asus ROG Strix G16 G615 | |
| Aorus MASTER 16 AM6H | |
| Lenovo Legion Pro 7i 16 Gen 10 | |
| Average Intel Core Ultra 9 275HX | |
| HP Omen Max 16 ah000 | |
| Asus ROG Strix Scar 16 G634JZR | |
| Average of class Gaming | |
| AIDA64 / FP32 Ray-Trace | |
| Asus ROG Strix Scar 16 2025 | |
| Asus ROG Strix G16 G615 | |
| Aorus MASTER 16 AM6H | |
| Lenovo Legion Pro 7i 16 Gen 10 | |
| Average Intel Core Ultra 9 275HX (28039 - 39895, n=30) | |
| HP Omen Max 16 ah000 | |
| Average of class Gaming (10227 - 85542, n=107, last 2 years) | |
| Asus ROG Strix Scar 16 G634JZR | |
| AIDA64 / FPU Julia | |
| Asus ROG Strix G16 G615 | |
| Asus ROG Strix Scar 16 2025 | |
| Aorus MASTER 16 AM6H | |
| Lenovo Legion Pro 7i 16 Gen 10 | |
| Average Intel Core Ultra 9 275HX (140254 - 200744, n=30) | |
| HP Omen Max 16 ah000 | |
| Average of class Gaming (51376 - 238426, n=107, last 2 years) | |
| Asus ROG Strix Scar 16 G634JZR | |
| AIDA64 / CPU SHA3 | |
| Asus ROG Strix Scar 16 2025 | |
| Asus ROG Strix G16 G615 | |
| Aorus MASTER 16 AM6H | |
| Lenovo Legion Pro 7i 16 Gen 10 | |
| Average Intel Core Ultra 9 275HX (6710 - 9817, n=30) | |
| HP Omen Max 16 ah000 | |
| Asus ROG Strix Scar 16 G634JZR | |
| Average of class Gaming (2180 - 9817, n=107, last 2 years) | |
| AIDA64 / CPU Queen | |
| Asus ROG Strix Scar 16 G634JZR | |
| Asus ROG Strix Scar 16 2025 | |
| Asus ROG Strix G16 G615 | |
| Lenovo Legion Pro 7i 16 Gen 10 | |
| Aorus MASTER 16 AM6H | |
| Average Intel Core Ultra 9 275HX (113887 - 140937, n=30) | |
| HP Omen Max 16 ah000 | |
| Average of class Gaming (49785 - 173351, n=94, last 2 years) | |
| AIDA64 / FPU SinJulia | |
| Asus ROG Strix Scar 16 G634JZR | |
| Average of class Gaming (4424 - 33636, n=107, last 2 years) | |
| Lenovo Legion Pro 7i 16 Gen 10 | |
| Asus ROG Strix Scar 16 2025 | |
| Asus ROG Strix G16 G615 | |
| Aorus MASTER 16 AM6H | |
| Average Intel Core Ultra 9 275HX (11172 - 14425, n=30) | |
| HP Omen Max 16 ah000 | |
| AIDA64 / FPU Mandel | |
| Asus ROG Strix G16 G615 | |
| Asus ROG Strix Scar 16 2025 | |
| Aorus MASTER 16 AM6H | |
| Lenovo Legion Pro 7i 16 Gen 10 | |
| Average Intel Core Ultra 9 275HX (72596 - 104508, n=30) | |
| HP Omen Max 16 ah000 | |
| Average of class Gaming (25115 - 128721, n=107, last 2 years) | |
| Asus ROG Strix Scar 16 G634JZR | |
| AIDA64 / CPU AES | |
| Asus ROG Strix Scar 16 G634JZR | |
| Asus ROG Strix G16 G615 | |
| Lenovo Legion Pro 7i 16 Gen 10 | |
| Asus ROG Strix Scar 16 2025 | |
| Average Intel Core Ultra 9 275HX (105608 - 247074, n=30) | |
| Aorus MASTER 16 AM6H | |
| HP Omen Max 16 ah000 | |
| Average of class Gaming (39258 - 247074, n=107, last 2 years) | |
| AIDA64 / CPU ZLib | |
| Asus ROG Strix G16 G615 | |
| Asus ROG Strix Scar 16 2025 | |
| Aorus MASTER 16 AM6H | |
| Lenovo Legion Pro 7i 16 Gen 10 | |
| Average Intel Core Ultra 9 275HX (1582 - 2263, n=30) | |
| HP Omen Max 16 ah000 | |
| Asus ROG Strix Scar 16 G634JZR | |
| Average of class Gaming (574 - 2531, n=107, last 2 years) | |
| AIDA64 / FP64 Ray-Trace | |
| Asus ROG Strix Scar 16 2025 | |
| Asus ROG Strix G16 G615 | |
| Aorus MASTER 16 AM6H | |
| Lenovo Legion Pro 7i 16 Gen 10 | |
| Average Intel Core Ultra 9 275HX (14847 - 21854, n=30) | |
| HP Omen Max 16 ah000 | |
| Average of class Gaming (5509 - 45446, n=107, last 2 years) | |
| Asus ROG Strix Scar 16 G634JZR | |
| AIDA64 / CPU PhotoWorxx | |
| Asus ROG Strix Scar 16 2025 | |
| Lenovo Legion Pro 7i 16 Gen 10 | |
| Average Intel Core Ultra 9 275HX (37482 - 62916, n=30) | |
| Asus ROG Strix Scar 16 G634JZR | |
| HP Omen Max 16 ah000 | |
| Aorus MASTER 16 AM6H | |
| Asus ROG Strix G16 G615 | |
| Average of class Gaming (12271 - 89891, n=107, last 2 years) | |
系统性能
不出所料,Strix SCAR 16 是一款超快的设备,我们在测试过程中没有遇到系统稳定性方面的问题。只有在切换显卡时有一点小问题,但这符合当前的技术水平。
CrossMark: Overall | Productivity | Creativity | Responsiveness
WebXPRT 3: Overall
WebXPRT 4: Overall
Mozilla Kraken 1.1: Total
| PCMark 10 / Score | |
| Lenovo Legion Pro 7i 16 Gen 10 | |
| Asus ROG Strix G16 G615 | |
| Asus ROG Strix Scar 16 2025 | |
| HP Omen Max 16 ah000 | |
| Average Intel Core Ultra 9 275HX, NVIDIA GeForce RTX 5090 Laptop (7474 - 9497, n=11) | |
| Average of class Gaming (5828 - 11574, n=95, last 2 years) | |
| Aorus MASTER 16 AM6H | |
| Asus ROG Strix Scar 16 G634JZR | |
| PCMark 10 / Essentials | |
| Asus ROG Strix Scar 16 G634JZR | |
| Lenovo Legion Pro 7i 16 Gen 10 | |
| Asus ROG Strix G16 G615 | |
| Asus ROG Strix Scar 16 2025 | |
| HP Omen Max 16 ah000 | |
| Average Intel Core Ultra 9 275HX, NVIDIA GeForce RTX 5090 Laptop (9994 - 11369, n=12) | |
| Average of class Gaming (8810 - 12600, n=99, last 2 years) | |
| Aorus MASTER 16 AM6H | |
| PCMark 10 / Productivity | |
| Average of class Gaming (6845 - 21327, n=97, last 2 years) | |
| Average Intel Core Ultra 9 275HX, NVIDIA GeForce RTX 5090 Laptop (9122 - 10925, n=11) | |
| Lenovo Legion Pro 7i 16 Gen 10 | |
| Aorus MASTER 16 AM6H | |
| Asus ROG Strix G16 G615 | |
| Asus ROG Strix Scar 16 2025 | |
| HP Omen Max 16 ah000 | |
| Asus ROG Strix Scar 16 G634JZR | |
| PCMark 10 / Digital Content Creation | |
| Lenovo Legion Pro 7i 16 Gen 10 | |
| HP Omen Max 16 ah000 | |
| Asus ROG Strix G16 G615 | |
| Asus ROG Strix Scar 16 2025 | |
| Average Intel Core Ultra 9 275HX, NVIDIA GeForce RTX 5090 Laptop (9952 - 19234, n=11) | |
| Aorus MASTER 16 AM6H | |
| Asus ROG Strix Scar 16 G634JZR | |
| Average of class Gaming (7602 - 19657, n=97, last 2 years) | |
| CrossMark / Overall | |
| Aorus MASTER 16 AM6H | |
| Average Intel Core Ultra 9 275HX, NVIDIA GeForce RTX 5090 Laptop (1995 - 2339, n=12) | |
| Asus ROG Strix G16 G615 | |
| Asus ROG Strix Scar 16 2025 | |
| Asus ROG Strix Scar 16 G634JZR | |
| Lenovo Legion Pro 7i 16 Gen 10 | |
| HP Omen Max 16 ah000 | |
| Average of class Gaming (1366 - 2409, n=96, last 2 years) | |
| CrossMark / Productivity | |
| Aorus MASTER 16 AM6H | |
| Average Intel Core Ultra 9 275HX, NVIDIA GeForce RTX 5090 Laptop (1847 - 2211, n=12) | |
| Asus ROG Strix G16 G615 | |
| Asus ROG Strix Scar 16 2025 | |
| Lenovo Legion Pro 7i 16 Gen 10 | |
| Asus ROG Strix Scar 16 G634JZR | |
| Average of class Gaming (1386 - 2254, n=96, last 2 years) | |
| HP Omen Max 16 ah000 | |
| CrossMark / Creativity | |
| Asus ROG Strix Scar 16 2025 | |
| Average Intel Core Ultra 9 275HX, NVIDIA GeForce RTX 5090 Laptop (2170 - 2642, n=12) | |
| Aorus MASTER 16 AM6H | |
| Asus ROG Strix G16 G615 | |
| Asus ROG Strix Scar 16 G634JZR | |
| Lenovo Legion Pro 7i 16 Gen 10 | |
| HP Omen Max 16 ah000 | |
| Average of class Gaming (1343 - 2729, n=96, last 2 years) | |
| CrossMark / Responsiveness | |
| Aorus MASTER 16 AM6H | |
| Average Intel Core Ultra 9 275HX, NVIDIA GeForce RTX 5090 Laptop (1673 - 2217, n=12) | |
| Asus ROG Strix G16 G615 | |
| Asus ROG Strix Scar 16 G634JZR | |
| Average of class Gaming (1226 - 2334, n=96, last 2 years) | |
| Asus ROG Strix Scar 16 2025 | |
| HP Omen Max 16 ah000 | |
| Lenovo Legion Pro 7i 16 Gen 10 | |
| WebXPRT 3 / Overall | |
| HP Omen Max 16 ah000 | |
| Lenovo Legion Pro 7i 16 Gen 10 | |
| Asus ROG Strix G16 G615 | |
| Average Intel Core Ultra 9 275HX, NVIDIA GeForce RTX 5090 Laptop (315 - 372, n=12) | |
| Aorus MASTER 16 AM6H | |
| Asus ROG Strix Scar 16 2025 | |
| Average of class Gaming (220 - 532, n=100, last 2 years) | |
| Asus ROG Strix Scar 16 G634JZR | |
| WebXPRT 4 / Overall | |
| Asus ROG Strix Scar 16 2025 | |
| Asus ROG Strix G16 G615 | |
| Aorus MASTER 16 AM6H | |
| Lenovo Legion Pro 7i 16 Gen 10 | |
| Average Intel Core Ultra 9 275HX, NVIDIA GeForce RTX 5090 Laptop (301 - 341, n=11) | |
| Asus ROG Strix Scar 16 G634JZR | |
| Average of class Gaming (165 - 354, n=101, last 2 years) | |
| Mozilla Kraken 1.1 / Total | |
| Average of class Gaming (391 - 590, n=104, last 2 years) | |
| Asus ROG Strix Scar 16 G634JZR | |
| HP Omen Max 16 ah000 | |
| Asus ROG Strix Scar 16 2025 | |
| Average Intel Core Ultra 9 275HX, NVIDIA GeForce RTX 5090 Laptop (402 - 424, n=12) | |
| Aorus MASTER 16 AM6H | |
| Lenovo Legion Pro 7i 16 Gen 10 | |
| Asus ROG Strix G16 G615 | |
* ... smaller is better
| PCMark 10 Score | 8819 points | |
Help | ||
| AIDA64 / Memory Copy | |
| Asus ROG Strix G16 G615 | |
| Lenovo Legion Pro 7i 16 Gen 10 | |
| Asus ROG Strix Scar 16 2025 | |
| Average Intel Core Ultra 9 275HX (56003 - 94460, n=30) | |
| Asus ROG Strix Scar 16 G634JZR | |
| HP Omen Max 16 ah000 | |
| Aorus MASTER 16 AM6H | |
| Average of class Gaming (21750 - 129946, n=107, last 2 years) | |
| AIDA64 / Memory Read | |
| Lenovo Legion Pro 7i 16 Gen 10 | |
| Asus ROG Strix Scar 16 2025 | |
| Asus ROG Strix Scar 16 G634JZR | |
| Average Intel Core Ultra 9 275HX (55795 - 97151, n=30) | |
| HP Omen Max 16 ah000 | |
| Asus ROG Strix G16 G615 | |
| Aorus MASTER 16 AM6H | |
| Average of class Gaming (22956 - 118858, n=107, last 2 years) | |
| AIDA64 / Memory Write | |
| Lenovo Legion Pro 7i 16 Gen 10 | |
| Asus ROG Strix Scar 16 2025 | |
| Average Intel Core Ultra 9 275HX (55663 - 116129, n=30) | |
| HP Omen Max 16 ah000 | |
| Asus ROG Strix Scar 16 G634JZR | |
| Average of class Gaming (22297 - 135096, n=107, last 2 years) | |
| Asus ROG Strix G16 G615 | |
| Aorus MASTER 16 AM6H | |
| AIDA64 / Memory Latency | |
| HP Omen Max 16 ah000 | |
| Average Intel Core Ultra 9 275HX (105.8 - 161.6, n=30) | |
| Aorus MASTER 16 AM6H | |
| Asus ROG Strix G16 G615 | |
| Asus ROG Strix Scar 16 2025 | |
| Lenovo Legion Pro 7i 16 Gen 10 | |
| Average of class Gaming (75.3 - 259, n=107, last 2 years) | |
| Asus ROG Strix Scar 16 G634JZR | |
* ... smaller is better
DPC 延迟
在我们的标准化延迟测试(网上冲浪、4K YouTube 播放、CPU 负载)中,使用当前 BIOS 版本的测试设备在使用实时音频应用程序时显示出轻微的限制。


| DPC Latencies / LatencyMon - interrupt to process latency (max), Web, Youtube, Prime95 | |
| Asus ROG Strix Scar 16 G634JZR | |
| Asus ROG Strix Scar 16 2025 | |
| Aorus MASTER 16 AM6H | |
| HP Omen Max 16 ah000 | |
| Asus ROG Strix G16 G615 | |
| Lenovo Legion Pro 7i 16 Gen 10 | |
* ... smaller is better
存储设备
ROG Strix SCAR 16 有两个 M.2 2280 SSD 插槽,但还不支持 PCIe 5.0。我们的测试设备配备了一个来自西部数据的 2 TB 硬盘(用户可免费使用 1.73 TB),在测试过程中传输速率高且稳定。

* ... smaller is better
Reading continuous performance: DiskSpd Read Loop, Queue Depth 8
图形处理器性能
我们的测试设备使用了全新的 GeForce RTX 5090 笔记本电脑配备 24GB VRAM(Advanced Optimus)。它是 175 瓦版本(150 瓦 + 25 瓦 Dynamic Boost),其基准测试结果非常好。与较大的 ROG Strix SCAR 18.
虽然 5090 笔记本电脑在我们的标准 1080p 测试中还不能显示出它的优势,但它在游戏中的表现同样出色。在 QHD 分辨率下,5090 笔记本电脑的性能几乎总是优于 5080 笔记本电脑,但正如我们在 图形处理器分析,5090 笔记本电脑尤其适合 4K 分辨率。如果您只想在设备的内部显示屏上玩游戏,而不会从额外的 VRAM 中获得任何其他好处(例如用于视频编辑),那么 RTX 5080 笔记本电脑就完全足够了。
| 3DMark 11 Performance | 47965 points | |
| 3DMark Fire Strike Score | 38818 points | |
| 3DMark Time Spy Score | 22241 points | |
| 3DMark Steel Nomad Score | 6008 points | |
Help | ||
| Blender / v3.3 Classroom OPTIX/RTX | |
| Average of class Gaming (9 - 32, n=109, last 2 years) | |
| Asus ROG Strix Scar 16 2025 | |
| Asus ROG Strix Scar 16 G634JZR | |
| HP Omen Max 16 ah000 | |
| Lenovo Legion Pro 7i 16 Gen 10 | |
| Average NVIDIA GeForce RTX 5090 Laptop (9 - 18, n=21) | |
| Asus ROG Strix G16 G615 | |
| Aorus MASTER 16 AM6H | |
| Blender / v3.3 Classroom CUDA | |
| Average of class Gaming (15 - 233, n=110, last 2 years) | |
| Asus ROG Strix Scar 16 G634JZR | |
| Asus ROG Strix G16 G615 | |
| Asus ROG Strix Scar 16 2025 | |
| Lenovo Legion Pro 7i 16 Gen 10 | |
| Average NVIDIA GeForce RTX 5090 Laptop (15 - 37, n=20) | |
| Aorus MASTER 16 AM6H | |
| HP Omen Max 16 ah000 | |
| Blender / v3.3 Classroom CPU | |
| Average of class Gaming (122 - 565, n=105, last 2 years) | |
| Asus ROG Strix Scar 16 G634JZR | |
| Average NVIDIA GeForce RTX 5090 Laptop (123 - 282, n=21) | |
| HP Omen Max 16 ah000 | |
| Aorus MASTER 16 AM6H | |
| Lenovo Legion Pro 7i 16 Gen 10 | |
| Asus ROG Strix Scar 16 2025 | |
| Asus ROG Strix G16 G615 | |
* ... smaller is better
| F1 24 - 2560x1440 Ultra High Preset AA:T AF:16x | |
| HP Omen Max 16 ah000 | |
| Asus ROG Strix Scar 16 2025 | |
| Average NVIDIA GeForce RTX 5090 Laptop (72.5 - 106.9, n=22) | |
| Aorus MASTER 16 AM6H | |
| Asus ROG Strix G16 G615 | |
| Average of class Gaming (29.8 - 106.9, n=58, last 2 years) | |
| Call of Duty Black Ops 6 - 2560x1440 Extreme Preset | |
| Average NVIDIA GeForce RTX 5090 Laptop (92 - 151, n=8) | |
| Average of class Gaming (60 - 151, n=15, last 2 years) | |
| Asus ROG Strix Scar 16 2025 | |
Cyberpunk 2077 ultra FPS diagram
| low | med. | high | ultra | QHD | |
|---|---|---|---|---|---|
| GTA V (2015) | 162.8 | 158 | |||
| Dota 2 Reborn (2015) | 223 | 184.1 | 177.5 | 167.2 | |
| Final Fantasy XV Benchmark (2018) | 234 | 230 | 194.6 | 157 | |
| X-Plane 11.11 (2018) | 158 | 143.3 | 115.9 | ||
| Strange Brigade (2018) | 553 | 398 | 397 | 375 | 315 |
| Baldur's Gate 3 (2023) | 250 | 218.2 | 196.7 | 193.3 | 141.7 |
| Cyberpunk 2077 (2023) | 191.2 | 187.9 | 168.9 | 153.6 | 107.7 |
| Alan Wake 2 (2023) | 130.5 | 129.6 | 120.6 | 83.4 | |
| F1 24 (2024) | 324 | 144.2 | 97.8 | ||
| Call of Duty Black Ops 6 (2024) | 201 | 186 | 135 | 128 | 92 |
| Indiana Jones and the Great Circle (2024) | 187.5 | 138.2 | 121.9 | 99.1 |
排放与能源管理
噪音排放

笔记本电脑的散热系统由一个大蒸发腔和三个风扇组成。我们始终建议在执行简单任务时使用静音模式,因为此时风扇通常会被关闭。而在"涡轮增压"模式下,我们注意到背景噪音持续为 29 分贝(A)。游戏时,噪音也很快达到 53.6 dB(A)。对手的噪音会稍大一些,但在这里也无法避免耳机的噪音。我们的测试设备没有发出其他电子噪音。
Noise level
| Idle |
| 29 / 29 / 29 dB(A) |
| Load |
| 40.5 / 53.6 dB(A) |
 | ||
30 dB silent 40 dB(A) audible 50 dB(A) loud |
||
min: | ||
| Asus ROG Strix Scar 16 2025 GeForce RTX 5090 Laptop, Ultra 9 275HX, WD PC SN8000S 2TB | Asus ROG Strix G16 G615 GeForce RTX 5080 Laptop, Ultra 9 275HX, Micron 2500 1TB MTFDKBA1T0QGN | Lenovo Legion Pro 7i 16 Gen 10 GeForce RTX 5080 Laptop, Ultra 9 275HX, SK Hynix HFS001TEJ9X115N | HP Omen Max 16 ah000 GeForce RTX 5090 Laptop, Ultra 9 275HX, WDC PC SN810 2TB | Aorus MASTER 16 AM6H GeForce RTX 5090 Laptop, Ultra 9 275HX, Kingston OM8PGP41024Q-A0 | Asus ROG Strix Scar 16 G634JZR GeForce RTX 4080 Laptop GPU, i9-14900HX, SK hynix PC801 HFS002TEJ9X101N | |
|---|---|---|---|---|---|---|
| Noise | 1% | 12% | -4% | 6% | -7% | |
| off / environment * (dB) | 23.8 | 24 -1% | 22.9 4% | 22.8 4% | 23 3% | 21.07 11% |
| Idle Minimum * (dB) | 29 | 24 17% | 22.9 21% | 29 -0% | 23 21% | 29.75 -3% |
| Idle Average * (dB) | 29 | 30.1 -4% | 22.9 21% | 29 -0% | 23 21% | 29.75 -3% |
| Idle Maximum * (dB) | 29 | 30.1 -4% | 26.3 9% | 29 -0% | 23 21% | 29.75 -3% |
| Load Average * (dB) | 40.5 | 41.1 -1% | 27.8 31% | 47.7 -18% | 40.46 -0% | 54.85 -35% |
| Cyberpunk 2077 ultra * (dB) | 53.6 | 54.2 -1% | 54.2 -1% | 54.8 -2% | 59.75 -11% | |
| Load Maximum * (dB) | 53.6 | 54.2 -1% | 53.9 -1% | 61.1 -14% | 59.75 -11% | 58 -8% |
| Witcher 3 ultra * (dB) | 57.8 |
* ... smaller is better
温度
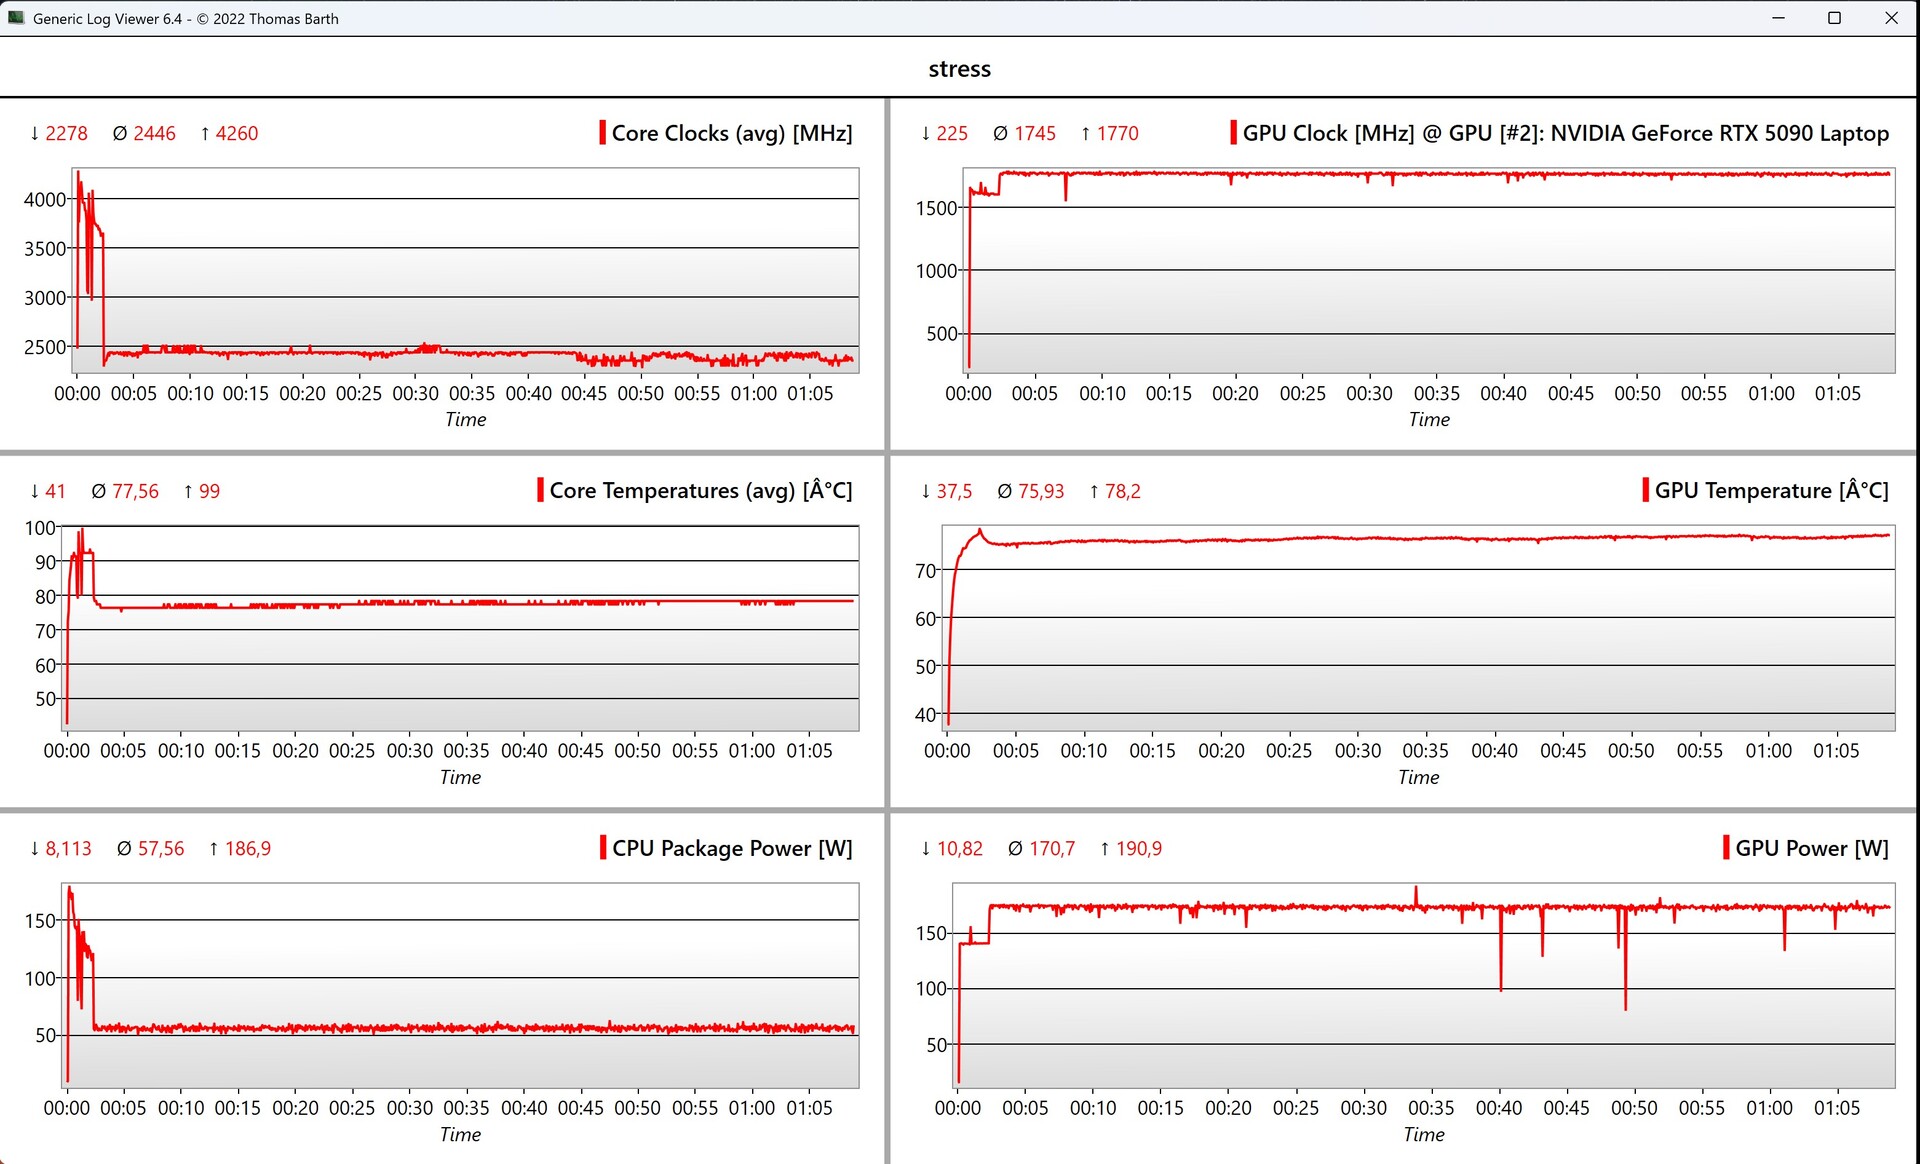
在低负载情况下,笔记本电脑的表面保持超低温,测试期间玩游戏时也没有受到任何限制,因为我们只在背面测得略高于 45°C 的温度。即便如此,键盘的温度仍然很低。在压力测试中,处理器和显卡的功率分别为 50 瓦和 175 瓦。
(±) The maximum temperature on the upper side is 44.2 °C / 112 F, compared to the average of 40.4 °C / 105 F, ranging from 21.2 to 68.8 °C for the class Gaming.
(-) The bottom heats up to a maximum of 48.1 °C / 119 F, compared to the average of 43.2 °C / 110 F
(+) In idle usage, the average temperature for the upper side is 30.8 °C / 87 F, compared to the device average of 33.9 °C / 93 F.
(±) 3: The average temperature for the upper side is 35.1 °C / 95 F, compared to the average of 33.9 °C / 93 F for the class Gaming.
(+) The palmrests and touchpad are reaching skin temperature as a maximum (34.3 °C / 93.7 F) and are therefore not hot.
(-) The average temperature of the palmrest area of similar devices was 28.8 °C / 83.8 F (-5.5 °C / -9.9 F).


| Asus ROG Strix Scar 16 2025 Intel Core Ultra 9 275HX, NVIDIA GeForce RTX 5090 Laptop | Asus ROG Strix G16 G615 Intel Core Ultra 9 275HX, NVIDIA GeForce RTX 5080 Laptop | Lenovo Legion Pro 7i 16 Gen 10 Intel Core Ultra 9 275HX, NVIDIA GeForce RTX 5080 Laptop | HP Omen Max 16 ah000 Intel Core Ultra 9 275HX, NVIDIA GeForce RTX 5090 Laptop | Aorus MASTER 16 AM6H Intel Core Ultra 9 275HX, NVIDIA GeForce RTX 5090 Laptop | Asus ROG Strix Scar 16 G634JZR Intel Core i9-14900HX, NVIDIA GeForce RTX 4080 Laptop GPU | |
|---|---|---|---|---|---|---|
| Heat | 13% | 7% | 11% | -2% | -2% | |
| Maximum Upper Side * (°C) | 44.2 | 39.6 10% | 42.6 4% | 42.8 3% | 39 12% | 47.8 -8% |
| Maximum Bottom * (°C) | 48.1 | 49.7 -3% | 41.2 14% | 50.2 -4% | 51 -6% | 52.2 -9% |
| Idle Upper Side * (°C) | 33 | 26.3 20% | 32.6 1% | 27.6 16% | 36 -9% | 32.4 2% |
| Idle Bottom * (°C) | 36.1 | 27.3 24% | 32.4 10% | 26.2 27% | 38 -5% | 33 9% |
* ... smaller is better
发言人
它的立体声扬声器整体表现不错,完全可以播放视频或音乐。不过,无论如何,笔记本电脑嘈杂的风扇在玩游戏时都会造成影响。
Asus ROG Strix Scar 16 2025 audio analysis
(±) | speaker loudness is average but good (81.4 dB)
Bass 100 - 315 Hz
(±) | reduced bass - on average 8.4% lower than median
(±) | linearity of bass is average (9.7% delta to prev. frequency)
Mids 400 - 2000 Hz
(±) | higher mids - on average 5.4% higher than median
(+) | mids are linear (2.9% delta to prev. frequency)
Highs 2 - 16 kHz
(+) | balanced highs - only 1.3% away from median
(+) | highs are linear (3.8% delta to prev. frequency)
Overall 100 - 16.000 Hz
(+) | overall sound is linear (10.7% difference to median)
Compared to same class
» 7% of all tested devices in this class were better, 2% similar, 91% worse
» The best had a delta of 6%, average was 18%, worst was 132%
Compared to all devices tested
» 6% of all tested devices were better, 2% similar, 93% worse
» The best had a delta of 4%, average was 23%, worst was 134%
Asus ROG Strix G16 G615 audio analysis
(+) | speakers can play relatively loud (82.2 dB)
Bass 100 - 315 Hz
(±) | reduced bass - on average 7.5% lower than median
(±) | linearity of bass is average (7.4% delta to prev. frequency)
Mids 400 - 2000 Hz
(+) | balanced mids - only 2.9% away from median
(+) | mids are linear (3.6% delta to prev. frequency)
Highs 2 - 16 kHz
(+) | balanced highs - only 2.8% away from median
(±) | linearity of highs is average (8.3% delta to prev. frequency)
Overall 100 - 16.000 Hz
(+) | overall sound is linear (9.4% difference to median)
Compared to same class
» 3% of all tested devices in this class were better, 2% similar, 95% worse
» The best had a delta of 6%, average was 18%, worst was 132%
Compared to all devices tested
» 3% of all tested devices were better, 1% similar, 96% worse
» The best had a delta of 4%, average was 23%, worst was 134%
Lenovo Legion Pro 7i 16 Gen 10 audio analysis
(±) | speaker loudness is average but good (81.4 dB)
Bass 100 - 315 Hz
(±) | reduced bass - on average 7.6% lower than median
(±) | linearity of bass is average (9.4% delta to prev. frequency)
Mids 400 - 2000 Hz
(+) | balanced mids - only 4.1% away from median
(+) | mids are linear (4.8% delta to prev. frequency)
Highs 2 - 16 kHz
(+) | balanced highs - only 1.9% away from median
(+) | highs are linear (4.8% delta to prev. frequency)
Overall 100 - 16.000 Hz
(+) | overall sound is linear (9.4% difference to median)
Compared to same class
» 3% of all tested devices in this class were better, 2% similar, 95% worse
» The best had a delta of 6%, average was 18%, worst was 132%
Compared to all devices tested
» 3% of all tested devices were better, 1% similar, 96% worse
» The best had a delta of 4%, average was 23%, worst was 134%
HP Omen Max 16 ah000 audio analysis
(±) | speaker loudness is average but good (77.9 dB)
Bass 100 - 315 Hz
(±) | reduced bass - on average 9.9% lower than median
(±) | linearity of bass is average (13.4% delta to prev. frequency)
Mids 400 - 2000 Hz
(+) | balanced mids - only 2.3% away from median
(+) | mids are linear (4.3% delta to prev. frequency)
Highs 2 - 16 kHz
(+) | balanced highs - only 1.9% away from median
(+) | highs are linear (4.8% delta to prev. frequency)
Overall 100 - 16.000 Hz
(+) | overall sound is linear (11.4% difference to median)
Compared to same class
» 9% of all tested devices in this class were better, 3% similar, 88% worse
» The best had a delta of 6%, average was 18%, worst was 132%
Compared to all devices tested
» 7% of all tested devices were better, 2% similar, 91% worse
» The best had a delta of 4%, average was 23%, worst was 134%
Aorus MASTER 16 AM6H audio analysis
(±) | speaker loudness is average but good (75.36 dB)
Bass 100 - 315 Hz
(±) | reduced bass - on average 12.6% lower than median
(±) | linearity of bass is average (9% delta to prev. frequency)
Mids 400 - 2000 Hz
(+) | balanced mids - only 2.8% away from median
(+) | mids are linear (4.4% delta to prev. frequency)
Highs 2 - 16 kHz
(+) | balanced highs - only 1.8% away from median
(+) | highs are linear (3.8% delta to prev. frequency)
Overall 100 - 16.000 Hz
(+) | overall sound is linear (13.5% difference to median)
Compared to same class
» 19% of all tested devices in this class were better, 7% similar, 73% worse
» The best had a delta of 6%, average was 18%, worst was 132%
Compared to all devices tested
» 14% of all tested devices were better, 4% similar, 82% worse
» The best had a delta of 4%, average was 23%, worst was 134%
Asus ROG Strix Scar 16 G634JZR audio analysis
(±) | speaker loudness is average but good (79 dB)
Bass 100 - 315 Hz
(±) | reduced bass - on average 7.1% lower than median
(±) | linearity of bass is average (9% delta to prev. frequency)
Mids 400 - 2000 Hz
(±) | higher mids - on average 5.5% higher than median
(+) | mids are linear (3.3% delta to prev. frequency)
Highs 2 - 16 kHz
(+) | balanced highs - only 1.4% away from median
(+) | highs are linear (2.6% delta to prev. frequency)
Overall 100 - 16.000 Hz
(+) | overall sound is linear (9.8% difference to median)
Compared to same class
» 5% of all tested devices in this class were better, 1% similar, 94% worse
» The best had a delta of 6%, average was 18%, worst was 132%
Compared to all devices tested
» 4% of all tested devices were better, 1% similar, 95% worse
» The best had a delta of 4%, average was 23%, worst was 134%
耗电量

ROG Strix SCAR 16 绝不是一款节俭的笔记本电脑,它的微型 LED 面板需要大量的电力,尤其是在高亮度水平下。在压力测试中,我们短暂测得的最大功率为 370 瓦,随后迅速降至 310 瓦左右。游戏时的功耗预计在 290 瓦左右,这也是所提供的 380 瓦电源绝对够用的原因。它的待机功耗为 2.3 瓦(尽管关闭了照明),但还是太高了。
| Off / Standby | |
| Idle | |
| Load |
|
Key:
min: | |
| Asus ROG Strix Scar 16 2025 Ultra 9 275HX, GeForce RTX 5090 Laptop, WD PC SN8000S 2TB, Mini-LED, 2560x1600, 16" | Asus ROG Strix G16 G615 Ultra 9 275HX, GeForce RTX 5080 Laptop, Micron 2500 1TB MTFDKBA1T0QGN, IPS, 2560x1600, 16" | Lenovo Legion Pro 7i 16 Gen 10 Ultra 9 275HX, GeForce RTX 5080 Laptop, SK Hynix HFS001TEJ9X115N, OLED, 2560x1600, 16" | HP Omen Max 16 ah000 Ultra 9 275HX, GeForce RTX 5090 Laptop, WDC PC SN810 2TB, OLED, 2560x1600, 16" | Aorus MASTER 16 AM6H Ultra 9 275HX, GeForce RTX 5090 Laptop, Kingston OM8PGP41024Q-A0, OLED, 2560x1600, 16" | Asus ROG Strix Scar 16 G634JZR i9-14900HX, GeForce RTX 4080 Laptop GPU, SK hynix PC801 HFS002TEJ9X101N, Mini LED, 2560x1600, 16" | Average NVIDIA GeForce RTX 5090 Laptop | Average of class Gaming | |
|---|---|---|---|---|---|---|---|---|
| Power Consumption | 23% | -11% | 17% | 8% | 31% | 19% | 36% | |
| Idle Minimum * (Watt) | 22.5 | 10.8 52% | 28.5 -27% | 9.9 56% | 25 -11% | 10.71 52% | 16.2 ? 28% | 13 ? 42% |
| Idle Average * (Watt) | 32.2 | 17.7 45% | 38.8 -20% | 28.6 11% | 29.4 9% | 14.75 54% | 24.3 ? 25% | 18.7 ? 42% |
| Idle Maximum * (Watt) | 34.3 | 18.8 45% | 45.6 -33% | 47.1 -37% | 31 10% | 30 13% | 30.3 ? 12% | 24.3 ? 29% |
| Load Average * (Watt) | 169.3 | 139.4 18% | 132.2 22% | 141.8 16% | 109 36% | 135 20% | 135.3 ? 20% | 108.2 ? 36% |
| Cyberpunk 2077 ultra * (Watt) | 294 | 295 -0% | 318 -8% | 253 14% | 290 1% | |||
| Cyberpunk 2077 ultra external monitor * (Watt) | 288 | 291 -1% | 319 -11% | 230 20% | 292 -1% | |||
| Load Maximum * (Watt) | 371.5 | 359.3 3% | 384 -3% | 233 37% | 325 13% | 307 17% | 336 ? 10% | 254 ? 32% |
| Witcher 3 ultra * (Watt) | 286 |
* ... smaller is better
Power consumption Cyberpunk / stress test
Power consumption with external monitor
运行时间
这款笔记本电脑的高闲置功耗体现在电池续航时间上。在 150 cd/m² 的 WLAN 测试中,我们仍然测得 6.5 小时的续航时间,但在全亮度条件下,它甚至连 3 小时都达不到。

Notebookcheck 总评分
Asus ROG Strix Scar 16 2025
- 05/07/2025 v8
Andreas Osthoff
 Total Sustainability Score:
 可能的替代品比较
Transparency
The selection of devices to be reviewed is made by our editorial team. The test sample was provided to the author as a loan by the manufacturer or retailer for the purpose of this review. The lender had no influence on this review, nor did the manufacturer receive a copy of this review before publication. There was no obligation to publish this review. As an independent media company, Notebookcheck is not subjected to the authority of manufacturers, retailers or publishers.
This is how Notebookcheck is testing
Every year, Notebookcheck independently reviews hundreds of laptops and smartphones using standardized procedures to ensure that all results are comparable. We have continuously developed our test methods for around 20 years and set industry standards in the process. In our test labs, high-quality measuring equipment is utilized by experienced technicians and editors. These tests involve a multi-stage validation process. Our complex rating system is based on hundreds of well-founded measurements and benchmarks, which maintains objectivity. Further information on our test methods can be found here.

