Aorus Master 18 游戏笔记本电脑评测:RTX 5090 带来的代价
18 英寸设备是否值得它的高价?
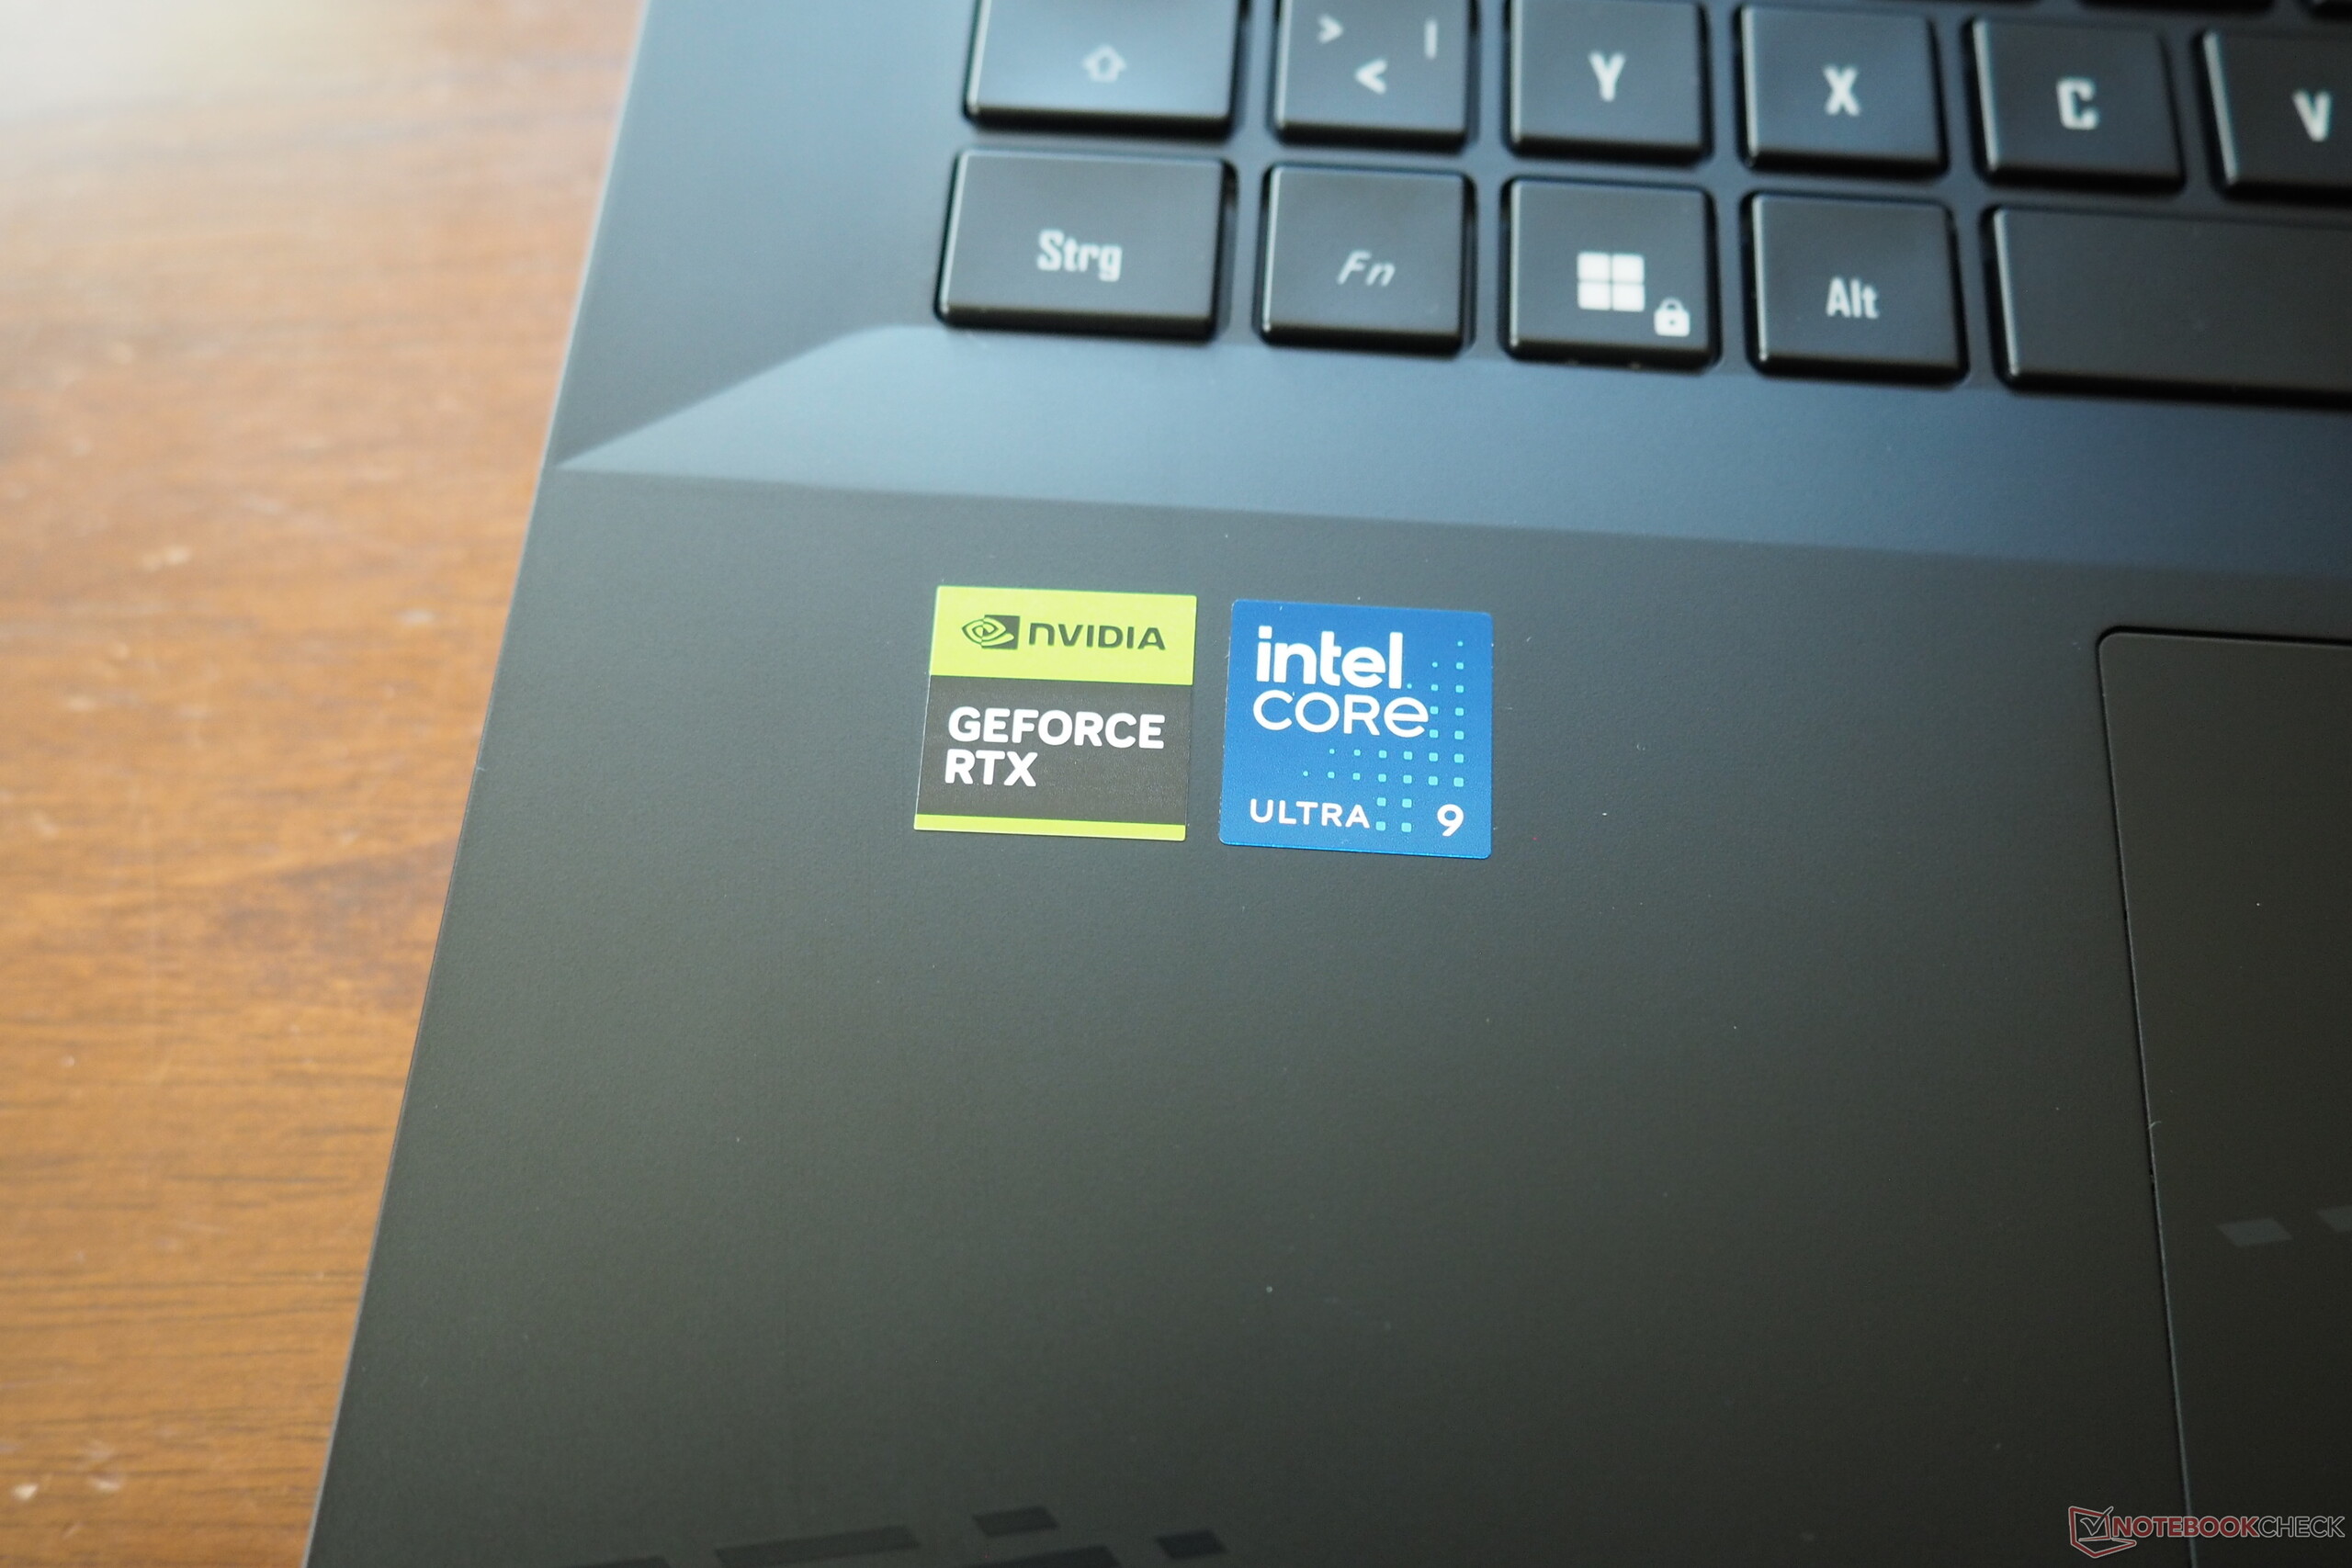
技嘉全力打造 Aorus Master 18:超大迷你 LED 显示屏、箭湖代 24 核处理器、GeForce RTX 5090 以及丰富的内存和固态硬盘配置,这些都应该能吸引狂热的游戏玩家。Florian Glaser, 👁 Florian Glaser (translated by DeepL / Ninh Duy) Published 🇺🇸 🇩🇪 ...
结论:RTX 5090 可在大师 18 中大显身手
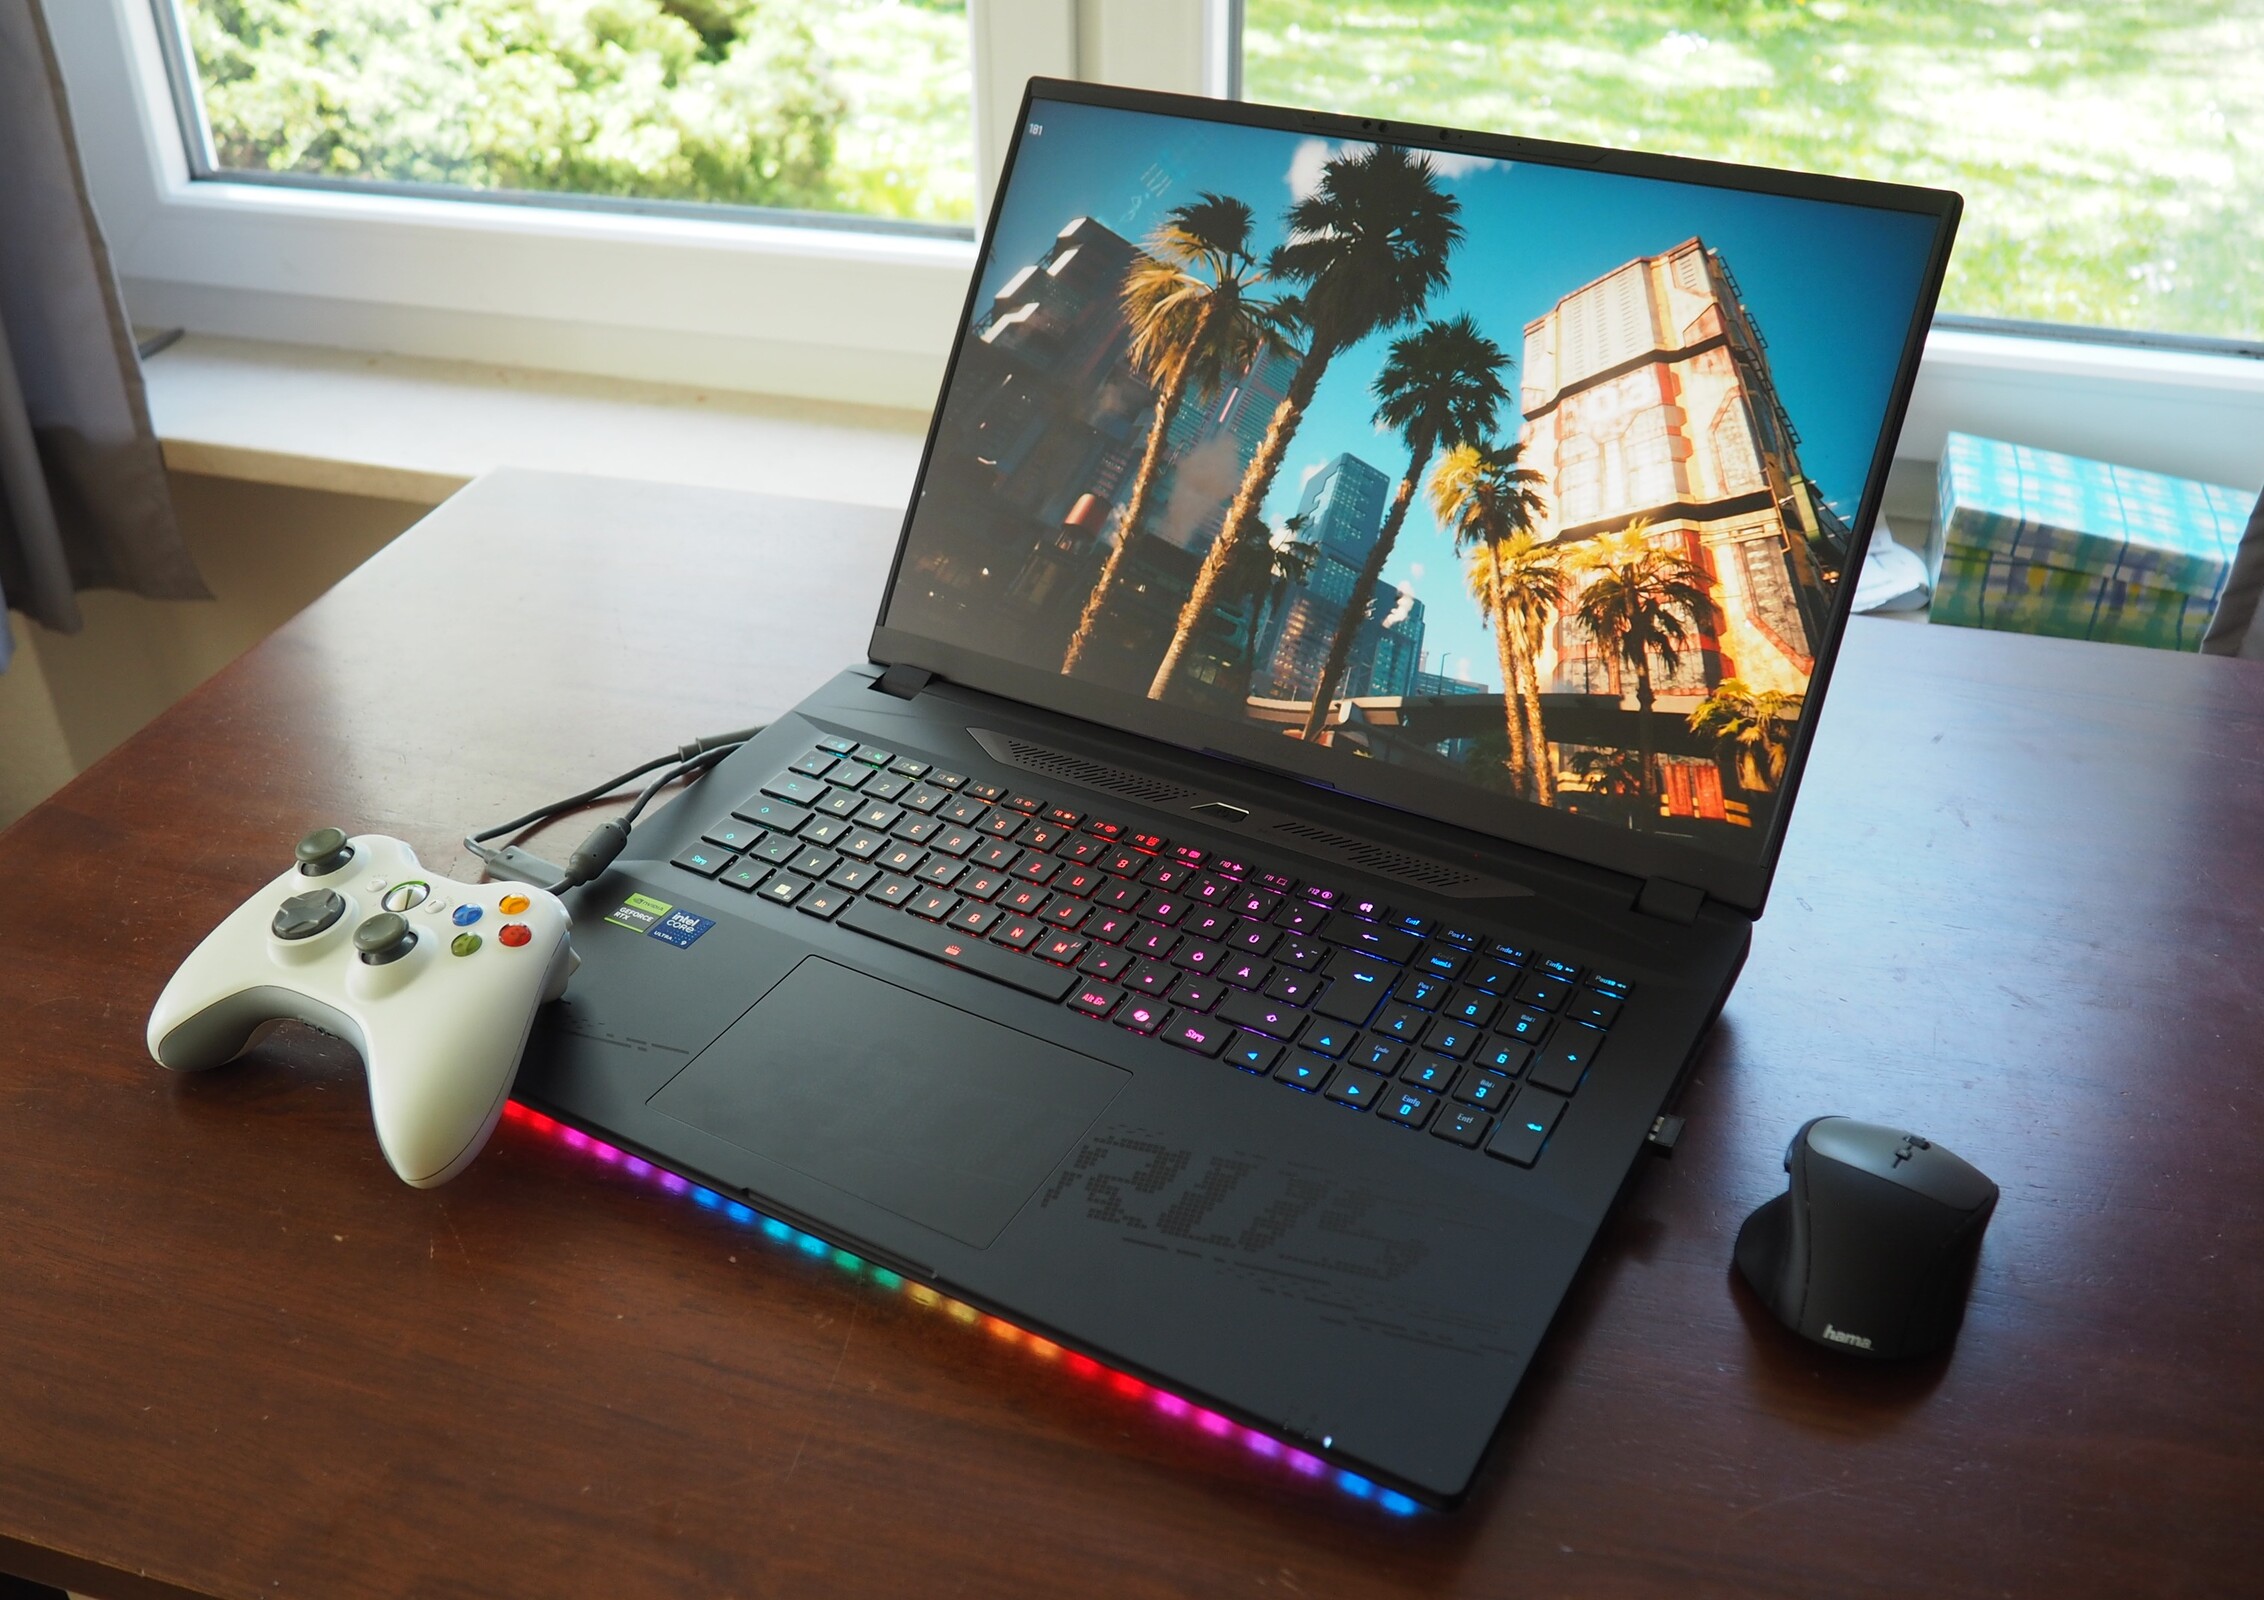
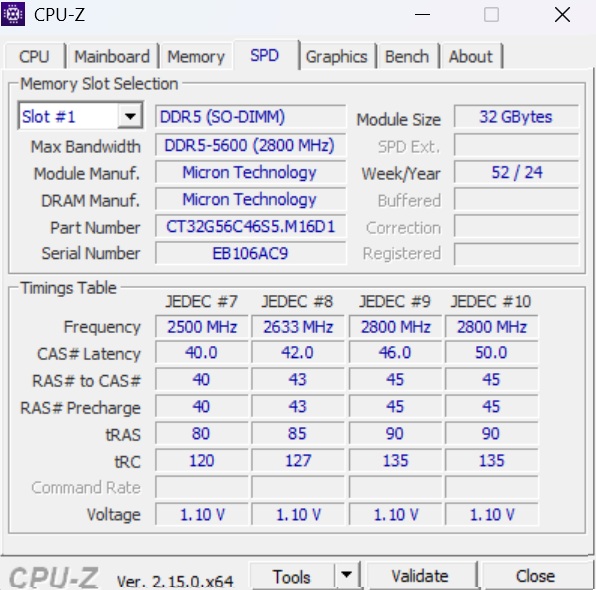
Aorus Master 18 是一款顶级高端笔记本电脑:光是它的四个机箱风扇就足以说明一切。这也难怪,因为酷睿 Ultra 9 275HX 和GeForce RTX 5090 都希望或需要相应的冷却效果,但 18 英寸设备在负载情况下确实会变得相当响亮。四个 SO-DIMM 组和三个 M.2 插槽(我们的测试设备有 2x 32 GB DDR5-5600 内存和两个 2 TB SSD)即使对于台式机替代品来说也不差,至少可以在一定程度上证明其超过 5,000 美元的高昂价格是合理的。
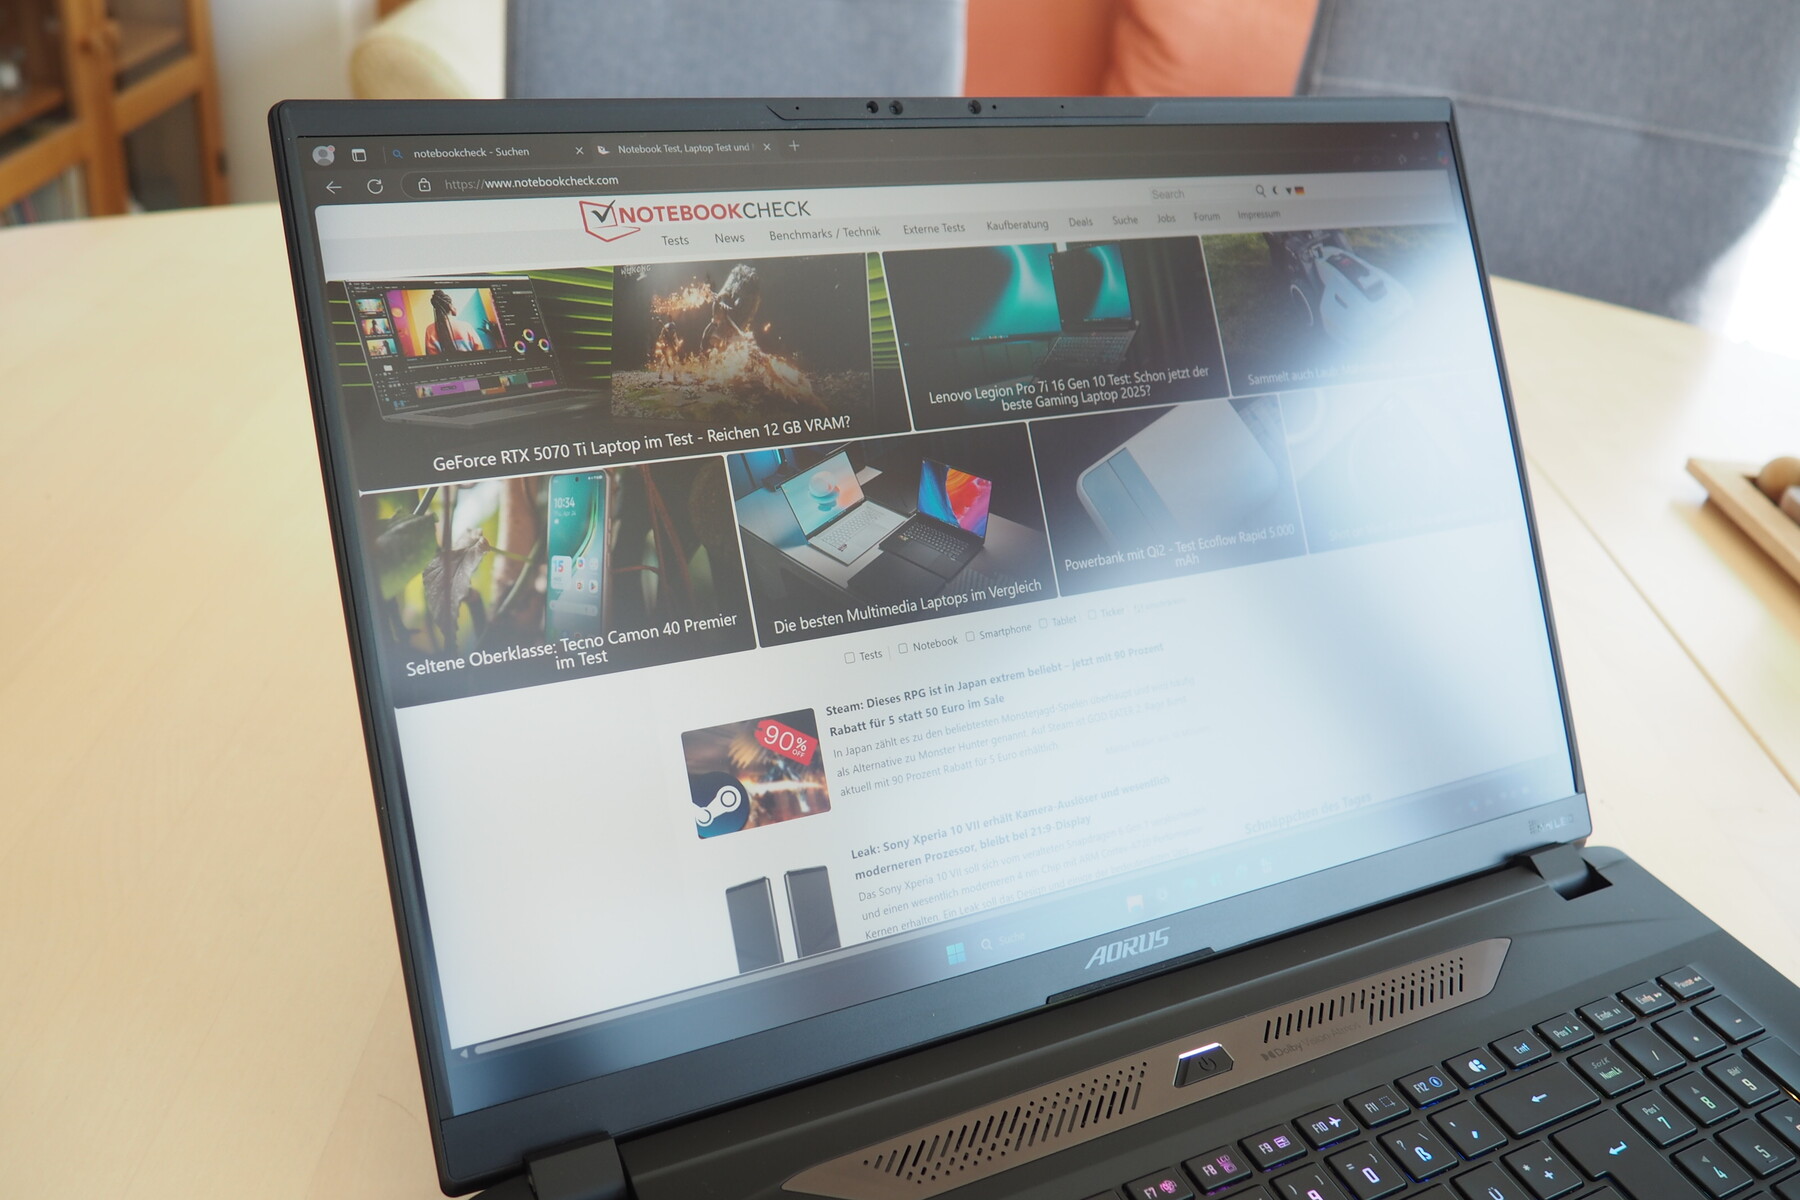
它的外壳和输入设备看起来不错,甚至非常好,由于采用了 Thunderbolt 5,它的连接选项尤其丰富和现代。其 16:10 格式的微型 LED 面板分辨率为 2,560 x 1,600 像素,刷新率为 240 Hz,即使在 SDR 模式下,也能在大多数情况下显示清晰的图像。制造商还可以做一些改进,尤其是在闲置消耗、系统配置文件调整和连续固态硬盘性能方面。如果你对其高昂的价格和 3D 模式下的噪音没有意见,那么 Aorus Master 18 绝对是游戏和其他 3D 应用程序的强大伴侣。
请注意:您可以在文章末尾找到我们对 RTX 5080 版 Master 18 的视频测试。
Pros
Cons
规格
案例
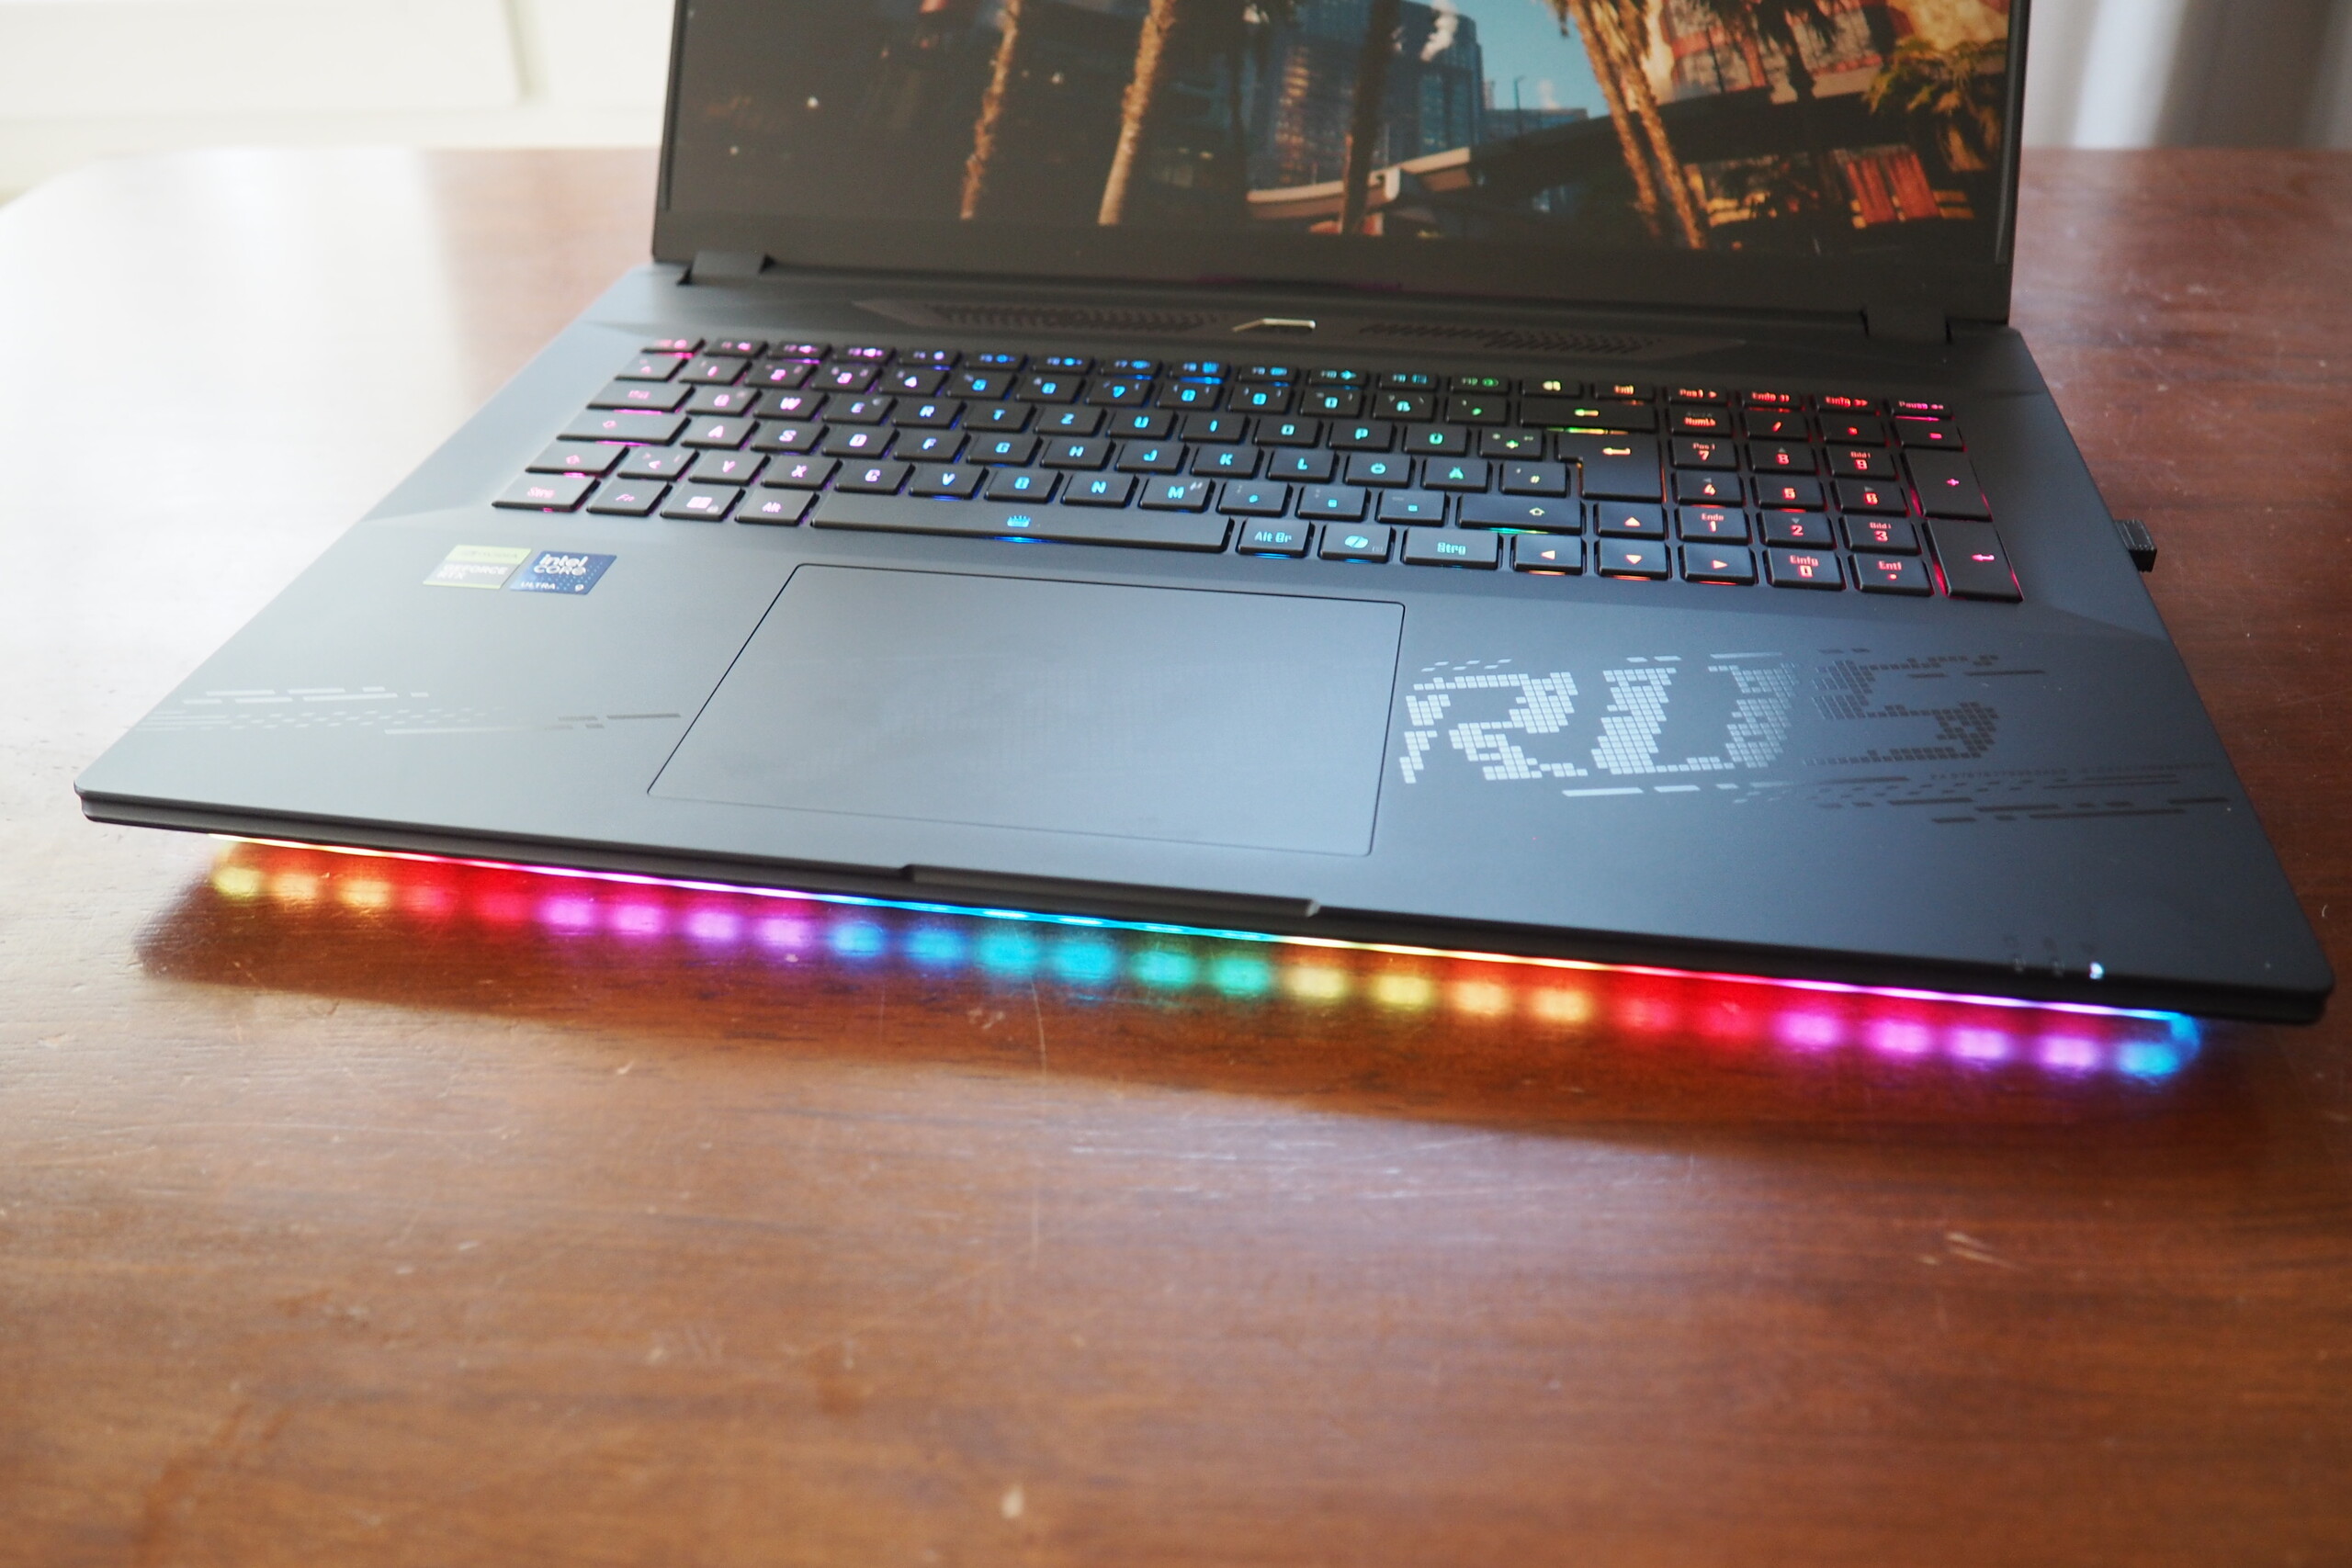
技嘉 18 英寸笔记本电脑的坚固外壳仅限于塑料材质,但这并不一定会立即引起注意。它的制造质量很好,但并不完美(例如,A 盖的制造工艺可以更好一些)。喜欢奢华照明的用户可以期待正面的明亮 LED 灯带和 RGB 键盘。显示屏的最大开启角度并不宽裕:仅有不到 120° 是相当微小的。另一方面,紧致的铰链能将盖子充分固定到位。

Master 18 的重量为 3.4 千克,与华硕的 18 英寸竞争设备相当。华硕 Strix Scar 18的重量约为 3.3 千克。其尺寸也差不多。
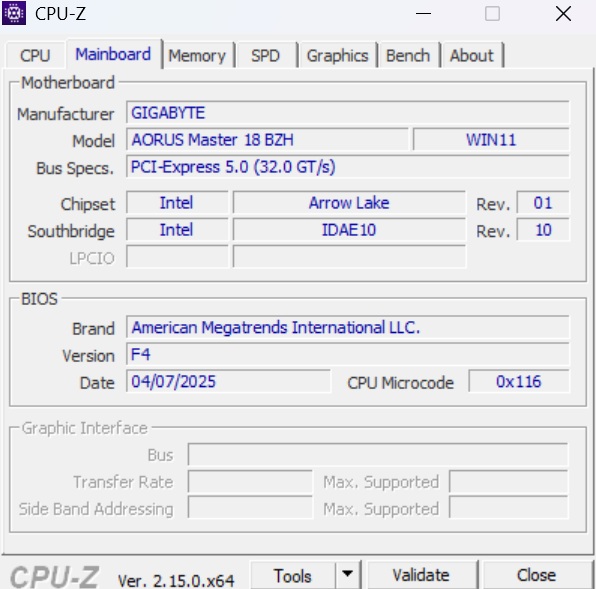
连接性
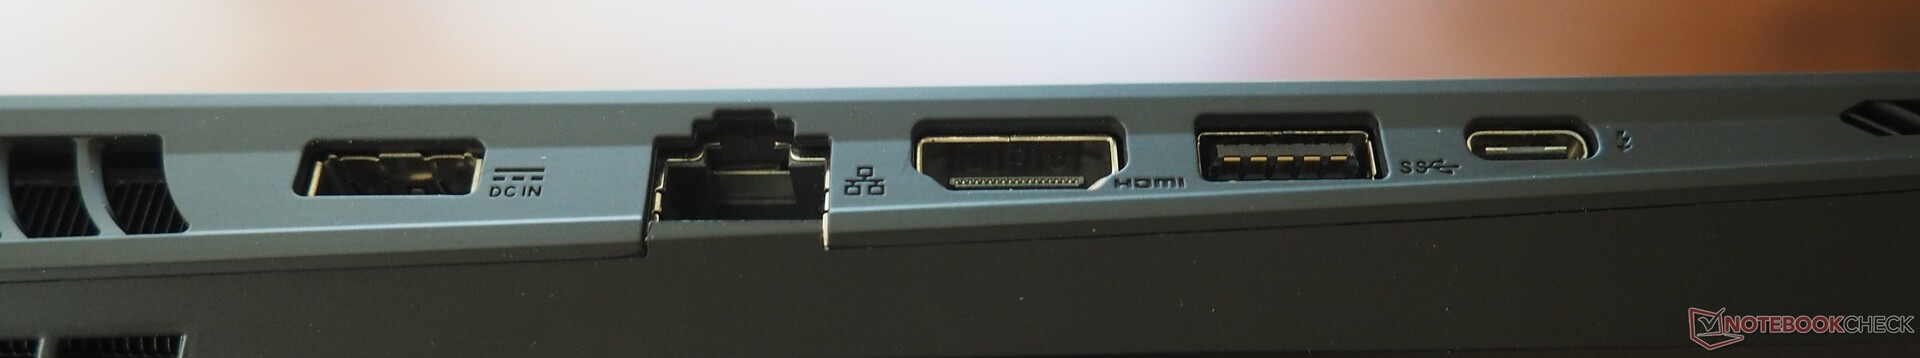
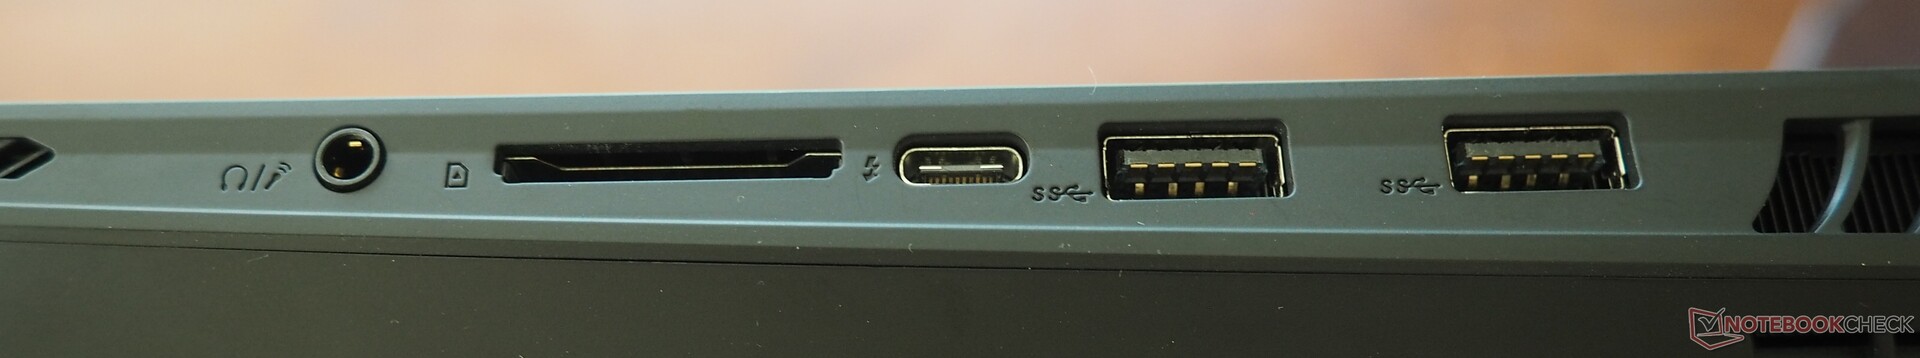
端口
在连接方面,技嘉笔记本电脑确实有过人之处。两个 Thunderbolt 端口(一个 v4 端口和一个 v5 端口)带有 DisplayPort 和 Power Delivery 功能,别无他求。此外,还有三个符合 3.2 Gen2 标准的经典 USB-A 端口。此外,还有一个音频接口、一个 HDMI 2.1 输出端口和一个功能齐全的 SD 读卡器。一个 2.5 GBit LAN 端口可处理有线网络。
SD 读卡器
已安装的读卡器速度更快,在顺序读取参考卡时,读卡速度约为 200 MB/s,这一成绩值得称赞。
| SD Card Reader | |
| average JPG Copy Test (av. of 3 runs) | |
| Alienware m18 R2 (Toshiba Exceria Pro SDXC 64 GB UHS-II) | |
| Aorus Master 18 AM8H (AV PRO microSD 128 GB V60) | |
| Asus ROG Zephyrus G16 GU605CX (Angelbird AV Pro V60) | |
| Razer Blade 16 2025 RTX 5090 (Angelbird AV Pro V60) | |
| Average of class Gaming (20.9 - 210, n=54, last 2 years) | |
| MSI Titan 18 HX A14VIG (Toshiba Exceria Pro SDXC 64 GB UHS-II) | |
| maximum AS SSD Seq Read Test (1GB) | |
| Alienware m18 R2 (Toshiba Exceria Pro SDXC 64 GB UHS-II) | |
| Asus ROG Zephyrus G16 GU605CX (Angelbird AV Pro V60) | |
| Aorus Master 18 AM8H (AV PRO microSD 128 GB V60) | |
| Razer Blade 16 2025 RTX 5090 (Angelbird AV Pro V60) | |
| Average of class Gaming (25.5 - 261, n=51, last 2 years) | |
| MSI Titan 18 HX A14VIG (Toshiba Exceria Pro SDXC 64 GB UHS-II) | |
交流
英特尔的 Wi-Fi 7 芯片(型号 BE200)负责无线连接,在我们的续航测试中取得了良好到非常好的结果。
网络摄像头
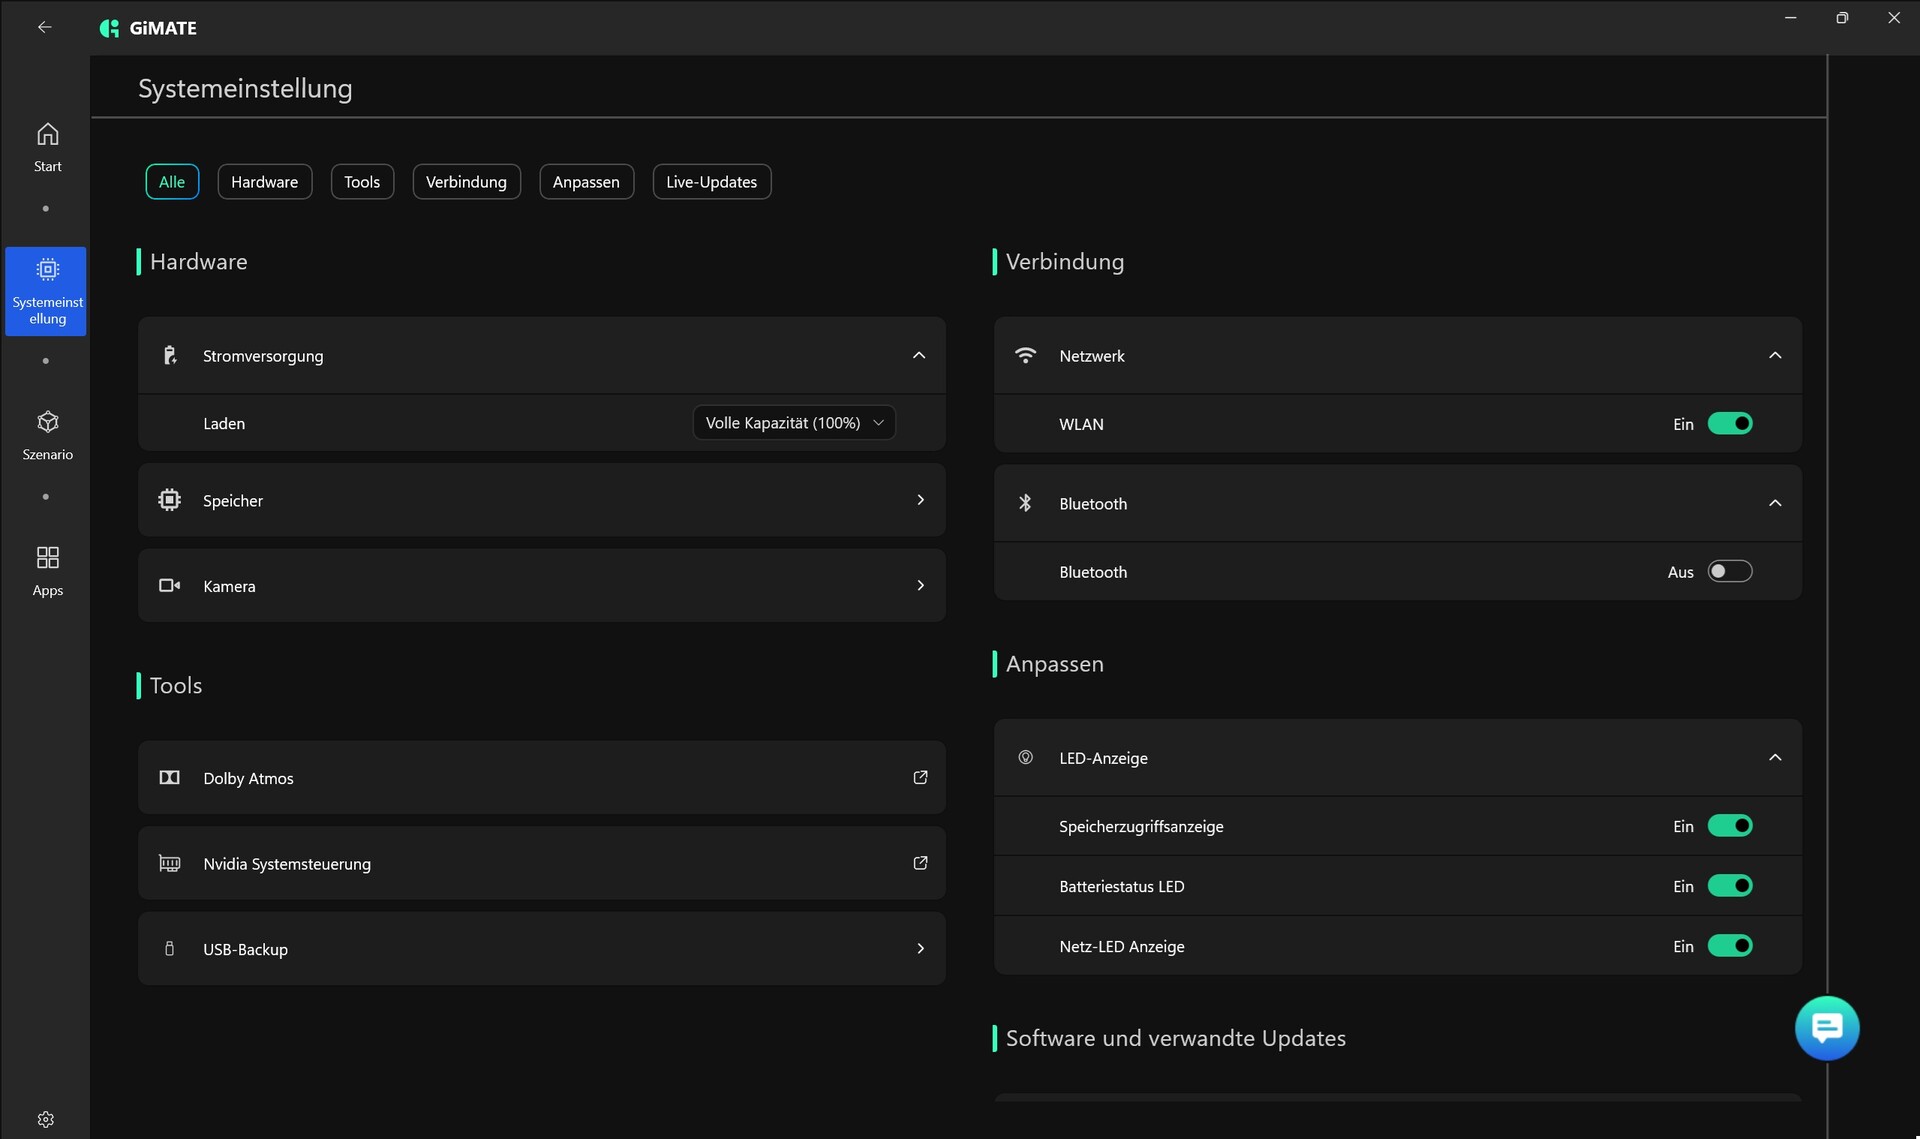
该设备的 200 万像素网络摄像头可生成清晰的图像,但并不令人印象深刻。在图像清晰度和色彩准确度方面仍有改进的余地。技嘉免去了隐私保护盖。作为回报,制造商的软件提供了各种隐私保护功能(见下面的截图)。


配件
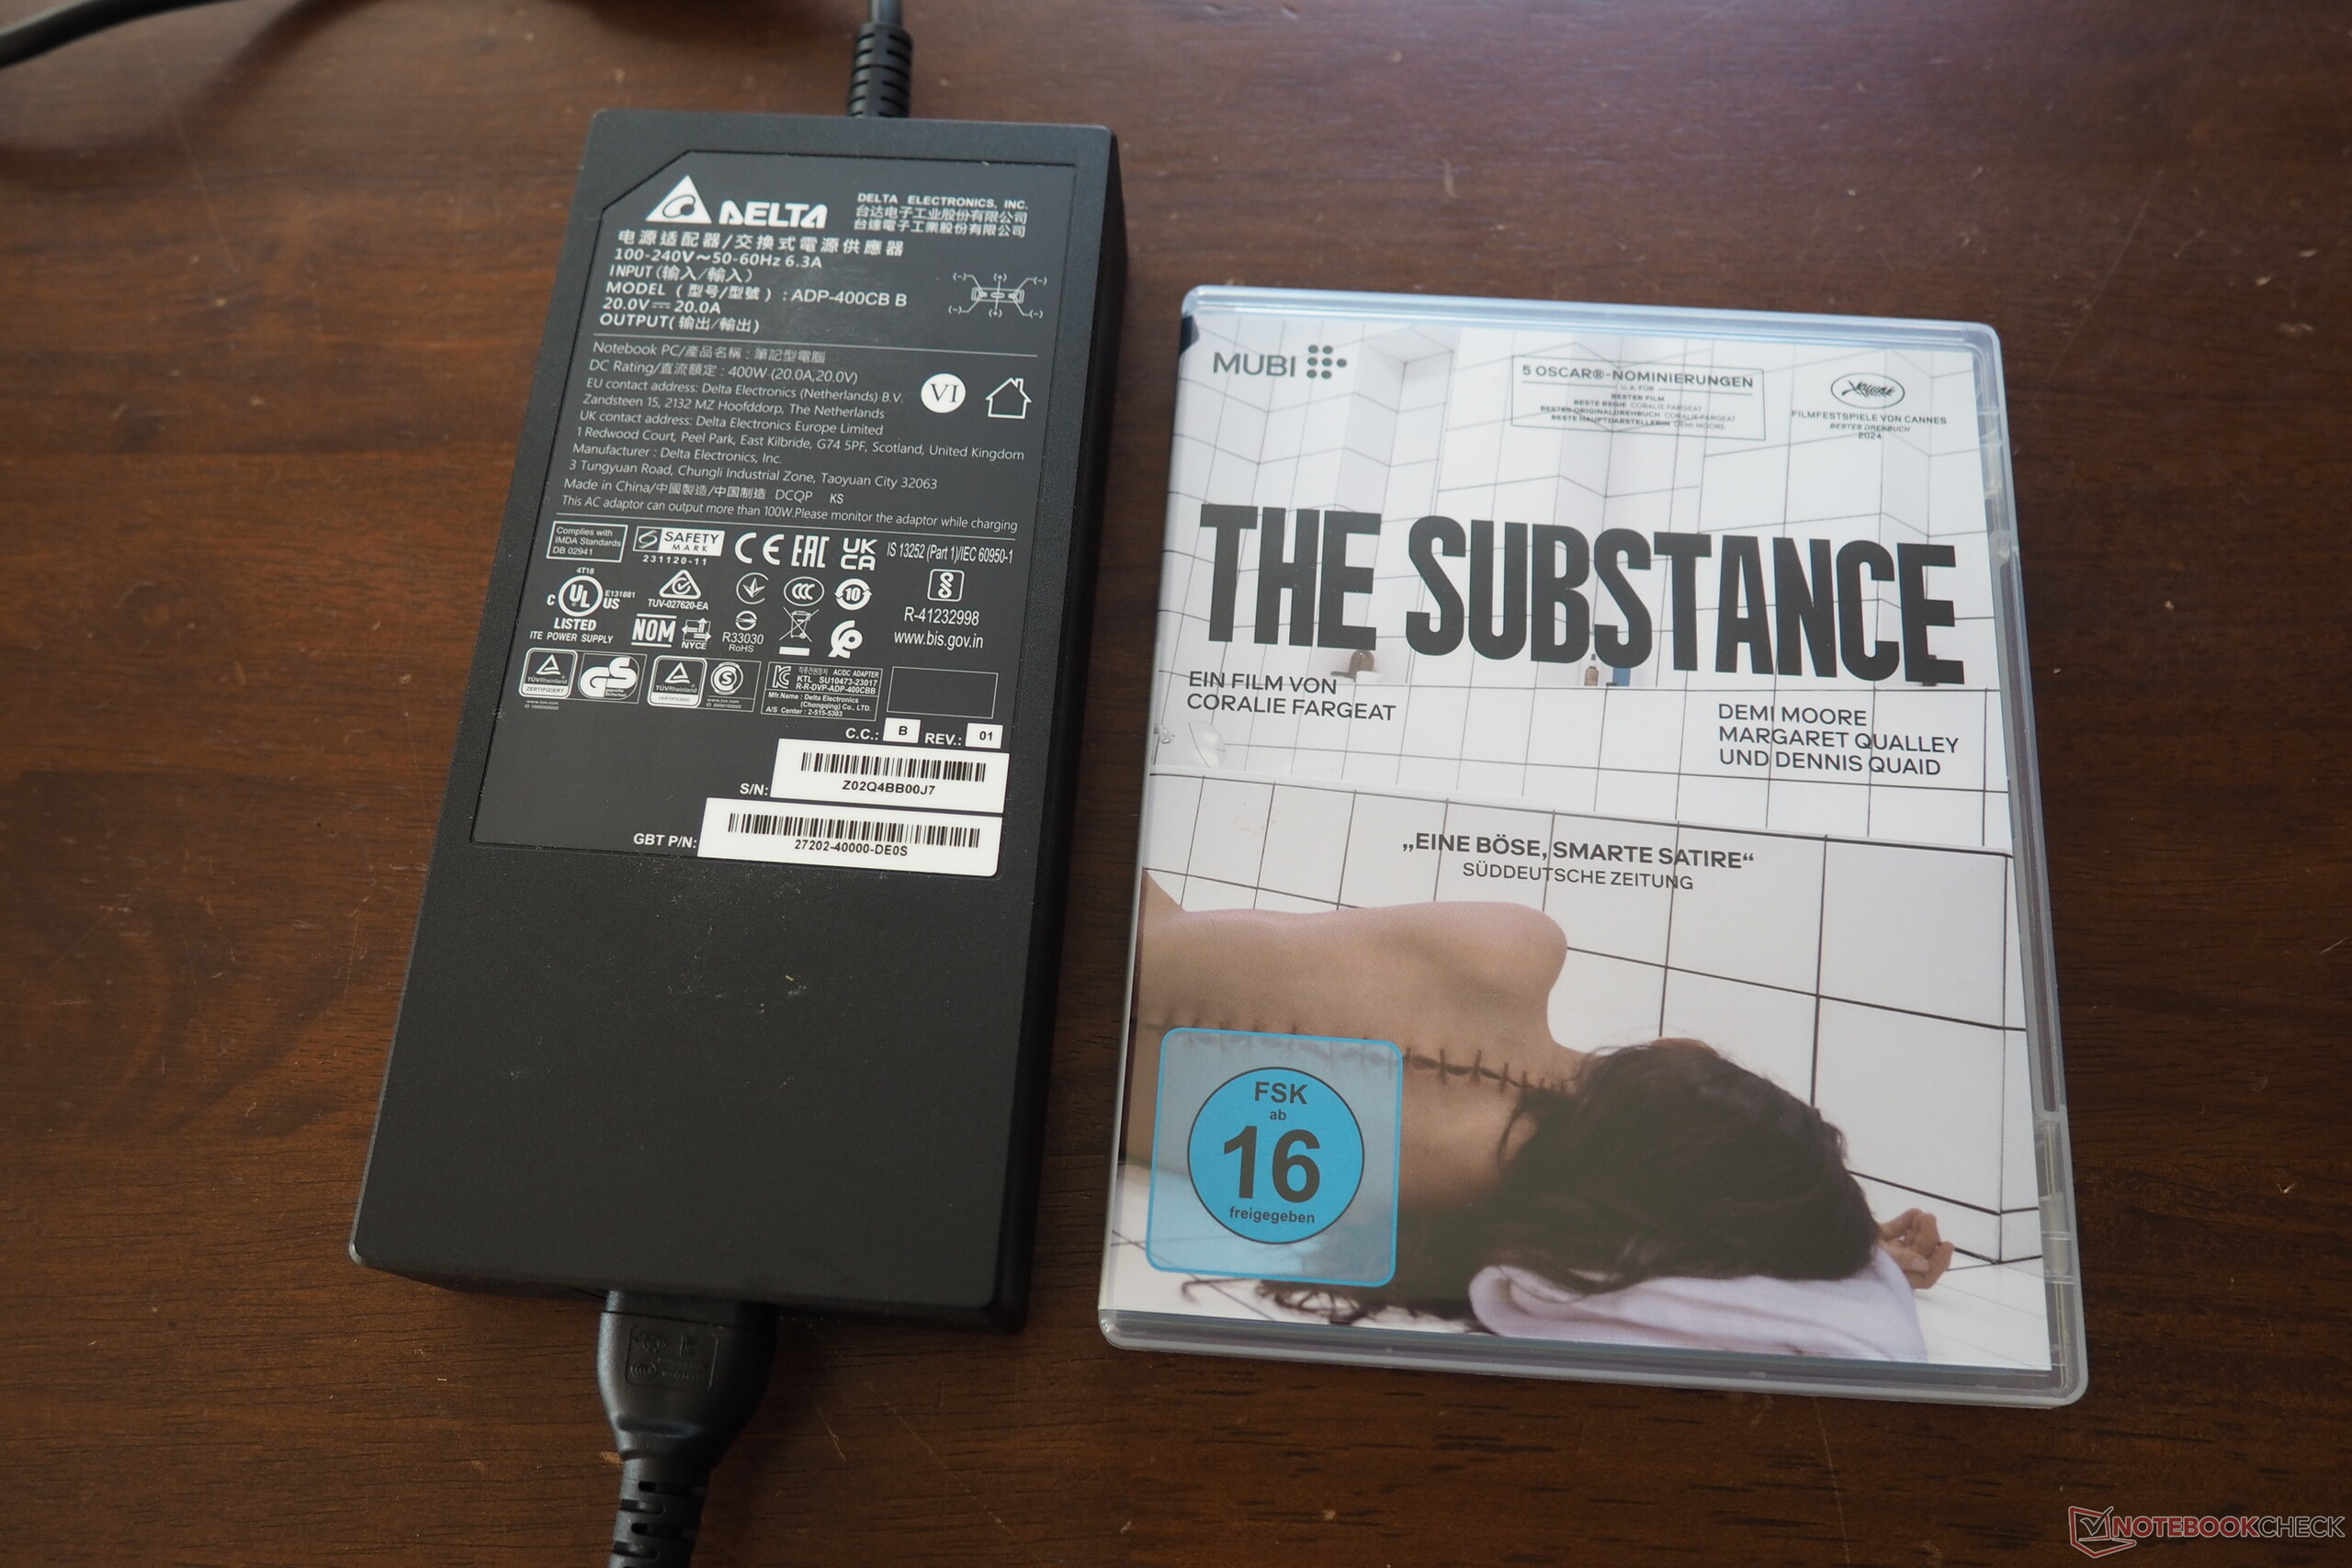
这款笔记本电脑配备了一个笨重的 400 瓦电源装置,重量超过 1 千克。
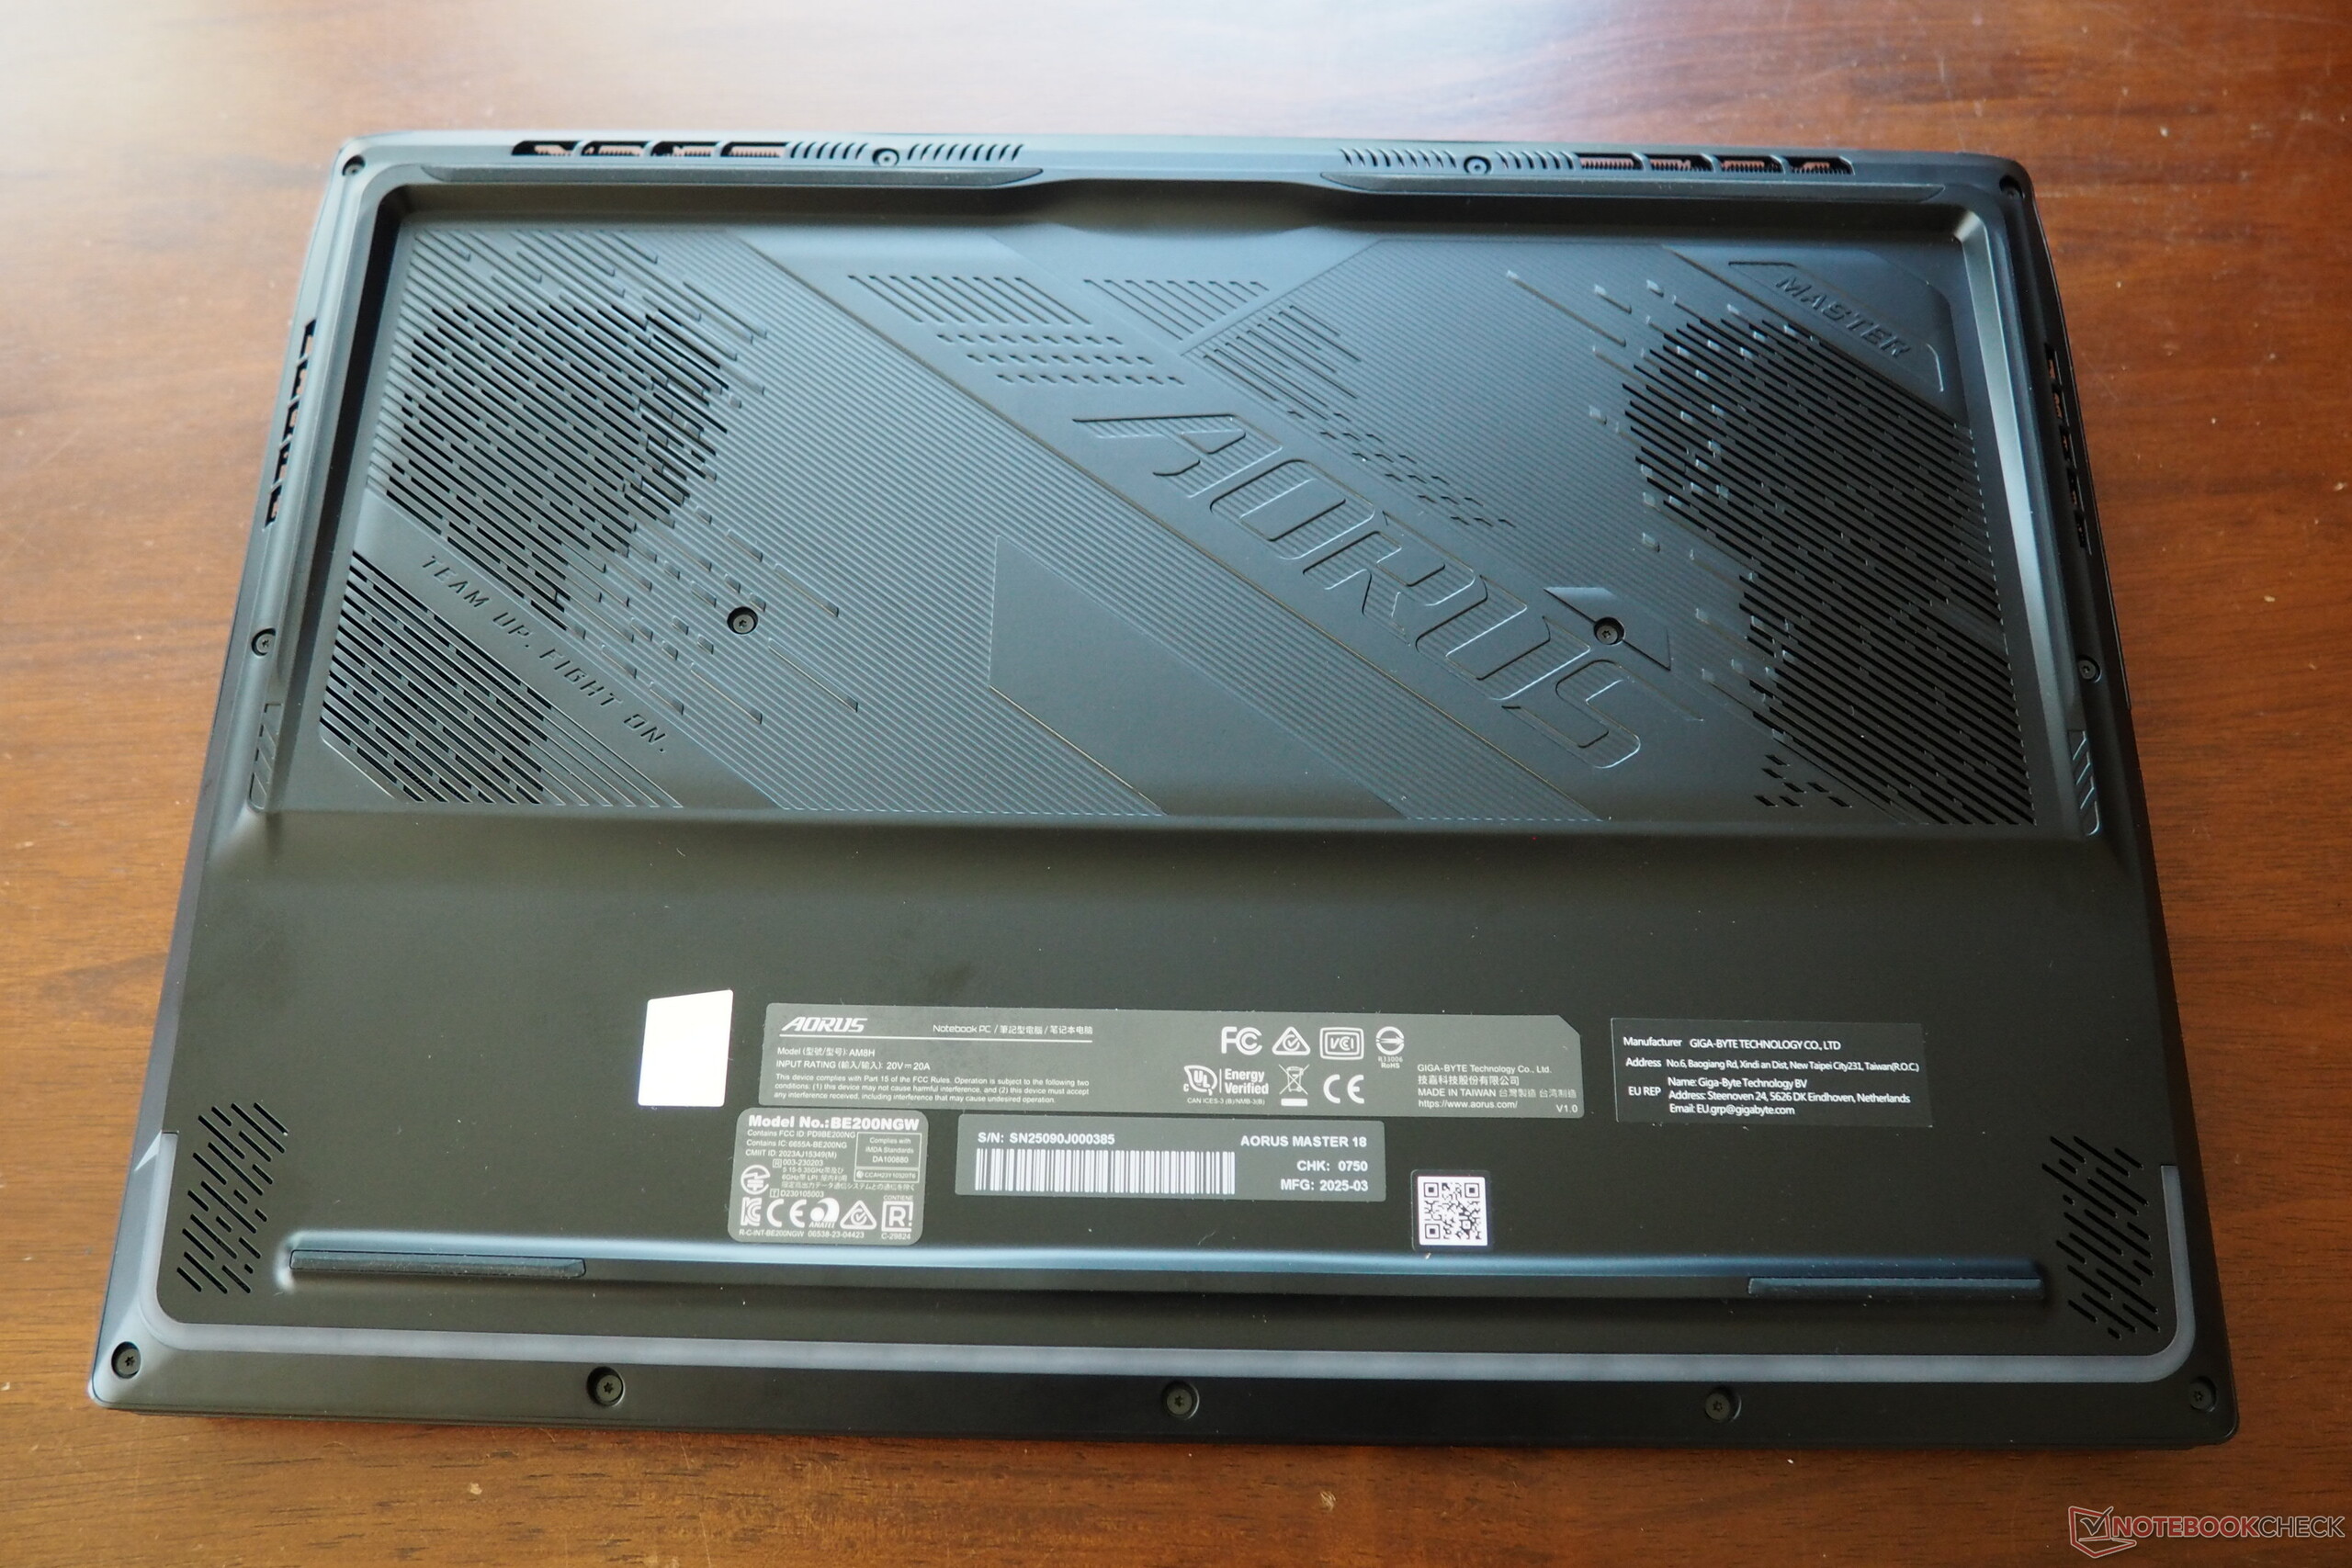
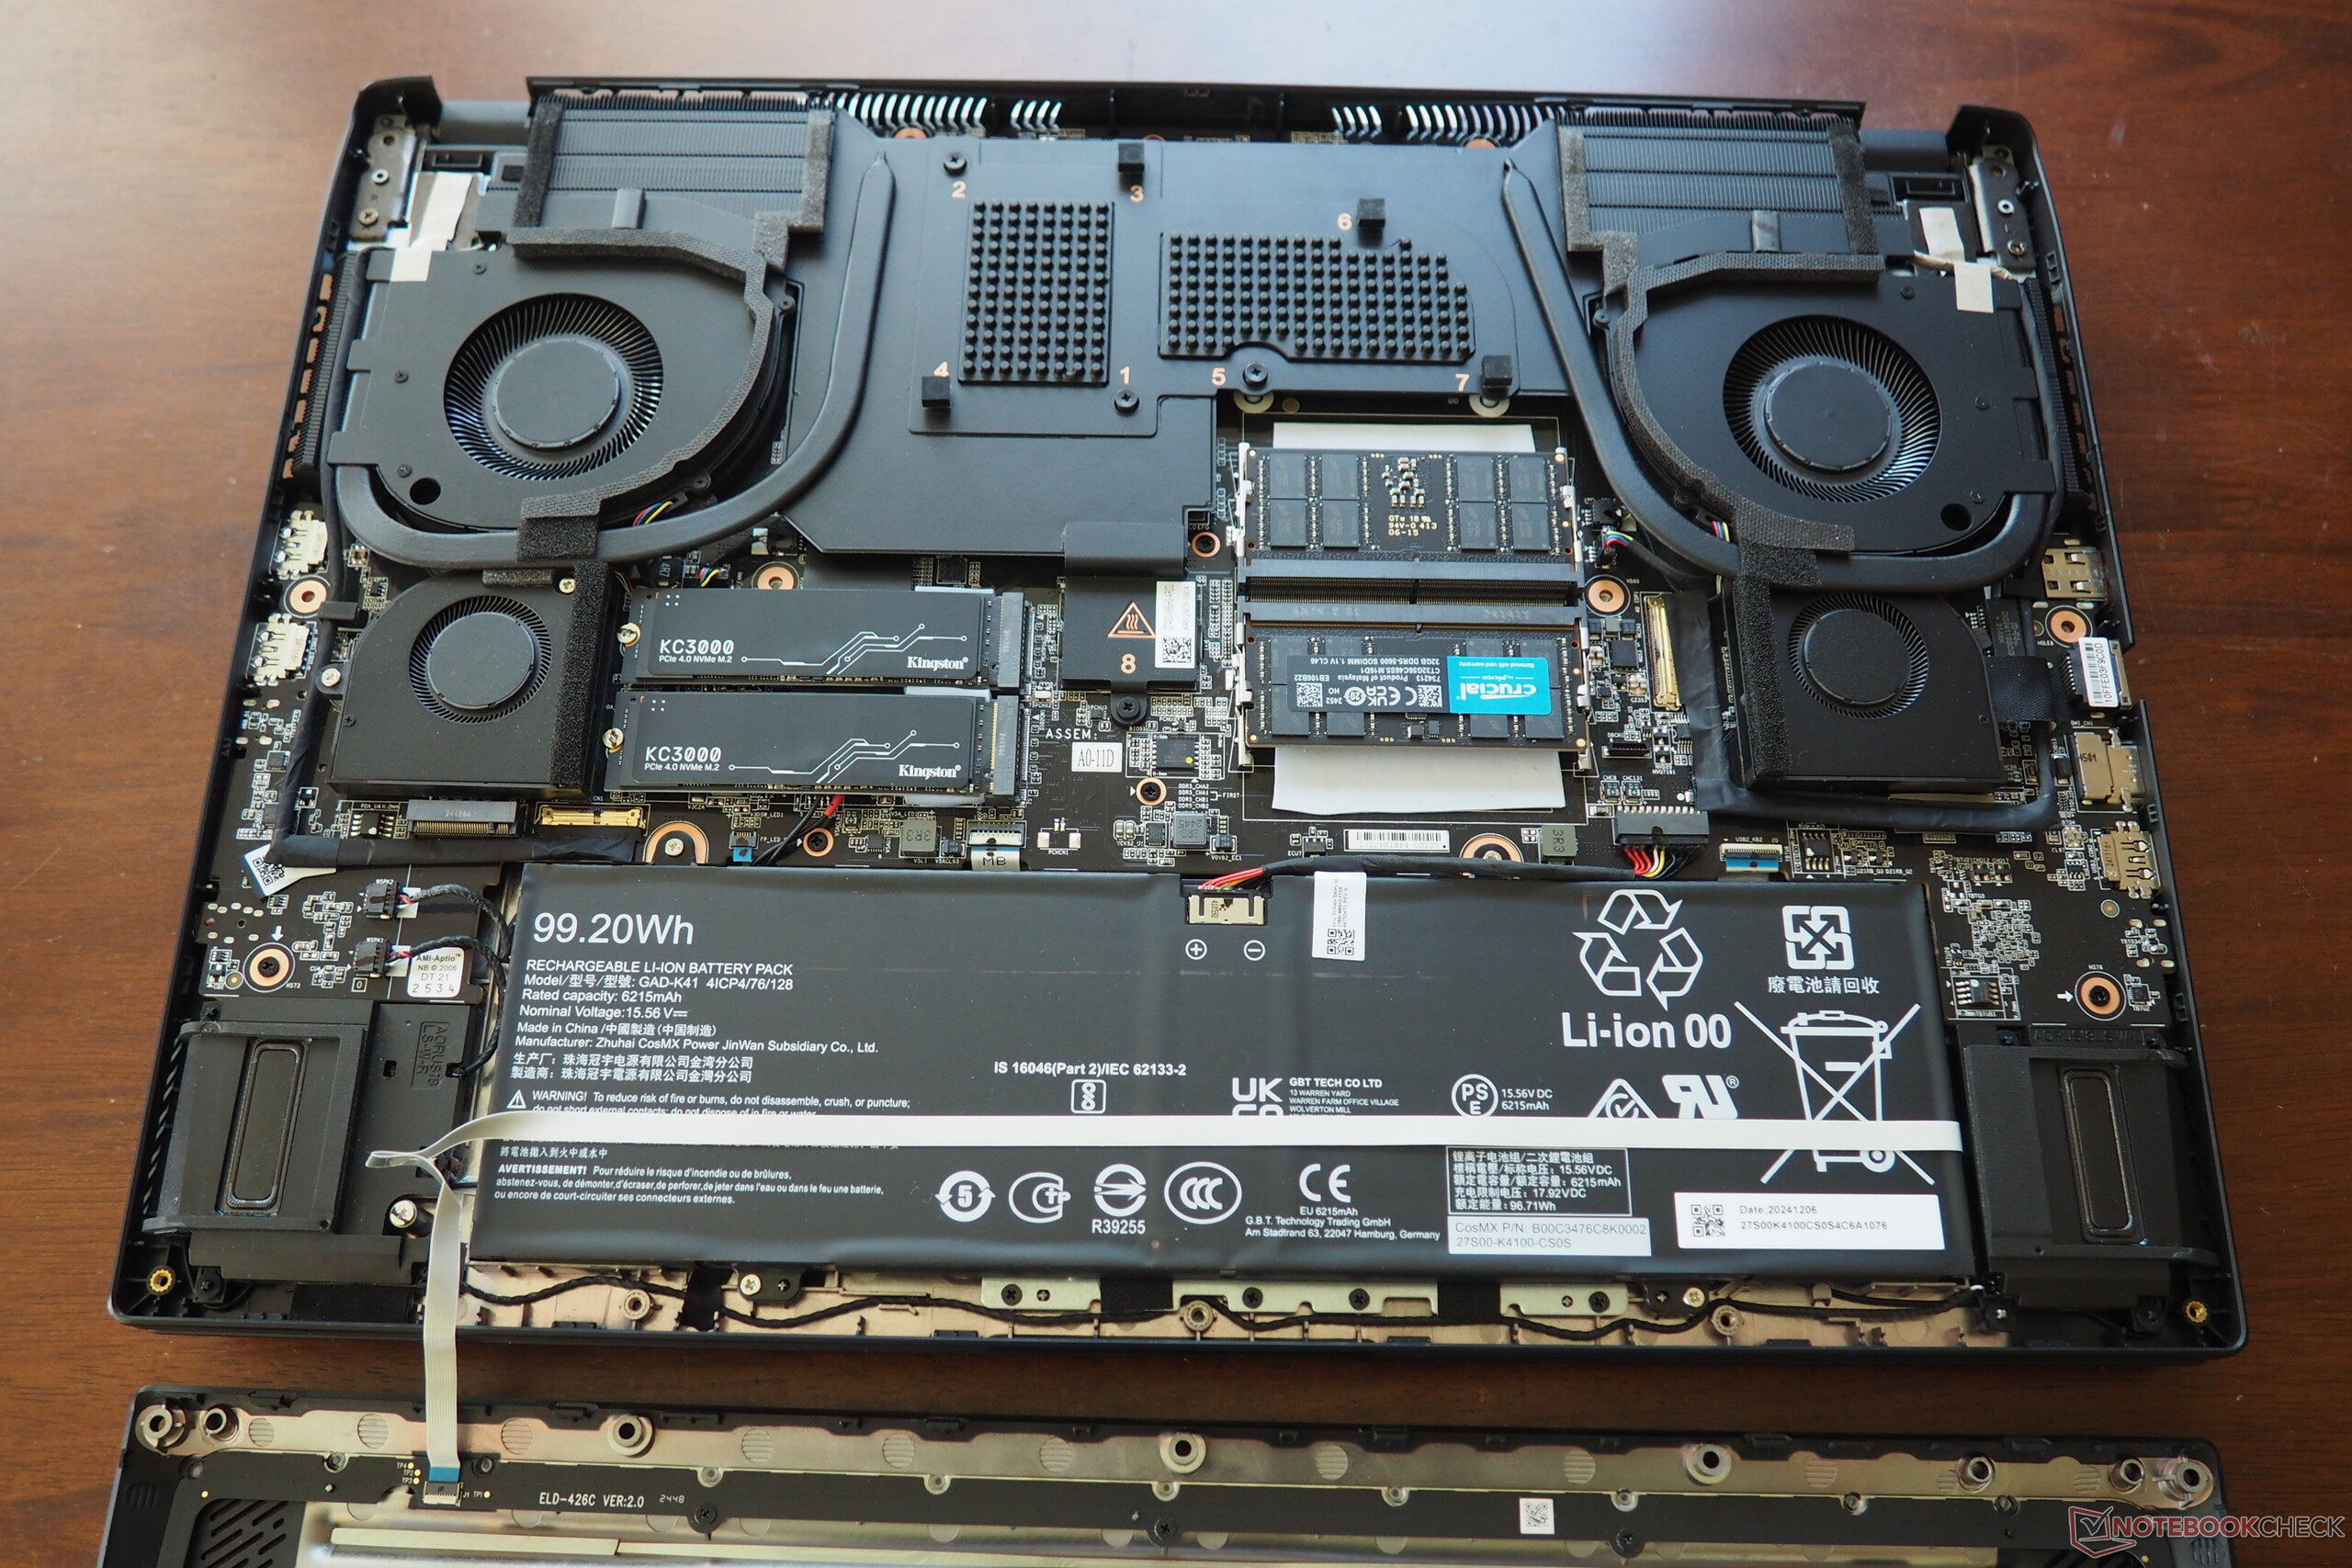
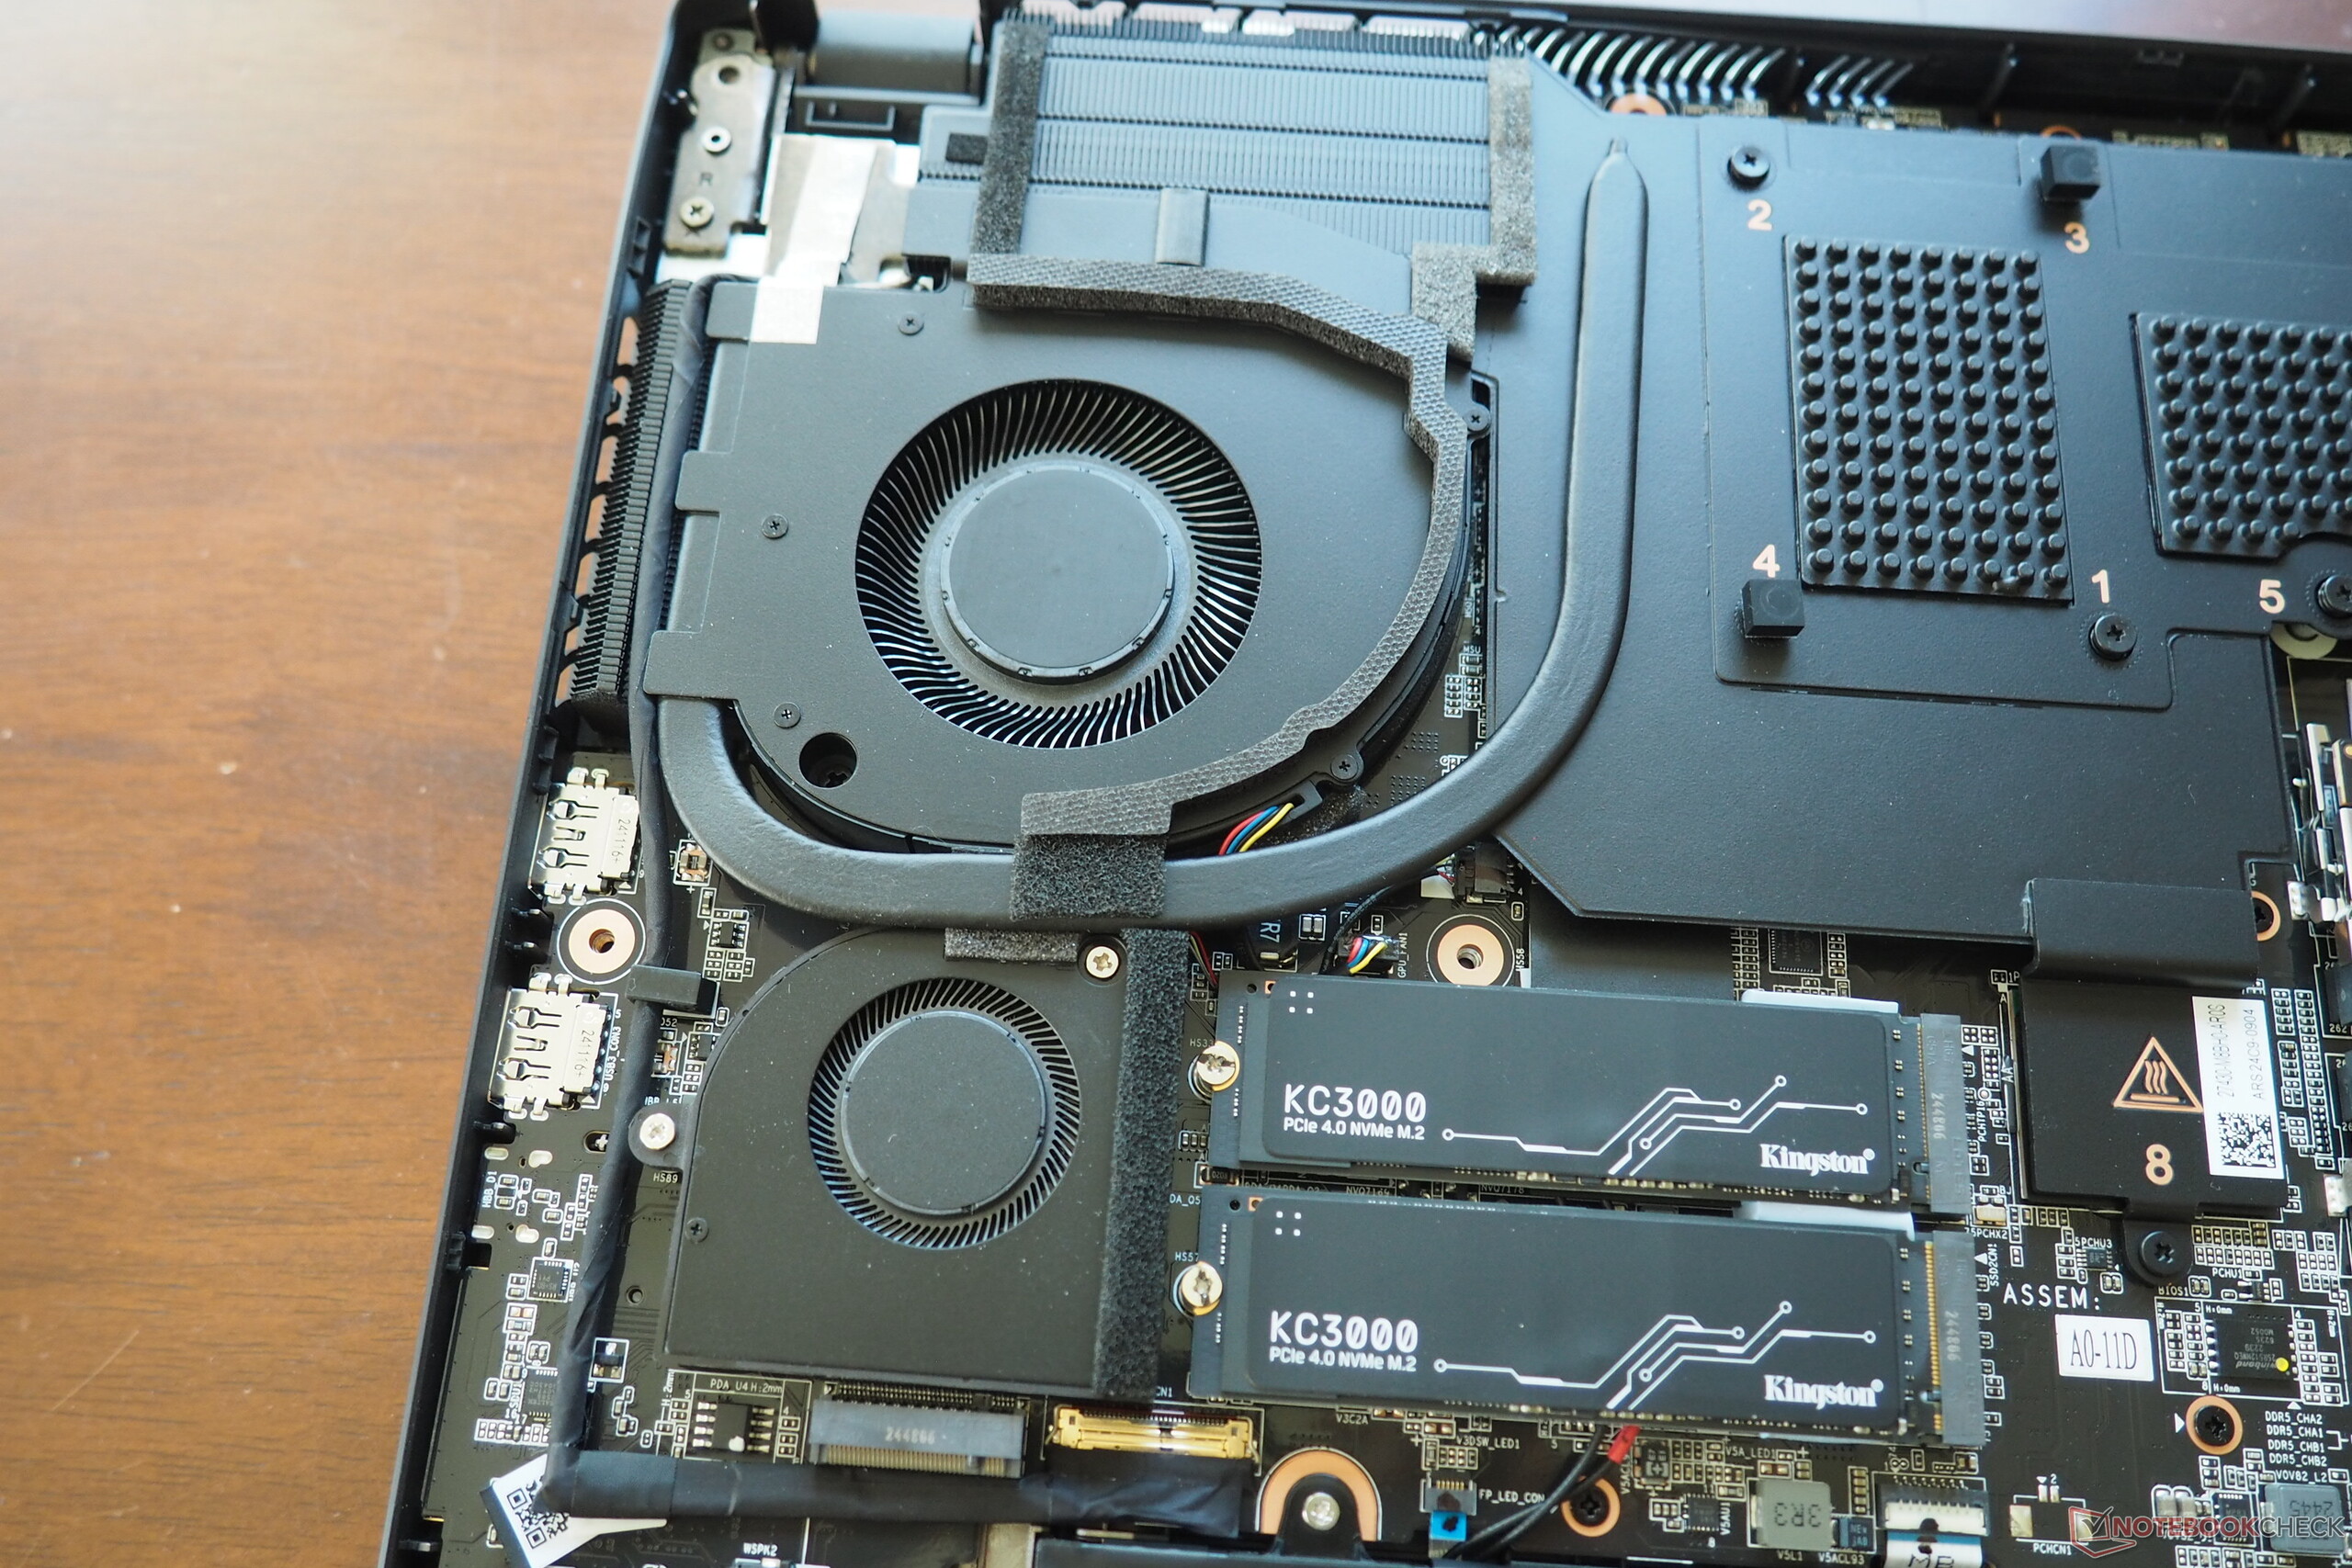
维护
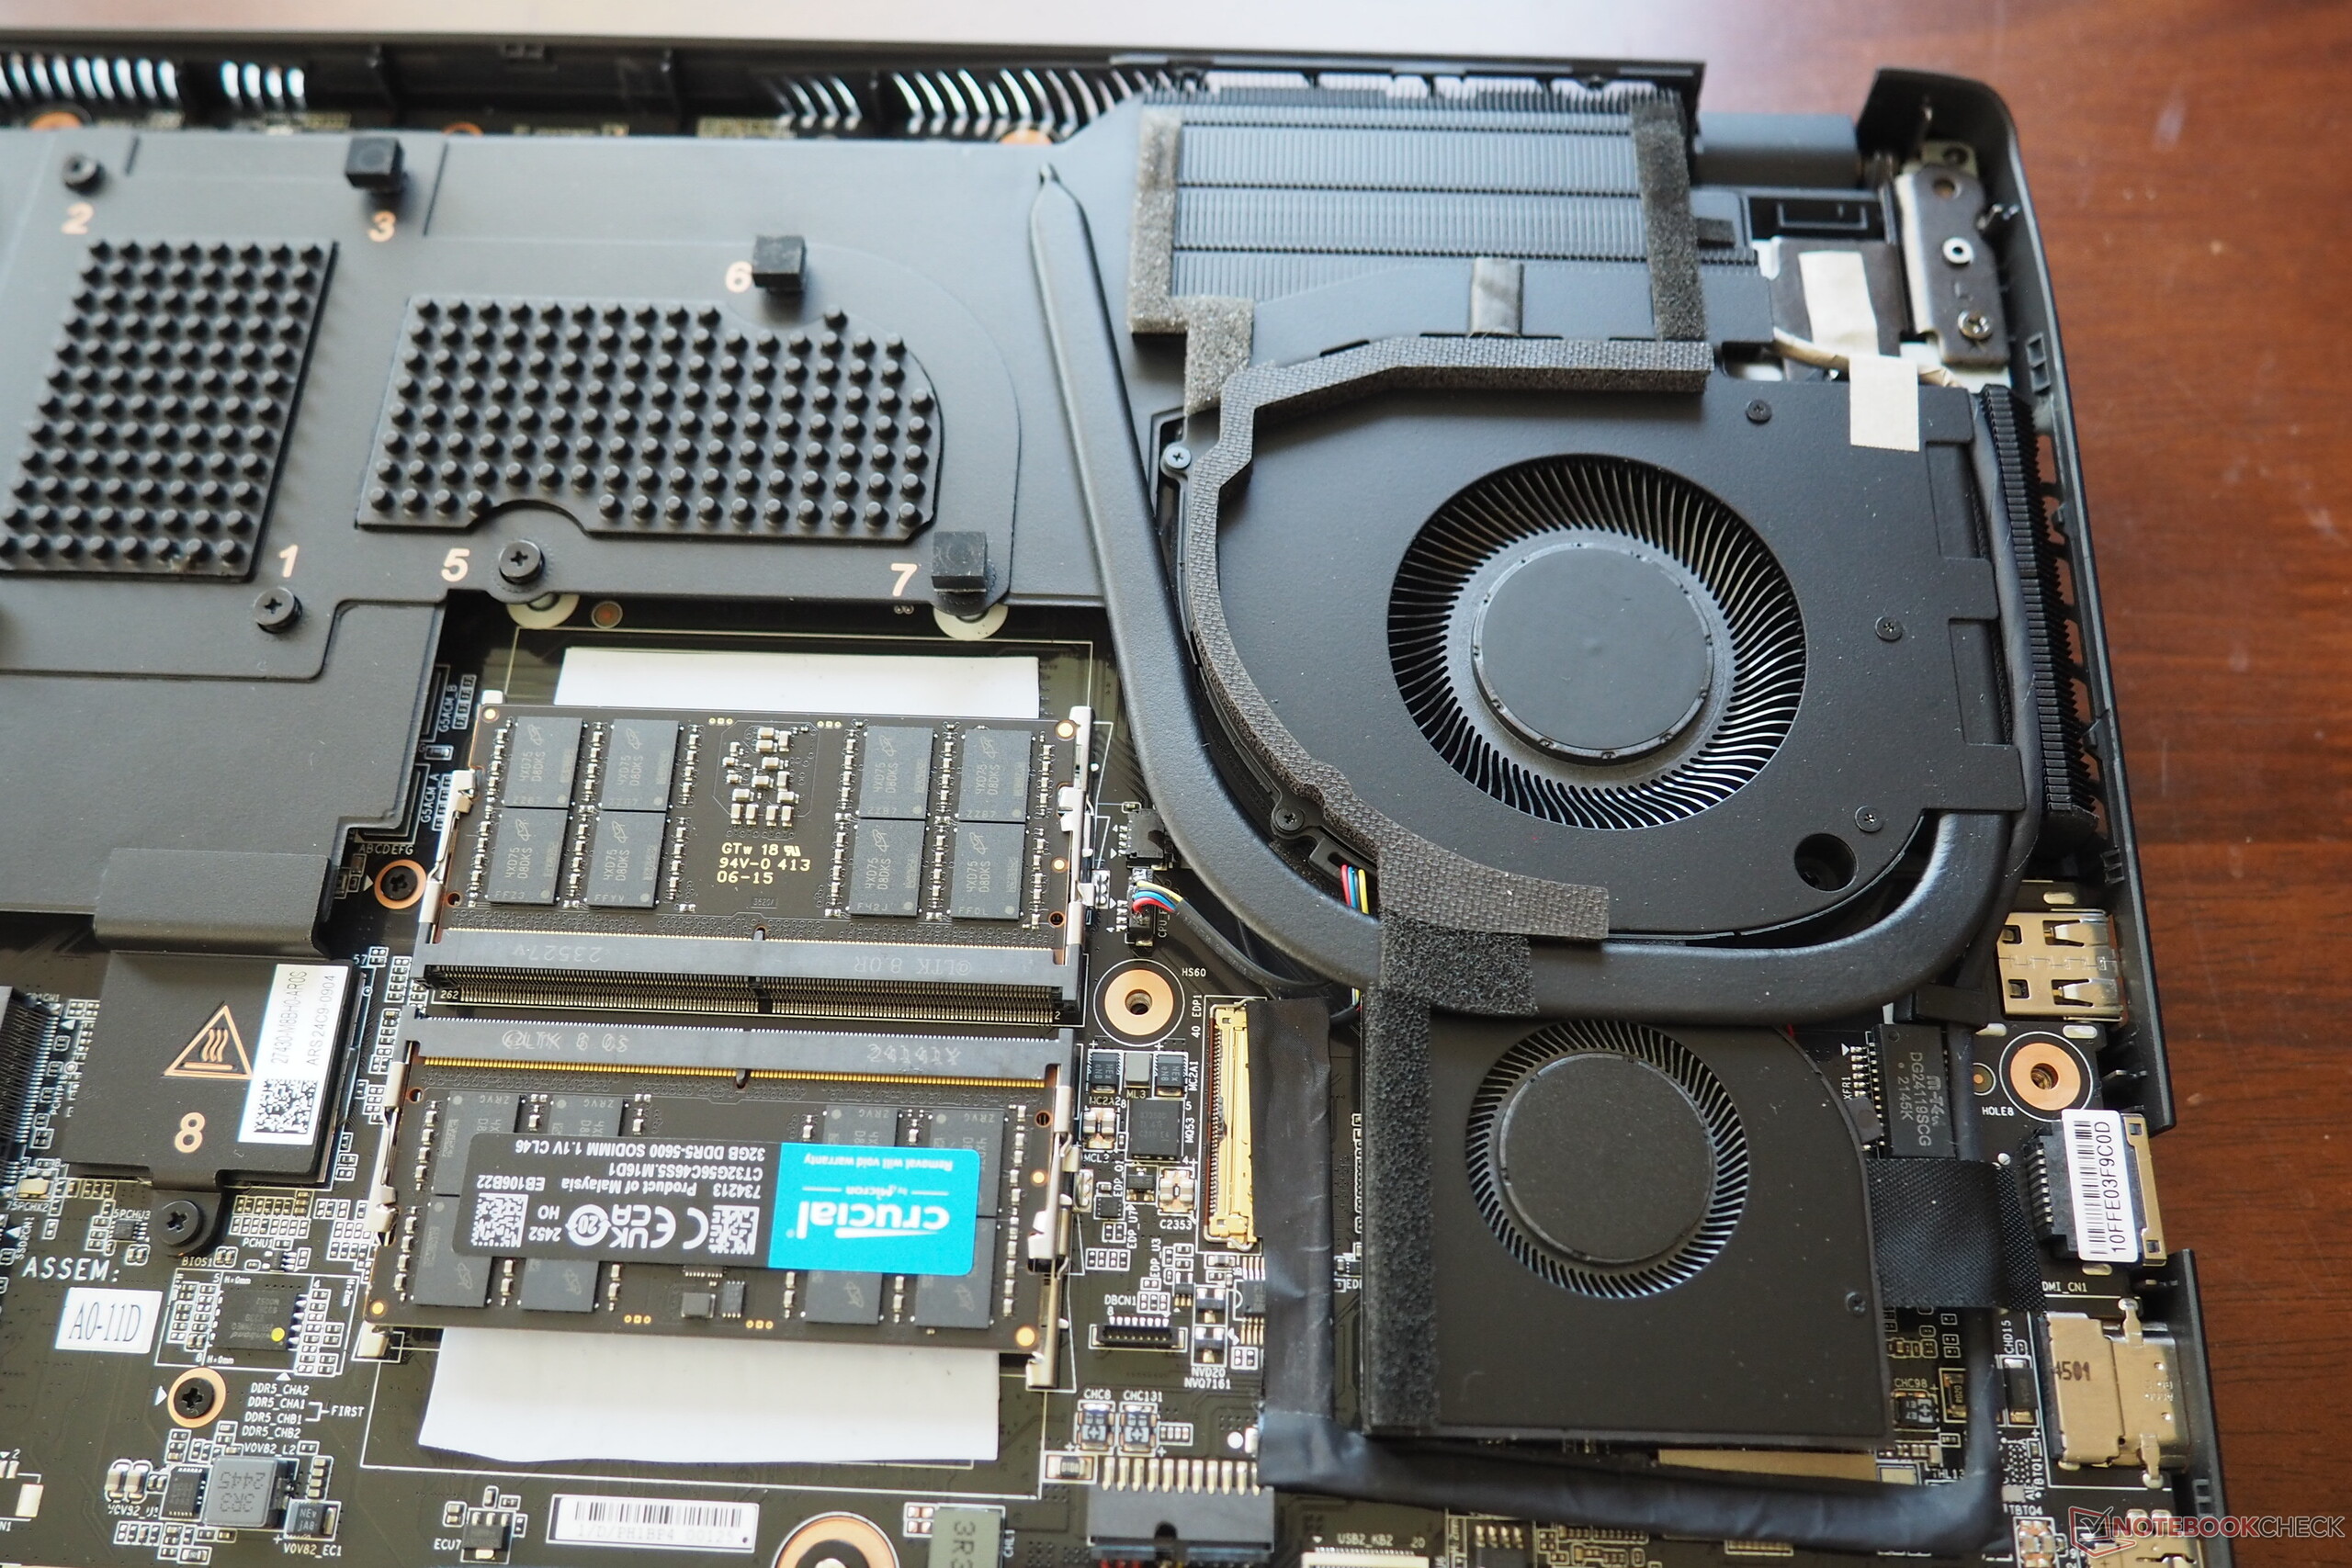
卸下 13 颗 Torx 螺钉后,即可松开底板(注意:机箱底座正面有用于照明的电线)。一个空的 M.2 插槽和两个空闲的内存组使升级选项成为可能。积极的一面笔记本电脑的散热系统采用蒸发腔技术。
可持续性
有些包装使用了聚丙烯,制造商在这方面可以做得更好。
保修
该设备在美国享有 12 个月的标准保修期。
输入设备
键盘
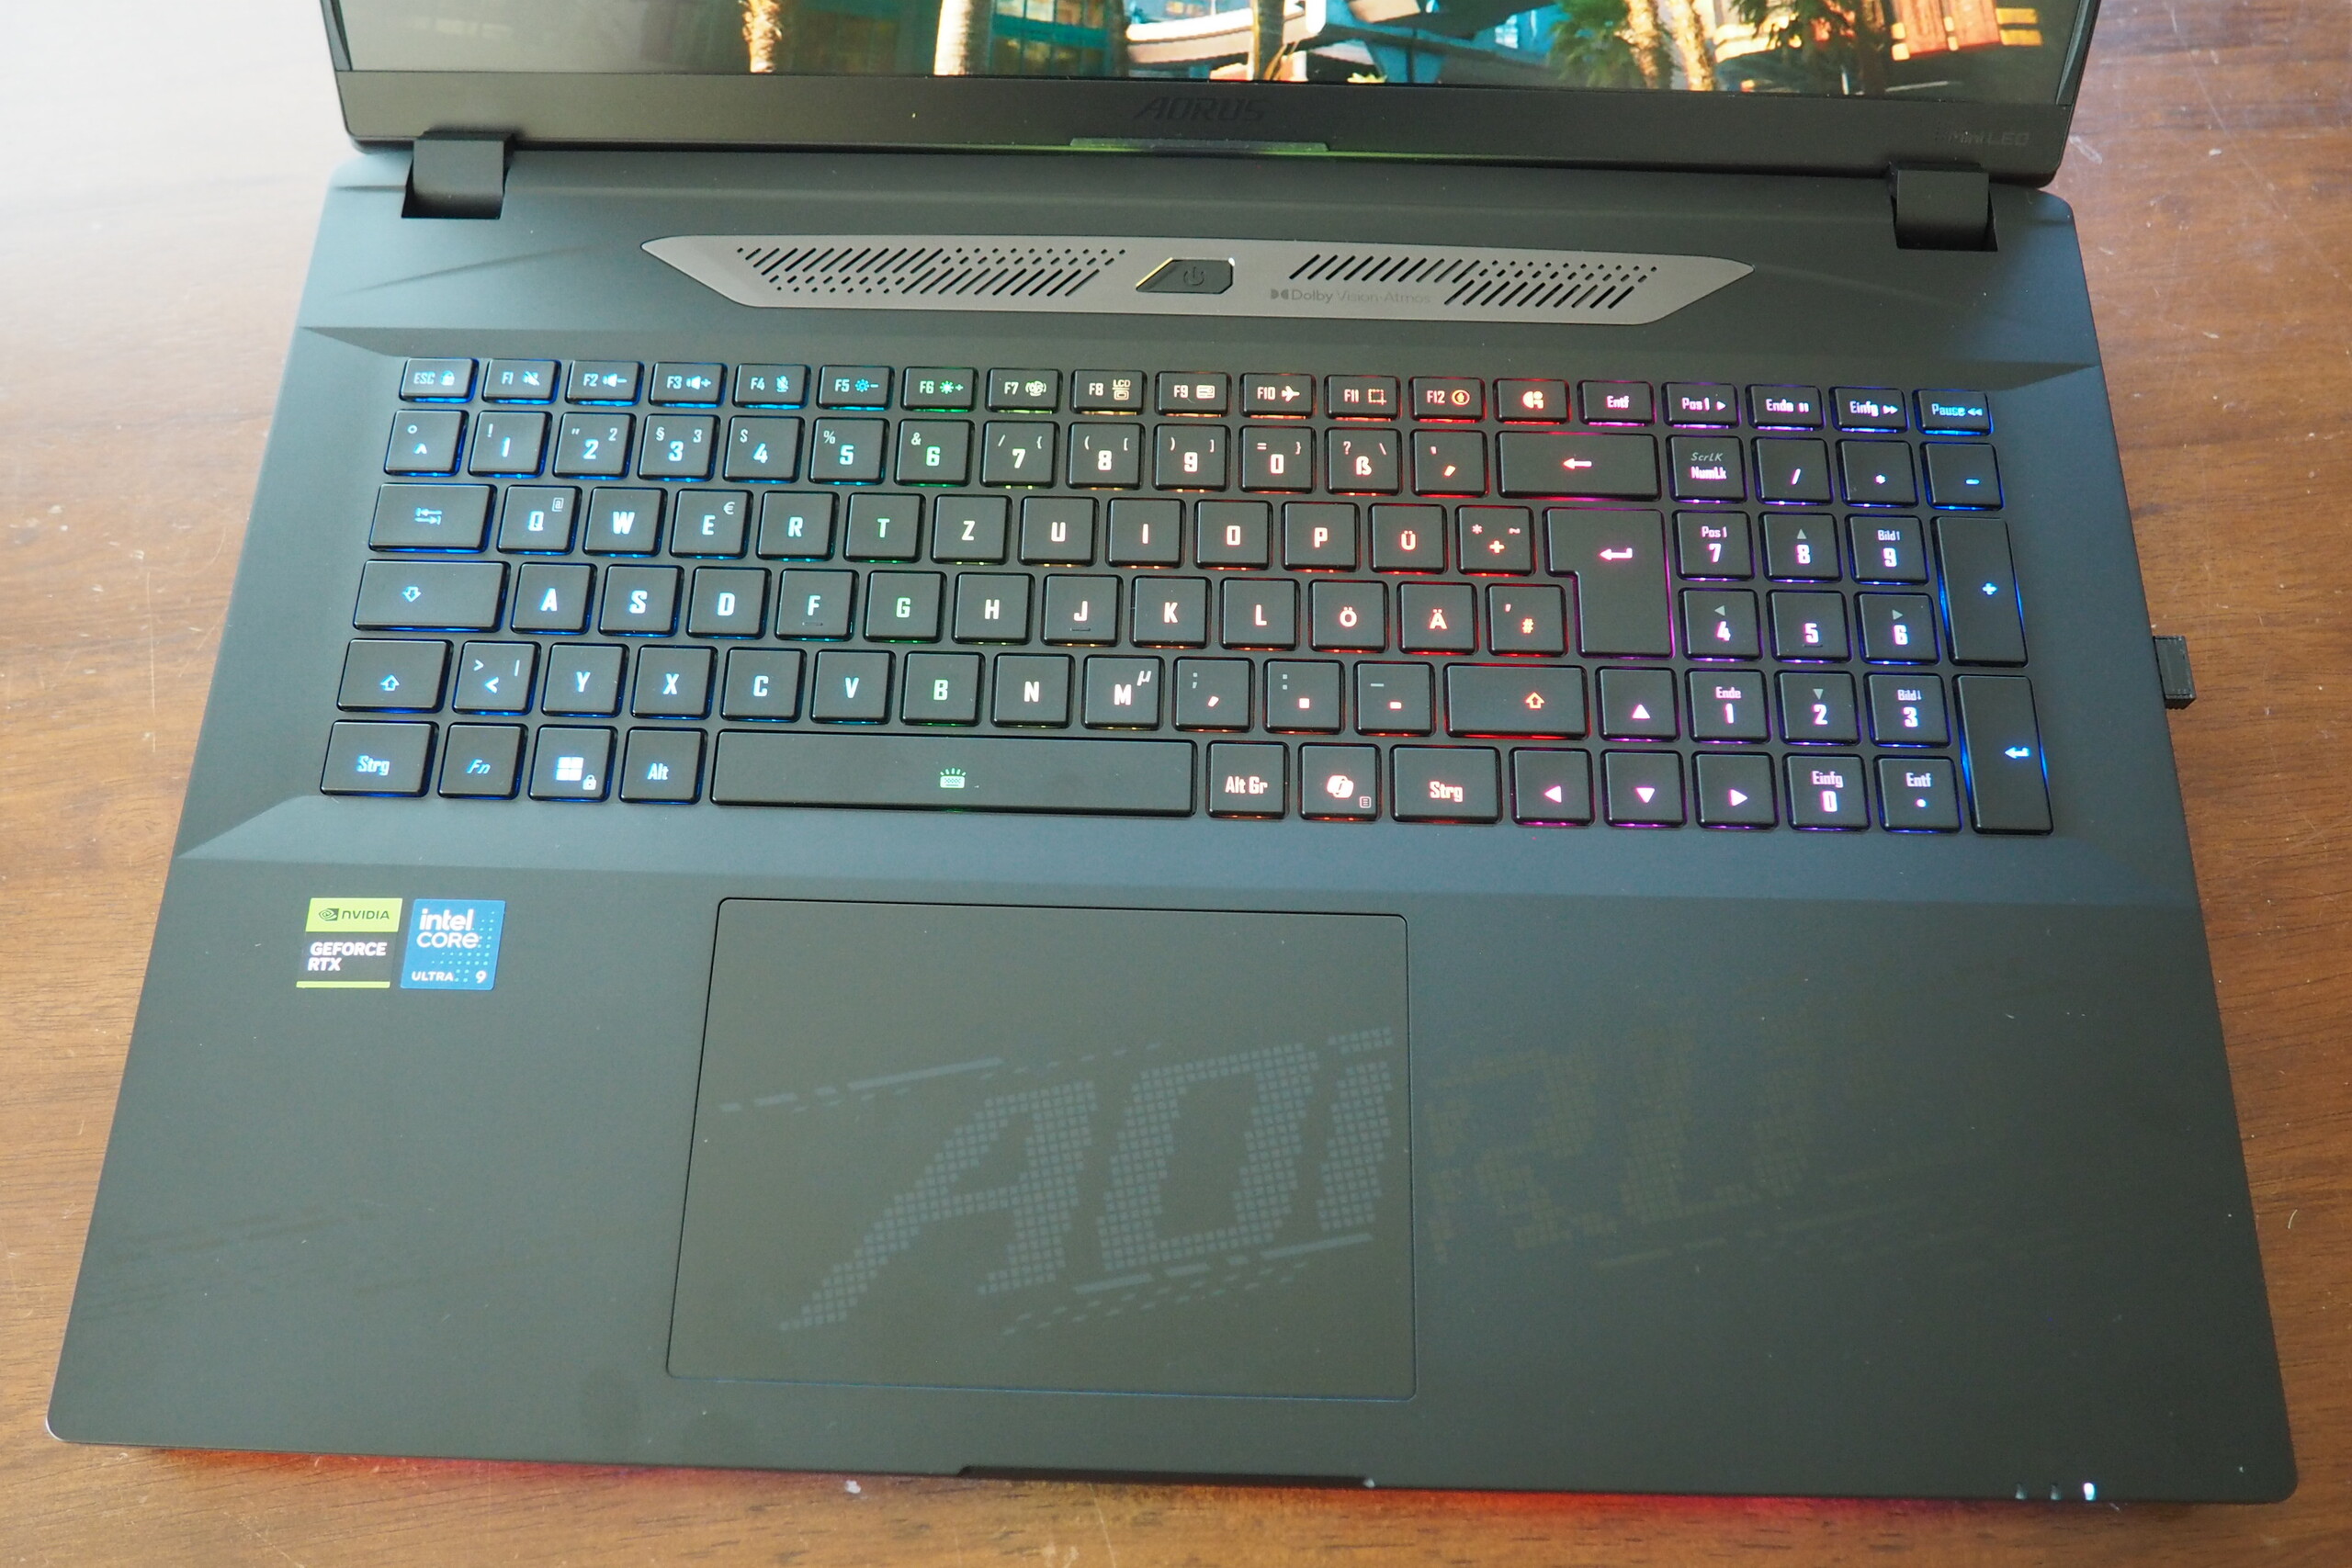
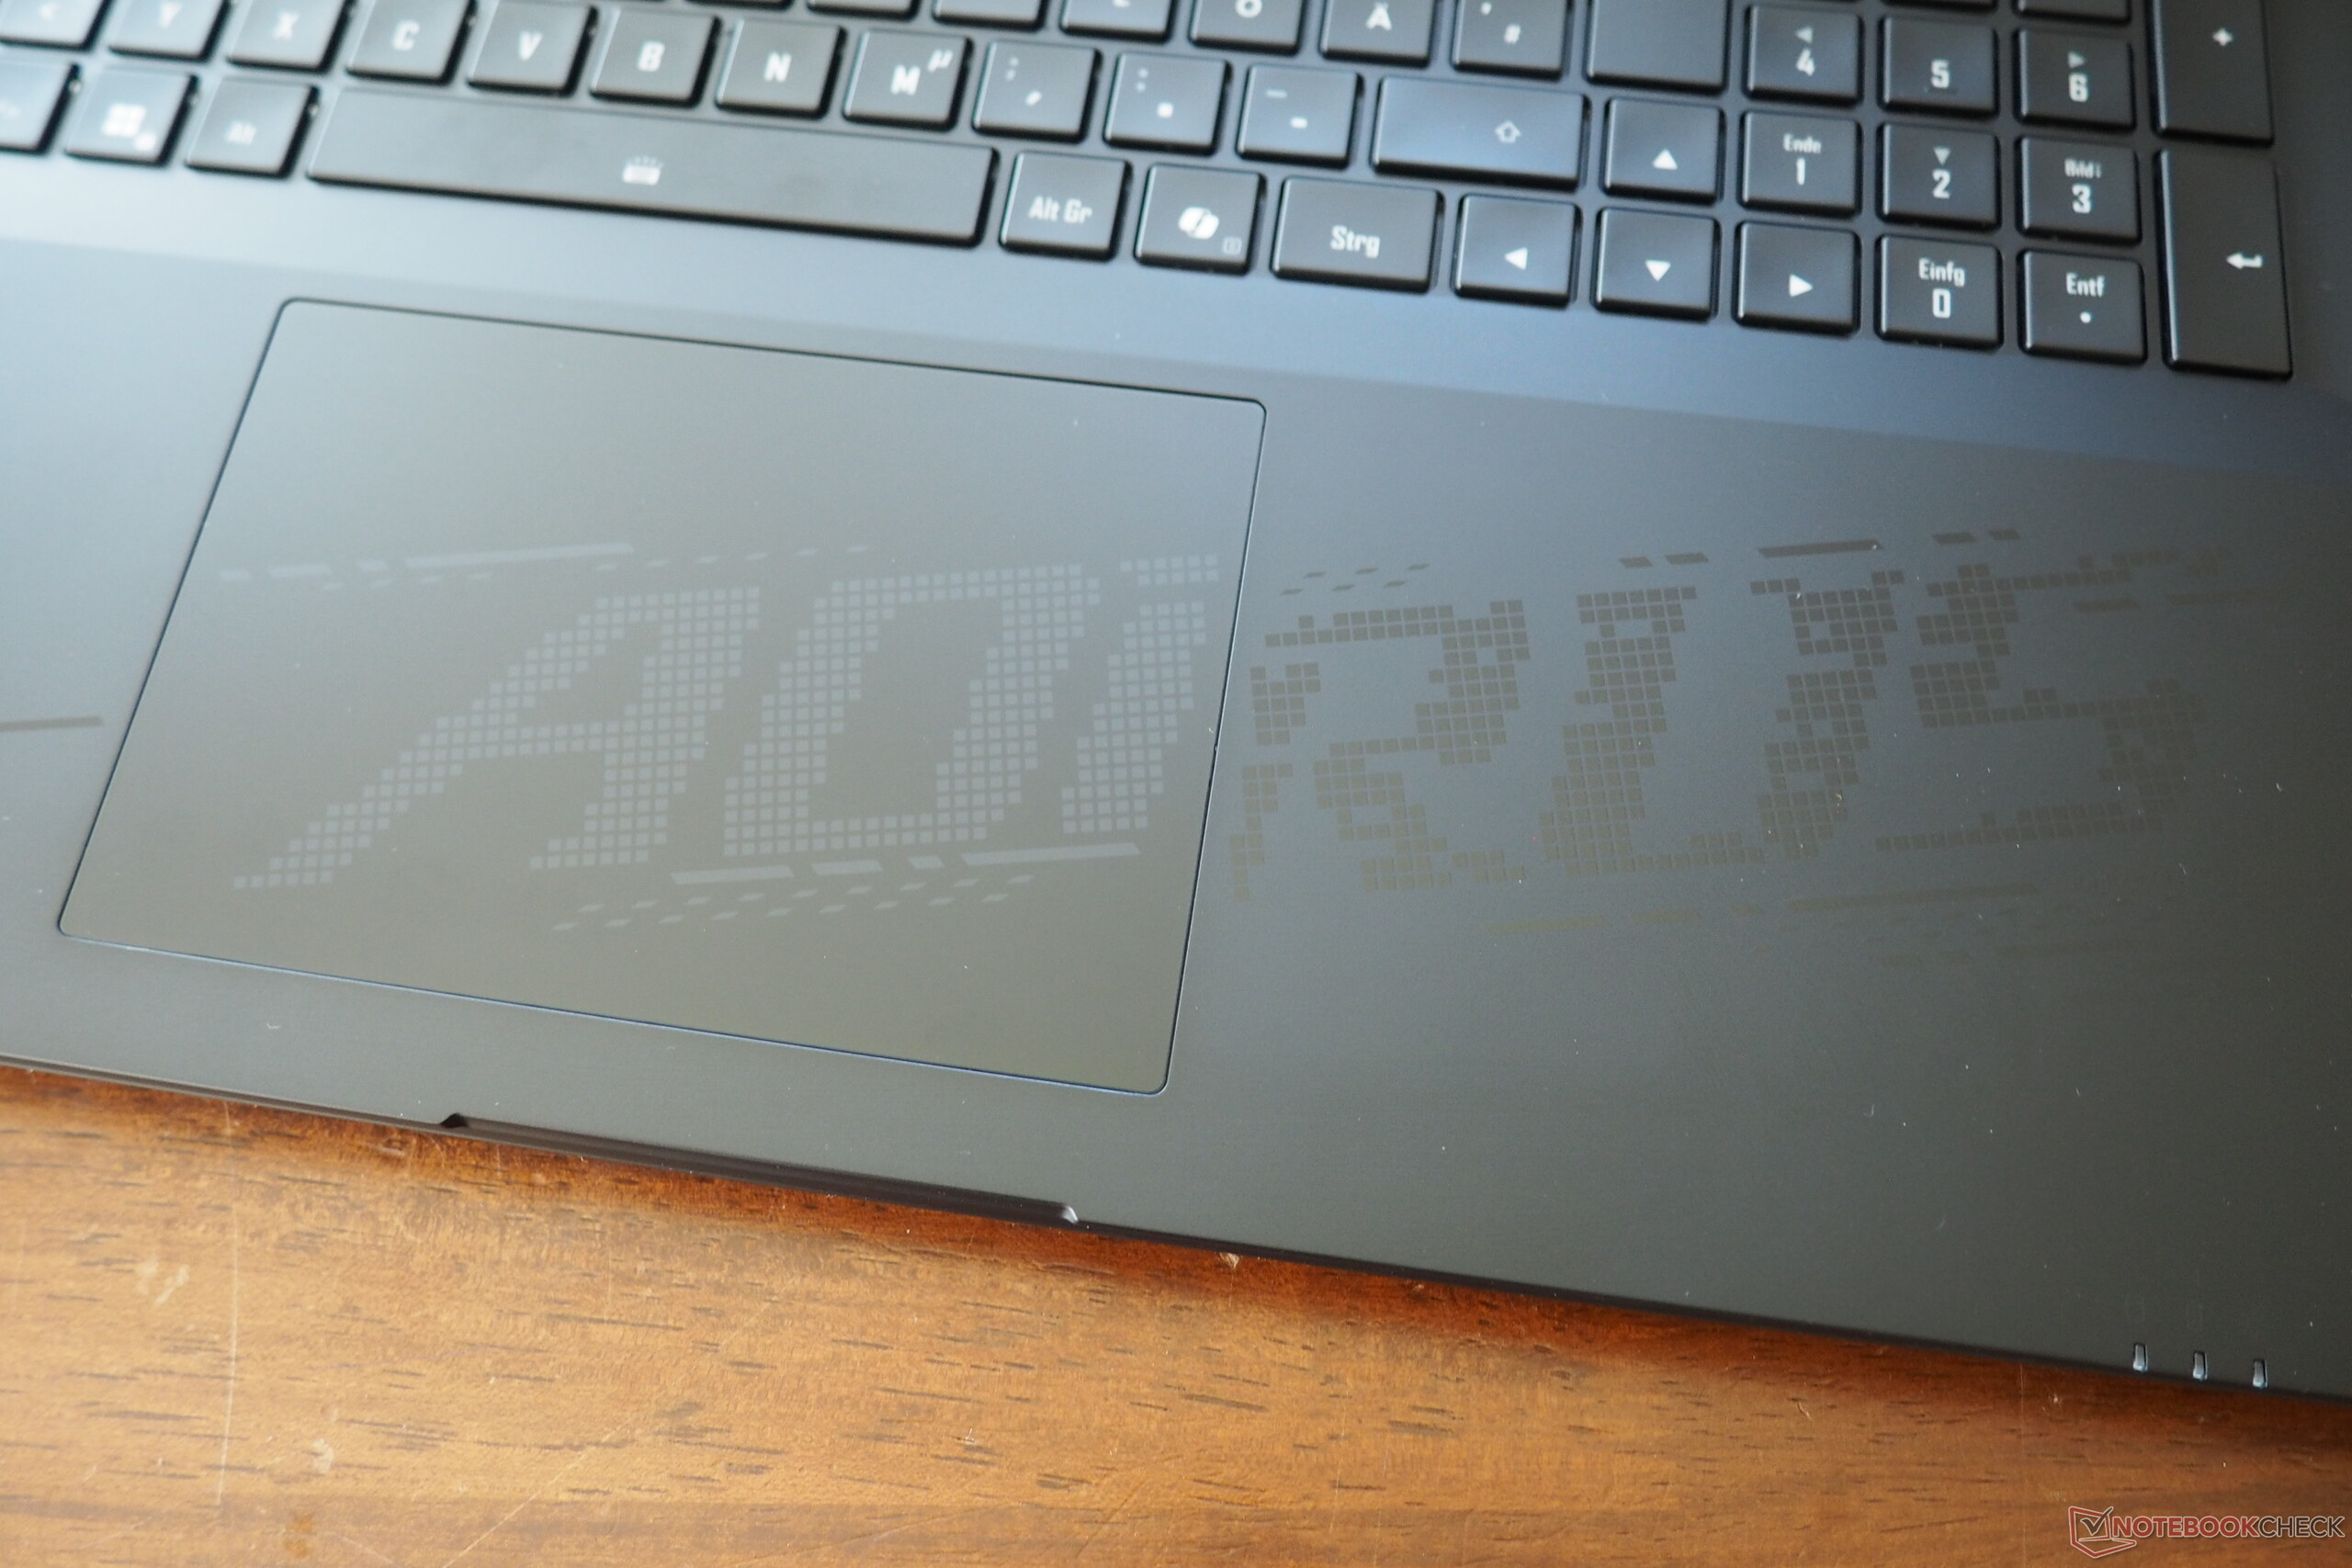
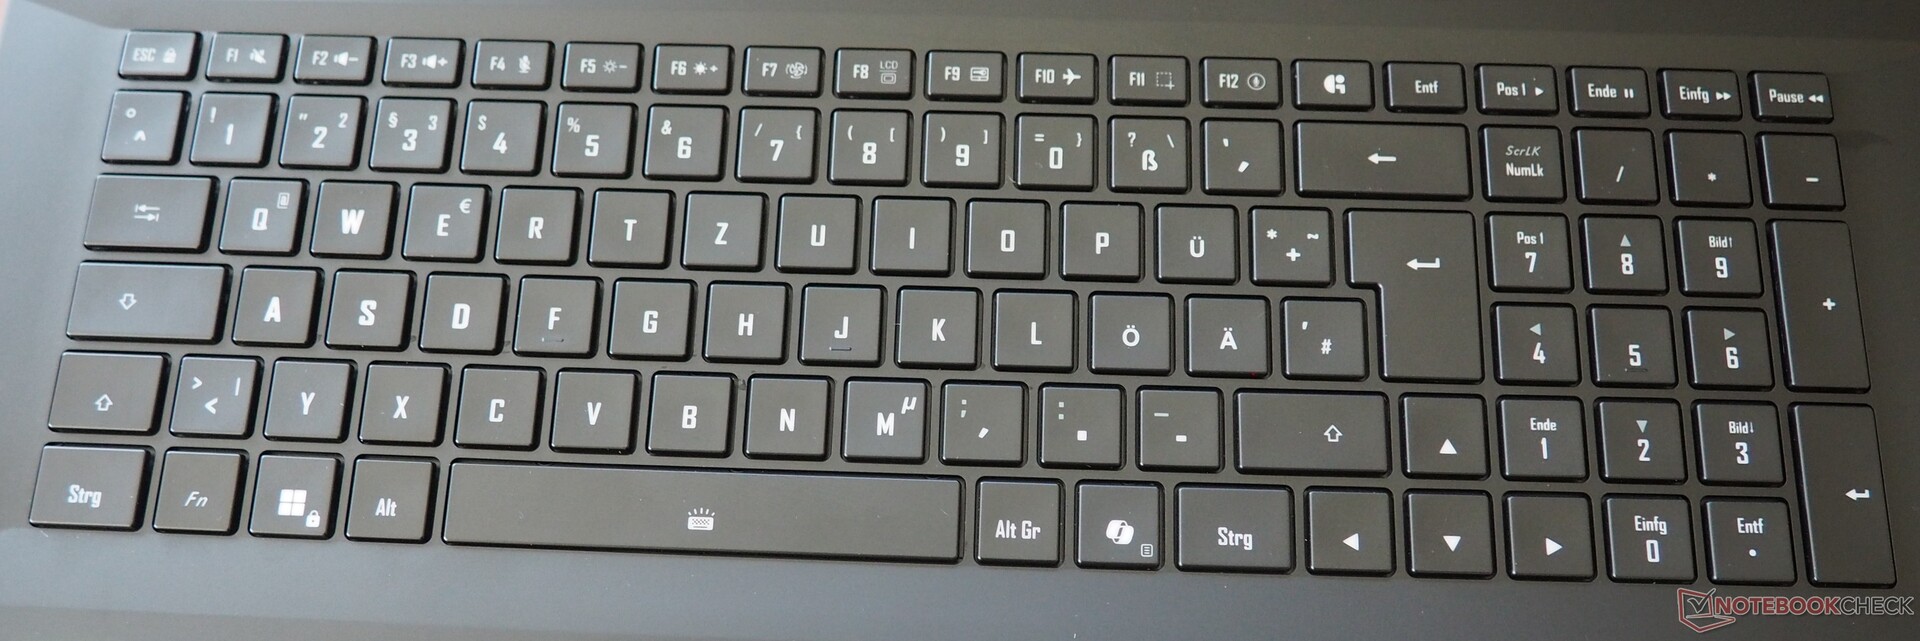
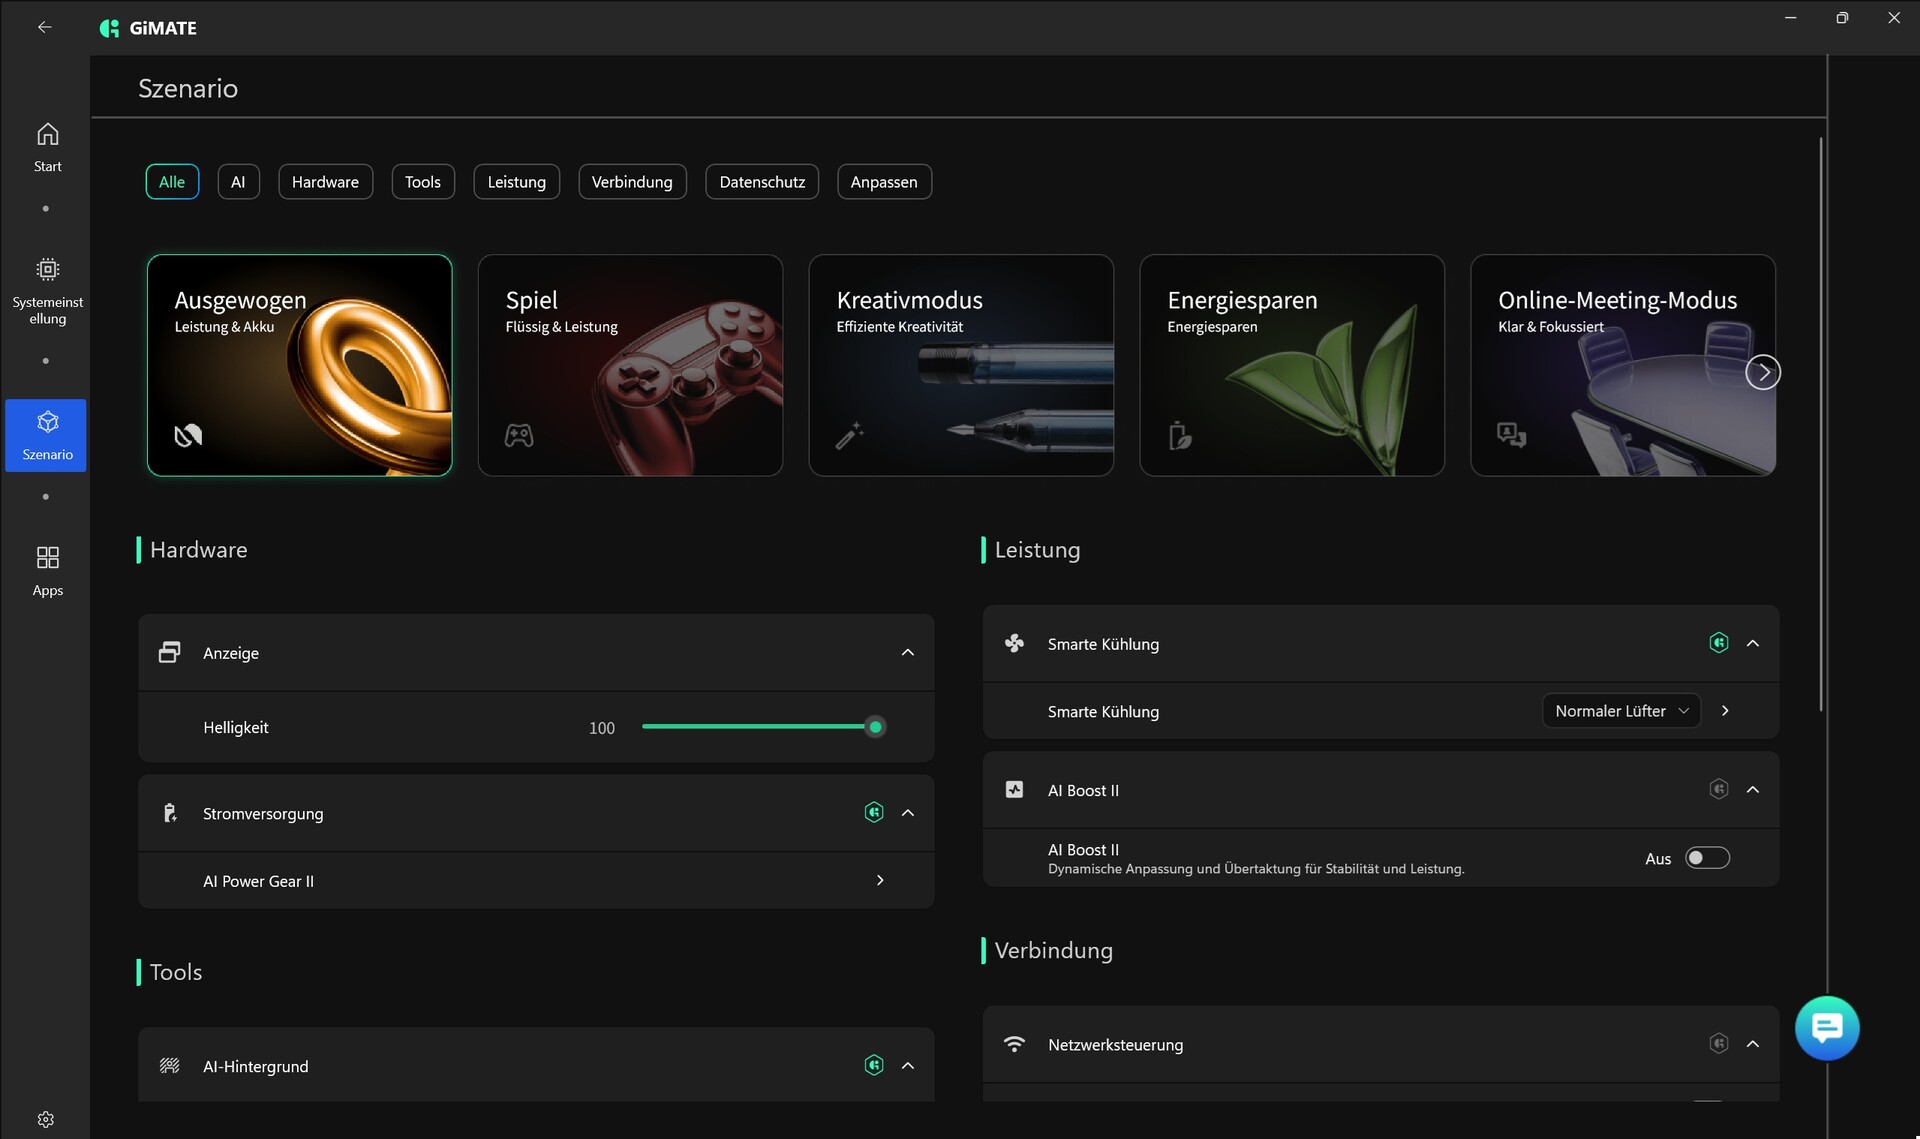
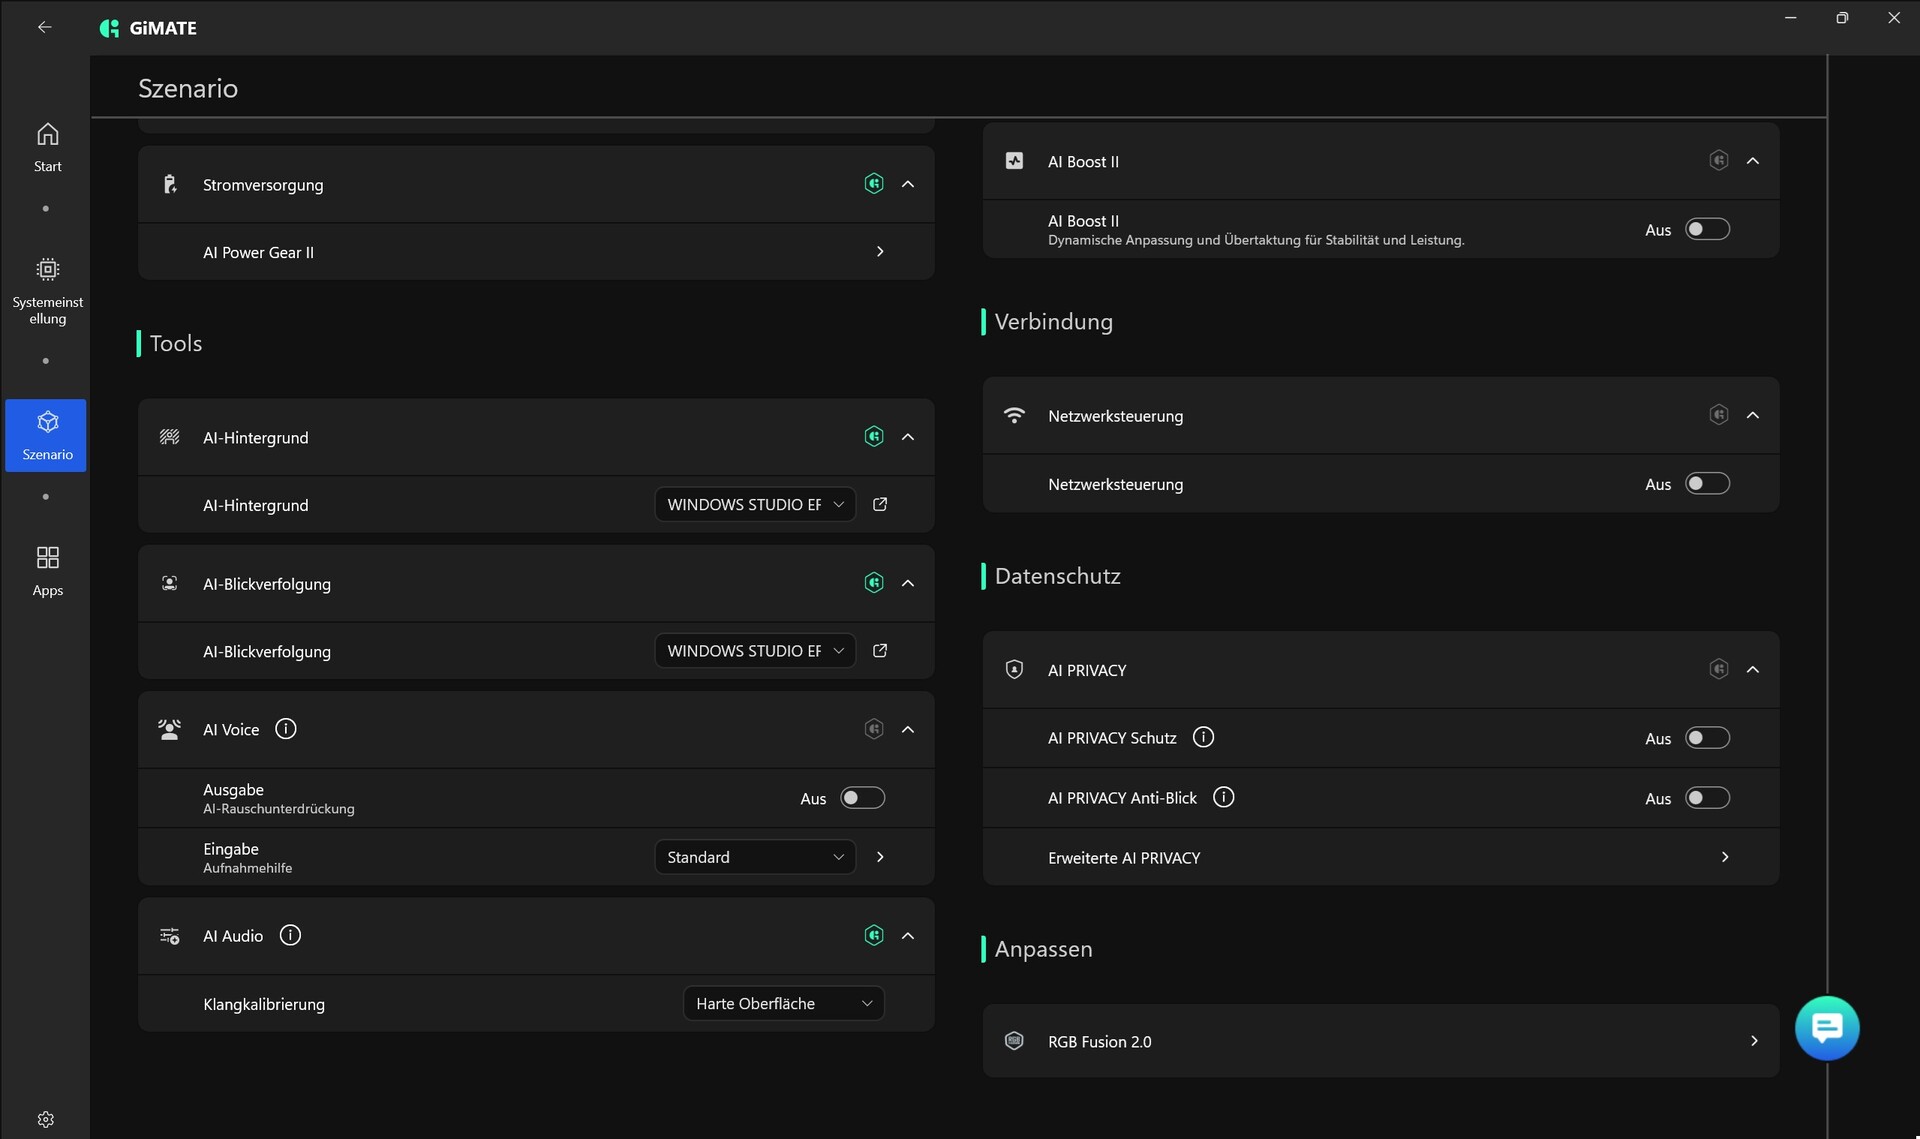
技嘉安装了带数字键盘的 Chiclet 键盘,打字时感觉不错。虽然我们喜欢它正常大小的方向箭头,但右上角的按键布局(如 Del 和 Ins 之间的距离)需要一些时间来适应。按下特殊的 Gi 键会打开一个对话框,显示制造商自己的 GiMATE AI。您必须自行决定这些功能是否有意义。与此同时,安装的照明设备可以在三个强度级别中进行调节。
触摸板
触摸板的尺寸为 13.4 x 9 厘米,对于 18 英寸的设备来说绰绰有余。不出所料,其光滑的表面确保了良好的滑动性能。它的手势支持也运行良好。下边缘的点击区域似乎有点不稳定(声音和触觉上都是如此),但触发可靠。
显示屏
与华硕的 18 英寸同类产品一样,Master 18 也采用了迷你 LED 面板,像素密度为 2,560 x 1,600 像素,虽然并不出众,但也还过得去。
| |||||||||||||||||||||||||
Brightness Distribution: 90 %
Center on Battery: 428 cd/m²
Contrast: 3369:1 (Black: 0.13 cd/m²)
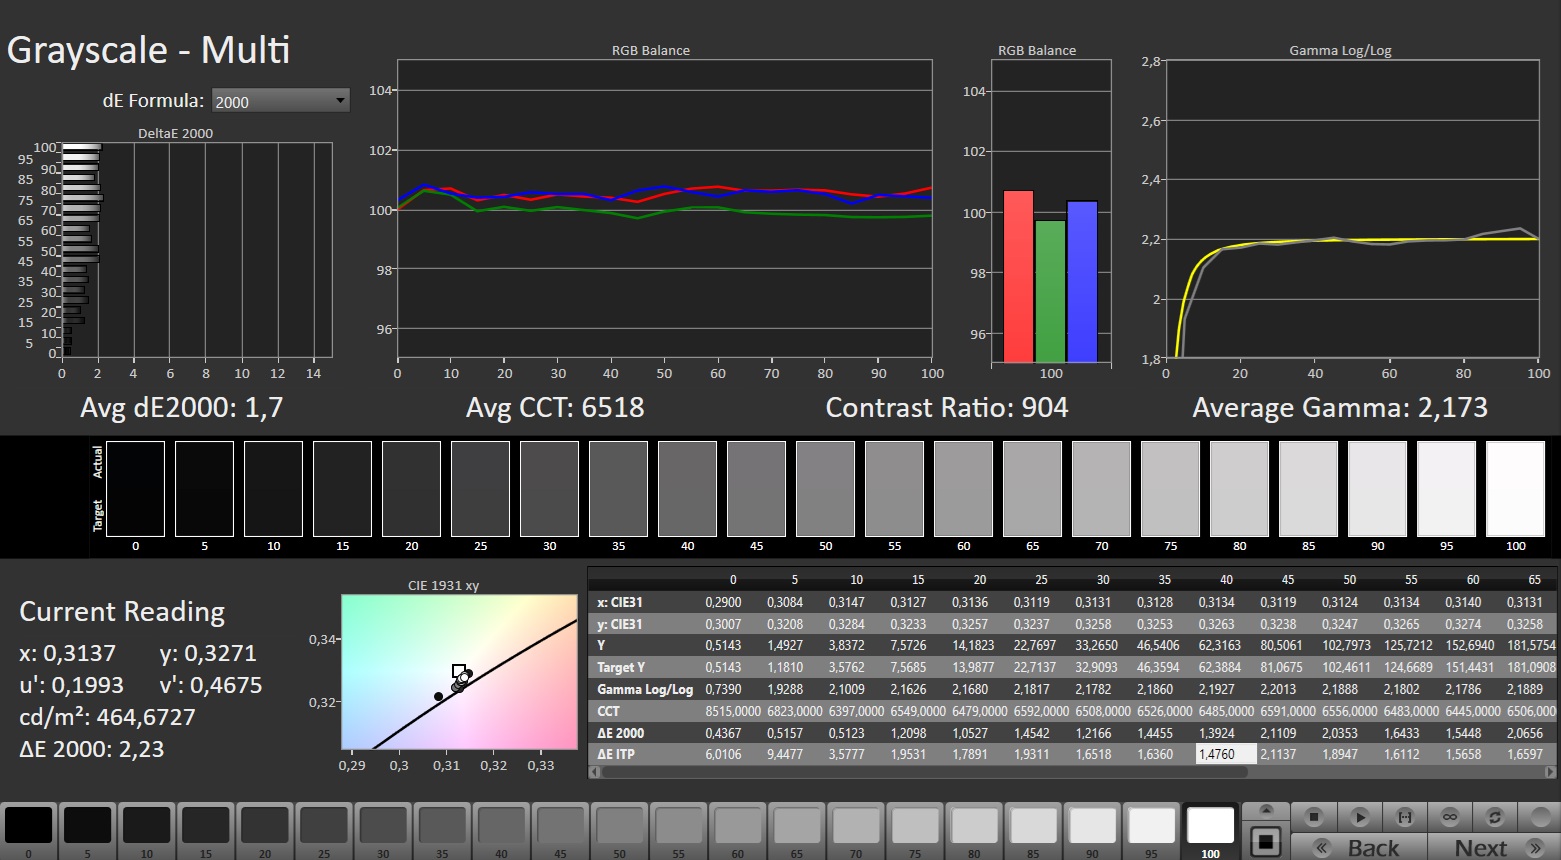
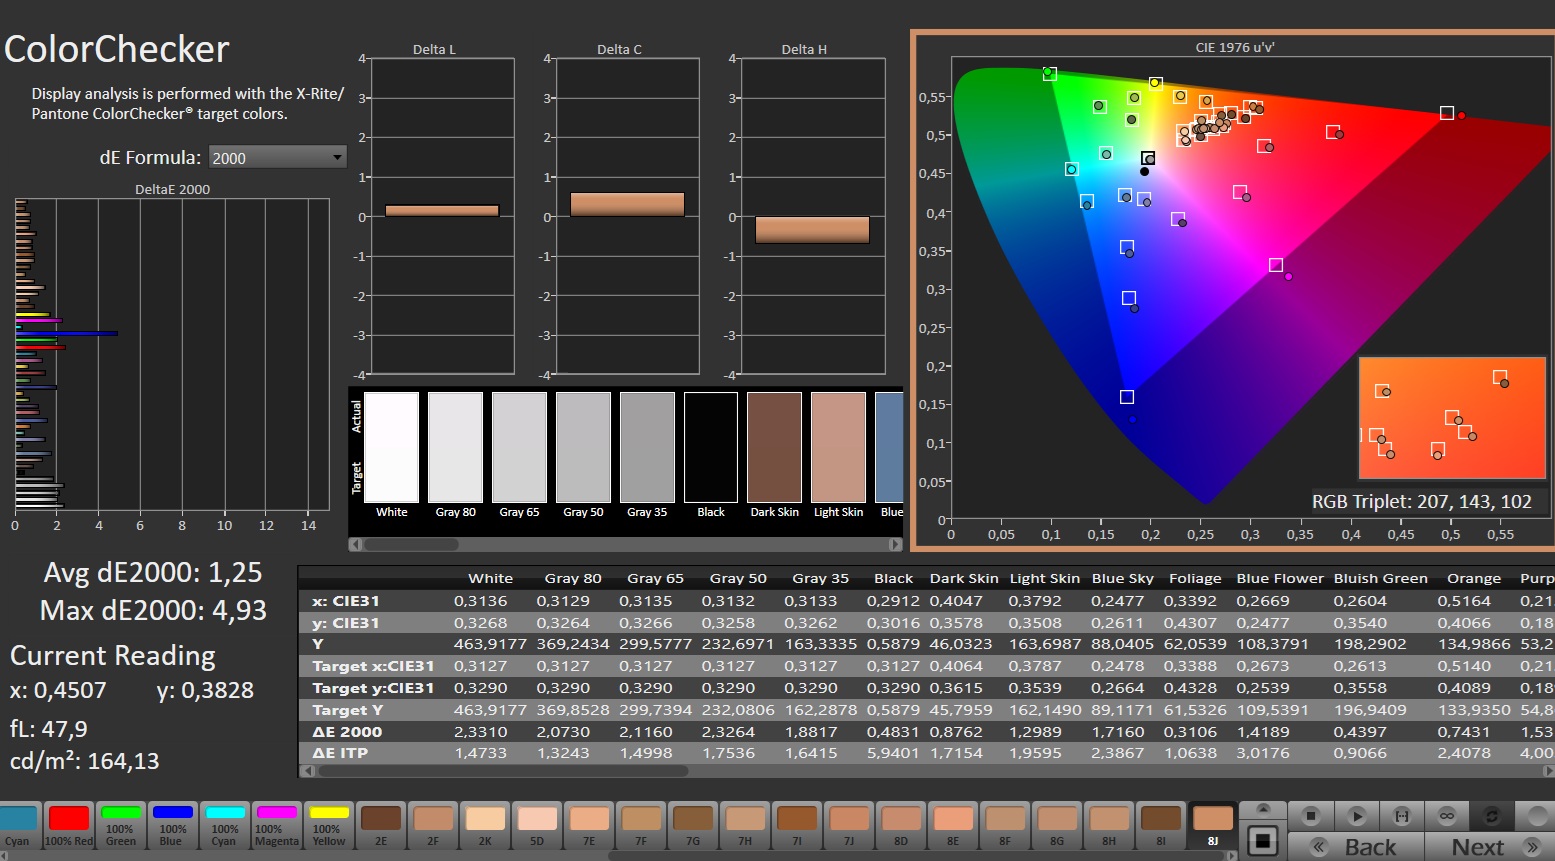
ΔE ColorChecker Calman: 1.25 | ∀{0.5-29.43 Ø4.71}
ΔE Greyscale Calman: 1.7 | ∀{0.09-98 Ø4.96}
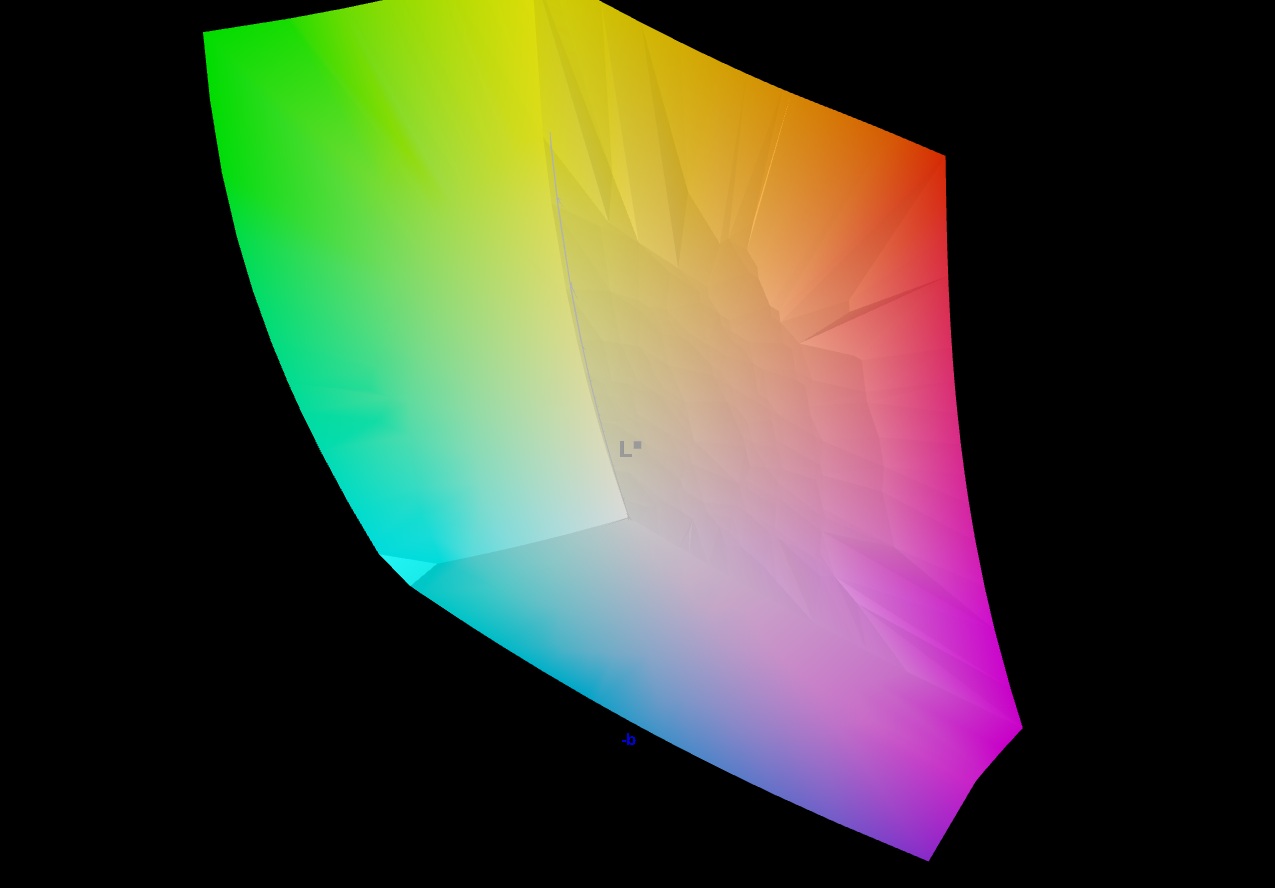
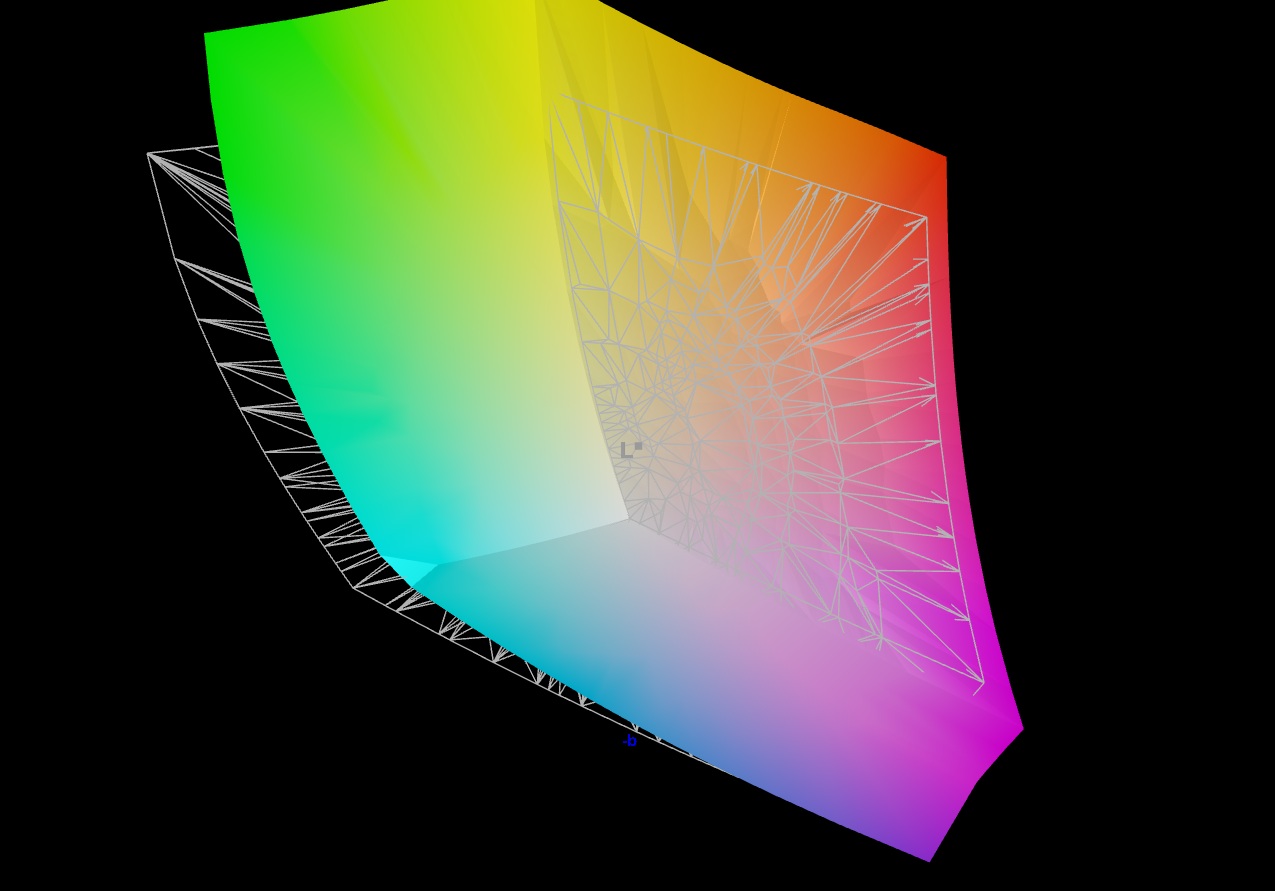
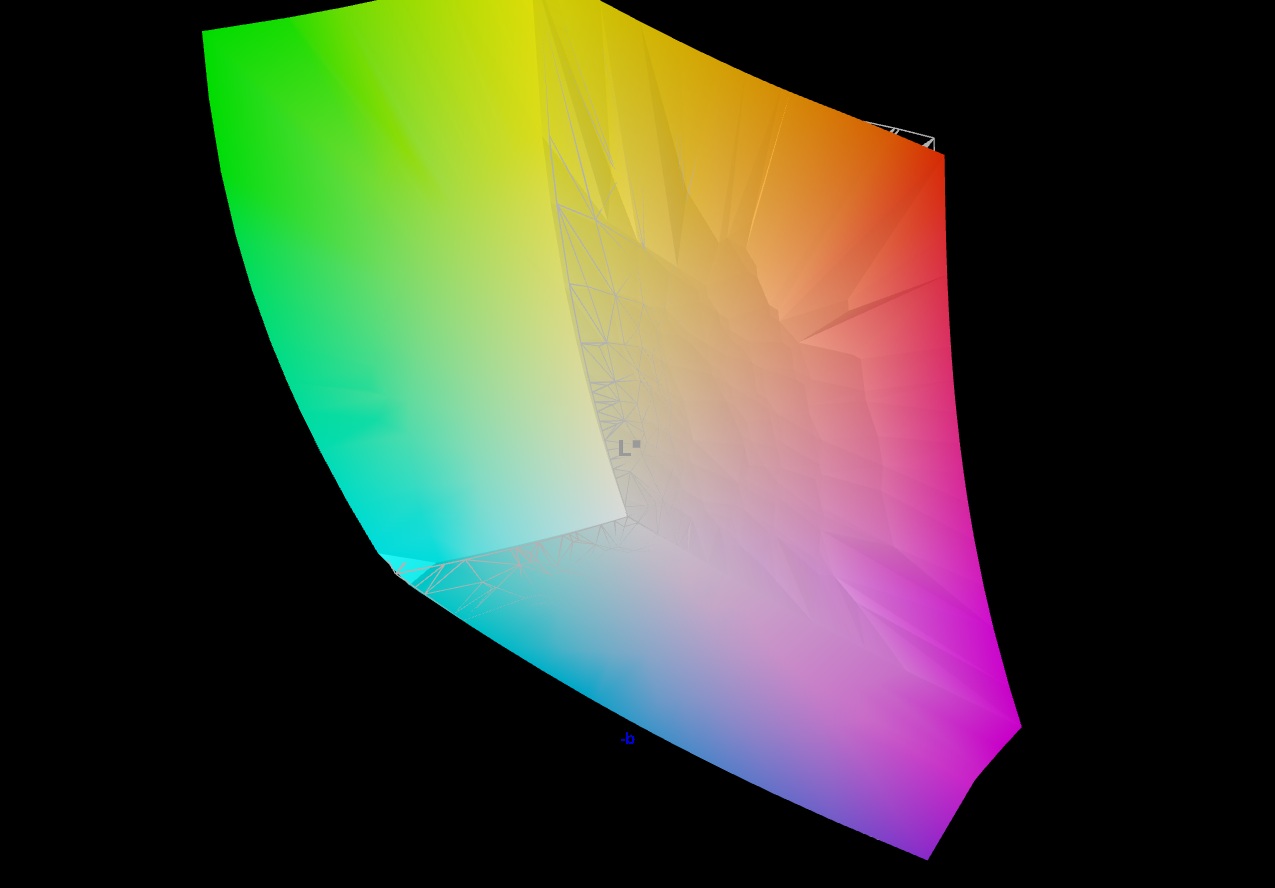
87.7% AdobeRGB 1998 (Argyll 3D)
100% sRGB (Argyll 3D)
99.9% Display P3 (Argyll 3D)
Gamma: 2.173
CCT: 6518 K
| Aorus Master 18 AM8H NE180QDM-NM1 (BOE0C58), Mini-LED, 2560x1600, 18", 240 Hz | Asus Strix Scar 18 G835LX N180QDM-NM2, Mini-LED, 2560x1600, 18", 240 Hz | Asus ROG Zephyrus G16 GU605CX ATNA60DL01-0, OLED, 2560x1600, 16", 240 Hz | Razer Blade 16 2025 RTX 5090 ATNA60DL04-0, OLED, 2560x1600, 16", 240 Hz | Alienware m18 R2 BOE NE18NZ1, IPS, 2560x1600, 18", 165 Hz | MSI Titan 18 HX A14VIG AU Optronics B180ZAN01.0, Mini-LED, 3840x2400, 18", 120 Hz | |
|---|---|---|---|---|---|---|
| Display | -1% | 3% | -2% | -0% | -1% | |
| Display P3 Coverage (%) | 99.9 | 99 -1% | 99.9 0% | 96.1 -4% | 97.8 -2% | 98.1 -2% |
| sRGB Coverage (%) | 100 | 100 0% | 100 0% | 99.9 0% | 99.5 0% | 99.8 0% |
| AdobeRGB 1998 Coverage (%) | 87.7 | 87.2 -1% | 96.9 10% | 85 -3% | 88.9 1% | 86.2 -2% |
| Response Times | 9% | 98% | 84% | 20% | -431% | |
| Response Time Grey 50% / Grey 80% * (ms) | 16.4 ? | 7.4 ? 55% | 0.22 99% | 0.2 ? 99% | 5.3 ? 68% | 8.6 ? 48% |
| Response Time Black / White * (ms) | 8.1 ? | 10.4 ? -28% | 0.25 97% | 0.25 ? 97% | 10.4 ? -28% | 81.8 ? -910% |
| PWM Frequency (Hz) | 1398 ? | 20610 ? | 960 | 960 ? | 2592 ? | |
| PWM Amplitude * (%) | 100 | 100 -0% | 44 56% | |||
| Screen | 44% | -6% | 3% | -62% | -51% | |
| Brightness middle (cd/m²) | 438 | 764 74% | 416 -5% | 391 -11% | 271.8 -38% | 467.5 7% |
| Brightness (cd/m²) | 451 | 747 66% | 418 -7% | 393 -13% | 275 -39% | 459 2% |
| Brightness Distribution (%) | 90 | 93 3% | 96 7% | 98 9% | 78 -13% | 90 0% |
| Black Level * (cd/m²) | 0.13 | 0.1 23% | 0.27 -108% | |||
| Contrast (:1) | 3369 | 7640 127% | 1007 -70% | |||
| Colorchecker dE 2000 * | 1.25 | 1.2 4% | 1.6 -28% | 1.2 4% | 2.48 -98% | 3.77 -202% |
| Colorchecker dE 2000 max. * | 4.93 | 2.8 43% | 2.1 57% | 3.2 35% | 5.59 -13% | 6.12 -24% |
| Greyscale dE 2000 * | 1.7 | 1.5 12% | 2.7 -59% | 1.8 -6% | 3.7 -118% | 3.2 -88% |
| Gamma | 2.173 101% | 2.17 101% | 2.16 102% | 2.2 100% | 2.2 100% | 2.43 91% |
| CCT | 6518 100% | 6556 99% | 6331 103% | 6493 100% | 6355 102% | 6478 100% |
| Colorchecker dE 2000 calibrated * | 0.56 | 2.94 | ||||
| Total Average (Program / Settings) | 17% /
27% | 32% /
16% | 28% /
22% | -14% /
-35% | -161% /
-106% |
* ... smaller is better
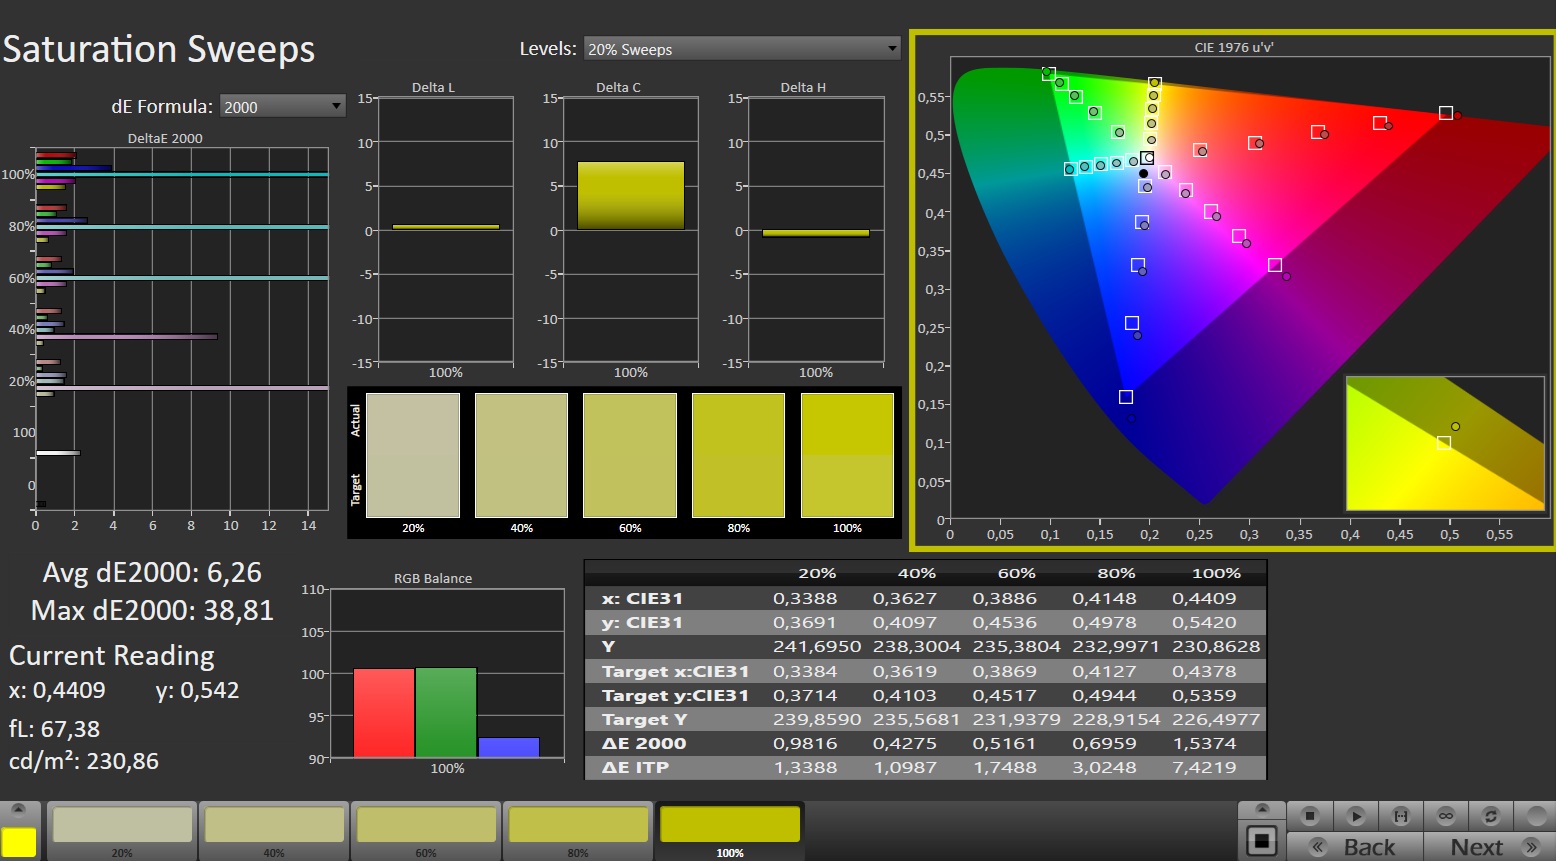
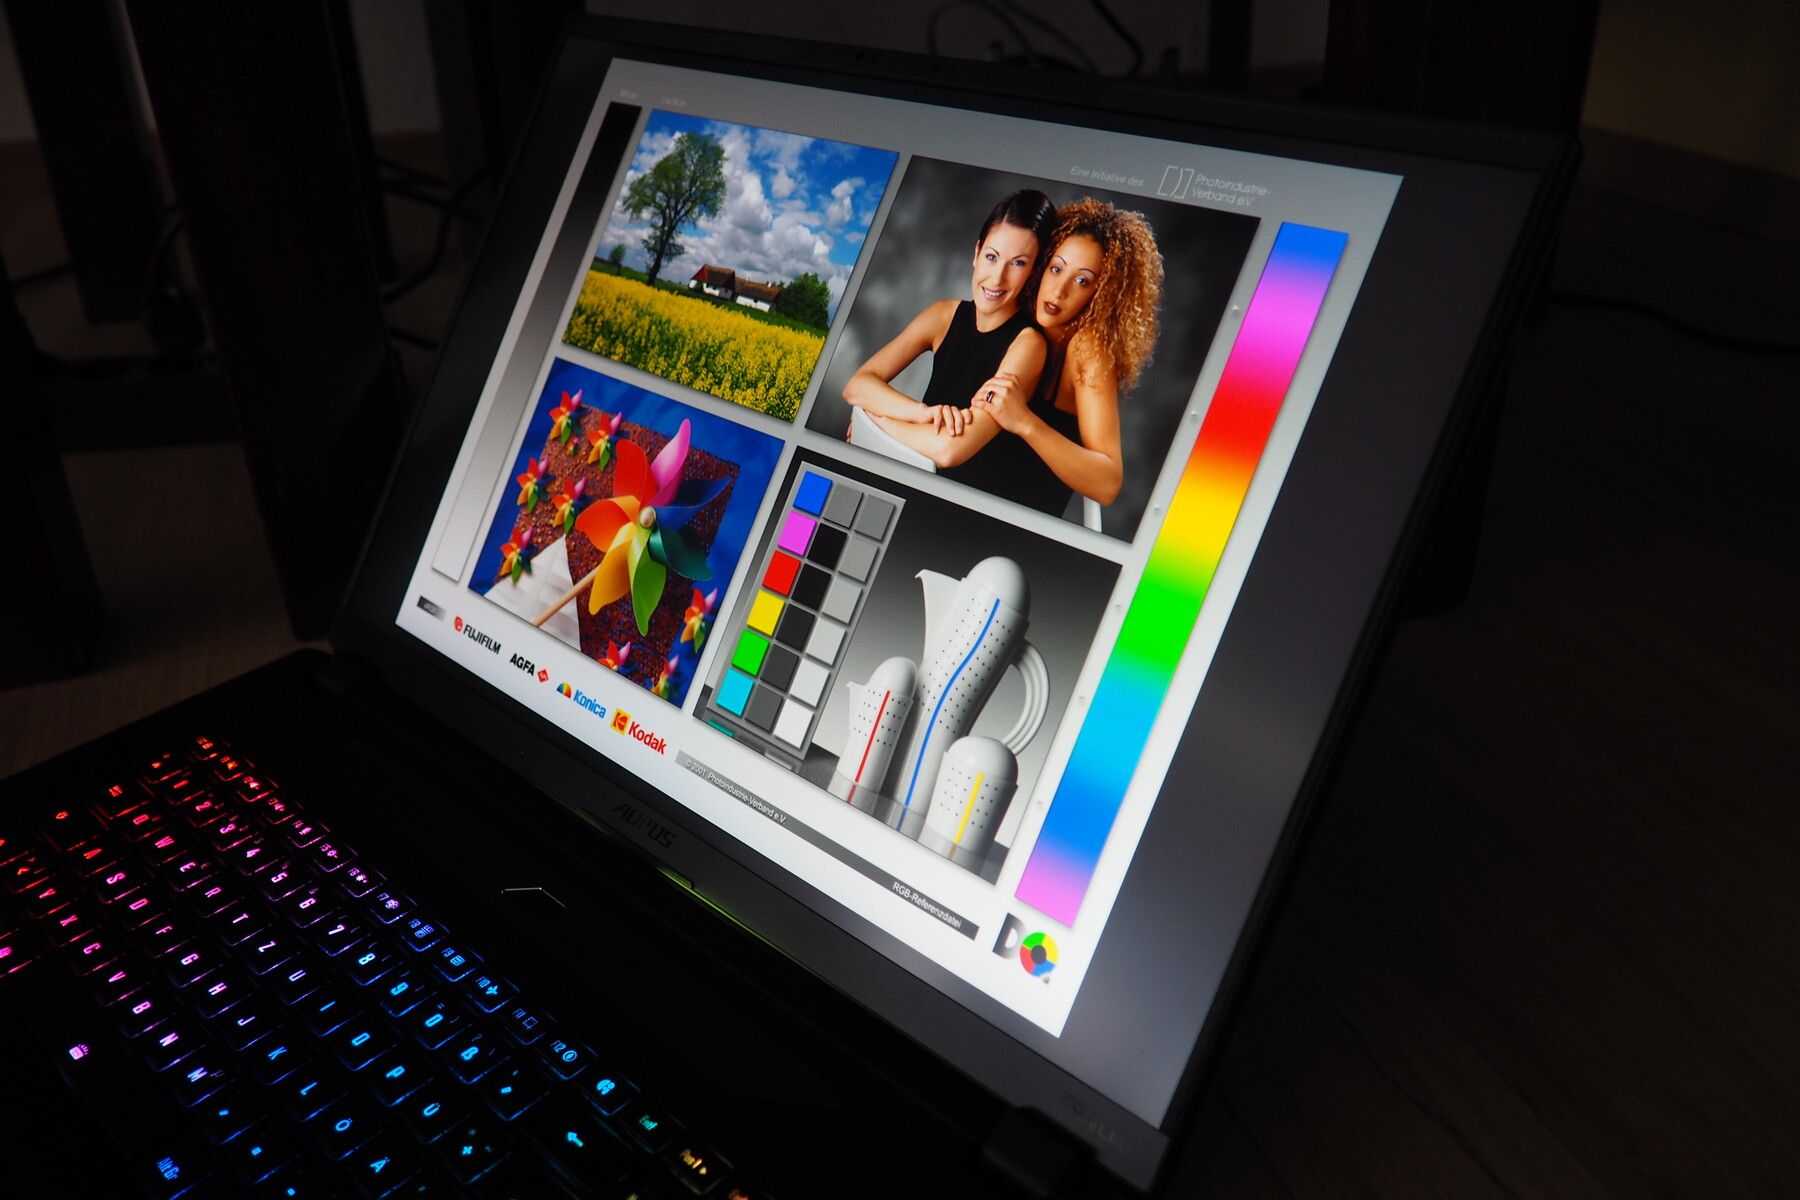
笔记本电脑 240 Hz 屏幕的优势之一是其丰富的色彩空间覆盖范围。除了 sRGB 之外,它还涵盖了 DCI-P3 的全部内容(以及 AdobeRGB 的 88%)。在 SDR 模式下测试亮度时,我们测得的亮度明显低于制造商规定的值。451 cd/m² 的平均亮度无法接近 Strix Scar 18 的水平,但仍足以满足大多数室内和偶尔室外使用的需求。正如我们的视频测试显示,在激活 HDR 的情况下,其亮度接近技嘉的宣传值。
只要忽略 OLED 的竞争,它的黑阶和对比度一般无需批评。响应时间也是如此。
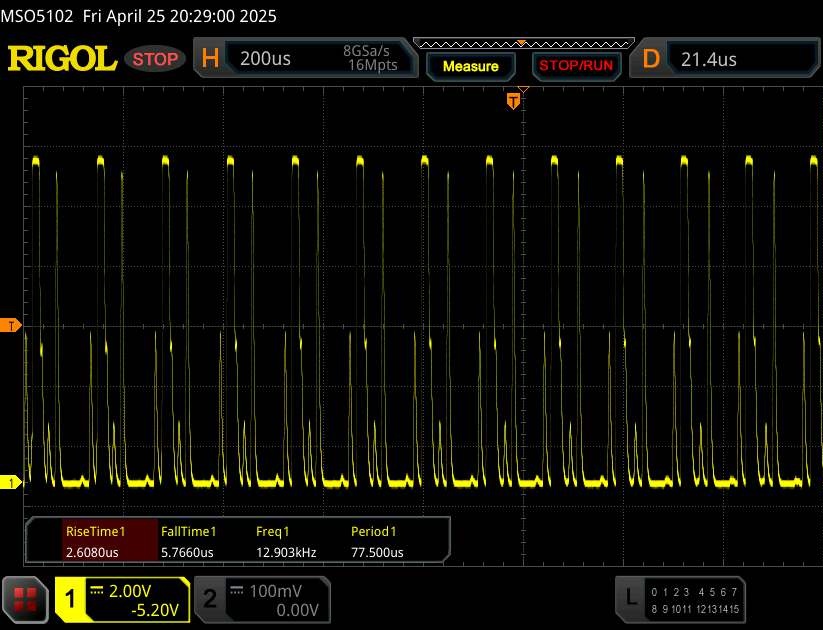
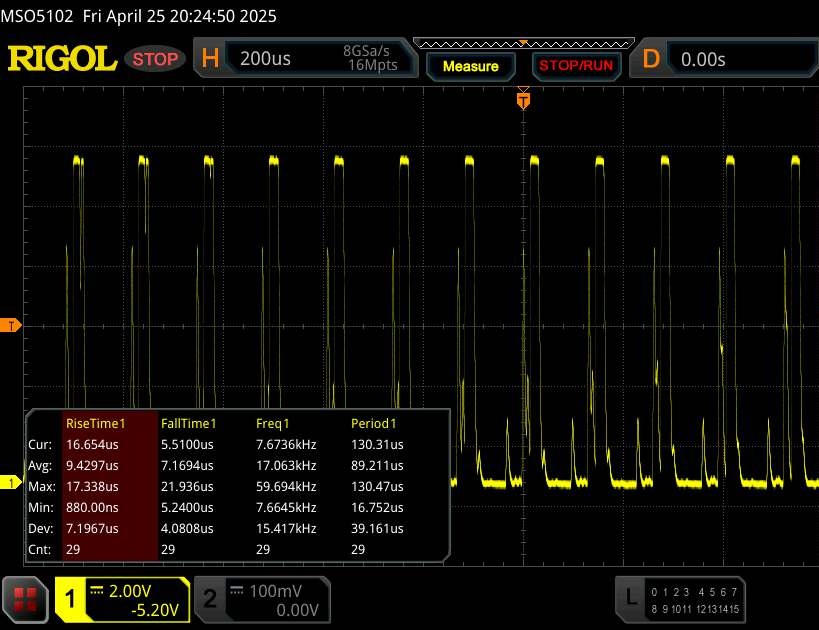
一个具体的批评点是它的画面闪烁,在每个亮度级别都会出现--但由于闪烁频率很高,这可能只是对极其敏感的人来说是个问题。
Display Response Times
| ↔ Response Time Black to White | ||
|---|---|---|
| 8.1 ms ... rise ↗ and fall ↘ combined | ↗ 8.1 ms rise | 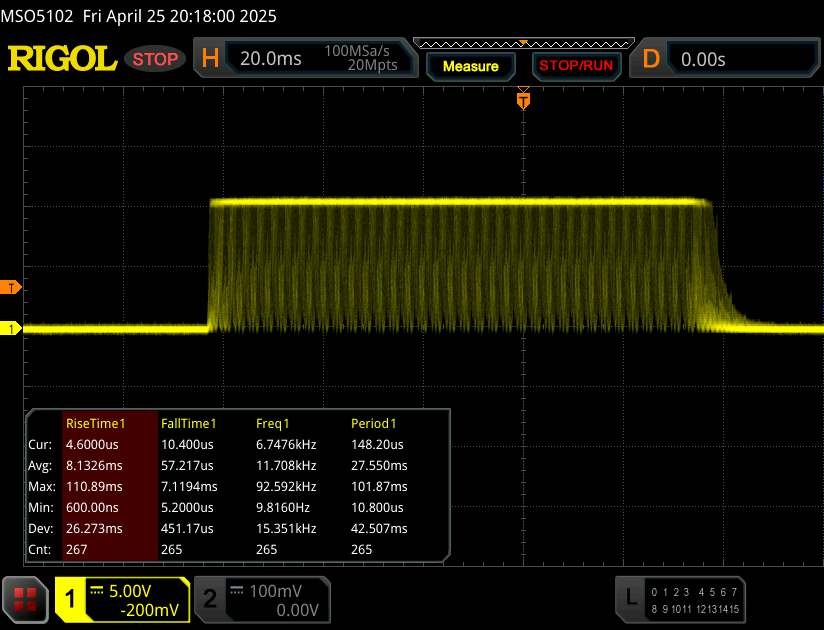 |
| ↘ ms fall | ||
| The screen shows fast response rates in our tests and should be suited for gaming. In comparison, all tested devices range from 0.1 (minimum) to 240 (maximum) ms. » 24 % of all devices are better. This means that the measured response time is better than the average of all tested devices (19.8 ms). | ||
| ↔ Response Time 50% Grey to 80% Grey | ||
| 16.4 ms ... rise ↗ and fall ↘ combined | ↗ 16.4 ms rise | 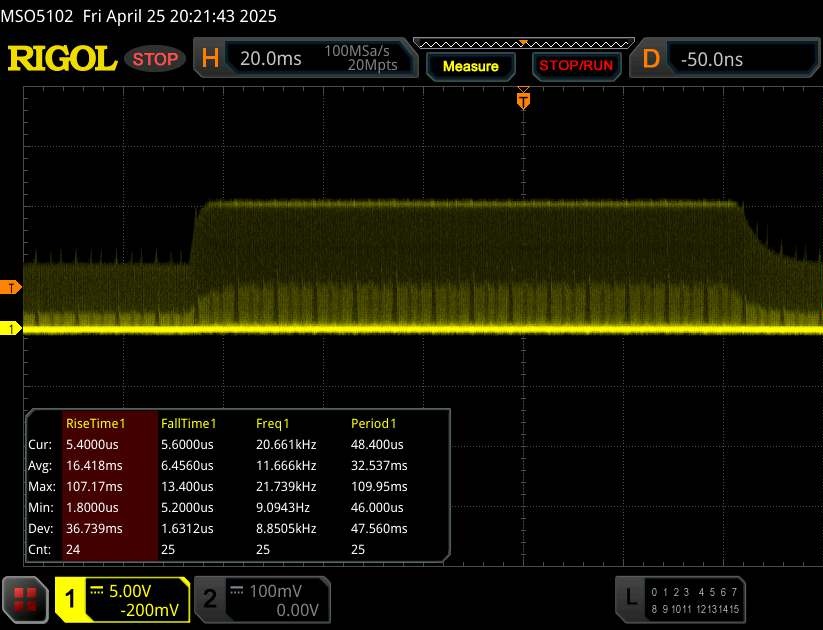 |
| ↘ ms fall | ||
| The screen shows good response rates in our tests, but may be too slow for competitive gamers. In comparison, all tested devices range from 0.165 (minimum) to 636 (maximum) ms. » 31 % of all devices are better. This means that the measured response time is better than the average of all tested devices (31 ms). | ||
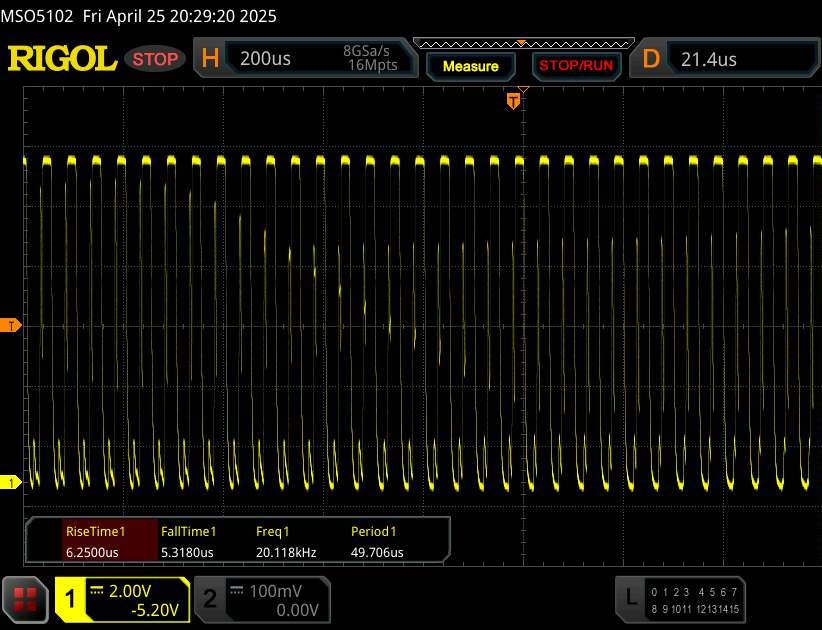
Screen Flickering / PWM (Pulse-Width Modulation)
| Screen flickering / PWM detected | 1398 Hz Amplitude: 100 % | ≤ 100 % brightness setting | 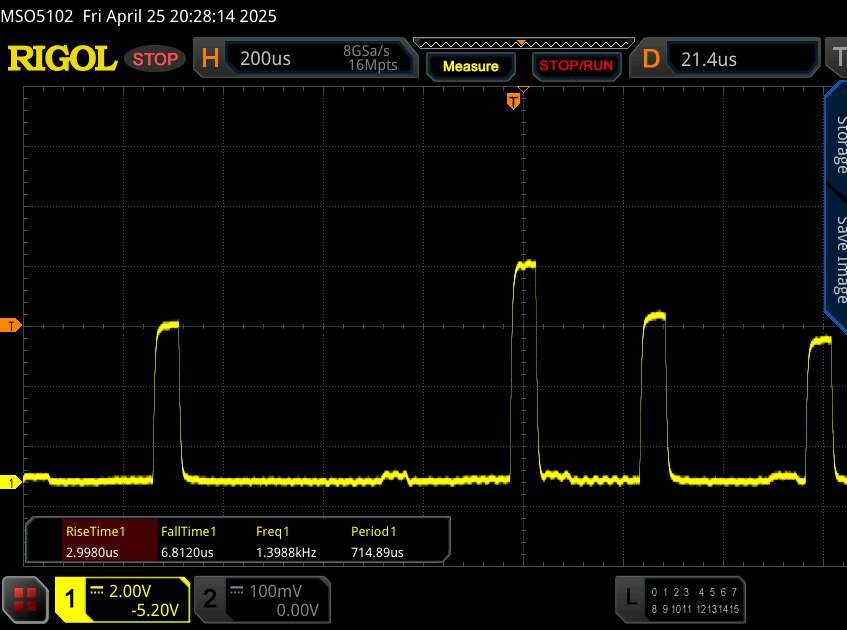 |
The display backlight flickers at 1398 Hz (worst case, e.g., utilizing PWM) Flickering detected at a brightness setting of 100 % and below. There should be no flickering or PWM above this brightness setting. The frequency of 1398 Hz is quite high, so most users sensitive to PWM should not notice any flickering. In comparison: 52 % of all tested devices do not use PWM to dim the display. If PWM was detected, an average of 7754 (minimum: 5 - maximum: 343500) Hz was measured. | |||
性能
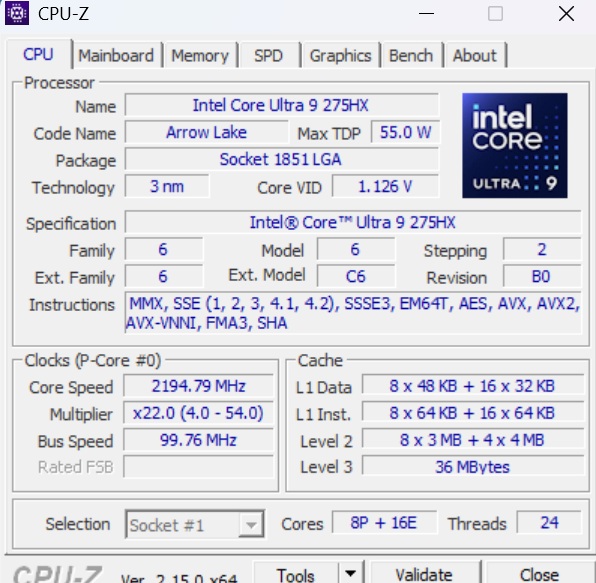
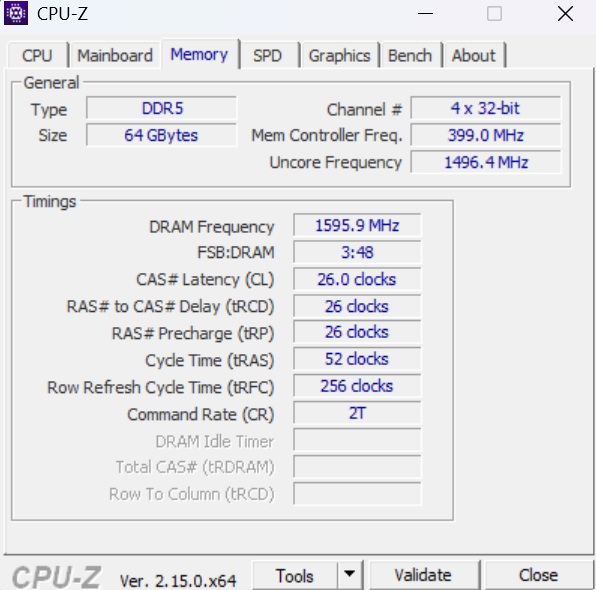
我们测试的 Master 18 配置属于绝对高端。24 个 CPU 内核、24 GB VRAM、64 GB 内存和 4 TB SSD 容量应能为未来几年提供足够的储备。
测试条件
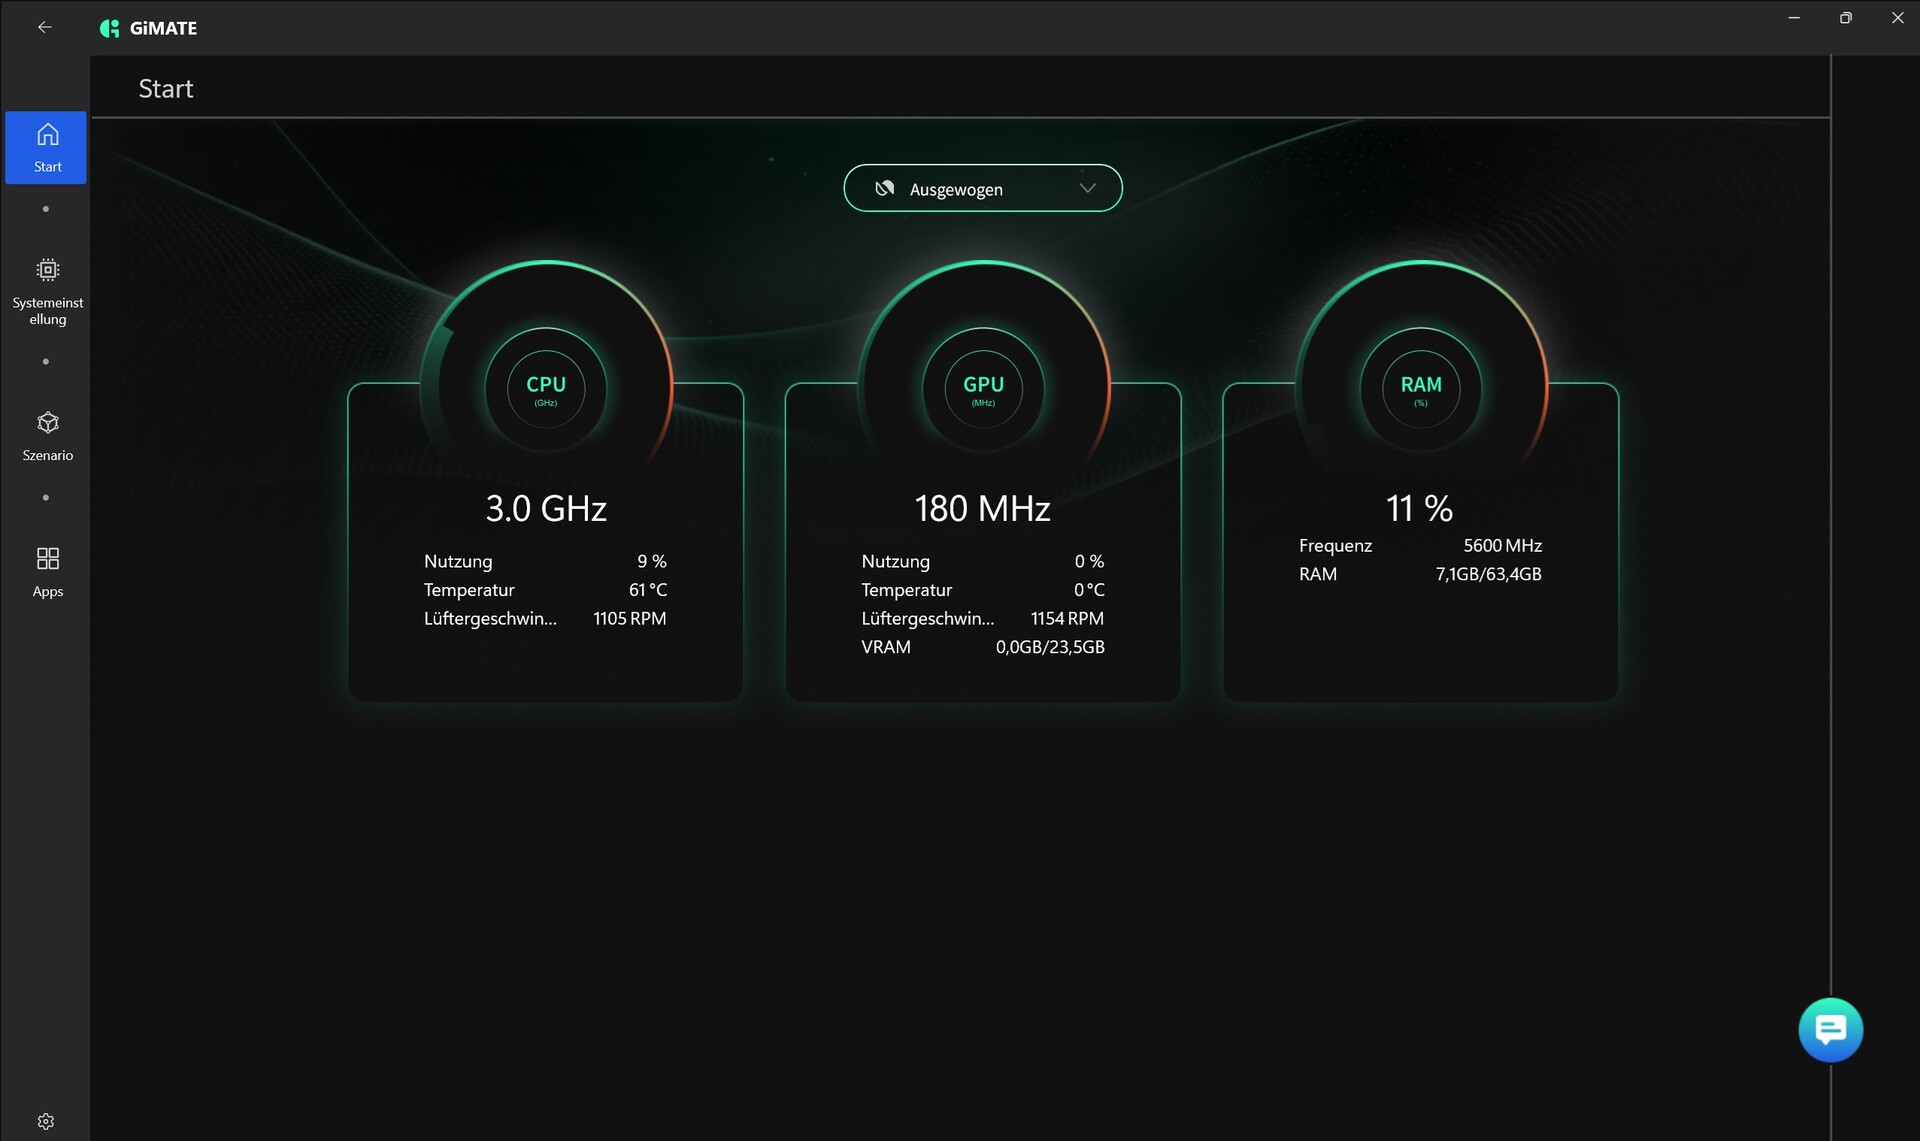
在 GiMATE 软件中有多种运行模式可供选择。由于这台 18 英寸设备在使用游戏和创意配置文件时声音非常大,因此我们只在平衡模式下进行了测量,该模式下产生的 3D 性能与其他 RTX 5090 笔记本电脑在最大模式下的性能相当。
| GiMATE 模式 | 平衡 | 游戏 | 创意 | 节能 |
| 赛博朋克 2077 噪音 | 52 dB(A) | 60 dB(A) | 60 dB(A) | 49 dB(A) |
| 赛博朋克 2077》性能(FHD/超高清) | 152.5fps | 159.1fps | 158.6fps | 121.2fps |
| Cinebench R15 Multi Score | 5096 分 | 5443 分 | 5479 分 | 4834 分 |
| CPU PL1 | 90 瓦 | 125 瓦 | 125 瓦 | 65 瓦 |
| CPU PL2 | 120 瓦 | 150 瓦 | 150 瓦 | 100 瓦 |
处理器
酷睿 Ultra 9 275HX 酷睿至尊 9 275HX箭湖系列配备 8 个性能核心和 16 个效率核心,使用平衡配置文件可达到 90 瓦(PL1)和 120 瓦(PL2)。如果综合考虑所有 CPU 基准测试,其性能与旧款 酷睿 i9-14900HX.非常好:在我们的 Cinebench 循环中,其结果保持非常稳定,这对其冷却系统非常有利。
Cinebench R15 Multi continuous test
* ... smaller is better
AIDA64: FP32 Ray-Trace | FPU Julia | CPU SHA3 | CPU Queen | FPU SinJulia | FPU Mandel | CPU AES | CPU ZLib | FP64 Ray-Trace | CPU PhotoWorxx
| Performance rating | |
| Asus Strix Scar 18 G835LX | |
| Average Intel Core Ultra 9 275HX | |
| Aorus Master 18 AM8H | |
| MSI Titan 18 HX A14VIG | |
| Alienware m18 R2 | |
| Razer Blade 16 2025 RTX 5090 | |
| Average of class Gaming | |
| Asus ROG Zephyrus G16 GU605CX | |
| AIDA64 / FP32 Ray-Trace | |
| Asus Strix Scar 18 G835LX | |
| Razer Blade 16 2025 RTX 5090 | |
| Average Intel Core Ultra 9 275HX (28039 - 39895, n=30) | |
| Aorus Master 18 AM8H | |
| Average of class Gaming (10227 - 85542, n=105, last 2 years) | |
| MSI Titan 18 HX A14VIG | |
| Alienware m18 R2 | |
| Asus ROG Zephyrus G16 GU605CX | |
| AIDA64 / FPU Julia | |
| Asus Strix Scar 18 G835LX | |
| Average Intel Core Ultra 9 275HX (140254 - 200744, n=30) | |
| Aorus Master 18 AM8H | |
| MSI Titan 18 HX A14VIG | |
| Alienware m18 R2 | |
| Razer Blade 16 2025 RTX 5090 | |
| Average of class Gaming (51376 - 238426, n=105, last 2 years) | |
| Asus ROG Zephyrus G16 GU605CX | |
| AIDA64 / CPU SHA3 | |
| Asus Strix Scar 18 G835LX | |
| Average Intel Core Ultra 9 275HX (6710 - 9817, n=30) | |
| Aorus Master 18 AM8H | |
| MSI Titan 18 HX A14VIG | |
| Alienware m18 R2 | |
| Average of class Gaming (2180 - 10115, n=105, last 2 years) | |
| Razer Blade 16 2025 RTX 5090 | |
| Asus ROG Zephyrus G16 GU605CX | |
| AIDA64 / CPU Queen | |
| MSI Titan 18 HX A14VIG | |
| Asus Strix Scar 18 G835LX | |
| Alienware m18 R2 | |
| Average Intel Core Ultra 9 275HX (113887 - 140937, n=30) | |
| Aorus Master 18 AM8H | |
| Average of class Gaming (49785 - 173351, n=90, last 2 years) | |
| Razer Blade 16 2025 RTX 5090 | |
| Asus ROG Zephyrus G16 GU605CX | |
| AIDA64 / FPU SinJulia | |
| Razer Blade 16 2025 RTX 5090 | |
| MSI Titan 18 HX A14VIG | |
| Alienware m18 R2 | |
| Average of class Gaming (4424 - 33636, n=105, last 2 years) | |
| Asus Strix Scar 18 G835LX | |
| Average Intel Core Ultra 9 275HX (11172 - 14425, n=30) | |
| Aorus Master 18 AM8H | |
| Asus ROG Zephyrus G16 GU605CX | |
| AIDA64 / FPU Mandel | |
| Asus Strix Scar 18 G835LX | |
| Average Intel Core Ultra 9 275HX (72596 - 104508, n=30) | |
| Aorus Master 18 AM8H | |
| Razer Blade 16 2025 RTX 5090 | |
| Average of class Gaming (25115 - 128721, n=105, last 2 years) | |
| Alienware m18 R2 | |
| MSI Titan 18 HX A14VIG | |
| Asus ROG Zephyrus G16 GU605CX | |
| AIDA64 / CPU AES | |
| MSI Titan 18 HX A14VIG | |
| Asus Strix Scar 18 G835LX | |
| Alienware m18 R2 | |
| Average Intel Core Ultra 9 275HX (105608 - 247074, n=30) | |
| Aorus Master 18 AM8H | |
| Average of class Gaming (39258 - 247074, n=105, last 2 years) | |
| Razer Blade 16 2025 RTX 5090 | |
| Asus ROG Zephyrus G16 GU605CX | |
| AIDA64 / CPU ZLib | |
| Asus Strix Scar 18 G835LX | |
| MSI Titan 18 HX A14VIG | |
| Alienware m18 R2 | |
| Average Intel Core Ultra 9 275HX (1582 - 2263, n=30) | |
| Aorus Master 18 AM8H | |
| Average of class Gaming (574 - 2531, n=105, last 2 years) | |
| Razer Blade 16 2025 RTX 5090 | |
| Asus ROG Zephyrus G16 GU605CX | |
| AIDA64 / FP64 Ray-Trace | |
| Asus Strix Scar 18 G835LX | |
| Razer Blade 16 2025 RTX 5090 | |
| Average Intel Core Ultra 9 275HX (14847 - 21854, n=30) | |
| Aorus Master 18 AM8H | |
| Average of class Gaming (5509 - 45446, n=105, last 2 years) | |
| Alienware m18 R2 | |
| MSI Titan 18 HX A14VIG | |
| Asus ROG Zephyrus G16 GU605CX | |
| AIDA64 / CPU PhotoWorxx | |
| Asus ROG Zephyrus G16 GU605CX | |
| Asus Strix Scar 18 G835LX | |
| Razer Blade 16 2025 RTX 5090 | |
| Average Intel Core Ultra 9 275HX (37482 - 62916, n=30) | |
| Alienware m18 R2 | |
| Aorus Master 18 AM8H | |
| Average of class Gaming (12271 - 89891, n=105, last 2 years) | |
| MSI Titan 18 HX A14VIG | |
系统性能
笔记本电脑的系统性能似乎尚未完全成熟。众所周知,在笔记本电脑上打开带有图形切换功能的程序时会出现短暂的死机现象。但在 Master 18 上,这些冻结的时间和频率都高于平均水平,这可能是由于其图形驱动程序造成的,因为在我们的测试过程中,这款 18 英寸设备在玩游戏时有时会出现黑屏。后者似乎在 Nvidia 的 Blackwell 代显卡上出现得更为频繁。
CrossMark: Overall | Productivity | Creativity | Responsiveness
WebXPRT 3: Overall
WebXPRT 4: Overall
Mozilla Kraken 1.1: Total
| PCMark 10 / Score | |
| Alienware m18 R2 | |
| MSI Titan 18 HX A14VIG | |
| Asus ROG Zephyrus G16 GU605CX | |
| Asus Strix Scar 18 G835LX | |
| Aorus Master 18 AM8H | |
| Average Intel Core Ultra 9 275HX, NVIDIA GeForce RTX 5090 Laptop (7474 - 9497, n=11) | |
| Average of class Gaming (5828 - 12414, n=93, last 2 years) | |
| Razer Blade 16 2025 RTX 5090 | |
| PCMark 10 / Essentials | |
| MSI Titan 18 HX A14VIG | |
| Alienware m18 R2 | |
| Aorus Master 18 AM8H | |
| Asus Strix Scar 18 G835LX | |
| Average Intel Core Ultra 9 275HX, NVIDIA GeForce RTX 5090 Laptop (9994 - 11369, n=12) | |
| Asus ROG Zephyrus G16 GU605CX | |
| Average of class Gaming (8810 - 11935, n=97, last 2 years) | |
| Razer Blade 16 2025 RTX 5090 | |
| PCMark 10 / Productivity | |
| Alienware m18 R2 | |
| Asus ROG Zephyrus G16 GU605CX | |
| Average of class Gaming (6845 - 25323, n=95, last 2 years) | |
| Razer Blade 16 2025 RTX 5090 | |
| MSI Titan 18 HX A14VIG | |
| Average Intel Core Ultra 9 275HX, NVIDIA GeForce RTX 5090 Laptop (9122 - 10925, n=11) | |
| Asus Strix Scar 18 G835LX | |
| Aorus Master 18 AM8H | |
| PCMark 10 / Digital Content Creation | |
| Asus Strix Scar 18 G835LX | |
| Aorus Master 18 AM8H | |
| MSI Titan 18 HX A14VIG | |
| Average Intel Core Ultra 9 275HX, NVIDIA GeForce RTX 5090 Laptop (9952 - 19234, n=11) | |
| Alienware m18 R2 | |
| Asus ROG Zephyrus G16 GU605CX | |
| Average of class Gaming (7602 - 19954, n=95, last 2 years) | |
| Razer Blade 16 2025 RTX 5090 | |
| CrossMark / Overall | |
| Aorus Master 18 AM8H | |
| Asus Strix Scar 18 G835LX | |
| Average Intel Core Ultra 9 275HX, NVIDIA GeForce RTX 5090 Laptop (1995 - 2339, n=12) | |
| Alienware m18 R2 | |
| Asus ROG Zephyrus G16 GU605CX | |
| Average of class Gaming (1366 - 2409, n=94, last 2 years) | |
| MSI Titan 18 HX A14VIG | |
| CrossMark / Productivity | |
| Aorus Master 18 AM8H | |
| Average Intel Core Ultra 9 275HX, NVIDIA GeForce RTX 5090 Laptop (1847 - 2211, n=12) | |
| Asus Strix Scar 18 G835LX | |
| Asus ROG Zephyrus G16 GU605CX | |
| Alienware m18 R2 | |
| Average of class Gaming (1386 - 2254, n=94, last 2 years) | |
| MSI Titan 18 HX A14VIG | |
| CrossMark / Creativity | |
| Asus Strix Scar 18 G835LX | |
| Average Intel Core Ultra 9 275HX, NVIDIA GeForce RTX 5090 Laptop (2170 - 2642, n=12) | |
| Aorus Master 18 AM8H | |
| Asus ROG Zephyrus G16 GU605CX | |
| Alienware m18 R2 | |
| Average of class Gaming (1343 - 2786, n=94, last 2 years) | |
| MSI Titan 18 HX A14VIG | |
| CrossMark / Responsiveness | |
| Aorus Master 18 AM8H | |
| Average Intel Core Ultra 9 275HX, NVIDIA GeForce RTX 5090 Laptop (1673 - 2217, n=12) | |
| Asus Strix Scar 18 G835LX | |
| Alienware m18 R2 | |
| Average of class Gaming (1226 - 2334, n=94, last 2 years) | |
| Asus ROG Zephyrus G16 GU605CX | |
| MSI Titan 18 HX A14VIG | |
| WebXPRT 3 / Overall | |
| Average Intel Core Ultra 9 275HX, NVIDIA GeForce RTX 5090 Laptop (315 - 372, n=12) | |
| Asus Strix Scar 18 G835LX | |
| Asus ROG Zephyrus G16 GU605CX | |
| MSI Titan 18 HX A14VIG | |
| Alienware m18 R2 | |
| Razer Blade 16 2025 RTX 5090 | |
| Average of class Gaming (220 - 532, n=98, last 2 years) | |
| Aorus Master 18 AM8H | |
| WebXPRT 4 / Overall | |
| Asus Strix Scar 18 G835LX | |
| Average Intel Core Ultra 9 275HX, NVIDIA GeForce RTX 5090 Laptop (301 - 341, n=11) | |
| Aorus Master 18 AM8H | |
| Asus ROG Zephyrus G16 GU605CX | |
| Alienware m18 R2 | |
| MSI Titan 18 HX A14VIG | |
| Average of class Gaming (165 - 354, n=98, last 2 years) | |
| Razer Blade 16 2025 RTX 5090 | |
| Mozilla Kraken 1.1 / Total | |
| Average of class Gaming (391 - 590, n=100, last 2 years) | |
| MSI Titan 18 HX A14VIG | |
| Asus ROG Zephyrus G16 GU605CX | |
| Alienware m18 R2 | |
| Razer Blade 16 2025 RTX 5090 | |
| Aorus Master 18 AM8H | |
| Average Intel Core Ultra 9 275HX, NVIDIA GeForce RTX 5090 Laptop (402 - 424, n=12) | |
| Asus Strix Scar 18 G835LX | |
* ... smaller is better
| PCMark 10 Score | 8608 points | |
Help | ||
| AIDA64 / Memory Copy | |
| Asus ROG Zephyrus G16 GU605CX | |
| Razer Blade 16 2025 RTX 5090 | |
| Asus Strix Scar 18 G835LX | |
| Average Intel Core Ultra 9 275HX (56003 - 94460, n=30) | |
| Alienware m18 R2 | |
| Aorus Master 18 AM8H | |
| Average of class Gaming (21750 - 129946, n=105, last 2 years) | |
| MSI Titan 18 HX A14VIG | |
| AIDA64 / Memory Read | |
| Razer Blade 16 2025 RTX 5090 | |
| Asus Strix Scar 18 G835LX | |
| Alienware m18 R2 | |
| Average Intel Core Ultra 9 275HX (55795 - 97151, n=30) | |
| Asus ROG Zephyrus G16 GU605CX | |
| Average of class Gaming (22956 - 118858, n=105, last 2 years) | |
| Aorus Master 18 AM8H | |
| MSI Titan 18 HX A14VIG | |
| AIDA64 / Memory Write | |
| Razer Blade 16 2025 RTX 5090 | |
| Asus Strix Scar 18 G835LX | |
| Average Intel Core Ultra 9 275HX (55663 - 116129, n=30) | |
| Alienware m18 R2 | |
| Average of class Gaming (22297 - 135096, n=105, last 2 years) | |
| Asus ROG Zephyrus G16 GU605CX | |
| Aorus Master 18 AM8H | |
| MSI Titan 18 HX A14VIG | |
| AIDA64 / Memory Latency | |
| Asus ROG Zephyrus G16 GU605CX | |
| Aorus Master 18 AM8H | |
| Average Intel Core Ultra 9 275HX (105.8 - 161.6, n=30) | |
| Asus Strix Scar 18 G835LX | |
| Average of class Gaming (75.3 - 259, n=105, last 2 years) | |
| MSI Titan 18 HX A14VIG | |
| Razer Blade 16 2025 RTX 5090 | |
| Alienware m18 R2 | |
* ... smaller is better
DPC 延迟
与许多笔记本电脑一样,它的延迟值也是引起抱怨的一个原因,尽管受此问题影响的用户可能很少。
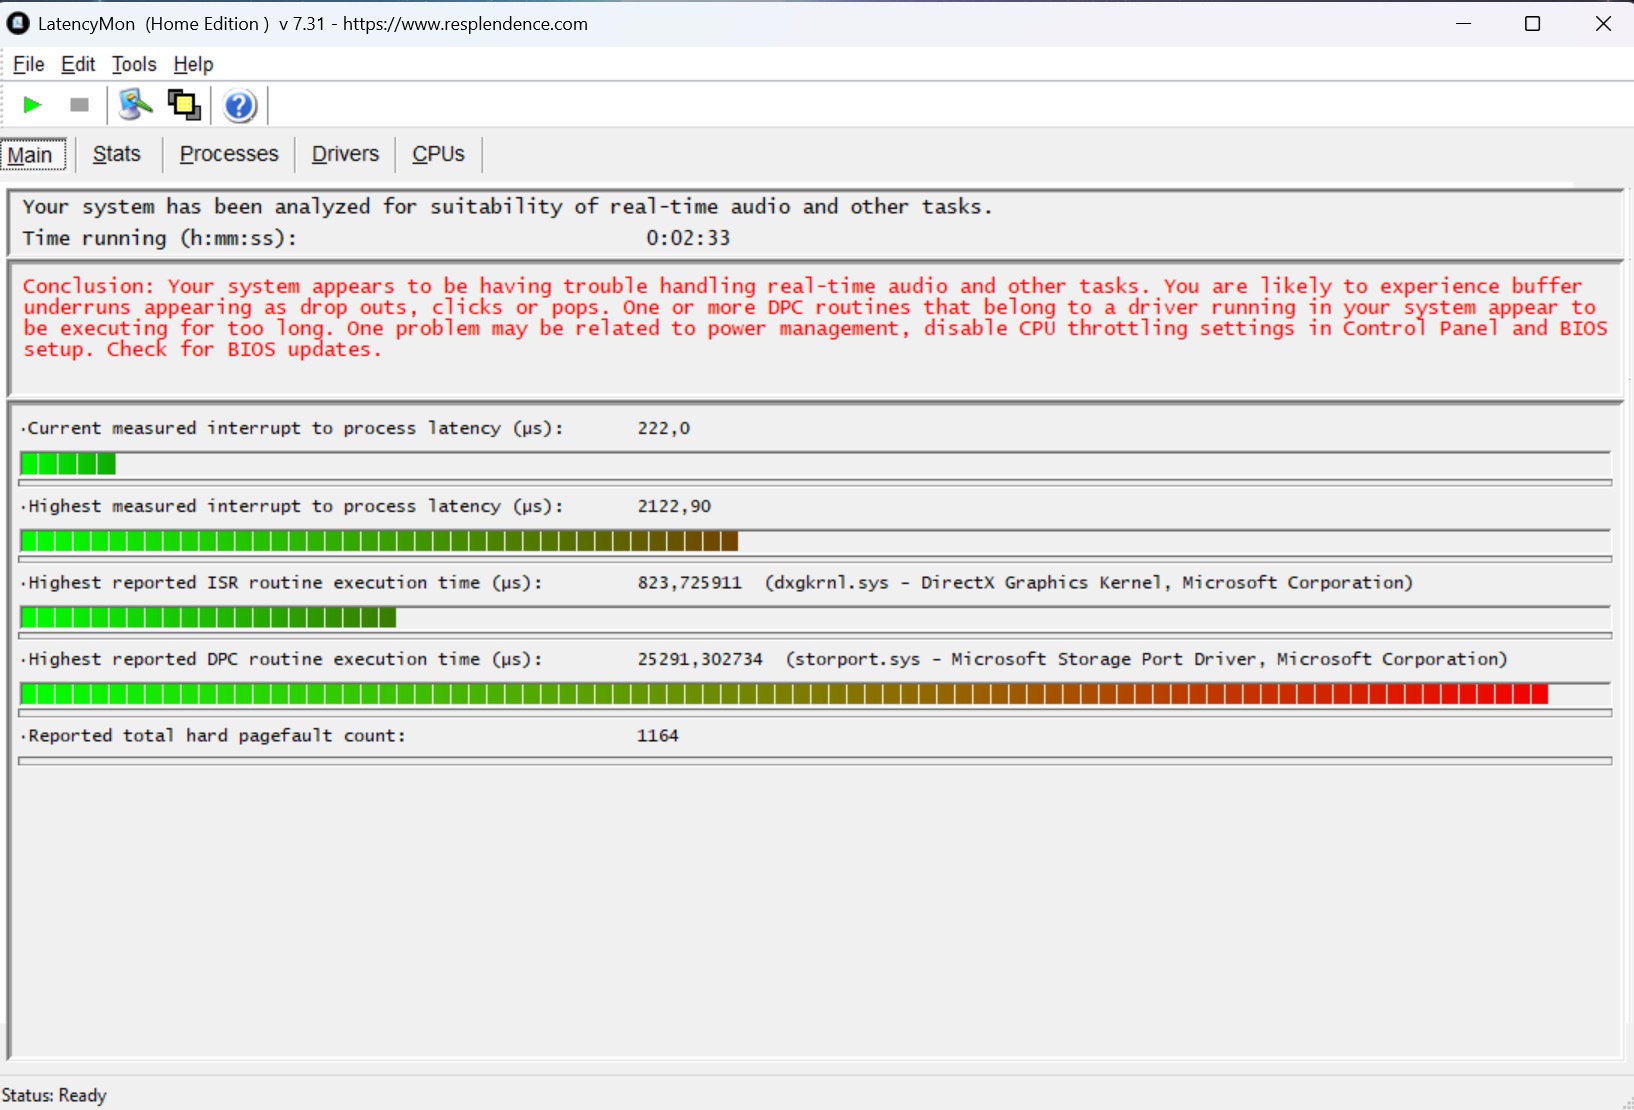
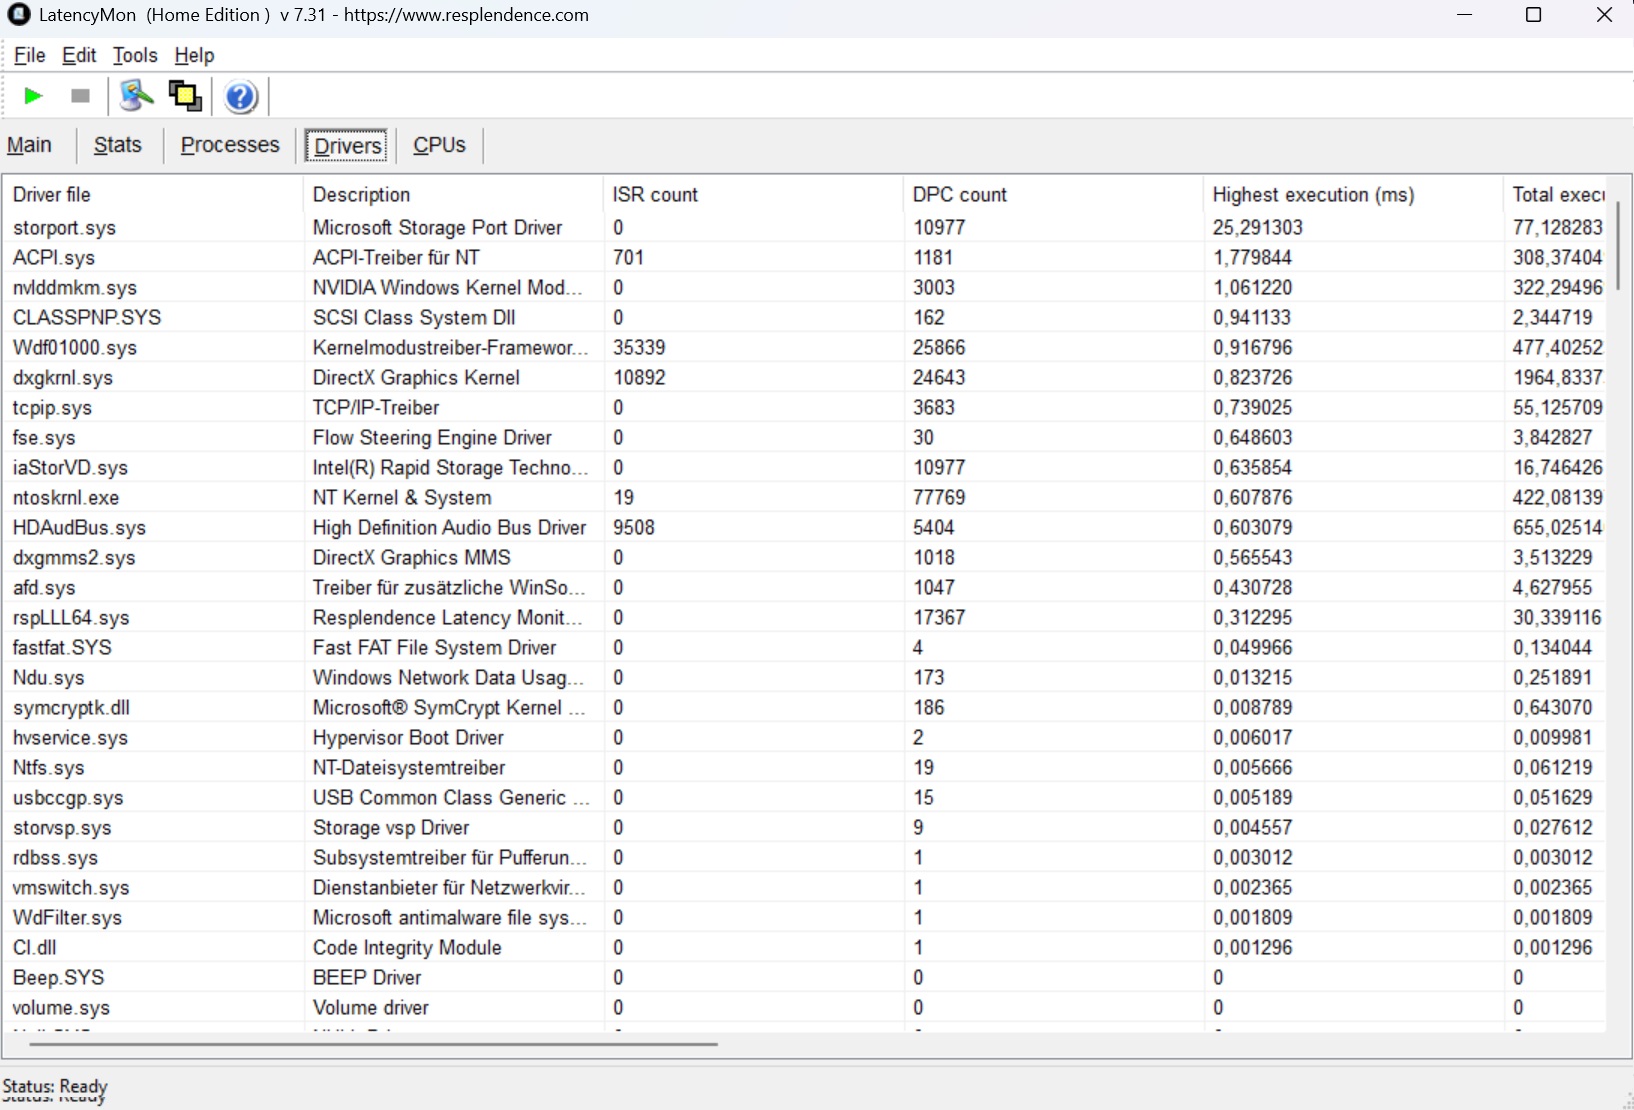
| DPC Latencies / LatencyMon - interrupt to process latency (max), Web, Youtube, Prime95 | |
| Asus ROG Zephyrus G16 GU605CX | |
| Alienware m18 R2 | |
| MSI Titan 18 HX A14VIG | |
| Aorus Master 18 AM8H | |
| Asus Strix Scar 18 G835LX | |
| Razer Blade 16 2025 RTX 5090 | |
* ... smaller is better
存储设备
我们的测试配置配备了两块金士顿固态硬盘,每块容量为 2 TB。在我们的测试中,M.2 双核固态硬盘实际上达到了非常高的速度,但在我们的 DiskSpd 循环中却出现了节流现象。在这种情况下,更好的固态硬盘散热可能会有所帮助。

* ... smaller is better
Reading continuous performance: DiskSpd Read Loop, Queue Depth 8
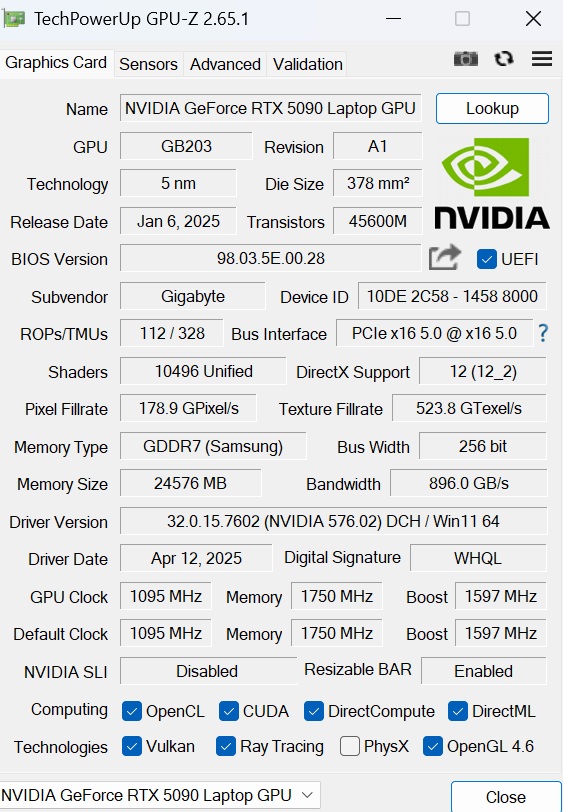
图形卡
尽管没有使用最大运行模式,但在合成图形测试中,Master 18 是我们目前测试过的最快的 RTX 5090 笔记本电脑,尽管差距或差距相当小。不过,这也揭示了老一代的 RTX 4090几乎没有落后--至少在与 微星泰坦 18和 Alienware m18 R2.通常情况下 GeForce RTX 5090拥有 10,496 个着色器单元、24 GB DDR7 VRAM 和高达 175 瓦的 TGP(包括动态提升)。Nvidia 喜欢将多帧生成作为其最大的卖点之一。
| 3DMark 11 Performance | 50464 points | |
| 3DMark Ice Storm Standard Score | 278456 points | |
| 3DMark Cloud Gate Standard Score | 72337 points | |
| 3DMark Fire Strike Score | 36895 points | |
| 3DMark Time Spy Score | 22138 points | |
Help | ||
* ... smaller is better
游戏性能
18 英寸设备在我们的游戏测试中表现同样出色,与 Strix Scar 18 并驾齐驱。即使是要求苛刻的游戏,如 星球大战亡命之徒在 QHD 下也能以接近 60fps 或更高的速度运行--注意是在全设置下。包括升频在内的数值可在下面的概览表中找到。从技术上讲,RTX 5090 通常有足够的储备来支持 4K,不过在紧急情况下可以或应该使用 DLSS 或(多)帧生成技术。
| low | med. | high | ultra | QHD DLSS | QHD | |
|---|---|---|---|---|---|---|
| GTA V (2015) | 186.7 | 182.5 | 166.1 | 164.3 | ||
| Dota 2 Reborn (2015) | 225 | 195.2 | 187.5 | 170.3 | ||
| Final Fantasy XV Benchmark (2018) | 226 | 201 | 160.7 | |||
| X-Plane 11.11 (2018) | 153.2 | 136.1 | 110 | |||
| Strange Brigade (2018) | 475 | 450 | 418 | 308 | ||
| Baldur's Gate 3 (2023) | 224 | 198.5 | 196.2 | 139.6 | ||
| Cyberpunk 2077 (2023) | 181.6 | 166.8 | 152.5 | 104.8 | ||
| Counter-Strike 2 (2023) | 390 | 327 | 275 | 224 | ||
| Prince of Persia The Lost Crown (2024) | 358 | 358 | 357 | 357 | ||
| Helldivers 2 (2024) | 157.7 | 157.3 | 153.8 | 140.1 | ||
| Dragon's Dogma 2 (2024) | 99.3 | 93.4 | ||||
| Horizon Forbidden West (2024) | 160.3 | 121.6 | 120.3 | 116.6 | 95 | |
| Ghost of Tsushima (2024) | 119.6 | 115.1 | 104.2 | 105.2 | 84.9 | |
| Senua's Saga Hellblade 2 (2024) | 96.8 | 76.6 | 81.9 | 56.2 | ||
| F1 24 (2024) | 335 | 305 | 139 | 141 | 95 | |
| Star Wars Outlaws (2024) | 91.1 | 82.9 | 71.6 | 70.9 | 54 | |
| Space Marine 2 (2024) | 104.1 | 103.1 | 100.8 | 100.8 | 98.6 | |
| Until Dawn (2024) | 110.6 | 96.9 | 87.5 | 79.7 | 65.6 | |
| Stalker 2 (2024) | 100 | 88.1 | 76.3 | 124.9 | 59.8 | |
| Kingdom Come Deliverance 2 (2025) | 184.3 | 151.7 | 108 | 98.7 | 82.6 | |
| Civilization 7 (2025) | 206 | 203 | 171.3 |
| Stalker 2 | |
| 2560x1440 Epic Preset | |
| Average NVIDIA GeForce RTX 5090 Laptop (59.8 - 110.7, n=3) | |
| Aorus Master 18 AM8H | |
| Average of class Gaming (29 - 110.7, n=13, last 2 years) | |
| 2560x1440 Epic Preset + Quality DLSS + FG | |
| Average NVIDIA GeForce RTX 5090 Laptop (124.9 - 134.6, n=2) | |
| Aorus Master 18 AM8H | |
| Average of class Gaming (58.3 - 134.6, n=12, last 2 years) | |
| Horizon Forbidden West | |
| 2560x1440 Very High Preset AA:T | |
| Average NVIDIA GeForce RTX 5090 Laptop (95 - 100.9, n=2) | |
| Aorus Master 18 AM8H | |
| Average of class Gaming (45.7 - 100.9, n=9, last 2 years) | |
| 2560x1440 Very High Preset + DLSS Quality | |
| Aorus Master 18 AM8H | |
| Average NVIDIA GeForce RTX 5090 Laptop (n=1) | |
| Average of class Gaming (58.4 - 116.6, n=8, last 2 years) | |
| Ghost of Tsushima | |
| 2560x1440 Very High Preset AA:T | |
| Average NVIDIA GeForce RTX 5090 Laptop (84.9 - 100.3, n=2) | |
| Aorus Master 18 AM8H | |
| Average of class Gaming (22.7 - 100.3, n=12, last 2 years) | |
| 2560x1440 Very High Preset + Quality DLSS | |
| Aorus Master 18 AM8H | |
| Average NVIDIA GeForce RTX 5090 Laptop (n=1) | |
| Average of class Gaming (55.2 - 105.2, n=10, last 2 years) | |
| Senua's Saga Hellblade 2 | |
| 2560x1440 High Preset | |
| Average NVIDIA GeForce RTX 5090 Laptop (56.2 - 63.1, n=2) | |
| Aorus Master 18 AM8H | |
| Average of class Gaming (24.2 - 63.1, n=10, last 2 years) | |
| 2560x1440 High Preset + Quality DLSS | |
| Aorus Master 18 AM8H | |
| Average NVIDIA GeForce RTX 5090 Laptop (n=1) | |
| Average of class Gaming (39.6 - 81.9, n=9, last 2 years) | |
| Star Wars Outlaws | |
| 2560x1440 cinem. ultra | |
| Aorus Master 18 AM8H | |
| Average NVIDIA GeForce RTX 5090 Laptop (43.7 - 61, n=4) | |
| Average of class Gaming (23.2 - 61, n=13, last 2 years) | |
| 2560x1440 cinem. ultra DLSS | |
| Aorus Master 18 AM8H | |
| Average NVIDIA GeForce RTX 5090 Laptop (66.5 - 70.9, n=3) | |
| Average of class Gaming (32.6 - 70.9, n=12, last 2 years) | |
| Until Dawn | |
| 2560x1440 Ultra Preset | |
| Average NVIDIA GeForce RTX 5090 Laptop (65.6 - 76.6, n=3) | |
| Aorus Master 18 AM8H | |
| Average of class Gaming (30.4 - 76.6, n=11, last 2 years) | |
| 2560x1440 Ultra Preset + Quality DLSS + Ray Tracing | |
| Average NVIDIA GeForce RTX 5090 Laptop (79.7 - 86.3, n=2) | |
| Aorus Master 18 AM8H | |
| Average of class Gaming (39.5 - 86.3, n=10, last 2 years) | |
| Kingdom Come Deliverance 2 | |
| 2560x1440 Ultra Preset | |
| Average NVIDIA GeForce RTX 5090 Laptop (82.6 - 97.2, n=4) | |
| Aorus Master 18 AM8H | |
| Average of class Gaming (36.8 - 97.2, n=14, last 2 years) | |
| 2560x1440 Ultra Preset + Quality DLSS | |
| Average NVIDIA GeForce RTX 5090 Laptop (98.7 - 115.5, n=3) | |
| Aorus Master 18 AM8H | |
| Average of class Gaming (50.3 - 115.5, n=13, last 2 years) | |
| Space Marine 2 | |
| 2560x1440 Ultra Preset AA:T | |
| Average NVIDIA GeForce RTX 5090 Laptop (97.2 - 107.4, n=3) | |
| Aorus Master 18 AM8H | |
| Average of class Gaming (48.2 - 107.4, n=11, last 2 years) | |
| 2560x1440 Ultra Preset + Quality DLSS | |
| Aorus Master 18 AM8H | |
| Average NVIDIA GeForce RTX 5090 Laptop (97.5 - 100.8, n=2) | |
| Average of class Gaming (58.5 - 100.8, n=10, last 2 years) | |
此外,我们的赛博朋克测试表明,它的 CPU 和 GPU 性能都保持了良好的稳定性。除了上面提到的零星黑屏之外,它的主观游戏体验非常出色,由于笔记本电脑的原始性能很高,画面总是感觉超级流畅。
Cyberpunk 2077 ultra FPS diagram
排放量
噪音排放
在测试过程中,当我们使用平衡配置文件运行时,Master 18 在涡轮增压模式下已经达到了 Scar 18 的噪音水平。在负载情况下,50 至 53 分贝(A)的噪音清晰可闻,因此你可能需要戴上耳机。在空闲模式下,情况要轻松愉快得多,因为风扇通常要么关闭,要么运行在相当低的水平(18 英寸的设备有时只会发出令人不悦的呜呜声)。
Noise level
| Idle |
| 26 / 29 / 34 dB(A) |
| Load |
| 50 / 53 dB(A) |
 | ||
30 dB silent 40 dB(A) audible 50 dB(A) loud |
||
min: | ||
| Aorus Master 18 AM8H Ultra 9 275HX, GeForce RTX 5090 Laptop | Asus Strix Scar 18 G835LX Ultra 9 275HX, GeForce RTX 5090 Laptop | Asus ROG Zephyrus G16 GU605CX Ultra 9 285H, GeForce RTX 5090 Laptop | Razer Blade 16 2025 RTX 5090 Ryzen AI 9 HX 370, GeForce RTX 5090 Laptop | Alienware m18 R2 i9-14900HX, GeForce RTX 4090 Laptop GPU | MSI Titan 18 HX A14VIG i9-14900HX, GeForce RTX 4090 Laptop GPU | |
|---|---|---|---|---|---|---|
| Noise | 2% | 5% | 4% | 10% | 10% | |
| off / environment * (dB) | 25 | 23.3 7% | 23.8 5% | 24.1 4% | 23.6 6% | 22.8 9% |
| Idle Minimum * (dB) | 26 | 29.8 -15% | 23.8 8% | 24.1 7% | 23.8 8% | 23.8 8% |
| Idle Average * (dB) | 29 | 29.8 -3% | 27.2 6% | 30.6 -6% | 26.1 10% | 23.8 18% |
| Idle Maximum * (dB) | 34 | 29.8 12% | 31.3 8% | 30.6 10% | 31.5 7% | 28 18% |
| Load Average * (dB) | 50 | 42.9 14% | 47.6 5% | 45.5 9% | 31.5 37% | 38 24% |
| Cyberpunk 2077 ultra * (dB) | 52 | 53.7 -3% | 51.3 1% | 48.2 7% | ||
| Load Maximum * (dB) | 53 | 53.7 -1% | 53.3 -1% | 53.4 -1% | 56.6 -7% | 62.8 -18% |
| Witcher 3 ultra * (dB) | 52.1 | 57.3 |
* ... smaller is better
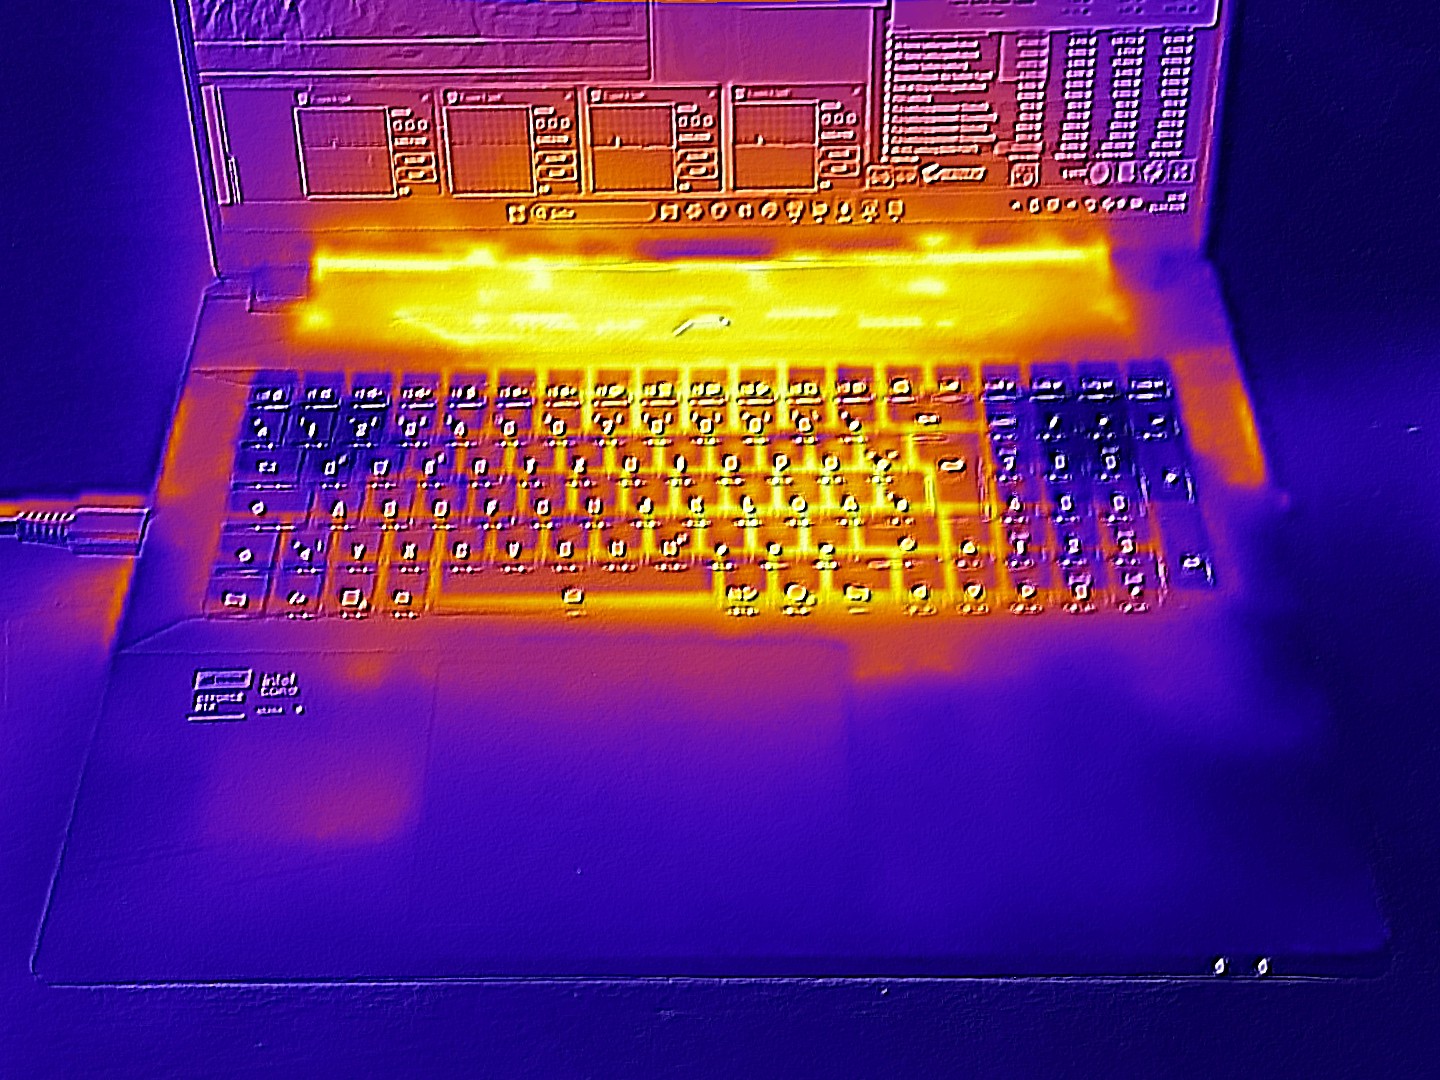
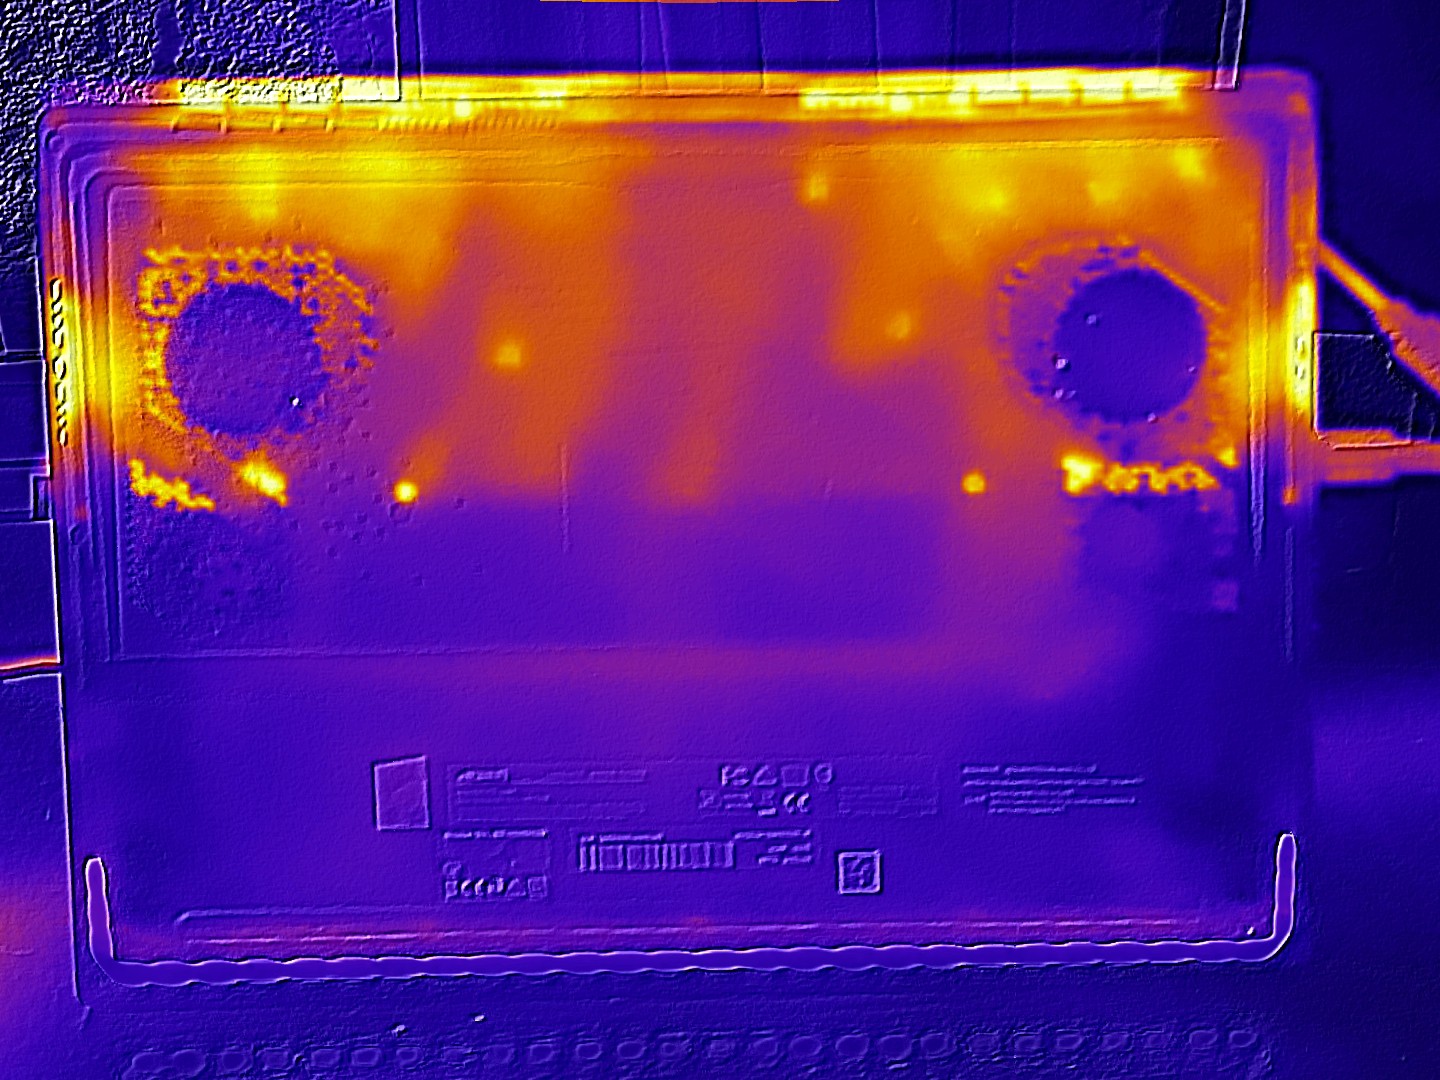
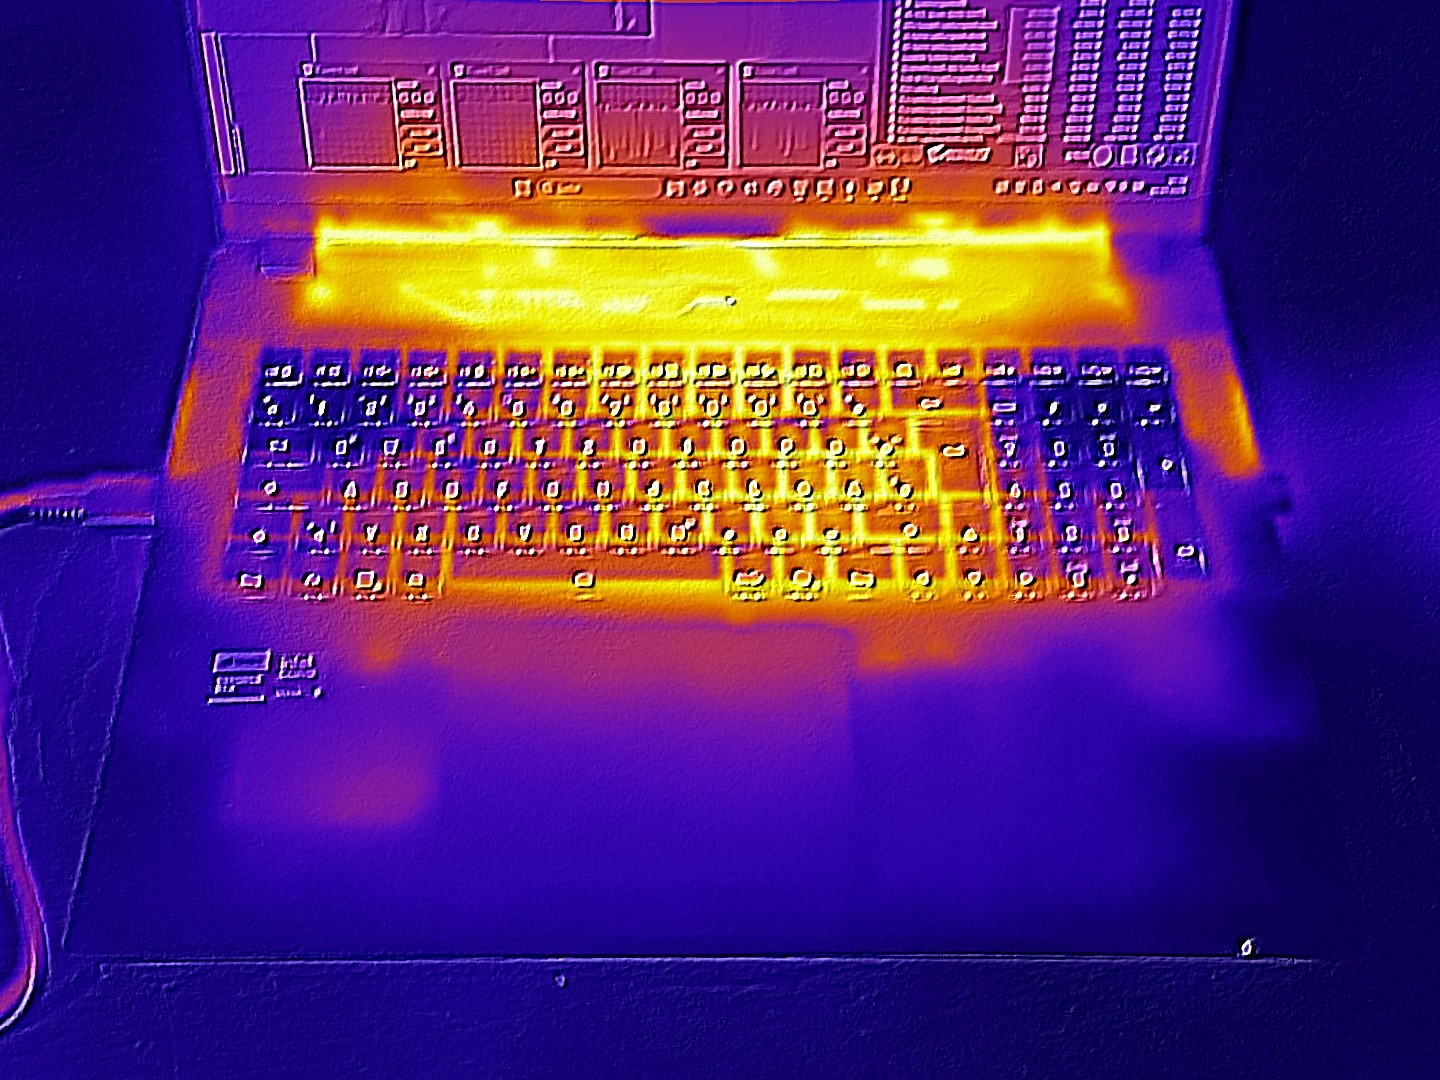
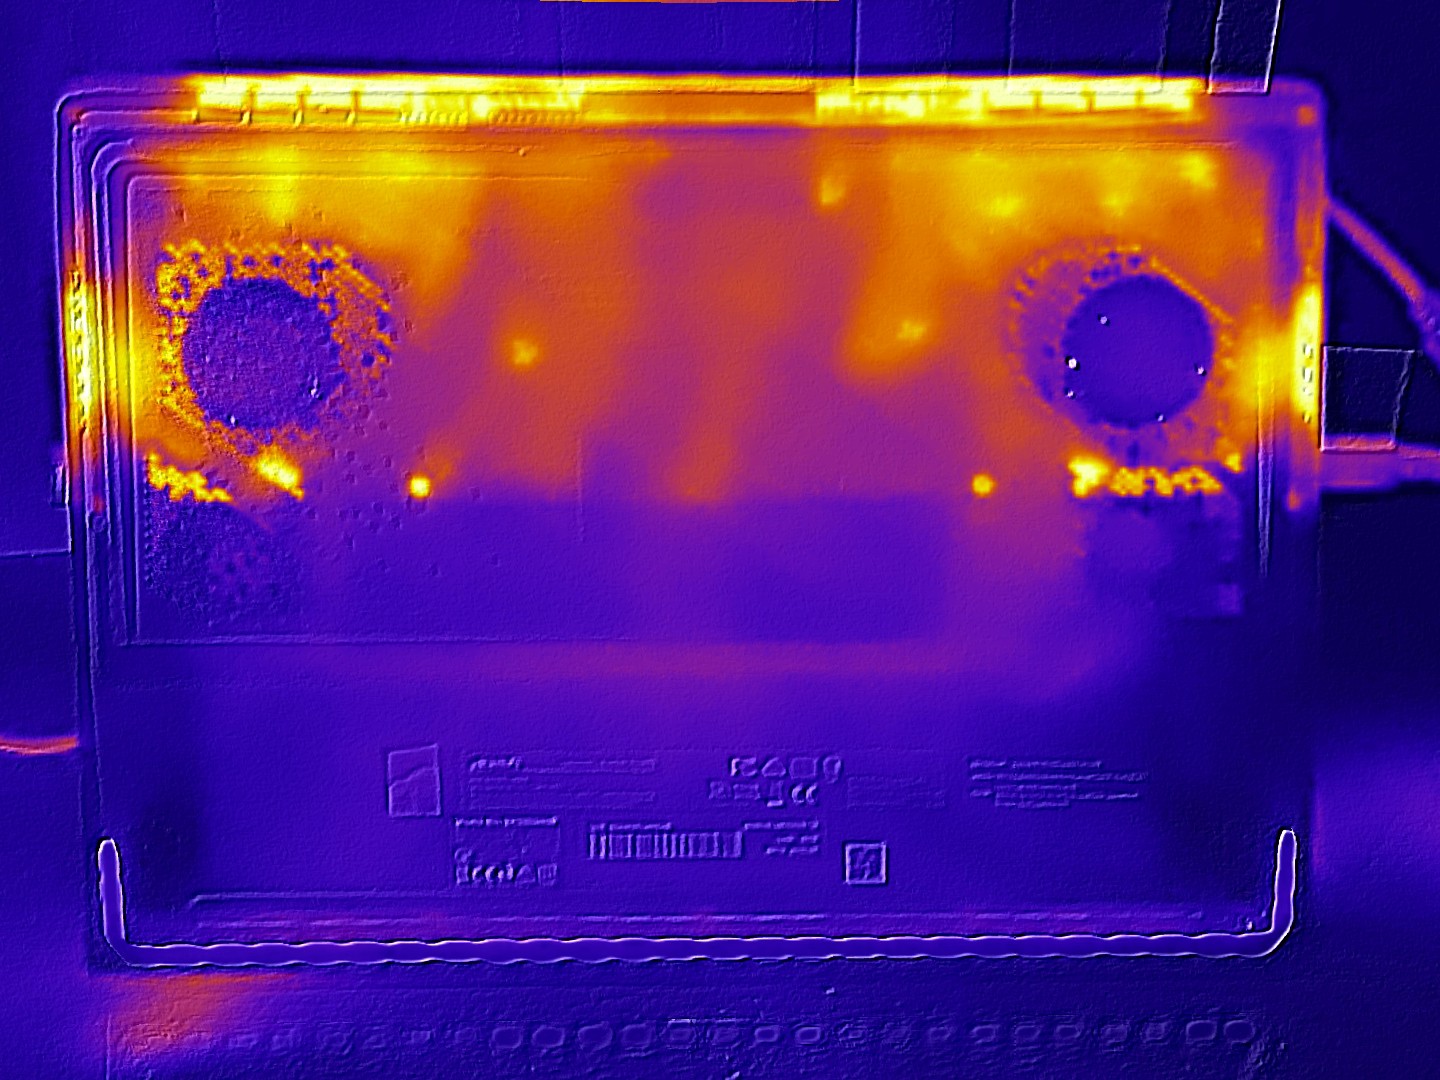
温度
笔记本电脑的机箱主要在后三分之一处发热。在 3D 模式下,我们可以从其表面测得高达 50 °C(顶部)和 46 °C(底部)的温度。另一方面,值得庆幸的是,我们注意到腕托的温度从未超过 34 °C。在空闲模式下,它的性能略显薄弱,因为在测试过程中,整个机箱很快就突破了 30 °C。
(-) The maximum temperature on the upper side is 50 °C / 122 F, compared to the average of 40.4 °C / 105 F, ranging from 21.2 to 68.8 °C for the class Gaming.
(-) The bottom heats up to a maximum of 46 °C / 115 F, compared to the average of 43.2 °C / 110 F
(±) In idle usage, the average temperature for the upper side is 33.9 °C / 93 F, compared to the device average of 33.9 °C / 93 F.
(-) 3: The average temperature for the upper side is 40.6 °C / 105 F, compared to the average of 33.9 °C / 93 F for the class Gaming.
(+) The palmrests and touchpad are reaching skin temperature as a maximum (34 °C / 93.2 F) and are therefore not hot.
(-) The average temperature of the palmrest area of similar devices was 28.8 °C / 83.8 F (-5.2 °C / -9.4 F).
| Aorus Master 18 AM8H Ultra 9 275HX, GeForce RTX 5090 Laptop | Asus Strix Scar 18 G835LX Ultra 9 275HX, GeForce RTX 5090 Laptop | Asus ROG Zephyrus G16 GU605CX Ultra 9 285H, GeForce RTX 5090 Laptop | Razer Blade 16 2025 RTX 5090 Ryzen AI 9 HX 370, GeForce RTX 5090 Laptop | Alienware m18 R2 i9-14900HX, GeForce RTX 4090 Laptop GPU | MSI Titan 18 HX A14VIG i9-14900HX, GeForce RTX 4090 Laptop GPU | |
|---|---|---|---|---|---|---|
| Heat | 12% | 18% | 5% | -0% | 11% | |
| Maximum Upper Side * (°C) | 50 | 45.6 9% | 44 12% | 48.3 3% | 41.2 18% | 37.8 24% |
| Maximum Bottom * (°C) | 46 | 46 -0% | 44.1 4% | 53.3 -16% | 34.6 25% | 37.6 18% |
| Idle Upper Side * (°C) | 36 | 28.9 20% | 26.1 27% | 28.3 21% | 42.8 -19% | 34.8 3% |
| Idle Bottom * (°C) | 35 | 29.2 17% | 25.5 27% | 30.3 13% | 43.6 -25% | 36 -3% |
* ... smaller is better
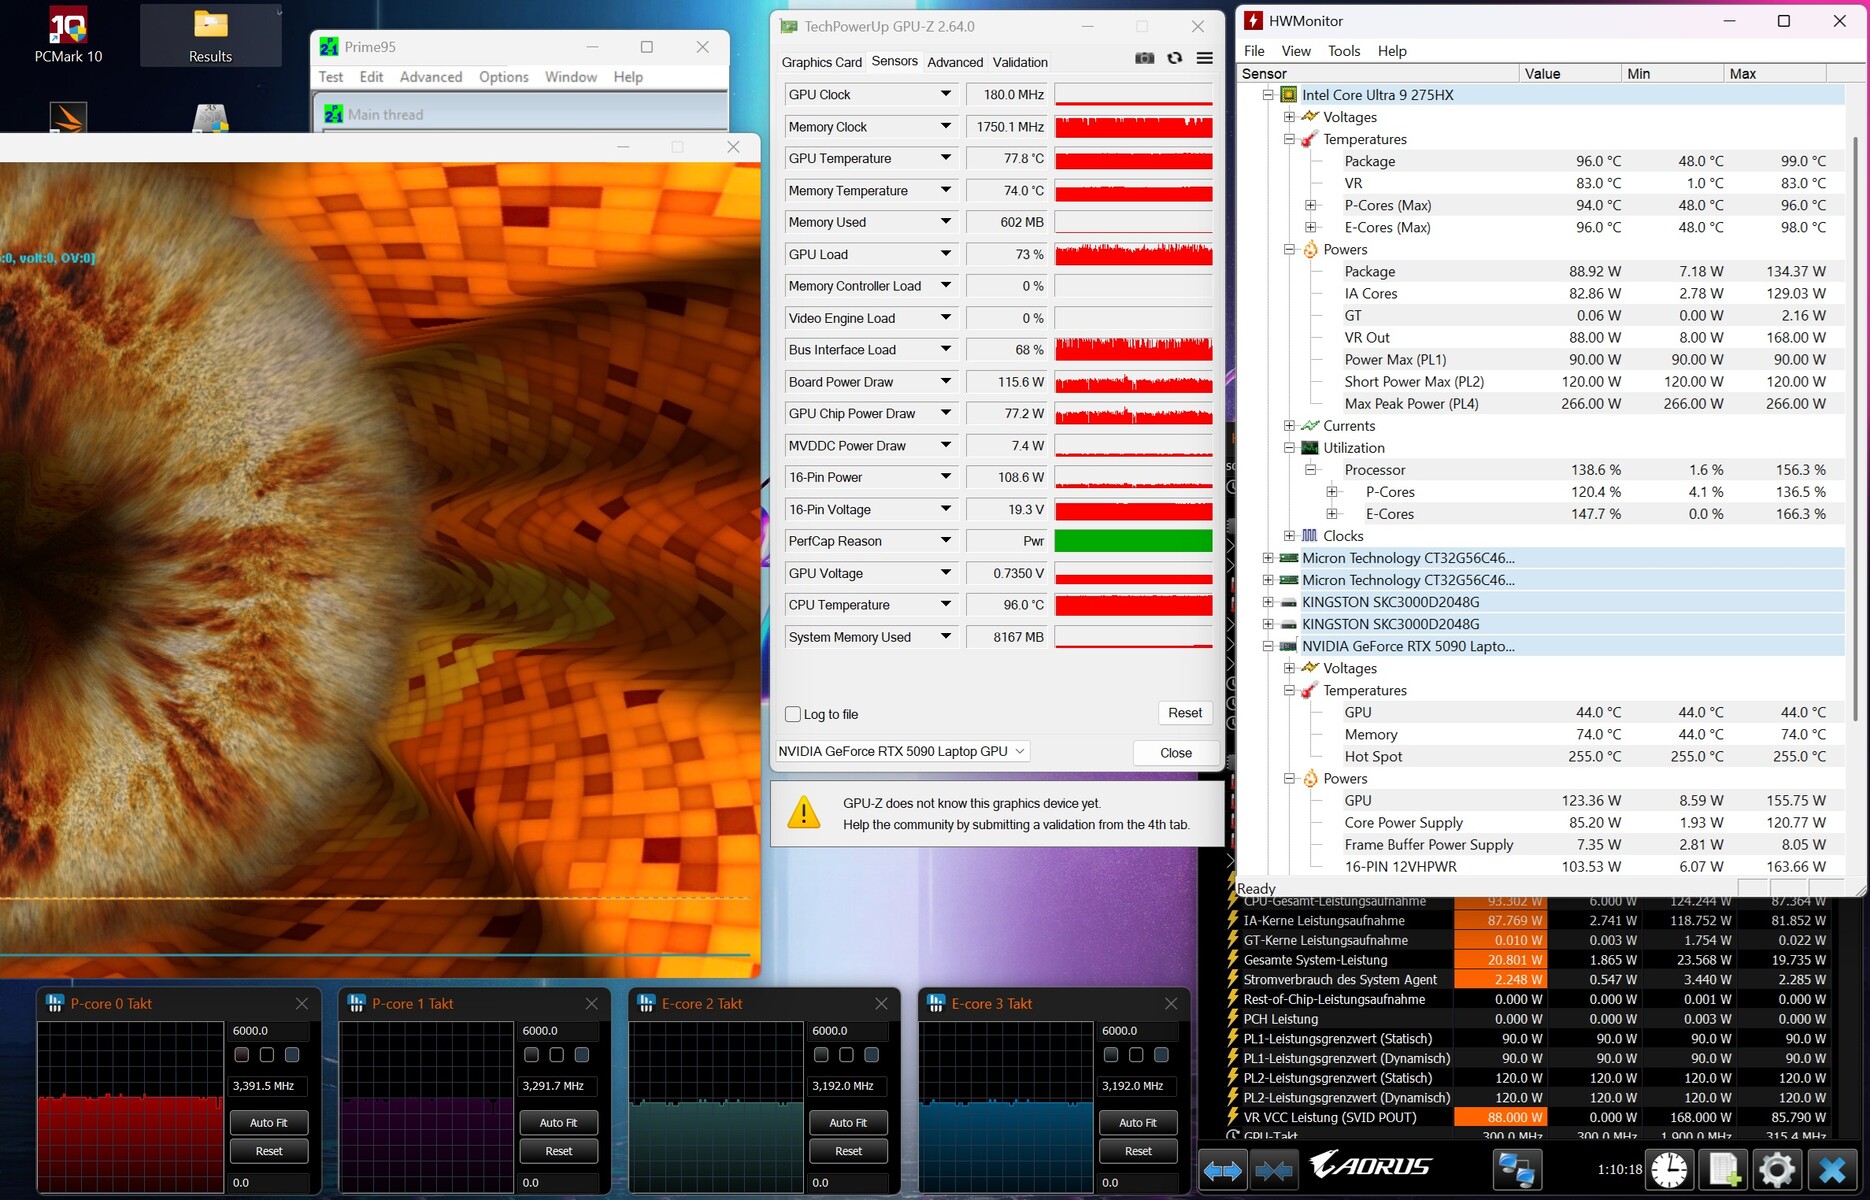
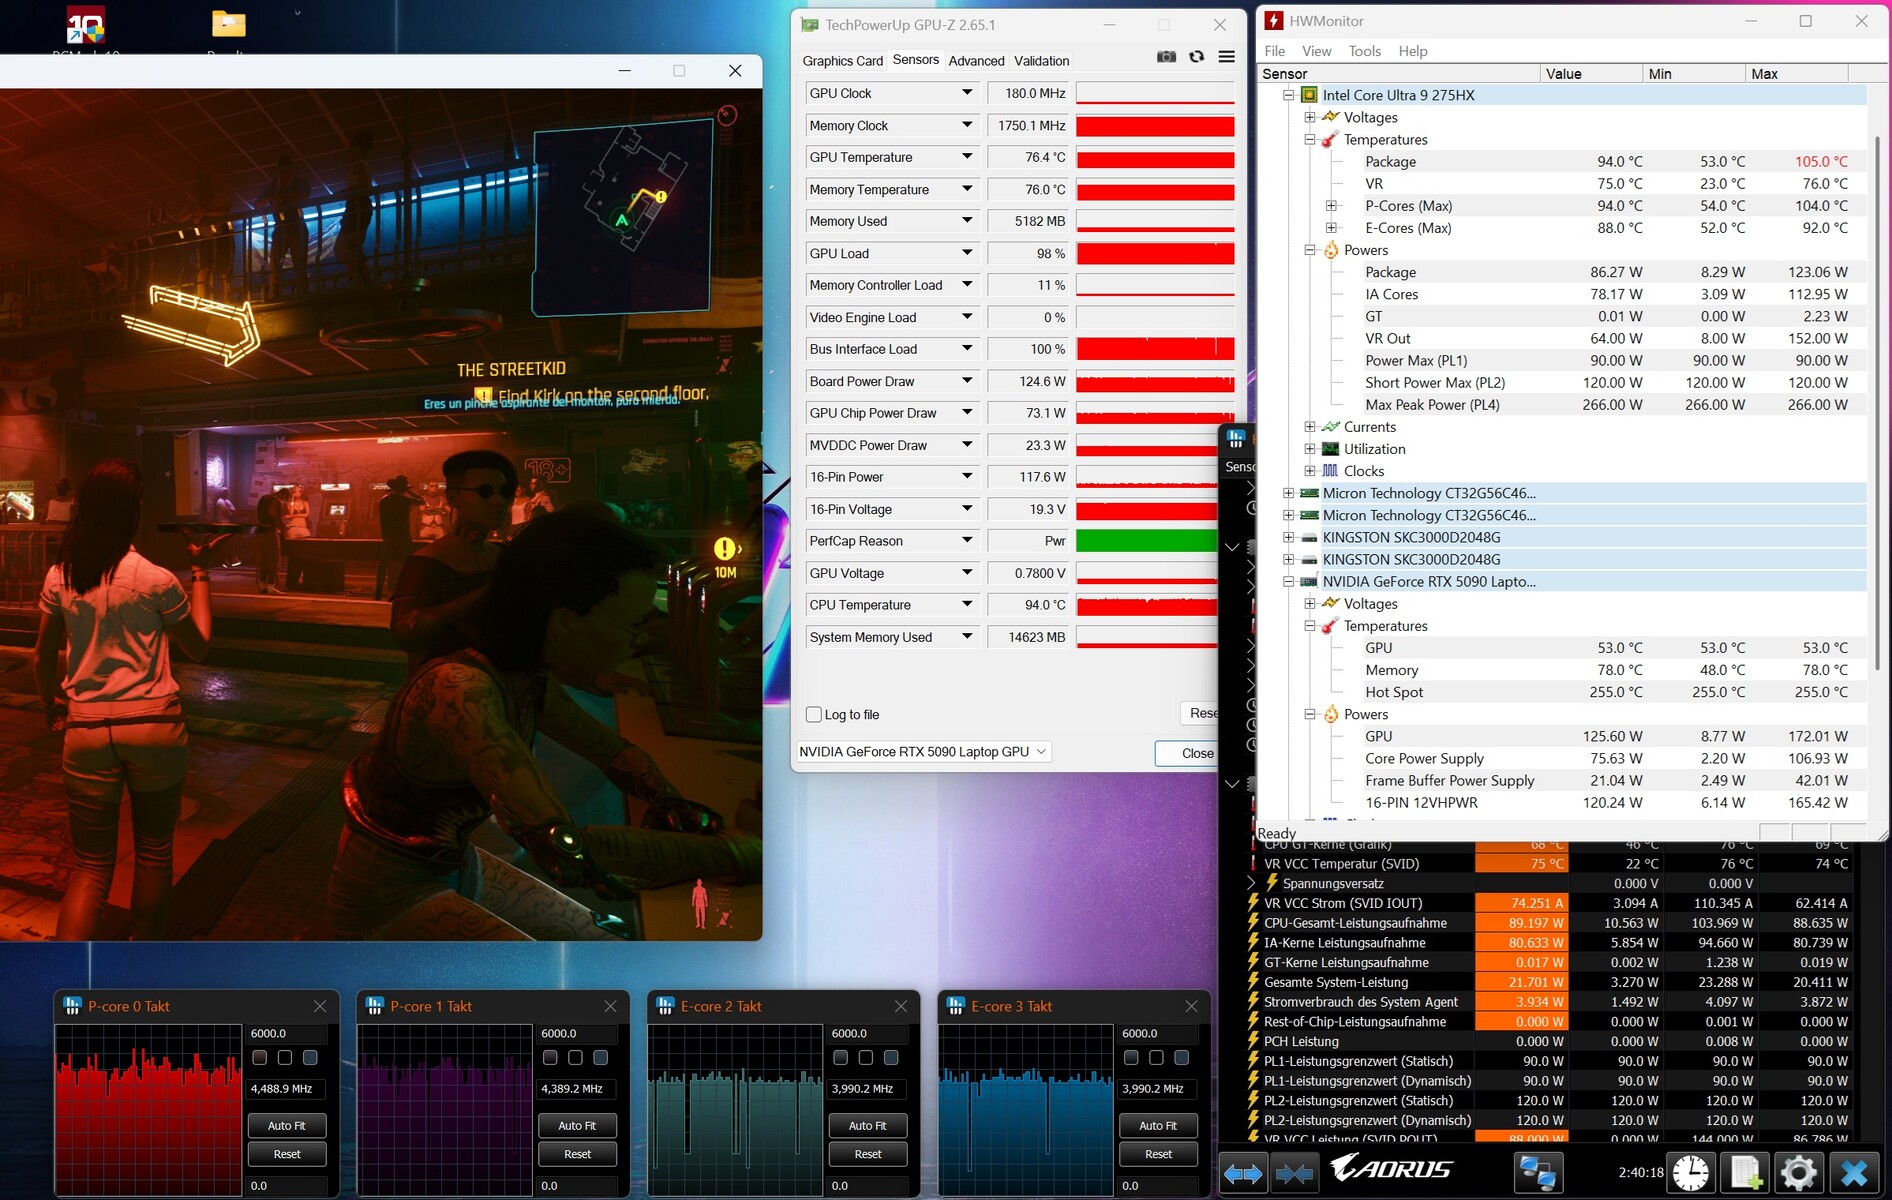
压力测试
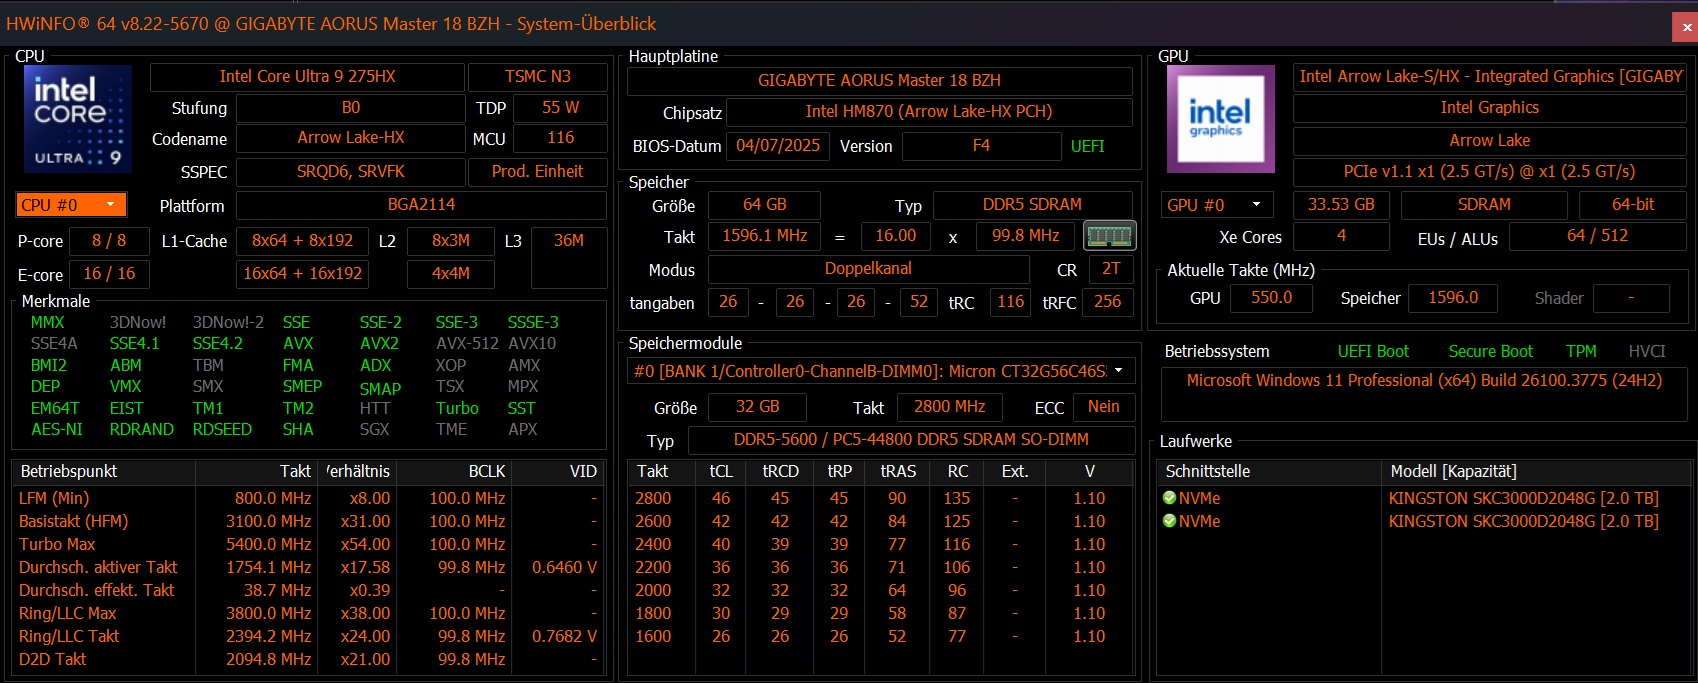
在使用 Furmark 和 Prime95 工具进行压力测试期间,根据我们的测量软件,GeForce RTX 5090 的平均发热温度为 78 °C,而 Core Ultra 9 275HX 的平均发热温度为 96 °C。运行《赛博朋克 2077》时的结果与此类似。
发言人
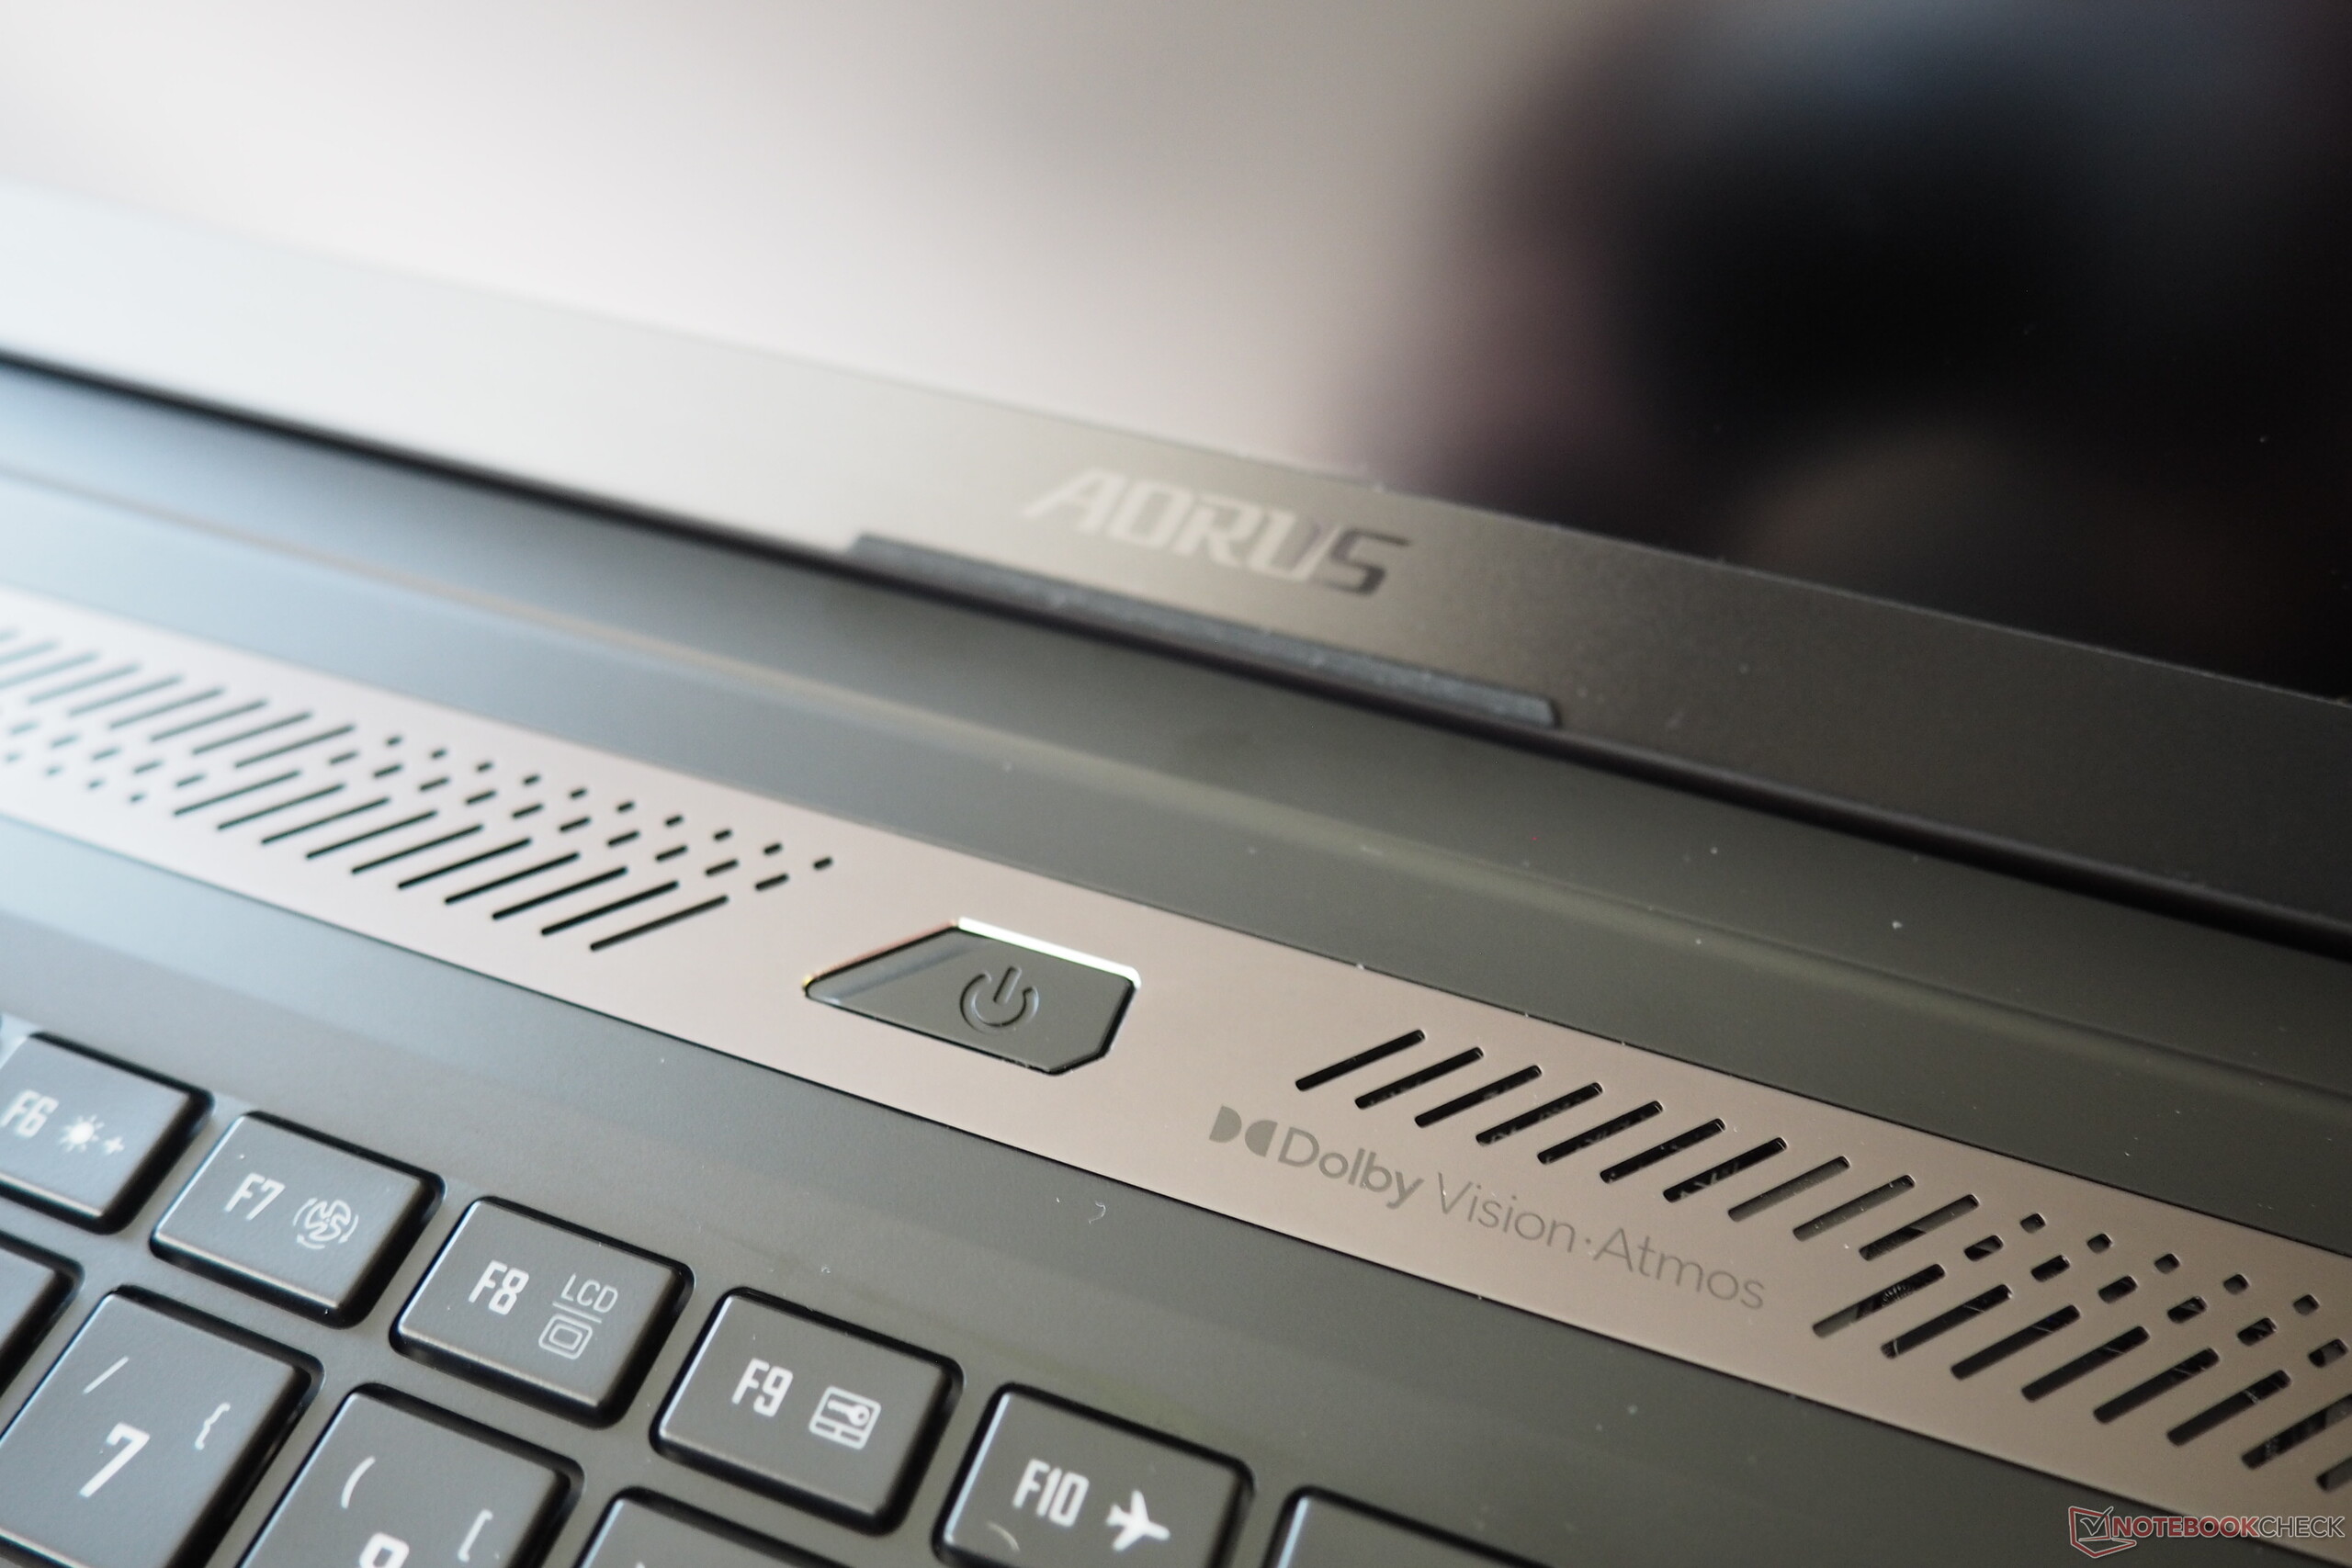
除了最大音量(77 分贝)一般之外,Master 18 的音响系统提供了良好的音效,可以轻松与 Strix Scar 18 相媲美。
Aorus Master 18 AM8H audio analysis
(±) | speaker loudness is average but good (77 dB)
Bass 100 - 315 Hz
(±) | reduced bass - on average 8.7% lower than median
(±) | linearity of bass is average (10.3% delta to prev. frequency)
Mids 400 - 2000 Hz
(+) | balanced mids - only 3% away from median
(+) | mids are linear (4.3% delta to prev. frequency)
Highs 2 - 16 kHz
(+) | balanced highs - only 2.8% away from median
(+) | highs are linear (5.4% delta to prev. frequency)
Overall 100 - 16.000 Hz
(+) | overall sound is linear (11.9% difference to median)
Compared to same class
» 12% of all tested devices in this class were better, 4% similar, 84% worse
» The best had a delta of 6%, average was 18%, worst was 132%
Compared to all devices tested
» 9% of all tested devices were better, 2% similar, 89% worse
» The best had a delta of 4%, average was 23%, worst was 134%
Asus Strix Scar 18 G835LX audio analysis
(+) | speakers can play relatively loud (86.3 dB)
Bass 100 - 315 Hz
(±) | reduced bass - on average 7.5% lower than median
(±) | linearity of bass is average (7.7% delta to prev. frequency)
Mids 400 - 2000 Hz
(±) | higher mids - on average 9.9% higher than median
(+) | mids are linear (6.9% delta to prev. frequency)
Highs 2 - 16 kHz
(+) | balanced highs - only 2.2% away from median
(+) | highs are linear (4.1% delta to prev. frequency)
Overall 100 - 16.000 Hz
(+) | overall sound is linear (13.7% difference to median)
Compared to same class
» 21% of all tested devices in this class were better, 7% similar, 72% worse
» The best had a delta of 6%, average was 18%, worst was 132%
Compared to all devices tested
» 15% of all tested devices were better, 4% similar, 81% worse
» The best had a delta of 4%, average was 23%, worst was 134%
能源管理
耗电量
Master 18 在空转时已经消耗了相当多的能量--Scar 18 发出了它的问候:从纸面上看,29 到 48 瓦的功率并不能保证电池长时间运行。在负载情况下,它的需求会攀升至 340 瓦,华硕笔记本电脑在这种情况下的能耗更高,这是因为其处理器的 PL1/PL2 值更为宽松。
| Off / Standby | |
| Idle | |
| Load |
|
Key:
min: | |
| Aorus Master 18 AM8H Ultra 9 275HX, GeForce RTX 5090 Laptop | Asus Strix Scar 18 G835LX Ultra 9 275HX, GeForce RTX 5090 Laptop | Asus ROG Zephyrus G16 GU605CX Ultra 9 285H, GeForce RTX 5090 Laptop | Razer Blade 16 2025 RTX 5090 Ryzen AI 9 HX 370, GeForce RTX 5090 Laptop | Alienware m18 R2 i9-14900HX, GeForce RTX 4090 Laptop GPU | MSI Titan 18 HX A14VIG i9-14900HX, GeForce RTX 4090 Laptop GPU | Average of class Gaming | |
|---|---|---|---|---|---|---|---|
| Power Consumption | 1% | 48% | 44% | 13% | 9% | 38% | |
| Idle Minimum * (Watt) | 29 | 11.4 61% | 9.4 68% | 10.9 62% | 10.6 63% | 13.2 54% | 13 ? 55% |
| Idle Average * (Watt) | 33 | 39.2 -19% | 13.6 59% | 13.5 59% | 20.9 37% | 25.4 23% | 19 ? 42% |
| Idle Maximum * (Watt) | 48 | 40.2 16% | 15.8 67% | 13.7 71% | 40 17% | 53.5 -11% | 24.6 ? 49% |
| Load Average * (Watt) | 141 | 161.2 -14% | 115.4 18% | 120.2 15% | 201.1 -43% | 151.4 -7% | 110.7 ? 21% |
| Cyberpunk 2077 ultra * (Watt) | 283 | 303 -7% | 164.5 42% | 178.2 37% | |||
| Cyberpunk 2077 ultra external monitor * (Watt) | 283 | 295 -4% | 160.4 43% | 177.6 37% | |||
| Load Maximum * (Watt) | 340 | 430.9 -27% | 216.7 36% | 246.1 28% | 378.9 -11% | 395.2 -16% | 259 ? 24% |
| Witcher 3 ultra * (Watt) | 358 | 336 |
* ... smaller is better
Power consumption Cyberpunk / stress test
Power consumption with external monitor
运行时间
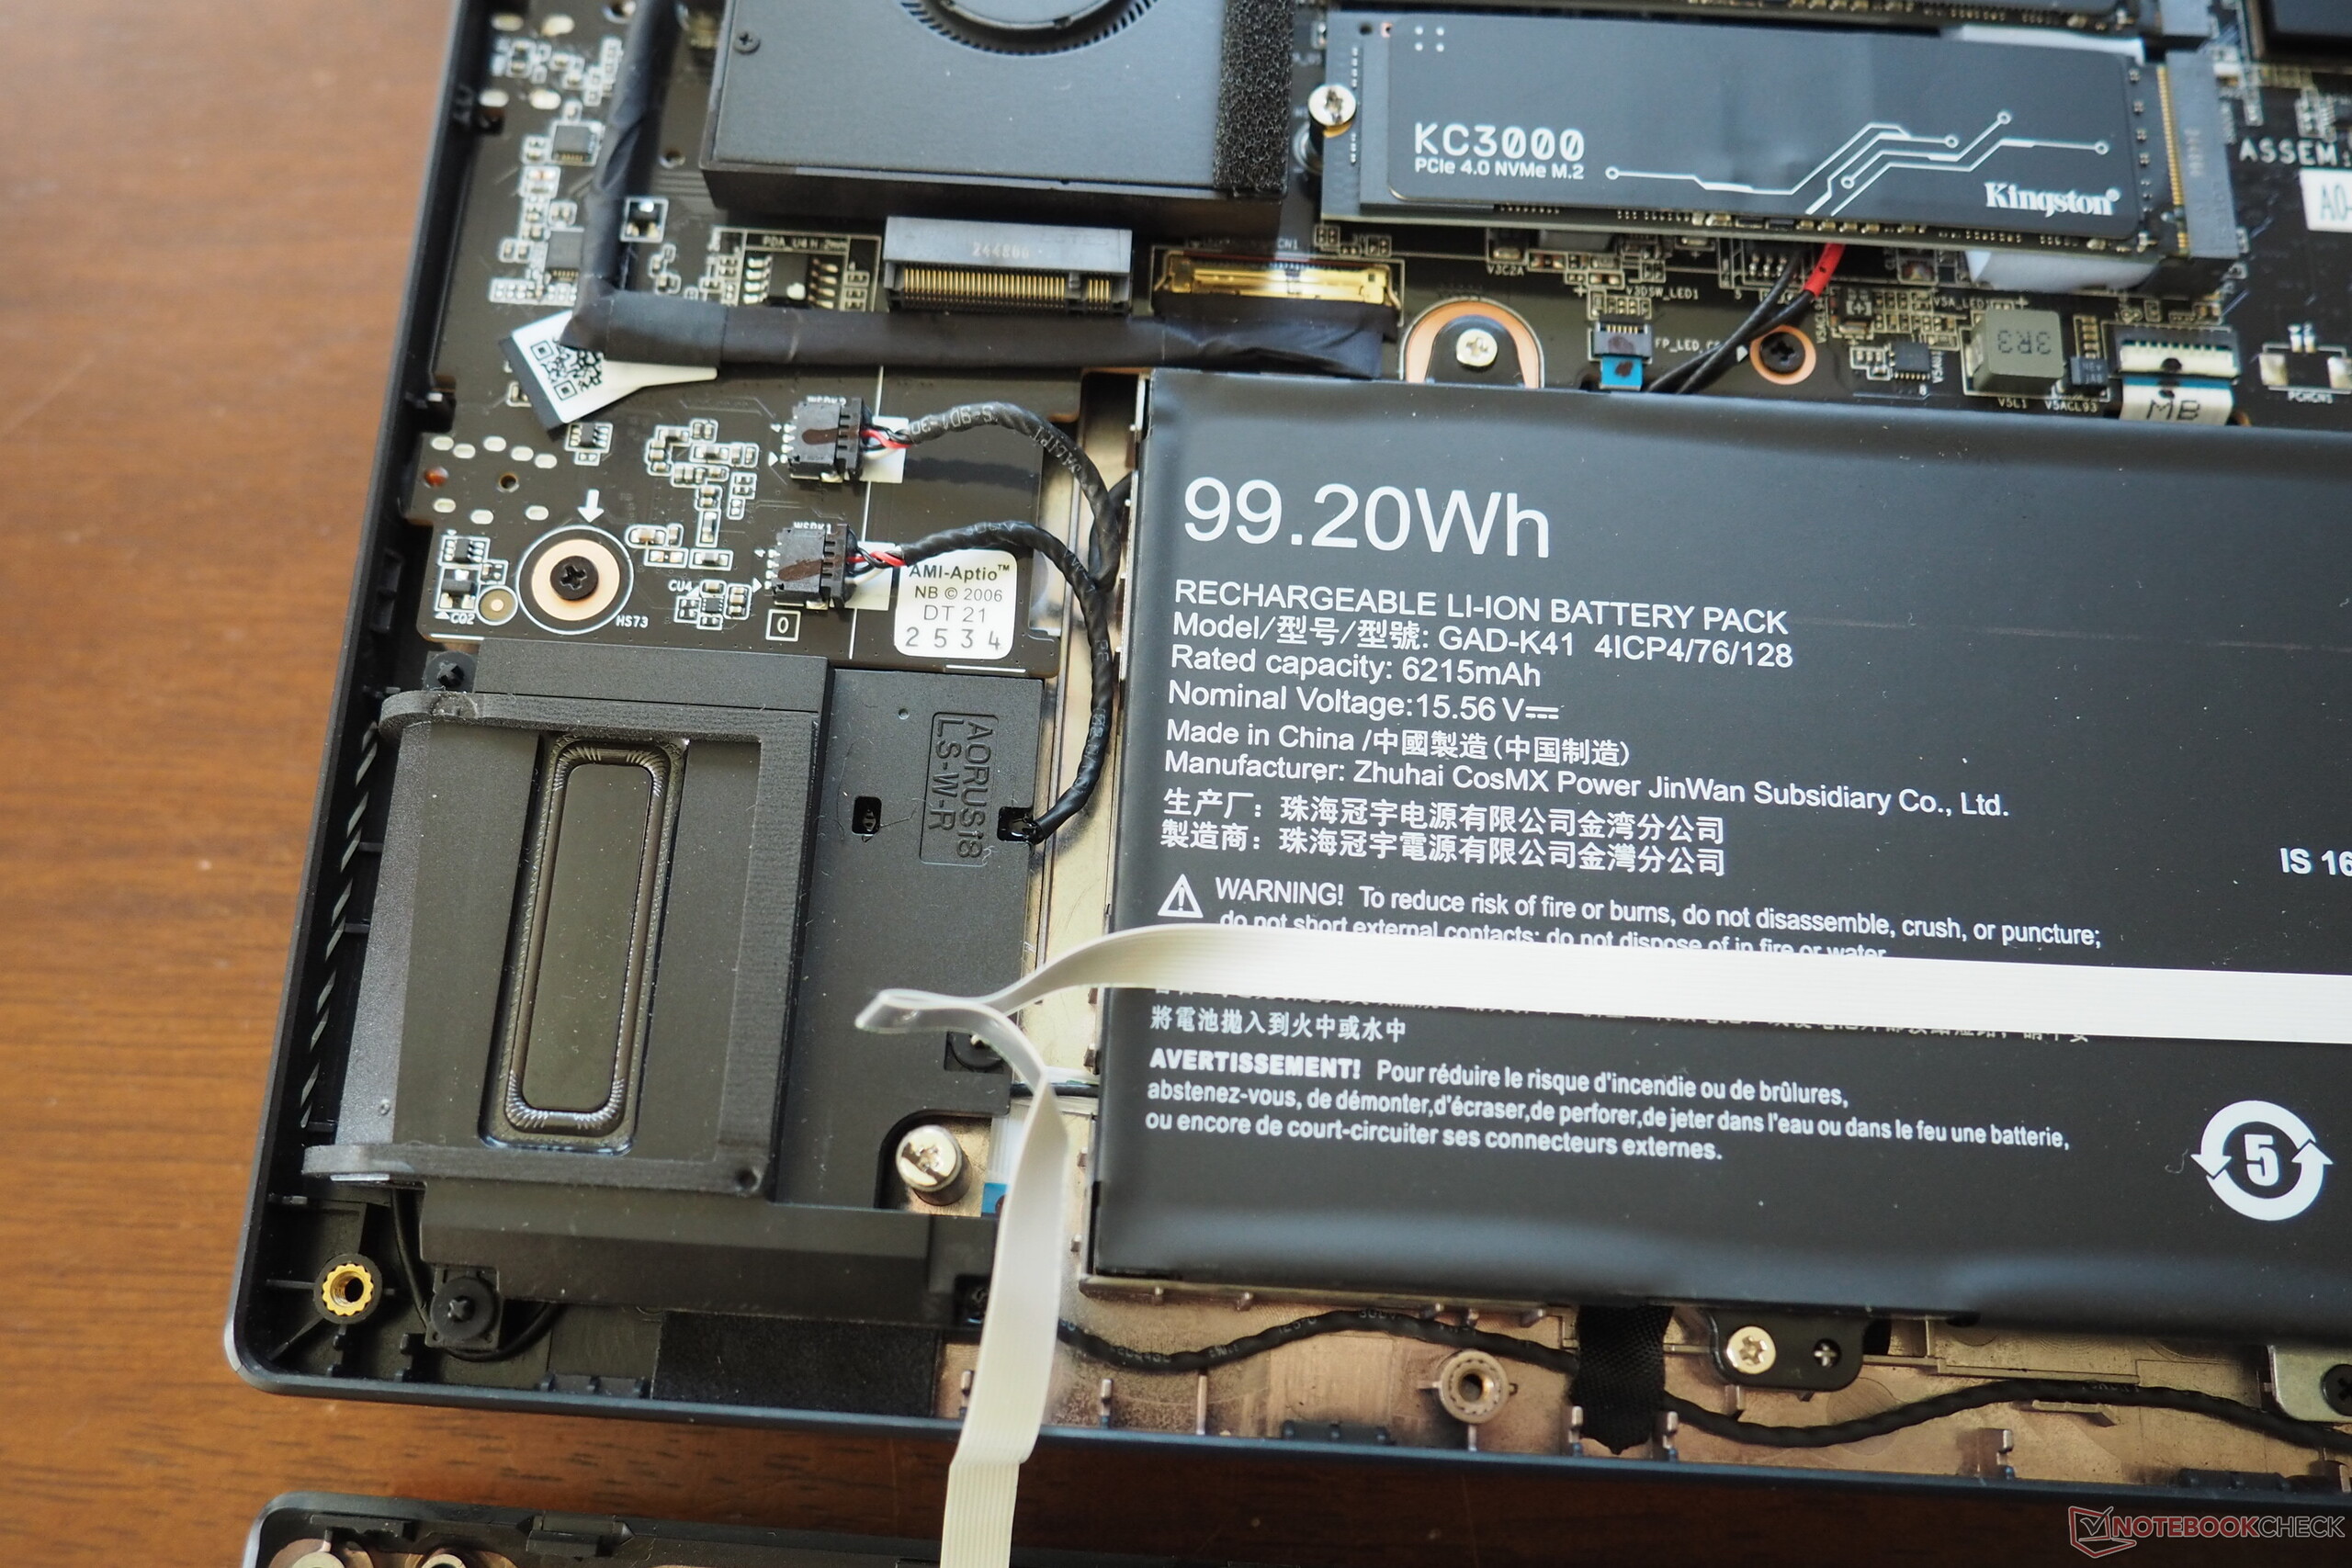
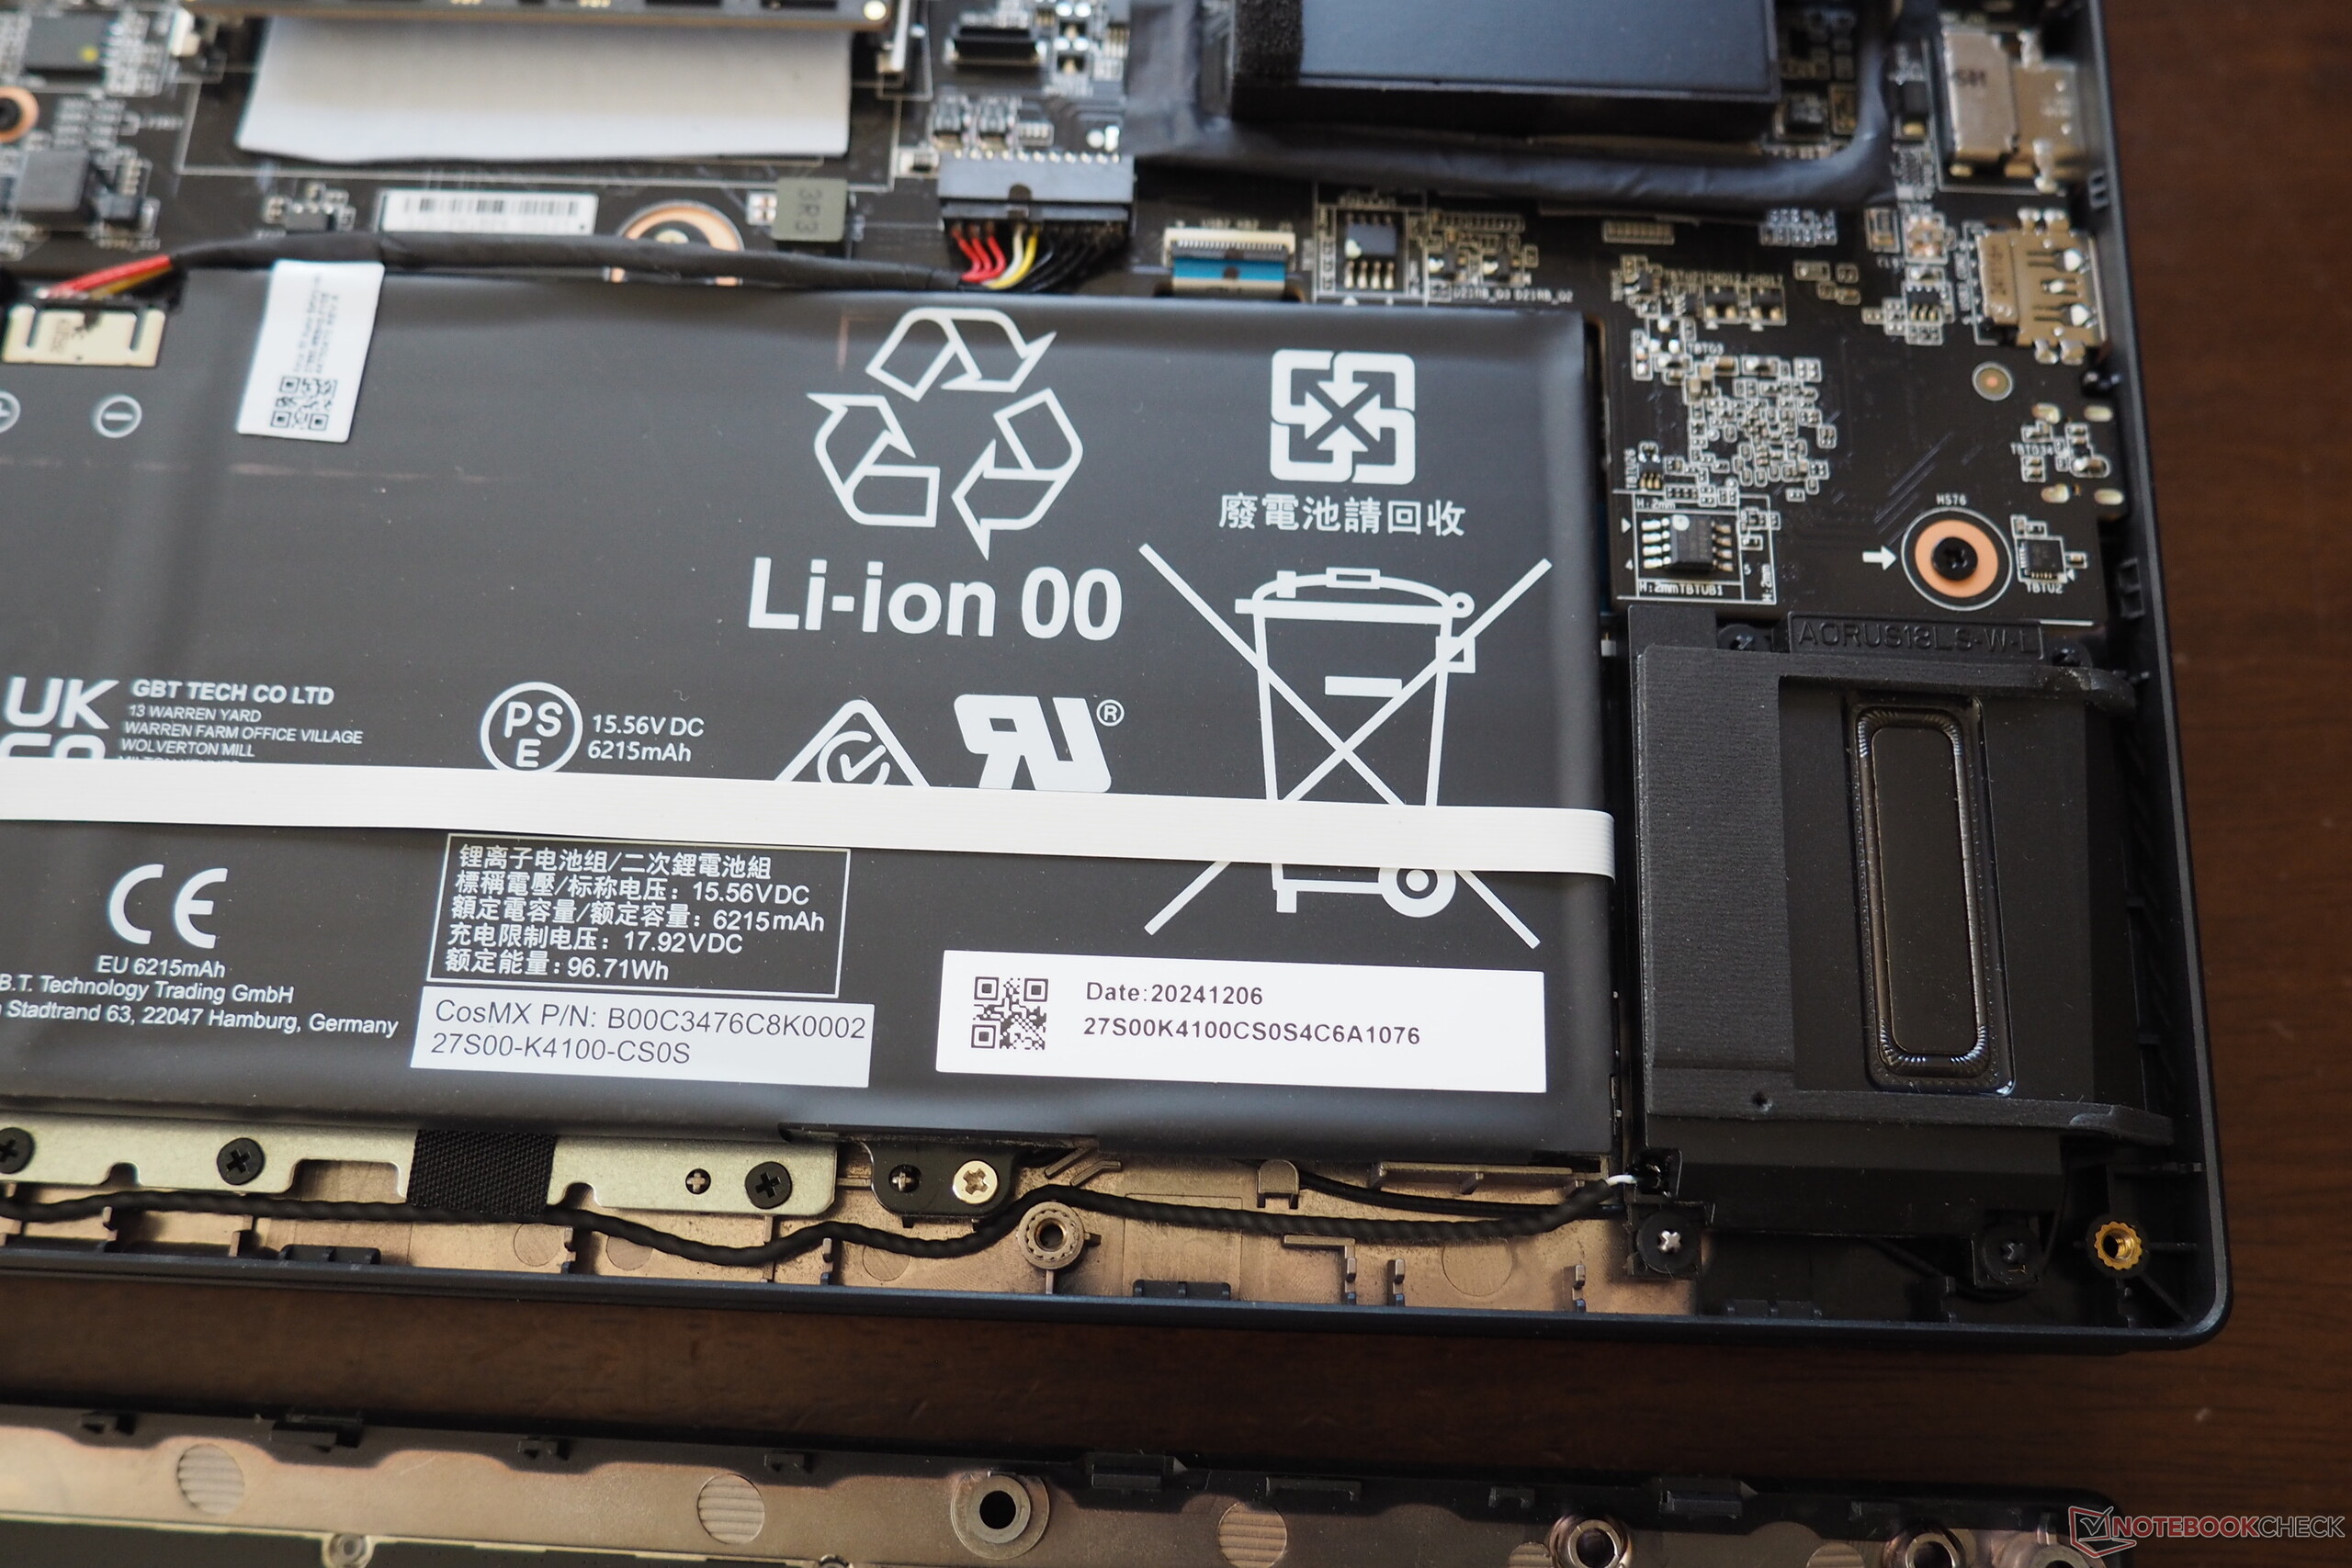
技嘉为其 18 英寸笔记本电脑配备了 99 Wh 的可观电池容量,高于 Scar 18 的 90 Wh。在亮度降至 150 cd/m² 的 Wi-Fi 测试中,Master 18 的续航时间约为 5 小时。相比之下,华硕笔记本电脑的续航时间不到 5.5 小时,尽管容量较低,但续航时间略长。顺便提一下,在使用平衡模式时,一旦设备断开电源,dGPU 就会自动停用。
| Aorus Master 18 AM8H Ultra 9 275HX, GeForce RTX 5090 Laptop, 99 Wh | Asus Strix Scar 18 G835LX Ultra 9 275HX, GeForce RTX 5090 Laptop, 90 Wh | Asus ROG Zephyrus G16 GU605CX Ultra 9 285H, GeForce RTX 5090 Laptop, 90 Wh | Razer Blade 16 2025 RTX 5090 Ryzen AI 9 HX 370, GeForce RTX 5090 Laptop, 90 Wh | Alienware m18 R2 i9-14900HX, GeForce RTX 4090 Laptop GPU, 97 Wh | MSI Titan 18 HX A14VIG i9-14900HX, GeForce RTX 4090 Laptop GPU, 99.9 Wh | Average of class Gaming | |
|---|---|---|---|---|---|---|---|
| Battery runtime | -13% | 84% | 61% | -2% | -16% | 22% | |
| Reader / Idle (h) | 5.8 | 5.9 2% | 8.27 ? 43% | ||||
| WiFi v1.3 (h) | 4.9 | 5.5 12% | 9 84% | 7.9 61% | 4.8 -2% | 4.2 -14% | 7.11 ? 45% |
| Load (h) | 1.9 | 1.2 -37% | 1.2 -37% | 1.502 ? -21% | |||
| H.264 (h) | 5.8 | 9.9 | 8.32 ? | ||||
| Cyberpunk 2077 ultra 150cd (h) | 0.7 | 1.2 |
Notebookcheck 总评分
Aorus Master 18 是一款极其昂贵但功能强大的 18 英寸台式机替代产品。
Aorus Master 18 AM8H
- 04/29/2025 v8
Florian Glaser
 Total Sustainability Score:
 Video test of the RTX 5080 version
Possible alternatives compared
Image | Model / Review | Price | Weight | Height | Display |
|---|---|---|---|---|---|
1. 86.8%  | Aorus Master 18 AM8H Intel Core Ultra 9 275HX ⎘ NVIDIA GeForce RTX 5090 Laptop ⎘ 64 GB Memory, 2048 GB SSD | Amazon: List Price: 5000 EUR | 3.4 kg | 31 mm | 18.00" 2560x1600 168 PPI Mini-LED |
2. 88% 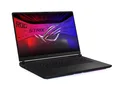 | Asus Strix Scar 18 G835LX Intel Core Ultra 9 275HX ⎘ NVIDIA GeForce RTX 5090 Laptop ⎘ 64 GB Memory, 2048 GB SSD | Amazon: List Price: 5799€ | 3.3 kg | 32 mm | 18.00" 2560x1600 168 PPI Mini-LED |
3. 90% 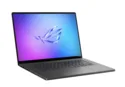 | Asus ROG Zephyrus G16 GU605CX Intel Core Ultra 9 285H ⎘ NVIDIA GeForce RTX 5090 Laptop ⎘ 64 GB Memory, 2048 GB SSD | Amazon: List Price: 4799€ | 1.9 kg | 17.4 mm | 16.00" 2560x1600 189 PPI OLED |
4. 87%  | Razer Blade 16 2025 RTX 5090 AMD Ryzen AI 9 HX 370 ⎘ NVIDIA GeForce RTX 5090 Laptop ⎘ 32 GB Memory, 2048 GB SSD | Amazon: List Price: 4399€ | 2.1 kg | 17.4 mm | 16.00" 2560x1600 189 PPI OLED |
5. 89.5% v7 (old)  | Alienware m18 R2 Intel Core i9-14900HX ⎘ NVIDIA GeForce RTX 4090 Laptop GPU ⎘ 32 GB Memory, 2048 GB SSD | Amazon: 1. $3,499.99 Dell Alienware m18 R2 Gaming... 2. $2,799.00 Alienware M18 Gaming Laptop ... 3. $3,699.00 Dell Alienware 18 Area-51 Ga... List Price: 3300 USD | 4 kg | 26.7 mm | 18.00" 2560x1600 168 PPI IPS |
6. 88.8% v7 (old) 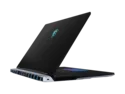 | MSI Titan 18 HX A14VIG Intel Core i9-14900HX ⎘ NVIDIA GeForce RTX 4090 Laptop GPU ⎘ 128 GB Memory, 4096 GB SSD | Amazon: 1. $6,699.99 msi Titan 18 HX AI 18" 240Hz... 2. $5,699.99 msi Titan 18 HX AI 18" 120Hz... 3. $2,699.99 msi Vector A18 HX 18” 240H... List Price: 5000 USD | 3.6 kg | 32.1 mm | 18.00" 3840x2400 252 PPI Mini-LED |
Transparency
The selection of devices to be reviewed is made by our editorial team. The test sample was provided to the author as a loan by the manufacturer or retailer for the purpose of this review. The lender had no influence on this review, nor did the manufacturer receive a copy of this review before publication. There was no obligation to publish this review. As an independent media company, Notebookcheck is not subjected to the authority of manufacturers, retailers or publishers.
This is how Notebookcheck is testing
Every year, Notebookcheck independently reviews hundreds of laptops and smartphones using standardized procedures to ensure that all results are comparable. We have continuously developed our test methods for around 20 years and set industry standards in the process. In our test labs, high-quality measuring equipment is utilized by experienced technicians and editors. These tests involve a multi-stage validation process. Our complex rating system is based on hundreds of well-founded measurements and benchmarks, which maintains objectivity. Further information on our test methods can be found here.

