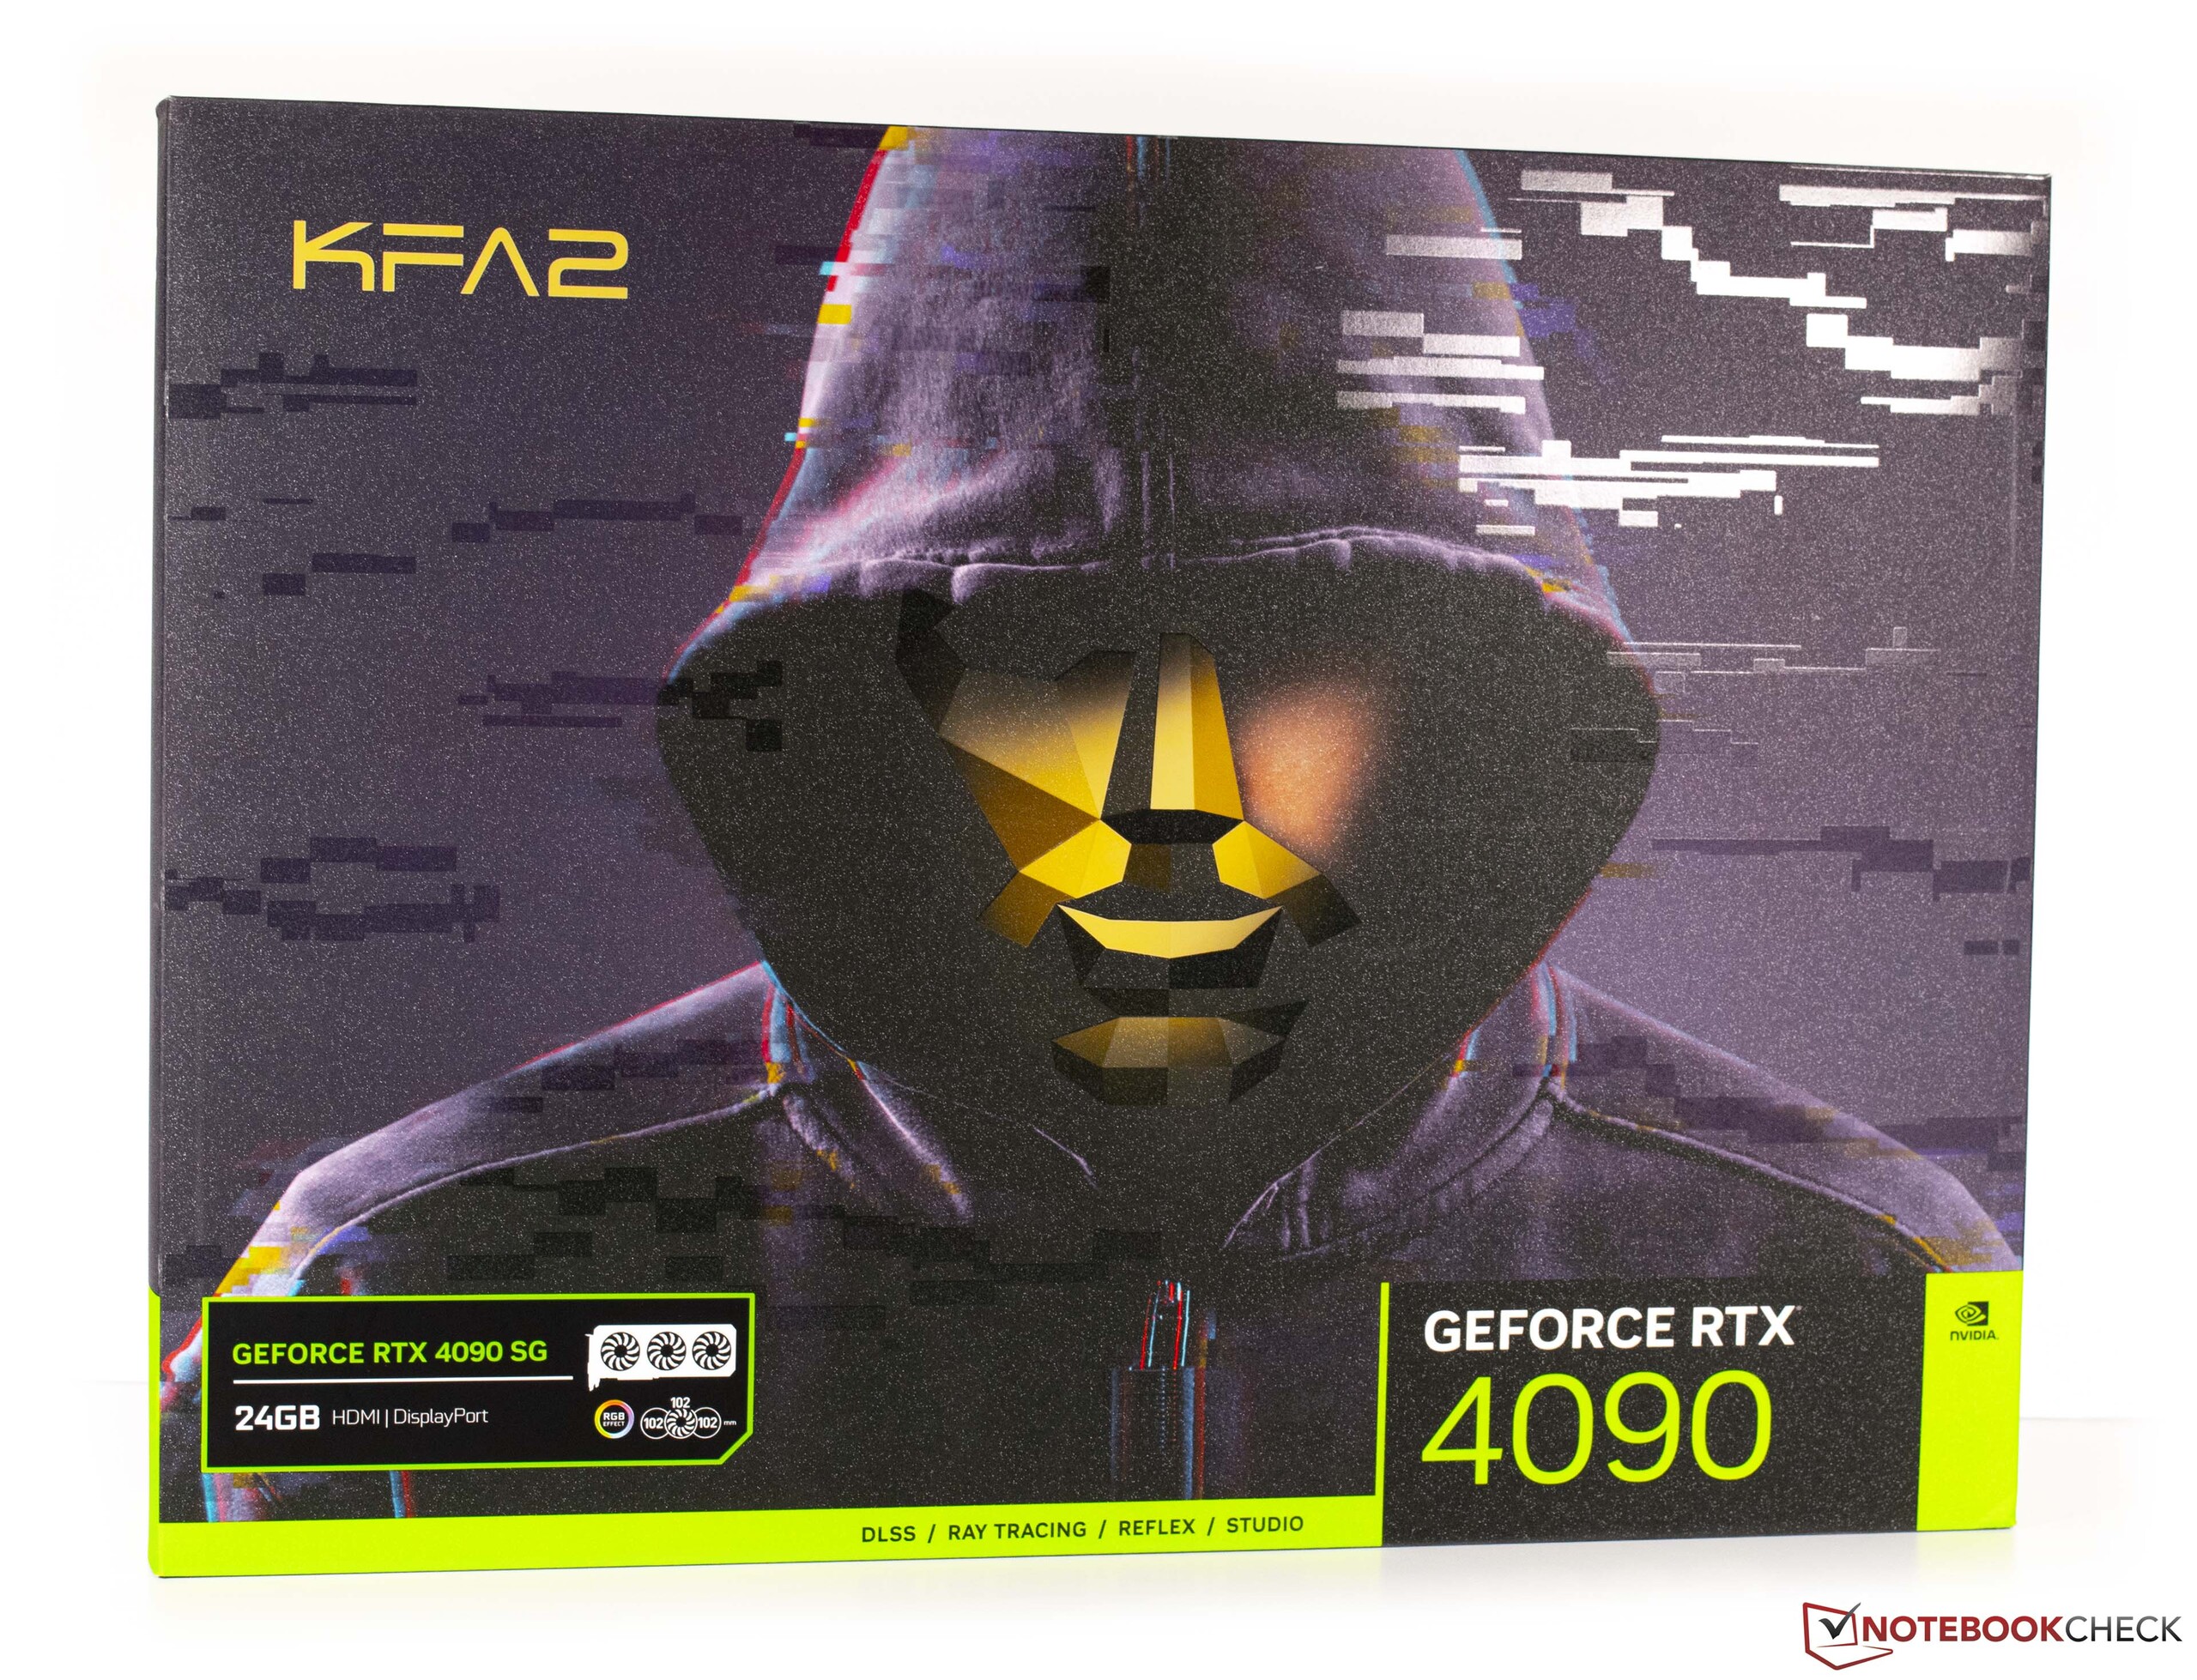
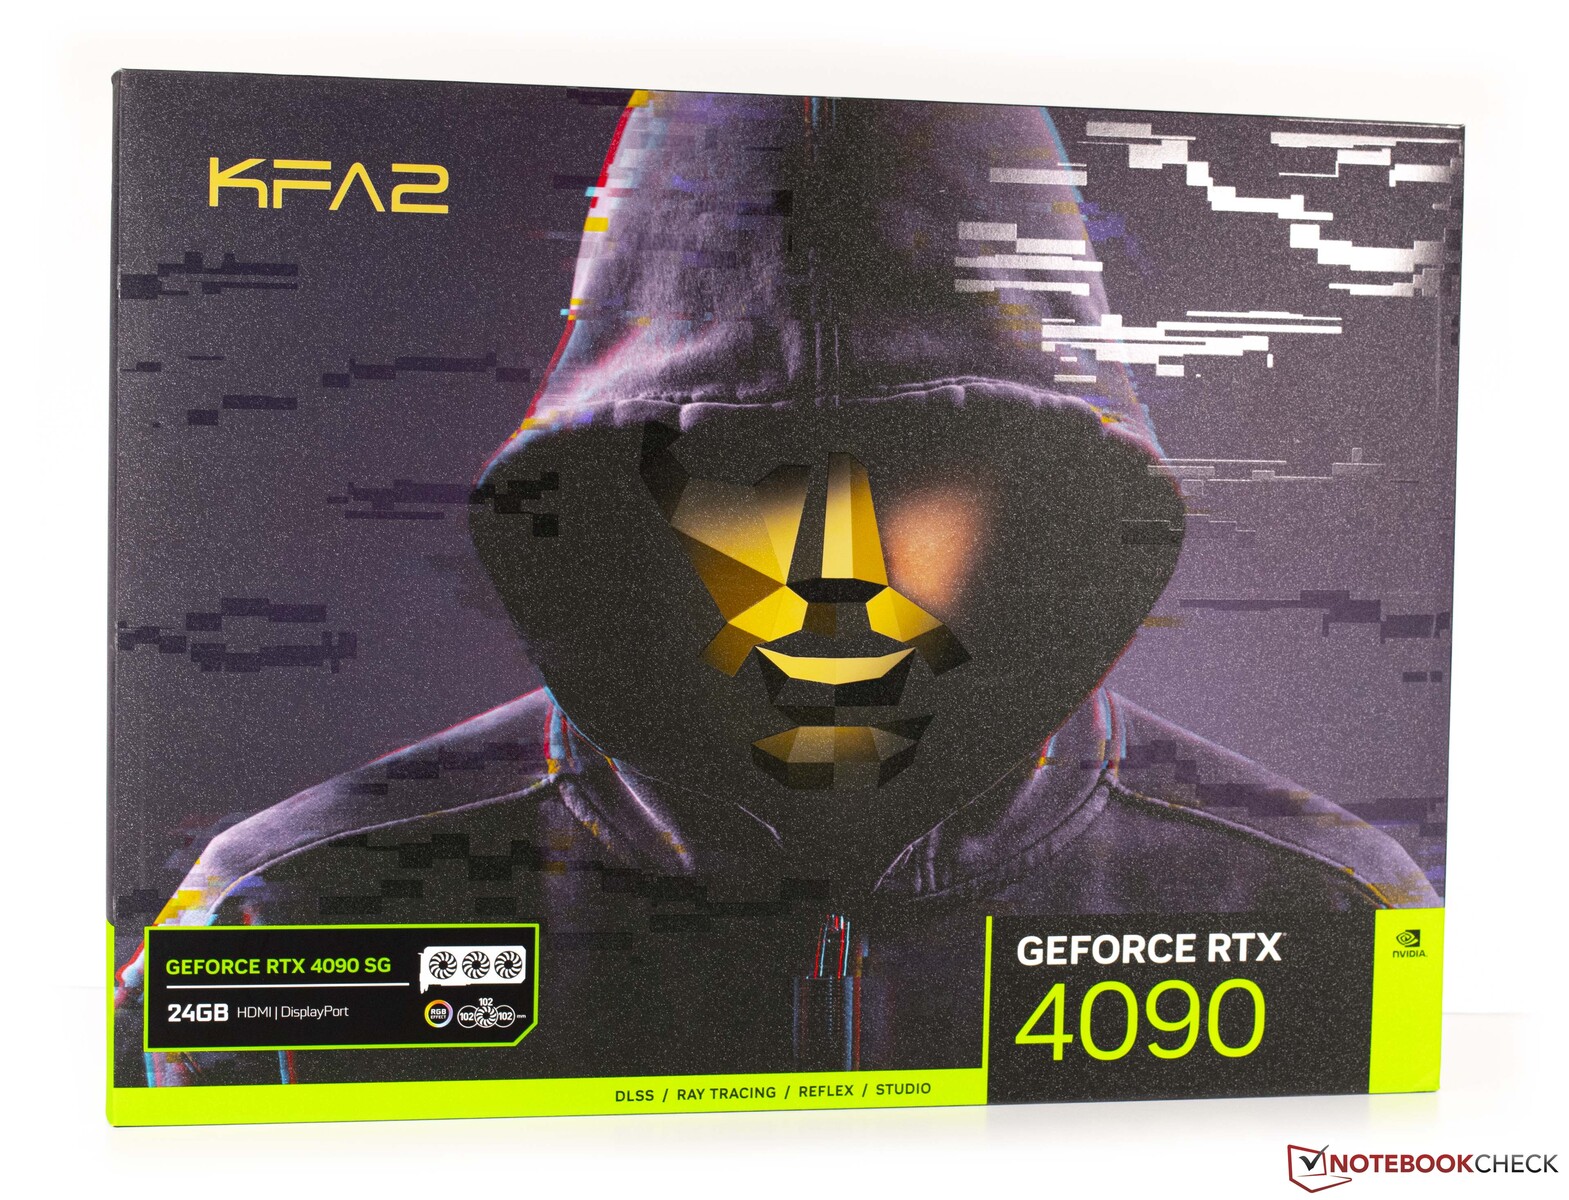
KFA2GeForce RTX 4090 SG评论。不折不扣的4K游戏,新的Nvidia旗舰机

Nvidia目前的顶级型号提供了令人印象深刻的性能。我们已经看到这一点的形式是 PalitGeForce RTX 4090 GameRock OC和 NvidiaGeForce RTX 4090 Founders Edition.通过KFA2的版本,我们看一下当前高端级别的另一个模型。
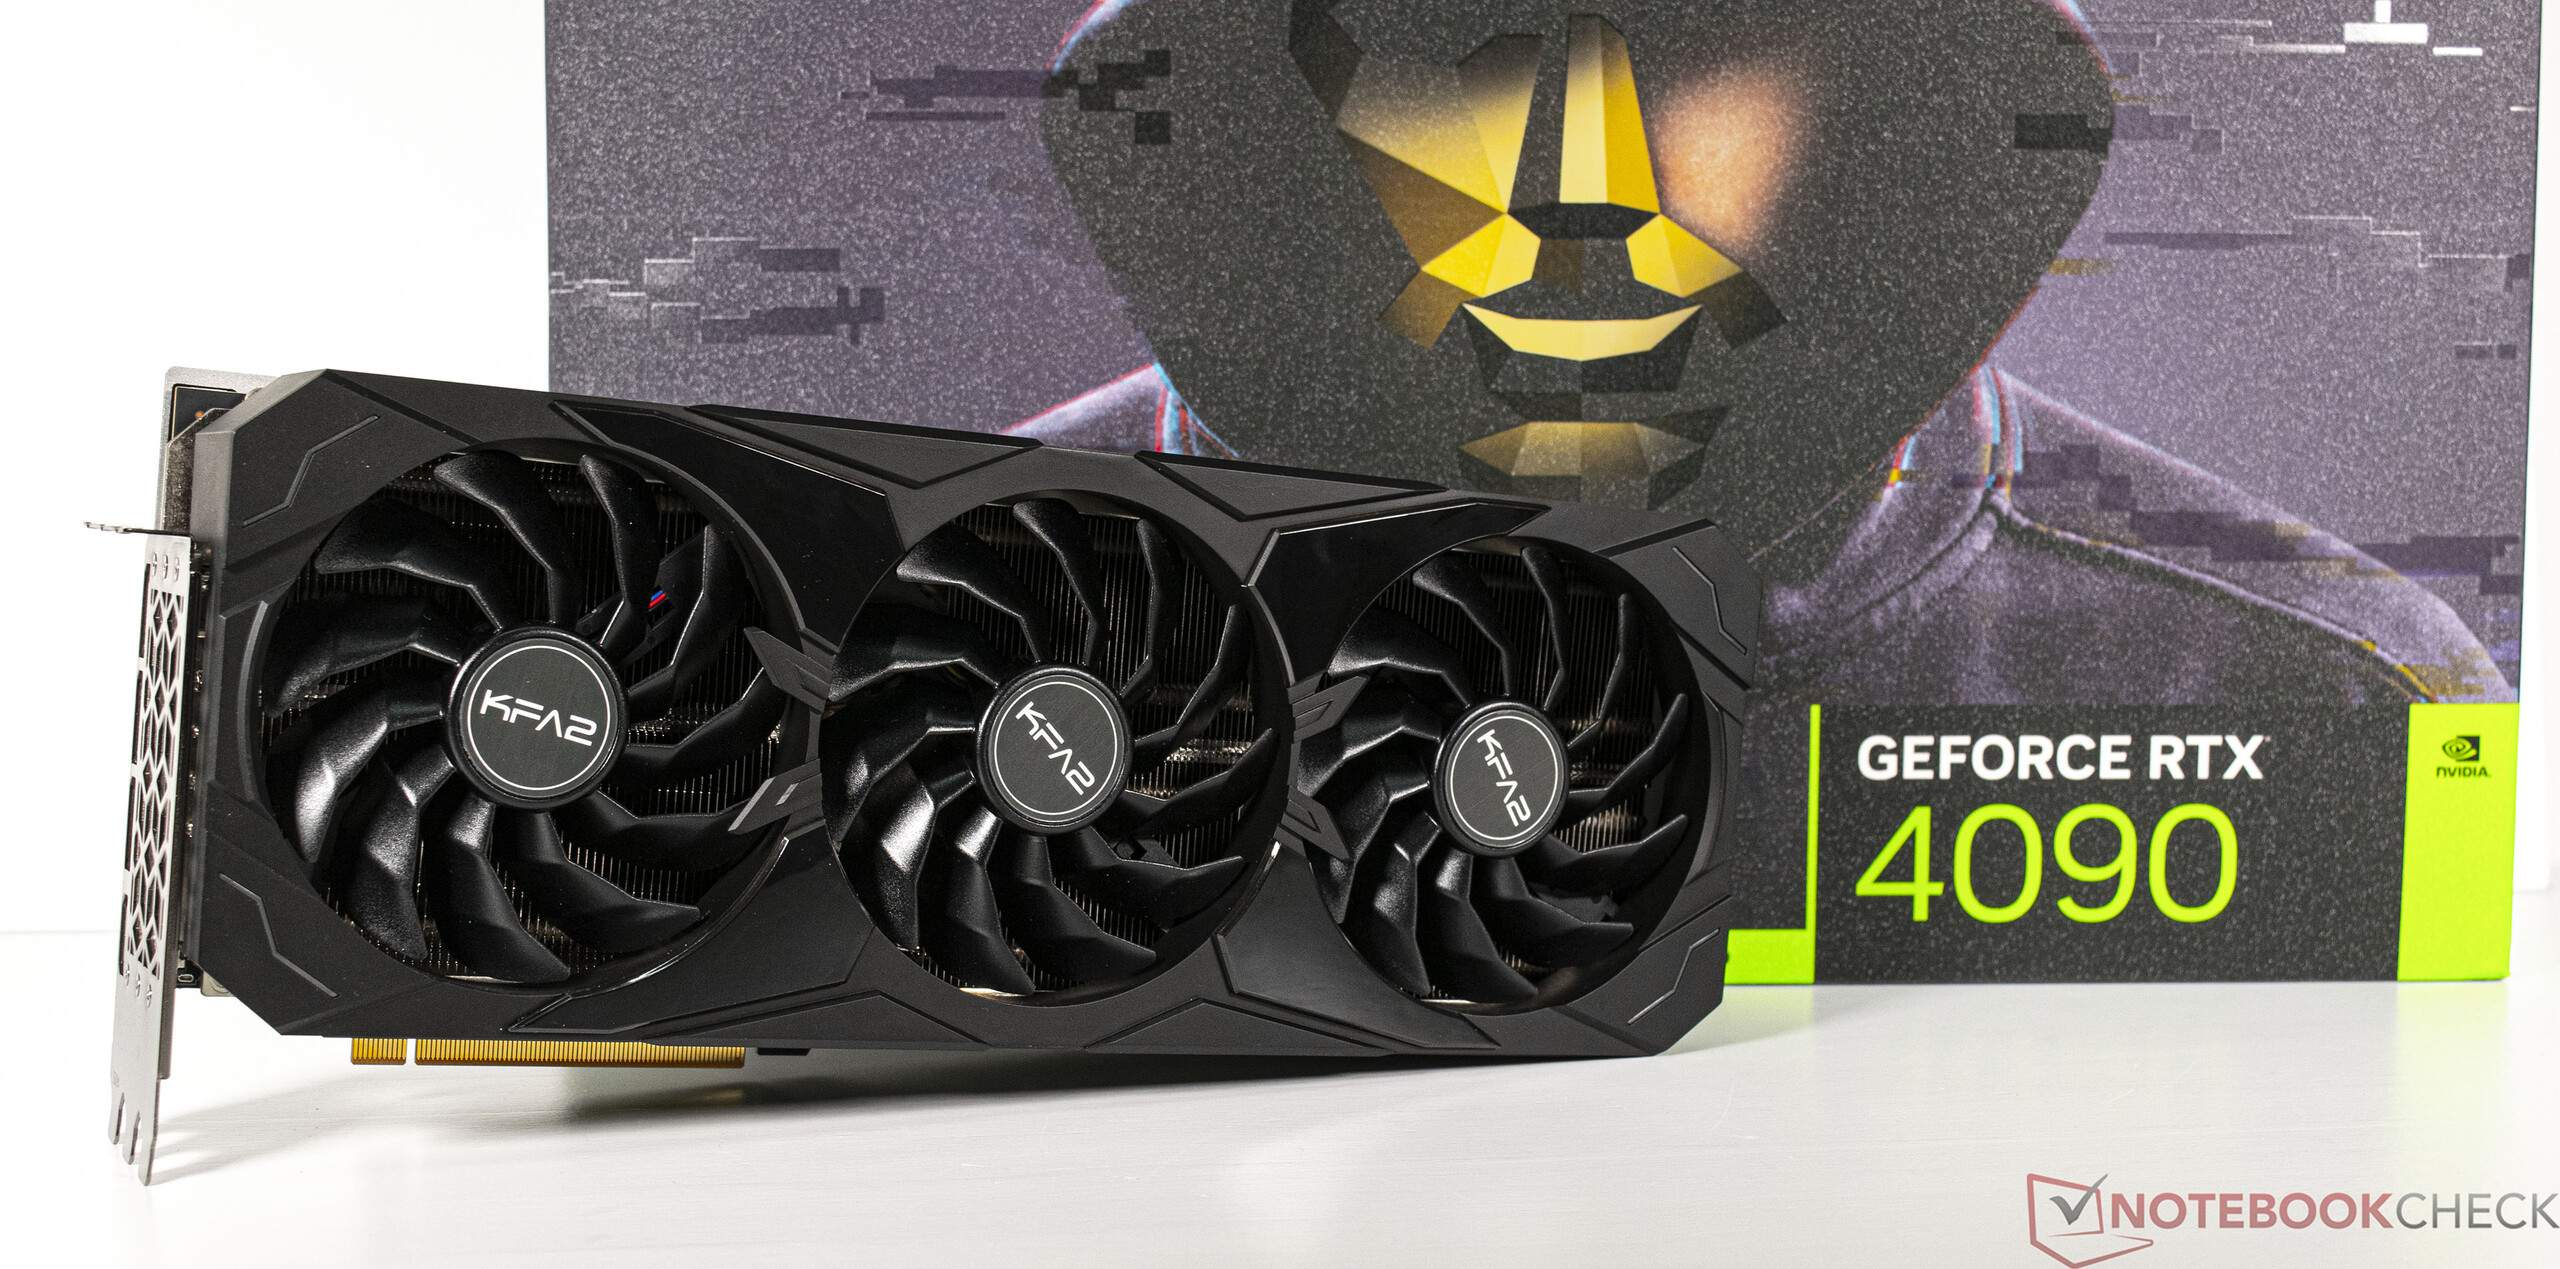
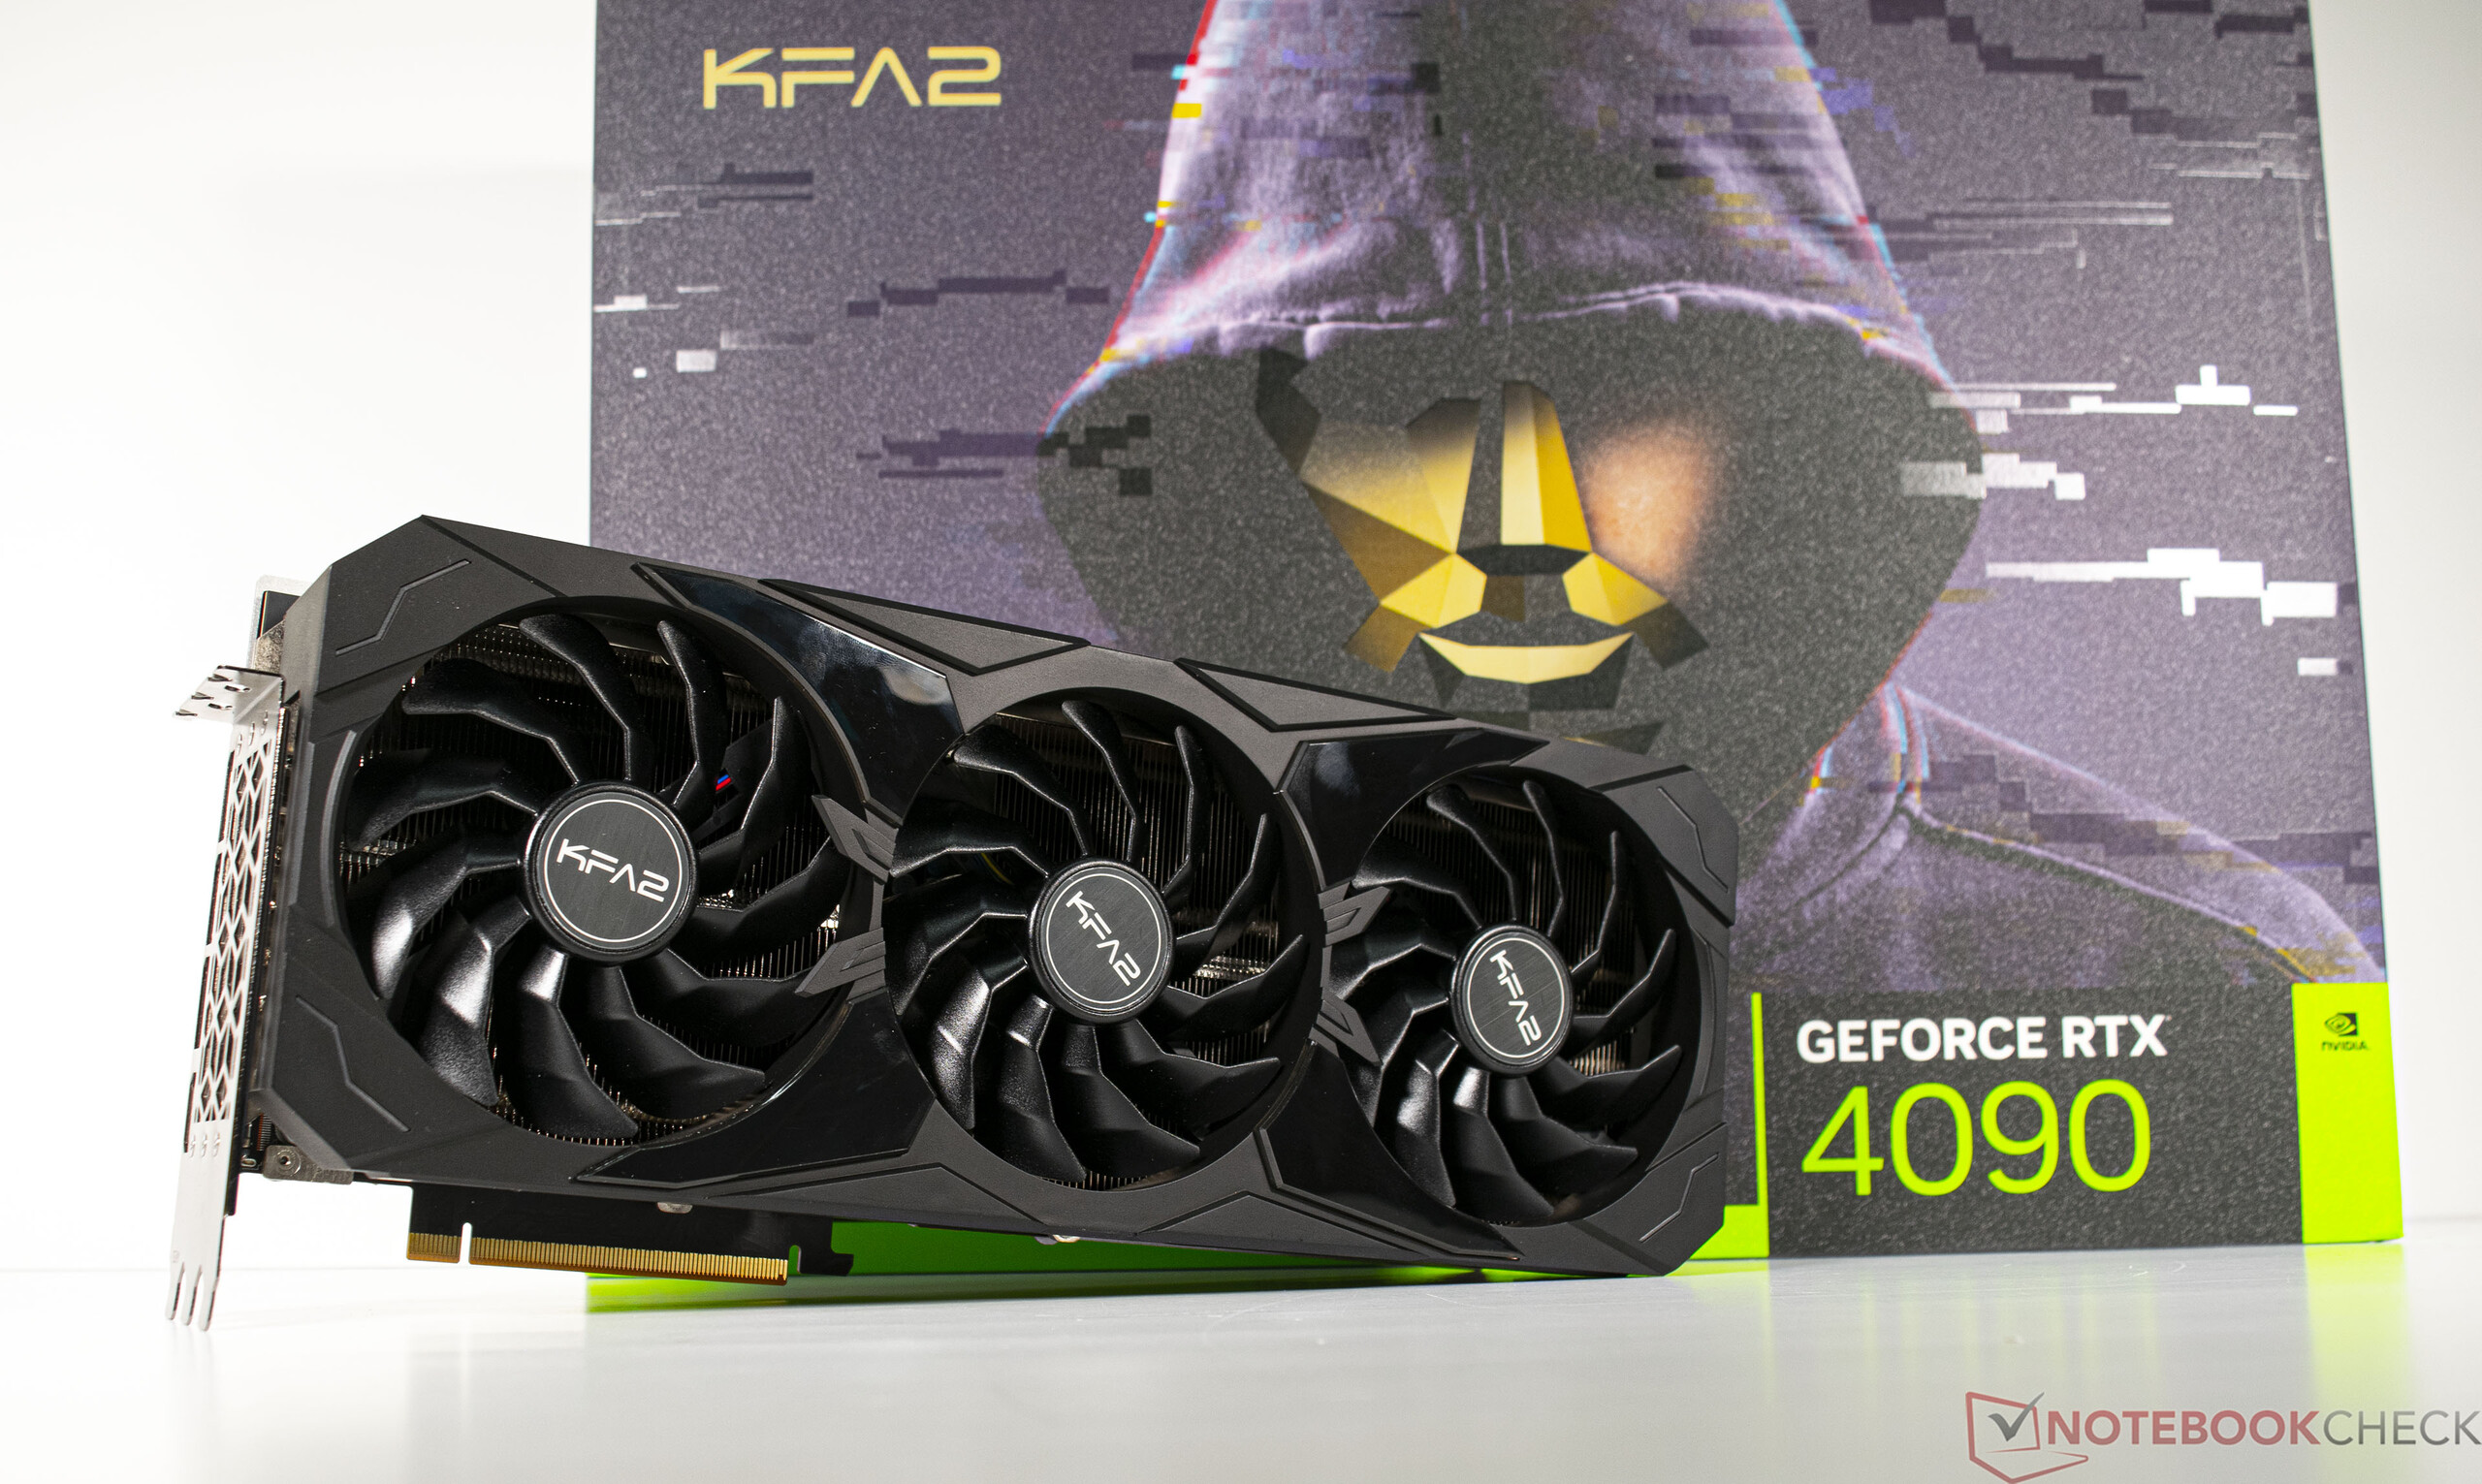
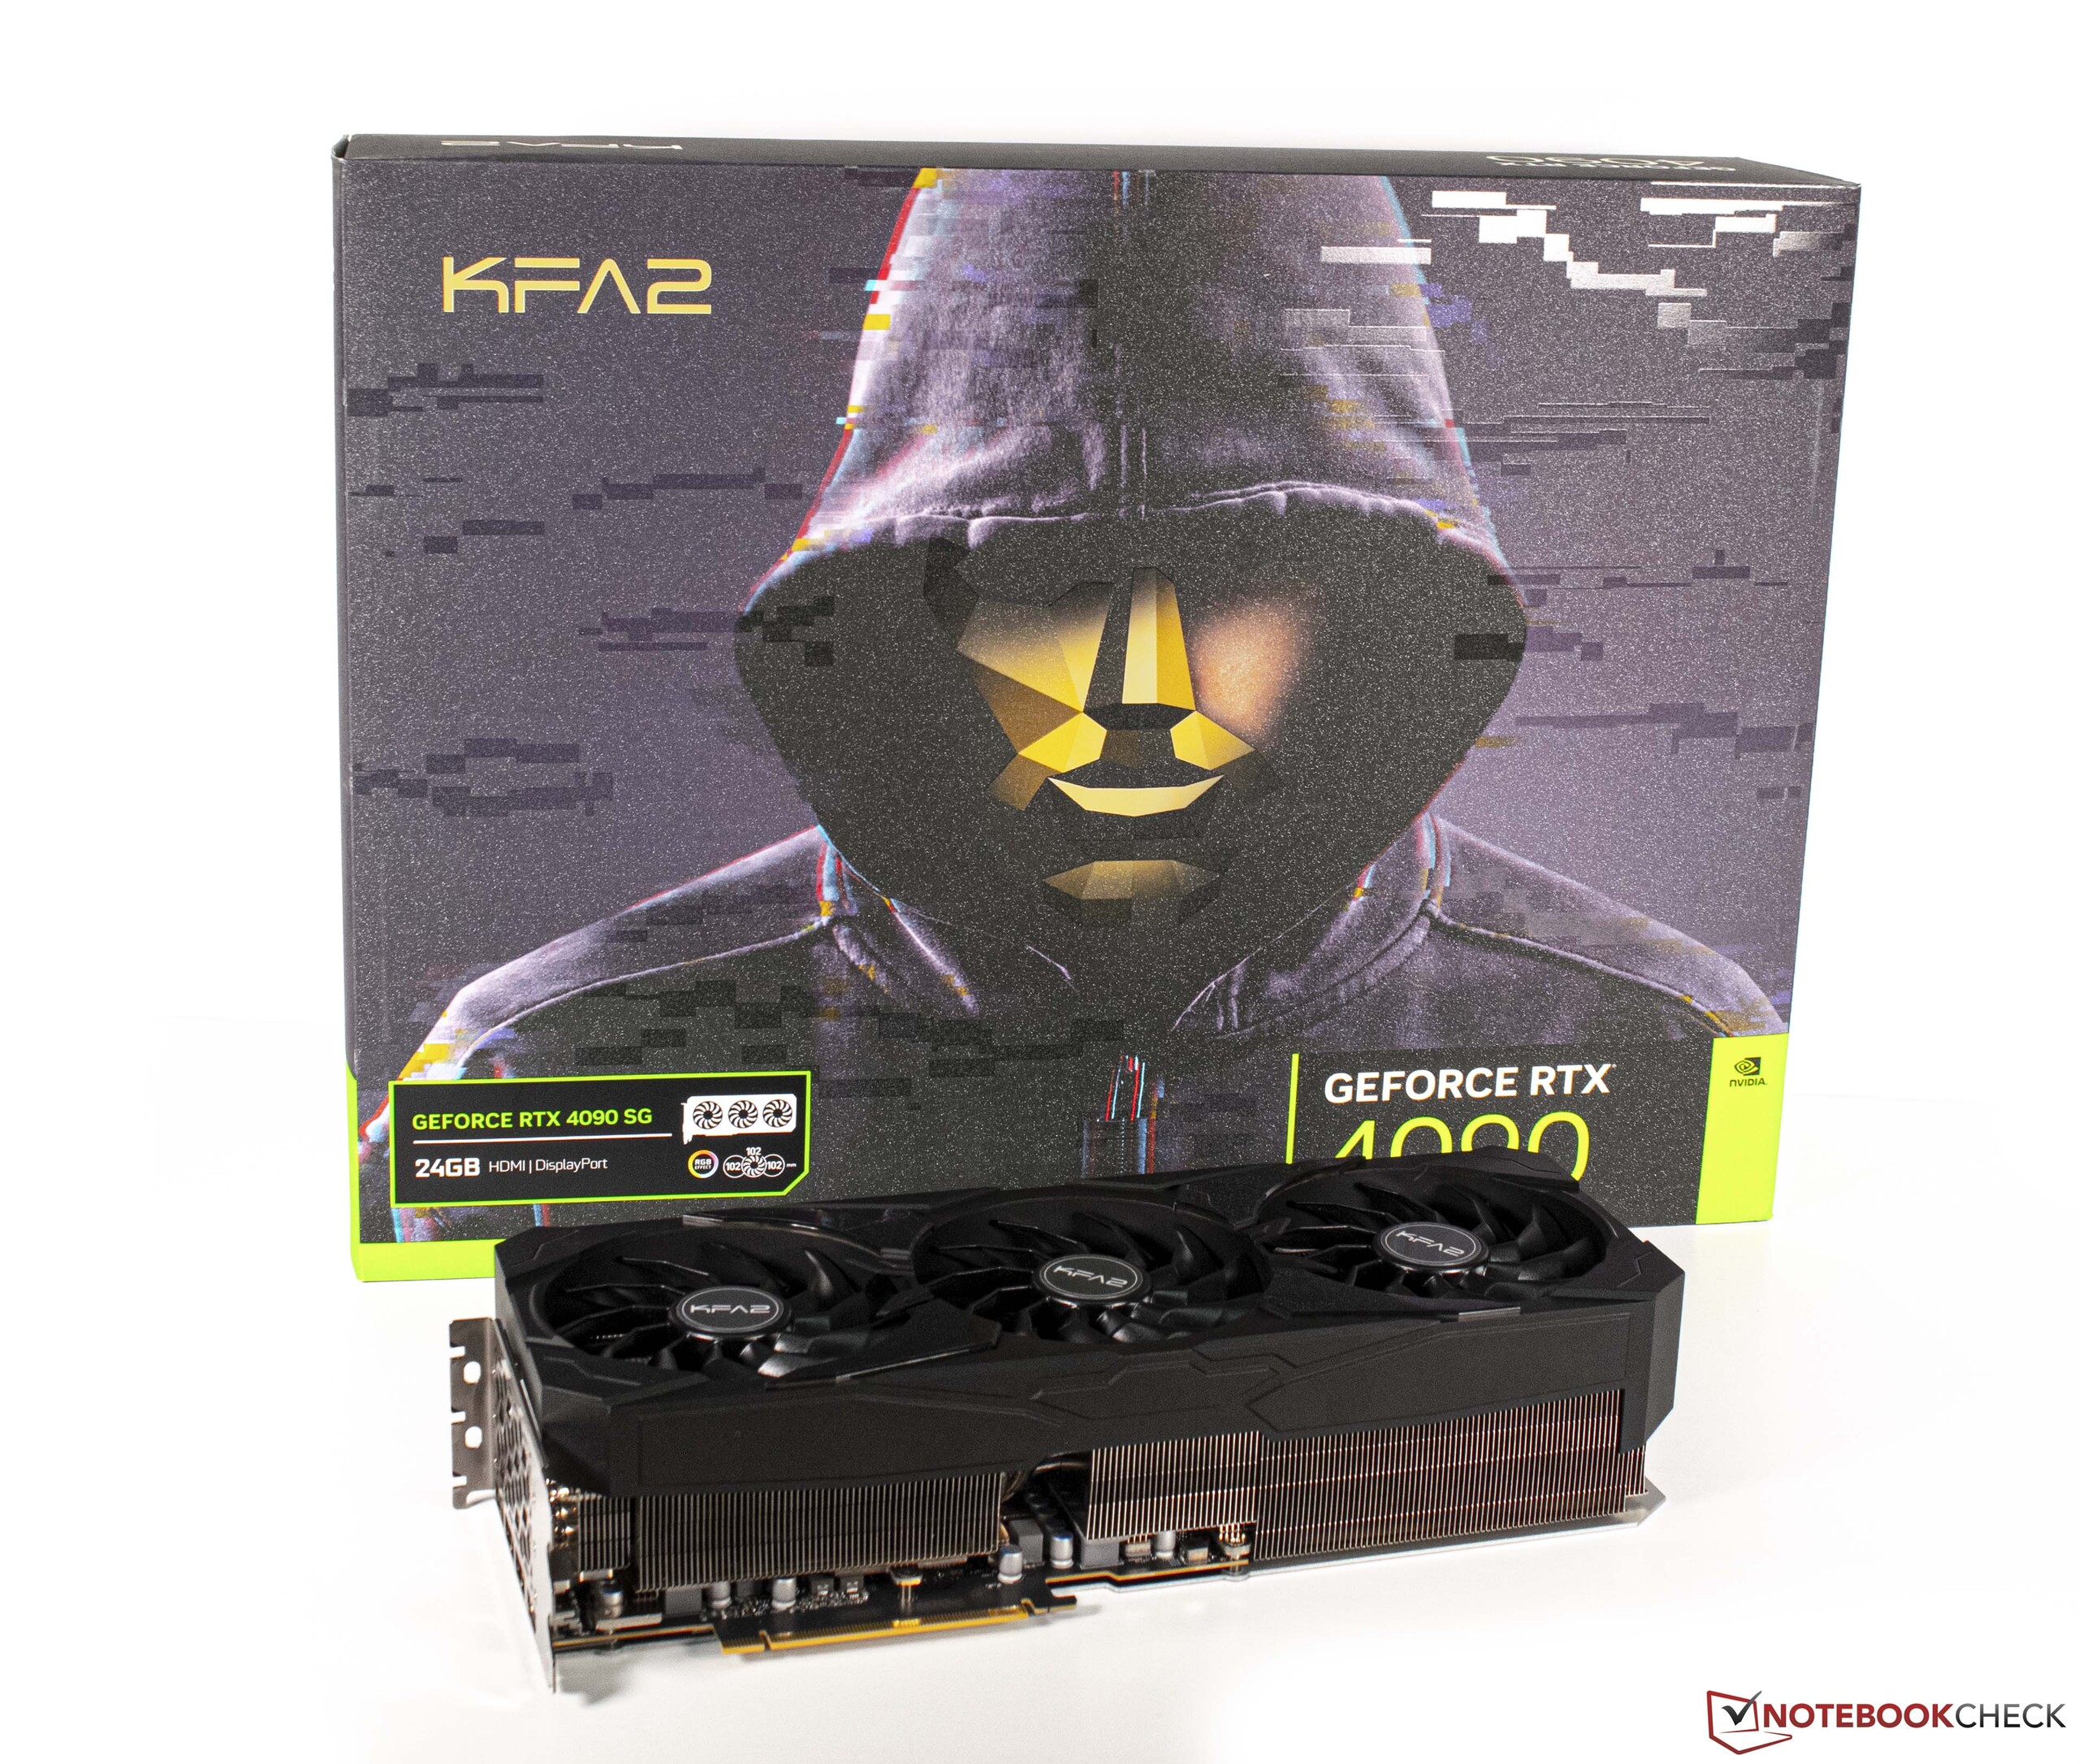
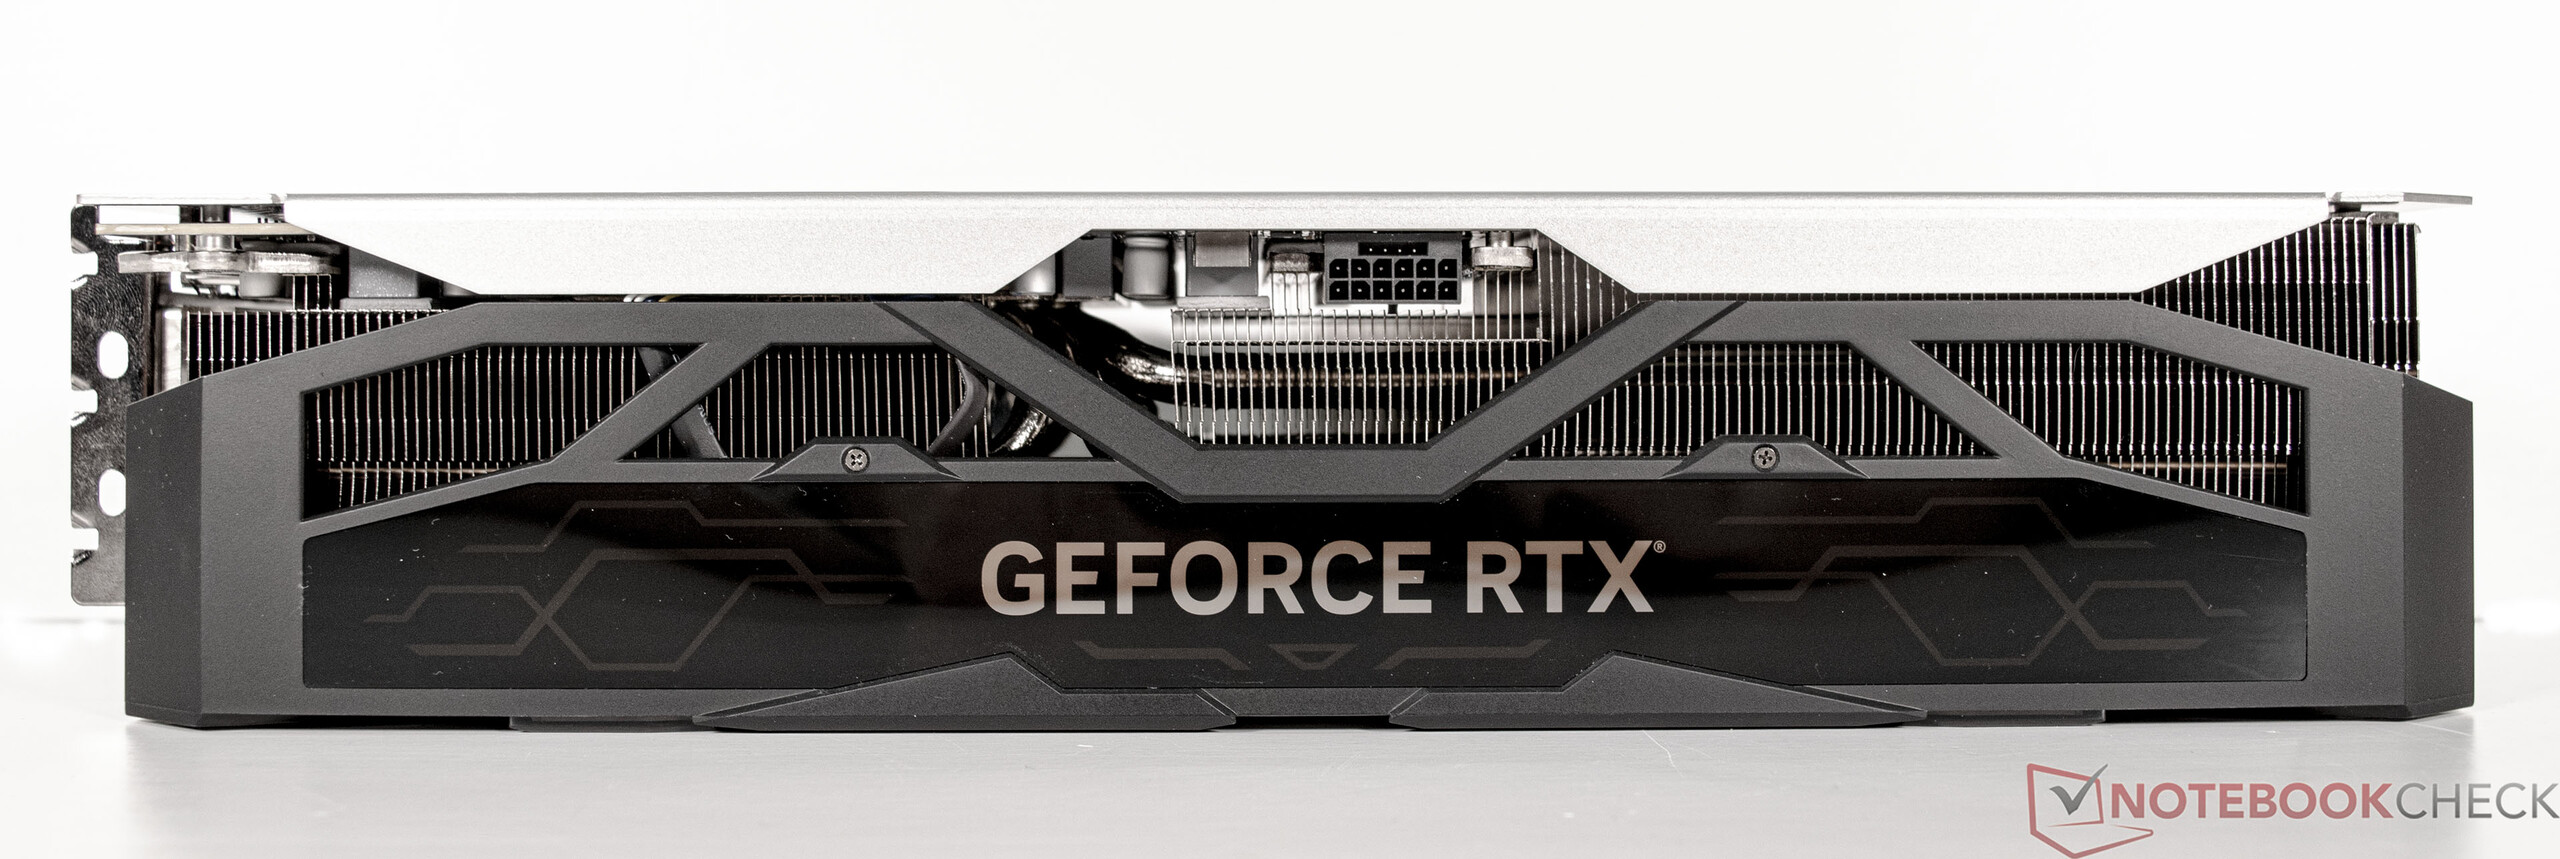
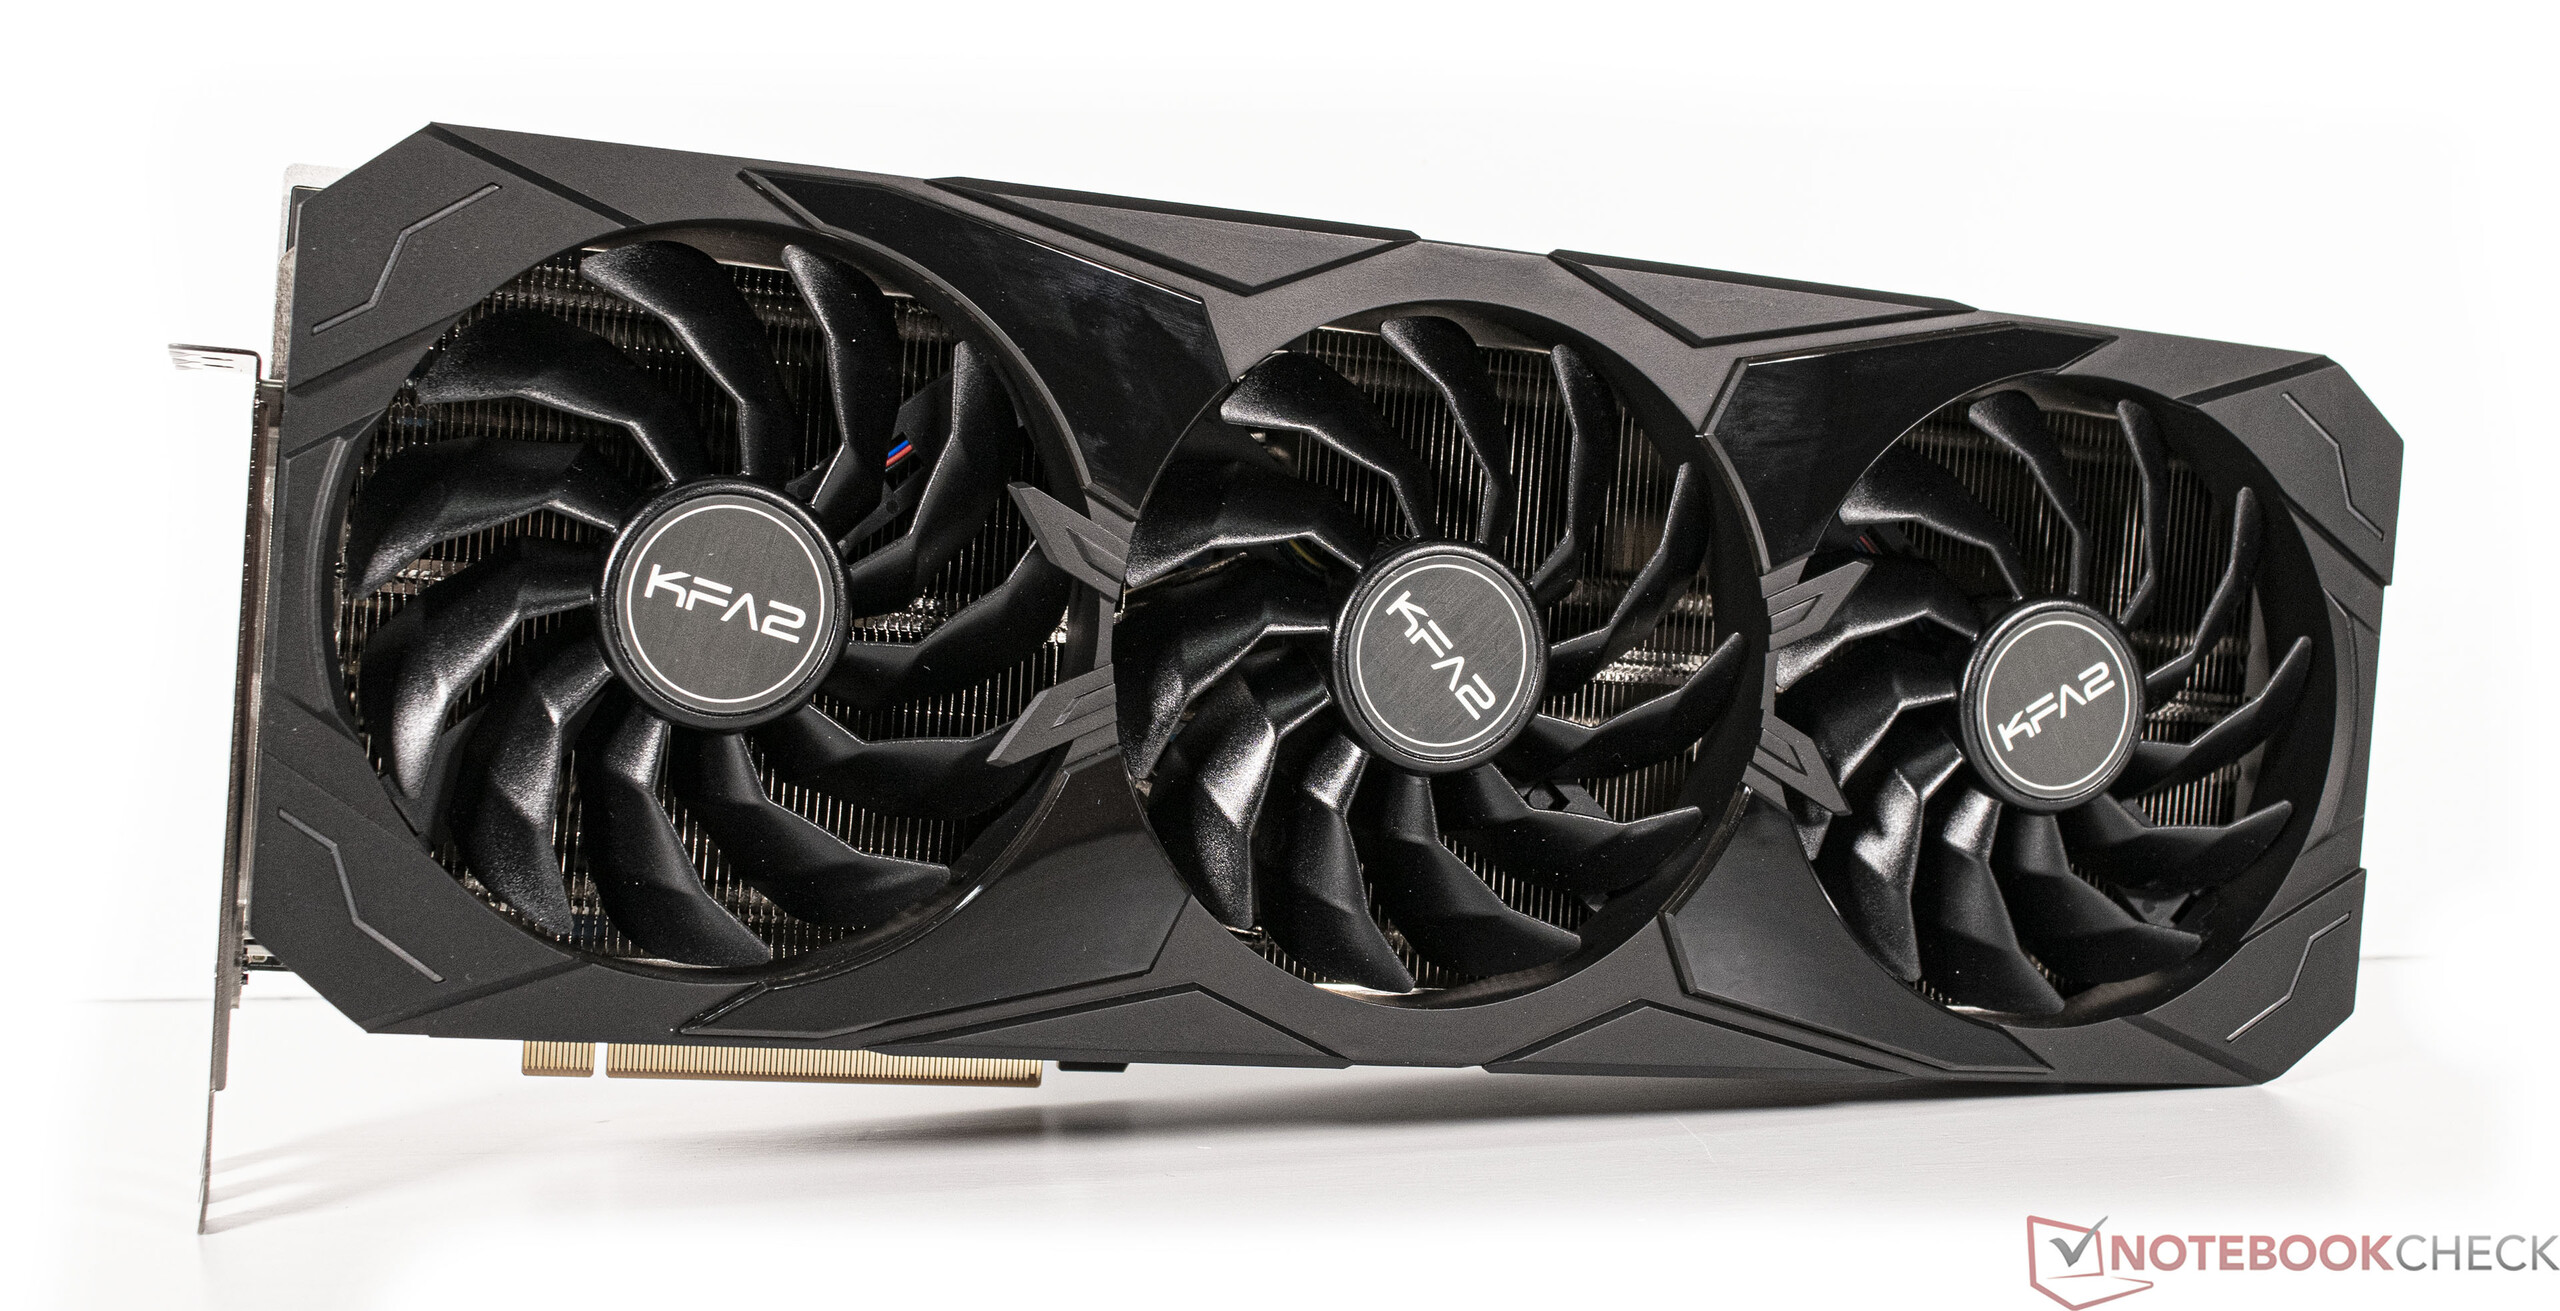
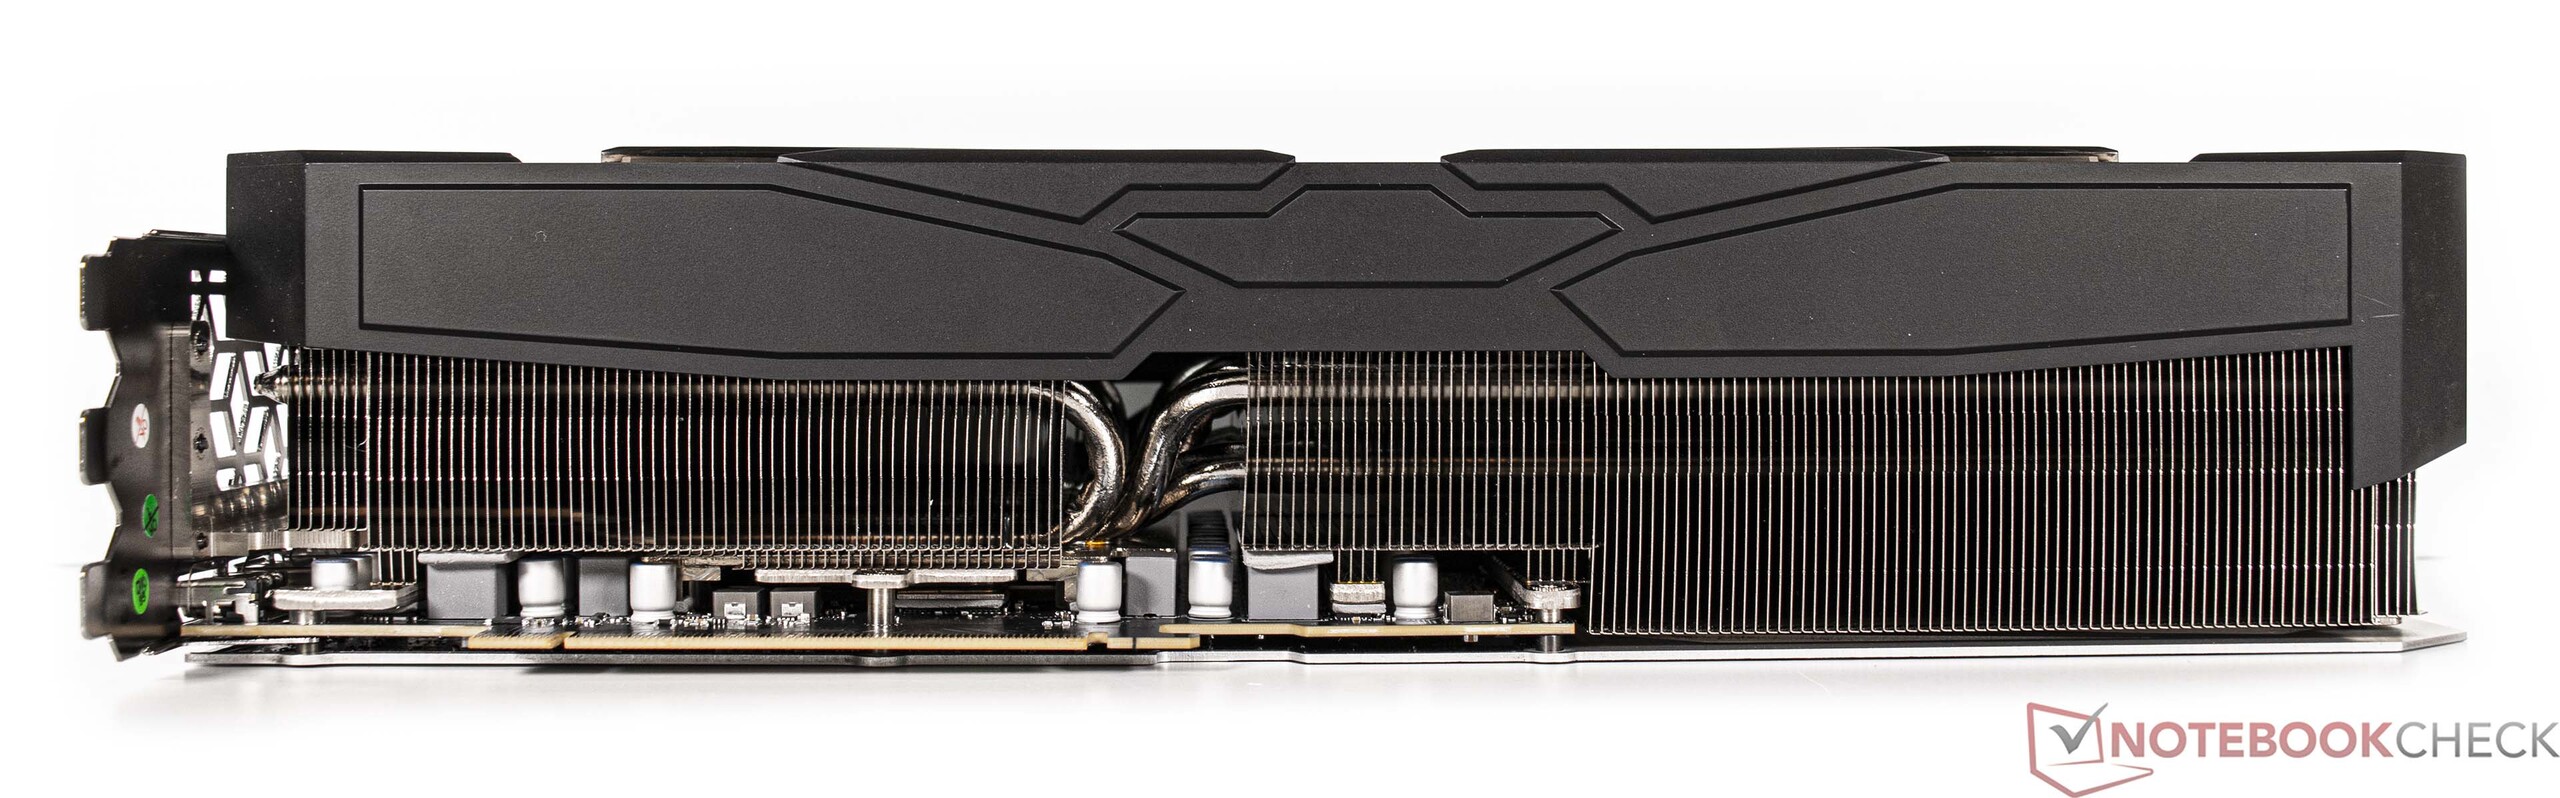
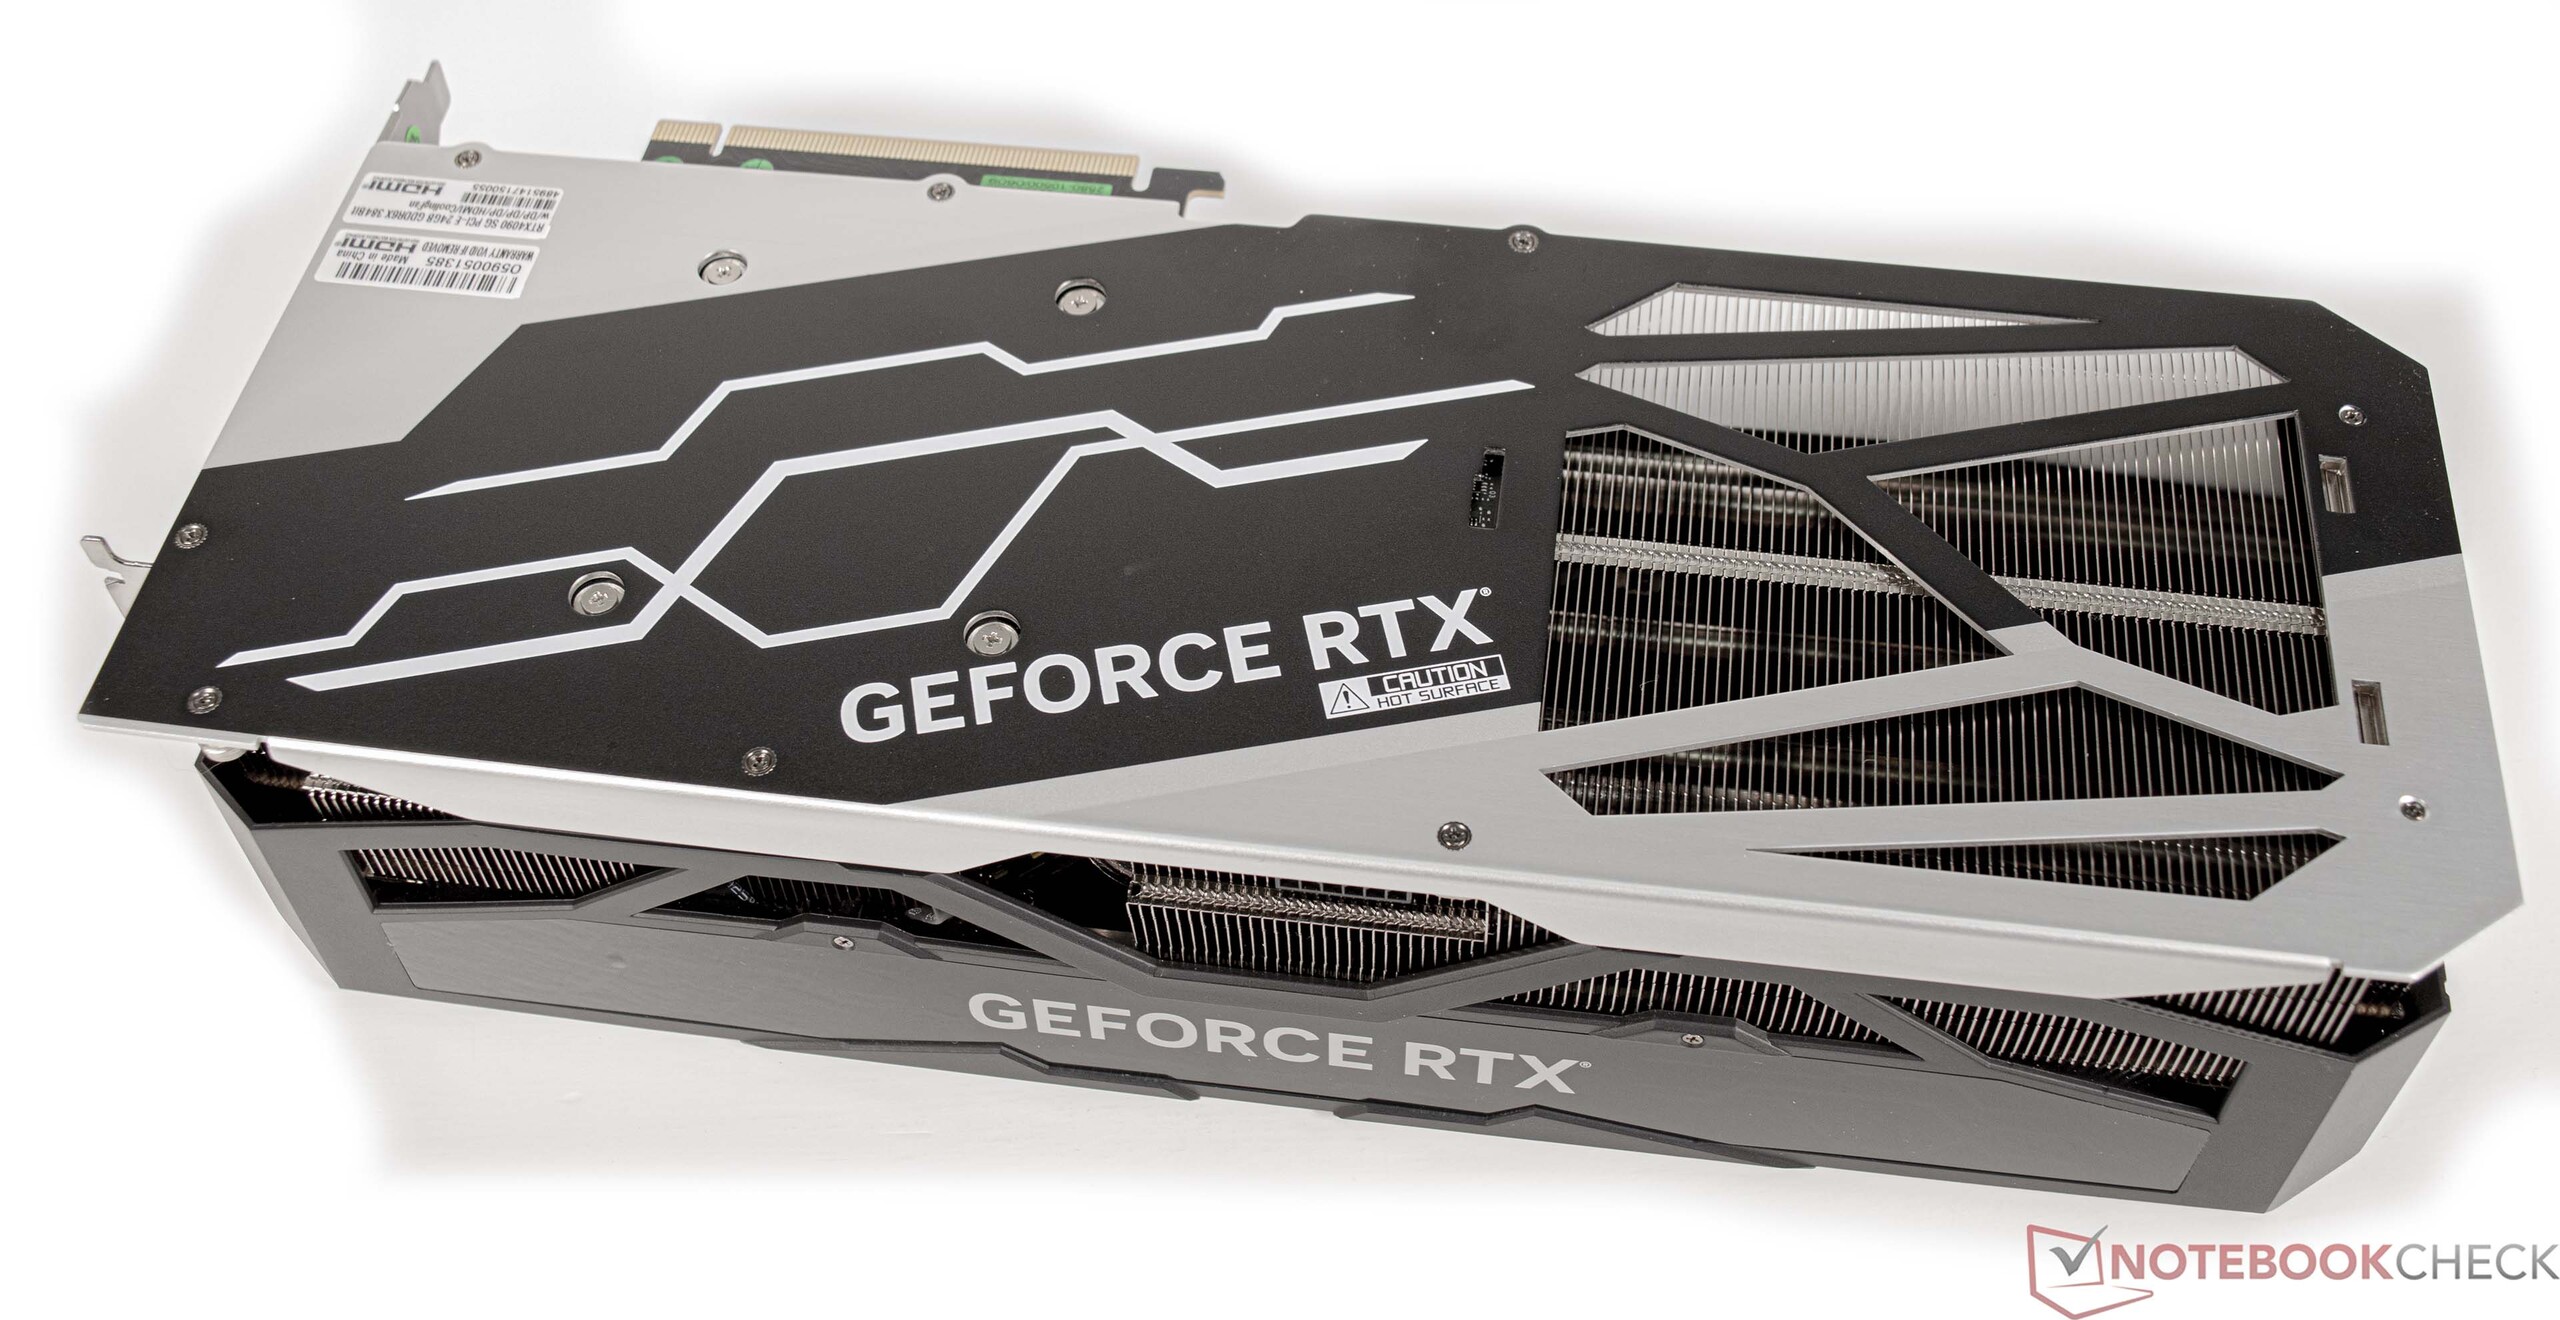
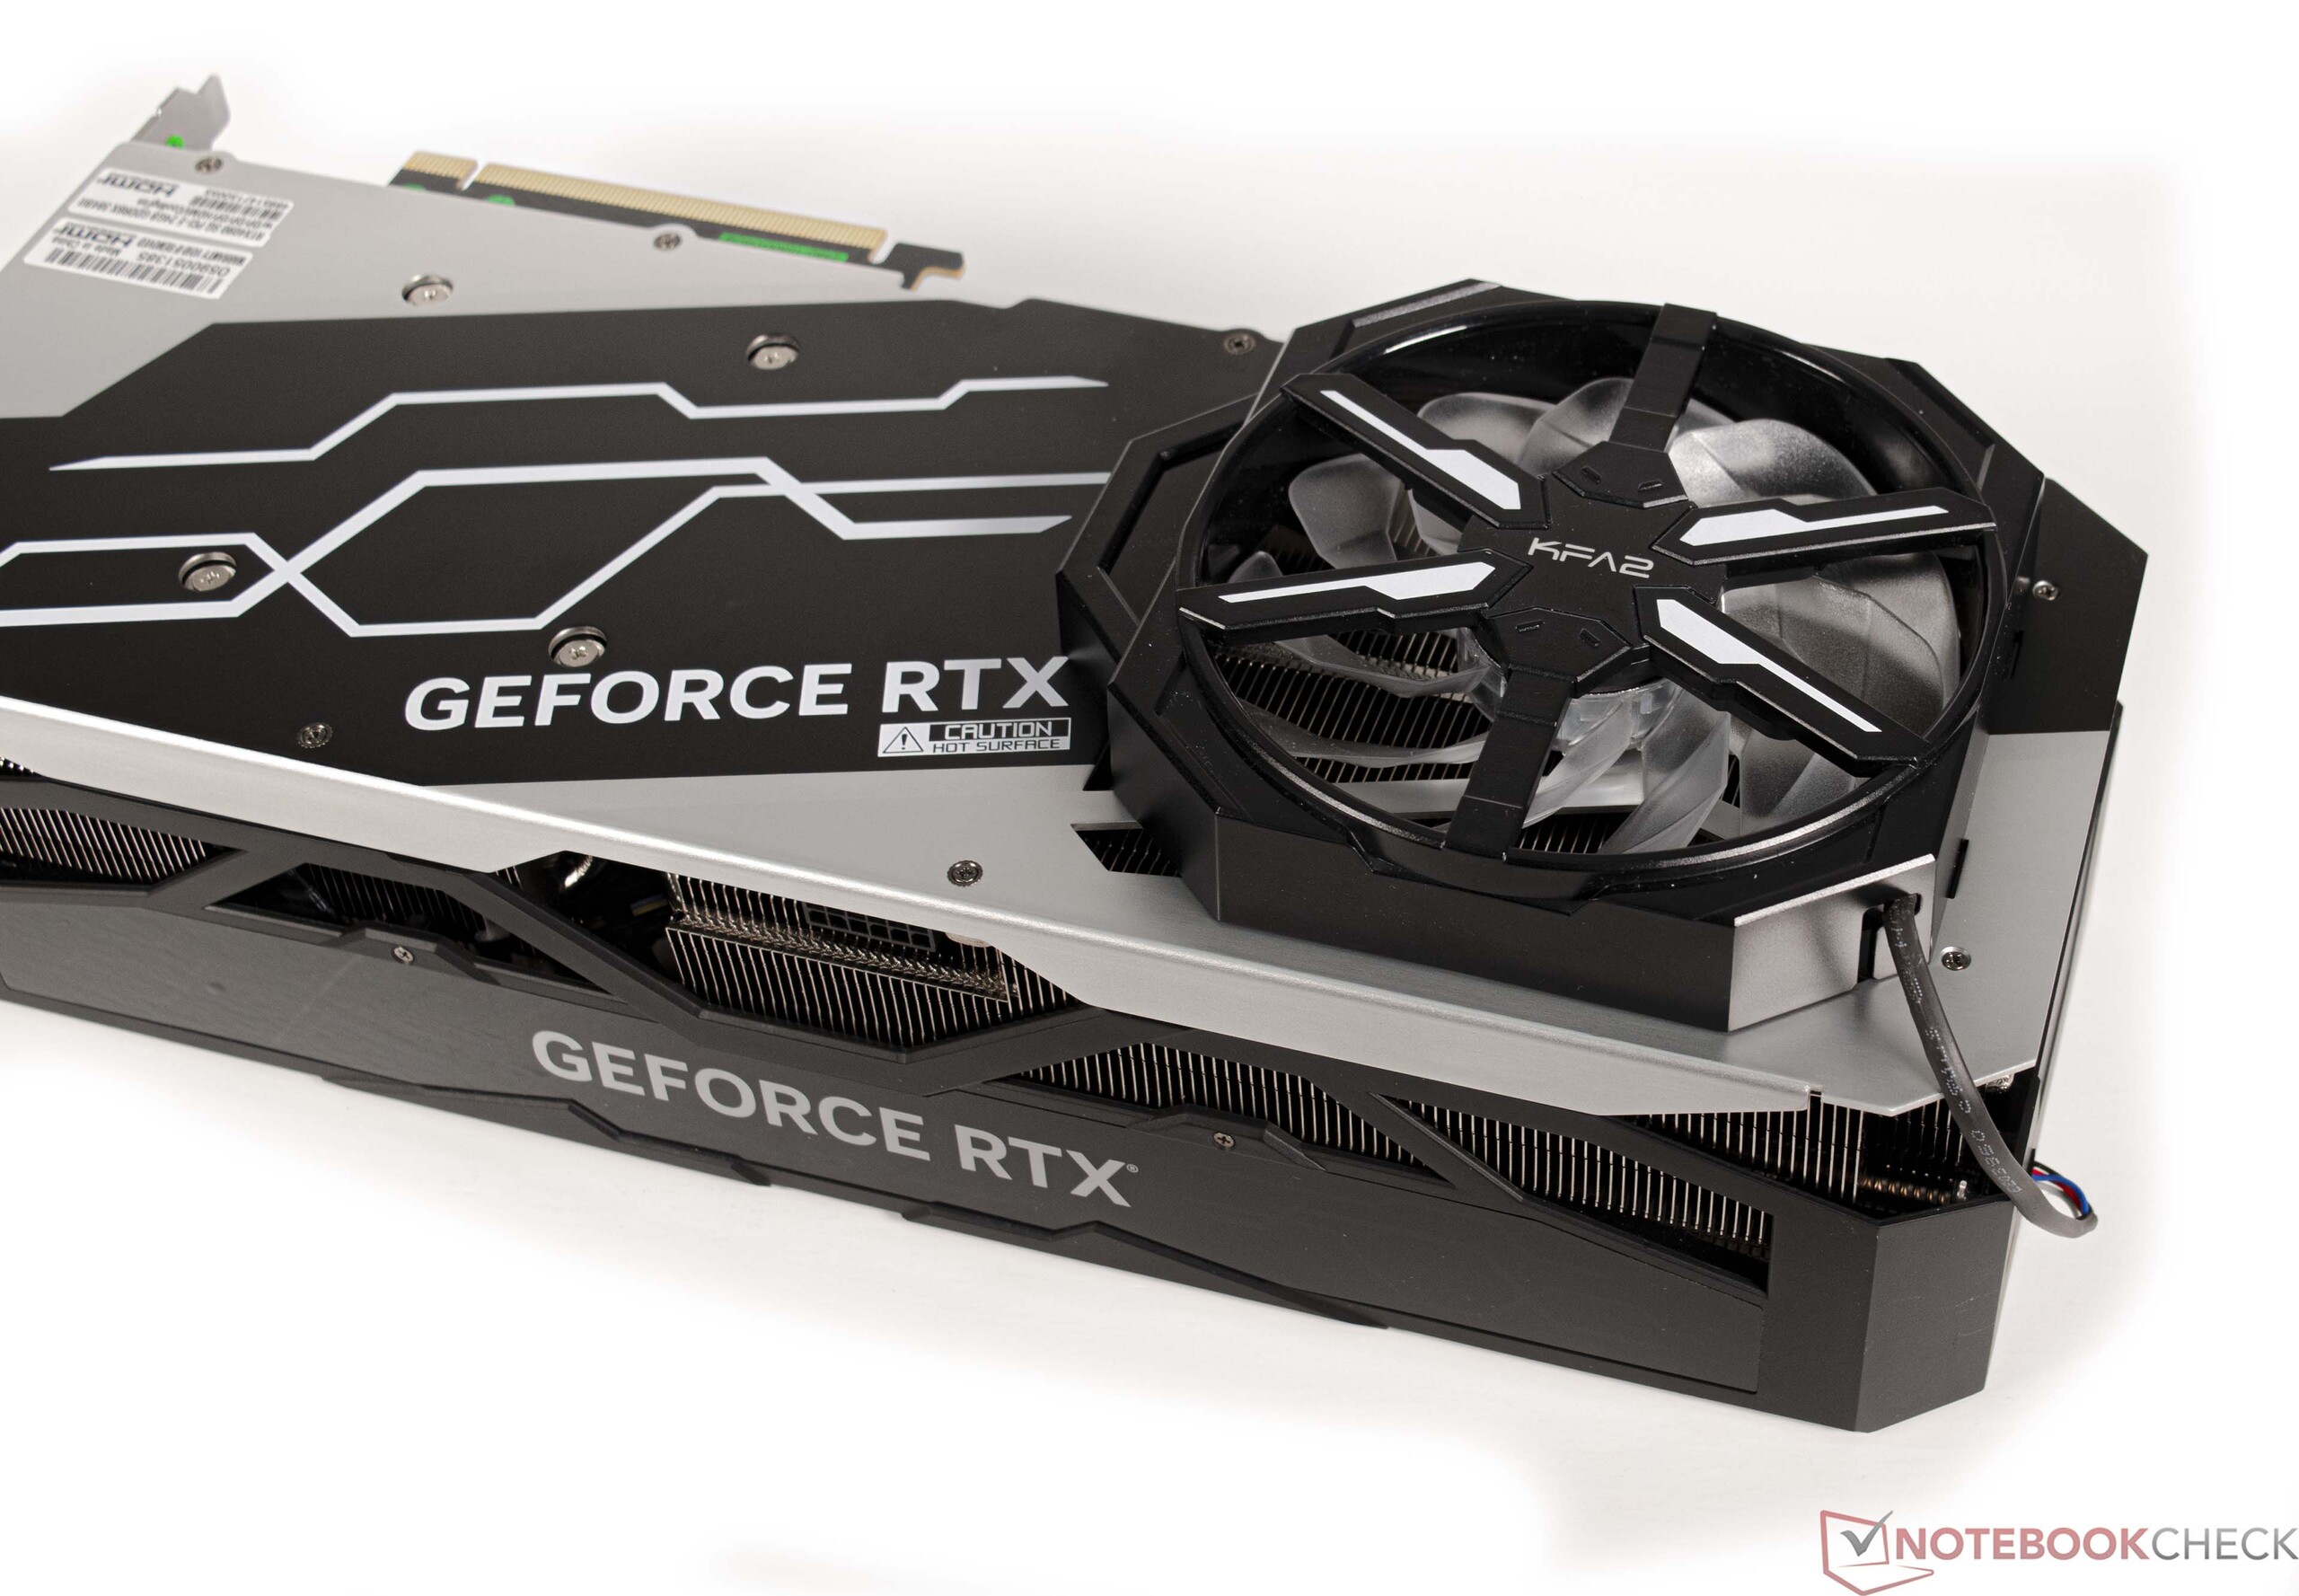
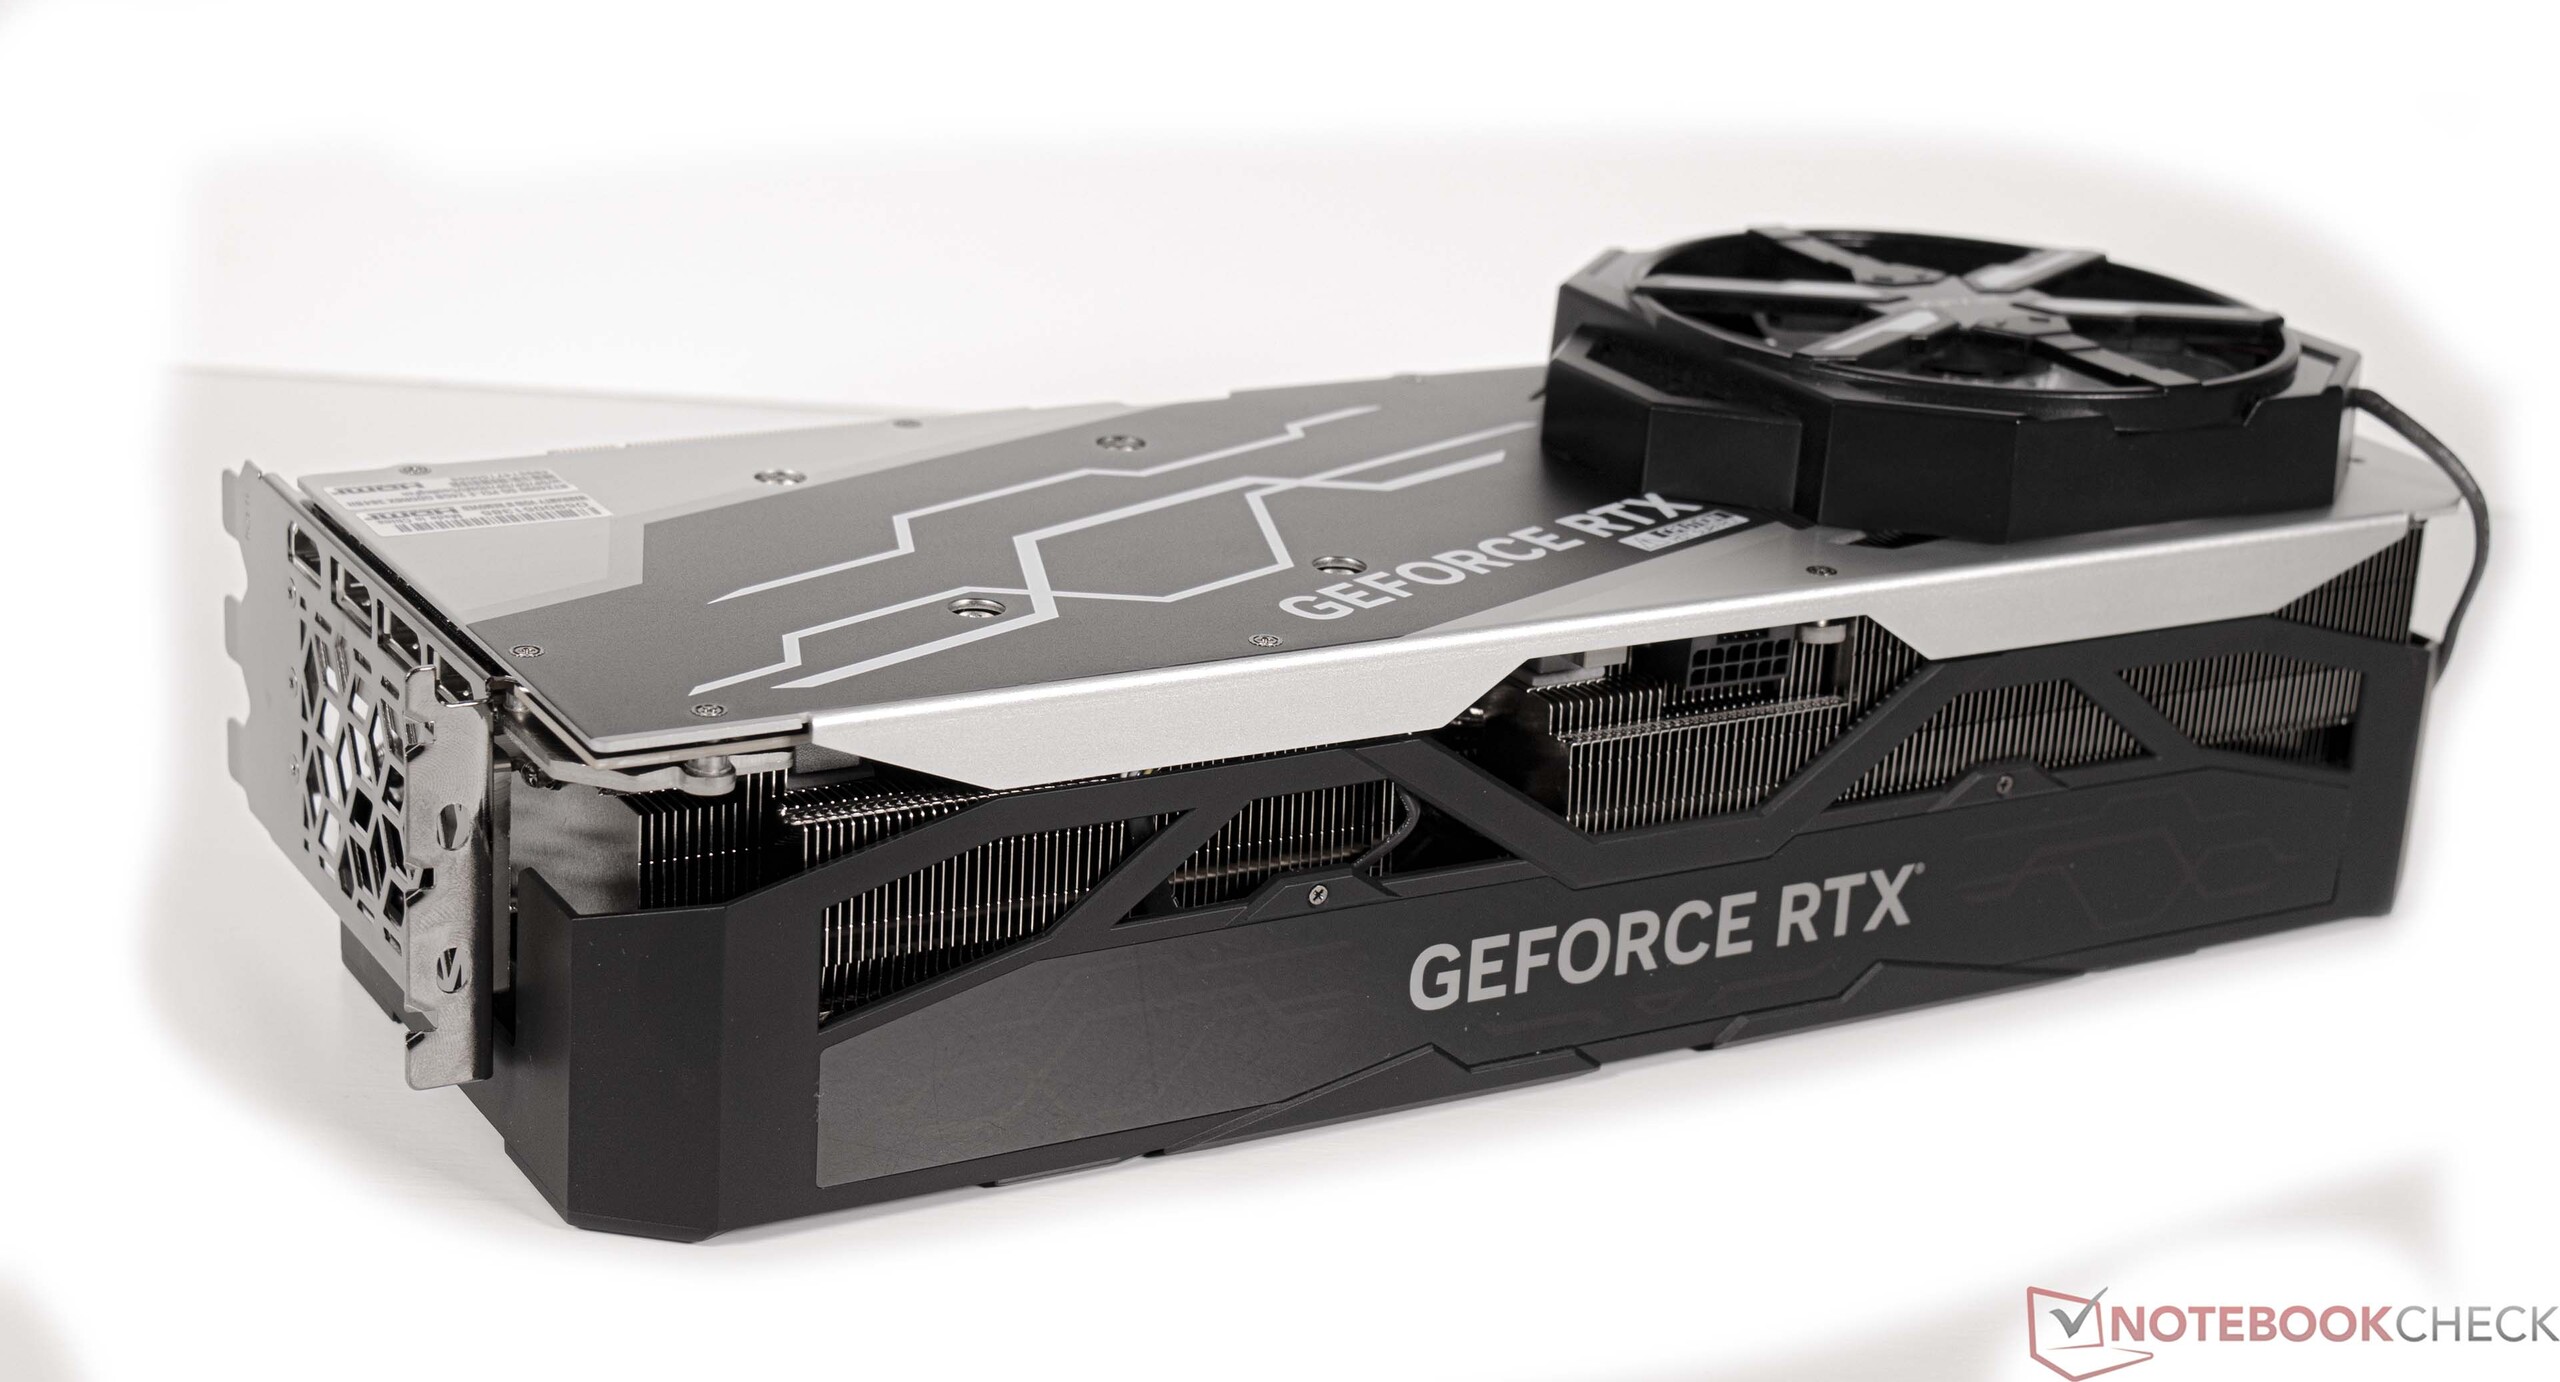
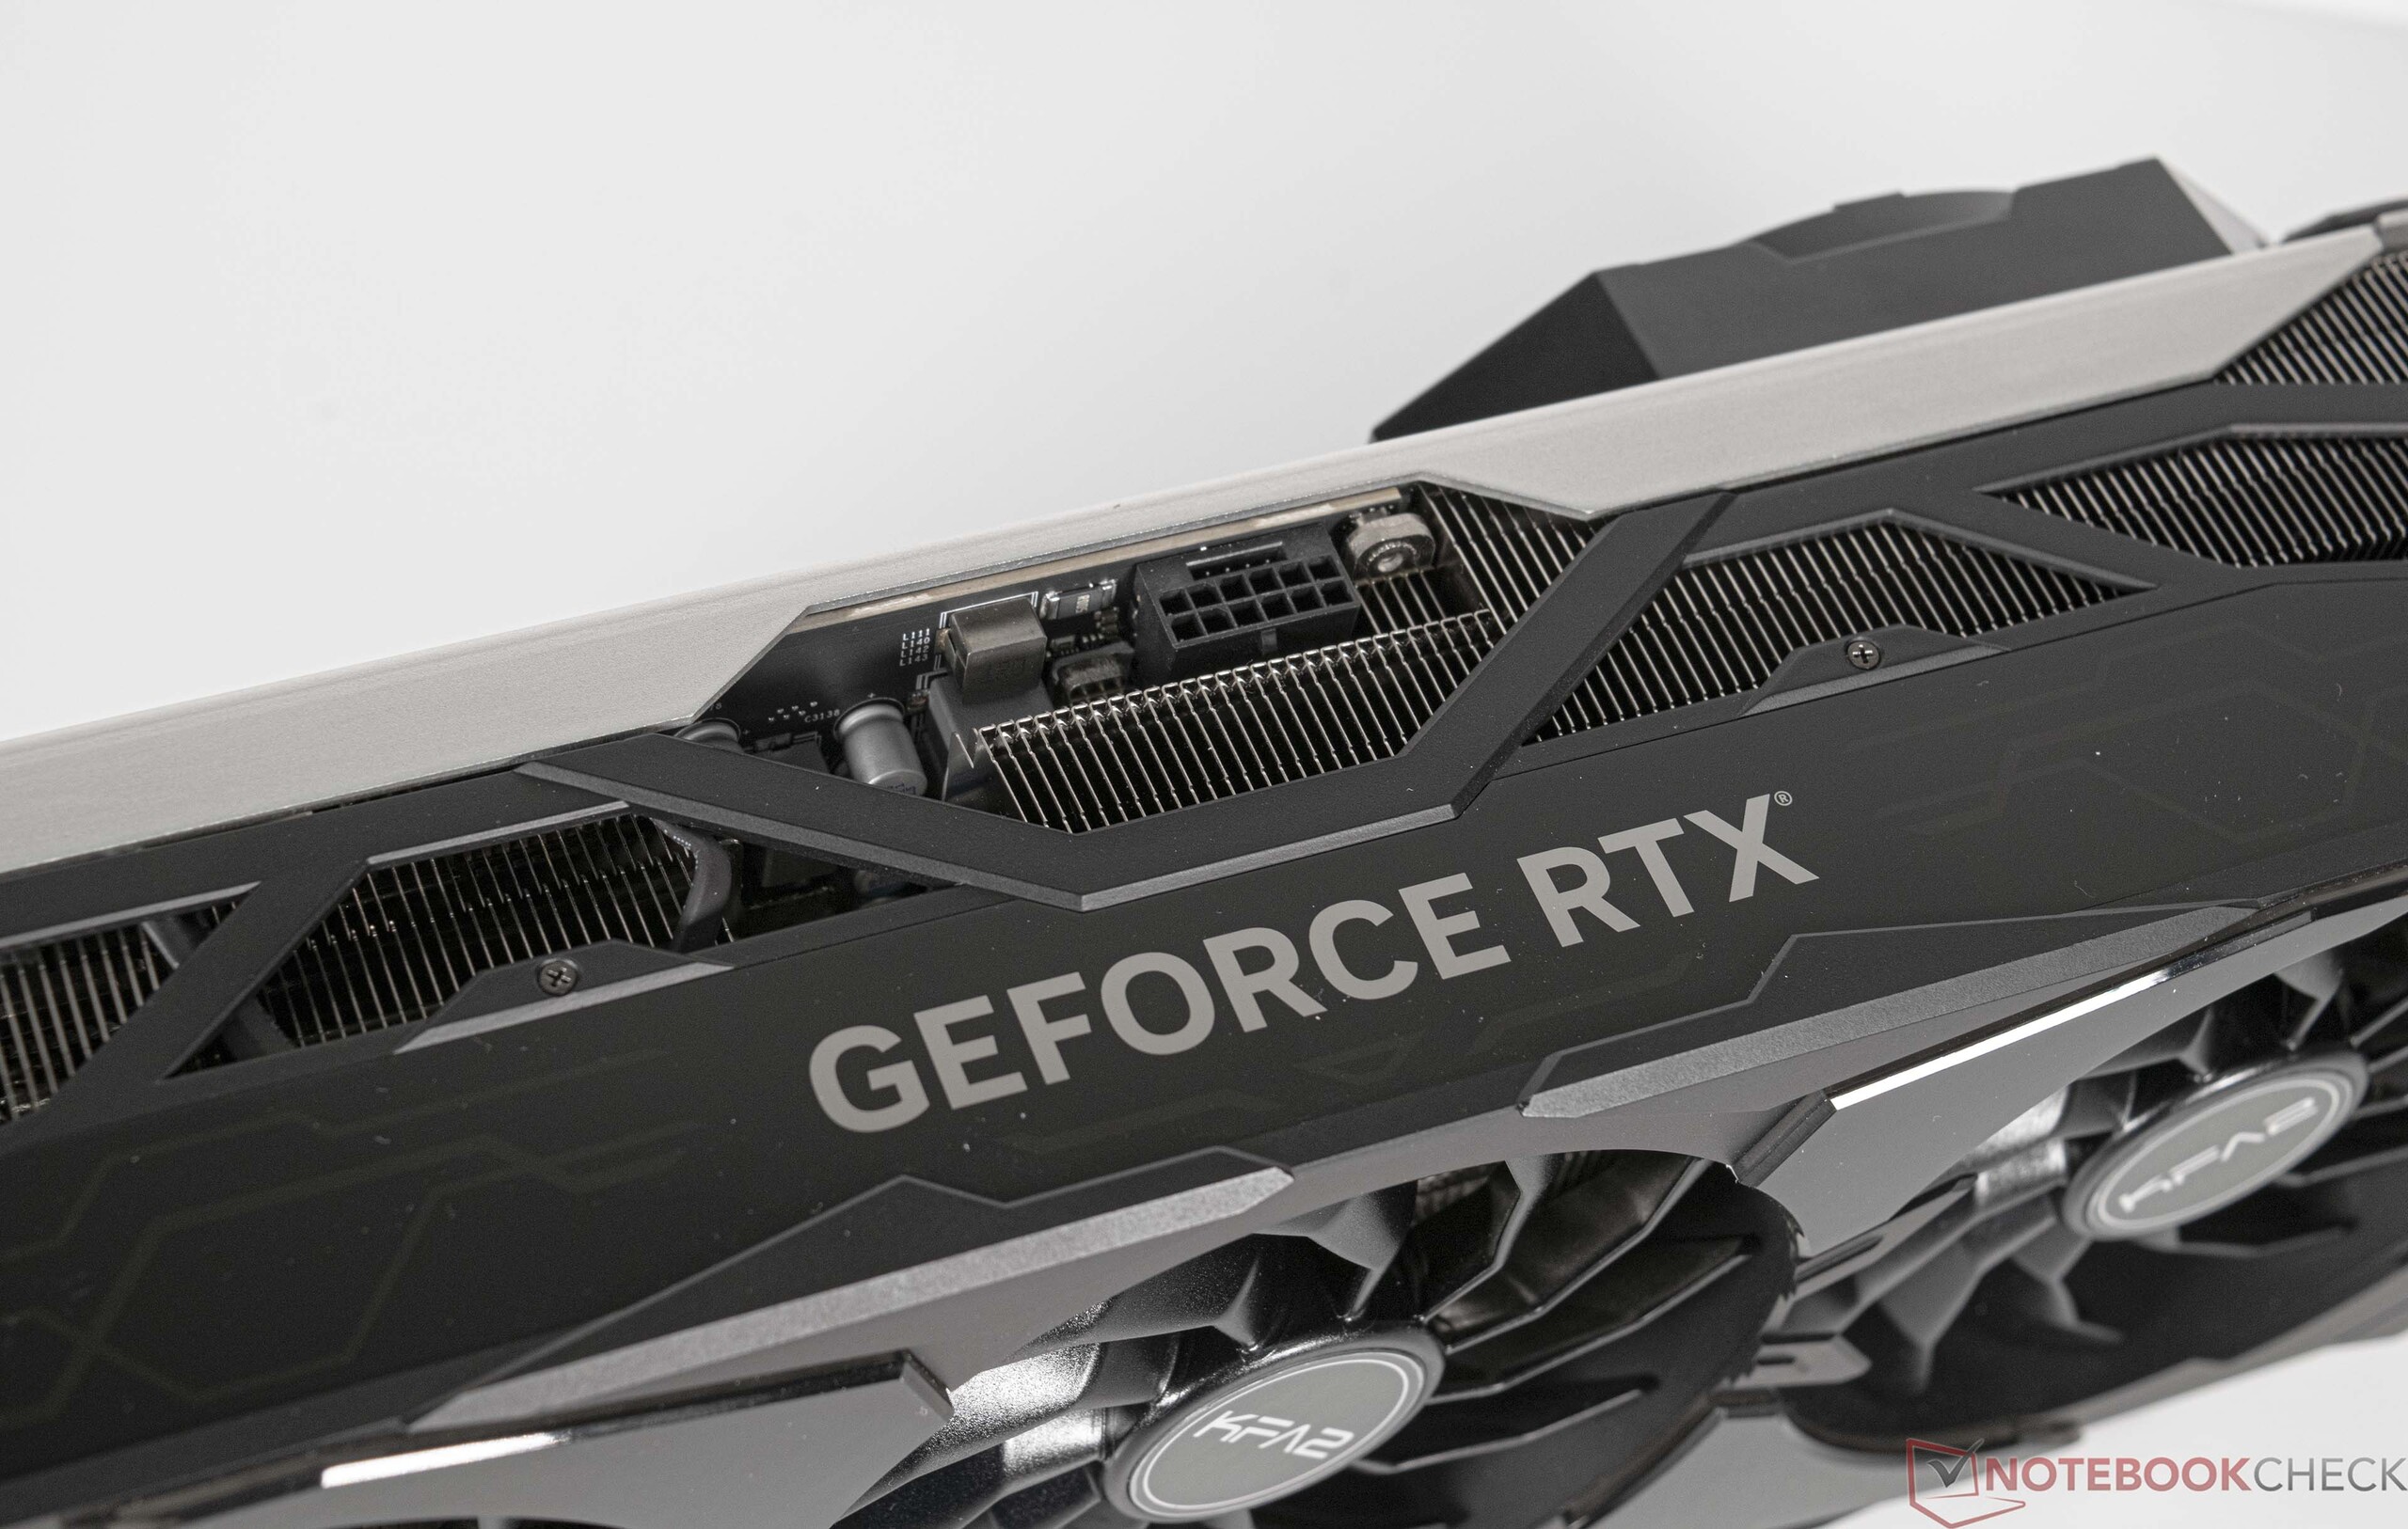
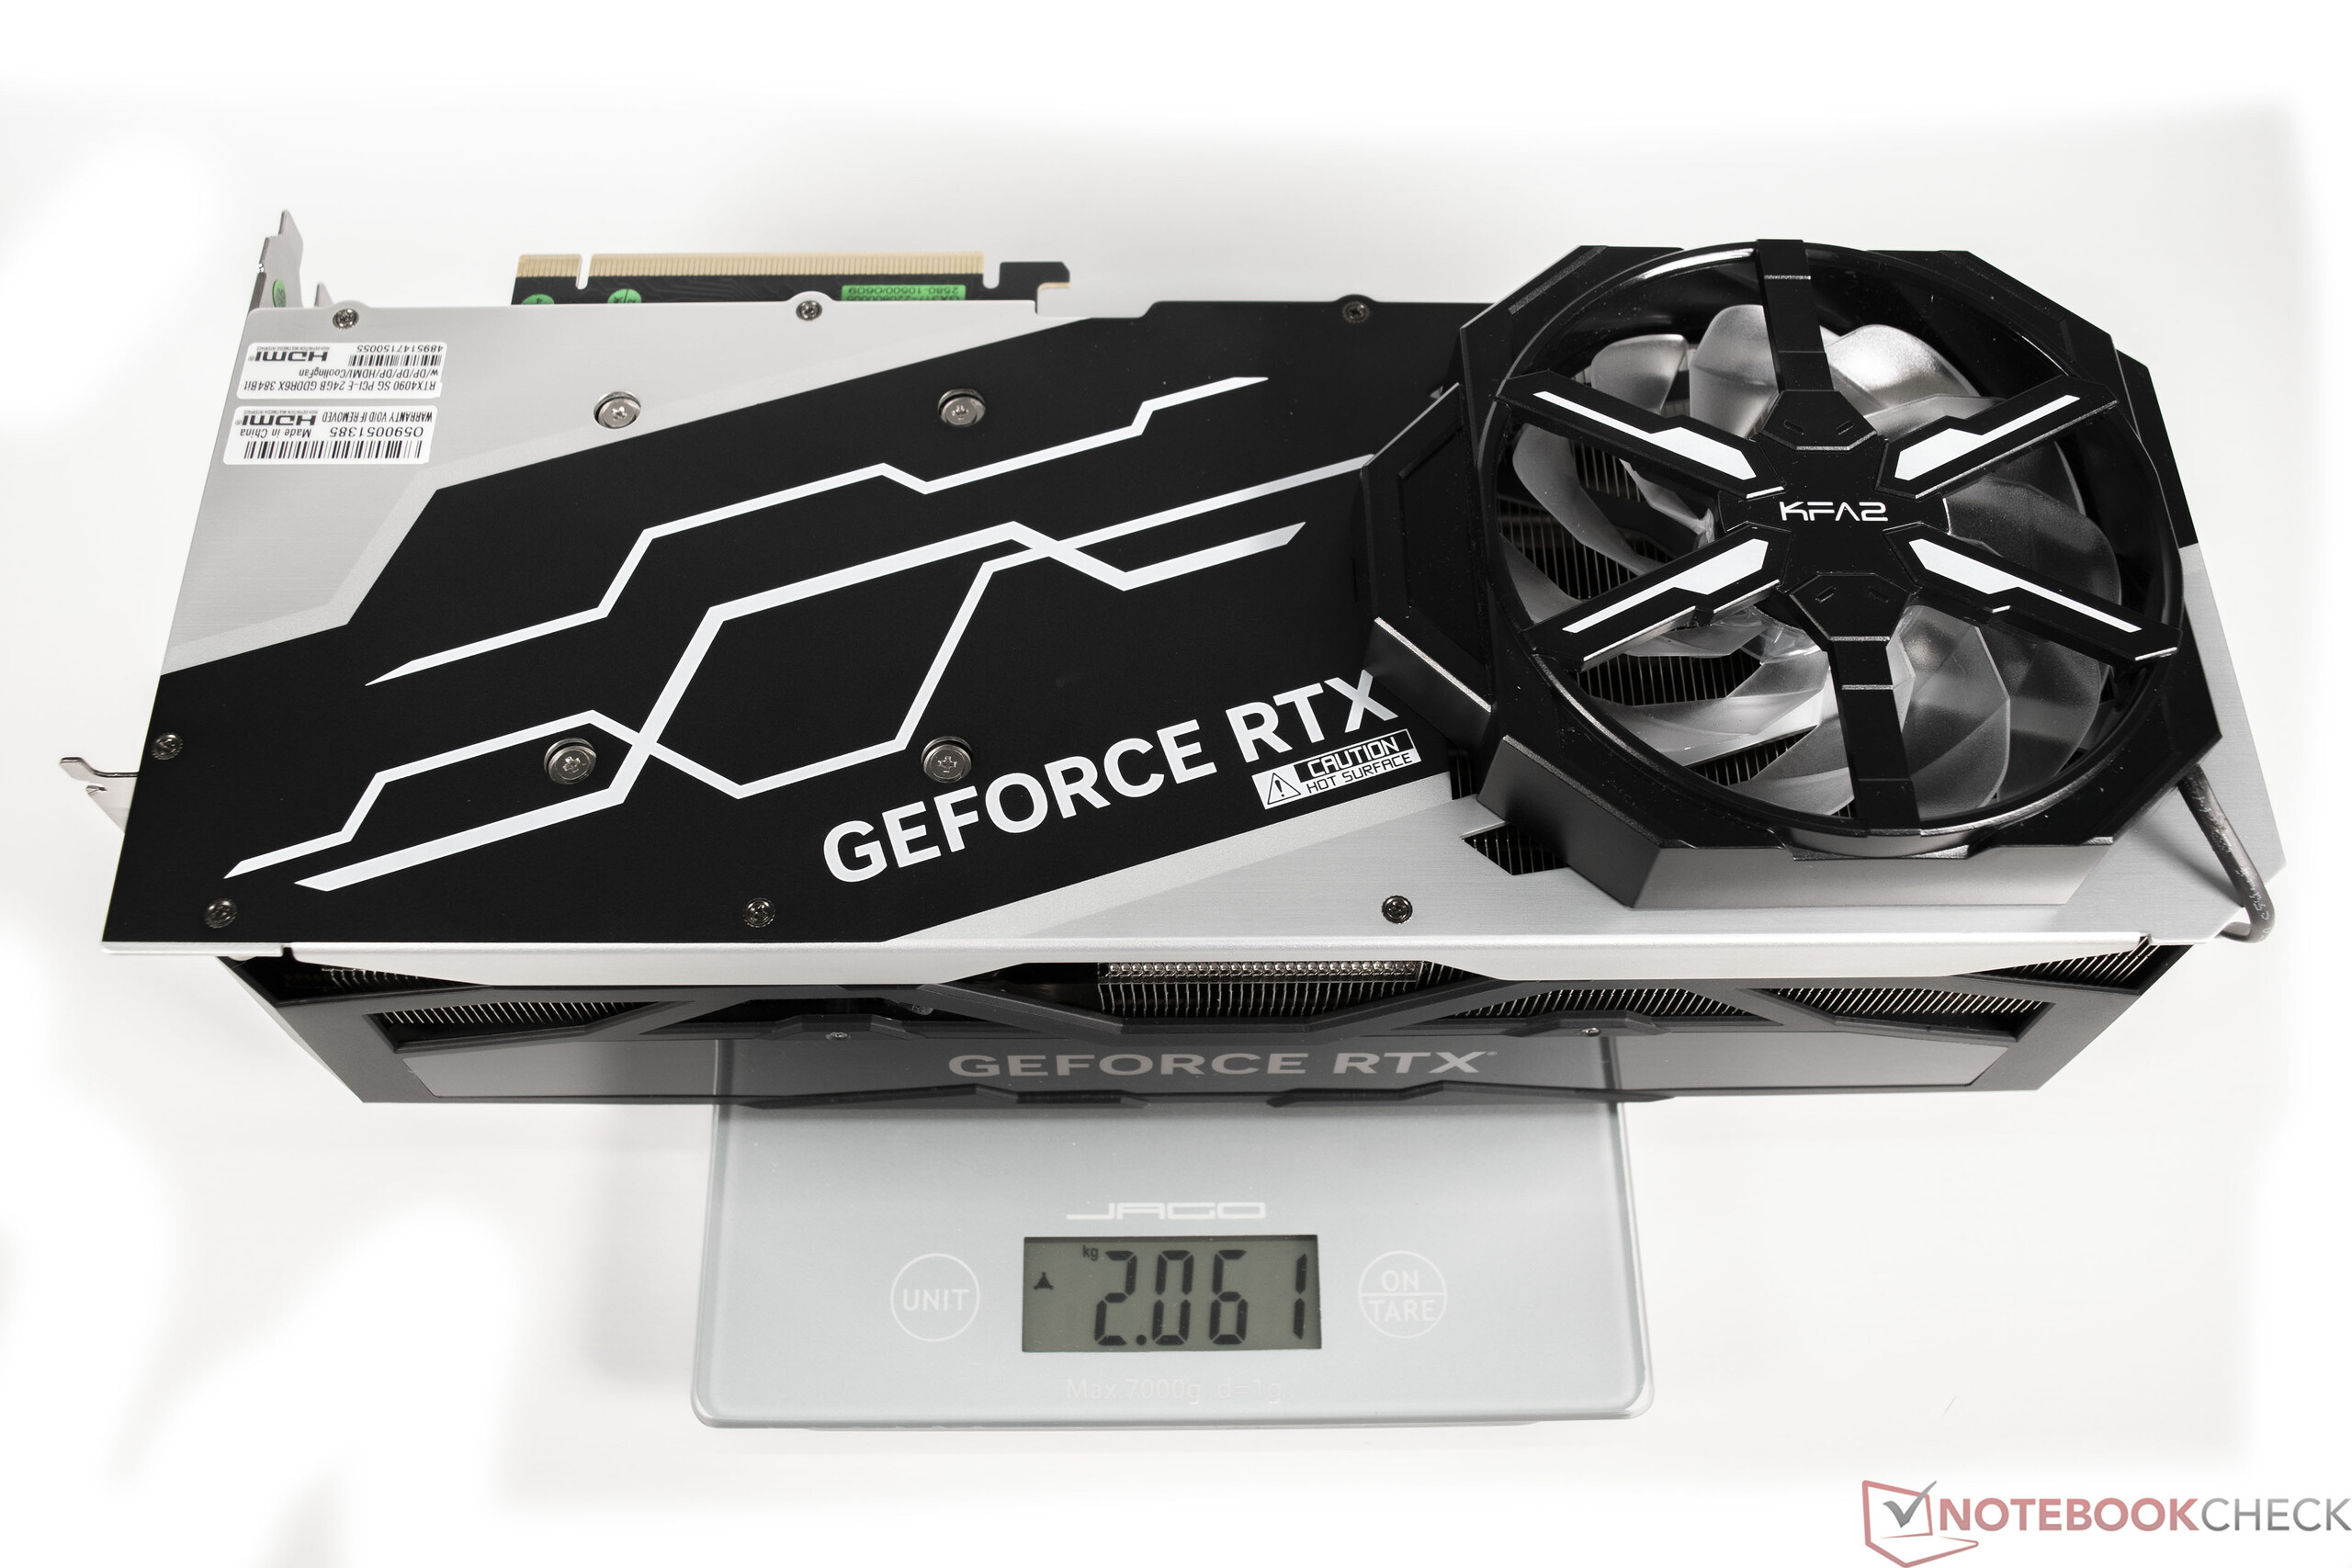
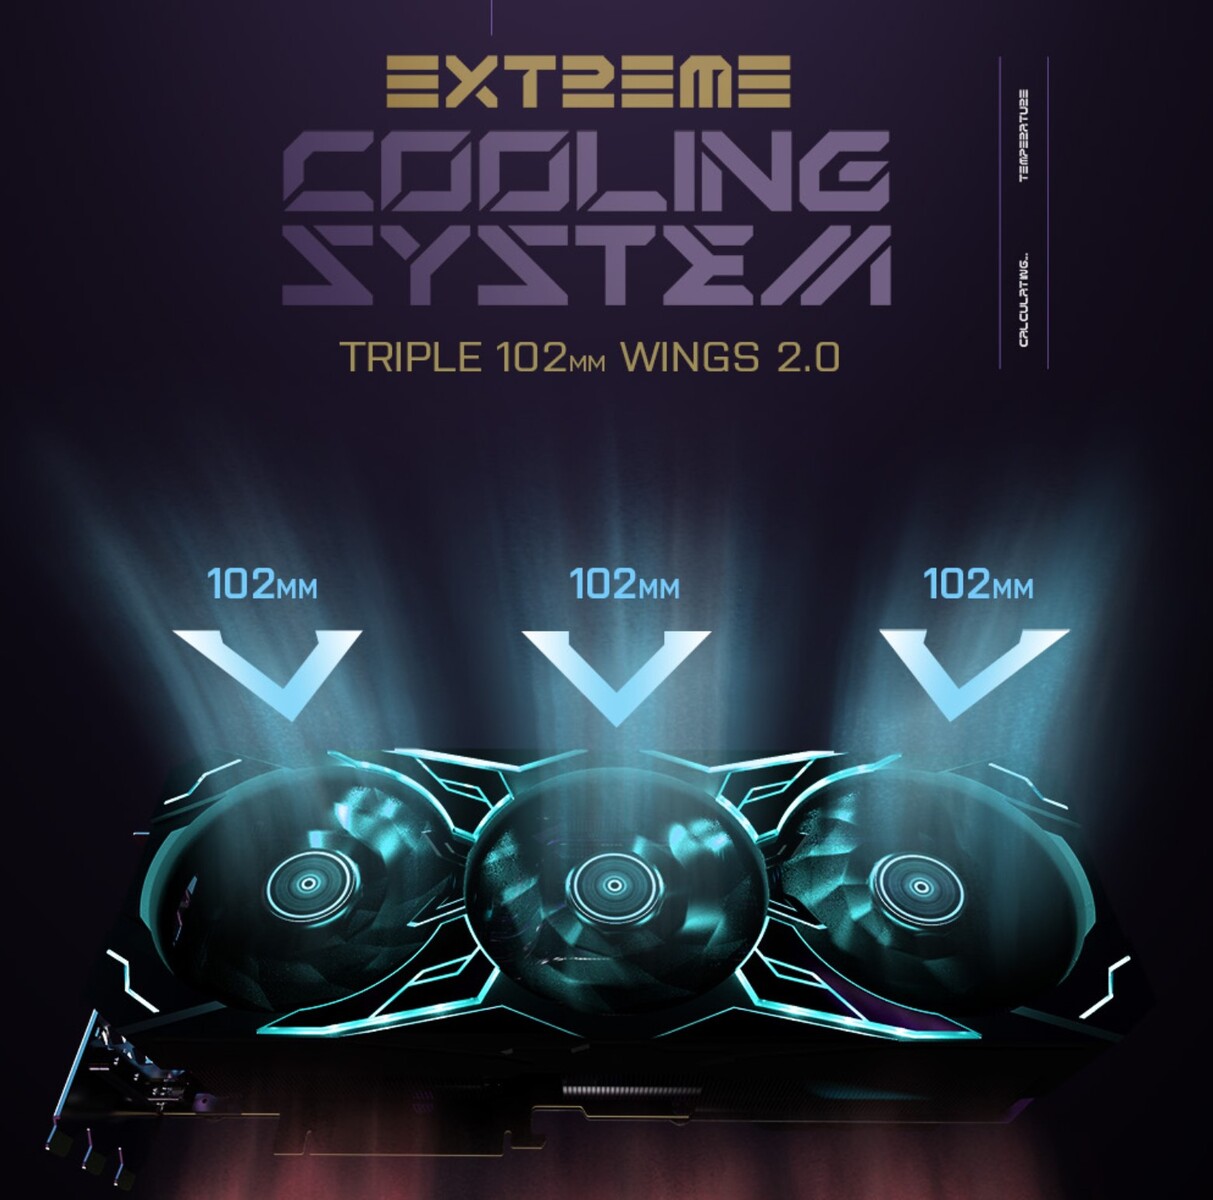
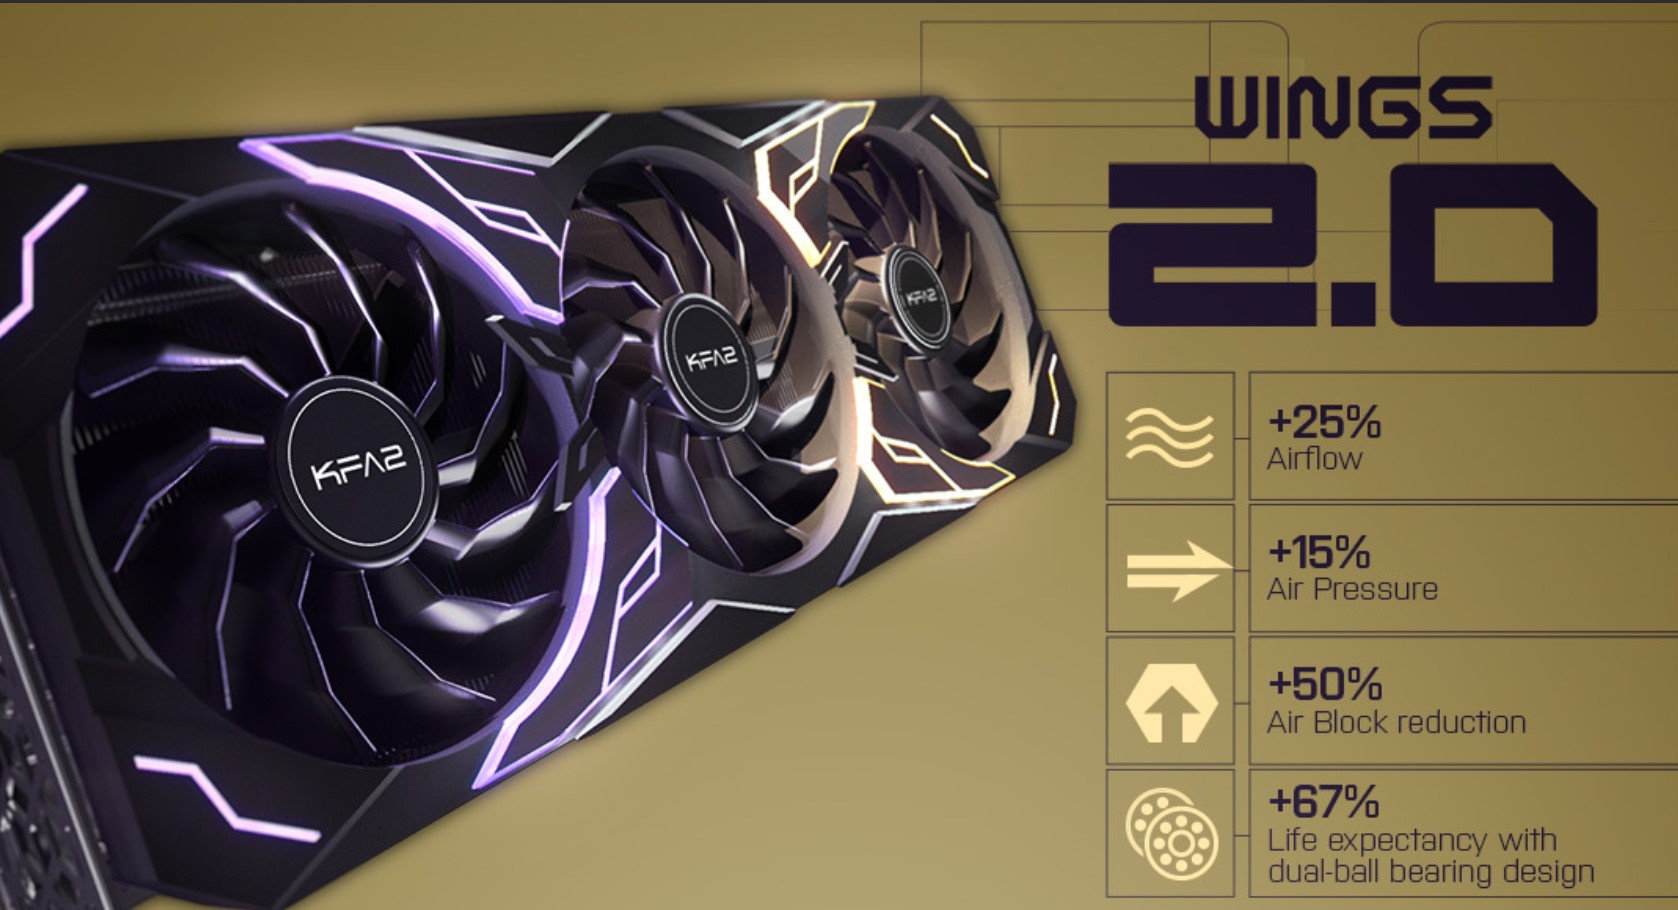
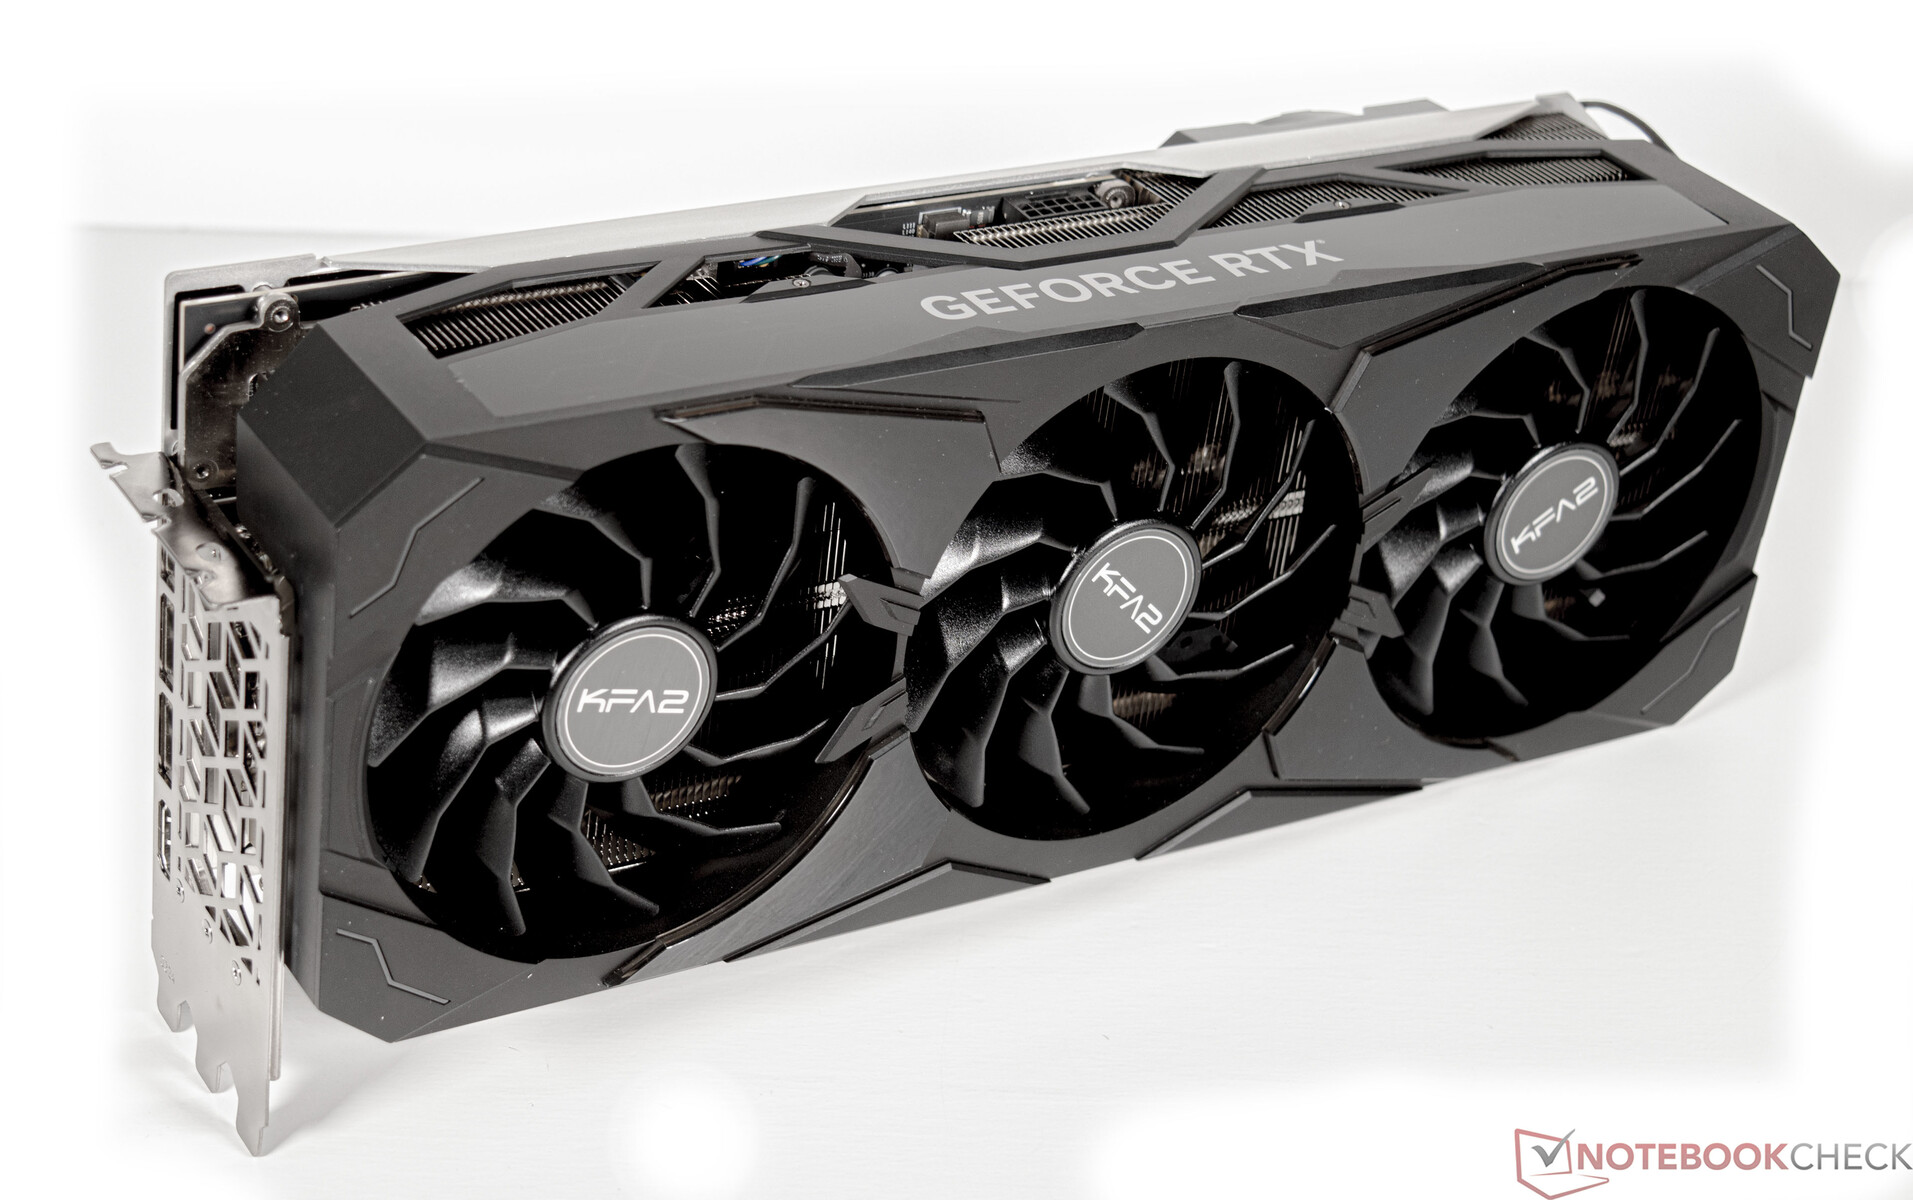
对于这项测试,我们使用KFA2GeForce RTX 4090 SG。制造商认为该显卡与华硕GeForce RTX 4090 Strix和微星GeForce RTX 4090 Suprim X处于同一水平,它们都是各自制造商的顶级型号。不幸的是,我们无法为您提供与这些竞争对手和KFA2GeForce RTX 4090 SG的直接比较,因为我们还没能拿到这两款机型。KFA2模型非常大,这确实也是RTX 4090所有模型的情况。四插槽设计占用了机箱内的大量空间,并承诺在负载下提供安静的显卡。对于风扇,制造商使用了三个直径为102毫米(约4英寸)的大型轴流风扇。它们经过重新设计,提供了高达25%的体积吞吐量。功率消耗为450瓦,也是按照Nvidia的参考模型。与GeForce RTX 4090显卡的所有型号一样,新的12VHPWR连接被用于电源。相应的适配器包括4x 6 + 2针PCIe。
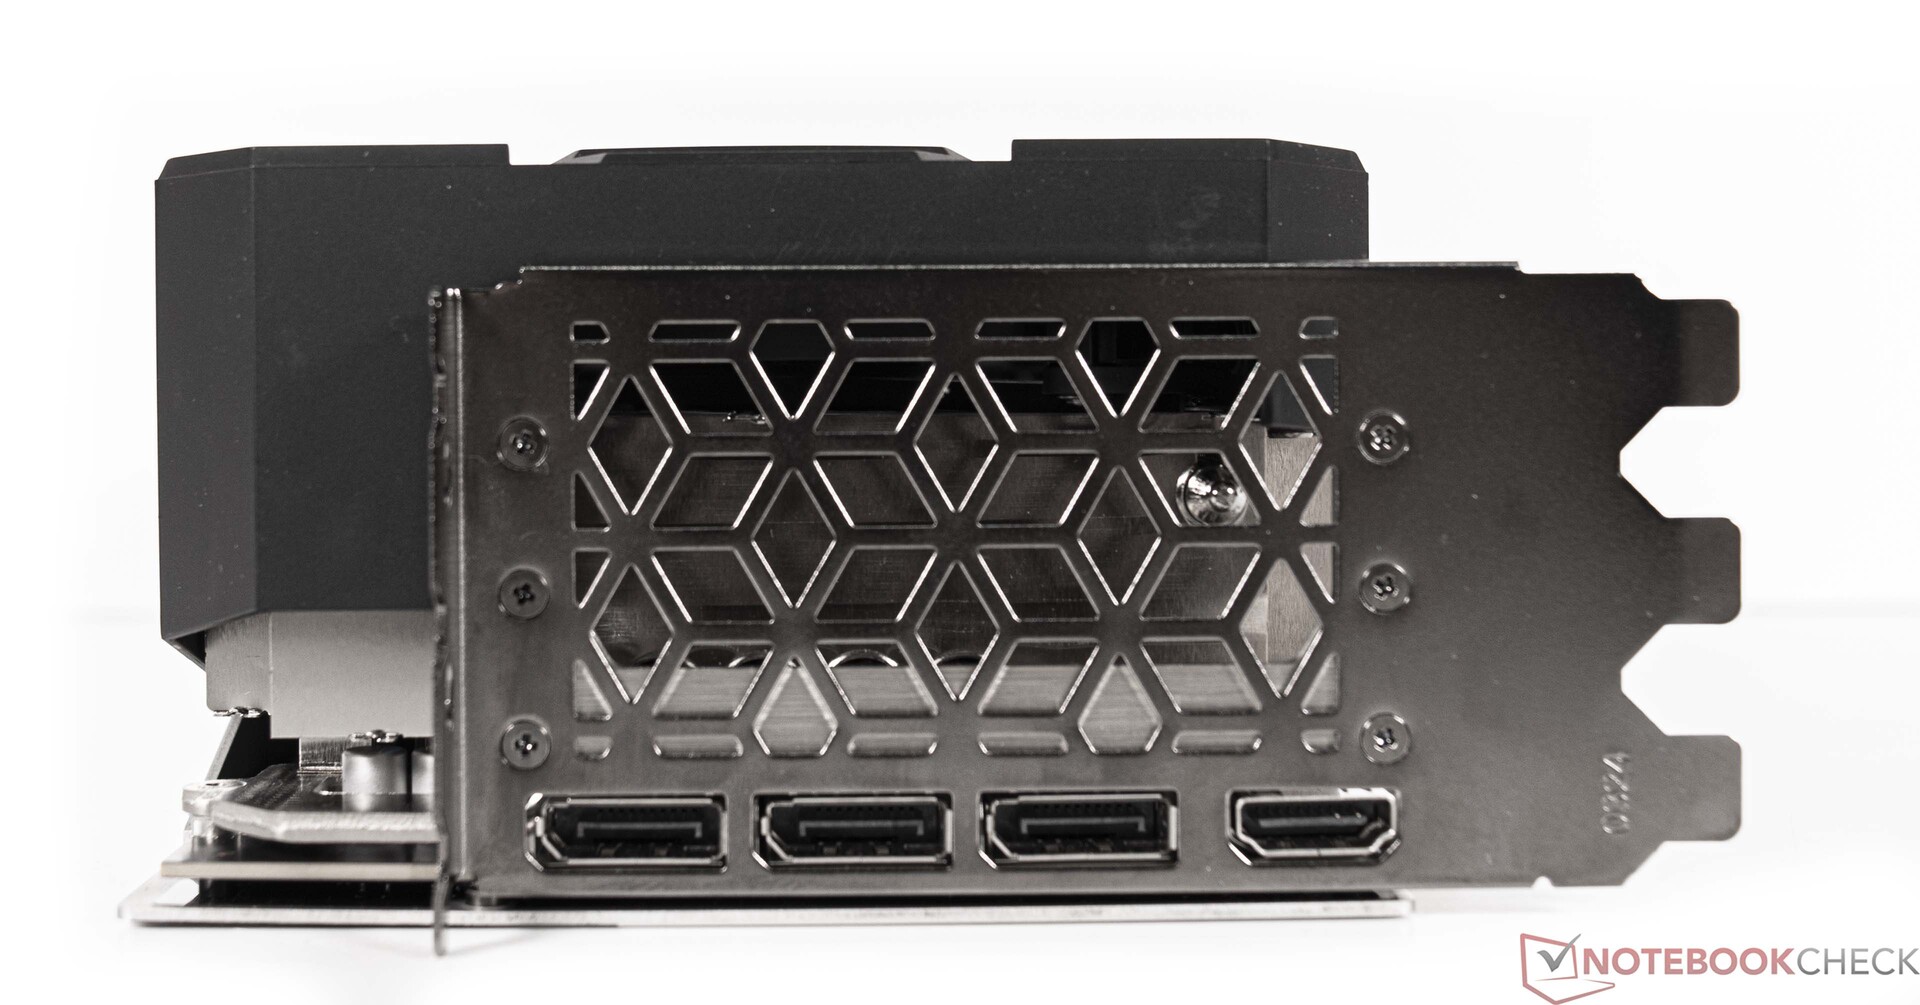
在外部,KFA2GeForce RTX 4090 SG提供1个HDMI 2.1a和3个DisplayPort 1.4a连接。

GeForce 显卡的规格比较
| 设备 | RTX 4090 (FE) | RTX 4080 | RTX 3090 Ti | RTX 3090 (FE) | RTX 3080 Ti (FE) | RTX 3080 (FE) | 泰坦RTX |
| 芯片 | AD102 | AD103 | GA102 | GA102 | GA102 | GA102 | TU102 |
| FinFET工艺 | 4纳米 | 4纳米 | 8纳米 | 8纳米 | 8纳米 | 8纳米 | 12纳米 |
| CUDA核心 | 16384 | 9728 | 10752 | 10496 | 10240 | 8,704 | 4,608 |
| 纹理单元 | 512 | 304 | 336 | 328 | 320 | 272 | 288 |
| Tensor Cores | 512 Gen. 4 | 304 Gen. 4 | 336 Gen. 3 | 328 Gen. 3 | 320 Gen. 3 | 272 Gen. 3 | 576 Gen. 2 |
| RT核心 | 128 | 76 | 84 | 82 | 80 | 68 | 72 |
| GPU基础时钟 | 2,235 MHz | 2,205 | 1,560 MHz | 1,395 MHz | 1,365 MHz | 1,440 MHz | 1,350 MHz |
| GPU Boost Clock | 2,520 MHz | 2,505 | 1,860 MHz | 1,695 MHz | 1,665 MHz | 1,710 MHz | 1,770 MHz |
| 内存总线 | 384 bit | 256 bit | 384 bit | 384 bit | 384 bit | 320 bit | 384 bit |
| 内存带宽 | 1,008 GB/s | 735.7 GB/s | 1,008 GB/s | 936 GB/s | 912.4 GB/s | 760 GB/s | 672 GB/s |
| 视频存储器 | 24 GB GDDR6X | 16 GB GDDR6X | 24 GB GDDR6X | 24 GB GDDR6X | 12 GB GDDR6X | 10 GB GDDR6X | 24 GB GDDR6 |
| 功耗 | 450 W | 320 W | 450 W | 350 W | 350 W | 320 W | 280 W |
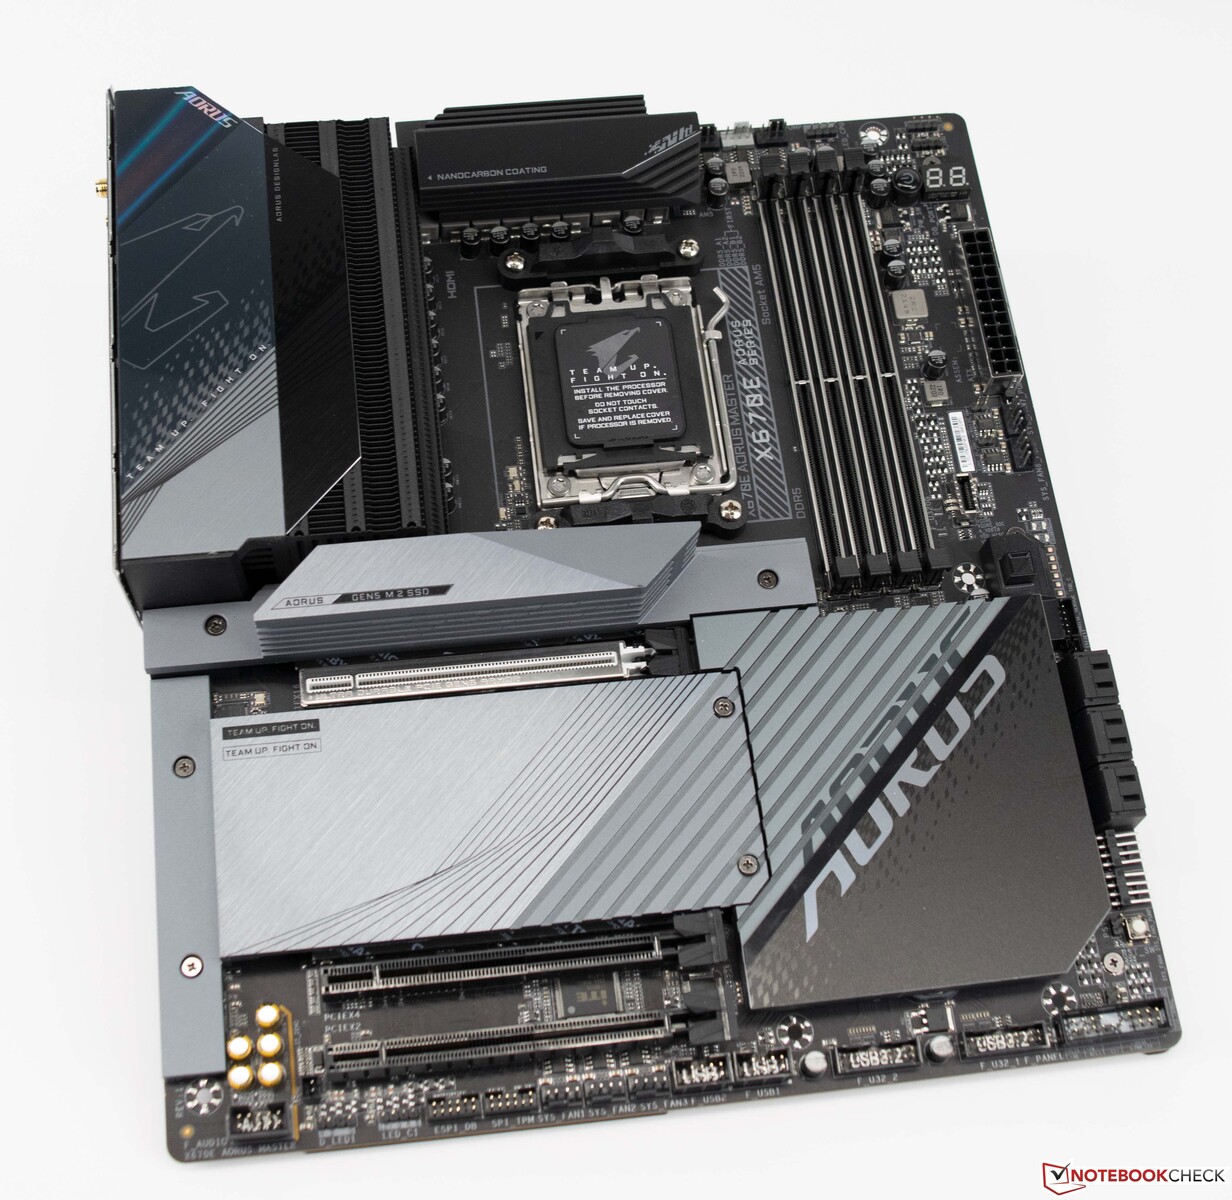
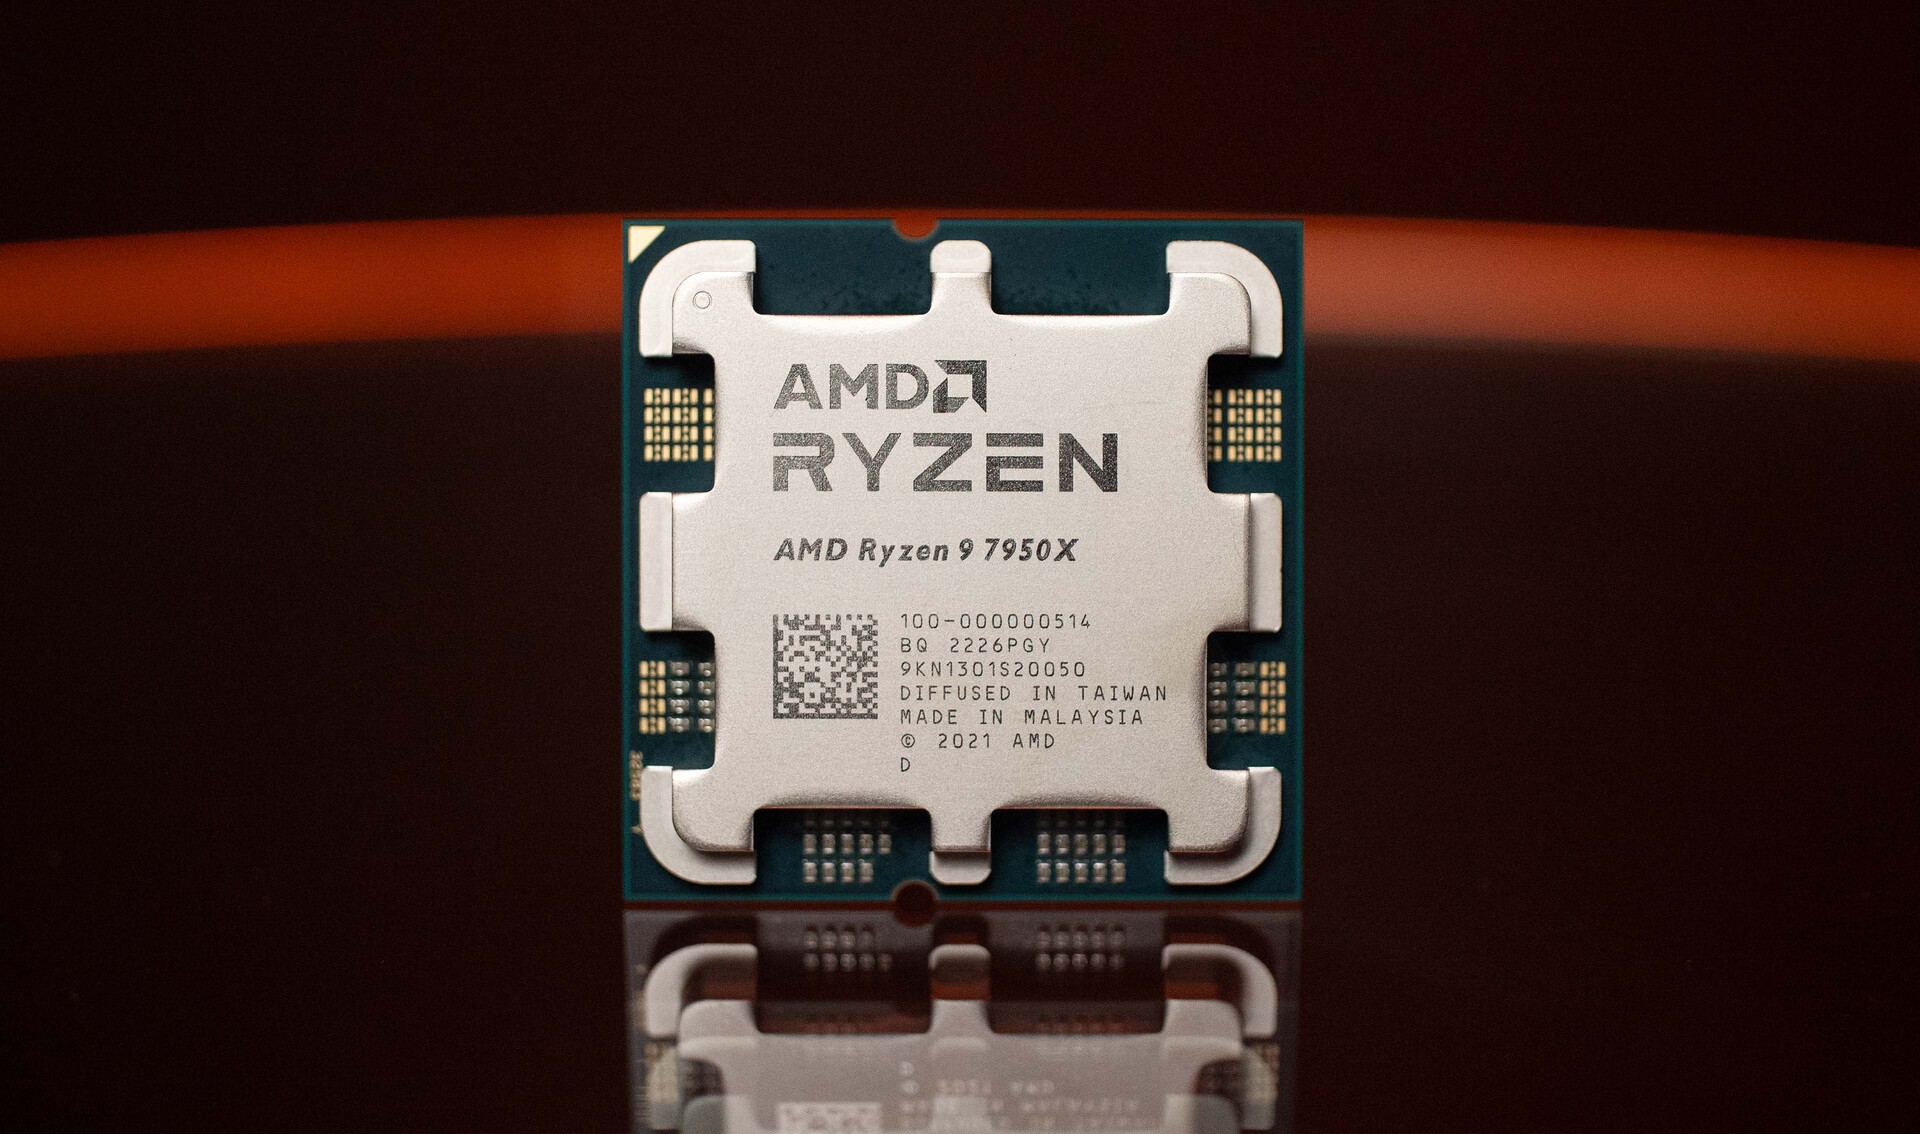
我们基于AMD Ryzen 9 7950X的测试系统
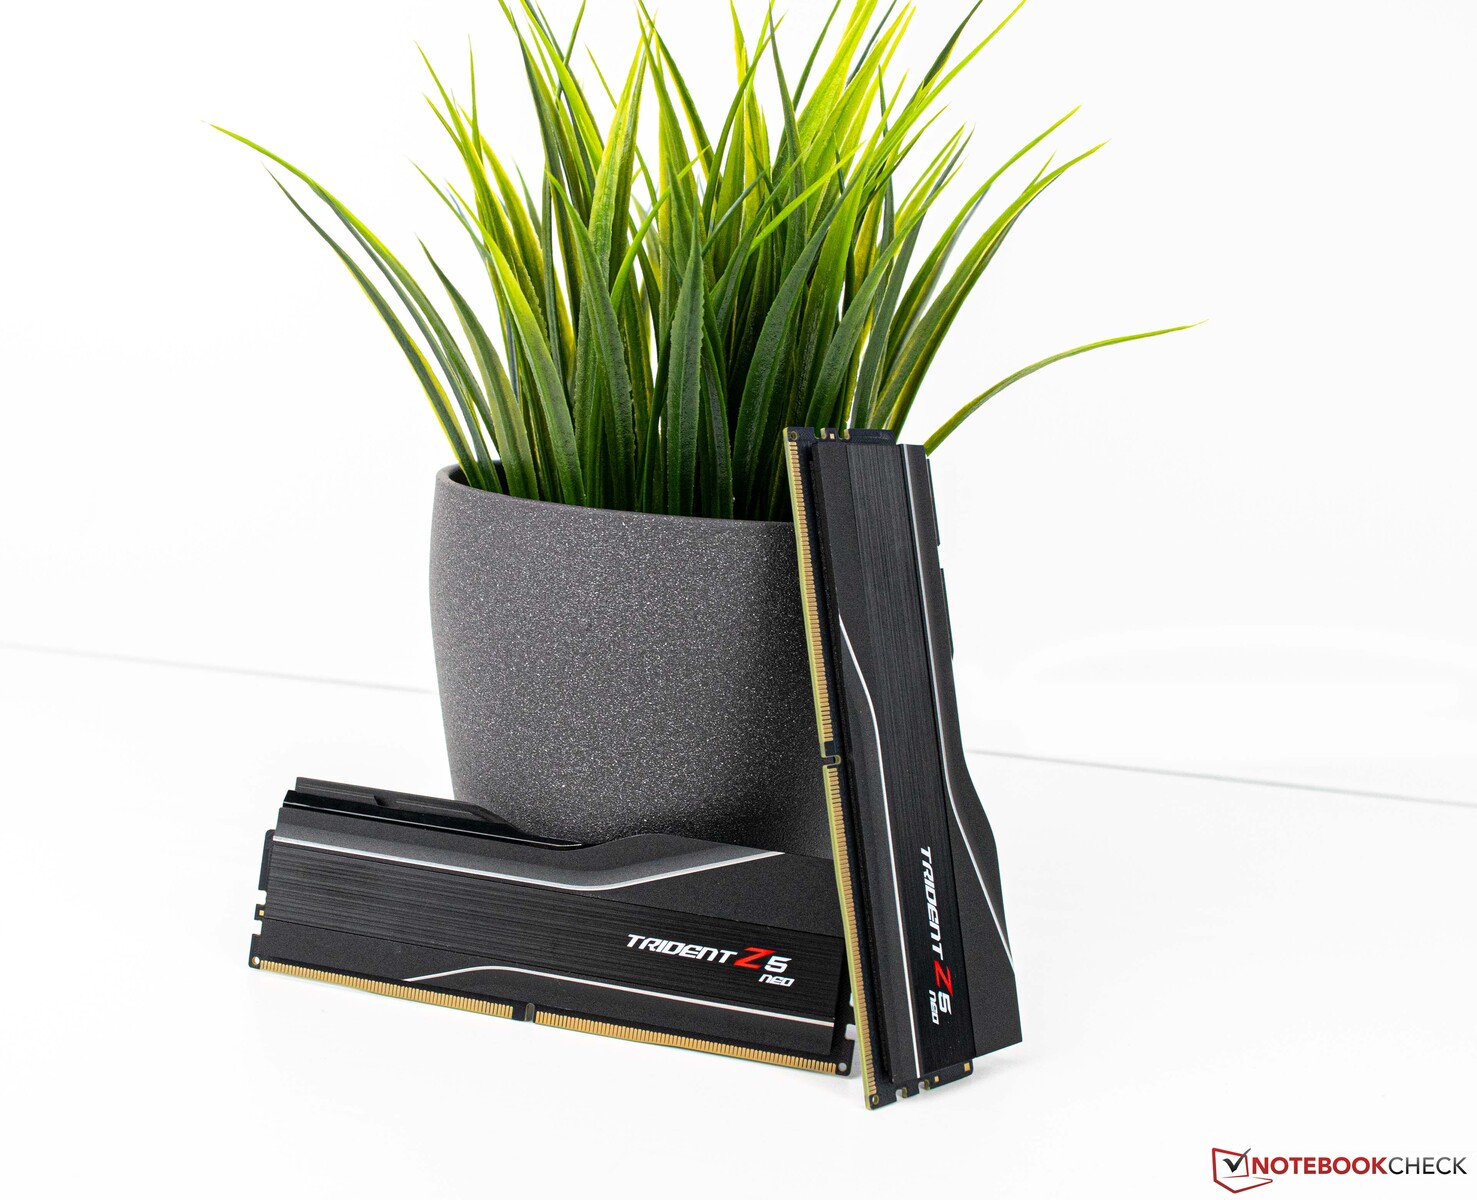
一个基于Gigabyte X670E Aorus Master的当前AMD平台作为我们的测试系统。该CPU (AMD Ryzen 9 7950X)提供了良好的性能,我们使用Alphacool的AiO解决方案(Alphacool Eisbear Aurora 360 mm)进行冷却。32GB的工作内存来自G.Skill,并以相应的EXPO配置文件运行。对于显示器,我们使用了技嘉的M32U。
测试系统的细节
我们使用以下系统进行以下基准测试。
- Lian-Li O11 Dynamic
- AMD Ryzen 9 7950X
- Gigabyte X670E Aorus Master, BIOS:F8a
- Alphacool Eisbear 360 AiO
- 海盗船RM 1000x Netzteil
- G.Skill Trident Z5 Neo DDR5-6000 2x 16 GB, EXPO (DDR5-6000 CL30-38-38-96)
- 海瑟尔MP600 2 TB
- Crucial MX500 2 TB
- 微软Windows 11专业版64位(版本22H2)。
关于KFA2GeForce RTX 4090 SG的详细信息
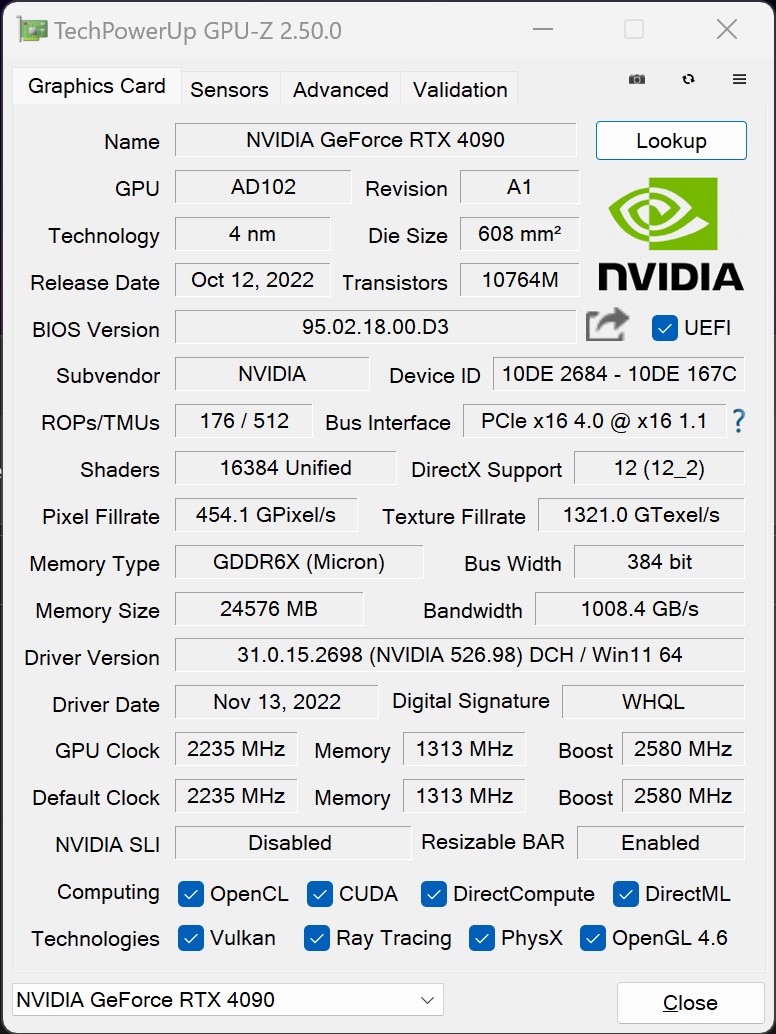
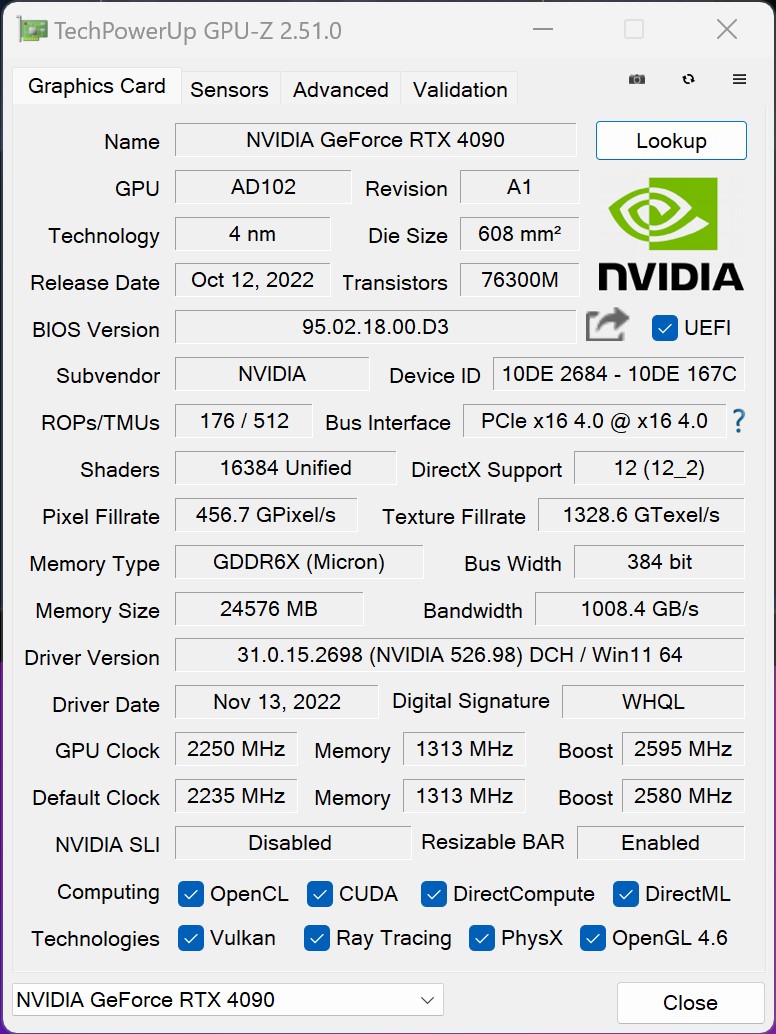
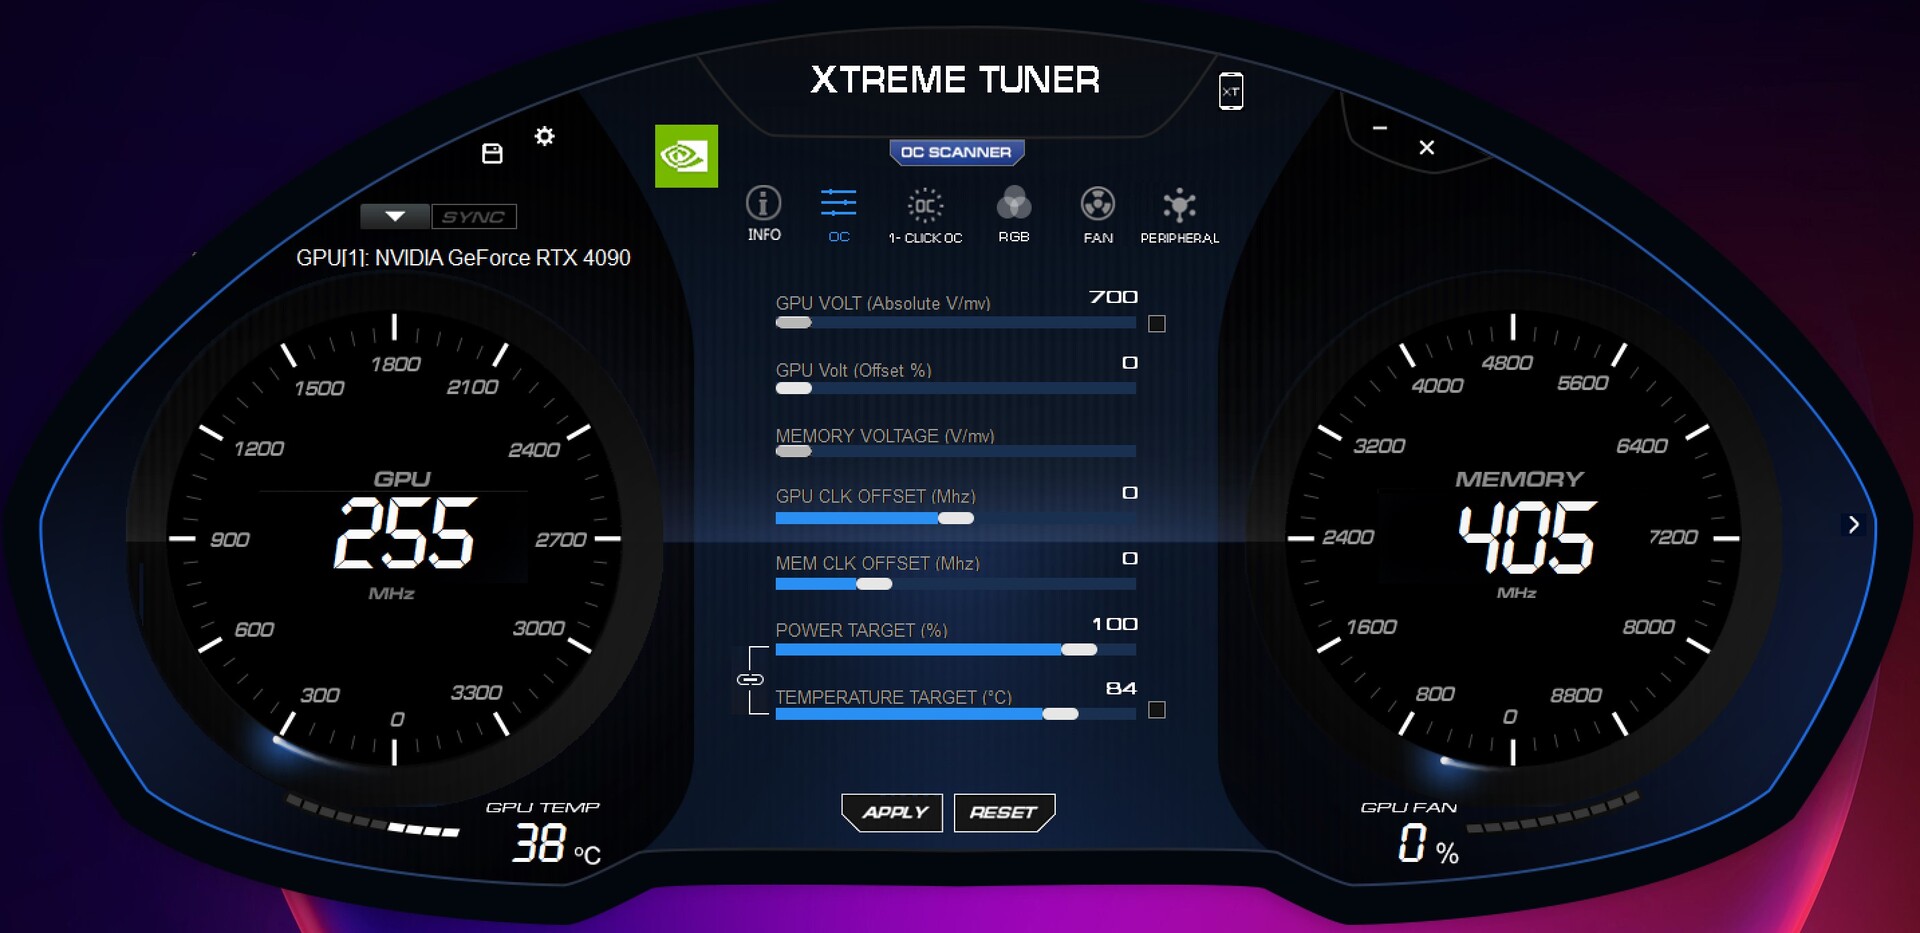
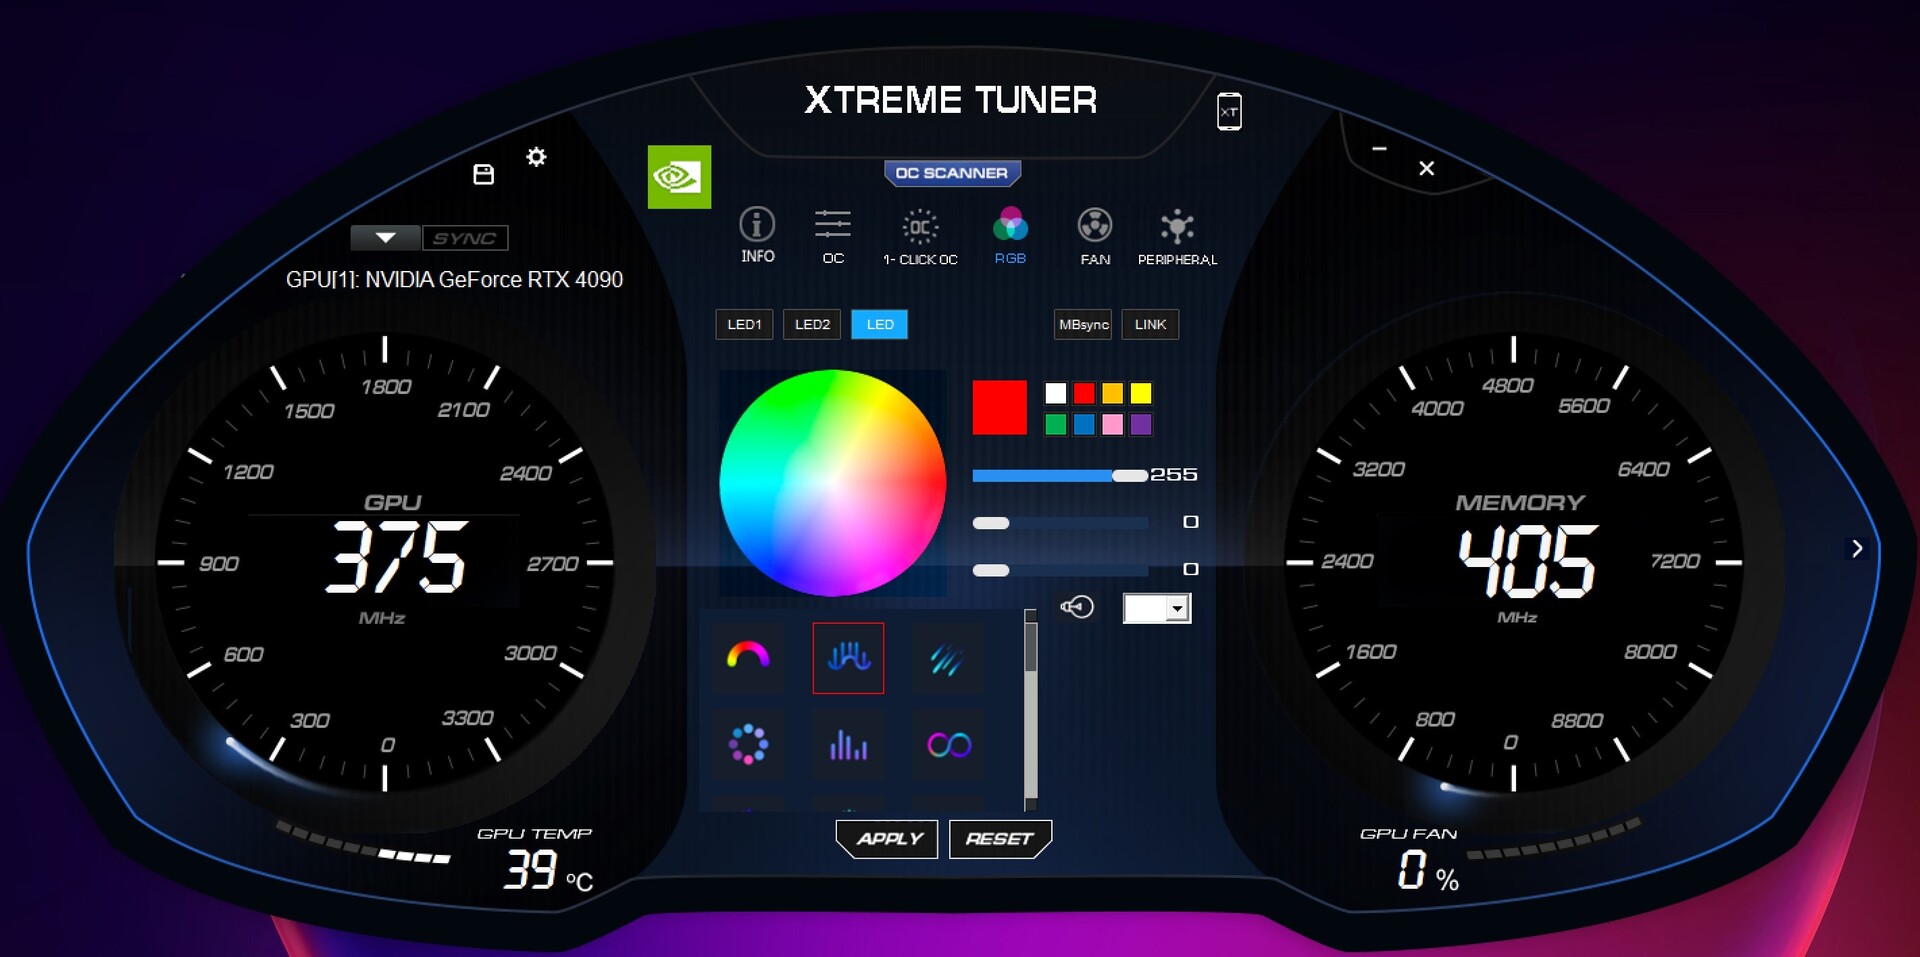
在时钟速度方面,KFA2完全坚持制造商在GeForce RTX 4090 SG的指导方针。有了这个,在纸面上为GPU指定了高达2580MHz的Boost频率。然而,这只是一个建议,在实践中,我们观察到在我们的游戏测试中,时钟速度明显更高。在2,730至2,760兆赫时,KFA2GeForce RTX 4090 SG的AD102的运行速度大多高于指定的Boost速率。有了Xtreme Tuner,制造商提供了一个小工具来读取显卡的所有重要数值。例如,它允许你控制照明或调整风扇曲线。 我们在测试中没有改变任何预定义的值。然而,在KFA2模型中经常使用的1 Click OC功能,与其说是真正的好处,不如说是一种幻觉。在实践中,GPU时钟速度仅增加15MHz并没有什么不同。我们希望这个功能能带来更明显的改善。
合成基准
在合成测试中,我们观察到的性能几乎与以下两者相同 帕利特GeForce RTX 4090 GameRock OC但我们的测试装置仍然略微落后于帕利特显卡。从主观上讲,这两种型号提供了相同的速度。直接与Nvidia RTX 4090相比,性能的提升是 NvidiaGeForce RTX 3090是非常大的(90分,而不是57分)。同时,Nvidia Titan RTX的表现也相当不错。继Quadro系列之后,由于驱动程序的优化,该显卡在这里的渲染测试中能够取得明显更好的性能。
与AMD相比,KFA2GeForce RTX 4090 SG也轻松领先。与蓝宝石AMD Radeon RX 6950 XT的比较显示出平均53%的性能优势。 然而,随着AMD Radeon RX 7900 XTX的出现,继任者已然在望。到12月中旬,它应该就在这里,红绿阵营之间的下一场战斗可以开始了。
| Performance rating - Percent | |
| Palit GeForce RTX 4090 GameRock OC | |
| KFA2 GeForce RTX 4090 SG | |
| Nvidia Titan RTX | |
| Sapphire AMD Radeon RX 6950 XT Nitro+ Pure | |
| NVIDIA GeForce RTX 3090 Founders Edition | |
| KFA2 GeForce RTX 3080 SG | |
| 3DMark | |
| 2560x1440 Time Spy Graphics | |
| Palit GeForce RTX 4090 GameRock OC | |
| KFA2 GeForce RTX 4090 SG | |
| Sapphire AMD Radeon RX 6950 XT Nitro+ Pure | |
| NVIDIA GeForce RTX 3090 Founders Edition | |
| KFA2 GeForce RTX 3080 SG | |
| Nvidia Titan RTX | |
| Fire Strike Extreme Graphics | |
| Palit GeForce RTX 4090 GameRock OC | |
| KFA2 GeForce RTX 4090 SG | |
| Sapphire AMD Radeon RX 6950 XT Nitro+ Pure | |
| NVIDIA GeForce RTX 3090 Founders Edition | |
| KFA2 GeForce RTX 3080 SG | |
| Nvidia Titan RTX | |
| 3840x2160 Fire Strike Ultra Graphics | |
| Palit GeForce RTX 4090 GameRock OC | |
| KFA2 GeForce RTX 4090 SG | |
| Sapphire AMD Radeon RX 6950 XT Nitro+ Pure | |
| NVIDIA GeForce RTX 3090 Founders Edition | |
| KFA2 GeForce RTX 3080 SG | |
| Nvidia Titan RTX | |
| 1920x1080 Fire Strike Graphics | |
| Palit GeForce RTX 4090 GameRock OC | |
| KFA2 GeForce RTX 4090 SG | |
| Sapphire AMD Radeon RX 6950 XT Nitro+ Pure | |
| NVIDIA GeForce RTX 3090 Founders Edition | |
| KFA2 GeForce RTX 3080 SG | |
| Nvidia Titan RTX | |
| Unigine Heaven 4.0 | |
| Extreme Preset DX11 | |
| Palit GeForce RTX 4090 GameRock OC | |
| KFA2 GeForce RTX 4090 SG | |
| NVIDIA GeForce RTX 3090 Founders Edition | |
| Sapphire AMD Radeon RX 6950 XT Nitro+ Pure | |
| KFA2 GeForce RTX 3080 SG | |
| Nvidia Titan RTX | |
| Extreme Preset OpenGL | |
| Palit GeForce RTX 4090 GameRock OC | |
| KFA2 GeForce RTX 4090 SG | |
| NVIDIA GeForce RTX 3090 Founders Edition | |
| KFA2 GeForce RTX 3080 SG | |
| Sapphire AMD Radeon RX 6950 XT Nitro+ Pure | |
| Nvidia Titan RTX | |
| Unigine Valley 1.0 | |
| 1920x1080 Extreme HD DirectX AA:x8 | |
| KFA2 GeForce RTX 4090 SG | |
| Palit GeForce RTX 4090 GameRock OC | |
| NVIDIA GeForce RTX 3090 Founders Edition | |
| Sapphire AMD Radeon RX 6950 XT Nitro+ Pure | |
| KFA2 GeForce RTX 3080 SG | |
| Nvidia Titan RTX | |
| 1920x1080 Extreme HD Preset OpenGL AA:x8 | |
| Palit GeForce RTX 4090 GameRock OC | |
| KFA2 GeForce RTX 4090 SG | |
| NVIDIA GeForce RTX 3090 Founders Edition | |
| KFA2 GeForce RTX 3080 SG | |
| Sapphire AMD Radeon RX 6950 XT Nitro+ Pure | |
| Nvidia Titan RTX | |
| 3DMark 11 | |
| 1280x720 Performance GPU | |
| Palit GeForce RTX 4090 GameRock OC | |
| KFA2 GeForce RTX 4090 SG | |
| Sapphire AMD Radeon RX 6950 XT Nitro+ Pure | |
| NVIDIA GeForce RTX 3090 Founders Edition | |
| KFA2 GeForce RTX 3080 SG | |
| Nvidia Titan RTX | |
| 1280x720 Performance | |
| Palit GeForce RTX 4090 GameRock OC | |
| KFA2 GeForce RTX 4090 SG | |
| NVIDIA GeForce RTX 3090 Founders Edition | |
| Nvidia Titan RTX | |
| Sapphire AMD Radeon RX 6950 XT Nitro+ Pure | |
| KFA2 GeForce RTX 3080 SG | |
| LuxMark v2.0 64Bit | |
| Sala GPUs-only | |
| Sapphire AMD Radeon RX 6950 XT Nitro+ Pure | |
| Palit GeForce RTX 4090 GameRock OC | |
| KFA2 GeForce RTX 4090 SG | |
| NVIDIA GeForce RTX 3090 Founders Edition | |
| KFA2 GeForce RTX 3080 SG | |
| Nvidia Titan RTX | |
| Room GPUs-only | |
| Palit GeForce RTX 4090 GameRock OC | |
| KFA2 GeForce RTX 4090 SG | |
| NVIDIA GeForce RTX 3090 Founders Edition | |
| KFA2 GeForce RTX 3080 SG | |
| Sapphire AMD Radeon RX 6950 XT Nitro+ Pure | |
| Nvidia Titan RTX | |
Compute Benchmarks and Professional Applications
| LuxMark v2.0 64Bit | |
| Sala GPUs-only | |
| AMD Radeon RX 6950 XT | |
| AMD Radeon RX 6900 XT | |
| NVIDIA GeForce RTX 4090 | |
| KFA2 GeForce RTX 4090 SG | |
| NVIDIA GeForce RTX 3090 | |
| NVIDIA GeForce RTX 3080 12 GB | |
| NVIDIA Titan RTX | |
| Room GPUs-only | |
| NVIDIA GeForce RTX 4090 | |
| KFA2 GeForce RTX 4090 SG | |
| NVIDIA GeForce RTX 3090 | |
| NVIDIA GeForce RTX 3080 12 GB | |
| AMD Radeon RX 6950 XT | |
| AMD Radeon RX 6900 XT | |
| NVIDIA Titan RTX | |
| Blender - v3.3 Classroom CUDA | |
| NVIDIA Titan RTX | |
| Geekbench 5.5 | |
| OpenCL Score | |
| NVIDIA GeForce RTX 4090 | |
| KFA2 GeForce RTX 4090 SG | |
| NVIDIA GeForce RTX 3090 Ti | |
| NVIDIA GeForce RTX 3090 | |
| NVIDIA GeForce RTX 3080 12 GB | |
| AMD Radeon RX 6950 XT | |
| AMD Radeon RX 6900 XT | |
| NVIDIA Titan RTX | |
| Vulkan Score 5.5 | |
| NVIDIA GeForce RTX 3090 Ti | |
| NVIDIA GeForce RTX 4090 | |
| KFA2 GeForce RTX 4090 SG | |
| NVIDIA Titan RTX | |
| NVIDIA GeForce RTX 3090 | |
| AMD Radeon RX 6900 XT | |
| AMD Radeon RX 6950 XT | |
| NVIDIA GeForce RTX 3080 12 GB | |
| V-Ray 5 Benchmark | |
| GPU CUDA | |
| NVIDIA GeForce RTX 4090 | |
| KFA2 GeForce RTX 4090 SG | |
| NVIDIA GeForce RTX 3090 | |
| NVIDIA GeForce RTX 3080 12 GB | |
| AMD Radeon RX 6950 XT | |
| GPU RTX | |
| NVIDIA GeForce RTX 4090 | |
| KFA2 GeForce RTX 4090 SG | |
| NVIDIA GeForce RTX 3090 | |
* ... smaller is better
游戏基准
KFA2GeForce RTX 4090 SG能够将合成基准测试中的高性能也转化为非常高的游戏性能。当它没有受到CPU的限制时,与Nvidia RTX 3090相比,其性能提高了80%以上。 NvidiaGeForce RTX 3090是可能的。在过去,我们只是很少看到两个GPU架构之间有如此高的性能提升。KFA2和帕利特又是眼见为实,我们无法看到两款机型之间有任何明显的差异。
RTX 4000的特殊功能,如DLSS 3.0,包括帧生成(FG),确保在许多游戏中获得额外的提升。作为一个例子,我们可以提到赛博朋克2077。在原生4K分辨率和Raytracing Ultra预设下,即使是KFA2GeForce RTX 4090 SG也只能达到平均44 FPS。但在激活DLSS后,超过100 FPS就不再是问题了。通过这一点,Nvidia提供了一个伟大的功能,在不久的将来,这可能真的会对购买决定产生影响。另一方面,通过FSR,AMD也有一个类似的功能正在开发中。因此,最终取决于游戏制造商,以及他们是否在其游戏中整合这些功能。你可以在这里找到已经支持DLSS 3.0或计划在未来这样做的游戏列表https://www.nvidia.com/en-us/geforce/news/dlss3-supports-over-35-games-apps/.
| GTA V - 3840x2160 High/On (Advanced Graphics Off) AA:FX AF:8x | |
| KFA2 GeForce RTX 4090 SG | |
| Palit GeForce RTX 4090 GameRock OC | |
| NVIDIA GeForce RTX 3090 Founders Edition | |
| Sapphire AMD Radeon RX 6950 XT Nitro+ Pure | |
| KFA2 GeForce RTX 3080 SG | |
| Nvidia Titan RTX | |
| The Witcher 3 - 3840x2160 High Graphics & Postprocessing (Nvidia HairWorks Off) | |
| KFA2 GeForce RTX 4090 SG | |
| Palit GeForce RTX 4090 GameRock OC | |
| NVIDIA GeForce RTX 3090 Founders Edition | |
| Sapphire AMD Radeon RX 6950 XT Nitro+ Pure | |
| KFA2 GeForce RTX 3080 SG | |
| AMD Radeon RX 6900 XT | |
| Nvidia Titan RTX | |
| Final Fantasy XV Benchmark - 3840x2160 High Quality | |
| Palit GeForce RTX 4090 GameRock OC | |
| KFA2 GeForce RTX 4090 SG | |
| NVIDIA GeForce RTX 3090 Founders Edition | |
| Sapphire AMD Radeon RX 6950 XT Nitro+ Pure | |
| KFA2 GeForce RTX 3080 SG | |
| Nvidia Titan RTX | |
| Strange Brigade - 3840x2160 ultra AA:ultra AF:16 | |
| Palit GeForce RTX 4090 GameRock OC | |
| KFA2 GeForce RTX 4090 SG | |
| Sapphire AMD Radeon RX 6950 XT Nitro+ Pure | |
| NVIDIA GeForce RTX 3090 Founders Edition | |
| KFA2 GeForce RTX 3080 SG | |
| Nvidia Titan RTX | |
| Far Cry 5 - 3840x2160 Ultra Preset AA:T | |
| Palit GeForce RTX 4090 GameRock OC | |
| KFA2 GeForce RTX 4090 SG | |
| Sapphire AMD Radeon RX 6950 XT Nitro+ Pure | |
| NVIDIA GeForce RTX 3090 Founders Edition | |
| KFA2 GeForce RTX 3080 SG | |
| Nvidia Titan RTX | |
| Far Cry New Dawn - 3840x2160 Ultra Preset | |
| Palit GeForce RTX 4090 GameRock OC | |
| KFA2 GeForce RTX 4090 SG | |
| Sapphire AMD Radeon RX 6950 XT Nitro+ Pure | |
| NVIDIA GeForce RTX 3090 Founders Edition | |
| AMD Radeon RX 6900 XT | |
| KFA2 GeForce RTX 3080 SG | |
| Nvidia Titan RTX | |
| Far Cry 6 - 3840x2160 Ultra Graphics Quality + HD Textures AA:T | |
| Palit GeForce RTX 4090 GameRock OC | |
| KFA2 GeForce RTX 4090 SG | |
| Sapphire AMD Radeon RX 6950 XT Nitro+ Pure | |
| NVIDIA GeForce RTX 3090 Founders Edition | |
| Nvidia Titan RTX | |
| KFA2 GeForce RTX 3080 SG | |
| Metro Exodus - 3840x2160 Ultra Quality AF:16x | |
| Palit GeForce RTX 4090 GameRock OC | |
| KFA2 GeForce RTX 4090 SG | |
| NVIDIA GeForce RTX 3090 Founders Edition | |
| Sapphire AMD Radeon RX 6950 XT Nitro+ Pure | |
| AMD Radeon RX 6900 XT | |
| KFA2 GeForce RTX 3080 SG | |
| Nvidia Titan RTX | |
| F1 2020 - 3840x2160 Ultra High Preset AA:T AF:16x | |
| Palit GeForce RTX 4090 GameRock OC | |
| KFA2 GeForce RTX 4090 SG | |
| Sapphire AMD Radeon RX 6950 XT Nitro+ Pure | |
| NVIDIA GeForce RTX 3090 Founders Edition | |
| AMD Radeon RX 6900 XT | |
| AMD Radeon RX 6900 XT | |
| KFA2 GeForce RTX 3080 SG | |
| Nvidia Titan RTX | |
| F1 2021 - 3840x2160 Ultra High Preset + Raytracing AA:T AF:16x | |
| Palit GeForce RTX 4090 GameRock OC | |
| KFA2 GeForce RTX 4090 SG | |
| NVIDIA GeForce RTX 3090 Founders Edition | |
| Sapphire AMD Radeon RX 6950 XT Nitro+ Pure | |
| KFA2 GeForce RTX 3080 SG | |
| Nvidia Titan RTX | |
| F1 22 - 3840x2160 Ultra High Preset AA:T AF:16x | |
| Palit GeForce RTX 4090 GameRock OC | |
| KFA2 GeForce RTX 4090 SG | |
| NVIDIA GeForce RTX 3090 Founders Edition | |
| Sapphire AMD Radeon RX 6950 XT Nitro+ Pure | |
| Nvidia Titan RTX | |
| Borderlands 3 - 3840x2160 Badass Overall Quality (DX11) | |
| Palit GeForce RTX 4090 GameRock OC | |
| KFA2 GeForce RTX 4090 SG | |
| NVIDIA GeForce RTX 3090 Founders Edition | |
| KFA2 GeForce RTX 3080 SG | |
| Sapphire AMD Radeon RX 6950 XT Nitro+ Pure | |
| AMD Radeon RX 6900 XT | |
| AMD Radeon RX 6900 XT | |
| Nvidia Titan RTX | |
| Cyberpunk 2077 1.6 - 3840x2160 Ultra Preset | |
| KFA2 GeForce RTX 4090 SG | |
| Palit GeForce RTX 4090 GameRock OC | |
| Sapphire AMD Radeon RX 6950 XT Nitro+ Pure | |
| Metro Exodus - 1920x1080 Ultra Quality DXR AF:16x | |
| KFA2 GeForce RTX 4090 SG | |
| Palit GeForce RTX 4090 GameRock OC | |
| NVIDIA GeForce RTX 3090 Founders Edition | |
| KFA2 GeForce RTX 3080 SG | |
| Nvidia Titan RTX | |
| AMD Radeon RX 6900 XT | |
| Far Cry 6 - 1920x1080 Ultra Graphics Quality + HD Textures + DXR AA:T | |
| KFA2 GeForce RTX 4090 SG | |
| Palit GeForce RTX 4090 GameRock OC | |
| NVIDIA GeForce RTX 3090 Founders Edition | |
| Nvidia Titan RTX | |
| Sapphire AMD Radeon RX 6950 XT Nitro+ Pure | |
| Cyberpunk 2077 1.6 | |
| 1920x1080 Ray Tracing Ultra Preset (DLSS off) | |
| KFA2 GeForce RTX 4090 SG | |
| Palit GeForce RTX 4090 GameRock OC | |
| 3840x2160 Ray Tracing Ultra Preset (DLSS off) | |
| KFA2 GeForce RTX 4090 SG | |
| Palit GeForce RTX 4090 GameRock OC | |
| low | med. | high | ultra | QHD | 4K | |
|---|---|---|---|---|---|---|
| GTA V (2015) | 188.2 | 188.4 | 187.1 | 163.3 | 166 | 187.8 |
| The Witcher 3 (2015) | 809 | 730 | 629 | 306 | 286 | |
| Dota 2 Reborn (2015) | 294 | 260 | 255 | 233 | 234 | |
| Rise of the Tomb Raider (2016) | 493 | 395 | 374 | 376 | 244 | |
| Final Fantasy XV Benchmark (2018) | 234 | 234 | 226 | 219 | 156.7 | |
| X-Plane 11.11 (2018) | 210 | 193.6 | 145.1 | 126 | ||
| Far Cry 5 (2018) | 246 | 216 | 208 | 191 | 189 | 175 |
| Strange Brigade (2018) | 710 | 582 | 568 | 562 | 504 | 277 |
| Shadow of the Tomb Raider (2018) | 350 | 317 | 319 | 308 | 282 | 186.4 |
| Far Cry New Dawn (2019) | 201 | 176 | 170 | 153 | 152 | 145 |
| Metro Exodus (2019) | 305 | 265 | 231 | 195.3 | 183.2 | 138.5 |
| Borderlands 3 (2019) | 238 | 215 | 198.7 | 189.4 | 184.3 | 134.1 |
| F1 2020 (2020) | 120 | 119.6 | 475 | 423 | 409 | 285 |
| Dirt 5 (2020) | 381 | 349 | 222 | 198 | 194 | 159 |
| F1 2021 (2021) | 672 | 637 | 521 | 274 | 263 | 195.1 |
| Far Cry 6 (2021) | 227 | 197.8 | 177.3 | 168.6 | 162.5 | 134.9 |
| Forza Horizon 5 (2021) | 328 | 259 | 253 | 194 | 184 | 159 |
| God of War (2022) | 277 | 274 | 248 | 204 | 177.1 | 125 |
| GRID Legends (2022) | 355 | 318 | 283 | 267 | 266 | 198.6 |
| Cyberpunk 2077 1.6 (2022) | 225 | 222 | 214 | 211 | 164.5 | 83.7 |
| Tiny Tina's Wonderlands (2022) | 430 | 355 | 308 | 285 | 227 | 129.5 |
| F1 22 (2022) | 440 | 418 | 409 | 207 | 156.2 | 82.5 |
| The Quarry (2022) | 425 | 334 | 284 | 252 | 192.4 | 75.3 |
| FIFA 23 (2022) | 304 | 303 | 300 | 302 | 302 | 299 |
| A Plague Tale Requiem (2022) | 179.2 | 173.6 | 165 | 155.3 | 125 | 73.5 |
| Uncharted Legacy of Thieves Collection (2022) | 151 | 152.3 | 146 | 149.2 | 145.2 | 100.5 |
| Call of Duty Modern Warfare 2 2022 (2022) | 315 | 285 | 246 | 245 | 194 | 131 |
| Spider-Man Miles Morales (2022) | 198.2 | 187.2 | 178.9 | 176.8 | 172.5 | 126.2 |
KFA2GeForce RTX 4090 SG的排放情况
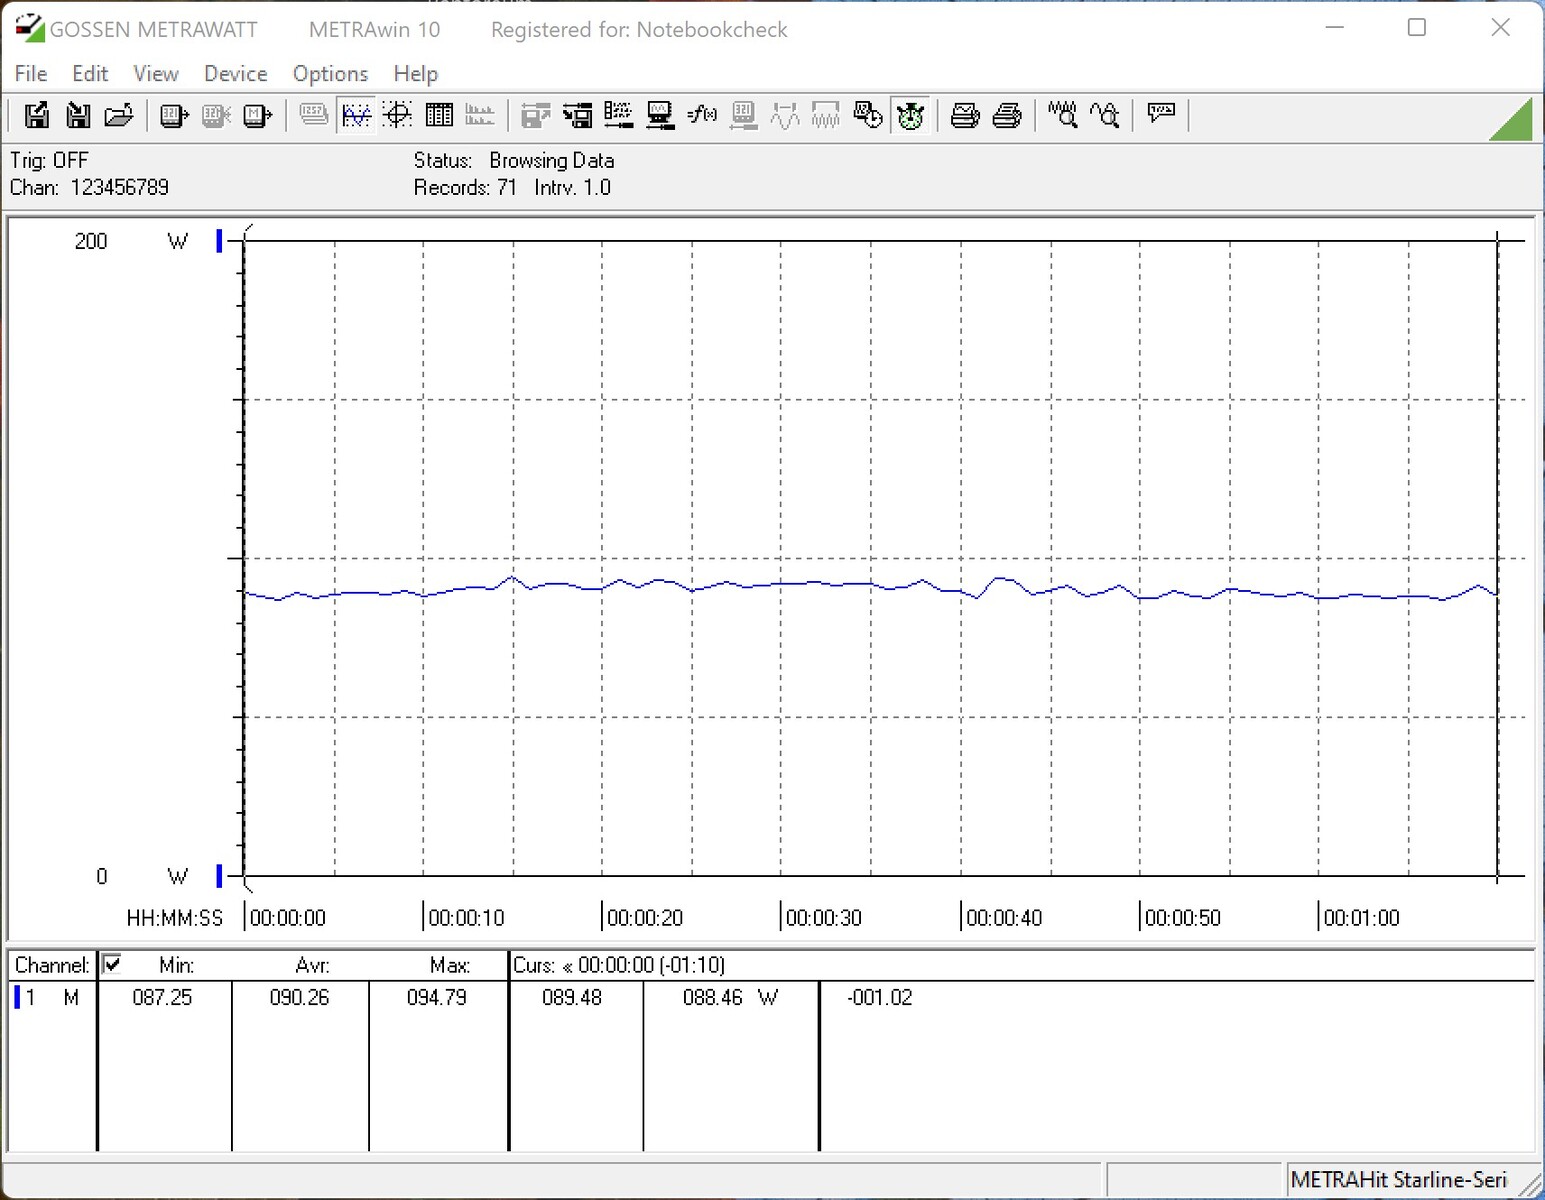
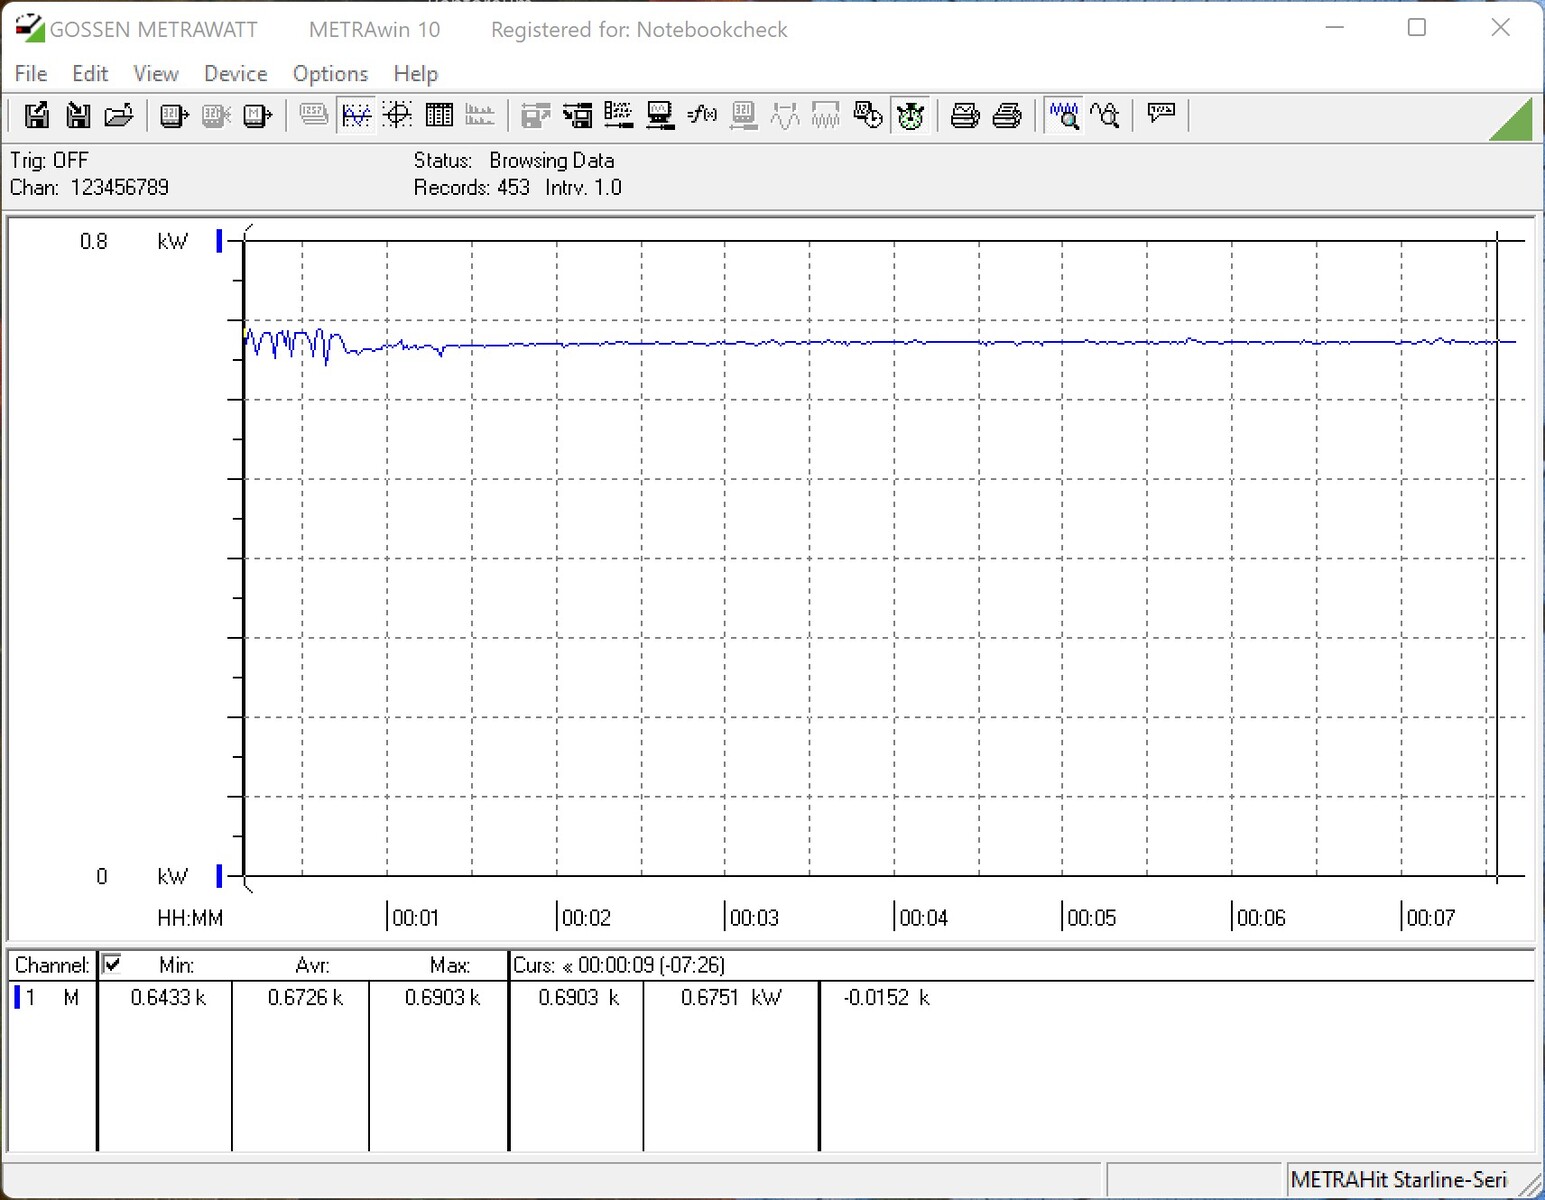
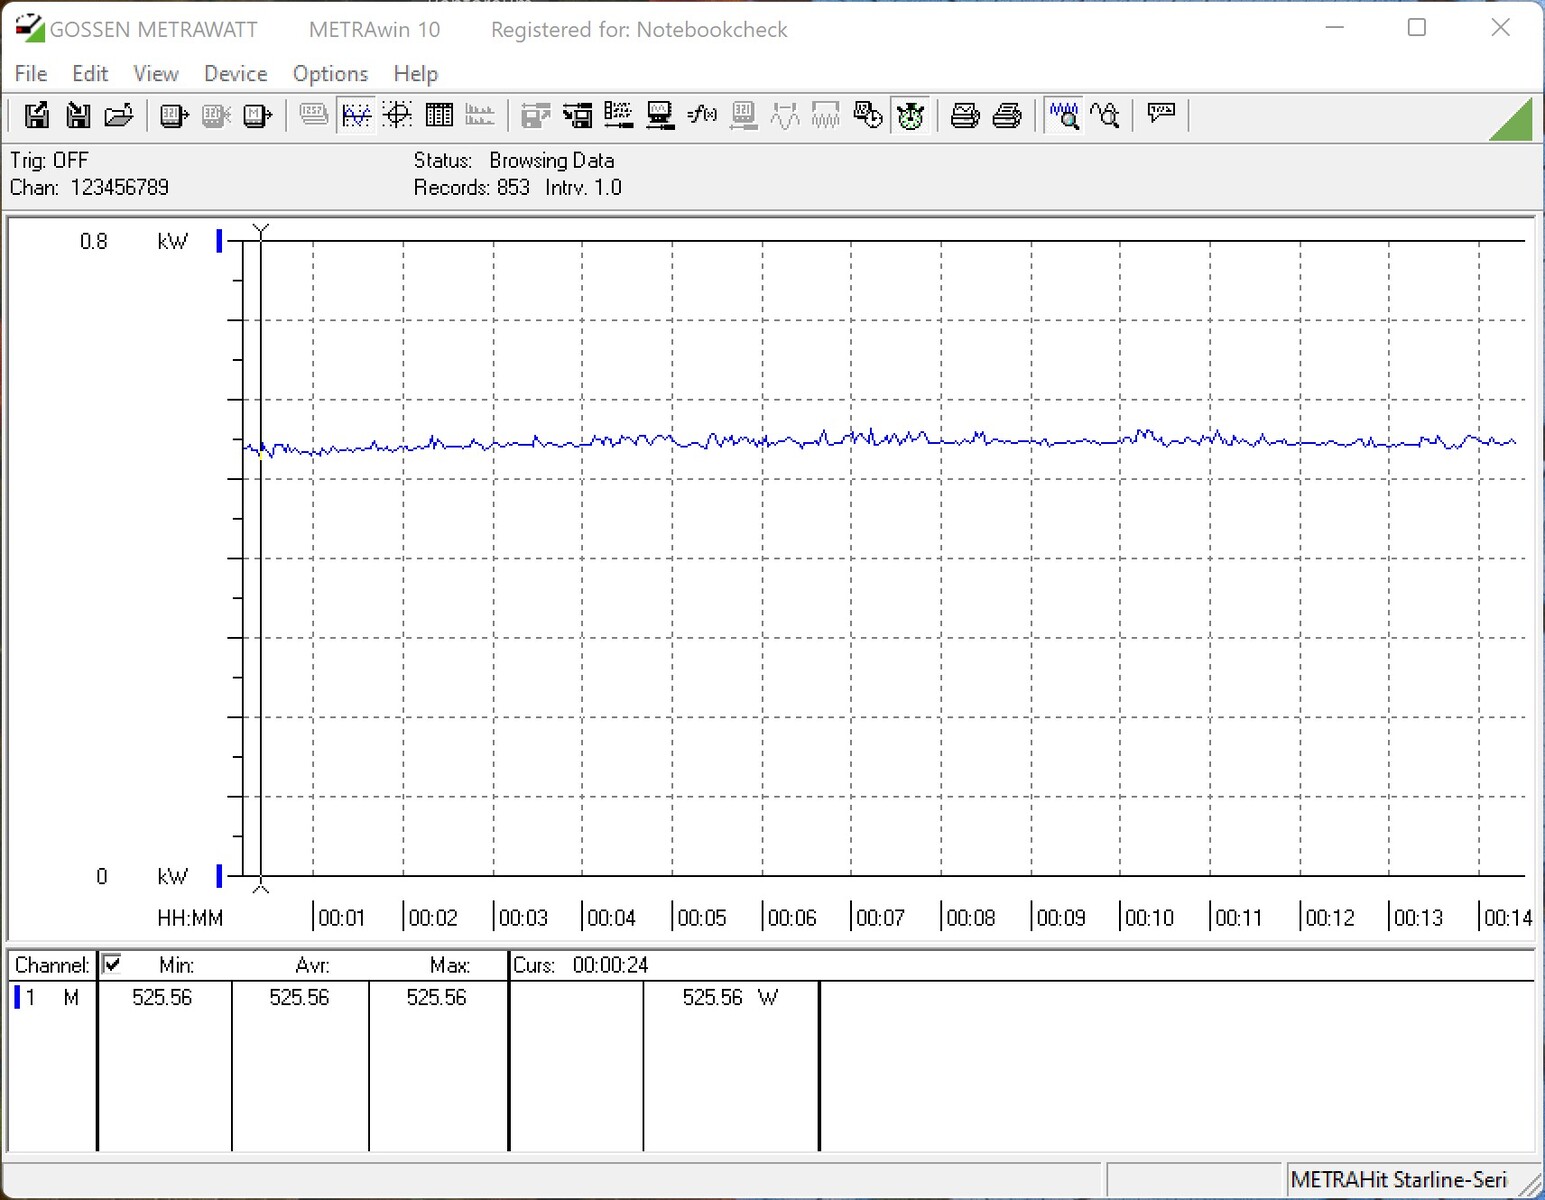
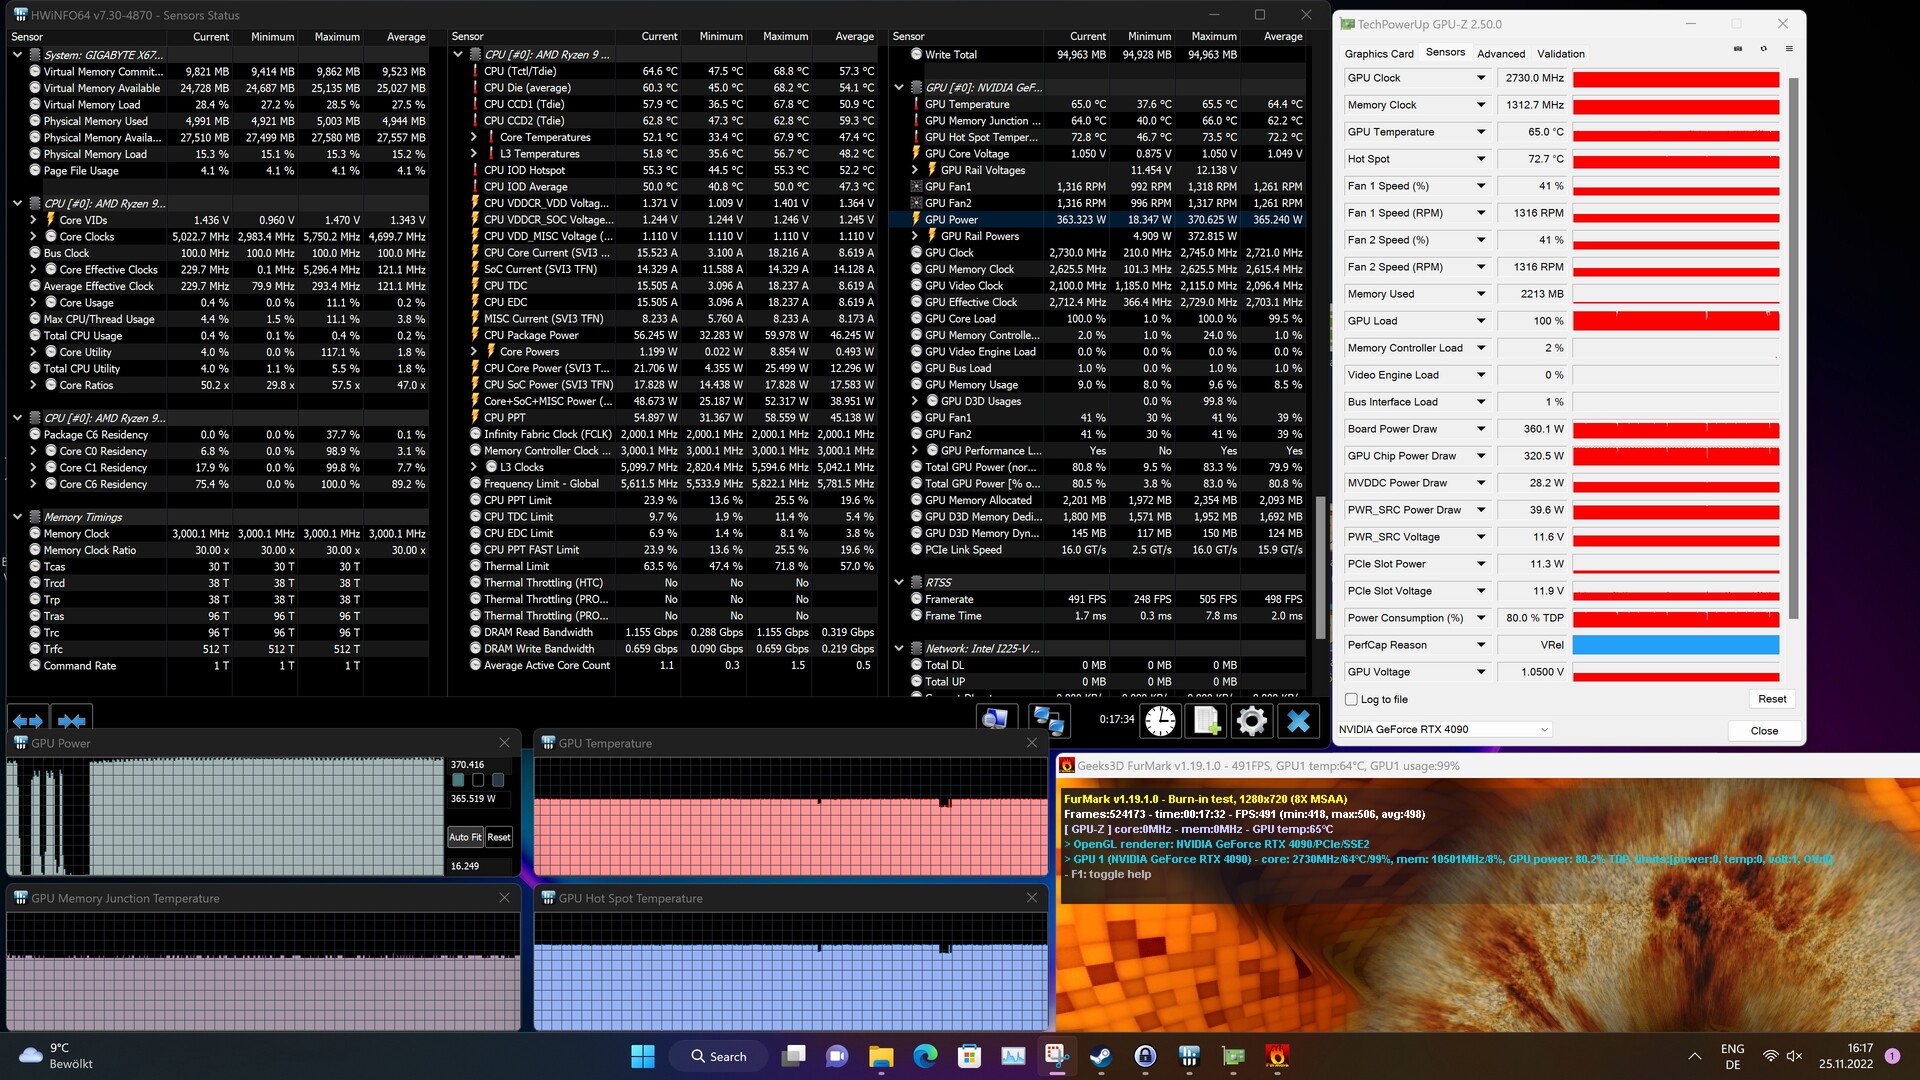
与其他GeForce RTX-4090型号相比,KFA2GeForce RTX 4090 SG的功耗也不例外。450瓦的标准功率限制与其他RTX-4090型号一样高。然而,在可选功率目标方面,各种型号之间存在一些偏差。通过额外的13%,你可以将KFA2GeForce RTX 4090 SG的功率极限提高到约510瓦。Nvidia的创始者版甚至允许达到600瓦,而PalitGeForce RTX 4090 GameRock OC只有500瓦。但在实践中,这并不发挥主要作用,因为只有在最罕见的情况下,才会达到450瓦的功率限制。FurMark压力测试中的消耗量略高于370瓦。当时,GPU的温度保持在65°C(145°F)的低温,而风扇转速只有每分钟1300转。在39 dB(A)下,显卡的声音很安静。
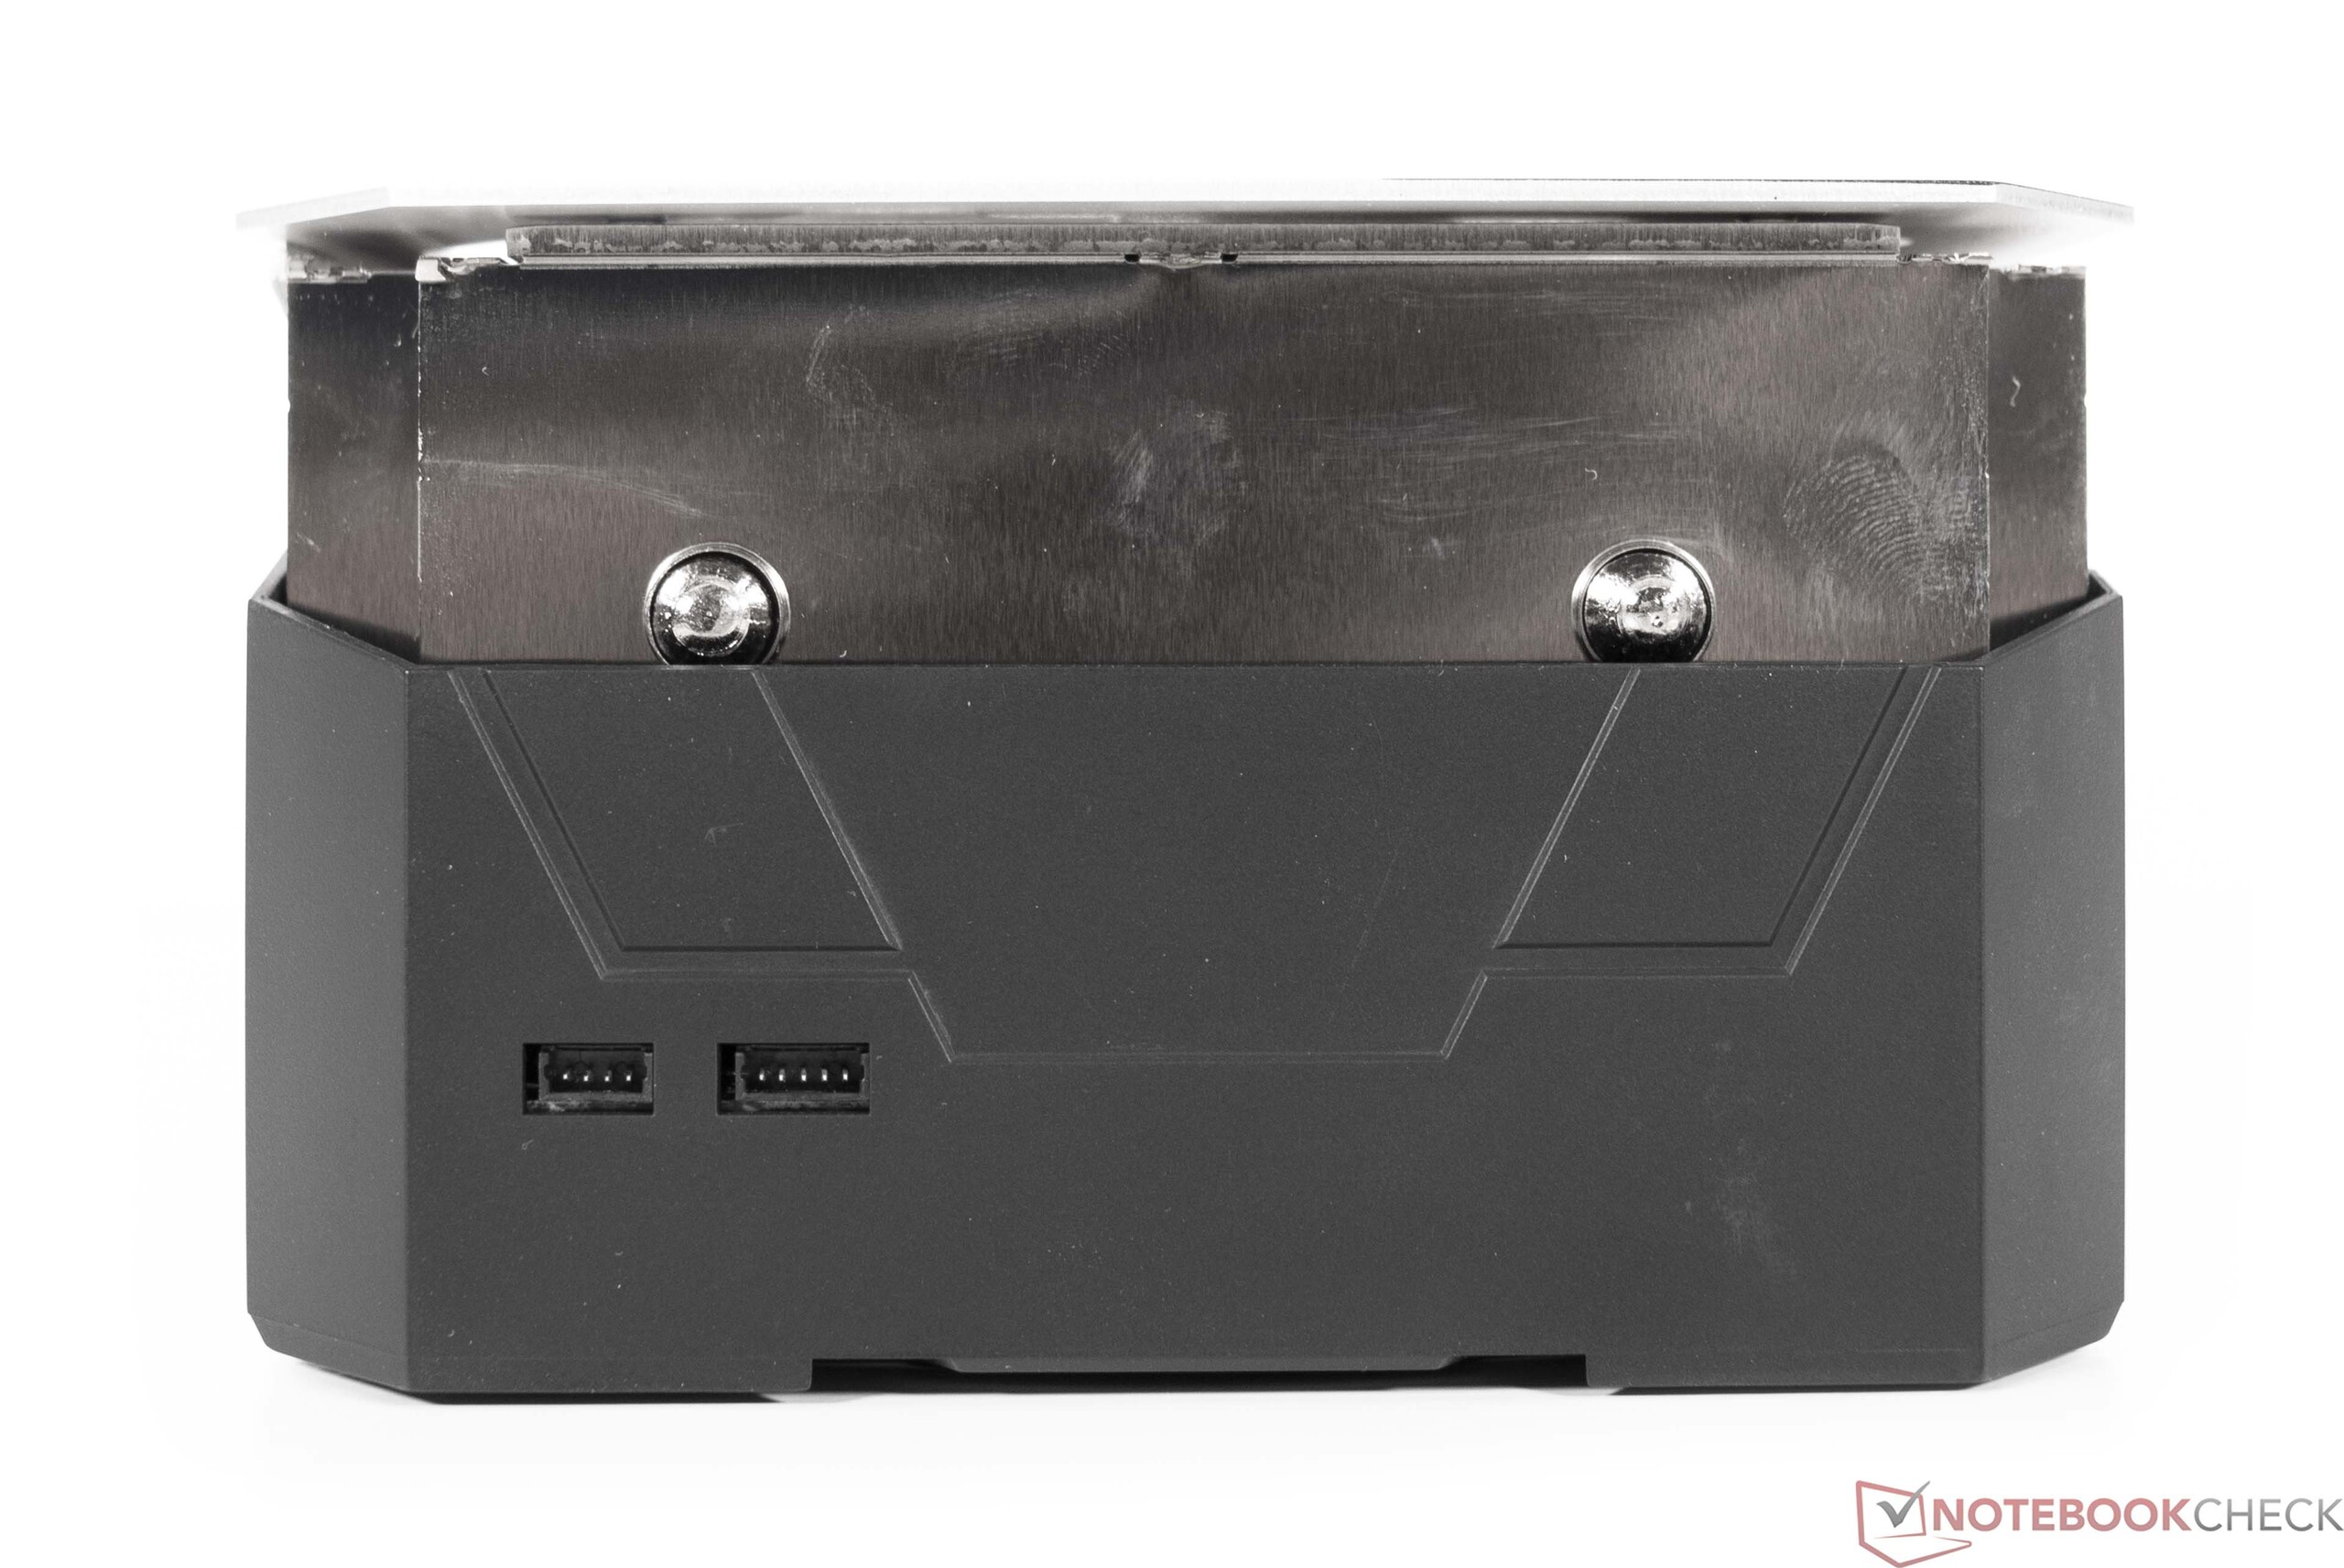
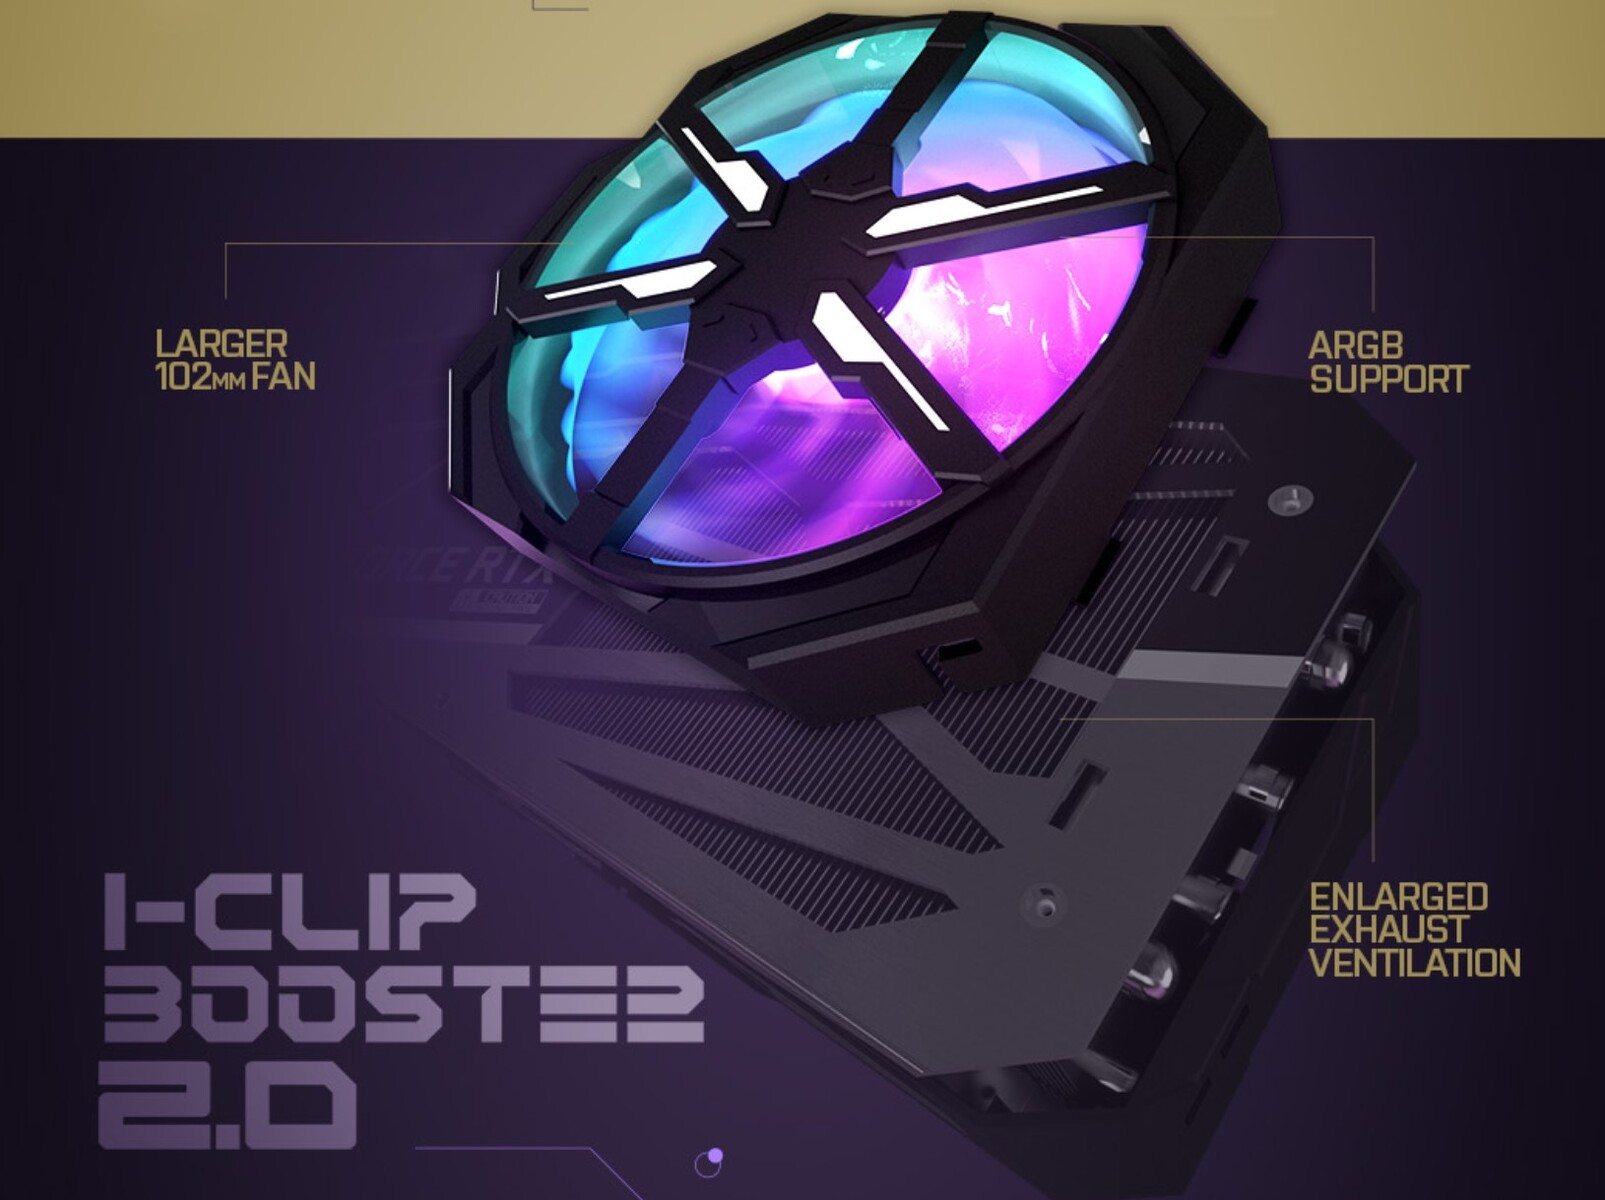
KFA2GeForce RTX 4090 SG使用一个巨大的散热器,带有三个102毫米(约4英寸)的大型轴流风扇。作为选择,你也可以在背面安装一个额外的102毫米的风扇。然而,你必须确保与所使用的主板的兼容性。在我们的案例中,我们无法安装额外的风扇,因为Gigabyte X670E Aorus Master的内存库阻止了这一点。
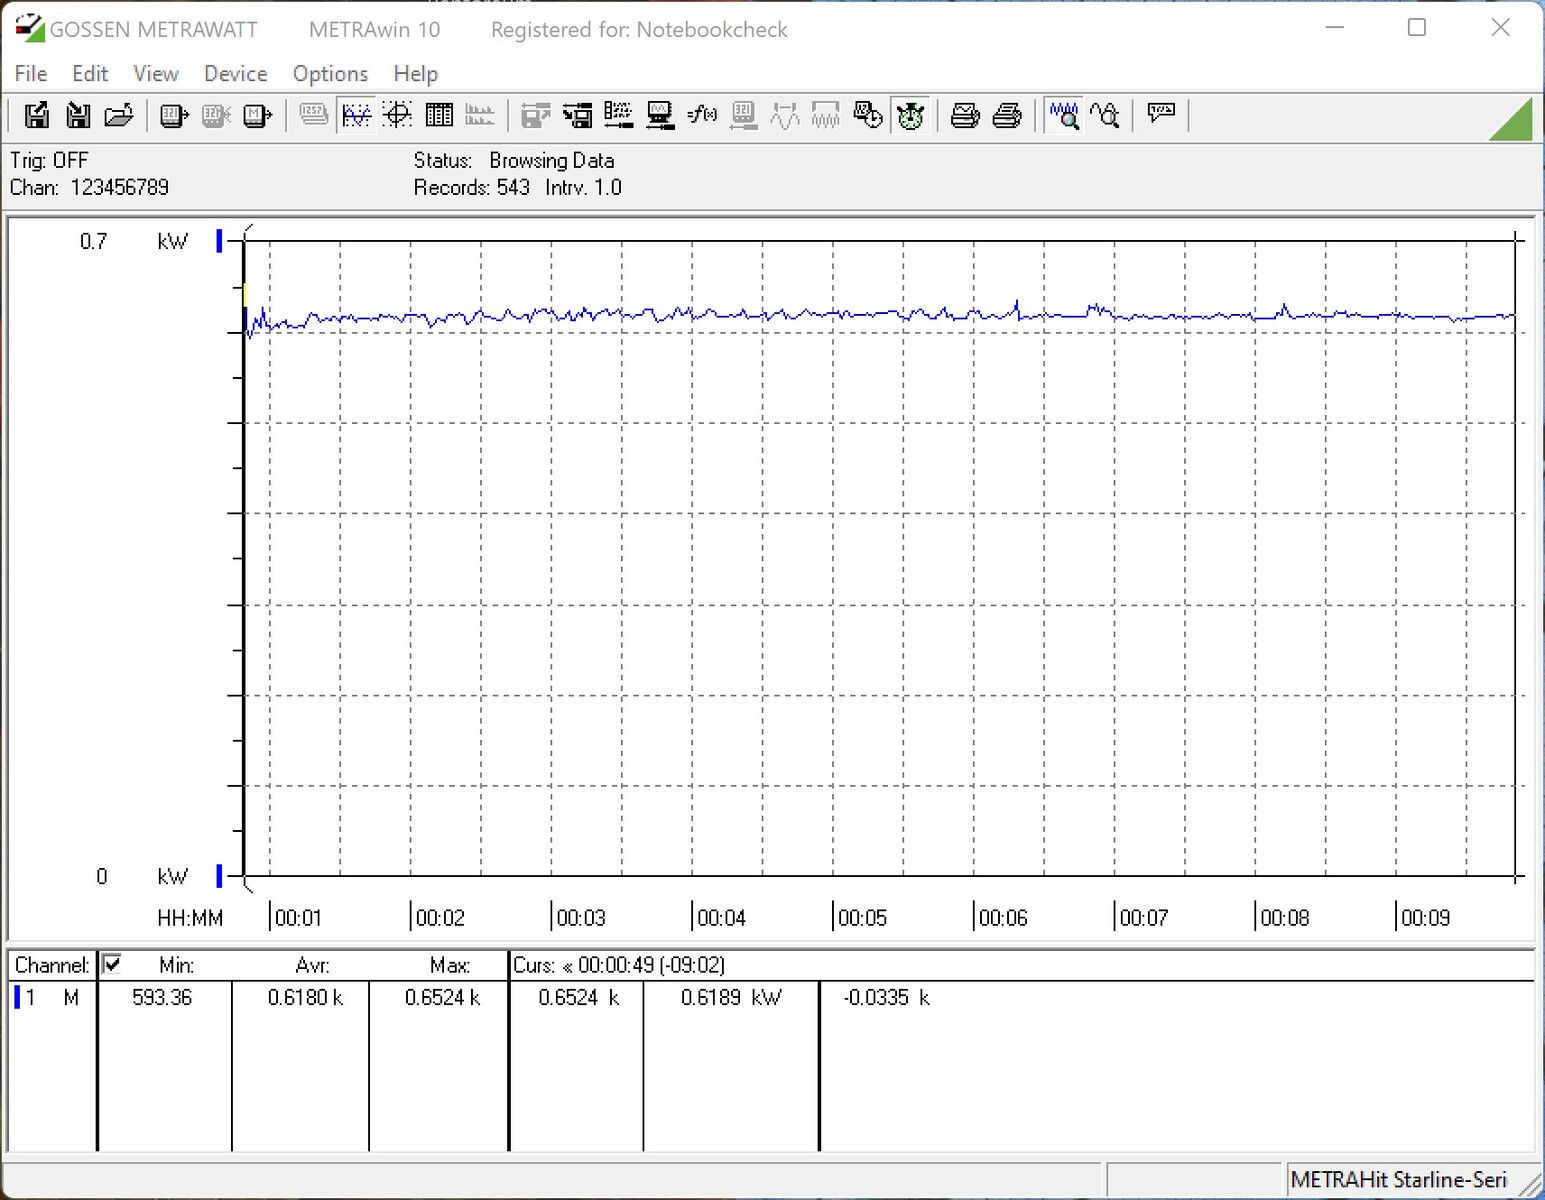
如果我们将其与整个测试系统的功耗相比较,游戏时的功耗约为546瓦特。这只比与NvidiaGeForce RTX 3090 Founders Edition相比略高。同时,我们仍然测量到性能的大幅提高,因此GeForce RTX 4090在每瓦特性能方面领先一大步。我们还为我们的测试系统测量了一些高达700瓦的消耗峰值。 KFA2规定,GeForce RTX 4090 SG的电源容量至少为850瓦。另一方面,其他一些制造商则指定至少1000瓦,在我们看来,这有点太高了。
在12VHPWR连接方面,我们想在此指出,你必须确保插头完全正确地坐落在连接器中。但到目前为止,我们测试的任何RTX-4090型号在这方面都没有问题。
| Power Consumption / The Witcher 3 ultra (external Monitor) | |
| Sapphire AMD Radeon RX 6950 XT Nitro+ Pure | |
| AMD Ryzen 7 5800X3D (Idle: 102 W) | |
| KFA2 GeForce RTX 4090 SG | |
| NVIDIA GeForce RTX 3090 Founders Edition | |
| Palit GeForce RTX 4090 GameRock OC | |
| KFA2 GeForce RTX 3080 SG | |
| AMD Radeon RX 6900 XT (Idle: 99.15 W) | |
| Power Consumption / FurMark 1.19 GPU Stress Test (external Monitor) | |
| KFA2 GeForce RTX 4090 SG | |
| Palit GeForce RTX 4090 GameRock OC | |
| Sapphire AMD Radeon RX 6950 XT Nitro+ Pure | |
| NVIDIA GeForce RTX 3090 Founders Edition | |
| KFA2 GeForce RTX 3080 SG | |
| AMD Radeon RX 6900 XT (Idle: 99.15 W) | |
* ... smaller is better
Power Consumption With External Monitor
Pros
Cons
结论 - 极其强大、安静和凉爽

那些正在寻找最快的显卡的人目前不会绕过NvidiaGeForce RTX 4090。只有在很少的情况下,我们才能发现连续两代产品之间有如此大的性能跳跃。Nvidia还将功耗增加了100瓦,这相当于到目前为止的顶级型号,即 NvidiaGeForce RTX 3090 Ti.然而,我们只是很少遇到GPU的最大值450瓦,这也意味着GeForce RTX 4090目前在所有的游戏中都没有得到充分的使用。KFA2GeForce RTX 4090 SG在这里也不例外,它的性能与我们经常使用的测试装置,即 PalitGeForce RTX 4090 GameRock OC.由于非常大的散热器和三个大风扇,温度始终保持在绿色范围内。像RGB这样的噱头也包括在内,可以使用内部软件轻松控制。风扇也是如此,在2D操作或低负载下甚至保持关闭。
KFA2GeForce RTX 4090 SG是一款非常好的显卡,整个游戏性能非常高,令人印象深刻。一个非常大的散热器,多达四个风扇,以及大量的RGB照明吸引了KFA2模型的注意。
与帕利特的竞争对手相比,一些线圈的啸叫声有点过于明显,而且在主观上更容易听到。然而,我们仍然不会说这是令人讨厌的。虽然你可以对使用的12VHPWR连接有不同的意见,但到目前为止,我们没有遇到任何问题。12VHPWR连接的位置并不理想,因为这个大的适配器,不应该直接弯曲在显卡旁边,在很多情况下会造成一些空间问题。
RTX 4090目前没有任何直接的竞争对手,现在只剩下不同的制造商之间的竞争。根据他们自己的公告,KFA2与华硕的Strix型号和微星的Suprim X型号竞争。如果你看一下直接的性能数据,在性能技术方面,这里没有明显的优势。这意味着,目前,制造商只能以性能、视觉效果和价格的程度吸引一些注意力。AMD目前无法跟上其顶级型号,我们必须耐心等待,直到AMD Radeon RX 7900 XTX的出现。
价格和可用性
目前显卡的供应没有问题(在德国),即使价格与Nvidia指定的建议零售价(1949欧元,约2018美元)相比要高得多。例如,KFA2GeForce RTX 4090 SG目前在亚马逊(在德国)的售价为2749欧元。它在美国似乎更难找到:虽然它在亚马逊没有上市,而且Ebay显示它 "售罄",但一家在线折扣店显示它以1400美元出售。它似乎在一些市场上以 "Galax "品牌出售。
透明度
Notebookcheck获得了KFA2GeForce RTX 4090 SG,作为本次测试的借阅机。在发表之前,制造商没有收到完成审查的版本。

