




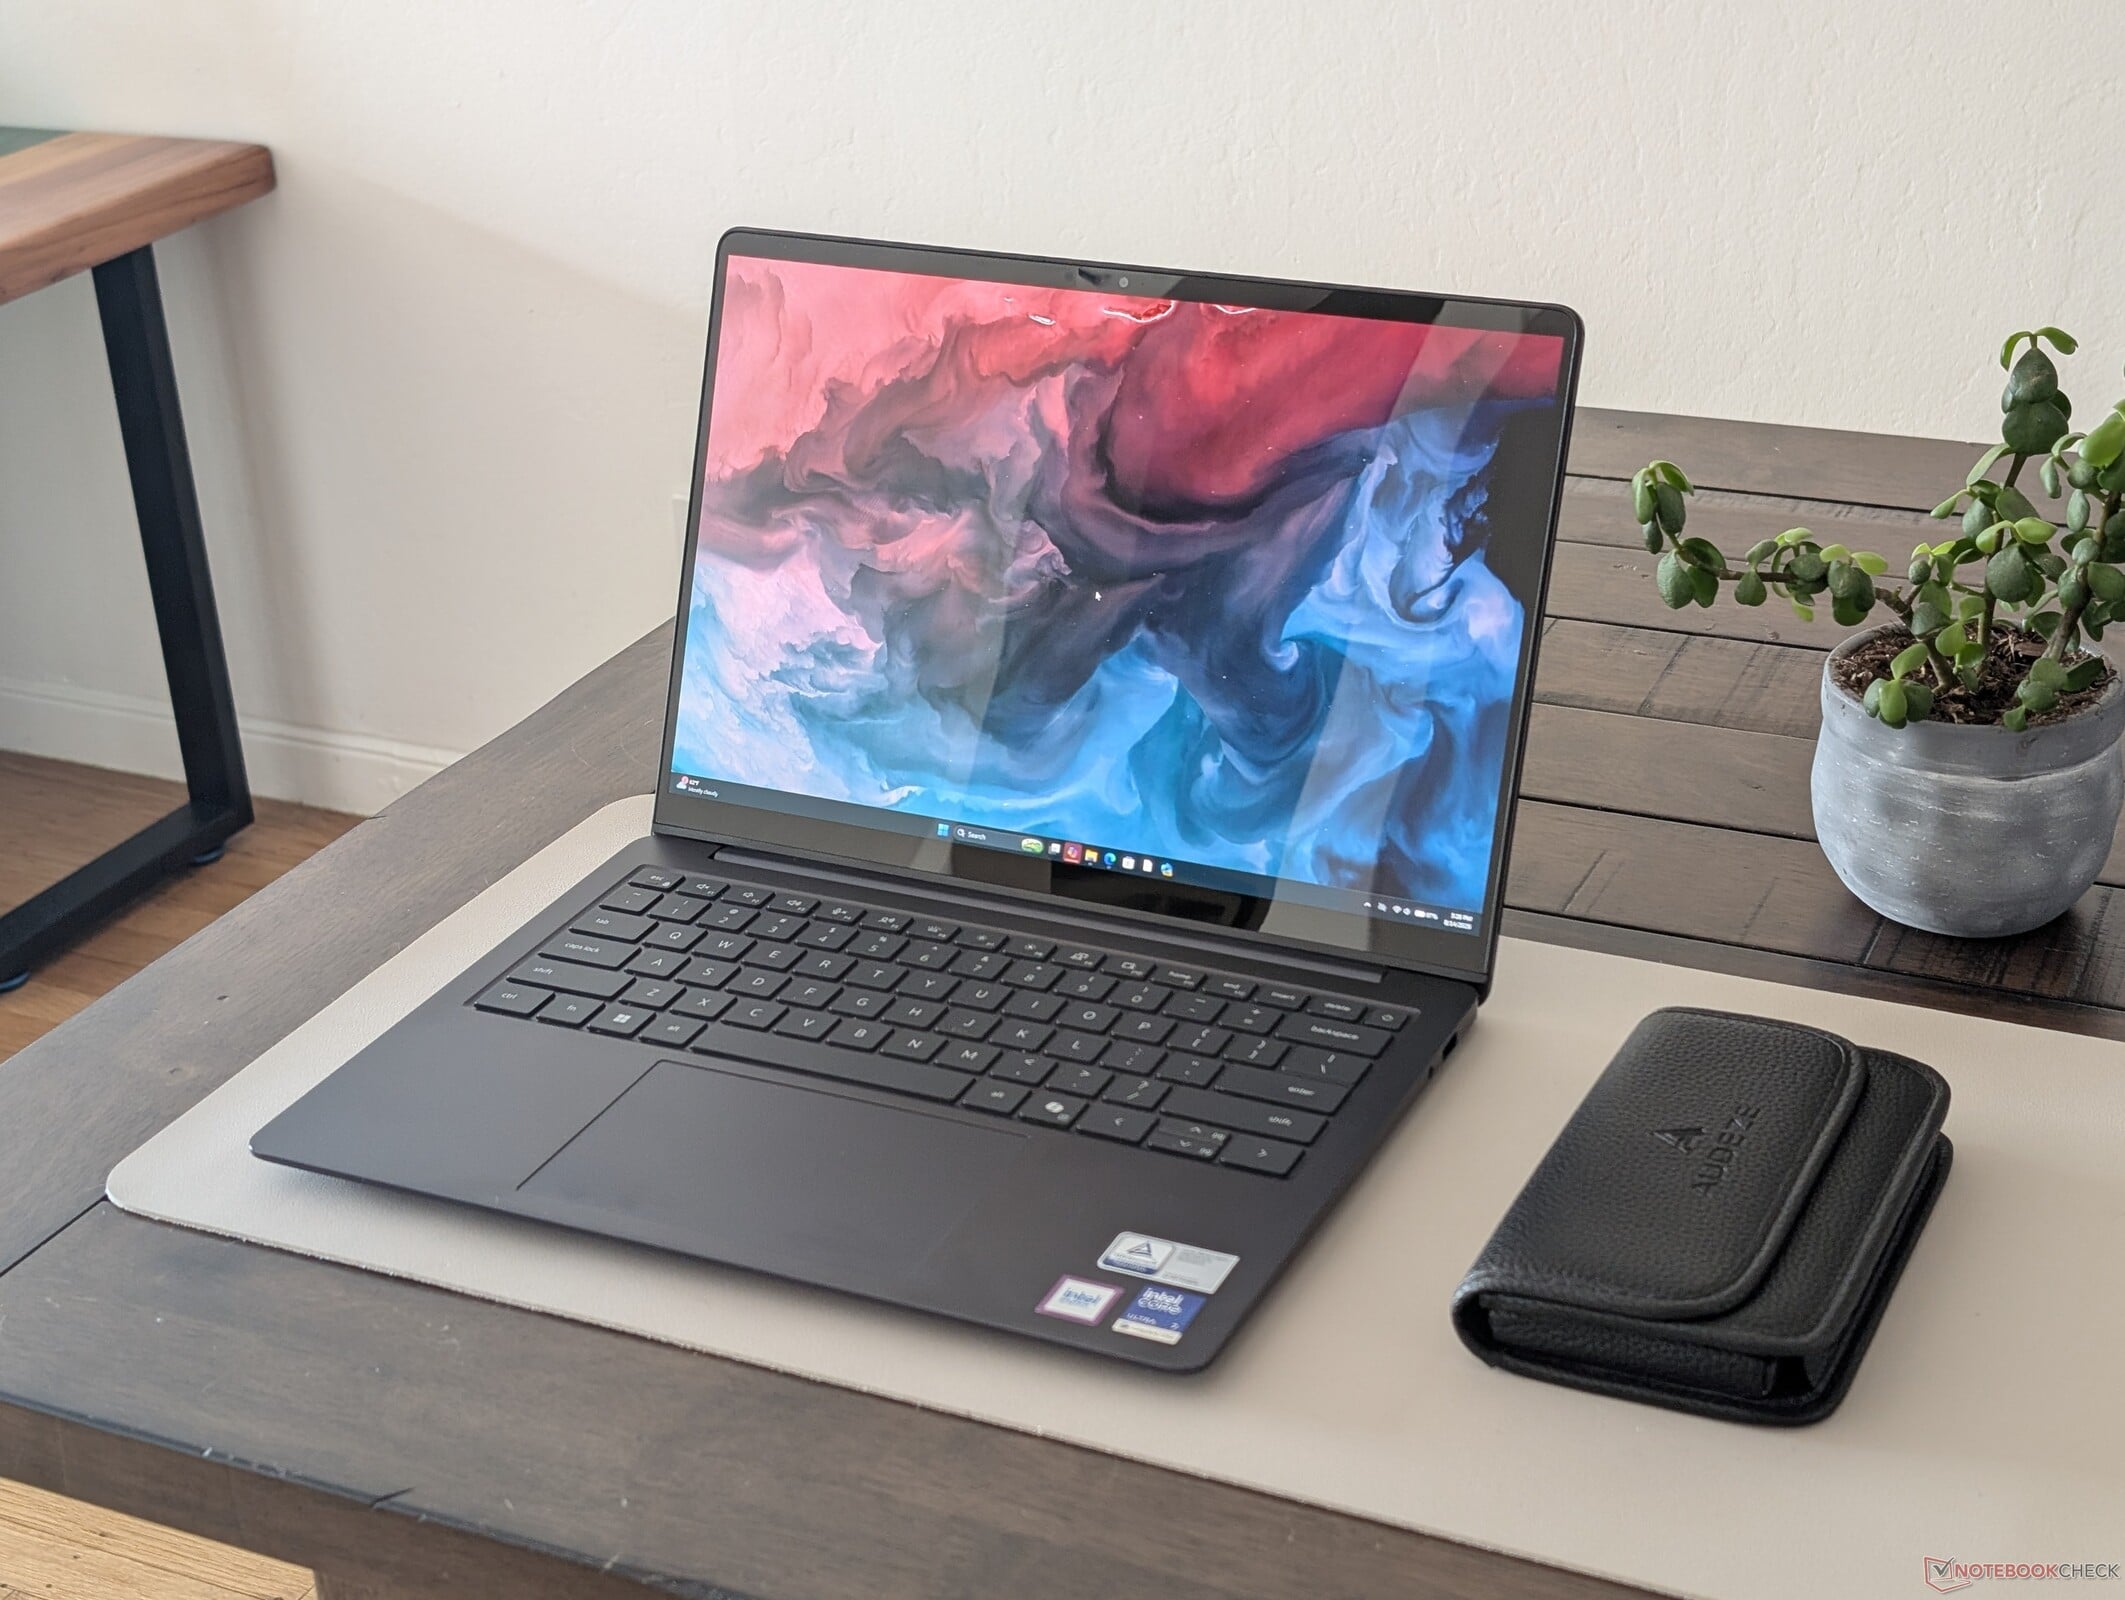
结论——外观和手感都比以前好多了
在我们对戴尔 14 Plus 的评测中,我们盛赞其得益于 Lunar Lake 平台带来的高效性能和相对实惠的价格,同时也批评了其沿袭自 Inspiron 时代的陈旧设计。至于戴尔 14S,制造商更新了机身设计,采用了更多金属材质,相比上一代机型,给人的第一印象更强,质感也更显高端。 可以说,全新的设计是戴尔 14S 的主要卖点之一,因为 Core Ultra 7 355 的原始性能与去年戴尔 14 Plus 搭载的 Lunar Lake Core Ultra 7 256V 相当接近。追求更高性能的用户不妨考虑 Core Ultra X7 配置。
为了更好地将主流机型戴尔 14S 与 XPS 14 等更昂贵的旗舰机型区分开来,戴尔 14S 最多仅配备中端显示屏。 例如,OLED选项仅支持60 Hz刷新率,亮度仅为XPS 14上OLED面板的一半,与华硕ExpertBook Ultra 14相比甚至更暗。虽然提供120 Hz选项,但该选项绑定在IPS面板上,这意味着用户必须以牺牲画质为代价来换取更流畅的刷新率。 此外,该机型是14英寸翻盖式笔记本中较重的一款,而像联想Yoga Slim 7 Ultra 14IPH11这样的竞品则轻了500克以上。重视HDR支持和便携性的用户不妨考虑此类替代产品。
Pros
Cons

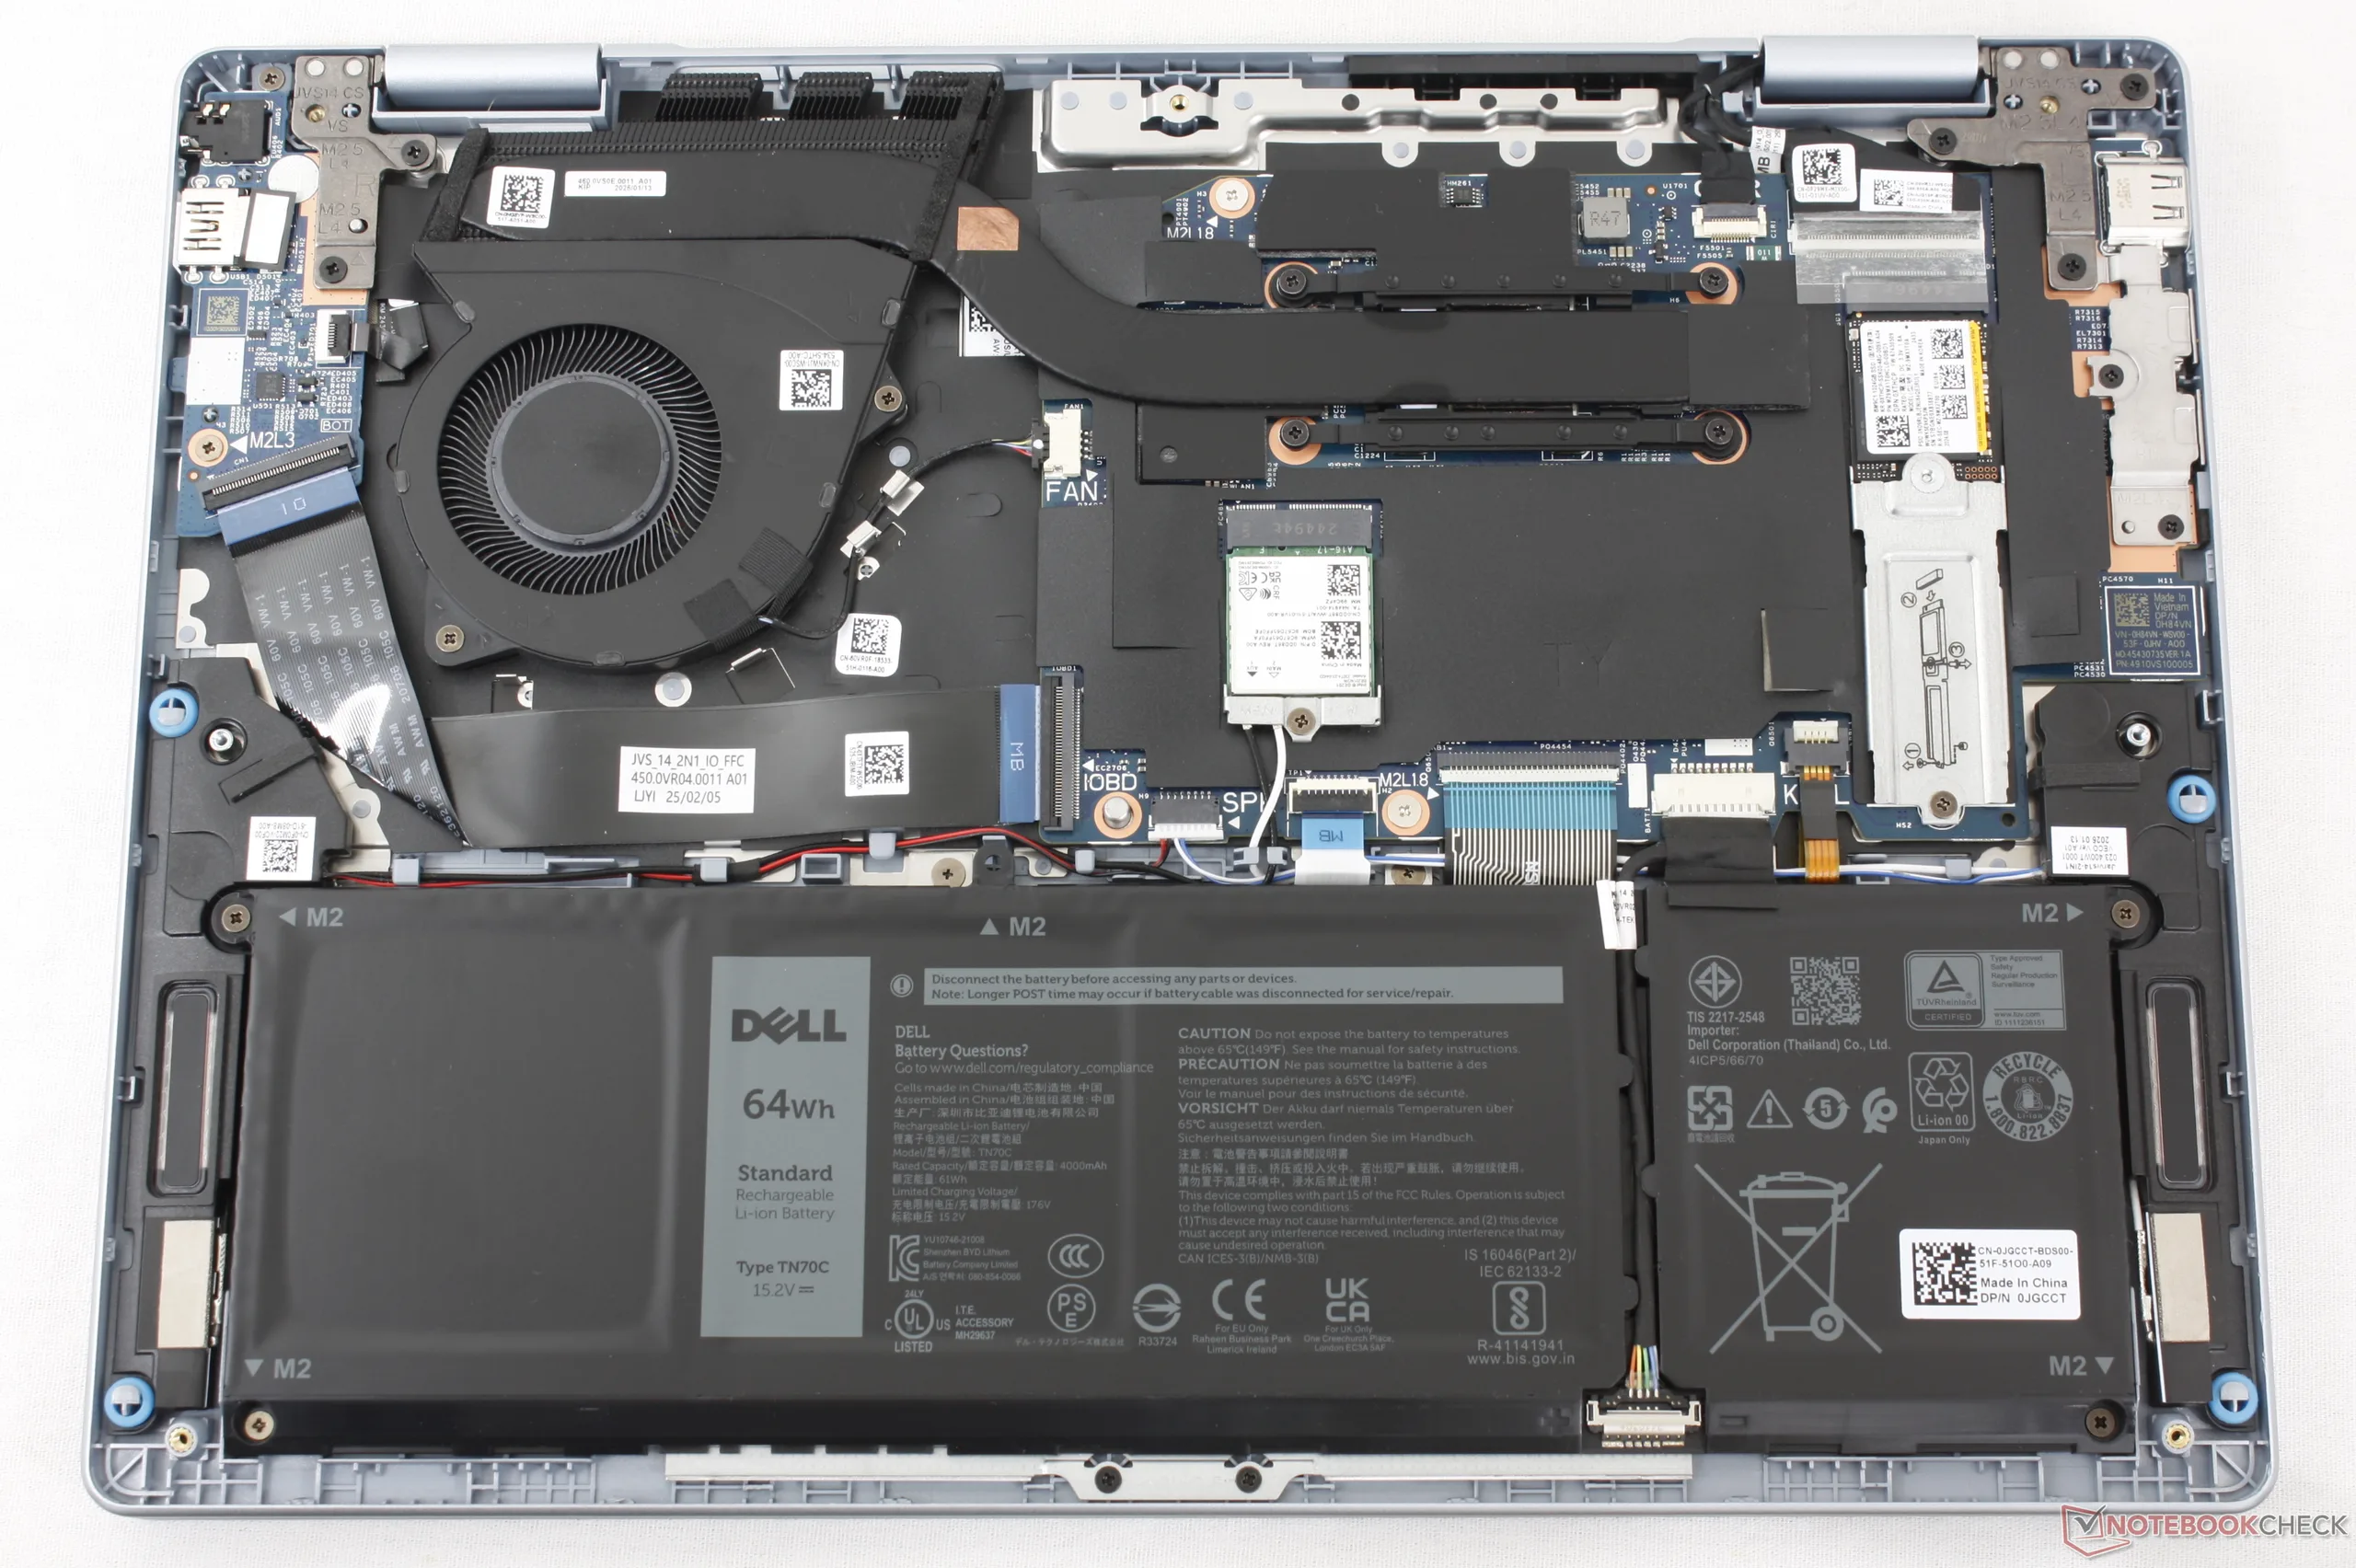
戴尔 14S 是该厂商最新推出的中端笔记本电脑,也是去年戴尔 14 Plus 的直接继任者。其机身采用了更坚固的金属材质进行升级,同时配备了比之前更大的风扇和电池组。
我们测试的这台是中端配置机型,搭载Core Ultra 7 355 Panther Lake处理器和1200p 60 Hz OLED触摸屏,售价约为1500美元。 更高价位的机型可能配备分辨率更高的 IPS 面板,或搭载速度显著更快的 Core Ultra X7 358H 处理器;而低端机型则采用 Core Ultra 5 322 处理器和 1200p IPS 非触控显示屏。
戴尔 14S 的替代产品包括其他中端多媒体超便携笔记本电脑,例如华硕 VivoBook S 14、惠普 OmniBook 7 系列或联想 IdeaPad Slim 系列。 该机型还有一款名为戴尔 16S 的 16 英寸版本。
更多戴尔评测:
规格
案例
连接性
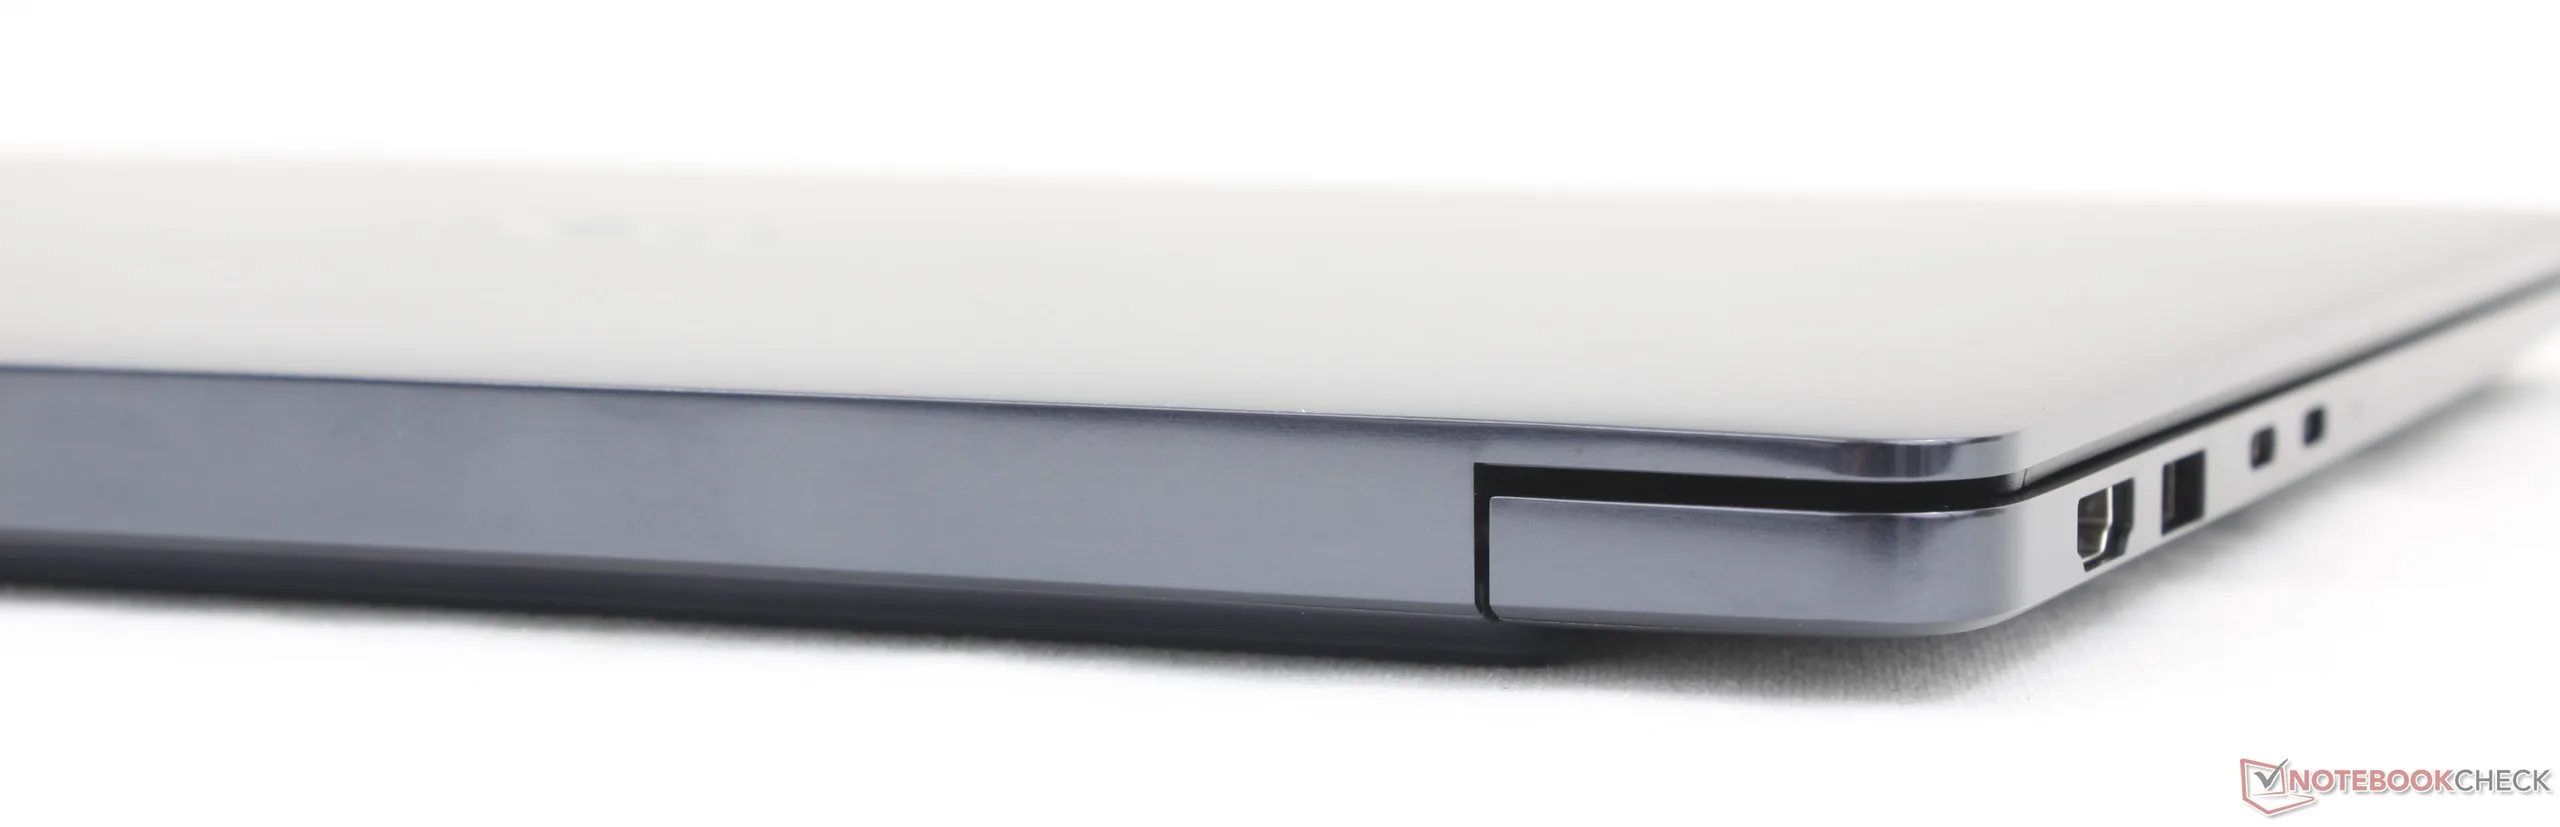
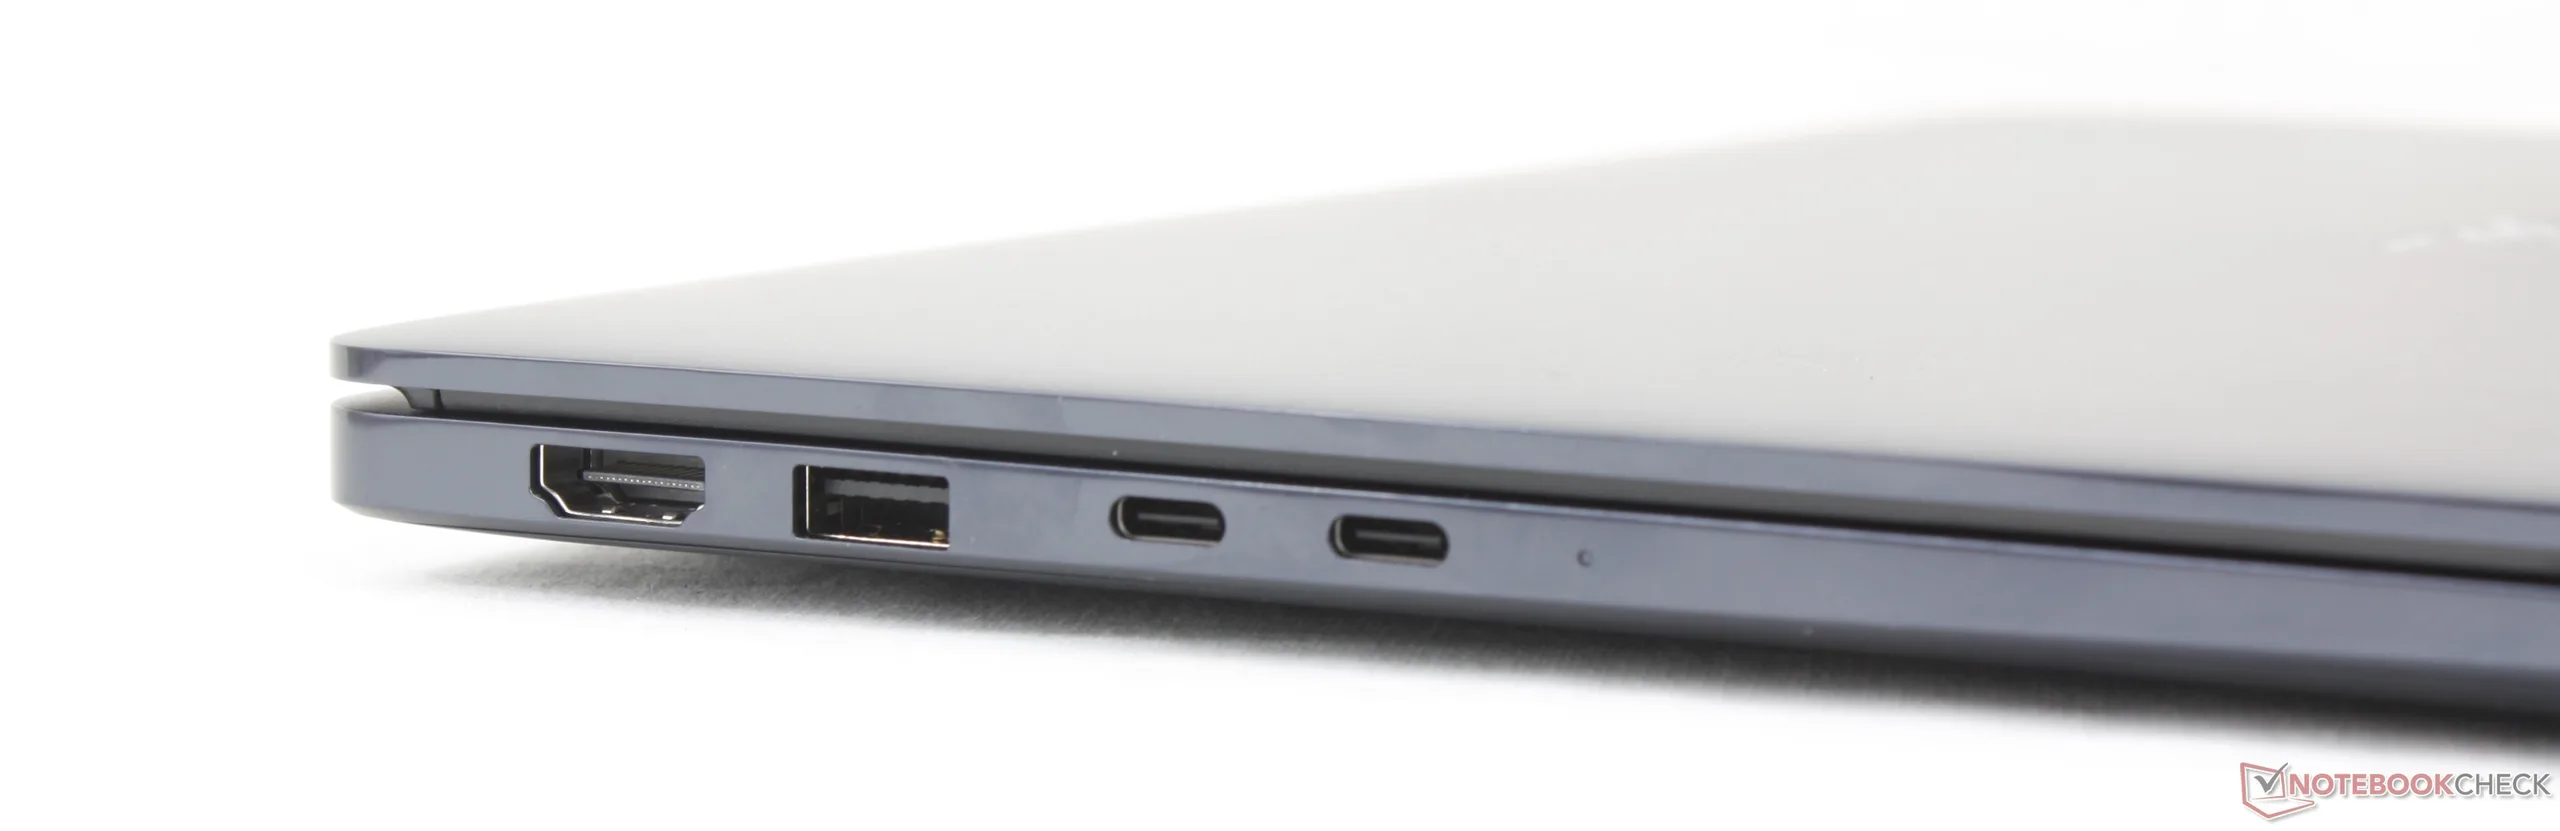
沟通
| Networking | |
| iperf3 transmit Wi-Fi6/7 RT-BE96U | |
| Lenovo ThinkBook 14 G9 IPL 21UX005PGE | |
| iperf3 receive Wi-Fi6/7 RT-BE96U | |
| Lenovo ThinkBook 14 G9 IPL 21UX005PGE | |
| iperf3 receive AXE11000 6GHz | |
| Dell XPS 14 Core Ultra X7 358H | |
| HP OmniBook Ultra 14 Core Ultra X9 | |
| Dell 14S DS14260 | |
| Dell Inspiron 14 7445 2-in-1 | |
| iperf3 transmit AXE11000 6GHz | |
| Dell 14S DS14260 | |
| HP OmniBook Ultra 14 Core Ultra X9 | |
| Dell XPS 14 Core Ultra X7 358H | |
| Dell Inspiron 14 7445 2-in-1 | |
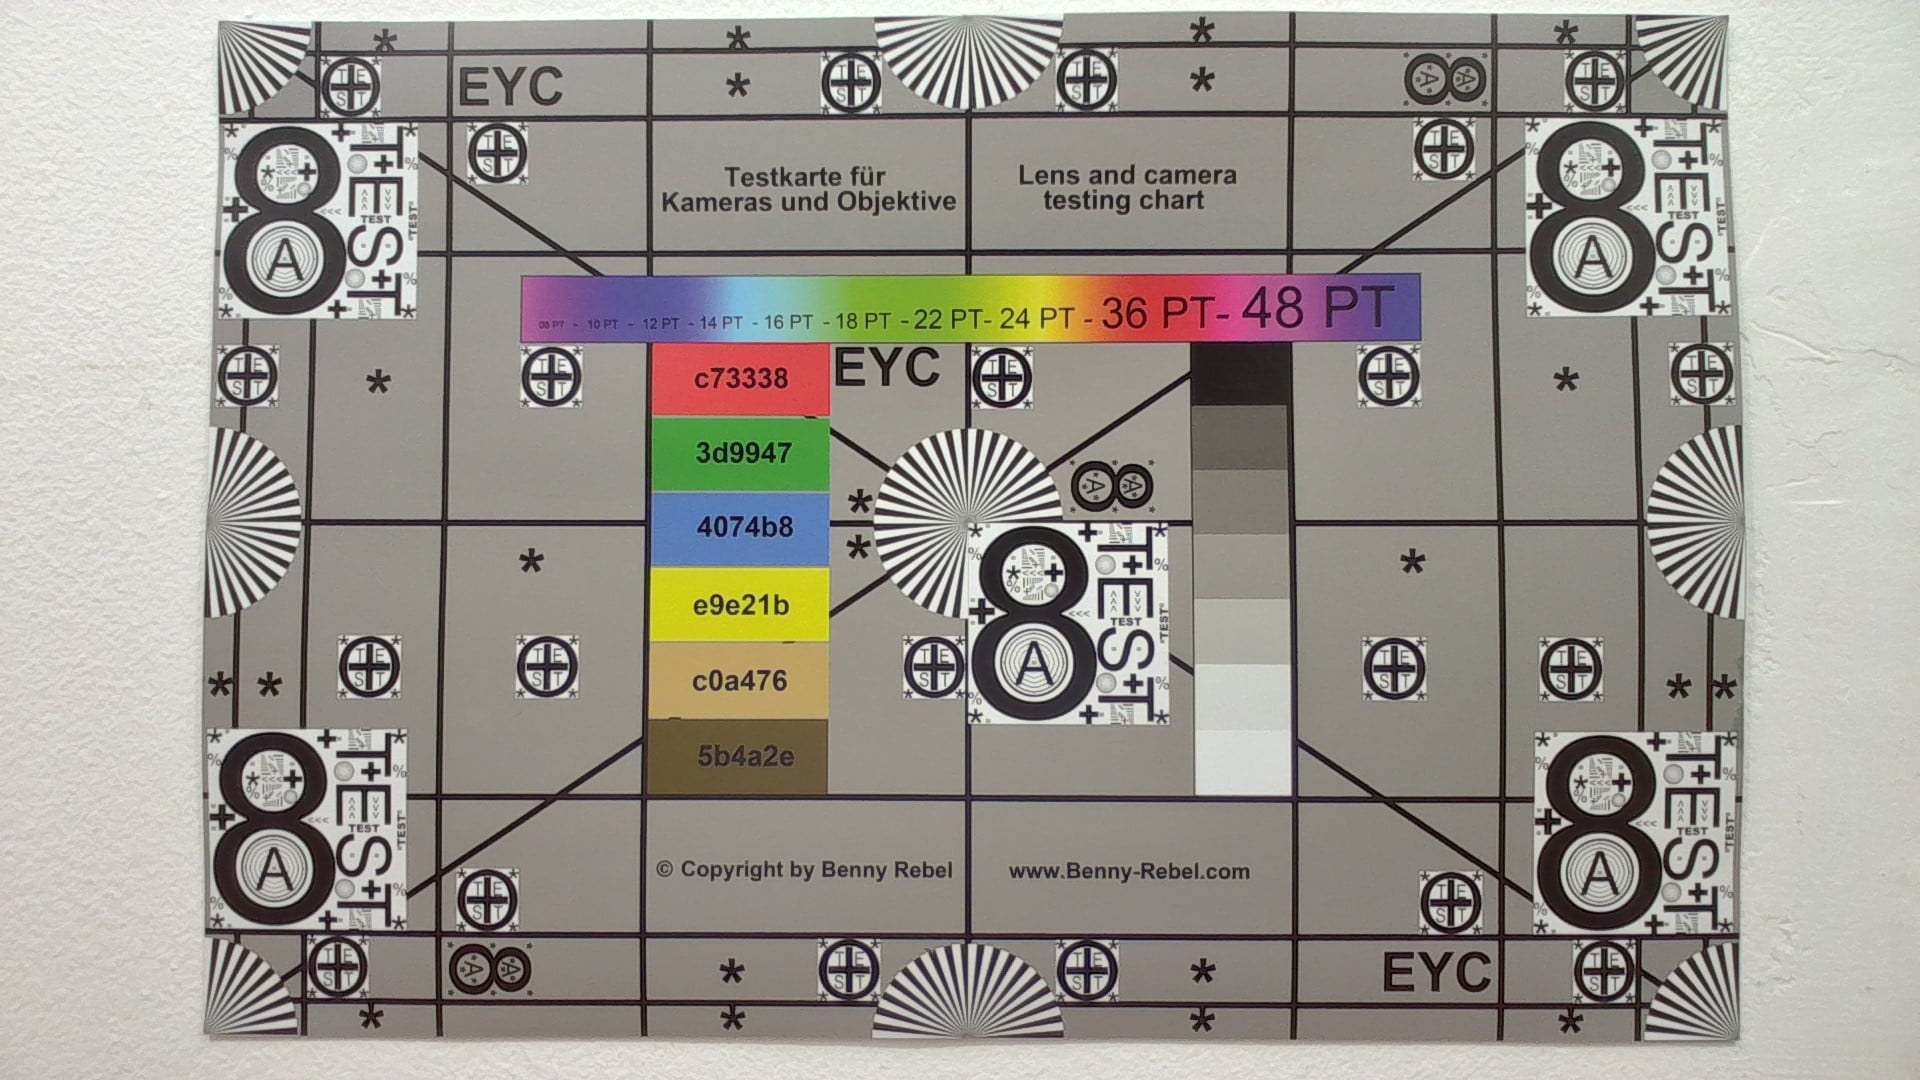
网络摄像头


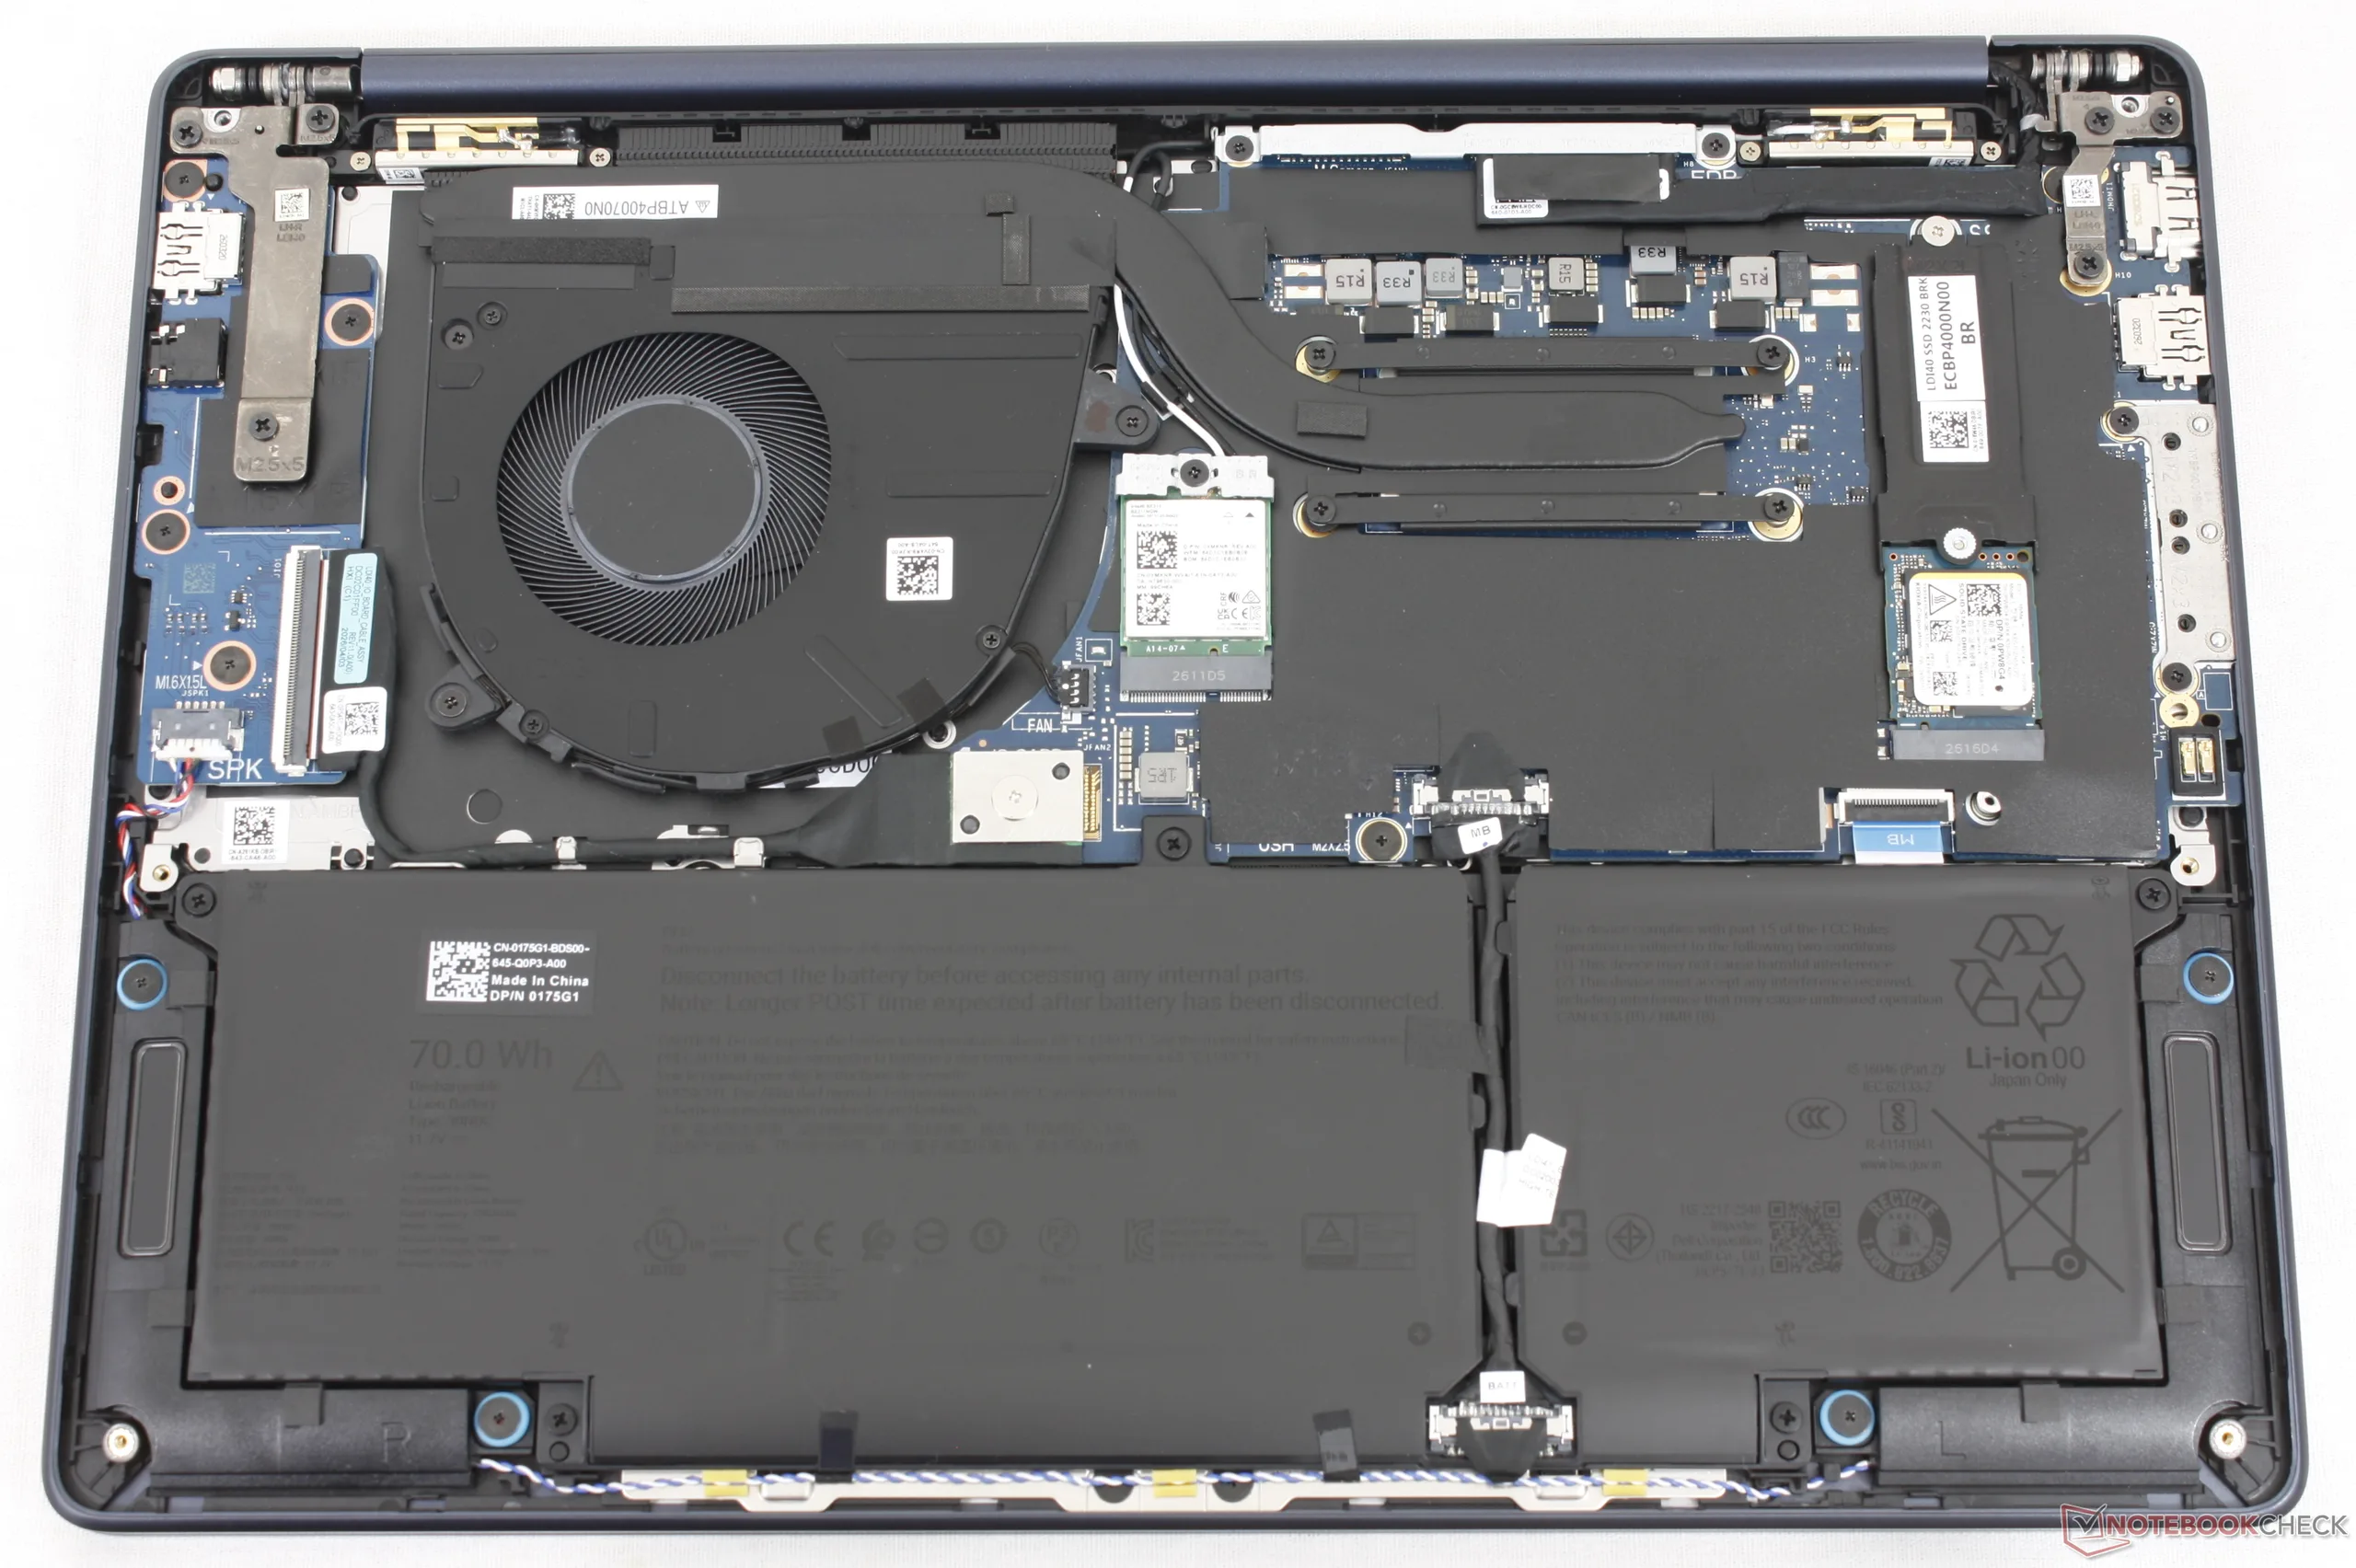
维护
可持续发展
机身、边框和扬声器中PCC塑料的使用比例最高可达50%,而外壳、掌托、键盘支架和电池中分别使用了最高50%的再生铝、钢和钴。包装不含塑料。
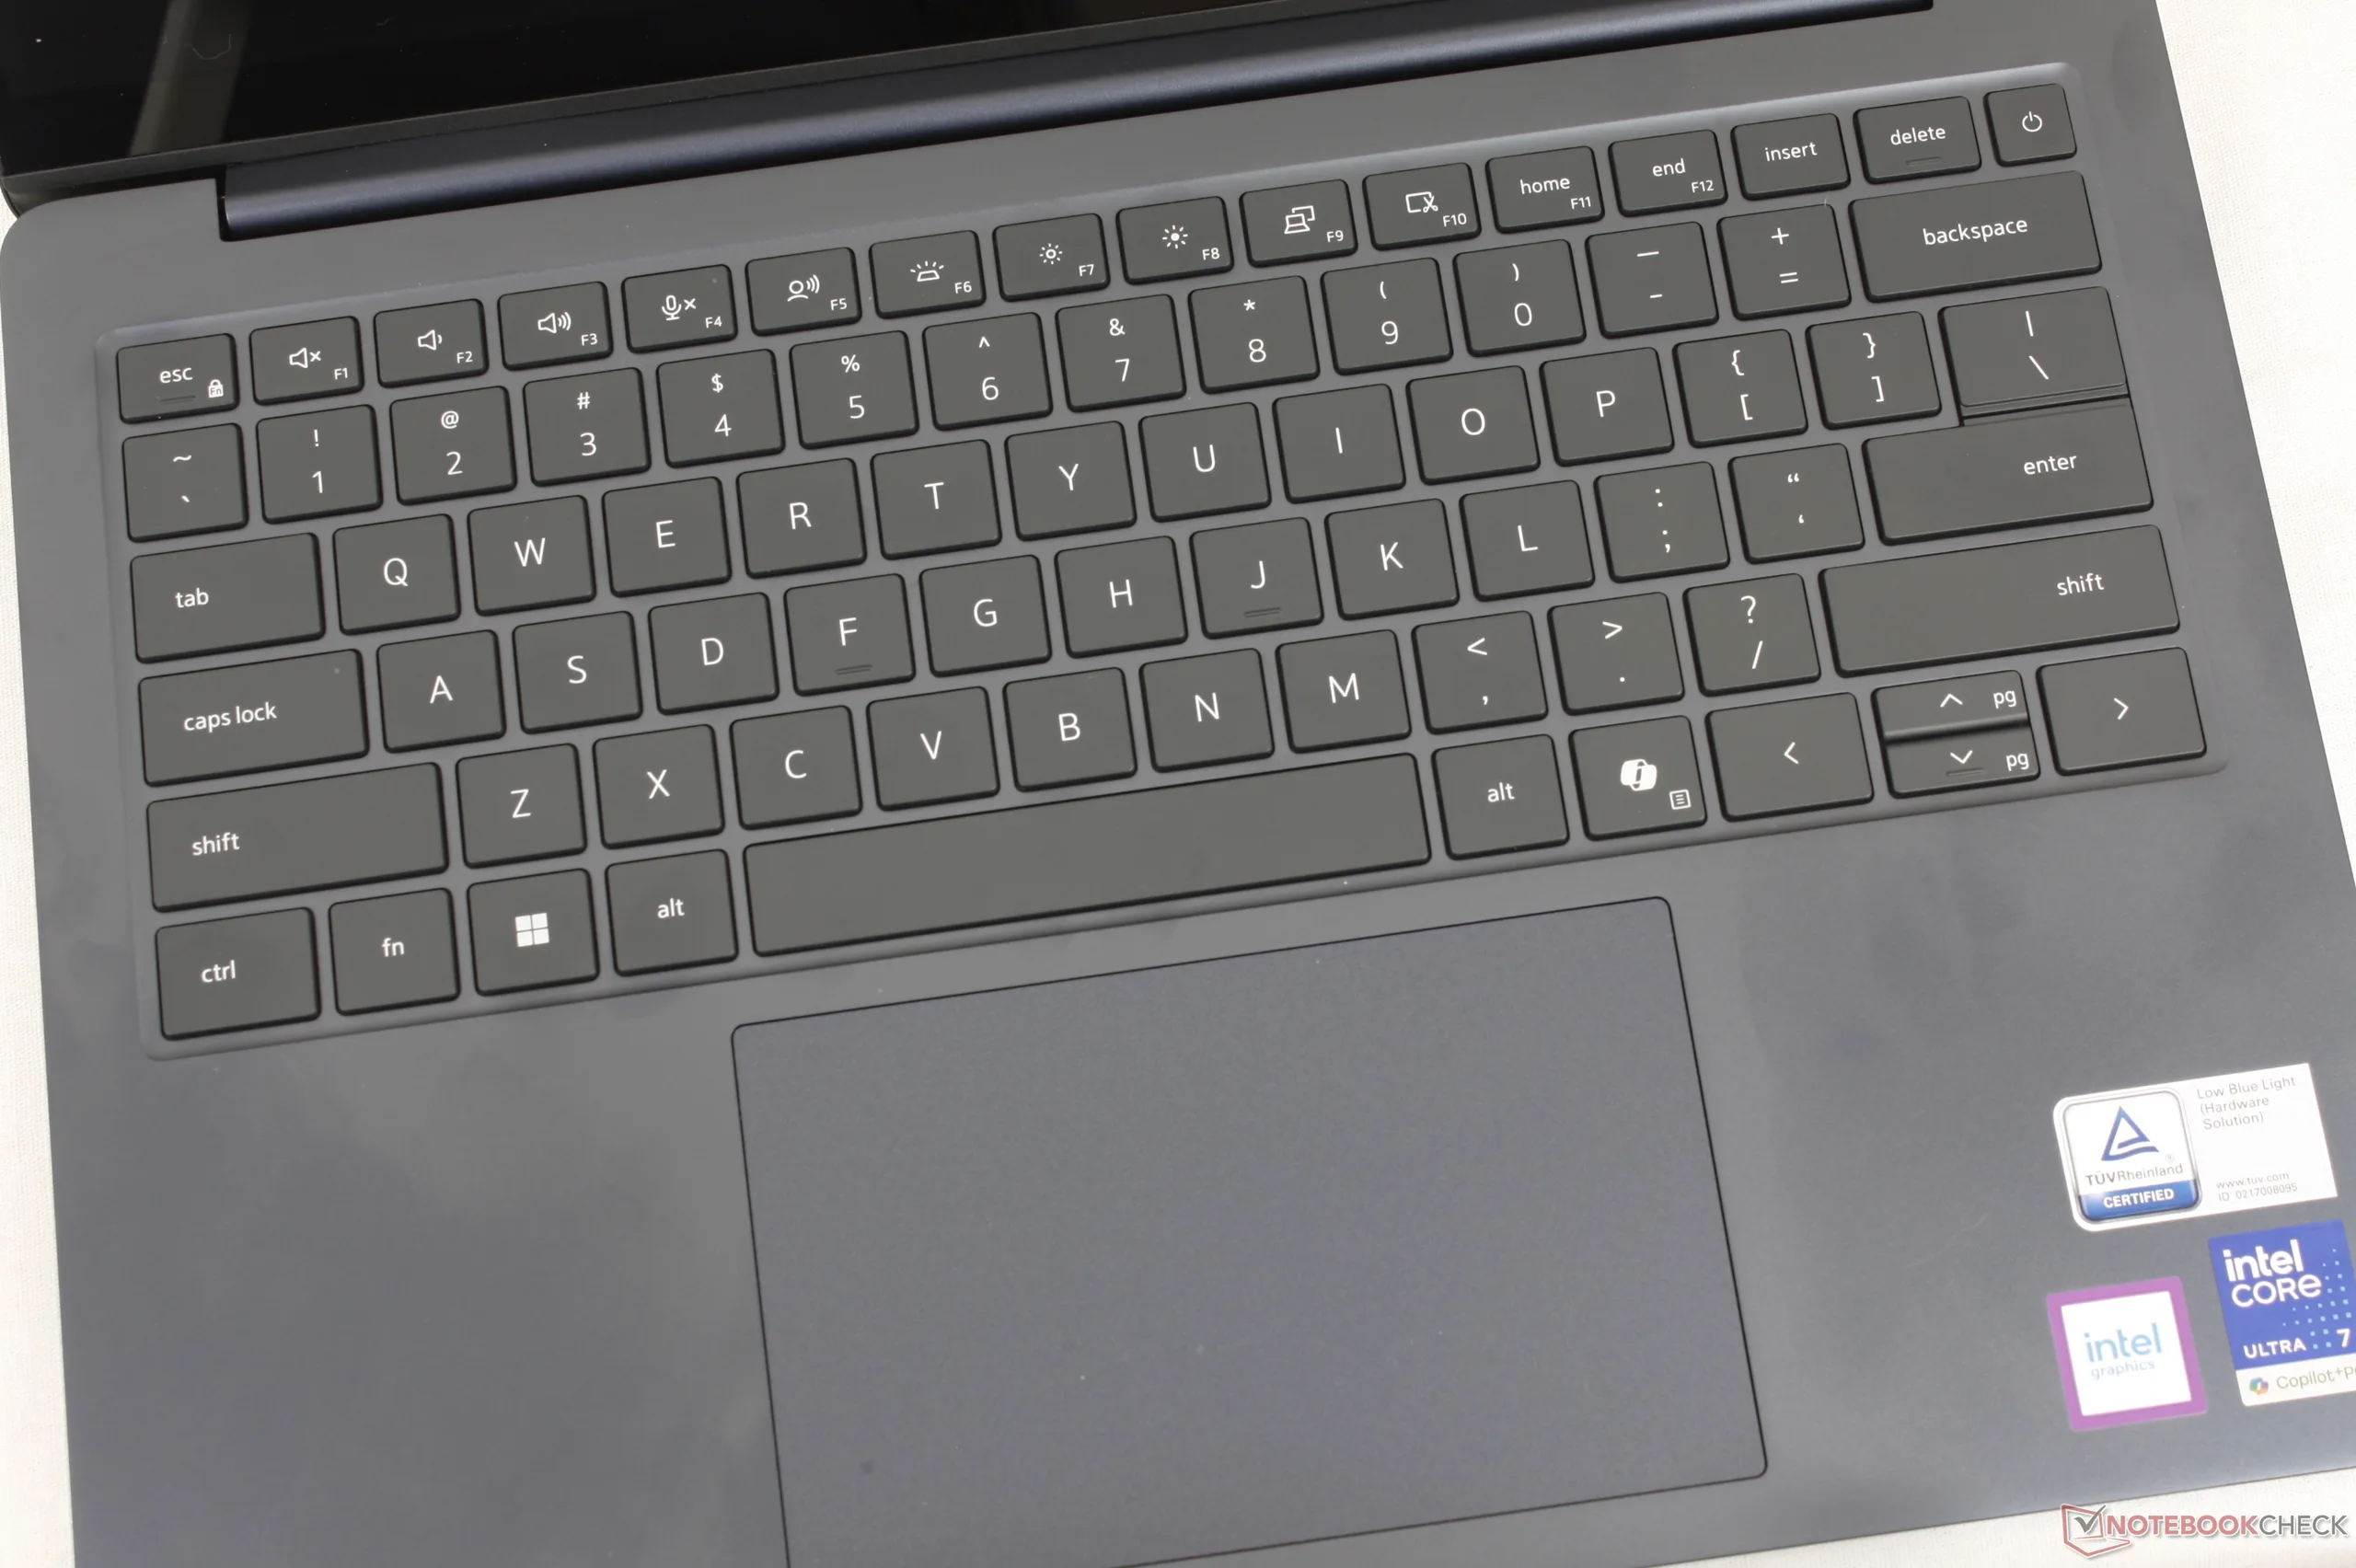
输入设备
显示

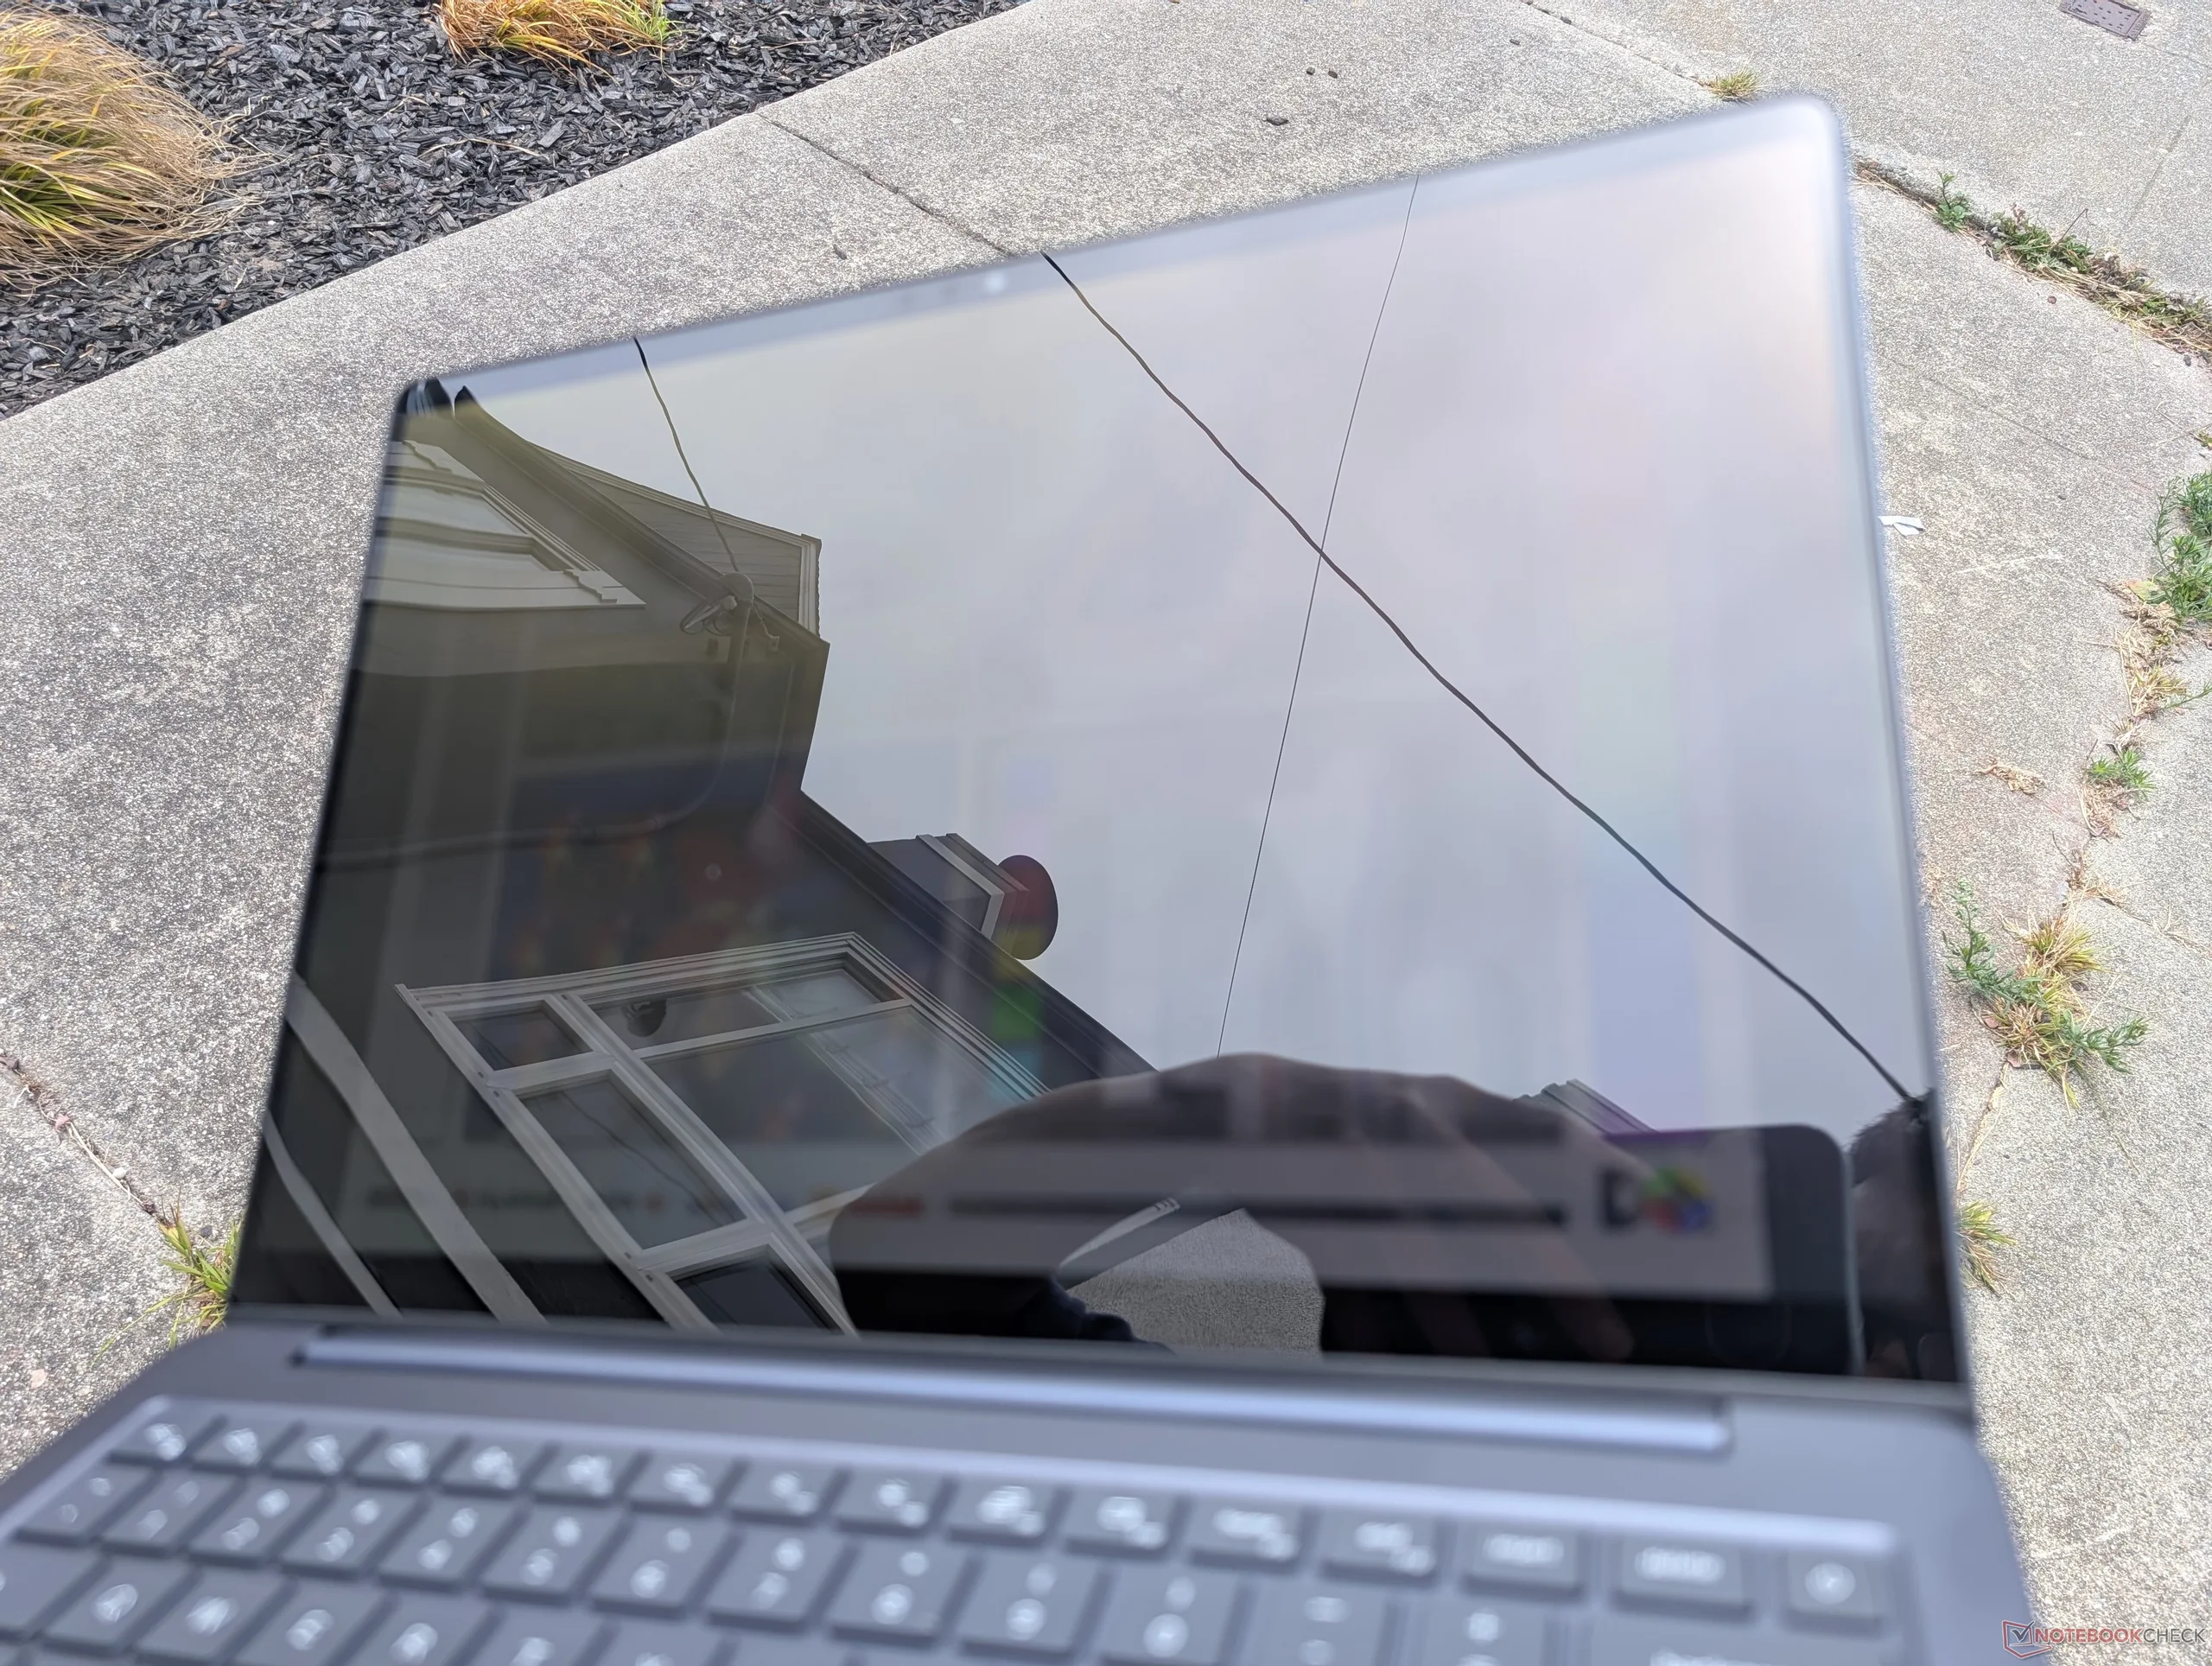
提供以下五种显示选项:
- 1920 x 1200,60 Hz,非触控,约60% sRGB,哑光屏,IPS,400尼特
- 1920 x 1200,60 Hz,触摸屏,约60% sRGB,镜面屏,IPS,400尼特
- 2560 x 1600,120 Hz,非触控,100% sRGB,哑光屏,IPS,500 尼特
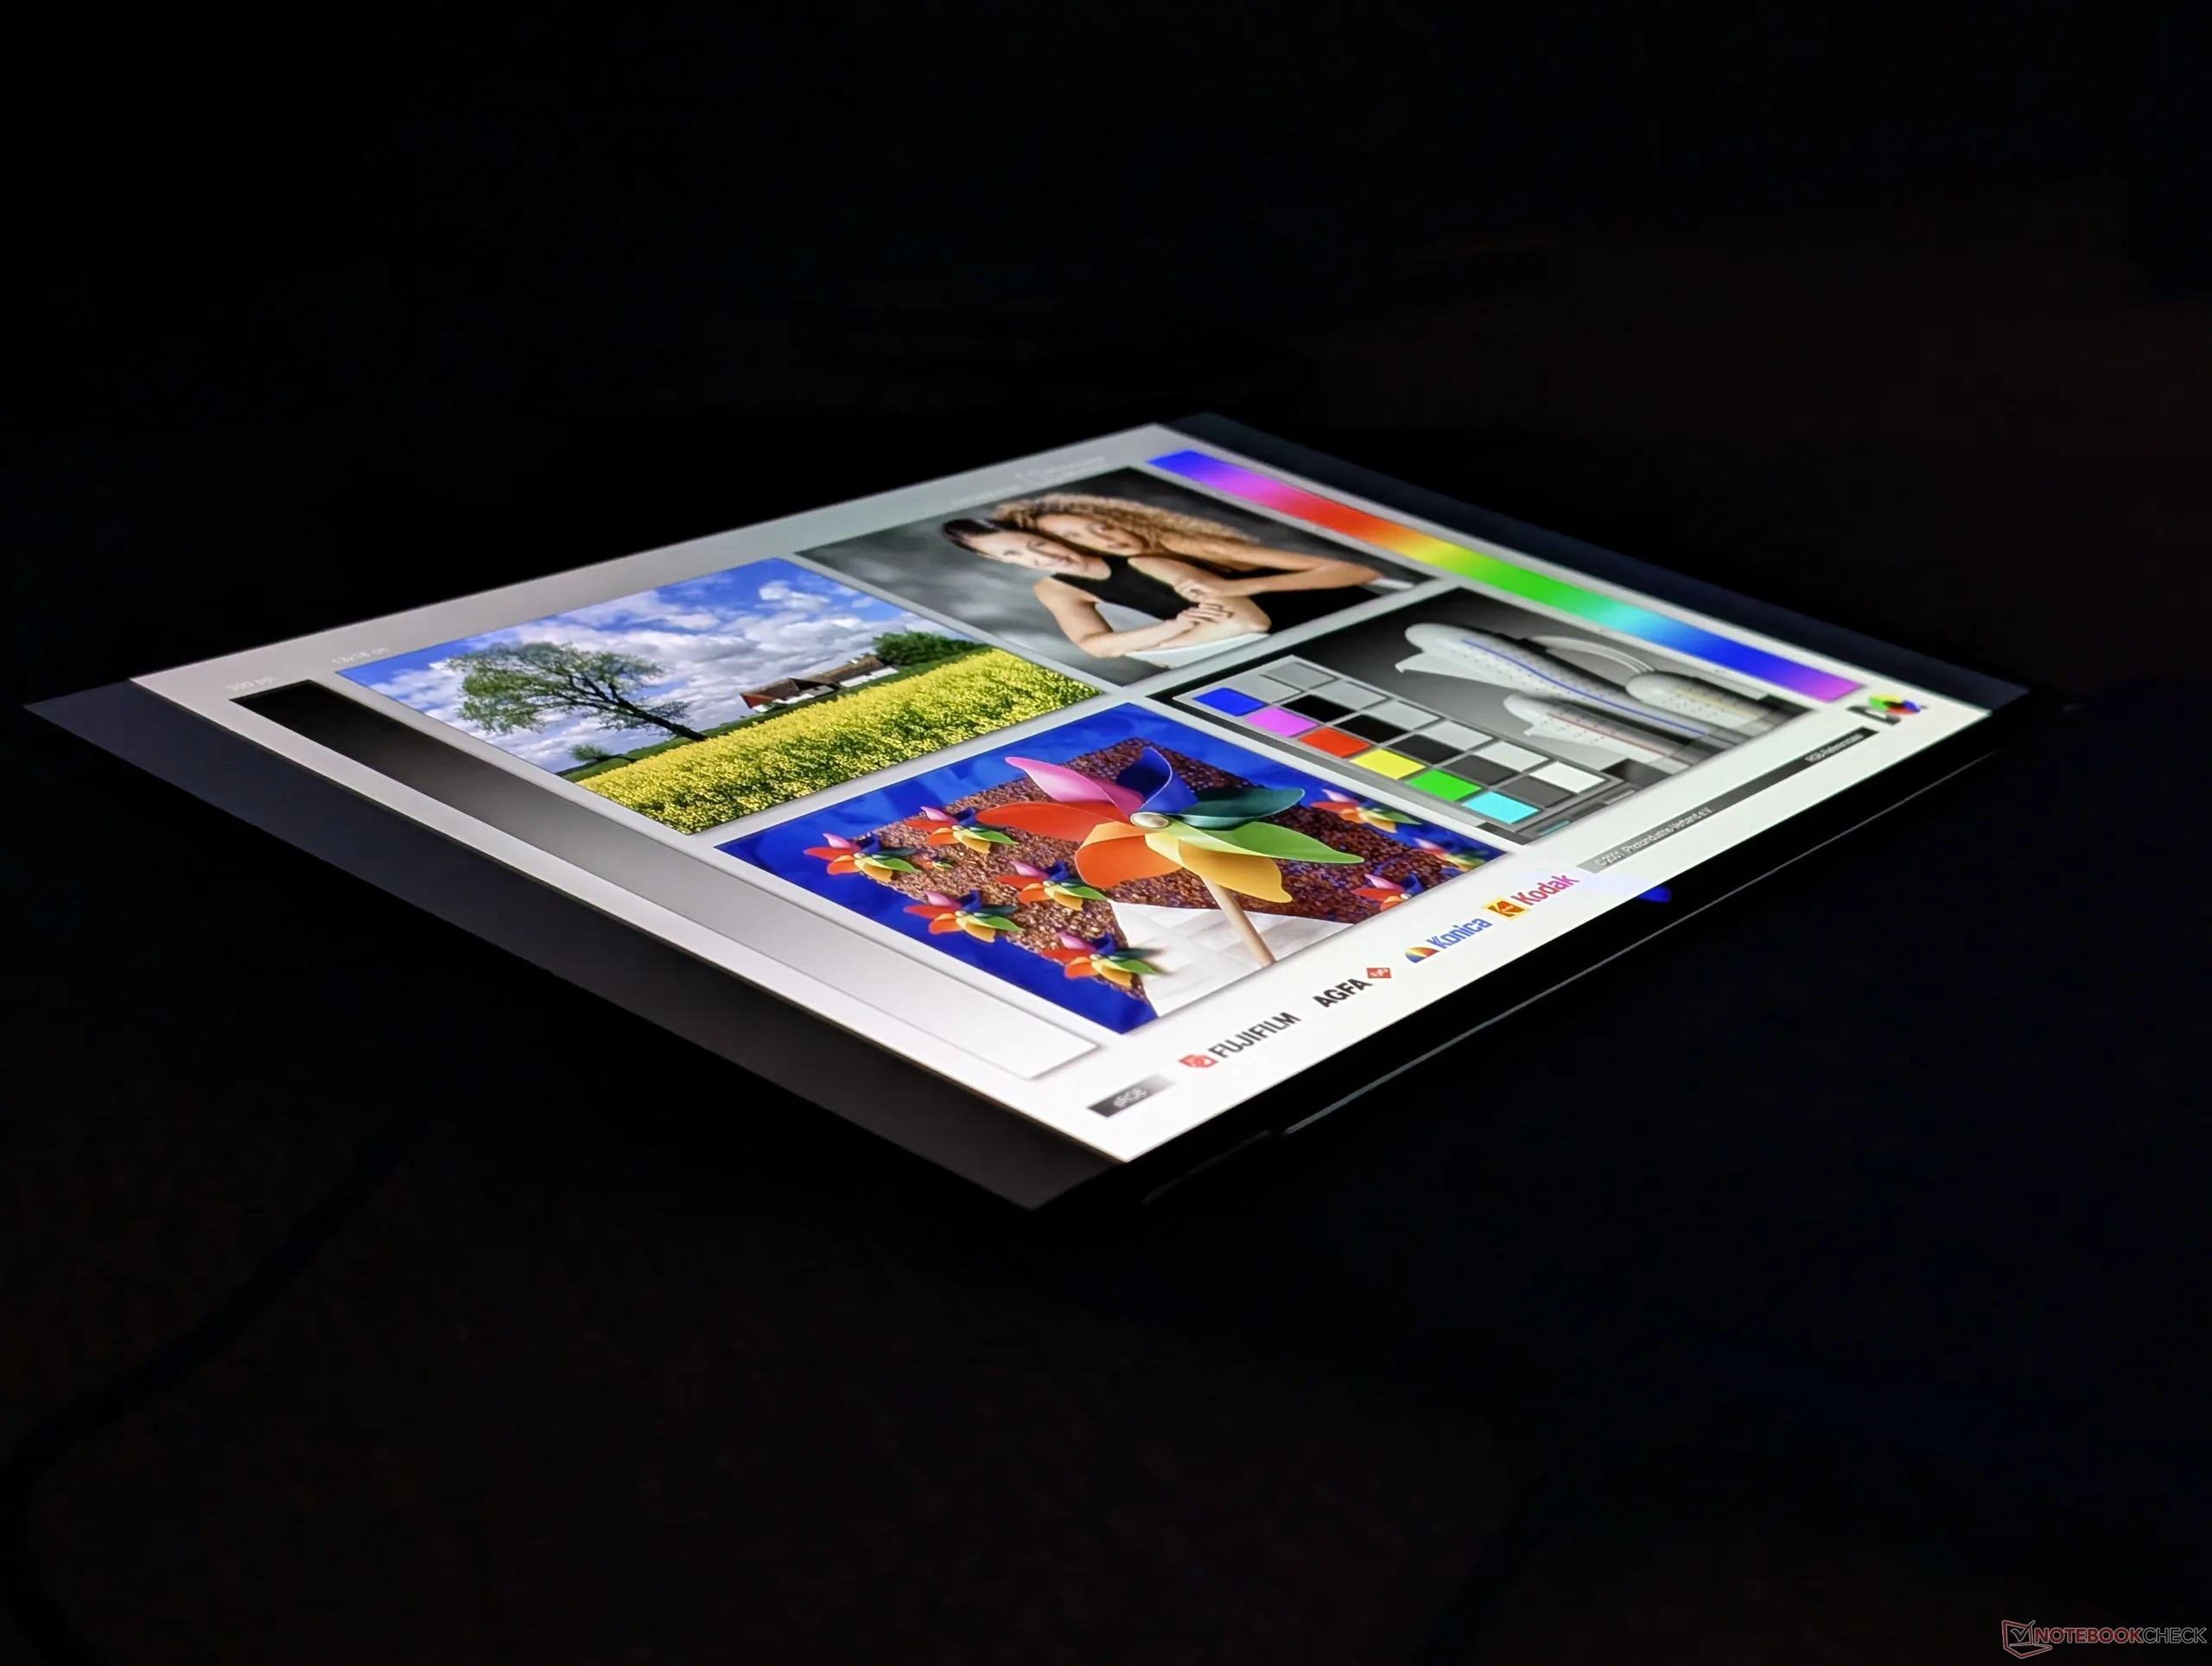
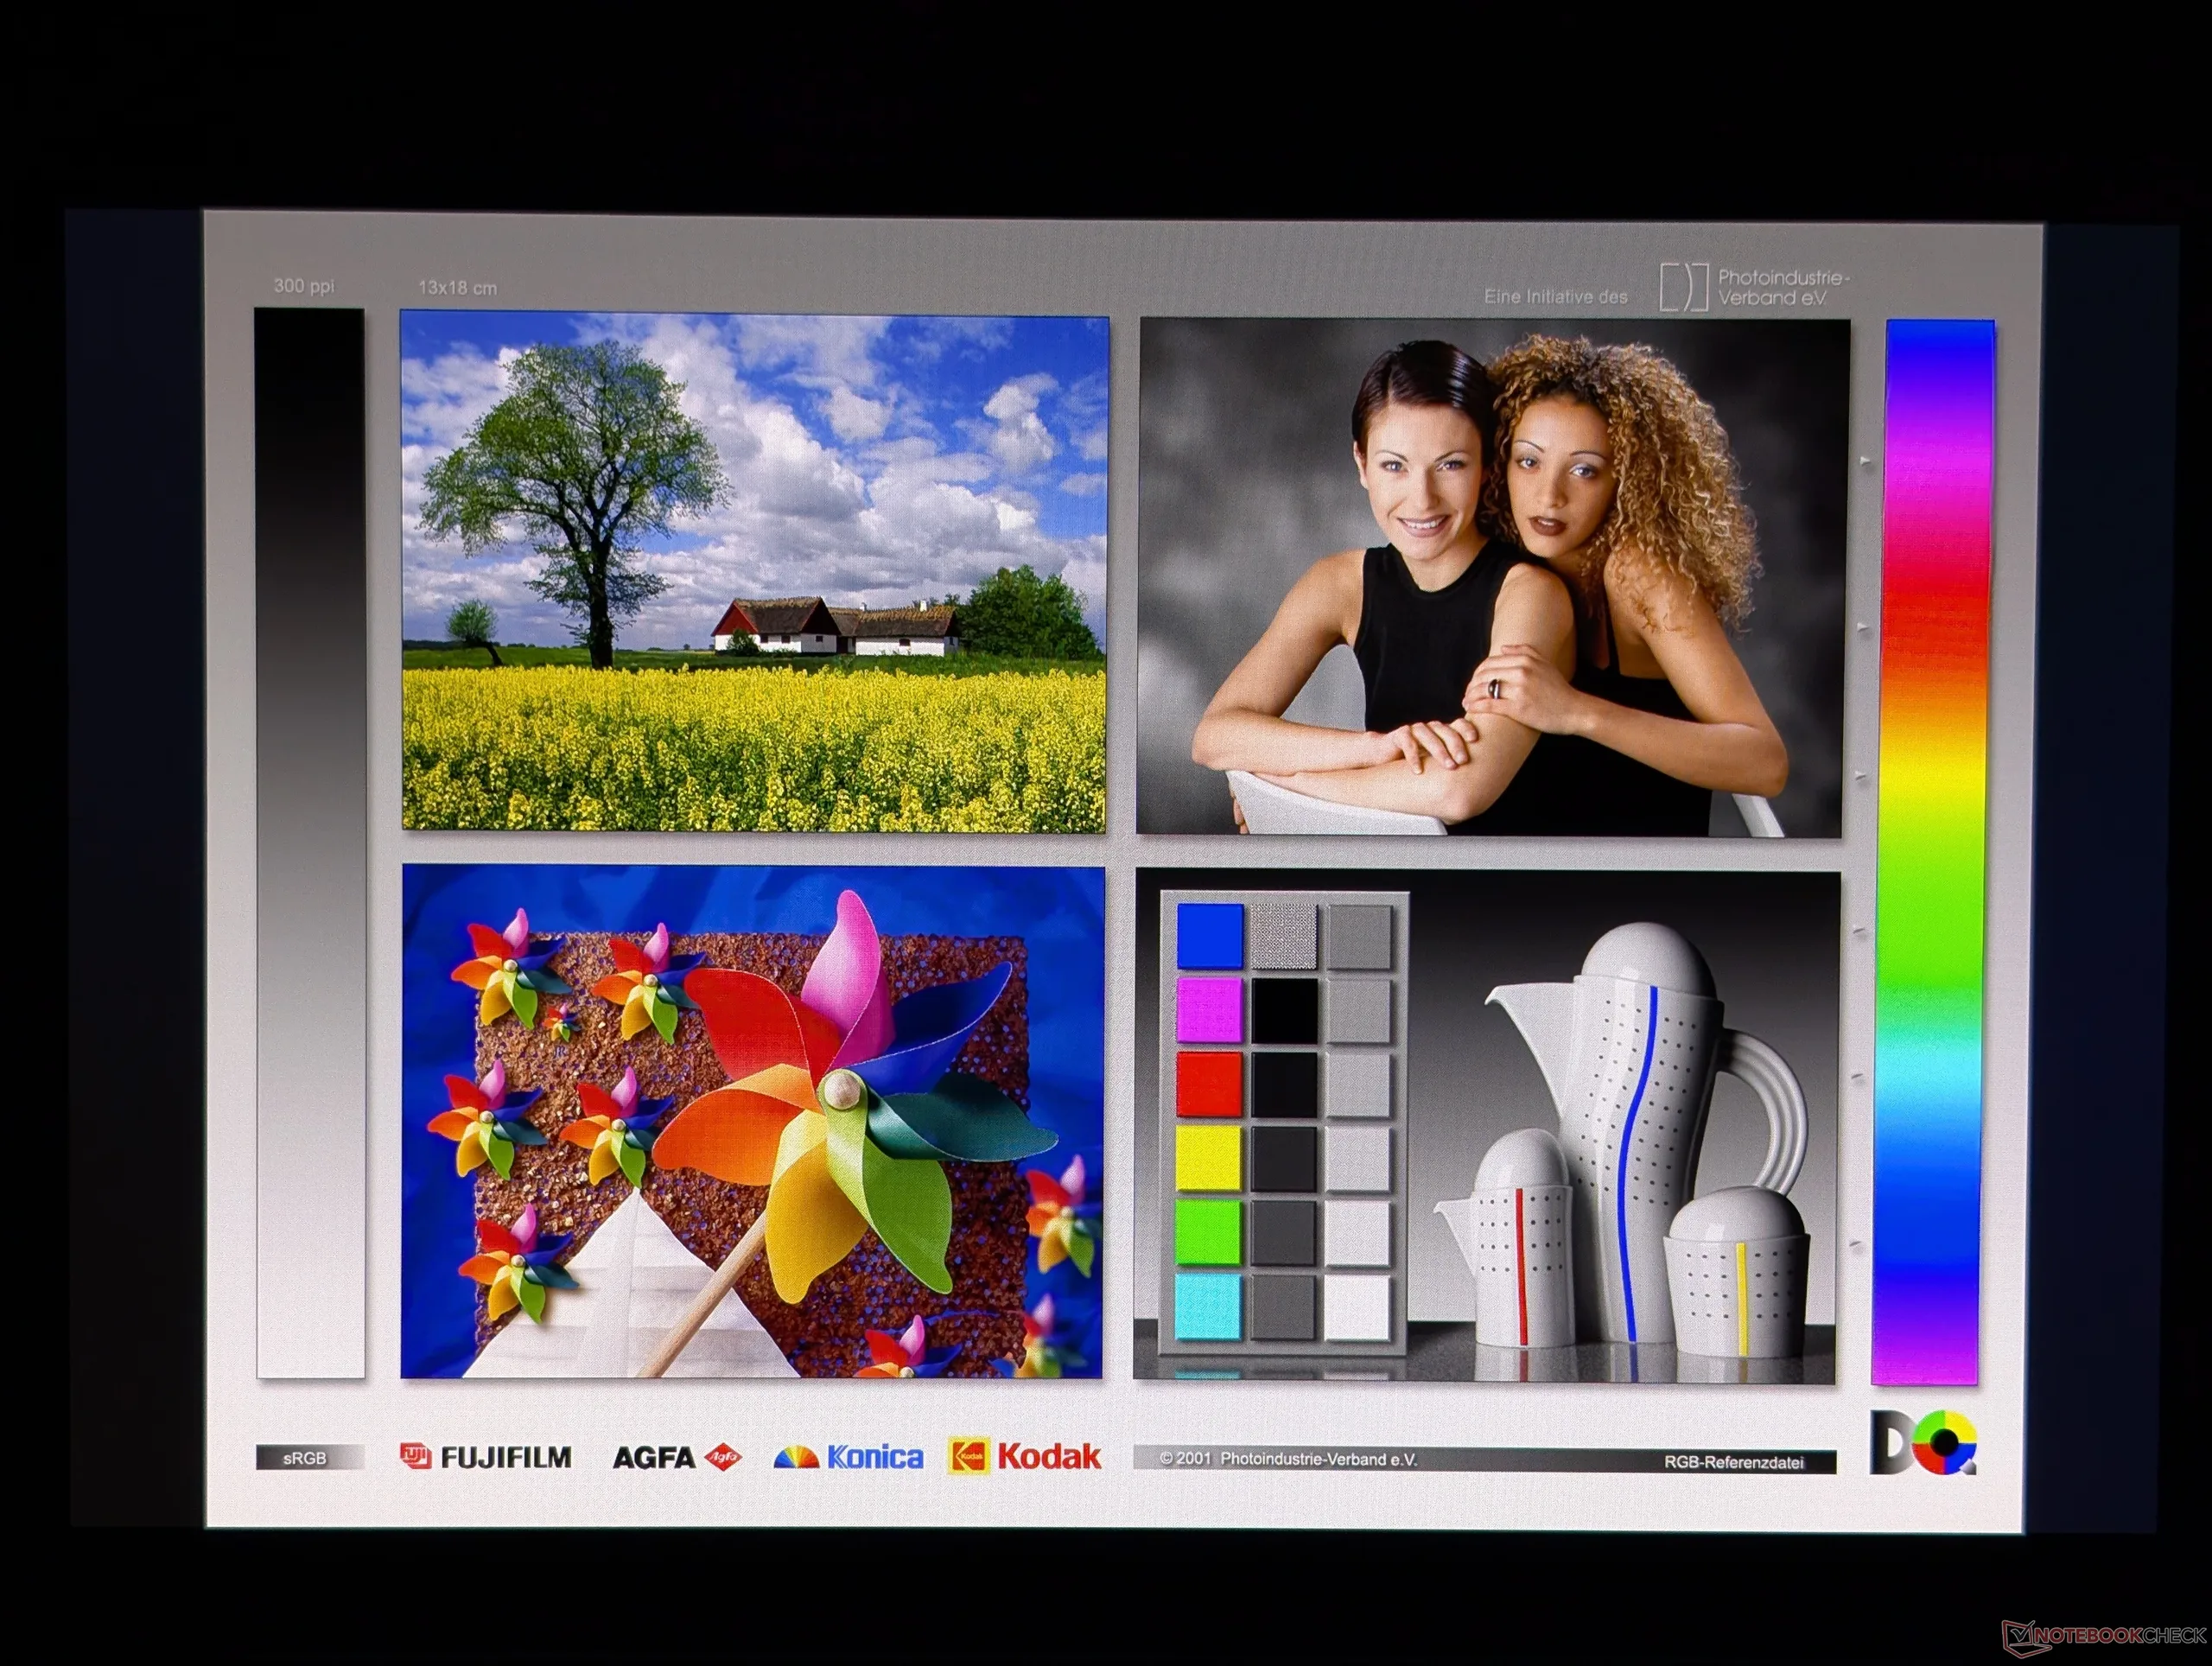
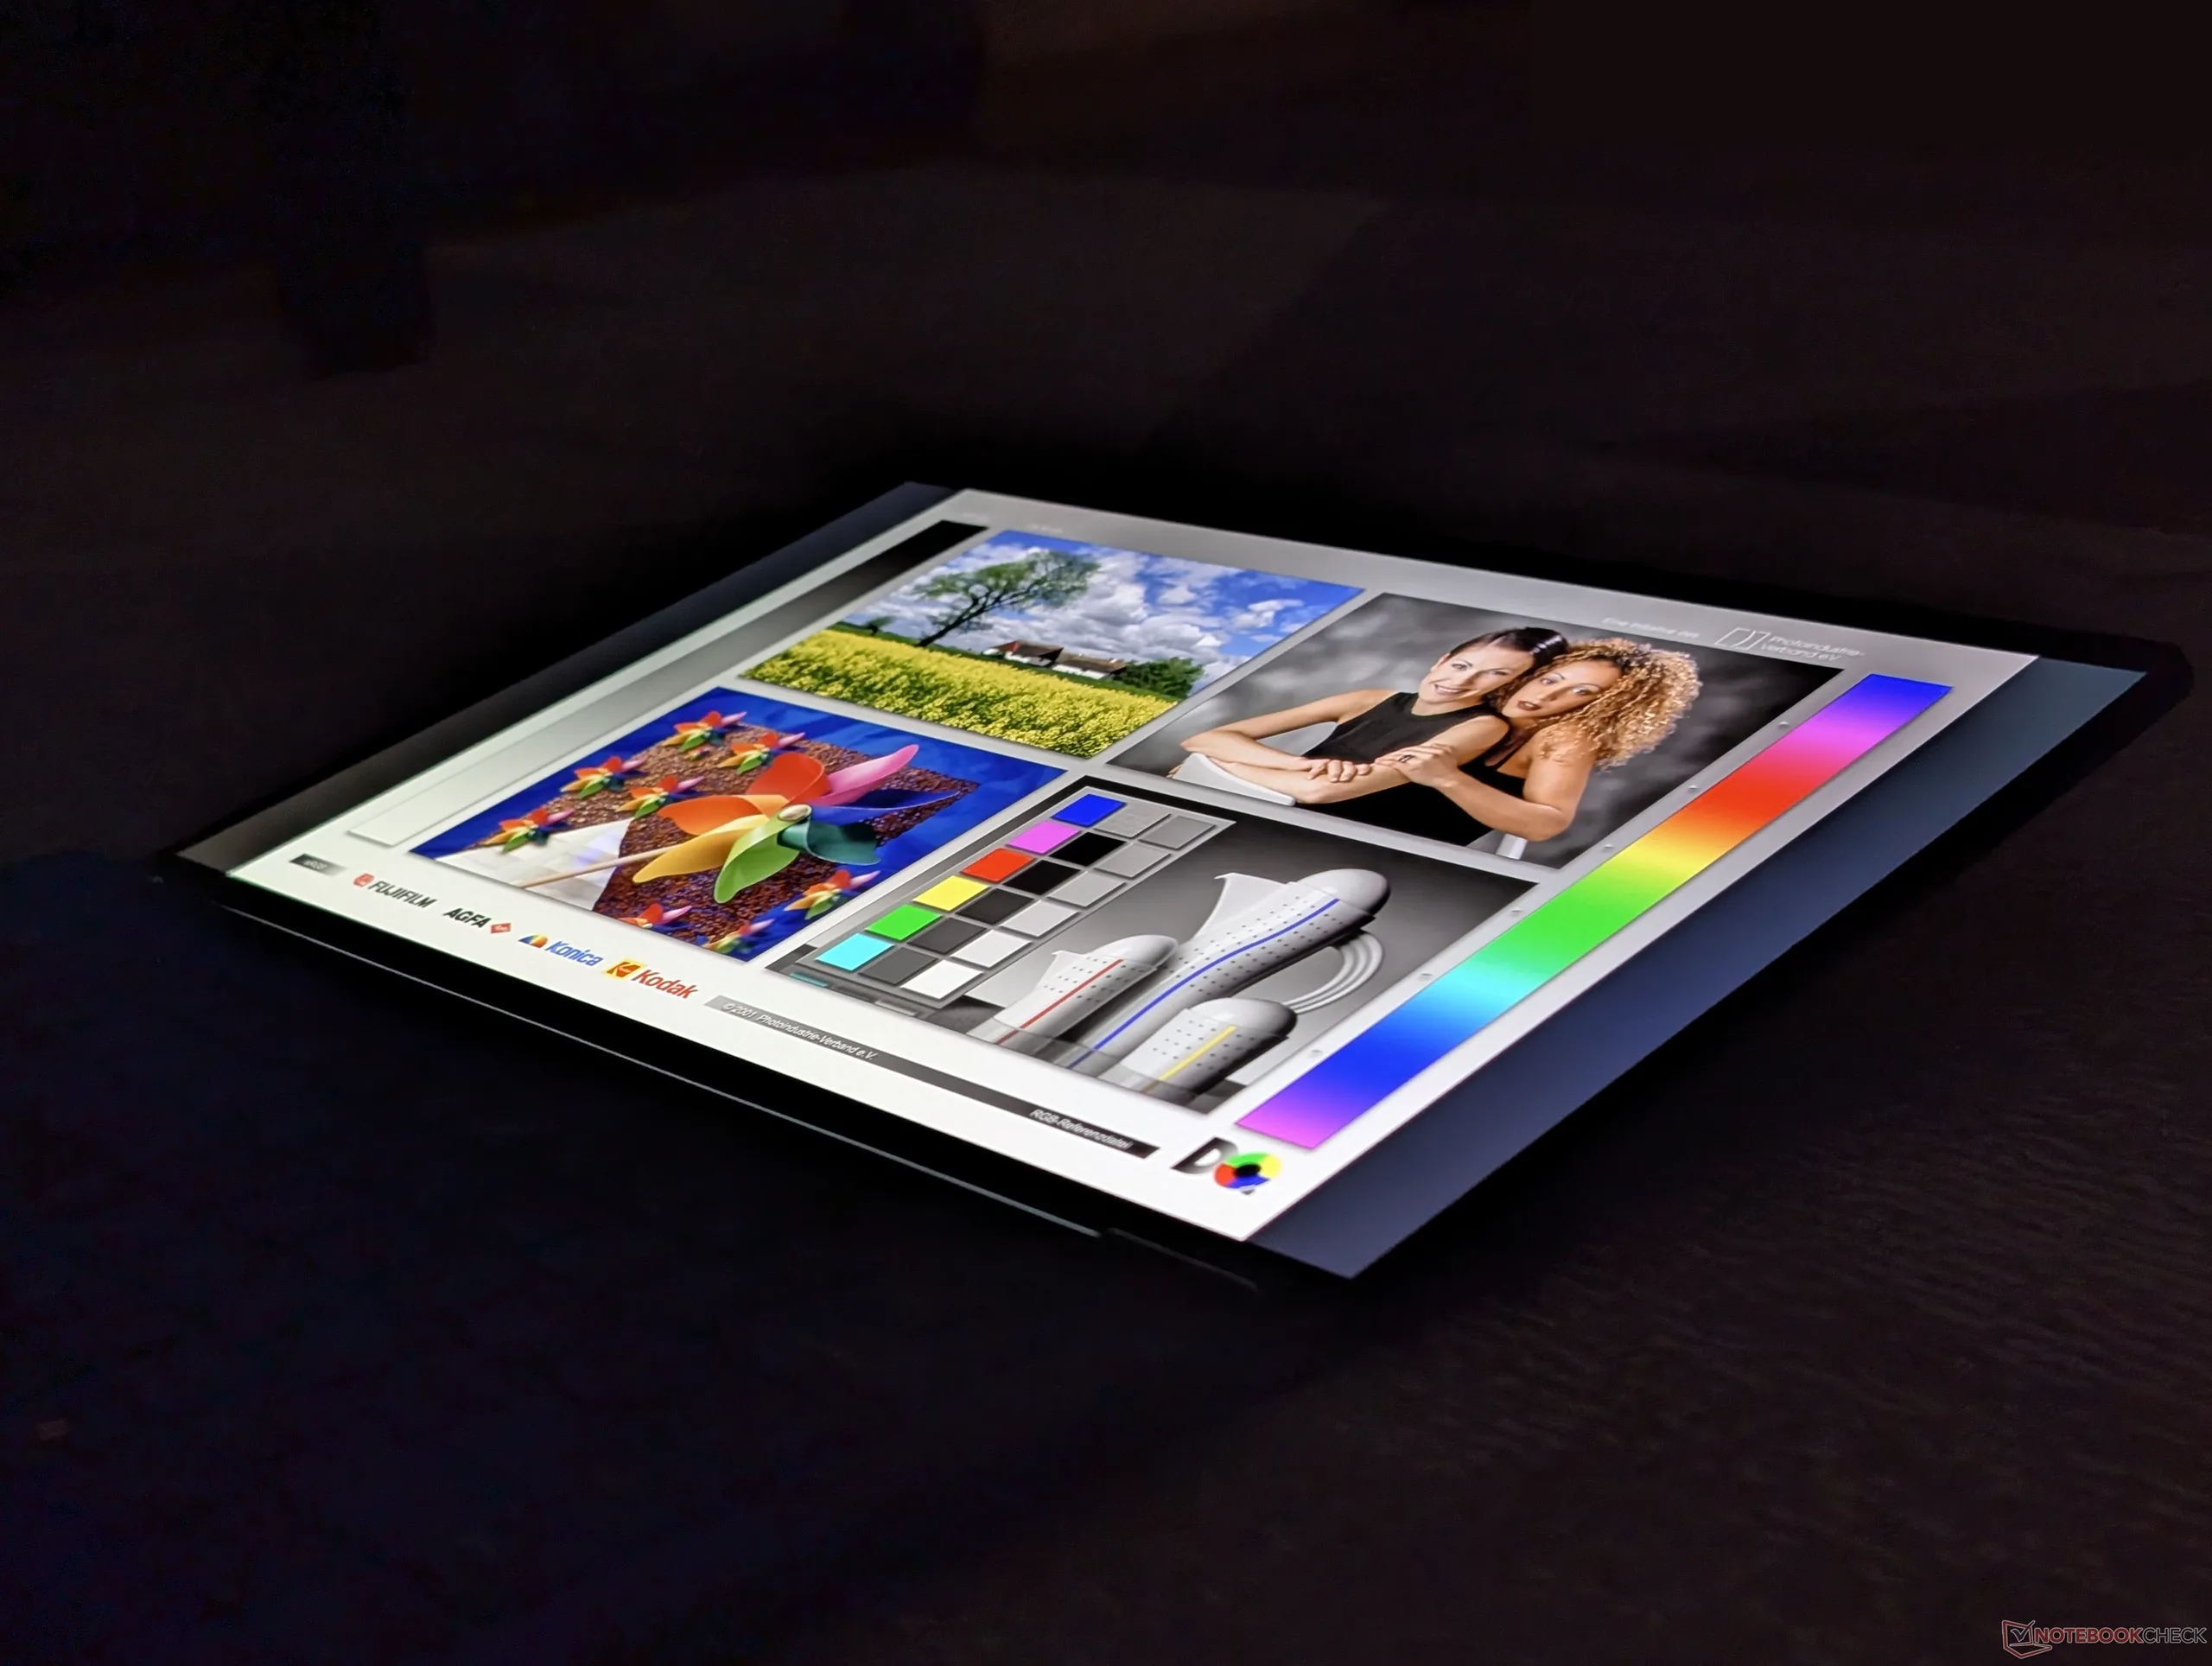
- 1920 x 1200,60 Hz,非触控,100% DCI-P3,镜面屏,OLED,300 nits
- 1920 x 1200,60 Hz,触控屏,100% DCI-P3,镜面屏,OLED,300 尼特
我们的测试机型配置了加粗显示的选项。
| |||||||||||||||||||||||||
Brightness Distribution: 98 %
Center on Battery: 282.4 cd/m²
Contrast: ∞:1 (Black: 0 cd/m²)
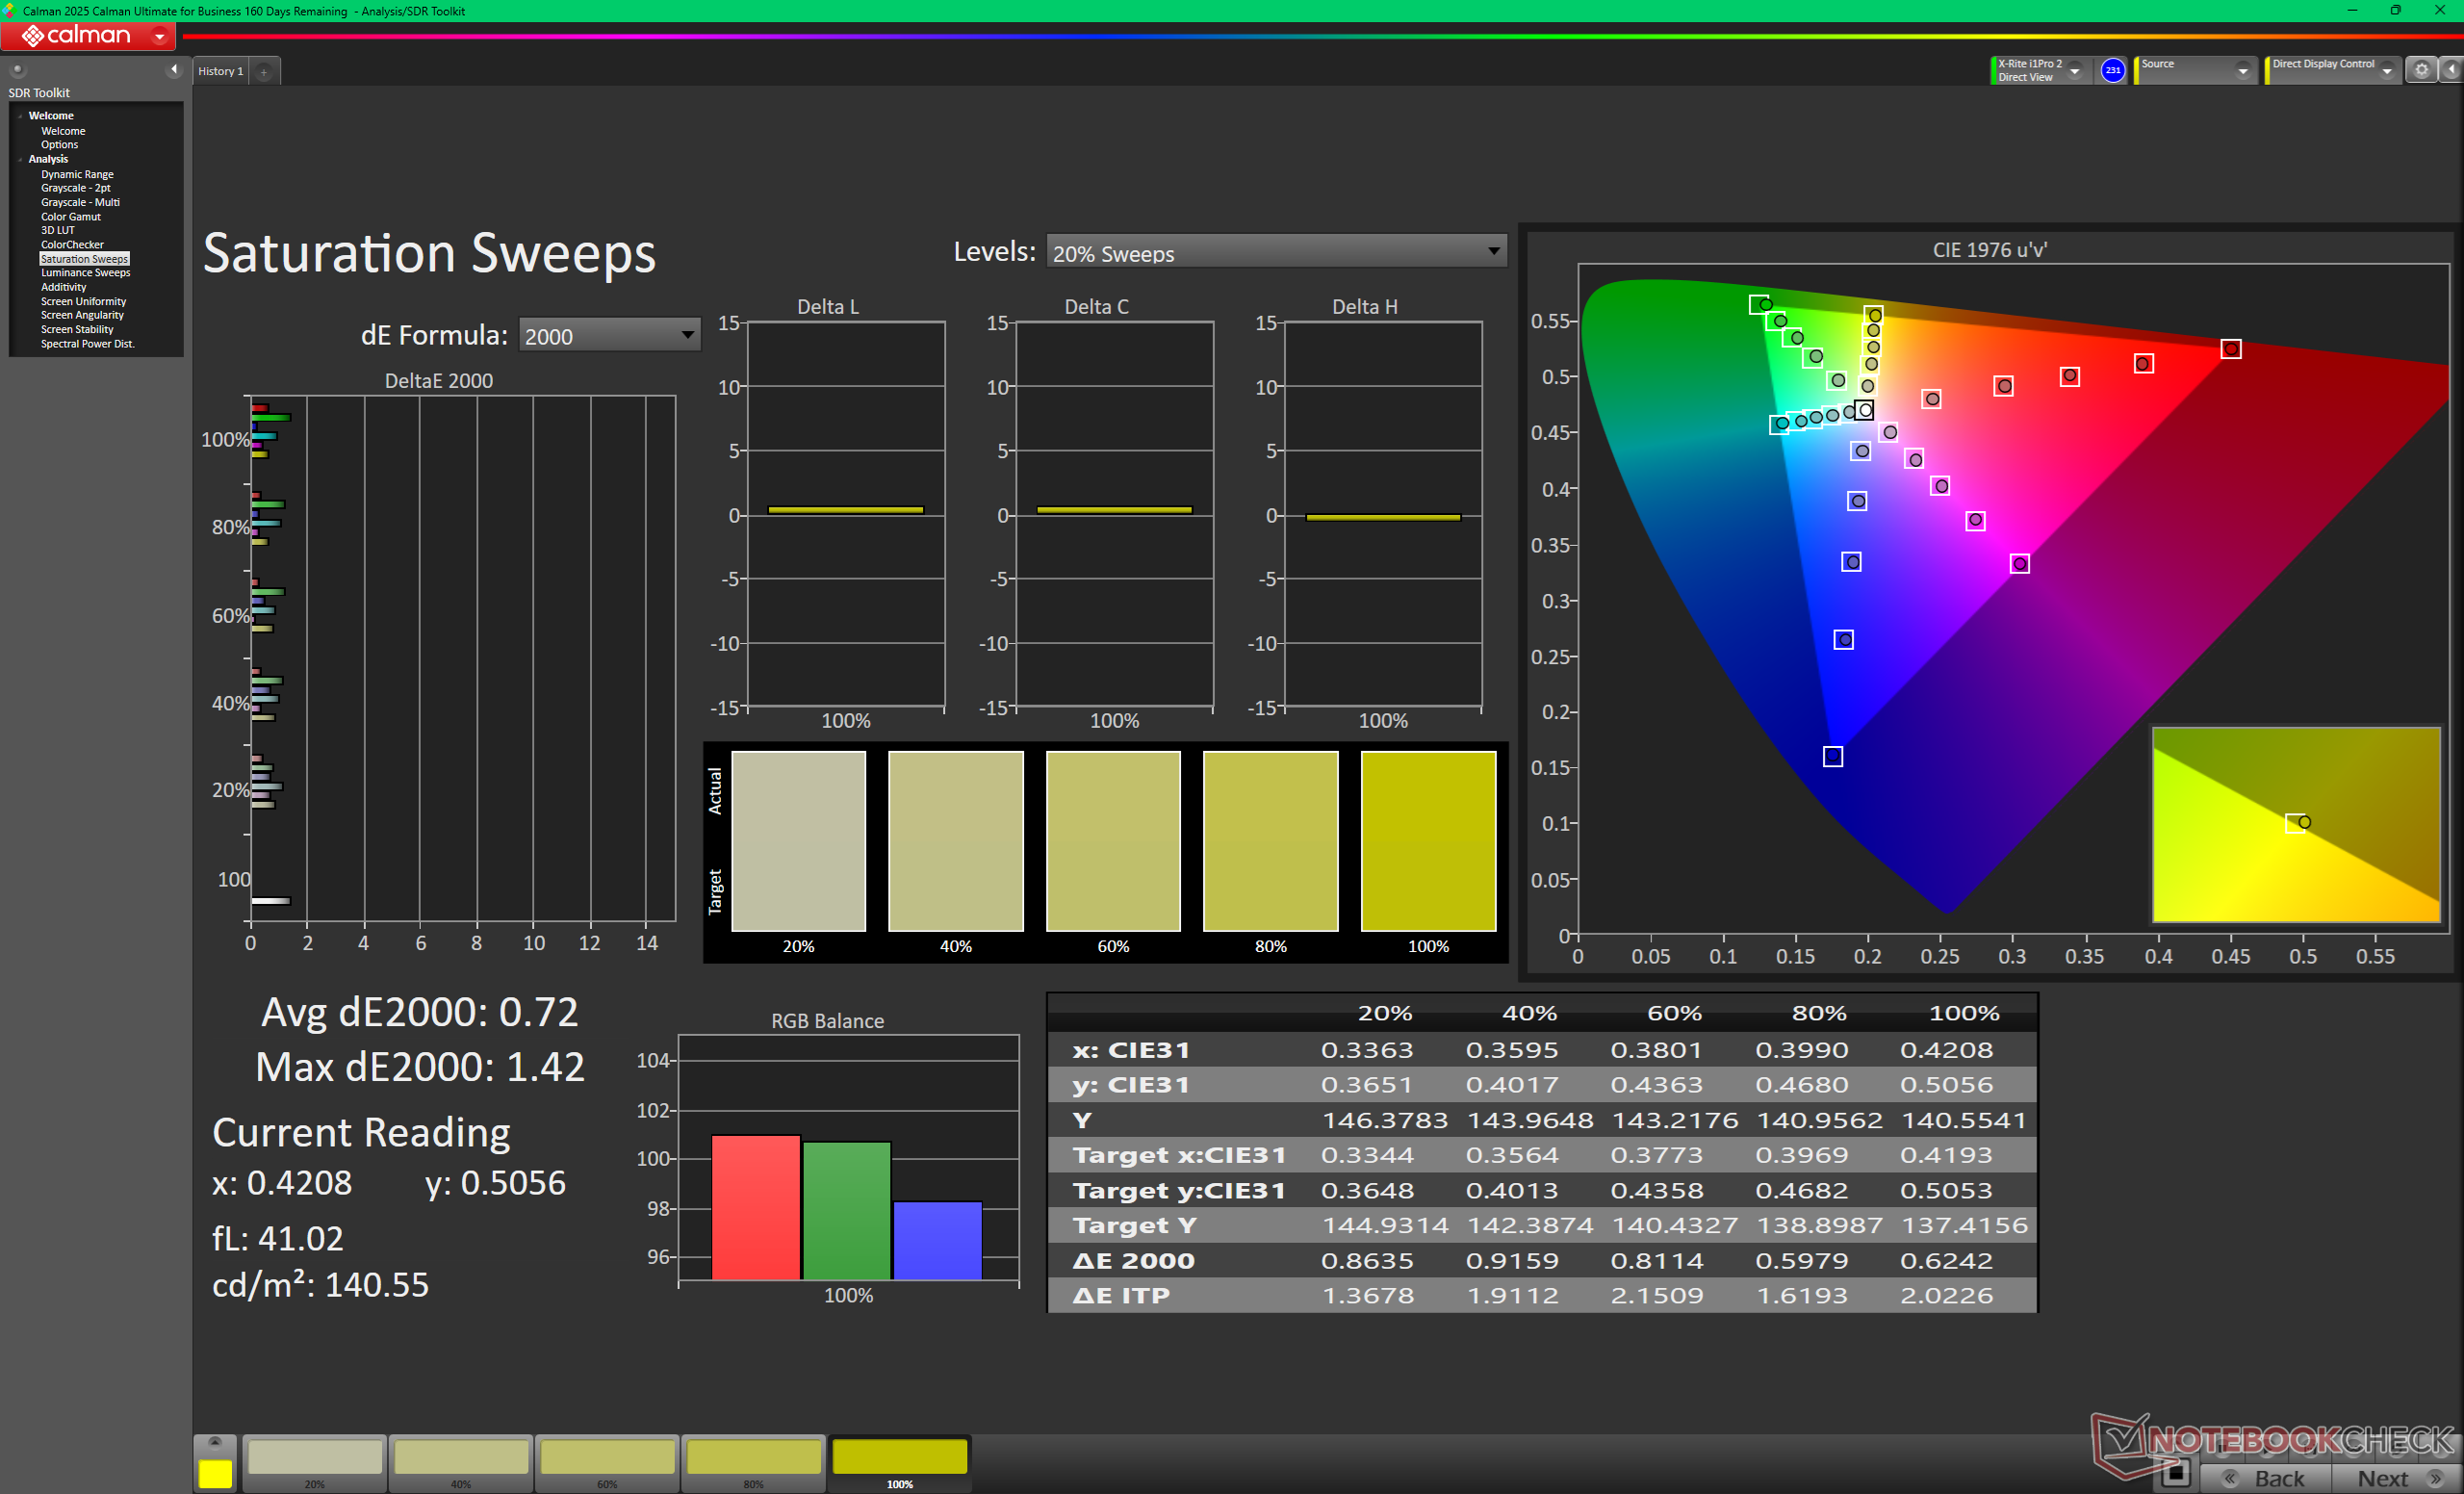
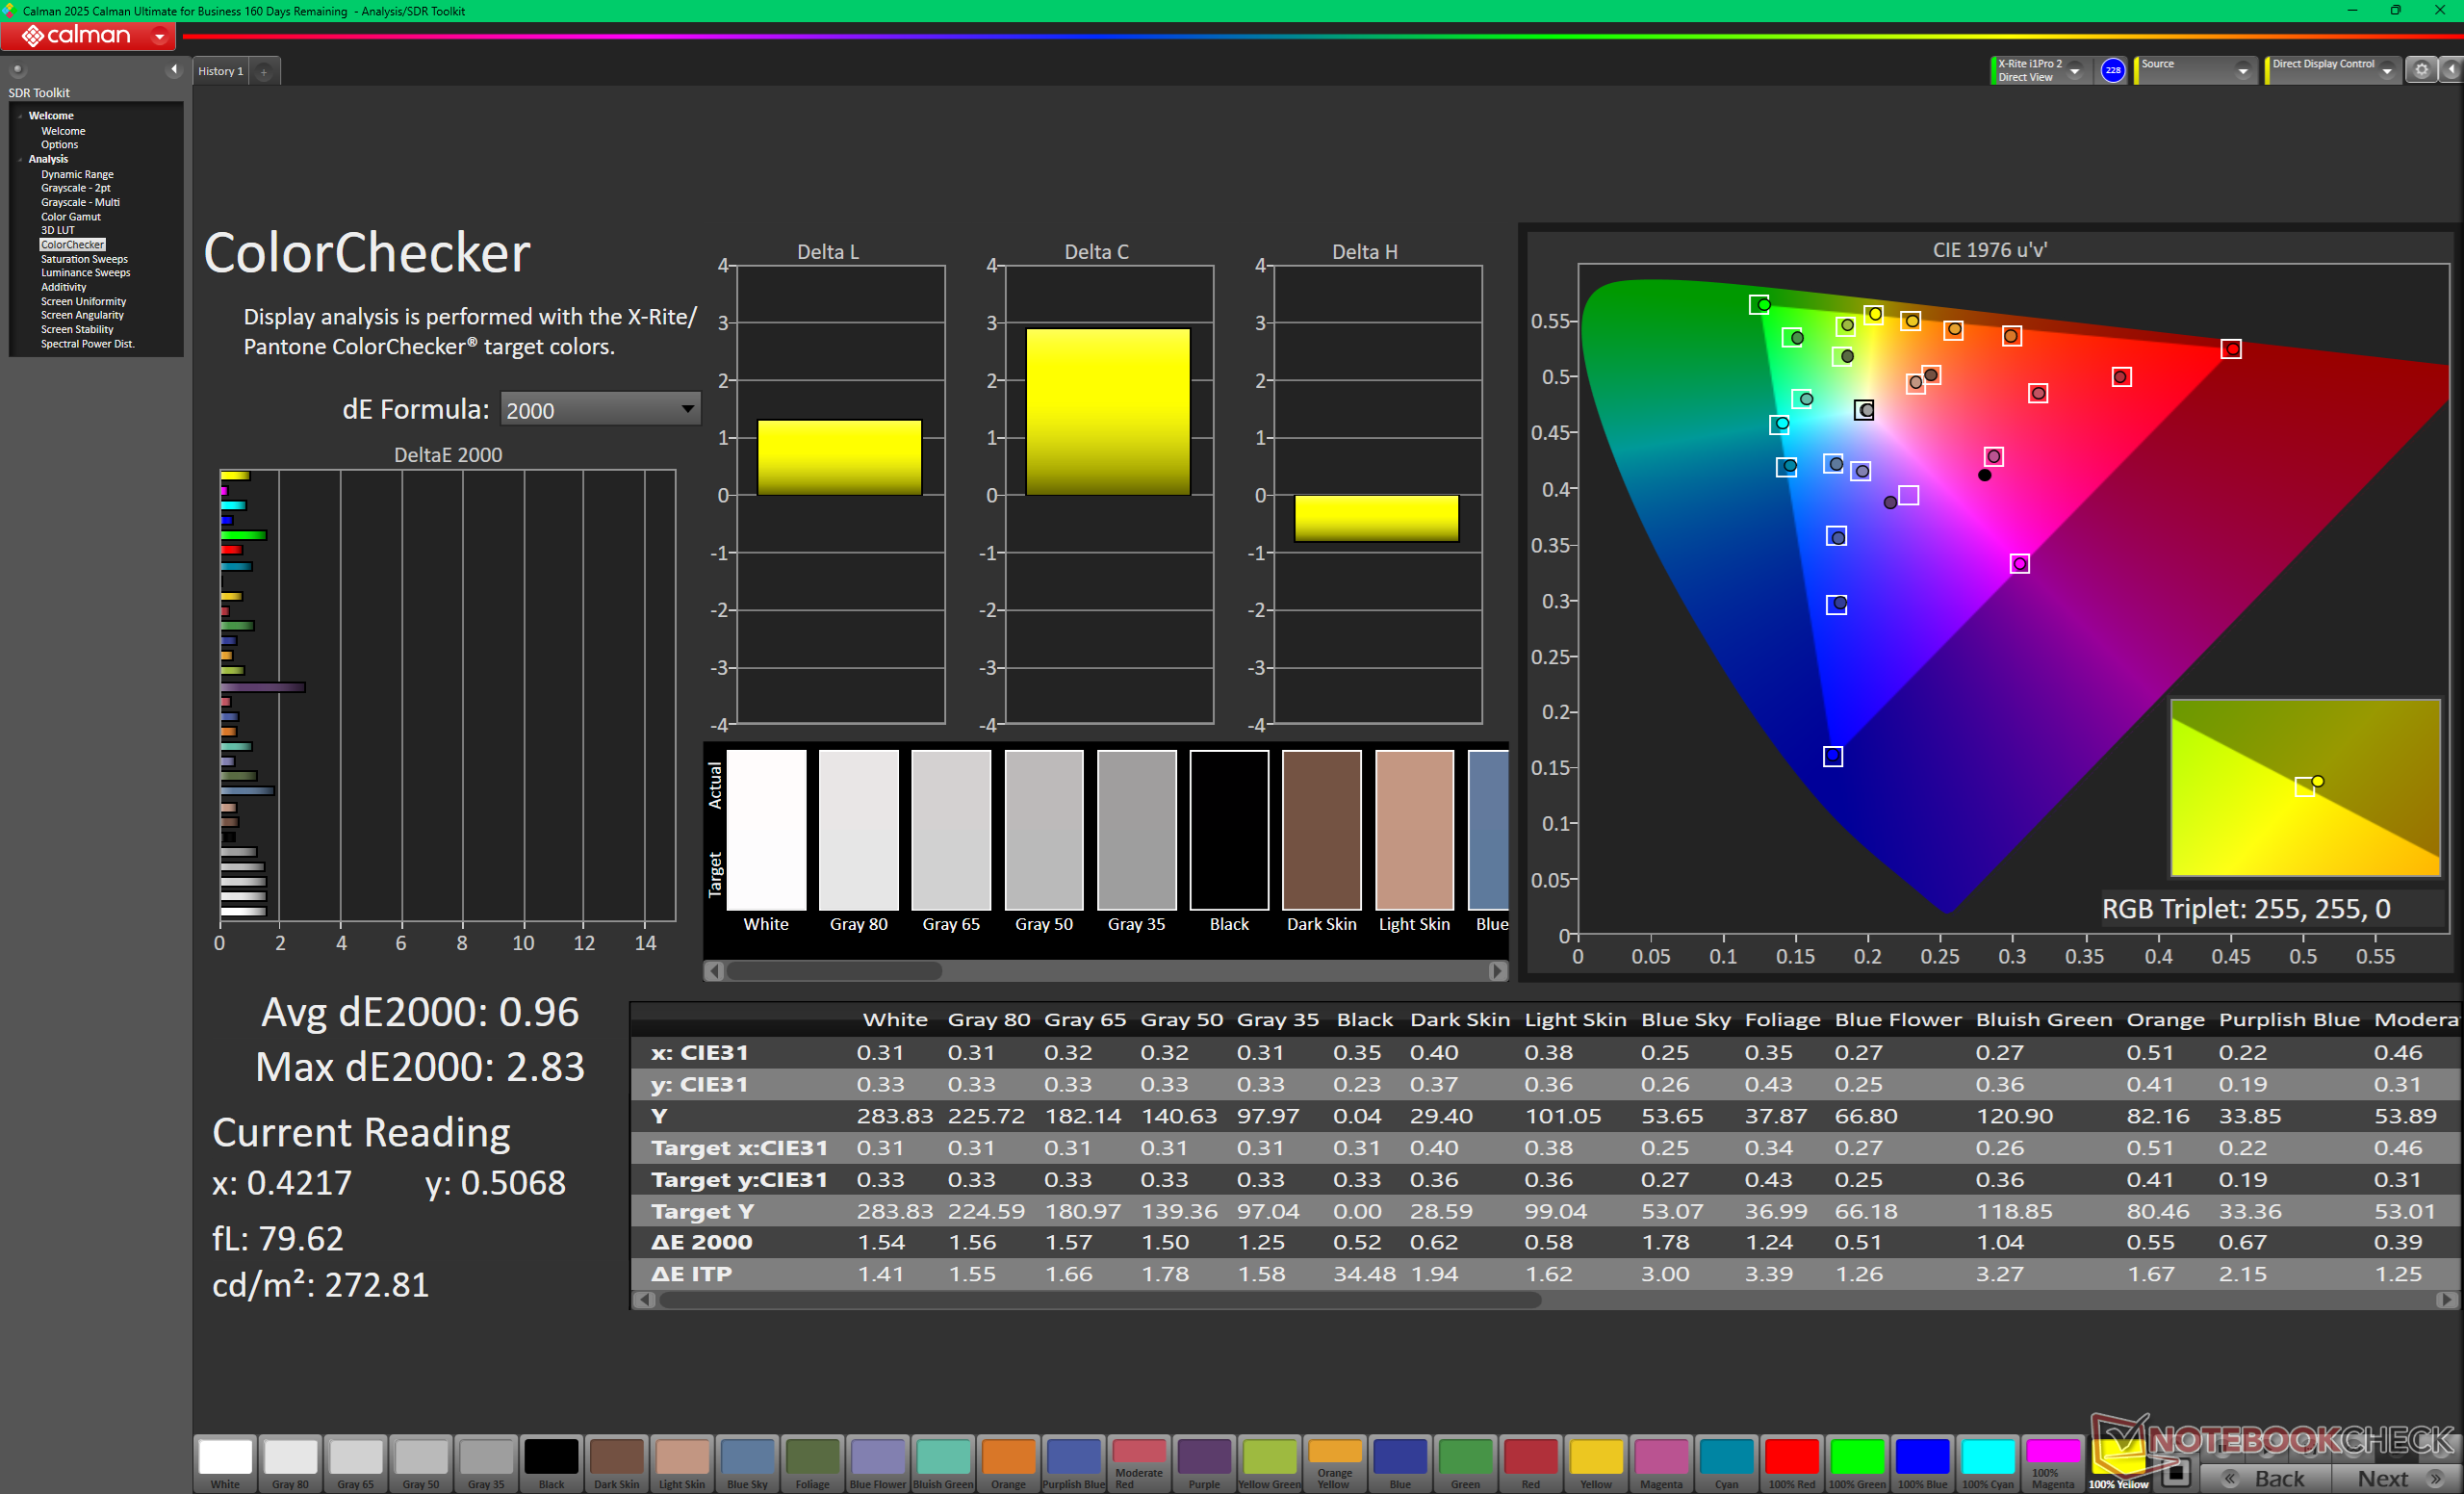
ΔE ColorChecker Calman: 0.96 | ∀{0.5-29.43 Ø4.69}
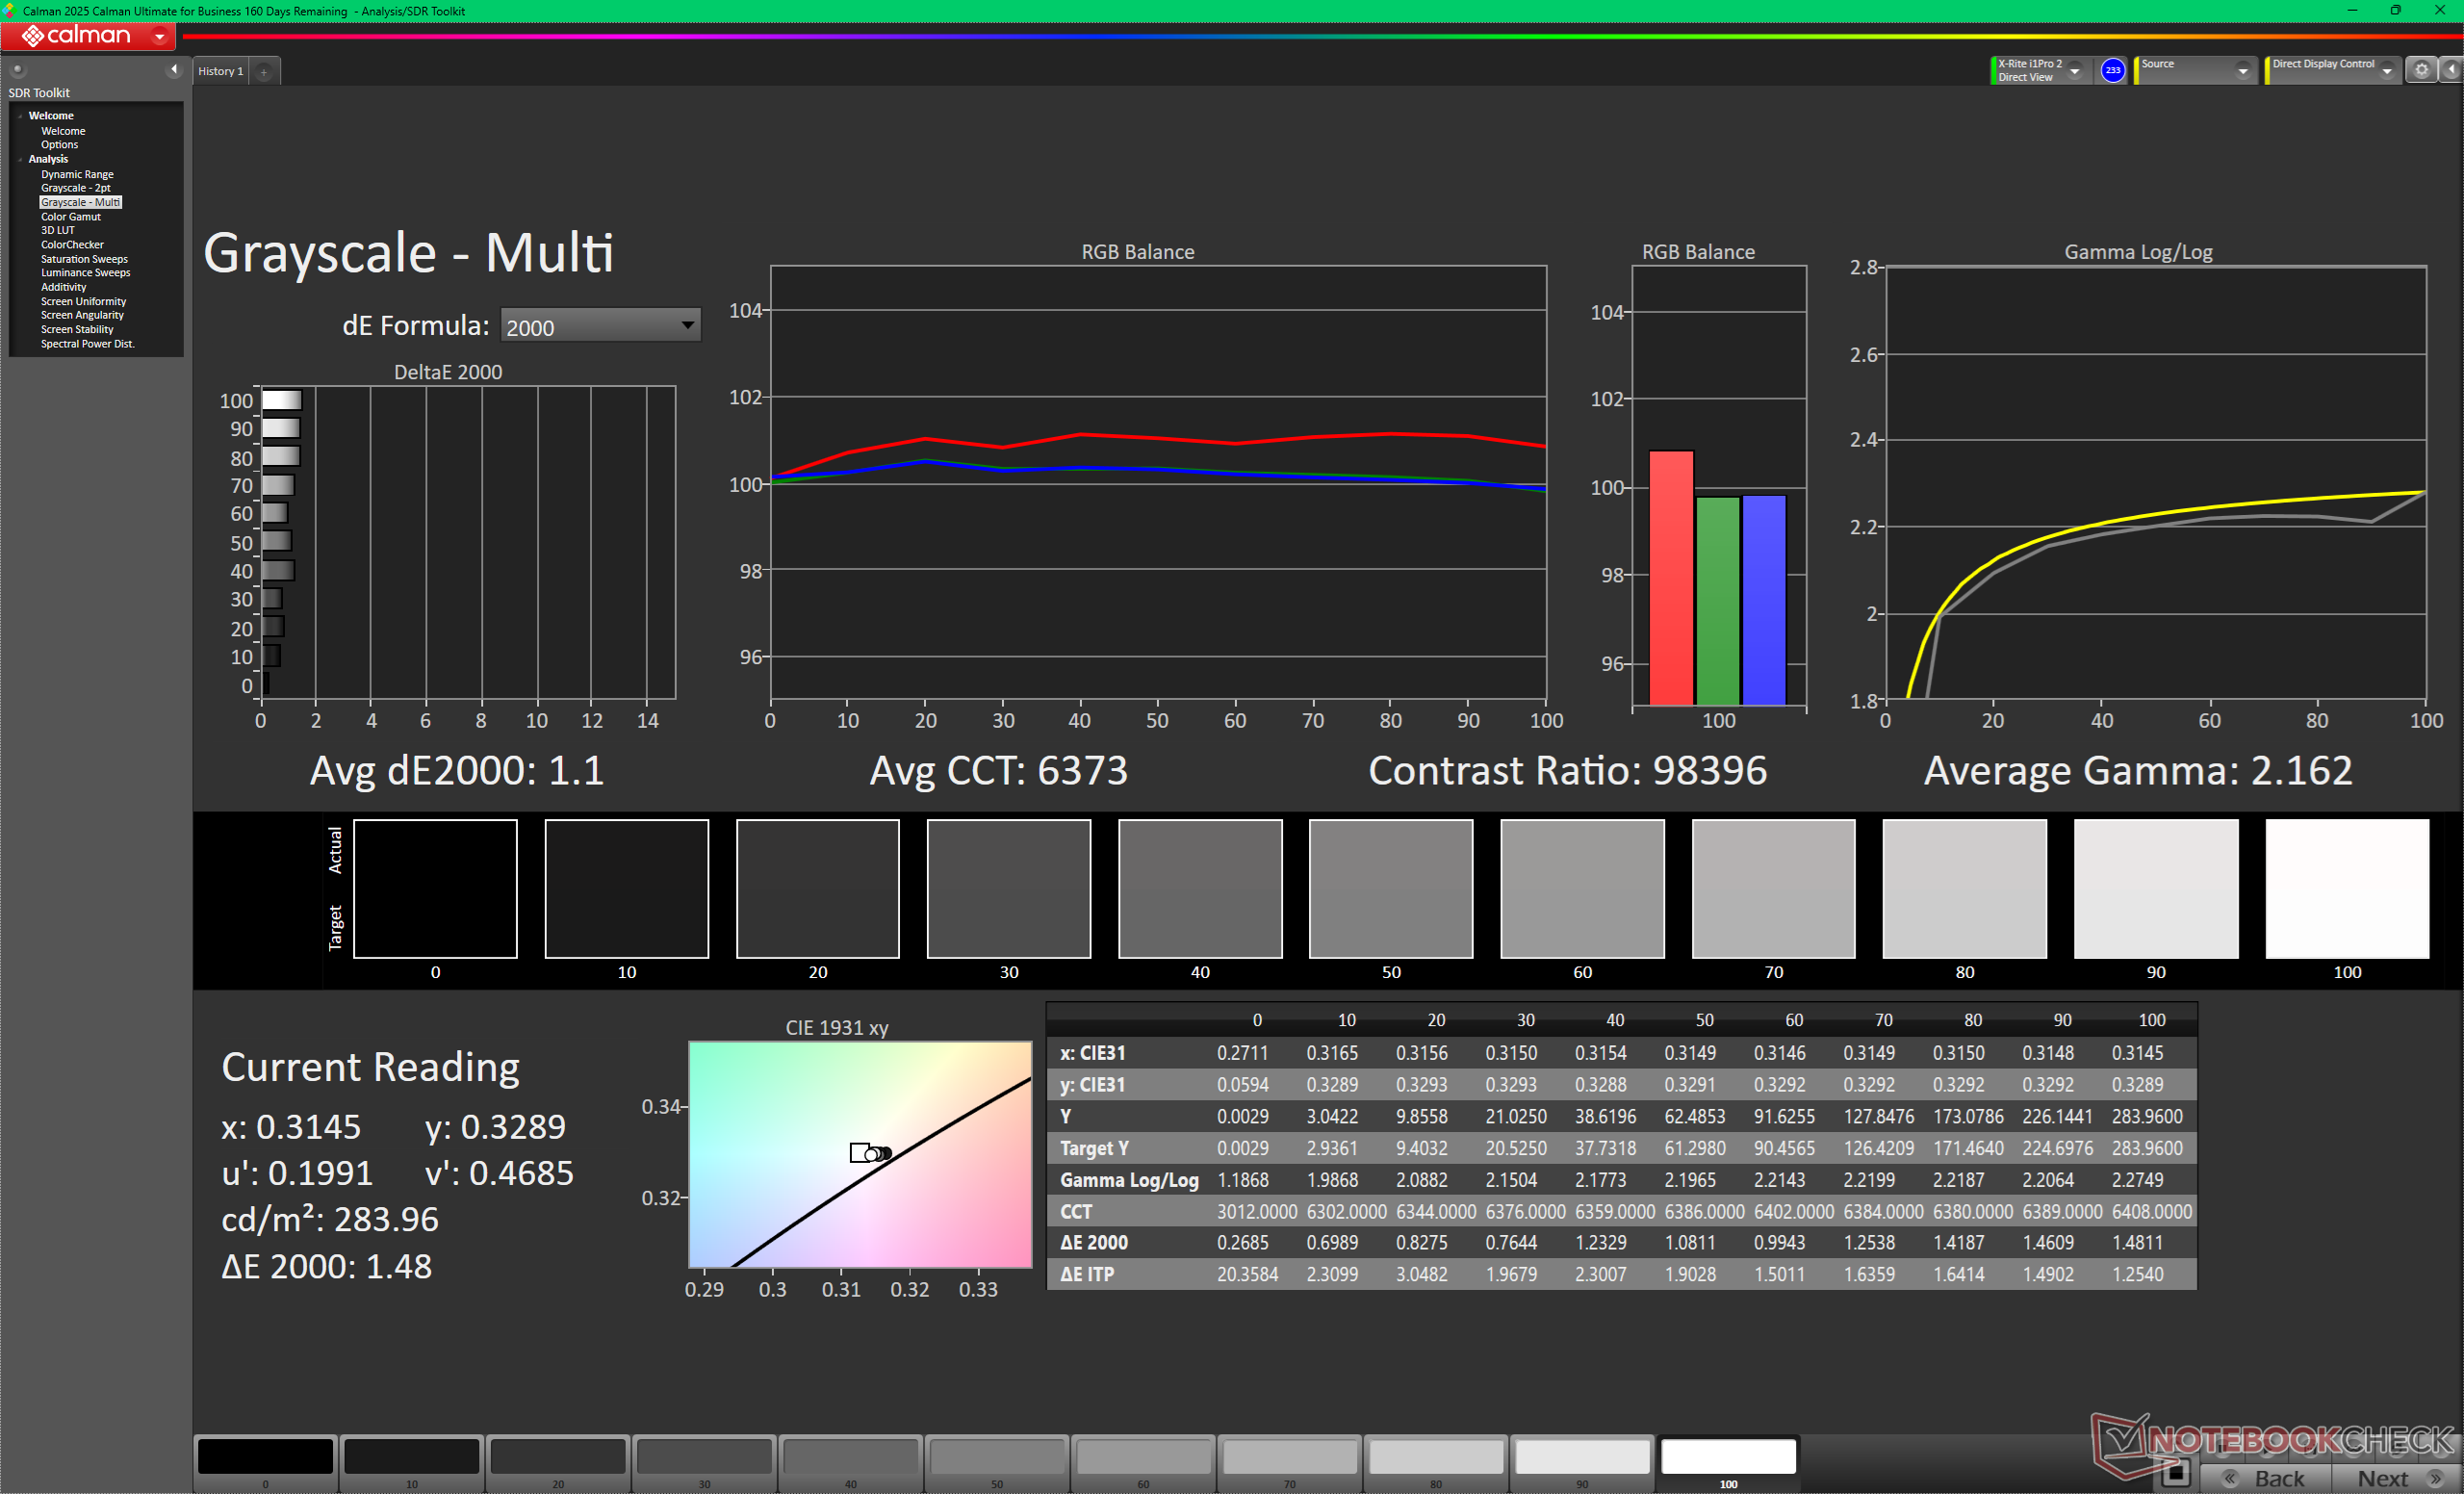
ΔE Greyscale Calman: 1.1 | ∀{0.09-98 Ø4.94}
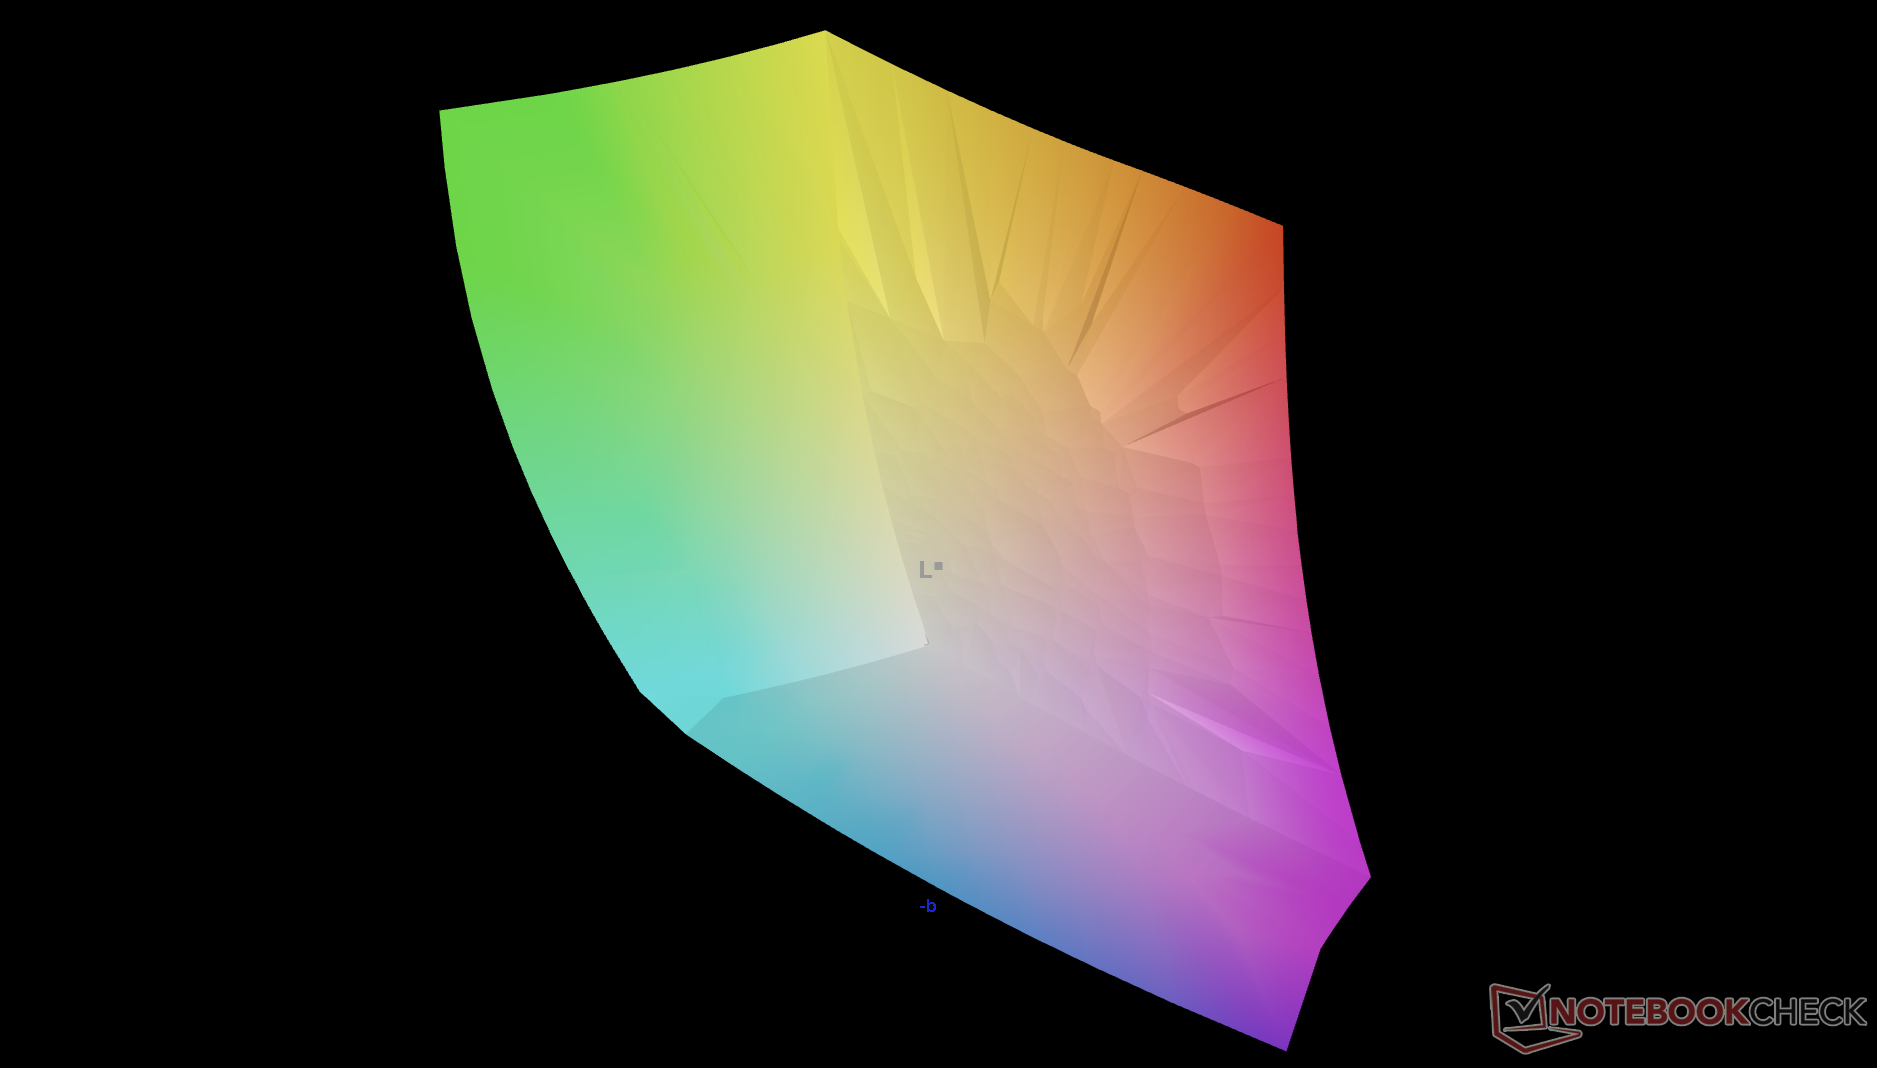
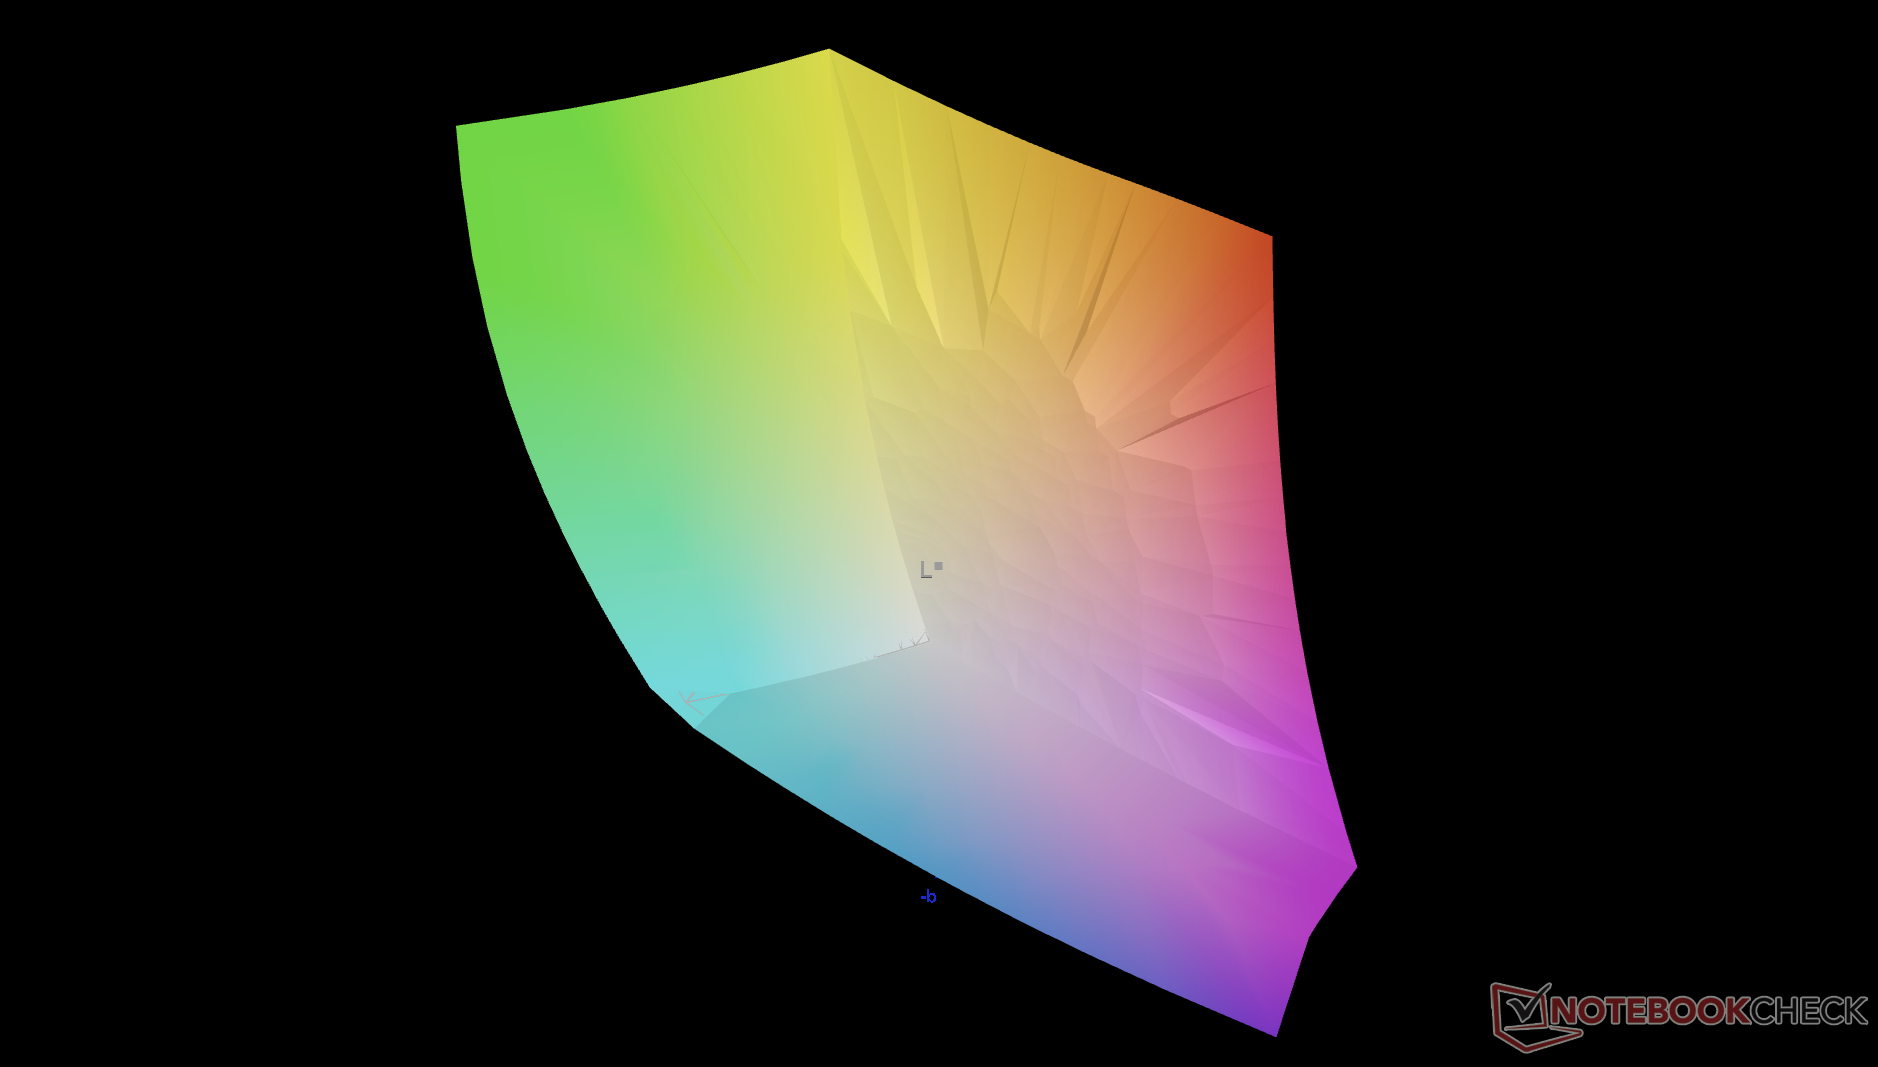
92.3% AdobeRGB 1998 (Argyll 3D)
100% sRGB (Argyll 3D)
100% Display P3 (Argyll 3D)
Gamma: 2.16
CCT: 6373 K
| Dell 14S DS14260 Samsung 140KW04, OLED, 1920x1200, 14", 60 Hz | Lenovo ThinkBook 14 G9 IPL 21UX005PGE LEN140WUXGA, IPS LED, 1920x1200, 14", 60 Hz | Dell XPS 14 Core Ultra X7 358H LG Philips 140WT2, OLED, 2880x1800, 14", 120 Hz | HP OmniBook Ultra 14 Core Ultra X9 Samsung SDC4215, OLED, 2880x1800, 14", 120 Hz | Dell Inspiron 14 7445 2-in-1 AU Optronics B14UAT, IPS, 1920x1200, 14", 60 Hz | Asus VivoBook S 14 OLED M5406WA ATNA40CT02-0 (SDC41A0), OLED, 1920x1200, 14", 60 Hz | |
|---|---|---|---|---|---|---|
| Display | -53% | 2% | 0% | -57% | 2% | |
| Display P3 Coverage (%) | 100 | 39.3 -61% | 99.7 0% | 99.9 0% | 35.7 -64% | 99.9 0% |
| sRGB Coverage (%) | 100 | 59 -41% | 100 0% | 100 0% | 53.6 -46% | 100 0% |
| AdobeRGB 1998 Coverage (%) | 92.3 | 40.7 -56% | 98.2 6% | 92.3 0% | 36.9 -60% | 97.2 5% |
| Response Times | -901% | 15% | 29% | -1009% | 29% | |
| Response Time Grey 50% / Grey 80% * (ms) | 1.71 ? | 19.2 ? -1023% | 0.75 ? 56% | 0.58 ? 66% | 23 ? -1245% | 1.3 ? 24% |
| Response Time Black / White * (ms) | 1.81 ? | 15.9 ? -778% | 1.03 ? 43% | 0.87 ? 52% | 15.8 ? -773% | 1.2 ? 34% |
| PWM Frequency (Hz) | 463.67 ? | 240.62 ? | 927.13 ? | 240 ? | ||
| PWM Amplitude * (%) | 19 | 29 -53% | 25 -32% | |||
| Screen | -163% | -10% | -15% | -170% | -7% | |
| Brightness middle (cd/m²) | 282.4 | 403 43% | 393.8 39% | 446 58% | 267.6 -5% | 385 36% |
| Brightness (cd/m²) | 281 | 386 37% | 389 38% | 447 59% | 240 -15% | 382 36% |
| Brightness Distribution (%) | 98 | 89 -9% | 96 -2% | 99 1% | 84 -14% | 95 -3% |
| Black Level * (cd/m²) | 0.4 | 0.31 | 0.03 | |||
| Colorchecker dE 2000 * | 0.96 | 4.5 -369% | 1.27 -32% | 1.76 -83% | 4.67 -386% | 1.99 -107% |
| Colorchecker dE 2000 max. * | 2.83 | 18 -536% | 3.35 -18% | 3.29 -16% | 17.52 -519% | 3.69 -30% |
| Greyscale dE 2000 * | 1.1 | 2.7 -145% | 2 -82% | 2.3 -109% | 2 -82% | 0.8 27% |
| Gamma | 2.16 102% | 2.22 99% | 2.19 100% | 2.25 98% | 2.15 102% | 2.204 100% |
| CCT | 6373 102% | 6832 95% | 6379 102% | 6470 100% | 6585 99% | 6474 100% |
| Contrast (:1) | 1008 | 863 | 12833 | |||
| Colorchecker dE 2000 calibrated * | 4.1 | 0.71 | 1.18 | 2.49 | 1.79 | |
| Total Average (Program / Settings) | -372% /
-267% | 2% /
-0% | 5% /
-0% | -412% /
-292% | 8% /
2% |
* ... smaller is better
Display Response Times
| ↔ Response Time Black to White | ||
|---|---|---|
| 1.81 ms ... rise ↗ and fall ↘ combined | ↗ 0.87 ms rise | 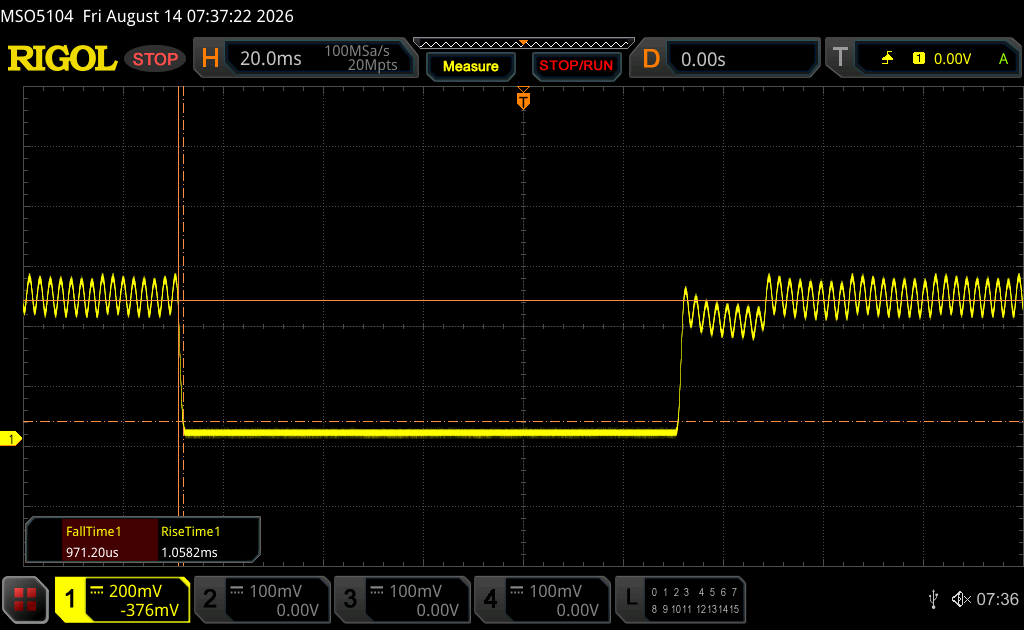 |
| ↘ 0.94 ms fall | ||
| The screen shows very fast response rates in our tests and should be very well suited for fast-paced gaming. In comparison, all tested devices range from 0.1 (minimum) to 240 (maximum) ms. » 11 % of all devices are better. This means that the measured response time is better than the average of all tested devices (19.7 ms). | ||
| ↔ Response Time 50% Grey to 80% Grey | ||
| 1.71 ms ... rise ↗ and fall ↘ combined | ↗ 0.88 ms rise | 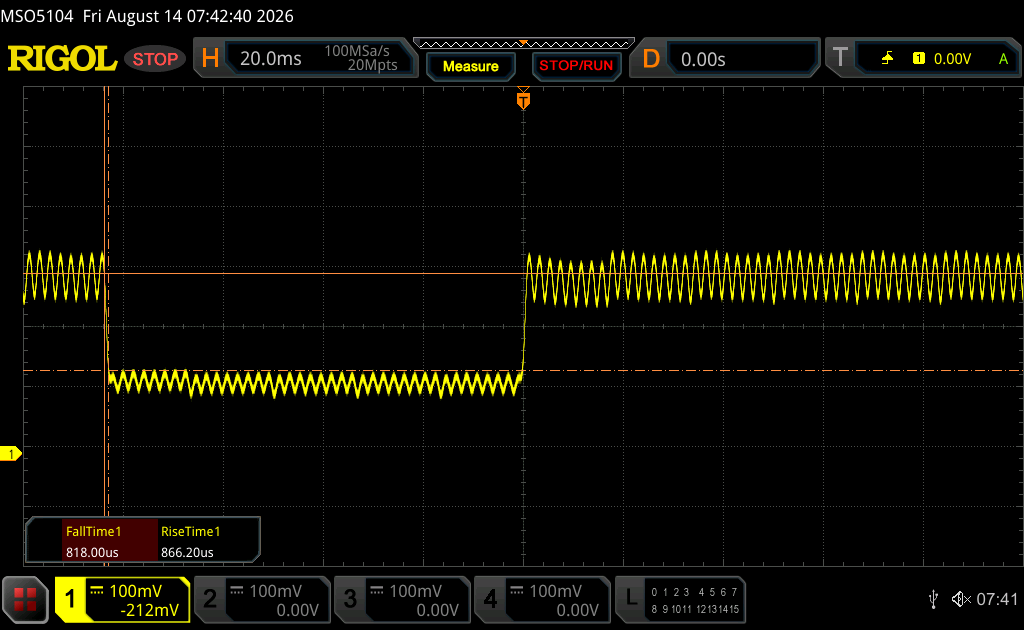 |
| ↘ 0.83 ms fall | ||
| The screen shows very fast response rates in our tests and should be very well suited for fast-paced gaming. In comparison, all tested devices range from 0.13 (minimum) to 636 (maximum) ms. » 9 % of all devices are better. This means that the measured response time is better than the average of all tested devices (30.7 ms). | ||
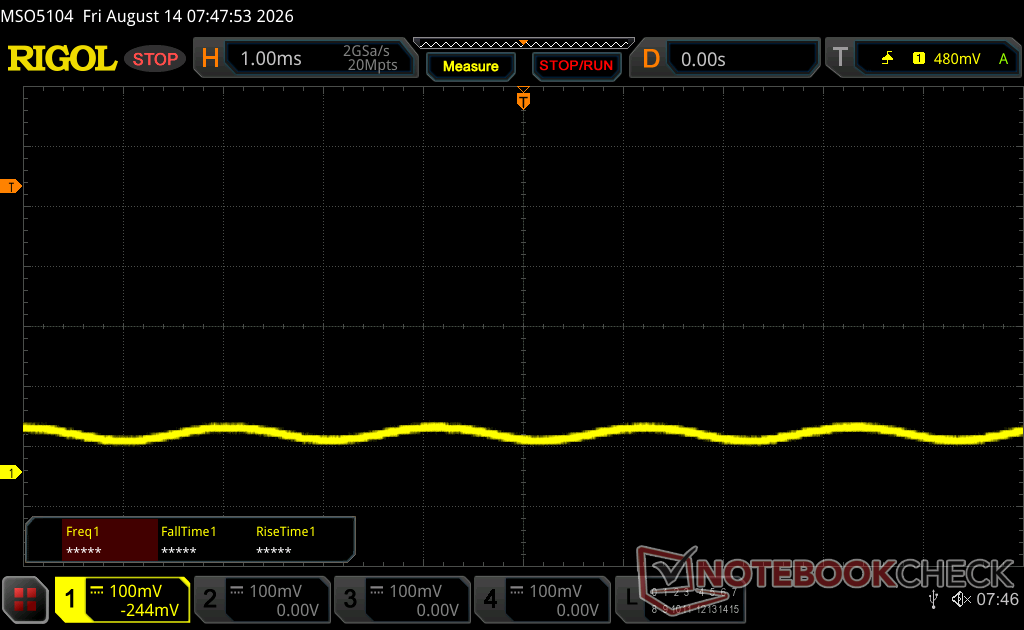
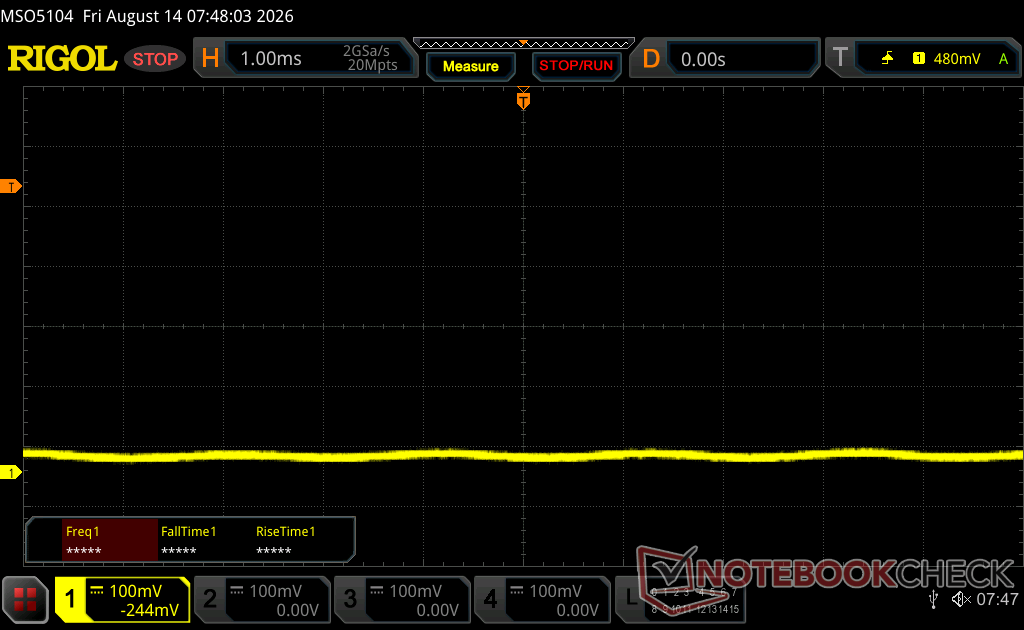
Screen Flickering / PWM (Pulse-Width Modulation)
| Screen flickering / PWM detected | 463.67 Hz Amplitude: 19 % | ≤ 100 % brightness setting | 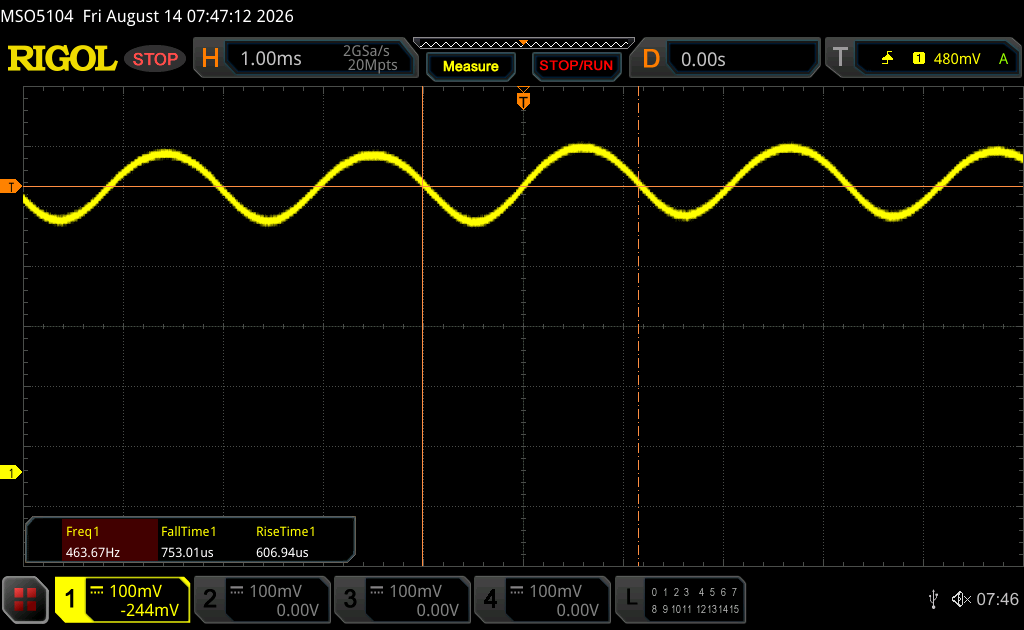 |
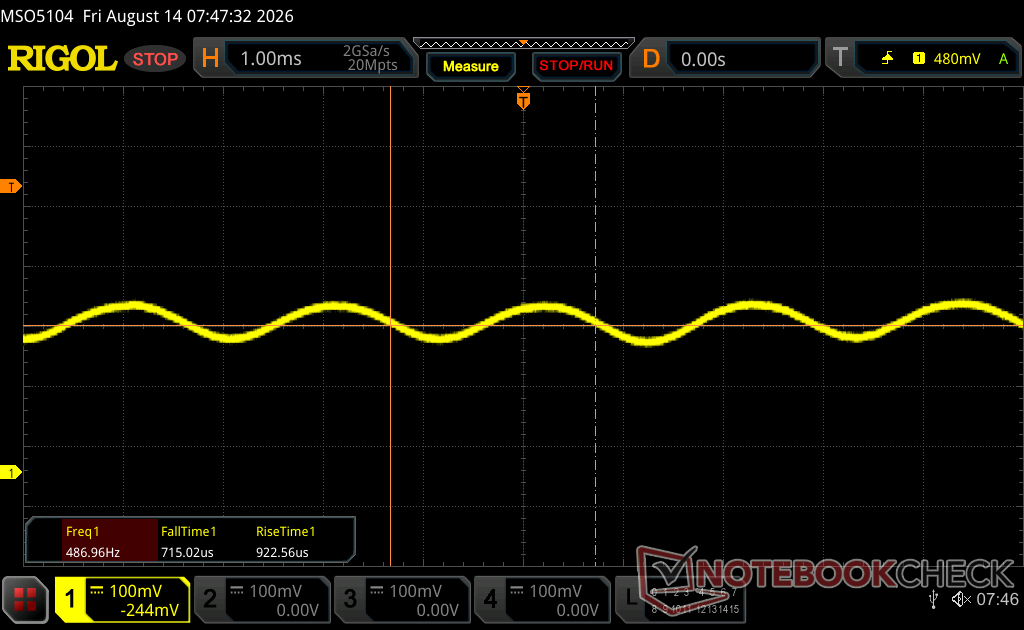
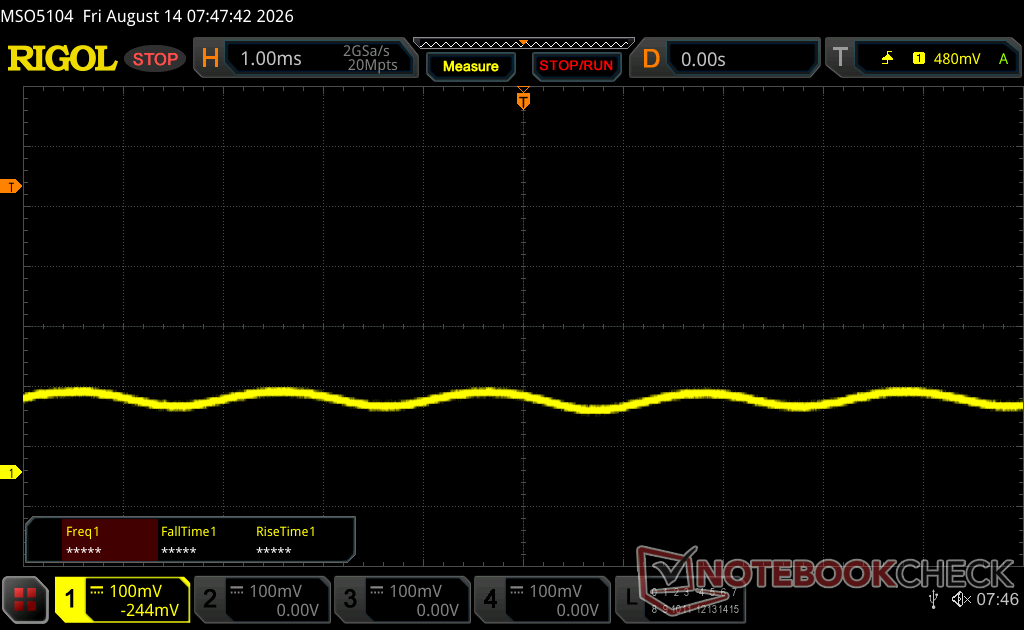
The display backlight flickers at 463.67 Hz (worst case, e.g., utilizing PWM) Flickering detected at a brightness setting of 100 % and below. There should be no flickering or PWM above this brightness setting. The frequency of 463.67 Hz is relatively high, so most users sensitive to PWM should not notice any flickering. However, there are reports that some users are still sensitive to PWM at 500 Hz and above, so be aware. In comparison: 52 % of all tested devices do not use PWM to dim the display. If PWM was detected, an average of 7622 (minimum: 5 - maximum: 343500) Hz was measured. | |||
性能
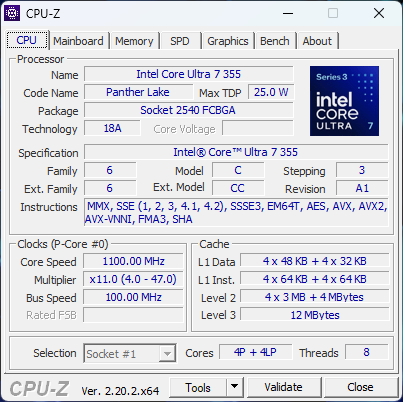
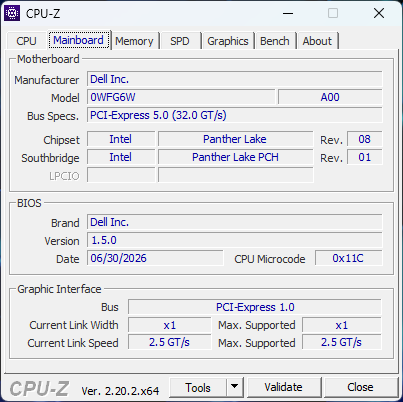
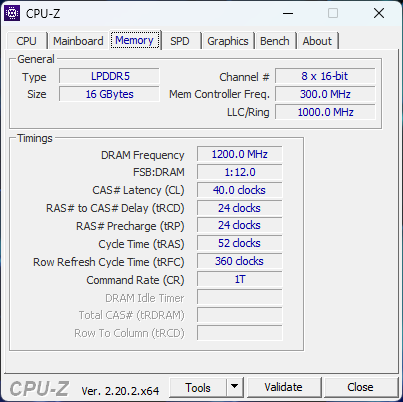
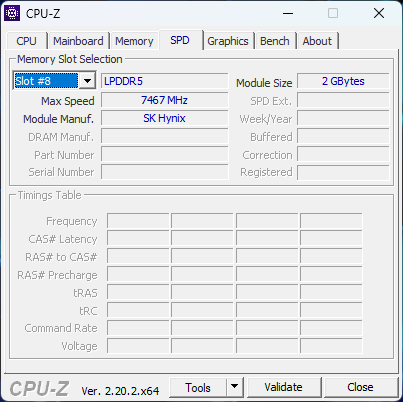
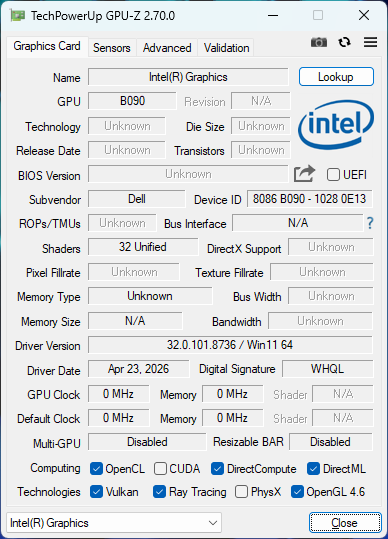
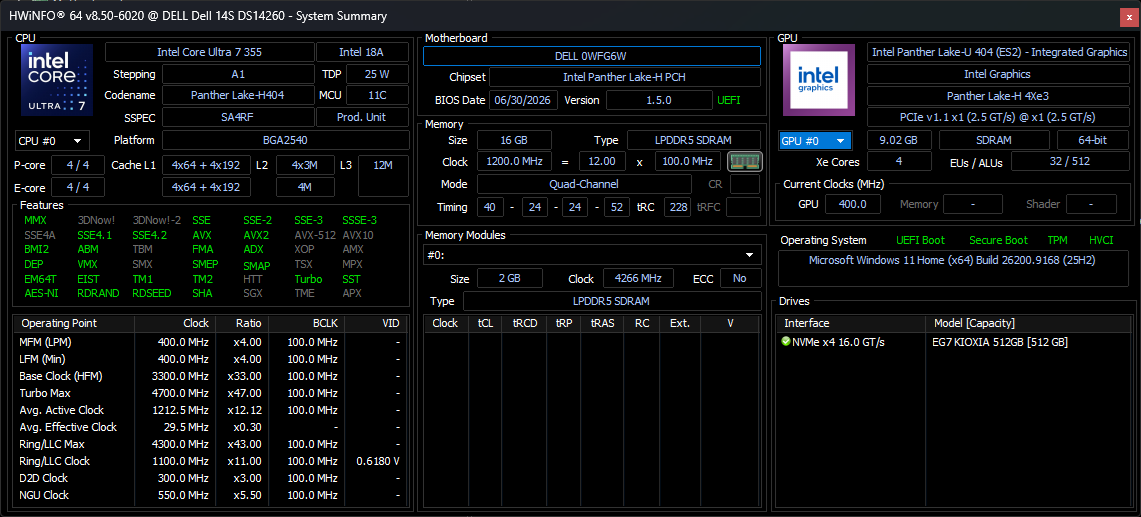
测试条件
在运行以下基准测试之前,我们将 Windows 设置为“性能”模式。
处理器性能
Cinebench R15 多核循环测试
Cinebench R23: Multi Core | Single Core
Cinebench R20: CPU (Multi Core) | CPU (Single Core)
Cinebench R15: CPU Multi 64Bit | CPU Single 64Bit
Blender: v2.79 BMW27 CPU
7-Zip 18.03: 7z b 4 | 7z b 4 -mmt1
Geekbench 6.7: Multi-Core | Single-Core
Geekbench 5.5: Multi-Core | Single-Core
HWBOT x265 Benchmark v2.2: 4k Preset
LibreOffice : 20 Documents To PDF
R Benchmark 2.5: Overall mean
* ... smaller is better
AIDA64: FP32 Ray-Trace | FPU Julia | CPU SHA3 | CPU Queen | FPU SinJulia | FPU Mandel | CPU AES | CPU ZLib | FP64 Ray-Trace | CPU PhotoWorxx | CPU CheckMate
| Performance rating | |
| Asus VivoBook S 14 OLED M5406WA -1! | |
| Dell Inspiron 14 7445 2-in-1 -1! | |
| HP OmniBook Ultra 14 Core Ultra X9 -1! | |
| Dell XPS 14 Core Ultra X7 358H | |
| Dell 14S DS14260 -1! | |
| Average Intel Core Ultra 7 355 | |
| Lenovo ThinkBook 14 G9 IPL 21UX005PGE -1! | |
| AIDA64 / FP32 Ray-Trace | |
| Asus VivoBook S 14 OLED M5406WA (v6.92.6600) | |
| Dell Inspiron 14 7445 2-in-1 (v6.92.6600) | |
| HP OmniBook Ultra 14 Core Ultra X9 (v8.20.8100) | |
| Dell XPS 14 Core Ultra X7 358H (v8.20.8100) | |
| Average Intel Core Ultra 7 355 (12088 - 12838, n=5) | |
| Dell 14S DS14260 (v8.20.8100) | |
| Lenovo ThinkBook 14 G9 IPL 21UX005PGE (v8.20.8100) | |
| AIDA64 / FPU Julia | |
| Asus VivoBook S 14 OLED M5406WA (v6.92.6600) | |
| Dell Inspiron 14 7445 2-in-1 (v6.92.6600) | |
| HP OmniBook Ultra 14 Core Ultra X9 (v8.20.8100) | |
| Dell XPS 14 Core Ultra X7 358H (v8.20.8100) | |
| Average Intel Core Ultra 7 355 (60741 - 65963, n=5) | |
| Dell 14S DS14260 (v8.20.8100) | |
| Lenovo ThinkBook 14 G9 IPL 21UX005PGE (v8.20.8100) | |
| AIDA64 / CPU SHA3 | |
| Asus VivoBook S 14 OLED M5406WA (v6.92.6600) | |
| HP OmniBook Ultra 14 Core Ultra X9 (v8.20.8100) | |
| Dell XPS 14 Core Ultra X7 358H (v8.20.8100) | |
| Dell Inspiron 14 7445 2-in-1 (v6.92.6600) | |
| Average Intel Core Ultra 7 355 (2763 - 2845, n=5) | |
| Dell 14S DS14260 (v8.20.8100) | |
| Lenovo ThinkBook 14 G9 IPL 21UX005PGE (v8.20.8100) | |
| AIDA64 / CPU Queen | |
| Dell Inspiron 14 7445 2-in-1 (v6.92.6600) | |
| Asus VivoBook S 14 OLED M5406WA (v6.92.6600) | |
| Dell XPS 14 Core Ultra X7 358H (v6.92.6600) | |
| Average Intel Core Ultra 7 355 (n=1) | |
| AIDA64 / FPU SinJulia | |
| Asus VivoBook S 14 OLED M5406WA (v6.92.6600) | |
| Dell Inspiron 14 7445 2-in-1 (v6.92.6600) | |
| HP OmniBook Ultra 14 Core Ultra X9 (v8.20.8100) | |
| Dell XPS 14 Core Ultra X7 358H (v8.20.8100) | |
| Average Intel Core Ultra 7 355 (4585 - 4601, n=5) | |
| Dell 14S DS14260 (v8.20.8100) | |
| Lenovo ThinkBook 14 G9 IPL 21UX005PGE (v8.20.8100) | |
| AIDA64 / FPU Mandel | |
| Asus VivoBook S 14 OLED M5406WA (v6.92.6600) | |
| Dell Inspiron 14 7445 2-in-1 (v6.92.6600) | |
| HP OmniBook Ultra 14 Core Ultra X9 (v8.20.8100) | |
| Dell XPS 14 Core Ultra X7 358H (v8.20.8100) | |
| Average Intel Core Ultra 7 355 (32404 - 35293, n=5) | |
| Lenovo ThinkBook 14 G9 IPL 21UX005PGE (v8.20.8100) | |
| Dell 14S DS14260 (v8.20.8100) | |
| AIDA64 / CPU AES | |
| Asus VivoBook S 14 OLED M5406WA (v6.92.6600) | |
| Dell XPS 14 Core Ultra X7 358H (v8.20.8100) | |
| HP OmniBook Ultra 14 Core Ultra X9 (v8.20.8100) | |
| Dell Inspiron 14 7445 2-in-1 (v6.92.6600) | |
| Average Intel Core Ultra 7 355 (38981 - 39424, n=5) | |
| Dell 14S DS14260 (v8.20.8100) | |
| Lenovo ThinkBook 14 G9 IPL 21UX005PGE (v8.20.8100) | |
| AIDA64 / CPU ZLib | |
| Asus VivoBook S 14 OLED M5406WA (v6.92.6600) | |
| Dell XPS 14 Core Ultra X7 358H (v8.20.8100) | |
| HP OmniBook Ultra 14 Core Ultra X9 (v8.20.8100) | |
| Dell Inspiron 14 7445 2-in-1 (v6.92.6600) | |
| Average Intel Core Ultra 7 355 (635 - 646, n=5) | |
| Dell 14S DS14260 (v8.20.8100) | |
| Lenovo ThinkBook 14 G9 IPL 21UX005PGE (v8.20.8100) | |
| AIDA64 / FP64 Ray-Trace | |
| Asus VivoBook S 14 OLED M5406WA (v6.92.6600) | |
| Dell Inspiron 14 7445 2-in-1 (v6.92.6600) | |
| HP OmniBook Ultra 14 Core Ultra X9 (v8.20.8100) | |
| Dell XPS 14 Core Ultra X7 358H (v8.20.8100) | |
| Lenovo ThinkBook 14 G9 IPL 21UX005PGE (v8.20.8100) | |
| Average Intel Core Ultra 7 355 (6138 - 6833, n=5) | |
| Dell 14S DS14260 (v8.20.8100) | |
| AIDA64 / CPU PhotoWorxx | |
| Dell XPS 14 Core Ultra X7 358H (v8.20.8100) | |
| HP OmniBook Ultra 14 Core Ultra X9 (v8.20.8100) | |
| Average Intel Core Ultra 7 355 (57998 - 60440, n=5) | |
| Dell 14S DS14260 (v8.20.8100) | |
| Lenovo ThinkBook 14 G9 IPL 21UX005PGE (v8.20.8100) | |
| Asus VivoBook S 14 OLED M5406WA (v6.92.6600) | |
| Dell Inspiron 14 7445 2-in-1 (v6.92.6600) | |
| AIDA64 / CPU CheckMate | |
| Dell XPS 14 Core Ultra X7 358H (v8.20.8100) | |
| HP OmniBook Ultra 14 Core Ultra X9 (v8.20.8100) | |
| Average Intel Core Ultra 7 355 (2747 - 2813, n=5) | |
| Dell 14S DS14260 (v8.20.8100) | |
| Lenovo ThinkBook 14 G9 IPL 21UX005PGE (v8.20.8100) | |
系统性能
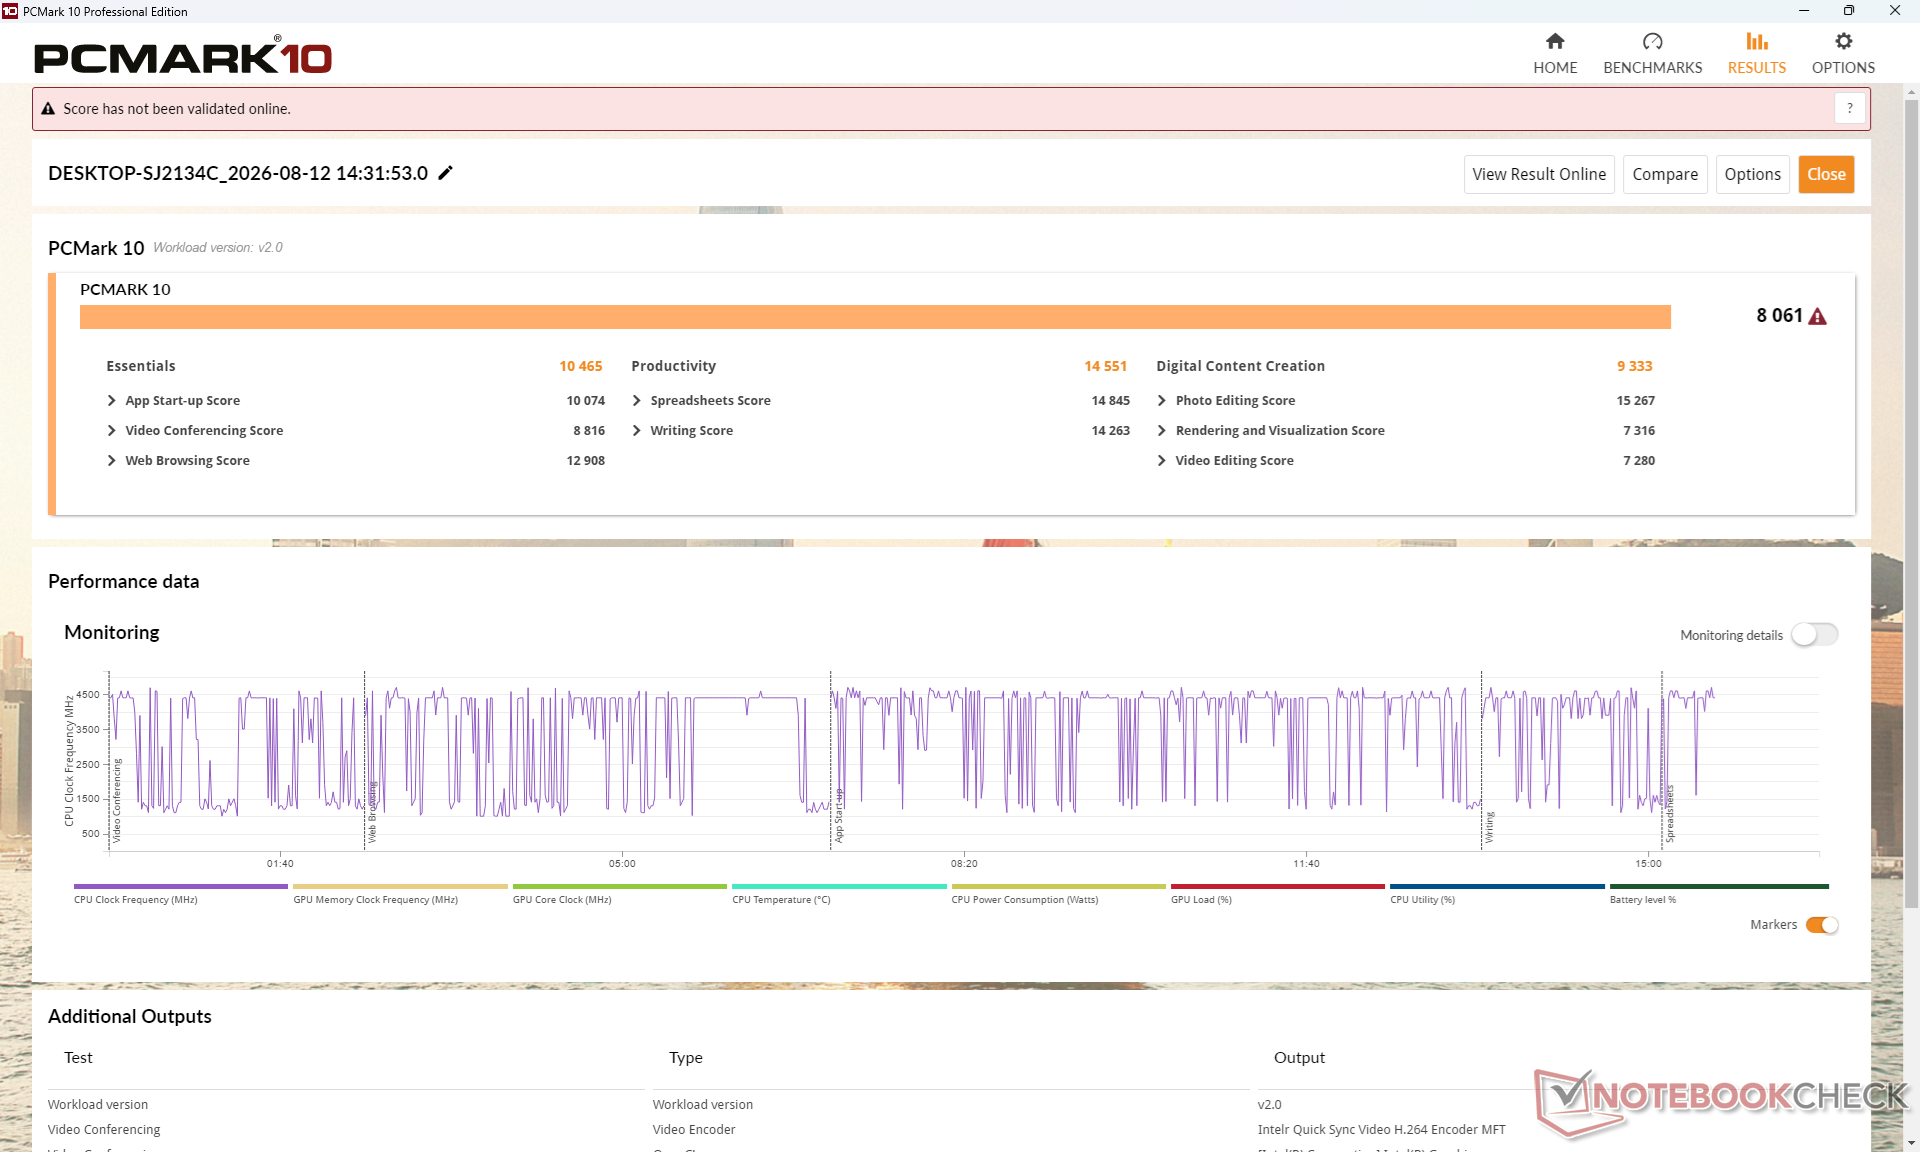
PCMark 10: Score | Essentials | Productivity | Digital Content Creation
CrossMark: Overall | Productivity | Creativity | Responsiveness
WebXPRT 3: Overall
WebXPRT 4: Overall
Mozilla Kraken 1.1: Total
| Performance rating | |
| HP OmniBook Ultra 14 Core Ultra X9 | |
| Dell XPS 14 Core Ultra X7 358H | |
| Dell 14S DS14260 | |
| Average Intel Core Ultra 7 355, Intel Graphics 4 Xe3 Panther Lake iGPU | |
| Dell Inspiron 14 7445 2-in-1 | |
| Lenovo ThinkBook 14 G9 IPL 21UX005PGE -4! | |
| Asus VivoBook S 14 OLED M5406WA -5! | |
| PCMark 10 / Score | |
| HP OmniBook Ultra 14 Core Ultra X9 | |
| Dell XPS 14 Core Ultra X7 358H | |
| Average Intel Core Ultra 7 355, Intel Graphics 4 Xe3 Panther Lake iGPU (7884 - 8201, n=5) | |
| Dell 14S DS14260 | |
| Lenovo ThinkBook 14 G9 IPL 21UX005PGE | |
| Asus VivoBook S 14 OLED M5406WA | |
| Dell Inspiron 14 7445 2-in-1 | |
| PCMark 10 / Essentials | |
| HP OmniBook Ultra 14 Core Ultra X9 | |
| Dell XPS 14 Core Ultra X7 358H | |
| Dell Inspiron 14 7445 2-in-1 | |
| Asus VivoBook S 14 OLED M5406WA | |
| Average Intel Core Ultra 7 355, Intel Graphics 4 Xe3 Panther Lake iGPU (10356 - 10820, n=5) | |
| Dell 14S DS14260 | |
| Lenovo ThinkBook 14 G9 IPL 21UX005PGE | |
| PCMark 10 / Productivity | |
| Dell XPS 14 Core Ultra X7 358H | |
| HP OmniBook Ultra 14 Core Ultra X9 | |
| Dell 14S DS14260 | |
| Average Intel Core Ultra 7 355, Intel Graphics 4 Xe3 Panther Lake iGPU (13871 - 14955, n=5) | |
| Lenovo ThinkBook 14 G9 IPL 21UX005PGE | |
| Asus VivoBook S 14 OLED M5406WA | |
| Dell Inspiron 14 7445 2-in-1 | |
| PCMark 10 / Digital Content Creation | |
| Dell XPS 14 Core Ultra X7 358H | |
| HP OmniBook Ultra 14 Core Ultra X9 | |
| Asus VivoBook S 14 OLED M5406WA | |
| Dell 14S DS14260 | |
| Average Intel Core Ultra 7 355, Intel Graphics 4 Xe3 Panther Lake iGPU (9258 - 9368, n=5) | |
| Lenovo ThinkBook 14 G9 IPL 21UX005PGE | |
| Dell Inspiron 14 7445 2-in-1 | |
| CrossMark / Overall | |
| HP OmniBook Ultra 14 Core Ultra X9 | |
| Dell XPS 14 Core Ultra X7 358H | |
| Dell 14S DS14260 | |
| Average Intel Core Ultra 7 355, Intel Graphics 4 Xe3 Panther Lake iGPU (1627 - 1892, n=5) | |
| Dell Inspiron 14 7445 2-in-1 | |
| CrossMark / Productivity | |
| HP OmniBook Ultra 14 Core Ultra X9 | |
| Dell 14S DS14260 | |
| Average Intel Core Ultra 7 355, Intel Graphics 4 Xe3 Panther Lake iGPU (1561 - 1826, n=5) | |
| Dell XPS 14 Core Ultra X7 358H | |
| Dell Inspiron 14 7445 2-in-1 | |
| CrossMark / Creativity | |
| Dell XPS 14 Core Ultra X7 358H | |
| HP OmniBook Ultra 14 Core Ultra X9 | |
| Dell 14S DS14260 | |
| Average Intel Core Ultra 7 355, Intel Graphics 4 Xe3 Panther Lake iGPU (1761 - 2052, n=5) | |
| Dell Inspiron 14 7445 2-in-1 | |
| CrossMark / Responsiveness | |
| HP OmniBook Ultra 14 Core Ultra X9 | |
| Dell 14S DS14260 | |
| Dell XPS 14 Core Ultra X7 358H | |
| Average Intel Core Ultra 7 355, Intel Graphics 4 Xe3 Panther Lake iGPU (1458 - 1671, n=5) | |
| Dell Inspiron 14 7445 2-in-1 | |
| WebXPRT 3 / Overall | |
| HP OmniBook Ultra 14 Core Ultra X9 | |
| Dell XPS 14 Core Ultra X7 358H | |
| Lenovo ThinkBook 14 G9 IPL 21UX005PGE | |
| Dell Inspiron 14 7445 2-in-1 | |
| Average Intel Core Ultra 7 355, Intel Graphics 4 Xe3 Panther Lake iGPU (300 - 303, n=5) | |
| Dell 14S DS14260 | |
| WebXPRT 4 / Overall | |
| HP OmniBook Ultra 14 Core Ultra X9 | |
| Dell XPS 14 Core Ultra X7 358H | |
| Dell 14S DS14260 | |
| Average Intel Core Ultra 7 355, Intel Graphics 4 Xe3 Panther Lake iGPU (279 - 284, n=5) | |
| Lenovo ThinkBook 14 G9 IPL 21UX005PGE | |
| Asus VivoBook S 14 OLED M5406WA | |
| Dell Inspiron 14 7445 2-in-1 | |
| Mozilla Kraken 1.1 / Total | |
| Dell Inspiron 14 7445 2-in-1 | |
| Lenovo ThinkBook 14 G9 IPL 21UX005PGE | |
| Average Intel Core Ultra 7 355, Intel Graphics 4 Xe3 Panther Lake iGPU (470 - 487, n=5) | |
| Dell 14S DS14260 | |
| Dell XPS 14 Core Ultra X7 358H | |
| Asus VivoBook S 14 OLED M5406WA | |
| Asus VivoBook S 14 OLED M5406WA | |
| HP OmniBook Ultra 14 Core Ultra X9 | |
* ... smaller is better
| PCMark 10 Score | 8061 points | |
Help | ||
| AIDA64 / Memory Copy | |
| Dell XPS 14 Core Ultra X7 358H | |
| HP OmniBook Ultra 14 Core Ultra X9 | |
| Average Intel Core Ultra 7 355 (97301 - 105135, n=5) | |
| Dell 14S DS14260 | |
| Asus VivoBook S 14 OLED M5406WA | |
| Lenovo ThinkBook 14 G9 IPL 21UX005PGE | |
| Dell Inspiron 14 7445 2-in-1 | |
| AIDA64 / Memory Read | |
| HP OmniBook Ultra 14 Core Ultra X9 | |
| Dell XPS 14 Core Ultra X7 358H | |
| Asus VivoBook S 14 OLED M5406WA | |
| Dell 14S DS14260 | |
| Average Intel Core Ultra 7 355 (79551 - 85807, n=5) | |
| Lenovo ThinkBook 14 G9 IPL 21UX005PGE | |
| Dell Inspiron 14 7445 2-in-1 | |
| AIDA64 / Memory Write | |
| HP OmniBook Ultra 14 Core Ultra X9 | |
| Dell XPS 14 Core Ultra X7 358H | |
| Dell 14S DS14260 | |
| Average Intel Core Ultra 7 355 (103056 - 108621, n=5) | |
| Asus VivoBook S 14 OLED M5406WA | |
| Dell Inspiron 14 7445 2-in-1 | |
| Lenovo ThinkBook 14 G9 IPL 21UX005PGE | |
| AIDA64 / Memory Latency | |
| Asus VivoBook S 14 OLED M5406WA | |
| Lenovo ThinkBook 14 G9 IPL 21UX005PGE | |
| Average Intel Core Ultra 7 355 (99.7 - 105.8, n=5) | |
| Dell 14S DS14260 | |
| Dell Inspiron 14 7445 2-in-1 | |
| Dell XPS 14 Core Ultra X7 358H | |
| HP OmniBook Ultra 14 Core Ultra X9 | |
* ... smaller is better
DPC 延迟
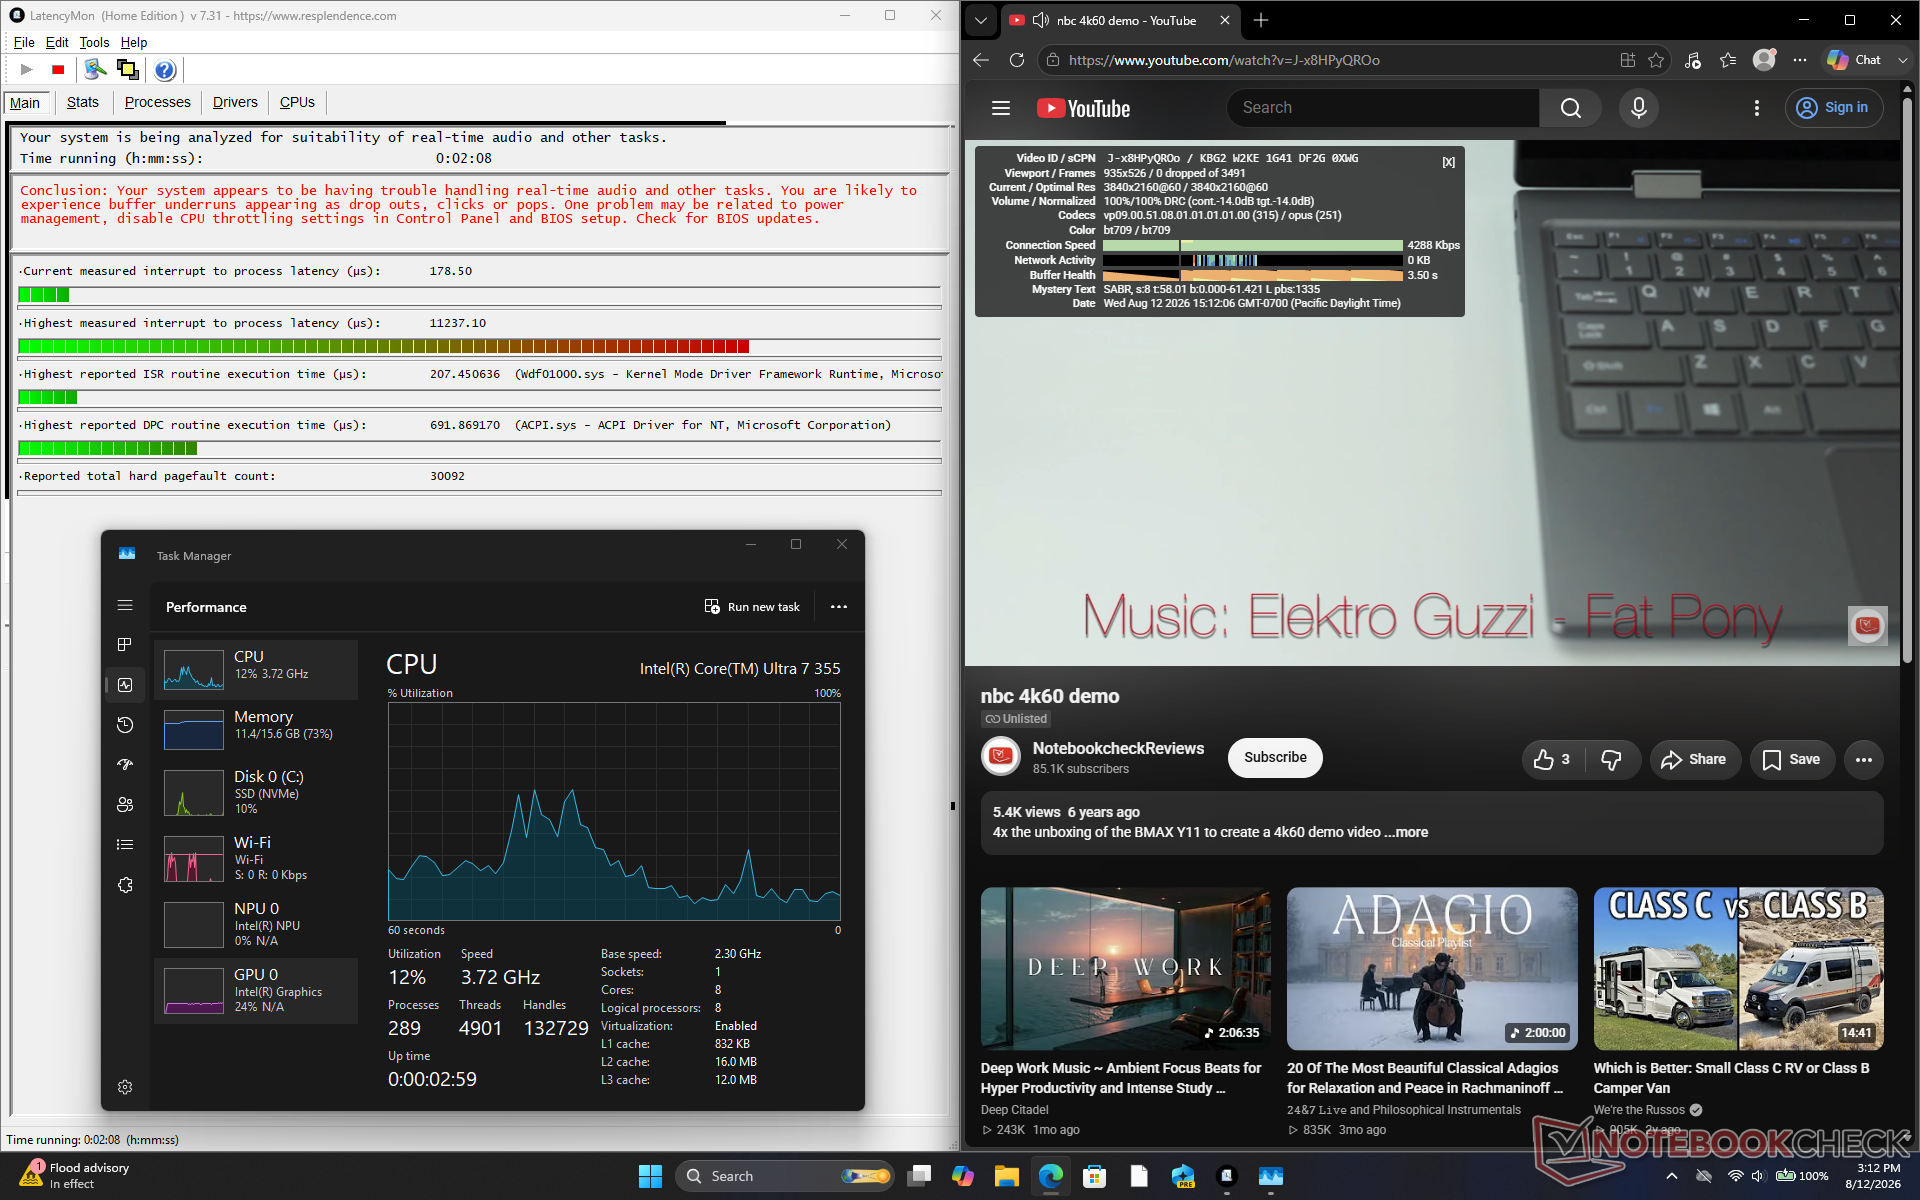
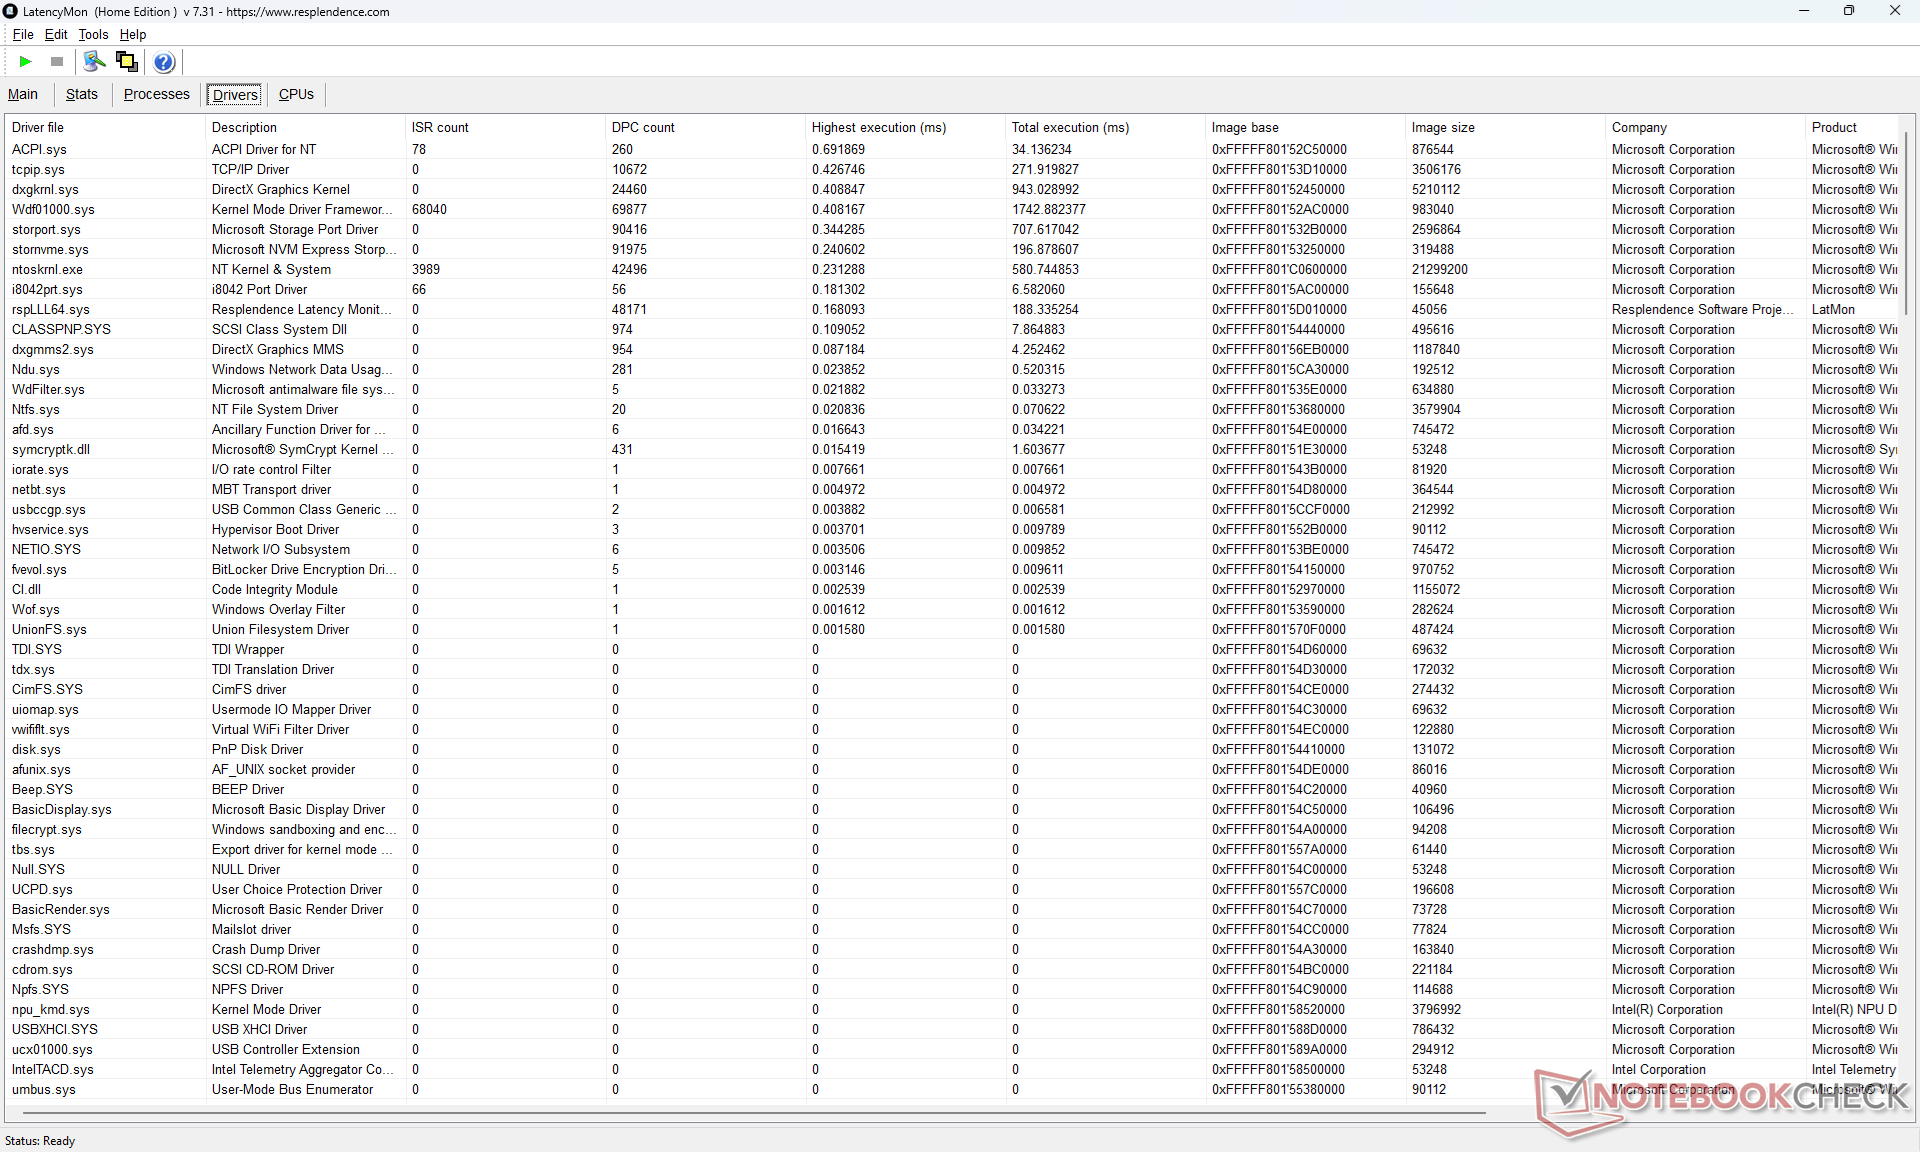
| DPC Latencies / LatencyMon - interrupt to process latency (max), Web, Youtube, Prime95 | |
| Dell 14S DS14260 | |
| HP OmniBook Ultra 14 Core Ultra X9 | |
| Dell XPS 14 Core Ultra X7 358H | |
| Dell Inspiron 14 7445 2-in-1 | |
| Asus VivoBook S 14 OLED M5406WA | |
| Lenovo ThinkBook 14 G9 IPL 21UX005PGE | |
* ... smaller is better
存储设备
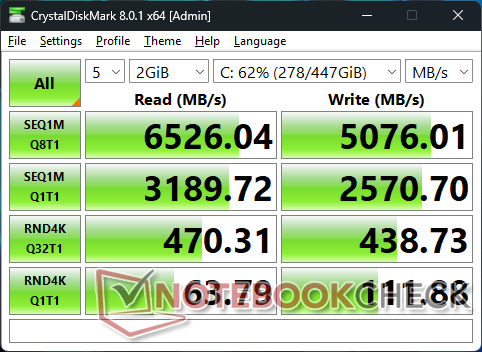
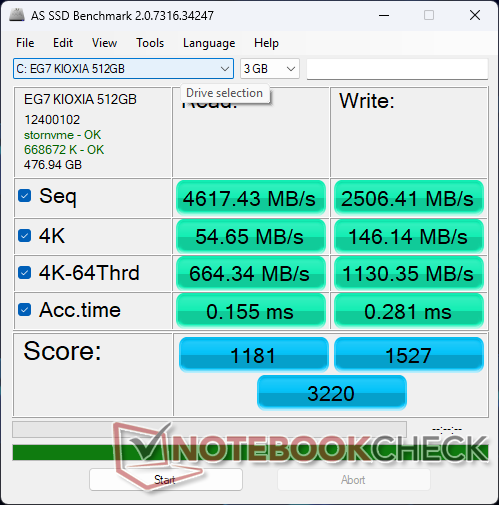

* ... smaller is better
磁盘限速:DiskSpd 读取循环,队列深度 8
GPU性能
| 性能概况 | Fire Strike 图形性能得分 | 物理性能得分 | 综合得分 |
| 性能模式 | 7123 | 21682 | 2182 |
| 电池电量 | 6996 (-2%) | 17440 (-20%) | 2156 |
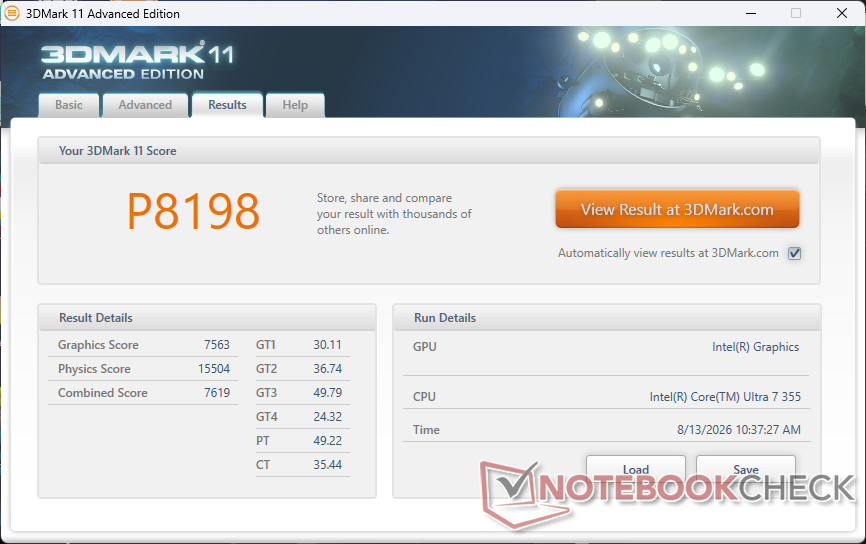
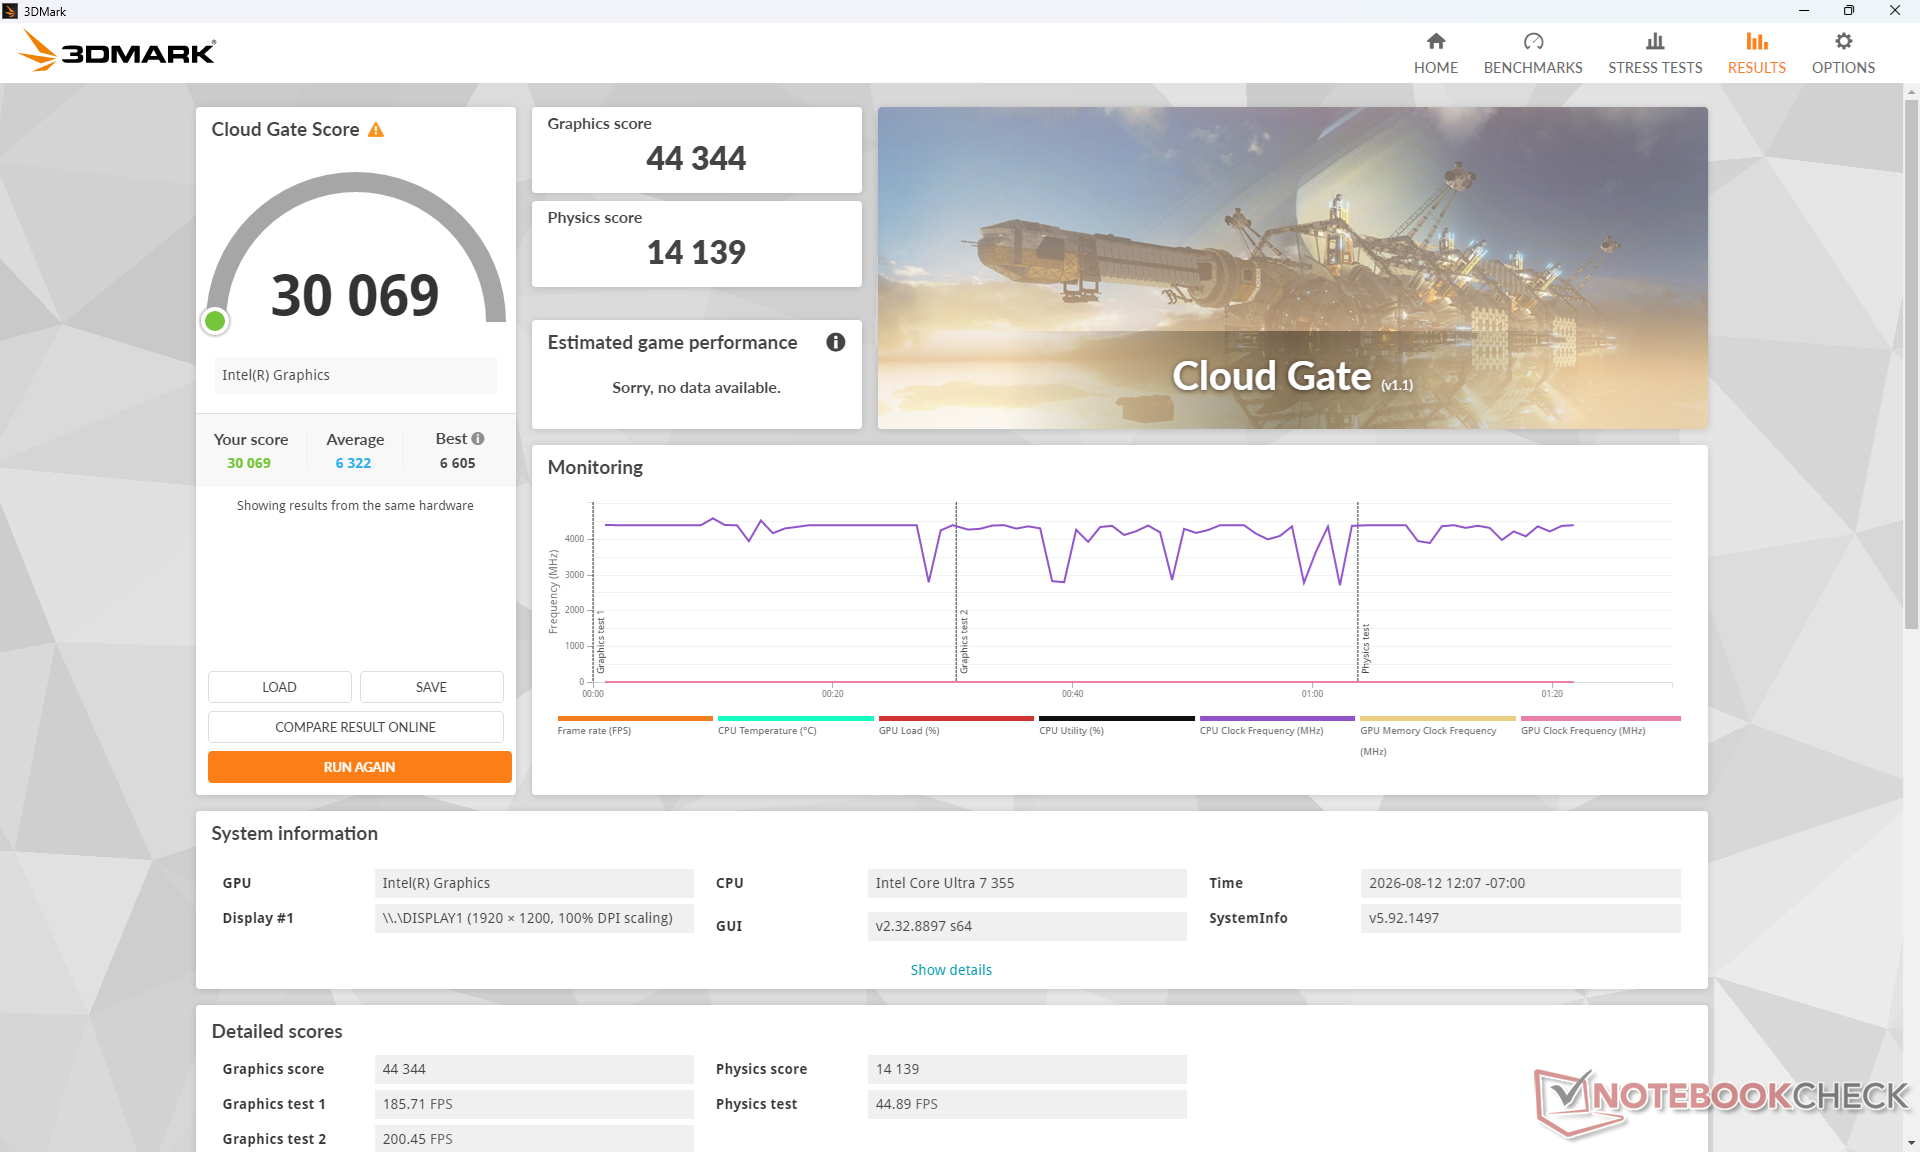
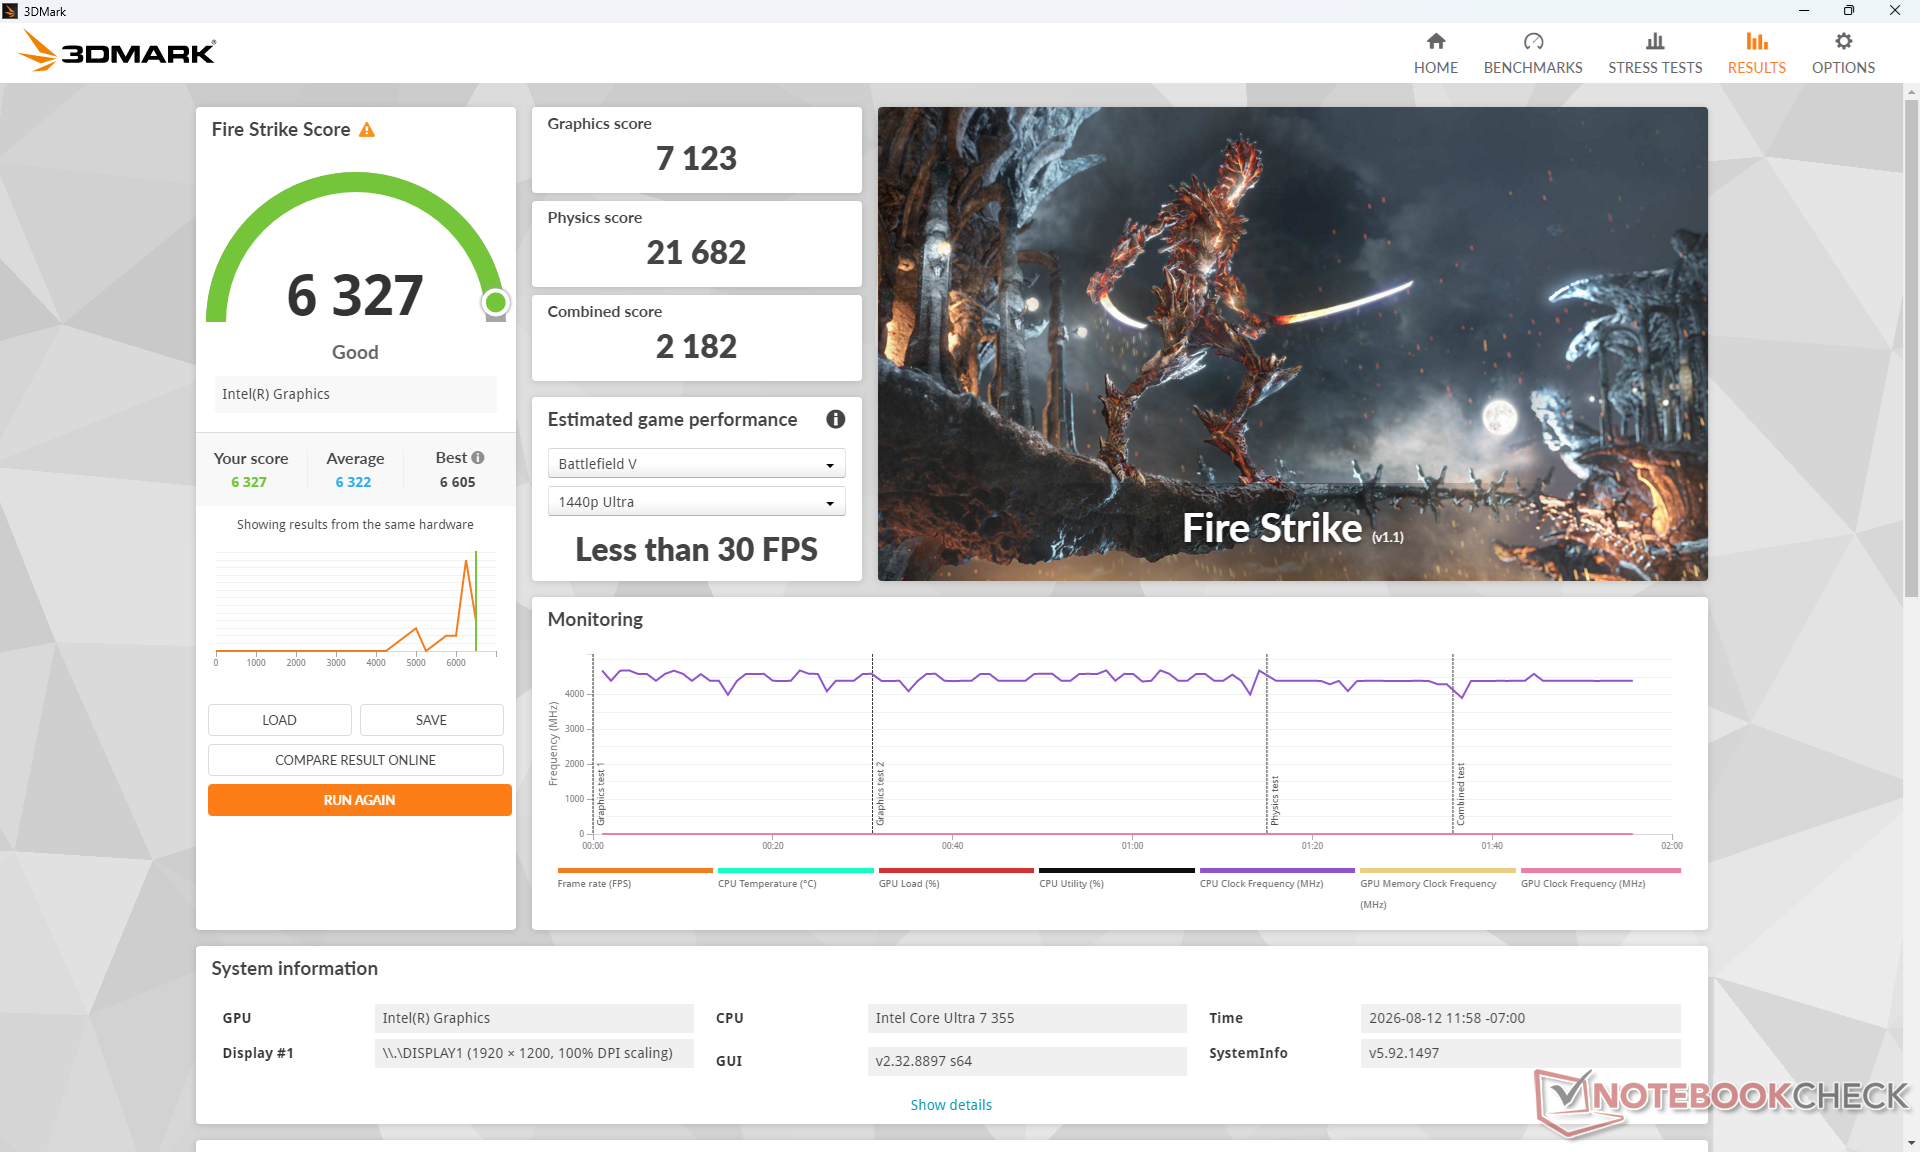
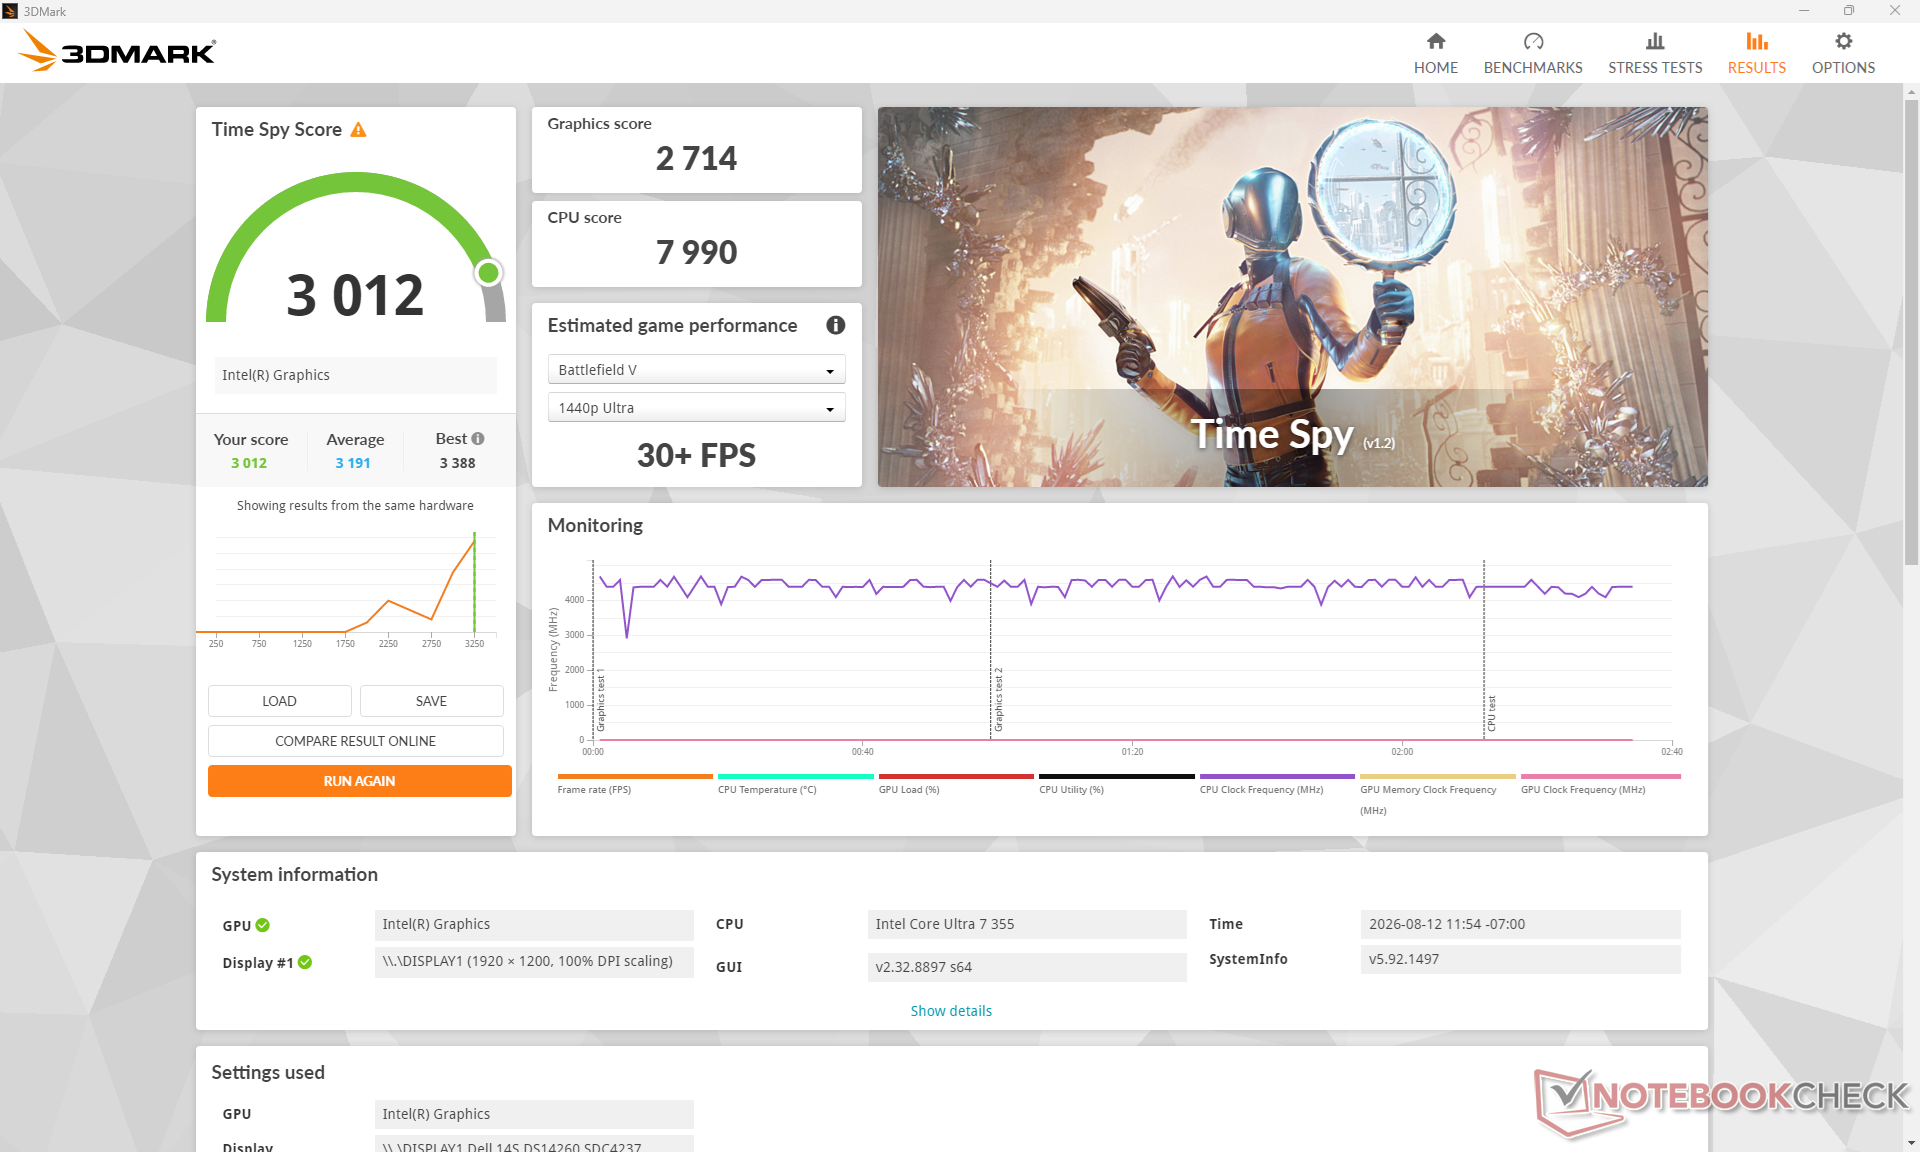
| 3DMark 11 Performance | 8198 points | |
| 3DMark Cloud Gate Standard Score | 30069 points | |
| 3DMark Fire Strike Score | 6327 points | |
| 3DMark Time Spy Score | 3012 points | |
Help | ||
* ... smaller is better
| Cyberpunk 2077 - 1920x1080 Ultra Preset (FSR off) | |
| HP OmniBook Ultra 14 Core Ultra X9 | |
| Dell XPS 14 Core Ultra X7 358H | |
| Asus VivoBook S 14 OLED M5406WA | |
| Lenovo ThinkBook 14 G9 IPL 21UX005PGE | |
| Dell Inspiron 14 7445 2-in-1 | |
| Dell 14S DS14260 | |
| Baldur's Gate 3 - 1920x1080 Ultra Preset AA:T | |
| HP OmniBook Ultra 14 Core Ultra X9 | |
| Dell XPS 14 Core Ultra X7 358H | |
| Asus VivoBook S 14 OLED M5406WA | |
| Lenovo ThinkBook 14 G9 IPL 21UX005PGE | |
| Dell Inspiron 14 7445 2-in-1 | |
| Dell 14S DS14260 | |
| GTA V - 1920x1080 Highest AA:4xMSAA + FX AF:16x | |
| HP OmniBook Ultra 14 Core Ultra X9 | |
| Dell XPS 14 Core Ultra X7 358H | |
| Asus VivoBook S 14 OLED M5406WA | |
| Dell 14S DS14260 | |
| Lenovo ThinkBook 14 G9 IPL 21UX005PGE | |
| Final Fantasy XV Benchmark - 1920x1080 High Quality | |
| HP OmniBook Ultra 14 Core Ultra X9 | |
| Dell XPS 14 Core Ultra X7 358H | |
| Asus VivoBook S 14 OLED M5406WA | |
| Dell 14S DS14260 | |
| Dell Inspiron 14 7445 2-in-1 | |
| Lenovo ThinkBook 14 G9 IPL 21UX005PGE | |
| Strange Brigade - 1920x1080 ultra AA:ultra AF:16 | |
| HP OmniBook Ultra 14 Core Ultra X9 | |
| Dell XPS 14 Core Ultra X7 358H | |
| Asus VivoBook S 14 OLED M5406WA | |
| Dell 14S DS14260 | |
| Dell Inspiron 14 7445 2-in-1 | |
| Dota 2 Reborn - 1920x1080 ultra (3/3) best looking | |
| Dell XPS 14 Core Ultra X7 358H | |
| HP OmniBook Ultra 14 Core Ultra X9 | |
| Dell 14S DS14260 | |
| Lenovo ThinkBook 14 G9 IPL 21UX005PGE | |
| Dell Inspiron 14 7445 2-in-1 | |
| Asus VivoBook S 14 OLED M5406WA | |
| X-Plane 11.11 - 1920x1080 high (fps_test=3) | |
| Asus VivoBook S 14 OLED M5406WA | |
| HP OmniBook Ultra 14 Core Ultra X9 | |
| Dell XPS 14 Core Ultra X7 358H | |
| Dell Inspiron 14 7445 2-in-1 | |
| Dell 14S DS14260 | |
| Lenovo ThinkBook 14 G9 IPL 21UX005PGE | |
《赛博朋克2077》极高画质帧率图表
| low | med. | high | ultra | |
|---|---|---|---|---|
| GTA V (2015) | 167.7 | 156.4 | 50.6 | 21 |
| Dota 2 Reborn (2015) | 107.1 | 96.1 | 81.9 | 90.7 |
| Final Fantasy XV Benchmark (2018) | 66.9 | 36.2 | 26 | |
| X-Plane 11.11 (2018) | 34.8 | 29.2 | 27.8 | |
| Strange Brigade (2018) | 187.5 | 70.4 | 56.7 | 48 |
| Baldur's Gate 3 (2023) | 28.1 | 22.9 | 19.4 | 19.2 |
| Cyberpunk 2077 (2023) | 37.3 | 26.4 | 21.2 | 16.8 |
| F1 24 (2024) | 64.1 | 57 | 42.4 | 14.2 |
排放
系统噪音
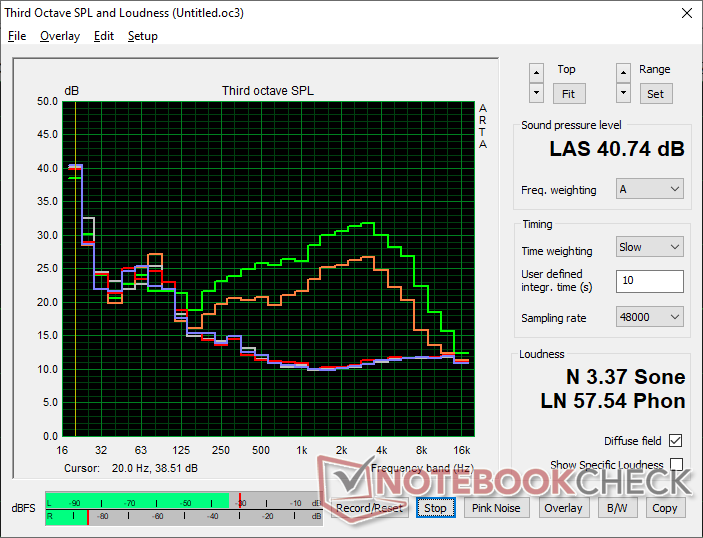
Noise level
| Idle |
| 23.4 / 23.4 / 23.4 dB(A) |
| Load |
| 30.3 / 47.4 dB(A) |
 | ||
30 dB silent 40 dB(A) audible 50 dB(A) loud |
||
min:  , med: , med:  , max: , max:  Earthworks M23R, Arta (15 cm distance) environment noise: 23.3 dB(A) Earthworks M23R, Arta (15 cm distance) environment noise: 23.3 dB(A) | ||
| Dell 14S DS14260 Ultra 7 355, Intel Graphics 4 Xe3 PTL | Lenovo ThinkBook 14 G9 IPL 21UX005PGE Ultra 5 325, Intel Graphics 4 Xe3 PTL | Dell XPS 14 Core Ultra X7 358H Ultra X7 358H, Arc B390 Panther Lake iGPU | HP OmniBook Ultra 14 Core Ultra X9 Ultra X9 388H, Arc B390 Panther Lake iGPU | Dell Inspiron 14 7445 2-in-1 R7 8840HS, Radeon 780M | Asus VivoBook S 14 OLED M5406WA Ryzen AI 9 HX 370, Radeon 890M | |
|---|---|---|---|---|---|---|
| Noise | -15% | -2% | -7% | -3% | -6% | |
| off / environment * (dB) | 23.3 | 24.8 -6% | 22.9 2% | 23.3 -0% | 23.6 -1% | 24 -3% |
| Idle Minimum * (dB) | 23.4 | 24.8 -6% | 23.3 -0% | 23.3 -0% | 24.3 -4% | 24 -3% |
| Idle Average * (dB) | 23.4 | 24.8 -6% | 23.3 -0% | 23.3 -0% | 24.3 -4% | 25 -7% |
| Idle Maximum * (dB) | 23.4 | 24.8 -6% | 23.3 -0% | 23.3 -0% | 24.8 -6% | 27 -15% |
| Load Average * (dB) | 30.3 | 46.1 -52% | 34 -12% | 42.9 -42% | 33.5 -11% | 40 -32% |
| Cyberpunk 2077 ultra * (dB) | 39.1 | 49.7 -27% | 43.5 -11% | 44.4 -14% | 39 -0% | |
| Load Maximum * (dB) | 47.4 | 48.2 -2% | 45.7 4% | 44.1 7% | 43.8 8% | 40 16% |
| Witcher 3 ultra * (dB) | 43.8 |
* ... smaller is better
温度
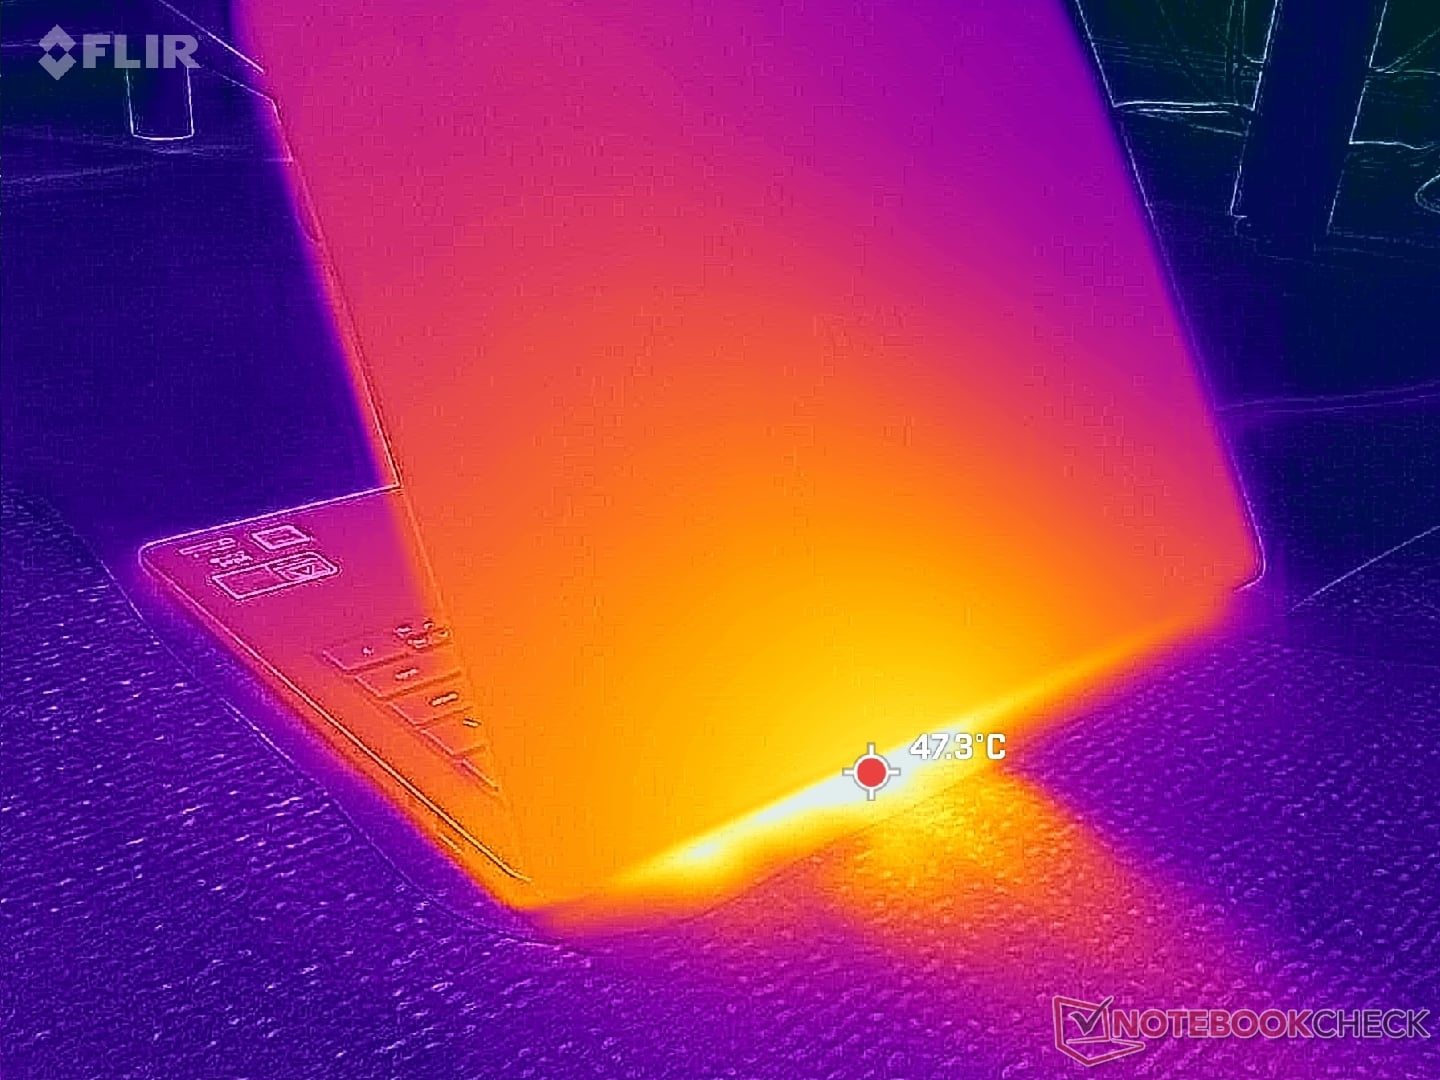
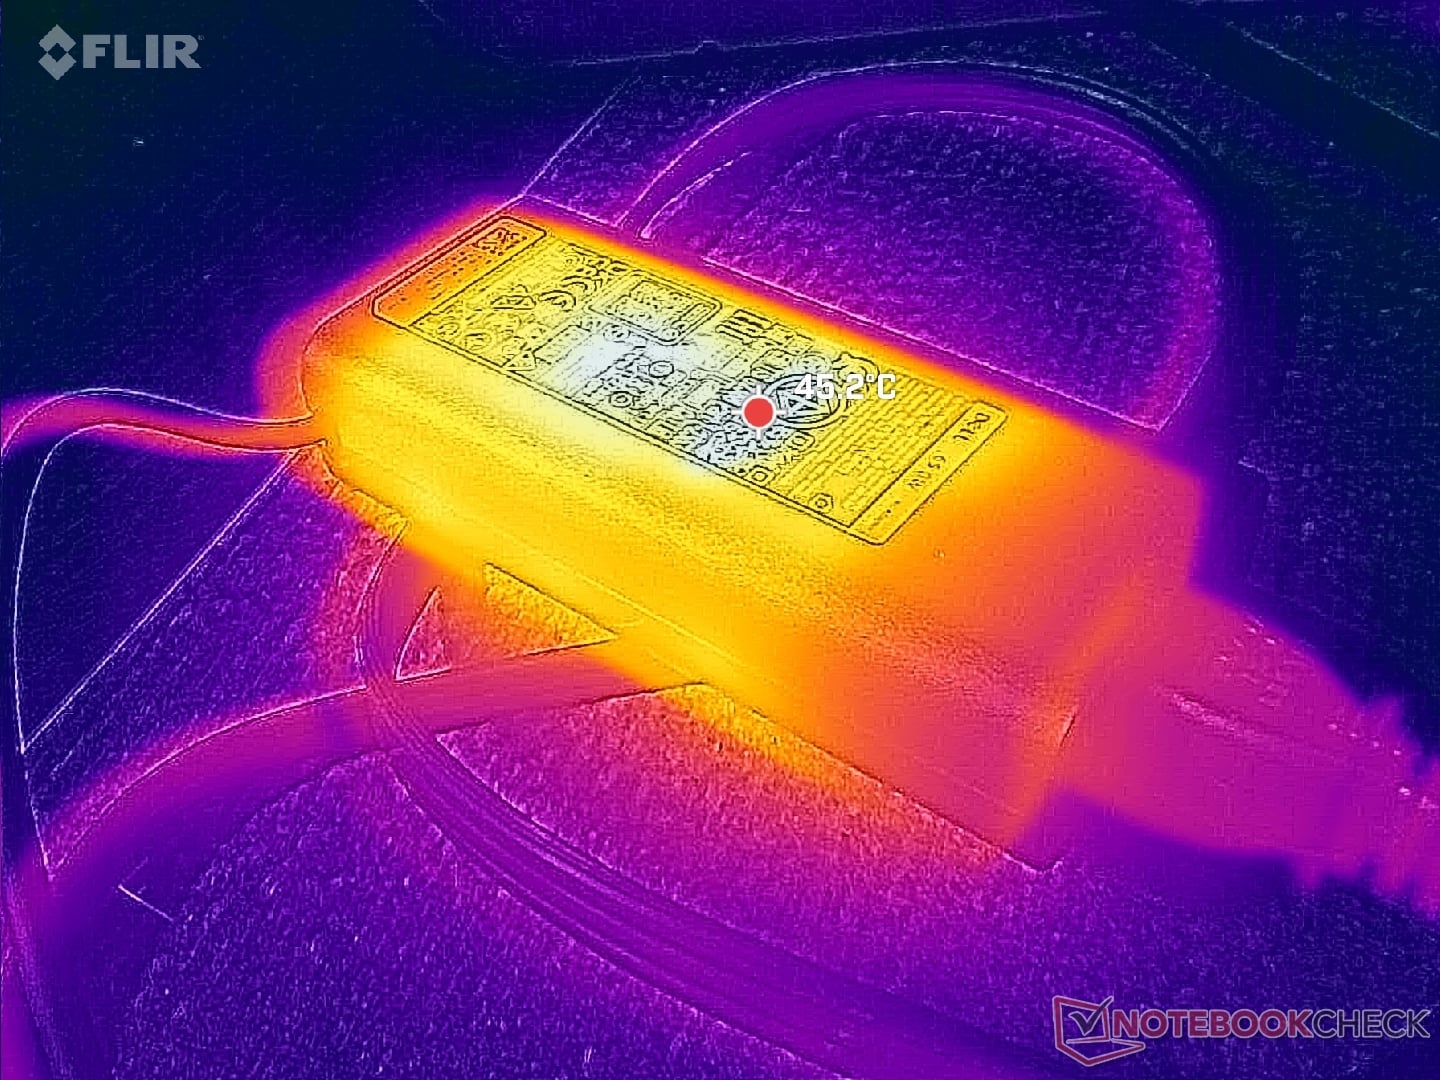
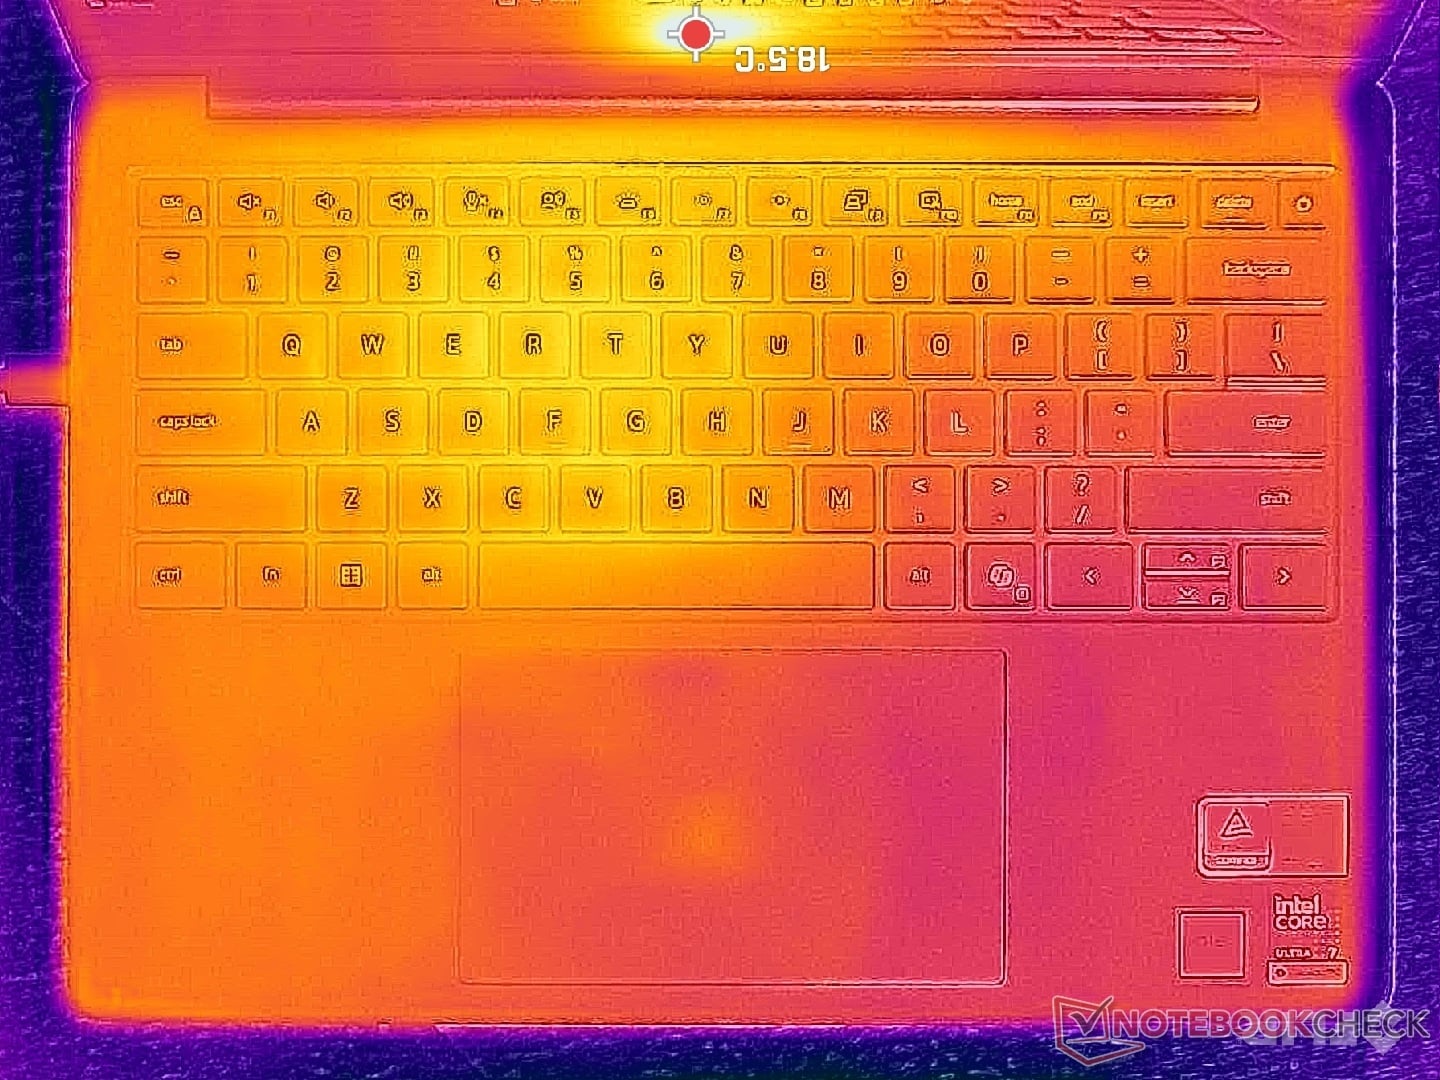
(±) The maximum temperature on the upper side is 44.4 °C / 112 F, compared to the average of 35.9 °C / 97 F, ranging from 21.4 to 59 °C for the class Subnotebook.
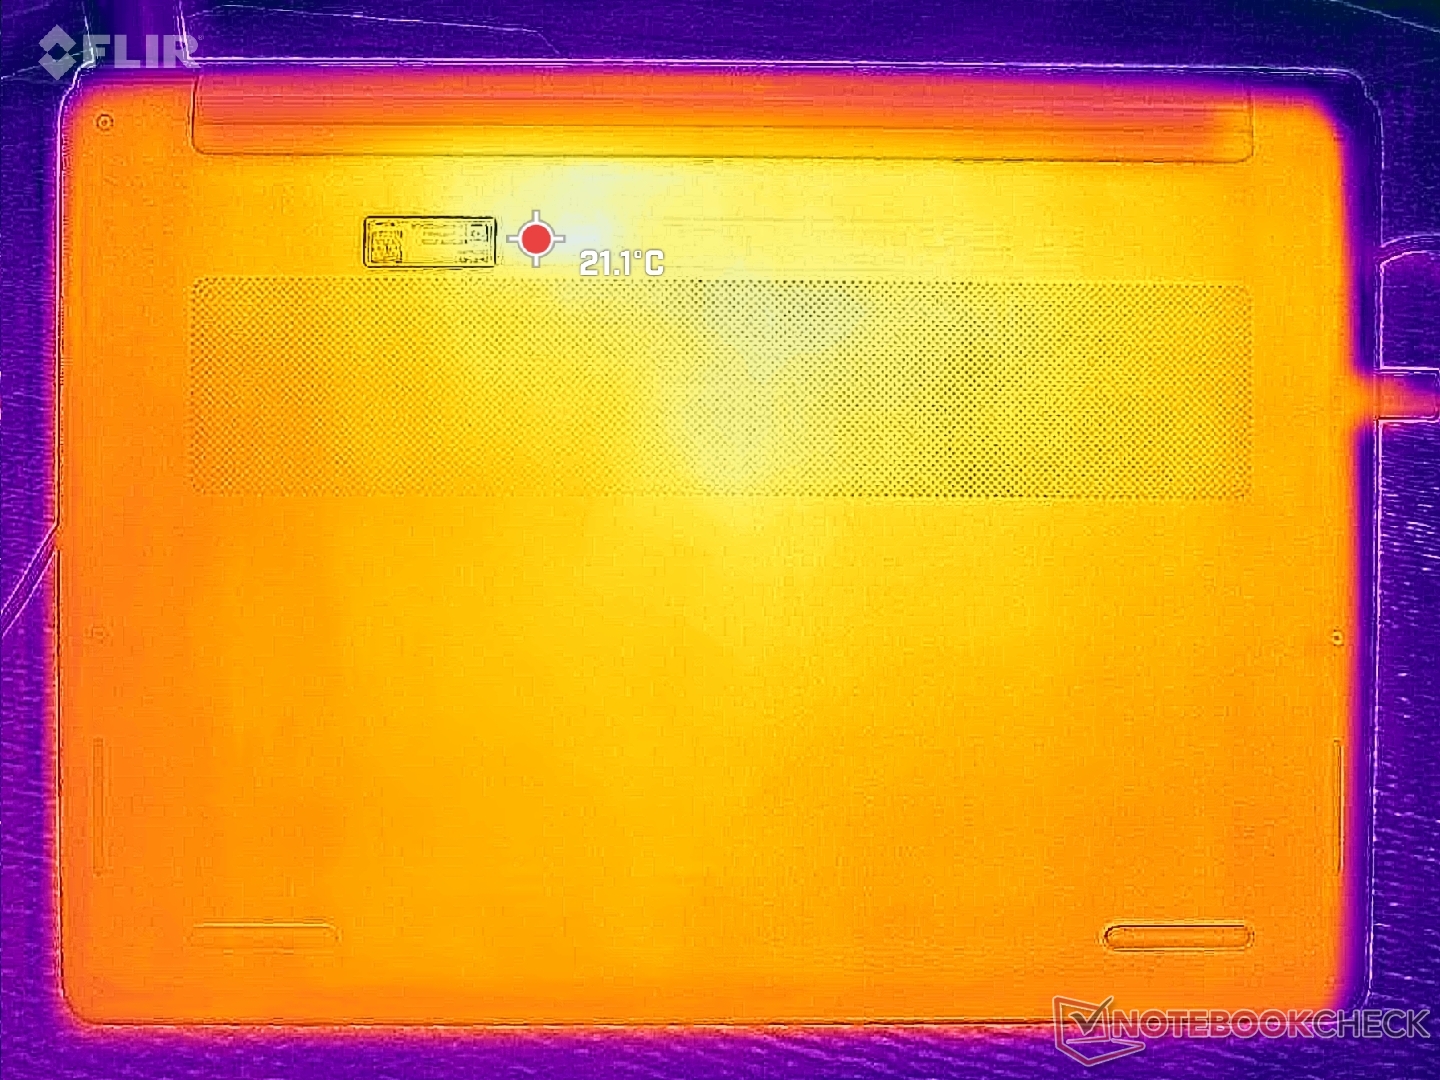
(±) The bottom heats up to a maximum of 41 °C / 106 F, compared to the average of 39.2 °C / 103 F
(+) In idle usage, the average temperature for the upper side is 25.6 °C / 78 F, compared to the device average of 30.8 °C / 87 F.
(+) The palmrests and touchpad are reaching skin temperature as a maximum (33 °C / 91.4 F) and are therefore not hot.
(-) The average temperature of the palmrest area of similar devices was 28.2 °C / 82.8 F (-4.8 °C / -8.6 F).
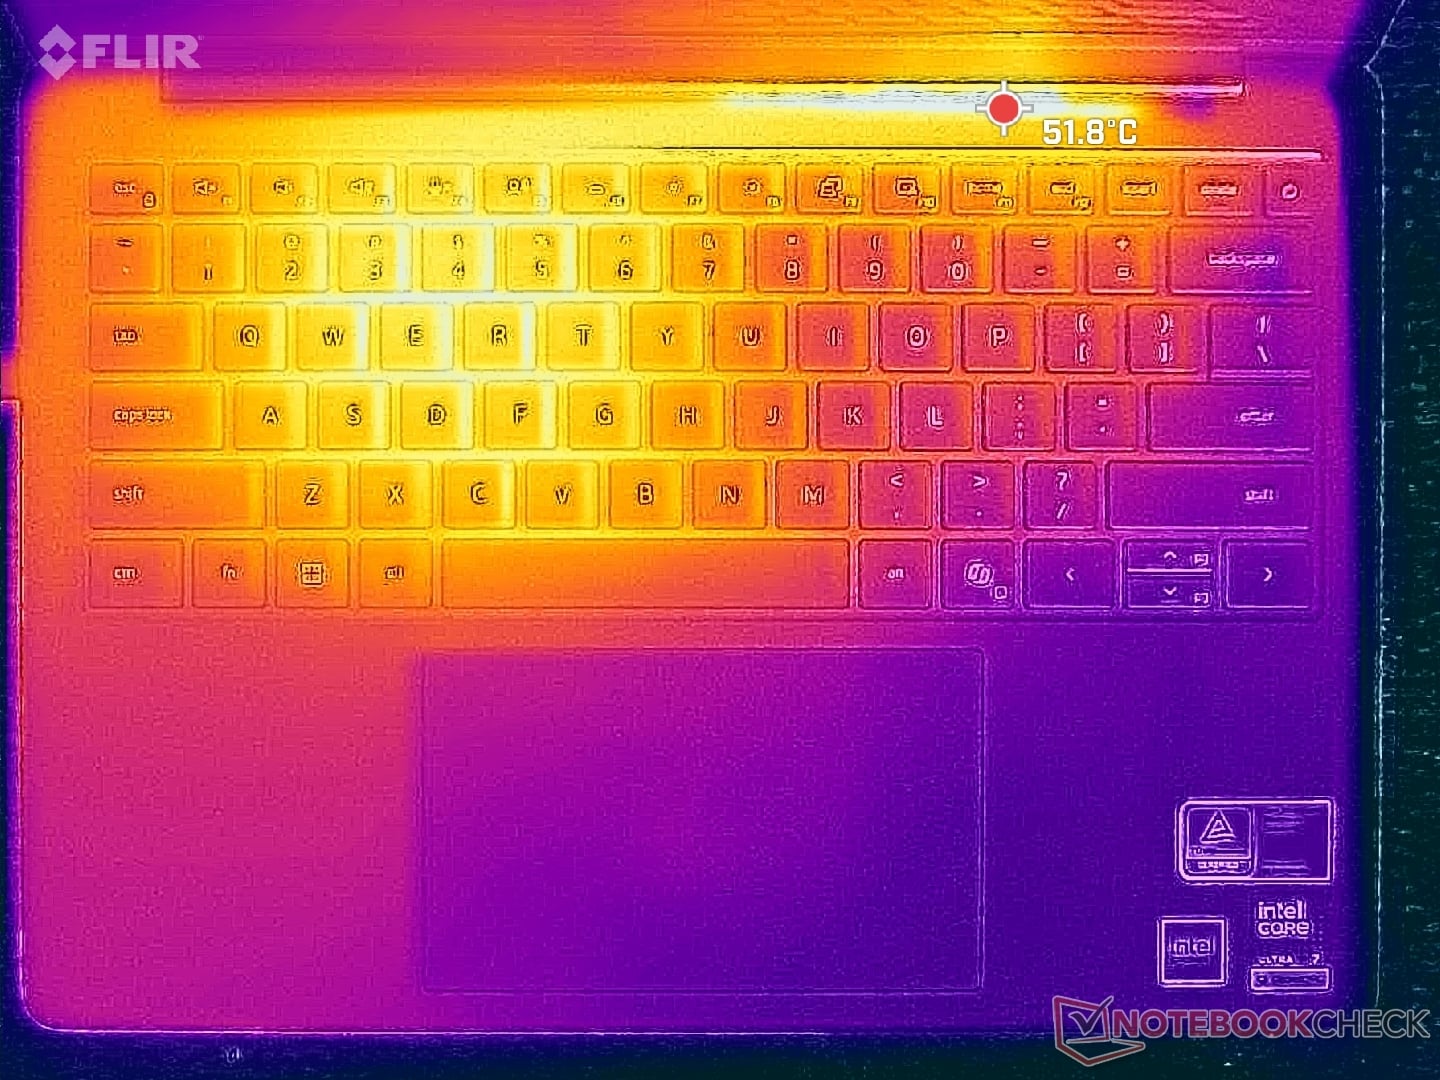
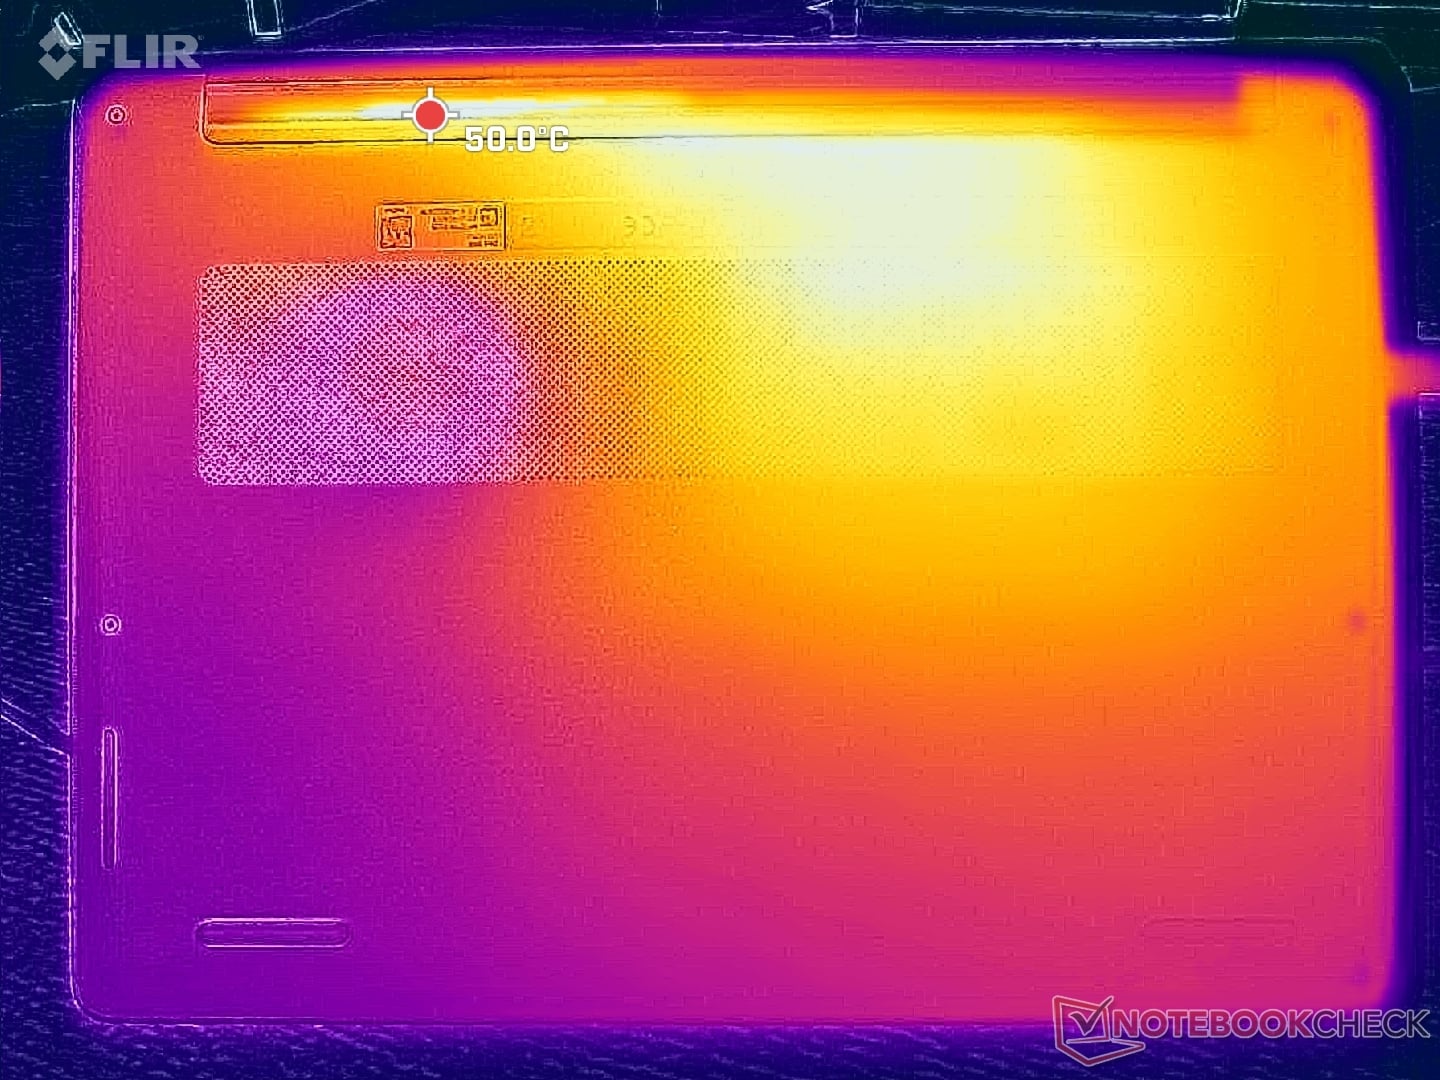
| Dell 14S DS14260 Ultra 7 355, Intel Graphics 4 Xe3 PTL | Lenovo ThinkBook 14 G9 IPL 21UX005PGE Ultra 5 325, Intel Graphics 4 Xe3 PTL | Dell XPS 14 Core Ultra X7 358H Ultra X7 358H, Arc B390 Panther Lake iGPU | HP OmniBook Ultra 14 Core Ultra X9 Ultra X9 388H, Arc B390 Panther Lake iGPU | Dell Inspiron 14 7445 2-in-1 R7 8840HS, Radeon 780M | Asus VivoBook S 14 OLED M5406WA Ryzen AI 9 HX 370, Radeon 890M | |
|---|---|---|---|---|---|---|
| Heat | -12% | 11% | 8% | -13% | -16% | |
| Maximum Upper Side * (°C) | 44.4 | 43.5 2% | 34 23% | 40.2 9% | 41.2 7% | 49 -10% |
| Maximum Bottom * (°C) | 41 | 42.5 -4% | 35.8 13% | 44.2 -8% | 48.4 -18% | 59 -44% |
| Idle Upper Side * (°C) | 26.6 | 33.6 -26% | 25.6 4% | 22.8 14% | 29.4 -11% | 28 -5% |
| Idle Bottom * (°C) | 27.4 | 32.8 -20% | 26.4 4% | 23.4 15% | 35.2 -28% | 29 -6% |
* ... smaller is better
压力测试
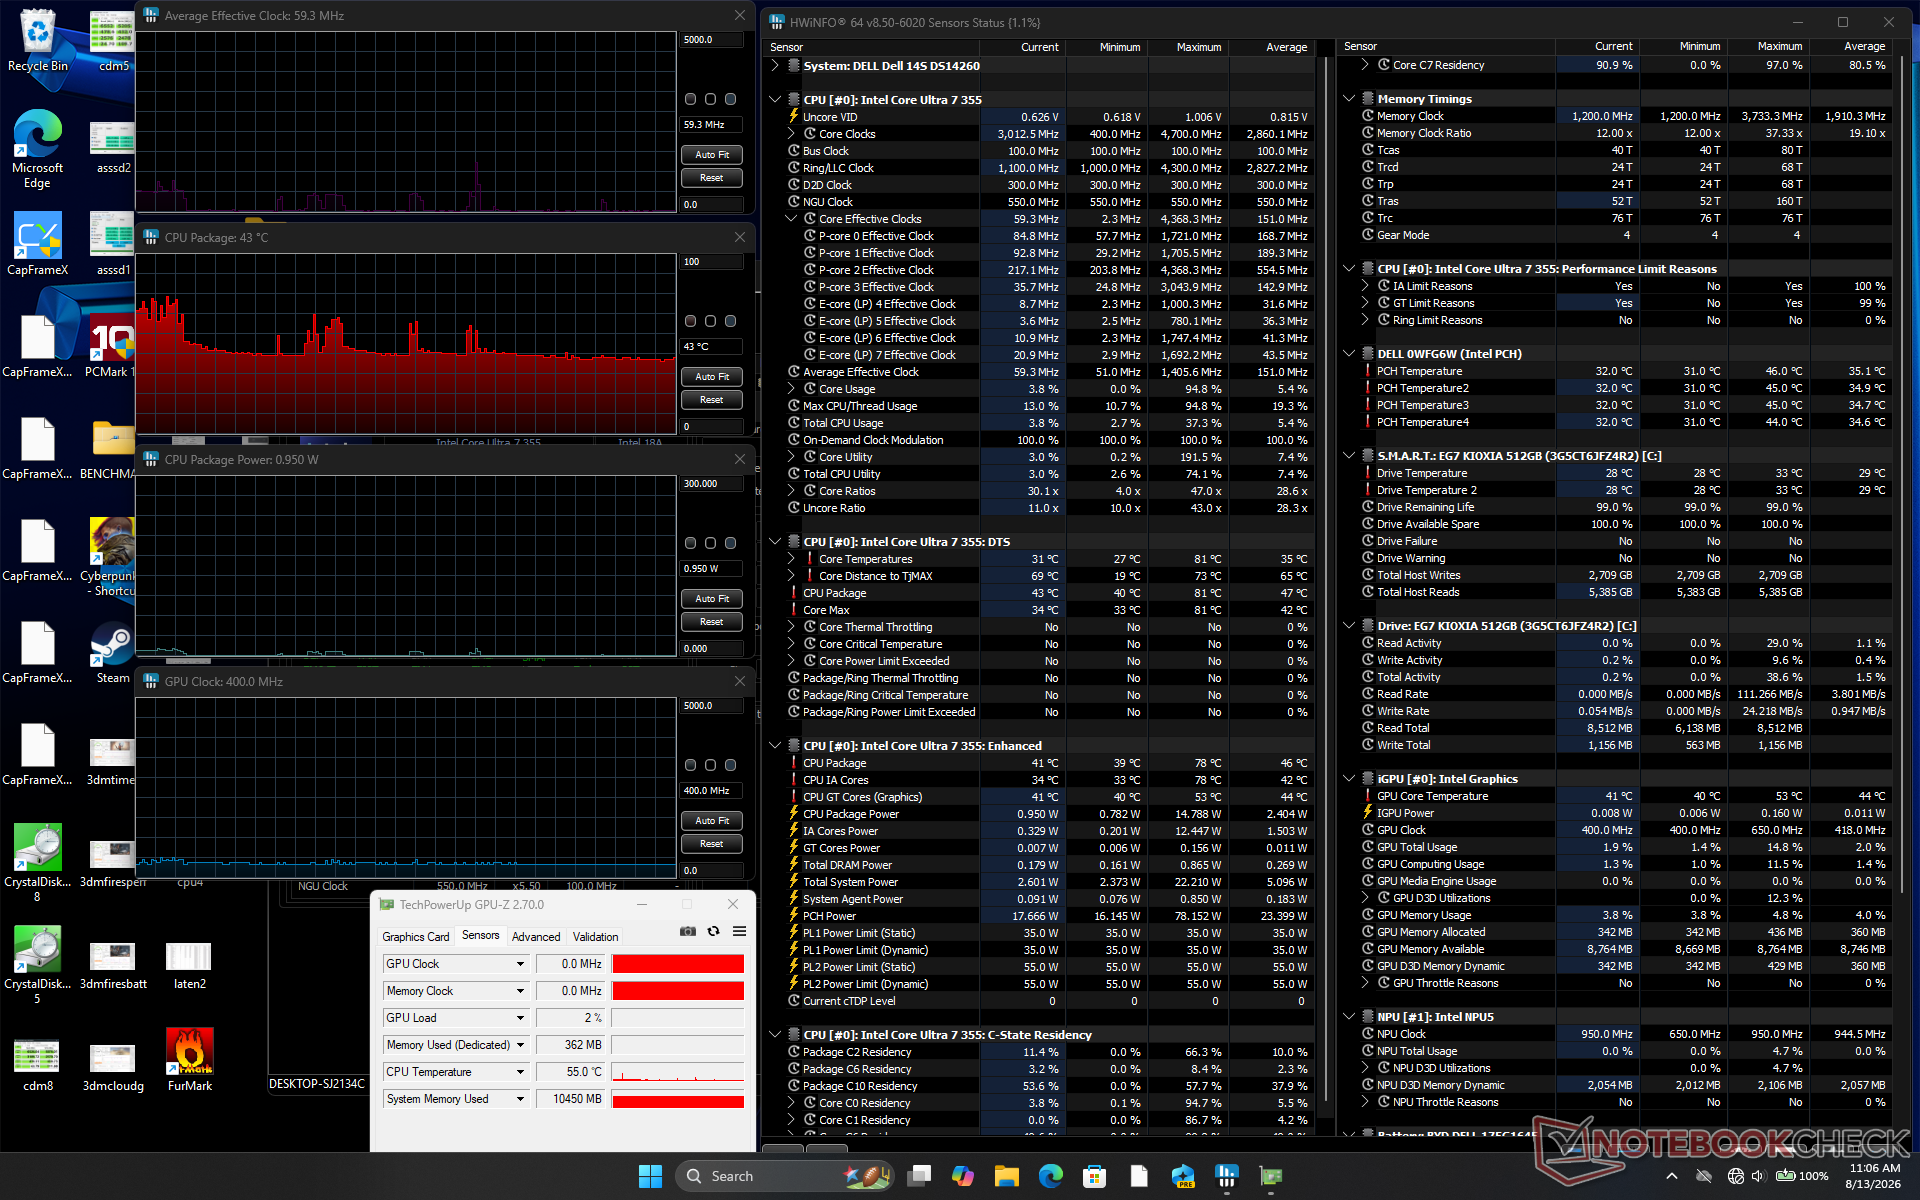
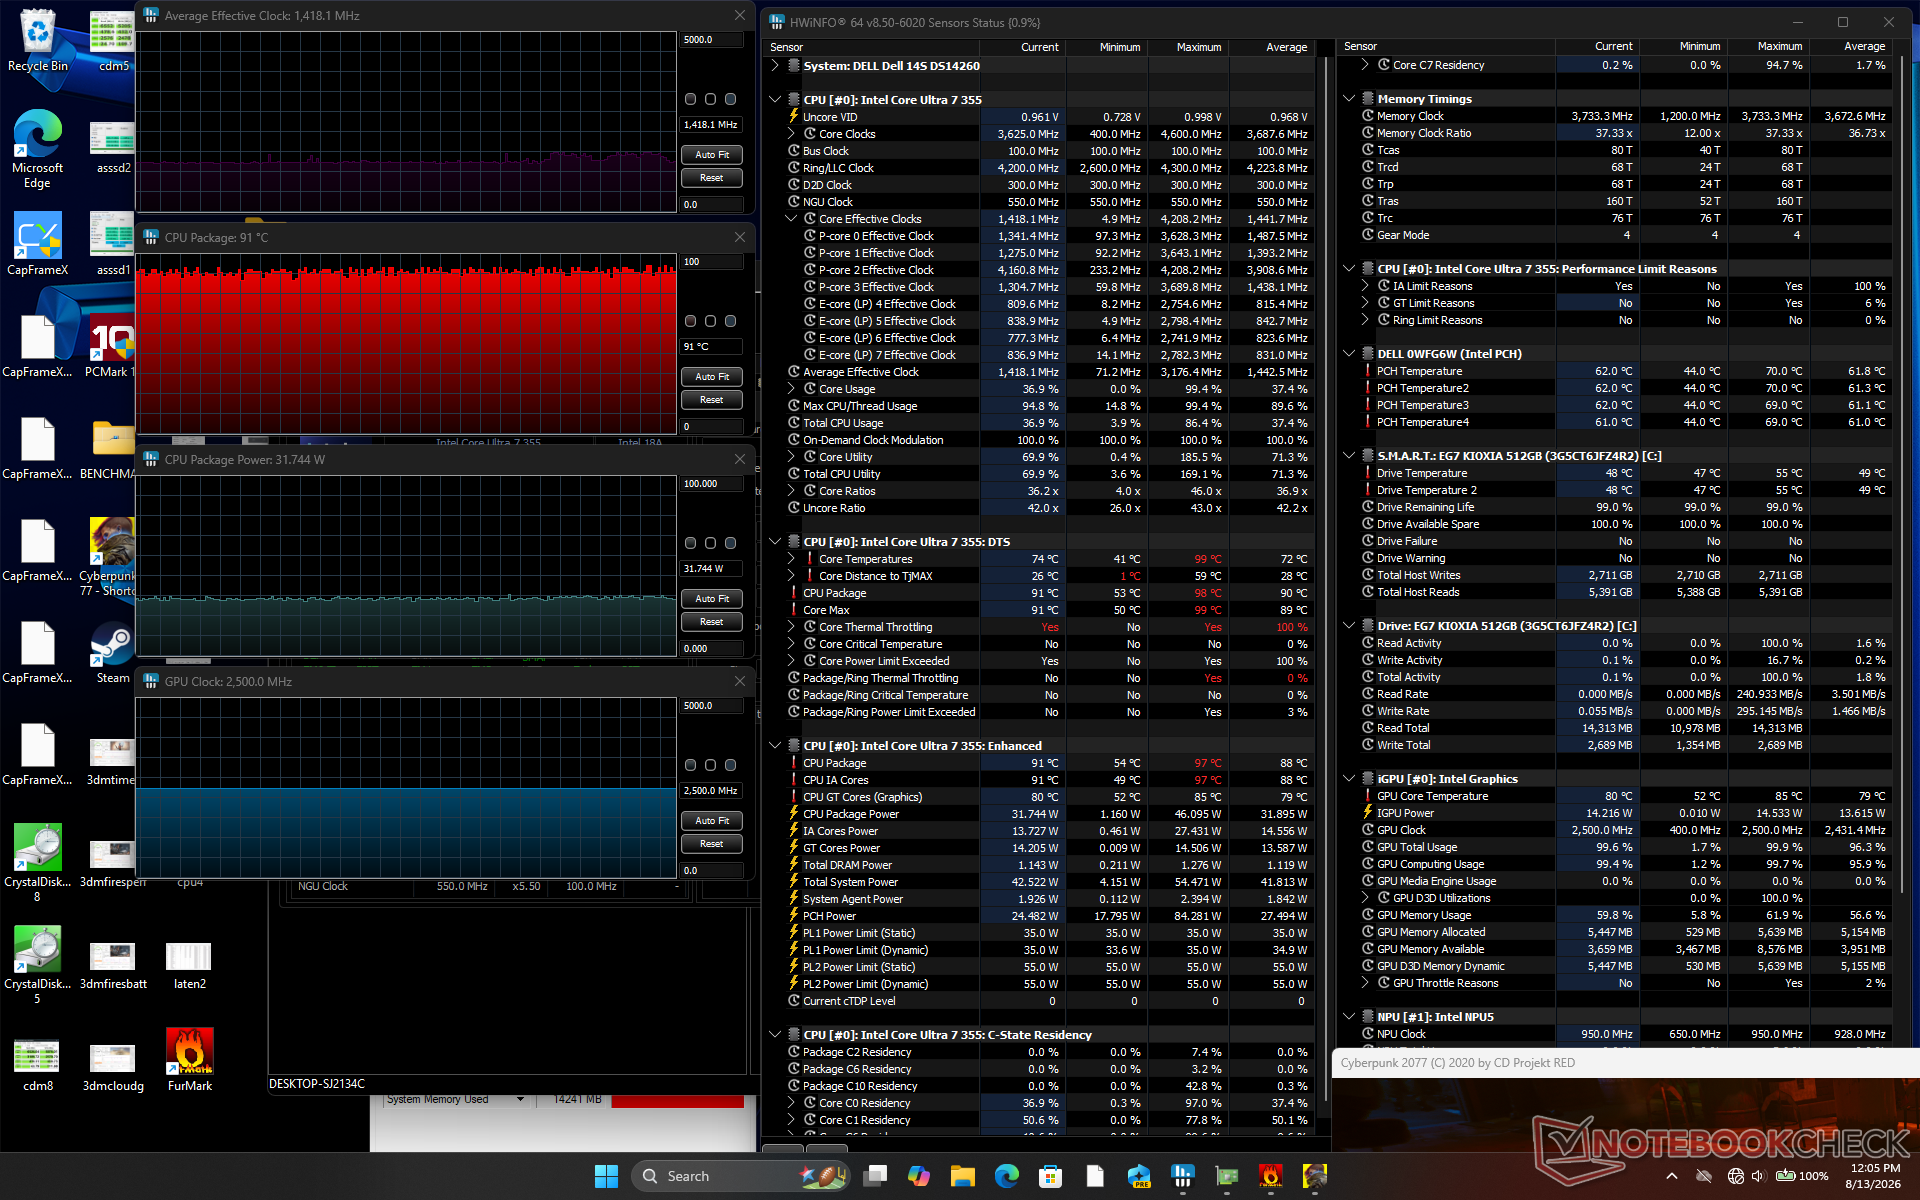
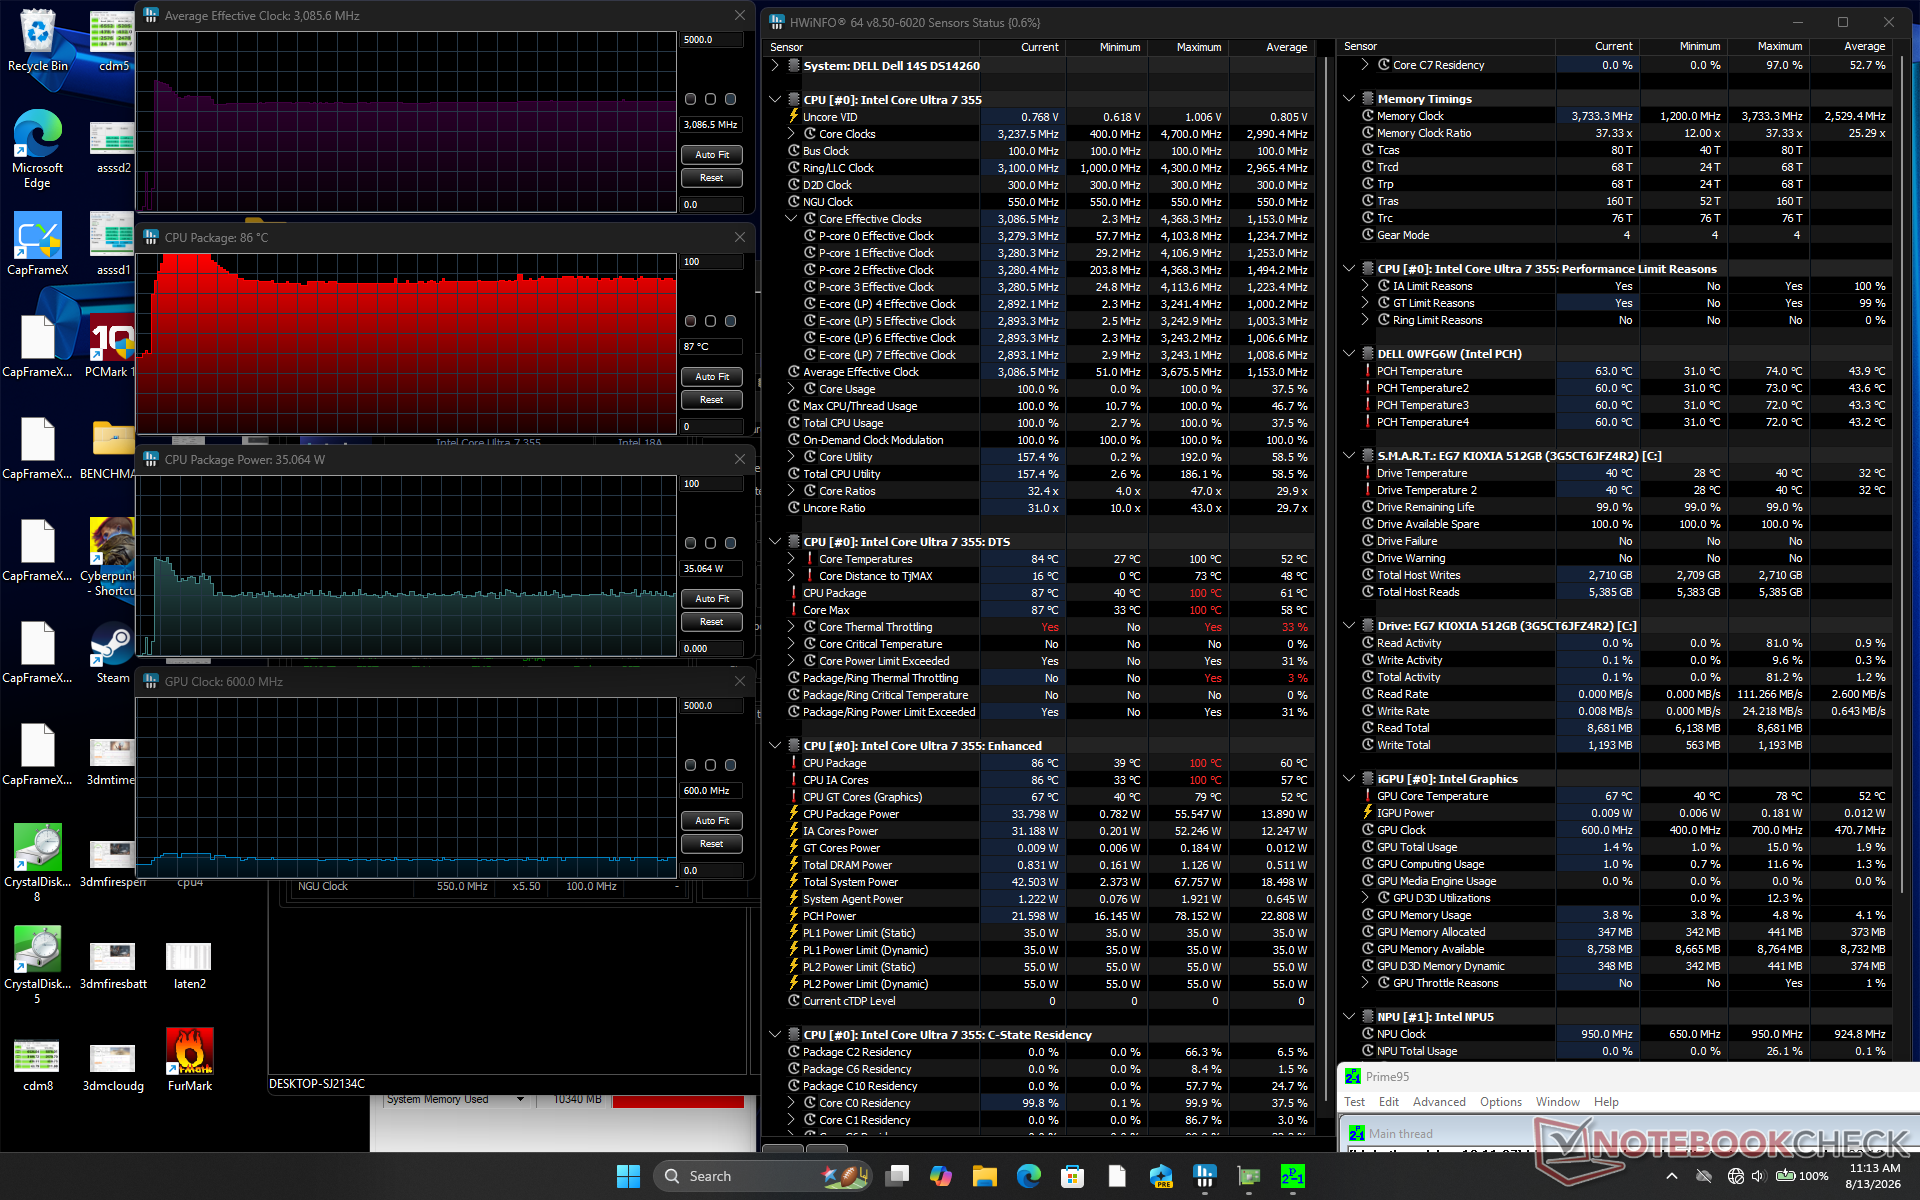
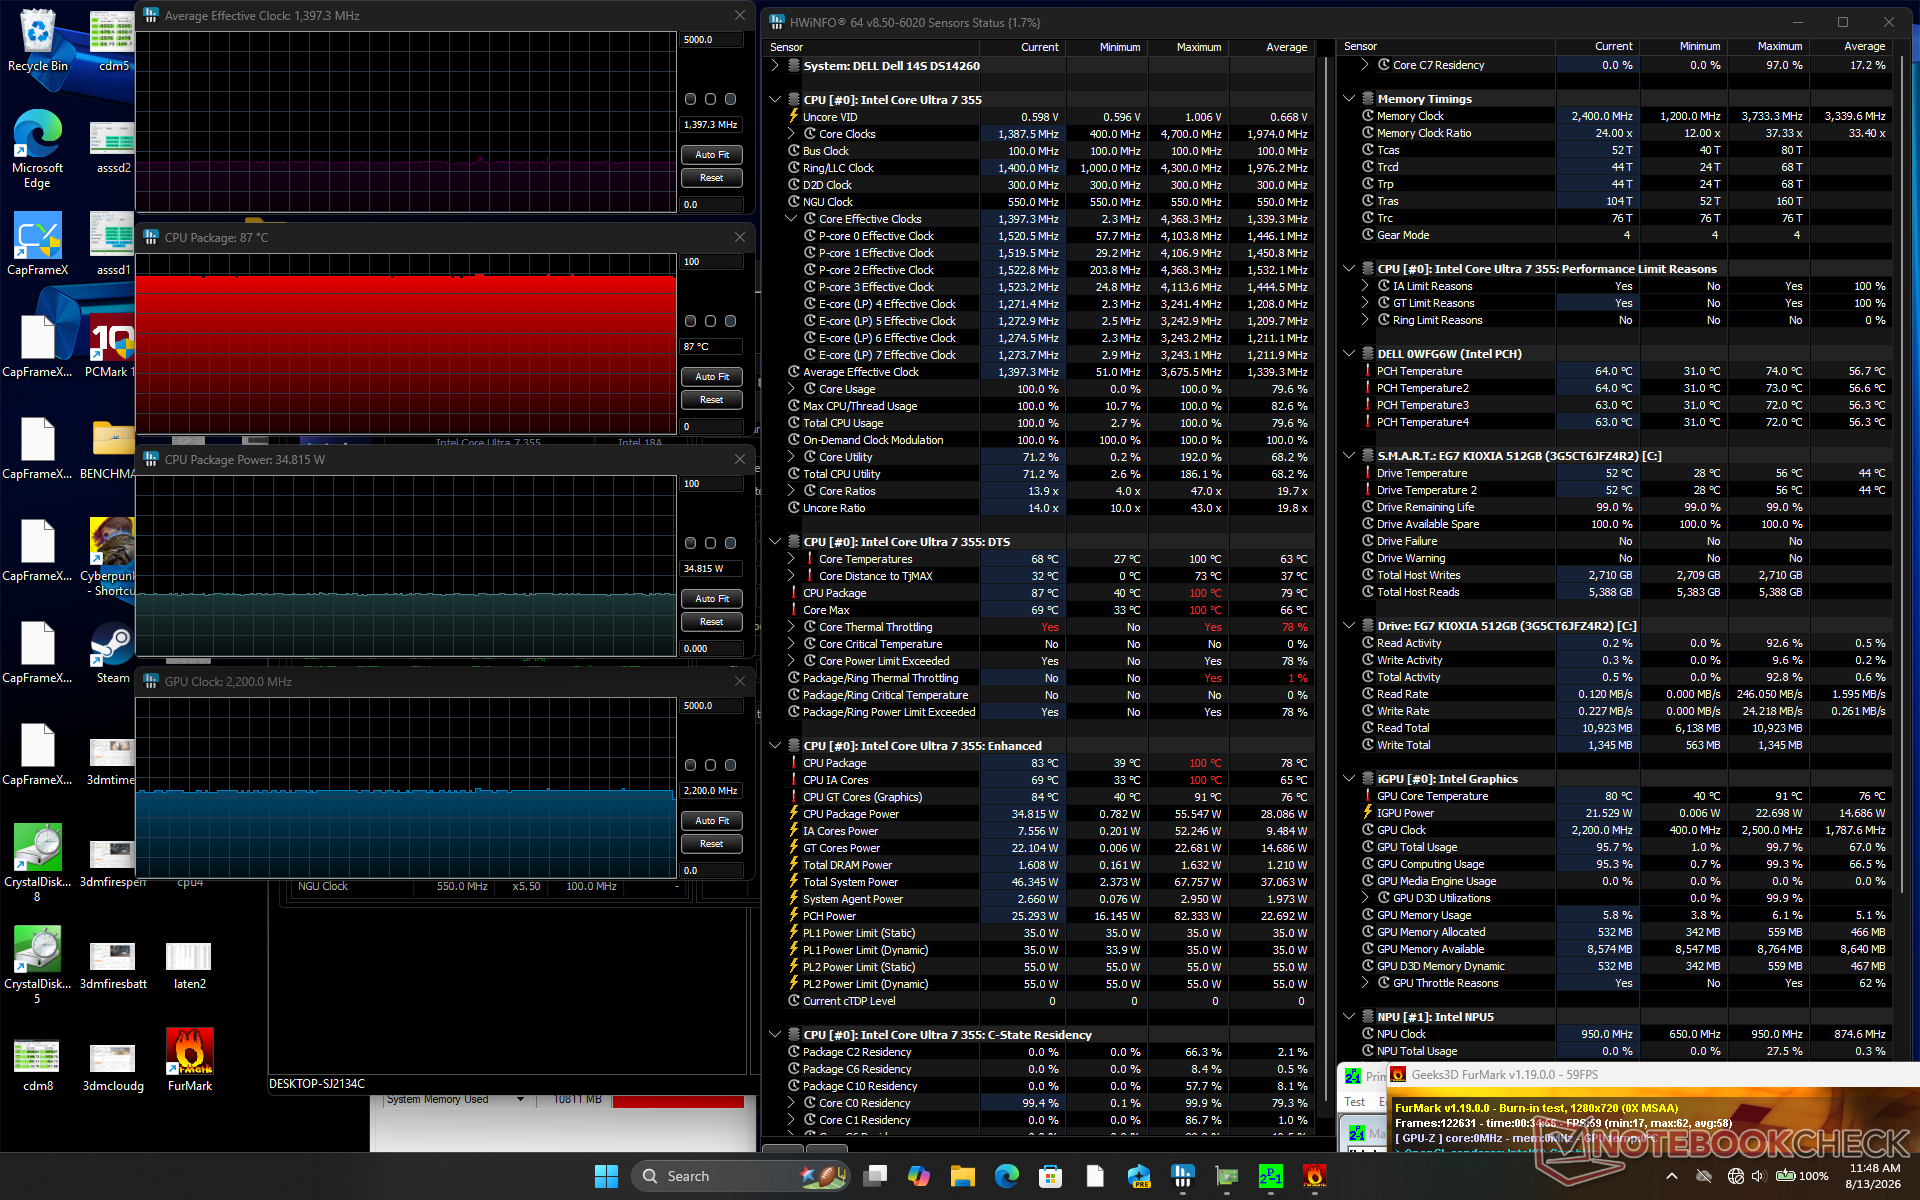
| 平均 CPU 时钟频率 (GHz) | GPU 时钟频率 (MHz) | 平均 CPU 温度 (°C) 系统空闲 | |
| -- | |||
| 400 | |||
| 43 | |||
| Prime95 压力测试 | |||
| 3.1 | |||
| -- | |||
| 87 | |||
| Prime95 + FurMark 压力测试 | |||
| 1.4 | |||
| 2200 | |||
| 87 | |||
| 《赛博朋克2077》压力测试 | |||
| 1.5 | |||
| 2500 | |||
| 91 |
发言人
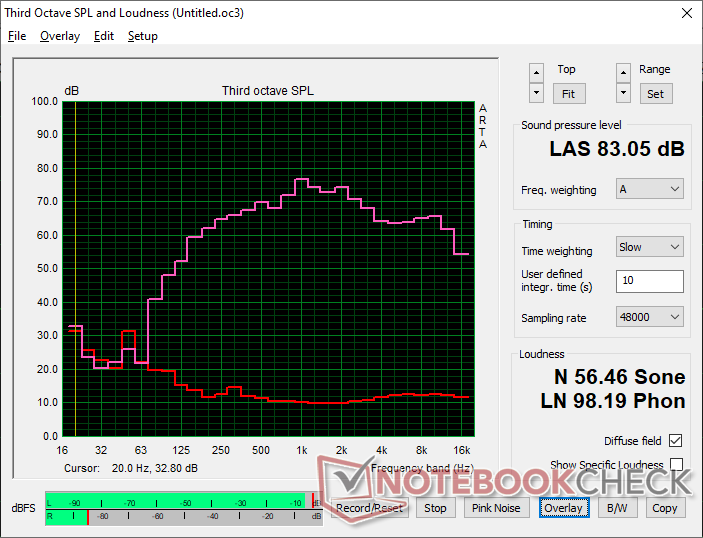
Dell 14S DS14260 audio analysis
(+) | speakers can play relatively loud (83.1 dB)
Bass 100 - 315 Hz
(±) | reduced bass - on average 7% lower than median
(±) | linearity of bass is average (7.8% delta to prev. frequency)
Mids 400 - 2000 Hz
(±) | higher mids - on average 6.3% higher than median
(+) | mids are linear (4.6% delta to prev. frequency)
Highs 2 - 16 kHz
(+) | balanced highs - only 1.9% away from median
(+) | highs are linear (3.3% delta to prev. frequency)
Overall 100 - 16.000 Hz
(+) | overall sound is linear (10.9% difference to median)
Compared to same class
» 10% of all tested devices in this class were better, 3% similar, 87% worse
» The best had a delta of 5%, average was 18%, worst was 53%
Compared to all devices tested
» 6% of all tested devices were better, 2% similar, 92% worse
» The best had a delta of 4%, average was 23%, worst was 136%
Apple MacBook Pro 16 2021 M1 Pro audio analysis
(+) | speakers can play relatively loud (84.7 dB)
Bass 100 - 315 Hz
(+) | good bass - only 3.8% away from median
(+) | bass is linear (5.2% delta to prev. frequency)
Mids 400 - 2000 Hz
(+) | balanced mids - only 1.3% away from median
(+) | mids are linear (2.1% delta to prev. frequency)
Highs 2 - 16 kHz
(+) | balanced highs - only 1.9% away from median
(+) | highs are linear (2.7% delta to prev. frequency)
Overall 100 - 16.000 Hz
(+) | overall sound is linear (4.6% difference to median)
Compared to same class
» 0% of all tested devices in this class were better, 0% similar, 100% worse
» The best had a delta of 5%, average was 17%, worst was 45%
Compared to all devices tested
» 0% of all tested devices were better, 0% similar, 100% worse
» The best had a delta of 4%, average was 23%, worst was 136%
能源管理
功耗
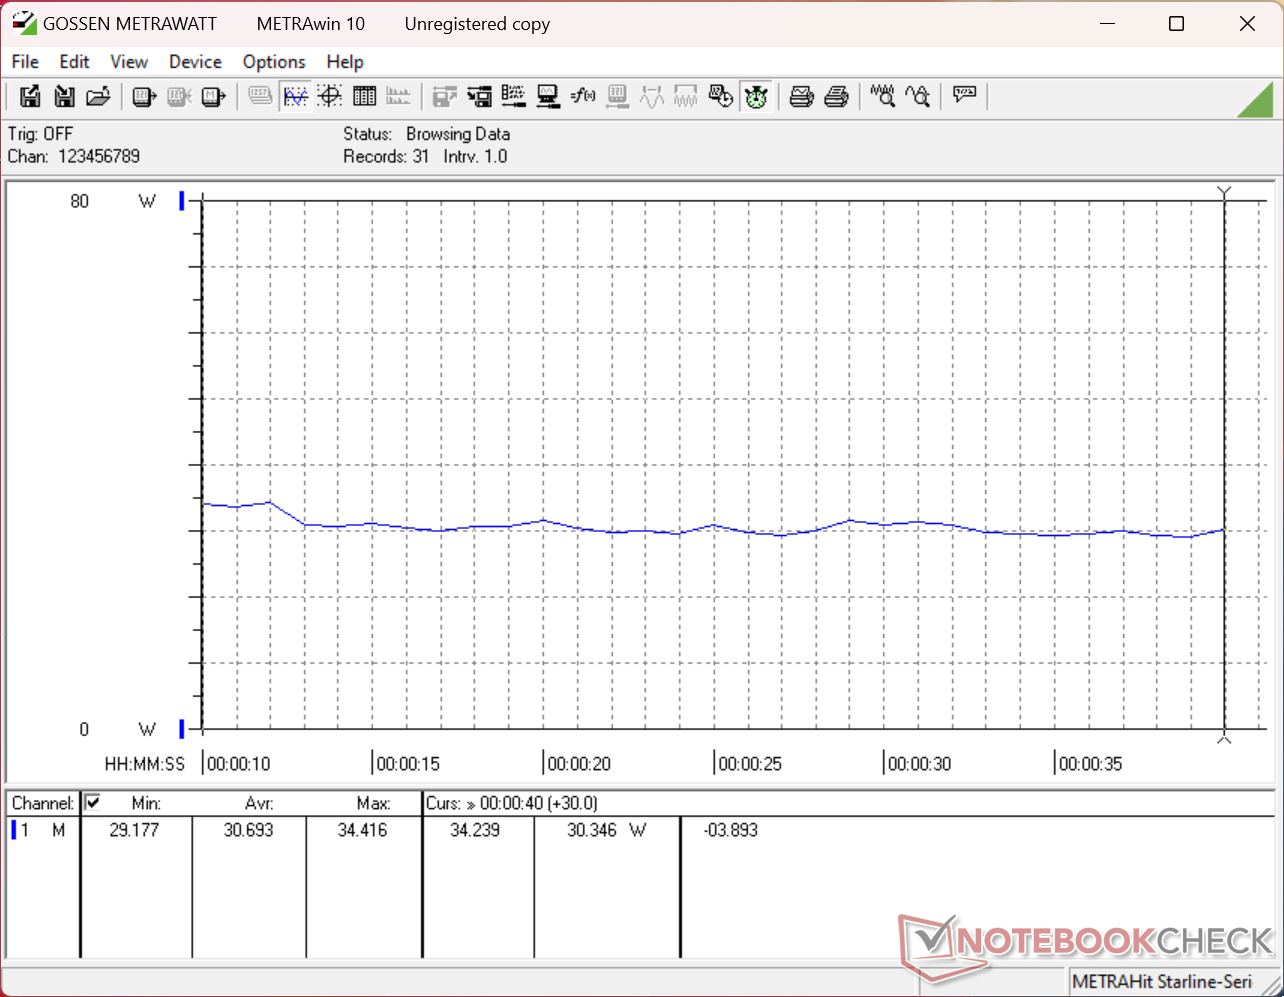
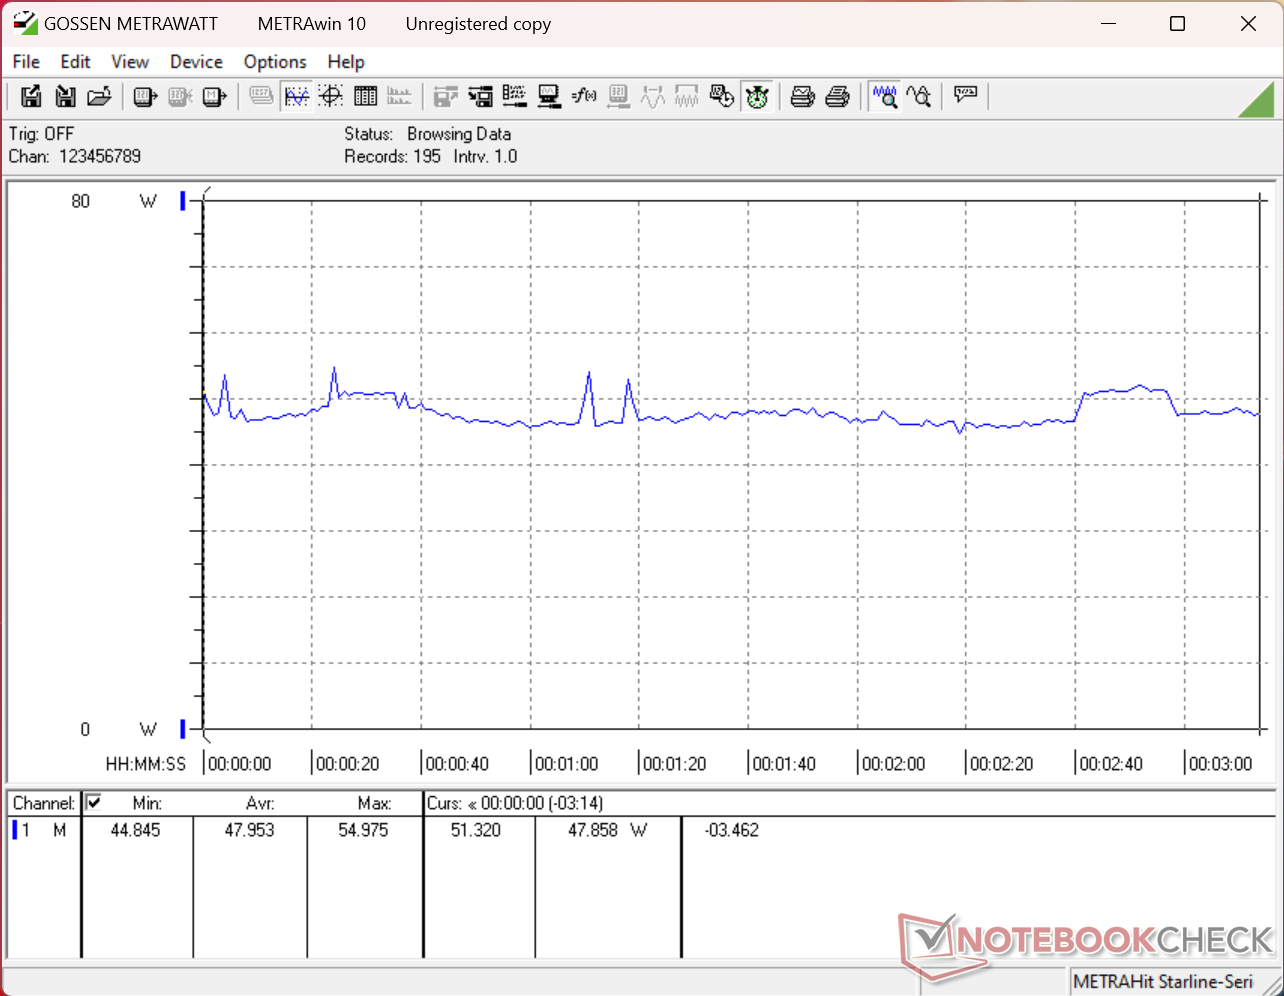
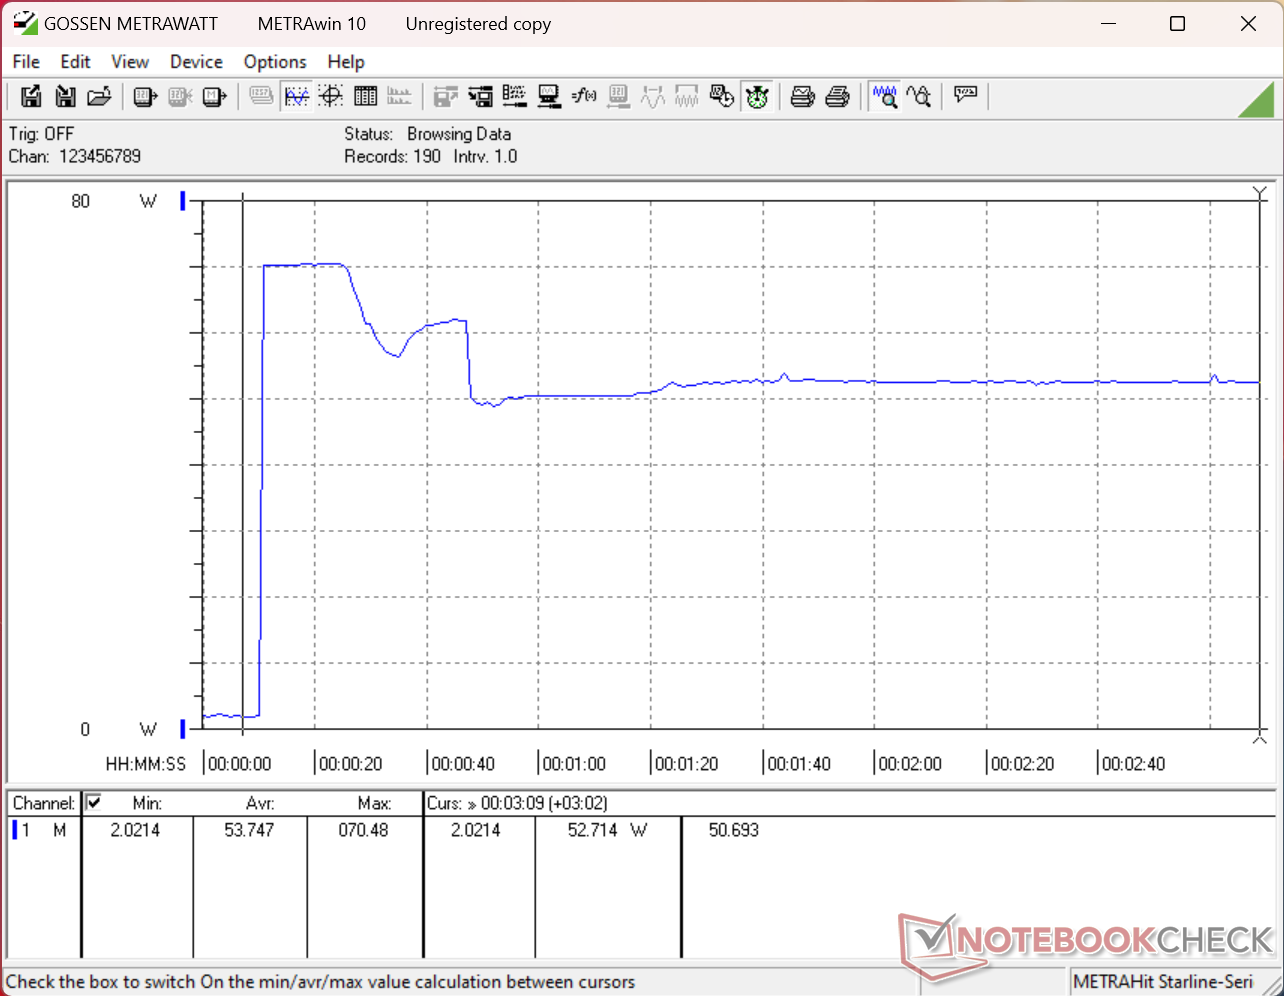
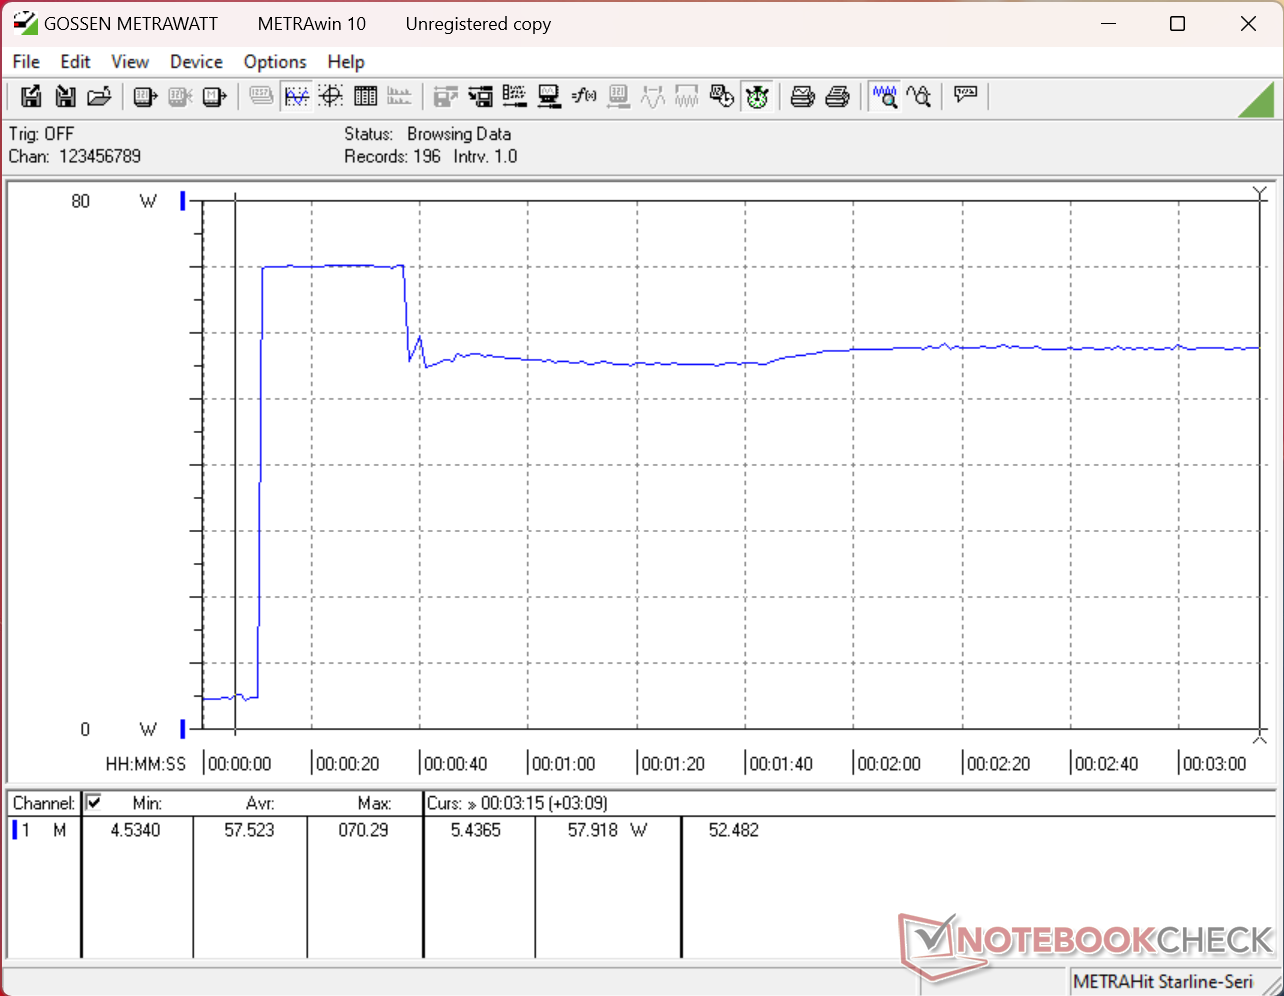
| Off / Standby | 0.15 / 0.56 Watt |
| Idle | 1.8 / 6.6 / 11.4 Watt |
| Load |
30.7 / 71 Watt |
   
| |
Key:
min: ,
med: ,
max: Metrahit Energy | |
| Dell 14S DS14260 Ultra 7 355, Intel Graphics 4 Xe3 PTL, , OLED, 1920x1200, 14" | Lenovo ThinkBook 14 G9 IPL 21UX005PGE Ultra 5 325, Intel Graphics 4 Xe3 PTL, YMTC PC42Q512GBG4Q, IPS LED, 1920x1200, 14" | Dell XPS 14 Core Ultra X7 358H Ultra X7 358H, Arc B390 Panther Lake iGPU, Samsung PM9C1b MZVL81T0HFLB-00BH1, OLED, 2880x1800, 14" | HP OmniBook Ultra 14 Core Ultra X9 Ultra X9 388H, Arc B390 Panther Lake iGPU, , OLED, 2880x1800, 14" | Dell Inspiron 14 7445 2-in-1 R7 8840HS, Radeon 780M, Micron 2400 MTFDKBK1T0QFM, IPS, 1920x1200, 14" | Asus VivoBook S 14 OLED M5406WA Ryzen AI 9 HX 370, Radeon 890M, Micron 2400 MTFDKBA1T0QFM, OLED, 1920x1200, 14" | |
|---|---|---|---|---|---|---|
| Power Consumption | -5% | -14% | -8% | -42% | -73% | |
| Idle Minimum * (Watt) | 1.8 | 2.4 -33% | 3.1 -72% | 2.5 -39% | 4.5 -150% | 6 -233% |
| Idle Average * (Watt) | 6.6 | 6.9 -5% | 3.6 45% | 5.1 23% | 8.4 -27% | 8 -21% |
| Idle Maximum * (Watt) | 11.4 | 7.9 31% | 10 12% | 5.8 49% | 8.9 22% | 14 -23% |
| Load Average * (Watt) | 30.7 | 41.5 -35% | 39.2 -28% | 49.8 -62% | 50.7 -65% | 76 -148% |
| Cyberpunk 2077 ultra external monitor * (Watt) | 47.6 | 48.3 -1% | 51.2 -8% | 55.1 -16% | 61.9 -30% | |
| Cyberpunk 2077 ultra * (Watt) | 48 | 48 -0% | 51.4 -7% | 55 -15% | 58.6 -22% | |
| Load Maximum * (Watt) | 71 | 66.9 6% | 101.4 -43% | 68 4% | 62.4 12% | 94 -32% |
| Witcher 3 ultra * (Watt) | 50.8 |
* ... smaller is better
功耗 赛博朋克 / 压力测试
外接显示器的功耗
电池续航时间
| Dell 14S DS14260 Ultra 7 355, Intel Graphics 4 Xe3 PTL, 70 Wh | Lenovo ThinkBook 14 G9 IPL 21UX005PGE Ultra 5 325, Intel Graphics 4 Xe3 PTL, 48 Wh | Dell XPS 14 Core Ultra X7 358H Ultra X7 358H, Arc B390 Panther Lake iGPU, 70 Wh | HP OmniBook Ultra 14 Core Ultra X9 Ultra X9 388H, Arc B390 Panther Lake iGPU, 70 Wh | Dell Inspiron 14 7445 2-in-1 R7 8840HS, Radeon 780M, 54 Wh | Asus VivoBook S 14 OLED M5406WA Ryzen AI 9 HX 370, Radeon 890M, 75 Wh | |
|---|---|---|---|---|---|---|
| Battery runtime | -54% | -12% | -34% | -31% | -14% | |
| WiFi v1.3 (h) | 19.1 | 8.7 -54% | 16.8 -12% | 12.6 -34% | 13.1 -31% | 16.5 -14% |
| Load (h) | 1.4 | 2.2 | 2.8 | |||
| Reader / Idle (h) | 22.2 | 31.7 |
Notebookcheck 评分
作为Inspiron 14系列的“真正”继任者,该机型不仅拥有全新外观,还提供了相对更快的Panther Lake处理器选项。
Dell 14S DS14260
- 08/17/2026 v8
Allen Ngo
 Total Sustainability Score:
 潜在竞争对手对比
Image | Model / Review | Price | Weight | Height | Display |
|---|---|---|---|---|---|
1. 81.9%  | Dell 14S DS14260 Intel Core Ultra 7 355 ⎘ Intel Graphics 4 Xe3 Panther Lake iGPU ⎘ 16 GB Memory | List Price: 1500 USD | 1.5 kg | 15.3 mm | 14.00" 1920x1200 162 PPI OLED |
2. 84.2% 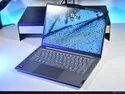 | Lenovo ThinkBook 14 G9 IPL 21UX005PGE Intel Core Ultra 5 325 ⎘ Intel Graphics 4 Xe3 Panther Lake iGPU ⎘ 32 GB Memory, 512 GB SSD | List Price: 1150 Euro | 1.4 kg | 21 mm | 14.00" 1920x1200 162 PPI IPS LED |
3. 87.4%  | Dell XPS 14 Core Ultra X7 358H Intel Core Ultra X7 358H ⎘ Intel Arc B390 12 Xe3 Panther Lake iGPU ⎘ 32 GB Memory, 1000 GB SSD | Amazon: 1. $1,849.99 Dell XPS 14 Premium Laptop 1... 2. $1,999.00 Dell XPS 14 Premium Laptop D... 3. $1,549.99 Dell XPS 13 9350 Laptop, 13.... List Price: 2200 USD | 1.4 kg | 14.62 mm | 14.00" 2880x1800 243 PPI OLED |
4. 87.9%  | HP OmniBook Ultra 14 Core Ultra X9 Intel Core Ultra X9 388H ⎘ Intel Arc B390 12 Xe3 Panther Lake iGPU ⎘ 32 GB Memory | List Price: 2800 USD | 1.3 kg | 10.7 mm | 14.00" 2880x1800 243 PPI OLED |
5. 80.1%  | Dell Inspiron 14 7445 2-in-1 AMD Ryzen 7 8840HS ⎘ AMD Radeon 780M ⎘ 16 GB Memory, 1024 GB SSD | Amazon: 1. $919.55 Dell 14 2-in-1 Laptop, FHD+,... 2. $889.00 Delca Customized Laptop Made... 3. $849.99 Dell Inspiron 14 7440, 14" 2... List Price: 950€ | 1.7 kg | 18.9 mm | 14.00" 1920x1200 162 PPI IPS |
6. 84.9%  | Asus VivoBook S 14 OLED M5406WA AMD Ryzen AI 9 HX 370 ⎘ AMD Radeon 890M ⎘ 24 GB Memory, 1024 GB SSD | List Price: 1400 EUR | 1.3 kg | 15.9 mm | 14.00" 1920x1200 162 PPI OLED |
Transparency
The selection of devices to be reviewed is made by our editorial team. The test sample was provided to the author as a loan by the manufacturer or retailer for the purpose of this review. The lender had no influence on this review, nor did the manufacturer receive a copy of this review before publication. There was no obligation to publish this review. As an independent media company, Notebookcheck is not subjected to the authority of manufacturers, retailers or publishers.
This is how Notebookcheck is testing
Every year, Notebookcheck independently reviews hundreds of laptops and smartphones using standardized procedures to ensure that all results are comparable. We have continuously developed our test methods for around 20 years and set industry standards in the process. In our test labs, high-quality measuring equipment is utilized by experienced technicians and editors. These tests involve a multi-stage validation process. Our complex rating system is based on hundreds of well-founded measurements and benchmarks, which maintains objectivity. Further information on our test methods can be found here.
 Add as a preferred source on Google