Aorus 15 XE5回顾。带有Thunderbolt 4的紧凑型QHD游戏笔记本
15.6英寸的Aorus 15 XE5加入了紧凑型游戏笔记本电脑的行列,并配备了一台 酷睿i7-12700H和一个 GeForce RTX 3070 Ti 笔记本电脑.该机器的竞争者是诸如 Acer Nitro 5 AN515-46,以及 MSI Katana GF66 12UGS,的 申克XMG Fusion 15 (Mid 22)和 华硕TUF DASH F15 FX517ZR.
潜在的竞争对手比较
Rating | Date | Model | Weight | Height | Size | Resolution | Price |
|---|---|---|---|---|---|---|---|
| 85.5 % v7 (old) | 12 / 2022 | Aorus 15 XE5 i7-12700H, GeForce RTX 3070 Ti Laptop GPU | 2.3 kg | 24 mm | 15.60" | 2560x1440 | |
| 83.9 % v7 (old) | 11 / 2022 | Acer Nitro 5 AN515-46-R1A1 R7 6800H, GeForce RTX 3070 Ti Laptop GPU | 2.5 kg | 26.8 mm | 15.60" | 1920x1080 | |
| 87.4 % v7 (old) | 08 / 2022 | Schenker XMG Fusion 15 (Mid 22) i7-11800H, GeForce RTX 3070 Laptop GPU | 1.9 kg | 21.65 mm | 15.60" | 2560x1440 | |
| 85.8 % v7 (old) | 07 / 2022 | Asus TUF Dash F15 FX517ZR i7-12650H, GeForce RTX 3070 Laptop GPU | 2 kg | 20.7 mm | 15.60" | 2560x1440 | |
| 80.3 % v7 (old) | 06 / 2022 | MSI Katana GF66 12UGS i7-12700H, GeForce RTX 3070 Ti Laptop GPU | 2.3 kg | 27.5 mm | 15.60" | 1920x1080 |
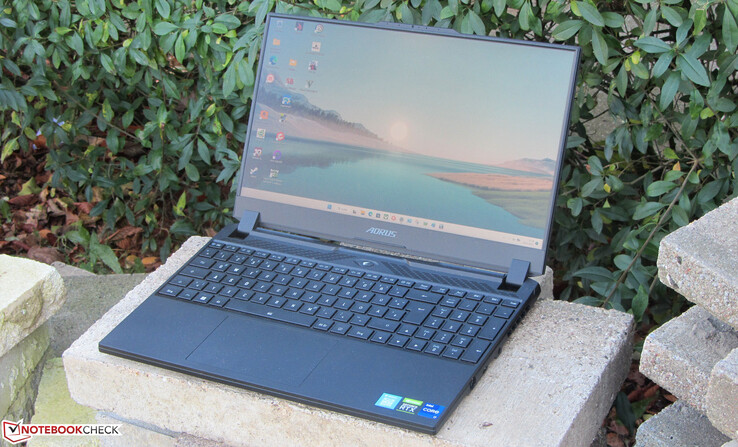
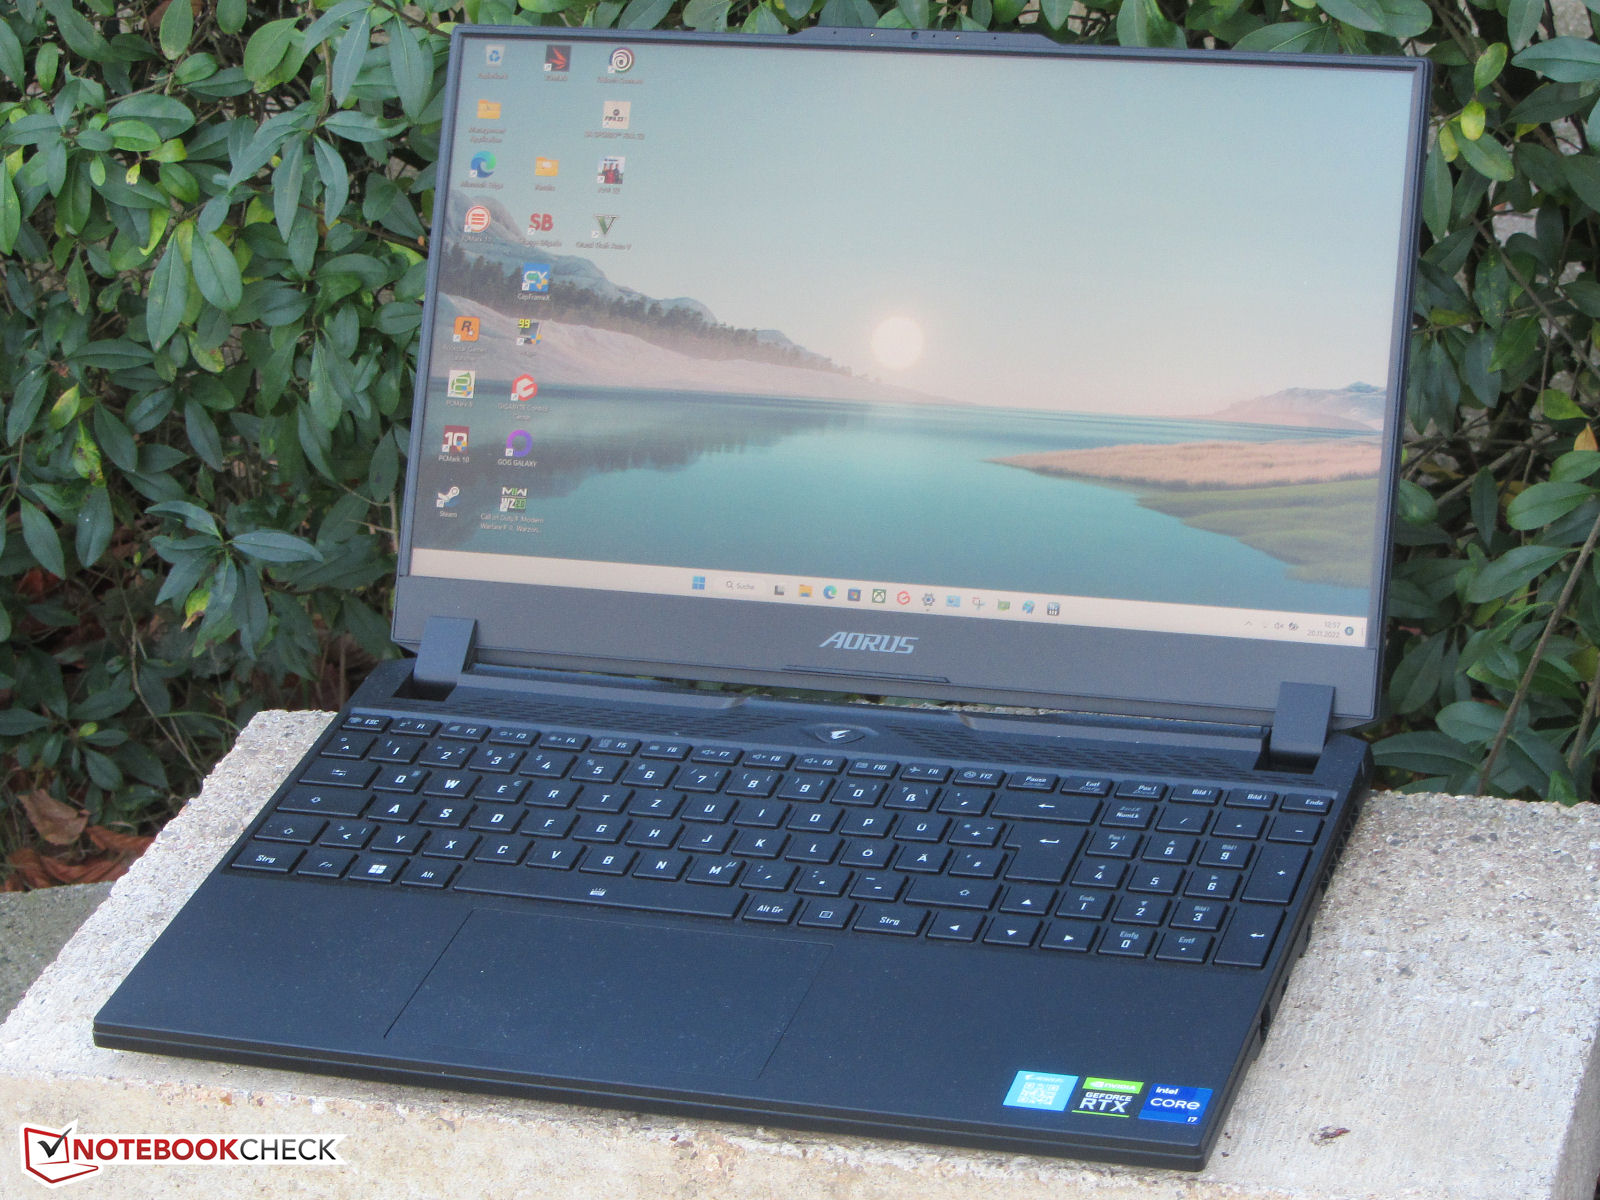
外壳--Aorus的紧凑程度令人印象深刻
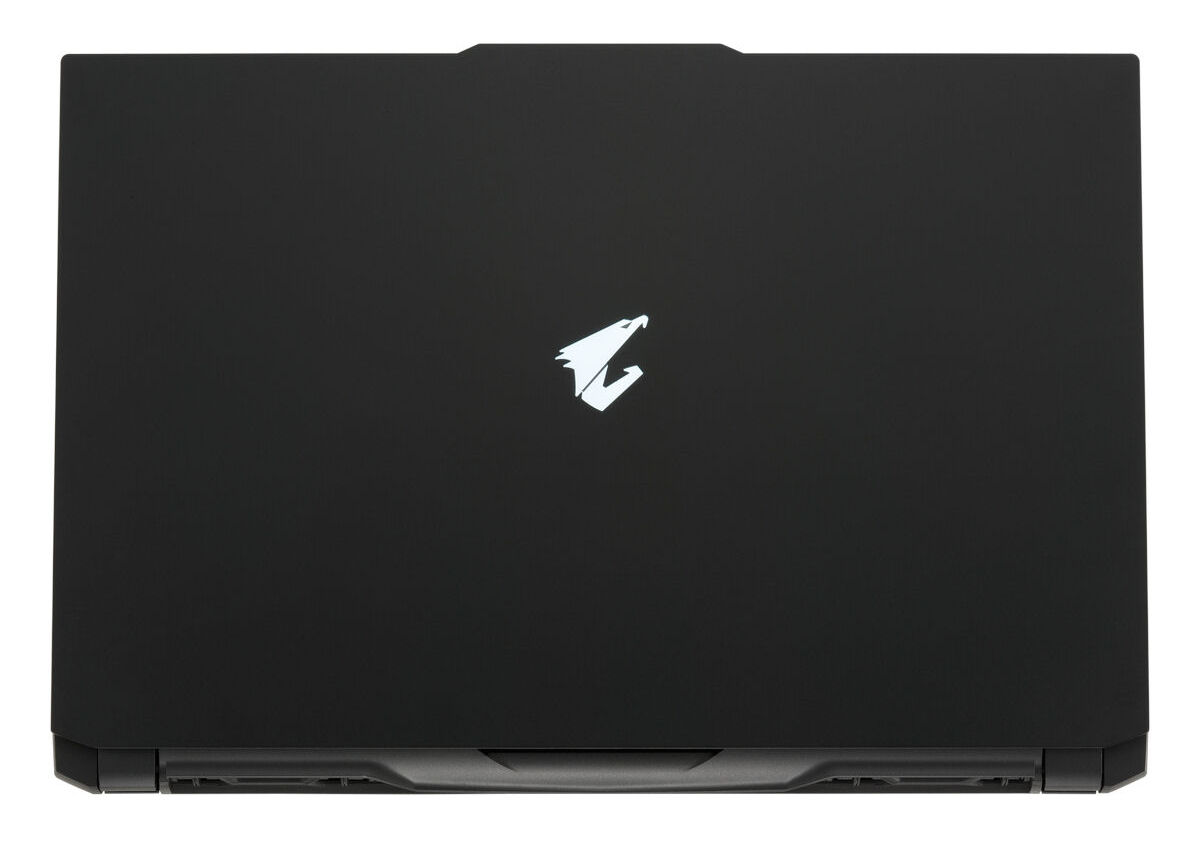
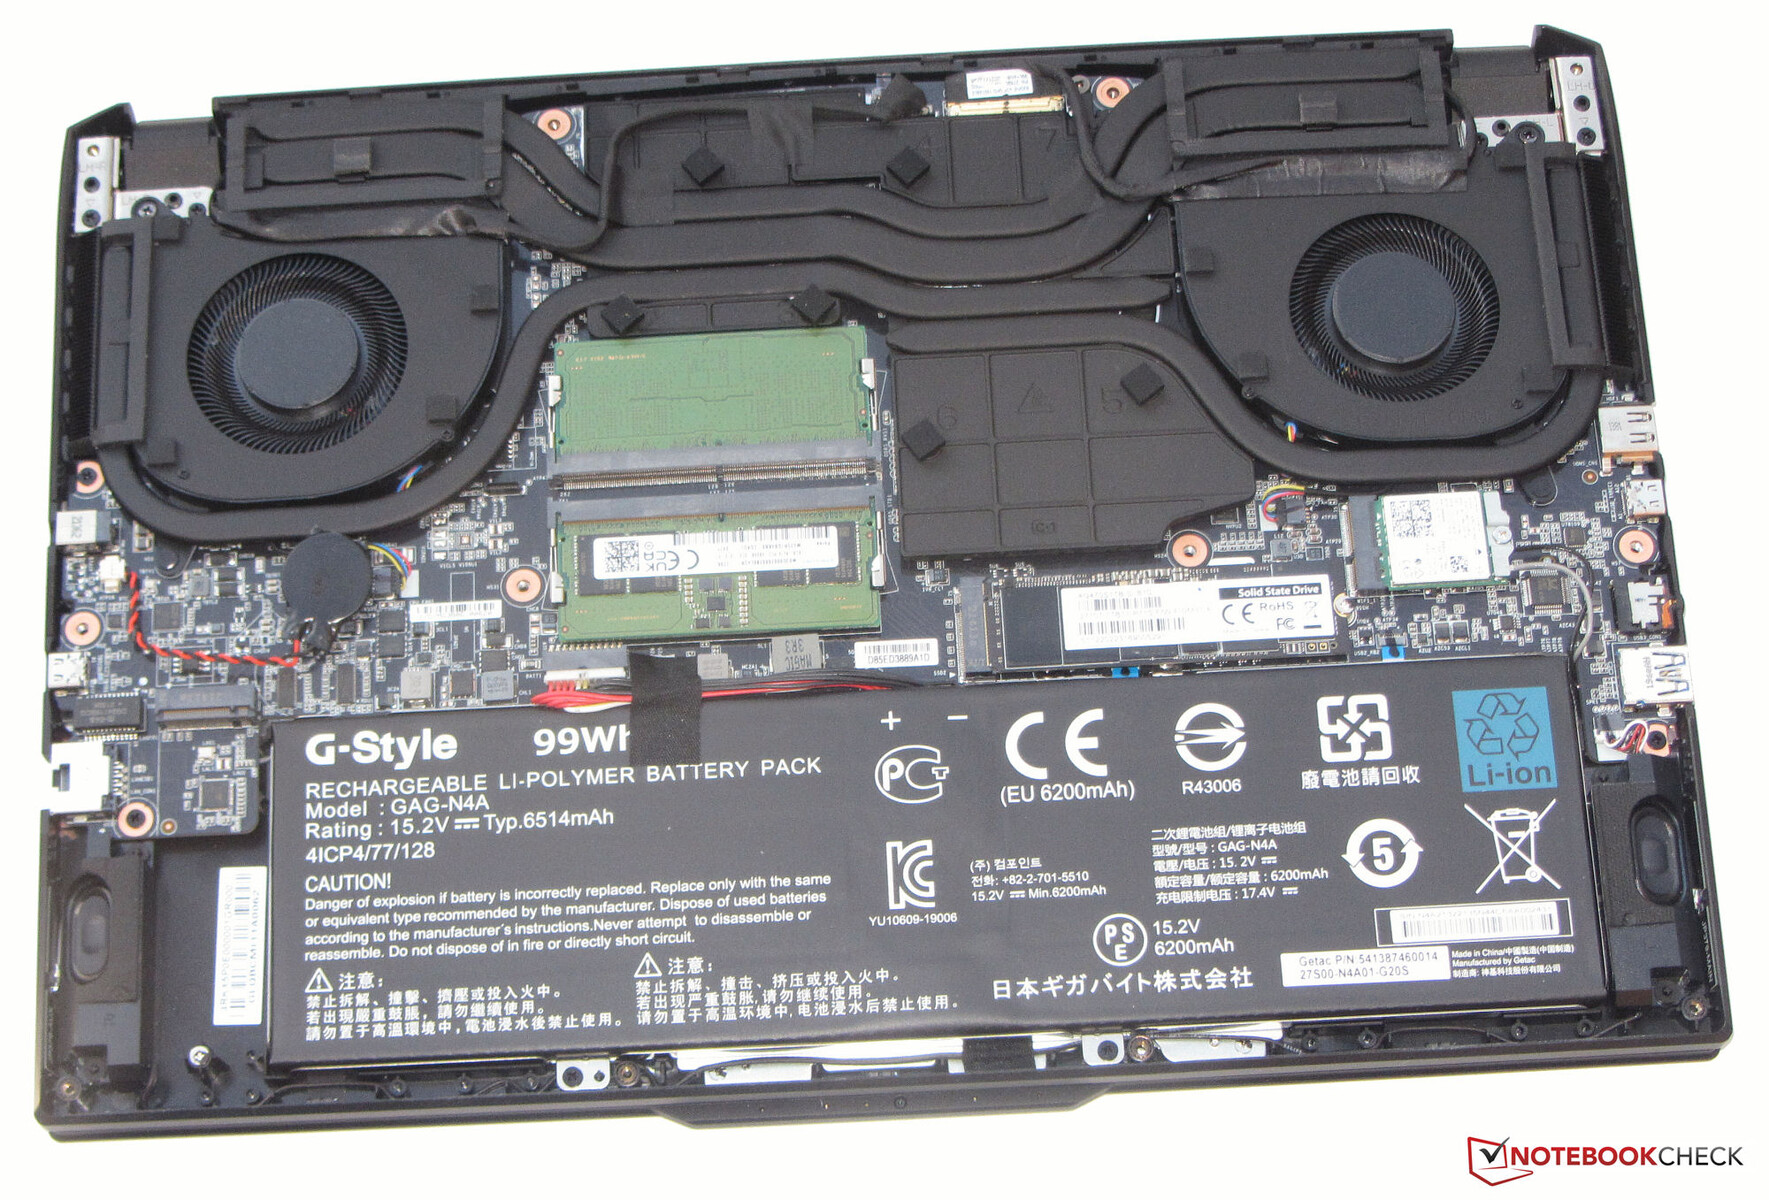
Gigabyte Aorus 15 XE5有一个黑色的塑料机箱,表面光滑、无光泽。该设备没有任何奢侈的设计元素。显示器周围的薄边框给笔记本电脑带来了某种优雅的气息。笔记本的设计因盖子背面的发光Aorus标志而更加突出。一旦卸下底板,你就可以接触到电池(拧下来的,不是粘上去的)和其余的内部零件。
我们的评测单元似乎没有任何做工问题。机箱中的缝隙很紧,没有多余的材料从笔记本上突出。底座部分在扭动时几乎没有移动,但盖子的弯曲度明显更大。盖子由两个铰链固定,允许显示屏向后折叠约150度。笔记本电脑可以只用一只手打开。
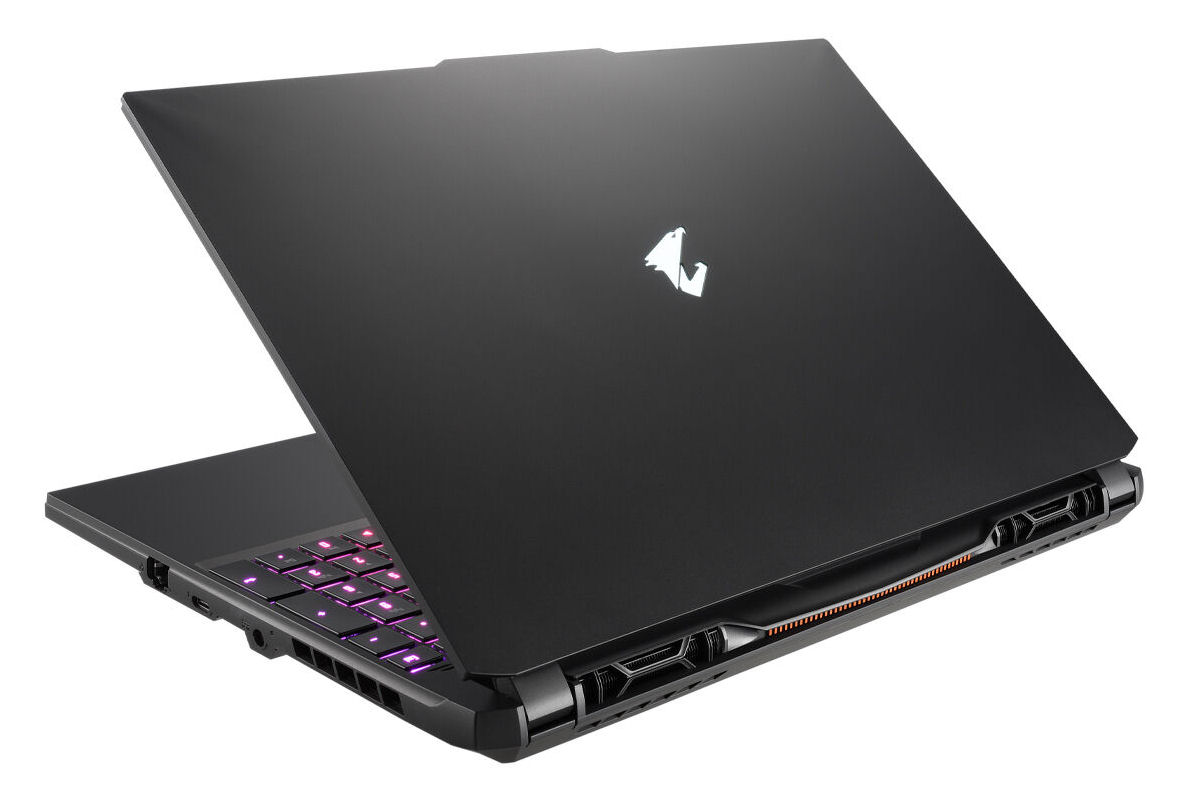
15 XE5是我们比较中比较紧凑的笔记本电脑之一。然而,在大约2.3公斤(5.07磅)的重量上,它比竞争对手的设备,如 XMG Fusion 15和 TUF Dash F15.
规格 - 支持Thunderbolt 4
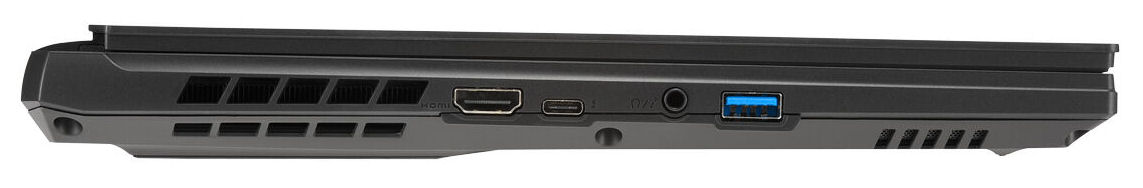
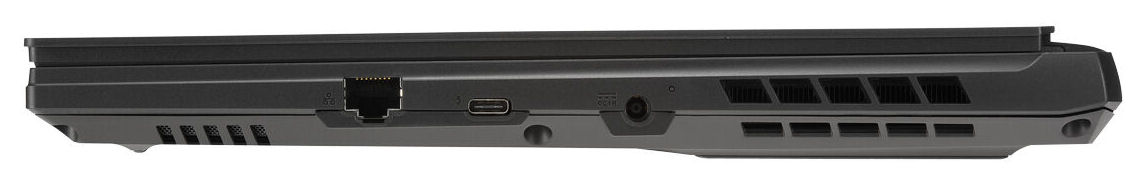
两个USB-C端口(1个Thunderbolt 4,1个USB 3.2 Gen 1)支持DisplayPort over USB-C,Thunderbolt 4连接器还提供Power Delivery。可惜的是,该设备上只有一个USB-A端口(USB 3.2 Gen 1)。那些需要更多外部连接的人将不得不使用一个适配器或一个底座。你可以将最多三个显示器连接到笔记本电脑上(2个DP,1个HDMI)。端口的选择还有一个组合音频插孔和一个千兆以太网端口。Aorus 15 XE5没有一个内置读卡器。
连接性
在最佳条件下(附近没有其他Wi-Fi设备,笔记本电脑和服务器PC之间的距离很短),我们测量了出色的Wi-Fi传输速度,与里面的Wi-Fi模块(英特尔AX210,802.11ax)的能力相符。有线网络连接由Realtek的千兆以太网芯片(RTL8125,2.5Gbit)处理。
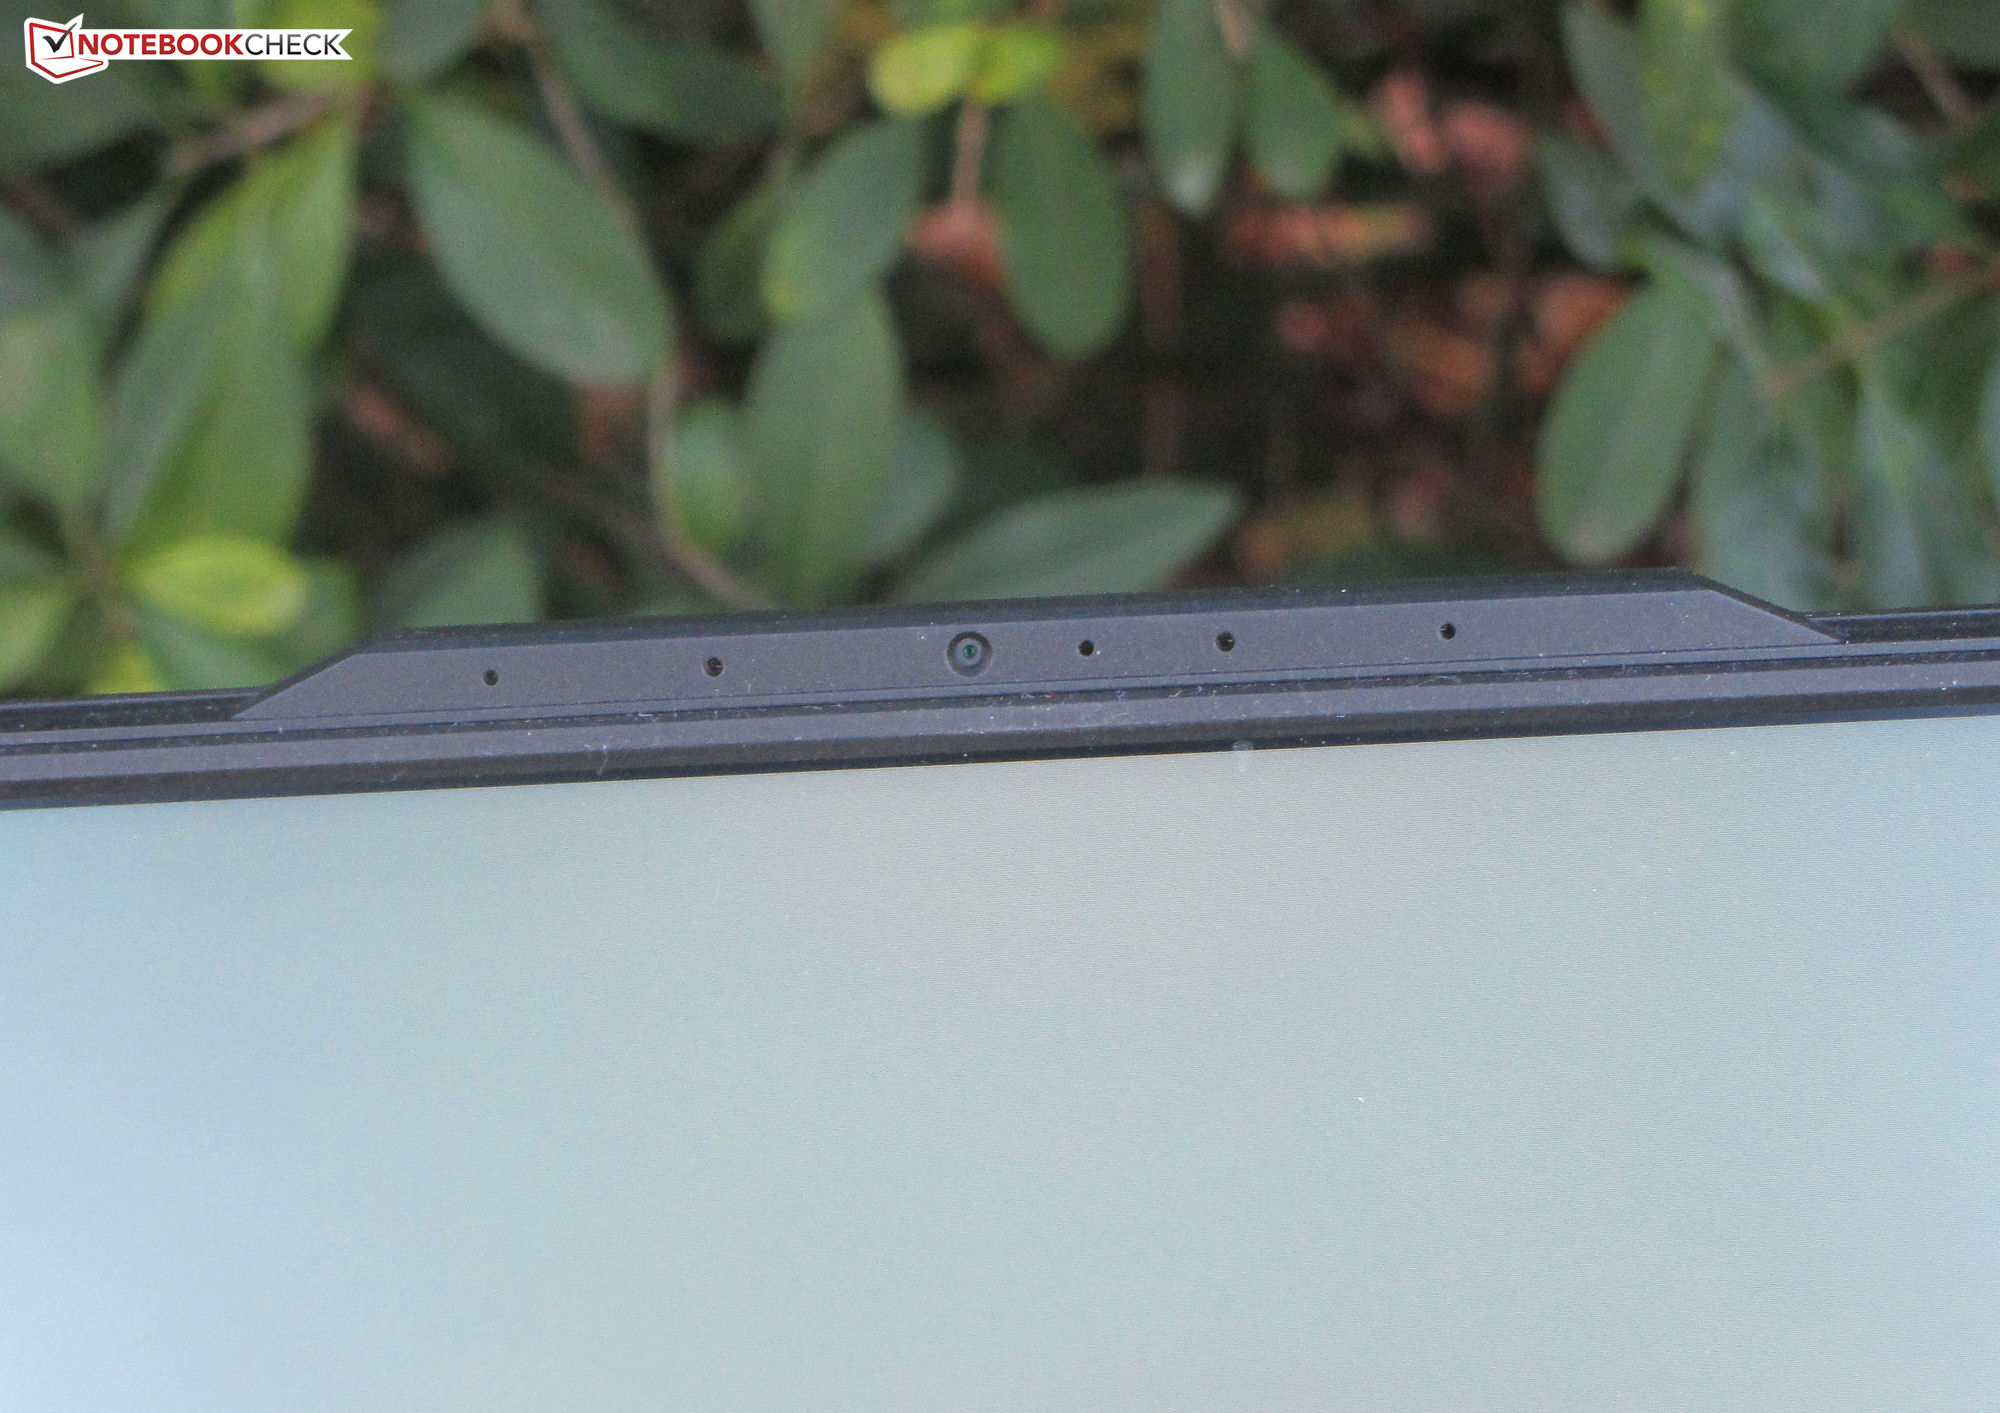
网络摄像头
网络摄像头(0.9MP)可以捕获分辨率高达1,280 x 720像素的图像。它缺乏色彩准确性,产生的色彩与参考值有很大偏差。网络摄像头上也没有机械的隐私快门。


辅料
Aorus 15 XE5除了充电器和通常的文件(快速入门指南和保修信息)外,没有附带任何其他附件。
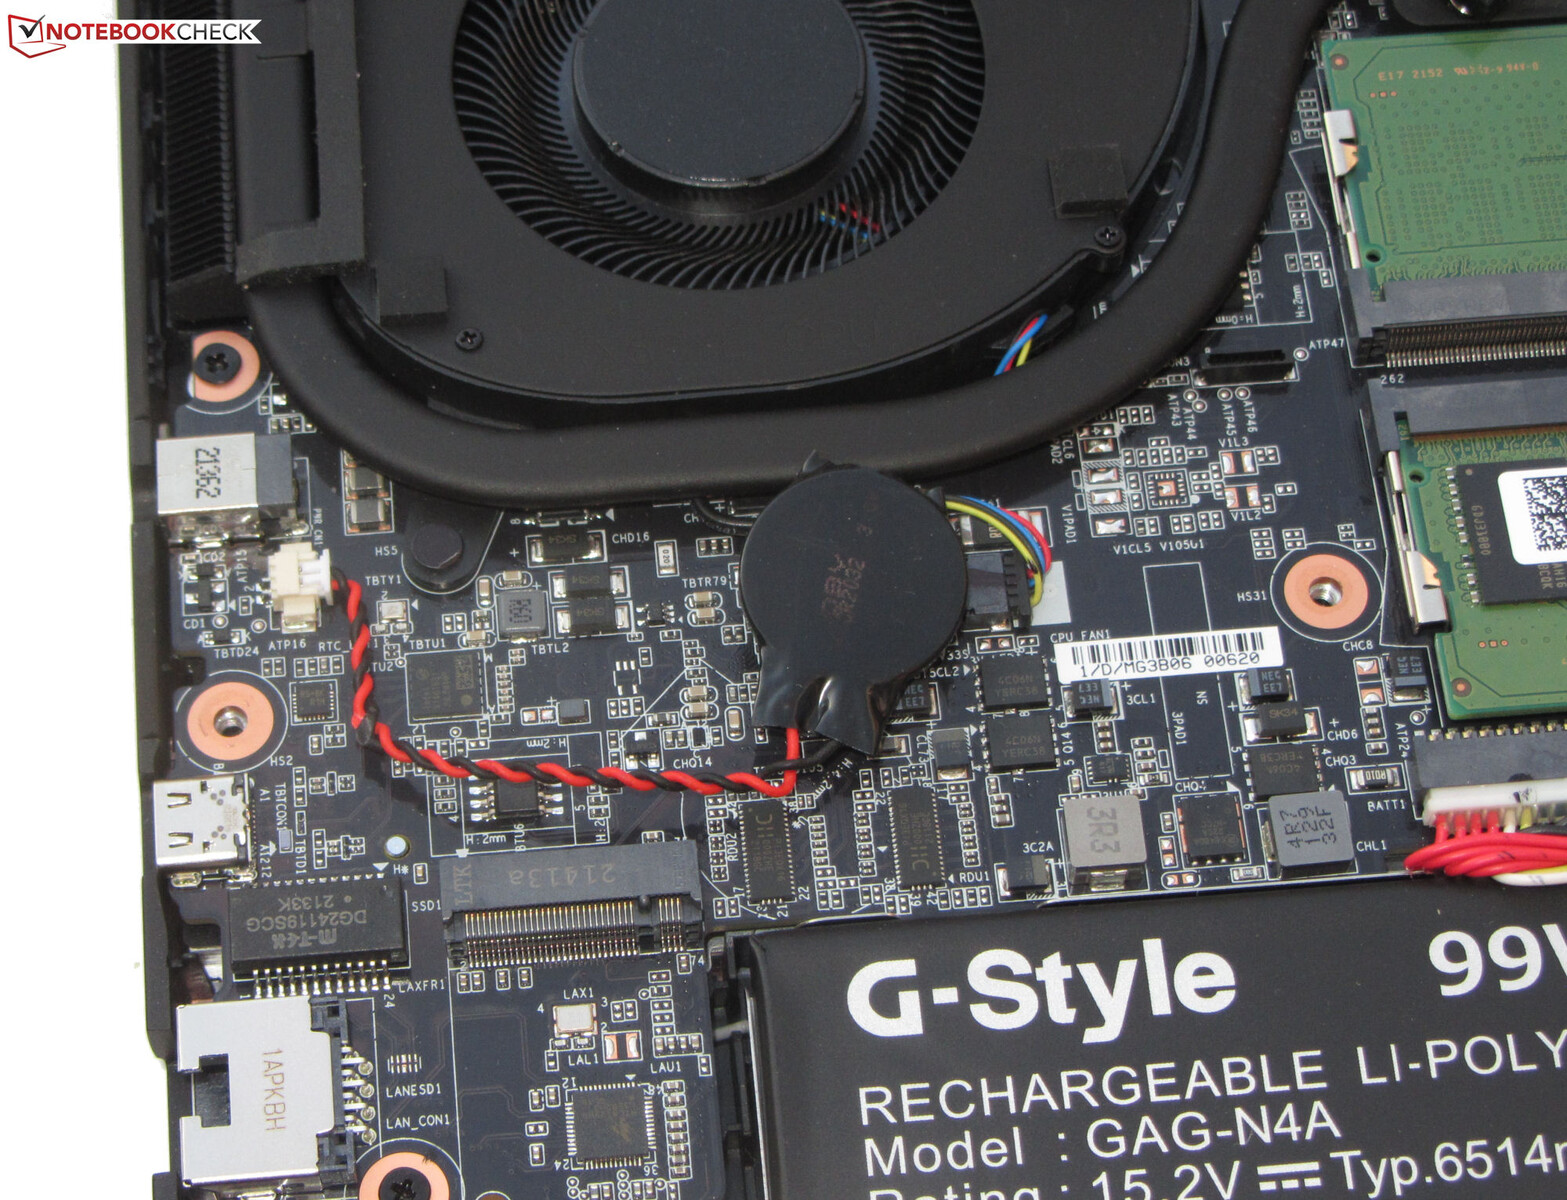
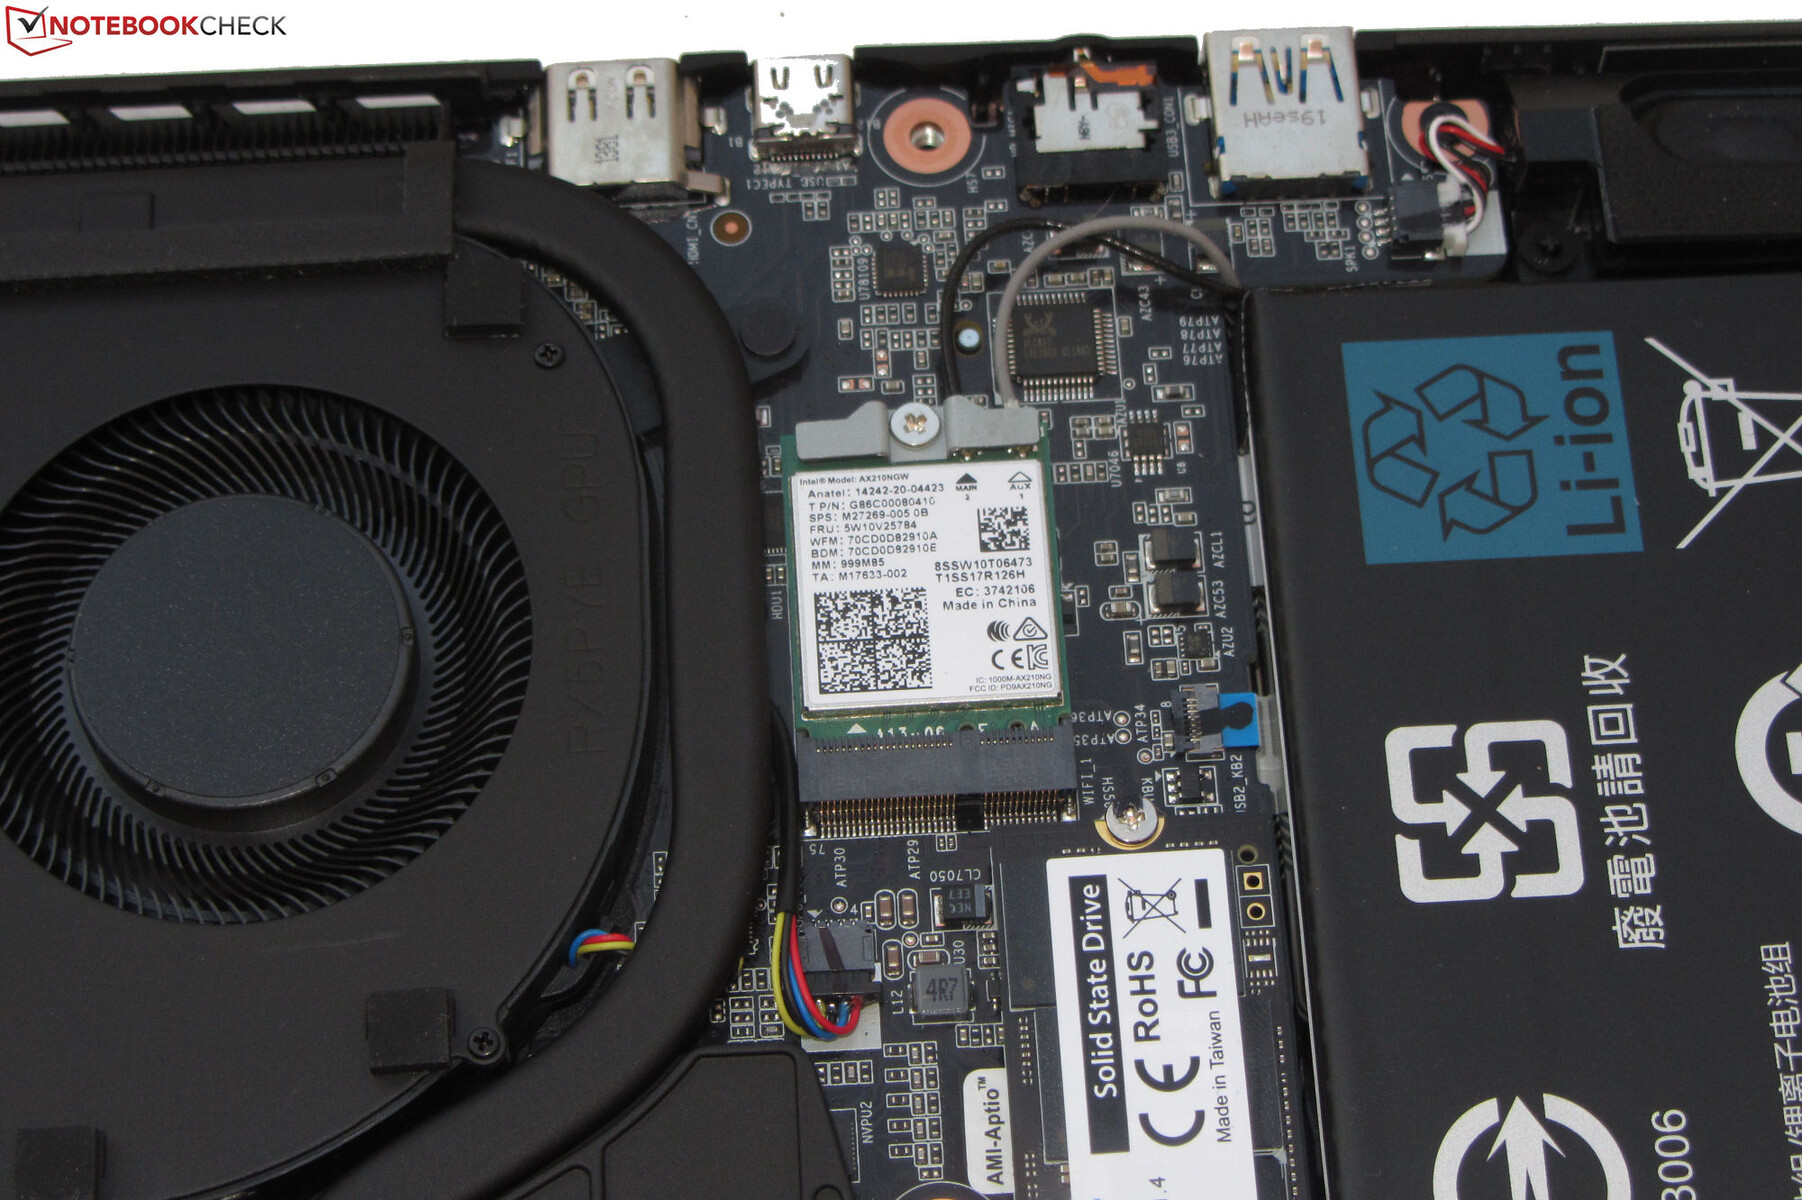
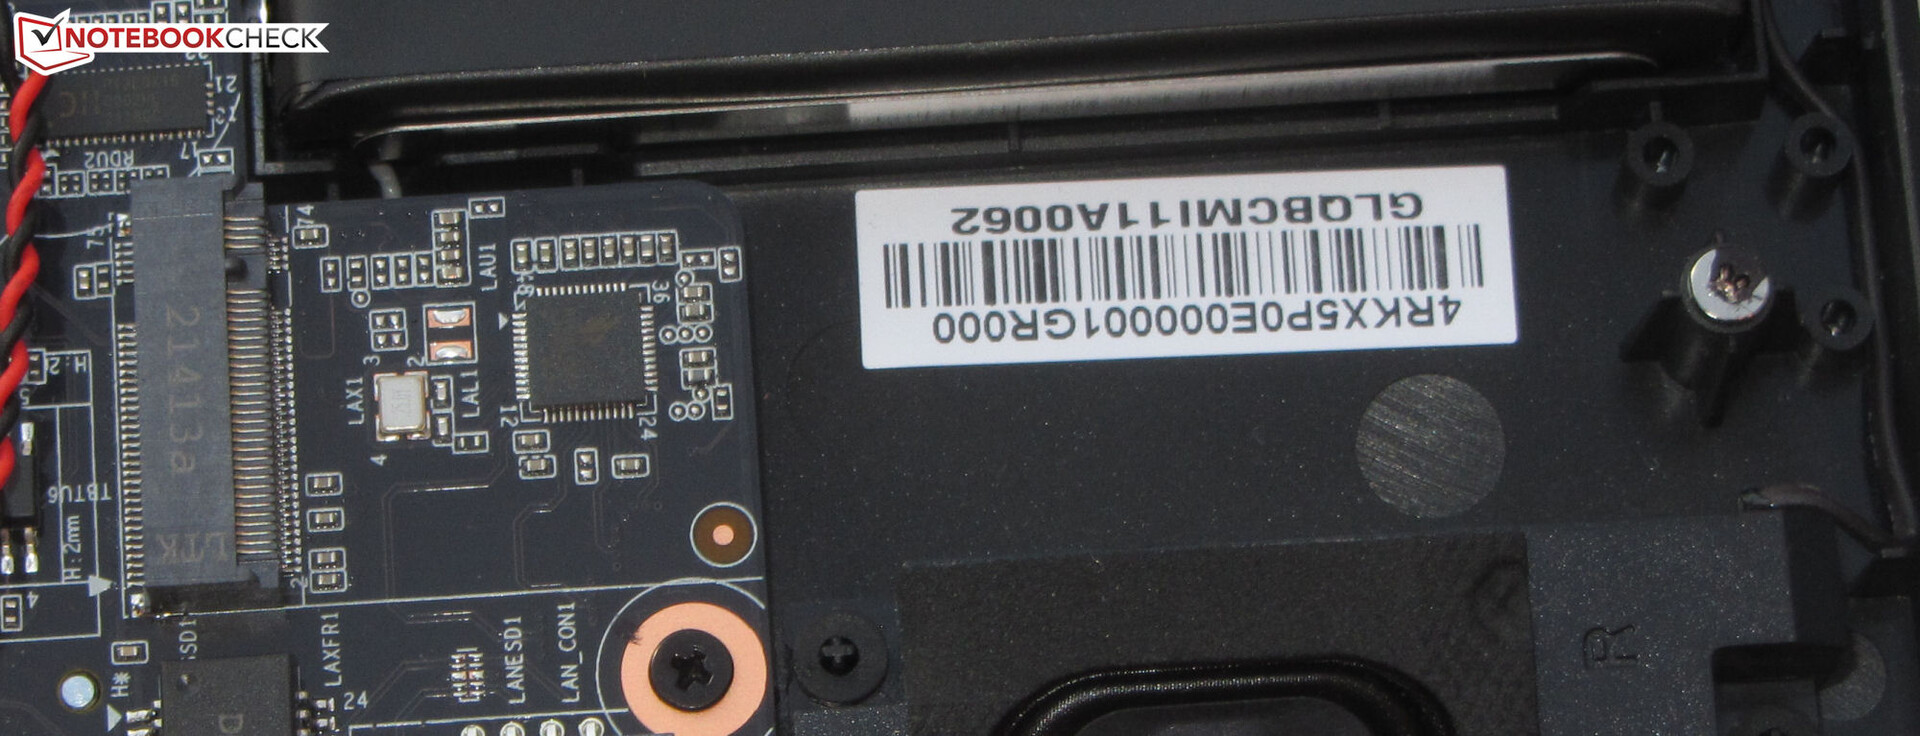
维护
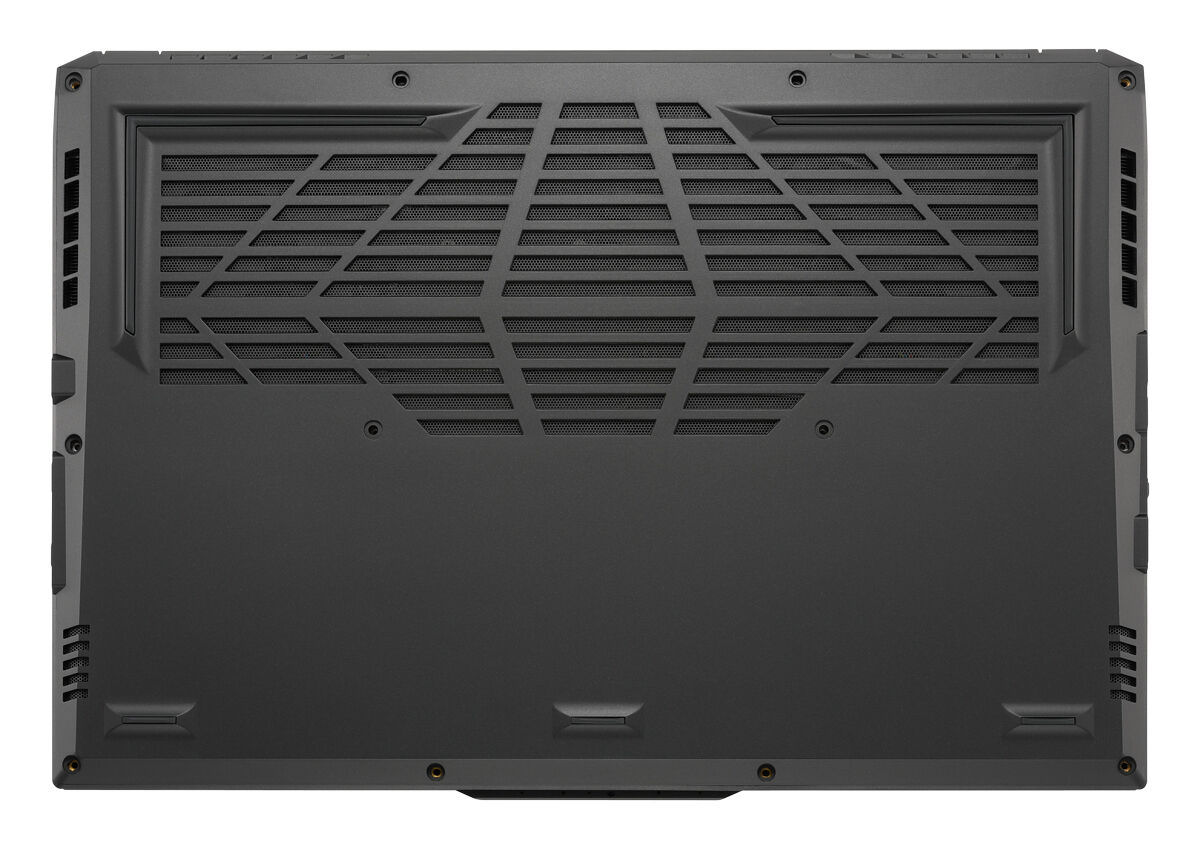
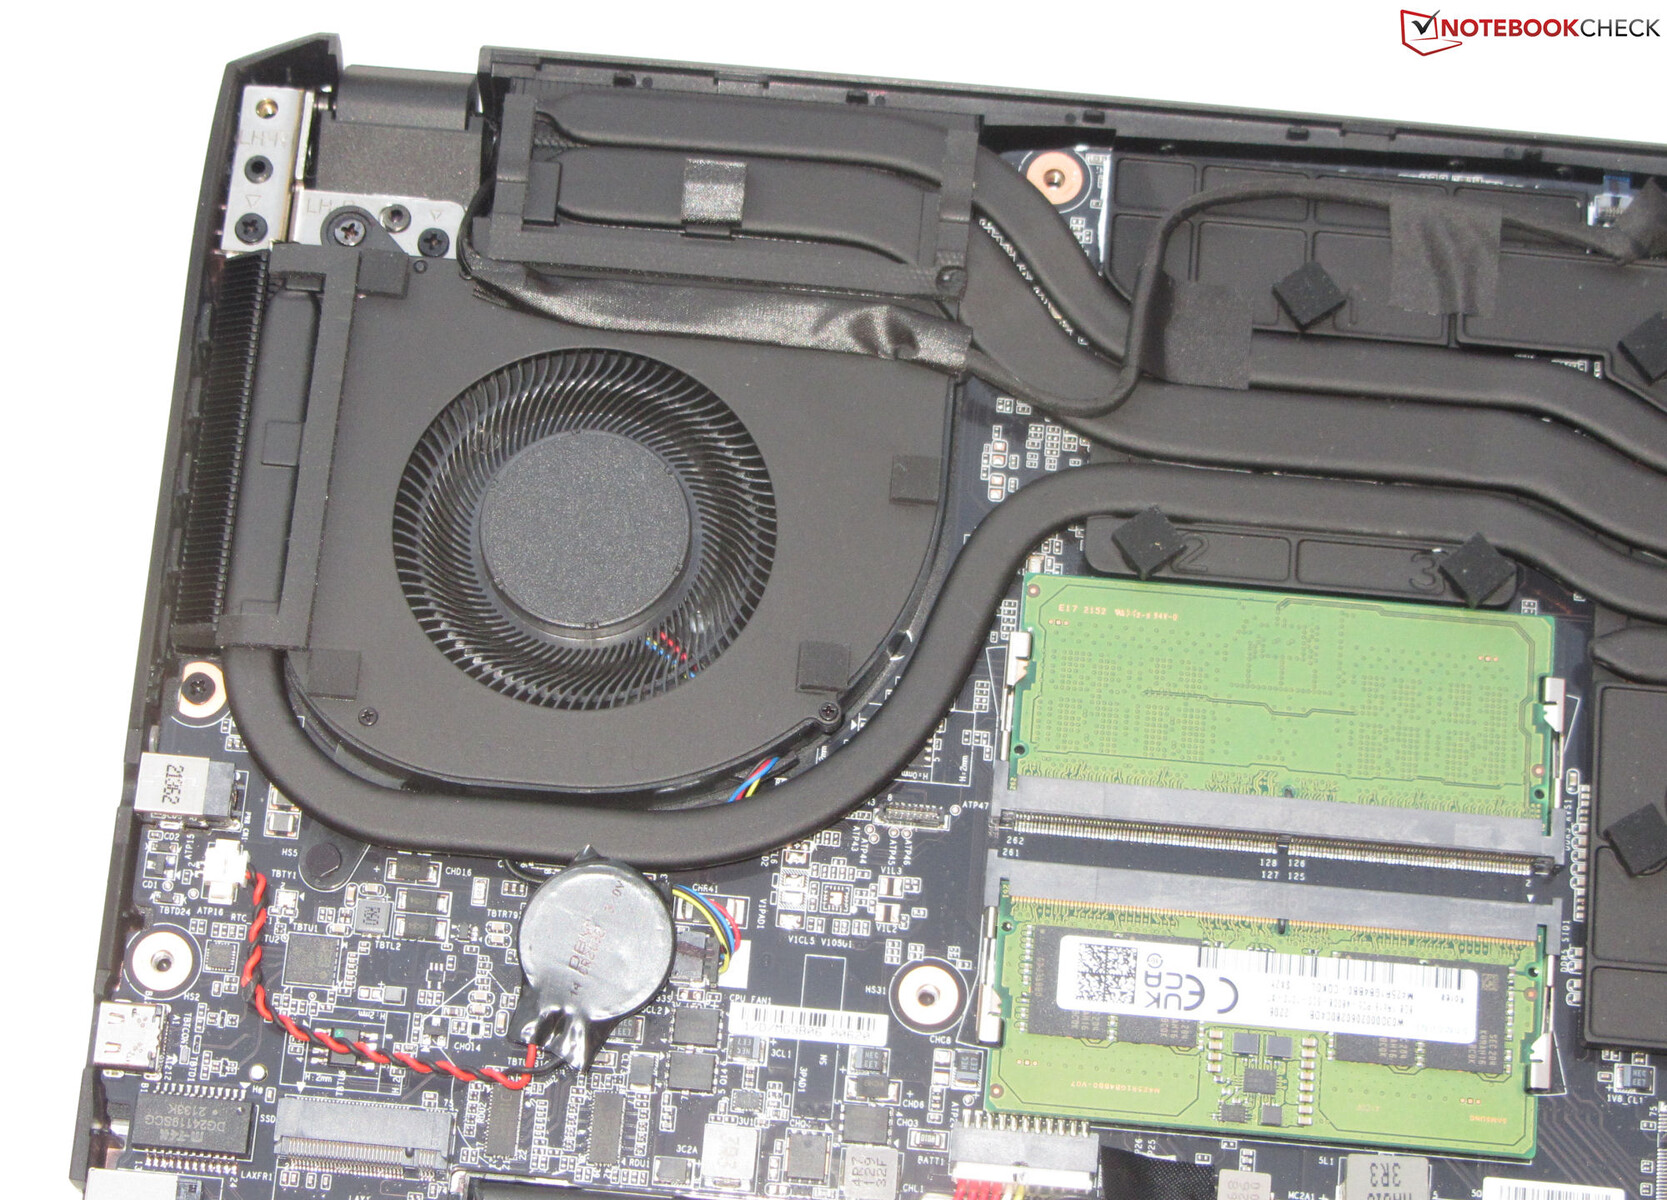
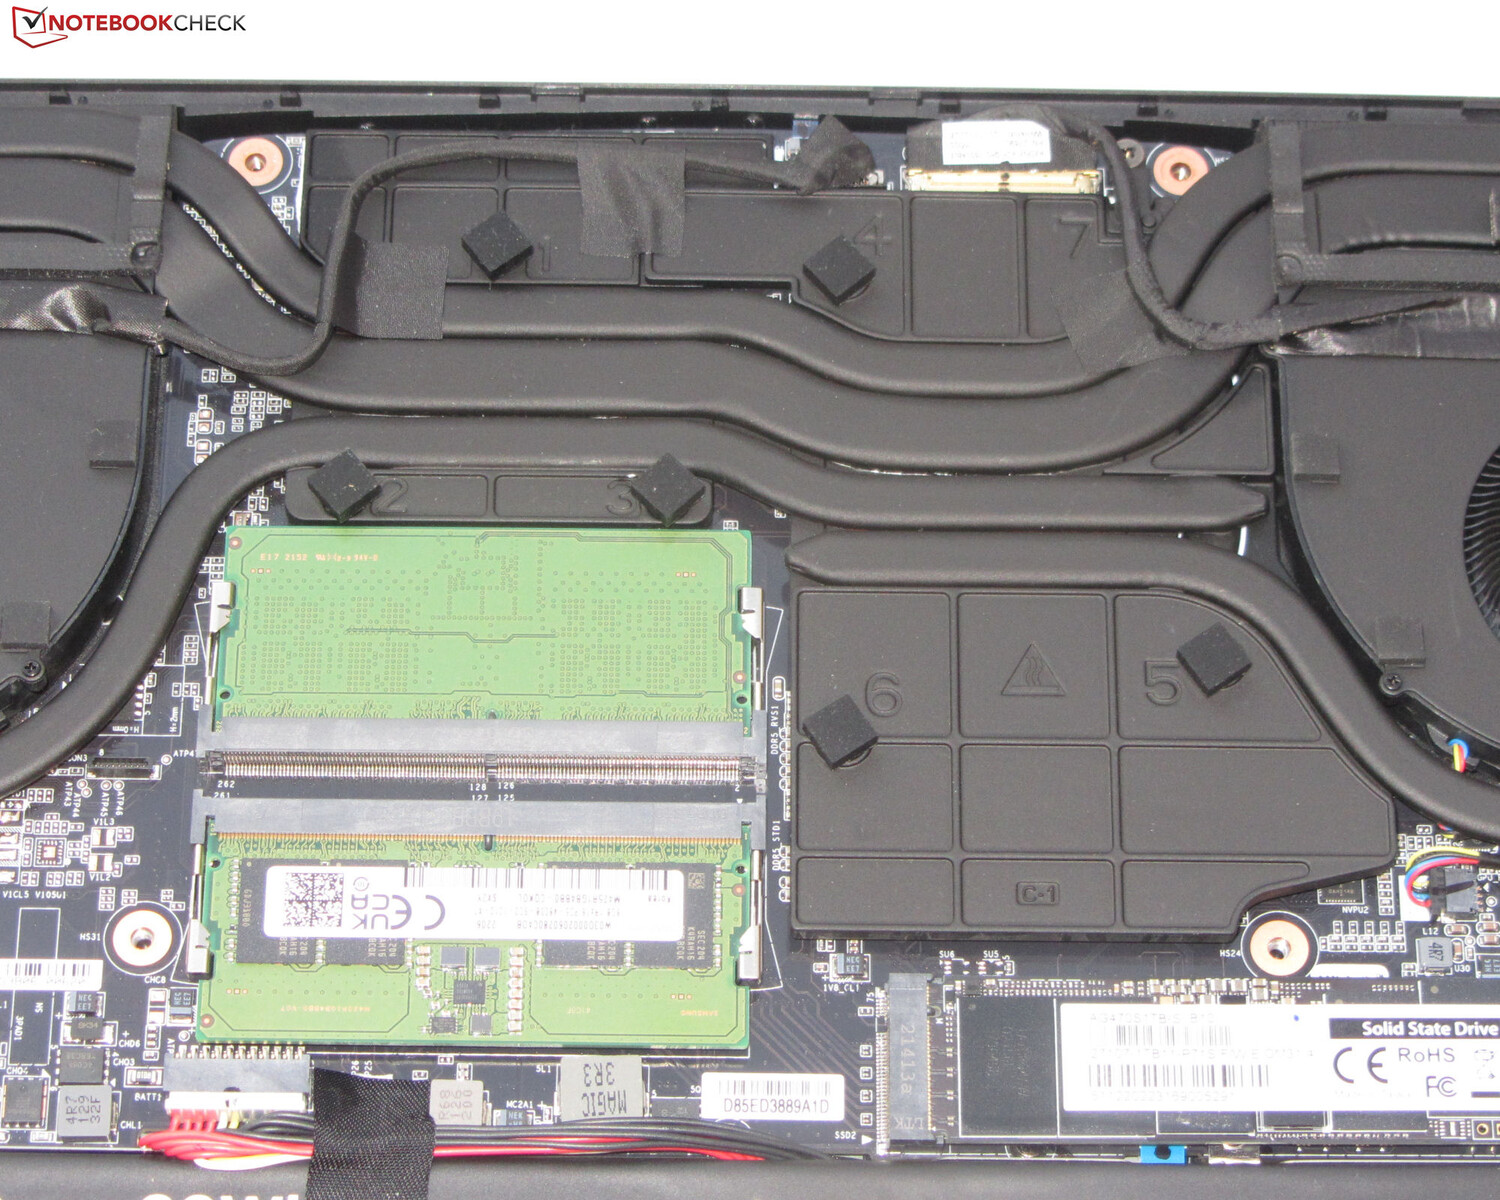
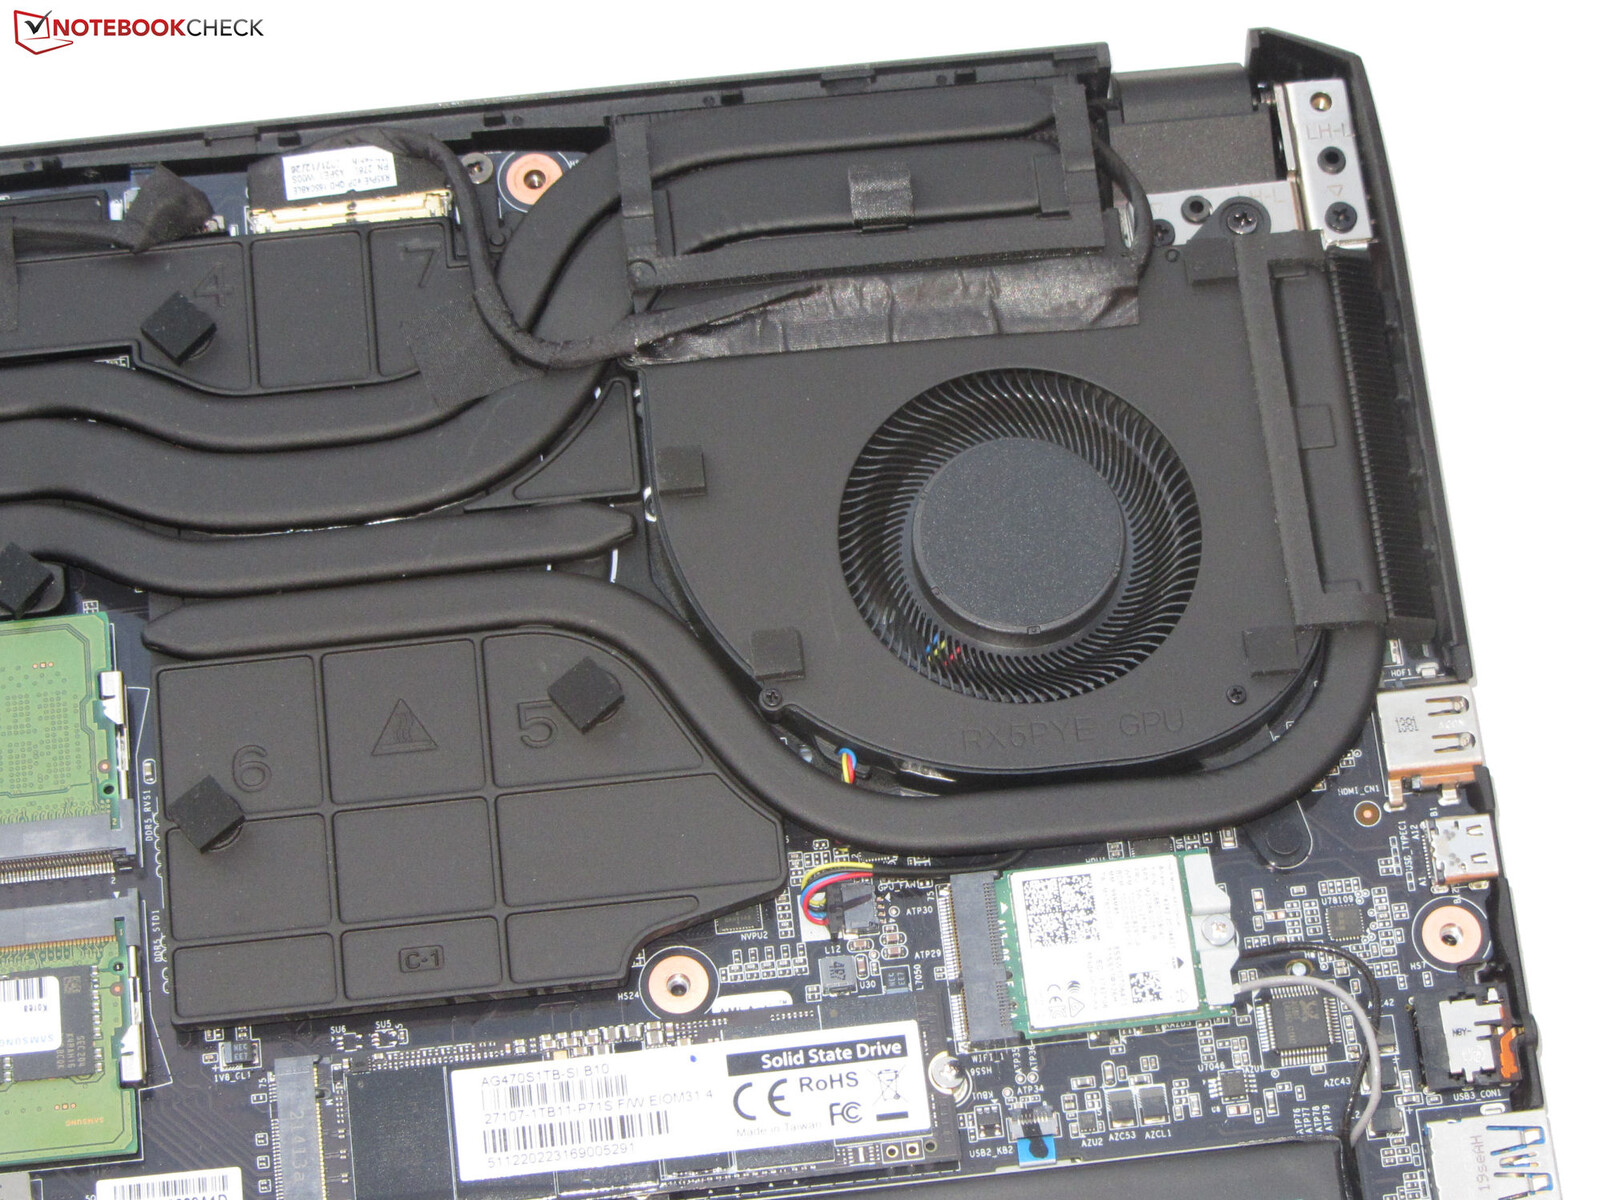
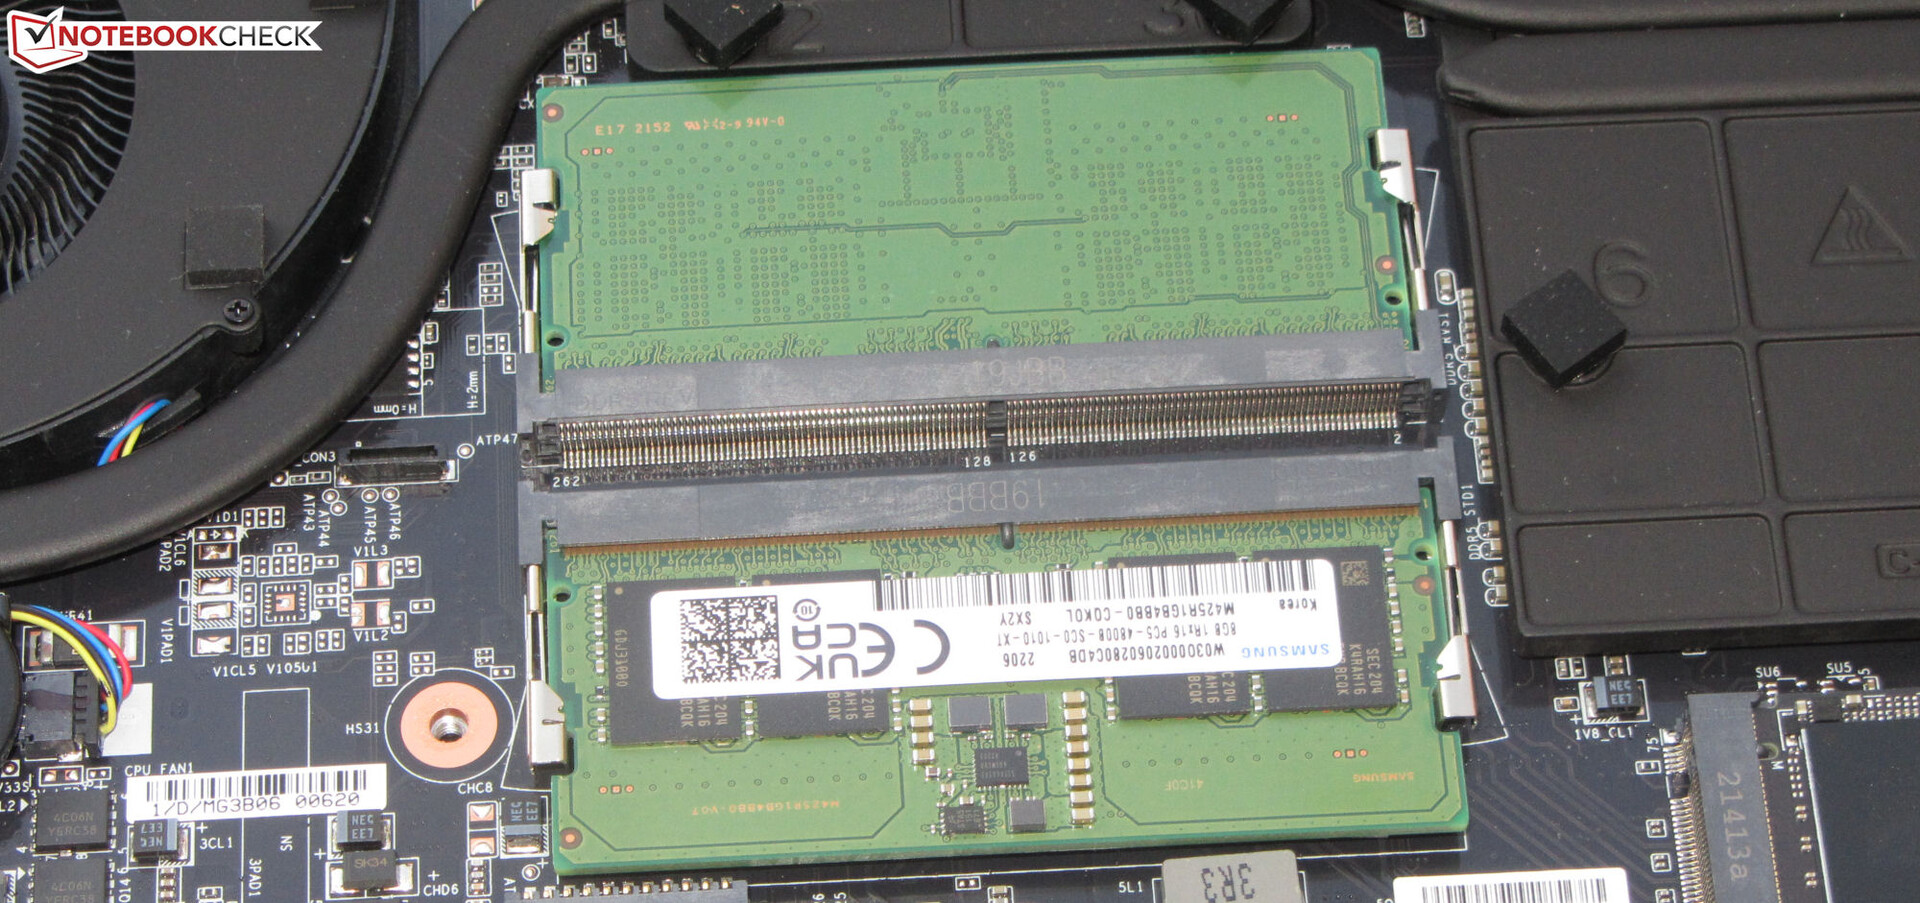
在底部的所有螺丝被卸下后,可以用平头铲子或填缝剂刮刀撬开底部面板。一旦面板被打开,你就可以看到两个内存插槽(都被占用)、PCIe 4.0固态硬盘、第二个M.2 2280插槽(PCIe 4.0)、BIOS电池、Wi-Fi模块、两个风扇、扬声器和电池。
担保
在德国,技嘉为这台15.6英寸的笔记本电脑提供了两年的保修期,没有任何延长选项。保修的范围和期限可能因地区而异。
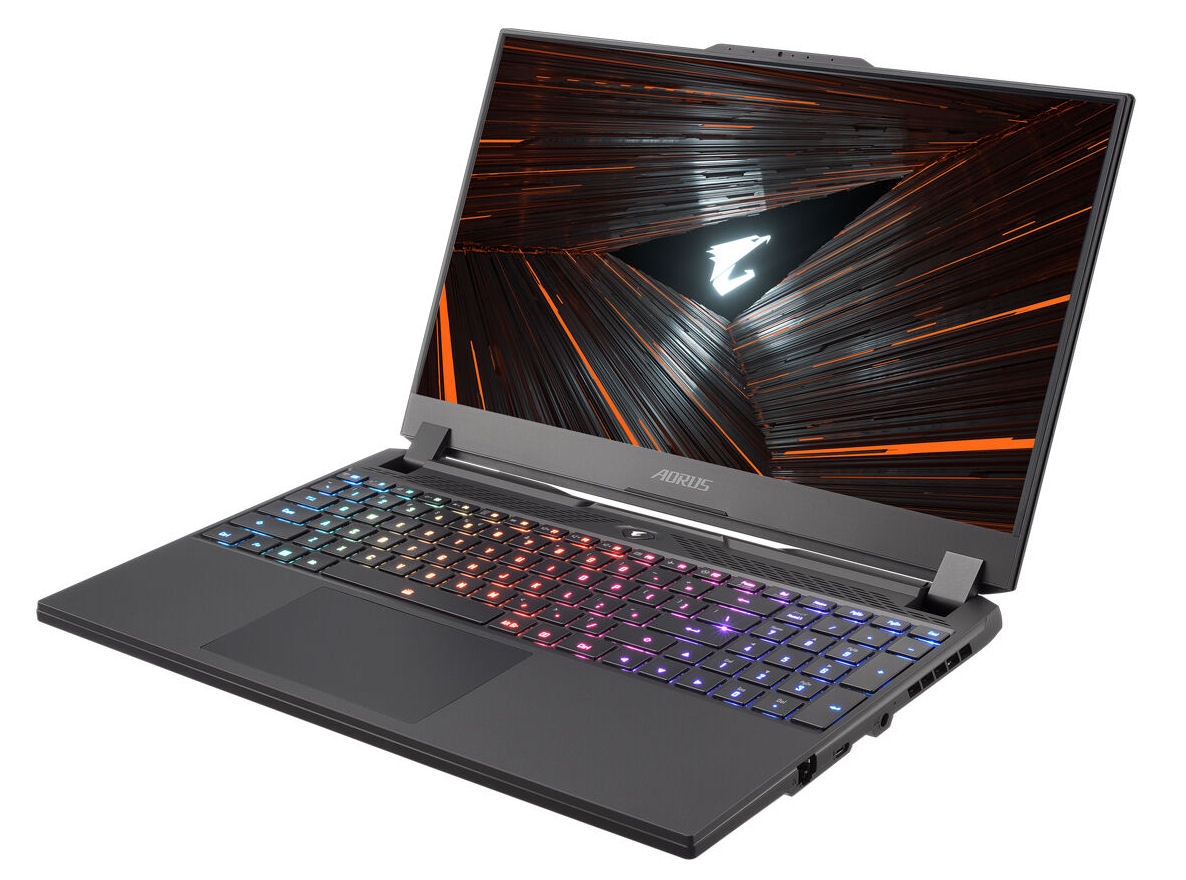
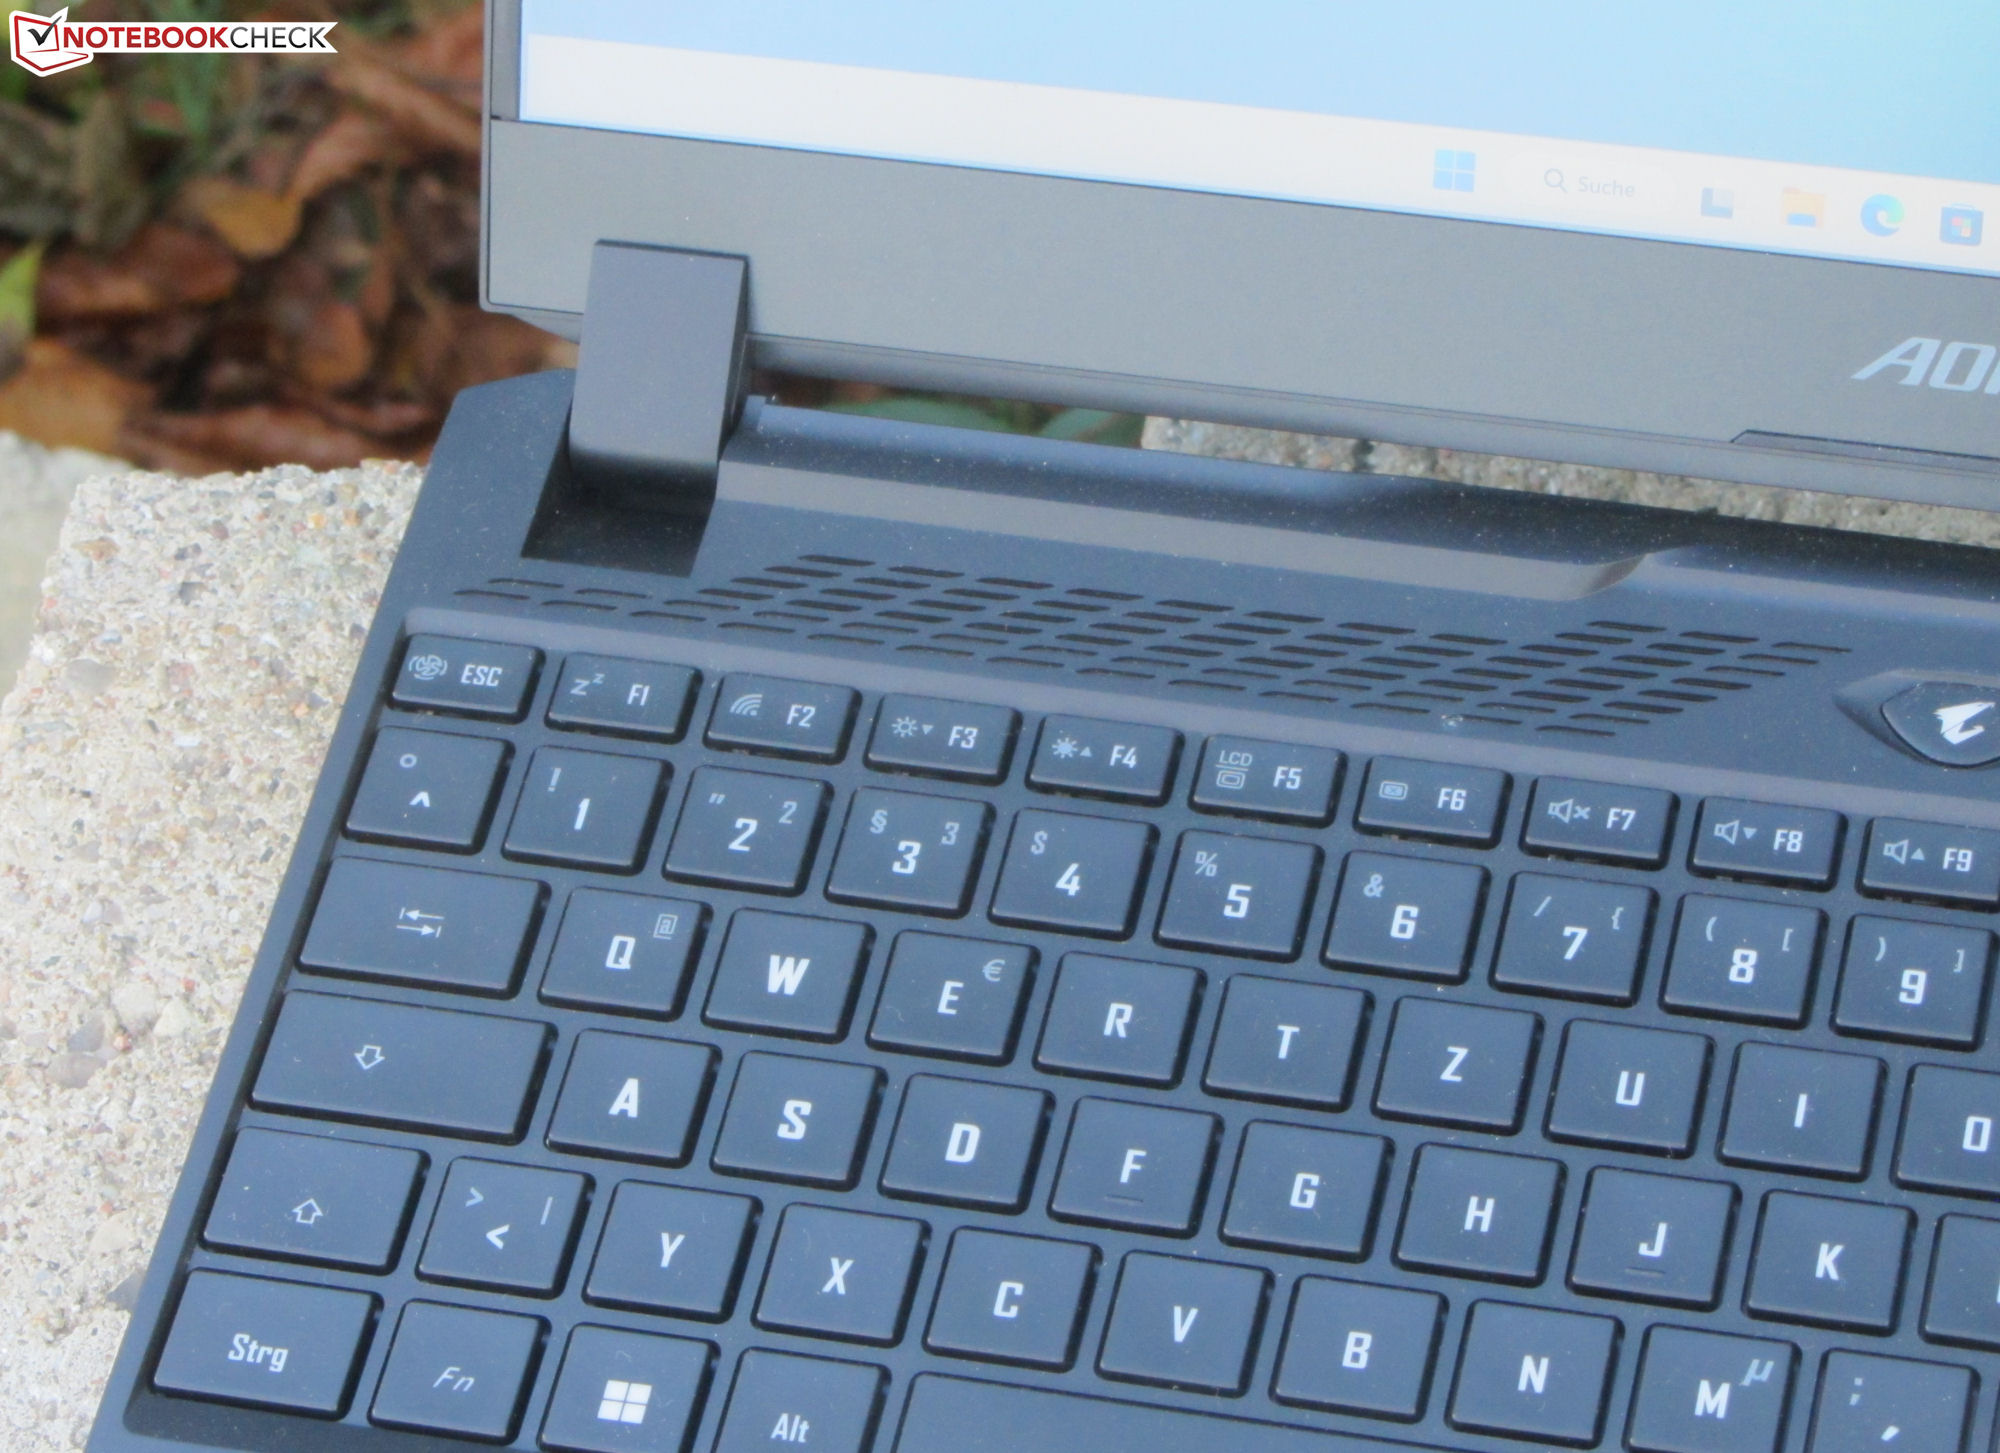
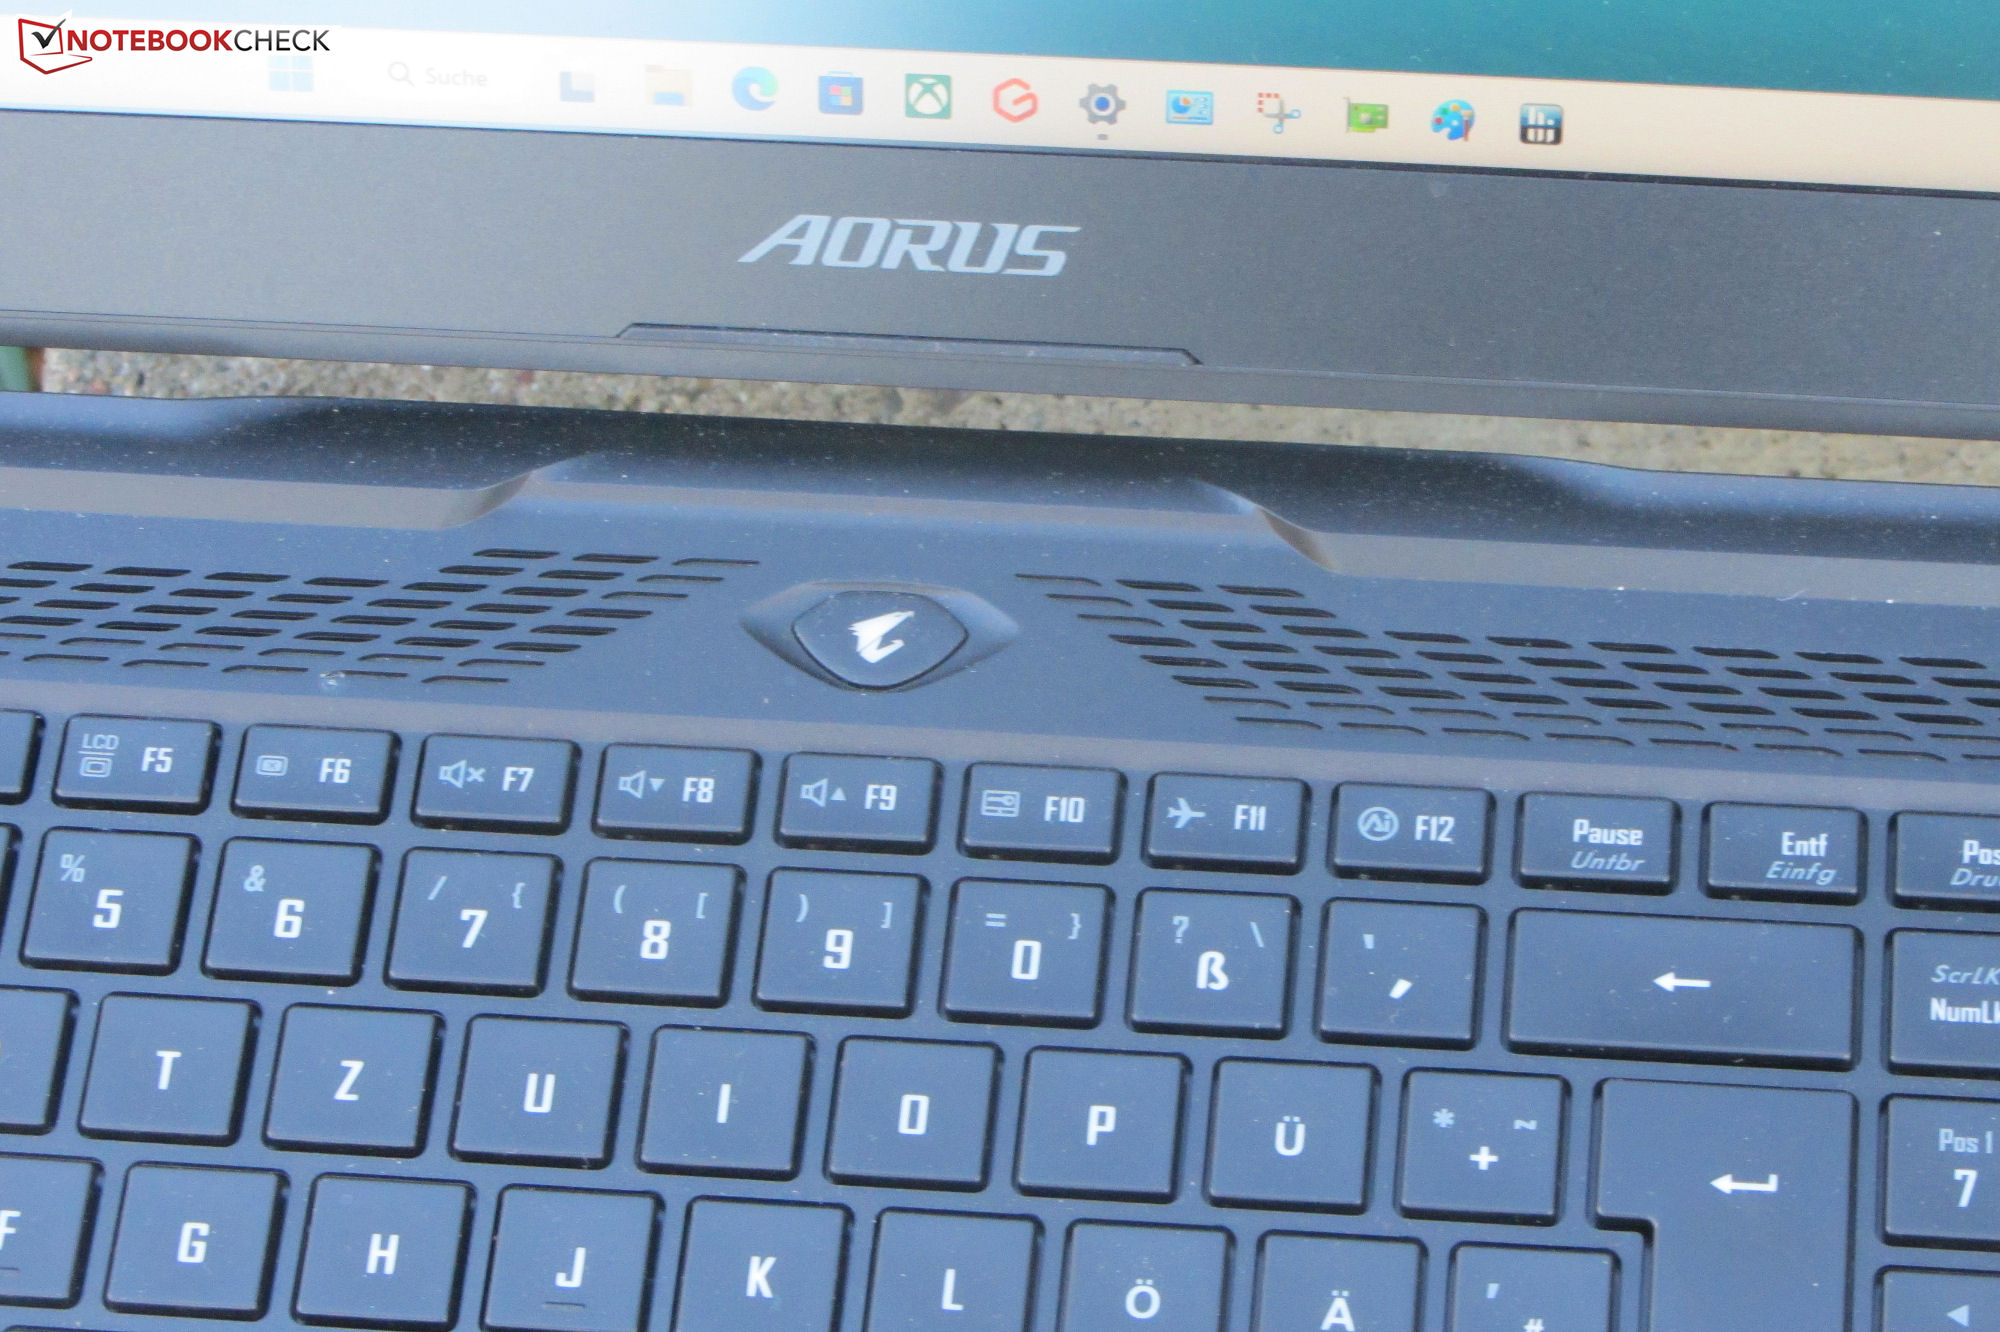
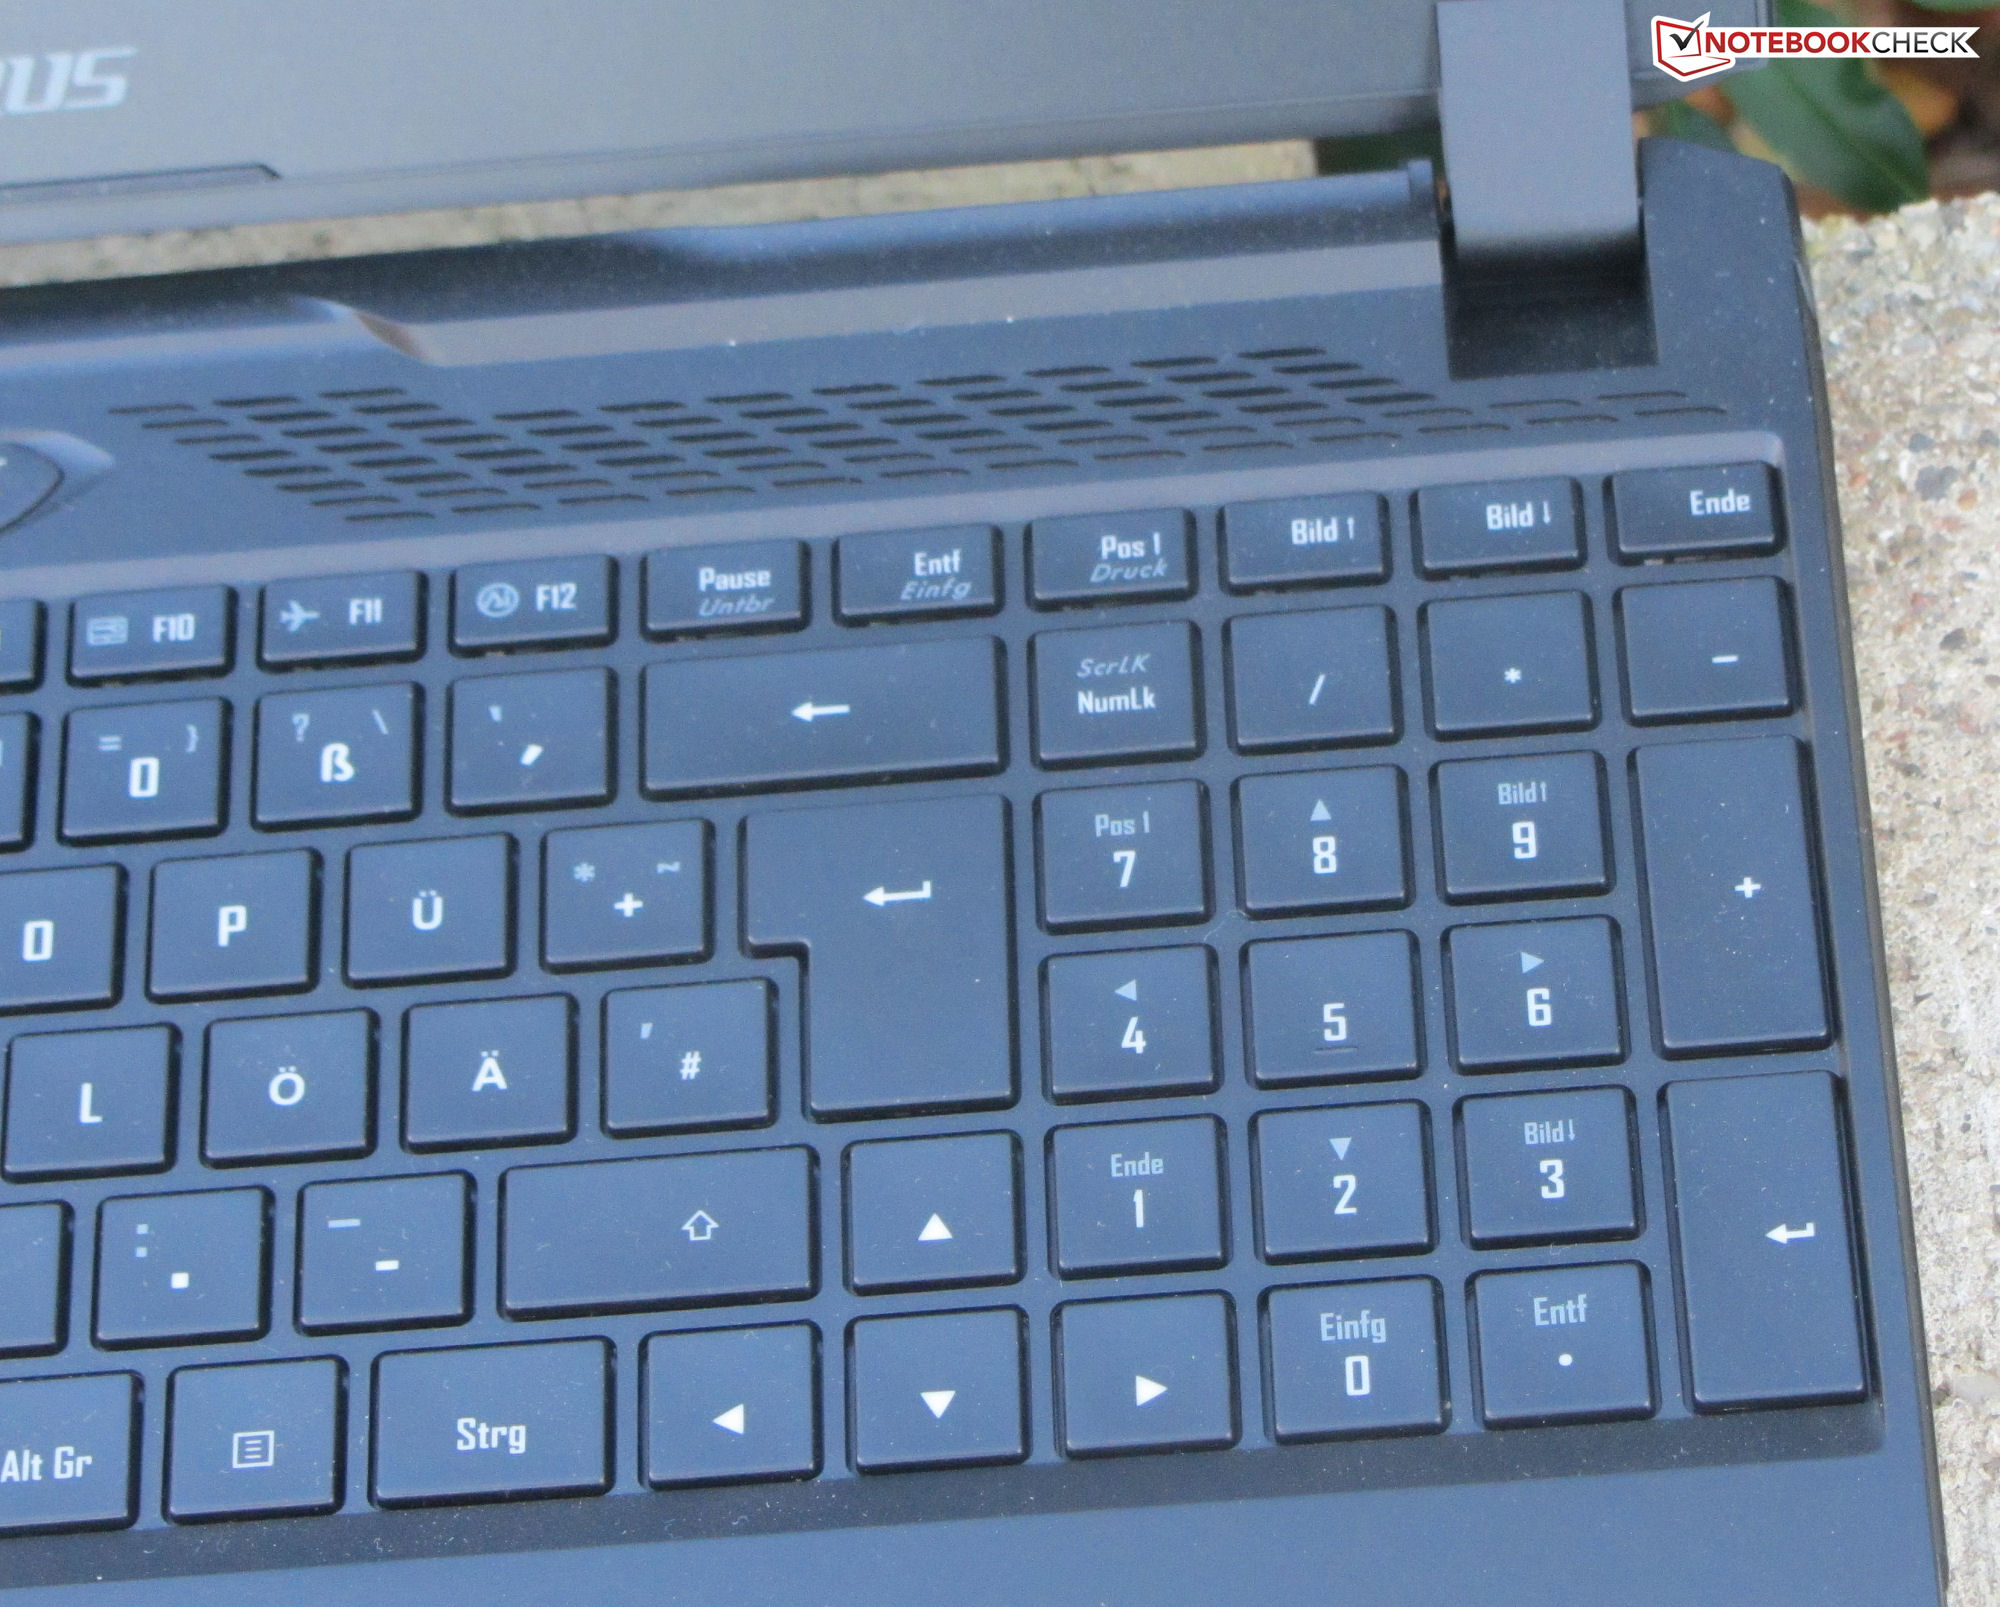
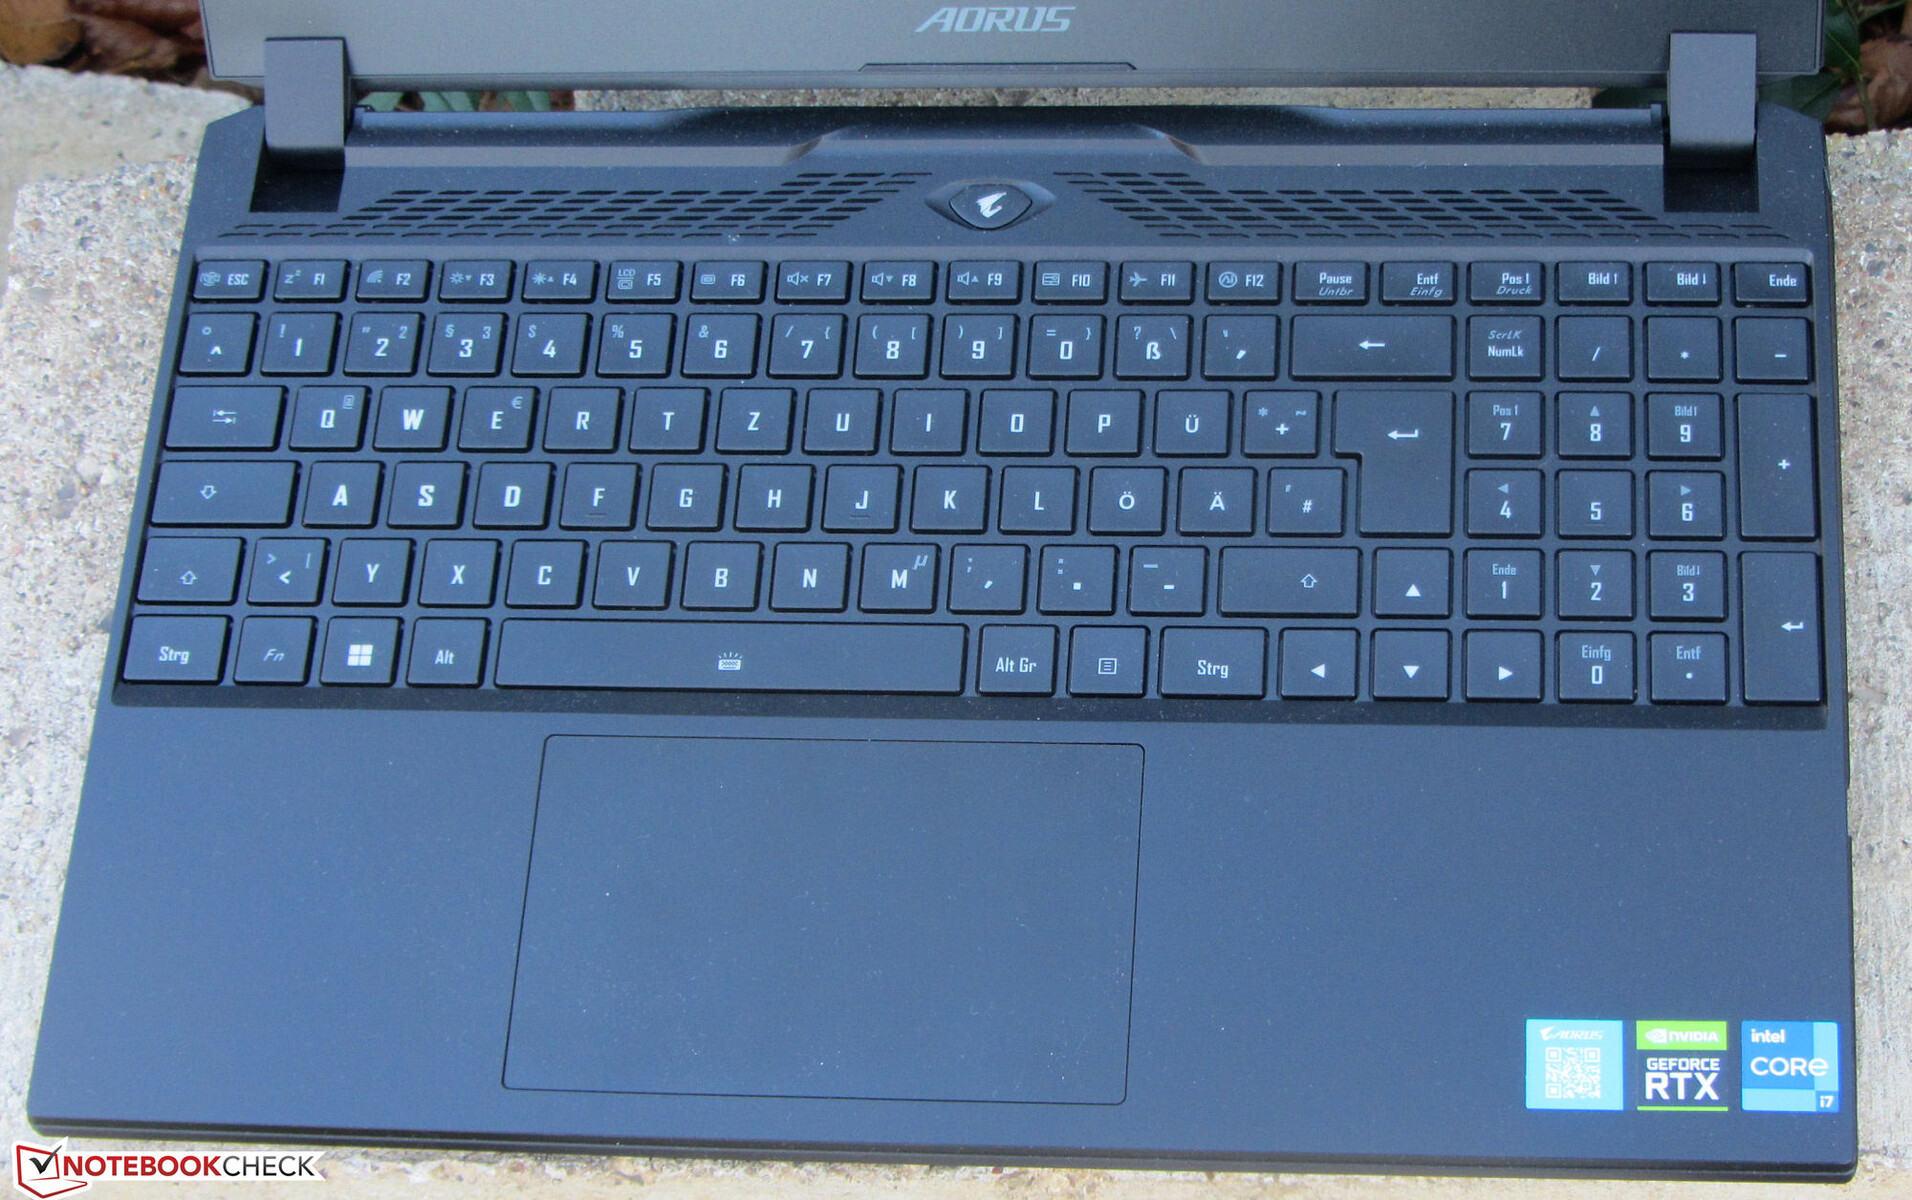
输入设备 - 独立点亮的RGB键
键盘
这款游戏笔记本电脑配备了一个包括数字键盘的小键盘。平滑的按键提供了一个适度的移动距离和一个明显的启动点。当你打字时,键盘不会弯曲。每个键都是单独点亮的,具有两个亮度级别。总的来说,技嘉公司提供了一个适合日常使用的键盘。
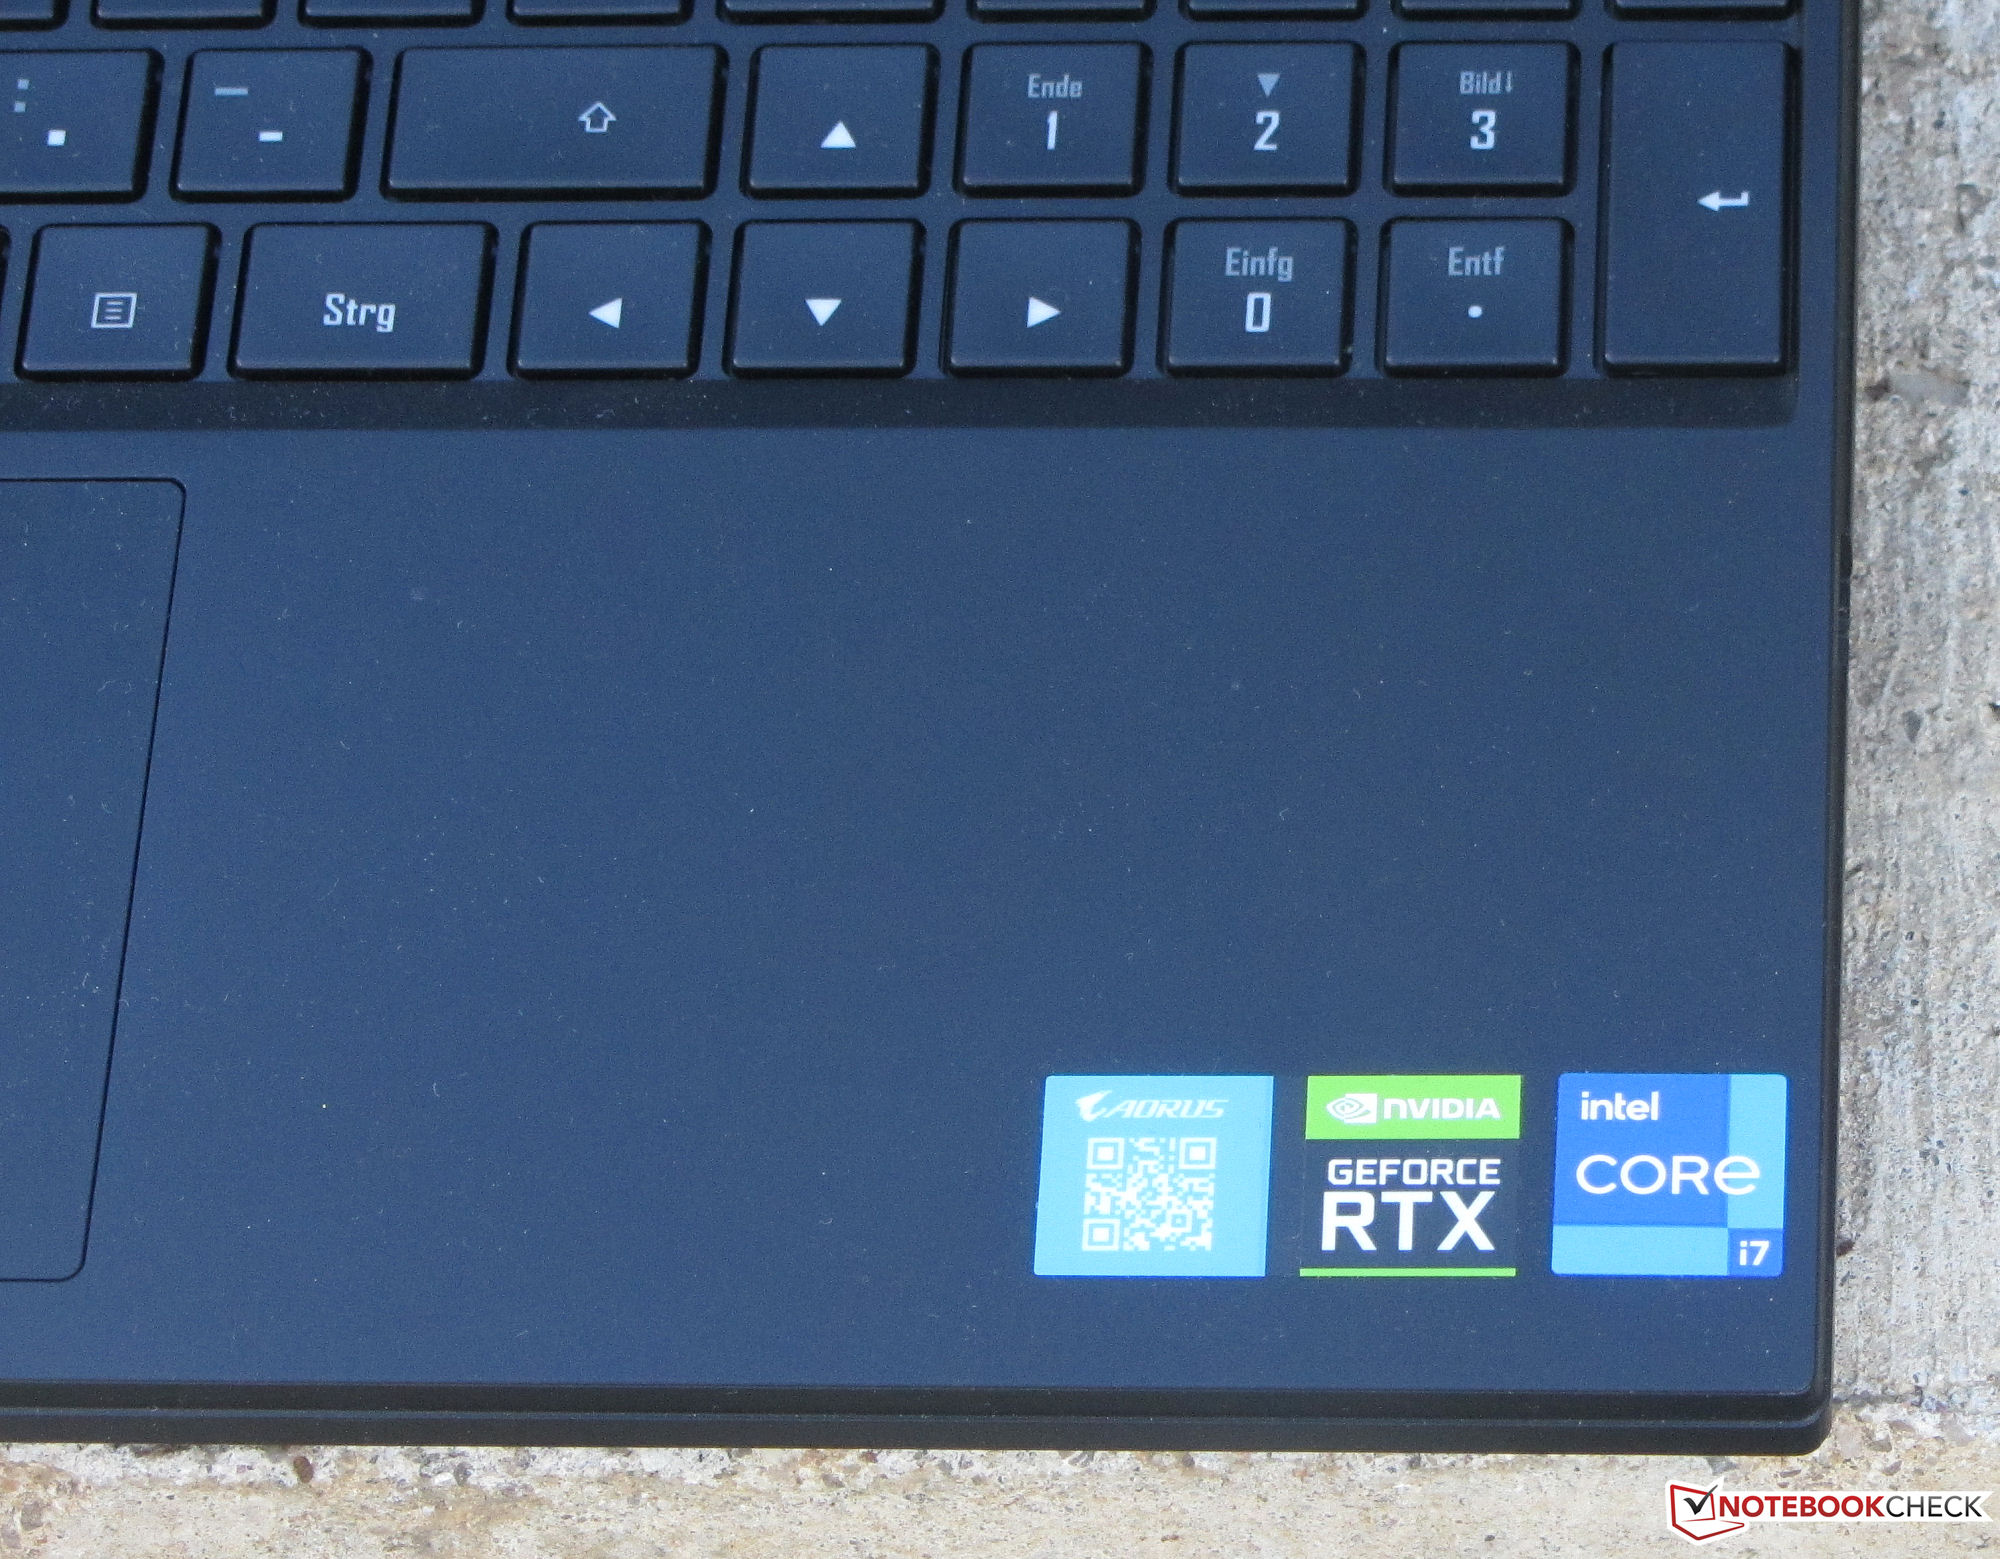
触摸板
笔记本电脑的多点触摸点击板(约12.1 x 7.6厘米,或4.8 x 3.0英寸)有一个光滑的表面,使你的手指很容易滑过。它对输入很敏感,甚至在角落里也是如此,而且有一个浅浅的点击和一个明显的启动点。
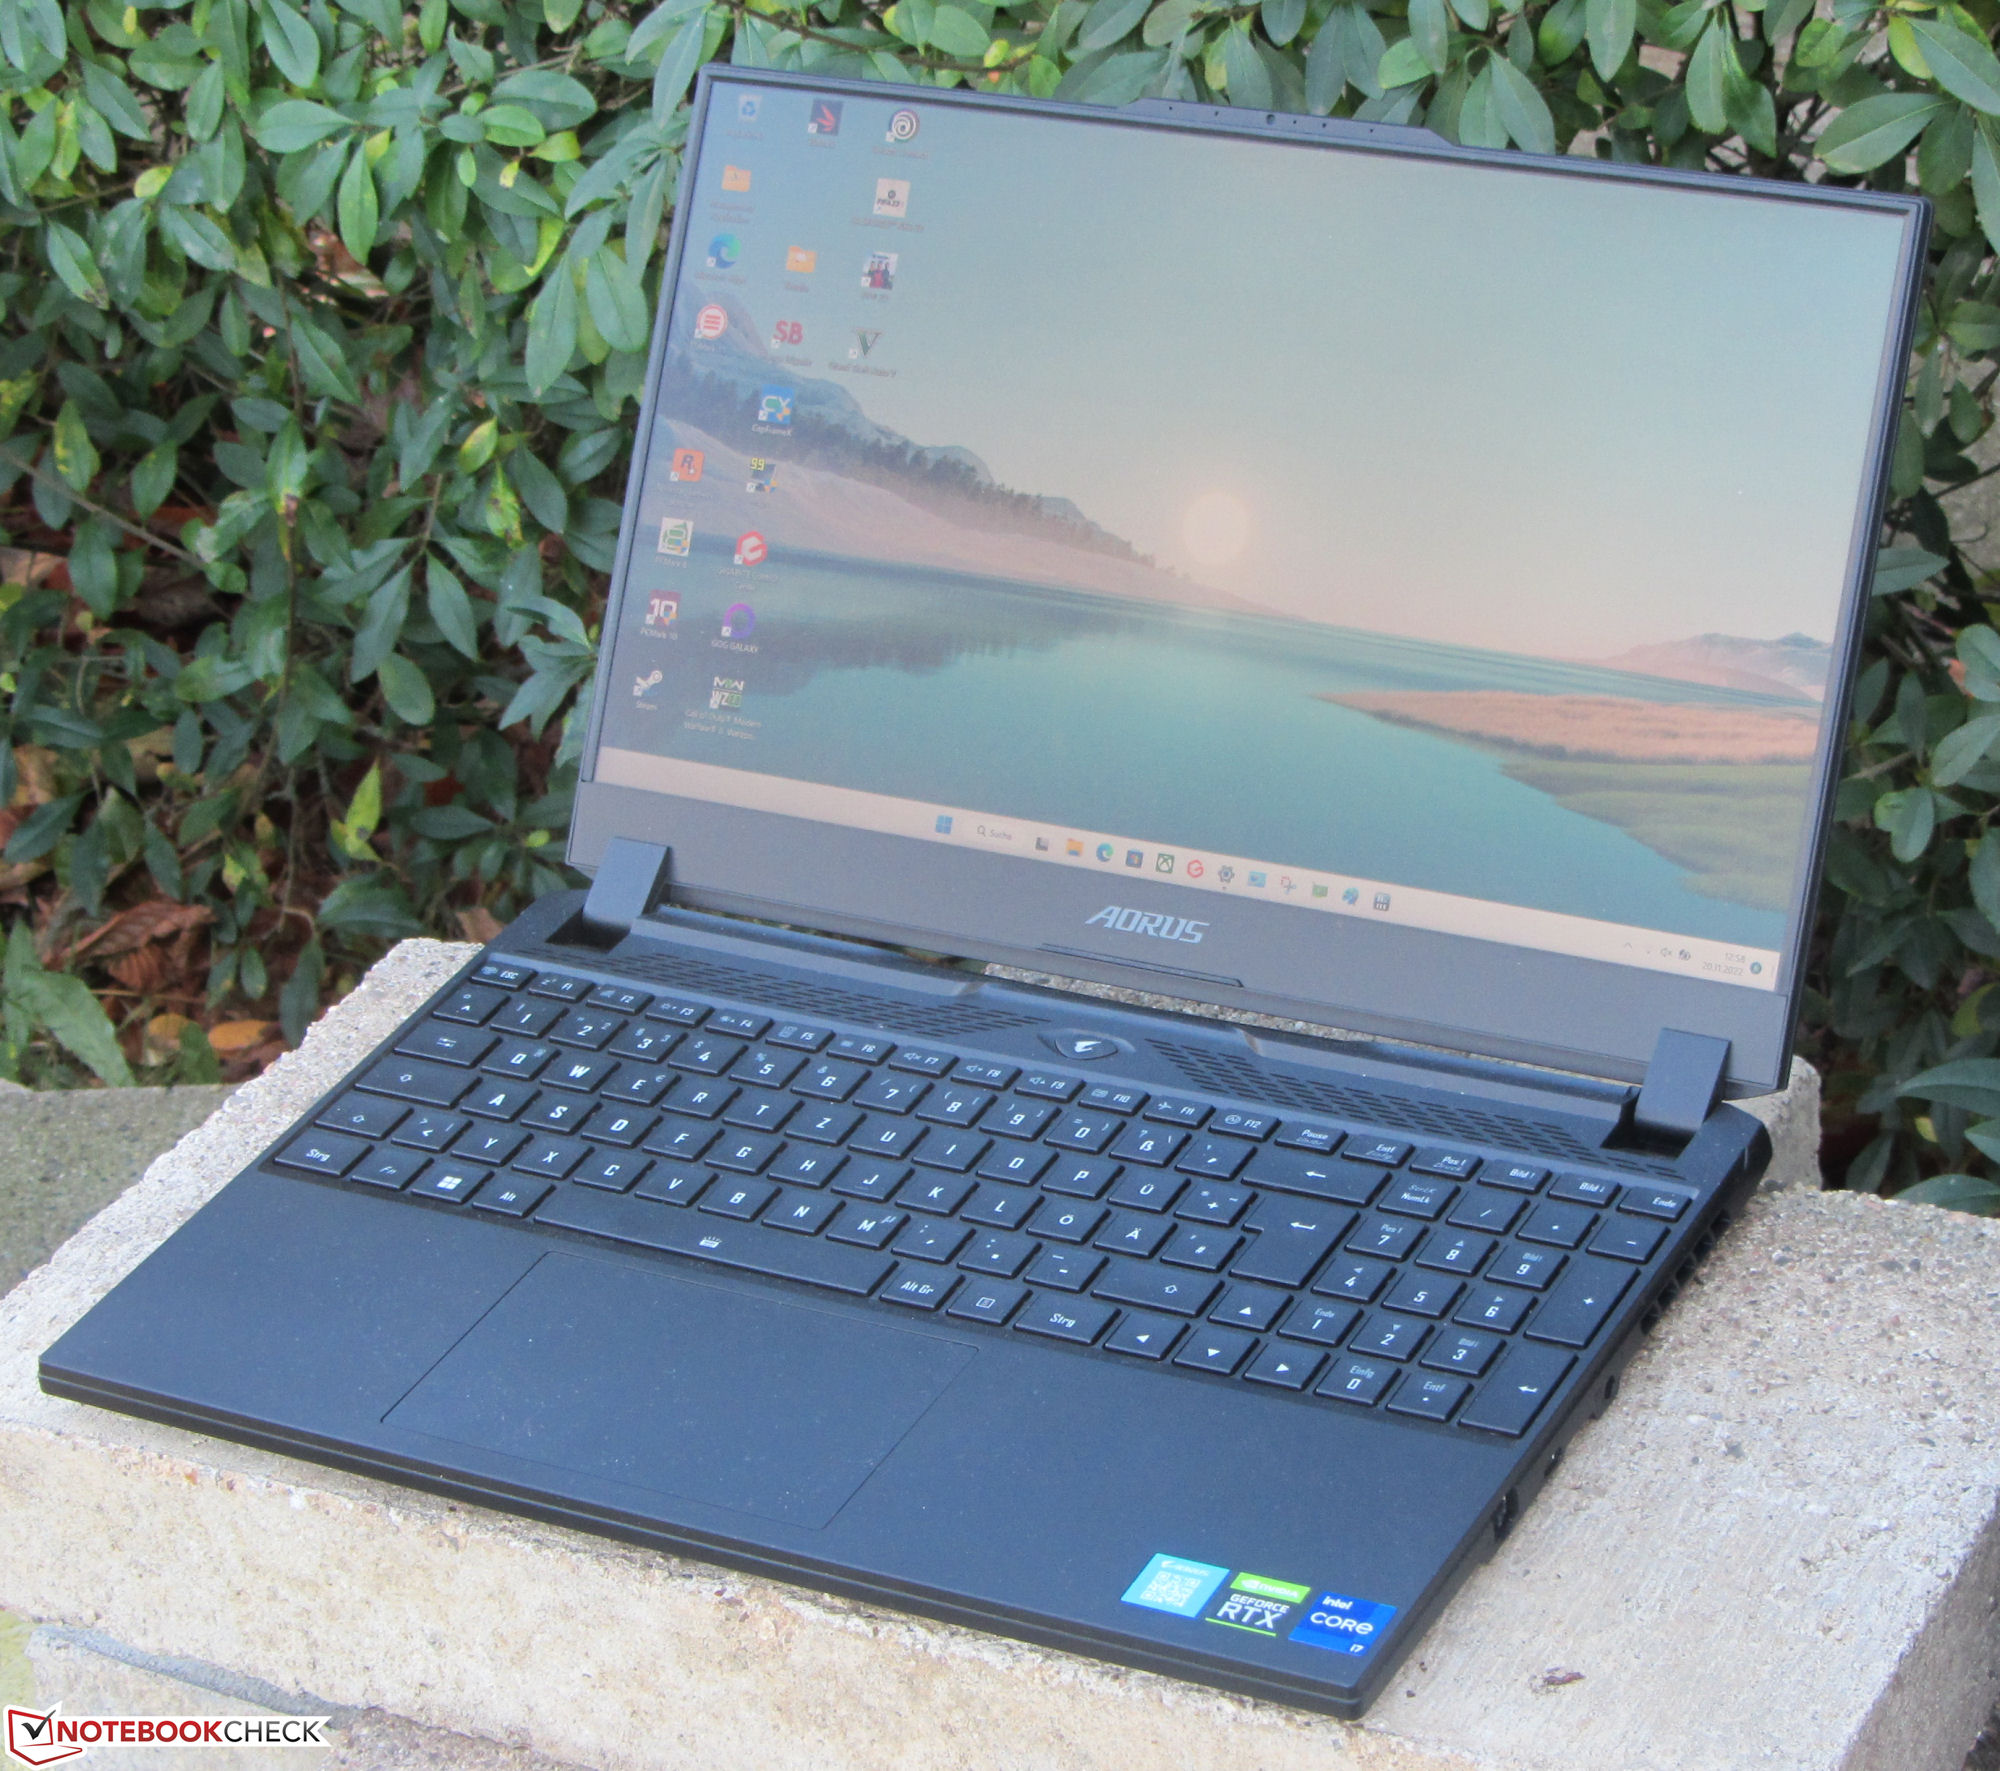
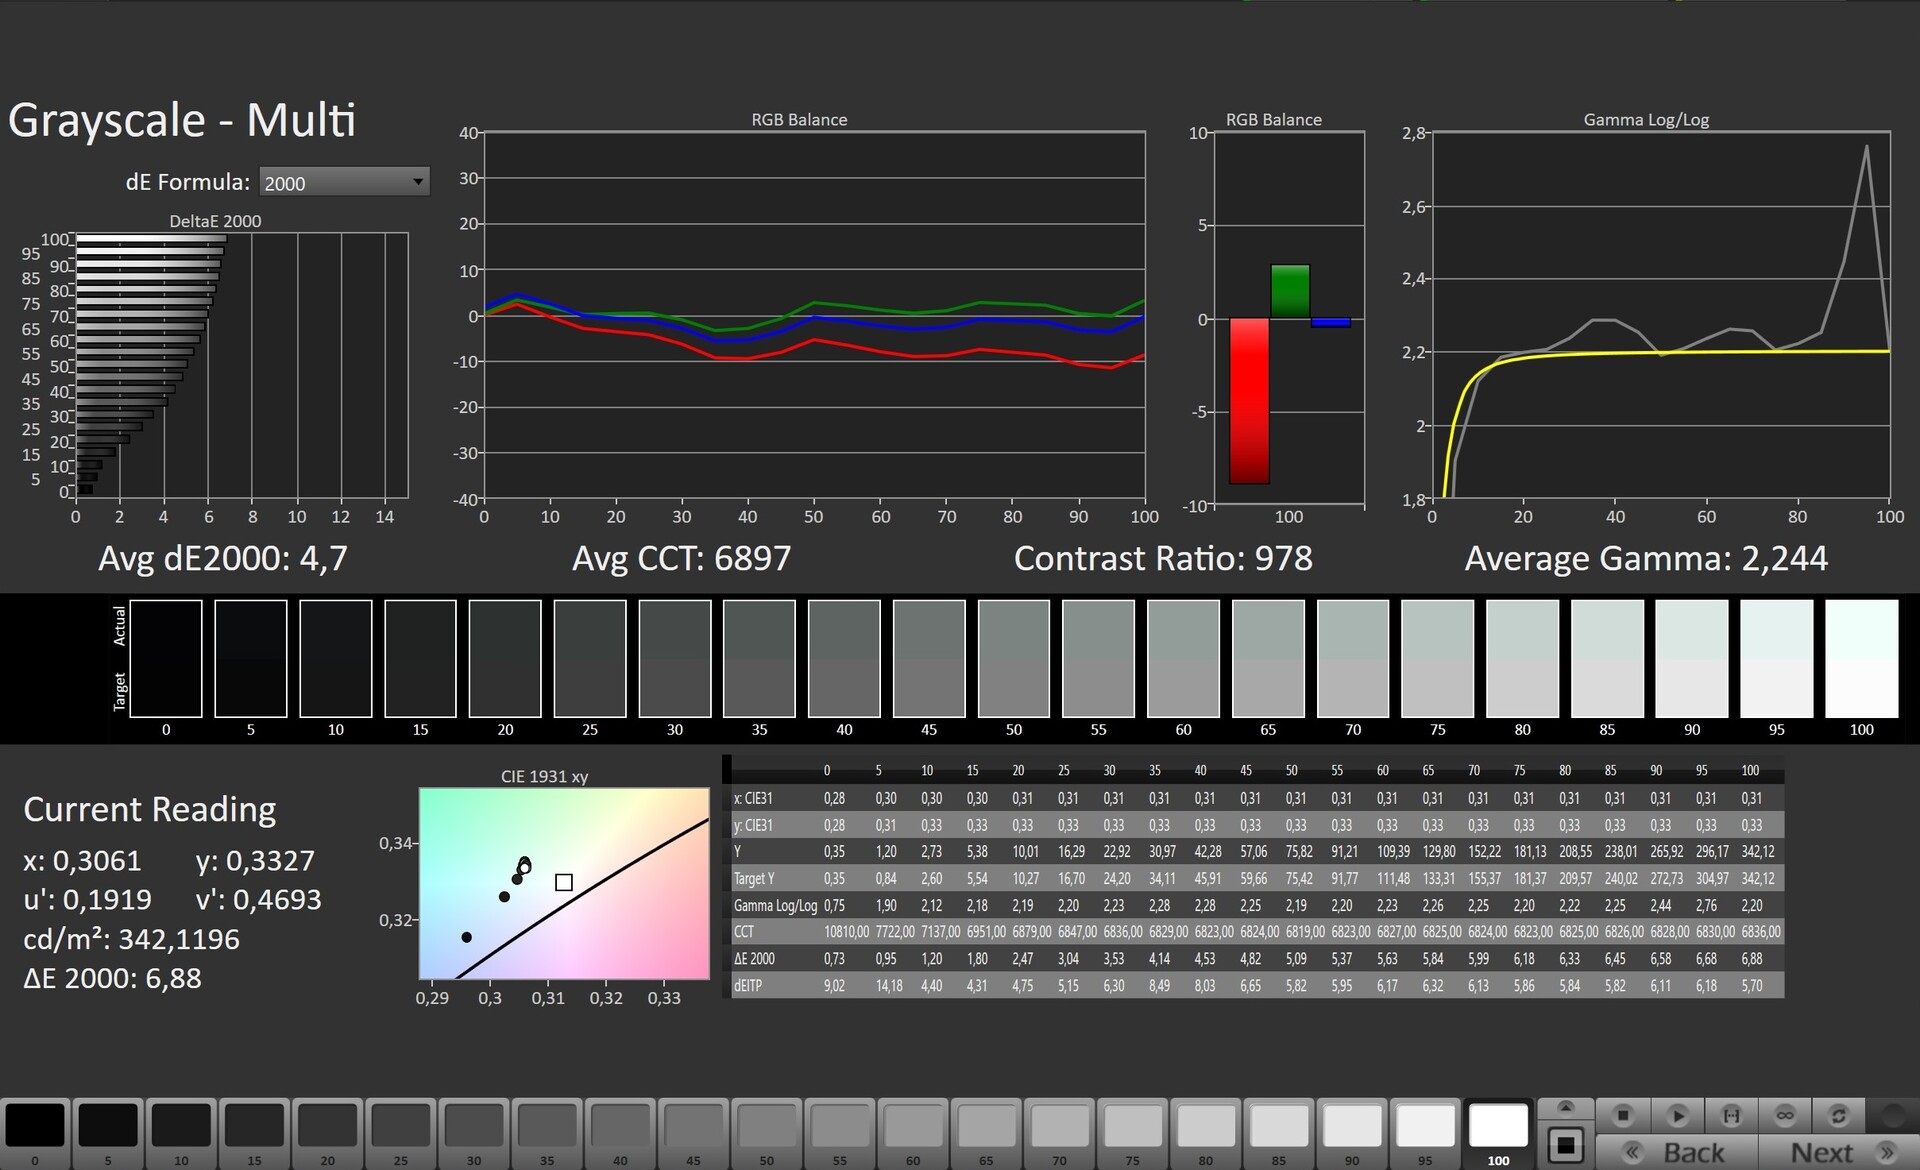
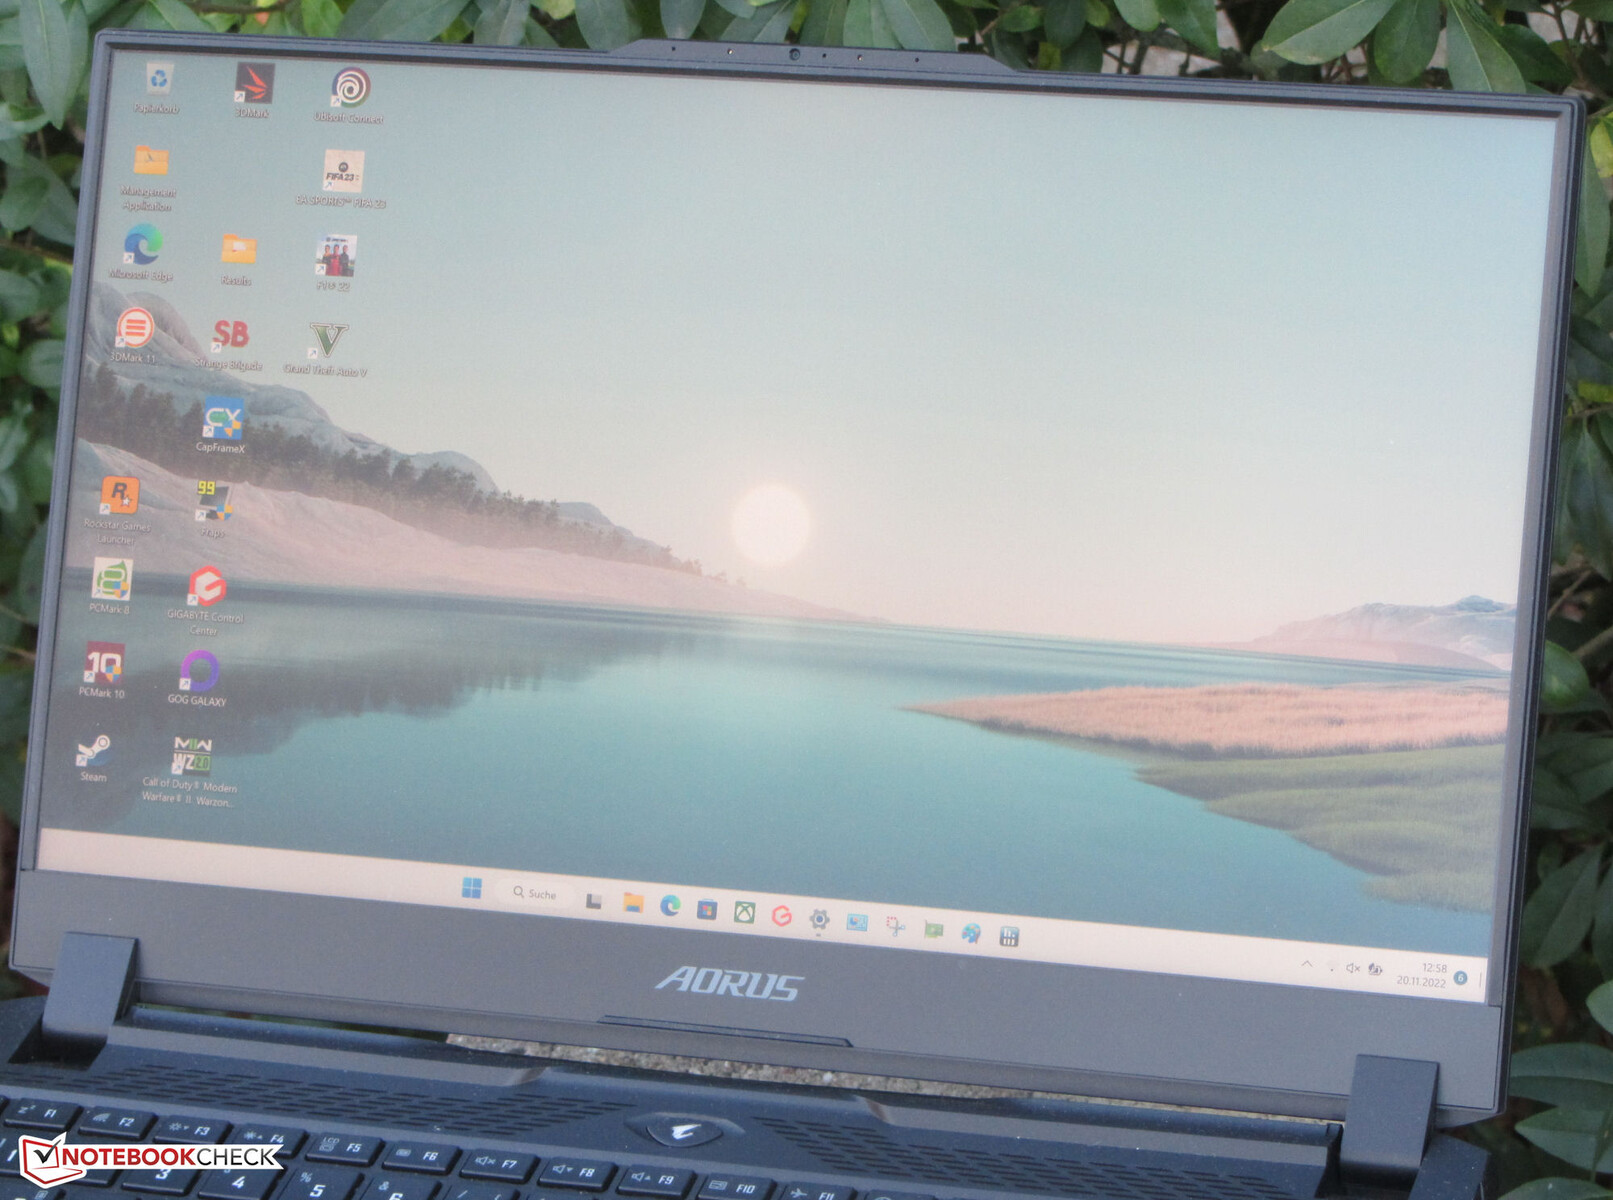
显示--色彩覆盖面大

这款笔记本电脑配备了高度响应的165Hz面板,没有表现出任何PWM闪烁的现象。15.6英寸的哑光显示屏(2560×1440像素)可以获得可接受的亮度(>300cd/m²),但其对比度(988:1)低于人们认为的好(>1000:1)。一些竞争对手的情况正好相反。只有 尼特罗有一个屏幕在这两个方面都做得很好。
| |||||||||||||||||||||||||
Brightness Distribution: 89 %
Center on Battery: 336 cd/m²
Contrast: 988:1 (Black: 0.34 cd/m²)
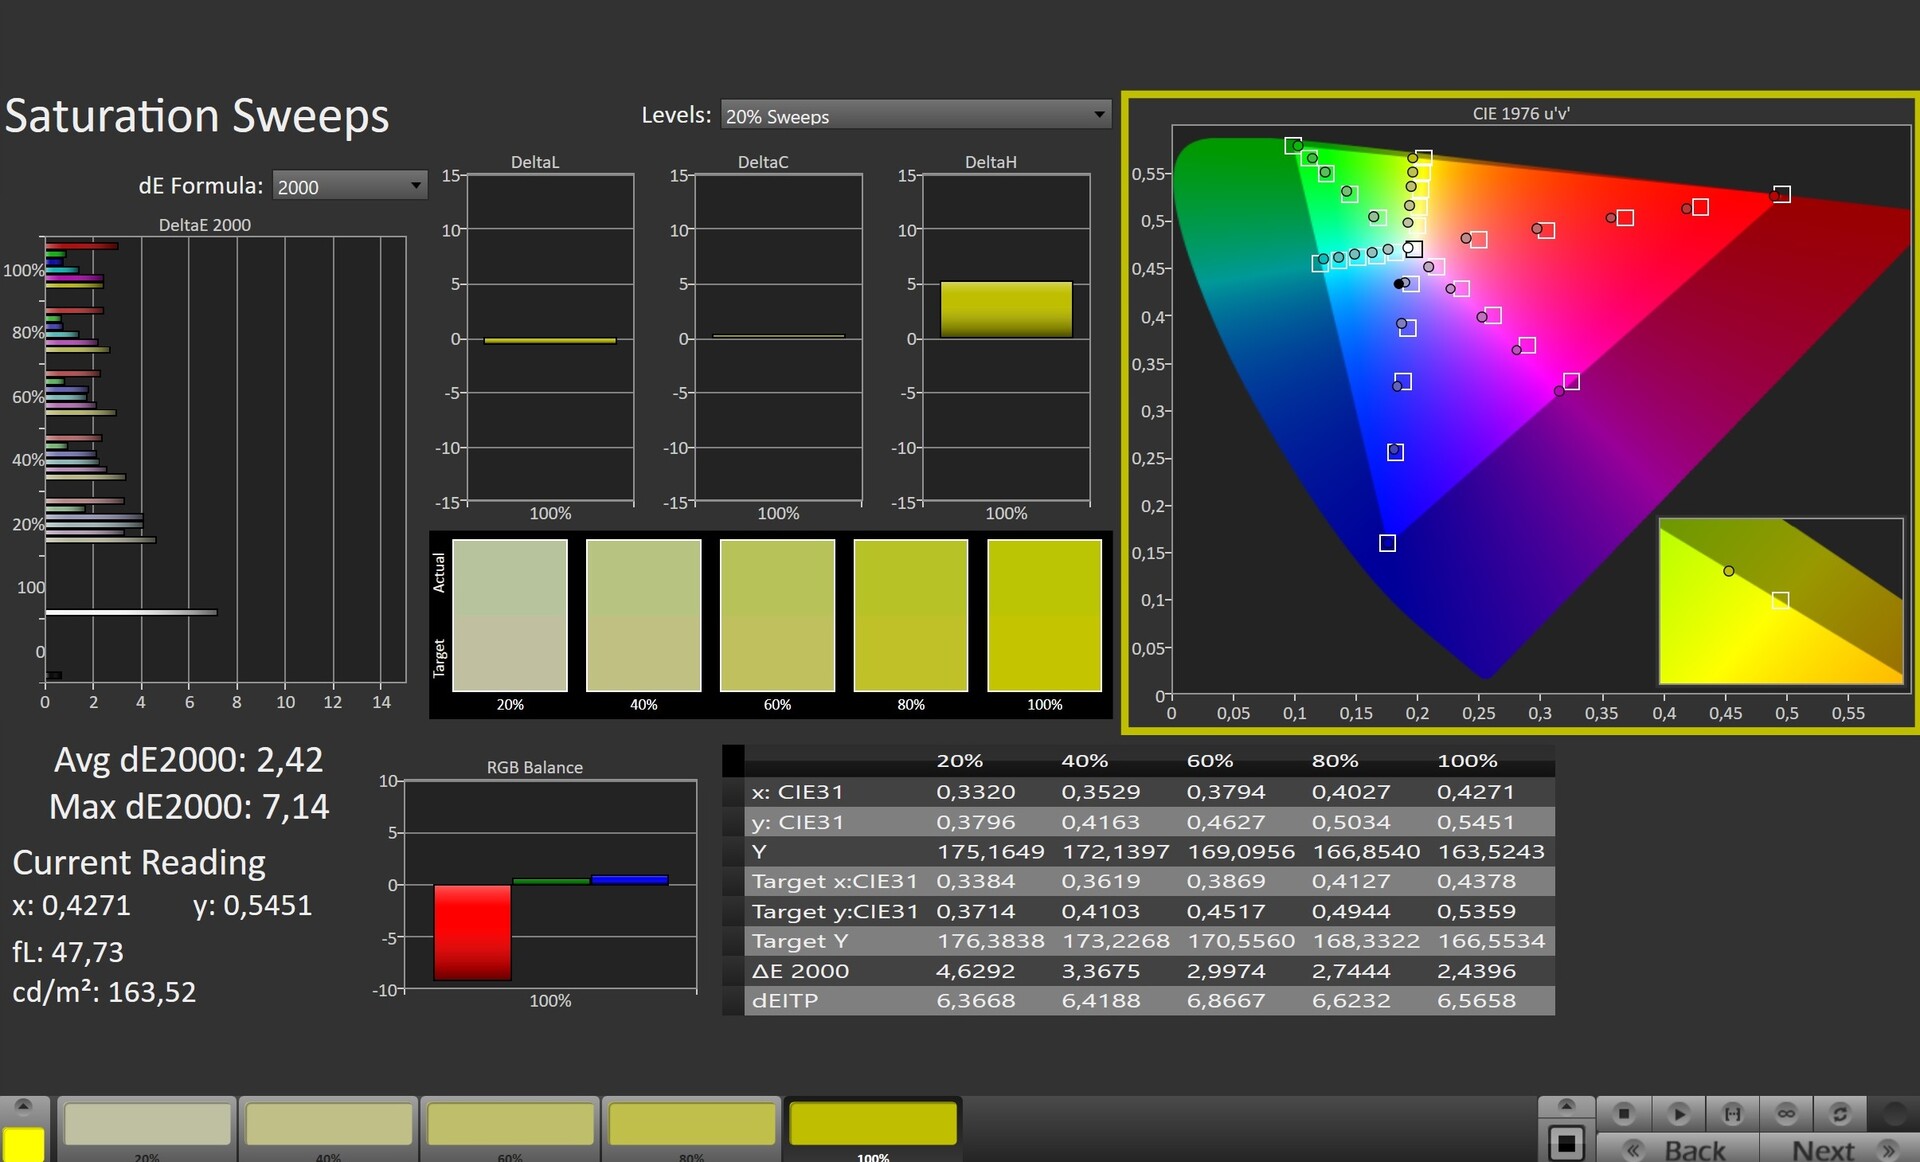
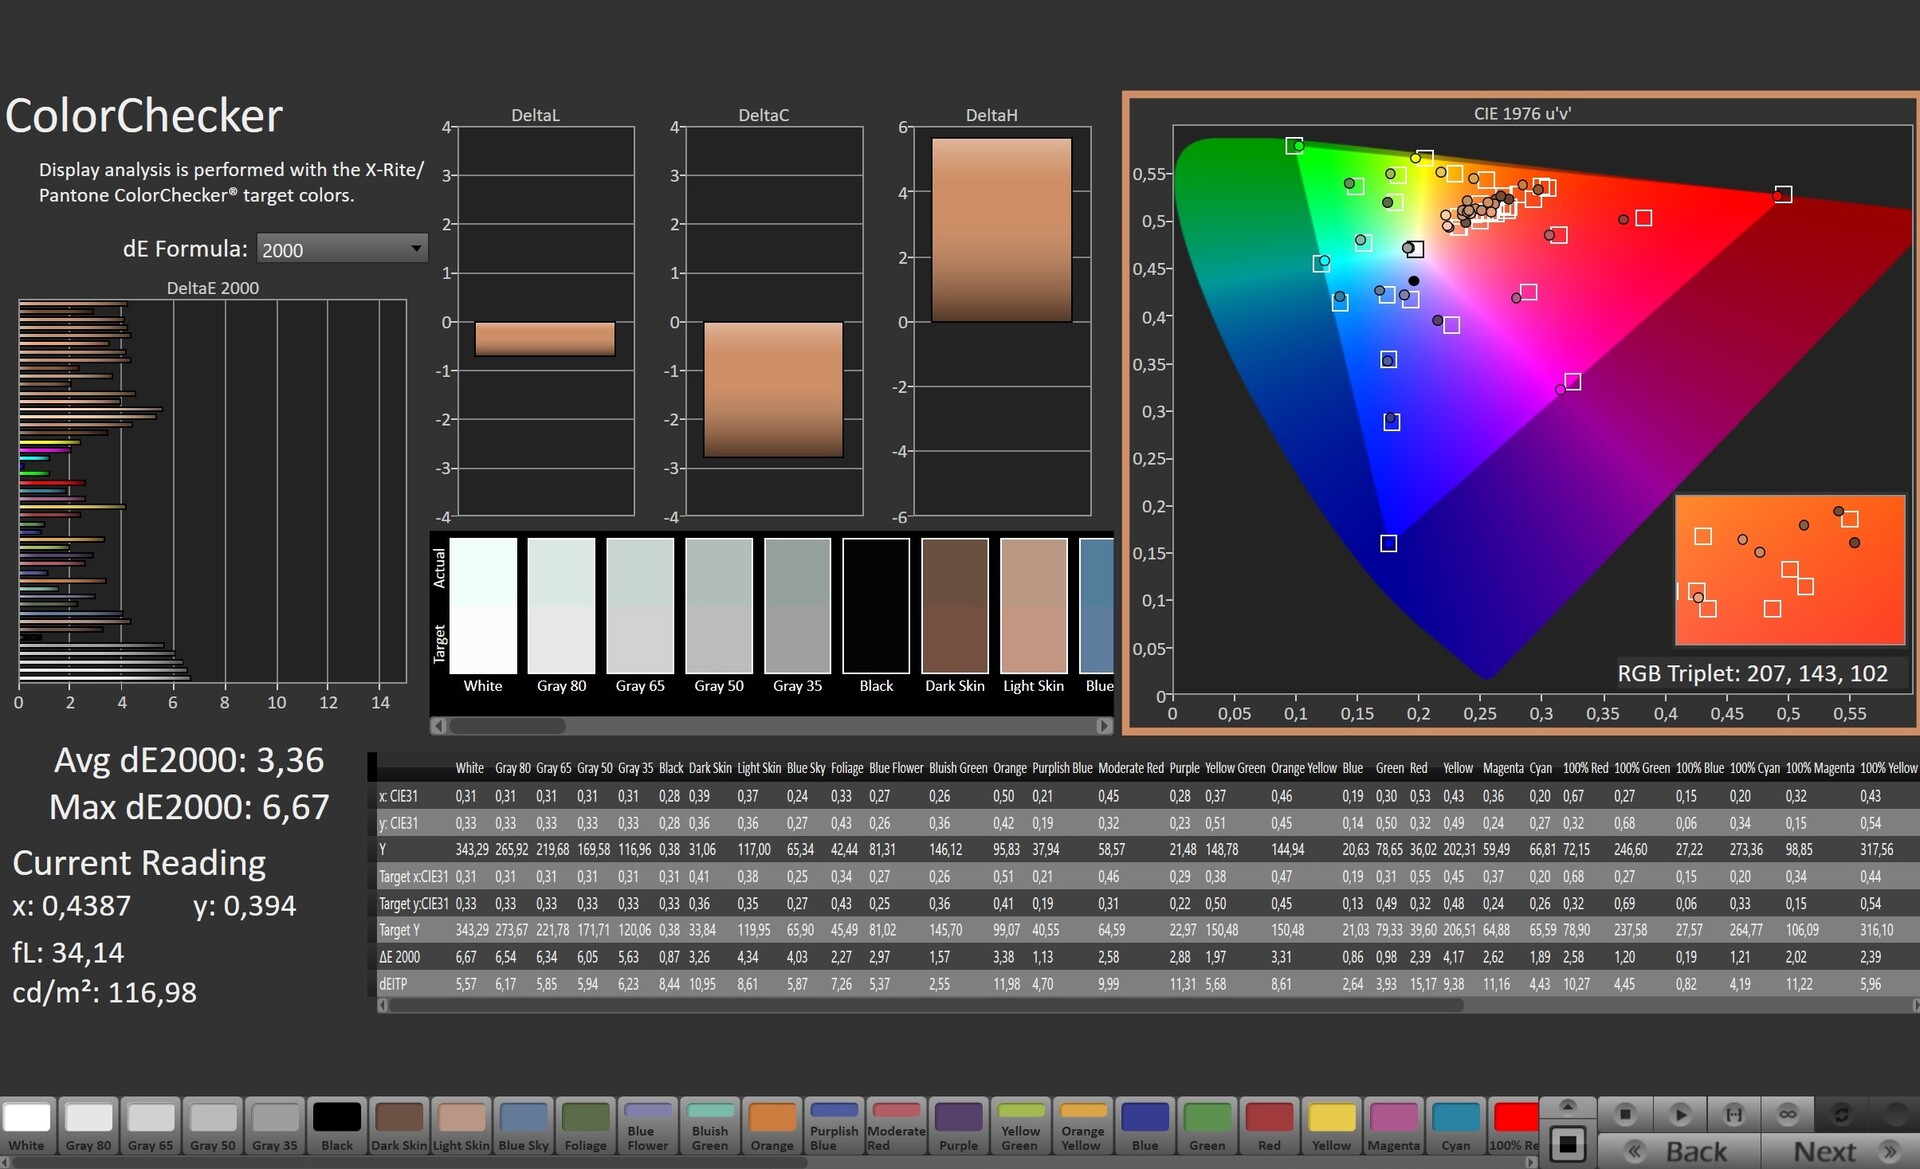
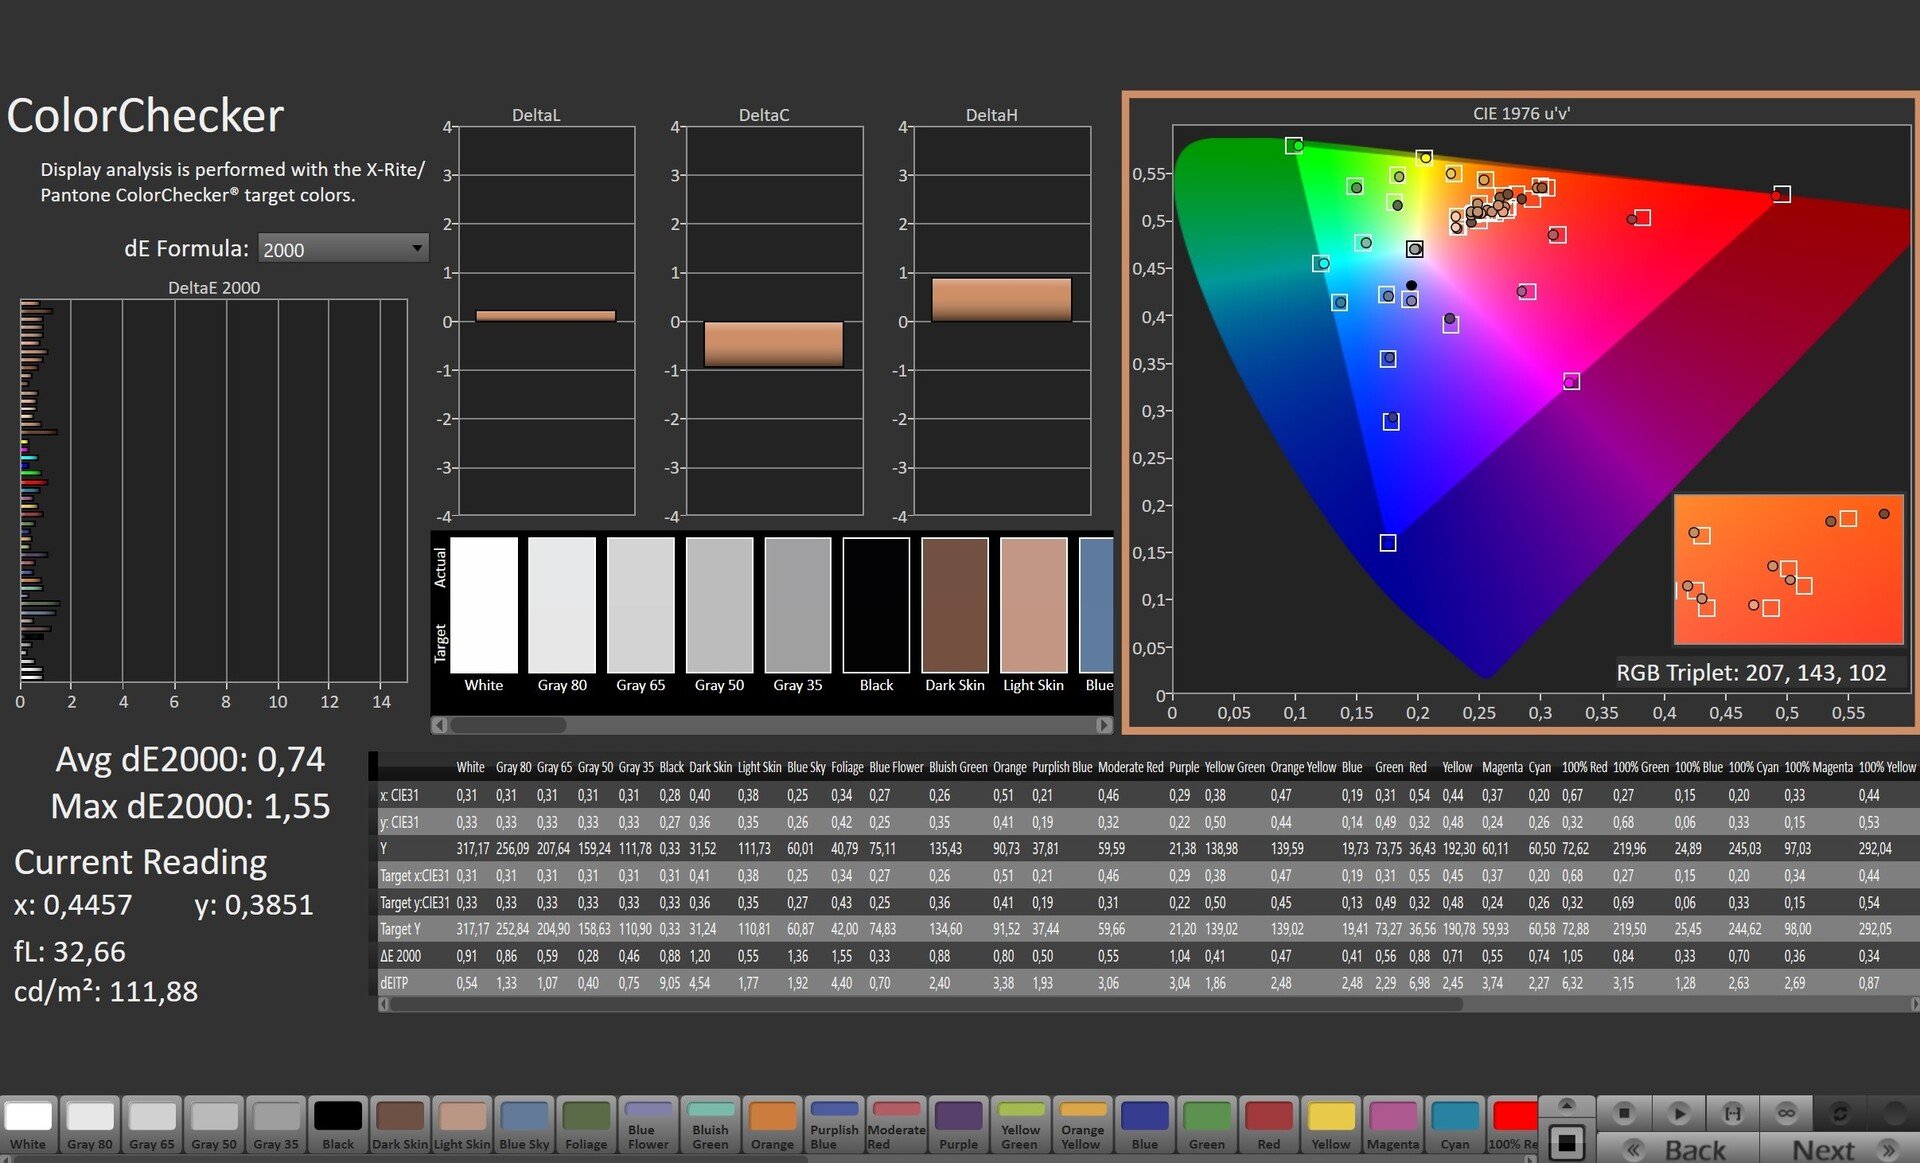
ΔE ColorChecker Calman: 3.36 | ∀{0.5-29.43 Ø4.71}
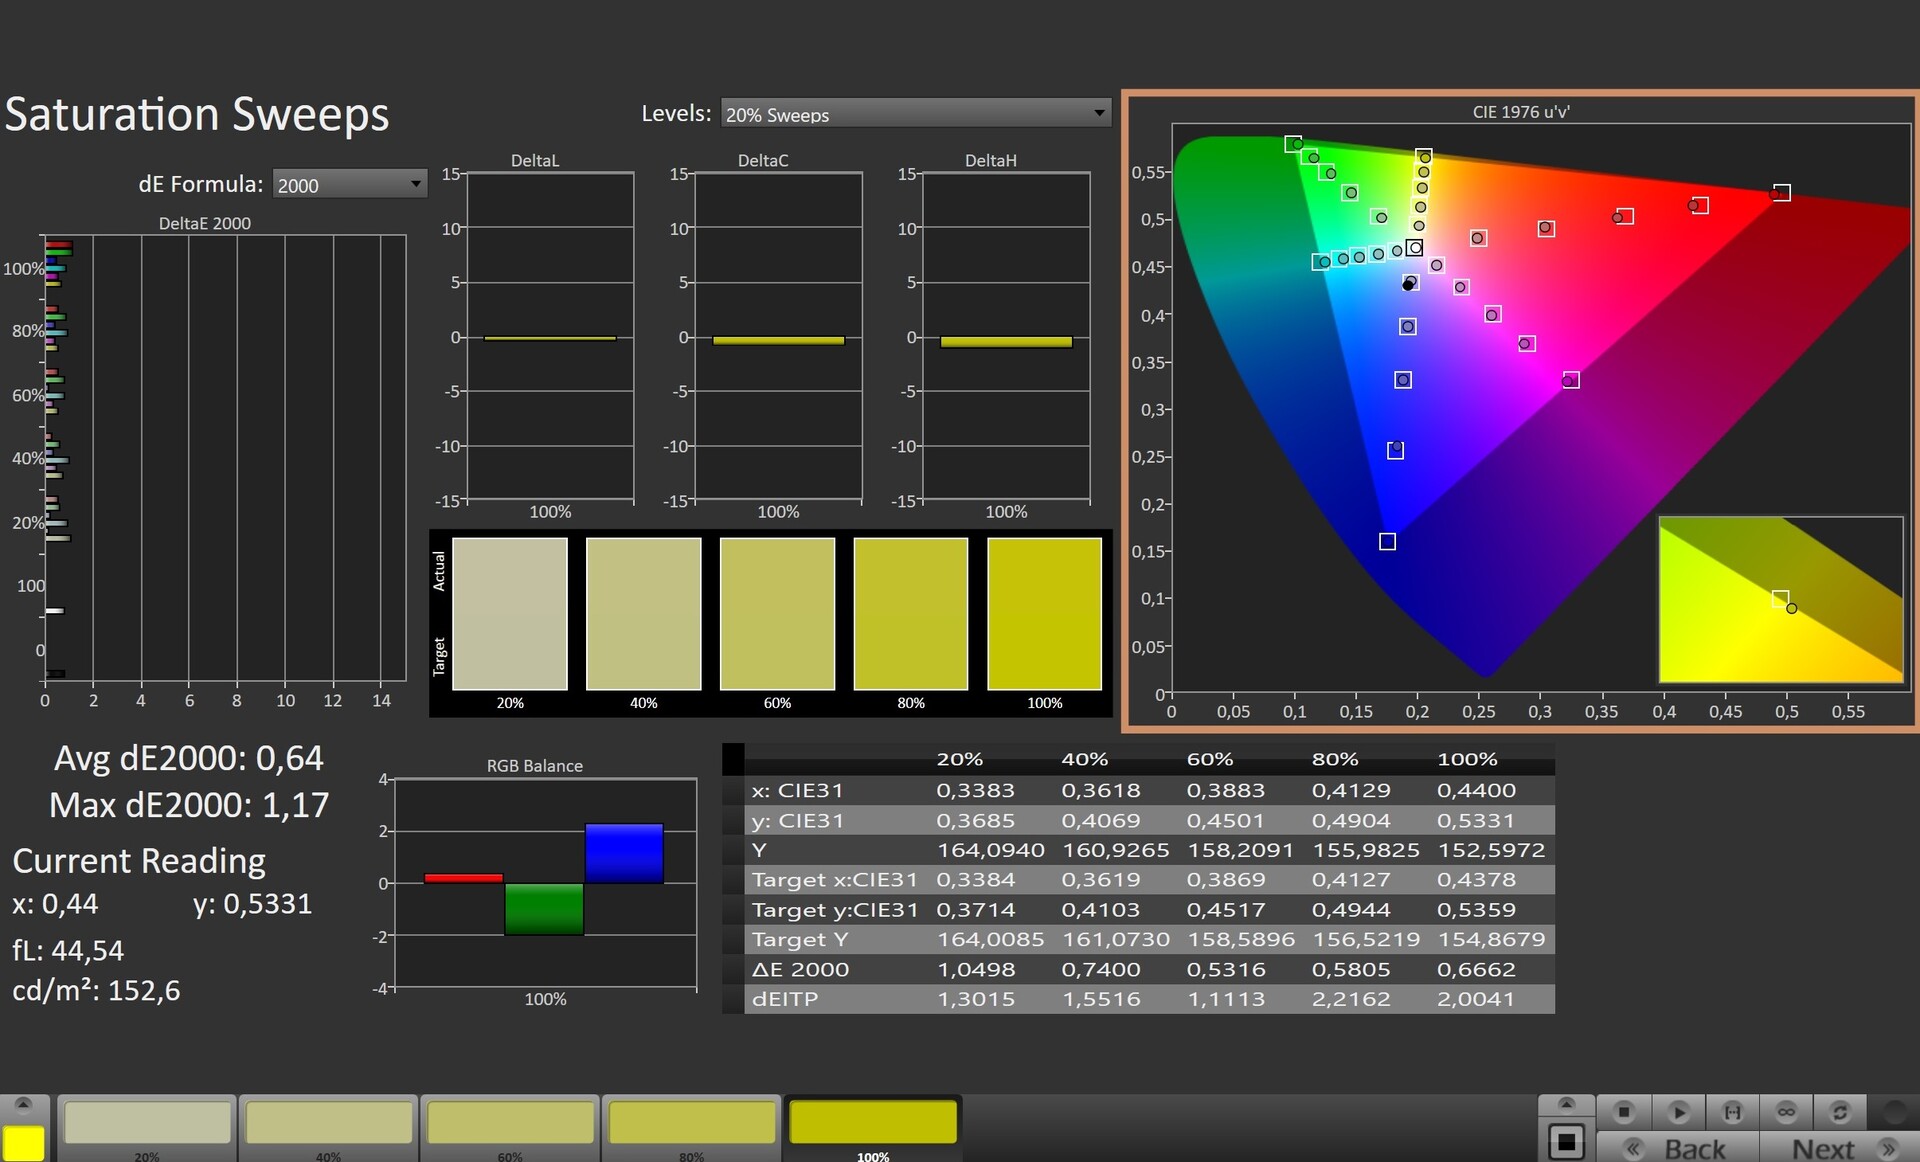
calibrated: 0.74
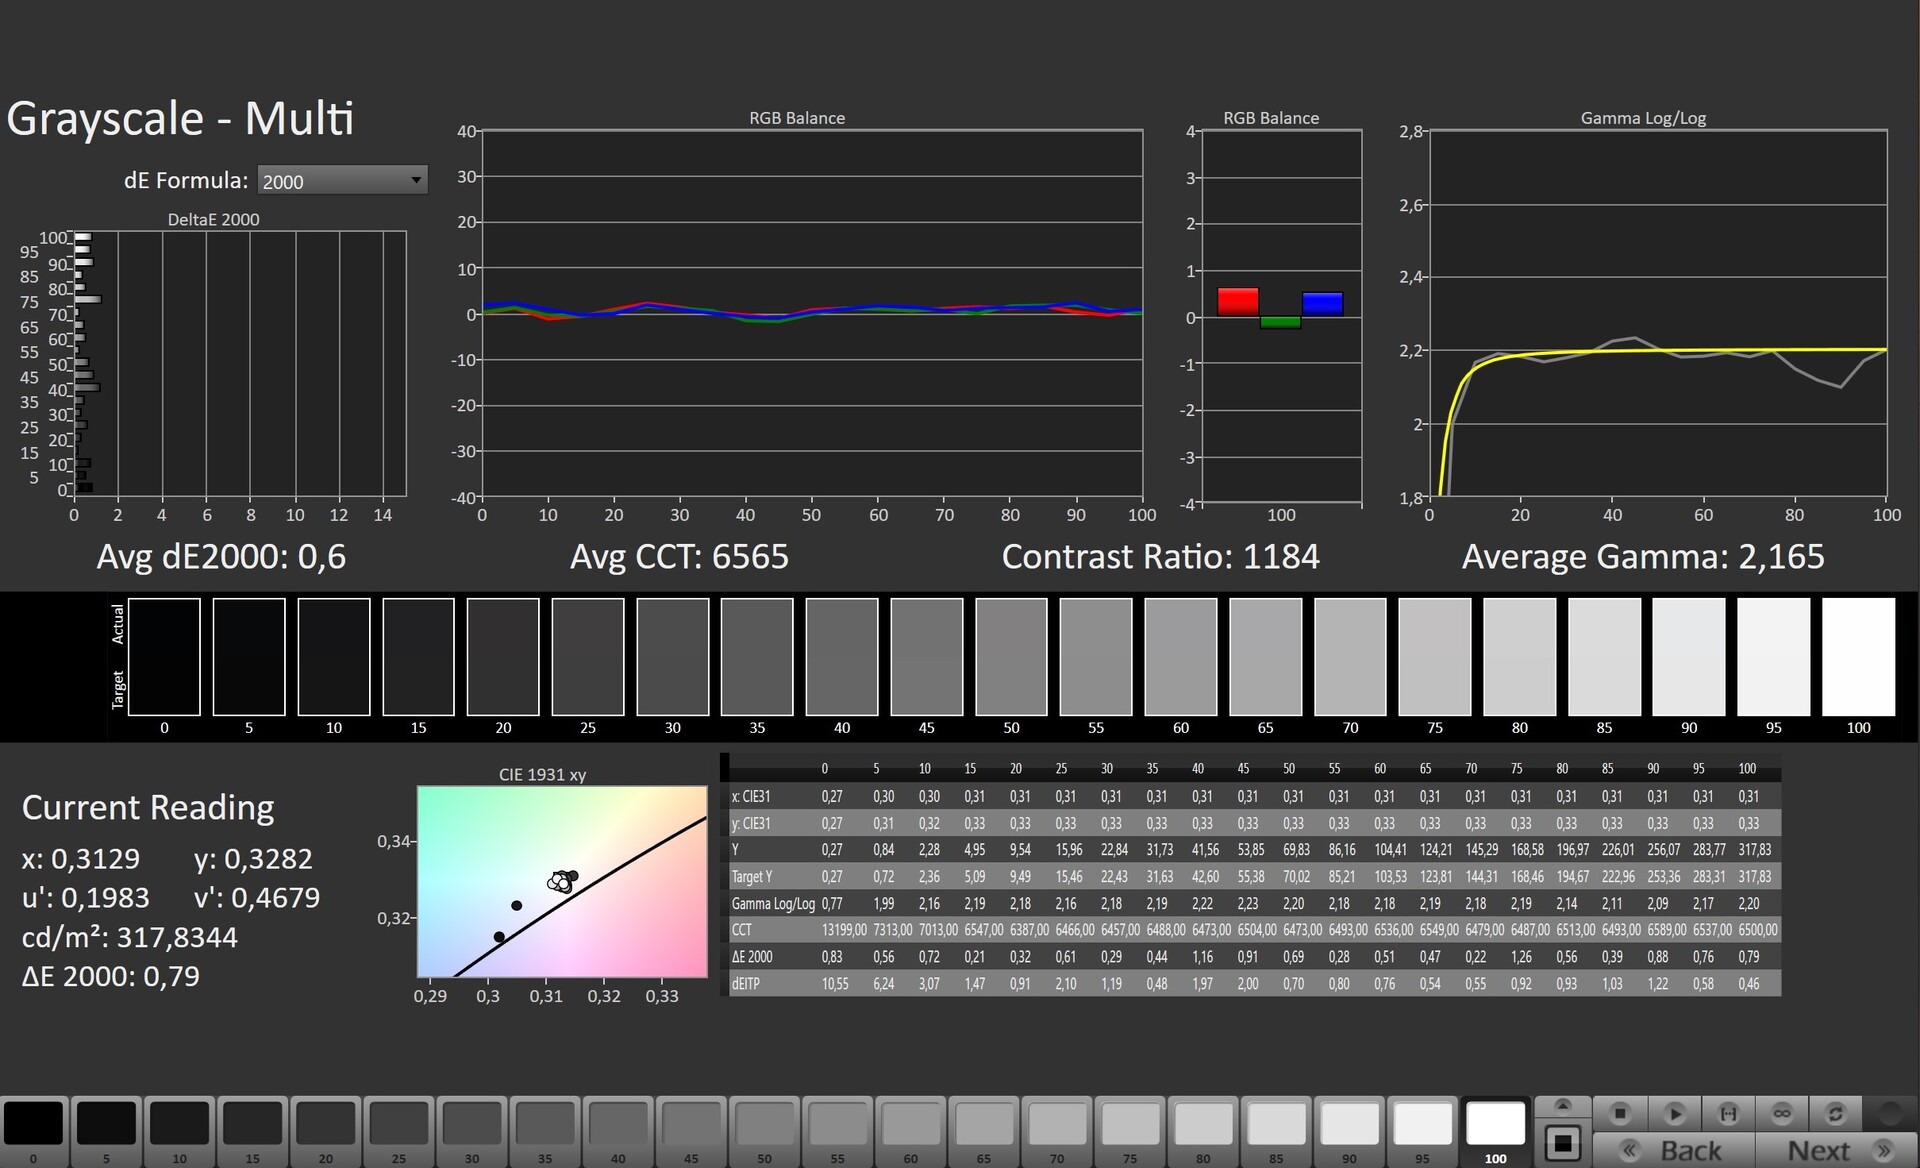
ΔE Greyscale Calman: 4.7 | ∀{0.09-98 Ø4.96}
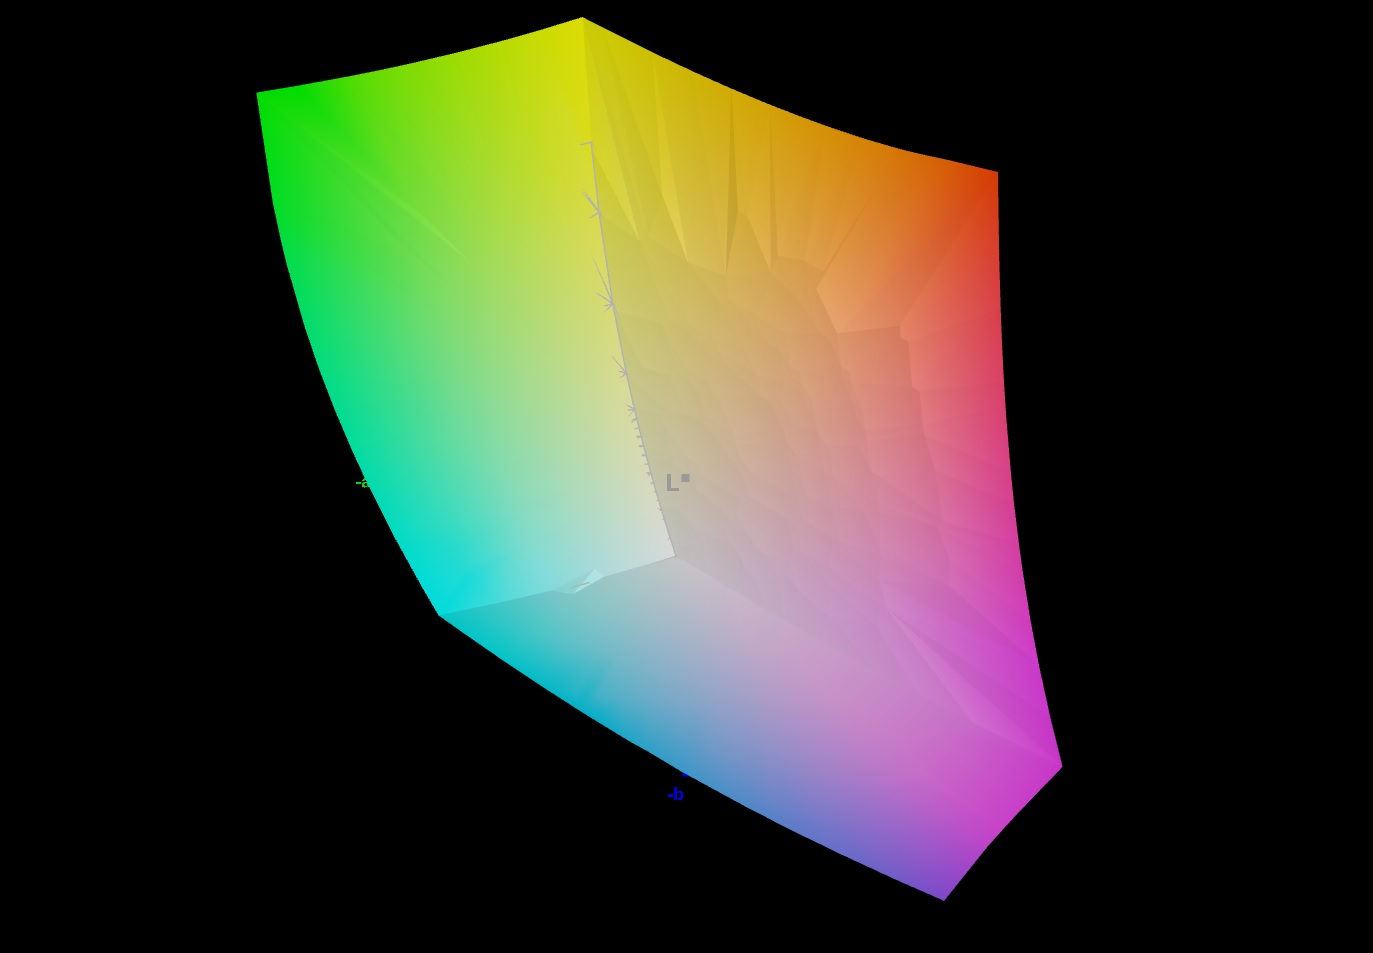
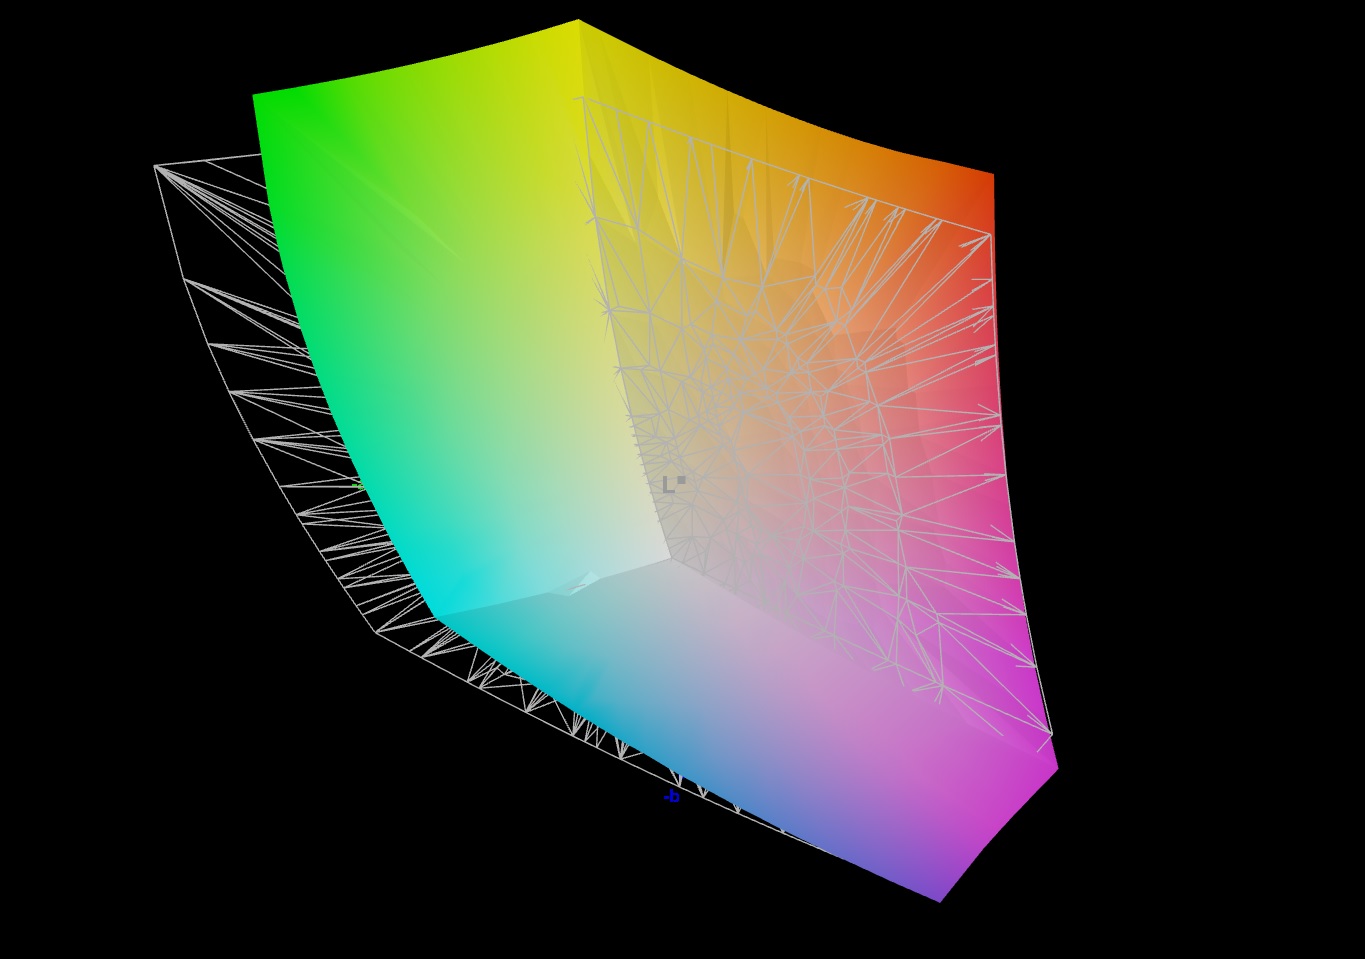
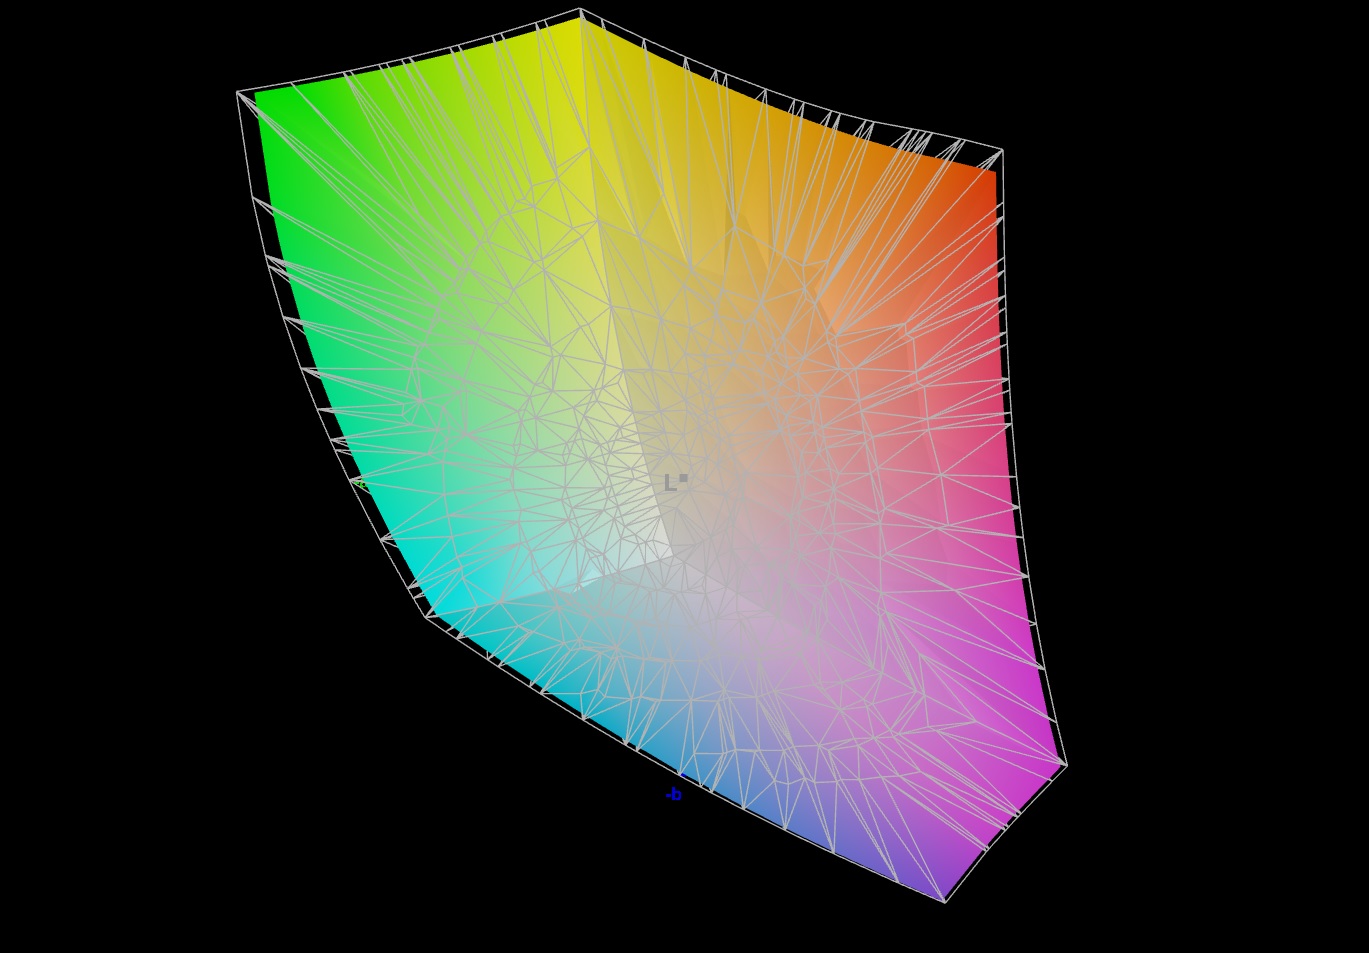
84.5% AdobeRGB 1998 (Argyll 3D)
99.9% sRGB (Argyll 3D)
95.2% Display P3 (Argyll 3D)
Gamma: 2.244
CCT: 6897 K
| Aorus 15 XE5 Chi Mei N156KME-GNA, IPS, 2560x1440, 15.6" | Acer Nitro 5 AN515-46-R1A1 AU Optronics B156HAN12.H, IPS, 1920x1080, 15.6" | Schenker XMG Fusion 15 (Mid 22) BOE CQ NE156QHM-NY2, IPS, 2560x1440, 15.6" | Asus TUF Dash F15 FX517ZR BOE CQ NE156QHM-NY1, IPS, 2560x1440, 15.6" | MSI Katana GF66 12UGS AU Optronics AUOAF90, IPS, 1920x1080, 15.6" | |
|---|---|---|---|---|---|
| Display | -16% | -17% | 2% | -51% | |
| Display P3 Coverage (%) | 95.2 | 68.8 -28% | 67.3 -29% | 98.4 3% | 39.1 -59% |
| sRGB Coverage (%) | 99.9 | 98.1 -2% | 96.7 -3% | 99.9 0% | 58.3 -42% |
| AdobeRGB 1998 Coverage (%) | 84.5 | 69.7 -18% | 68.2 -19% | 85.9 2% | 40.4 -52% |
| Response Times | 9% | 19% | 26% | -204% | |
| Response Time Grey 50% / Grey 80% * (ms) | 14.4 ? | 13 ? 10% | 11.6 ? 19% | 5.6 ? 61% | 40 ? -178% |
| Response Time Black / White * (ms) | 8.6 ? | 8 ? 7% | 7 ? 19% | 9.4 ? -9% | 28.4 ? -230% |
| PWM Frequency (Hz) | |||||
| Screen | 2% | -14% | 13% | -64% | |
| Brightness middle (cd/m²) | 336 | 327 -3% | 326 -3% | 286 -15% | 227 -32% |
| Brightness (cd/m²) | 316 | 320 1% | 303 -4% | 266 -16% | 225 -29% |
| Brightness Distribution (%) | 89 | 93 4% | 89 0% | 87 -2% | 90 1% |
| Black Level * (cd/m²) | 0.34 | 0.24 29% | 0.33 3% | 0.25 26% | 0.21 38% |
| Contrast (:1) | 988 | 1363 38% | 988 0% | 1144 16% | 1081 9% |
| Colorchecker dE 2000 * | 3.36 | 3.26 3% | 2.73 19% | 2.14 36% | 4.19 -25% |
| Colorchecker dE 2000 max. * | 6.67 | 8.73 -31% | 9.54 -43% | 5.22 22% | 17.45 -162% |
| Colorchecker dE 2000 calibrated * | 0.74 | 0.87 -18% | 1.36 -84% | 0.67 9% | 3.81 -415% |
| Greyscale dE 2000 * | 4.7 | 4.87 -4% | 5.2 -11% | 2.8 40% | 2.7 43% |
| Gamma | 2.244 98% | 2.3 96% | 2.074 106% | 2.23 99% | 2.208 100% |
| CCT | 6897 94% | 7070 92% | 6911 94% | 7092 92% | 6176 105% |
| Total Average (Program / Settings) | -2% /
-1% | -4% /
-10% | 14% /
12% | -106% /
-81% |
* ... smaller is better
这款显示器开箱后就有很好的色彩还原能力。它的色差为3.36,只是稍微超出了理想范围(DeltaE<3)。校准屏幕后,色差减少到0.74,并使灰色的阴影看起来更平滑。该显示器完全覆盖了sRGB色彩空间(100%),并几乎能够再现整个DCI-P3色域(95%)。它的AdobeRGB覆盖率也达到了85%。
由我们创建的色彩配置文件可以免费下载和使用。你可以在显示器的信息框中找到一个下载链接。
Display Response Times
| ↔ Response Time Black to White | ||
|---|---|---|
| 8.6 ms ... rise ↗ and fall ↘ combined | ↗ 5.1 ms rise | 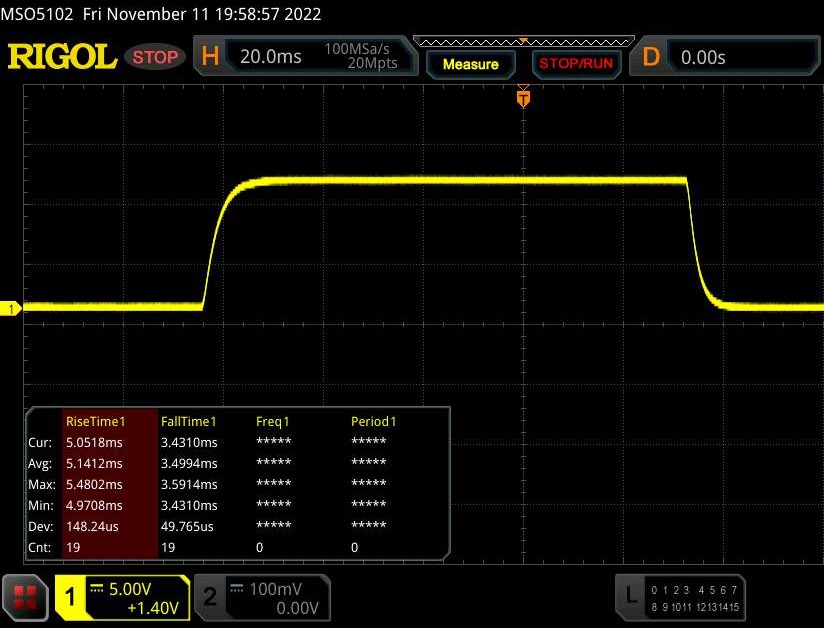 |
| ↘ 3.5 ms fall | ||
| The screen shows fast response rates in our tests and should be suited for gaming. In comparison, all tested devices range from 0.1 (minimum) to 240 (maximum) ms. » 24 % of all devices are better. This means that the measured response time is better than the average of all tested devices (19.8 ms). | ||
| ↔ Response Time 50% Grey to 80% Grey | ||
| 14.4 ms ... rise ↗ and fall ↘ combined | ↗ 6.9 ms rise | 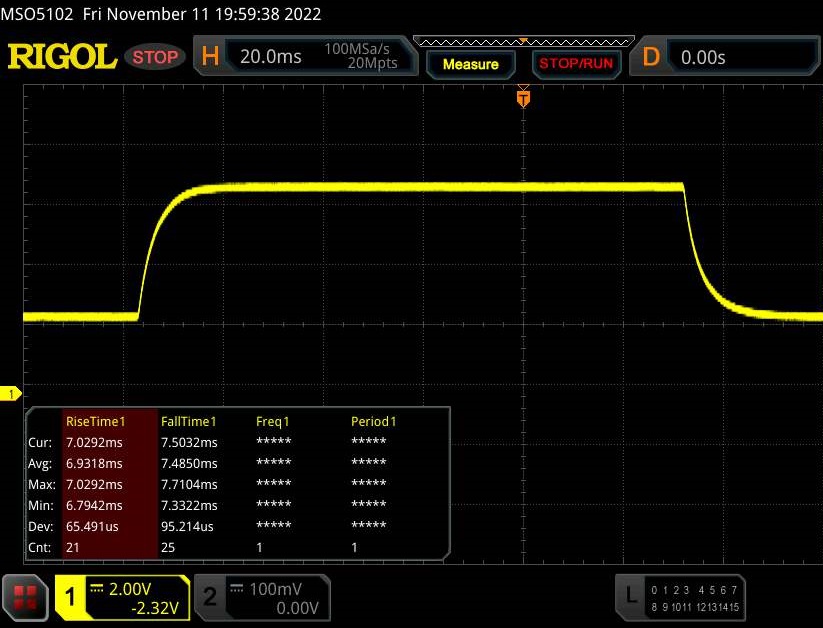 |
| ↘ 7.5 ms fall | ||
| The screen shows good response rates in our tests, but may be too slow for competitive gamers. In comparison, all tested devices range from 0.165 (minimum) to 636 (maximum) ms. » 28 % of all devices are better. This means that the measured response time is better than the average of all tested devices (31 ms). | ||
Screen Flickering / PWM (Pulse-Width Modulation)
| Screen flickering / PWM not detected | 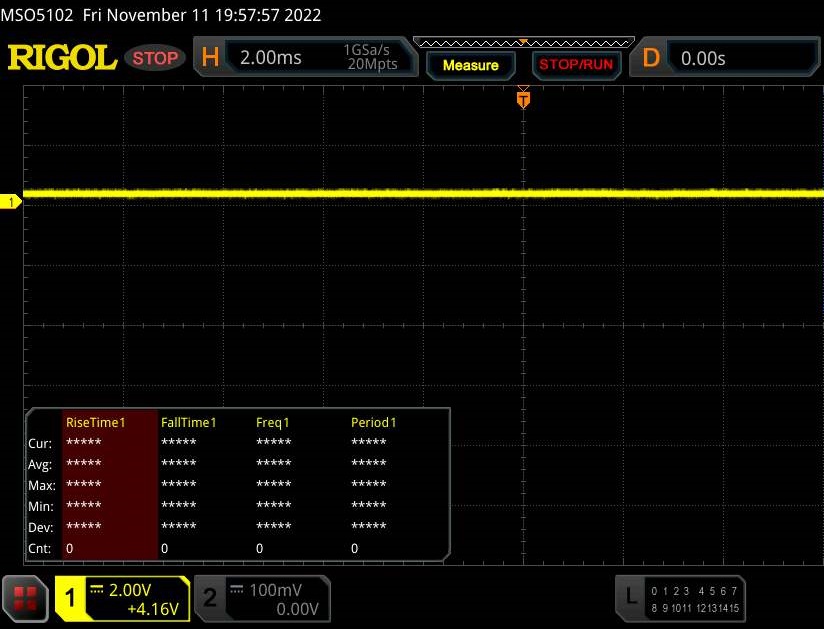 | ||
In comparison: 52 % of all tested devices do not use PWM to dim the display. If PWM was detected, an average of 7757 (minimum: 5 - maximum: 343500) Hz was measured. | |||
IPS显示屏具有宽广的可视角度,从任何位置都可以阅读。也可以在户外使用该显示屏,前提是阳光不要太亮。

性能 - 得益于Alder Lake和Ampere的充足动力
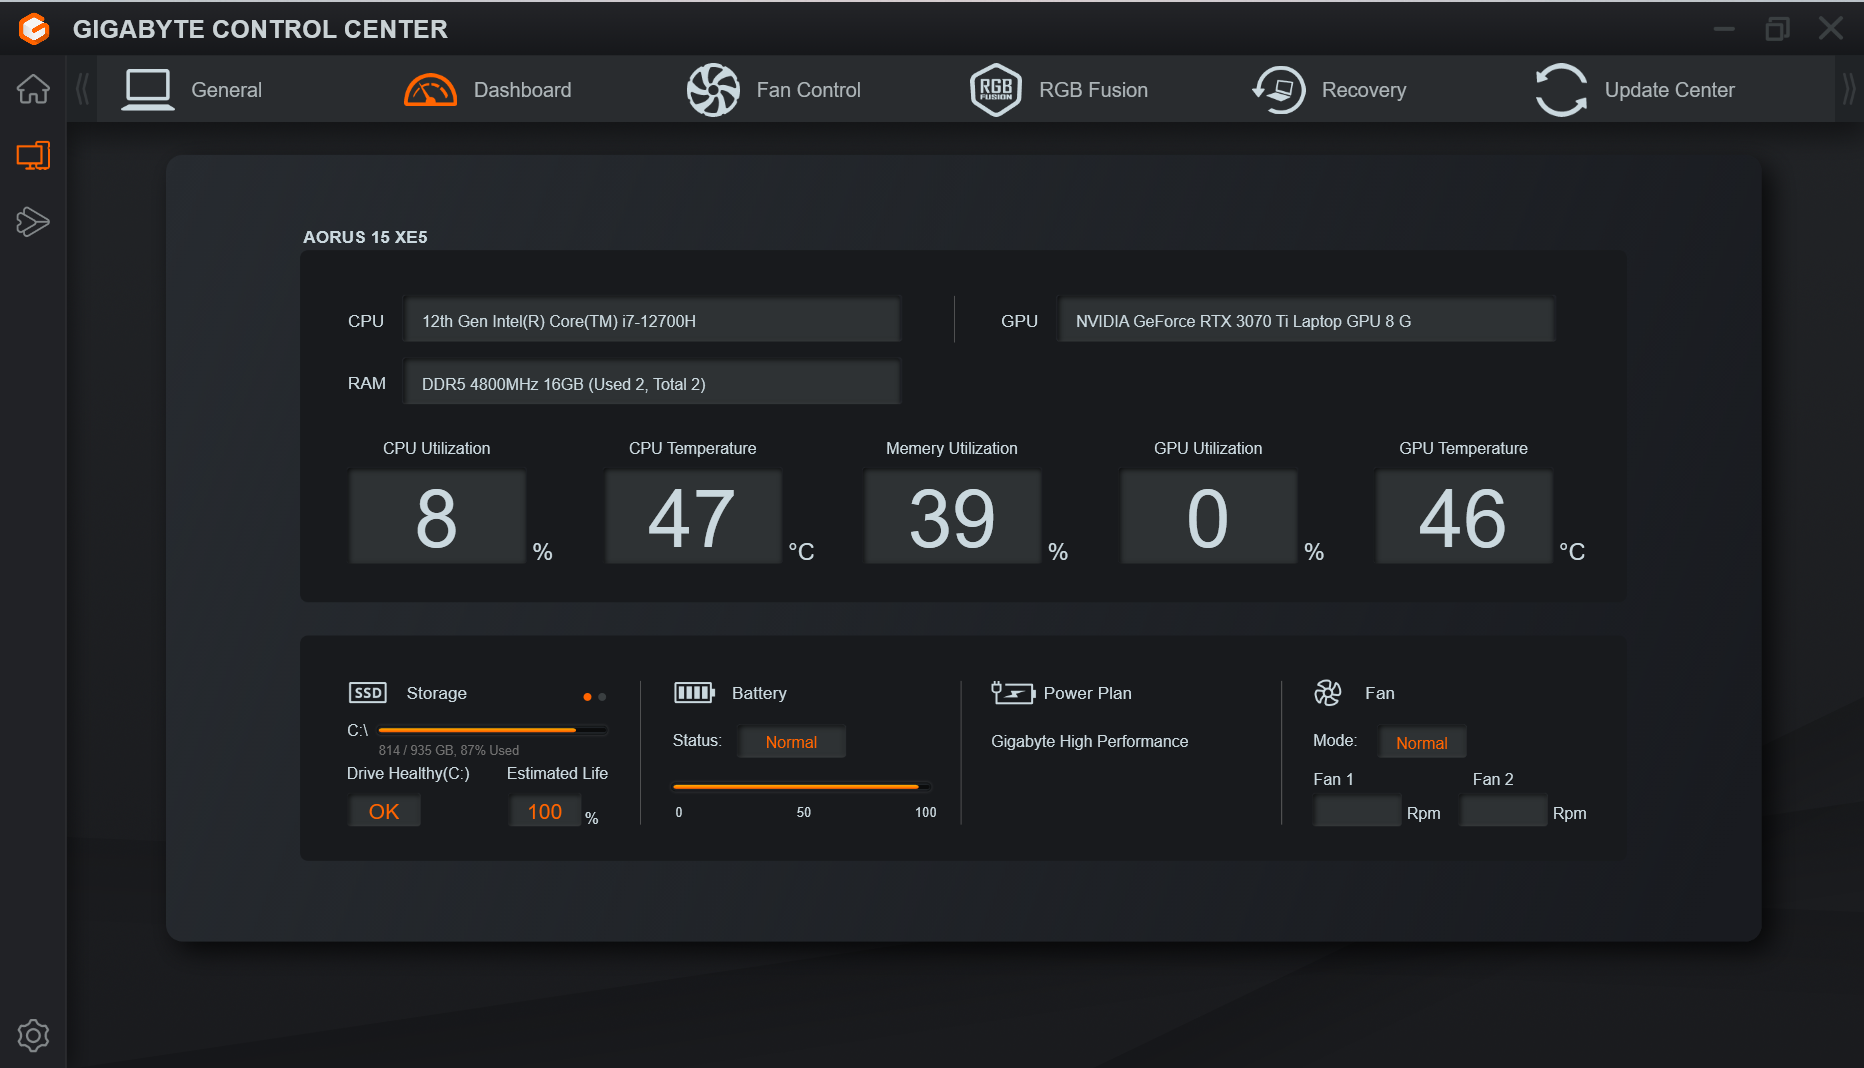
技嘉Aorus 15 XE5是一款强大的15.6英寸笔记本电脑,在各种苛刻的使用场景中表现良好。除了评测配置外,技嘉还提供其他两种型号:一种是RTX 3080 Ti笔记本电脑(Aorus 15 YE5),另一种是RTX 3060笔记本电脑(Aorus 15 KE5)。
测试条件
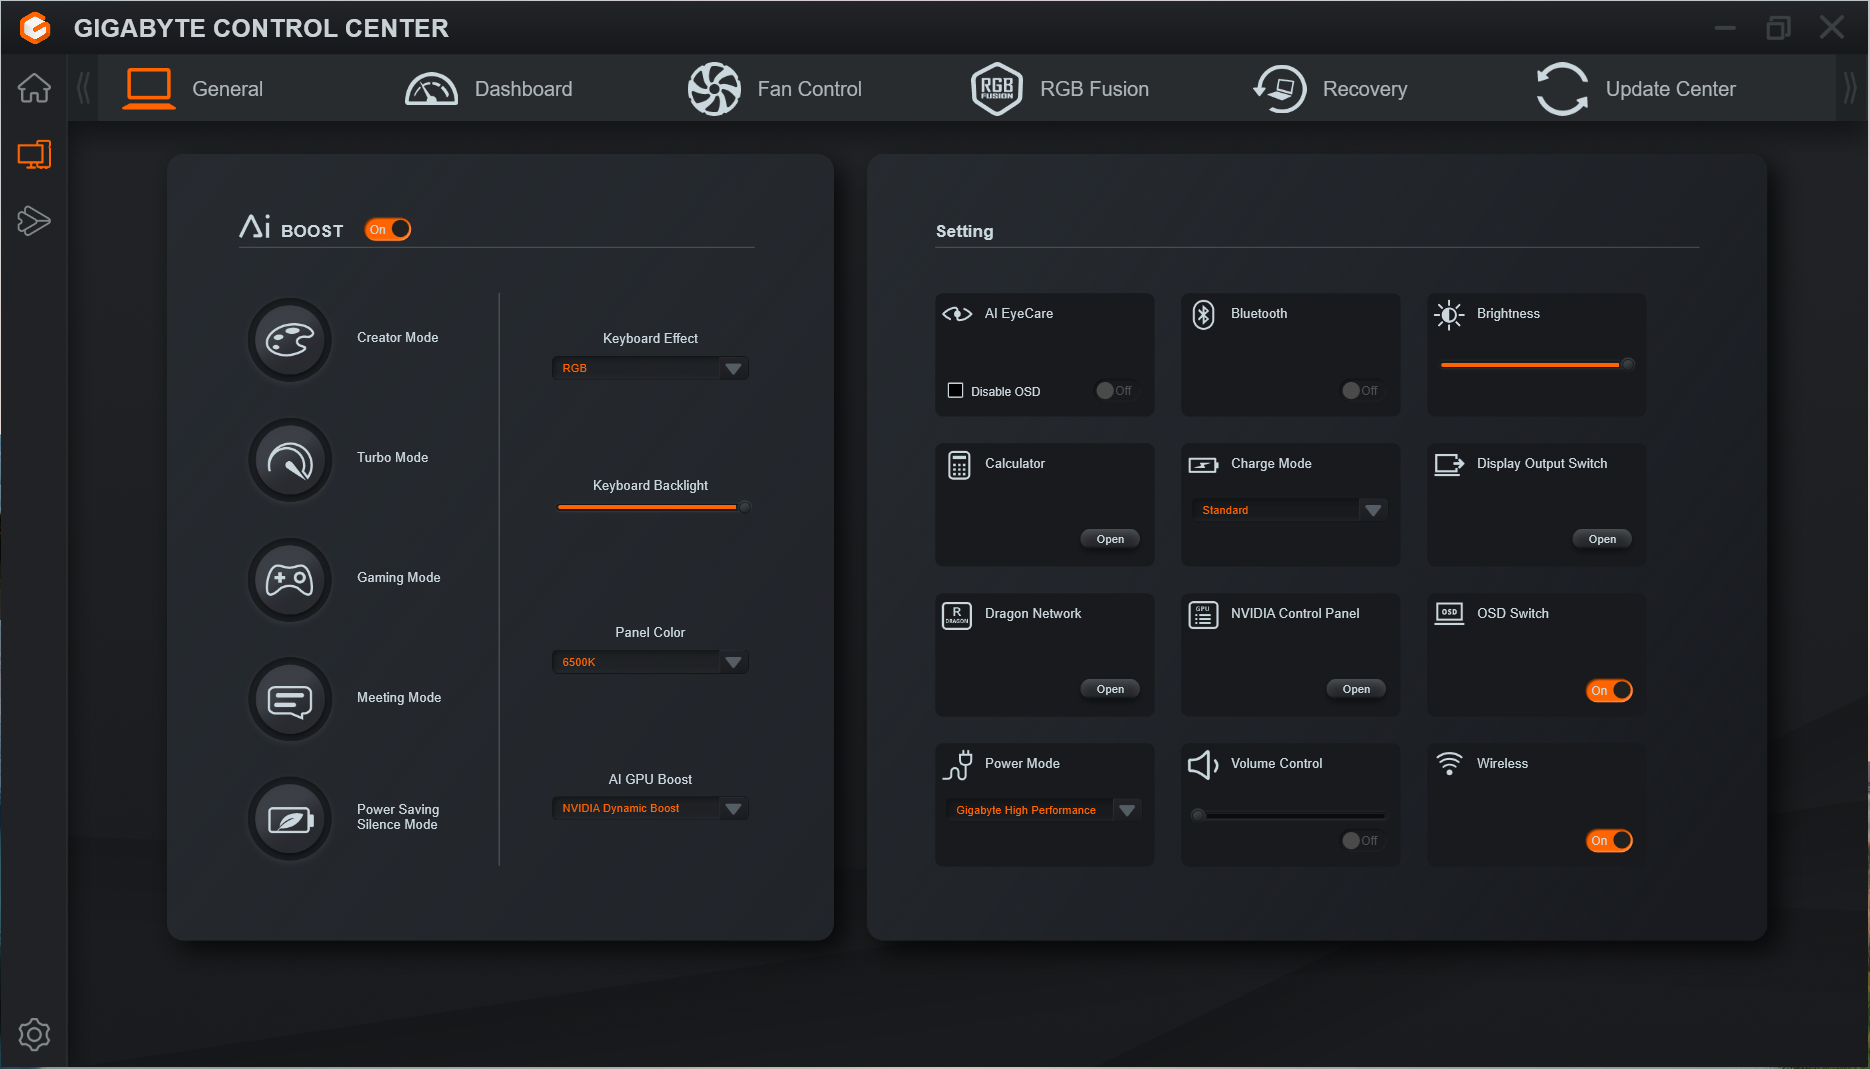
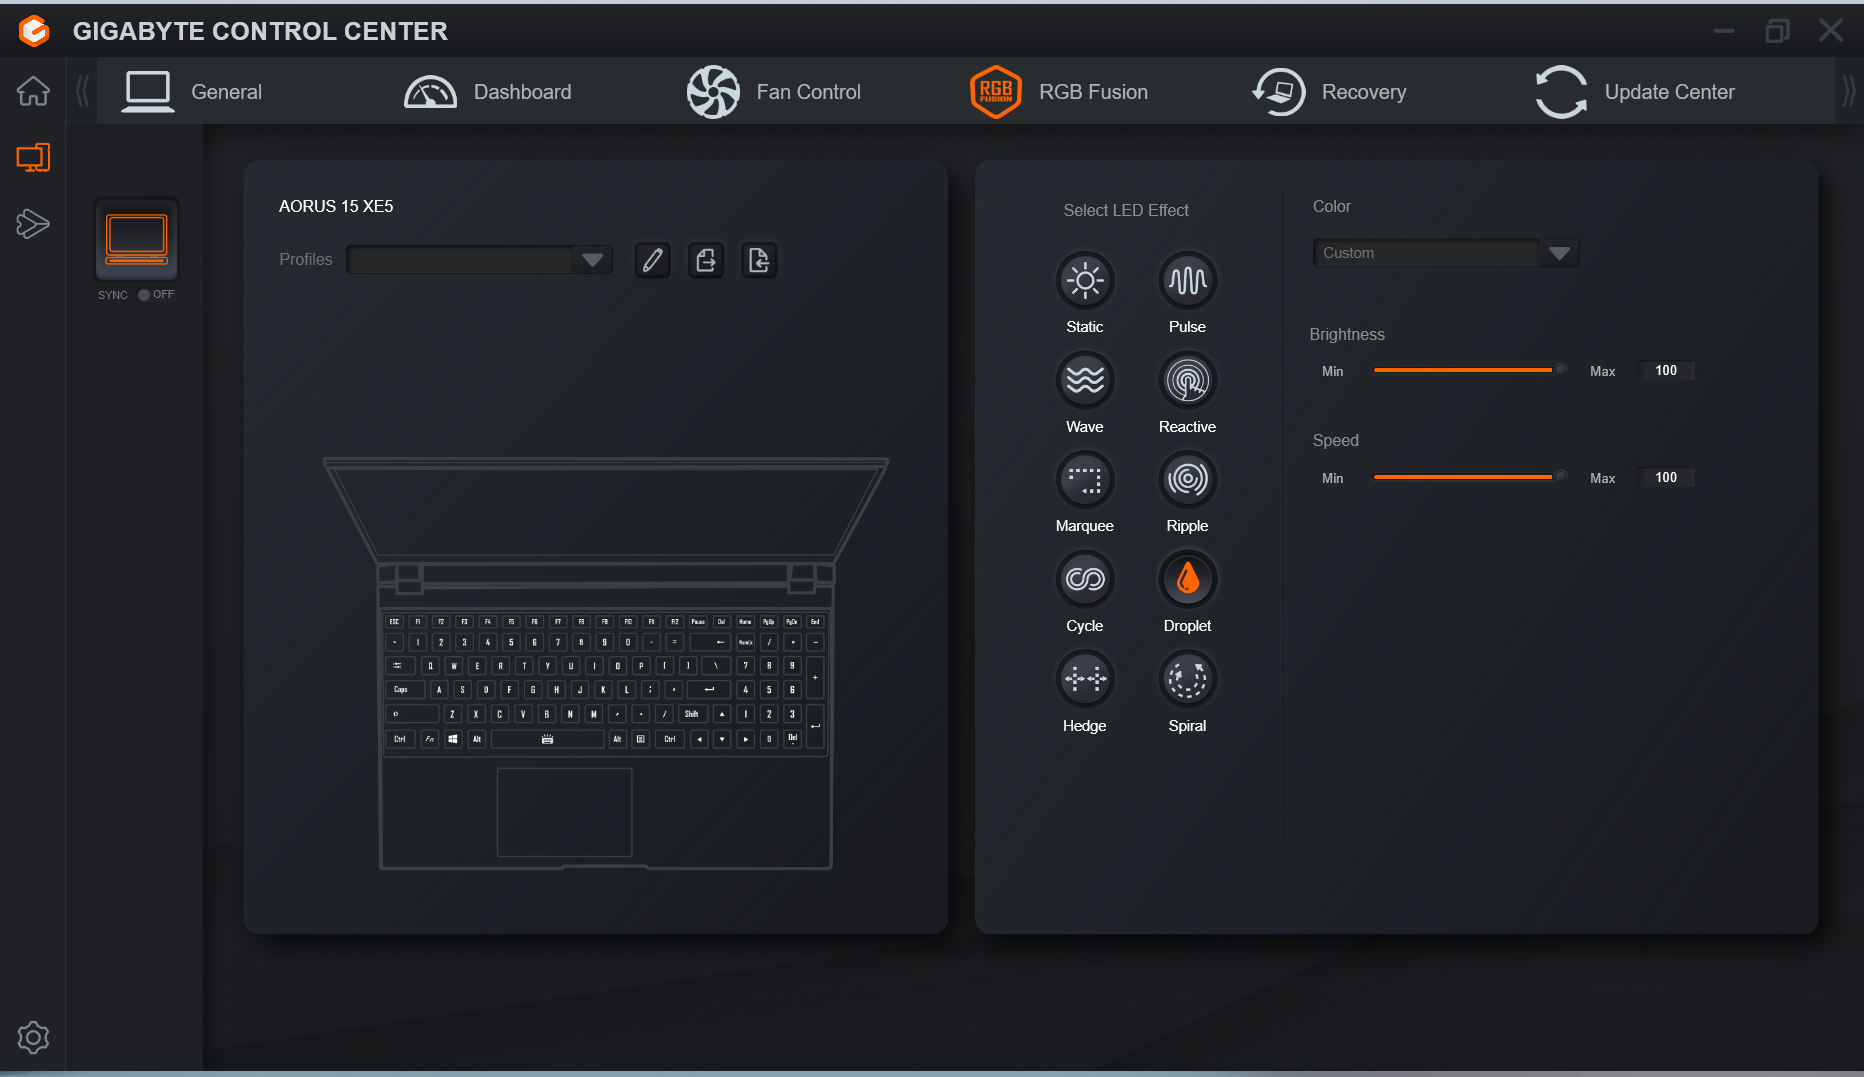
预装的技嘉控制中心有各种性能配置文件,让你配置CPU和GPU性能、风扇活动、屏幕亮度和色温等等。在我们的测试中,我们使用了AI Boost功能,它覆盖了任何手动性能设置,并允许控制中心选择适当的配置文件。
使用 "涡轮增压模式 "几乎没有提高峰值性能,但在恒定负载下却带来了更高的持续性能(见CB15循环测试结果)。尽管如此,这种增益是有代价的--风扇连续全速运行。
| 创造者模式 | 涡轮模式 | 游戏模式 | 会议模式 | 省电静音模式 | |
|---|---|---|---|---|---|
| 功率限制1 | 70瓦 | 70瓦 | 55瓦 | 15瓦 | 15瓦 |
| 功率限制2 | 115瓦 | 115瓦 | 115瓦 | 30瓦 | 30瓦 |
处理器
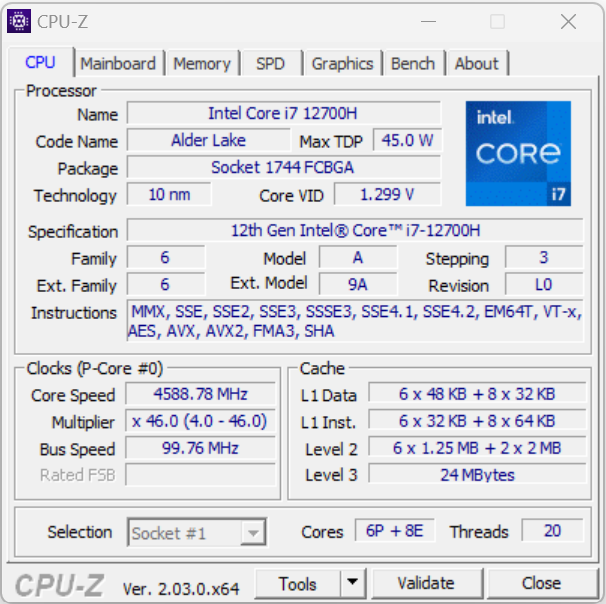
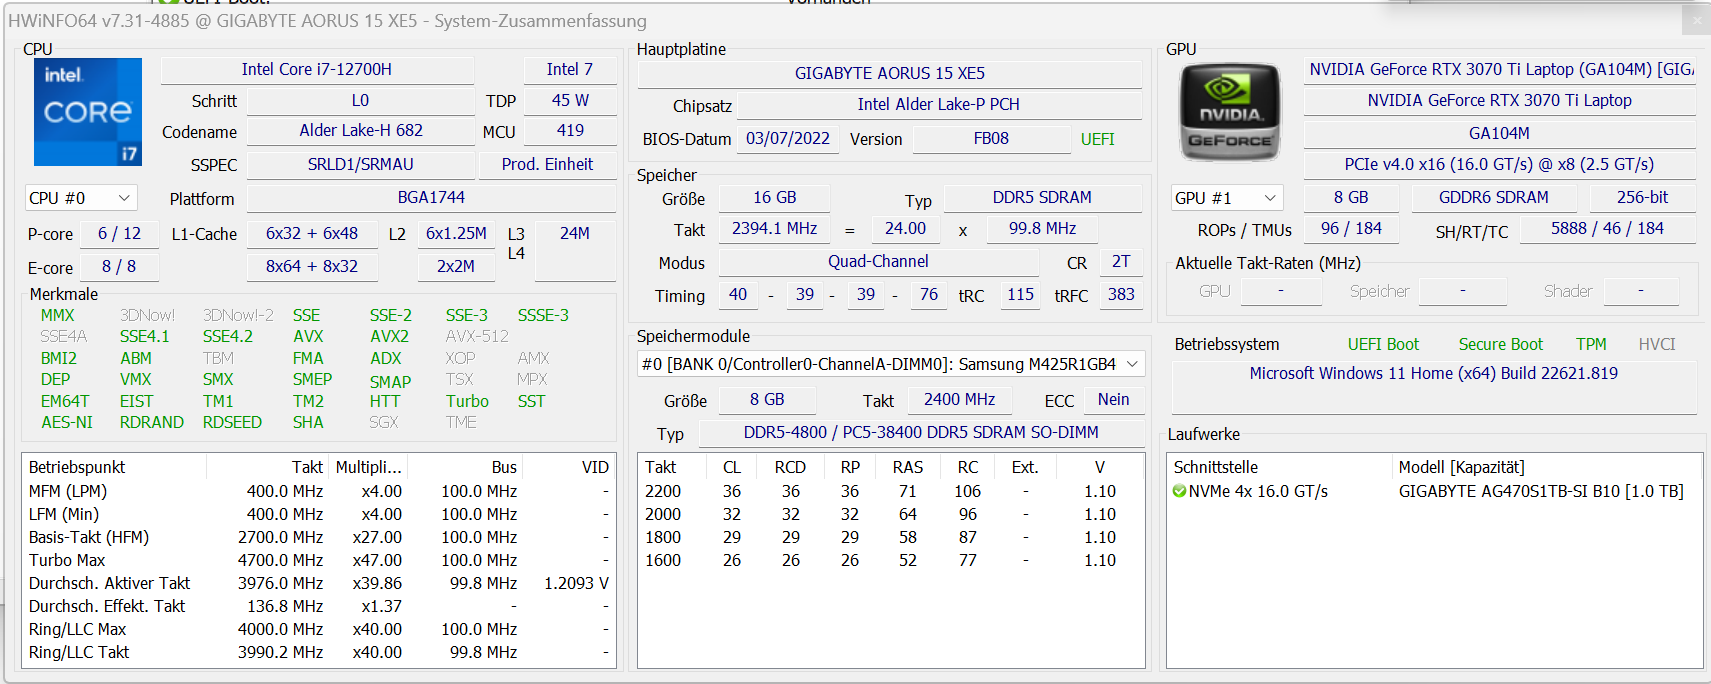
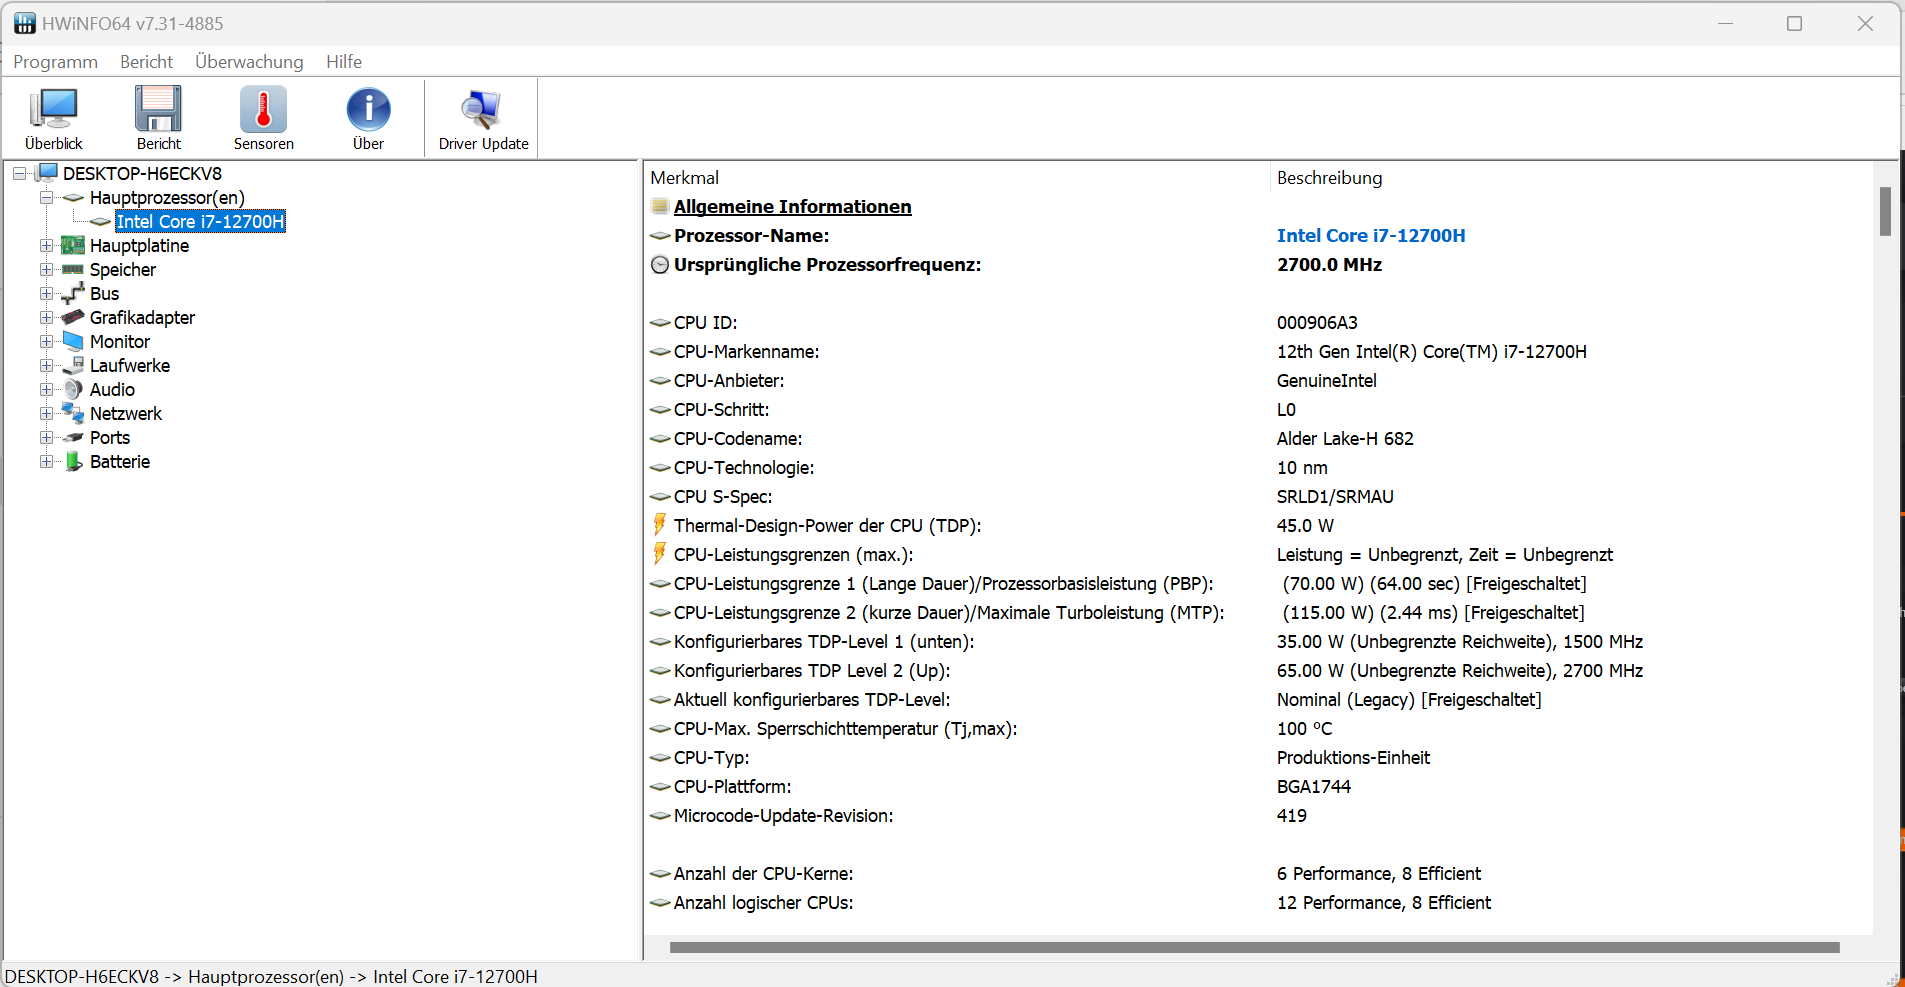
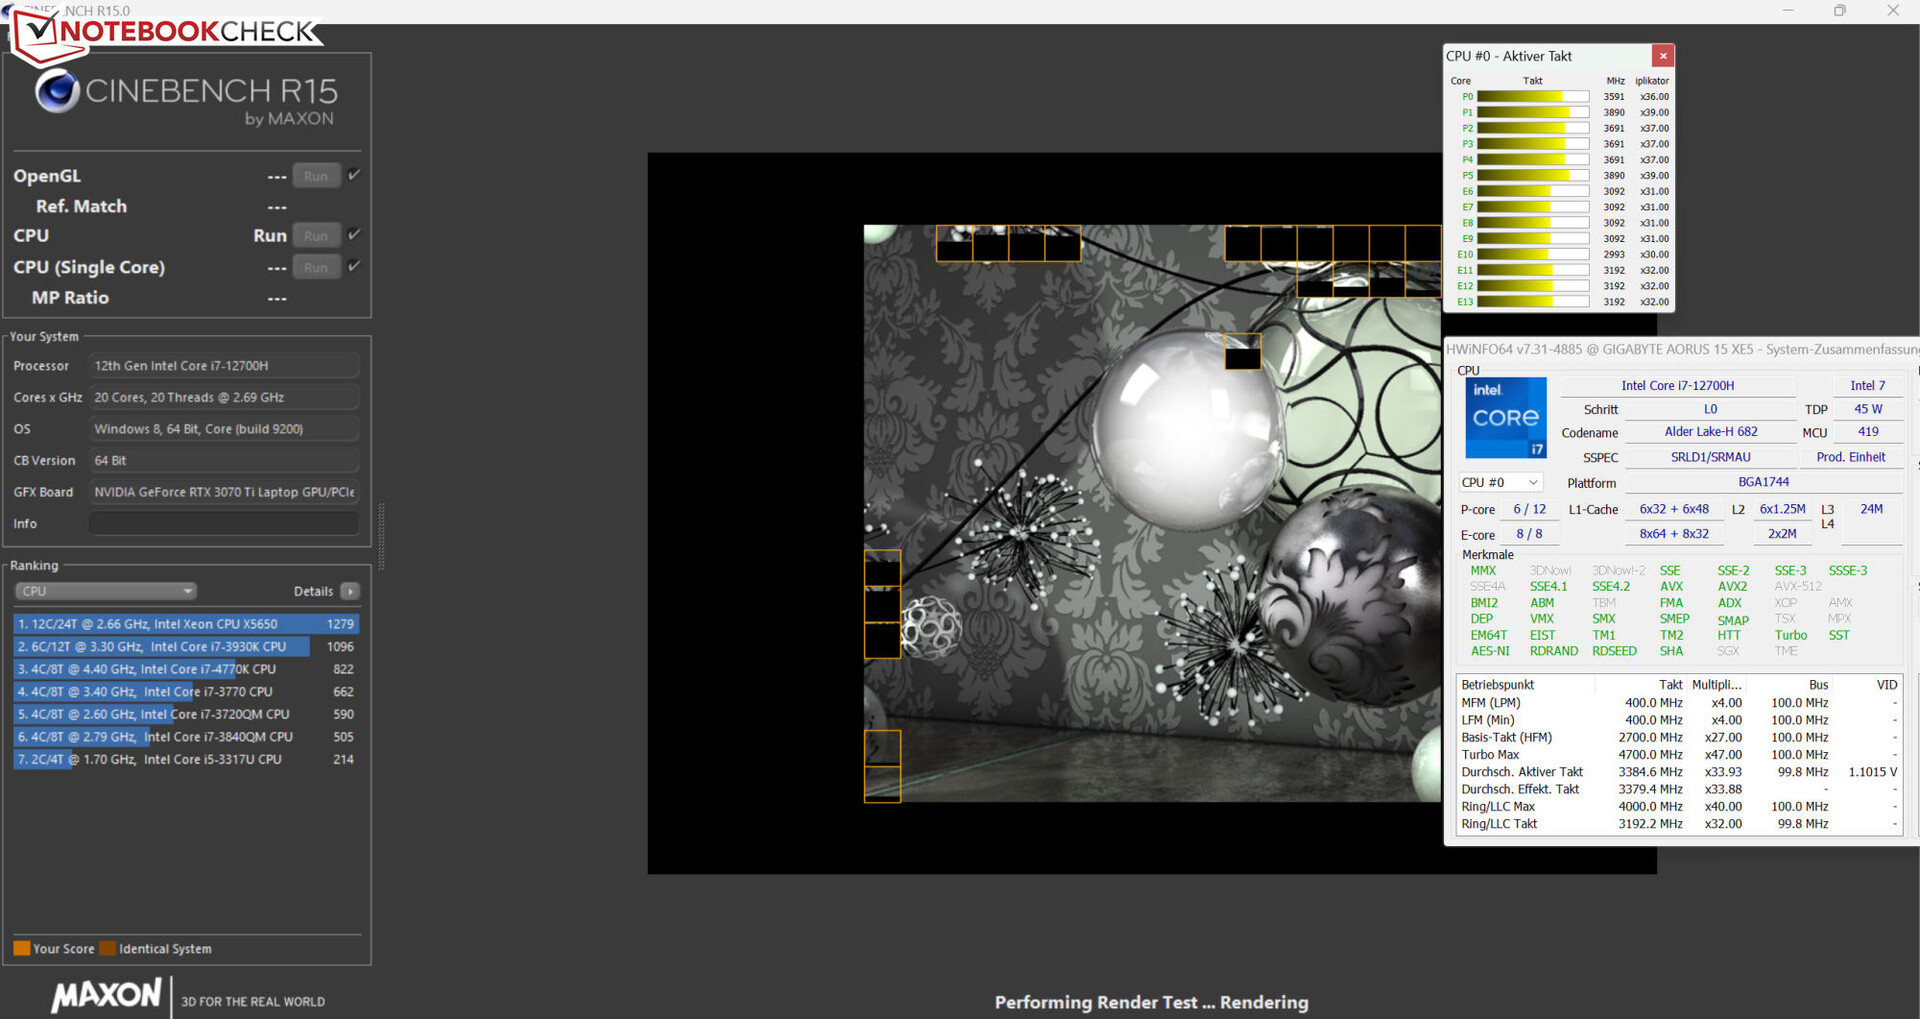
这台 酷睿i7-12700H处理器(Alder Lake)包含六个性能核心(超线程,2.4至4.7GHz)和八个效率核心(无超线程,1.8至3.5GHz),总共有20个逻辑CPU核心。
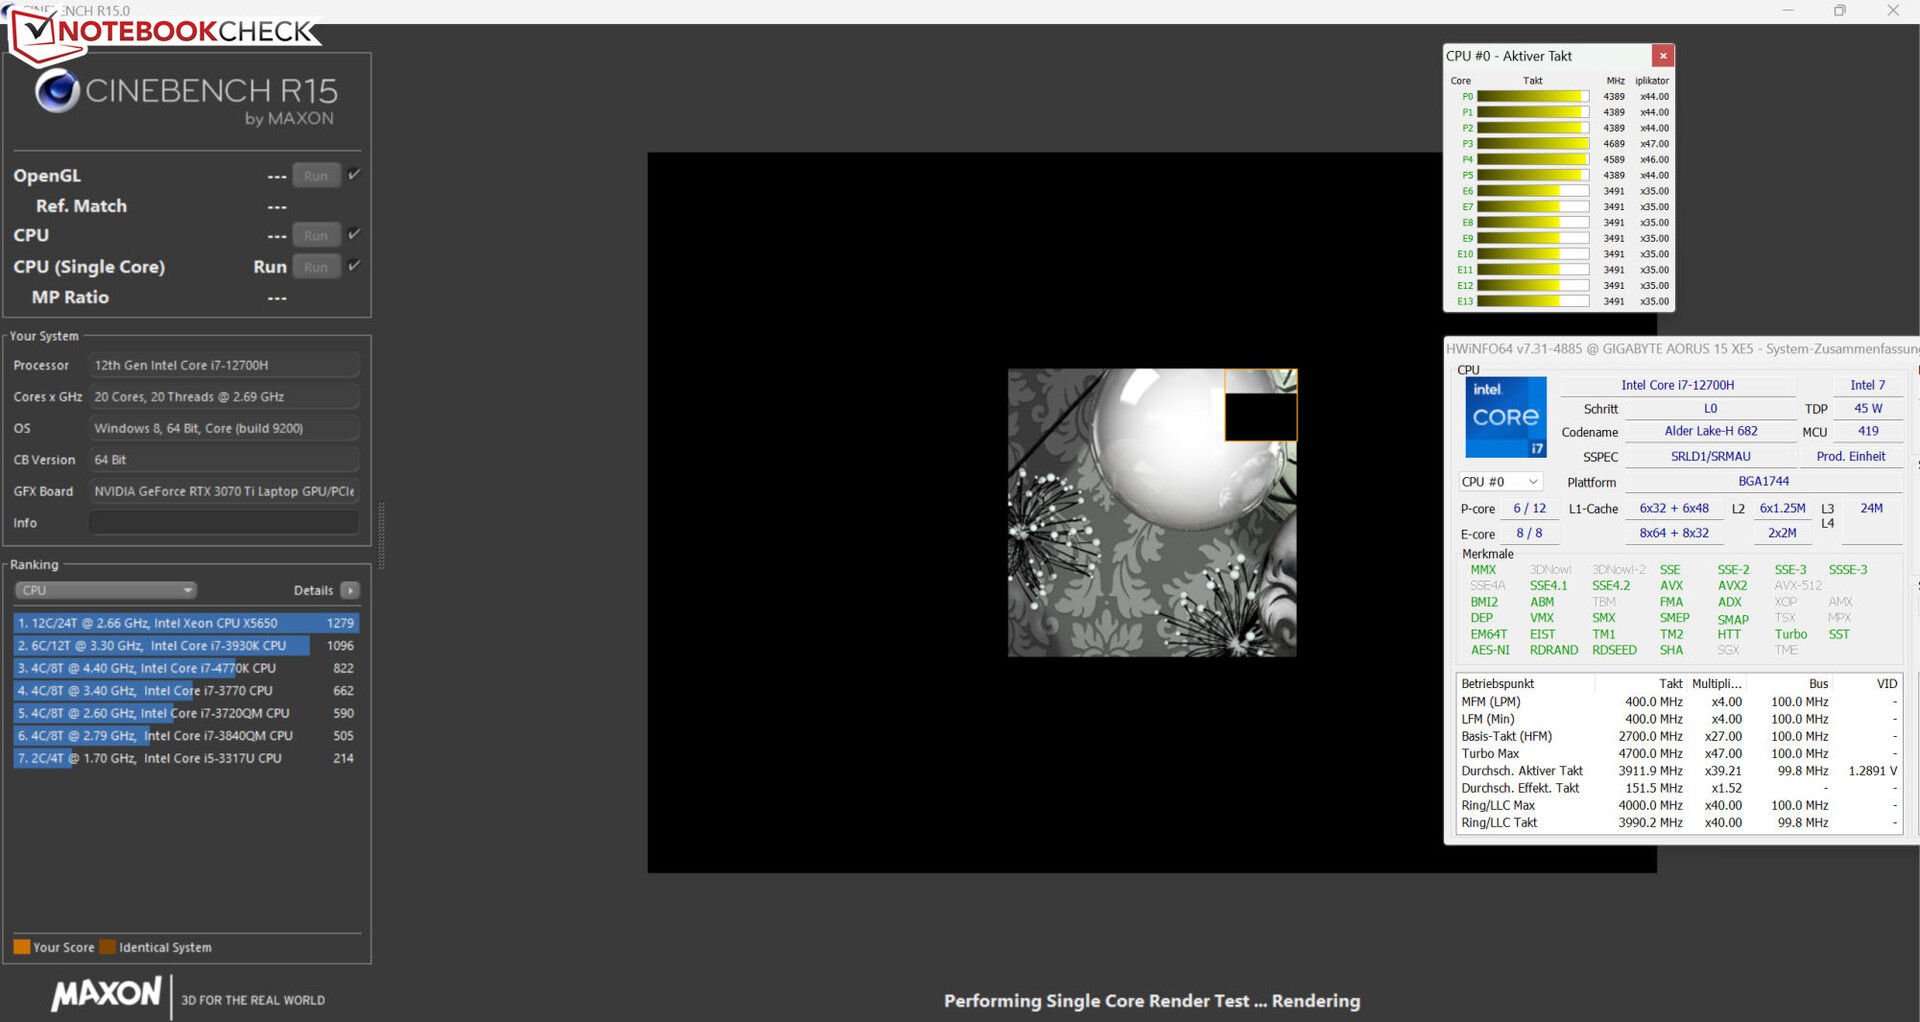
在Cinebench R15多线程测试中,CPU短暂地以高时钟速度运行(P-cores:4.4 GHz,E-cores:3.5 GHz),然后稳定在稍低的频率(P-cores:3.5至3.8 GHz,E-cores:3至3.2 GHz)。在单线程测试中,P-cores运行在4.4至4.7GHz,E-cores运行在3.5GHz。当笔记本电脑使用电池供电时,时钟速度大大降低。总的来说,Aorus 15 XE5的Core i7提供了略高于平均水平的基准测试结果。
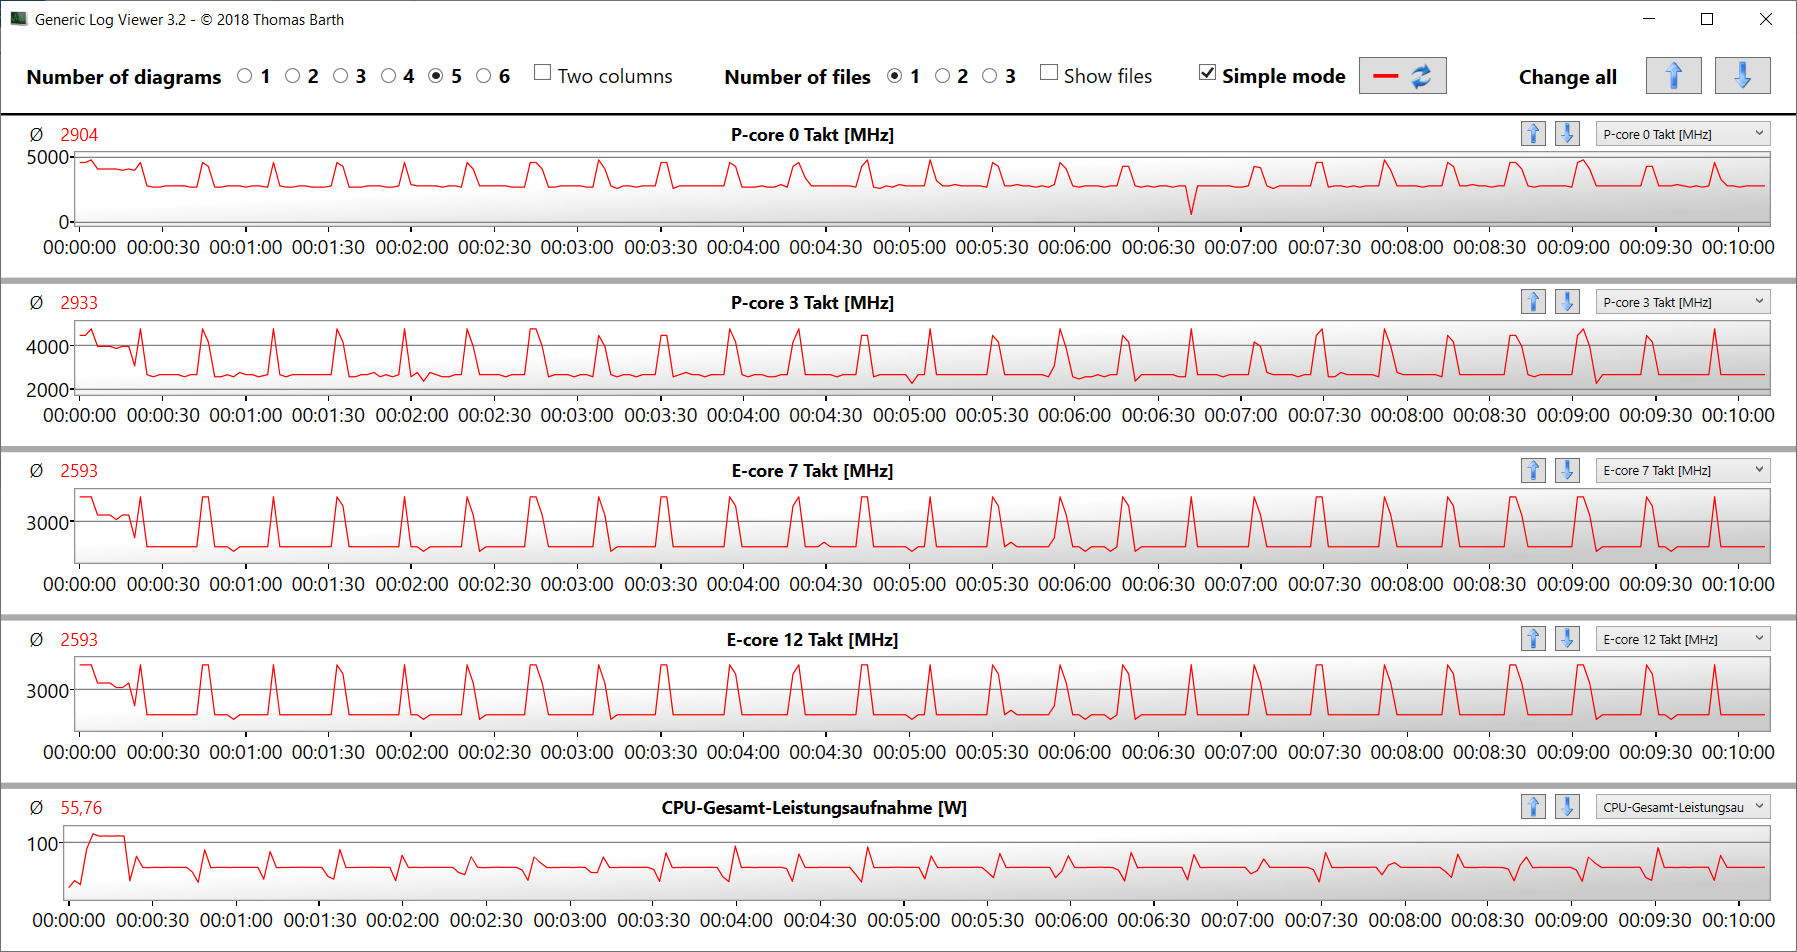
我们还在Cinebench R15中循环运行了多线程测试,以确定CPU是否能够长时间保持其涡轮增压速度。CPU只能够在短时间内保持高的时钟速度。随后,P核主要是在涡轮增压范围的中间位置运行。启用 "涡轮增压模式 "使CPU的性能略有提高--不是在峰值,而是在平均水平上。
Cinebench R15 Multi Sustained Load
| CPU Performance rating - Percent | |
| Average of class Gaming | |
| Aorus 15 XE5 | |
| Aorus 15 XE5 | |
| MSI Katana GF66 12UGS | |
| Average Intel Core i7-12700H | |
| Asus TUF Dash F15 FX517ZR | |
| Acer Nitro 5 AN515-46-R1A1 | |
| Schenker XMG Fusion 15 (Mid 22) | |
| Cinebench R20 | |
| CPU (Multi Core) | |
| Average of class Gaming (4029 - 16433, n=106, last 2 years) | |
| MSI Katana GF66 12UGS | |
| Aorus 15 XE5 (Turbo Mode) | |
| Aorus 15 XE5 | |
| Average Intel Core i7-12700H (1576 - 7407, n=64) | |
| Asus TUF Dash F15 FX517ZR | |
| Acer Nitro 5 AN515-46-R1A1 | |
| Schenker XMG Fusion 15 (Mid 22) | |
| CPU (Single Core) | |
| Average of class Gaming (442 - 913, n=106, last 2 years) | |
| MSI Katana GF66 12UGS | |
| Asus TUF Dash F15 FX517ZR | |
| Aorus 15 XE5 | |
| Average Intel Core i7-12700H (300 - 704, n=64) | |
| Aorus 15 XE5 (Turbo Mode) | |
| Acer Nitro 5 AN515-46-R1A1 | |
| Schenker XMG Fusion 15 (Mid 22) | |
| Blender - v2.79 BMW27 CPU | |
| Schenker XMG Fusion 15 (Mid 22) | |
| MSI Katana GF66 12UGS | |
| Aorus 15 XE5 | |
| Acer Nitro 5 AN515-46-R1A1 | |
| Asus TUF Dash F15 FX517ZR | |
| Average Intel Core i7-12700H (168 - 732, n=63) | |
| Aorus 15 XE5 (Turbo Mode) | |
| Average of class Gaming (79 - 330, n=104, last 2 years) | |
| HWBOT x265 Benchmark v2.2 - 4k Preset | |
| Average of class Gaming (11.5 - 44.4, n=105, last 2 years) | |
| Aorus 15 XE5 (Turbo Mode) | |
| Acer Nitro 5 AN515-46-R1A1 | |
| Asus TUF Dash F15 FX517ZR | |
| Average Intel Core i7-12700H (4.67 - 21.8, n=64) | |
| Aorus 15 XE5 | |
| MSI Katana GF66 12UGS | |
| Schenker XMG Fusion 15 (Mid 22) | |
| LibreOffice - 20 Documents To PDF | |
| Acer Nitro 5 AN515-46-R1A1 | |
| Average of class Gaming (33.2 - 88.8, n=105, last 2 years) | |
| Schenker XMG Fusion 15 (Mid 22) | |
| Average Intel Core i7-12700H (34.2 - 95.3, n=63) | |
| Asus TUF Dash F15 FX517ZR | |
| Aorus 15 XE5 (Turbo Mode) | |
| Aorus 15 XE5 | |
| MSI Katana GF66 12UGS | |
| R Benchmark 2.5 - Overall mean | |
| Schenker XMG Fusion 15 (Mid 22) | |
| Acer Nitro 5 AN515-46-R1A1 | |
| Aorus 15 XE5 (Turbo Mode) | |
| Average Intel Core i7-12700H (0.4441 - 1.052, n=63) | |
| Aorus 15 XE5 | |
| Asus TUF Dash F15 FX517ZR | |
| MSI Katana GF66 12UGS | |
| Average of class Gaming (0.3439 - 0.759, n=106, last 2 years) | |
* ... smaller is better
AIDA64: FP32 Ray-Trace | FPU Julia | CPU SHA3 | CPU Queen | FPU SinJulia | FPU Mandel | CPU AES | CPU ZLib | FP64 Ray-Trace | CPU PhotoWorxx
| Performance rating | |
| Average of class Gaming | |
| Acer Nitro 5 AN515-46-R1A1 | |
| Aorus 15 XE5 | |
| Aorus 15 XE5 | |
| Schenker XMG Fusion 15 (Mid 22) | |
| Asus TUF Dash F15 FX517ZR | |
| Average Intel Core i7-12700H | |
| MSI Katana GF66 12UGS | |
| AIDA64 / FP32 Ray-Trace | |
| Average of class Gaming (10227 - 85542, n=105, last 2 years) | |
| Acer Nitro 5 AN515-46-R1A1 (v6.75.6100) | |
| Aorus 15 XE5 (v6.75.6100, Turbo Mode) | |
| Asus TUF Dash F15 FX517ZR (v6.70.6000) | |
| Aorus 15 XE5 (v6.75.6100) | |
| Schenker XMG Fusion 15 (Mid 22) (v6.70.6000) | |
| Average Intel Core i7-12700H (2585 - 17957, n=64) | |
| MSI Katana GF66 12UGS (v6.50.5800) | |
| AIDA64 / FPU Julia | |
| Average of class Gaming (51376 - 238426, n=105, last 2 years) | |
| Acer Nitro 5 AN515-46-R1A1 (v6.75.6100) | |
| Aorus 15 XE5 (v6.75.6100, Turbo Mode) | |
| Asus TUF Dash F15 FX517ZR (v6.70.6000) | |
| Aorus 15 XE5 (v6.75.6100) | |
| Schenker XMG Fusion 15 (Mid 22) (v6.70.6000) | |
| Average Intel Core i7-12700H (12439 - 90760, n=64) | |
| MSI Katana GF66 12UGS (v6.50.5800) | |
| AIDA64 / CPU SHA3 | |
| Average of class Gaming (2180 - 10115, n=105, last 2 years) | |
| Schenker XMG Fusion 15 (Mid 22) (v6.70.6000) | |
| Aorus 15 XE5 (v6.75.6100, Turbo Mode) | |
| Acer Nitro 5 AN515-46-R1A1 (v6.75.6100) | |
| Average Intel Core i7-12700H (833 - 4242, n=64) | |
| MSI Katana GF66 12UGS (v6.50.5800) | |
| Aorus 15 XE5 (v6.75.6100) | |
| Asus TUF Dash F15 FX517ZR (v6.70.6000) | |
| AIDA64 / CPU Queen | |
| Average of class Gaming (49785 - 173351, n=90, last 2 years) | |
| Acer Nitro 5 AN515-46-R1A1 (v6.75.6100) | |
| Aorus 15 XE5 (v6.75.6100) | |
| Aorus 15 XE5 (v6.75.6100, Turbo Mode) | |
| MSI Katana GF66 12UGS (v6.50.5800) | |
| Average Intel Core i7-12700H (57923 - 103202, n=63) | |
| Asus TUF Dash F15 FX517ZR (v6.70.6000) | |
| Schenker XMG Fusion 15 (Mid 22) | |
| AIDA64 / FPU SinJulia | |
| Average of class Gaming (4424 - 33636, n=105, last 2 years) | |
| Acer Nitro 5 AN515-46-R1A1 (v6.75.6100) | |
| MSI Katana GF66 12UGS (v6.50.5800) | |
| Aorus 15 XE5 (v6.75.6100, Turbo Mode) | |
| Average Intel Core i7-12700H (3249 - 9939, n=64) | |
| Schenker XMG Fusion 15 (Mid 22) (v6.70.6000) | |
| Asus TUF Dash F15 FX517ZR (v6.70.6000) | |
| Aorus 15 XE5 (v6.75.6100) | |
| AIDA64 / FPU Mandel | |
| Average of class Gaming (25115 - 128721, n=105, last 2 years) | |
| Acer Nitro 5 AN515-46-R1A1 (v6.75.6100) | |
| Schenker XMG Fusion 15 (Mid 22) (v6.70.6000) | |
| Aorus 15 XE5 (v6.75.6100, Turbo Mode) | |
| Asus TUF Dash F15 FX517ZR (v6.70.6000) | |
| Aorus 15 XE5 (v6.75.6100) | |
| Average Intel Core i7-12700H (7135 - 44760, n=64) | |
| MSI Katana GF66 12UGS (v6.50.5800) | |
| AIDA64 / CPU AES | |
| Schenker XMG Fusion 15 (Mid 22) (v6.70.6000) | |
| Acer Nitro 5 AN515-46-R1A1 | |
| Aorus 15 XE5 (v6.75.6100, Turbo Mode) | |
| Aorus 15 XE5 (v6.75.6100) | |
| Average of class Gaming (39258 - 247074, n=105, last 2 years) | |
| MSI Katana GF66 12UGS (v6.50.5800) | |
| Average Intel Core i7-12700H (31839 - 144360, n=64) | |
| Asus TUF Dash F15 FX517ZR (v6.70.6000) | |
| AIDA64 / CPU ZLib | |
| Average of class Gaming (574 - 2531, n=105, last 2 years) | |
| MSI Katana GF66 12UGS (v6.50.5800) | |
| Aorus 15 XE5 (v6.75.6100, Turbo Mode) | |
| Average Intel Core i7-12700H (305 - 1171, n=64) | |
| Asus TUF Dash F15 FX517ZR (v6.70.6000) | |
| Acer Nitro 5 AN515-46-R1A1 (v6.75.6100) | |
| Aorus 15 XE5 (v6.75.6100) | |
| Schenker XMG Fusion 15 (Mid 22) (v6.70.6000) | |
| AIDA64 / FP64 Ray-Trace | |
| Average of class Gaming (5509 - 45446, n=105, last 2 years) | |
| Acer Nitro 5 AN515-46-R1A1 (v6.75.6100) | |
| Aorus 15 XE5 (v6.75.6100, Turbo Mode) | |
| Asus TUF Dash F15 FX517ZR (v6.70.6000) | |
| Schenker XMG Fusion 15 (Mid 22) (v6.70.6000) | |
| Aorus 15 XE5 (v6.75.6100) | |
| Average Intel Core i7-12700H (1437 - 9692, n=64) | |
| MSI Katana GF66 12UGS (v6.50.5800) | |
| AIDA64 / CPU PhotoWorxx | |
| Average of class Gaming (12271 - 89891, n=105, last 2 years) | |
| Aorus 15 XE5 (v6.75.6100, Turbo Mode) | |
| Aorus 15 XE5 (v6.75.6100) | |
| Asus TUF Dash F15 FX517ZR (v6.70.6000) | |
| Average Intel Core i7-12700H (12863 - 52207, n=64) | |
| Acer Nitro 5 AN515-46-R1A1 | |
| MSI Katana GF66 12UGS (v6.50.5800) | |
| Schenker XMG Fusion 15 (Mid 22) (v6.70.6000) | |
系统性能
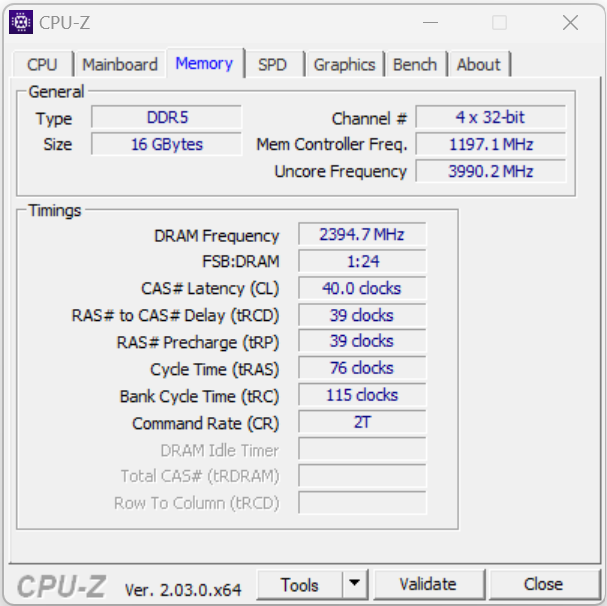
该系统运行平稳,为渲染、视频编辑和游戏等高要求的应用提供足够的计算能力。这台笔记本电脑设法提供了伟大的PCMark结果。内存的数据传输率对于DDR5-4800内存来说相当典型。
CrossMark: Overall | Productivity | Creativity | Responsiveness
| PCMark 10 / Score | |
| Average of class Gaming (5828 - 12414, n=93, last 2 years) | |
| Aorus 15 XE5 | |
| Average Intel Core i7-12700H, NVIDIA GeForce RTX 3070 Ti Laptop GPU (6941 - 7947, n=11) | |
| MSI Katana GF66 12UGS | |
| Asus TUF Dash F15 FX517ZR | |
| Acer Nitro 5 AN515-46-R1A1 | |
| Schenker XMG Fusion 15 (Mid 22) | |
| PCMark 10 / Essentials | |
| Aorus 15 XE5 | |
| Average of class Gaming (8810 - 11935, n=97, last 2 years) | |
| Average Intel Core i7-12700H, NVIDIA GeForce RTX 3070 Ti Laptop GPU (9892 - 10935, n=11) | |
| MSI Katana GF66 12UGS | |
| Acer Nitro 5 AN515-46-R1A1 | |
| Asus TUF Dash F15 FX517ZR | |
| Schenker XMG Fusion 15 (Mid 22) | |
| PCMark 10 / Productivity | |
| Average of class Gaming (6845 - 25323, n=95, last 2 years) | |
| Aorus 15 XE5 | |
| MSI Katana GF66 12UGS | |
| Average Intel Core i7-12700H, NVIDIA GeForce RTX 3070 Ti Laptop GPU (9024 - 10638, n=11) | |
| Asus TUF Dash F15 FX517ZR | |
| Acer Nitro 5 AN515-46-R1A1 | |
| Schenker XMG Fusion 15 (Mid 22) | |
| PCMark 10 / Digital Content Creation | |
| Average of class Gaming (7602 - 19954, n=95, last 2 years) | |
| Average Intel Core i7-12700H, NVIDIA GeForce RTX 3070 Ti Laptop GPU (10165 - 12546, n=11) | |
| Aorus 15 XE5 | |
| MSI Katana GF66 12UGS | |
| Asus TUF Dash F15 FX517ZR | |
| Acer Nitro 5 AN515-46-R1A1 | |
| Schenker XMG Fusion 15 (Mid 22) | |
| CrossMark / Overall | |
| Average of class Gaming (1366 - 2409, n=94, last 2 years) | |
| Aorus 15 XE5 | |
| MSI Katana GF66 12UGS | |
| Average Intel Core i7-12700H, NVIDIA GeForce RTX 3070 Ti Laptop GPU (974 - 2000, n=12) | |
| Asus TUF Dash F15 FX517ZR | |
| Schenker XMG Fusion 15 (Mid 22) | |
| Acer Nitro 5 AN515-46-R1A1 | |
| CrossMark / Productivity | |
| MSI Katana GF66 12UGS | |
| Aorus 15 XE5 | |
| Average of class Gaming (1386 - 2254, n=94, last 2 years) | |
| Average Intel Core i7-12700H, NVIDIA GeForce RTX 3070 Ti Laptop GPU (907 - 1962, n=12) | |
| Asus TUF Dash F15 FX517ZR | |
| Schenker XMG Fusion 15 (Mid 22) | |
| Acer Nitro 5 AN515-46-R1A1 | |
| CrossMark / Creativity | |
| Average of class Gaming (1343 - 2786, n=94, last 2 years) | |
| Asus TUF Dash F15 FX517ZR | |
| Aorus 15 XE5 | |
| MSI Katana GF66 12UGS | |
| Average Intel Core i7-12700H, NVIDIA GeForce RTX 3070 Ti Laptop GPU (1027 - 2057, n=12) | |
| Schenker XMG Fusion 15 (Mid 22) | |
| Acer Nitro 5 AN515-46-R1A1 | |
| CrossMark / Responsiveness | |
| MSI Katana GF66 12UGS | |
| Aorus 15 XE5 | |
| Average Intel Core i7-12700H, NVIDIA GeForce RTX 3070 Ti Laptop GPU (1029 - 2142, n=12) | |
| Average of class Gaming (1226 - 2334, n=94, last 2 years) | |
| Schenker XMG Fusion 15 (Mid 22) | |
| Asus TUF Dash F15 FX517ZR | |
| Acer Nitro 5 AN515-46-R1A1 | |
| PCMark 8 Home Score Accelerated v2 | 5280 points | |
| PCMark 8 Work Score Accelerated v2 | 6287 points | |
| PCMark 10 Score | 7695 points | |
Help | ||
| AIDA64 / Memory Copy | |
| Average of class Gaming (21750 - 129946, n=105, last 2 years) | |
| Average Intel Core i7-12700H (25615 - 80511, n=64) | |
| Asus TUF Dash F15 FX517ZR | |
| Aorus 15 XE5 | |
| Acer Nitro 5 AN515-46-R1A1 | |
| Schenker XMG Fusion 15 (Mid 22) | |
| MSI Katana GF66 12UGS | |
| AIDA64 / Memory Read | |
| Average of class Gaming (22956 - 118858, n=105, last 2 years) | |
| Asus TUF Dash F15 FX517ZR | |
| Aorus 15 XE5 | |
| Average Intel Core i7-12700H (25586 - 79442, n=64) | |
| Acer Nitro 5 AN515-46-R1A1 | |
| Schenker XMG Fusion 15 (Mid 22) | |
| MSI Katana GF66 12UGS | |
| AIDA64 / Memory Write | |
| Average of class Gaming (22297 - 135096, n=105, last 2 years) | |
| Asus TUF Dash F15 FX517ZR | |
| Aorus 15 XE5 | |
| Acer Nitro 5 AN515-46-R1A1 | |
| Average Intel Core i7-12700H (23679 - 88660, n=64) | |
| MSI Katana GF66 12UGS | |
| Schenker XMG Fusion 15 (Mid 22) | |
| AIDA64 / Memory Latency | |
| Average of class Gaming (75.3 - 259, n=105, last 2 years) | |
| MSI Katana GF66 12UGS | |
| Asus TUF Dash F15 FX517ZR | |
| Aorus 15 XE5 | |
| Schenker XMG Fusion 15 (Mid 22) | |
| Acer Nitro 5 AN515-46-R1A1 | |
| Average Intel Core i7-12700H (76.2 - 133.9, n=62) | |
* ... smaller is better
DPC延时
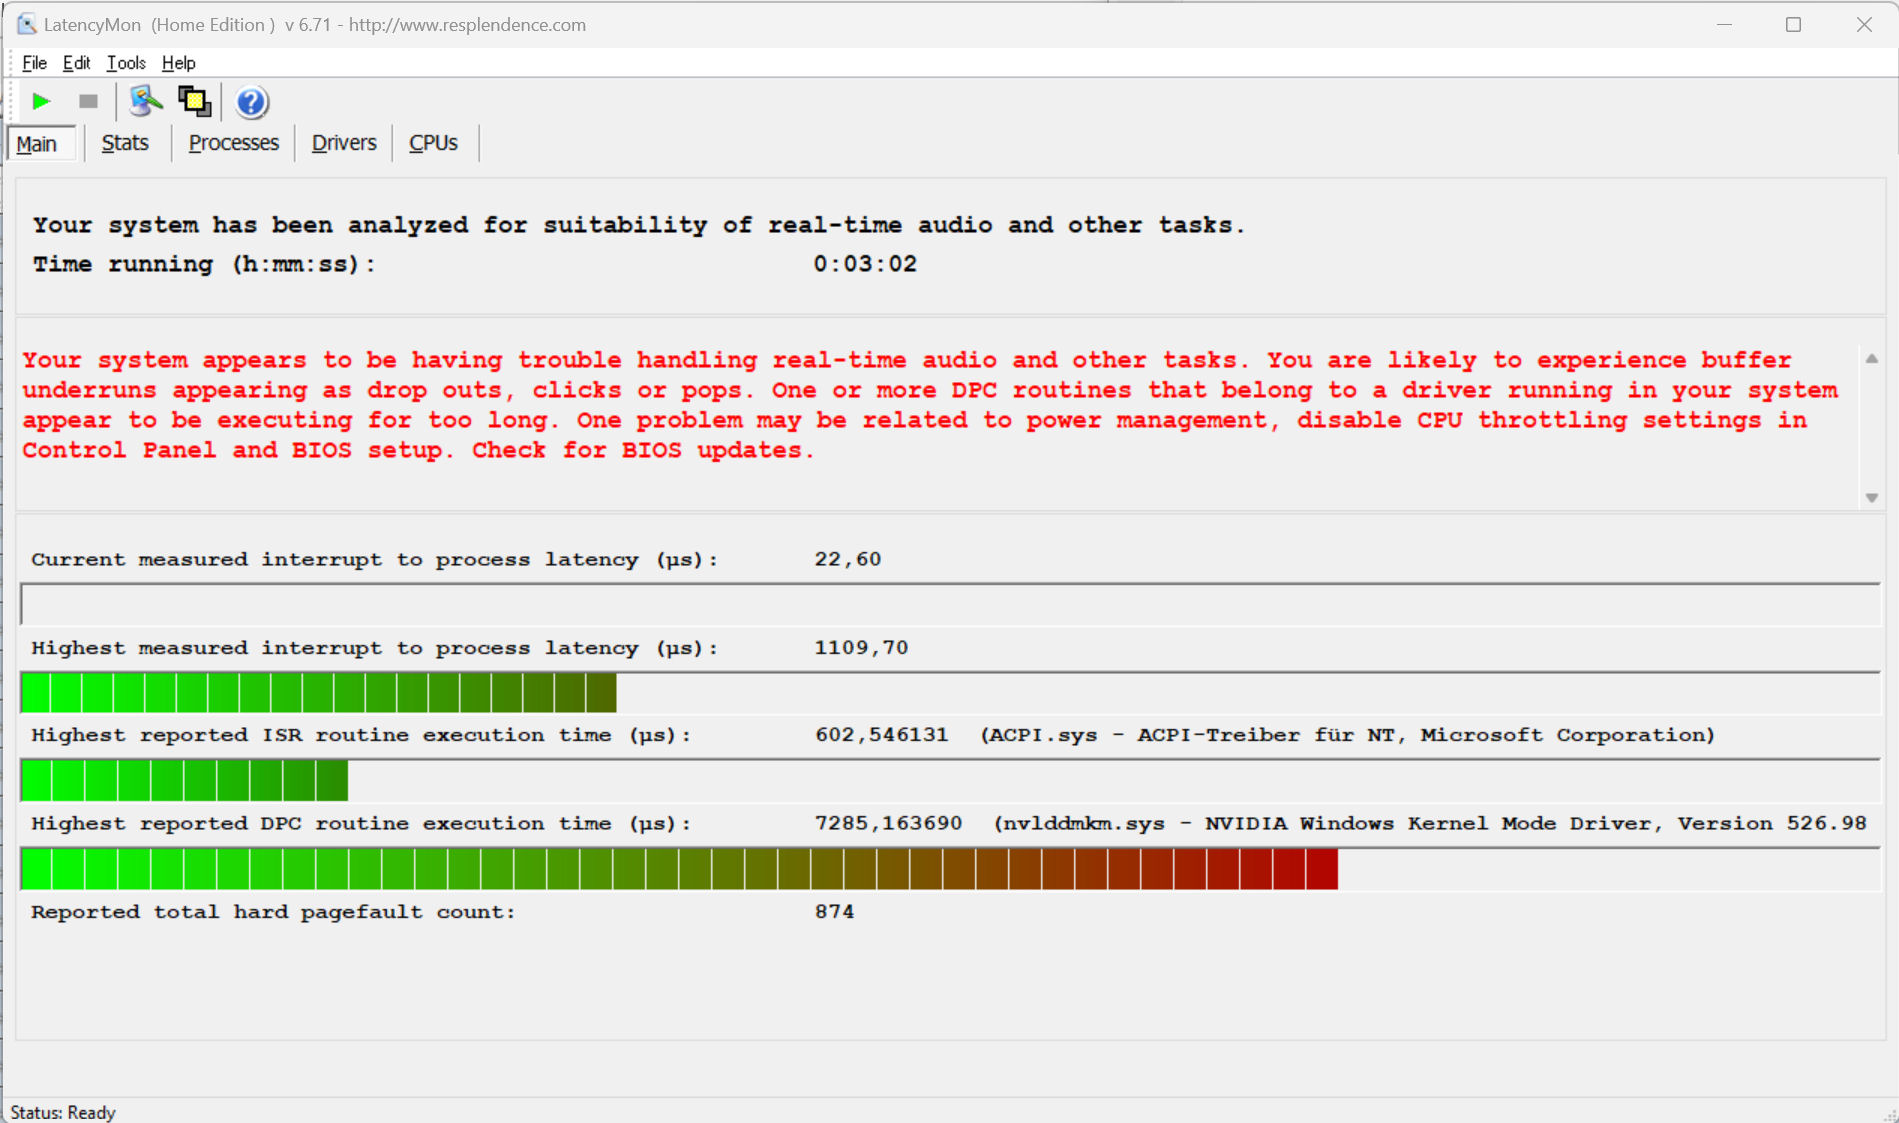
我们的标准化延迟显示器测试(网页浏览、4K视频播放、Prime95高负荷)发现了系统的一些问题。即使这台笔记本电脑没有过高的延迟,但它似乎有一个驱动问题。希望未来的软件更新能解决这个问题。
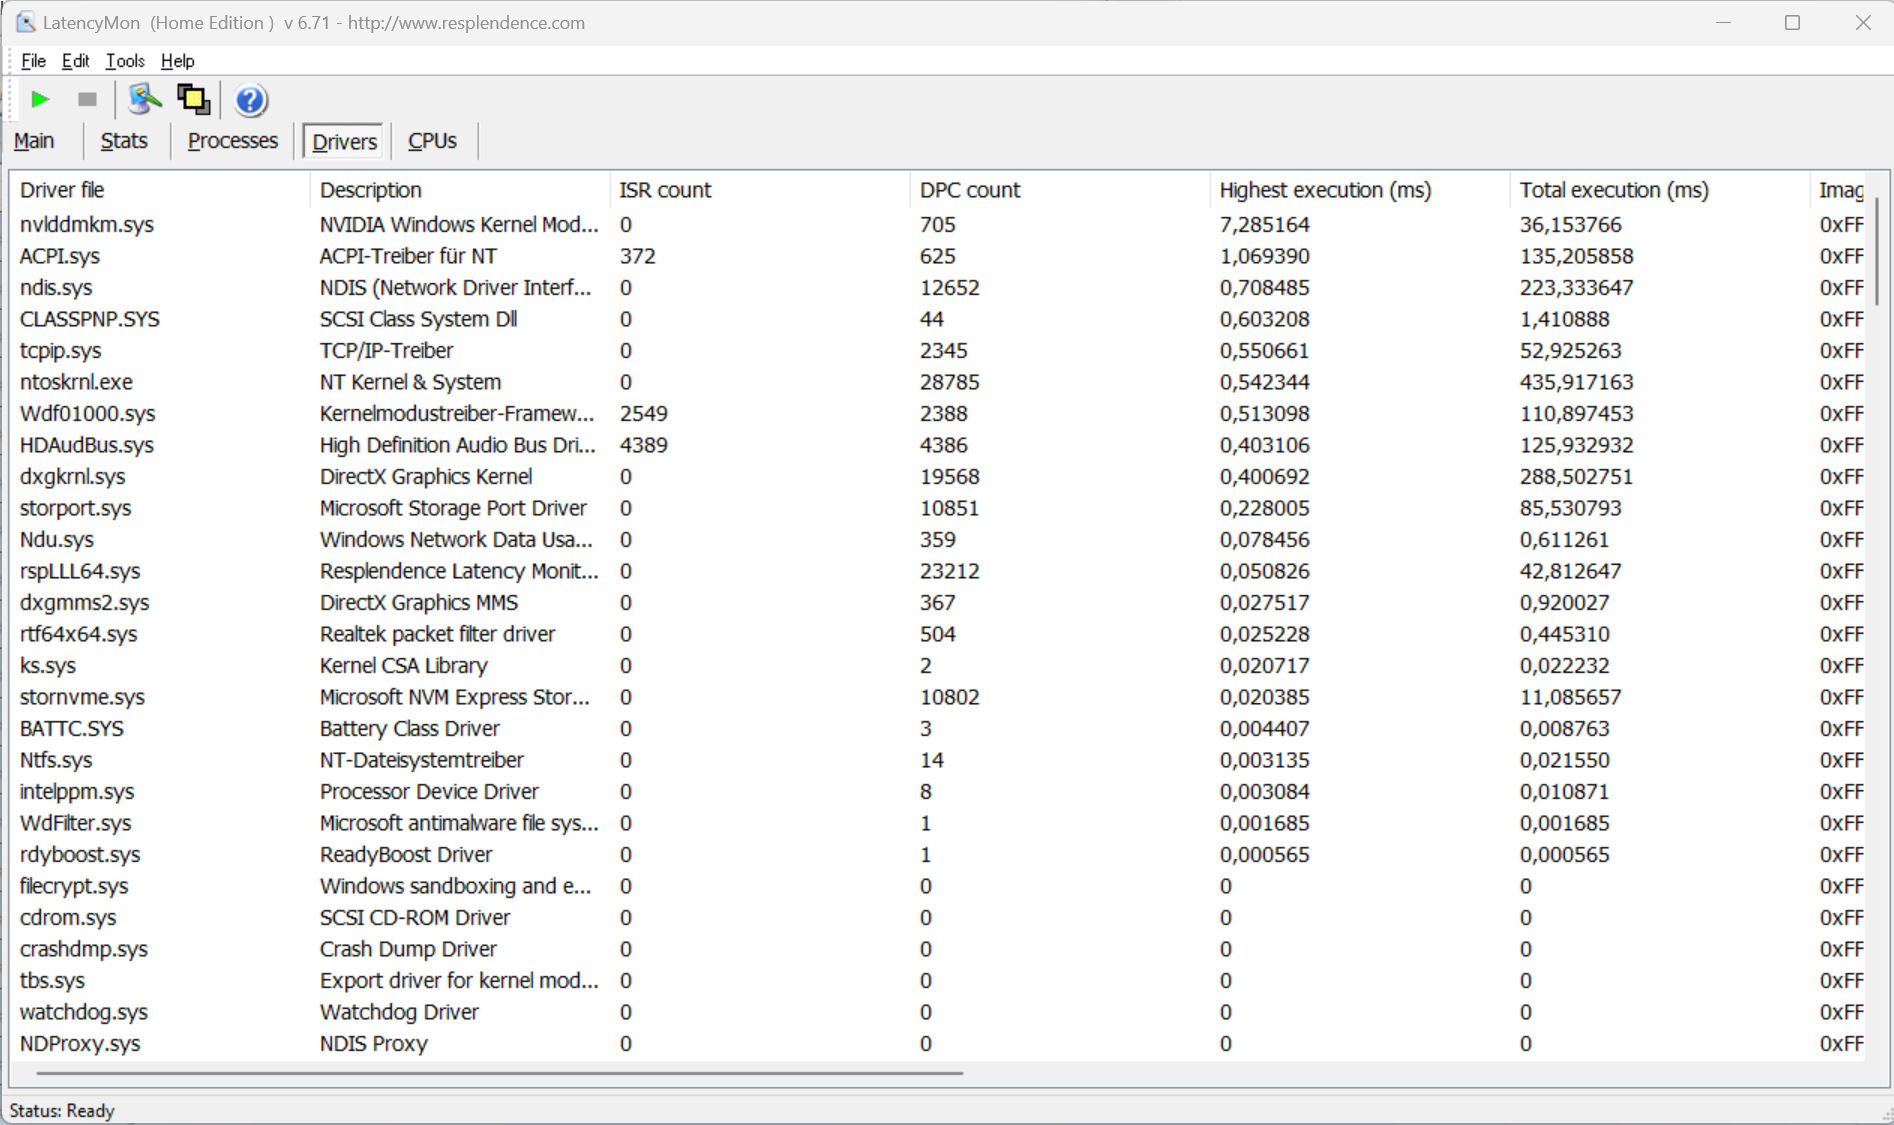
| DPC Latencies / LatencyMon - interrupt to process latency (max), Web, Youtube, Prime95 | |
| Acer Nitro 5 AN515-46-R1A1 | |
| Schenker XMG Fusion 15 (Mid 22) | |
| Aorus 15 XE5 | |
| MSI Katana GF66 12UGS | |
| Asus TUF Dash F15 FX517ZR | |
* ... smaller is better
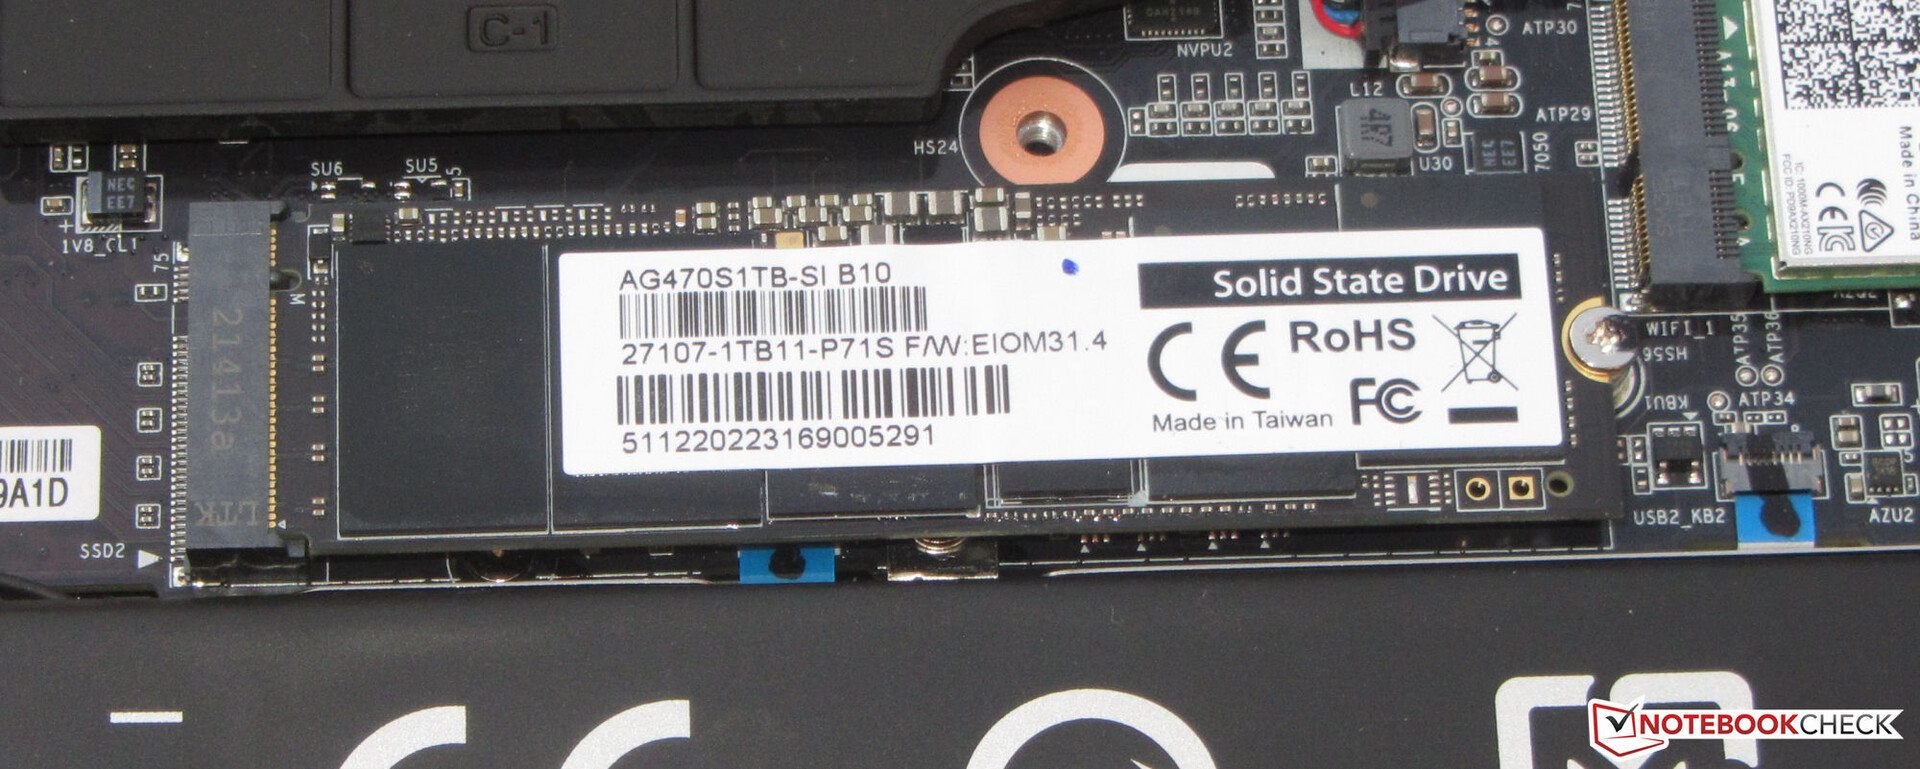
大容量存储
技嘉为Aorus 15 XE5配备了由该公司自己制造的PCIe 4.0固态硬盘(1TB,M.2 2280)。这种存储驱动器提供了出色的传输速度。这款笔记本电脑还有一个免费的M.2 2280插槽,用于添加第二个PCIe 4.0固态硬盘。

* ... smaller is better
Sustained Read: DiskSpd Read Loop, Queue Depth 8
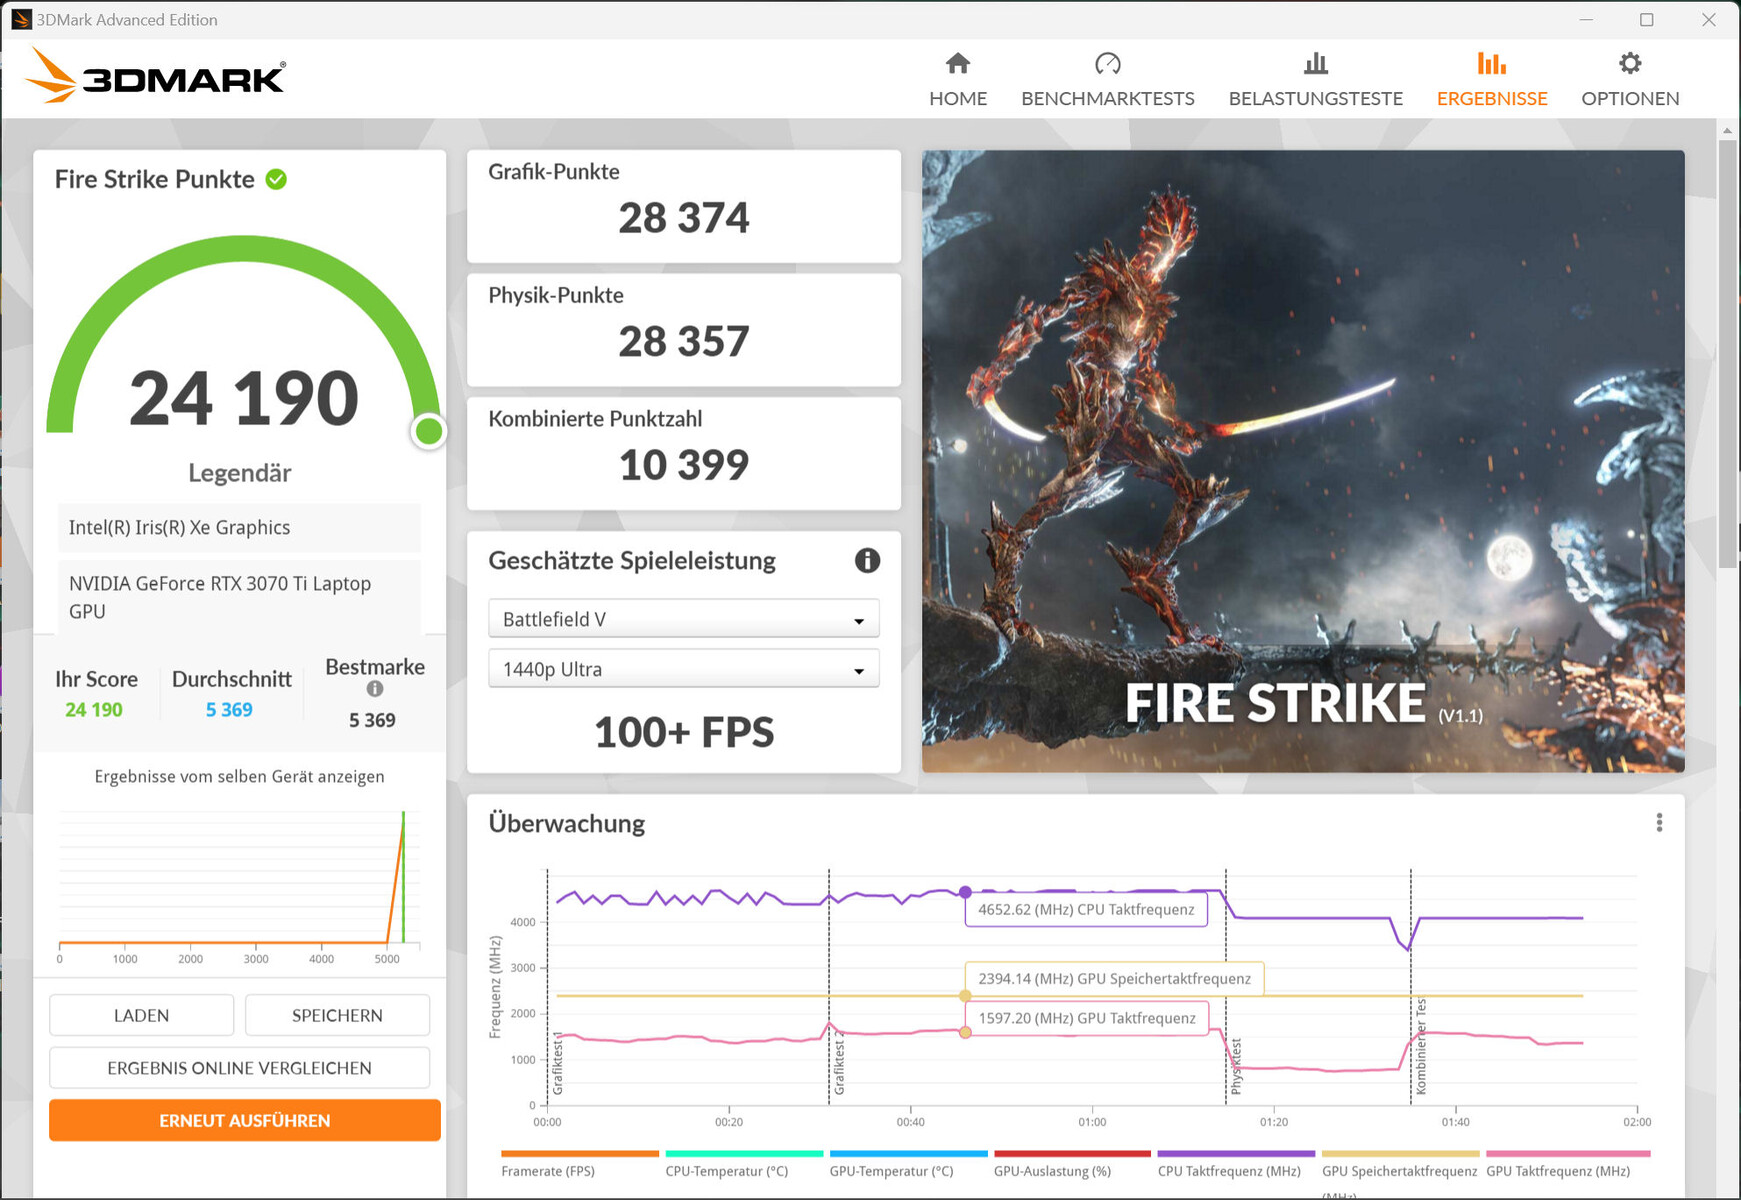
图形卡
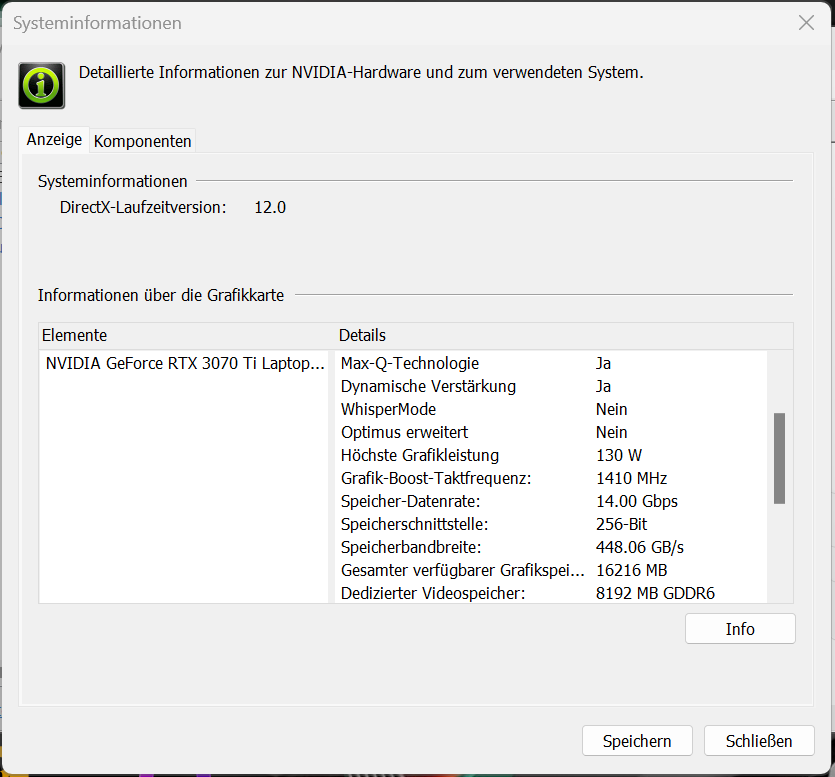
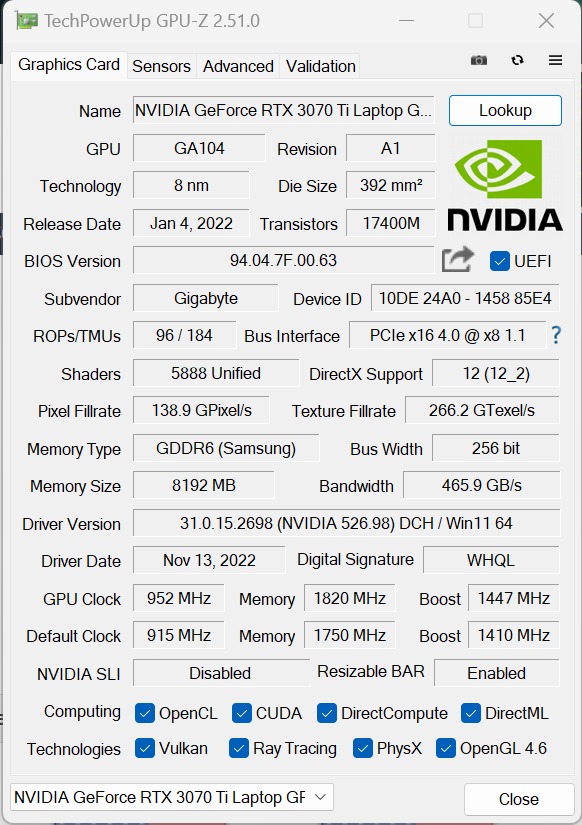
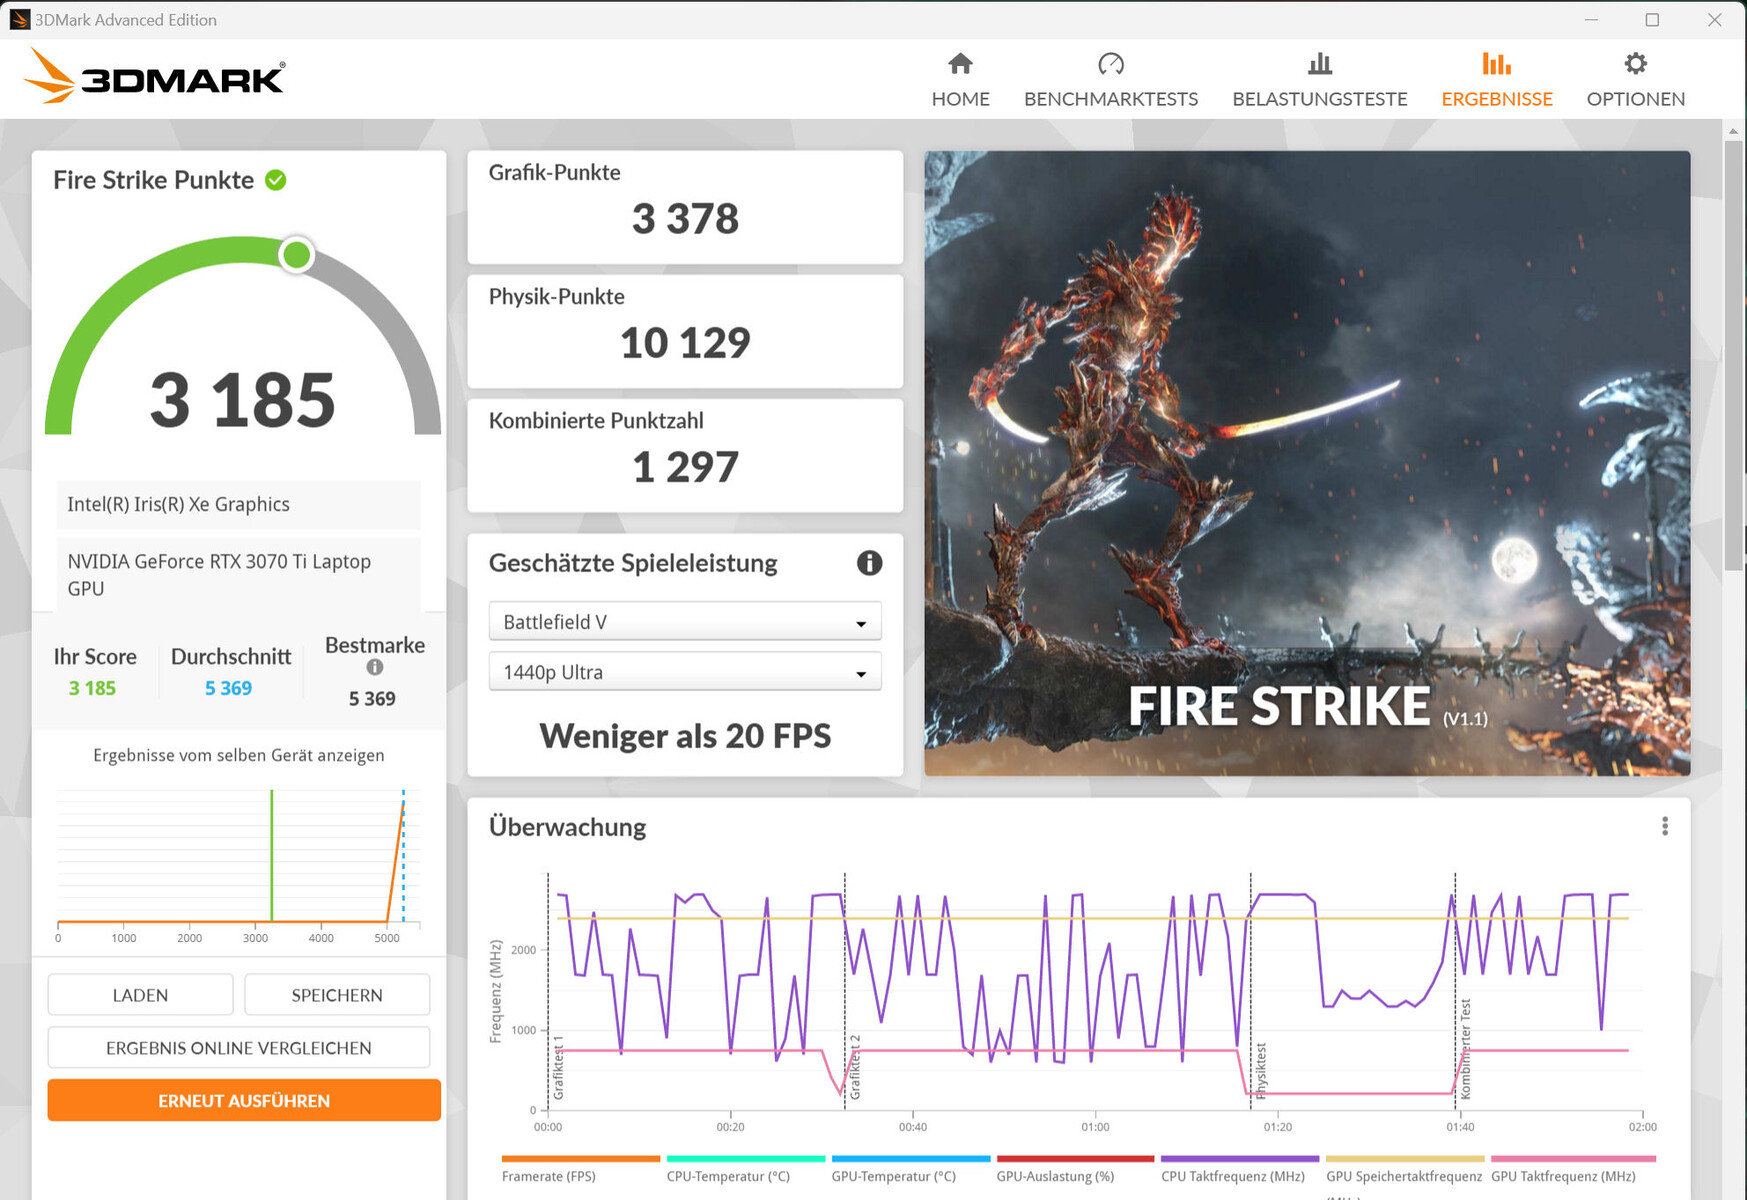
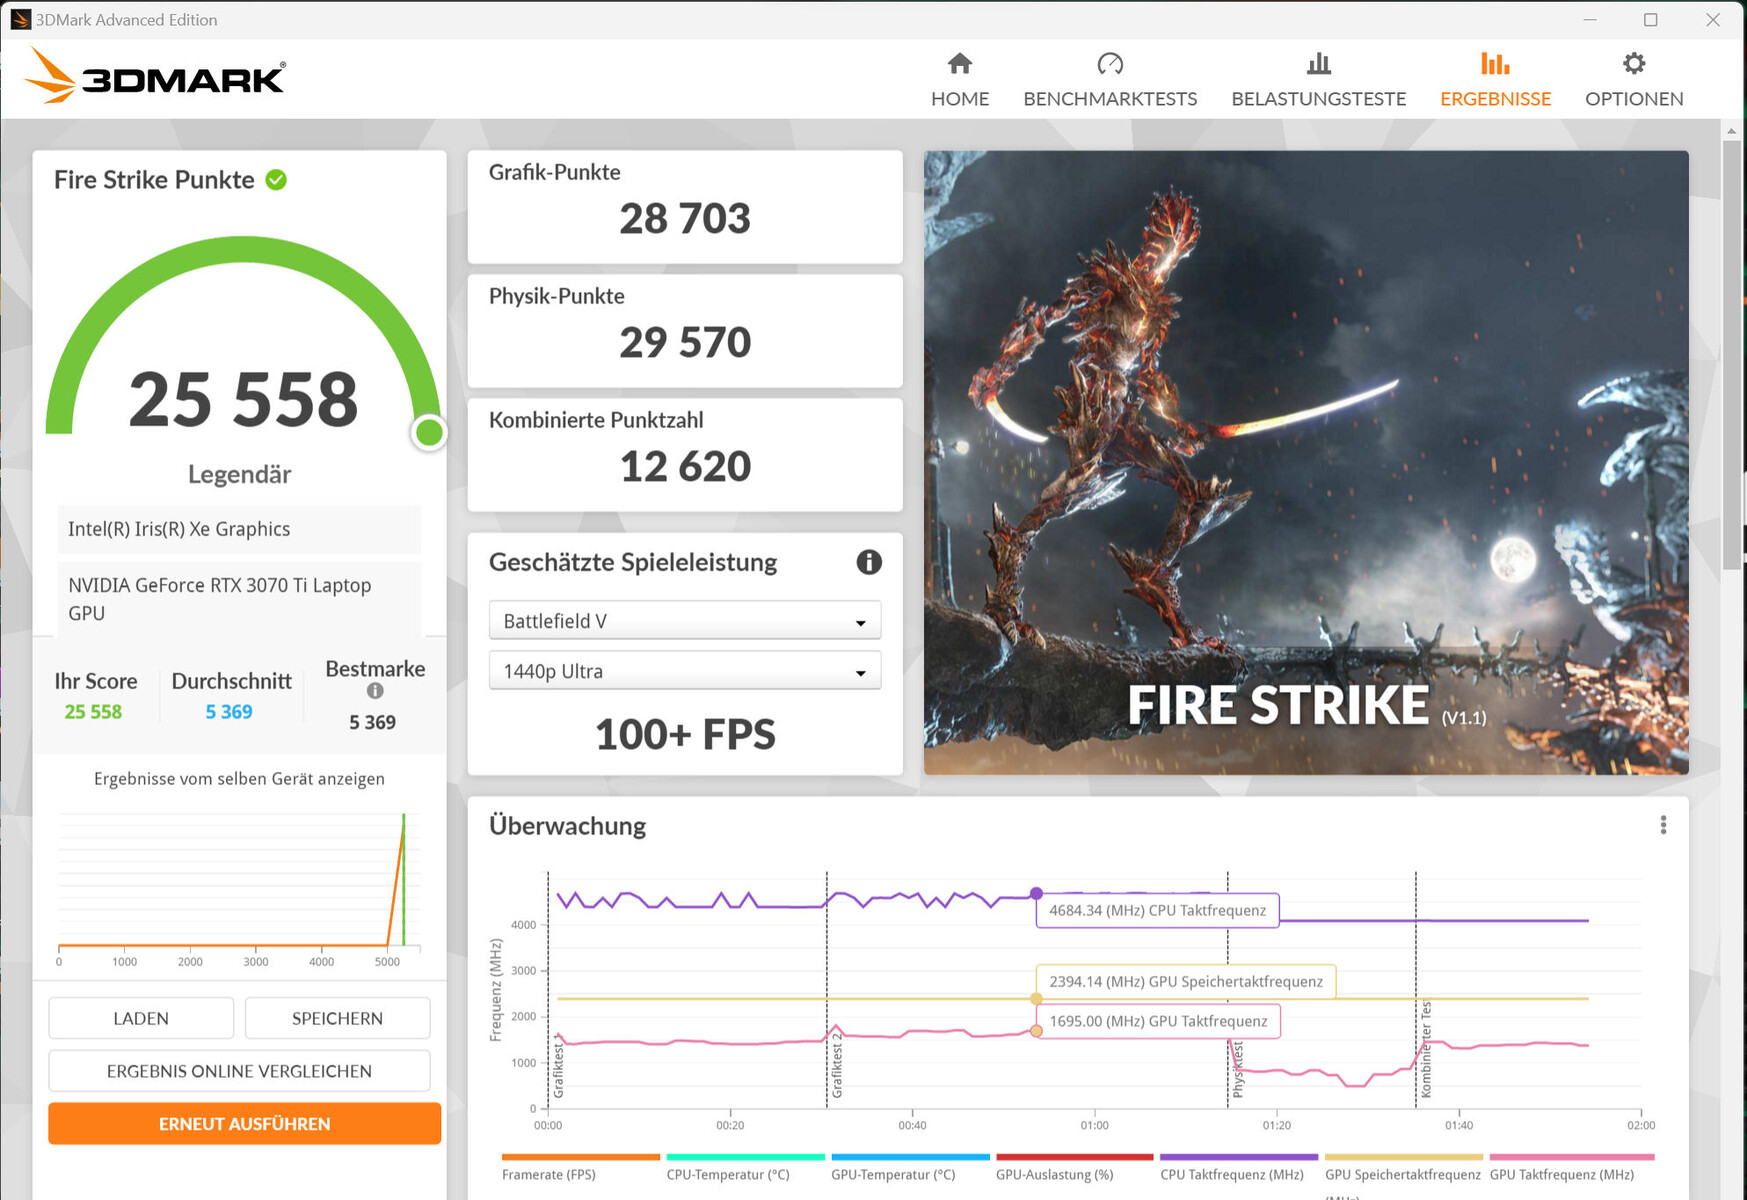
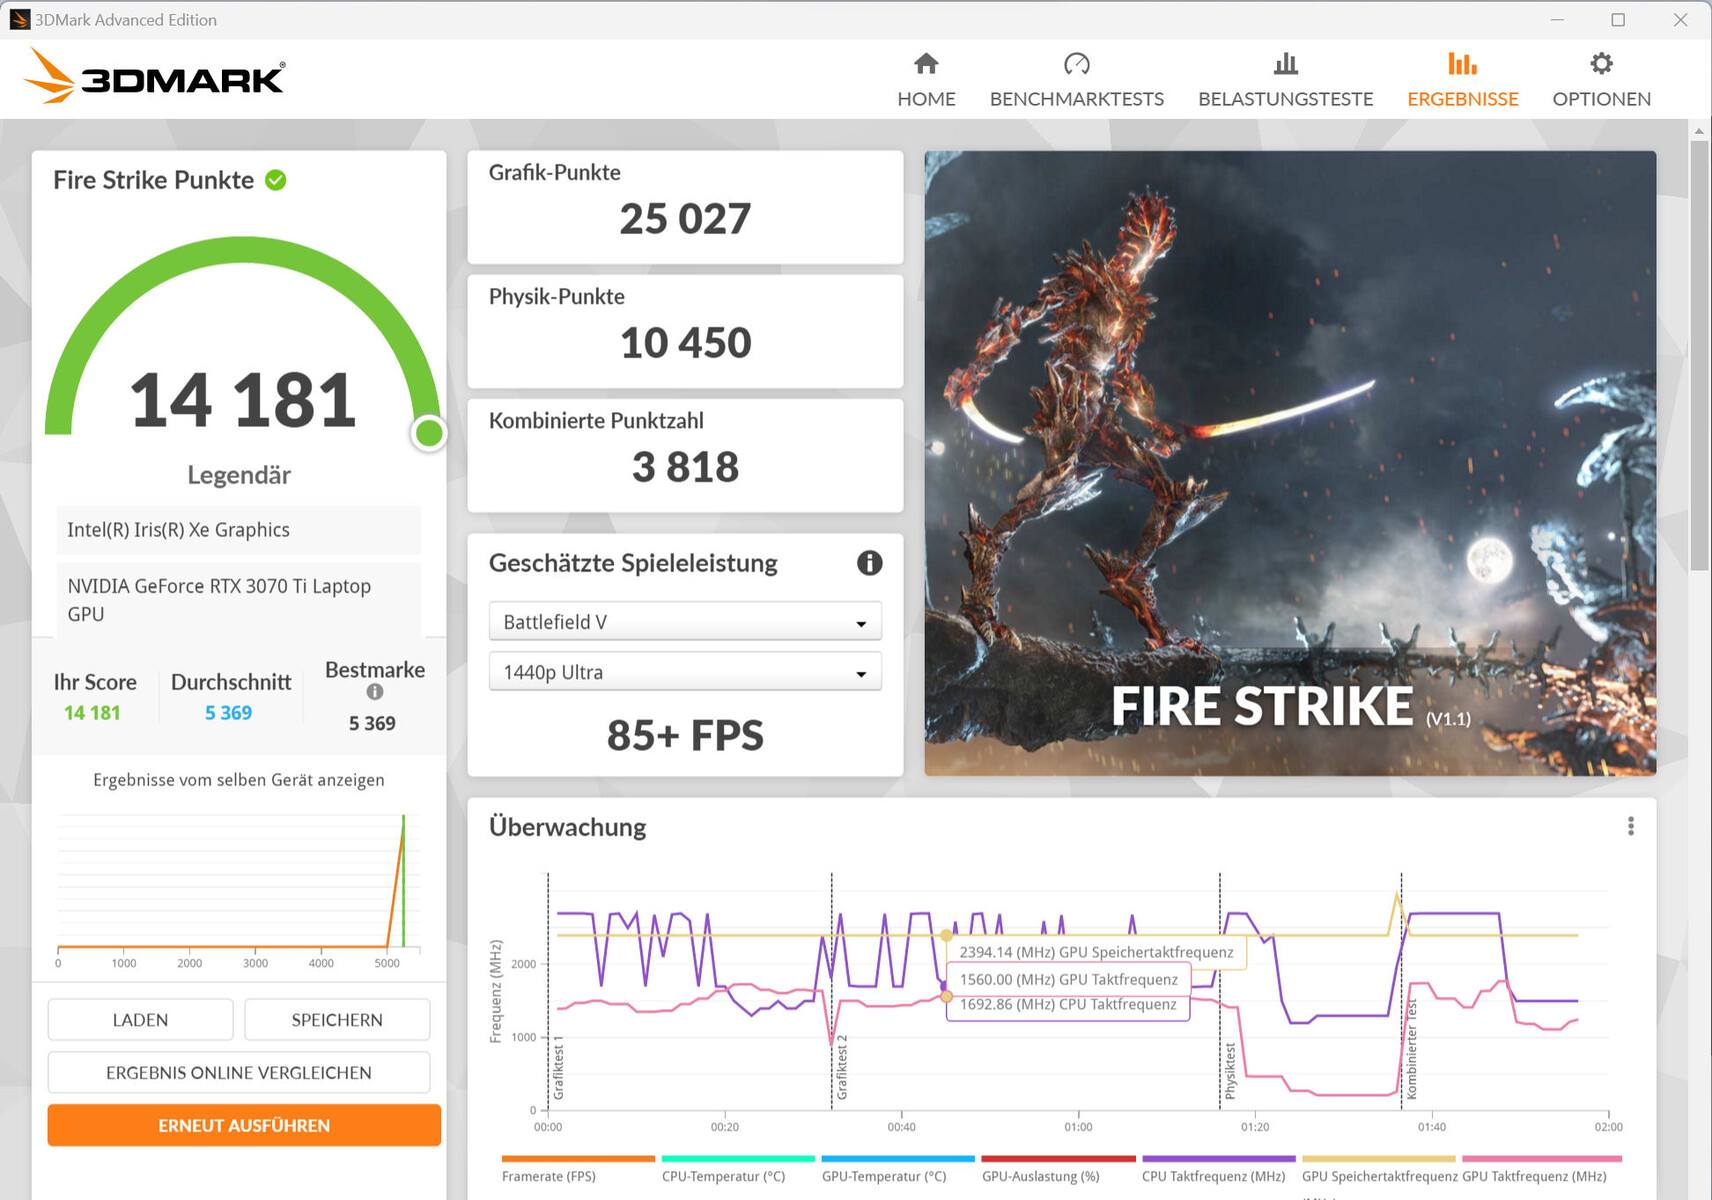
RTX 30系列GPU的实际性能取决于几个因素:冷却、内存配置和笔记本电脑制造商指定的TGP(在Nvidia定义的范围内)。Gigabyte选择给 RTX 3070 Ti Laptop的TGP为130瓦。然而,我们的Witcher 3 测试显示,该系统并没有完全利用这个TGP。
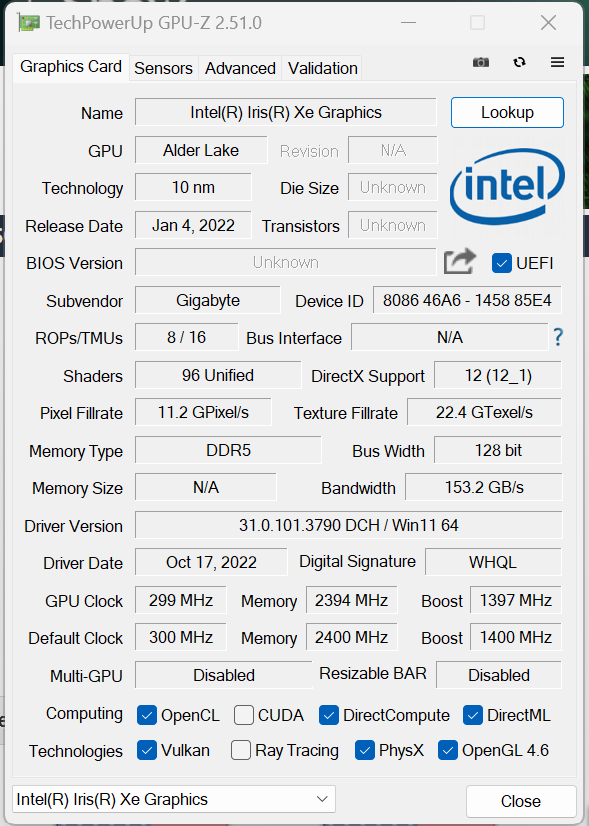
Aorus的GPU可以访问8192MB的快速GDDR6 VRAM,并提供了比我们从RTX 3070 Ti平均看到的3DMark结果略好的结果。集成的 Iris Xe Graphics G7 96EU是主动的;该笔记本电脑使用Nvidia的Optimus图形切换技术,不提供dGPU模式。
| 3DMark Performance rating - Percent | |
| Average of class Gaming | |
| Acer Nitro 5 AN515-46-R1A1 | |
| Aorus 15 XE5 | |
| Aorus 15 XE5 | |
| Average NVIDIA GeForce RTX 3070 Ti Laptop GPU | |
| MSI Katana GF66 12UGS | |
| Schenker XMG Fusion 15 (Mid 22) | |
| Asus TUF Dash F15 FX517ZR | |
| 3DMark 11 - 1280x720 Performance GPU | |
| Average of class Gaming (21841 - 80022, n=104, last 2 years) | |
| Aorus 15 XE5 (Turbo Mode) | |
| Aorus 15 XE5 | |
| Acer Nitro 5 AN515-46-R1A1 | |
| Average NVIDIA GeForce RTX 3070 Ti Laptop GPU (13799 - 42569, n=36) | |
| MSI Katana GF66 12UGS | |
| Schenker XMG Fusion 15 (Mid 22) | |
| Asus TUF Dash F15 FX517ZR | |
| 3DMark | |
| 1920x1080 Fire Strike Graphics | |
| Average of class Gaming (12242 - 62849, n=115, last 2 years) | |
| Acer Nitro 5 AN515-46-R1A1 | |
| Aorus 15 XE5 (Turbo Mode) | |
| Aorus 15 XE5 | |
| Average NVIDIA GeForce RTX 3070 Ti Laptop GPU (22612 - 32550, n=37) | |
| MSI Katana GF66 12UGS | |
| Schenker XMG Fusion 15 (Mid 22) | |
| Asus TUF Dash F15 FX517ZR | |
| 2560x1440 Time Spy Graphics | |
| Average of class Gaming (5012 - 26212, n=115, last 2 years) | |
| Acer Nitro 5 AN515-46-R1A1 | |
| Aorus 15 XE5 | |
| Aorus 15 XE5 (Turbo Mode) | |
| Average NVIDIA GeForce RTX 3070 Ti Laptop GPU (8142 - 12324, n=37) | |
| MSI Katana GF66 12UGS | |
| Schenker XMG Fusion 15 (Mid 22) | |
| Asus TUF Dash F15 FX517ZR | |
| 2560x1440 Port Royal Graphics | |
| Average of class Gaming (4395 - 17286, n=71, last 2 years) | |
| Acer Nitro 5 AN515-46-R1A1 | |
| Aorus 15 XE5 (Turbo Mode) | |
| Aorus 15 XE5 | |
| Average NVIDIA GeForce RTX 3070 Ti Laptop GPU (5091 - 7510, n=23) | |
| MSI Katana GF66 12UGS | |
| Schenker XMG Fusion 15 (Mid 22) | |
| Asus TUF Dash F15 FX517ZR | |
| 3DMark 06 Standard Score | 51253 points | |
| 3DMark 11 Performance | 32155 points | |
| 3DMark Fire Strike Score | 24190 points | |
| 3DMark Time Spy Score | 10840 points | |
Help | ||
| Blender | |
| v3.3 Classroom OPTIX/RTX | |
| Asus TUF Dash F15 FX517ZR | |
| Average NVIDIA GeForce RTX 3070 Ti Laptop GPU (22 - 30, n=15) | |
| Acer Nitro 5 AN515-46-R1A1 (3.3.0) | |
| Aorus 15 XE5 (3.3.0) | |
| Aorus 15 XE5 (3.3.0, Turbo Mode) | |
| Average of class Gaming (9 - 32, n=106, last 2 years) | |
| v3.3 Classroom CUDA | |
| Asus TUF Dash F15 FX517ZR | |
| Average NVIDIA GeForce RTX 3070 Ti Laptop GPU (36 - 46, n=16) | |
| Acer Nitro 5 AN515-46-R1A1 (3.3.0) | |
| Aorus 15 XE5 (3.3.0) | |
| Aorus 15 XE5 (3.3.0, Turbo Mode) | |
| Average of class Gaming (15 - 228, n=106, last 2 years) | |
| v3.3 Classroom CPU | |
| Schenker XMG Fusion 15 (Mid 22) | |
| Asus TUF Dash F15 FX517ZR | |
| Aorus 15 XE5 (3.3.0) | |
| Acer Nitro 5 AN515-46-R1A1 (3.3.0) | |
| Average NVIDIA GeForce RTX 3070 Ti Laptop GPU (285 - 459, n=16) | |
| Aorus 15 XE5 (3.3.0, Turbo Mode) | |
| Average of class Gaming (122 - 565, n=102, last 2 years) | |
* ... smaller is better
游戏性能
笔记本电脑的硬件能够以QHD和高至最大设置运行游戏。如果你将设备连接到一个合适的显示器上,你也可以以更高的分辨率玩游戏--尽管这有时可能需要你降低设置。在Aorus 15 XE5上,我们用于测试的游戏通常以高于RTX 3070 Ti平均能产生的帧率运行。在某些情况下,启用 "涡轮模式 "导致帧率略有增加。
| Performance rating - Percent | |
| Average of class Gaming | |
| Aorus 15 XE5 | |
| MSI Katana GF66 12UGS | |
| Schenker XMG Fusion 15 (Mid 22) | |
| Asus TUF Dash F15 FX517ZR | |
| Acer Nitro 5 AN515-46-R1A1 | |
| The Witcher 3 - 1920x1080 Ultra Graphics & Postprocessing (HBAO+) | |
| Average of class Gaming (104.7 - 240, n=7, last 2 years) | |
| Acer Nitro 5 AN515-46-R1A1 | |
| Aorus 15 XE5 | |
| MSI Katana GF66 12UGS | |
| Schenker XMG Fusion 15 (Mid 22) | |
| Asus TUF Dash F15 FX517ZR | |
| GTA V - 1920x1080 Highest AA:4xMSAA + FX AF:16x | |
| Average of class Gaming (48.3 - 186.9, n=94, last 2 years) | |
| Aorus 15 XE5 | |
| Asus TUF Dash F15 FX517ZR | |
| MSI Katana GF66 12UGS | |
| Schenker XMG Fusion 15 (Mid 22) | |
| Acer Nitro 5 AN515-46-R1A1 | |
| Final Fantasy XV Benchmark - 1920x1080 High Quality | |
| Average of class Gaming (41 - 215, n=95, last 2 years) | |
| Acer Nitro 5 AN515-46-R1A1 | |
| Aorus 15 XE5 | |
| Schenker XMG Fusion 15 (Mid 22) | |
| MSI Katana GF66 12UGS | |
| Asus TUF Dash F15 FX517ZR | |
| Strange Brigade - 1920x1080 ultra AA:ultra AF:16 | |
| Average of class Gaming (76.3 - 458, n=87, last 2 years) | |
| Aorus 15 XE5 | |
| Acer Nitro 5 AN515-46-R1A1 | |
| MSI Katana GF66 12UGS | |
| Schenker XMG Fusion 15 (Mid 22) | |
| Asus TUF Dash F15 FX517ZR | |
| Dota 2 Reborn - 1920x1080 ultra (3/3) best looking | |
| Average of class Gaming (84.8 - 248, n=107, last 2 years) | |
| Aorus 15 XE5 | |
| MSI Katana GF66 12UGS | |
| Schenker XMG Fusion 15 (Mid 22) | |
| Asus TUF Dash F15 FX517ZR | |
| Acer Nitro 5 AN515-46-R1A1 | |
| X-Plane 11.11 - 1920x1080 high (fps_test=3) | |
| Aorus 15 XE5 | |
| MSI Katana GF66 12UGS | |
| Asus TUF Dash F15 FX517ZR | |
| Average of class Gaming (55.5 - 143.5, n=109, last 2 years) | |
| Schenker XMG Fusion 15 (Mid 22) | |
| Acer Nitro 5 AN515-46-R1A1 | |
| Performance rating - Percent | |
| Average of class Gaming -5! | |
| Aorus 15 XE5 | |
| Average NVIDIA GeForce RTX 3070 Ti Laptop GPU | |
| Aorus 15 XE5 -6! | |
| Acer Nitro 5 AN515-46-R1A1 -4! | |
| MSI Katana GF66 12UGS -6! | |
| Schenker XMG Fusion 15 (Mid 22) -6! | |
| Asus TUF Dash F15 FX517ZR -6! | |
| The Witcher 3 - 1920x1080 Ultra Graphics & Postprocessing (HBAO+) | |
| Average of class Gaming (104.7 - 240, n=7, last 2 years) | |
| Acer Nitro 5 AN515-46-R1A1 | |
| Aorus 15 XE5 (Turbo Mode) | |
| Average NVIDIA GeForce RTX 3070 Ti Laptop GPU (76.8 - 124.1, n=39) | |
| Aorus 15 XE5 | |
| MSI Katana GF66 12UGS | |
| Schenker XMG Fusion 15 (Mid 22) | |
| Asus TUF Dash F15 FX517ZR | |
| GTA V - 1920x1080 Highest AA:4xMSAA + FX AF:16x | |
| Average of class Gaming (48.3 - 186.9, n=94, last 2 years) | |
| Aorus 15 XE5 (Turbo Mode) | |
| Aorus 15 XE5 | |
| Average NVIDIA GeForce RTX 3070 Ti Laptop GPU (44 - 123.9, n=36) | |
| Asus TUF Dash F15 FX517ZR | |
| MSI Katana GF66 12UGS | |
| Schenker XMG Fusion 15 (Mid 22) | |
| Acer Nitro 5 AN515-46-R1A1 | |
| Final Fantasy XV Benchmark - 1920x1080 High Quality | |
| Average of class Gaming (41 - 215, n=95, last 2 years) | |
| Acer Nitro 5 AN515-46-R1A1 (1.3) | |
| Aorus 15 XE5 (1.3, Turbo Mode) | |
| Aorus 15 XE5 (1.3) | |
| Average NVIDIA GeForce RTX 3070 Ti Laptop GPU (49.5 - 122.4, n=35) | |
| Schenker XMG Fusion 15 (Mid 22) (1.3) | |
| MSI Katana GF66 12UGS (1.3) | |
| Asus TUF Dash F15 FX517ZR (1.3) | |
| Strange Brigade - 1920x1080 ultra AA:ultra AF:16 | |
| Average of class Gaming (76.3 - 458, n=87, last 2 years) | |
| Aorus 15 XE5 (1.47.22.14 D3D12, Turbo Mode) | |
| Aorus 15 XE5 (1.47.22.14 D3D12) | |
| Average NVIDIA GeForce RTX 3070 Ti Laptop GPU (109 - 221, n=37) | |
| Acer Nitro 5 AN515-46-R1A1 (1.47.22.14 D3D12) | |
| MSI Katana GF66 12UGS (1.47.22.14 D3D12) | |
| Schenker XMG Fusion 15 (Mid 22) (1.47.22.14 D3D12) | |
| Asus TUF Dash F15 FX517ZR (1.47.22.14 D3D12) | |
| Dota 2 Reborn - 1920x1080 ultra (3/3) best looking | |
| Average of class Gaming (84.8 - 248, n=107, last 2 years) | |
| Aorus 15 XE5 | |
| Aorus 15 XE5 (Turbo Mode) | |
| MSI Katana GF66 12UGS | |
| Average NVIDIA GeForce RTX 3070 Ti Laptop GPU (68.7 - 160.5, n=38) | |
| Schenker XMG Fusion 15 (Mid 22) | |
| Asus TUF Dash F15 FX517ZR | |
| Acer Nitro 5 AN515-46-R1A1 | |
| X-Plane 11.11 - 1920x1080 high (fps_test=3) | |
| Aorus 15 XE5 | |
| Aorus 15 XE5 (Turbo Mode) | |
| MSI Katana GF66 12UGS | |
| Asus TUF Dash F15 FX517ZR | |
| Average of class Gaming (55.5 - 143.5, n=109, last 2 years) | |
| Average NVIDIA GeForce RTX 3070 Ti Laptop GPU (51.6 - 116.9, n=37) | |
| Schenker XMG Fusion 15 (Mid 22) | |
| Acer Nitro 5 AN515-46-R1A1 | |
| F1 22 - 1920x1080 Ultra High Preset AA:T AF:16x | |
| Average of class Gaming (40.1 - 121.2, n=4, last 2 years) | |
| Acer Nitro 5 AN515-46-R1A1 (923662) | |
| Average NVIDIA GeForce RTX 3070 Ti Laptop GPU (58.1 - 80, n=8) | |
| Aorus 15 XE5 (928484, Turbo Mode) | |
| Aorus 15 XE5 (928484) | |
| The Quarry - 1920x1080 Ultra Preset | |
| Acer Nitro 5 AN515-46-R1A1 | |
| Average NVIDIA GeForce RTX 3070 Ti Laptop GPU (80 - 81.5, n=2) | |
| Aorus 15 XE5 | |
| A Plague Tale Requiem - 1920x1080 Ultra Preset | |
| Average NVIDIA GeForce RTX 3070 Ti Laptop GPU (61.9 - 62.9, n=2) | |
| Aorus 15 XE5 | |
| Uncharted Legacy of Thieves Collection - 1920x1080 Ultra Preset | |
| Aorus 15 XE5 | |
| Average NVIDIA GeForce RTX 3070 Ti Laptop GPU (69.3 - 72.4, n=2) | |
| Call of Duty Modern Warfare 2 2022 - 1920x1080 Extreme Quality Preset AA:T2X Filmic SM | |
| Aorus 15 XE5 | |
| Average NVIDIA GeForce RTX 3070 Ti Laptop GPU (84 - 86, n=3) | |
| Spider-Man Miles Morales - 1920x1080 Very High Preset AA:T | |
| Average NVIDIA GeForce RTX 3070 Ti Laptop GPU (91 - 93.2, n=2) | |
| Aorus 15 XE5 | |
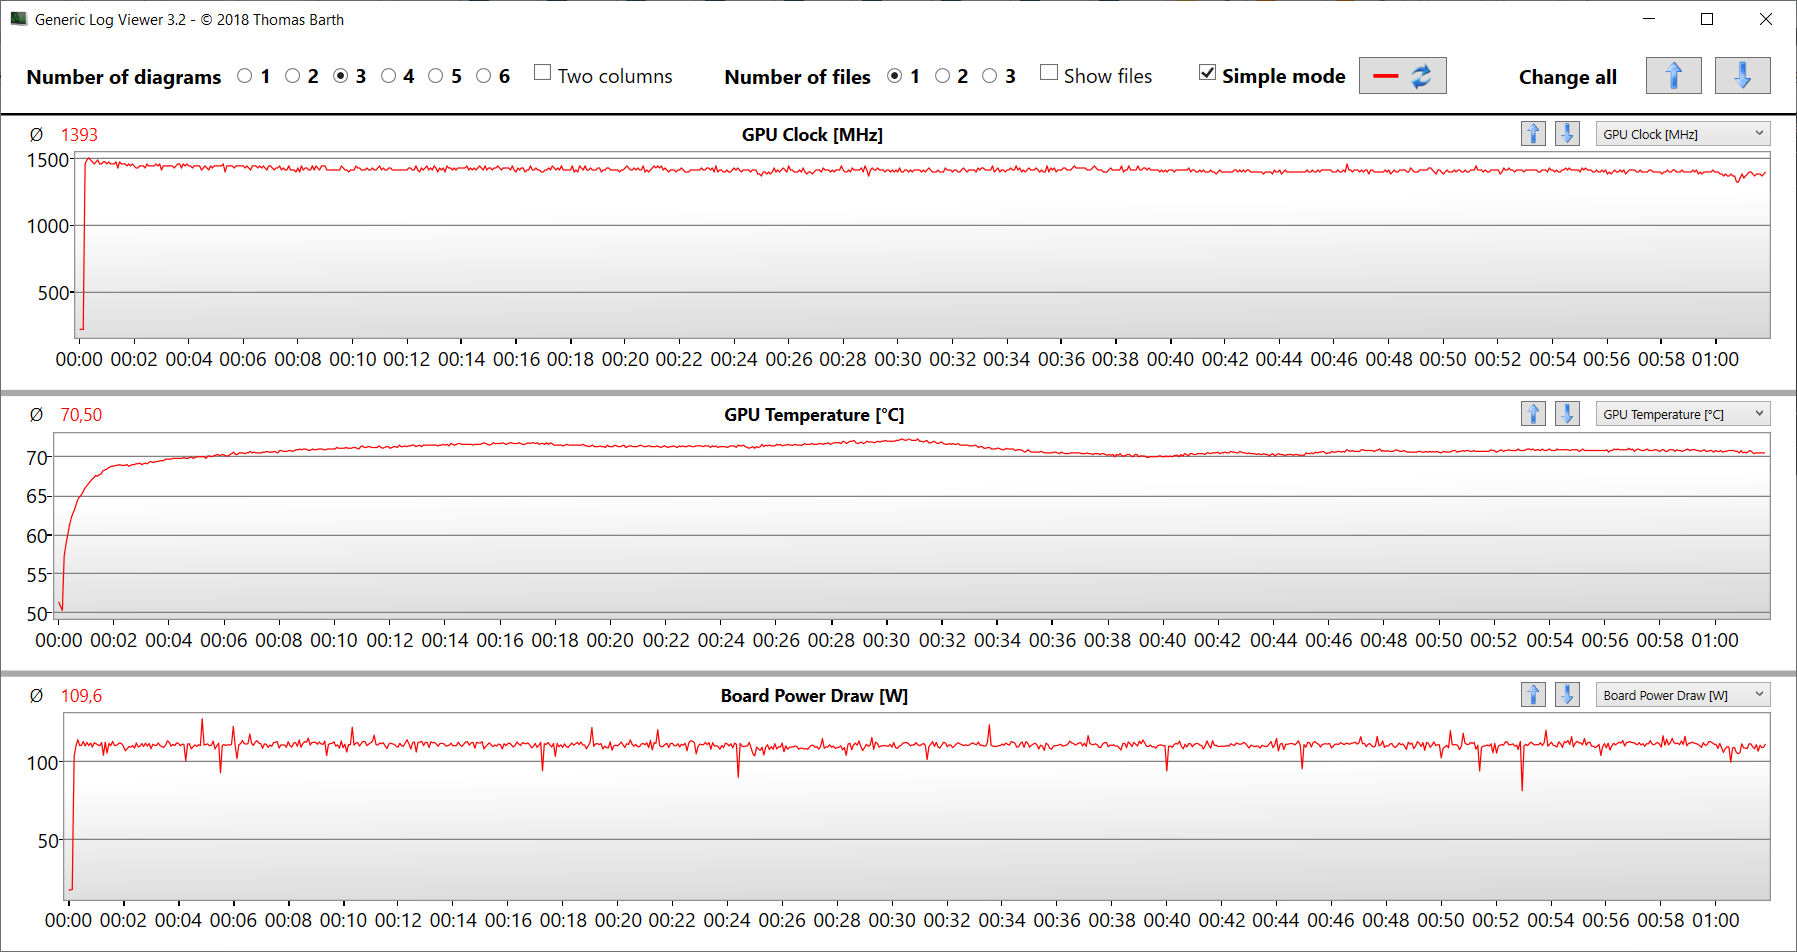
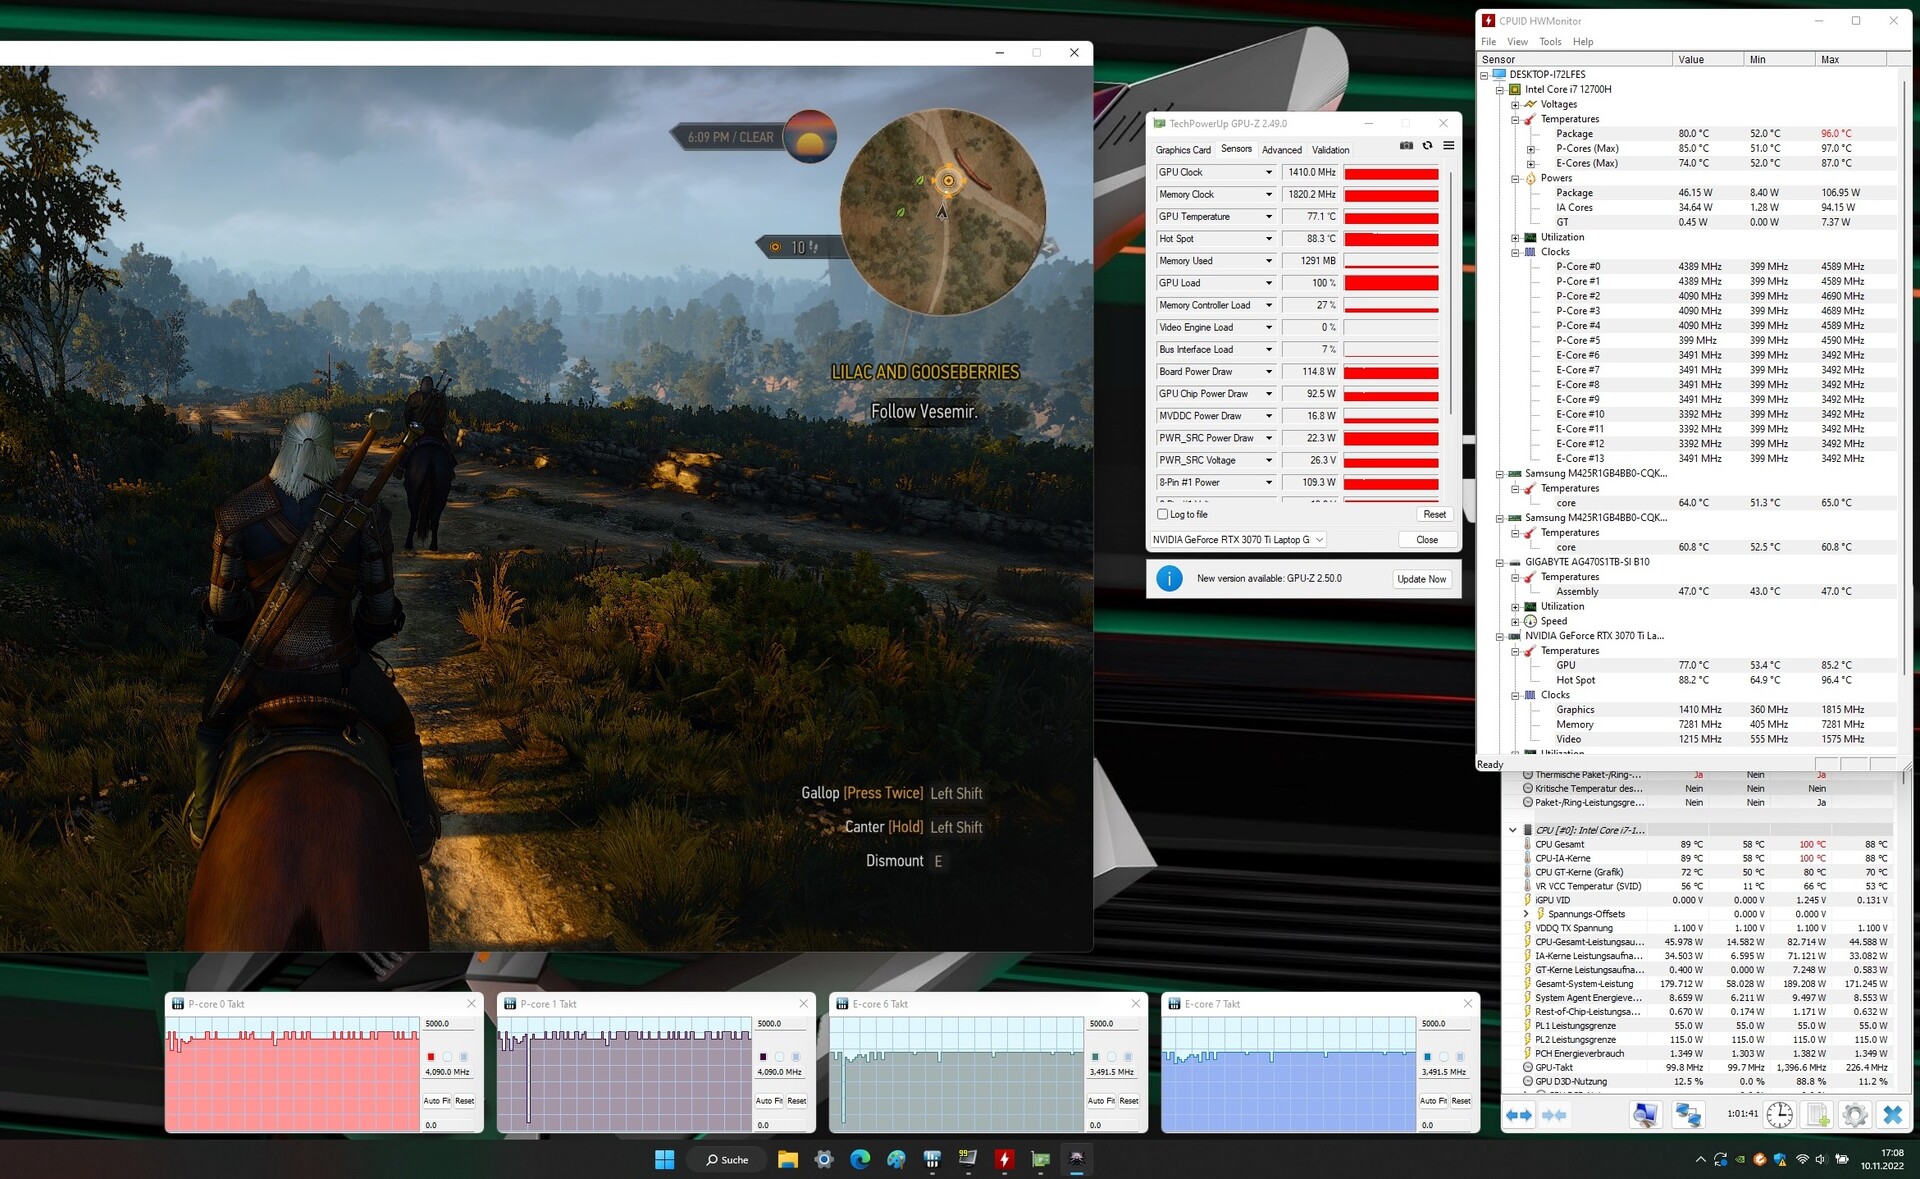
为了了解笔记本是否能在长时间内以基本稳定的帧率运行游戏,我们在全高清分辨率和最大质量设置下运行了 "TheWitcher 3"大约60分钟,没有移动玩家角色。结果是:帧率没有任何下降。
Witcher 3 FPS chart
| low | med. | high | ultra | QHD | |
|---|---|---|---|---|---|
| GTA V (2015) | 186.4 | 182.3 | 176.4 | 115.6 | 99.9 |
| The Witcher 3 (2015) | 357 | 300 | 183.2 | 100.1 | |
| Dota 2 Reborn (2015) | 168.4 | 158 | 148.4 | 140.8 | |
| Final Fantasy XV Benchmark (2018) | 196.3 | 138.8 | 104.6 | 79.2 | |
| X-Plane 11.11 (2018) | 142 | 130.7 | 105.3 | ||
| Far Cry 5 (2018) | 166 | 144 | 137 | 129 | 103 |
| Strange Brigade (2018) | 445 | 255 | 212 | 188.5 | 140.9 |
| F1 22 (2022) | 220 | 215 | 181.3 | 64.2 | 42.7 |
| The Quarry (2022) | 156.2 | 119.1 | 98.4 | 80 | 56.1 |
| A Plague Tale Requiem (2022) | 93.8 | 81.8 | 71.1 | 61.9 | 48.6 |
| Uncharted Legacy of Thieves Collection (2022) | 81 | 80.2 | 75.4 | 72.4 | 55.5 |
| Call of Duty Modern Warfare 2 2022 (2022) | 127 | 111 | 87 | 86 | 61 |
| Spider-Man Miles Morales (2022) | 108.2 | 103.8 | 93 | 91 | 73.5 |
排放 - 需要进行一些改进
噪声排放
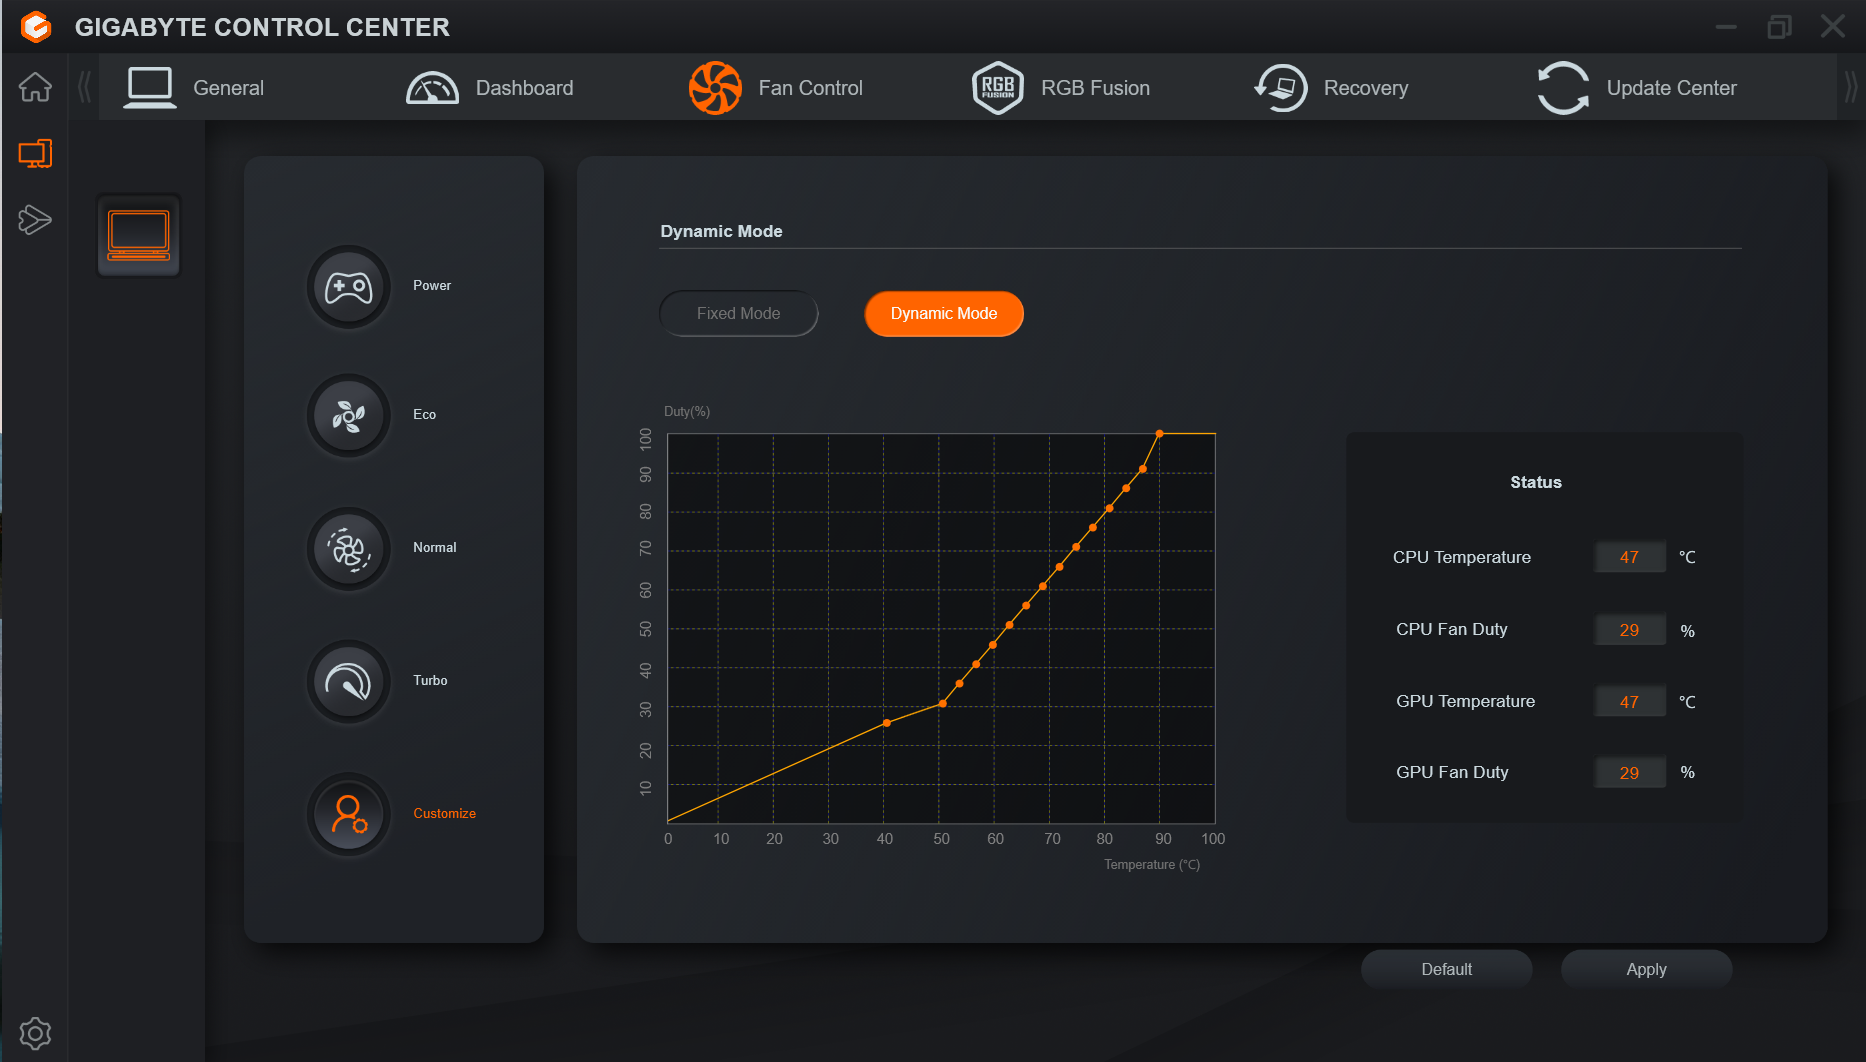
在日常使用中(如办公应用、网络浏览)和闲置时,笔记本电脑的两个风扇相对安静,有时甚至根本不转。在中高负荷下,系统变得相当响亮,在压力测试和Witcher 3 ,噪音水平高达52 dB(A)。技嘉控制中心允许用户调整风扇速度和配置风扇曲线。
Noise level
| Idle |
| 26 / 28 / 30 dB(A) |
| Load |
| 48 / 52 dB(A) |
 | ||
30 dB silent 40 dB(A) audible 50 dB(A) loud |
||
min: | ||
| Aorus 15 XE5 i7-12700H, GeForce RTX 3070 Ti Laptop GPU | Acer Nitro 5 AN515-46-R1A1 R7 6800H, GeForce RTX 3070 Ti Laptop GPU | Schenker XMG Fusion 15 (Mid 22) i7-11800H, GeForce RTX 3070 Laptop GPU | Asus TUF Dash F15 FX517ZR i7-12650H, GeForce RTX 3070 Laptop GPU | MSI Katana GF66 12UGS i7-12700H, GeForce RTX 3070 Ti Laptop GPU | |
|---|---|---|---|---|---|
| Noise | -9% | 2% | -2% | 3% | |
| off / environment * (dB) | 24 | 25 -4% | 26 -8% | 26 -8% | 26 -8% |
| Idle Minimum * (dB) | 26 | 25 4% | 26 -0% | 26 -0% | 27 -4% |
| Idle Average * (dB) | 28 | 28.6 -2% | 28 -0% | 32 -14% | 28 -0% |
| Idle Maximum * (dB) | 30 | 44.3 -48% | 31 -3% | 33 -10% | 31 -3% |
| Load Average * (dB) | 48 | 47.6 1% | 45 6% | 48 -0% | 44 8% |
| Witcher 3 ultra * (dB) | 52 | 46 12% | 47 10% | 44 15% | |
| Load Maximum * (dB) | 52 | 53.6 -3% | 48 8% | 49 6% | 45 13% |
* ... smaller is better
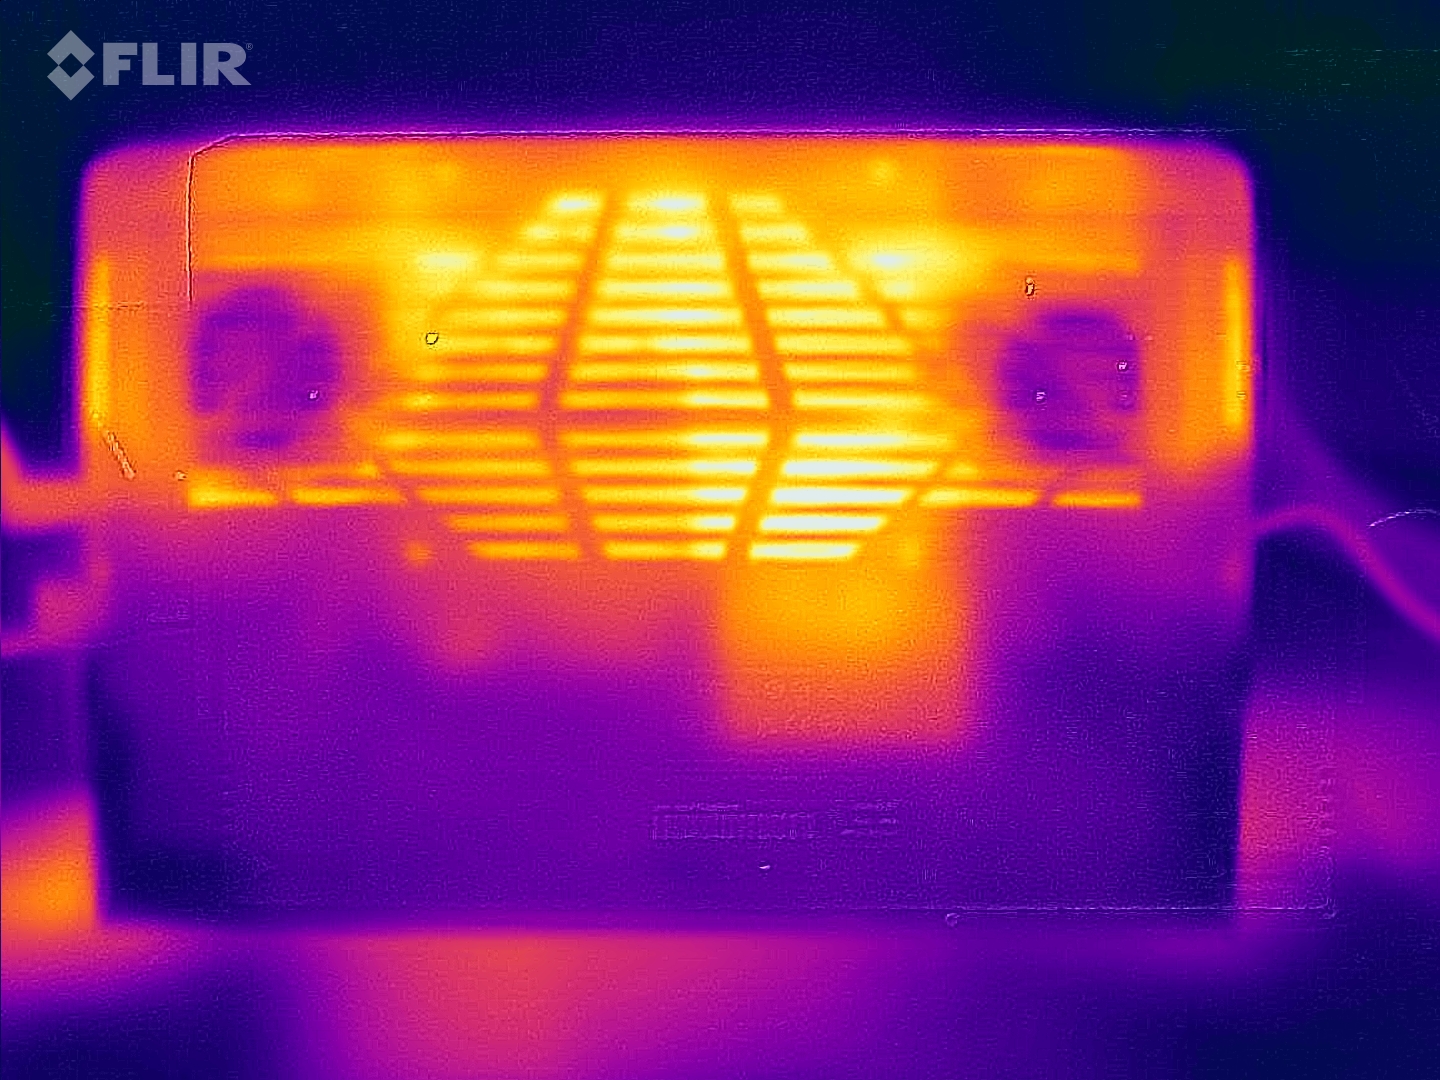
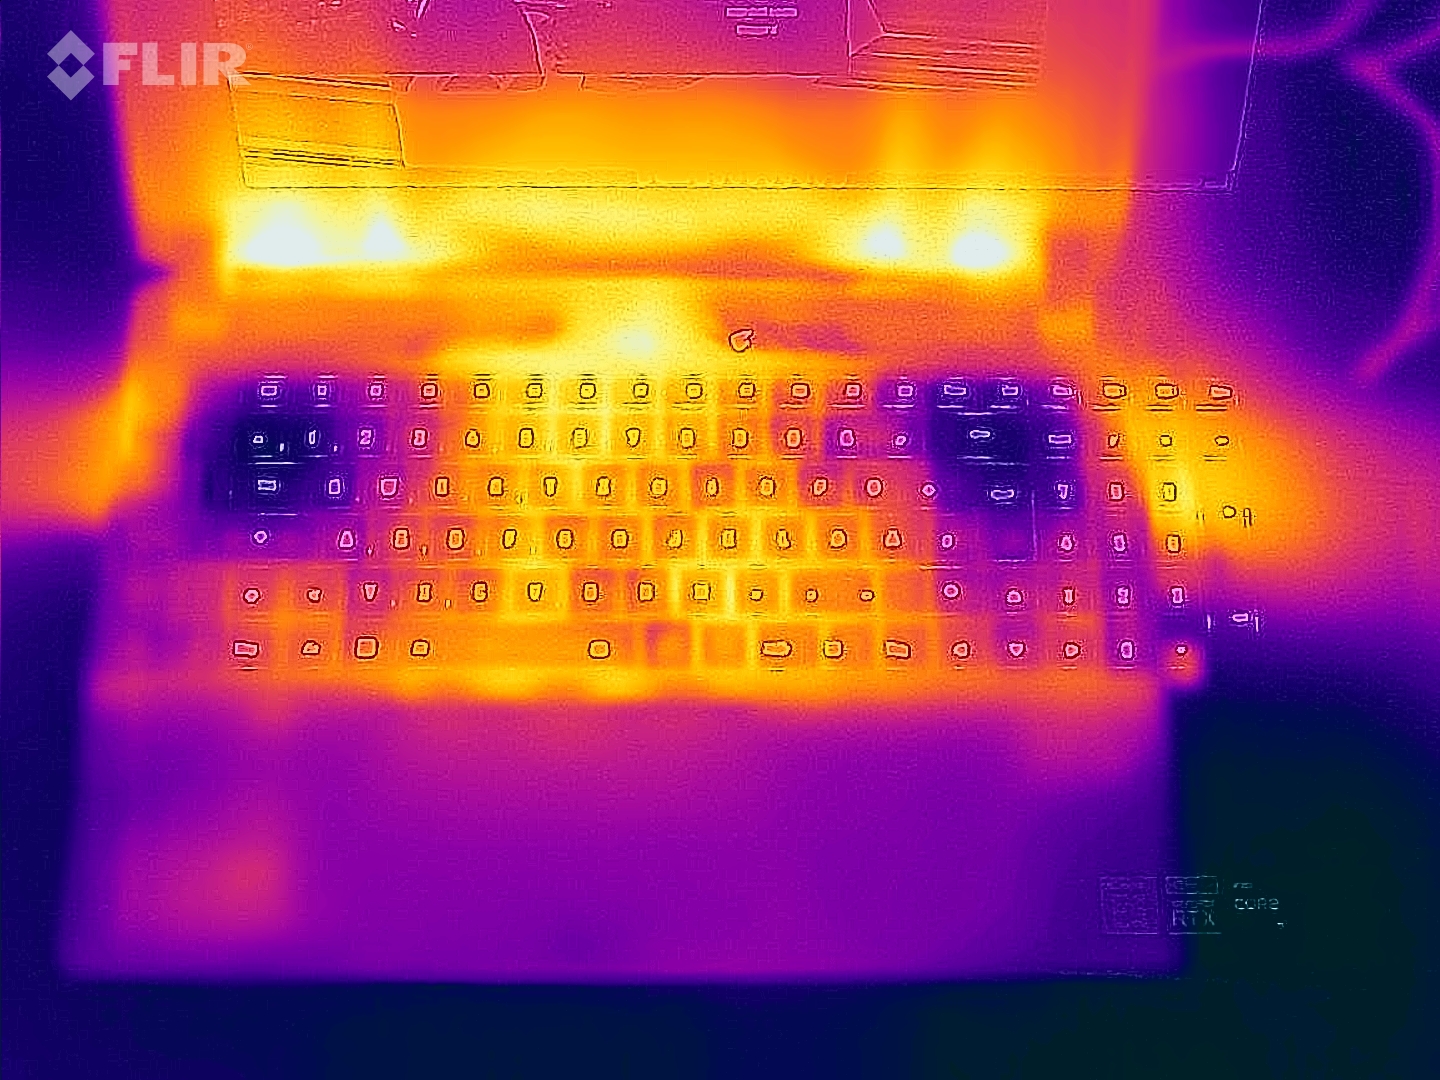
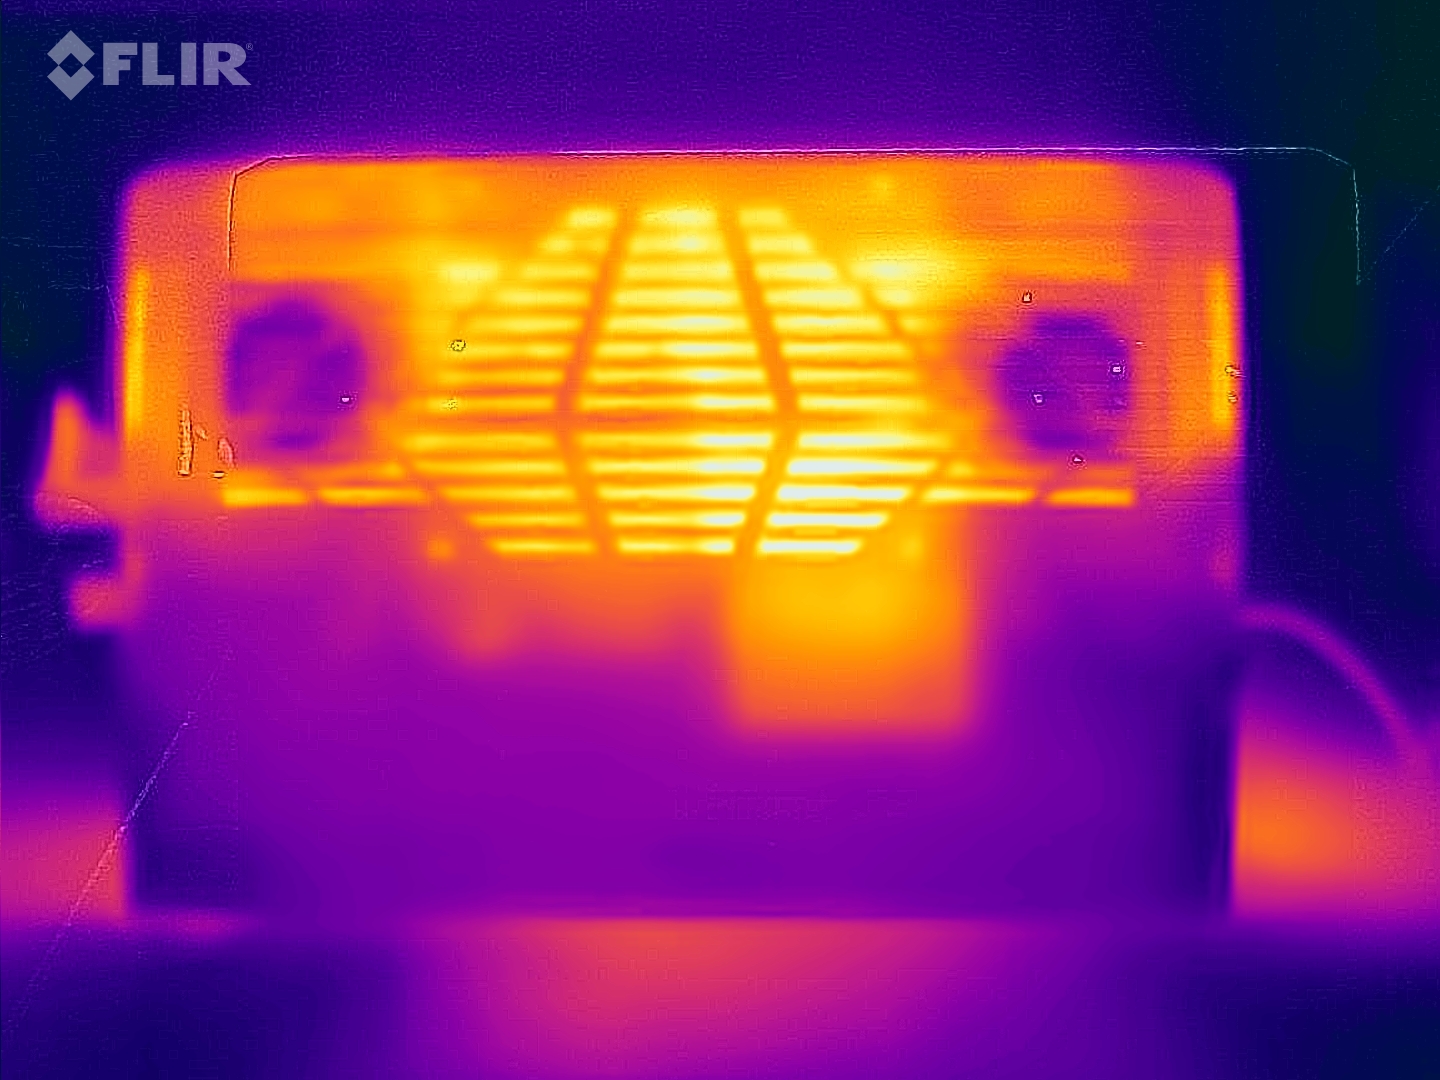
温度
当笔记本电脑处理日常任务时,机箱会变得相对温暖,但其温度仍在可接受的范围内。在负载情况下(压力测试,Witcher 3 ),笔记本在整个设备上的平均温度变得适中,但有一些非常明显的热点。也就是说,CPU的温度并没有引起任何关注。
(-) The maximum temperature on the upper side is 46 °C / 115 F, compared to the average of 40.4 °C / 105 F, ranging from 21.2 to 68.8 °C for the class Gaming.
(-) The bottom heats up to a maximum of 57 °C / 135 F, compared to the average of 43.2 °C / 110 F
(±) In idle usage, the average temperature for the upper side is 32.4 °C / 90 F, compared to the device average of 33.9 °C / 93 F.
(±) Playing The Witcher 3, the average temperature for the upper side is 37.6 °C / 100 F, compared to the device average of 33.9 °C / 93 F.
(+) The palmrests and touchpad are reaching skin temperature as a maximum (35 °C / 95 F) and are therefore not hot.
(-) The average temperature of the palmrest area of similar devices was 28.8 °C / 83.8 F (-6.2 °C / -11.2 F).
| Aorus 15 XE5 Intel Core i7-12700H, NVIDIA GeForce RTX 3070 Ti Laptop GPU | Acer Nitro 5 AN515-46-R1A1 AMD Ryzen 7 6800H, NVIDIA GeForce RTX 3070 Ti Laptop GPU | Schenker XMG Fusion 15 (Mid 22) Intel Core i7-11800H, NVIDIA GeForce RTX 3070 Laptop GPU | Asus TUF Dash F15 FX517ZR Intel Core i7-12650H, NVIDIA GeForce RTX 3070 Laptop GPU | MSI Katana GF66 12UGS Intel Core i7-12700H, NVIDIA GeForce RTX 3070 Ti Laptop GPU | |
|---|---|---|---|---|---|
| Heat | 14% | -3% | 6% | -8% | |
| Maximum Upper Side * (°C) | 46 | 48.1 -5% | 52 -13% | 52 -13% | 61 -33% |
| Maximum Bottom * (°C) | 57 | 49.7 13% | 63 -11% | 52 9% | 55 4% |
| Idle Upper Side * (°C) | 38 | 30 21% | 37 3% | 33 13% | 43 -13% |
| Idle Bottom * (°C) | 42 | 31.7 25% | 38 10% | 36 14% | 38 10% |
* ... smaller is better
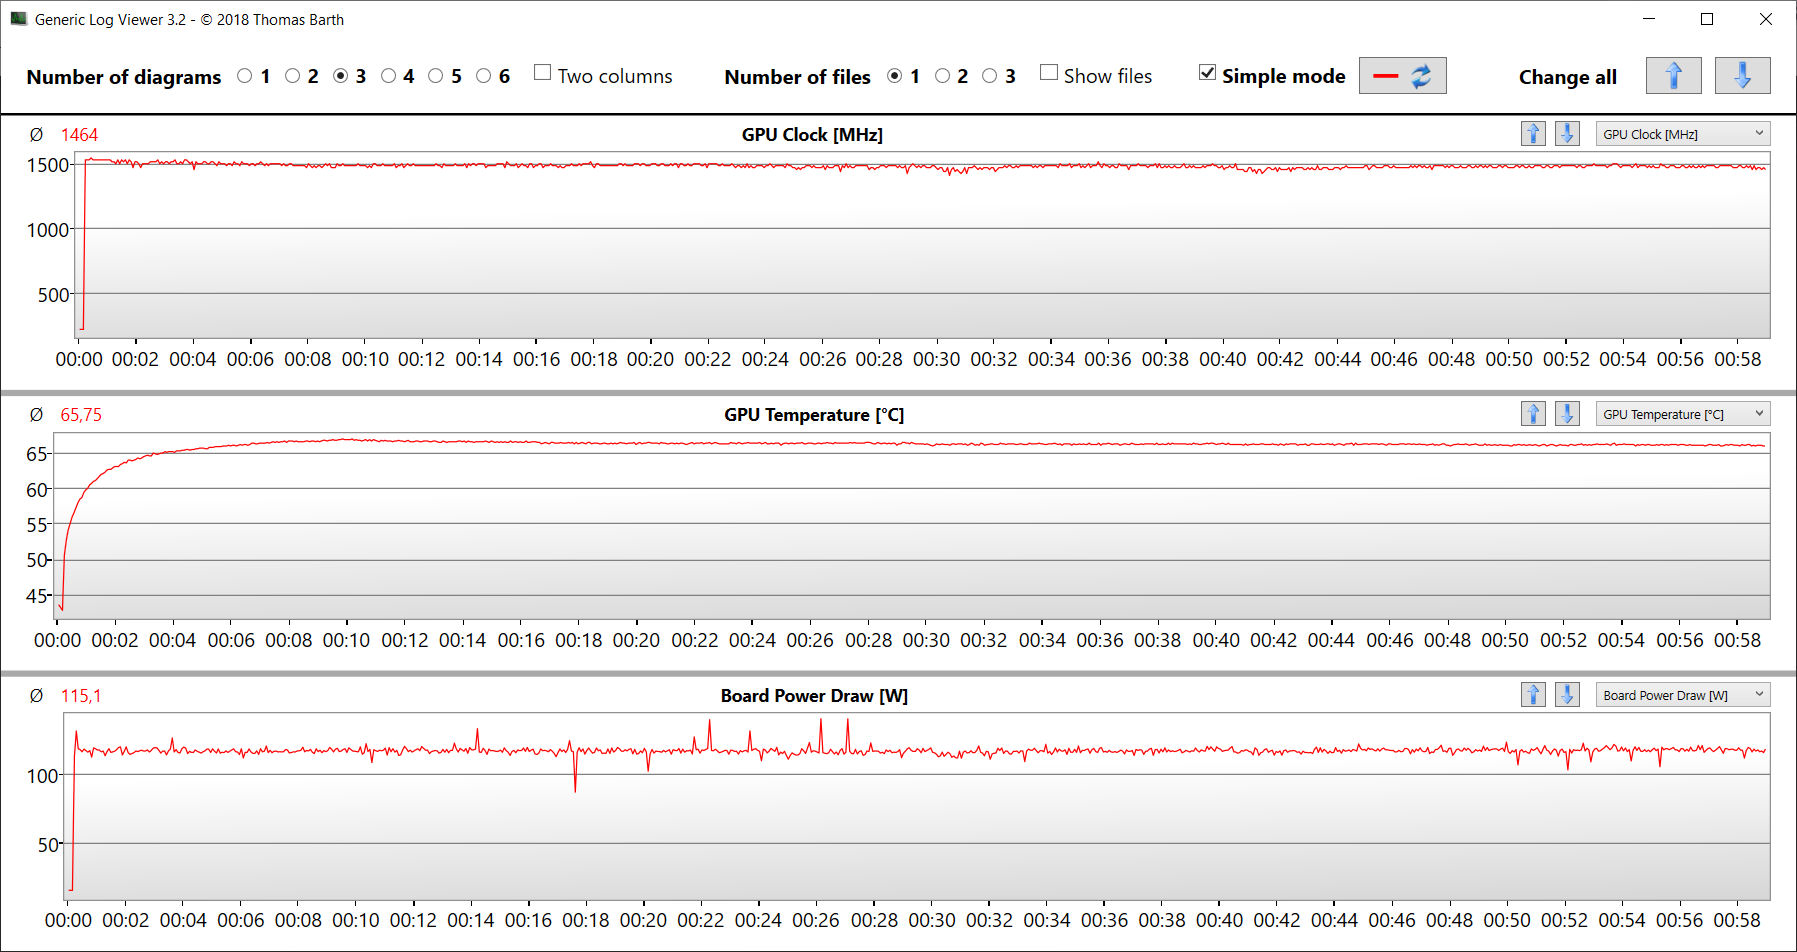
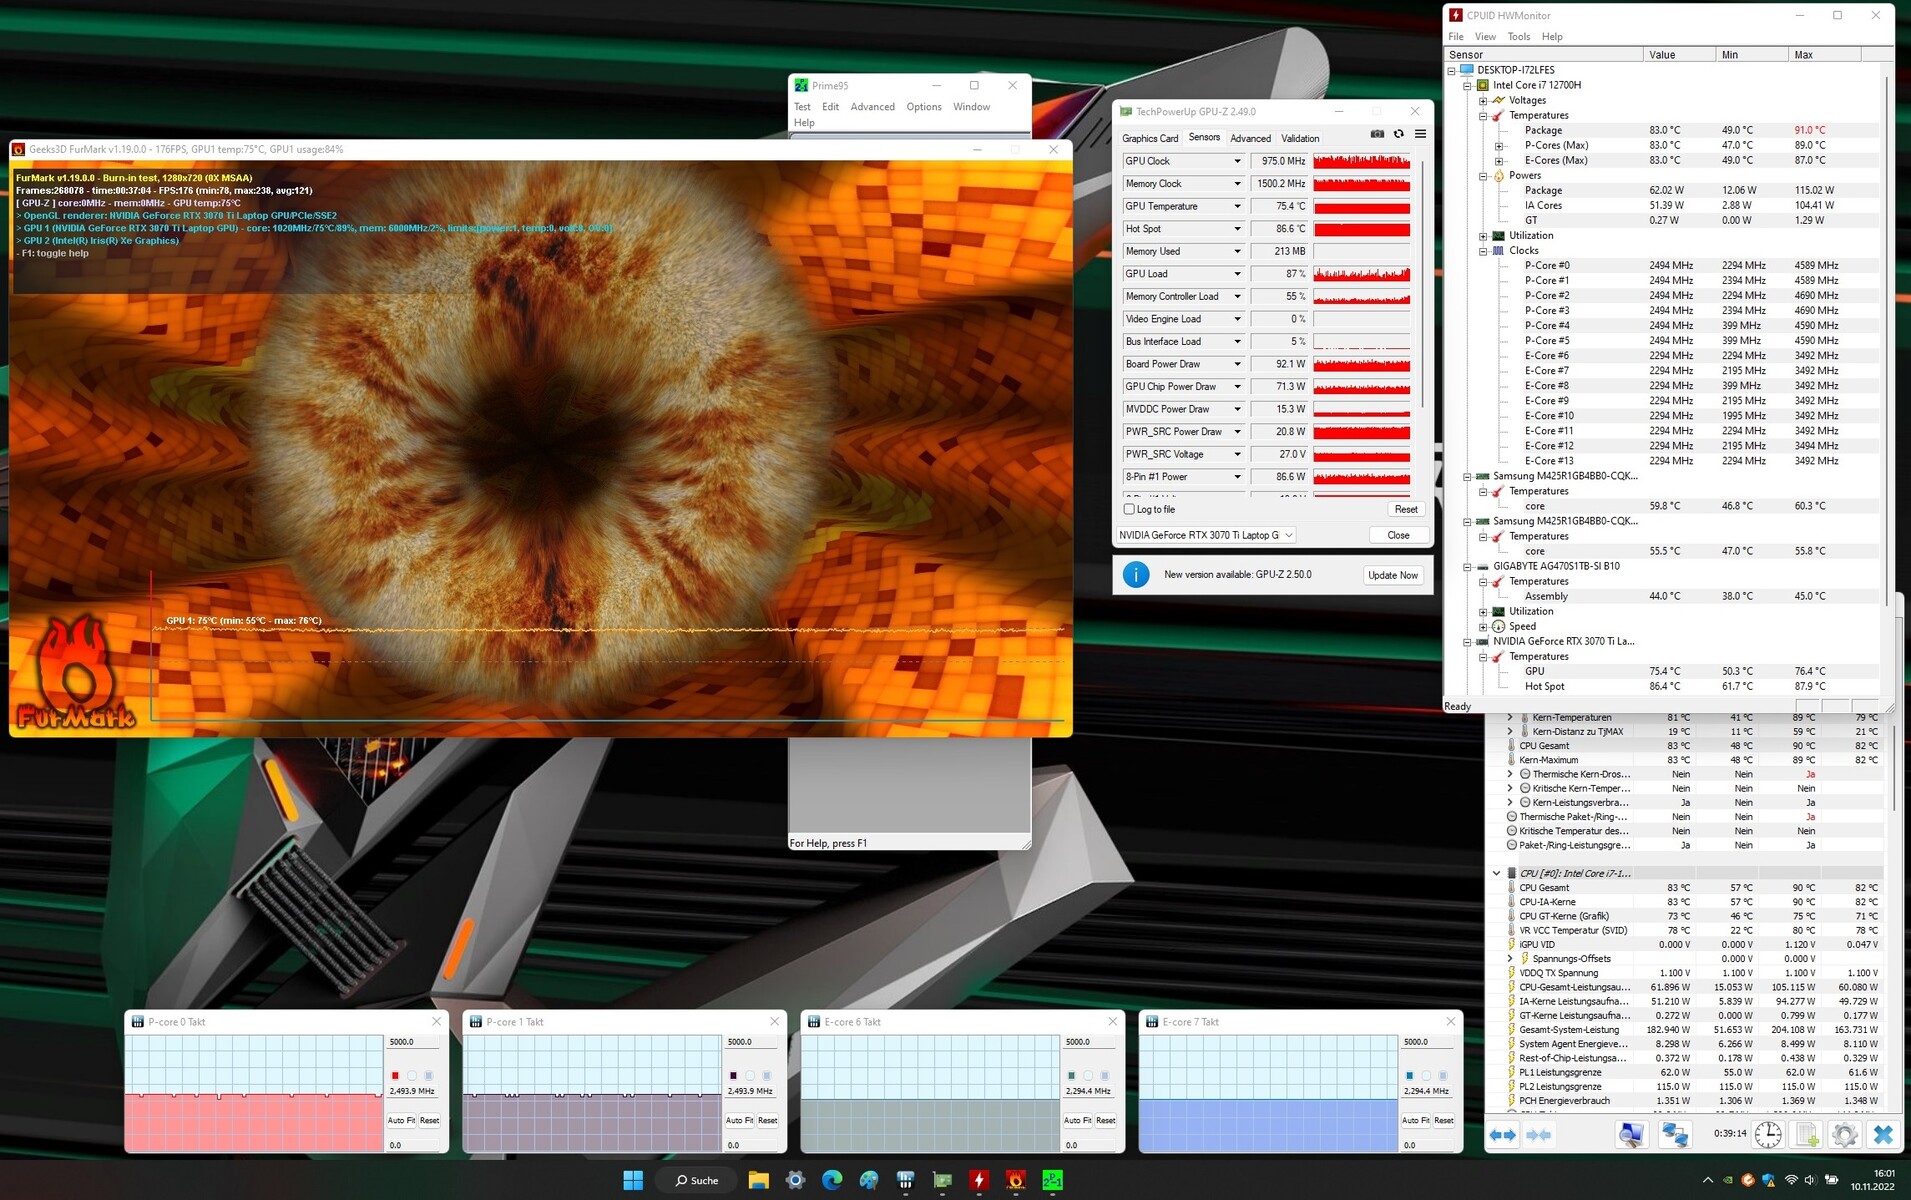
压力测试
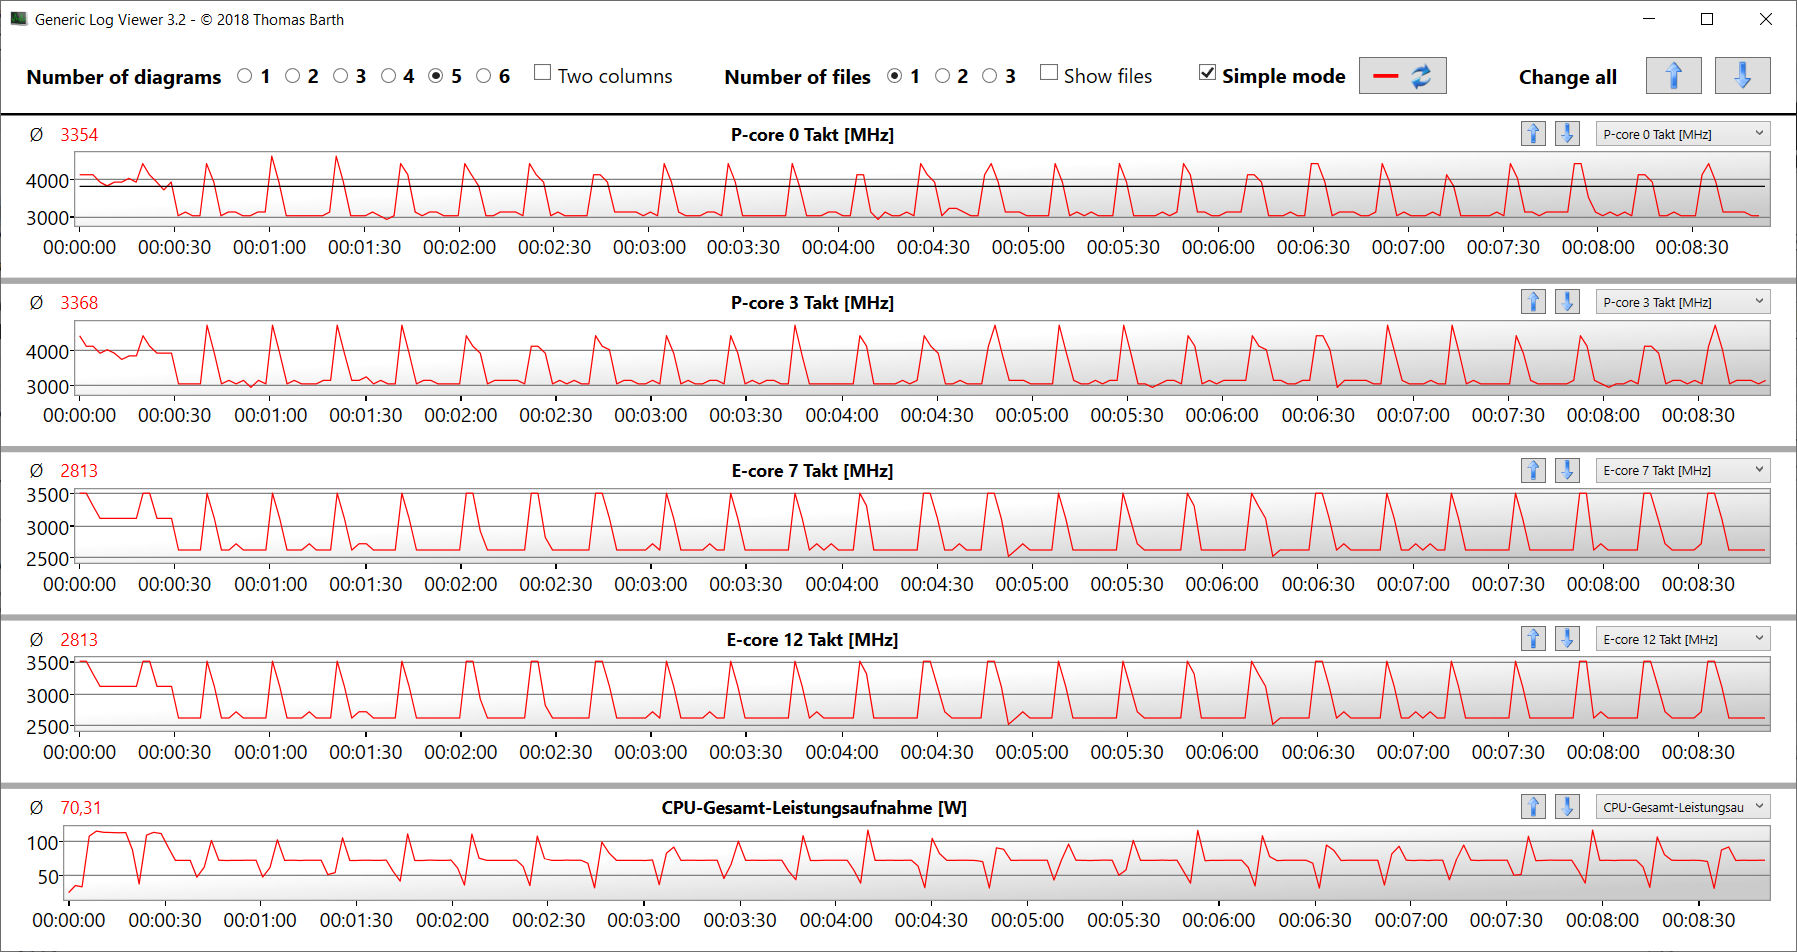
我们的压力测试,包括同时连续运行Prime95和FurMark,代表了一种极端情况,旨在评估系统在全负荷下的稳定性。在测试期间(至少持续一个小时),CPU以中等的时钟速度运行(P-cores:约2.5GHz;E-cores:约2.3GHz),而GPU则在1,000至1,500MHz之间波动。

发言人
立体声扬声器听起来还不错,但几乎没有任何低音。我们建议使用耳机或外部扬声器以获得更好的听觉体验。
Aorus 15 XE5 audio analysis
(+) | speakers can play relatively loud (85 dB)
Bass 100 - 315 Hz
(-) | nearly no bass - on average 27.9% lower than median
(±) | linearity of bass is average (11.4% delta to prev. frequency)
Mids 400 - 2000 Hz
(+) | balanced mids - only 4.9% away from median
(+) | mids are linear (4.4% delta to prev. frequency)
Highs 2 - 16 kHz
(+) | balanced highs - only 3.5% away from median
(+) | highs are linear (2.9% delta to prev. frequency)
Overall 100 - 16.000 Hz
(±) | linearity of overall sound is average (19.4% difference to median)
Compared to same class
» 67% of all tested devices in this class were better, 7% similar, 26% worse
» The best had a delta of 6%, average was 18%, worst was 132%
Compared to all devices tested
» 48% of all tested devices were better, 7% similar, 45% worse
» The best had a delta of 4%, average was 23%, worst was 134%
Asus TUF Dash F15 FX517ZR audio analysis
(±) | speaker loudness is average but good (79 dB)
Bass 100 - 315 Hz
(-) | nearly no bass - on average 19.2% lower than median
(±) | linearity of bass is average (9.6% delta to prev. frequency)
Mids 400 - 2000 Hz
(+) | balanced mids - only 2.7% away from median
(+) | mids are linear (5% delta to prev. frequency)
Highs 2 - 16 kHz
(+) | balanced highs - only 2.2% away from median
(±) | linearity of highs is average (7.7% delta to prev. frequency)
Overall 100 - 16.000 Hz
(±) | linearity of overall sound is average (15.3% difference to median)
Compared to same class
» 34% of all tested devices in this class were better, 6% similar, 60% worse
» The best had a delta of 6%, average was 18%, worst was 132%
Compared to all devices tested
» 22% of all tested devices were better, 4% similar, 74% worse
» The best had a delta of 4%, average was 23%, worst was 134%
电源管理 - XE5需要太多的电力
消耗功率
Aorus 15 XE5在空闲时太耗电了,大约消耗31至46瓦,有时甚至在最坏的情况下高达80瓦。将XE5与竞争对手进行比较,可以看出一台支持Optimus的笔记本电脑在闲置时应该消耗多少功率。这种高功率使用可能是由于一个错误造成的。即使禁用AI Boost功能,这个问题也持续存在。因此,我们将不得不等待,看看技嘉是否能够通过软件或BIOS更新来解决这个问题。
在整个压力测试和Witcher 3 ,笔记本电脑的功耗保持稳定,达到了硬件的正常水平。附带的充电器有足够的容量为笔记本电脑供电,也能够应对超过其输出额定值(240瓦)的瞬时峰值。
| Off / Standby | |
| Idle | |
| Load |
|
Key:
min: | |
| Aorus 15 XE5 i7-12700H, GeForce RTX 3070 Ti Laptop GPU | Acer Nitro 5 AN515-46-R1A1 R7 6800H, GeForce RTX 3070 Ti Laptop GPU | Schenker XMG Fusion 15 (Mid 22) i7-11800H, GeForce RTX 3070 Laptop GPU | Asus TUF Dash F15 FX517ZR i7-12650H, GeForce RTX 3070 Laptop GPU | MSI Katana GF66 12UGS i7-12700H, GeForce RTX 3070 Ti Laptop GPU | Average NVIDIA GeForce RTX 3070 Ti Laptop GPU | Average of class Gaming | |
|---|---|---|---|---|---|---|---|
| Power Consumption | 28% | 36% | 41% | 43% | 28% | 32% | |
| Idle Minimum * (Watt) | 31 | 7 77% | 12 61% | 10 68% | 9 71% | 14.2 ? 54% | 13 ? 58% |
| Idle Average * (Watt) | 35 | 8.9 75% | 17 51% | 14 60% | 13 63% | 19.9 ? 43% | 19 ? 46% |
| Idle Maximum * (Watt) | 46 | 14.4 69% | 24 48% | 20 57% | 20 57% | 26.2 ? 43% | 24.6 ? 47% |
| Load Average * (Watt) | 120 | 202 -68% | 106 12% | 122 -2% | 100 17% | 125.8 ? -5% | 110.7 ? 8% |
| Witcher 3 ultra * (Watt) | 202 | 203 -0% | 159.9 21% | 138.6 31% | 149 26% | ||
| Load Maximum * (Watt) | 268 | 230 14% | 208 22% | 189 29% | 212 21% | 248 ? 7% | 259 ? 3% |
* ... smaller is better
Power consumption Witcher 3 / Stress test
Power consumption with external monitor
电池寿命
在我们的Wi-Fi测试(使用脚本访问网站)和视频测试(以FHD格式循环播放H.264编码的短片 "Big Buck Bunny")中,这台15.6英寸的设备分别持续了6小时50分钟和6小时11分钟。在这两项测试中,笔记本电脑的所有省电功能都被禁用,显示器的亮度被调整到大约150cd/m²。此外,在视频测试中,无线模块也被停用了。
总而言之,对于一款QHD游戏笔记本来说,XE5的电池寿命肯定很好。尽管如此,Aorus并没有在很大程度上领先于像Nitro 5这样的竞争对手,这一点并不令人惊讶。 Nitro 5在电池寿命方面,尽管有几乎两倍的电池容量(99Wh对57.5Wh),但并不令人惊讶。这是因为宏碁笔记本电脑配备了一个更省电的处理器和一个FHD显示屏。
| Aorus 15 XE5 i7-12700H, GeForce RTX 3070 Ti Laptop GPU, 99 Wh | Acer Nitro 5 AN515-46-R1A1 R7 6800H, GeForce RTX 3070 Ti Laptop GPU, 57.5 Wh | Schenker XMG Fusion 15 (Mid 22) i7-11800H, GeForce RTX 3070 Laptop GPU, 93.48 Wh | Asus TUF Dash F15 FX517ZR i7-12650H, GeForce RTX 3070 Laptop GPU, 76 Wh | MSI Katana GF66 12UGS i7-12700H, GeForce RTX 3070 Ti Laptop GPU, 52 Wh | Average of class Gaming | |
|---|---|---|---|---|---|---|
| Battery runtime | -13% | 20% | 7% | -46% | 0% | |
| Reader / Idle (h) | 10 | 10.5 5% | 15.5 55% | 10.8 8% | 8.27 ? -17% | |
| H.264 (h) | 6.2 | 5.7 -8% | 7.5 21% | 5.8 -6% | 8.32 ? 34% | |
| WiFi v1.3 (h) | 6.8 | 5.8 -15% | 7.4 9% | 7 3% | 2.4 -65% | 7.11 ? 5% |
| Load (h) | 1.9 | 1.3 -32% | 1.8 -5% | 2.3 21% | 1.4 -26% | 1.502 ? -21% |
Pros
Cons
评语 - 渴望权力的游戏巨兽
Aorus 15 XE5被设计用于在QHD和高至最大设置下运行游戏。但它在其他要求较高的应用中,如视频编辑和渲染,也有不错的表现。这是由 酷睿i7 12700H和 GeForce RTX 3070 Ti Laptop内的机器。一个快如闪电的PCIe 4.0固态硬盘(1TB)可以在短时间内加载。
Aorus 15 XE5做了它应该做的:在其流畅的屏幕上流畅地运行游戏。然而,它的电源使用量太高。
这台笔记本电脑的CPU和GPU能够以持续的高时钟速度运行。虽然Aorus 15 XE5产生的噪音量对游戏笔记本来说是典型的,但它在空闲时产生的热量太高。它在空闲和低负载时的功耗也是如此--人们只能希望技嘉发布一个更新来解决这个问题。然而,这款笔记本电脑在电池运行时没有这个问题,在日常使用中可以持续6到7个小时左右--这是很可观的。
哑光QHD显示屏(15.6英寸,IPS,165Hz刷新率)大多留下了积极的印象,尽管它当然可以使用更多的对比度。Thunderbolt 4端口允许你连接各种扩展选项,如对接解决方案或外部GPU。它还支持Power Delivery,意味着笔记本电脑可以通过该端口充电(USB-C适配器,最小65瓦,20V)。
这款 申克XMG Fusion 15 (Mid 22)和 华硕TUF Dash F15是Aorus 15 XE5的两个替代品。虽然这两款笔记本电脑的性能较差,而且在负载下会非常热,但它们更轻,在某些情况下电池寿命更长。
Aorus 15 XE5
- 12/06/2022 v7 (old)
Sascha Mölck
Price comparison

