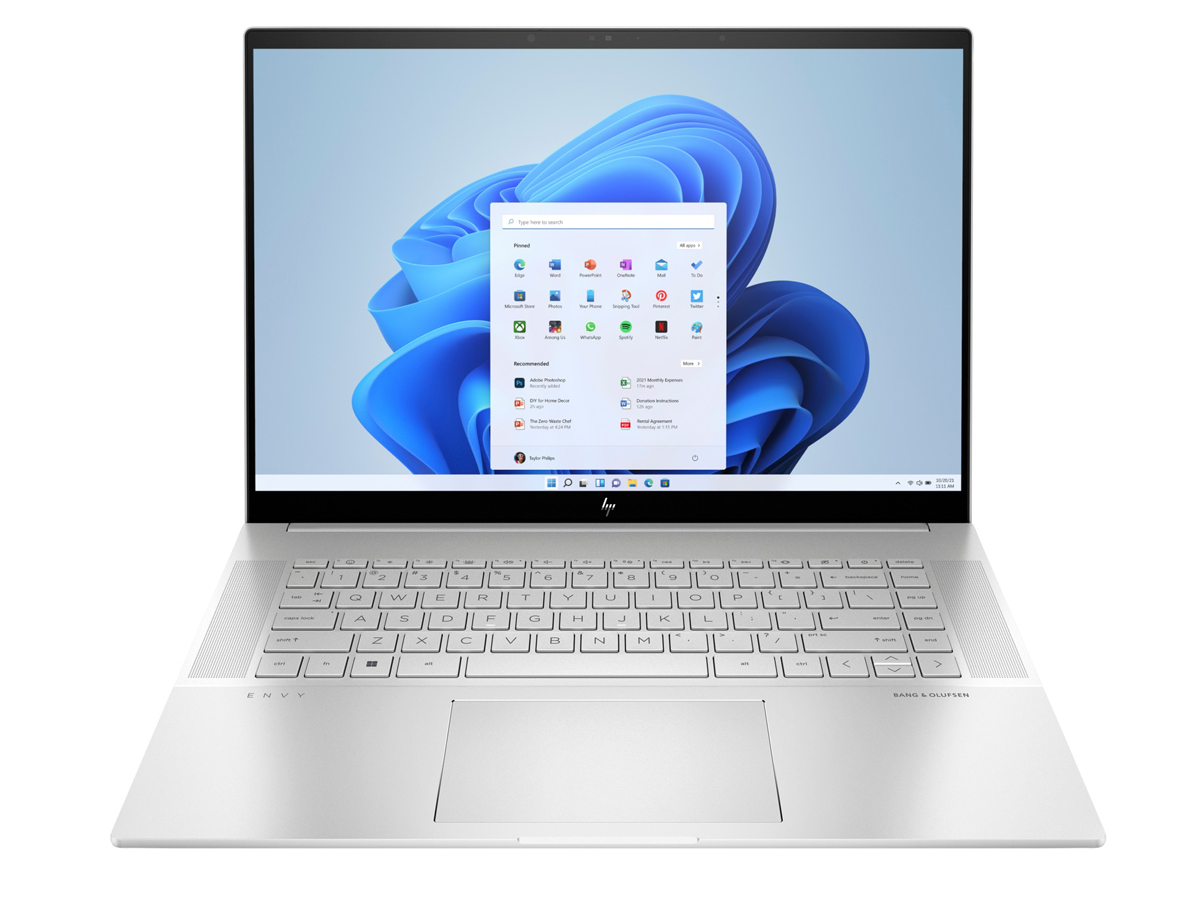
2022年惠普Envy 16笔记本电脑评测。适用于多媒体、游戏玩家、创作者以及两者之间的所有人
Envy 16取代了去年的 15.6英寸的Envy 15通过转移到一个新的16英寸外形尺寸,以及最新的英特尔第12代CPU和Nvidia和英特尔独立显卡选项。与价格较低的Pavilion 系列不同,Envy系列是更高端的专业消费者机型的所在地,通常具有更高的性能,更少的塑料,以及更好的制造质量。
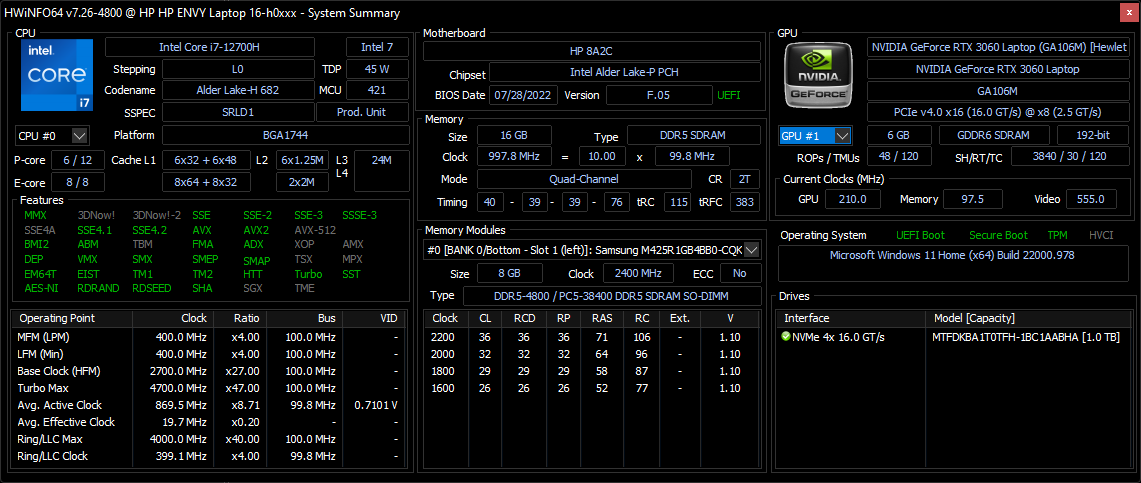
我们的具体配置是一个高端SKU,配备酷睿i7-12700H、GeForce RTX 3060和2400p OLED触摸屏,价格约为1700美元。其他配置有较慢的酷睿i5-12500H,更快的i9-12900H,英特尔A370M显卡,或1600p IPS显示屏,价格从1180美元至2380美元不等。
Envy 16的替代品包括其他高端专业消费者笔记本电脑,如 戴尔XPS 15系列, MacBook Pro 16,华为MateBook 16s,或LG Gram 16.
更多惠普评论。
潜在的竞争对手比较
Rating | Date | Model | Weight | Height | Size | Resolution | Price |
|---|---|---|---|---|---|---|---|
| 86.9 % v7 (old) | 09 / 2022 | HP Envy 16 h0112nr i7-12700H, GeForce RTX 3060 Laptop GPU | 2.3 kg | 19.8 mm | 16.00" | 3840x2400 | |
| 88.4 % v7 (old) | 09 / 2022 | Lenovo ThinkBook 16 G4+ IAP i7-12700H, GeForce RTX 2050 Mobile | 1.8 kg | 16.5 mm | 16.00" | 2560x1600 | |
| 83.7 % v7 (old) | 06 / 2022 | MSI Creator Z16P B12UHST i9-12900H, GeForce RTX 3080 Ti Laptop GPU | 2.4 kg | 20.4 mm | 16.00" | 2560x1600 | |
| 82.6 % v7 (old) | 11 / 2021 | Dell Inspiron 16 Plus 7610-MHJ8F i7-11800H, UHD Graphics Xe 32EUs (Tiger Lake-H) | 2 kg | 19 mm | 16.00" | 3072x1920 | |
| 93.2 % v7 (old) | 11 / 2021 | Apple MacBook Pro 16 2021 M1 Pro M1 Pro, M1 Pro 16-Core GPU | 2.2 kg | 16.8 mm | 16.20" | 3456x2234 | |
| 86.4 % v7 (old) | 07 / 2022 | Huawei MateBook 16s i7 i7-12700H, Iris Xe G7 96EUs | 2 kg | 17.8 mm | 16.00" | 2520x1680 |
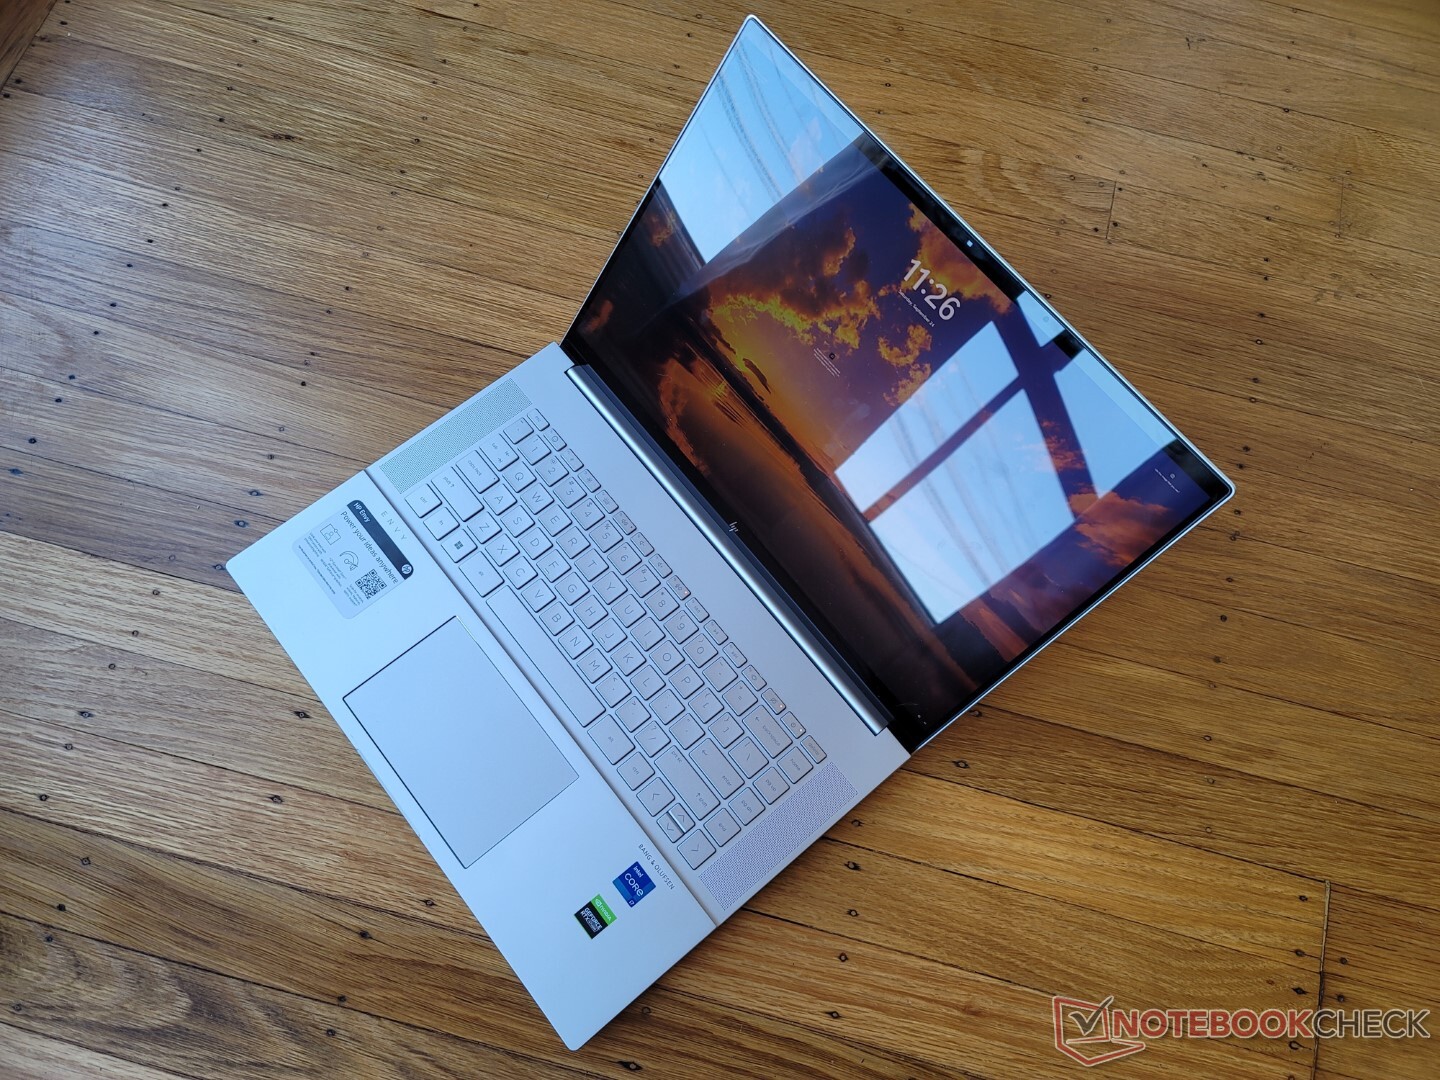
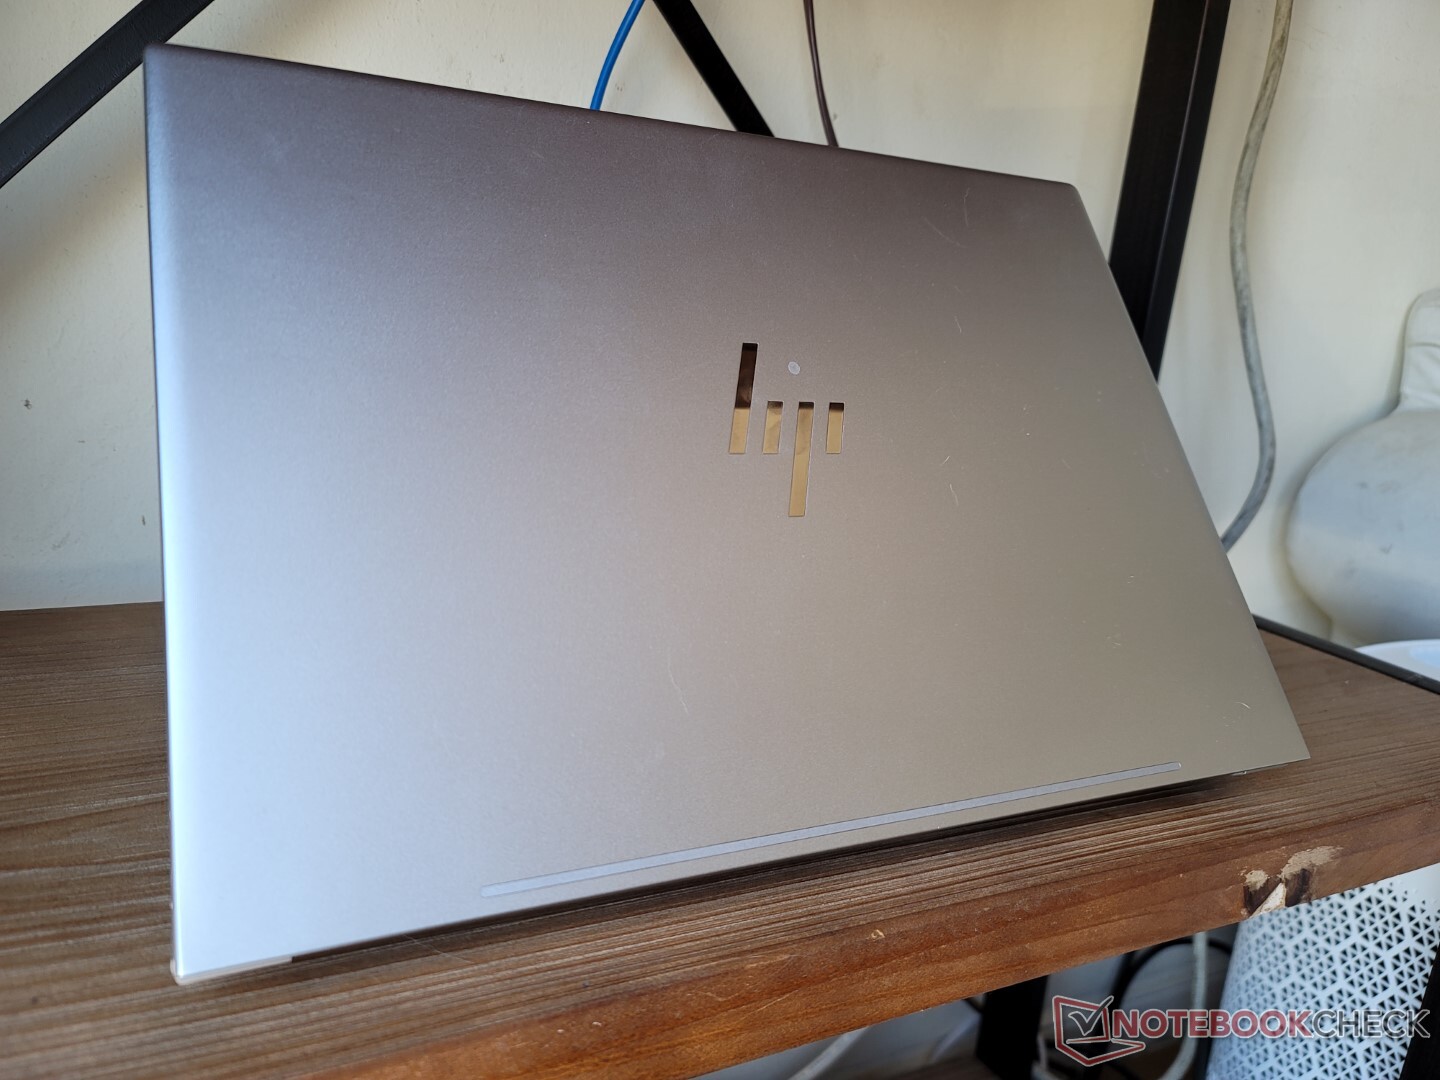
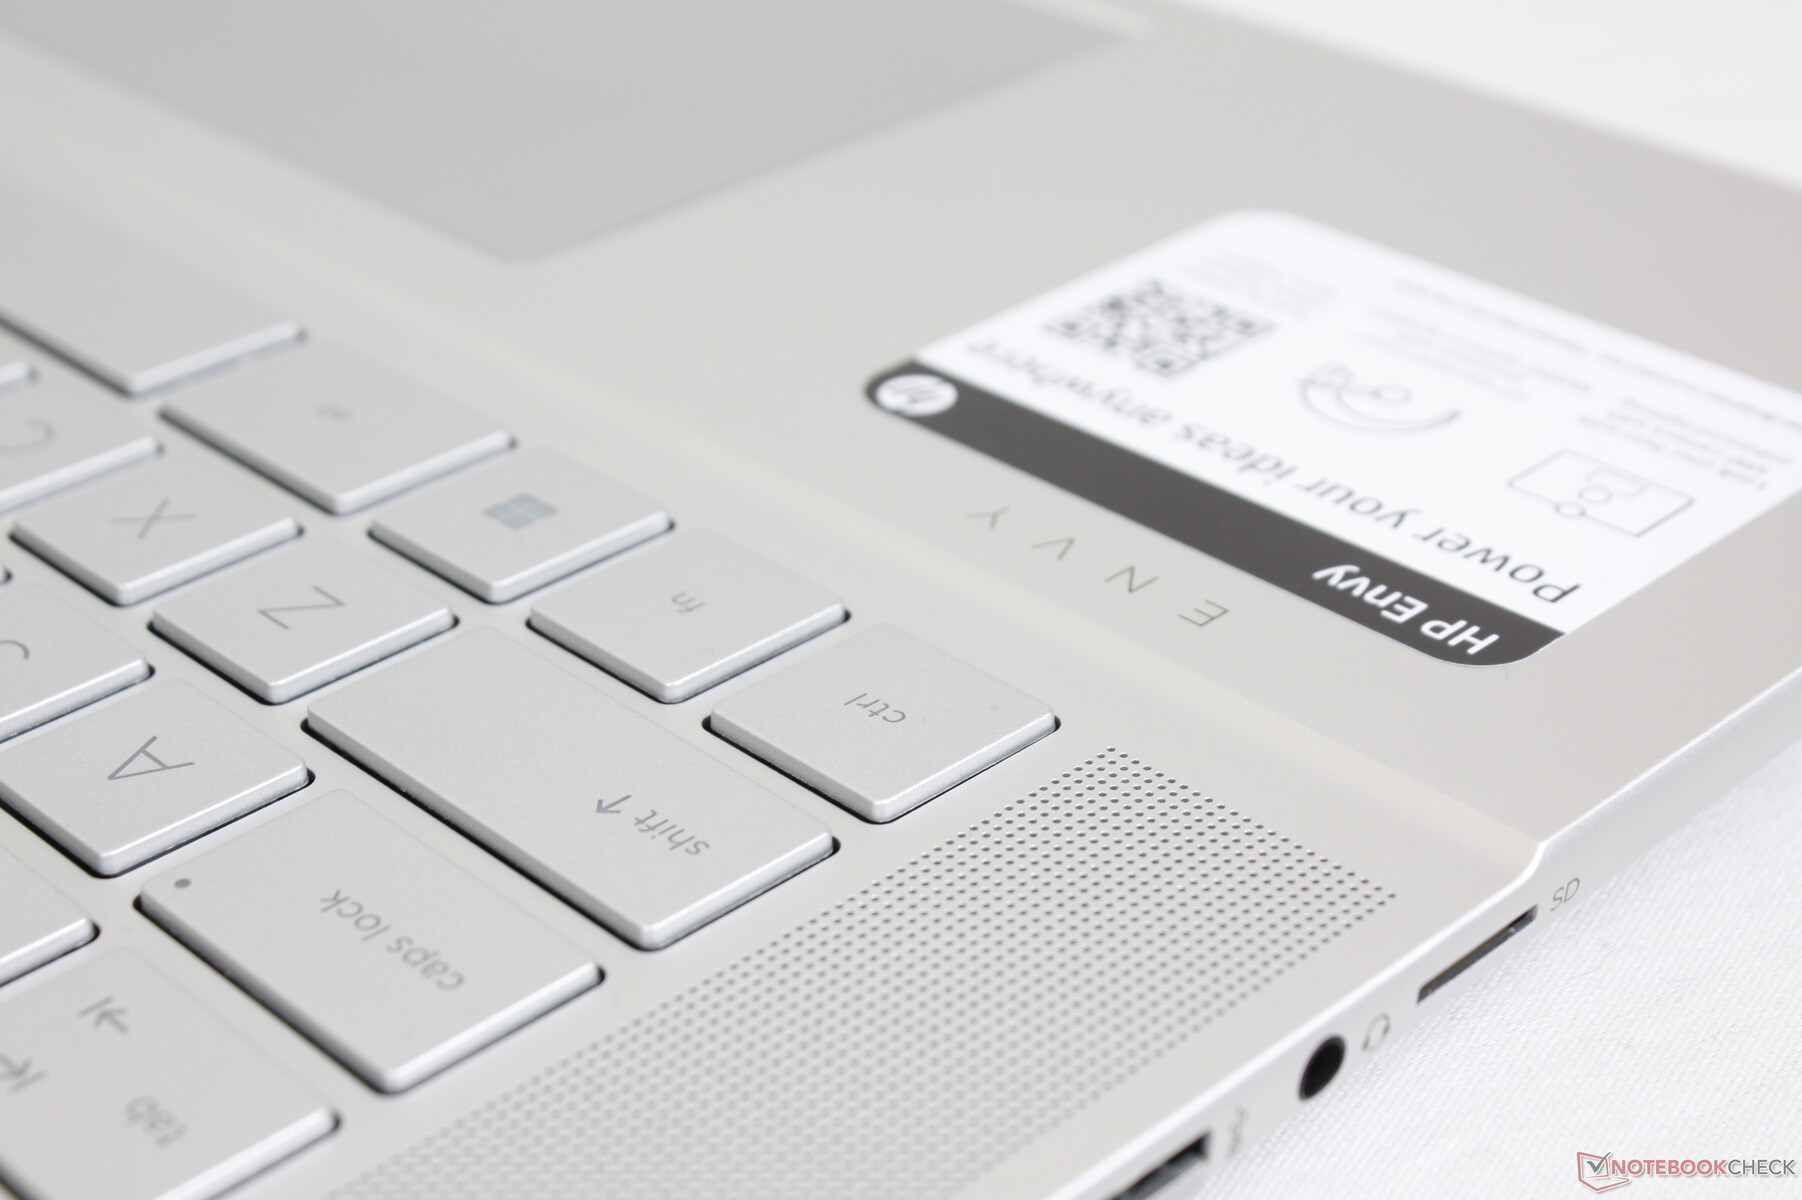
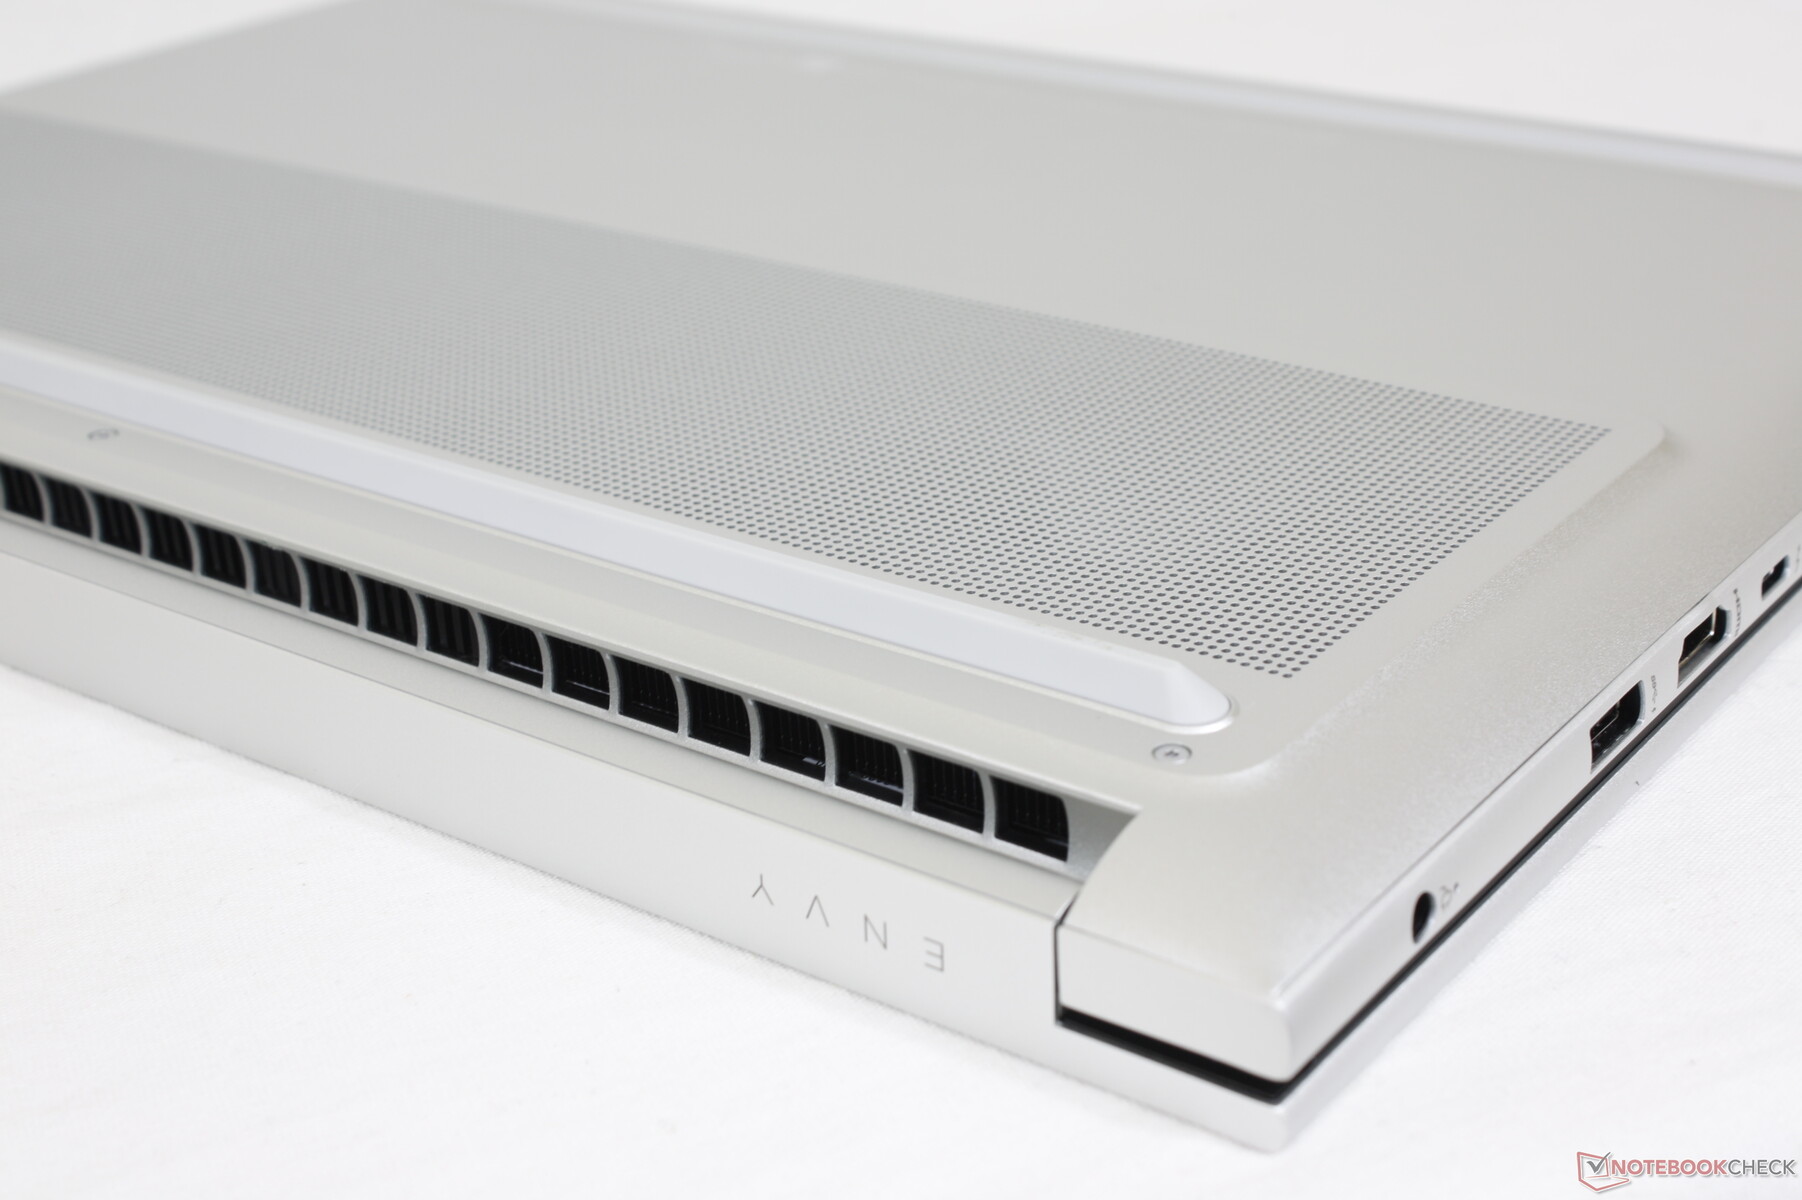
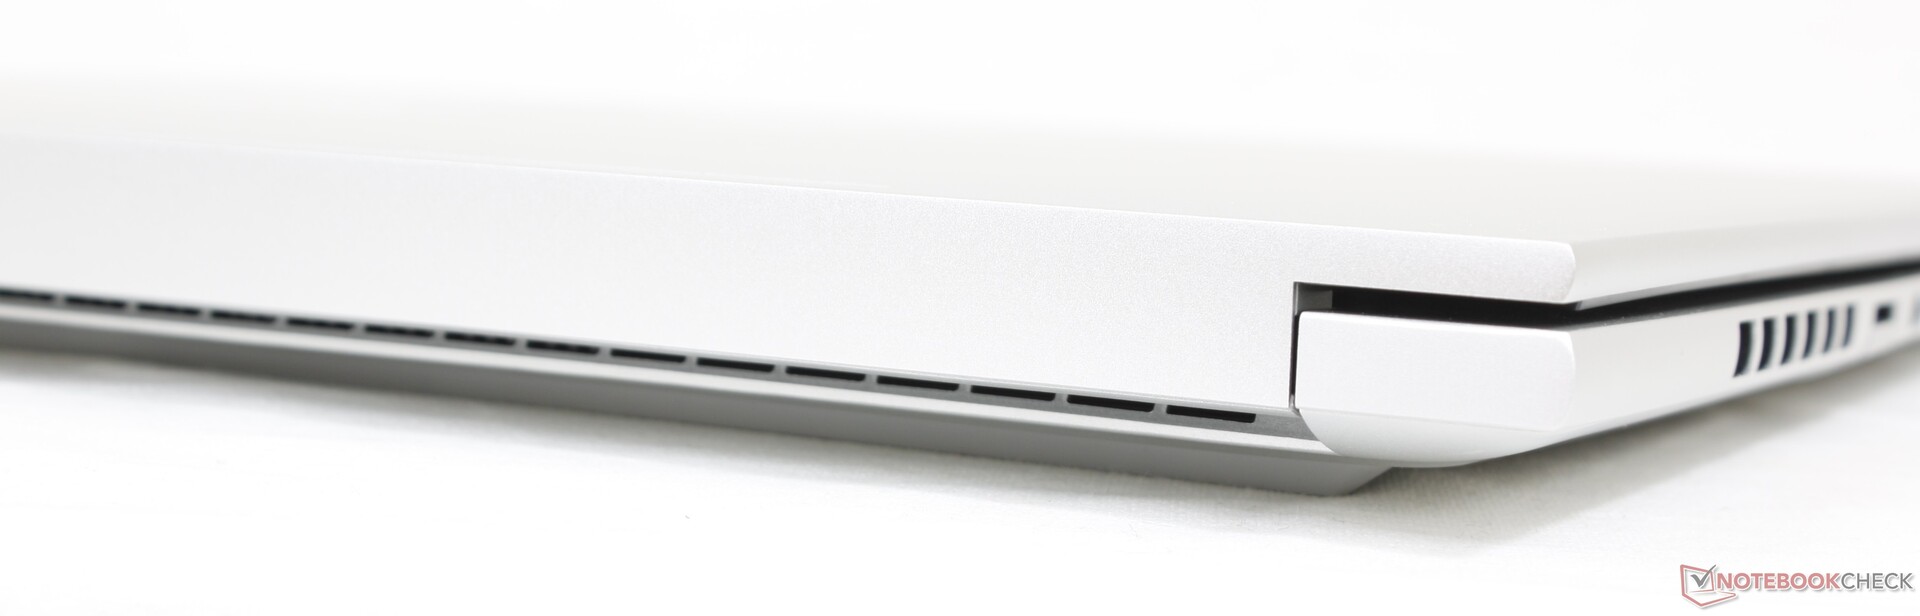
案例 - 同样的颜色,有很多的调整
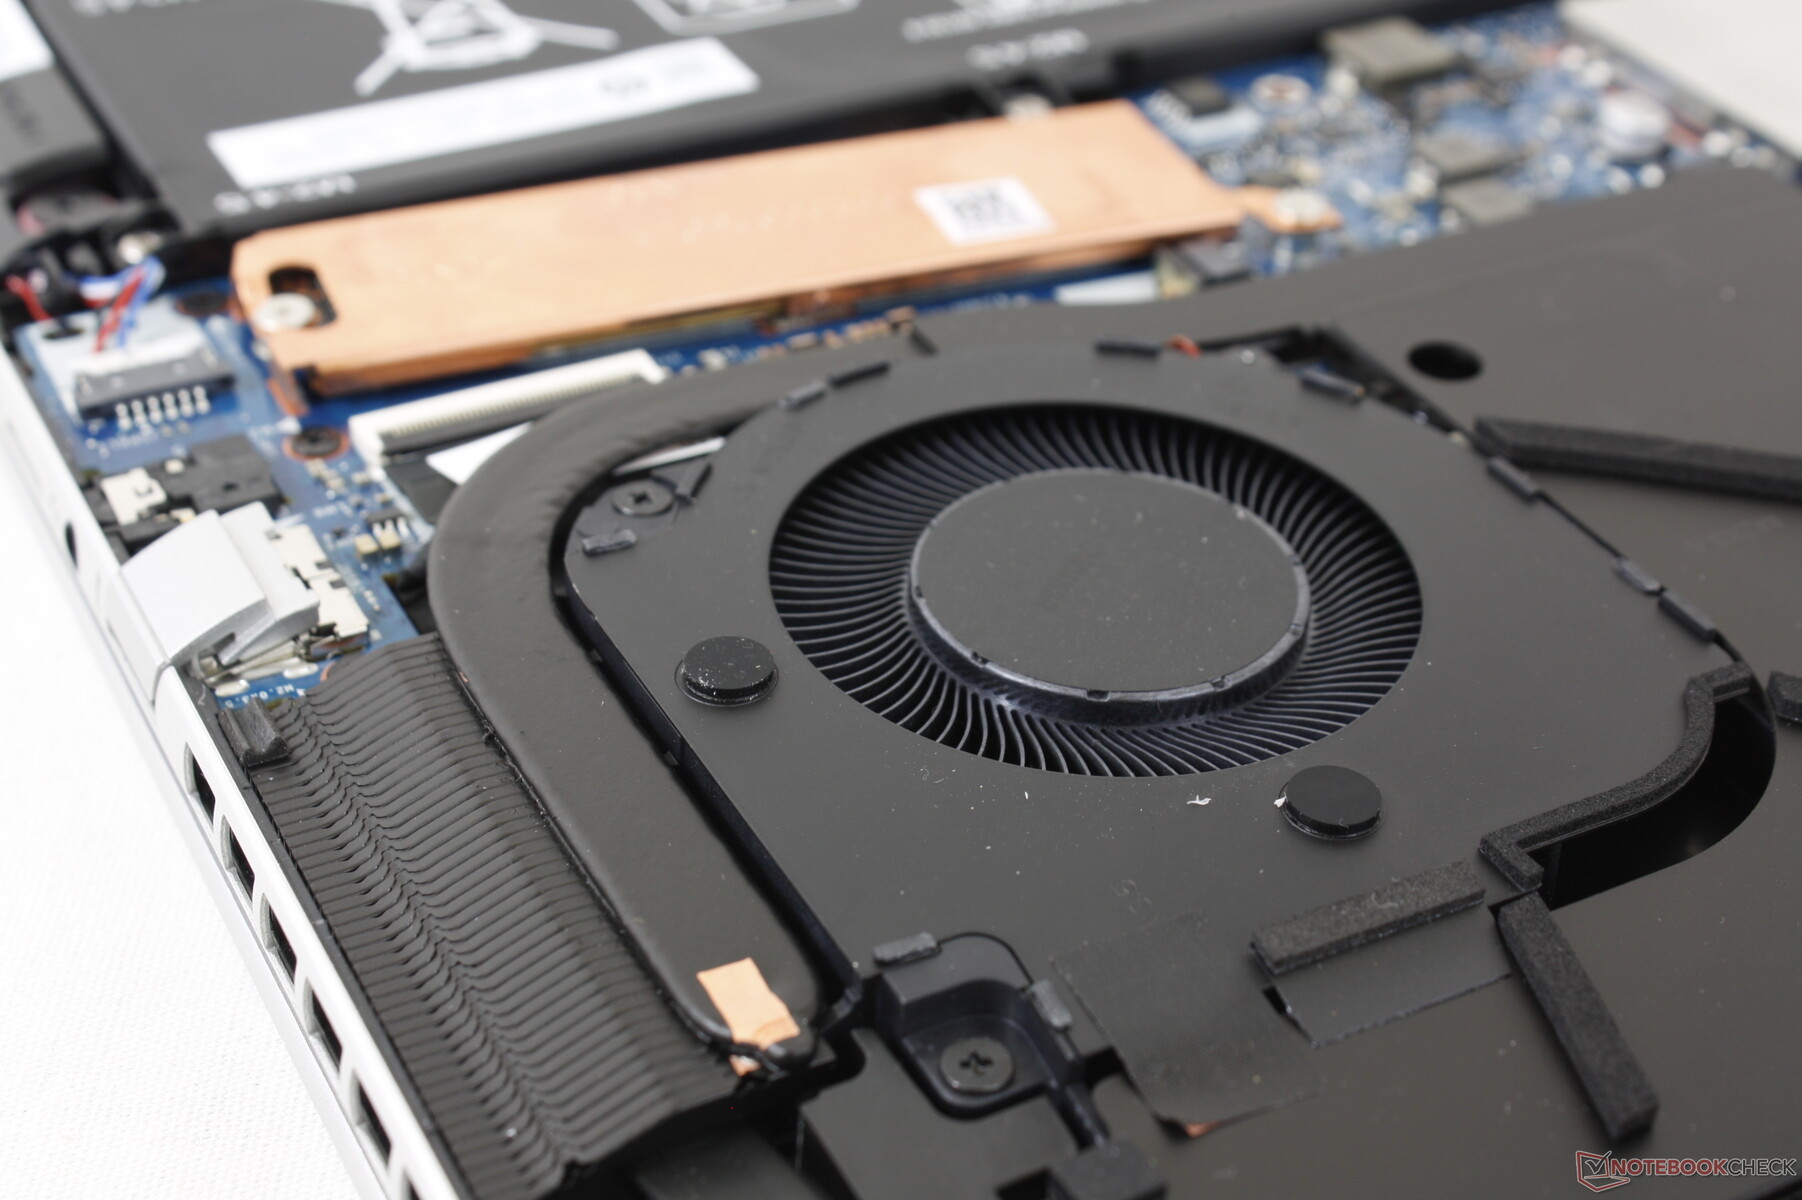
Envy 16第一眼看上去可能与Envy 15相似,因为它们的颜色方案相似,但实际上内外都有许多变化。最明显的是,Envy 16的边缘和角落更圆,而Envy 15的设计更尖锐、更平坦。同时,如下面的图片所示,底部面板的通风部分是凸起的,而不是平的。掌托甲板和扬声器格栅也被重新设计。这些变化中的一些似乎是表面的,而另一些则应改善该机型的散热能力。
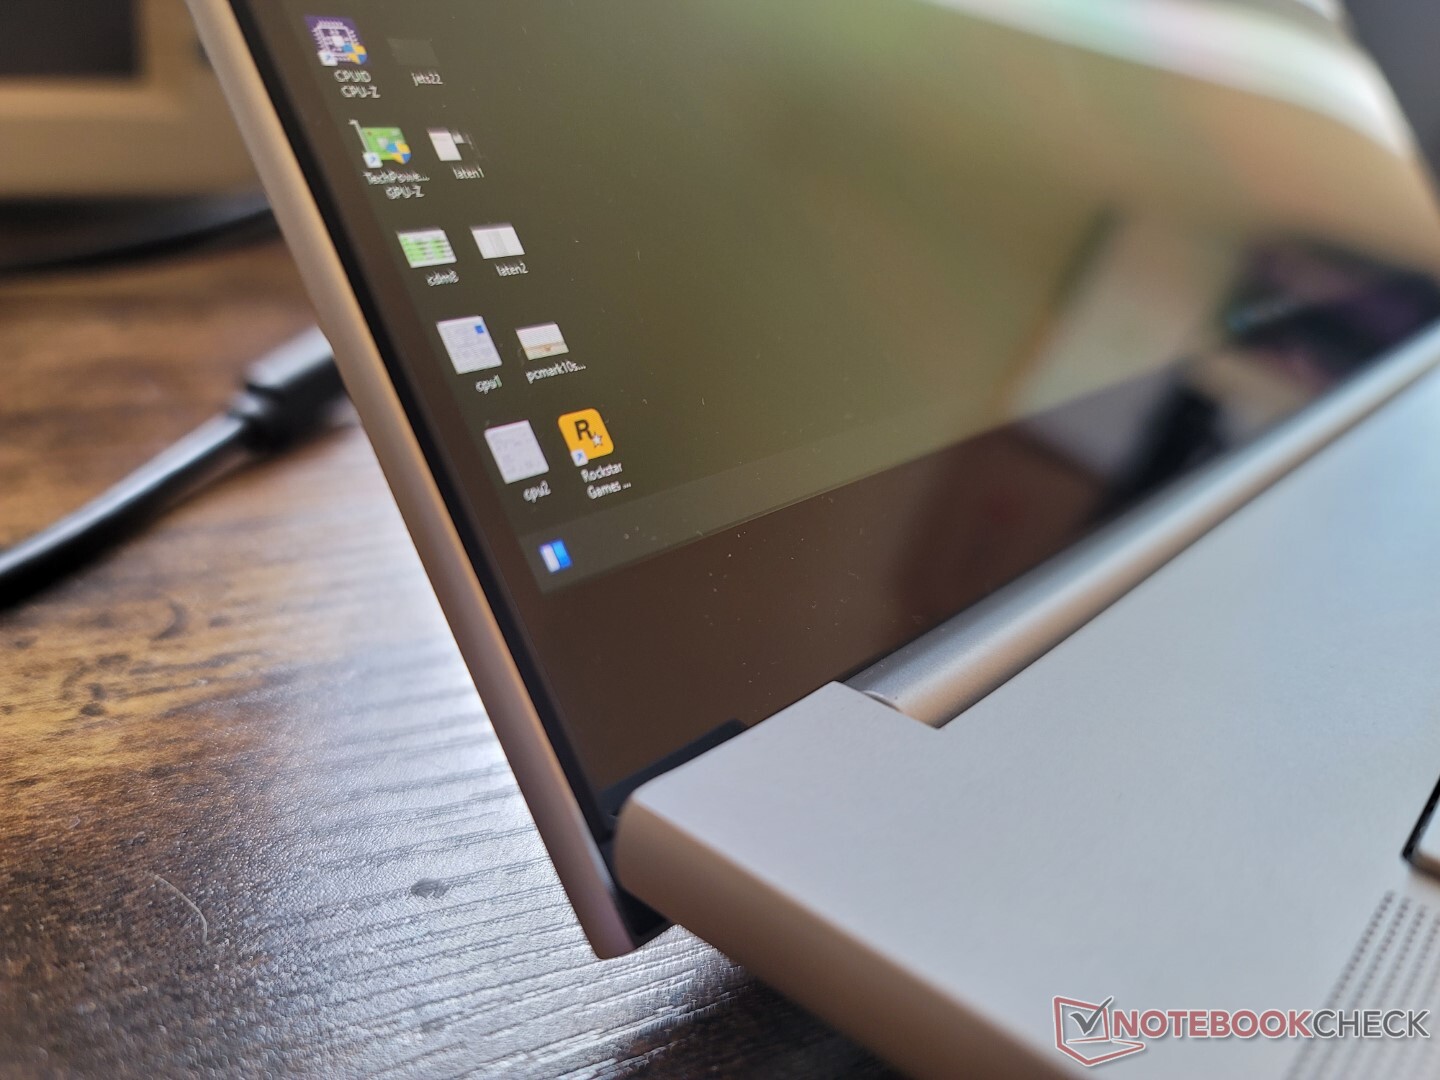
底盘质量仍然和以前一样强 2020年 Envy 15尽管尺寸增加。底座只表现出轻微的扭曲和翘曲,并且由于边缘到边缘的玻璃和铝制背板,盖子相当坚硬。然而,铰链可以更硬,因为盖子在调整角度时比ZenBook Pro更容易摇晃。 ZenBook Pro系列或 Razer Blade 15.
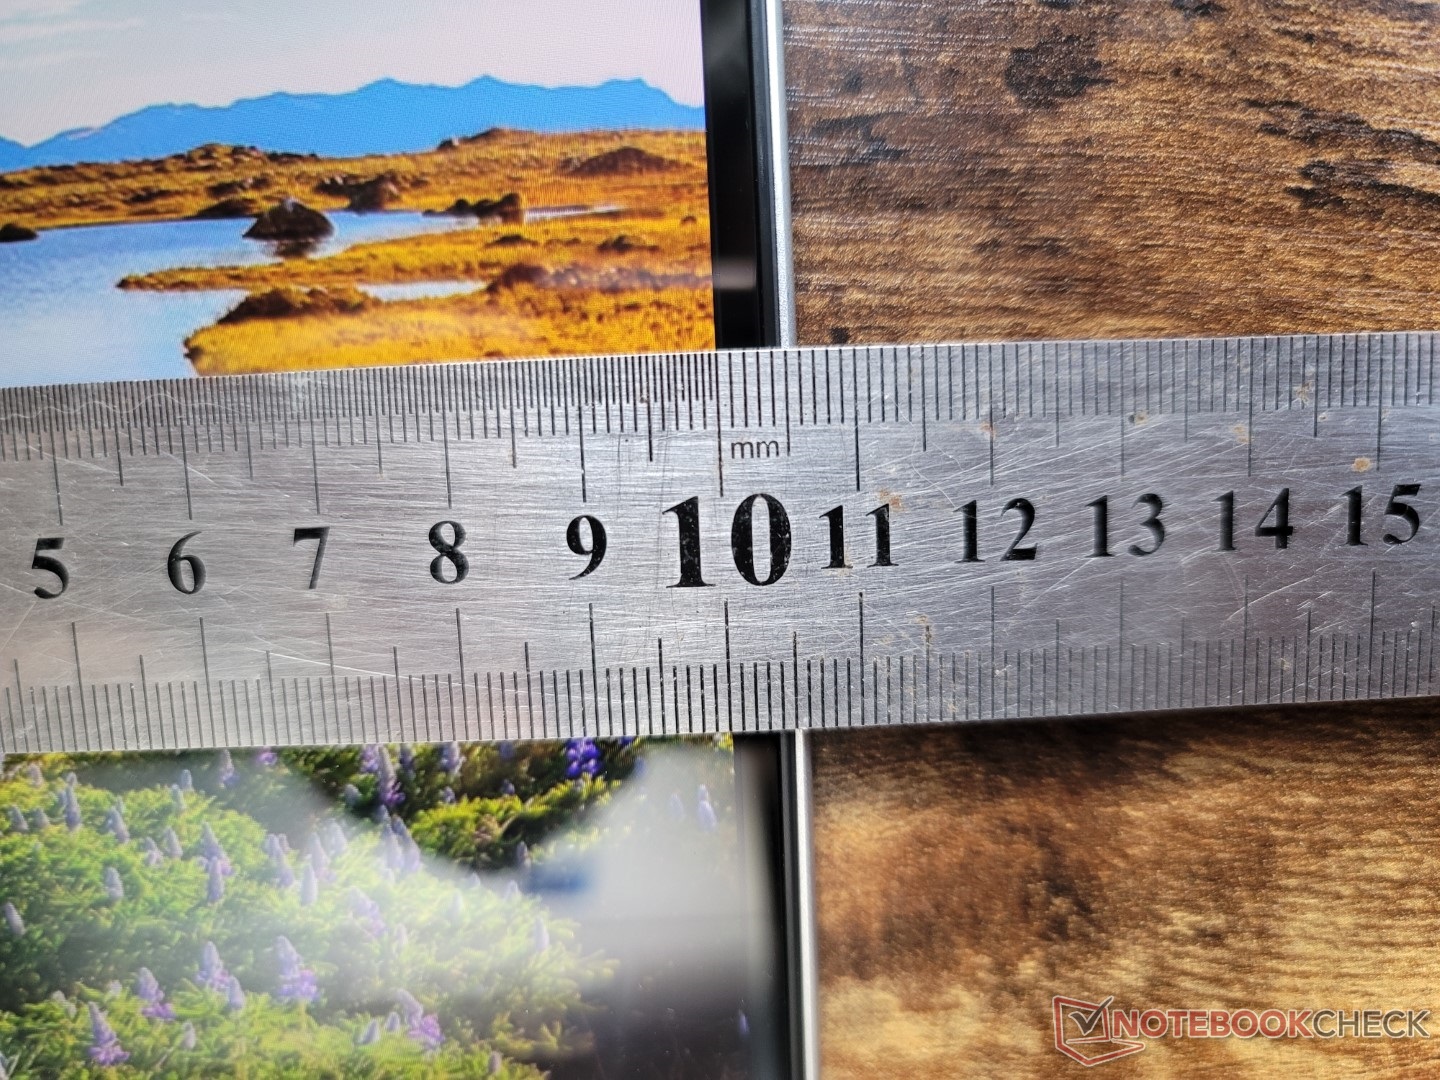
如下图所示,2022款比2020款更厚、更重、更大。鉴于从15.6英寸的外形尺寸跳到16英寸,更大的尺寸也许并不意外。即便如此,惠普仍然比许多竞争性的16英寸多媒体笔记本电脑略大且重,包括MacBook Pro 16、华为MateBook 16s或戴尔Inspiron 16 Plus 7610.

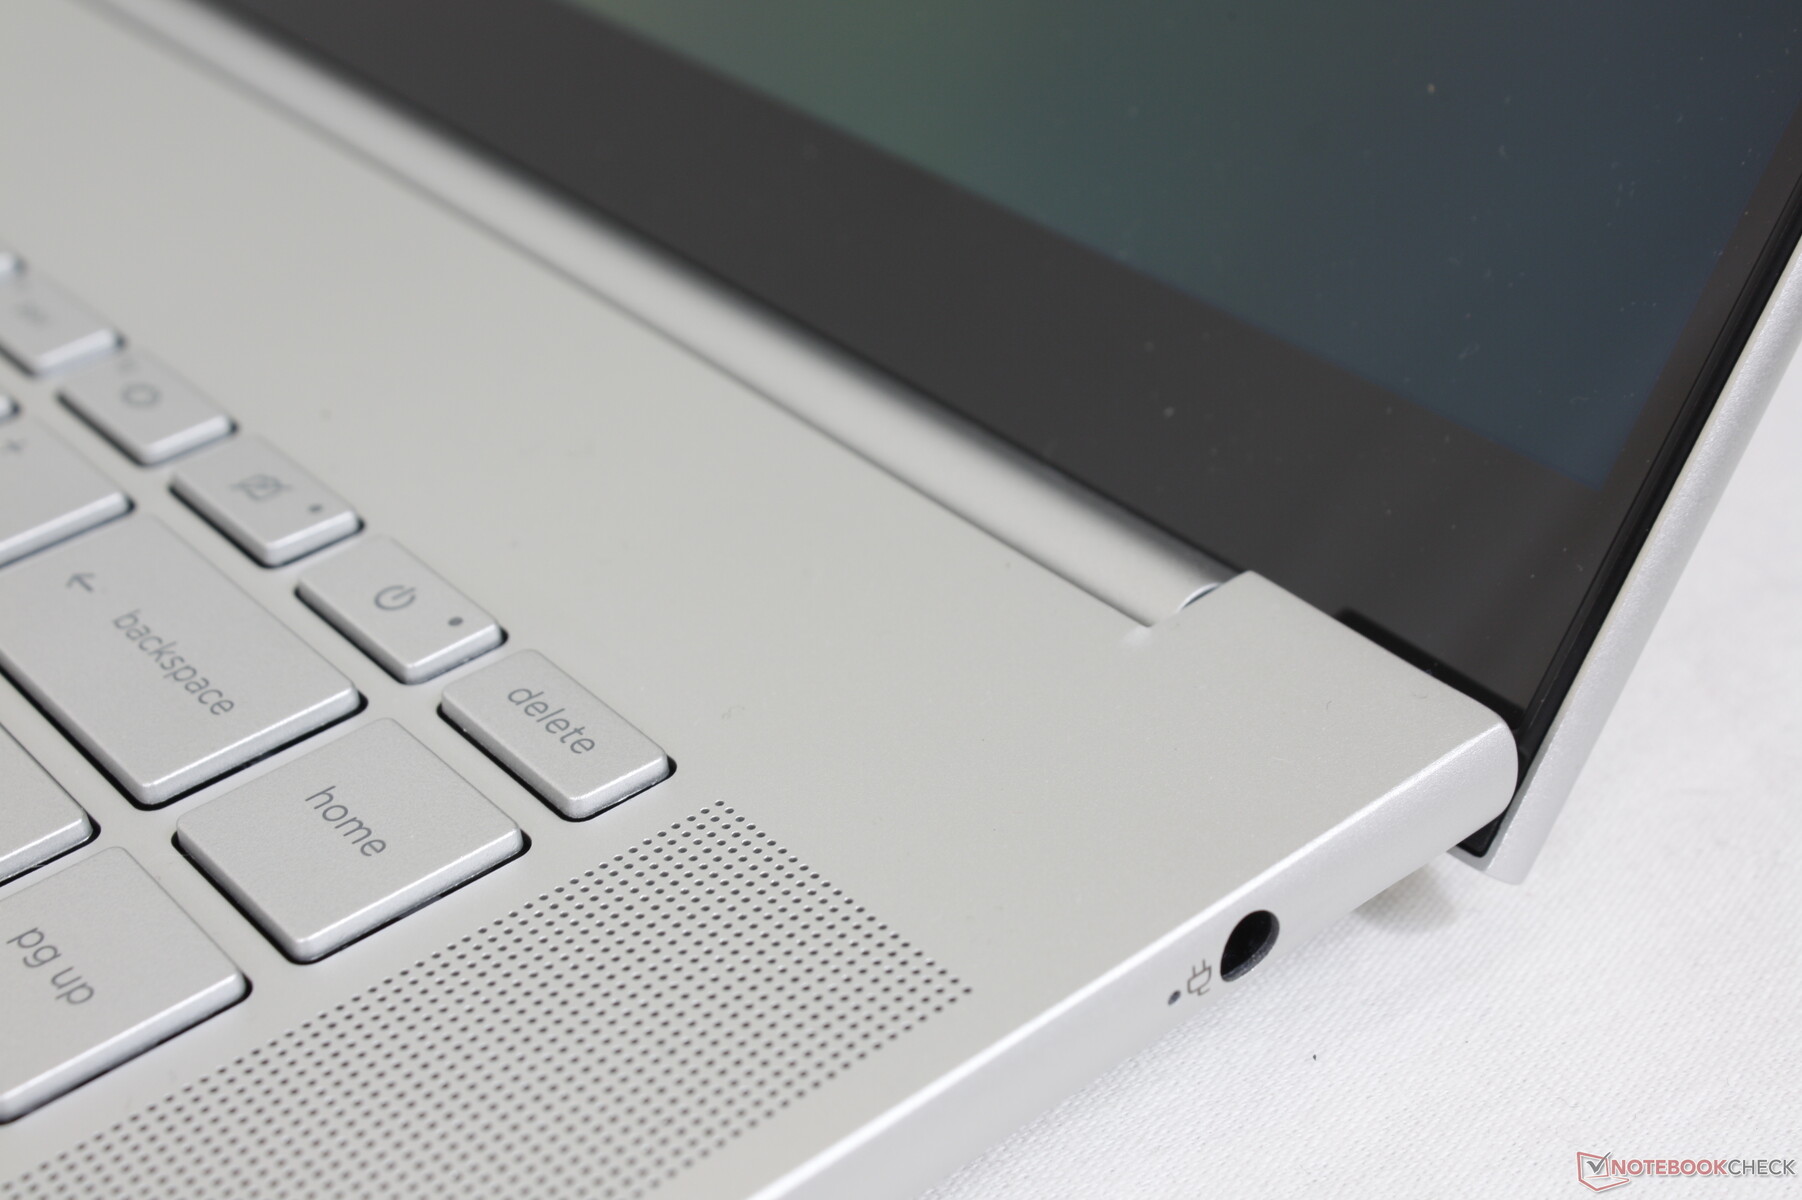
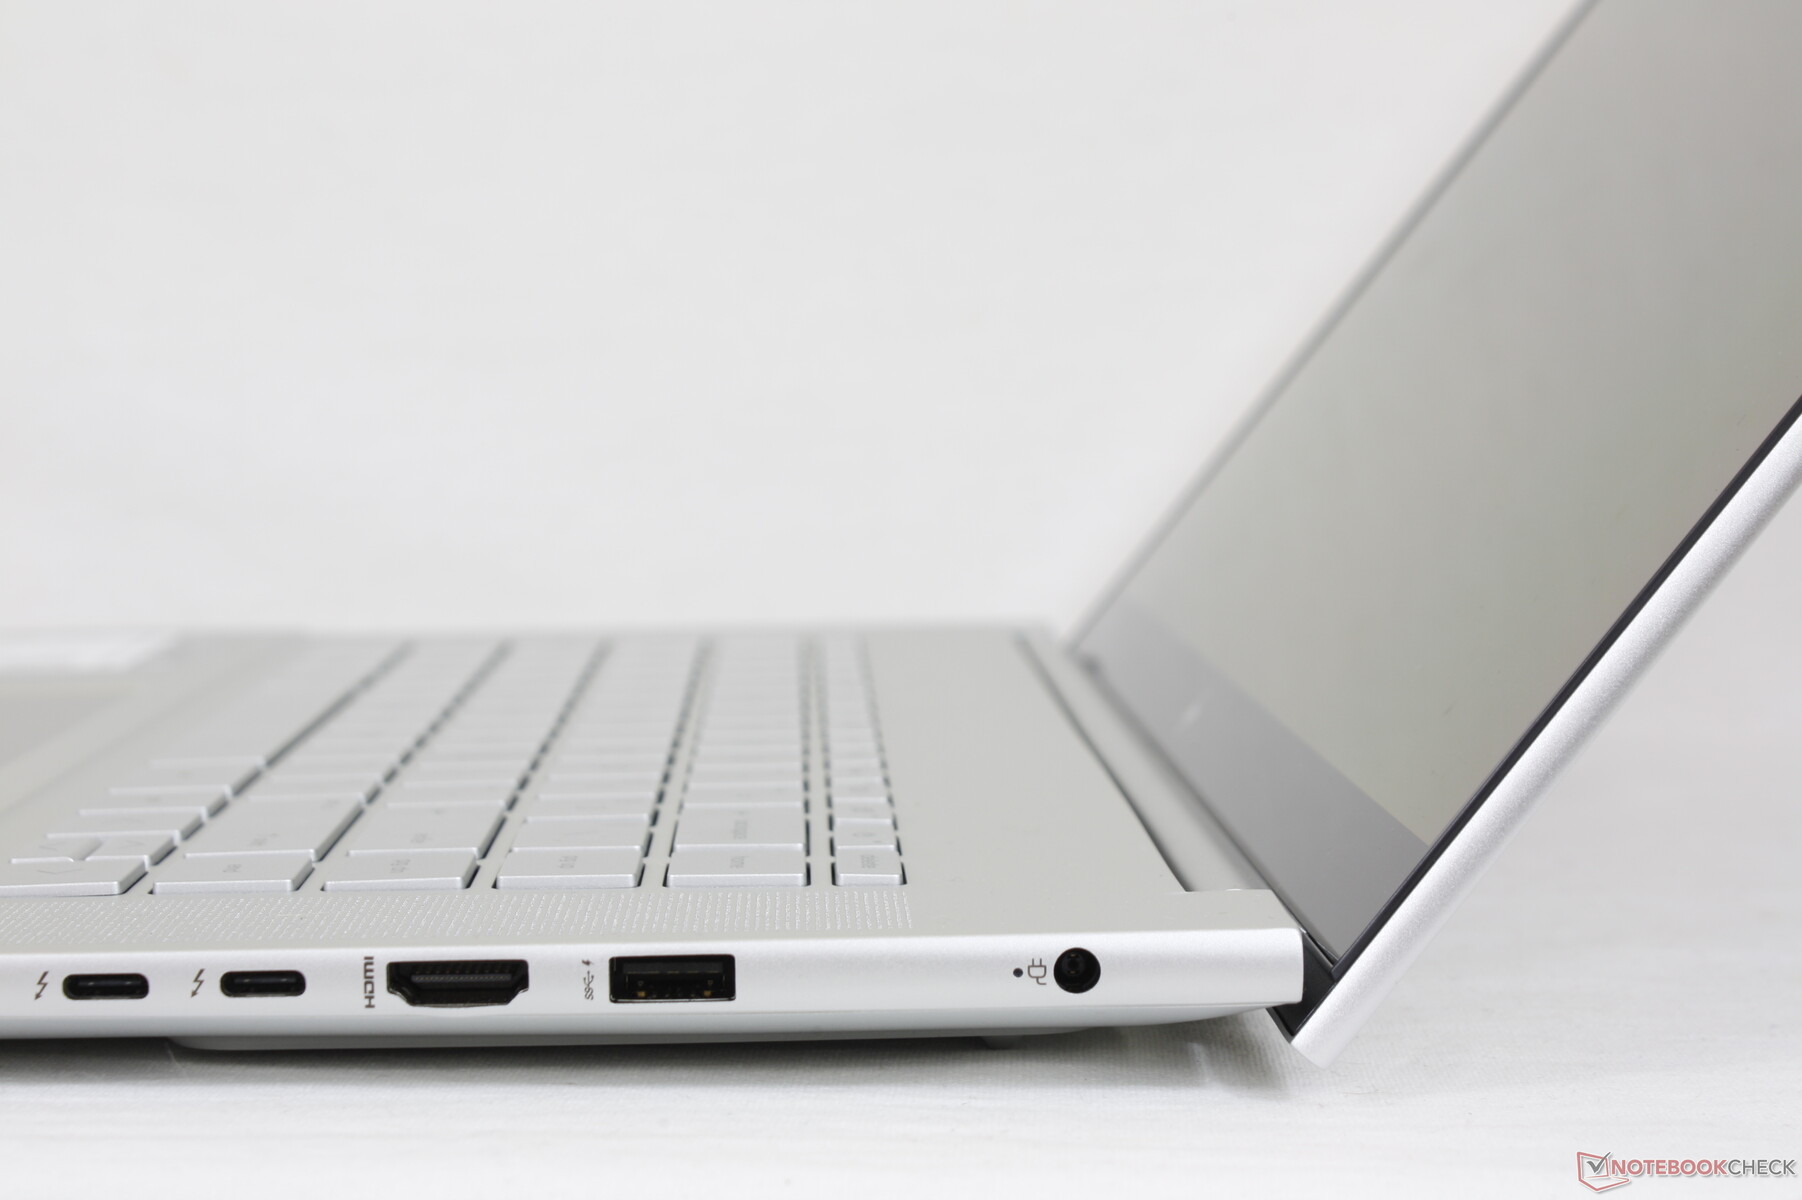
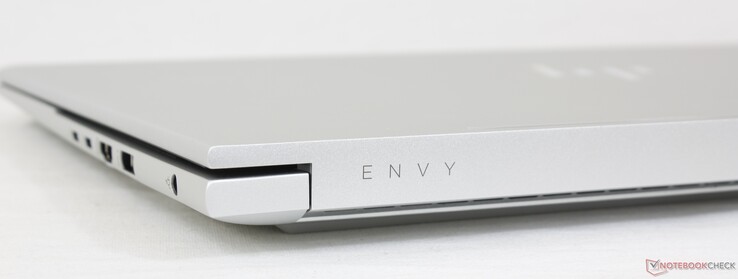
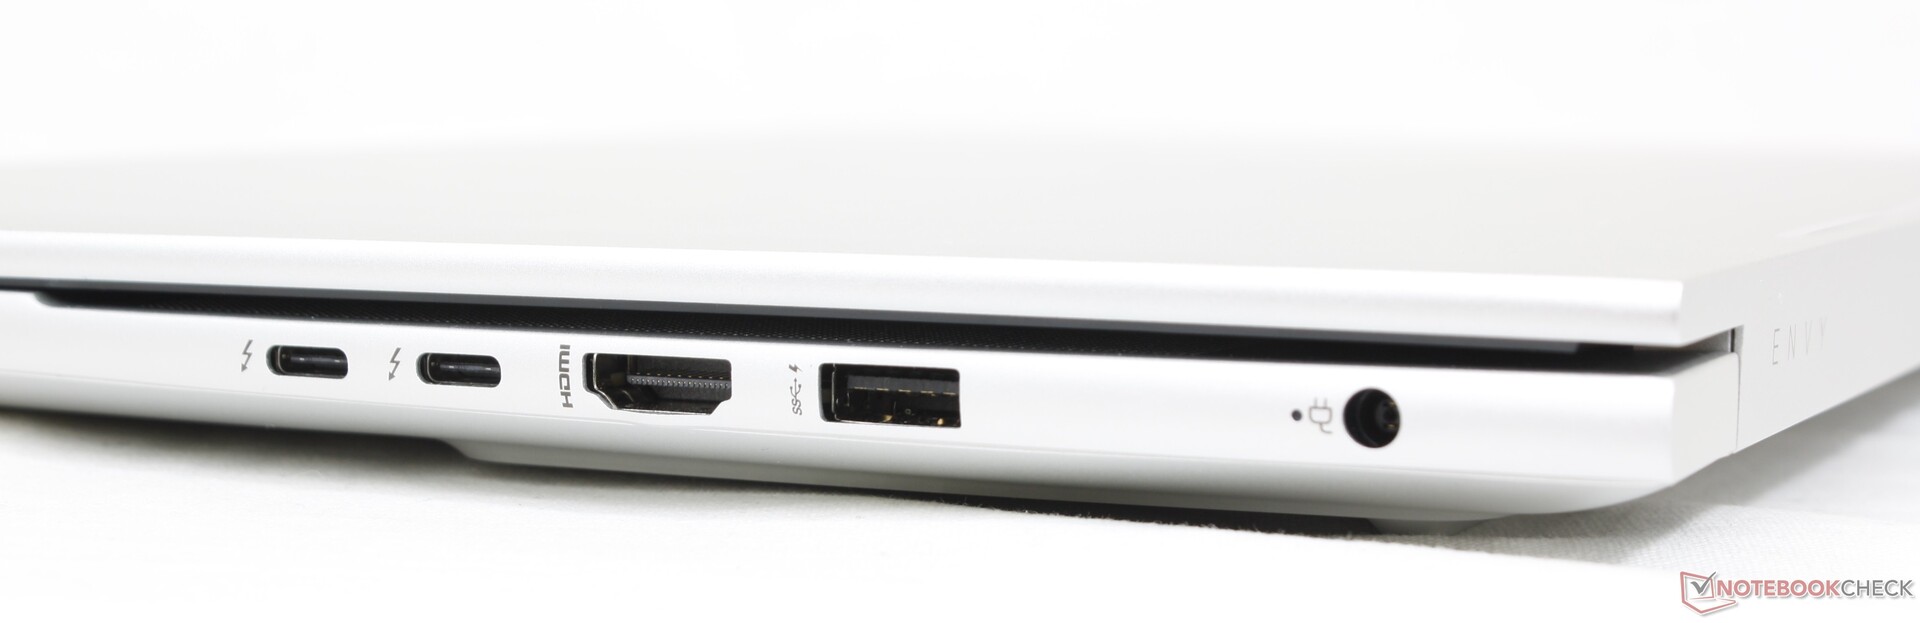
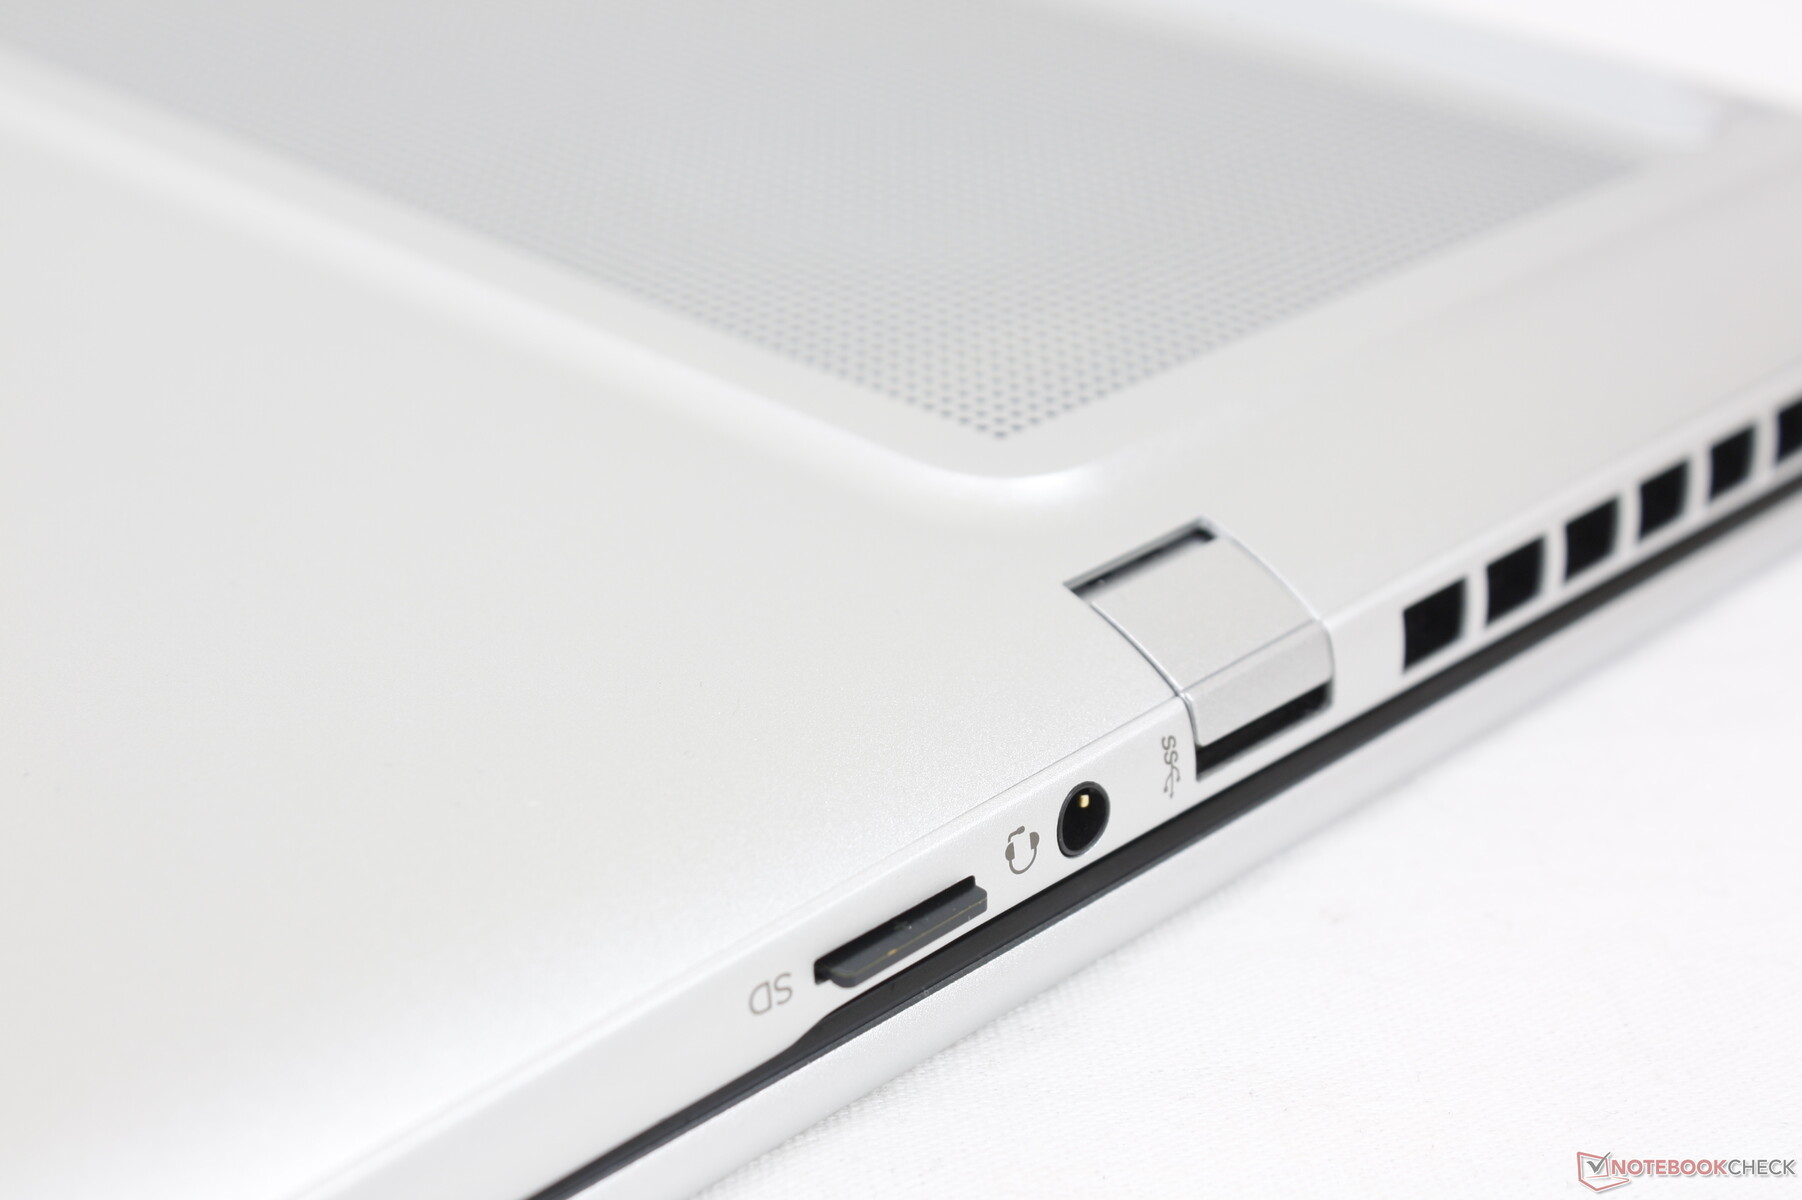
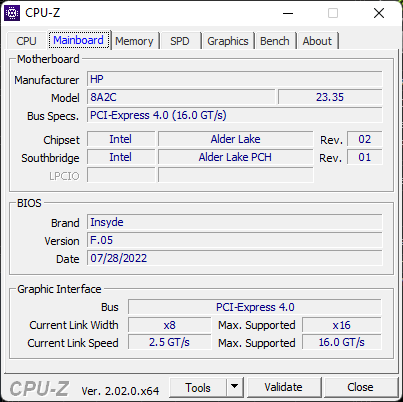
连接性 - Thunderbolt 4支持标准
2020年Envy 15的所有端口都回到了2022年的修订版上,尽管是重新安排的。大多数端口现在都是沿着机箱的右侧边缘,而不是左侧,无论好坏。令人讨厌的是,仍然没有Kensington锁插槽。
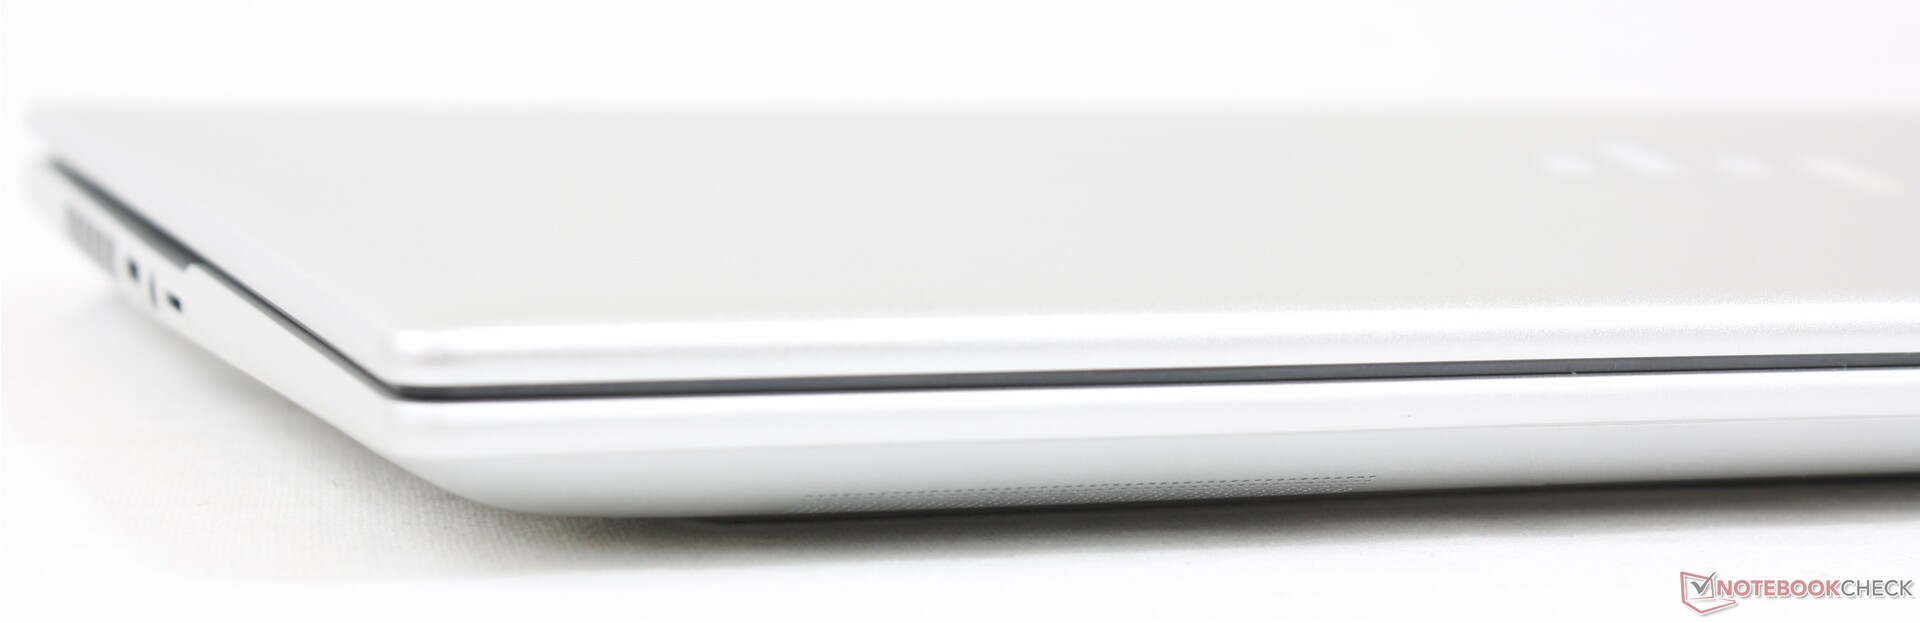
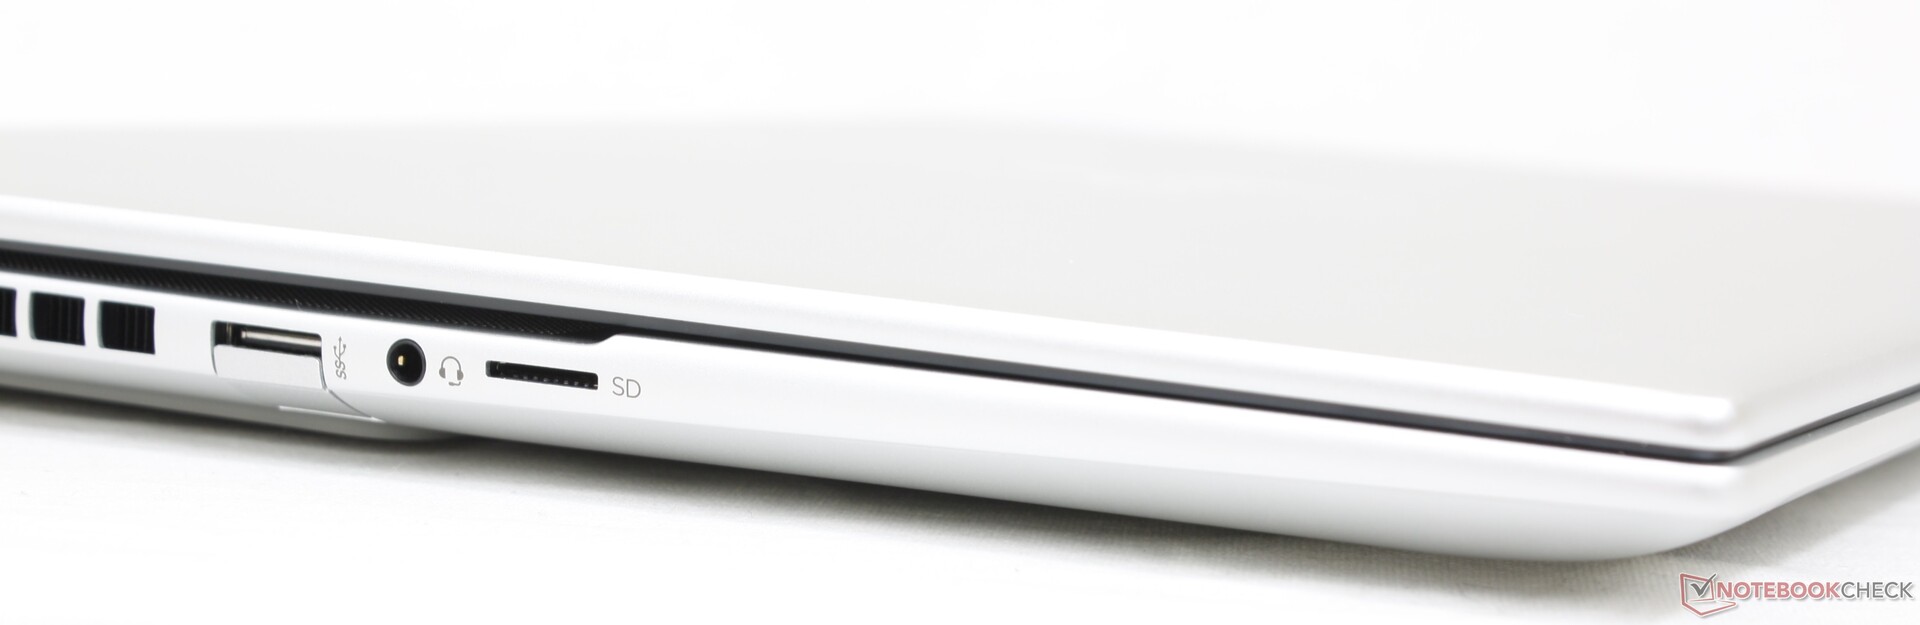
SD卡阅读器
集成的MicroSD读卡器的传输速率是平均水平。将1GB的图片从我们的UHS-II测试卡移动到桌面上需要大约17秒。
| SD Card Reader | |
| average JPG Copy Test (av. of 3 runs) | |
| Apple MacBook Pro 16 2021 M1 Pro (Angelbird AV Pro V60) | |
| Lenovo ThinkBook 16 G4+ IAP (Angelbird AV Pro V60) | |
| MSI Creator Z16P B12UHST (AV PRO microSD 128 GB V60) | |
| HP Envy 16 h0112nr (AV Pro SD microSD 128 GB V60) | |
| Dell Inspiron 16 Plus 7610-MHJ8F (AV Pro SD microSD 128 GB V60) | |
| maximum AS SSD Seq Read Test (1GB) | |
| Lenovo ThinkBook 16 G4+ IAP (Angelbird AV Pro V60) | |
| HP Envy 16 h0112nr (AV Pro SD microSD 128 GB V60) | |
| Dell Inspiron 16 Plus 7610-MHJ8F (AV Pro SD microSD 128 GB V60) | |
沟通
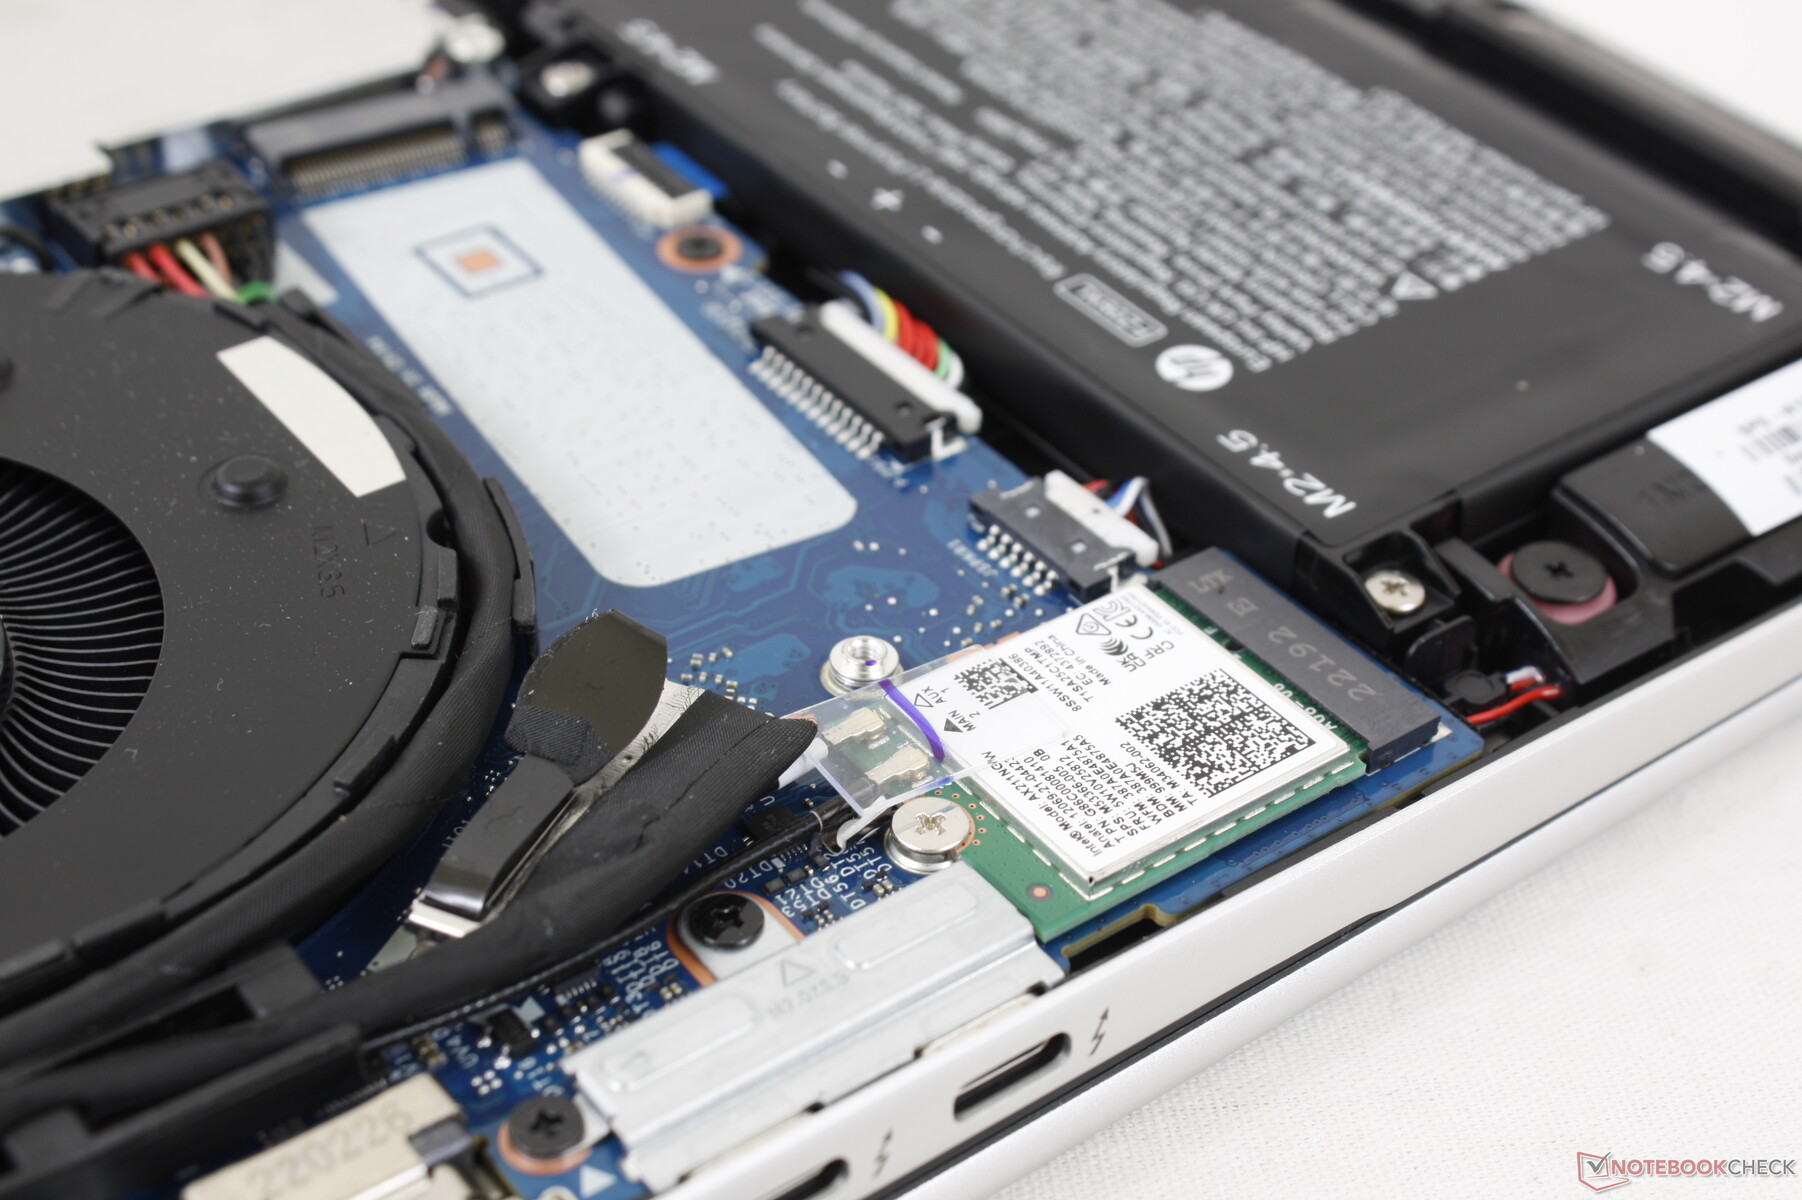
英特尔AX211是Wi-Fi 6E和蓝牙5.2连接的标准配置。在与我们的6GHz网络配对时,我们没有遇到任何可靠性问题。
| Networking | |
| iperf3 transmit AX12 | |
| Dell Inspiron 16 Plus 7610-MHJ8F | |
| Apple MacBook Pro 16 2021 M1 Pro | |
| iperf3 receive AX12 | |
| Dell Inspiron 16 Plus 7610-MHJ8F | |
| Apple MacBook Pro 16 2021 M1 Pro | |
| iperf3 receive AXE11000 6GHz | |
| Huawei MateBook 16s i7 | |
| HP Envy 16 h0112nr | |
| iperf3 receive AXE11000 | |
| MSI Creator Z16P B12UHST | |
| Lenovo ThinkBook 16 G4+ IAP | |
| Apple MacBook Pro 16 2021 M1 Pro | |
| iperf3 transmit AXE11000 6GHz | |
| Huawei MateBook 16s i7 | |
| HP Envy 16 h0112nr | |
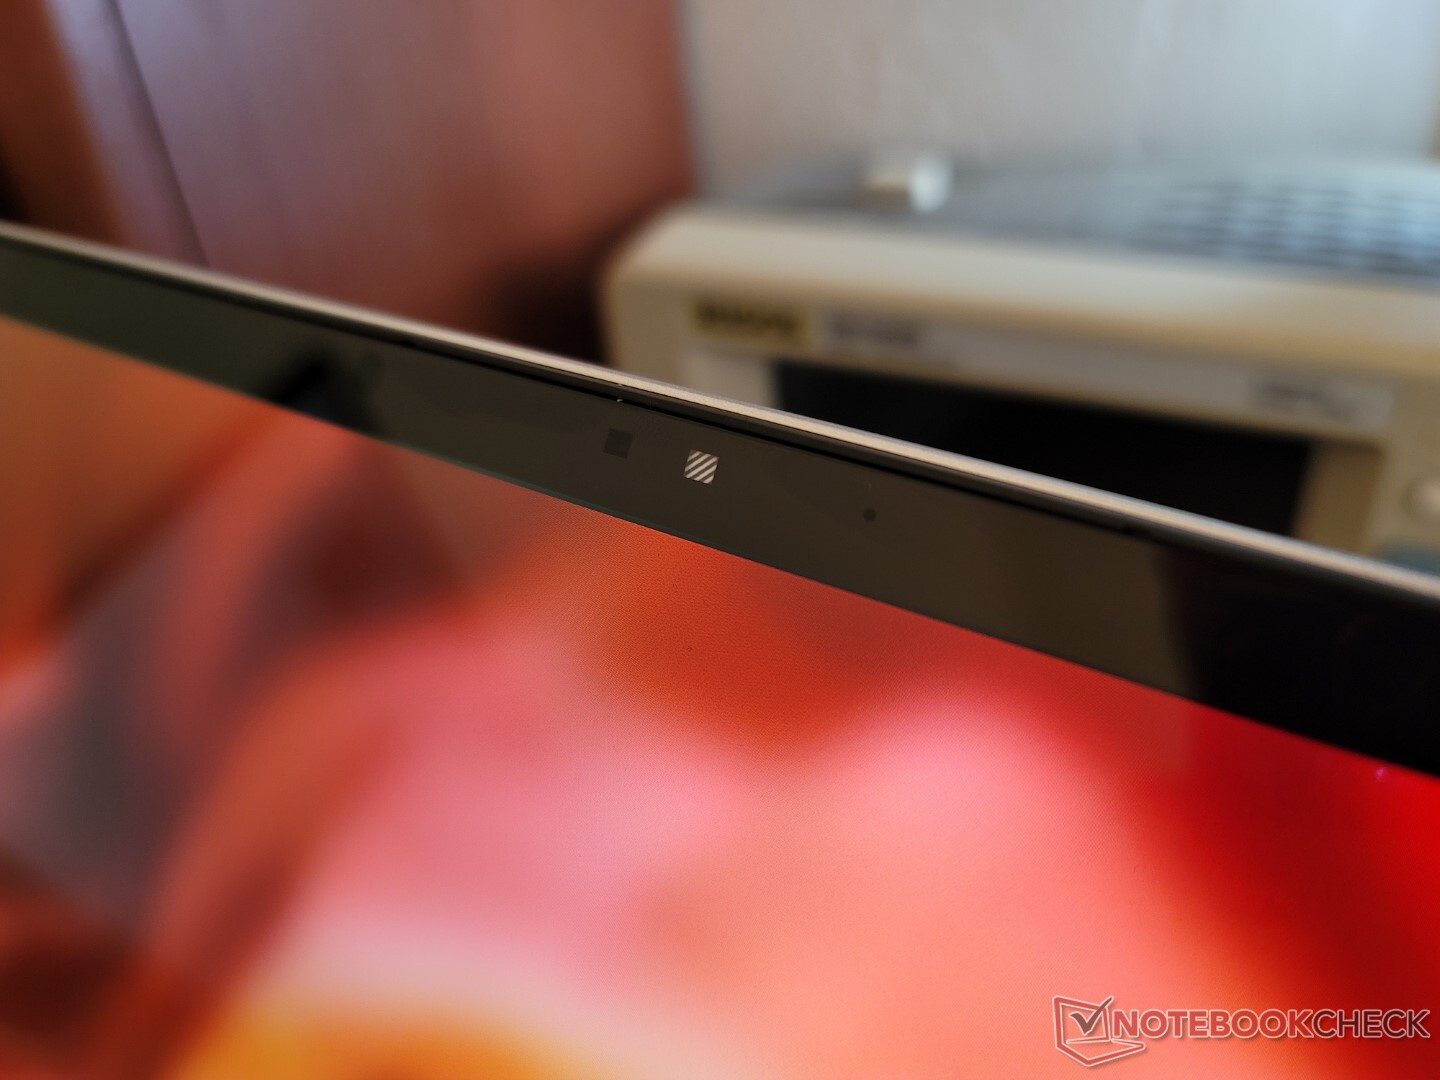
网络摄像头 - 5MP!
该系统集成了一个500万像素的摄像头,类似于最新的 幽灵 和EliteBook机型类似。与其他大多数笔记本电脑相比,图像质量明显更清晰,在这些笔记本电脑上,100万像素和200万像素的网络摄像头仍然是常态。
网络摄像头快门是标准配置,同时也支持你好的红外功能。


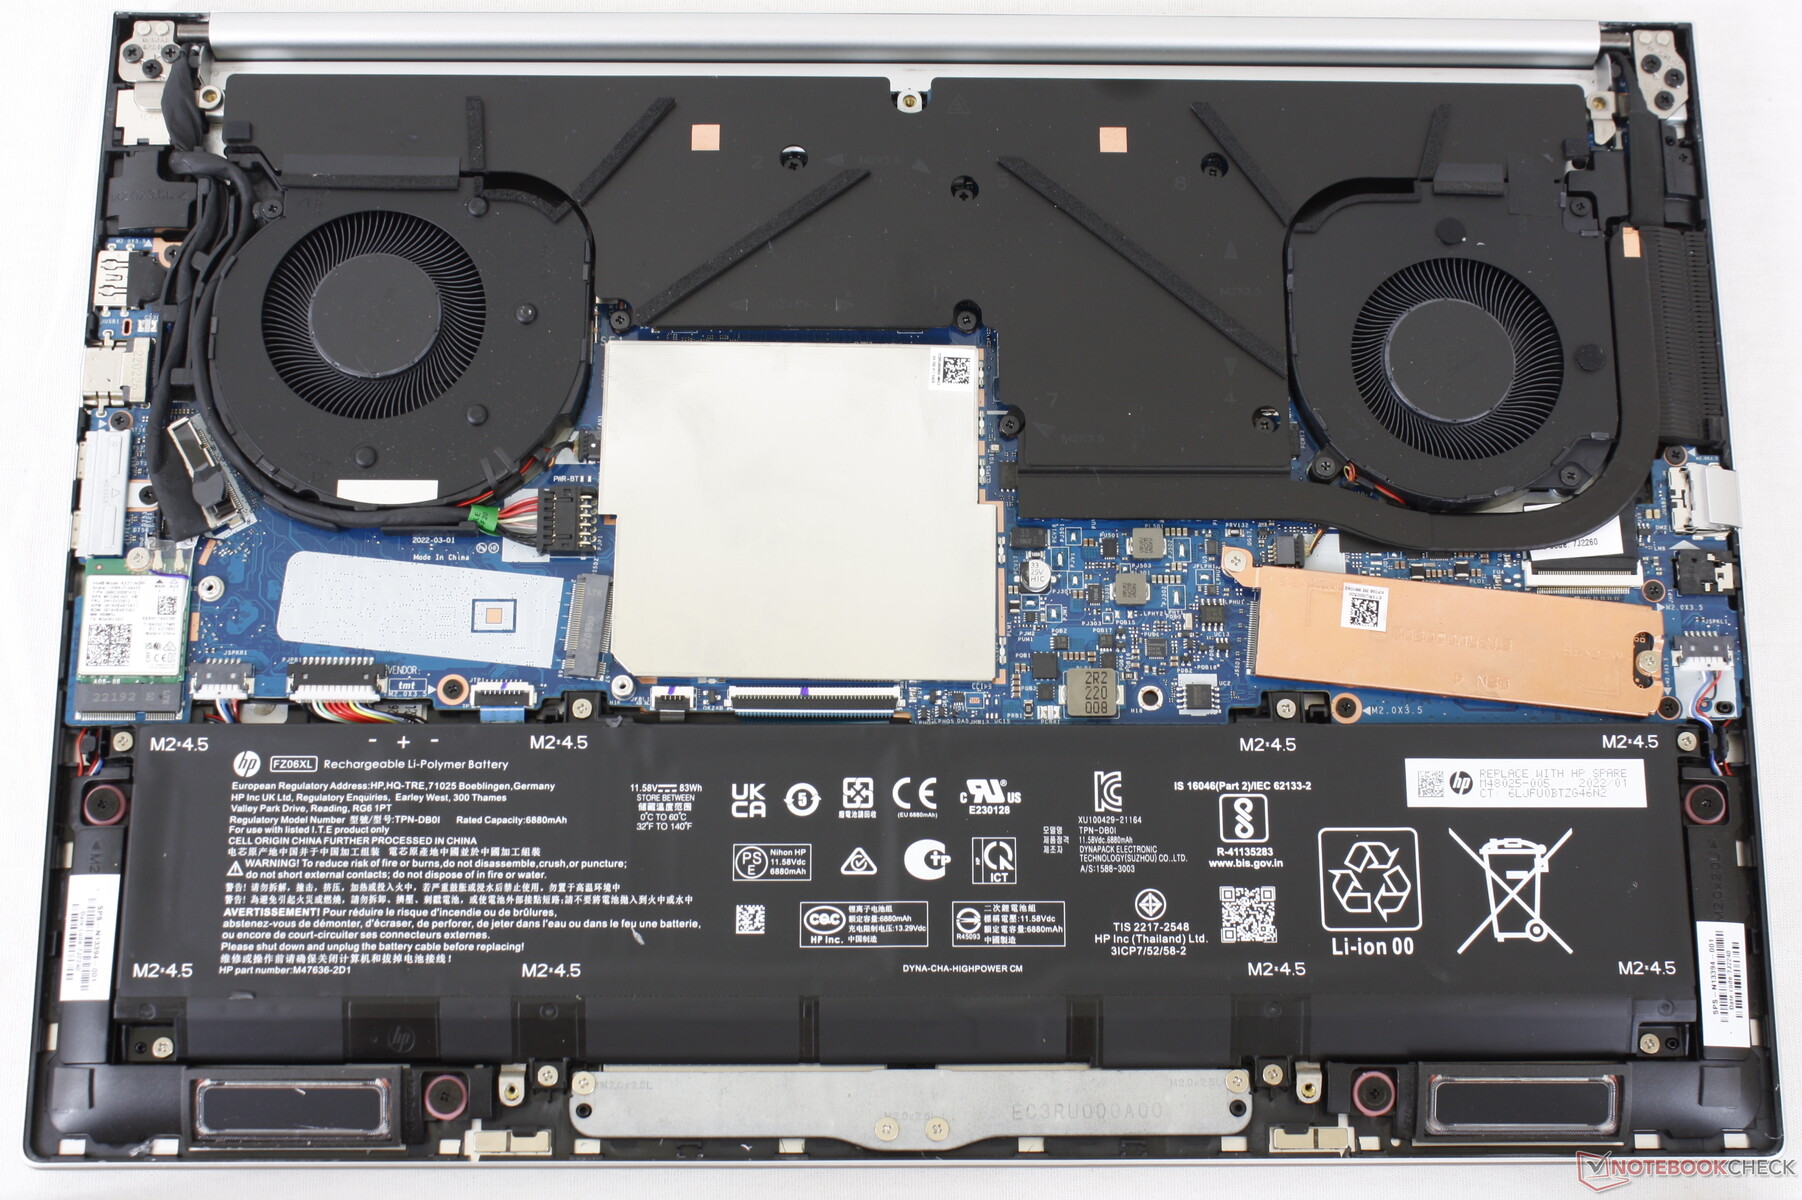
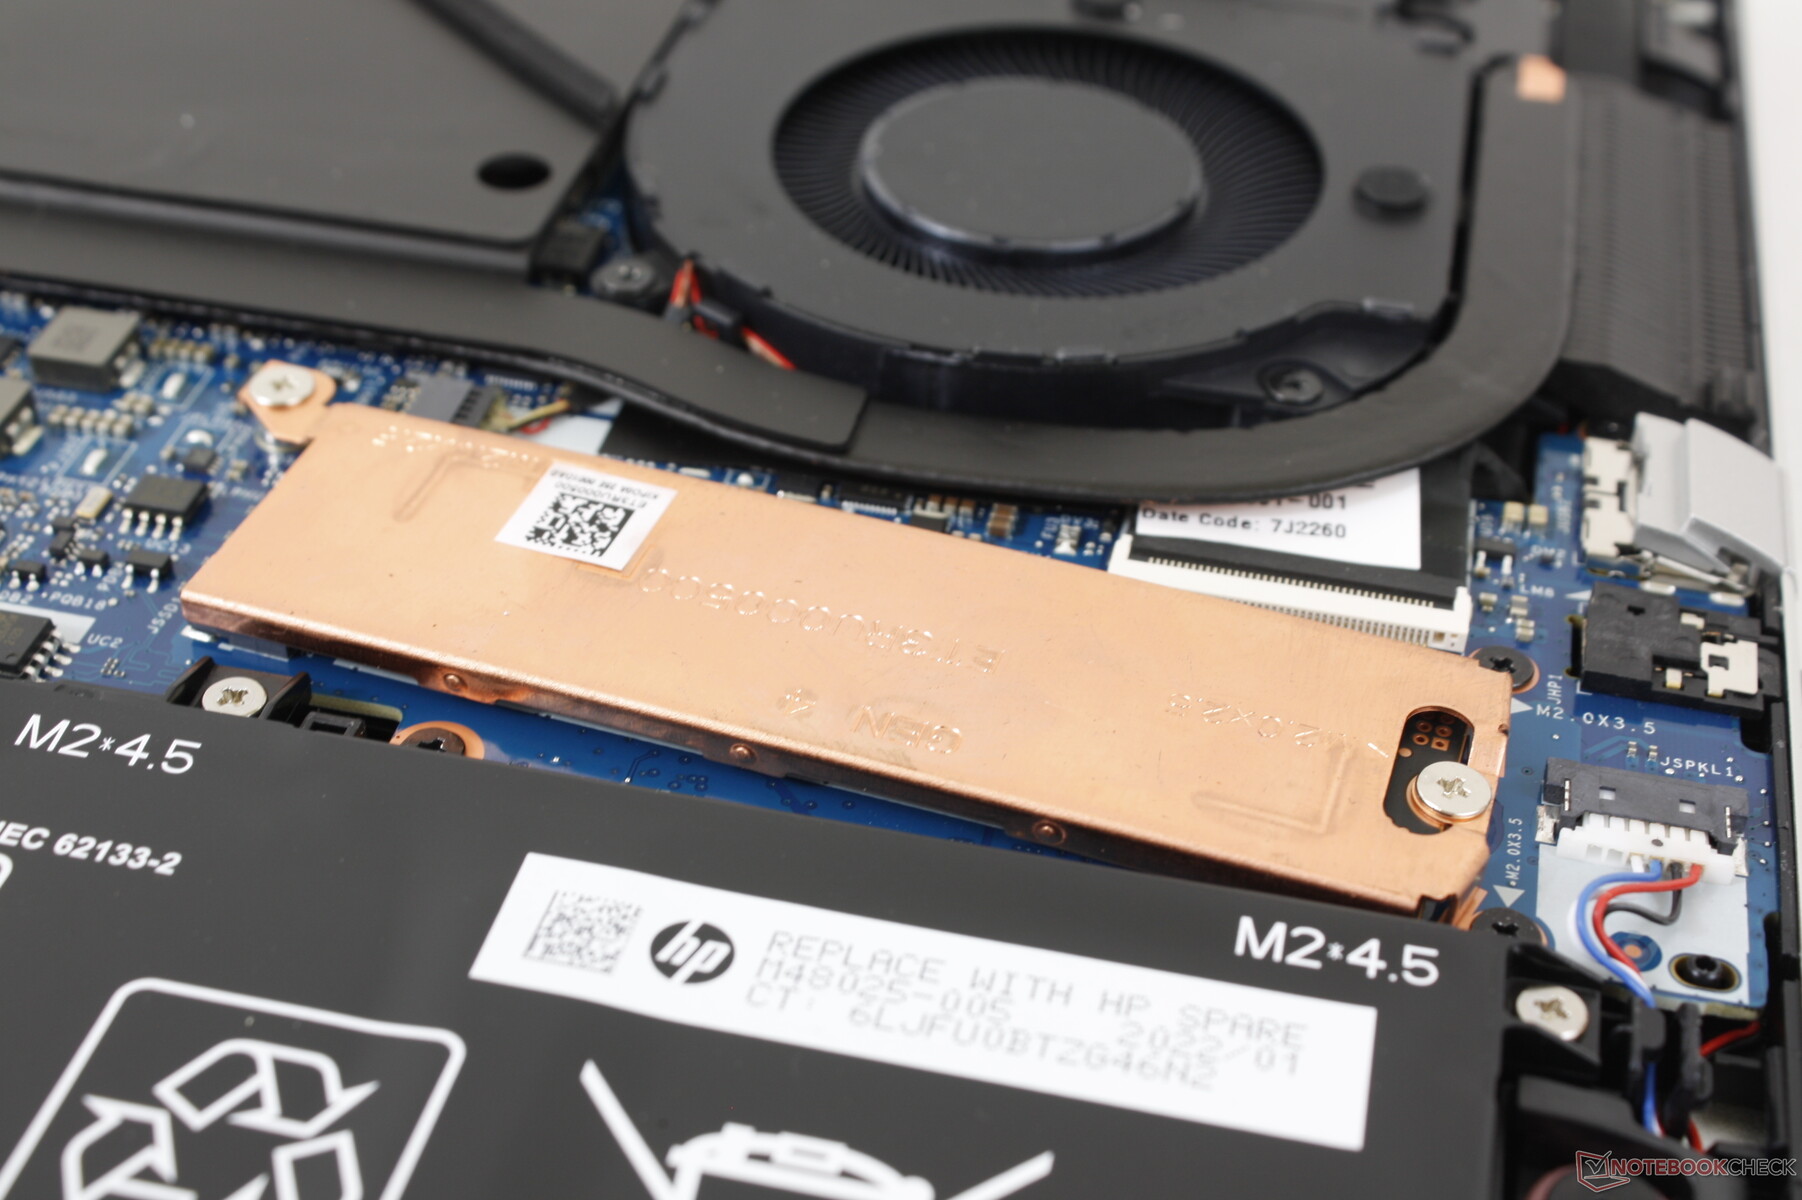
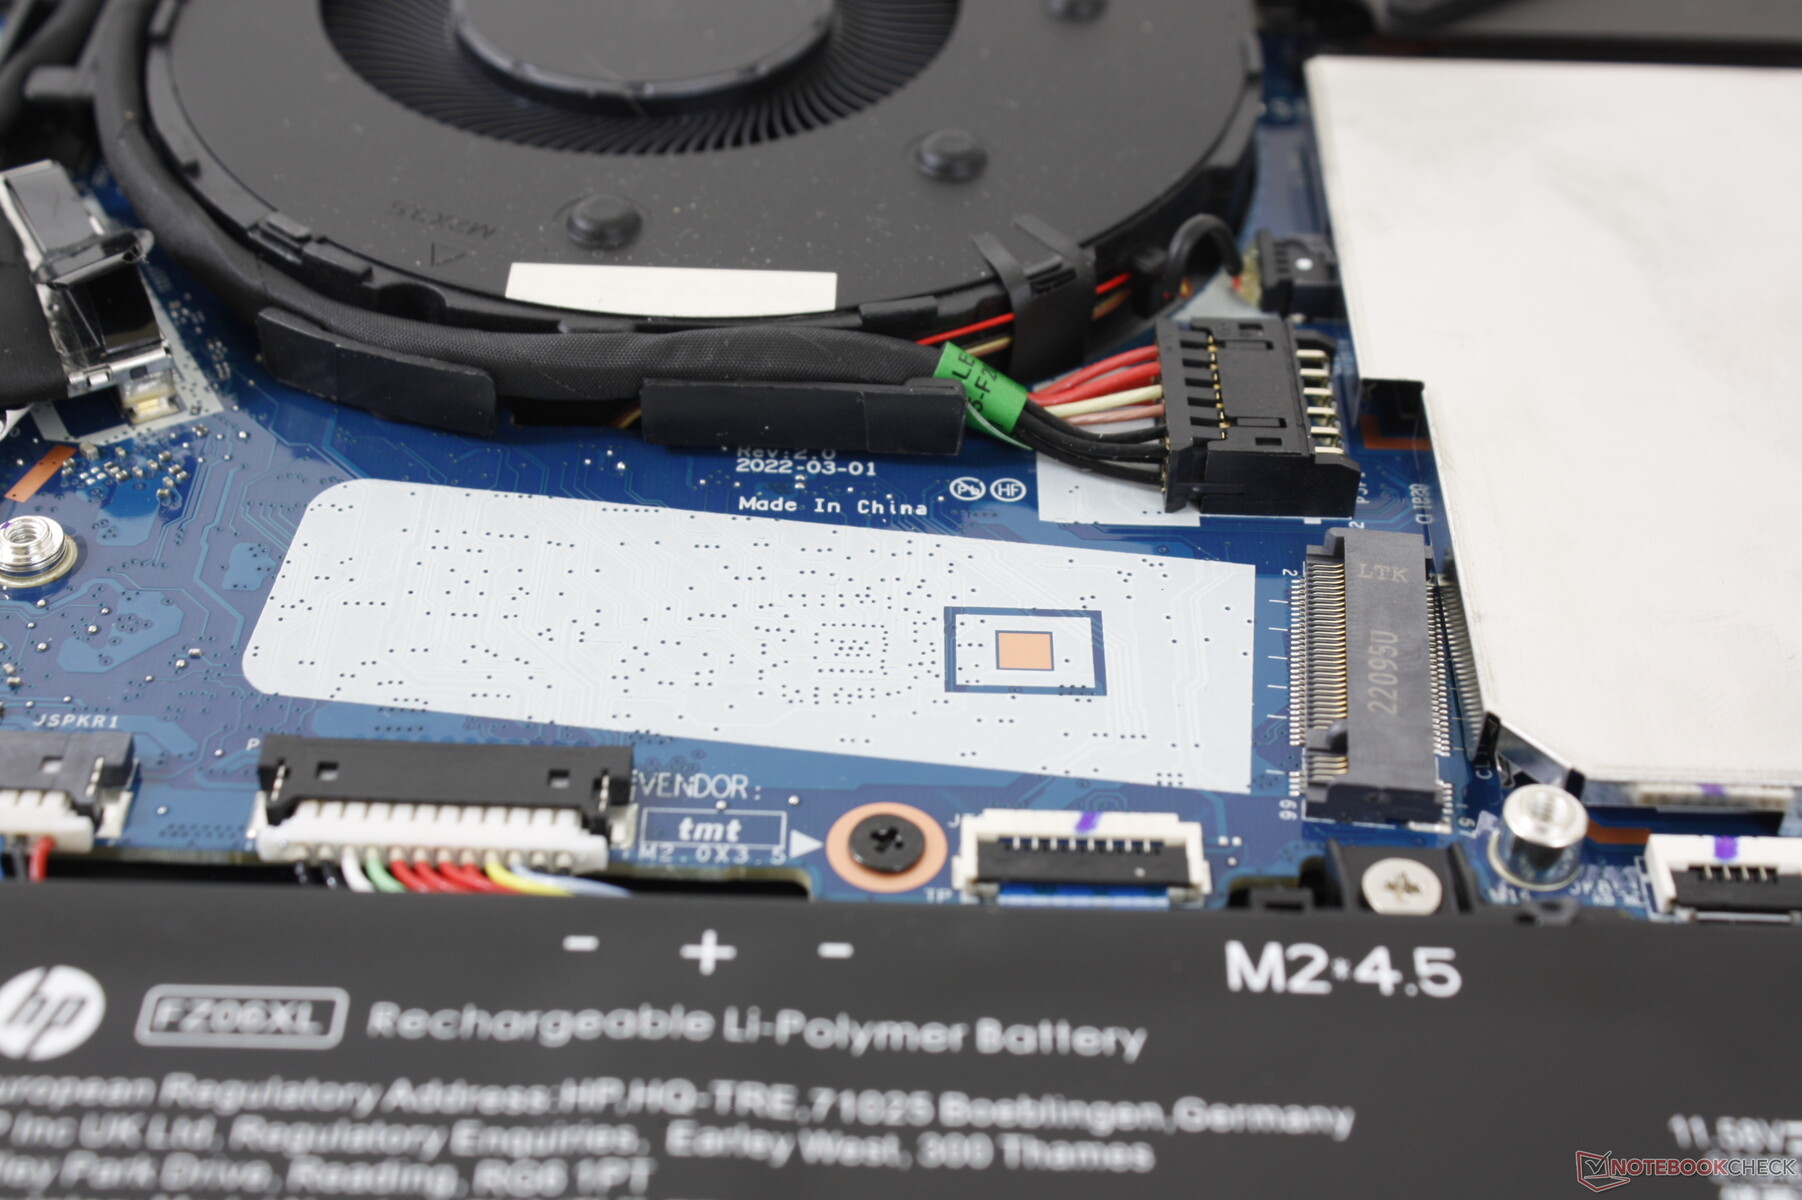
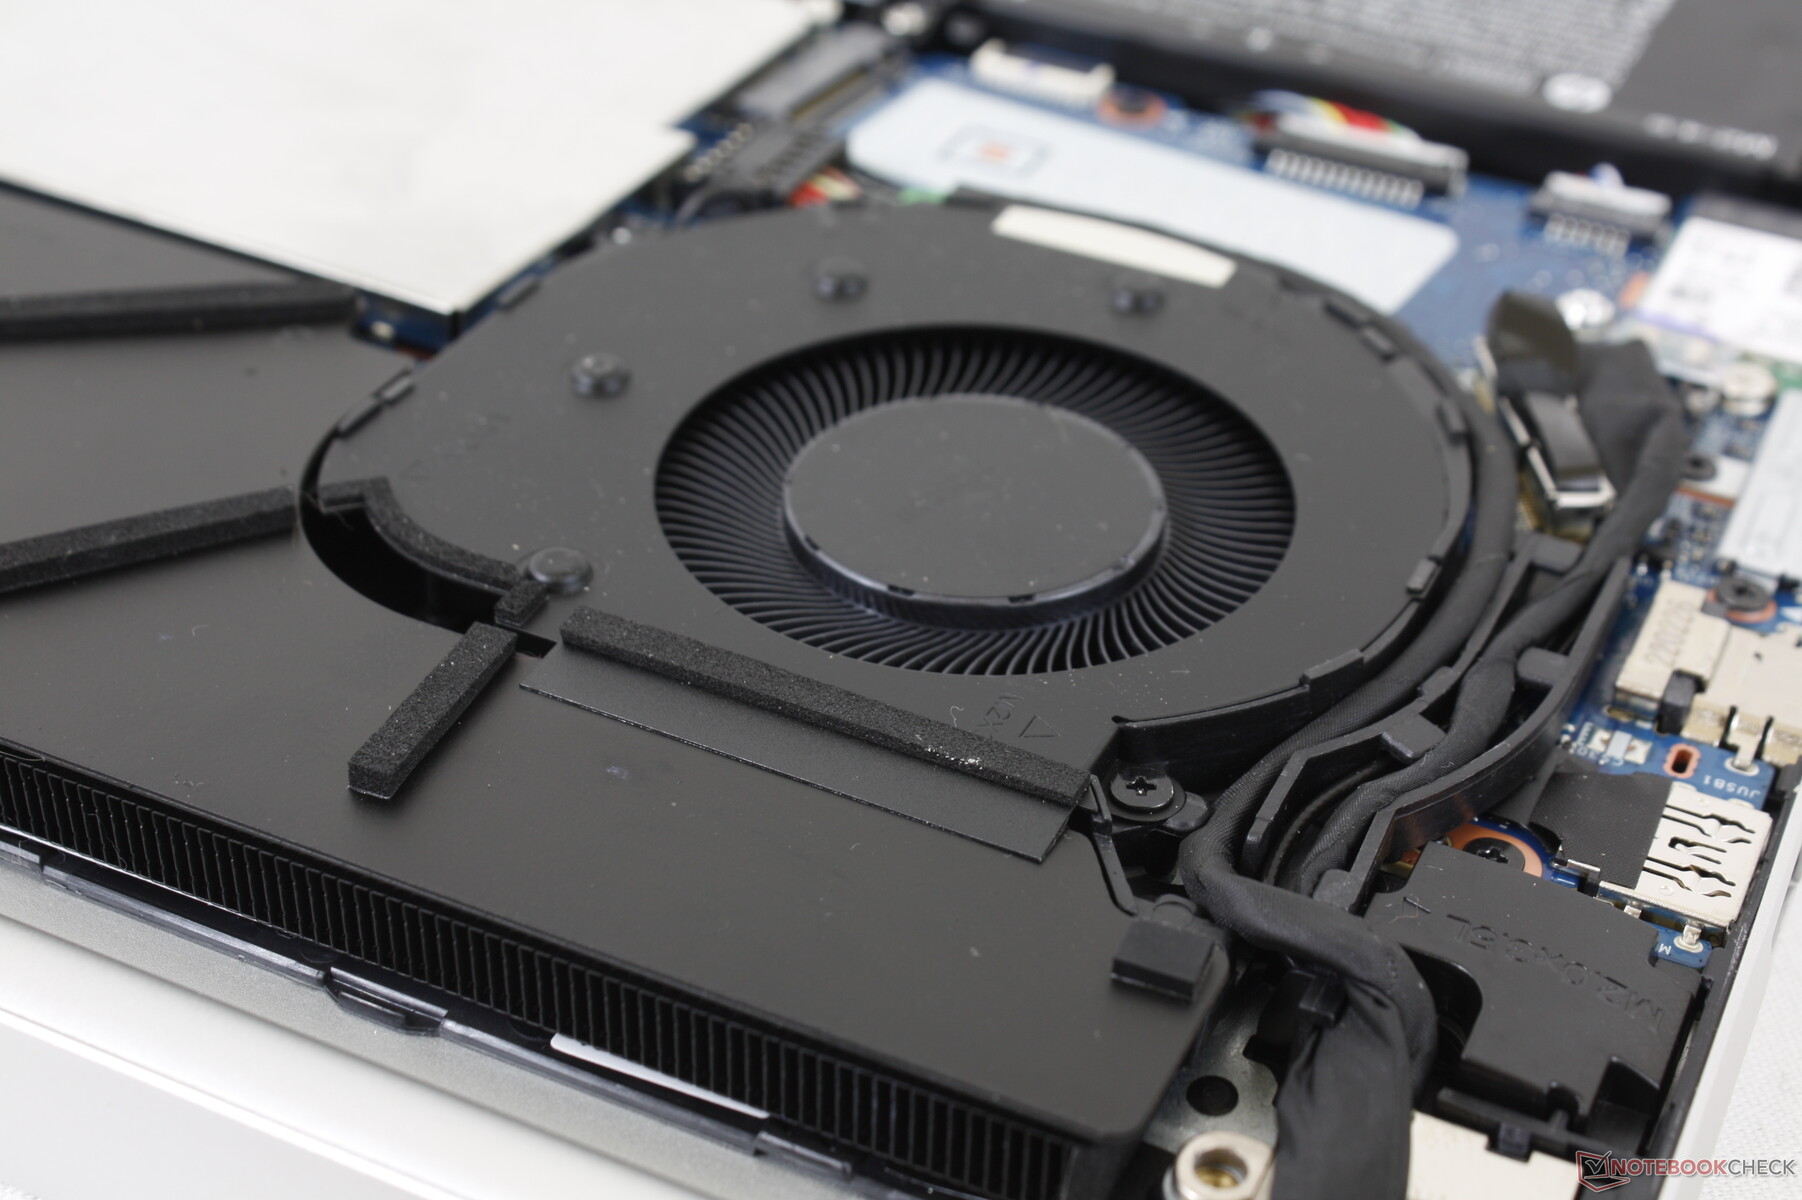
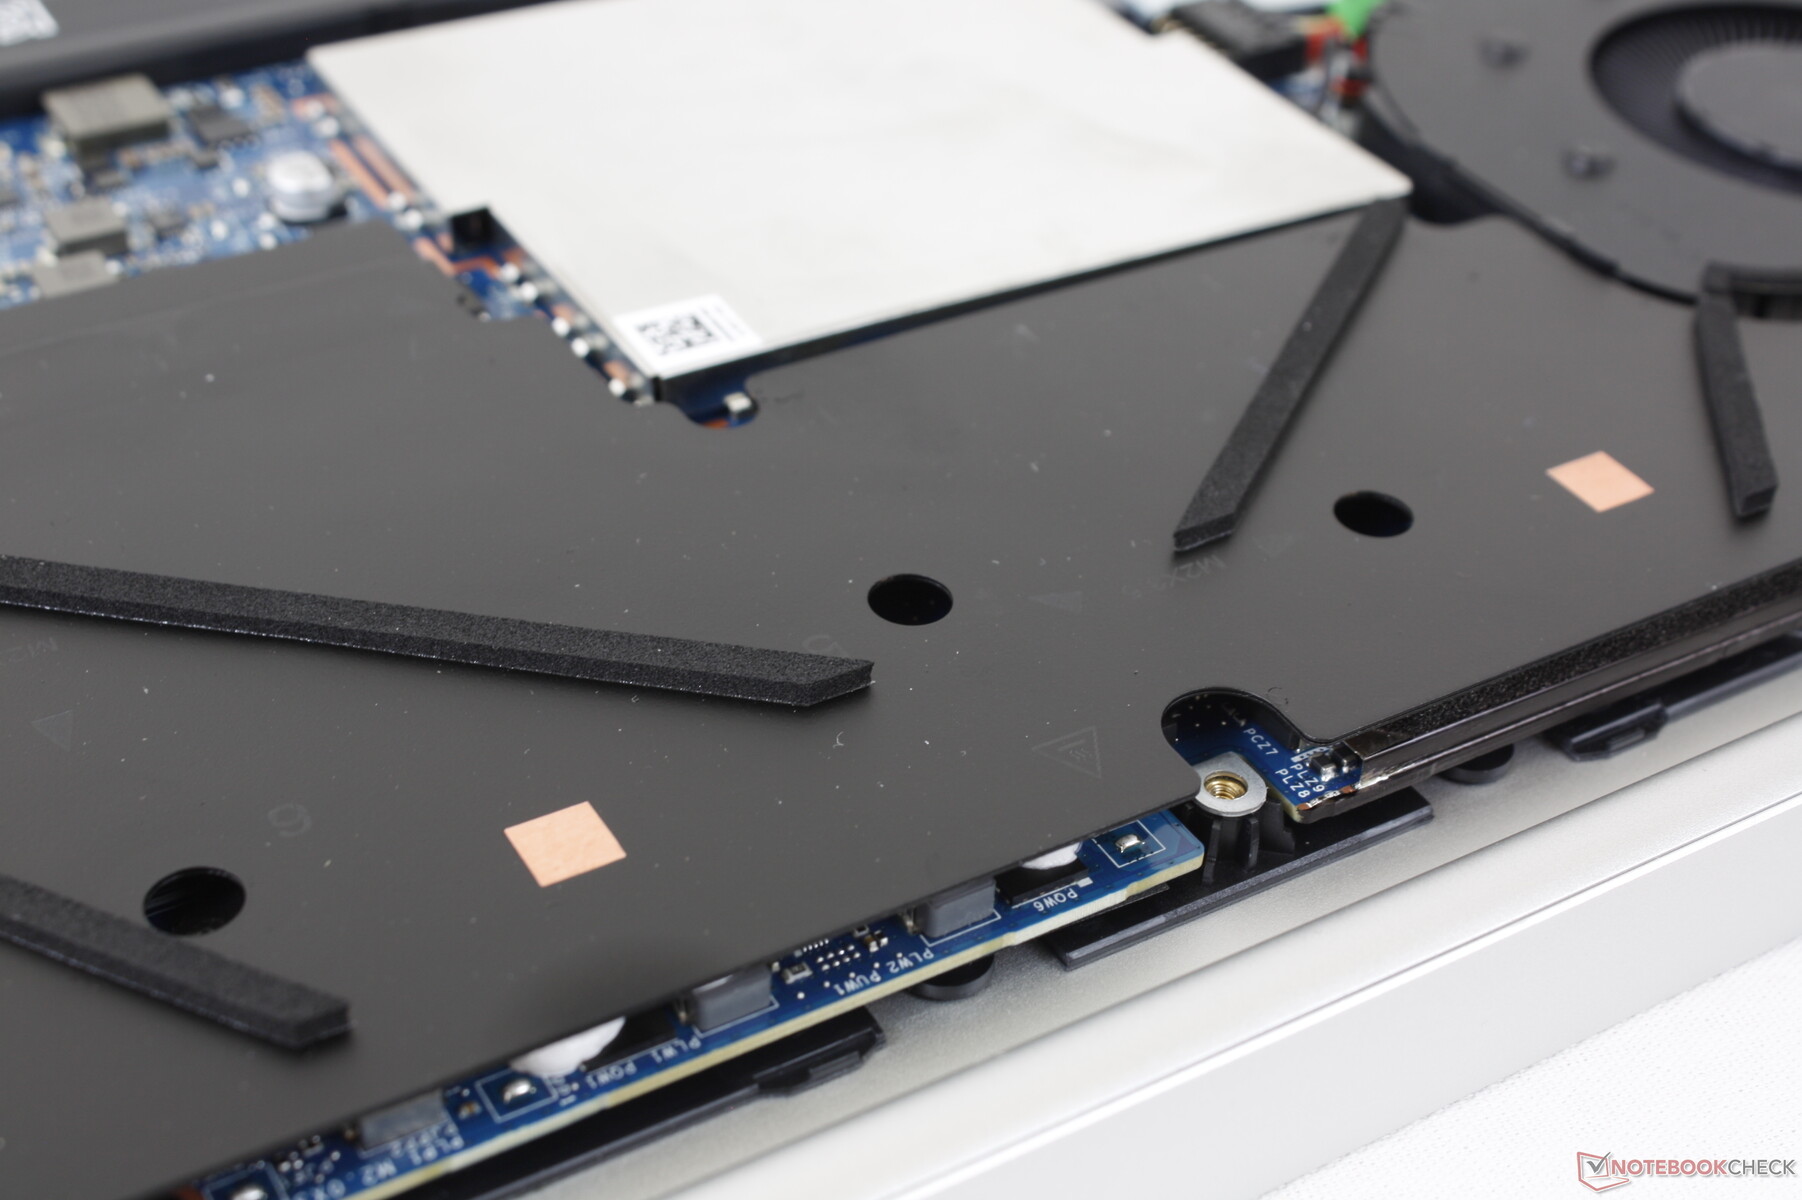
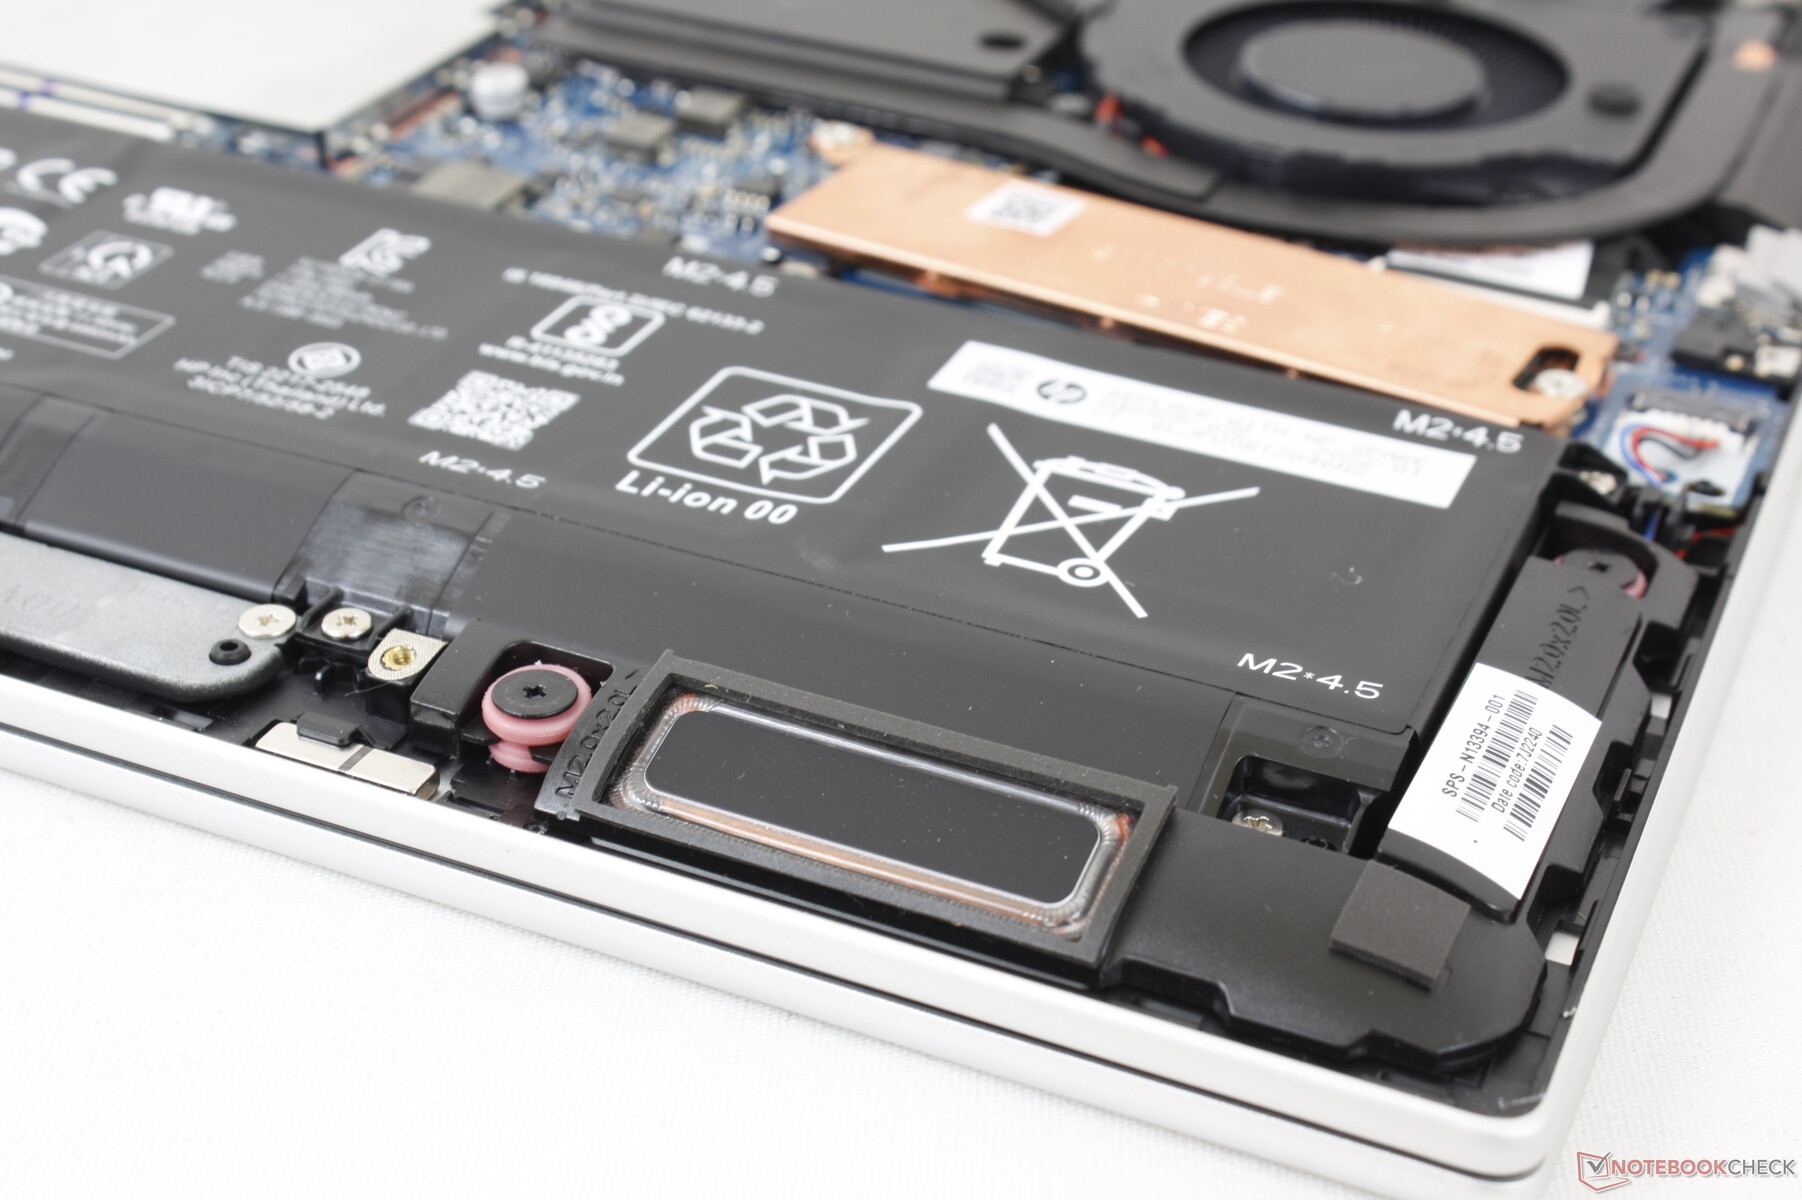
维护
底部面板仅由5颗Torx螺钉固定,便于维修。事实上,惠普有一个非常有用的YouTube视频关于如何一步一步地拆卸笔记本电脑。用户可以进入2个SODIMM插槽,2个存储插槽,以及WLAN模块,一旦进入。
配件和保修
除了交流电适配器和文件外,零售盒中没有任何额外的东西。如果在美国购买,通常有一年的有限保修。
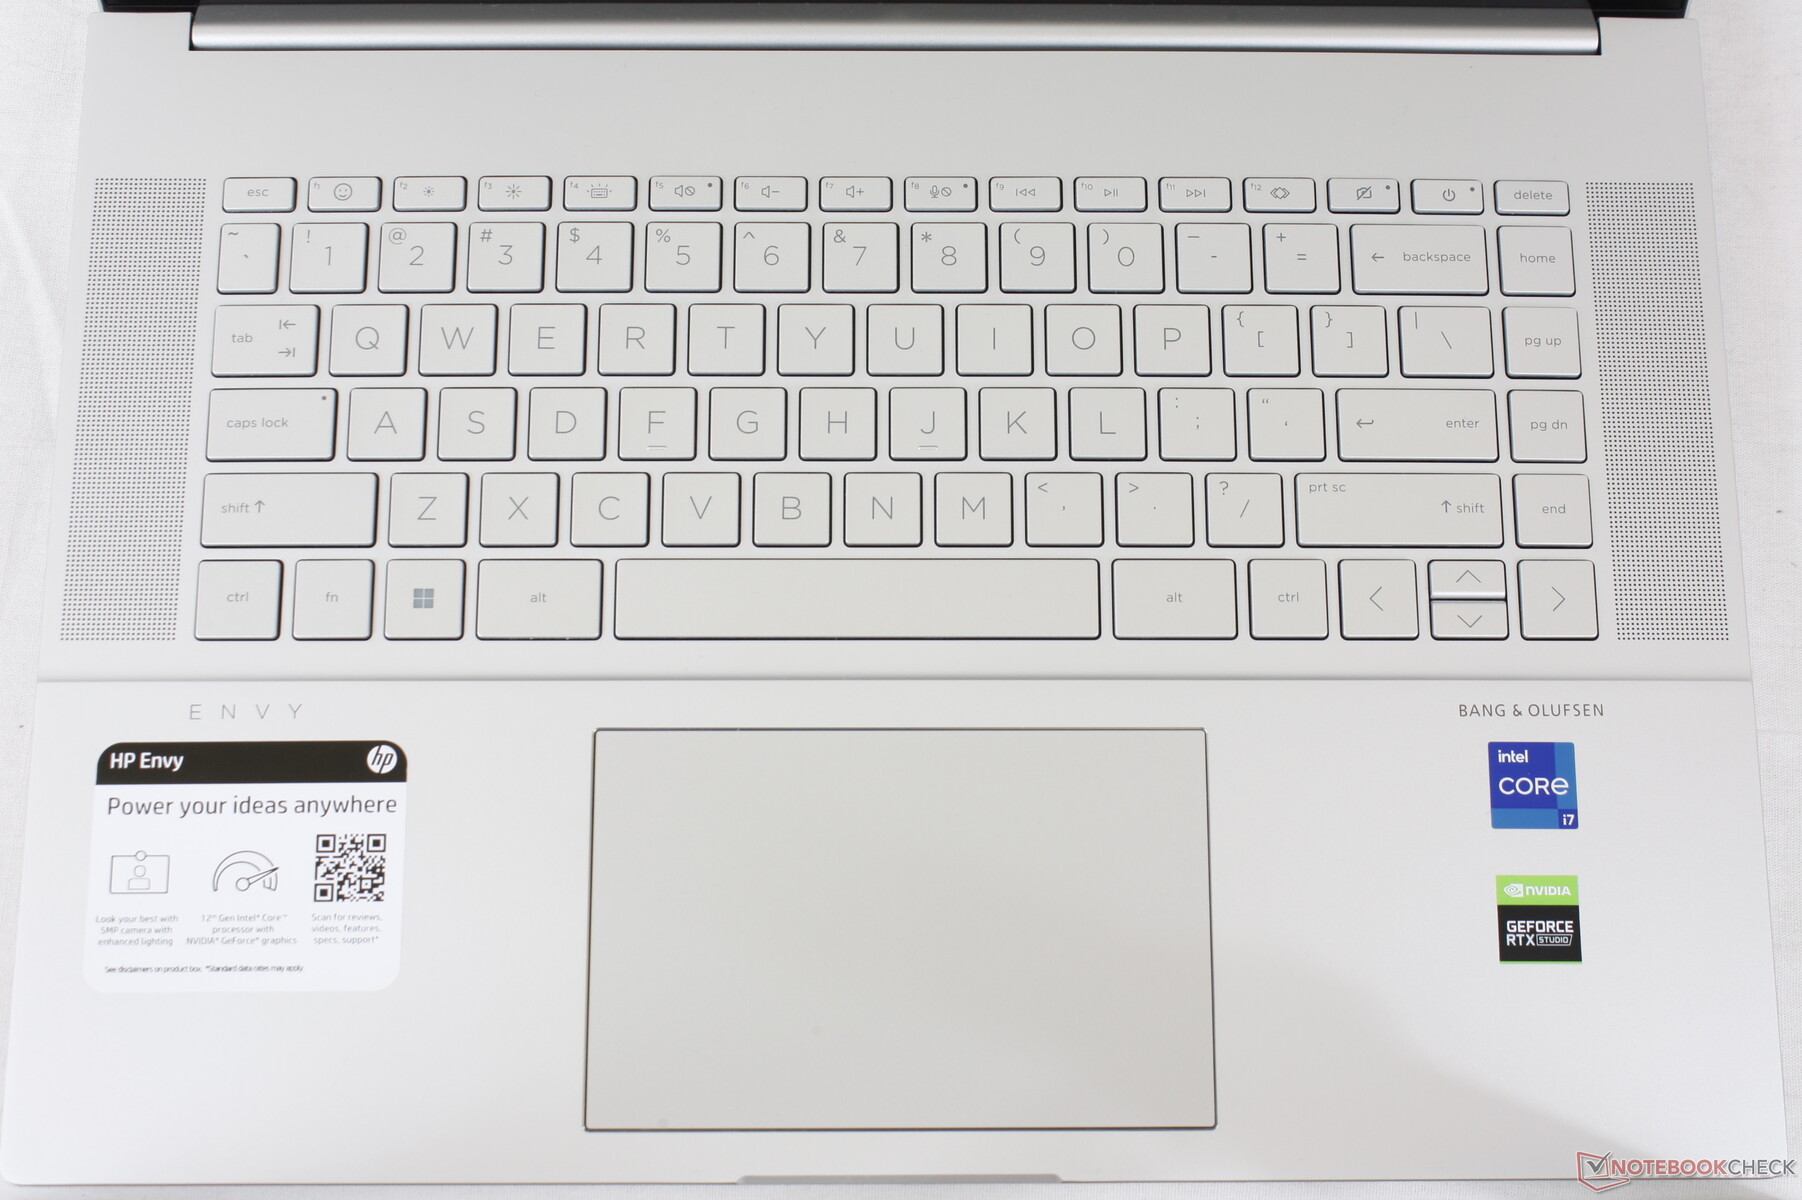
输入设备 - 更大的触摸板,熟悉的键盘
键盘
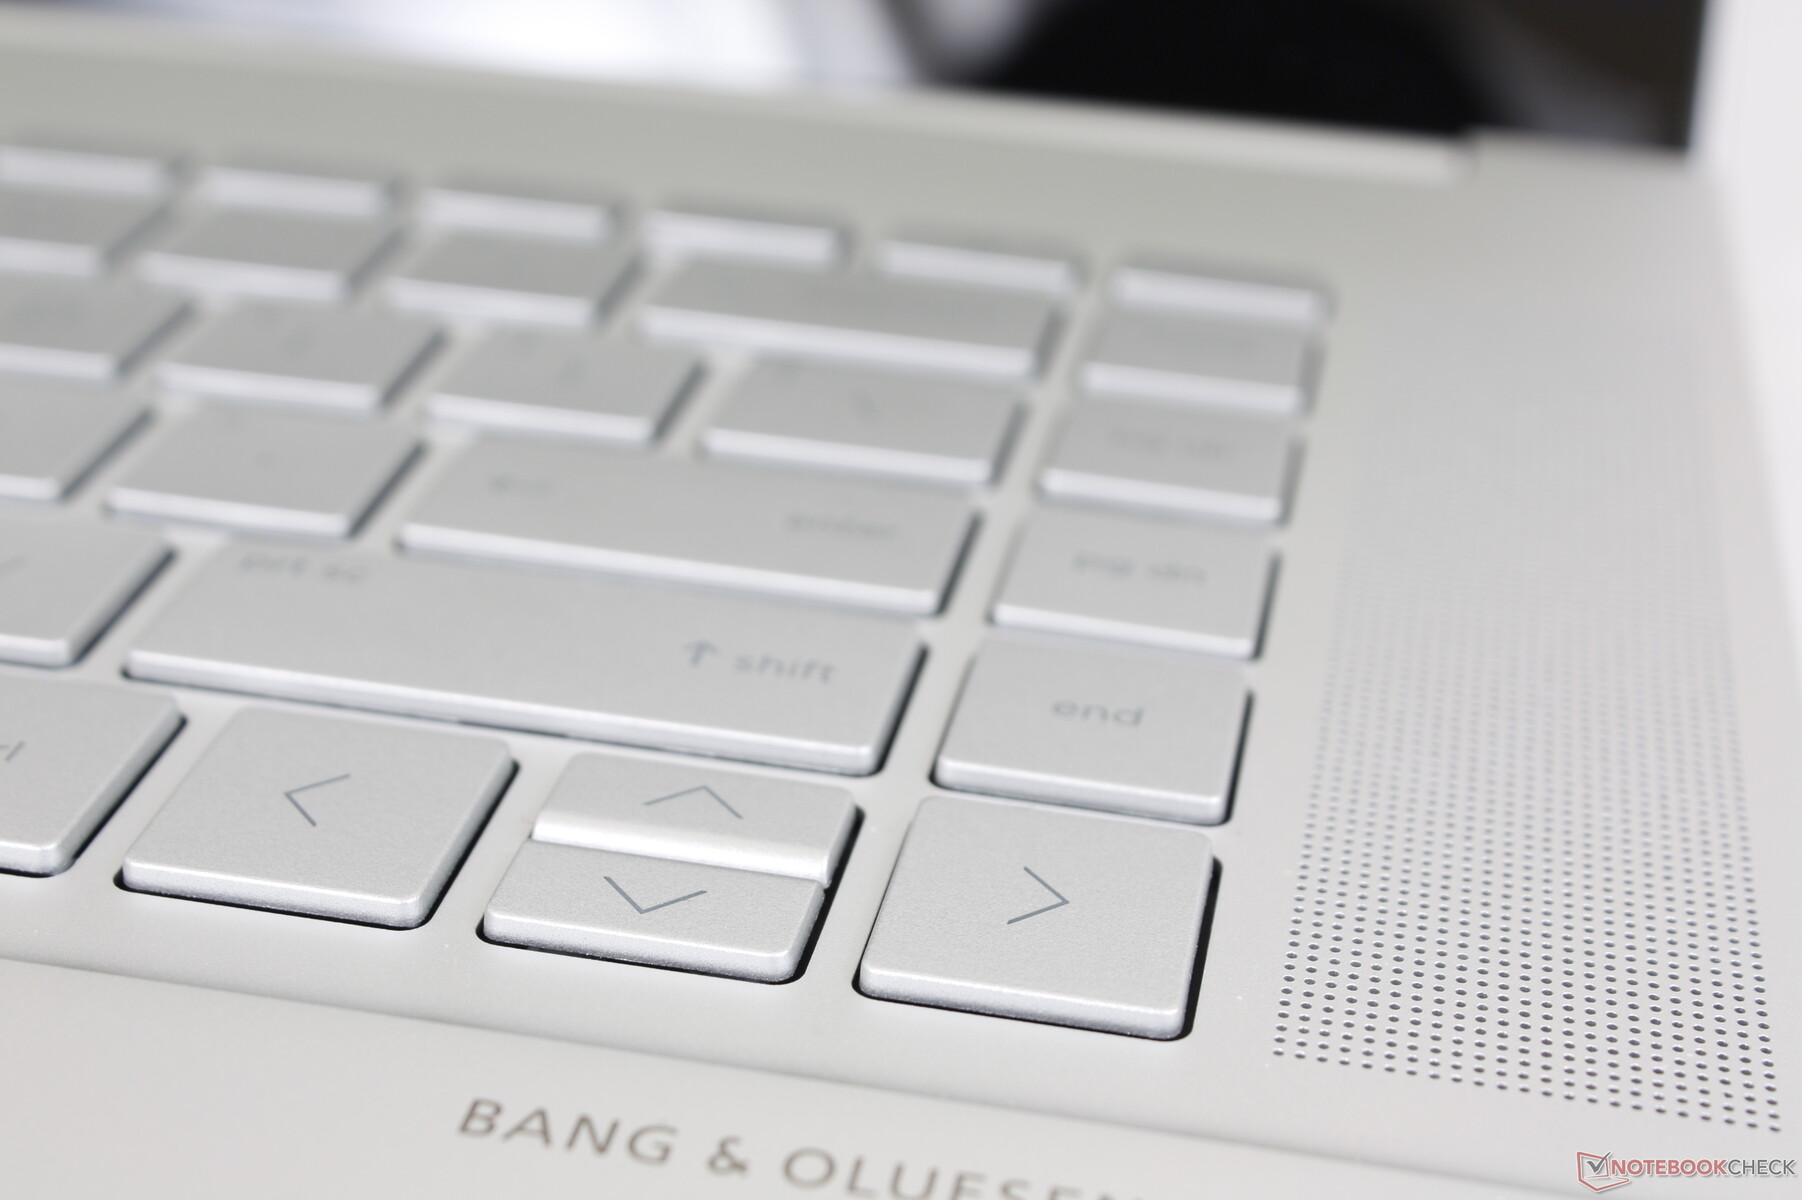
与2020年的Envy 15相比,惠普没有对键盘的反馈或感觉做任何改变。一方面,习惯了Envy键盘的用户不会有任何问题,但另一方面,我们更希望打字体验更接近Spectre 15或EliteBook的更坚实、更令人满意的按键。 EliteBook 机型的打字体验。
有两个小的表面变化值得一提。F12键的次要功能现在已改为 "系统事件实用程序 "功能,这基本上是惠普命令中心、Omen游戏中心、myHP和惠普调色板的快速启动键。其次,F1键的辅助功能现在启动了一个弹出窗口,用于选择表情符号和GIF,就像在 最新的Pavilion.
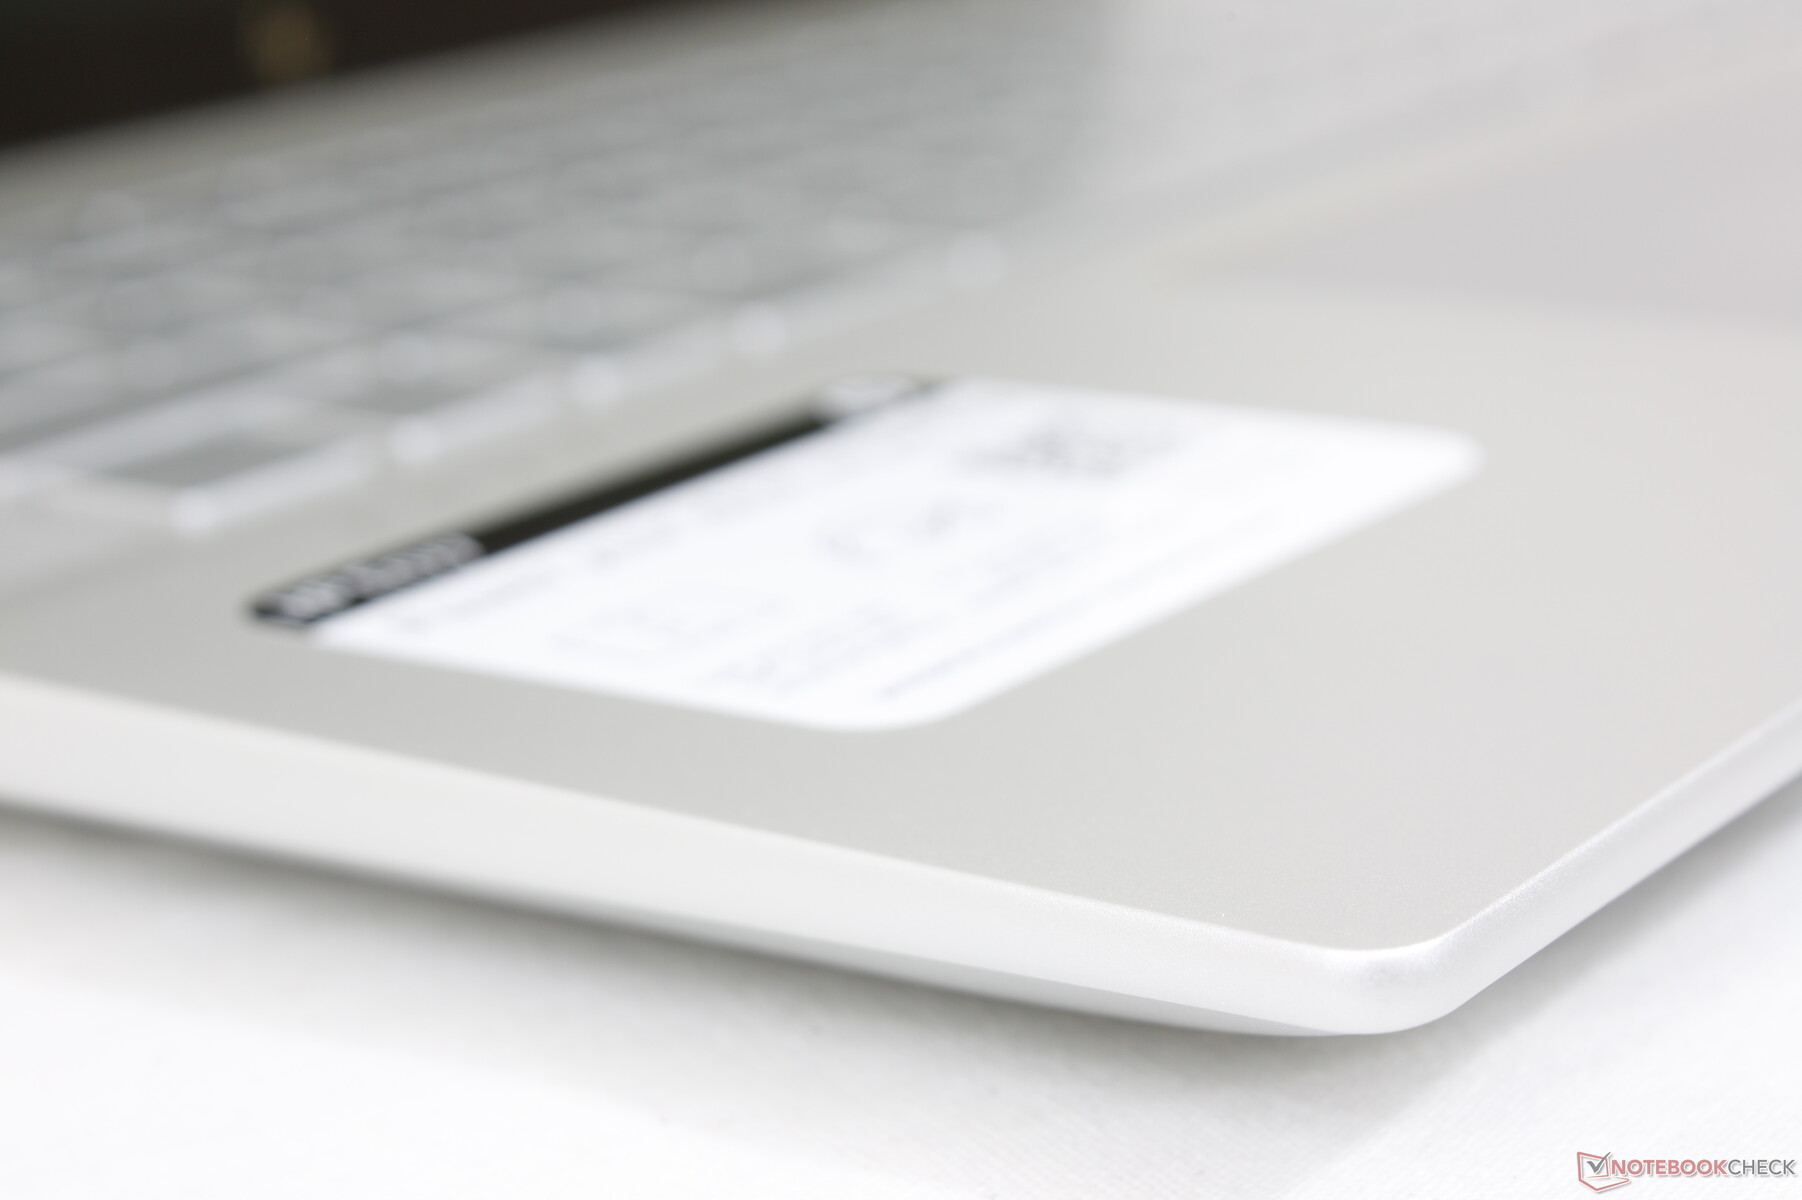
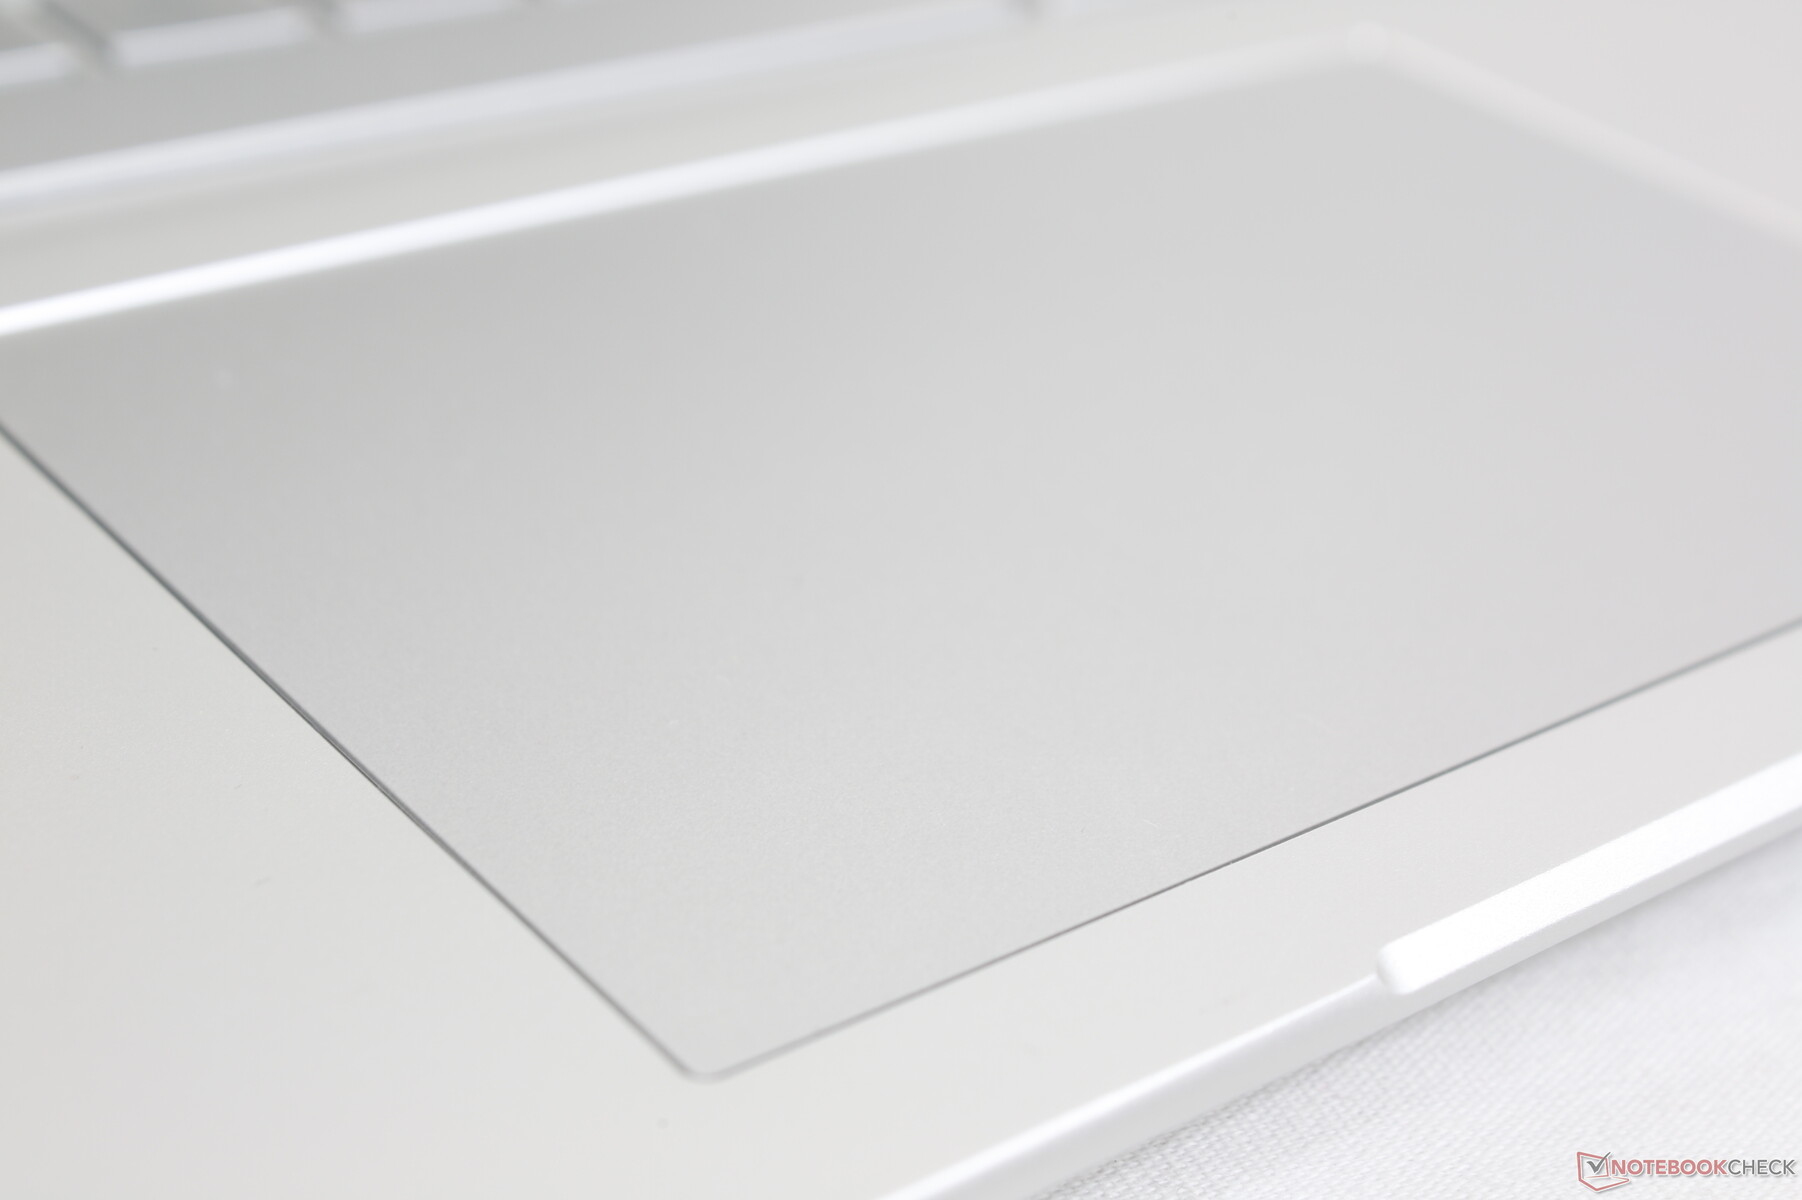
触摸板
点击板比即将推出的Envy 15上的点击板要大(12.5 x 8厘米对11.5 x 7.5厘米)。表面很光滑,几乎没有纹理,如果以较慢的速度滑行以获得更准确的点击,仅有极少的粘性。同时,点击点击板时的反馈是相对柔软和安静的,有一种海绵般的感觉。如果有更强的、更令人满意的点击,会使点击板更容易使用。

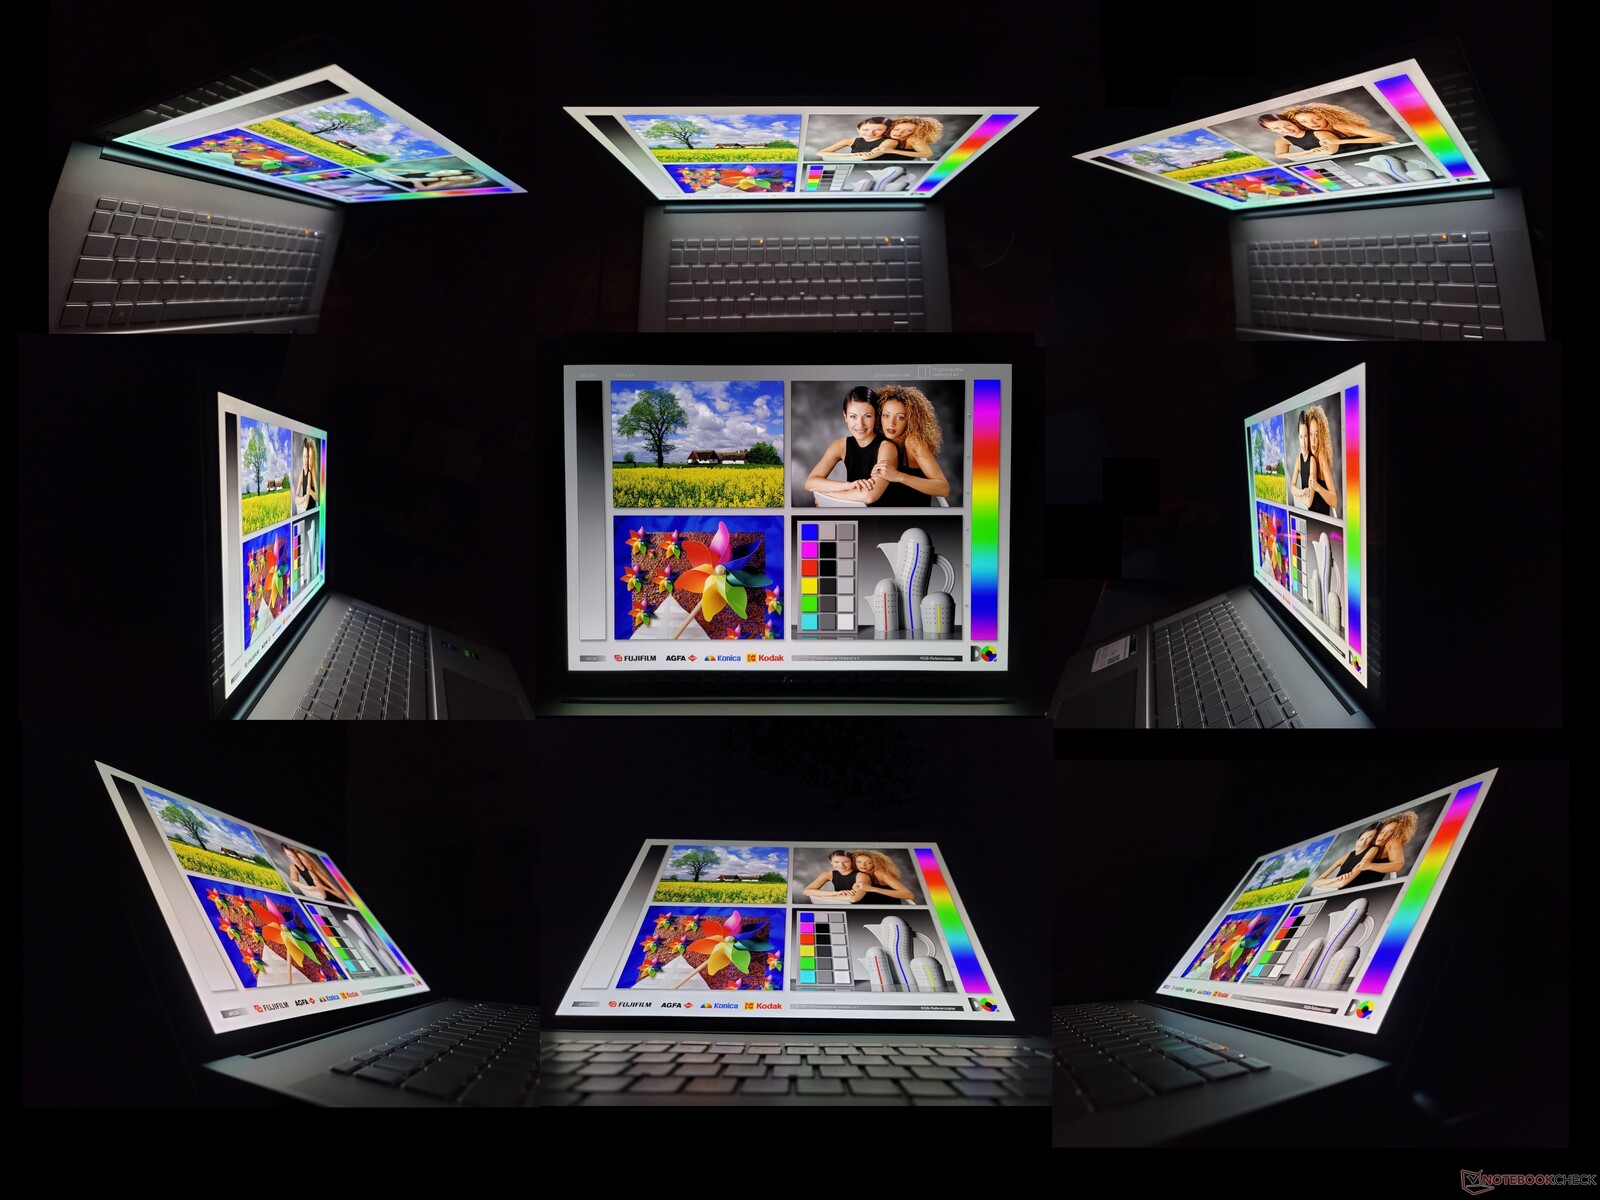
显示器 - IPS还是OLED?
有两种显示器可供选择。
- 2560 x 1600, 120 Hz, IPS, 100% sRGB
- 3840 x 2400, 60 Hz, OLED, 100% P3
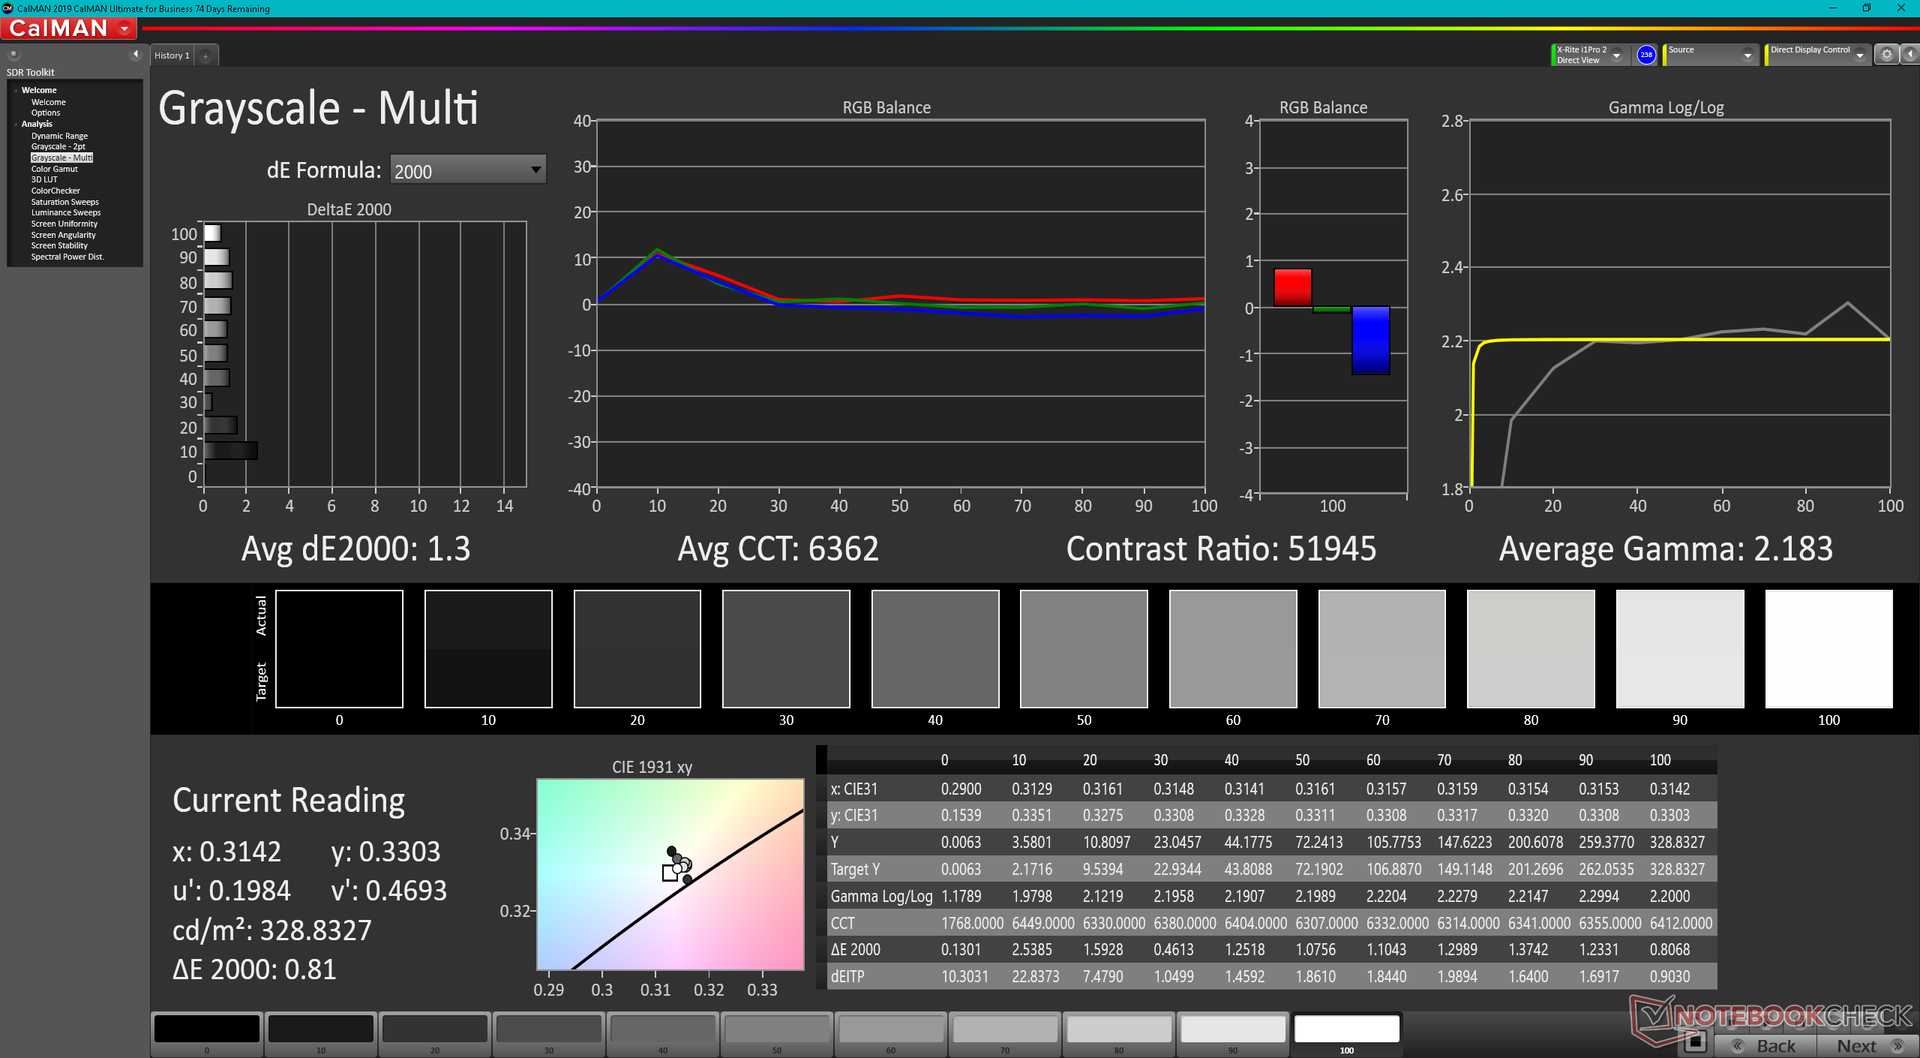
我们下面的测量结果只反映了OLED选项。它的主要优势包括更深的色彩,漆黑的对比度,以及比IPS明显更快的黑白和灰度响应时间,但代价是更高的功耗和屏幕闪烁,可能会影响一小部分用户。
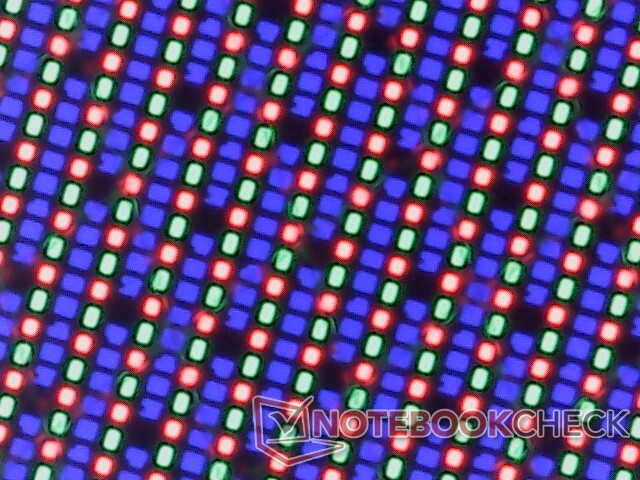
图像质量很清晰,但有明显的颜色颗粒,在高亮度设置下显示白色时变得更加明显。对于那些不需要P3色彩的人来说,IPS选项可能更受欢迎,因为120赫兹的刷新率提供了更流畅的体验。
| |||||||||||||||||||||||||
Brightness Distribution: 97 %
Center on Battery: 328.8 cd/m²
Contrast: ∞:1 (Black: 0 cd/m²)
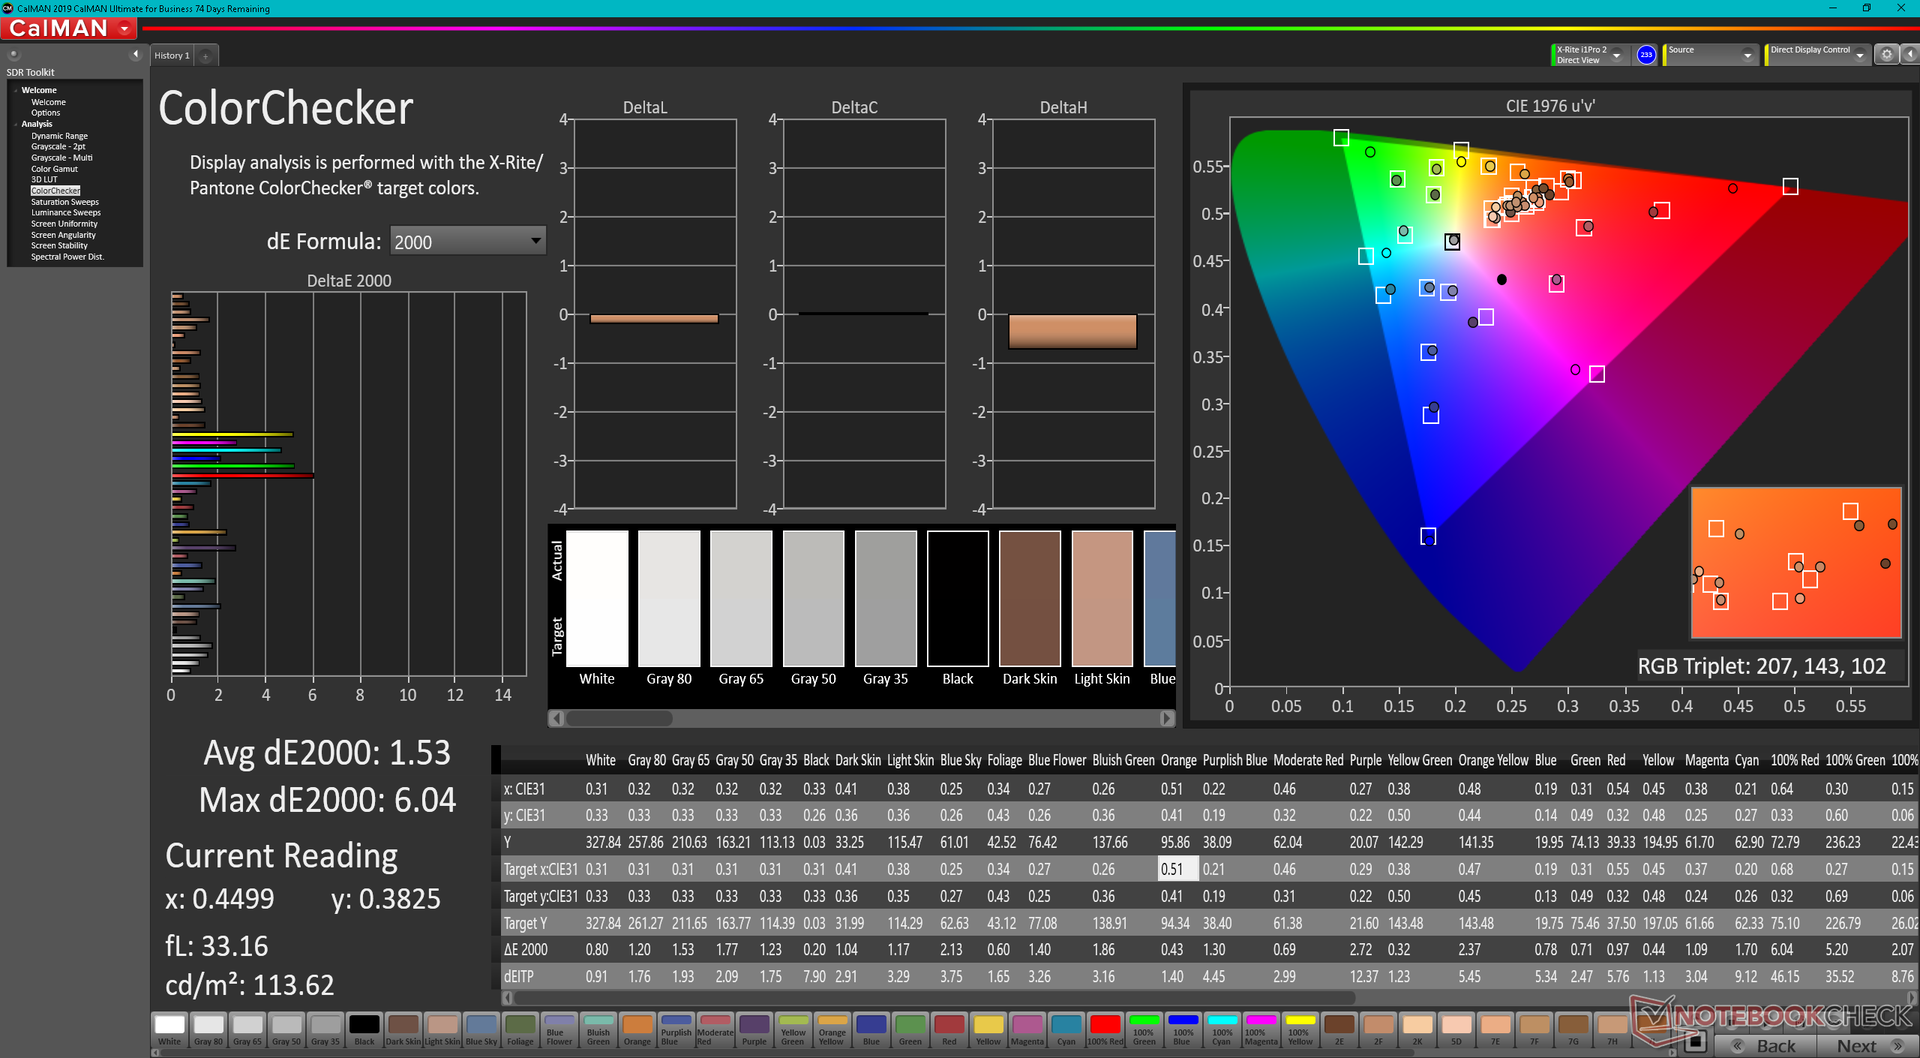
ΔE ColorChecker Calman: 1.53 | ∀{0.5-29.43 Ø4.71}
ΔE Greyscale Calman: 1.3 | ∀{0.09-98 Ø4.96}
88% AdobeRGB 1998 (Argyll 3D)
100% sRGB (Argyll 3D)
99.3% Display P3 (Argyll 3D)
Gamma: 2.18
CCT: 6362 K
| HP Envy 16 h0112nr Samsung SDC4174, OLED, 3840x2400, 16" | Lenovo ThinkBook 16 G4+ IAP LEN160WQXGA, IPS, 2560x1600, 16" | MSI Creator Z16P B12UHST AUOD298, IPS True Pixel (~100% DCI-P3), 2560x1600, 16" | Dell Inspiron 16 Plus 7610-MHJ8F AU Optronics B160QAN, AUO9F91, IPS, 3072x1920, 16" | Apple MacBook Pro 16 2021 M1 Pro Liquid Retina XDR, Mini-LED, 3456x2234, 16.2" | Huawei MateBook 16s i7 BOE XS TV160DKT-NH0, IPS, 2520x1680, 16" | |
|---|---|---|---|---|---|---|
| Display | -17% | -1% | -13% | 0% | -21% | |
| Display P3 Coverage (%) | 99.3 | 69.6 -30% | 97.6 -2% | 75 -24% | 99.1 0% | 64.5 -35% |
| sRGB Coverage (%) | 100 | 97.5 -2% | 99.9 0% | 100 0% | 100 0% | 96.7 -3% |
| AdobeRGB 1998 Coverage (%) | 88 | 71.7 -19% | 86.8 -1% | 76 -14% | 88 0% | 66.6 -24% |
| Response Times | -1160% | -391% | -2092% | -3381% | -1403% | |
| Response Time Grey 50% / Grey 80% * (ms) | 2 ? | 32.7 ? -1535% | 12.9 ? -545% | 54 ? -2600% | 42.8 ? -2040% | 35.7 ? -1685% |
| Response Time Black / White * (ms) | 1.9 ? | 16.8 ? -784% | 6.4 ? -237% | 32 ? -1584% | 91.6 ? -4721% | 23.2 ? -1121% |
| PWM Frequency (Hz) | 240.4 ? | 14880 | ||||
| Screen | -36% | -17% | -37% | 15% | 13% | |
| Brightness middle (cd/m²) | 328.8 | 371 13% | 428 30% | 290 -12% | 514 56% | 311 -5% |
| Brightness (cd/m²) | 332 | 357 8% | 394 19% | 285 -14% | 497 50% | 319 -4% |
| Brightness Distribution (%) | 97 | 91 -6% | 86 -11% | 88 -9% | 95 -2% | 91 -6% |
| Black Level * (cd/m²) | 0.23 | 0.42 | 0.21 | 0.02 | 0.17 | |
| Colorchecker dE 2000 * | 1.53 | 2.6 -70% | 1.67 -9% | 2.57 -68% | 1.4 8% | 1 35% |
| Colorchecker dE 2000 max. * | 6.04 | 4.4 27% | 5.71 5% | 4.78 21% | 2.8 54% | 1.7 72% |
| Greyscale dE 2000 * | 1.3 | 3.7 -185% | 3.1 -138% | 3.14 -142% | 2.3 -77% | 1.5 -15% |
| Gamma | 2.18 101% | 2.32 95% | 2.195 100% | 2.34 94% | 2.27 97% | 2.15 102% |
| CCT | 6362 102% | 7271 89% | 6498 100% | 6408 101% | 6792 96% | 6432 101% |
| Contrast (:1) | 1613 | 1019 | 1381 | 25700 | 1829 | |
| Colorchecker dE 2000 calibrated * | 1.3 | 0.71 | 1.89 | 0.8 | ||
| Total Average (Program / Settings) | -404% /
-235% | -136% /
-81% | -714% /
-404% | -1122% /
-607% | -470% /
-254% |
* ... smaller is better
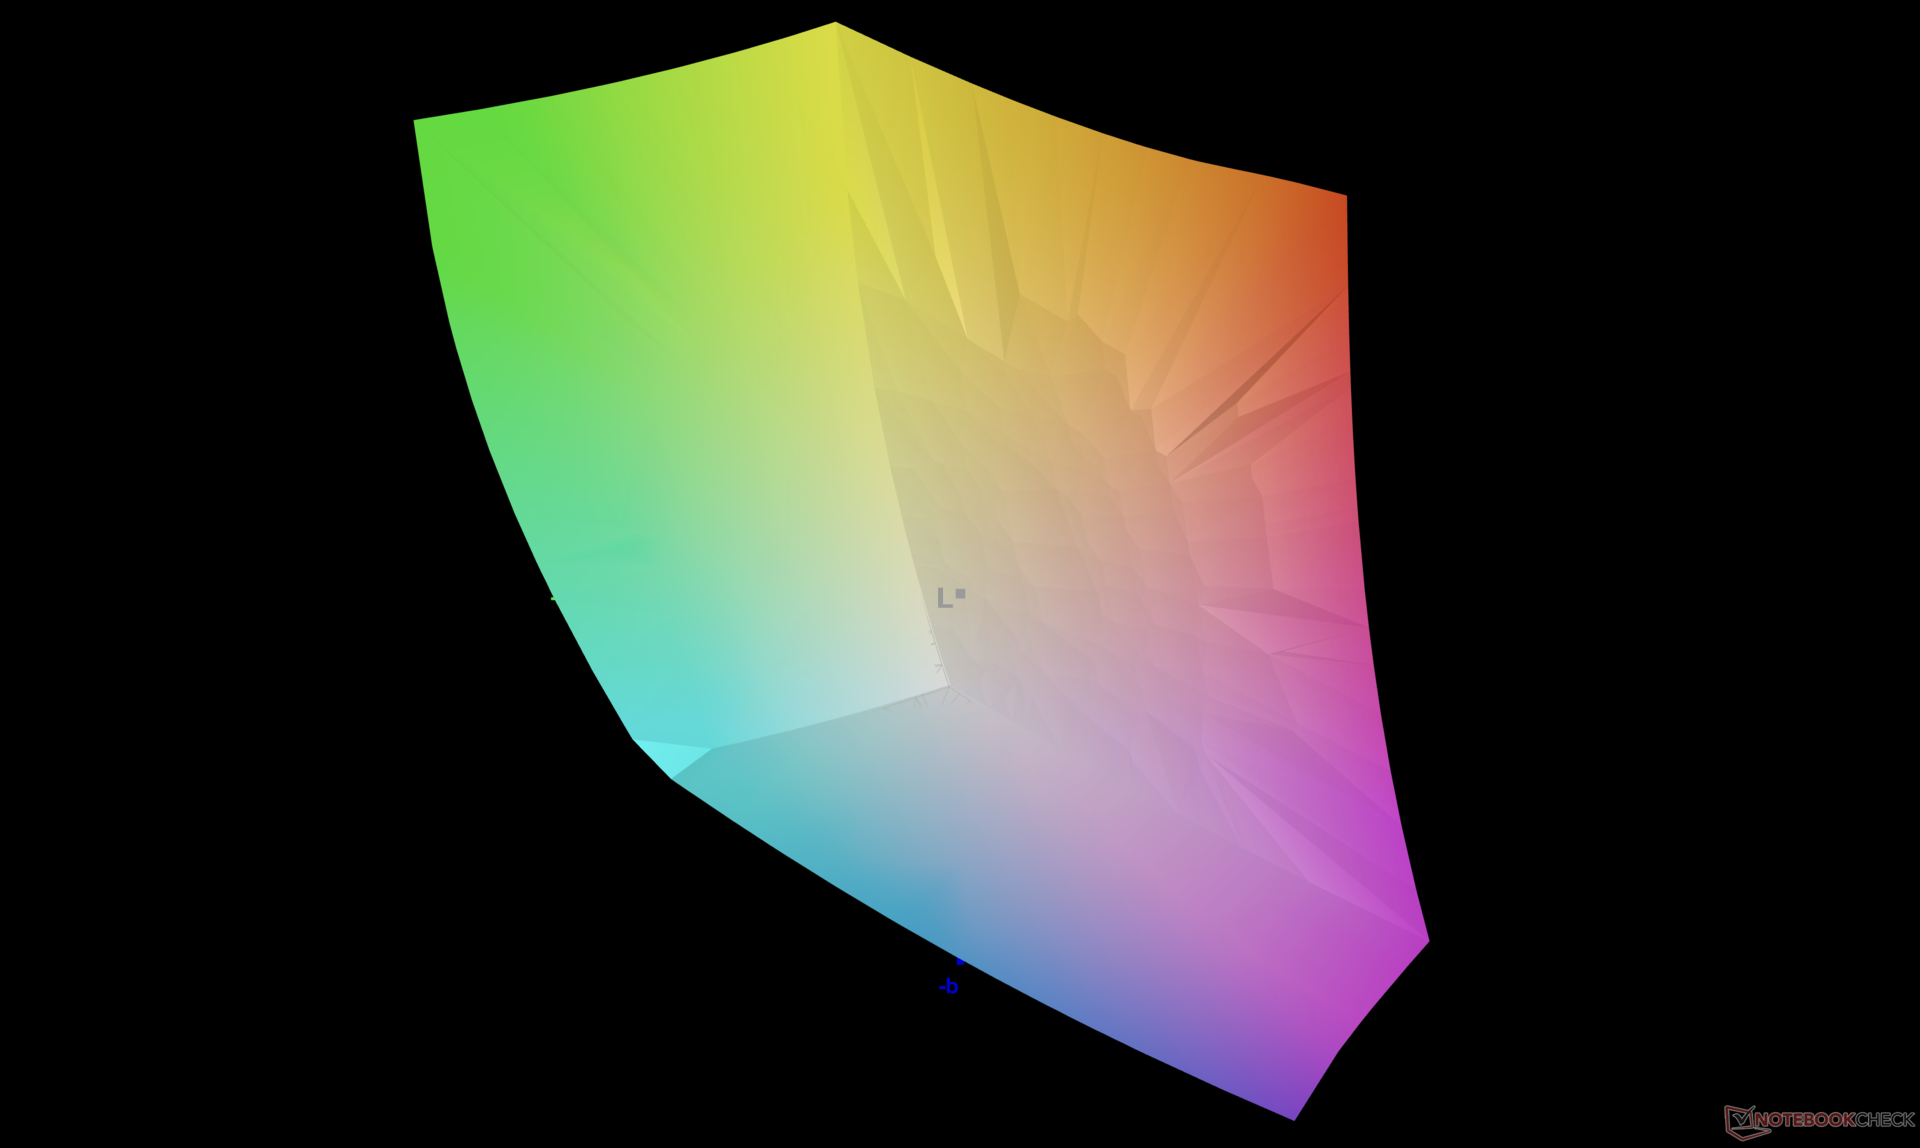
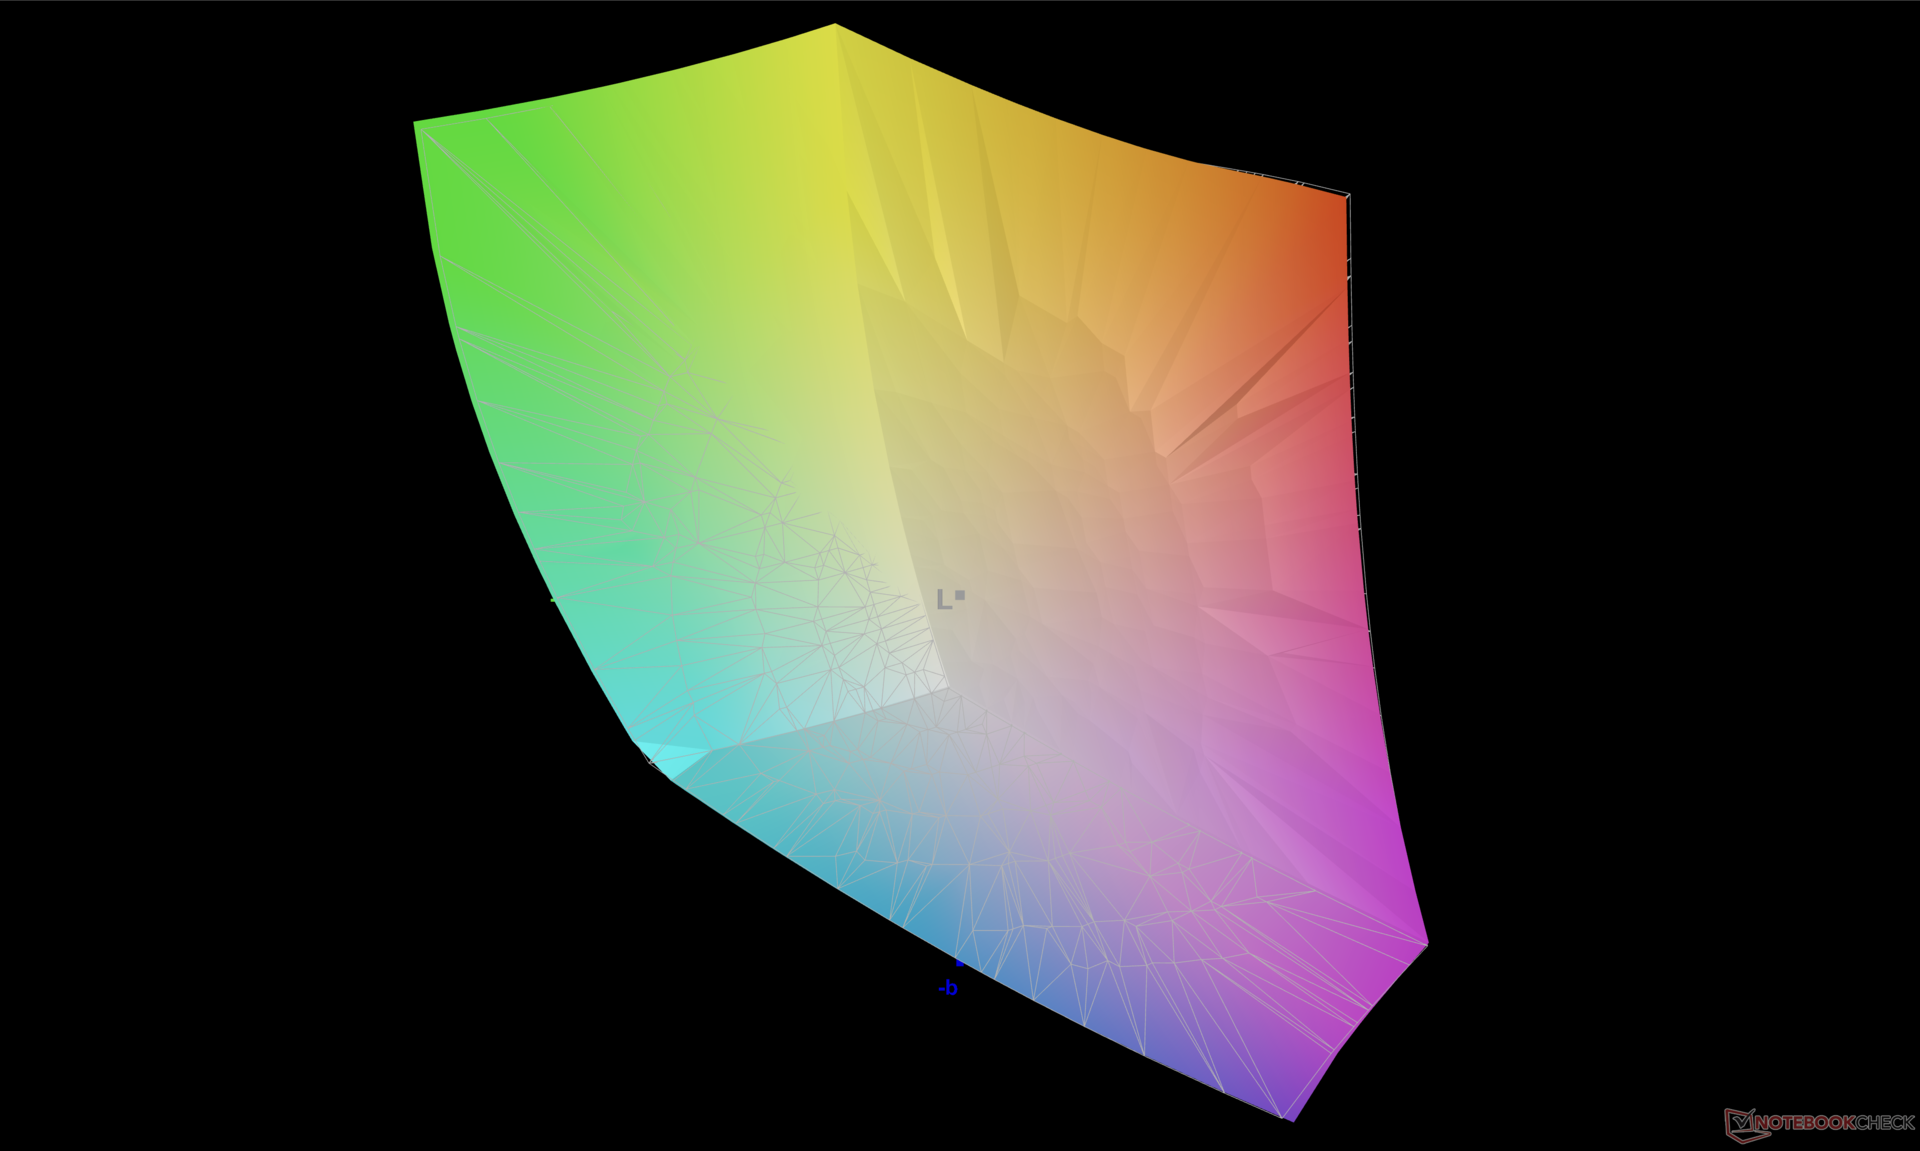
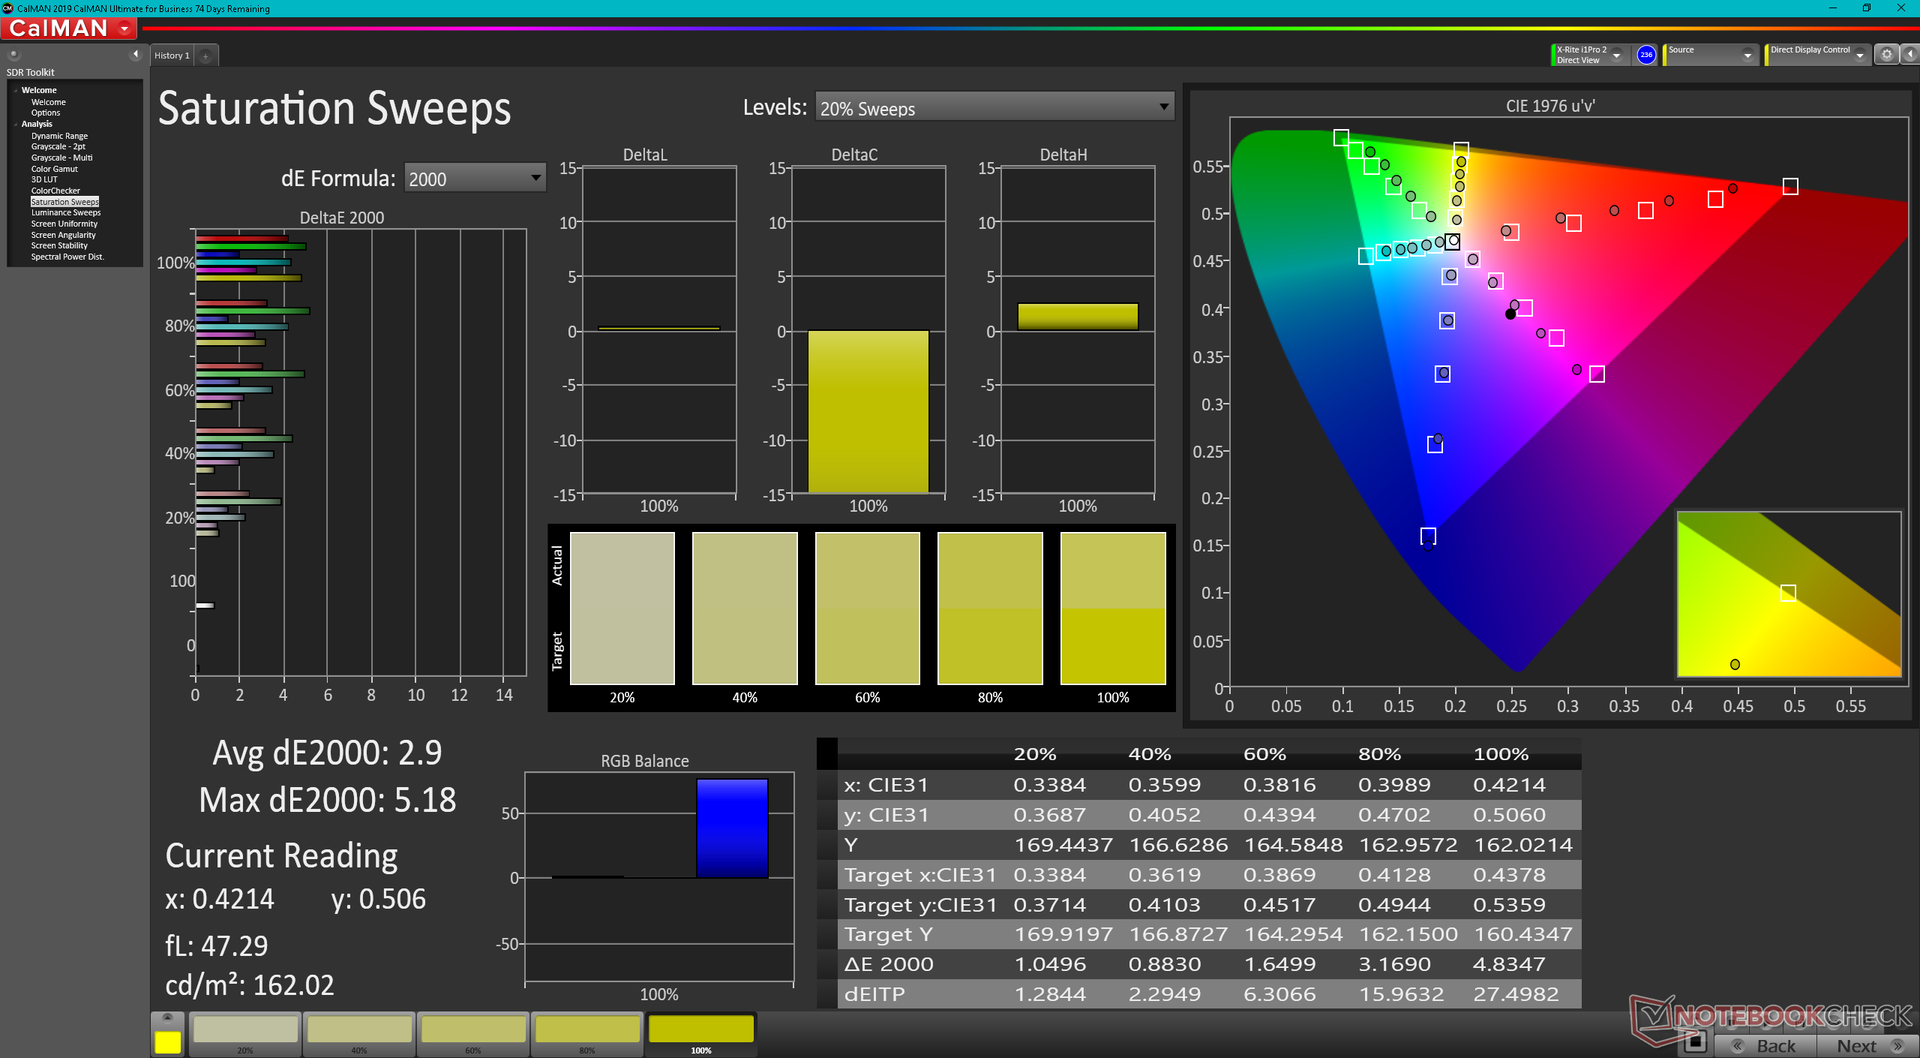
该面板是根据P3标准进行开箱校准的,平均灰度和彩色DeltaE值分别只有1.3和1.53。颜色在较高的饱和度水平上似乎比较低的饱和度水平更不准确。
Display Response Times
| ↔ Response Time Black to White | ||
|---|---|---|
| 1.9 ms ... rise ↗ and fall ↘ combined | ↗ 0.8 ms rise | 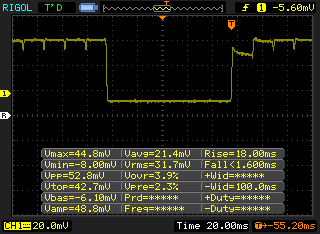 |
| ↘ 1.1 ms fall | ||
| The screen shows very fast response rates in our tests and should be very well suited for fast-paced gaming. In comparison, all tested devices range from 0.1 (minimum) to 240 (maximum) ms. » 11 % of all devices are better. This means that the measured response time is better than the average of all tested devices (19.8 ms). | ||
| ↔ Response Time 50% Grey to 80% Grey | ||
| 2 ms ... rise ↗ and fall ↘ combined | ↗ 1 ms rise | 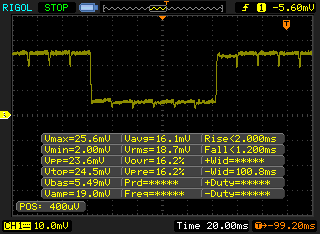 |
| ↘ 1 ms fall | ||
| The screen shows very fast response rates in our tests and should be very well suited for fast-paced gaming. In comparison, all tested devices range from 0.165 (minimum) to 636 (maximum) ms. » 10 % of all devices are better. This means that the measured response time is better than the average of all tested devices (31 ms). | ||
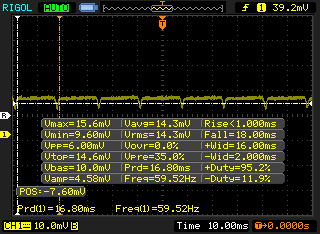
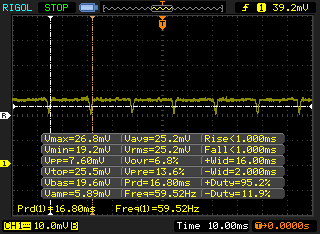
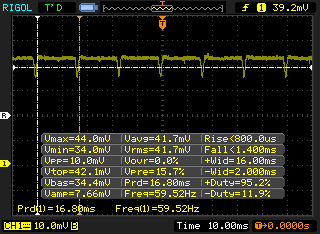
Screen Flickering / PWM (Pulse-Width Modulation)
| Screen flickering / PWM detected | 240.4 Hz | ≤ 100 % brightness setting | 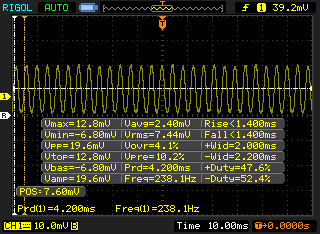 |
The display backlight flickers at 240.4 Hz (worst case, e.g., utilizing PWM) Flickering detected at a brightness setting of 100 % and below. There should be no flickering or PWM above this brightness setting. The frequency of 240.4 Hz is relatively low, so sensitive users will likely notice flickering and experience eyestrain at the stated brightness setting and below. In comparison: 52 % of all tested devices do not use PWM to dim the display. If PWM was detected, an average of 7754 (minimum: 5 - maximum: 343500) Hz was measured. | |||
闪烁或脉宽调制存在于所有的亮度水平,就像最新的OLED面板一样。 华硕VivoBook或ZenBook笔记本电脑的OLED面板。从0到40%的亮度,频率为240.4赫兹,从41%到100%的亮度,频率为60赫兹。


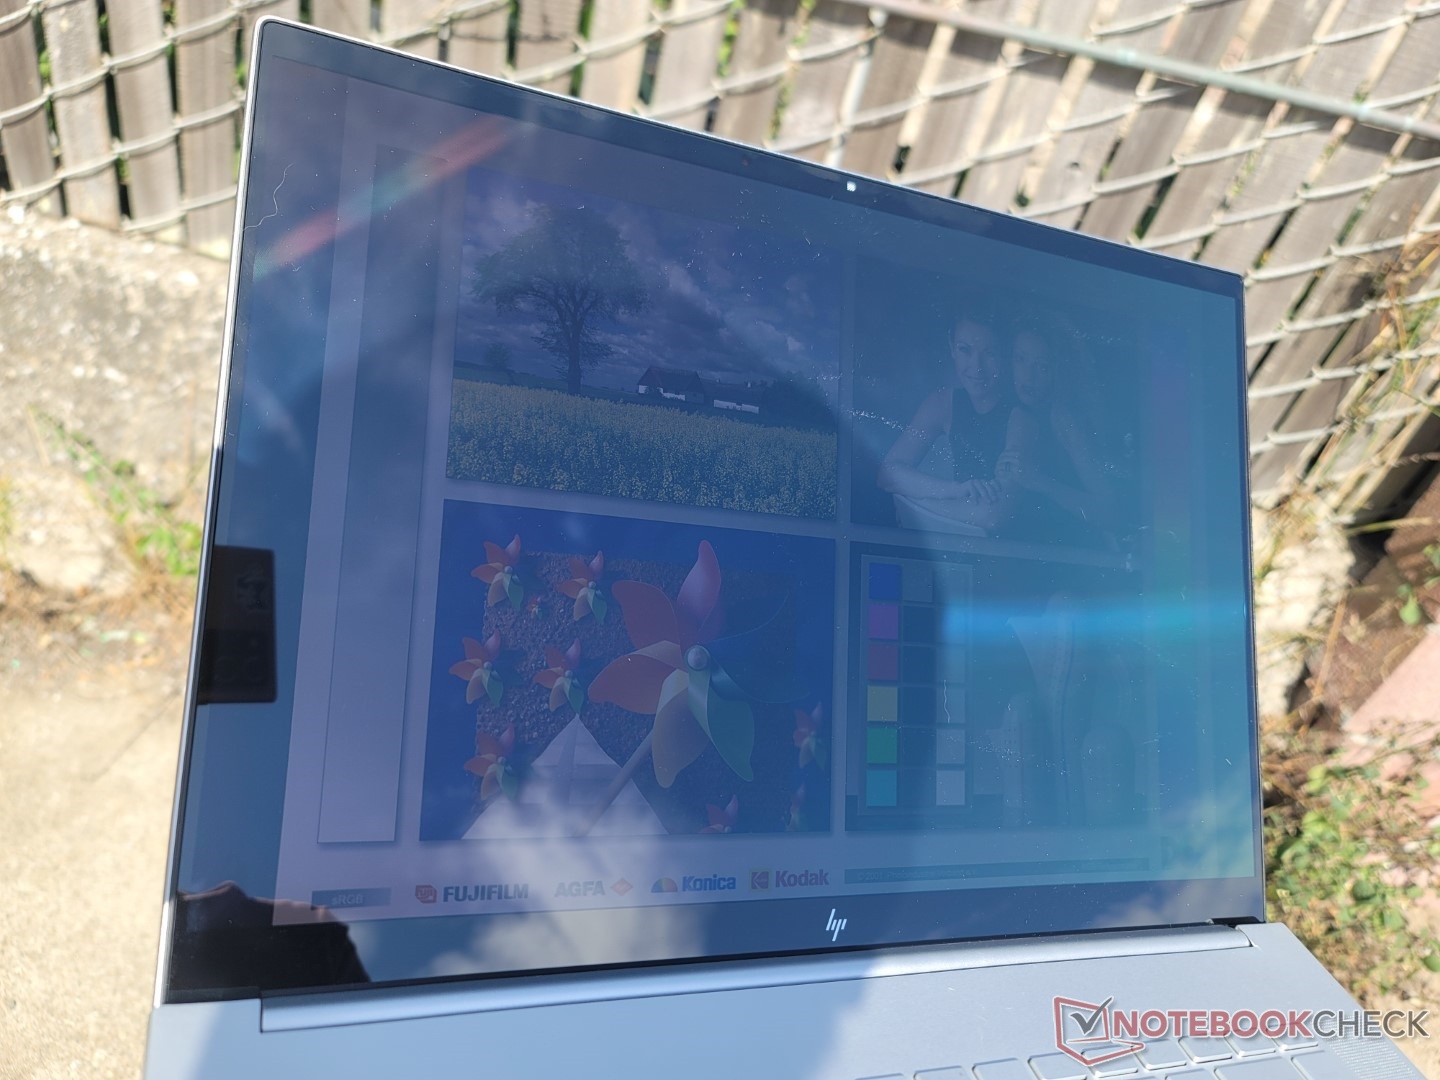
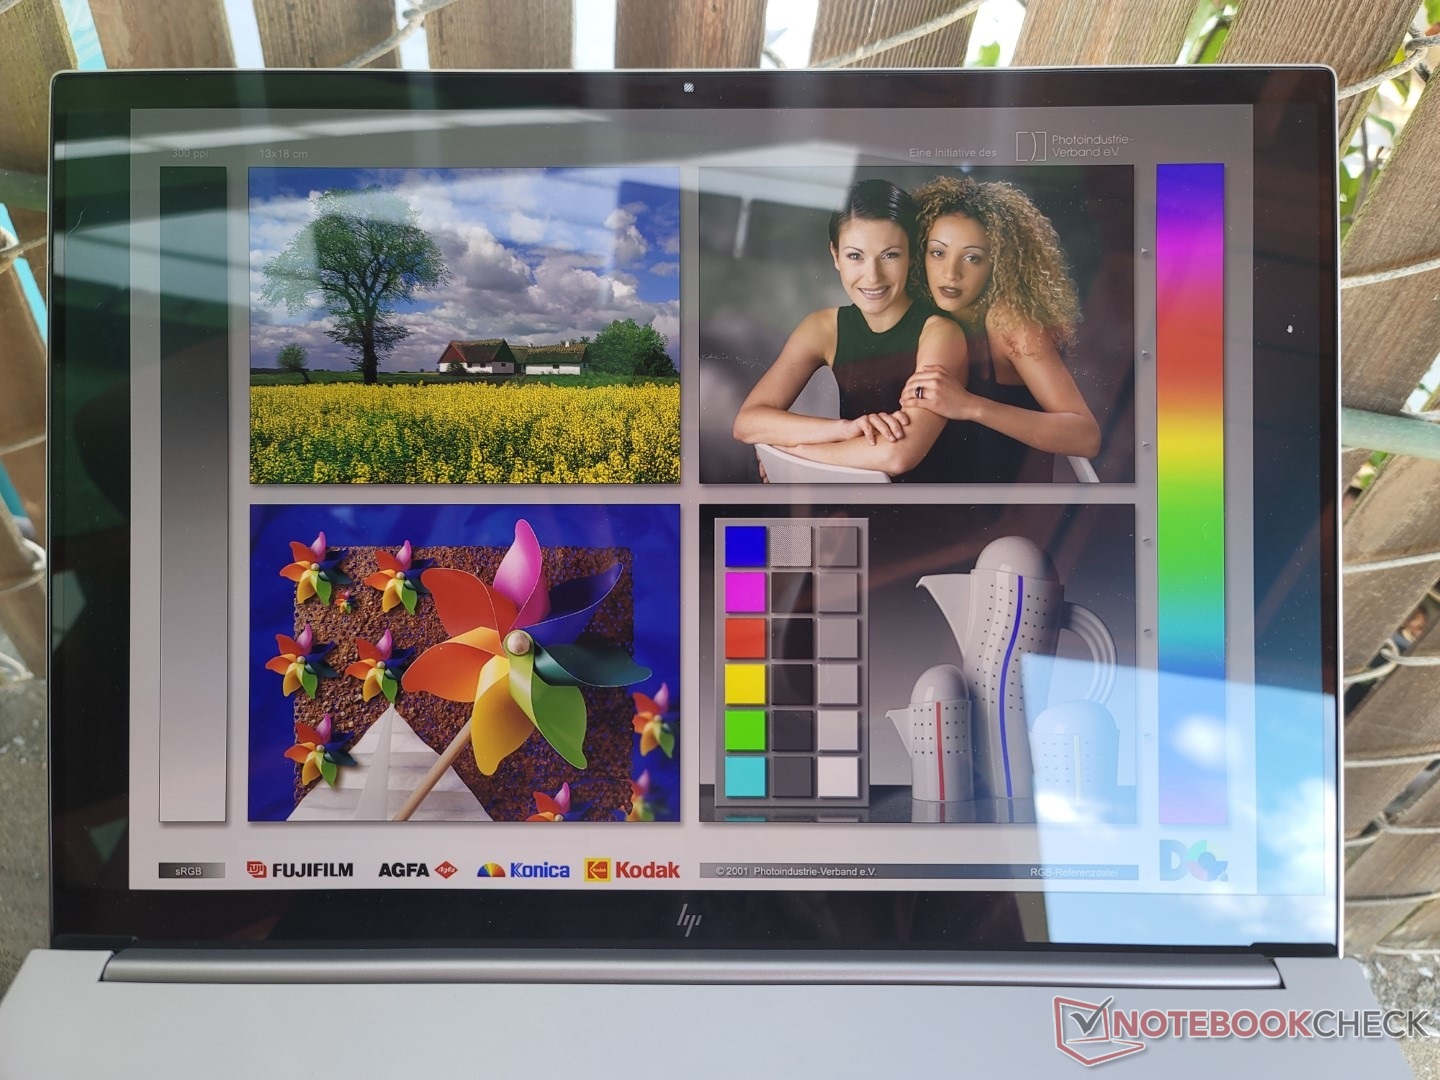
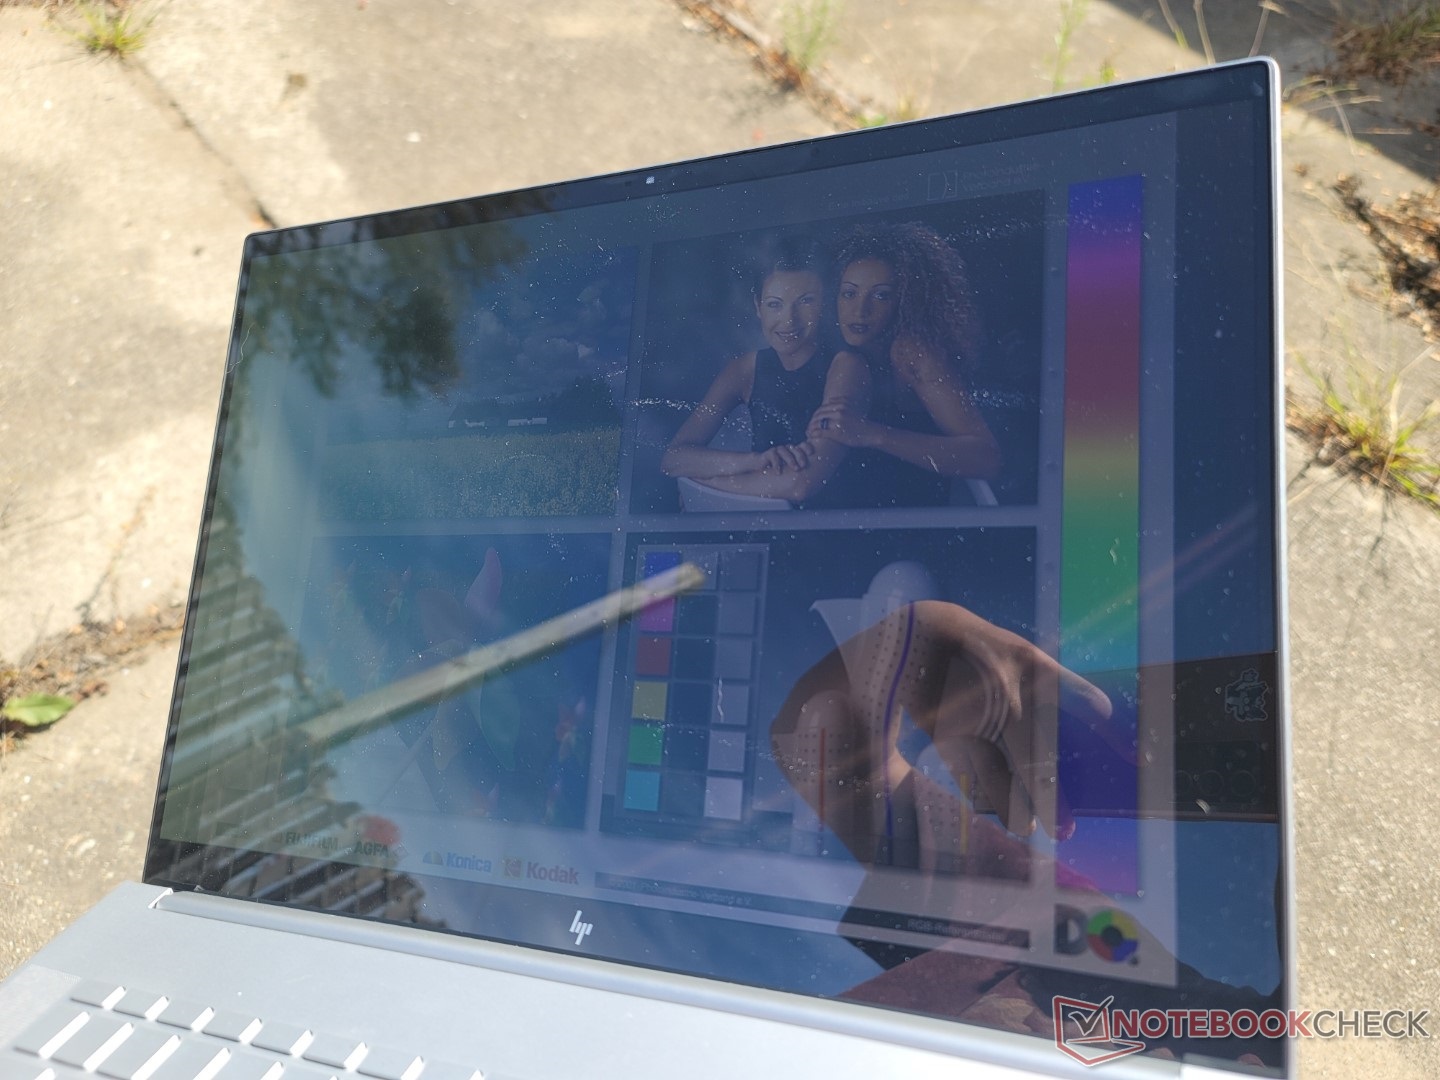
在大多数户外条件下,眩光是不可避免的。光面显示屏的亮度远不及MacBook Pro 16的显示屏。在最大略高于320尼特时,这是市场上较暗的OLED面板之一。
性能 - 英特尔第12代酷睿H
测试条件
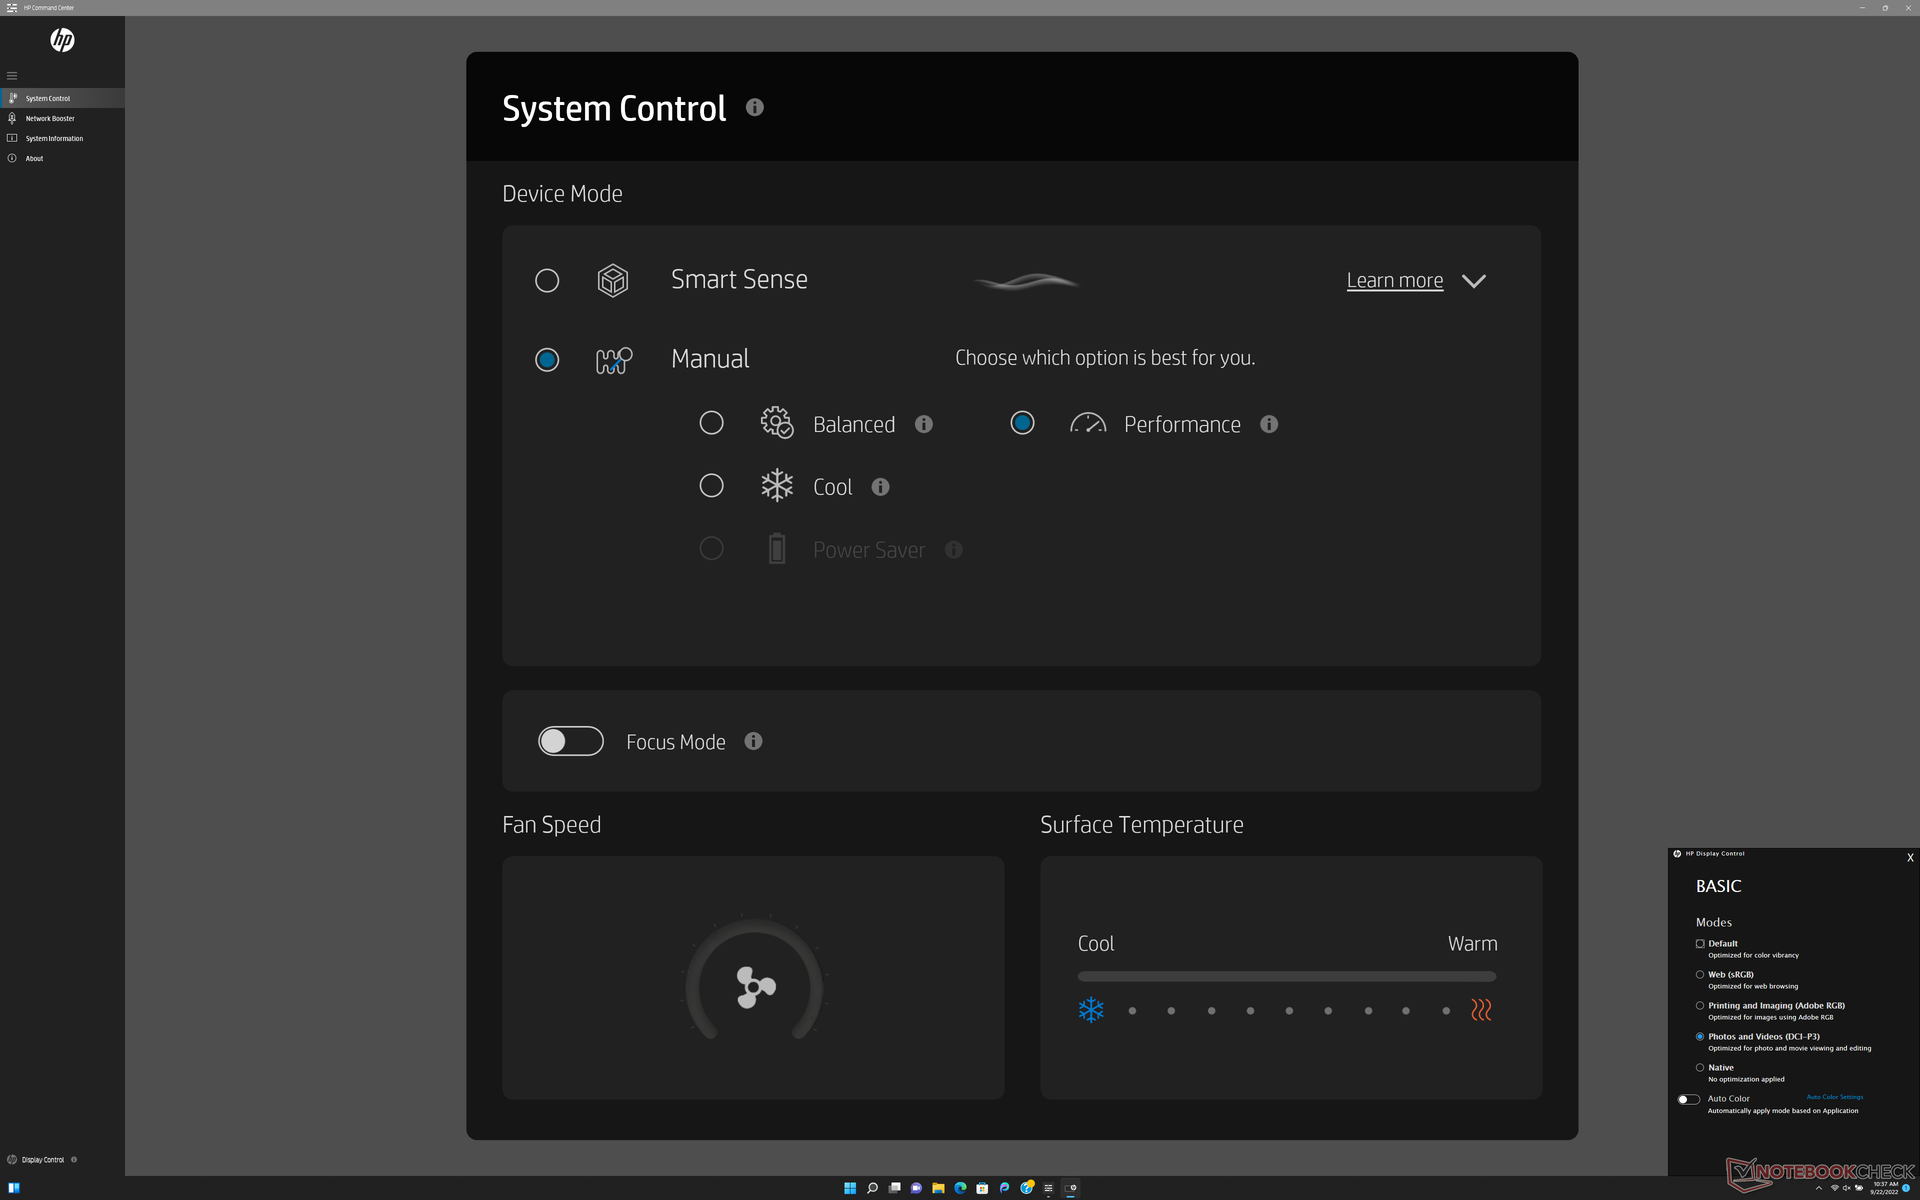
在运行以下任何基准测试之前,我们通过Windows和惠普命令中心软件将我们的设备设置为性能模式。如下面的截图所示,惠普命令中心是控制电源配置文件和显示颜色的枢纽。
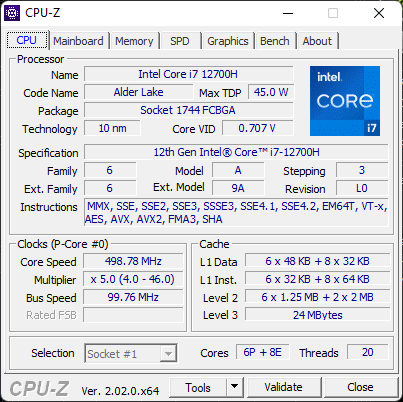
处理器
多线程性能比我们数据库中配备相同的笔记本电脑平均慢15%左右。 酷睿i7-12700HCPU。例如,联想Legion Slim 7 16,即使考虑到任何节流因素,也能更快地运行相同的处理器。尽管如此,性能仍然明显优于第十代酷睿i7-10750H相比,2020年Envy 15的性能仍然明显好了60%左右。
升级到 酷睿i9-12900HSKU预计将比我们的酷睿i7-12700H SKU的多线程性能提高30%至40%。
Cinebench R15 Multi Loop
Cinebench R23: Multi Core | Single Core
Cinebench R15: CPU Multi 64Bit | CPU Single 64Bit
Blender: v2.79 BMW27 CPU
7-Zip 18.03: 7z b 4 | 7z b 4 -mmt1
Geekbench 5.5: Multi-Core | Single-Core
HWBOT x265 Benchmark v2.2: 4k Preset
LibreOffice : 20 Documents To PDF
R Benchmark 2.5: Overall mean
| Cinebench R20 / CPU (Multi Core) | |
| MSI GE67 HX 12UGS | |
| MSI Creator Z16P B12UHST | |
| Average Intel Core i7-12700H (1576 - 7407, n=64) | |
| Lenovo Legion 7 16ARHA7 | |
| Asus ROG Flow X16 GV601RW-M5082W | |
| HP Envy 16 h0112nr | |
| HP Omen 16-c0077ng | |
| Schenker XMG Apex 15 Max | |
| Dell Inspiron 16 Plus 7610-MHJ8F | |
| Lenovo Legion C7 15IMH05 82EH0030GE | |
| Lenovo ThinkPad X1 Nano Gen 2 Core i7-1280P | |
| Asus ProArt StudioBook Pro 15 W500G5T | |
| HP Envy 15-ep0098nr | |
| Apple MacBook Pro 16 2021 M1 Pro | |
| Cinebench R20 / CPU (Single Core) | |
| MSI Creator Z16P B12UHST | |
| HP Envy 16 h0112nr | |
| Average Intel Core i7-12700H (300 - 704, n=64) | |
| MSI GE67 HX 12UGS | |
| Lenovo ThinkPad X1 Nano Gen 2 Core i7-1280P | |
| Lenovo Legion 7 16ARHA7 | |
| Asus ROG Flow X16 GV601RW-M5082W | |
| Dell Inspiron 16 Plus 7610-MHJ8F | |
| Schenker XMG Apex 15 Max | |
| HP Omen 16-c0077ng | |
| Lenovo Legion C7 15IMH05 82EH0030GE | |
| Asus ProArt StudioBook Pro 15 W500G5T | |
| HP Envy 15-ep0098nr | |
| Apple MacBook Pro 16 2021 M1 Pro | |
| Cinebench R15 / CPU Multi 64Bit | |
| MSI GE67 HX 12UGS | |
| MSI Creator Z16P B12UHST | |
| HP Envy 16 h0112nr | |
| Average Intel Core i7-12700H (1379 - 2916, n=70) | |
| Lenovo Legion 7 16ARHA7 | |
| Asus ROG Flow X16 GV601RW-M5082W | |
| Lenovo ThinkPad X1 Nano Gen 2 Core i7-1280P | |
| HP Omen 16-c0077ng | |
| Dell Inspiron 16 Plus 7610-MHJ8F | |
| Schenker XMG Apex 15 Max | |
| Apple MacBook Pro 16 2021 M1 Pro | |
| Lenovo Legion C7 15IMH05 82EH0030GE | |
| HP Envy 15-ep0098nr | |
| Asus ProArt StudioBook Pro 15 W500G5T | |
| Cinebench R15 / CPU Single 64Bit | |
| MSI Creator Z16P B12UHST | |
| MSI GE67 HX 12UGS | |
| HP Envy 16 h0112nr | |
| Average Intel Core i7-12700H (113 - 263, n=65) | |
| Lenovo Legion 7 16ARHA7 | |
| Schenker XMG Apex 15 Max | |
| Asus ROG Flow X16 GV601RW-M5082W | |
| Lenovo ThinkPad X1 Nano Gen 2 Core i7-1280P | |
| HP Omen 16-c0077ng | |
| Dell Inspiron 16 Plus 7610-MHJ8F | |
| Apple MacBook Pro 16 2021 M1 Pro | |
| Lenovo Legion C7 15IMH05 82EH0030GE | |
| HP Envy 15-ep0098nr | |
| Asus ProArt StudioBook Pro 15 W500G5T | |
| Blender / v2.79 BMW27 CPU | |
| Asus ProArt StudioBook Pro 15 W500G5T | |
| HP Envy 15-ep0098nr | |
| Lenovo Legion C7 15IMH05 82EH0030GE | |
| Dell Inspiron 16 Plus 7610-MHJ8F | |
| Lenovo ThinkPad X1 Nano Gen 2 Core i7-1280P | |
| Schenker XMG Apex 15 Max | |
| HP Omen 16-c0077ng | |
| HP Envy 16 h0112nr | |
| Average Intel Core i7-12700H (168 - 732, n=63) | |
| Asus ROG Flow X16 GV601RW-M5082W | |
| Lenovo Legion 7 16ARHA7 | |
| MSI Creator Z16P B12UHST | |
| Apple MacBook Pro 16 2021 M1 Pro | |
| MSI GE67 HX 12UGS | |
| 7-Zip 18.03 / 7z b 4 | |
| MSI GE67 HX 12UGS | |
| MSI Creator Z16P B12UHST | |
| Schenker XMG Apex 15 Max | |
| Lenovo Legion 7 16ARHA7 | |
| Asus ROG Flow X16 GV601RW-M5082W | |
| Average Intel Core i7-12700H (22844 - 73067, n=63) | |
| HP Envy 16 h0112nr | |
| Lenovo ThinkPad X1 Nano Gen 2 Core i7-1280P | |
| Lenovo Legion C7 15IMH05 82EH0030GE | |
| Dell Inspiron 16 Plus 7610-MHJ8F | |
| Asus ProArt StudioBook Pro 15 W500G5T | |
| HP Envy 15-ep0098nr | |
| 7-Zip 18.03 / 7z b 4 -mmt1 | |
| Schenker XMG Apex 15 Max | |
| MSI Creator Z16P B12UHST | |
| HP Envy 16 h0112nr | |
| Asus ROG Flow X16 GV601RW-M5082W | |
| Lenovo Legion 7 16ARHA7 | |
| Average Intel Core i7-12700H (2743 - 5972, n=63) | |
| MSI GE67 HX 12UGS | |
| Lenovo ThinkPad X1 Nano Gen 2 Core i7-1280P | |
| HP Omen 16-c0077ng | |
| Lenovo Legion C7 15IMH05 82EH0030GE | |
| Dell Inspiron 16 Plus 7610-MHJ8F | |
| Asus ProArt StudioBook Pro 15 W500G5T | |
| HP Envy 15-ep0098nr | |
| HWBOT x265 Benchmark v2.2 / 4k Preset | |
| MSI GE67 HX 12UGS | |
| MSI Creator Z16P B12UHST | |
| Lenovo Legion 7 16ARHA7 | |
| Average Intel Core i7-12700H (4.67 - 21.8, n=64) | |
| Asus ROG Flow X16 GV601RW-M5082W | |
| HP Omen 16-c0077ng | |
| HP Envy 16 h0112nr | |
| Schenker XMG Apex 15 Max | |
| Dell Inspiron 16 Plus 7610-MHJ8F | |
| Lenovo Legion C7 15IMH05 82EH0030GE | |
| HP Envy 15-ep0098nr | |
| Lenovo ThinkPad X1 Nano Gen 2 Core i7-1280P | |
| Asus ProArt StudioBook Pro 15 W500G5T | |
| LibreOffice / 20 Documents To PDF | |
| HP Omen 16-c0077ng | |
| Asus ProArt StudioBook Pro 15 W500G5T | |
| Asus ROG Flow X16 GV601RW-M5082W | |
| Lenovo Legion C7 15IMH05 82EH0030GE | |
| Lenovo Legion 7 16ARHA7 | |
| Schenker XMG Apex 15 Max | |
| HP Envy 15-ep0098nr | |
| Average Intel Core i7-12700H (34.2 - 95.3, n=63) | |
| Dell Inspiron 16 Plus 7610-MHJ8F | |
| Lenovo ThinkPad X1 Nano Gen 2 Core i7-1280P | |
| HP Envy 16 h0112nr | |
| MSI GE67 HX 12UGS | |
| MSI Creator Z16P B12UHST | |
| R Benchmark 2.5 / Overall mean | |
| Asus ProArt StudioBook Pro 15 W500G5T | |
| HP Envy 15-ep0098nr | |
| Lenovo Legion C7 15IMH05 82EH0030GE | |
| Dell Inspiron 16 Plus 7610-MHJ8F | |
| HP Omen 16-c0077ng | |
| Schenker XMG Apex 15 Max | |
| Asus ROG Flow X16 GV601RW-M5082W | |
| Lenovo Legion 7 16ARHA7 | |
| Lenovo ThinkPad X1 Nano Gen 2 Core i7-1280P | |
| Average Intel Core i7-12700H (0.4441 - 1.052, n=63) | |
| MSI GE67 HX 12UGS | |
| HP Envy 16 h0112nr | |
| MSI Creator Z16P B12UHST | |
Cinebench R23: Multi Core | Single Core
Cinebench R15: CPU Multi 64Bit | CPU Single 64Bit
Blender: v2.79 BMW27 CPU
7-Zip 18.03: 7z b 4 | 7z b 4 -mmt1
Geekbench 5.5: Multi-Core | Single-Core
HWBOT x265 Benchmark v2.2: 4k Preset
LibreOffice : 20 Documents To PDF
R Benchmark 2.5: Overall mean
* ... smaller is better
AIDA64: FP32 Ray-Trace | FPU Julia | CPU SHA3 | CPU Queen | FPU SinJulia | FPU Mandel | CPU AES | CPU ZLib | FP64 Ray-Trace | CPU PhotoWorxx
| Performance rating | |
| Lenovo ThinkBook 16 G4+ IAP | |
| HP Envy 16 h0112nr | |
| MSI Creator Z16P B12UHST | |
| Average Intel Core i7-12700H | |
| Dell Inspiron 16 Plus 7610-MHJ8F | |
| Huawei MateBook 16s i7 | |
| AIDA64 / FP32 Ray-Trace | |
| Lenovo ThinkBook 16 G4+ IAP | |
| HP Envy 16 h0112nr | |
| Average Intel Core i7-12700H (2585 - 17957, n=64) | |
| Dell Inspiron 16 Plus 7610-MHJ8F | |
| MSI Creator Z16P B12UHST | |
| Huawei MateBook 16s i7 | |
| AIDA64 / FPU Julia | |
| Lenovo ThinkBook 16 G4+ IAP | |
| HP Envy 16 h0112nr | |
| Dell Inspiron 16 Plus 7610-MHJ8F | |
| Average Intel Core i7-12700H (12439 - 90760, n=64) | |
| MSI Creator Z16P B12UHST | |
| Huawei MateBook 16s i7 | |
| AIDA64 / CPU SHA3 | |
| Dell Inspiron 16 Plus 7610-MHJ8F | |
| Lenovo ThinkBook 16 G4+ IAP | |
| Average Intel Core i7-12700H (833 - 4242, n=64) | |
| MSI Creator Z16P B12UHST | |
| HP Envy 16 h0112nr | |
| Huawei MateBook 16s i7 | |
| AIDA64 / CPU Queen | |
| MSI Creator Z16P B12UHST | |
| Lenovo ThinkBook 16 G4+ IAP | |
| HP Envy 16 h0112nr | |
| Average Intel Core i7-12700H (57923 - 103202, n=63) | |
| Huawei MateBook 16s i7 | |
| Dell Inspiron 16 Plus 7610-MHJ8F | |
| AIDA64 / FPU SinJulia | |
| MSI Creator Z16P B12UHST | |
| Lenovo ThinkBook 16 G4+ IAP | |
| Average Intel Core i7-12700H (3249 - 9939, n=64) | |
| Dell Inspiron 16 Plus 7610-MHJ8F | |
| HP Envy 16 h0112nr | |
| Huawei MateBook 16s i7 | |
| AIDA64 / FPU Mandel | |
| Lenovo ThinkBook 16 G4+ IAP | |
| Dell Inspiron 16 Plus 7610-MHJ8F | |
| HP Envy 16 h0112nr | |
| Average Intel Core i7-12700H (7135 - 44760, n=64) | |
| MSI Creator Z16P B12UHST | |
| Huawei MateBook 16s i7 | |
| AIDA64 / CPU AES | |
| Dell Inspiron 16 Plus 7610-MHJ8F | |
| HP Envy 16 h0112nr | |
| MSI Creator Z16P B12UHST | |
| Average Intel Core i7-12700H (31839 - 144360, n=64) | |
| Lenovo ThinkBook 16 G4+ IAP | |
| Huawei MateBook 16s i7 | |
| AIDA64 / CPU ZLib | |
| MSI Creator Z16P B12UHST | |
| Lenovo ThinkBook 16 G4+ IAP | |
| Average Intel Core i7-12700H (305 - 1171, n=64) | |
| HP Envy 16 h0112nr | |
| Dell Inspiron 16 Plus 7610-MHJ8F | |
| Huawei MateBook 16s i7 | |
| AIDA64 / FP64 Ray-Trace | |
| Lenovo ThinkBook 16 G4+ IAP | |
| HP Envy 16 h0112nr | |
| Average Intel Core i7-12700H (1437 - 9692, n=64) | |
| Dell Inspiron 16 Plus 7610-MHJ8F | |
| MSI Creator Z16P B12UHST | |
| Huawei MateBook 16s i7 | |
| AIDA64 / CPU PhotoWorxx | |
| Huawei MateBook 16s i7 | |
| MSI Creator Z16P B12UHST | |
| Lenovo ThinkBook 16 G4+ IAP | |
| HP Envy 16 h0112nr | |
| Average Intel Core i7-12700H (12863 - 52207, n=64) | |
| Dell Inspiron 16 Plus 7610-MHJ8F | |
系统性能
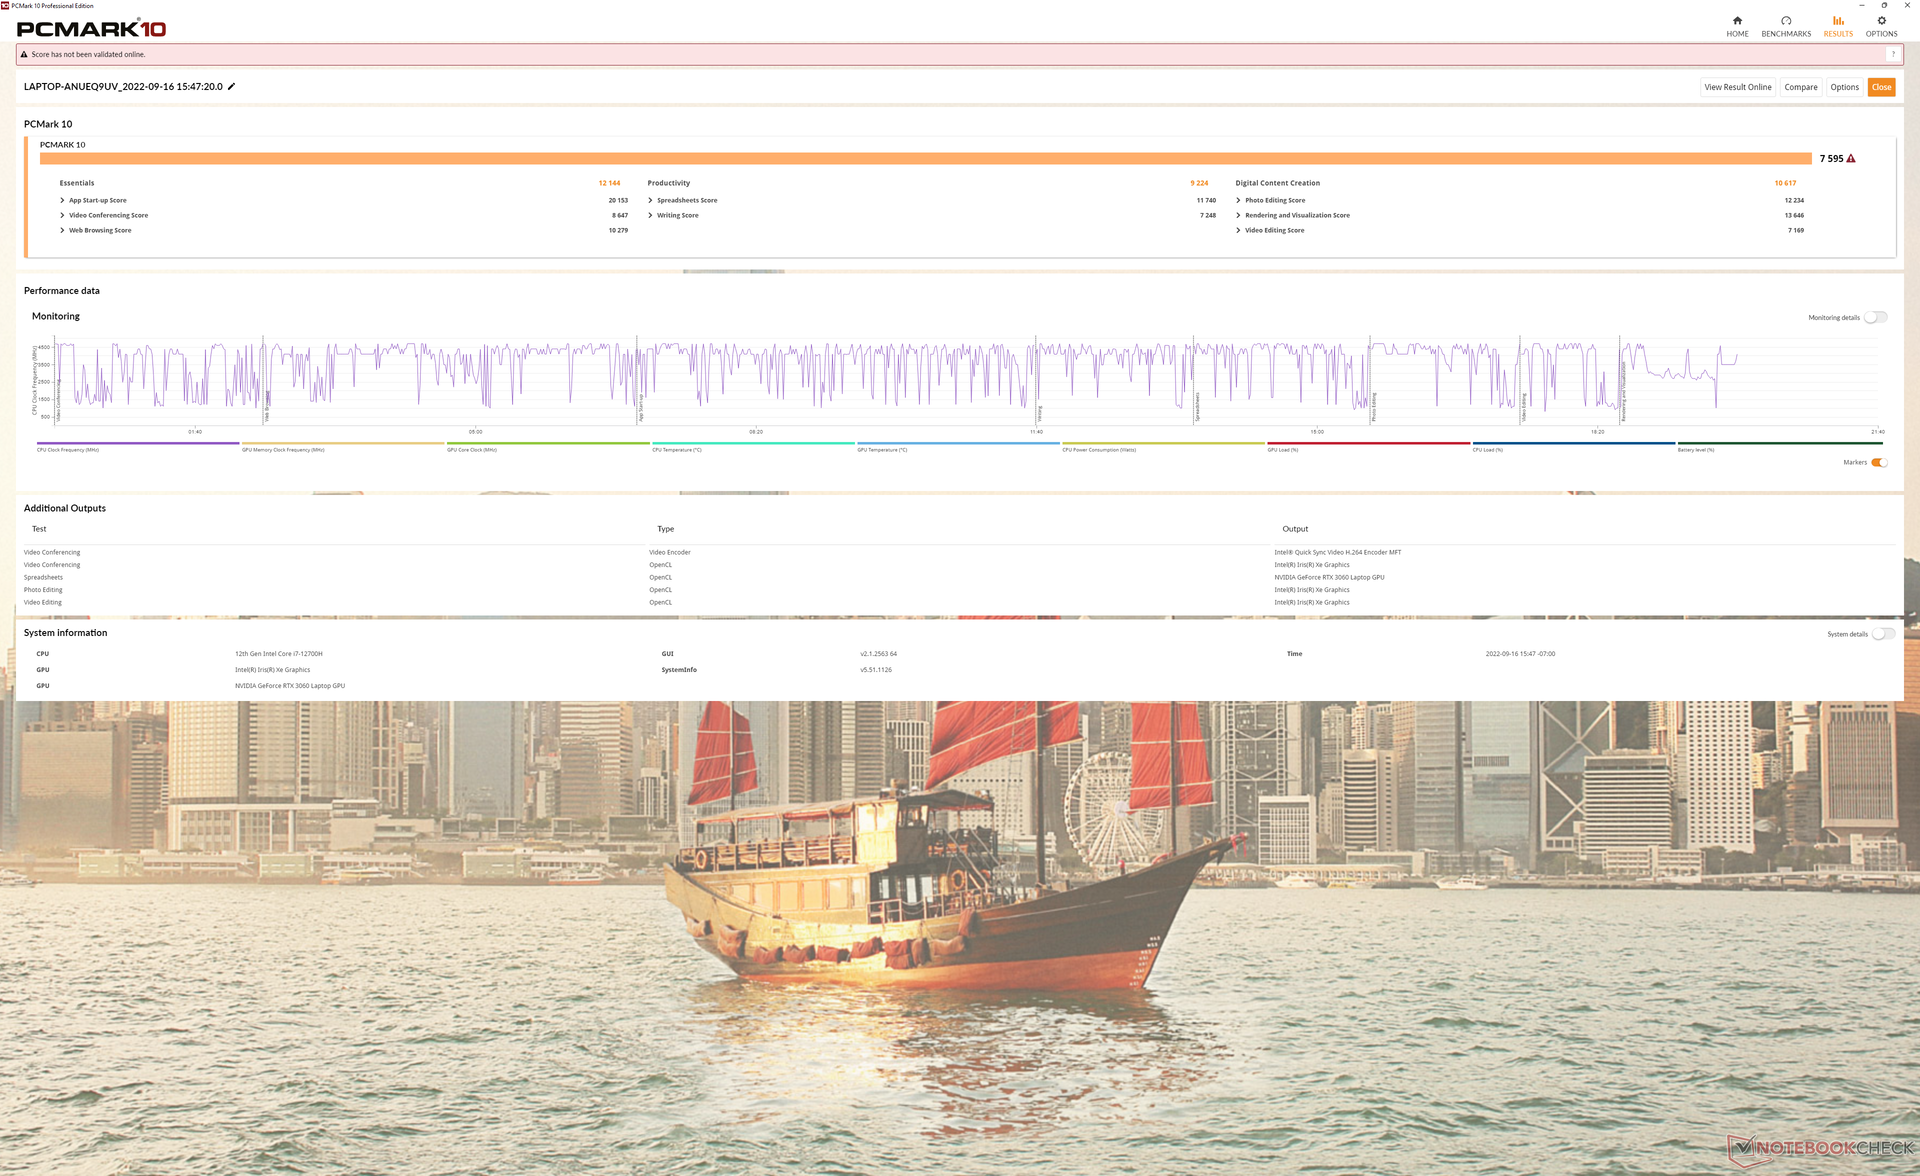
PCMark的结果一直以很大的优势领先于2020年的Envy 15。我们怀疑不再使用英特尔Optane在分数的提升中起了很大作用。
CrossMark: Overall | Productivity | Creativity | Responsiveness
| PCMark 10 / Score | |
| MSI Creator Z16P B12UHST | |
| HP Envy 16 h0112nr | |
| Average Intel Core i7-12700H, NVIDIA GeForce RTX 3060 Laptop GPU (5986 - 8156, n=12) | |
| Huawei MateBook 16s i7 | |
| HP Envy 15-ep0098nr | |
| Dell Inspiron 16 Plus 7610-MHJ8F | |
| PCMark 10 / Essentials | |
| HP Envy 16 h0112nr | |
| Huawei MateBook 16s i7 | |
| MSI Creator Z16P B12UHST | |
| Average Intel Core i7-12700H, NVIDIA GeForce RTX 3060 Laptop GPU (9289 - 12144, n=12) | |
| Dell Inspiron 16 Plus 7610-MHJ8F | |
| HP Envy 15-ep0098nr | |
| PCMark 10 / Productivity | |
| MSI Creator Z16P B12UHST | |
| HP Envy 16 h0112nr | |
| Average Intel Core i7-12700H, NVIDIA GeForce RTX 3060 Laptop GPU (6161 - 10362, n=12) | |
| Huawei MateBook 16s i7 | |
| HP Envy 15-ep0098nr | |
| Dell Inspiron 16 Plus 7610-MHJ8F | |
| PCMark 10 / Digital Content Creation | |
| MSI Creator Z16P B12UHST | |
| Average Intel Core i7-12700H, NVIDIA GeForce RTX 3060 Laptop GPU (8950 - 12554, n=12) | |
| HP Envy 16 h0112nr | |
| Huawei MateBook 16s i7 | |
| HP Envy 15-ep0098nr | |
| Dell Inspiron 16 Plus 7610-MHJ8F | |
| CrossMark / Overall | |
| Huawei MateBook 16s i7 | |
| HP Envy 16 h0112nr | |
| Average Intel Core i7-12700H, NVIDIA GeForce RTX 3060 Laptop GPU (1649 - 2017, n=11) | |
| Lenovo ThinkBook 16 G4+ IAP | |
| Apple MacBook Pro 16 2021 M1 Pro | |
| CrossMark / Productivity | |
| Huawei MateBook 16s i7 | |
| HP Envy 16 h0112nr | |
| Average Intel Core i7-12700H, NVIDIA GeForce RTX 3060 Laptop GPU (1536 - 1958, n=11) | |
| Lenovo ThinkBook 16 G4+ IAP | |
| Apple MacBook Pro 16 2021 M1 Pro | |
| CrossMark / Creativity | |
| Apple MacBook Pro 16 2021 M1 Pro | |
| HP Envy 16 h0112nr | |
| Huawei MateBook 16s i7 | |
| Lenovo ThinkBook 16 G4+ IAP | |
| Average Intel Core i7-12700H, NVIDIA GeForce RTX 3060 Laptop GPU (1816 - 2084, n=11) | |
| CrossMark / Responsiveness | |
| Huawei MateBook 16s i7 | |
| Average Intel Core i7-12700H, NVIDIA GeForce RTX 3060 Laptop GPU (1210 - 2207, n=11) | |
| HP Envy 16 h0112nr | |
| Lenovo ThinkBook 16 G4+ IAP | |
| Apple MacBook Pro 16 2021 M1 Pro | |
| PCMark 10 Score | 7595 points | |
Help | ||
| AIDA64 / Memory Copy | |
| Huawei MateBook 16s i7 | |
| Lenovo ThinkBook 16 G4+ IAP | |
| MSI Creator Z16P B12UHST | |
| HP Envy 16 h0112nr | |
| Average Intel Core i7-12700H (25615 - 80511, n=64) | |
| Dell Inspiron 16 Plus 7610-MHJ8F | |
| AIDA64 / Memory Read | |
| Lenovo ThinkBook 16 G4+ IAP | |
| Huawei MateBook 16s i7 | |
| MSI Creator Z16P B12UHST | |
| HP Envy 16 h0112nr | |
| Average Intel Core i7-12700H (25586 - 79442, n=64) | |
| Dell Inspiron 16 Plus 7610-MHJ8F | |
| AIDA64 / Memory Write | |
| MSI Creator Z16P B12UHST | |
| Huawei MateBook 16s i7 | |
| HP Envy 16 h0112nr | |
| Lenovo ThinkBook 16 G4+ IAP | |
| Average Intel Core i7-12700H (23679 - 88660, n=64) | |
| Dell Inspiron 16 Plus 7610-MHJ8F | |
| AIDA64 / Memory Latency | |
| Lenovo ThinkBook 16 G4+ IAP | |
| Huawei MateBook 16s i7 | |
| Dell Inspiron 16 Plus 7610-MHJ8F | |
| MSI Creator Z16P B12UHST | |
| HP Envy 16 h0112nr | |
| Average Intel Core i7-12700H (76.2 - 133.9, n=62) | |
* ... smaller is better
DPC延时
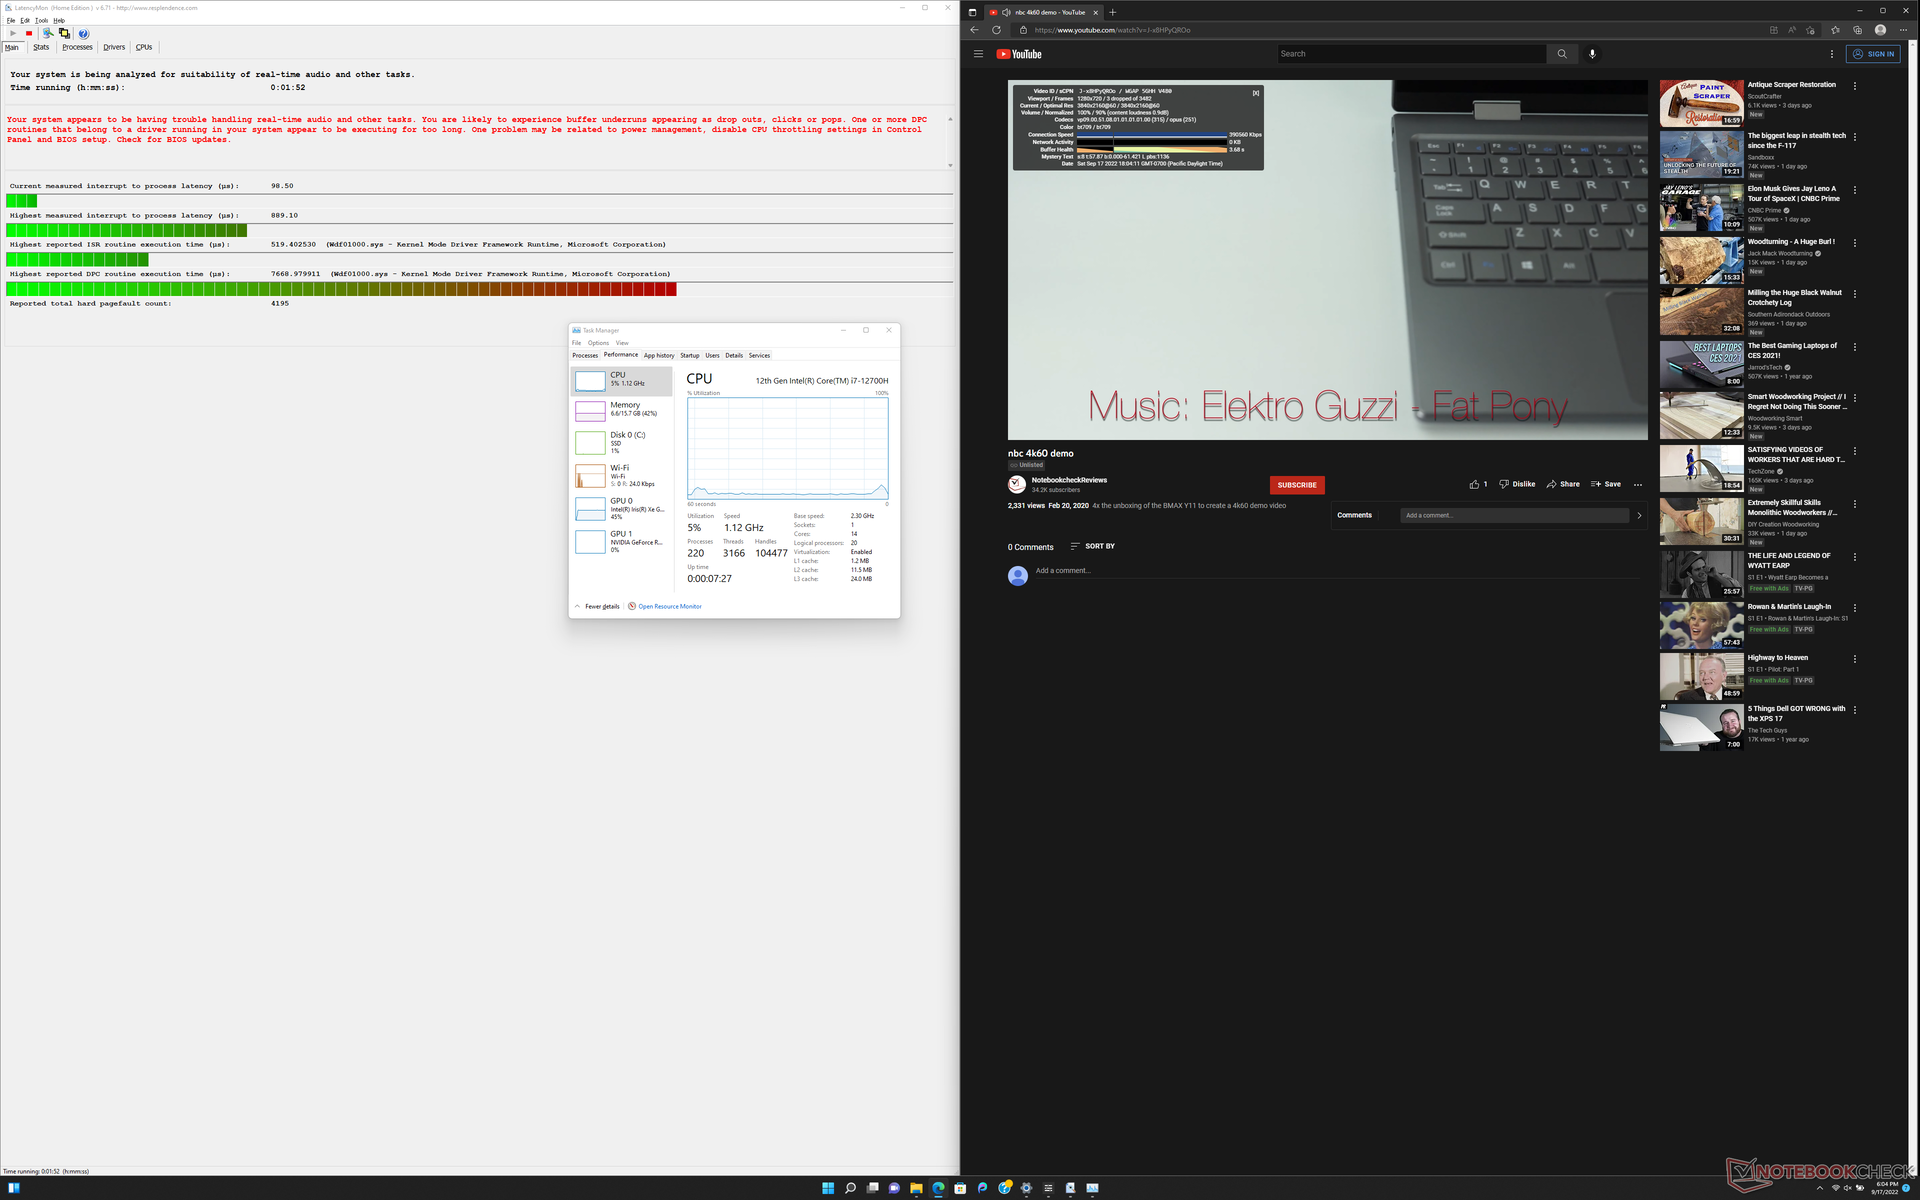
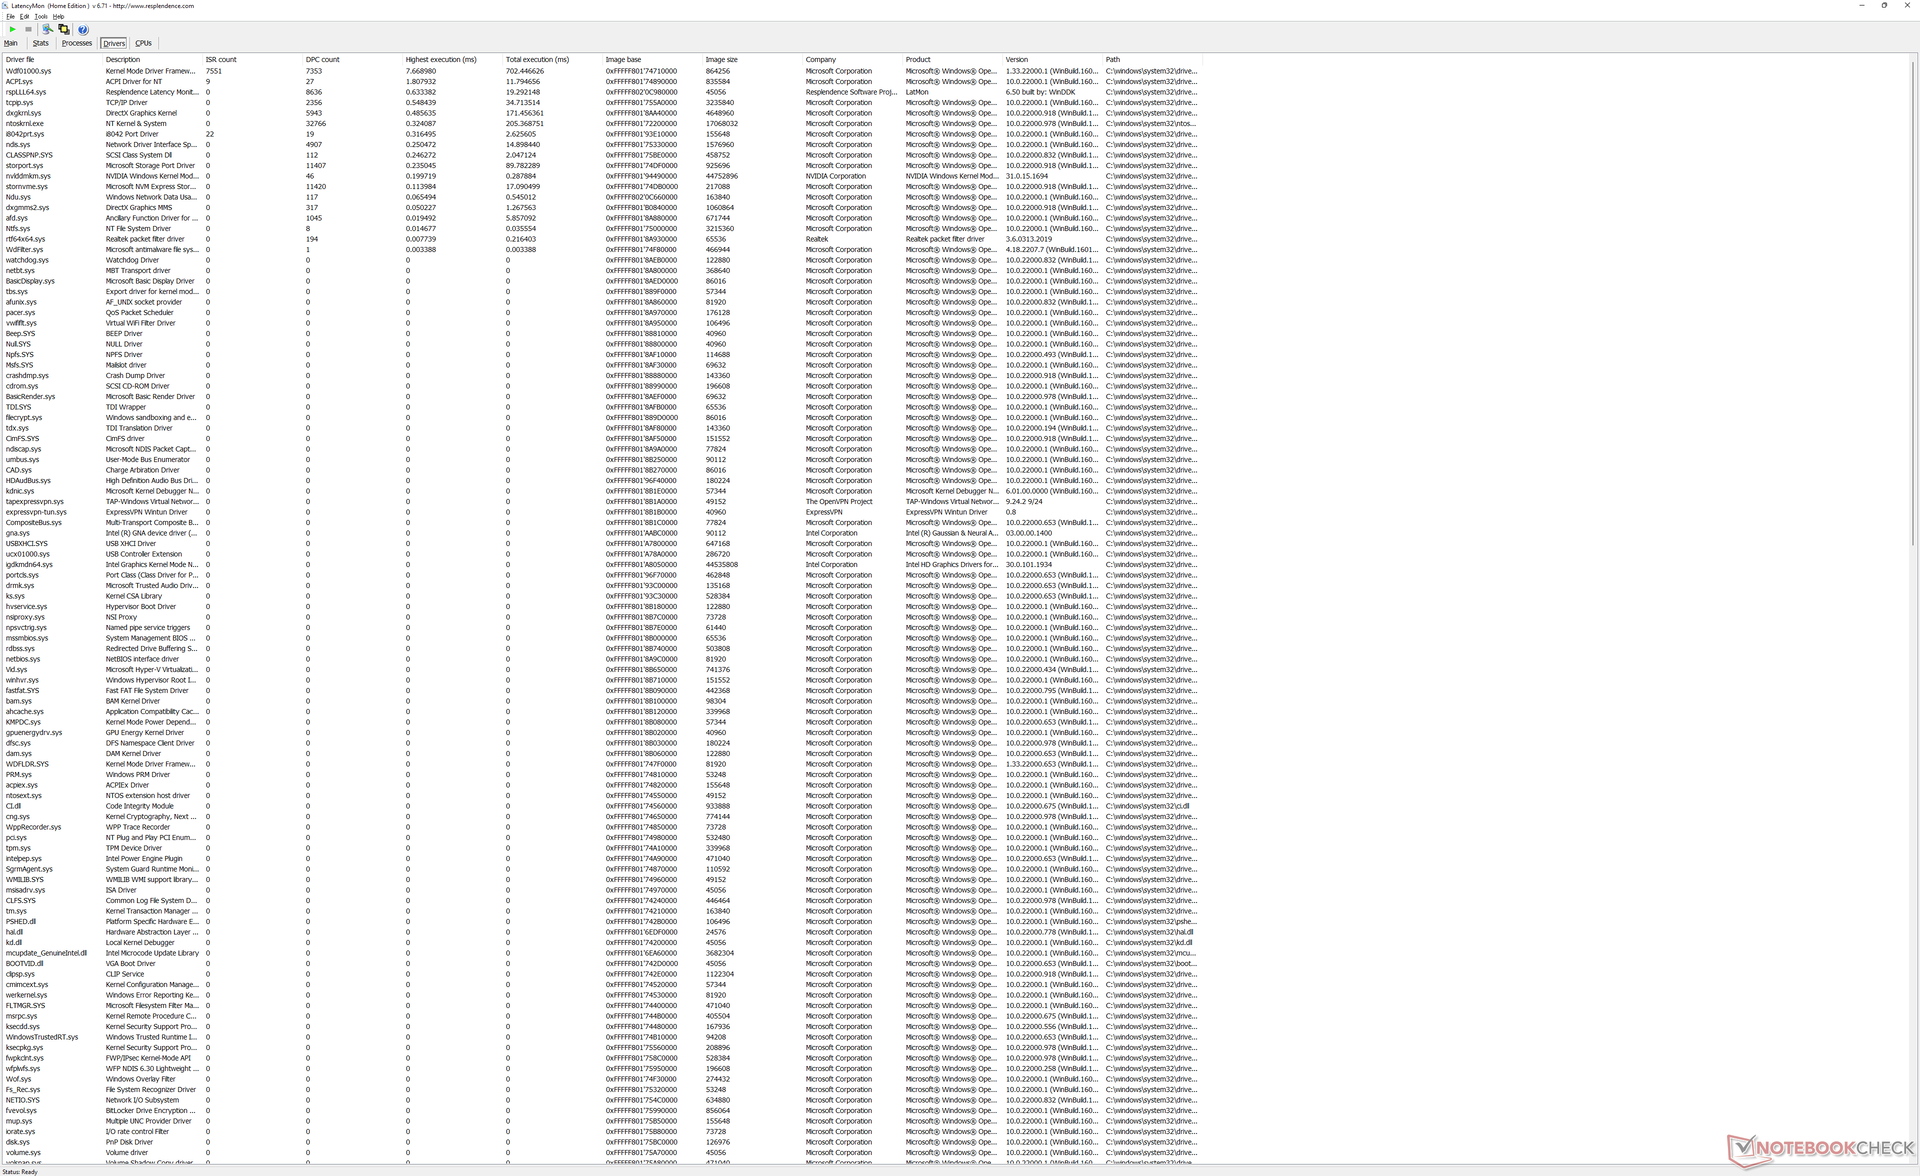
LatencyMon显示,在打开我们主页的多个浏览器标签时存在DPC问题。在我们长达1分钟的测试视频中,以60 FPS播放4K视频也是不完美的,有3个丢帧。
| DPC Latencies / LatencyMon - interrupt to process latency (max), Web, Youtube, Prime95 | |
| Lenovo ThinkBook 16 G4+ IAP | |
| HP Envy 16 h0112nr | |
| MSI Creator Z16P B12UHST | |
* ... smaller is better
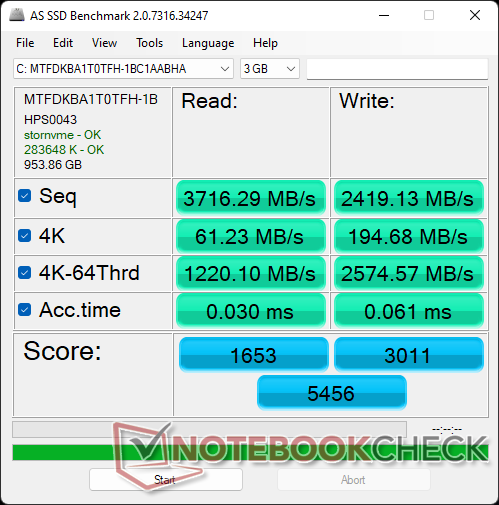
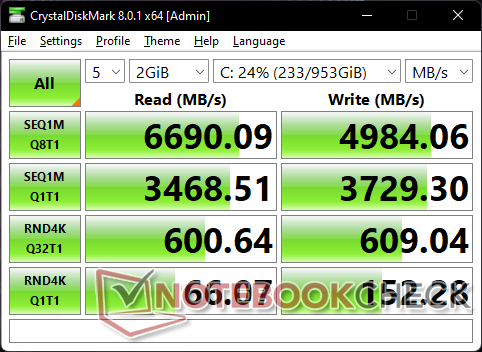
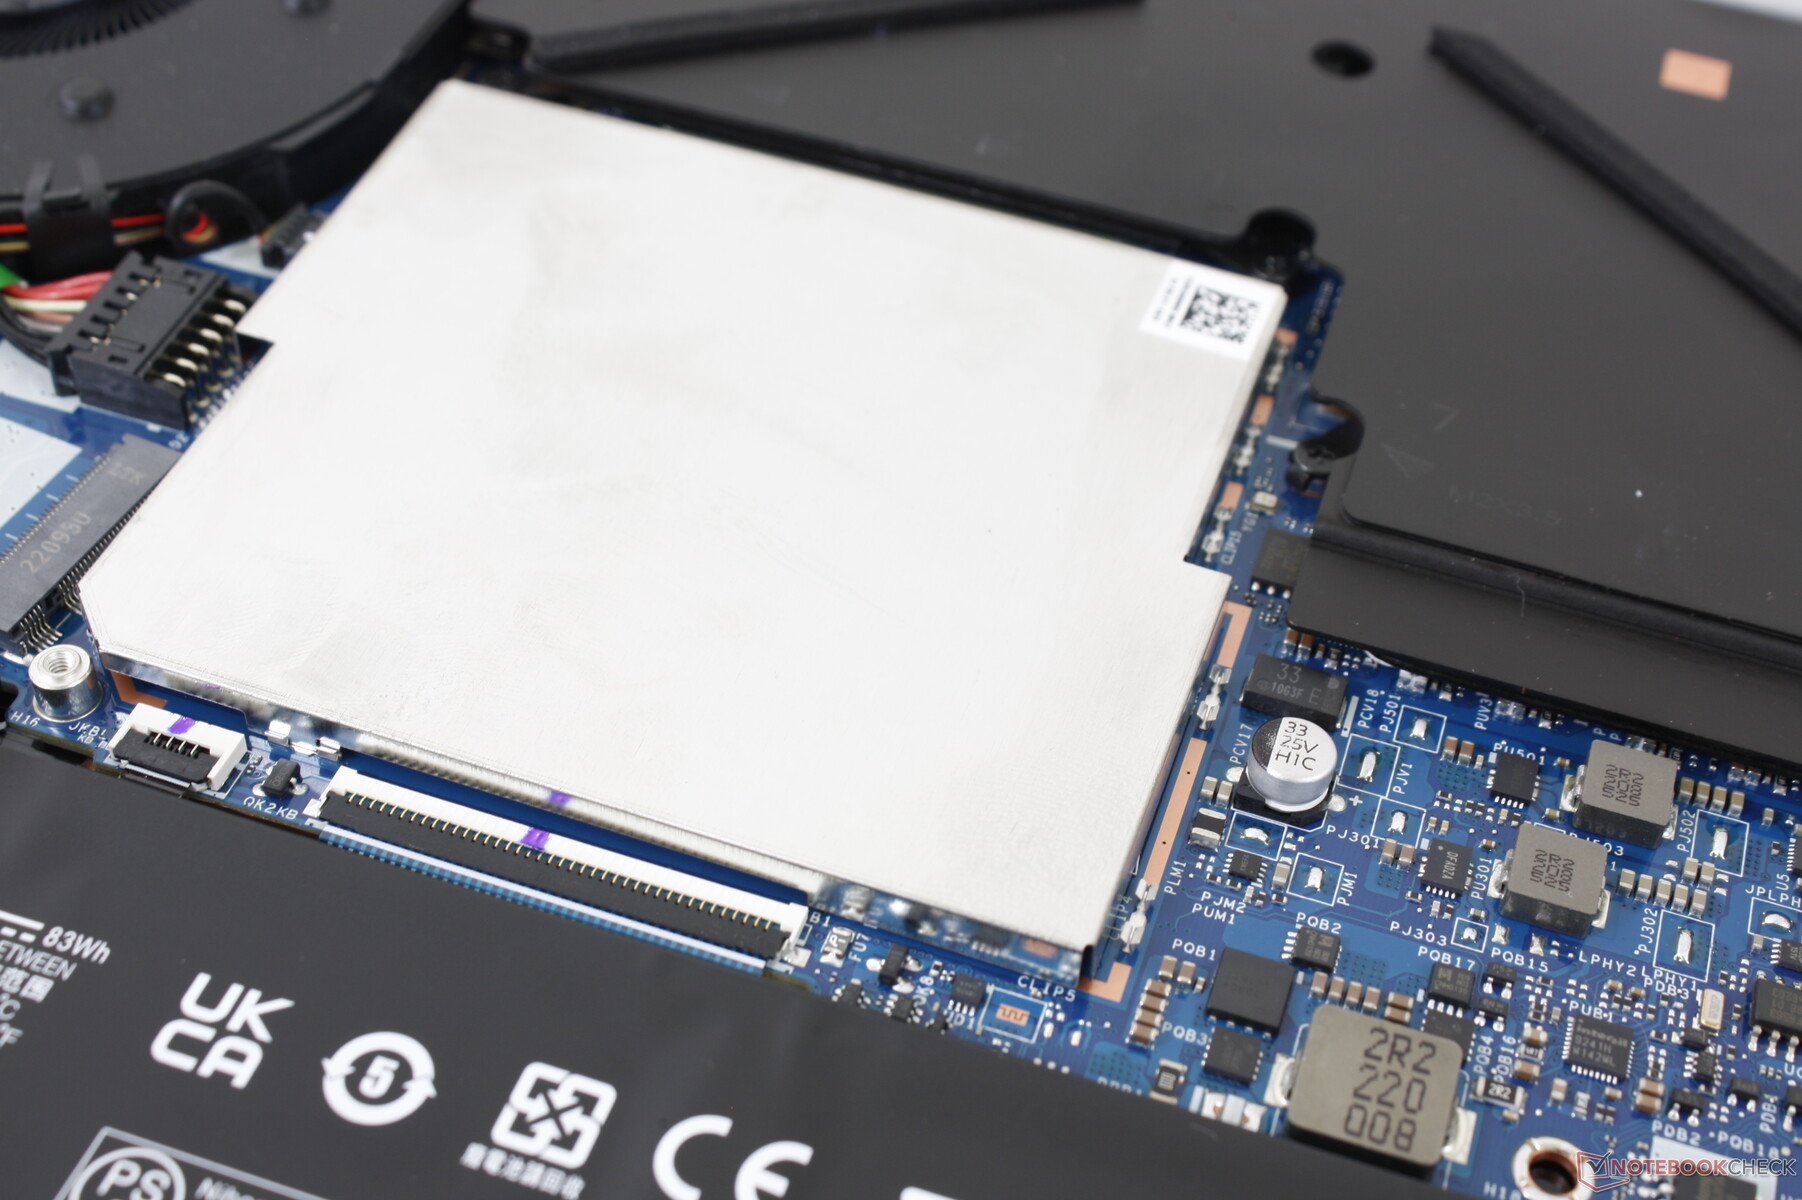
存储设备 - 支持RAID 0
我们的测试装置配备了相同的美光3400PCIe4 x4 NVMe固态硬盘,这在许多其他高端系统上都能找到,包括 微星隐形GS77或 HP Spectre x360 13.5.在我们的测试设备上,该驱动器没有表现出节流问题,但写入速度几乎没有竞争性的三星PM9A1系列那么快。
尽管有两个固态硬盘插槽,惠普只提供了一个固态硬盘盖。如果你打算安装第二个驱动器,那么它很有可能会在更高的温度下运行。

| Drive Performance rating - Percent | |
| MSI Creator Z16P B12UHST | |
| HP Envy 16 h0112nr | |
| Huawei MateBook 16s i7 | |
| Lenovo ThinkBook 16 G4+ IAP | |
| Dell Inspiron 16 Plus 7610-MHJ8F -1! | |
* ... smaller is better
Disk Throttling: DiskSpd Read Loop, Queue Depth 8
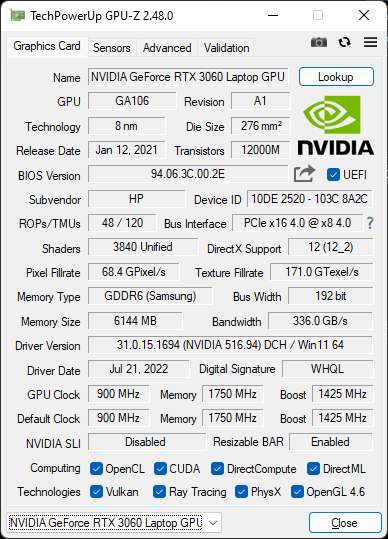
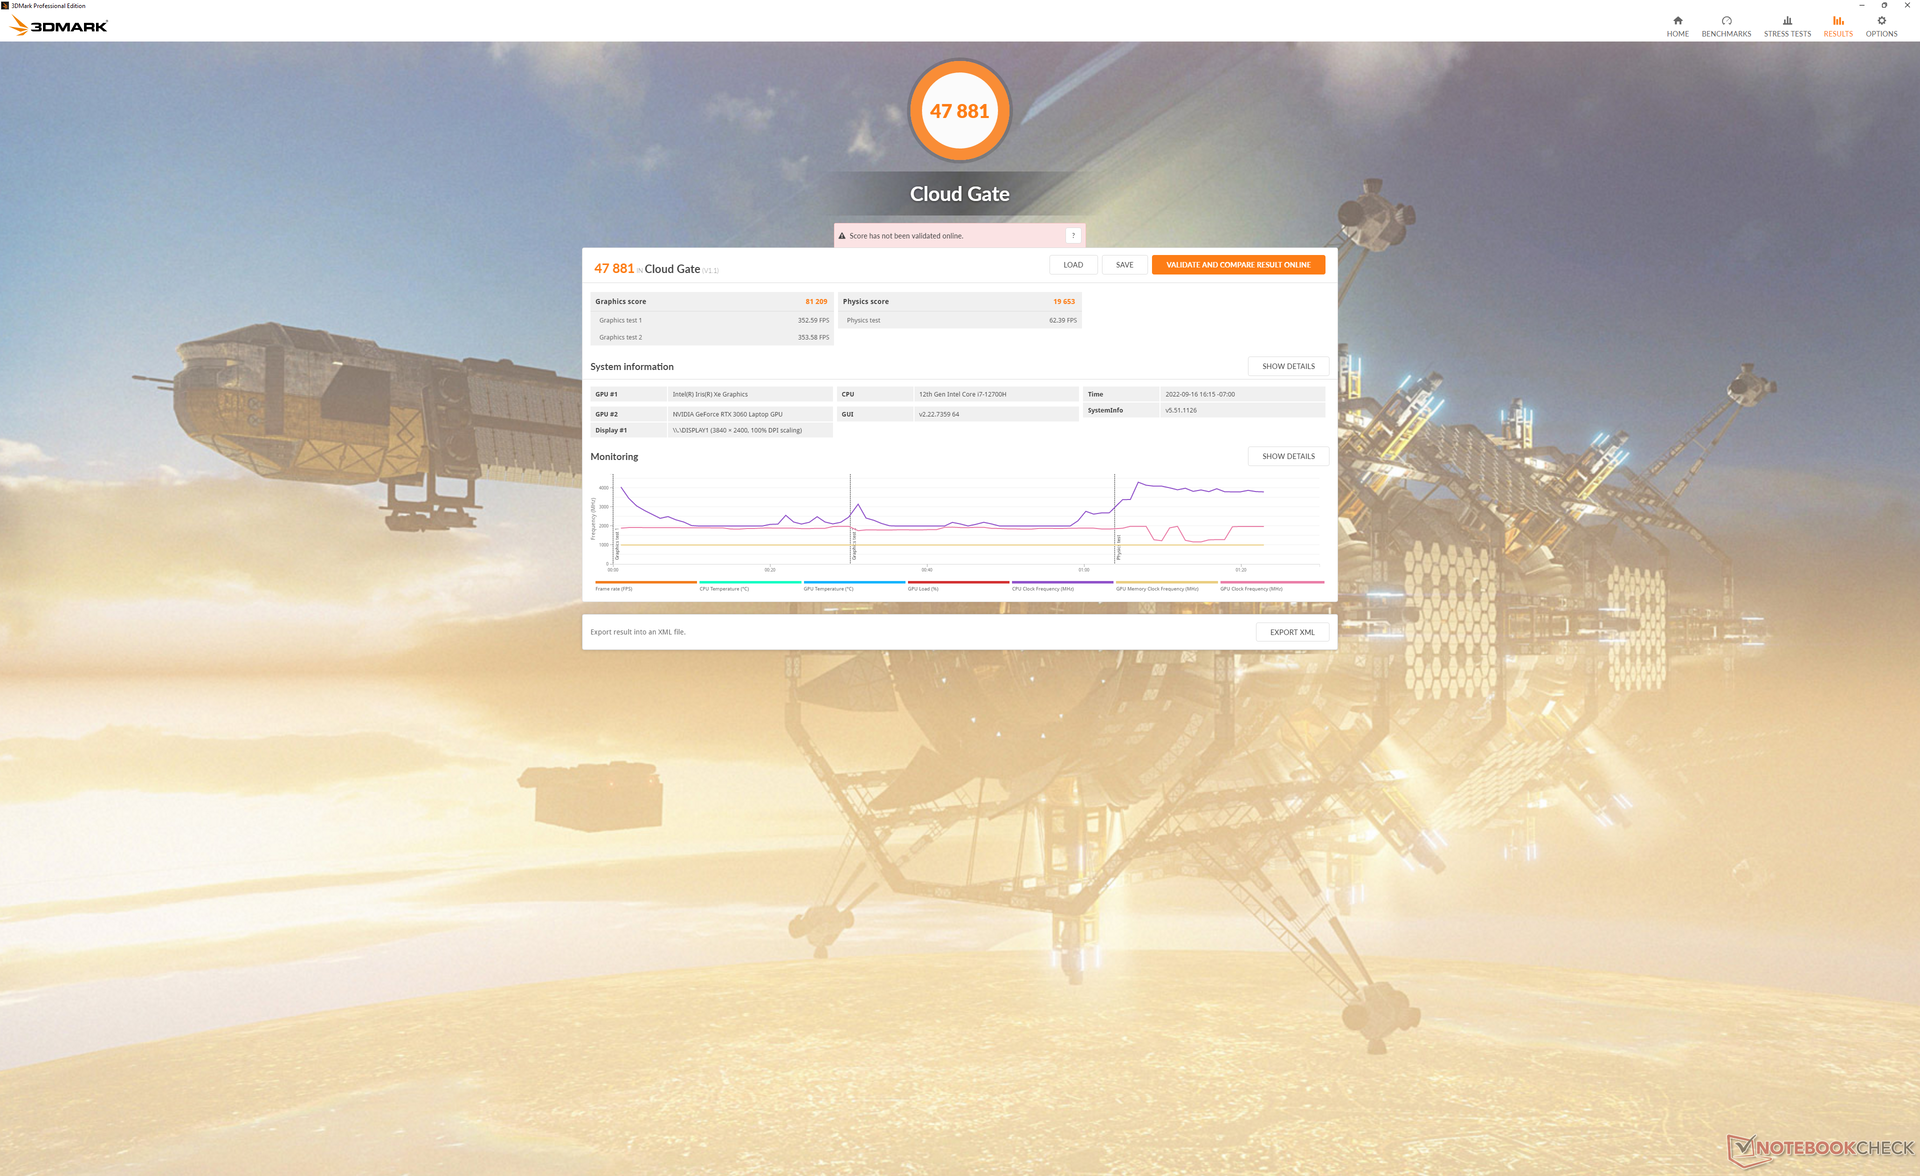
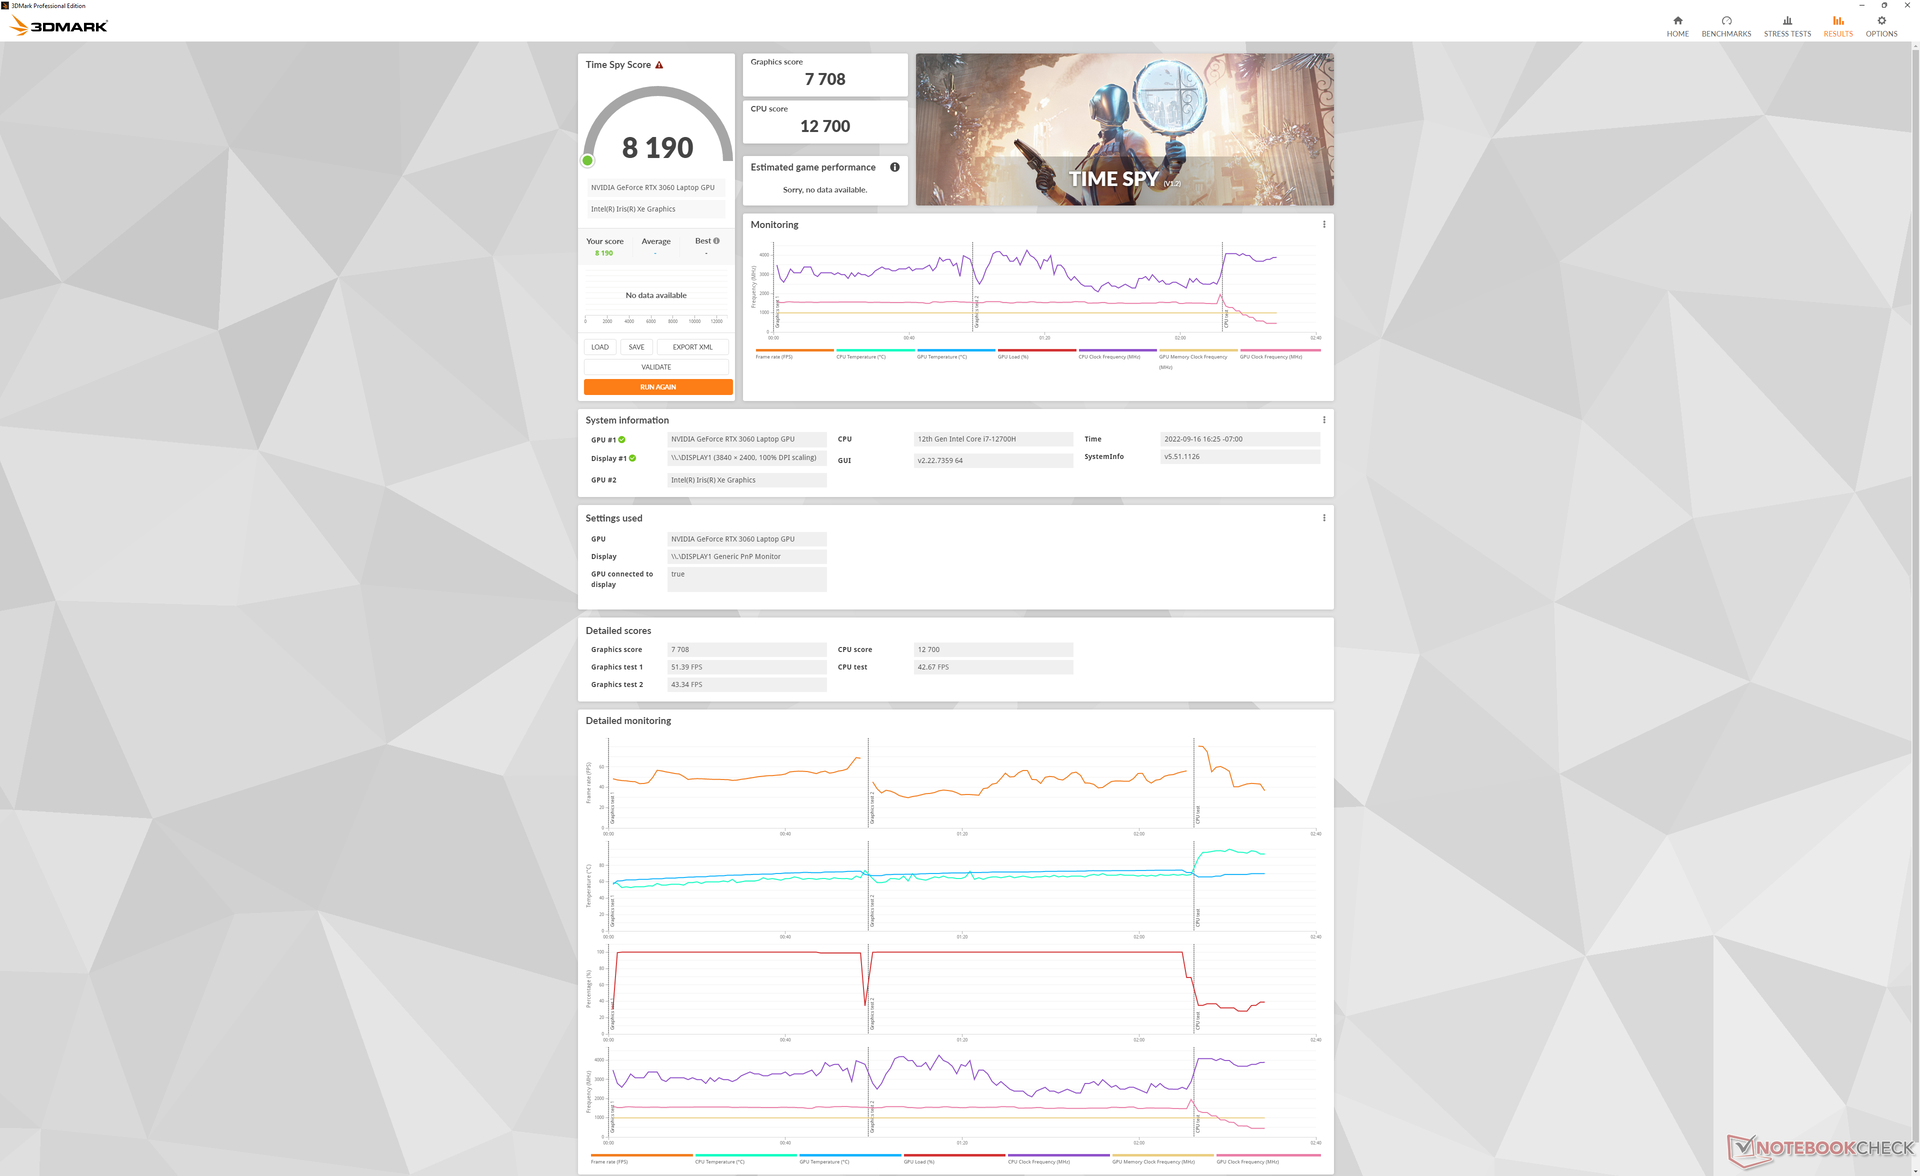
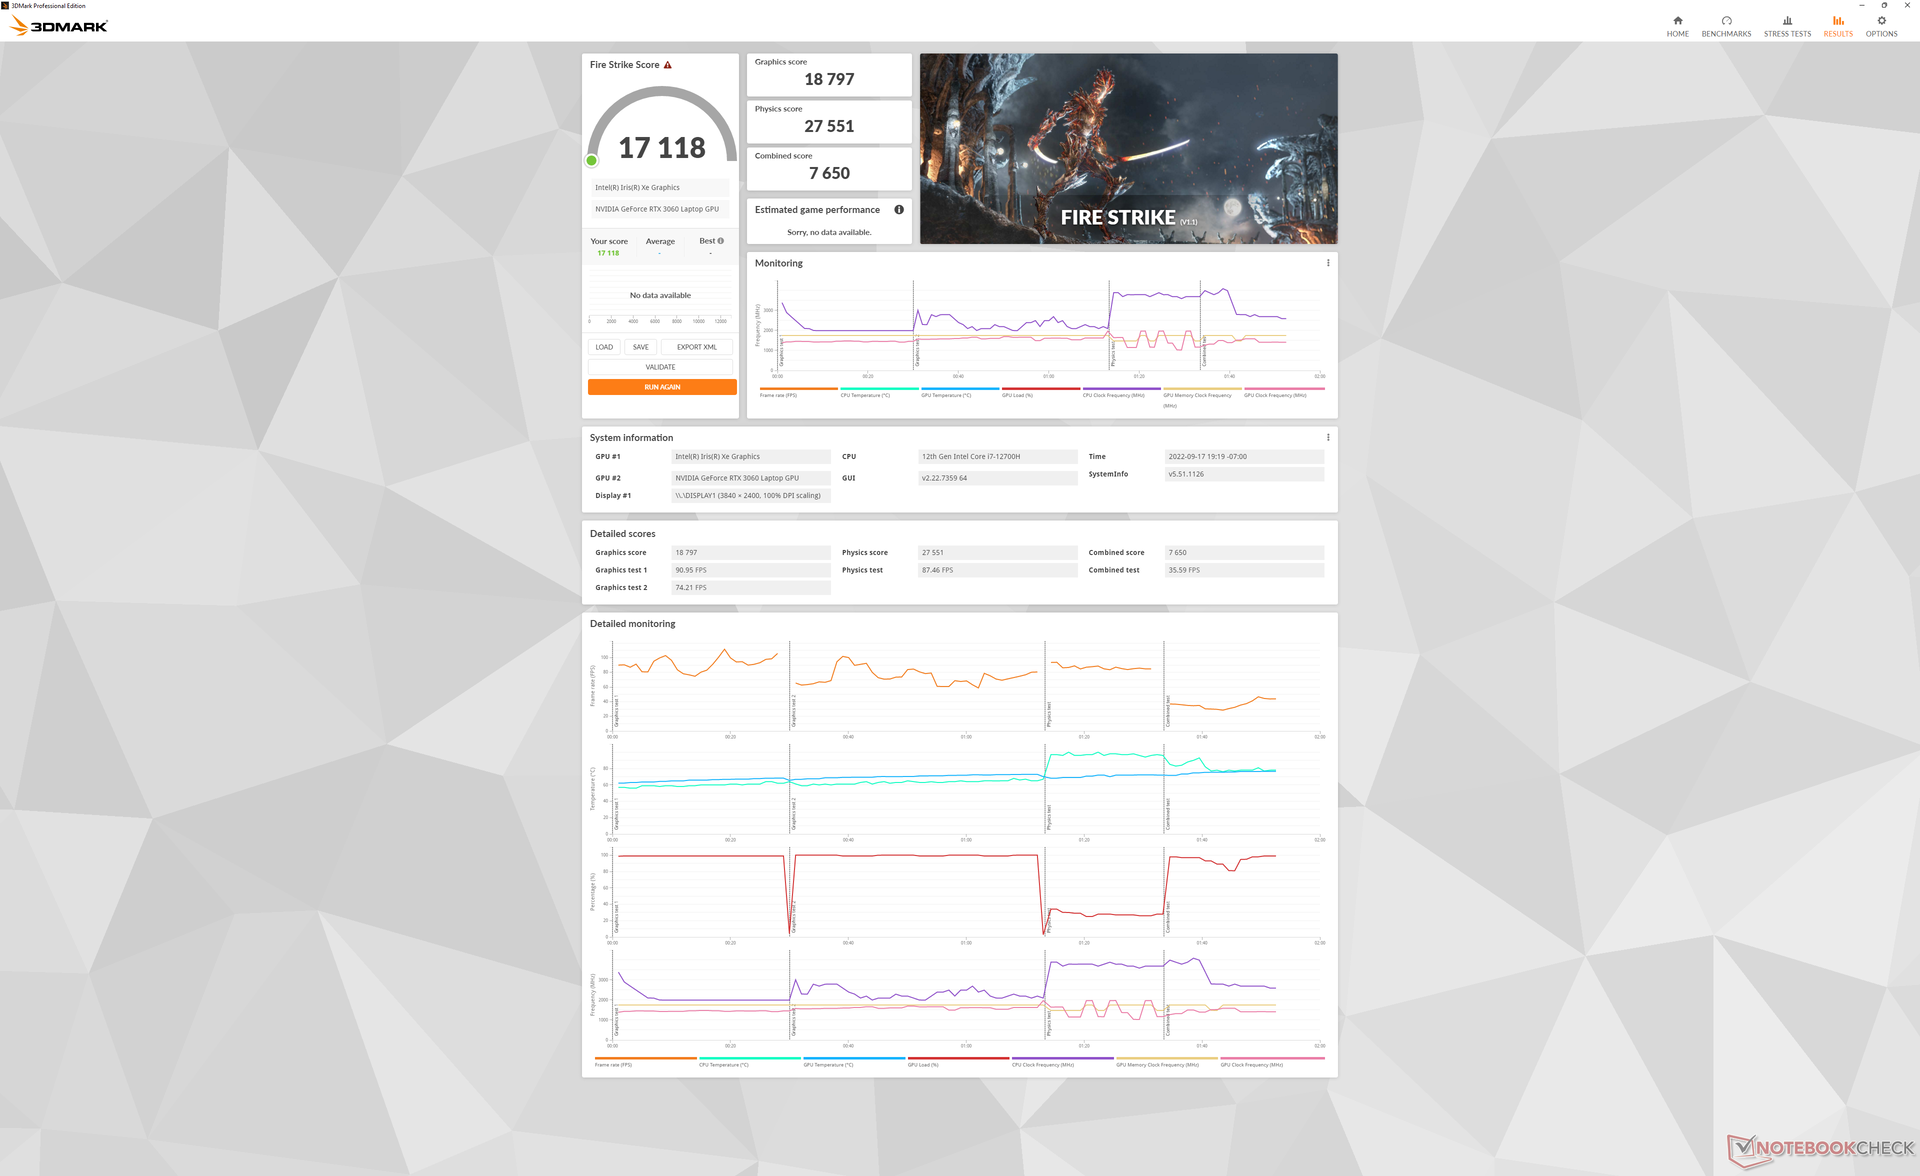
GPU性能 - 95 W TGPGeForce RTX 3060
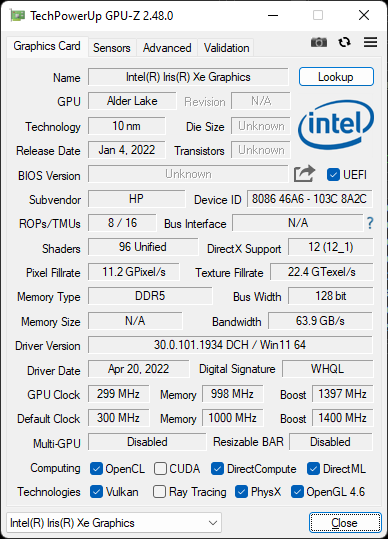
图形性能比我们数据库中的平均笔记本电脑慢5%左右,配备了相同的 同样的GeForce RTX 3060.这种差距很小,用户不太可能注意到。
从较小的 弧形A370M选项升级到GeForce RTX 3060,将使用户获得超过2倍的原始图形性能。
在平衡模式下运行,而不是性能模式下运行,可将图形性能降低6%,而风扇则更安静,详见我们的系统噪音部分。
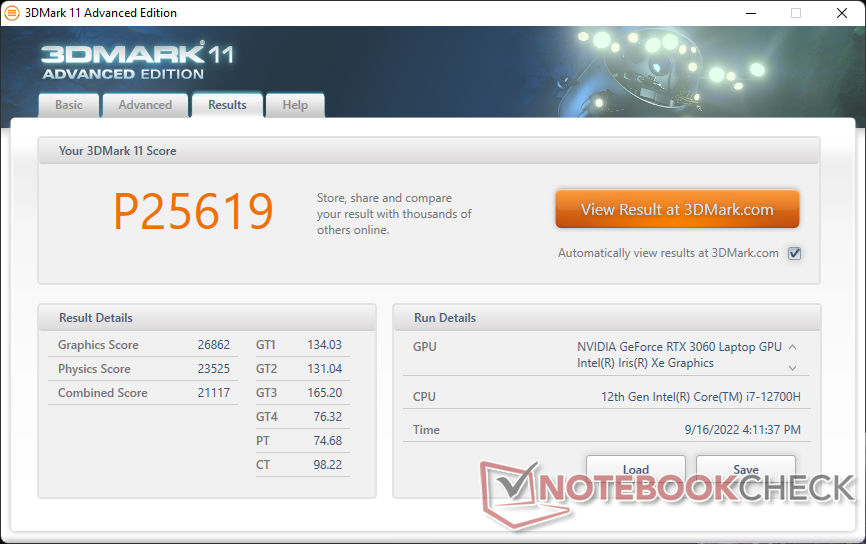

| 3DMark 11 Performance | 25619 points | |
| 3DMark Cloud Gate Standard Score | 47881 points | |
| 3DMark Fire Strike Score | 17118 points | |
| 3DMark Time Spy Score | 8190 points | |
Help | ||
Witcher 3 FPS Chart
| low | med. | high | ultra | QHD | 4K | |
|---|---|---|---|---|---|---|
| GTA V (2015) | 185.6 | 181.2 | 174.1 | 103.3 | 76.7 | |
| The Witcher 3 (2015) | 402.3 | 264 | 161.2 | 82.8 | 55.1 | |
| Dota 2 Reborn (2015) | 180.6 | 164.8 | 149.1 | 139 | 46.9 | |
| Final Fantasy XV Benchmark (2018) | 177.2 | 111.7 | 83.9 | 62 | 34.6 | |
| X-Plane 11.11 (2018) | 140.3 | 127 | 103 | 60.5 | ||
| Strange Brigade (2018) | 418 | 202 | 162 | 140.4 | 103.5 | |
| Cyberpunk 2077 1.6 (2022) | 115.7 | 94.4 | 72.3 | 59.5 | 17.9 |
排放
系统噪音--与许多游戏笔记本一样响亮
如果设置为平衡功率配置文件或更高,风扇的噪音会趋于脉冲。预计在浏览网页或播放视频时,风扇的噪音在30至34 dB(A)之间,而安静的背景为22.8 dB(A)。其他16英寸笔记本电脑,如华为MateBook 16s或MacBook Pro 16都能比Envy 16保持更长时间的安静。
在运行3DMark 06时,风扇的噪音可以达到41 dB(A),而上述Apple 和华为的风扇噪音分别只有26 dB(A) 和34 dB(A)。
当在性能模式下运行Witcher 3 ,风扇噪音变得更加响亮,刚刚超过51分贝(A)。如果改用平衡模式运行,这将大大降低到41.6 dB(A),但如上所述,图形性能将慢5%到10%。总的来说,如果你想利用其性能,这是一台相当响亮的笔记本电脑。
Noise level
| Idle |
| 22.9 / 22.9 / 30.5 dB(A) |
| Load |
| 41.4 / 51.4 dB(A) |
 | ||
30 dB silent 40 dB(A) audible 50 dB(A) loud |
||
min: | ||
| HP Envy 16 h0112nr GeForce RTX 3060 Laptop GPU, i7-12700H, Micron 3400 1TB MTFDKBA1T0TFH | Lenovo ThinkBook 16 G4+ IAP GeForce RTX 2050 Mobile, i7-12700H, Micron 2450 1TB MTFDKCD1T0TFK | MSI Creator Z16P B12UHST GeForce RTX 3080 Ti Laptop GPU, i9-12900H, Samsung PM9A1 MZVL22T0HBLB | Dell Inspiron 16 Plus 7610-MHJ8F UHD Graphics Xe 32EUs (Tiger Lake-H), i7-11800H, OM3PDP3-AD NVMe KDI 512GB | Apple MacBook Pro 16 2021 M1 Pro M1 Pro 16-Core GPU, M1 Pro, Apple SSD AP1024R | Huawei MateBook 16s i7 Iris Xe G7 96EUs, i7-12700H, Silicon Motion PCIe-8 SSD | |
|---|---|---|---|---|---|---|
| Noise | 1% | -5% | -1% | 10% | 9% | |
| off / environment * (dB) | 22.8 | 24.2 -6% | 26 -14% | 26.3 -15% | 24.7 -8% | 24 -5% |
| Idle Minimum * (dB) | 22.9 | 24.2 -6% | 27 -18% | 26.3 -15% | 24.7 -8% | 24 -5% |
| Idle Average * (dB) | 22.9 | 24.2 -6% | 29 -27% | 26.3 -15% | 24.7 -8% | 25.2 -10% |
| Idle Maximum * (dB) | 30.5 | 24.2 21% | 31 -2% | 24.7 19% | 27.2 11% | |
| Load Average * (dB) | 41.4 | 47 -14% | 43 -4% | 33 20% | 26.1 37% | 34.8 16% |
| Witcher 3 ultra * (dB) | 51.1 | 47 8% | 43 16% | 44 14% | 34.8 32% | |
| Load Maximum * (dB) | 51.4 | 47 9% | 46 11% | 49.2 4% | 37.4 27% | 39 24% |
* ... smaller is better
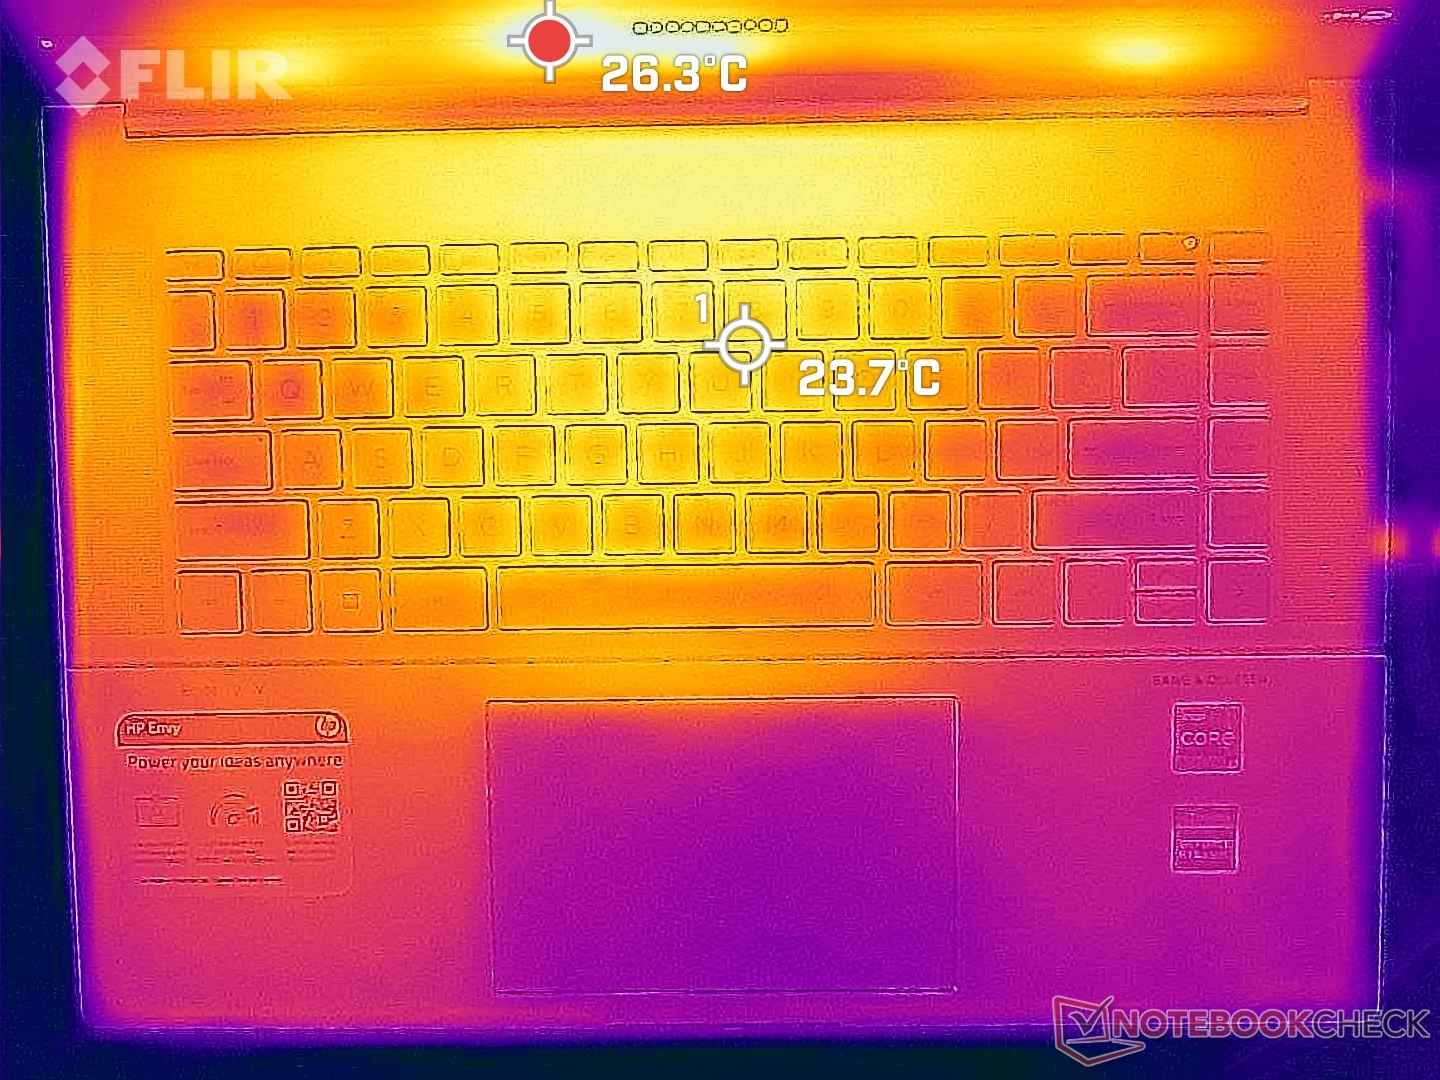
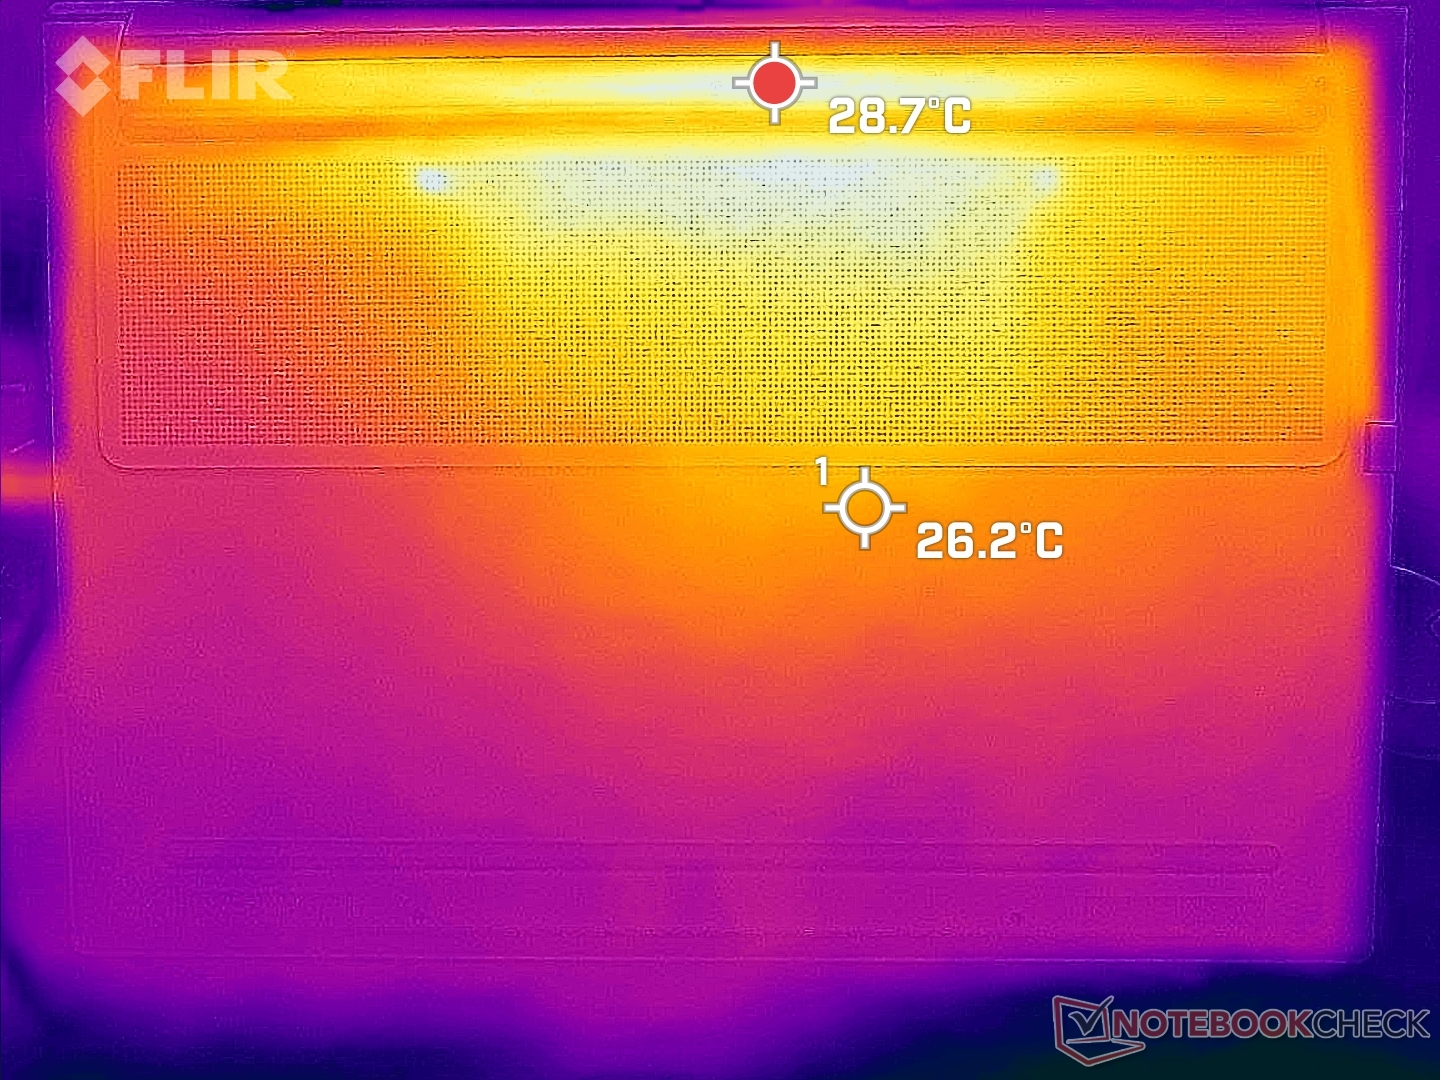
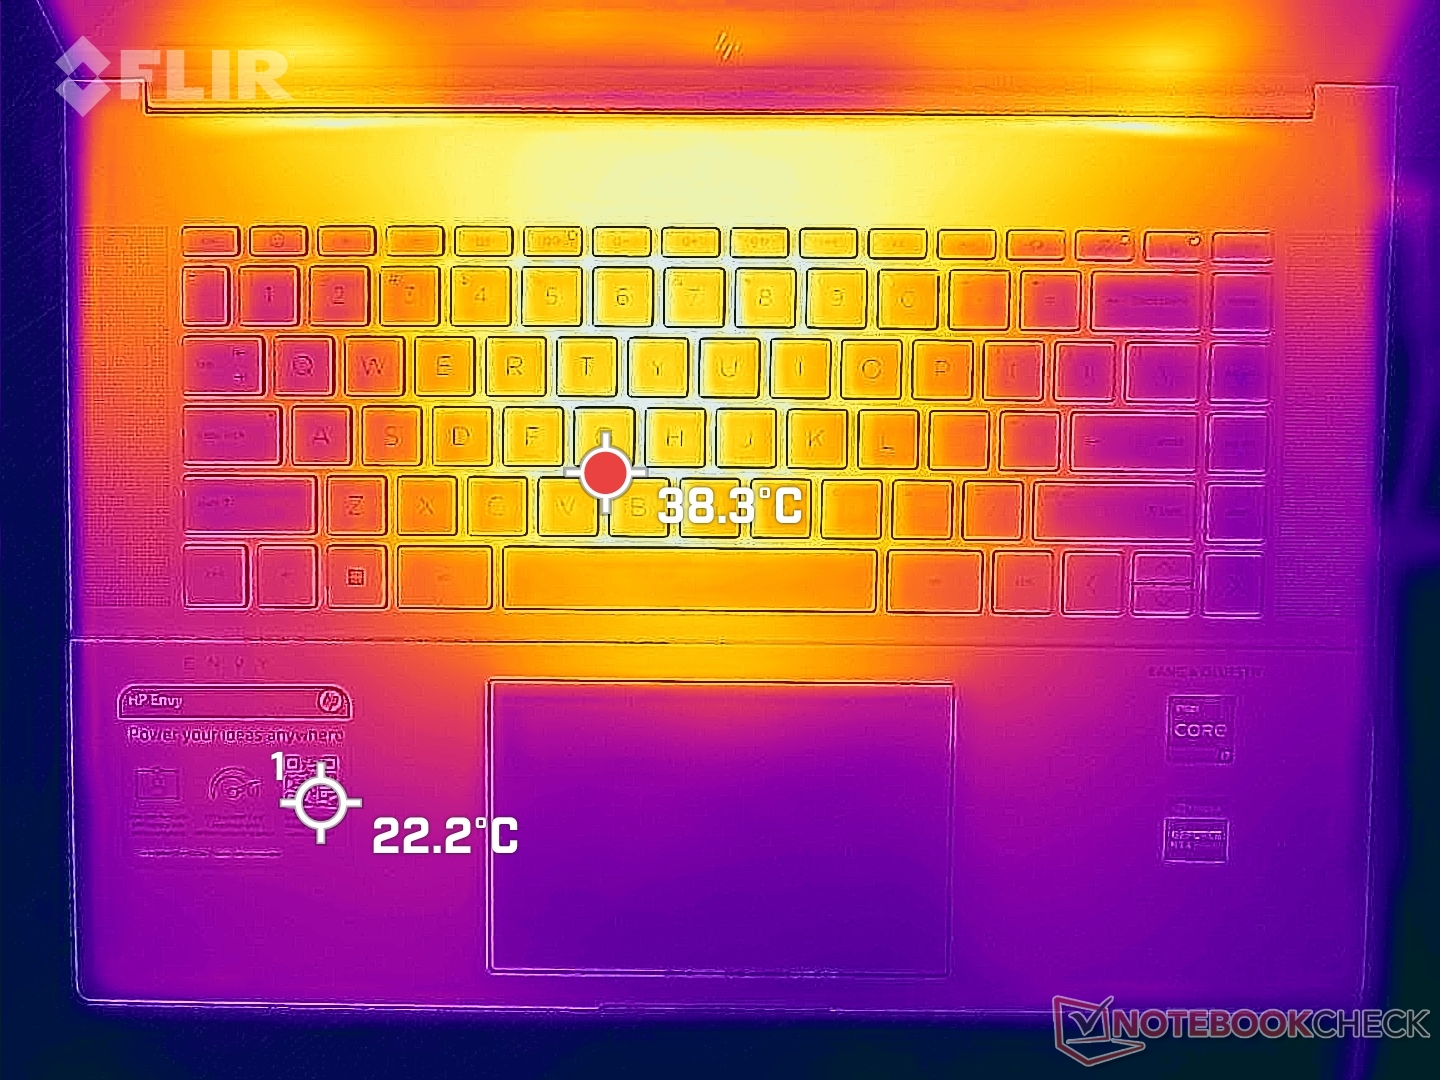
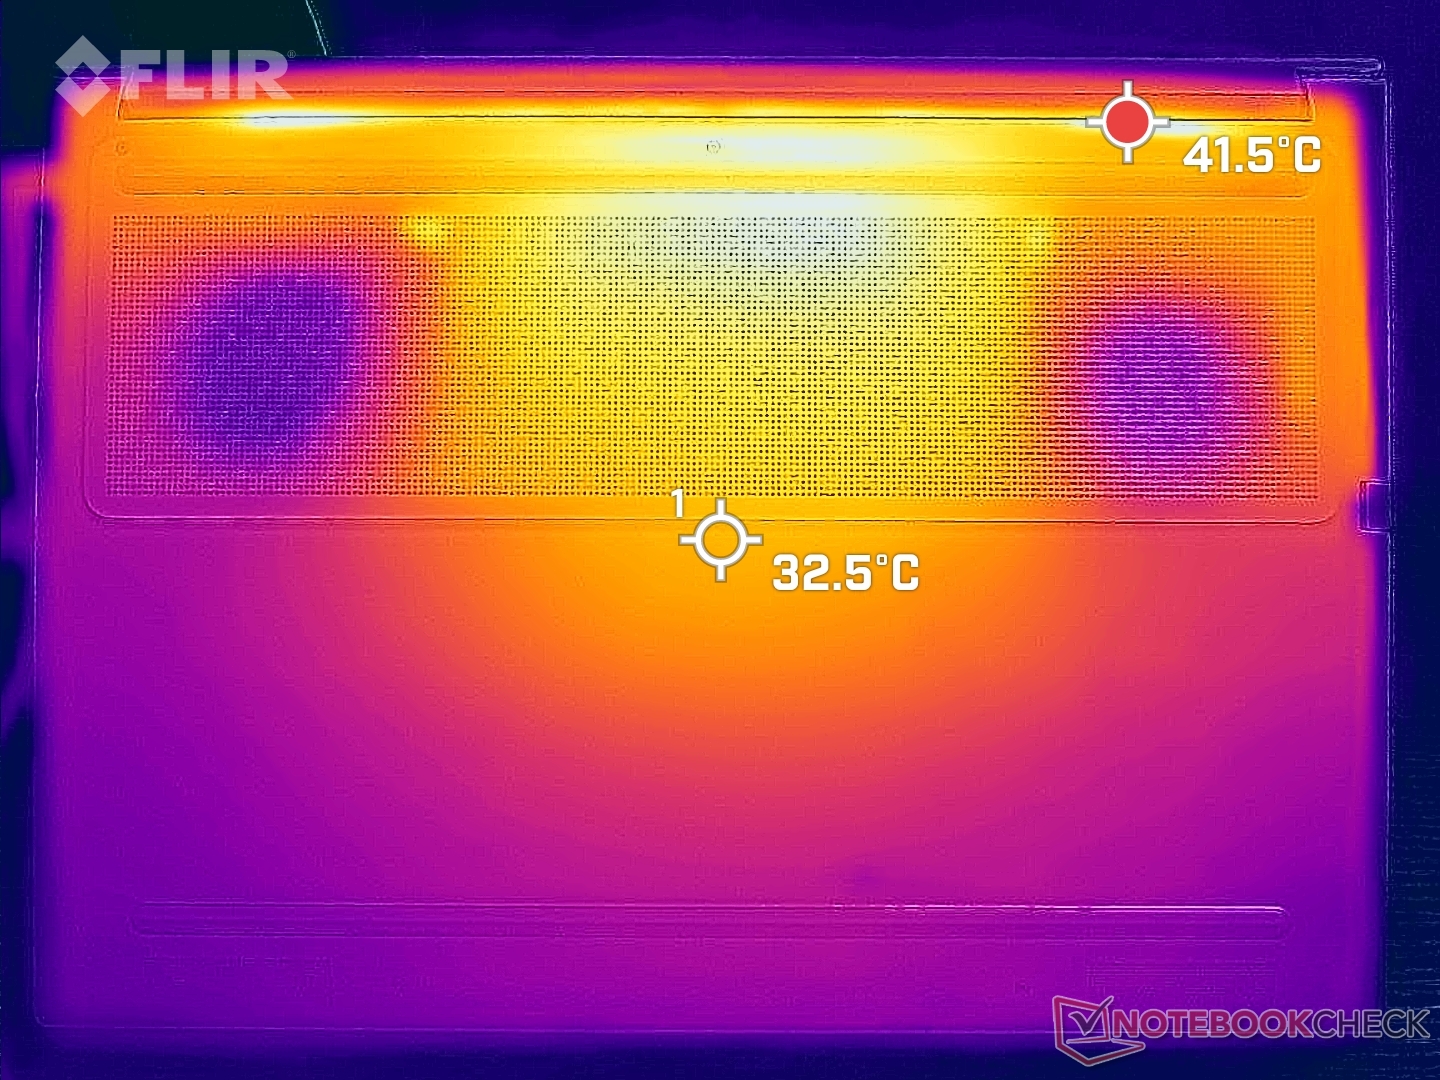
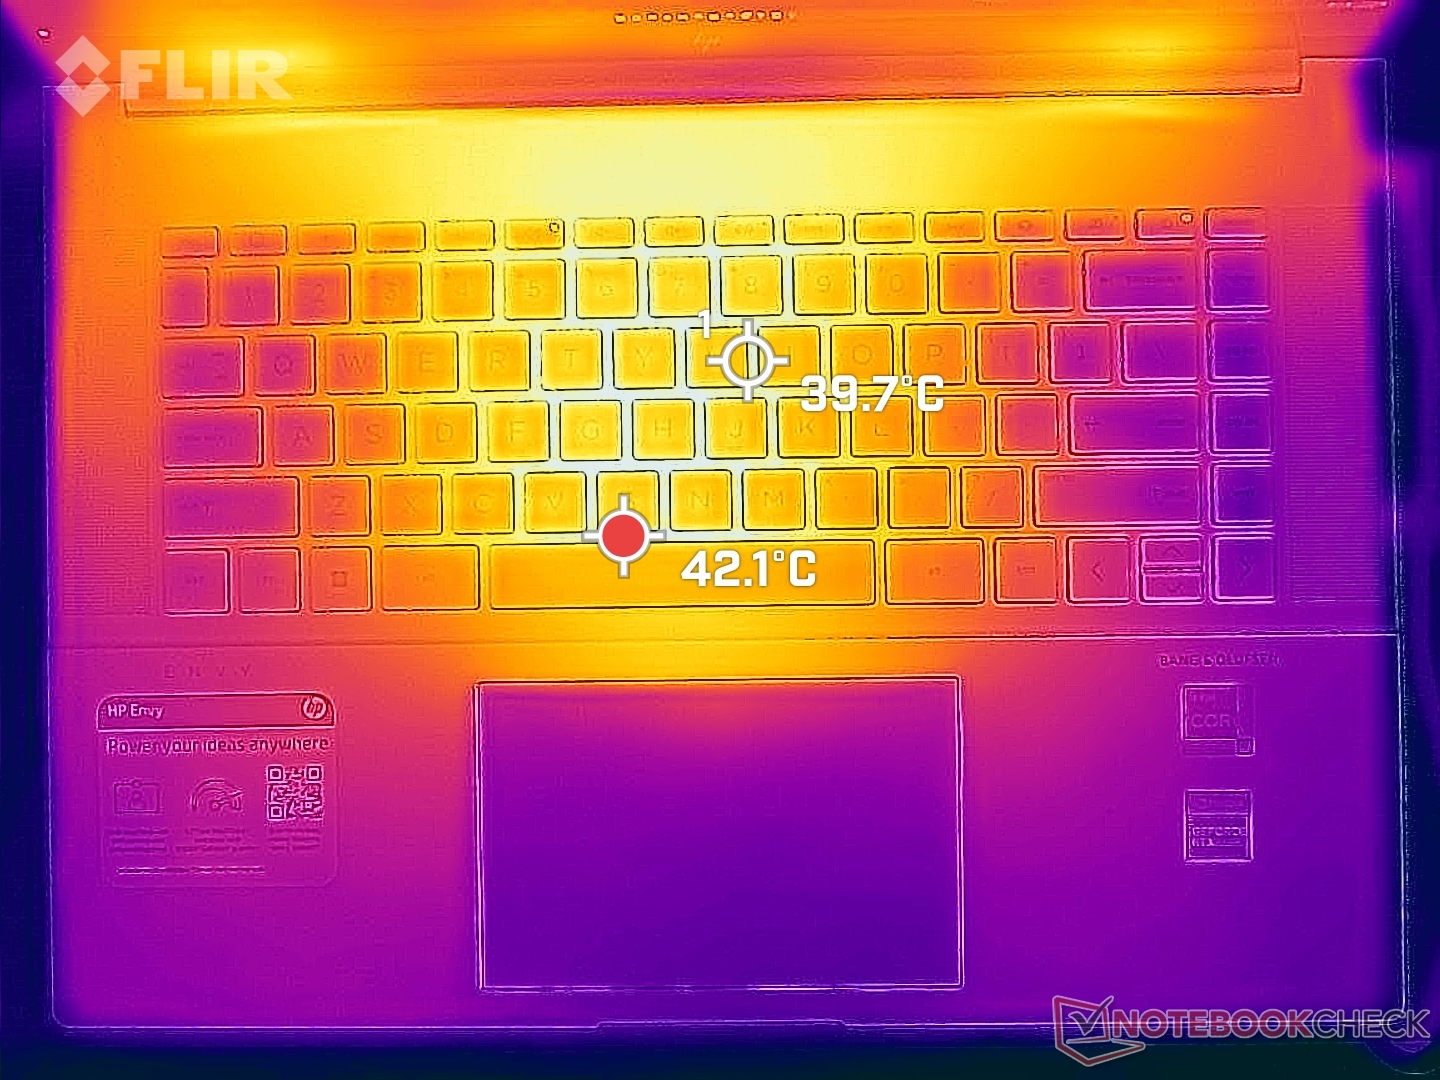
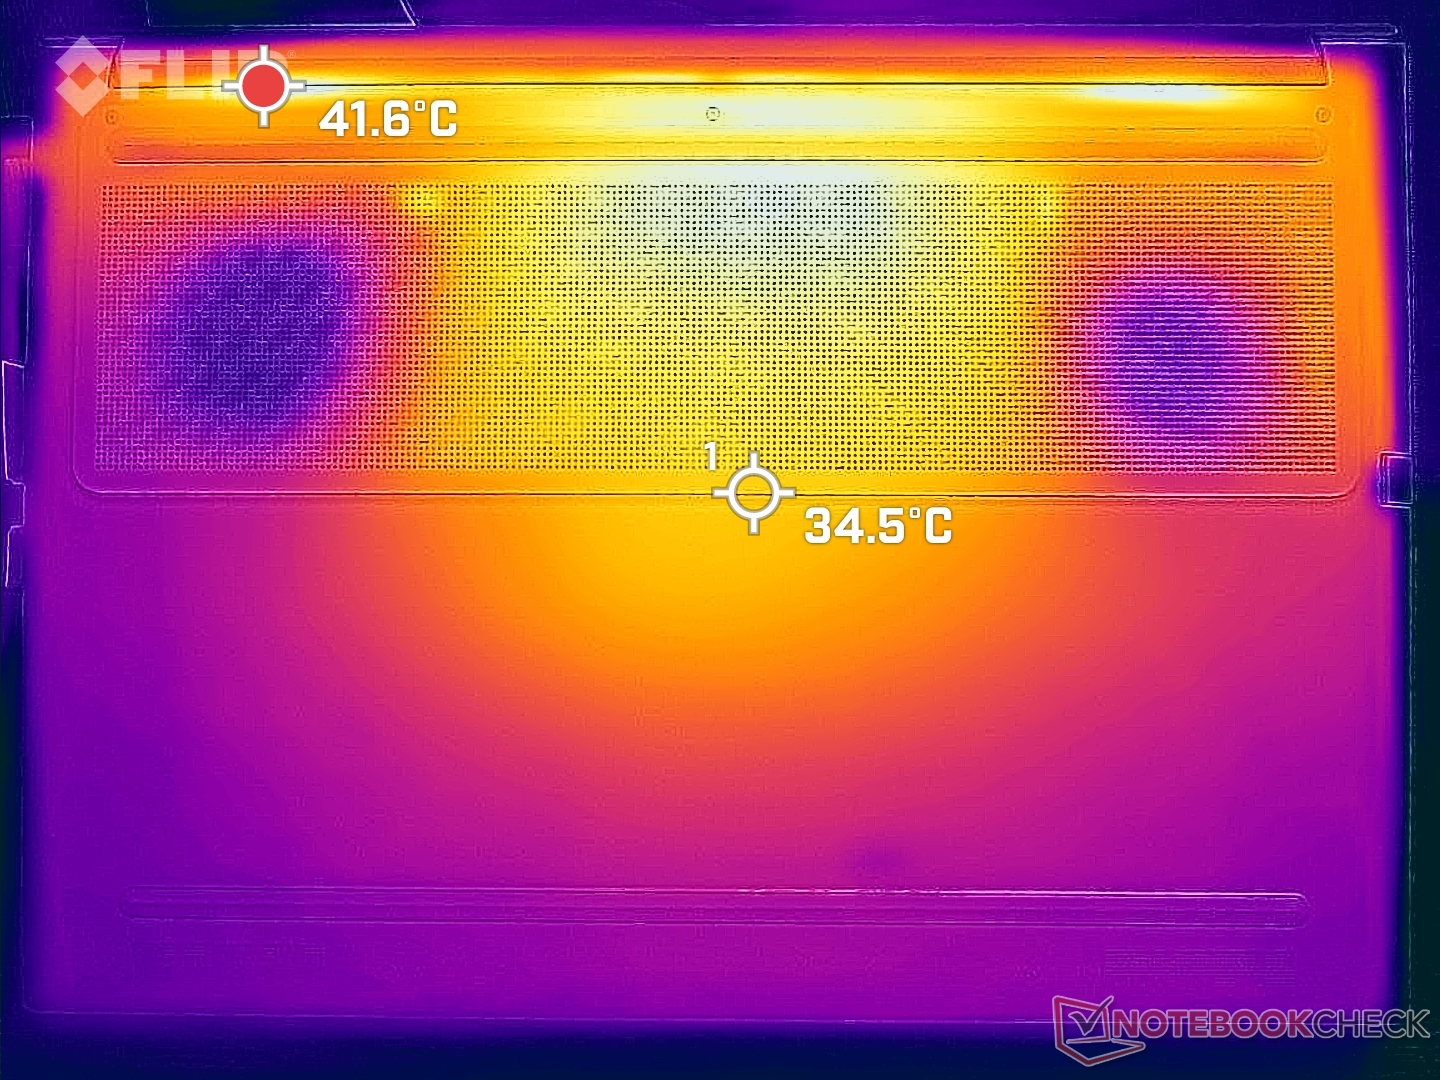
温度
即使在没有运行任何应用程序的情况下在桌面上空转,表面温度也相当高。在这些条件下,顶部和底部的热点都可以达到33摄氏度,而ThinkBook 16 G4的热点只有26摄氏度。 ThinkBook 16 G4.如果运行高负荷,这些区域可以达到45℃以上。掌托仍然相对凉爽,但底部会让皮肤感到不舒服。
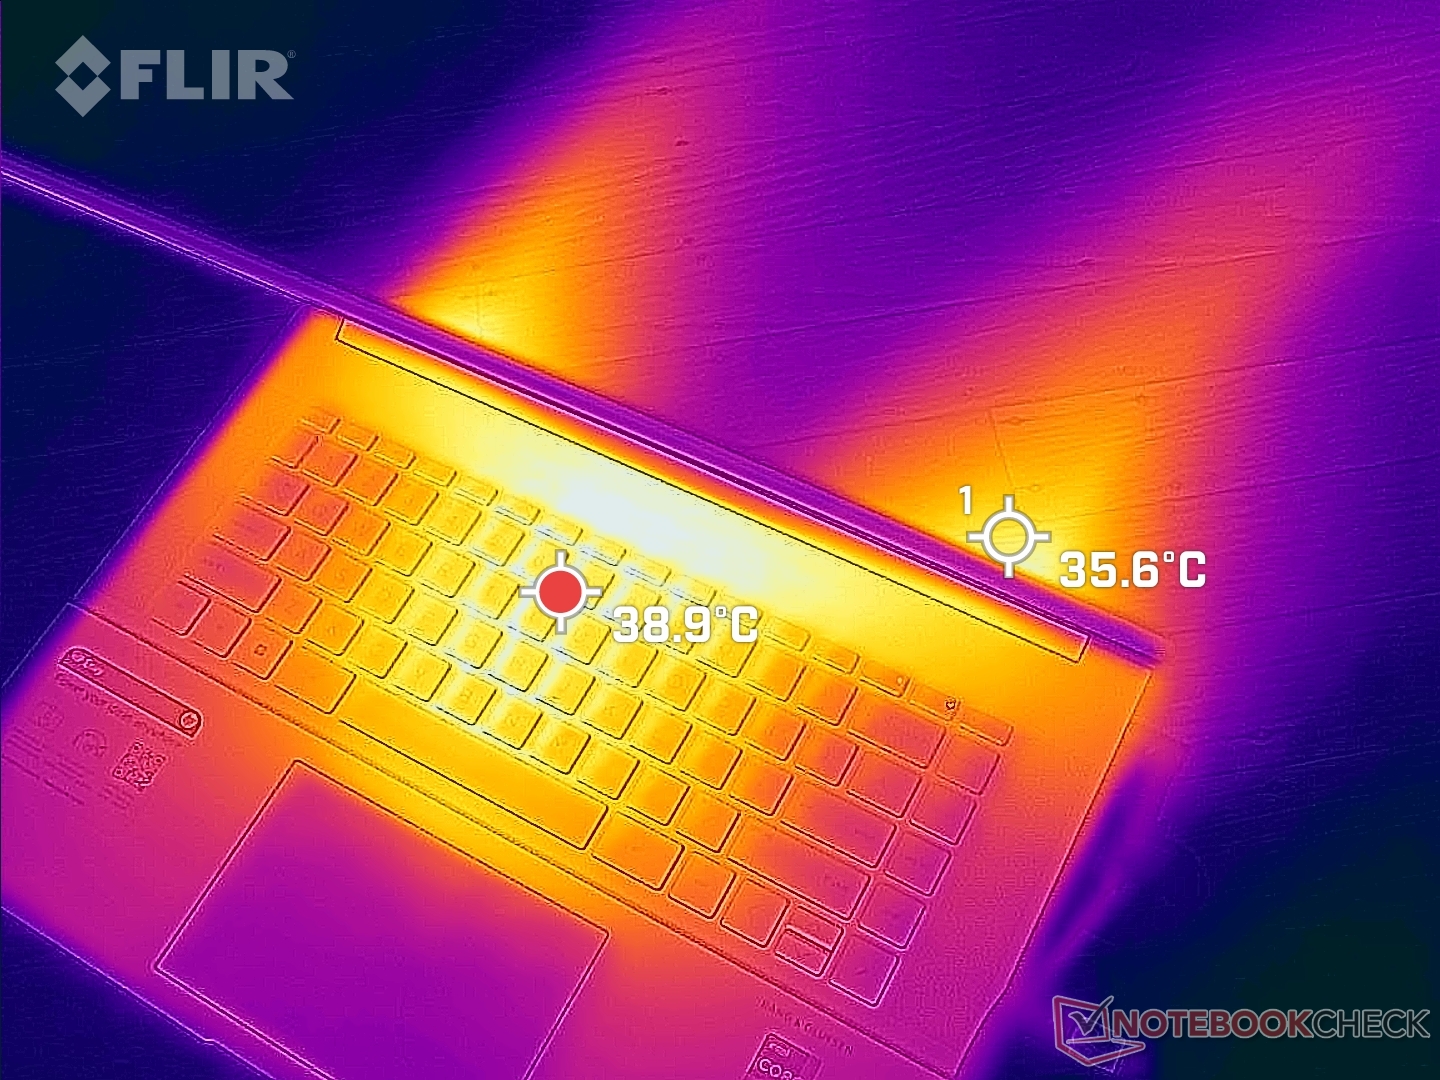
(-) The maximum temperature on the upper side is 45.2 °C / 113 F, compared to the average of 36.8 °C / 98 F, ranging from 21 to 71 °C for the class Multimedia.
(±) The bottom heats up to a maximum of 44 °C / 111 F, compared to the average of 39.1 °C / 102 F
(+) In idle usage, the average temperature for the upper side is 31 °C / 88 F, compared to the device average of 31.3 °C / 88 F.
(±) Playing The Witcher 3, the average temperature for the upper side is 33.6 °C / 92 F, compared to the device average of 31.3 °C / 88 F.
(+) The palmrests and touchpad are cooler than skin temperature with a maximum of 29.8 °C / 85.6 F and are therefore cool to the touch.
(±) The average temperature of the palmrest area of similar devices was 28.7 °C / 83.7 F (-1.1 °C / -1.9 F).
| HP Envy 16 h0112nr Intel Core i7-12700H, NVIDIA GeForce RTX 3060 Laptop GPU | Lenovo ThinkBook 16 G4+ IAP Intel Core i7-12700H, NVIDIA GeForce RTX 2050 Mobile | MSI Creator Z16P B12UHST Intel Core i9-12900H, NVIDIA GeForce RTX 3080 Ti Laptop GPU | Dell Inspiron 16 Plus 7610-MHJ8F Intel Core i7-11800H, Intel UHD Graphics Xe 32EUs (Tiger Lake-H) | Apple MacBook Pro 16 2021 M1 Pro Apple M1 Pro, Apple M1 Pro 16-Core GPU | Huawei MateBook 16s i7 Intel Core i7-12700H, Intel Iris Xe Graphics G7 96EUs | |
|---|---|---|---|---|---|---|
| Heat | 8% | -20% | 4% | 19% | 5% | |
| Maximum Upper Side * (°C) | 45.2 | 42.9 5% | 67 -48% | 43.4 4% | 41 9% | 40.9 10% |
| Maximum Bottom * (°C) | 44 | 50.6 -15% | 69 -57% | 45.1 -3% | 39 11% | 48.3 -10% |
| Idle Upper Side * (°C) | 33.6 | 26 23% | 29 14% | 30.6 9% | 24 29% | 29.2 13% |
| Idle Bottom * (°C) | 32.6 | 26.5 19% | 29 11% | 31.1 5% | 24 26% | 30.4 7% |
* ... smaller is better
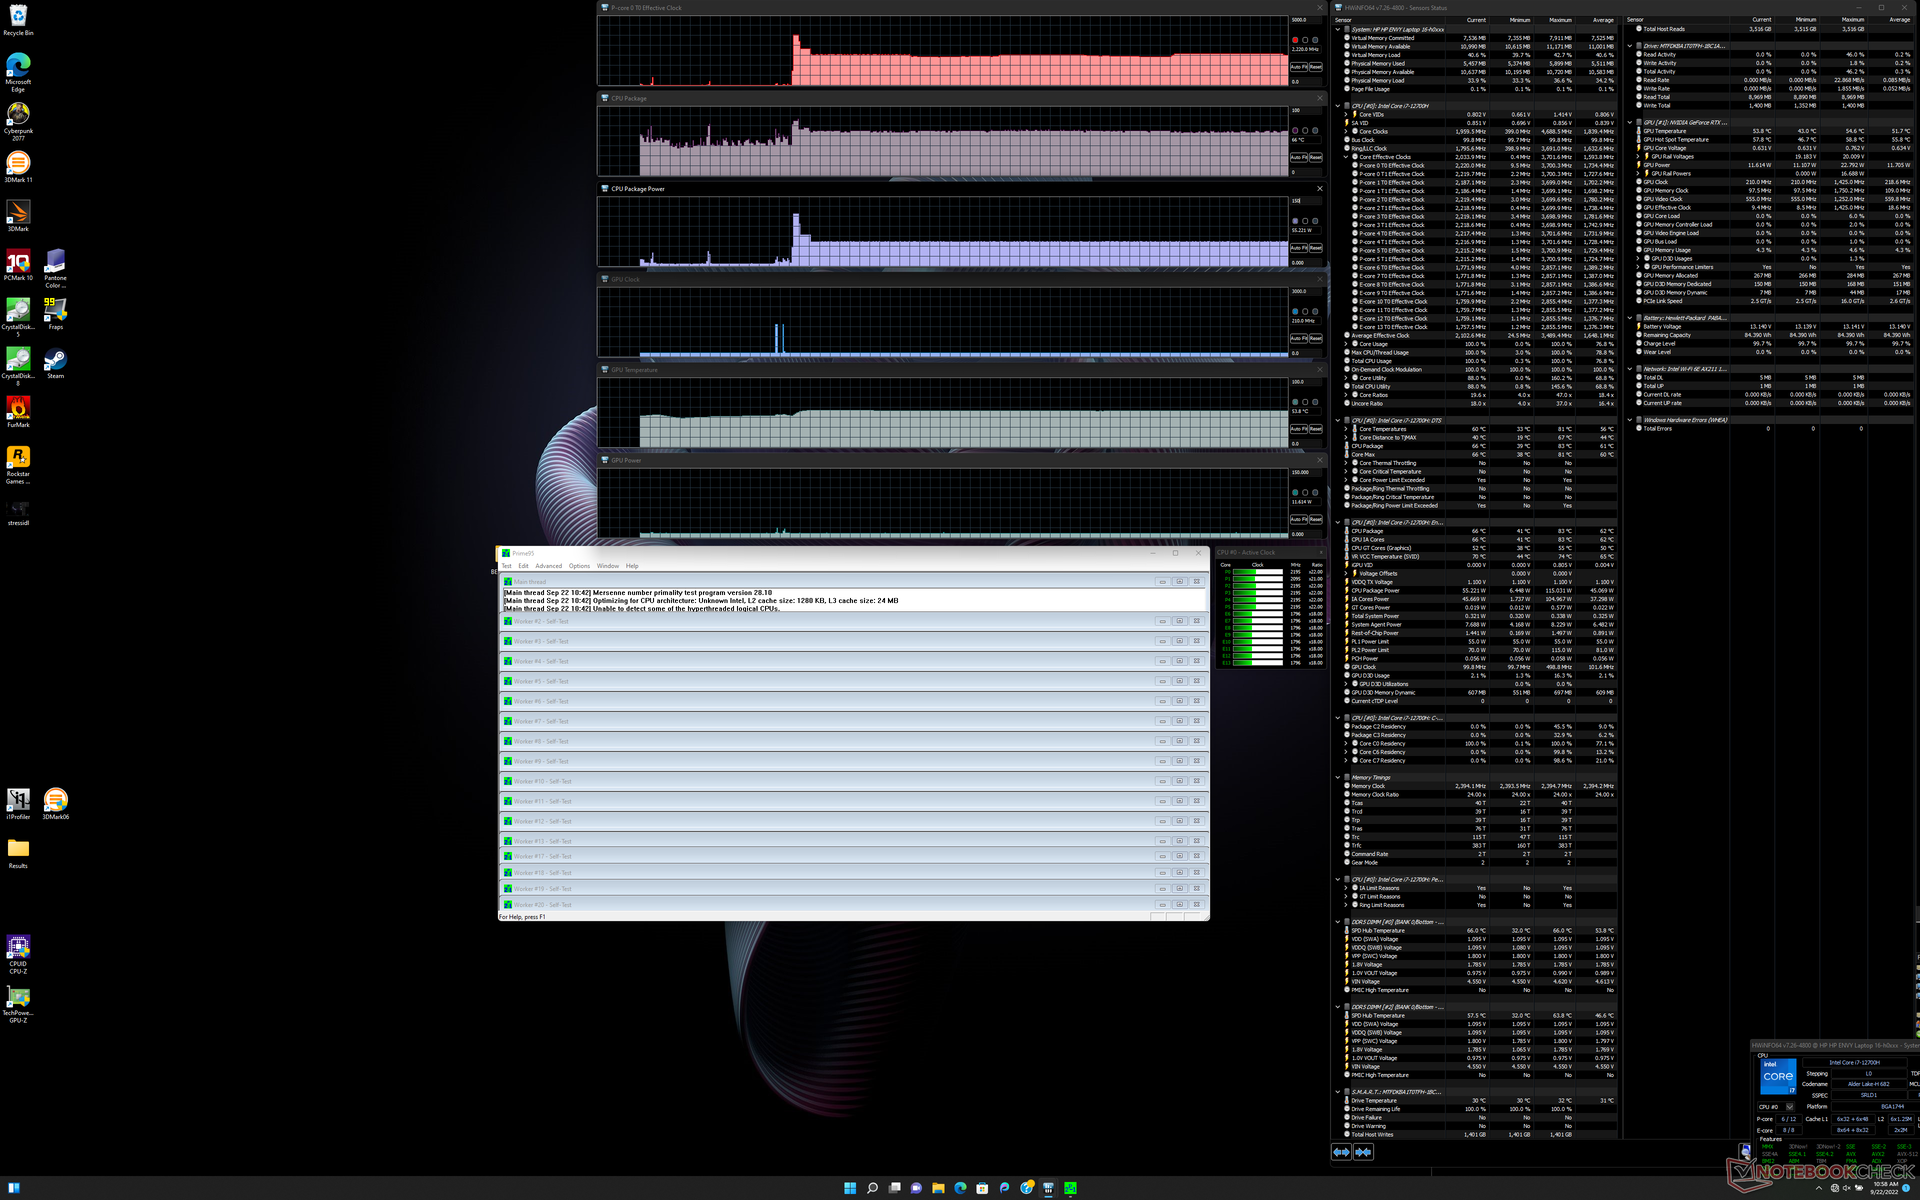
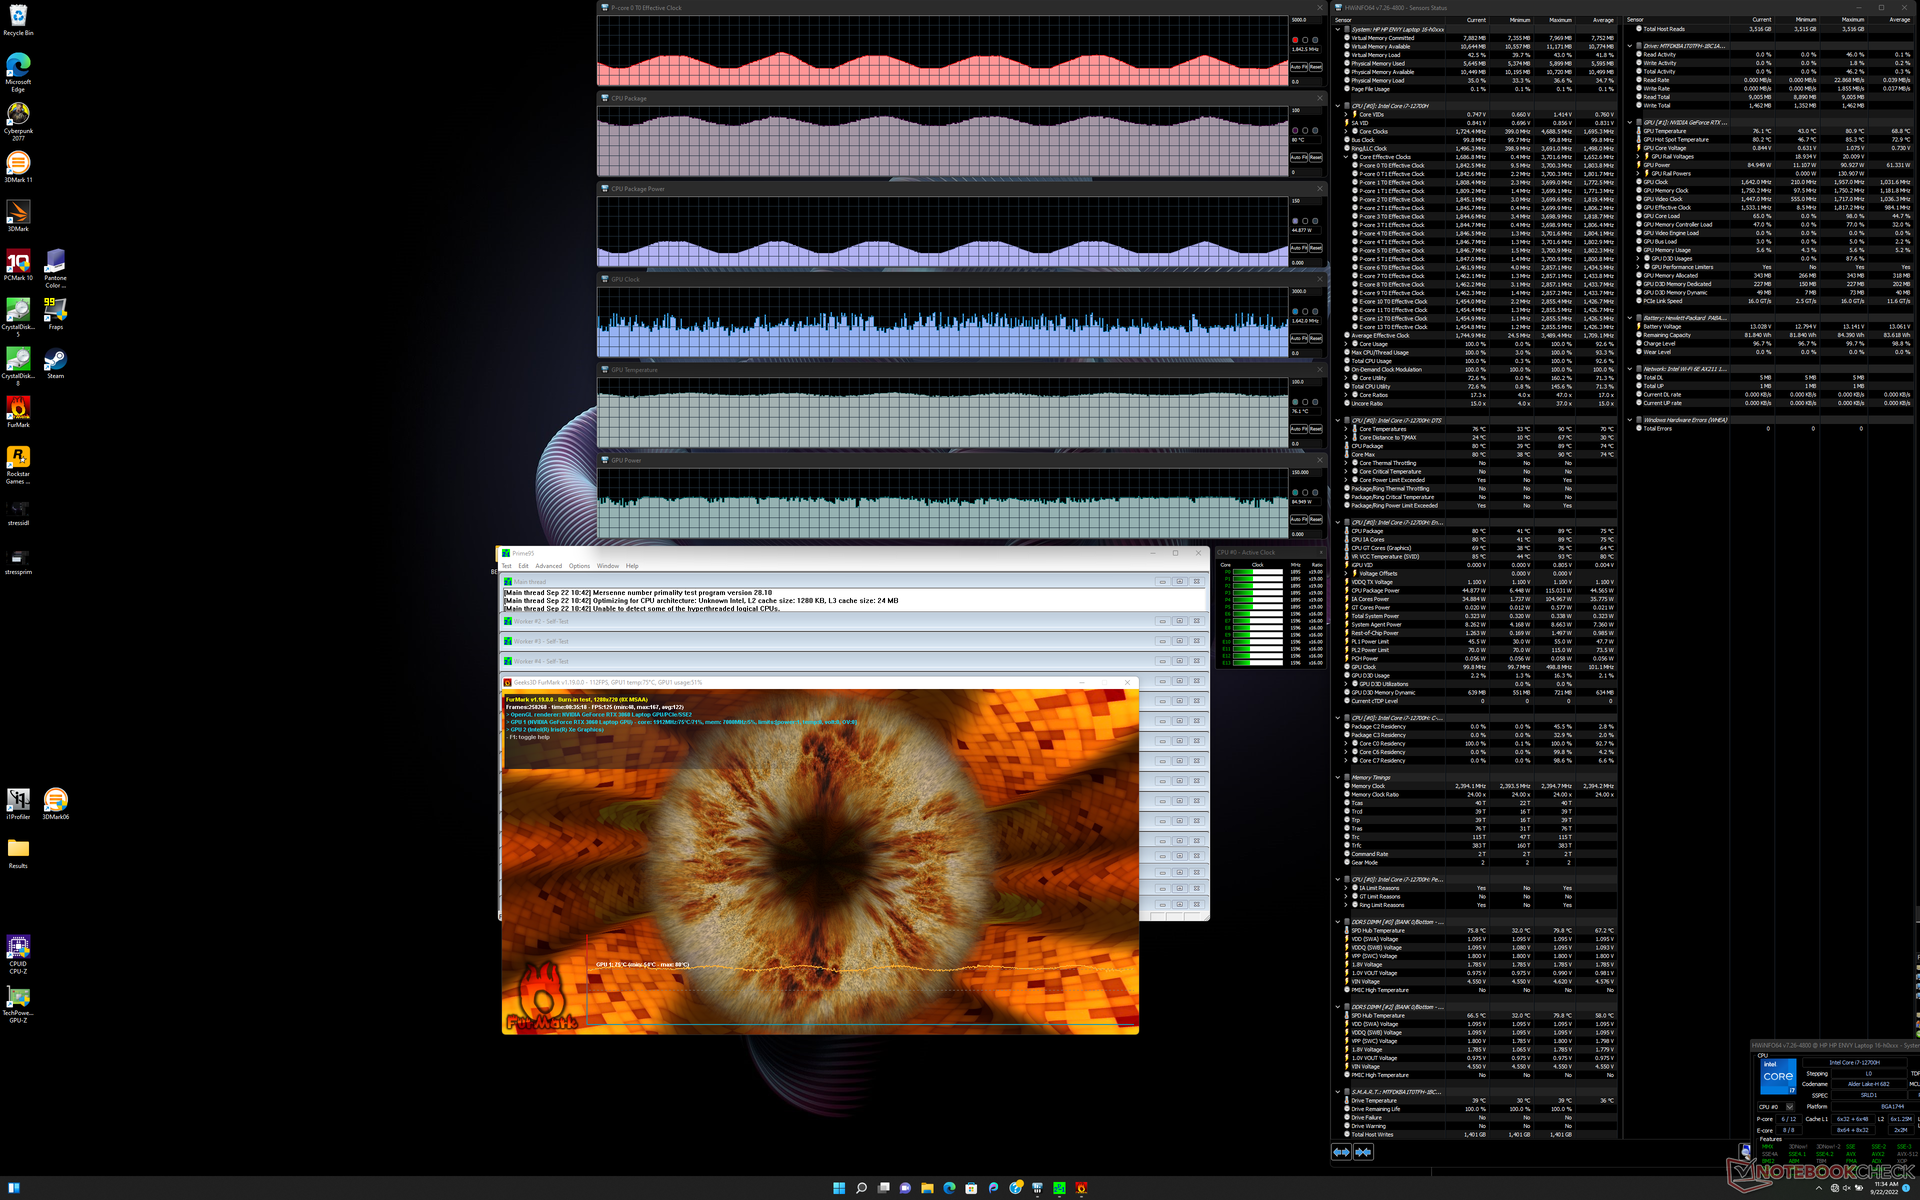
压力测试--有限的涡轮增压
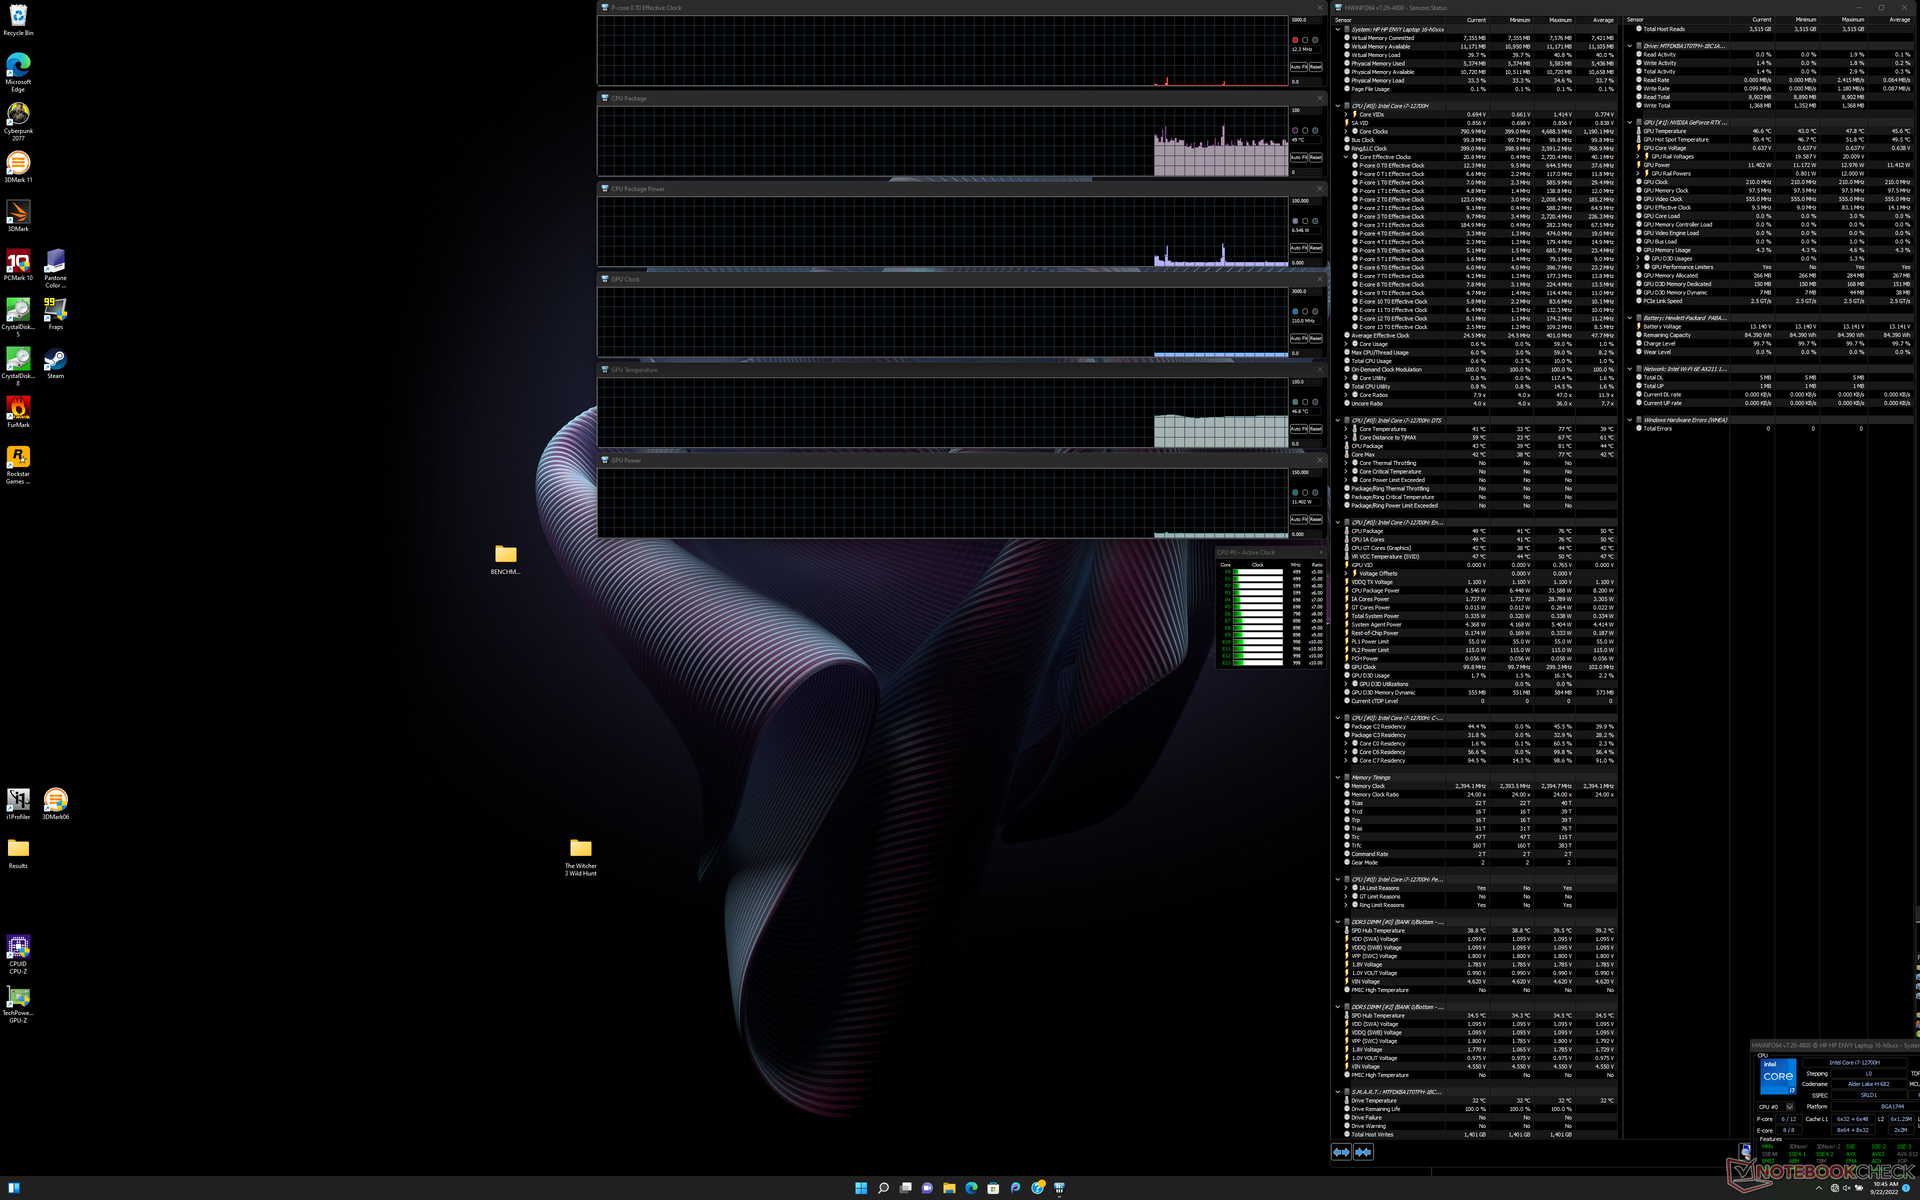
运行Prime95会导致CPU时钟速率、温度和板卡功耗分别飙升至3.7 GHz、80 C和115 W,持续约15秒。此后,CPU将下降并稳定在2.1至2.2 GHz、66 C和55 W。相比之下,在微星GS77上运行同样的测试 微星GS77进行同样的测试,同样的酷睿i7-12700H CPU将导致更高的稳定时钟速率和核心温度,分别为2.7-3.0 GHz和96 C。惠普可能对其Envy 16采取更安全的路线,以较慢的Turbo Boost时钟速率运行,以保持较低的温度。
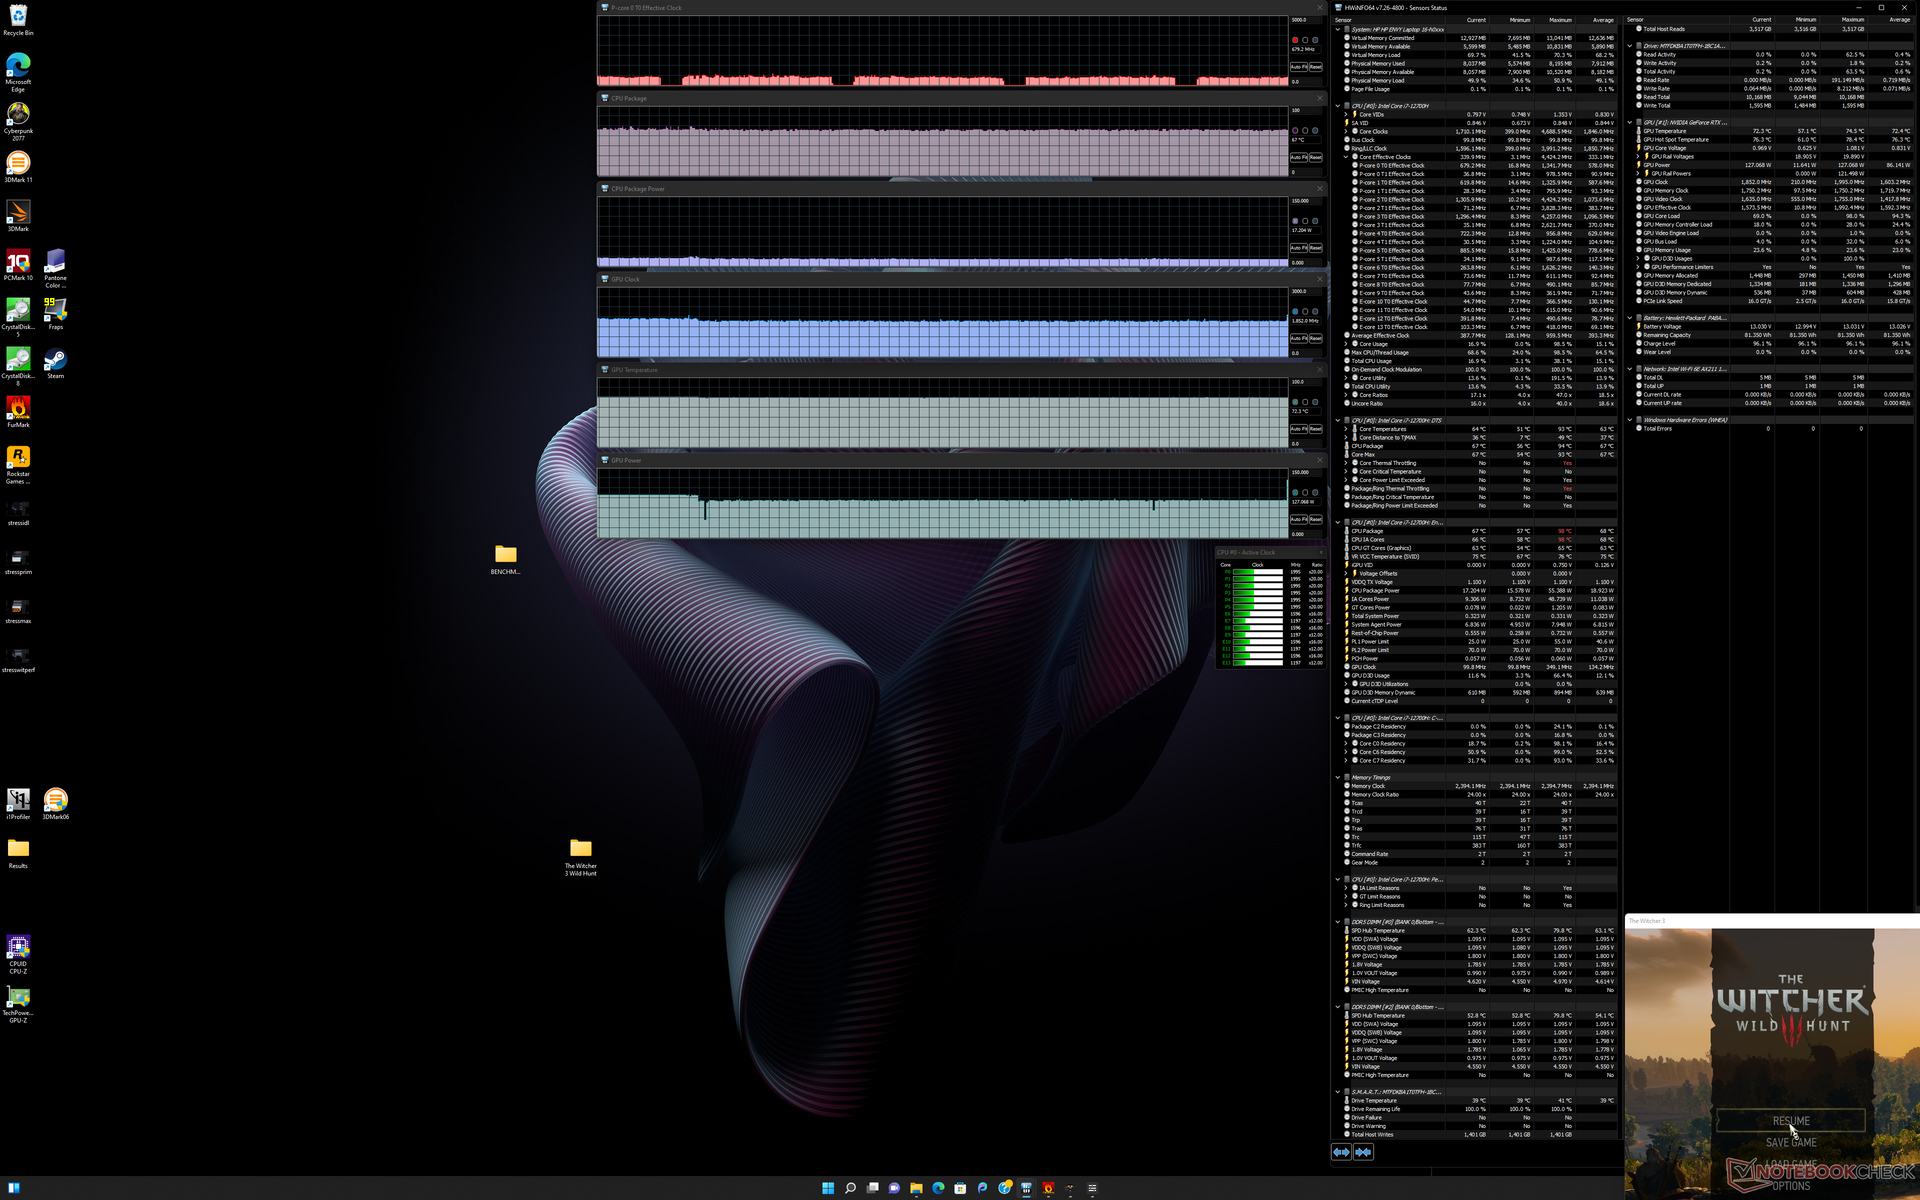
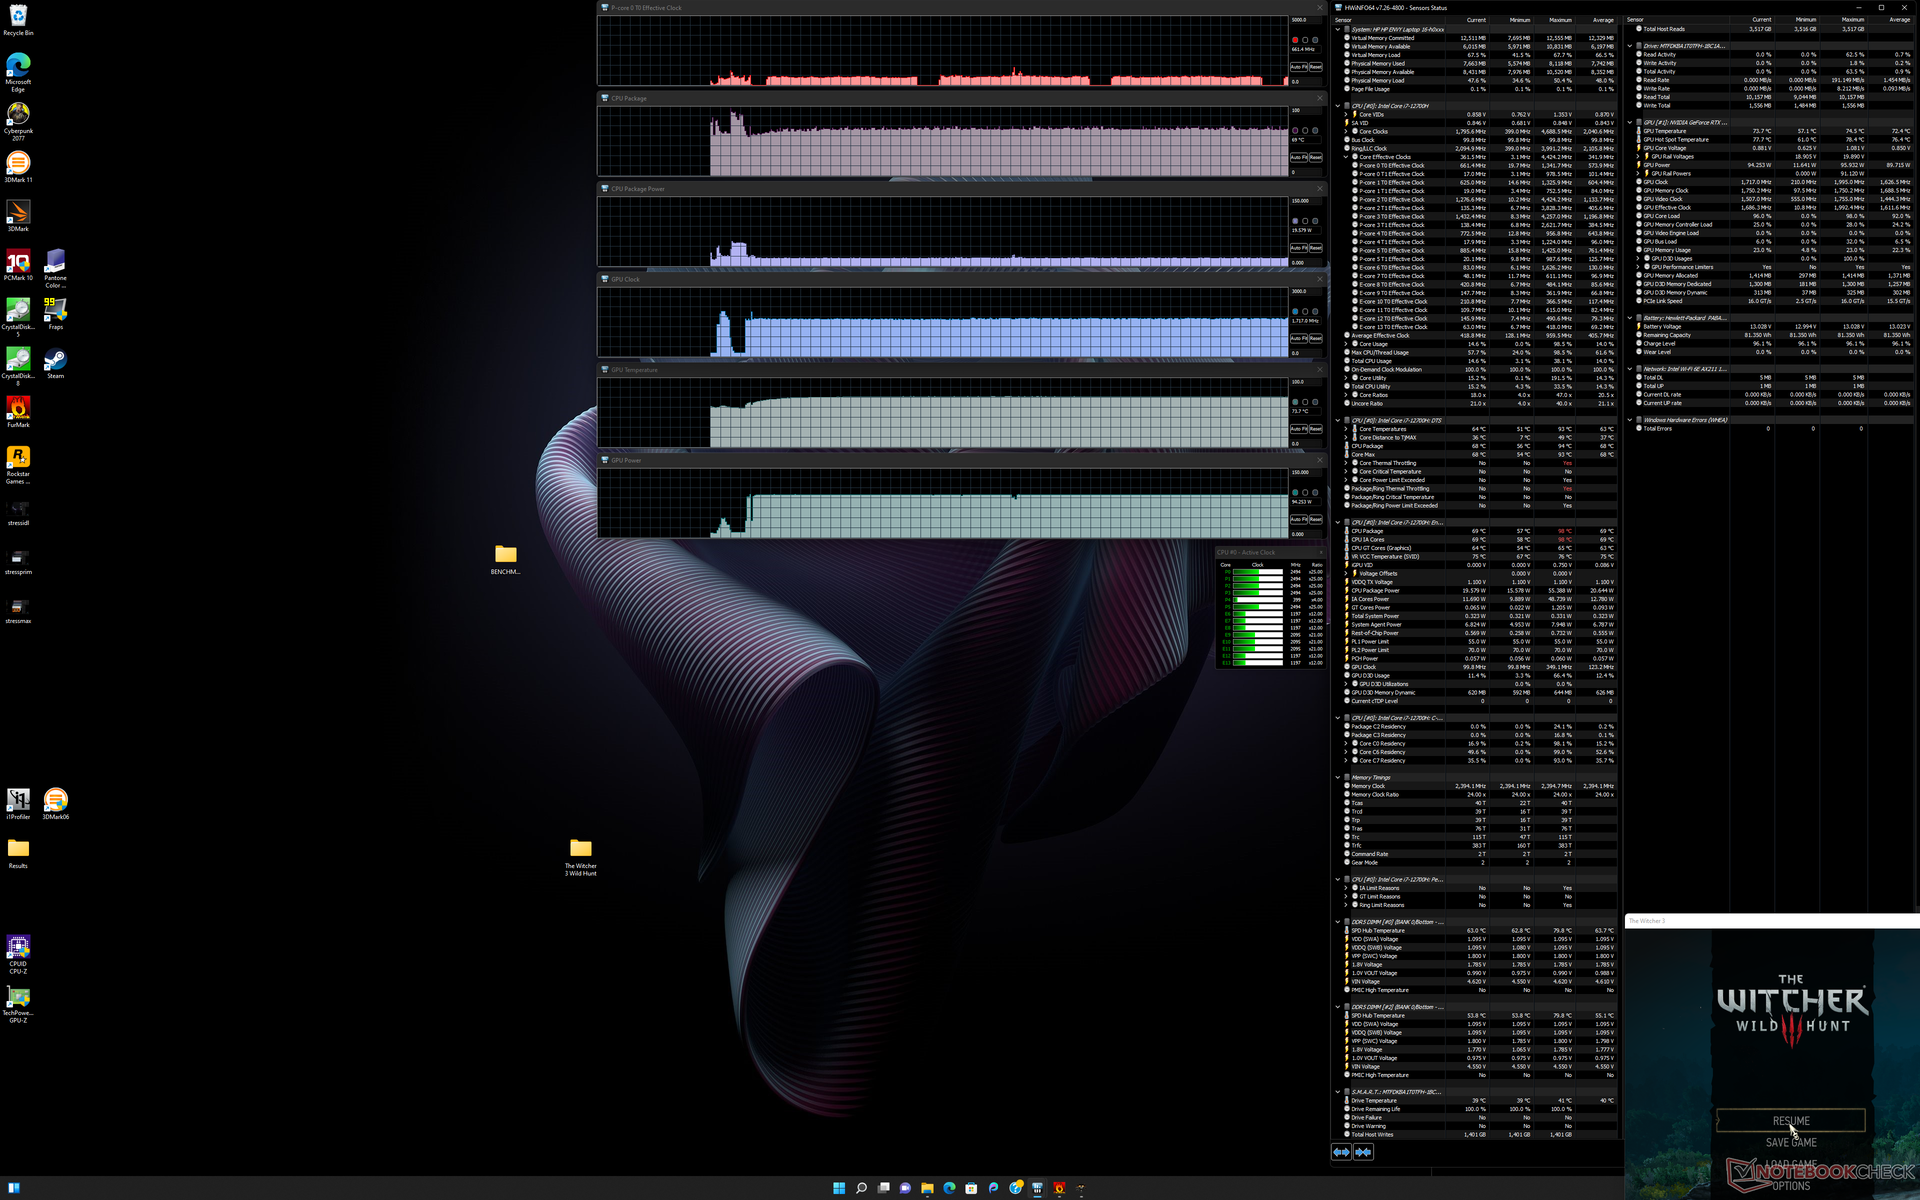
当运行在性能模式时,GPU时钟频率、温度和主板功耗将分别稳定在1717 MHz、74 C和94 W。 Witcher 3在性能模式下。如果改用平衡模式运行游戏,则降至1542 MHz、72 C和80 W。如果用户希望充分发挥GPU的作用,他们将不得不忍受系统的最大风扇噪音。
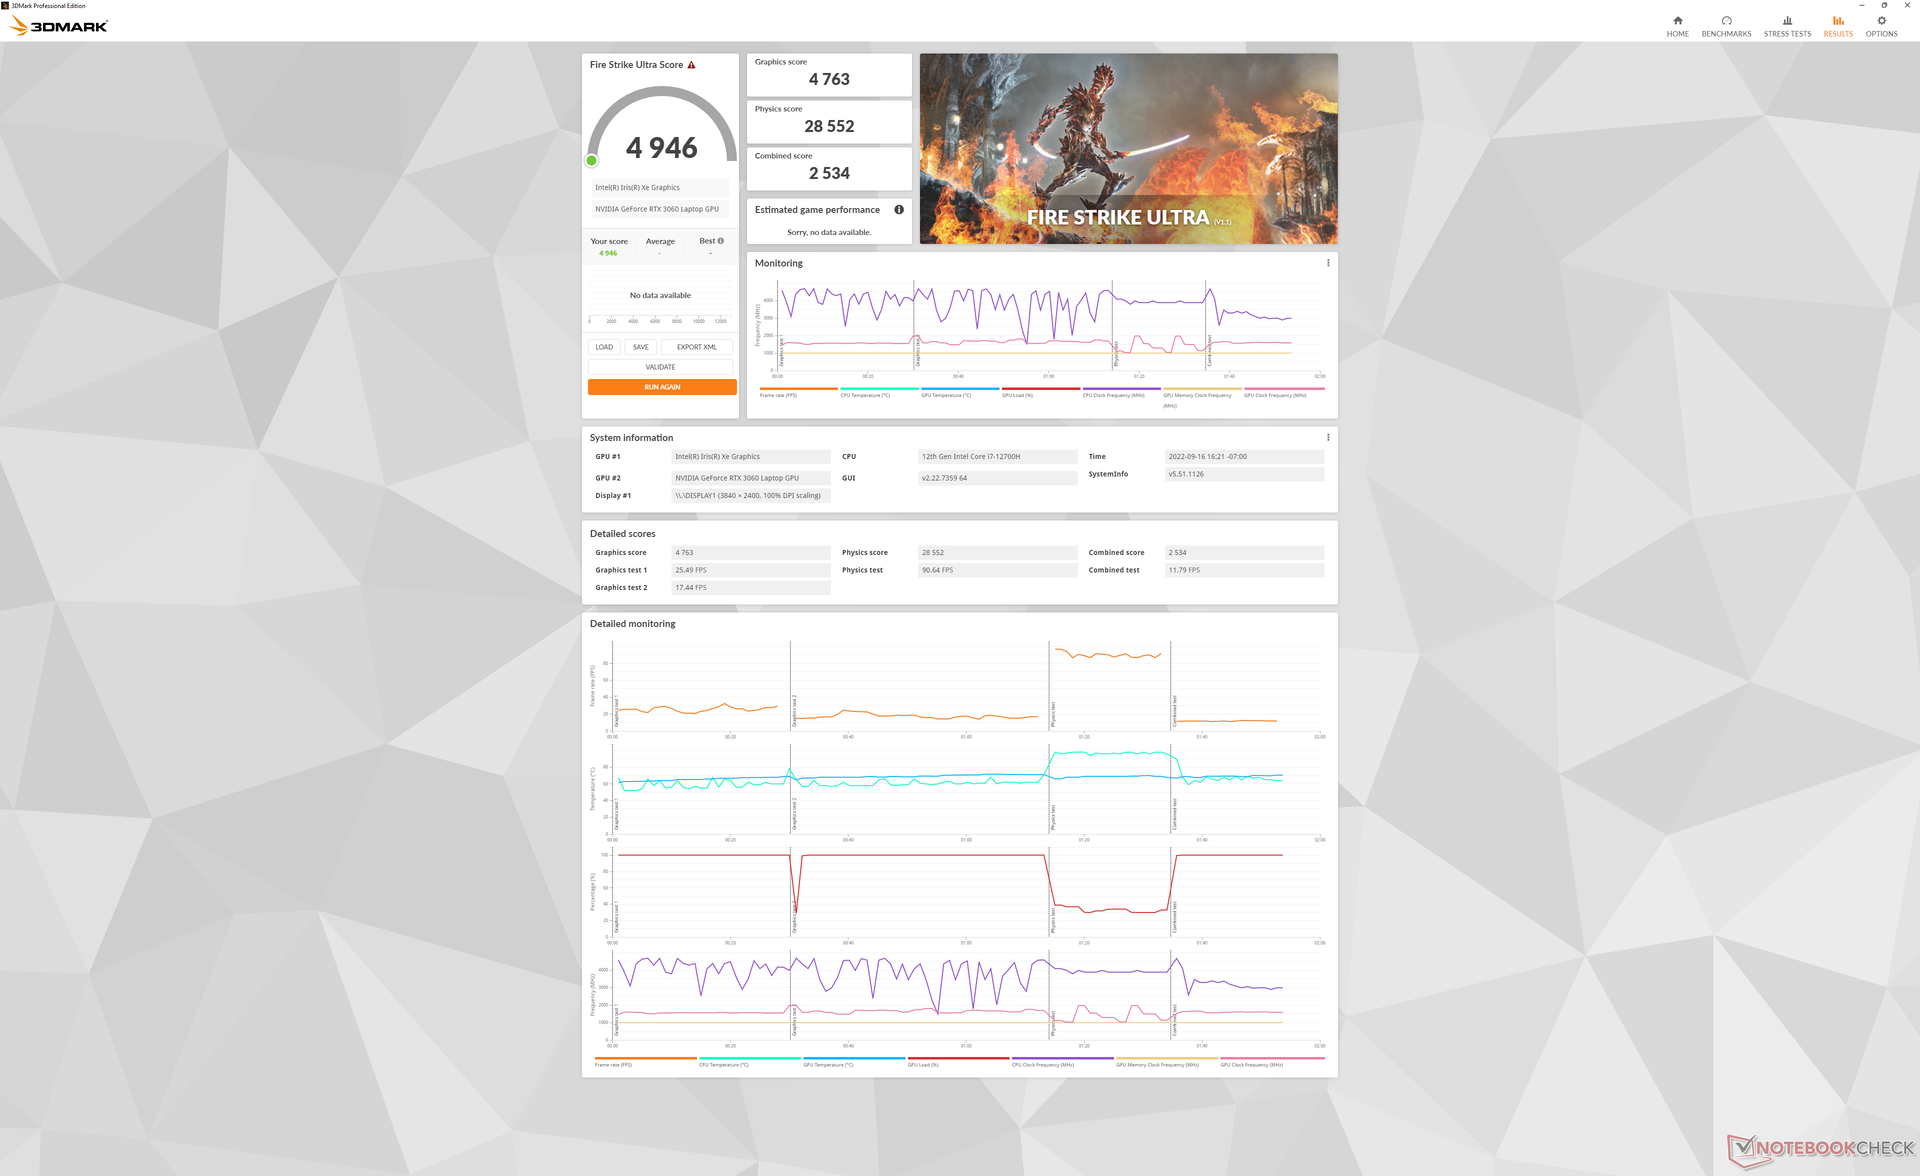
在电池上运行限制了性能。在电池上进行的Fire Strike 测试将返回物理和图形分数,分别为17295和10572分,而在主电源上则为28353和19890分。
| CPU时钟(GHz) | GPU时钟(MHz) | CPU平均温度(℃) | GPU平均温度(℃) | |
| 系统空闲 | -- | -- | 49 | 47 |
| Prime95压力 | 2.1 - 2.2 | -- | 66 | 54 |
| Prime95 + FurMark 压力 | 1.2 - 2.2 | ~1642 | 74 - 87 | 76 |
| Witcher 3 压力(平衡模式) | 0.67 | 1542 | 67 | 72 |
| Witcher 3 压力(性能模式) | 0.67 | 1717 | 69 | 74 |
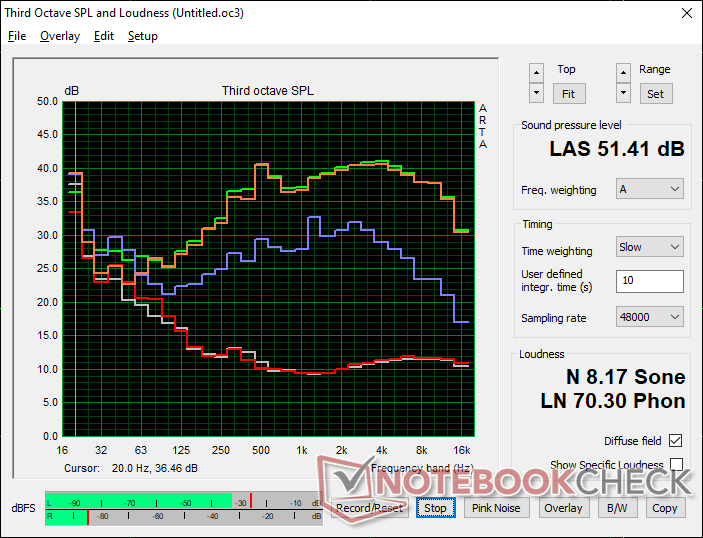
发言人
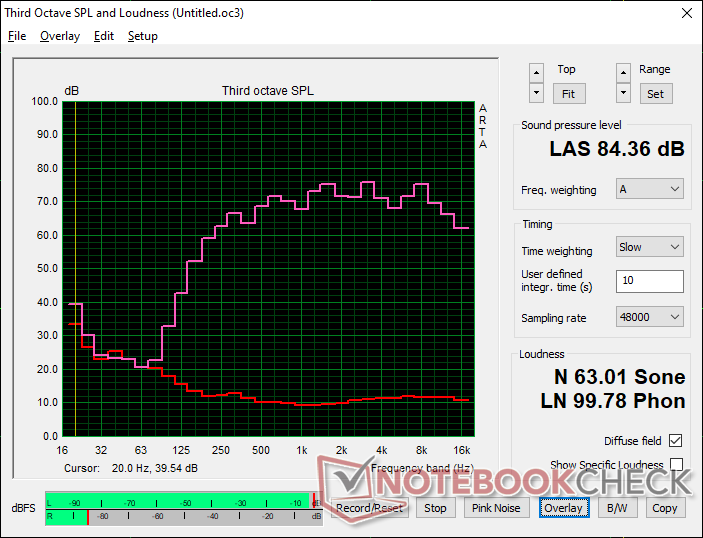
HP Envy 16 h0112nr audio analysis
(+) | speakers can play relatively loud (84.4 dB)
Bass 100 - 315 Hz
(-) | nearly no bass - on average 15.9% lower than median
(±) | linearity of bass is average (12.8% delta to prev. frequency)
Mids 400 - 2000 Hz
(+) | balanced mids - only 3.1% away from median
(+) | mids are linear (5.5% delta to prev. frequency)
Highs 2 - 16 kHz
(+) | balanced highs - only 3.4% away from median
(+) | highs are linear (6.3% delta to prev. frequency)
Overall 100 - 16.000 Hz
(+) | overall sound is linear (12.1% difference to median)
Compared to same class
» 22% of all tested devices in this class were better, 3% similar, 76% worse
» The best had a delta of 5%, average was 17%, worst was 45%
Compared to all devices tested
» 10% of all tested devices were better, 2% similar, 88% worse
» The best had a delta of 4%, average was 23%, worst was 134%
Apple MacBook Pro 16 2021 M1 Pro audio analysis
(+) | speakers can play relatively loud (84.7 dB)
Bass 100 - 315 Hz
(+) | good bass - only 3.8% away from median
(+) | bass is linear (5.2% delta to prev. frequency)
Mids 400 - 2000 Hz
(+) | balanced mids - only 1.3% away from median
(+) | mids are linear (2.1% delta to prev. frequency)
Highs 2 - 16 kHz
(+) | balanced highs - only 1.9% away from median
(+) | highs are linear (2.7% delta to prev. frequency)
Overall 100 - 16.000 Hz
(+) | overall sound is linear (4.6% difference to median)
Compared to same class
» 0% of all tested devices in this class were better, 0% similar, 100% worse
» The best had a delta of 5%, average was 17%, worst was 45%
Compared to all devices tested
» 0% of all tested devices were better, 0% similar, 100% worse
» The best had a delta of 4%, average was 23%, worst was 134%
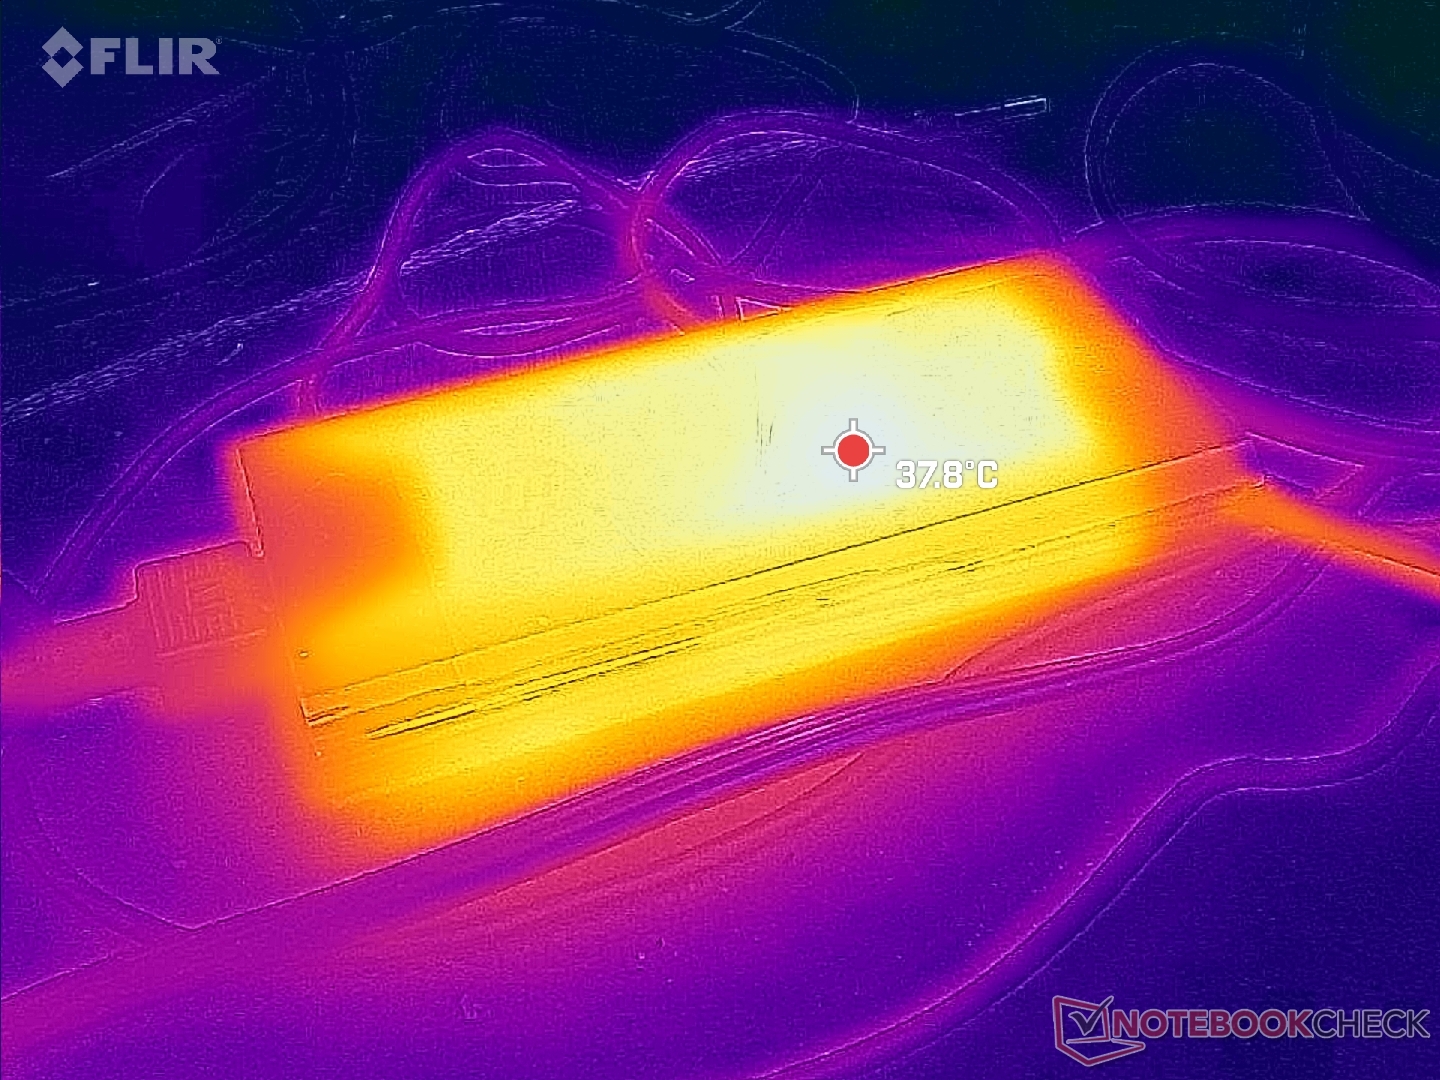
能源管理
消耗功率
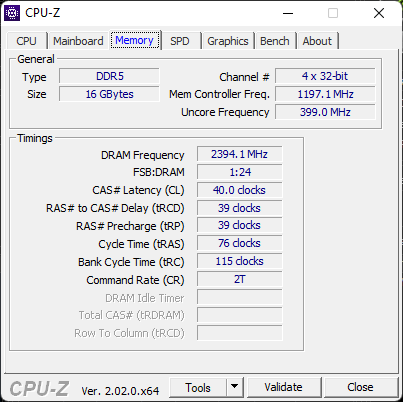
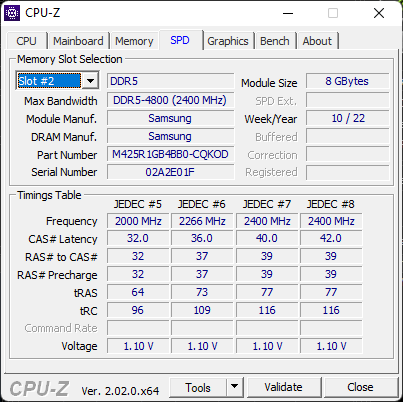
在桌面上空转时,根据亮度水平、电源配置文件和Optimus设置,耗电在10瓦到28瓦之间,而2020年的Envy 15只有9瓦到18瓦,这是由于OLED面板和12代CPU的要求更高。请记住,在OLED面板上,某些颜色会比其他颜色需要更多的电力。 详见这里.
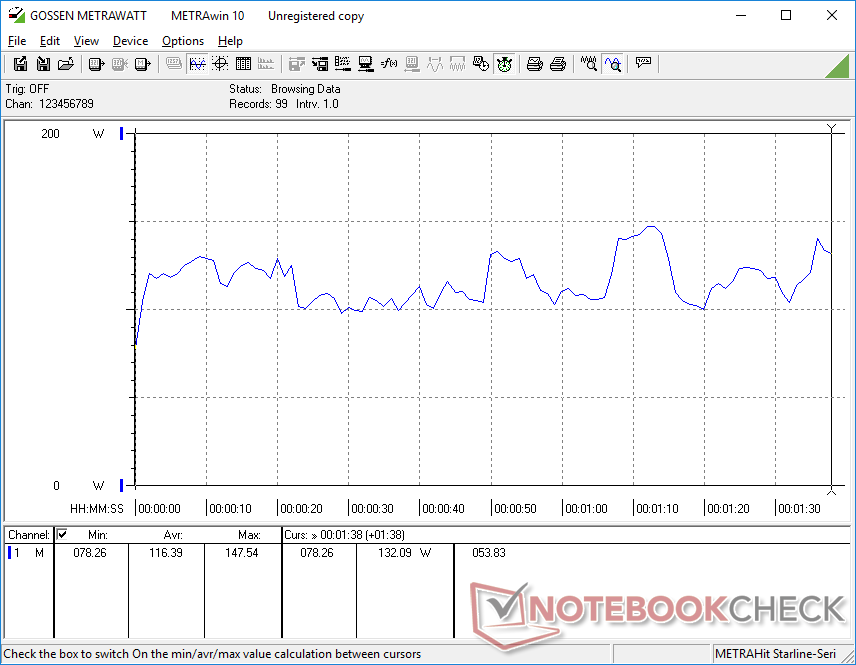
游戏时的功耗很高,约为134W,可与微星创造者Z16P或联想Legion Slim 7 16,采用相同的Core i7 CPU和GPU。然而,与2020年的Envy 15相比,尽管图形性能快了20%至30%,每瓦性能更高,但游戏时的消耗量只高约7%。
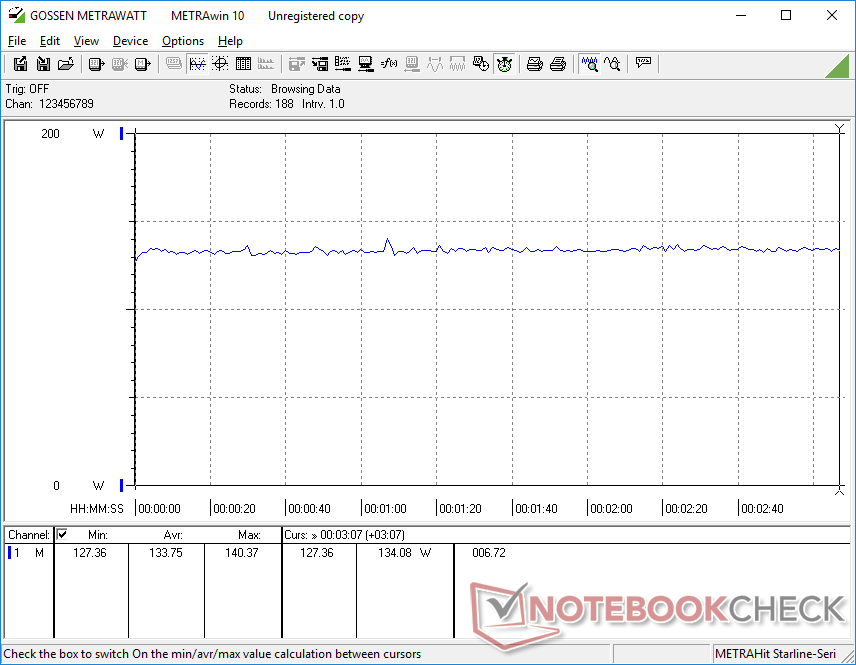
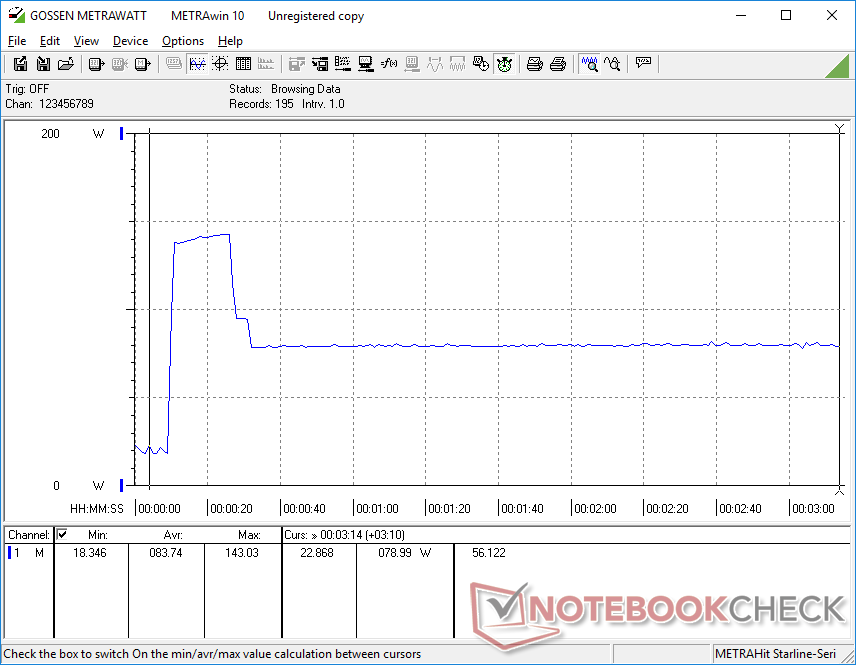
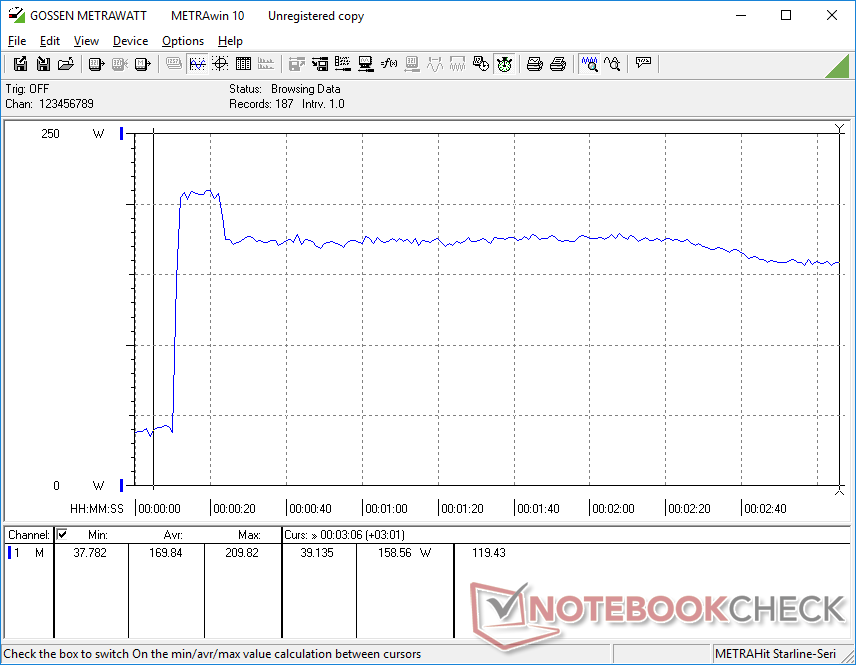
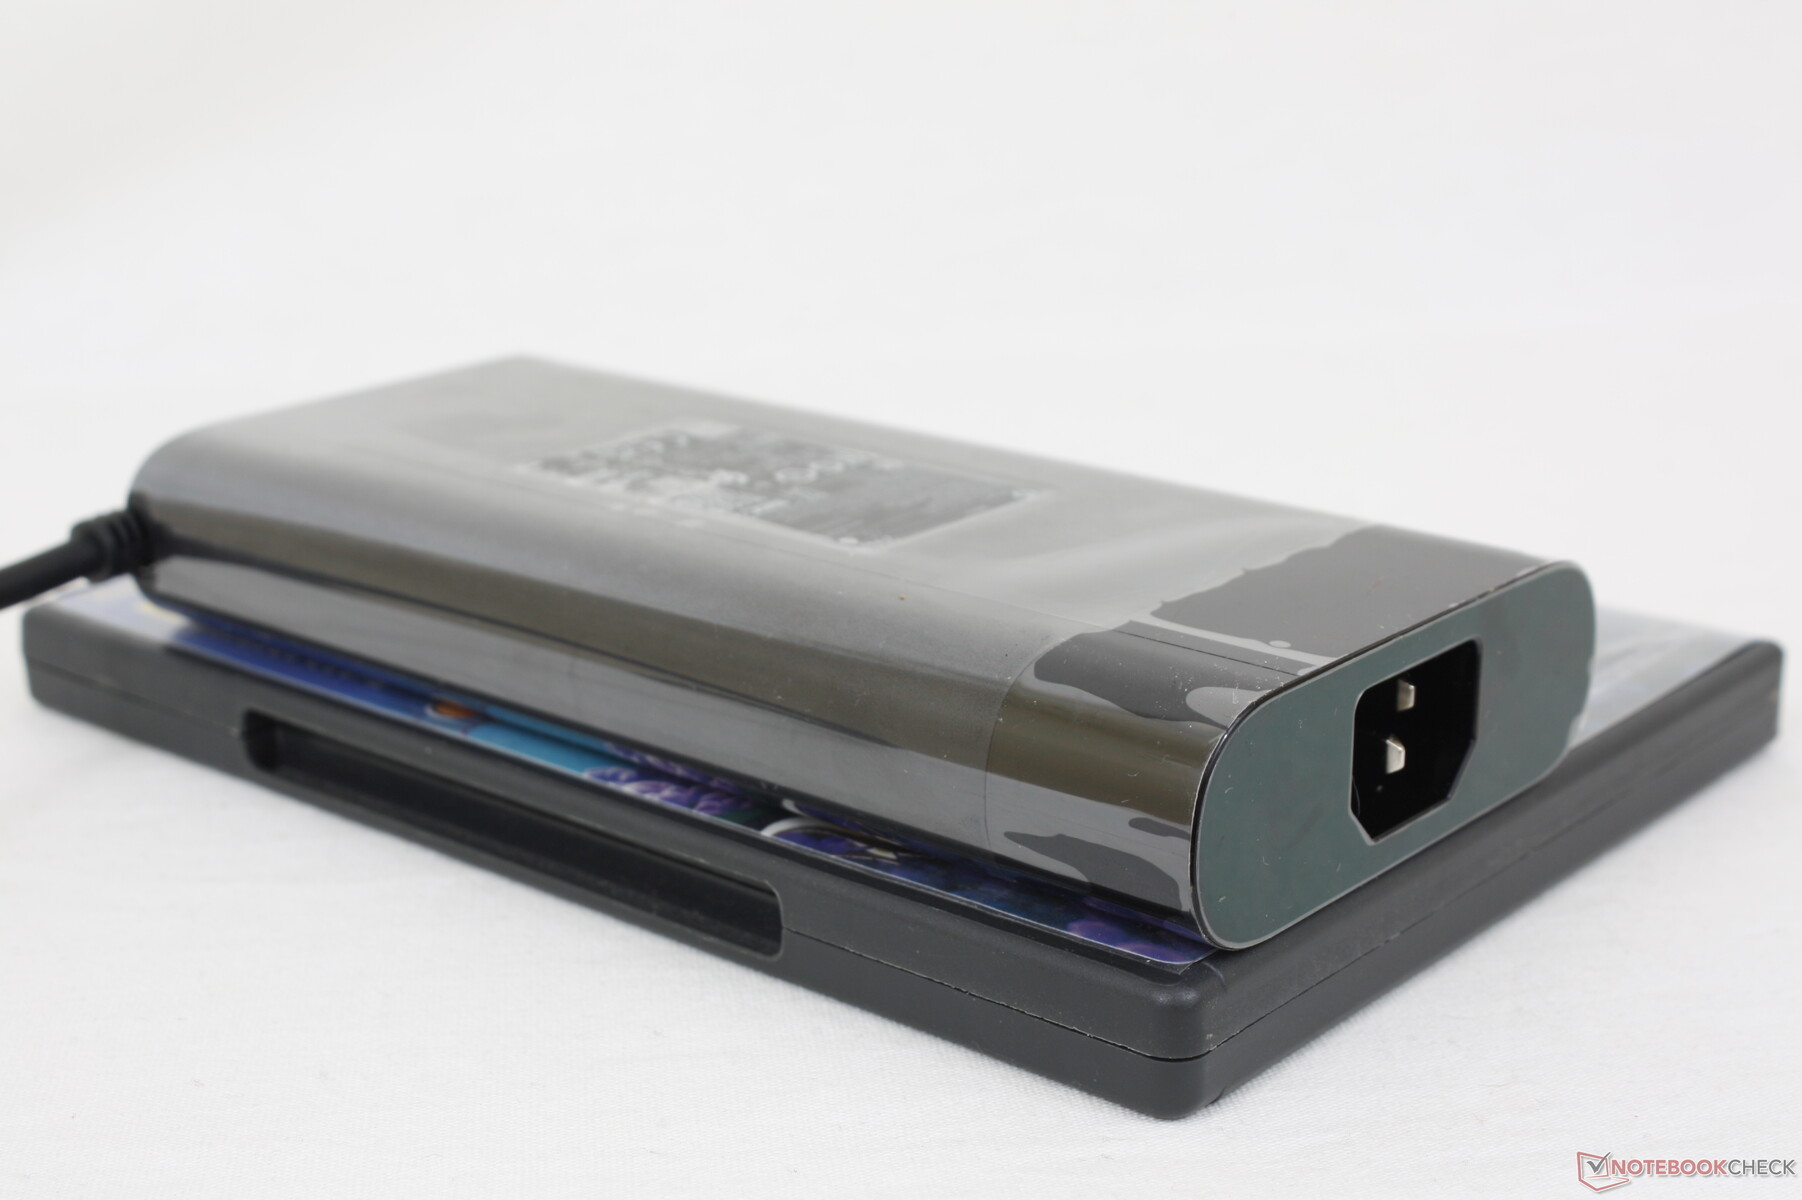
当CPU和GPU的利用率为100%时,我们能够从中等大小(约16.5 x 7.8 x 2.5厘米)的200瓦交流适配器测量到209.8瓦的临时最大消耗。如果运行极端负载,消耗量将稳定在160瓦左右。
| Off / Standby | |
| Idle | |
| Load |
|
Key:
min: | |
| HP Envy 16 h0112nr i7-12700H, GeForce RTX 3060 Laptop GPU, Micron 3400 1TB MTFDKBA1T0TFH, OLED, 3840x2400, 16" | Lenovo ThinkBook 16 G4+ IAP i7-12700H, GeForce RTX 2050 Mobile, Micron 2450 1TB MTFDKCD1T0TFK, IPS, 2560x1600, 16" | MSI Creator Z16P B12UHST i9-12900H, GeForce RTX 3080 Ti Laptop GPU, Samsung PM9A1 MZVL22T0HBLB, IPS True Pixel (~100% DCI-P3), 2560x1600, 16" | Dell Inspiron 16 Plus 7610-MHJ8F i7-11800H, UHD Graphics Xe 32EUs (Tiger Lake-H), OM3PDP3-AD NVMe KDI 512GB, IPS, 3072x1920, 16" | Apple MacBook Pro 16 2021 M1 Pro M1 Pro, M1 Pro 16-Core GPU, Apple SSD AP1024R, Mini-LED, 3456x2234, 16.2" | Huawei MateBook 16s i7 i7-12700H, Iris Xe G7 96EUs, Silicon Motion PCIe-8 SSD, IPS, 2520x1680, 16" | |
|---|---|---|---|---|---|---|
| Power Consumption | 36% | -11% | 50% | 33% | 35% | |
| Idle Minimum * (Watt) | 10 | 5 50% | 11 -10% | 5.4 46% | 5 50% | 6.8 32% |
| Idle Average * (Watt) | 10.9 | 11.2 -3% | 17 -56% | 9.8 10% | 15.1 -39% | 13.2 -21% |
| Idle Maximum * (Watt) | 27.8 | 11.6 58% | 26 6% | 14 50% | 15.5 44% | 13.8 50% |
| Load Average * (Watt) | 116.4 | 89.3 23% | 124 -7% | 44 62% | 54 54% | 75.2 35% |
| Witcher 3 ultra * (Watt) | 133.7 | 83 38% | 133.5 -0% | 44 67% | 56.1 58% | |
| Load Maximum * (Watt) | 209.8 | 102 51% | 212 -1% | 76.8 63% | 90 57% | 90.6 57% |
* ... smaller is better
Power Consumption Witcher 3 / Stresstest
Power Consumption external Monitor
电池寿命
WLAN运行时间与MateBook 16s i7或ThinkBook 16 G4+ IAP相当,约8小时。电池容量与2020年的Envy 15保持一致,尽管转移到更大的屏幕尺寸。
用随附的桶式适配器从空到满充电大约需要1.5小时。尽管官方规格可能声称,该系统不能 通过USB-C充电。当一个100瓦的USB-C充电器插入时,系统会简单地发出警告,要求使用更高容量的充电器。我们已经联系了惠普公司要求澄清,并将相应地更新本节。
| HP Envy 16 h0112nr i7-12700H, GeForce RTX 3060 Laptop GPU, 83 Wh | Lenovo ThinkBook 16 G4+ IAP i7-12700H, GeForce RTX 2050 Mobile, 71 Wh | MSI Creator Z16P B12UHST i9-12900H, GeForce RTX 3080 Ti Laptop GPU, 90 Wh | Dell Inspiron 16 Plus 7610-MHJ8F i7-11800H, UHD Graphics Xe 32EUs (Tiger Lake-H), 86 Wh | Apple MacBook Pro 16 2021 M1 Pro M1 Pro, M1 Pro 16-Core GPU, 99.6 Wh | Huawei MateBook 16s i7 i7-12700H, Iris Xe G7 96EUs, 84 Wh | |
|---|---|---|---|---|---|---|
| Battery runtime | -1% | -36% | 67% | 114% | 11% | |
| Reader / Idle (h) | 17.8 | 22.5 26% | ||||
| WiFi v1.3 (h) | 7.9 | 8.2 4% | 5.2 -34% | 9.5 20% | 16.9 114% | 8.1 3% |
| Load (h) | 1.6 | 1.5 -6% | 1 -37% | 4.1 156% | 1.9 19% | |
| H.264 (h) | 12.6 | 5.8 | 17.5 | 9.3 | ||
| WiFi (h) | 9.5 |
Pros
Cons
结论 - 像一个预算的MacBook Pro 16
当然,Envy 16比老款Envy 15更快,但是我们在Envy 15上提到的一些缺点还没有得到解决。嘈杂的风扇、没有Kensington锁、海绵状的点击板和相对较弱的铰链都比MacBook Pro 16等替代品低了一个等级。 MacBook Pro 16或 戴尔Inspiron 16 Plus.该系统也是市场上较大和较重的16英寸笔记本电脑之一,这可能会阻止旅行者和学生。
惠普Envy 16比基本的MacBook Pro 16便宜近1000美元,同时提供有竞争力的性能特点和颜色。然而,它是一个相当响亮和沉重的系统。
不为重量所累的用户会发现Envy 16是一个多功能的系统,其性能、屏幕尺寸和颜色适合游戏和编辑用途。我们特别欣赏在需要时添加更多存储或内存的简单方式。然而,如果你的任务不需要很大的马力,那么应该考虑更轻的16英寸选项,如 LG Gram 16或 华为MateBook 16s.
价格和可用性
Envy 16现已在各大零售商处发售,包括新蛋网、百思买,Costco, Micro Center, 和HP.com各种配置的产品。我们的具体配置可以在Micro Center上找到。我们的具体配置可以在 Micro Center找到,价格为1700美元,而英特尔Arc A370M SKUs可以在其他地方找到。
HP Envy 16 h0112nr
- 09/24/2022 v7 (old)
Allen Ngo
Price comparison

