结论:功能均衡的超薄工作站
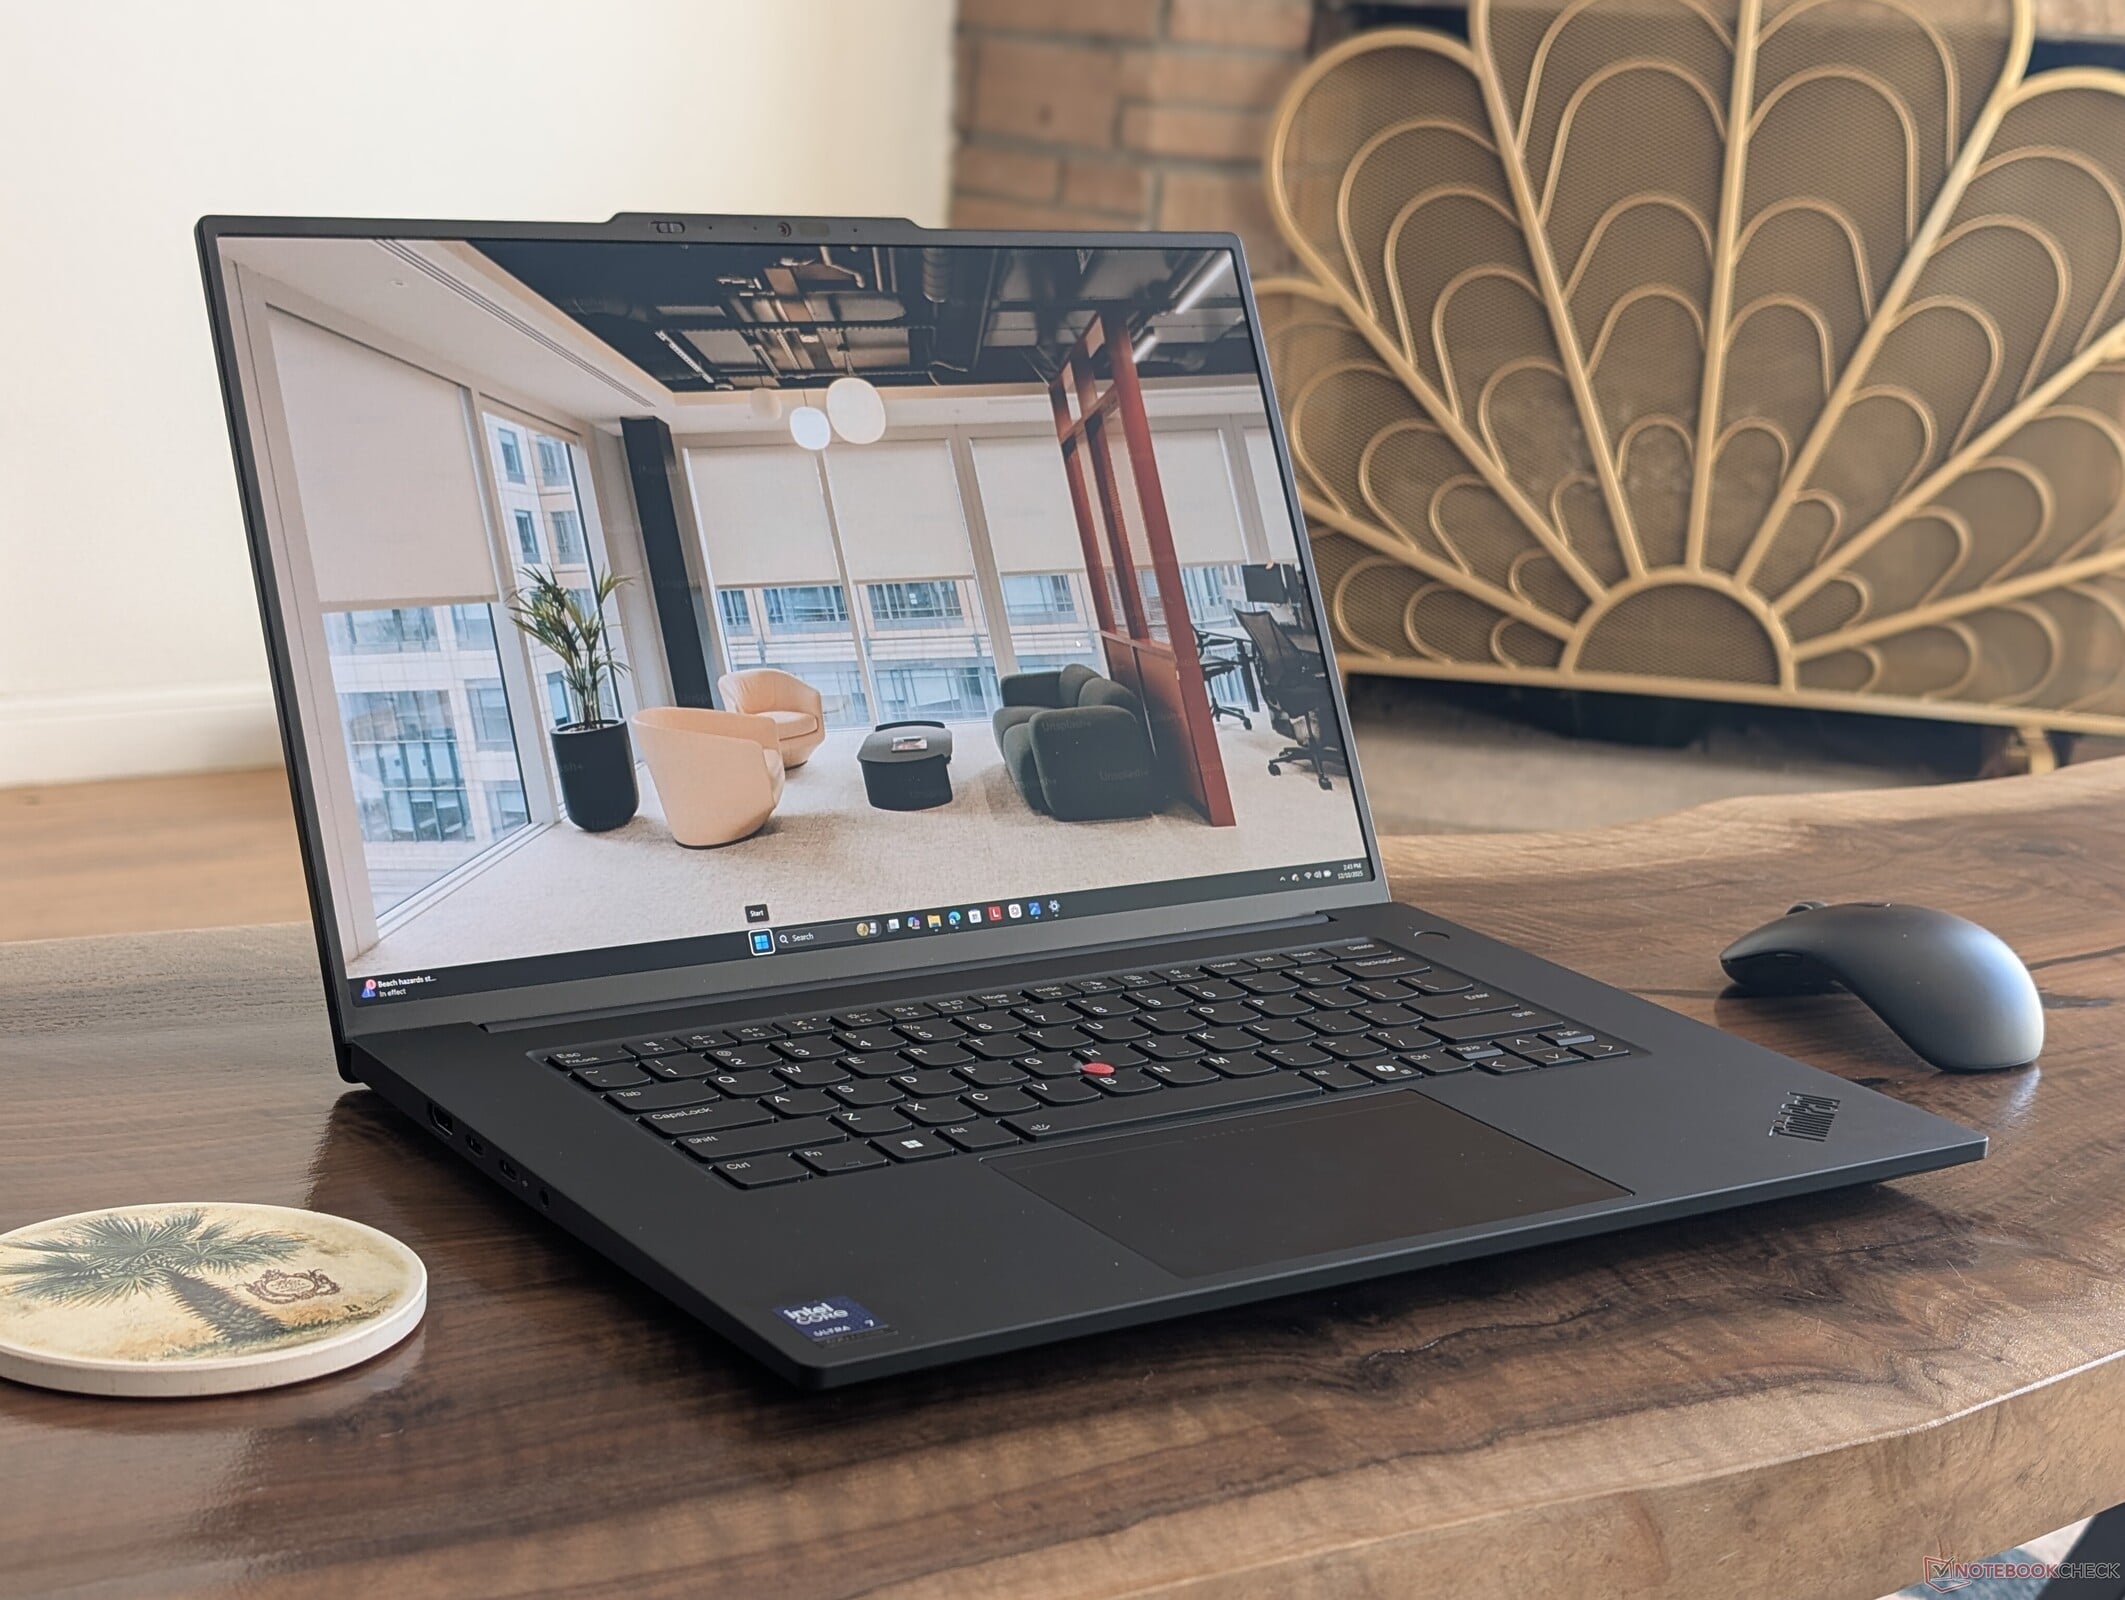
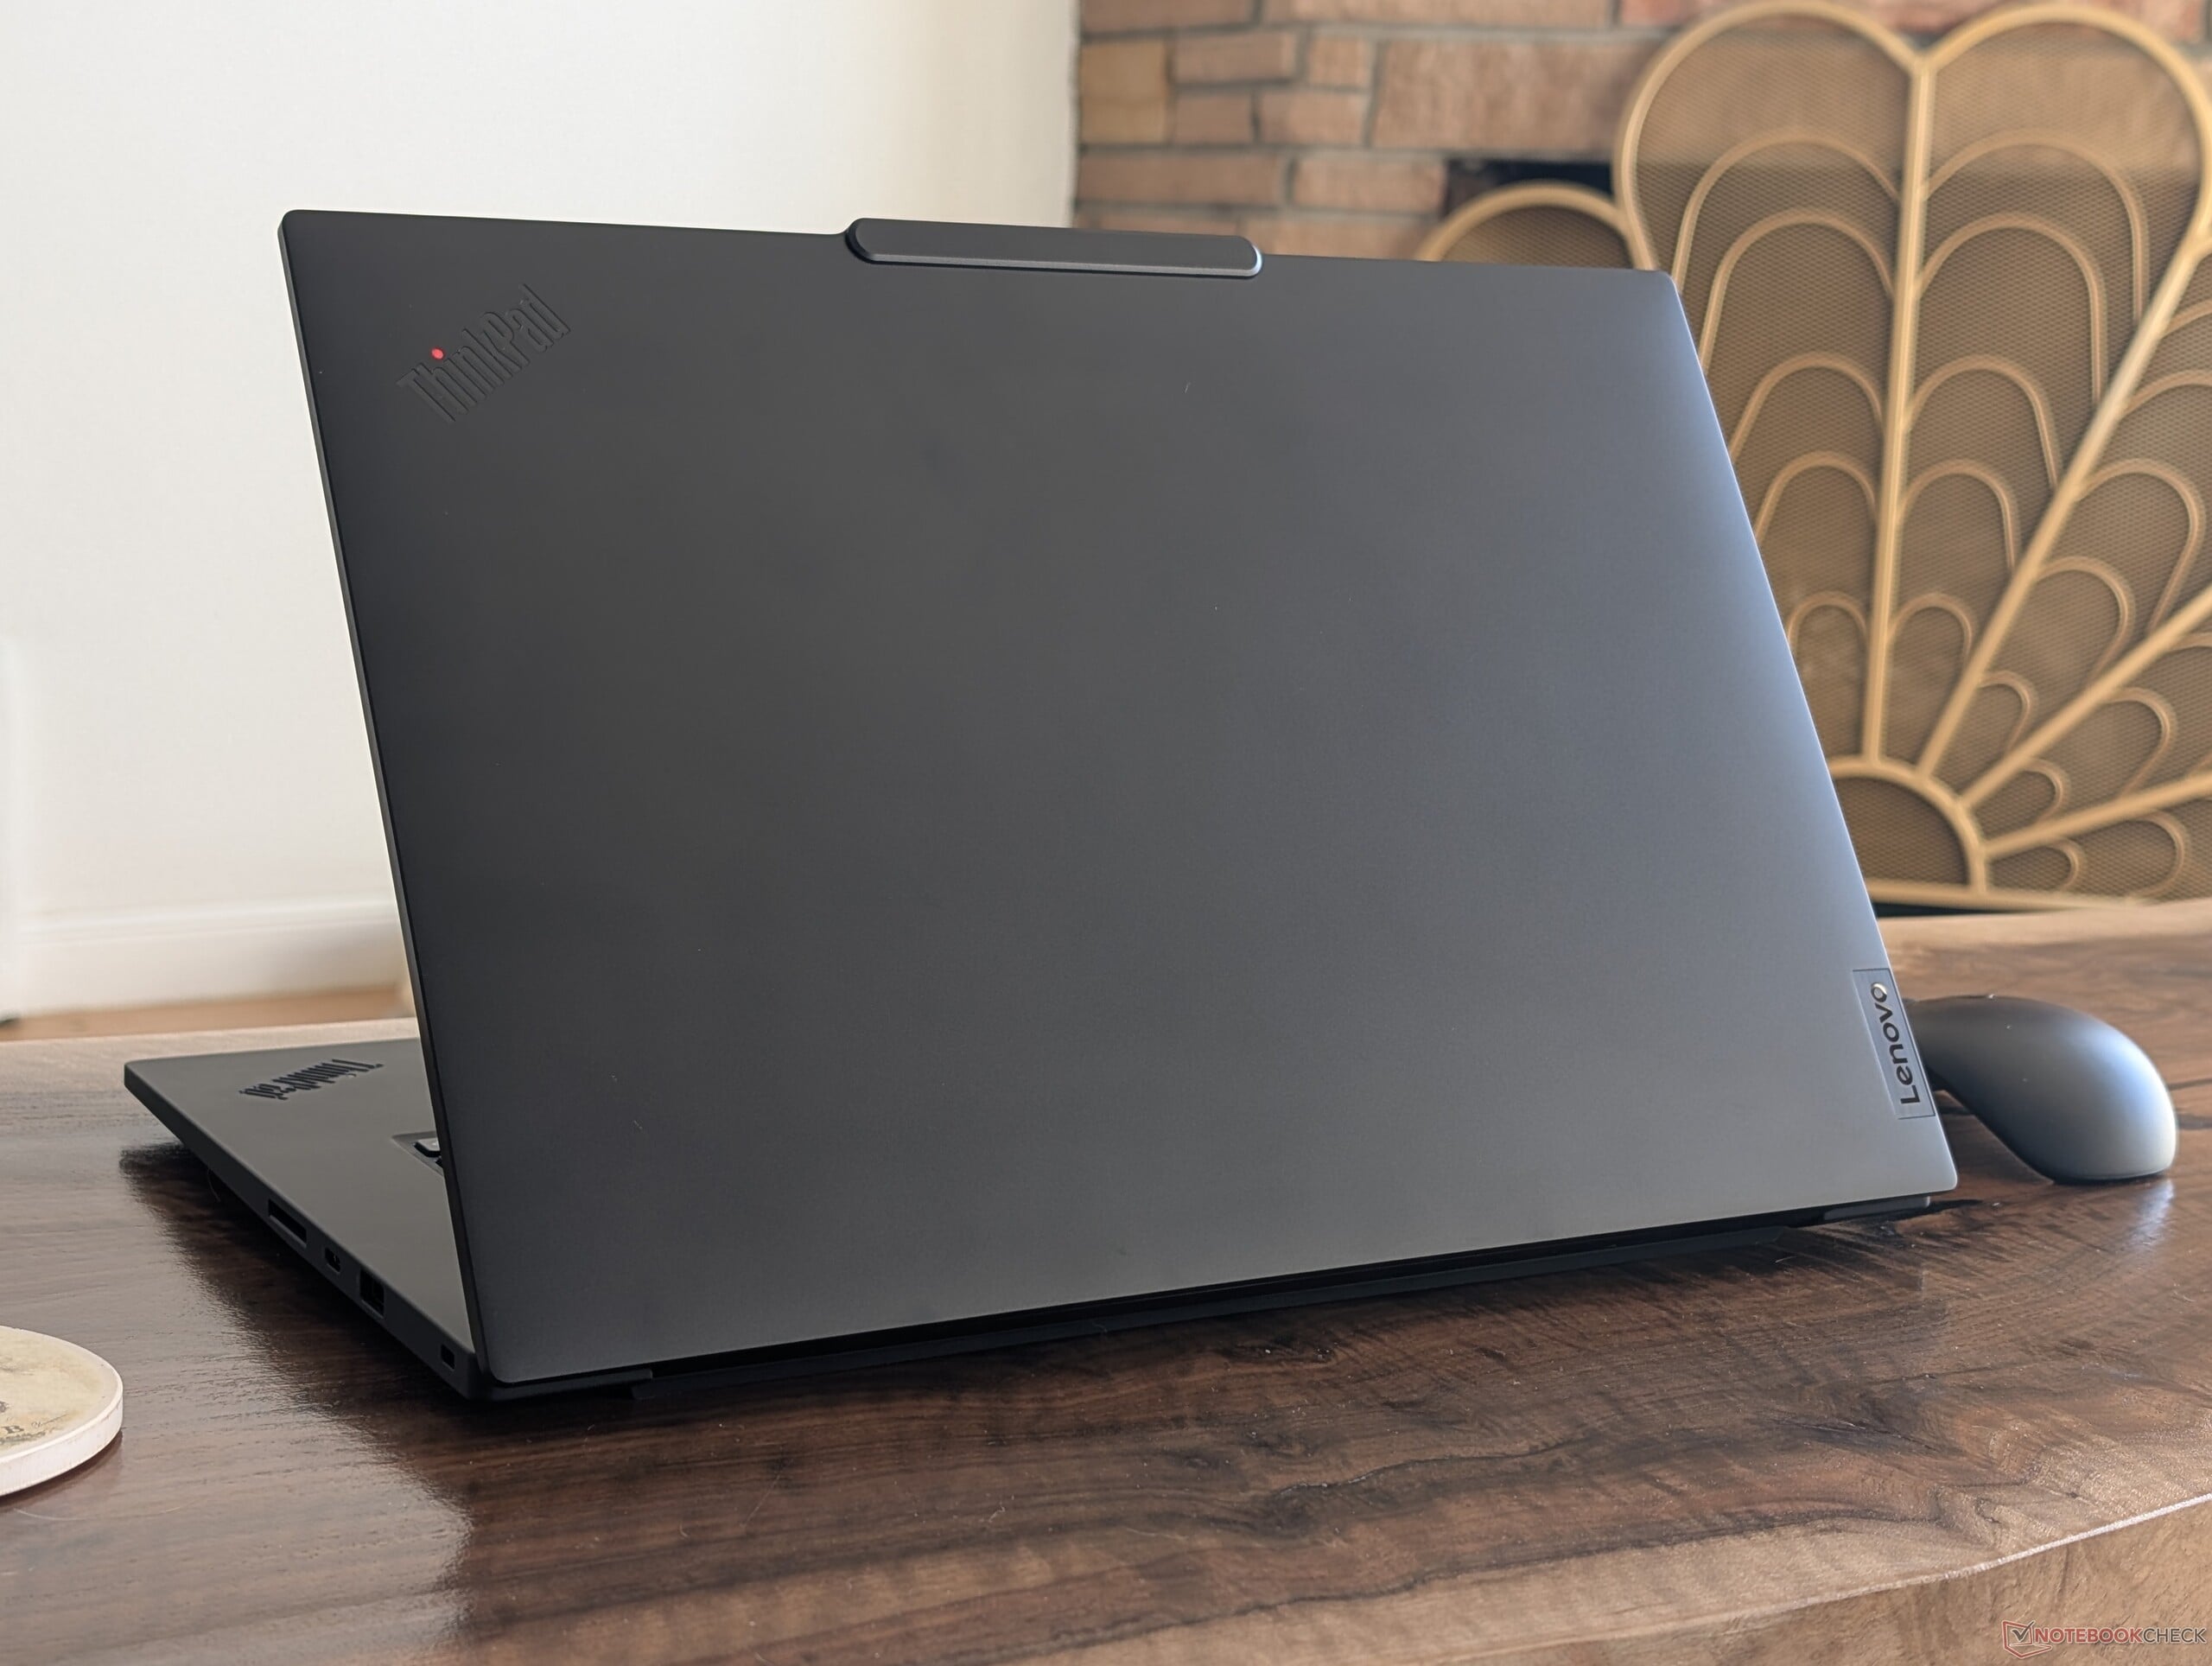
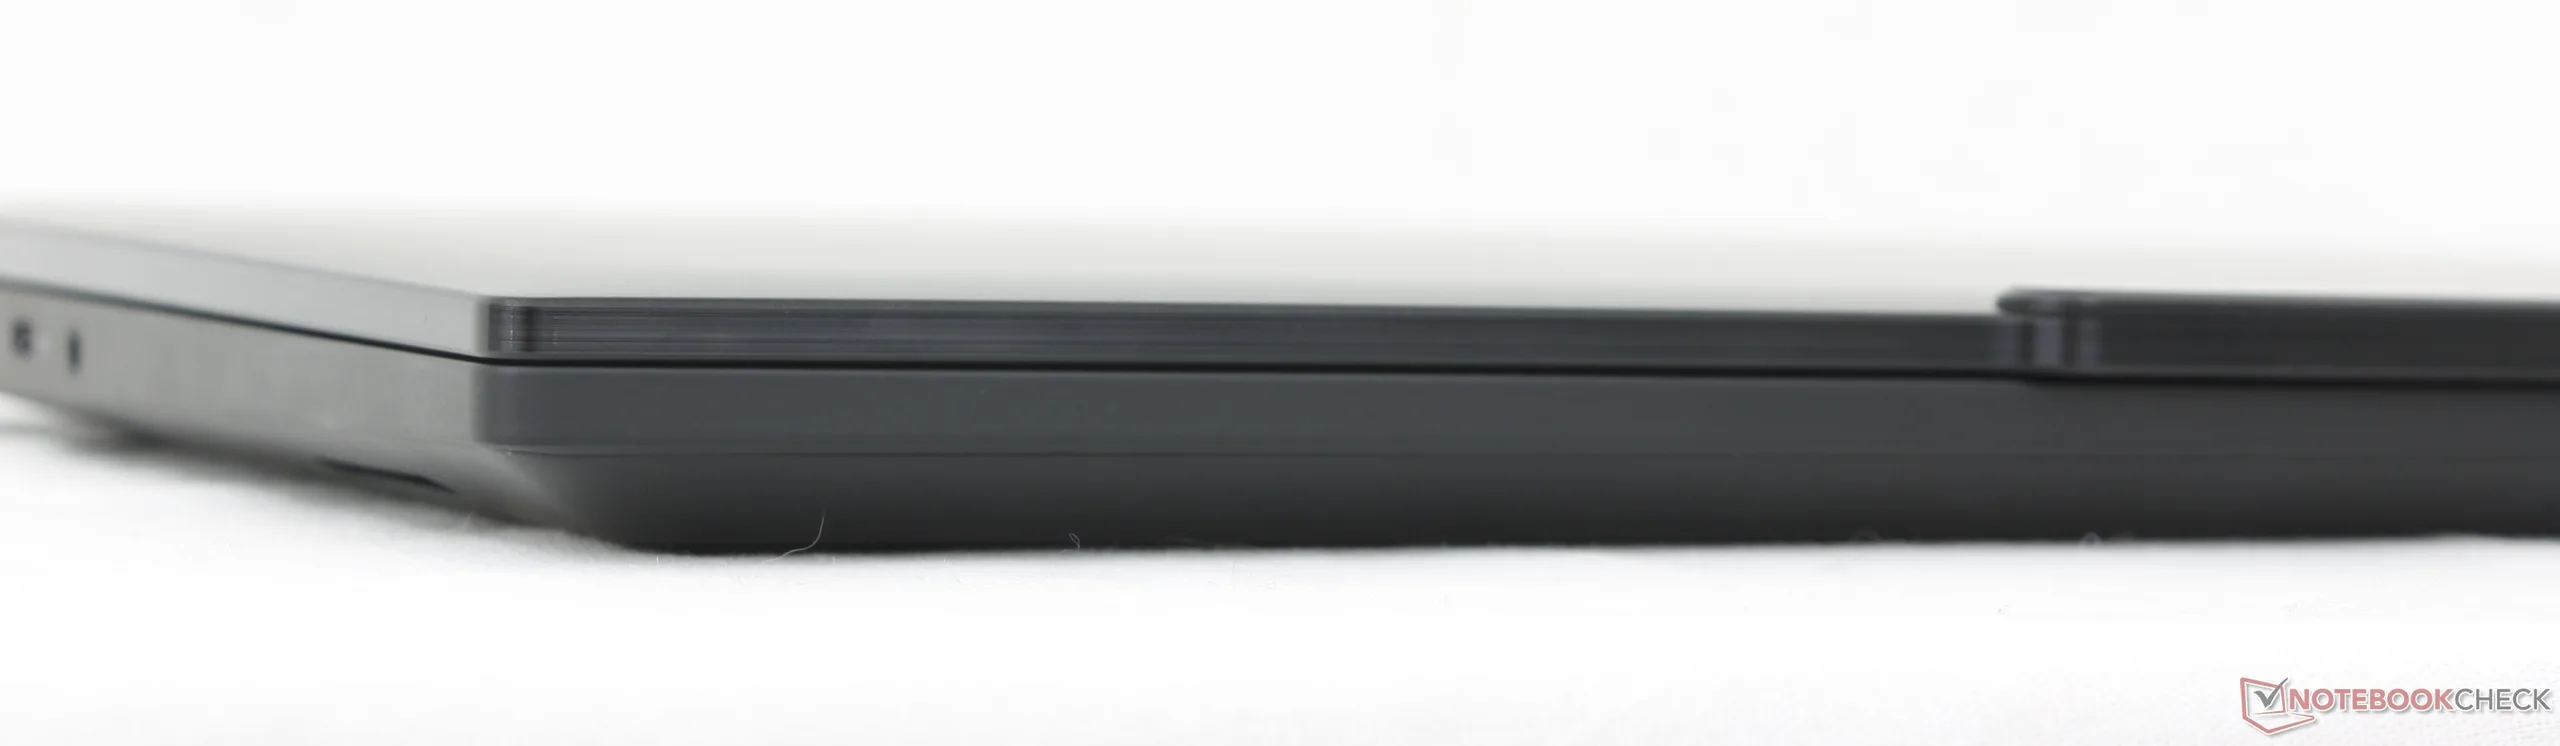
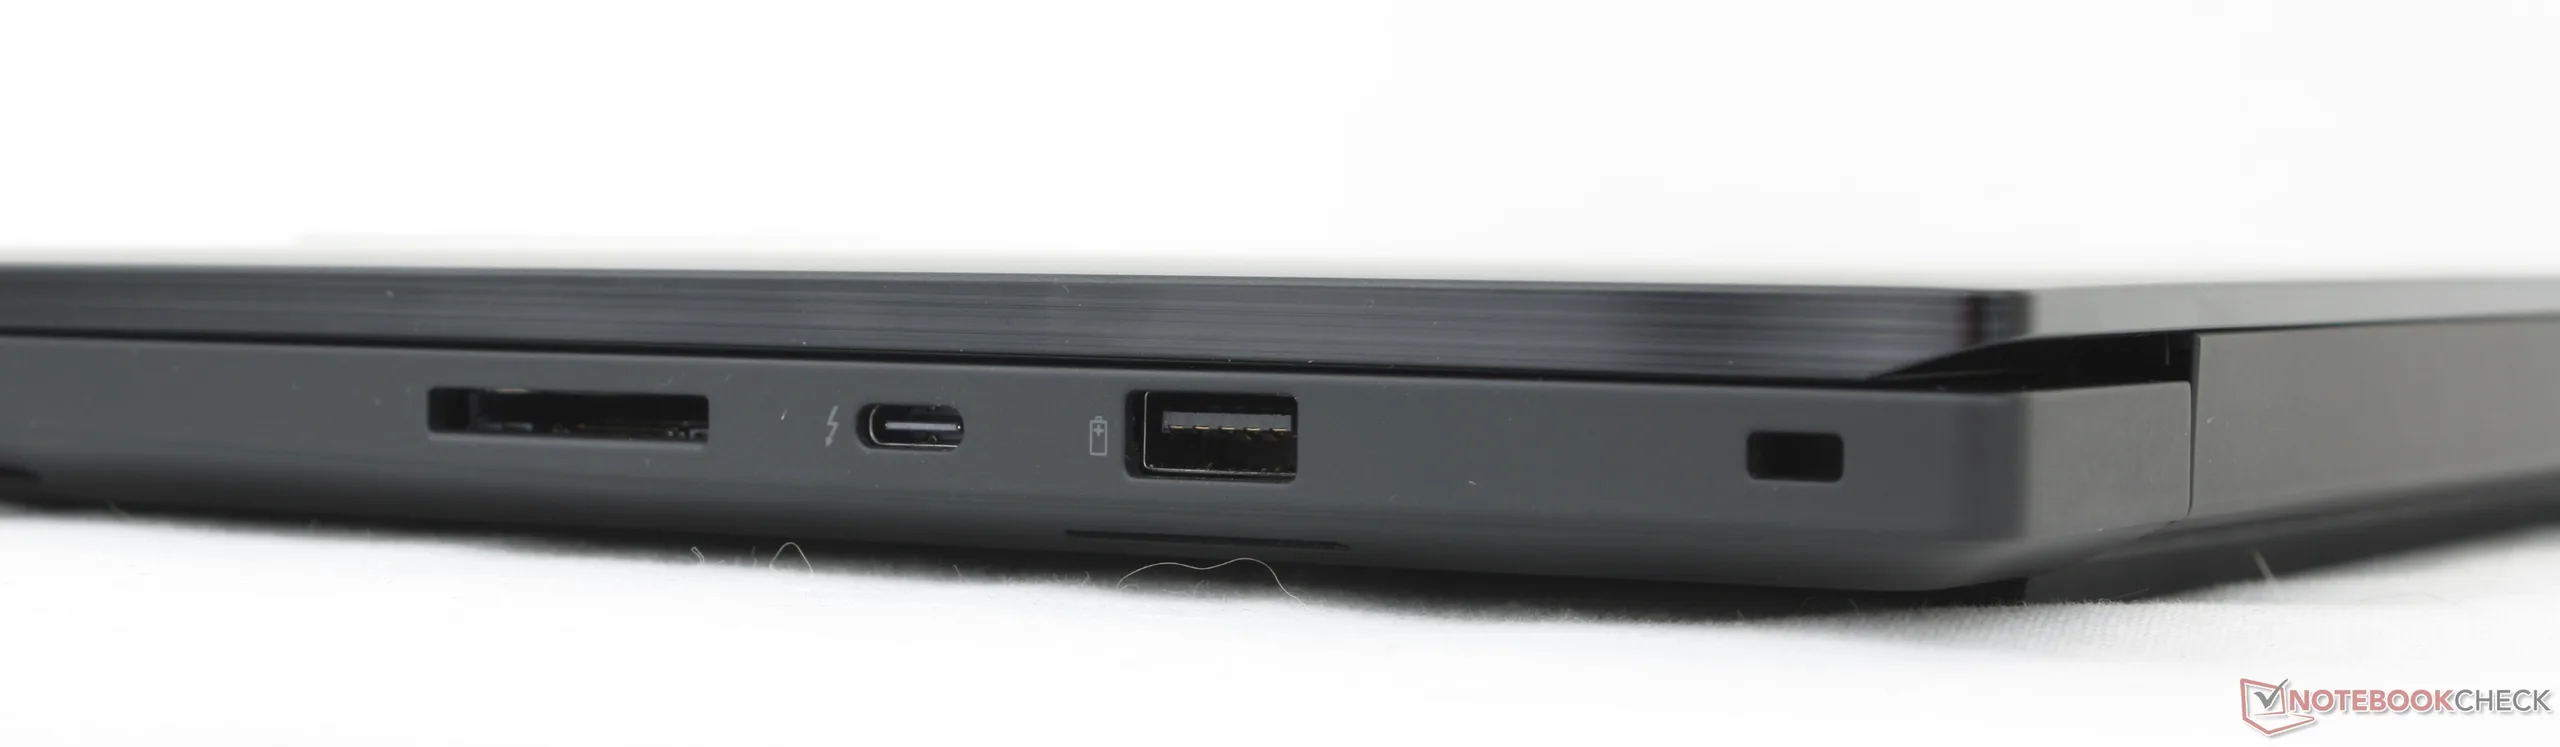
ThinkPad P1 Gen 8 比 ThinkPad P1 Gen 7 快了一步,同时增加了对 Thunderbolt 5 连接的支持和一个新的、更小的 USB-C AC 适配器。该系列以提供独立的 Nvidia 显卡选项而著称,尽管采用了超薄外形,但仍能实现较高的单位体积性能,因此这款最新机型延续了这一趋势。此外,今年的改版没有其他外部变化。
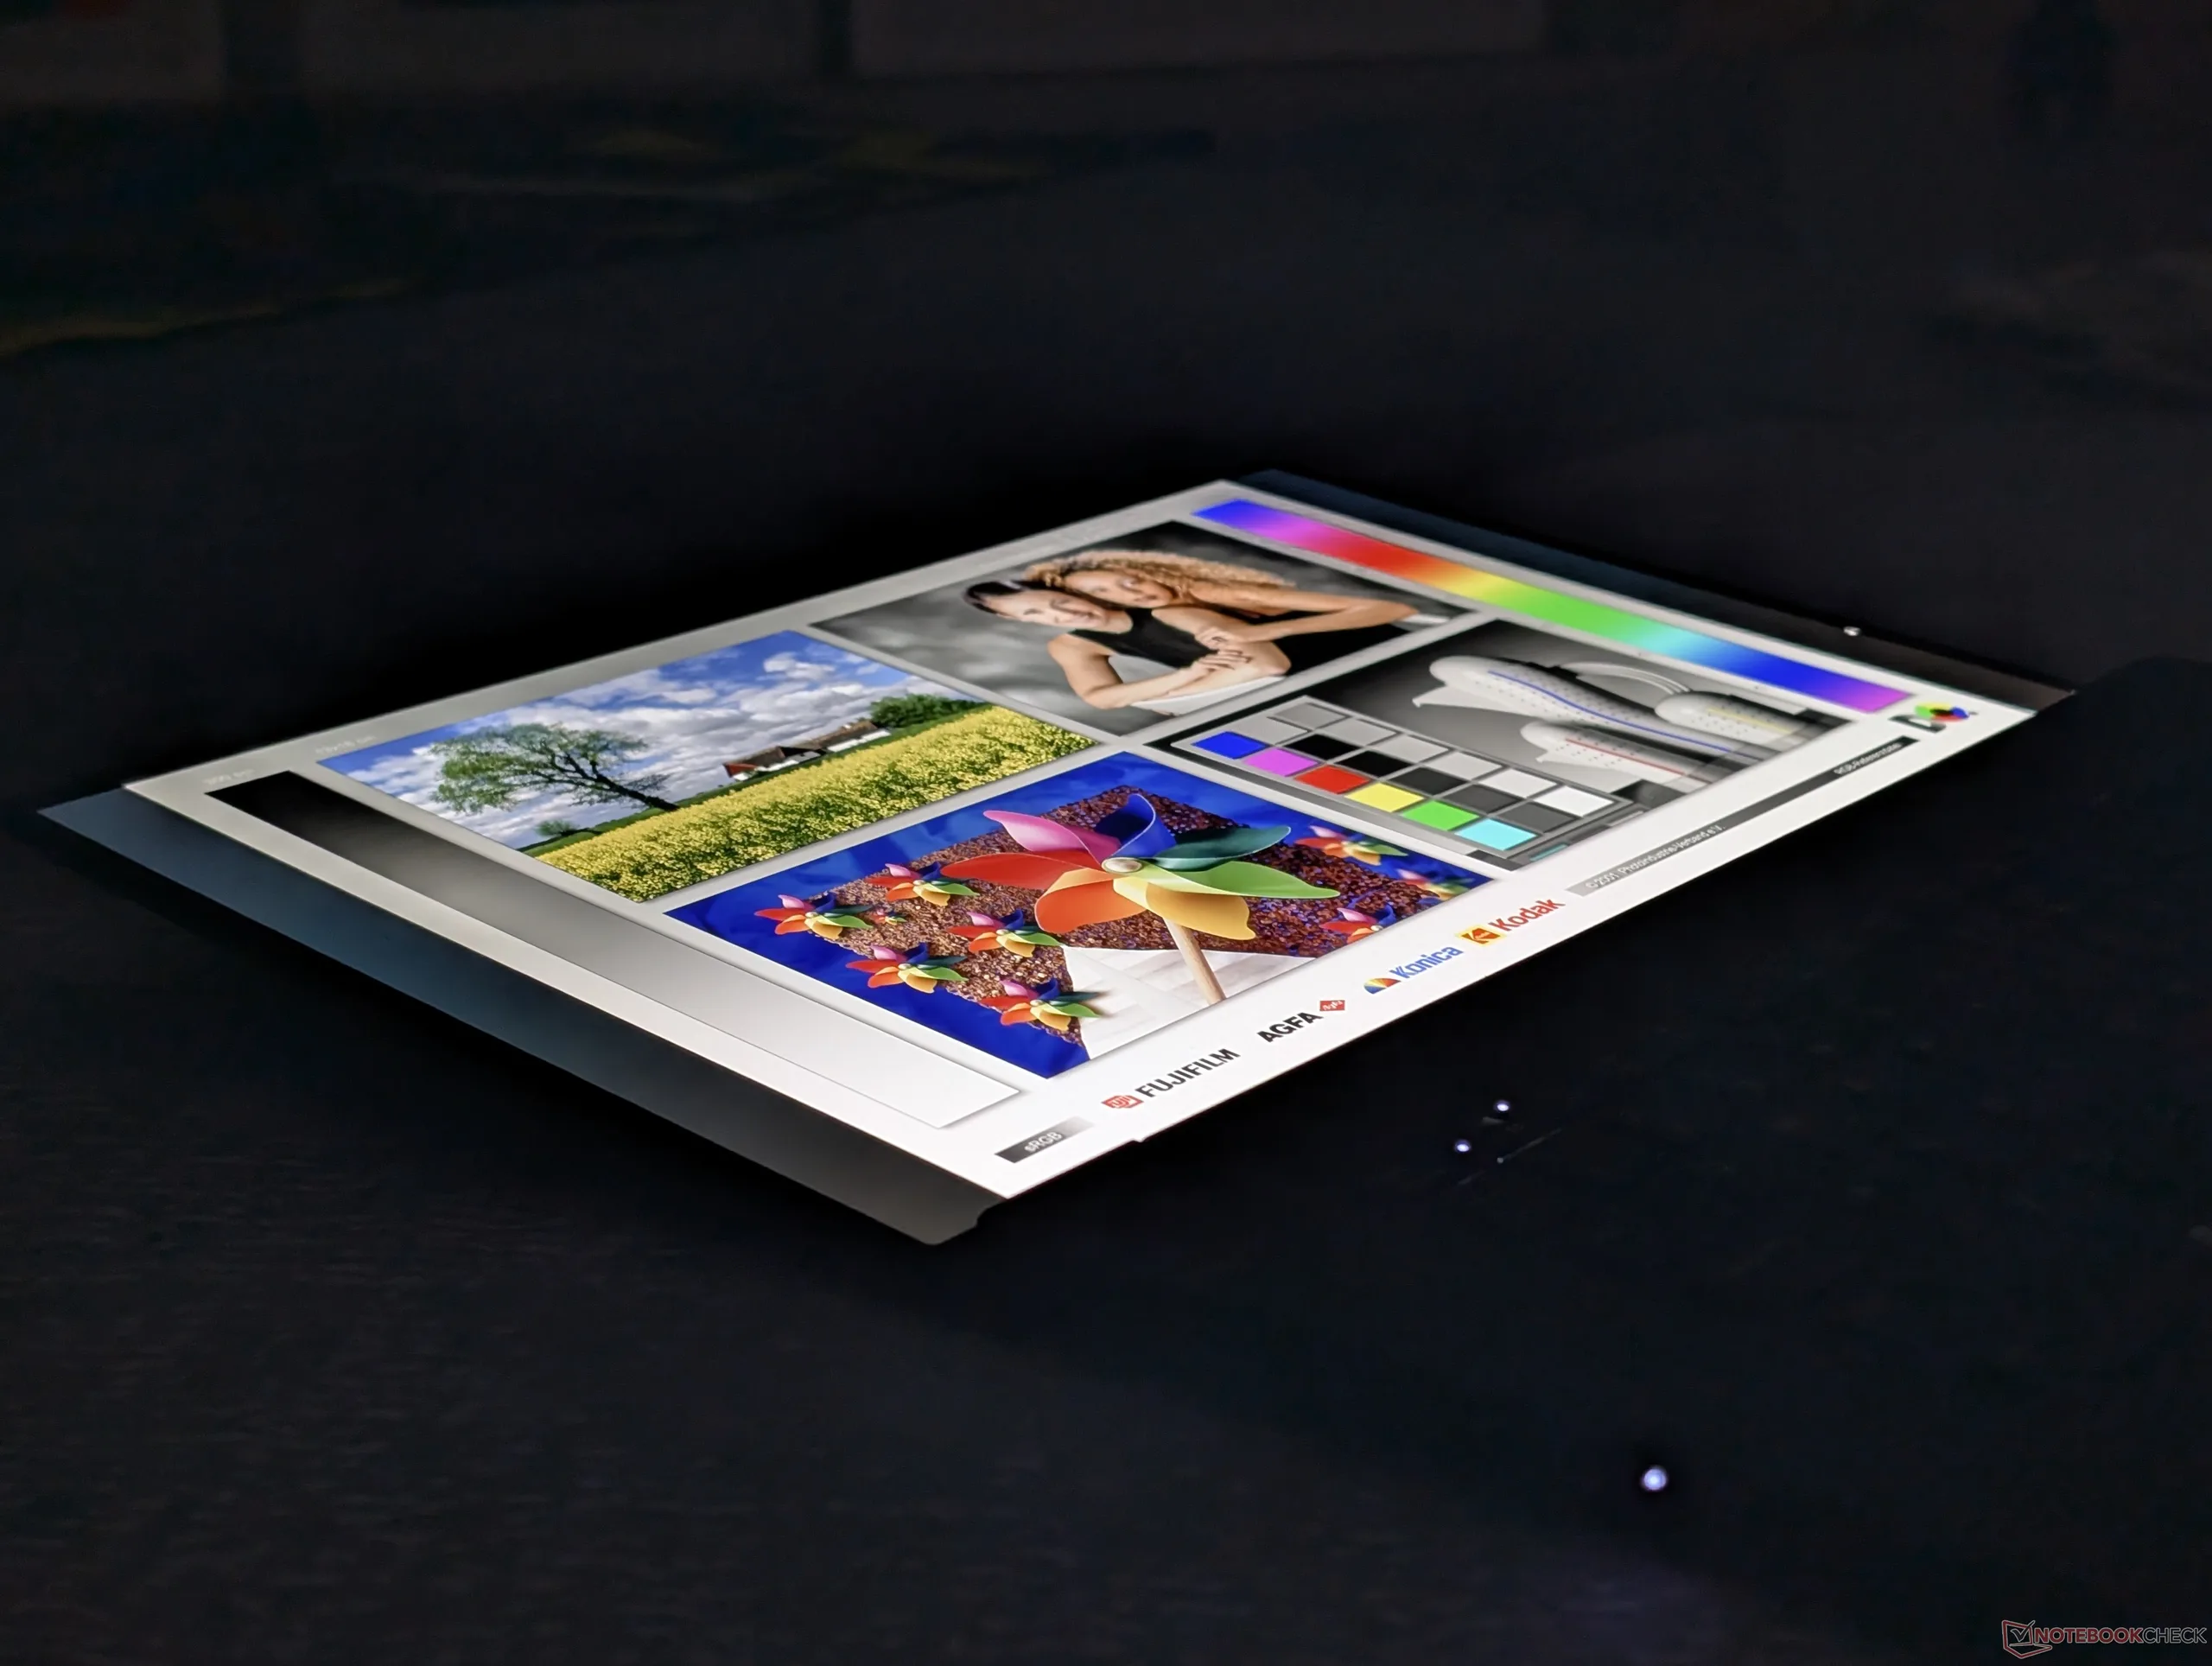
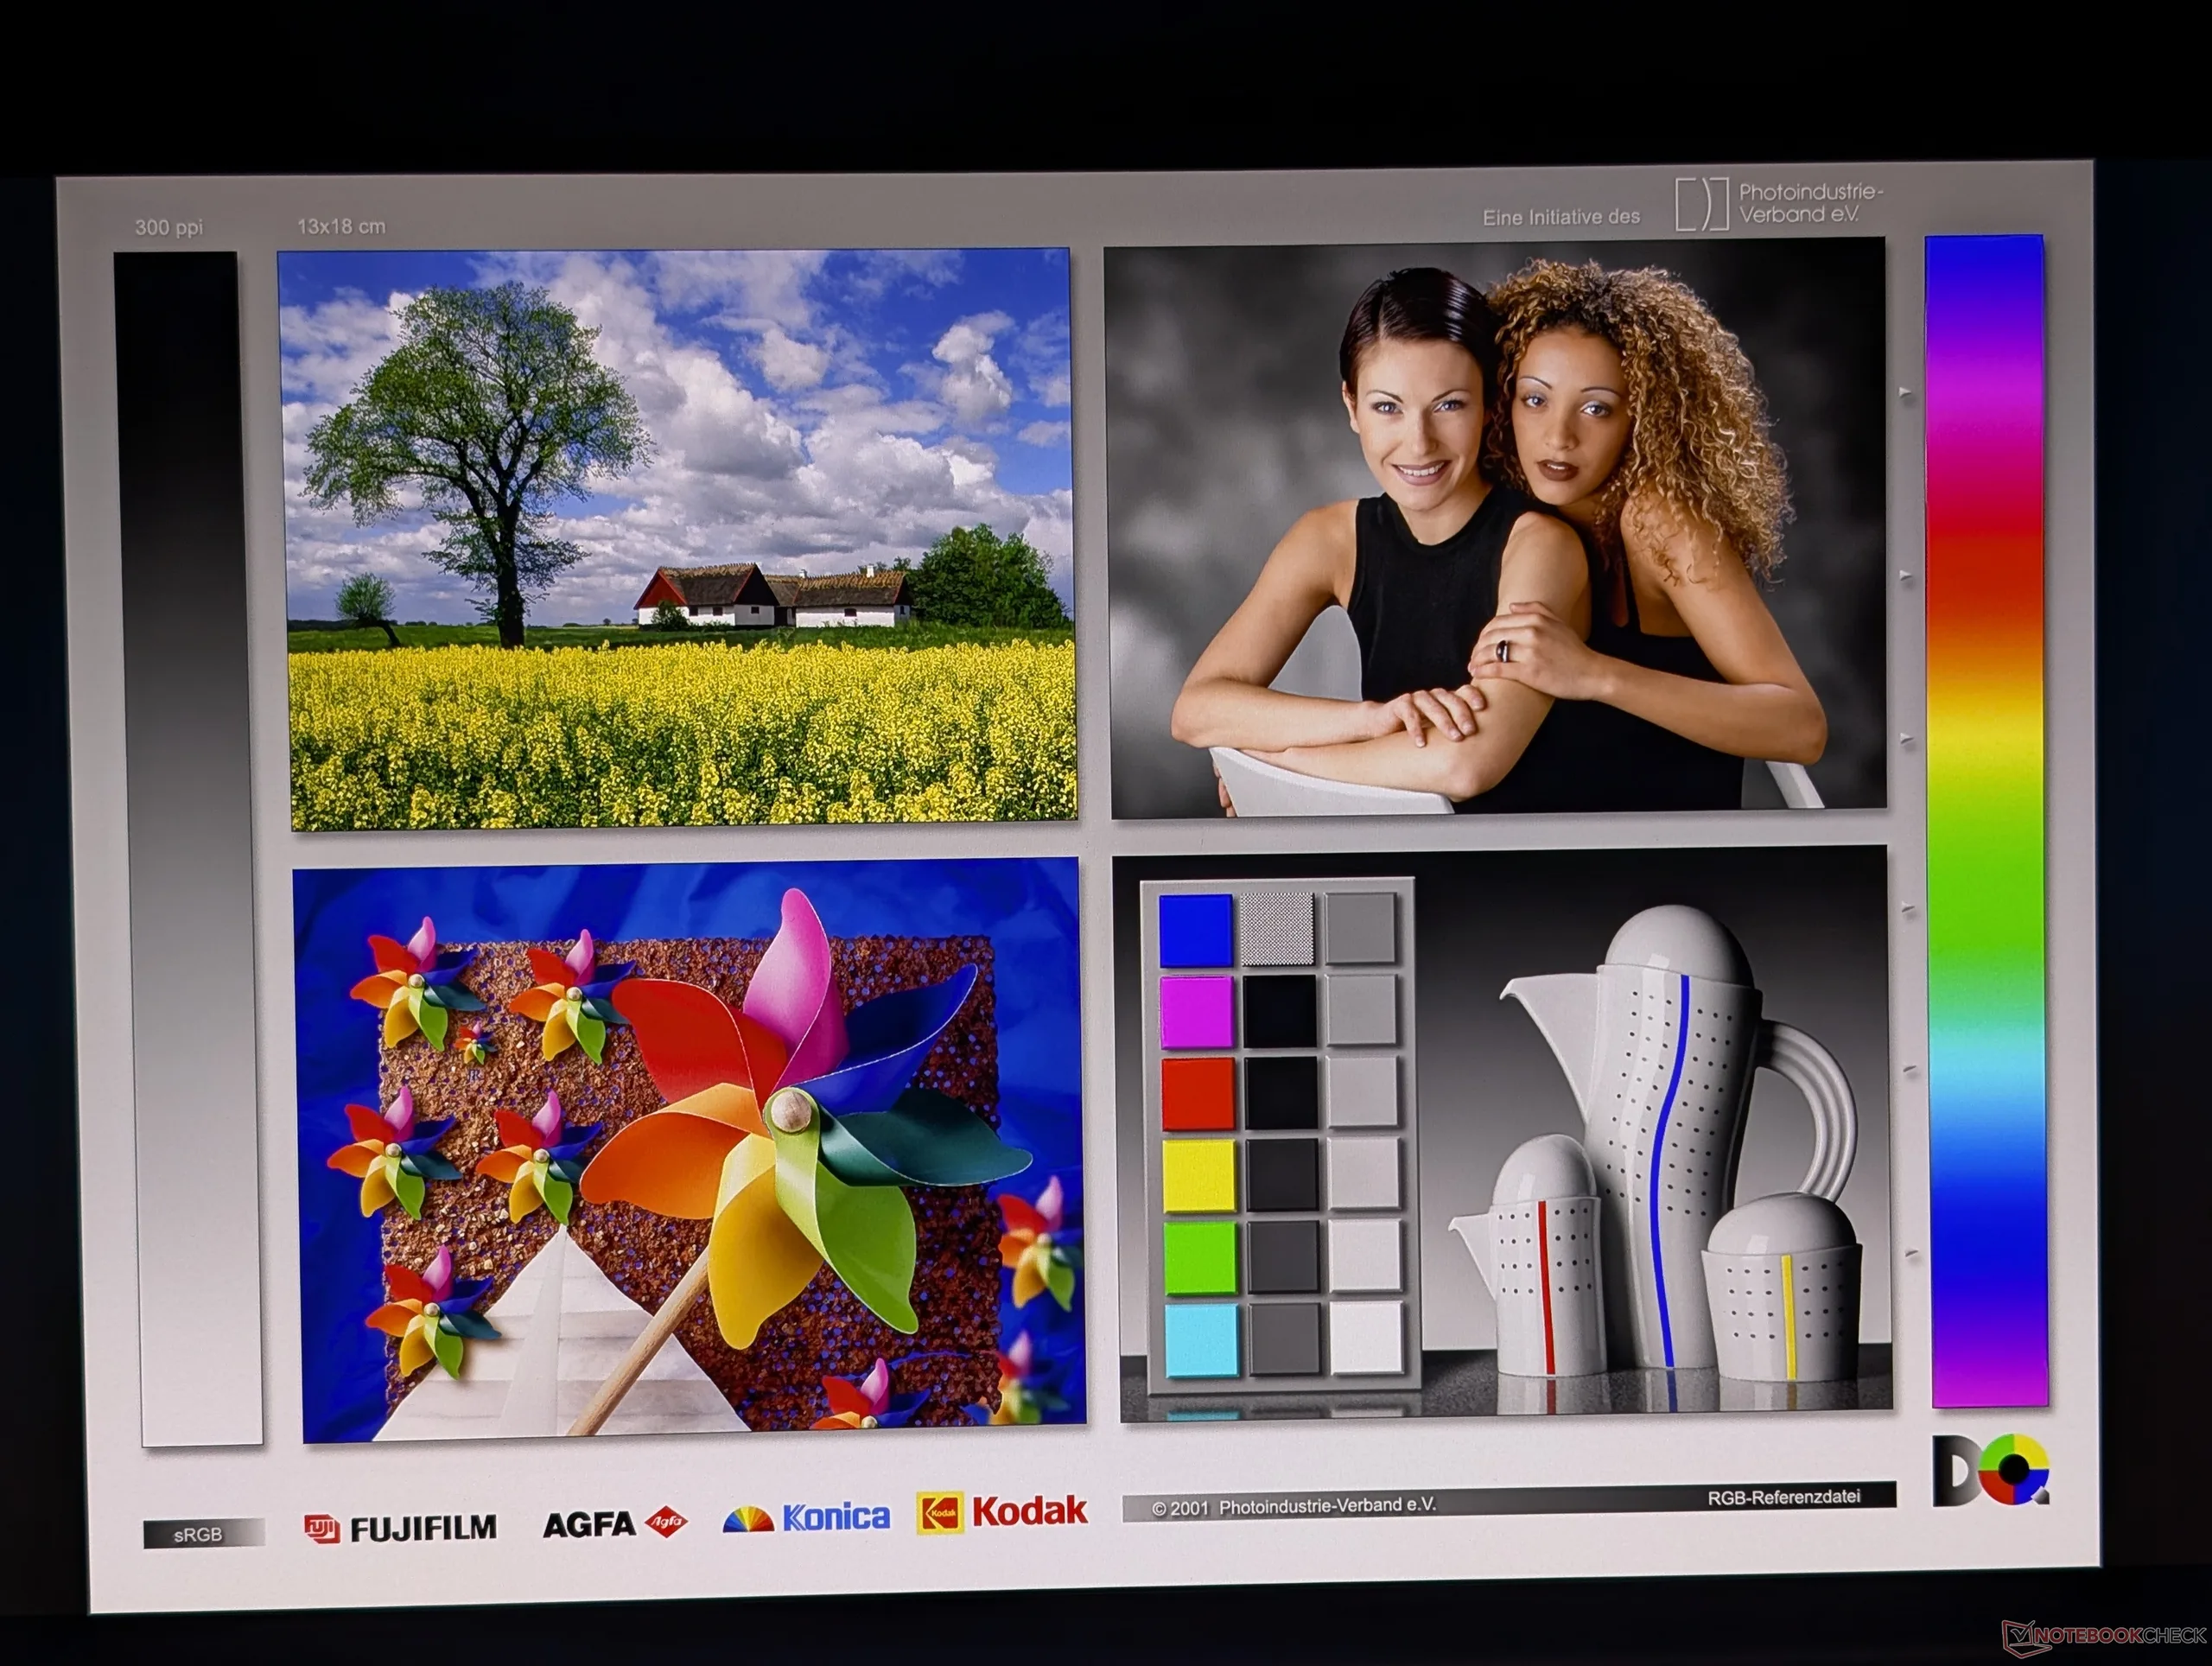
不过,ThinkPad P1 Gen 8 更令人兴奋的功能可以说是其全新的串联式 OLED 触摸屏。它的最大亮度为 1500 尼特,是目前亮度最高的 16 英寸移动工作站之一,HDR 播放效果优于绝大多数笔记本电脑。不过,在工作站上看到这样的选项就有点奇怪了,因为专业人士的目标受众不太可能在日常工作中需要超亮的 HDR 触摸屏。事实上,这种配置的电池续航时间较短,因此用户可能希望配置普通的 4K IPS 面板,因为它能提供相似的色彩和更高的原始分辨率。Tandem OLED 可能更适合游戏或以多媒体为中心的笔记本电脑,如 Yoga 或Legion 系列。
需要更强马力的强力用户可以考虑更厚的 P16 系列它提供 RTX Pro 2000 Blackwell 之外的图形选项。
Pros
Cons
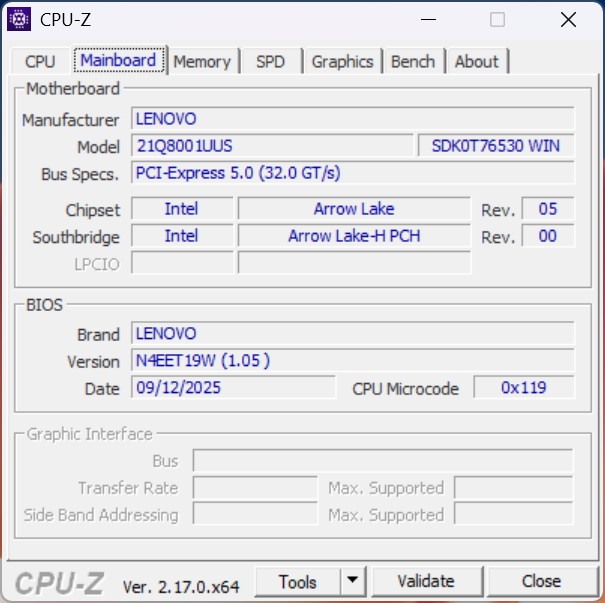
ThinkPad P1 Gen 8 继承了去年的 ThinkPad P1 Gen 7,引入了英特尔 Arrow Lake-H 和 Nvidia Blackwell 选项,分别取代了旧版的 Meteor Lake-H 和 Ada Lovelace 选项。它还配备了新的显示屏选项,包括 4K IPS 或串联 OLED。在其他方面,ThinkPad P1 的机身没有任何变化,因此我们建议您查看我们的 关于 ThinkPad P1 第 7 代的评测了解该系统的更多物理特性。
我们的测试机为中端配置,配备酷睿至尊 7 255H CPU、75 W RTX Pro 2000 Blackwell GPU 和 3.2K 同步 OLED 触摸屏,售价约为 2220 美元。较低端的 SKU 从酷睿 Ultra 5 235H 开始,只集成了 Arc 140T 图形处理器和标准的 1200p60 IPS 显示屏,而较高端的 SKU 则配备了酷睿 Ultra 9 285H 和 4K IPS 显示屏。没有 RTX Pro 2000 Blackwell 以上的显卡可供选择。
ThinkPad P1 Gen 8 的替代产品包括其他 16 英寸超薄工作站,如 惠普 ZBook X G1i 16戴尔 Pro 16 Plus 或 华硕 ExpertBook 系列.
更多联想评测:
规格
案例
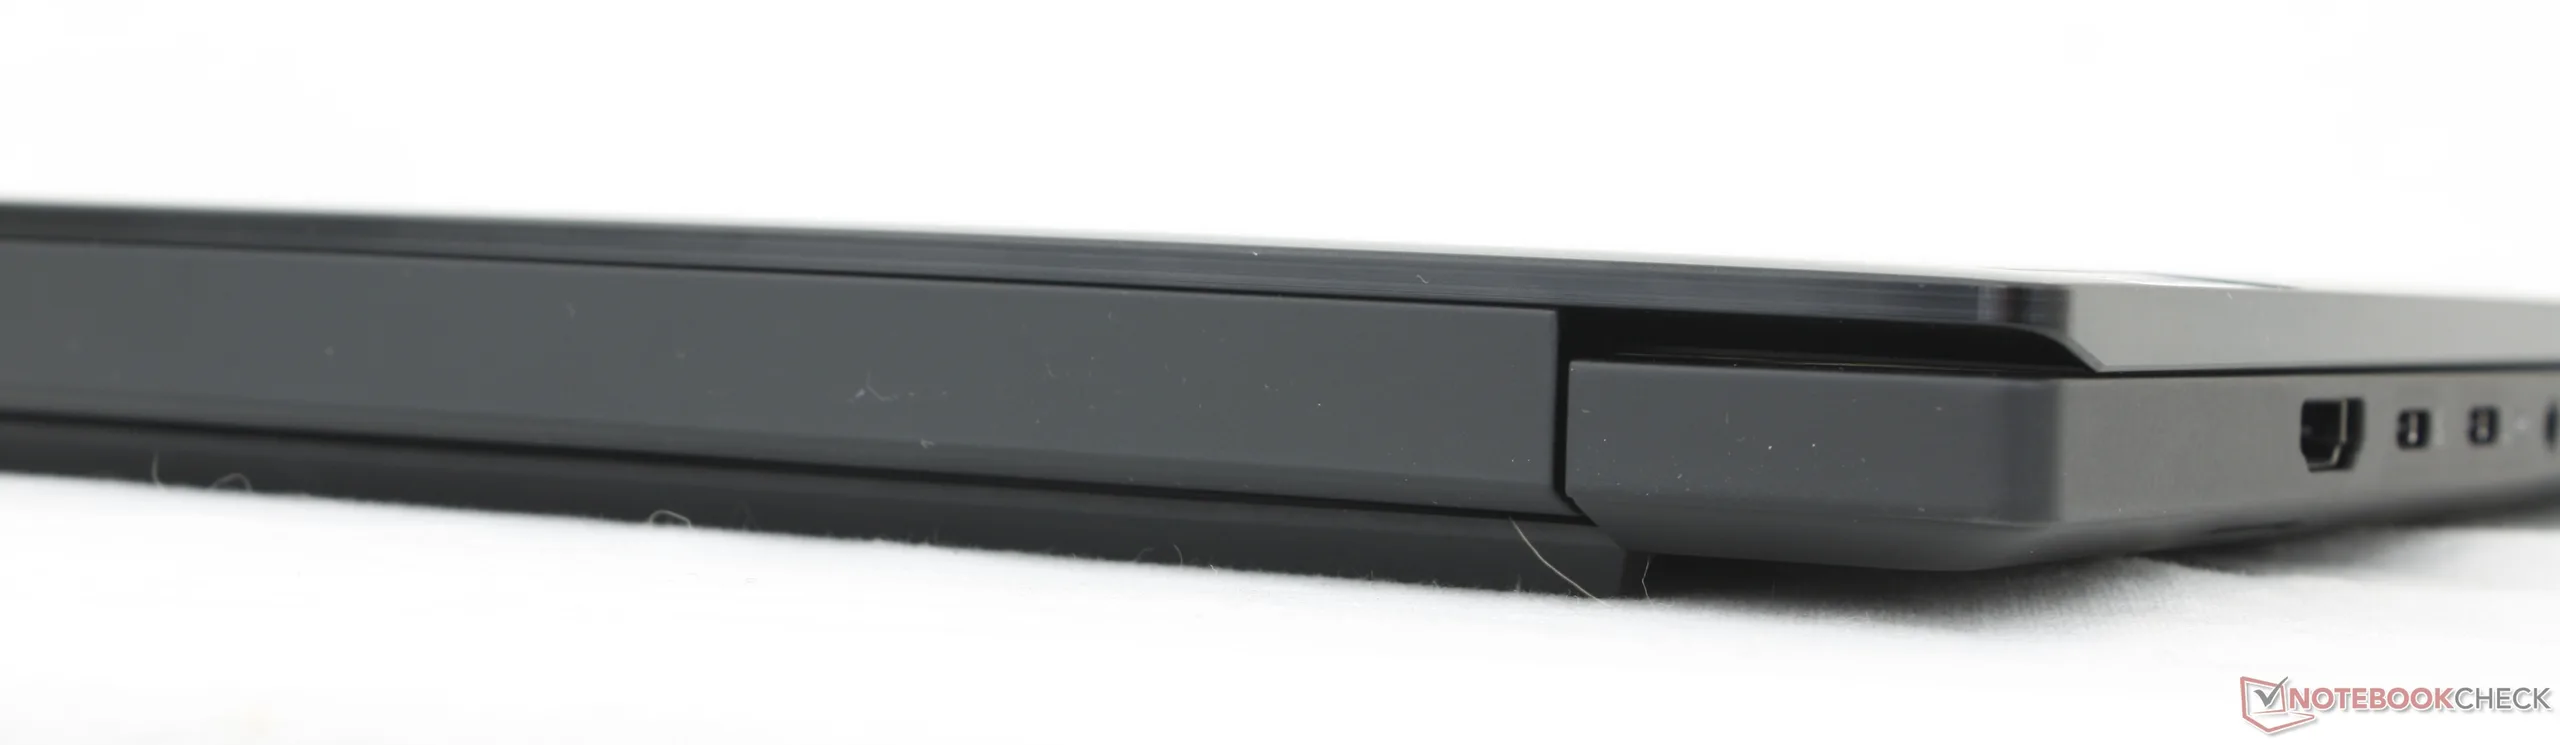
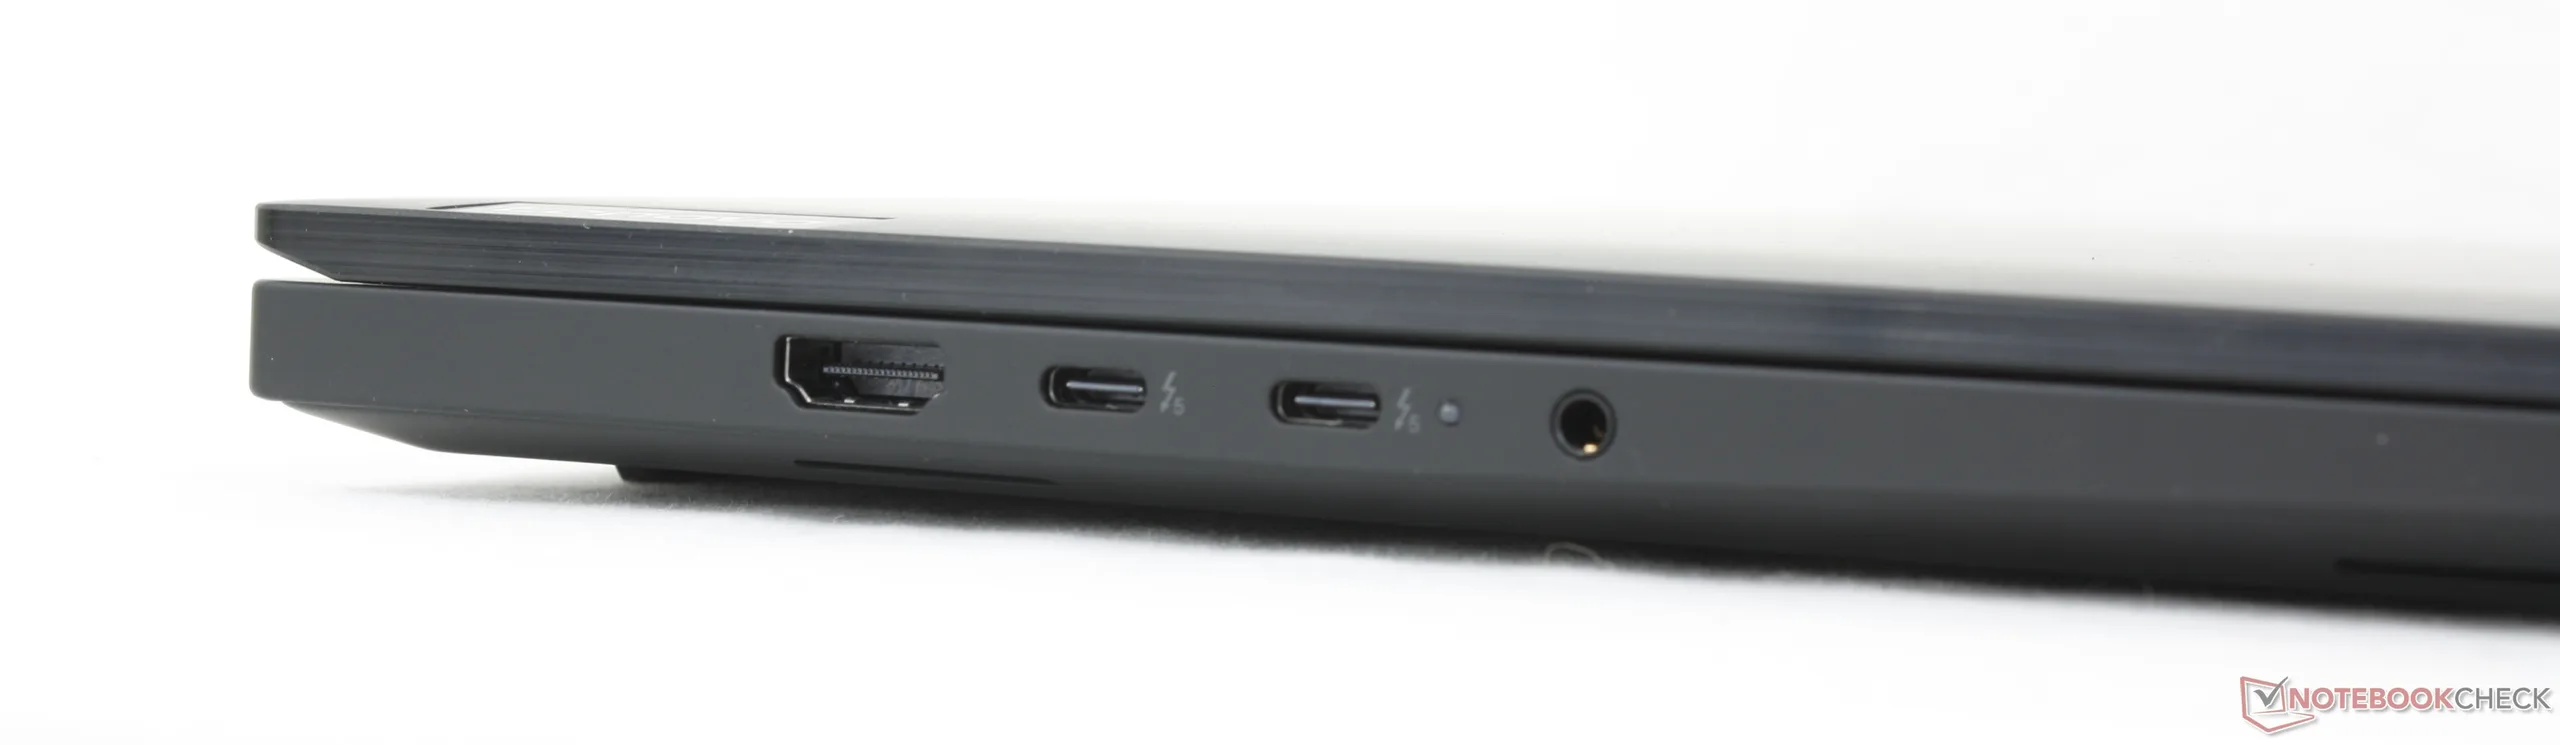
虽然机身和尺寸与以前相同,但与 7 代相比,8 代机型引入了几个值得注意的端口变化。现在支持 Thunderbolt 5,同时放弃了专有的交流适配器端口,仅使用 USB-C 供电。因此,三个 USB-C 端口中将始终有一个用于交流适配器供电,而去年的机型则不是这样。
连接性
SD 读卡器
| SD Card Reader | |
| average JPG Copy Test (av. of 3 runs) | |
| HP ZBook X G1i 16 (Toshiba Exceria Pro SDXC 64 GB UHS-II) | |
| Lenovo ThinkPad P1 Gen 8 (Toshiba Exceria Pro SDXC 64 GB UHS-II) | |
| Dell Pro Max 16 Plus (Toshiba Exceria Pro SDXC 64 GB UHS-II) | |
| Lenovo ThinkPad P1 Gen 7 21KV001SGE (AV Pro V60) | |
| maximum AS SSD Seq Read Test (1GB) | |
| HP ZBook X G1i 16 (Toshiba Exceria Pro SDXC 64 GB UHS-II) | |
| Dell Pro Max 16 Plus (Toshiba Exceria Pro SDXC 64 GB UHS-II) | |
| Lenovo ThinkPad P1 Gen 8 (Toshiba Exceria Pro SDXC 64 GB UHS-II) | |
| Lenovo ThinkPad P1 Gen 7 21KV001SGE (AV Pro V60) | |
交流
网络摄像头


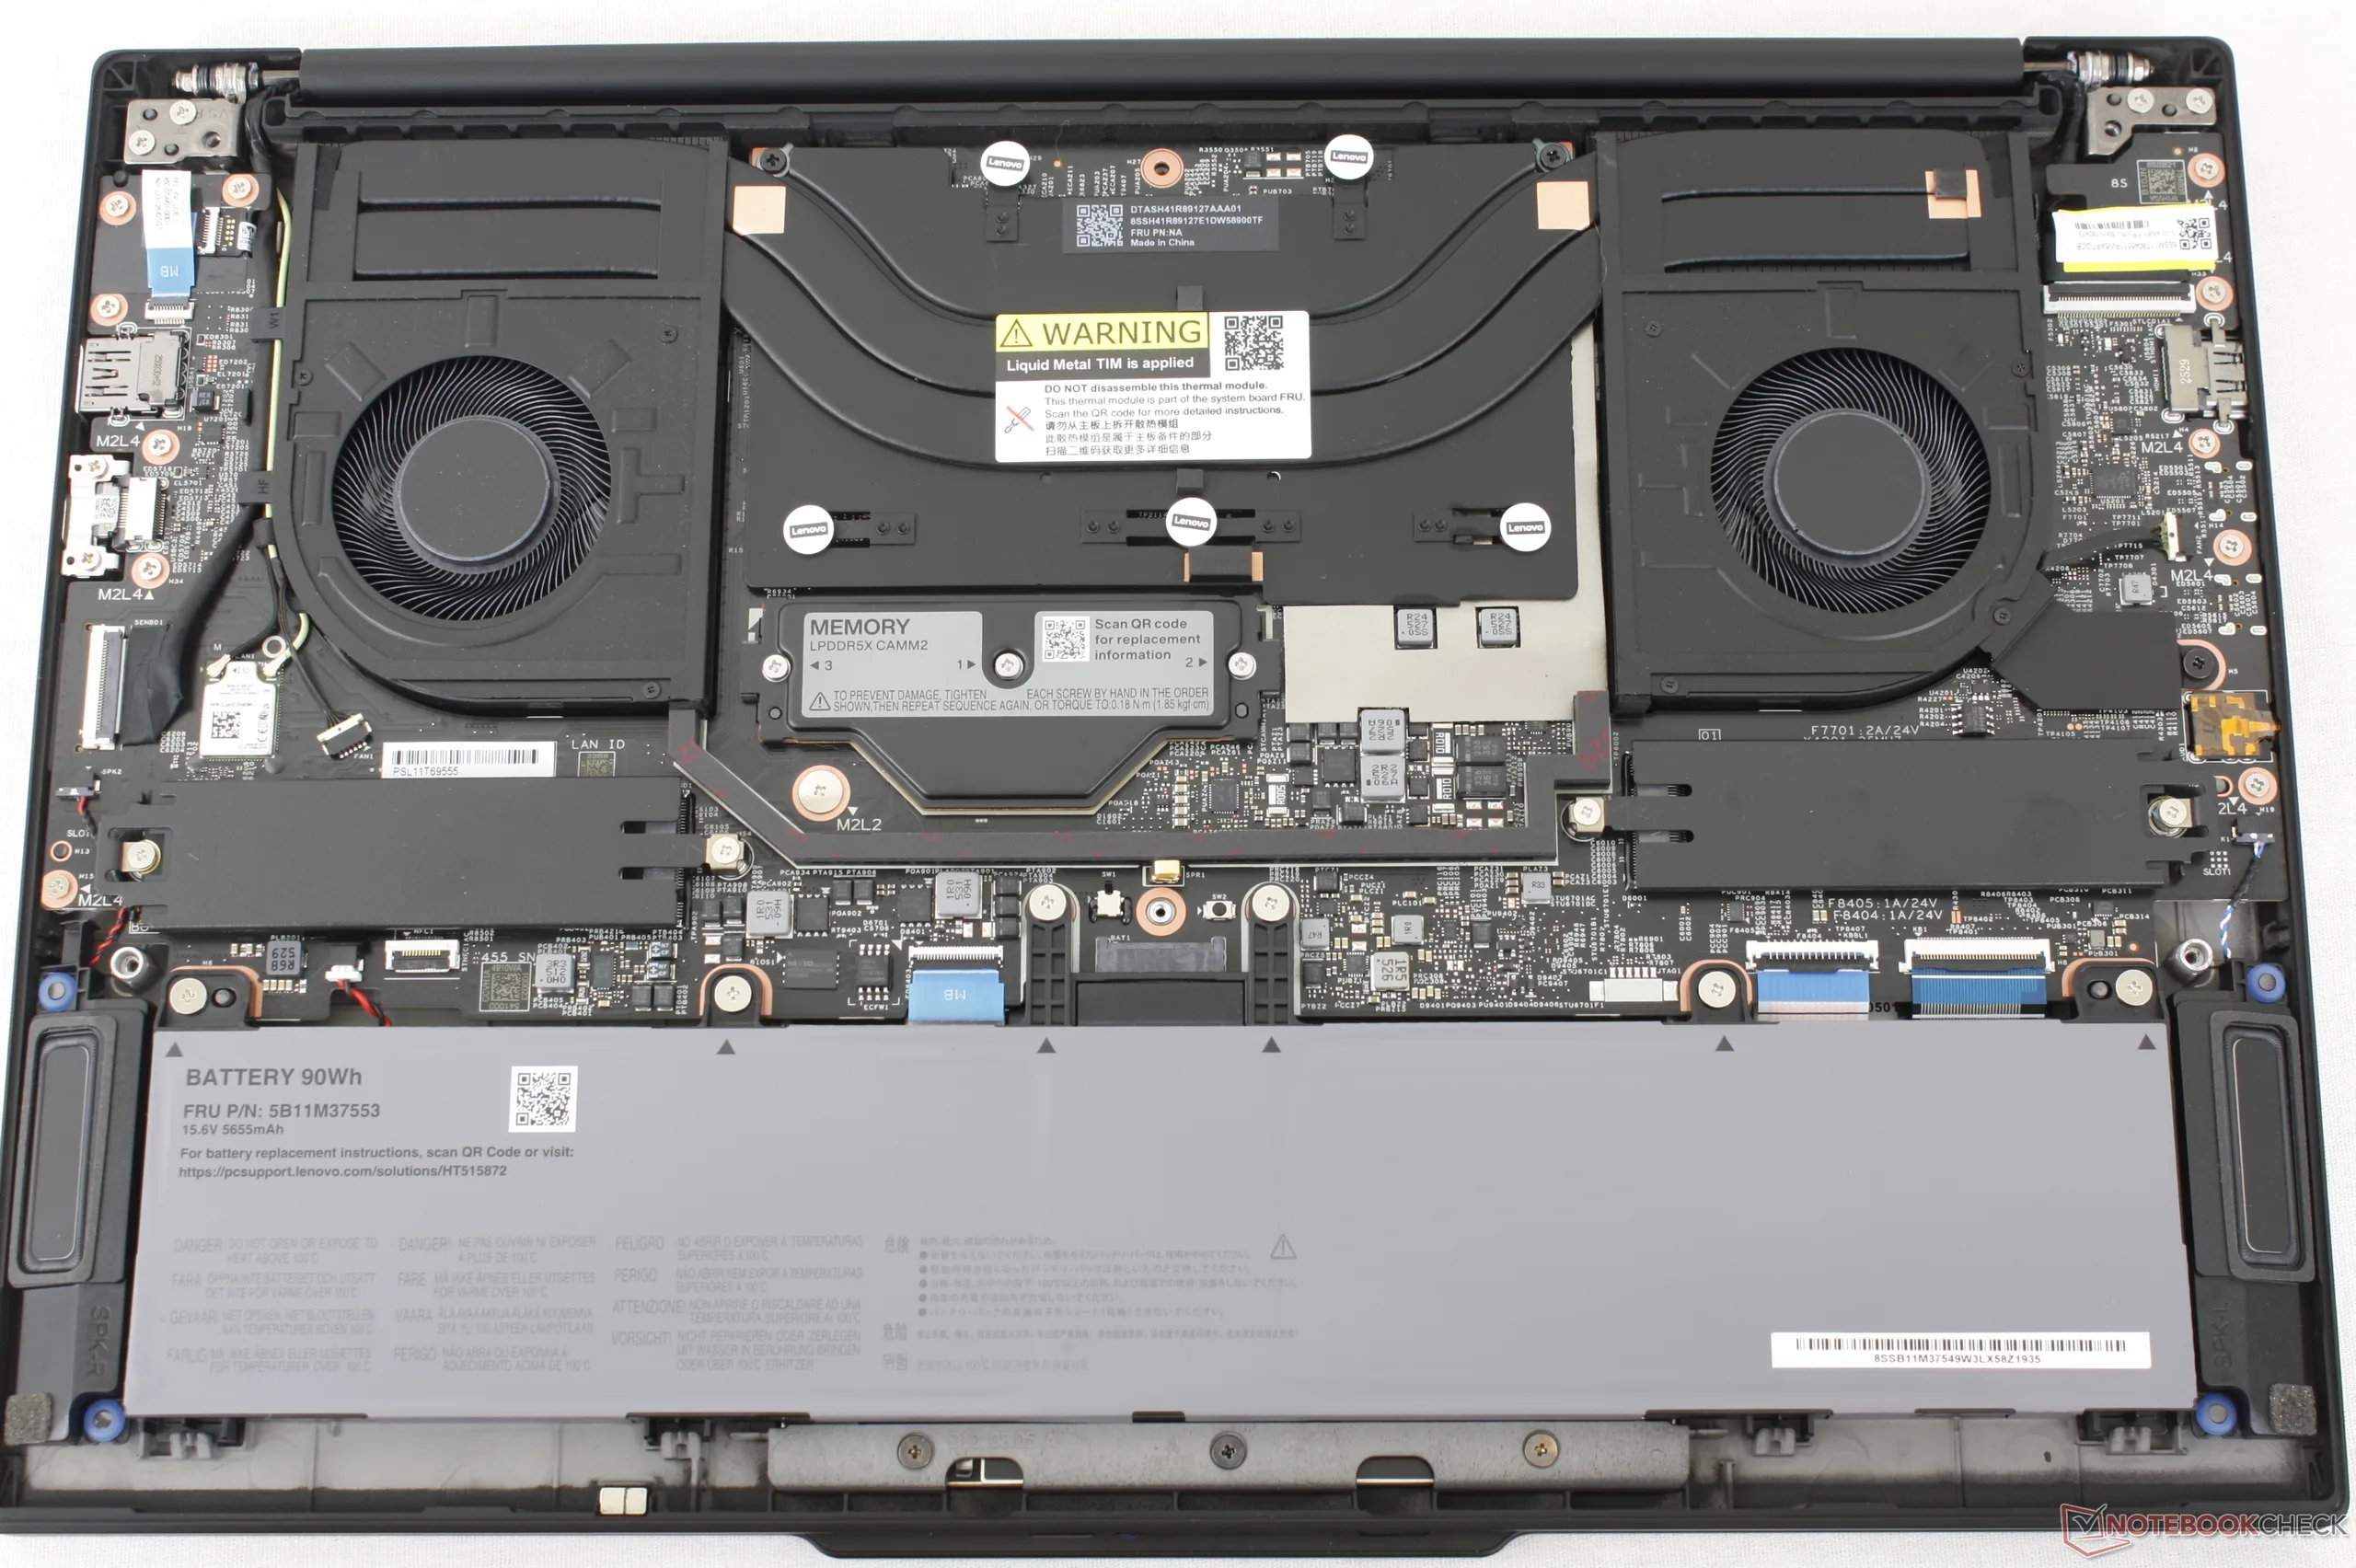
维护
可持续性
键盘底座的骨架由 90% 的可回收镁铝合金组成,顶盖和底盖由 55% 至 75% 的可回收铝合金组成,其他几乎所有部件均由 50% 至 90% 的塑料制成。包装也不含塑料。
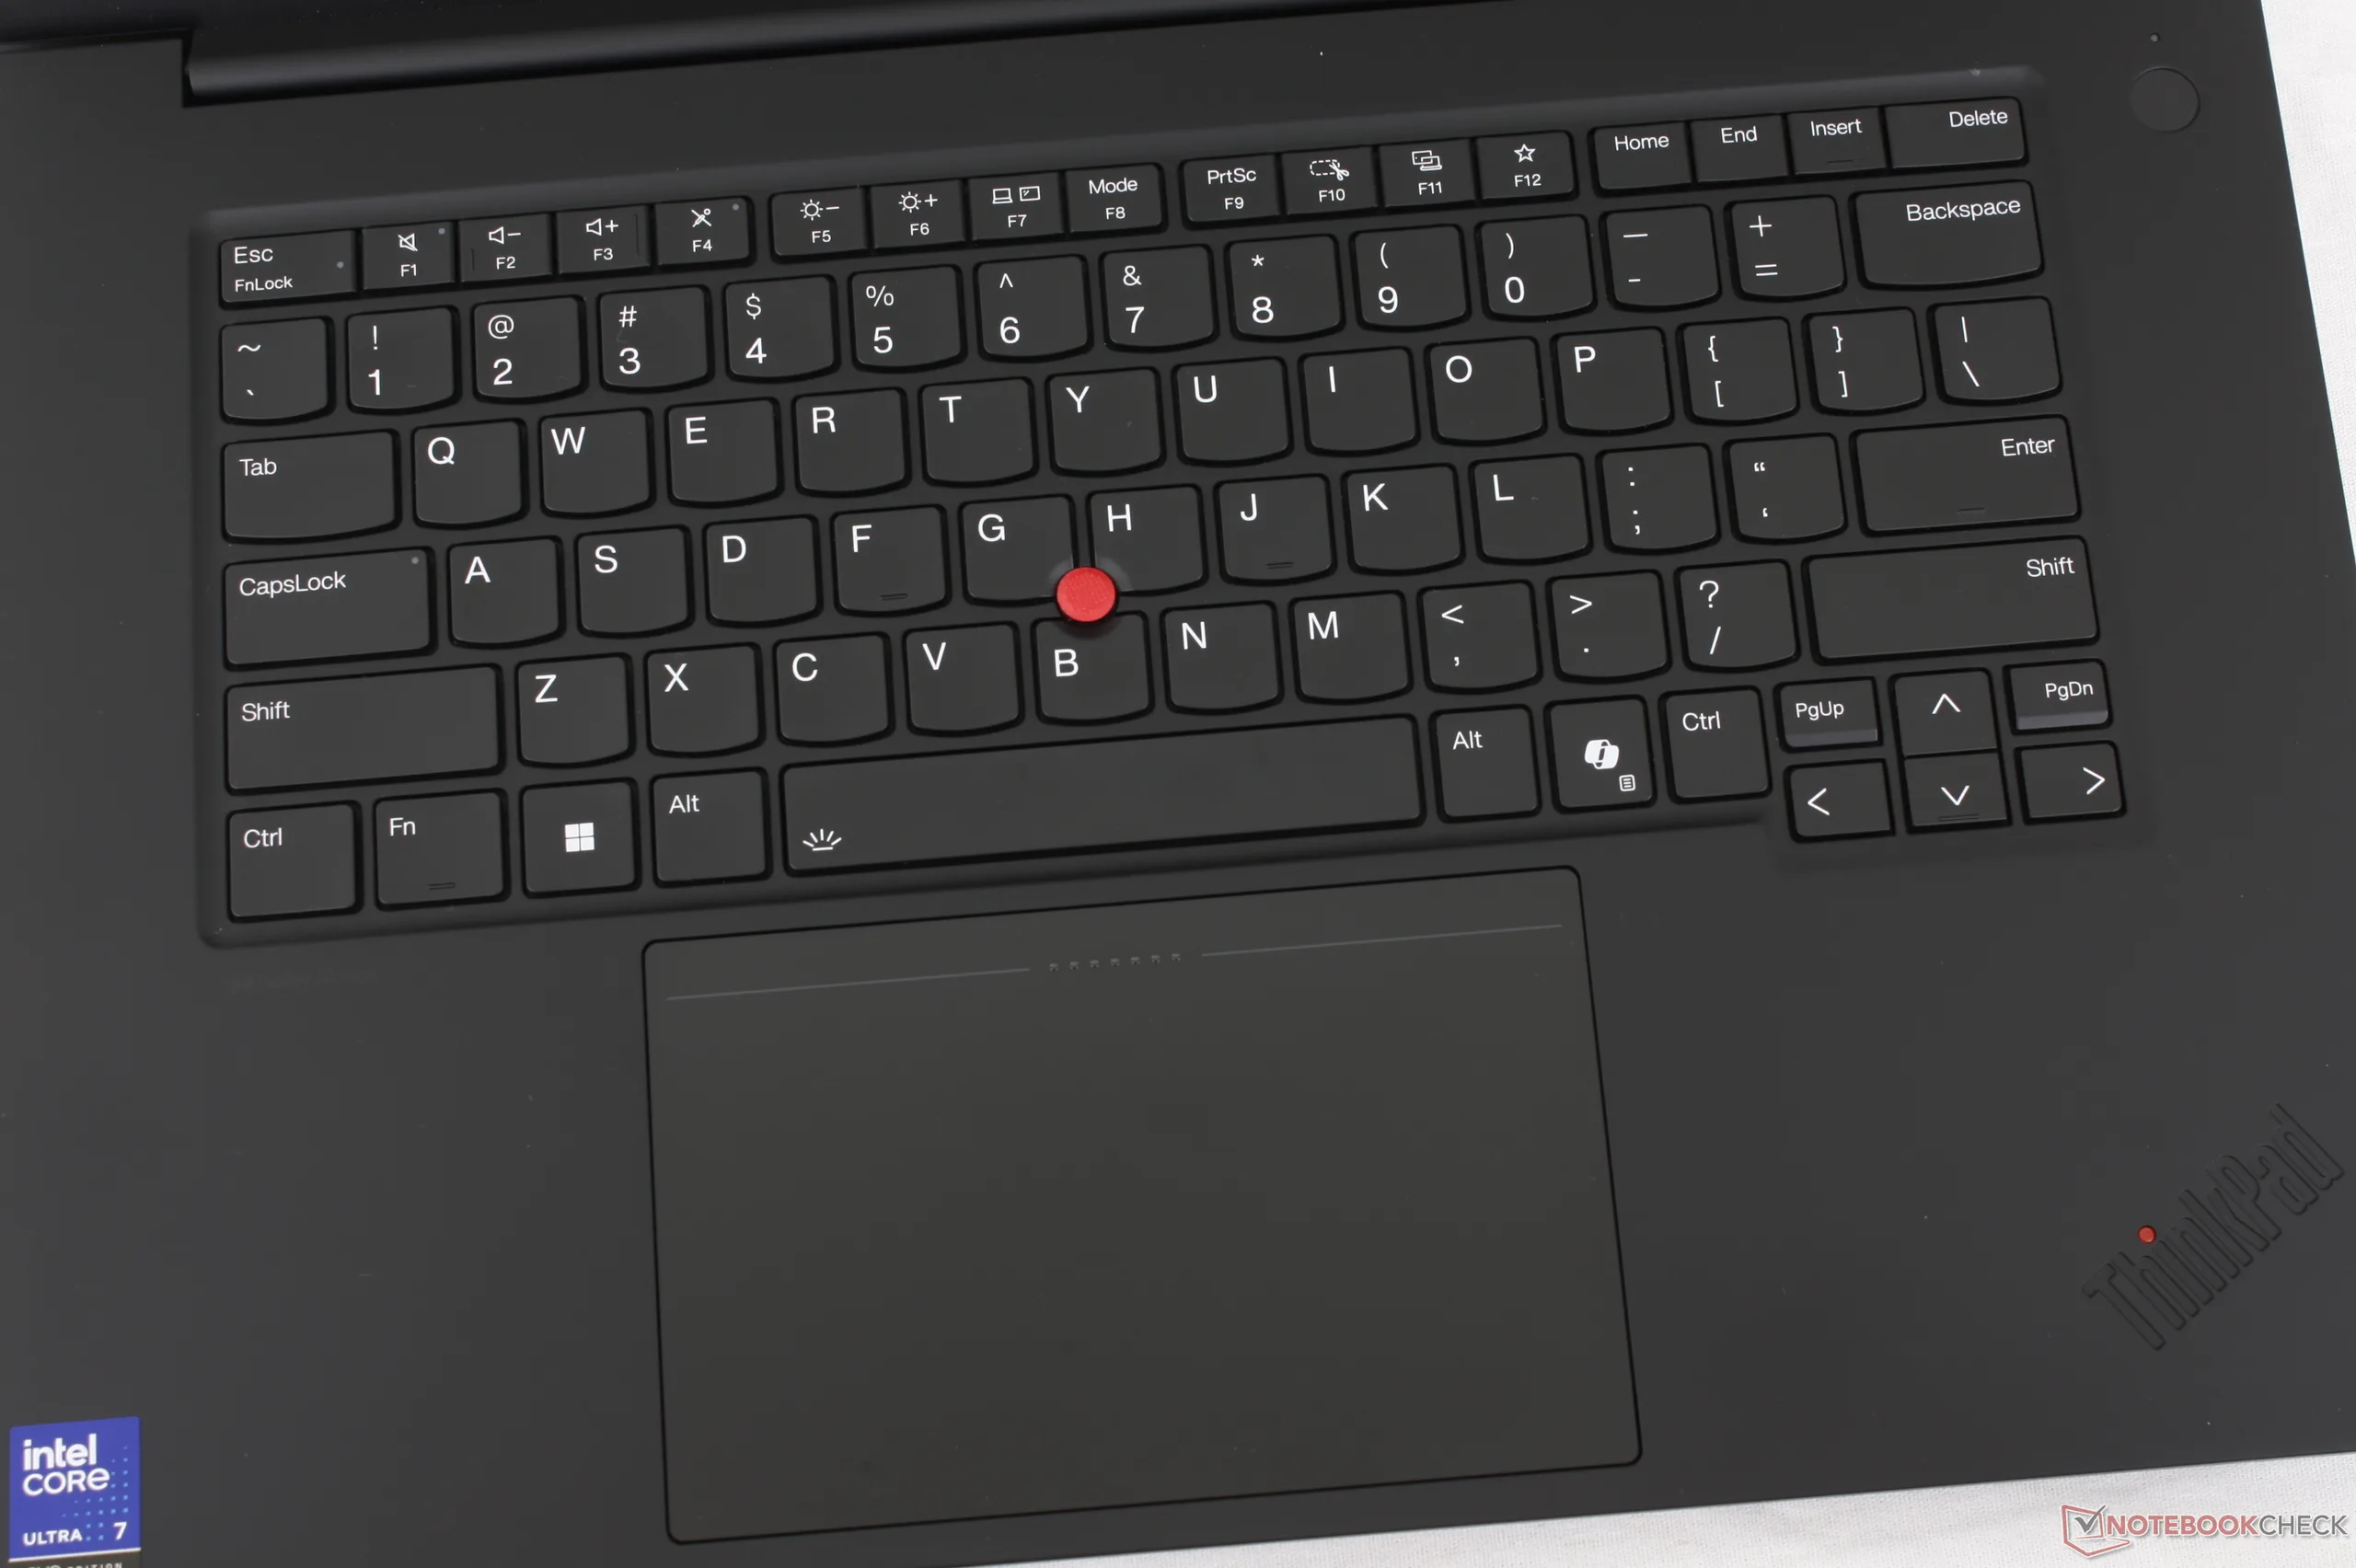
输入设备
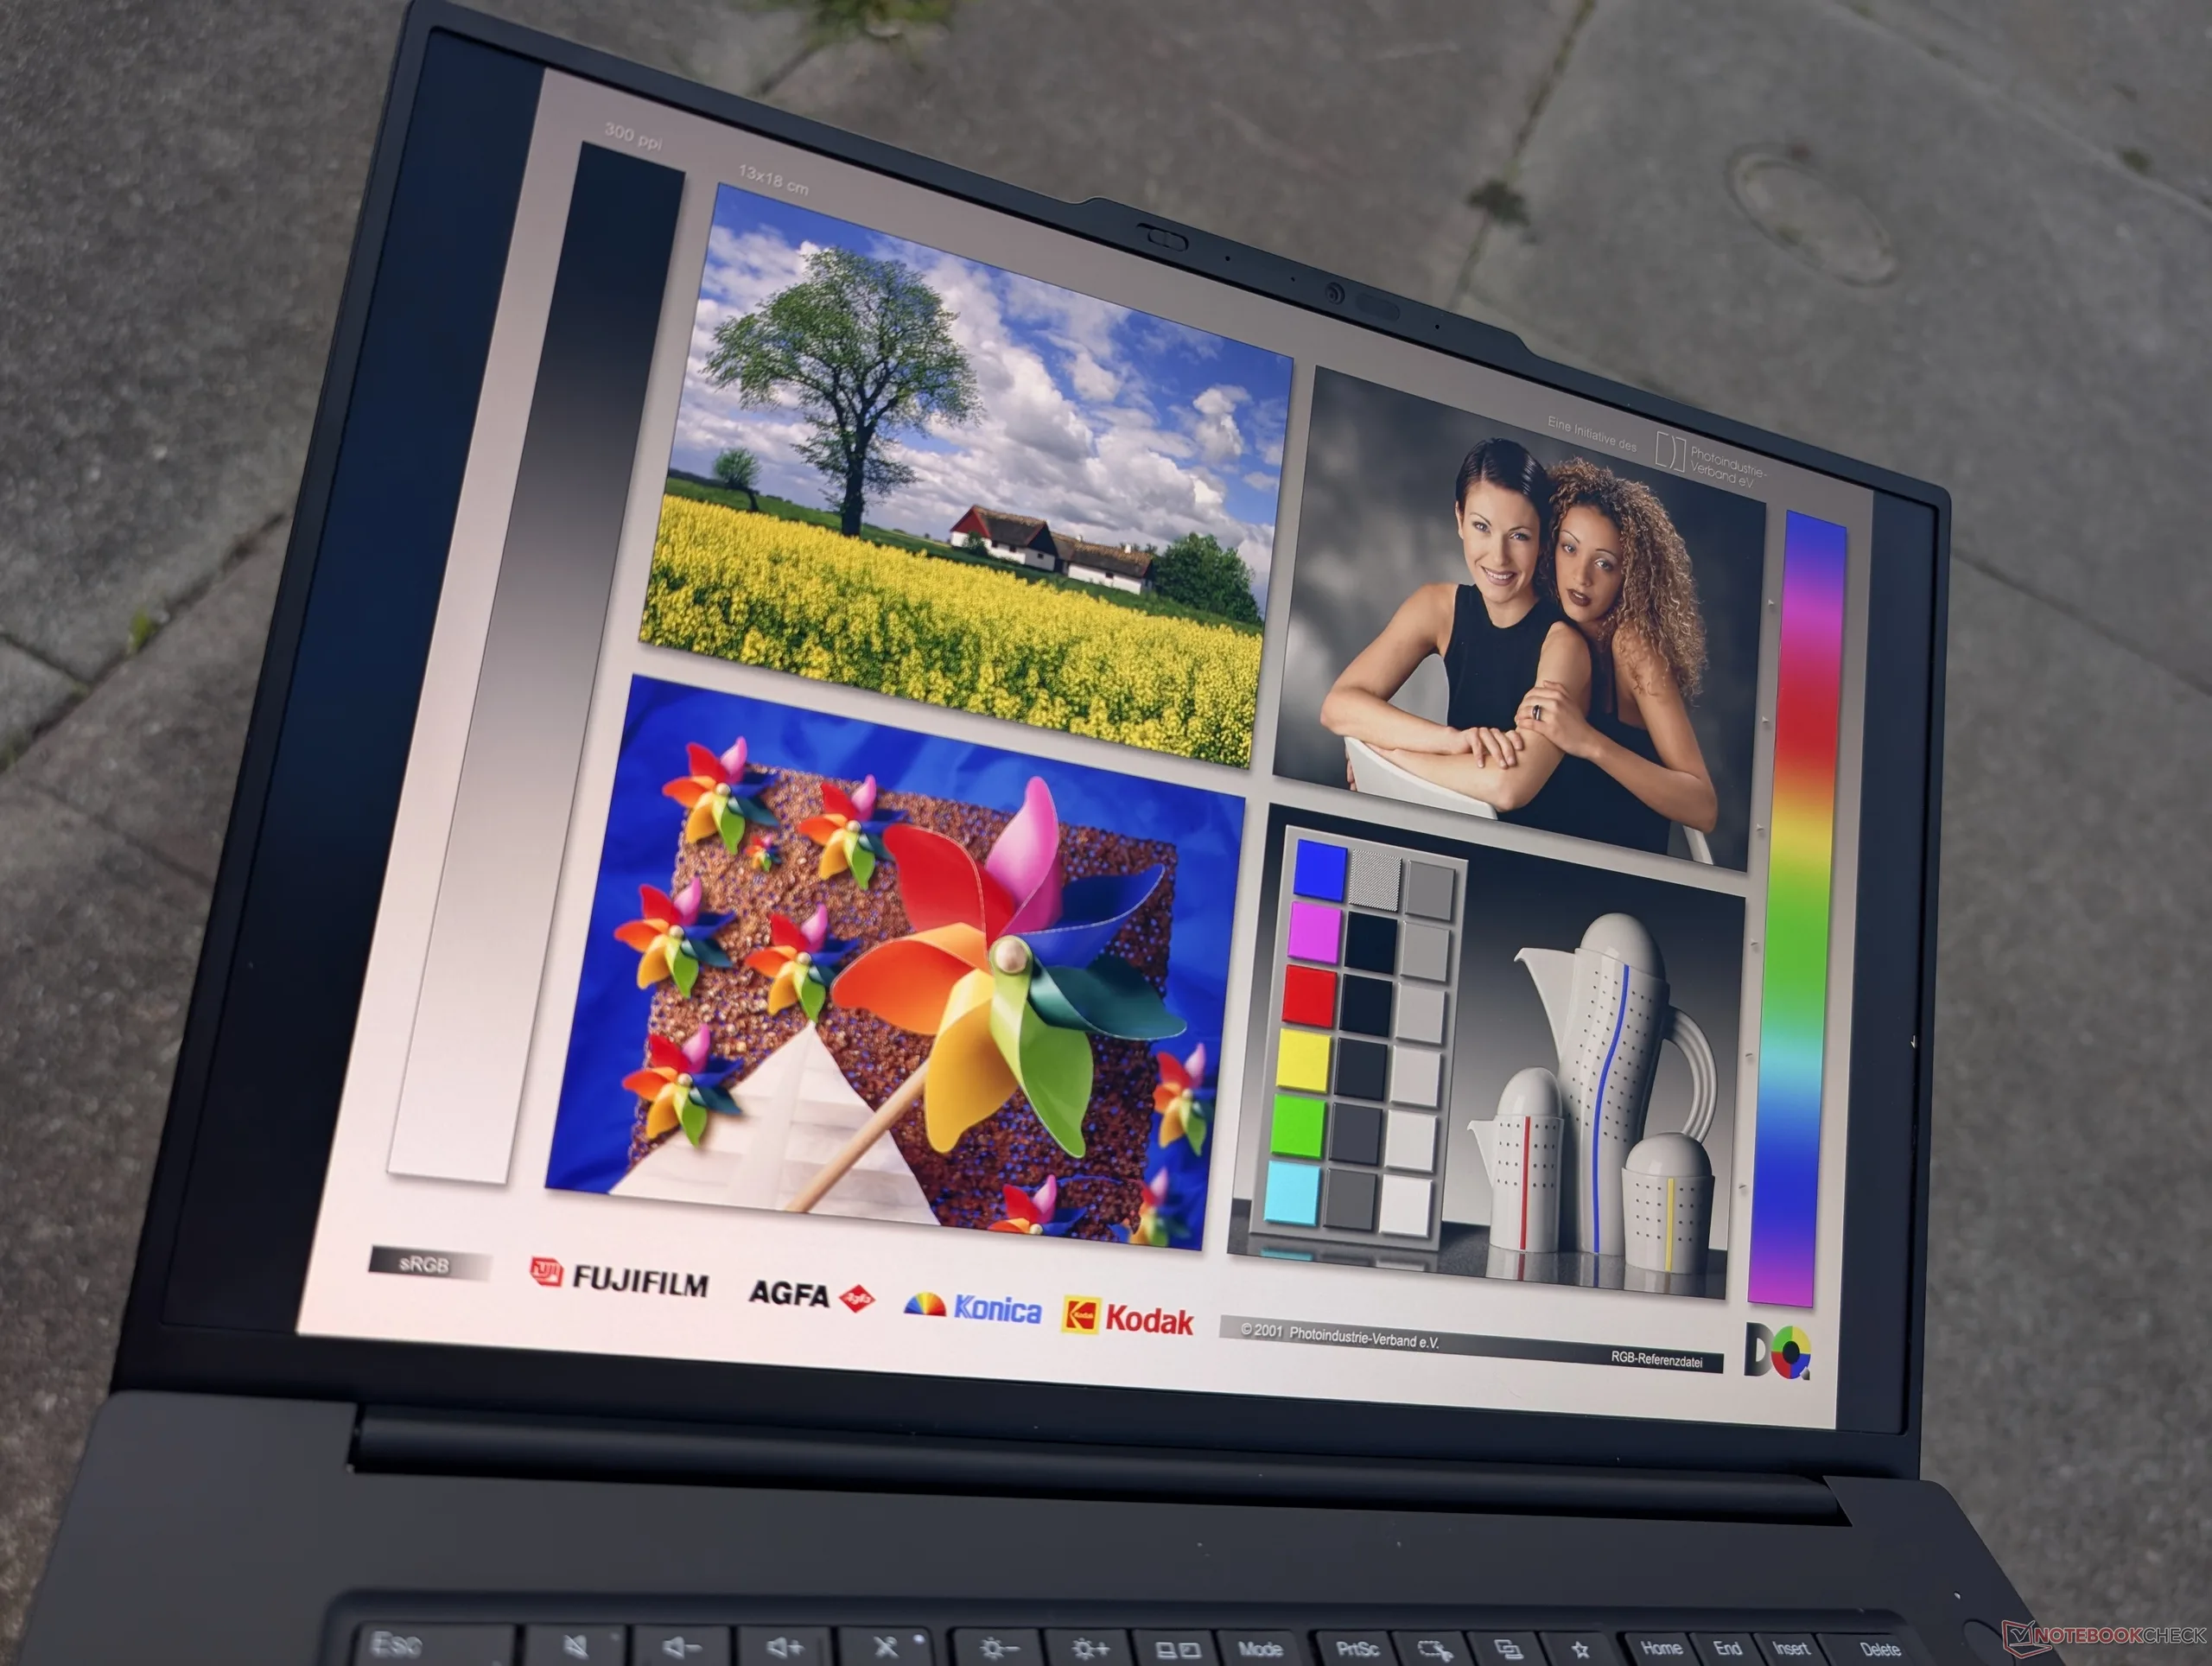
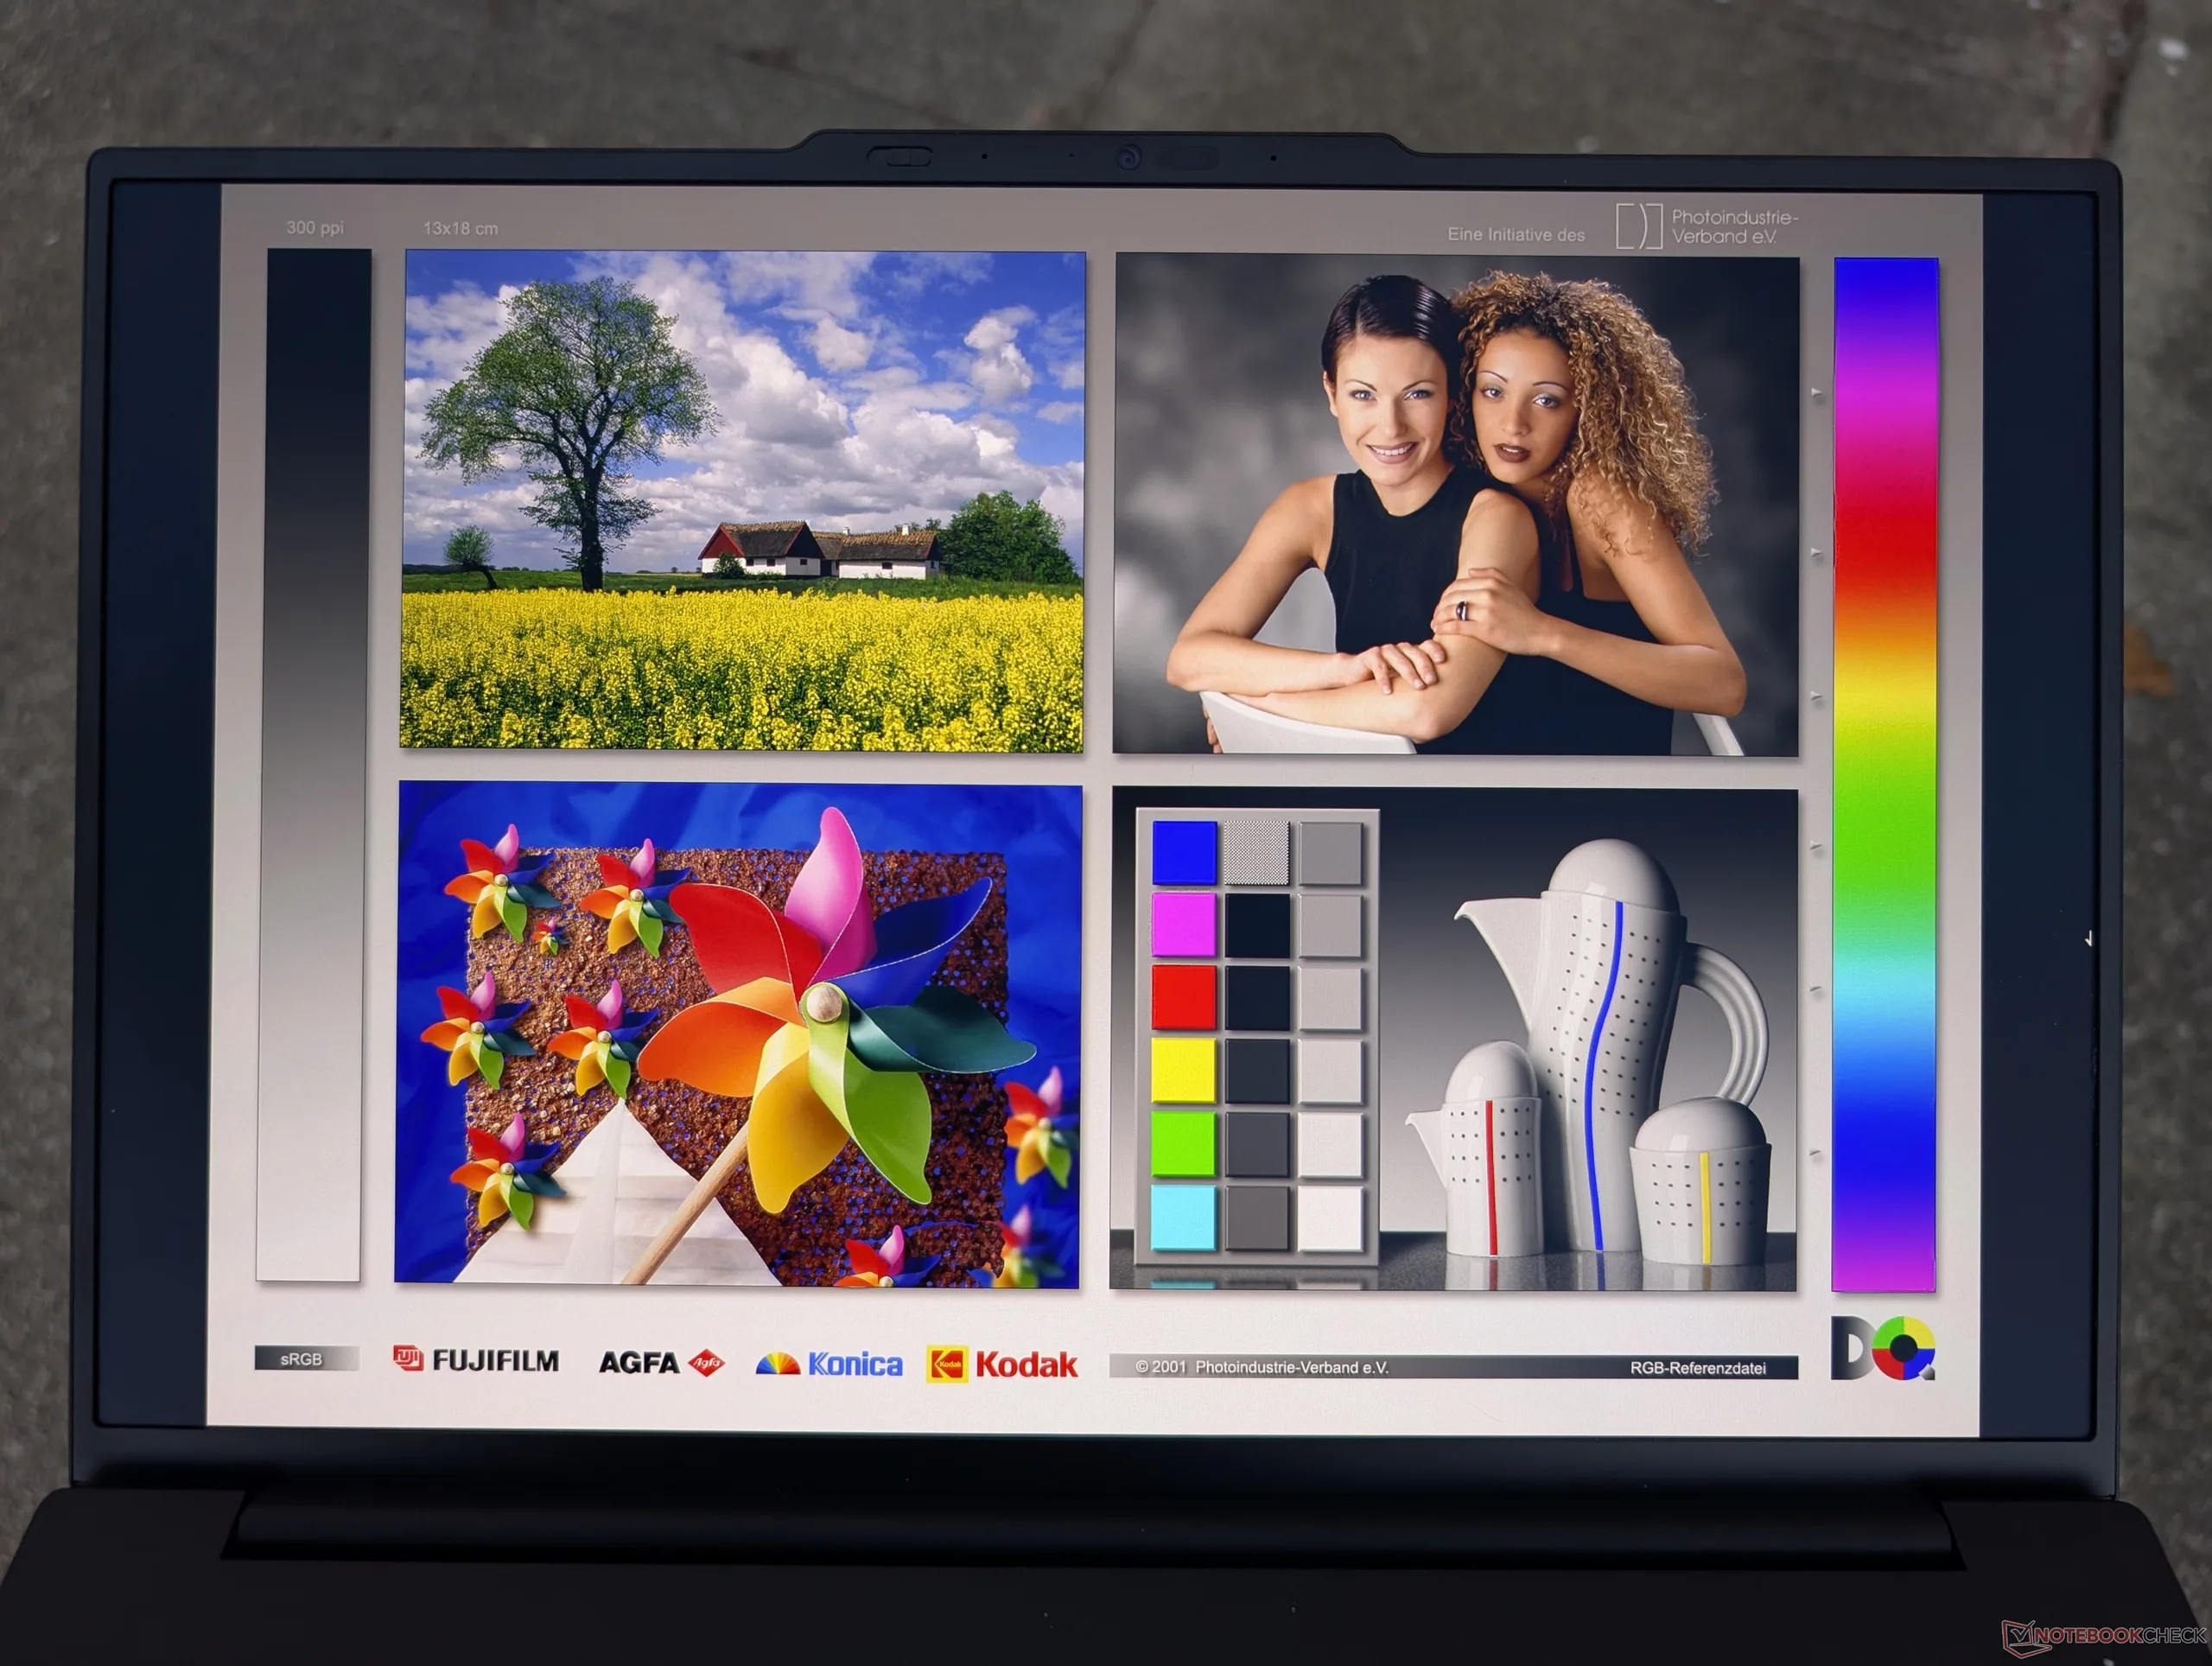
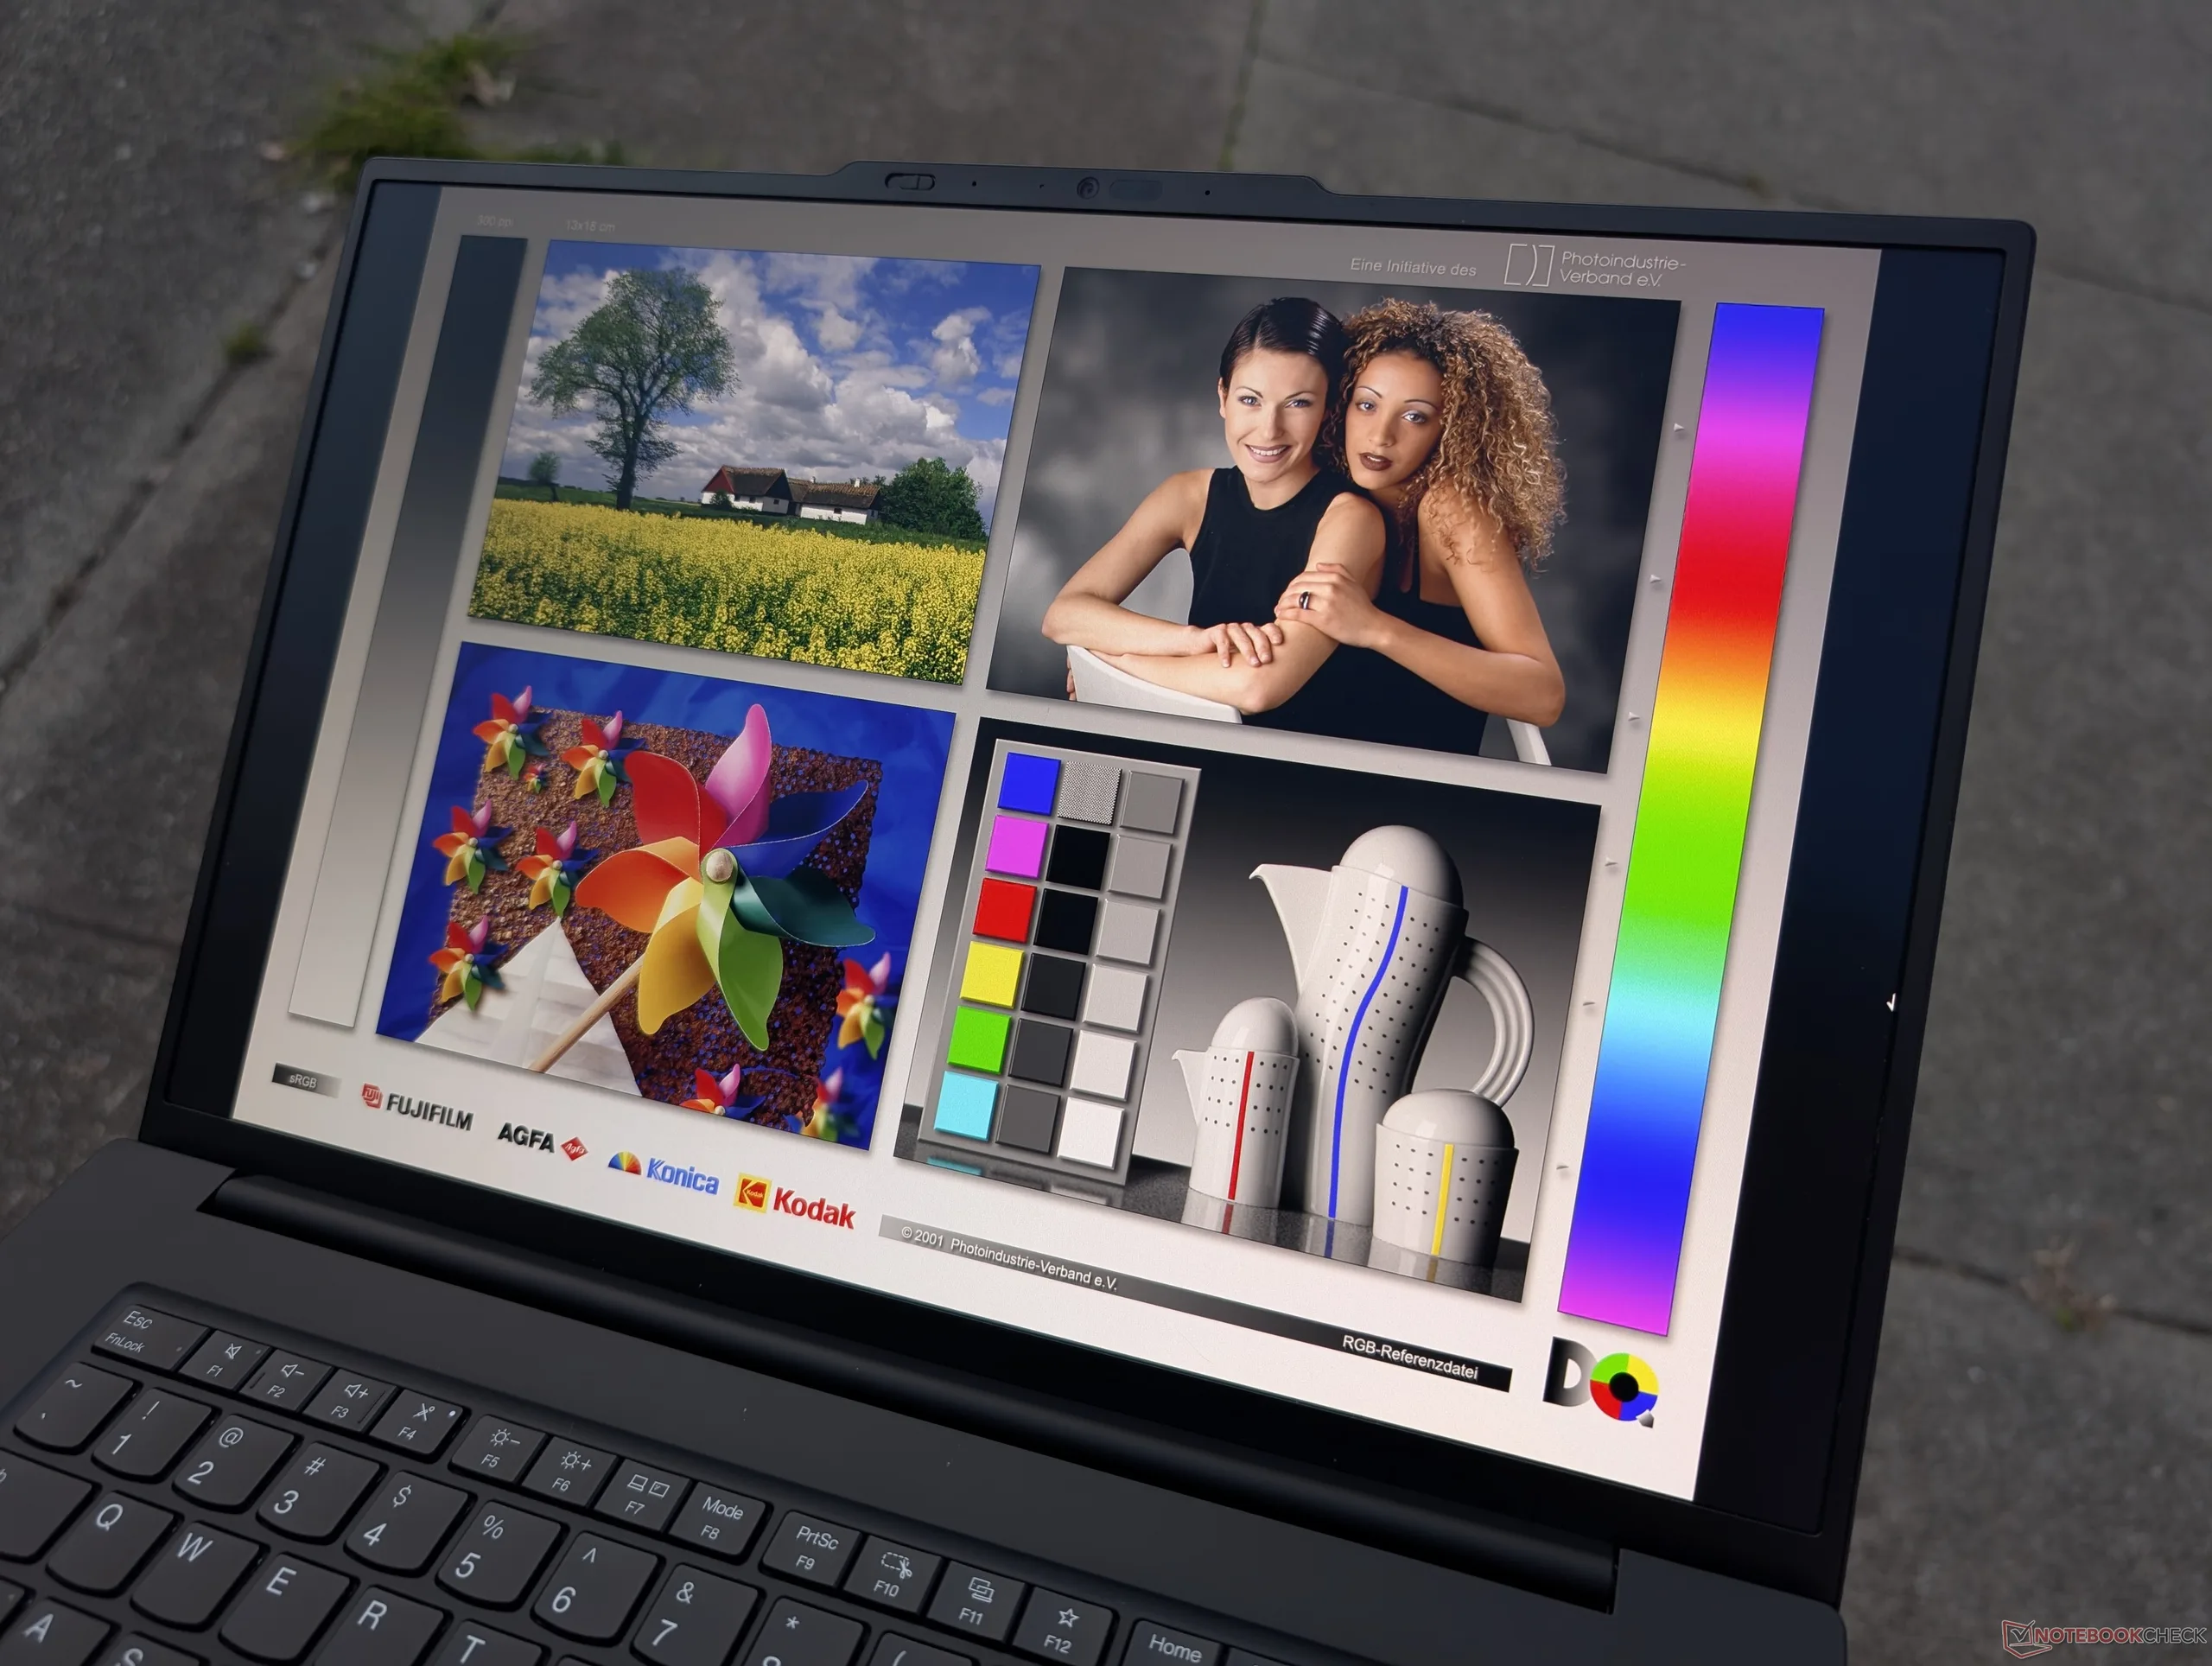
显示屏

有以下三种显示屏可供选择。请注意,最高分辨率选项牺牲了串联式 OLED 选项的更快刷新率、深黑电平、触摸功能和卓越的 HDR 支持。
- 1920 x 1200,非触摸,IPS,500 尼特,无光泽,100% sRGB,60 赫兹,直流调光
- 3200 x 2000,触摸式,串联 OLED,1500 尼特 HDR,无光泽,100% DCI-P3,120 赫兹,PWM 调光
- 3840 x 2400,非触摸式,IPS,800 尼特,100% DCI-P3,60 赫兹,DC 调光
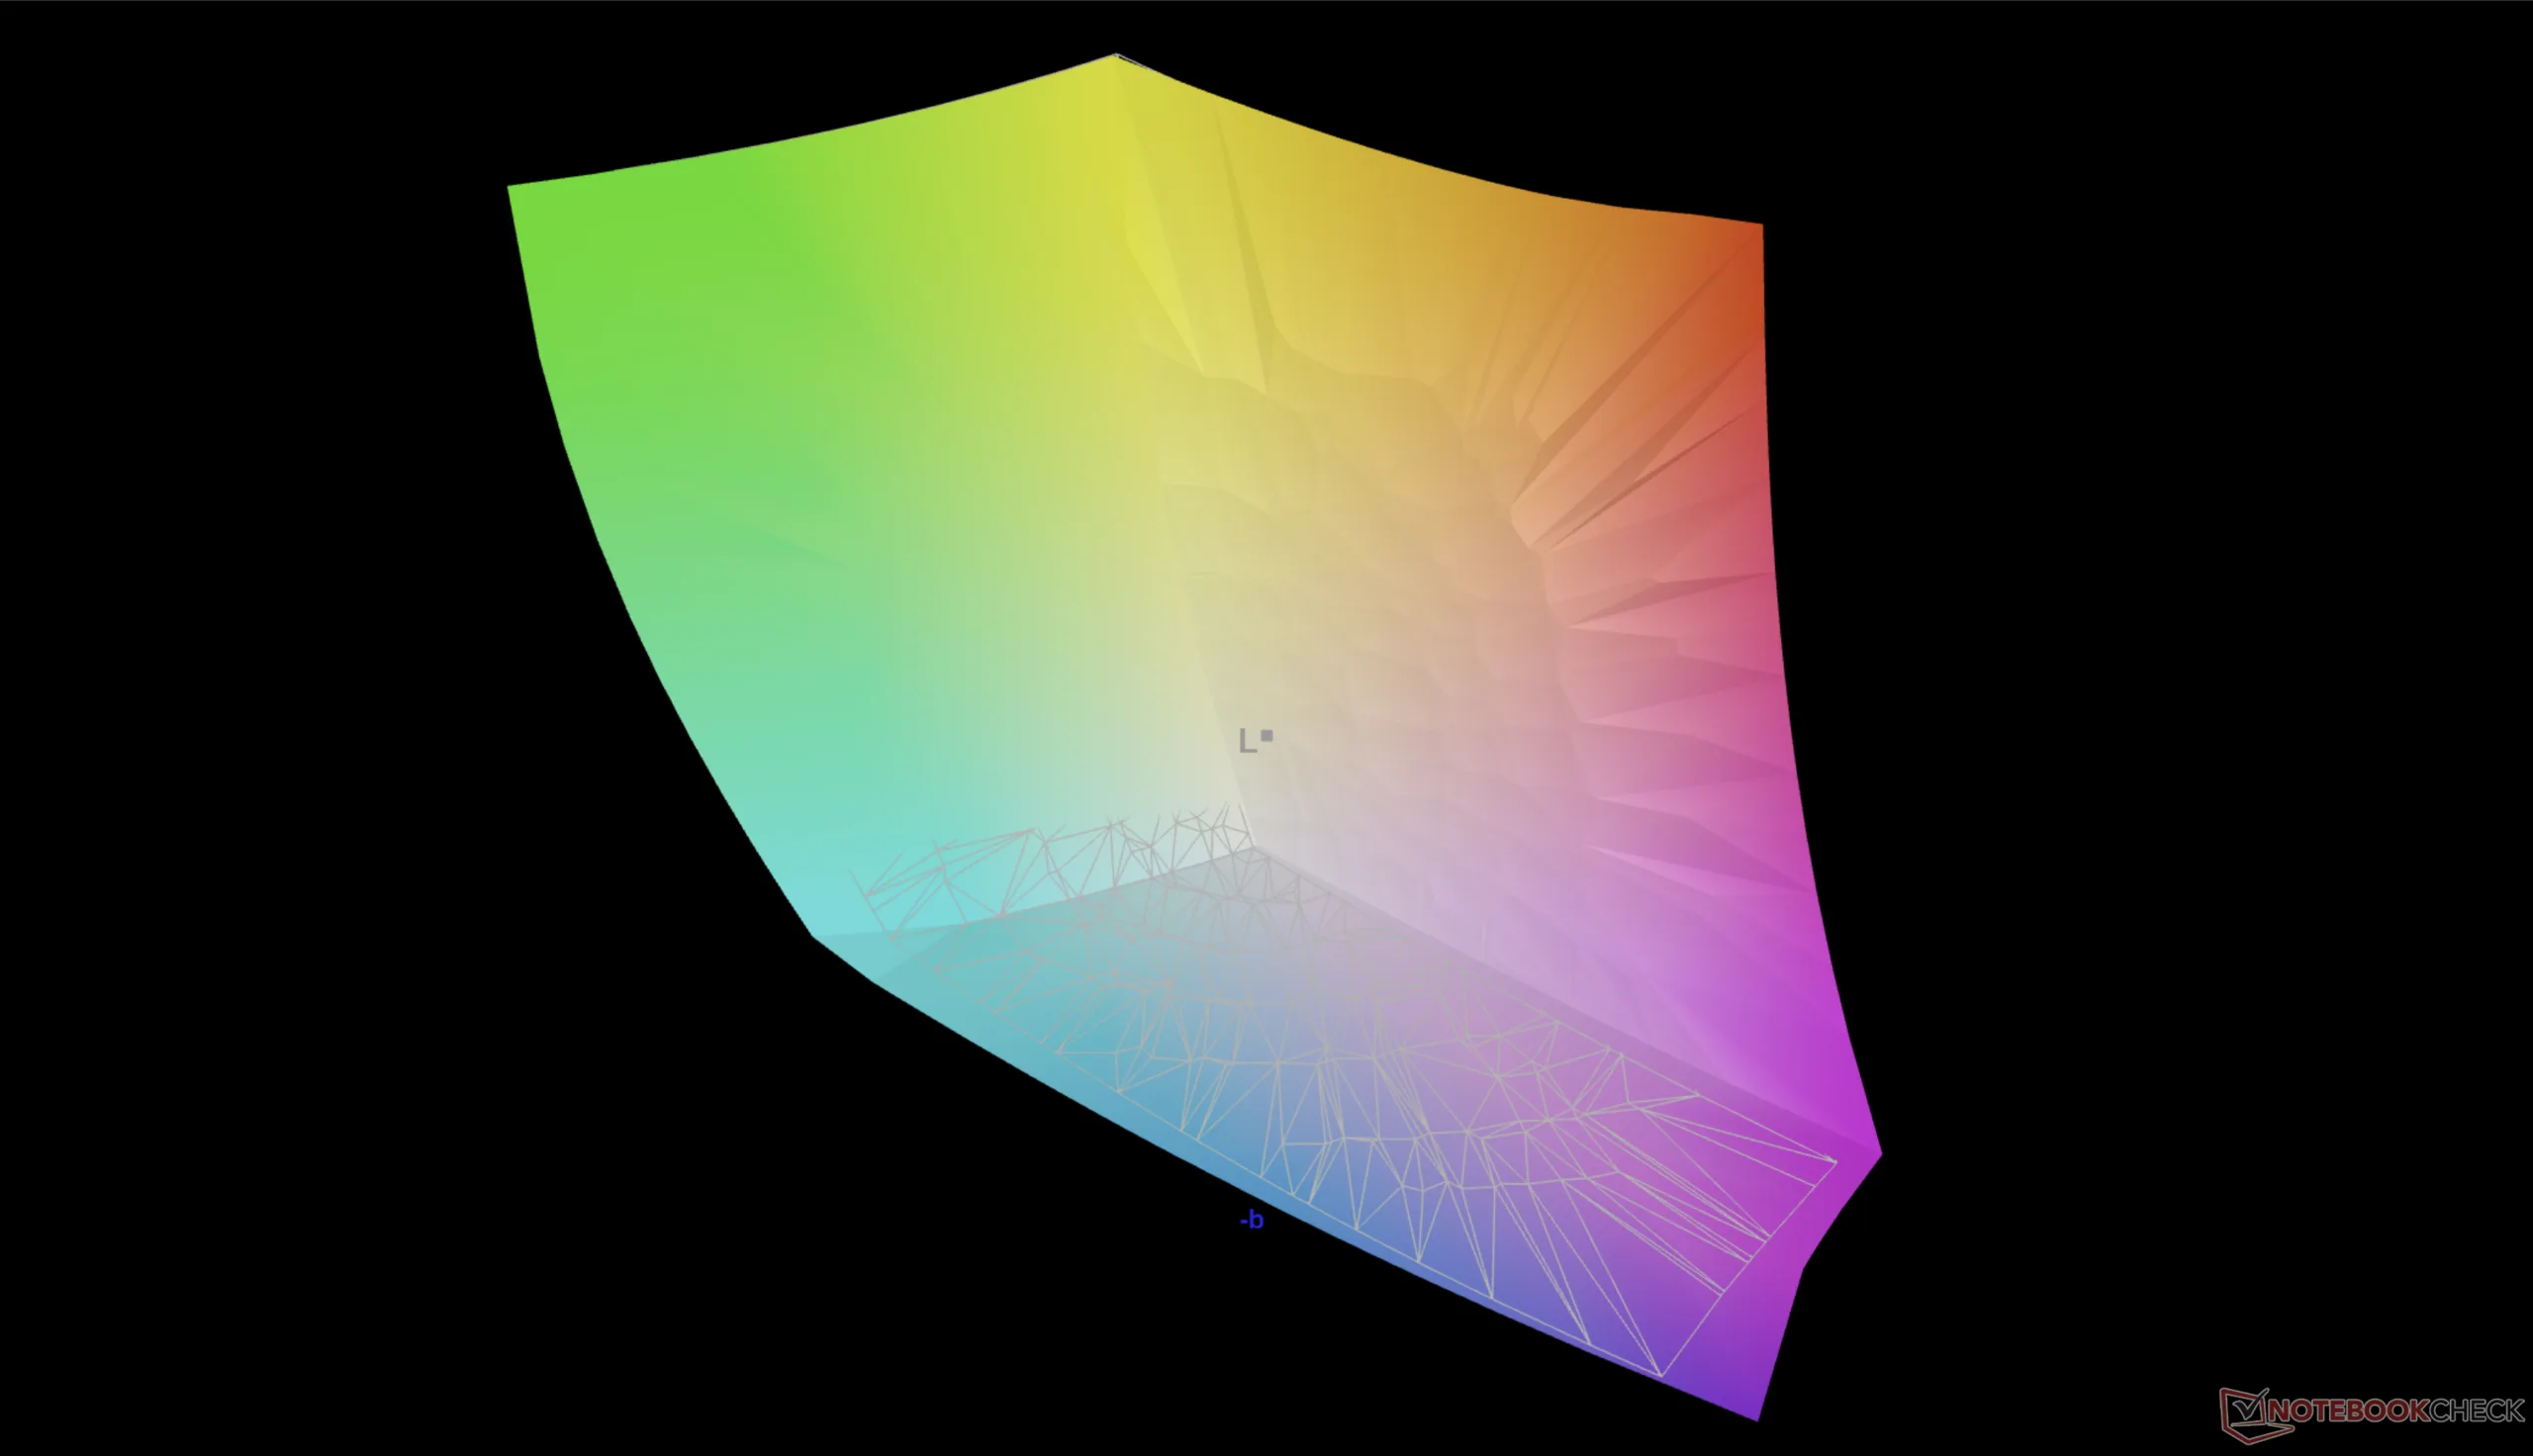
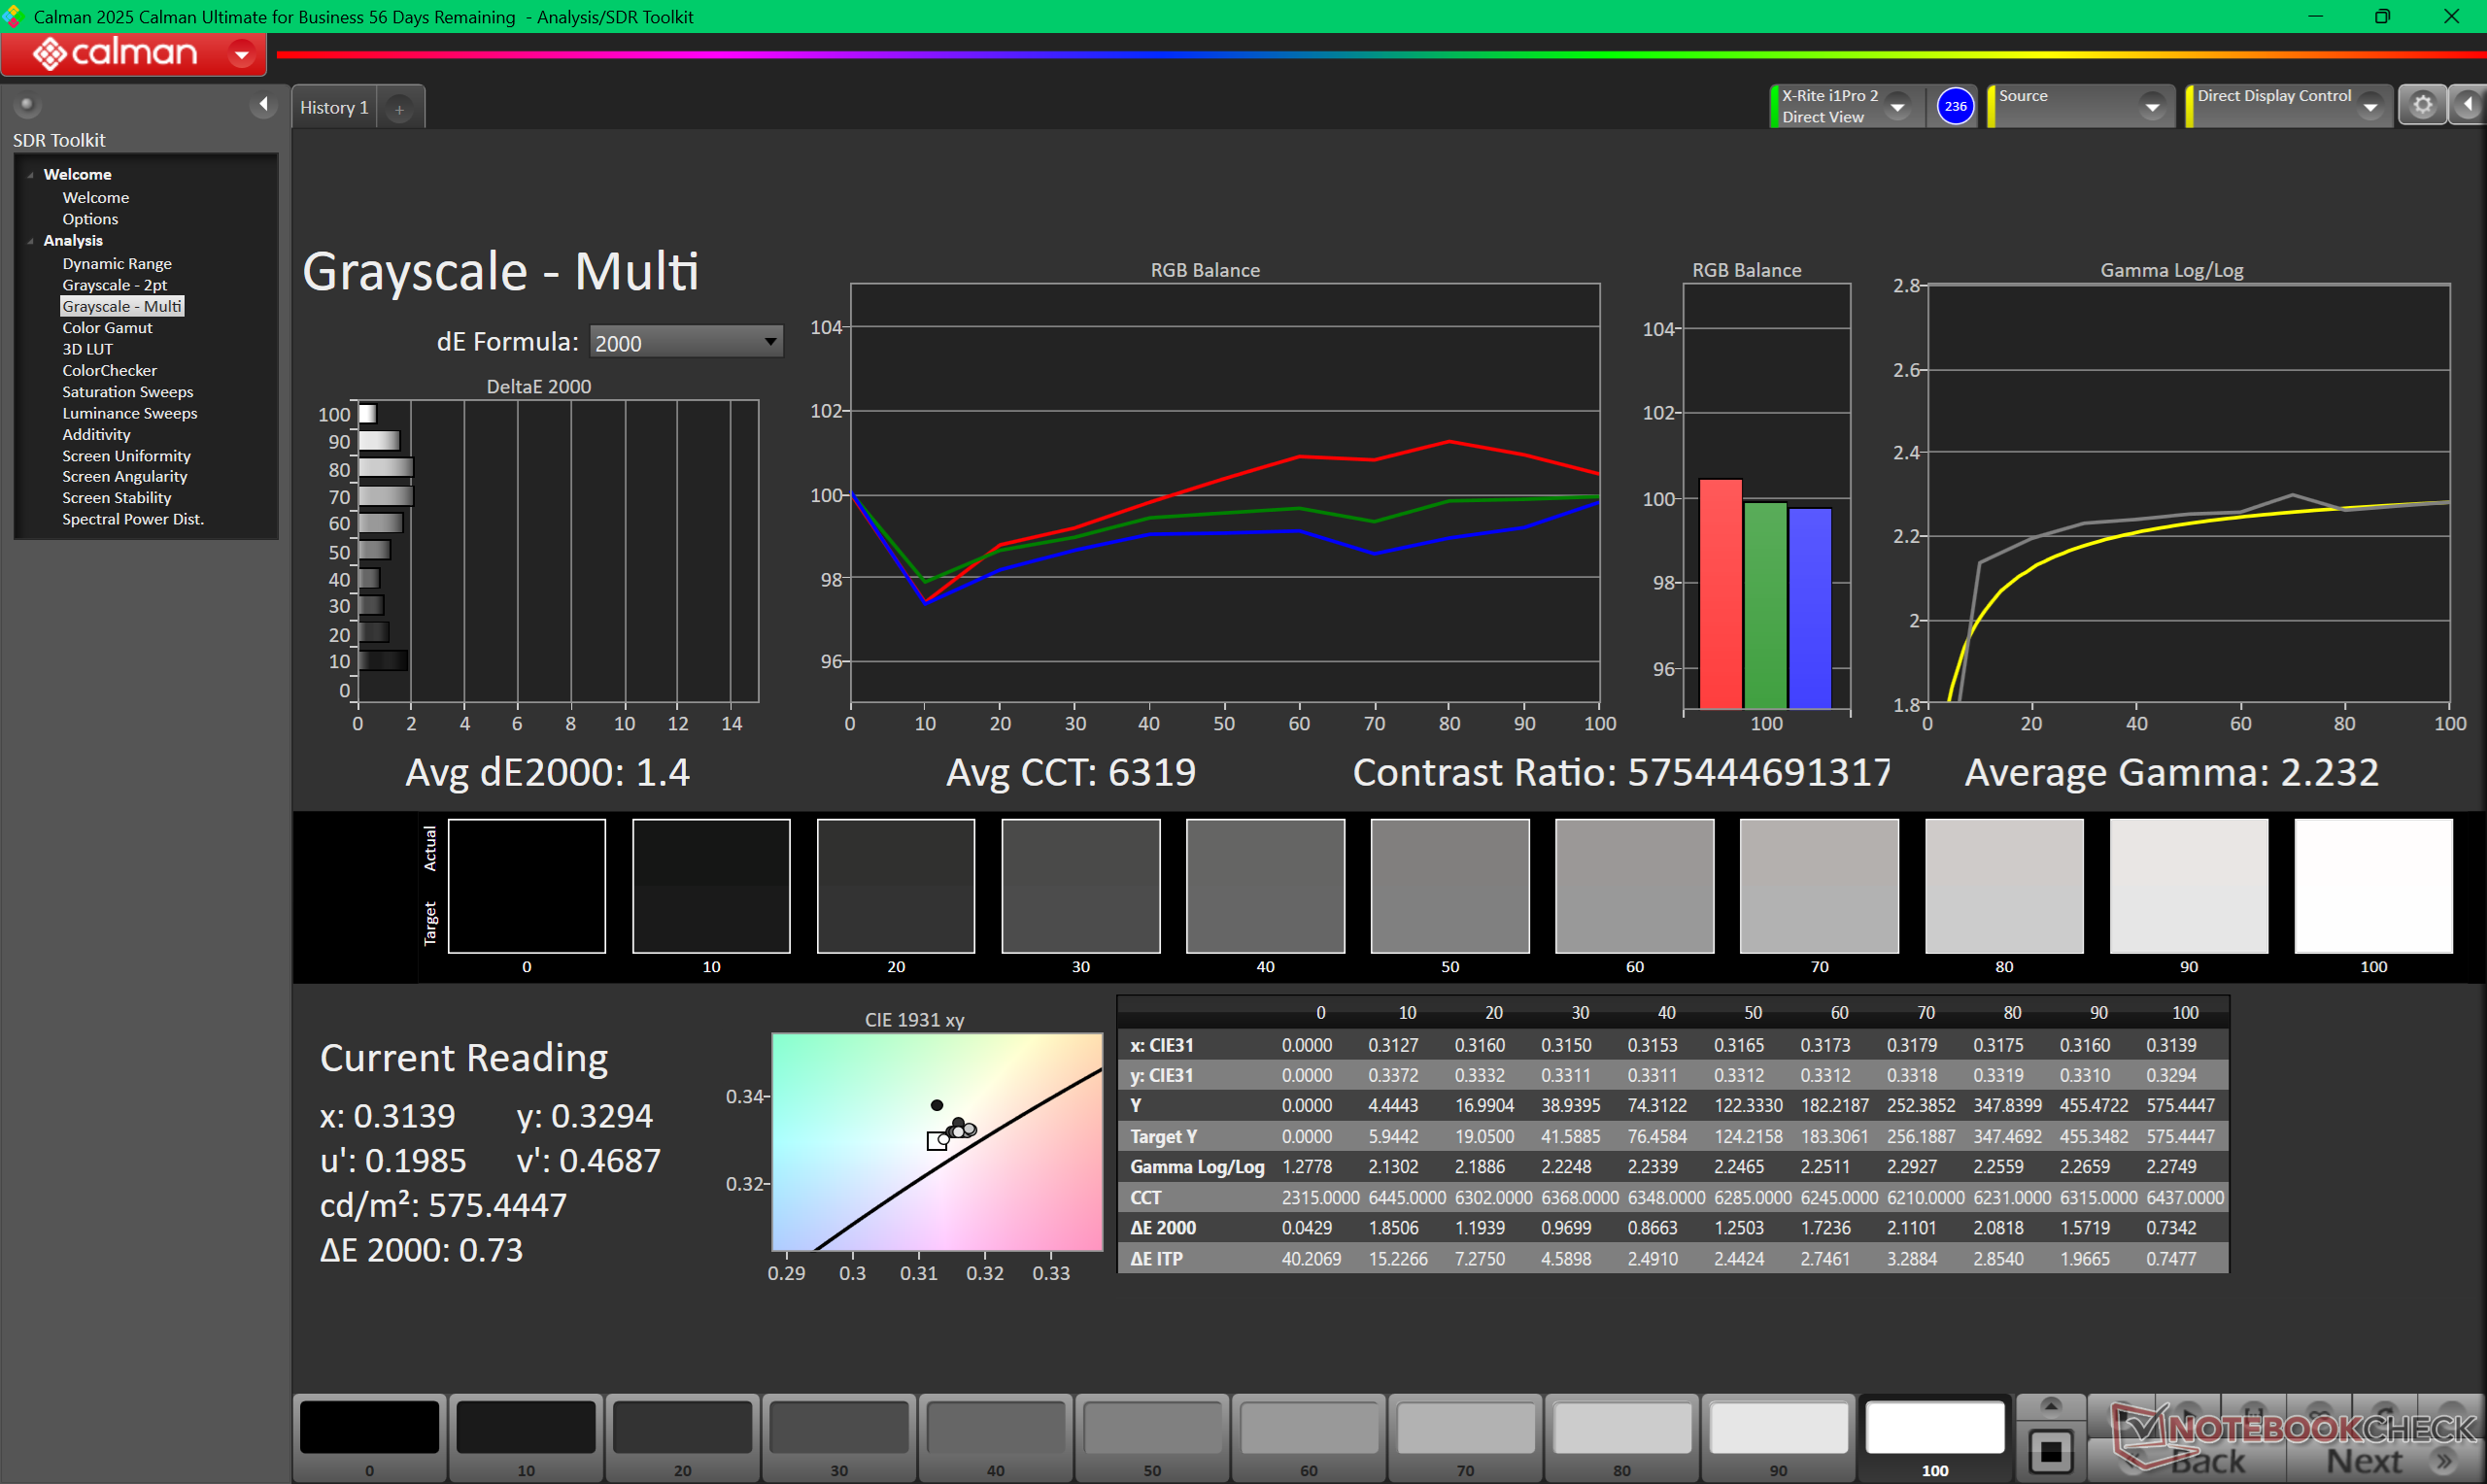
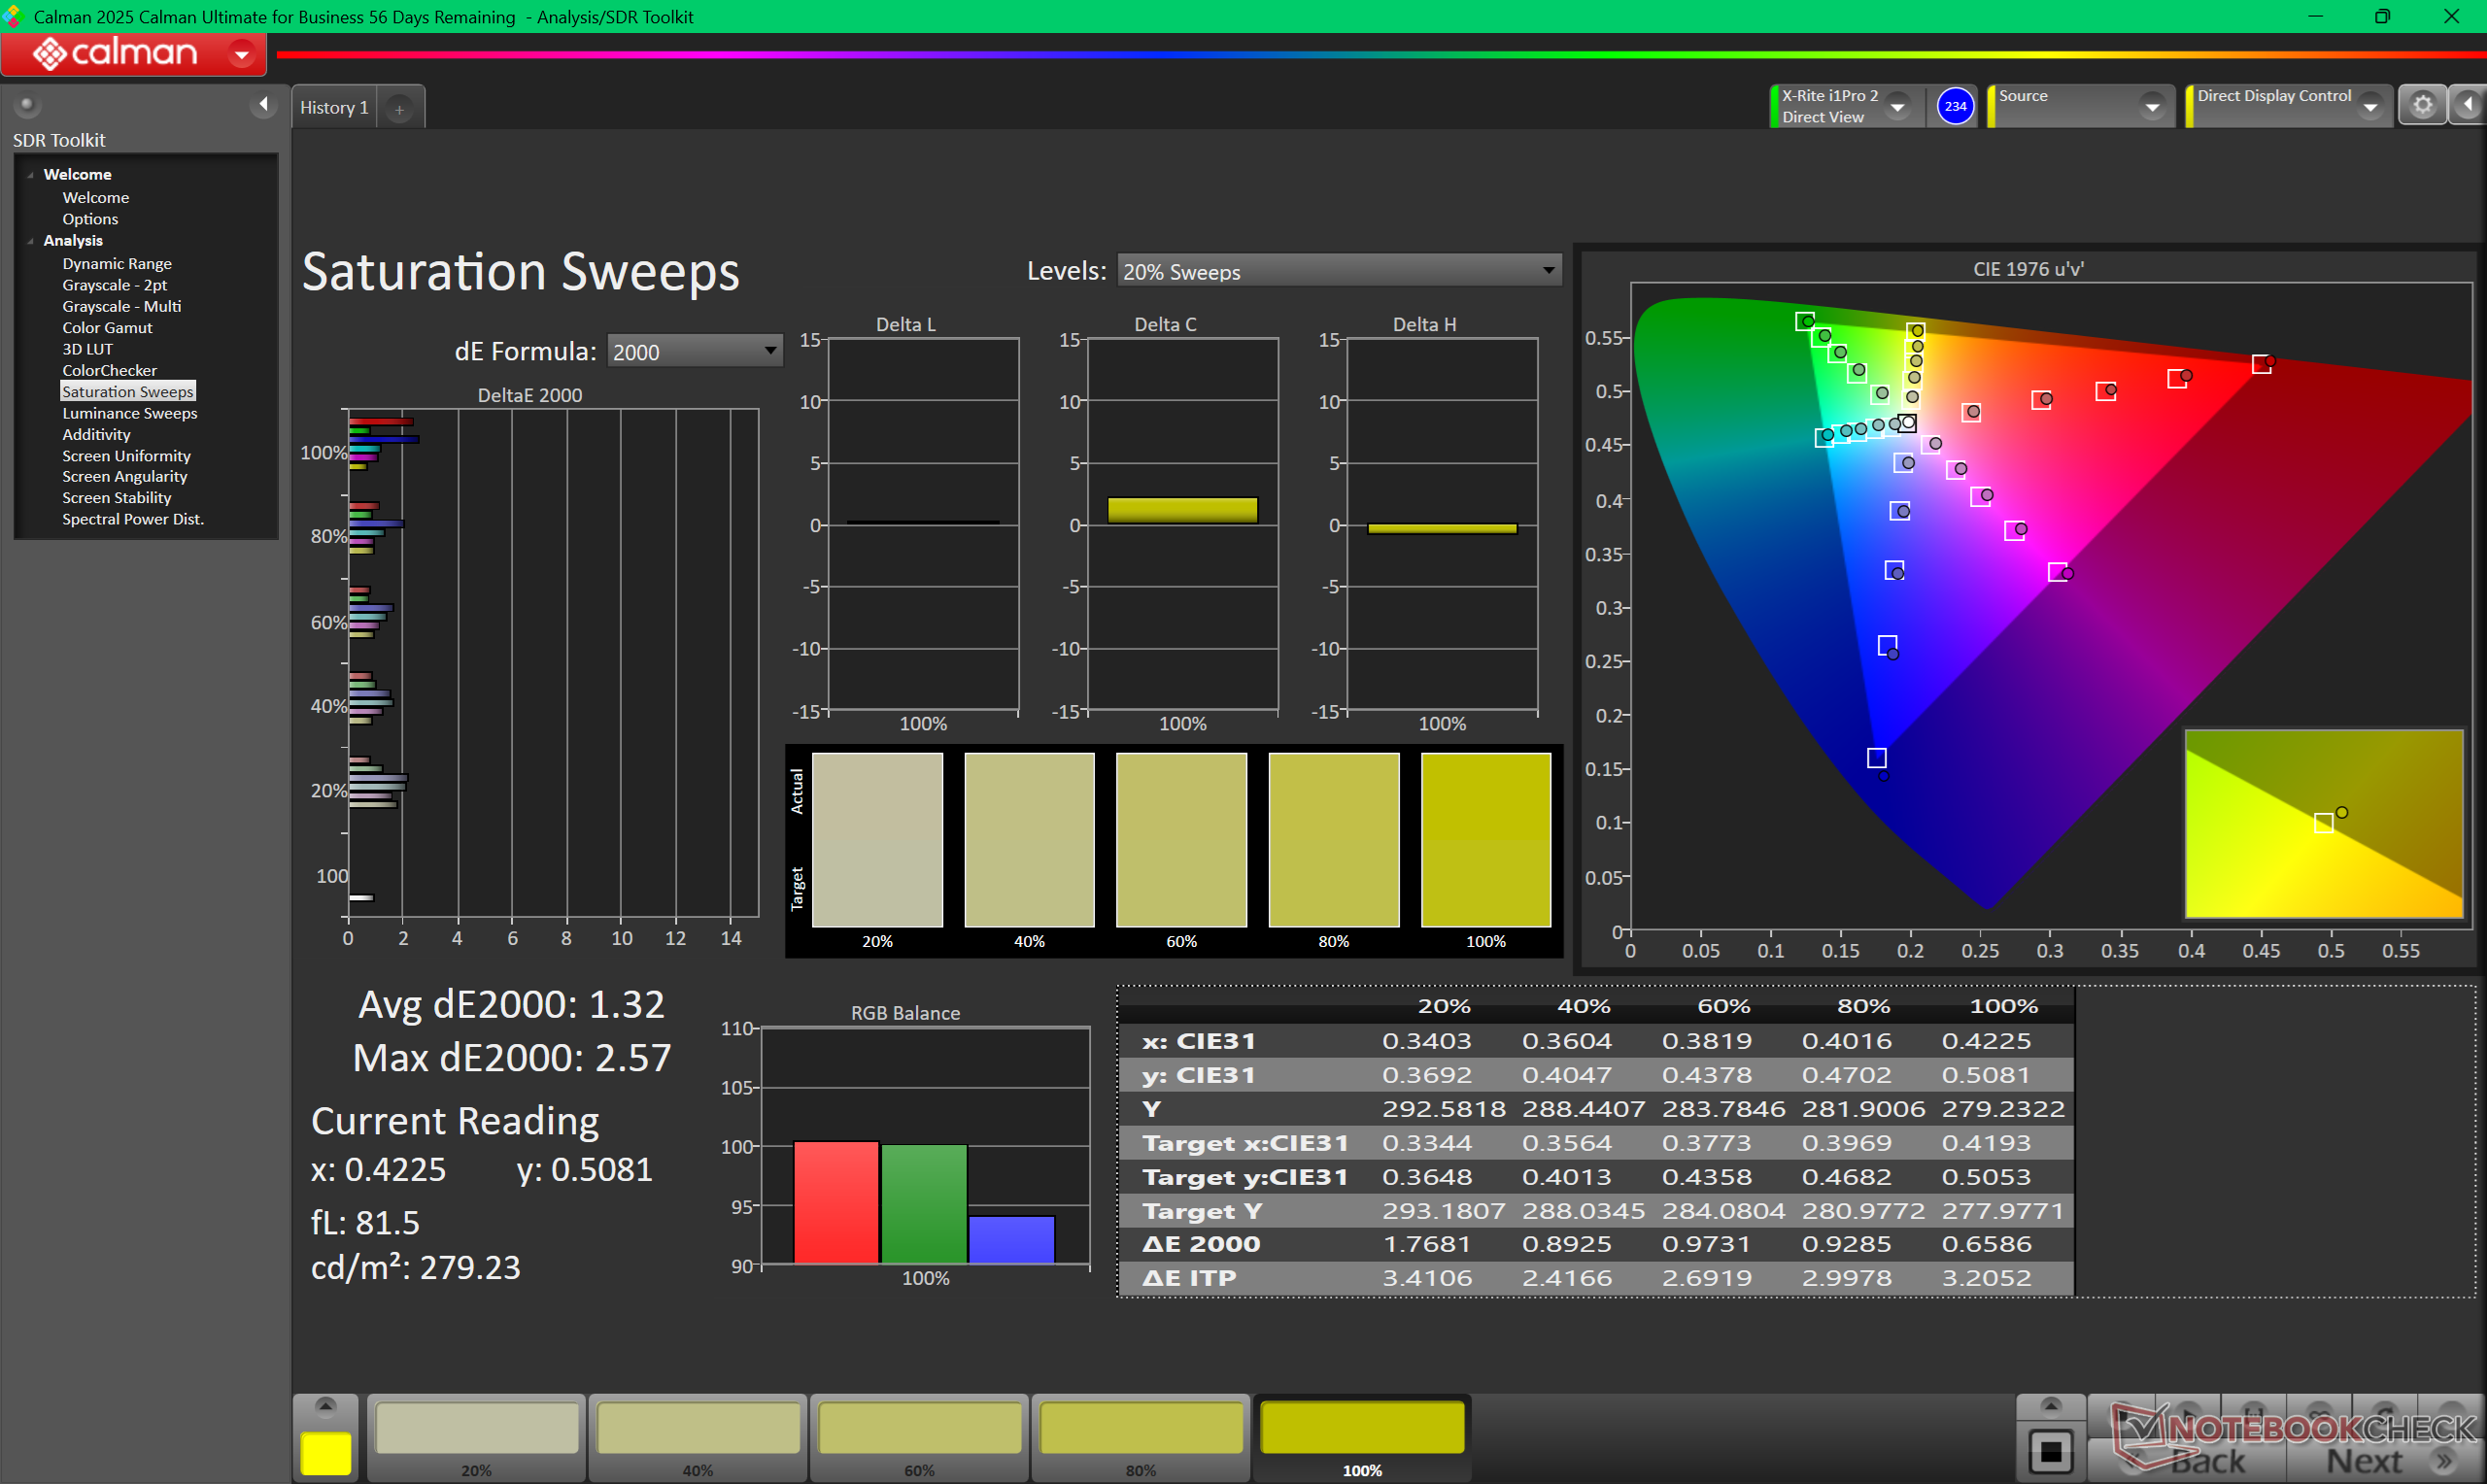
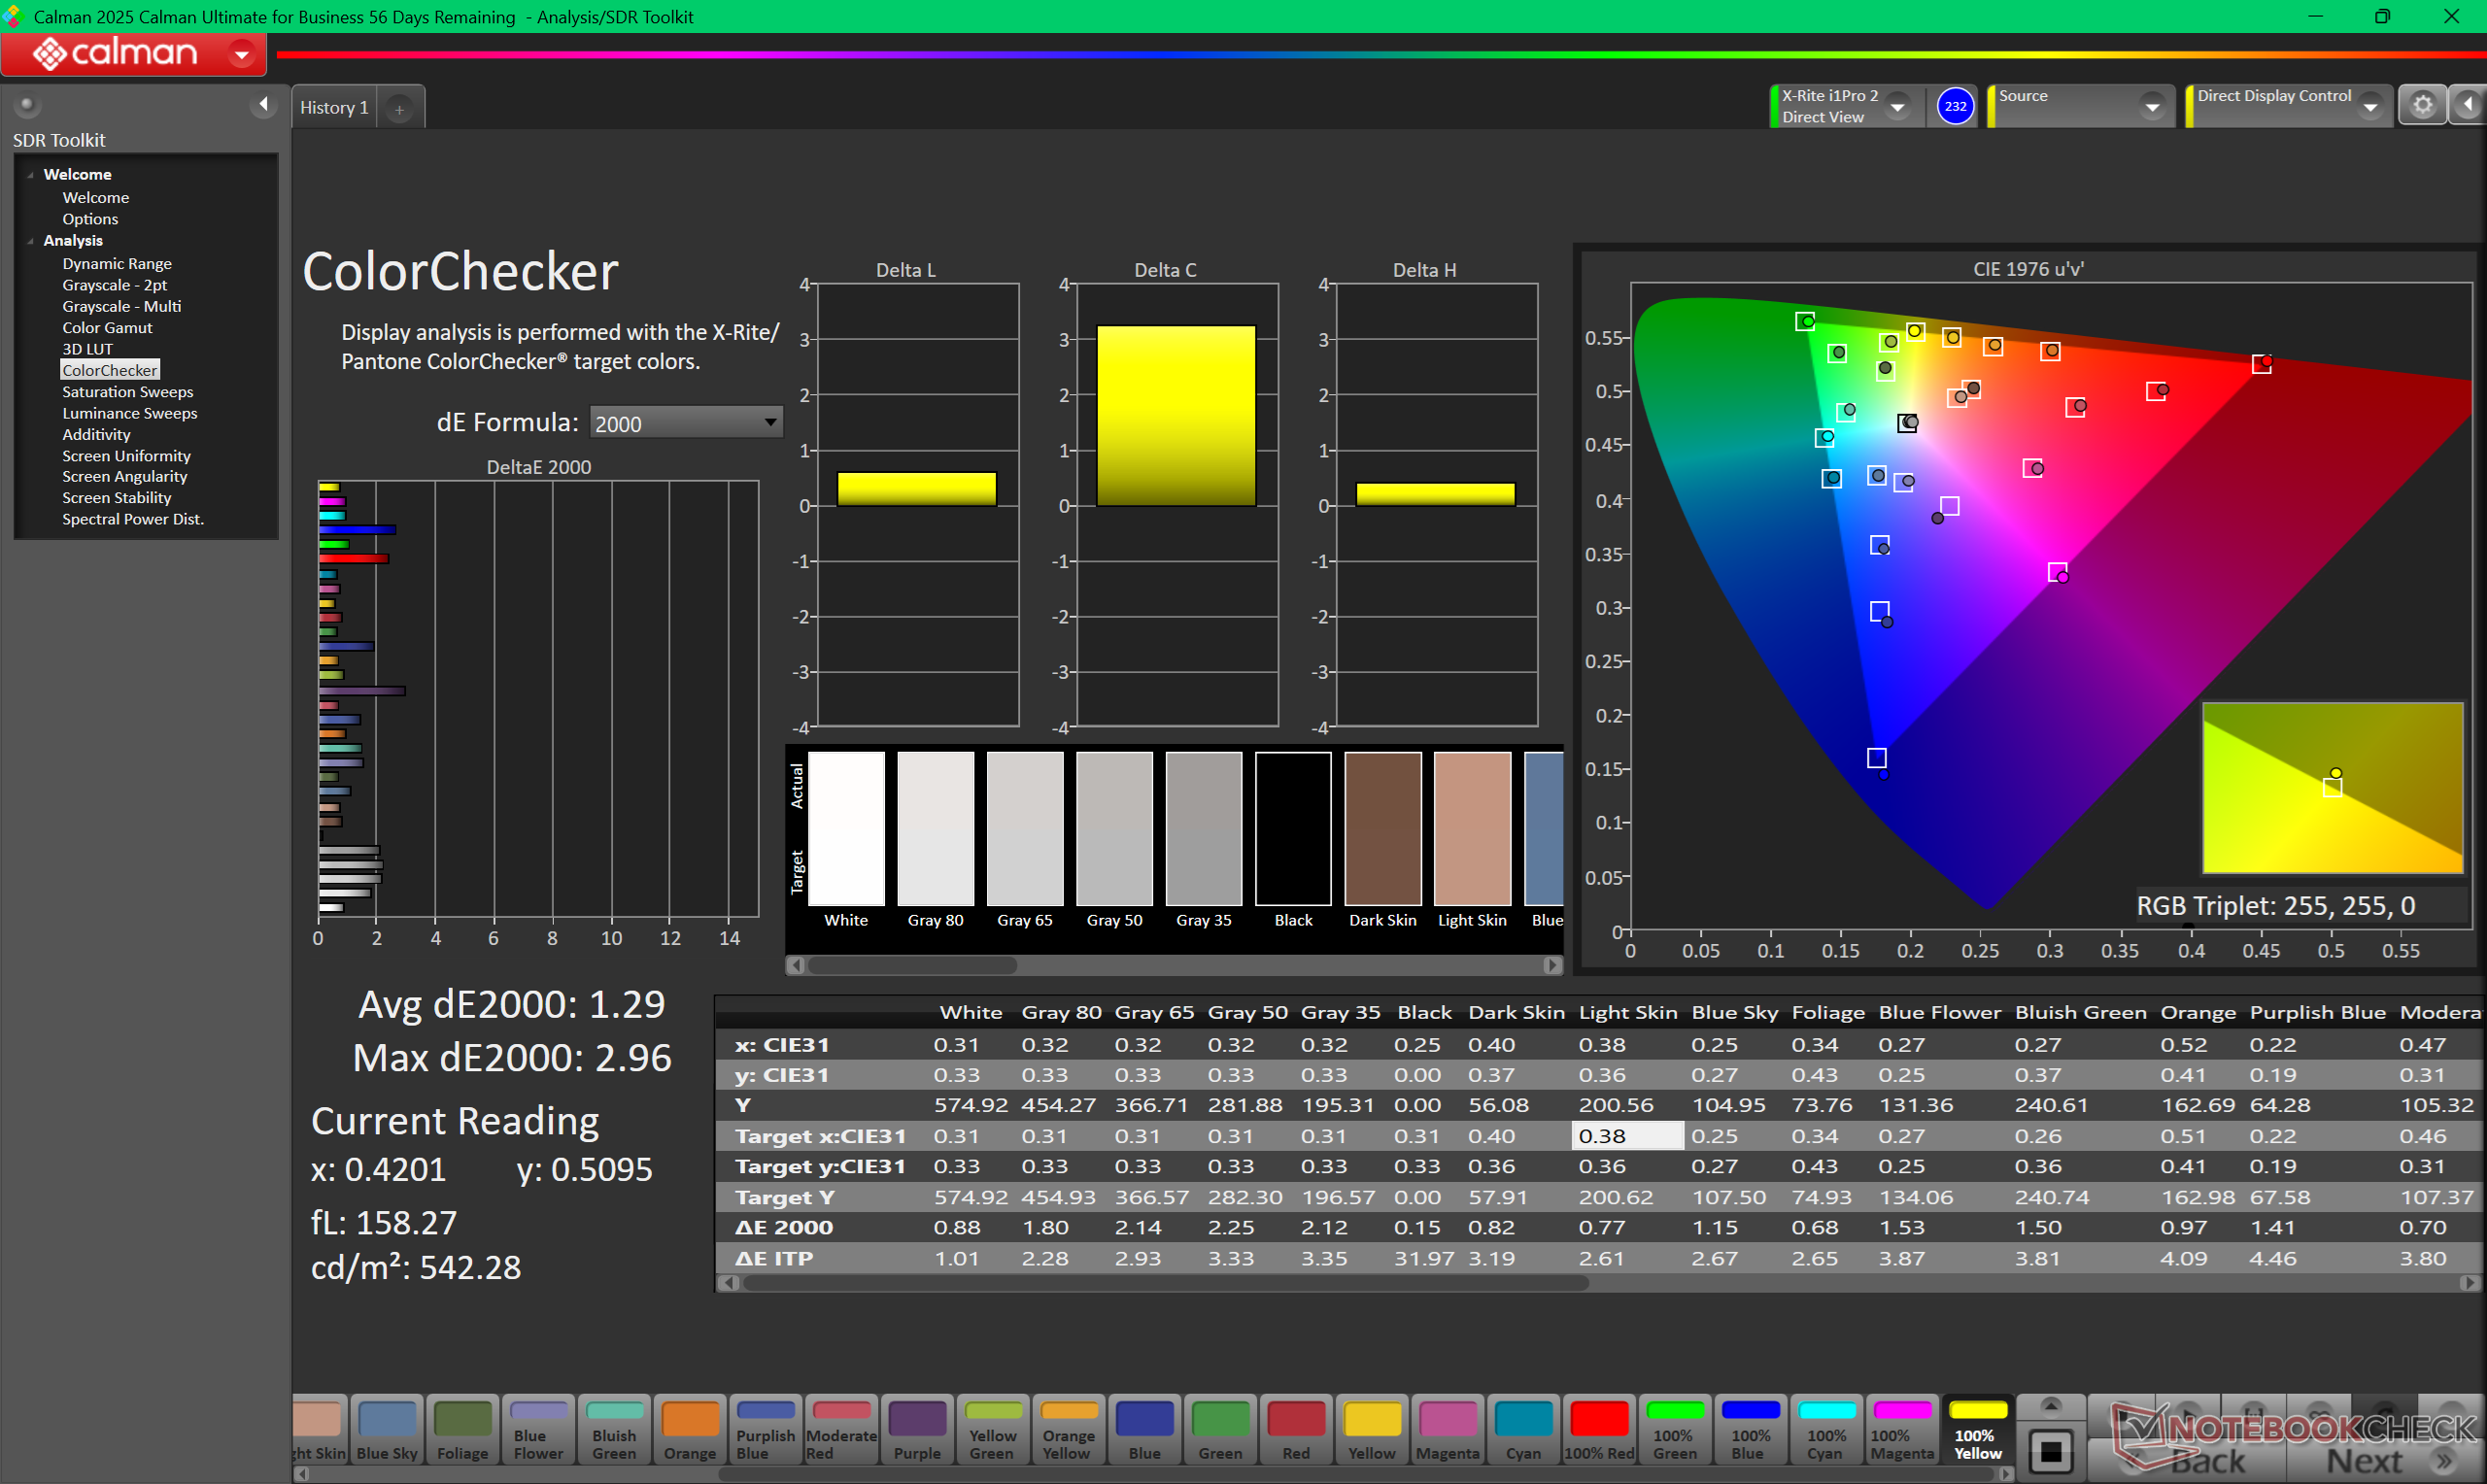
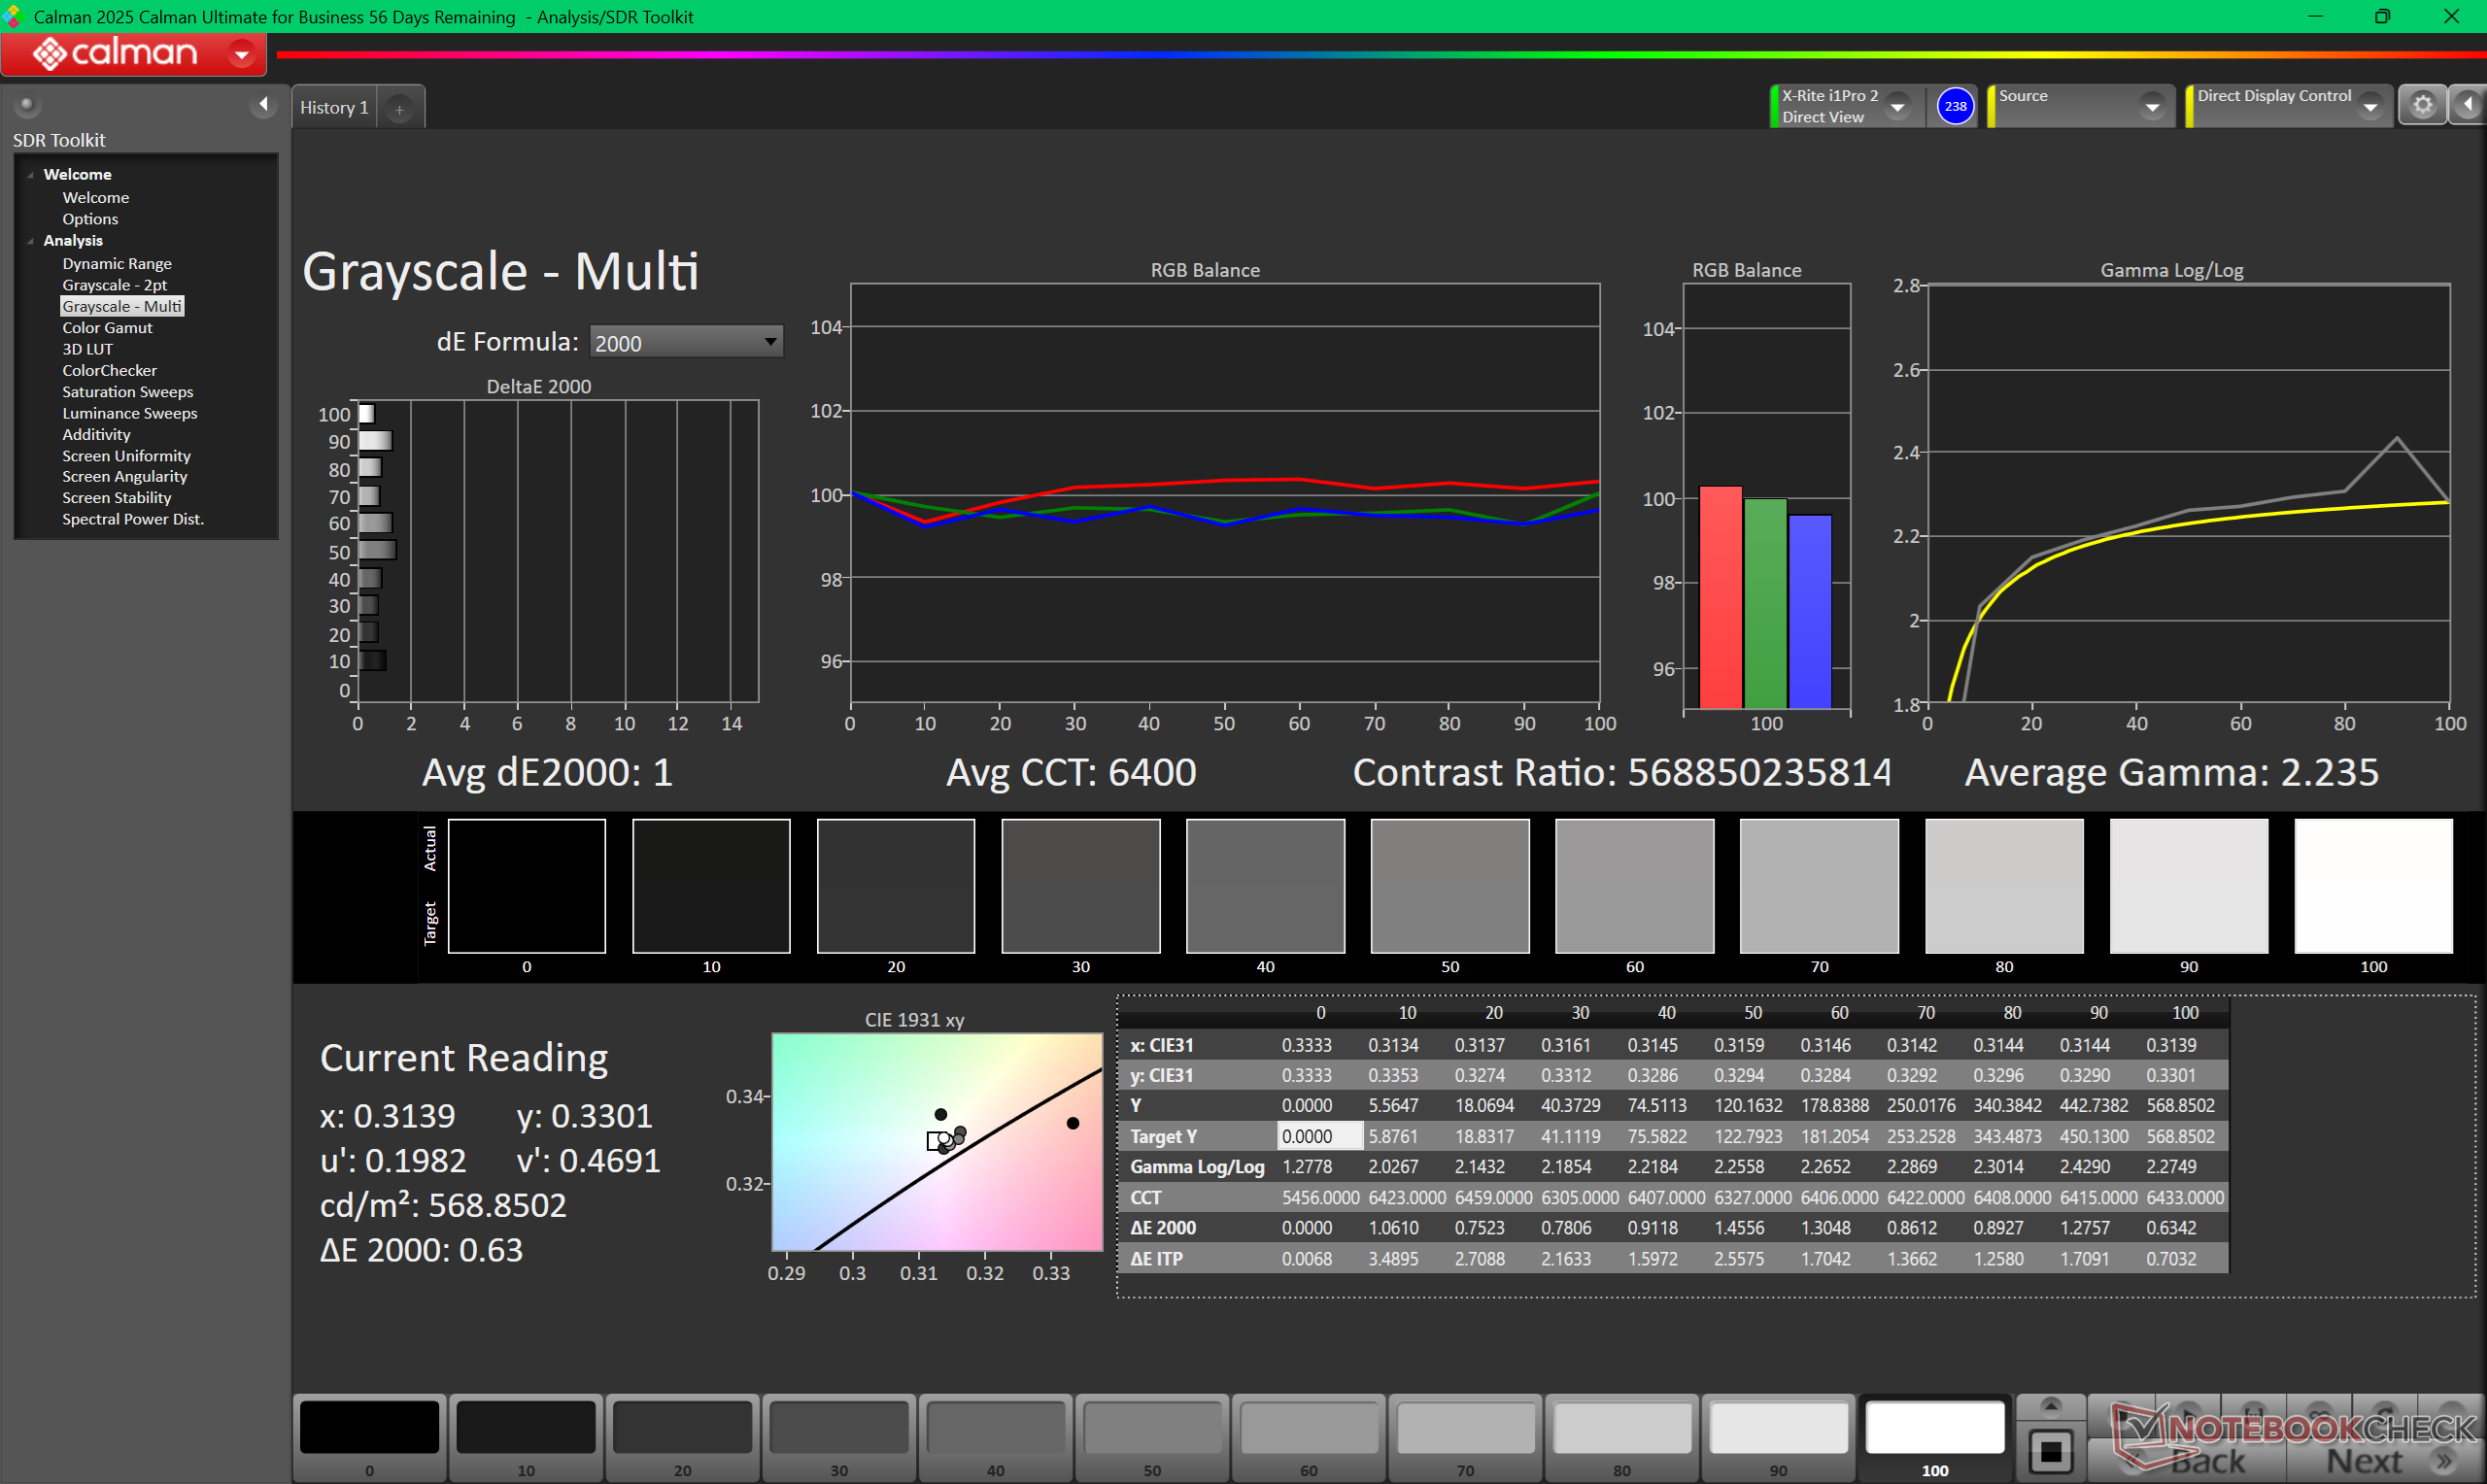
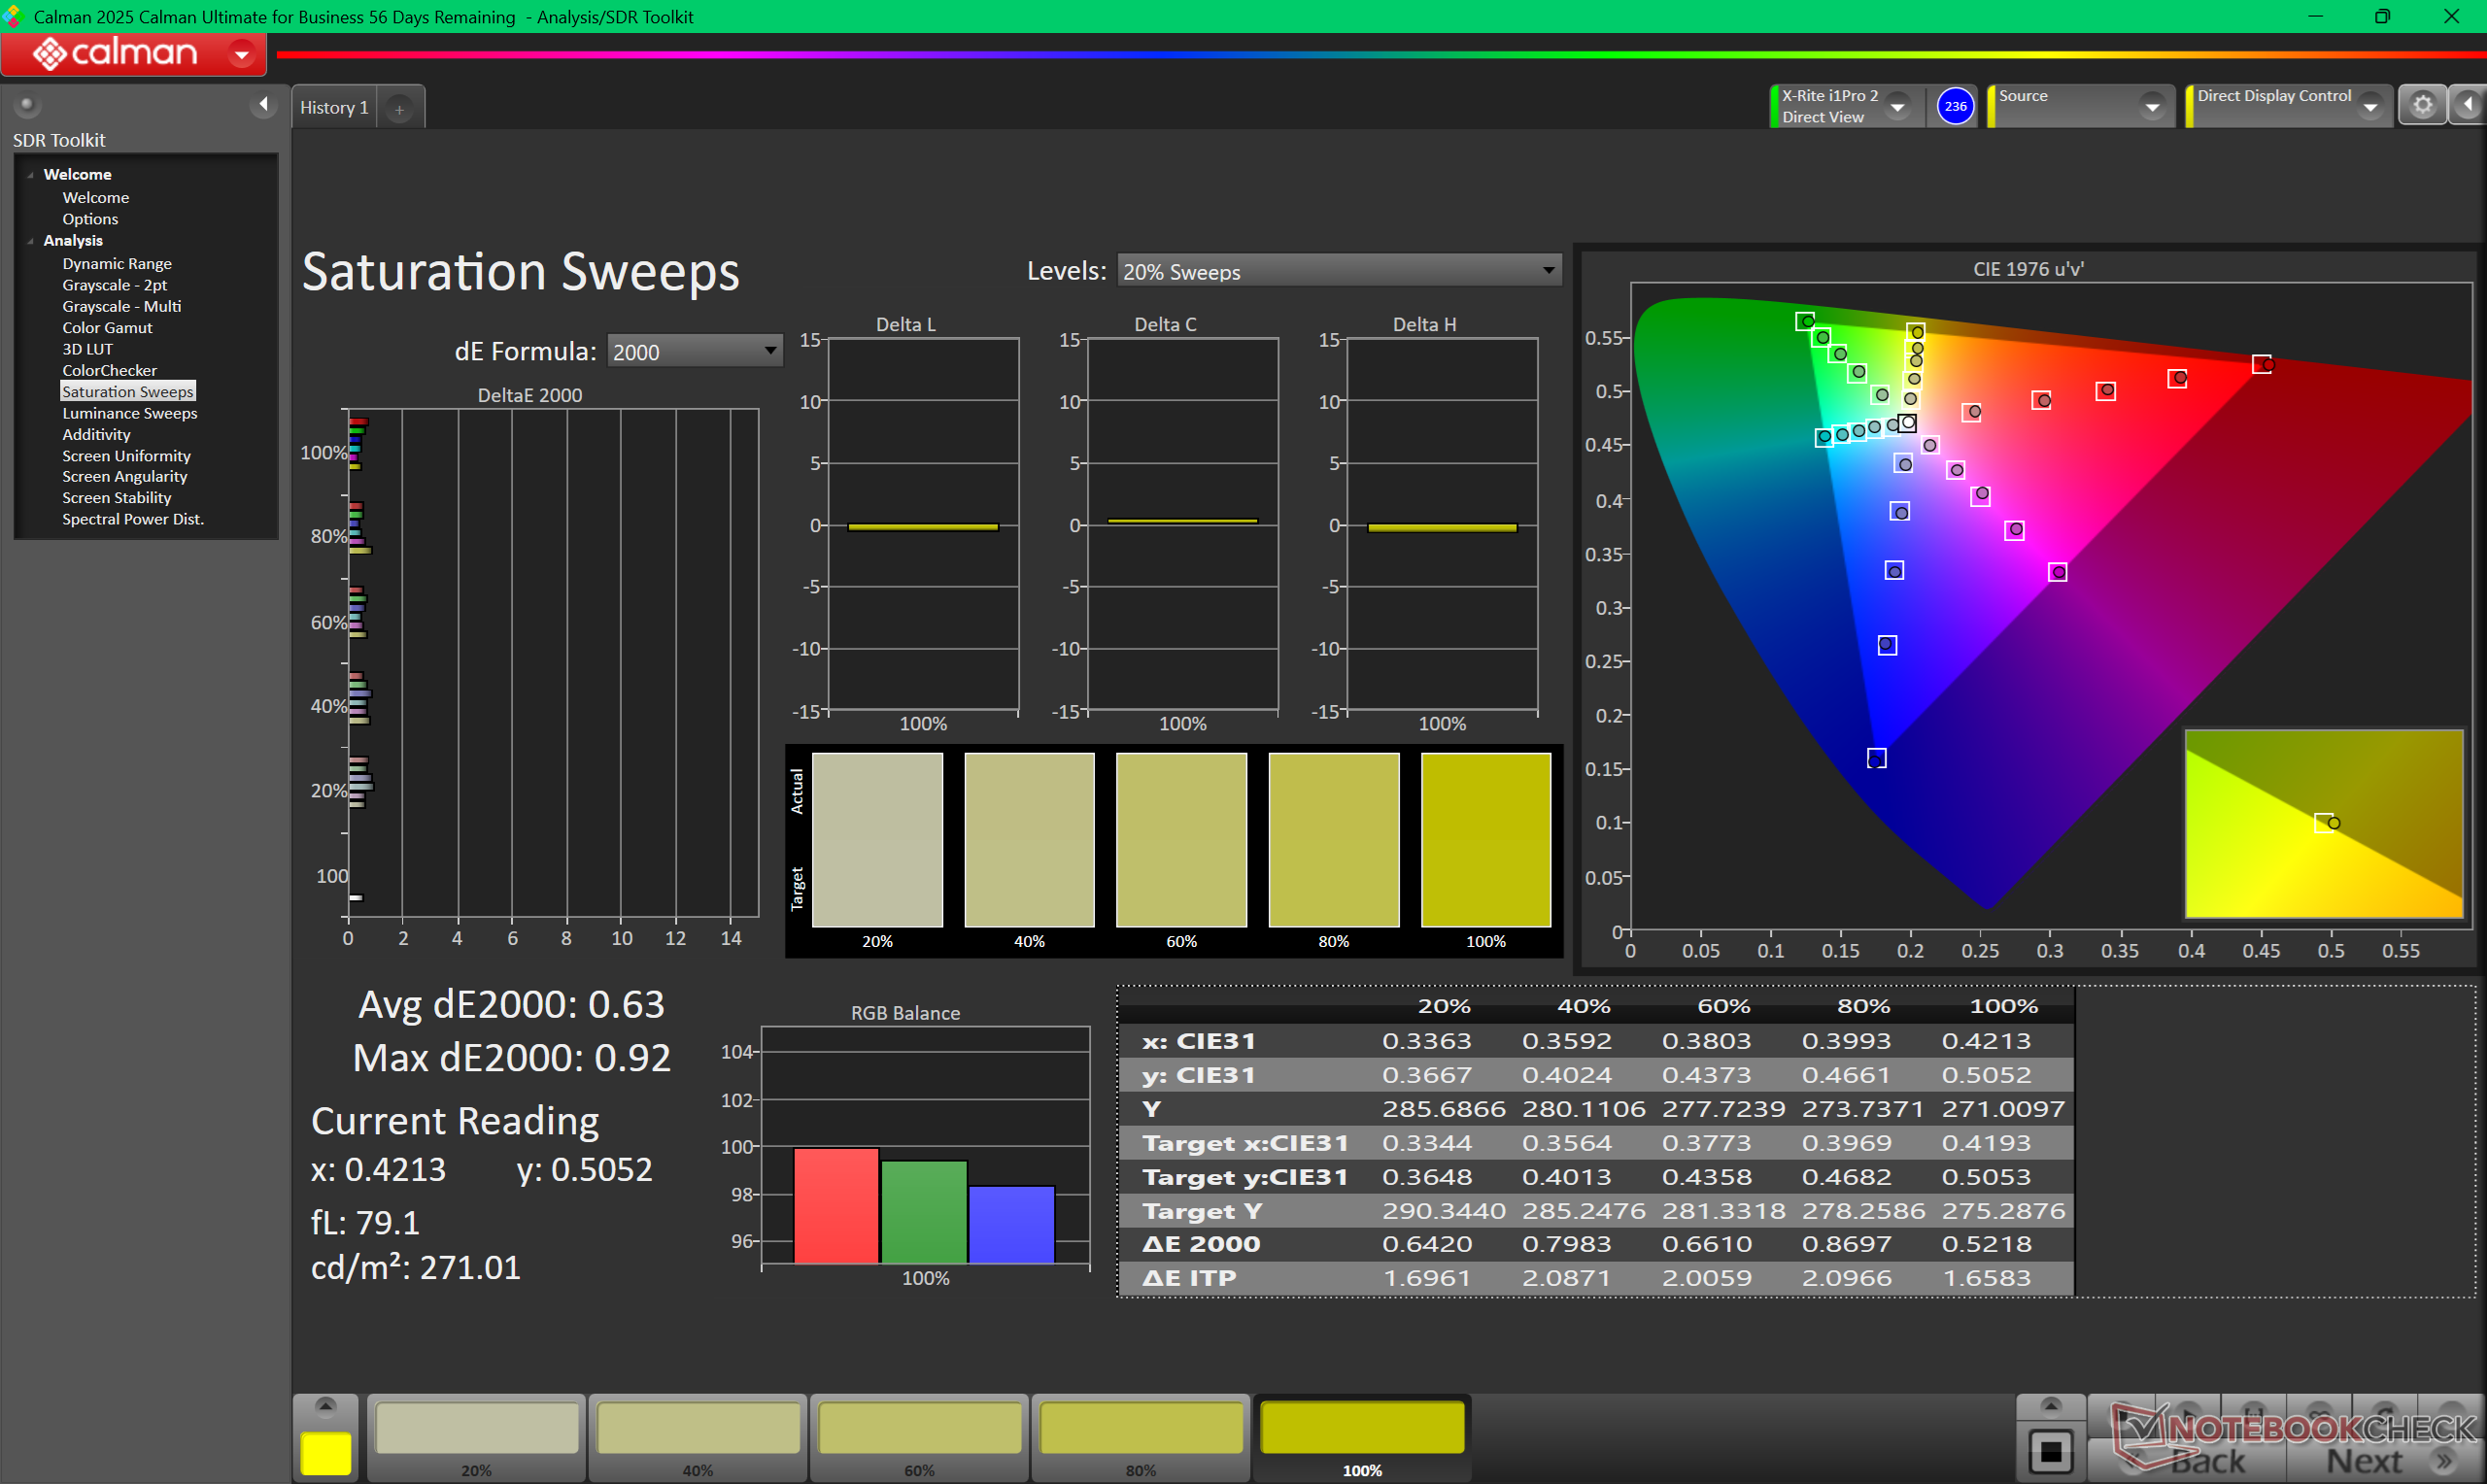
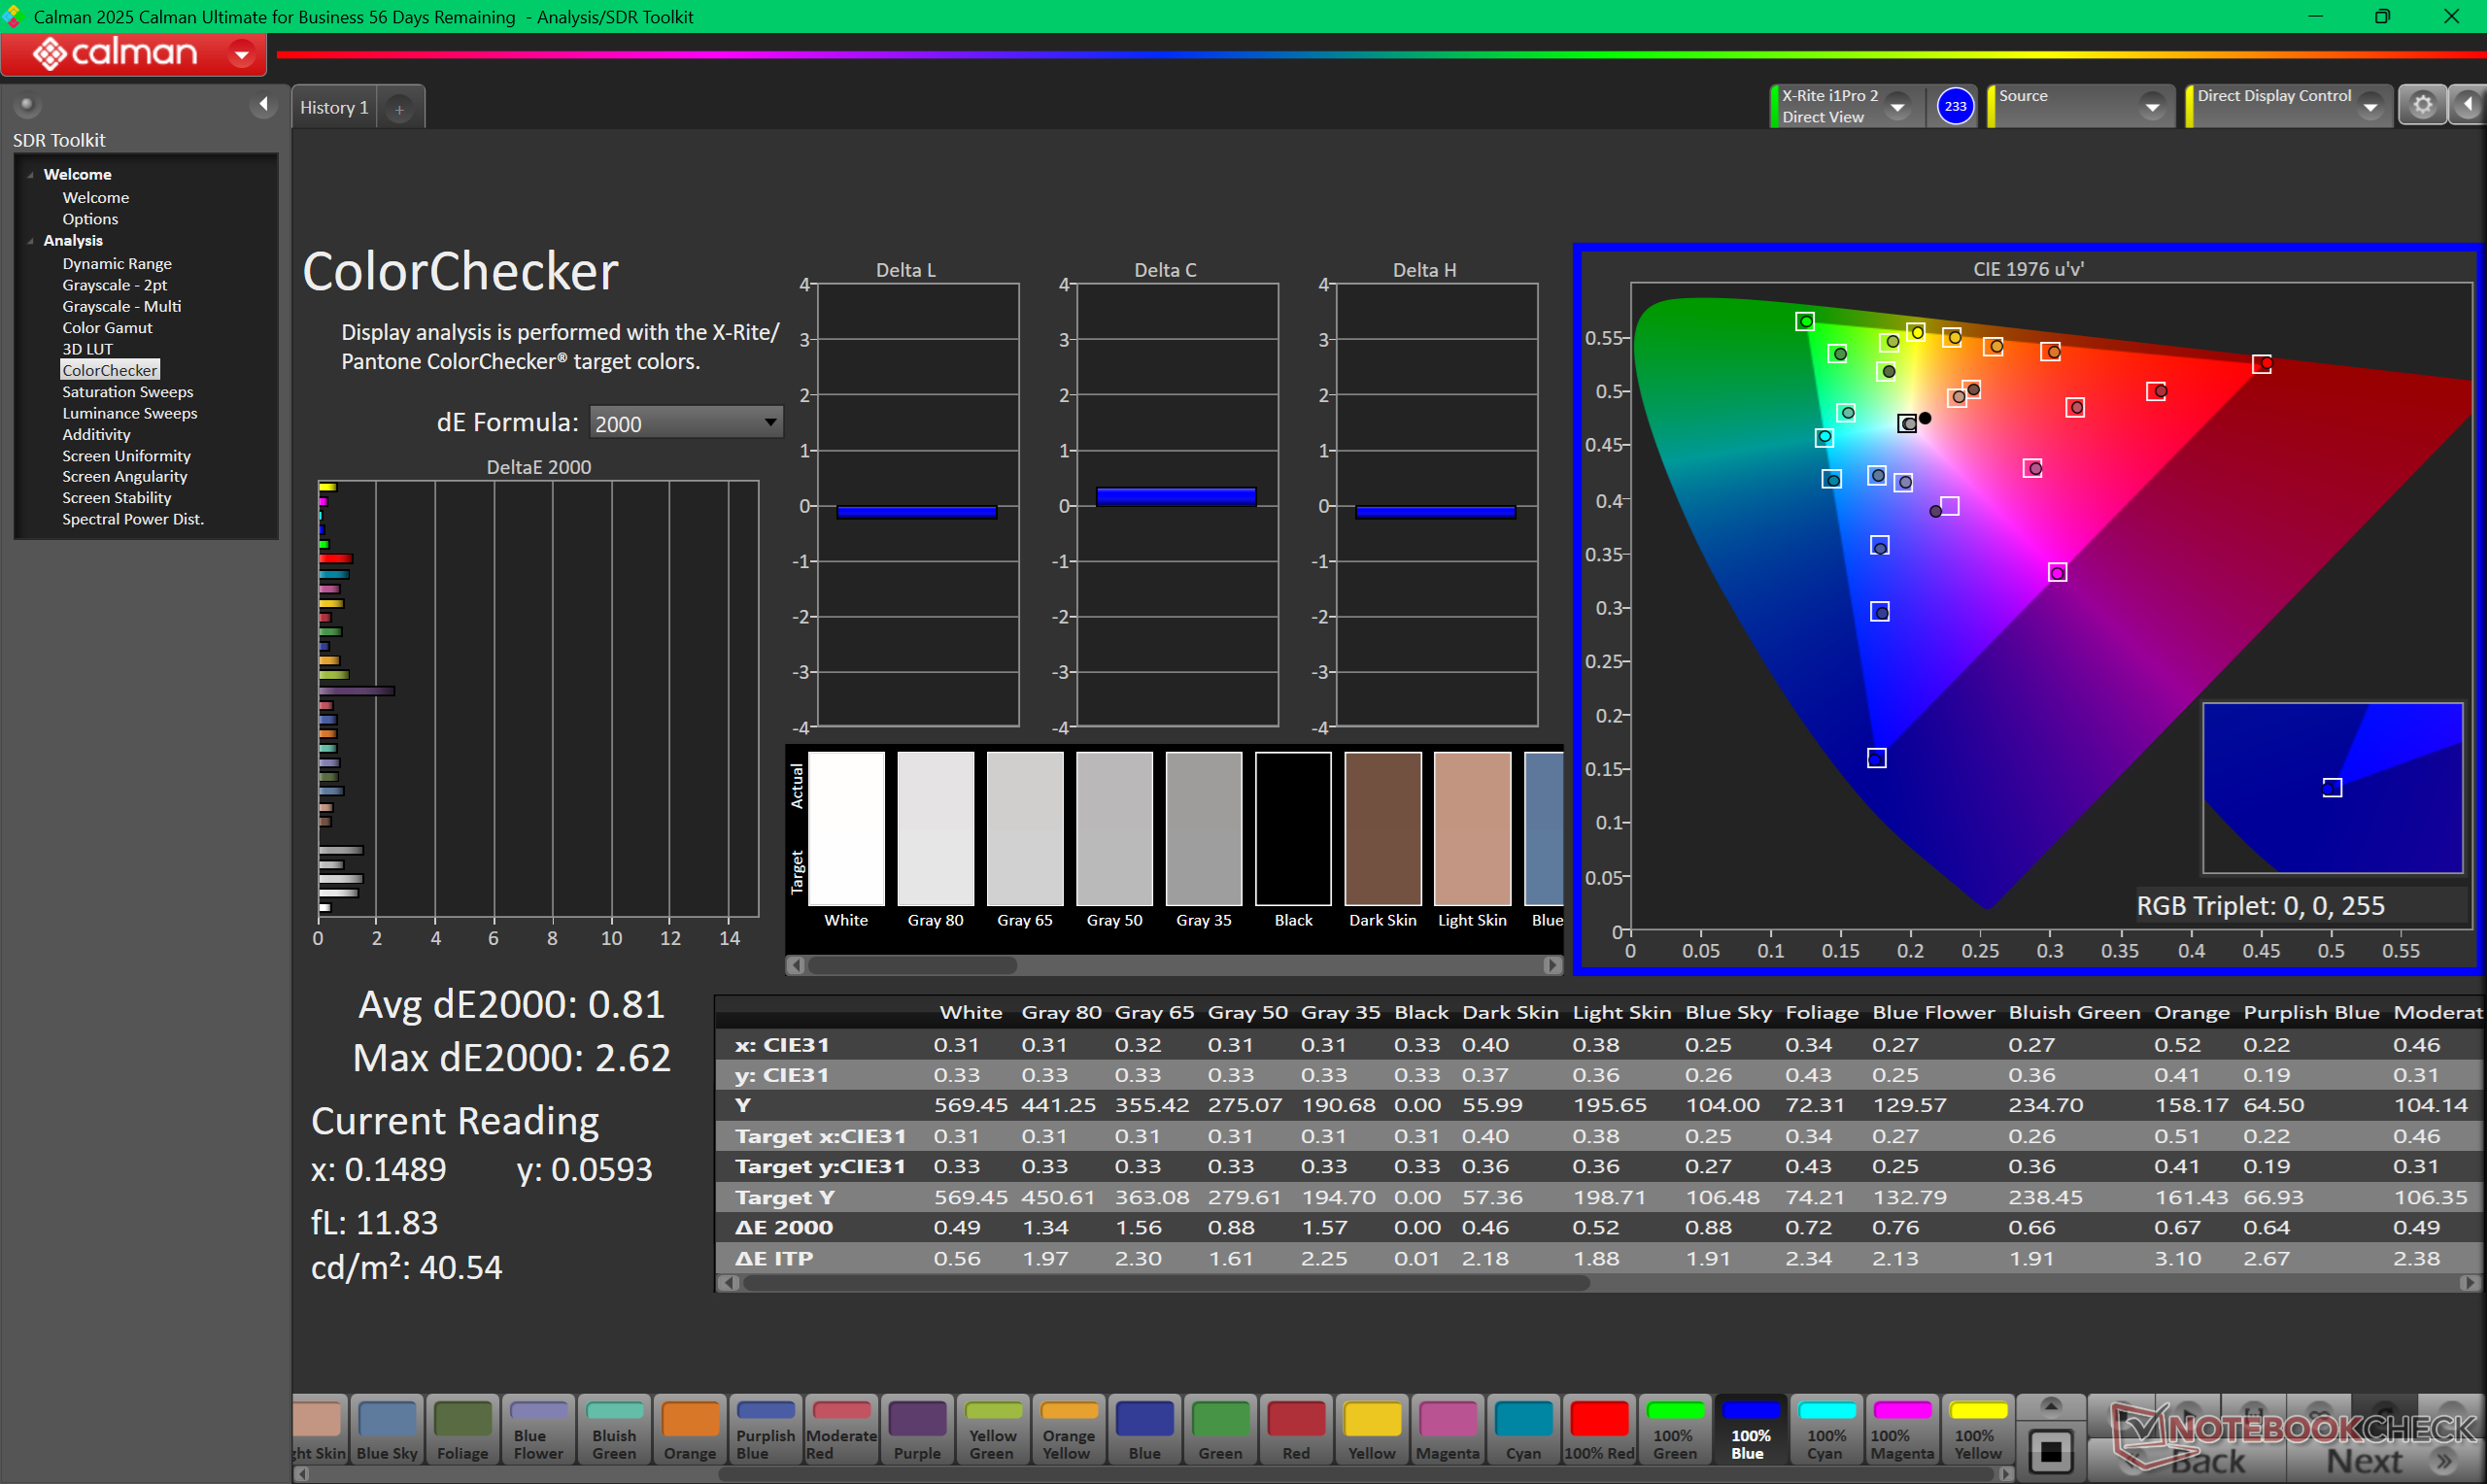
从主观上看,我们测试设备上的哑光串联 OLED 屏幕比传统的亮光屏幕更有颗粒感,尤其是在显示全白图像时。尽管如此,它在 HDR 播放方面仍然表现出色,因为它的亮度非常高,尤其是对于 OLED 面板而言。我们使用 X-Rite 色差计进行的独立测量显示,SDR 模式下的最大亮度为 566 尼特,HDR 模式下的最大亮度为 1430 尼特,分别接近广告宣传的 600 尼特和 1500 尼特。不过,如果触摸屏和 HDR 功能并不重要,那么 2400p 选项可能因其更密集的像素数而更有价值。
| |||||||||||||||||||||||||
Brightness Distribution: 99 %
Center on Battery: 561.8 cd/m²
Contrast: ∞:1 (Black: 0 cd/m²)
ΔE ColorChecker Calman: 1.29 | ∀{0.5-29.43 Ø4.71}
calibrated: 0.81
ΔE Greyscale Calman: 1.4 | ∀{0.09-98 Ø4.96}
97.5% AdobeRGB 1998 (Argyll 3D)
100% sRGB (Argyll 3D)
98.8% Display P3 (Argyll 3D)
Gamma: 2.23
CCT: 6319 K
| Lenovo ThinkPad P1 Gen 8 Samsung ATNA60KA02-0, Tandem OLED, 3200x2000, 16", 120 Hz | Lenovo ThinkPad P16s Gen 4 21RX000YGE N160JCA-GT1, IPS LED, 1920x1200, 16", 60 Hz | Lenovo ThinkPad P1 Gen 7 21KV001SGE MNG007DA1-9 , IPS LED, 2560x1600, 16", 165 Hz | HP ZBook X G1i 16 LG Philips LGD07B3, IPS, 2560x1600, 16", 120 Hz | Dell Pro Max 16 Plus Samsung 160HC01, OLED, 3840x2400, 16", 120 Hz | Asus ExpertBook B6 Flip B6602FC2 AU Optronics Model: AUOE495, IPS, 2560x1600, 16", 120 Hz | |
|---|---|---|---|---|---|---|
| Display | -22% | -19% | 0% | -4% | -4% | |
| Display P3 Coverage (%) | 98.8 | 65.8 -33% | 69.4 -30% | 97.2 -2% | 97.3 -2% | 97.9 -1% |
| sRGB Coverage (%) | 100 | 96.8 -3% | 97.6 -2% | 100 0% | 100 0% | 99.89 0% |
| AdobeRGB 1998 Coverage (%) | 97.5 | 67.8 -30% | 71.8 -26% | 99.9 2% | 88.8 -9% | 85.52 -12% |
| Response Times | -4013% | -1609% | -3839% | -30% | -4223% | |
| Response Time Grey 50% / Grey 80% * (ms) | 0.57 ? | 29.4 ? -5058% | 11.2 ? -1865% | 45.5 ? -7882% | 0.63 ? -11% | 36 ? -6216% |
| Response Time Black / White * (ms) | 0.73 ? | 22.4 ? -2968% | 10.6 ? -1352% | 26.1 ? -3475% | 0.89 ? -22% | 17 ? -2229% |
| PWM Frequency (Hz) | 1199 | 26536 ? | 479.9 ? | |||
| PWM Amplitude * (%) | 18 | 47 -161% | 28 -56% | |||
| Screen | -72% | -106% | -84% | -20% | -68% | |
| Brightness middle (cd/m²) | 561.8 | 540 -4% | 516 -8% | 461.8 -18% | 530.9 -6% | 440 -22% |
| Brightness (cd/m²) | 566 | 516 -9% | 505 -11% | 427 -25% | 540 -5% | 418 -26% |
| Brightness Distribution (%) | 99 | 93 -6% | 89 -10% | 88 -11% | 95 -4% | 82 -17% |
| Black Level * (cd/m²) | 0.37 | 0.41 | 0.46 | 0.3 | ||
| Colorchecker dE 2000 * | 1.29 | 3.4 -164% | 3.5 -171% | 4.08 -216% | 2.42 -88% | 2.81 -118% |
| Colorchecker dE 2000 max. * | 2.96 | 5.6 -89% | 8.8 -197% | 8.1 -174% | 5.76 -95% | 4.62 -56% |
| Colorchecker dE 2000 calibrated * | 0.81 | 0.9 -11% | 1.2 -48% | 0.75 7% | 0.7 14% | 2.99 -269% |
| Greyscale dE 2000 * | 1.4 | 4.5 -221% | 5.6 -300% | 3.5 -150% | 0.8 43% | 0.91 35% |
| Gamma | 2.23 99% | 2.51 88% | 2.27 97% | 2.15 102% | 2.23 99% | 2.2 100% |
| CCT | 6319 103% | 6294 103% | 6071 107% | 6715 97% | 6488 100% | 6600 98% |
| Contrast (:1) | 1459 | 1259 | 1004 | 1467 | ||
| Total Average (Program / Settings) | -1369% /
-716% | -578% /
-335% | -1308% /
-931% | -18% /
-19% | -1432% /
-744% |
* ... smaller is better

显示屏经过预校准,因此开箱后的平均 deltaE 值已经很低,如下所示的 CalMAN 结果。
Display Response Times
| ↔ Response Time Black to White | ||
|---|---|---|
| 0.73 ms ... rise ↗ and fall ↘ combined | ↗ 0.34 ms rise |  |
| ↘ 0.39 ms fall | ||
| The screen shows very fast response rates in our tests and should be very well suited for fast-paced gaming. In comparison, all tested devices range from 0.1 (minimum) to 240 (maximum) ms. » 2 % of all devices are better. This means that the measured response time is better than the average of all tested devices (19.8 ms). | ||
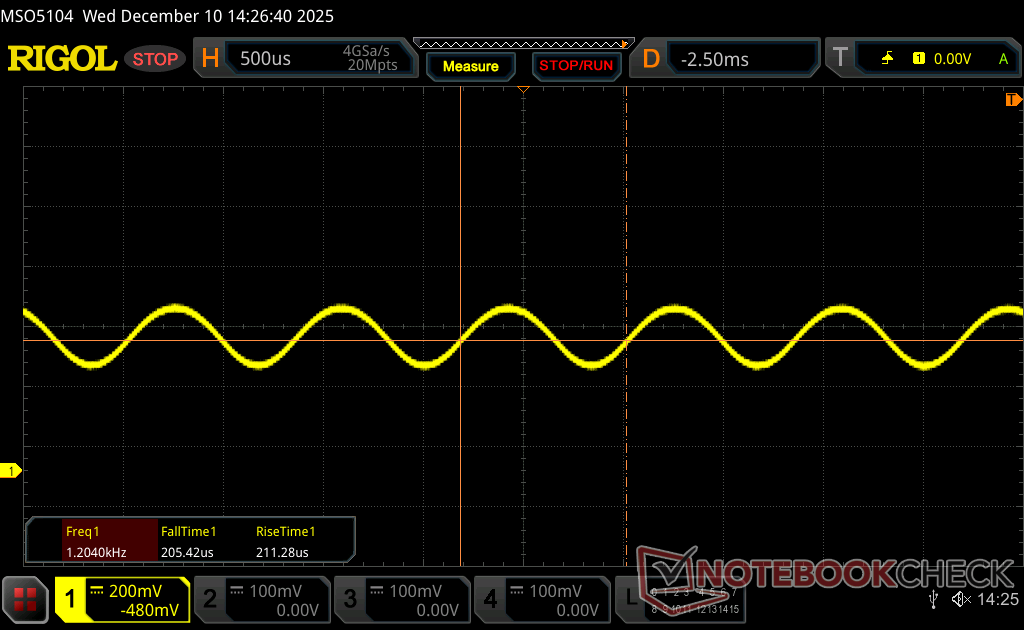
| ↔ Response Time 50% Grey to 80% Grey | ||
| 0.57 ms ... rise ↗ and fall ↘ combined | ↗ 0.29 ms rise | 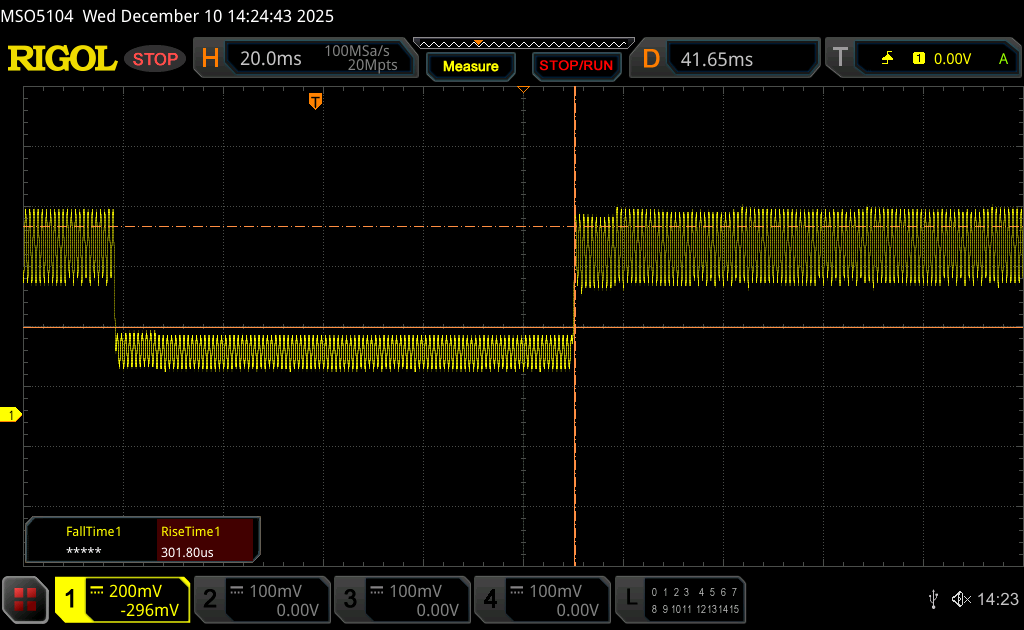 |
| ↘ 0.28 ms fall | ||
| The screen shows very fast response rates in our tests and should be very well suited for fast-paced gaming. In comparison, all tested devices range from 0.165 (minimum) to 636 (maximum) ms. » 1 % of all devices are better. This means that the measured response time is better than the average of all tested devices (31 ms). | ||
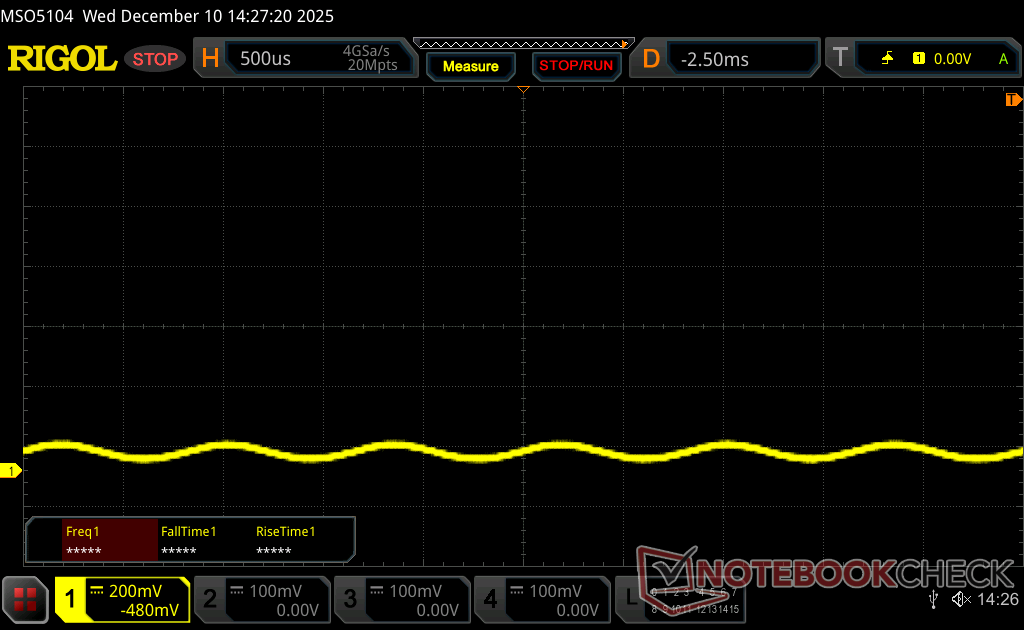
Screen Flickering / PWM (Pulse-Width Modulation)
| Screen flickering / PWM detected | 1199 Hz Amplitude: 18 % | 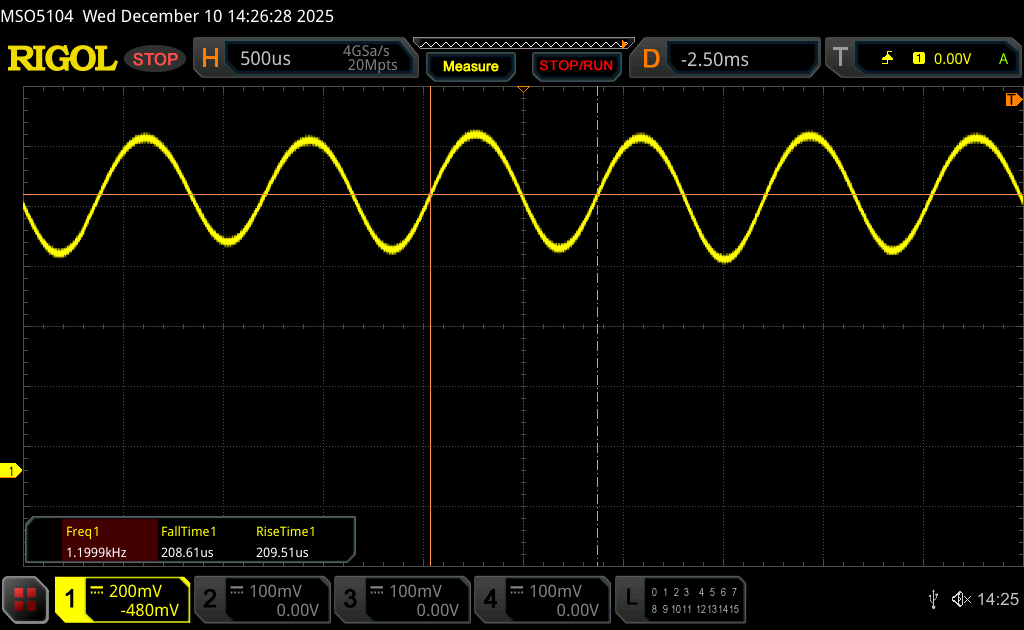 | |
The display backlight flickers at 1199 Hz (worst case, e.g., utilizing PWM) . The frequency of 1199 Hz is quite high, so most users sensitive to PWM should not notice any flickering. In comparison: 52 % of all tested devices do not use PWM to dim the display. If PWM was detected, an average of 7747 (minimum: 5 - maximum: 343500) Hz was measured. | |||

性能
测试条件
在运行以下基准测试之前,我们将 Windows 和 Nvidia 设置为性能模式。不支持高级优化和 GPU ECC。
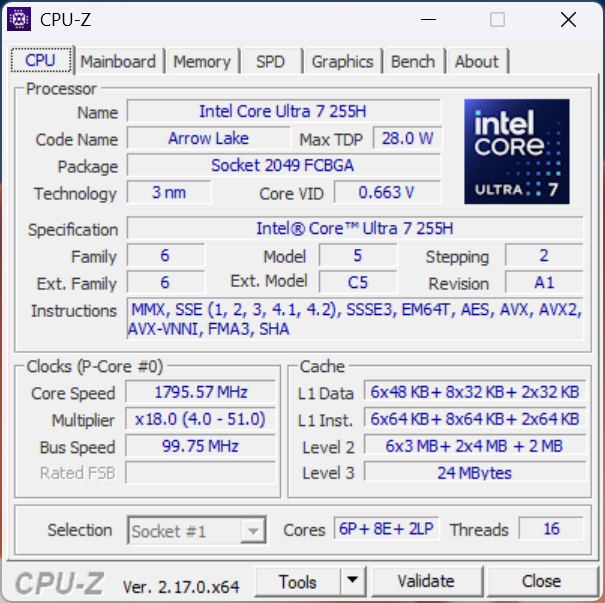
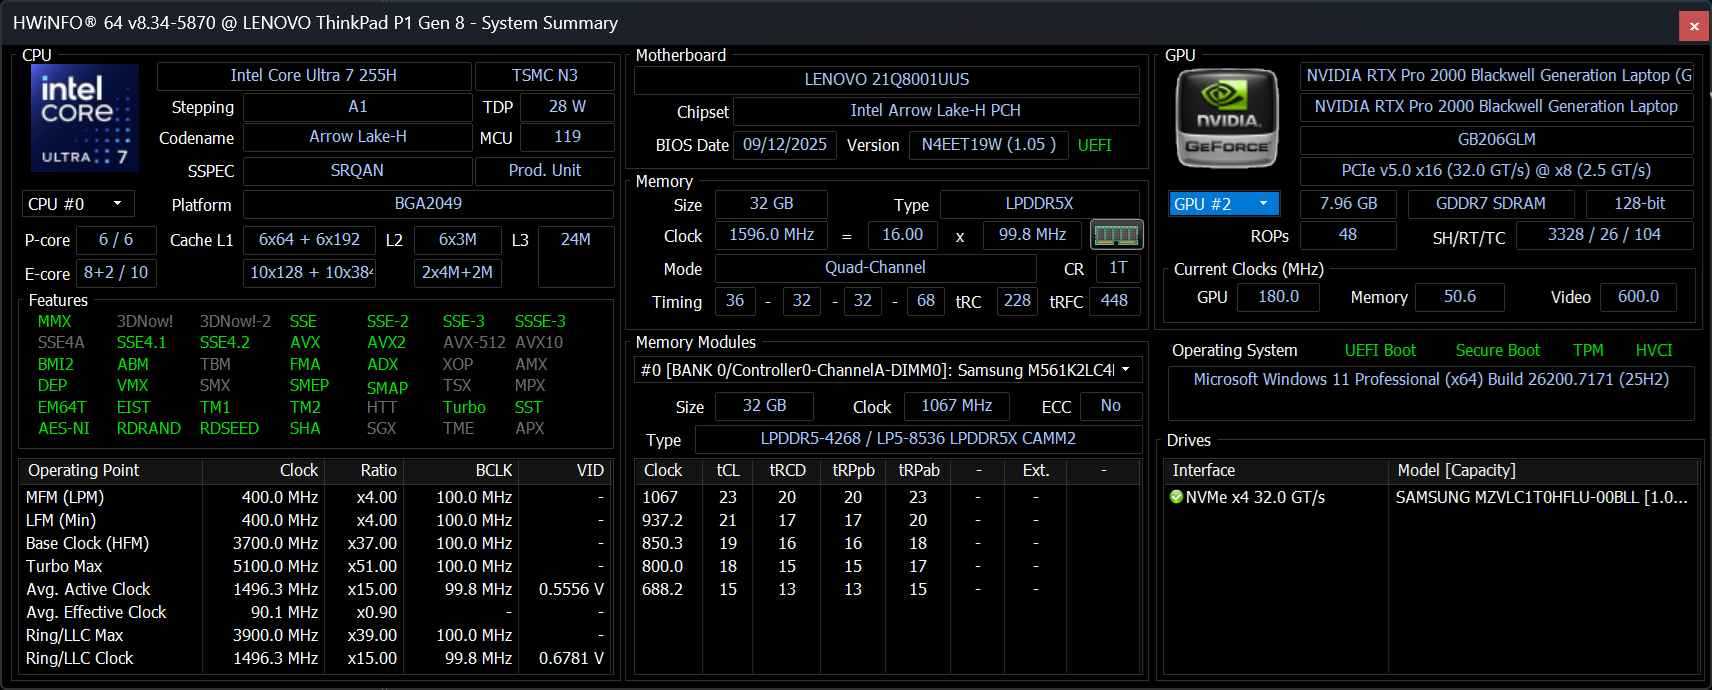
处理器
酷睿至尊 7 255H Core Ultra 7 255H多线程性能比 酷睿至尊 7 155H多线程性能提高了 15%。升级到最高端的 Core Ultra 9 285H配置,性能有望进一步提升,尽管与酷睿 Ultra 7 255H 相比,提升幅度仅为 5% 至 10%。
性能的可持续性很好,但并不完美;在循环运行 CineBench R15 xT 时,仅 4 或 5 个循环后,原来的 3388 分就会下降近 13%。
Cinebench R15 多回路运行
Cinebench R23: Multi Core | Single Core
Cinebench R20: CPU (Multi Core) | CPU (Single Core)
Cinebench R15: CPU Multi 64Bit | CPU Single 64Bit
Blender: v2.79 BMW27 CPU
7-Zip 18.03: 7z b 4 | 7z b 4 -mmt1
Geekbench 6.7: Multi-Core | Single-Core
Geekbench 5.5: Multi-Core | Single-Core
HWBOT x265 Benchmark v2.2: 4k Preset
LibreOffice : 20 Documents To PDF
R Benchmark 2.5: Overall mean
* ... smaller is better
AIDA64: FP32 Ray-Trace | FPU Julia | CPU SHA3 | CPU Queen | FPU SinJulia | FPU Mandel | CPU AES | CPU ZLib | FP64 Ray-Trace | CPU PhotoWorxx
| Performance rating | |
| Dell Pro Max 16 Plus | |
| Lenovo ThinkPad P16s Gen 4 21RX000YGE | |
| Lenovo ThinkPad P1 Gen 8 | |
| Lenovo ThinkPad P1 Gen 7 21KV001SGE | |
| Average Intel Core Ultra 7 255H | |
| Asus ExpertBook B6 Flip B6602FC2 | |
| AIDA64 / FP32 Ray-Trace | |
| Dell Pro Max 16 Plus | |
| Lenovo ThinkPad P16s Gen 4 21RX000YGE | |
| Lenovo ThinkPad P1 Gen 8 | |
| Average Intel Core Ultra 7 255H (13863 - 24741, n=17) | |
| Lenovo ThinkPad P1 Gen 7 21KV001SGE | |
| Asus ExpertBook B6 Flip B6602FC2 | |
| AIDA64 / FPU Julia | |
| Dell Pro Max 16 Plus | |
| Lenovo ThinkPad P1 Gen 8 | |
| Lenovo ThinkPad P16s Gen 4 21RX000YGE | |
| Average Intel Core Ultra 7 255H (71030 - 119222, n=17) | |
| Lenovo ThinkPad P1 Gen 7 21KV001SGE | |
| Asus ExpertBook B6 Flip B6602FC2 | |
| AIDA64 / CPU SHA3 | |
| Dell Pro Max 16 Plus | |
| Lenovo ThinkPad P1 Gen 8 | |
| Lenovo ThinkPad P16s Gen 4 21RX000YGE | |
| Average Intel Core Ultra 7 255H (3408 - 5548, n=17) | |
| Lenovo ThinkPad P1 Gen 7 21KV001SGE | |
| Asus ExpertBook B6 Flip B6602FC2 | |
| AIDA64 / CPU Queen | |
| Dell Pro Max 16 Plus | |
| Asus ExpertBook B6 Flip B6602FC2 | |
| Lenovo ThinkPad P16s Gen 4 21RX000YGE | |
| Lenovo ThinkPad P1 Gen 7 21KV001SGE | |
| Lenovo ThinkPad P1 Gen 8 | |
| Average Intel Core Ultra 7 255H (59098 - 68460, n=16) | |
| AIDA64 / FPU SinJulia | |
| Lenovo ThinkPad P16s Gen 4 21RX000YGE | |
| Dell Pro Max 16 Plus | |
| Asus ExpertBook B6 Flip B6602FC2 | |
| Lenovo ThinkPad P1 Gen 7 21KV001SGE | |
| Lenovo ThinkPad P1 Gen 8 | |
| Average Intel Core Ultra 7 255H (6716 - 9006, n=17) | |
| AIDA64 / FPU Mandel | |
| Dell Pro Max 16 Plus | |
| Lenovo ThinkPad P1 Gen 8 | |
| Lenovo ThinkPad P16s Gen 4 21RX000YGE | |
| Average Intel Core Ultra 7 255H (37031 - 63347, n=17) | |
| Lenovo ThinkPad P1 Gen 7 21KV001SGE | |
| Asus ExpertBook B6 Flip B6602FC2 | |
| AIDA64 / CPU AES | |
| Dell Pro Max 16 Plus | |
| Lenovo ThinkPad P16s Gen 4 21RX000YGE | |
| Lenovo ThinkPad P1 Gen 7 21KV001SGE | |
| Lenovo ThinkPad P1 Gen 8 | |
| Asus ExpertBook B6 Flip B6602FC2 | |
| Average Intel Core Ultra 7 255H (58402 - 83568, n=17) | |
| AIDA64 / CPU ZLib | |
| Dell Pro Max 16 Plus | |
| Lenovo ThinkPad P1 Gen 8 | |
| Lenovo ThinkPad P16s Gen 4 21RX000YGE | |
| Lenovo ThinkPad P1 Gen 7 21KV001SGE | |
| Average Intel Core Ultra 7 255H (822 - 1316, n=17) | |
| Asus ExpertBook B6 Flip B6602FC2 | |
| AIDA64 / FP64 Ray-Trace | |
| Dell Pro Max 16 Plus | |
| Lenovo ThinkPad P16s Gen 4 21RX000YGE | |
| Lenovo ThinkPad P1 Gen 8 | |
| Average Intel Core Ultra 7 255H (7384 - 13231, n=17) | |
| Lenovo ThinkPad P1 Gen 7 21KV001SGE | |
| Asus ExpertBook B6 Flip B6602FC2 | |
| AIDA64 / CPU PhotoWorxx | |
| Dell Pro Max 16 Plus | |
| Lenovo ThinkPad P1 Gen 8 | |
| Average Intel Core Ultra 7 255H (23836 - 65787, n=17) | |
| Lenovo ThinkPad P16s Gen 4 21RX000YGE | |
| Lenovo ThinkPad P1 Gen 7 21KV001SGE | |
| Asus ExpertBook B6 Flip B6602FC2 | |
系统性能
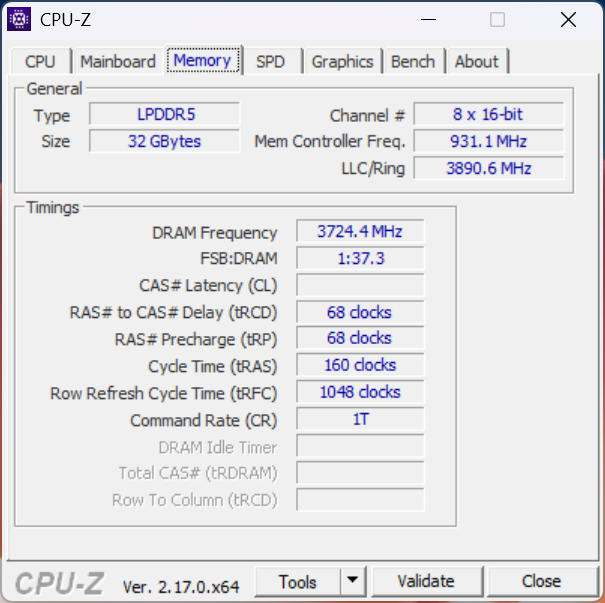
对于配备 32GB 可移动内存的笔记本电脑来说,AIDA64 内存基准测试成绩显然非常出色。该机型标配 LPDDR5x-7467 LPCAMM2,其设计克服了 SODIMM 的许多限制。
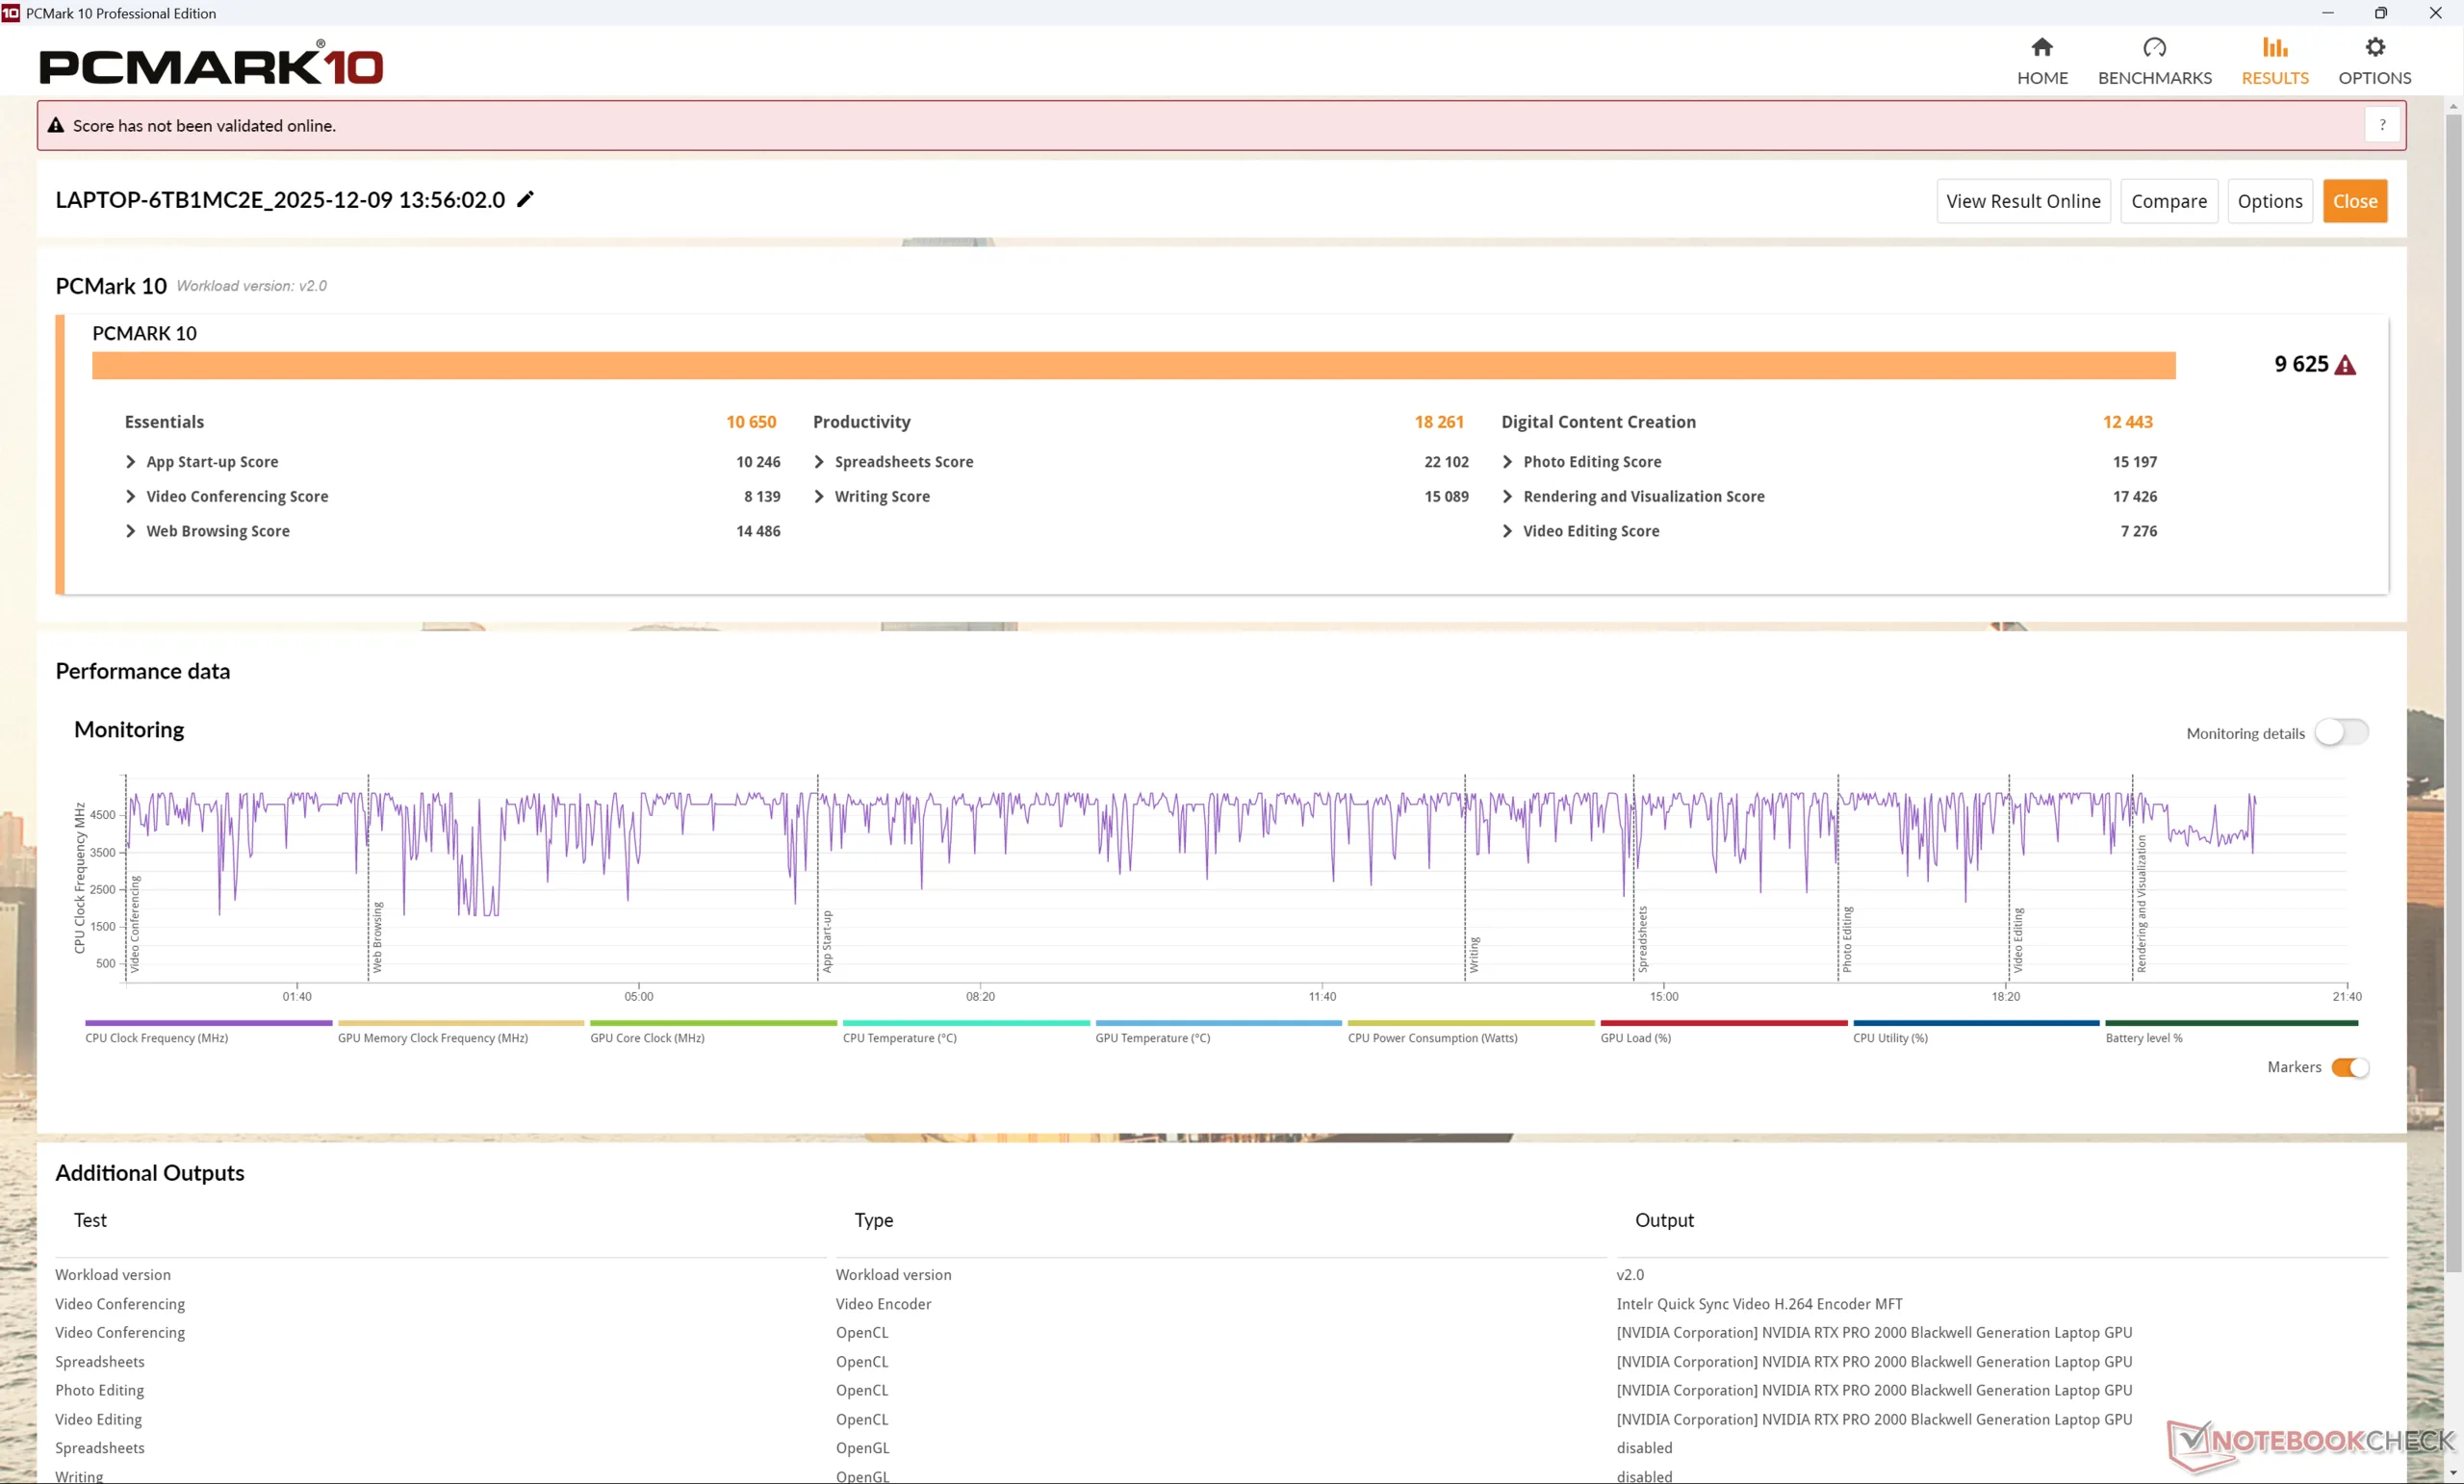
PCMark 10: Score | Essentials | Productivity | Digital Content Creation
CrossMark: Overall | Productivity | Creativity | Responsiveness
WebXPRT 3: Overall
WebXPRT 4: Overall
Mozilla Kraken 1.1: Total
| Performance rating | |
| Dell Pro Max 16 Plus -4! | |
| Lenovo ThinkPad P1 Gen 8 | |
| Average Intel Core Ultra 7 255H, NVIDIA RTX PRO 2000 Blackwell Generation Laptop | |
| HP ZBook X G1i 16 -4! | |
| Asus ExpertBook B6 Flip B6602FC2 | |
| Lenovo ThinkPad P1 Gen 7 21KV001SGE | |
| Lenovo ThinkPad P16s Gen 4 21RX000YGE | |
| PCMark 10 / Score | |
| Average Intel Core Ultra 7 255H, NVIDIA RTX PRO 2000 Blackwell Generation Laptop (9625 - 9723, n=2) | |
| Lenovo ThinkPad P1 Gen 8 | |
| Lenovo ThinkPad P16s Gen 4 21RX000YGE | |
| Lenovo ThinkPad P1 Gen 7 21KV001SGE | |
| Asus ExpertBook B6 Flip B6602FC2 | |
| PCMark 10 / Essentials | |
| Asus ExpertBook B6 Flip B6602FC2 | |
| Average Intel Core Ultra 7 255H, NVIDIA RTX PRO 2000 Blackwell Generation Laptop (10650 - 10921, n=2) | |
| Lenovo ThinkPad P16s Gen 4 21RX000YGE | |
| Lenovo ThinkPad P1 Gen 8 | |
| Lenovo ThinkPad P1 Gen 7 21KV001SGE | |
| PCMark 10 / Productivity | |
| Lenovo ThinkPad P1 Gen 8 | |
| Average Intel Core Ultra 7 255H, NVIDIA RTX PRO 2000 Blackwell Generation Laptop (18083 - 18261, n=2) | |
| Asus ExpertBook B6 Flip B6602FC2 | |
| Lenovo ThinkPad P16s Gen 4 21RX000YGE | |
| Lenovo ThinkPad P1 Gen 7 21KV001SGE | |
| PCMark 10 / Digital Content Creation | |
| Average Intel Core Ultra 7 255H, NVIDIA RTX PRO 2000 Blackwell Generation Laptop (12443 - 12631, n=2) | |
| Lenovo ThinkPad P1 Gen 8 | |
| Lenovo ThinkPad P1 Gen 7 21KV001SGE | |
| Lenovo ThinkPad P16s Gen 4 21RX000YGE | |
| Asus ExpertBook B6 Flip B6602FC2 | |
| CrossMark / Overall | |
| Dell Pro Max 16 Plus | |
| HP ZBook X G1i 16 | |
| Asus ExpertBook B6 Flip B6602FC2 | |
| Lenovo ThinkPad P1 Gen 8 | |
| Average Intel Core Ultra 7 255H, NVIDIA RTX PRO 2000 Blackwell Generation Laptop (1942 - 1953, n=2) | |
| Lenovo ThinkPad P1 Gen 7 21KV001SGE | |
| Lenovo ThinkPad P16s Gen 4 21RX000YGE | |
| CrossMark / Productivity | |
| Dell Pro Max 16 Plus | |
| HP ZBook X G1i 16 | |
| Asus ExpertBook B6 Flip B6602FC2 | |
| Lenovo ThinkPad P1 Gen 8 | |
| Average Intel Core Ultra 7 255H, NVIDIA RTX PRO 2000 Blackwell Generation Laptop (1834 - 1836, n=2) | |
| Lenovo ThinkPad P1 Gen 7 21KV001SGE | |
| Lenovo ThinkPad P16s Gen 4 21RX000YGE | |
| CrossMark / Creativity | |
| Dell Pro Max 16 Plus | |
| HP ZBook X G1i 16 | |
| Average Intel Core Ultra 7 255H, NVIDIA RTX PRO 2000 Blackwell Generation Laptop (2211 - 2232, n=2) | |
| Lenovo ThinkPad P1 Gen 8 | |
| Asus ExpertBook B6 Flip B6602FC2 | |
| Lenovo ThinkPad P1 Gen 7 21KV001SGE | |
| Lenovo ThinkPad P16s Gen 4 21RX000YGE | |
| CrossMark / Responsiveness | |
| Dell Pro Max 16 Plus | |
| Asus ExpertBook B6 Flip B6602FC2 | |
| Lenovo ThinkPad P1 Gen 8 | |
| Average Intel Core Ultra 7 255H, NVIDIA RTX PRO 2000 Blackwell Generation Laptop (1520 - 1622, n=2) | |
| HP ZBook X G1i 16 | |
| Lenovo ThinkPad P1 Gen 7 21KV001SGE | |
| Lenovo ThinkPad P16s Gen 4 21RX000YGE | |
| WebXPRT 3 / Overall | |
| Lenovo ThinkPad P1 Gen 8 | |
| Dell Pro Max 16 Plus | |
| Average Intel Core Ultra 7 255H, NVIDIA RTX PRO 2000 Blackwell Generation Laptop (322 - 330, n=2) | |
| HP ZBook X G1i 16 | |
| Lenovo ThinkPad P16s Gen 4 21RX000YGE | |
| Asus ExpertBook B6 Flip B6602FC2 | |
| Lenovo ThinkPad P1 Gen 7 21KV001SGE | |
| WebXPRT 4 / Overall | |
| Dell Pro Max 16 Plus | |
| Average Intel Core Ultra 7 255H, NVIDIA RTX PRO 2000 Blackwell Generation Laptop (298 - 307, n=2) | |
| HP ZBook X G1i 16 | |
| Lenovo ThinkPad P1 Gen 8 | |
| Asus ExpertBook B6 Flip B6602FC2 | |
| Lenovo ThinkPad P1 Gen 7 21KV001SGE | |
| Lenovo ThinkPad P16s Gen 4 21RX000YGE | |
| Mozilla Kraken 1.1 / Total | |
| Lenovo ThinkPad P1 Gen 7 21KV001SGE | |
| Asus ExpertBook B6 Flip B6602FC2 | |
| Lenovo ThinkPad P16s Gen 4 21RX000YGE | |
| Lenovo ThinkPad P1 Gen 8 | |
| HP ZBook X G1i 16 | |
| Average Intel Core Ultra 7 255H, NVIDIA RTX PRO 2000 Blackwell Generation Laptop (448 - 461, n=2) | |
| Dell Pro Max 16 Plus | |
* ... smaller is better
| PCMark 10 Score | 9625 points | |
Help | ||
| AIDA64 / Memory Copy | |
| Lenovo ThinkPad P1 Gen 8 | |
| Dell Pro Max 16 Plus | |
| Average Intel Core Ultra 7 255H (39188 - 110930, n=17) | |
| Lenovo ThinkPad P16s Gen 4 21RX000YGE | |
| Lenovo ThinkPad P1 Gen 7 21KV001SGE | |
| Asus ExpertBook B6 Flip B6602FC2 | |
| AIDA64 / Memory Read | |
| Dell Pro Max 16 Plus | |
| Lenovo ThinkPad P16s Gen 4 21RX000YGE | |
| Average Intel Core Ultra 7 255H (43703 - 90552, n=17) | |
| Lenovo ThinkPad P1 Gen 8 | |
| Lenovo ThinkPad P1 Gen 7 21KV001SGE | |
| Asus ExpertBook B6 Flip B6602FC2 | |
| AIDA64 / Memory Write | |
| Dell Pro Max 16 Plus | |
| Lenovo ThinkPad P16s Gen 4 21RX000YGE | |
| Average Intel Core Ultra 7 255H (36438 - 87199, n=17) | |
| Lenovo ThinkPad P1 Gen 7 21KV001SGE | |
| Lenovo ThinkPad P1 Gen 8 | |
| Asus ExpertBook B6 Flip B6602FC2 | |
| AIDA64 / Memory Latency | |
| Lenovo ThinkPad P1 Gen 8 | |
| Lenovo ThinkPad P1 Gen 7 21KV001SGE | |
| Average Intel Core Ultra 7 255H (107.6 - 147.2, n=17) | |
| Dell Pro Max 16 Plus | |
| Lenovo ThinkPad P16s Gen 4 21RX000YGE | |
| Asus ExpertBook B6 Flip B6602FC2 | |
* ... smaller is better
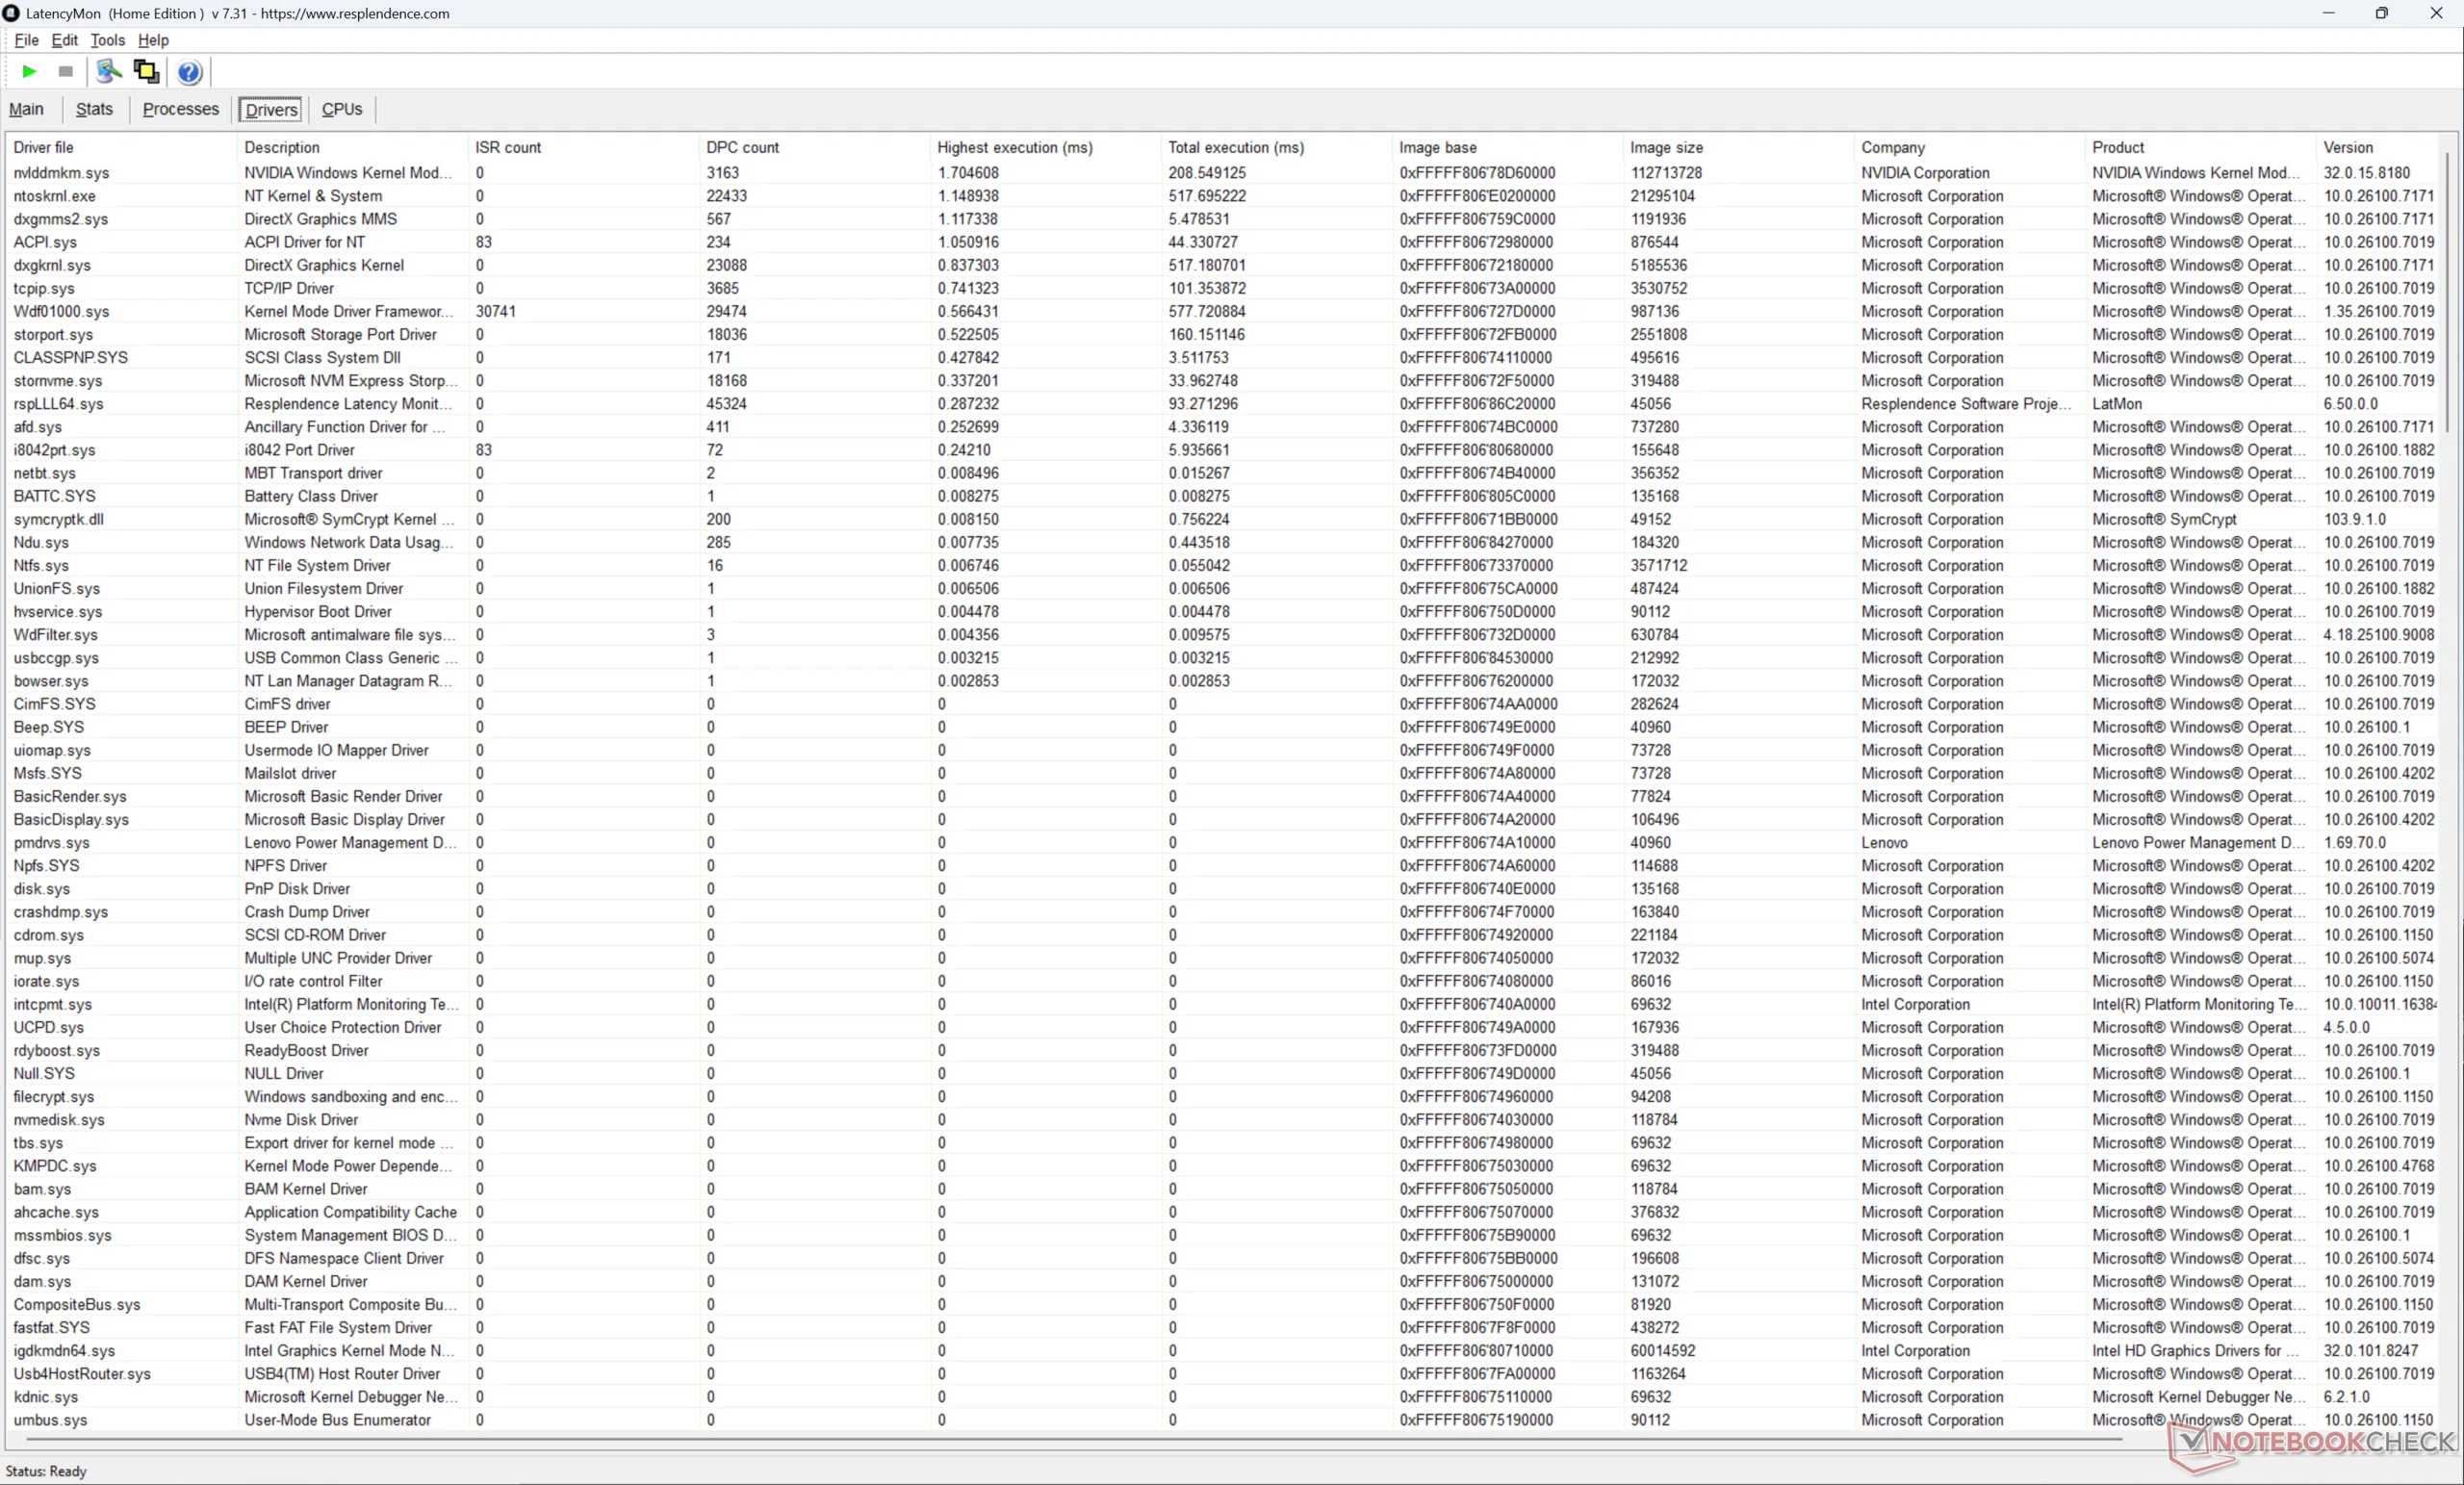
DPC 延迟
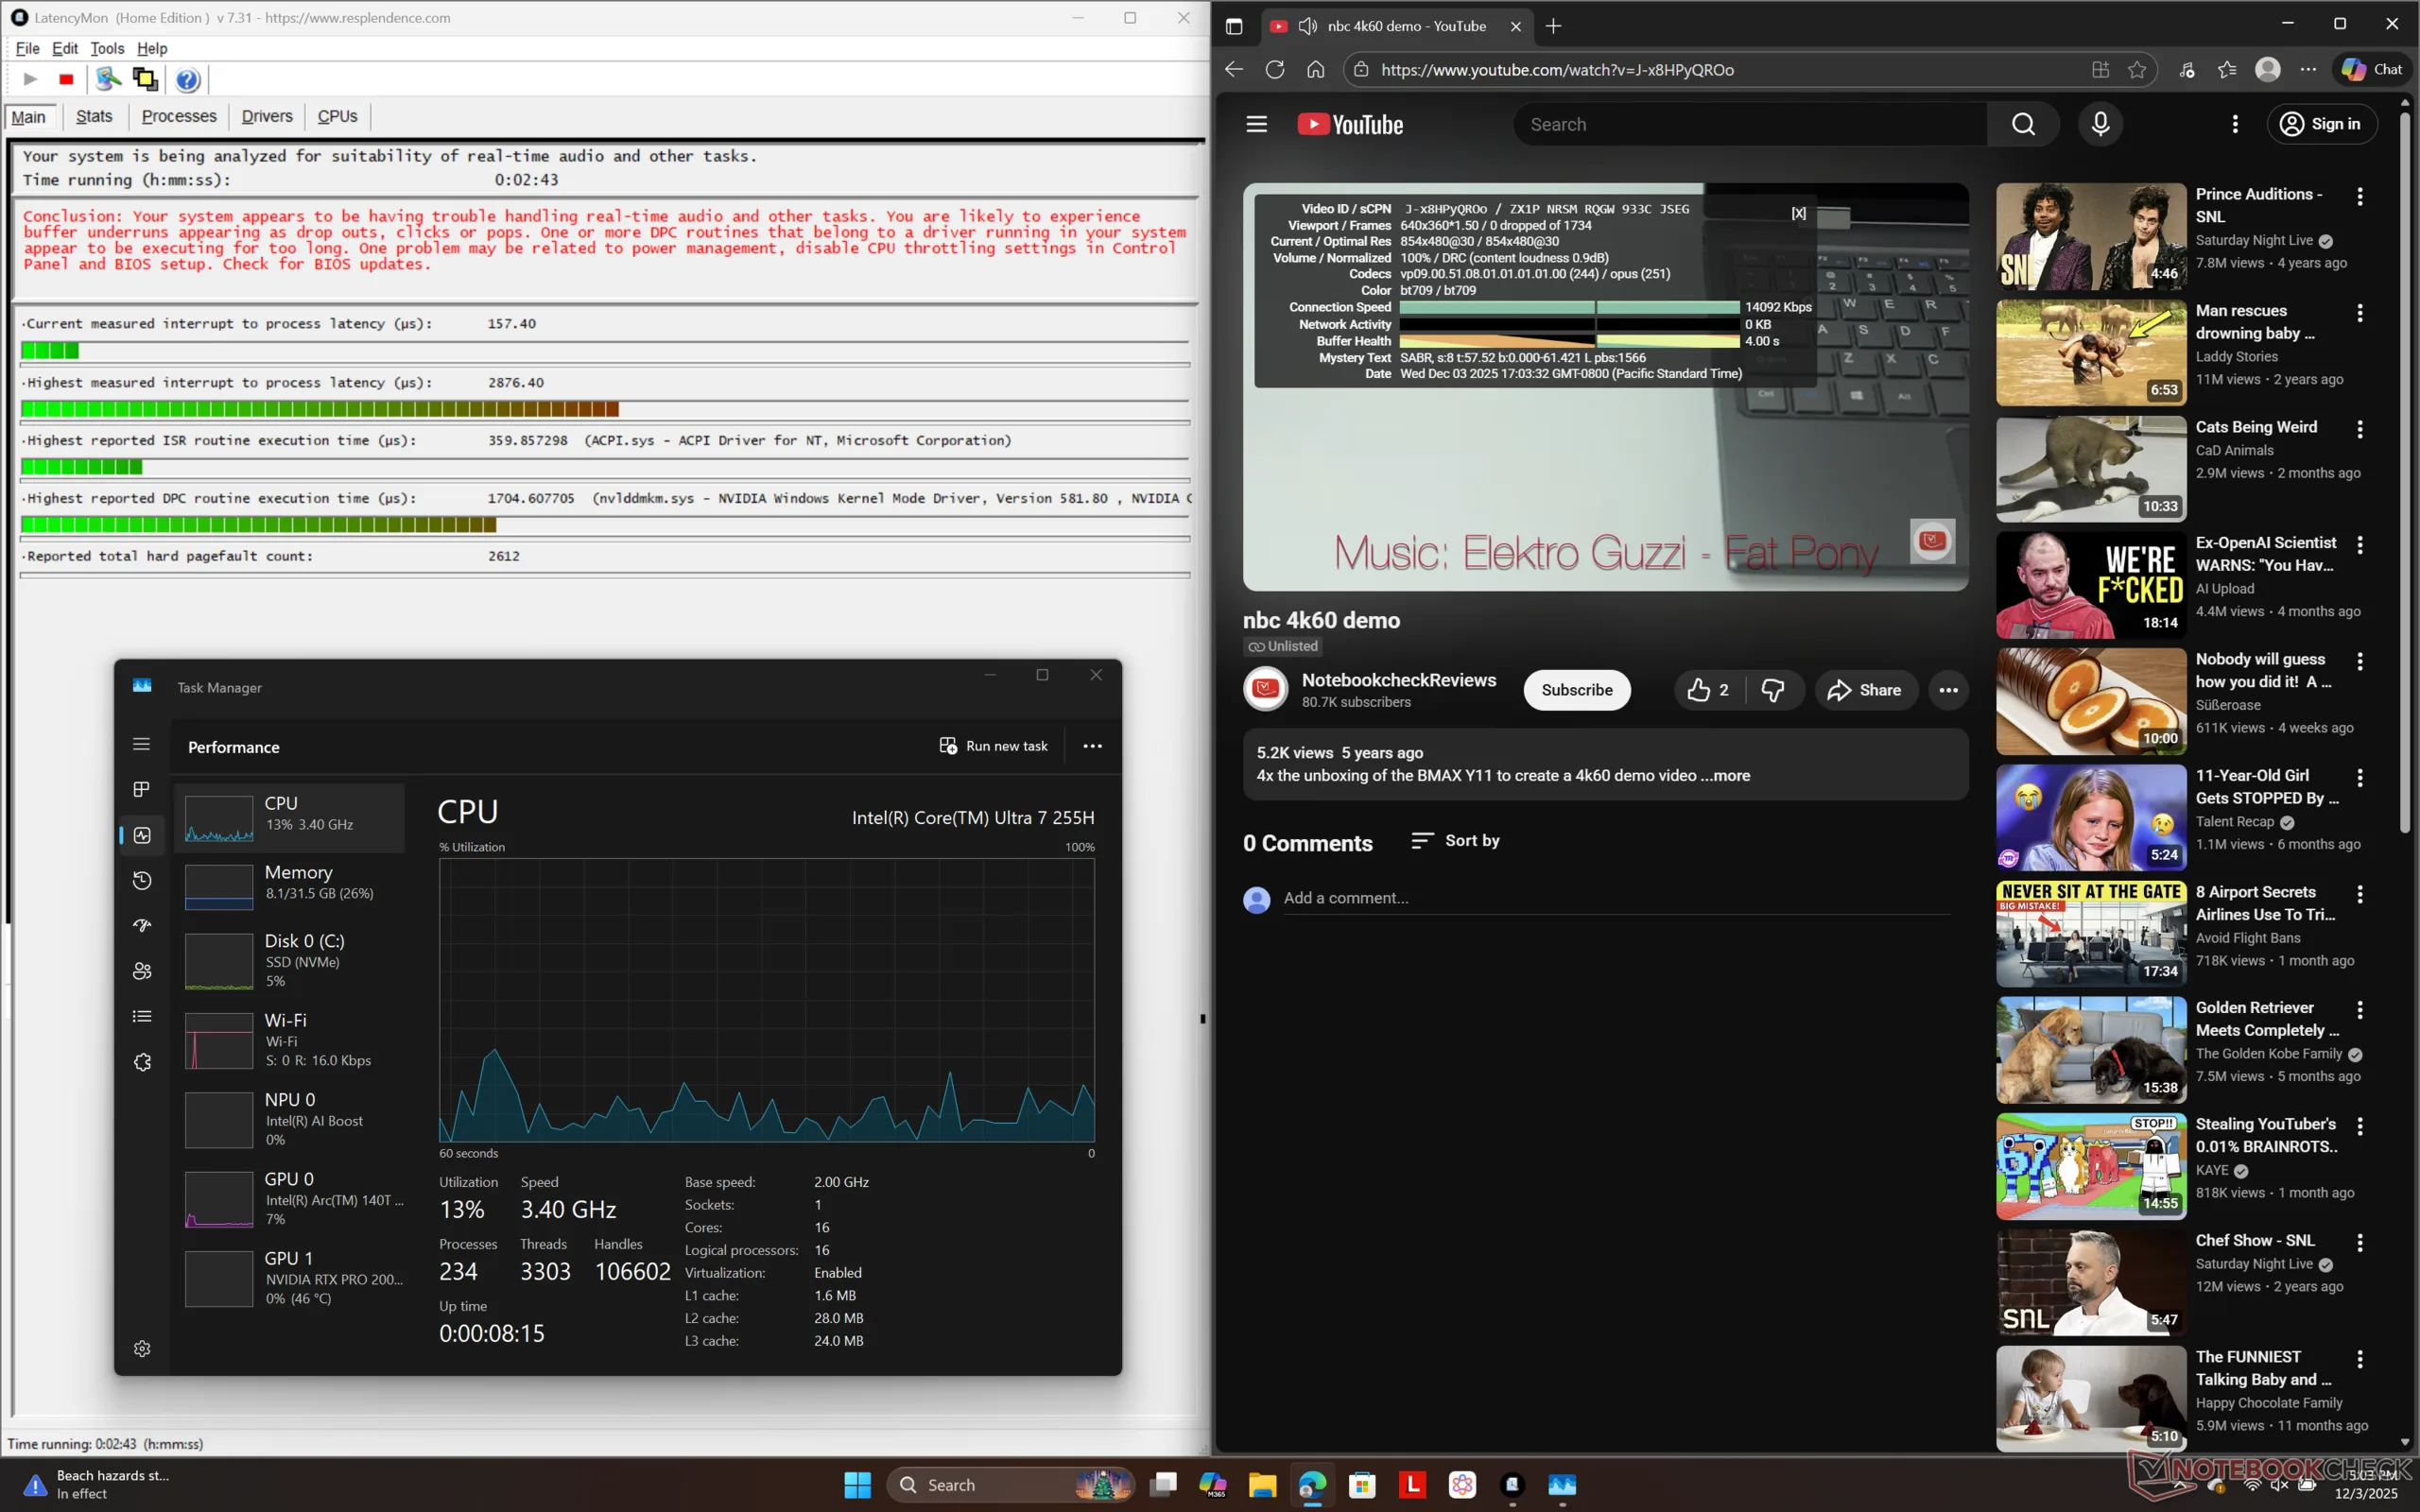
LatencyMon 显示了轻微的 DPC 问题,但在播放 4K60 视频时没有出现掉帧现象。
| DPC Latencies / LatencyMon - interrupt to process latency (max), Web, Youtube, Prime95 | |
| Lenovo ThinkPad P1 Gen 8 | |
| Dell Pro Max 16 Plus | |
| Asus ExpertBook B6 Flip B6602FC2 | |
| Lenovo ThinkPad P1 Gen 7 21KV001SGE | |
| Lenovo ThinkPad P16s Gen 4 21RX000YGE | |
| HP ZBook X G1i 16 | |
* ... smaller is better
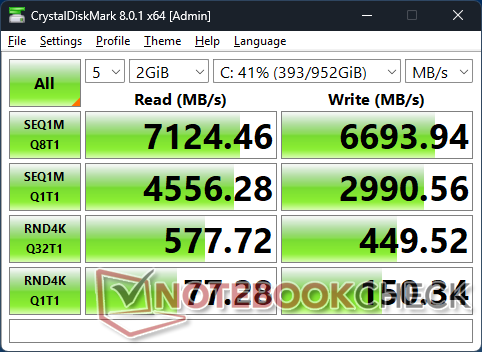
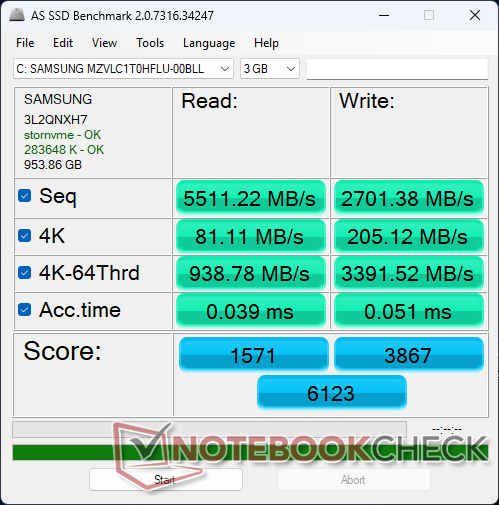
存储设备
我们的测试机配备了 三星 PM9E1PCIe5 NVMe 固态硬盘,而去年的 ThinkPad P1 Gen 7 配备的是 Kioxia XG8 KXG8AZNV1T02 PCIe4 NVMe 固态硬盘。传输速率更快,最高可达稳定的 7000 MB/s。

* ... smaller is better
磁盘节流DiskSpd 读取循环,队列深度 8
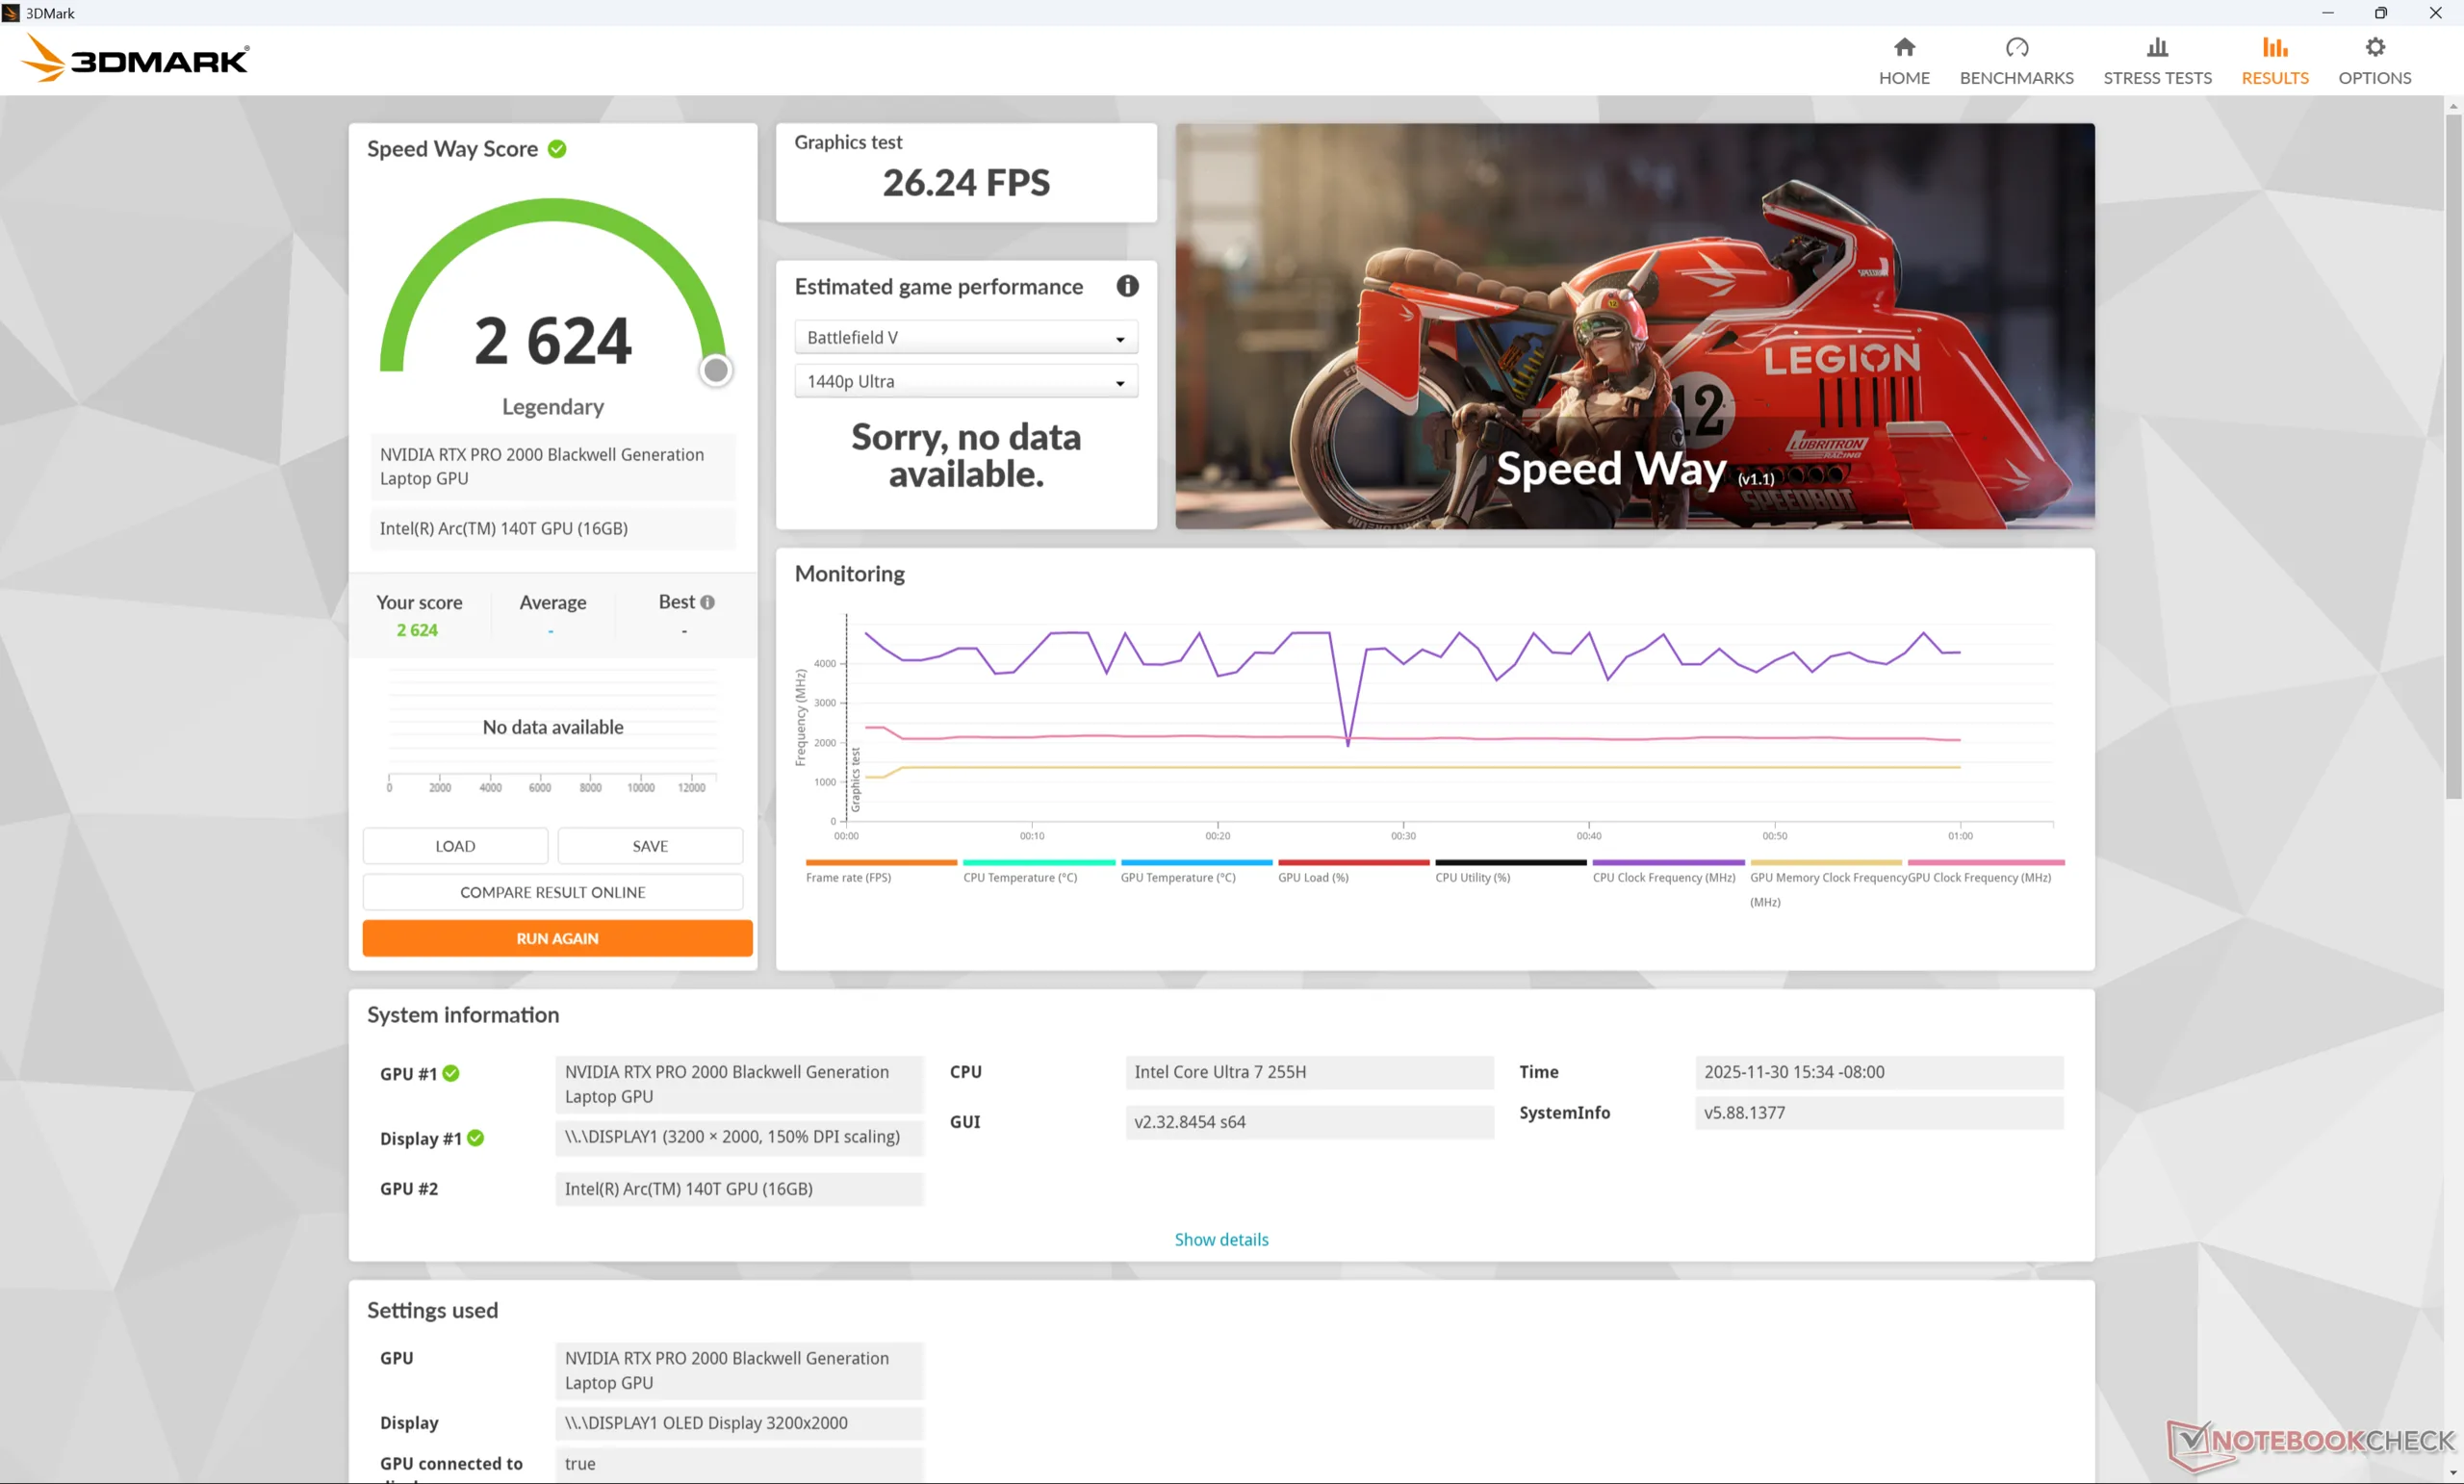
图形处理器性能
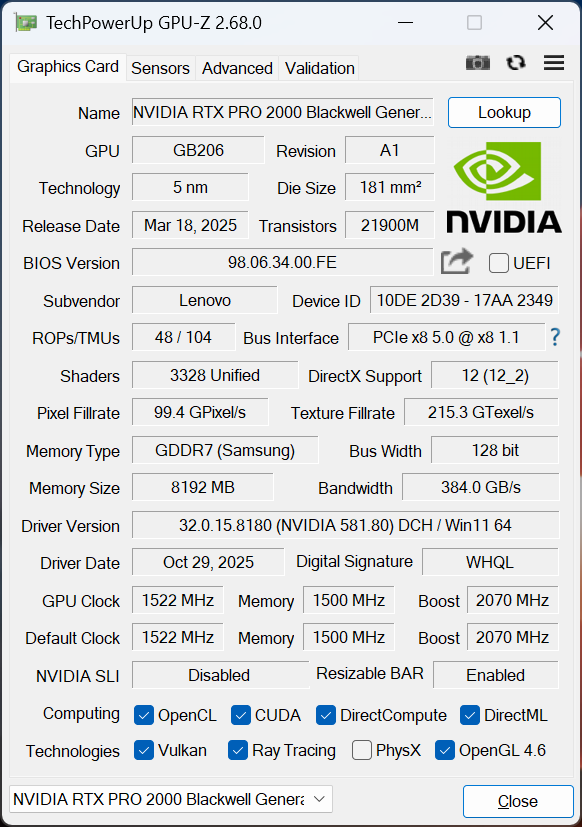
移动 移动 RTX Pro 2000 Blackwell源于 移动GeForce RTX 5060因此,它们都具有相似的特性,包括统一流水线、TMU、张量内核和内存带宽的总数。原始性能与 移动 RTX Pro 3000 Ada的原始性能与移动 RTX Pro 3000 Ada 大致相当。
| 电源配置文件 | 图形得分 | 物理得分 | 综合得分 |
| 性能模式 | 27781 | 34580 | 12628 |
| 均衡模式 | 26859 (-3%) | 35322 (+2%) | 11593 (-8%) |
| 电池电量 | 25193 (-9%) | 26579 (-23%) | 10800 (-15%) |
| 3DMark Performance rating - Percent | |
| Dell Pro Max 16 Plus -10! | |
| Lenovo ThinkPad P1 Gen 8 -1! | |
| HP ZBook Fury 16 G11 -9! | |
| Average NVIDIA RTX PRO 2000 Blackwell Generation Laptop -1! | |
| HP ZBook X G1i 16 -10! | |
| HP ZBook Studio 16 G11 -9! | |
| HP ZBook Power 16 G11 A -9! | |
| Lenovo ThinkPad P1 Gen 7 21KV001SGE -26! | |
| Asus ExpertBook B6 Flip B6602FC2 -18! | |
| HP ZBook Studio 16 G9 62U04EA -11! | |
| Lenovo ThinkPad P1 G4-20Y4Z9DVUS -18! | |
| Lenovo ThinkPad P16s Gen 4 21RX000YGE -26! | |
| Lenovo ThinkPad P16s G2 21K9000CGE -18! | |
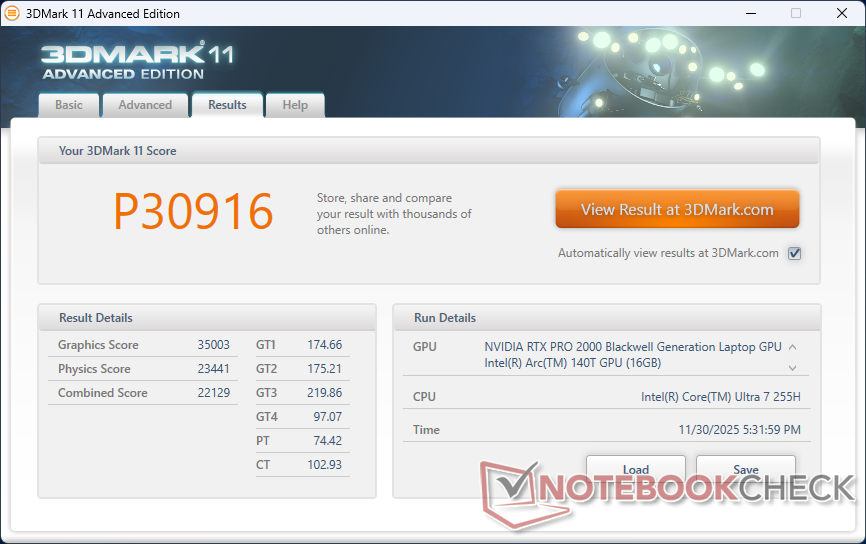
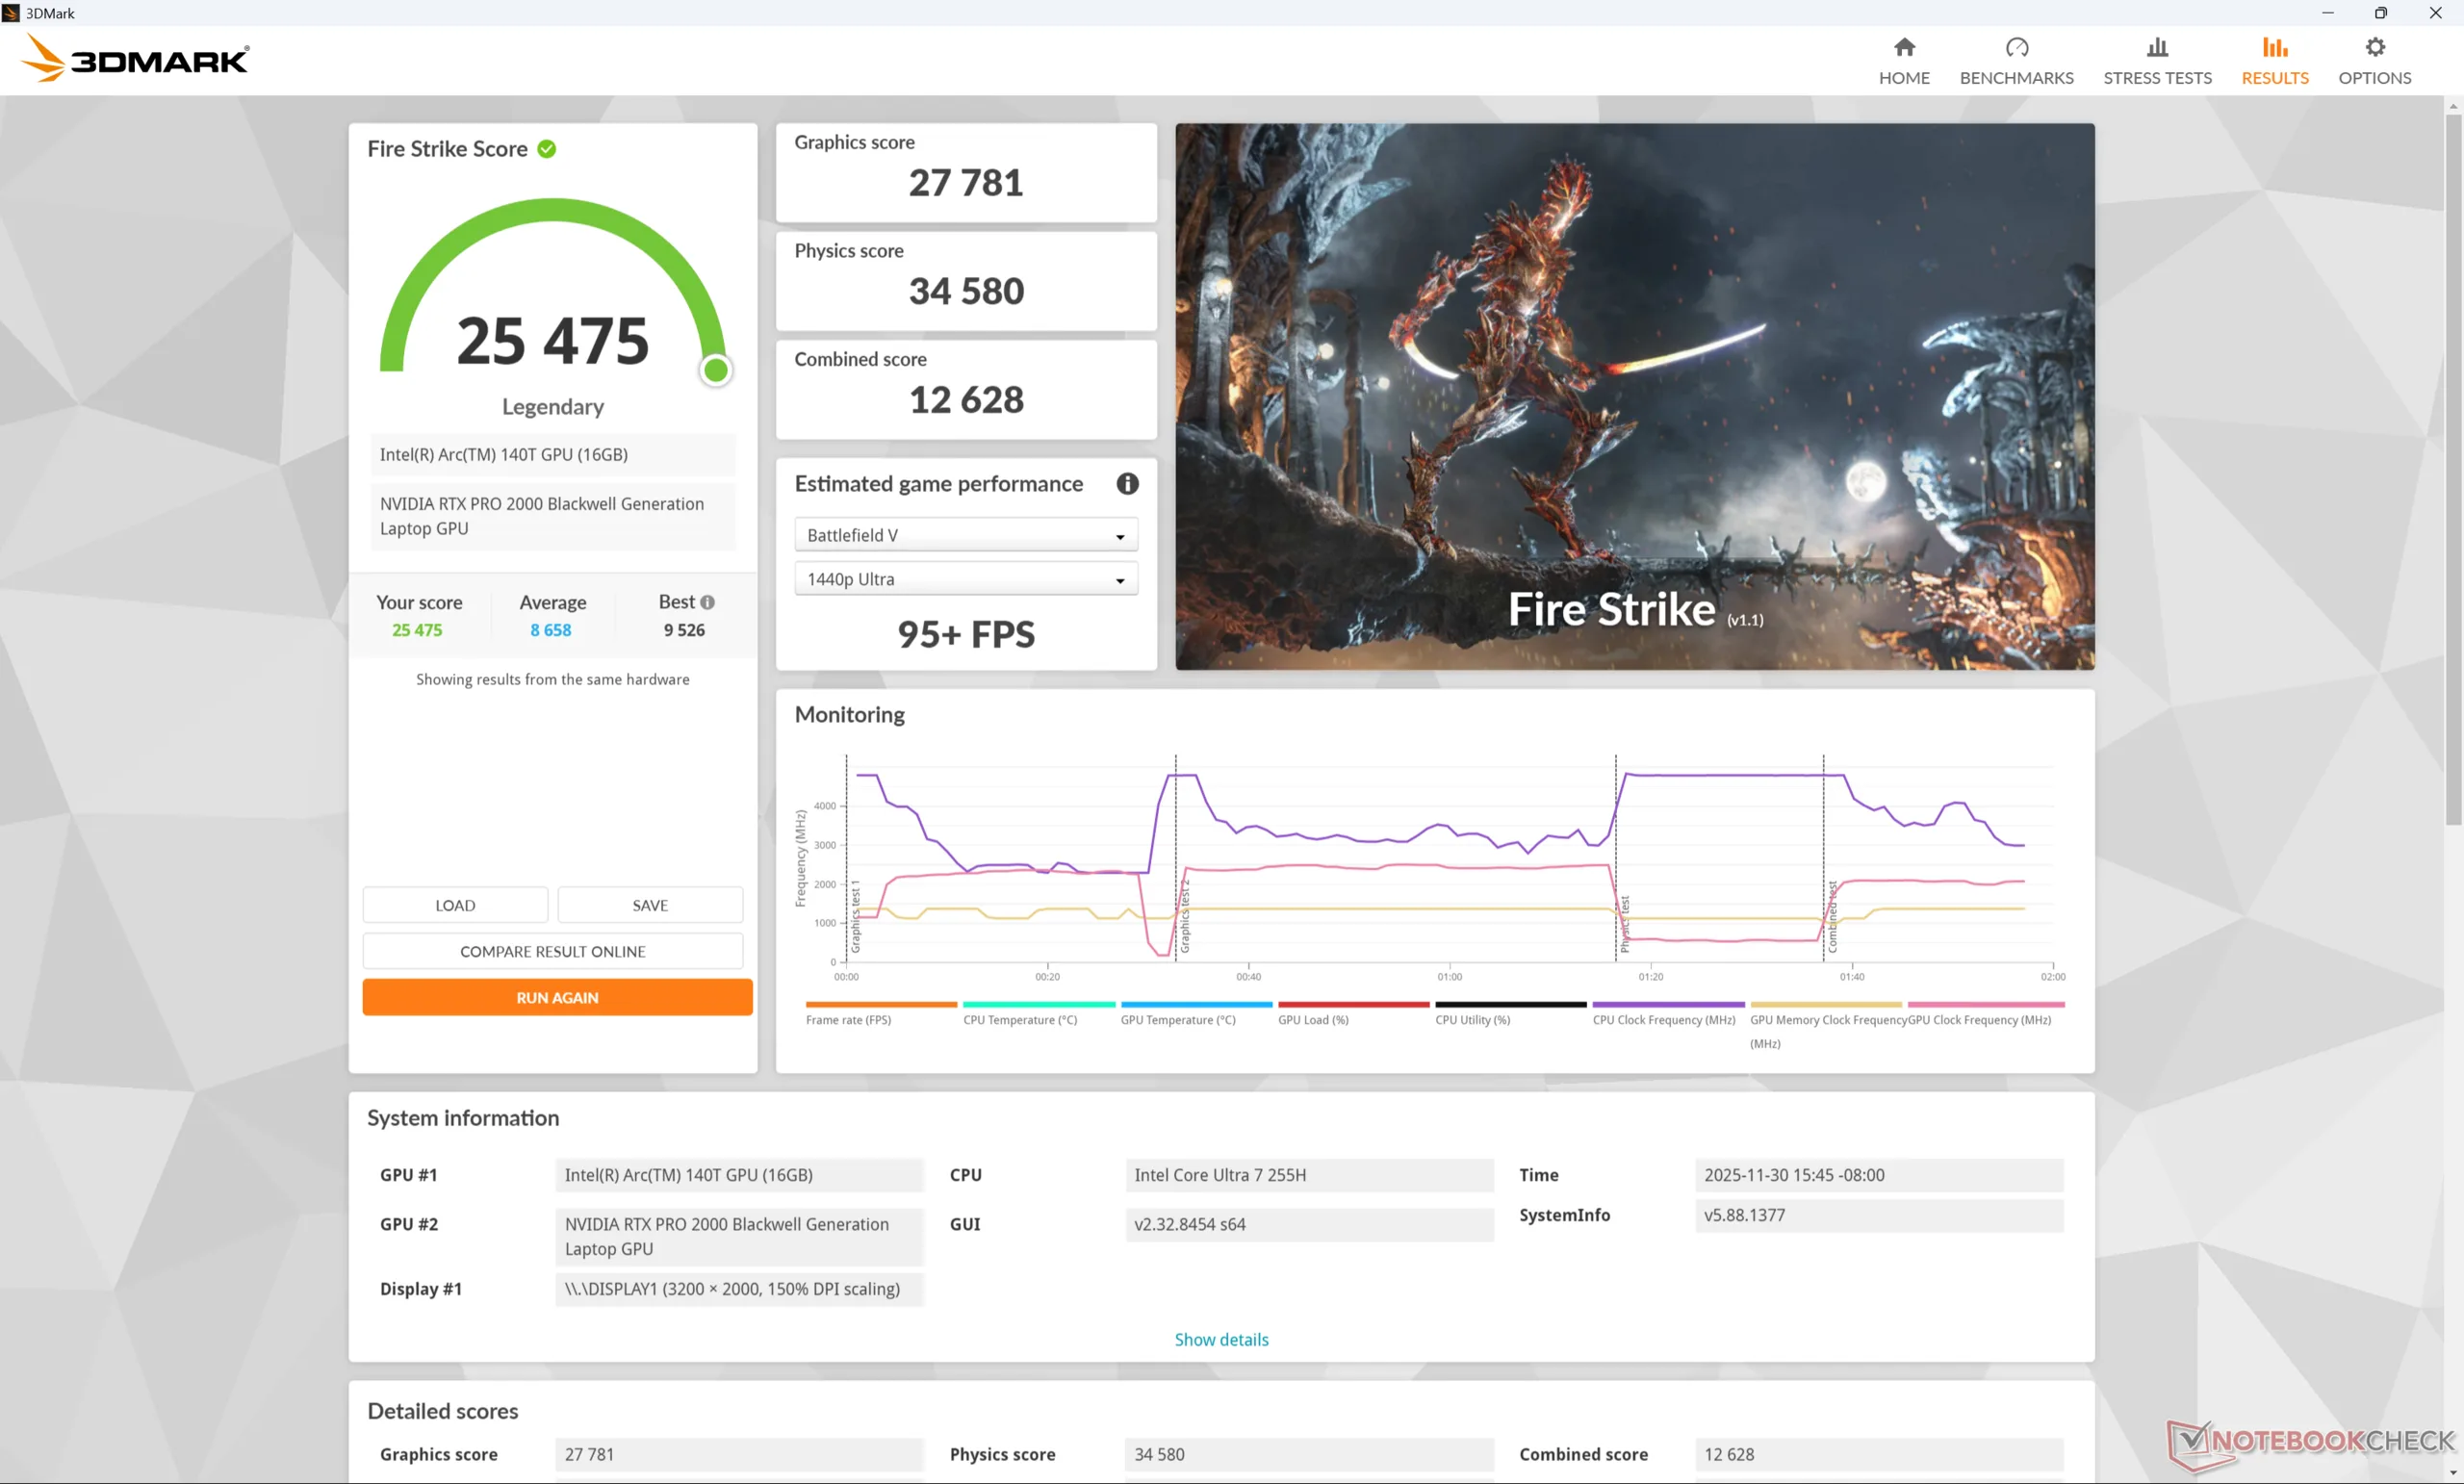
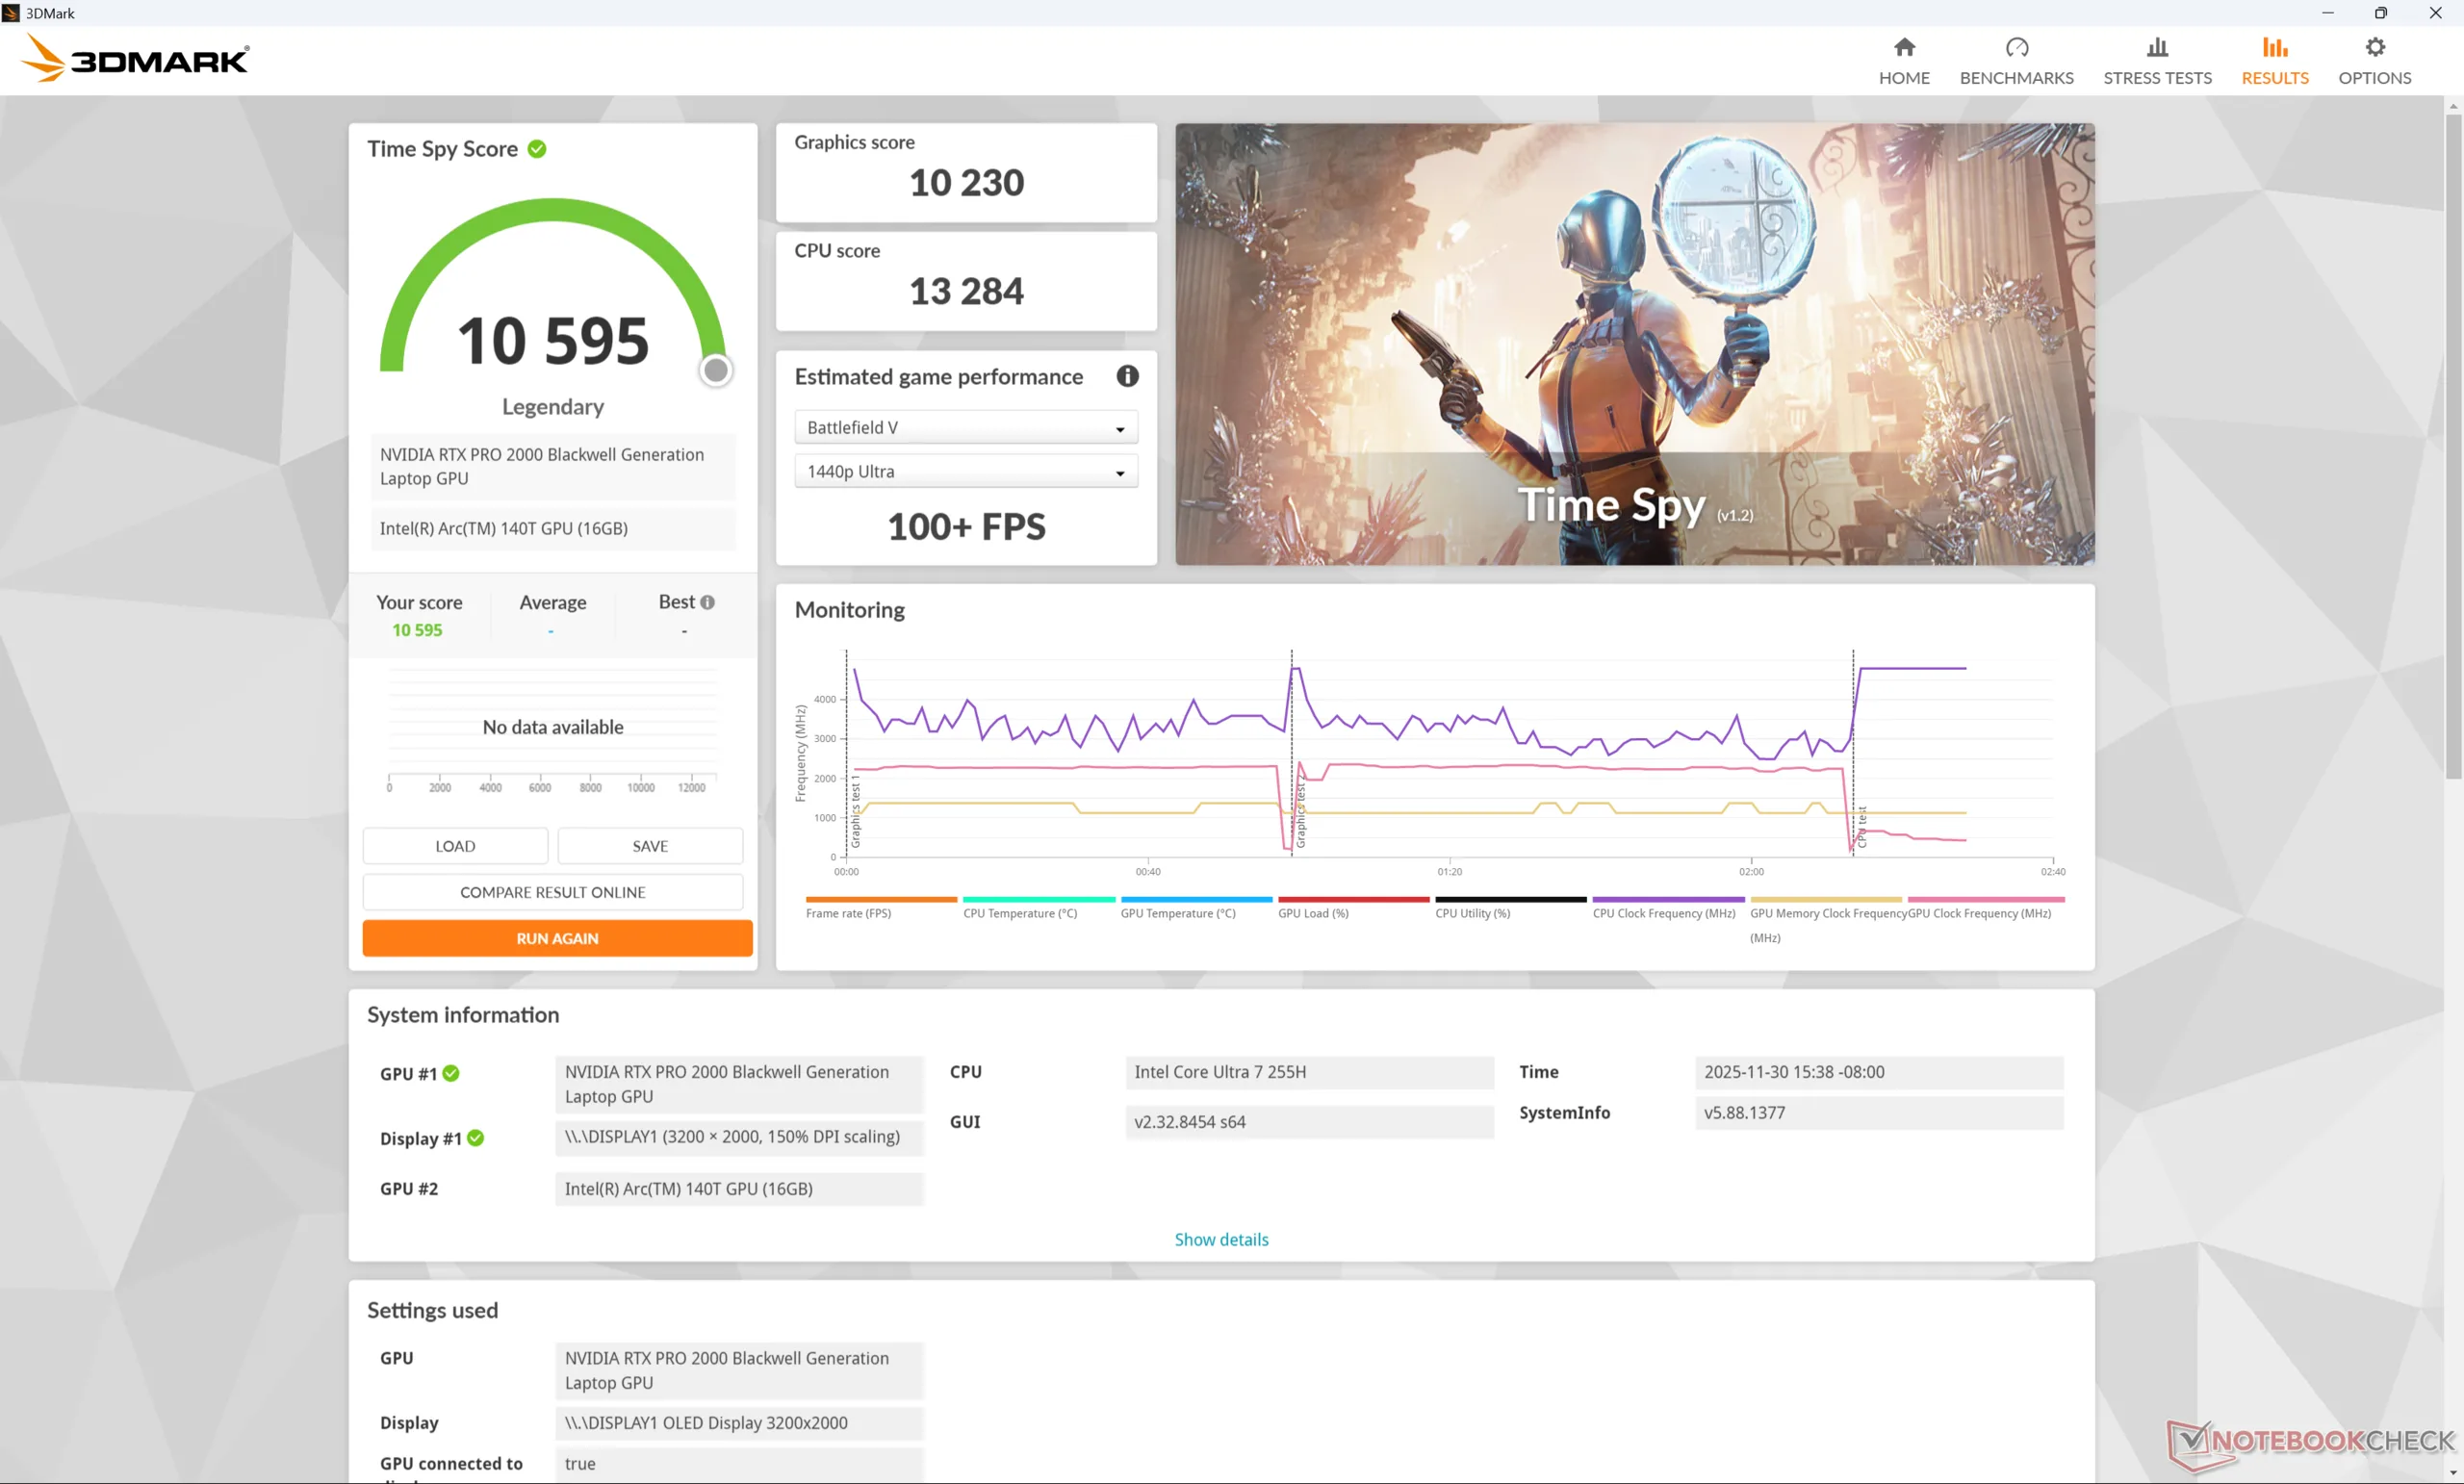
| 3DMark 11 Performance | 30916 points | |
| 3DMark Cloud Gate Standard Score | 62652 points | |
| 3DMark Fire Strike Score | 25475 points | |
| 3DMark Time Spy Score | 10595 points | |
Help | ||
* ... smaller is better
游戏性能
虽然游戏不是它的主要功能,但 ThinkPad P1 Gen 8 完全能够以 1080p 至 2K 分辨率运行要求苛刻的游戏,其性能水平大约落后于 HP Omen 16 10%。 惠普预兆 16的 10%。
| Performance rating - Percent | |
| Dell Pro Max 16 Plus | |
| Lenovo ThinkPad P1 Gen 8 | |
| HP ZBook X G1i 16 | |
| Asus ExpertBook B6 Flip B6602FC2 -2! | |
| Lenovo ThinkPad P1 Gen 7 21KV001SGE -1! | |
| Lenovo ThinkPad P16s Gen 4 21RX000YGE -1! | |
| Cyberpunk 2077 - 1920x1080 Ultra Preset (FSR off) | |
| Dell Pro Max 16 Plus | |
| Lenovo ThinkPad P1 Gen 8 | |
| HP ZBook X G1i 16 | |
| Lenovo ThinkPad P1 Gen 7 21KV001SGE | |
| Lenovo ThinkPad P16s Gen 4 21RX000YGE | |
| Baldur's Gate 3 - 1920x1080 Ultra Preset AA:T | |
| Dell Pro Max 16 Plus | |
| Lenovo ThinkPad P1 Gen 8 | |
| HP ZBook X G1i 16 | |
| Lenovo ThinkPad P1 Gen 7 21KV001SGE | |
| Lenovo ThinkPad P16s Gen 4 21RX000YGE | |
| GTA V - 1920x1080 Highest AA:4xMSAA + FX AF:16x | |
| Dell Pro Max 16 Plus | |
| Lenovo ThinkPad P1 Gen 8 | |
| HP ZBook X G1i 16 | |
| Lenovo ThinkPad P1 Gen 7 21KV001SGE | |
| Asus ExpertBook B6 Flip B6602FC2 | |
| Lenovo ThinkPad P16s Gen 4 21RX000YGE | |
| Final Fantasy XV Benchmark - 1920x1080 High Quality | |
| Dell Pro Max 16 Plus | |
| Lenovo ThinkPad P1 Gen 8 | |
| HP ZBook X G1i 16 | |
| Lenovo ThinkPad P1 Gen 7 21KV001SGE | |
| Asus ExpertBook B6 Flip B6602FC2 | |
| Lenovo ThinkPad P16s Gen 4 21RX000YGE | |
| Strange Brigade - 1920x1080 ultra AA:ultra AF:16 | |
| Dell Pro Max 16 Plus | |
| Lenovo ThinkPad P1 Gen 8 | |
| HP ZBook X G1i 16 | |
| Asus ExpertBook B6 Flip B6602FC2 | |
| Dota 2 Reborn - 1920x1080 ultra (3/3) best looking | |
| Dell Pro Max 16 Plus | |
| Asus ExpertBook B6 Flip B6602FC2 | |
| HP ZBook X G1i 16 | |
| Lenovo ThinkPad P1 Gen 7 21KV001SGE | |
| Lenovo ThinkPad P1 Gen 8 | |
| Lenovo ThinkPad P16s Gen 4 21RX000YGE | |
| X-Plane 11.11 - 1920x1080 high (fps_test=3) | |
| Asus ExpertBook B6 Flip B6602FC2 | |
| Dell Pro Max 16 Plus | |
| Lenovo ThinkPad P1 Gen 7 21KV001SGE | |
| HP ZBook X G1i 16 | |
| Lenovo ThinkPad P1 Gen 8 | |
| Lenovo ThinkPad P16s Gen 4 21RX000YGE | |
| F1 24 | |
| 1920x1080 High Preset AA:T AF:16x | |
| Dell Pro Max 16 Plus | |
| Lenovo ThinkPad P1 Gen 8 | |
| Average NVIDIA RTX PRO 2000 Blackwell Generation Laptop (161.4 - 185.2, n=3) | |
| HP ZBook X G1i 16 | |
| Lenovo ThinkPad P1 Gen 7 21KV001SGE | |
| 1920x1080 Ultra High Preset AA:T AF:16x | |
| Dell Pro Max 16 Plus | |
| Lenovo ThinkPad P1 Gen 8 | |
| Average NVIDIA RTX PRO 2000 Blackwell Generation Laptop (48.2 - 57.2, n=3) | |
| HP ZBook X G1i 16 | |
| Lenovo ThinkPad P1 Gen 7 21KV001SGE | |
| 2560x1440 Ultra High Preset AA:T AF:16x | |
| Dell Pro Max 16 Plus | |
| Lenovo ThinkPad P1 Gen 8 | |
| Average NVIDIA RTX PRO 2000 Blackwell Generation Laptop (32.2 - 36.5, n=2) | |
| HP ZBook X G1i 16 | |
| Lenovo ThinkPad P1 Gen 7 21KV001SGE | |
| 2560x1440 Ultra High Preset + Quality DLSS AF:16x | |
| Dell Pro Max 16 Plus | |
| HP ZBook X G1i 16 | |
| Average NVIDIA RTX PRO 2000 Blackwell Generation Laptop (n=1) | |
| Lenovo ThinkPad P1 Gen 7 21KV001SGE | |
赛博朋克 2077》超 FPS 图表
| low | med. | high | ultra | QHD DLSS | QHD | 4K | |
|---|---|---|---|---|---|---|---|
| GTA V (2015) | 184.4 | 179.9 | 175 | 119.3 | 97.2 | ||
| Dota 2 Reborn (2015) | 149.2 | 137.2 | 132.5 | 125.7 | 103.5 | ||
| Final Fantasy XV Benchmark (2018) | 204 | 142.7 | 106.5 | 79.4 | |||
| X-Plane 11.11 (2018) | 108.6 | 91 | 76.3 | 58.7 | |||
| Strange Brigade (2018) | 502 | 281 | 229 | 199.8 | 142.4 | ||
| Baldur's Gate 3 (2023) | 132.2 | 116.4 | 101.4 | 102 | 101.3 | 69.9 | |
| Cyberpunk 2077 (2023) | 124 | 101.5 | 86.4 | 77.8 | 57.9 | 48.9 | |
| F1 24 (2024) | 250 | 229 | 185.2 | 57.2 | 36.5 |
排放量
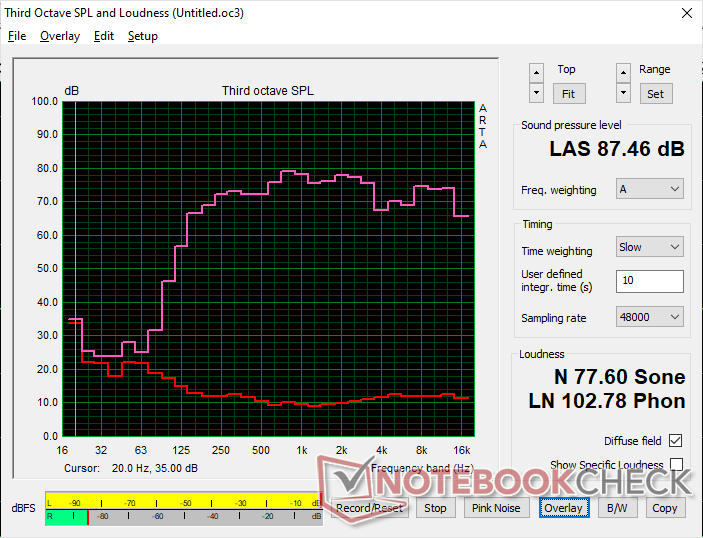
系统噪音
在浏览或运行低负载时,风扇是静音的,即使设置为 "性能 "模式,在流媒体播放时也会保持安静,噪音仅为 27 分贝(A)。在玩游戏或 CPU 和 GPU 长时间处于紧张状态时,最大噪音可达 48 dB(A)。
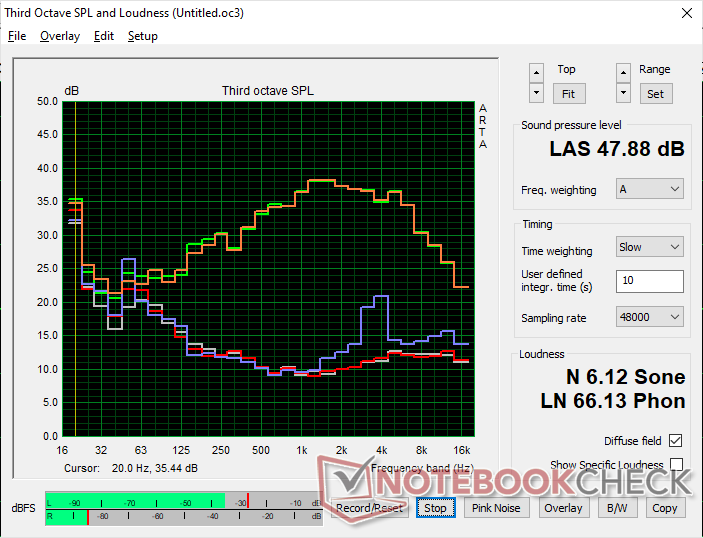
Noise level
| Idle |
| 23.1 / 23.1 / 23.1 dB(A) |
| Load |
| 27.3 / 47.9 dB(A) |
 | ||
30 dB silent 40 dB(A) audible 50 dB(A) loud |
||
min: | ||
| Lenovo ThinkPad P1 Gen 8 Ultra 7 255H, RTX PRO 2000 Blackwell Generation Laptop | Lenovo ThinkPad P16s Gen 4 21RX000YGE Ryzen AI 9 HX PRO 370, Radeon 890M | Lenovo ThinkPad P1 Gen 7 21KV001SGE Ultra 7 155H, GeForce RTX 4060 Laptop GPU | HP ZBook X G1i 16 Ultra 7 265H, RTX PRO 2000 Blackwell Generation Laptop | Dell Pro Max 16 Plus Ultra 9 285HX, RTX PRO 5000 Blackwell Generation Laptop | Asus ExpertBook B6 Flip B6602FC2 i9-12950HX, RTX A2000 Laptop GPU | |
|---|---|---|---|---|---|---|
| Noise | -20% | -17% | -5% | -26% | -39% | |
| off / environment * (dB) | 23.1 | 25.9 -12% | 24.7 -7% | 23.7 -3% | 23.2 -0% | 26 -13% |
| Idle Minimum * (dB) | 23.1 | 25.9 -12% | 24.7 -7% | 23.7 -3% | 26.7 -16% | 32.4 -40% |
| Idle Average * (dB) | 23.1 | 25.9 -12% | 24.7 -7% | 23.7 -3% | 30.5 -32% | 32.4 -40% |
| Idle Maximum * (dB) | 23.1 | 28.5 -23% | 24.7 -7% | 23.7 -3% | 34 -47% | 32.4 -40% |
| Load Average * (dB) | 27.3 | 42.9 -57% | 43.7 -60% | 32.7 -20% | 39.8 -46% | 51.9 -90% |
| Load Maximum * (dB) | 47.9 | 48.5 -1% | 53.3 -11% | 48 -0% | 54.3 -13% | 52.1 -9% |
| Cyberpunk 2077 ultra * (dB) | 48.7 | 53.2 | 50.9 | 54.3 |
* ... smaller is better
温度
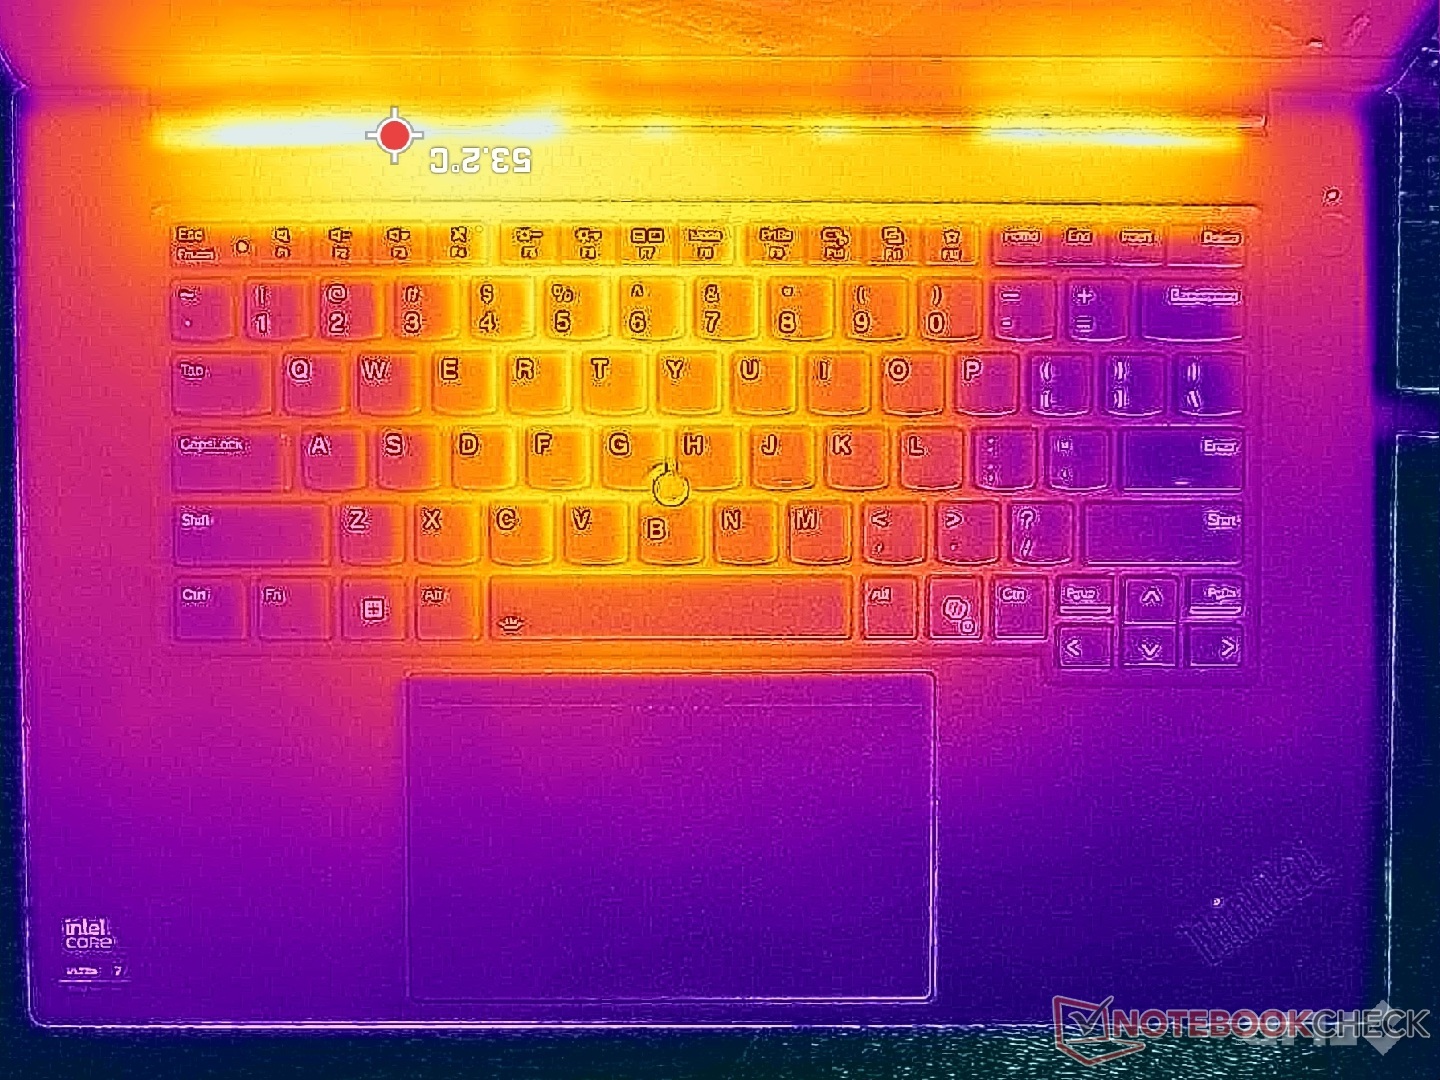
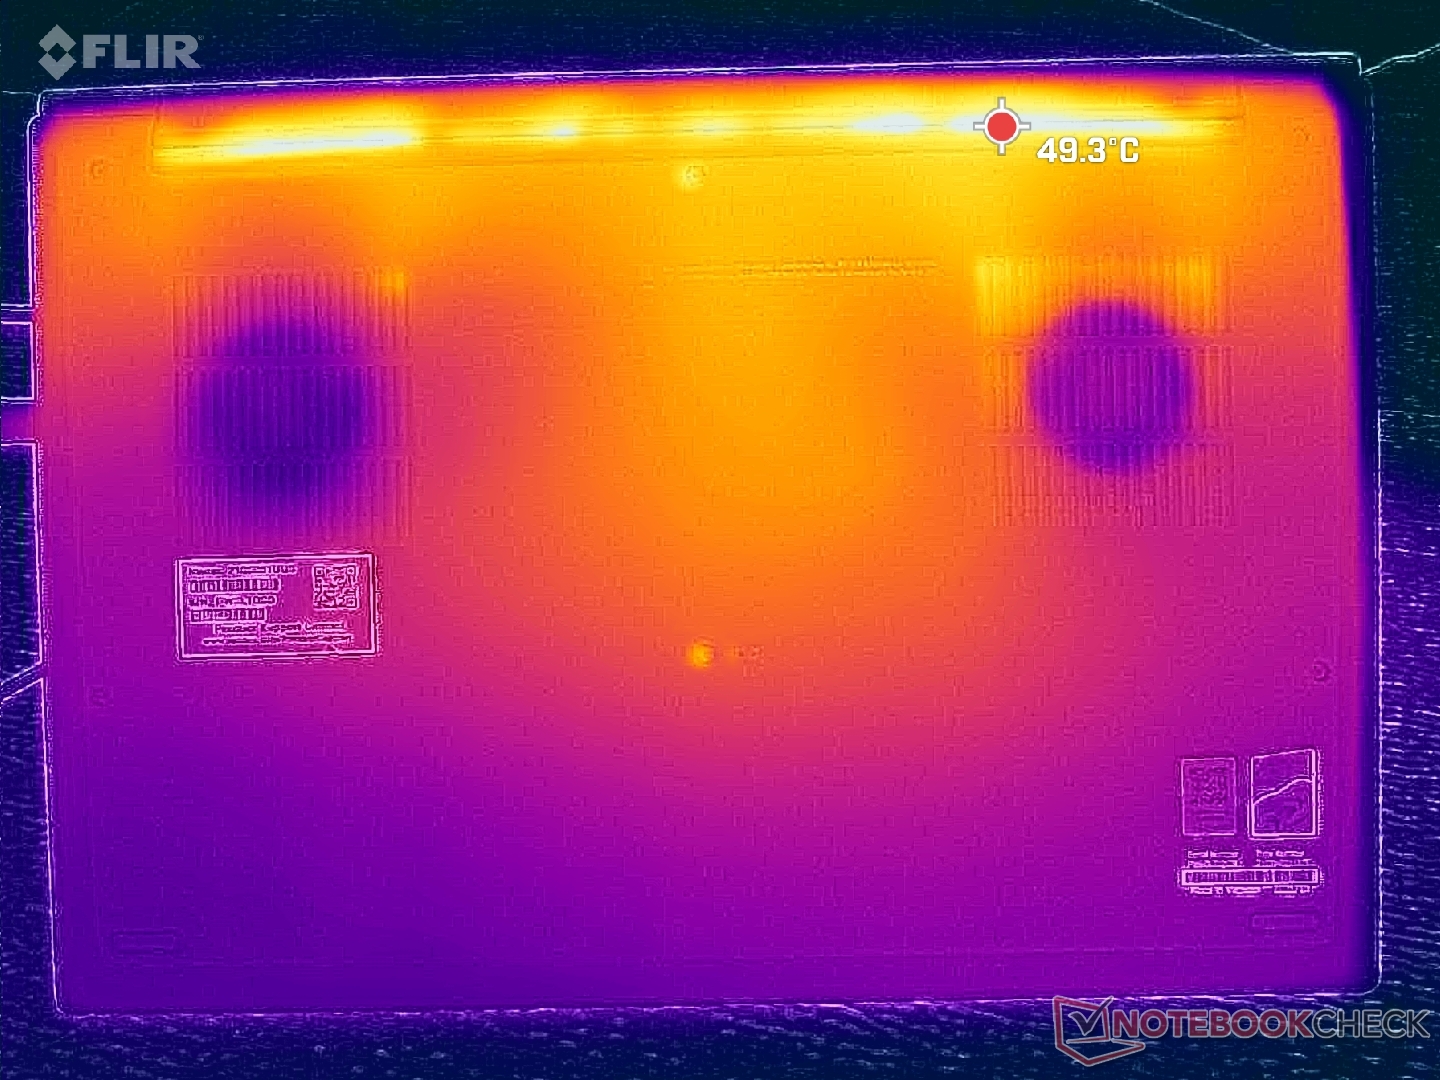
表面温度的变化是对称的,当运行 Prime95 或 FurMark 等要求非常苛刻的负载时,键盘中心附近的热点温度可达 40 C 至 45 C。考虑到纤薄的机箱设计,这一结果比预期的要低。去年的 ThinkPad P1 7 代相比之下,其表面温度更高,这可能是由于其较高的 170 W 功率包络线造成的。
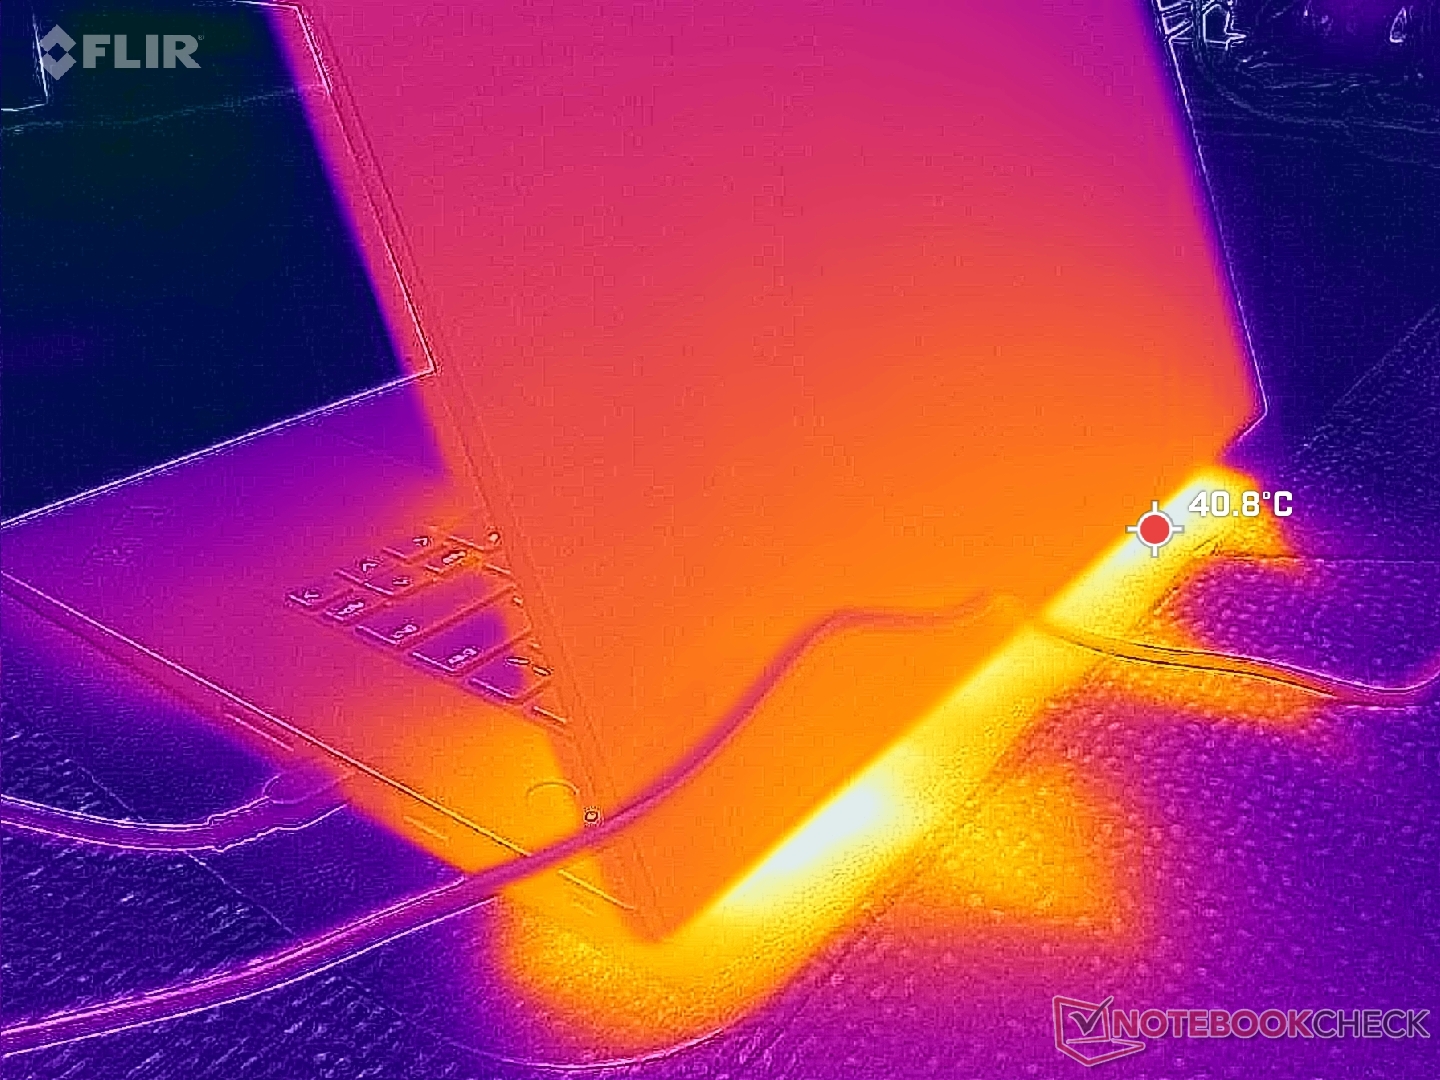
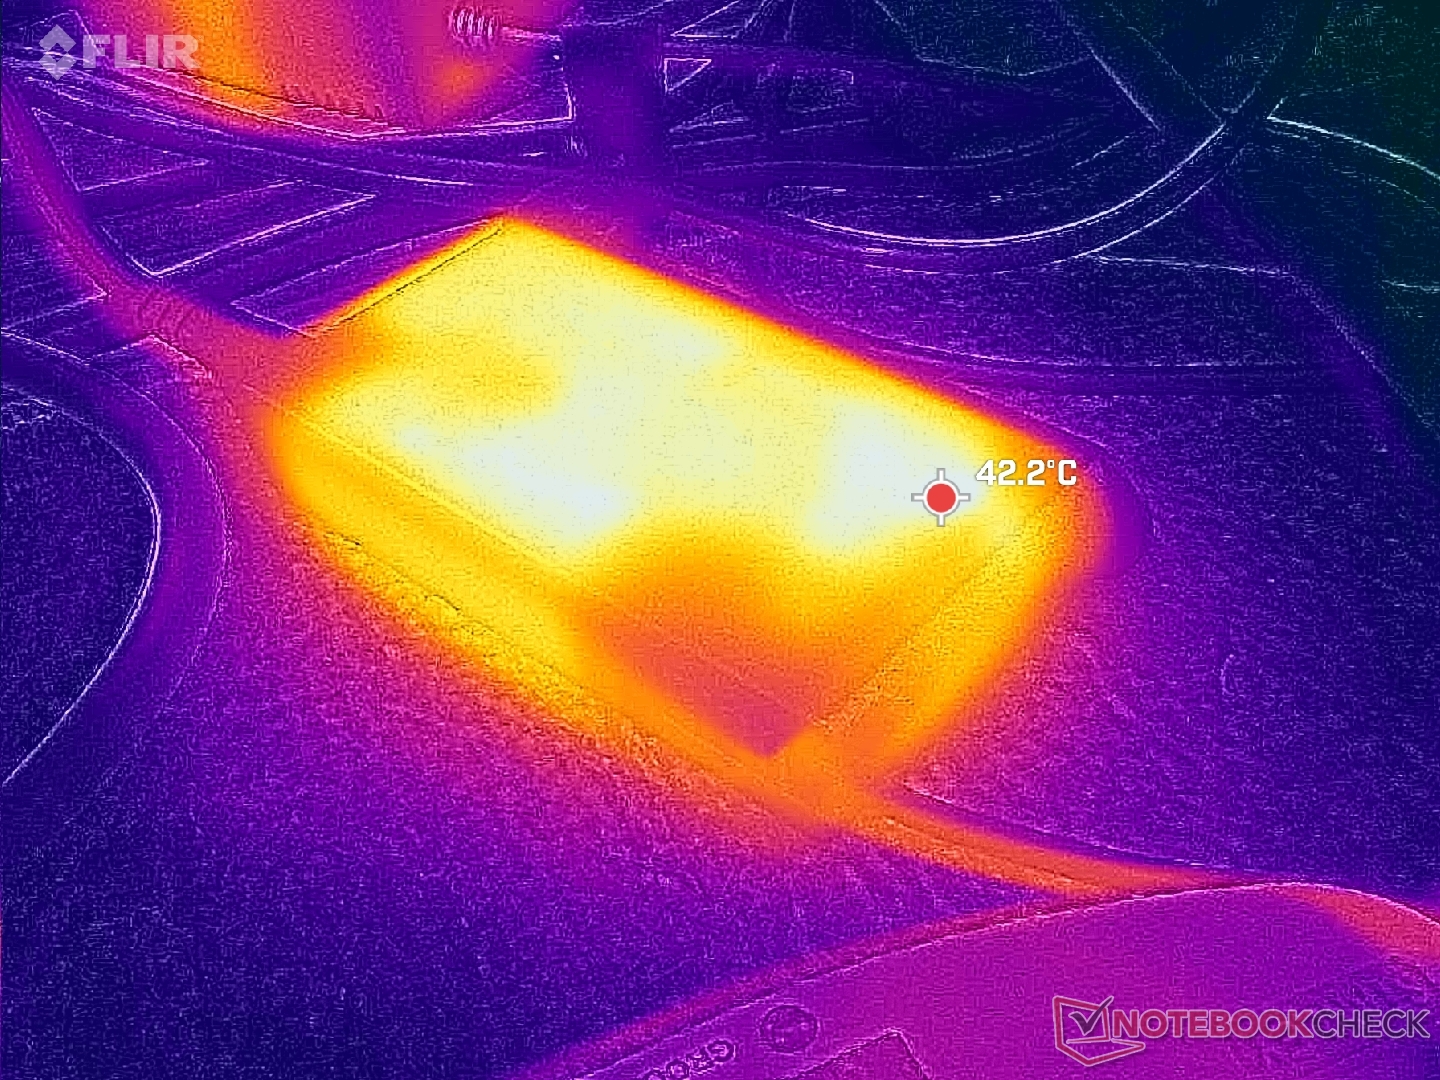
(±) The maximum temperature on the upper side is 45 °C / 113 F, compared to the average of 38.2 °C / 101 F, ranging from 22.2 to 69.8 °C for the class Workstation.
(+) The bottom heats up to a maximum of 33 °C / 91 F, compared to the average of 41.1 °C / 106 F
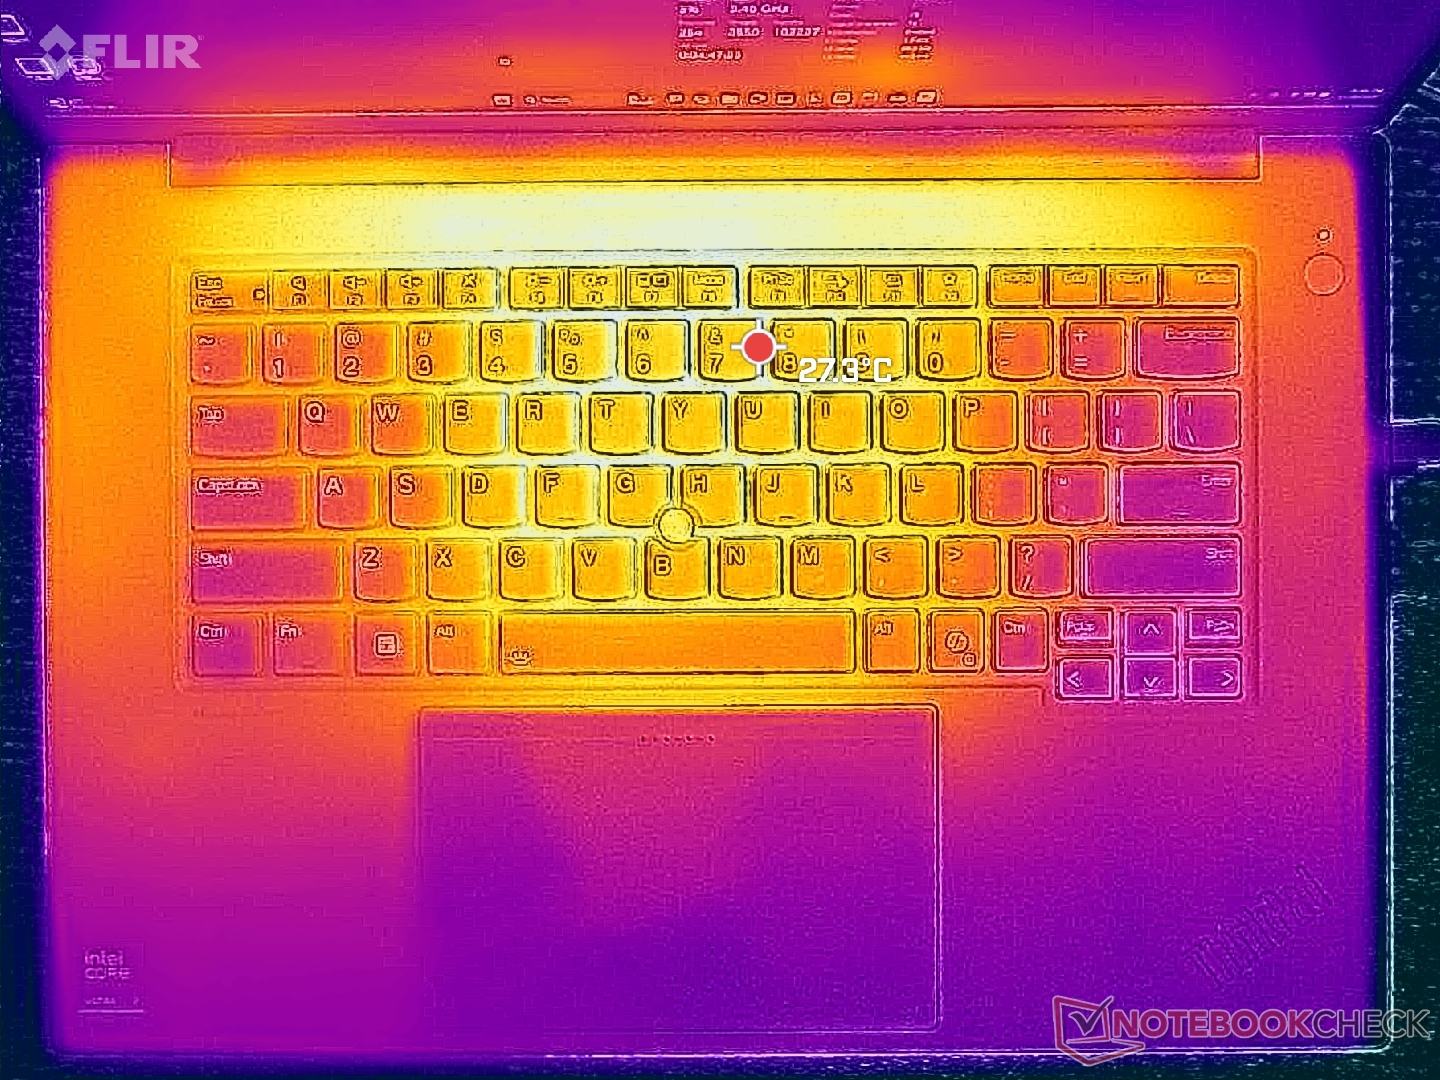
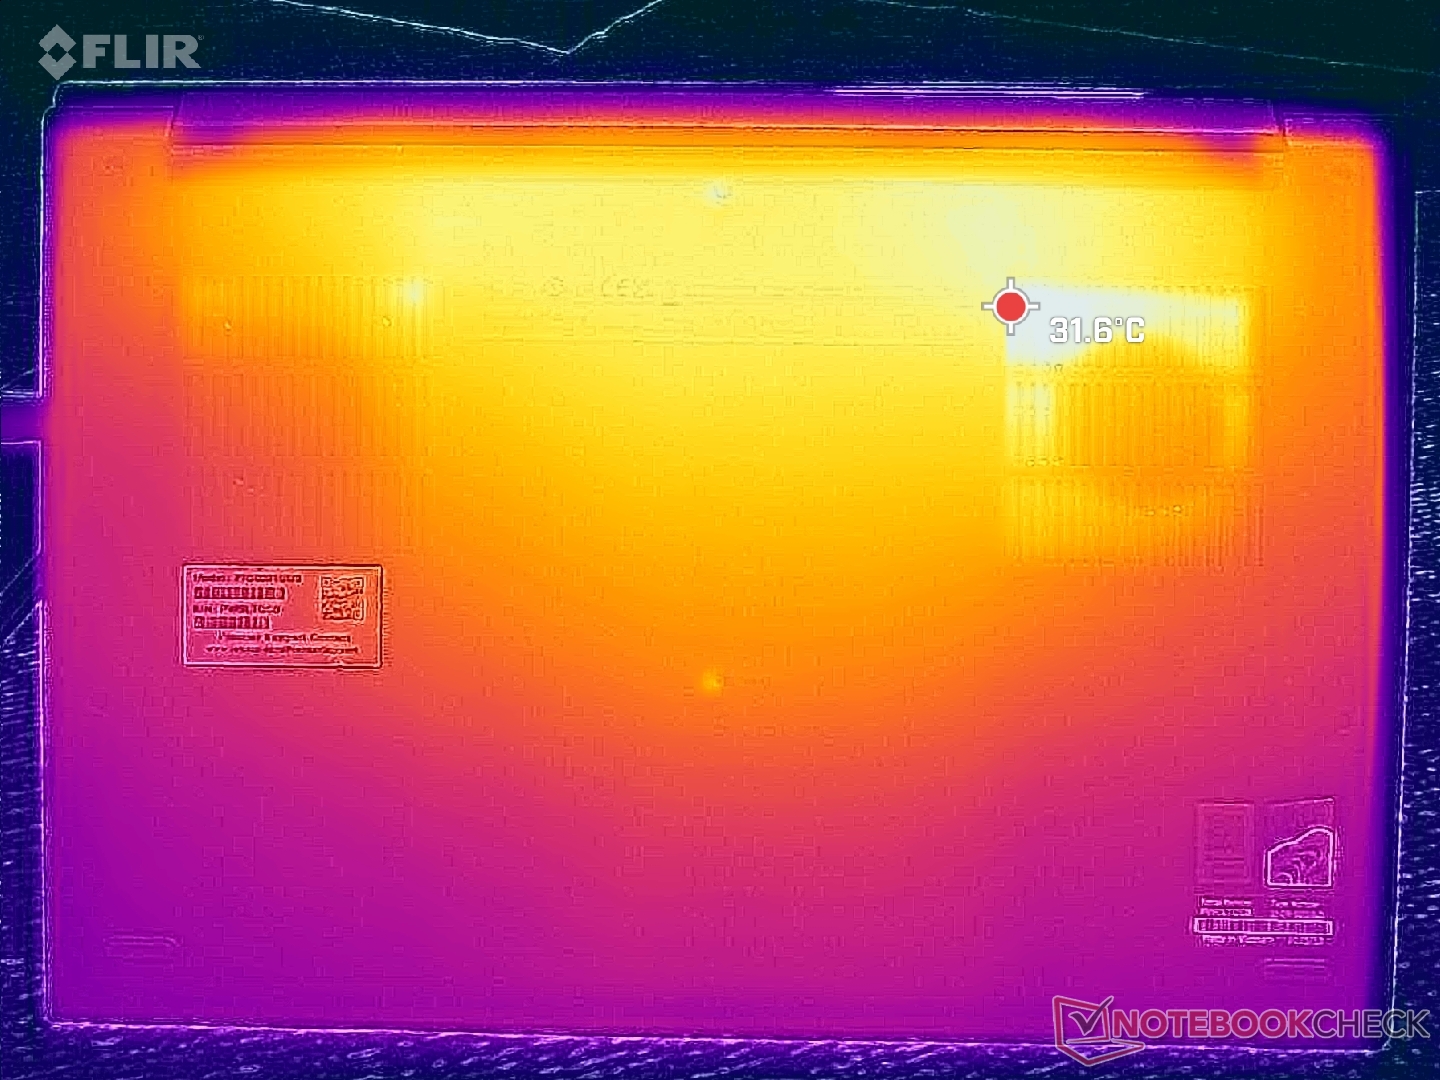
(+) In idle usage, the average temperature for the upper side is 26 °C / 79 F, compared to the device average of 32 °C / 90 F.
(+) The palmrests and touchpad are cooler than skin temperature with a maximum of 23.2 °C / 73.8 F and are therefore cool to the touch.
(+) The average temperature of the palmrest area of similar devices was 27.8 °C / 82 F (+4.6 °C / 8.2 F).
| Lenovo ThinkPad P1 Gen 8 Ultra 7 255H, RTX PRO 2000 Blackwell Generation Laptop | Lenovo ThinkPad P16s Gen 4 21RX000YGE Ryzen AI 9 HX PRO 370, Radeon 890M | Lenovo ThinkPad P1 Gen 7 21KV001SGE Ultra 7 155H, GeForce RTX 4060 Laptop GPU | HP ZBook X G1i 16 Ultra 7 265H, RTX PRO 2000 Blackwell Generation Laptop | Dell Pro Max 16 Plus Ultra 9 285HX, RTX PRO 5000 Blackwell Generation Laptop | Asus ExpertBook B6 Flip B6602FC2 i9-12950HX, RTX A2000 Laptop GPU | |
|---|---|---|---|---|---|---|
| Heat | -29% | -1% | 0% | -10% | -13% | |
| Maximum Upper Side * (°C) | 45 | 50.6 -12% | 50.3 -12% | 36 20% | 40.4 10% | 48.4 -8% |
| Maximum Bottom * (°C) | 33 | 54.3 -65% | 38 -15% | 39.4 -19% | 45.6 -38% | 52.3 -58% |
| Idle Upper Side * (°C) | 30.6 | 35.3 -15% | 28.3 8% | 30.4 1% | 32.8 -7% | 27.8 9% |
| Idle Bottom * (°C) | 31.6 | 38.5 -22% | 27.3 14% | 31.8 -1% | 33 -4% | 30.3 4% |
* ... smaller is better
压力测试
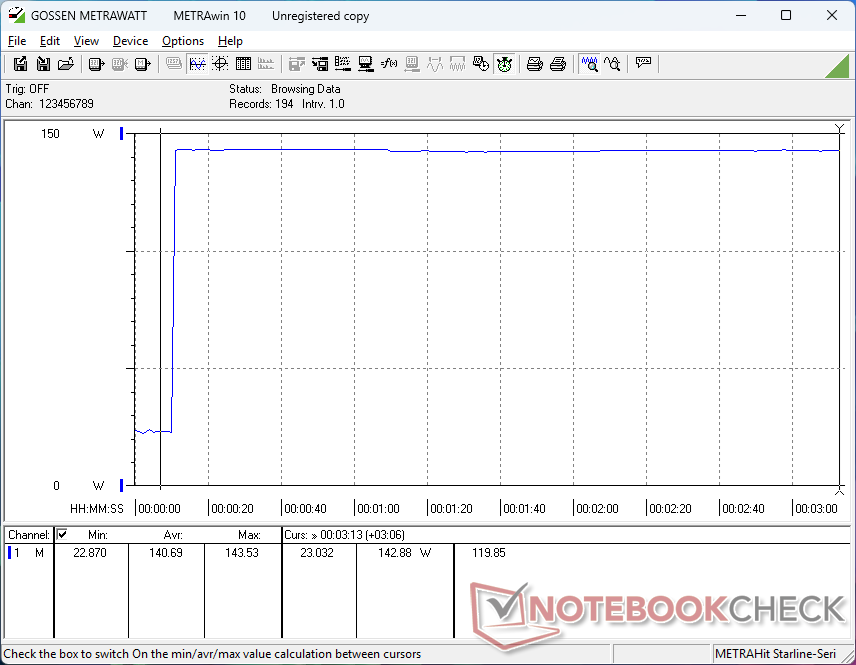
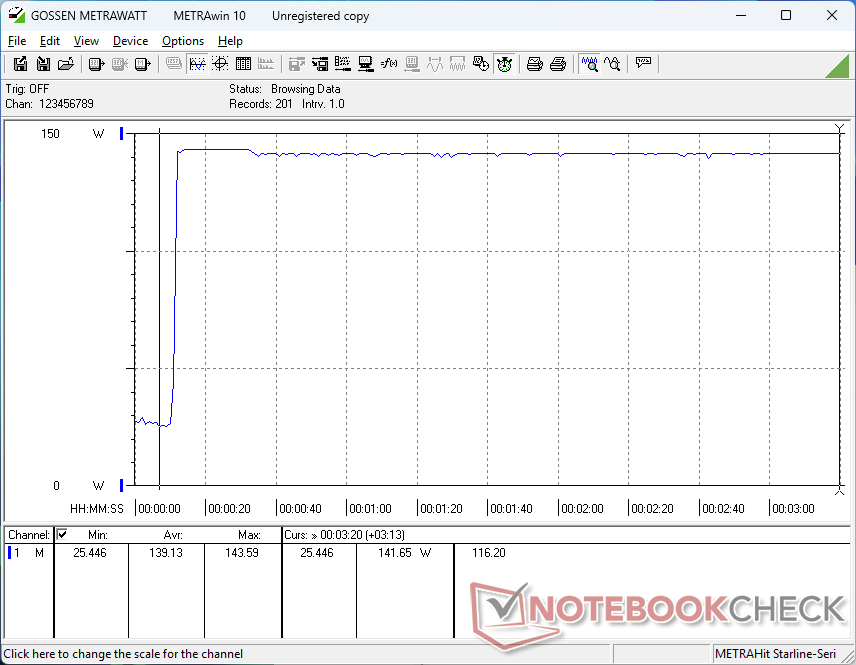
从平衡模式切换到性能模式时,GPU 板功耗从 63 W 跃升至近 70 W,因此我们建议运行性能模式,尽管其核心温度略高,约为 75 C。
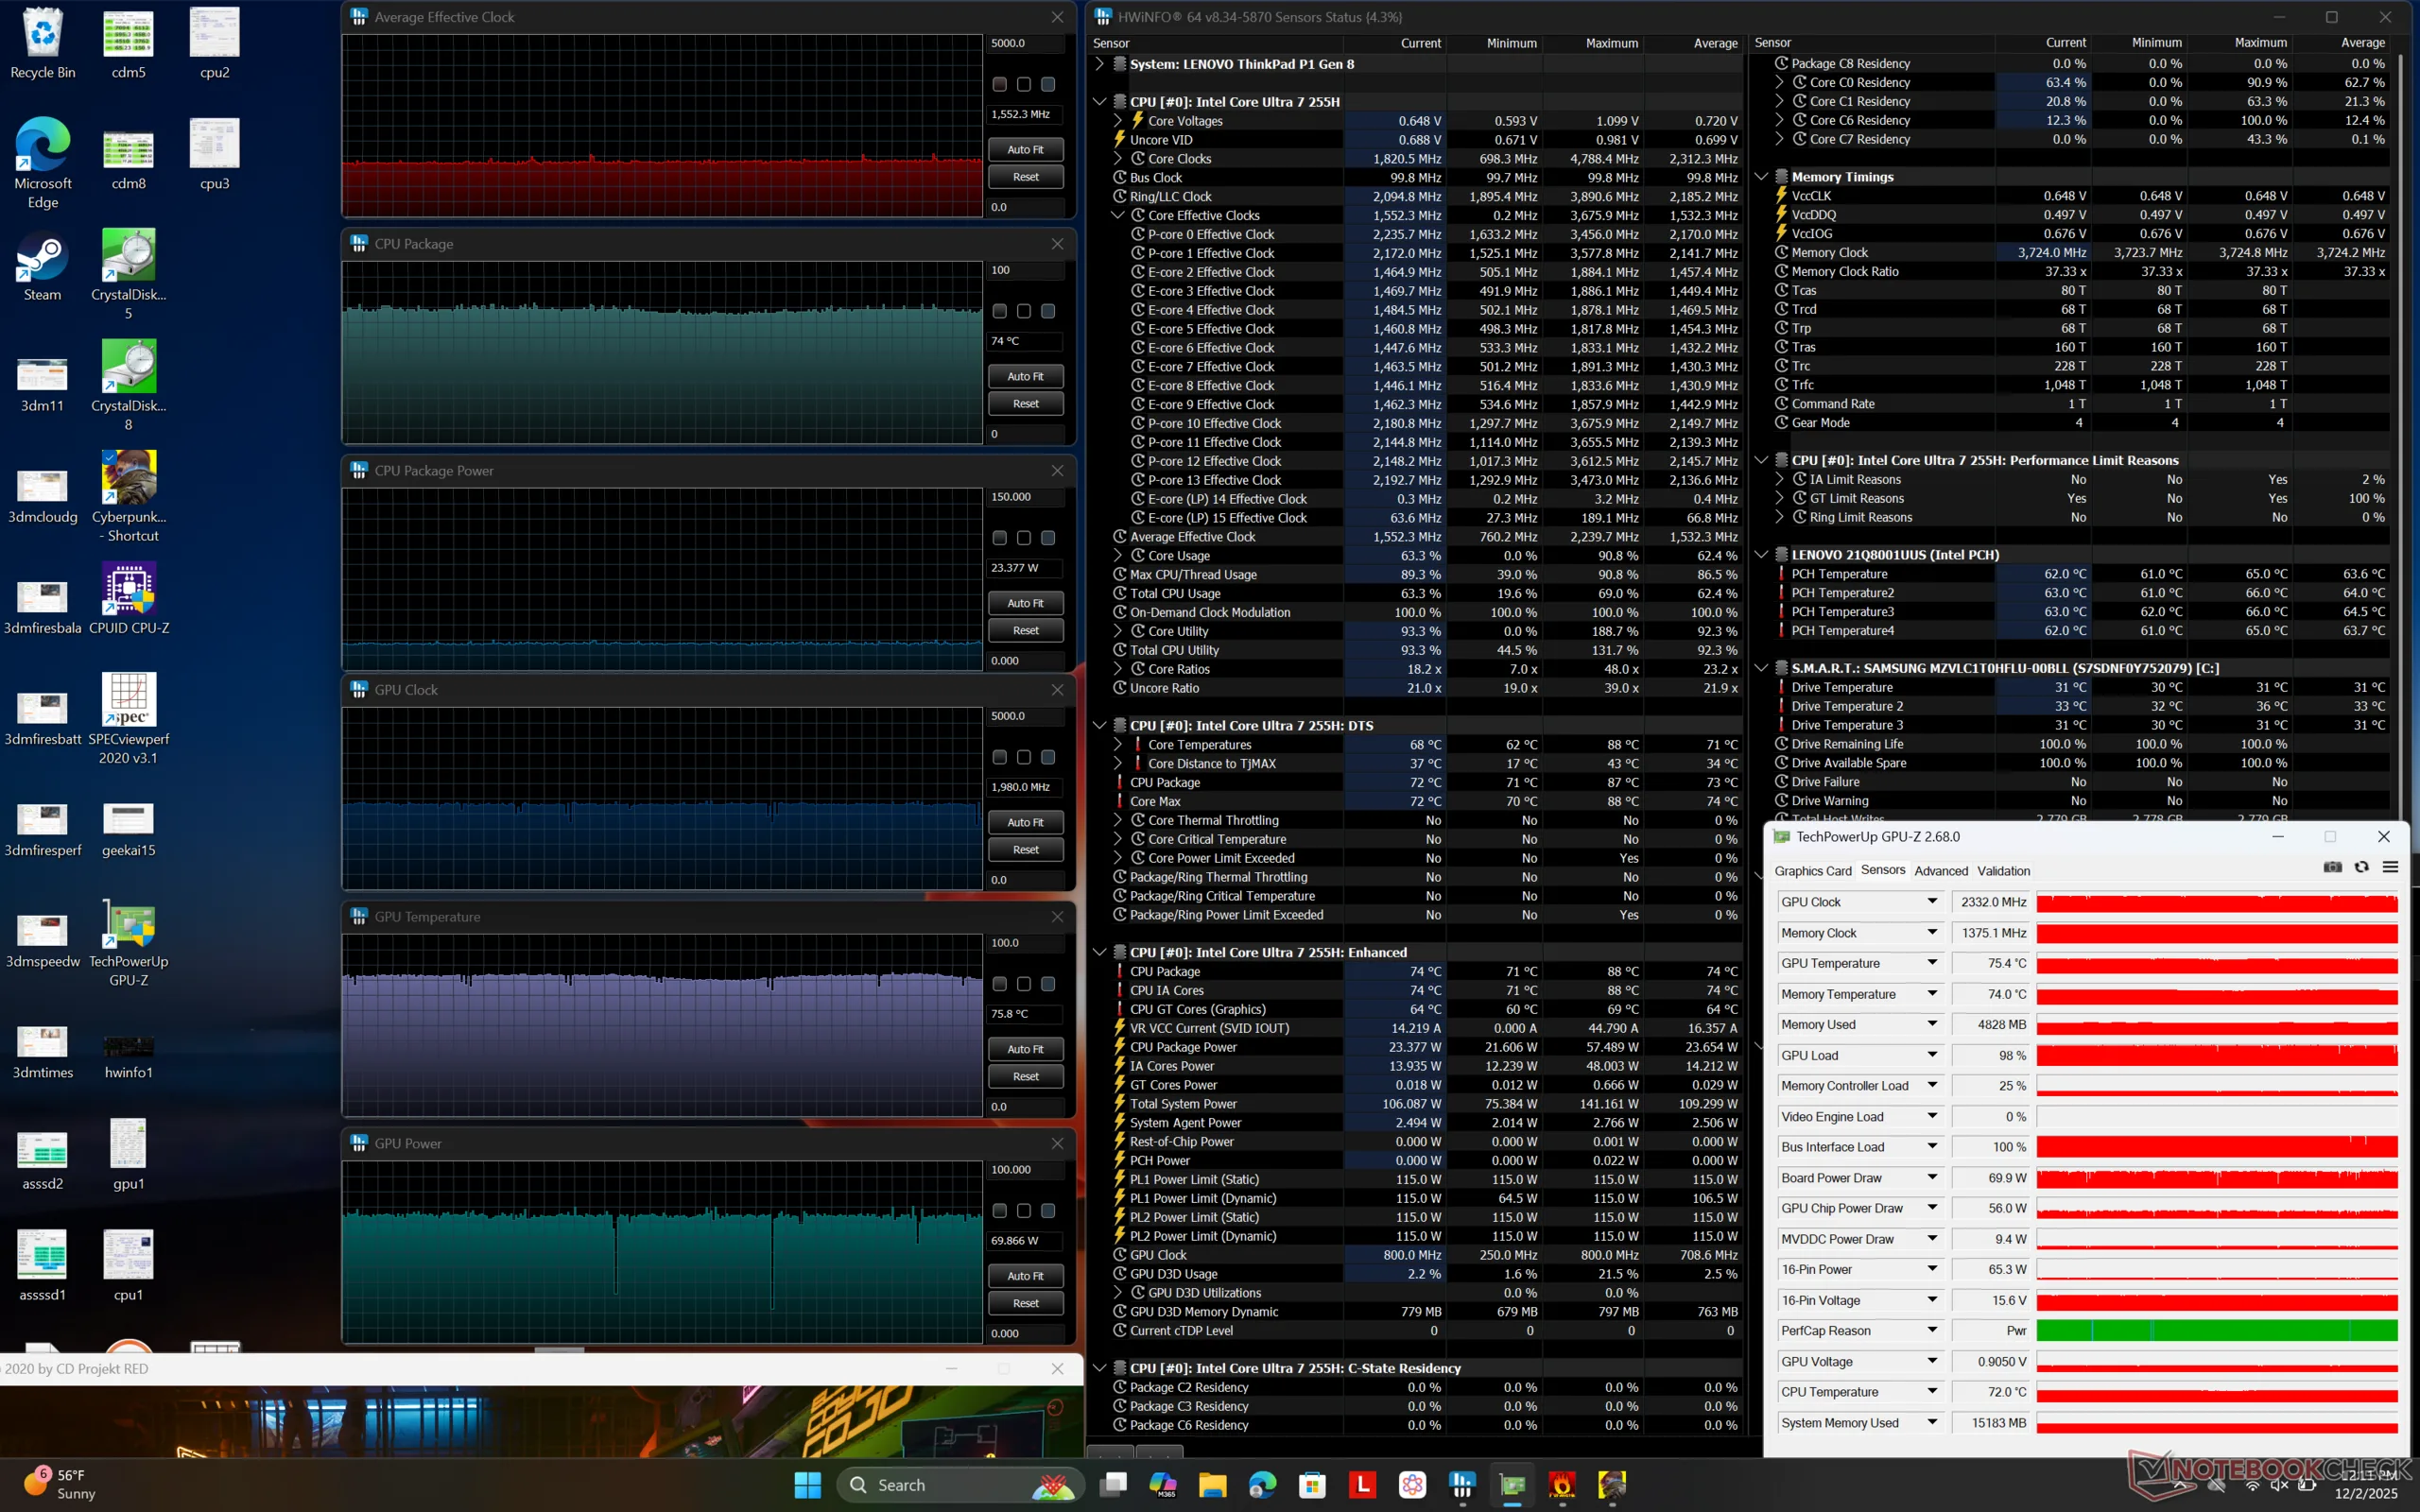
| CPU 时钟 (GHz) | GPU 时钟 (MHz) | CPU 平均温度 (°C) | GPU 平均温度 (°C) | |
| 系统闲置 | -- | -- | 52 | 45 |
| Prime95 压力 | 3.6 | -- | 91 | 60 |
| Prime95 + FurMark Stress | 2.7 | 1672 | 77 | 72 |
| 赛博朋克 2077》压力(平衡模式) | 1.6 | 2325 | 63 | 66 |
| 赛博朋克 2077》压力(性能模式) | 1.6 | 2332 | 74 | 76 |
发言人
Lenovo ThinkPad P1 Gen 8 audio analysis
(+) | speakers can play relatively loud (87.5 dB)
Bass 100 - 315 Hz
(±) | reduced bass - on average 9.8% lower than median
(±) | linearity of bass is average (11.2% delta to prev. frequency)
Mids 400 - 2000 Hz
(+) | balanced mids - only 2.9% away from median
(+) | mids are linear (2.8% delta to prev. frequency)
Highs 2 - 16 kHz
(+) | balanced highs - only 3% away from median
(+) | highs are linear (4.7% delta to prev. frequency)
Overall 100 - 16.000 Hz
(+) | overall sound is linear (8.3% difference to median)
Compared to same class
» 1% of all tested devices in this class were better, 1% similar, 97% worse
» The best had a delta of 7%, average was 17%, worst was 35%
Compared to all devices tested
» 2% of all tested devices were better, 1% similar, 97% worse
» The best had a delta of 4%, average was 23%, worst was 134%
Apple MacBook Pro 16 2021 M1 Pro audio analysis
(+) | speakers can play relatively loud (84.7 dB)
Bass 100 - 315 Hz
(+) | good bass - only 3.8% away from median
(+) | bass is linear (5.2% delta to prev. frequency)
Mids 400 - 2000 Hz
(+) | balanced mids - only 1.3% away from median
(+) | mids are linear (2.1% delta to prev. frequency)
Highs 2 - 16 kHz
(+) | balanced highs - only 1.9% away from median
(+) | highs are linear (2.7% delta to prev. frequency)
Overall 100 - 16.000 Hz
(+) | overall sound is linear (4.6% difference to median)
Compared to same class
» 0% of all tested devices in this class were better, 0% similar, 100% worse
» The best had a delta of 5%, average was 17%, worst was 45%
Compared to all devices tested
» 0% of all tested devices were better, 0% similar, 100% worse
» The best had a delta of 4%, average was 23%, worst was 134%
能源管理
耗电量
空闲时的耗电量普遍高于去年 IPS 机型的耗电量,导致运行时间缩短。在运行要求更高的负载时,尽管第 8 代机型的性能水平更高,每瓦性能也有所提高,但两款机型的耗电量却非常接近。
需要注意的是,ThinkPad P1 Gen 8 配备的是较小的 140 瓦 USB-C AC 适配器(约 12.8 x 6.2 x 2.3 厘米),而 ThinkPad P1 Gen 7 配备的是 170 瓦适配器。
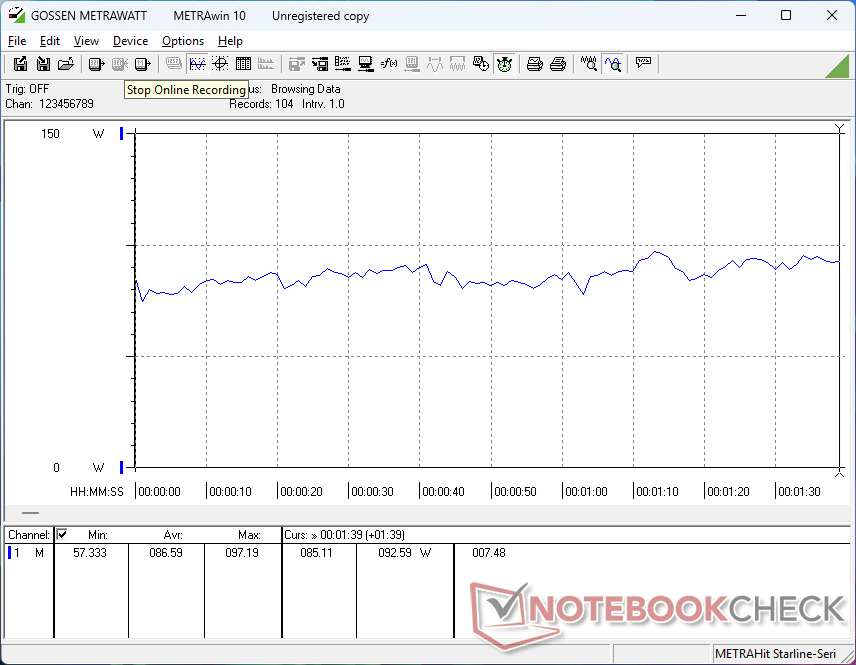
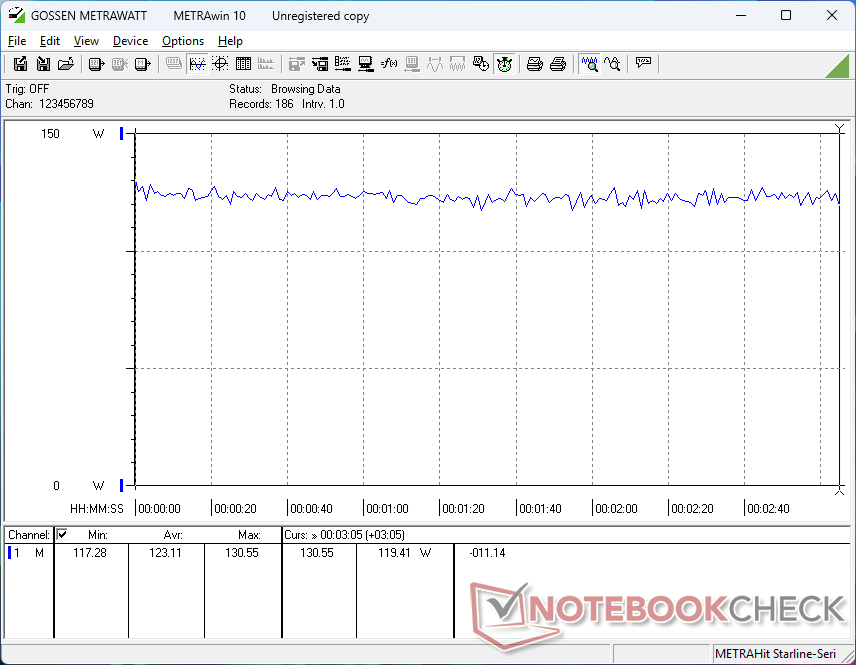
| Off / Standby | |
| Idle | |
| Load |
|
Key:
min: | |
| Lenovo ThinkPad P1 Gen 8 Ultra 7 255H, RTX PRO 2000 Blackwell Generation Laptop, Samsung PM9E1 1 TB MZVLC1T0HFLU, Tandem OLED, 3200x2000, 16" | Lenovo ThinkPad P16s Gen 4 21RX000YGE Ryzen AI 9 HX PRO 370, Radeon 890M, Micron 3500 1TB MTFDKBA1T0TGD, IPS LED, 1920x1200, 16" | Lenovo ThinkPad P1 Gen 7 21KV001SGE Ultra 7 155H, GeForce RTX 4060 Laptop GPU, Kioxia XG8 KXG8AZNV1T02, IPS LED, 2560x1600, 16" | HP ZBook X G1i 16 Ultra 7 265H, RTX PRO 2000 Blackwell Generation Laptop, Samsung PM9A1 MZVL22T0HBLB, IPS, 2560x1600, 16" | Dell Pro Max 16 Plus Ultra 9 285HX, RTX PRO 5000 Blackwell Generation Laptop, SK hynix PCB01 HFS001TFM9X186N, OLED, 3840x2400, 16" | Asus ExpertBook B6 Flip B6602FC2 i9-12950HX, RTX A2000 Laptop GPU, Samsung PM9A1 MZVL21T0HCLR, IPS, 2560x1600, 16" | |
|---|---|---|---|---|---|---|
| Power Consumption | 56% | 14% | 29% | -103% | -17% | |
| Idle Minimum * (Watt) | 15.4 | 3.9 75% | 7.3 53% | 4.1 73% | 35.1 -128% | 10.5 32% |
| Idle Average * (Watt) | 16.5 | 8.3 50% | 12.3 25% | 9 45% | 39.2 -138% | 11.9 28% |
| Idle Maximum * (Watt) | 23.1 | 8.7 62% | 17.9 23% | 9.4 59% | 56 -142% | 18 22% |
| Load Average * (Watt) | 86.6 | 51.6 40% | 78.2 10% | 86.7 -0% | 130.2 -50% | 182 -110% |
| Cyberpunk 2077 ultra external monitor * (Watt) | 121.8 | 54.6 55% | 117.7 3% | 102 16% | 213 -75% | |
| Cyberpunk 2077 ultra * (Watt) | 123.1 | 55.4 55% | 123.5 -0% | 106.1 14% | 229 -86% | |
| Load Maximum * (Watt) | 143.6 | 63.7 56% | 167.5 -17% | 152.9 -6% | 285.2 -99% | 229 -59% |
| Witcher 3 ultra * (Watt) | 177.5 |
* ... smaller is better
功耗 赛博朋克/压力测试
外部显示器功耗
电池寿命
即使设置为平衡模式和相同的 ~150 nit 亮度水平,运行时间也明显比去年的 IPS 配置短几个小时。
| Lenovo ThinkPad P1 Gen 8 Ultra 7 255H, RTX PRO 2000 Blackwell Generation Laptop, 90 Wh | Lenovo ThinkPad P1 Gen 7 21KV001SGE Ultra 7 155H, GeForce RTX 4060 Laptop GPU, 90 Wh | HP ZBook X G1i 16 Ultra 7 265H, RTX PRO 2000 Blackwell Generation Laptop, 83 Wh | Dell Pro Max 16 Plus Ultra 9 285HX, RTX PRO 5000 Blackwell Generation Laptop, 96 Wh | Asus ExpertBook B6 Flip B6602FC2 i9-12950HX, RTX A2000 Laptop GPU, 90 Wh | |
|---|---|---|---|---|---|
| Battery runtime | 80% | 127% | -35% | 58% | |
| WiFi v1.3 (h) | 5.5 | 9.9 80% | 12.5 127% | 3.6 -35% | 8.7 58% |
| Load (h) | 1.9 | 1.7 | |||
| Reader / Idle (h) | 12.5 | ||||
| H.264 (h) | 5.8 |
笔记本检查评级
ThinkPad P1 Gen 8 是一款超薄的 16 英寸工作站,配备中端酷睿 H 系列处理器和 Nvidia Pro RTX 独立显卡。
Lenovo ThinkPad P1 Gen 8
- 12/10/2025 v8
Allen Ngo
 Total Sustainability Score:
 潜在竞争对手比较
Image | Model / Review | Price | Weight | Height | Display |
|---|---|---|---|---|---|
1. 91.6%  | Lenovo ThinkPad P1 Gen 8 Intel Core Ultra 7 255H ⎘ NVIDIA RTX PRO 2000 Blackwell Generation Laptop ⎘ 32 GB Memory, 1024 GB SSD | Amazon: List Price: 2000 USD | 1.9 kg | 20.6 mm | 16.00" 3200x2000 236 PPI Tandem OLED |
2. 82%  | Lenovo ThinkPad P16s Gen 4 21RX000YGE AMD Ryzen AI 9 HX PRO 370 ⎘ AMD Radeon 890M ⎘ 64 GB Memory, 1024 GB SSD | Amazon: List Price: 2440 Euro | 2 kg | 23 mm | 16.00" 1920x1200 142 PPI IPS LED |
3. 83.5%  | Lenovo ThinkPad P1 Gen 7 21KV001SGE Intel Core Ultra 7 155H ⎘ NVIDIA GeForce RTX 4060 Laptop GPU ⎘ 32 GB Memory, 1024 GB SSD | Amazon: List Price: 3239 Euro | 2 kg | 20.5 mm | 16.00" 2560x1600 189 PPI IPS LED |
4. 87.4%  | HP ZBook X G1i 16 Intel Core Ultra 7 265H ⎘ NVIDIA RTX PRO 2000 Blackwell Generation Laptop ⎘ 64 GB Memory, 2048 GB SSD | Amazon: List Price: 2700 USD | 2.2 kg | 23 mm | 16.00" 2560x1600 189 PPI IPS |
5. 88.4%  | Dell Pro Max 16 Plus Intel Core Ultra 9 285HX ⎘ NVIDIA RTX PRO 5000 Blackwell Generation Laptop ⎘ 128 GB Memory, SSD | Amazon: List Price: 5000 USD | 2.8 kg | 30.9 mm | 16.00" 3840x2400 283 PPI OLED |
6. 89.6% v7 (old)  | Asus ExpertBook B6 Flip B6602FC2 Intel Core i9-12950HX ⎘ NVIDIA RTX A2000 Laptop GPU ⎘ 32 GB Memory, 1024 GB SSD | Amazon: 1. $265.00 for ASUS ExpertBook B6 Flip ... 2. $198.00 for ASUS ExpertBook B6 Flip ... 3. $1,519.99 ASUS ExpertBook B5 Thin & Li... | 2.8 kg | 27.2 mm | 16.00" 2560x1600 189 PPI IPS |
Transparency
The selection of devices to be reviewed is made by our editorial team. The test sample was provided to the author as a loan by the manufacturer or retailer for the purpose of this review. The lender had no influence on this review, nor did the manufacturer receive a copy of this review before publication. There was no obligation to publish this review. As an independent media company, Notebookcheck is not subjected to the authority of manufacturers, retailers or publishers.
This is how Notebookcheck is testing
Every year, Notebookcheck independently reviews hundreds of laptops and smartphones using standardized procedures to ensure that all results are comparable. We have continuously developed our test methods for around 20 years and set industry standards in the process. In our test labs, high-quality measuring equipment is utilized by experienced technicians and editors. These tests involve a multi-stage validation process. Our complex rating system is based on hundreds of well-founded measurements and benchmarks, which maintains objectivity. Further information on our test methods can be found here.

