惠普Envy 17笔记本电脑评论: GeForce GPU在多媒体笔记本电脑的优雅4K显示屏上的发挥
惠普的Envy机型系列代表了为移动创意专业人士提供的强大笔记本电脑。在这个系列中,制造商提供了从紧凑的13.3到大型的17.3英寸的型号。惠普Envy 17-cr0079ng被定位在最高端,在这个型号版本中带来了一个大的17.3英寸UHD显示屏。
在引擎盖下,惠普Envy 17-cr0079ng也能提供一些好的设备:惠普使用 英特尔酷睿i7-1255U第12代(桤木湖)处理器,将其与专用的 NvidiaGeForce RTX 2050 Laptop4GB GDDR6的中低端GPU,32GB DDR4工作内存,以及一个大型的1TB SSD。再加上一个55瓦时的电池,这导致一个~2.5公斤(~5.5磅)的17英寸笔记本电脑,现在必须在我们的测试中证明自己。
在我们的审查中,Envy 17必须与其他采用Core i7-1255U的笔记本电脑竞争,比如更紧凑的 HP ProBook 450 G9 6A180EA,以及同样的图形解决方案,如 Acer Aspire 5 A515-57G-53N8和17英寸的 LG Gram 17耐力冠军。
潜在的竞争对手比较
Rating | Date | Model | Weight | Height | Size | Resolution | Price |
|---|---|---|---|---|---|---|---|
| 86.3 % v7 (old) | 04 / 2023 | HP Envy 17-cr0079ng i7-1255U, GeForce RTX 2050 Mobile | 2.6 kg | 19.6 mm | 17.30" | 3840x2160 | |
| 85 % v7 (old) | 08 / 2022 | HP ProBook 450 G9 6A180EA i7-1255U, Iris Xe G7 96EUs | 1.7 kg | 19.9 mm | 15.60" | 1920x1080 | |
| 86.4 % v7 (old) | 03 / 2023 | LG Gram 17Z90Q-E.AD78G i7-1260P, GeForce RTX 2050 Mobile | 1.4 kg | 17.8 mm | 17.00" | 2560x1600 | |
| 80.7 % v7 (old) | 09 / 2022 | Acer Aspire 5 A515-57G-53N8 i5-1240P, GeForce RTX 2050 Mobile | 1.8 kg | 18 mm | 15.60" | 1920x1080 | |
| 89.3 % v7 (old) | 06 / 2022 | Dell XPS 17 9720 i7-12700H, GeForce RTX 3050 4GB Laptop GPU | 2.5 kg | 19.5 mm | 17.00" | 3840x2400 | |
| 79.4 % v7 (old) | 03 / 2023 | Lenovo IdeaPad 3 17ABA7 R5 5625U, Vega 7 | 2 kg | 19.9 mm | 17.30" | 1920x1080 |
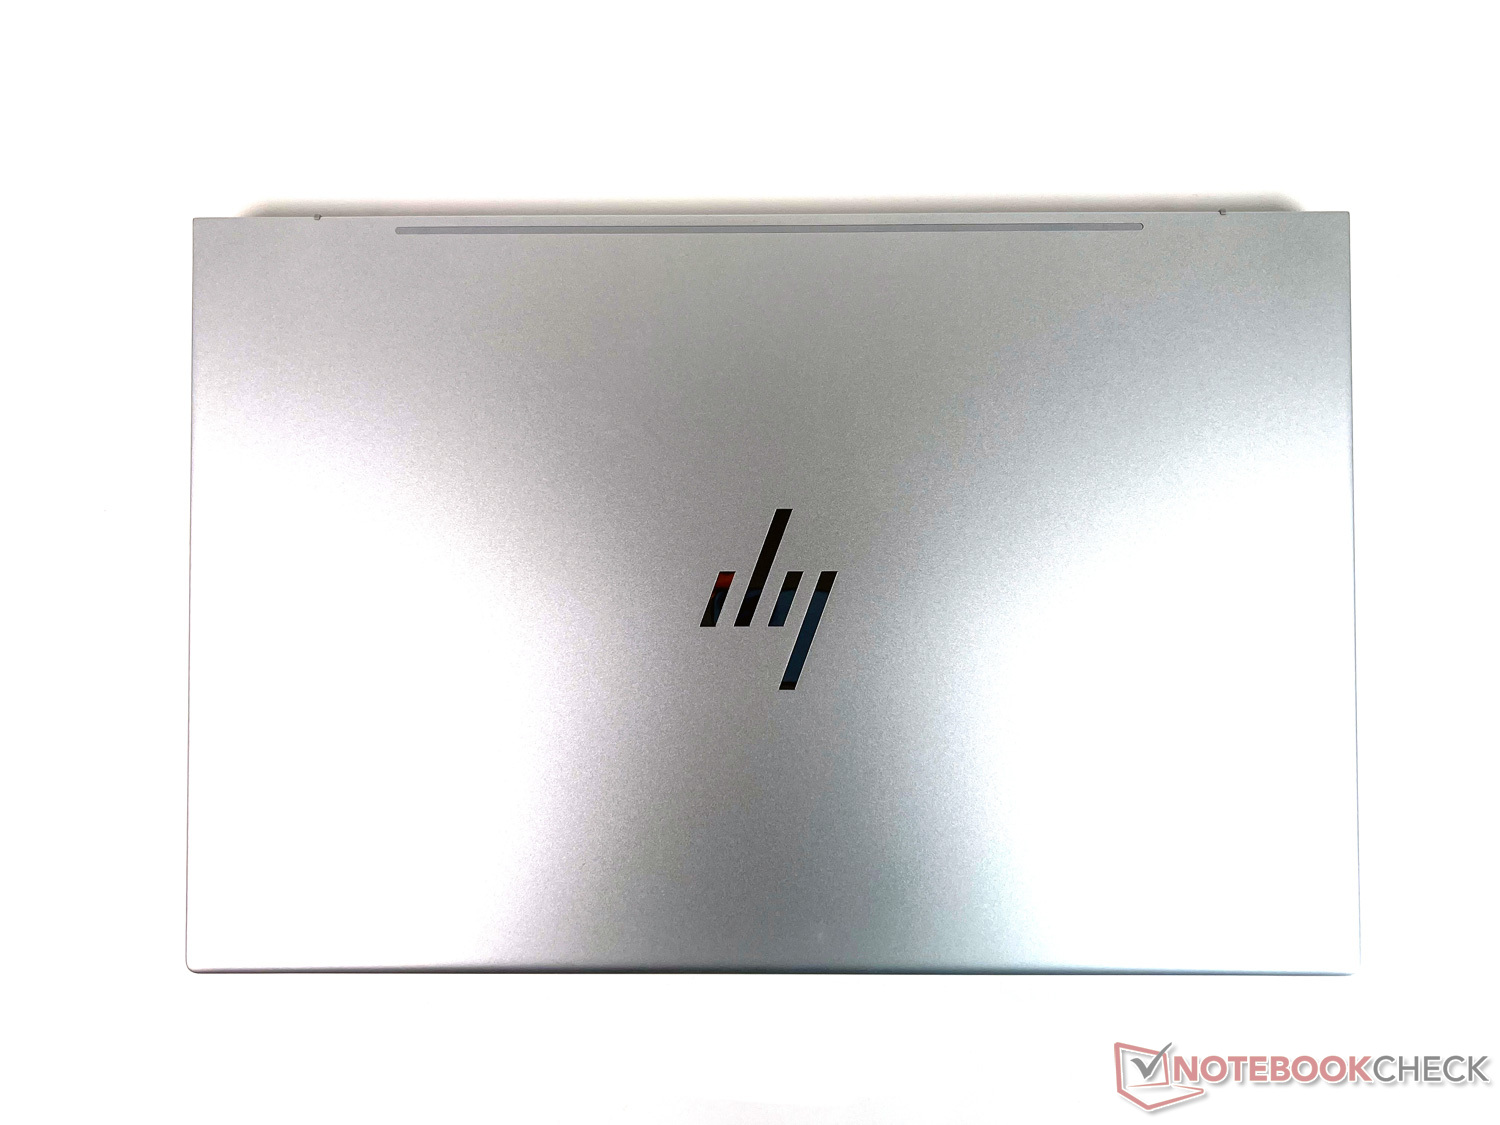
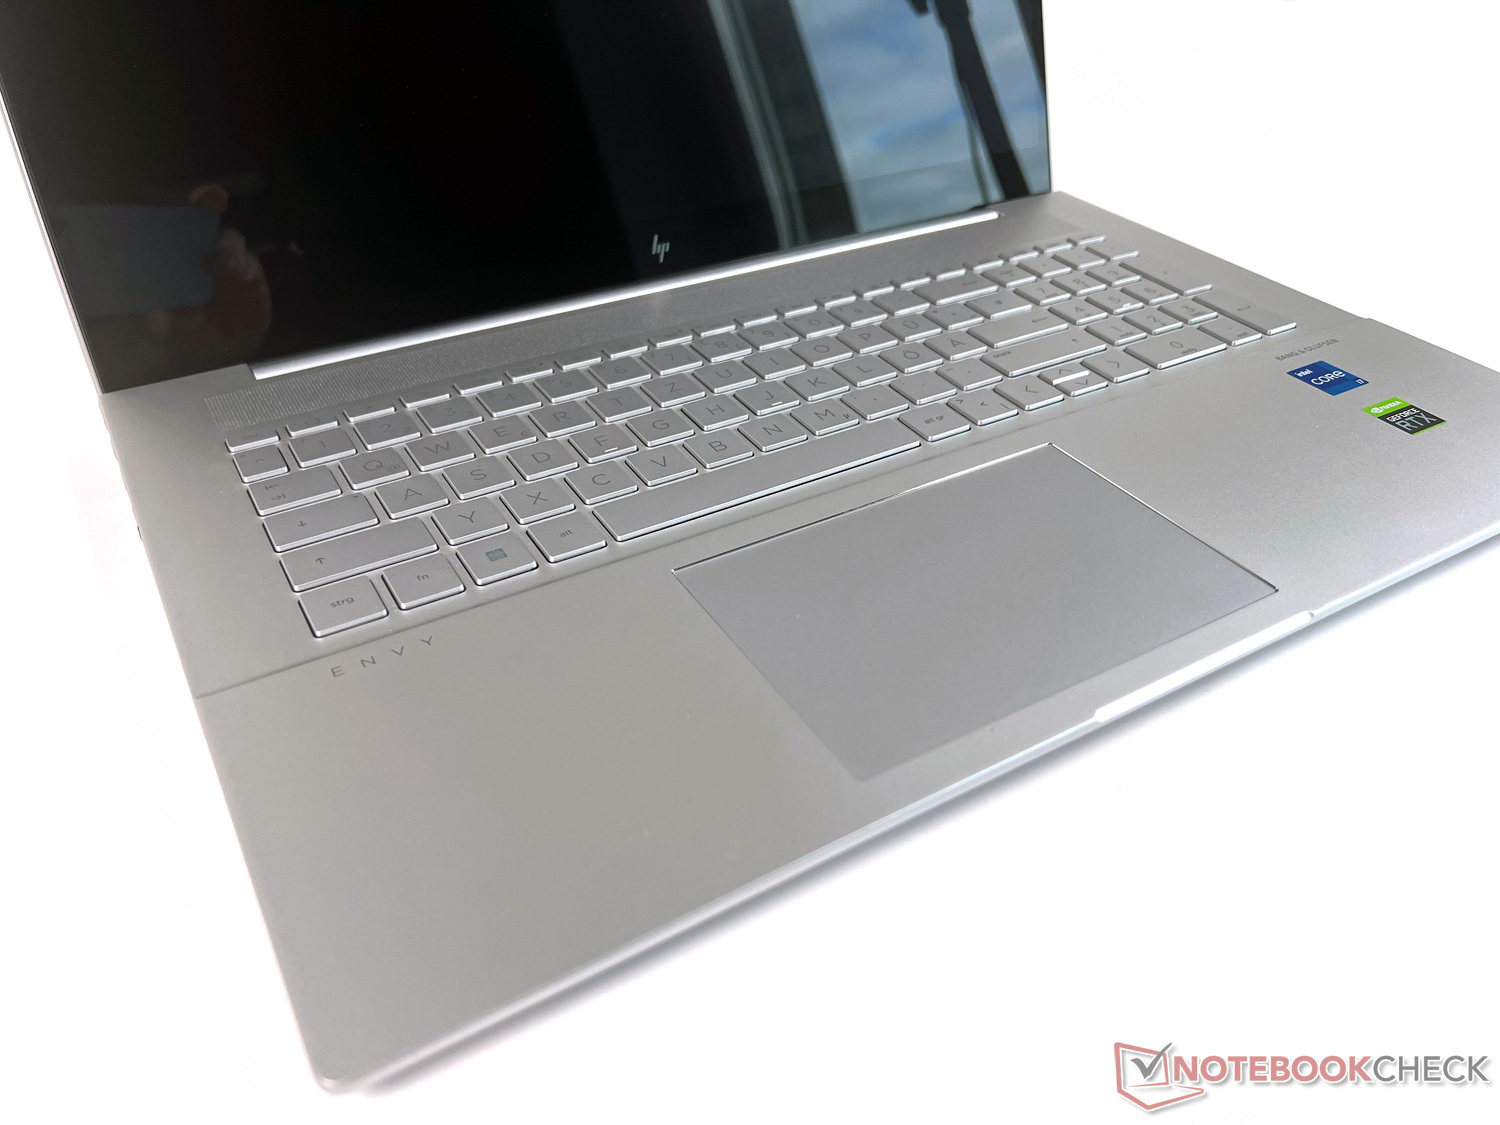
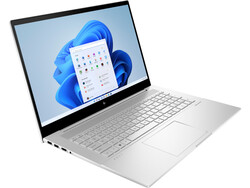
外壳:银色的优雅和简单的颜色
惠普Envy 17采用了银色的简单设计。尽管外壳大部分是由塑料制成的,但它以良好的做工给人以高质量的印象。宽大的铰链使大屏幕相当紧密地固定在那里,因此你必须用双手来打开笔记本电脑。
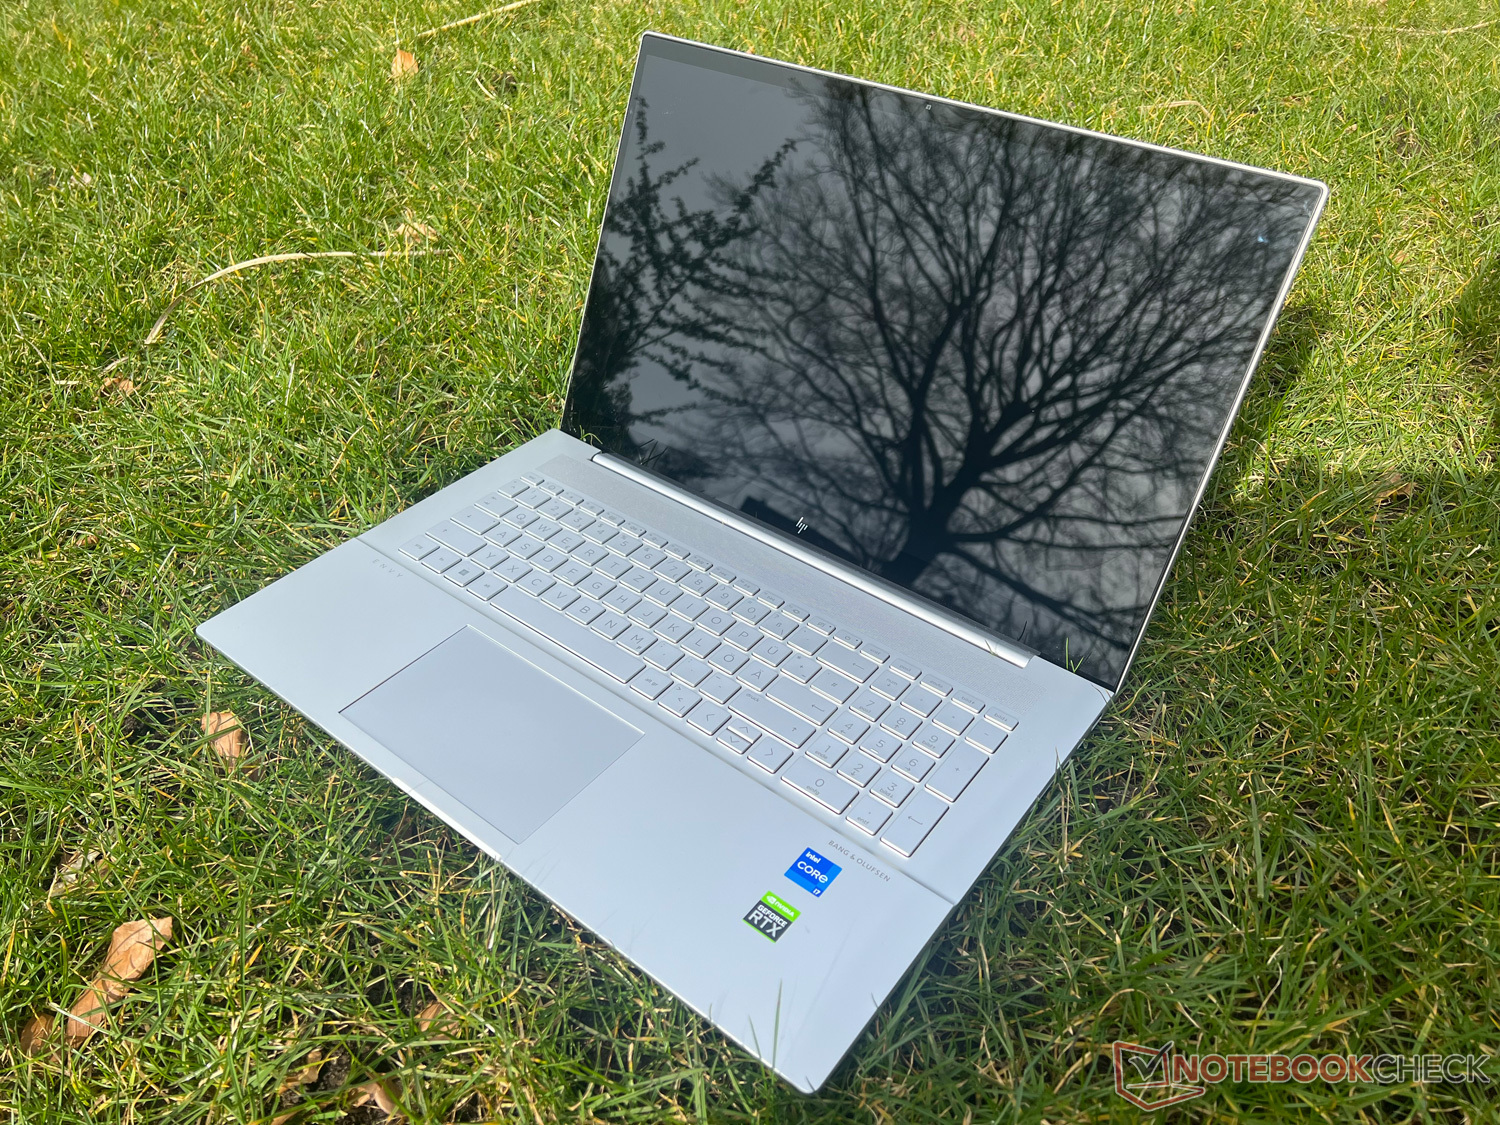
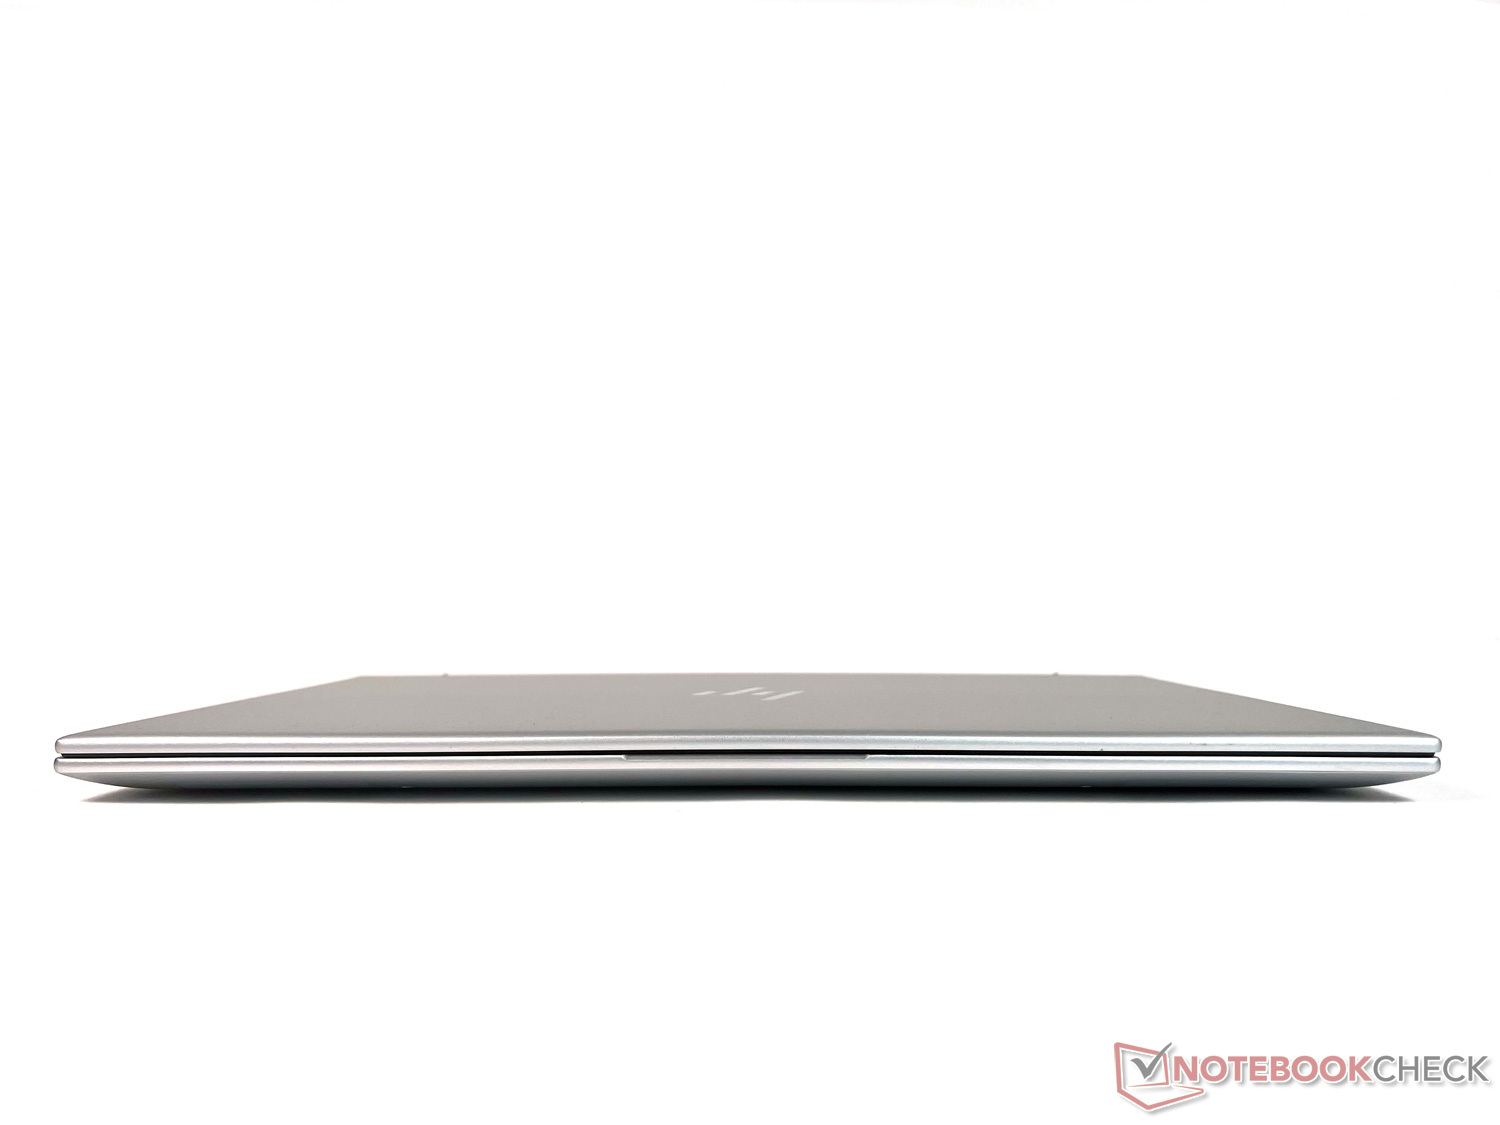
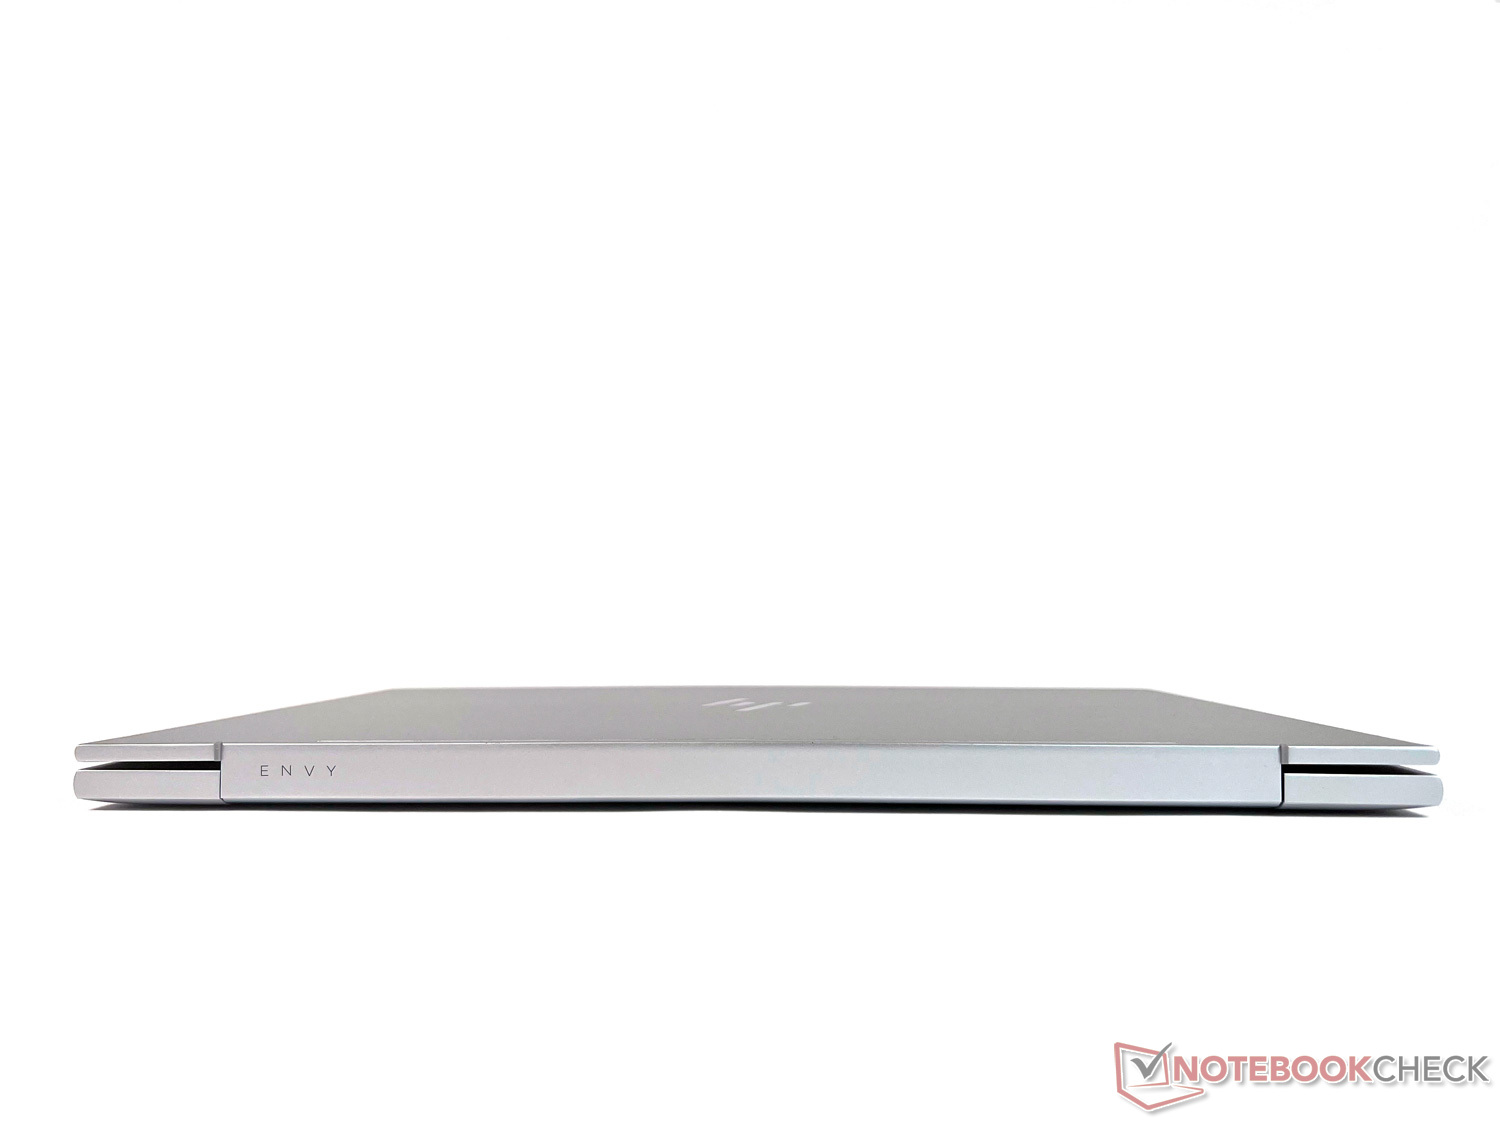
作为一款17英寸的笔记本电脑,惠普Envy 17当然不是非常紧凑。但由于纤细的显示屏边框,特别是在左侧和右侧,整体尺寸仍在限制范围内。与其他大型17英寸设备相比,它处于测试领域的中间位置。
约2.5公斤(约5.5磅)的重量加上500克(约1.1磅)的充电器,对移动使用有影响。大尺寸的显示屏对角线要求其应得的。然而,即使在这种尺寸下,笔记本电脑甚至可以更轻,正如竞争对手所显示的那样。我们的测试设备是这里最重的型号之一,这对移动使用来说是一个负面的观点。
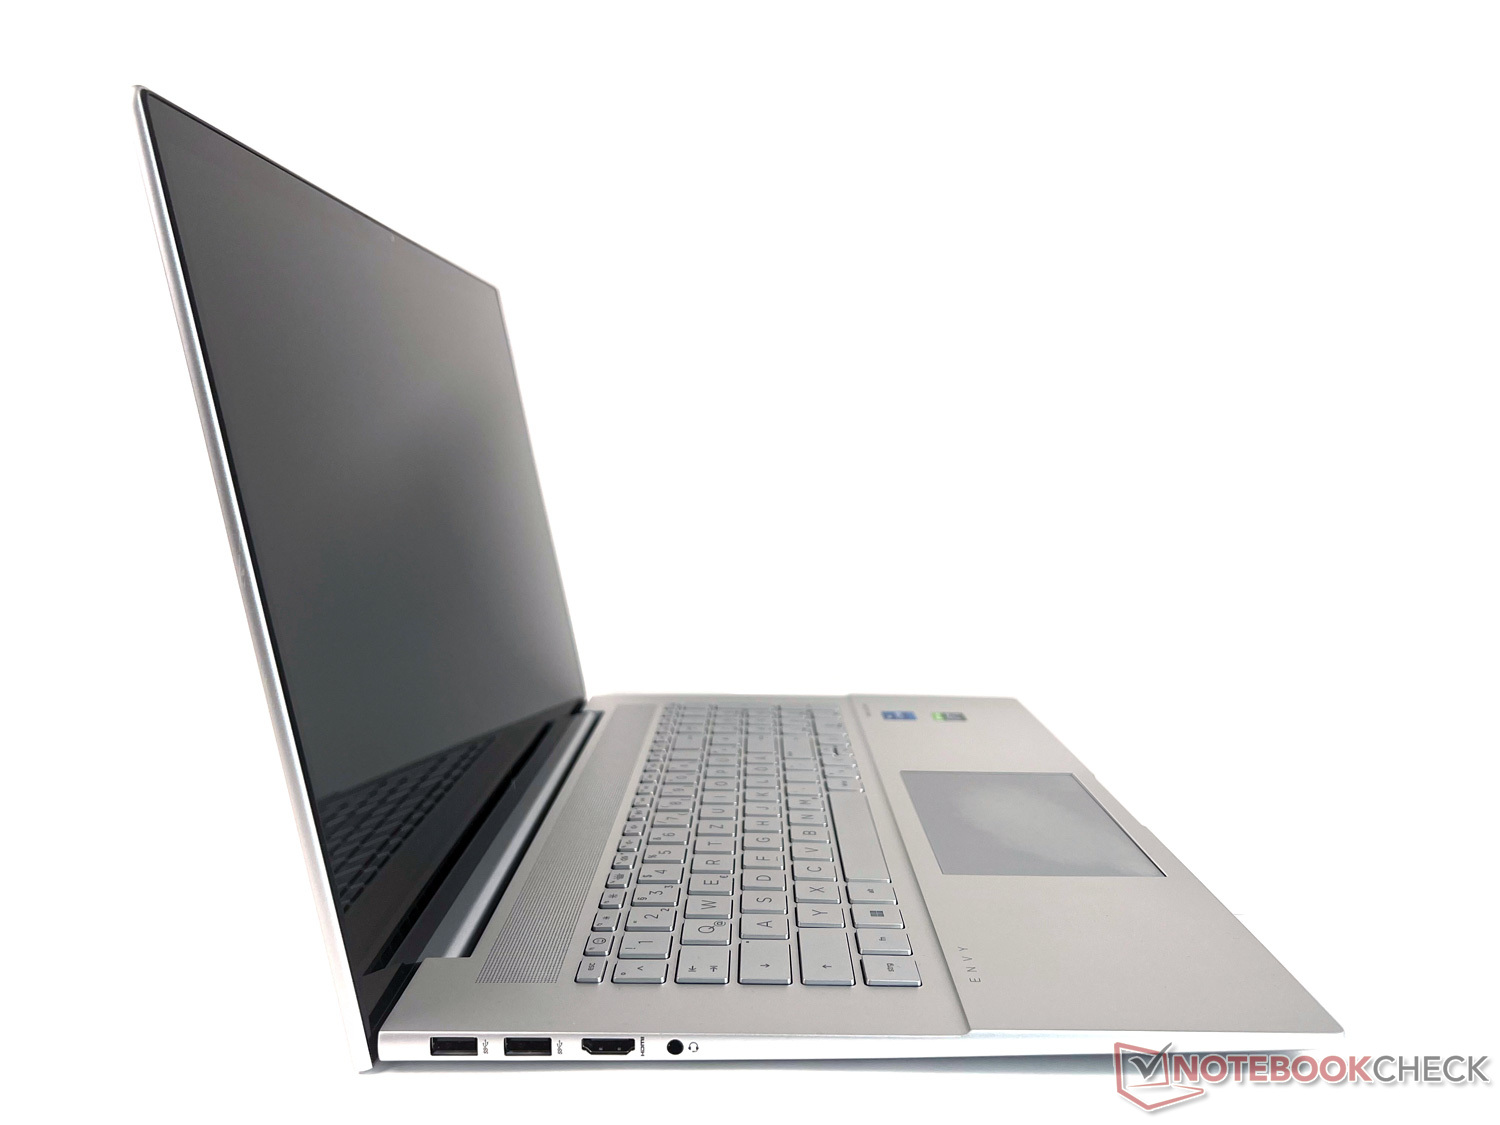
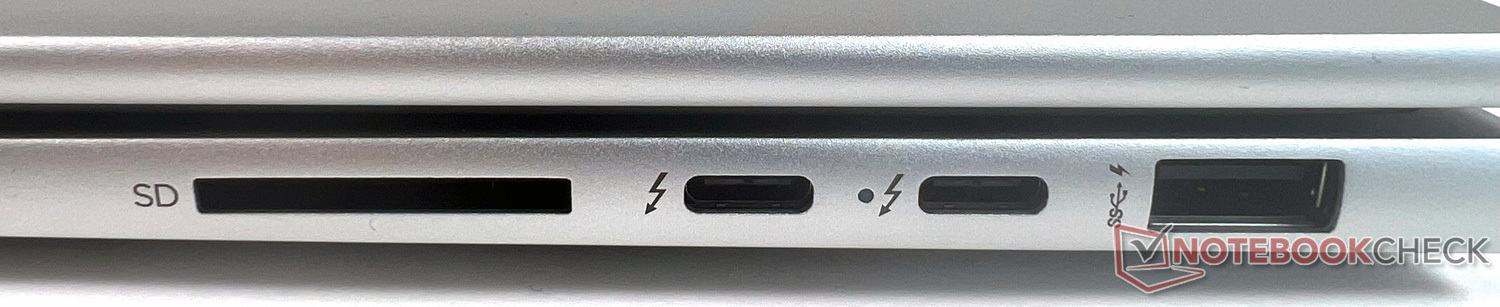
设备:带有2个Thunderbolt 4的多媒体笔记本电脑
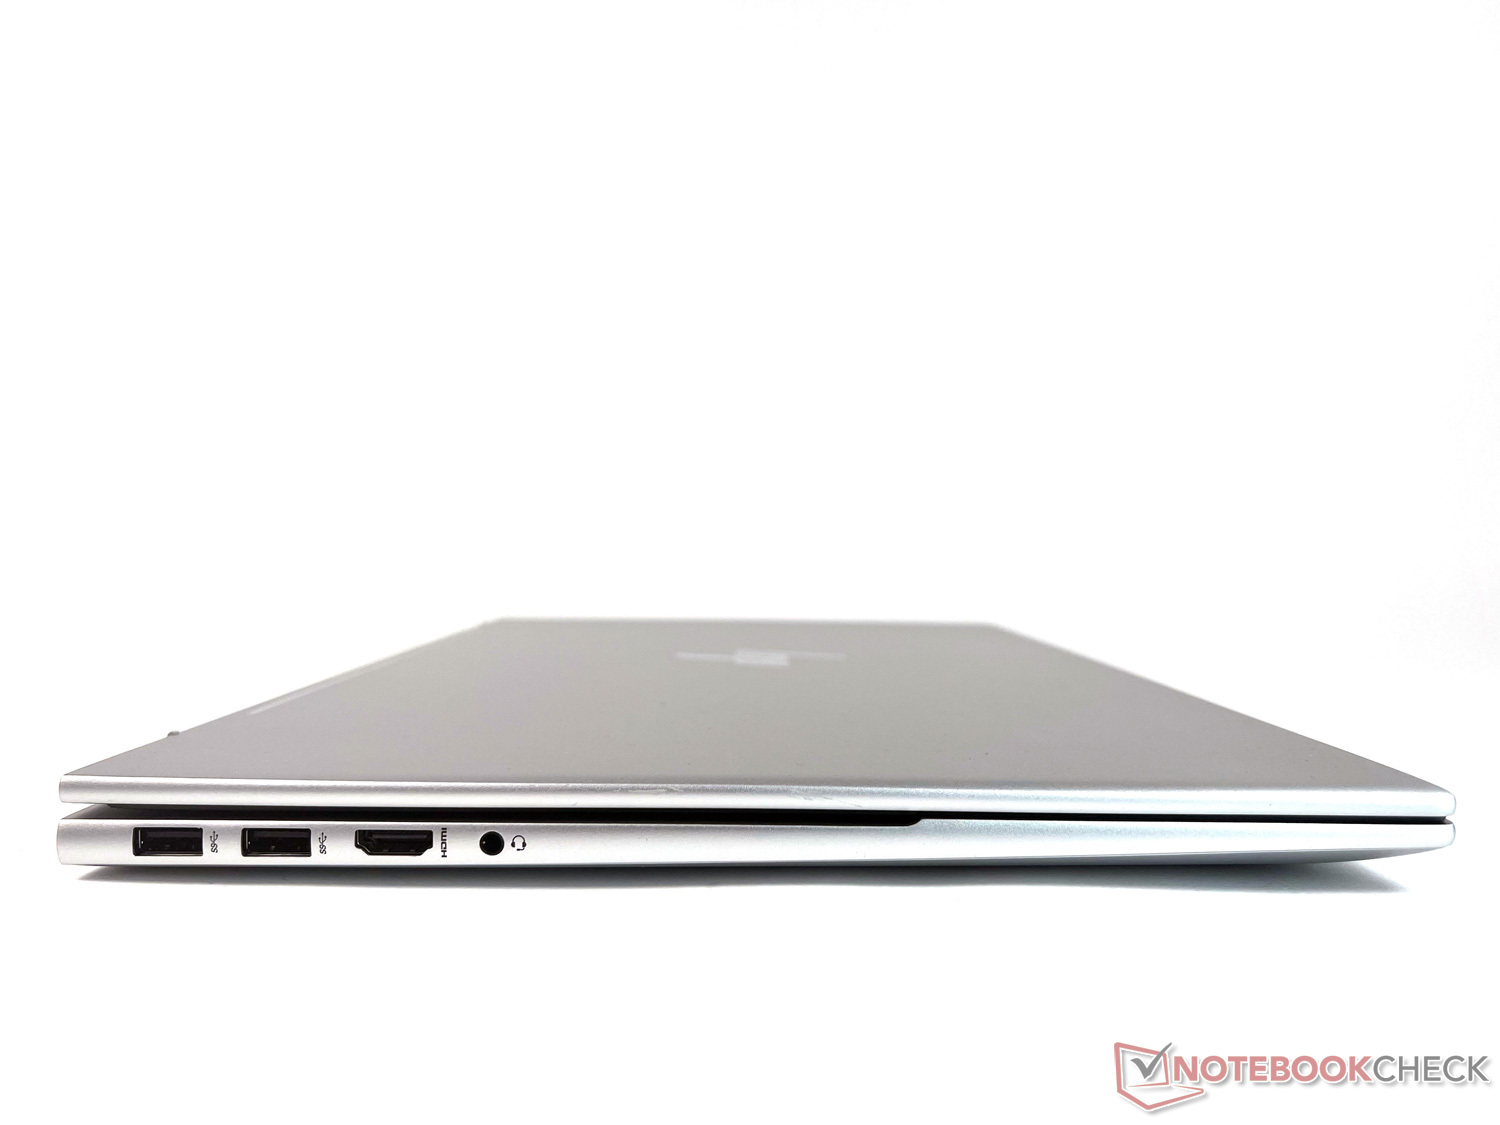
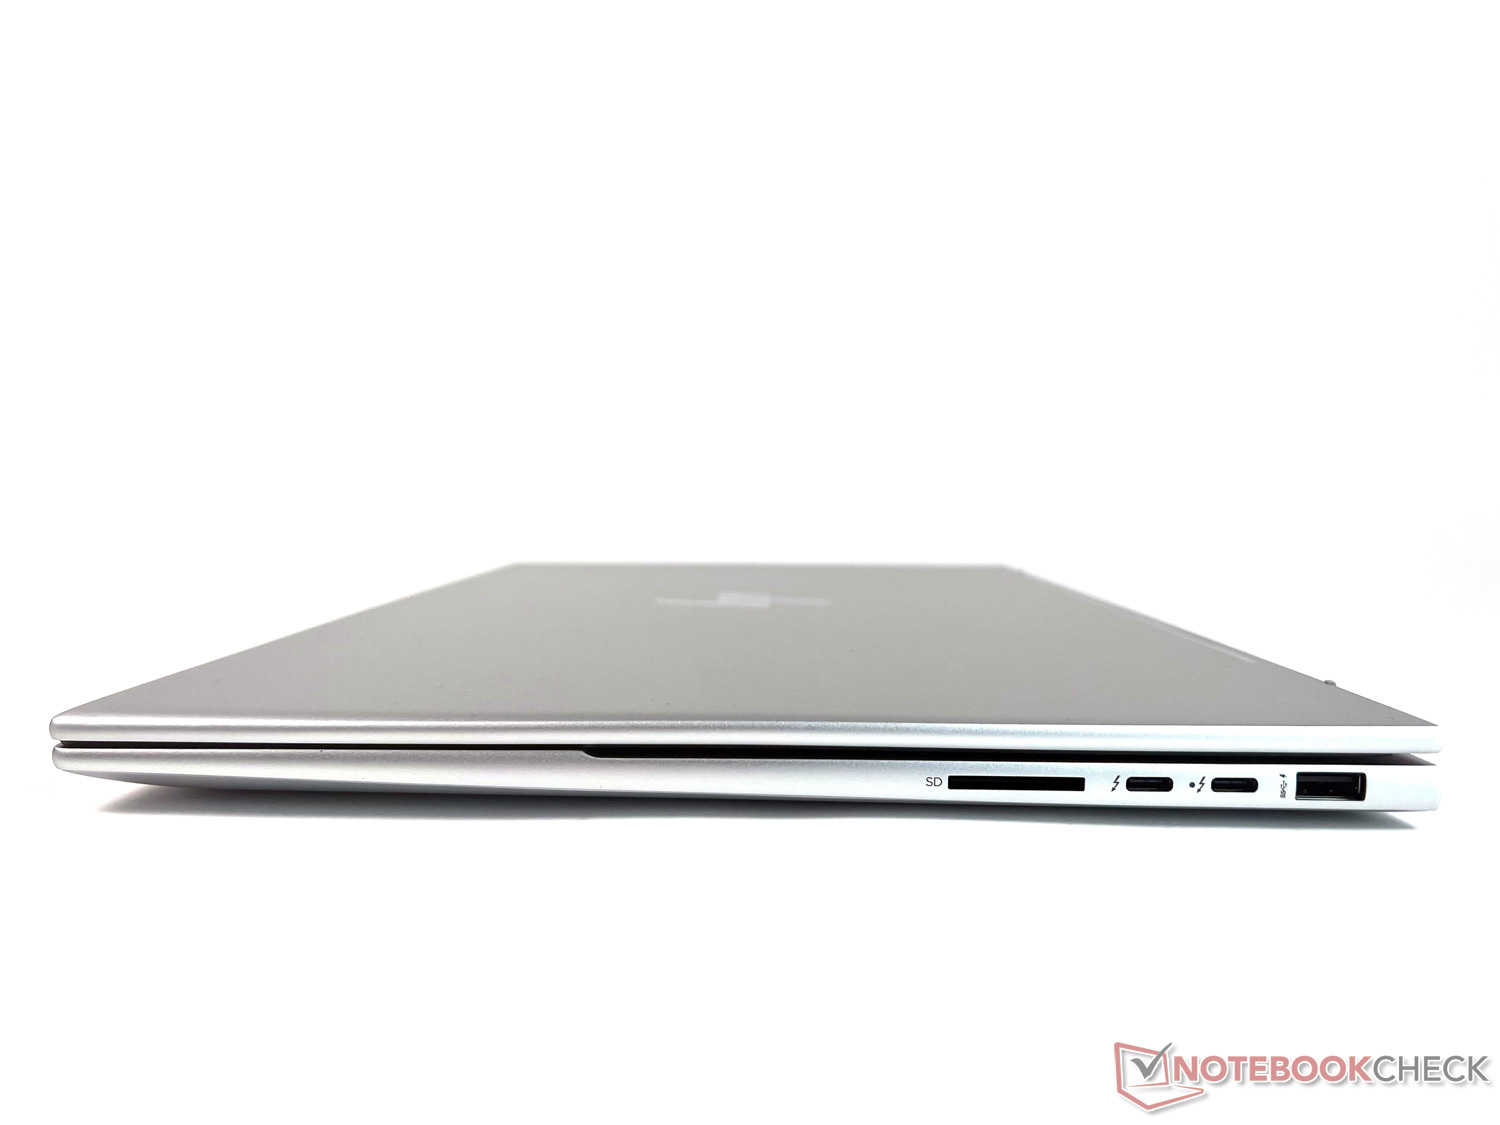
Envy 17提供了广泛的端口设备,除了一个LAN端口。包括两个Thunderbolt 4端口与USB 4 Type-C,用于高达40 Gbit/s的数据传输、充电和DisplayPort 1.4,这两个端口都被安置在右侧。在某些情况下,将它们分布在两边会更理想。其中一个Thunderbolt端口被附带的充电器用来提供电源。
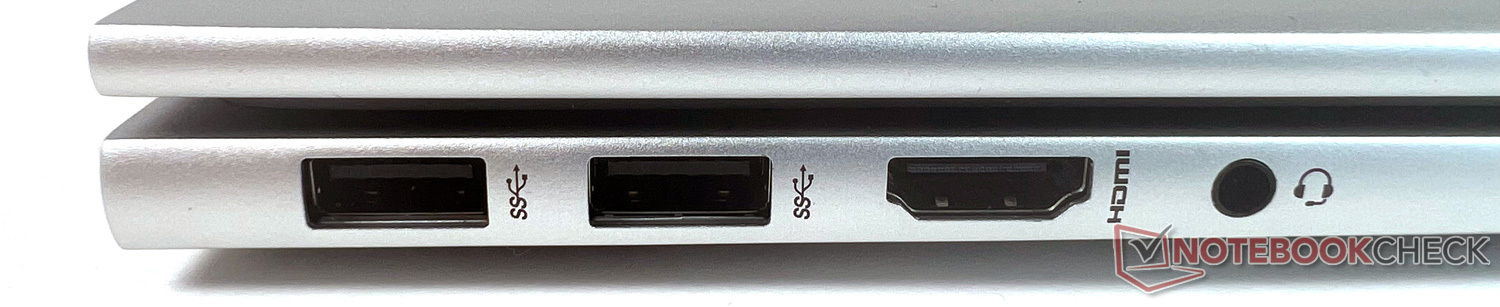
在左侧,一个HDMI-2.1端口允许你连接一个外部显示器,与DisplayPort连接交替使用。另外三个分布在两侧的USB-A端口已经足够,还有一个SD读卡器。所有的连接都很容易接近。
SD卡阅读器
内置的SD读卡器并不是同类产品中的快速代表。在我们使用AV PRO microSD 128 GB V60参考存储卡的测量中,它总是排在最后,但与大多数竞争对手的距离并不是很远。然而,那些经常需要从存储卡中复制大量数据的人,仍然会被其他设备更好地服务。
| SD Card Reader | |
| average JPG Copy Test (av. of 3 runs) | |
| Dell XPS 17 9720 (Toshiba Exceria Pro SDXC 64 GB UHS-II) | |
| Average of class Multimedia (23 - 531, n=36, last 2 years) | |
| Lenovo IdeaPad 3 17ABA7 (AV Pro SD microSD 128 GB V60) | |
| LG Gram 17Z90Q-E.AD78G (AV Pro SD microSD 128 GB V60) | |
| HP Envy 17-cr0079ng (AV Pro SD microSD 128 GB V60) | |
| maximum AS SSD Seq Read Test (1GB) | |
| Dell XPS 17 9720 (Toshiba Exceria Pro SDXC 64 GB UHS-II) | |
| Average of class Multimedia (37.3 - 1455, n=35, last 2 years) | |
| LG Gram 17Z90Q-E.AD78G (AV Pro SD microSD 128 GB V60) | |
| Lenovo IdeaPad 3 17ABA7 (AV Pro SD microSD 128 GB V60) | |
| HP Envy 17-cr0079ng (AV Pro SD microSD 128 GB V60) | |
沟通
这里使用的英特尔的Wi-Fi 6E AX211模块确保了快速的WLAN连接,随着时间推移几乎保持不变。我们的测量结果处于这种WLAN模块的平均水平。以LAN端口或移动连接形式的有线网络连接是不存在的。
网络摄像头
惠普True Vision红外摄像头设置在顶部显示屏边框的中央。它提供临时噪音抑制和一个集成的双阵列数字麦克风。它的分辨率为500万像素,相当高,而且还可以用于Windows Hello。虽然图像质量很好,但它有轻微的红色色调。与我们测试中的竞争对手相比,它的色彩偏差是第二低的,∆E为8,这对于专业或私人视频通话来说绝对足够了。
一个不错的噱头:隐私快门不是通过滑块手动打开和关闭,而是通过键盘上的按键。此外,相机旁边的一个小灯指示何时激活。


安全问题
除了摄像头的隐私保护,惠普Envy 17还支持可信平台模块(固件TPM)。没有Kensington锁或指纹传感器,但支持Windows Hello,可通过面部识别解锁。
辅料
惠普在笔记本电脑中包括一个功能强大的90瓦USB-C充电器。可选的是,惠普还提供了一些配件,但它们不是专门为这款笔记本电脑设计的。
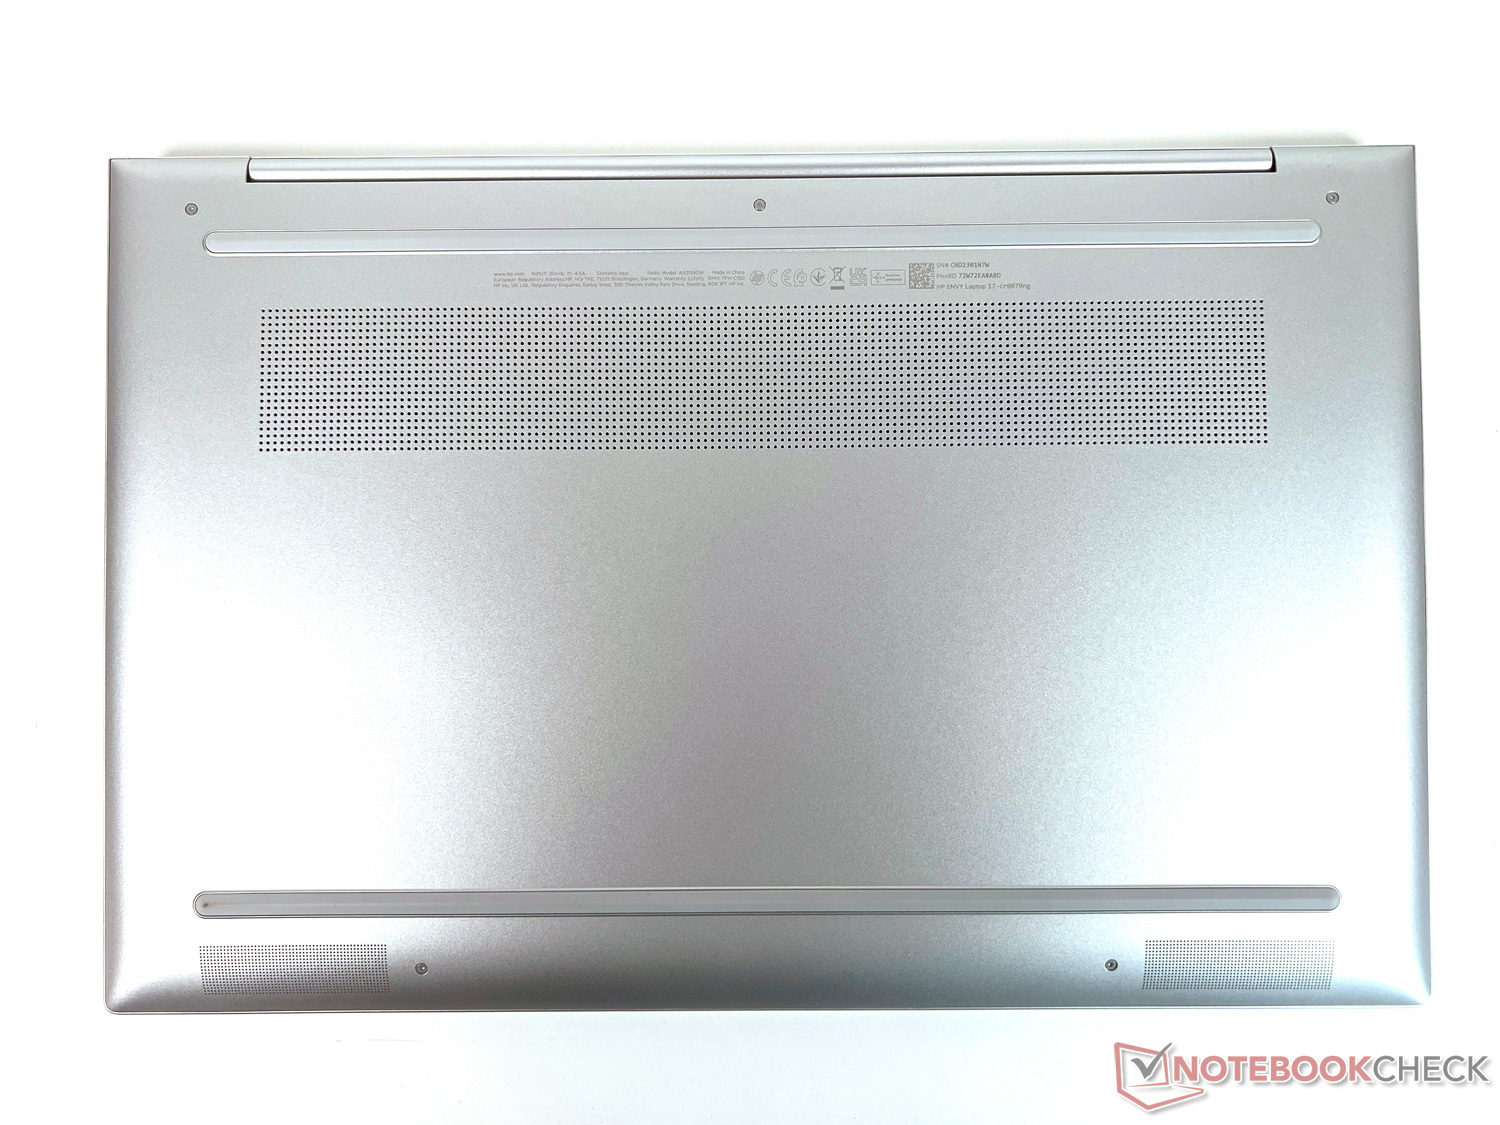
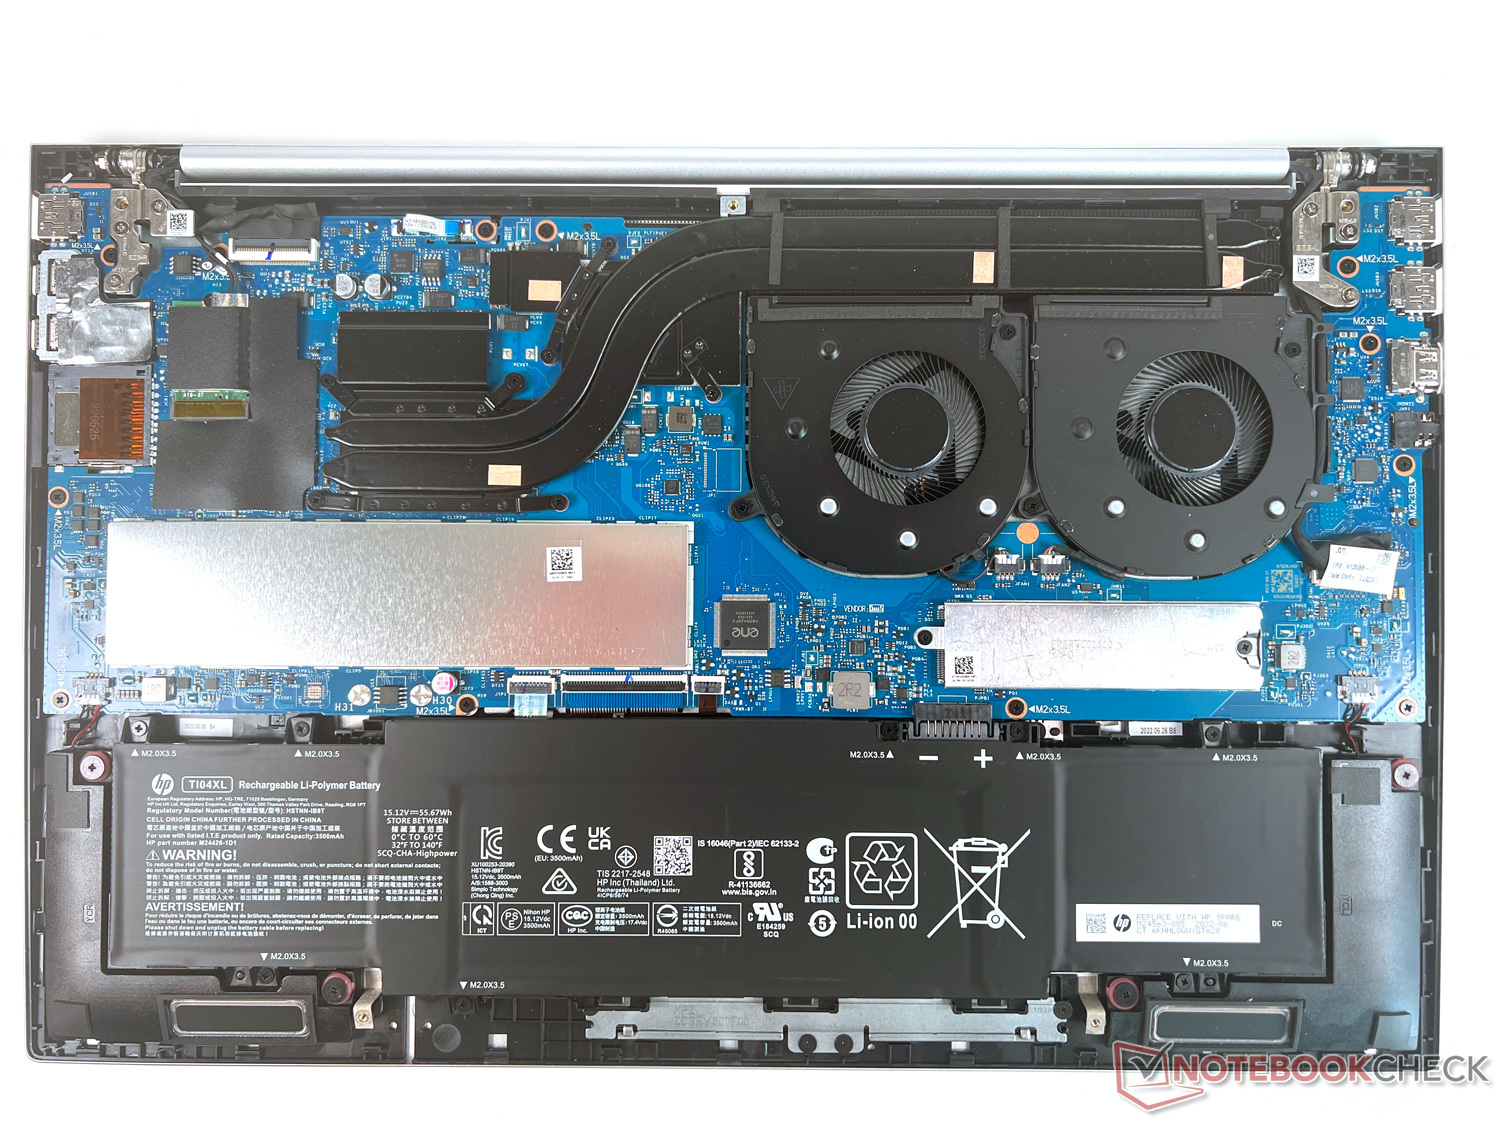
维护
进入内部的通道被五颗微小的Torx螺丝挡住了。 一旦你获得了通道,你几乎没有任何机会进行维护。没有免费的存储扩展插槽,但考虑到它已经提供了32GB的内存,这应该不会太难接受。电池、M.2固态硬盘和Wi-Fi模块可以被替换。
担保
在德国,惠普提供为期2年的制造商部件和人工保修服务。
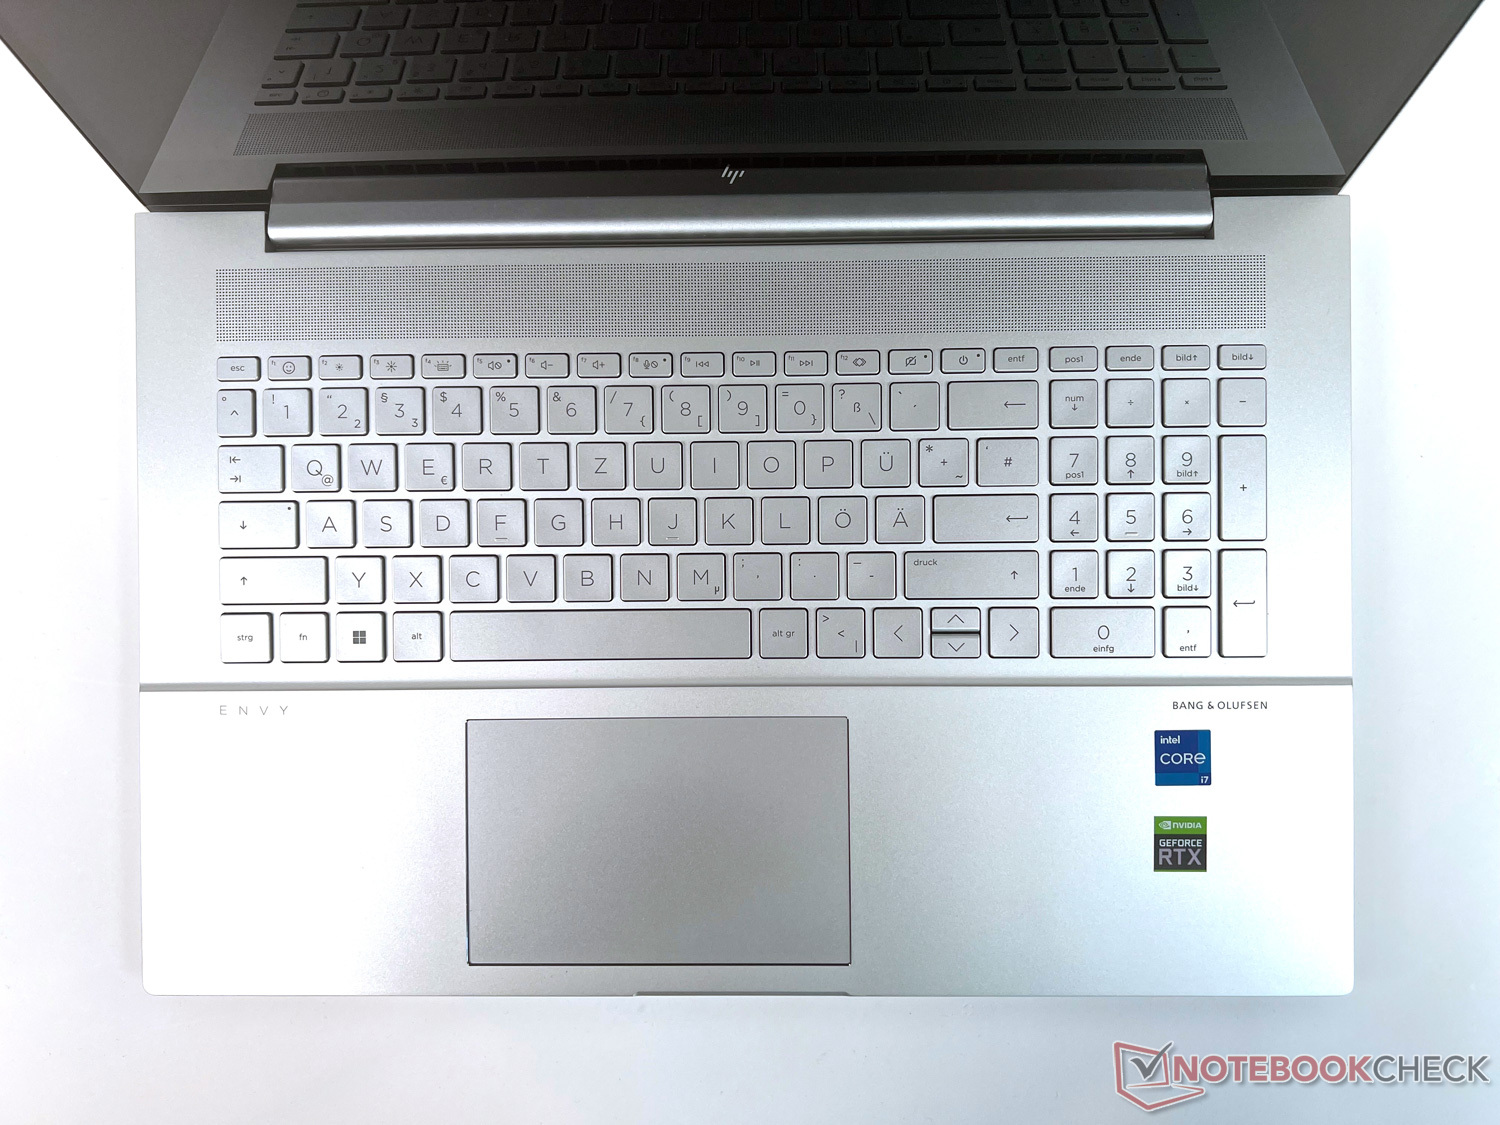
输入设备:大尺寸的键盘让人没有理由抱怨
17.3英寸的显示屏对角线也意味着有很大的空间用于键盘。除了边缘约3厘米(约1.2英寸)外,惠普将这一空间用于足够大的键盘以及侧面的数字键盘。
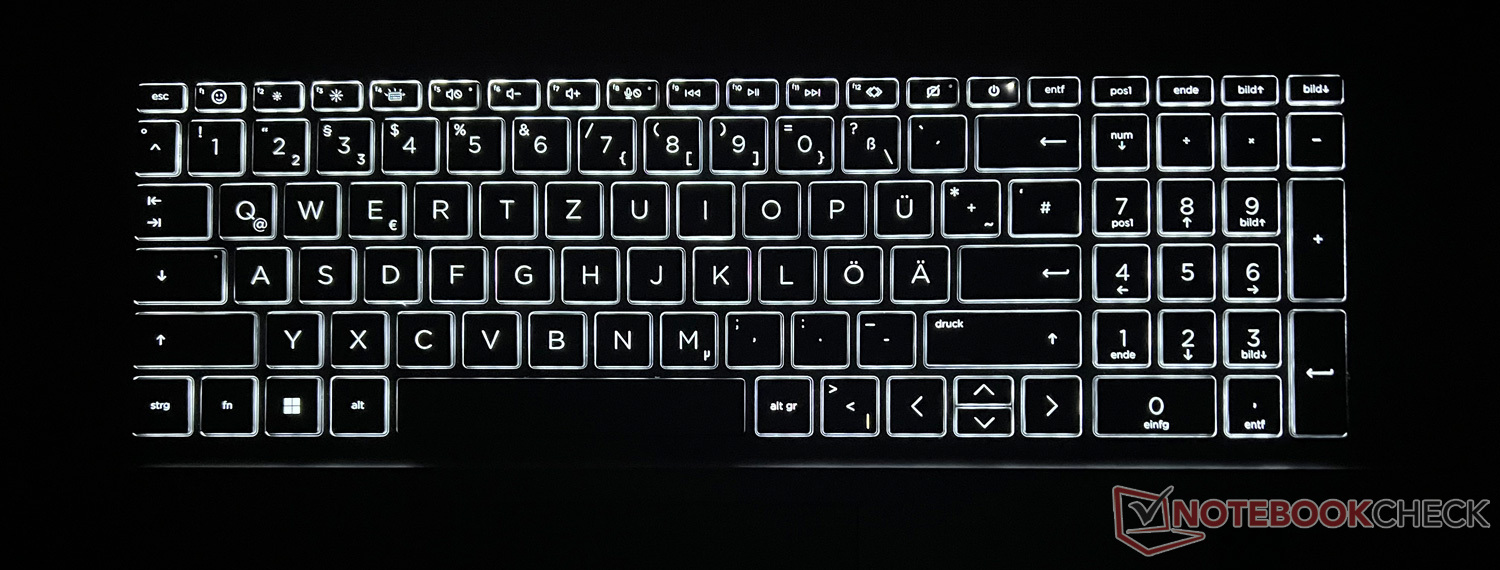
键盘
在大约1.7 x 1.7厘米(约0.67英寸)的范围内,按键足够大,加上大约2毫米(约0.08英寸)的键距,键盘提供了舒适的打字体验。制造商用通常的附加功能占据了F1至F12键,例如控制三段式键盘照明、音量、显示亮度,或我们已经提到的相机快门。右侧是电源键,用于打开设备。
数字键特别便于数字输入。键盘照明确保了按键的均匀照明和标签的良好可读性。
触摸板
触摸板被放置在键盘下方,略微偏向中央。约12.5 x 8厘米(约4.9 x 3.15英寸),由于表面光滑,我们既没有理由抱怨尺寸也没有理由抱怨触觉。几乎整个触摸板表面都可以进行左键点击,除了右下角之外,也可以进行右键点击。 这些区域没有触觉分离,但在日常操作中你不会注意到这一点。
对输入的反应是迅速的,没有任何问题。支持多点触摸手势,如用两个手指滚动或放大和缩小。
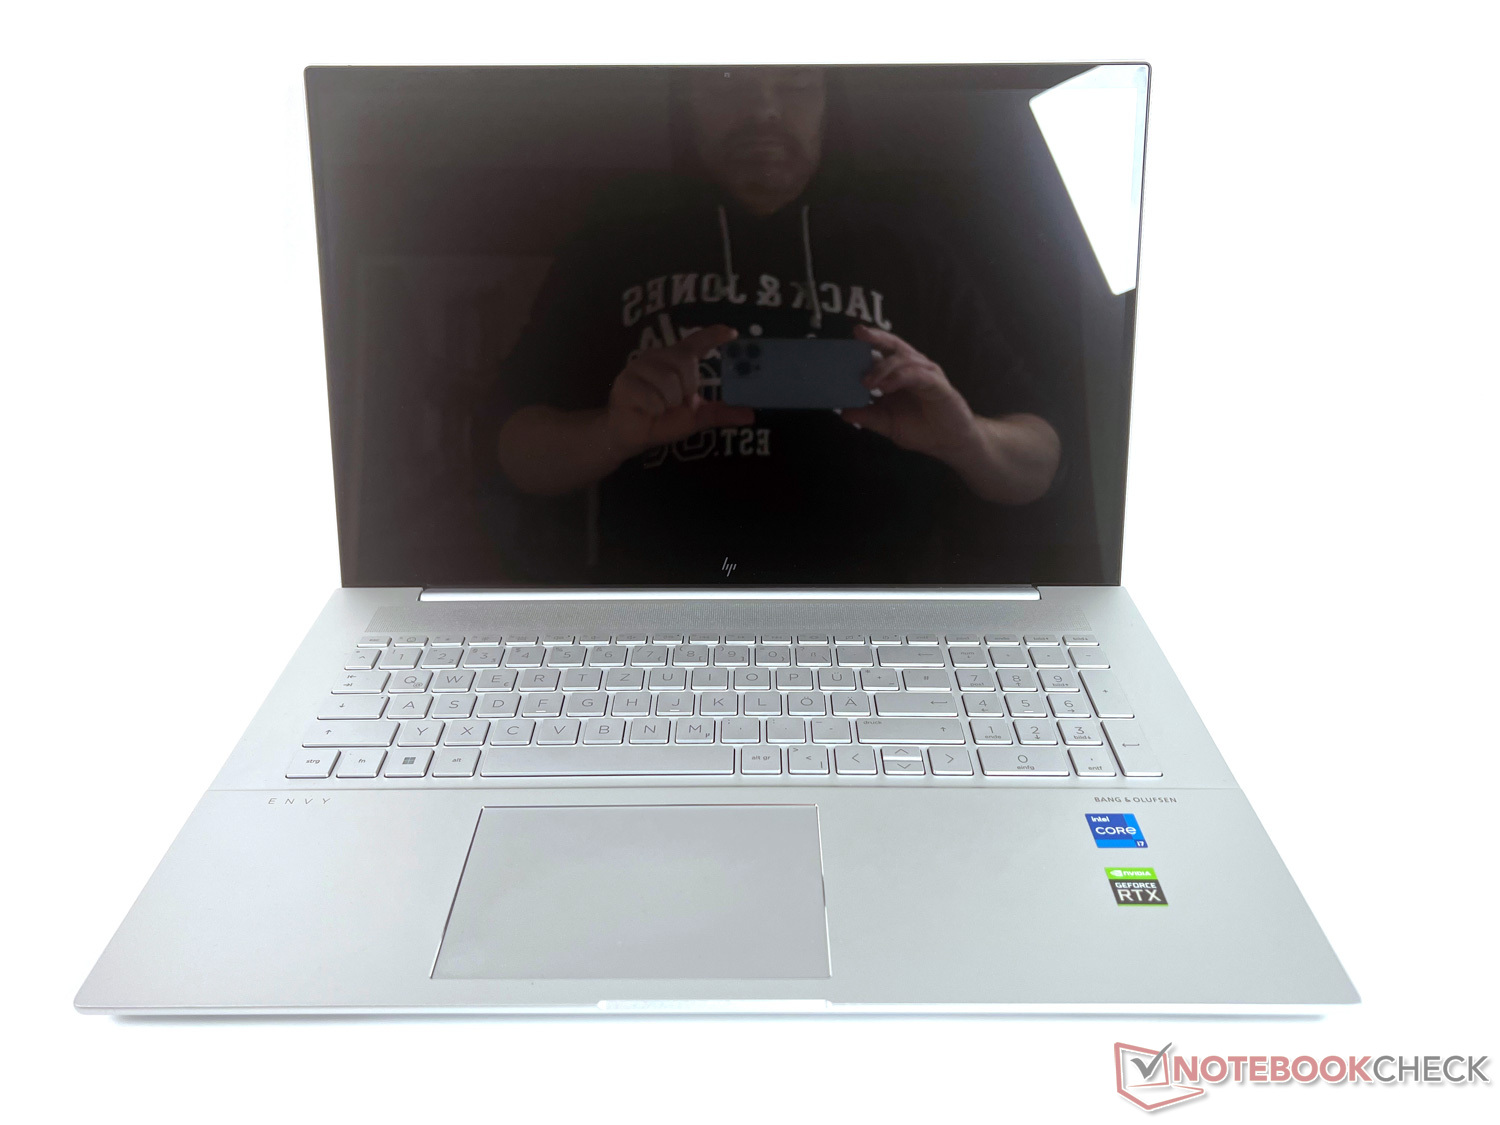
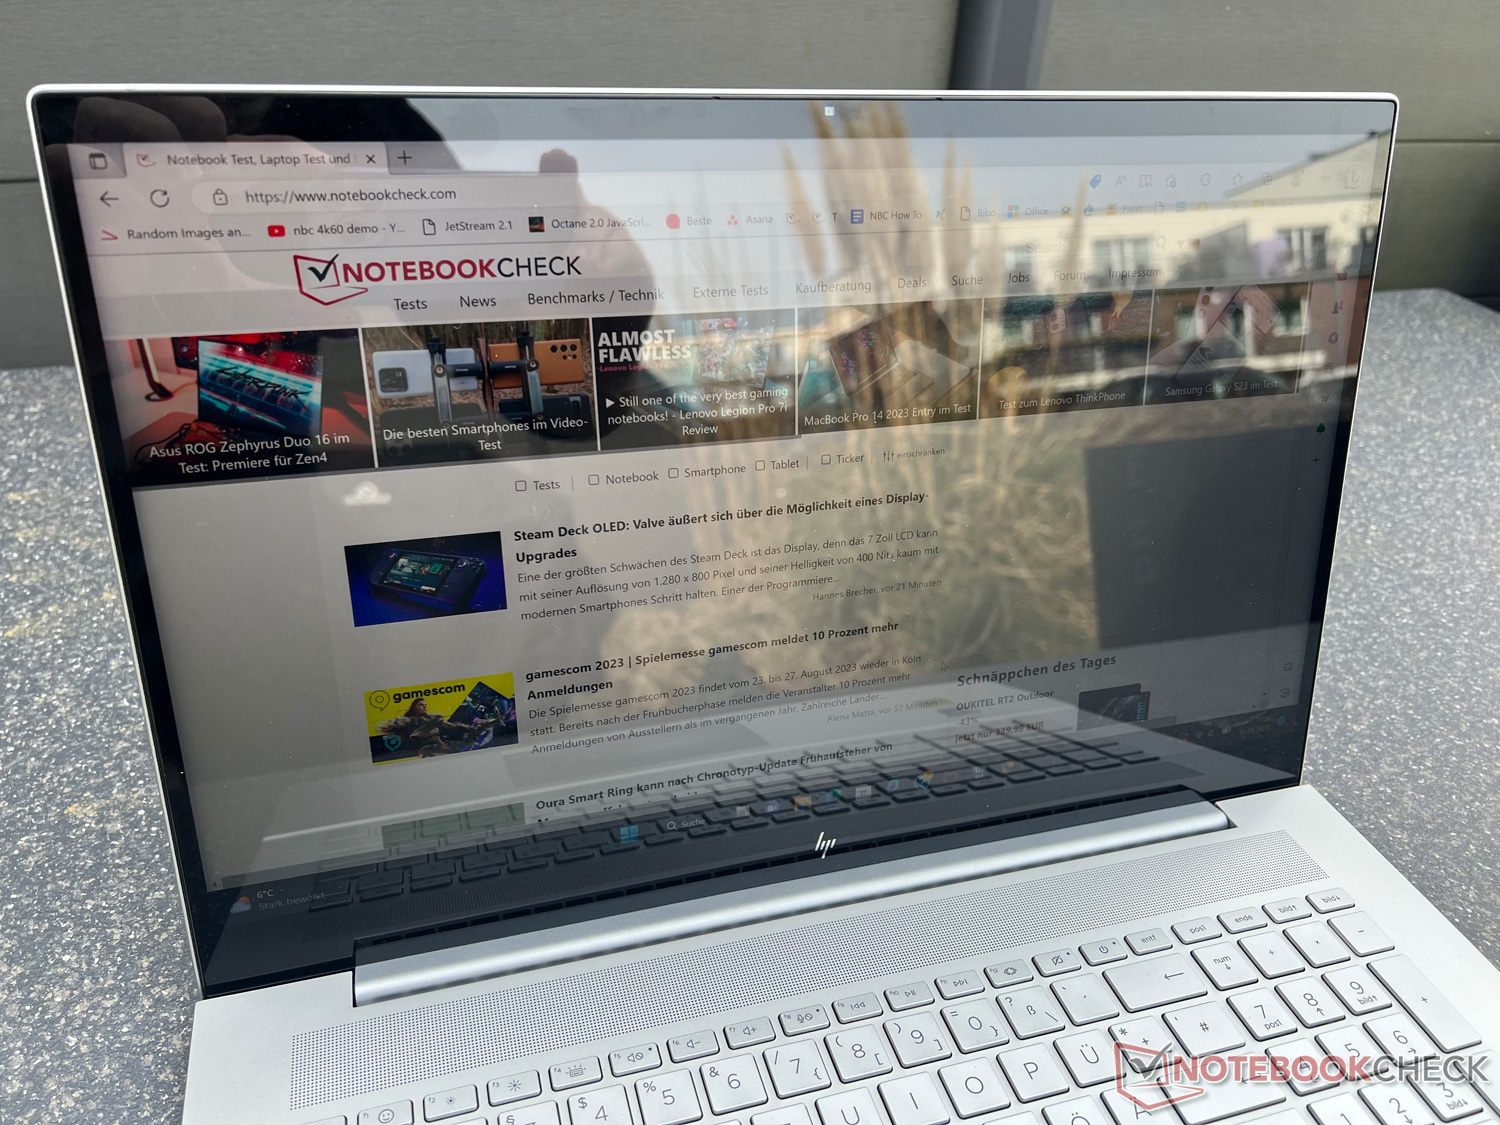
显示:分辨率高,效果好,但反射性很强
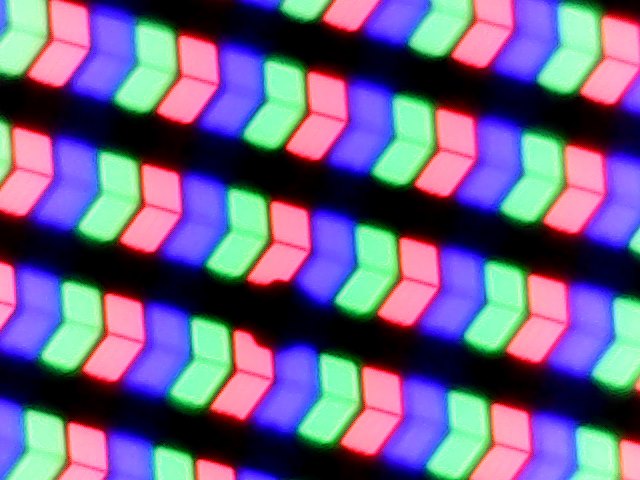

惠普为Envy 17-cr0079ng配备了京东方的17.3英寸高分辨率4K IPS大面板,像素为3840 x 2160,60Hz,响应时间短。另外,你也可以在这个模型系列中选择带有FHD显示屏的版本。
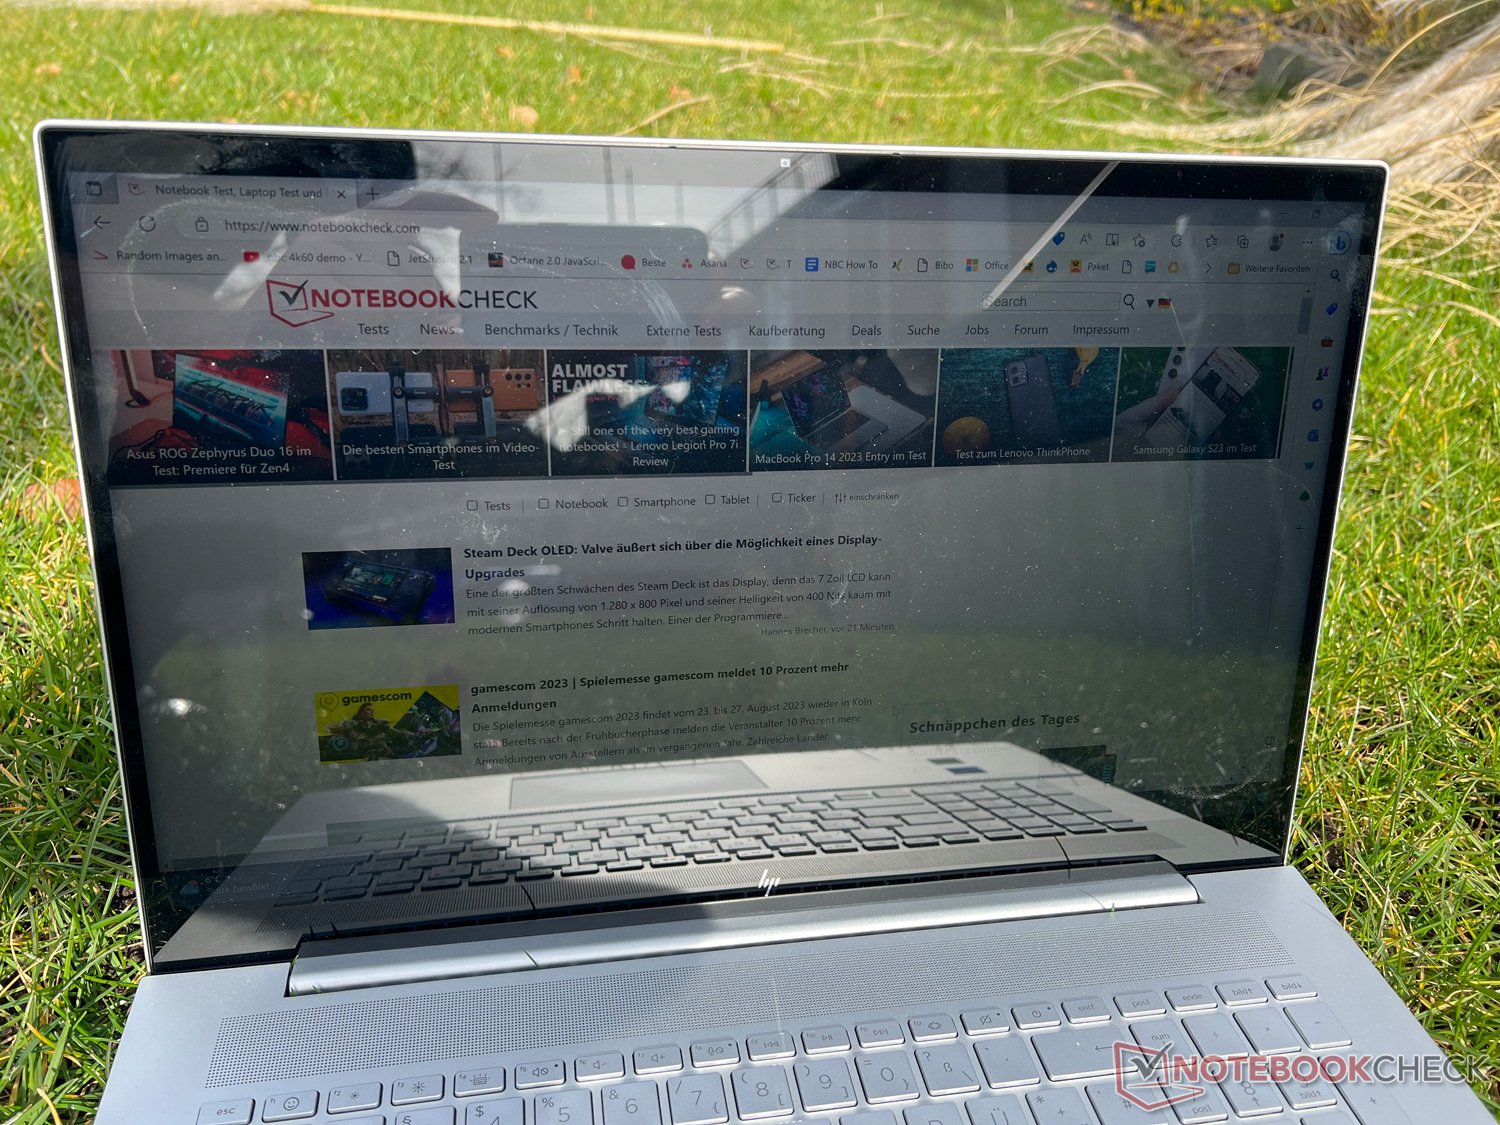
制造商承诺显示亮度为400尼特,在我们的测试测量中,我们能够在某些地方确认这一点,也几乎在整个区域的平均水平上。在我们的比较领域,我们的测试装置提供了最明亮的显示屏之一,但不幸的是,在户外使用时,这并没有帮助,因为制造商已经决定使用一个反射版本。尽管这看起来很好,但它也会产生强烈的反射,使内容在户外很难被识别(见下面的图片)。在室内,这个效果更好,但你仍然会从灯或窗户等光源处得到恼人的反射。
在黑值和对比度方面,惠普Envy 17被我们的大多数竞争对手超越了。在我们的比较领域,该显示器产生了最好的整体结果之一,但它也有一些轻微的混浊和明显的背光渗漏,这意味着在显示黑暗内容时,你可以看到边缘的背景照明中有一些浅色斑点。
| |||||||||||||||||||||||||
Brightness Distribution: 86 %
Center on Battery: 390 cd/m²
Contrast: 987:1 (Black: 0.395 cd/m²)
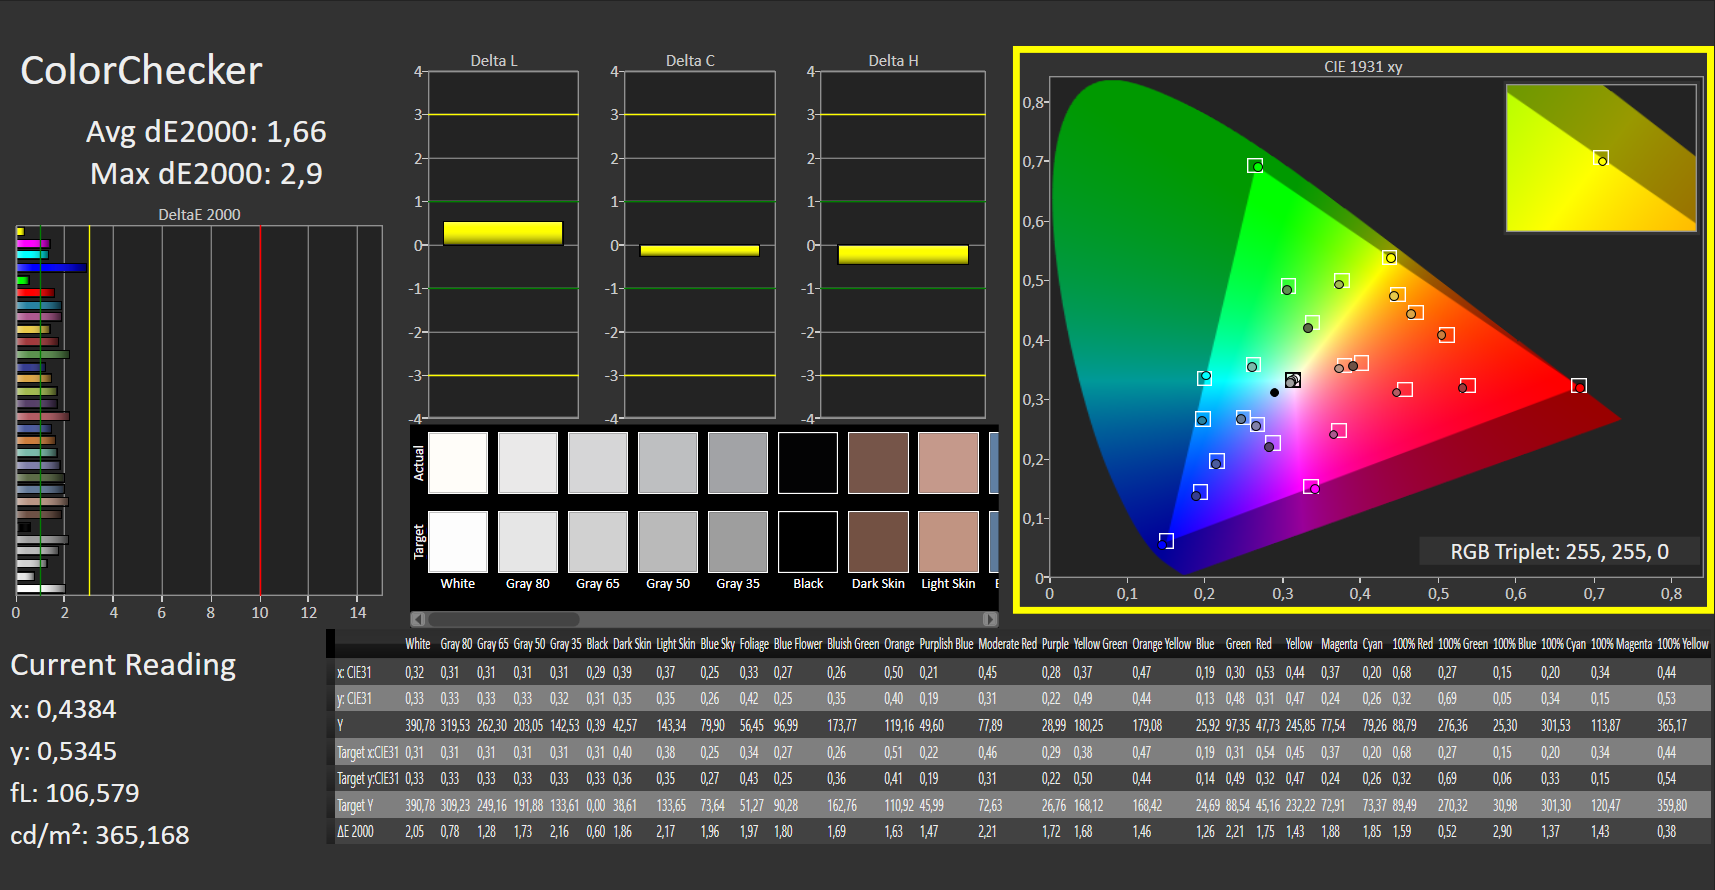
ΔE ColorChecker Calman: 1.66 | ∀{0.5-29.43 Ø4.71}
calibrated: 1.16
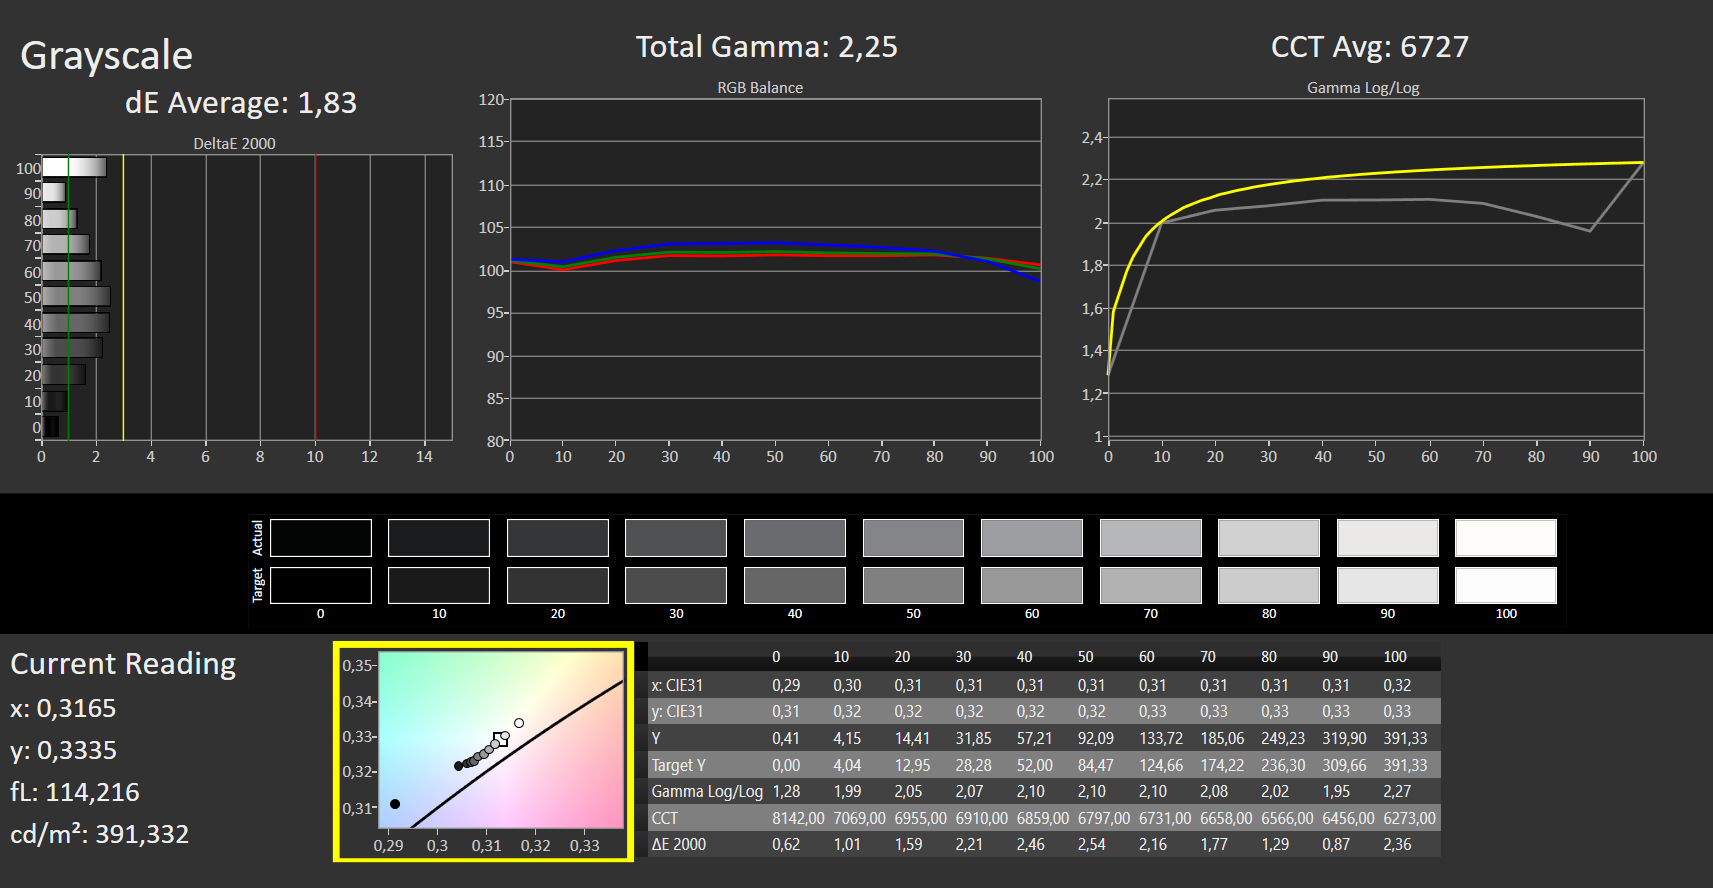
ΔE Greyscale Calman: 1.83 | ∀{0.09-98 Ø4.96}
87.03% AdobeRGB 1998 (Argyll 3D)
100% sRGB (Argyll 3D)
98.31% Display P3 (Argyll 3D)
Gamma: 2.25
CCT: 6727 K
| HP Envy 17-cr0079ng BOE0A66, IPS, 3840x2160, 17.3" | HP ProBook 450 G9 6A180EA Chi Mei CMN1512, , 1920x1080, 15.6" | LG Gram 17Z90Q-E.AD78G LG Display LP170WQ1-SPF2, IPS, 2560x1600, 17" | Acer Aspire 5 A515-57G-53N8 CMN N156HCA-EAB, IPS, 1920x1080, 15.6" | Dell XPS 17 9720 Sharp LQ170R1, IPS, 3840x2400, 17" | Lenovo IdeaPad 3 17ABA7 Lenovo LEN173FHD, IPS, 1920x1080, 17.3" | |
|---|---|---|---|---|---|---|
| Display | -47% | -4% | -47% | 4% | -22% | |
| Display P3 Coverage (%) | 98.31 | 42.76 -57% | 92.2 -6% | 43.3 -56% | 94.8 -4% | 67.8 -31% |
| sRGB Coverage (%) | 100 | 63.9 -36% | 98.66 -1% | 65 -35% | 100 0% | 88.9 -11% |
| AdobeRGB 1998 Coverage (%) | 87.03 | 44.2 -49% | 82.98 -5% | 44.8 -49% | 100 15% | 65 -25% |
| Response Times | -1443% | -1086% | -1855% | -2763% | -443% | |
| Response Time Grey 50% / Grey 80% * (ms) | 1 | 28 ? -2700% | 22 ? -2100% | 35.6 ? -3460% | 53.2 ? -5220% | 10 ? -900% |
| Response Time Black / White * (ms) | 7 ? | 20 ? -186% | 12 ? -71% | 24.5 ? -250% | 28.4 ? -306% | 6 ? 14% |
| PWM Frequency (Hz) | 17990 ? | |||||
| Screen | -124% | -36% | -97% | -17% | -109% | |
| Brightness middle (cd/m²) | 390 | 234 -40% | 391 0% | 250 -36% | 438 12% | 353 -9% |
| Brightness (cd/m²) | 385 | 218 -43% | 358 -7% | 234 -39% | 411 7% | 307 -20% |
| Brightness Distribution (%) | 86 | 85 -1% | 84 -2% | 79 -8% | 86 0% | 78 -9% |
| Black Level * (cd/m²) | 0.395 | 0.17 57% | 0.29 27% | 0.19 52% | 0.27 32% | 0.775 -96% |
| Contrast (:1) | 987 | 1376 39% | 1348 37% | 1316 33% | 1622 64% | 455 -54% |
| Colorchecker dE 2000 * | 1.66 | 5.04 -204% | 3.52 -112% | 3.94 -137% | 2.5 -51% | 5.48 -230% |
| Colorchecker dE 2000 max. * | 2.9 | 18.04 -522% | 6.06 -109% | 16.73 -477% | 6.3 -117% | 10.13 -249% |
| Colorchecker dE 2000 calibrated * | 1.16 | 4.13 -256% | 1.43 -23% | 3.09 -166% | 0.8 31% | 2.44 -110% |
| Greyscale dE 2000 * | 1.83 | 4.43 -142% | 4.27 -133% | 3.6 -97% | 4.2 -130% | 5.56 -204% |
| Gamma | 2.25 98% | 2.41 91% | 2.3 96% | 2.081 106% | 2.22 99% | 2.43 91% |
| CCT | 6727 97% | 6350 102% | 7203 90% | 6476 100% | 7034 92% | 7582 86% |
| Total Average (Program / Settings) | -538% /
-296% | -375% /
-179% | -666% /
-338% | -925% /
-405% | -191% /
-138% |
* ... smaller is better
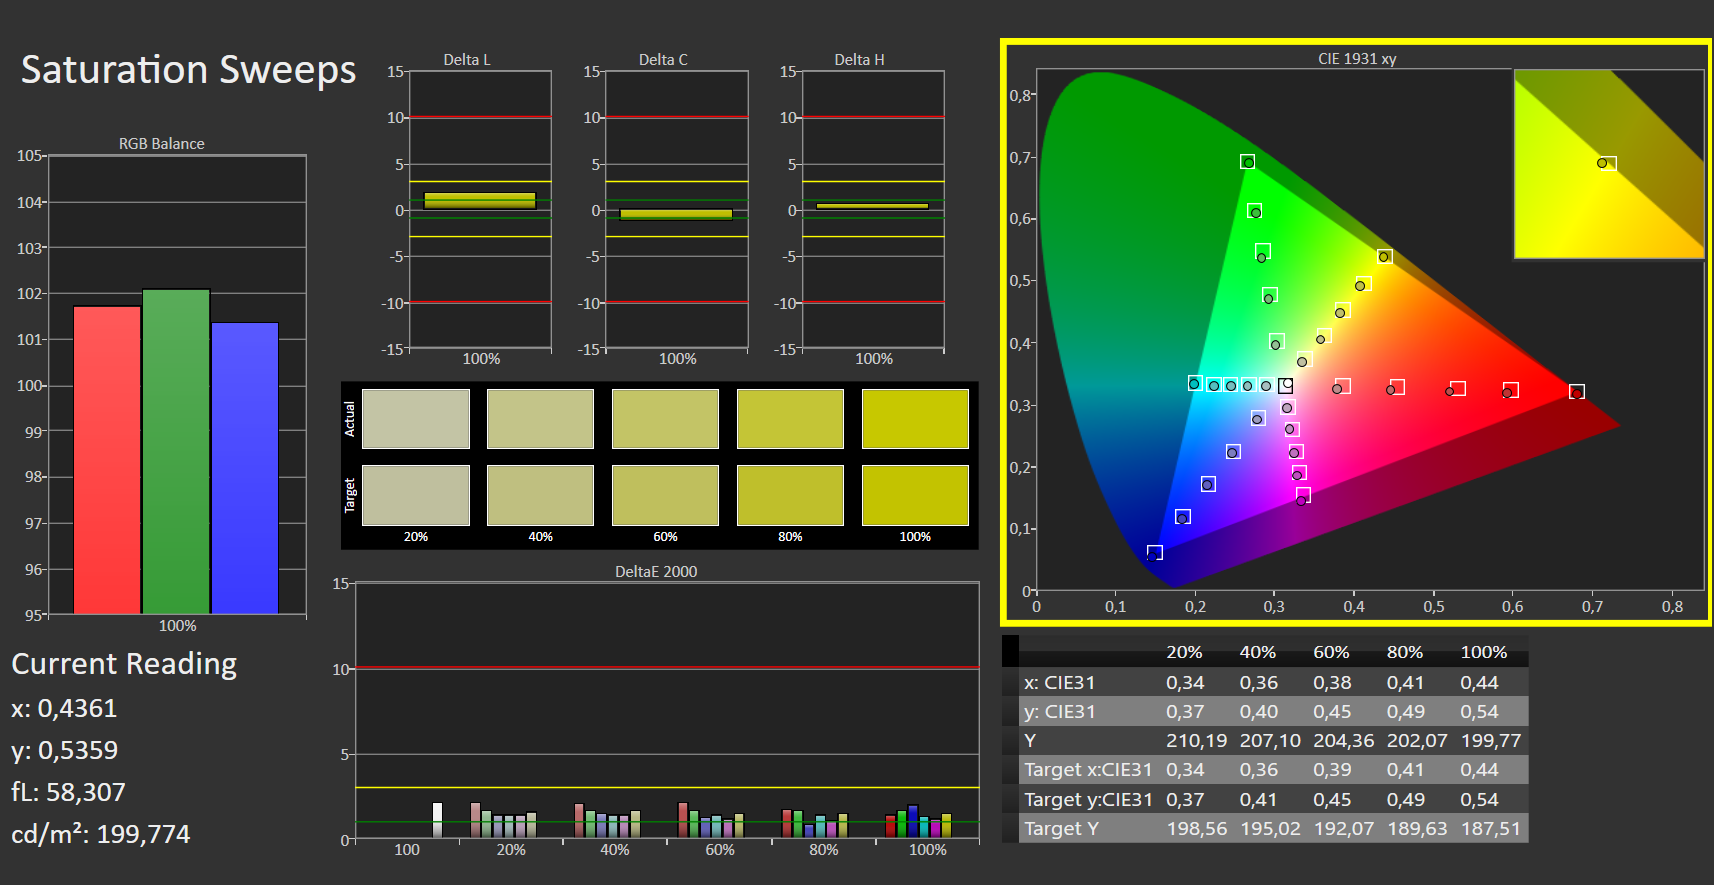
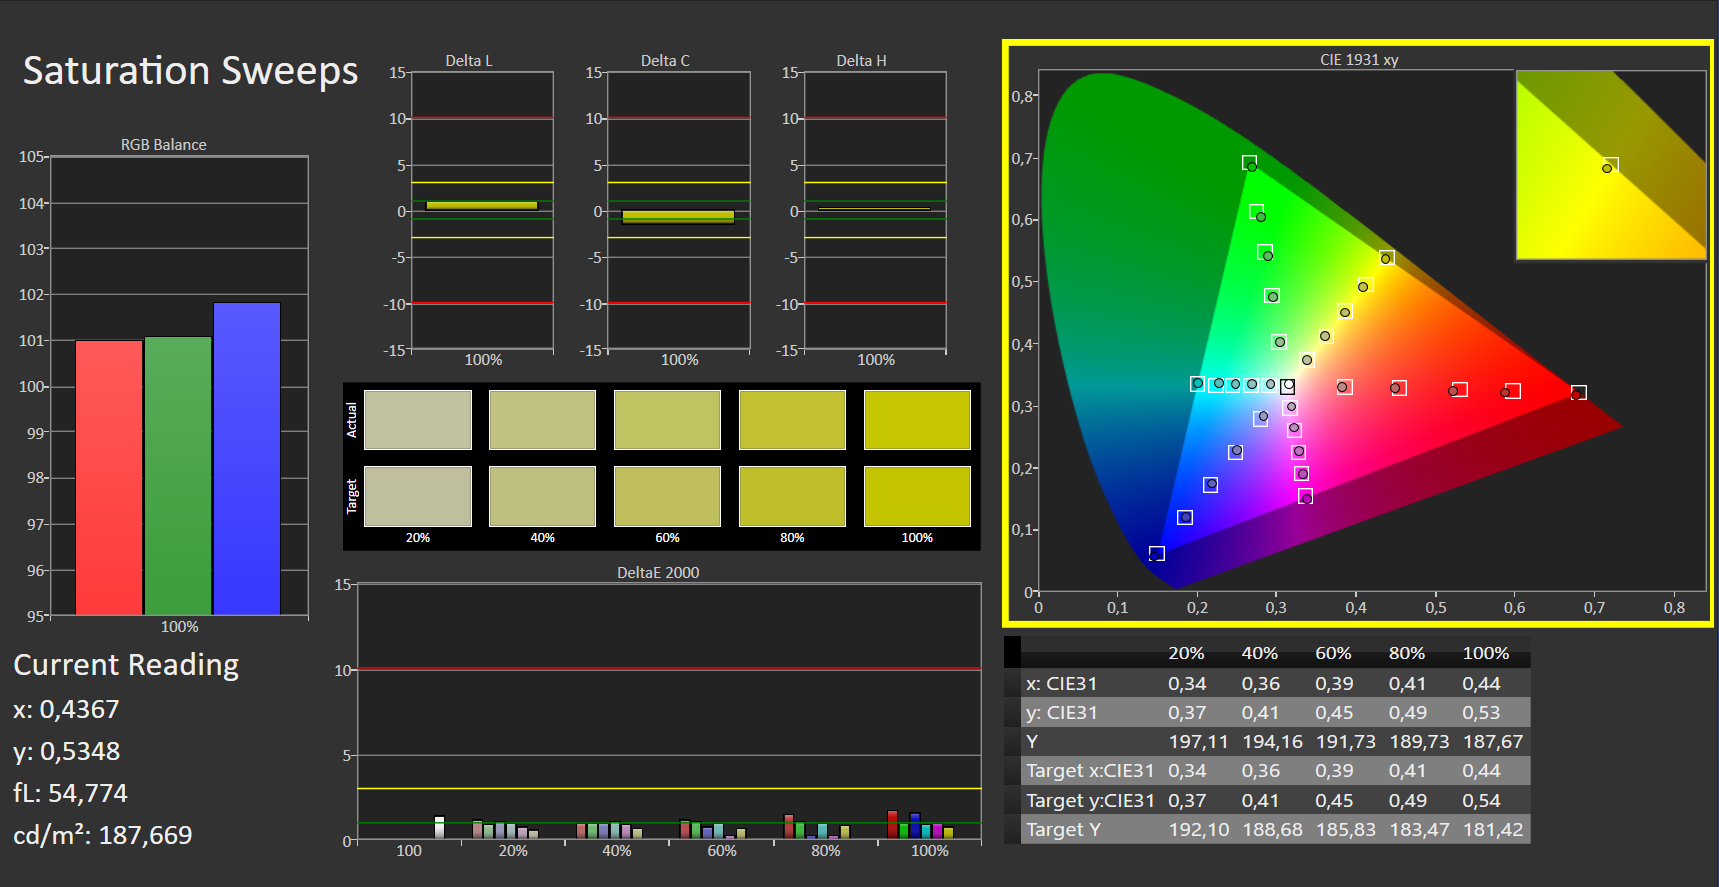
与其他测试对象相比,色彩空间覆盖率很好。该面板覆盖了100%的小型sRGB色彩空间。P3的98%和AdobeRGB色彩空间的87%,它实现了良好的价值,但仍然不会是图形设计师的完美选择。
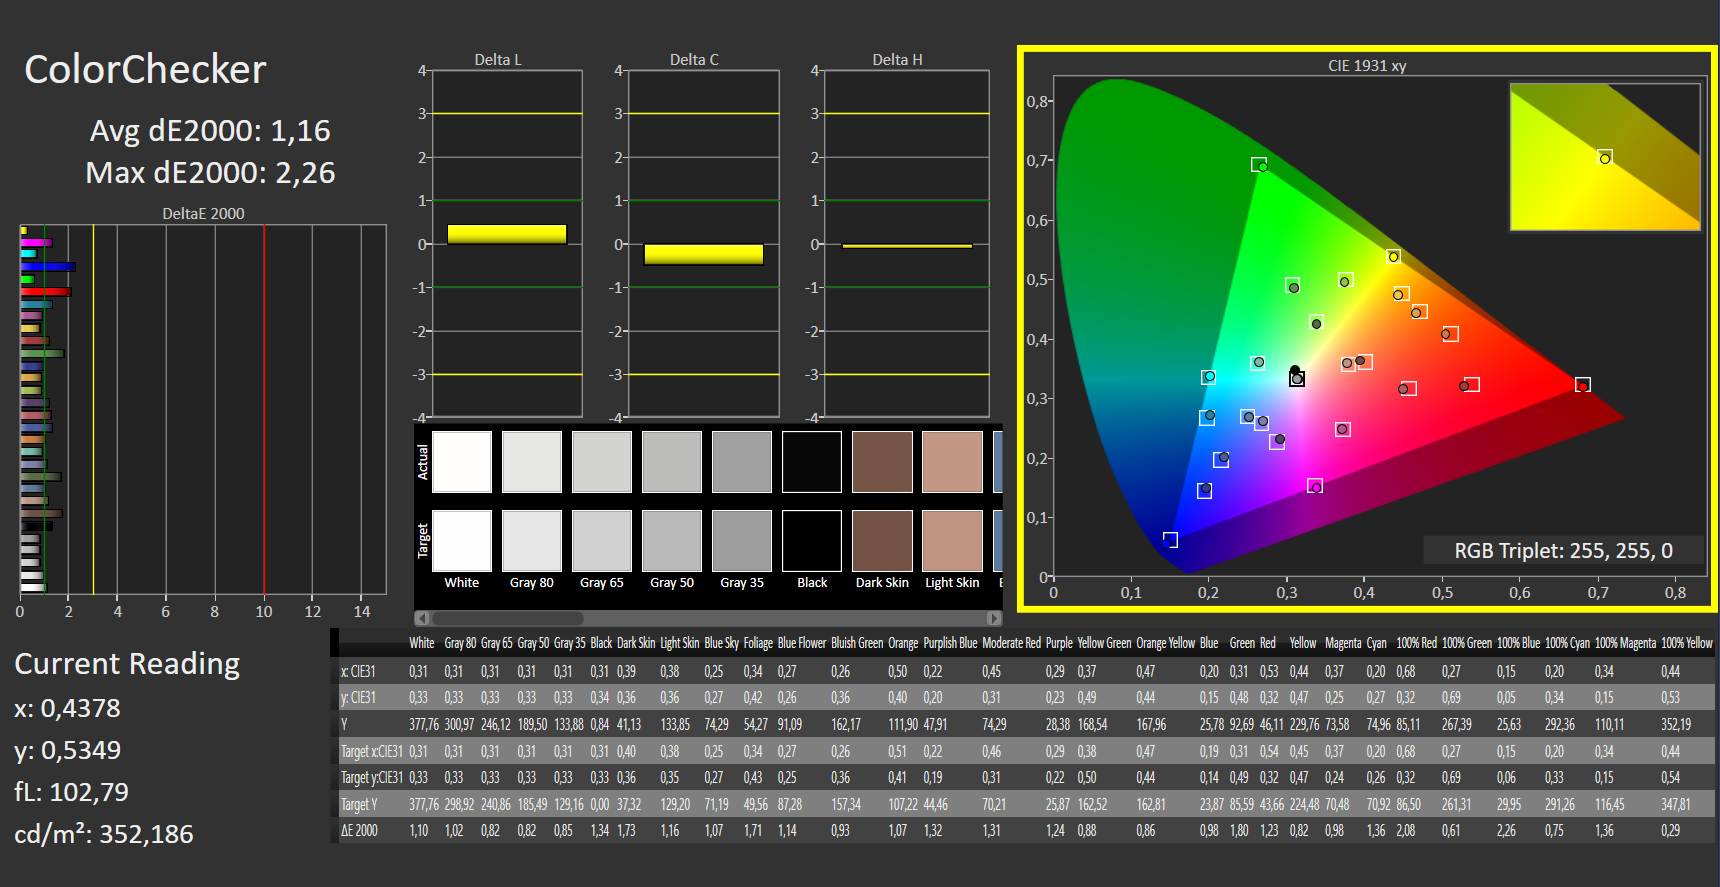
与竞争对手相比,该设备还提供了良好的色彩再现,如低Delta E测量值所示。在交付状态下已经相当平衡的数值,可以通过校准进一步提高。

Display Response Times
| ↔ Response Time Black to White | ||
|---|---|---|
| 7 ms ... rise ↗ and fall ↘ combined | ↗ 1 ms rise |  |
| ↘ 6 ms fall | ||
| The screen shows very fast response rates in our tests and should be very well suited for fast-paced gaming. In comparison, all tested devices range from 0.1 (minimum) to 240 (maximum) ms. » 21 % of all devices are better. This means that the measured response time is better than the average of all tested devices (19.8 ms). | ||
| ↔ Response Time 50% Grey to 80% Grey | ||
| 1 ms ... rise ↗ and fall ↘ combined | ↗ 0 ms rise |  |
| ↘ 0 ms fall | ||
| The screen shows very fast response rates in our tests and should be very well suited for fast-paced gaming. In comparison, all tested devices range from 0.165 (minimum) to 636 (maximum) ms. » 4 % of all devices are better. This means that the measured response time is better than the average of all tested devices (30.9 ms). | ||
Screen Flickering / PWM (Pulse-Width Modulation)
| Screen flickering / PWM not detected |  | ||
In comparison: 52 % of all tested devices do not use PWM to dim the display. If PWM was detected, an average of 7748 (minimum: 5 - maximum: 343500) Hz was measured. | |||
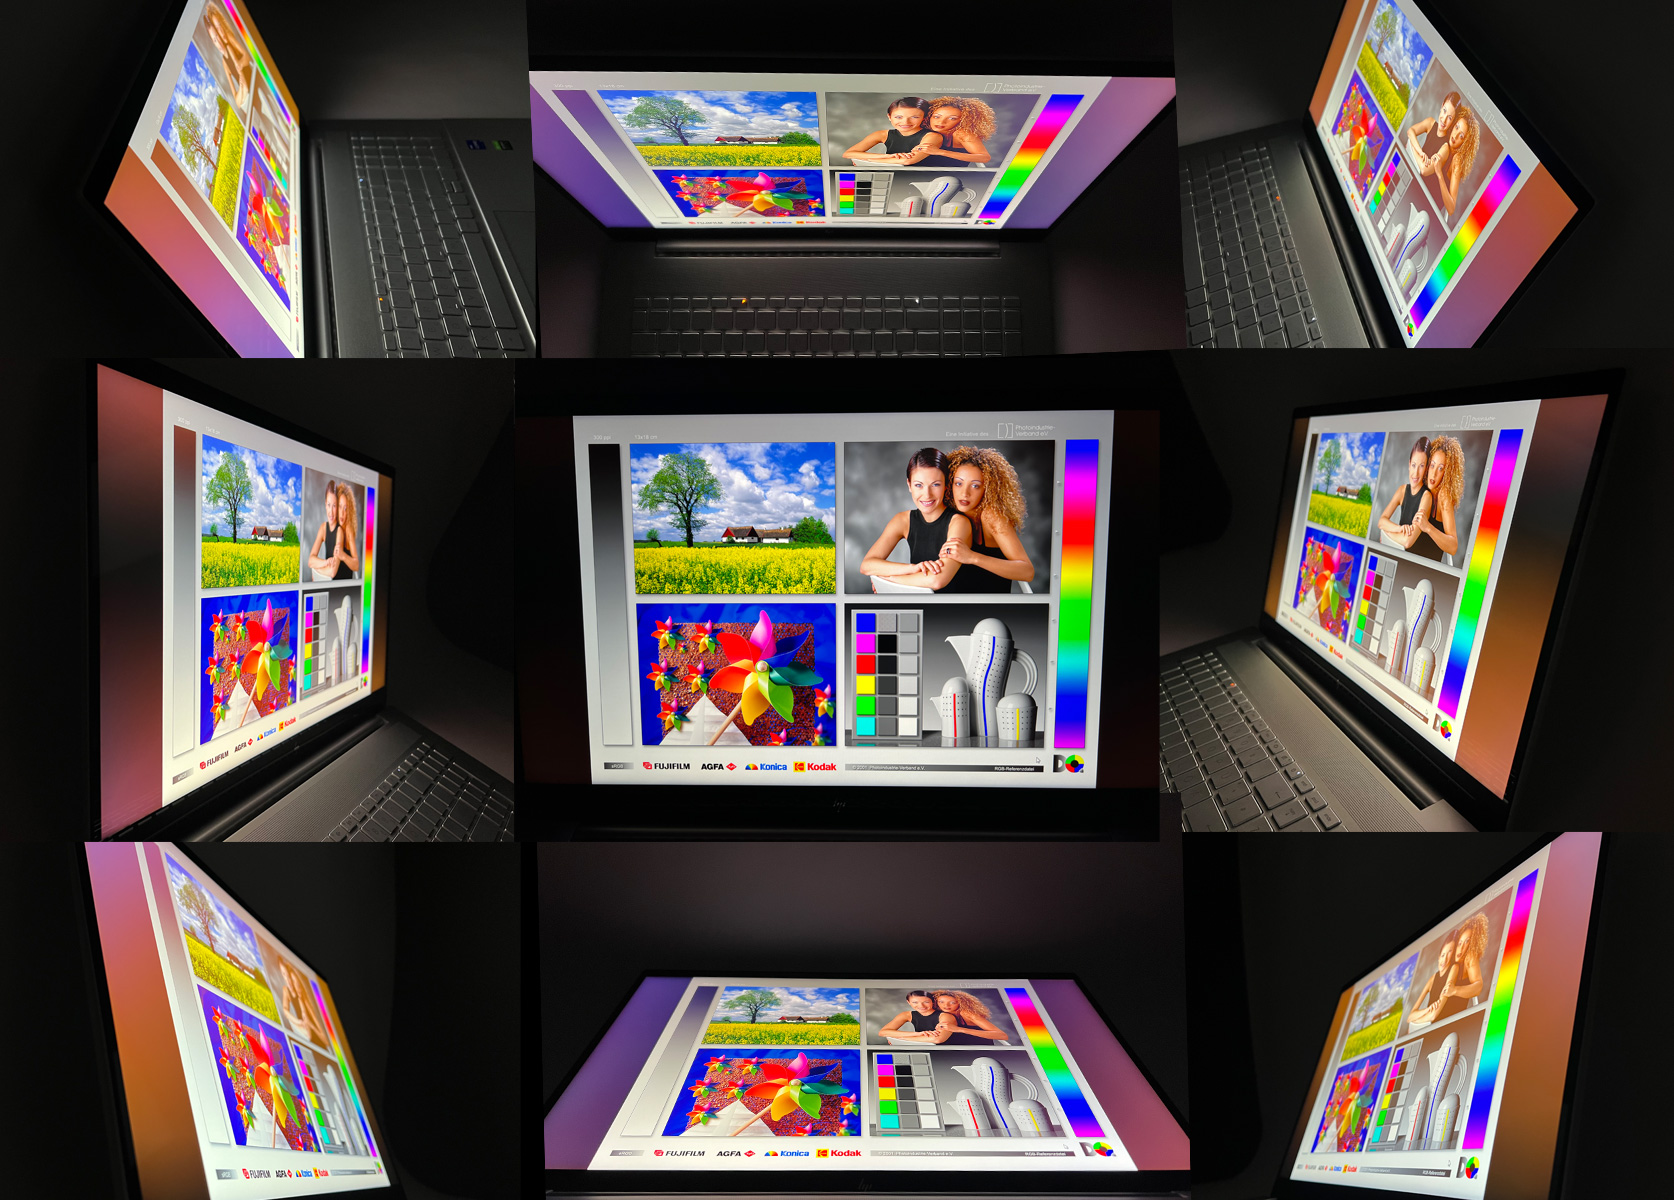
在户外使用时,反射式显示屏会产生一些问题。IPS显示屏提供了良好的视角稳定性,这是这种面板的典型特征。
性能:与GeForce RTX 2050也适合游戏
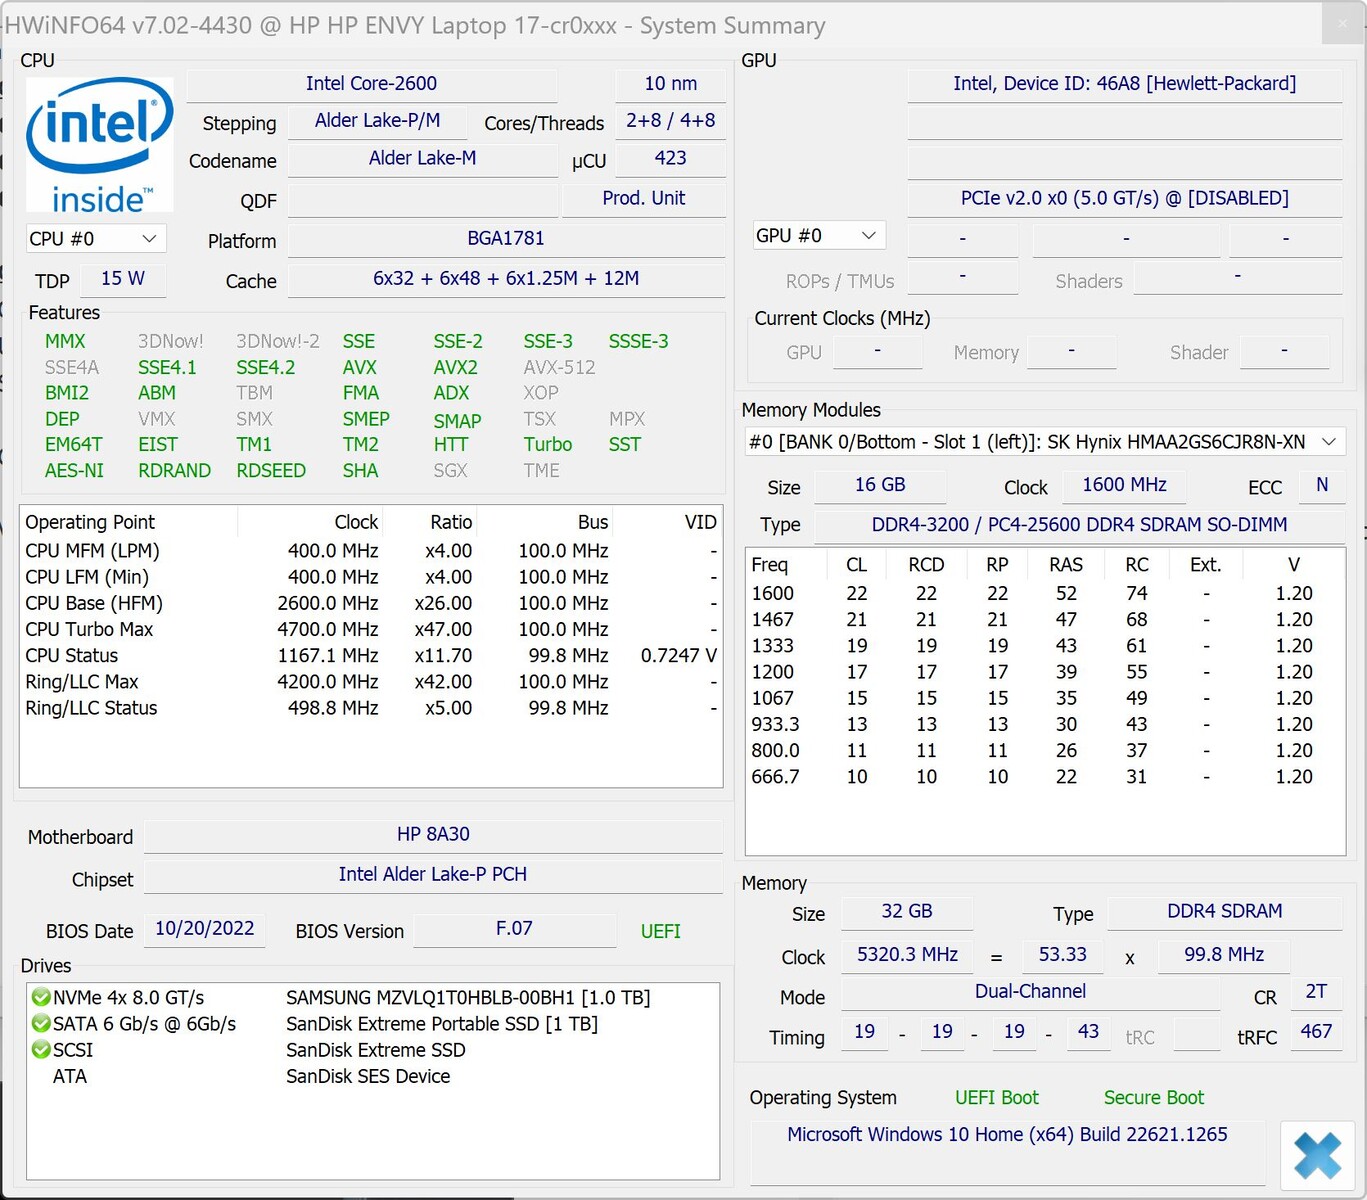
在我们的cr0079ng(72W72EA)测试配置中,惠普Envy 17配备了 酷睿i7-1255U来自英特尔的第12代处理器(桤木湖U)。制造商将其与额外的32GB DDR4 3200 MHz内存(2x 16GB)和一个大型的1-TB PCIe NVMe M.2 SSD相结合。根据不同的需求,专用 NvidiaGeForce RTX 2050 笔记本电脑4GB GDDR6的GPU或内部英特尔Iris Xe图形处理图形输出。
另外,惠普还提供Envy 17的许多其他配置,例如,使用较少的内存和存储空间或不同的CPU,如 英特尔酷睿i5-1235U或 酷睿i7-1260P.
测试条件
通过命令中心,惠普提供了自己的工具,允许你在性能模式 "平衡"、"性能 "和 "冷却 "中进行选择,以及在电池运行中的 "省电 "模式,或者你也可以选择自动 "智能调整 "模式。对于我们的基准测试,我们通常选择 "性能 "惠普模式,同时选择 "最佳性能 "Windows设置。
| 性能 模式 | 智能调节 模式 | 冷却 模式 | |
|---|---|---|---|
| 功率限制1 | 18瓦 | 15瓦 | 10瓦 |
| 功率限制2 | 51瓦 | 46瓦 | 15瓦 |
处理器
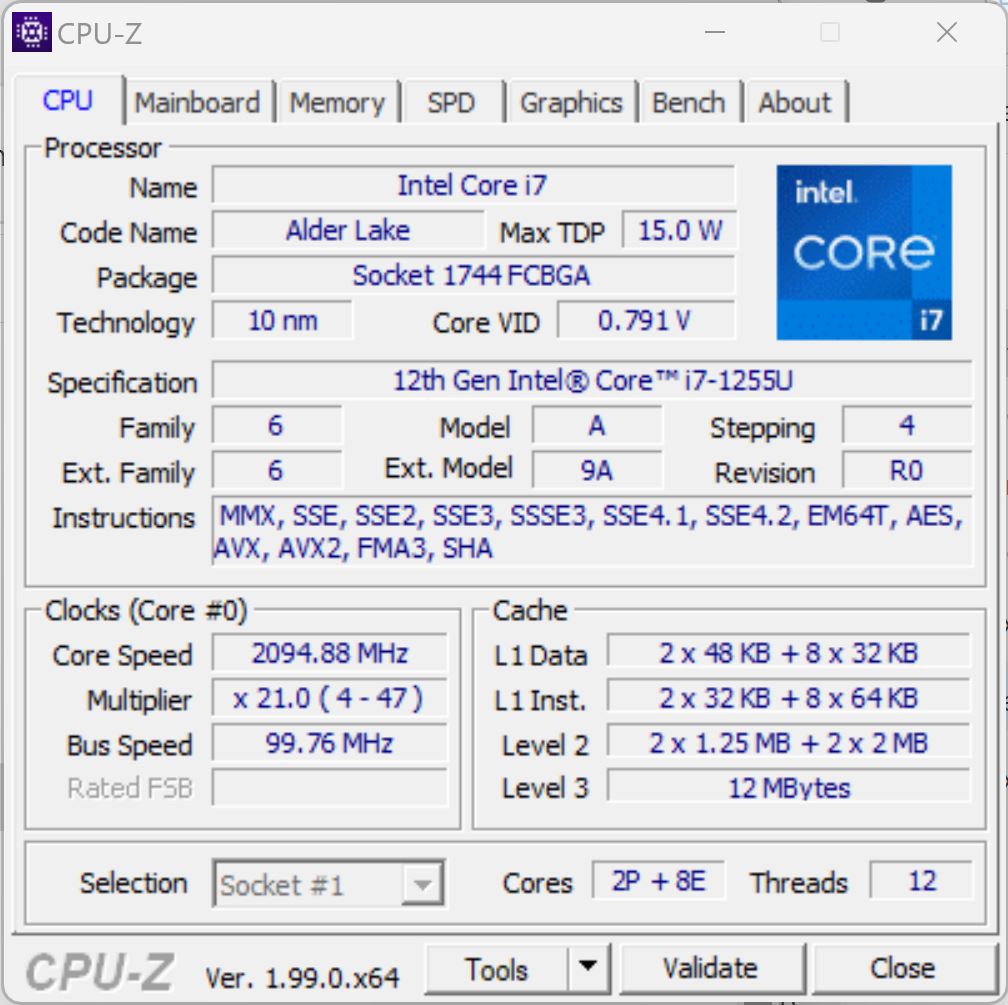
芯片 酷睿i7-1255U这里使用的是英特尔第12代处理器(桤木湖),是为高端笔记本电脑设计的。这款十核处理器由两个性能核和八个效率核组成,由于P核的超线程,因此有12个线程。时钟速度在1.7和4.7GHz之间。
在我们测试期间的CPU基准测试中,惠普Envy 17大多提供了非常好的结果,通常定位高于CPU和具有相同CPU的竞争对手的平均水平。在我们的恒定负载测试中,性能也是持续可用的。在电池运行中,性能降低了约70%。
Cinebench R15 Multi Constant Load Test
Cinebench R23: Multi Core | Single Core
Cinebench R20: CPU (Multi Core) | CPU (Single Core)
Cinebench R15: CPU Multi 64Bit | CPU Single 64Bit
Blender: v2.79 BMW27 CPU
7-Zip 18.03: 7z b 4 | 7z b 4 -mmt1
Geekbench 5.5: Multi-Core | Single-Core
HWBOT x265 Benchmark v2.2: 4k Preset
LibreOffice : 20 Documents To PDF
R Benchmark 2.5: Overall mean
| CPU Performance rating | |
| Average of class Multimedia | |
| Dell XPS 17 9720 | |
| Acer Aspire 5 A515-57G-53N8 | |
| HP Envy 17-cr0079ng | |
| LG Gram 17Z90Q-E.AD78G | |
| Average Intel Core i7-1255U | |
| Lenovo IdeaPad 3 17ABA7 | |
| HP ProBook 450 G9 6A180EA | |
| HP Envy 17-cg | |
| Cinebench R23 / Multi Core | |
| Dell XPS 17 9720 | |
| Average of class Multimedia (4861 - 33362, n=65, last 2 years) | |
| Acer Aspire 5 A515-57G-53N8 | |
| HP Envy 17-cr0079ng | |
| LG Gram 17Z90Q-E.AD78G | |
| LG Gram 17Z90Q-E.AD78G | |
| Lenovo IdeaPad 3 17ABA7 | |
| Average Intel Core i7-1255U (5269 - 9628, n=11) | |
| HP ProBook 450 G9 6A180EA | |
| HP Envy 17-cg | |
| Cinebench R23 / Single Core | |
| Average of class Multimedia (1128 - 2459, n=64, last 2 years) | |
| Dell XPS 17 9720 | |
| Acer Aspire 5 A515-57G-53N8 | |
| Average Intel Core i7-1255U (1408 - 1775, n=11) | |
| LG Gram 17Z90Q-E.AD78G | |
| HP Envy 17-cr0079ng | |
| HP ProBook 450 G9 6A180EA | |
| Lenovo IdeaPad 3 17ABA7 | |
| HP Envy 17-cg | |
| Cinebench R20 / CPU (Multi Core) | |
| Average of class Multimedia (1887 - 12912, n=56, last 2 years) | |
| Dell XPS 17 9720 | |
| Acer Aspire 5 A515-57G-53N8 | |
| HP Envy 17-cr0079ng | |
| Lenovo IdeaPad 3 17ABA7 | |
| LG Gram 17Z90Q-E.AD78G | |
| Average Intel Core i7-1255U (2095 - 3702, n=11) | |
| HP ProBook 450 G9 6A180EA | |
| HP Envy 17-cg | |
| Cinebench R20 / CPU (Single Core) | |
| Average of class Multimedia (425 - 853, n=56, last 2 years) | |
| Dell XPS 17 9720 | |
| Acer Aspire 5 A515-57G-53N8 | |
| Average Intel Core i7-1255U (550 - 682, n=11) | |
| HP Envy 17-cr0079ng | |
| LG Gram 17Z90Q-E.AD78G | |
| HP ProBook 450 G9 6A180EA | |
| Lenovo IdeaPad 3 17ABA7 | |
| HP Envy 17-cg | |
| Cinebench R15 / CPU Multi 64Bit | |
| Dell XPS 17 9720 | |
| Dell XPS 17 9720 | |
| Average of class Multimedia (856 - 5224, n=60, last 2 years) | |
| Acer Aspire 5 A515-57G-53N8 | |
| LG Gram 17Z90Q-E.AD78G | |
| Lenovo IdeaPad 3 17ABA7 | |
| HP Envy 17-cr0079ng | |
| Average Intel Core i7-1255U (919 - 1577, n=11) | |
| HP ProBook 450 G9 6A180EA | |
| HP Envy 17-cg | |
| Cinebench R15 / CPU Single 64Bit | |
| Average of class Multimedia (184.8 - 326, n=58, last 2 years) | |
| Dell XPS 17 9720 | |
| HP Envy 17-cr0079ng | |
| Acer Aspire 5 A515-57G-53N8 | |
| Average Intel Core i7-1255U (161 - 251, n=12) | |
| Lenovo IdeaPad 3 17ABA7 | |
| LG Gram 17Z90Q-E.AD78G | |
| HP ProBook 450 G9 6A180EA | |
| HP Envy 17-cg | |
| Blender / v2.79 BMW27 CPU | |
| HP ProBook 450 G9 6A180EA | |
| HP Envy 17-cg | |
| HP Envy 17-cr0079ng | |
| Average Intel Core i7-1255U (372 - 601, n=11) | |
| LG Gram 17Z90Q-E.AD78G | |
| Acer Aspire 5 A515-57G-53N8 | |
| Lenovo IdeaPad 3 17ABA7 | |
| Average of class Multimedia (100 - 557, n=57, last 2 years) | |
| Dell XPS 17 9720 | |
| 7-Zip 18.03 / 7z b 4 | |
| Dell XPS 17 9720 | |
| Average of class Multimedia (26062 - 130368, n=54, last 2 years) | |
| Acer Aspire 5 A515-57G-53N8 | |
| LG Gram 17Z90Q-E.AD78G | |
| HP Envy 17-cr0079ng | |
| Lenovo IdeaPad 3 17ABA7 | |
| Average Intel Core i7-1255U (24126 - 37365, n=11) | |
| HP ProBook 450 G9 6A180EA | |
| HP Envy 17-cg | |
| 7-Zip 18.03 / 7z b 4 -mmt1 | |
| Average of class Multimedia (3666 - 7545, n=55, last 2 years) | |
| Dell XPS 17 9720 | |
| HP Envy 17-cr0079ng | |
| Average Intel Core i7-1255U (5059 - 5529, n=11) | |
| Lenovo IdeaPad 3 17ABA7 | |
| HP ProBook 450 G9 6A180EA | |
| Acer Aspire 5 A515-57G-53N8 | |
| LG Gram 17Z90Q-E.AD78G | |
| HP Envy 17-cg | |
| Geekbench 5.5 / Multi-Core | |
| Dell XPS 17 9720 | |
| Average of class Multimedia (4652 - 20422, n=55, last 2 years) | |
| Acer Aspire 5 A515-57G-53N8 | |
| LG Gram 17Z90Q-E.AD78G | |
| HP Envy 17-cr0079ng | |
| Average Intel Core i7-1255U (4463 - 8821, n=12) | |
| HP ProBook 450 G9 6A180EA | |
| Lenovo IdeaPad 3 17ABA7 | |
| HP Envy 17-cg | |
| Geekbench 5.5 / Single-Core | |
| Average of class Multimedia (805 - 2974, n=55, last 2 years) | |
| Dell XPS 17 9720 | |
| HP Envy 17-cr0079ng | |
| HP ProBook 450 G9 6A180EA | |
| Average Intel Core i7-1255U (1560 - 1712, n=12) | |
| Acer Aspire 5 A515-57G-53N8 | |
| LG Gram 17Z90Q-E.AD78G | |
| HP Envy 17-cg | |
| Lenovo IdeaPad 3 17ABA7 | |
| HWBOT x265 Benchmark v2.2 / 4k Preset | |
| Average of class Multimedia (5.26 - 36.1, n=55, last 2 years) | |
| Dell XPS 17 9720 | |
| Acer Aspire 5 A515-57G-53N8 | |
| HP Envy 17-cr0079ng | |
| LG Gram 17Z90Q-E.AD78G | |
| Lenovo IdeaPad 3 17ABA7 | |
| Average Intel Core i7-1255U (6.31 - 10.1, n=11) | |
| HP ProBook 450 G9 6A180EA | |
| HP Envy 17-cg | |
| LibreOffice / 20 Documents To PDF | |
| LG Gram 17Z90Q-E.AD78G | |
| Acer Aspire 5 A515-57G-53N8 | |
| HP Envy 17-cg | |
| Lenovo IdeaPad 3 17ABA7 | |
| HP ProBook 450 G9 6A180EA | |
| Average of class Multimedia (23.9 - 146.7, n=56, last 2 years) | |
| Average Intel Core i7-1255U (35.6 - 52.5, n=11) | |
| HP Envy 17-cr0079ng | |
| Dell XPS 17 9720 | |
| R Benchmark 2.5 / Overall mean | |
| HP Envy 17-cg | |
| Lenovo IdeaPad 3 17ABA7 | |
| HP ProBook 450 G9 6A180EA | |
| LG Gram 17Z90Q-E.AD78G | |
| Average Intel Core i7-1255U (0.4688 - 0.558, n=11) | |
| Acer Aspire 5 A515-57G-53N8 | |
| HP Envy 17-cr0079ng | |
| Average of class Multimedia (0.3604 - 0.947, n=55, last 2 years) | |
| Dell XPS 17 9720 | |
* ... smaller is better
AIDA64: FP32 Ray-Trace | FPU Julia | CPU SHA3 | CPU Queen | FPU SinJulia | FPU Mandel | CPU AES | CPU ZLib | FP64 Ray-Trace | CPU PhotoWorxx
| Performance rating | |
| Average of class Multimedia | |
| Lenovo IdeaPad 3 17ABA7 | |
| Dell XPS 17 9720 | |
| HP Envy 17-cr0079ng | |
| Acer Aspire 5 A515-57G-53N8 | |
| Average Intel Core i7-1255U | |
| LG Gram 17Z90Q-E.AD78G | |
| HP ProBook 450 G9 6A180EA | |
| HP Envy 17-cg -9! | |
| AIDA64 / FP32 Ray-Trace | |
| Average of class Multimedia (2214 - 50388, n=53, last 2 years) | |
| Lenovo IdeaPad 3 17ABA7 | |
| HP Envy 17-cr0079ng | |
| Dell XPS 17 9720 | |
| Average Intel Core i7-1255U (4313 - 8127, n=11) | |
| Acer Aspire 5 A515-57G-53N8 | |
| HP ProBook 450 G9 6A180EA | |
| LG Gram 17Z90Q-E.AD78G | |
| AIDA64 / FPU Julia | |
| Average of class Multimedia (12867 - 201874, n=53, last 2 years) | |
| Lenovo IdeaPad 3 17ABA7 | |
| HP Envy 17-cr0079ng | |
| Average Intel Core i7-1255U (19813 - 41353, n=11) | |
| Dell XPS 17 9720 | |
| Acer Aspire 5 A515-57G-53N8 | |
| HP ProBook 450 G9 6A180EA | |
| LG Gram 17Z90Q-E.AD78G | |
| AIDA64 / CPU SHA3 | |
| Average of class Multimedia (626 - 8623, n=53, last 2 years) | |
| Dell XPS 17 9720 | |
| Lenovo IdeaPad 3 17ABA7 | |
| HP Envy 17-cr0079ng | |
| Average Intel Core i7-1255U (1325 - 2135, n=11) | |
| Acer Aspire 5 A515-57G-53N8 | |
| LG Gram 17Z90Q-E.AD78G | |
| HP ProBook 450 G9 6A180EA | |
| AIDA64 / CPU Queen | |
| Dell XPS 17 9720 | |
| Acer Aspire 5 A515-57G-53N8 | |
| Lenovo IdeaPad 3 17ABA7 | |
| Average of class Multimedia (13483 - 181505, n=40, last 2 years) | |
| LG Gram 17Z90Q-E.AD78G | |
| HP Envy 17-cr0079ng | |
| Average Intel Core i7-1255U (61375 - 65892, n=11) | |
| HP ProBook 450 G9 6A180EA | |
| AIDA64 / FPU SinJulia | |
| Lenovo IdeaPad 3 17ABA7 | |
| Average of class Multimedia (886 - 28794, n=53, last 2 years) | |
| Dell XPS 17 9720 | |
| Acer Aspire 5 A515-57G-53N8 | |
| LG Gram 17Z90Q-E.AD78G | |
| HP Envy 17-cr0079ng | |
| Average Intel Core i7-1255U (3577 - 5095, n=11) | |
| HP ProBook 450 G9 6A180EA | |
| AIDA64 / FPU Mandel | |
| Average of class Multimedia (6395 - 105740, n=53, last 2 years) | |
| Lenovo IdeaPad 3 17ABA7 | |
| HP Envy 17-cr0079ng | |
| Dell XPS 17 9720 | |
| Average Intel Core i7-1255U (11759 - 20187, n=11) | |
| Acer Aspire 5 A515-57G-53N8 | |
| LG Gram 17Z90Q-E.AD78G | |
| HP ProBook 450 G9 6A180EA | |
| AIDA64 / CPU AES | |
| Lenovo IdeaPad 3 17ABA7 | |
| Dell XPS 17 9720 | |
| Average of class Multimedia (8171 - 126790, n=53, last 2 years) | |
| HP Envy 17-cr0079ng | |
| Average Intel Core i7-1255U (27900 - 67458, n=11) | |
| Acer Aspire 5 A515-57G-53N8 | |
| LG Gram 17Z90Q-E.AD78G | |
| HP ProBook 450 G9 6A180EA | |
| AIDA64 / CPU ZLib | |
| Average of class Multimedia (143.8 - 2022, n=53, last 2 years) | |
| Dell XPS 17 9720 | |
| Acer Aspire 5 A515-57G-53N8 | |
| HP Envy 17-cr0079ng | |
| LG Gram 17Z90Q-E.AD78G | |
| Lenovo IdeaPad 3 17ABA7 | |
| Average Intel Core i7-1255U (393 - 640, n=11) | |
| HP ProBook 450 G9 6A180EA | |
| HP Envy 17-cg | |
| AIDA64 / FP64 Ray-Trace | |
| Average of class Multimedia (1014 - 26875, n=53, last 2 years) | |
| Lenovo IdeaPad 3 17ABA7 | |
| HP Envy 17-cr0079ng | |
| Dell XPS 17 9720 | |
| Average Intel Core i7-1255U (2474 - 4400, n=11) | |
| Acer Aspire 5 A515-57G-53N8 | |
| LG Gram 17Z90Q-E.AD78G | |
| HP ProBook 450 G9 6A180EA | |
| AIDA64 / CPU PhotoWorxx | |
| Average of class Multimedia (8187 - 88154, n=53, last 2 years) | |
| Dell XPS 17 9720 | |
| LG Gram 17Z90Q-E.AD78G | |
| Average Intel Core i7-1255U (13899 - 44054, n=11) | |
| HP Envy 17-cr0079ng | |
| Acer Aspire 5 A515-57G-53N8 | |
| HP ProBook 450 G9 6A180EA | |
| Lenovo IdeaPad 3 17ABA7 | |
系统性能
在实际操作中,这里使用的硬件提供了更多稳定的性能。在PCMark 10等基准测试中,这台笔记本电脑能够很好地跟上该领域的顶级产品,而且大多时候只被配备了更强大硬件的两台笔记本电脑所超越。那些想要更多性能的人甚至可以通过 英特尔酷睿i7-12700H中的戴尔XPS 17 9720,比如说。
由于一些奇怪的原因,PCMark 8的创意基准测试总是在中间被我们测试装置的硬件和驱动配置打断。因此,我们放弃了这个基准测试。
CrossMark: Overall | Productivity | Creativity | Responsiveness
| PCMark 10 / Score | |
| Average of class Multimedia (4325 - 10386, n=51, last 2 years) | |
| Dell XPS 17 9720 | |
| LG Gram 17Z90Q-E.AD78G | |
| HP Envy 17-cr0079ng | |
| Average Intel Core i7-1255U, NVIDIA GeForce RTX 2050 Mobile (n=1) | |
| Acer Aspire 5 A515-57G-53N8 | |
| Lenovo IdeaPad 3 17ABA7 | |
| HP Envy 17-cg | |
| HP ProBook 450 G9 6A180EA | |
| PCMark 10 / Essentials | |
| Average of class Multimedia (8025 - 11664, n=50, last 2 years) | |
| Lenovo IdeaPad 3 17ABA7 | |
| Dell XPS 17 9720 | |
| HP Envy 17-cr0079ng | |
| Average Intel Core i7-1255U, NVIDIA GeForce RTX 2050 Mobile (n=1) | |
| LG Gram 17Z90Q-E.AD78G | |
| HP ProBook 450 G9 6A180EA | |
| Acer Aspire 5 A515-57G-53N8 | |
| HP Envy 17-cg | |
| PCMark 10 / Productivity | |
| Average of class Multimedia (7323 - 18233, n=50, last 2 years) | |
| LG Gram 17Z90Q-E.AD78G | |
| Dell XPS 17 9720 | |
| Lenovo IdeaPad 3 17ABA7 | |
| HP Envy 17-cr0079ng | |
| Average Intel Core i7-1255U, NVIDIA GeForce RTX 2050 Mobile (n=1) | |
| HP Envy 17-cg | |
| Acer Aspire 5 A515-57G-53N8 | |
| HP ProBook 450 G9 6A180EA | |
| PCMark 10 / Digital Content Creation | |
| Average of class Multimedia (3651 - 16240, n=50, last 2 years) | |
| Dell XPS 17 9720 | |
| LG Gram 17Z90Q-E.AD78G | |
| HP Envy 17-cr0079ng | |
| Average Intel Core i7-1255U, NVIDIA GeForce RTX 2050 Mobile (n=1) | |
| Acer Aspire 5 A515-57G-53N8 | |
| HP Envy 17-cg | |
| Lenovo IdeaPad 3 17ABA7 | |
| HP ProBook 450 G9 6A180EA | |
| CrossMark / Overall | |
| Average of class Multimedia (866 - 2728, n=59, last 2 years) | |
| Dell XPS 17 9720 | |
| LG Gram 17Z90Q-E.AD78G | |
| HP Envy 17-cr0079ng | |
| Average Intel Core i7-1255U, NVIDIA GeForce RTX 2050 Mobile (n=1) | |
| HP ProBook 450 G9 6A180EA | |
| Lenovo IdeaPad 3 17ABA7 | |
| CrossMark / Productivity | |
| Average of class Multimedia (931 - 2489, n=59, last 2 years) | |
| Dell XPS 17 9720 | |
| LG Gram 17Z90Q-E.AD78G | |
| HP Envy 17-cr0079ng | |
| Average Intel Core i7-1255U, NVIDIA GeForce RTX 2050 Mobile (n=1) | |
| HP ProBook 450 G9 6A180EA | |
| Lenovo IdeaPad 3 17ABA7 | |
| CrossMark / Creativity | |
| Average of class Multimedia (907 - 3465, n=59, last 2 years) | |
| Dell XPS 17 9720 | |
| LG Gram 17Z90Q-E.AD78G | |
| HP Envy 17-cr0079ng | |
| Average Intel Core i7-1255U, NVIDIA GeForce RTX 2050 Mobile (n=1) | |
| HP ProBook 450 G9 6A180EA | |
| Lenovo IdeaPad 3 17ABA7 | |
| CrossMark / Responsiveness | |
| Dell XPS 17 9720 | |
| Average of class Multimedia (605 - 2024, n=59, last 2 years) | |
| LG Gram 17Z90Q-E.AD78G | |
| HP Envy 17-cr0079ng | |
| Average Intel Core i7-1255U, NVIDIA GeForce RTX 2050 Mobile (n=1) | |
| Lenovo IdeaPad 3 17ABA7 | |
| HP ProBook 450 G9 6A180EA | |
| PCMark 8 Home Score Accelerated v2 | 5469 points | |
| PCMark 8 Work Score Accelerated v2 | 5812 points | |
| PCMark 10 Score | 6351 points | |
Help | ||
| AIDA64 / Memory Copy | |
| Average of class Multimedia (11299 - 132135, n=53, last 2 years) | |
| LG Gram 17Z90Q-E.AD78G | |
| Dell XPS 17 9720 | |
| Average Intel Core i7-1255U (22846 - 67017, n=11) | |
| HP Envy 17-cr0079ng | |
| Acer Aspire 5 A515-57G-53N8 | |
| HP ProBook 450 G9 6A180EA | |
| Lenovo IdeaPad 3 17ABA7 | |
| AIDA64 / Memory Read | |
| Average of class Multimedia (11624 - 174586, n=53, last 2 years) | |
| LG Gram 17Z90Q-E.AD78G | |
| Dell XPS 17 9720 | |
| Average Intel Core i7-1255U (22877 - 67398, n=11) | |
| HP Envy 17-cr0079ng | |
| Acer Aspire 5 A515-57G-53N8 | |
| HP ProBook 450 G9 6A180EA | |
| Lenovo IdeaPad 3 17ABA7 | |
| AIDA64 / Memory Write | |
| Average of class Multimedia (11755 - 134998, n=53, last 2 years) | |
| Dell XPS 17 9720 | |
| LG Gram 17Z90Q-E.AD78G | |
| Average Intel Core i7-1255U (22883 - 65839, n=11) | |
| HP Envy 17-cr0079ng | |
| Acer Aspire 5 A515-57G-53N8 | |
| HP ProBook 450 G9 6A180EA | |
| Lenovo IdeaPad 3 17ABA7 | |
| AIDA64 / Memory Latency | |
| Average of class Multimedia (7 - 535, n=52, last 2 years) | |
| LG Gram 17Z90Q-E.AD78G | |
| Dell XPS 17 9720 | |
| Lenovo IdeaPad 3 17ABA7 | |
| Average Intel Core i7-1255U (76 - 163.2, n=11) | |
| HP ProBook 450 G9 6A180EA | |
| HP Envy 17-cr0079ng | |
| HP Envy 17-cg | |
* ... smaller is better
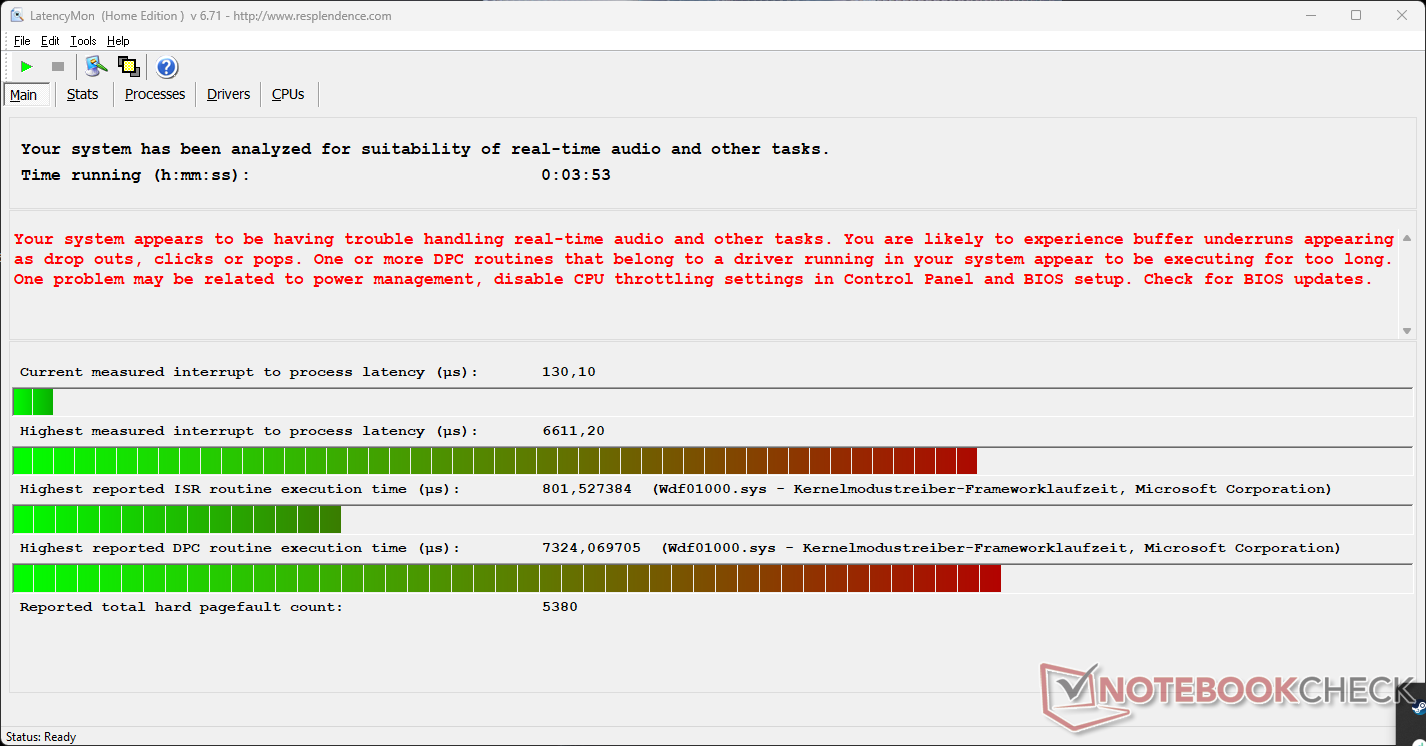
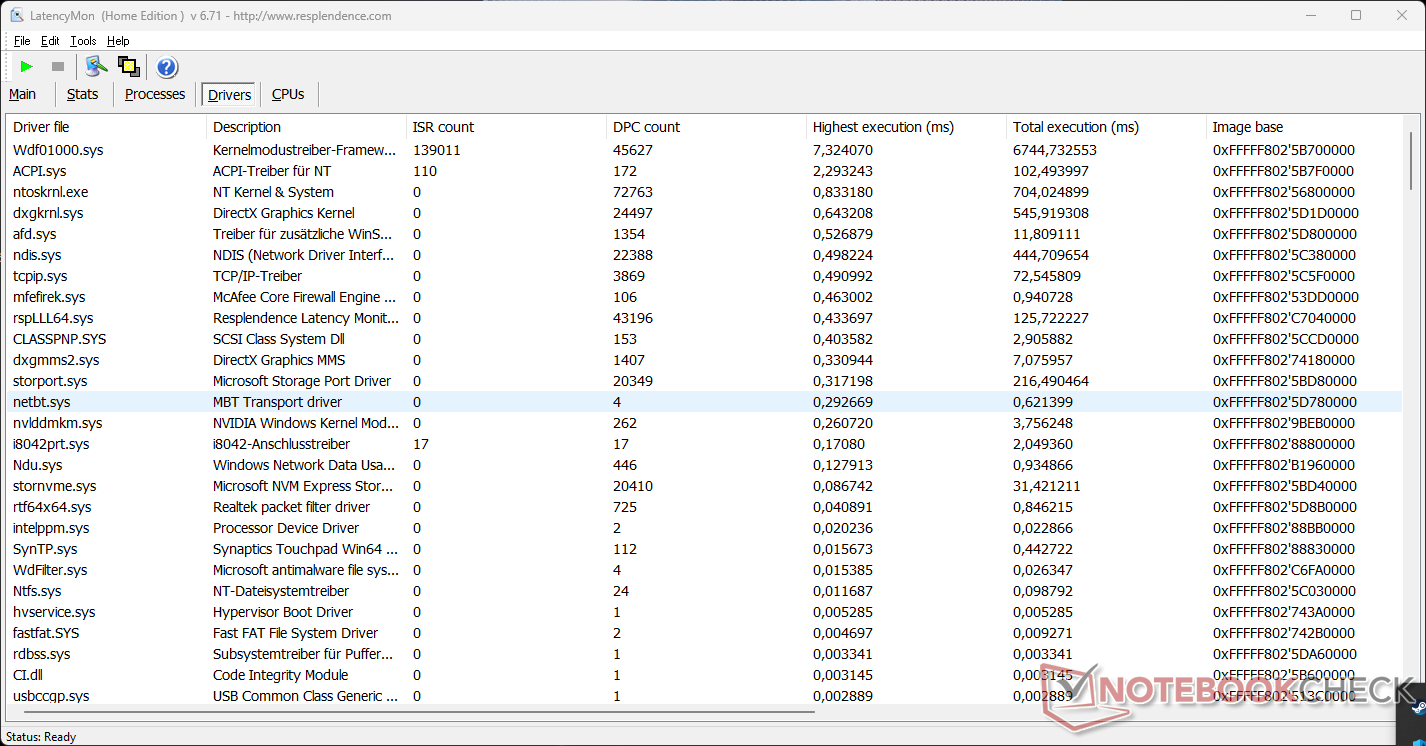
DPC延迟
我们的测试装置显示出相对较高的DPC延迟。虽然这可能表明在实时音频和视频处理方面可能会出现一些问题,但像往常一样,这也只是当前驱动配置的一个瞬间快照。
| DPC Latencies / LatencyMon - interrupt to process latency (max), Web, Youtube, Prime95 | |
| HP ProBook 450 G9 6A180EA | |
| HP Envy 17-cr0079ng | |
| LG Gram 17Z90Q-E.AD78G | |
| HP Envy 17-cg | |
| Acer Aspire 5 A515-57G-53N8 | |
| Lenovo IdeaPad 3 17ABA7 | |
| Dell XPS 17 9720 | |
* ... smaller is better
存储解决方案
在我们的测试测量中,三星的1TB固态硬盘并没有表现得特别好。它不仅排在大多数其他竞争对手的后面,而且还低于固态硬盘的平均水平。惠普的这种选择并没有给自己带来任何好处,但在日常操作中你仍然不会注意到任何限制。至少在恒定的性能中,数值几乎保持一致,没有开始被节流。

* ... smaller is better
Disk Throttling: DiskSpd Read Loop, Queue Depth 8
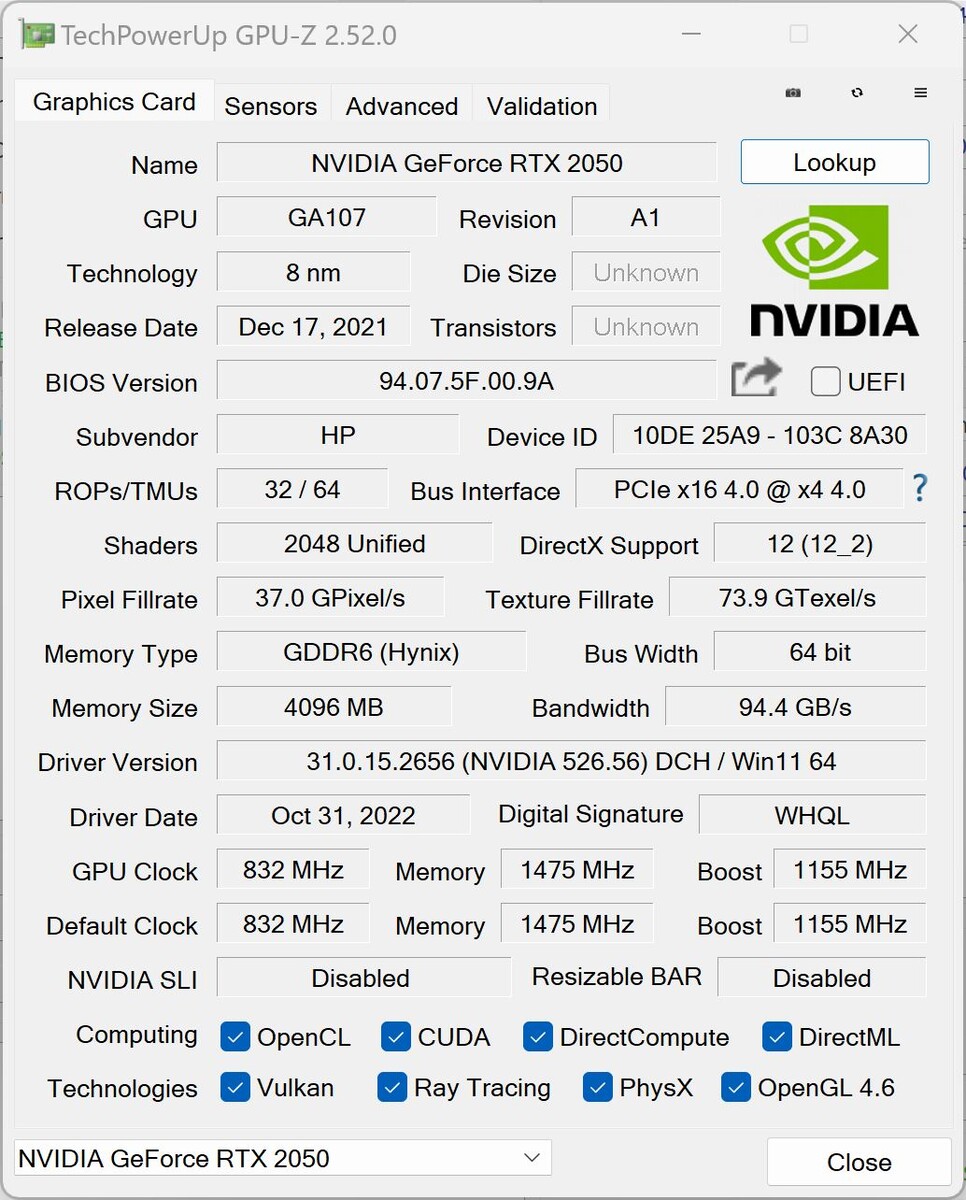
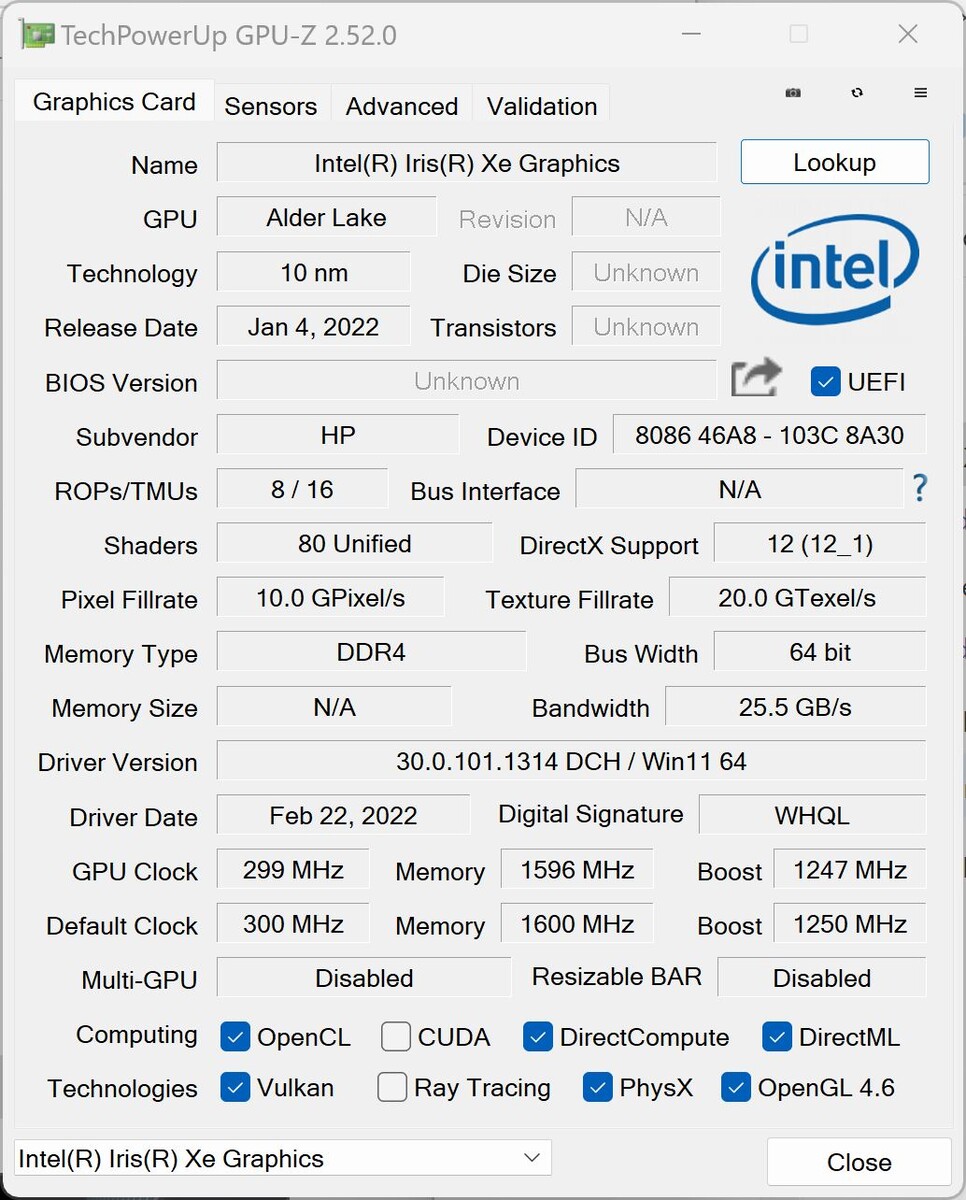
图形卡
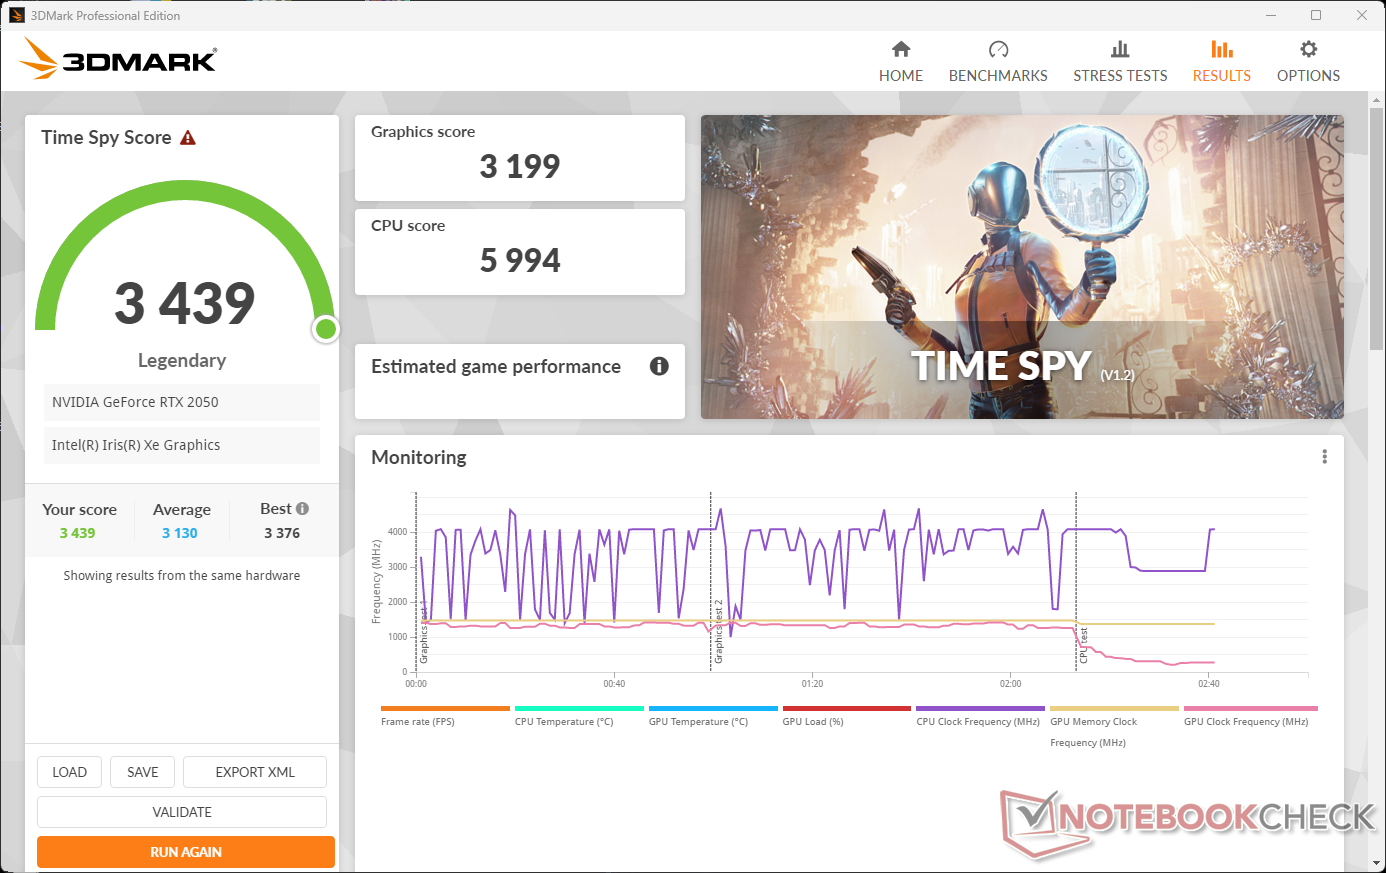
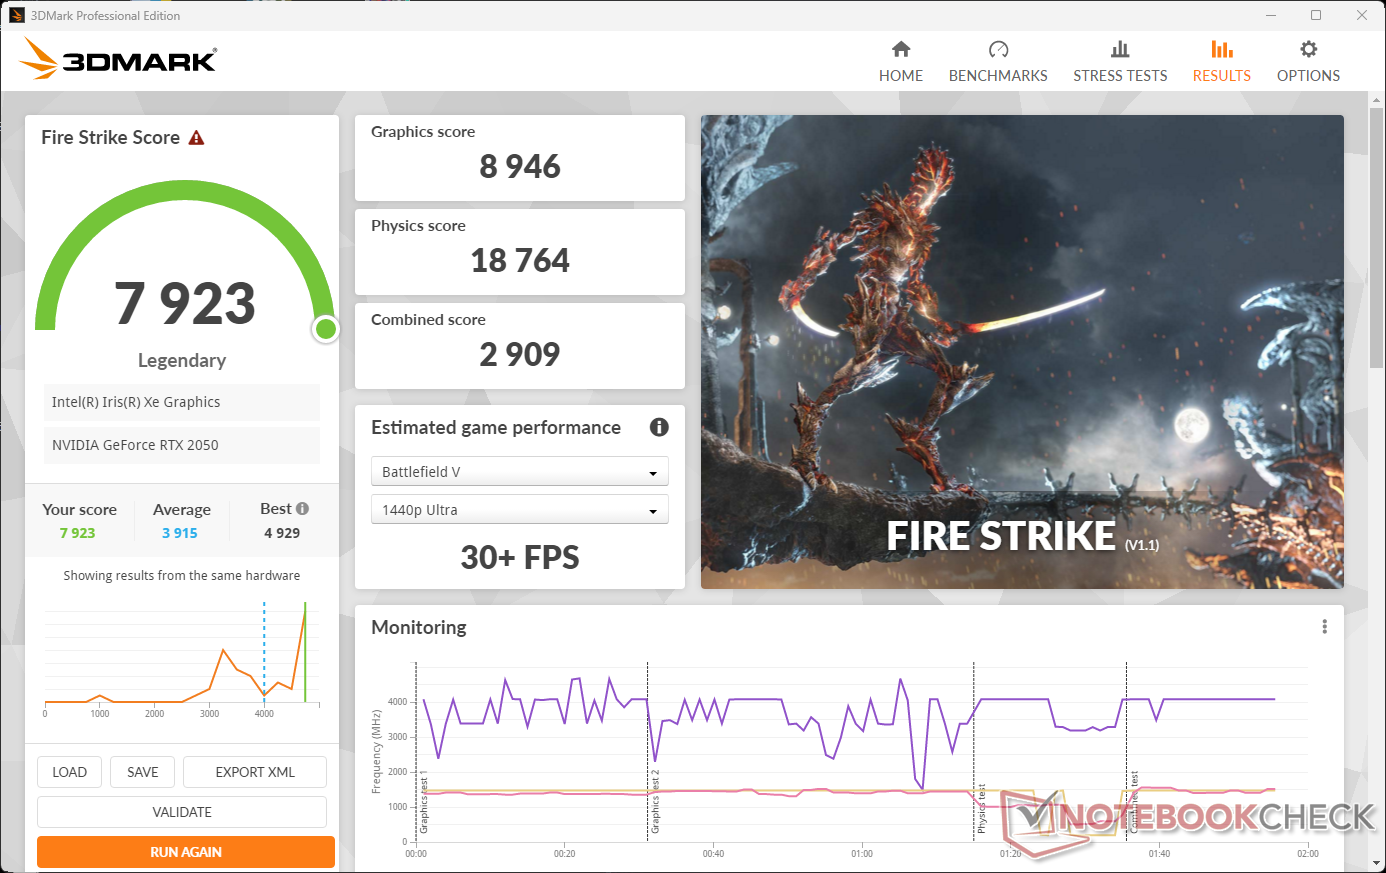
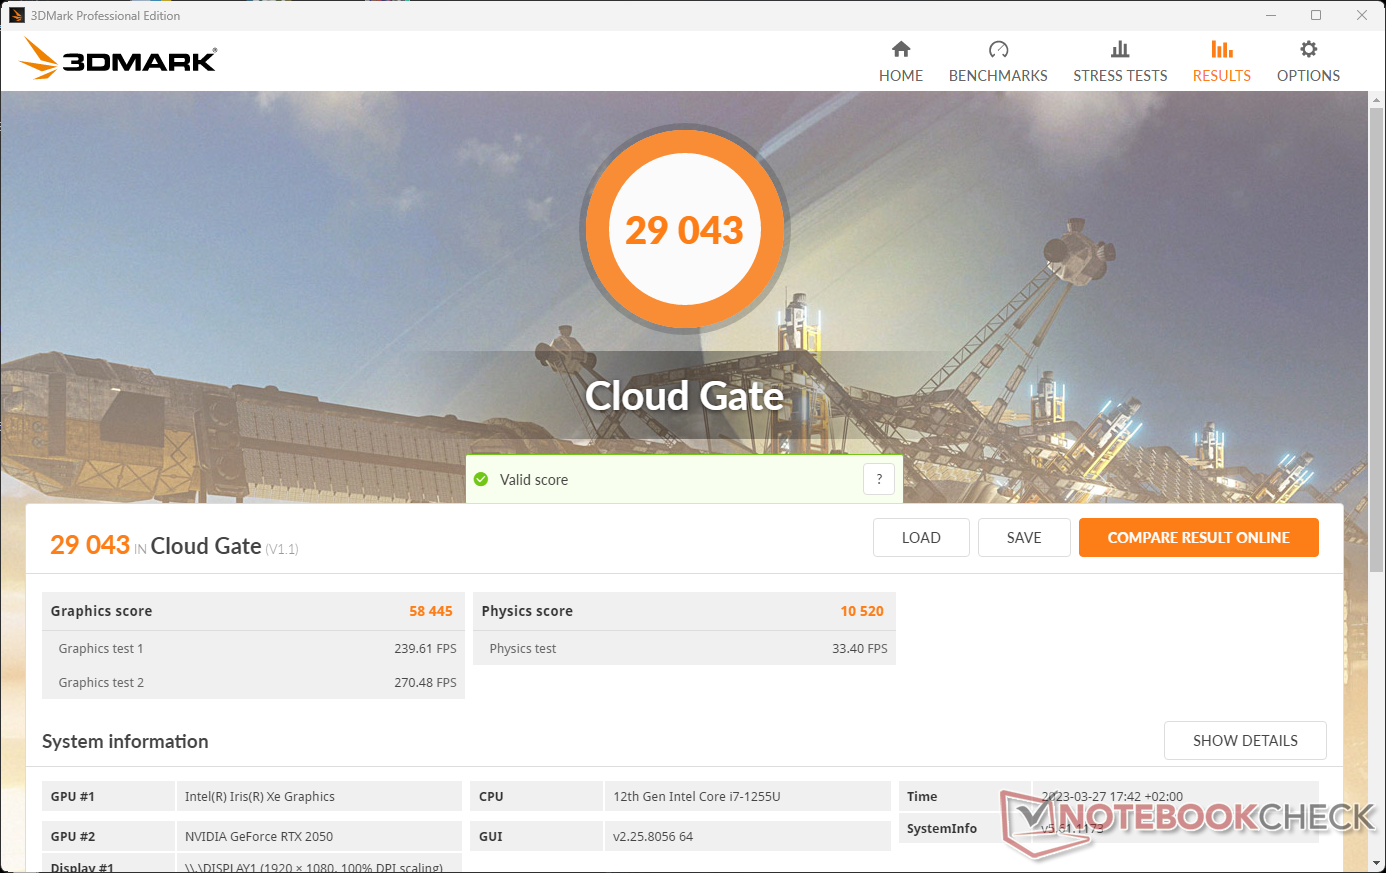
虽然英特尔Iris Xe图形iGPU处理要求不高的图形任务,但在要求较高的情况下 NvidiaGeForce RTX 2050 LaptopGPU被激活。有了这个,就有了一个中低端的专用图形解决方案。 然而,该GPU也来自2021年,所以它不再是春风得意。该显卡配备了4GB GDDR6图形存储,并以高达1,477 MHz的时钟速度运行。它无法跟上 GeForce RTX 4050这是由Nvidia最近推出的,这让它远远落后。
在图形基准测试中,惠普Envy 17-cr0079ng在我们的测试中达到坚实的数值。尽管它们仍然有部分低于这个图形解决方案的平均值,但它们总是高于那些轻量级的 LG Gram 17Z90Q耐力冠军,并在水平的 Acer Aspire 5 A515的水平,它们都配备了相同的dGPU。
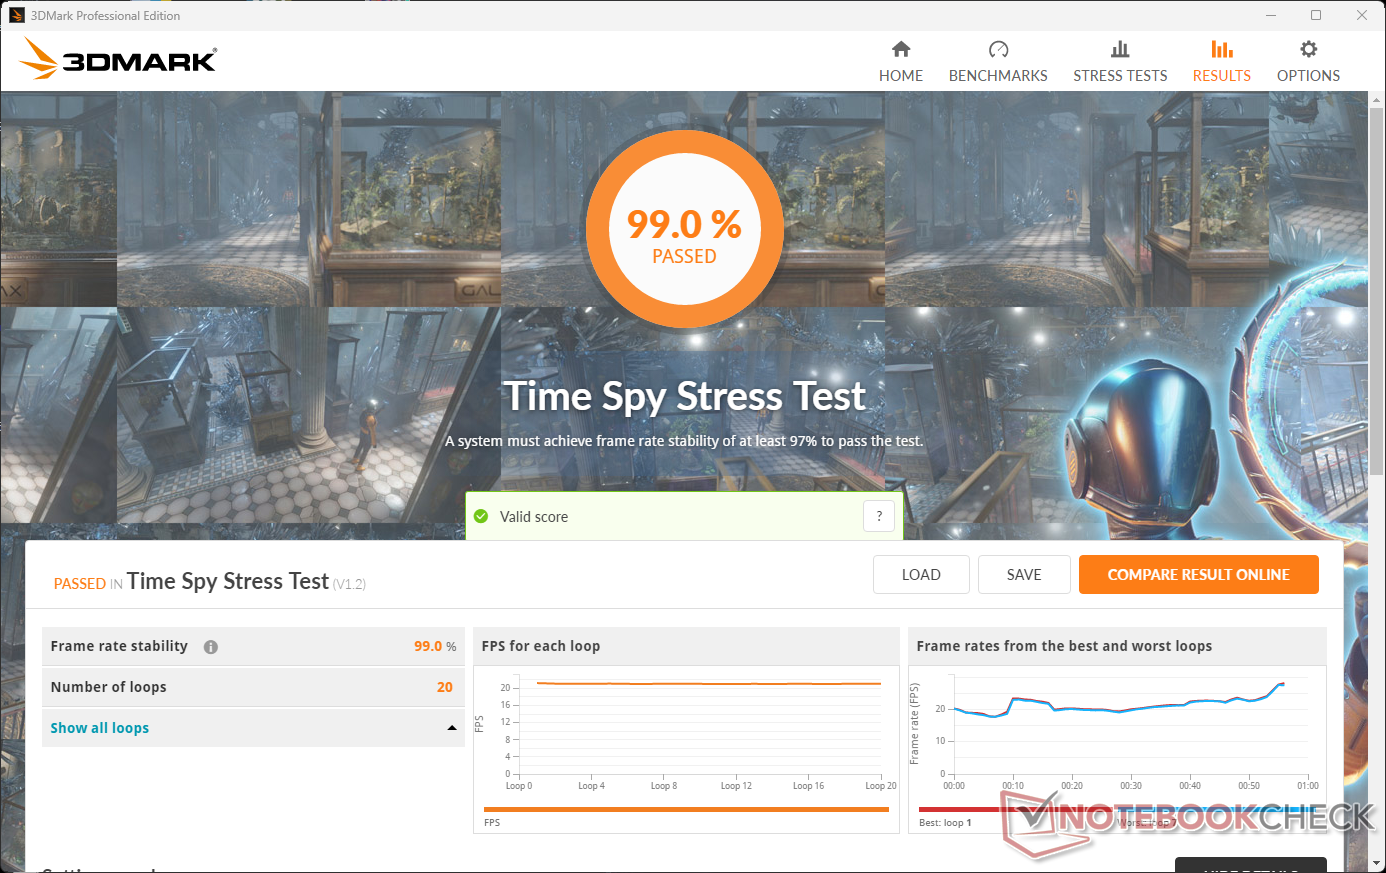
在主电源操作中,图形性能随着时间的推移保持不变,正如3DMark的压力测试(结果:99%)所示。在电池操作中,笔记本电脑仍然达到80%至90%,这取决于基准测试(3DMark 11:11,017个图形点)。
| 3DMark 11 Performance | 12472 points | |
| 3DMark Cloud Gate Standard Score | 29043 points | |
| 3DMark Fire Strike Score | 7923 points | |
| 3DMark Time Spy Score | 3439 points | |
Help | ||
* ... smaller is better
游戏性能
对于使用惠普Envy 17多媒体笔记本电脑进行一轮有修养的游戏,专用图形解决方案很容易就能满足。我们为测试选择的大多数游戏都能在FHD分辨率下的高甚至最大图形设置下顺利运行。然而,GPU很难让你享受到显示屏的完整4K分辨率。
一个恼人的问题:使用惠普命令中心的 "性能 "模式,许多游戏在改变显示分辨率时被最小化,之后我们无法继续游戏,或者甚至完全崩溃了。在对惠普Envy 17的测试中,我们无法掌握这个问题。因此,一些游戏的测量只使用了 "智能调整 "模式,在该模式下没有出现这种问题。
| The Witcher 3 - 1920x1080 Ultra Graphics & Postprocessing (HBAO+) | |
| MSI Katana 15 B12VEK | |
| Dell XPS 17 9720 | |
| Average of class Multimedia (11 - 107, n=5, last 2 years) | |
| LG Gram 17Z90Q-E.AD78G | |
| HP Envy 17-cr0079ng | |
| Acer Aspire 5 A515-57G-53N8 | |
| HP ProBook 450 G9 6A180EA | |
| Lenovo IdeaPad 3 17ABA7 | |
| GTA V - 1920x1080 Highest AA:4xMSAA + FX AF:16x | |
| MSI Katana 15 B12VEK | |
| Dell XPS 17 9720 | |
| Average of class Multimedia (7.92 - 141.6, n=53, last 2 years) | |
| HP Envy 17-cr0079ng | |
| Acer Aspire 5 A515-57G-53N8 | |
| LG Gram 17Z90Q-E.AD78G | |
| Lenovo IdeaPad 3 17ABA7 | |
| Final Fantasy XV Benchmark - 1920x1080 High Quality | |
| MSI Katana 15 B12VEK | |
| Average of class Multimedia (7.61 - 144.4, n=56, last 2 years) | |
| Dell XPS 17 9720 | |
| HP Envy 17-cr0079ng | |
| Acer Aspire 5 A515-57G-53N8 | |
| LG Gram 17Z90Q-E.AD78G | |
| HP ProBook 450 G9 6A180EA | |
| Lenovo IdeaPad 3 17ABA7 | |
| Strange Brigade - 1920x1080 ultra AA:ultra AF:16 | |
| MSI Katana 15 B12VEK | |
| Average of class Multimedia (13.3 - 303, n=55, last 2 years) | |
| Dell XPS 17 9720 | |
| HP Envy 17-cr0079ng | |
| LG Gram 17Z90Q-E.AD78G | |
| HP ProBook 450 G9 6A180EA | |
| Lenovo IdeaPad 3 17ABA7 | |
| Dota 2 Reborn - 1920x1080 ultra (3/3) best looking | |
| Dell XPS 17 9720 | |
| MSI Katana 15 B12VEK | |
| HP Envy 17-cr0079ng | |
| Average of class Multimedia (29 - 179.9, n=57, last 2 years) | |
| Acer Aspire 5 A515-57G-53N8 | |
| LG Gram 17Z90Q-E.AD78G | |
| HP ProBook 450 G9 6A180EA | |
| Lenovo IdeaPad 3 17ABA7 | |
在我们的 "TheWitcher 3" 恒定负载测试中,帧率保持在一个恒定的水平,我们没有测量到任何下降。
The Witcher 3 FPS Chart
| low | med. | high | ultra | QHD | 4K | |
|---|---|---|---|---|---|---|
| GTA V (2015) | 150.7 | 139.3 | 90.2 | 44.8 | ||
| The Witcher 3 (2015) | 175.7 | 106.4 | 58.2 | 33.4 | ||
| Dota 2 Reborn (2015) | 140.9 | 125.8 | 119.5 | 112.6 | 54.8 | |
| Final Fantasy XV Benchmark (2018) | 90.5 | 49 | 35 | 25 | 13.4 | |
| X-Plane 11.11 (2018) | 97.8 | 83.9 | 68.1 | 51.7 | ||
| Far Cry 5 (2018) | 107 | 59 | 53 | 49 | 35 | 18 |
| Strange Brigade (2018) | 170.8 | 74.2 | 60.9 | 53.3 | ||
| Monster Hunter Stories 2 (2021) | 94.4 | 91.2 | 89.7 | 72.5 | ||
| F1 2021 (2021) | 190.7 | 105.6 | 66.2 | 36.1 | 27 | 11 |
| GRID Legends (2022) | 100.6 | 80.8 | 67.9 | 49.5 | 39.4 | 23.3 |
| F1 22 (2022) | 167.7 | 106.6 | 92.7 | 59 | 12 | |
| Dead Space Remake (2023) | 30.8 | 25.8 | 20.4 | 17.8 | 7.4 |
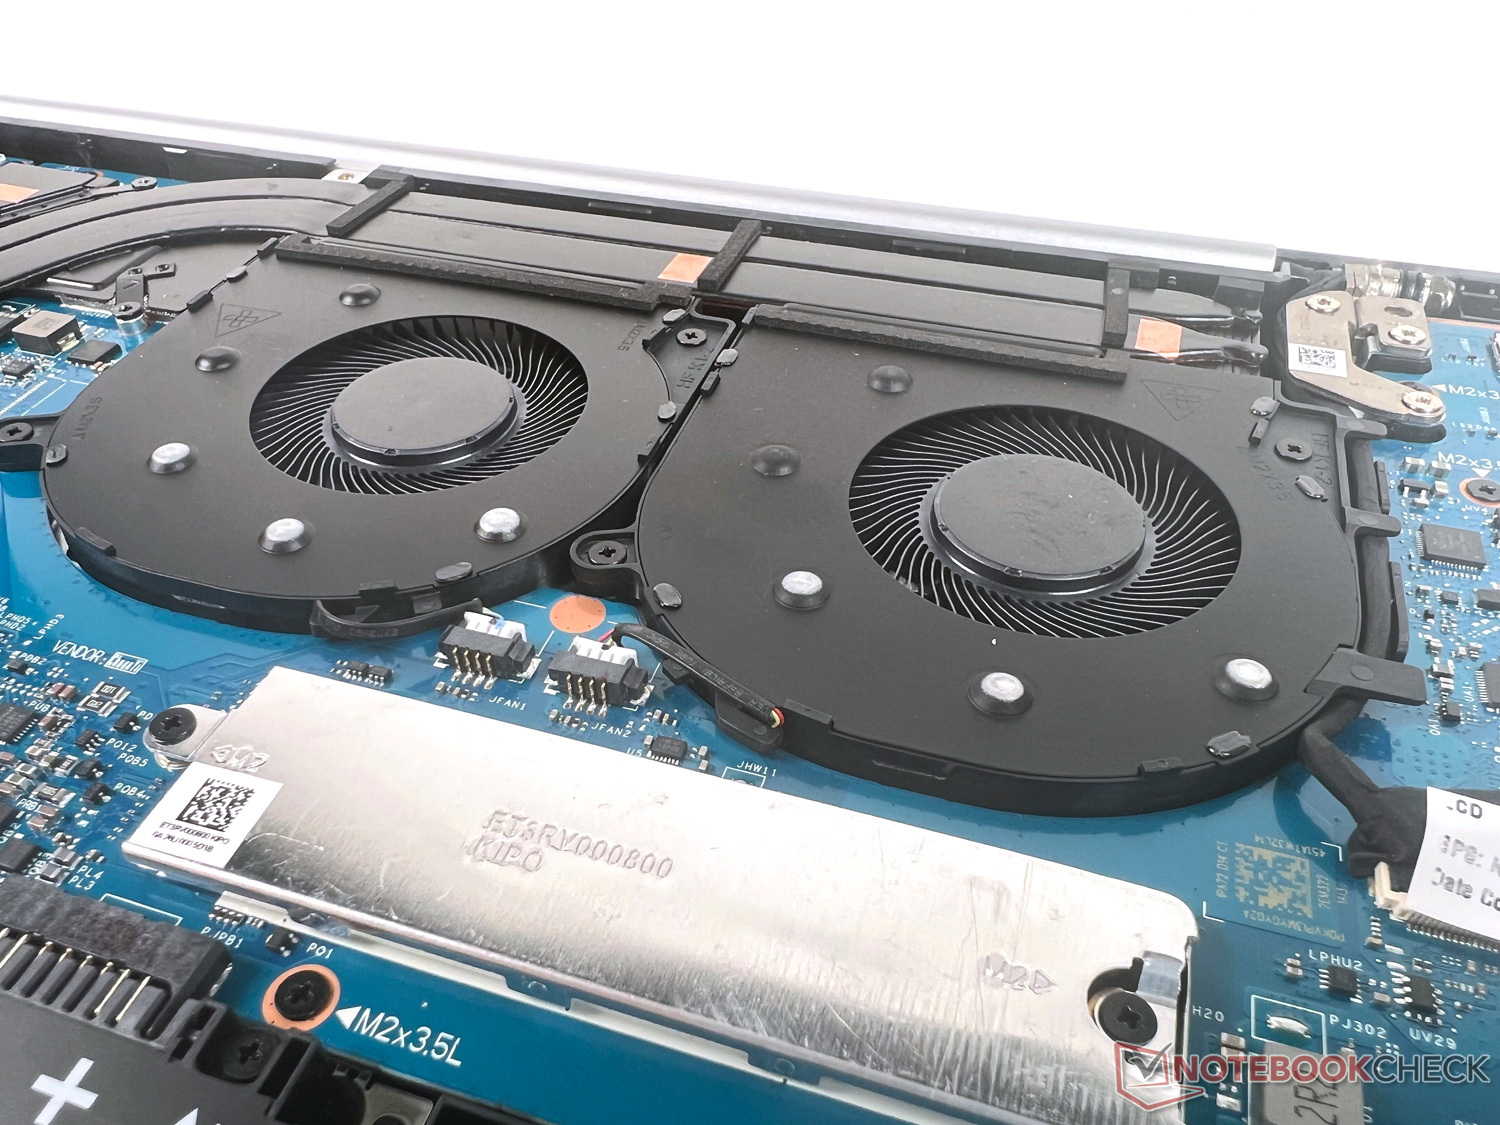
排放:低音,低音,低音在哪里...。
噪声水平
在空闲运行和低负载情况下,惠普Envy 17没有声音。在一些轻度需求下,用于CPU和GPU的两个风扇不断发出呼噜声,不会特别烦人。另一方面,如果你挑战内置硬件(例如在游戏过程中),该设备的噪音水平最高可达48分贝。当负载稍微降低时,"智能调整 "模式几乎没有带来任何噪音优势。
我们的测试装置没有产生任何其他恼人的噪音。
Noise level
| Idle |
| 28.5 / 28.5 / 29.7 dB(A) |
| Load |
| 39.5 / 48 dB(A) |
 | ||
30 dB silent 40 dB(A) audible 50 dB(A) loud |
||
min: | ||
| HP Envy 17-cr0079ng GeForce RTX 2050 Mobile, i7-1255U, Samsung PM991a MZVLQ1T0HBLB | HP ProBook 450 G9 6A180EA Iris Xe G7 96EUs, i7-1255U, SK Hynix HFM512GD3JX013N | LG Gram 17Z90Q-E.AD78G GeForce RTX 2050 Mobile, i7-1260P, Samsung PM9A1 MZVL21T0HCLR | Acer Aspire 5 A515-57G-53N8 GeForce RTX 2050 Mobile, i5-1240P, Micron 2450 512GB MTFDKBA512TFK | Dell XPS 17 9720 GeForce RTX 3050 4GB Laptop GPU, i7-12700H, Micron 3400 MTFDKBA512TFH 512GB | Lenovo IdeaPad 3 17ABA7 Vega 7, R5 5625U, Intel SSDPEKNW512GZL | |
|---|---|---|---|---|---|---|
| Noise | 19% | -3% | -0% | 8% | -5% | |
| off / environment * (dB) | 26.5 | 25.5 4% | 26 2% | 25 6% | 24 9% | 26 2% |
| Idle Minimum * (dB) | 28.5 | 25.5 11% | 28 2% | 25 12% | 24 16% | 26 9% |
| Idle Average * (dB) | 28.5 | 25.5 11% | 28 2% | 29 -2% | 24 16% | 30.8 -8% |
| Idle Maximum * (dB) | 29.7 | 25.5 14% | 28.8 3% | 31 -4% | 24 19% | 33.4 -12% |
| Load Average * (dB) | 39.5 | 28 29% | 49.3 -25% | 46 -16% | 43.9 -11% | 47.6 -21% |
| Load Maximum * (dB) | 48 | 27.7 42% | 49.1 -2% | 47 2% | 48.4 -1% | 47.5 1% |
| Witcher 3 ultra * (dB) | 42 | 48.4 |
* ... smaller is better
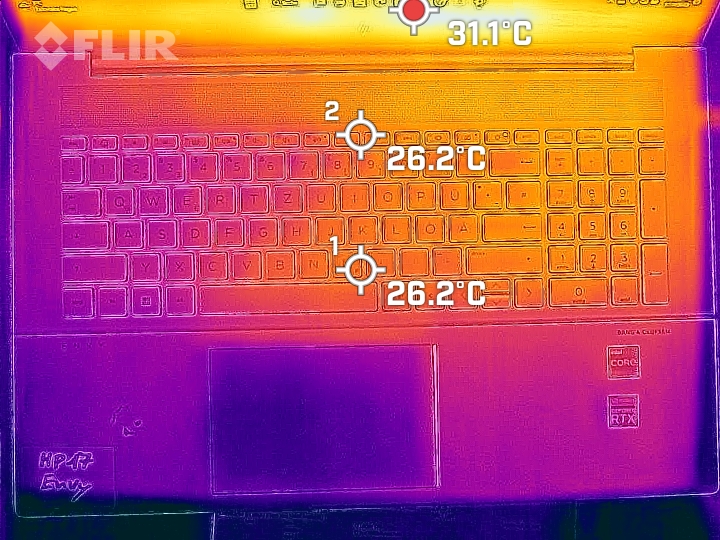
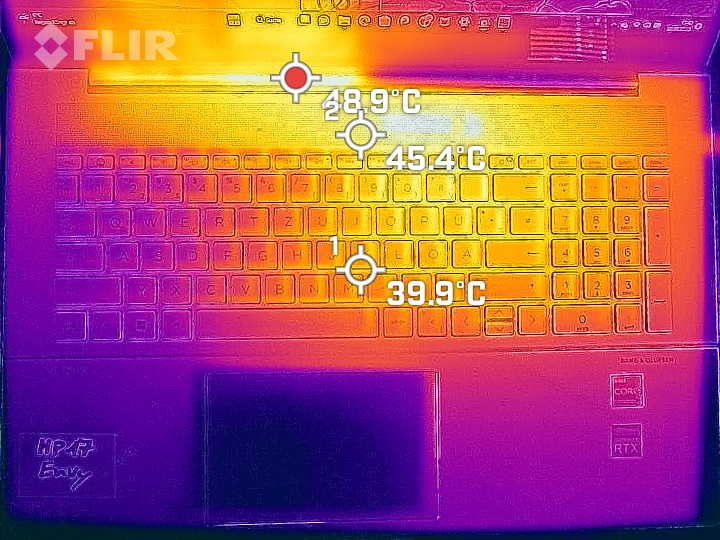
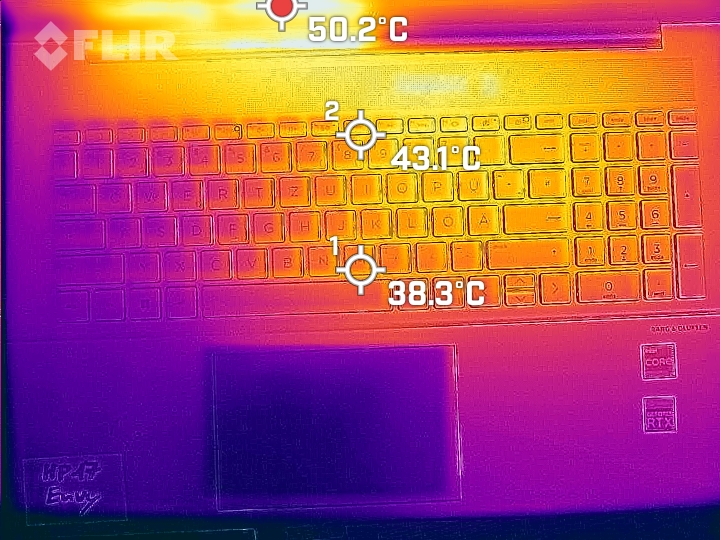
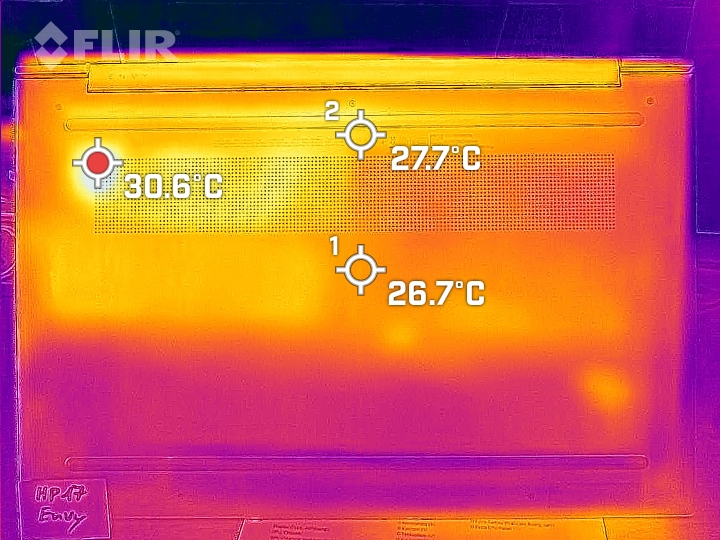
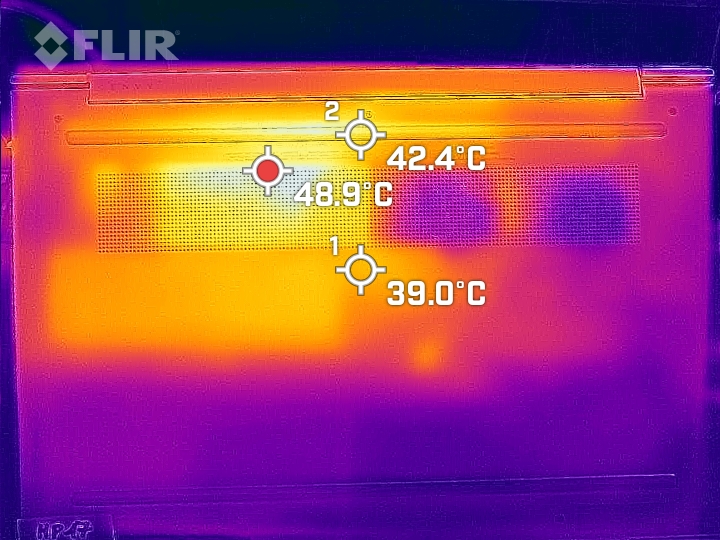
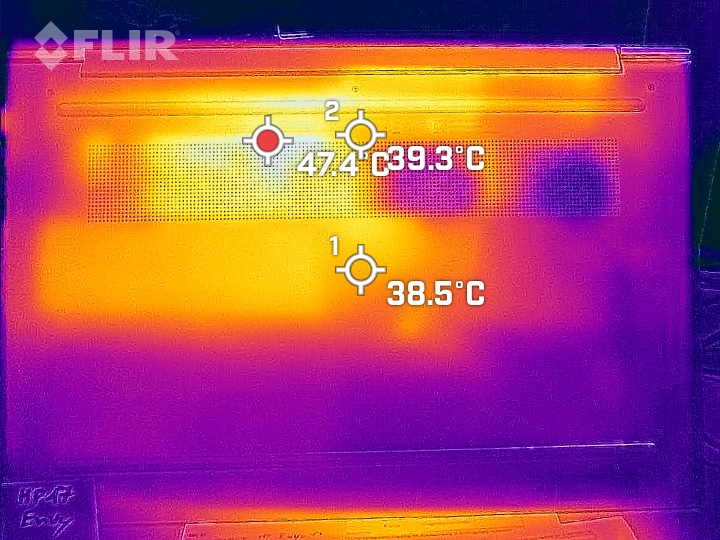
温度
在空闲操作期间,笔记本电脑的温度几乎没有超过室温。在负载情况下,显示屏前面的中心位置会出现一个热点,然后向键盘方向扩展,温度接近50-℃(122°F)。虽然这种升温在打字时很明显,但它不会变得太不舒服。
(-) The maximum temperature on the upper side is 47.1 °C / 117 F, compared to the average of 36.8 °C / 98 F, ranging from 21 to 71 °C for the class Multimedia.
(±) The bottom heats up to a maximum of 43.8 °C / 111 F, compared to the average of 39.1 °C / 102 F
(+) In idle usage, the average temperature for the upper side is 23.9 °C / 75 F, compared to the device average of 31.3 °C / 88 F.
(±) Playing The Witcher 3, the average temperature for the upper side is 34.5 °C / 94 F, compared to the device average of 31.3 °C / 88 F.
(+) The palmrests and touchpad are cooler than skin temperature with a maximum of 31.7 °C / 89.1 F and are therefore cool to the touch.
(-) The average temperature of the palmrest area of similar devices was 28.7 °C / 83.7 F (-3 °C / -5.4 F).
| HP Envy 17-cr0079ng Intel Core i7-1255U, NVIDIA GeForce RTX 2050 Mobile | HP ProBook 450 G9 6A180EA Intel Core i7-1255U, Intel Iris Xe Graphics G7 96EUs | LG Gram 17Z90Q-E.AD78G Intel Core i7-1260P, NVIDIA GeForce RTX 2050 Mobile | Acer Aspire 5 A515-57G-53N8 Intel Core i5-1240P, NVIDIA GeForce RTX 2050 Mobile | Dell XPS 17 9720 Intel Core i7-12700H, NVIDIA GeForce RTX 3050 4GB Laptop GPU | Lenovo IdeaPad 3 17ABA7 AMD Ryzen 5 5625U, AMD Radeon RX Vega 7 | Average of class Multimedia | |
|---|---|---|---|---|---|---|---|
| Heat | -14% | -9% | -2% | -3% | 1% | 0% | |
| Maximum Upper Side * (°C) | 47.1 | 40.5 14% | 50.3 -7% | 43 9% | 49.5 -5% | 43.1 8% | 41 ? 13% |
| Maximum Bottom * (°C) | 43.8 | 47.6 -9% | 52.5 -20% | 48 -10% | 38.4 12% | 43.6 -0% | 43.4 ? 1% |
| Idle Upper Side * (°C) | 25.2 | 32.6 -29% | 26.9 -7% | 26 -3% | 28 -11% | 25.1 -0% | 26.9 ? -7% |
| Idle Bottom * (°C) | 25.9 | 34.2 -32% | 26.5 -2% | 27 -4% | 27.8 -7% | 27 -4% | 27.8 ? -7% |
* ... smaller is better
压力测试
在我们用Prime95和Furmark对硬件进行的至少一个小时的压力测试中,CPU和GPU在测试过程中保持了一个恒定的结果,没有任何较大的下降。CPU的平均温度为71°C(160°F),频率为1.65GHz左右,略低于1.7GHz的基本时钟速度。然而,这对日常运行没有任何影响。GPU消耗35瓦,以大约1.1GHz的速度运行,温度约为75℃(167°F)。
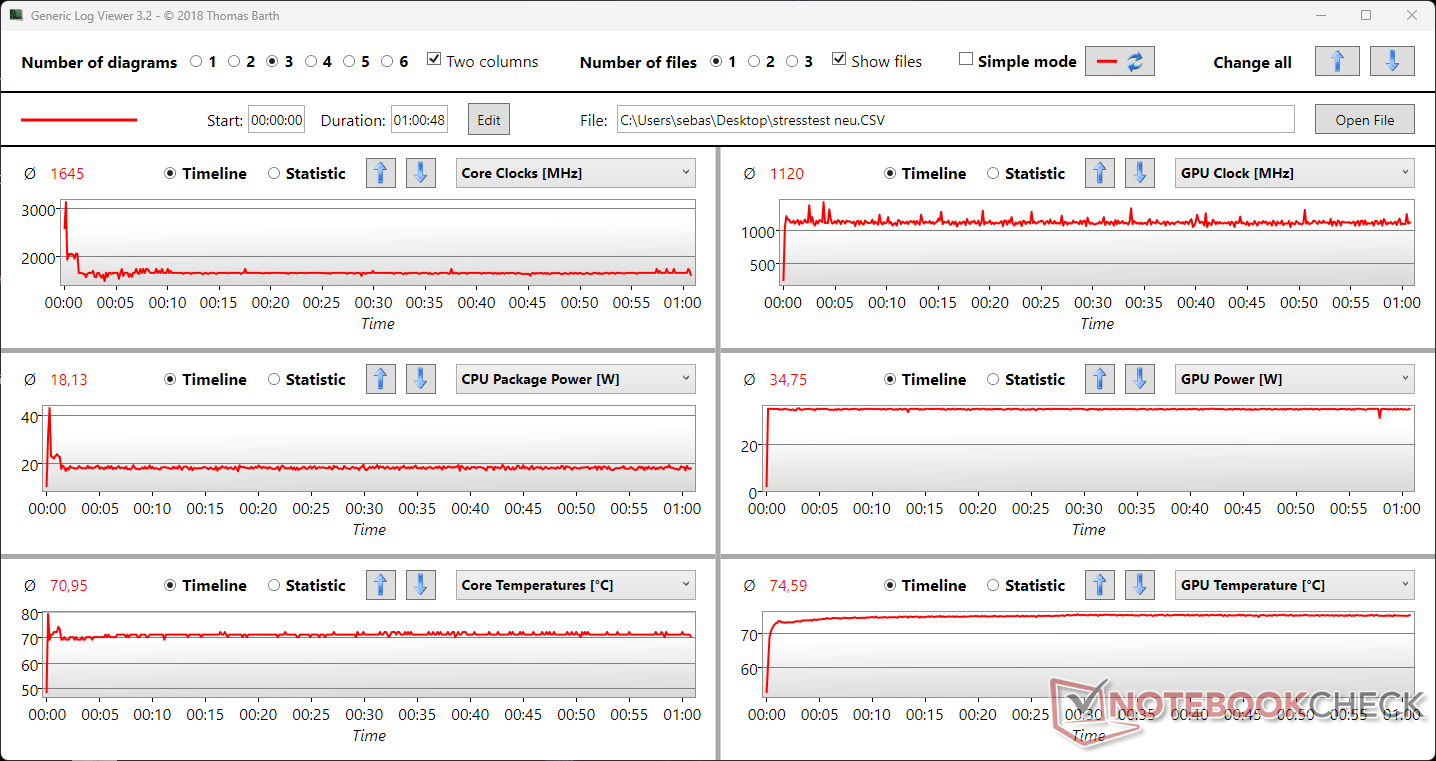
| CPU时钟(GHz) | GPU时钟(MHz) | CPU平均温度(℃) | GPU平均温度(℃) | |
| 系统空闲 | 2.0 | 0 | 49 | 55 |
| Prime95, Stress | 2.5 | 0 | 68 | 55 |
| Prime95 + FurMark, Stress | 1.65 | 1.1 | 71 | 75 |
| TheWitcher 3, Stress | 3.3 | 1.3 | 65 | 71 |
发言人
Bang & Olufsen的立体声扬声器可以发挥相对较大的音量,并提供相当平衡的中音和高音。然而,低音几乎完全缺乏。总的来说,我们的测试设备在音频再现方面处于多媒体领域的下半区。特别是对于音乐或游戏,我们建议通过3.5毫米音频端口连接耳机或耳麦。
HP Envy 17-cr0079ng audio analysis
(+) | speakers can play relatively loud (86.2 dB)
Bass 100 - 315 Hz
(-) | nearly no bass - on average 17.6% lower than median
(±) | linearity of bass is average (12.4% delta to prev. frequency)
Mids 400 - 2000 Hz
(+) | balanced mids - only 2.5% away from median
(+) | mids are linear (3.6% delta to prev. frequency)
Highs 2 - 16 kHz
(±) | higher highs - on average 10.1% higher than median
(+) | highs are linear (4.2% delta to prev. frequency)
Overall 100 - 16.000 Hz
(±) | linearity of overall sound is average (18.3% difference to median)
Compared to same class
» 56% of all tested devices in this class were better, 7% similar, 38% worse
» The best had a delta of 5%, average was 17%, worst was 45%
Compared to all devices tested
» 40% of all tested devices were better, 8% similar, 52% worse
» The best had a delta of 4%, average was 23%, worst was 134%
Apple MacBook Pro 16 2021 M1 Pro audio analysis
(+) | speakers can play relatively loud (84.7 dB)
Bass 100 - 315 Hz
(+) | good bass - only 3.8% away from median
(+) | bass is linear (5.2% delta to prev. frequency)
Mids 400 - 2000 Hz
(+) | balanced mids - only 1.3% away from median
(+) | mids are linear (2.1% delta to prev. frequency)
Highs 2 - 16 kHz
(+) | balanced highs - only 1.9% away from median
(+) | highs are linear (2.7% delta to prev. frequency)
Overall 100 - 16.000 Hz
(+) | overall sound is linear (4.6% difference to median)
Compared to same class
» 0% of all tested devices in this class were better, 0% similar, 100% worse
» The best had a delta of 5%, average was 17%, worst was 45%
Compared to all devices tested
» 0% of all tested devices were better, 0% similar, 100% worse
» The best had a delta of 4%, average was 23%, worst was 134%
电源管理:惠普Envy 17并不是续航能力的冠军
消耗功率
惠普Envy 17-cr0079ng的效率并不高。相比之下 LG Gram 17具有相同的显示屏对角线和dGPU,以及大多数其他对比型号,它从充电器消耗更多的电力,90W的功率足以满足70W左右的电力消耗。只有在绝对的峰值负载下,消耗量才达到93W,勉强更高。
| Off / Standby | |
| Idle | |
| Load |
|
Key:
min: | |
| HP Envy 17-cr0079ng i7-1255U, GeForce RTX 2050 Mobile, Samsung PM991a MZVLQ1T0HBLB, IPS, 3840x2160, 17.3" | HP ProBook 450 G9 6A180EA i7-1255U, Iris Xe G7 96EUs, SK Hynix HFM512GD3JX013N, , 1920x1080, 15.6" | LG Gram 17Z90Q-E.AD78G i7-1260P, GeForce RTX 2050 Mobile, Samsung PM9A1 MZVL21T0HCLR, IPS, 2560x1600, 17" | Acer Aspire 5 A515-57G-53N8 i5-1240P, GeForce RTX 2050 Mobile, Micron 2450 512GB MTFDKBA512TFK, IPS, 1920x1080, 15.6" | Dell XPS 17 9720 i7-12700H, GeForce RTX 3050 4GB Laptop GPU, Micron 3400 MTFDKBA512TFH 512GB, IPS, 3840x2400, 17" | Lenovo IdeaPad 3 17ABA7 R5 5625U, Vega 7, Intel SSDPEKNW512GZL, IPS, 1920x1080, 17.3" | Average NVIDIA GeForce RTX 2050 Mobile | Average of class Multimedia | |
|---|---|---|---|---|---|---|---|---|
| Power Consumption | 47% | 31% | 26% | -35% | 42% | 18% | 10% | |
| Idle Minimum * (Watt) | 5.8 | 4.5 22% | 4.1 29% | 4 31% | 7.8 -34% | 5.1 12% | 5.11 ? 12% | 5.62 ? 3% |
| Idle Average * (Watt) | 14.3 | 7.3 49% | 9.8 31% | 8 44% | 15.1 -6% | 8.3 42% | 9.15 ? 36% | 10.2 ? 29% |
| Idle Maximum * (Watt) | 18.4 | 8.1 56% | 12 35% | 13 29% | 17 8% | 9.6 48% | 11.2 ? 39% | 12.5 ? 32% |
| Load Average * (Watt) | 70 | 32.8 53% | 49.3 30% | 62 11% | 114 -63% | 33.6 52% | 70.6 ? -1% | 65 ? 7% |
| Witcher 3 ultra * (Watt) | 69.4 | 32 54% | 49.3 29% | 60 14% | 115.2 -66% | 33.3 52% | ||
| Load Maximum * (Watt) | 93 | 47 49% | 66 29% | 70 25% | 135.6 -46% | 51.9 44% | 87.4 ? 6% | 111.9 ? -20% |
* ... smaller is better
Power Consumption The Witcher 3 / Stress Test
Power Consumption with External Monitor
电池寿命
惠普为我们的Envy 17测试设备配备了一个55瓦时的电池。有了这个,它比其他大多数对比设备的电池略大。只有LG Gram 17耐力冠军和戴尔XPS 17电源笔记本电脑的电池明显更大。
然而,电池大小只在有限的意义上反映在我们测试设备的电池寿命上。在比较领域,我们的设备排在最后,这可能主要是由于相当明亮的高分辨率4K显示屏。在负载情况下,电池仅在大约90分钟后耗尽,而在冲浪或看视频时,其数值也没有真正吸引一些热情,分别为4.5和5.5小时。
| HP Envy 17-cr0079ng i7-1255U, GeForce RTX 2050 Mobile, 55 Wh | HP ProBook 450 G9 6A180EA i7-1255U, Iris Xe G7 96EUs, 51 Wh | LG Gram 17Z90Q-E.AD78G i7-1260P, GeForce RTX 2050 Mobile, 90 Wh | Acer Aspire 5 A515-57G-53N8 i5-1240P, GeForce RTX 2050 Mobile, 50 Wh | Dell XPS 17 9720 i7-12700H, GeForce RTX 3050 4GB Laptop GPU, 97 Wh | Lenovo IdeaPad 3 17ABA7 R5 5625U, Vega 7, 38 Wh | Average of class Multimedia | |
|---|---|---|---|---|---|---|---|
| Battery runtime | 111% | 124% | 19% | 58% | 45% | 123% | |
| H.264 (h) | 5.5 | 11.2 104% | 16.8 ? 205% | ||||
| WiFi v1.3 (h) | 4.7 | 10.1 115% | 14.5 209% | 7.1 51% | 9.2 96% | 6.8 45% | 12.3 ? 162% |
| Load (h) | 1.6 | 3.3 106% | 2.2 38% | 1.4 -13% | 1.2 -25% | 1.645 ? 3% | |
| Witcher 3 ultra (h) | 2.7 | 1.7 | |||||
| Reader / Idle (h) | 15.8 | 24.9 ? |
Pros
Cons
结论:惠普Envy 17是一款不错的全能型产品,亮点不多
在我们的测试中,惠普Envy 17-cr0079ng呈现为一台平衡的多媒体笔记本电脑。由于其坚实的CPU性能和专用的入门级GeForce ,它也可以用来玩视频游戏,只要要求不是太高。那些寻找更多东西的人可以在 戴尔XPS 17例如。
亮点之一确实应该是具有UHD分辨率的大而明亮的显示屏。由于其高光泽度的设计,它看起来也非常好,但这在光线反射或户外时变成了一个问题。
这款笔记本电脑在电池寿命方面也显示出一些弱点,所以它不是户外或移动使用的理想伴侣。那些希望能够在远离插座的情况下尽可能长时间工作的人肯定应该选择另一台笔记本电脑,如极其持久的LG Gram 17.
总的来说,惠普Envy 17在我们的测试中优势多于劣势,但无法在任何领域真正脱颖而出。它为多媒体、游戏和办公提供了良好的混合功能,但价格也很高,建议零售价接近2000欧元(约2210美元)。其他设备在这里提供更多的钱,如 Acer Aspire 5 A515-57G具有相同的dGPU,但没有4K显示器,价格只有一半,或者更贵,但也更强大,整体上更 "完美" 的 戴尔XPS 17.
价格和可用性
HP Envy 17-cr0079ng
- 03/28/2023 v7 (old)
Marcus Schwarten
Transparency
The selection of devices to be reviewed is made by our editorial team. The test sample was provided to the author as a loan by the manufacturer or retailer for the purpose of this review. The lender had no influence on this review, nor did the manufacturer receive a copy of this review before publication. There was no obligation to publish this review. As an independent media company, Notebookcheck is not subjected to the authority of manufacturers, retailers or publishers.
This is how Notebookcheck is testing
Every year, Notebookcheck independently reviews hundreds of laptops and smartphones using standardized procedures to ensure that all results are comparable. We have continuously developed our test methods for around 20 years and set industry standards in the process. In our test labs, high-quality measuring equipment is utilized by experienced technicians and editors. These tests involve a multi-stage validation process. Our complex rating system is based on hundreds of well-founded measurements and benchmarks, which maintains objectivity. Further information on our test methods can be found here.
Price comparison

