微星造物主Z16:带AdobeRGB的创意笔记本电脑回顾
")
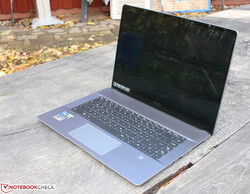
微星公司用16英寸的Creator Z16填补了方便的15英寸和通常太大的17英寸之间的利基。这里没有4K屏幕或OLED,而是一个3K、16:10、AdobeRGB显示屏和两个雷电4端口。
虽然 RTX 3060在目前的游戏中可能会被4K所淹没,但它应该能够处理3K。微星公司是否在这里放弃了过大的尺寸,而选择了一个准确的分辨率来提供性能?纤细的三风扇机箱与180瓦的电源相结合,能否将组件的性能发挥到极致?它应该如此,因为对一台2000欧元(约2263美元)的笔记本电脑的期望很高。
英特尔的Tiger Lake H处理器应该在性能方面定下基调,而 RTX 3060已经以其高游戏能力而闻名。再加上良好的可升级性和每个键都有RGB灯的键盘,这是不是一个色彩鲜艳的全能型创造者?
我们将微星的16英寸机与目前的一些竞争者进行比较,包括全新的 Apple MacBook Pro 16 2021 M1 Pro,以及 惠普ZBook Studio G7和 Razer Blade 15 Advanced(2021年中期),所有笔记本电脑的评分都是 "非常好"。
Possible competitors in comparison
Rating | Date | Model | Weight | Height | Size | Resolution | Price |
|---|---|---|---|---|---|---|---|
| 86.7 % v7 (old) | 11 / 2021 | MSI Creator Z16 A11UET-209 i7-11800H, GeForce RTX 3060 Laptop GPU | 2.2 kg | 15.9 mm | 16.00" | 2560x1600 | |
| 90.6 % v7 (old) | 02 / 2021 | HP ZBook Studio G7 i9-10885H, Quadro RTX 3000 Max-Q | 2 kg | 18 mm | 15.60" | 3840x2160 | |
| 88.9 % v7 (old) | 10 / 2021 | Razer Blade 15 Advanced (Mid 2021) i7-11800H, GeForce RTX 3080 Laptop GPU | 2 kg | 16.99 mm | 15.60" | 1920x1080 | |
| 87 % v7 (old) | 09 / 2021 | Lenovo ThinkBook 16p G2 ACH R9 5900HX, GeForce RTX 3060 Laptop GPU | 2 kg | 19.5 mm | 16.00" | 2560x1600 | |
| 87.9 % v7 (old) | 09 / 2021 | Dell XPS 17 9710 Core i7 RTX 3060 i7-11800H, GeForce RTX 3060 Laptop GPU | 2.5 kg | 19.5 mm | 17.00" | 3840x2400 | |
| 88.4 % v7 (old) | 09 / 2021 | Dell XPS 15 9510 11800H RTX 3050 Ti OLED i7-11800H, GeForce RTX 3050 Ti Laptop GPU | 1.9 kg | 18 mm | 15.60" | 3456x2160 | |
| 93.2 % v7 (old) | 11 / 2021 | Apple MacBook Pro 16 2021 M1 Pro M1 Pro, M1 Pro 16-Core GPU | 2.2 kg | 16.8 mm | 16.20" | 3456x2234 |
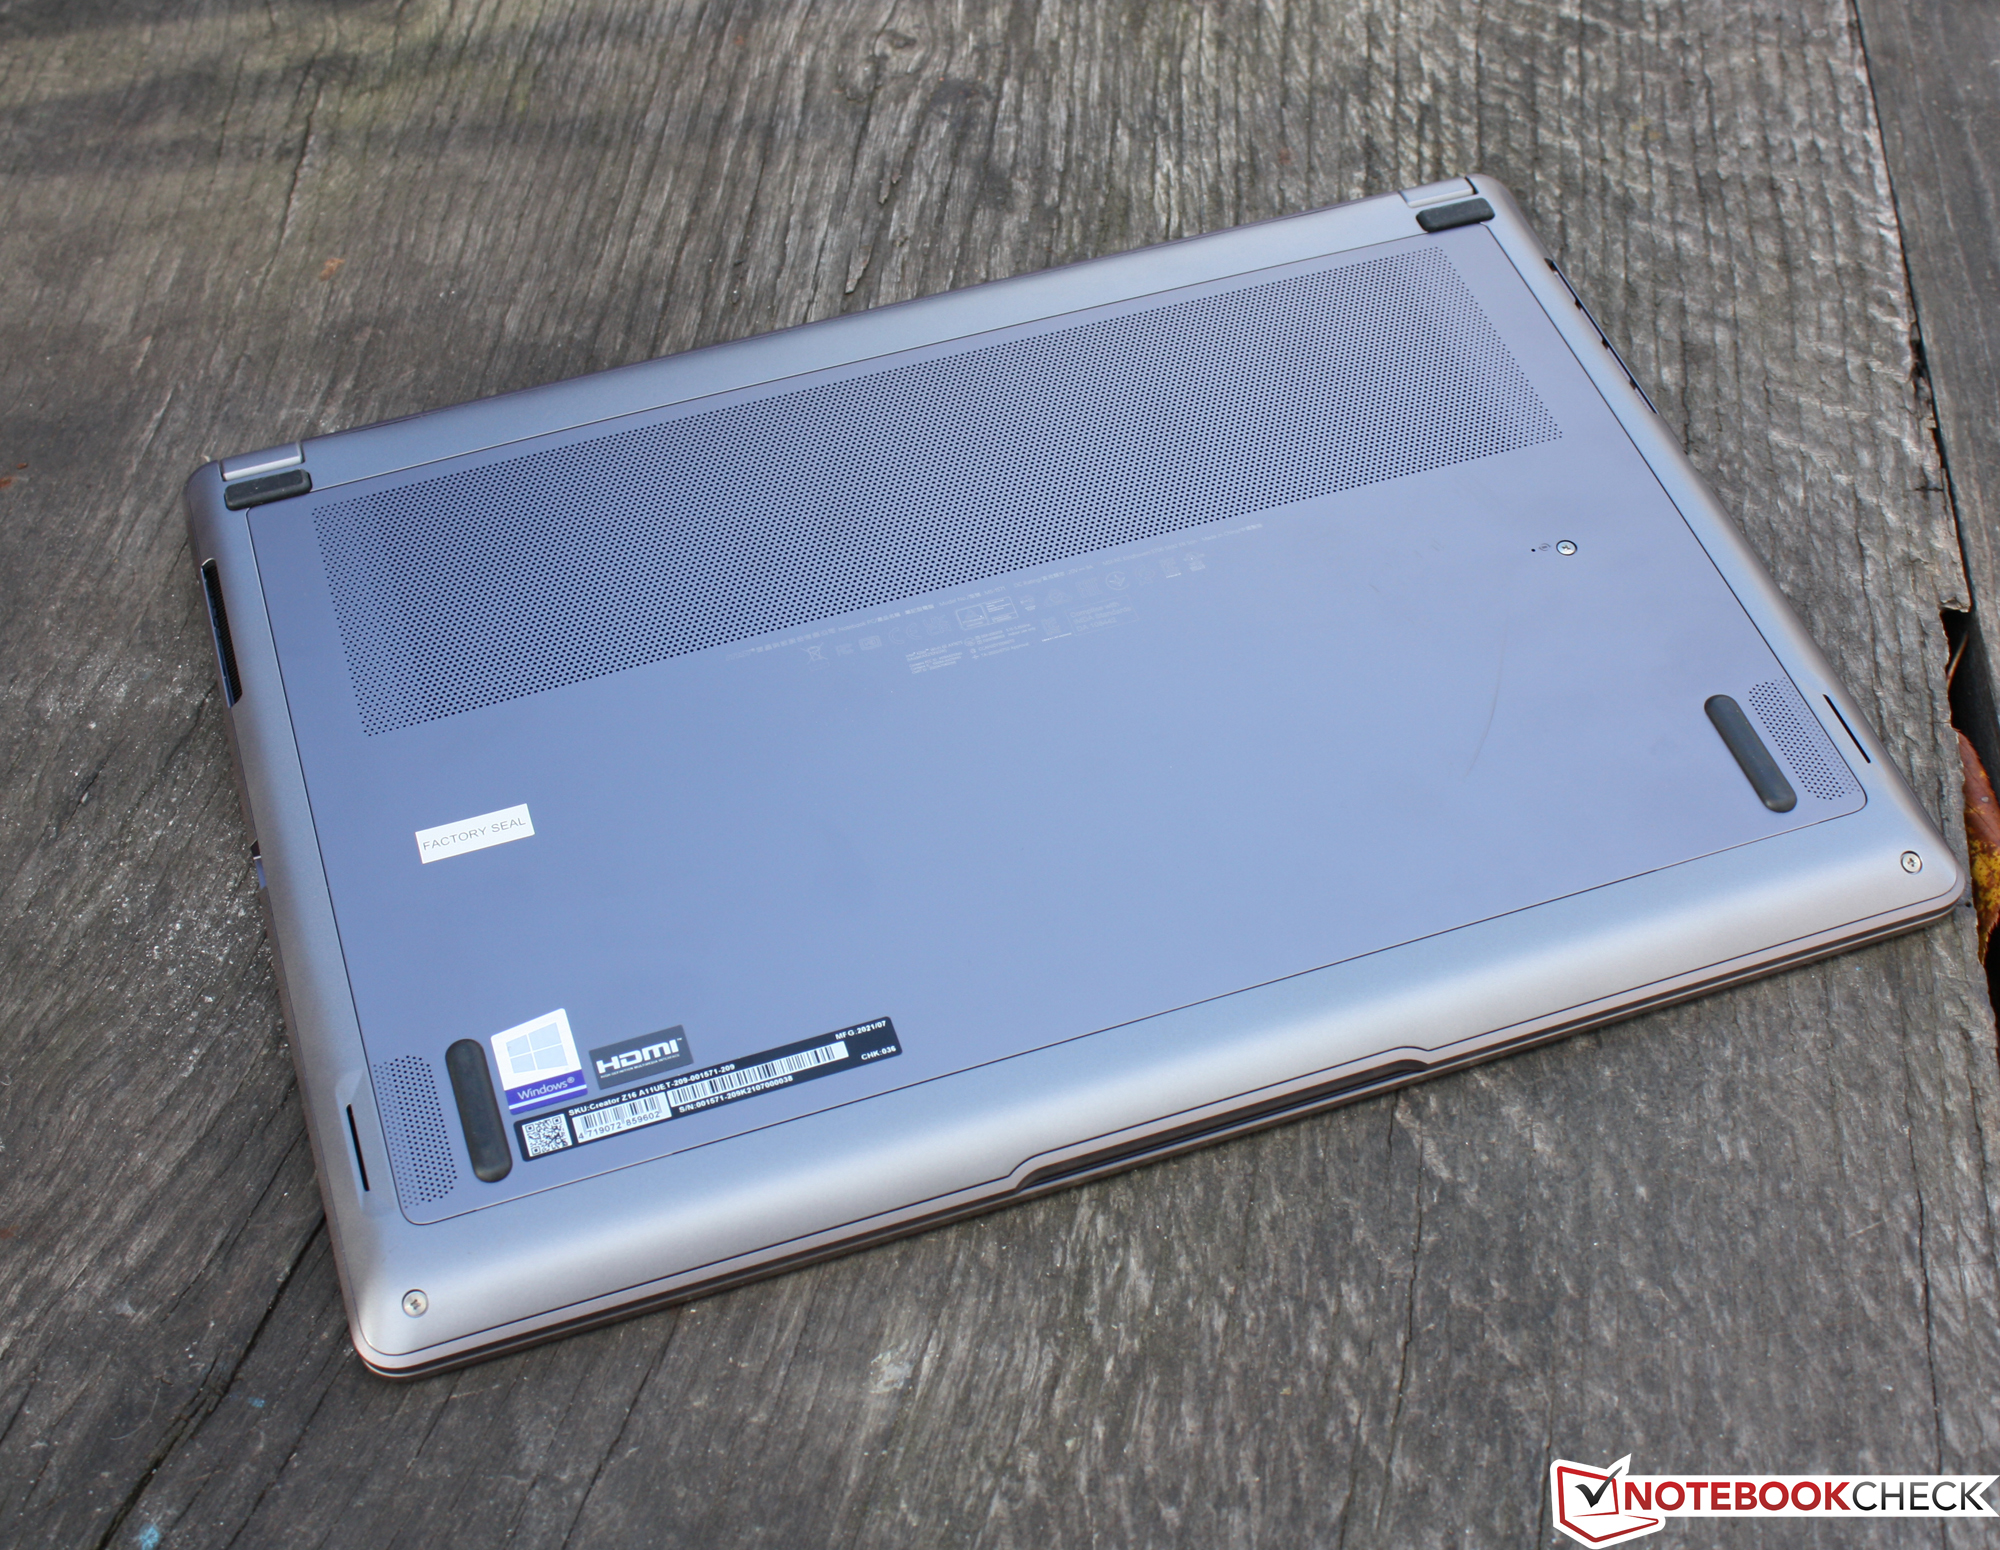
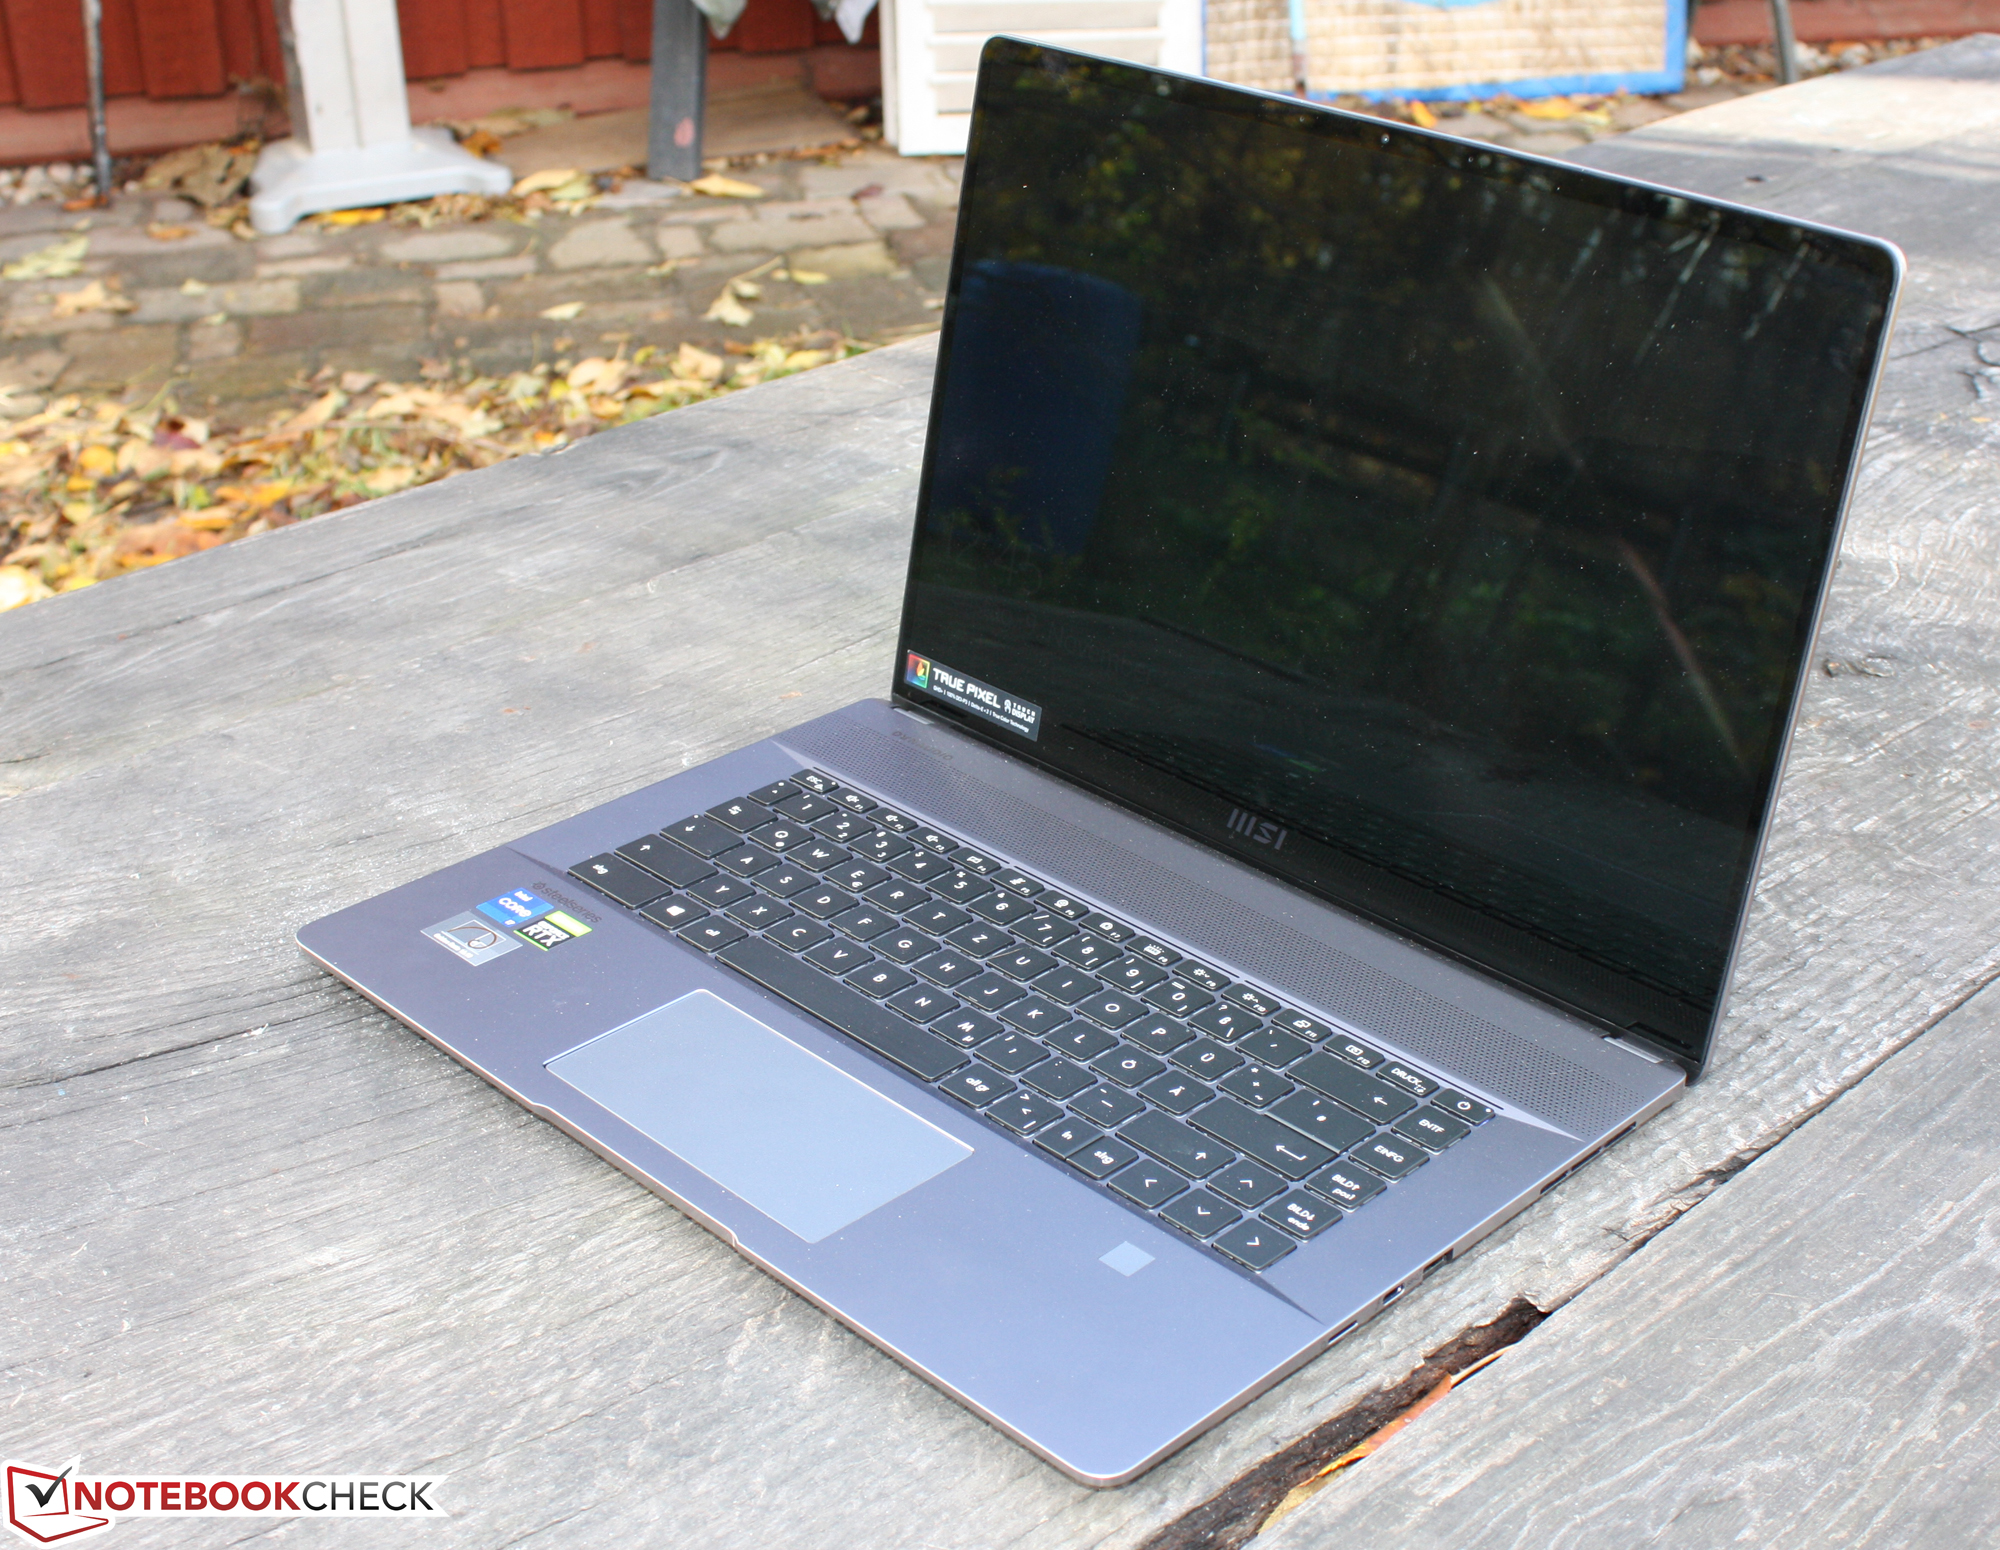
外壳 - 稳定的创意笔记本电脑
虽然我们的同事批评说,底盘的 创造者17,但我们不必抱怨Z16:铝和塑料结构提供了良好的--尽管不是很好的--扭转刚度。16英寸的宽度很容易弯曲,当我们在转角处抬起它时,底盘确实有点弯曲(2.2公斤/~4.9磅)。工作区以及盖子是由铝制成的,边缘经过抛光处理,表面经过阳极氧化处理。屏幕有很好的强度,背面不能凹陷。
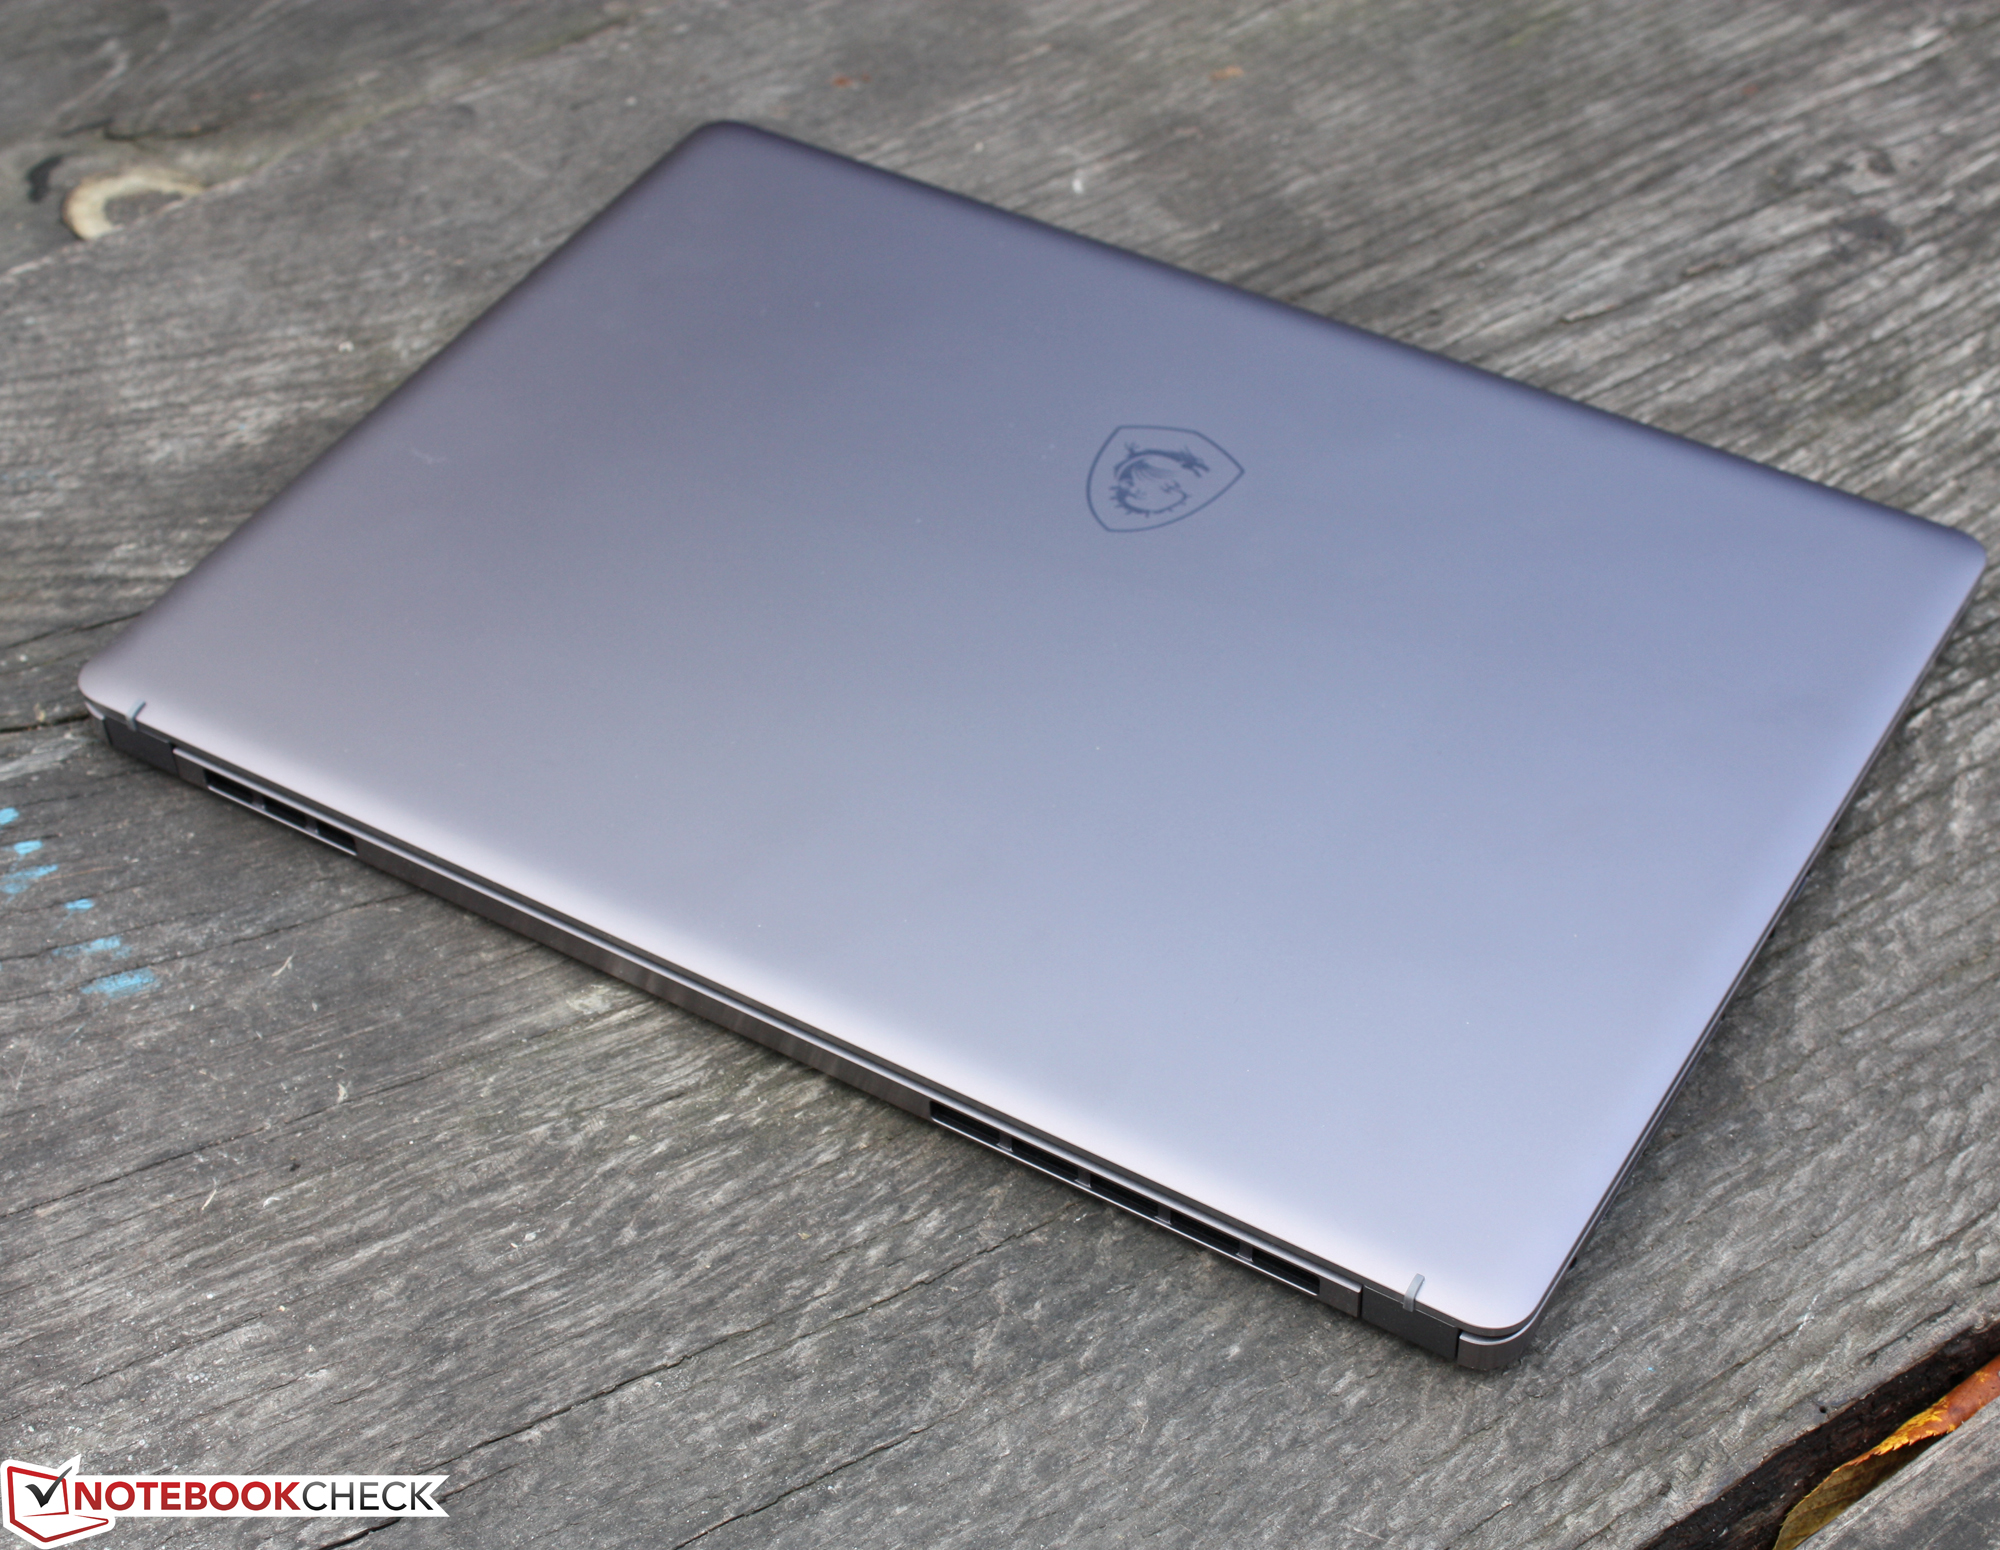
这款16英寸的产品比Apple"的占地面积稍大。 MacBook Pro 162021年,但在重量相同的情况下,它略显单薄。如果你朝15.6的方向看,你会看到一个 Razer Blade 15 Advanced在宽度大致相同的情况下,深度明显减少,但少了200克(约7盎司)。圆形的17英寸机。 戴尔XPS 17 9710比Z16重300克(约11盎司),而且明显更宽。
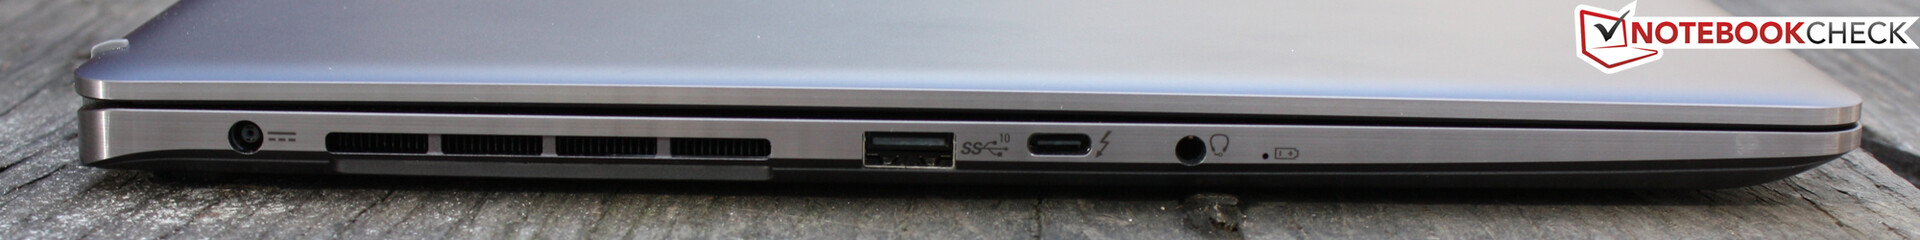
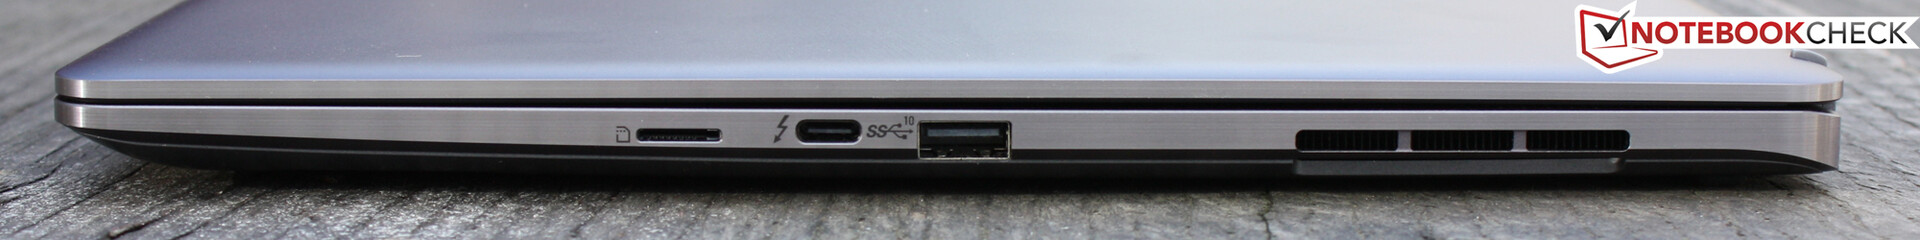
设备 - 现代化的雷电4和USB4.0
微星提供现代化的端口,这在这个价格范围内是可以预期的。Type-C外围设备可以连接到两个Thunderbolt 4端口,或者一个或两个平面屏幕(通过Type-C的DisplayPort)。电源不是通过Type-C,这对于180瓦的电源来说是不合适的,而且一个端口也会被阻断。16英寸机没有任何其他显示输出。
SD卡阅读器
我们使用我们的参考SD卡(AV Pro V60)来测试所用读卡器的性能。在复制大的数据块时,最大的传输速率可达185MB/s,而对于普通的JPG图像文件(每个约5MB),甚至可以预计225MB/s。
| SD Card Reader | |
| average JPG Copy Test (av. of 3 runs) | |
| MSI Creator Z16 A11UET-209 (AV Pro SD microSD 128 GB V60) | |
| Dell XPS 15 9510 11800H RTX 3050 Ti OLED (AV Pro V60) | |
| Dell XPS 17 9710 Core i7 RTX 3060 (AV PRO microSD 128 GB V60) | |
| HP ZBook Studio G7 (AV Pro V60) | |
| Average of class Multimedia (23 - 531, n=39, last 2 years) | |
| Apple MacBook Pro 16 2021 M1 Pro (Angelbird AV Pro V60) | |
| Lenovo ThinkBook 16p G2 ACH | |
| maximum AS SSD Seq Read Test (1GB) | |
| Dell XPS 15 9510 11800H RTX 3050 Ti OLED (AV Pro V60) | |
| Average of class Multimedia (37.3 - 1455, n=38, last 2 years) | |
| MSI Creator Z16 A11UET-209 (AV Pro SD microSD 128 GB V60) | |
| HP ZBook Studio G7 (AV Pro V60) | |
| Dell XPS 17 9710 Core i7 RTX 3060 (AV PRO microSD 128 GB V60) | |
| Lenovo ThinkBook 16p G2 ACH | |
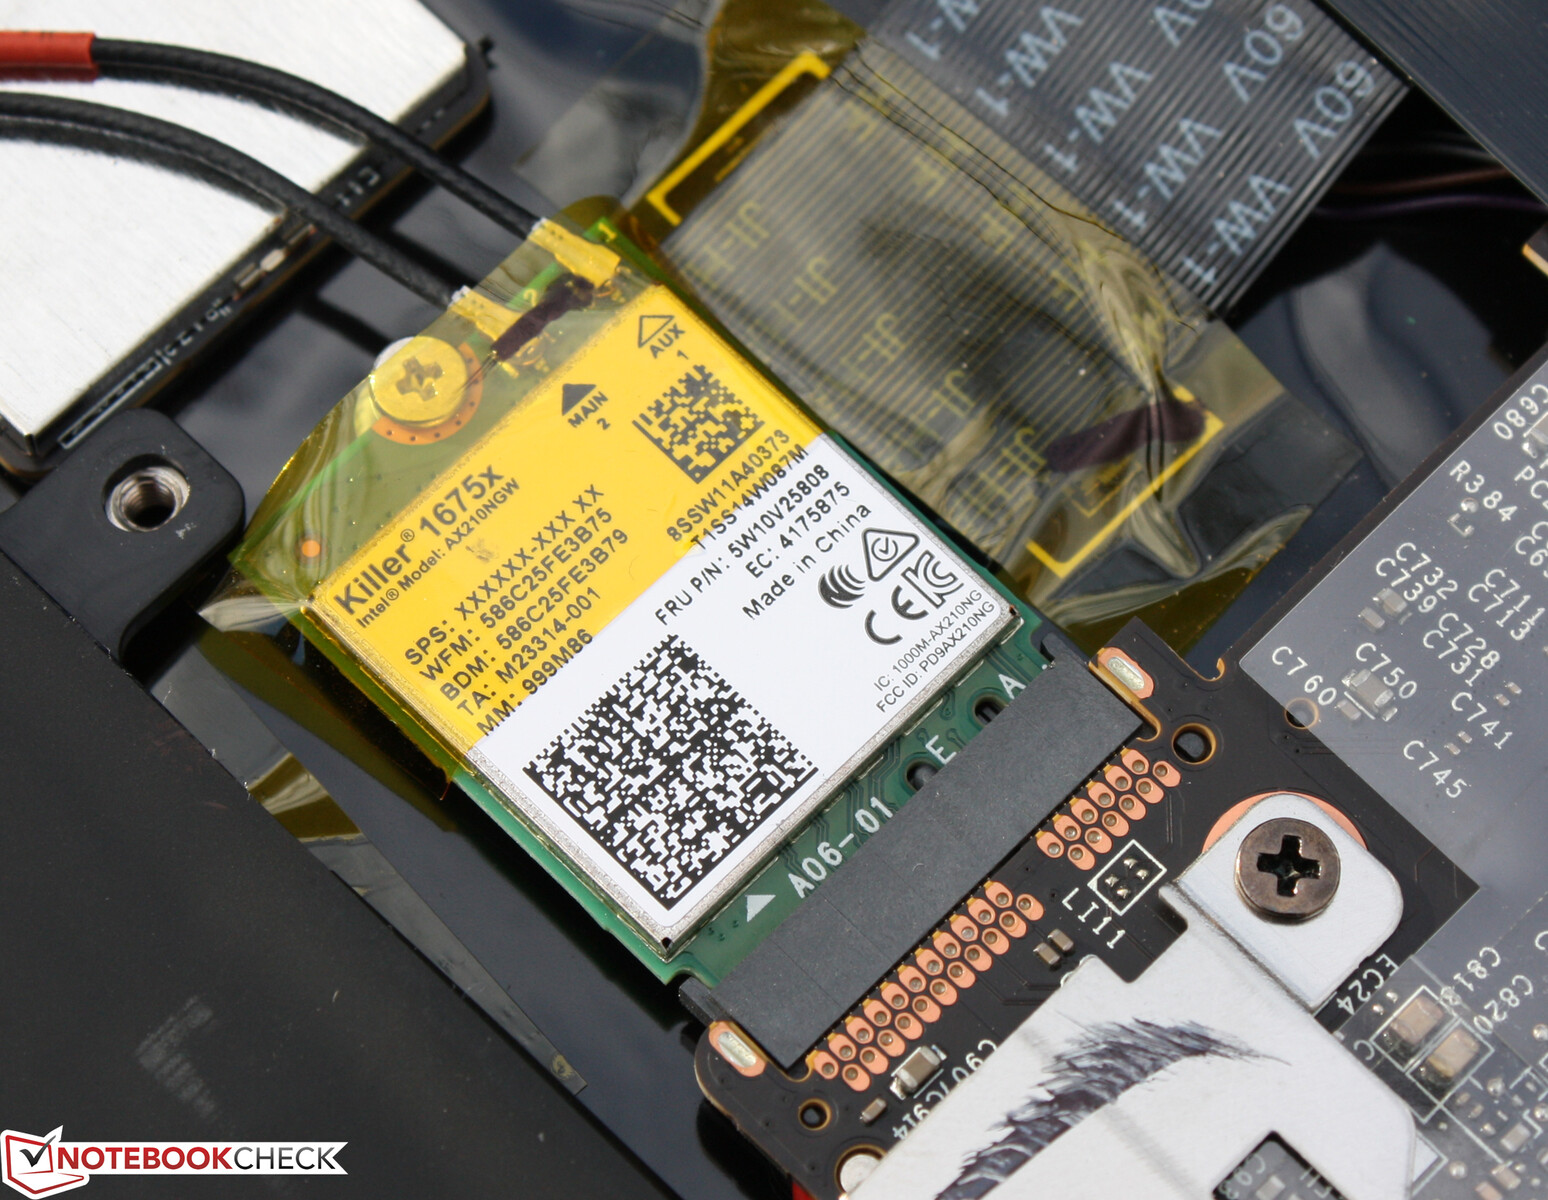
沟通
随着英特尔杀手Wi-Fi 6 AX1650s的推出,Wi-Fi 6E也随之而来。Wi-Fi 6E首次使用6GHz频率,缓解了拥挤的2.4和5GHz频段。这需要一个合适的路由器,例如FRITZ!Boxes 7530 AX或6660 Cable。
在使用5GHz路由器的测试中,Killer WLAN的速度不是特别快,但该卡仍然远远高于平均水平。竞争者如 惠普ZBook Studio G7,它只有一个 "简单的 "英特尔Wi-Fi 6 AX201,明显领先。有趣的是 Apple MacBook Pro 16 2021 M1 Pro显然落后于其他人。
登录是通过指纹扫描或Windows Hello的面部识别完成的。后者工作顺利而迅速。
网络摄像头
正如通常的情况一样,网络摄像头被忽略了。它的分辨率和质量无法描述--就像比较领域中的几乎所有笔记本电脑一样。在这次比较中,几乎没有任何制造商能够将高质量的摄像头放入框架中--Apple 是唯一的例外,正如下面的测试图表图片所示。


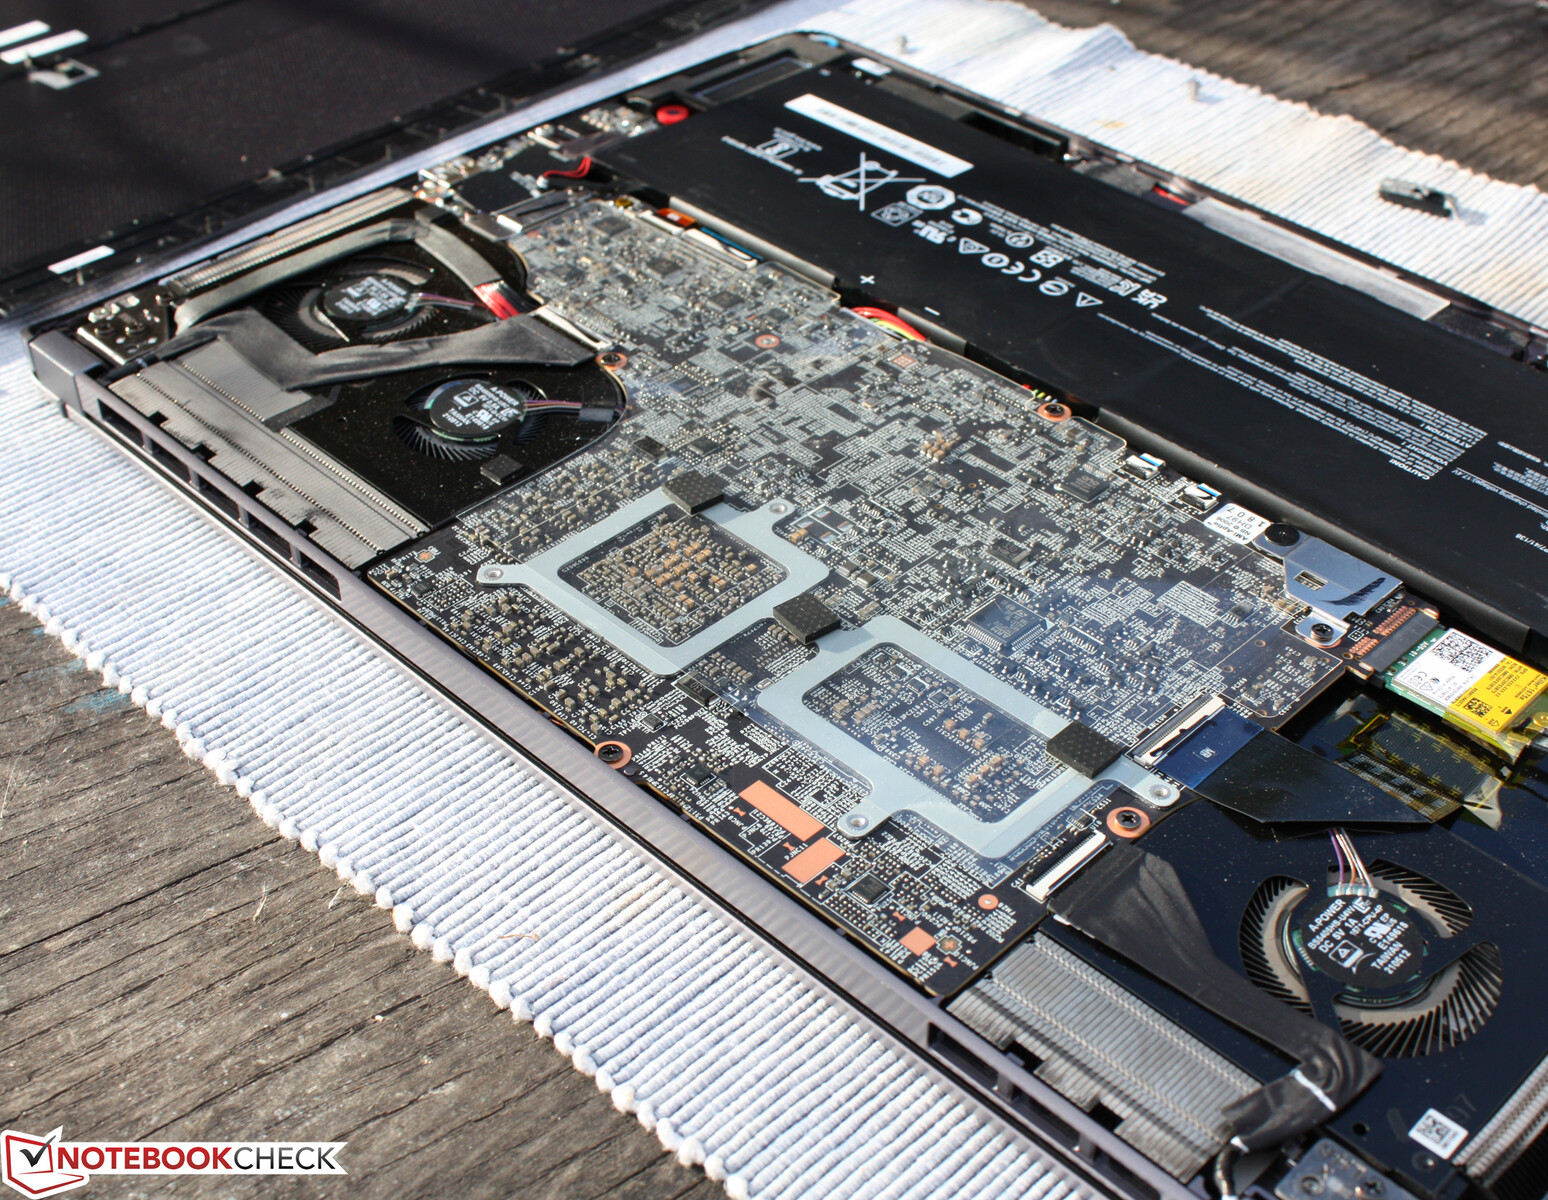
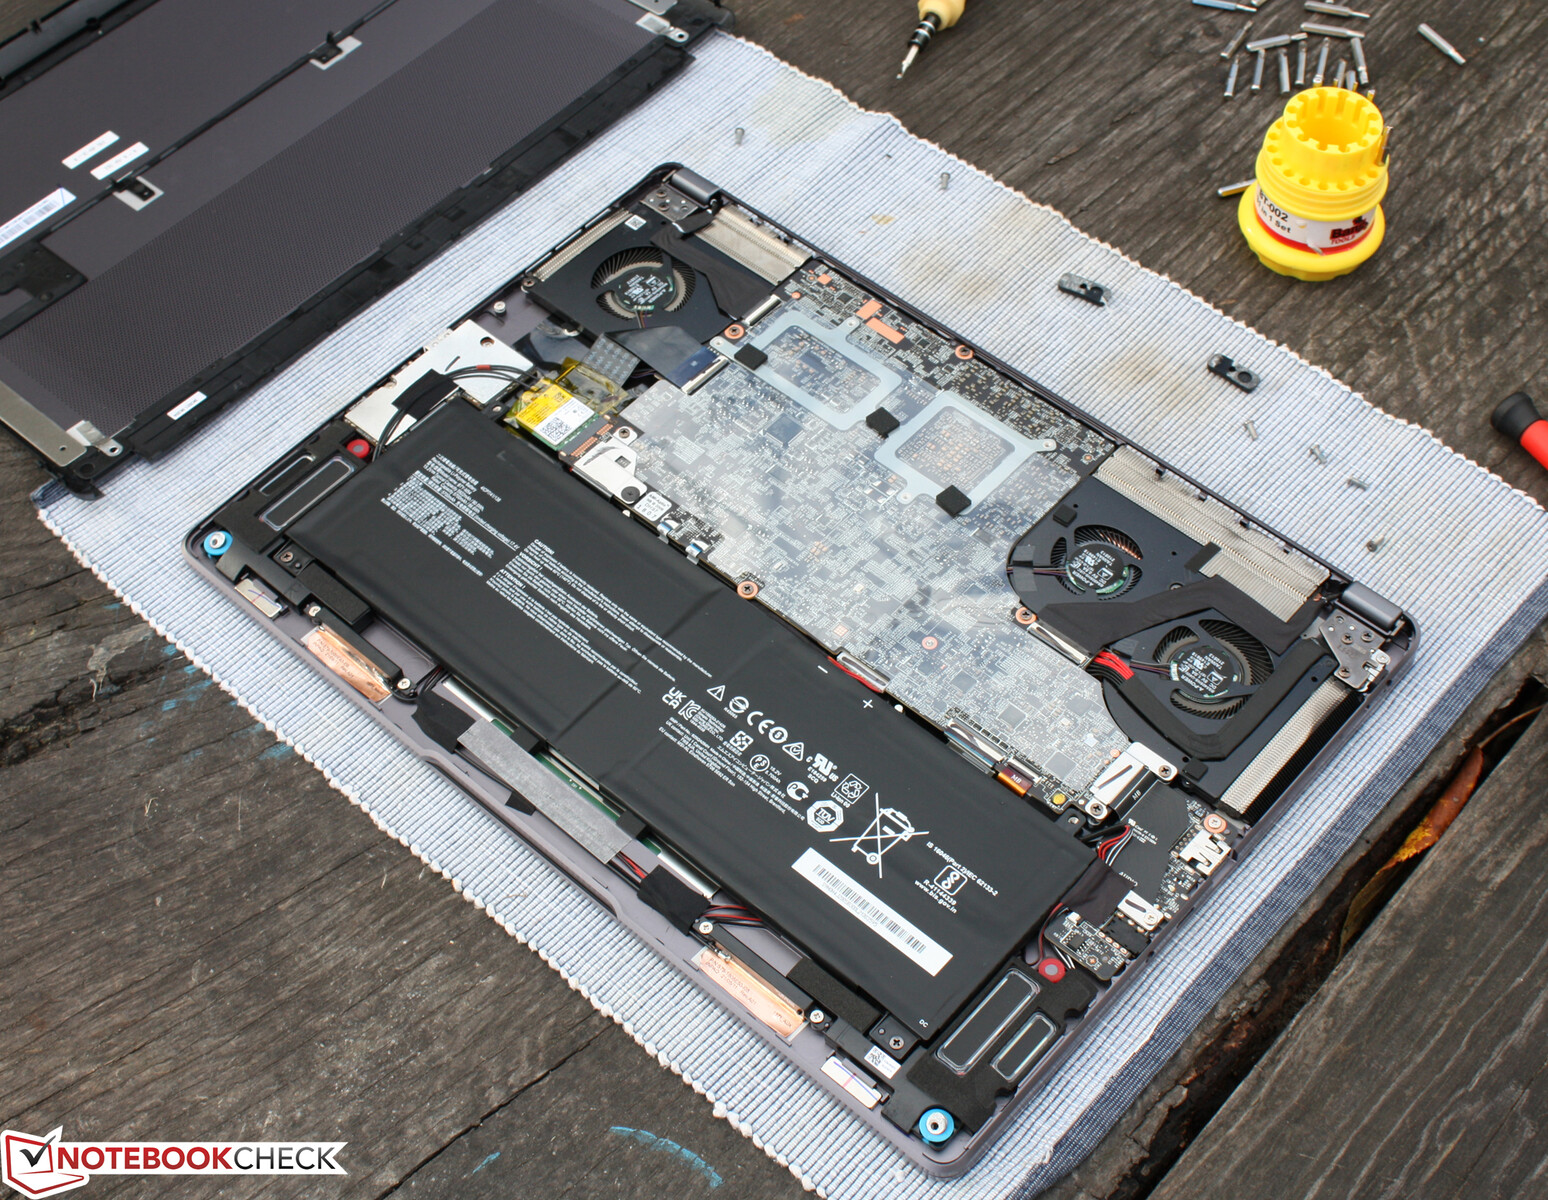
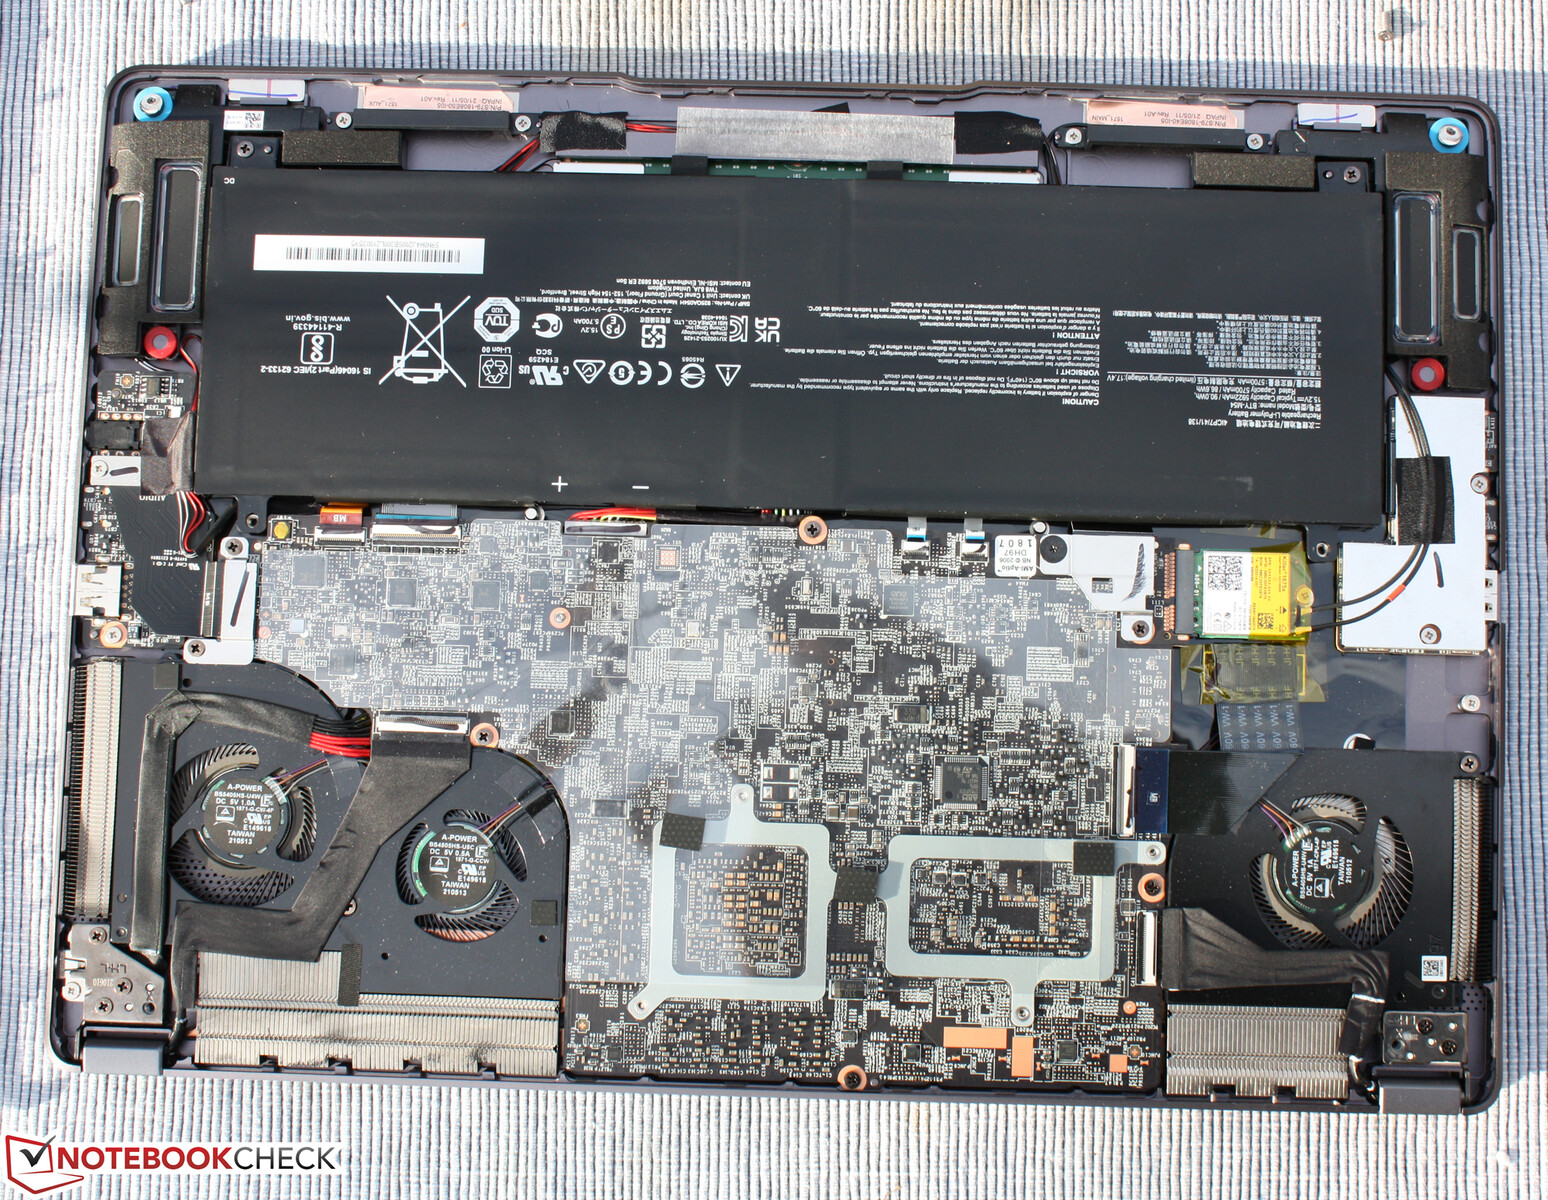
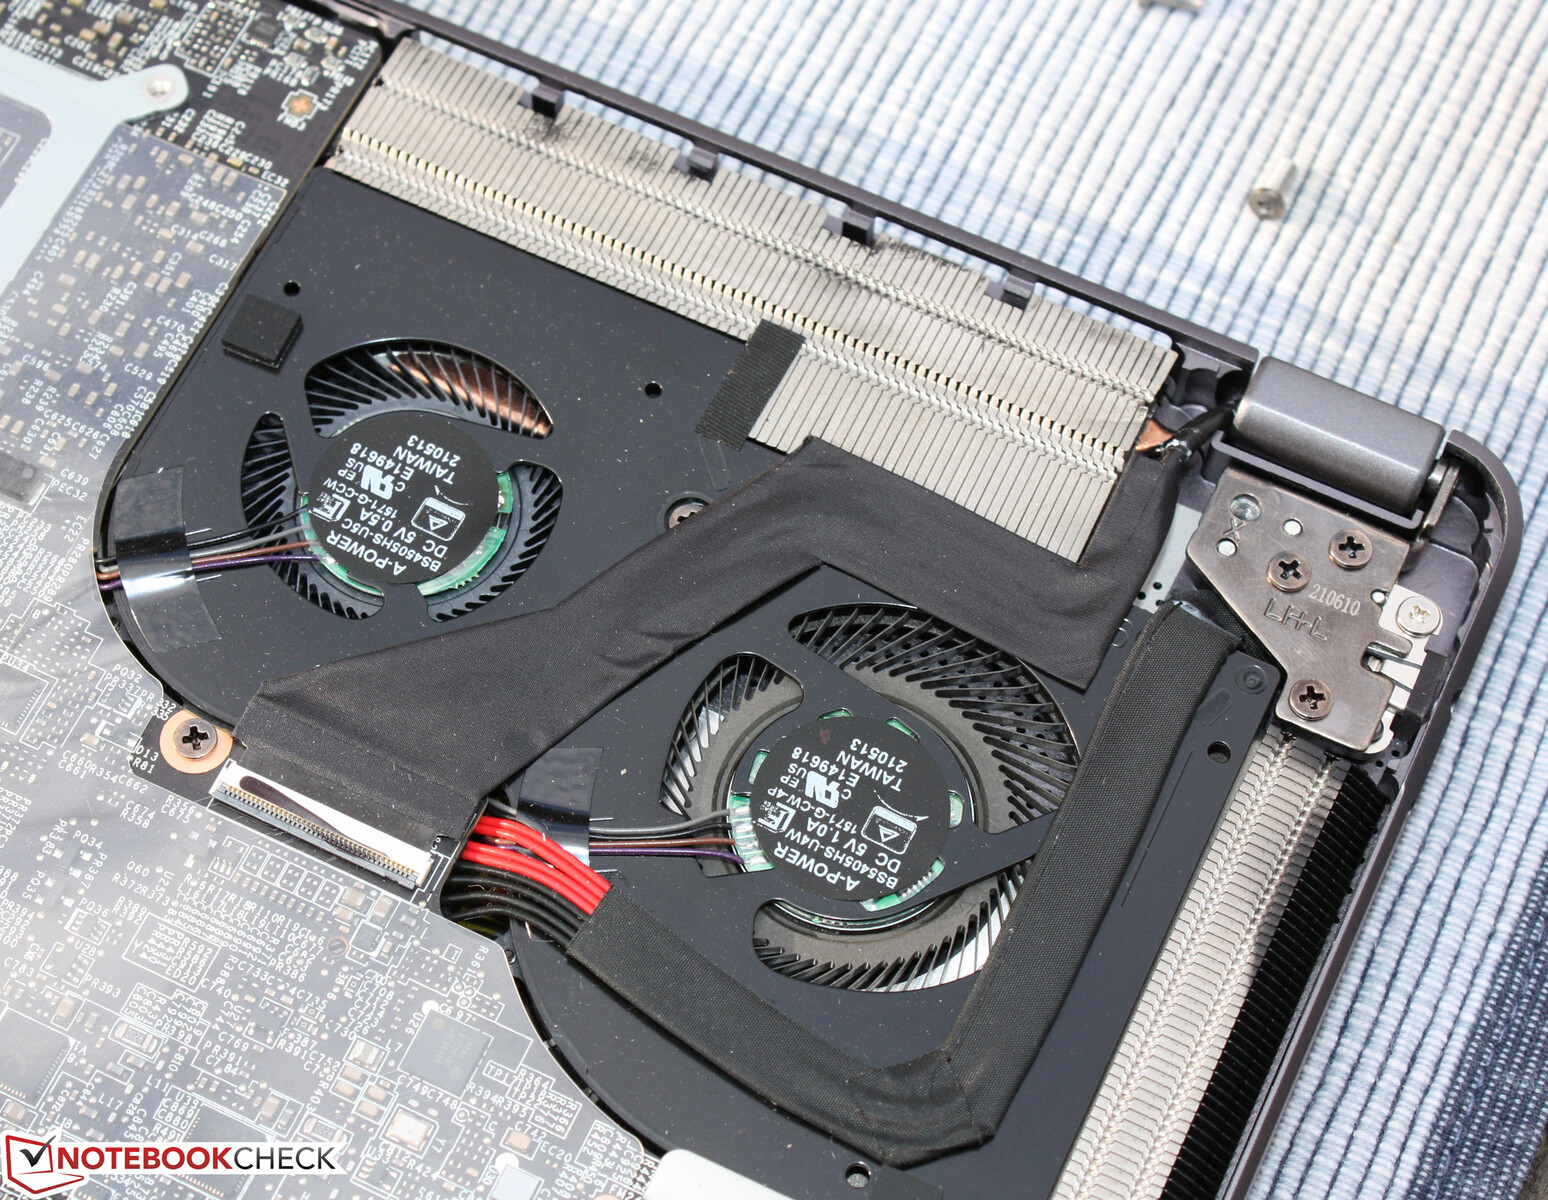
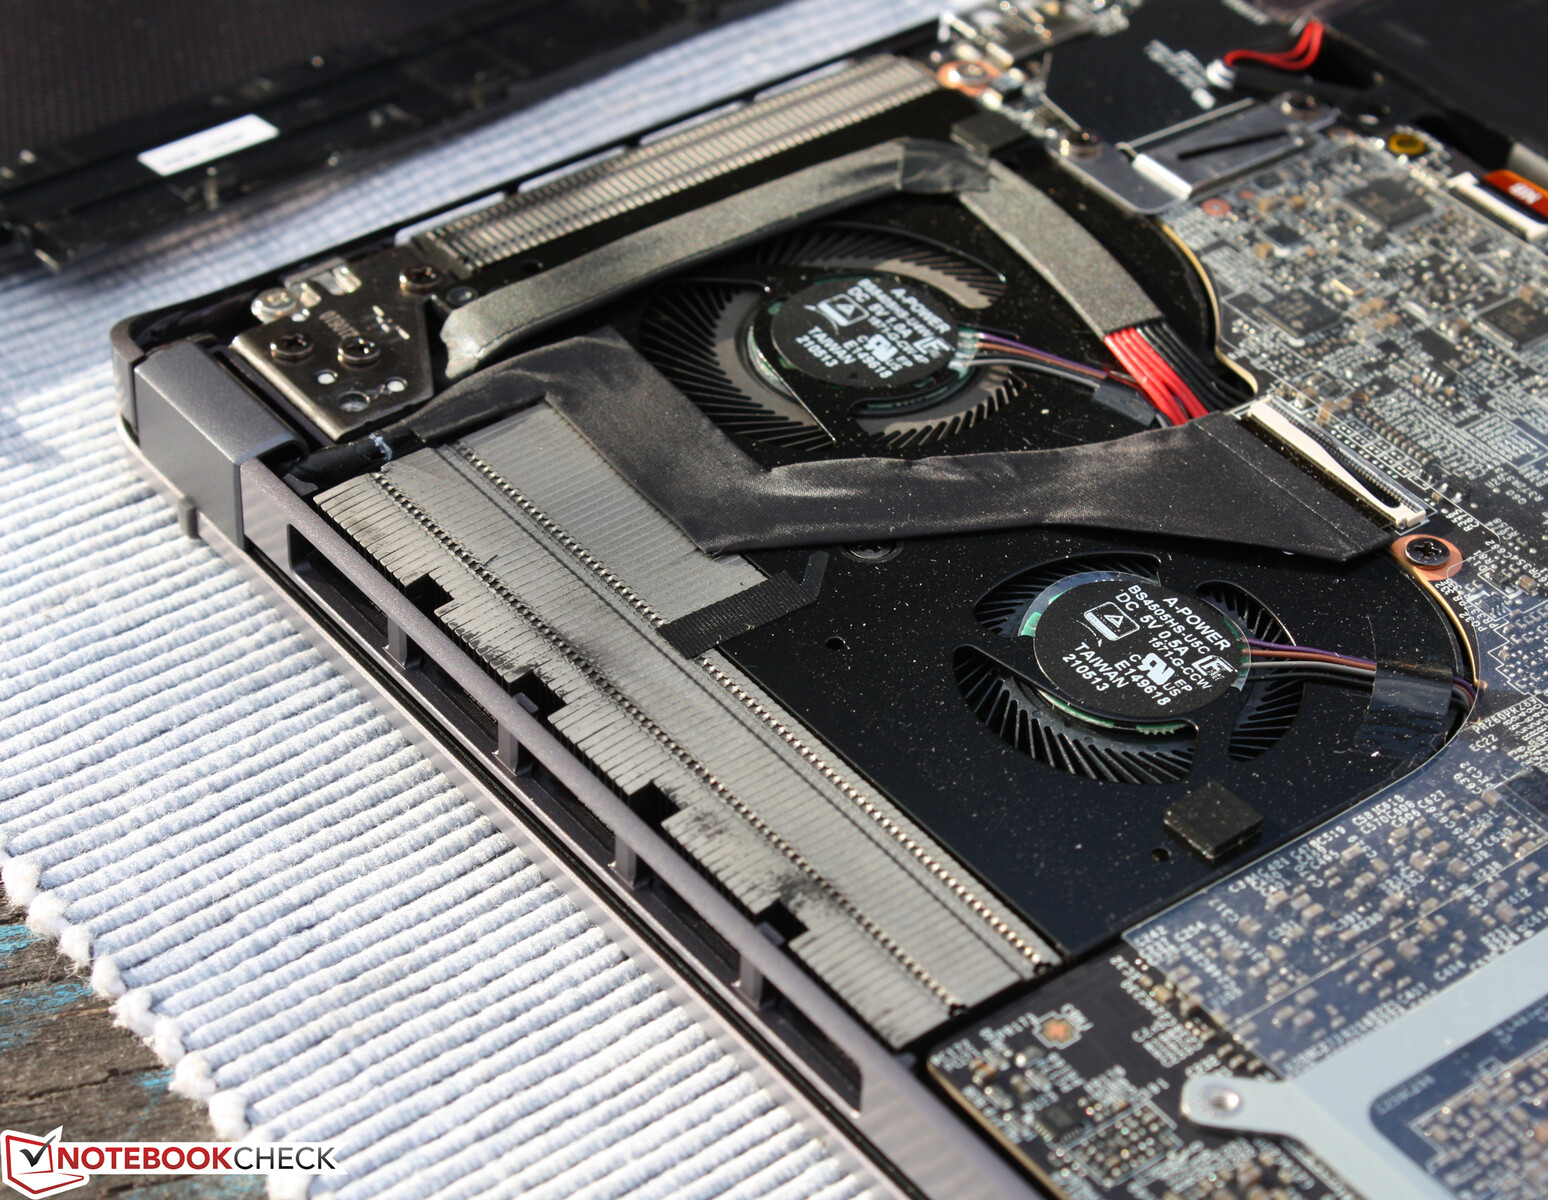
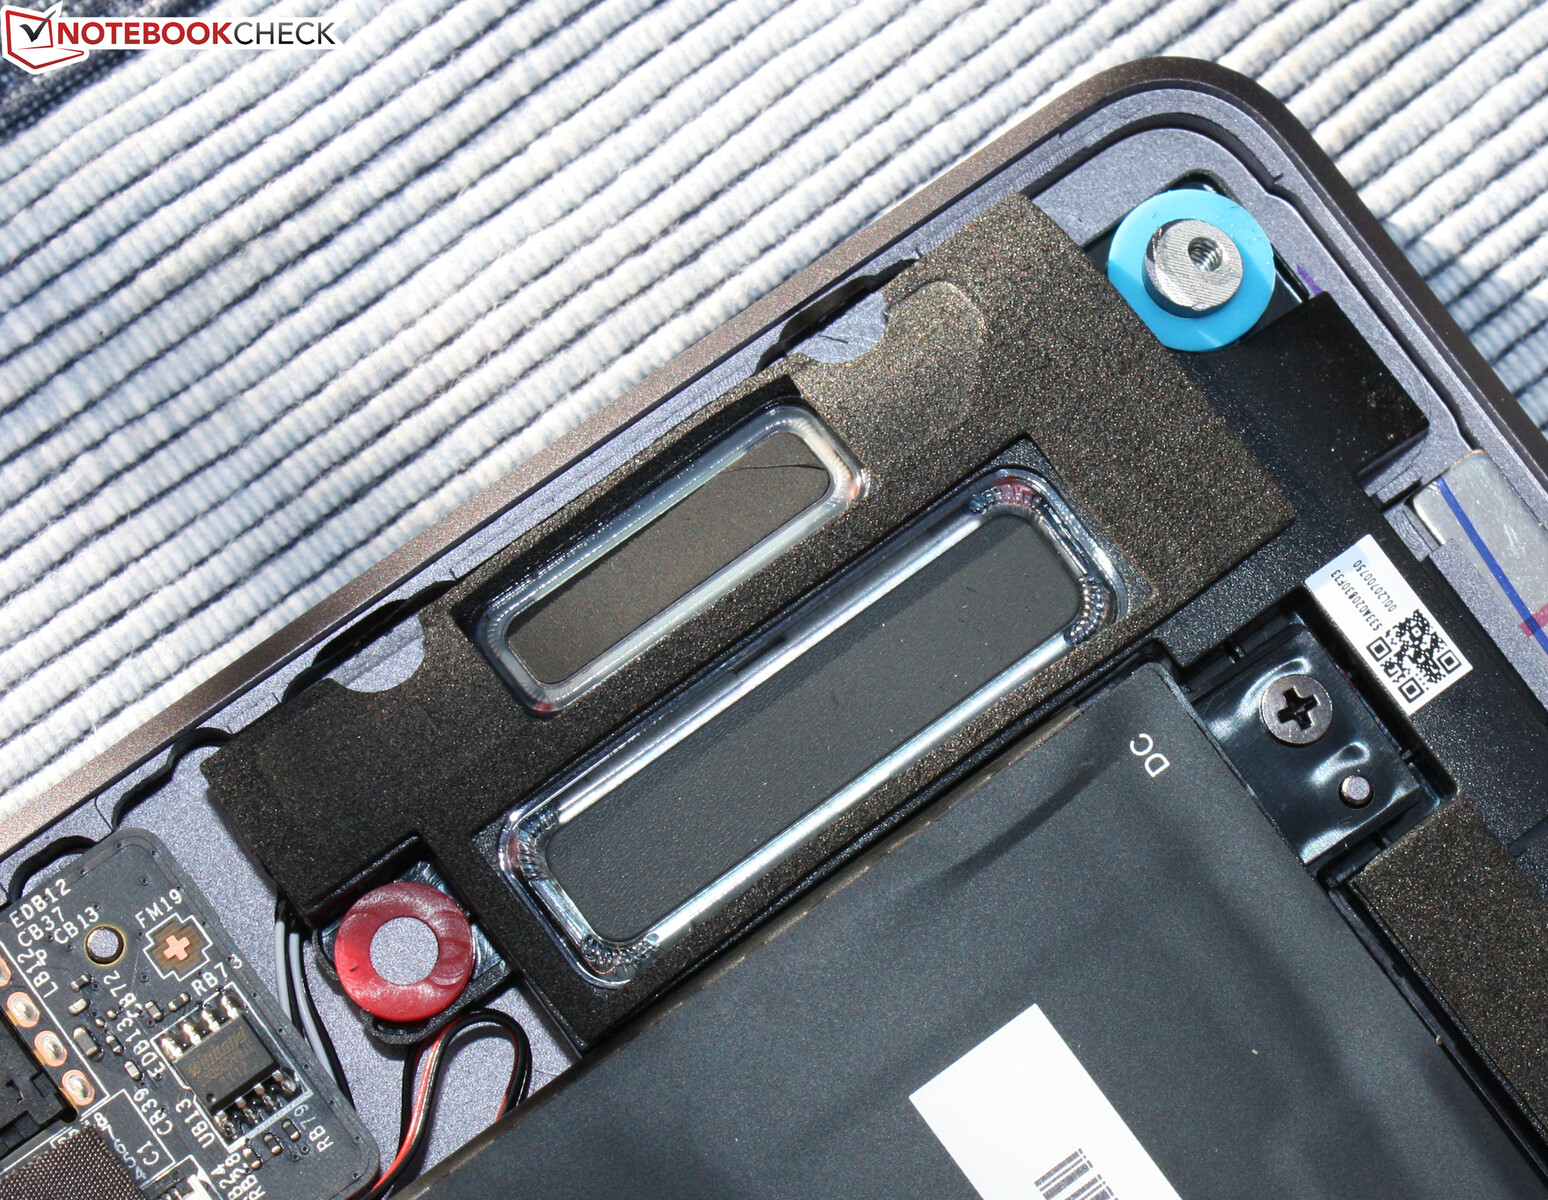
维护
升级Z16是可能的,但比看起来更难。有两个M.2插槽,其中一个被Phison SSD占据。内存可以升级到64GB,有两个插槽。在样品中,这两个插槽被两个16GB的双通道占用,除非你购买16GB的Z16变体,在这种情况下,有一个插槽是免费的。
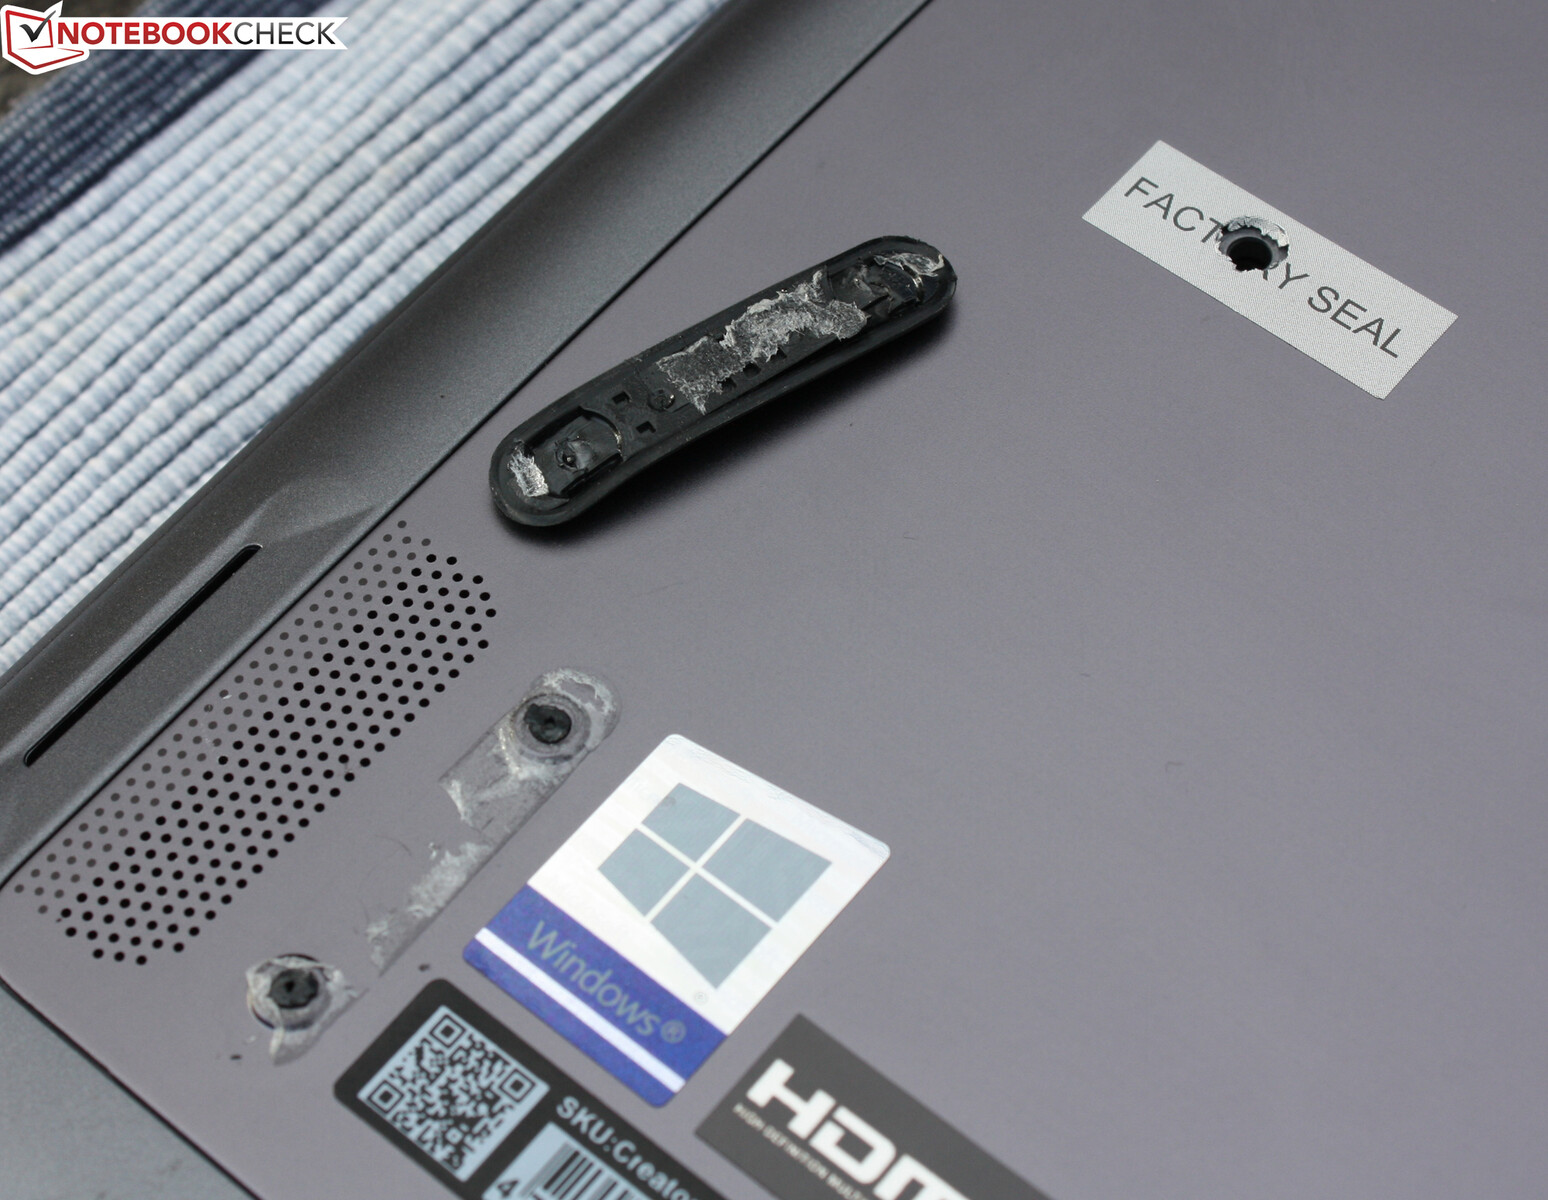
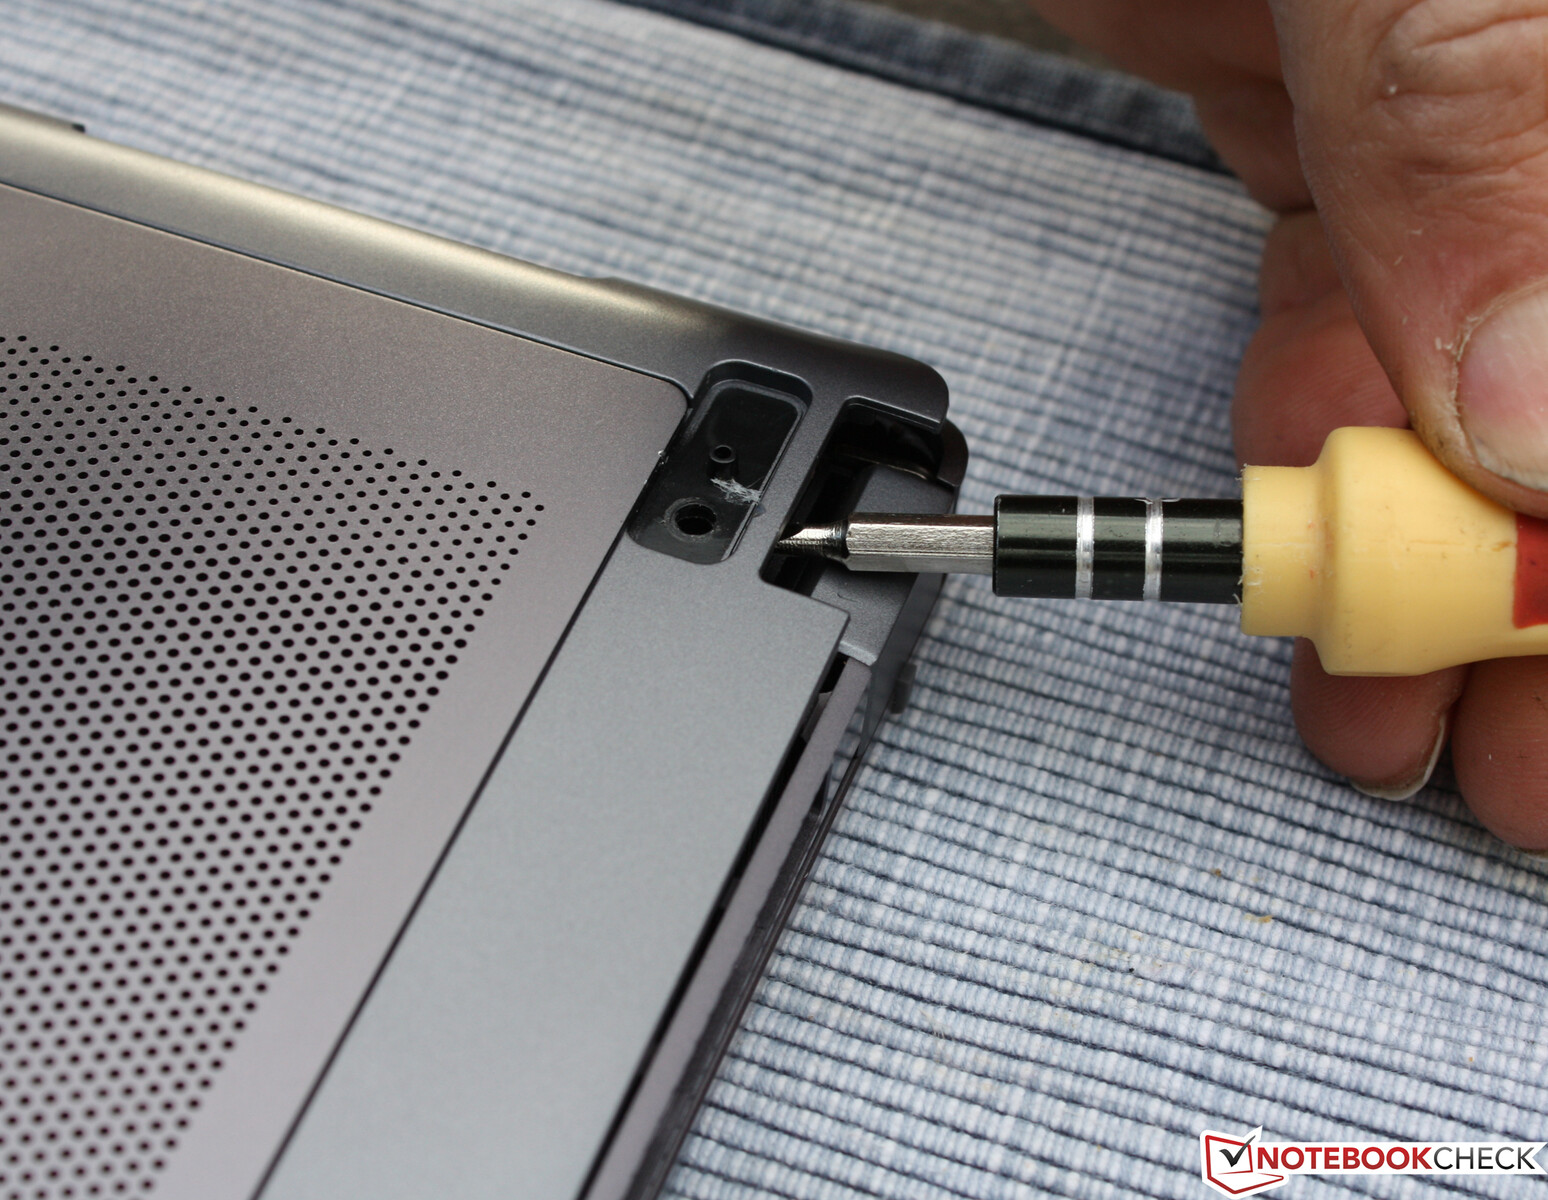
如果你想升级,你应该阅读如何操作。底部看起来像一个居中的维护舱口,其实根本不是。我们是在拆下前脚后才意识到这一点的--当时不幸的是,前脚已经坏了,无法修复。整个底板是由后脚下可见的螺丝之类的东西固定的。
你可以快速进入第一个维护层,在那里可以更换电池、Wi-Fi芯片和两个固态硬盘。然而,必须完全拆下主板才能接触到RAM插座。这是一个很大的努力,因为所有的电缆都必须被拆除。这里有一个非常好的视频教程:微星创造者Z16升级教程.
辅料
纤细的180瓦电源是盒子里唯一的配件。
担保
在德国,制造商提供两年的保修期(提货和退货)。
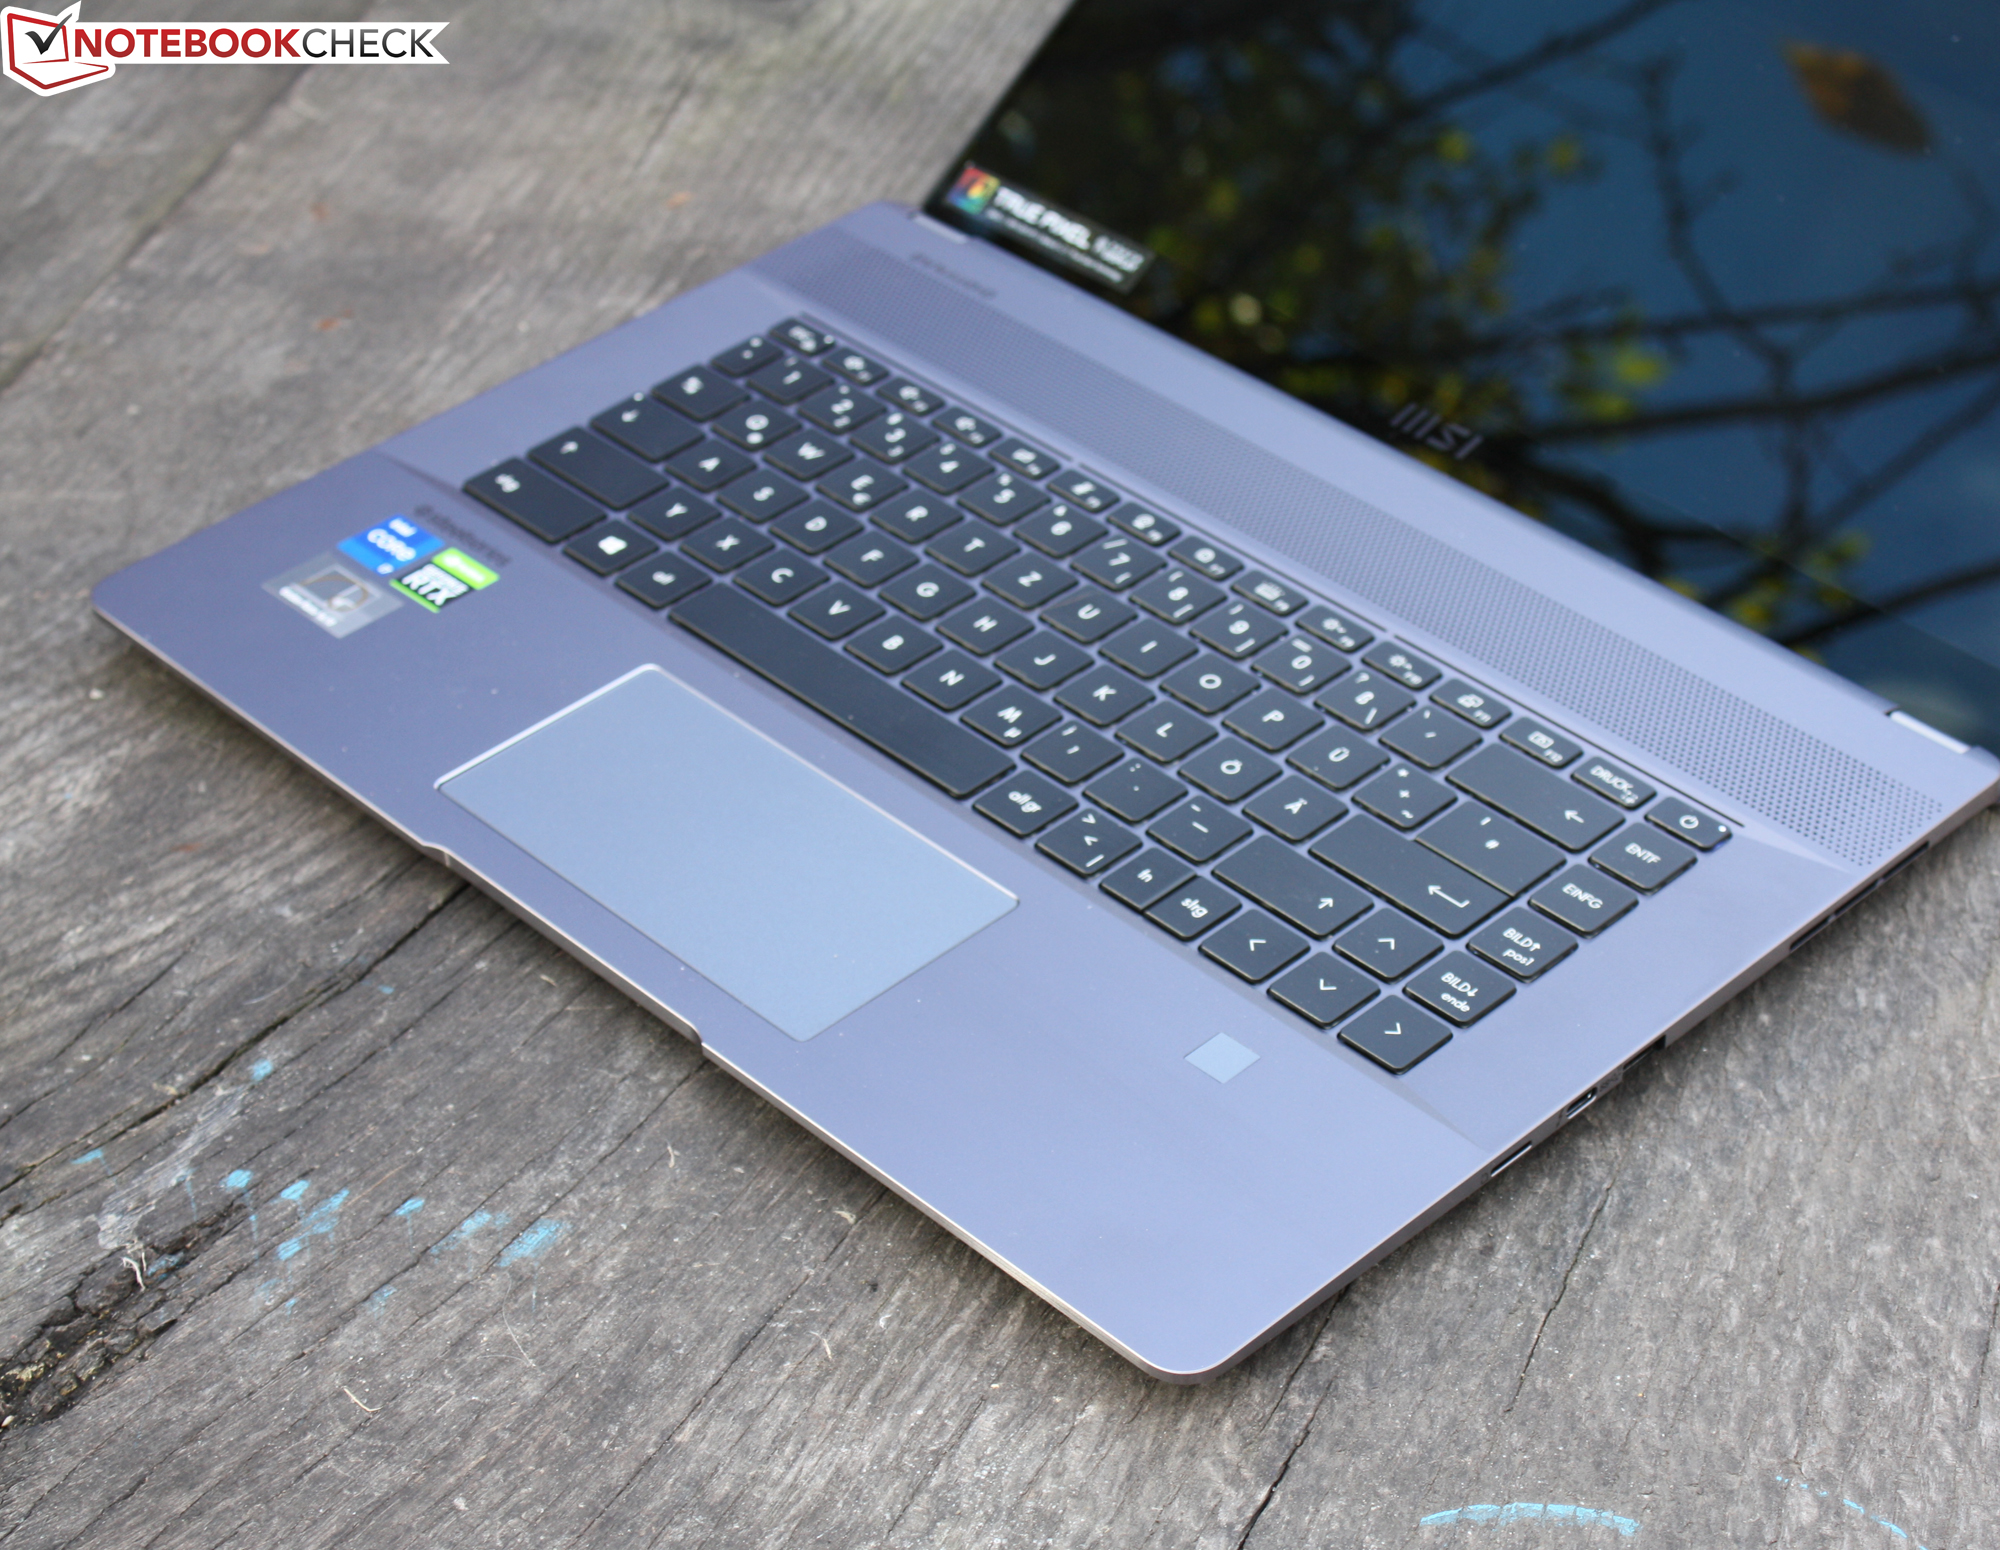
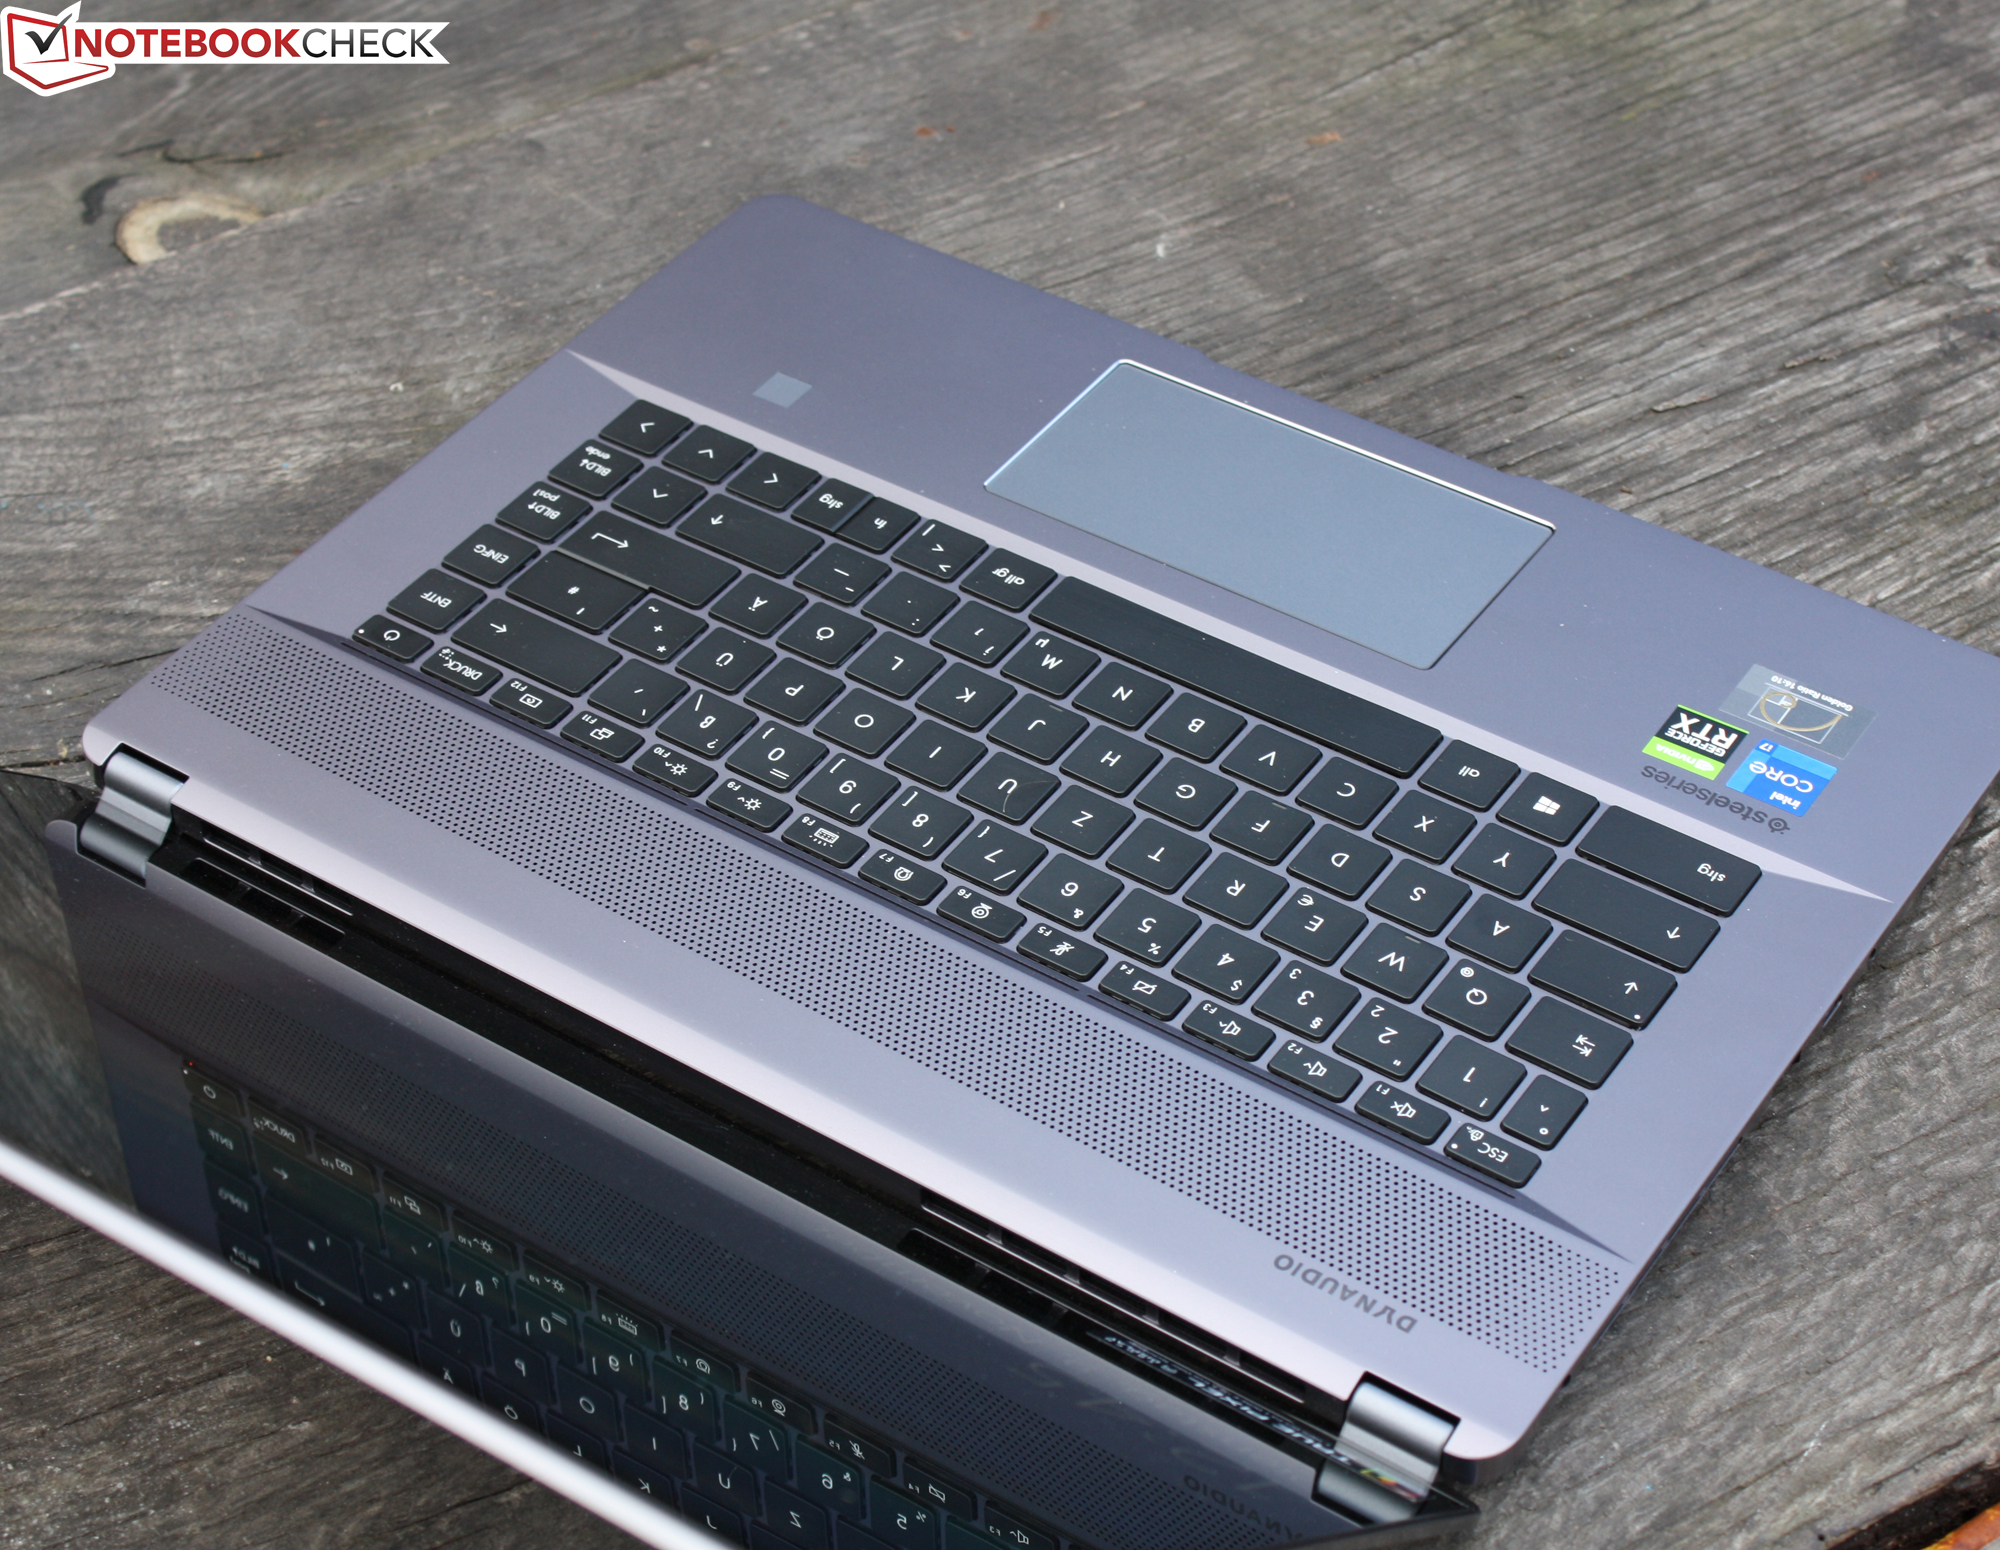
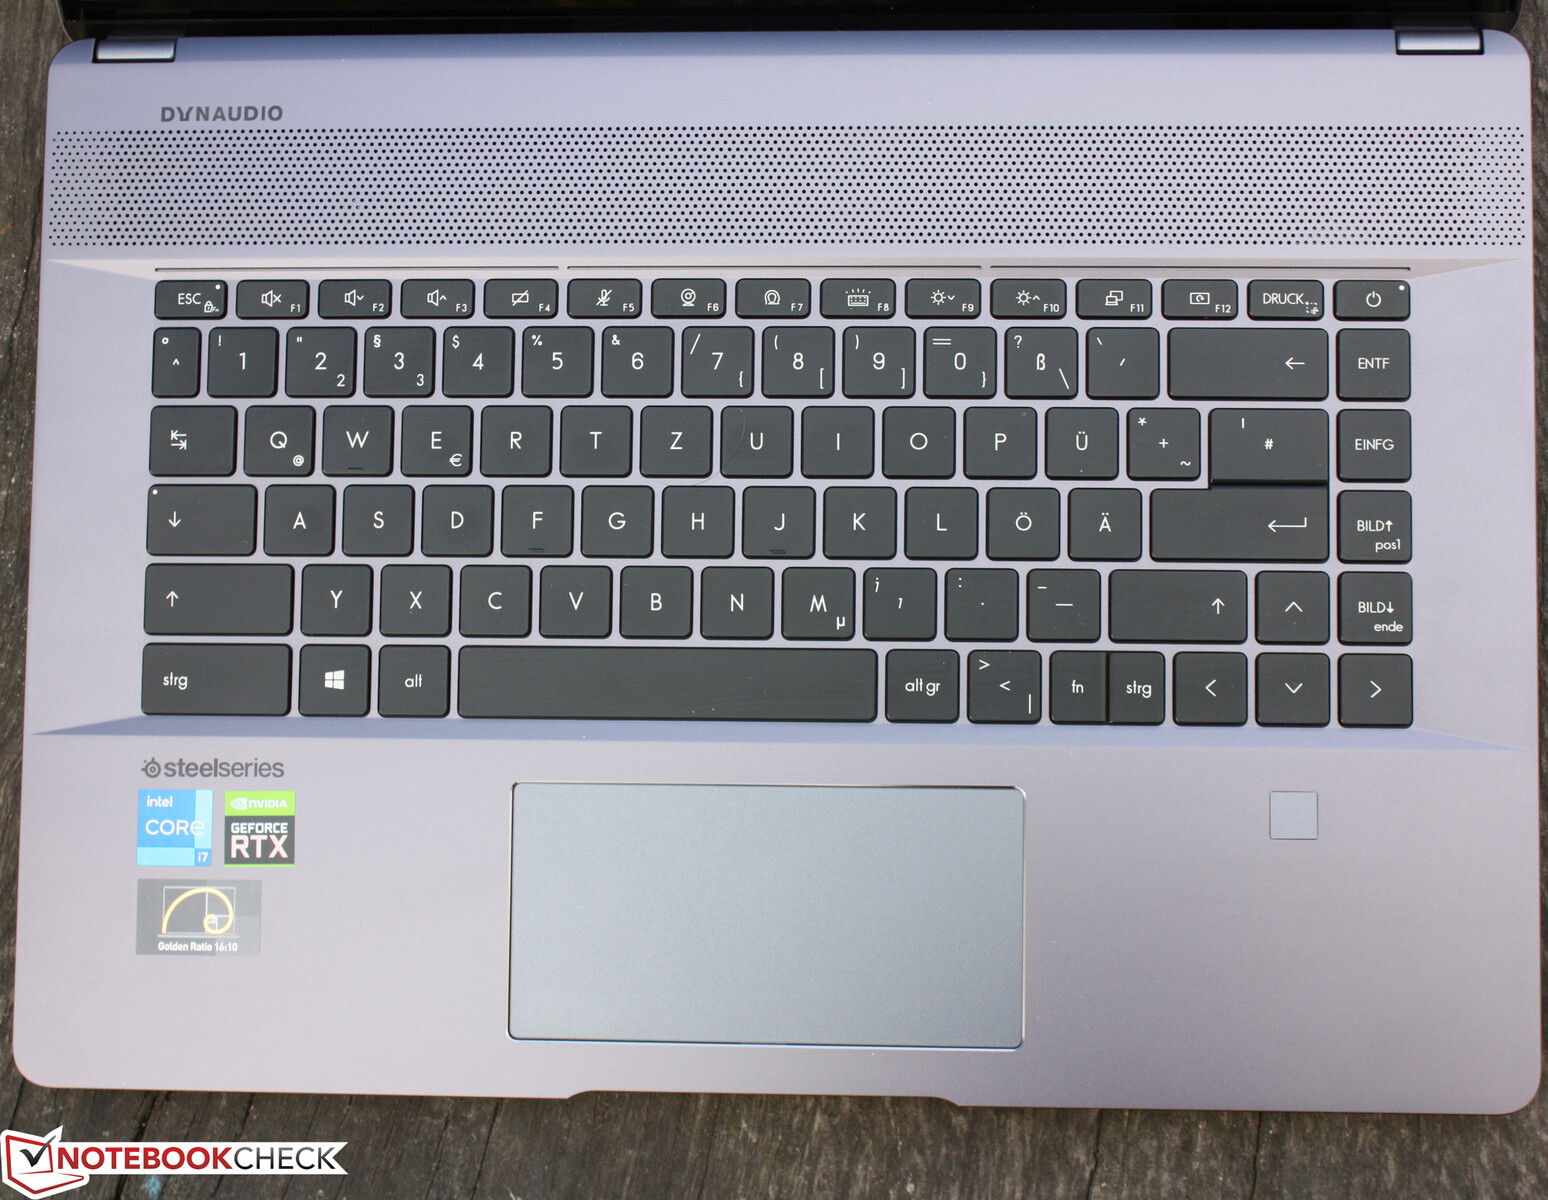
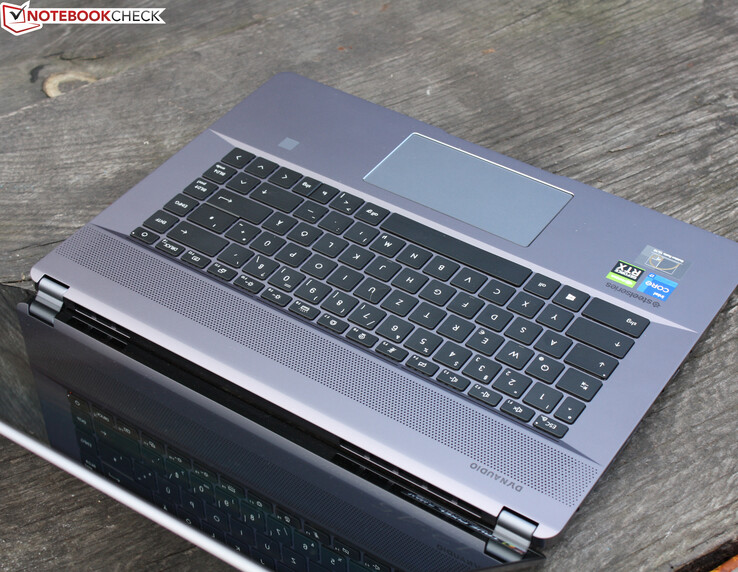
输入设备 - 笔记本电脑键盘下的RGB灯光效果
键盘
该键盘配有迷你LED键盘背光,这意味着每个字母都可以用不同的颜色来照明。预装的设置是一种移动的灯光。如果这让你感到困扰,或者你想设置其他颜色或混合物,那么必须安装Mystic Light。不幸的是,MSI Center Pro不允许修改按键的照明。
SteelSeries的输入法呈现出非常硬的冲程,宽大的按键以及坚固的底座,即使用力冲程也不会让步。我们喜欢的是清晰的压力点,尽管行程很短,却能提供良好的反馈。另一方面,坚硬的键程和短行程使打字变得令人厌烦。简而言之:SteelSeries到目前为止不是一个糟糕的键盘,大手可以很好地使用它。然而,如果有更多的行程,速度会更好。
触摸板
狭窄的ClickPad对某些人来说是一个失败的设计。虽然竞争对手,如MacBook Pro 162021年M1或 戴尔XPS 15 9510(15 x 9 cm/~5.9 x 3.5 in),通常提供巨大的ClickPads,而微星只使用12 x 6 cm (~4.7 x 2.4 in)。特别是在垂直滑动物体的时候,低矮的高度会让人很不爽。
这是一个遗憾,因为垫子本身很容易使用,在垫子的下部区域有一个清晰的压力点和适度的行程,以及一个光滑的表面。

触摸屏
光滑的表面允许直接在屏幕上快速工作,可以轻松擦拭。遗憾的是,盖子有点晃动,打字的手指无意中把显示屏从大约140度的开口处推了下去。
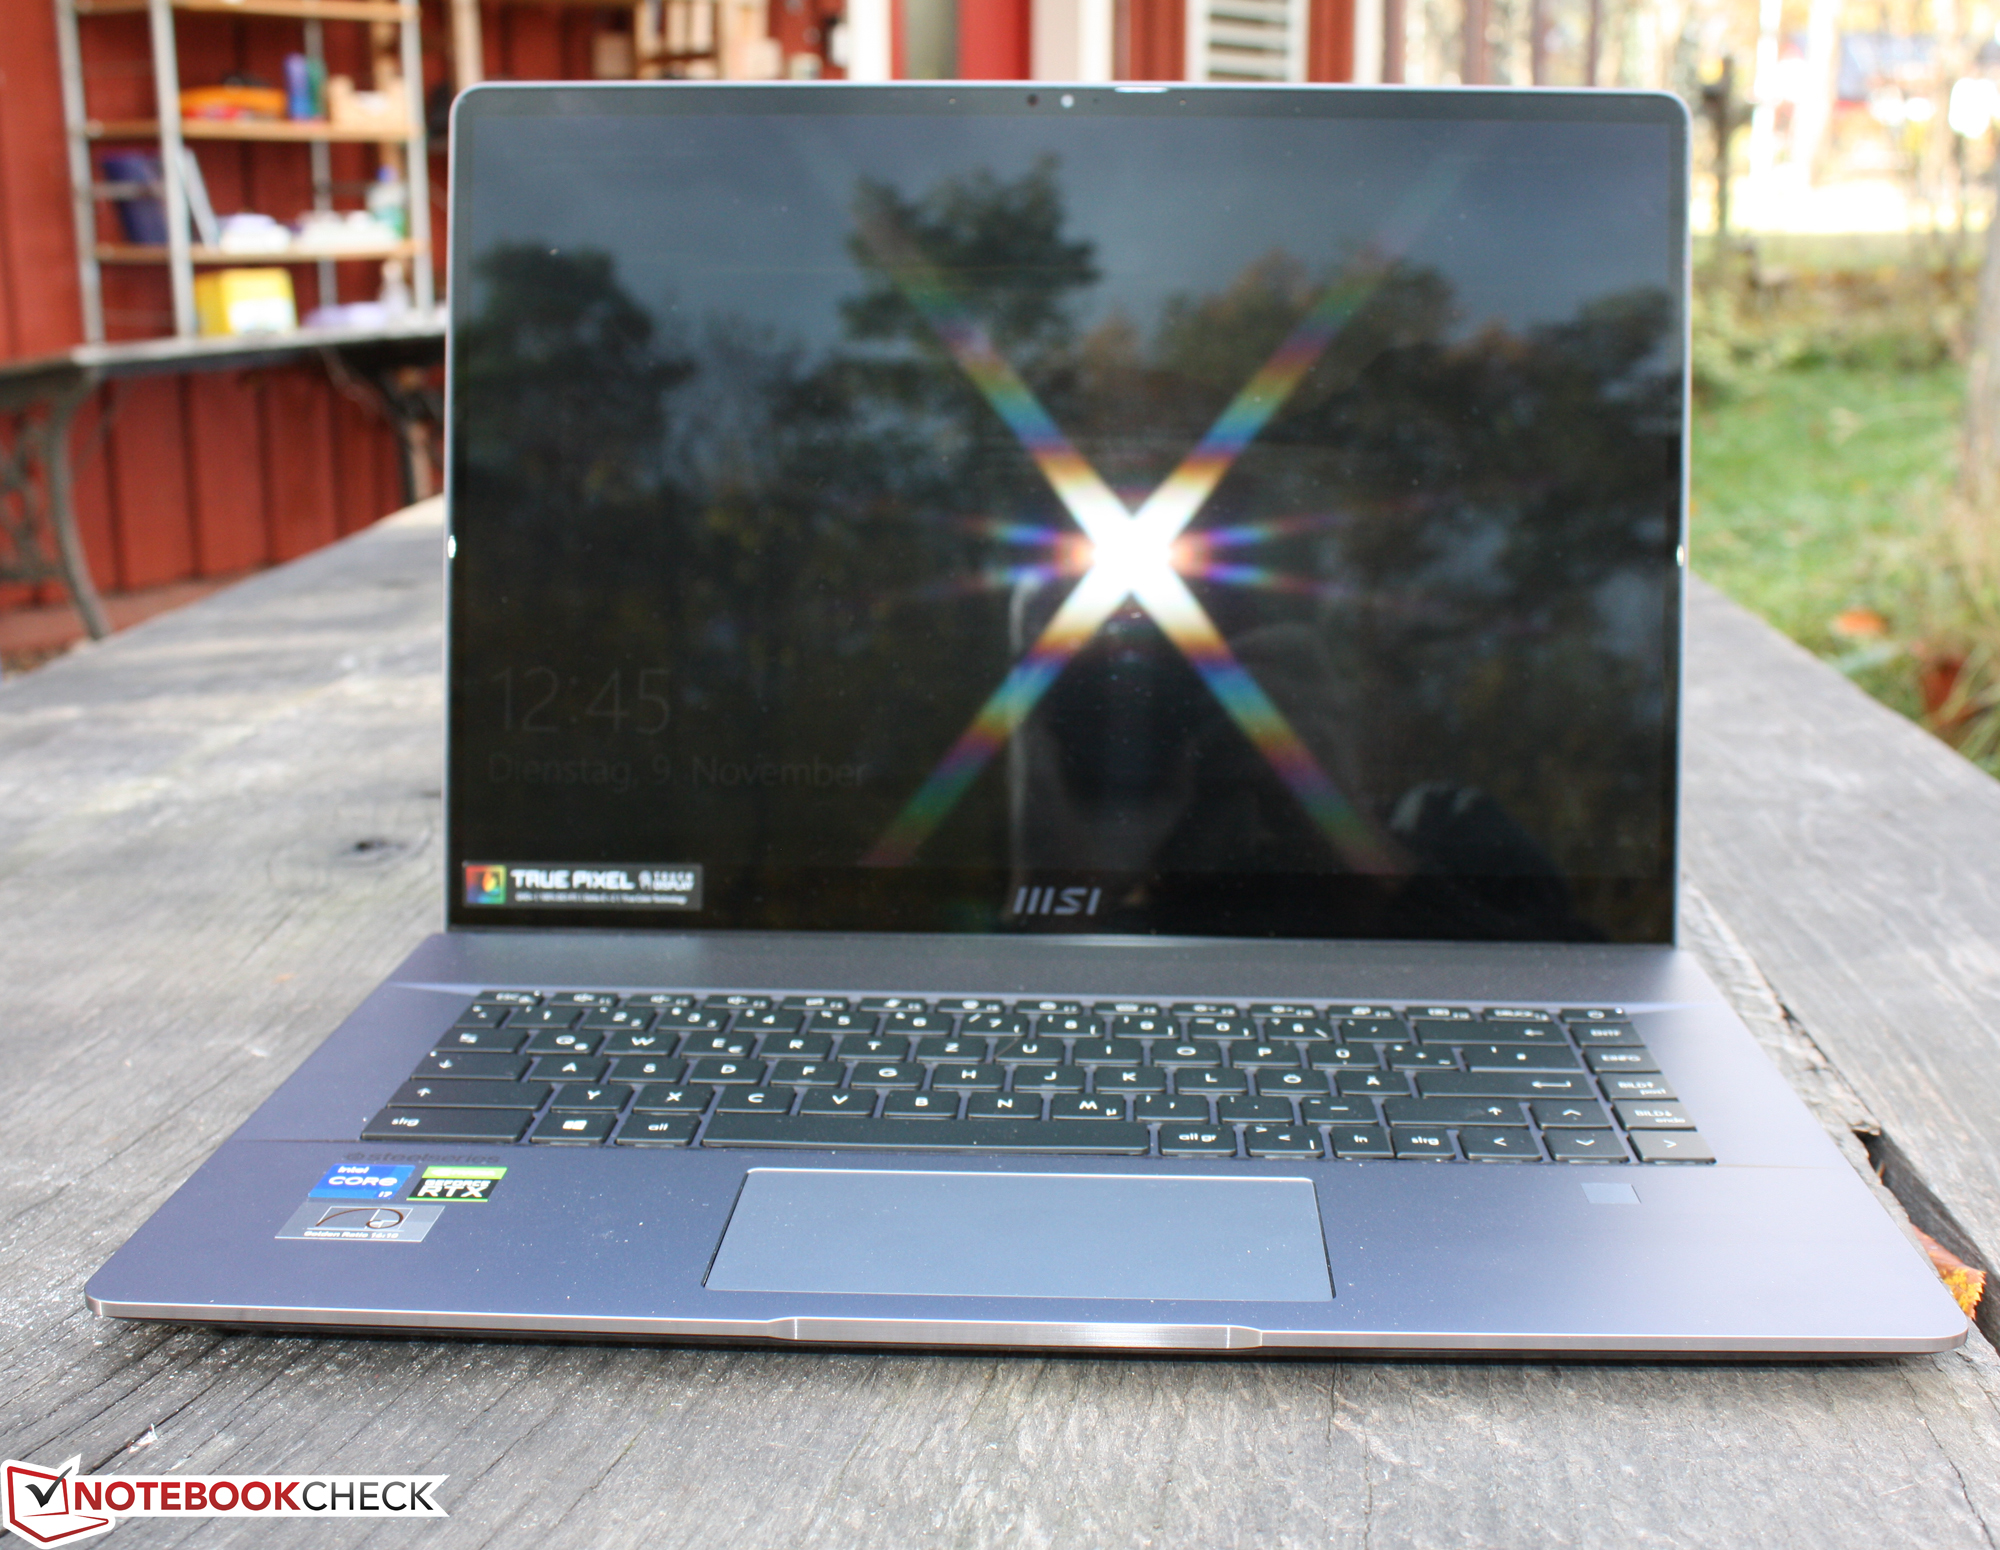
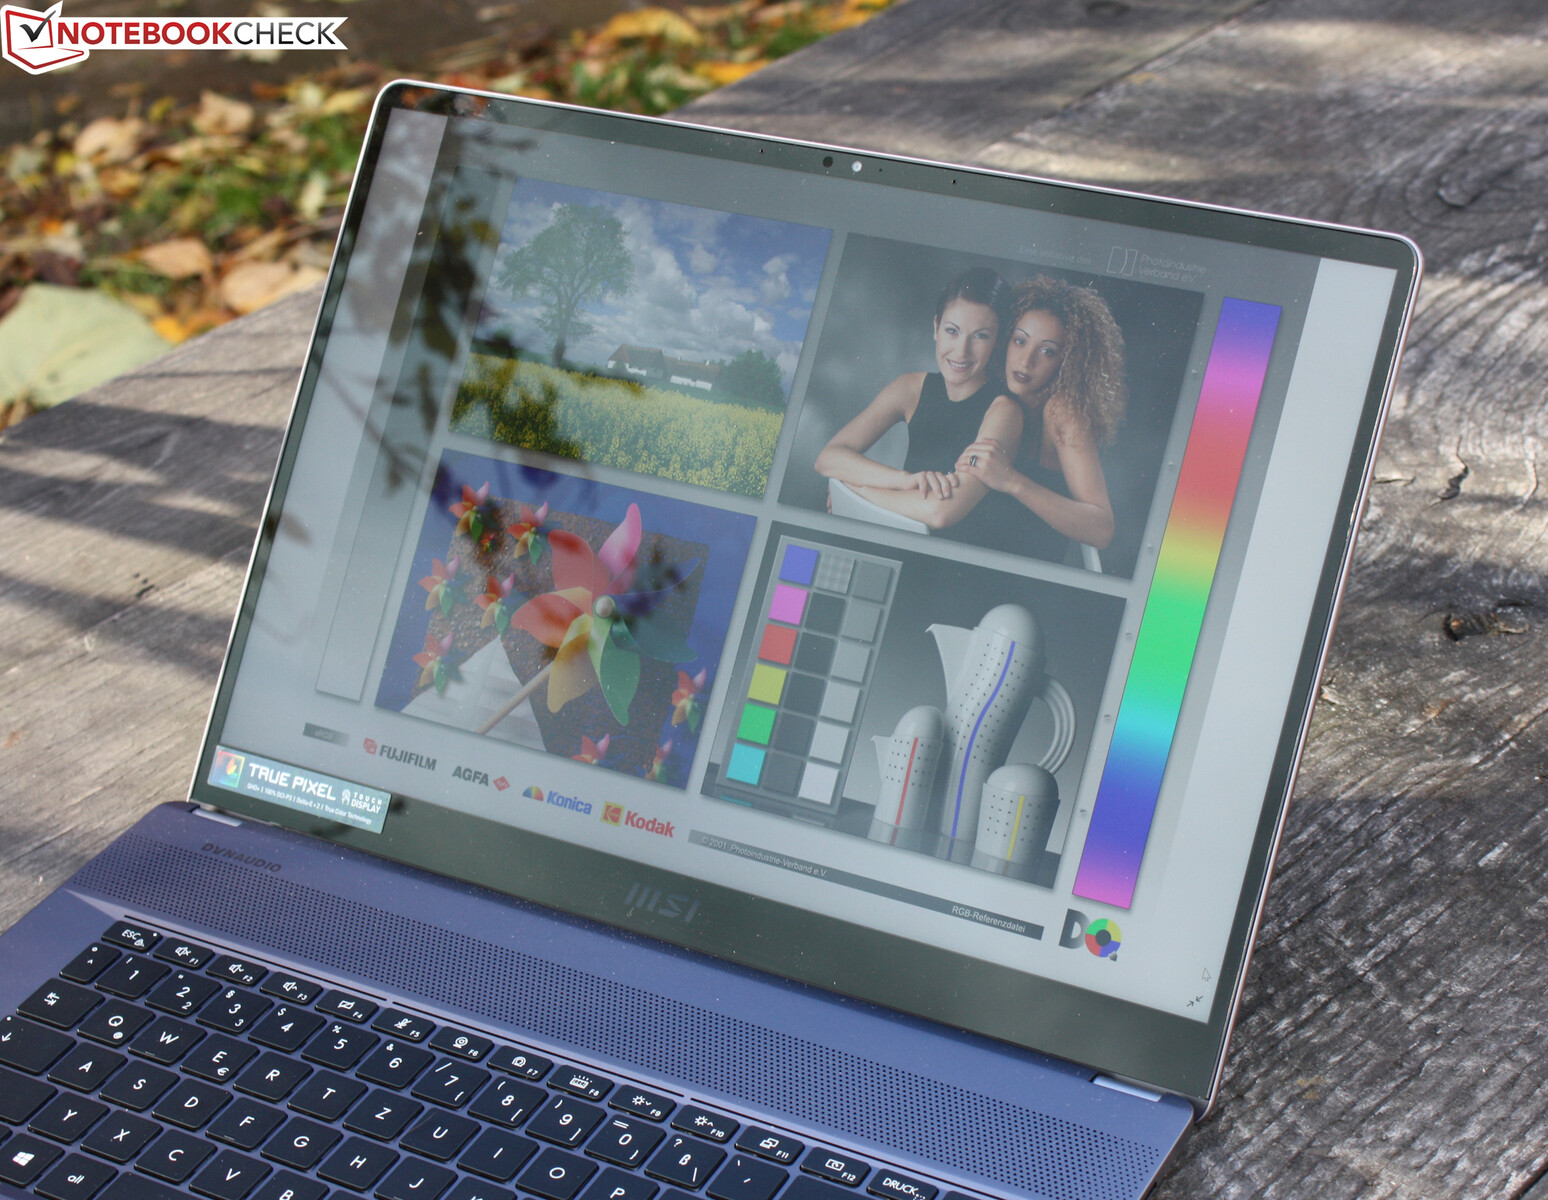
显示器 - 笔记本,几乎具有AdobeRGB色彩空间

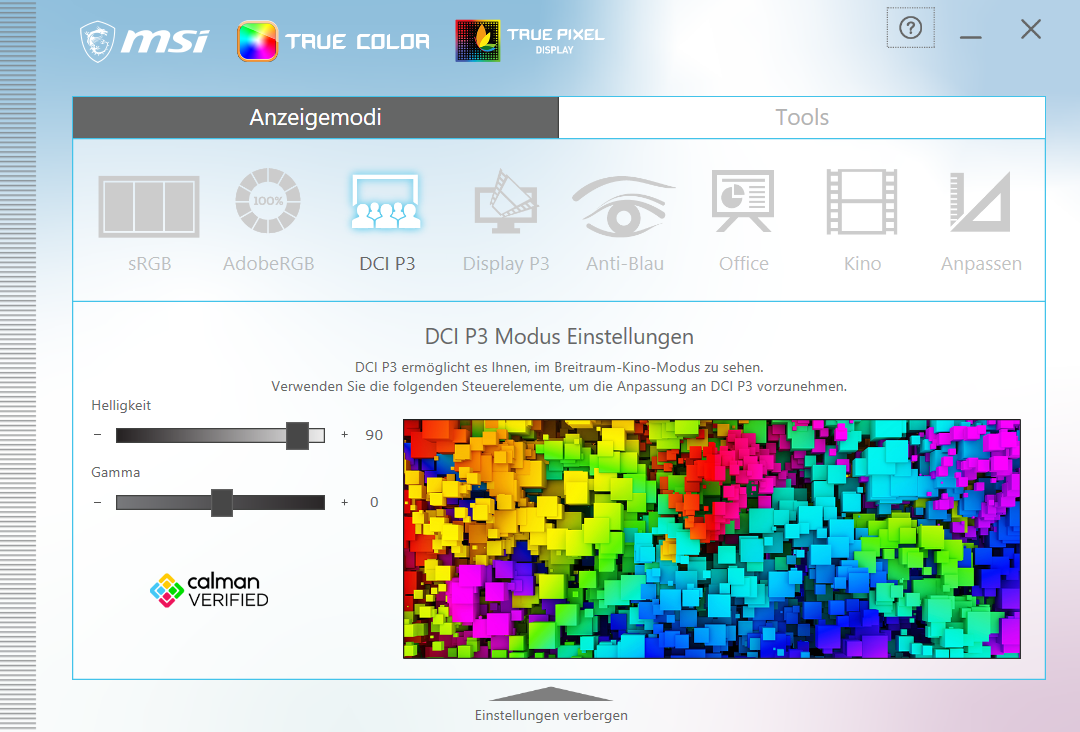
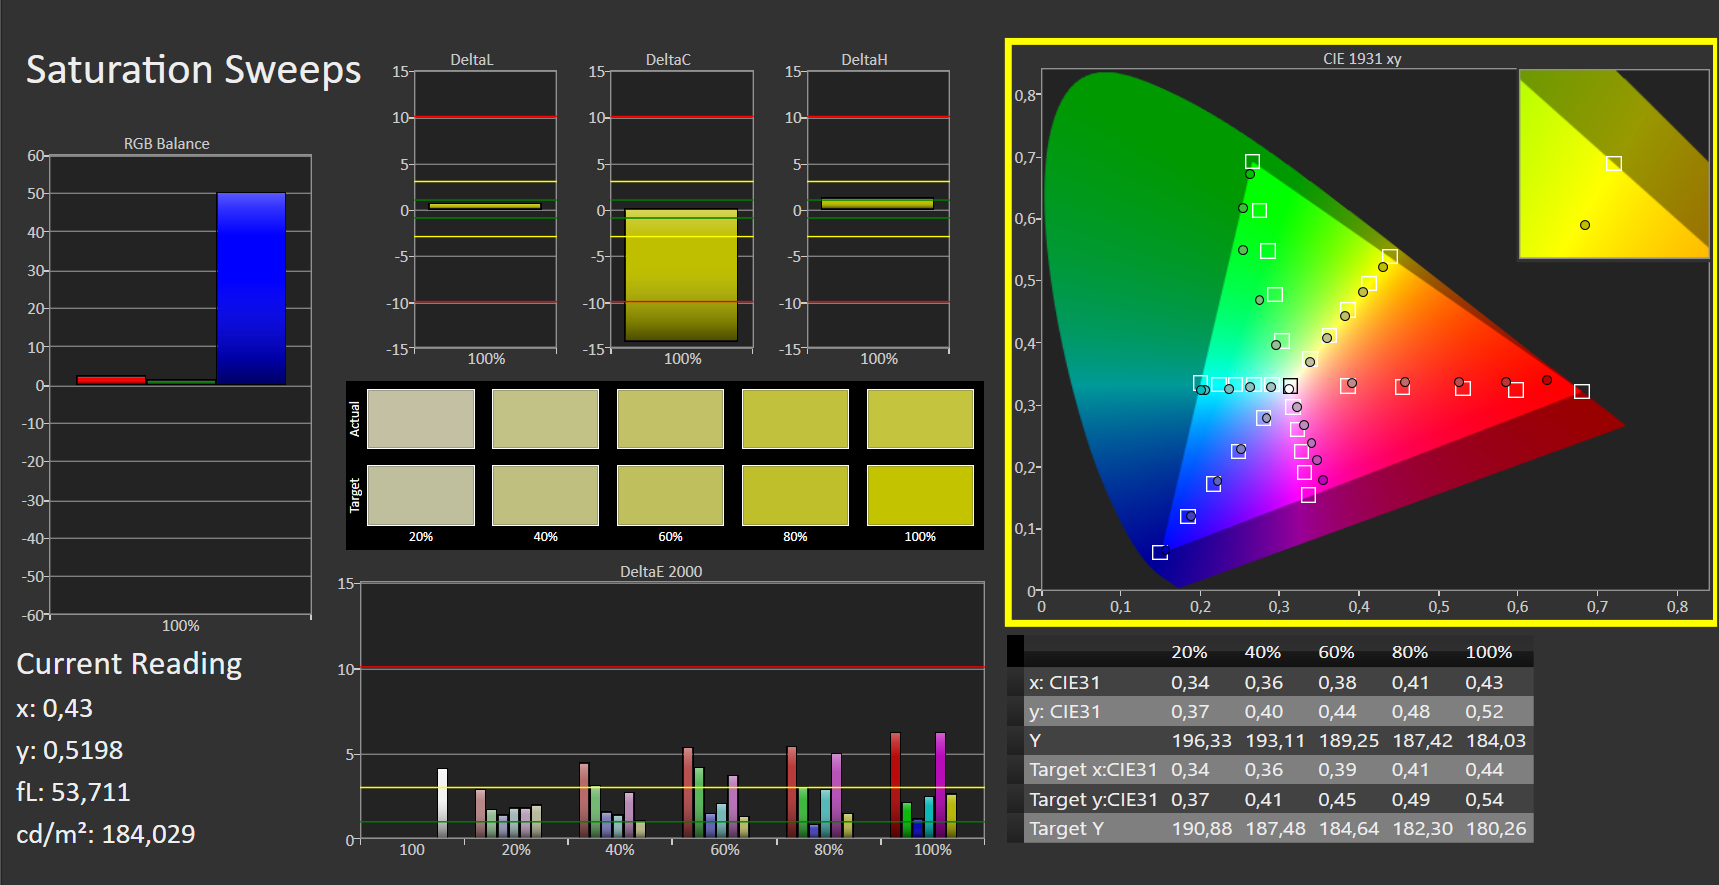
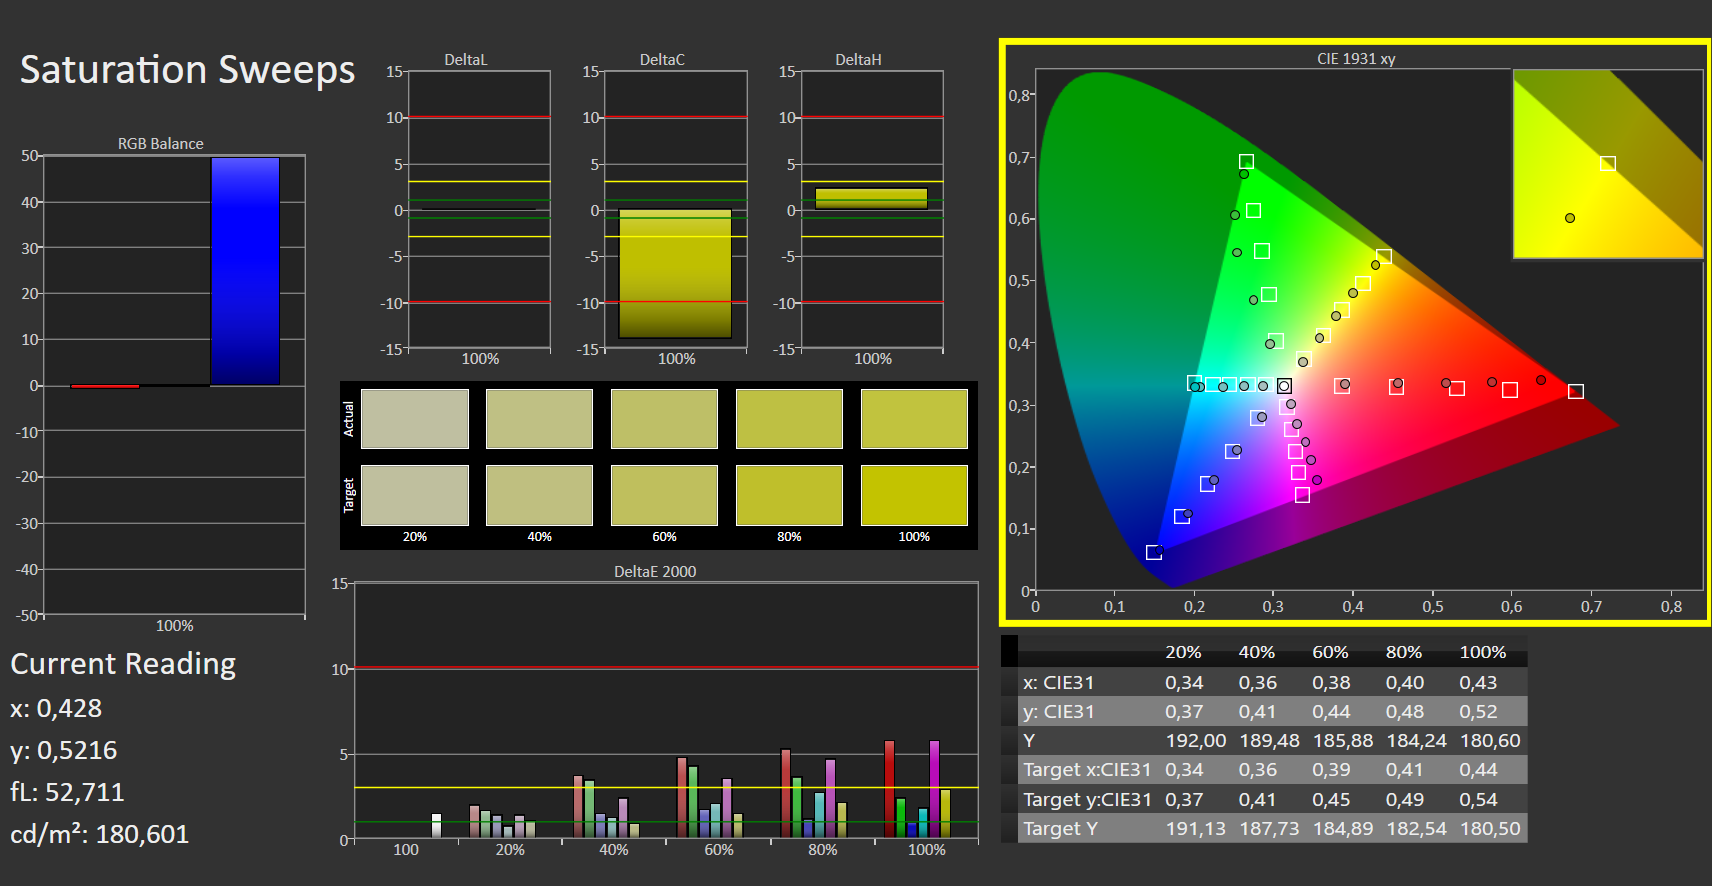
16英寸的面板是宽视角IPS,120赫兹和QHD+分辨率(2,560 x 1,600像素)。微星表示完全覆盖了DCI-P3,并称其为真像素。该显示器为16:10格式。微星在这里宣传的是黄金比例。
那些不想要触摸屏但喜欢防眩光的人可以购买三种防眩光的变体之一,它们也有一个120赫兹的真像素屏幕。
我们测得平均亮度为347cd/m²,最大亮度为347。亮度是均匀分布的,这就是89%所代表的意义。积极的一面。微星不使用PWM来调节亮度。响应时间为7和14毫秒,非常好。
我们不知道为什么微星没有提供OLED变体。在竞争中的OLED选项的背景下,必须指出良好的IPS面板的优势。OLED面板不应该长期在最大亮度下运行,OLED屏幕需要更多的能量,(可禁用的)强制屏幕保护程序因为烧毁问题而被预装。OLED屏幕对能源的不必要的高需求,我们在对华硕Zenbook 14X OLED的评测中体会到了。这在电池模式下尤其令人讨厌。
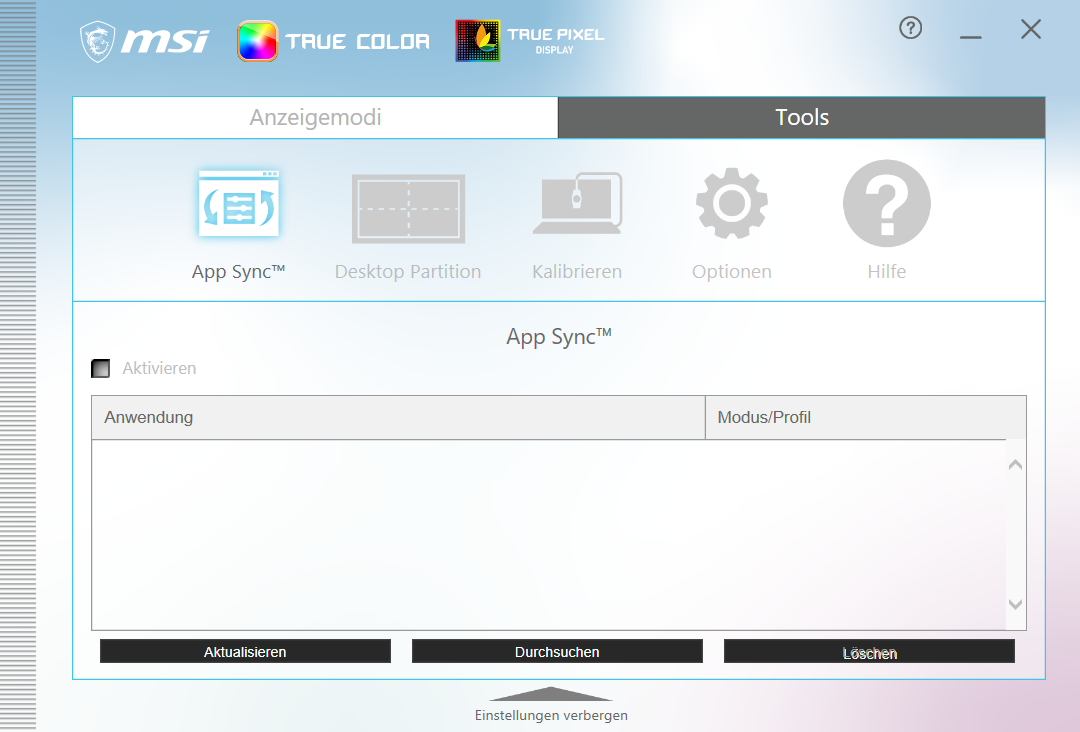
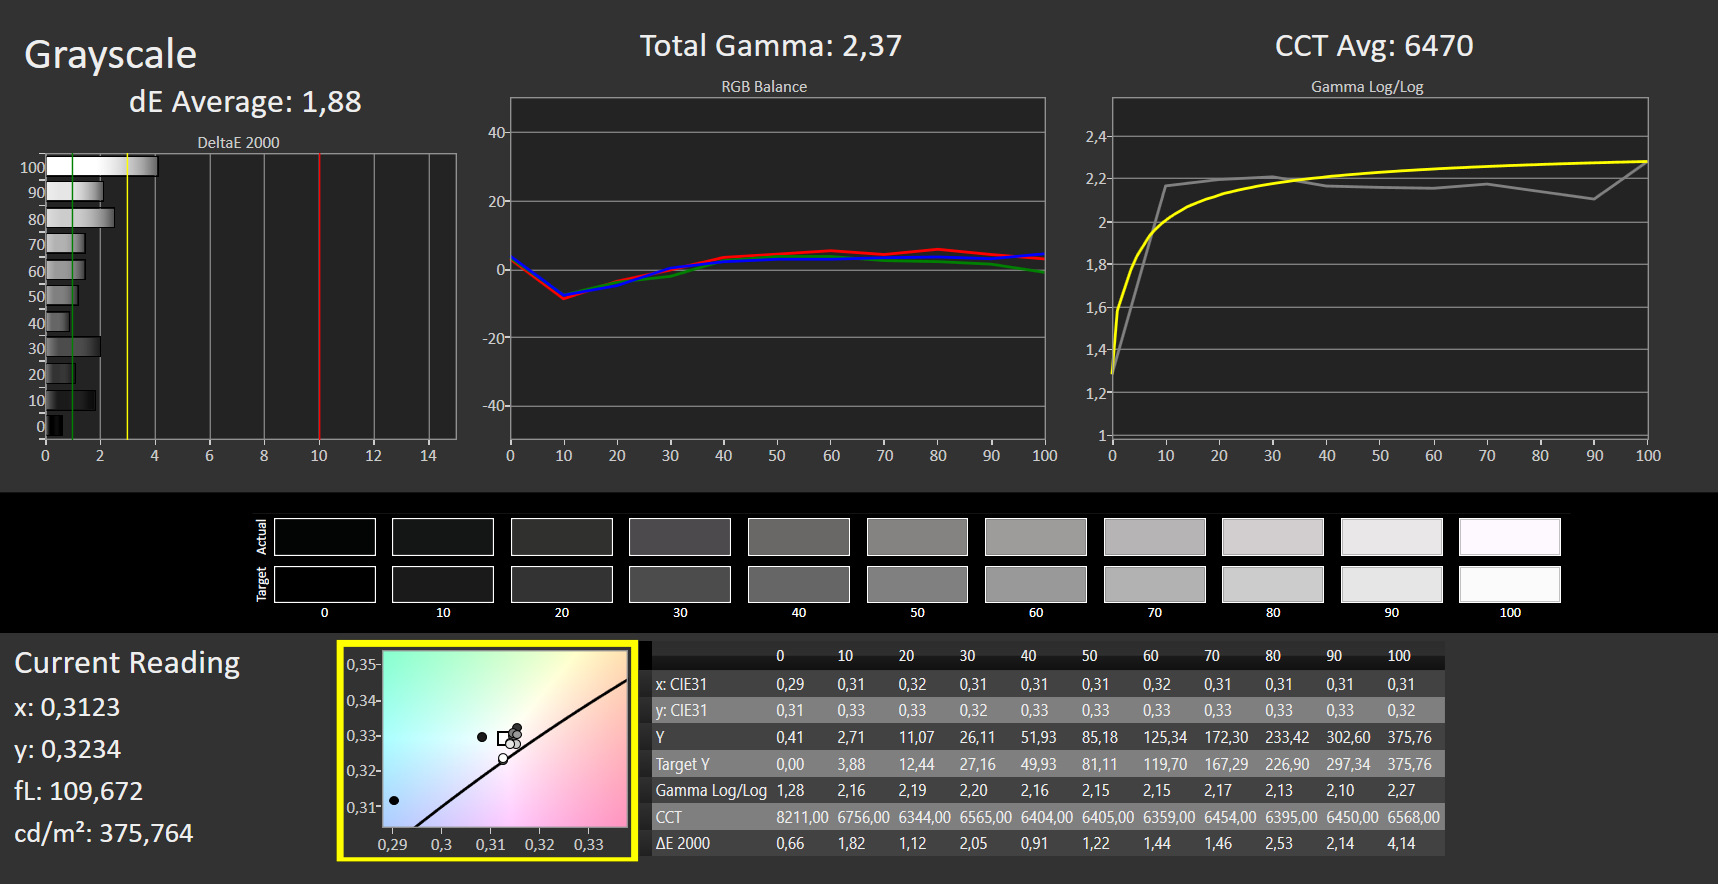
出厂校准的显示屏完全覆盖了DCI-P3的色彩空间。然而,这种扩展的空间并不总是需要的,而且可能是令人讨厌的,例如在使用Outlook和Excel的办公室中。这就是微星真彩发挥作用的地方。在那里,可以选择适合该场景的显示模式。程序可以通过App Sync来分配。因此,在下次启动Photoshop时,匹配的颜色配置文件会自动激活。
| |||||||||||||||||||||||||
Brightness Distribution: 89 %
Center on Battery: 375 cd/m²
Contrast: 915:1 (Black: 0.41 cd/m²)
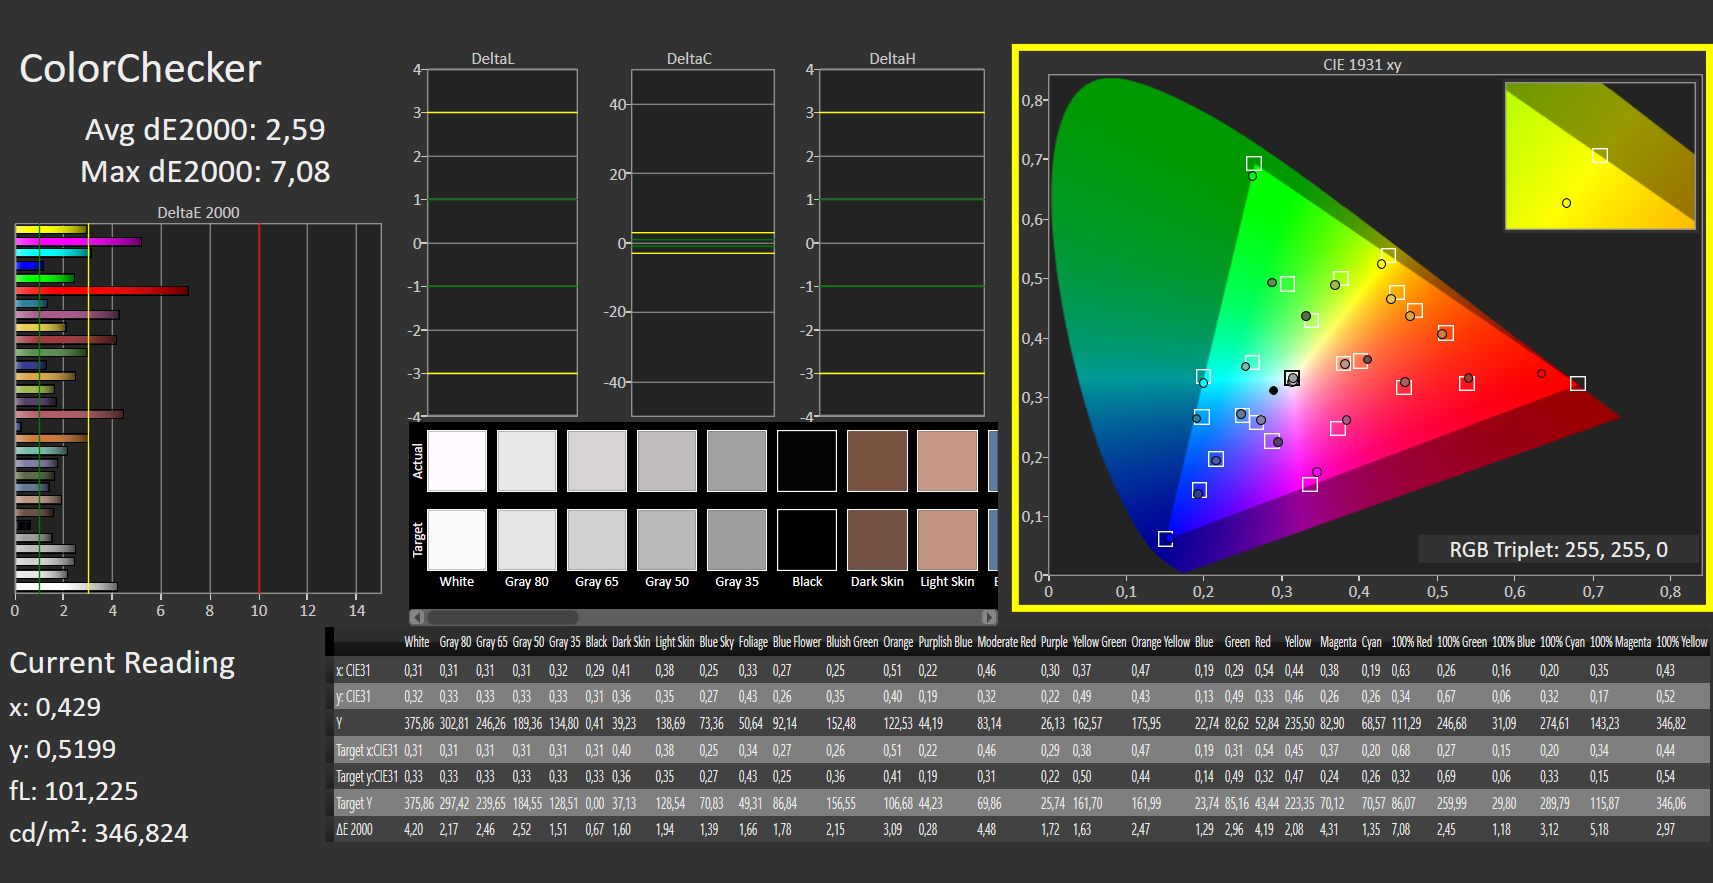
ΔE ColorChecker Calman: 2.59 | ∀{0.5-29.43 Ø4.71}
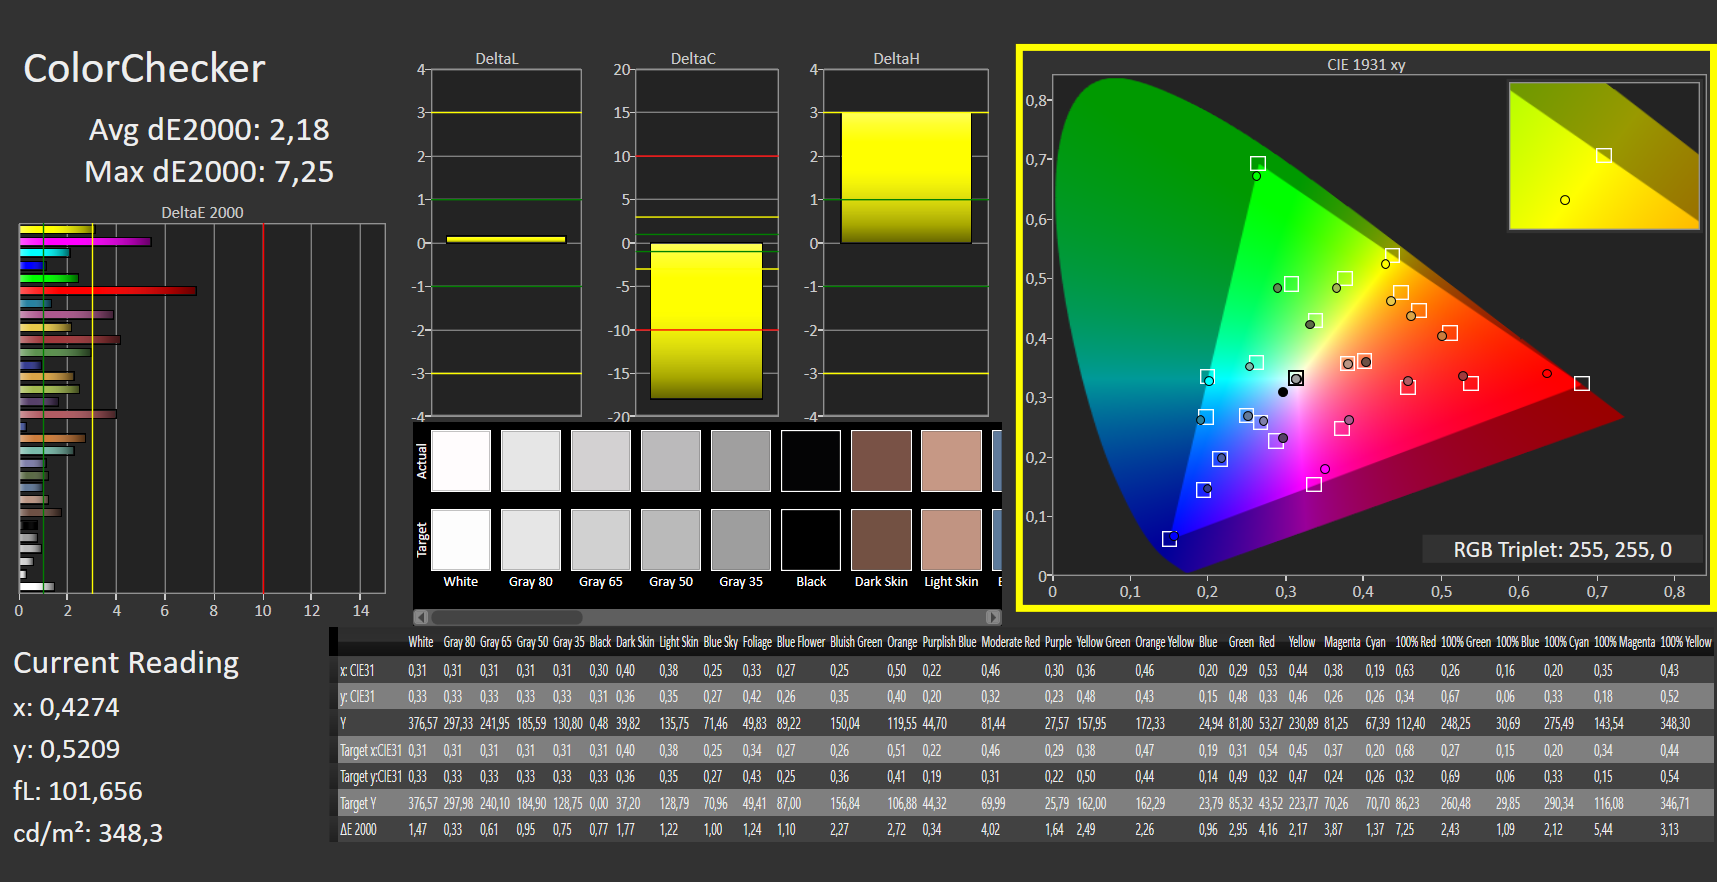
calibrated: 2.18
ΔE Greyscale Calman: 1.88 | ∀{0.09-98 Ø4.96}
96% AdobeRGB 1998 (Argyll 3D)
100% sRGB (Argyll 3D)
100% Display P3 (Argyll 3D)
Gamma: 2.37
CCT: 6470 K
| MSI Creator Z16 A11UET-209 AUO B160QAN02.P, IPS True Pixel, 2560x1600, 16" | HP ZBook Studio G7 LGD0661, IPS, 3840x2160, 15.6" | Razer Blade 15 Advanced (Mid 2021) TL156VDXP02-0, IPS, 1920x1080, 15.6" | Lenovo ThinkBook 16p G2 ACH Lenovo LEN8A95 (AUO B160QAN02.M), IPS, 2560x1600, 16" | Dell XPS 17 9710 Core i7 RTX 3060 Sharp LQ170R1, IPS, 3840x2400, 17" | Dell XPS 15 9510 11800H RTX 3050 Ti OLED SDC414D, OLED, 3456x2160, 15.6" | Apple MacBook Pro 16 2021 M1 Pro Liquid Retina XDR, Mini-LED, 3456x2234, 16.2" | |
|---|---|---|---|---|---|---|---|
| Display | -4% | -21% | -14% | -0% | 1% | -3% | |
| Display P3 Coverage (%) | 100 | 98.2 -2% | 66.9 -33% | 76.4 -24% | 94.8 -5% | 99.9 0% | 99.1 -1% |
| sRGB Coverage (%) | 100 | 99.9 0% | 97.1 -3% | 100 0% | 100 0% | 100 0% | 100 0% |
| AdobeRGB 1998 Coverage (%) | 96 | 86.5 -10% | 69 -28% | 77.4 -19% | 100 4% | 98.1 2% | 88 -8% |
| Response Times | -370% | 14% | -146% | -289% | 67% | -708% | |
| Response Time Grey 50% / Grey 80% * (ms) | 14 ? | 56.4 ? -303% | 4.2 ? 70% | 36 -157% | 44.8 ? -220% | 3.6 ? 74% | 42.8 ? -206% |
| Response Time Black / White * (ms) | 7 ? | 37.6 ? -437% | 10 ? -43% | 16.4 -134% | 32 ? -357% | 2.8 ? 60% | 91.6 ? -1209% |
| PWM Frequency (Hz) | 59.5 ? | 14880 | |||||
| Screen | 57% | 6% | 19% | 12% | 81% | 372% | |
| Brightness middle (cd/m²) | 375 | 723 93% | 353.4 -6% | 439 17% | 536.5 43% | 362 -3% | 514 37% |
| Brightness (cd/m²) | 348 | 707 103% | 340 -2% | 397 14% | 489 41% | 367 5% | 497 43% |
| Brightness Distribution (%) | 89 | 92 3% | 92 3% | 83 -7% | 85 -4% | 97 9% | 95 7% |
| Black Level * (cd/m²) | 0.41 | 0.35 15% | 0.31 24% | 0.44 -7% | 0.37 10% | 0.06 85% | 0.02 95% |
| Contrast (:1) | 915 | 2066 126% | 1140 25% | 998 9% | 1450 58% | 6033 559% | 25700 2709% |
| Colorchecker dE 2000 * | 2.59 | 1.4 46% | 2.17 16% | 1.68 35% | 2.46 5% | 2.1 19% | 1.4 46% |
| Colorchecker dE 2000 max. * | 7.08 | 2.9 59% | 5.69 20% | 2.36 67% | 7.74 -9% | 4.1 42% | 2.8 60% |
| Colorchecker dE 2000 calibrated * | 2.18 | 0.5 77% | 1.05 52% | 1.57 28% | 1.85 15% | 2.5 -15% | |
| Greyscale dE 2000 * | 1.88 | 2 -6% | 3.4 -81% | 1.64 13% | 2.9 -54% | 1.4 26% | 2.3 -22% |
| Gamma | 2.37 93% | 2.14 103% | 2.2 100% | 2.39 92% | 2.12 104% | 2.18 101% | 2.27 97% |
| CCT | 6470 100% | 6484 100% | 6830 95% | 6616 98% | 6868 95% | 6608 98% | 6792 96% |
| Color Space (Percent of AdobeRGB 1998) (%) | 77.3 | ||||||
| Color Space (Percent of sRGB) (%) | 99.9 | ||||||
| Total Average (Program / Settings) | -106% /
-17% | -0% /
1% | -47% /
-12% | -92% /
-34% | 50% /
62% | -113% /
119% |
* ... smaller is better
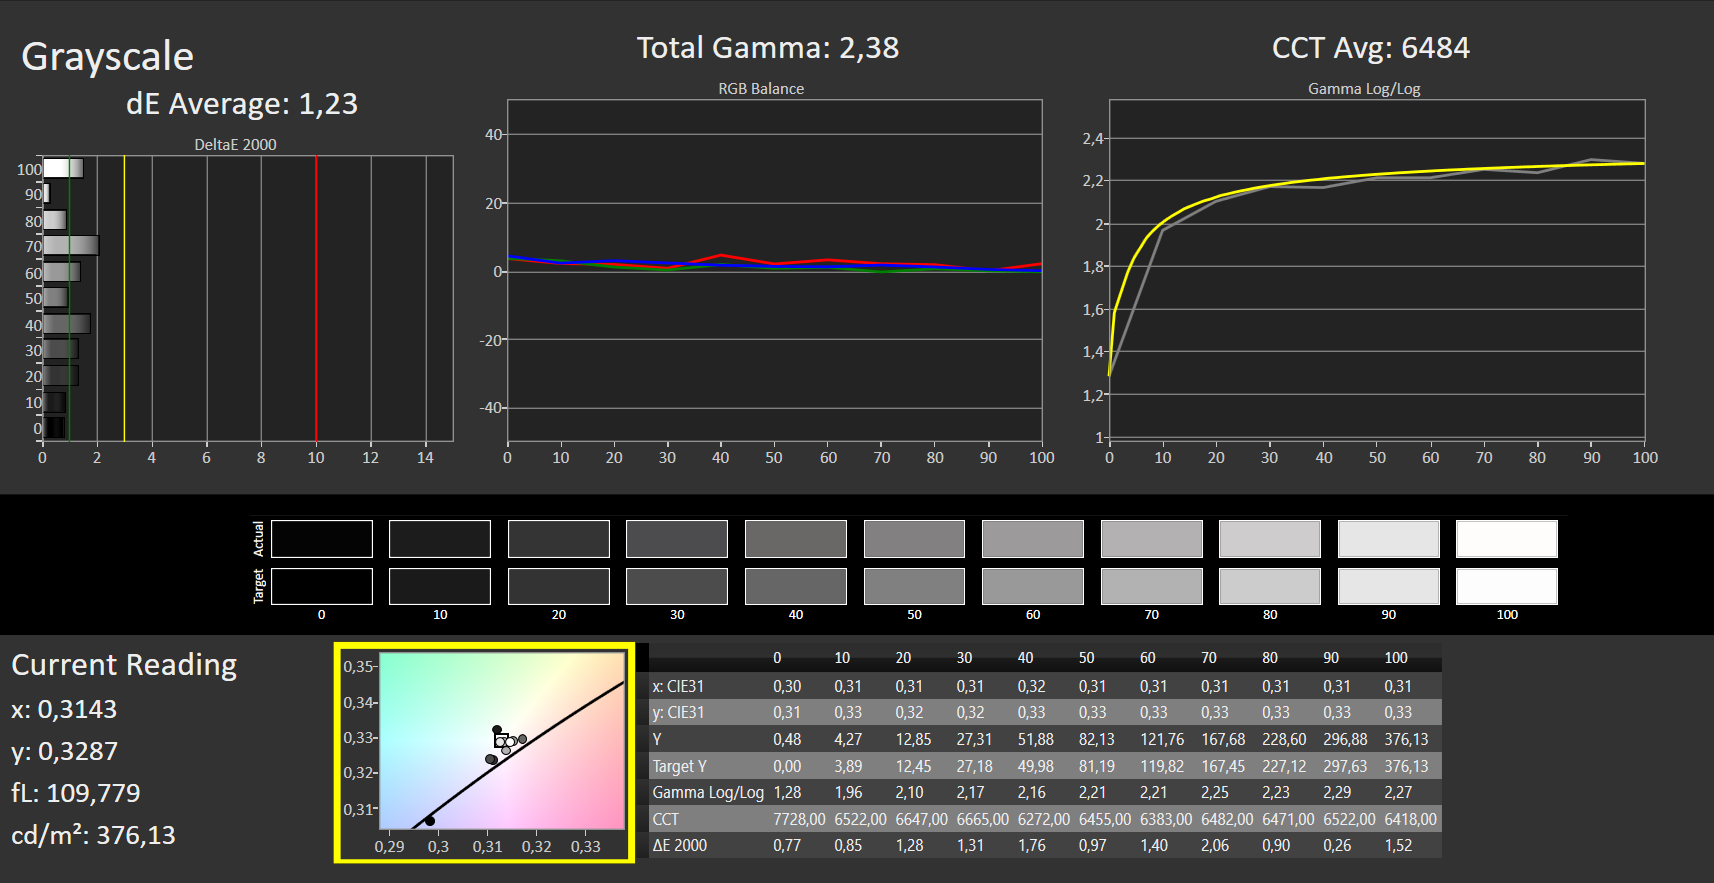
我们校准了面板并创建了我们自己的颜色配置文件。我们只是稍微改善了已经很好的数值。工厂校准似乎是非常好的。微星承诺DeltaE<2,这就是工厂校准应该有的准确度。我们的测量结果证实了灰度的准确度,而颜色的准确度则刚好高于这个值(2.5)。
Display Response Times
| ↔ Response Time Black to White | ||
|---|---|---|
| 7 ms ... rise ↗ and fall ↘ combined | ↗ 3 ms rise |  |
| ↘ 4 ms fall | ||
| The screen shows very fast response rates in our tests and should be very well suited for fast-paced gaming. In comparison, all tested devices range from 0.1 (minimum) to 240 (maximum) ms. » 21 % of all devices are better. This means that the measured response time is better than the average of all tested devices (19.8 ms). | ||
| ↔ Response Time 50% Grey to 80% Grey | ||
| 14 ms ... rise ↗ and fall ↘ combined | ↗ 8 ms rise |  |
| ↘ 6 ms fall | ||
| The screen shows good response rates in our tests, but may be too slow for competitive gamers. In comparison, all tested devices range from 0.165 (minimum) to 636 (maximum) ms. » 28 % of all devices are better. This means that the measured response time is better than the average of all tested devices (31 ms). | ||
Screen Flickering / PWM (Pulse-Width Modulation)
| Screen flickering / PWM not detected |  | ||
In comparison: 52 % of all tested devices do not use PWM to dim the display. If PWM was detected, an average of 7757 (minimum: 5 - maximum: 343500) Hz was measured. | |||
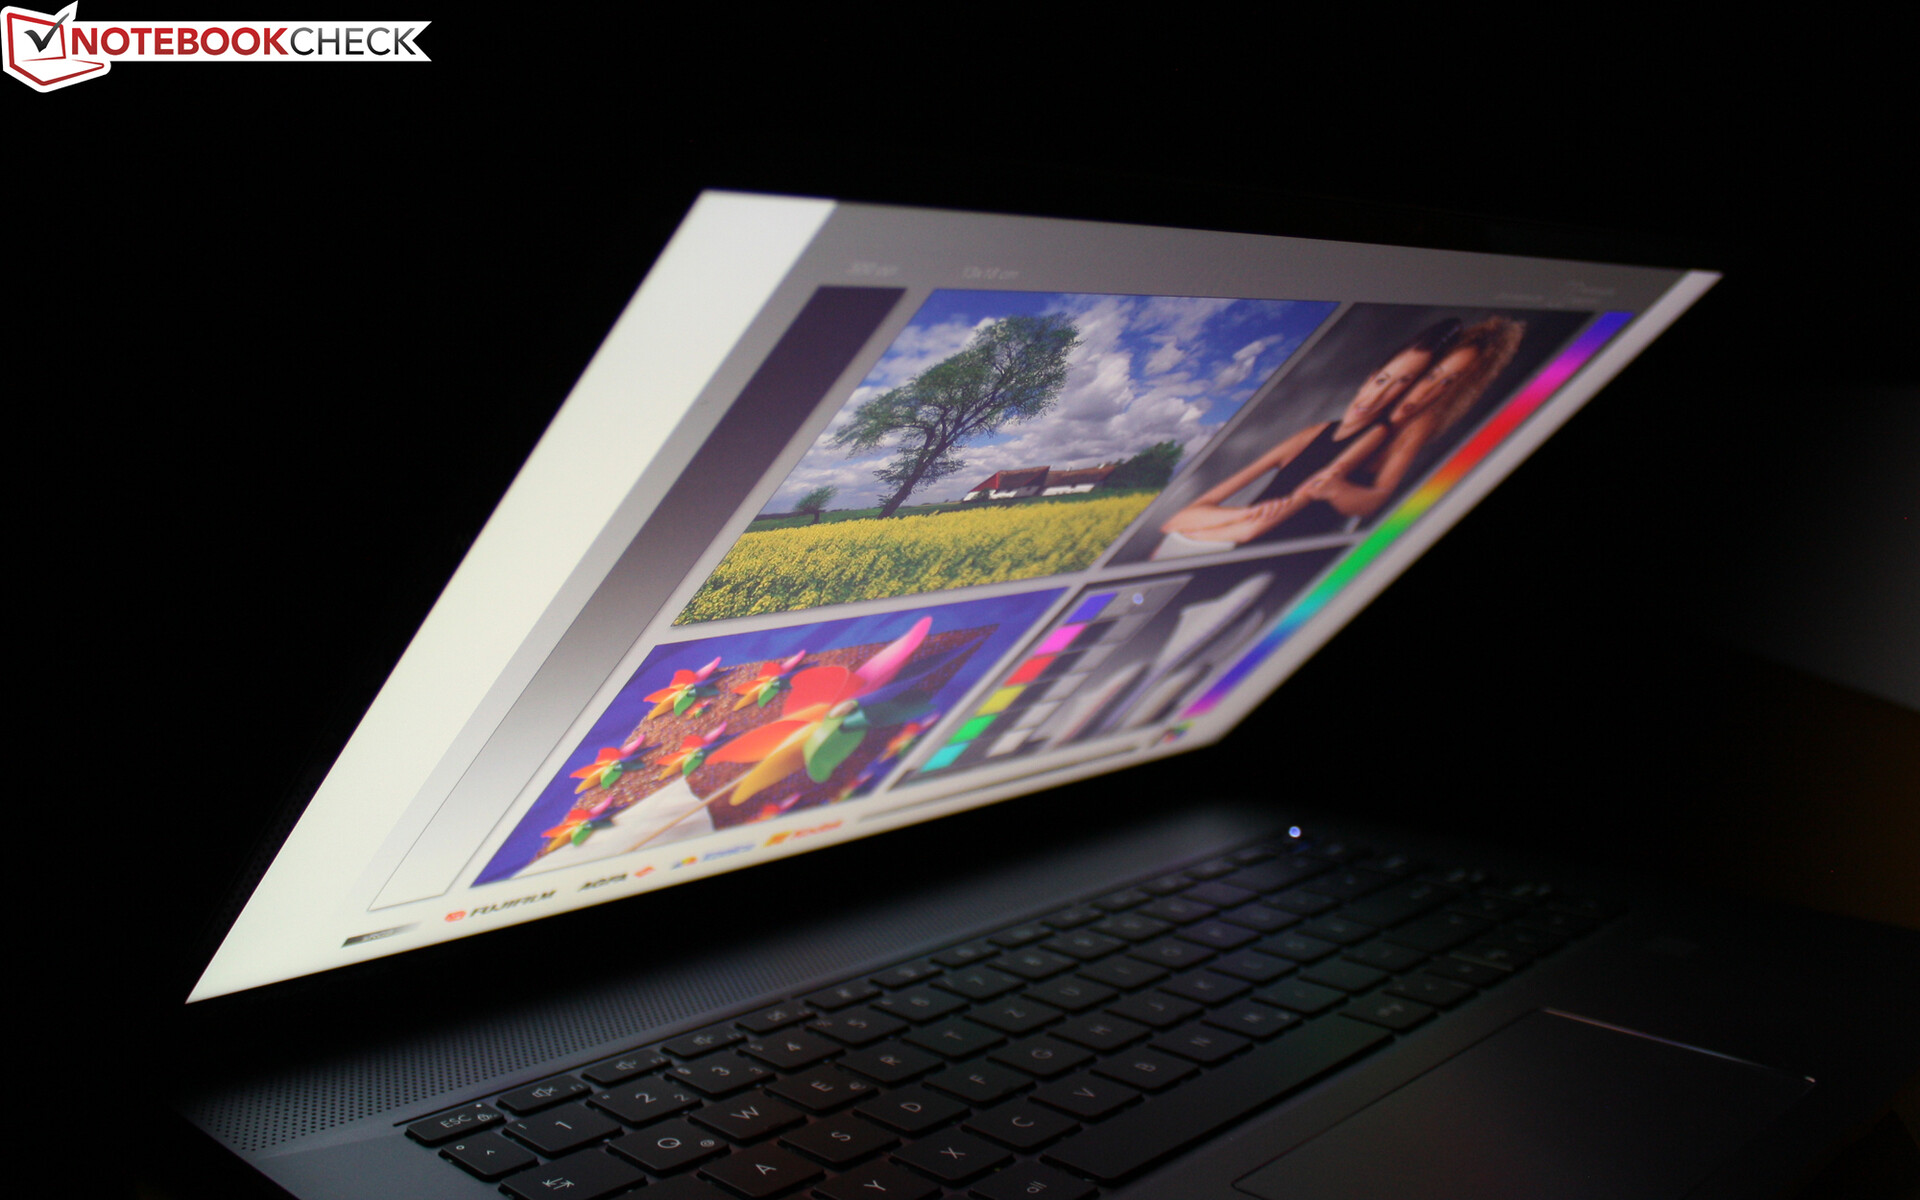
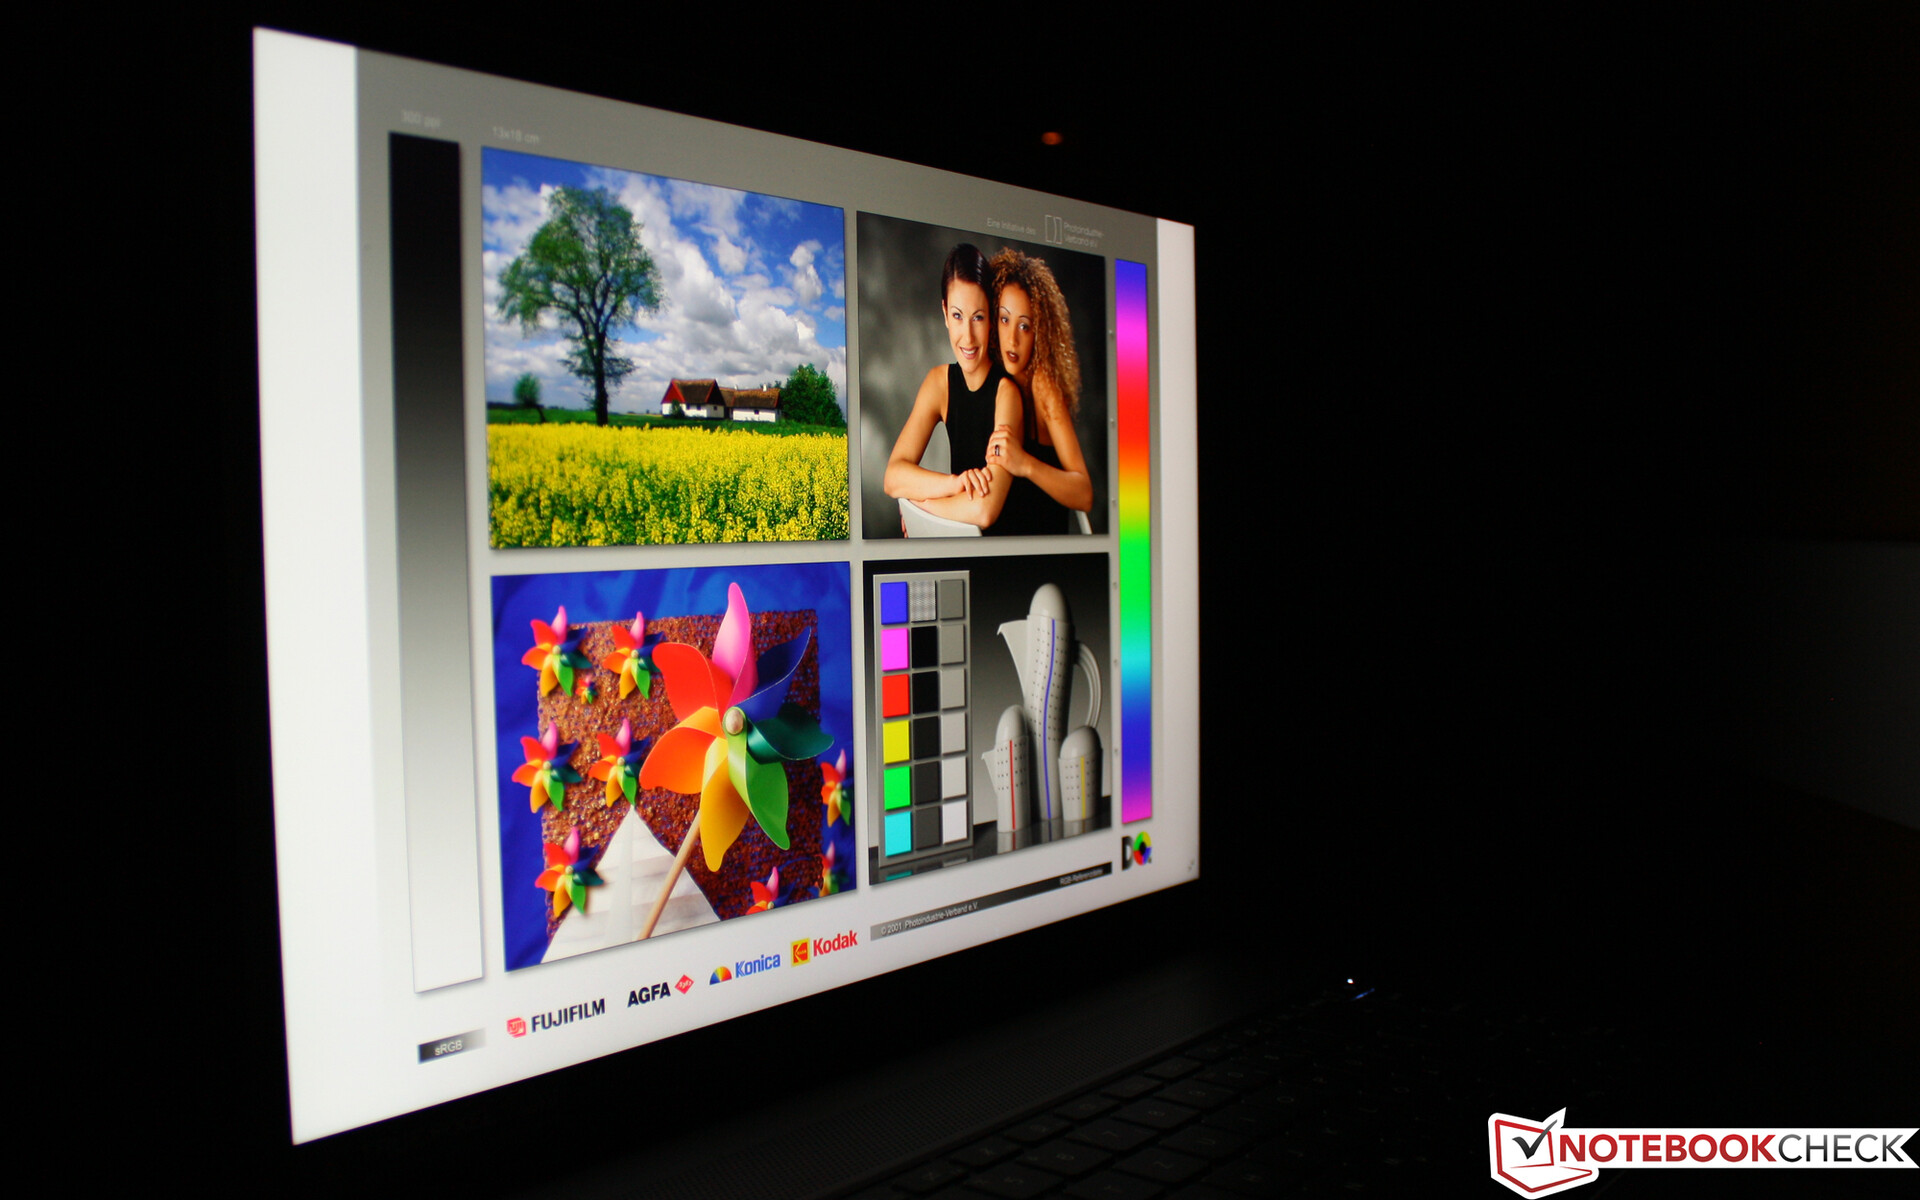
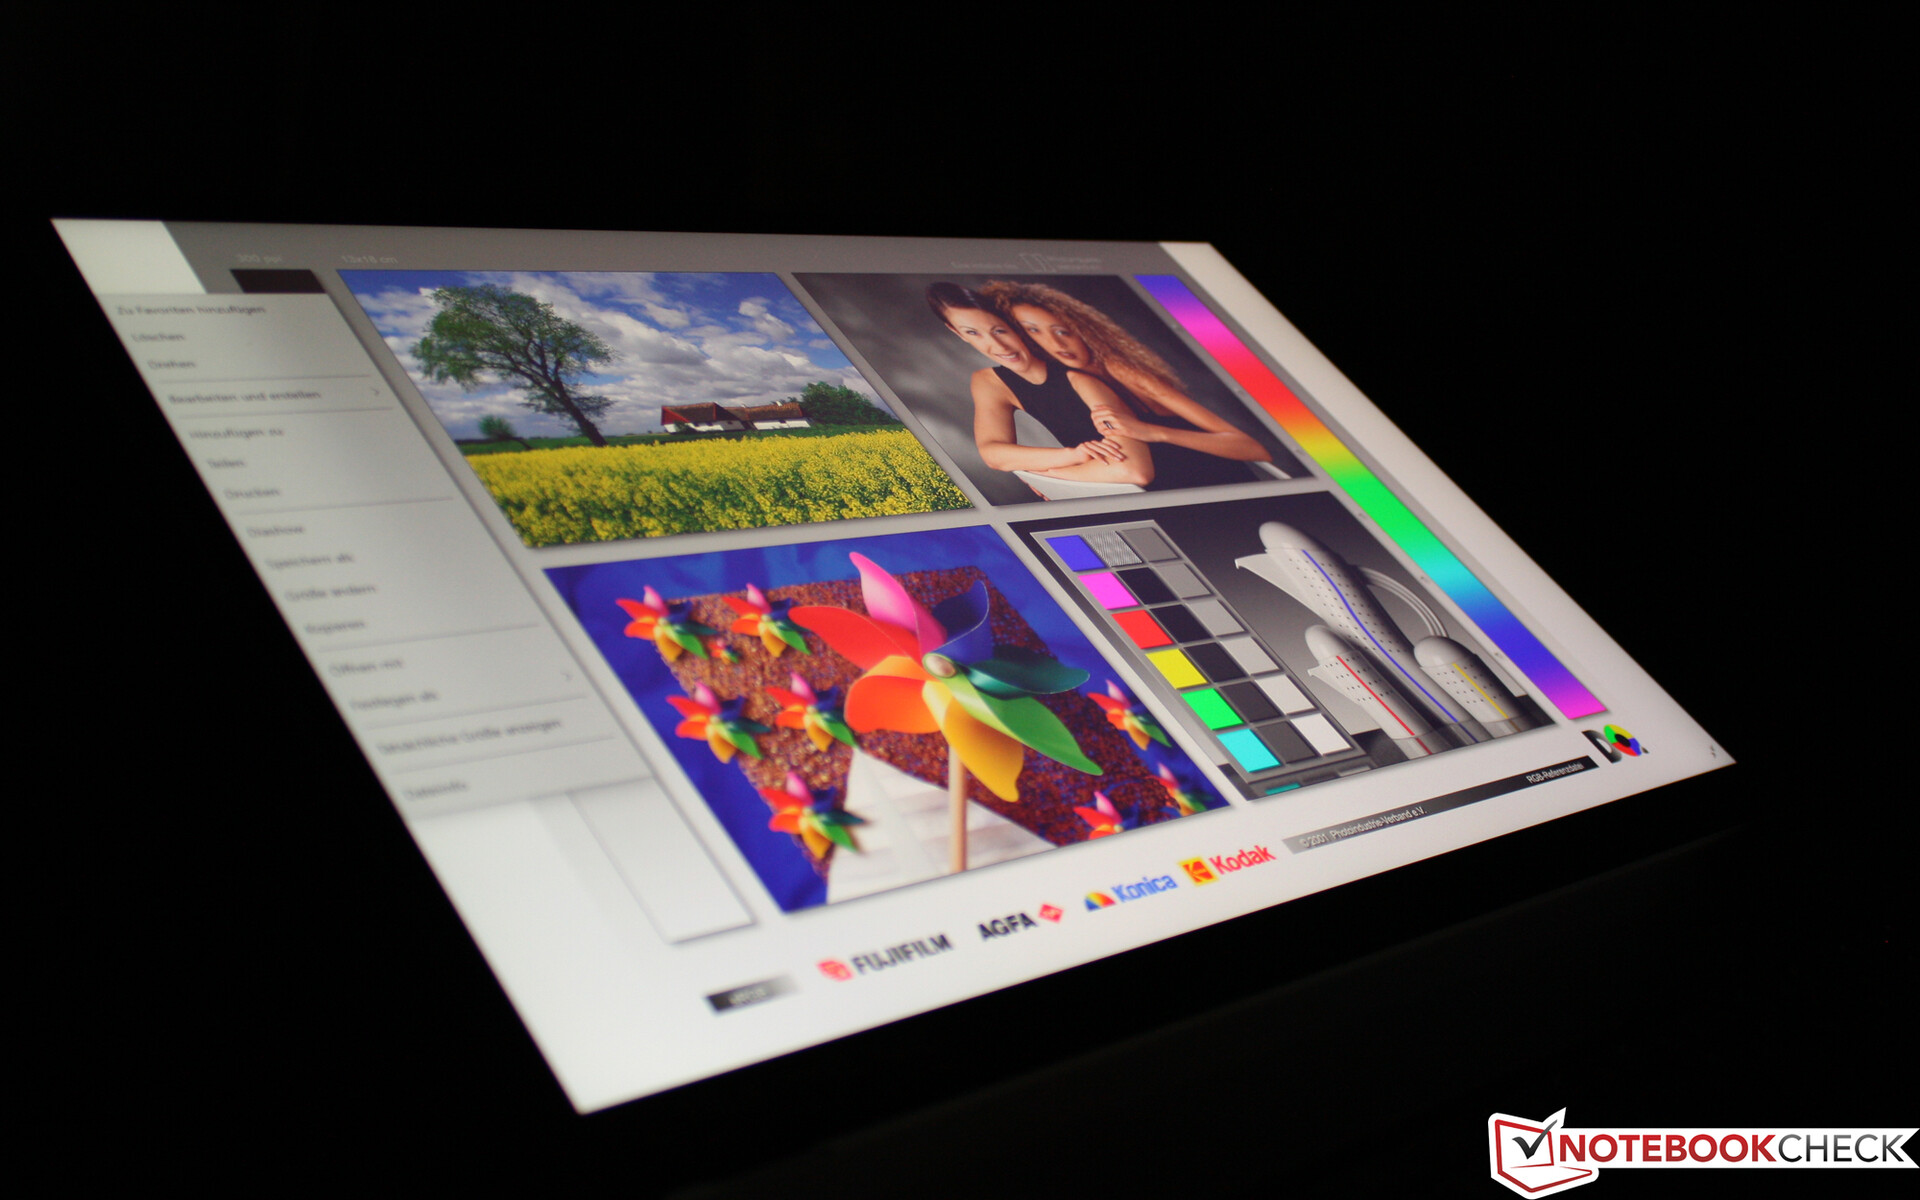
TFT的反射表面只能在户外阳光下有限地使用,最大亮度略低于350cd/m²(平均),用处不大。
视角非常宽,是典型的IPS面板。从每个观察方向看,颜色都保持清晰,轮廓鲜明。
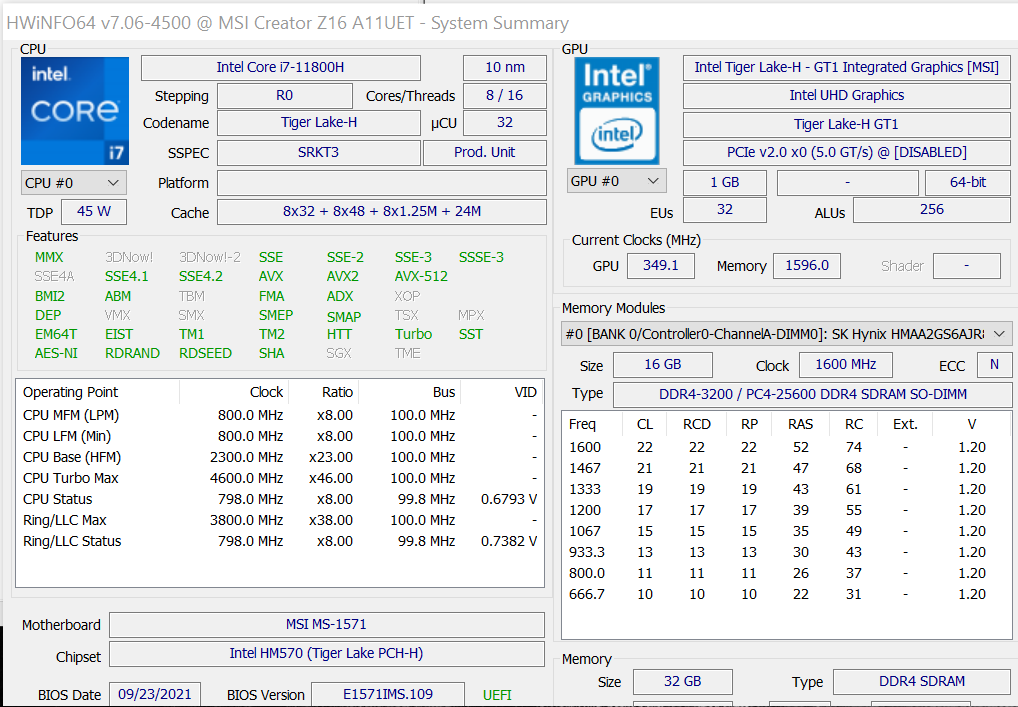
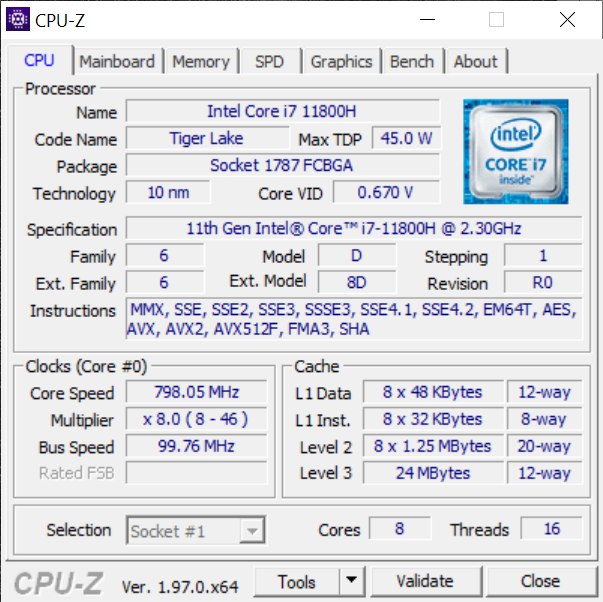
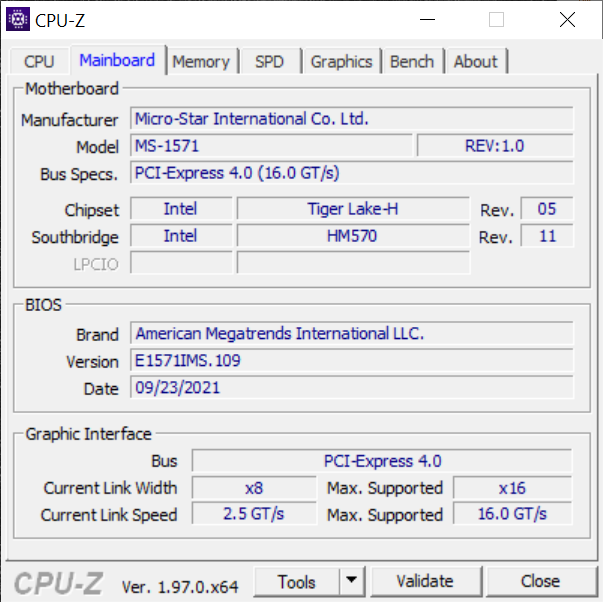
性能 - 英特尔酷睿i7带来的压力
Tiger Lake H45芯片(Willow Cove,10纳米)是一个45瓦的模型,目前属于移动处理器的先锋。英特尔的 酷睿i7-11800H(8个核心)工作频率高达4.60 GHz,并有24 MB+10 MB的巨大缓存。
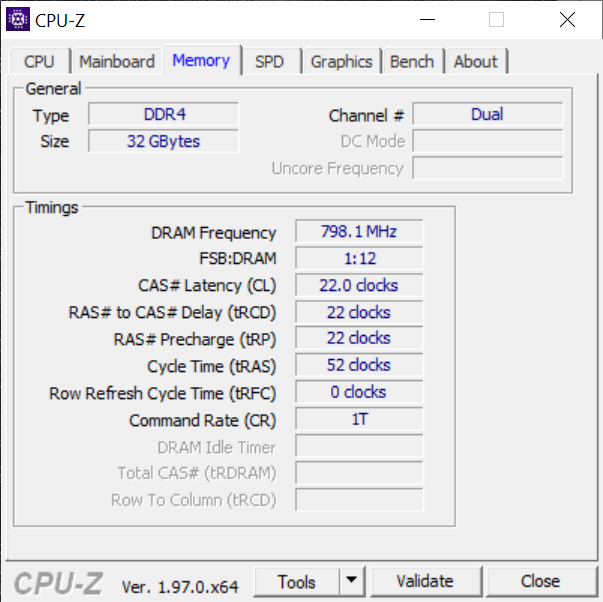
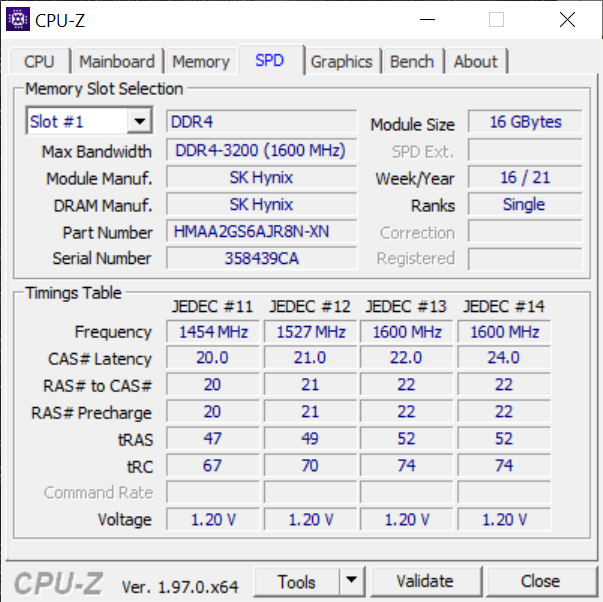
在测试设备中配备了两个RAM插座(2x 16 GB),我们有32 GB DDR4-3200。然而,该系统可以做得更多,即高达64 GB(2x 32 GB)。
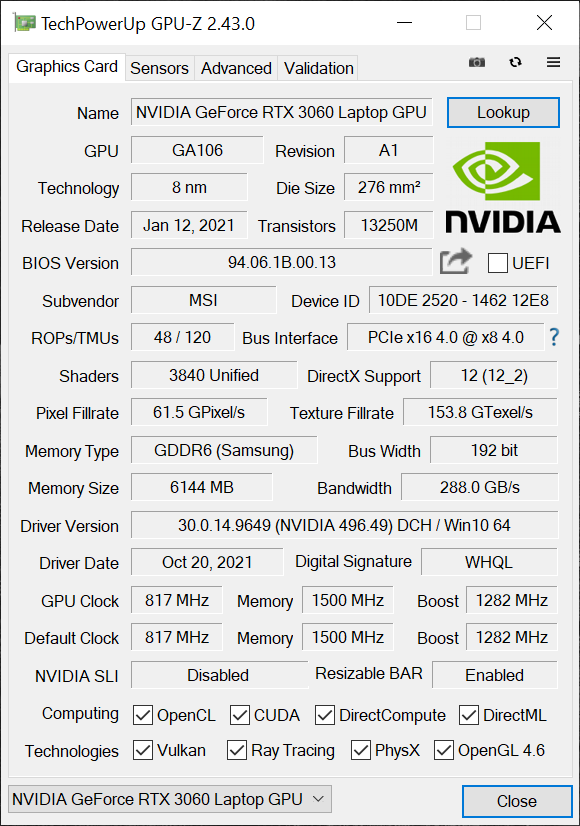
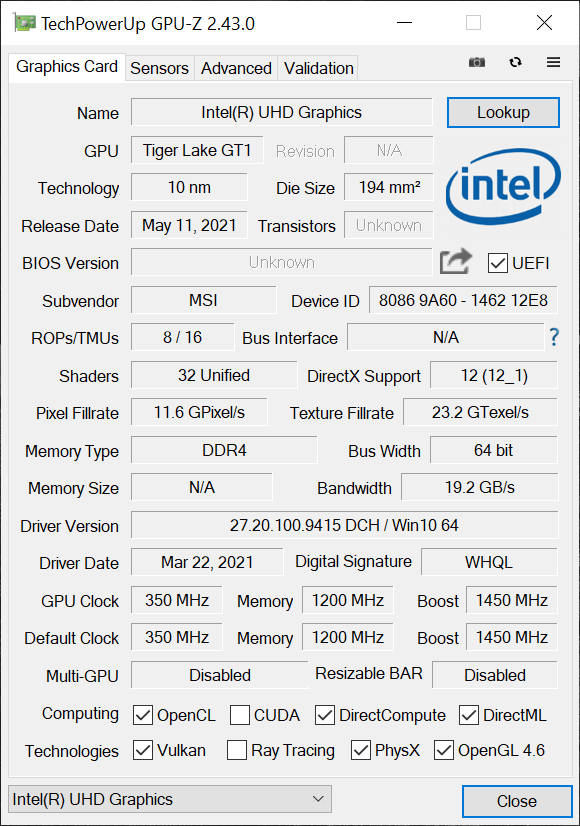
Nvidia GeForce RTX 3060是Z16的标准配置,而且不能取消选择。GA106(安培,8纳米)的最大GPU功率为65W。当闲置或做简单的工作时,RTX会自行关闭,而支持英特尔Xe(32个EU)。
测试条件
在MSI Center Pro中--或者通过一个功能键--你可以在电源配置文件之间切换。我们选择了高性能作为基准。我们将风扇速度保持在自动状态,在高性能状态下只能从自动到扩展/冷却器提升进行设置。Cooler Boost提供了一个永久的、难以忍受的巨大噪音,几乎没有人会在出现时激活它。所提到的配置文件被固定在硬件方面的BIOS中,也可以在那里设置。
处理器
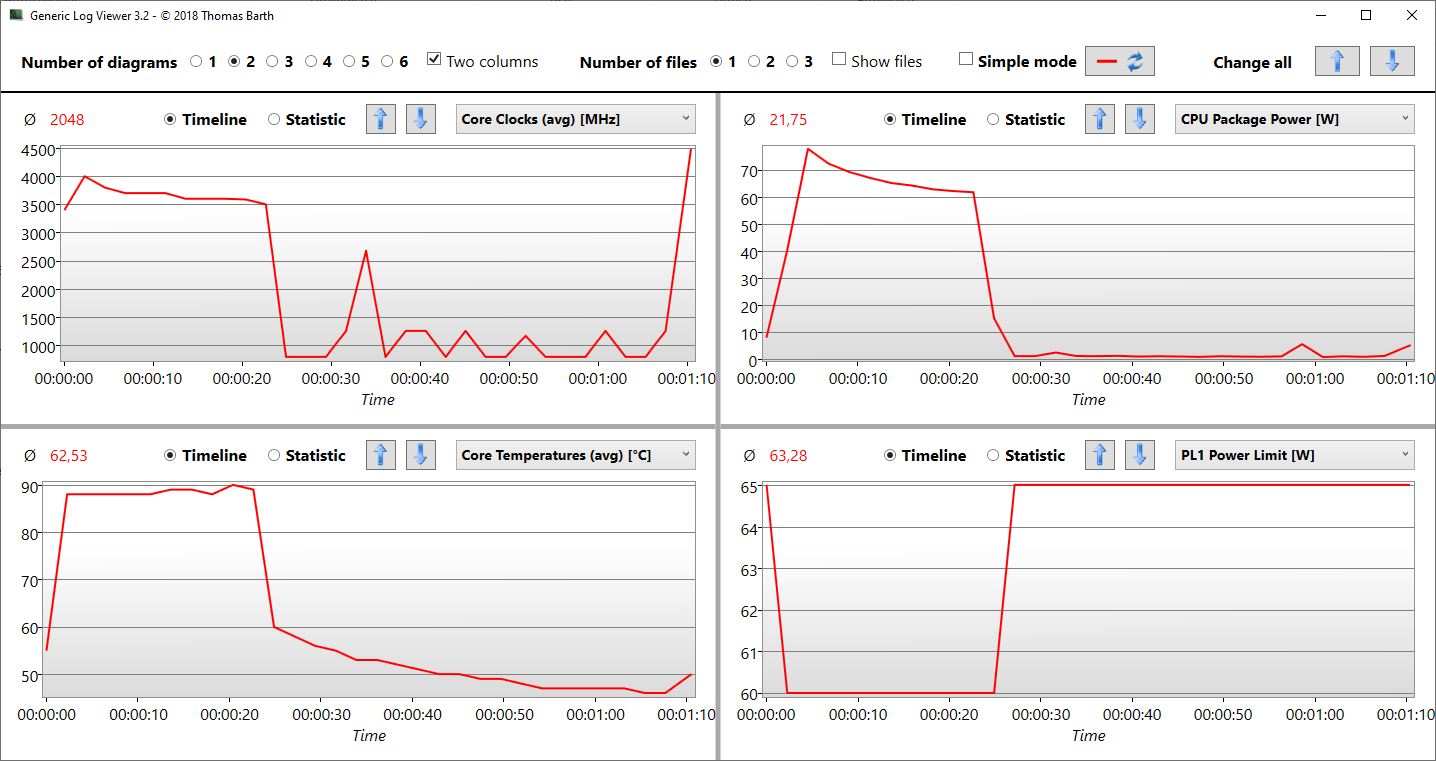
8核处理器 i7-11800H可以执行高达4.60 GHz,但只能有选择地在一个核心上执行。在多核实践中,那么它在所有核心上最多只有4GHz,正如我们在Cinebench中看到的那样。但这不是永久性的,因为SoC希望避免超过90°C(194°F)的过热,这就是为什么它被降低到最高3.6GHz。在这种情况下,CPU封装的功率从最初的75瓦下降到62瓦。
在循环中,取得的R15分数因此从1933分滑落到平均1820分(-6%)。以下是采用相同SoC的相同定位 Razer Blade 15 Advanced(2021年中期)和XPS 17,但这些机型的起点水平较低(1,840)。戴尔的XPS 15 9510 ,其11800H显示,功率输出并不总是那么恒定。即使在性能模式下,15.6英寸机型在R15回路中下降了28%。简而言之:Z16的性能令人印象深刻,这就是为什么CPU的基准测试全面高于平均水平。
在Prime95中,我们注意到与Cinebench中非常相似的行为。在这里,所有核心的连续工作甚至只用3.0GHz运行,因为温度已经上升到刚刚超过90℃(194°F)。
Cinebench R15 Multi Endurance test
Cinebench R23: Multi Core | Single Core
Cinebench R20: CPU (Multi Core) | CPU (Single Core)
Cinebench R15: CPU Multi 64Bit | CPU Single 64Bit
Blender: v2.79 BMW27 CPU
7-Zip 18.03: 7z b 4 | 7z b 4 -mmt1
Geekbench 5.5: Multi-Core | Single-Core
HWBOT x265 Benchmark v2.2: 4k Preset
LibreOffice : 20 Documents To PDF
R Benchmark 2.5: Overall mean
| CPU Performance rating | |
| Average of class Multimedia | |
| Lenovo ThinkBook 16p G2 ACH | |
| Apple MacBook Pro 16 2021 M1 Pro -5! | |
| Razer Blade 15 Advanced (Mid 2021) -2! | |
| MSI Creator Z16 A11UET-209 -3! | |
| Average Intel Core i7-11800H | |
| Dell XPS 17 9710 Core i7 RTX 3060 -2! | |
| Dell XPS 15 9510 11800H RTX 3050 Ti OLED | |
| HP ZBook Studio G7 | |
| Cinebench R23 / Multi Core | |
| Average of class Multimedia (4861 - 33362, n=75, last 2 years) | |
| Lenovo ThinkBook 16p G2 ACH | |
| Apple MacBook Pro 16 2021 M1 Pro | |
| Razer Blade 15 Advanced (Mid 2021) | |
| MSI Creator Z16 A11UET-209 | |
| Dell XPS 17 9710 Core i7 RTX 3060 | |
| Average Intel Core i7-11800H (6508 - 14088, n=48) | |
| Dell XPS 15 9510 11800H RTX 3050 Ti OLED | |
| HP ZBook Studio G7 | |
| Cinebench R23 / Single Core | |
| Average of class Multimedia (1128 - 2459, n=67, last 2 years) | |
| Apple MacBook Pro 16 2021 M1 Pro | |
| Razer Blade 15 Advanced (Mid 2021) | |
| MSI Creator Z16 A11UET-209 | |
| Dell XPS 17 9710 Core i7 RTX 3060 | |
| Dell XPS 15 9510 11800H RTX 3050 Ti OLED | |
| Average Intel Core i7-11800H (1386 - 1522, n=45) | |
| Lenovo ThinkBook 16p G2 ACH | |
| HP ZBook Studio G7 | |
| Cinebench R20 / CPU (Multi Core) | |
| Average of class Multimedia (1887 - 12912, n=58, last 2 years) | |
| Lenovo ThinkBook 16p G2 ACH | |
| MSI Creator Z16 A11UET-209 | |
| Razer Blade 15 Advanced (Mid 2021) | |
| Average Intel Core i7-11800H (2498 - 5408, n=50) | |
| Dell XPS 17 9710 Core i7 RTX 3060 | |
| Dell XPS 15 9510 11800H RTX 3050 Ti OLED | |
| HP ZBook Studio G7 | |
| Apple MacBook Pro 16 2021 M1 Pro | |
| Cinebench R20 / CPU (Single Core) | |
| Average of class Multimedia (425 - 853, n=58, last 2 years) | |
| Razer Blade 15 Advanced (Mid 2021) | |
| Dell XPS 15 9510 11800H RTX 3050 Ti OLED | |
| Lenovo ThinkBook 16p G2 ACH | |
| MSI Creator Z16 A11UET-209 | |
| Dell XPS 17 9710 Core i7 RTX 3060 | |
| Average Intel Core i7-11800H (520 - 586, n=47) | |
| HP ZBook Studio G7 | |
| Apple MacBook Pro 16 2021 M1 Pro | |
| Cinebench R15 / CPU Multi 64Bit | |
| Average of class Multimedia (856 - 5224, n=62, last 2 years) | |
| Lenovo ThinkBook 16p G2 ACH | |
| Dell XPS 15 9510 11800H RTX 3050 Ti OLED | |
| Dell XPS 15 9510 11800H RTX 3050 Ti OLED | |
| MSI Creator Z16 A11UET-209 | |
| Average Intel Core i7-11800H (1342 - 2173, n=50) | |
| Razer Blade 15 Advanced (Mid 2021) | |
| Dell XPS 17 9710 Core i7 RTX 3060 | |
| HP ZBook Studio G7 | |
| Apple MacBook Pro 16 2021 M1 Pro | |
| Cinebench R15 / CPU Single 64Bit | |
| Average of class Multimedia (184.8 - 326, n=60, last 2 years) | |
| Lenovo ThinkBook 16p G2 ACH | |
| Dell XPS 15 9510 11800H RTX 3050 Ti OLED | |
| Razer Blade 15 Advanced (Mid 2021) | |
| Dell XPS 17 9710 Core i7 RTX 3060 | |
| Average Intel Core i7-11800H (201 - 231, n=46) | |
| HP ZBook Studio G7 | |
| Apple MacBook Pro 16 2021 M1 Pro | |
| MSI Creator Z16 A11UET-209 | |
| Blender / v2.79 BMW27 CPU | |
| Dell XPS 15 9510 11800H RTX 3050 Ti OLED | |
| HP ZBook Studio G7 | |
| Average Intel Core i7-11800H (217 - 454, n=46) | |
| Dell XPS 17 9710 Core i7 RTX 3060 | |
| Razer Blade 15 Advanced (Mid 2021) | |
| MSI Creator Z16 A11UET-209 | |
| Average of class Multimedia (100 - 557, n=59, last 2 years) | |
| Lenovo ThinkBook 16p G2 ACH | |
| Apple MacBook Pro 16 2021 M1 Pro | |
| 7-Zip 18.03 / 7z b 4 | |
| Lenovo ThinkBook 16p G2 ACH | |
| Average of class Multimedia (26062 - 130368, n=56, last 2 years) | |
| Razer Blade 15 Advanced (Mid 2021) | |
| Dell XPS 17 9710 Core i7 RTX 3060 | |
| Average Intel Core i7-11800H (33718 - 56758, n=46) | |
| HP ZBook Studio G7 | |
| Dell XPS 15 9510 11800H RTX 3050 Ti OLED | |
| 7-Zip 18.03 / 7z b 4 -mmt1 | |
| Average of class Multimedia (3666 - 7545, n=57, last 2 years) | |
| Lenovo ThinkBook 16p G2 ACH | |
| HP ZBook Studio G7 | |
| Average Intel Core i7-11800H (5138 - 5732, n=46) | |
| Dell XPS 17 9710 Core i7 RTX 3060 | |
| Razer Blade 15 Advanced (Mid 2021) | |
| Dell XPS 15 9510 11800H RTX 3050 Ti OLED | |
| Geekbench 5.5 / Multi-Core | |
| Average of class Multimedia (4652 - 20422, n=57, last 2 years) | |
| Apple MacBook Pro 16 2021 M1 Pro | |
| MSI Creator Z16 A11UET-209 | |
| MSI Creator Z16 A11UET-209 | |
| Lenovo ThinkBook 16p G2 ACH | |
| Average Intel Core i7-11800H (4655 - 9851, n=40) | |
| Dell XPS 15 9510 11800H RTX 3050 Ti OLED | |
| HP ZBook Studio G7 | |
| Geekbench 5.5 / Single-Core | |
| Average of class Multimedia (805 - 2974, n=57, last 2 years) | |
| Apple MacBook Pro 16 2021 M1 Pro | |
| MSI Creator Z16 A11UET-209 | |
| MSI Creator Z16 A11UET-209 | |
| Average Intel Core i7-11800H (1429 - 1625, n=40) | |
| Lenovo ThinkBook 16p G2 ACH | |
| Dell XPS 15 9510 11800H RTX 3050 Ti OLED | |
| HP ZBook Studio G7 | |
| HWBOT x265 Benchmark v2.2 / 4k Preset | |
| Average of class Multimedia (5.26 - 36.1, n=57, last 2 years) | |
| Lenovo ThinkBook 16p G2 ACH | |
| Razer Blade 15 Advanced (Mid 2021) | |
| Dell XPS 17 9710 Core i7 RTX 3060 | |
| MSI Creator Z16 A11UET-209 | |
| Average Intel Core i7-11800H (7.38 - 17.4, n=46) | |
| HP ZBook Studio G7 | |
| Dell XPS 15 9510 11800H RTX 3050 Ti OLED | |
| LibreOffice / 20 Documents To PDF | |
| HP ZBook Studio G7 | |
| Lenovo ThinkBook 16p G2 ACH | |
| Average of class Multimedia (23.9 - 146.7, n=58, last 2 years) | |
| Dell XPS 15 9510 11800H RTX 3050 Ti OLED | |
| Average Intel Core i7-11800H (38.6 - 59.9, n=45) | |
| Razer Blade 15 Advanced (Mid 2021) | |
| Dell XPS 17 9710 Core i7 RTX 3060 | |
| R Benchmark 2.5 / Overall mean | |
| Dell XPS 15 9510 11800H RTX 3050 Ti OLED | |
| Average Intel Core i7-11800H (0.548 - 0.615, n=46) | |
| HP ZBook Studio G7 | |
| MSI Creator Z16 A11UET-209 | |
| Dell XPS 17 9710 Core i7 RTX 3060 | |
| Razer Blade 15 Advanced (Mid 2021) | |
| Lenovo ThinkBook 16p G2 ACH | |
| Average of class Multimedia (0.3604 - 0.947, n=57, last 2 years) | |
* ... smaller is better
AIDA64: FP32 Ray-Trace | FPU Julia | CPU SHA3 | CPU Queen | FPU SinJulia | FPU Mandel | CPU AES | CPU ZLib | FP64 Ray-Trace | CPU PhotoWorxx
| Performance rating | |
| Average of class Multimedia | |
| Average Intel Core i7-11800H | |
| HP ZBook Studio G7 | |
| MSI Creator Z16 A11UET-209 -7! | |
| Razer Blade 15 Advanced (Mid 2021) -9! | |
| Dell XPS 17 9710 Core i7 RTX 3060 -9! | |
| Dell XPS 15 9510 11800H RTX 3050 Ti OLED -9! | |
| AIDA64 / FP32 Ray-Trace | |
| Average of class Multimedia (2214 - 50388, n=54, last 2 years) | |
| Average Intel Core i7-11800H (8772 - 15961, n=20) | |
| HP ZBook Studio G7 | |
| AIDA64 / FPU Julia | |
| Average of class Multimedia (12867 - 201874, n=55, last 2 years) | |
| HP ZBook Studio G7 | |
| Average Intel Core i7-11800H (39404 - 65636, n=20) | |
| AIDA64 / CPU SHA3 | |
| Average of class Multimedia (626 - 8623, n=55, last 2 years) | |
| Average Intel Core i7-11800H (2599 - 4439, n=20) | |
| HP ZBook Studio G7 | |
| AIDA64 / CPU Queen | |
| HP ZBook Studio G7 | |
| Average Intel Core i7-11800H (85233 - 91941, n=20) | |
| Average of class Multimedia (13483 - 181505, n=42, last 2 years) | |
| AIDA64 / FPU SinJulia | |
| HP ZBook Studio G7 | |
| Average Intel Core i7-11800H (6420 - 9792, n=20) | |
| Average of class Multimedia (886 - 28794, n=55, last 2 years) | |
| AIDA64 / FPU Mandel | |
| Average of class Multimedia (6395 - 105740, n=54, last 2 years) | |
| Average Intel Core i7-11800H (23365 - 39464, n=20) | |
| HP ZBook Studio G7 | |
| AIDA64 / CPU AES | |
| Average Intel Core i7-11800H (74617 - 149388, n=20) | |
| Average of class Multimedia (8171 - 126790, n=55, last 2 years) | |
| HP ZBook Studio G7 | |
| AIDA64 / CPU ZLib | |
| Average of class Multimedia (143.8 - 2022, n=55, last 2 years) | |
| MSI Creator Z16 A11UET-209 | |
| HP ZBook Studio G7 | |
| Average Intel Core i7-11800H (461 - 830, n=43) | |
| Razer Blade 15 Advanced (Mid 2021) | |
| Dell XPS 17 9710 Core i7 RTX 3060 | |
| Dell XPS 15 9510 11800H RTX 3050 Ti OLED | |
| AIDA64 / FP64 Ray-Trace | |
| Average of class Multimedia (1014 - 26875, n=55, last 2 years) | |
| MSI Creator Z16 A11UET-209 | |
| Average Intel Core i7-11800H (4545 - 8717, n=21) | |
| HP ZBook Studio G7 | |
| AIDA64 / CPU PhotoWorxx | |
| Average of class Multimedia (8187 - 88154, n=55, last 2 years) | |
| MSI Creator Z16 A11UET-209 | |
| Average Intel Core i7-11800H (11898 - 26757, n=21) | |
| HP ZBook Studio G7 | |
系统性能
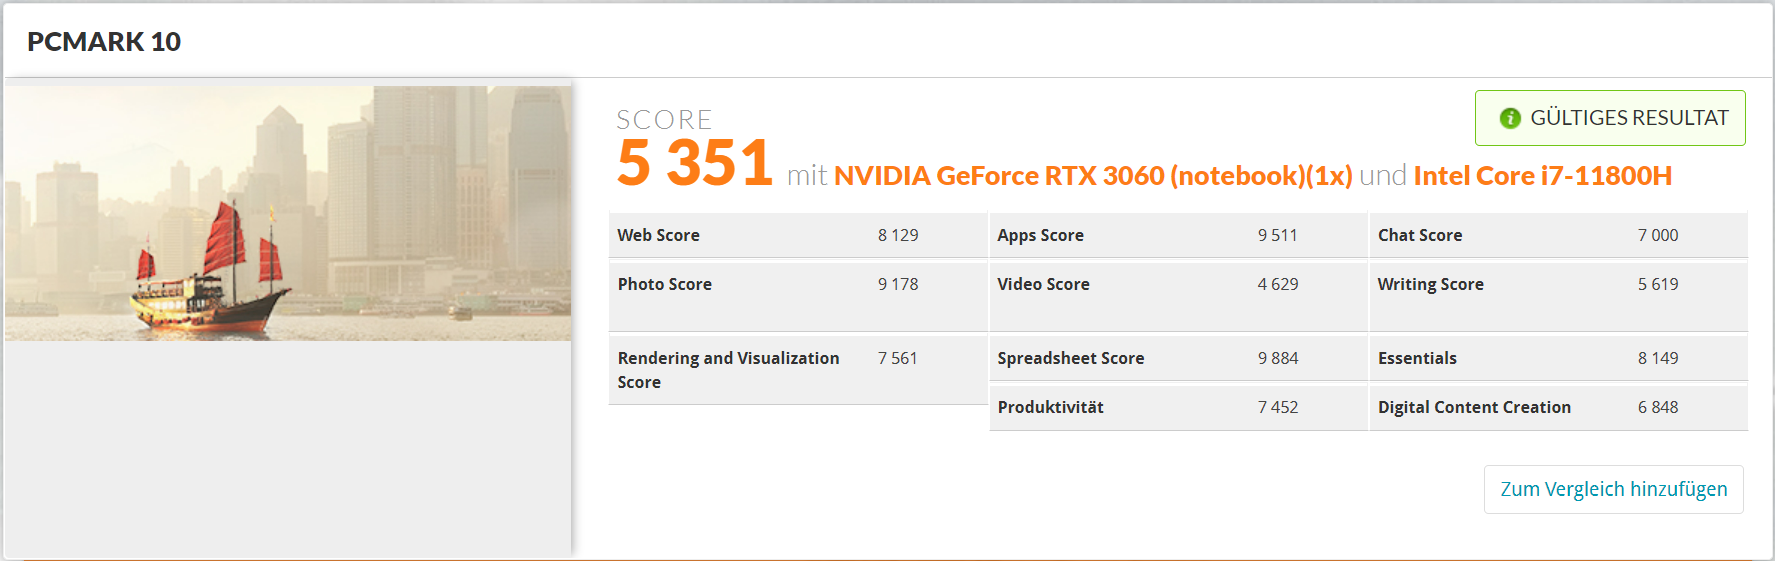
根据PCMark 10的应用性能低于平均水平,考虑到处理器的速率,这令人惊讶。这主要不是由于Phison固态硬盘的原因,正如固态硬盘的基准测试随后显示的那样。这可能是由于组件之间的相互作用,这一点在 Razer Blade 15 Advanced或 联想ThinkBook 16p.在电池模式下,PCMark 10得分从6,156分下降到5,351分(-13%)(最大性能配置文件)。相应地,几乎所有的性能都可以在旅途中使用。
| PCMark 10 / Score | |
| Average of class Multimedia (4325 - 10386, n=53, last 2 years) | |
| Razer Blade 15 Advanced (Mid 2021) | |
| Lenovo ThinkBook 16p G2 ACH | |
| Dell XPS 17 9710 Core i7 RTX 3060 | |
| Average Intel Core i7-11800H, NVIDIA GeForce RTX 3060 Laptop GPU (6156 - 6865, n=4) | |
| MSI Creator Z16 A11UET-209 | |
| Dell XPS 15 9510 11800H RTX 3050 Ti OLED | |
| HP ZBook Studio G7 | |
| PCMark 10 / Essentials | |
| Razer Blade 15 Advanced (Mid 2021) | |
| Average of class Multimedia (8025 - 11664, n=52, last 2 years) | |
| Lenovo ThinkBook 16p G2 ACH | |
| Dell XPS 17 9710 Core i7 RTX 3060 | |
| Average Intel Core i7-11800H, NVIDIA GeForce RTX 3060 Laptop GPU (9063 - 10522, n=4) | |
| Dell XPS 15 9510 11800H RTX 3050 Ti OLED | |
| MSI Creator Z16 A11UET-209 | |
| HP ZBook Studio G7 | |
| PCMark 10 / Productivity | |
| Average of class Multimedia (7323 - 18233, n=52, last 2 years) | |
| Lenovo ThinkBook 16p G2 ACH | |
| Razer Blade 15 Advanced (Mid 2021) | |
| Dell XPS 17 9710 Core i7 RTX 3060 | |
| Average Intel Core i7-11800H, NVIDIA GeForce RTX 3060 Laptop GPU (8200 - 8874, n=4) | |
| Dell XPS 15 9510 11800H RTX 3050 Ti OLED | |
| MSI Creator Z16 A11UET-209 | |
| HP ZBook Studio G7 | |
| PCMark 10 / Digital Content Creation | |
| Razer Blade 15 Advanced (Mid 2021) | |
| Average of class Multimedia (3651 - 16240, n=52, last 2 years) | |
| Dell XPS 17 9710 Core i7 RTX 3060 | |
| Average Intel Core i7-11800H, NVIDIA GeForce RTX 3060 Laptop GPU (8520 - 9423, n=4) | |
| Lenovo ThinkBook 16p G2 ACH | |
| MSI Creator Z16 A11UET-209 | |
| Dell XPS 15 9510 11800H RTX 3050 Ti OLED | |
| HP ZBook Studio G7 | |
| PCMark 10 Score | 6156 points | |
Help | ||
| AIDA64 / Memory Copy | |
| Average of class Multimedia (11299 - 132135, n=55, last 2 years) | |
| MSI Creator Z16 A11UET-209 | |
| Lenovo ThinkPad P15s Gen2-20W6000GGE | |
| Average Intel Core i7-11800H (24508 - 48144, n=21) | |
| Lenovo ThinkBook 16p G2 ACH | |
| HP ZBook Studio G7 | |
| AIDA64 / Memory Read | |
| Average of class Multimedia (11624 - 174586, n=55, last 2 years) | |
| Lenovo ThinkPad P15s Gen2-20W6000GGE | |
| Lenovo ThinkBook 16p G2 ACH | |
| Average Intel Core i7-11800H (25882 - 50365, n=20) | |
| HP ZBook Studio G7 | |
| AIDA64 / Memory Write | |
| Average of class Multimedia (11755 - 134998, n=55, last 2 years) | |
| Lenovo ThinkPad P15s Gen2-20W6000GGE | |
| Average Intel Core i7-11800H (22240 - 46214, n=20) | |
| Lenovo ThinkBook 16p G2 ACH | |
| HP ZBook Studio G7 | |
| AIDA64 / Memory Latency | |
| Average of class Multimedia (7 - 535, n=54, last 2 years) | |
| MSI Creator Z16 A11UET-209 | |
| Lenovo ThinkBook 16p G2 ACH | |
| Lenovo ThinkPad P15s Gen2-20W6000GGE | |
| HP ZBook Studio G7 | |
| Average Intel Core i7-11800H (71.9 - 104.1, n=44) | |
| Razer Blade 15 Advanced (Mid 2021) | |
| Dell XPS 17 9710 Core i7 RTX 3060 | |
| Dell XPS 15 9510 11800H RTX 3050 Ti OLED | |
* ... smaller is better
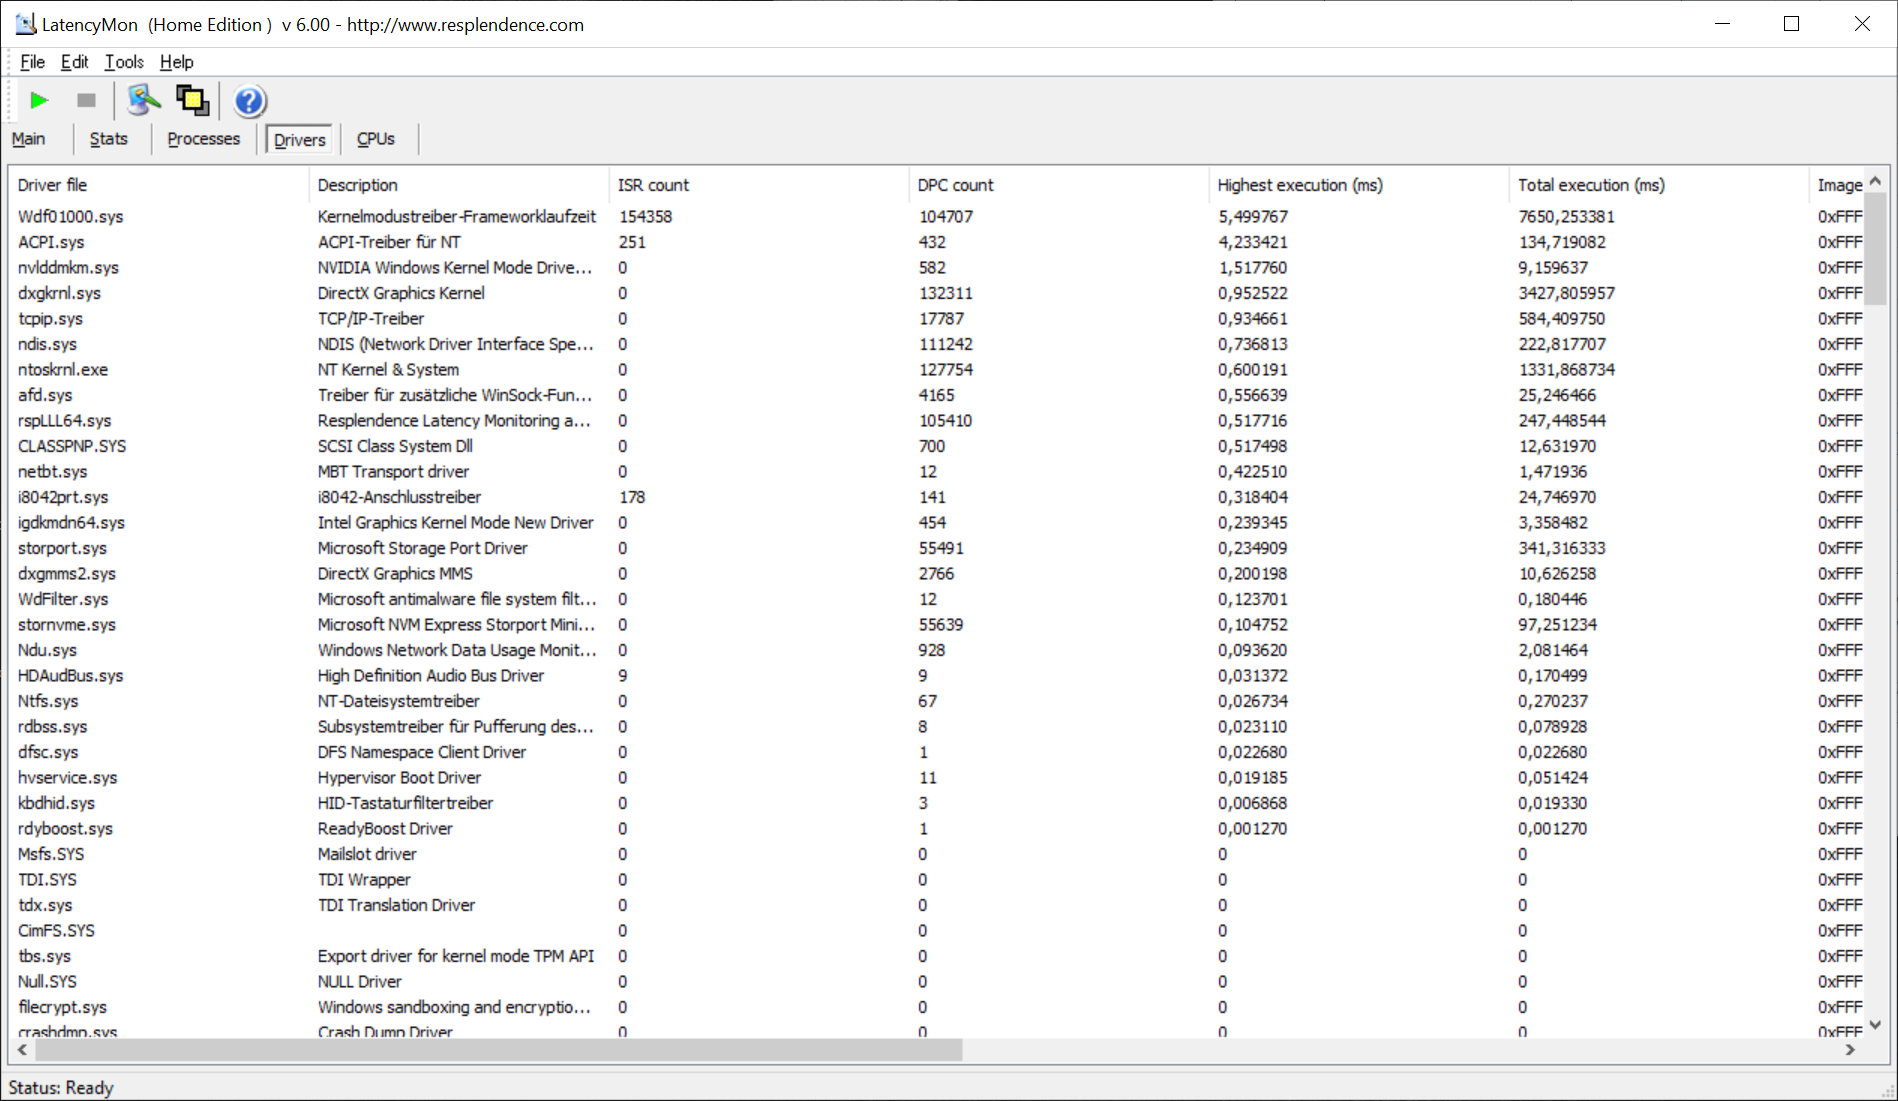
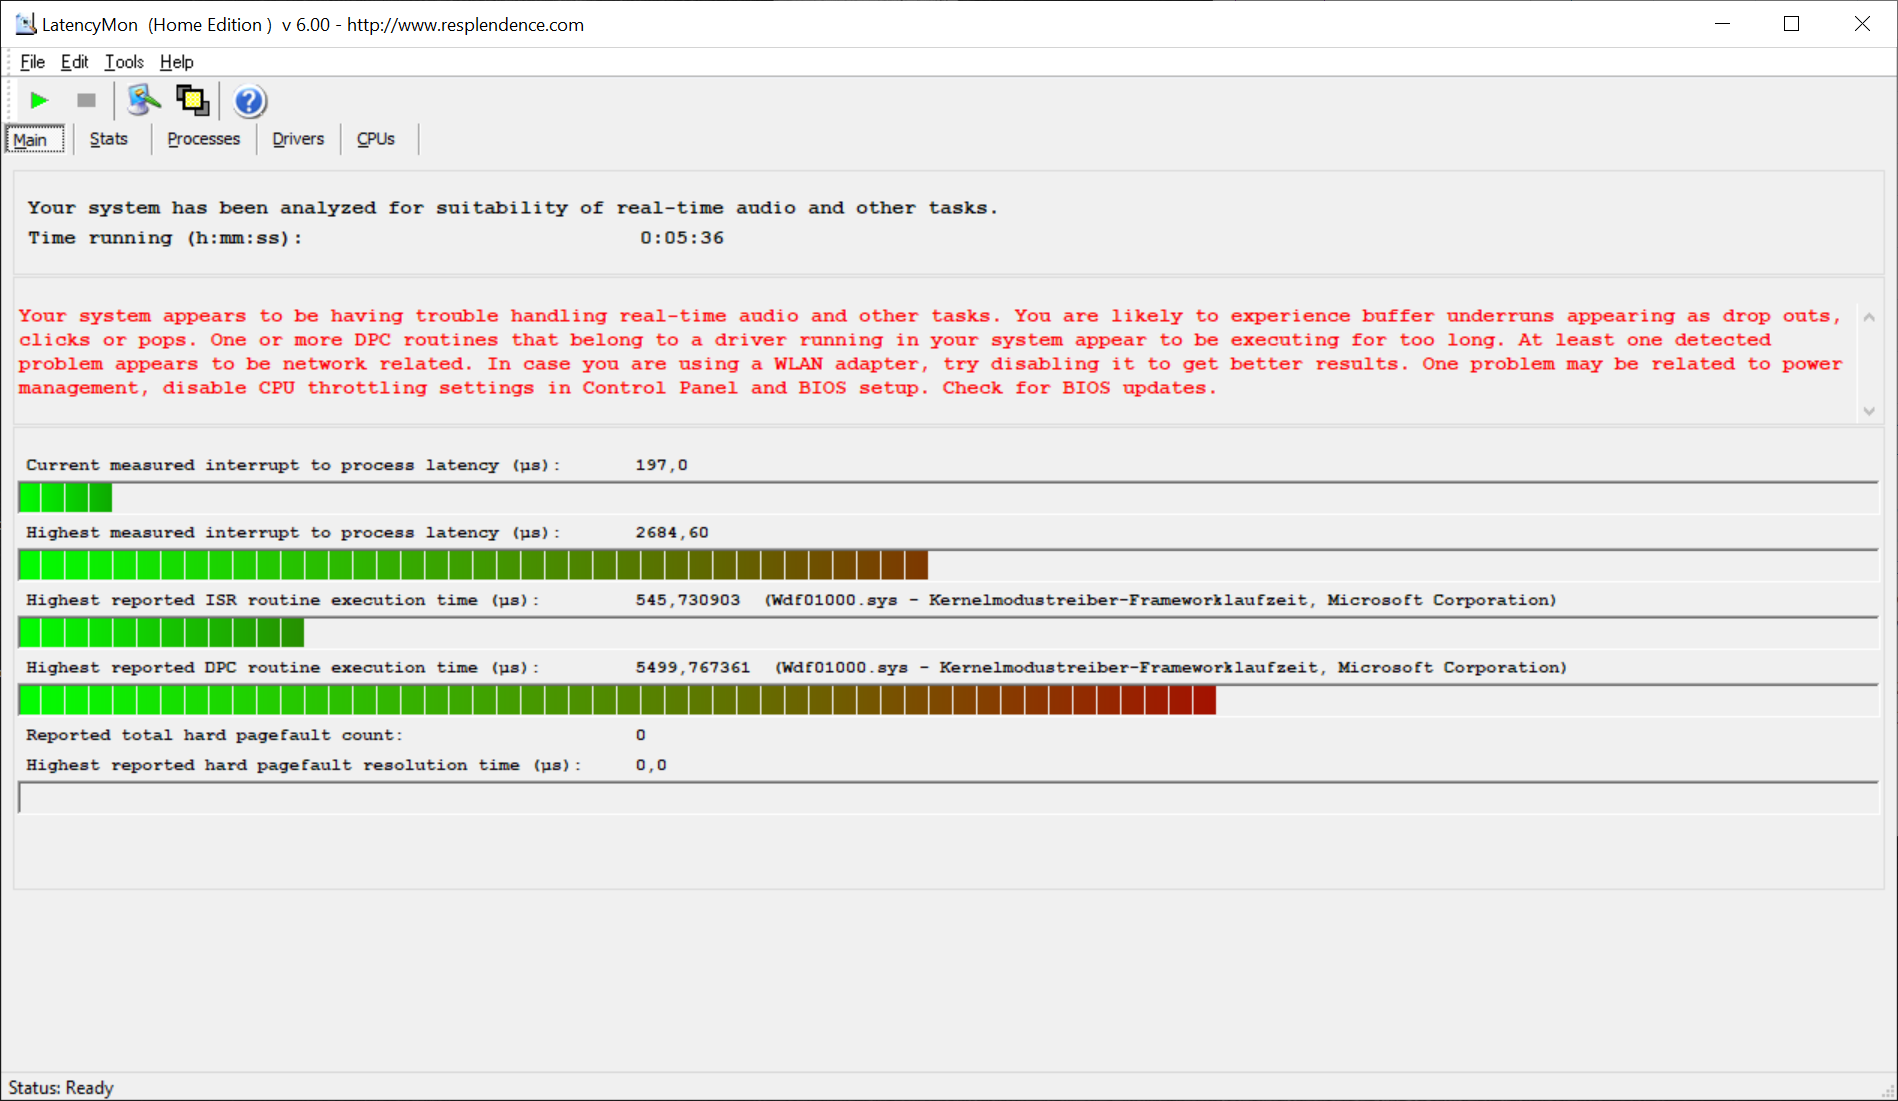
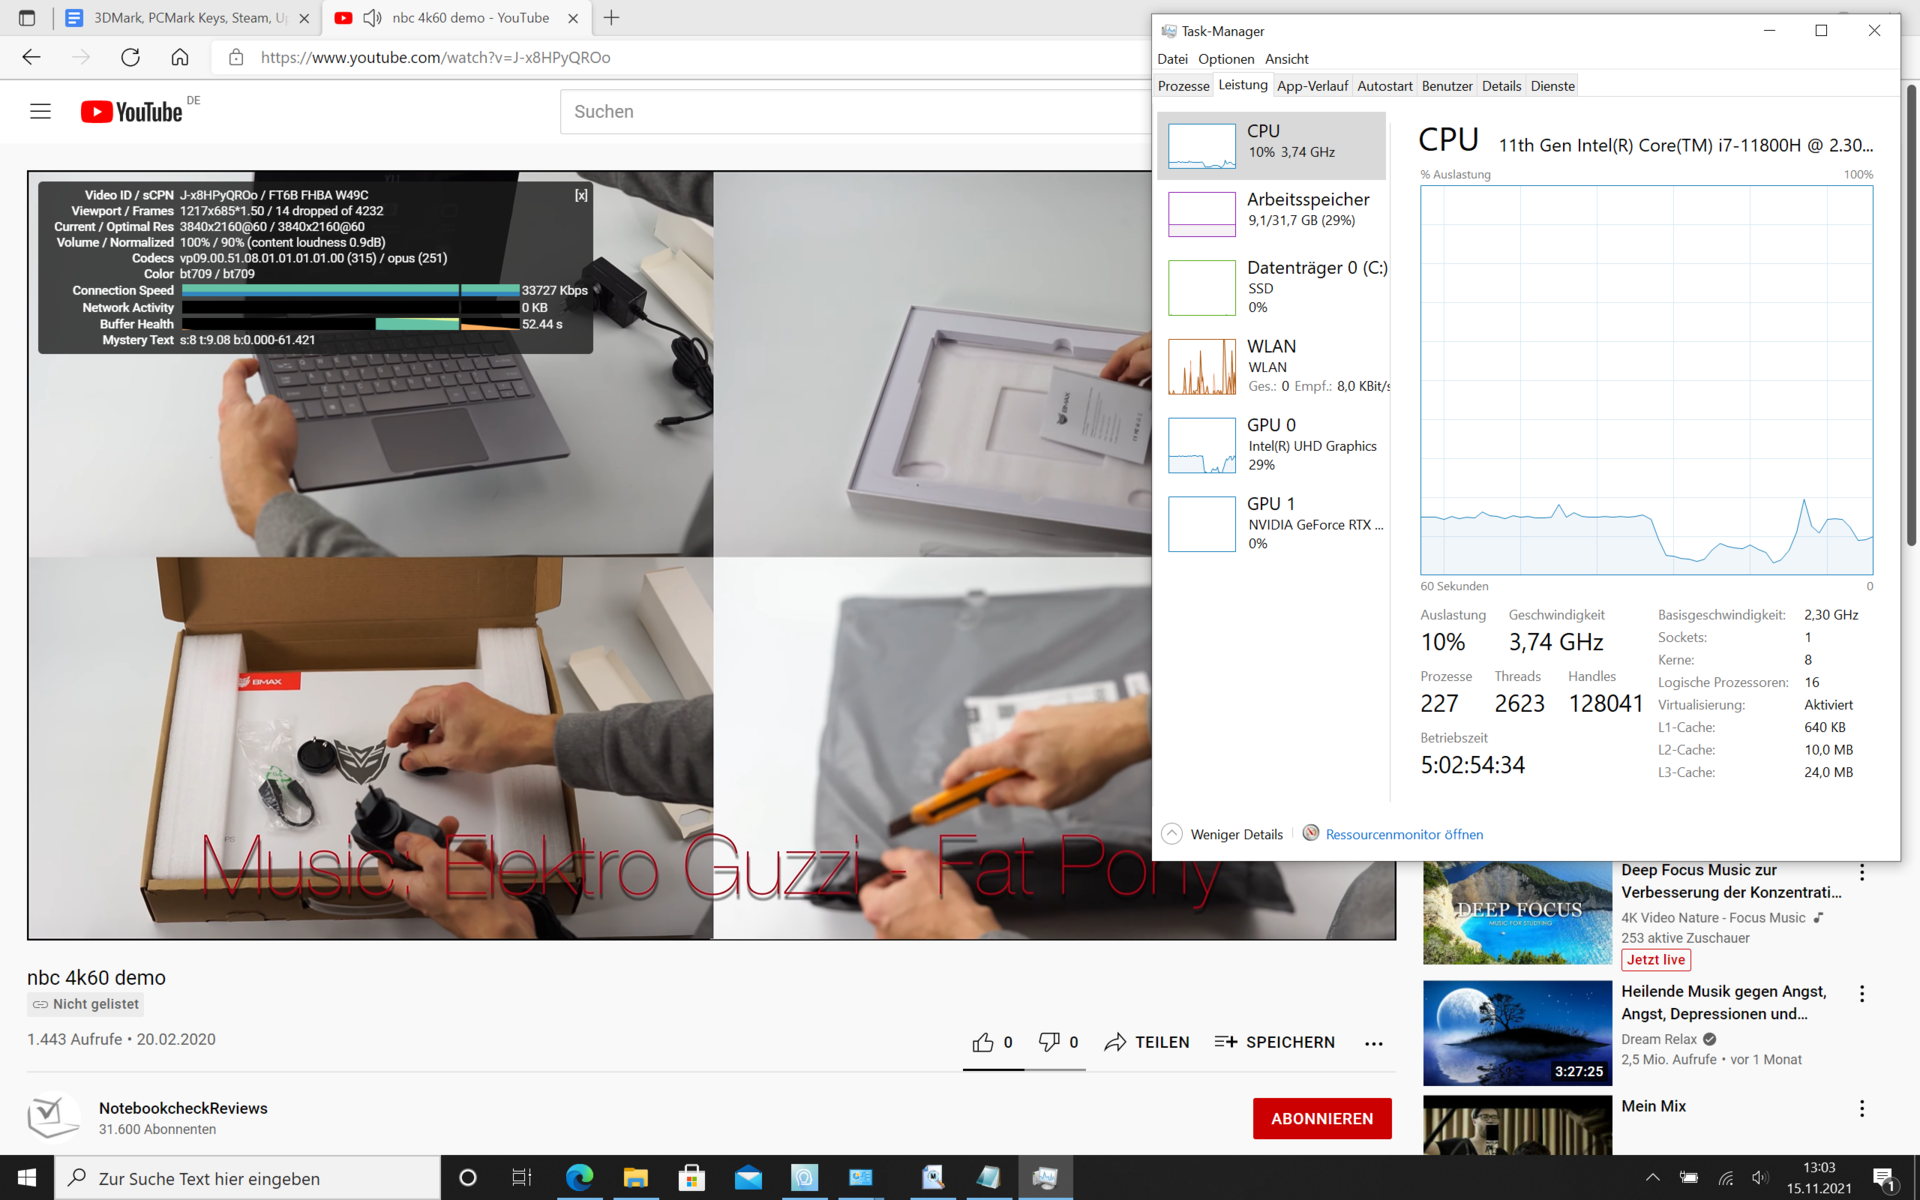
DPC延迟
延迟监测器观察到由内核和ACPI驱动程序驱动的高延迟。对于实时音频和视频,这可能是一个问题。测量是基于目前的驱动程序和硬件配置。
| DPC Latencies / LatencyMon - interrupt to process latency (max), Web, Youtube, Prime95 | |
| HP ZBook Studio G7 | |
| Lenovo ThinkPad P15s Gen2-20W6000GGE | |
| Razer Blade 15 Advanced (Mid 2021) | |
| MSI Creator Z16 A11UET-209 | |
| Dell XPS 15 9510 11800H RTX 3050 Ti OLED | |
| Dell XPS 17 9710 Core i7 RTX 3060 | |
| Lenovo ThinkBook 16p G2 ACH | |
* ... smaller is better
大容量存储
总容量为一兆字节的Phison固态硬盘占据了两个M.2插座中的一个,所以有升级的可能。RAID显然是不可能的,BIOS也没有提供任何相应的选项--至少在升级状态下没有SSD。
驱动器性能评级总结了不同的测量结果。Phison固态硬盘紧跟在SSSTC后面,从 Razer并将其他所有型号的产品甩在后面。特别是在小块的读写方面,Phison显得特别好。

* ... smaller is better
Continuous load read: DiskSpd Read Loop, Queue Depth 8
图形卡
的。 GeForce RTX 3060显卡以其良好的性价比而闻名,它为办公室带来了中上等的游戏能力。在Z16中,它可以访问6GB的VRAM,并以高达1,357MHz的提升时钟工作。
| 3DMark 11 Performance | 21117 points | |
| 3DMark Fire Strike Score | 15753 points | |
| 3DMark Time Spy Score | 6721 points | |
Help | ||
游戏性能
3DMark性能评级将3DMark和3DMark 11捆绑成一个数字。这里的 RTX 3060落后于其自身的平均水平,因此它的得分低于联想ThinkBook 16p和 戴尔XPS 17 9710.毫无疑问, RTX 3080作为一个基准,显然高于所有其他产品。
| Final Fantasy XV Benchmark - 2560x1440 High Quality | |
| Average of class Multimedia (18.4 - 129.9, n=23, last 2 years) | |
| Average NVIDIA GeForce RTX 3060 Laptop GPU (41.1 - 73.7, n=25) | |
| Dell XPS 17 9710 Core i7 RTX 3060 | |
| MSI Creator Z16 A11UET-209 | |
| Dell XPS 15 9510 11800H RTX 3050 Ti OLED | |
| X-Plane 11.11 - 3840x2160 high (fps_test=3) | |
| Average of class Multimedia (63.4 - 114.7, n=4, last 2 years) | |
| MSI Creator Z16 A11UET-209 | |
| Average NVIDIA GeForce RTX 3060 Laptop GPU (58.5 - 92.3, n=12) | |
| HP ZBook Studio G7 | |
| Dell XPS 17 9710 Core i7 RTX 3060 | |
| Far Cry 5 - 2560x1440 Ultra Preset AA:T | |
| Average of class Multimedia (45 - 106, n=4, last 2 years) | |
| Average NVIDIA GeForce RTX 3060 Laptop GPU (58 - 92, n=12) | |
| MSI Creator Z16 A11UET-209 | |
| Dell XPS 15 9510 11800H RTX 3050 Ti OLED | |
| New World - 2560x1440 Very High Video Quality | |
| Average NVIDIA GeForce RTX 3060 Laptop GPU (52.9 - 54.2, n=3) | |
| MSI Creator Z16 A11UET-209 | |
微星指定动态提升的最大图形功率为65W。 Witcher 3超质量设置大约证实了这一点。我们看到恒定负载下的功率为60瓦。帧率是恒定的,因此,他们没有下降。
图中 Witcher 3FPS图表显示 RTX 3060在较低的中场。 联想ThinkBook 16p和 戴尔XPS 17 9710具有相同的图形做得更好。因此,竞争对手从RTX中榨取了更多的性能。游戏基准测试证实了这一点。联想ThinkBook 16p和 戴尔XPS 17 9710始终领先。平均而言 RTX 3060 - 在我们数据库中的所有笔记本电脑中都配备了它--比安装在Z16中的那台表现得更多。
Witcher 3 FPS Chart
| low | med. | high | ultra | QHD | 4K | |
|---|---|---|---|---|---|---|
| GTA V (2015) | 89 | 74 | ||||
| The Witcher 3 (2015) | 204 | 81 | 62.4 | |||
| Dota 2 Reborn (2015) | 164 | 146 | 140 | 131 | 84.8 | |
| Final Fantasy XV Benchmark (2018) | 64.4 | 48.3 | ||||
| X-Plane 11.11 (2018) | 123 | 103 | 83.4 | 73.4 | ||
| Far Cry 5 (2018) | 92 | 86 | 59 | |||
| Strange Brigade (2018) | 339 | 159 | 129 | 114 | ||
| New World (2021) | 71 | 65 | 53 |
排放 - 怠速时很舒适,负载时声音很大
噪声排放
噪声排放和风扇特性基本上说服了我们。风扇在空闲模式下定期关闭,甚至在性能模式下也是如此。静音模式带来了永久的安静,但当然只有在CPU/GPU无事可做的时候。当风扇运转时--有三个风扇--它们也是可以听到的,但只比办公室里的背景噪音强一点儿。
在负载情况下,风扇的速度逐渐增加,但不可能分辨出哪个风扇启动。我们在中等负荷下测得54和55 dB(A)(在Ultra质量设置下),在办公室里测得54和55 dB(A)。Witcher 3在超质量设置下)和压力测试中。因此,高负荷和最大负荷之间没有明显的区别;噪音的决定性因素是它持续的时间。
Noise level
| Idle |
| 26.3 / 26.3 / 26.3 dB(A) |
| Load |
| 53.9 / 54.8 dB(A) |
 | ||
30 dB silent 40 dB(A) audible 50 dB(A) loud |
||
min: | ||
| MSI Creator Z16 A11UET-209 GeForce RTX 3060 Laptop GPU, i7-11800H, Phison 1TB SM2801T24GKBB4S-E162 | HP ZBook Studio G7 Quadro RTX 3000 Max-Q, i9-10885H, Micron 2300 1TB MTFDHBA1T0TDV | Razer Blade 15 Advanced (Mid 2021) GeForce RTX 3080 Laptop GPU, i7-11800H, SSSTC CA6-8D1024 | Lenovo ThinkBook 16p G2 ACH GeForce RTX 3060 Laptop GPU, R9 5900HX, WDC PC SN730 SDBPNTY-1T00 | Dell XPS 17 9710 Core i7 RTX 3060 GeForce RTX 3060 Laptop GPU, i7-11800H, Micron 2300 1TB MTFDHBA1T0TDV | Dell XPS 15 9510 11800H RTX 3050 Ti OLED GeForce RTX 3050 Ti Laptop GPU, i7-11800H, Micron 2300 512GB MTFDHBA512TDV | |
|---|---|---|---|---|---|---|
| Noise | 10% | 9% | 15% | 7% | 19% | |
| off / environment * (dB) | 26.3 | 24.4 7% | 25.1 5% | 23 13% | 25.5 3% | 23.8 10% |
| Idle Minimum * (dB) | 26.3 | 24.4 7% | 25.3 4% | 23 13% | 25.2 4% | 23.8 10% |
| Idle Average * (dB) | 26.3 | 24.4 7% | 25.3 4% | 23 13% | 25.2 4% | 23.8 10% |
| Idle Maximum * (dB) | 26.3 | 27.9 -6% | 25.3 4% | 23 13% | 25.2 4% | 23.8 10% |
| Load Average * (dB) | 53.9 | 38.8 28% | 42 22% | 35.66 34% | 45.9 15% | 36 33% |
| Witcher 3 ultra * (dB) | 53.9 | 46.3 14% | 45.6 15% | 48.7 10% | 49 9% | 36 33% |
| Load Maximum * (dB) | 54.8 | 46.3 16% | 51.6 6% | 48.13 12% | 50.4 8% | 38.2 30% |
* ... smaller is better
温度
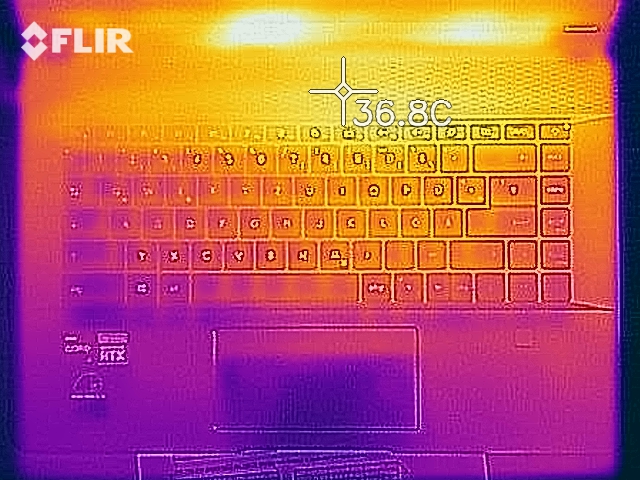
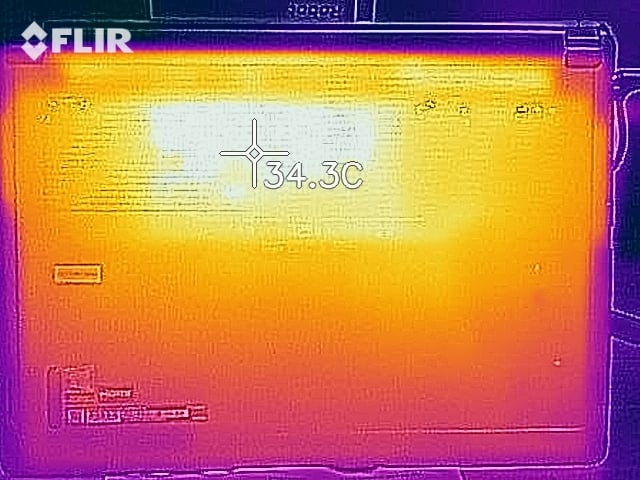
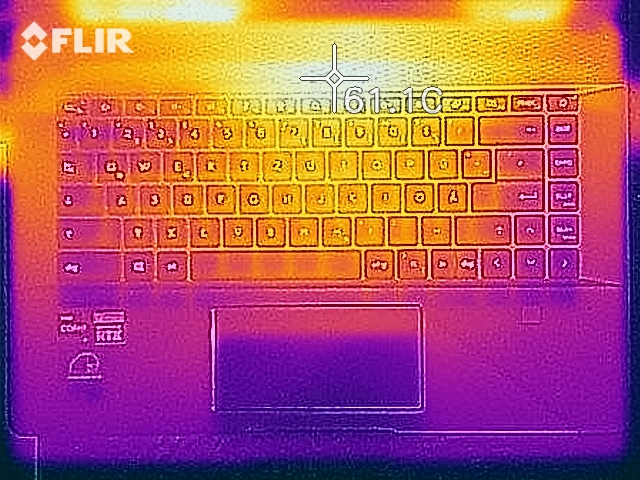
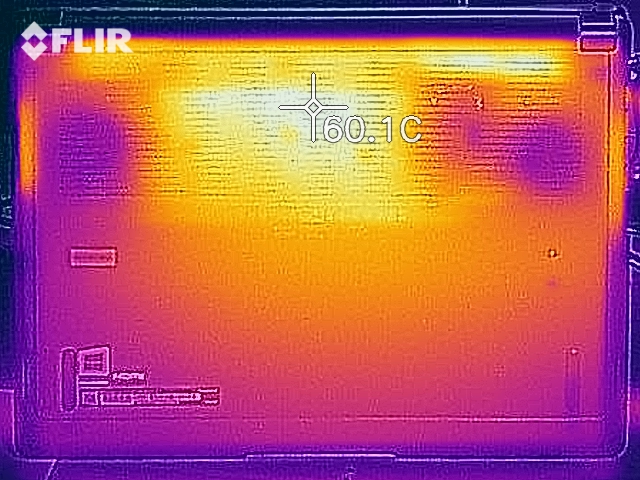
Z16在空闲时几乎保持低温,顶部和底部的平均温度为30℃(86°F)。在静音模式下,只要没有负载,风扇很少启动,而且只是非常短暂的启动。在负载情况下,温度急剧上升,在某些地方的底部达到57℃(134.6°F),平均42℃(107.6°F)。
(-) The maximum temperature on the upper side is 52.5 °C / 127 F, compared to the average of 36.8 °C / 98 F, ranging from 21 to 71 °C for the class Multimedia.
(-) The bottom heats up to a maximum of 56.7 °C / 134 F, compared to the average of 39.1 °C / 102 F
(+) In idle usage, the average temperature for the upper side is 29.9 °C / 86 F, compared to the device average of 31.3 °C / 88 F.
(+) The palmrests and touchpad are reaching skin temperature as a maximum (35.3 °C / 95.5 F) and are therefore not hot.
(-) The average temperature of the palmrest area of similar devices was 28.7 °C / 83.7 F (-6.6 °C / -11.8 F).
| MSI Creator Z16 A11UET-209 Intel Core i7-11800H, NVIDIA GeForce RTX 3060 Laptop GPU | HP ZBook Studio G7 Intel Core i9-10885H, NVIDIA Quadro RTX 3000 Max-Q | Razer Blade 15 Advanced (Mid 2021) Intel Core i7-11800H, NVIDIA GeForce RTX 3080 Laptop GPU | Lenovo ThinkBook 16p G2 ACH AMD Ryzen 9 5900HX, NVIDIA GeForce RTX 3060 Laptop GPU | Dell XPS 17 9710 Core i7 RTX 3060 Intel Core i7-11800H, NVIDIA GeForce RTX 3060 Laptop GPU | Dell XPS 15 9510 11800H RTX 3050 Ti OLED Intel Core i7-11800H, NVIDIA GeForce RTX 3050 Ti Laptop GPU | Apple MacBook Pro 16 2021 M1 Pro Apple M1 Pro, Apple M1 Pro 16-Core GPU | |
|---|---|---|---|---|---|---|---|
| Heat | 18% | -2% | 9% | 5% | 18% | 27% | |
| Maximum Upper Side * (°C) | 52.5 | 45.7 13% | 51 3% | 50 5% | 50.2 4% | 45.5 13% | 41 22% |
| Maximum Bottom * (°C) | 56.7 | 50.6 11% | 52 8% | 53 7% | 38.4 32% | 44.2 22% | 39 31% |
| Idle Upper Side * (°C) | 33.9 | 24.8 27% | 35.2 -4% | 29 14% | 37.6 -11% | 27 20% | 24 29% |
| Idle Bottom * (°C) | 32.7 | 26.1 20% | 37.8 -16% | 30 8% | 34.2 -5% | 26.7 18% | 24 27% |
* ... smaller is better
压力测试
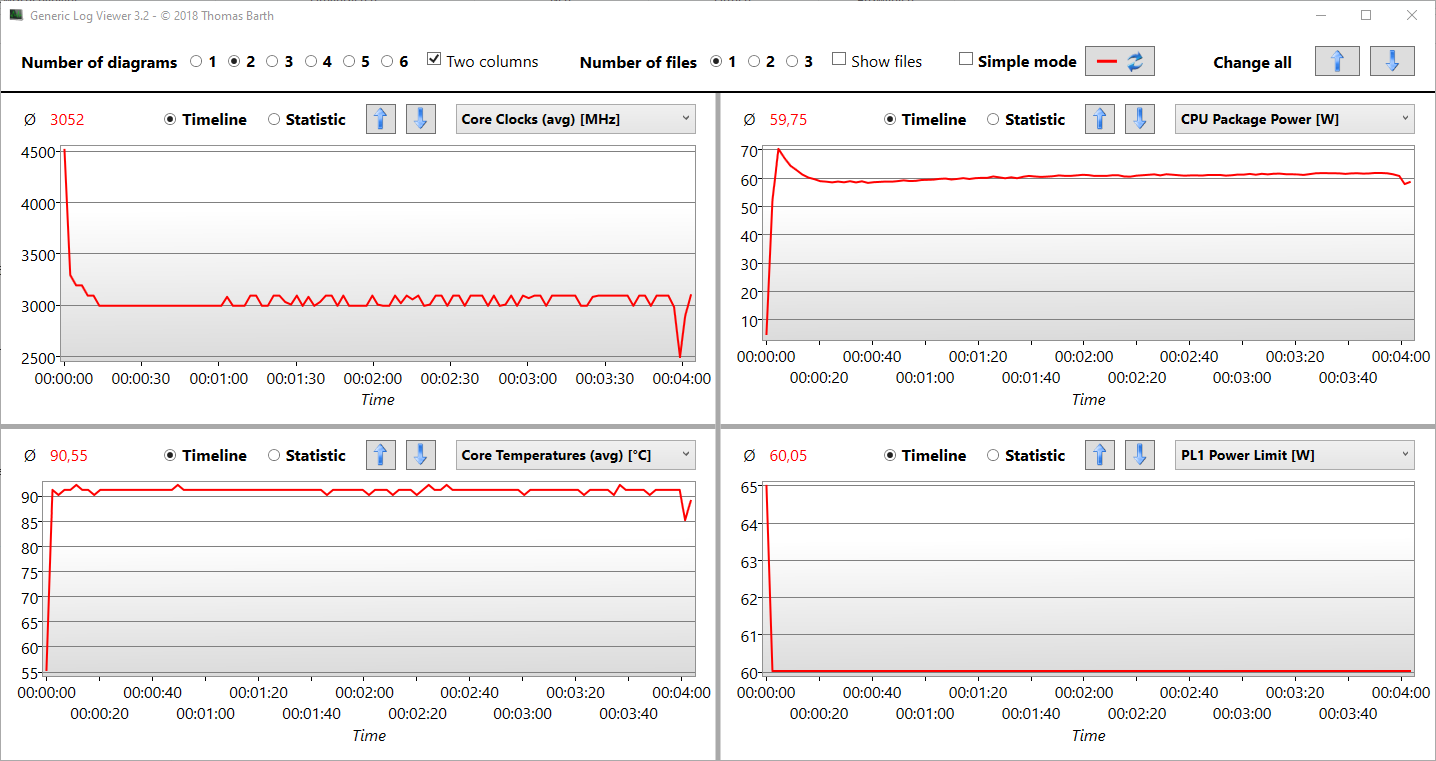
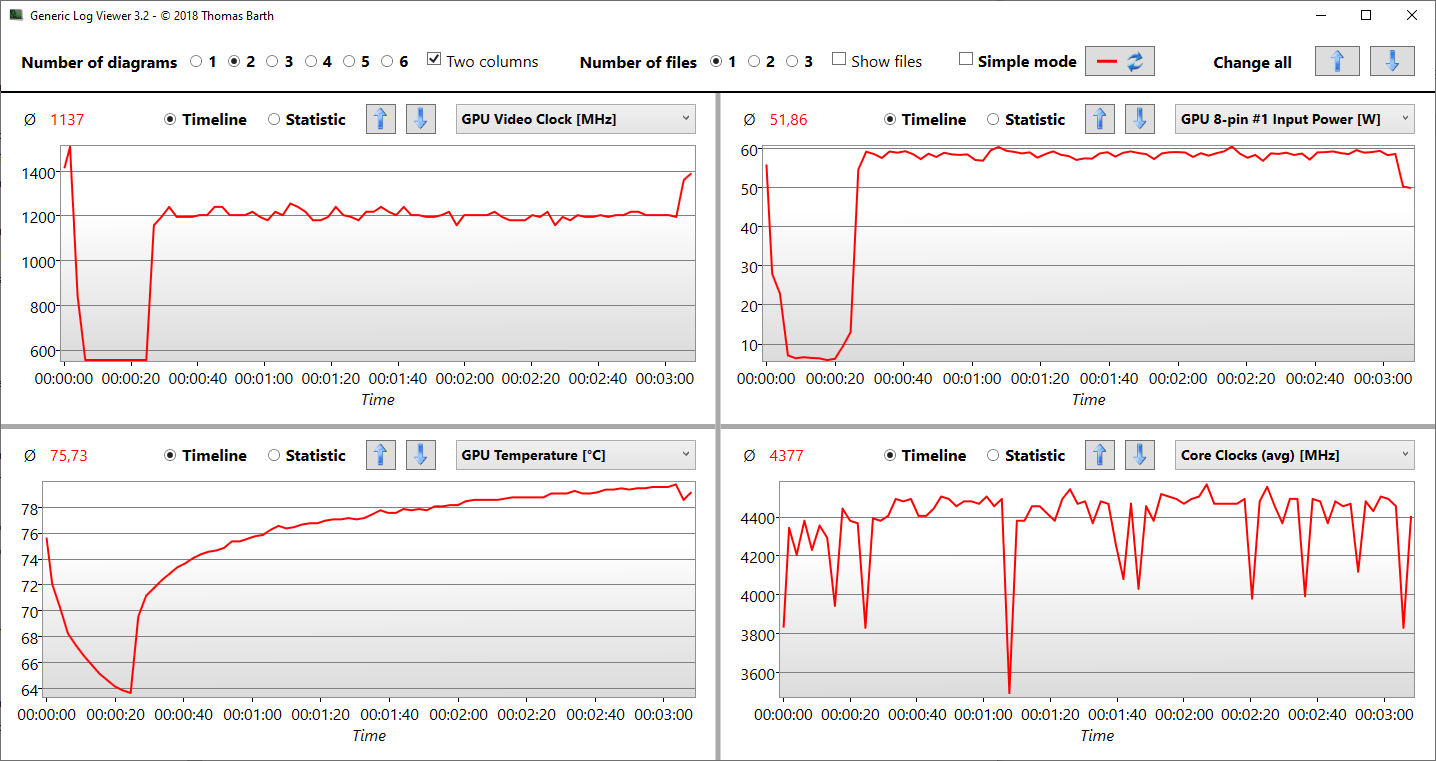
压力测试是一种极端情况,它提供了关于在100%的GPU和CPU负载的情况下热能和计算性能如何表现的信息。Prime95和FurMark为此同时运行。CPU的时钟从近4.5GHz大幅降低到2.8GHz。它这样做是因为SoC温度很快达到90°C(194°F),需要防止进一步加热。
值得注意的是。虽然RTX的GPU温度上升较慢,但显卡可以永久性地消耗60瓦。要么GPU散热与CPU完全分离,要么GPU有优先权。
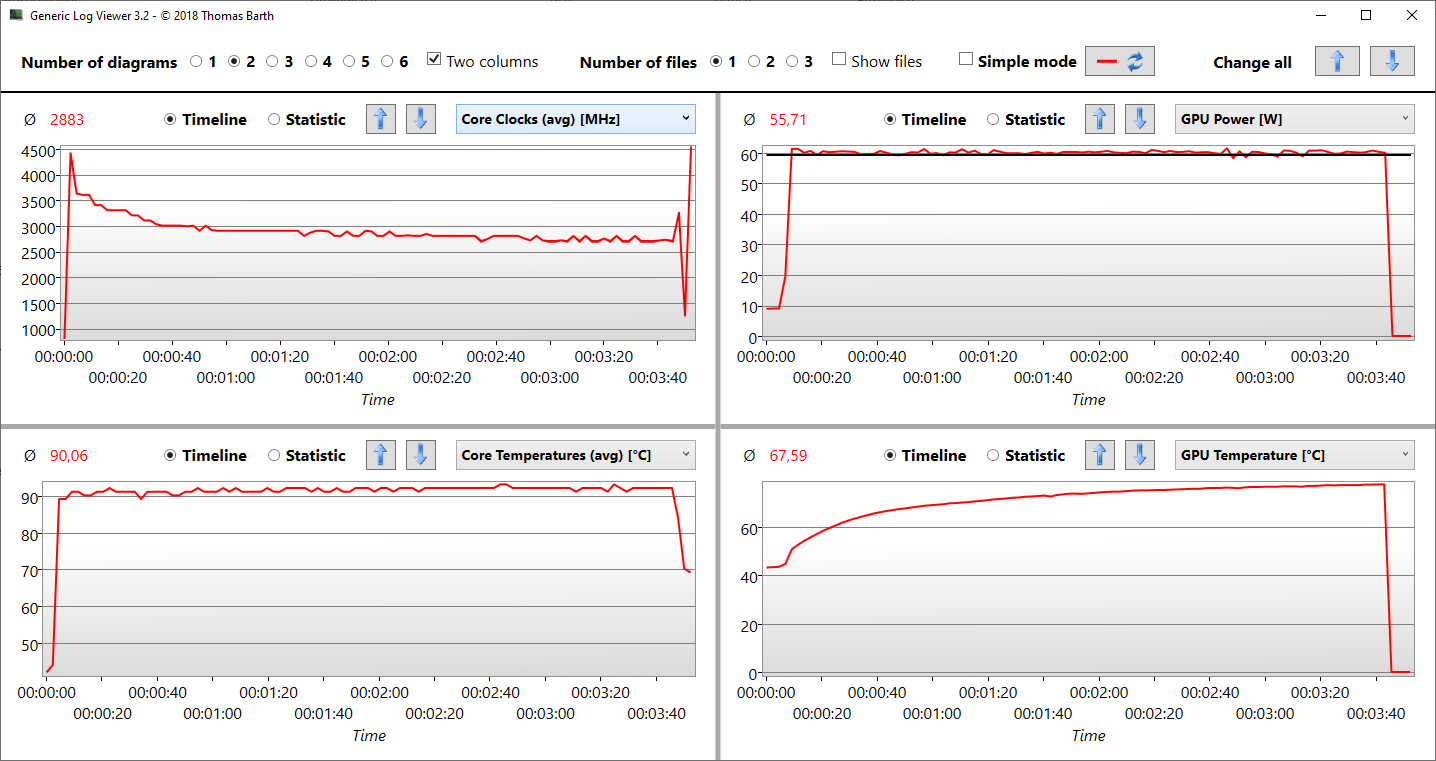
| CPU时钟(GHz) | GPU时钟(MHz) | 平均CPU温度(℃) | 平均GPU温度(℃) |
| 系统空闲 | 1.5 | 210 | 43 |
| Prime95压力 | 2.9 | 210 | 92 |
| Prime95 + FurMark压力 | 2.6 | 1200 | 89 |
| Witcher 3 Stress | 4,2 | 1556 | 83 |
演讲者
Dynaudio的两路立体声扬声器是基于一个高音扬声器和一个低音扬声器。这使你能够更好地划分高低音,你可以在音乐和游戏中听到这一点,但特别是在讲话中。我们可以感觉到清晰和高音量,可以填满一个20平方米(215平方英尺)的中等大小的房间。不过,低音是不存在的。
双阵列麦克风只有在我们停在笔记本前面时才会以恒定的音量记录声音。在房间里走来走去,甚至看向不同的方向,都会导致音量的明显波动。另一方面,质量在任何地方都很好,也就是没有噪音。微星中心提供了一个语音放大器模式。
MSI Creator Z16 A11UET-209 audio analysis
(+) | speakers can play relatively loud (86.1 dB)
Bass 100 - 315 Hz
(-) | nearly no bass - on average 19.8% lower than median
(±) | linearity of bass is average (10.1% delta to prev. frequency)
Mids 400 - 2000 Hz
(+) | balanced mids - only 4.3% away from median
(+) | mids are linear (6.1% delta to prev. frequency)
Highs 2 - 16 kHz
(+) | balanced highs - only 2.8% away from median
(±) | linearity of highs is average (7.8% delta to prev. frequency)
Overall 100 - 16.000 Hz
(+) | overall sound is linear (14% difference to median)
Compared to same class
» 32% of all tested devices in this class were better, 3% similar, 65% worse
» The best had a delta of 5%, average was 17%, worst was 45%
Compared to all devices tested
» 16% of all tested devices were better, 4% similar, 80% worse
» The best had a delta of 4%, average was 23%, worst was 134%
Dell XPS 15 9510 11800H RTX 3050 Ti OLED audio analysis
(+) | speakers can play relatively loud (88.8 dB)
Bass 100 - 315 Hz
(±) | reduced bass - on average 5.6% lower than median
(+) | bass is linear (4.3% delta to prev. frequency)
Mids 400 - 2000 Hz
(+) | balanced mids - only 3.9% away from median
(+) | mids are linear (4.1% delta to prev. frequency)
Highs 2 - 16 kHz
(+) | balanced highs - only 2.4% away from median
(+) | highs are linear (4.9% delta to prev. frequency)
Overall 100 - 16.000 Hz
(+) | overall sound is linear (8.4% difference to median)
Compared to same class
» 9% of all tested devices in this class were better, 2% similar, 89% worse
» The best had a delta of 5%, average was 17%, worst was 45%
Compared to all devices tested
» 2% of all tested devices were better, 1% similar, 97% worse
» The best had a delta of 4%, average was 23%, worst was 134%
Apple MacBook Pro 16 2021 M1 Pro audio analysis
(+) | speakers can play relatively loud (84.7 dB)
Bass 100 - 315 Hz
(+) | good bass - only 3.8% away from median
(+) | bass is linear (5.2% delta to prev. frequency)
Mids 400 - 2000 Hz
(+) | balanced mids - only 1.3% away from median
(+) | mids are linear (2.1% delta to prev. frequency)
Highs 2 - 16 kHz
(+) | balanced highs - only 1.9% away from median
(+) | highs are linear (2.7% delta to prev. frequency)
Overall 100 - 16.000 Hz
(+) | overall sound is linear (4.6% difference to median)
Compared to same class
» 0% of all tested devices in this class were better, 0% similar, 100% worse
» The best had a delta of 5%, average was 17%, worst was 45%
Compared to all devices tested
» 0% of all tested devices were better, 0% similar, 100% worse
» The best had a delta of 4%, average was 23%, worst was 134%
电源管理
能源消耗
空闲时的功耗在9到27瓦之间,比大多数竞争对手(性能模式)要高。然而,如果我们以空闲平均数为基础(14瓦),Z16处于良好范围。该 RTX 3060被Optimus禁用,那么Iris Xe是活跃的,这非常有利于节俭。相比之下,只有 Razer Blade 15 Advanced明显出众,这可能是由于其 RTX 3080在手动模式下没有禁用它。
119瓦的负载平均值是Z16中11800h良好的电源开发--即Turbo利用--的另一个迹象。具有相同SoC的可比设备没有这样的数值。
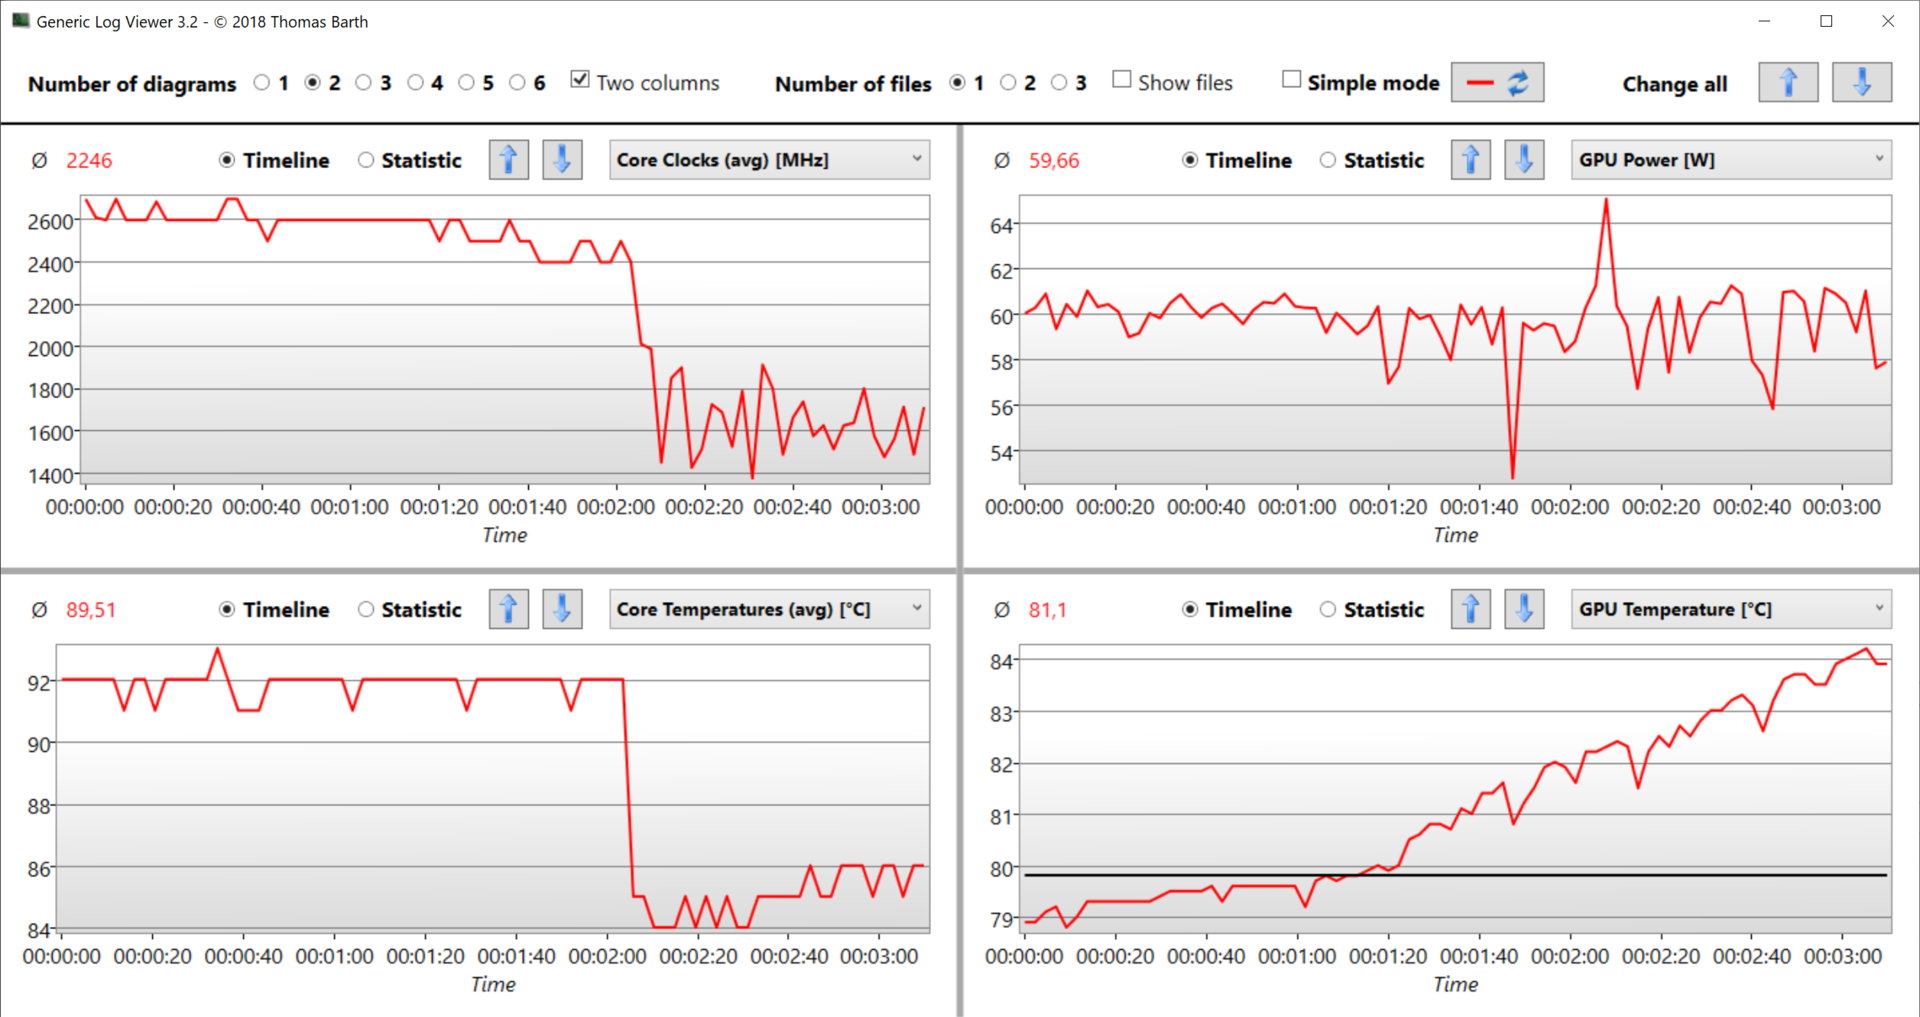
Witcher 3在Ultra质量设置下,这对RTX 3060来说是一个很高的游戏负荷。 RTX 3060,我们指定用125瓦。如下图所示,功耗是恒定的,而且GPU的计算性能是一致的。
在压力测试中,180瓦的电源确实必须在最大负荷下工作。它必须在开始时的一个短暂的峰值中提供190瓦的功率。正如压力测试所显示的,节流使功耗在三分钟后降低到150瓦。
戴尔的 XPS 15 9510的功耗下降了 Witcher 3甚至在压力测试中下降更多(-47%!)。
| Off / Standby | |
| Idle | |
| Load |
|
Key:
min: | |
| MSI Creator Z16 A11UET-209 i7-11800H, GeForce RTX 3060 Laptop GPU, Phison 1TB SM2801T24GKBB4S-E162, IPS True Pixel, 2560x1600, 16" | HP ZBook Studio G7 i9-10885H, Quadro RTX 3000 Max-Q, Micron 2300 1TB MTFDHBA1T0TDV, IPS, 3840x2160, 15.6" | Razer Blade 15 Advanced (Mid 2021) i7-11800H, GeForce RTX 3080 Laptop GPU, SSSTC CA6-8D1024, IPS, 1920x1080, 15.6" | Lenovo ThinkBook 16p G2 ACH R9 5900HX, GeForce RTX 3060 Laptop GPU, WDC PC SN730 SDBPNTY-1T00, IPS, 2560x1600, 16" | Dell XPS 17 9710 Core i7 RTX 3060 i7-11800H, GeForce RTX 3060 Laptop GPU, Micron 2300 1TB MTFDHBA1T0TDV, IPS, 3840x2400, 17" | Apple MacBook Pro 16 2021 M1 Pro M1 Pro, M1 Pro 16-Core GPU, Apple SSD AP1024R, Mini-LED, 3456x2234, 16.2" | Average NVIDIA GeForce RTX 3060 Laptop GPU | Average of class Multimedia | |
|---|---|---|---|---|---|---|---|---|
| Power Consumption | 10% | -48% | 1% | 12% | 35% | -4% | 38% | |
| Idle Minimum * (Watt) | 9 | 5.5 39% | 19.5 -117% | 13.2 -47% | 7.5 17% | 5 44% | 10.4 ? -16% | 5.69 ? 37% |
| Idle Average * (Watt) | 14 | 13.7 2% | 23.3 -66% | 17 -21% | 15.7 -12% | 15.1 -8% | 14.5 ? -4% | 10.2 ? 27% |
| Idle Maximum * (Watt) | 26.7 | 16.6 38% | 40.1 -50% | 18.6 30% | 23.1 13% | 15.5 42% | 21.4 ? 20% | 12.5 ? 53% |
| Load Average * (Watt) | 119 | 118.4 1% | 98.9 17% | 88.8 25% | 87.2 27% | 54 55% | 109.3 ? 8% | 65.4 ? 45% |
| Witcher 3 ultra * (Watt) | 125 | 120 4% | 174 -39% | 123 2% 123 2% | 116 7% | |||
| Load Maximum * (Watt) | 160 | 203.3 -27% | 214 -34% | 132 17% | 131.6 18% | 90 44% | 206 ? -29% | 112.9 ? 29% |
* ... smaller is better
Energy consumption Witcher 3 / Stress test
电池寿命
Z16的运行时间是好到非常好。它在Wi-Fi测试中持续了9:30小时,空闲状态下持续了13小时(飞行模式,最低亮度)。我们在平衡模式下进行了Wi-Fi测试,在超级电池下进行了空闲测试。最低运行时间约为1.5小时。
Zenbook的电池容量为90Wh,而诸如 戴尔XPS 17 9710(97Wh)的电池甚至更多,但在开始时仍然缩短了20%。该 Apple MacBook Pro 16 2021M1(100Wh)在Wi-Fi测试中以17小时的出色成绩击败了Z16。然而,这里没有安装如此强大的GPU。
| MSI Creator Z16 A11UET-209 i7-11800H, GeForce RTX 3060 Laptop GPU, 90 Wh | HP ZBook Studio G7 i9-10885H, Quadro RTX 3000 Max-Q, 83 Wh | Razer Blade 15 Advanced (Mid 2021) i7-11800H, GeForce RTX 3080 Laptop GPU, 80 Wh | Lenovo ThinkBook 16p G2 ACH R9 5900HX, GeForce RTX 3060 Laptop GPU, 71 Wh | Dell XPS 17 9710 Core i7 RTX 3060 i7-11800H, GeForce RTX 3060 Laptop GPU, 97 Wh | Apple MacBook Pro 16 2021 M1 Pro M1 Pro, M1 Pro 16-Core GPU, 99.6 Wh | Average of class Multimedia | |
|---|---|---|---|---|---|---|---|
| Battery runtime | -6% | -38% | 11% | 30% | 78% | 44% | |
| Reader / Idle (h) | 13 | 17.7 36% | 24.9 ? 92% | ||||
| WiFi v1.3 (h) | 9.5 | 7.8 -18% | 5.9 -38% | 8.5 -11% | 7.6 -20% | 16.9 78% | 12.2 ? 28% |
| Load (h) | 1.5 | 1.6 7% | 2 33% | 2.6 73% | 1.7 ? 13% | ||
| H.264 (h) | 10.8 | 7 | 17.5 | 16.8 ? |
Pros
Cons
结论--创意王位的竞争者
微星以其Z16提供了一个超轻薄但功能强大的创意巨兽。它的制造质量、端口和屏幕都令人印象深刻。这款机箱的质量和稳定性适合日常使用,但它仍然可以通过一些努力进行升级(内存、SSD 2x M.2、Wi-Fi芯片)。
Thunderbolt 4和USB 4.0都在机上。屏幕通过Type-C的DisplayPort运行,没有笨重的HDMI或以太网端口。2,560 x 1,600像素的显示屏(QHD+)囊括了96%的AdobeRGB色彩空间,P3是完全可见的。触摸面板使使用更加灵活,但不可避免地防止了哑光表面。然而,良好的亮度和高对比度弥补了这一缺陷;微星还提供了一个非眩光版本,应该包含一个相同的True Pixel面板。
性能处于高水平,特别是处理器。45瓦的i7 SoC 11800H在一个联盟中与Apple MacBook Pro 16 2021 M1 Pro, Razer刀片15和XPS 17,除了Apple ,它们依靠相同的英特尔芯片。
正如我们的随机测试所显示的,性能的展开有利于 RTX 3060 - CPU和GPU的负载是相同的。因此,在CPU压力测试中,GPU继续以65瓦的60瓦计算。因此,随着时间的推移,游戏性能是稳定的。尽管如此, RTX 3060略低于平均水平(在游戏和合成基准测试中),但这并不影响一般游戏的适用性。
现代化的端口,哑光显示选项,具有AdobeRGB的快速TFT和出色的处理器性能。然后是像键盘和负载量这样的细节,搞砸了Z16的非常好的评级。
在散热方面,Z16的定位是合格的。在平衡模式下,风扇在怠速时大多保持关闭状态,但在性能下偶尔会打开。浪费的热量与性能相适应,主要是在笔记本电脑的后部区域被注意到。在负载情况下,三个风扇产生了相当大的噪音,但至少是稳定的,从不紧张。
弱点表现在输入设备上。由于键程短,敲击力度大,我们体验到了疲惫和嘈杂的打字体验,即使是RGB键的照明也不能掩盖这一点。Z16不是一个打字的世界冠军。Windows Hello与红外摄像头和指纹的配合非常好,但网络摄像头的快照却无法描述。
竞争者是什么样子的?XPS 17在显示方面(亮度、分辨率)似乎要好一些。XPS 15(15.6英寸,分辨率更高)提供了一个OLED。Apple's MacBook Pro 162021年的M1 Pro没有装相当多的AdobeRGB,而且响应时间更差。作为回报,Liquid Retina XDR的亮度更高。
如果你喜欢游戏,你会找到比微星更好的设备,它的 RTX 3060这里有 Razer Blade 15 Advanced(2021年中期)位居榜首,但它的屏幕在平衡上要差一些。在这里 MacBook Pro 162021不是一个游戏的选择,因为可用的游戏以及弱的GPU。
底线是,Z16非常好,或者至少在各方面都得到了很好的服务。这款16英寸手机没有任何严重的弱点。输入设备、音量、摄像头和相对较高的重量在评级中被划伤。如果这些对你来说都不是什么问题,那么Z16将是你在合理价格下的一个候选产品。
价格和可用性
目前,测试配置Creator Z16 A11UET-209与Core i7-11800H1TB内存和32GB DDR4-3200,在亚马逊的价格为2400欧元(~2716美元)的价格,与同等竞争对手持平。
MSI Creator Z16 A11UET-209
- 11/18/2021 v7 (old)
Sebastian Jentsch
Price comparison
