Notebookcheck Logo

Apple M3 SoC 分析:提高性能和效率

首款 3 纳米芯片问世 Apple全新 M3 SoC 是首款采用 3 纳米工艺制造的芯片。我们在对新 MacBook Pro 14 的评测中已经看到了性能的提升,但处理器和显卡的效率又如何呢?我们还将结果与高通公司新推出的 Snapdragon X Elite 进行了比较。
Apple ARM Laptop / Notebook MacBook Ultrabook
Apple M3:概览(图片: )Apple

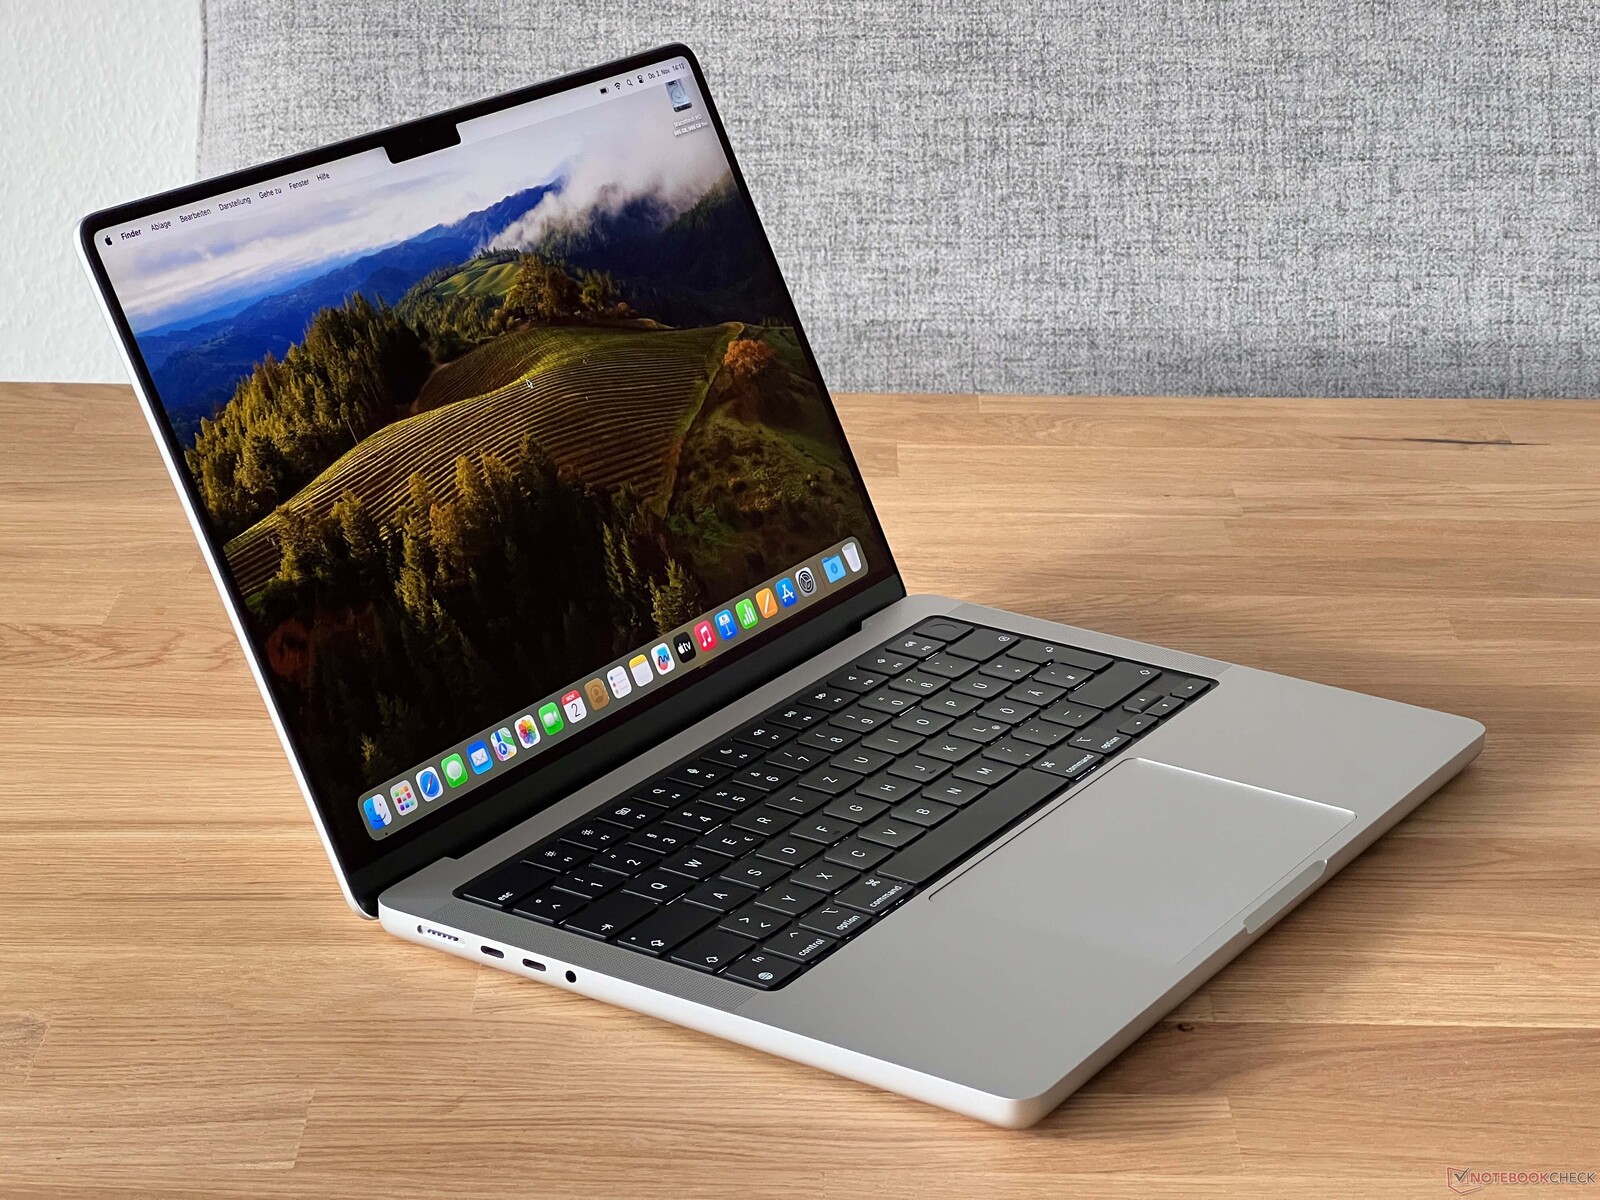
上周,Apple 发布了采用现代 3 纳米工艺生产的新款 M3 SoC(M3、M3 Pro 和 M3 Max)。我们已经评测了 新款入门级 MacBook Pro 14及其新的 M3 SoC(作为旧款 MacBook Pro 13的替代机型)。现在,我们将对新款 M3 进行更深入的了解,它也将用于下一代流行的 MacBook Air 机型。我们还将其性能和效率与 AMD、英特尔和 Nvidia 的 CPU/GPU 进行了比较。最后,我们将其与新的 骁龙 X Elite进行比较。有关 M3 Pro/M3 Max 的分析文章也将在近期发布。

Apple M3 一览

Apple M3 (Bild: )Apple

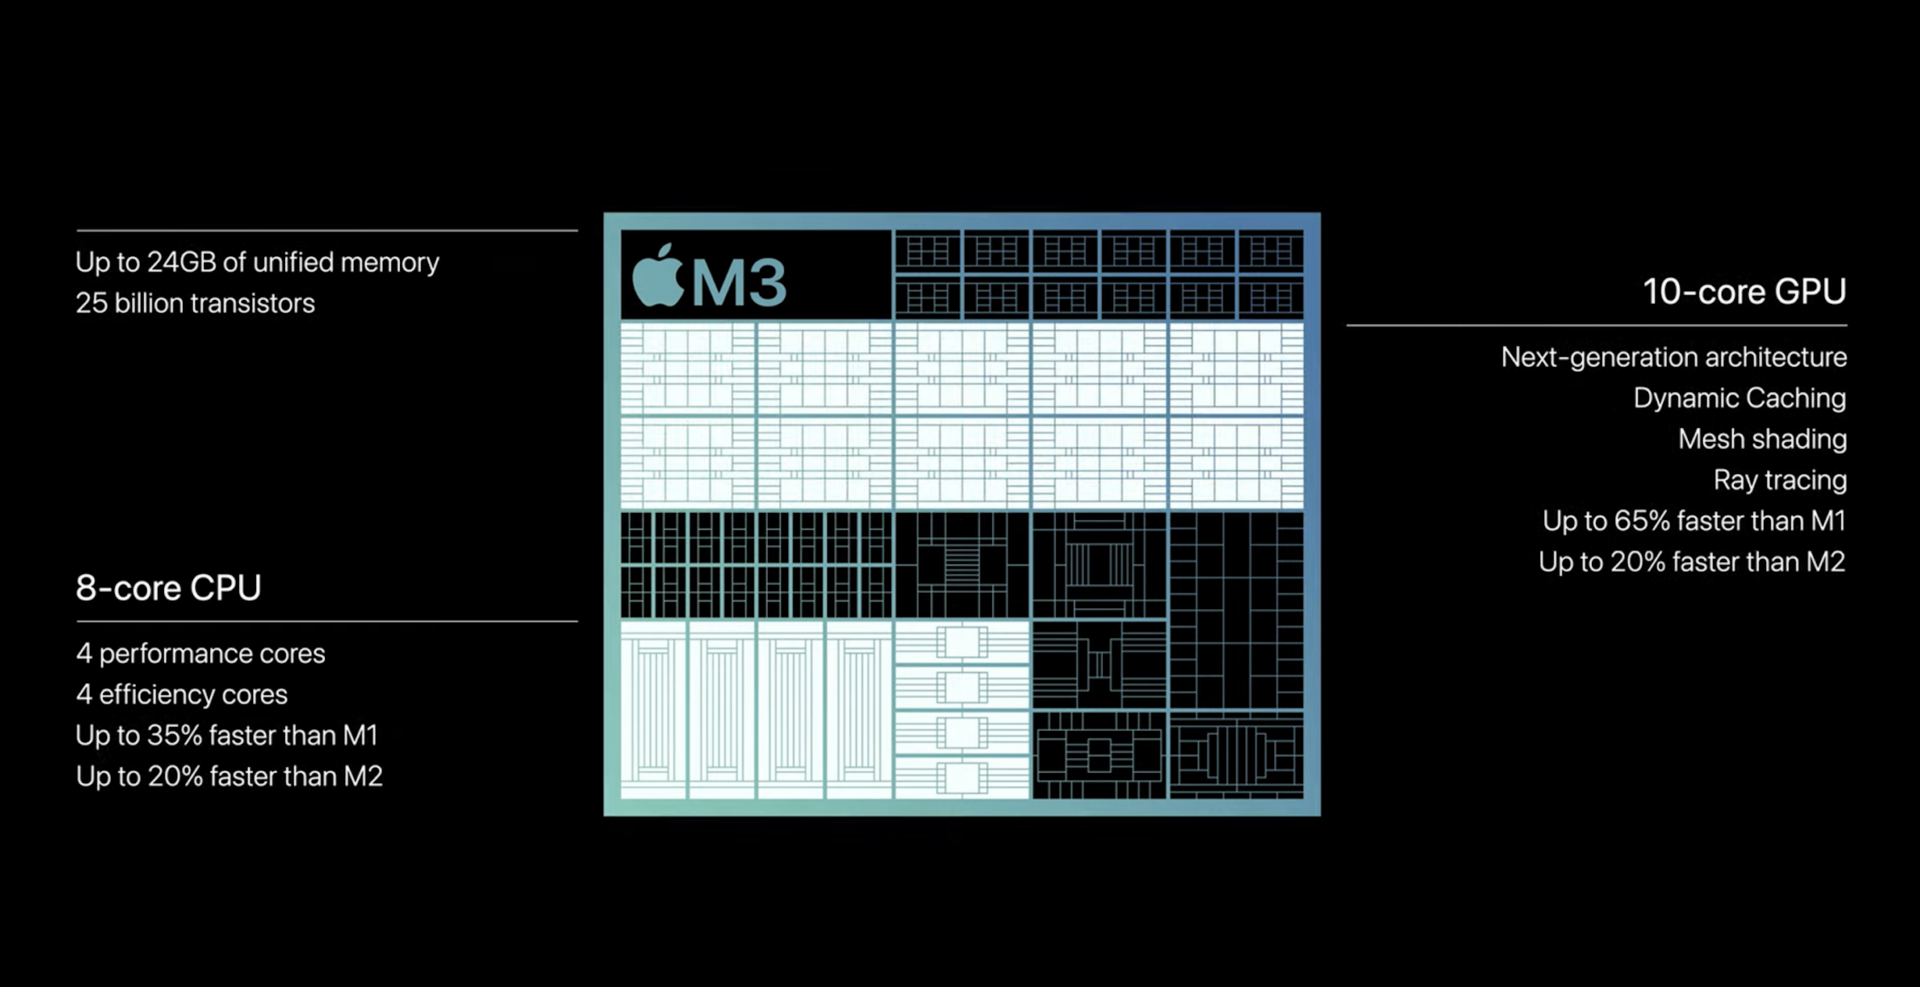
M3 SoC 是Apple 新推出的入门级芯片,与前代产品一样,将用于 MacBook Pro 和台式电脑(主动散热),以及 MacBook Air(被动散热),与前两代产品一样。虽然内核配置发生了变化,但速度更快的M3 Pro/M3 Max、基础版 M3 的配置保持不变。

在 CPU 方面,有一个配备 4 个内核的性能集群,最高主频可达 4.056 GHz(或当所有内核都加载时约为 3.6 GHz);还有一个配备 4 个内核的效率集群,最高主频可达 2.748 GHz。由于采用了新的 3 纳米生产工艺(估计是台积电的 N3B 工艺),Apple ,因此能够在不对功耗做出重大妥协的情况下大幅提高时钟频率。此外,晶体管的数量也从 M2 和 M3 的 200 亿个增加到了 M4 和 M5。M2增加到 250 亿个。

集成显卡也发生了一些重大变化。M3 仍有配备 8 个 GPU 内核的版本(iMac 和即将推出的 MacBook Air 的基本型号),也有配备 10 个 GPU 内核的更强大版本,如MacBook Pro 14 。不过,Apple 对 GPU 的整个架构进行了全面修改,现在使用动态缓存,即根据应用程序的实际需求动态分配缓存和内存。此外,M3 现在还支持基于硬件的光线追踪、网格着色和 AV1 解码。不过,一次只能使用两个显示器。

与旧的

M2 SoC一样,M3 SoC 可以配备 8 GB、16 GB 或最多 24 GB 的内存。

测试程序

为了在不同笔记本电脑之间进行有意义的比较,我们不仅要看合成基准测试中的纯性能,还要看功耗,然后根据功耗确定效率。功耗测量总是在外部显示器上进行,这样我们就可以排除不同内部显示器的影响因素。不过,我们在这里测量的是系统的整体功耗,而不仅仅是 CPU 和 GPU 的显示值。

单核性能

Apple 新的 M3 处理器的单核性能比旧的M2和 M2 Pro M2 Pro与旧的 M1 处理器相比M3 的性能提高了 30%。CPU 本身的功耗(根据 Power Metrics 的数据)在基准测试开始时约为 6.5 瓦,后来增加到 5.5 瓦,这就是功耗与旧款 M2 相比略有增加的原因。尽管性能大幅提升,Apple ,MacBook Pro 13 的能效仍比 M2 提高了约 18%,这是一个非常出色的结果。不过,与被动散热的 MacBook Air 机型相比,领先优势较小。

Single-Core Performance Rating - Percent
Apple M3
Apple MacBook Pro 14 2023 M3
100 pt
Apple M2 Pro
Apple MacBook Pro 14 2023 M2 Pro
85.1 pt
Apple M2 Pro 10-Core
Apple MacBook Pro 14 2023 M2 Pro Entry
84.3 pt
Apple M2
Apple MacBook Pro 13 2022 M2
82.9 pt
Apple M2
Apple MacBook Air M2 Entry
82.5 pt
Apple M1 Pro
Apple MacBook Pro 16 2021 M1 Pro
78 pt
Apple M1 Pro 8-Core
Apple MacBook Pro 14 2021 M1 Pro Entry
78 pt
Apple M1
Apple MacBook Pro 13 Late 2020 M1 Entry (8 / 256 GB)
76.9 pt
Apple M1
Apple MacBook Air 2020 M1 Entry
76.2 pt
Cinebench R23 - Single Core
Apple M3
Apple MacBook Pro 14 2023 M3
1904 Points
Apple M2 Pro
Apple MacBook Pro 14 2023 M2 Pro
1647 Points -13%
Apple M2 Pro 10-Core
Apple MacBook Pro 14 2023 M2 Pro Entry
1643 Points -14%
Apple M2
Apple MacBook Air M2 Entry
1585 Points -17%
Apple M2
Apple MacBook Pro 13 2022 M2
1581 Points -17%
Apple M1 Pro
Apple MacBook Pro 16 2021 M1 Pro
1534 Points -19%
Apple M1 Pro 8-Core
Apple MacBook Pro 14 2021 M1 Pro Entry
1531 Points -20%
Apple M1
Apple MacBook Pro 13 Late 2020 M1 Entry (8 / 256 GB)
1513 Points -21%
Apple M1
Apple MacBook Air 2020 M1 Entry
1496 Points -21%
Geekbench 5.5 - Single-Core
Apple M3
Apple MacBook Pro 14 2023 M3
2342 Points
Apple M2 Pro
Apple MacBook Pro 14 2023 M2 Pro
1961 Points -16%
Apple M2
Apple MacBook Pro 13 2022 M2
1937 Points -17%
Apple M2 Pro 10-Core
Apple MacBook Pro 14 2023 M2 Pro Entry
1926 Points -18%
Apple M2
Apple MacBook Air M2 Entry
1914 Points -18%
Apple M1 Pro 8-Core
Apple MacBook Pro 14 2021 M1 Pro Entry
1769 Points -24%
Apple M1 Pro
Apple MacBook Pro 16 2021 M1 Pro
1768 Points -25%
Apple M1
Apple MacBook Pro 13 Late 2020 M1 Entry (8 / 256 GB)
1740 Points -26%
Apple M1
Apple MacBook Air 2020 M1 Entry
1727 Points -26%
Power Consumption / Cinebench R23 Single Power Efficiency - external Monitor
Apple M3
Apple MacBook Pro 14 2023 M3
190.4 Points per Watt
Apple M2
Apple MacBook Air M2 Entry
179.3 Points per Watt -6%
Apple M1
Apple MacBook Air 2020 M1 Entry
165.1 Points per Watt -13%
Apple M2
Apple MacBook Pro 13 2022 M2
161.7 Points per Watt -15%
Apple M2 Pro
Apple MacBook Pro 14 2023 M2 Pro
140.8 Points per Watt -26%
Apple M2 Pro 10-Core
Apple MacBook Pro 14 2023 M2 Pro Entry
118.2 Points per Watt -38%
Apple M1 Pro
Apple MacBook Pro 16 2021 M1 Pro
110.4 Points per Watt -42%
Power Consumption / Cinebench R23 Single (external Monitor)
Apple M1 Pro
Apple MacBook Pro 16 2021 M1 Pro
13.9 (12.3min, 13.3P1 - 22.1max) Watt * -39%
Apple M2 Pro 10-Core
Apple MacBook Pro 14 2023 M2 Pro Entry
13.9 (12.2min, 12.7P1 - 16.5max) Watt * -39%
Apple M2 Pro
Apple MacBook Pro 14 2023 M2 Pro
11.7 (9.94min, 10.7P1 - 13.6max) Watt * -17%
Apple M3
Apple MacBook Pro 14 2023 M3
10 (9.53min, 9.57P1 - 12.8max) Watt *
Apple M2
Apple MacBook Pro 13 2022 M2
9.78 (9.13min, 9.21P1 - 11.2max) Watt * +2%
Apple M1
Apple MacBook Air 2020 M1 Entry
9.06 (8.41min, 8.57P1 - 19max) Watt * +9%
Apple M2
Apple MacBook Air M2 Entry
8.84 (8.3min, 8.37P1 - 9.82max) Watt * +12%

* ... smaller is better

多核性能

与 MacBook Pro 13 中的旧版 M2 相比,多核性能也提高了约 20%,不过 CPU 内核的功耗也略有增加。M2 的功耗略低于 20 瓦,而 M3 满载时需要 20-21 瓦。这使得新款 M3 仅领先于旧款入门级 8 核 M1 Pro,但所有其他 MacBook Pro CPU 的速度仍然更快。另一方面,这里的效率也有所提高,但在 MBP 13 中比 M2 领先 8%,并不像单核负载时那么高。

Multi-Core Performance Rating - Percent
Apple M2 Pro
Apple MacBook Pro 14 2023 M2 Pro
100 pt
Apple M1 Pro
Apple MacBook Pro 16 2021 M1 Pro
83.9 pt
Apple M2 Pro 10-Core
Apple MacBook Pro 14 2023 M2 Pro Entry
81 pt
Apple M3
Apple MacBook Pro 14 2023 M3
71.6 pt
Apple M1 Pro 8-Core
Apple MacBook Pro 14 2021 M1 Pro Entry
65.9 pt
Apple M2
Apple MacBook Pro 13 2022 M2
59.7 pt
Apple M2
Apple MacBook Air M2 Entry
59.4 pt
Apple M1
Apple MacBook Pro 13 Late 2020 M1 Entry (8 / 256 GB)
52 pt
Apple M1
Apple MacBook Air 2020 M1 Entry
50.6 pt
Cinebench R23 - Multi Core
Apple M2 Pro
Apple MacBook Pro 14 2023 M2 Pro
14787 Points +41%
Apple M1 Pro
Apple MacBook Pro 16 2021 M1 Pro
12370 Points +18%
Apple M2 Pro 10-Core
Apple MacBook Pro 14 2023 M2 Pro Entry
11811 Points +13%
Apple M3
Apple MacBook Pro 14 2023 M3
10454 Points
Apple M1 Pro 8-Core
Apple MacBook Pro 14 2021 M1 Pro Entry
9581 Points -8%
Apple M2
Apple MacBook Pro 13 2022 M2
8745 Points -16%
Apple M2
Apple MacBook Air M2 Entry
8667 Points -17%
Apple M1
Apple MacBook Pro 13 Late 2020 M1 Entry (8 / 256 GB)
7811 Points -25%
Apple M1
Apple MacBook Air 2020 M1 Entry
7409 (6401.39min - 7409.31max) Points -29%
Geekbench 5.5 - Multi-Core
Apple M2 Pro
Apple MacBook Pro 14 2023 M2 Pro
14859 Points +38%
Apple M1 Pro
Apple MacBook Pro 16 2021 M1 Pro
12499 Points +16%
Apple M2 Pro 10-Core
Apple MacBook Pro 14 2023 M2 Pro Entry
12189 Points +13%
Apple M3
Apple MacBook Pro 14 2023 M3
10774 Points
Apple M1 Pro 8-Core
Apple MacBook Pro 14 2021 M1 Pro Entry
9942 Points -8%
Apple M2
Apple MacBook Pro 13 2022 M2
8962 Points -17%
Apple M2
Apple MacBook Air M2 Entry
8951 Points -17%
Apple M1
Apple MacBook Pro 13 Late 2020 M1 Entry (8 / 256 GB)
7590 Points -30%
Apple M1
Apple MacBook Air 2020 M1 Entry
7578 Points -30%
Power Consumption / Cinebench R23 Multi Power Efficiency - external Monitor
Apple M3
Apple MacBook Pro 14 2023 M3
375 (27.4min, 28P1 - 30.7max) Points per Watt
Apple M2
Apple MacBook Pro 13 2022 M2
346 Points per Watt -8%
Apple M2
Apple MacBook Air M2 Entry
343 Points per Watt -9%
Apple M1
Apple MacBook Air 2020 M1 Entry
337 Points per Watt -10%
Apple M1 Pro
Apple MacBook Pro 16 2021 M1 Pro
290 Points per Watt -23%
Apple M2 Pro
Apple MacBook Pro 14 2023 M2 Pro
275 Points per Watt -27%
Apple M2 Pro 10-Core
Apple MacBook Pro 14 2023 M2 Pro Entry
250 Points per Watt -33%
Power Consumption / Cinebench R23 Multi (external Monitor)
Apple M2 Pro
Apple MacBook Pro 14 2023 M2 Pro
53.7 (50.8min, 51.2P1 - 60.8max) Watt * -92%
Apple M2 Pro 10-Core
Apple MacBook Pro 14 2023 M2 Pro Entry
47.2 (45.8min, 46.1P1 - 48.5max) Watt * -69%
Apple M1 Pro
Apple MacBook Pro 16 2021 M1 Pro
42.7 (16.4min, 25.7P1 - 50.1max) Watt * -53%
Apple M3
Apple MacBook Pro 14 2023 M3
27.9 (26.6min, 27P1 - 30max) Watt *
Apple M2
Apple MacBook Pro 13 2022 M2
25.3 (24.4min, 24.5P1 - 27.2max) Watt * +9%
Apple M2
Apple MacBook Air M2 Entry
25.3 (23.2min, 23.5P1 - 27.5max) Watt * +9%
Apple M1
Apple MacBook Air 2020 M1 Entry
22 (18.7min, 18.8P1 - 25.2max) Watt * +21%

* ... smaller is better

Apple M3 与 AMD、英特尔和高通的比较

现在,我们将Apple M3 与当前 AMD、英特尔和高通公司的移动处理器进行比较。在选择对比设备时,我们主要关注 AMD 的 U 系列芯片和英特尔的 U/P 系列芯片。我们还将 TDP 值相对较低(最大 50 瓦)的个别 H45 和 HS 芯片纳入比较范围,尽管这些芯片与 M3 并不直接竞争。我们还将骁龙 8cx Gen3中的骁龙 8cx Gen3。

从单核性能开始,我们可以清楚地看到Apple 在 M3 上取得的进步。尽管功耗较低,但 M3 的性能内核仍能轻松赶上英特尔当前 Raptor Lake CPU 的性能内核,而后者所需的功耗要高得多。在我们的对比中,即使是最高效的英特尔芯片酷睿 i7-1355U目前的 AMD Zen4 芯片在效率方面 "只 "落后 2 倍,但性能也比不上 M3。在 Geekbench 测试中,骁龙 8cx Gen3 只能在一定程度上跟上(-28%),但在时间更长的 R23 单项测试中却远远落后(-68%),在效率方面也只是略微领先于英特尔 CPU。

Cinebench R23 - Single Core
Intel Core i7-13700H
SCHENKER Vision 14 2023
1912 Points 0%
Apple M3
Apple MacBook Pro 14 2023 M3
1904 Points
Intel Core i7-1360P
Lenovo Yoga 9 14IRP G8
1877 Points -1%
Intel Core i7-1365U
Lenovo ThinkPad X1 Carbon G11-21HNS00000
1877 Points -1%
AMD Ryzen 7 7840S
Lenovo Yoga Slim 7 14APU G8
1761 Points -8%
Intel Core i7-1355U
Asus ExpertBook B9 B9403CVA-KM0153X
1687 Points -11%
AMD Ryzen 7 7840U
HP EliteBook 845 G10 5Z4X0ES
1581 Points -17%
AMD Ryzen 9 PRO 7940HS
HP EliteBook 845 G10 818N0EA
1568 Points -18%
Qualcomm Snapdragon 8cx Gen 3
Microsoft Surface Pro 9, ARM
608 Points -68%
Geekbench 5.5 - Single-Core
Apple M3
Apple MacBook Pro 14 2023 M3
2342 Points
AMD Ryzen 7 7840S
Lenovo Yoga Slim 7 14APU G8
1939 Points -17%
Intel Core i7-1365U
Lenovo ThinkPad X1 Carbon G11-21HNS00000
1938 Points -17%
Intel Core i7-13700H
SCHENKER Vision 14 2023
1830 Points -22%
Intel Core i7-1360P
Lenovo Yoga 9 14IRP G8
1790 Points -24%
AMD Ryzen 9 PRO 7940HS
HP EliteBook 845 G10 818N0EA
1758 Points -25%
Intel Core i7-1355U
Asus ExpertBook B9 B9403CVA-KM0153X
1740 Points -26%
AMD Ryzen 7 7840U
HP EliteBook 845 G10 5Z4X0ES
1723 Points -26%
Qualcomm Snapdragon 8cx Gen 3
Microsoft Surface Pro 9, ARM
1690 Points -28%
Power Consumption - Cinebench R23 Single Power Efficiency - external Monitor
Apple M3
Apple MacBook Pro 14 2023 M3
190.4 Points per Watt
AMD Ryzen 7 7840U
HP EliteBook 845 G10 5Z4X0ES
100.7 Points per Watt -47%
AMD Ryzen 9 PRO 7940HS
HP EliteBook 845 G10 818N0EA
92.2 Points per Watt -52%
Qualcomm Snapdragon 8cx Gen 3
Microsoft Surface Pro 9, ARM
66.7 Points per Watt -65%
Intel Core i7-1355U
Asus ExpertBook B9 B9403CVA-KM0153X
64.7 Points per Watt -66%
Intel Core i7-13700H
SCHENKER Vision 14 2023
53.3 Points per Watt -72%
Intel Core i7-1365U
Lenovo ThinkPad X1 Carbon G11-21HNS00000
49.4 Points per Watt -74%
AMD Ryzen 7 7840S
Lenovo Yoga Slim 7 14APU G8
48.2 Points per Watt -75%
Intel Core i7-1360P
Lenovo Yoga 9 14IRP G8
48 Points per Watt -75%

在多核测试中,由于 AMD 和 Intel 的一些竞争对手提供了更好的性能,特别是在 Cinebench R23 测试中,情况稍有好转。由于 M3 处理器不支持超线程,因此成绩仍然很好。然而,英特尔的两款 U 系列处理器(只有两个性能内核)却落在了后面,而高通芯片则再次毫无机会(-68%)。在简短的 Geekbench 测试中,Apple 芯片明显更胜一筹,仅以微弱优势被AMD Ryzen 7 7840S。

在效率方面,差异明显小于单核负载和 Ryzen 7 7840U几乎不相上下。AMD 和英特尔的其他 CPU 则落在了后面,而高通芯片则再次毫无胜算。

Cinebench R23: Multi Core | Geekbench 5.5: Multi-Core | Power Consumption: Cinebench R23 Multi Power Efficiency - external Monitor
Cinebench R23 / Multi Core
AMD Ryzen 7 7840S
Lenovo Yoga Slim 7 14APU G8
15102 Points +44%
AMD Ryzen 9 PRO 7940HS
HP EliteBook 845 G10 818N0EA
14919 Points +43%
AMD Ryzen 7 7840U
HP EliteBook 845 G10 5Z4X0ES
12385 Points +18%
Intel Core i7-13700H
SCHENKER Vision 14 2023
12275 Points +17%
Intel Core i7-1360P
Lenovo Yoga 9 14IRP G8
11922 Points +14%
Apple M3
Apple MacBook Pro 14 2023 M3
10454 Points
Intel Core i7-1365U
Lenovo ThinkPad X1 Carbon G11-21HNS00000
9343 Points -11%
Intel Core i7-1355U
Asus ExpertBook B9 B9403CVA-KM0153X
7733 Points -26%
Qualcomm Snapdragon 8cx Gen 3
Microsoft Surface Pro 9, ARM
3567 Points -66%
Geekbench 5.5 / Multi-Core
AMD Ryzen 7 7840S
Lenovo Yoga Slim 7 14APU G8
11288 Points +5%
Intel Core i7-1360P
Lenovo Yoga 9 14IRP G8
10785 Points 0%
Apple M3
Apple MacBook Pro 14 2023 M3
10774 Points
Intel Core i7-13700H
SCHENKER Vision 14 2023
10515 Points -2%
AMD Ryzen 9 PRO 7940HS
HP EliteBook 845 G10 818N0EA
9897 Points -8%
AMD Ryzen 7 7840U
HP EliteBook 845 G10 5Z4X0ES
9864 Points -8%
Intel Core i7-1365U
Lenovo ThinkPad X1 Carbon G11-21HNS00000
8709 Points -19%
Intel Core i7-1355U
Asus ExpertBook B9 B9403CVA-KM0153X
7635 Points -29%
Qualcomm Snapdragon 8cx Gen 3
Microsoft Surface Pro 9, ARM
7522 Points -30%
Power Consumption / Cinebench R23 Multi Power Efficiency - external Monitor
Apple M3
Apple MacBook Pro 14 2023 M3
375 (27.4min, 28P1 - 30.7max) Points per Watt
AMD Ryzen 7 7840U
HP EliteBook 845 G10 5Z4X0ES
369 Points per Watt -2%
AMD Ryzen 9 PRO 7940HS
HP EliteBook 845 G10 818N0EA
254 Points per Watt -32%
AMD Ryzen 7 7840S
Lenovo Yoga Slim 7 14APU G8
235 Points per Watt -37%
Intel Core i7-1355U
Asus ExpertBook B9 B9403CVA-KM0153X
209 Points per Watt -44%
Intel Core i7-1365U
Lenovo ThinkPad X1 Carbon G11-21HNS00000
208 Points per Watt -45%
Intel Core i7-13700H
SCHENKER Vision 14 2023
184.9 Points per Watt -51%
Intel Core i7-1360P
Lenovo Yoga 9 14IRP G8
183.7 Points per Watt -51%
Qualcomm Snapdragon 8cx Gen 3
Microsoft Surface Pro 9, ARM
111.5 Points per Watt -70%

GPU 性能和效率

在所有图形测试中,新的 10 核 M3 GPU 比旧的 10 核 M2 GPU 领先 10-22%。 10 核 M2 GPU但最大功耗也从 M2 的约 13.5 瓦增至 M3 的约 15 瓦。不过,Apple 过去所有的 Pro GPU(无论是 M1 还是 M2)速度都更快,即使是基本的 14 核 M14 Pro.

与 Windows 竞争对手相比,M3 GPU 明显优于AMD Radeon 780MIris Xe Graphics G7但在 Geekbench OpenCL 测试中,Apple GPU 不得不向 Radeon 780M 认输。专用的中端 Nvidia GPU(从 RTX 3050以上)性能明显更强,功耗自然也更高(35 瓦以上)。为了更好地进行分类,我们也将这些结果包括在内。

3DMark / Wild Life Extreme Unlimited
NVIDIA GeForce RTX 4050 Laptop GPU
Lenovo Yoga Pro 9-14IRP G8
15208 Points +83%
Apple M2 Pro 19-Core GPU
Apple MacBook Pro 14 2023 M2 Pro
12968 Points +56%
Apple M2 Pro 16-Core GPU
Apple MacBook Pro 14 2023 M2 Pro Entry
11224 Points +35%
Apple M1 Pro 16-Core GPU
Apple MacBook Pro 16 2021 M1 Pro
10352 Points +25%
NVIDIA GeForce RTX 3050 Ti Laptop GPU
SCHENKER Vision 14 2022 RTX 3050 Ti
9340 Points +13%
Apple M1 Pro 14-Core GPU
Apple MacBook Pro 14 2021 M1 Pro Entry
9267 Points +12%
Apple M3 10-Core GPU
Apple MacBook Pro 14 2023 M3
8302 Points
Apple M2 10-Core GPU
Apple MacBook Air M2 10C GPU
6824 Points -18%
Apple M2 8-Core GPU
Apple MacBook Air M2 Entry
5689 Points -31%
AMD Radeon 780M
Lenovo Yoga Slim 7 14APU G8
5465 Points -34%
Apple M1 8-Core GPU
Apple MacBook Pro 13 Late 2020 M1 Entry (8 / 256 GB)
4997 Points -40%
AMD Radeon 780M
Asus ROG Zephyrus G14 GA402XY
4663 Points -44%
Apple M1 7-Core GPU
Apple MacBook Air 2020 M1 Entry
4515 Points -46%
AMD Radeon 780M
Lenovo ThinkPad T14s G4-21F8002TGE
4332 Points -48%
Intel Iris Xe Graphics G7 96EUs
SCHENKER Vision 14 2023
4304 Points -48%
Intel Iris Xe Graphics G7 96EUs
Lenovo Yoga 9 14IRP G8
4221 Points -49%
Intel Iris Xe Graphics G7 96EUs
Lenovo ThinkPad X1 Carbon G11-21HNS00000
3520 Points -58%
Geekbench 5.5 / Metal Score
Apple M2 Pro 19-Core GPU
Apple MacBook Pro 14 2023 M2 Pro
52054 Points +51%
Apple M2 Pro 16-Core GPU
Apple MacBook Pro 14 2023 M2 Pro Entry
46834 Points +36%
Apple M1 Pro 16-Core GPU
Apple MacBook Pro 16 2021 M1 Pro
42115 Points +22%
Apple M1 Pro 14-Core GPU
Apple MacBook Pro 14 2021 M1 Pro Entry
37319 Points +8%
Apple M3 10-Core GPU
Apple MacBook Pro 14 2023 M3
34398 Points
Apple M2 10-Core GPU
Apple MacBook Air M2 10C GPU
30269 Points -12%
Apple M2 8-Core GPU
Apple MacBook Air M2 Entry
26079 Points -24%
Apple M1 8-Core GPU
Apple MacBook Pro 13 Late 2020 M1 Entry (8 / 256 GB)
21951 Points -36%
Apple M1 7-Core GPU
Apple MacBook Air 2020 M1 Entry
19064 Points -45%
Geekbench 5.5 / OpenCL Score
NVIDIA GeForce RTX 4050 Laptop GPU
Lenovo Yoga Pro 9-14IRP G8
86275 Points +165%
NVIDIA GeForce RTX 3050 6GB Laptop GPU
Lenovo Slim Pro 7 14ARP8
62409 Points +92%
NVIDIA GeForce RTX 3050 Ti Laptop GPU
SCHENKER Vision 14 2022 RTX 3050 Ti
61067 Points +88%
Apple M2 Pro 19-Core GPU
Apple MacBook Pro 14 2023 M2 Pro
46941 Points +44%
Apple M2 Pro 16-Core GPU
Apple MacBook Pro 14 2023 M2 Pro Entry
42483 Points +31%
Apple M1 Pro 16-Core GPU
Apple MacBook Pro 16 2021 M1 Pro
37867 Points +16%
AMD Radeon 780M
Lenovo Yoga Slim 7 14APU G8
36162 Points +11%
Apple M1 Pro 14-Core GPU
Apple MacBook Pro 14 2021 M1 Pro Entry
35173 Points +8%
AMD Radeon 780M
Lenovo ThinkPad T14s G4-21F8002TGE
34161 Points +5%
AMD Radeon 780M
Asus ROG Zephyrus G14 GA402XY
33853 Points +4%
Apple M3 10-Core GPU
Apple MacBook Pro 14 2023 M3
32540 Points
Apple M2 10-Core GPU
Apple MacBook Air M2 10C GPU
27489 Points -16%
Apple M2 8-Core GPU
Apple MacBook Air M2 Entry
23633 Points -27%
Intel Iris Xe Graphics G7 96EUs
Lenovo Yoga 9 14IRP G8
20890 Points -36%
Intel Iris Xe Graphics G7 96EUs
SCHENKER Vision 14 2023
20765 Points -36%
Apple M1 8-Core GPU
Apple MacBook Pro 13 Late 2020 M1 Entry (8 / 256 GB)
19078 Points -41%
Intel Iris Xe Graphics G7 96EUs
Lenovo ThinkPad X1 Carbon G11-21HNS00000
19004 Points -42%
Apple M1 7-Core GPU
Apple MacBook Air 2020 M1 Entry
17029 Points -48%
GFXBench / Aztec Ruins High Tier Offscreen
Apple M2 Pro 19-Core GPU
Apple MacBook Pro 14 2023 M2 Pro
210.4 fps +74%
Apple M2 Pro 16-Core GPU
Apple MacBook Pro 14 2023 M2 Pro Entry
181.1 fps +50%
Apple M1 Pro 16-Core GPU
Apple MacBook Pro 16 2021 M1 Pro
166 fps +37%
Apple M1 Pro 14-Core GPU
Apple MacBook Pro 14 2021 M1 Pro Entry
147 fps +21%
Apple M3 10-Core GPU
Apple MacBook Pro 14 2023 M3
121 fps
Apple M2 10-Core GPU
Apple MacBook Air M2 10C GPU
110 fps -9%
Apple M2 8-Core GPU
Apple MacBook Air M2 Entry
91 fps -25%
Apple M1 8-Core GPU
Apple MacBook Pro 13 Late 2020 M1 Entry (8 / 256 GB)
78.2 fps -35%
Apple M1 7-Core GPU
Apple MacBook Air 2020 M1 Entry
72.4 fps -40%
AMD Radeon 780M
Asus ROG Zephyrus G14 GA402XY
58.3 fps -52%

在检查效率时,我们或多或少必须使用Witcher 3 ,因为我们的数据库中存储了最多的比较值,而且 CPU 负载相当低。当然,对于 MacBook 而言,这并不是一个最佳的起点,其数值也不能完全与 Windows 笔记本电脑相提并论,因为在 Mac 上只能通过 CrossOver 运行模拟版本,这也会降低一些性能。去年,我们首次在 MacBook(即 M2 Pro 机型)上进行了此项测试。M2 MacBook Air 15.新款 MacBook Pro 14 M3效率提高了 8%。

Power Consumption - Witcher 3 ultra Efficiency (external Monitor)
Apple M3 10-Core GPU
Apple MacBook Pro 14 2023 M3
1.207 fps per Watt
Apple M2 10-Core GPU
Apple MacBook Air 15 2023 M2 16 GB
1.116 fps per Watt -8%
Apple M2 Pro 19-Core GPU
Apple MacBook Pro 14 2023 M2 Pro
1.028 fps per Watt -15%
Apple M2 Pro 16-Core GPU
Apple MacBook Pro 14 2023 M2 Pro Entry
0.941 fps per Watt -22%
NVIDIA GeForce RTX 4060 Laptop GPU
Lenovo Legion Slim 7 16APH8
0.773 fps per Watt -36%
NVIDIA GeForce RTX 4060 Laptop GPU
Microsoft Surface Laptop Studio 2 RTX 4060
0.764 fps per Watt -37%
NVIDIA GeForce RTX 4050 Laptop GPU
Asus VivoBook Pro 16 K6602VU
0.703 fps per Watt -42%
AMD Radeon 780M
Lenovo ThinkPad T14s G4-21F8002TGE
0.658 fps per Watt -45%
NVIDIA GeForce RTX 4050 Laptop GPU
SCHENKER XMG Apex 15 (Late 23)
0.616 fps per Watt -49%
NVIDIA GeForce RTX 3050 6GB Laptop GPU
Lenovo Slim Pro 7 14ARP8
0.614 fps per Watt -49%
AMD Radeon RX 6600M
Minisforum Neptune Series HX77G
0.587 fps per Watt -51%
NVIDIA GeForce RTX 2050 Mobile
Acer Aspire 5 A515-57G-53N8
0.57 fps per Watt -53%
AMD Radeon 780M
Lenovo Yoga Slim 7 14APU G8
0.495 fps per Watt -59%
NVIDIA GeForce RTX 3050 Ti Laptop GPU
SCHENKER Vision 14 2022 RTX 3050 Ti
0.4933 fps per Watt -59%
Intel Iris Xe Graphics G7 96EUs
Lenovo ThinkPad X1 Carbon G11 21HNS54T00
0.2782 fps per Watt -77%
Intel Iris Xe Graphics G7 96EUs
Lenovo ThinkPad E14 G5 i7-1355U
0.2569 fps per Watt -79%

Apple M3 与高通骁龙 X 精英版的对比

在Apple 新款 M3 处理器发布前不久,高通公司推出了骁龙 X 精英并展示了 23 瓦和 80 瓦两种参考设计的基准测试结果。当然,我们也将这些结果与新的Apple M3 进行了比较,为此我们采用了高通公司使用的 Cinebench 2024、Geekbench 6.2 和 GFXBench 基准(Aztec Ruins Normal Tier Offscreen)。

Cinebench 2024: CPU Multi Core | CPU Single Core | Geekbench 6.2: Multi-Core | Single-Core
Cinebench 2024 / CPU Multi Core
SD X Elite Reference 80W
SD X Elite Adreno GPU , Snapdragon X Elite
1220 Points +71%
SD X Elite Reference 23W
SD X Elite Adreno GPU , Snapdragon X Elite
950 Points +33%
Lenovo Yoga Slim 7 14APU G8
Radeon 780M, R7 7840S, Samsung PM9A1 MZVL21T0HCLR
853 Points +20%
Apple MacBook Pro 14 2023 M3
M3 10-Core GPU, M3, Apple SSD AP1024Z
712 Points
Lenovo ThinkPad T14s G4-21F8002TGE
Radeon 780M, R7 7840U, Samsung PM9A1a MZVL21T0HDLU
609 Points -14%
Lenovo ThinkPad X1 Carbon G11 21HNS54T00
Iris Xe G7 96EUs, i7-1370P, WDC PC SN810 2TB
366 Points -49%
Cinebench 2024 / CPU Single Core
Apple MacBook Pro 14 2023 M3
M3 10-Core GPU, M3, Apple SSD AP1024Z
140 Points
SD X Elite Reference 80W
SD X Elite Adreno GPU , Snapdragon X Elite
133 Points -5%
SD X Elite Reference 23W
SD X Elite Adreno GPU , Snapdragon X Elite
124 Points -11%
Lenovo Yoga Slim 7 14APU G8
Radeon 780M, R7 7840S, Samsung PM9A1 MZVL21T0HCLR
103 Points -26%
Lenovo ThinkPad T14s G4-21F8002TGE
Radeon 780M, R7 7840U, Samsung PM9A1a MZVL21T0HDLU
97 Points -31%
Lenovo ThinkPad X1 Carbon G11 21HNS54T00
Iris Xe G7 96EUs, i7-1370P, WDC PC SN810 2TB
90 Points -36%
Geekbench 6.2 / Multi-Core
SD X Elite Reference 80W
SD X Elite Adreno GPU , Snapdragon X Elite
15239 Points +27%
SD X Elite Reference 23W
SD X Elite Adreno GPU , Snapdragon X Elite
14056 Points +17%
Lenovo ThinkPad X1 Carbon G11 21HNS54T00
Iris Xe G7 96EUs, i7-1370P, WDC PC SN810 2TB
12891 Points +8%
Lenovo Yoga Slim 7 14APU G8
Radeon 780M, R7 7840S, Samsung PM9A1 MZVL21T0HCLR
12598 Points +5%
Apple MacBook Pro 14 2023 M3
M3 10-Core GPU, M3, Apple SSD AP1024Z
11966 Points
Lenovo ThinkPad T14s G4-21F8002TGE
Radeon 780M, R7 7840U, Samsung PM9A1a MZVL21T0HDLU
10893 Points -9%
Geekbench 6.2 / Single-Core
Apple MacBook Pro 14 2023 M3
M3 10-Core GPU, M3, Apple SSD AP1024Z
3099 Points
SD X Elite Reference 80W
SD X Elite Adreno GPU , Snapdragon X Elite
2966 Points -4%
SD X Elite Reference 23W
SD X Elite Adreno GPU , Snapdragon X Elite
2777 Points -10%
Lenovo ThinkPad X1 Carbon G11 21HNS54T00
Iris Xe G7 96EUs, i7-1370P, WDC PC SN810 2TB
2644 Points -15%
Lenovo Yoga Slim 7 14APU G8
Radeon 780M, R7 7840S, Samsung PM9A1 MZVL21T0HCLR
2605 Points -16%
Lenovo ThinkPad T14s G4-21F8002TGE
Radeon 780M, R7 7840U, Samsung PM9A1a MZVL21T0HDLU
2399 Points -23%

高通公司(Qualcomm)的两个参考系统在多核性能方面都有明显优势(取决于测试,23 瓦时在 17-33% 之间,80 瓦时在 27-71% 之间)。不过,这是与最慢的新 M3 芯片进行的比较,我们已经可以看出,28 瓦的 M3 Pro(12 核)比 80 瓦的高通参考设计更快,至少在 Geekbench Multi 中是如此。

在单核测试中,Apple M3 可轻松超越性能强劲的 Snapdragon X Elite。高通芯片在单核负载下究竟需要多少功率,我们拭目以待。

GFXBench - 1920x1080 Aztec Ruins Normal Tier Offscreen
Apple MacBook Pro 14 2023 M2 Pro Entry
M2 Pro 16-Core GPU, M2 Pro 10-Core, Apple SSD AP0512Z
493 fps +50%
SD X Elite Reference 80W
SD X Elite Adreno GPU , Snapdragon X Elite
356 fps +8%
Apple MacBook Pro 14 2023 M3
M3 10-Core GPU, M3, Apple SSD AP1024Z
329.6 fps
SD X Elite Reference 23W
SD X Elite Adreno GPU , Snapdragon X Elite
294 fps -11%
Apple Mac Mini M2
M2 10-Core GPU, M2, Apple SSD AP0512Z
289.5 fps -12%
Asus ROG Zephyrus G14 GA402XY
Radeon 780M, R9 7940HS
141 fps -57%
HP ZBook Firefly 14 G10 A
Radeon 760M, R5 PRO 7640HS, Samsung PM9B1 512GB MZVL4512HBLU
123.2 fps -63%
Asus Zenbook S 13 OLED
Radeon 680M, R7 6800U, Samsung PM9A1 MZVL21T0HCLR
120 fps -64%
Asus Chromebook Flip CX5 CX5601FB
Iris Xe G7 96EUs, i7-1255U, Intel SSD 670p SSDPEKNU512GZ
84 fps -75%

在高通公司的 GPU 基准测试中,结果非常明显,10 核 M3 GPU(最大功耗为 15 瓦)比高通公司的小型参考系统高出 12%,仅比 80 瓦系统低 7%。然而新款 M3 Pro 的 18 核 GPU在 580 FPS 的性能上明显更胜一筹。

结论 -Apple 首款 3 纳米芯片取得圆满成功

Apple MacBook Pro 中的 M3 SoC 14 2023

从 M1 到 M2,Apple ,芯片的性能通过更高的时钟速度得到了提升,但由于采用了相同的制造工艺(5 纳米),其代价是更高的功耗。在 M3 中,CPU 和 GPU 的基本核心配置保持不变,但时钟速度再次提高。由于采用了现代的 3 纳米制造工艺,这对功耗的影响微乎其微,因此Apple 能够同时提高性能和效率。

Apple 在单核心和多核心测试中,《NVIDIA® Core™ 处理器》都将处理器性能提高了近 20%。尤其是单核性能,现在已可与英特尔当前一代 Raptor Lake 处理器的快速性能内核媲美,而后者的功耗要高得多。与 AMD 的 Zen4 处理器相比,M3 的优势也很明显,因为它们在效率或纯性能方面都无法与 M3 竞争。不过,在多核测试中,情况发生了变化,Zen4 处理器(来自 Ryzen 7 U 系列)和英特尔的 Raptor Lake P 处理器都能提供更高的性能,但英特尔 CPU 的效率要低得多。英特尔的 U 系列,如目前的酷睿 i7-1365U,在多核性能方面也落后了。AMD 的 Zen4 芯片(如 Ryzen 7 7840U)在多核效率方面几乎不相上下。AMD 很有可能在 2024 年初推出 Ryzen 8000 芯片,超越Apple 。

更高的性能,更高的效率--Apple ,新的 M3 和即将推出的 MacBook Air 也将从性能提升中受益。

在图形性能方面,与 M2 相比,优势高达 20%。尽管功耗略有增加,但我们仍然看到效率略有提高,而目前 AMD 的 iGPU (Radeon 780M)和英特尔Iris Xe Graphics G7)明显落后。只有在 OpenCL 测试中,Radeon 780M 才能轻松战胜 M3 GPU。

与新的高通 Snapdragon X Elite的比较也非常有趣,因为骁龙似乎更具优势,尤其是在多核性能方面。不过,至少在 23 瓦的小型参考设计中,图形性能要弱于Apple M3,而且高通公司提供的基准测试数量非常有限。这些数据显示,与之前的 8cx Gen3 芯片但我们还需要等待,看看首批设备上市后的性能表现到底如何。

Please share our article, every link counts!
> Notebookcheck中文版(NBC中国) > 评测 > Apple M3 SoC 分析:提高性能和效率
Andreas Osthoff, 2023-11-12 (Update: 2023-11-12)