华硕Zenbook S 13 OLED笔记本电脑回顾。副笔记本以快速的AMD Ryzen 7 6800U给人留下深刻印象
新的华硕Zenbook S 13是一款超移动笔记本,重量仅为1公斤,并提供目前最新的技术。除了2.8K OLED屏幕(13.3英寸)外,客户还得到了AMD的最新移动芯片,即 Ryzen 7 6800U,其中还包括快速的 Radeon 680M集成显卡。另外,也可以选择使用英特尔最新的Alder Lake芯片的型号。在这里,我们处理的是一台传统的笔记本电脑,但那些喜欢可转换的人应该看看Zenbook S 13 Flip。
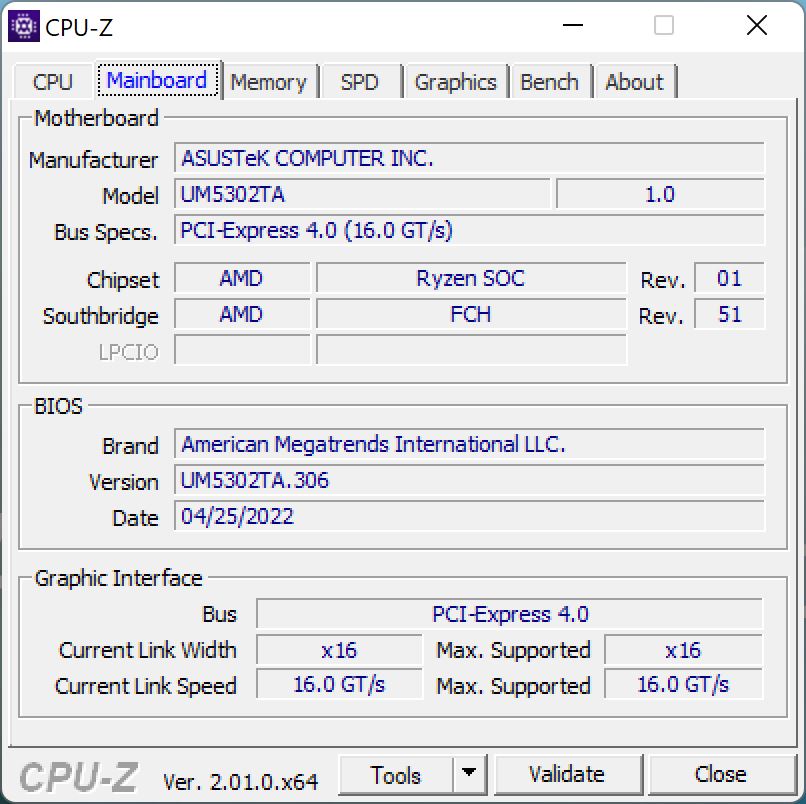
我们的评测单元配备了新的AMD Ryzen 7 6800U,快速的Radeon 680M图形,16GB内存,1TB PCIe 4.0固态硬盘和2.8K OLED屏幕。在写这篇文章的时候,Zenbook S 13还没有在商店出售,但据预测,定价将在1000-1500美元之间。
潜在的竞争对手比较
Rating | Date | Model | Weight | Height | Size | Resolution | Price |
|---|---|---|---|---|---|---|---|
| 90.1 % v7 (old) | 07 / 2022 | Asus Zenbook S 13 OLED R7 6800U, Radeon 680M | 1.1 kg | 14.9 mm | 13.30" | 2880x1800 | |
| 91.1 % v7 (old) | 12 / 2020 | Apple MacBook Air 2020 M1 Entry M1, M1 7-Core GPU | 1.3 kg | 16.1 mm | 13.30" | 2560x1600 | |
| 88.3 % v7 (old) | 06 / 2021 | Dell XPS 13 9310 OLED i7-1185G7, Iris Xe G7 96EUs | 1.2 kg | 14.8 mm | 13.40" | 3456x2160 | |
| 86.7 % v7 (old) | 05 / 2022 | Samsung Galaxy Book2 Pro 13 NP930XED-KA1DE i5-1240P, Iris Xe G7 80EUs | 885 g | 11 mm | 13.30" | 1920x1080 | |
| 88.8 % v7 (old) | 02 / 2022 | Huawei MateBook 13s i5 11300H i5-11300H, Iris Xe G7 80EUs | 1.3 kg | 16.5 mm | 13.40" | 2520x1680 |
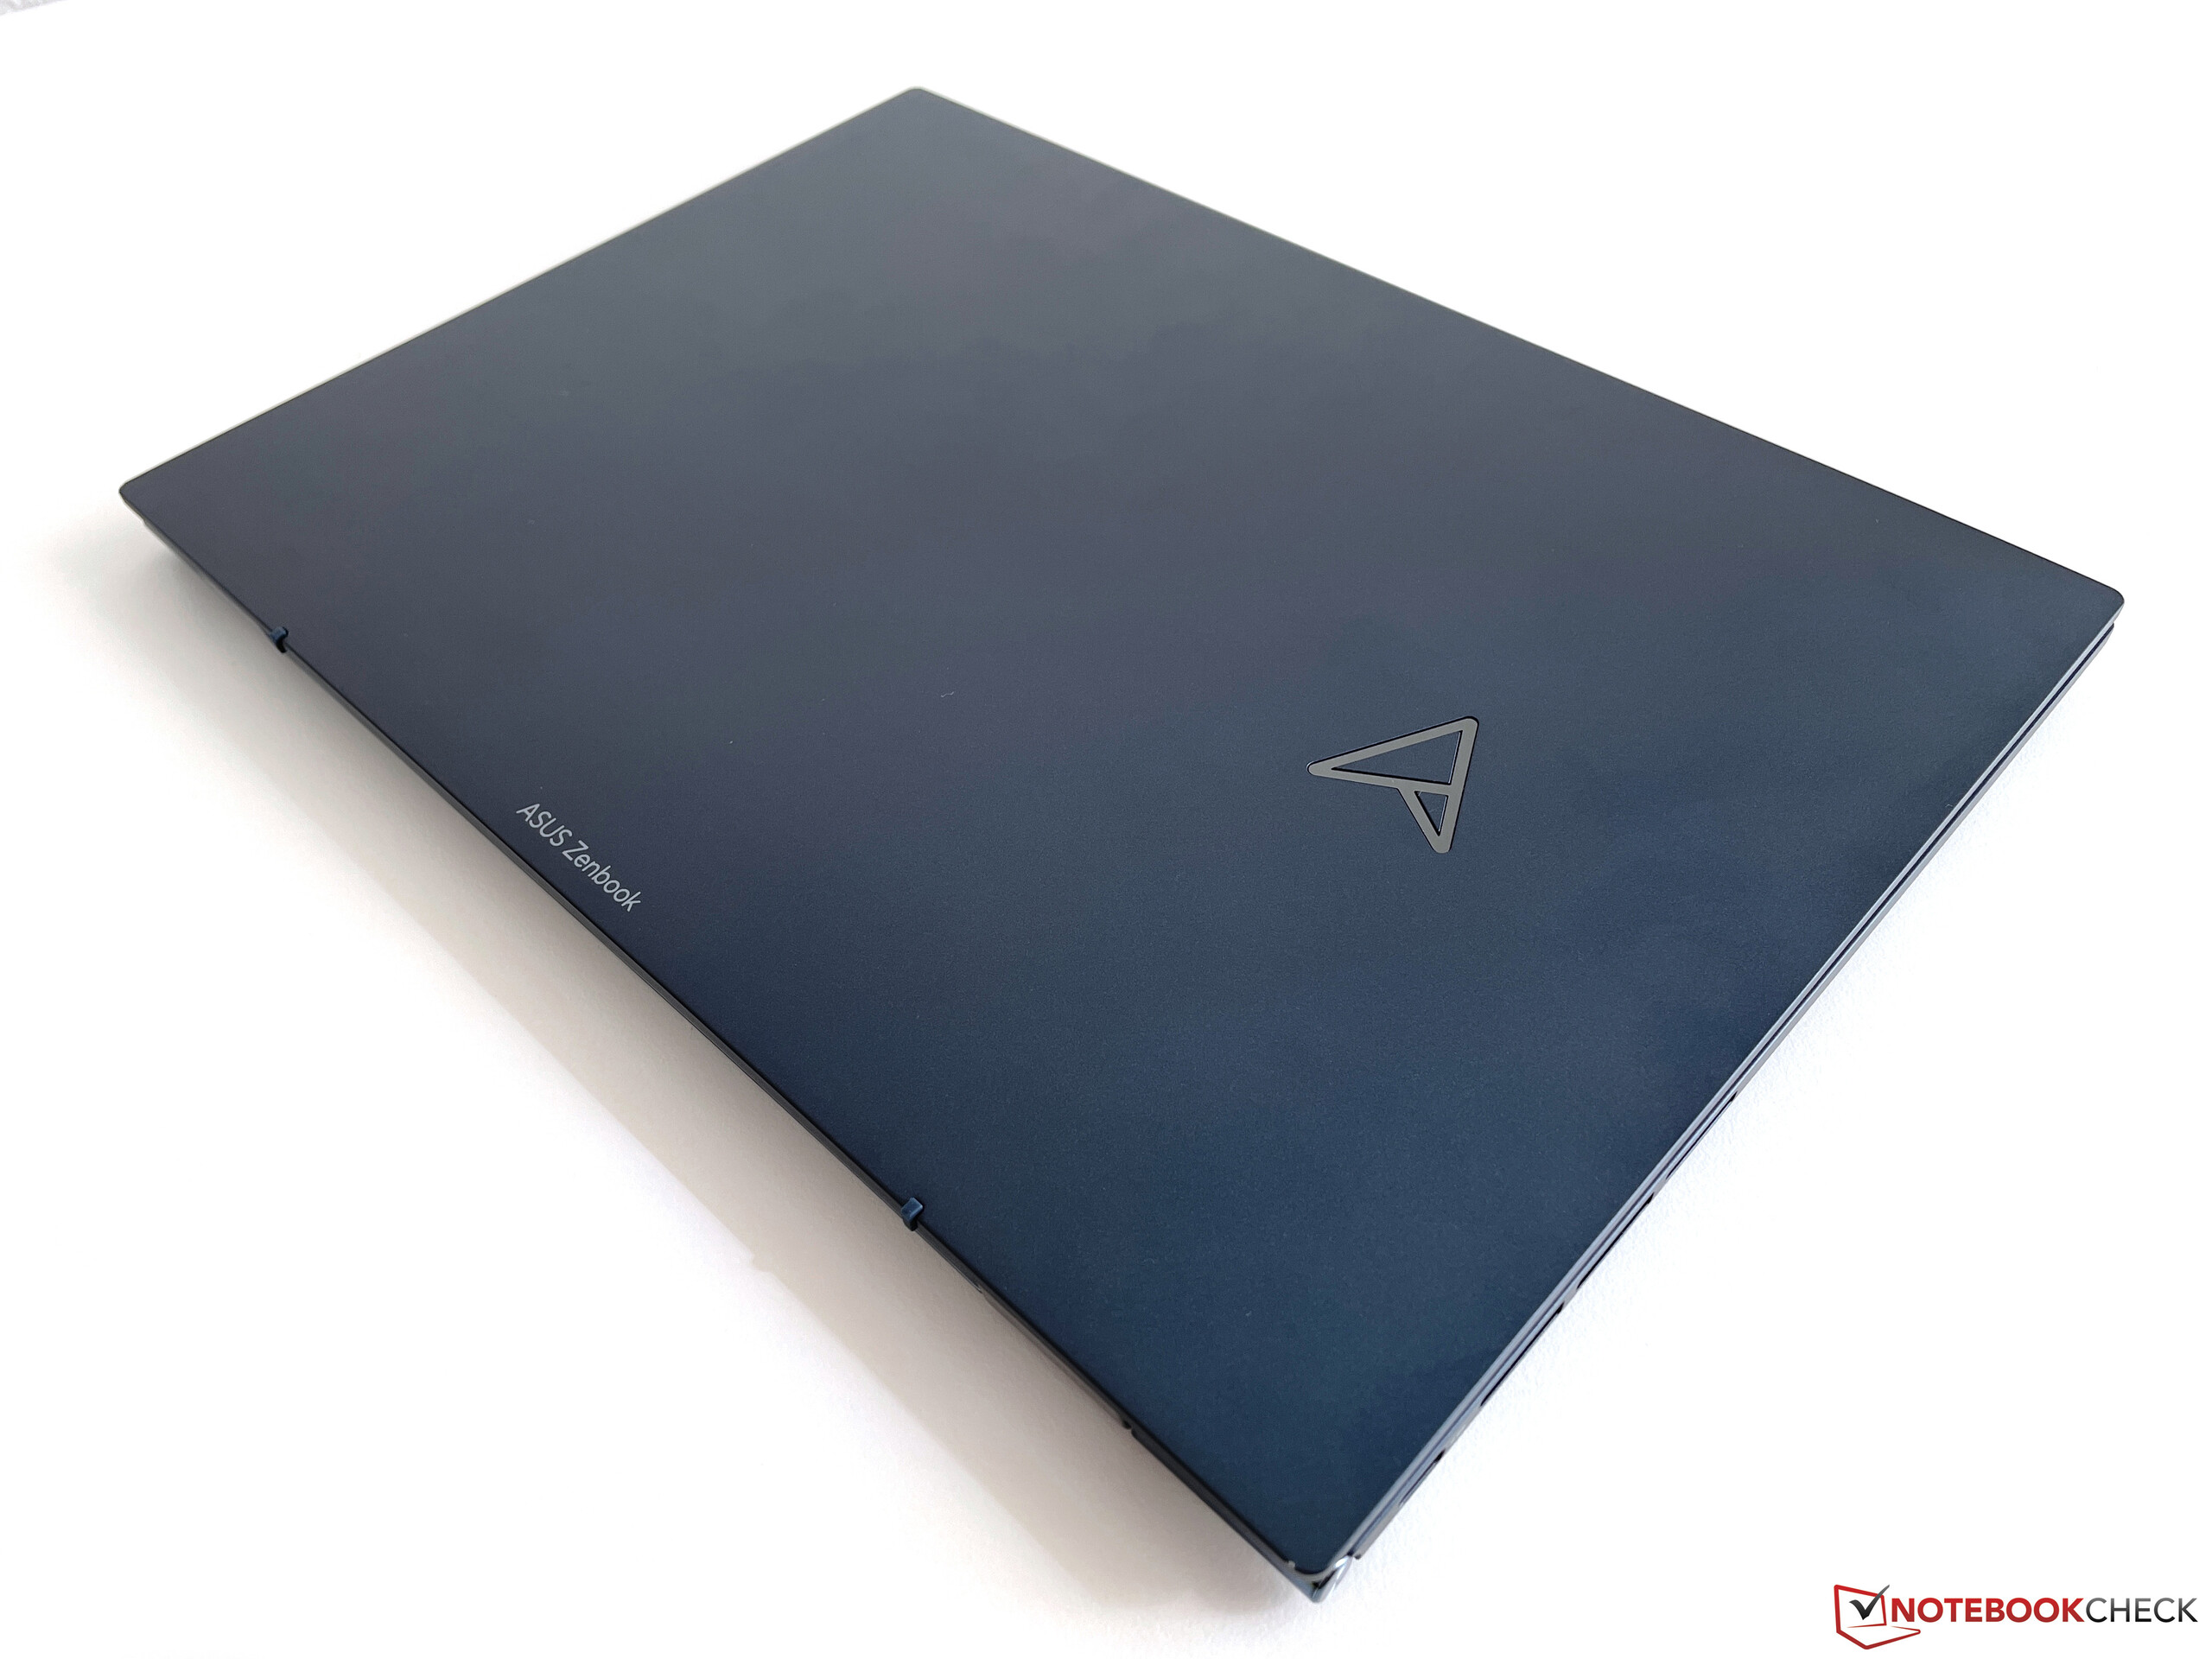
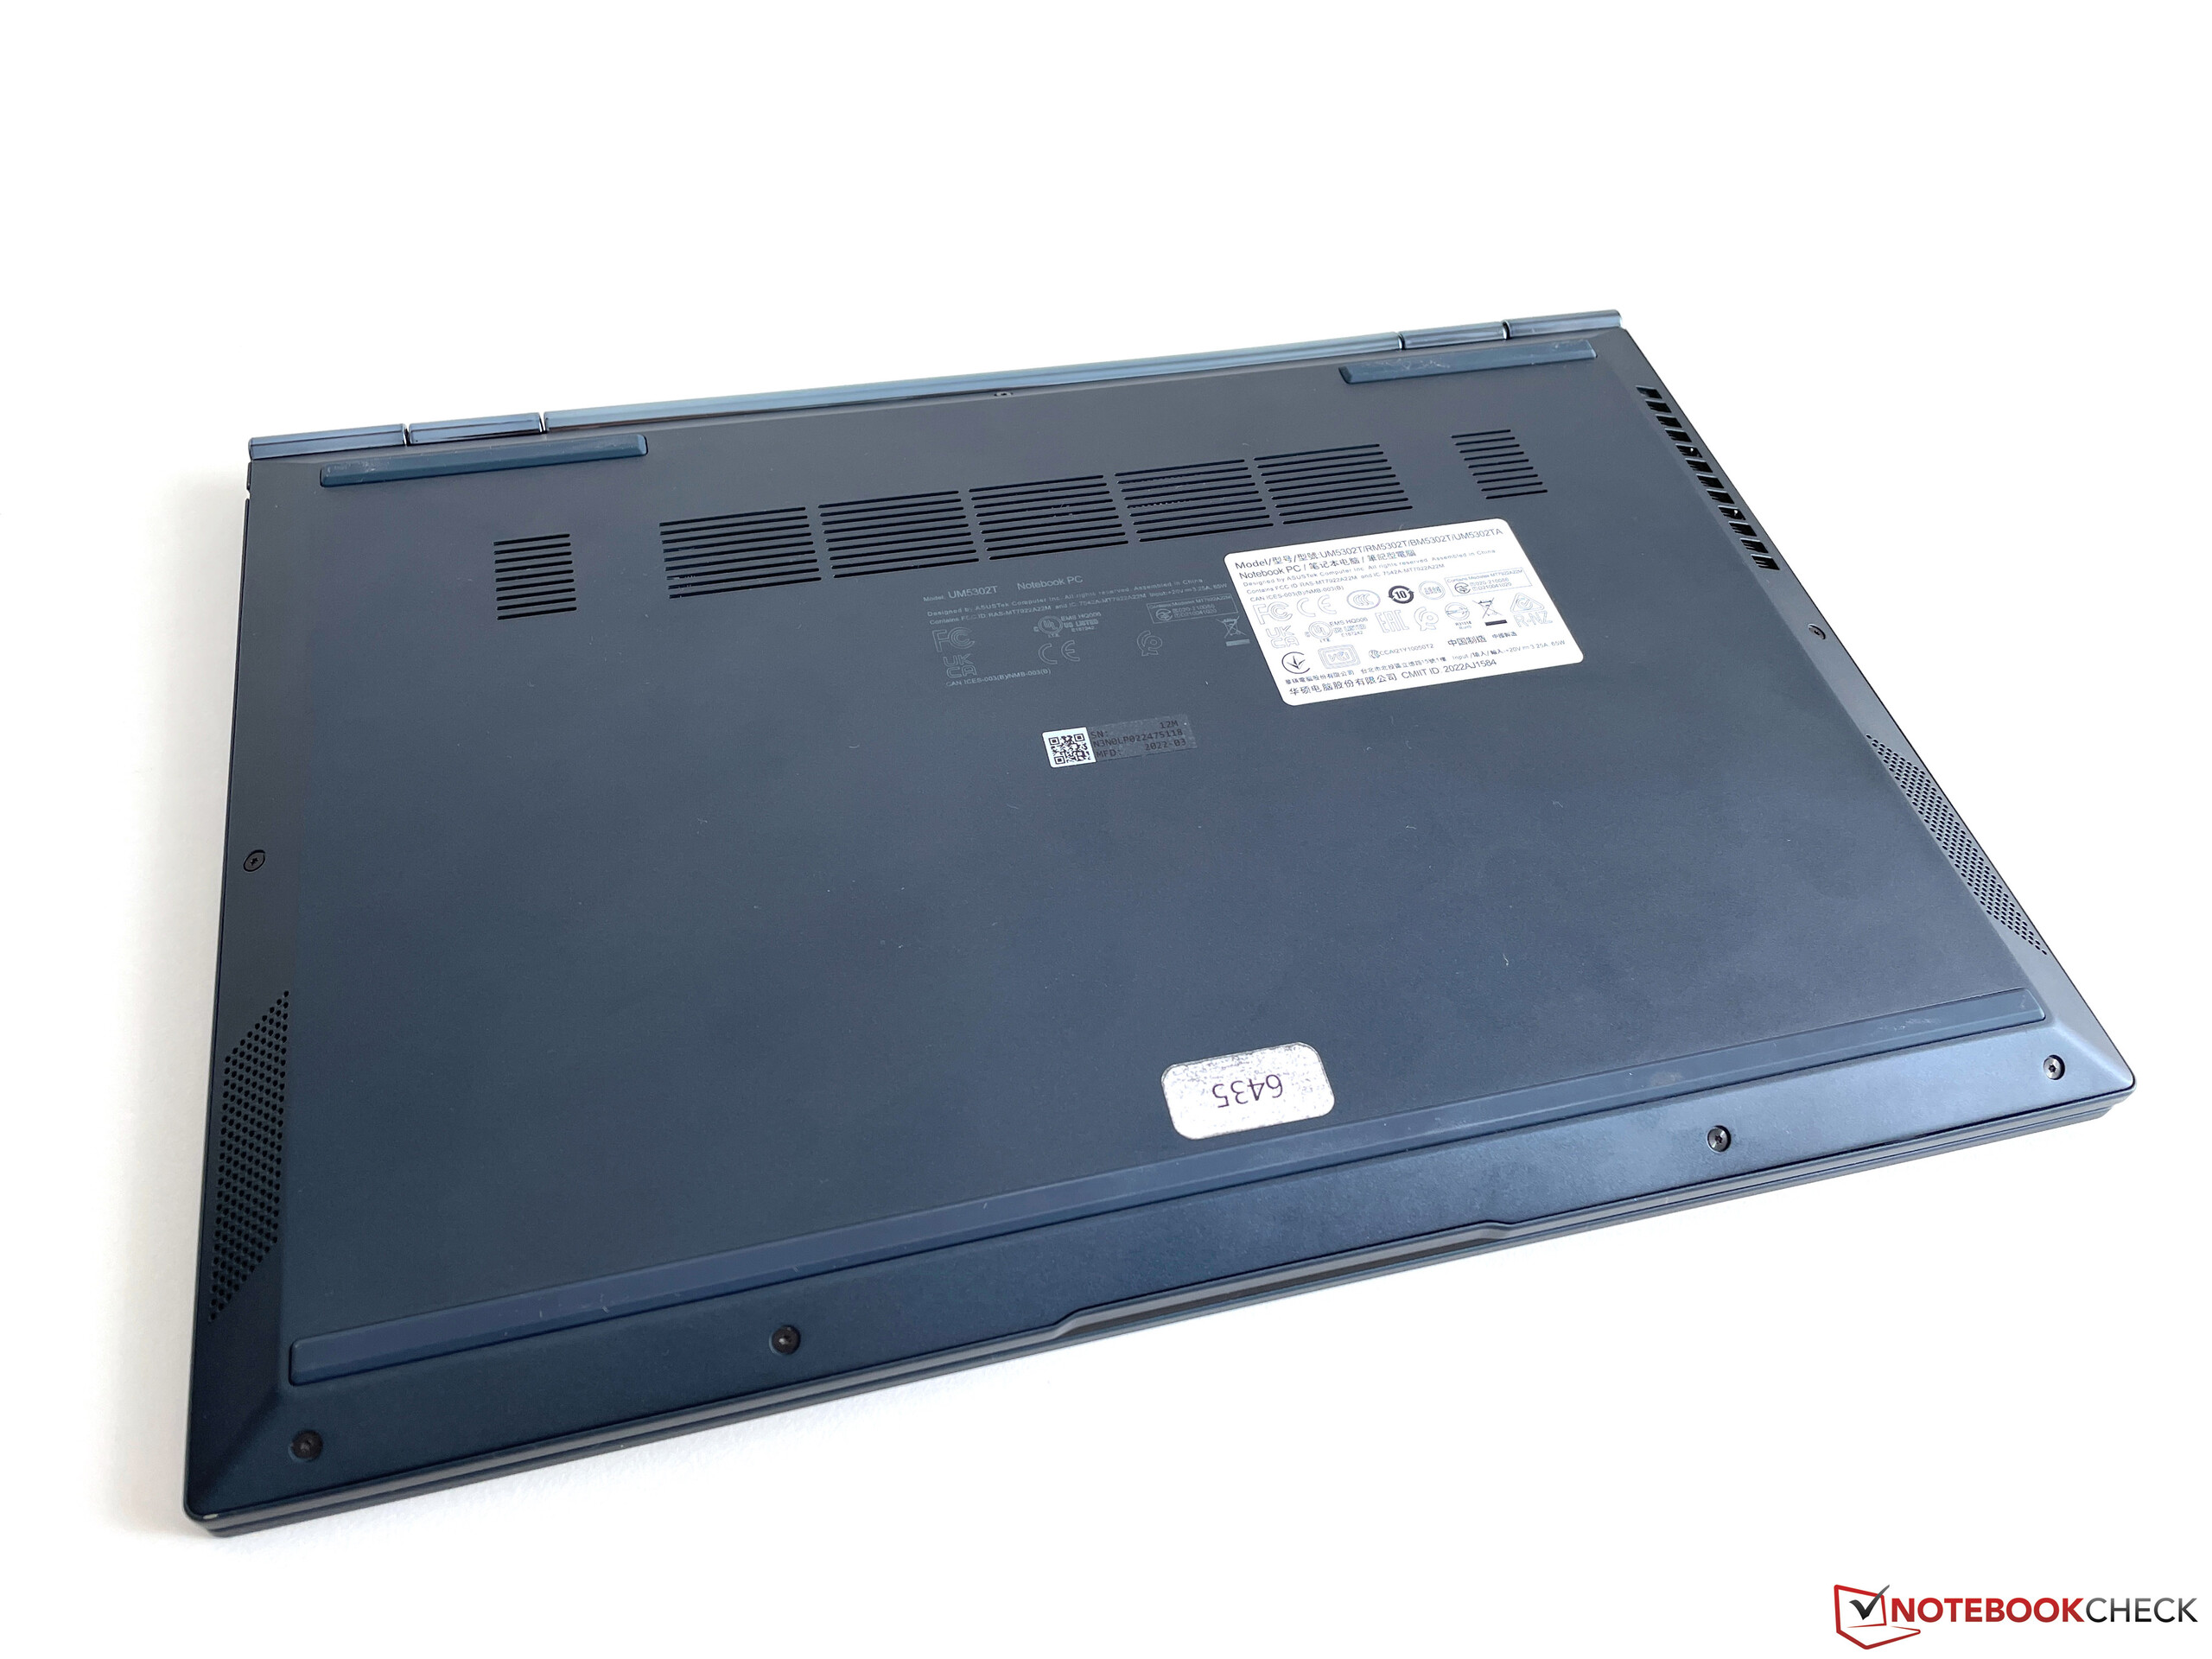
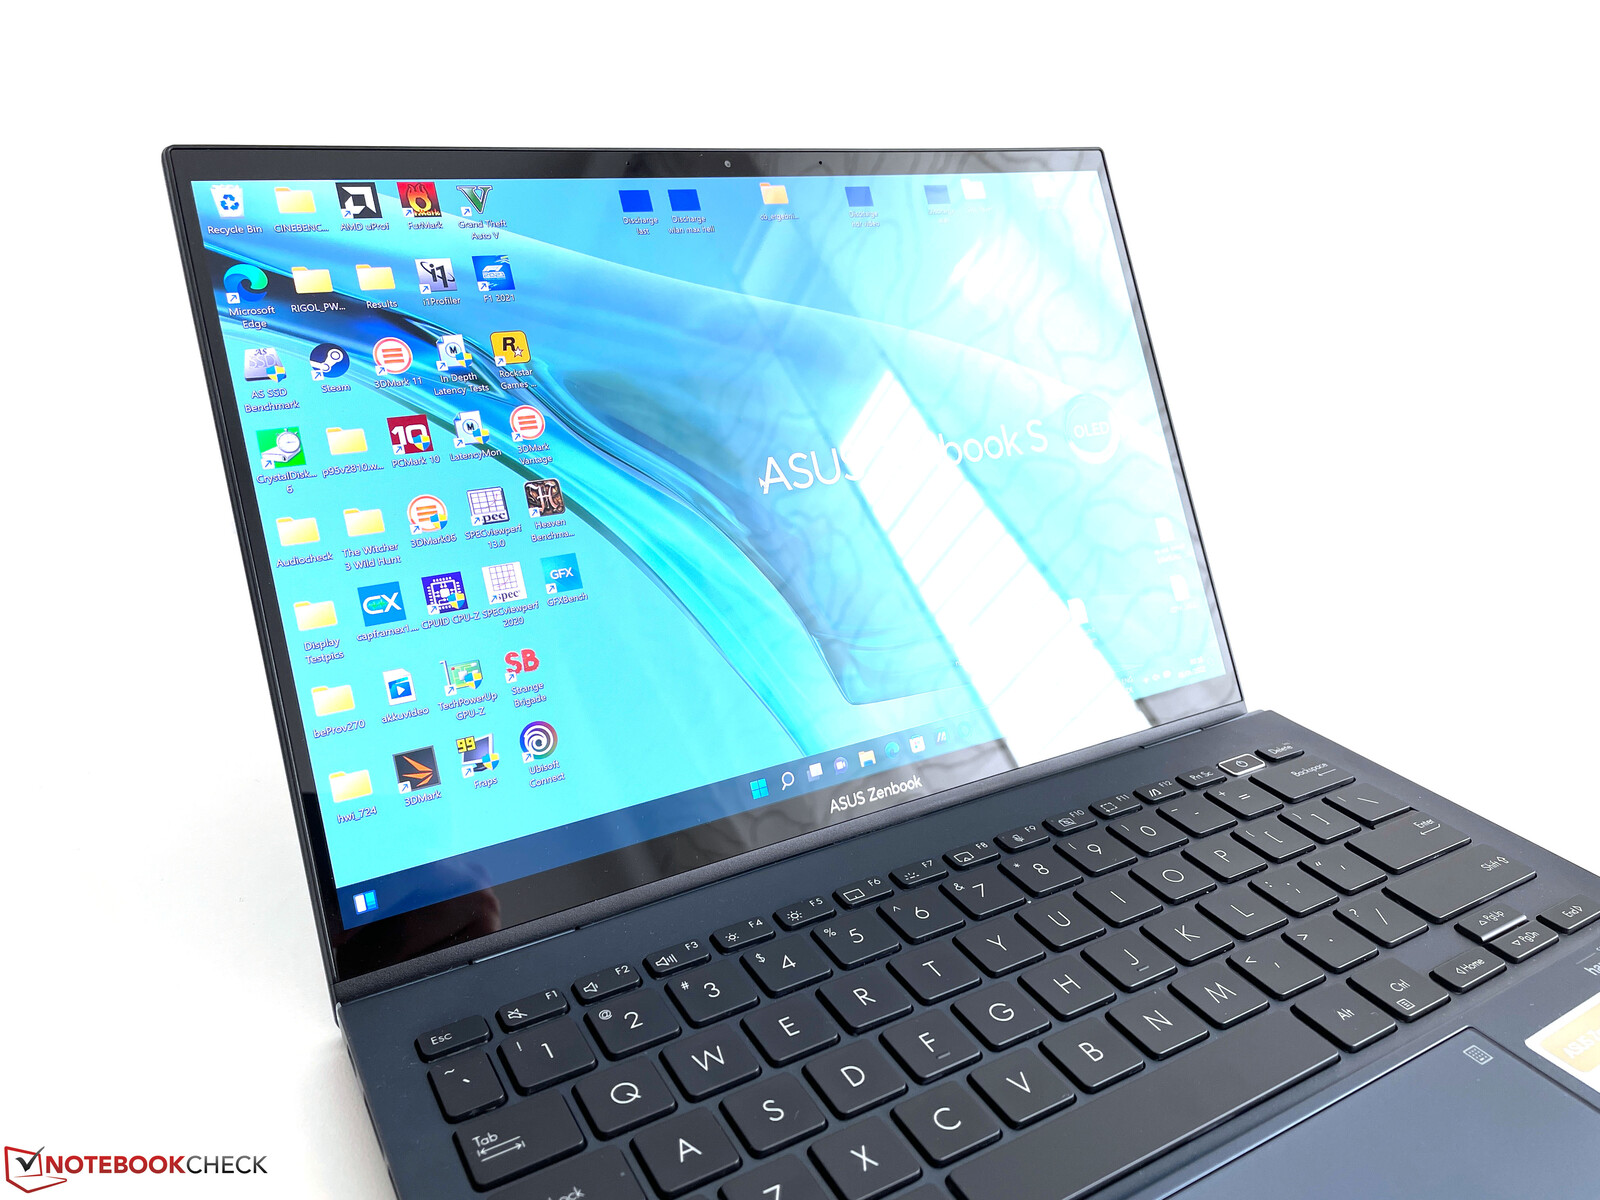
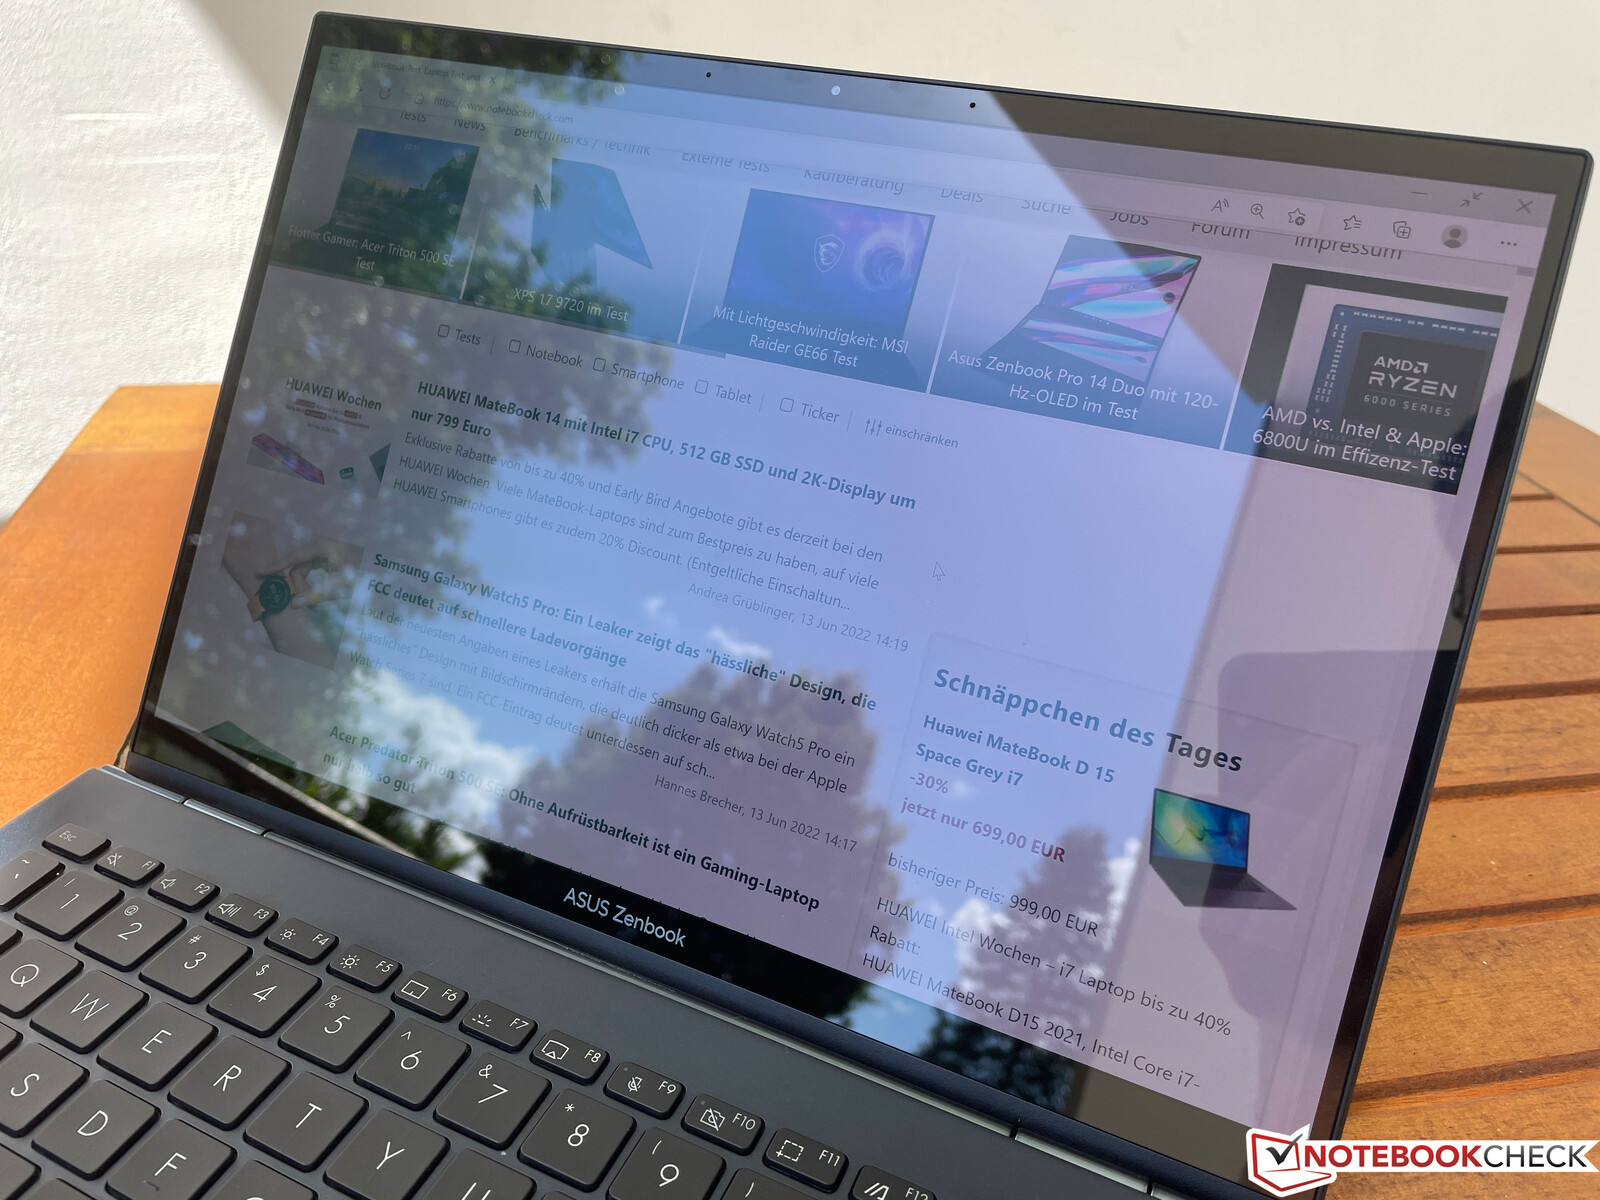
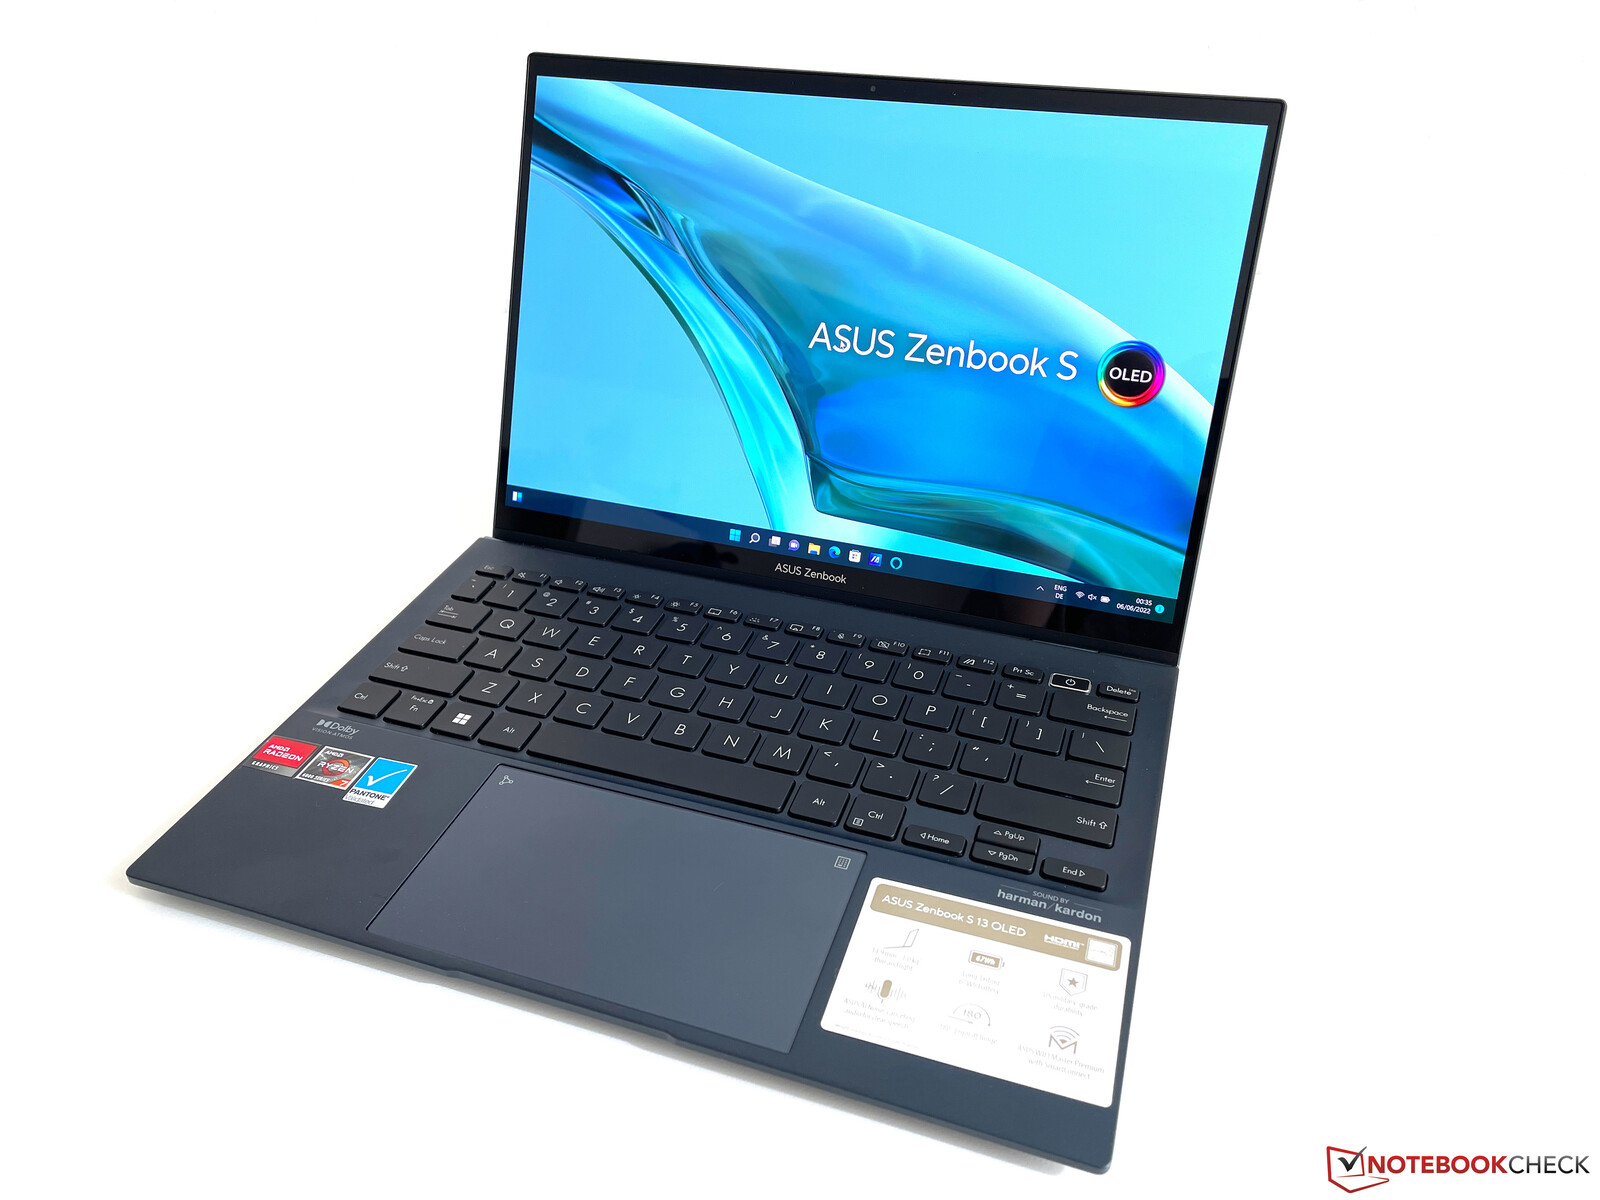
外壳。华硕提供四种颜色的金属外壳
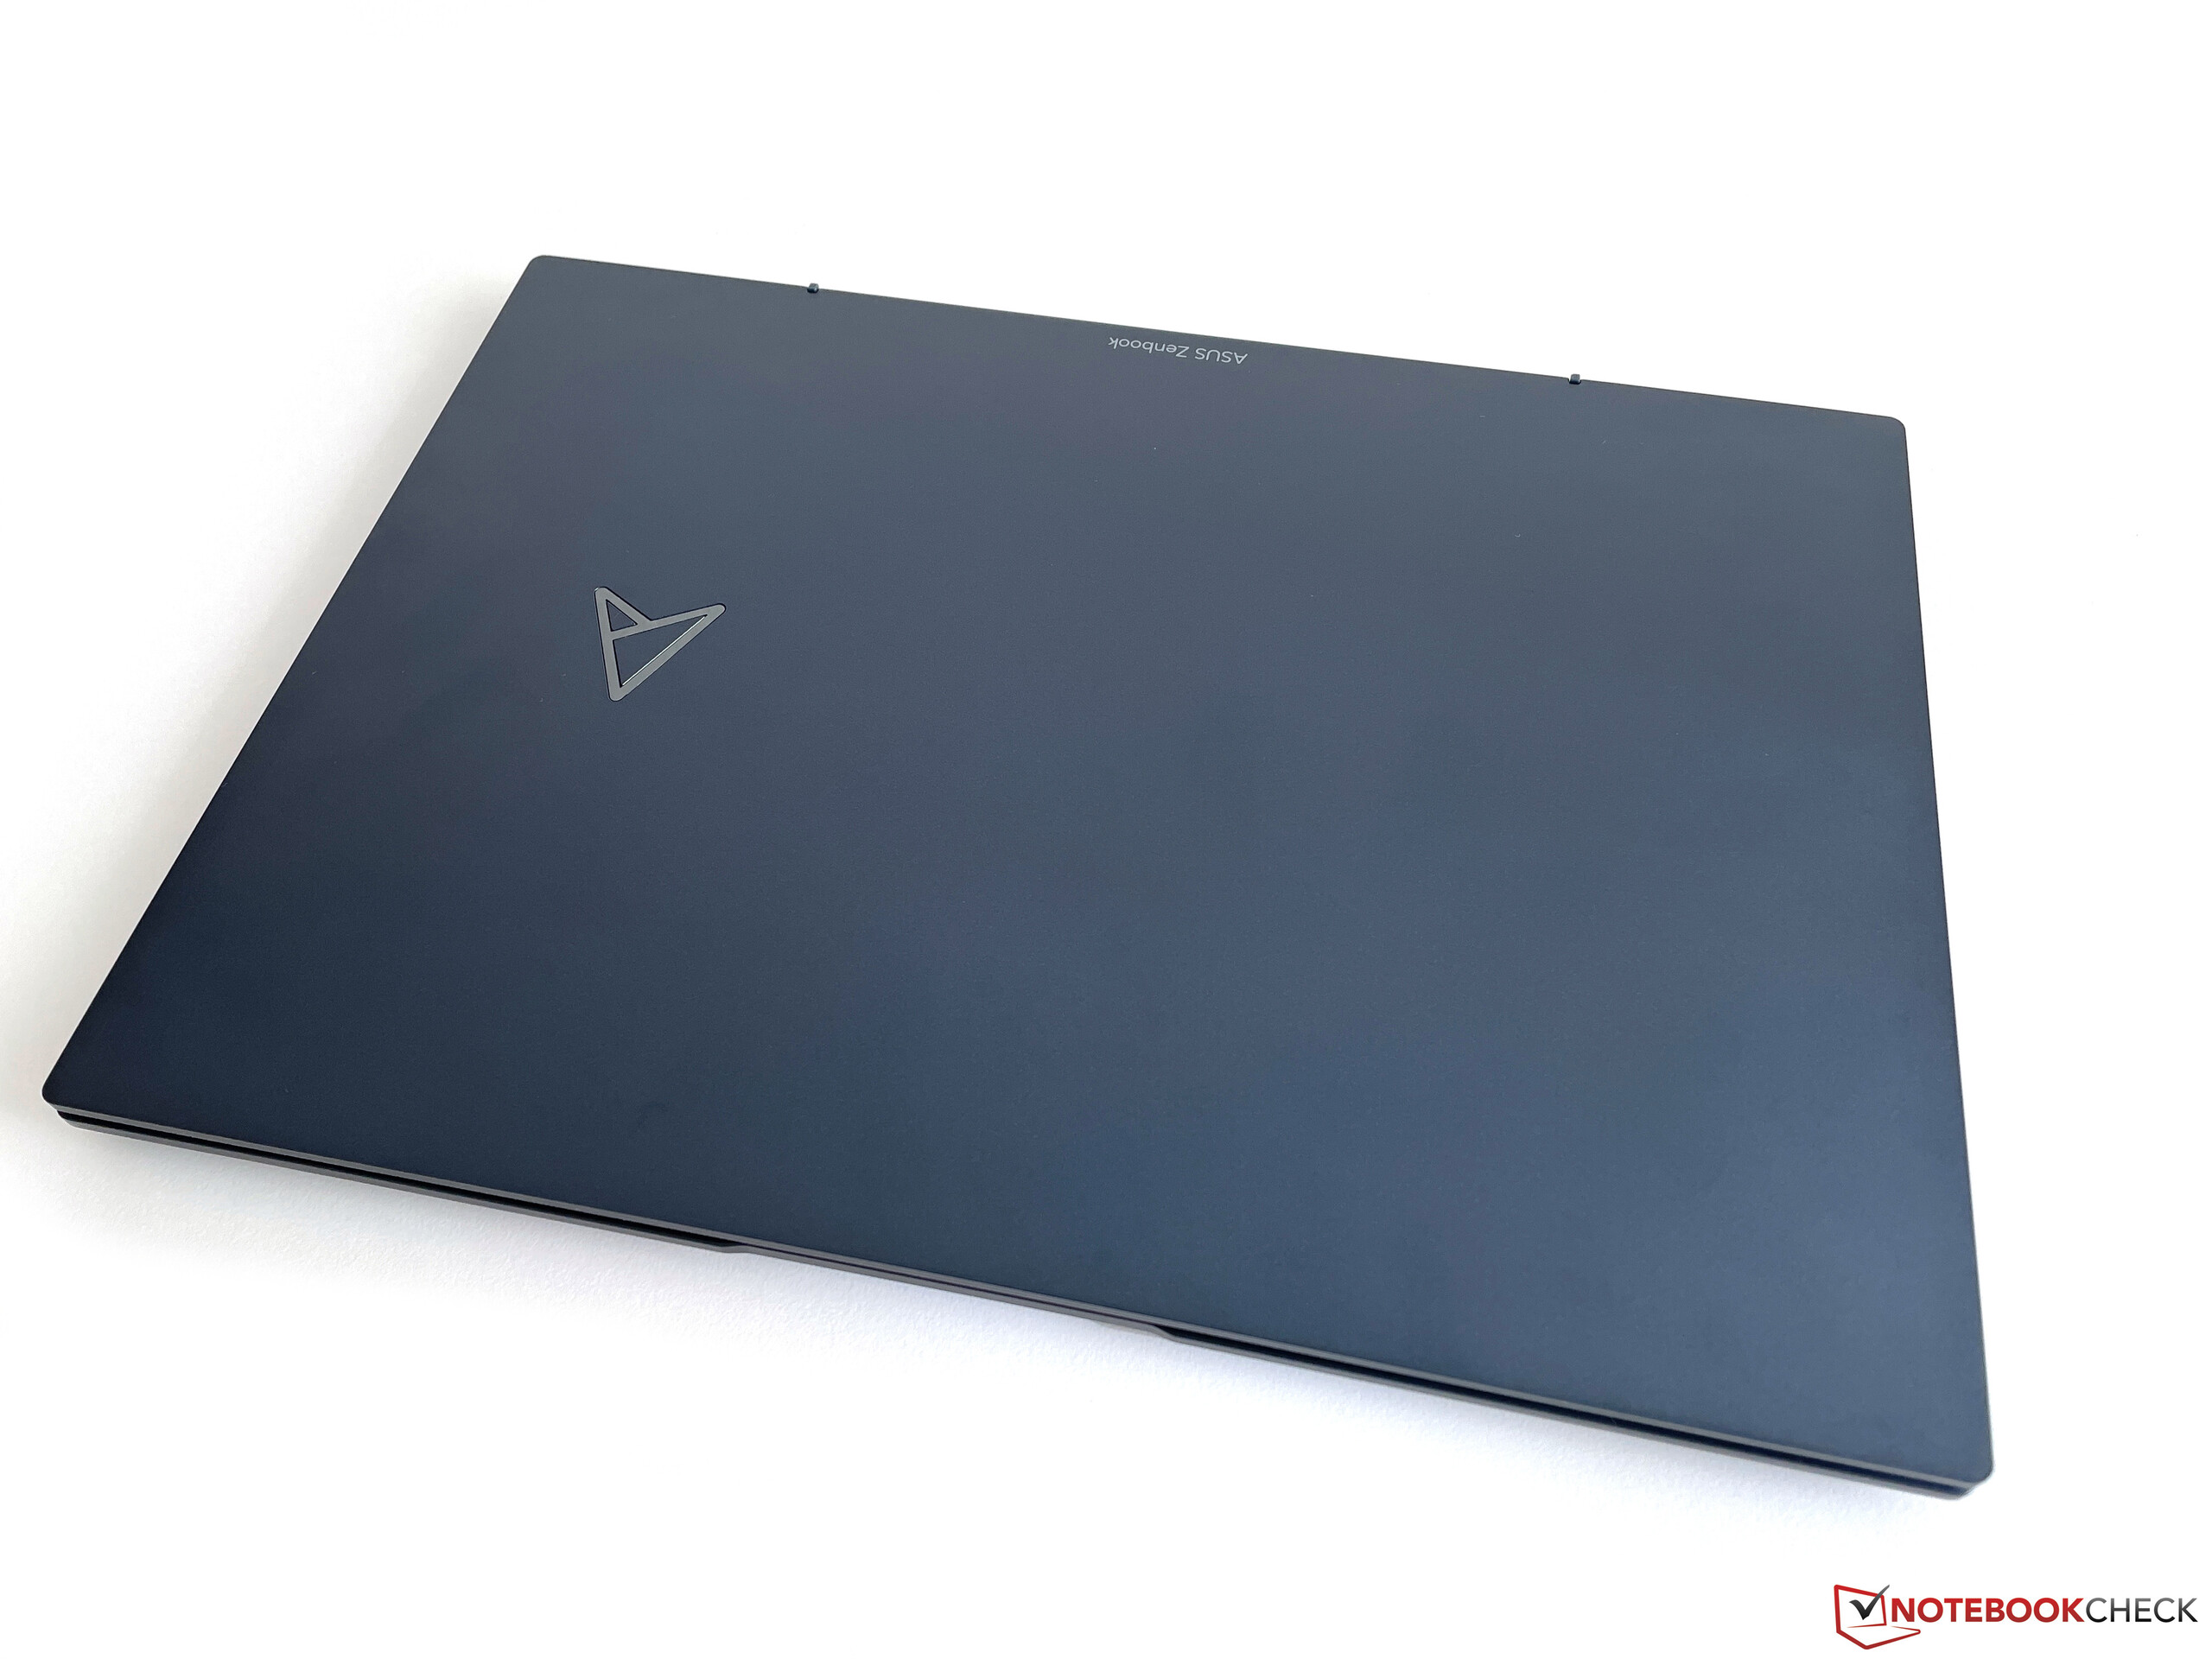
华硕使用镁铝合金做外壳,Zenbook显得非常高质量。它也非常紧凑和机动,重量仅超过一公斤。我们的评测单元采用深思蓝的颜色,看起来非常优雅,略微粗糙的表面也感觉不错。然而,这些表面也是相当敏感的指纹。华硕提供了其他可选的颜色变体,其键盘也会改变颜色。除了白色外,Zenbook S13还有浅绿色和米色可供选择。
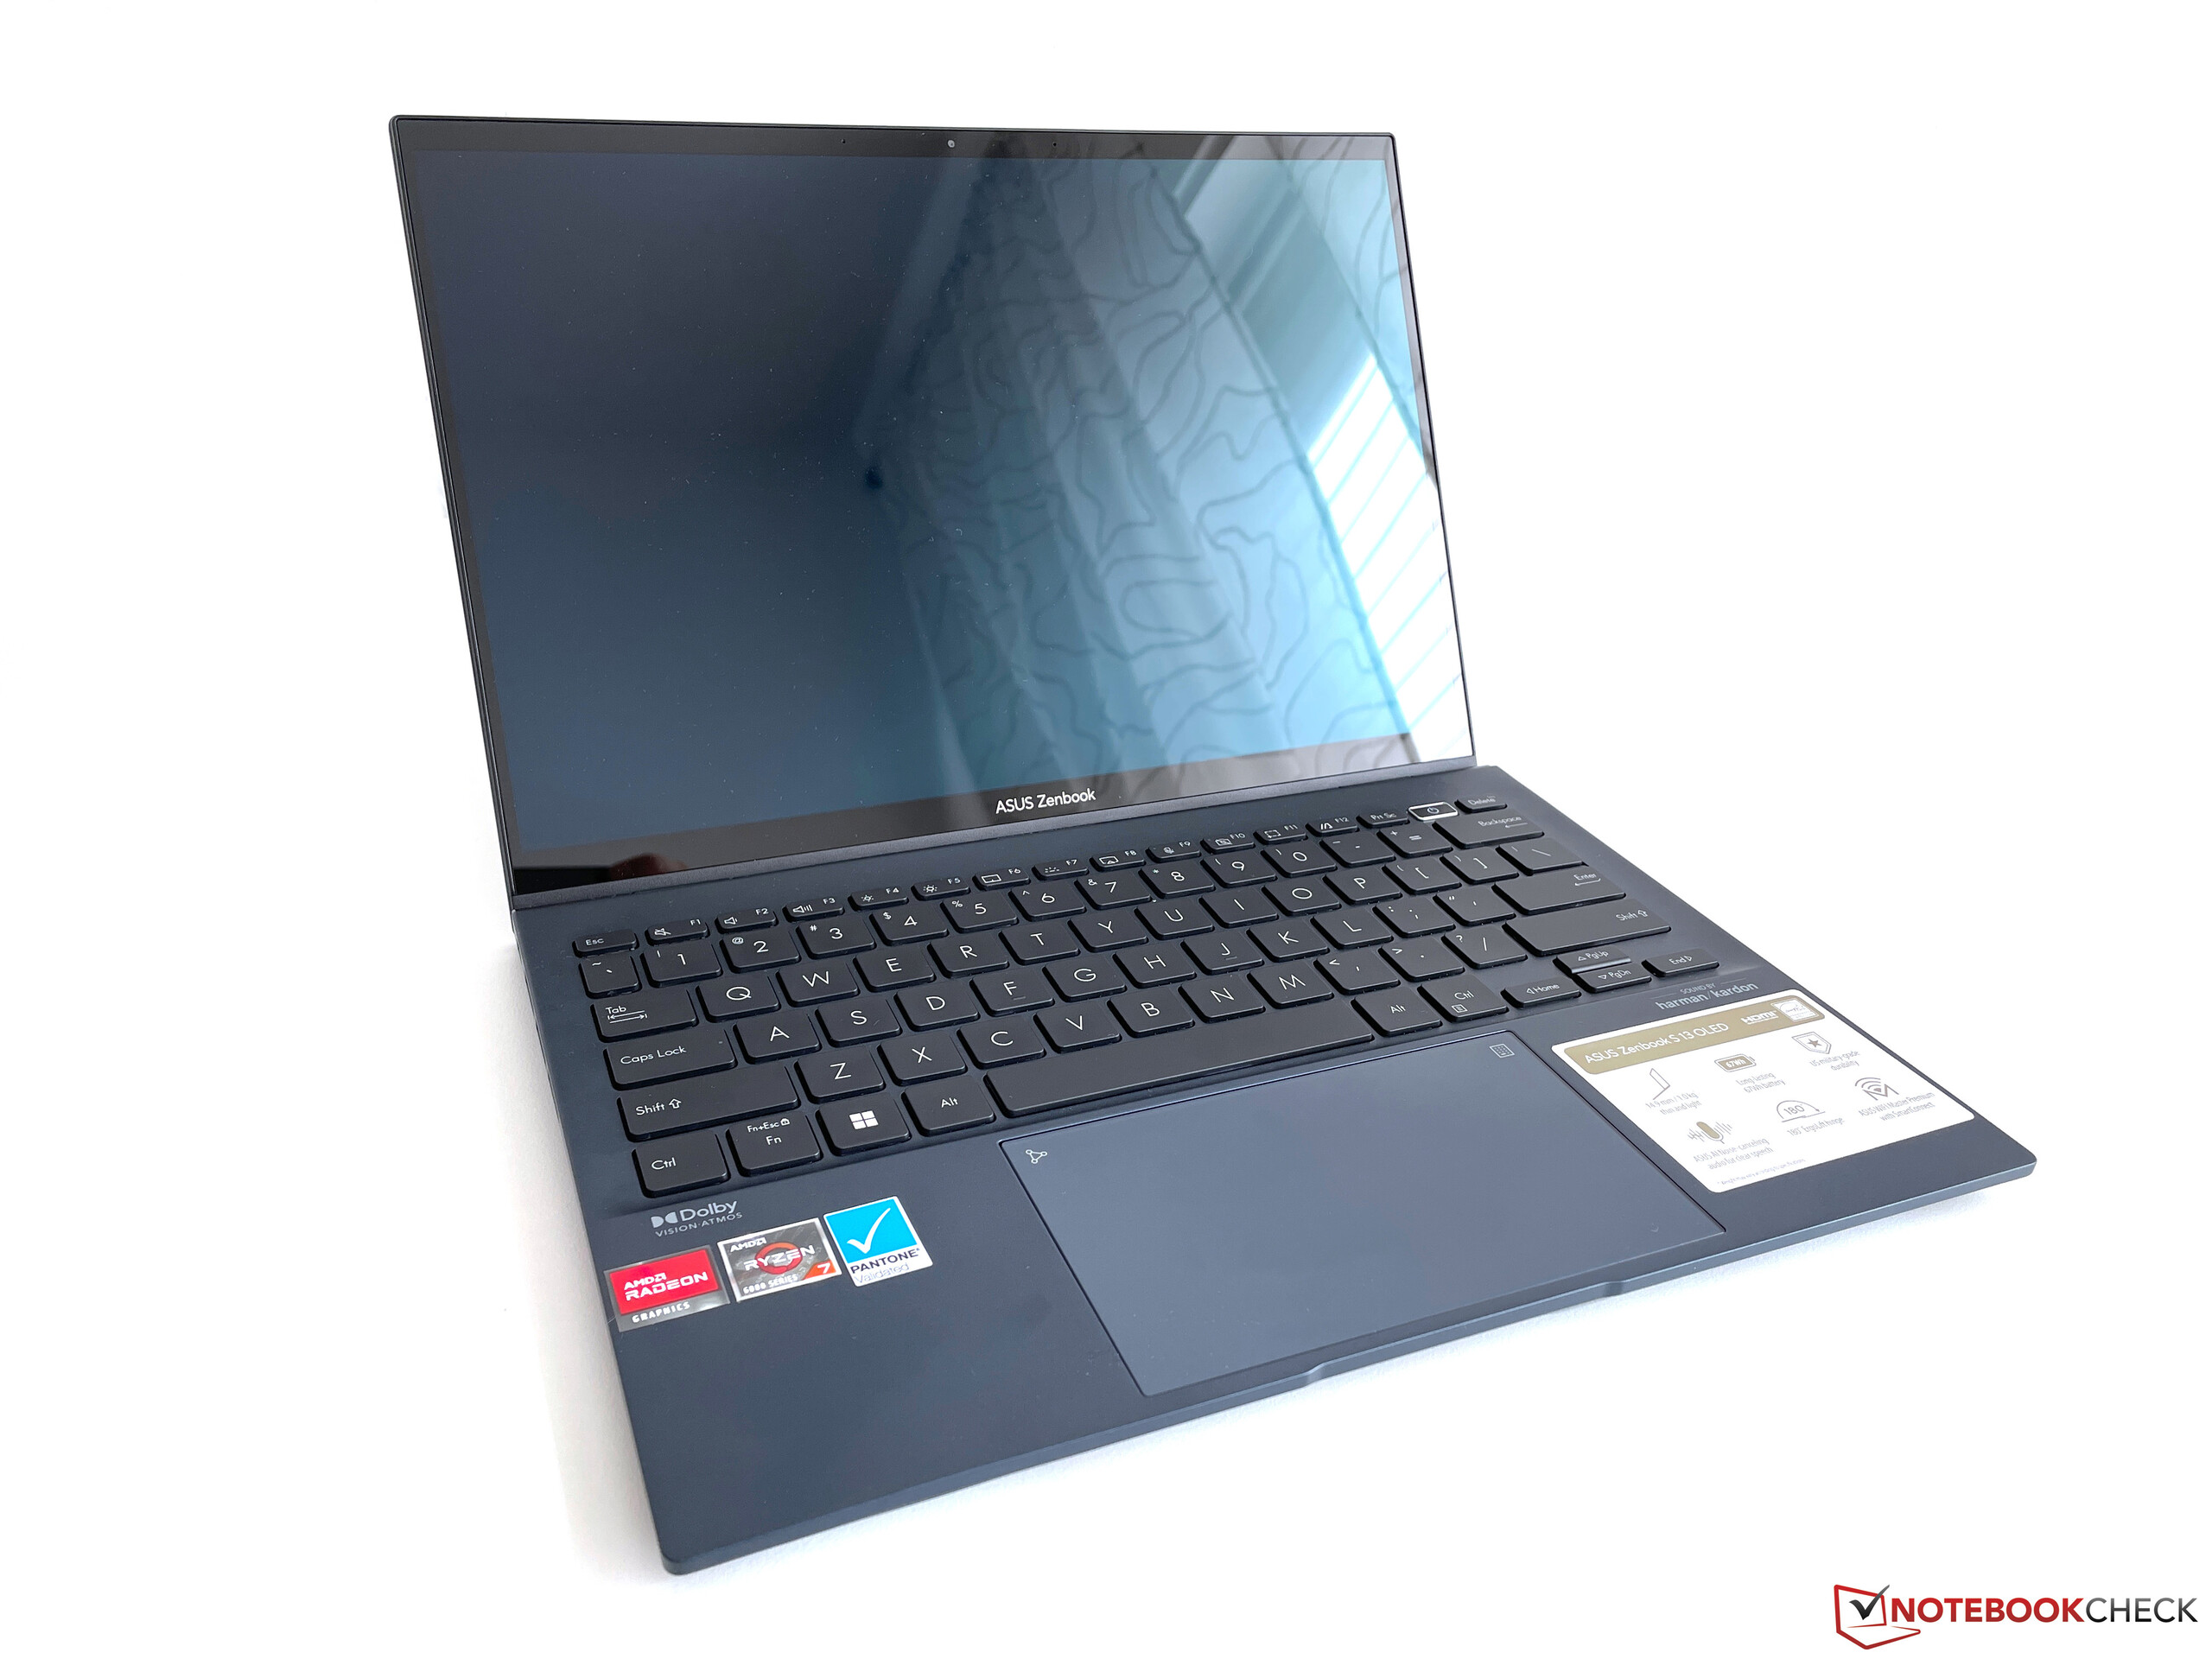
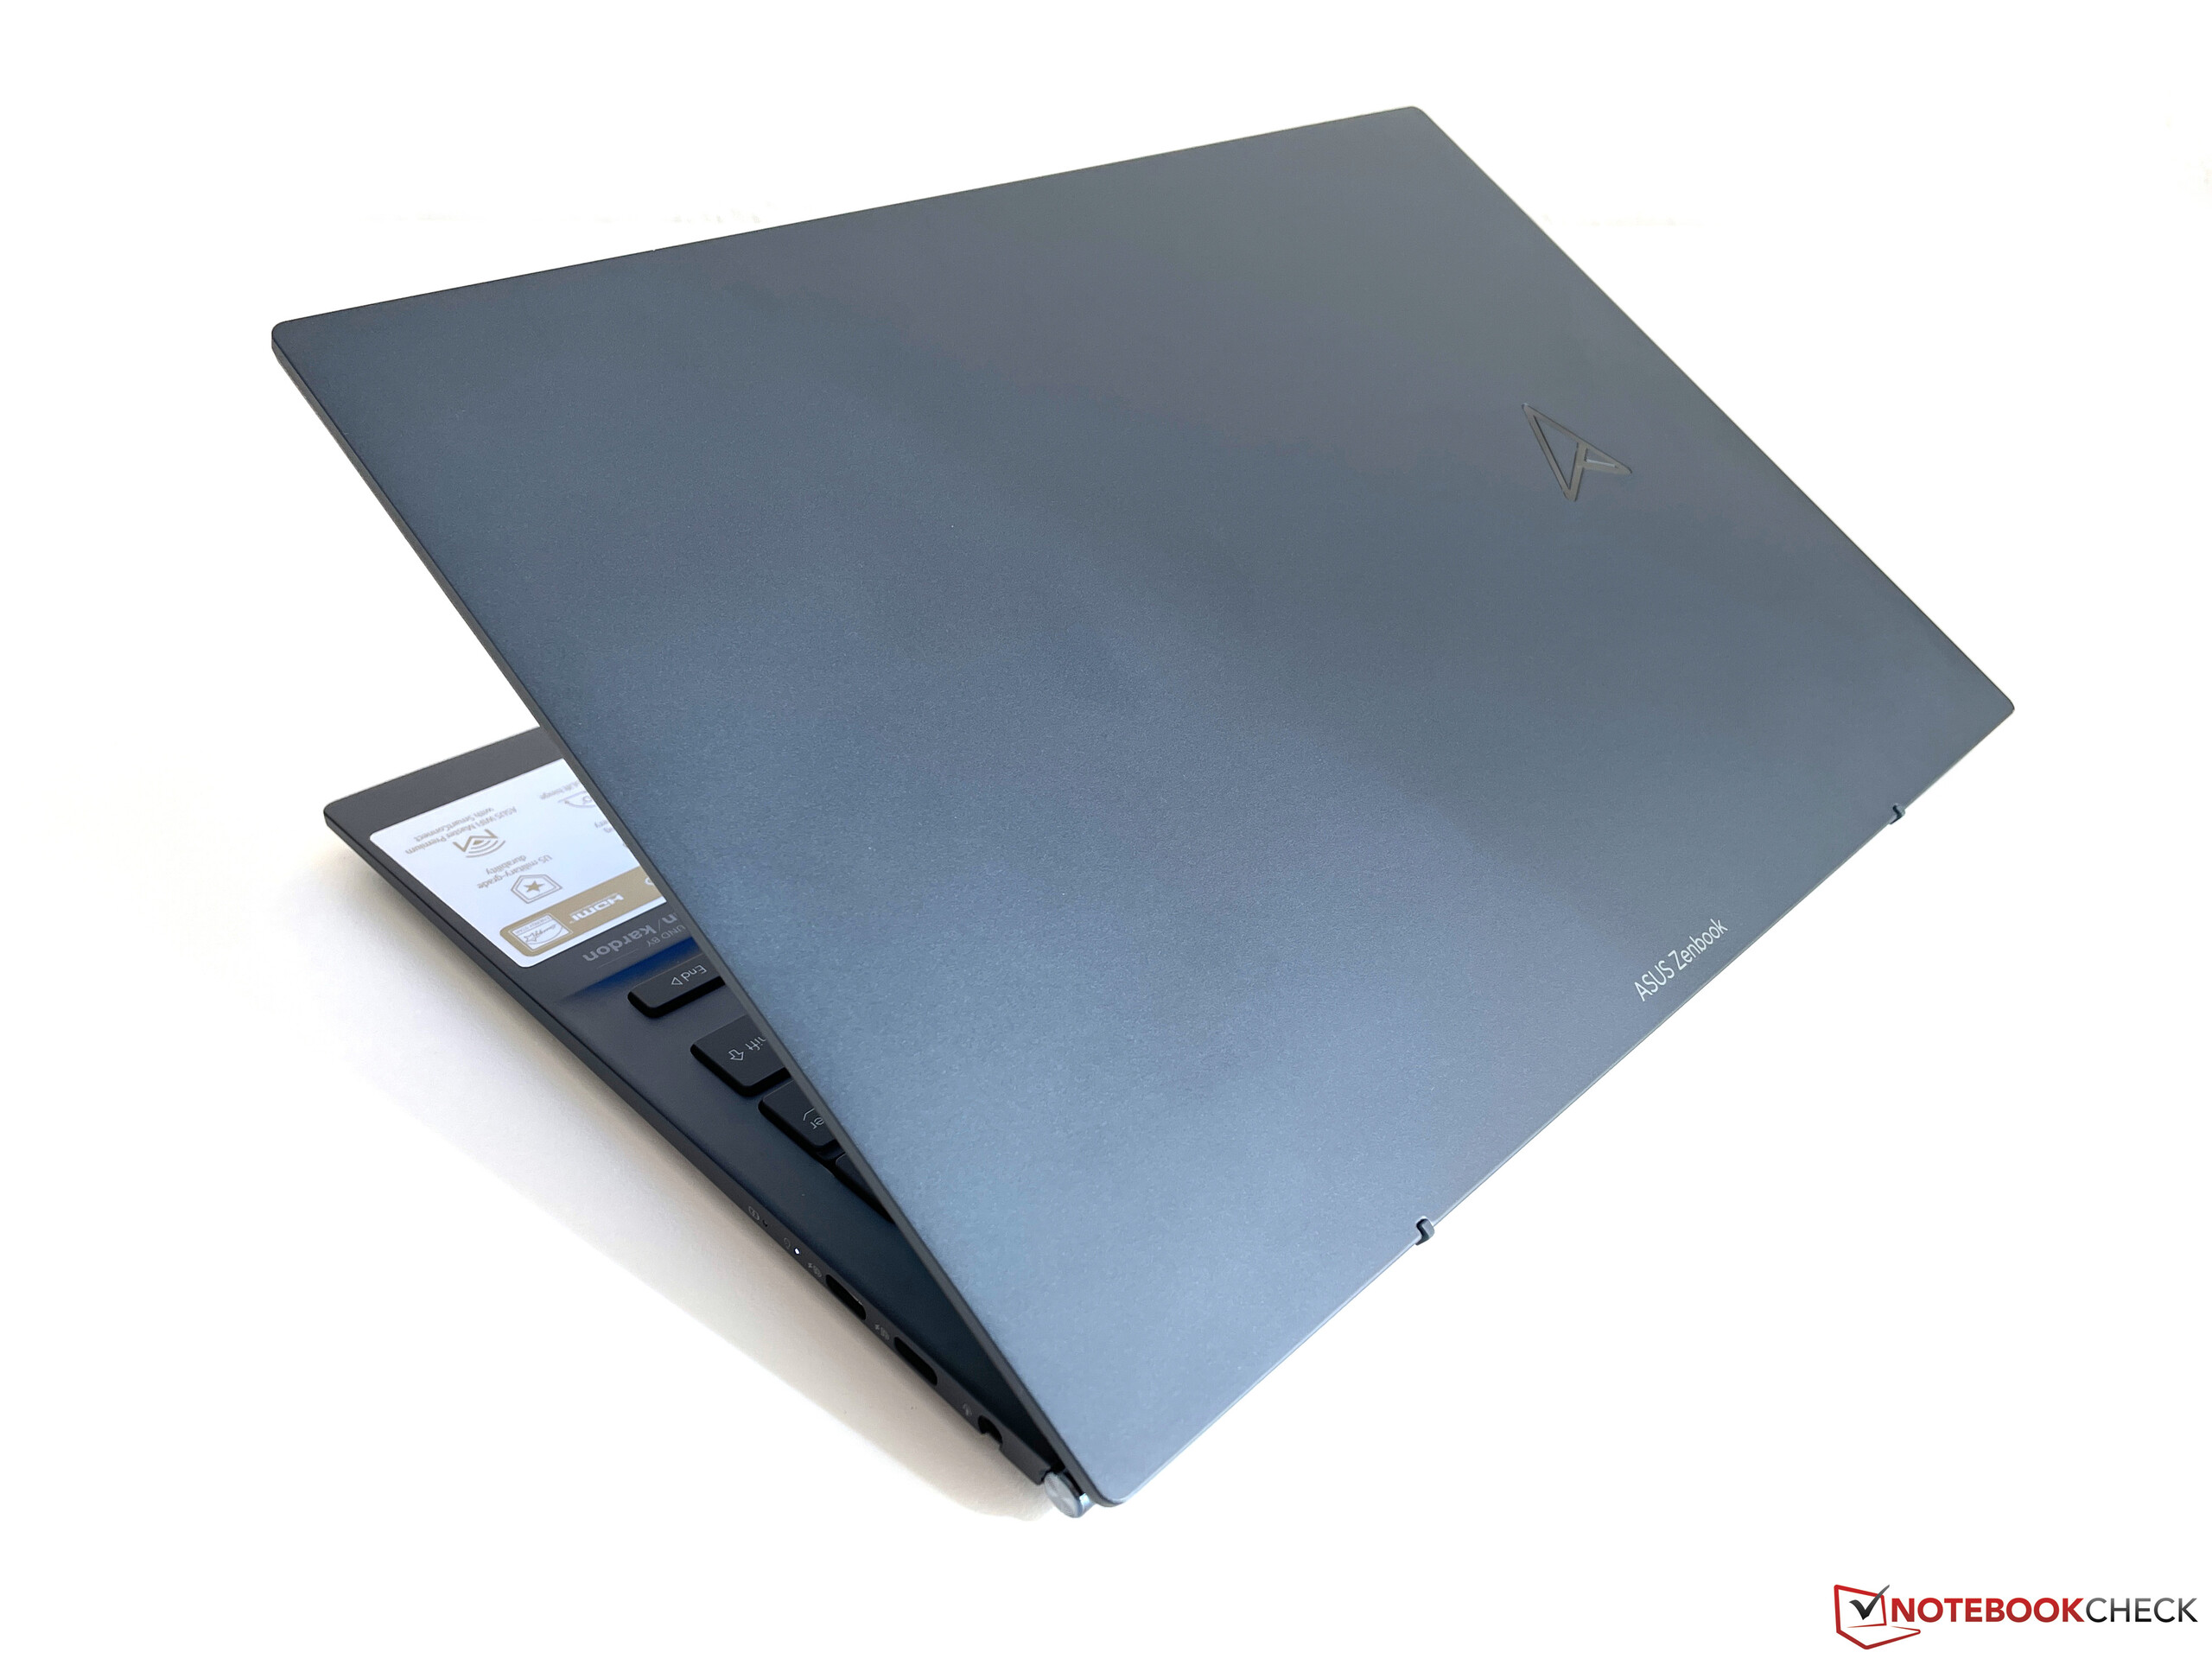
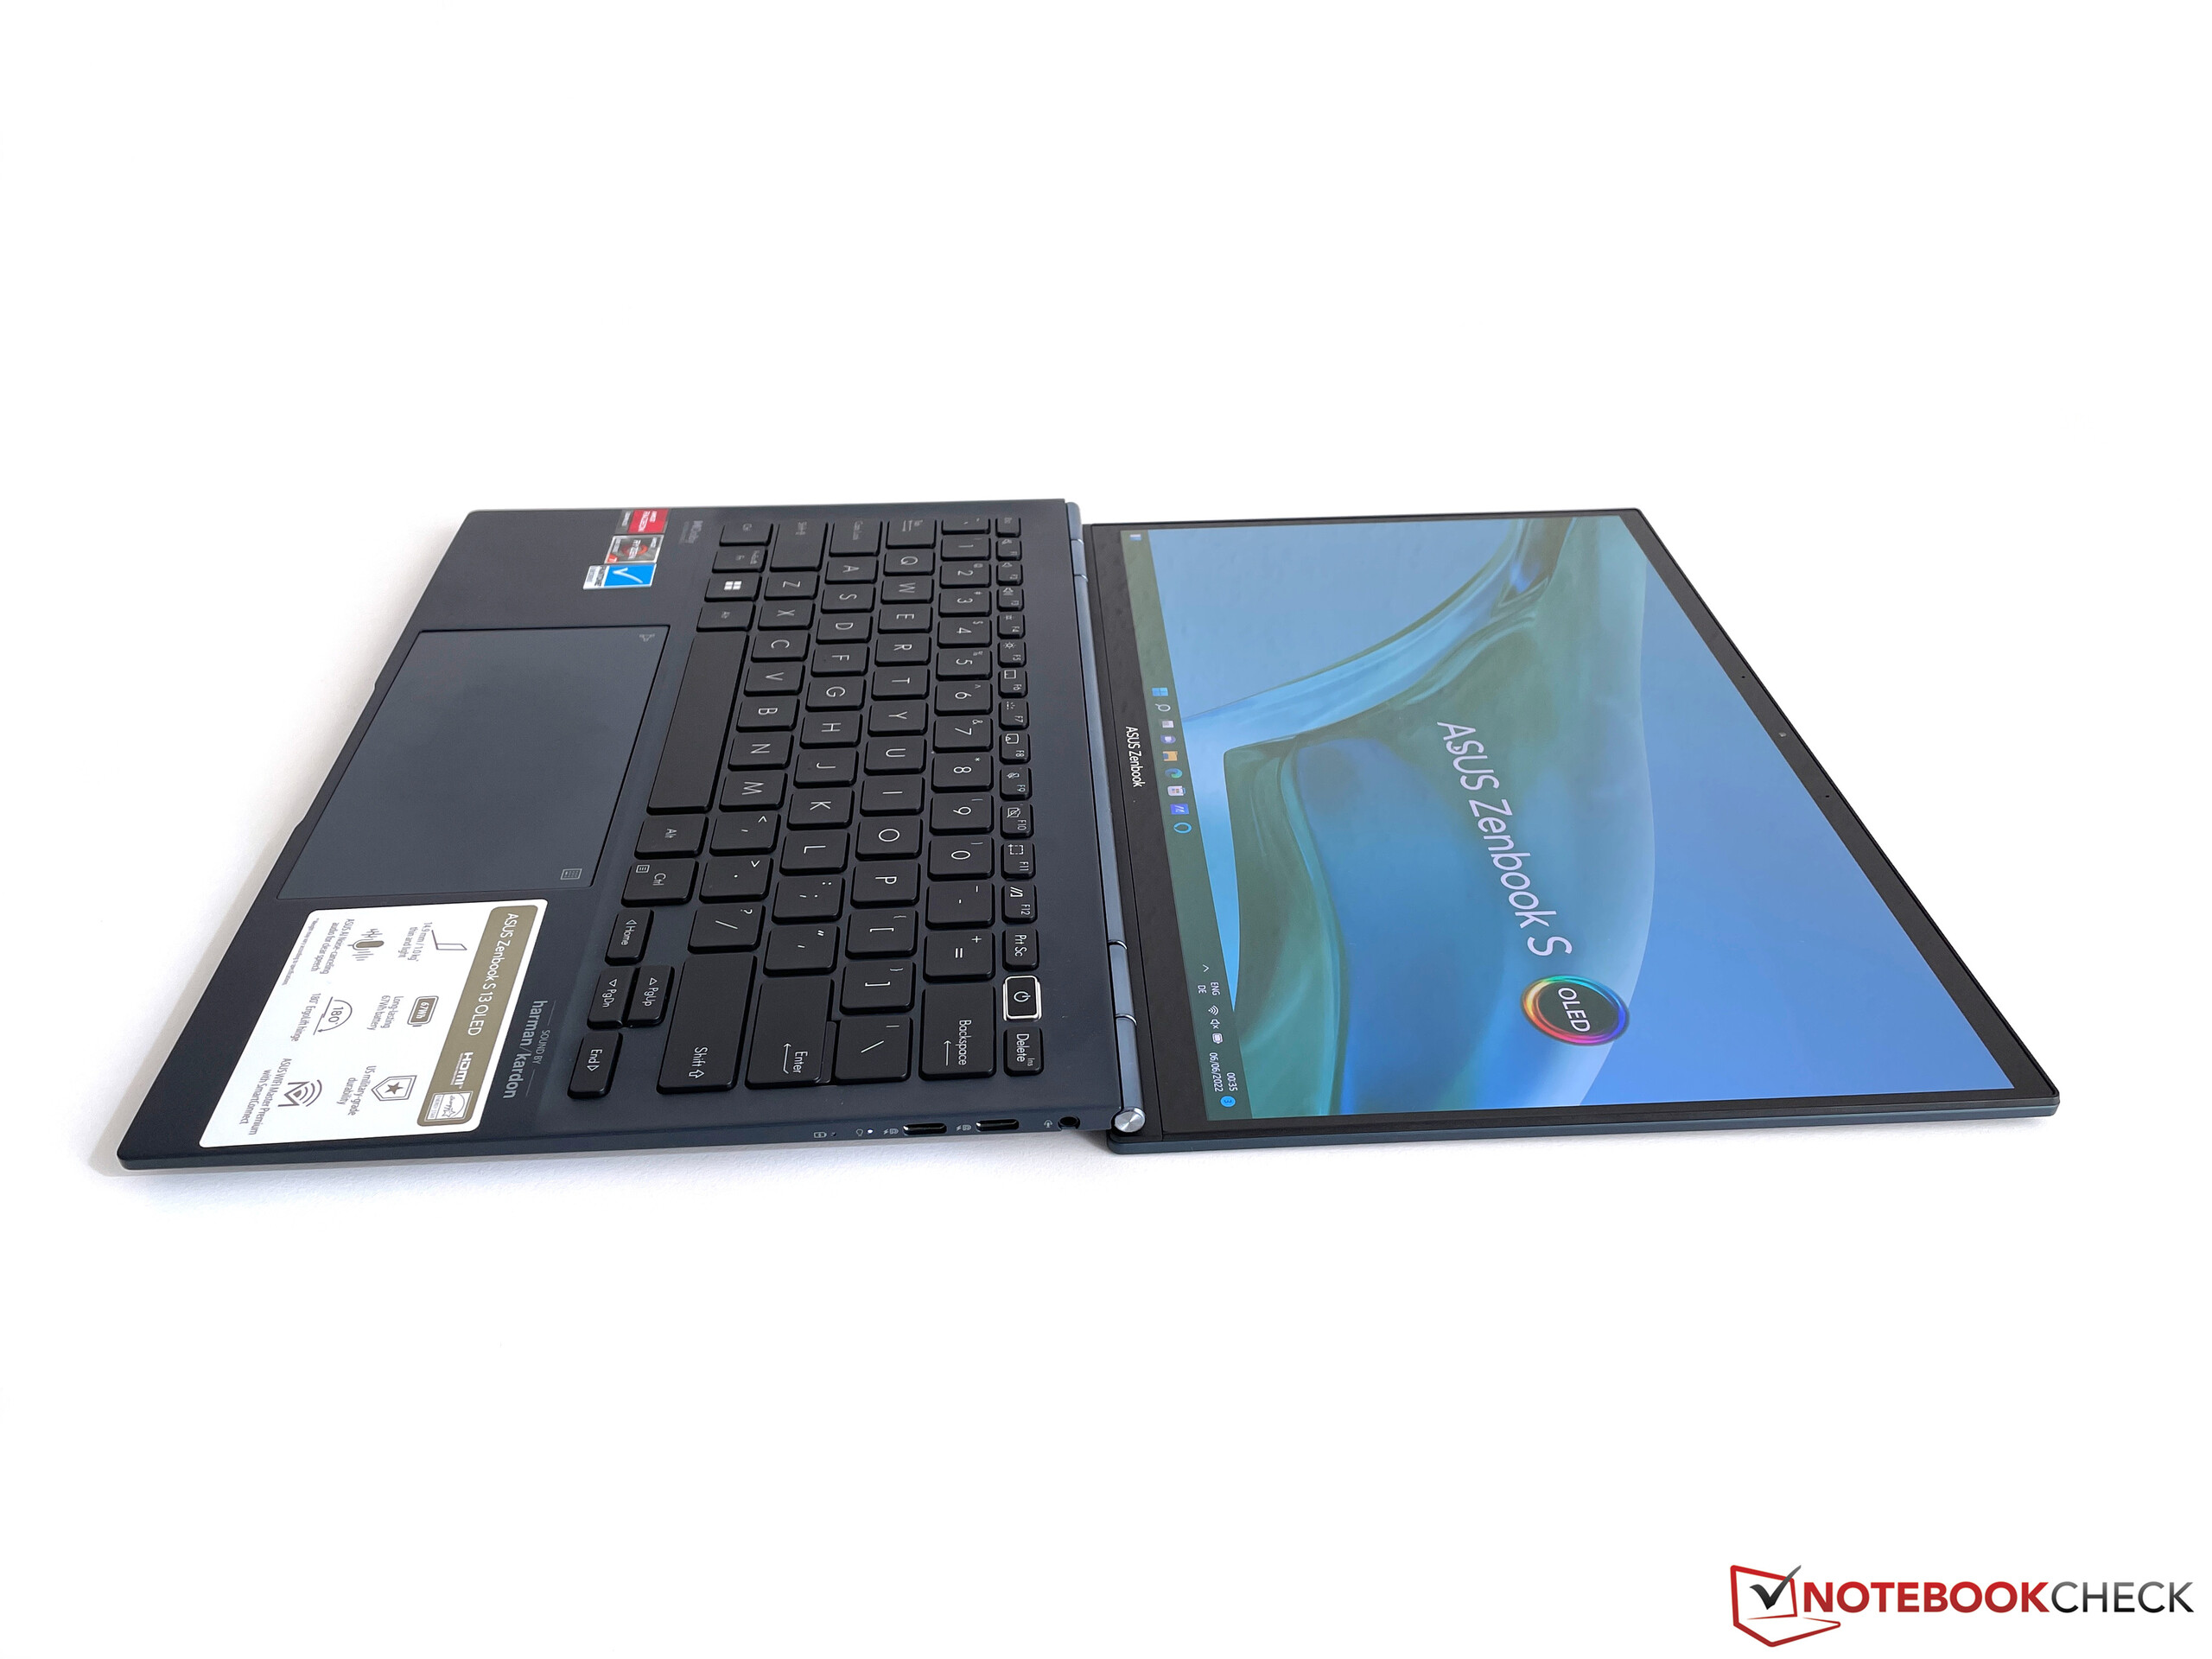
屏幕的边缘在侧面特别薄,但显示屏的顶部和底部边缘还有改进的余地。因此,Zenbook实现的机身与屏幕的比例只有81%。与其他笔记本电脑一样,华硕使用了所谓的Ergo-Lift铰链,在背面略微提高了基本单元。这改善了新鲜空气的供应,也实现了180度的开启角度。铰链本身是非常有教养的,用一只手打开它需要一些技巧,但在调整打开角度时,摇晃的幅度很小。
底座单元本身的稳定性非常好,没有吱吱嘎嘎的声音。与掌托区相比,键盘区略微凹陷,允许键盘有更多的行程。由于底座略微凸起,键盘的后部中心区域在大量压力下屈服,但这需要大量的用力,在日常使用中应该不会构成问题。尽管显示屏盖子很薄,但它非常稳定。

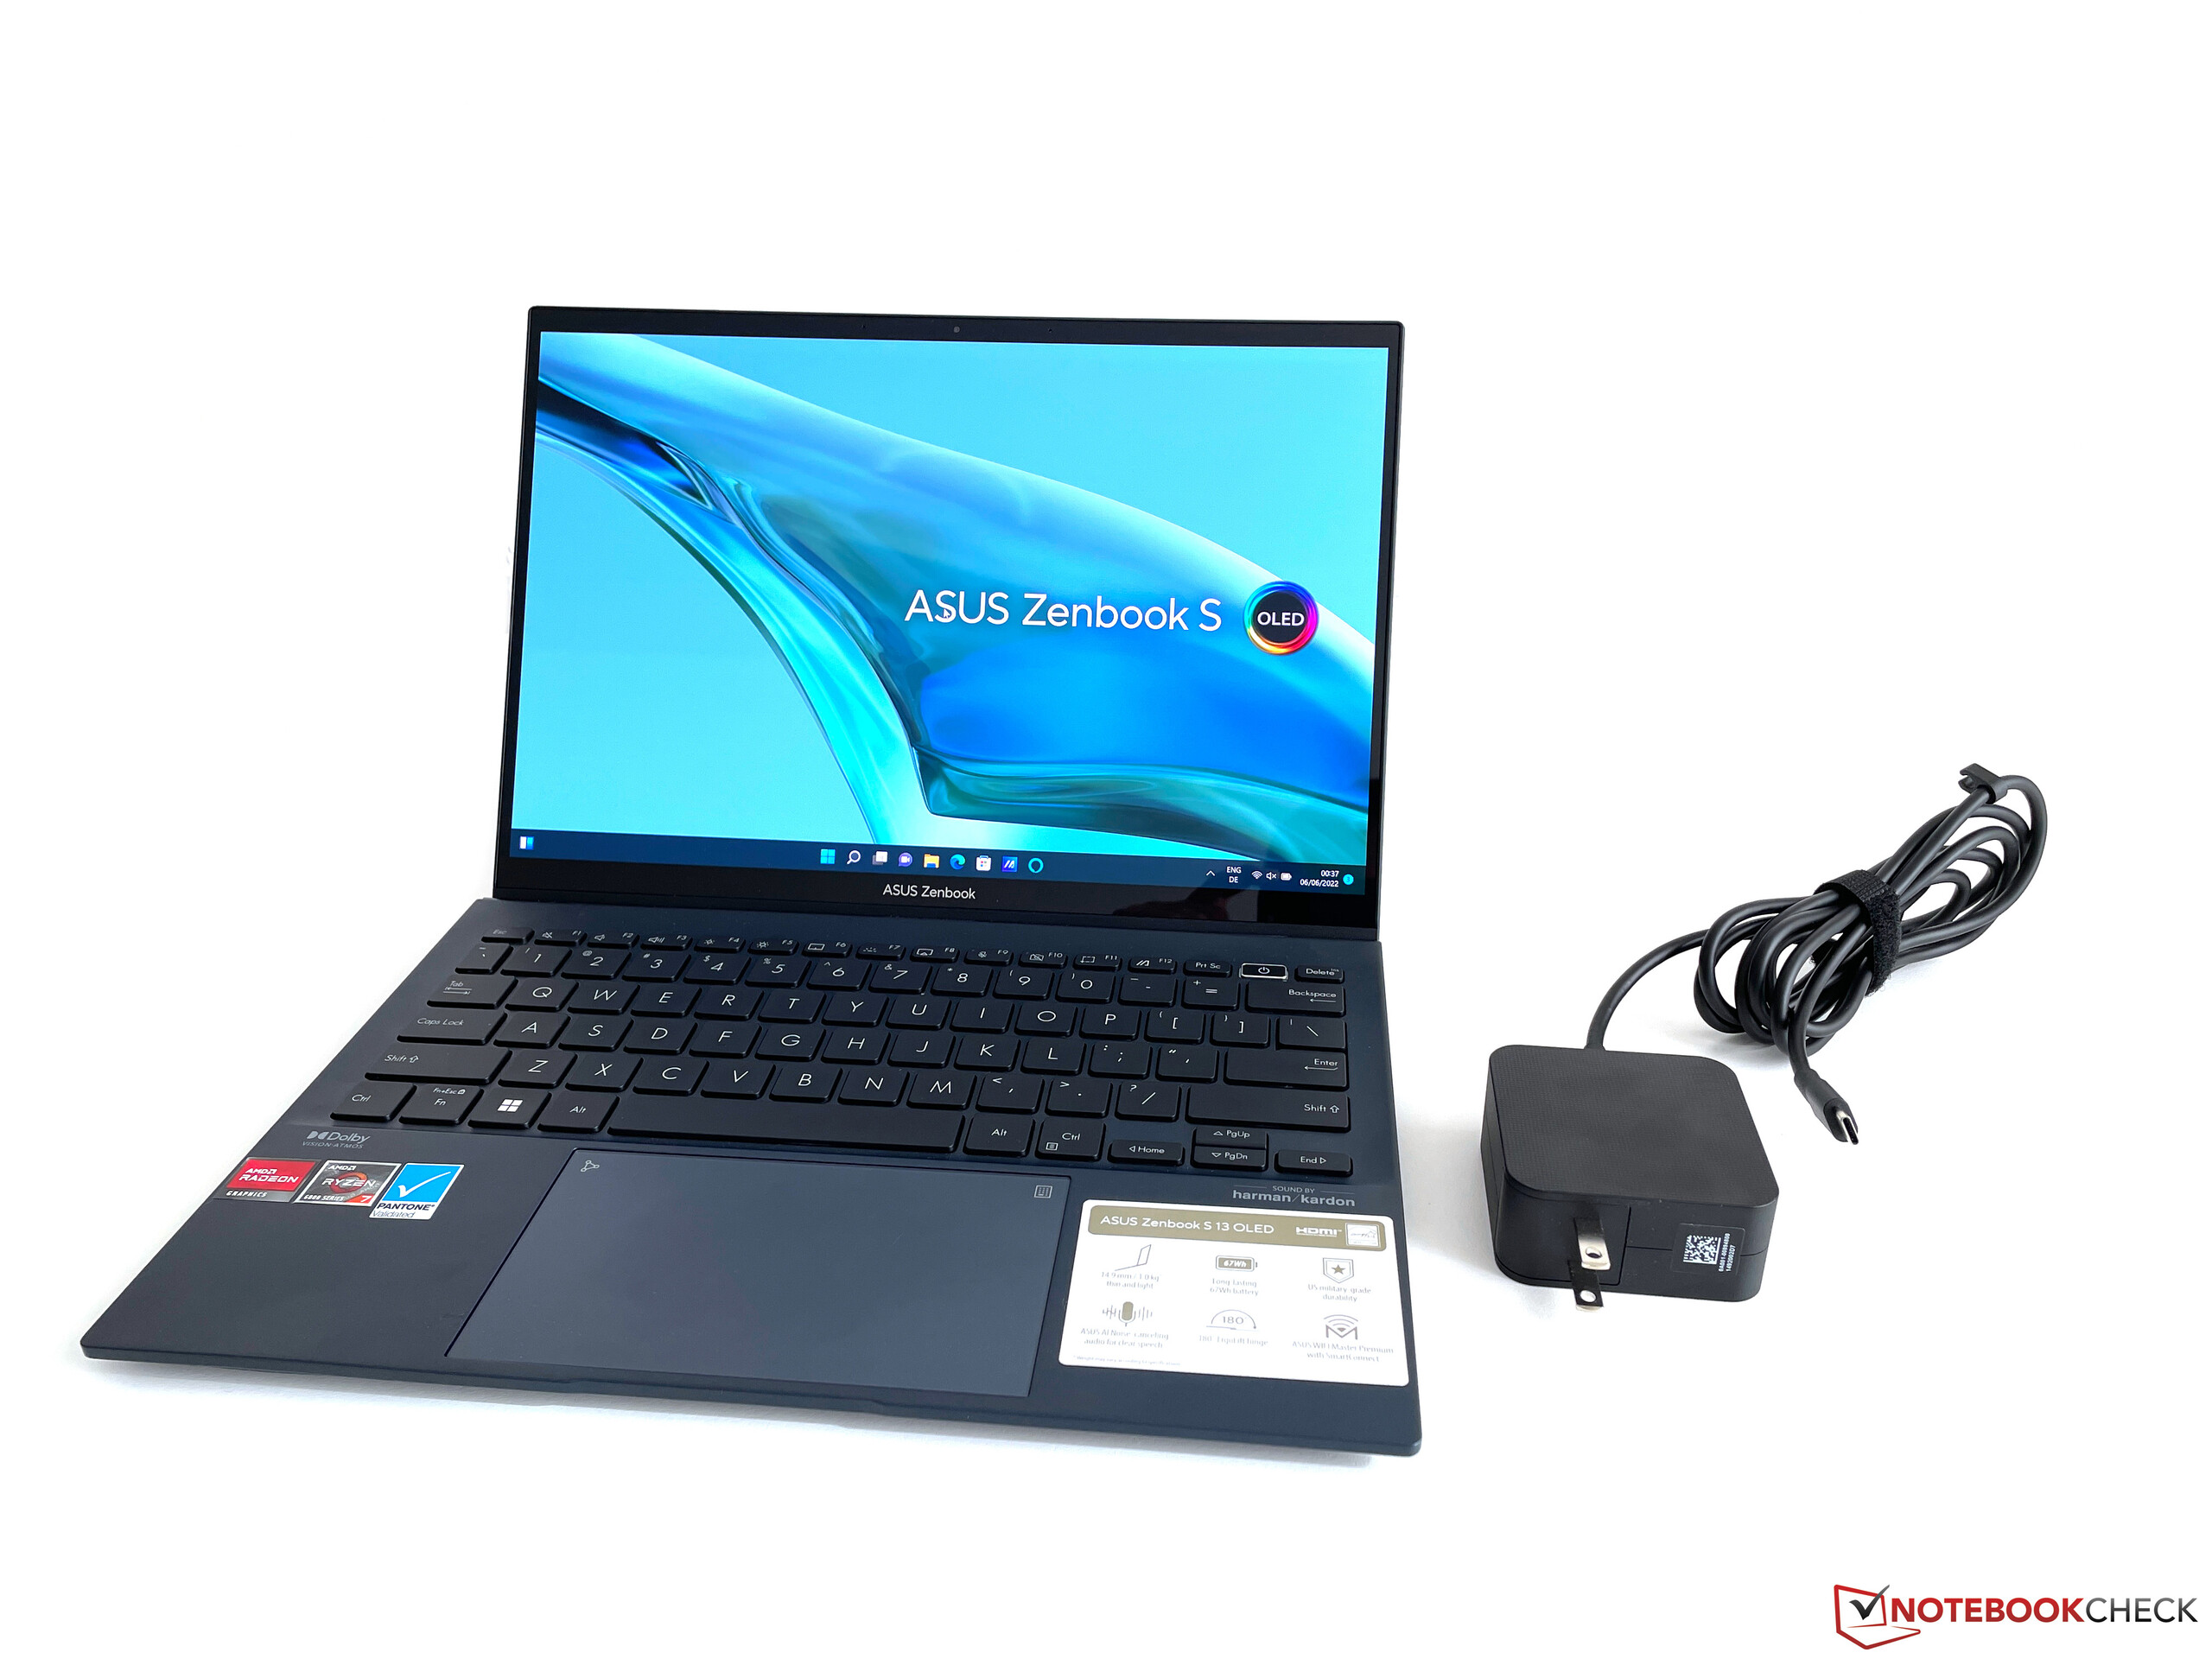
我们的带触摸屏的版本重量为1.095公斤。没有触摸支持的型号被华硕指定为重量少100克。Zenbook可以很容易地被收进任何袋子或背包。只有 戴尔XPS 13在我们的对比组中,只有戴尔XPS 13在深度上明显占用了较少的空间,但也稍重一些。
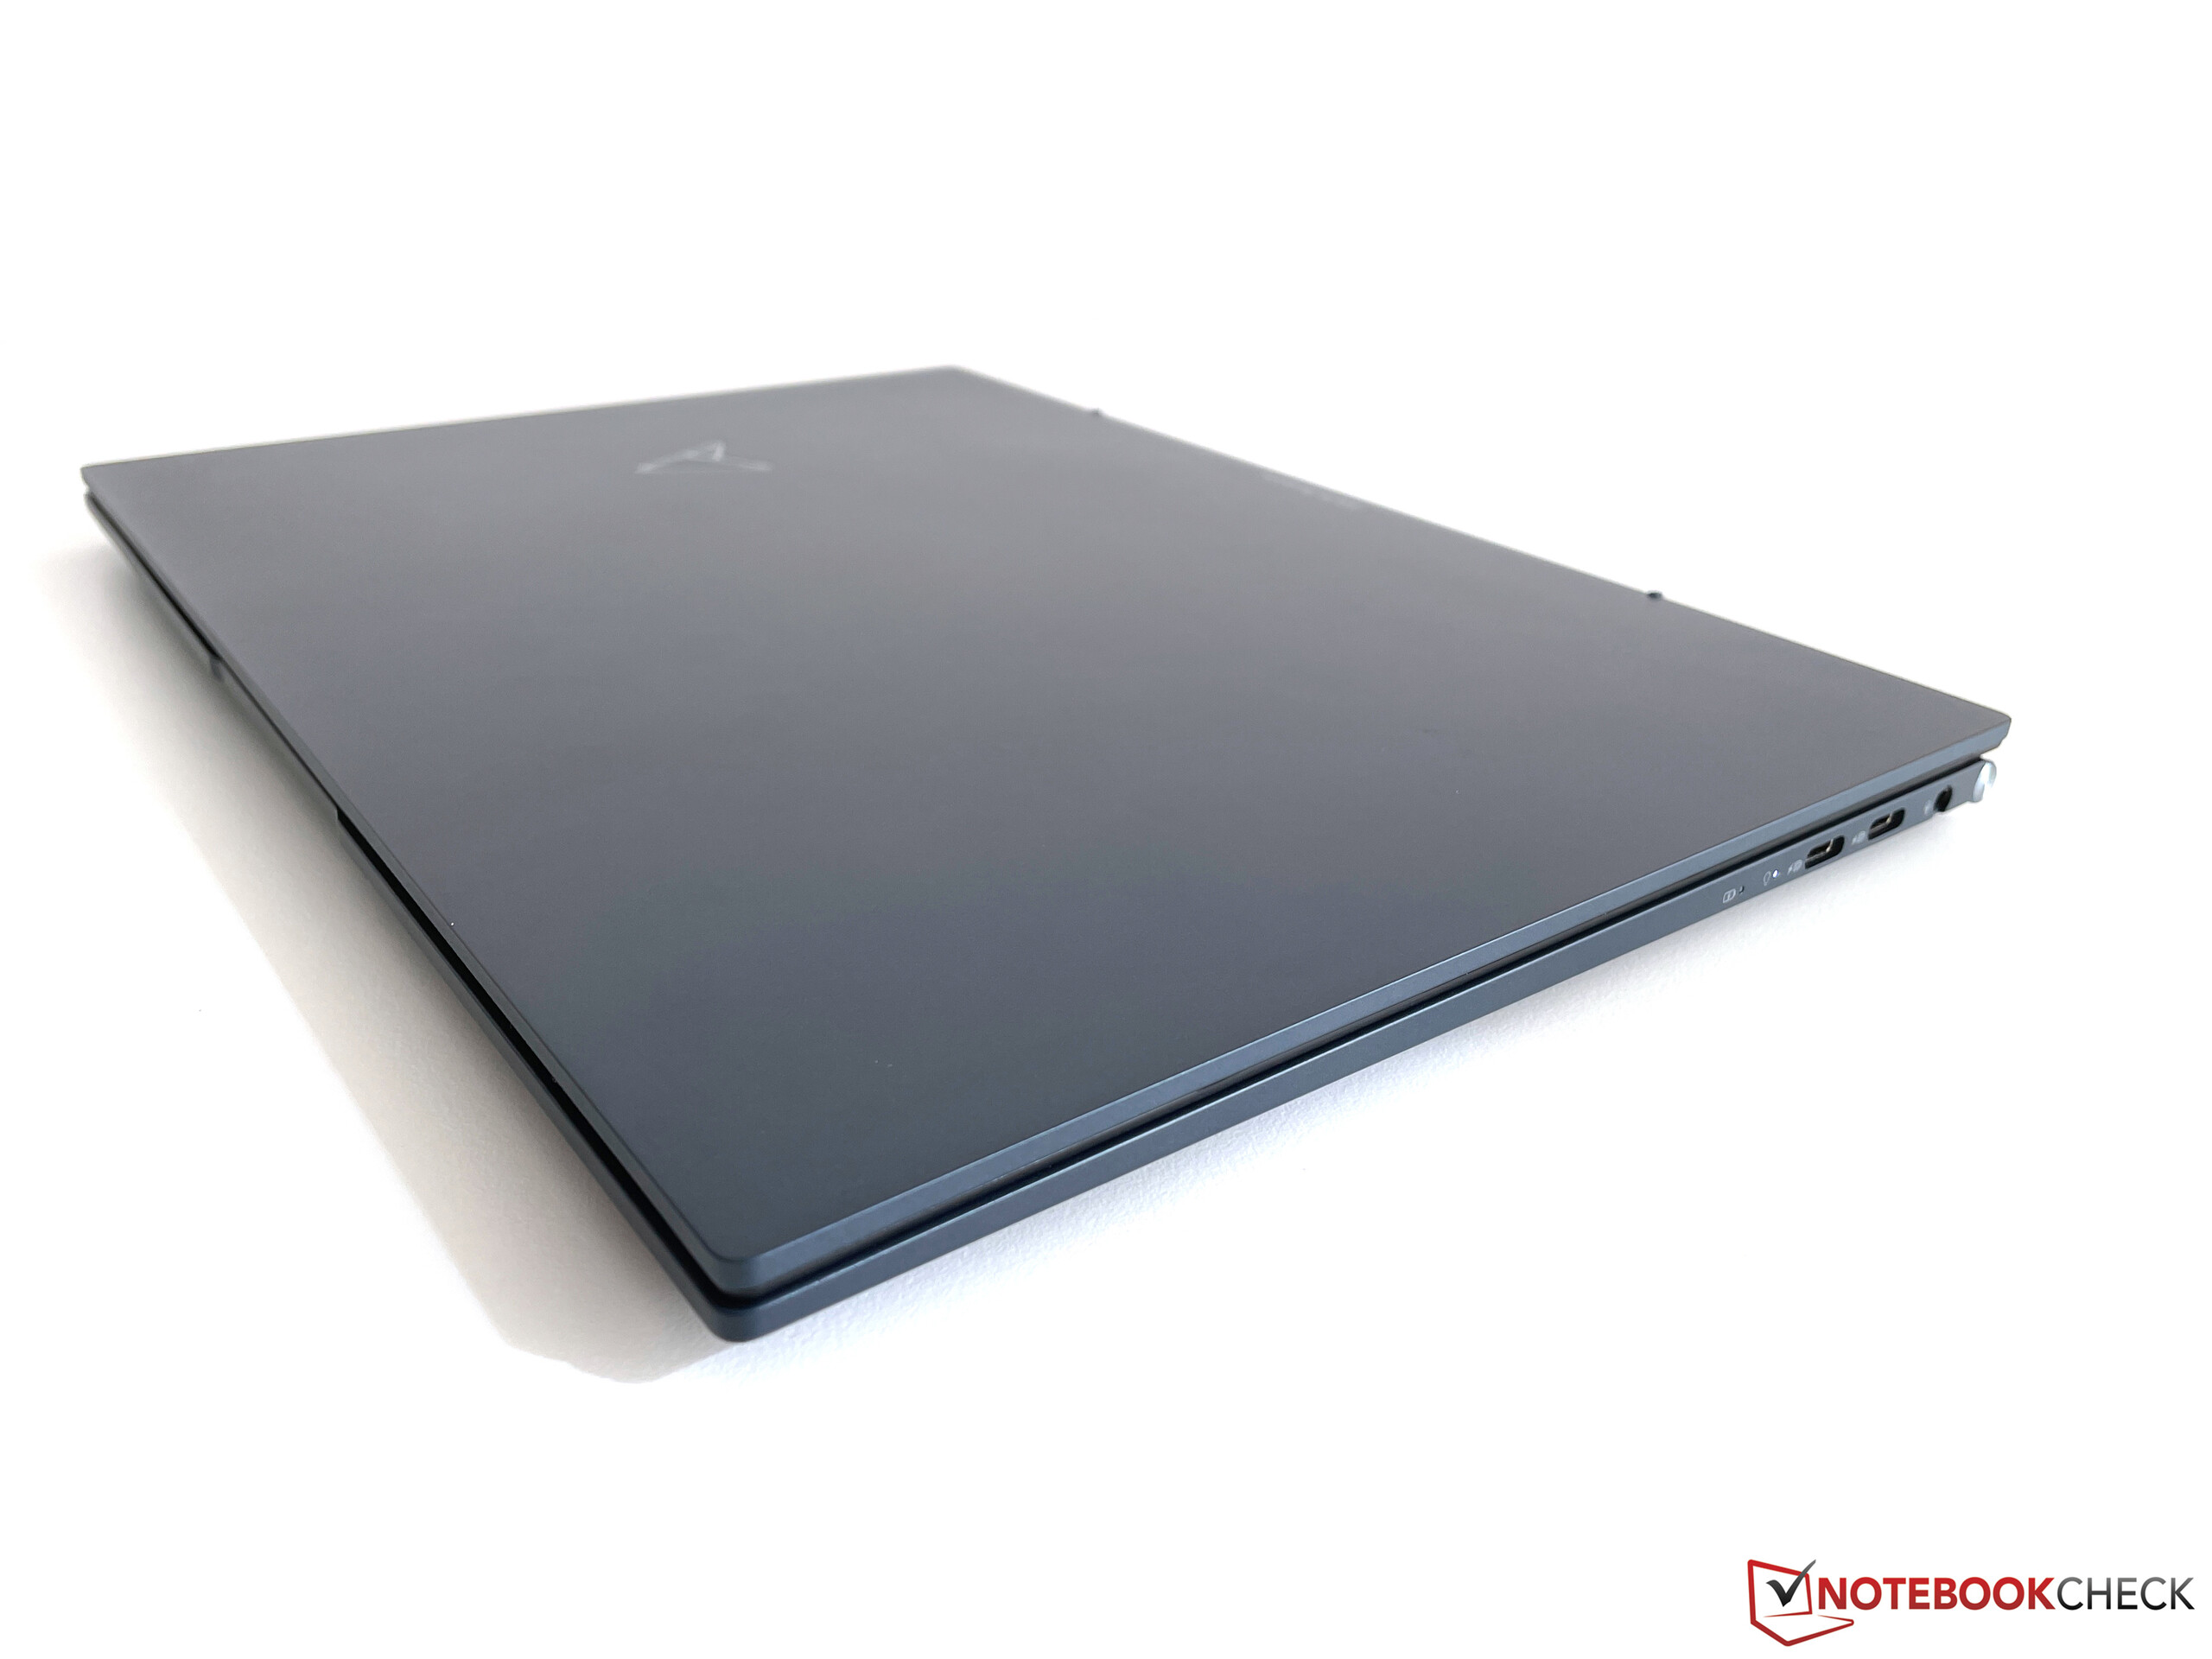
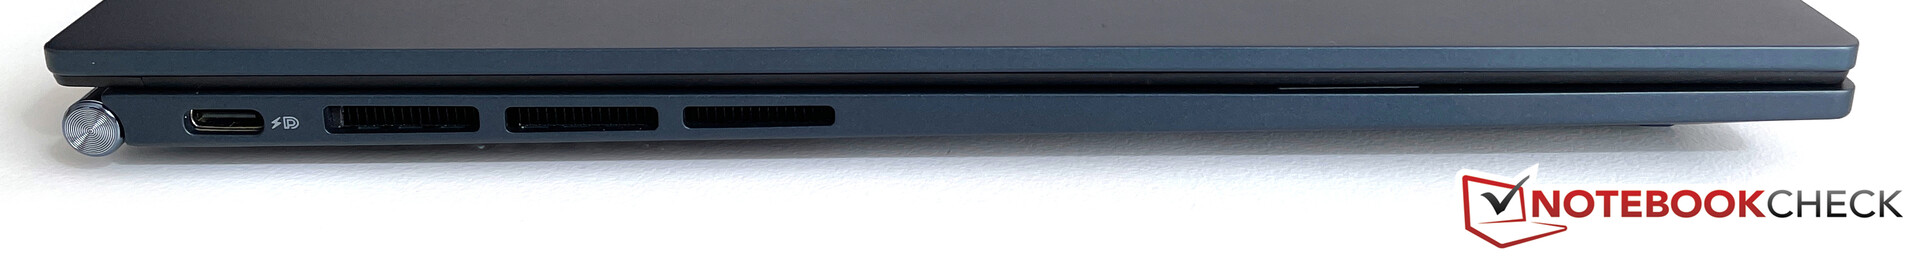
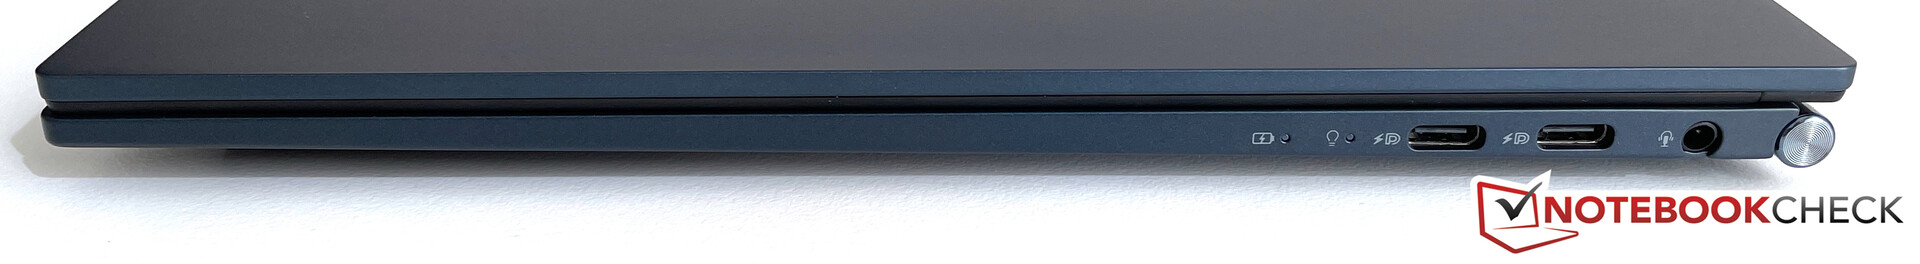
设备。AMD-Zenbook已具备USB-4功能
从根本上说,Zenbook S 13提供了一个3.5毫米耳机插孔和三个USB-C端口。这些仅支持USB 3.2标准,但以后可以通过BIOS更新升级到完整的40GBit/s的USB 4,在股票规格方面与Thunderbolt 4协议没有区别。据AMD称,未来还将支持外置显卡,相应的更新应该在Zenbook上市后不久就会推出。
沟通
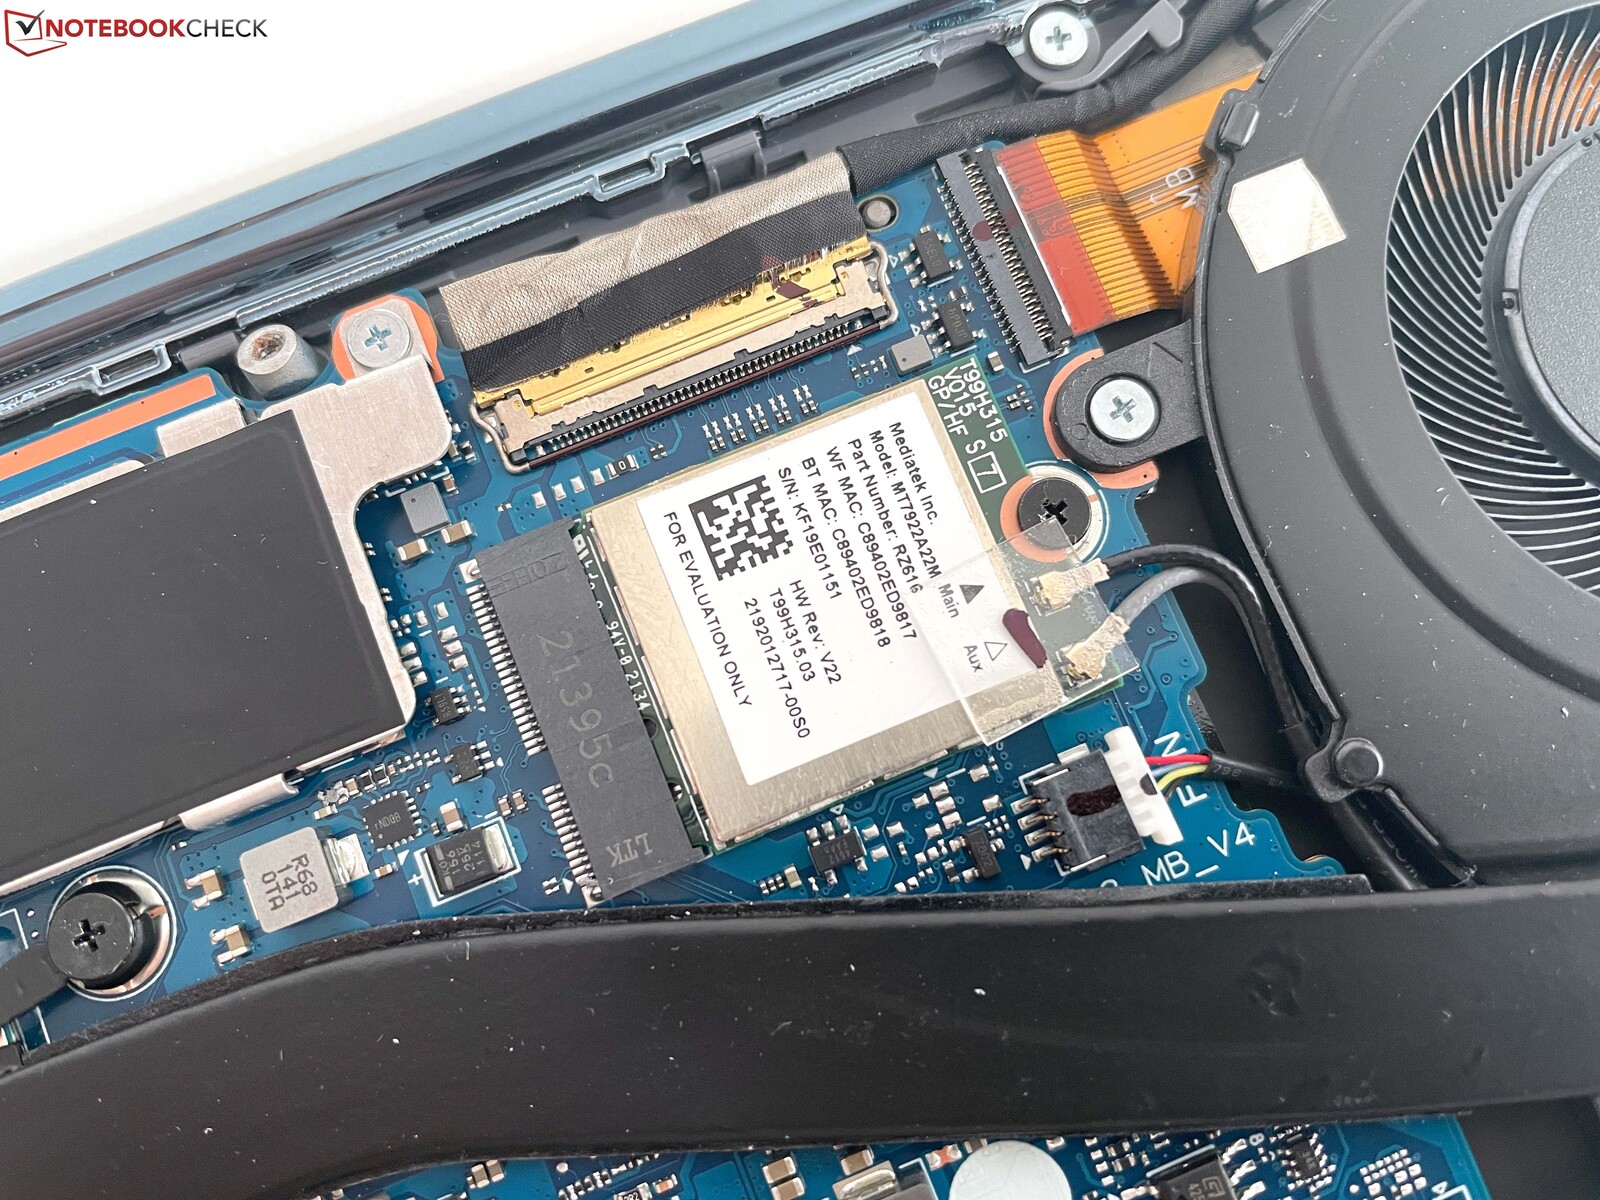
联发科的最新模块被用作Wi-Fi适配器(MT9972),它也支持最新的Wi-Fi 6E标准。至少在理论上,因为我们的Zenbook S 13的美国设备拒绝连接到我们的华硕参考路由器的6GHz网络。
尽管如此,在正常的5GHz网络(Wi-Fi 6)上,传输速率非常好,也很稳定。对蓝牙5.2的支持也是可用的。
网络摄像头
华硕继续使用720p模块的网络摄像头,即使在最佳照明条件下也不能真正拍出好照片。


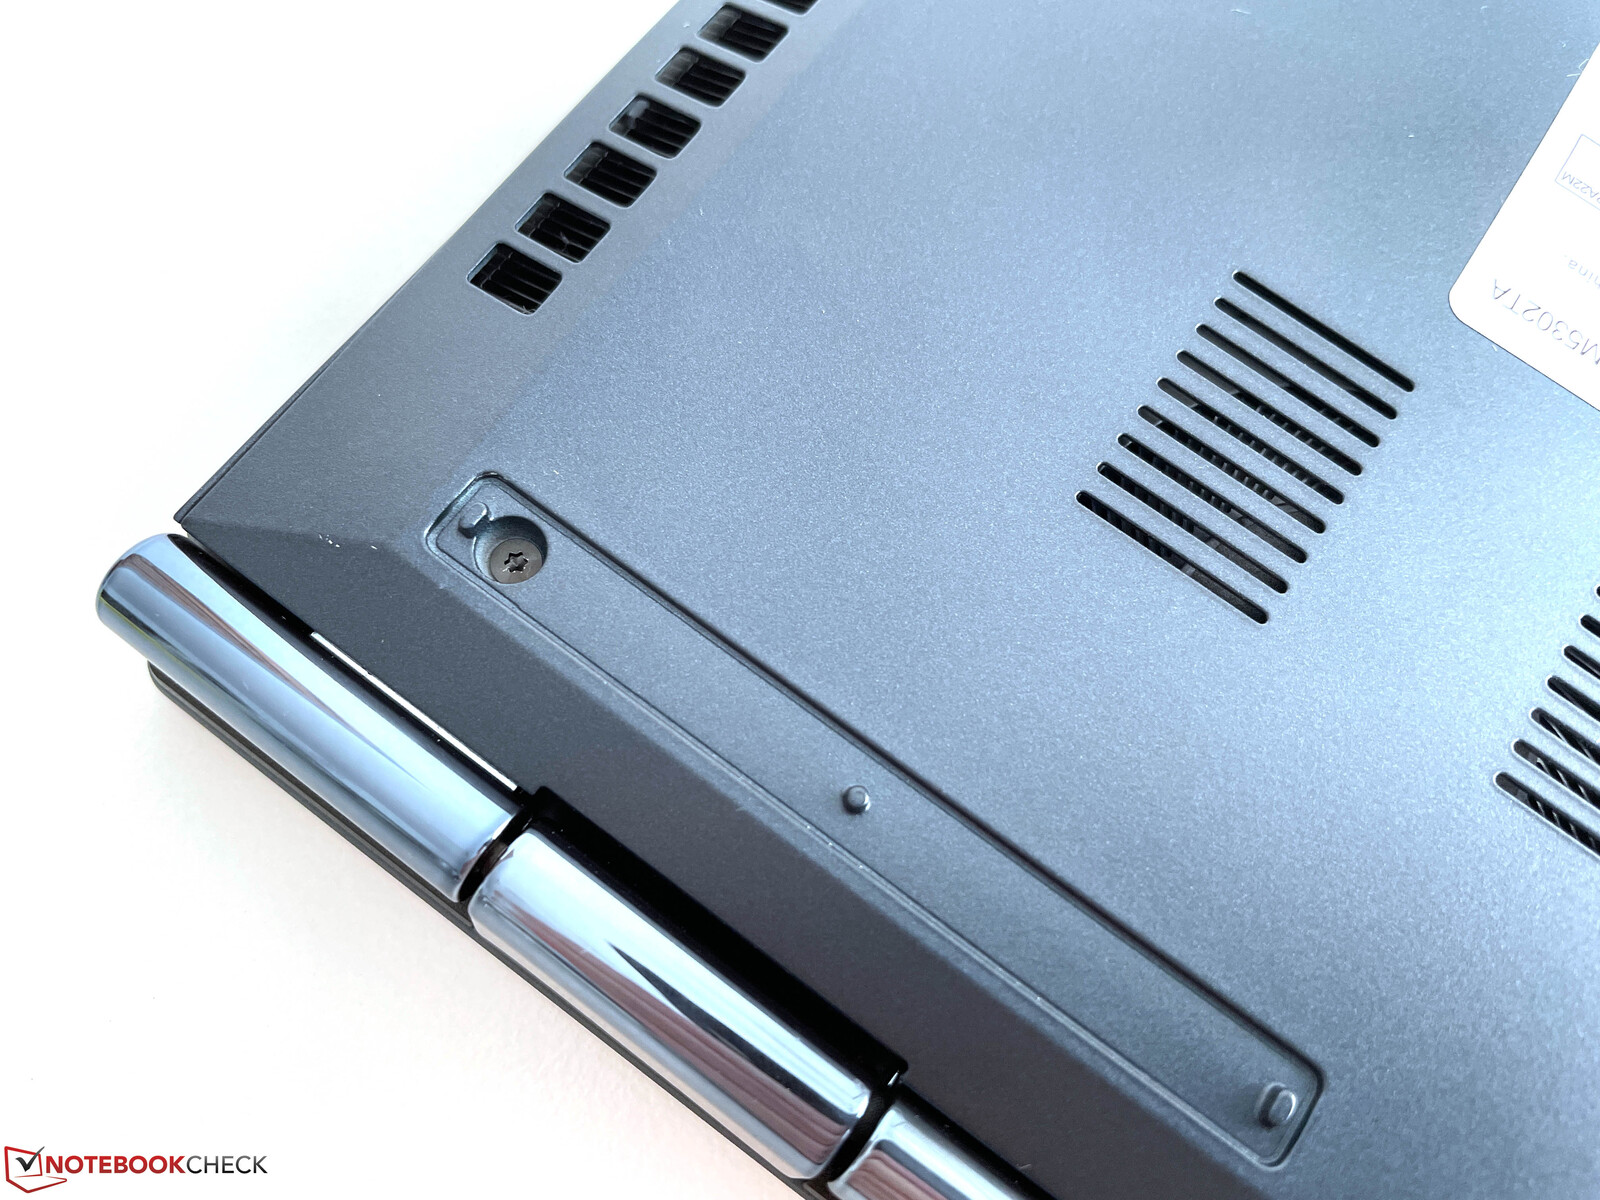
维护
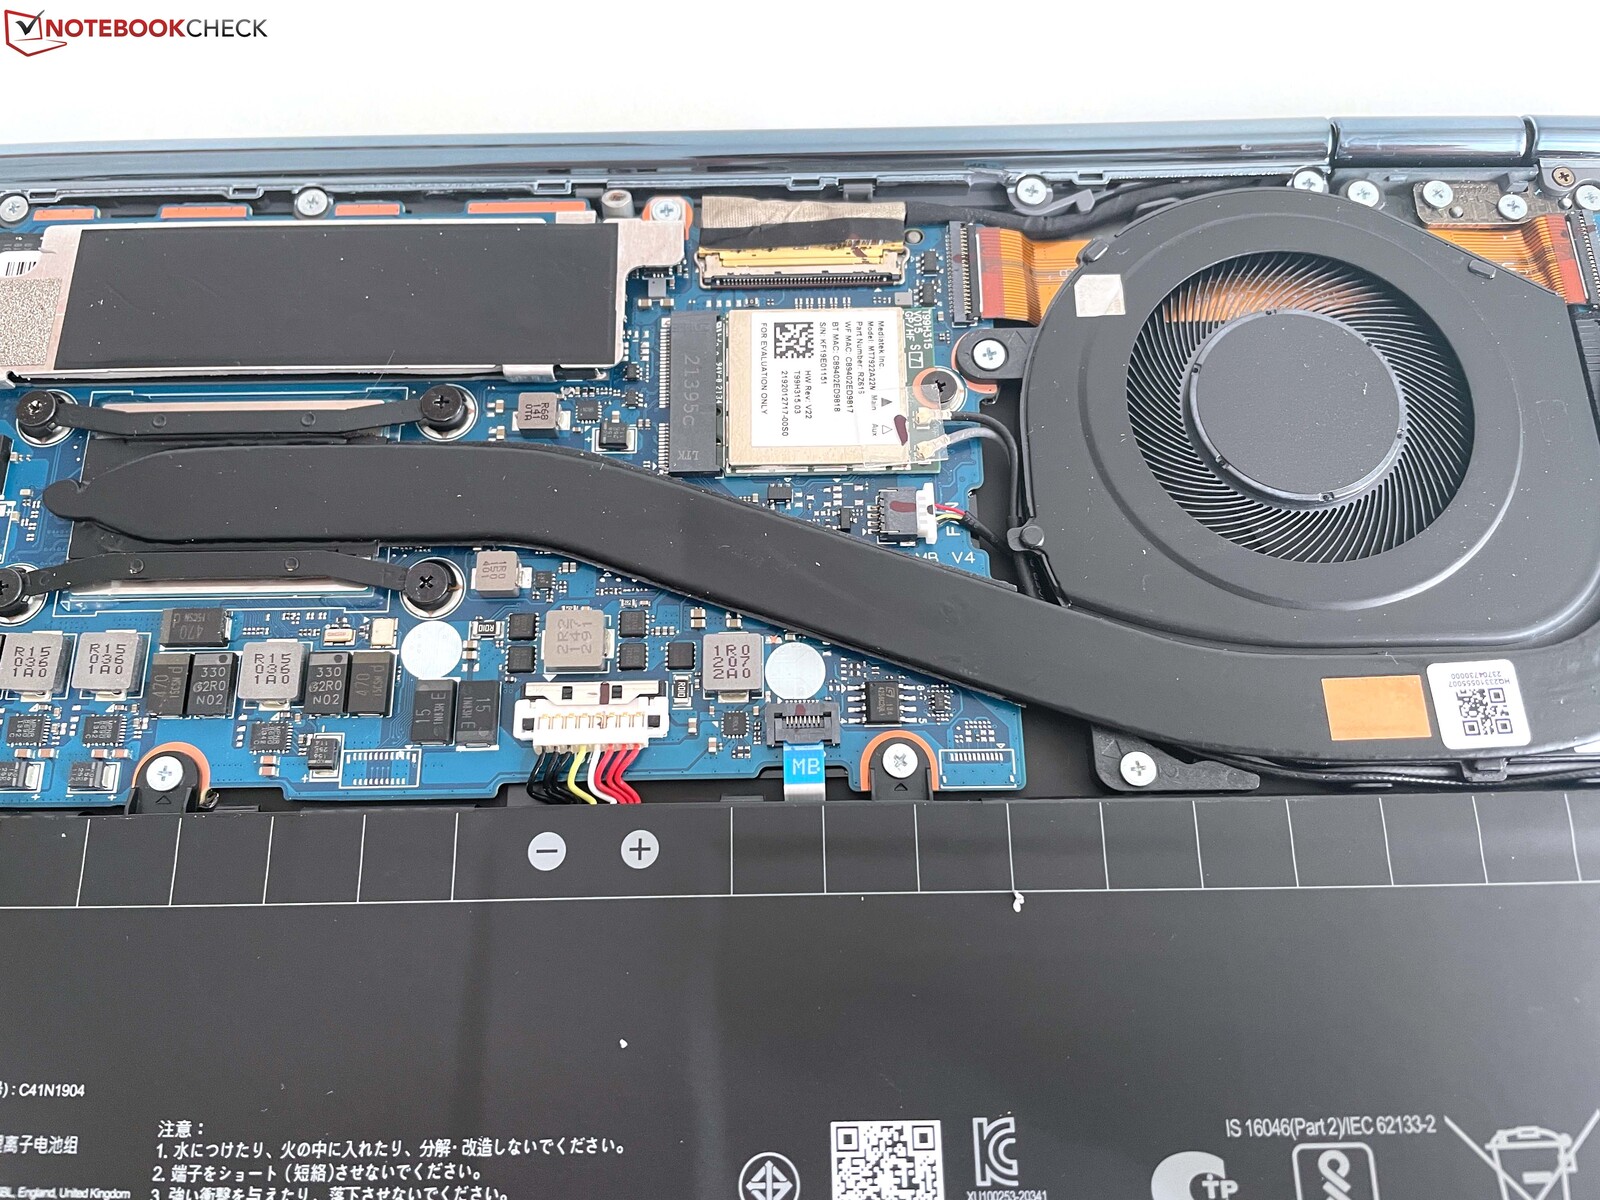
底板用小的Torx螺钉(T5)固定,但除了可见的螺钉外,还有两个隐藏在两个后部橡胶脚下的螺钉,它们本身是用胶水粘住的。几乎没有比这更复杂的了。
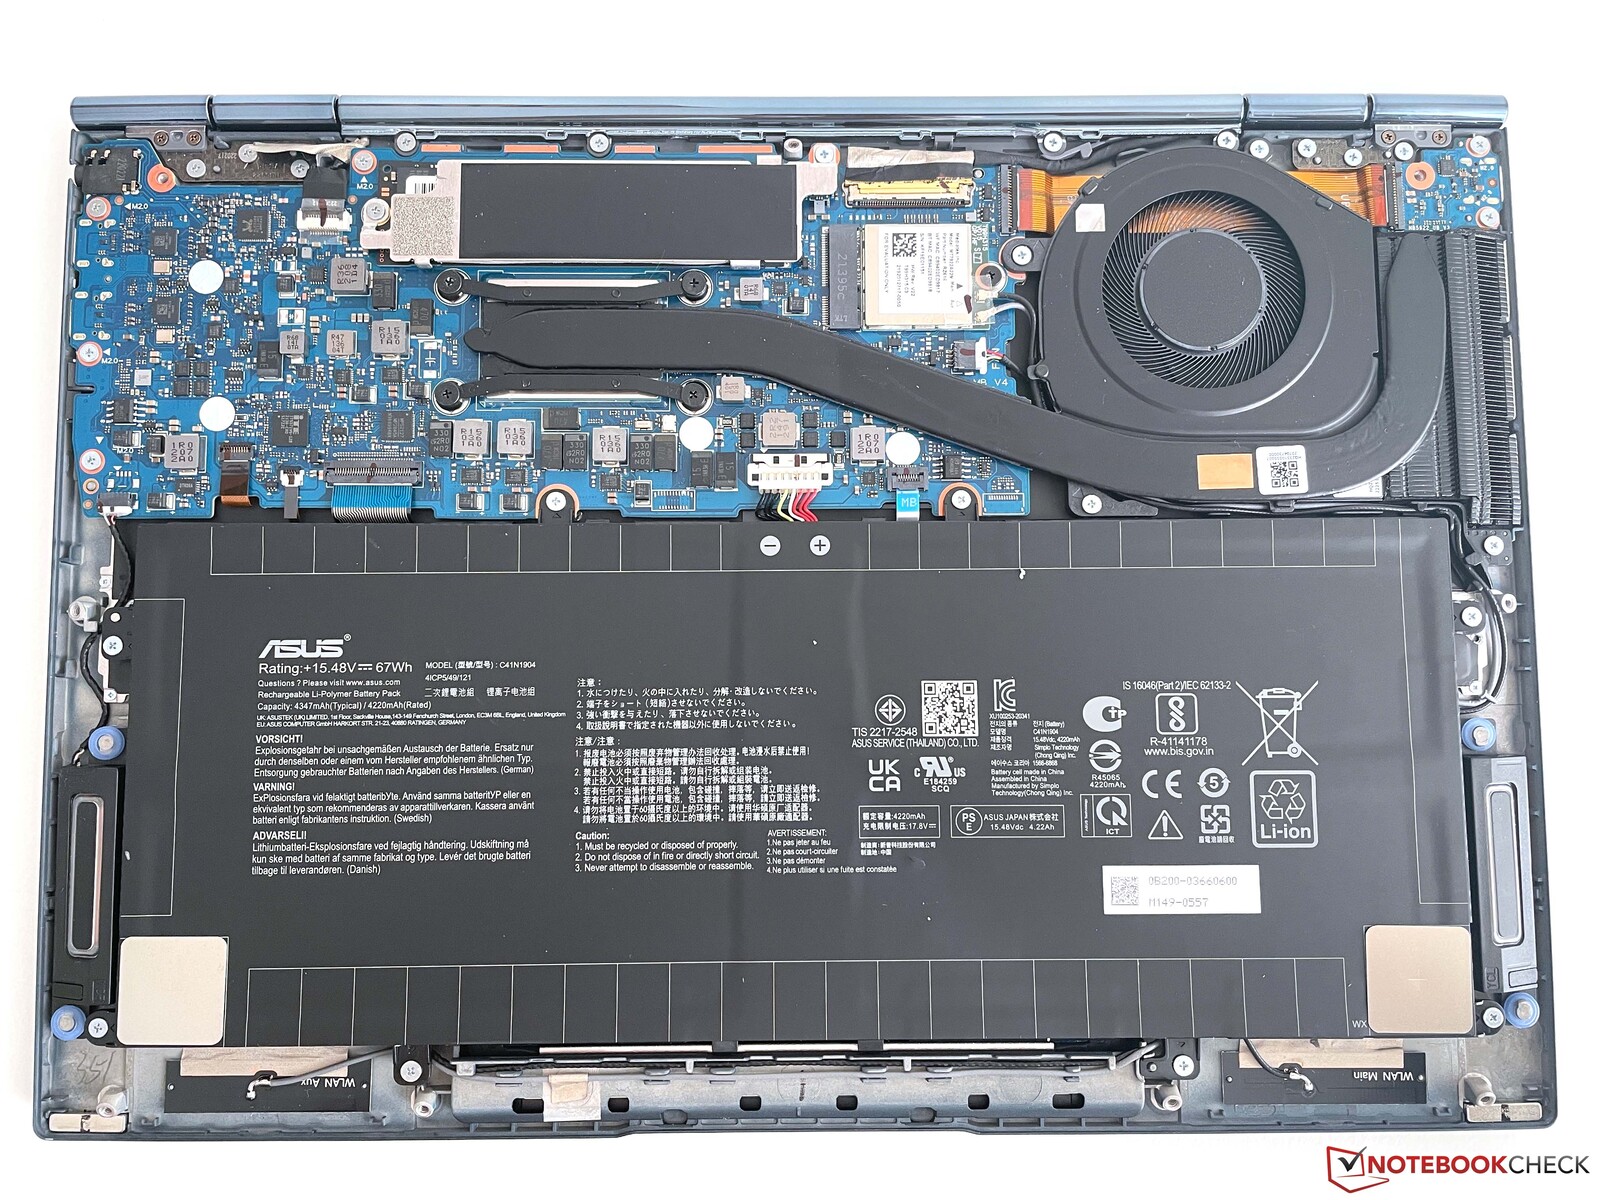
一旦进入内部,在维护或升级方面可以做的事情不多。除了风扇清洁和访问M.2-2280固态硬盘外,只有WLAN模块可以更换。
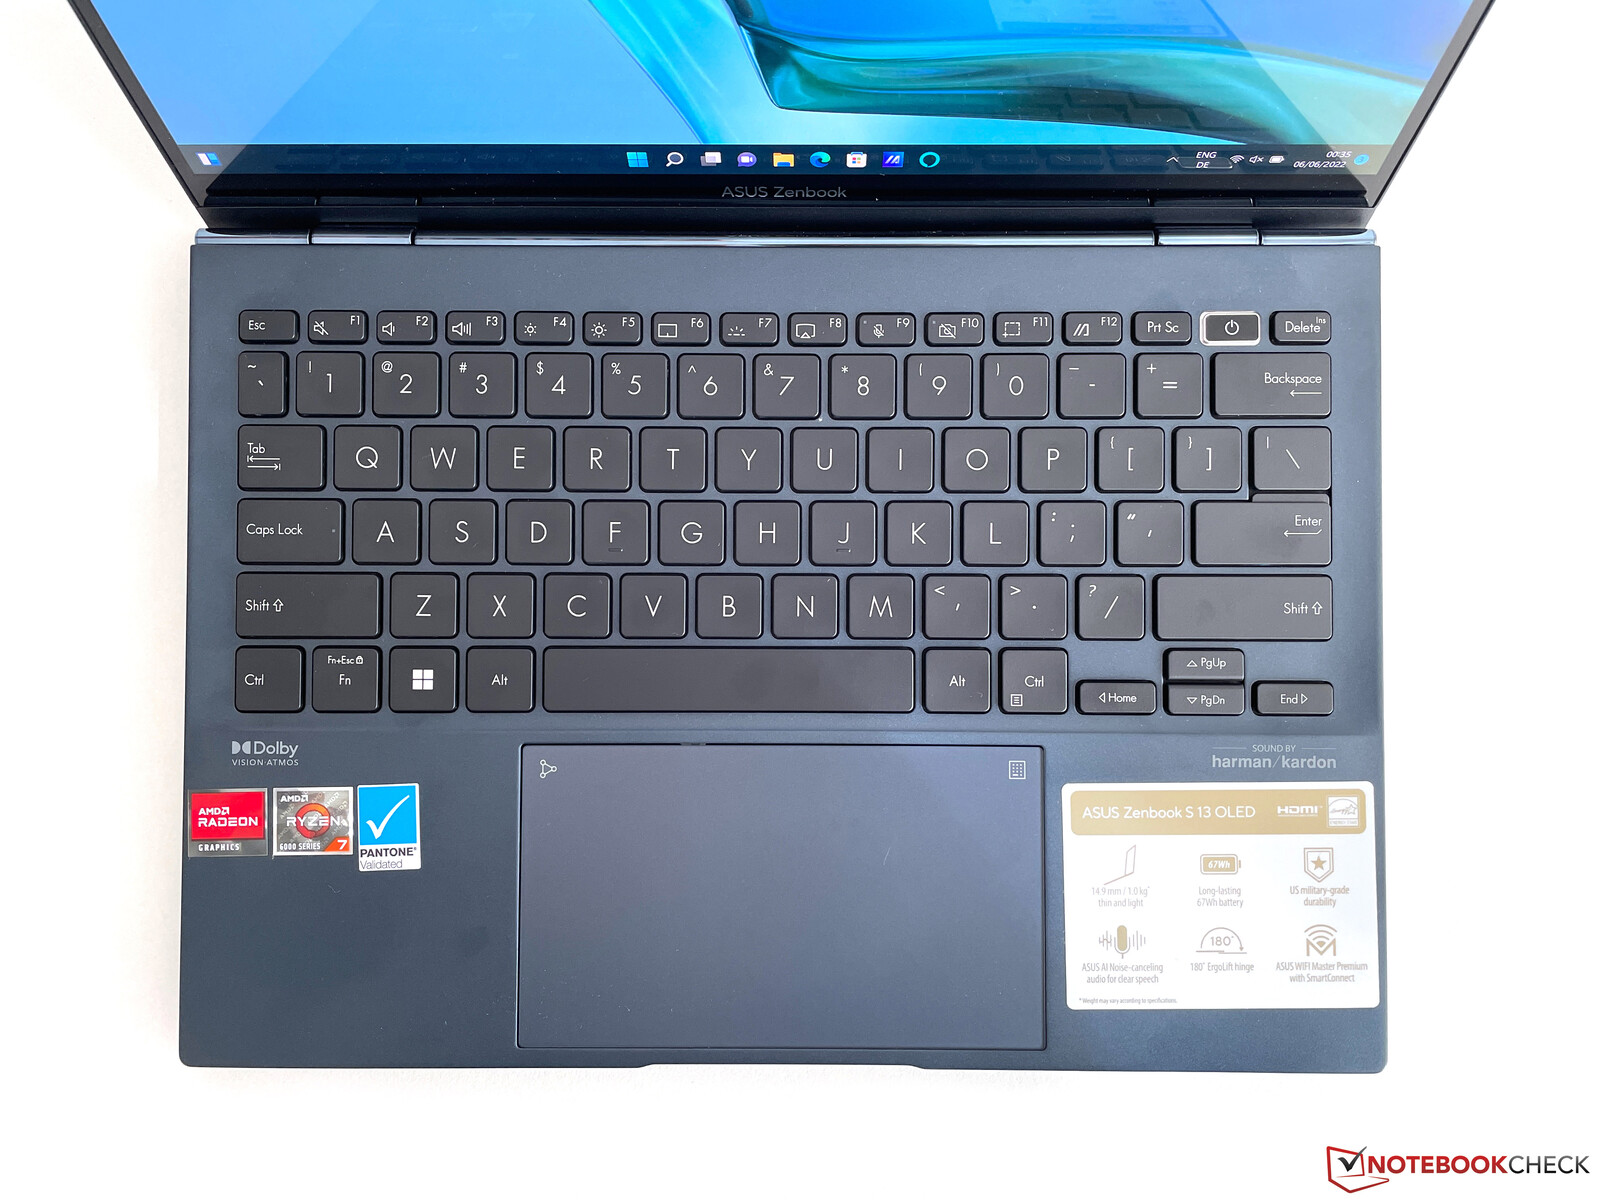
输入设备。华硕安装了一个舒适的键盘
键盘
对于这样一个紧凑的笔记本,Zenbook提供了一个相对慷慨的1.4毫米的键位。打字的感觉总体上非常好,由于反馈精确,打长文没有问题。然而,击键本身可以更安静一些。方向键相当小,但除此之外,其布局没有什么值得批评的地方。电源键位于键盘的右上方,使用了一个略微不同的机制,冲程较短,点击的声音有点大。它也是一个指纹扫描仪,在测试中可靠地工作。
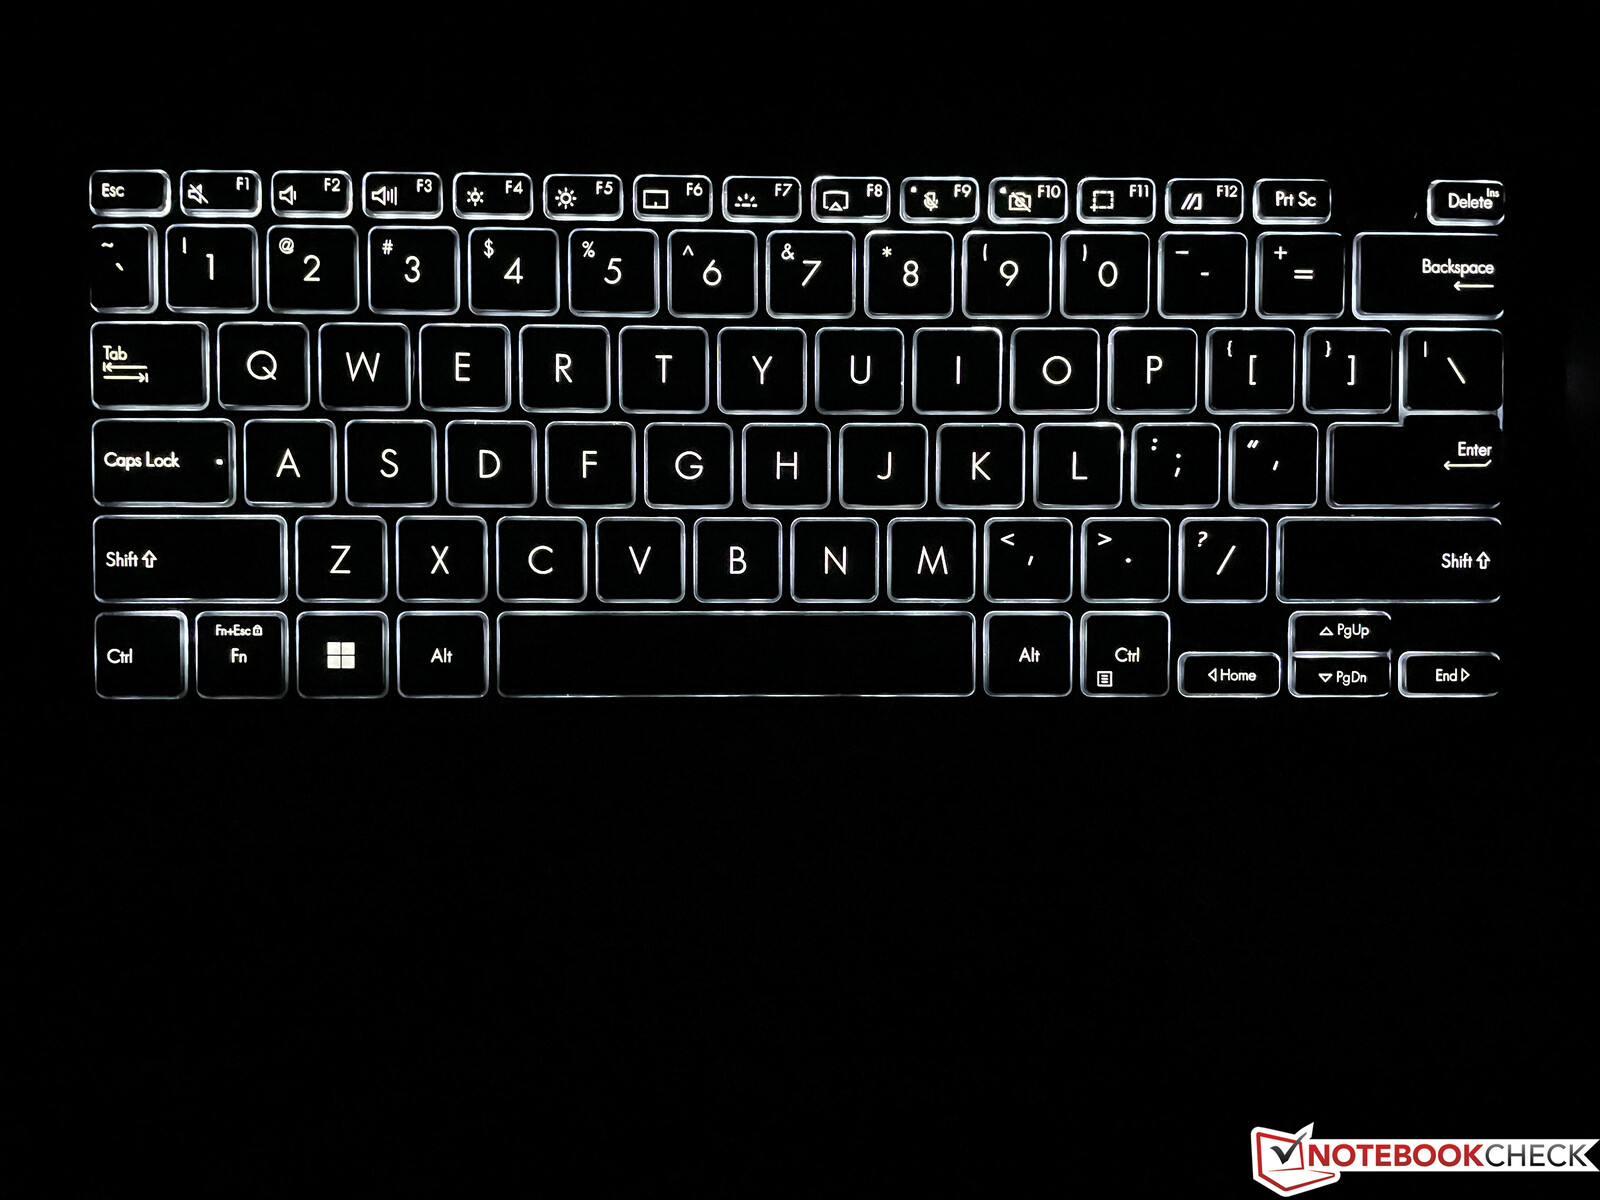
三段式白色背光在黑暗环境下有帮助,但不能通过传感器自动激活。
触摸板和触摸屏
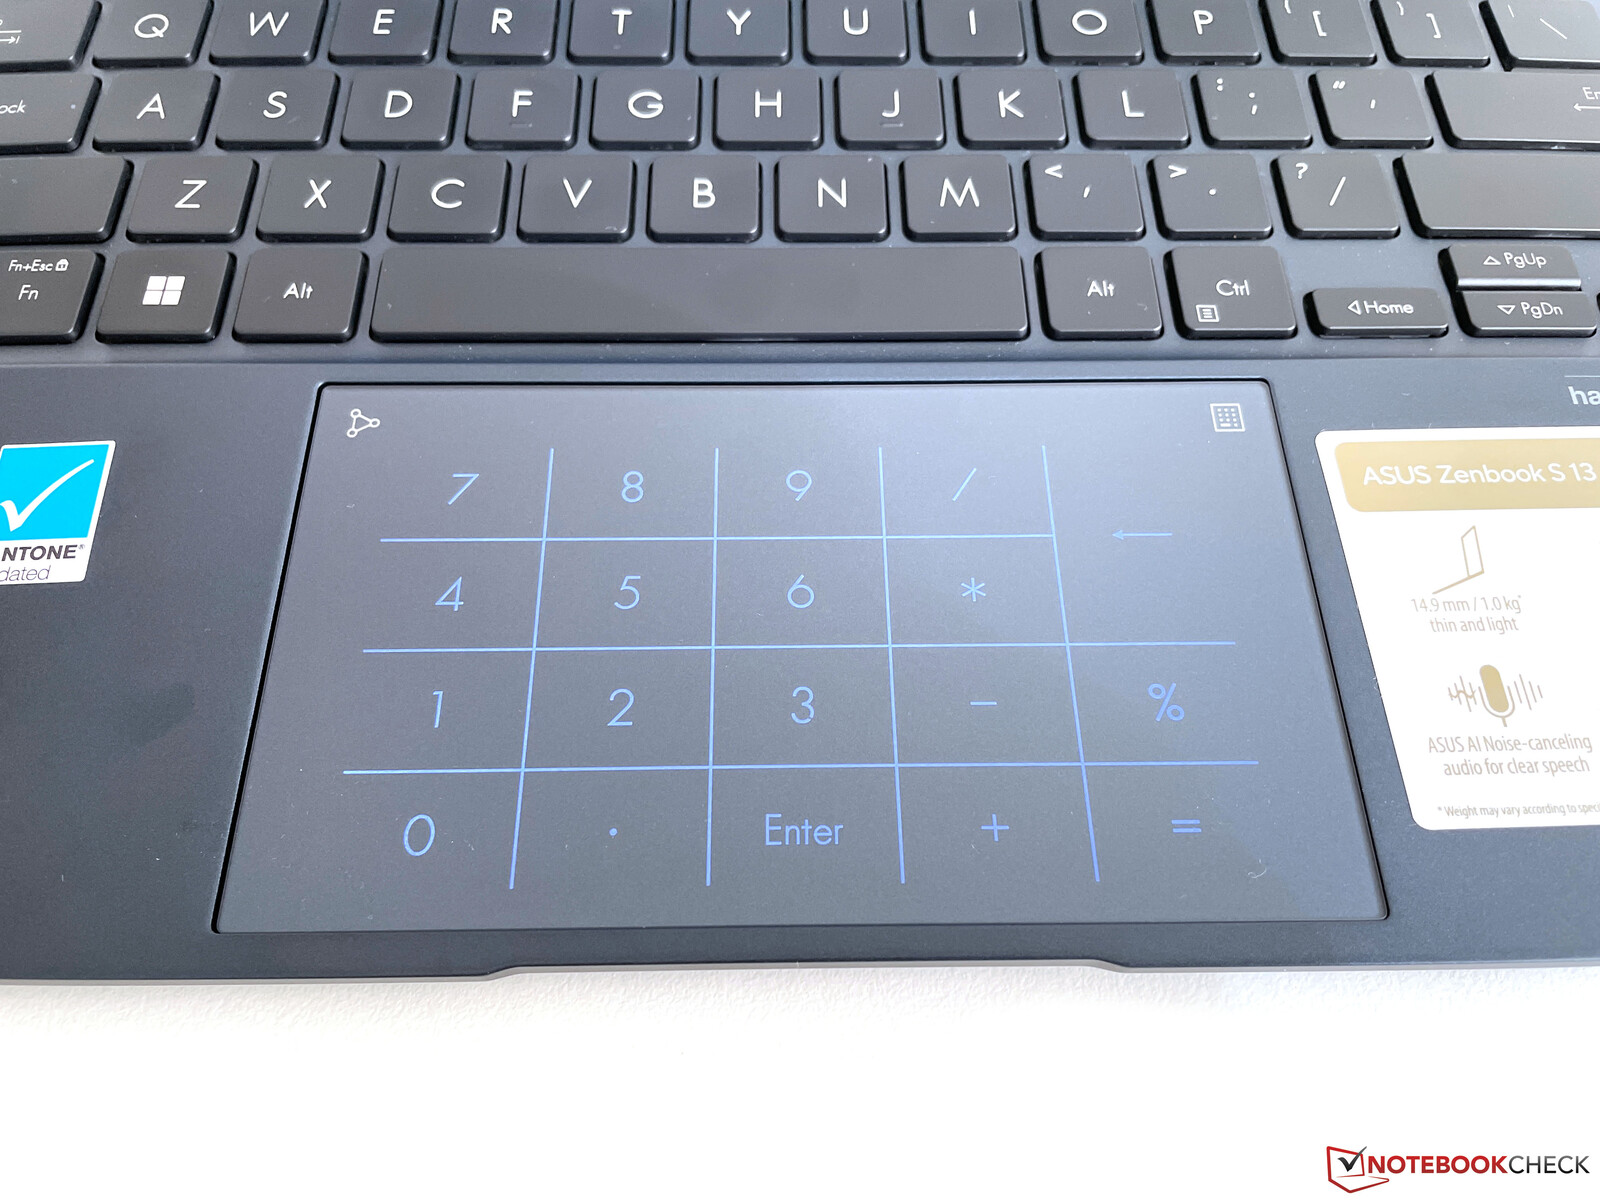
大的ClickPad在实践中工作得非常好,用四个手指做手势也能正确实现。按右上角会在触摸板上出现一个数字板,这个数字板运行良好,在输入大量数字时证明非常有用。正常的光标控制功能也很正常。触摸板的下半部分可以机械地点击,但与许多其他笔记本电脑一样,这具有非常响亮的点击噪音的特点。
当然,电容式触摸屏也可以使用,它的工作原理与预期的一样完美。据华硕称,还支持手写笔,但我们的评测样品中没有提供这个。
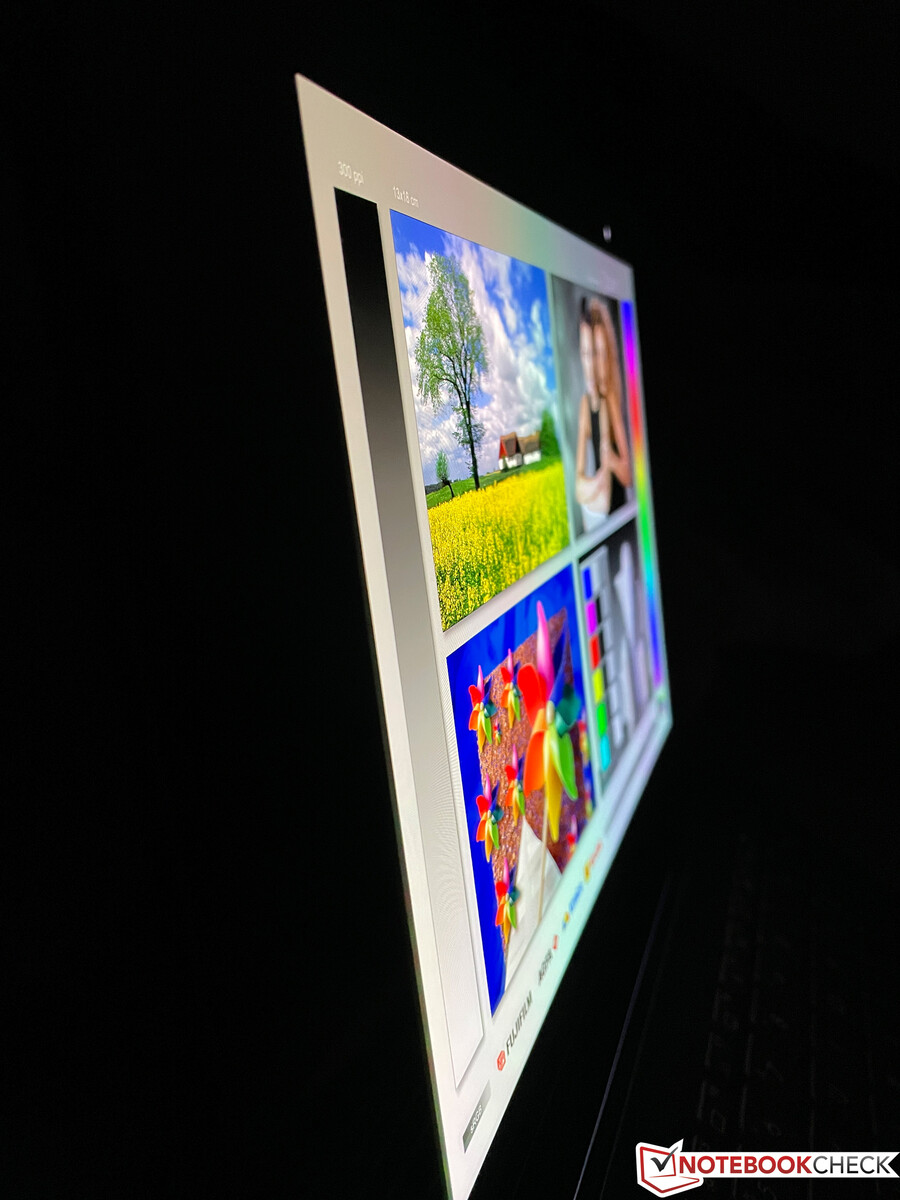
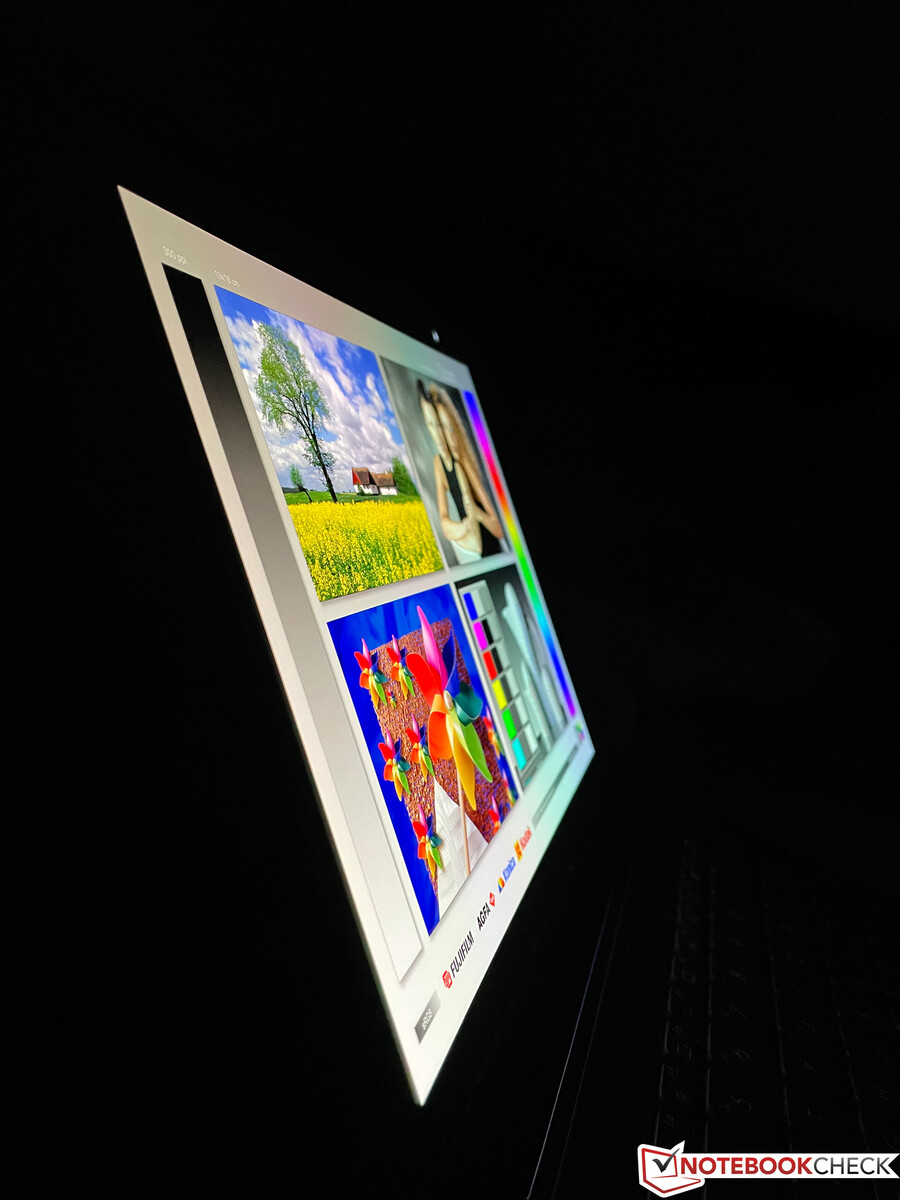
显示器。有软件对抗PWM的Zenbook
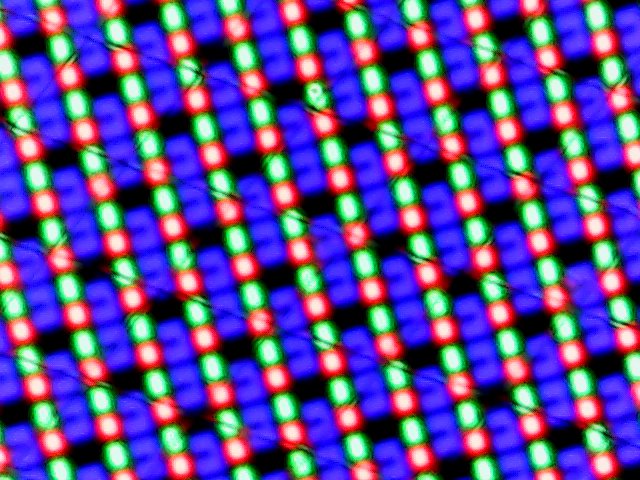
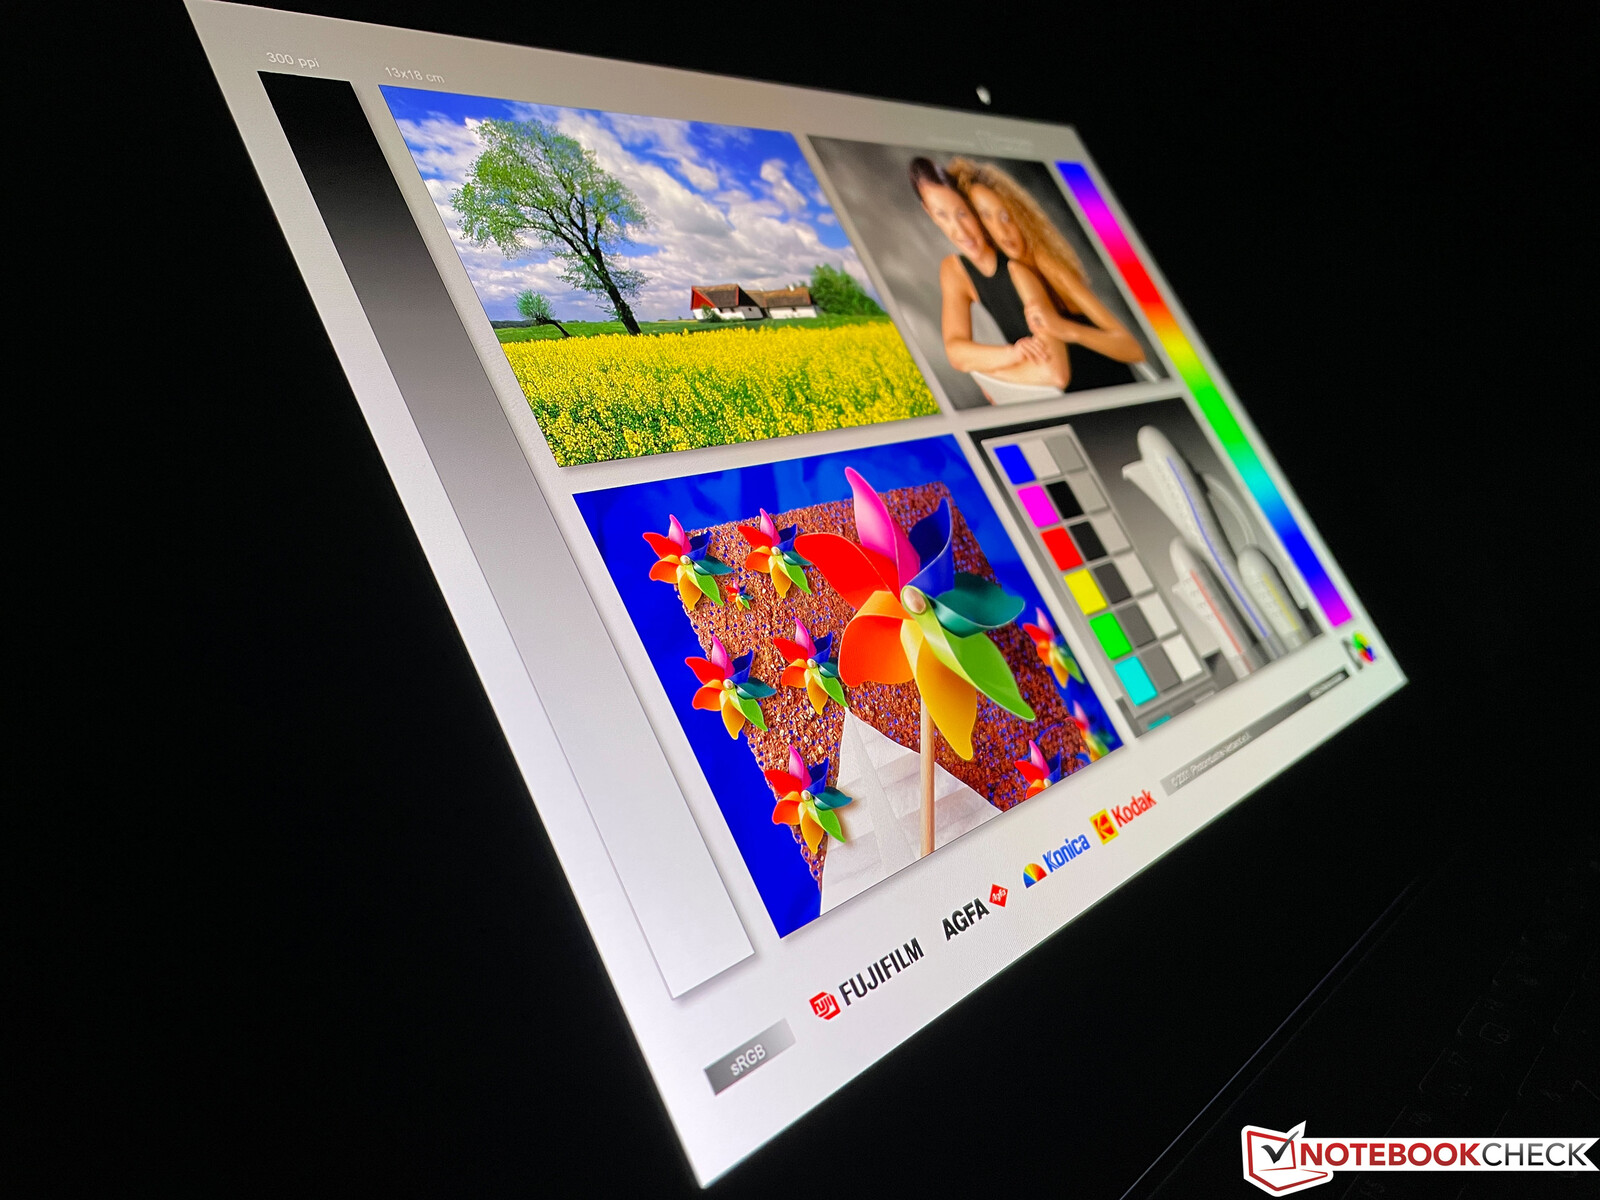
Zenbook S 13配备了一个16:10的OLED屏幕,在其13.3英寸的对角线上提供了2880 x 1,800的高分辨率。主观的画质,其与生动的色彩和锐利的内容,是非常好的。
华硕规定最大亮度可达550cd/m²,但这只适用于HDR内容。我们的测量结果显示,小幅白色图像的最大亮度为~570 cd/m²,然后在接近完整的白色图像中变成~460 cd/m²。不幸的是,HDR切换不会自动工作,而是必须在Windows显示设置中手动激活。
对于正常的SDR内容,最大亮度只有340cd/m²。图片印象自然得益于特别低的黑值,这反过来又导致了非常高的对比度。由于OLED技术,光晕不是一个问题,而且响应时间非常快。MyAsus应用程序中有一些功能(如像素移动),是为了防止静态内容的烧毁。然而,用于自动亮度控制的环境光传感器是缺乏的。
| |||||||||||||||||||||||||
Brightness Distribution: 99 %
Center on Battery: 335 cd/m²
Contrast: 16800:1 (Black: 0.02 cd/m²)
ΔE ColorChecker Calman: 1.8 | ∀{0.5-29.43 Ø4.71}
calibrated: 1.8
ΔE Greyscale Calman: 0.9 | ∀{0.09-98 Ø4.96}
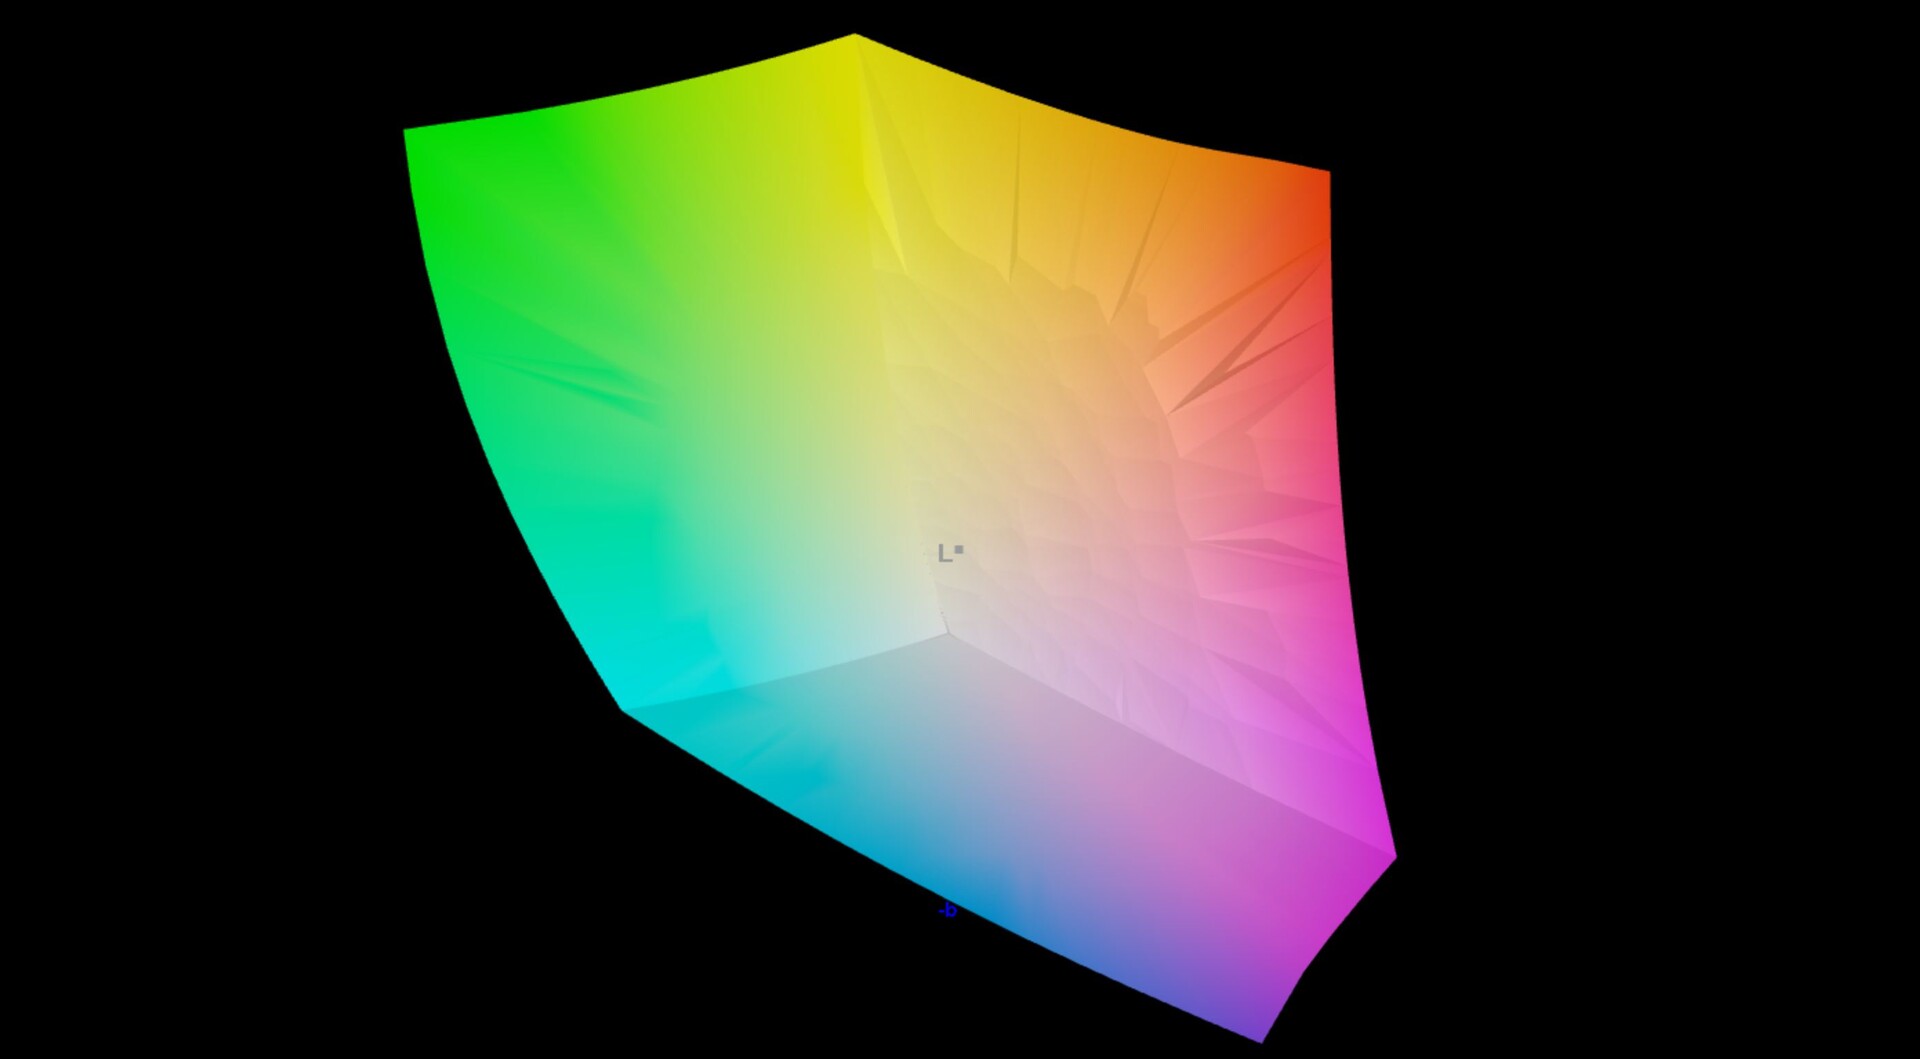
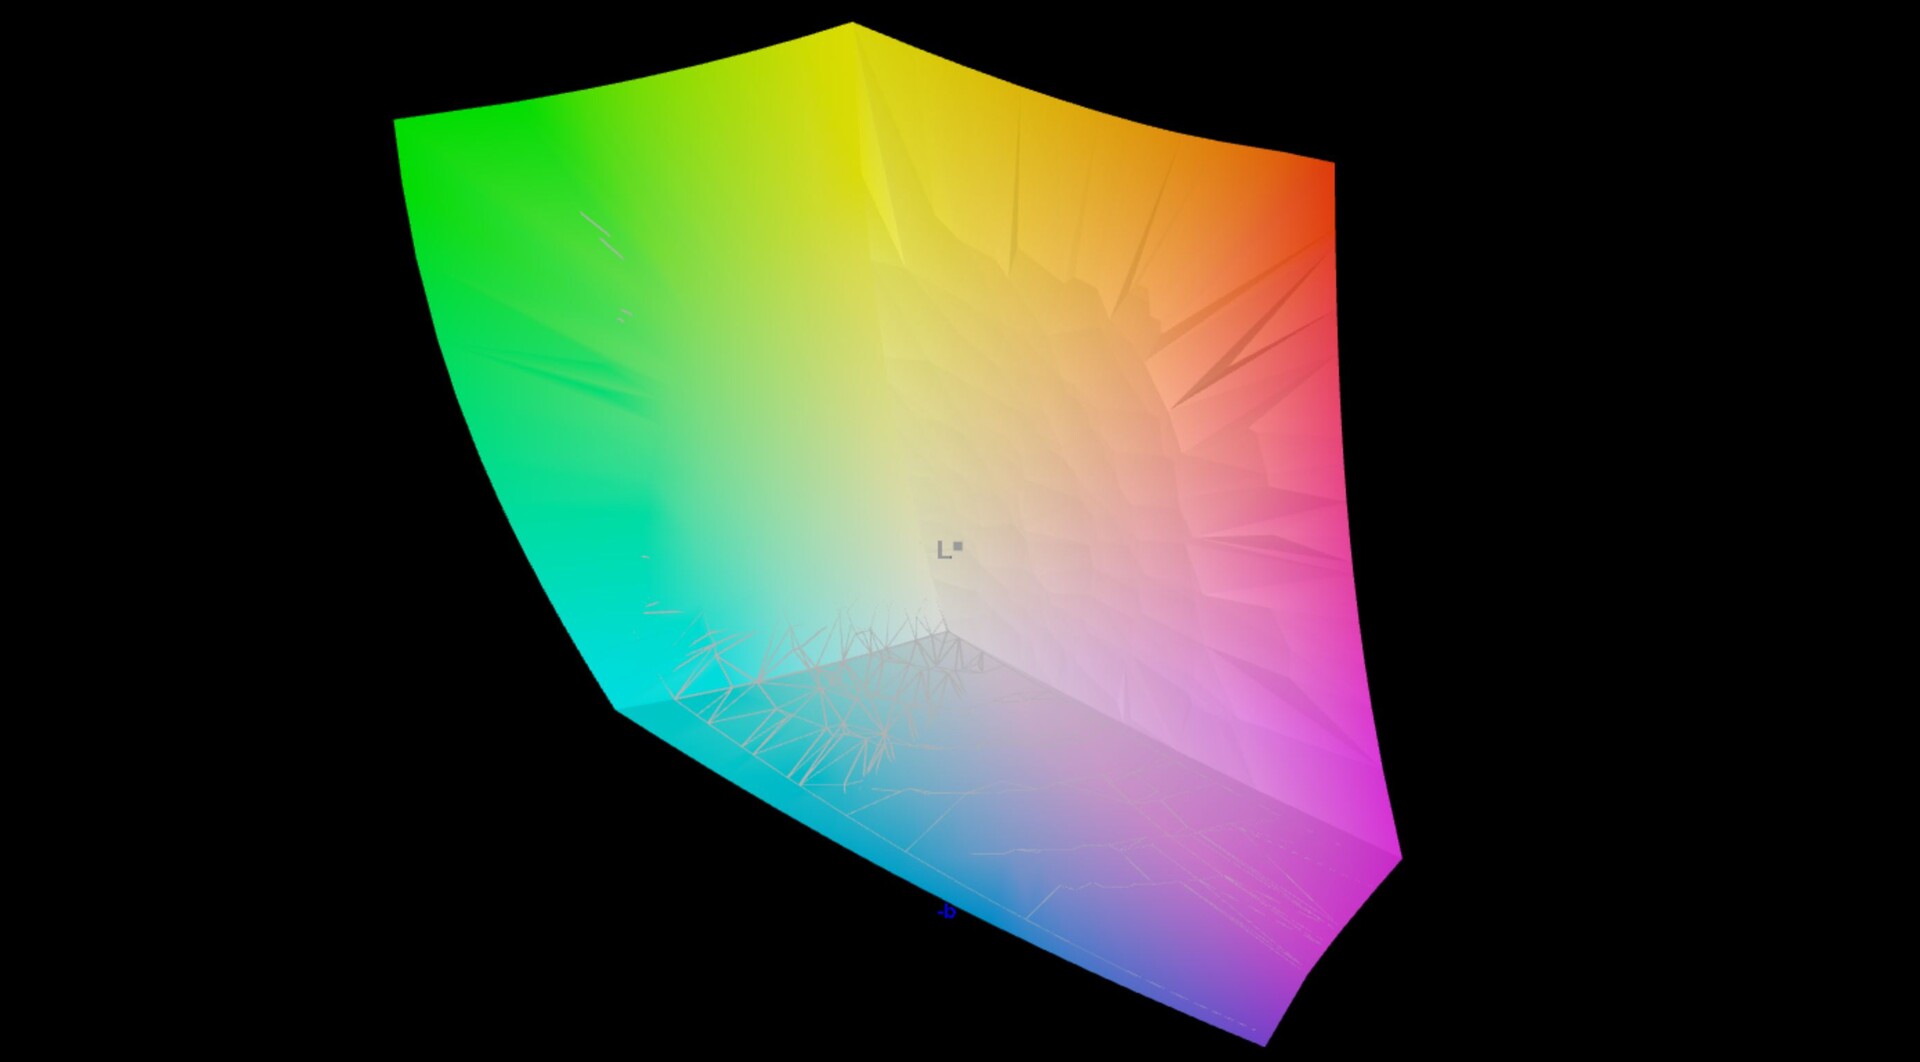
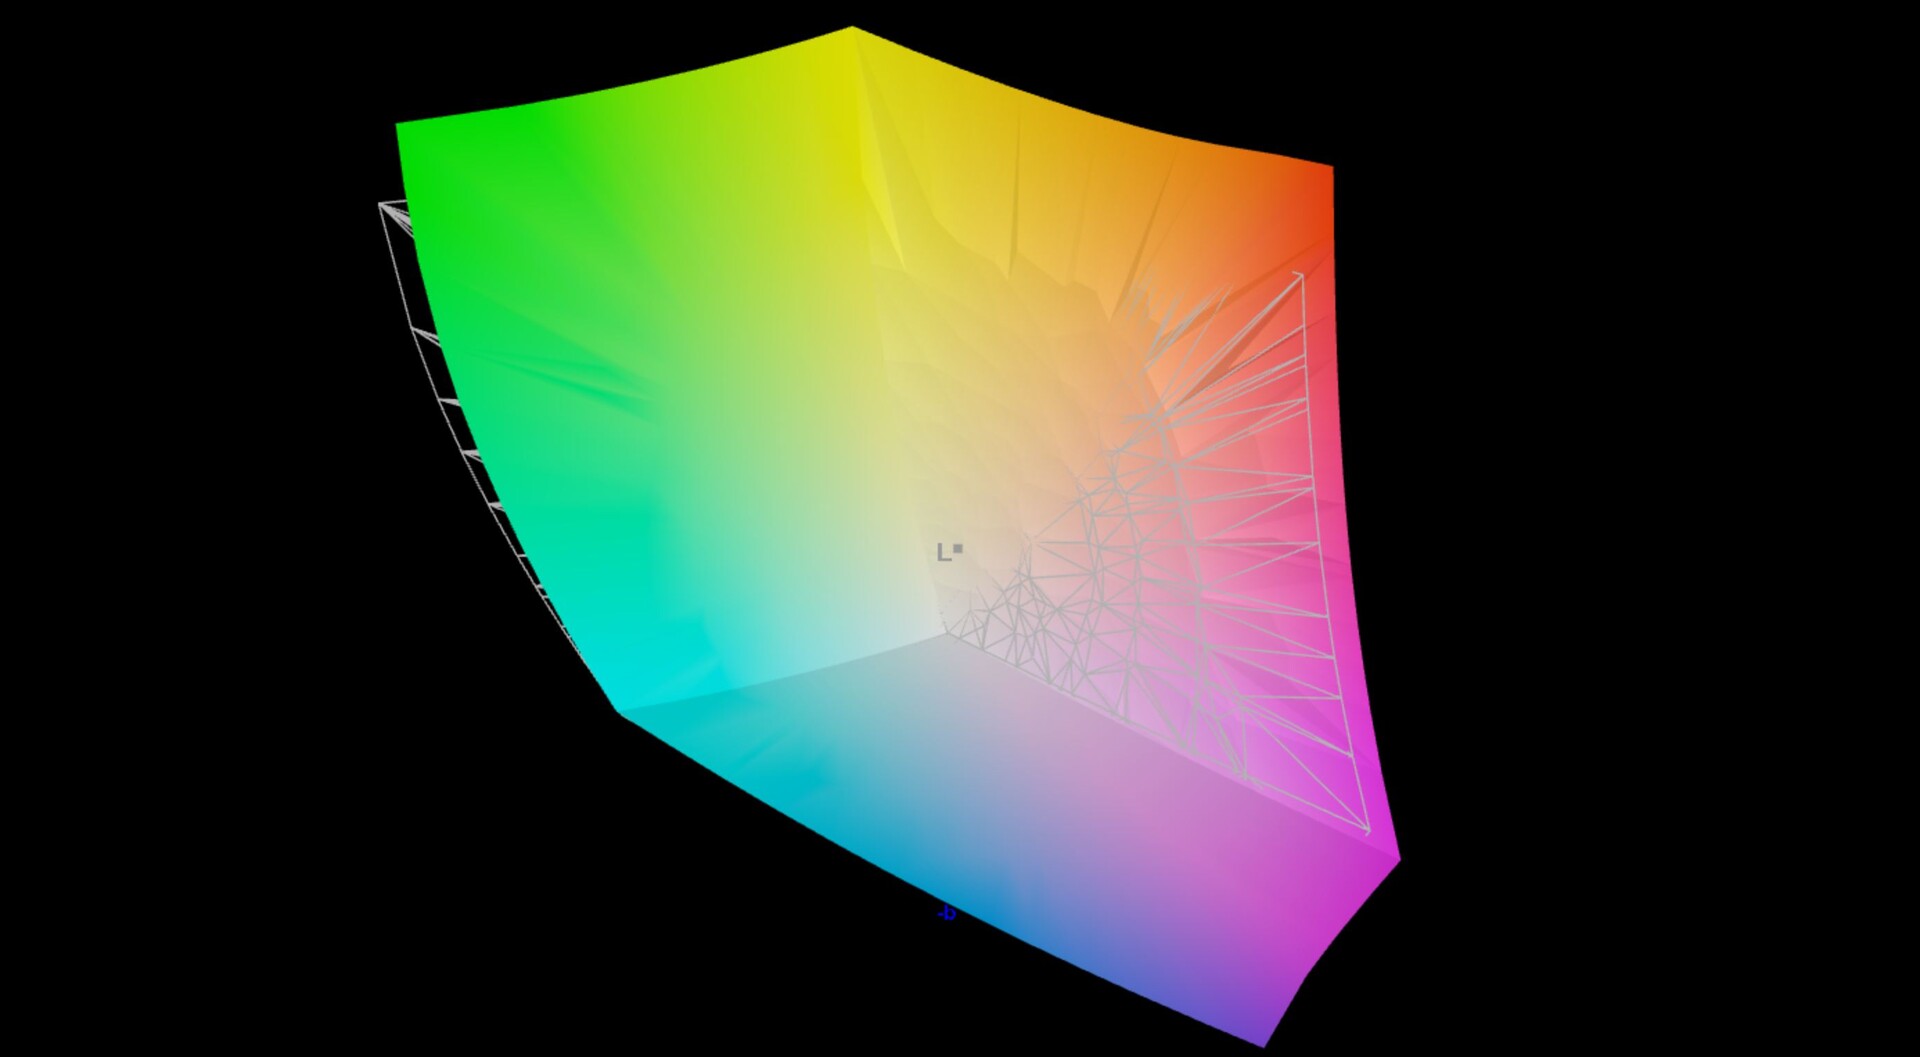
97.8% AdobeRGB 1998 (Argyll 3D)
100% sRGB (Argyll 3D)
99.8% Display P3 (Argyll 3D)
Gamma: 2.22
CCT: 6580 K
| Asus Zenbook S 13 OLED SDC4172, OLED, 2880x1800, 13.3" | Apple MacBook Air 2020 M1 Entry IPS, 2560x1600, 13.3" | Dell XPS 13 9310 OLED Samsung 134XK01, OLED, 3456x2160, 13.4" | Samsung Galaxy Book2 Pro 13 NP930XED-KA1DE ATNA33XC10-0, OLED, 1920x1080, 13.3" | Huawei MateBook 13s i5 11300H TL134GDXP02-0, LTPS, 2520x1680, 13.4" | |
|---|---|---|---|---|---|
| Display | -4% | 0% | -1% | -25% | |
| Display P3 Coverage (%) | 99.8 | 98.6 -1% | 99.7 0% | 99.81 0% | 65.2 -35% |
| sRGB Coverage (%) | 100 | 100 0% | 100 0% | 100 0% | 92 -8% |
| AdobeRGB 1998 Coverage (%) | 97.8 | 85.9 -12% | 97.7 0% | 95.55 -2% | 67.5 -31% |
| Response Times | -1415% | -18% | -55% | -1645% | |
| Response Time Grey 50% / Grey 80% * (ms) | 2.1 ? | 31 ? -1376% | 2.2 ? -5% | 4 ? -90% | 44.8 ? -2033% |
| Response Time Black / White * (ms) | 1.68 ? | 26.1 ? -1454% | 2.2 ? -31% | 2 ? -19% | 22.8 ? -1257% |
| PWM Frequency (Hz) | 240.4 ? | 118000 ? | 240.4 ? | 61 ? | 9804 ? |
| Screen | -208% | -62% | -40% | -145% | |
| Brightness middle (cd/m²) | 336 | 417 24% | 384 14% | 399 19% | 468 39% |
| Brightness (cd/m²) | 338 | 395 17% | 387 14% | 403 19% | 450 33% |
| Brightness Distribution (%) | 99 | 91 -8% | 97 -2% | 98 -1% | 92 -7% |
| Black Level * (cd/m²) | 0.02 | 0.39 -1850% | 0.07 -250% | 0.23 -1050% | |
| Contrast (:1) | 16800 | 1069 -94% | 5700 -66% | 2035 -88% | |
| Colorchecker dE 2000 * | 1.8 | 1.12 38% | 4.56 -153% | 1.35 25% | 2 -11% |
| Colorchecker dE 2000 max. * | 3.8 | 2.71 29% | 7.27 -91% | 2.77 27% | 5.5 -45% |
| Colorchecker dE 2000 calibrated * | 1.8 | 0.77 57% | 4.52 -151% | 1.35 25% | 1.5 17% |
| Greyscale dE 2000 * | 0.9 | 1.7 -89% | 1.5 -67% | 2.35 -161% | 2.6 -189% |
| Gamma | 2.22 99% | 2207 0% | 2.26 97% | 2.21 100% | 2.17 101% |
| CCT | 6580 99% | 6870 95% | 6219 105% | 6824 95% | 6511 100% |
| Color Space (Percent of AdobeRGB 1998) (%) | 87.1 | ||||
| Color Space (Percent of sRGB) (%) | 100 | ||||
| Total Average (Program / Settings) | -542% /
-337% | -27% /
-39% | -32% /
-34% | -605% /
-333% |
* ... smaller is better
在预装的MyAsus应用程序中,可以对色彩空间进行各种设置。我们选择了预设的 "本地 "模式,通过专业的CalMAN软件(X-Rite i1 Pro 2)进行测试。在交付状态下,显示质量已经非常好,没有明显的偏色或色温的偏差。颜色中只有两个异常值,略高于DeltaE-2000的重要偏差3。

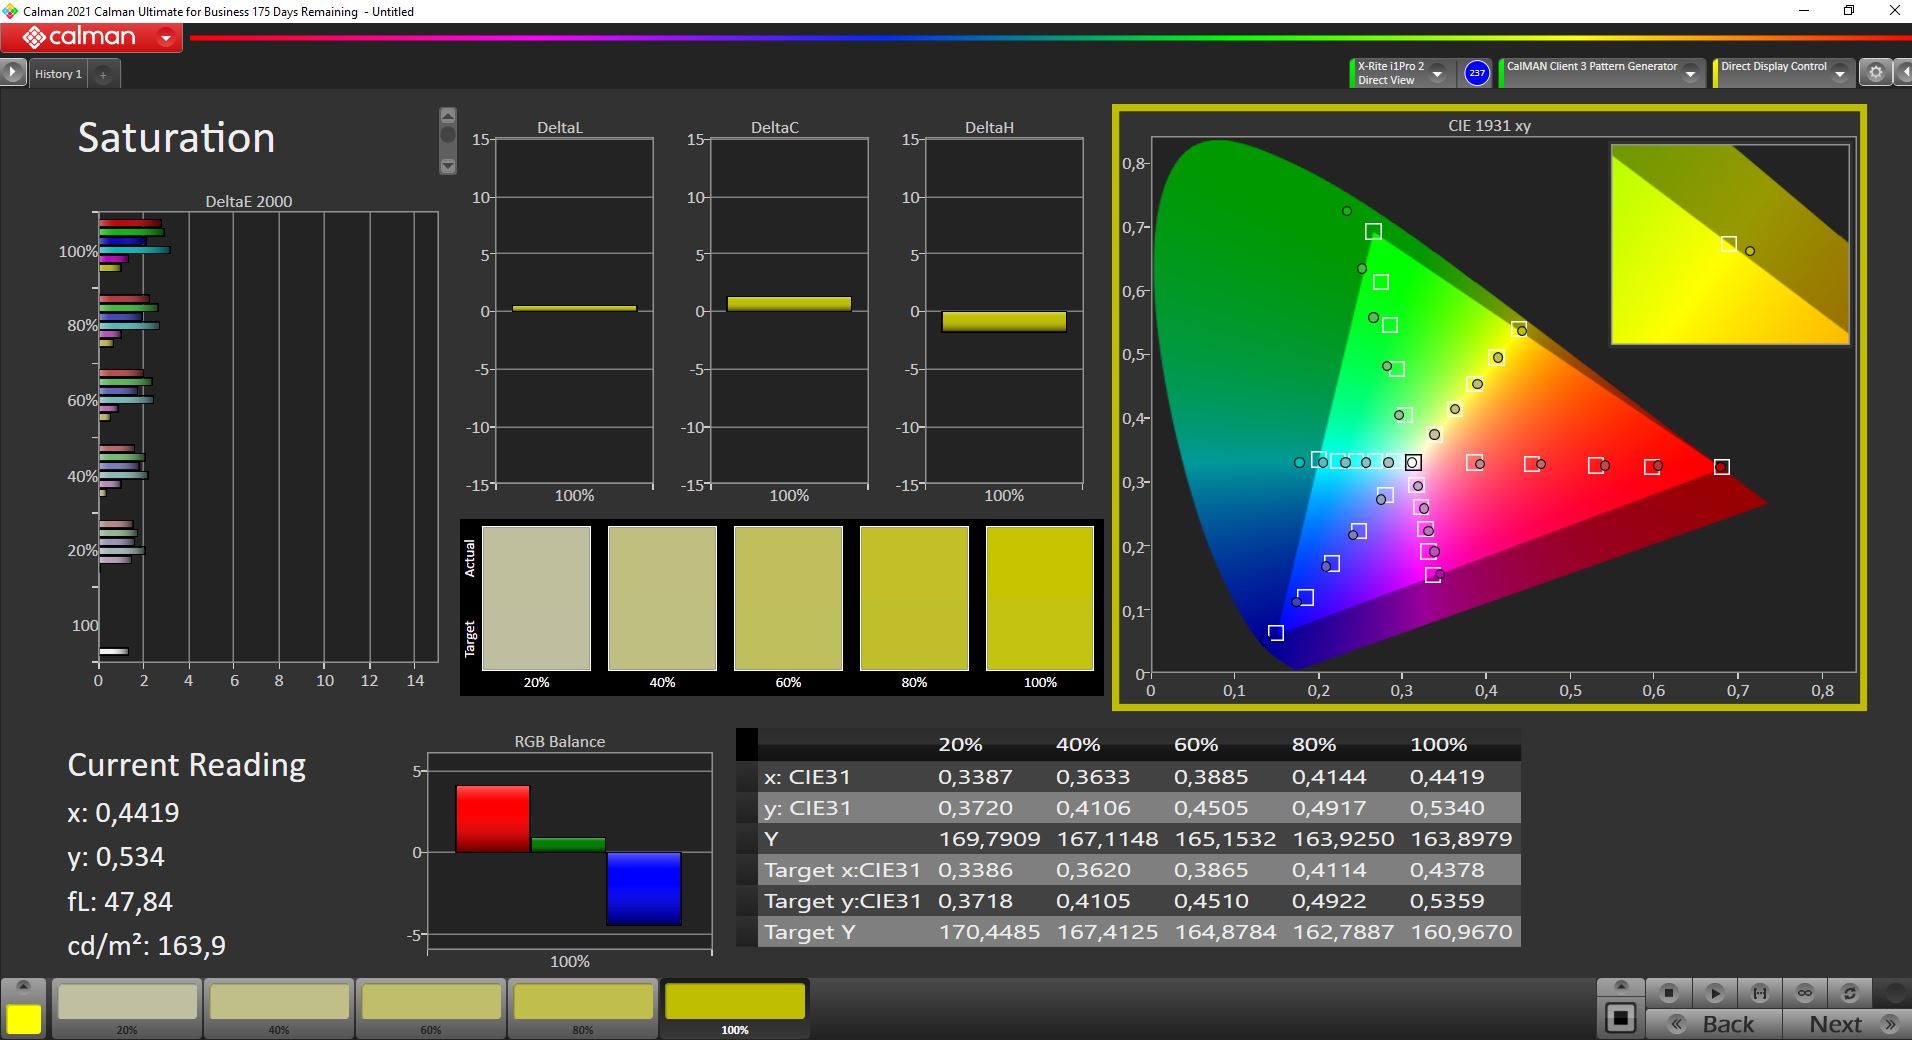
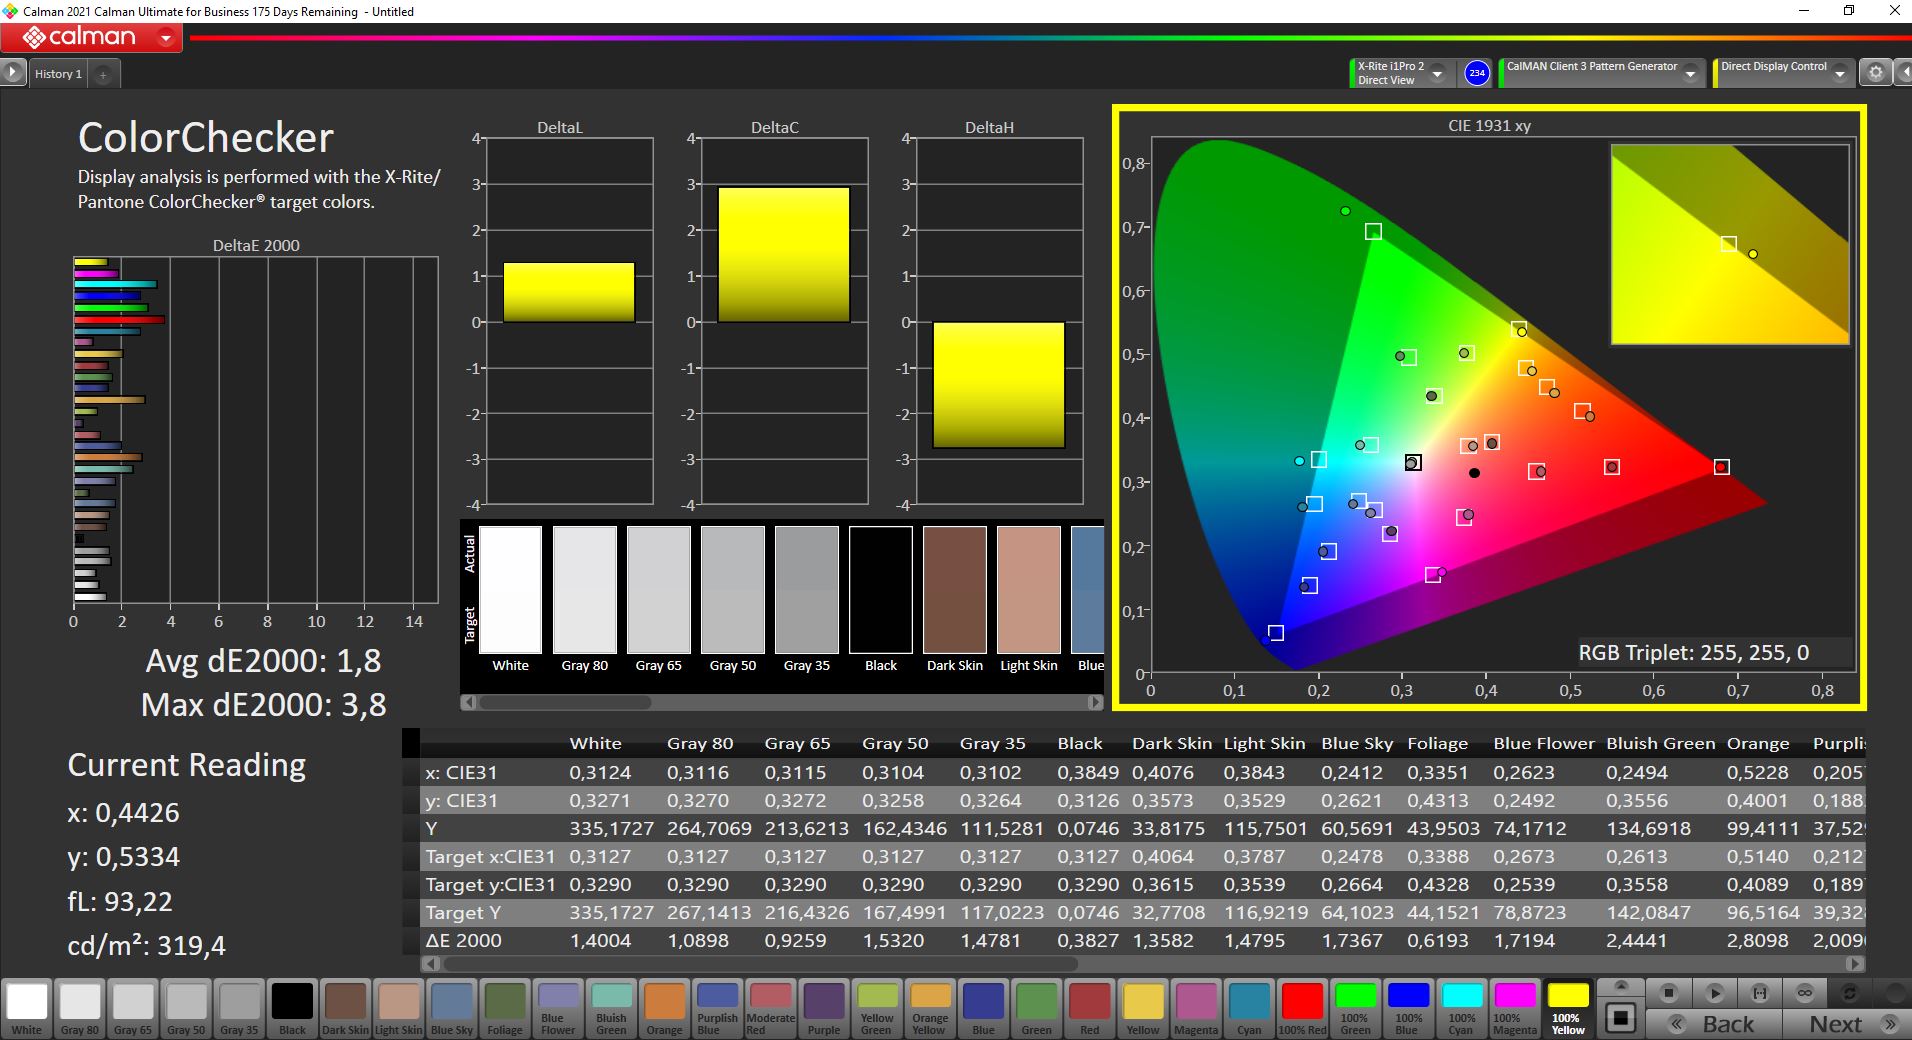
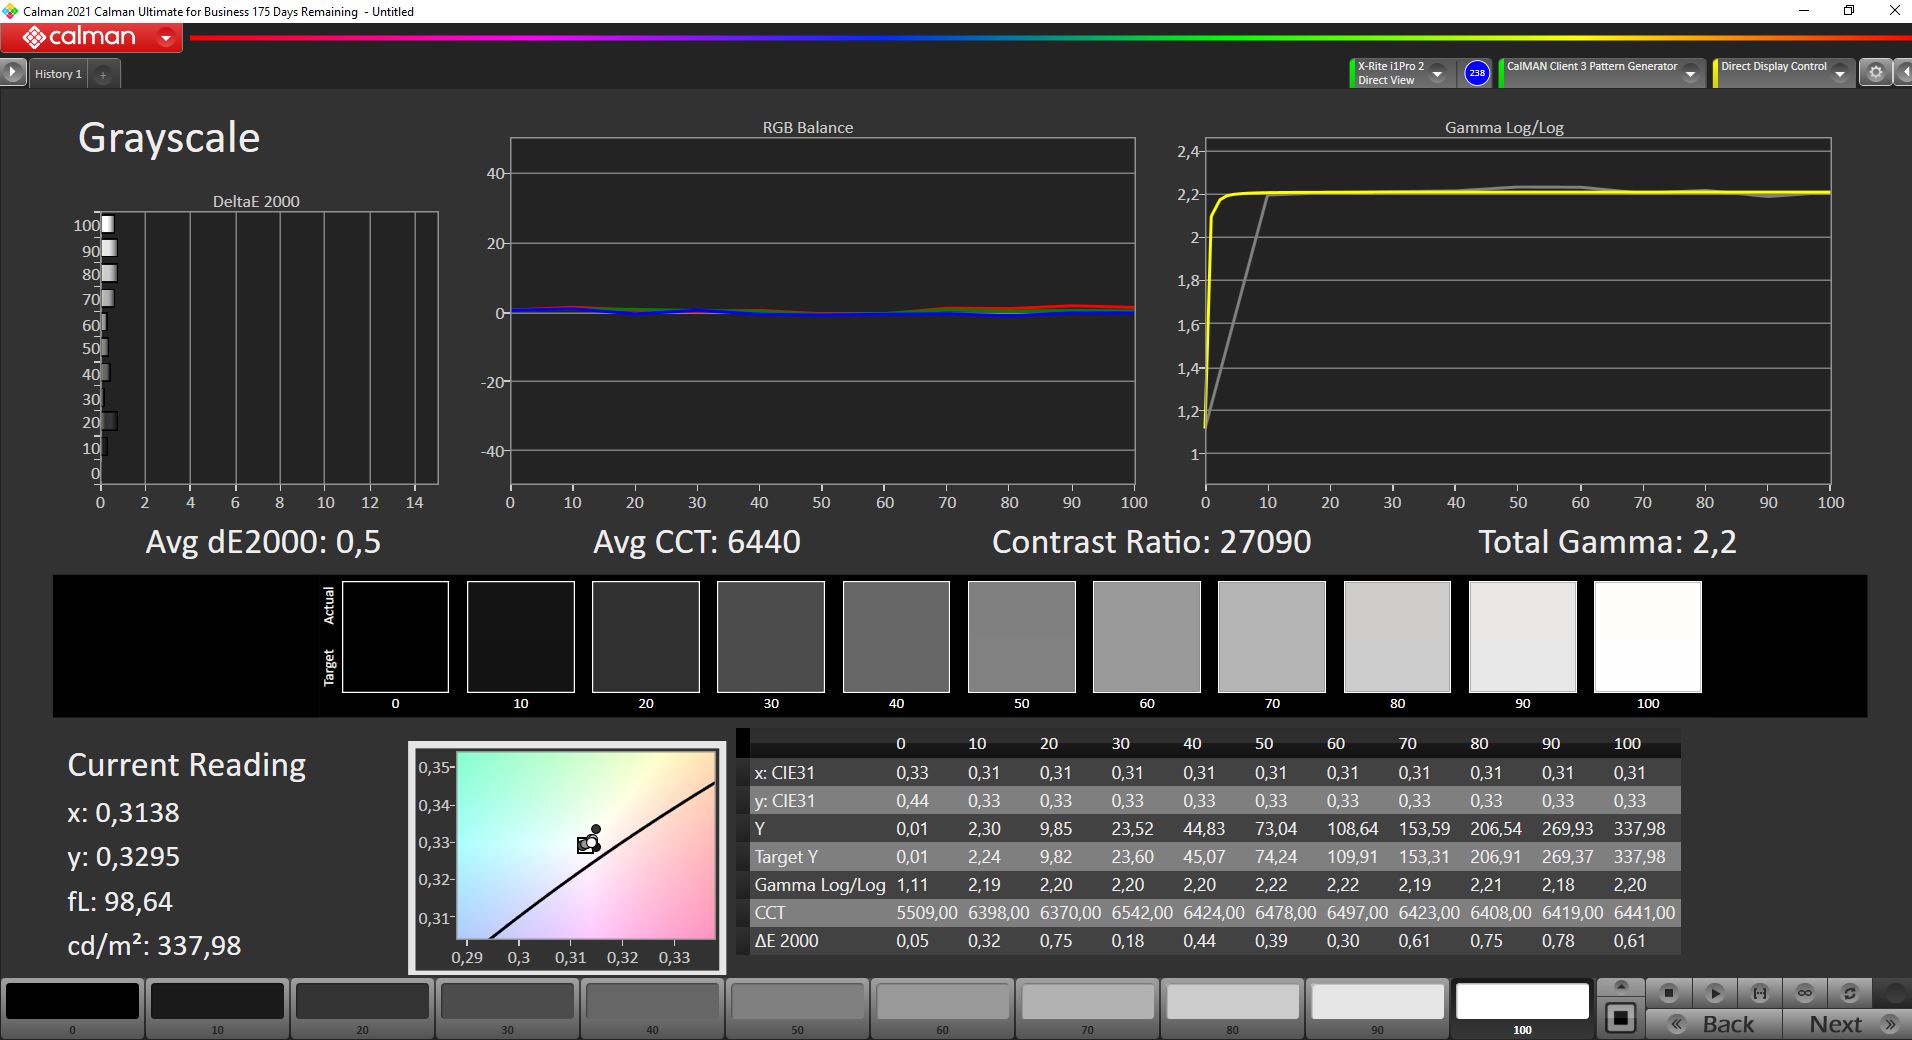
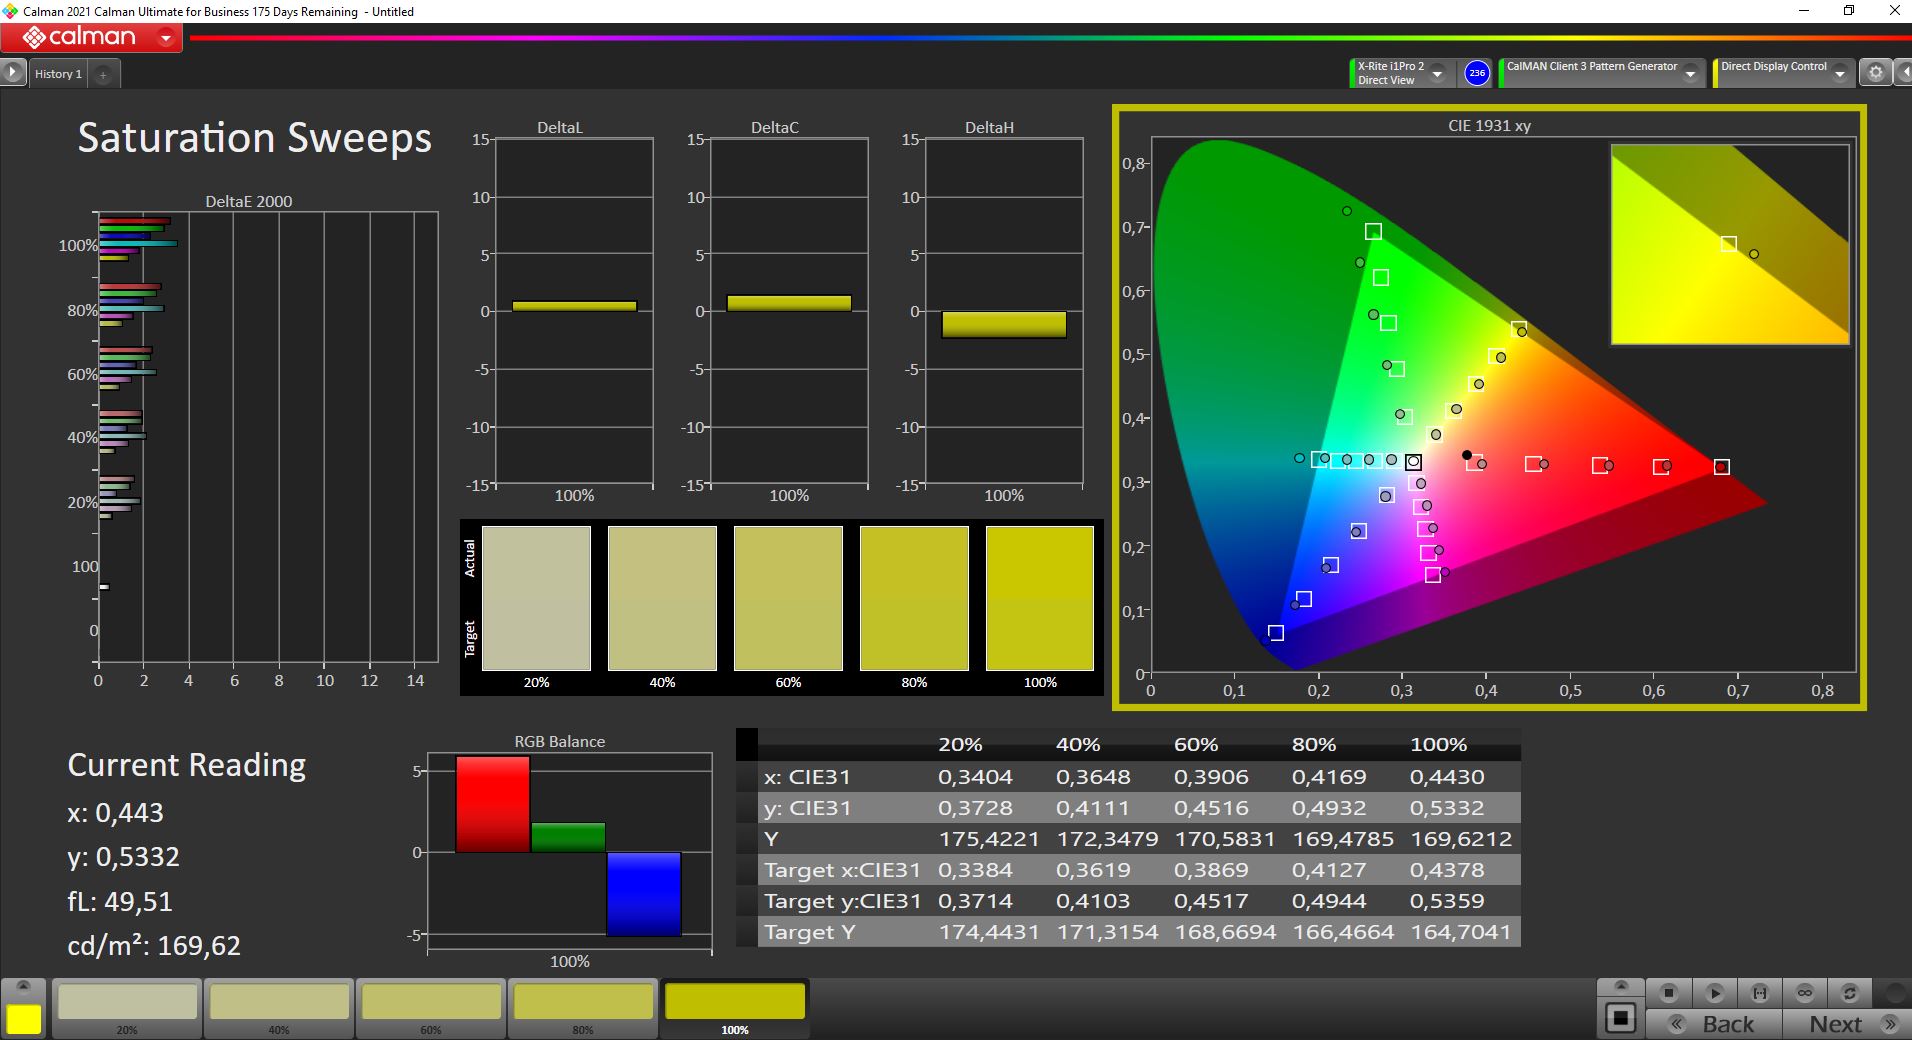

当然,我们也对面板进行了校准(相应的配置文件可在上面下载),我们也能够稍微改善灰度的平均DeltaE-2000偏差,但在颜色方面没有变化。因此,购买后的校准其实是没有必要的。OLED面板几乎完全覆盖了P3色彩空间,因此你可以在Zenbook上编辑图片/视频,没有问题。
Display Response Times
| ↔ Response Time Black to White | ||
|---|---|---|
| 1.68 ms ... rise ↗ and fall ↘ combined | ↗ 0.86 ms rise | 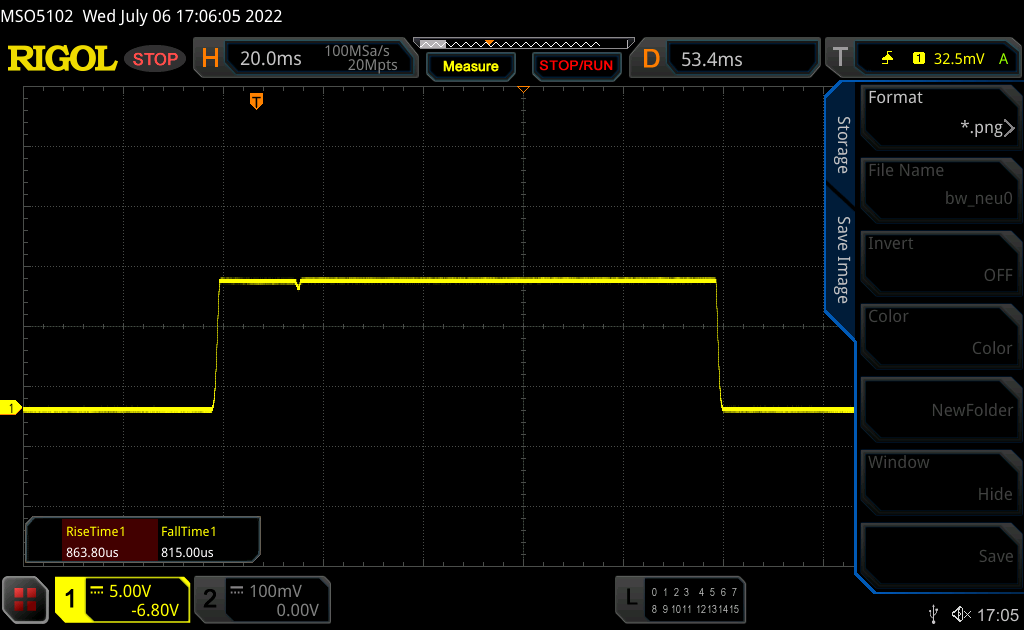 |
| ↘ 0.82 ms fall | ||
| The screen shows very fast response rates in our tests and should be very well suited for fast-paced gaming. In comparison, all tested devices range from 0.1 (minimum) to 240 (maximum) ms. » 10 % of all devices are better. This means that the measured response time is better than the average of all tested devices (19.8 ms). | ||
| ↔ Response Time 50% Grey to 80% Grey | ||
| 2.1 ms ... rise ↗ and fall ↘ combined | ↗ 1.1 ms rise | 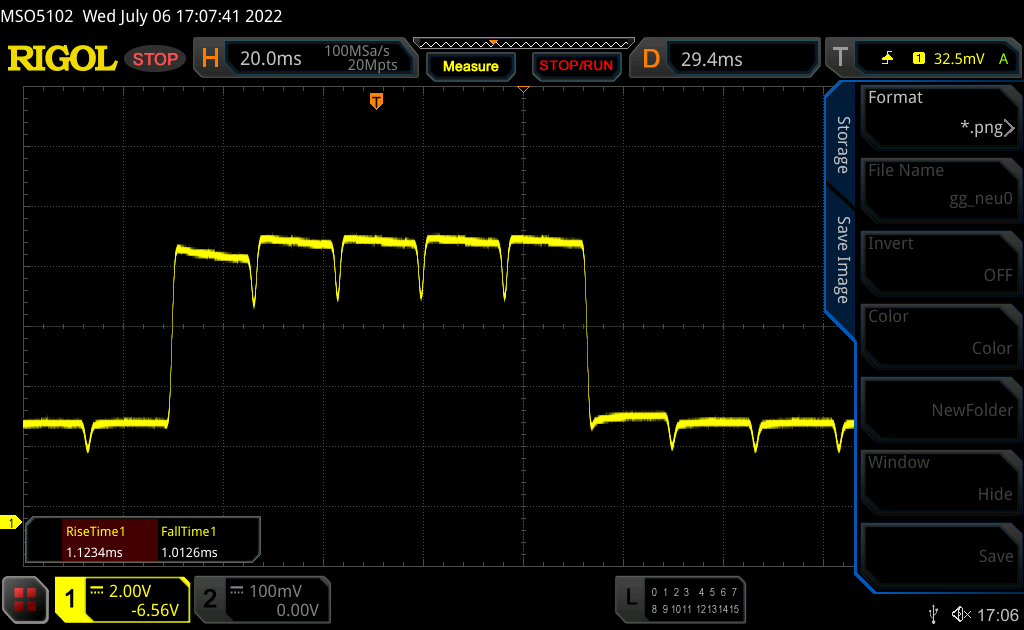 |
| ↘ 1 ms fall | ||
| The screen shows very fast response rates in our tests and should be very well suited for fast-paced gaming. In comparison, all tested devices range from 0.165 (minimum) to 636 (maximum) ms. » 11 % of all devices are better. This means that the measured response time is better than the average of all tested devices (30.9 ms). | ||
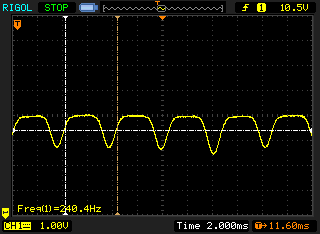
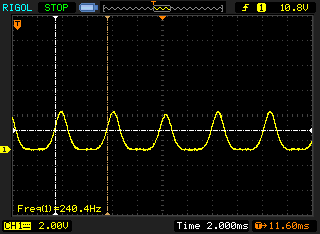
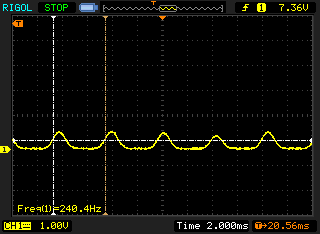
Screen Flickering / PWM (Pulse-Width Modulation)
| Screen flickering / PWM detected | 240.4 Hz | ≤ 53 % brightness setting | 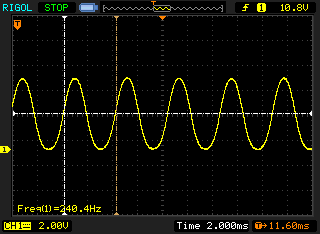 |
The display backlight flickers at 240.4 Hz (worst case, e.g., utilizing PWM) Flickering detected at a brightness setting of 53 % and below. There should be no flickering or PWM above this brightness setting. The frequency of 240.4 Hz is relatively low, so sensitive users will likely notice flickering and experience eyestrain at the stated brightness setting and below. In comparison: 52 % of all tested devices do not use PWM to dim the display. If PWM was detected, an average of 7748 (minimum: 5 - maximum: 343500) Hz was measured. | |||
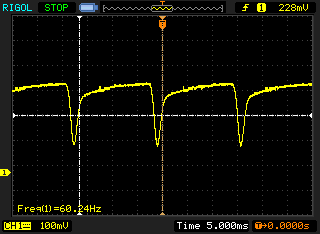
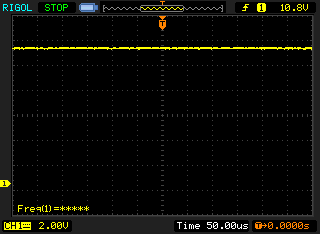
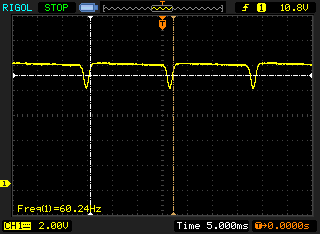
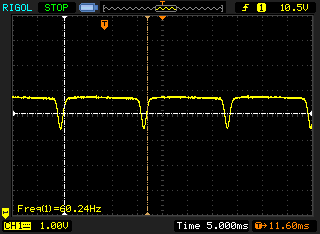
像 禅书Pro 14 Duo,Zenbook S 13的OLED面板以240赫兹的频率显示PWM闪烁,这可能会导致损害的发生。另一方面,直流调光用于54%以上的亮度值。虽然频率为60赫兹,但与经典的PWM无法相比,而且振幅也明显较低,所以直流调光应该不会有问题。华硕还提供了一个基于软件的解决方案,可以在不落入PWM范围的情况下降低屏幕的亮度,而且只要你把正常亮度降低到60%以下,也会有相应的通知。为此,在MyAsus应用程序中,有无闪烁的OLED调光选项。用户应该记住,在使用OLED调光时,总是使用直流调光,即使基本亮度被设置为100%。
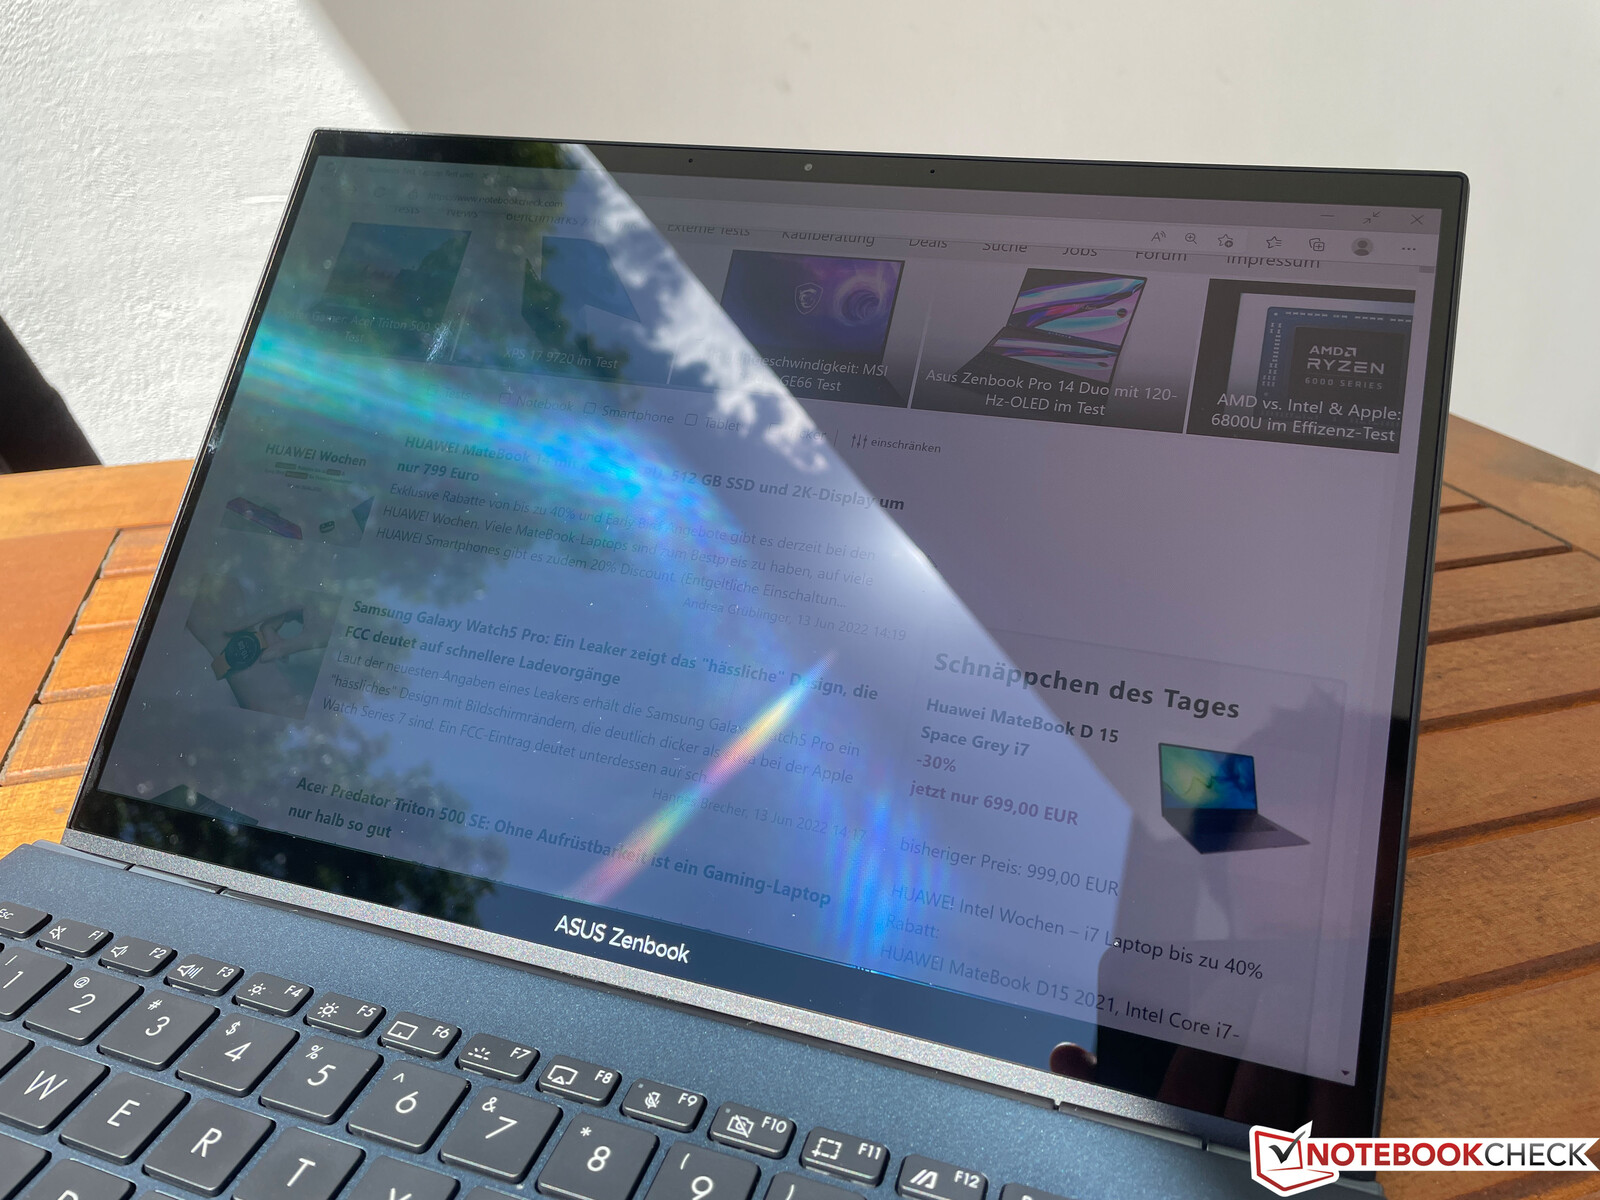
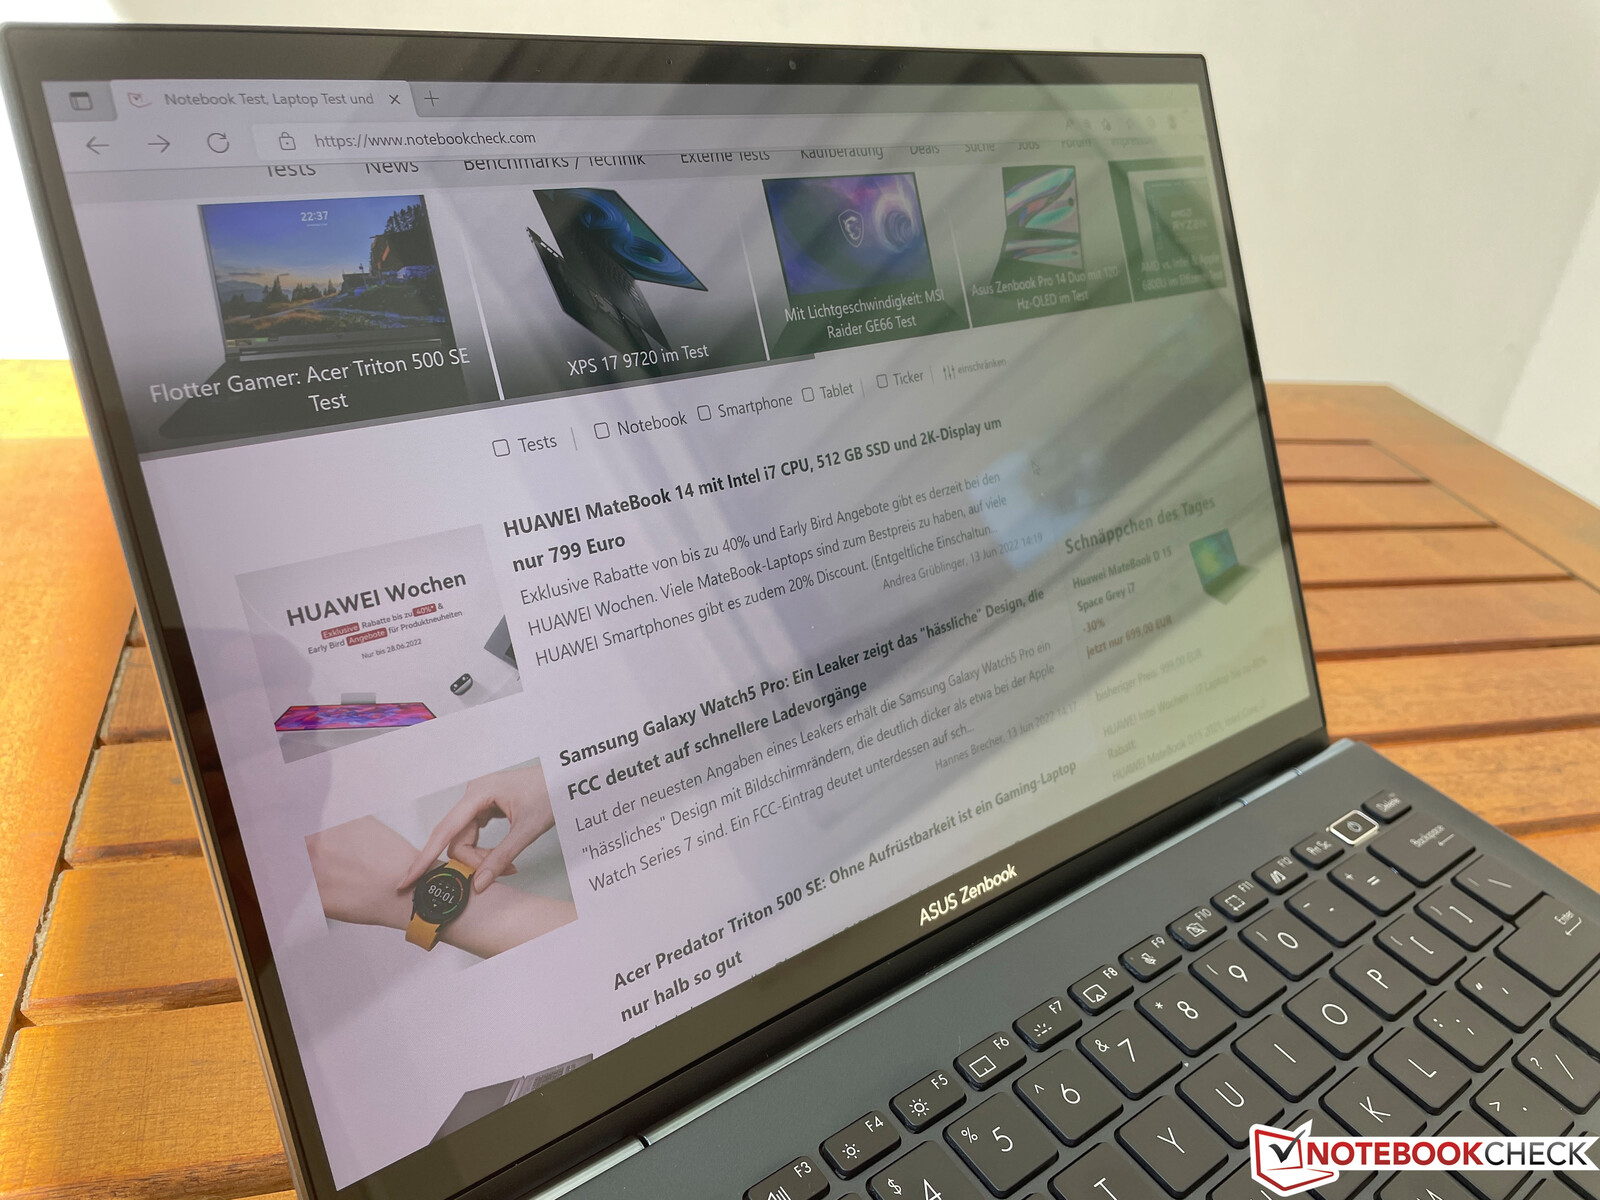
OLED触摸屏具有高反射性,在室内也会引起反射。当然,这也适用于户外使用。虽然亮度不是很高,但非常高的对比度在这些情况下有帮助。也就是说,在明亮的日子里,避免反射和舒适地阅读屏幕内容并不容易。正常SDR模式下的全HDR亮度在这里肯定会有帮助。
OLED屏幕的可视角度稳定性总体上非常好,但在某些(有限的)角度上有典型的OLED蓝色色调。尽管如此,这在实践中并没有造成任何限制。
性能。AMD Zen3+和RDNA2

测试条件
我们在MyAsus应用程序中的(默认)平衡电源模式下进行了以下基准测试和测量,因为可选的性能模式(仅在插入时可用)最初对TDP限制(各为30/25W)没有影响,而且只导致在永久负载下的性能稍微稳定,这对这样的移动设备来说当然不是一个关键因素。平衡模式只是更适合设备的日常使用,如果你确实想把设备的性能发挥到极致,你可以轻松切换到性能模式。尽管如此,我们还将在一些测试领域看看性能模式的效果。在可选的Whisper模式下,处理器的消耗被限制在12瓦特。
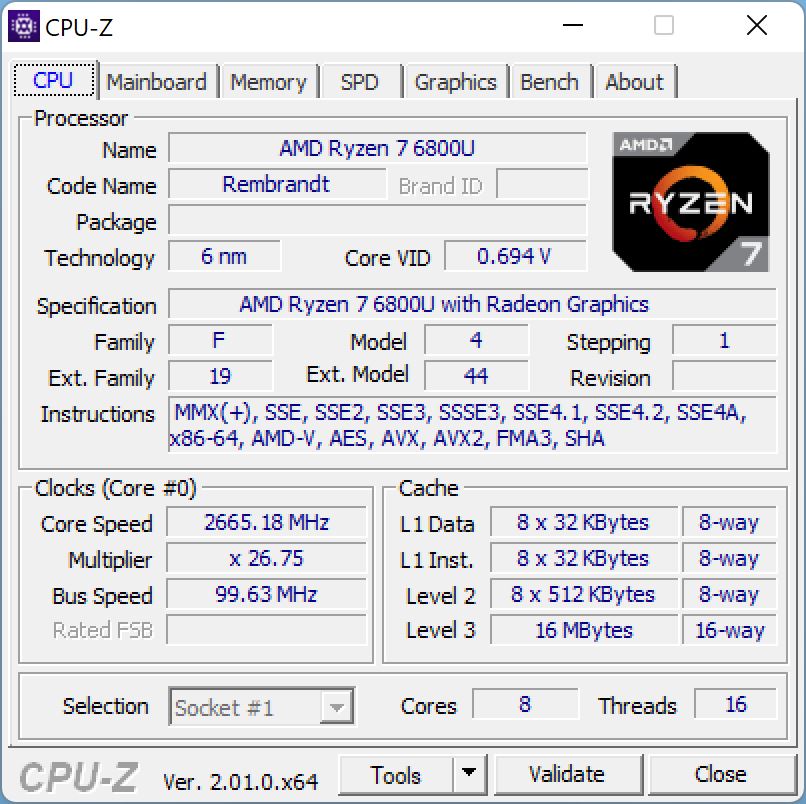
处理器。Ryzen 7 6800U,8个核心
如其 锐真7 5800U前辈一样,新的 AMD Ryzen 7 6800U继续使用8个内核(16个线程),现在使用6纳米工艺制造。AMD规定芯片的TDP范围为15-28瓦,在Zenbook的情况下,短时负载为30瓦,之后稳定为25瓦。在这里,我们看到了与英特尔目前的Alder Lake处理器的明显区别,后者的功率限制明显更高,超过50瓦,供其支配。
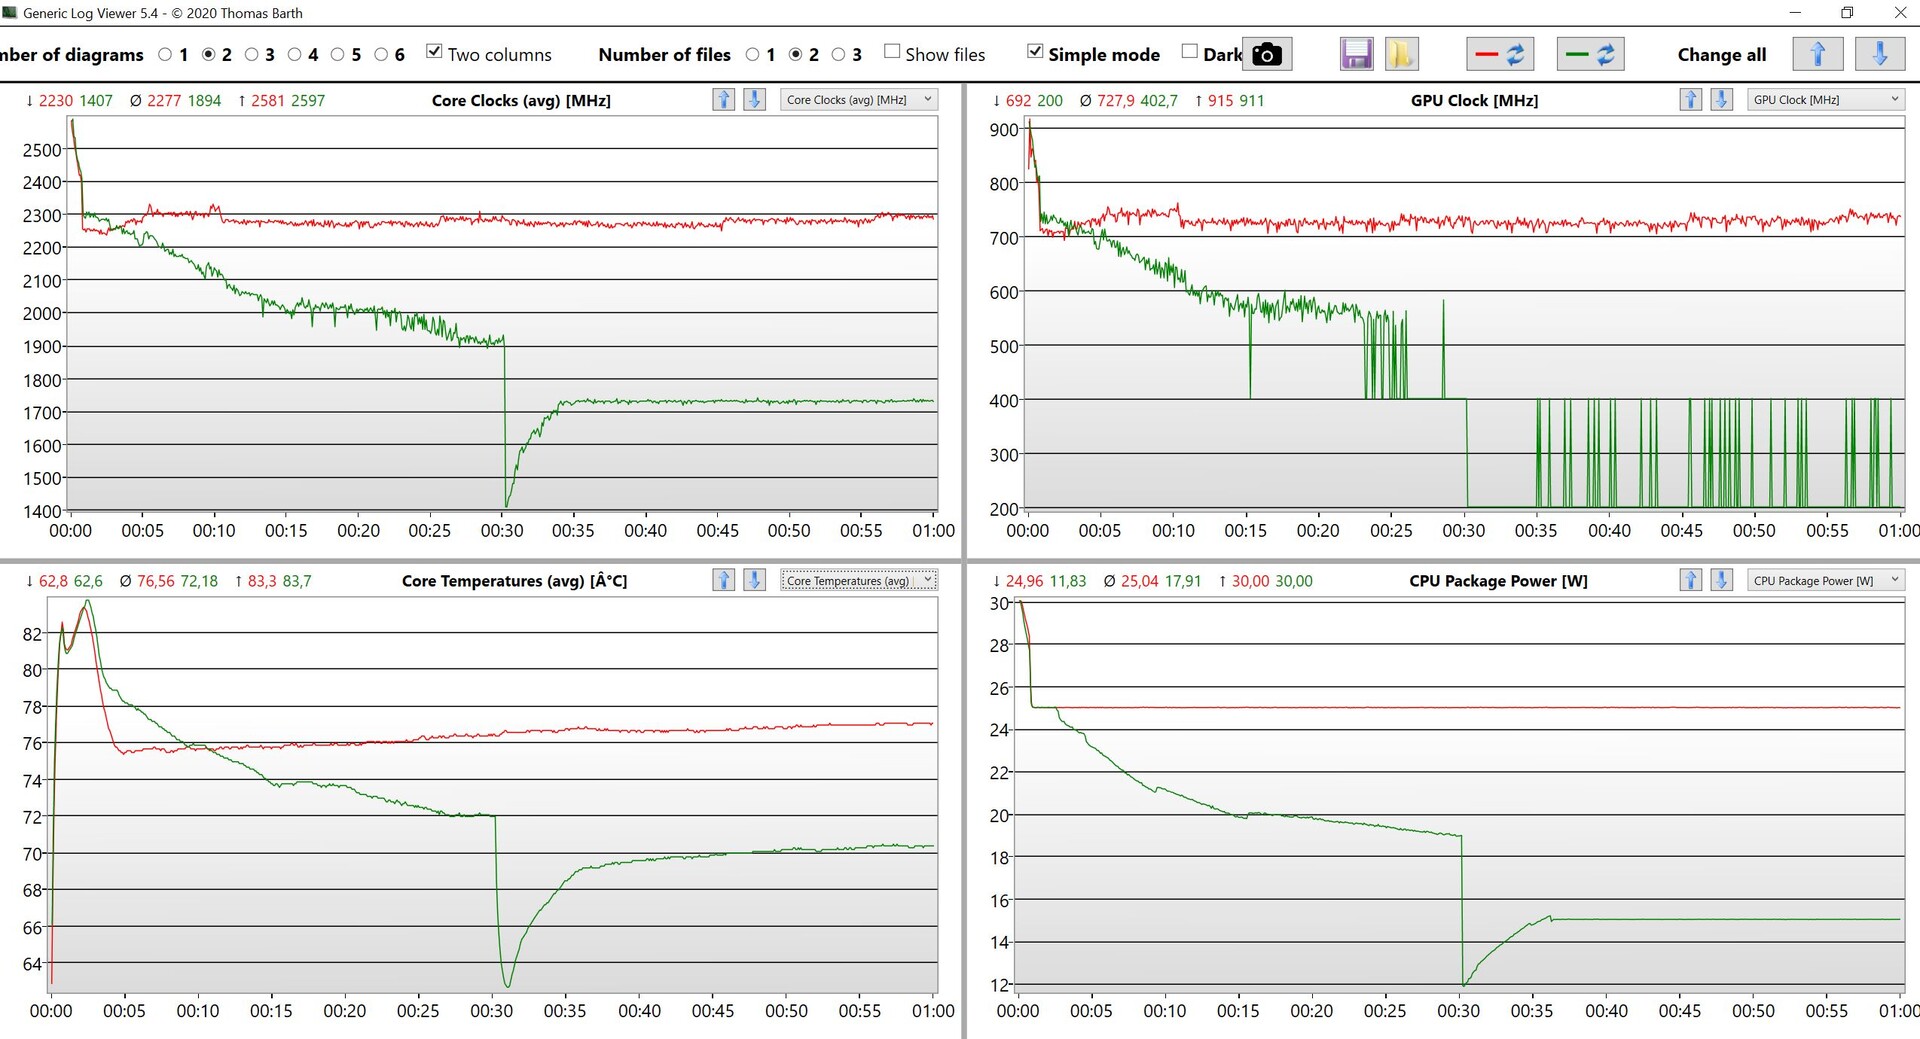
Cinebench R15 Multi Sustained Load
Cinebench R15多循环清楚地表明,Ryzen 7 6800U在头几次运行后只损失了一点性能,然后在25瓦下稳定地运行。然而,与旧的Ryzen 7 5800U相比,也没有明显的性能优势。CB循环显示在性能模式下没有任何好处。
Ryzen 7的真正竞争者是新的酷睿i7-1255U我们能够在戴尔Inspiron 14上测试它。 戴尔Inspiron 14。这款产品在短时间内消耗高达39瓦,然后迅速平息在23瓦,这与Ryzen 7 6800U相当。然而,[酷睿i7-1255U]的多核性能显著降低(在CB循环期间为-30%)。事实上,桤木湖P 酷睿i7-1260P芯片在多核性能方面具有可比性,尽管由于额外的性能核心,它自然需要明显更多的功率(恒定的38瓦)。
在原始单核性能方面,AMD和Apple ,几乎不相上下(尽管Apple ,在这里效率更高),但由于性能核心的存在,英特尔在这里获得了领先。然而,这是以更高的时钟频率和更高的功耗为代价的,这通常也会导致风扇活动增加。
总而言之,新的Ryzen 7 6800U,由于其功率限制,是一个适合紧凑型笔记本电脑的处理器。然而,在电池模式下,性能会有所下降,因为处理器最多只允许消耗18瓦,几秒钟后降至16瓦。这并不影响单核性能,而多核性能则降低约25%。在12瓦的Whisper模式下,多核性能下降了约35%。
更多基准测试可在我们的 技术部分我们还建议看一下我们广泛的CPU效率比较评论。,在那里我们将新的AMD处理器与目前来自Apple 和英特尔的芯片进行比较。
Cinebench R23: Multi Core | Single Core
Cinebench R20: CPU (Multi Core) | CPU (Single Core)
Cinebench R15: CPU Multi 64Bit | CPU Single 64Bit
Blender: v2.79 BMW27 CPU
7-Zip 18.03: 7z b 4 | 7z b 4 -mmt1
Geekbench 5.5: Multi-Core | Single-Core
HWBOT x265 Benchmark v2.2: 4k Preset
LibreOffice : 20 Documents To PDF
R Benchmark 2.5: Overall mean
| CPU Performance rating | |
| Average of class Subnotebook | |
| Lenovo Yoga 9i 14 2022 i7-1260P | |
| Apple MacBook Pro 14 2021 M1 Pro Entry -8! | |
| Asus Zenbook S 13 OLED | |
| Average AMD Ryzen 7 6800U | |
| Lenovo ThinkBook 13s G3 20YA0005GE | |
| Dell Inspiron 14 7420 2-in-1 | |
| Apple MacBook Air 2020 M1 Entry -1! | |
| Huawei MateBook 13s i5 11300H | |
| Dell XPS 13 9310 OLED | |
| Samsung Galaxy Book2 Pro 13 NP930XED-KA1DE | |
| Cinebench R23 / Multi Core | |
| Average of class Subnotebook (1555 - 21812, n=60, last 2 years) | |
| Lenovo Yoga 9i 14 2022 i7-1260P | |
| Average AMD Ryzen 7 6800U (9130 - 11741, n=7) | |
| Asus Zenbook S 13 OLED | |
| Apple MacBook Pro 14 2021 M1 Pro Entry | |
| Lenovo ThinkBook 13s G3 20YA0005GE | |
| Apple MacBook Air 2020 M1 Entry | |
| Dell Inspiron 14 7420 2-in-1 | |
| Samsung Galaxy Book2 Pro 13 NP930XED-KA1DE | |
| Huawei MateBook 13s i5 11300H | |
| Dell XPS 13 9310 OLED | |
| Cinebench R23 / Single Core | |
| Lenovo Yoga 9i 14 2022 i7-1260P | |
| Dell Inspiron 14 7420 2-in-1 | |
| Average of class Subnotebook (358 - 2213, n=61, last 2 years) | |
| Apple MacBook Pro 14 2021 M1 Pro Entry | |
| Apple MacBook Air 2020 M1 Entry | |
| Asus Zenbook S 13 OLED | |
| Dell XPS 13 9310 OLED | |
| Lenovo ThinkBook 13s G3 20YA0005GE | |
| Average AMD Ryzen 7 6800U (878 - 1534, n=7) | |
| Huawei MateBook 13s i5 11300H | |
| Samsung Galaxy Book2 Pro 13 NP930XED-KA1DE | |
| Cinebench R20 / CPU (Multi Core) | |
| Average of class Subnotebook (579 - 8541, n=57, last 2 years) | |
| Average AMD Ryzen 7 6800U (3529 - 4574, n=8) | |
| Asus Zenbook S 13 OLED | |
| Lenovo Yoga 9i 14 2022 i7-1260P | |
| Lenovo ThinkBook 13s G3 20YA0005GE | |
| Dell Inspiron 14 7420 2-in-1 | |
| Samsung Galaxy Book2 Pro 13 NP930XED-KA1DE | |
| Huawei MateBook 13s i5 11300H | |
| Dell XPS 13 9310 OLED | |
| Apple MacBook Air 2020 M1 Entry | |
| Cinebench R20 / CPU (Single Core) | |
| Dell Inspiron 14 7420 2-in-1 | |
| Average of class Subnotebook (128 - 832, n=57, last 2 years) | |
| Lenovo Yoga 9i 14 2022 i7-1260P | |
| Asus Zenbook S 13 OLED | |
| Lenovo ThinkBook 13s G3 20YA0005GE | |
| Dell XPS 13 9310 OLED | |
| Average AMD Ryzen 7 6800U (341 - 602, n=8) | |
| Huawei MateBook 13s i5 11300H | |
| Apple MacBook Air 2020 M1 Entry | |
| Samsung Galaxy Book2 Pro 13 NP930XED-KA1DE | |
| Cinebench R15 / CPU Single 64Bit | |
| Average of class Subnotebook (72.4 - 322, n=57, last 2 years) | |
| Dell Inspiron 14 7420 2-in-1 | |
| Lenovo Yoga 9i 14 2022 i7-1260P | |
| Asus Zenbook S 13 OLED | |
| Lenovo ThinkBook 13s G3 20YA0005GE | |
| Average AMD Ryzen 7 6800U (142.6 - 246, n=6) | |
| Dell XPS 13 9310 OLED | |
| Apple MacBook Pro 14 2021 M1 Pro Entry | |
| Apple MacBook Air 2020 M1 Entry | |
| Huawei MateBook 13s i5 11300H | |
| Samsung Galaxy Book2 Pro 13 NP930XED-KA1DE | |
| Blender / v2.79 BMW27 CPU | |
| Apple MacBook Air 2020 M1 Entry | |
| Dell XPS 13 9310 OLED | |
| Samsung Galaxy Book2 Pro 13 NP930XED-KA1DE | |
| Huawei MateBook 13s i5 11300H | |
| Dell Inspiron 14 7420 2-in-1 | |
| Lenovo ThinkBook 13s G3 20YA0005GE | |
| Average of class Subnotebook (159 - 2271, n=58, last 2 years) | |
| Asus Zenbook S 13 OLED | |
| Average AMD Ryzen 7 6800U (272 - 347, n=7) | |
| Lenovo Yoga 9i 14 2022 i7-1260P | |
| 7-Zip 18.03 / 7z b 4 | |
| Average AMD Ryzen 7 6800U (40058 - 53934, n=6) | |
| Asus Zenbook S 13 OLED | |
| Lenovo Yoga 9i 14 2022 i7-1260P | |
| Average of class Subnotebook (11668 - 77867, n=57, last 2 years) | |
| Lenovo ThinkBook 13s G3 20YA0005GE | |
| Apple MacBook Air 2020 M1 Entry | |
| Dell Inspiron 14 7420 2-in-1 | |
| Huawei MateBook 13s i5 11300H | |
| Samsung Galaxy Book2 Pro 13 NP930XED-KA1DE | |
| Dell XPS 13 9310 OLED | |
| 7-Zip 18.03 / 7z b 4 -mmt1 | |
| Average of class Subnotebook (2643 - 6699, n=59, last 2 years) | |
| Dell Inspiron 14 7420 2-in-1 | |
| Apple MacBook Air 2020 M1 Entry | |
| Asus Zenbook S 13 OLED | |
| Lenovo ThinkBook 13s G3 20YA0005GE | |
| Lenovo Yoga 9i 14 2022 i7-1260P | |
| Average AMD Ryzen 7 6800U (3398 - 5511, n=6) | |
| Huawei MateBook 13s i5 11300H | |
| Dell XPS 13 9310 OLED | |
| Samsung Galaxy Book2 Pro 13 NP930XED-KA1DE | |
| Geekbench 5.5 / Multi-Core | |
| Average of class Subnotebook (2557 - 17218, n=49, last 2 years) | |
| Lenovo Yoga 9i 14 2022 i7-1260P | |
| Apple MacBook Pro 14 2021 M1 Pro Entry | |
| Average AMD Ryzen 7 6800U (6854 - 8935, n=9) | |
| Asus Zenbook S 13 OLED | |
| Apple MacBook Air 2020 M1 Entry | |
| Lenovo ThinkBook 13s G3 20YA0005GE | |
| Dell Inspiron 14 7420 2-in-1 | |
| Dell XPS 13 9310 OLED | |
| Huawei MateBook 13s i5 11300H | |
| Samsung Galaxy Book2 Pro 13 NP930XED-KA1DE | |
| Geekbench 5.5 / Single-Core | |
| Average of class Subnotebook (726 - 2224, n=49, last 2 years) | |
| Apple MacBook Pro 14 2021 M1 Pro Entry | |
| Lenovo Yoga 9i 14 2022 i7-1260P | |
| Apple MacBook Air 2020 M1 Entry | |
| Dell Inspiron 14 7420 2-in-1 | |
| Dell XPS 13 9310 OLED | |
| Asus Zenbook S 13 OLED | |
| Lenovo ThinkBook 13s G3 20YA0005GE | |
| Average AMD Ryzen 7 6800U (926 - 1555, n=9) | |
| Huawei MateBook 13s i5 11300H | |
| Samsung Galaxy Book2 Pro 13 NP930XED-KA1DE | |
| HWBOT x265 Benchmark v2.2 / 4k Preset | |
| Average of class Subnotebook (0.97 - 25.1, n=57, last 2 years) | |
| Average AMD Ryzen 7 6800U (11.8 - 14.2, n=6) | |
| Asus Zenbook S 13 OLED | |
| Lenovo Yoga 9i 14 2022 i7-1260P | |
| Lenovo ThinkBook 13s G3 20YA0005GE | |
| Dell Inspiron 14 7420 2-in-1 | |
| Huawei MateBook 13s i5 11300H | |
| Samsung Galaxy Book2 Pro 13 NP930XED-KA1DE | |
| Dell XPS 13 9310 OLED | |
| LibreOffice / 20 Documents To PDF | |
| Samsung Galaxy Book2 Pro 13 NP930XED-KA1DE | |
| Average AMD Ryzen 7 6800U (50.1 - 84.9, n=6) | |
| Average of class Subnotebook (39.9 - 220, n=56, last 2 years) | |
| Asus Zenbook S 13 OLED | |
| Lenovo ThinkBook 13s G3 20YA0005GE | |
| Dell Inspiron 14 7420 2-in-1 | |
| Huawei MateBook 13s i5 11300H | |
| Lenovo Yoga 9i 14 2022 i7-1260P | |
| Dell XPS 13 9310 OLED | |
| Apple MacBook Air 2020 M1 Entry | |
| R Benchmark 2.5 / Overall mean | |
| Samsung Galaxy Book2 Pro 13 NP930XED-KA1DE | |
| Apple MacBook Air 2020 M1 Entry | |
| Huawei MateBook 13s i5 11300H | |
| Dell XPS 13 9310 OLED | |
| Lenovo ThinkBook 13s G3 20YA0005GE | |
| Asus Zenbook S 13 OLED | |
| Average of class Subnotebook (0.4024 - 1.456, n=58, last 2 years) | |
| Average AMD Ryzen 7 6800U (0.508 - 0.529, n=5) | |
| Lenovo Yoga 9i 14 2022 i7-1260P | |
| Dell Inspiron 14 7420 2-in-1 | |
* ... smaller is better
AIDA64: FP32 Ray-Trace | FPU Julia | CPU SHA3 | CPU Queen | FPU SinJulia | FPU Mandel | CPU AES | CPU ZLib | FP64 Ray-Trace | CPU PhotoWorxx
| Performance rating | |
| Average AMD Ryzen 7 6800U | |
| Asus Zenbook S 13 OLED | |
| Average of class Subnotebook | |
| Huawei MateBook 13s i5 11300H | |
| Dell XPS 13 9310 OLED | |
| Samsung Galaxy Book2 Pro 13 NP930XED-KA1DE | |
| AIDA64 / FP32 Ray-Trace | |
| Average of class Subnotebook (1135 - 32888, n=58, last 2 years) | |
| Average AMD Ryzen 7 6800U (10902 - 12818, n=6) | |
| Asus Zenbook S 13 OLED | |
| Huawei MateBook 13s i5 11300H | |
| Dell XPS 13 9310 OLED | |
| Samsung Galaxy Book2 Pro 13 NP930XED-KA1DE | |
| AIDA64 / FPU Julia | |
| Average AMD Ryzen 7 6800U (67503 - 84031, n=6) | |
| Asus Zenbook S 13 OLED | |
| Average of class Subnotebook (5218 - 123315, n=58, last 2 years) | |
| Huawei MateBook 13s i5 11300H | |
| Dell XPS 13 9310 OLED | |
| Samsung Galaxy Book2 Pro 13 NP930XED-KA1DE | |
| AIDA64 / CPU SHA3 | |
| Average of class Subnotebook (444 - 5287, n=58, last 2 years) | |
| Average AMD Ryzen 7 6800U (2296 - 2818, n=6) | |
| Asus Zenbook S 13 OLED | |
| Huawei MateBook 13s i5 11300H | |
| Dell XPS 13 9310 OLED | |
| Samsung Galaxy Book2 Pro 13 NP930XED-KA1DE | |
| AIDA64 / CPU Queen | |
| Average AMD Ryzen 7 6800U (62082 - 96306, n=6) | |
| Asus Zenbook S 13 OLED | |
| Average of class Subnotebook (10579 - 95002, n=48, last 2 years) | |
| Huawei MateBook 13s i5 11300H | |
| Dell XPS 13 9310 OLED | |
| Samsung Galaxy Book2 Pro 13 NP930XED-KA1DE | |
| AIDA64 / FPU SinJulia | |
| Average AMD Ryzen 7 6800U (7753 - 11982, n=6) | |
| Asus Zenbook S 13 OLED | |
| Average of class Subnotebook (744 - 18418, n=58, last 2 years) | |
| Huawei MateBook 13s i5 11300H | |
| Dell XPS 13 9310 OLED | |
| Samsung Galaxy Book2 Pro 13 NP930XED-KA1DE | |
| AIDA64 / FPU Mandel | |
| Average AMD Ryzen 7 6800U (37417 - 45748, n=6) | |
| Asus Zenbook S 13 OLED | |
| Average of class Subnotebook (3341 - 65433, n=58, last 2 years) | |
| Huawei MateBook 13s i5 11300H | |
| Dell XPS 13 9310 OLED | |
| Samsung Galaxy Book2 Pro 13 NP930XED-KA1DE | |
| AIDA64 / CPU AES | |
| Asus Zenbook S 13 OLED | |
| Average AMD Ryzen 7 6800U (50547 - 115681, n=6) | |
| Huawei MateBook 13s i5 11300H | |
| Average of class Subnotebook (638 - 96917, n=58, last 2 years) | |
| Dell XPS 13 9310 OLED | |
| Samsung Galaxy Book2 Pro 13 NP930XED-KA1DE | |
| AIDA64 / CPU ZLib | |
| Average of class Subnotebook (164.9 - 1379, n=58, last 2 years) | |
| Average AMD Ryzen 7 6800U (554 - 755, n=6) | |
| Asus Zenbook S 13 OLED | |
| Huawei MateBook 13s i5 11300H | |
| Samsung Galaxy Book2 Pro 13 NP930XED-KA1DE | |
| Dell XPS 13 9310 OLED | |
| AIDA64 / FP64 Ray-Trace | |
| Average of class Subnotebook (610 - 17495, n=58, last 2 years) | |
| Average AMD Ryzen 7 6800U (5825 - 6694, n=6) | |
| Asus Zenbook S 13 OLED | |
| Huawei MateBook 13s i5 11300H | |
| Dell XPS 13 9310 OLED | |
| Samsung Galaxy Book2 Pro 13 NP930XED-KA1DE | |
| AIDA64 / CPU PhotoWorxx | |
| Average of class Subnotebook (6569 - 85600, n=58, last 2 years) | |
| Huawei MateBook 13s i5 11300H | |
| Samsung Galaxy Book2 Pro 13 NP930XED-KA1DE | |
| Dell XPS 13 9310 OLED | |
| Average AMD Ryzen 7 6800U (24728 - 27274, n=6) | |
| Asus Zenbook S 13 OLED | |
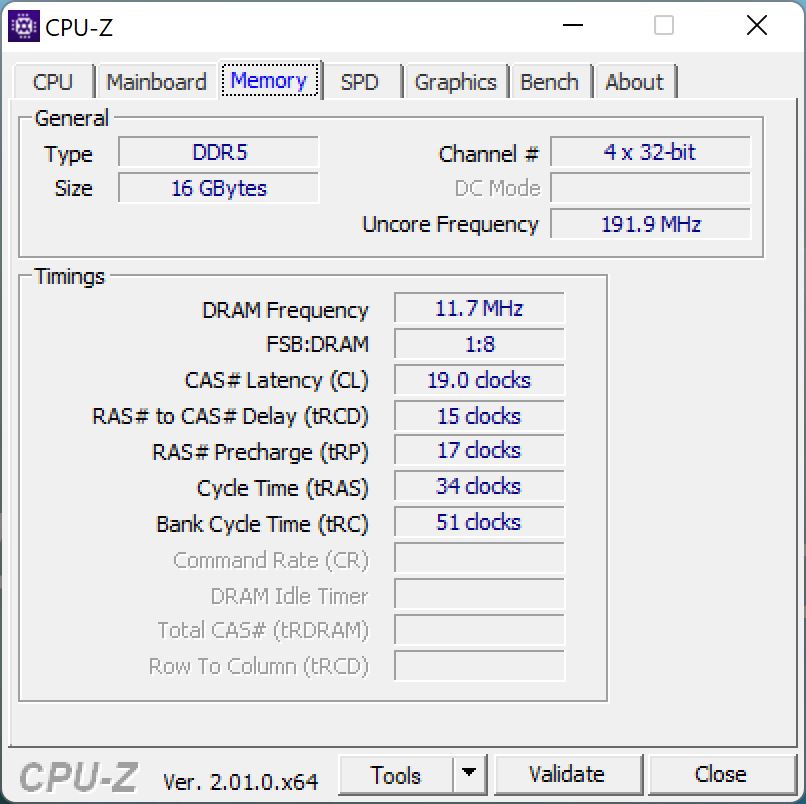
系统性能
凭借快速的AMD处理器、16GB LPDDR5-6400内存和PCIe 4.0固态硬盘,Zenbook是一个非常强大和反应迅速的系统。合成基准测试也证实了这一点,在这些测试中,我们的评测设备几乎总是领先于竞争对手。在正常使用中也没有发现问题。
CrossMark: Overall | Productivity | Creativity | Responsiveness
| PCMark 10 / Score | |
| Average of class Subnotebook (4920 - 9939, n=46, last 2 years) | |
| Asus Zenbook S 13 OLED | |
| Average AMD Ryzen 7 6800U, AMD Radeon 680M (5057 - 6639, n=7) | |
| Dell XPS 13 9310 OLED | |
| Huawei MateBook 13s i5 11300H | |
| Samsung Galaxy Book2 Pro 13 NP930XED-KA1DE | |
| PCMark 10 / Essentials | |
| Asus Zenbook S 13 OLED | |
| Dell XPS 13 9310 OLED | |
| Average of class Subnotebook (8552 - 11646, n=46, last 2 years) | |
| Average AMD Ryzen 7 6800U, AMD Radeon 680M (8143 - 10766, n=6) | |
| Huawei MateBook 13s i5 11300H | |
| Samsung Galaxy Book2 Pro 13 NP930XED-KA1DE | |
| PCMark 10 / Productivity | |
| Average of class Subnotebook (5435 - 16606, n=46, last 2 years) | |
| Asus Zenbook S 13 OLED | |
| Average AMD Ryzen 7 6800U, AMD Radeon 680M (6089 - 9328, n=6) | |
| Dell XPS 13 9310 OLED | |
| Samsung Galaxy Book2 Pro 13 NP930XED-KA1DE | |
| Huawei MateBook 13s i5 11300H | |
| PCMark 10 / Digital Content Creation | |
| Average of class Subnotebook (5722 - 13779, n=46, last 2 years) | |
| Average AMD Ryzen 7 6800U, AMD Radeon 680M (6066 - 8144, n=6) | |
| Asus Zenbook S 13 OLED | |
| Huawei MateBook 13s i5 11300H | |
| Dell XPS 13 9310 OLED | |
| Samsung Galaxy Book2 Pro 13 NP930XED-KA1DE | |
| CrossMark / Overall | |
| Average of class Subnotebook (365 - 2356, n=60, last 2 years) | |
| Asus Zenbook S 13 OLED | |
| Average AMD Ryzen 7 6800U, AMD Radeon 680M (1009 - 1575, n=7) | |
| Apple MacBook Air 2020 M1 Entry | |
| Huawei MateBook 13s i5 11300H | |
| CrossMark / Productivity | |
| Average of class Subnotebook (364 - 2277, n=60, last 2 years) | |
| Asus Zenbook S 13 OLED | |
| Average AMD Ryzen 7 6800U, AMD Radeon 680M (971 - 1596, n=7) | |
| Huawei MateBook 13s i5 11300H | |
| Apple MacBook Air 2020 M1 Entry | |
| CrossMark / Creativity | |
| Average of class Subnotebook (372 - 2743, n=60, last 2 years) | |
| Apple MacBook Air 2020 M1 Entry | |
| Asus Zenbook S 13 OLED | |
| Average AMD Ryzen 7 6800U, AMD Radeon 680M (1054 - 1686, n=7) | |
| Huawei MateBook 13s i5 11300H | |
| CrossMark / Responsiveness | |
| Huawei MateBook 13s i5 11300H | |
| Average of class Subnotebook (312 - 1854, n=60, last 2 years) | |
| Average AMD Ryzen 7 6800U, AMD Radeon 680M (994 - 1473, n=7) | |
| Asus Zenbook S 13 OLED | |
| Apple MacBook Air 2020 M1 Entry | |
| PCMark 10 Score | 6346 points | |
Help | ||
| AIDA64 / Memory Copy | |
| Average of class Subnotebook (14554 - 131023, n=58, last 2 years) | |
| Dell XPS 13 9310 OLED | |
| Samsung Galaxy Book2 Pro 13 NP930XED-KA1DE | |
| Huawei MateBook 13s i5 11300H | |
| Average AMD Ryzen 7 6800U (47010 - 52159, n=6) | |
| Asus Zenbook S 13 OLED | |
| AIDA64 / Memory Read | |
| Average of class Subnotebook (15948 - 127174, n=58, last 2 years) | |
| Huawei MateBook 13s i5 11300H | |
| Samsung Galaxy Book2 Pro 13 NP930XED-KA1DE | |
| Dell XPS 13 9310 OLED | |
| Average AMD Ryzen 7 6800U (39197 - 45084, n=6) | |
| Asus Zenbook S 13 OLED | |
| AIDA64 / Memory Write | |
| Average of class Subnotebook (15709 - 135141, n=58, last 2 years) | |
| Dell XPS 13 9310 OLED | |
| Huawei MateBook 13s i5 11300H | |
| Samsung Galaxy Book2 Pro 13 NP930XED-KA1DE | |
| Average AMD Ryzen 7 6800U (48723 - 51117, n=6) | |
| Asus Zenbook S 13 OLED | |
| AIDA64 / Memory Latency | |
| Asus Zenbook S 13 OLED | |
| Dell XPS 13 9310 OLED | |
| Average AMD Ryzen 7 6800U (106.3 - 123.1, n=6) | |
| Average of class Subnotebook (6.1 - 159.9, n=56, last 2 years) | |
| Huawei MateBook 13s i5 11300H | |
* ... smaller is better
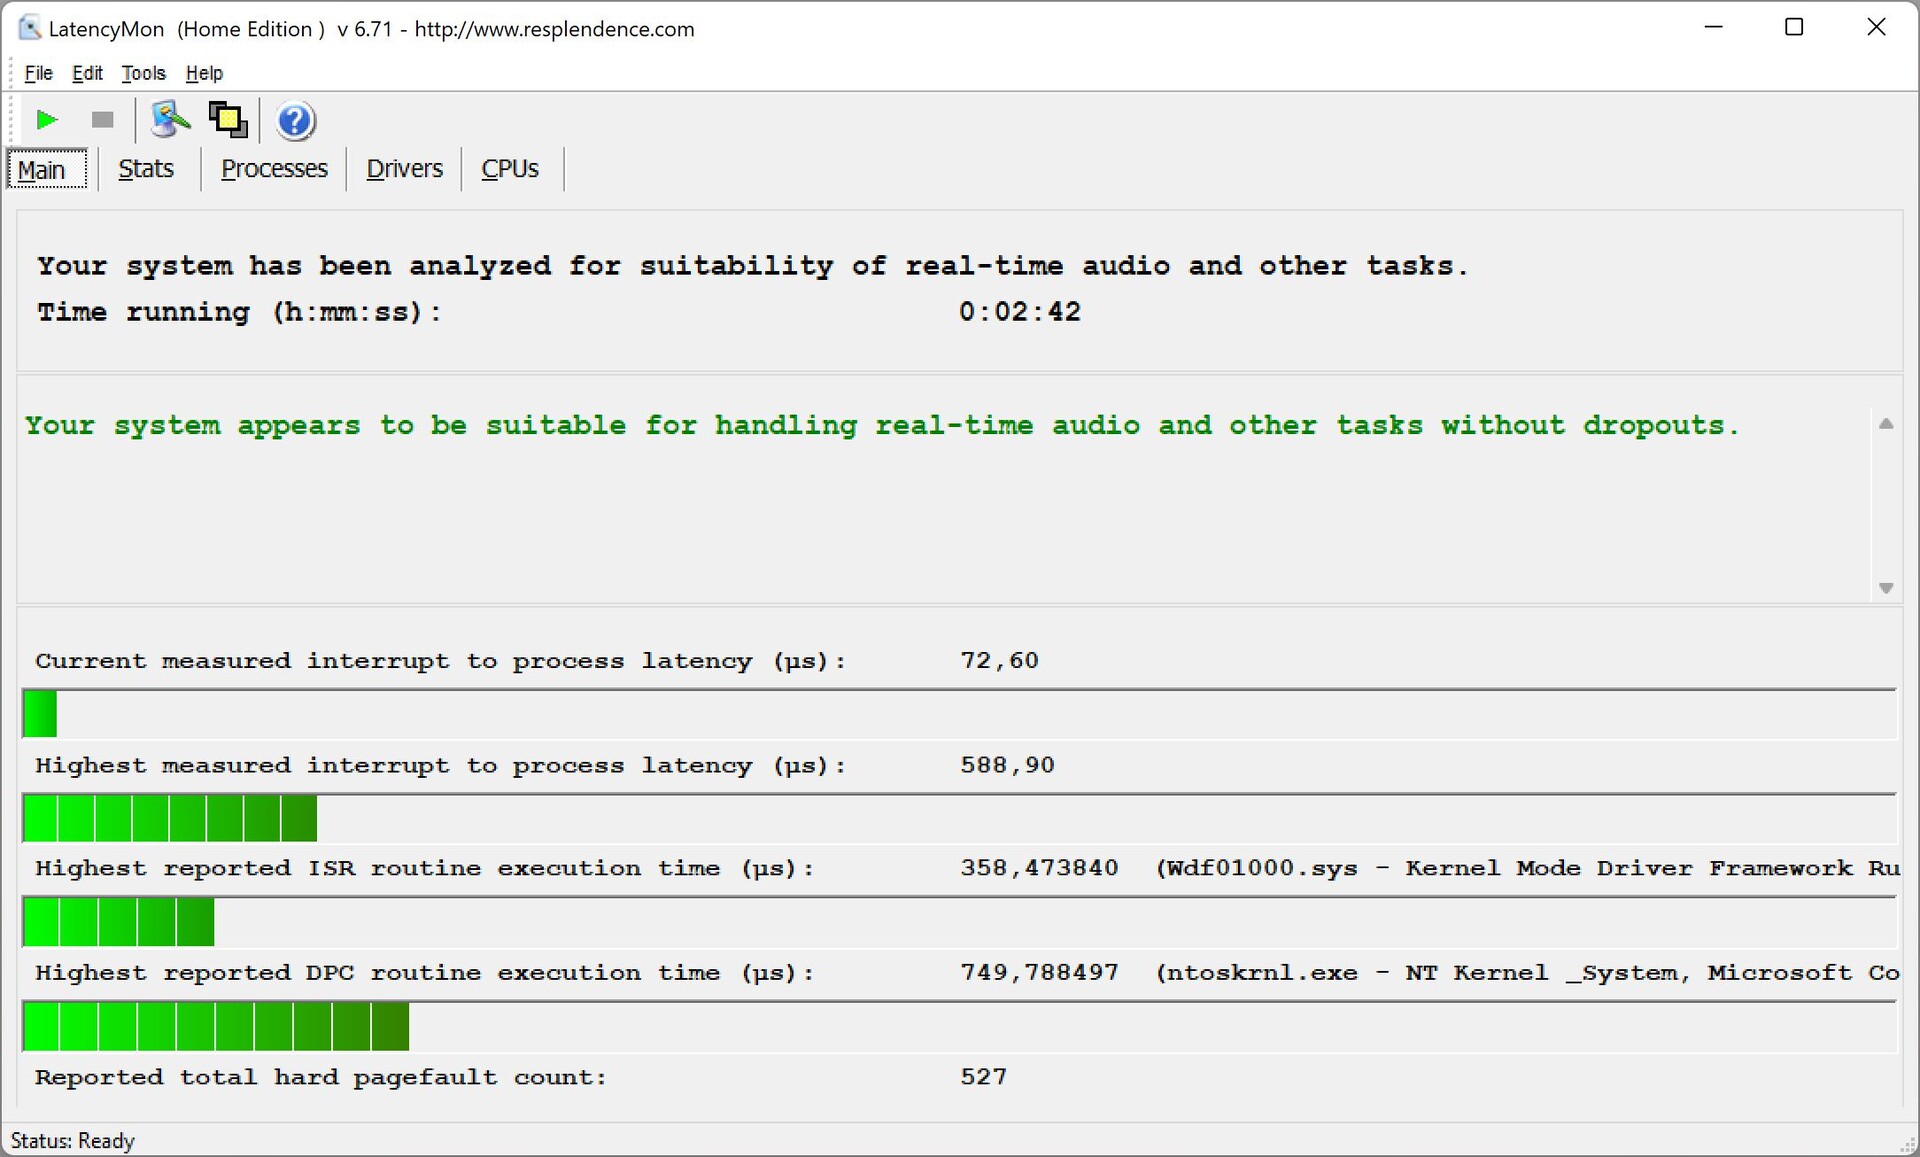
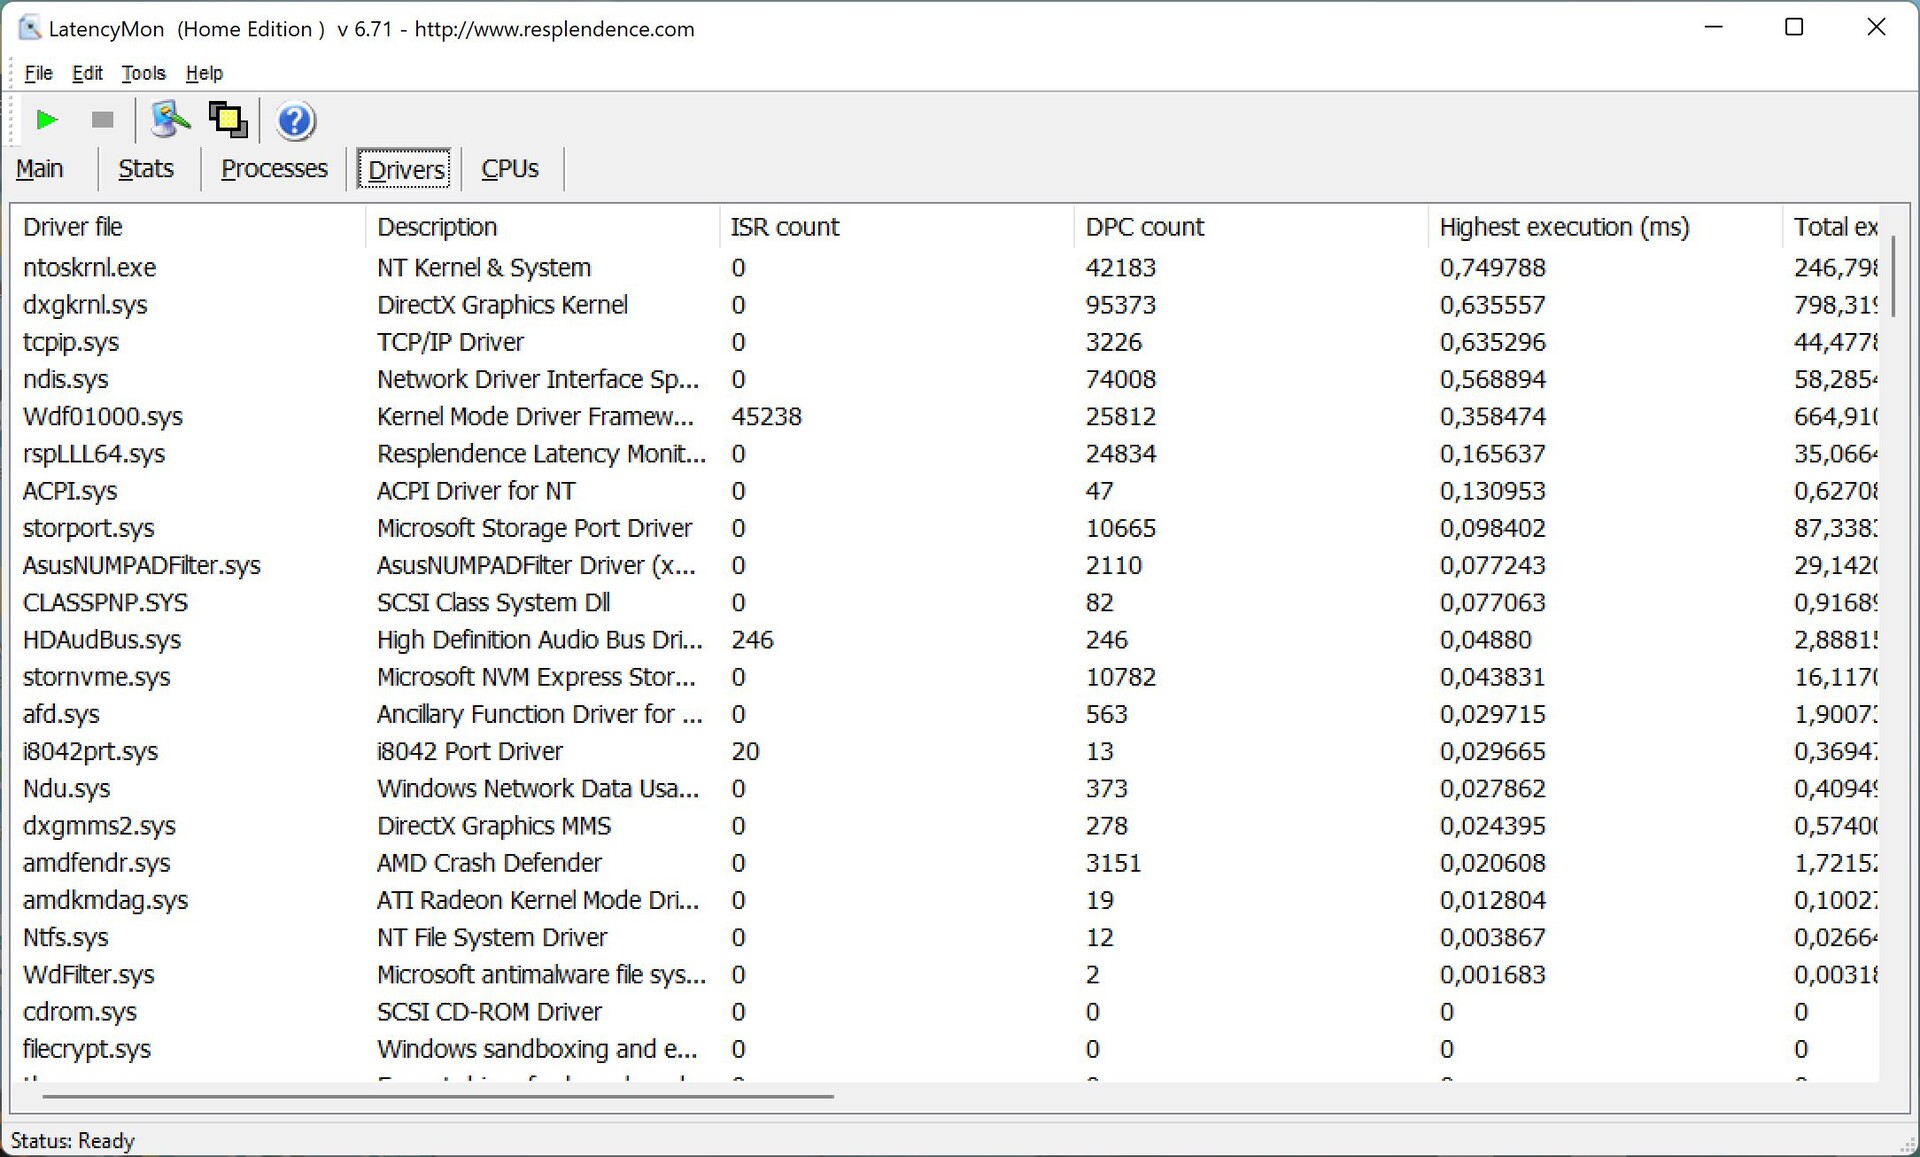
DPC延时
在我们的延迟测试中,当播放4K YouTube视频时,Zenbook没有显示任何问题,既没有延迟,也没有跳帧。
| DPC Latencies / LatencyMon - interrupt to process latency (max), Web, Youtube, Prime95 | |
| Samsung Galaxy Book2 Pro 13 NP930XED-KA1DE | |
| Dell XPS 13 9310 OLED | |
| Huawei MateBook 13s i5 11300H | |
| Asus Zenbook S 13 OLED | |
* ... smaller is better
存储设备
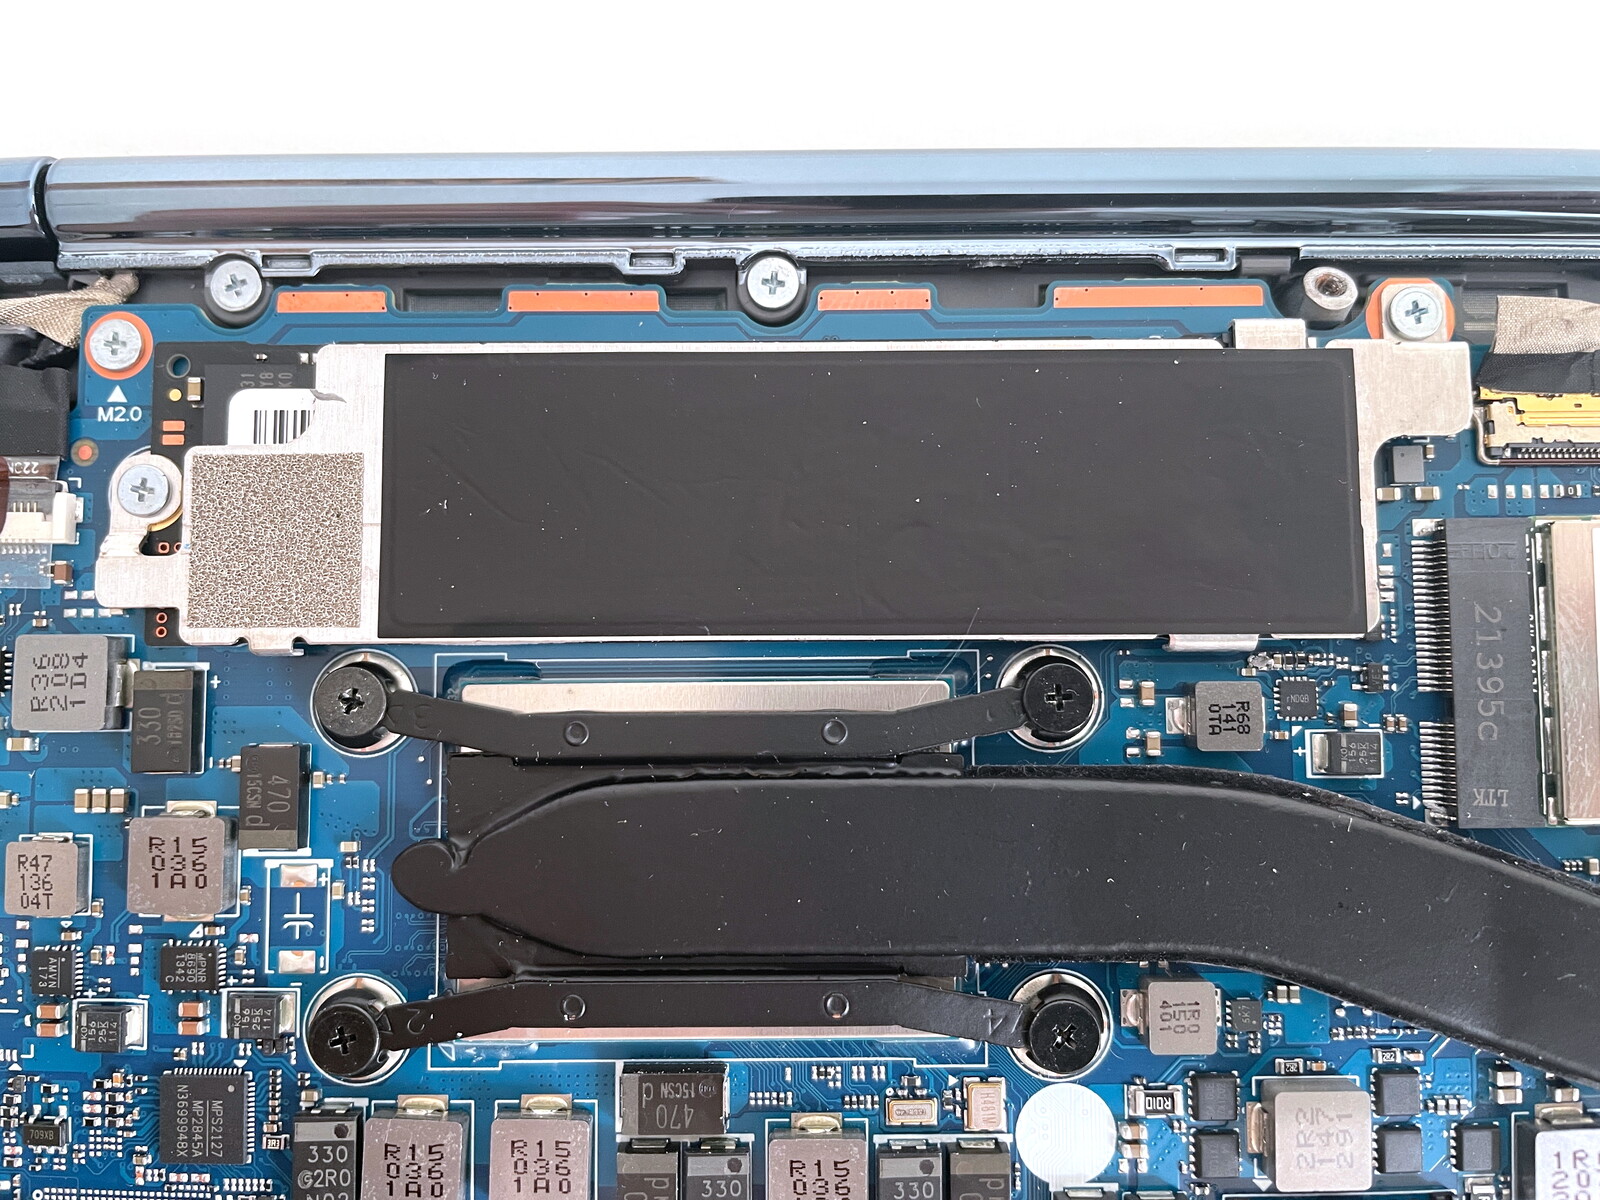
华硕使用了三星的快速PCIe 4.0固态硬盘。PM9A1(980 Pro的OEM版本)提供了1TB的存储容量,首次启动后大约有904GB可用。在基准测试中,M.2-2280硬盘实现了超过6GB/s的极高传输率,因此是目前移动领域最快的SSD之一。此外,尽管紧挨着CPU的位置有些不利,但性能仍然稳定,并不是所有拥有快速PCIe 4.0 SSD的设备都能做到这一点。更多SSD基准测试可在 这里.

* ... smaller is better
Sustained Read Performance: DiskSpd Read Loop, Queue Depth 8
GPU性能
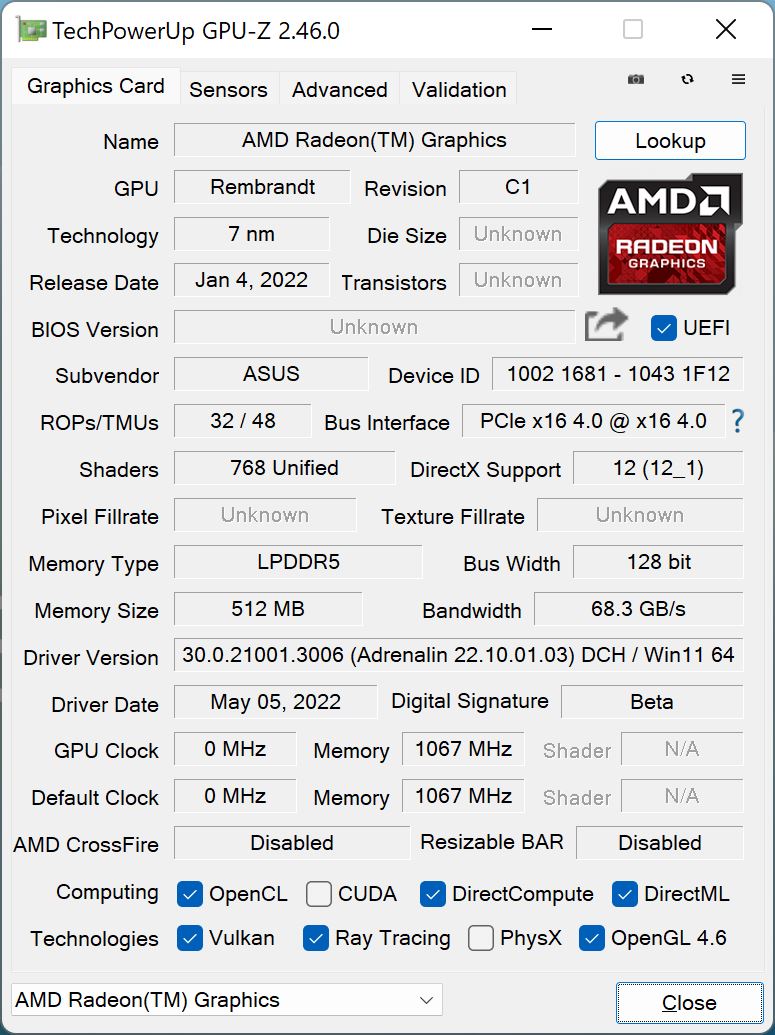
新Ryzen 6000 CPU的最大改进是集成显卡,即Radeon 680M。这是基于RDNA2架构(与目前的Radeon 6000M显卡一样),与Ryzen 7 6800U相结合,最大时钟为2.2 GHz(在H-CPU中高达2.4 GHz)。关于680M的更多技术细节可以在以下网站找到这里.
在合成基准测试中,新的Radeon 680M的速度约为旧的 RX Vega 8的前辈。即使是最快版本的 Xe Graphics G7 witt 96 EUs也明显超过了,就像专用的 NvidiaGeForce MX450.较新的 MX550仍然快一点,但差别不是很明显。然而。 Apple的7核M1-GPU更快,这也适用于OpenGL和OpenCL基准测试。
Radeon 680M的一大优势,特别是与目前Alder Lake CPU的Xe Graphics G7相比,是在视频播放过程中GPU负载非常低,这在本评论后面的电池运行时间测试中也很明显。在播放4K YouTube视频时,Radeon只使用了4-5%的容量,而目前的Xe Graphics G7使用了40%以上。
在性能模式下,苛刻的Time Spy 压力测试以97%通过,而在平衡模式下略低于90%,所以你应该预期有10%左右的性能损失。另外值得注意的是,性能模式在正常的GPU基准测试中没有带来任何优势。在电池模式下,图形性能下降了约20%。更多的GPU基准测试可在 这里.
| 3DMark 11 Performance | 9140 points | |
| 3DMark Fire Strike Score | 6154 points | |
| 3DMark Time Spy Score | 2548 points | |
Help | ||
游戏性能
合成测试中的性能是一回事,但Radeon 680M在游戏测试中也取得了不错的成绩,明显领先于 Xe Graphics G7在大多数情况下,特别是在高图形细节方面,但 GeForce MX450仍然略快。总的来说,对于iGPU来说,性能非常好,在许多情况下,你可以在1080p下以中等或高细节进行游戏,只要标题不是太苛刻。例如,《赛博朋克2077》勉强可以玩,因为它即使在最低设置下也无法超过30 FPS。
| F1 2021 | |
| 1920x1080 High Preset AA:T AF:16x | |
| Asus Zenbook S 13 OLED | |
| Average AMD Radeon 680M (26.8 - 69, n=21) | |
| Lenovo IdeaCentre AIO 3 24IAP7 | |
| Lenovo Yoga 9i 14 2022 i7-1260P | |
| 1920x1080 Ultra High Preset + Raytracing AA:T AF:16x | |
| Lenovo IdeaCentre AIO 3 24IAP7 | |
| Lenovo Yoga 9i 14 2022 i7-1260P | |
| Asus Zenbook S 13 OLED | |
| Average AMD Radeon 680M (16.1 - 29.1, n=18) | |
在我们的Witcher 3 长时间测试中,即使在平衡模式下,游戏性能也保持稳定,但在要求较高的游戏中,短时间后会出现约10%的性能损失(与GPU压力测试类似)。在电池模式下也会出现20%左右的性能轻微下降。关于更多的游戏基准测试,我们可以参考我们的 技术部分.
Witcher 3 FPS Chart
| low | med. | high | ultra | QHD | |
|---|---|---|---|---|---|
| GTA V (2015) | 136.1 | 120.4 | 47 | 21.3 | |
| The Witcher 3 (2015) | 123 | 40 | 23 | ||
| Dota 2 Reborn (2015) | 111.2 | 96.9 | 72.3 | 62.7 | |
| Final Fantasy XV Benchmark (2018) | 59.8 | 31.6 | 21.9 | 16.3 | |
| X-Plane 11.11 (2018) | 46.9 | 39.7 | 33.6 | ||
| Far Cry 5 (2018) | 57 | 36 | 33 | 31 | |
| Strange Brigade (2018) | 125.1 | 54.7 | 46.6 | 40.2 | 25.3 |
| F1 2021 (2021) | 156.5 | 76.7 | 57.7 | 24.7 | 16.9 |
| Farming Simulator 22 (2021) | 123 | 62 | 48 | 44 | |
| Cyberpunk 2077 1.6 (2022) | 32 | 24 | 18 | 14 |
排放。带有良好扬声器的Zenbook
系统噪音
Zenbook S 13在日常使用中是一个非常安静的伙伴。在平衡模式下,短时间的负载峰值甚至可以在没有风扇的情况下进行管理。在游戏中,Zenbook达到了约40分贝(A),在压力测试中接近42分贝(A)。当然,风扇的噪音是可以听到的,但它绝不是令人不快或高调的。此外,在我们的评测样本中,我们没有发现任何电子噪音,如线圈啸叫。
在可选的性能模式下(仅在主电源运行时),风扇启动得更快,而且我们还观察到在负载下风扇噪音明显增大(压力测试和Witcher 3 ,均为47 dB(A))。如果你想在负载下保持安静,你应该选择耳语模式,因为在这里几乎听不到风扇的声音,只有33分贝(A)。
Noise level
| Idle |
| 24 / 24 / 24 dB(A) |
| Load |
| 33.1 / 41.7 dB(A) |
 | ||
30 dB silent 40 dB(A) audible 50 dB(A) loud |
||
min: | ||
| Asus Zenbook S 13 OLED Radeon 680M, R7 6800U, Samsung PM9A1 MZVL21T0HCLR | Dell XPS 13 9310 OLED Iris Xe G7 96EUs, i7-1185G7, Toshiba XG6 KXG60ZNV512G | Samsung Galaxy Book2 Pro 13 NP930XED-KA1DE Iris Xe G7 80EUs, i5-1240P, Samsung PM991a MZVLQ256HBJD | Huawei MateBook 13s i5 11300H Iris Xe G7 80EUs, i5-11300H, Phison Electronics PS5012 | |
|---|---|---|---|---|
| Noise | 5% | -5% | -2% | |
| off / environment * (dB) | 24 | 24.8 -3% | 24.6 -3% | 24.5 -2% |
| Idle Minimum * (dB) | 24 | 25 -4% | 24.6 -3% | 24.5 -2% |
| Idle Average * (dB) | 24 | 25 -4% | 24.6 -3% | 24.5 -2% |
| Idle Maximum * (dB) | 24 | 25 -4% | 26.3 -10% | 28 -17% |
| Load Average * (dB) | 33.1 | 25.3 24% | 38.4 -16% | 35.9 -8% |
| Witcher 3 ultra * (dB) | 40.2 | 35.8 11% | 35.9 11% | |
| Load Maximum * (dB) | 41.7 | 35.8 14% | 38.7 7% | 38.6 7% |
* ... smaller is better
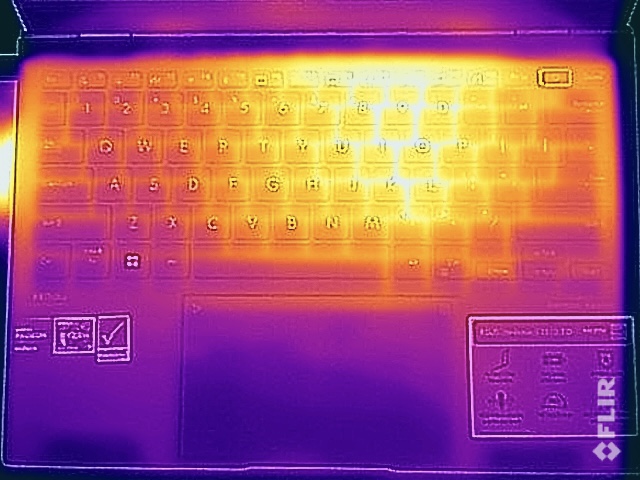
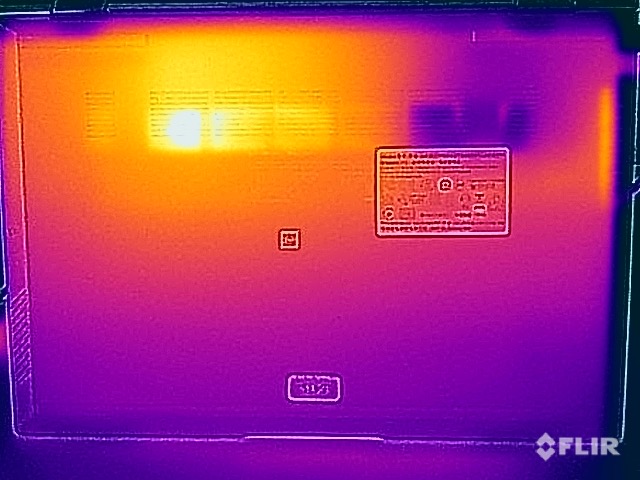
温度
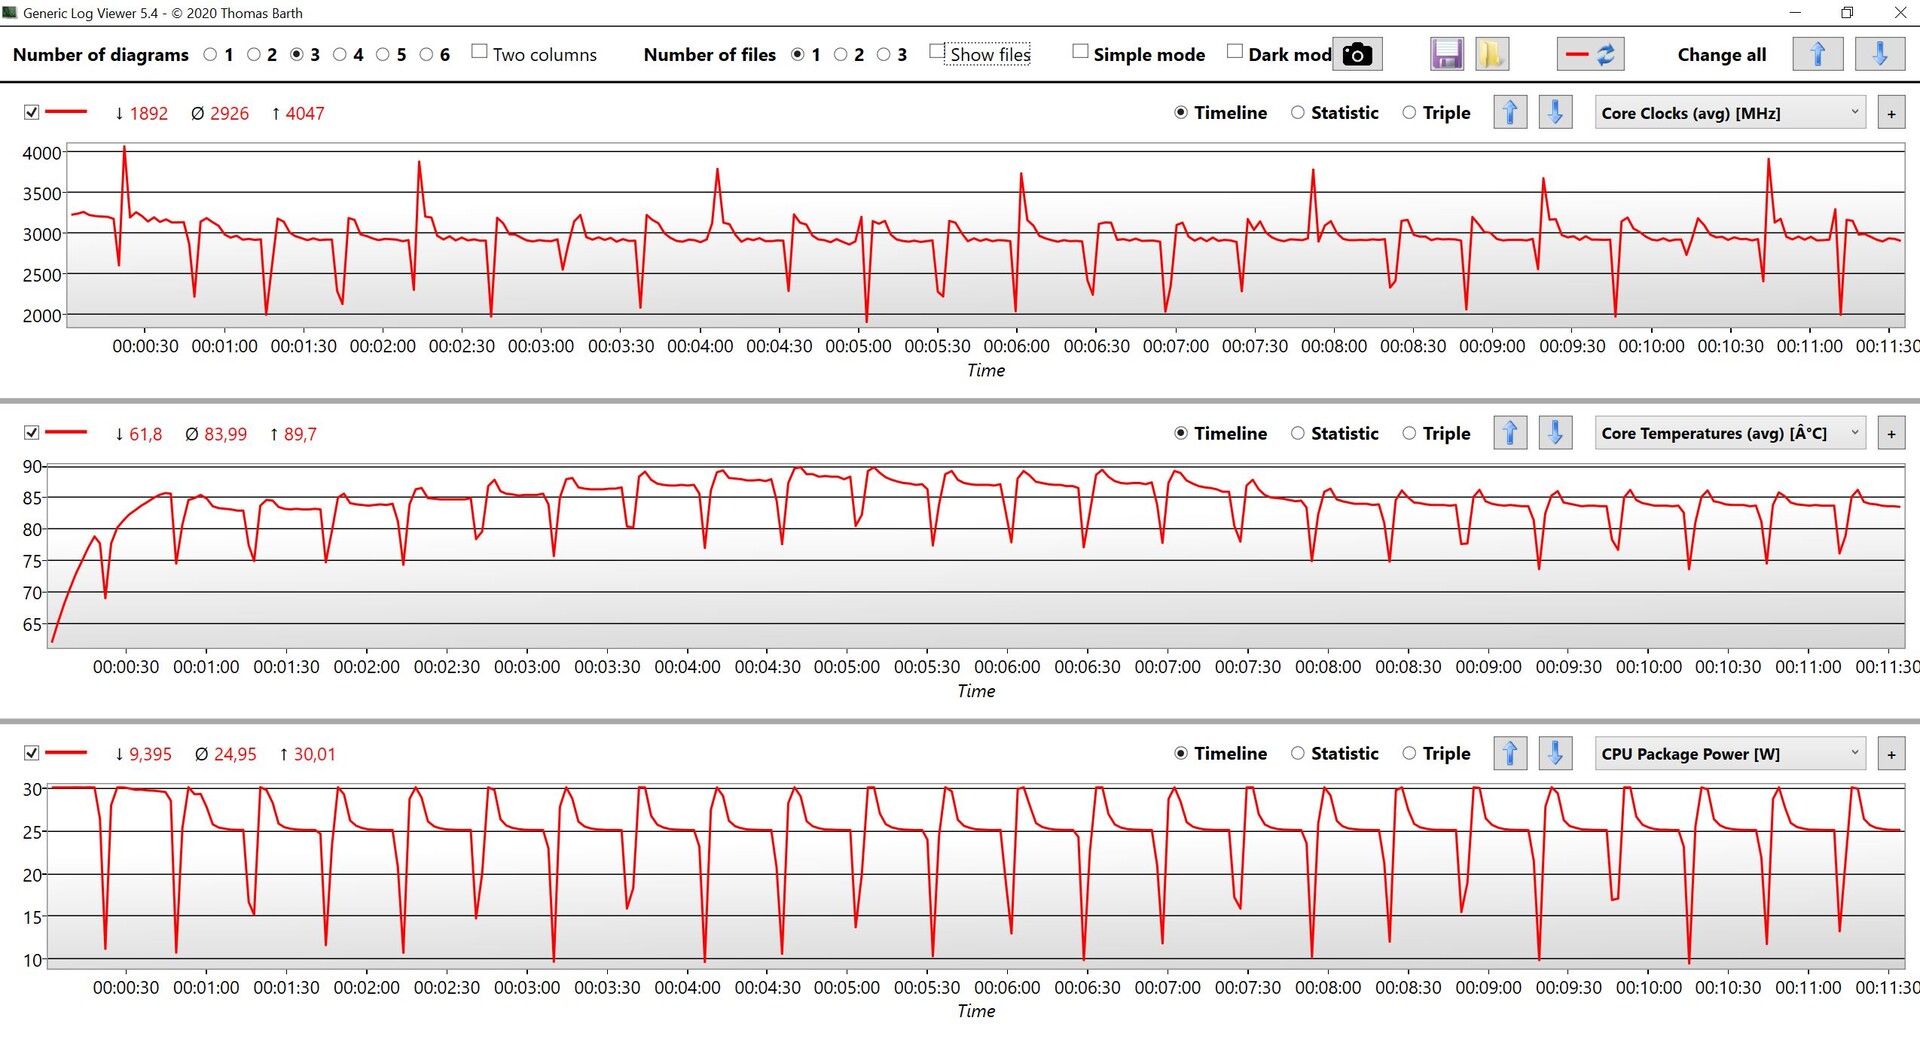
Zenbook的表面温度在正常任务中完全没有问题,但在游戏或极端负荷下,你不应该把设备放在你的大腿上,因为我们偶尔会登记超过50℃的温度。在这些情况下,键盘也会强烈发热,但这并不证明对使用有限制。
由于风扇速度不同,在一小时的压力测试后,平衡模式和性能模式下的表面温度几乎是相同的。在性能模式下,TDP保持在25瓦,而平衡模式下的消耗量在测试过程中逐渐下降,最终稳定在15瓦。因此,那些需要最大性能的人应该使用性能模式。
(-) The maximum temperature on the upper side is 47.9 °C / 118 F, compared to the average of 35.9 °C / 97 F, ranging from 21.4 to 59 °C for the class Subnotebook.
(-) The bottom heats up to a maximum of 56.1 °C / 133 F, compared to the average of 39.2 °C / 103 F
(+) In idle usage, the average temperature for the upper side is 25.4 °C / 78 F, compared to the device average of 30.8 °C / 87 F.
(-) Playing The Witcher 3, the average temperature for the upper side is 38.8 °C / 102 F, compared to the device average of 30.8 °C / 87 F.
(+) The palmrests and touchpad are cooler than skin temperature with a maximum of 31.8 °C / 89.2 F and are therefore cool to the touch.
(-) The average temperature of the palmrest area of similar devices was 28.2 °C / 82.8 F (-3.6 °C / -6.4 F).
| Asus Zenbook S 13 OLED AMD Ryzen 7 6800U, AMD Radeon 680M | Apple MacBook Air 2020 M1 Entry Apple M1, Apple M1 7-Core GPU | Dell XPS 13 9310 OLED Intel Core i7-1185G7, Intel Iris Xe Graphics G7 96EUs | Samsung Galaxy Book2 Pro 13 NP930XED-KA1DE Intel Core i5-1240P, Intel Iris Xe Graphics G7 80EUs | Huawei MateBook 13s i5 11300H Intel Core i5-11300H, Intel Iris Xe Graphics G7 80EUs | |
|---|---|---|---|---|---|
| Heat | 8% | 4% | -1% | 10% | |
| Maximum Upper Side * (°C) | 47.9 | 44 8% | 46.6 3% | 47.9 -0% | 42.8 11% |
| Maximum Bottom * (°C) | 56.1 | 44 22% | 46 18% | 51.3 9% | 46.9 16% |
| Idle Upper Side * (°C) | 26.8 | 27 -1% | 26.6 1% | 28.5 -6% | 25.2 6% |
| Idle Bottom * (°C) | 27.3 | 27 1% | 29.2 -7% | 29.6 -8% | 26 5% |
* ... smaller is better
发言人
Zenbook S 13的声音系统由两个模块组成,默认情况下,杜比访问应用程序的改进被激活。该应用程序有各种配置文件以及一个均衡器,允许你自己调整设置。整体效果非常令人信服:你可以毫无问题地听音乐或看视频,所以外部扬声器不是绝对必要的。由于笔记本电脑的结构,只有低音有些不足,但这也适用于大多数竞争对手。
Asus Zenbook S 13 OLED audio analysis
(±) | speaker loudness is average but good (76.5 dB)
Bass 100 - 315 Hz
(±) | reduced bass - on average 12.6% lower than median
(±) | linearity of bass is average (11.1% delta to prev. frequency)
Mids 400 - 2000 Hz
(±) | higher mids - on average 5.8% higher than median
(+) | mids are linear (4.7% delta to prev. frequency)
Highs 2 - 16 kHz
(+) | balanced highs - only 2.6% away from median
(+) | highs are linear (5.3% delta to prev. frequency)
Overall 100 - 16.000 Hz
(+) | overall sound is linear (14.7% difference to median)
Compared to same class
» 31% of all tested devices in this class were better, 5% similar, 64% worse
» The best had a delta of 5%, average was 18%, worst was 53%
Compared to all devices tested
» 19% of all tested devices were better, 4% similar, 77% worse
» The best had a delta of 4%, average was 23%, worst was 134%
Apple MacBook Air 2020 M1 Entry audio analysis
(±) | speaker loudness is average but good (79.6 dB)
Bass 100 - 315 Hz
(±) | reduced bass - on average 7.1% lower than median
(±) | linearity of bass is average (9.5% delta to prev. frequency)
Mids 400 - 2000 Hz
(+) | balanced mids - only 2.2% away from median
(+) | mids are linear (5.3% delta to prev. frequency)
Highs 2 - 16 kHz
(+) | balanced highs - only 2.3% away from median
(+) | highs are linear (4% delta to prev. frequency)
Overall 100 - 16.000 Hz
(+) | overall sound is linear (8.7% difference to median)
Compared to same class
» 3% of all tested devices in this class were better, 1% similar, 96% worse
» The best had a delta of 5%, average was 18%, worst was 53%
Compared to all devices tested
» 3% of all tested devices were better, 1% similar, 97% worse
» The best had a delta of 4%, average was 23%, worst was 134%
电源管理。Zenbook仍然经济实惠
消耗功率
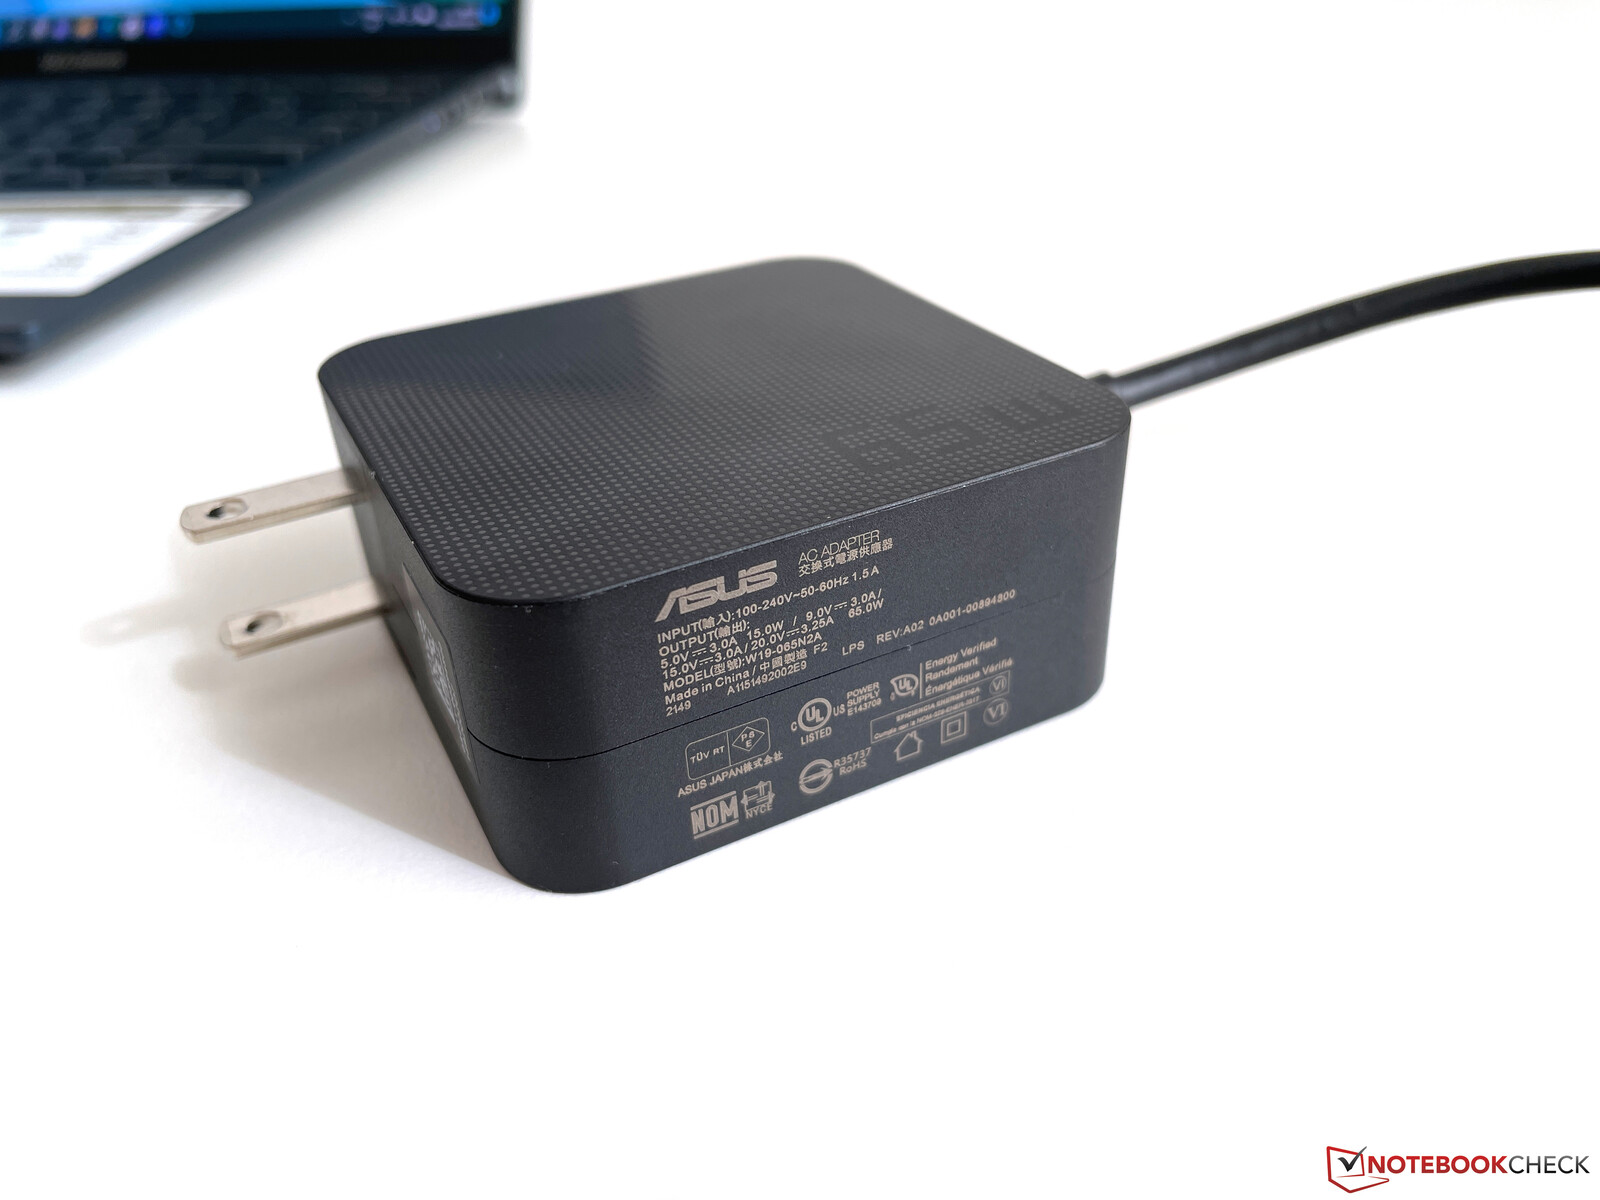
高分辨率的OLED屏幕 在空闲测量中让人感觉到,尽管SDR的亮度有限,但空闲消耗却增加到10瓦。在负载情况下,较低的TDP值的优势再次变得明显:与目前的英特尔笔记本电脑相比,它们往往不能从其65瓦的电源中获得足够的功率,在峰值负载期间总是不得不短暂地从电池中汲取能量,我们在Zenbook中记录的最大消耗量略低于50瓦,然后在测试过程中达到了略低于35瓦(平衡)或45瓦(性能)的水平。
因此,即使在压力测试中,65瓦的电源也有足够的规模,甚至有足够的容量为电池充电。
| Off / Standby | |
| Idle | |
| Load |
|
Key:
min: | |
| Asus Zenbook S 13 OLED R7 6800U, Radeon 680M, Samsung PM9A1 MZVL21T0HCLR, OLED, 2880x1800, 13.3" | Apple MacBook Air 2020 M1 Entry M1, M1 7-Core GPU, Apple SSD AP0256Q, IPS, 2560x1600, 13.3" | Dell XPS 13 9310 OLED i7-1185G7, Iris Xe G7 96EUs, Toshiba XG6 KXG60ZNV512G, OLED, 3456x2160, 13.4" | Samsung Galaxy Book2 Pro 13 NP930XED-KA1DE i5-1240P, Iris Xe G7 80EUs, Samsung PM991a MZVLQ256HBJD, OLED, 1920x1080, 13.3" | Huawei MateBook 13s i5 11300H i5-11300H, Iris Xe G7 80EUs, Phison Electronics PS5012, LTPS, 2520x1680, 13.4" | Average AMD Radeon 680M | Average of class Subnotebook | |
|---|---|---|---|---|---|---|---|
| Power Consumption | 40% | 2% | 13% | 1% | -22% | 9% | |
| Idle Minimum * (Watt) | 4.8 | 1.9 60% | 5.7 -19% | 4.3 10% | 4.2 12% | 6.93 ? -44% | 3.71 ? 23% |
| Idle Average * (Watt) | 8.7 | 6.4 26% | 6 31% | 6 31% | 8.1 7% | 8.98 ? -3% | 6.54 ? 25% |
| Idle Maximum * (Watt) | 10.1 | 7 31% | 12.3 -22% | 8.8 13% | 9 11% | 10.5 ? -4% | 7.89 ? 22% |
| Load Average * (Watt) | 45.6 | 25 45% | 44.4 3% | 36 21% | 41.7 9% | 53.5 ? -17% | 42.1 ? 8% |
| Witcher 3 ultra * (Watt) | 42.4 | 36.5 14% | 32.9 22% | 40.1 5% | |||
| Load Maximum * (Watt) | 49.5 | 30.3 39% | 47.8 3% | 60 -21% | 68 -37% | 70.5 ? -42% | 65.1 ? -32% |
* ... smaller is better
Power consumption Witcher 3 / Stress test
Power consumption with external monitor
电池寿命
Zenbook S 13有一个67Wh的电池(4个单元),可以确保体面的运行时间。在日常使用中,OLED面板是最大的消费者,这就是为什么最大亮度对运行时间也有很大影响。例如,我们在150cd/m²(相当于最大亮度的70%)的WLAN测试中,运行时间略多于9小时。在全SDR亮度下,运行时间少了两个小时,约为7小时。
我们的HDR测试视频显示了为什么最大的HDR亮度并不总是可用:在全亮度下只能运行3小时多一点。另一个极端是我们在150cd/m²的正常视频测试,这表明新的Radeon 680M GPU的效率有多高。这里的运行时间刚刚超过15小时,我们反复检查了几次。
在笔记本电脑打开的情况下,充满电只需要2个多小时,在达到60%的标记(约41分钟)后,速度会稍微平缓下来。
| Asus Zenbook S 13 OLED R7 6800U, Radeon 680M, 67 Wh | Apple MacBook Air 2020 M1 Entry M1, M1 7-Core GPU, 49.9 Wh | Dell XPS 13 9310 OLED i7-1185G7, Iris Xe G7 96EUs, 52 Wh | Samsung Galaxy Book2 Pro 13 NP930XED-KA1DE i5-1240P, Iris Xe G7 80EUs, 63 Wh | Huawei MateBook 13s i5 11300H i5-11300H, Iris Xe G7 80EUs, 60 Wh | Average of class Subnotebook | |
|---|---|---|---|---|---|---|
| Battery runtime | 74% | -29% | 2% | -20% | 12% | |
| H.264 (h) | 15.2 | 11.6 -24% | 11 -28% | 15.3 ? 1% | ||
| WiFi v1.3 (h) | 9.2 | 16 74% | 6.5 -29% | 11.6 26% | 9.4 2% | 14.1 ? 53% |
| Load (h) | 2.4 | 2.5 4% | 1.6 -33% | 1.998 ? -17% |
Pros
Cons
结论:Zenbook是一个非常坚实的移动伴侣
华硕Zenbook S 13是一款非常成功的紧凑型笔记本,它结合了许多现代技术特征和全新的 Ryzen 7 6800U融合了许多现代技术特征和AMD的全新Ryzen 7 6800U。在审查过程中,我们没有遇到任何真正的弱点,我们的正面印象显然超过了负面印象。
AMD的新移动处理器在CPU领域只提供了轻微的改进,但集成的 Radeon-680M-GPU在性能上有了相当大的飞跃,甚至能够与专用的 GeForce MX450在真正的游戏基准测试中竞争。同时,该SoC的消耗率并不像目前Alder Lake芯片(不管是P系列还是U系列)那样高得离谱,这就是为什么在日常使用中风扇启动的频率要低得多。此外,65瓦的电源也完全足够。
但不仅是新的AMD芯片令人印象深刻。高质量的镁合金外壳非常紧凑,我们也喜欢输入设备,特别是键盘,因为Zenbook为一个非常薄的笔记本提供了1.4毫米的体面的键落。触摸板上的可选数字键盘也证明是有用的。端口(即使只有USB-C)是合适的,并将在未来通过BIOS更新扩展到USB 4,这将允许连接外部显卡,例如。电池寿命很好,OLED屏幕提供了非常好的图像质量,而且由于华硕的软件解决方案,面板可以调光,而不必忍受恼人的PWM闪烁。通过MyAsus应用程序进行的额外控制有些麻烦,我们希望看到与标准亮度控制更好的整合,但这是朝着正确方向迈出的一步。
新的Zenbook S 13是一款非常好的次笔记本,没有任何重大失误,并提供了很多性能。新的AMD Ryzen 7 6800U也给人留下了非常好的印象,比同类的英特尔Alder-Lake CPU工作效率高得多,使其成为目前紧凑型笔记本电脑的更好选择。
就缺点而言,我们肯定应该提到不必要的复杂的内部访问,而且1080p的网络摄像头肯定比720p的模块更符合时代要求。另一个读卡器也是可取的。但是,这些问题几乎没有影响到整体上的良好印象。相反,我们更认为可用性是一个问题,因为Zenbook还没有在商店里买到,而其他配备6800U的笔记本电脑也供不应求。
尽管功耗相对较低,但整体性能显然与Alder Lake P芯片相当,在我们的评测中,Alder Lake P芯片的功耗往往明显更高,给非常紧凑的笔记本电脑(或其冷却)带来了困难。该 三星Galaxy Book 2 Pro 13其较低的消耗率也表明,桤木湖i5-1240P在20瓦时几乎没有竞争力,而酷睿i7-1255U只在单核测试中具有优势,但它也需要相当多的电力。只要你使用所有的核心或显卡,AMD的Ryzen 7 6800U就明显领先。旧的 MacBook Air M1仍然是一个强大的竞争对手,仍然与完全更新的MacBook Air M2一起提供。尽管是被动冷却,但它提供了很多性能,因此效率更高,但显示屏不支持HDR。我们期望能够对目前的 戴尔XPS 13但根据我们之前对新英特尔芯片的研究结果,它的性能不太可能跟上Zenbook S 13。
价格和可用性
华硕Zenbook S 13尚未上市,无论是从华硕本身还是从通常的网上商店。建议感兴趣的买家定期在网上和供应商处查询。
Asus Zenbook S 13 OLED
- 07/06/2022 v7 (old)
Andreas Osthoff
Price comparison

