Notebookcheck Logo

Apple MacBook Pro 14 2023入门评测。基础机型,削减了M2 Pro,固态硬盘降级,耗电量略高
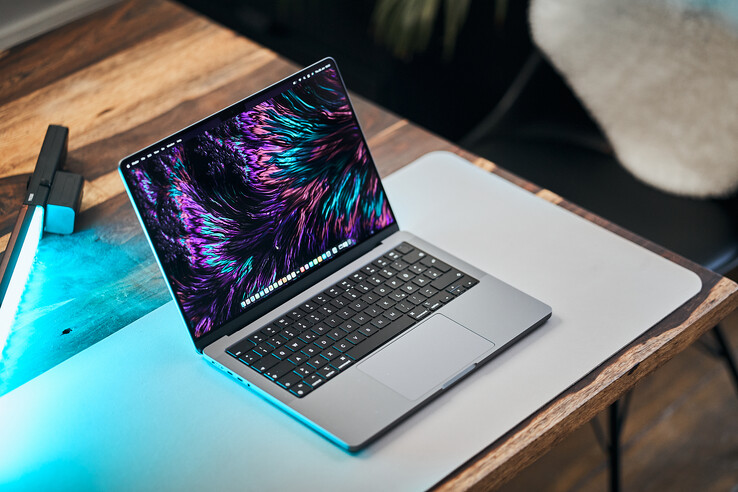
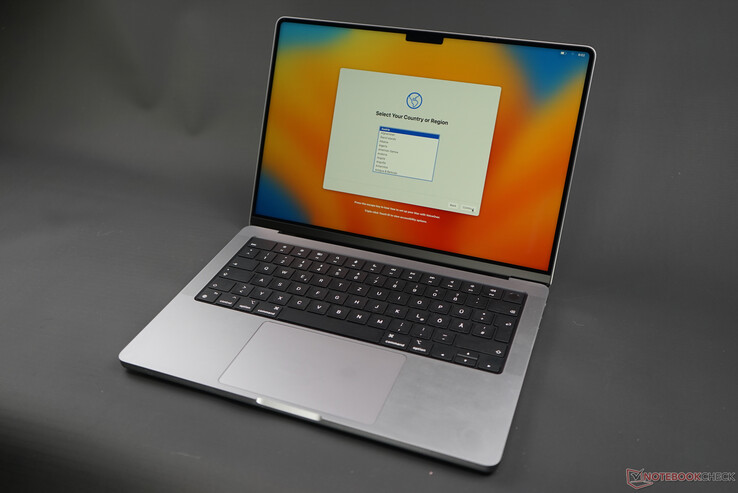
更贵,更糟糕? 新款MacBook Pro 14 2023的基本型号配备了M2 Pro SoC的瘦身版,在固态硬盘速度方面也有所退步,但售价更高。但这真的会影响笔记本电脑在日常使用中的性能吗?
ARM Laptop / Notebook MacBook Thunderbolt

此前,我们曾对新的 2023年MacBook Pro 14具备完整的 M2 Pro芯片(12个CPU核心,19个GPU核心),32GB内存和2TB SSD。接近4,000欧元的价格证明这是一个昂贵的配置。

今天,我们来看看基本型号的MacBook Pro 14,配备了一个缩小的M2 Pro。 削减的M2 ProSoC(10个CPU内核,16个GPU内核),16GB内存和512GB SSD。与2021年的型号相比,基本型号的要价有所提高。官方称,新的MacBook Pro 14的起价为2399欧元,与2021年的版本相比,贵了150欧元。2021年的变体当时的价格。在美国,基本型号2023年的MacBook Pro 14在Apple 网站上的价格是1,999美元。

在这篇评论中,我们主要关注CPU、GPU和SSD的性能,同时看一下它们对排放的影响。机箱、连接、输入设备和显示器与2023年的MacBook Pro 14相同。关于这些方面的更多信息可以在下面的链接中找到。

Apple MacBook Pro 14 2023 M2 Pro Entry (MacBook Pro 14 2023 Series)
Processor
Apple M2 Pro 10-Core 10 x 2.4 - 3.7 GHz, 27 W PL1 / Sustained
Graphics adapter
Apple M2 Pro 16-Core GPU, Core: 1400 MHz, 25 W TDP
Memory
16 GB 
, LPDDR5-6400, Dual-Channel, onboard
Display
14.20 inch 16:10, 3024 x 1964 pixel 254 PPI, Mini-LED, glossy: yes, HDR, 120 Hz
Storage
Apple SSD AP0512Z, 512 GB 
, 470 GB free
Connections
3 USB 4.0 40 Gbps, 3 Thunderbolt, USB-C Power Delivery (PD), 1 HDMI, 3 DisplayPort, Audio Connections: 3.5 mm Stereo, Card Reader: SDXC, 1 Fingerprint Reader, Brightness Sensor
Networking
Broadcom 0x14E4, 0x4388 WiFi 6E AirPort (a/b/g/n = Wi-Fi 4/ac = Wi-Fi 5/ax = Wi-Fi 6/ Wi-Fi 6E 6 GHz), Bluetooth 5.3
Size
height x width x depth (in mm): 15.5 x 312.6 x 221.2
Battery
70 Wh Lithium-Polymer
Operating System
Apple macOS 13 Ventura
Camera
Webcam: 1080p
Primary Camera: 2 MPix
Additional features
Speakers: 6 Speakers, 3D Audio, Keyboard: Chiclet, Keyboard Light: yes, 67W PSU, 12 Months Warranty
Weight
1.604 kg, Power Supply: 272 g
Price
2399 Euro
Note: The manufacturer may use components from different suppliers including display panels, drives or memory sticks with similar specifications.


潜在的竞争对手比较

Rating
Date
Model
Weight
Height
Size
Resolution
Price
93.4 %
03/2023
Apple MacBook Pro 14 2023 M2 Pro Entry
M2 Pro 10-Core, M2 Pro 16-Core GPU
1.6 kg15.5 mm14.20"3024x1964
92 %
08/2022
Apple MacBook Air M2 10C GPU
M2, M2 10-Core GPU
1.2 kg11.3 mm13.60"2560x1664
93.9 %
03/2023
Apple MacBook Pro 14 2023 M2 Pro
M2 Pro, M2 Pro 19-Core GPU
1.6 kg15.5 mm14.20"3024x1964
92.7 %
11/2021
Apple MacBook Pro 14 2021 M1 Pro Entry
M1 Pro 8-Core, M1 Pro 14-Core GPU
1.6 kg15.5 mm14.20"3024x1964
87.7 %
12/2022
Lenovo Yoga Slim 7 Pro X 14IAH7 82TK006CGE
i7-12700H, GeForce RTX 3050 4GB Laptop GPU
1.5 kg18 mm14.50"3072x1920
88.8 %
10/2022
SCHENKER Vision 14 2022 RTX 3050 Ti
i7-12700H, GeForce RTX 3050 Ti Laptop GPU
1.3 kg16.6 mm14.00"2880x1800
89 %
03/2022
Microsoft Surface Laptop Studio i7 RTX 3050 Ti
i7-11370H, GeForce RTX 3050 Ti Laptop GPU
1.8 kg19 mm14.40"2400x1600

尺寸比较

325 mm 221 mm 18 mm 1.5 kg323 mm 228 mm 19 mm 1.8 kg312.6 mm 221.2 mm 15.5 mm 1.6 kg308.8 mm 215 mm 16.6 mm 1.3 kg304.1 mm 215 mm 11.3 mm 1.2 kg297 mm 210 mm 1 mm 5.7 g

性能。拥有10个核心的M2 Pro

基本的2023年MacBook Pro 14依靠的是经过强化的M2 Pro SoC,有10个内核(6倍性能内核+4倍效率内核),而GPU只使用16个内核。16GB内存是基本型号的标准配置,但在配置时可以选择升级到32GB。

处理器

M2 Pro继续使用与M1 Pro相同的5纳米架构,但增加了两个额外的效率核心。M2 Pro的基本型号只提供六个性能核心,而M2 Pro和M2 Max的高端型号则有八个性能核心。

效率核心最高可达2.4GHz,而性能核心在单核时可达到3.5GHz,多核时可达到3.26GHz。请查看我们专门的M2 Pro SoC 页面,了解更多信息和基准测试。

Cinebench R15 Multi Loop

012024036048060072084096010801200132014401560168018001920204021602280Tooltip
Apple MacBook Pro 14 2023 M2 Pro Entry Apple M2 Pro 10-Core: Ø1658 (1642.58-1664.45)
Apple MacBook Air M2 10C GPU Apple M2: Ø994 (917.47-1212.01)
Apple MacBook Pro 14 2023 M2 Pro Apple M2 Pro: Ø2069 (2052.12-2075.23)
Lenovo Yoga Slim 7 Pro X 14IAH7 82TK006CGE Intel Core i7-12700H: Ø2055 (2007.13-2332.91)
SCHENKER Vision 14 2022 RTX 3050 Ti Intel Core i7-12700H: Ø1988 (1948.94-2166.26)
Microsoft Surface Laptop Studio i7 RTX 3050 Ti Intel Core i7-11370H: Ø947 (936.68-1007.91)
Lenovo Yoga 7-14ARB G7 AMD Ryzen 7 6800U: Ø1771 (1657.55-1978.53)
Lenovo Yoga 9 14IRP G8 Intel Core i7-1360P: Ø1703 (1611.41-2114.84)
Apple MacBook Pro 14 2021 M1 Pro Entry Apple M1 Pro 8-Core; Rosetta 2: Ø1311 (1303.74-1319.74)

在我们的Cinebench R15多核循环测试中,CPU的性能保持不变,即使在电池供电的情况下也没有任何性能下降(只有在3%的电池下我们才看到任何性能限制)。与基本的M1 Pro相比,在原生Cinebench R23测试中,单核性能似乎增加了23%。这与高端的M2 Pro和M2 Max芯片处于同一水平。

与M1 Pro的作品相比,M2 Pro作品的多核性能在Cinebench R23中快了约23%。另一方面,配备12核CPU的M2 Pro比基本的M2 Pro快25%。多核分数与英特尔猛禽湖酷睿i7相比或多或少是相同的。 英特尔猛禽湖酷睿i7-1360P即使在Apple 芯片的消耗较低。

然而,英特尔在这里有一个单核的优势,同时也需要更高的功率。

AMD Zen 3 CPU,如Ryzen 7 6800U ,在单核测试中处于劣势,但在多核测试中几乎与M2 Pro入门级打平。我们将在未来几周对采用4纳米Zen 4芯片的笔记本电脑进行测试。

Cinebench R23 / Multi Core
Average of class Multimedia
  (6936 - 30789, n=99, last 2 years)
15283 Points +29%
SCHENKER Vision 14 2022 RTX 3050 Ti
Intel Core i7-12700H
14917 Points +26%
Apple MacBook Pro 14 2023 M2 Pro
Apple M2 Pro
14787 Points +25%
Lenovo Yoga Slim 7 Pro X 14IAH7 82TK006CGE
Intel Core i7-12700H
13572 Points +15%
Apple MacBook Pro 16 2021 M1 Pro
Apple M1 Pro
12370 Points +5%
Lenovo Yoga 9 14IRP G8
Intel Core i7-1360P
11922 Points +1%
Apple MacBook Pro 14 2023 M2 Pro Entry
Apple M2 Pro 10-Core
11811 Points
Average Apple M2 Pro 10-Core
  ()
11811 Points 0%
Lenovo Yoga 7-14ARB G7
AMD Ryzen 7 6800U
11741 Points -1%
Apple MacBook Pro 14 2021 M1 Pro Entry
Apple M1 Pro 8-Core
9581 Points -19%
Apple MacBook Air M2 10C GPU
Apple M2
8517 Points -28%
Microsoft Surface Laptop Studio i7 RTX 3050 Ti
Intel Core i7-11370H
6495 Points -45%
Cinebench R23 / Single Core
Lenovo Yoga 9 14IRP G8
Intel Core i7-1360P
1877 Points +14%
Average of class Multimedia
  (878 - 2245, n=90, last 2 years)
1743 Points +6%
Lenovo Yoga Slim 7 Pro X 14IAH7 82TK006CGE
Intel Core i7-12700H
1701 Points +4%
SCHENKER Vision 14 2022 RTX 3050 Ti
Intel Core i7-12700H
1678 Points +2%
Apple MacBook Pro 14 2023 M2 Pro
Apple M2 Pro
1647 Points 0%
Apple MacBook Pro 14 2023 M2 Pro Entry
Apple M2 Pro 10-Core
1643 Points
Average Apple M2 Pro 10-Core
  ()
1643 Points 0%
Apple MacBook Air M2 10C GPU
Apple M2
1580 Points -4%
Apple MacBook Pro 16 2021 M1 Pro
Apple M1 Pro
1534 Points -7%
Apple MacBook Pro 14 2021 M1 Pro Entry
Apple M1 Pro 8-Core
1531 Points -7%
Lenovo Yoga 7-14ARB G7
AMD Ryzen 7 6800U
1518 Points -8%
Microsoft Surface Laptop Studio i7 RTX 3050 Ti
Intel Core i7-11370H
1497 Points -9%
Cinebench R20 / CPU (Multi Core)
SCHENKER Vision 14 2022 RTX 3050 Ti
Intel Core i7-12700H
5762 Points +78%
Average of class Multimedia
  (2681 - 11768, n=87, last 2 years)
5706 Points +76%
Lenovo Yoga Slim 7 Pro X 14IAH7 82TK006CGE
Intel Core i7-12700H
5247 Points +62%
Lenovo Yoga 7-14ARB G7
AMD Ryzen 7 6800U
4574 Points +41%
Lenovo Yoga 9 14IRP G8
Intel Core i7-1360P
4472 Points +38%
Apple MacBook Pro 14 2023 M2 Pro
Apple M2 Pro
4044 Points +25%
Apple MacBook Pro 14 2023 M2 Pro Entry
Apple M2 Pro 10-Core
3235 Points
Average Apple M2 Pro 10-Core
  ()
3235 Points 0%
Apple MacBook Pro 16 2021 M1 Pro
Apple M1 Pro
2721 Points -16%
Microsoft Surface Laptop Studio i7 RTX 3050 Ti
Intel Core i7-11370H
2526 Points -22%
Apple MacBook Air M2 10C GPU
Apple M2
2306 Points -29%
Cinebench R20 / CPU (Single Core)
Lenovo Yoga 9 14IRP G8
Intel Core i7-1360P
727 Points +62%
SCHENKER Vision 14 2022 RTX 3050 Ti
Intel Core i7-12700H
701 Points +56%
Lenovo Yoga Slim 7 Pro X 14IAH7 82TK006CGE
Intel Core i7-12700H
672 Points +50%
Average of class Multimedia
  (341 - 853, n=87, last 2 years)
652 Points +45%
Lenovo Yoga 7-14ARB G7
AMD Ryzen 7 6800U
597 Points +33%
Microsoft Surface Laptop Studio i7 RTX 3050 Ti
Intel Core i7-11370H
578 Points +29%
Apple MacBook Pro 14 2023 M2 Pro Entry
Apple M2 Pro 10-Core
449 Points
Average Apple M2 Pro 10-Core
  ()
449 Points 0%
Apple MacBook Pro 14 2023 M2 Pro
Apple M2 Pro
447 Points 0%
Apple MacBook Pro 16 2021 M1 Pro
Apple M1 Pro
393 Points -12%
Apple MacBook Air M2 10C GPU
Apple M2
380 Points -15%
Cinebench R15 / CPU Multi 64Bit
Average of class Multimedia
  (1252 - 4774, n=91, last 2 years)
2433 Points +46%
Lenovo Yoga Slim 7 Pro X 14IAH7 82TK006CGE
Intel Core i7-12700H
2333 (2007.13min - 2332.91max) Points +40%
SCHENKER Vision 14 2022 RTX 3050 Ti
Intel Core i7-12700H
2166 (1948.94min - 2166.26max) Points +30%
Lenovo Yoga 9 14IRP G8
Intel Core i7-1360P
2115 (1611.41min - 2114.84max) Points +27%
Apple MacBook Pro 14 2023 M2 Pro
Apple M2 Pro
2069 (2052.12min, 2054.58P1 - 2075.23max) Points +24%
Lenovo Yoga 7-14ARB G7
AMD Ryzen 7 6800U
1978.53 (1657.55min, 1658.26P1 - 1978.53max) Points +19%
Apple MacBook Pro 16 2021 M1 Pro
Apple M1 Pro
1690 (1675min - 1690max) Points +2%
Apple MacBook Pro 14 2023 M2 Pro Entry
Apple M2 Pro 10-Core
1664 (1643min - 1664max) Points
Average Apple M2 Pro 10-Core
  ()
1664 Points 0%
Apple MacBook Pro 14 2021 M1 Pro Entry
Apple M1 Pro 8-Core
1320 (1307min - 1320max) Points -21%
Apple MacBook Air M2 10C GPU
Apple M2
1212 (917min - 1212max) Points -27%
Microsoft Surface Laptop Studio i7 RTX 3050 Ti
Intel Core i7-11370H
1008 (936.68min - 1007.91max) Points -39%
Cinebench R15 / CPU Single 64Bit
Lenovo Yoga 9 14IRP G8
Intel Core i7-1360P
271 Points +17%
SCHENKER Vision 14 2022 RTX 3050 Ti
Intel Core i7-12700H
263 Points +14%
Average of class Multimedia
  (99.6 - 323, n=88, last 2 years)
257 Points +11%
Lenovo Yoga Slim 7 Pro X 14IAH7 82TK006CGE
Intel Core i7-12700H
245 Points +6%
Lenovo Yoga 7-14ARB G7
AMD Ryzen 7 6800U
243 Points +5%
Apple MacBook Pro 14 2023 M2 Pro Entry
Apple M2 Pro 10-Core
231 Points
Average Apple M2 Pro 10-Core
  ()
231 Points 0%
Apple MacBook Pro 14 2023 M2 Pro
Apple M2 Pro
230 Points 0%
Microsoft Surface Laptop Studio i7 RTX 3050 Ti
Intel Core i7-11370H
223 Points -3%
Apple MacBook Air M2 10C GPU
Apple M2
223 Points -3%
Apple MacBook Pro 14 2021 M1 Pro Entry
Apple M1 Pro 8-Core
210 Points -9%
Apple MacBook Pro 16 2021 M1 Pro
Apple M1 Pro
209 Points -10%
Blender / v2.79 BMW27 CPU
Apple MacBook Air M2 10C GPU
Apple M2
616.7 Seconds * -49%
Microsoft Surface Laptop Studio i7 RTX 3050 Ti
Intel Core i7-11370H
491 Seconds * -18%
Apple MacBook Pro 14 2023 M2 Pro Entry
Apple M2 Pro 10-Core
415 Seconds *
Average Apple M2 Pro 10-Core
  ()
415 Seconds * -0%
Lenovo Yoga 9 14IRP G8
Intel Core i7-1360P
289 Seconds * +30%
Lenovo Yoga 7-14ARB G7
AMD Ryzen 7 6800U
272 Seconds * +34%
SCHENKER Vision 14 2022 RTX 3050 Ti
Intel Core i7-12700H
262 Seconds * +37%
Average of class Multimedia
  (107 - 502, n=85, last 2 years)
251 Seconds * +40%
Lenovo Yoga Slim 7 Pro X 14IAH7 82TK006CGE
Intel Core i7-12700H
225 Seconds * +46%
Apple MacBook Pro 16 2021 M1 Pro
Apple M1 Pro
183.3 Seconds * +56%
Geekbench 5.5 / Multi-Core
Apple MacBook Pro 14 2023 M2 Pro
Apple M2 Pro
14859 Points +22%
Lenovo Yoga Slim 7 Pro X 14IAH7 82TK006CGE
Intel Core i7-12700H
12843 Points +5%
Apple MacBook Pro 16 2021 M1 Pro
Apple M1 Pro
12499 Points +3%
Apple MacBook Pro 14 2023 M2 Pro Entry
Apple M2 Pro 10-Core
12189 Points
Average Apple M2 Pro 10-Core
  (12074 - 12189, n=2)
12132 Points 0%
Average of class Multimedia
  (4990 - 23059, n=87, last 2 years)
12033 Points -1%
SCHENKER Vision 14 2022 RTX 3050 Ti
Intel Core i7-12700H
10976 Points -10%
Lenovo Yoga 9 14IRP G8
Intel Core i7-1360P
10785 Points -12%
Apple MacBook Pro 14 2021 M1 Pro Entry
Apple M1 Pro 8-Core
9942 Points -18%
Apple MacBook Air M2 10C GPU
Apple M2
8991 Points -26%
Lenovo Yoga 7-14ARB G7
AMD Ryzen 7 6800U
8935 Points -27%
Microsoft Surface Laptop Studio i7 RTX 3050 Ti
Intel Core i7-11370H
5701 Points -53%
Geekbench 5.5 / Single-Core
Apple MacBook Pro 14 2023 M2 Pro
Apple M2 Pro
1961 Points +2%
Average Apple M2 Pro 10-Core
  (1926 - 1947, n=2)
1937 Points +1%
Apple MacBook Pro 14 2023 M2 Pro Entry
Apple M2 Pro 10-Core
1926 Points
Apple MacBook Air M2 10C GPU
Apple M2
1925 Points 0%
Average of class Multimedia
  (891 - 2342, n=87, last 2 years)
1817 Points -6%
Lenovo Yoga 9 14IRP G8
Intel Core i7-1360P
1790 Points -7%
SCHENKER Vision 14 2022 RTX 3050 Ti
Intel Core i7-12700H
1778 Points -8%
Apple MacBook Pro 14 2021 M1 Pro Entry
Apple M1 Pro 8-Core
1769 Points -8%
Apple MacBook Pro 16 2021 M1 Pro
Apple M1 Pro
1768 Points -8%
Lenovo Yoga Slim 7 Pro X 14IAH7 82TK006CGE
Intel Core i7-12700H
1762 Points -9%
Lenovo Yoga 7-14ARB G7
AMD Ryzen 7 6800U
1555 Points -19%
Microsoft Surface Laptop Studio i7 RTX 3050 Ti
Intel Core i7-11370H
1551 Points -19%
Blender / v3.3 Classroom CPU
Apple MacBook Air M2 10C GPU
Apple M2
645 Seconds * -48%
Lenovo Yoga 9 14IRP G8
Intel Core i7-1360P
527 Seconds * -21%
Lenovo Yoga 7-14ARB G7
AMD Ryzen 7 6800U
504 Seconds * -16%
SCHENKER Vision 14 2022 RTX 3050 Ti
Intel Core i7-12700H
456 Seconds * -5%
Apple MacBook Pro 14 2023 M2 Pro Entry
Apple M2 Pro 10-Core
435 Seconds *
Average Apple M2 Pro 10-Core
  ()
435 Seconds * -0%
Average of class Multimedia
  (189 - 946, n=86, last 2 years)
426 Seconds * +2%
Lenovo Yoga Slim 7 Pro X 14IAH7 82TK006CGE
Intel Core i7-12700H
388 Seconds * +11%
Apple MacBook Pro 14 2023 M2 Pro
Apple M2 Pro
331 Seconds * +24%

* ... smaller is better

Cinebench R15 CPU Single 64Bit
231 Points
Cinebench R15 OpenGL 64Bit
141.9 fps
Cinebench R15 Ref. Match 64Bit
99.5 %
Cinebench R15 CPU Multi 64Bit
1664 Points
Help

说到效率,M2 Pro入门版在单核和多核测量中都落后于速度更快的M2 Pro,也落后于MacBook Air的普通M2 SoC。

英特尔在Raptor Lake上的效率无法与M2 Pro相比,但AMD Ryzen 7 6800U在多核效率测试中只是略微落后于M2 Pro。

我们在综合分析中研究了M2 Pro和M2 Max SoC的性能和功率效率指标

Power Consumption
Cinebench R23 Multi Power Efficiency - external Monitor
Apple MacBook Air M2 10C GPU
M2 10-Core GPU, M2, Apple SSD AP1024Z
342 Points per Watt +37%
Apple MacBook Pro 14 2023 M2 Pro
M2 Pro 19-Core GPU, M2 Pro, Apple SSD AP2048Z
275 Points per Watt +10%
Apple MacBook Pro 14 2023 M2 Pro Entry
M2 Pro 16-Core GPU, M2 Pro 10-Core, Apple SSD AP0512Z
250 Points per Watt
Lenovo Yoga 7-14ARB G7
Radeon 680M, R7 6800U, Kioxia BG5 KBG50ZNT1T02
232 Points per Watt -7%
Lenovo Yoga 9 14IRP G8
Iris Xe G7 96EUs, i7-1360P, SK hynix PC801 HFS512GEJ9X101N BF
183.7 Points per Watt -27%
SCHENKER Vision 14 2022 RTX 3050 Ti
GeForce RTX 3050 Ti Laptop GPU, i7-12700H, Samsung SSD 980 Pro 1TB MZ-V8P1T0BW
153.8 Points per Watt -38%
Cinebench R23 Single Power Efficiency - external Monitor
Apple MacBook Air M2 10C GPU
M2 10-Core GPU, M2, Apple SSD AP1024Z
173.1 Points per Watt +46%
Apple MacBook Pro 14 2023 M2 Pro
M2 Pro 19-Core GPU, M2 Pro, Apple SSD AP2048Z
140.8 Points per Watt +19%
Apple MacBook Pro 14 2023 M2 Pro Entry
M2 Pro 16-Core GPU, M2 Pro 10-Core, Apple SSD AP0512Z
118.2 Points per Watt
Lenovo Yoga 7-14ARB G7
Radeon 680M, R7 6800U, Kioxia BG5 KBG50ZNT1T02
55 Points per Watt -53%
Lenovo Yoga 9 14IRP G8
Iris Xe G7 96EUs, i7-1360P, SK hynix PC801 HFS512GEJ9X101N BF
48 Points per Watt -59%
SCHENKER Vision 14 2022 RTX 3050 Ti
GeForce RTX 3050 Ti Laptop GPU, i7-12700H, Samsung SSD 980 Pro 1TB MZ-V8P1T0BW
36 Points per Watt -70%

系统性能

主观上,基础的2023年MacBook Pro 14在整体系统性能上似乎与更高级的MacBook Pro 14和MacBook Pro 16机型相似。虽然原生应用程序确实运行得更好,但在测试过程中,我们没有遇到仿真应用程序的任何问题。

这一点在Photoshop和Premiere Pro等Adobe应用程序中得到了最好的说明。这里显示的PugetBench结果是通过这些应用程序的模拟X86版本获得的,并不反映实际性能。在跨平台的CrossMark测试中,结果非常好。

CrossMark: Overall | Productivity | Creativity | Responsiveness
Premiere Pro PugetBench: Overall Score 0.9
Photoshop PugetBench: Overall Score
Blackmagic RAW Speed Test: 12:1 8K Metal | 12:1 8K CPU
Jetstream 2: Total Score
Speedometer 2.0: Result
WebXPRT 4: Overall
WebXPRT 3: Overall
CrossMark / Overall
Apple MacBook Pro 14 2023 M2 Pro
M2 Pro 19-Core GPU, M2 Pro, Apple SSD AP2048Z
1812 Points +2%
Lenovo Yoga Slim 7 Pro X 14IAH7 82TK006CGE
GeForce RTX 3050 4GB Laptop GPU, i7-12700H, Micron 3400 1TB MTFDKBA1T0TFH
1786 Points +1%
Apple MacBook Pro 14 2023 M2 Pro Entry
M2 Pro 16-Core GPU, M2 Pro 10-Core, Apple SSD AP0512Z
1772 Points
Average Apple M2 Pro 10-Core, Apple M2 Pro 16-Core GPU
  ()
1772 Points 0%
Lenovo Yoga 9 14IRP G8
Iris Xe G7 96EUs, i7-1360P, SK hynix PC801 HFS512GEJ9X101N BF
1756 Points -1%
Average of class Multimedia
  (978 - 2184, n=86, last 2 years)
1692 Points -5%
SCHENKER Vision 14 2022 RTX 3050 Ti
GeForce RTX 3050 Ti Laptop GPU, i7-12700H, Samsung SSD 980 Pro 1TB MZ-V8P1T0BW
1654 Points -7%
Lenovo Yoga 7-14ARB G7
Radeon 680M, R7 6800U, Kioxia BG5 KBG50ZNT1T02
1571 Points -11%
Apple MacBook Air M2 10C GPU
M2 10-Core GPU, M2, Apple SSD AP1024Z
1496 Points -16%
Apple MacBook Pro 14 2021 M1 Pro Entry
M1 Pro 14-Core GPU, M1 Pro 8-Core, Apple SSD AP0512
1490 Points -16%
Microsoft Surface Laptop Studio i7 RTX 3050 Ti
GeForce RTX 3050 Ti Laptop GPU, i7-11370H, SK Hynix PC711 1TB HFS001TDE9X084N
1407 Points -21%
CrossMark / Productivity
Lenovo Yoga 9 14IRP G8
Iris Xe G7 96EUs, i7-1360P, SK hynix PC801 HFS512GEJ9X101N BF
1669 Points +8%
Lenovo Yoga Slim 7 Pro X 14IAH7 82TK006CGE
GeForce RTX 3050 4GB Laptop GPU, i7-12700H, Micron 3400 1TB MTFDKBA1T0TFH
1653 Points +7%
SCHENKER Vision 14 2022 RTX 3050 Ti
GeForce RTX 3050 Ti Laptop GPU, i7-12700H, Samsung SSD 980 Pro 1TB MZ-V8P1T0BW
1625 Points +5%
Average of class Multimedia
  (913 - 2064, n=86, last 2 years)
1606 Points +4%
Apple MacBook Pro 14 2023 M2 Pro
M2 Pro 19-Core GPU, M2 Pro, Apple SSD AP2048Z
1562 Points +1%
Lenovo Yoga 7-14ARB G7
Radeon 680M, R7 6800U, Kioxia BG5 KBG50ZNT1T02
1552 Points +1%
Apple MacBook Pro 14 2023 M2 Pro Entry
M2 Pro 16-Core GPU, M2 Pro 10-Core, Apple SSD AP0512Z
1543 Points
Average Apple M2 Pro 10-Core, Apple M2 Pro 16-Core GPU
  ()
1543 Points 0%
Microsoft Surface Laptop Studio i7 RTX 3050 Ti
GeForce RTX 3050 Ti Laptop GPU, i7-11370H, SK Hynix PC711 1TB HFS001TDE9X084N
1417 Points -8%
Apple MacBook Air M2 10C GPU
M2 10-Core GPU, M2, Apple SSD AP1024Z
1377 Points -11%
Apple MacBook Pro 14 2021 M1 Pro Entry
M1 Pro 14-Core GPU, M1 Pro 8-Core, Apple SSD AP0512
1305 Points -15%
CrossMark / Creativity
Apple MacBook Pro 14 2023 M2 Pro
M2 Pro 19-Core GPU, M2 Pro, Apple SSD AP2048Z
2330 Points +4%
Apple MacBook Pro 14 2023 M2 Pro Entry
M2 Pro 16-Core GPU, M2 Pro 10-Core, Apple SSD AP0512Z
2239 Points
Average Apple M2 Pro 10-Core, Apple M2 Pro 16-Core GPU
  ()
2239 Points 0%
Lenovo Yoga Slim 7 Pro X 14IAH7 82TK006CGE
GeForce RTX 3050 4GB Laptop GPU, i7-12700H, Micron 3400 1TB MTFDKBA1T0TFH
2049 Points -8%
Lenovo Yoga 9 14IRP G8
Iris Xe G7 96EUs, i7-1360P, SK hynix PC801 HFS512GEJ9X101N BF
1947 Points -13%
Apple MacBook Pro 14 2021 M1 Pro Entry
M1 Pro 14-Core GPU, M1 Pro 8-Core, Apple SSD AP0512
1915 Points -14%
Average of class Multimedia
  (1054 - 2564, n=86, last 2 years)
1893 Points -15%
Apple MacBook Air M2 10C GPU
M2 10-Core GPU, M2, Apple SSD AP1024Z
1819 Points -19%
SCHENKER Vision 14 2022 RTX 3050 Ti
GeForce RTX 3050 Ti Laptop GPU, i7-12700H, Samsung SSD 980 Pro 1TB MZ-V8P1T0BW
1727 Points -23%
Lenovo Yoga 7-14ARB G7
Radeon 680M, R7 6800U, Kioxia BG5 KBG50ZNT1T02
1686 Points -25%
Microsoft Surface Laptop Studio i7 RTX 3050 Ti
GeForce RTX 3050 Ti Laptop GPU, i7-11370H, SK Hynix PC711 1TB HFS001TDE9X084N
1472 Points -34%
CrossMark / Responsiveness
SCHENKER Vision 14 2022 RTX 3050 Ti
GeForce RTX 3050 Ti Laptop GPU, i7-12700H, Samsung SSD 980 Pro 1TB MZ-V8P1T0BW
1531 Points +15%
Lenovo Yoga 9 14IRP G8
Iris Xe G7 96EUs, i7-1360P, SK hynix PC801 HFS512GEJ9X101N BF
1500 Points +13%
Lenovo Yoga Slim 7 Pro X 14IAH7 82TK006CGE
GeForce RTX 3050 4GB Laptop GPU, i7-12700H, Micron 3400 1TB MTFDKBA1T0TFH
1491 Points +12%
Average of class Multimedia
  (869 - 2171, n=86, last 2 years)
1434 Points +8%
Apple MacBook Pro 14 2023 M2 Pro
M2 Pro 19-Core GPU, M2 Pro, Apple SSD AP2048Z
1333 Points 0%
Apple MacBook Pro 14 2023 M2 Pro Entry
M2 Pro 16-Core GPU, M2 Pro 10-Core, Apple SSD AP0512Z
1329 Points
Average Apple M2 Pro 10-Core, Apple M2 Pro 16-Core GPU
  ()
1329 Points 0%
Lenovo Yoga 7-14ARB G7
Radeon 680M, R7 6800U, Kioxia BG5 KBG50ZNT1T02
1319 Points -1%
Microsoft Surface Laptop Studio i7 RTX 3050 Ti
GeForce RTX 3050 Ti Laptop GPU, i7-11370H, SK Hynix PC711 1TB HFS001TDE9X084N
1202 Points -10%
Apple MacBook Air M2 10C GPU
M2 10-Core GPU, M2, Apple SSD AP1024Z
1065 Points -20%
Apple MacBook Pro 14 2021 M1 Pro Entry
M1 Pro 14-Core GPU, M1 Pro 8-Core, Apple SSD AP0512
1044 Points -21%
Premiere Pro PugetBench / Overall Score 0.9
Apple MacBook Pro 14 2023 M2 Pro
M2 Pro 19-Core GPU, M2 Pro, Apple SSD AP2048Z
913 Points +6%
Average of class Multimedia
  (686 - 1118, n=4, last 2 years)
895 Points +4%
Apple MacBook Pro 14 2023 M2 Pro Entry
M2 Pro 16-Core GPU, M2 Pro 10-Core, Apple SSD AP0512Z
861 Points
Average Apple M2 Pro 10-Core, Apple M2 Pro 16-Core GPU
  ()
861 Points 0%
Apple MacBook Pro 14 2021 M1 Pro Entry
M1 Pro 14-Core GPU, M1 Pro 8-Core, Apple SSD AP0512
837 Points -3%
Apple MacBook Air M2 10C GPU
M2 10-Core GPU, M2, Apple SSD AP1024Z
500 Points -42%
Microsoft Surface Laptop Studio i7 RTX 3050 Ti
GeForce RTX 3050 Ti Laptop GPU, i7-11370H, SK Hynix PC711 1TB HFS001TDE9X084N
455 Points -47%
Photoshop PugetBench / Overall Score
Average of class Multimedia
  (947 - 1442, n=11, last 2 years)
1150 Points +21%
Apple MacBook Pro 14 2023 M2 Pro
M2 Pro 19-Core GPU, M2 Pro, Apple SSD AP2048Z
1075 Points +14%
Apple MacBook Pro 14 2023 M2 Pro Entry
M2 Pro 16-Core GPU, M2 Pro 10-Core, Apple SSD AP0512Z
947 Points
Average Apple M2 Pro 10-Core, Apple M2 Pro 16-Core GPU
  ()
947 Points 0%
Apple MacBook Air M2 10C GPU
M2 10-Core GPU, M2, Apple SSD AP1024Z
828 Points -13%
Microsoft Surface Laptop Studio i7 RTX 3050 Ti
GeForce RTX 3050 Ti Laptop GPU, i7-11370H, SK Hynix PC711 1TB HFS001TDE9X084N
726 Points -23%
Apple MacBook Pro 14 2021 M1 Pro Entry
M1 Pro 14-Core GPU, M1 Pro 8-Core, Apple SSD AP0512
667 Points -30%
Blackmagic RAW Speed Test / 12:1 8K Metal
Average of class Multimedia
  (67 - 294, n=8, last 2 years)
176.9 fps +11%
Apple MacBook Pro 14 2023 M2 Pro
M2 Pro 19-Core GPU, M2 Pro, Apple SSD AP2048Z
169 fps +6%
Apple MacBook Pro 14 2023 M2 Pro Entry
M2 Pro 16-Core GPU, M2 Pro 10-Core, Apple SSD AP0512Z
159 fps
Average Apple M2 Pro 10-Core, Apple M2 Pro 16-Core GPU
  ()
159 fps 0%
Apple MacBook Pro 14 2021 M1 Pro Entry
M1 Pro 14-Core GPU, M1 Pro 8-Core, Apple SSD AP0512
133 fps -16%
Apple MacBook Air M2 10C GPU
M2 10-Core GPU, M2, Apple SSD AP1024Z
80 fps -50%
Blackmagic RAW Speed Test / 12:1 8K CPU
Average of class Multimedia
  (32 - 68, n=8, last 2 years)
46.4 fps +36%
Apple MacBook Pro 14 2023 M2 Pro
M2 Pro 19-Core GPU, M2 Pro, Apple SSD AP2048Z
43 fps +26%
Apple MacBook Pro 14 2023 M2 Pro Entry
M2 Pro 16-Core GPU, M2 Pro 10-Core, Apple SSD AP0512Z
34 fps
Average Apple M2 Pro 10-Core, Apple M2 Pro 16-Core GPU
  ()
34 fps 0%
Apple MacBook Air M2 10C GPU
M2 10-Core GPU, M2, Apple SSD AP1024Z
24 fps -29%
Apple MacBook Pro 14 2021 M1 Pro Entry
M1 Pro 14-Core GPU, M1 Pro 8-Core, Apple SSD AP0512
21 fps -38%
Jetstream 2 / Total Score
Average of class Multimedia
  (150.6 - 374, n=55, last 2 years)
284 Points +21%
Lenovo Yoga 9 14IRP G8
Iris Xe G7 96EUs, i7-1360P, SK hynix PC801 HFS512GEJ9X101N BF
282 Points +20%
SCHENKER Vision 14 2022 RTX 3050 Ti
GeForce RTX 3050 Ti Laptop GPU, i7-12700H, Samsung SSD 980 Pro 1TB MZ-V8P1T0BW
264.4 Points +13%
Apple MacBook Pro 14 2023 M2 Pro
M2 Pro 19-Core GPU, M2 Pro, Apple SSD AP2048Z
239 Points +2%
Lenovo Yoga 7-14ARB G7
Radeon 680M, R7 6800U, Kioxia BG5 KBG50ZNT1T02
236.3 Points +1%
Average Apple M2 Pro 10-Core, Apple M2 Pro 16-Core GPU
  ()
235 Points 0%
Apple MacBook Pro 14 2023 M2 Pro Entry
M2 Pro 16-Core GPU, M2 Pro 10-Core, Apple SSD AP0512Z
234.8 Points
Apple MacBook Air M2 10C GPU
M2 10-Core GPU, M2, Apple SSD AP1024Z
226.8 Points -3%
Apple MacBook Pro 14 2021 M1 Pro Entry
M1 Pro 14-Core GPU, M1 Pro 8-Core, Apple SSD AP0512
207.9 Points -11%
Microsoft Surface Laptop Studio i7 RTX 3050 Ti
GeForce RTX 3050 Ti Laptop GPU, i7-11370H, SK Hynix PC711 1TB HFS001TDE9X084N
192.8 Points -18%
Speedometer 2.0 / Result
Apple MacBook Pro 14 2023 M2 Pro
M2 Pro 19-Core GPU, M2 Pro, Apple SSD AP2048Z
403 runs/min +2%
Apple MacBook Pro 14 2023 M2 Pro Entry
M2 Pro 16-Core GPU, M2 Pro 10-Core, Apple SSD AP0512Z
395 runs/min
Average Apple M2 Pro 10-Core, Apple M2 Pro 16-Core GPU
  ()
395 runs/min 0%
Apple MacBook Air M2 10C GPU
M2 10-Core GPU, M2, Apple SSD AP1024Z
392 runs/min -1%
Average of class Multimedia
  (169 - 562, n=41, last 2 years)
375 runs/min -5%
SCHENKER Vision 14 2022 RTX 3050 Ti
GeForce RTX 3050 Ti Laptop GPU, i7-12700H, Samsung SSD 980 Pro 1TB MZ-V8P1T0BW
307 runs/min -22%
Lenovo Yoga 9 14IRP G8
Iris Xe G7 96EUs, i7-1360P, SK hynix PC801 HFS512GEJ9X101N BF
275 runs/min -30%
Apple MacBook Pro 14 2021 M1 Pro Entry
M1 Pro 14-Core GPU, M1 Pro 8-Core, Apple SSD AP0512
262 runs/min -34%
Lenovo Yoga 7-14ARB G7
Radeon 680M, R7 6800U, Kioxia BG5 KBG50ZNT1T02
225 runs/min -43%
Microsoft Surface Laptop Studio i7 RTX 3050 Ti
GeForce RTX 3050 Ti Laptop GPU, i7-11370H, SK Hynix PC711 1TB HFS001TDE9X084N
198 runs/min -50%
WebXPRT 4 / Overall
Lenovo Yoga 9 14IRP G8
Iris Xe G7 96EUs, i7-1360P, SK hynix PC801 HFS512GEJ9X101N BF
263 Points +5%
SCHENKER Vision 14 2022 RTX 3050 Ti
GeForce RTX 3050 Ti Laptop GPU, i7-12700H, Samsung SSD 980 Pro 1TB MZ-V8P1T0BW
256 Points +2%
Average of class Multimedia
  (133.2 - 348, n=76, last 2 years)
256 Points +2%
Apple MacBook Pro 14 2023 M2 Pro
M2 Pro 19-Core GPU, M2 Pro, Apple SSD AP2048Z
253 Points +1%
Apple MacBook Pro 14 2023 M2 Pro Entry
M2 Pro 16-Core GPU, M2 Pro 10-Core, Apple SSD AP0512Z
250 Points
Average Apple M2 Pro 10-Core, Apple M2 Pro 16-Core GPU
  ()
250 Points 0%
Lenovo Yoga Slim 7 Pro X 14IAH7 82TK006CGE
GeForce RTX 3050 4GB Laptop GPU, i7-12700H, Micron 3400 1TB MTFDKBA1T0TFH
249 Points 0%
Apple MacBook Air M2 10C GPU
M2 10-Core GPU, M2, Apple SSD AP1024Z
225 Points -10%
Lenovo Yoga 7-14ARB G7
Radeon 680M, R7 6800U, Kioxia BG5 KBG50ZNT1T02
213 Points -15%
WebXPRT 3 / Overall
Apple MacBook Pro 14 2023 M2 Pro Entry
M2 Pro 16-Core GPU, M2 Pro 10-Core, Apple SSD AP0512Z
391 Points
Average Apple M2 Pro 10-Core, Apple M2 Pro 16-Core GPU
  ()
391 Points 0%
Apple MacBook Pro 14 2023 M2 Pro
M2 Pro 19-Core GPU, M2 Pro, Apple SSD AP2048Z
386 Points -1%
Apple MacBook Air M2 10C GPU
M2 10-Core GPU, M2, Apple SSD AP1024Z
375 Points -4%
Apple MacBook Pro 14 2021 M1 Pro Entry
M1 Pro 14-Core GPU, M1 Pro 8-Core, Apple SSD AP0512
343 Points -12%
Average of class Multimedia
  (136.4 - 476, n=83, last 2 years)
307 Points -21%
Lenovo Yoga 9 14IRP G8
Iris Xe G7 96EUs, i7-1360P, SK hynix PC801 HFS512GEJ9X101N BF
306 Points -22%
SCHENKER Vision 14 2022 RTX 3050 Ti
GeForce RTX 3050 Ti Laptop GPU, i7-12700H, Samsung SSD 980 Pro 1TB MZ-V8P1T0BW
301 Points -23%
Lenovo Yoga 7-14ARB G7
Radeon 680M, R7 6800U, Kioxia BG5 KBG50ZNT1T02
270 Points -31%
Microsoft Surface Laptop Studio i7 RTX 3050 Ti
GeForce RTX 3050 Ti Laptop GPU, i7-11370H, SK Hynix PC711 1TB HFS001TDE9X084N
248 Points -37%

存储设备

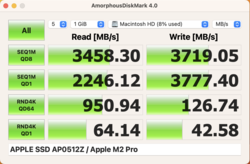
AmorphousDiskMarkApple AP0512Z
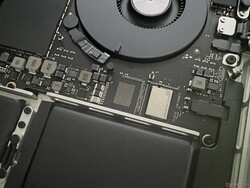
基本的MacBook Pro 14只使用一个SSD芯片

我们现在来到有争议的MacBook SSD性能问题。Apple ,在新的MacBook Air入口处安装了更大的SSD,这导致其性能比旧型号更慢。这是因为macOS可以在内存满时将数据卸载到固态硬盘上,这对整体性能会产生负面影响。

在新的2023年MacBook Pro 14中,只使用了一个512GB的SSD芯片。坏消息是,其性能明显不如2021年的MacBook Pro 14和目前采用1TB存储的机型。很明显,PCIe Gen 4的速度在这里没有得到充分的利用。

尽管如此,积极的方面是,整体性能仍然比 M2 MacBook Air入门配备256GB固态硬盘。当然,人们可以争辩说,专业机型应该有更快的存储,而且考虑到增加的MSRP,Apple ,完全可以提供一个1TB驱动器作为标准配置。然而,在实践中,512GB应该仍然是相当足够的,而且比M2 MacBook Air的1TB闪存更快。 M2 MacBook Air.

更多的SSD基准测试可以在这里找到Laptop harddisks (HDD, SSD) benchmarks

Drive Performance Rating - Percent
Apple MacBook Pro 14 2023 M2 Pro
Apple SSD AP2048Z
99.2 pt
Average of class Multimedia
 
85.1 pt
Apple MacBook Pro 14 2021 M1 Pro Entry
Apple SSD AP0512
84.9 pt
Average Apple SSD AP0512Z
 
58.9 pt
Apple MacBook Pro 14 2023 M2 Pro Entry
Apple SSD AP0512Z
53.9 pt
Apple MacBook Air M2 10C GPU
Apple SSD AP1024Z
49.3 pt
Blackmagic Disk Speed Test
5GB Read
Apple MacBook Pro 14 2021 M1 Pro Entry
Apple SSD AP0512
5448 MB/s +88%
Apple MacBook Pro 14 2023 M2 Pro
Apple SSD AP2048Z
5359.8 MB/s +85%
Average of class Multimedia
  (2877 - 5666, n=9, last 2 years)
4638 MB/s +60%
Average Apple SSD AP0512Z
  (2896 - 4756, n=7)
3422 MB/s +18%
Apple MacBook Pro 14 2023 M2 Pro Entry
Apple SSD AP0512Z
2901.3 MB/s
Apple MacBook Air M2 10C GPU
Apple SSD AP1024Z
2796.5 MB/s -4%
5GB Write
Apple MacBook Pro 14 2023 M2 Pro
Apple SSD AP2048Z
6388.9 MB/s +83%
Average of class Multimedia
  (2993 - 8271, n=9, last 2 years)
5440 MB/s +56%
Apple MacBook Pro 14 2021 M1 Pro Entry
Apple SSD AP0512
4463 MB/s +28%
Average Apple SSD AP0512Z
  (3123 - 4199, n=7)
3517 MB/s +1%
Apple MacBook Pro 14 2023 M2 Pro Entry
Apple SSD AP0512Z
3489.5 MB/s
Apple MacBook Air M2 10C GPU
Apple SSD AP1024Z
3017.3 MB/s -14%

GPU性能

的GPU。 基础版M2 Pro的GPU现在具有16个而不是14个核心,最大时钟为1.4GHz。这使M2 Pro的入门级GPU比M1 Pro的16核GPU领先约7%。 16核GPU的M1 Pro.装备19核心的 配备19核GPU的M2 Pro的速度约为12-17%,具体取决于测试。

在3DMark WildLife中,它在Apple 硅片上原生运行,即使是 NvidiaGeForce RTX 3050 Ti Laptop GPU中的 微软Surface Laptop StudioSchenker Vision 14都被入门级的M2 Pro GPU打败了。英特尔和AMD的集成GPU则处于明显的劣势。

入门级M2 Pro的图形性能在长时间的负载和电池供电的情况下都保持完全稳定。

更多的GPU基准测试和性能比较可在这里移动显示芯片——基准测试成绩列表

3DMark
Wild Life Extreme Unlimited
Apple MacBook Pro 14 2023 M2 Pro
Apple M2 Pro 19-Core GPU, Apple M2 Pro
12968 Points +16%
Apple MacBook Pro 14 2023 M2 Pro Entry
Apple M2 Pro 16-Core GPU, Apple M2 Pro 10-Core
11224 Points
Apple MacBook Pro 16 2021 M1 Pro
Apple M1 Pro 16-Core GPU, Apple M1 Pro
10352 Points -8%
Microsoft Surface Laptop Studio i7 RTX 3050 Ti
NVIDIA GeForce RTX 3050 Ti Laptop GPU, Intel Core i7-11370H
9565 Points -15%
SCHENKER Vision 14 2022 RTX 3050 Ti
NVIDIA GeForce RTX 3050 Ti Laptop GPU, Intel Core i7-12700H
9340 Points -17%
Apple MacBook Pro 14 2021 M1 Pro Entry
Apple M1 Pro 14-Core GPU, Apple M1 Pro 8-Core
9267 Points -17%
Apple MacBook Air M2 10C GPU
Apple M2 10-Core GPU, Apple M2
6824 Points -39%
Lenovo Yoga 9 14IRP G8
Intel Iris Xe Graphics G7 96EUs, Intel Core i7-1360P
4221 Points -62%
Lenovo Yoga 7-14ARB G7
AMD Radeon 680M, AMD Ryzen 7 6800U
3960 Points -65%
Wild Life Extreme
Apple MacBook Pro 14 2023 M2 Pro
Apple M2 Pro 19-Core GPU, Apple M2 Pro
12875 Points +16%
Apple MacBook Pro 14 2023 M2 Pro Entry
Apple M2 Pro 16-Core GPU, Apple M2 Pro 10-Core
11105 Points
Apple MacBook Pro 16 2021 M1 Pro
Apple M1 Pro 16-Core GPU, Apple M1 Pro
10351 Points -7%
Microsoft Surface Laptop Studio i7 RTX 3050 Ti
NVIDIA GeForce RTX 3050 Ti Laptop GPU, Intel Core i7-11370H
9501 Points -14%
SCHENKER Vision 14 2022 RTX 3050 Ti
NVIDIA GeForce RTX 3050 Ti Laptop GPU, Intel Core i7-12700H
9404 Points -15%
Apple MacBook Pro 14 2021 M1 Pro Entry
Apple M1 Pro 14-Core GPU, Apple M1 Pro 8-Core
9089 Points -18%
Apple MacBook Air M2 10C GPU
Apple M2 10-Core GPU, Apple M2
6772 Points -39%
Lenovo Yoga 7-14ARB G7
AMD Radeon 680M, AMD Ryzen 7 6800U
4240 Points -62%
Lenovo Yoga 9 14IRP G8
Intel Iris Xe Graphics G7 96EUs, Intel Core i7-1360P
4237 Points -62%
GFXBench
3840x2160 4K Aztec Ruins High Tier Offscreen
Apple MacBook Pro 14 2023 M2 Pro
Apple M2 Pro 19-Core GPU, Apple M2 Pro
92.1 fps +17%
Apple MacBook Pro 14 2023 M2 Pro Entry
Apple M2 Pro 16-Core GPU, Apple M2 Pro 10-Core
78.7 fps
Apple MacBook Pro 16 2021 M1 Pro
Apple M1 Pro 16-Core GPU, Apple M1 Pro
71.7 fps -9%
Apple MacBook Air M2 10C GPU
Apple M2 10-Core GPU, Apple M2
48.6 fps -38%
2560x1440 Aztec Ruins High Tier Offscreen
Apple MacBook Pro 14 2023 M2 Pro
Apple M2 Pro 19-Core GPU, Apple M2 Pro
210.4 fps +16%
Apple MacBook Pro 14 2023 M2 Pro Entry
Apple M2 Pro 16-Core GPU, Apple M2 Pro 10-Core
181.1 fps
Apple MacBook Pro 16 2021 M1 Pro
Apple M1 Pro 16-Core GPU, Apple M1 Pro
166 fps -8%
Apple MacBook Pro 14 2021 M1 Pro Entry
Apple M1 Pro 14-Core GPU, Apple M1 Pro 8-Core
147 fps -19%
Apple MacBook Air M2 10C GPU
Apple M2 10-Core GPU, Apple M2
110 fps -39%
Microsoft Surface Laptop Studio i7 RTX 3050 Ti
NVIDIA GeForce RTX 3050 Ti Laptop GPU, Intel Core i7-11370H
108 fps -40%
1920x1080 Car Chase Offscreen
Apple MacBook Pro 14 2023 M2 Pro
Apple M2 Pro 19-Core GPU, Apple M2 Pro
434.4 fps +12%
Apple MacBook Pro 14 2023 M2 Pro Entry
Apple M2 Pro 16-Core GPU, Apple M2 Pro 10-Core
389 fps
Apple MacBook Pro 16 2021 M1 Pro
Apple M1 Pro 16-Core GPU, Apple M1 Pro
345 fps -11%
Apple MacBook Pro 14 2021 M1 Pro Entry
Apple M1 Pro 14-Core GPU, Apple M1 Pro 8-Core
316 fps -19%
Microsoft Surface Laptop Studio i7 RTX 3050 Ti
NVIDIA GeForce RTX 3050 Ti Laptop GPU, Intel Core i7-11370H
252 fps -35%
Apple MacBook Air M2 10C GPU
Apple M2 10-Core GPU, Apple M2
226 fps -42%
Geekbench 6.0
GPU Metal
Apple MacBook Pro 14 2023 M2 Pro Entry
Apple M2 Pro 16-Core GPU, Apple M2 Pro 10-Core
73104 Points
Apple MacBook Pro 16 2021 M1 Pro
Apple M1 Pro 16-Core GPU, Apple M1 Pro
67095 Points -8%
GPU OpenCL 6.0
Apple MacBook Pro 14 2023 M2 Pro Entry
Apple M2 Pro 16-Core GPU, Apple M2 Pro 10-Core
43717 Points
Apple MacBook Pro 16 2021 M1 Pro
Apple M1 Pro 16-Core GPU, Apple M1 Pro
40953 Points -6%
Geekbench 5.5
OpenCL Score
SCHENKER Vision 14 2022 RTX 3050 Ti
NVIDIA GeForce RTX 3050 Ti Laptop GPU, Intel Core i7-12700H
61067 Points +44%
Microsoft Surface Laptop Studio i7 RTX 3050 Ti
NVIDIA GeForce RTX 3050 Ti Laptop GPU, Intel Core i7-11370H
58047 Points +37%
Lenovo Yoga Slim 7 Pro X 14IAH7 82TK006CGE
NVIDIA GeForce RTX 3050 4GB Laptop GPU, Intel Core i7-12700H
53776 Points +27%
Apple MacBook Pro 14 2023 M2 Pro
Apple M2 Pro 19-Core GPU, Apple M2 Pro
46941 Points +10%
Apple MacBook Pro 14 2023 M2 Pro Entry
Apple M2 Pro 16-Core GPU, Apple M2 Pro 10-Core
42483 Points
Apple MacBook Pro 16 2021 M1 Pro
Apple M1 Pro 16-Core GPU, Apple M1 Pro
37867 Points -11%
Apple MacBook Pro 14 2021 M1 Pro Entry
Apple M1 Pro 14-Core GPU, Apple M1 Pro 8-Core
35173 Points -17%
Lenovo Yoga 7-14ARB G7
AMD Radeon 680M, AMD Ryzen 7 6800U
32927 Points -22%
Apple MacBook Air M2 10C GPU
Apple M2 10-Core GPU, Apple M2
27489 Points -35%
Lenovo Yoga 9 14IRP G8
Intel Iris Xe Graphics G7 96EUs, Intel Core i7-1360P
20890 Points -51%
Metal Score
Apple MacBook Pro 14 2023 M2 Pro
Apple M2 Pro 19-Core GPU, Apple M2 Pro
52054 Points +11%
Apple MacBook Pro 14 2023 M2 Pro Entry
Apple M2 Pro 16-Core GPU, Apple M2 Pro 10-Core
46834 Points
Apple MacBook Pro 16 2021 M1 Pro
Apple M1 Pro 16-Core GPU, Apple M1 Pro
42115 Points -10%
Apple MacBook Pro 14 2021 M1 Pro Entry
Apple M1 Pro 14-Core GPU, Apple M1 Pro 8-Core
37319 Points -20%
Apple MacBook Air M2 10C GPU
Apple M2 10-Core GPU, Apple M2
30269 Points -35%
Blender / v3.3 Classroom METAL
Apple MacBook Pro 14 2023 M2 Pro Entry
Apple M2 Pro 16-Core GPU, Apple M2 Pro 10-Core
132 Seconds *
Average Apple M2 Pro 16-Core GPU
  ()
132 Seconds * -0%
Apple MacBook Pro 14 2023 M2 Pro
Apple M2 Pro 19-Core GPU, Apple M2 Pro
97 Seconds * +27%
Average of class Multimedia
  (29.6 - 132, n=8, last 2 years)
75.6 Seconds * +43%
Apple MacBook Pro 16 2023 M2 Max
Apple M2 Max 38-Core GPU, Apple M2 Max
51.2 Seconds * +61%
Blender / v3.3 Classroom HIP/AMD
Average of class Multimedia
  (308 - 683, n=5, last 2 years)
461 Seconds *
Lenovo Yoga 7-14ARB G7
AMD Radeon 680M, AMD Ryzen 7 6800U
346 Seconds *
Blender / v3.3 Classroom OPTIX/RTX
Lenovo Yoga Slim 7 Pro X 14IAH7 82TK006CGE
NVIDIA GeForce RTX 3050 4GB Laptop GPU, Intel Core i7-12700H
58 Seconds *
SCHENKER Vision 14 2022 RTX 3050 Ti
NVIDIA GeForce RTX 3050 Ti Laptop GPU, Intel Core i7-12700H
53 Seconds *
Average of class Multimedia
  (19 - 99, n=46, last 2 years)
40.9 Seconds *
Blender / v3.3 Classroom CUDA
Lenovo Yoga Slim 7 Pro X 14IAH7 82TK006CGE
NVIDIA GeForce RTX 3050 4GB Laptop GPU, Intel Core i7-12700H
111 Seconds *
SCHENKER Vision 14 2022 RTX 3050 Ti
NVIDIA GeForce RTX 3050 Ti Laptop GPU, Intel Core i7-12700H
91 Seconds *
Average of class Multimedia
  (32 - 181, n=48, last 2 years)
72.9 Seconds *
Blender / v3.3 Classroom CPU
Apple MacBook Air M2 10C GPU
Apple M2 10-Core GPU, Apple M2
645 Seconds * -48%
Lenovo Yoga 9 14IRP G8
Intel Iris Xe Graphics G7 96EUs, Intel Core i7-1360P
527 Seconds * -21%
Lenovo Yoga 7-14ARB G7
AMD Radeon 680M, AMD Ryzen 7 6800U
504 Seconds * -16%
SCHENKER Vision 14 2022 RTX 3050 Ti
NVIDIA GeForce RTX 3050 Ti Laptop GPU, Intel Core i7-12700H
456 Seconds * -5%
Apple MacBook Pro 14 2023 M2 Pro Entry
Apple M2 Pro 16-Core GPU, Apple M2 Pro 10-Core
435 Seconds *
Average Apple M2 Pro 16-Core GPU
  ()
435 Seconds * -0%
Average of class Multimedia
  (189 - 946, n=86, last 2 years)
426 Seconds * +2%
Lenovo Yoga Slim 7 Pro X 14IAH7 82TK006CGE
NVIDIA GeForce RTX 3050 4GB Laptop GPU, Intel Core i7-12700H
388 Seconds * +11%
Apple MacBook Pro 14 2023 M2 Pro
Apple M2 Pro 19-Core GPU, Apple M2 Pro
331 Seconds * +24%
Apple MacBook Pro 16 2023 M2 Max
Apple M2 Max 38-Core GPU, Apple M2 Max
326 Seconds * +25%

* ... smaller is better

游戏性能

评估MacBooks的游戏性能或将其与Windows笔记本电脑进行比较仍然相当困难。原生游戏如《生化危机村》,在入门级M2 Pro上以1080p运行没有问题,但我们没有可能记录和评估fps数字。

因此,下面的基准测试只显示了仿真游戏的结果,如《古墓丽影》或用CrossOver测试的Windows游戏。 GTAV 等游戏就是这种情况,在这些游戏中,我们甚至可以运行我们常规的Windows基准测试,但是你应该始终记住,这些游戏没有针对ARM SoC进行优化。

The Witcher 3
1920x1080 High Graphics & Postprocessing (Nvidia HairWorks Off)
Average of class Multimedia
  (11.2 - 290, n=75, last 2 years)
101.3 fps +99%
SCHENKER Vision 14 2022 RTX 3050 Ti
Intel Core i7-12700H, NVIDIA GeForce RTX 3050 Ti Laptop GPU
92 fps +80%
Microsoft Surface Laptop Studio i7 RTX 3050 Ti
Intel Core i7-11370H, NVIDIA GeForce RTX 3050 Ti Laptop GPU
85 fps +67%
Apple MacBook Pro 14 2023 M2 Pro
Apple M2 Pro, Apple M2 Pro 19-Core GPU
57 fps +12%
Lenovo Yoga Slim 7 Pro X 14IAH7 82TK006CGE
Intel Core i7-12700H, NVIDIA GeForce RTX 3050 4GB Laptop GPU
53.5 fps +5%
Apple MacBook Pro 14 2023 M2 Pro Entry
Apple M2 Pro 10-Core, Apple M2 Pro 16-Core GPU
51 fps
Average Apple M2 Pro 16-Core GPU
  ()
51 fps 0%
Lenovo Yoga 7-14ARB G7
AMD Ryzen 7 6800U, AMD Radeon 680M
43 fps -16%
Lenovo Yoga 9 14IRP G8
Intel Core i7-1360P, Intel Iris Xe Graphics G7 96EUs
37 fps -27%
1920x1080 Ultra Graphics & Postprocessing (HBAO+)
Average of class Multimedia
  (8 - 143.2, n=82, last 2 years)
54.2 fps +20%
Apple MacBook Pro 14 2023 M2 Pro
Apple M2 Pro, Apple M2 Pro 19-Core GPU
51 fps +13%
Apple MacBook Pro 14 2023 M2 Pro Entry
Apple M2 Pro 10-Core, Apple M2 Pro 16-Core GPU
45 fps
Average Apple M2 Pro 16-Core GPU
  ()
45 fps 0%
SCHENKER Vision 14 2022 RTX 3050 Ti
Intel Core i7-12700H, NVIDIA GeForce RTX 3050 Ti Laptop GPU
44.2 (42min, 42P1) fps -2%
Lenovo Yoga Slim 7 Pro X 14IAH7 82TK006CGE
Intel Core i7-12700H, NVIDIA GeForce RTX 3050 4GB Laptop GPU
42.8 fps -5%
Microsoft Surface Laptop Studio i7 RTX 3050 Ti
Intel Core i7-11370H, NVIDIA GeForce RTX 3050 Ti Laptop GPU
41.6 (39min, 40P1) fps -8%
Lenovo Yoga 7-14ARB G7
AMD Ryzen 7 6800U, AMD Radeon 680M
25.4 (19min, 24P1) fps -44%
Lenovo Yoga 9 14IRP G8
Intel Core i7-1360P, Intel Iris Xe Graphics G7 96EUs
14.8 (14min, 14P1) fps -67%
Shadow of the Tomb Raider
1920x1080 High Preset AA:SM
Average of class Multimedia
  (23 - 146, n=13, last 2 years)
81.4 fps +25%
Apple MacBook Pro 14 2023 M2 Pro
Apple M2 Pro, Apple M2 Pro 19-Core GPU
72 fps +11%
Apple MacBook Pro 14 2023 M2 Pro Entry
Apple M2 Pro 10-Core, Apple M2 Pro 16-Core GPU
65 fps
Average Apple M2 Pro 16-Core GPU
  ()
65 fps 0%
Microsoft Surface Laptop Studio i7 RTX 3050 Ti
Intel Core i7-11370H, NVIDIA GeForce RTX 3050 Ti Laptop GPU
60 fps -8%
Apple MacBook Pro 14 2021 M1 Pro Entry
Apple M1 Pro 8-Core, Apple M1 Pro 14-Core GPU
53 fps -18%
Apple MacBook Air M2 10C GPU
Apple M2, Apple M2 10-Core GPU
25 fps -62%
1920x1080 Highest Preset AA:T
Average of class Multimedia
  (23 - 153, n=13, last 2 years)
82.8 fps +45%
Apple MacBook Pro 14 2023 M2 Pro
Apple M2 Pro, Apple M2 Pro 19-Core GPU
63 fps +11%
Apple MacBook Pro 14 2023 M2 Pro Entry
Apple M2 Pro 10-Core, Apple M2 Pro 16-Core GPU
57 fps
Average Apple M2 Pro 16-Core GPU
  ()
57 fps 0%
Microsoft Surface Laptop Studio i7 RTX 3050 Ti
Intel Core i7-11370H, NVIDIA GeForce RTX 3050 Ti Laptop GPU
49 fps -14%
Apple MacBook Pro 14 2021 M1 Pro Entry
Apple M1 Pro 8-Core, Apple M1 Pro 14-Core GPU
46 fps -19%
Apple MacBook Air M2 10C GPU
Apple M2, Apple M2 10-Core GPU
21 fps -63%
GTA V
1366x768 Normal/Off AF:4x
Lenovo Yoga Slim 7 Pro X 14IAH7 82TK006CGE
Intel Core i7-12700H, NVIDIA GeForce RTX 3050 4GB Laptop GPU
164.7 (3.69min, 83.3P1) fps +126%
SCHENKER Vision 14 2022 RTX 3050 Ti
Intel Core i7-12700H, NVIDIA GeForce RTX 3050 Ti Laptop GPU
163.3 (4.58min, 90.9P1) fps +124%
Microsoft Surface Laptop Studio i7 RTX 3050 Ti
Intel Core i7-11370H, NVIDIA GeForce RTX 3050 Ti Laptop GPU
163 (4.61min, 100P1) fps +123%
Average of class Multimedia
  (45.6 - 186.4, n=67, last 2 years)
142.3 fps +95%
Lenovo Yoga 7-14ARB G7
AMD Ryzen 7 6800U, AMD Radeon 680M
119.6 (26.1min, 76.9P1) fps +64%
Lenovo Yoga 9 14IRP G8
Intel Core i7-1360P, Intel Iris Xe Graphics G7 96EUs
101.8 (9.83min, 62.5P1) fps +39%
Apple MacBook Pro 14 2023 M2 Pro Entry
Apple M2 Pro 10-Core, Apple M2 Pro 16-Core GPU
73 fps
Average Apple M2 Pro 16-Core GPU
  ()
73 fps 0%
1920x1080 High/On (Advanced Graphics Off) AA:2xMSAA + FX AF:8x
SCHENKER Vision 14 2022 RTX 3050 Ti
Intel Core i7-12700H, NVIDIA GeForce RTX 3050 Ti Laptop GPU
121 (14.8min, 76.9P1) fps +163%
Microsoft Surface Laptop Studio i7 RTX 3050 Ti
Intel Core i7-11370H, NVIDIA GeForce RTX 3050 Ti Laptop GPU
111 (31.6min, 76.9P1) fps +141%
Lenovo Yoga Slim 7 Pro X 14IAH7 82TK006CGE
Intel Core i7-12700H, NVIDIA GeForce RTX 3050 4GB Laptop GPU
107.5 (14.1min, 58.8P1) fps +134%
Average of class Multimedia
  (11.9 - 186.1, n=81, last 2 years)
99.1 fps +115%
Lenovo Yoga 7-14ARB G7
AMD Ryzen 7 6800U, AMD Radeon 680M
49.5 (0.668min, 32.3P1) fps +8%
Apple MacBook Pro 14 2023 M2 Pro Entry
Apple M2 Pro 10-Core, Apple M2 Pro 16-Core GPU
46 fps
Average Apple M2 Pro 16-Core GPU
  ()
46 fps 0%
Lenovo Yoga 9 14IRP G8
Intel Core i7-1360P, Intel Iris Xe Graphics G7 96EUs
25.1 (9.38min, 18.5P1) fps -45%
Total War: Three Kingdoms
1920x1080 High (incl textures)
Average of class Multimedia
  (33 - 113, n=8, last 2 years)
69.8 fps +45%
Apple MacBook Pro 14 2023 M2 Pro
Apple M2 Pro, Apple M2 Pro 19-Core GPU
54 fps +13%
Microsoft Surface Laptop Studio i7 RTX 3050 Ti
Intel Core i7-11370H, NVIDIA GeForce RTX 3050 Ti Laptop GPU
52 fps +8%
Apple MacBook Pro 14 2023 M2 Pro Entry
Apple M2 Pro 10-Core, Apple M2 Pro 16-Core GPU
48 fps
Average Apple M2 Pro 16-Core GPU
  ()
48 fps 0%
Apple MacBook Pro 14 2021 M1 Pro Entry
Apple M1 Pro 8-Core, Apple M1 Pro 14-Core GPU
36 fps -25%
Apple MacBook Air M2 10C GPU
Apple M2, Apple M2 10-Core GPU
26.3 fps -45%
1920x1080 Ultra (incl textures)
Average of class Multimedia
  (24 - 84, n=8, last 2 years)
51.5 fps +43%
Apple MacBook Pro 14 2023 M2 Pro
Apple M2 Pro, Apple M2 Pro 19-Core GPU
40 fps +11%
Microsoft Surface Laptop Studio i7 RTX 3050 Ti
Intel Core i7-11370H, NVIDIA GeForce RTX 3050 Ti Laptop GPU
37 fps +3%
Apple MacBook Pro 14 2023 M2 Pro Entry
Apple M2 Pro 10-Core, Apple M2 Pro 16-Core GPU
36 fps
Average Apple M2 Pro 16-Core GPU
  ()
36 fps 0%
Apple MacBook Pro 14 2021 M1 Pro Entry
Apple M1 Pro 8-Core, Apple M1 Pro 14-Core GPU
27 fps -25%
Apple MacBook Air M2 10C GPU
Apple M2, Apple M2 10-Core GPU
15.9 fps -56%
Borderlands 3
1920x1080 High Overall Quality (DX11)
Microsoft Surface Laptop Studio i7 RTX 3050 Ti
Intel Core i7-11370H, NVIDIA GeForce RTX 3050 Ti Laptop GPU
55 fps +45%
Average of class Multimedia
  (38 - 60.2, n=4, last 2 years)
44.7 fps +18%
Apple MacBook Pro 14 2023 M2 Pro
Apple M2 Pro, Apple M2 Pro 19-Core GPU
40 fps +5%
Apple MacBook Pro 14 2023 M2 Pro Entry
Apple M2 Pro 10-Core, Apple M2 Pro 16-Core GPU
38 fps
Average Apple M2 Pro 16-Core GPU
  ()
38 fps 0%
Apple MacBook Pro 14 2021 M1 Pro Entry
Apple M1 Pro 8-Core, Apple M1 Pro 14-Core GPU
31.9 fps -16%
Apple MacBook Air M2 10C GPU
Apple M2, Apple M2 10-Core GPU
23.8 fps -37%
1920x1080 Badass Overall Quality (DX11)
Microsoft Surface Laptop Studio i7 RTX 3050 Ti
Intel Core i7-11370H, NVIDIA GeForce RTX 3050 Ti Laptop GPU
45 fps +56%
Average of class Multimedia
  (28.9 - 48.6, n=4, last 2 years)
34.2 fps +18%
Apple MacBook Pro 14 2023 M2 Pro
Apple M2 Pro, Apple M2 Pro 19-Core GPU
29 fps 0%
Apple MacBook Pro 14 2023 M2 Pro Entry
Apple M2 Pro 10-Core, Apple M2 Pro 16-Core GPU
28.9 fps
Average Apple M2 Pro 16-Core GPU
  ()
28.9 fps 0%
Apple MacBook Pro 14 2021 M1 Pro Entry
Apple M1 Pro 8-Core, Apple M1 Pro 14-Core GPU
24.1 fps -17%
Apple MacBook Air M2 10C GPU
Apple M2, Apple M2 10-Core GPU
16.4 fps -43%

我们可以用TheWitcher 3 (通过CrossOver运行)测试入门M2 Pro的电源效率,并与Windows笔记本电脑进行比较。然而,游戏中的Ultra设置只在MacBook Pro上禁用SSAO和Nvidia Hairworks的情况下运行(在Windows中,我们在Ultra中同时启用HBAO和Hairworks)。

因此,这些结果并不完全是一个苹果对苹果(双关语)的比较,但它们仍然提供了一个关于新SoC立场的想法。入门的M2 Pro GPU领先于其来自Nvidia和AMD的竞争对手。猛禽湖移动中过时的Intel Iris Xe Graphics G7 ,被甩得更远。

Power Consumption - Witcher 3 ultra Efficiency (external Monitor)
Apple MacBook Pro 14 2023 M2 Pro
M2 Pro 19-Core GPU, M2 Pro, Apple SSD AP2048Z
1.028 fps per Watt +9%
Apple MacBook Pro 14 2023 M2 Pro Entry
M2 Pro 16-Core GPU, M2 Pro 10-Core, Apple SSD AP0512Z
0.941 fps per Watt
Lenovo Yoga 7-14ARB G7
Radeon 680M, R7 6800U, Kioxia BG5 KBG50ZNT1T02
0.531 fps per Watt -44%
Microsoft Surface Laptop Studio i7 RTX 3050 Ti
GeForce RTX 3050 Ti Laptop GPU, i7-11370H, SK Hynix PC711 1TB HFS001TDE9X084N
0.518 fps per Watt -45%
SCHENKER Vision 14 2022 RTX 3050 Ti
GeForce RTX 3050 Ti Laptop GPU, i7-12700H, Samsung SSD 980 Pro 1TB MZ-V8P1T0BW
0.4933 fps per Watt -48%
Lenovo Yoga Slim 7 Pro X 14IAH7 82TK006CGE
GeForce RTX 3050 4GB Laptop GPU, i7-12700H, Micron 3400 1TB MTFDKBA1T0TFH
0.4897 fps per Watt -48%
Lenovo Yoga 9 14IRP G8
Iris Xe G7 96EUs, i7-1360P, SK hynix PC801 HFS512GEJ9X101N BF
0.2766 fps per Watt -71%
low med. high ultraQHD
GTA V (2015) 76 73 46
The Witcher 3 (2015) 51 45
Shadow of the Tomb Raider (2018) 159 72 65 57 36
Total War: Three Kingdoms (2019) 258 75 48 36 22
Borderlands 3 (2019) 80.8 52 38 28.9

排放。CPU负载决定了风扇噪音

系统噪音

基础型2023年的MacBook Pro 14的风扇行为与全配置的M2 Pro略有不同。基本型号在日常使用中非常安静,风扇在大多数情况下一般听不到。在纯粹的GPU负载下也是如此,几分钟后风扇启动,但几乎听不到,声压级(SPL)刚刚超过24 dB(A)。

在CPU满负荷的情况下,风扇的噪音确实有所增加。然而,由于非常保守的风扇曲线,风扇噪音声压级短暂地增加到47.5 dB(A),以使芯片温度得到控制,然后在36-38 dB(A)左右趋于平稳。这也适用于综合负载的情况,在这种情况下,CPU的压力会更大。

也就是说,当GPU承受更高的负载时(例如,在我们的Cinebench R23多核和3DMark WildLife极端压力测试的综合负载中),我们没有看到这种峰值噪音,SPL从一开始就保持在36-38 dB(A)左右。

我们听不到任何其他随机的电子噪音。

Noise Level

Idle
23.6 / 23.6 / 23.6 dB(A)
Load
24.2 / 47.5 dB(A)
  red to green bar
 
 
30 dB
silent
40 dB(A)
audible
50 dB(A)
loud
 
min: dark, med: mid, max: light   Earthworks M23R, Arta (15 cm distance)   environment noise: 23.6 dB(A)
dB(A) 0102030405060708090Deep BassMiddle BassHigh BassLower RangeMidsHigher MidsLower HighsMid HighsUpper HighsSuper Highs202724.522.724.625.123.525.72529.630.227.127.926.825.830.53128.926.330.329.529.826.326.84035.636.138.140.331.53530.95027.829.32829.726.225.226.86323.92423.824.32324.123.28022.423.122.420.222.321.920.210023.522.321.820.721.621.526.212523.625.119.820.519.919.822.916022.620.818.918.117.316.818.120023.920.618.818.316.816.518.425024.420.519.319.917.817.818.731525.321.2201916.614.716.940027.922.420.519.912.912.214.750029.222.521.120.312.91114.863029.921.820.320.81210.713.380031.925.824.924.211.91012.5100033.127.5272612.110.212.8125035.228.227.326.111.19.812.2160036.728.727.426.510.610.111.7200037.128.72726.21110.511.9250040.331.229.428.1111112315036.525.623.522.411.611.311.7400036.924.924.523.411.911.81250003623.921.219.611.911.912.2630032.915.914.513.712.31212.3800027.81413.31312.312.212.31000022.31312.712.612.512.212.31250020.212.512.312.312.31212.31600015.511.91211.811.811.511.6SPL47.538.4373624.223.624.9N5.52.62.32.10.60.50.7median 29.2median 22.4median 20.5median 20.3median 12.3median 11.9median 12.3Delta6.23.83.94.21.52.32hearing rangehide median Fan NoiseApple MacBook Pro 14 2023 M2 Pro Entry
Apple MacBook Pro 14 2023 M2 Pro Entry
M2 Pro 16-Core GPU, M2 Pro 10-Core, Apple SSD AP0512Z
Apple MacBook Air M2 10C GPU
M2 10-Core GPU, M2, Apple SSD AP1024Z
Apple MacBook Pro 14 2023 M2 Pro
M2 Pro 19-Core GPU, M2 Pro, Apple SSD AP2048Z
Apple MacBook Pro 14 2021 M1 Pro Entry
M1 Pro 14-Core GPU, M1 Pro 8-Core, Apple SSD AP0512
Lenovo Yoga Slim 7 Pro X 14IAH7 82TK006CGE
GeForce RTX 3050 4GB Laptop GPU, i7-12700H, Micron 3400 1TB MTFDKBA1T0TFH
SCHENKER Vision 14 2022 RTX 3050 Ti
GeForce RTX 3050 Ti Laptop GPU, i7-12700H, Samsung SSD 980 Pro 1TB MZ-V8P1T0BW
Microsoft Surface Laptop Studio i7 RTX 3050 Ti
GeForce RTX 3050 Ti Laptop GPU, i7-11370H, SK Hynix PC711 1TB HFS001TDE9X084N
Noise
-0%
-7%
-18%
-18%
-9%
off / environment *
23.6
23.9
-1%
24.8
-5%
24.6
-4%
24.4
-3%
24.7
-5%
Idle Minimum *
23.6
23.9
-1%
24.8
-5%
24.6
-4%
24.4
-3%
24.7
-5%
Idle Average *
23.6
23.9
-1%
24.8
-5%
24.6
-4%
24.4
-3%
24.7
-5%
Idle Maximum *
23.6
23.9
-1%
24.8
-5%
24.6
-4%
27.8
-18%
24.7
-5%
Load Average *
24.2
26
-7%
27.8
-15%
45.1
-86%
43.3
-79%
33.2
-37%
Load Maximum *
47.5
43.2
9%
49.5
-4%
50.4
-6%
48.8
-3%
46.7
2%
Witcher 3 ultra *
27.8
49.1
48.2
44.5

* ... smaller is better

温度

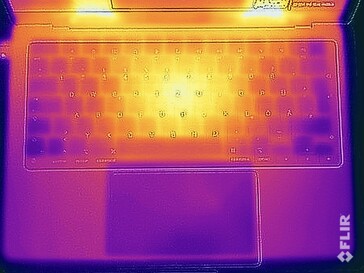
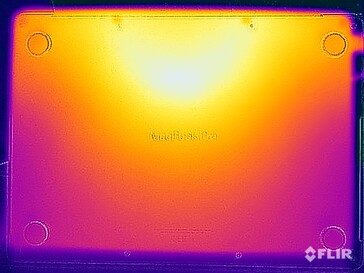
保守的风扇行为反映在表面温度上。键盘区域变得很不舒服,特别是在玩游戏的时候,温度超过45℃。我们还记录了笔记本背面中央区域附近的类似温度,这对于在这种负载下将设备放在腿上来说并不是一个好兆头。也就是说,金属机壳在日常使用中几乎不发热,也不构成这种限制。

压力测试中的行为似乎有点奇怪,因为基本型号似乎比完整的M2 Pro消耗的功率略多。基本型M2 Pro的CPU和GPU分别消耗10W和25W,而我们相应地注意到全芯片的消耗量为8W和25W。

0510152025Tooltip
Apple MacBook Pro 14 2023 M2 Pro Entry M2 Pro 16-Core GPU, M2 Pro 10-Core, Apple SSD AP0512Z; Cinebench R23 Multi + 3DMark Wild Life Extreme Stress Test GPU Power: Ø24.5 (18.438-25.67)
Apple MacBook Pro 14 2023 M2 Pro M2 Pro 19-Core GPU, M2 Pro, Apple SSD AP2048Z; Cinebench R23 Multi + 3DMark Wild Life Extreme Stress Test GPU Power: Ø25 (23.803-25.493)
Apple MacBook Pro 14 2023 M2 Pro Entry M2 Pro 16-Core GPU, M2 Pro 10-Core, Apple SSD AP0512Z; Cinebench R23 Multi + 3DMark Wild Life Extreme Stress Test CPU Power: Ø9.99 (8.506-26.697)
Apple MacBook Pro 14 2023 M2 Pro M2 Pro 19-Core GPU, M2 Pro, Apple SSD AP2048Z; Cinebench R23 Multi + 3DMark Wild Life Extreme Stress Test CPU Power: Ø8.08 (7.65-23.333)
Max. Load
 41.4 °C47 °C41.5 °C 
 39.8 °C45 °C41.5 °C 
 31.7 °C28.2 °C30.9 °C 
Maximum: 47 °C
Average: 38.6 °C
42.2 °C42.8 °C42.3 °C
39.9 °C41.4 °C39.2 °C
33.3 °C35.3 °C32.8 °C
Maximum: 42.8 °C
Average: 38.8 °C
Power Supply (max.)  41.9 °C | Room Temperature 20.1 °C | Fluke t3000FC (calibrated), Voltcraft IR-900
(-) The average temperature for the upper side under maximal load is 38.6 °C / 101 F, compared to the average of 31.3 °C / 88 F for the devices in the class Multimedia.
(-) The maximum temperature on the upper side is 47 °C / 117 F, compared to the average of 36.9 °C / 98 F, ranging from 21.1 to 71 °C for the class Multimedia.
(±) The bottom heats up to a maximum of 42.8 °C / 109 F, compared to the average of 39.2 °C / 103 F
(+) In idle usage, the average temperature for the upper side is 22 °C / 72 F, compared to the device average of 31.3 °C / 88 F.
(-) Playing The Witcher 3, the average temperature for the upper side is 39.7 °C / 103 F, compared to the device average of 31.3 °C / 88 F.
(+) The palmrests and touchpad are reaching skin temperature as a maximum (34.2 °C / 93.6 F) and are therefore not hot.
(-) The average temperature of the palmrest area of similar devices was 28.8 °C / 83.8 F (-5.4 °C / -9.8 F).
上部温度 稳定性测试(上部)
上部温度 稳定性测试(上部)
上部温度 压力测试 (Unterseite)
Apple MacBook Pro 14 2023 M2 Pro Entry
Apple M2 Pro 10-Core, Apple M2 Pro 16-Core GPU
Apple MacBook Air M2 10C GPU
Apple M2, Apple M2 10-Core GPU
Apple MacBook Pro 14 2023 M2 Pro
Apple M2 Pro, Apple M2 Pro 19-Core GPU
Apple MacBook Pro 14 2021 M1 Pro Entry
Apple M1 Pro 8-Core, Apple M1 Pro 14-Core GPU
Lenovo Yoga Slim 7 Pro X 14IAH7 82TK006CGE
Intel Core i7-12700H, NVIDIA GeForce RTX 3050 4GB Laptop GPU
SCHENKER Vision 14 2022 RTX 3050 Ti
Intel Core i7-12700H, NVIDIA GeForce RTX 3050 Ti Laptop GPU
Microsoft Surface Laptop Studio i7 RTX 3050 Ti
Intel Core i7-11370H, NVIDIA GeForce RTX 3050 Ti Laptop GPU
Heat
-7%
2%
-4%
-21%
-24%
2%
Maximum Upper Side *
47
44.7
5%
46.9
-0%
46.8
-0%
48
-2%
48.4
-3%
42.3
10%
Maximum Bottom *
42.8
44.6
-4%
41.7
3%
40.9
4%
50.2
-17%
57.1
-33%
38.2
11%
Idle Upper Side *
22.3
25.1
-13%
21.4
4%
24.2
-9%
27.7
-24%
28.1
-26%
23.4
-5%
Idle Bottom *
21.7
25.3
-17%
21.4
1%
24.2
-12%
30.1
-39%
29
-34%
23.5
-8%

* ... smaller is better

电源管理。基础版M2 Pro,功耗略高

消耗功率

我们的2023 MacBook Pro 14设备与配备全M2 Pro芯片的变体相比,空转时的耗电量似乎略高。这是否是一个普遍的趋势,或者仅仅是我们设备的问题,目前还无法判断。

功率消耗会随着HDR内容的增加而增加,我们能够测量到25-26W的最大功率。然而,在负载下,基本型号更经济一些,但在压力测试的开始阶段就会遇到电源限制。我们无法测量到更大的电源的功耗增加--基本型MacBook Pro 14在几秒钟后就稳定在66W。待机和关机时的耗电量非常低。

所提供的电源刚好够用,而且不能够在负载下为电池正常充电。如果你打算用MacBook Pro 14完成高要求的任务,你应该买一个更高瓦数的电源。

Power Consumption
Off / Standbydarklight 0.12 / 0.26 Watt
Idledarkmidlight 2.5 / 12.1 / 12.3 Watt
Load midlight 49.8 / 71.4 Watt
 color bar
Key: min: dark, med: mid, max: light        Metrahit Energy
Currently we use the Metrahit Energy, a professional single phase power quality and energy measurement digital multimeter, for our measurements. Find out more about it here. All of our test methods can be found here.
Apple MacBook Pro 14 2023 M2 Pro Entry
M2 Pro 10-Core, M2 Pro 16-Core GPU, Apple SSD AP0512Z, Mini-LED, 3024x1964, 14.2"
Apple MacBook Air M2 10C GPU
M2, M2 10-Core GPU, Apple SSD AP1024Z, IPS, 2560x1664, 13.6"
Apple MacBook Pro 14 2023 M2 Pro
M2 Pro, M2 Pro 19-Core GPU, Apple SSD AP2048Z, Mini-LED, 3024x1964, 14.2"
Apple MacBook Pro 14 2021 M1 Pro Entry
M1 Pro 8-Core, M1 Pro 14-Core GPU, Apple SSD AP0512, Mini-LED, 3024x1964, 14.2"
Lenovo Yoga Slim 7 Pro X 14IAH7 82TK006CGE
i7-12700H, GeForce RTX 3050 4GB Laptop GPU, Micron 3400 1TB MTFDKBA1T0TFH, IPS, 3072x1920, 14.5"
SCHENKER Vision 14 2022 RTX 3050 Ti
i7-12700H, GeForce RTX 3050 Ti Laptop GPU, Samsung SSD 980 Pro 1TB MZ-V8P1T0BW, IPS, 2880x1800, 14"
Microsoft Surface Laptop Studio i7 RTX 3050 Ti
i7-11370H, GeForce RTX 3050 Ti Laptop GPU, SK Hynix PC711 1TB HFS001TDE9X084N, IPS, 2400x1600, 14.4"
Average Apple M2 Pro 16-Core GPU
 
Average of class Multimedia
 
Power Consumption
31%
-10%
-5%
-62%
-67%
-16%
0%
-58%
Idle Minimum *
2.5
1.9
24%
2.4
4%
2.9
-16%
7.1
-184%
7.5
-200%
2.6
-4%
2.5 ?()
-0%
Idle Average *
12.1
9.6
21%
11.3
7%
11.6
4%
10.8
11%
10.4
14%
7.1
41%
12.1 ?()
-0%
Idle Maximum *
12.3
9.7
21%
11.5
7%
11.9
3%
11.6
6%
11.4
7%
7.9
36%
12.3 ?()
-0%
Load Average *
49.8
32.4
35%
59.6
-20%
49.5
1%
84.8
-70%
83.3
-67%
76.8
-54%
49.8 ?()
-0%
Witcher 3 ultra *
46.6
30.8
34%
55.9
-20%
58.2
-25%
91.3
-96%
92.7
-99%
83
-78%
Load Maximum *
71.4
35.7
50%
100
-40%
68.5
4%
100.8
-41%
110.3
-54%
97.3
-36%
71.4 ?()
-0%

* ... smaller is better

Energieaufnahme Witcher 3 / Stresstest

0510152025303540455055606570Tooltip
Apple MacBook Pro 14 2023 M2 Pro Entry; Witcher 3 ultra: Ø46.6 (44.6-48.9)
Apple MacBook Pro 14 2023 M2 Pro Entry; 1280x720 Prime95 28.10 and Furmark 1.25: Ø65.9 (62.4-71.4)
Apple MacBook Pro 14 2023 M2 Pro Entry; Idle 150cd/m2: Ø5.2 (5.14-5.62)

Energieaufnahme mit externem Monitor