Notebookcheck Logo
Teaser

得益于 300 Hz mini LED,最快的游戏笔记本电脑现在更出色了 - XMG Neo 16 E25 RTX 5090 笔记本电脑评测

采用外部水冷,亮度为 1,700 尼特。

Neo 16 是 XMG 传统上速度最快的游戏笔记本电脑,2025 型号除了配备 AMD/Intel 的 HX CPU 和新的 Blackwell GPU 外,还配备了 300 Hz mini LED 雾面显示屏。然而,它的高性能却被一些连接方面的瑕疵所抵消。
Andreas Osthoff, 👁 Andreas Osthoff (translated by DeepL / Ninh Duy) Published 🇺🇸 🇩🇪 ...
Arrow Lake Blackwell RTX 5000 Gaming Geforce Laptop / Notebook Thunderbolt Windows

结论 - XMG Neo 16 性能良好,但在连接性方面存在缺陷

传统上,Neo 16 是市场上速度最快的游戏笔记本电脑之一,目前的 E25 型号也不例外。其 酷睿至尊 9 275HXGeForce RTX 5090 笔记本电脑都能提供保持稳定的巨大性能。此外,它还配备了快速的 PCIe 5.0 固态硬盘,可以在原生分辨率下流畅运行所有现代游戏。我们已经开始期待 AMD 版本的 Ryzen 9 9955HX3D因为 XMG 是为数不多的同时为高端玩家提供 AMD 芯片的制造商之一,因此其游戏性能应该会更好一些。

它的哑光微型 LED 面板是一次重大升级,可提供出色的画质。其高亮度尤其适合 HDR 内容;得益于其 300 Hz 的频率,动作看起来非常流畅。其亮度在 SDR 模式下超过 800 尼特,在 HDR 模式下超过 1,500 尼特,优于任何 OLED 面板。它可以关闭局部调光功能,并完全支持 P3 色彩空间,但该设备的 P3 色彩配置文件并不是最准确的。

Download your licensed rating image as SVG / PNG

此外,面板的局部调光功能还对设备的功耗产生了积极影响,尤其是在显示较暗内容时,功耗更低。对于如此强大的笔记本电脑来说,它的运行时间同样令人印象深刻。它拥有足够的端口、出色的扬声器、漂亮的输入设备和方便的维护选项,所有这些都装在一个超级稳定的金属外壳中。

话虽如此,尽管价格不菲,但你还是得忍受没有 Thunderbolt 5 或 Wi-Fi 7 等多种连接选项。不过,对于 2025 年的高端笔记本电脑来说,没有高级擎天柱和内部显示屏的 G-Sync 功能是一个很大的减分项。目前,XMG 正在与 Nvidia 合作寻找解决方案,并已将广泛的信息传递给客户。不过,目前还不能保证该功能一定会实现。

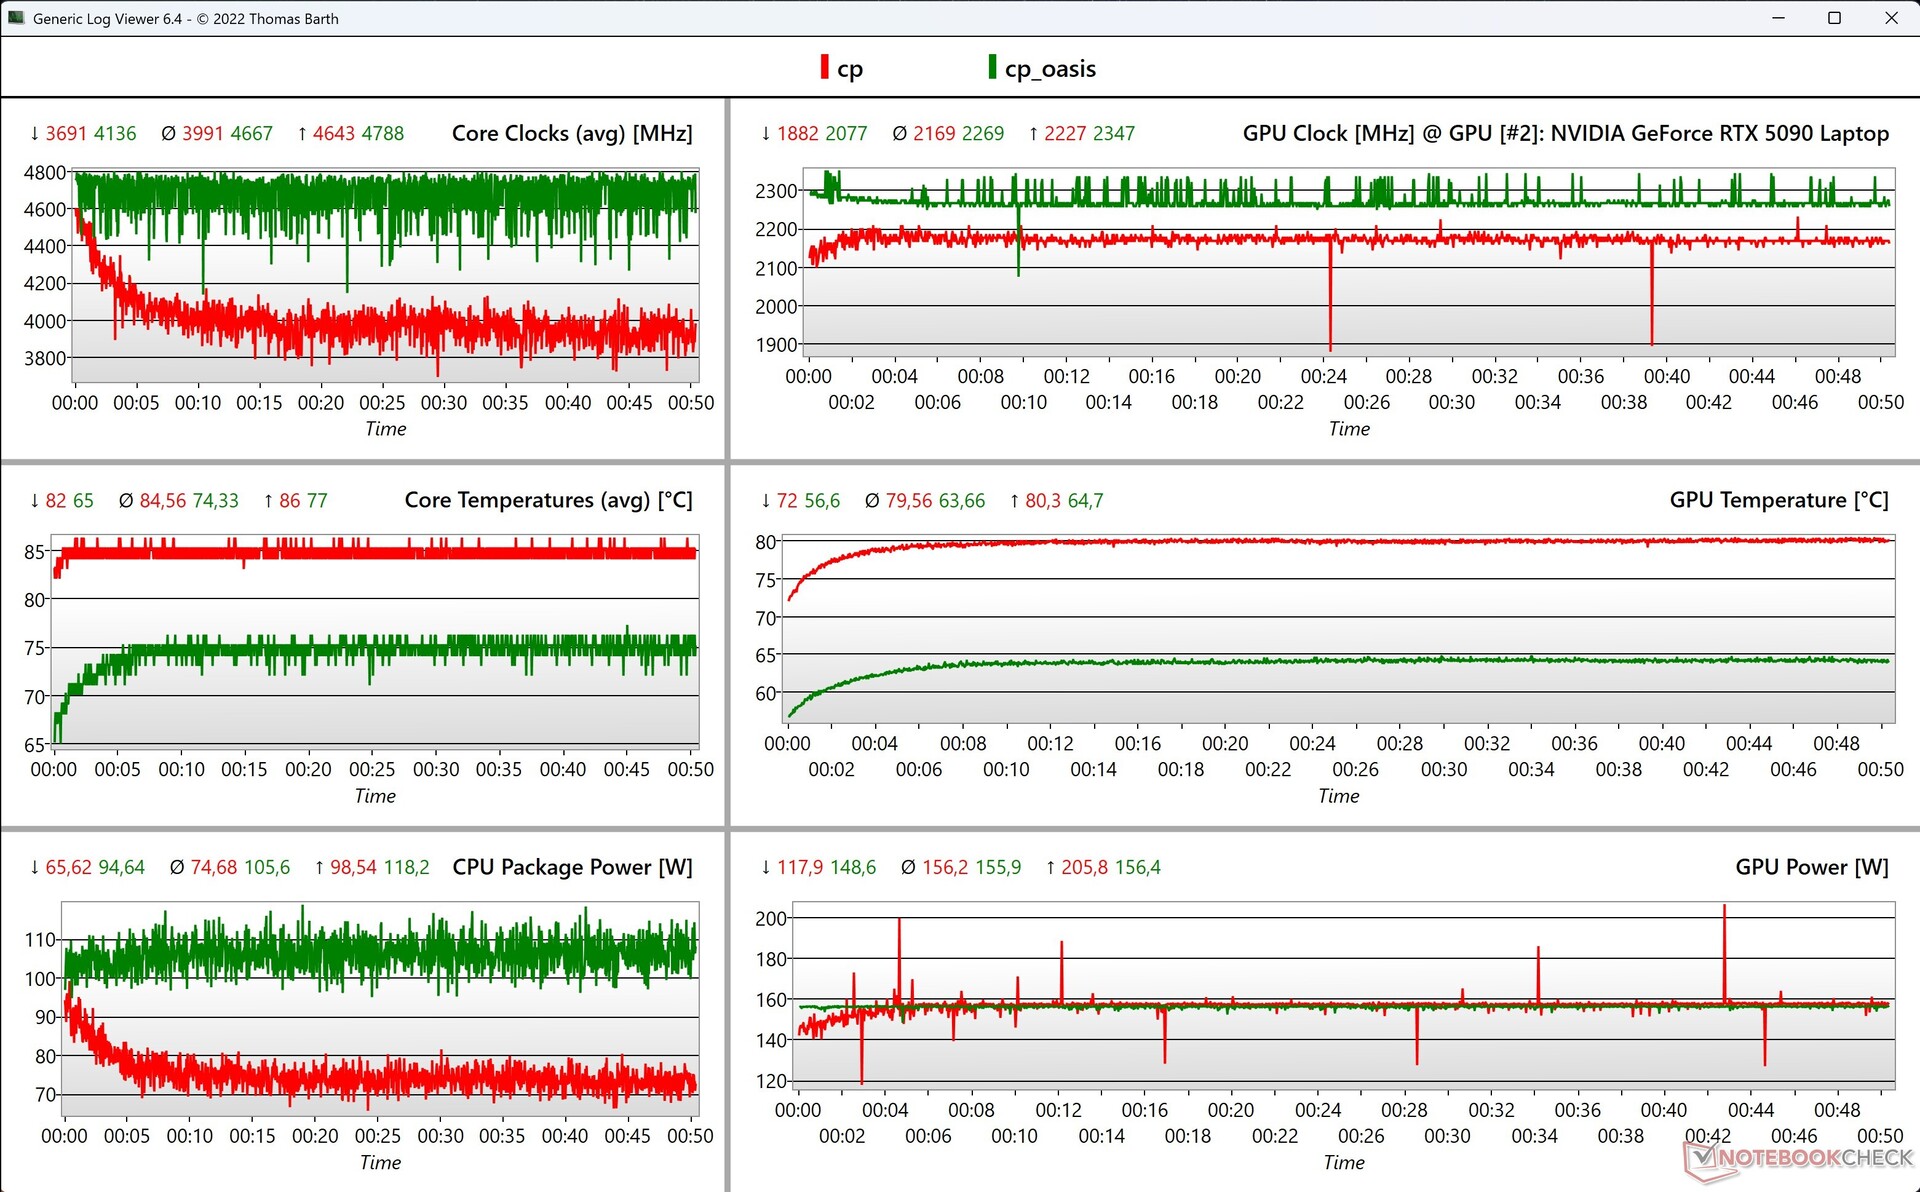
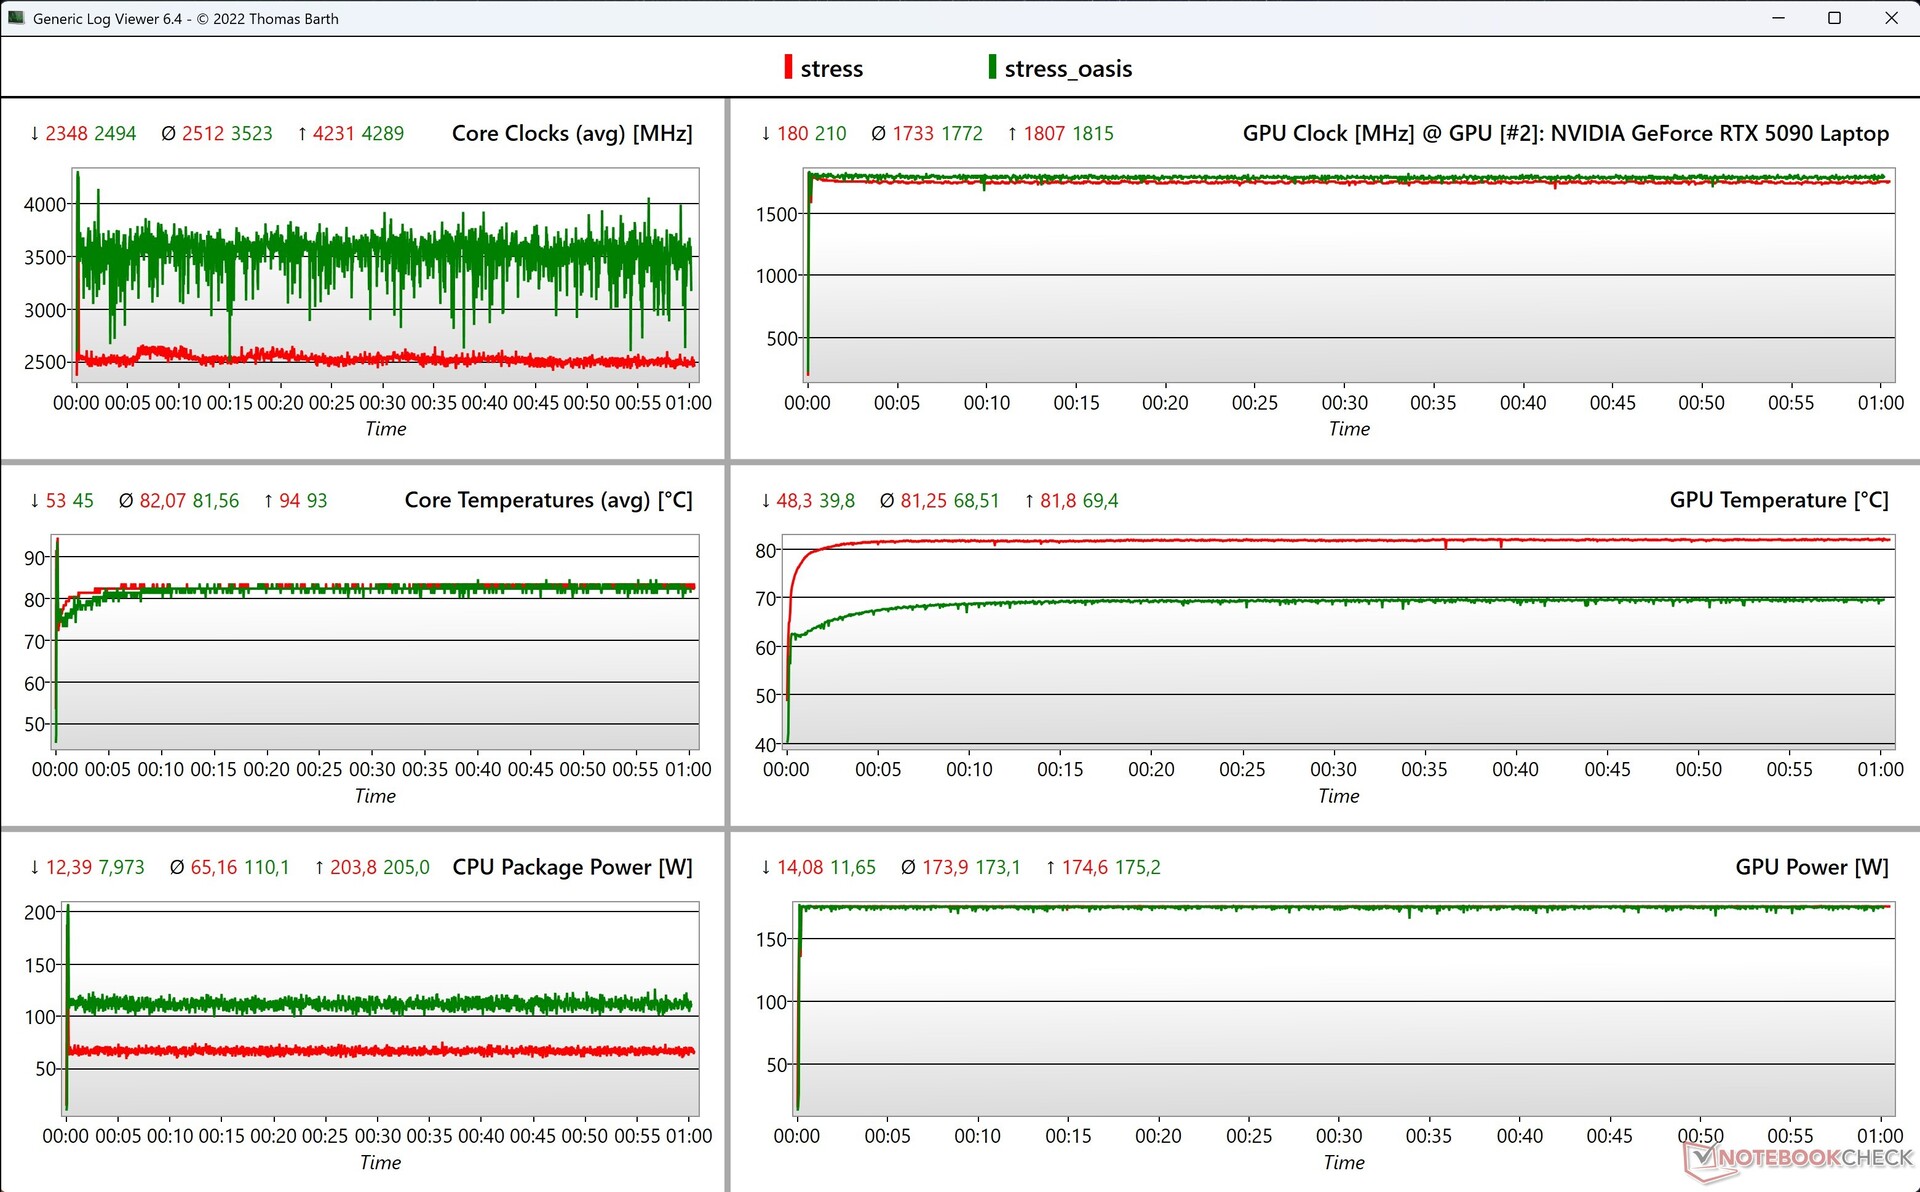
该设备的可选外部水冷系统运行良好,主要有助于降低风扇体积以及机箱和组件的温度。CPU 的性能略有提升,尤其是在综合负载情况下,一些游戏也会从中受益。即便如此,它的纯 GPU 性能并没有改变,因为即使没有 Oasis,Neo 16 也能达到 175 瓦的最大功率。

Pros

+ 极高性能(CPU 和 GPU)
+ PCIe 5.0 和大量端口
+ 超亮迷你 LED 面板
+ 极佳的画质和 300 Hz 频率
+ 稳定且高质量的机箱
+ 舒适的键盘
+ 良好的维护选项和高达 128 GB 的内存
+ 更长的电池寿命
+ 快速读卡器
+ 可选水冷

Cons

- 没有内置显示屏的高级 Optimus 和 G-Sync 功能
- 没有 Wi-Fi 7 或 Thunderbolt 5
- 游戏时风扇噪音大
- 电源线短
- P3 出厂配置文件不太准确

价格和供应情况

新款 XMG Neo 16 E25 的基本版售价约为 3000 美元,但目前在美国尚未接受预订。

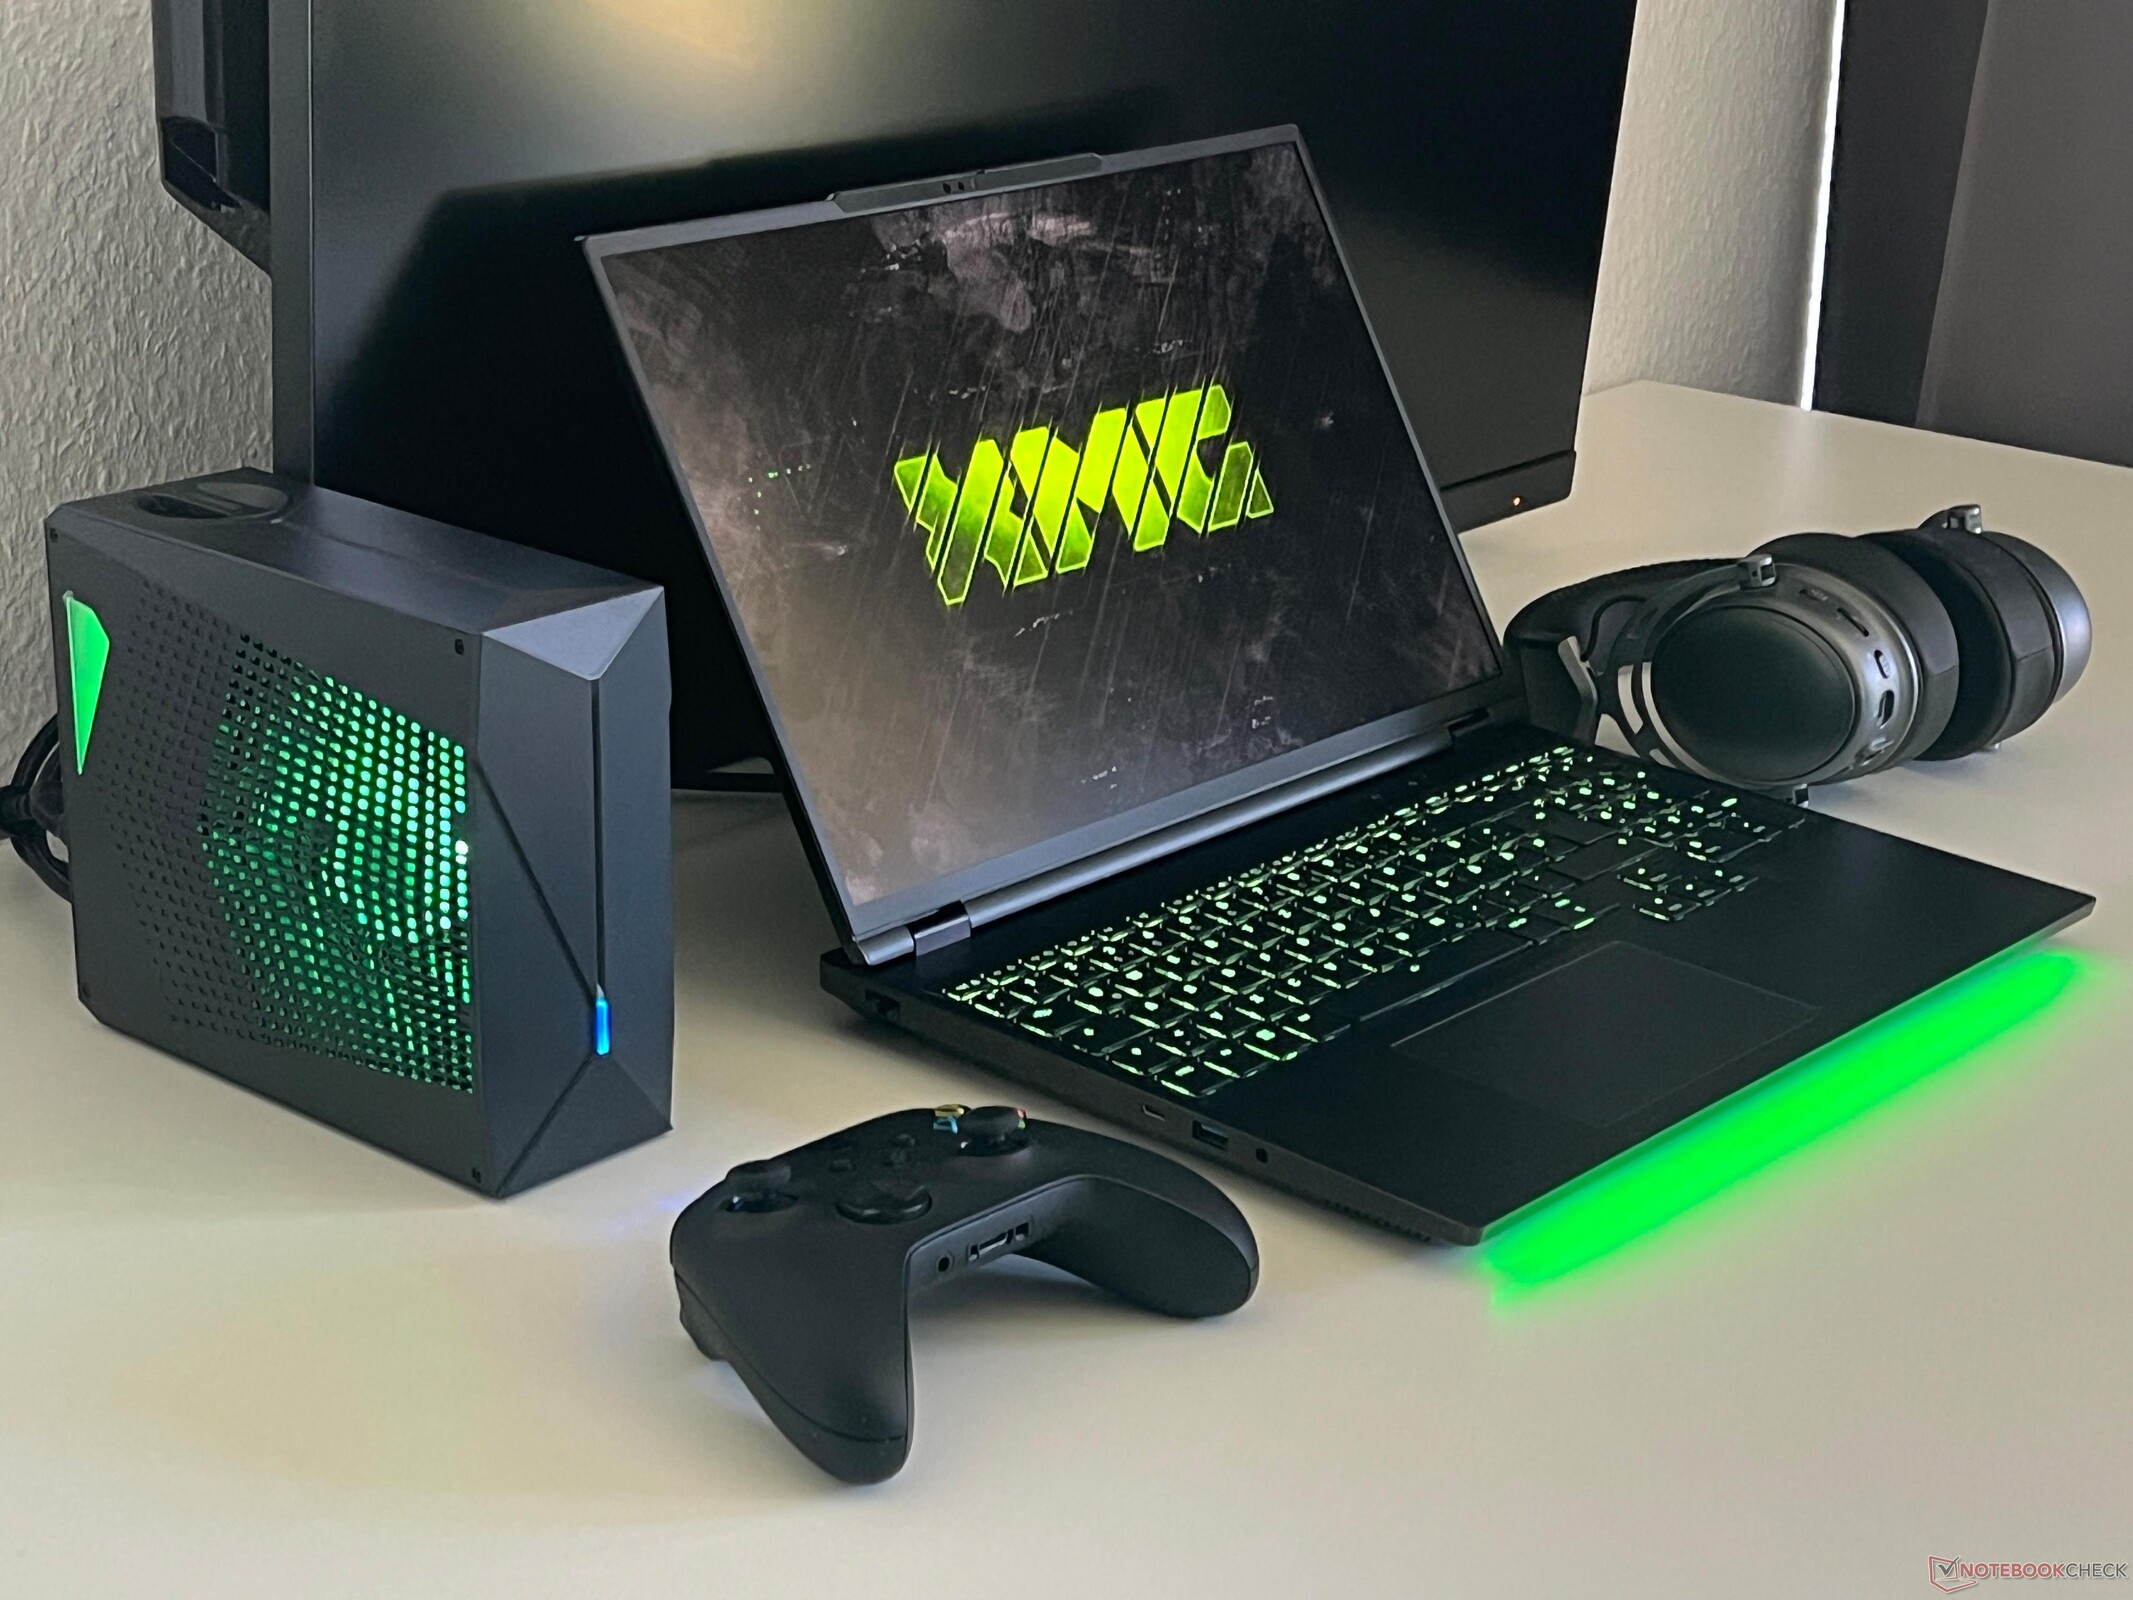
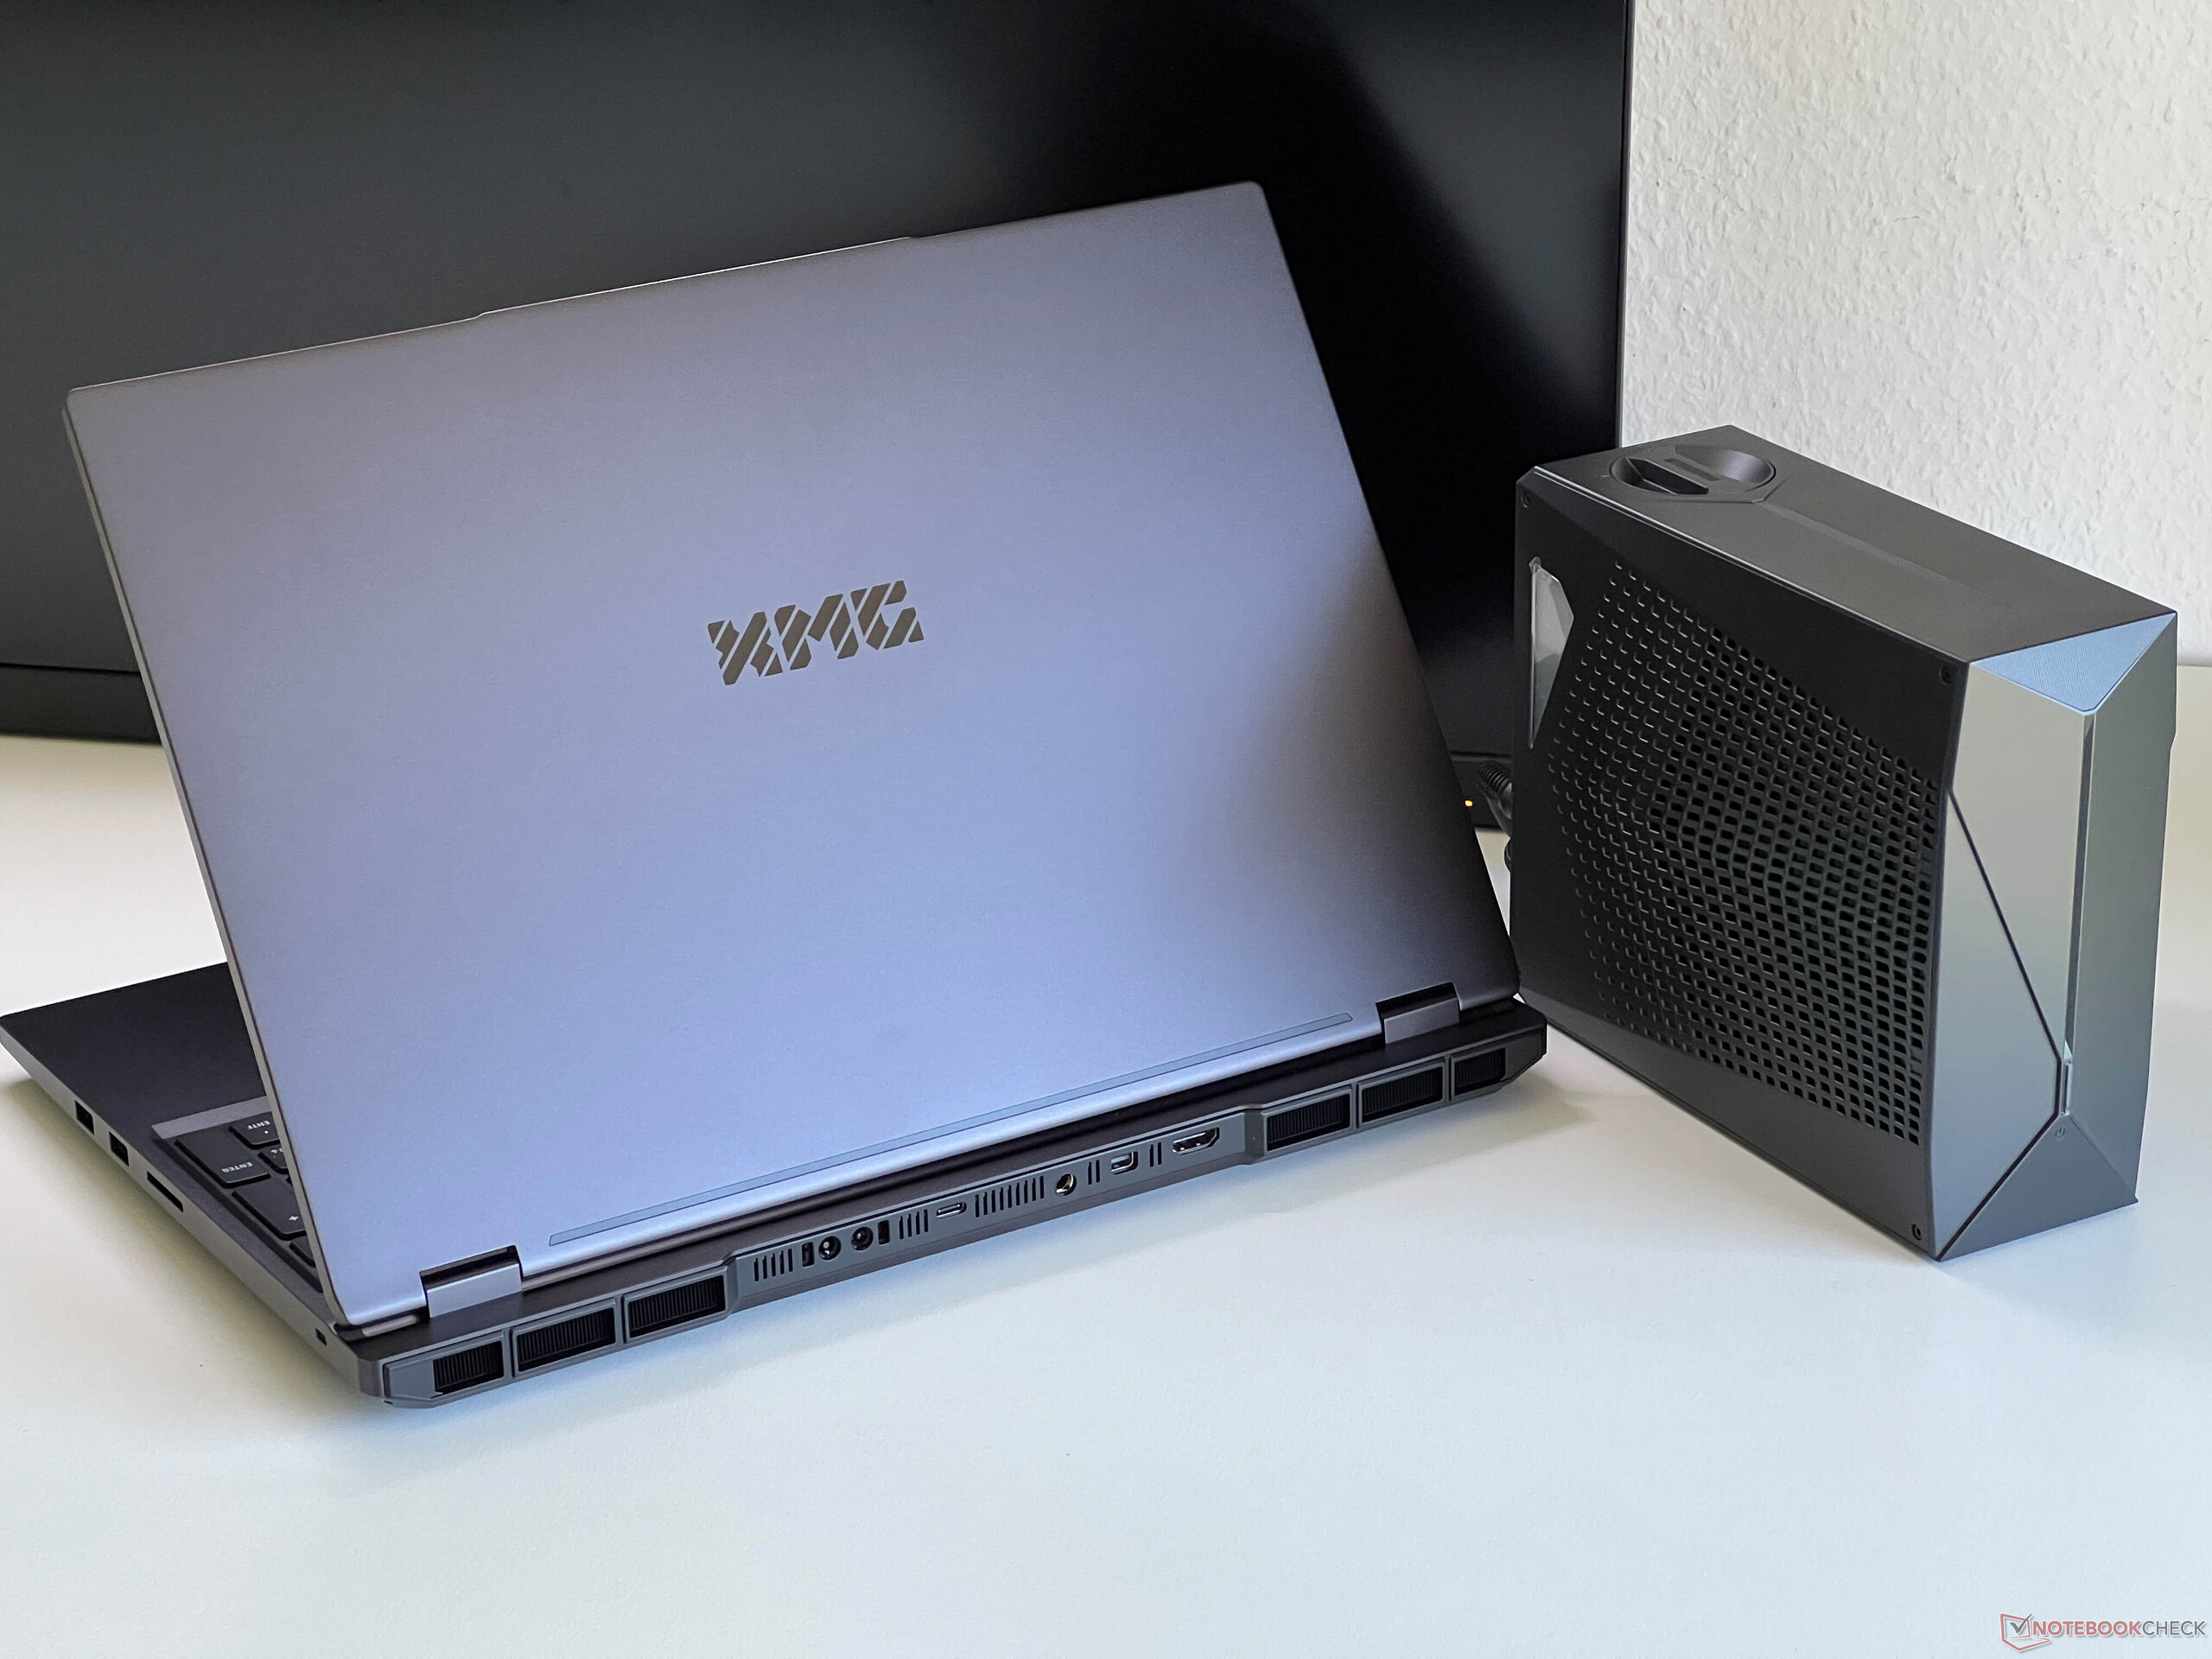
我们获得了 新款 XMG Neo 16 的第一印象的第一印象。事实证明,它的性能非常出色,但我们还无法对其新型微型 LED 面板进行精确测量。现在,我们在编辑部拥有了新款 Neo 16 E25 的零售机,并对其进行了广泛测试--RTX 5090 笔记本电脑、酷睿 Ultra 9 275HX 和新款迷你 LED 面板。我们还测试了新版的外置 Oasis 水冷系统。我们的测试设备与上述组件的价格约为 5,000 美元。

规格

SCHENKER XMG Neo 16 E25 RTX 5090 Laptop (XMG Neo 16 Series)
Processor
Intel Core Ultra 9 275HX 24 x 2.1 - 5.4 GHz, 200 W PL2 / Short Burst, 185 W PL1 / Sustained, Arrow Lake-HX
Graphics adapter
Nvidia GeForce RTX 5090 Laptop - 24 GB VRAM, Core: 2535 MHz, RAM: 1750 MHz, 175 W TDP ( including 25 W Dynamic Boost), GDDR7, 576.40, Optimus, MUX Switch
Memory
32 GB 
, DDR5-6400, Dual-Channel, 2 Slots, max. 128 GB RAM
Display
16.00 inch 16:10, 2560 x 1600 pixel 189 PPI, NE160QDM-NM9, Mini-LED, glossy: yes, HDR, 300 Hz
Mainboard
Intel HM870 (Arrow Lake-HX PCH)
Storage
Samsung 9100 Pro 1 TB, 1024 GB 
, 870 GB free
Soundcard
Intel Arrow Lake-S PCH - ACE (Audio Context Engine)
Connections
3 USB 3.0 / 3.1 Gen1, 1 USB 3.1 Gen2, 1 USB 4.0 40 Gbps, 1 Thunderbolt, USB-C Power Delivery (PD), 1 HDMI, 3 DisplayPort, 1 Kensington Lock, Audio Connections: 3.5 mm Stereo, Card Reader: SDXC
Networking
Realtek RTL8125 2.5GBe Family Ethernet Controller (10/100/1000/2500MBit/s), Intel Wi-Fi 6E AX211 (a/b/g/h/n = Wi-Fi 4/ac = Wi-Fi 5/ax = Wi-Fi 6/ Wi-Fi 6E 6 GHz), Bluetooth 5.3
Size
height x width x depth (in mm): 27.9 x 356.7 x 259.9
Battery
99.8 Wh, 6450 mAh Lithium-Polymer
Camera
Webcam: 1080p w/ mechanical shutter + IR
Primary Camera: 2 MPix
Additional features
Speakers: Stereo, Keyboard: Chiclet, Keyboard Light: yes, 420W PSU, 24 Months Warranty
Weight
2.853 kg, Power Supply: 835 g
Price
4450 Euro
Note: The manufacturer may use components from different suppliers including display panels, drives or memory sticks with similar specifications.


外壳和连接

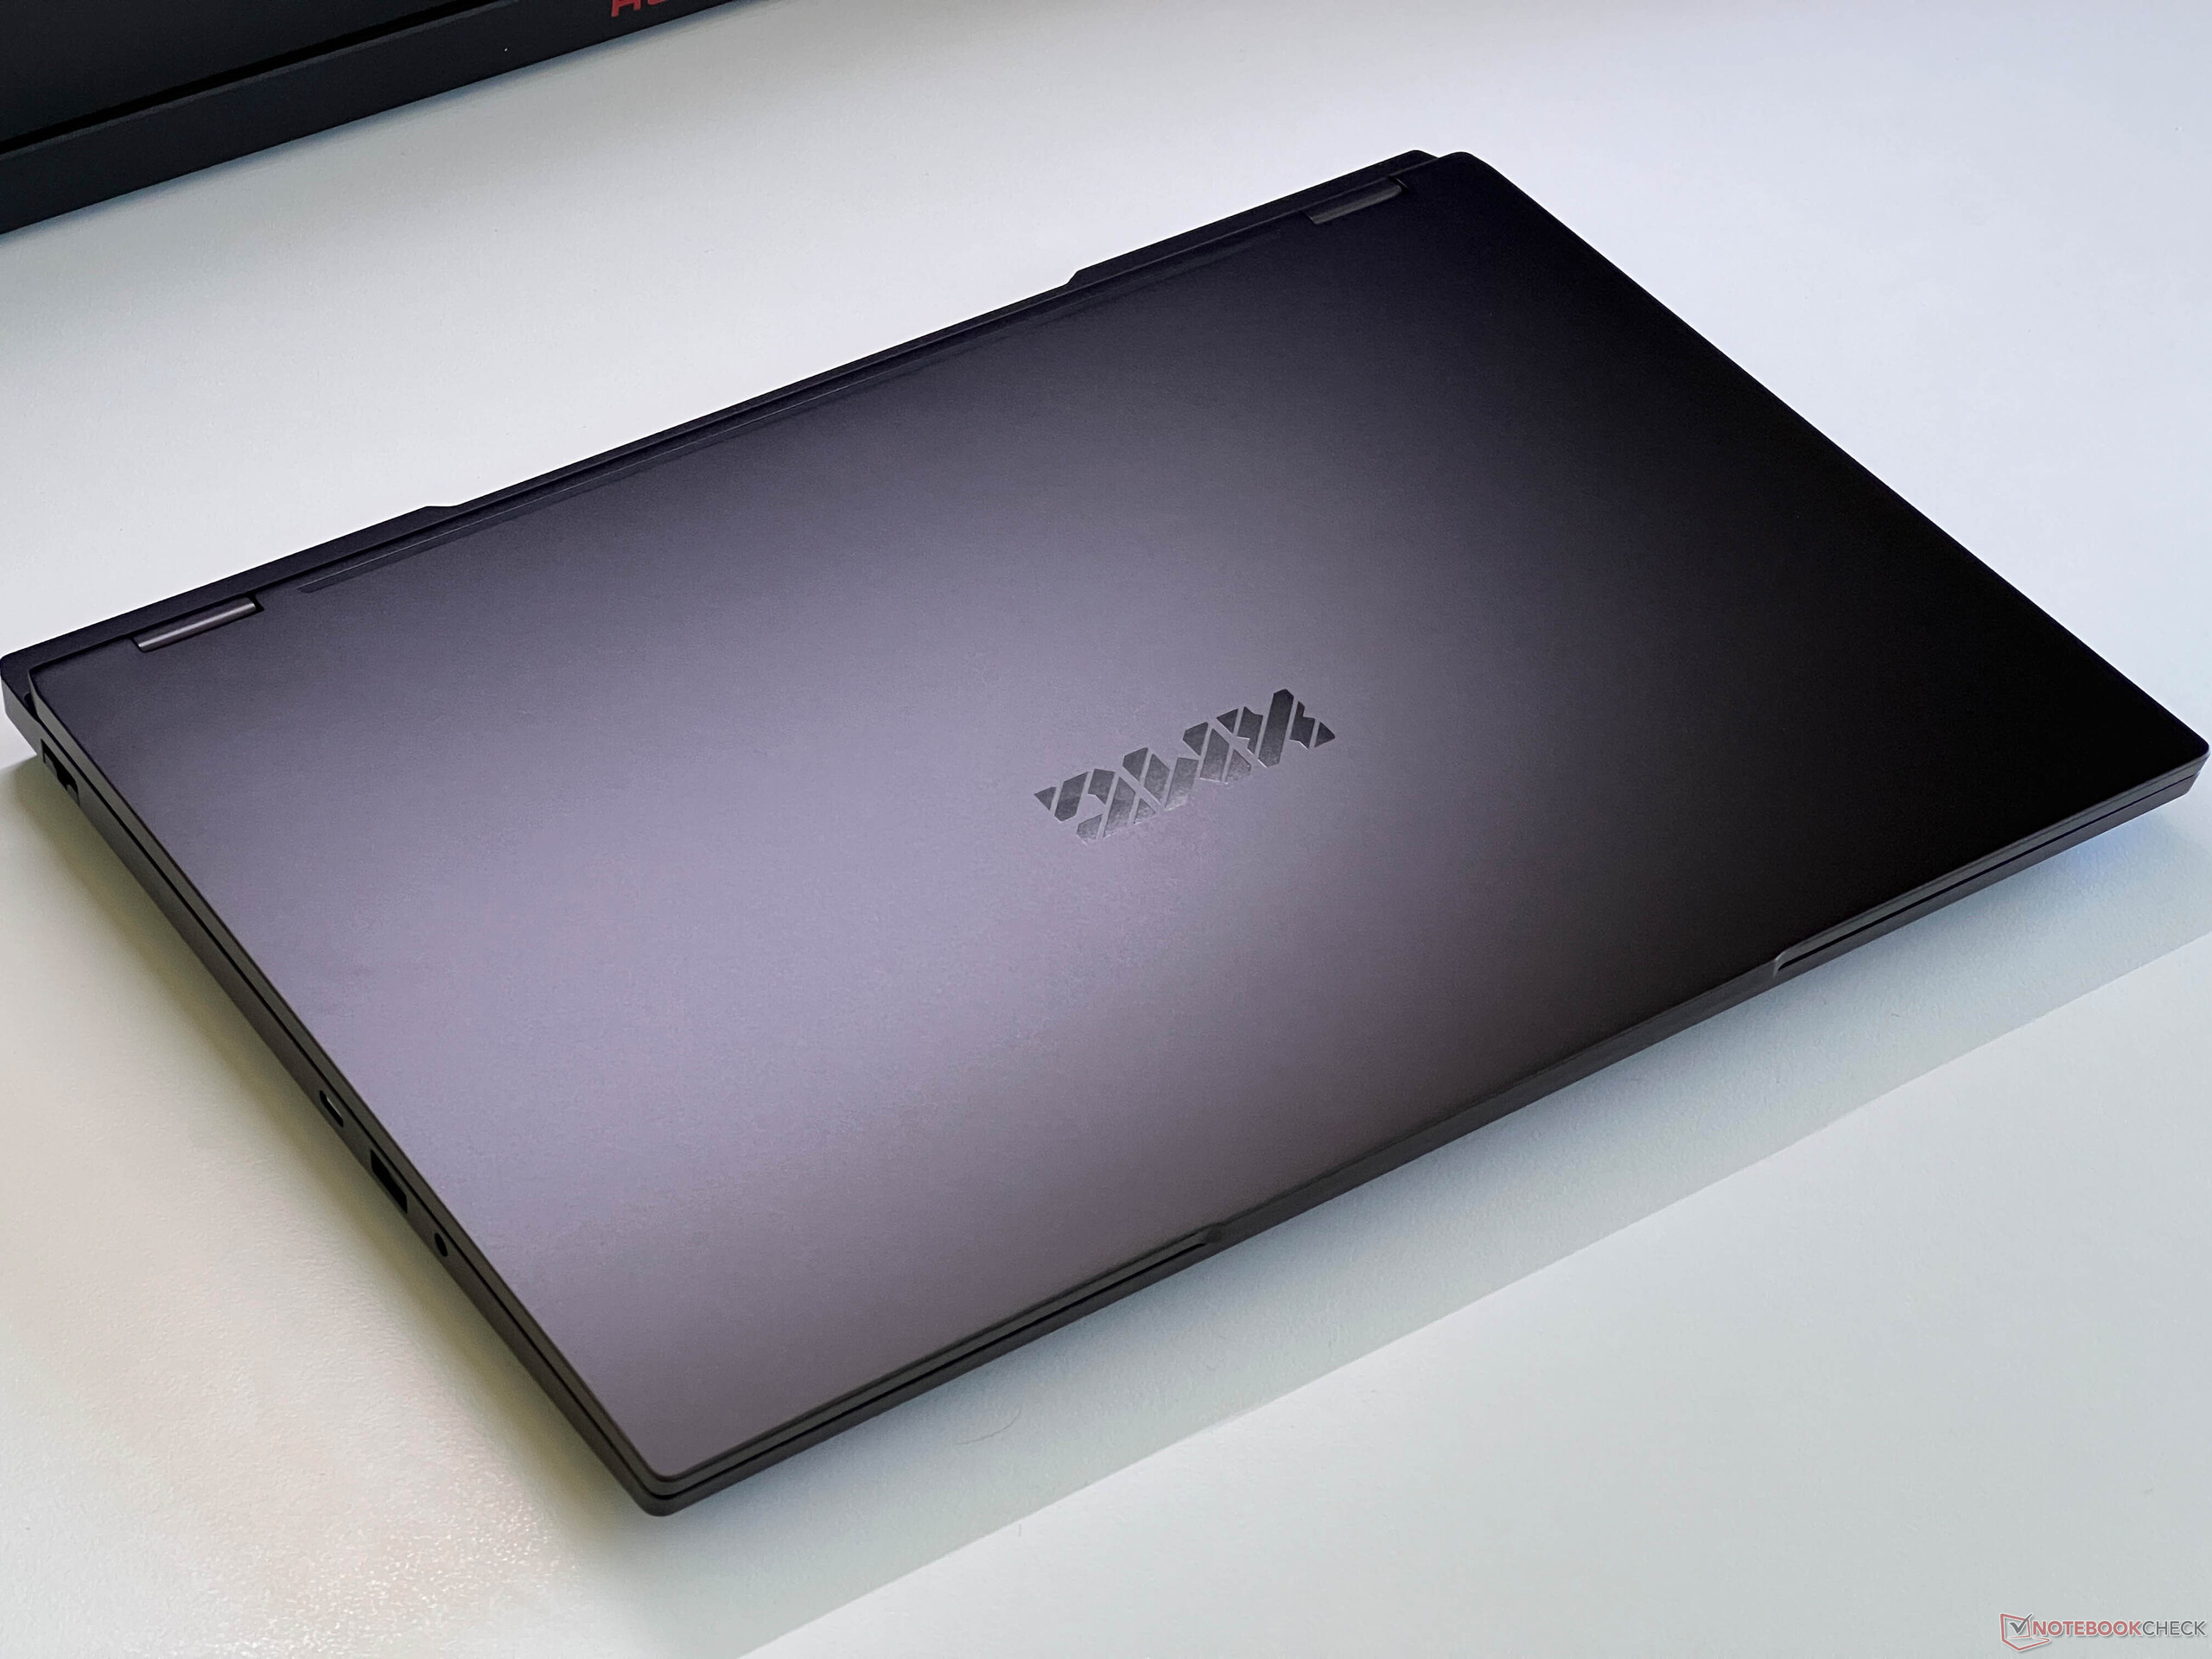
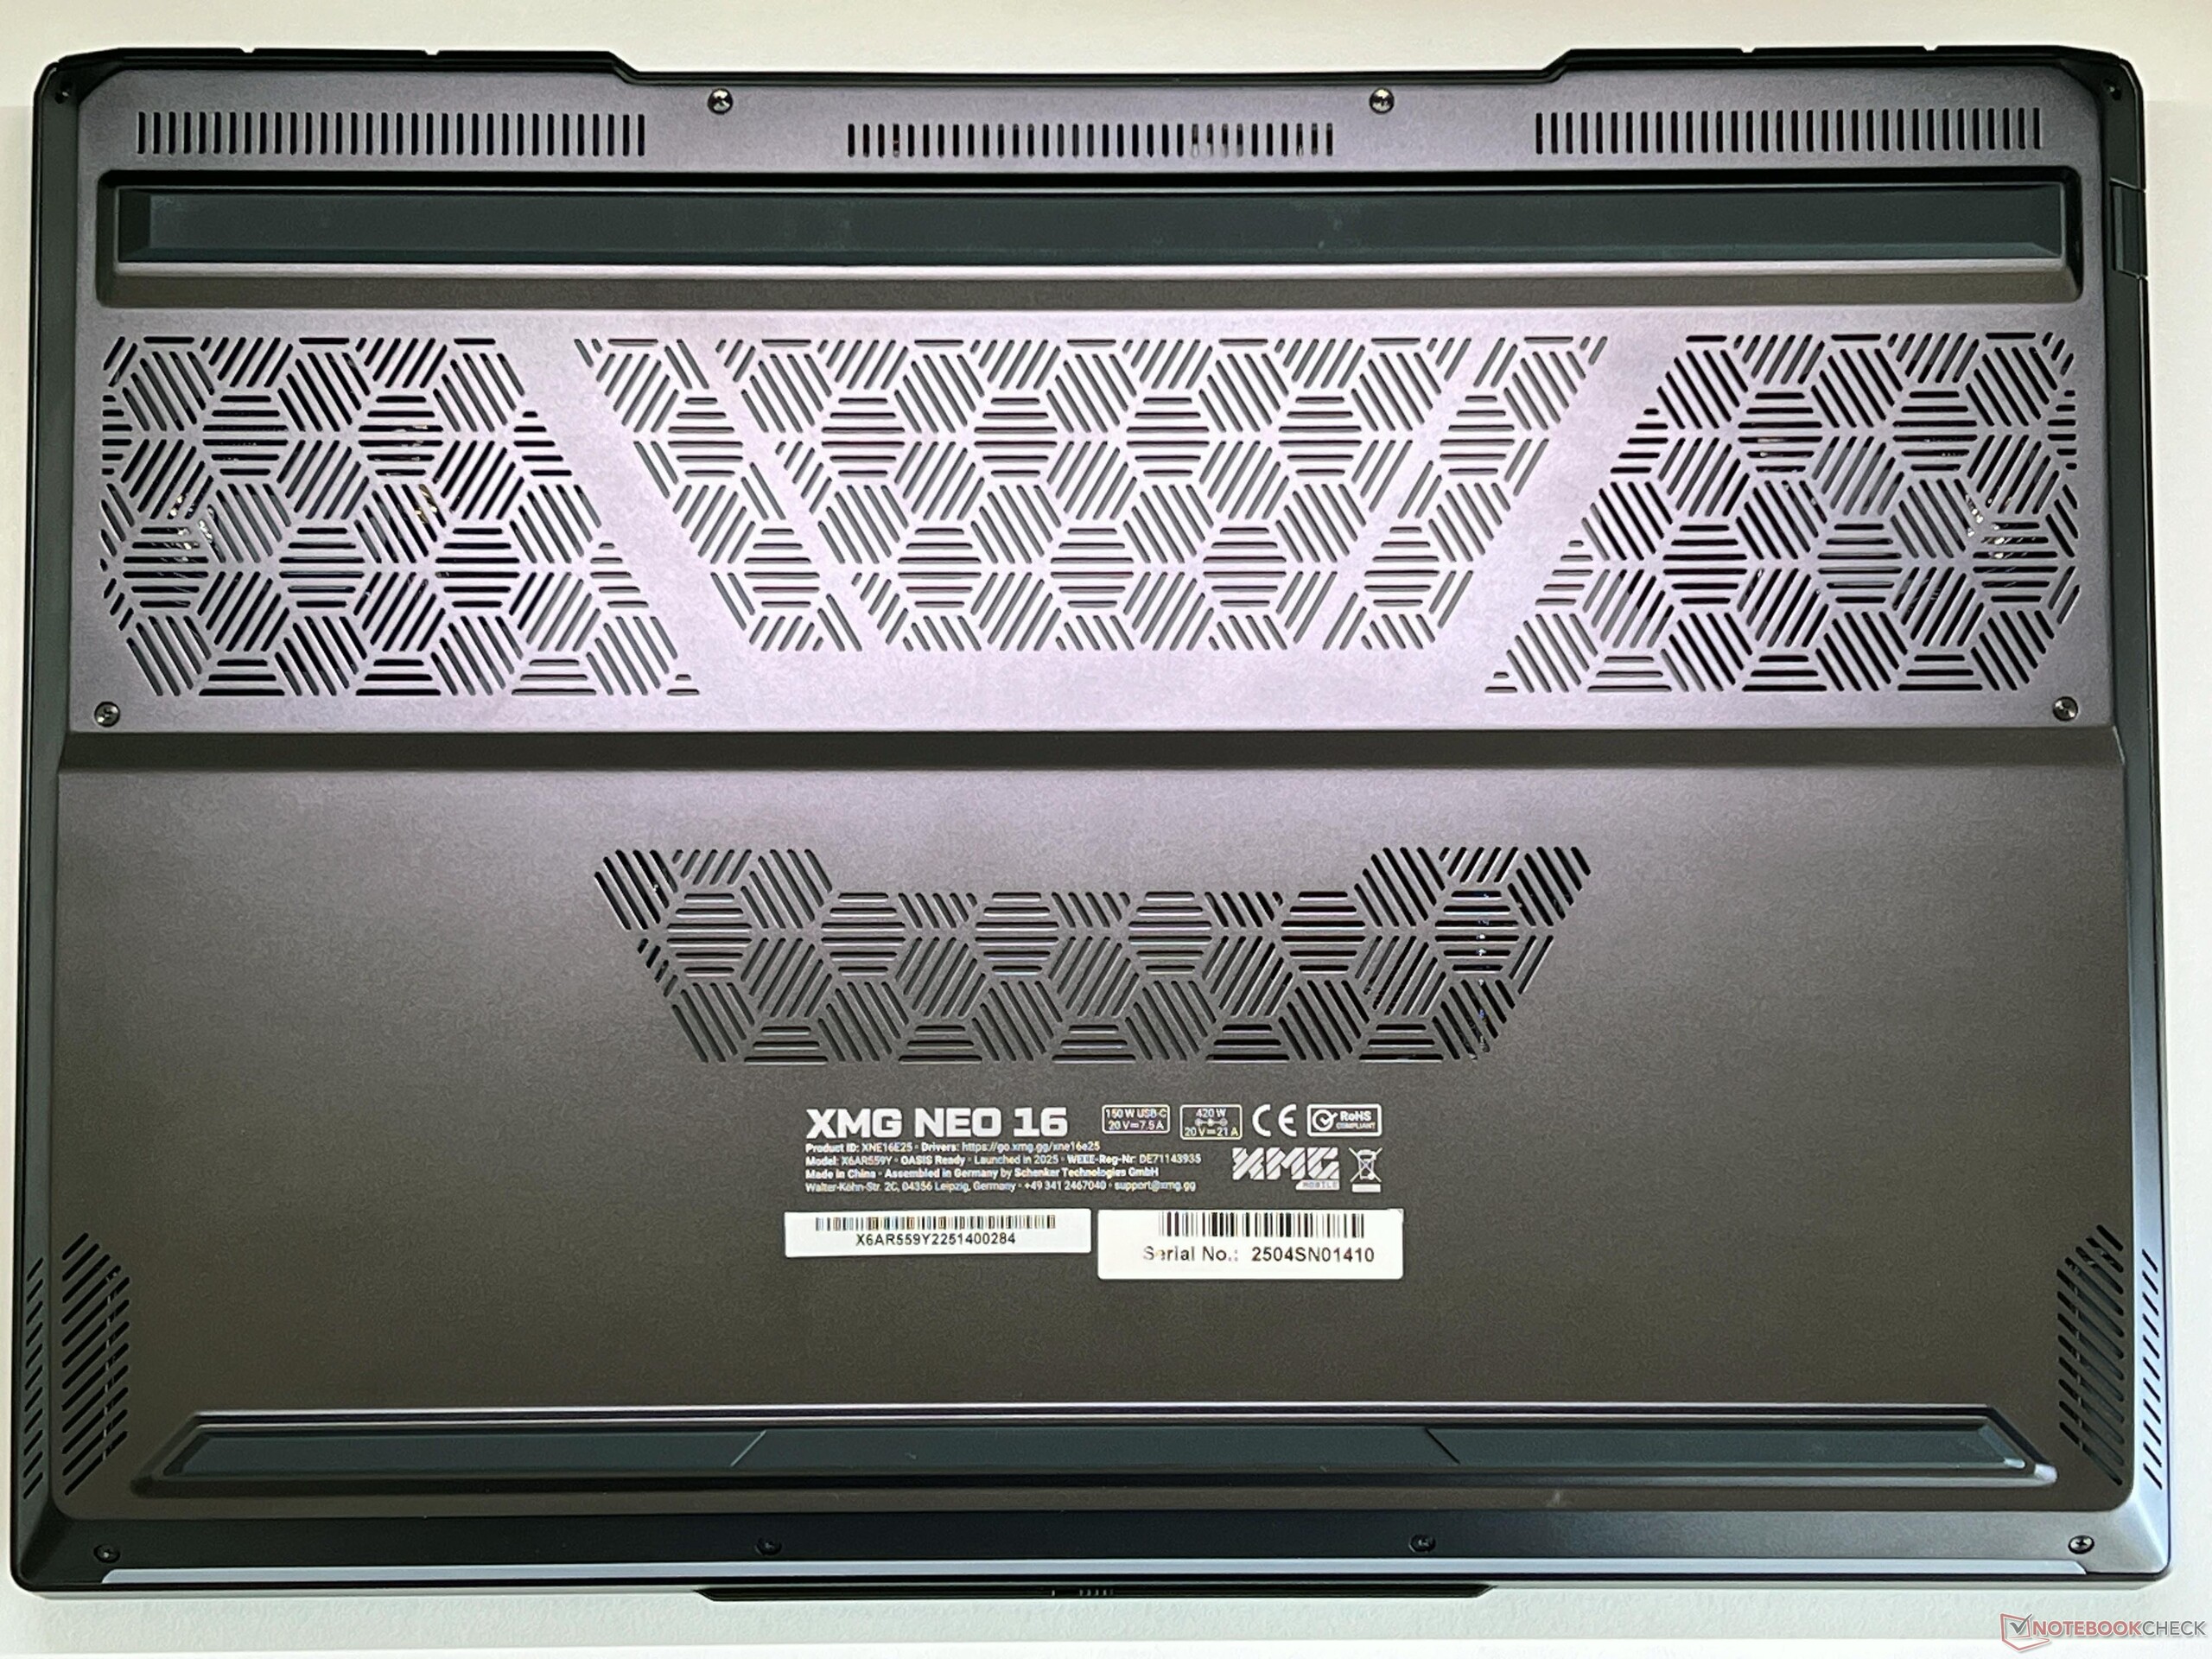
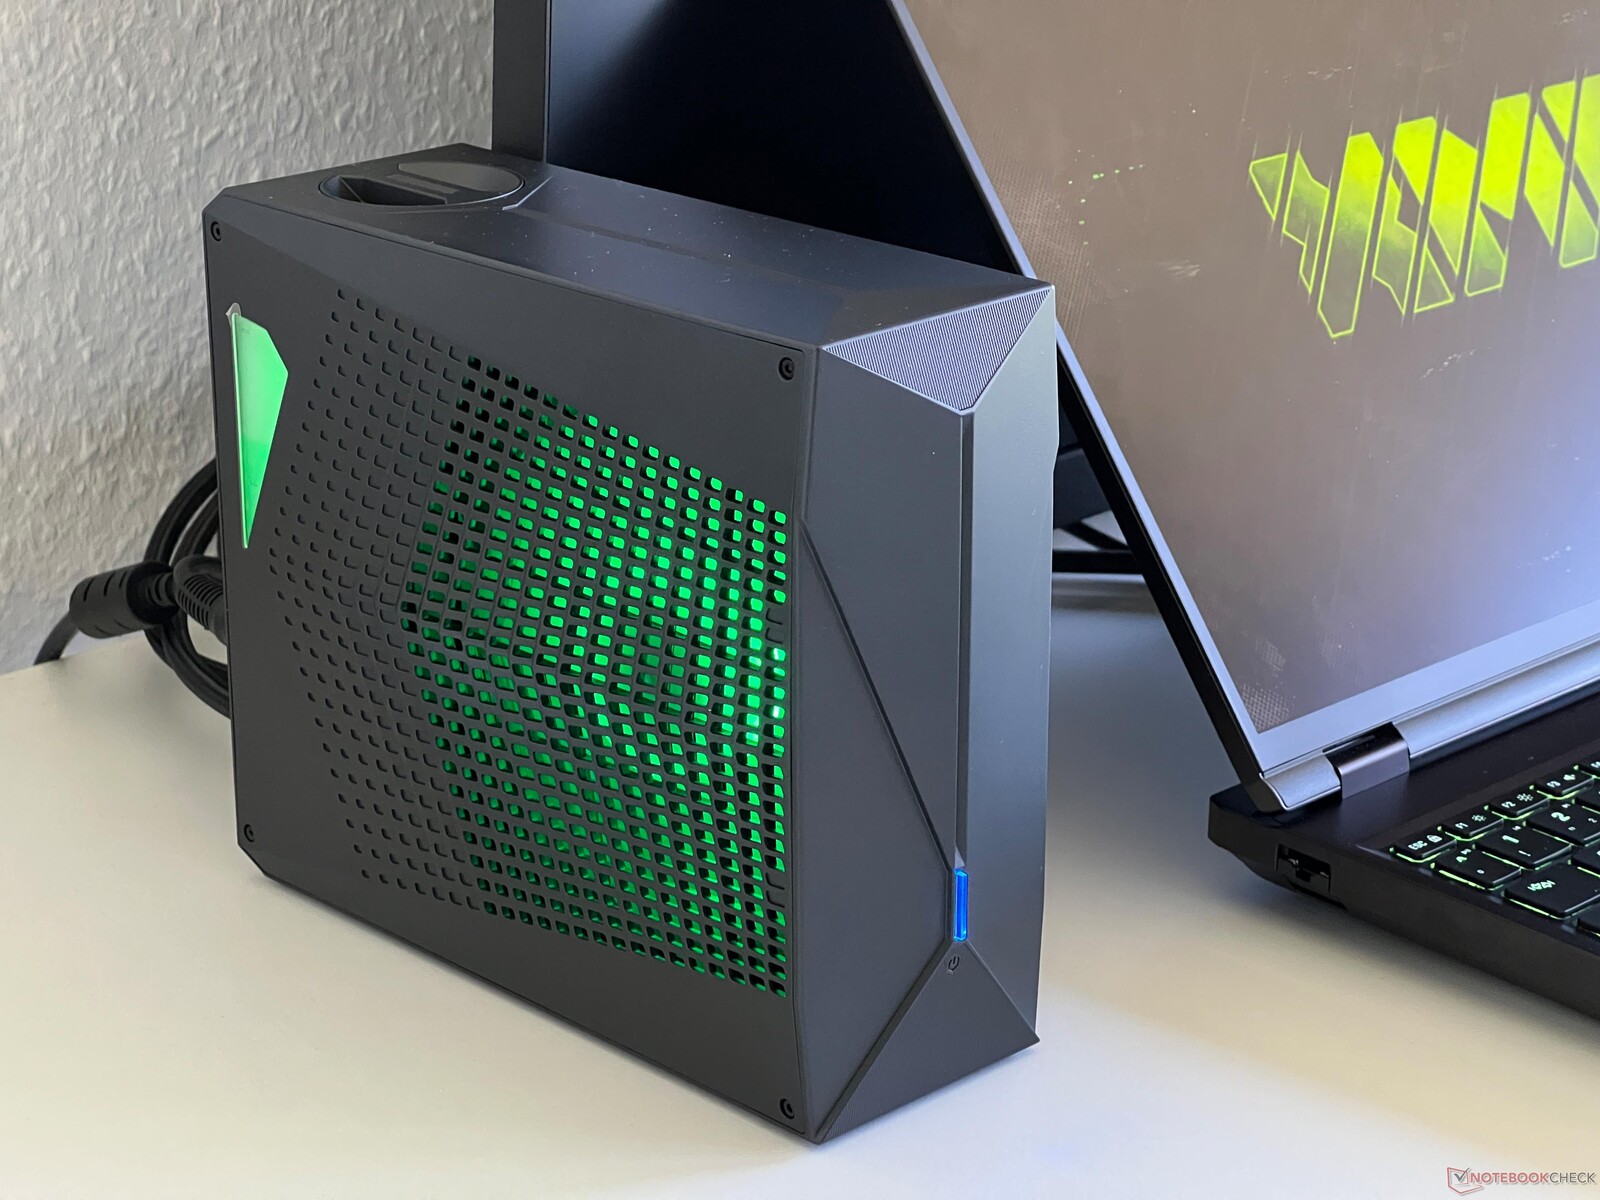
今年,Neo 16 的总体设计依然非常相似,但其金属外壳的某些部分有所改变。例如,机身侧面不再有出风口,连接处的分布也略有调整。其制造质量和稳定性仍然很好,但遗憾的是,其表面仍然很容易留下污痕。新的微型 LED 面板使笔记本电脑的重量增加了约 150 克,Neo 16 的重量为 2.85 千克,是我们对比组中最重的设备之一。它的正面还有一个 LED 灯带。

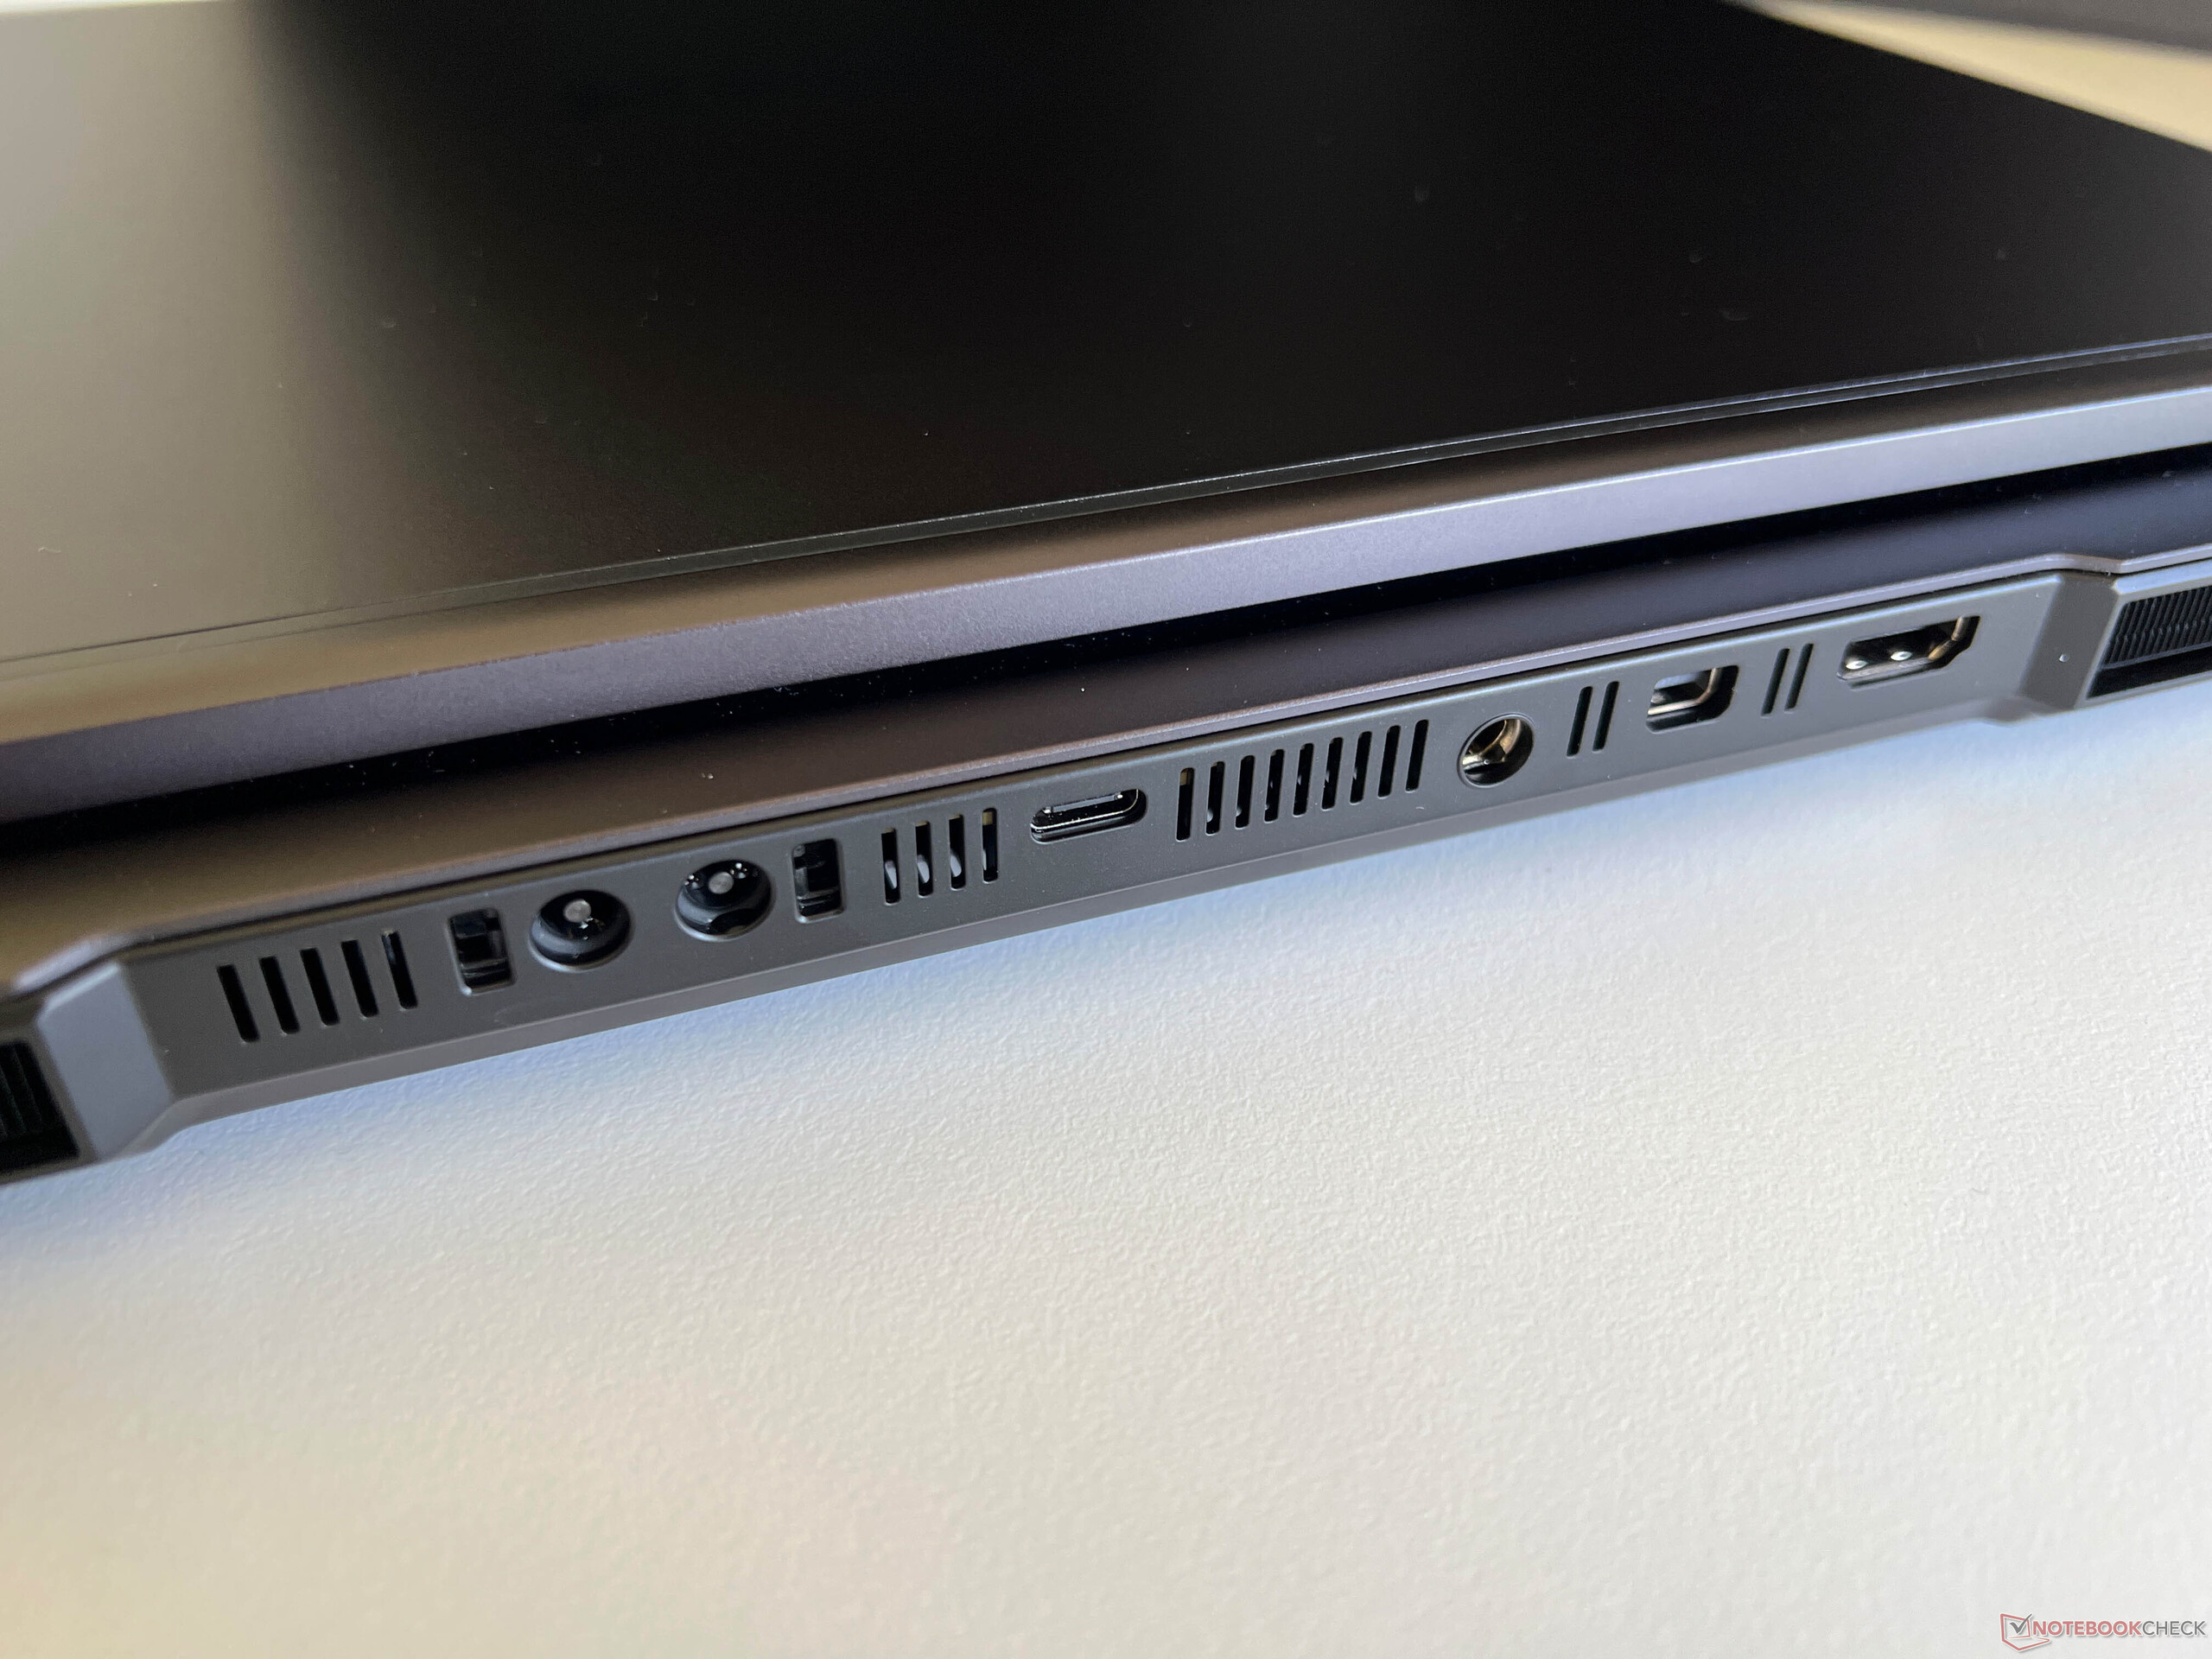
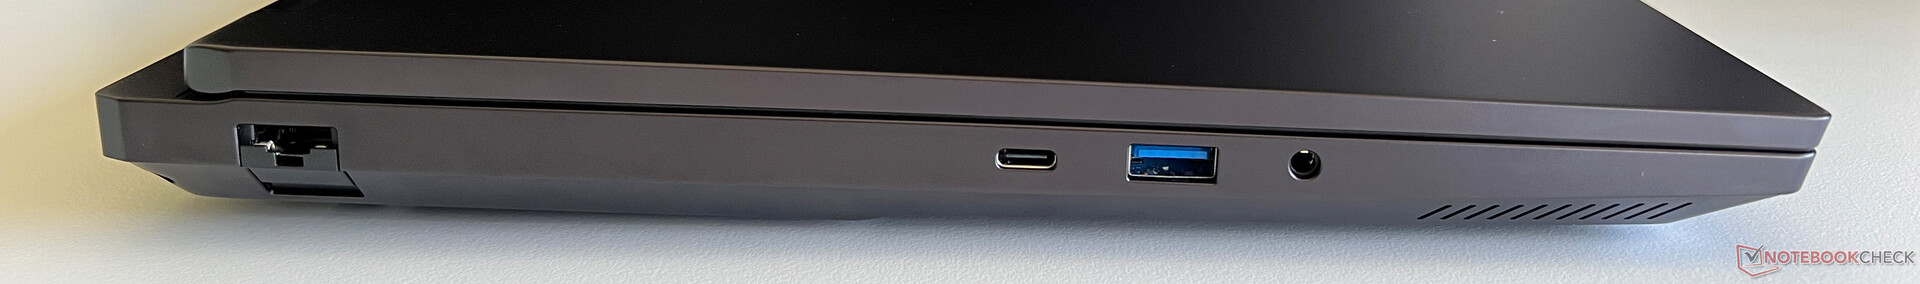
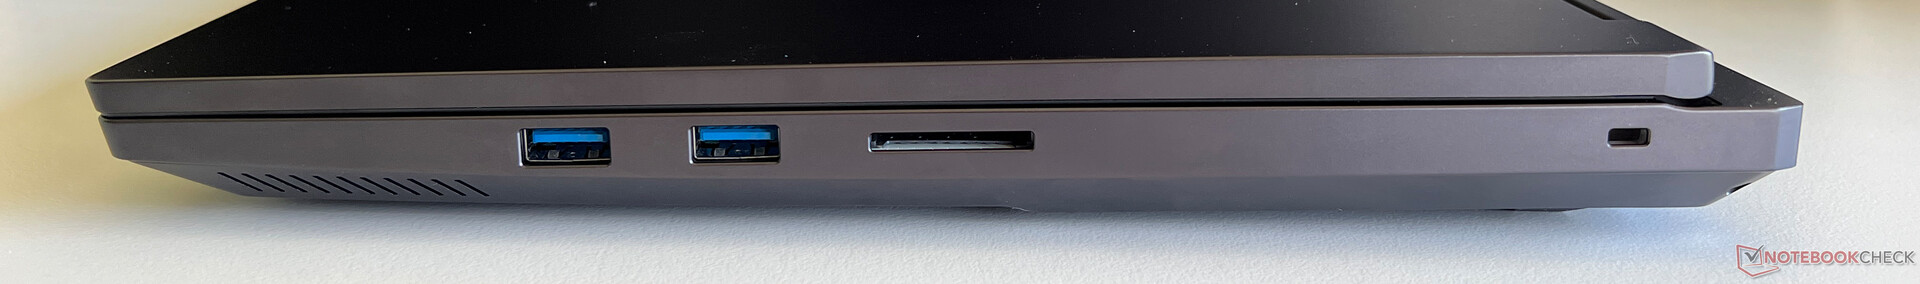
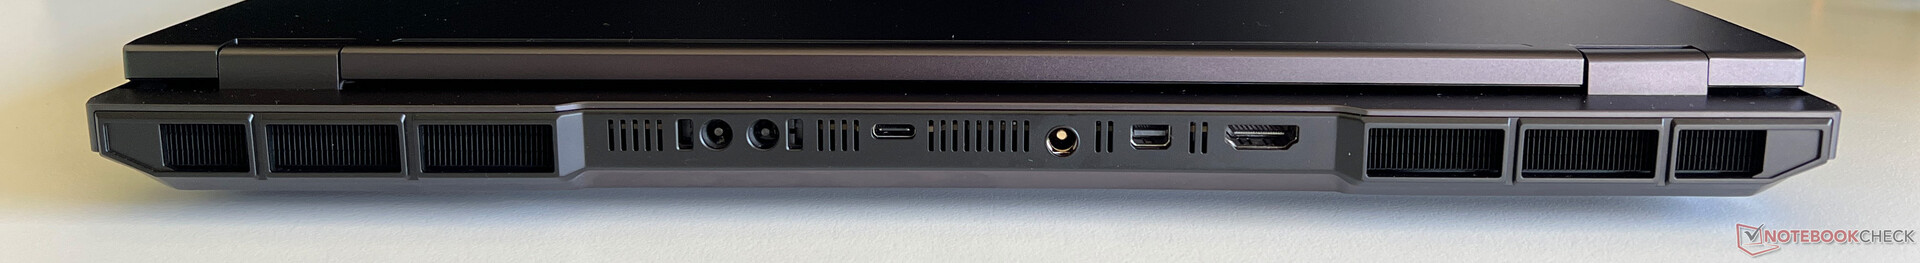
虽然没有最新的 Thunderbolt 5 标准,但其连接性仍然包括 Thunderbolt 4、HDMI 2.1 和足够的 USB 端口。机箱右侧的全功能读卡器速度超快,Wi-Fi 模块的传输速率也很高且稳定--尽管它还不支持 Wi-Fi 7。该设备的 1080p 网络摄像头(包括机械快门和红外模块)可满足其用途,但不支持 Studio Effects。它不是 Copilot+ 笔记本电脑,但可以使用实时字幕。

尺寸比较

364.38 mm 275.94 mm 26.65 mm 2.6 kg357 mm 254 mm 29.9 mm 2.5 kg354 mm 268 mm 30.8 mm 2.8 kg356.7 mm 259.9 mm 27.9 mm 2.9 kg356.7 mm 253 mm 26.6 mm 2.5 kg357 mm 269 mm 24.9 mm 2.8 kg297 mm 210 mm 1 mm 5.7 g
左:以太网(2.5 GBit/s)、USB-C 3.2 Gen 2(10 GBit/s、DisplayPort 1.4a、100 瓦功率传输)、USB-A 3.2 Gen 1(5 GBit/s)、3.5 毫米音频
右:2 个 USB-A 3.2 Gen 1(5 GBit/s)、SD 读卡器、Kensington NanoSaver Lock
背面:连接 Oasis 水冷系统、USB-C 4.0 和 Thunderbolt 4(40 GBit/s、DisplayPort ALT Mode 2.1、140 瓦 Power Delivery)、电源、Mini DisplayPort 2.1、HDMI 2.1
SD Card Reader
average JPG Copy Test (av. of 3 runs)
SCHENKER XMG Neo 16 E25 RTX 5090 Laptop
Intel Core Ultra 9 275HX (Angelbird AV Pro V60)
123 MB/s
Aorus MASTER 16 AM6H
Intel Core Ultra 9 275HX
112.95 (84.14min - 119.3max) MB/s -8%
Average of class Gaming
  (19 - 204, n=68, last 2 years)
94.2 MB/s -23%
SCHENKER XMG Neo 16 (Early 24)
Intel Core i9-14900HX (AV PRO microSD 128 GB V60)
76 MB/s -38%
maximum AS SSD Seq Read Test (1GB)
SCHENKER XMG Neo 16 E25 RTX 5090 Laptop
Intel Core Ultra 9 275HX (Angelbird AV Pro V60)
260.6 MB/s
Aorus MASTER 16 AM6H
Intel Core Ultra 9 275HX
205.44 MB/s -21%
Average of class Gaming
  (25.8 - 261, n=67, last 2 years)
120.7 MB/s -54%
SCHENKER XMG Neo 16 (Early 24)
Intel Core i9-14900HX (AV PRO microSD 128 GB V60)
87 MB/s -67%
Networking
SCHENKER XMG Neo 16 E25 RTX 5090 Laptop
Intel Wi-Fi 6E AX211
iperf3 transmit AXE11000
1681 (min: 1637) MBit/s ∼100%
iperf3 receive AXE11000
1717 (min: 1648) MBit/s ∼100%
Asus ROG Strix Scar 16 2025
Intel Wi-Fi 7 BE200 320MHz
iperf3 transmit AXE11000
1641 (min: 1404) MBit/s ∼98%
iperf3 receive AXE11000
1574 (min: 1553) MBit/s ∼92%
Lenovo Legion Pro 7i 16 Gen 10
Intel Wi-Fi 7 BE200 320MHz
iperf3 transmit AXE11000
1194 (min: 998) MBit/s ∼71%
iperf3 receive AXE11000
1312 (min: 1065) MBit/s ∼76%
iperf3 transmit AXE11000 6GHz
1402 (min: 997) MBit/s ∼86%
iperf3 receive AXE11000 6GHz
1564 (min: 1521) MBit/s ∼92%
HP Omen Max 16 ah000
Intel Wi-Fi 7 BE200 320MHz
iperf3 transmit AXE11000
1270 (min: 961) MBit/s ∼76%
iperf3 receive AXE11000
1422 (min: 1224) MBit/s ∼83%
iperf3 transmit AXE11000 6GHz
1242 (min: 1202) MBit/s ∼77%
iperf3 receive AXE11000 6GHz
1513 (min: 1456) MBit/s ∼89%
Aorus MASTER 16 AM6H
Intel Wi-Fi 7 BE200 320MHz
iperf3 transmit AXE11000
1588 (min: 743) MBit/s ∼94%
iperf3 receive AXE11000
1677 (min: 1641) MBit/s ∼98%
iperf3 transmit AXE11000 6GHz
1621 (min: 1491) MBit/s ∼100%
iperf3 receive AXE11000 6GHz
1694 (min: 842) MBit/s ∼100%
SCHENKER XMG Neo 16 (Early 24)
Intel Wi-Fi 6E AX211
iperf3 transmit AXE11000
1018 (min: 656) MBit/s ∼61%
iperf3 receive AXE11000
1689 (min: 843) MBit/s ∼98%
050100150200250300350400450500550600650700750800850900950100010501100115012001250130013501400145015001550160016501700Tooltip
SCHENKER XMG Neo 16 E25 RTX 5090 Laptop; iperf3 transmit AXE11000; iperf 3.1.3: Ø1681 (1637-1732)
SCHENKER XMG Neo 16 E25 RTX 5090 Laptop; iperf3 receive AXE11000; iperf 3.1.3: Ø1717 (1648-1739)
ColorChecker
5.1 ∆E
6 ∆E
10.9 ∆E
7.3 ∆E
8.5 ∆E
8.2 ∆E
7.1 ∆E
7.9 ∆E
9.5 ∆E
6.5 ∆E
6.5 ∆E
2.8 ∆E
3 ∆E
7.6 ∆E
6.2 ∆E
3.3 ∆E
7.1 ∆E
12.2 ∆E
5.6 ∆E
7.1 ∆E
8.4 ∆E
7.5 ∆E
6.6 ∆E
9.4 ∆E
ColorChecker SCHENKER XMG Neo 16 E25 RTX 5090 Laptop: 7.09 ∆E min: 2.82 - max: 12.22 ∆E

配件 - XMG Oasis(Mk2-V4)

一般来说,我们已经知道了前几年的新版 Oasis(Mk2-V4),但对它进行了一些小的改进,包括双区照明和用于当前 Neo 16 的新连接线,因为笔记本电脑本身的连接线现在可以卡入到位。安装非常简单,除了水管外,只有一根电源线,而原来的电源只需插入 Oasis 即可。Oasis 设备和笔记本电脑之间通过蓝牙进行通信,指挥中心提供大量设置选项。Oasis 与 Neo 16 的捆绑售价约为 220 美元(单价约为 240 美元)。

绿洲 Mk2-V4
绿洲 Mk2-V4
电缆连接
电缆连接

维护

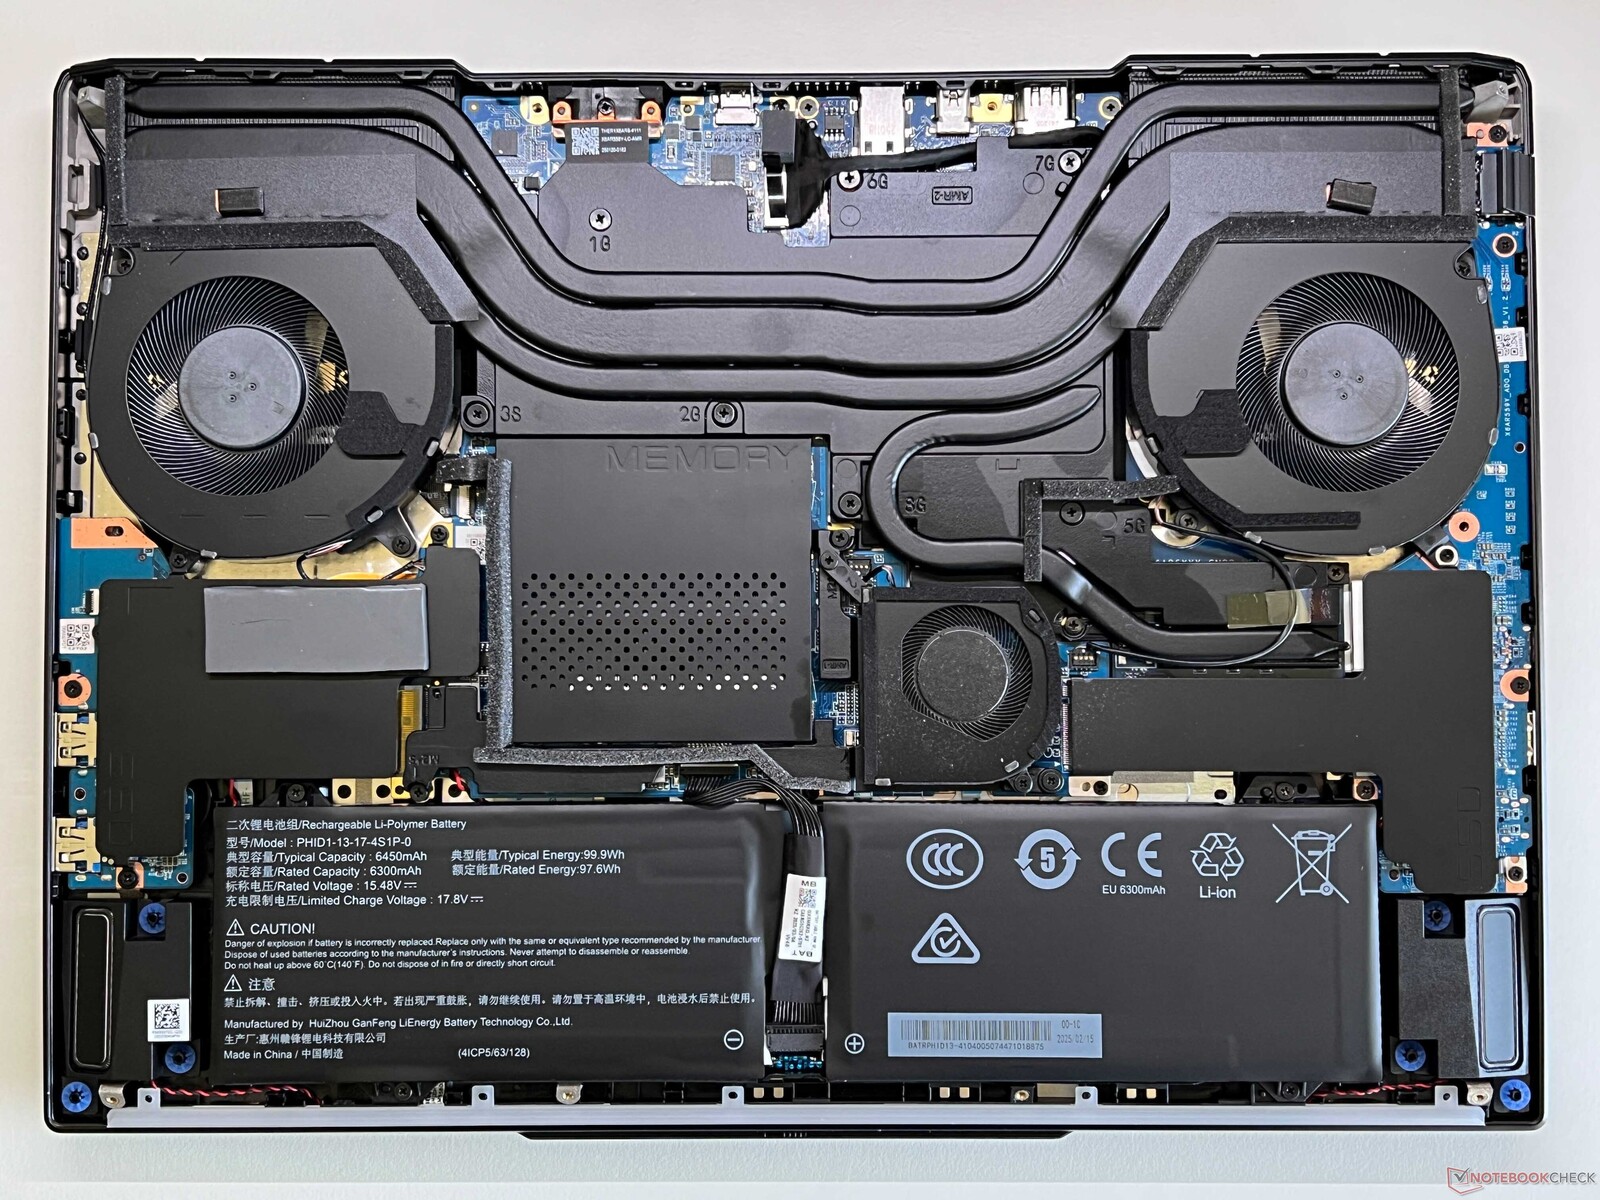
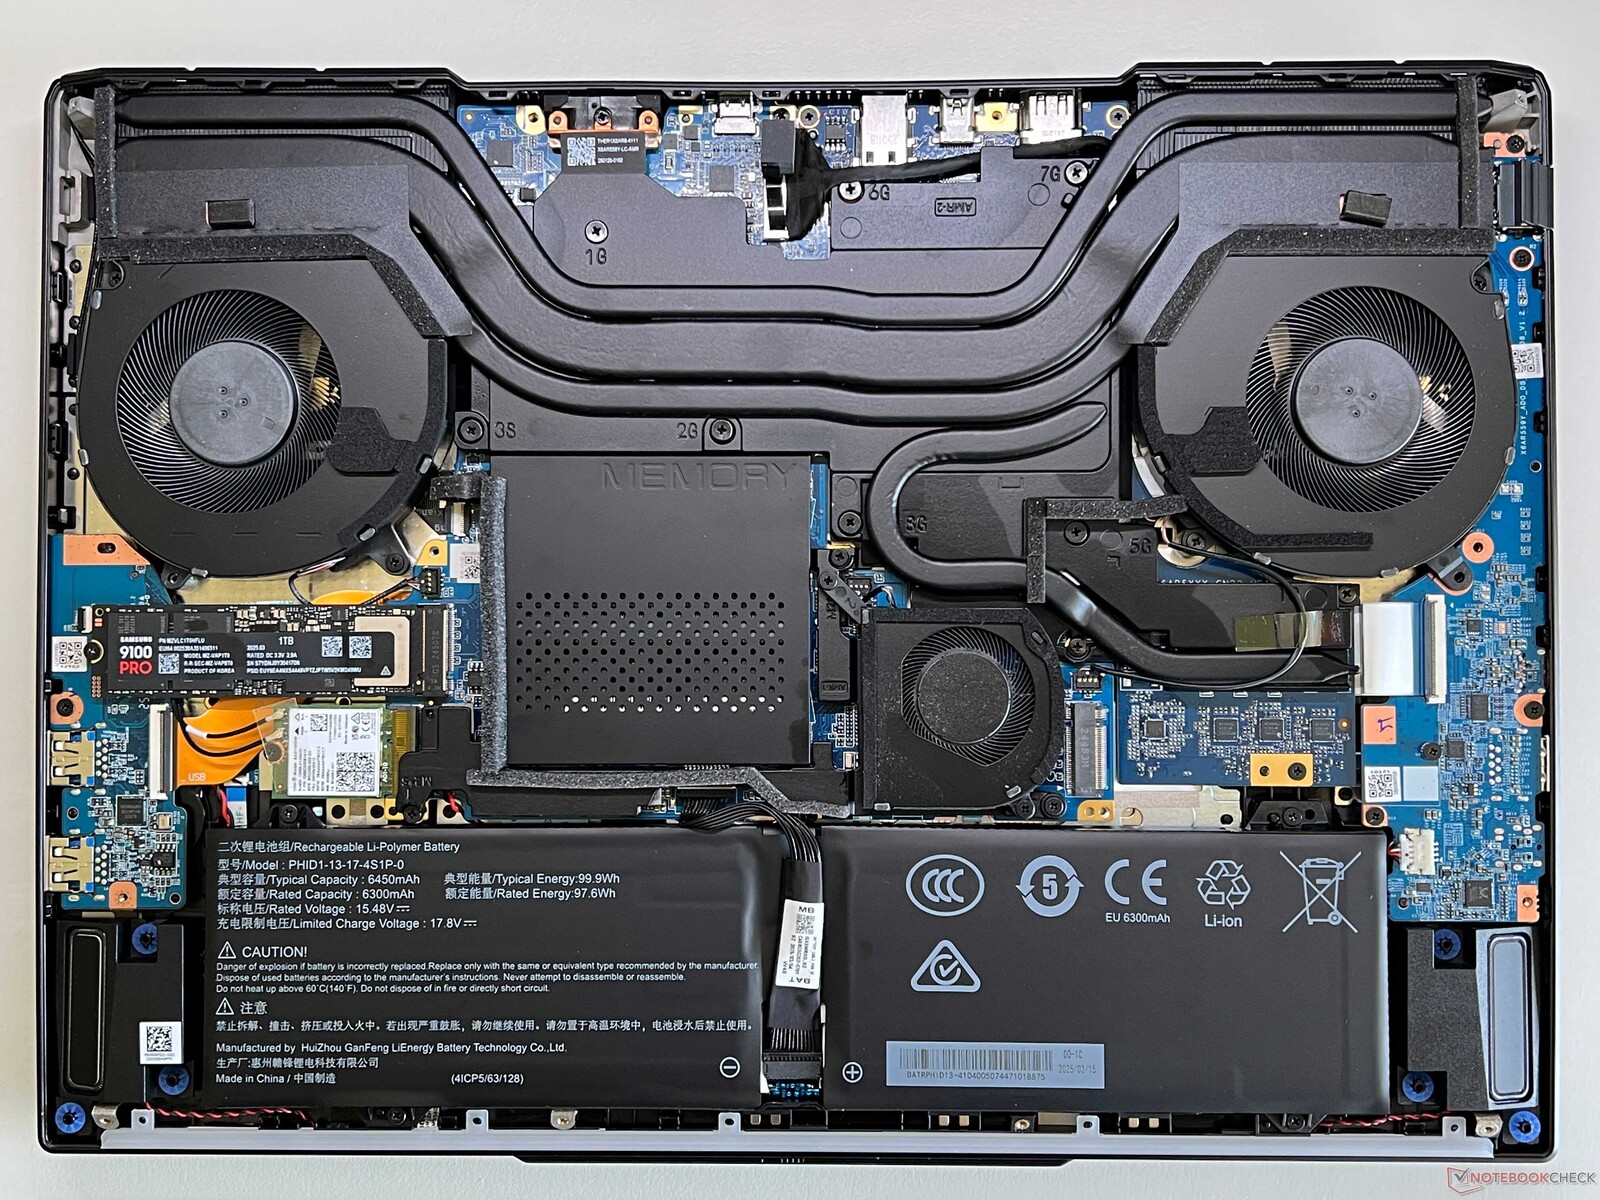
机箱下盖用 10 颗十字螺丝固定,可以轻松取下。该设备的内部结构经过全面修改,主板现在由两部分组成(CPU/GPU 分离),另外,现在使用三个风扇而不是两个。固态硬盘位于螺钉固定的盖板下,而内存插槽盖板是插进去的,非常紧,这在一定程度上增加了维护工作的难度。WLAN 模块也可以更换,电池用螺丝固定。

内部建设
内部建设
内部结构(无固态硬盘盖)
内部结构(无固态硬盘盖)
PCIe 5.0 固态硬盘和无线局域网模块

可持续性

XMG 没有提供任何有关该设备的二氧化碳排放量或使用回收材料的信息。这款笔记本电脑的包装几乎全部由纸板组成。

保修

其标准保修期为 24 个月(取货和退货),包括前 6 个月的快速维修。根据不同的快速维修条款,保修期可延长至 3 年。
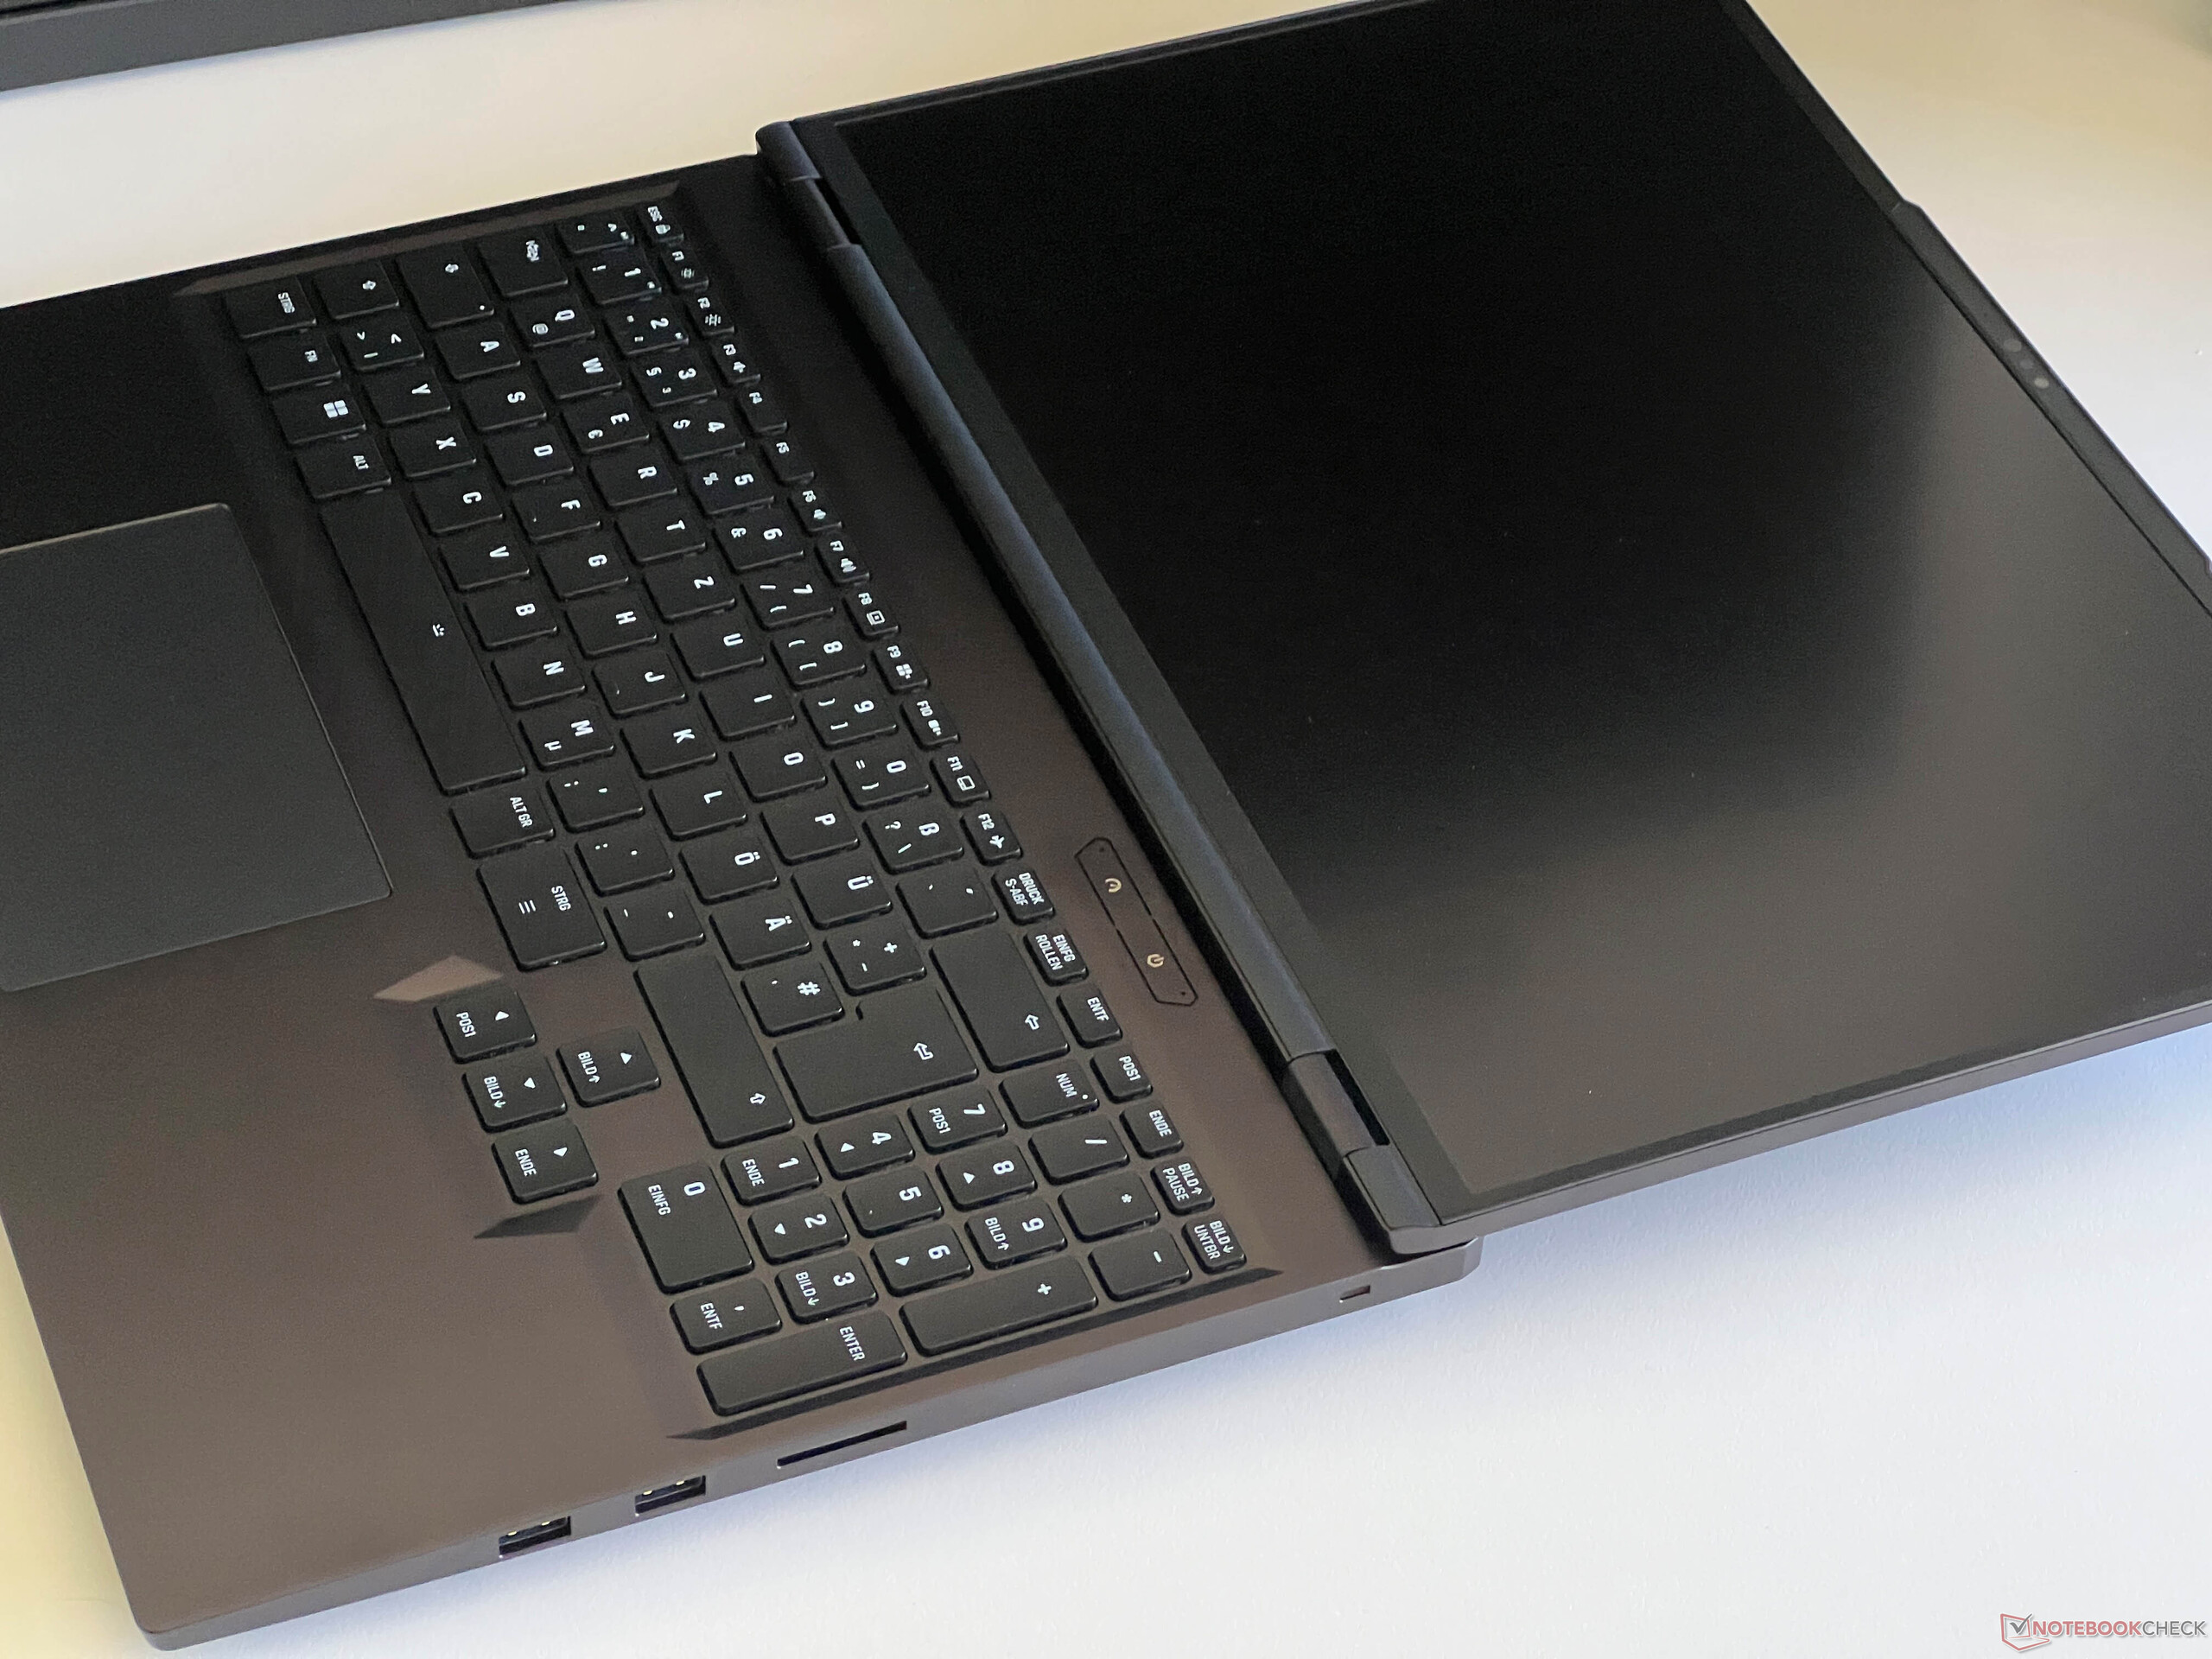
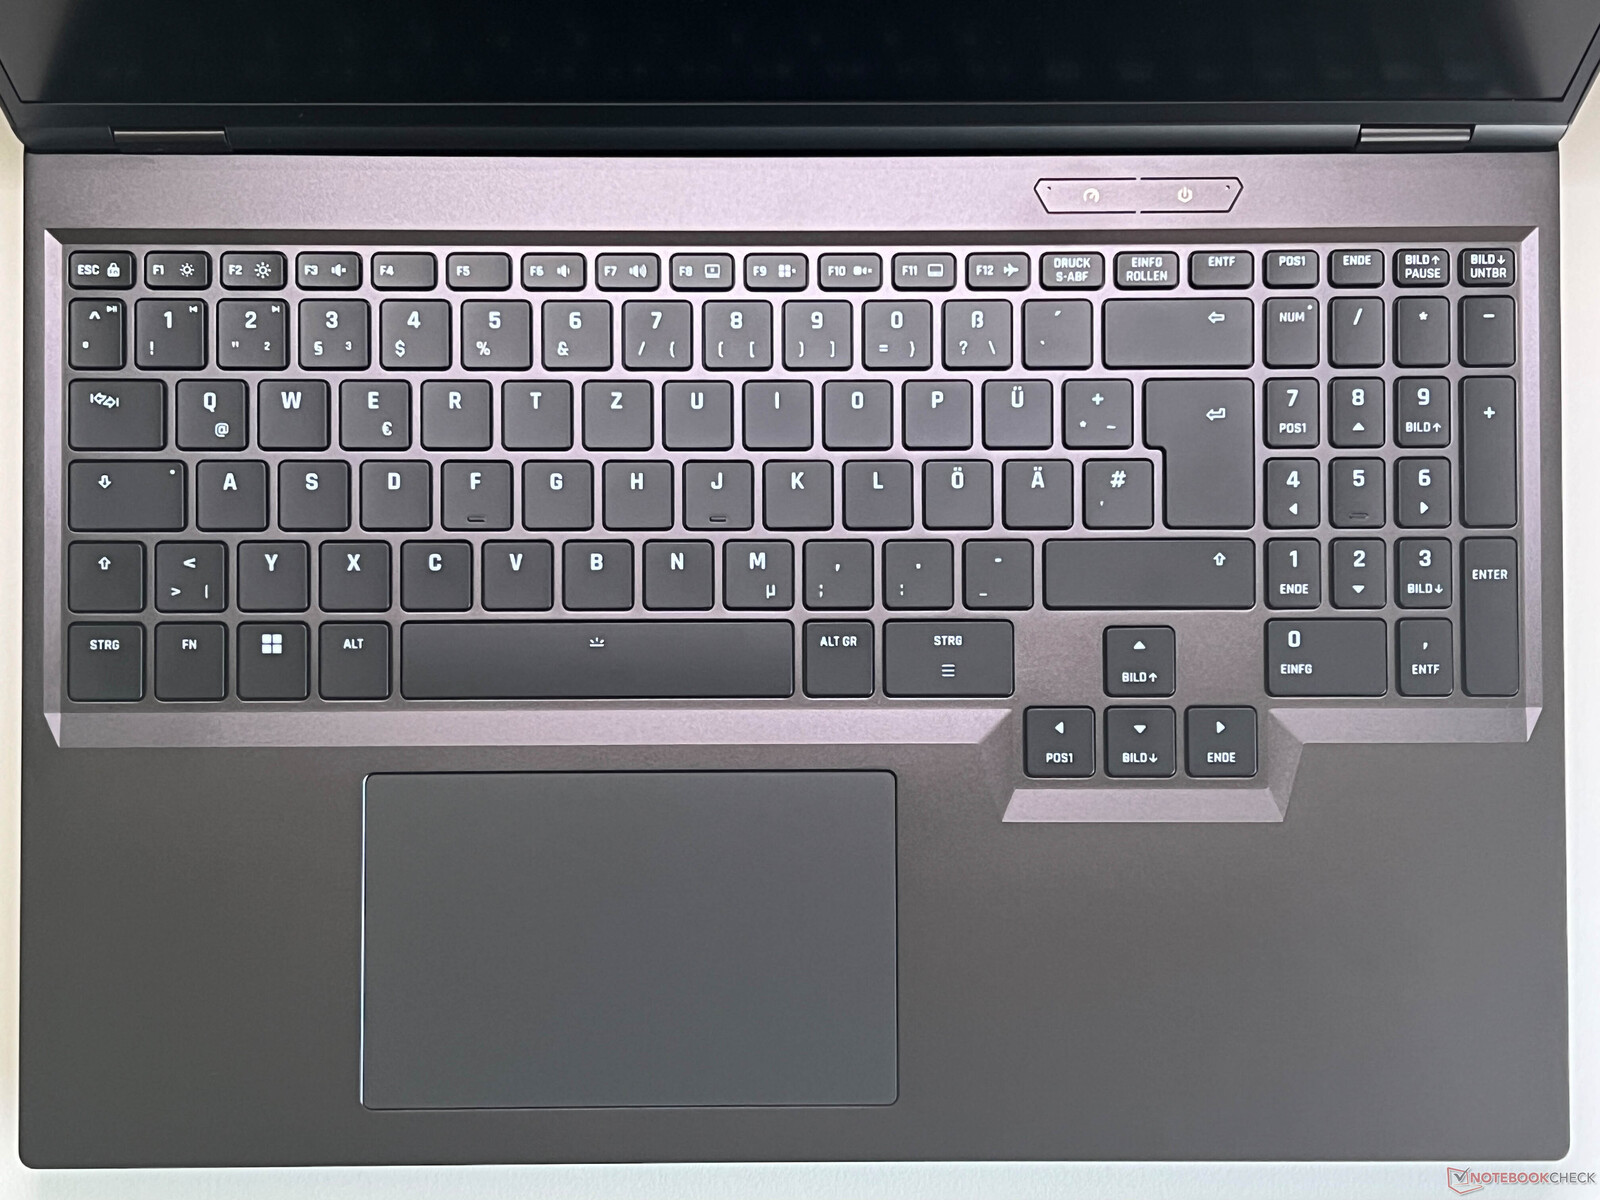
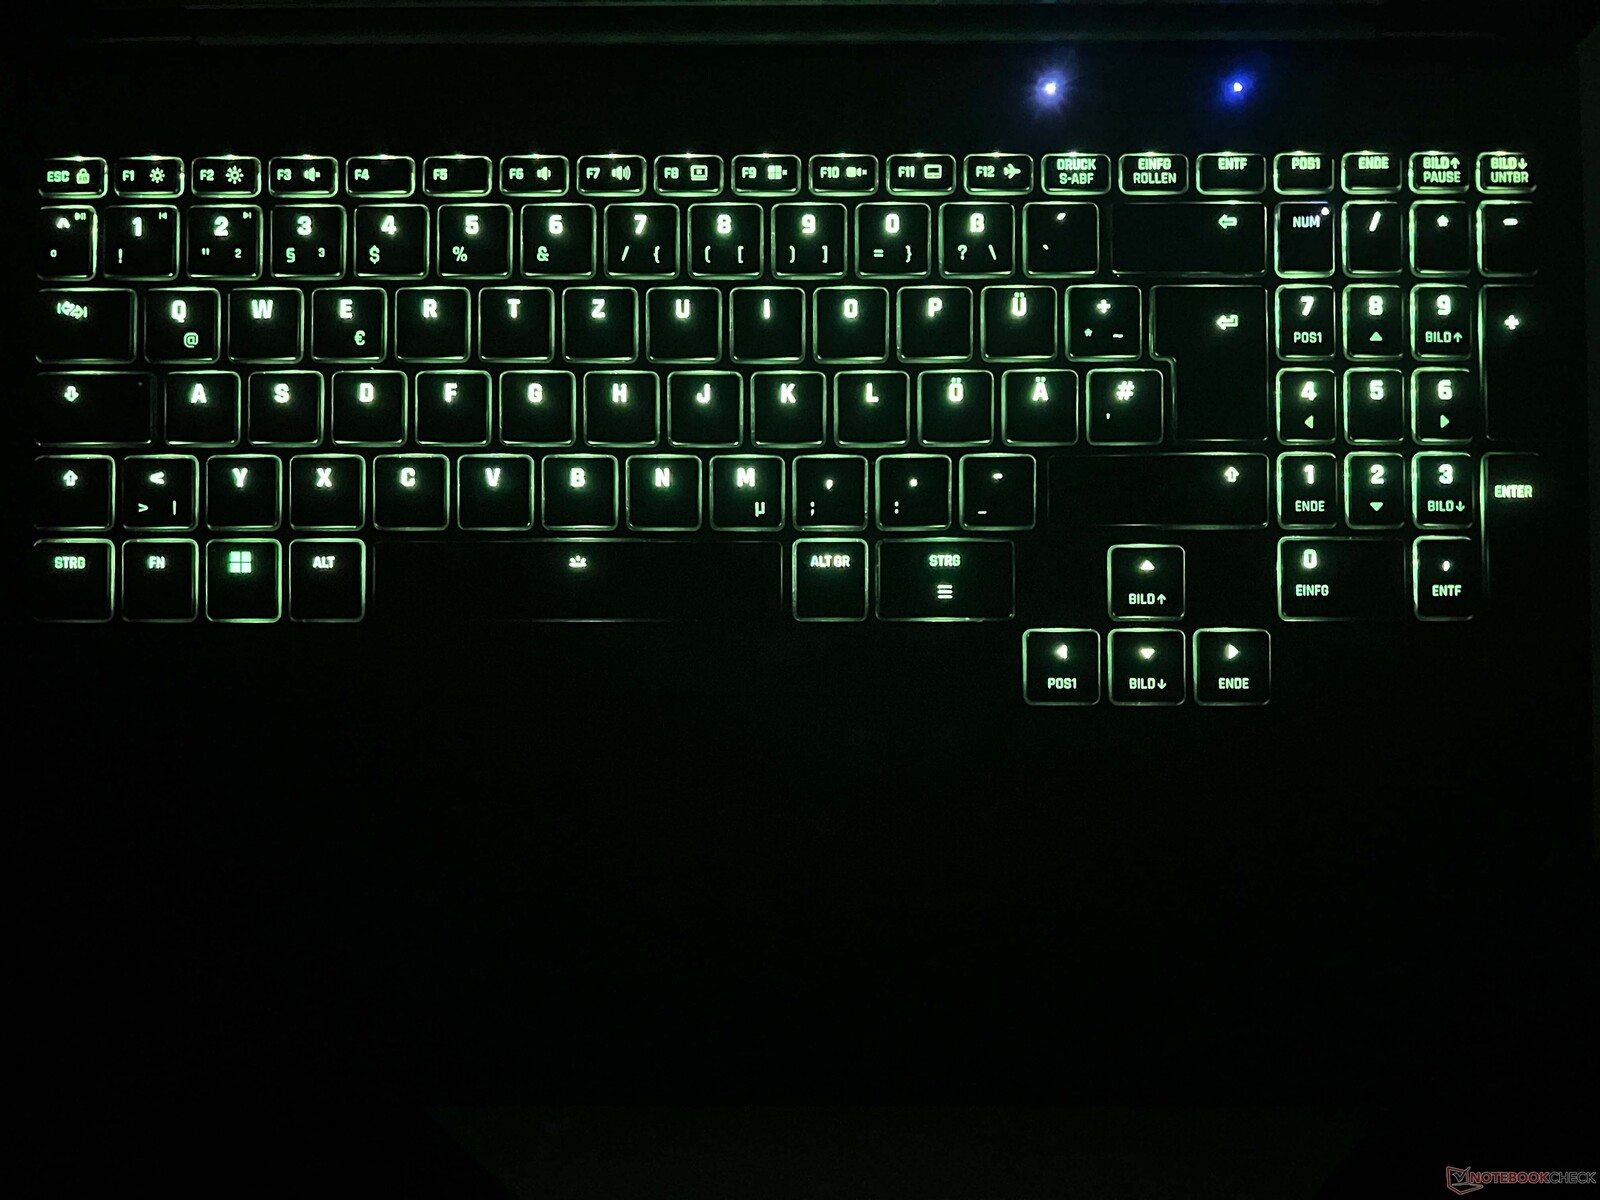
输入设备 - 舒适的键盘

笔记本电脑的输入设备几乎没有变化。用户继续使用非常舒适的键盘(包括数字小键盘),键盘反馈丰富,按键精准,不过现在的按键感觉稍硬。键盘布局清晰,每个按键的背光(4 级强度)均可单独调节。ClickPad(12.3 x 7.8 厘米)光滑平整,没有异响,不过下部的机械咔哒声听起来有点响。

输入设备
输入设备
键盘背光(以绿色为例)
键盘背光(以绿色为例)

显示屏 - 超亮迷你 LED 面板

子像素阵列
子像素阵列
最大 HDR 亮度
最大 HDR 亮度

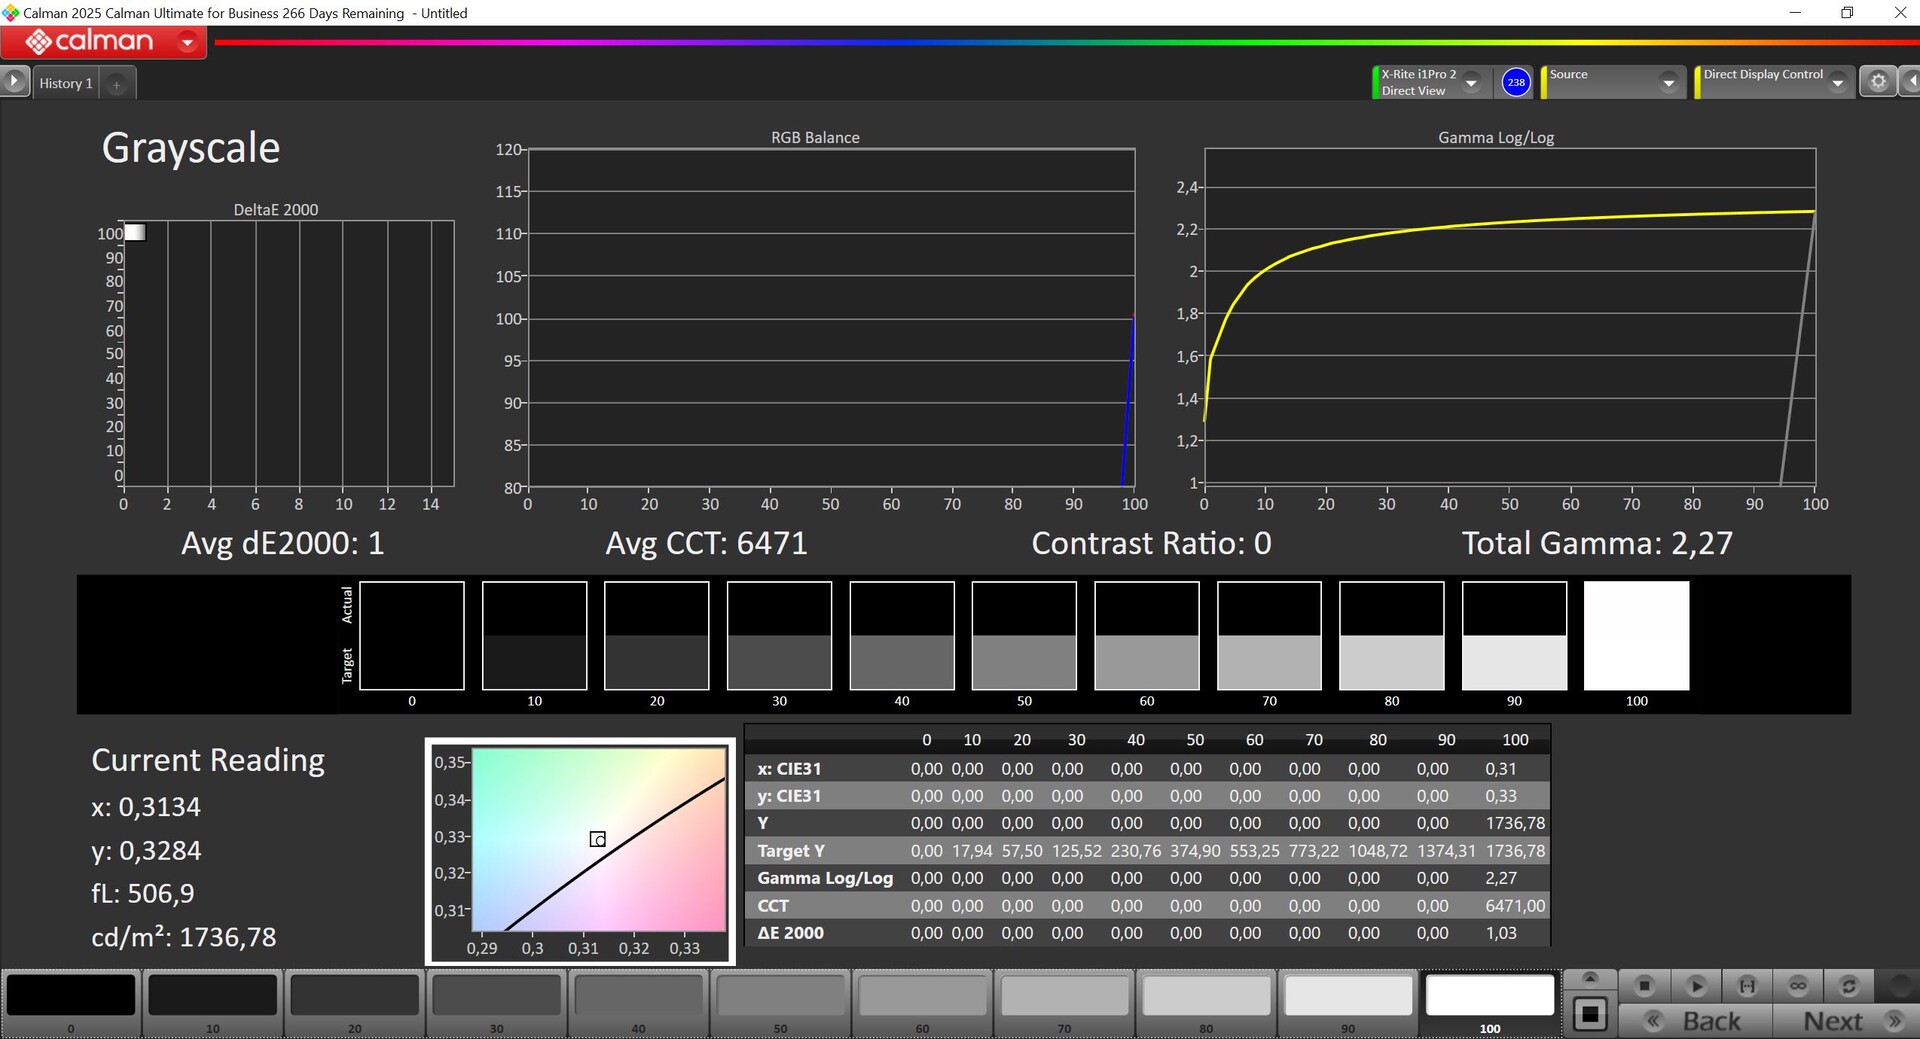
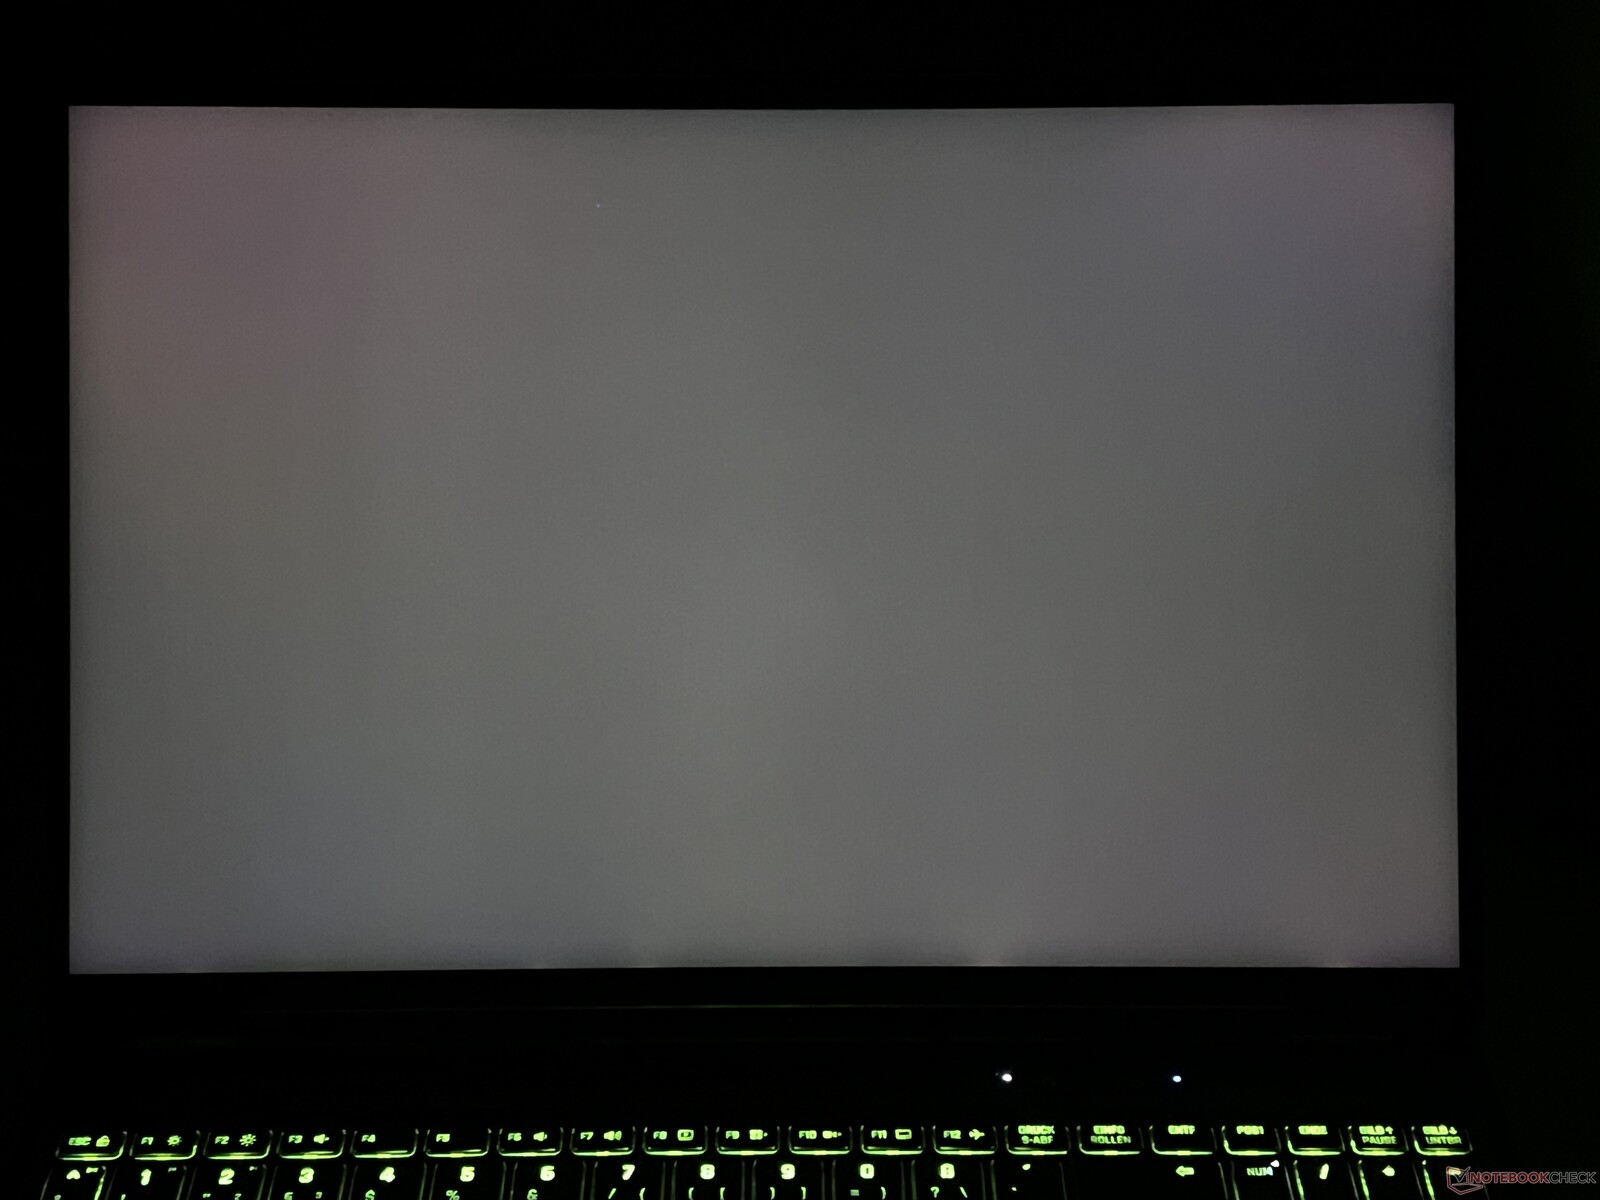
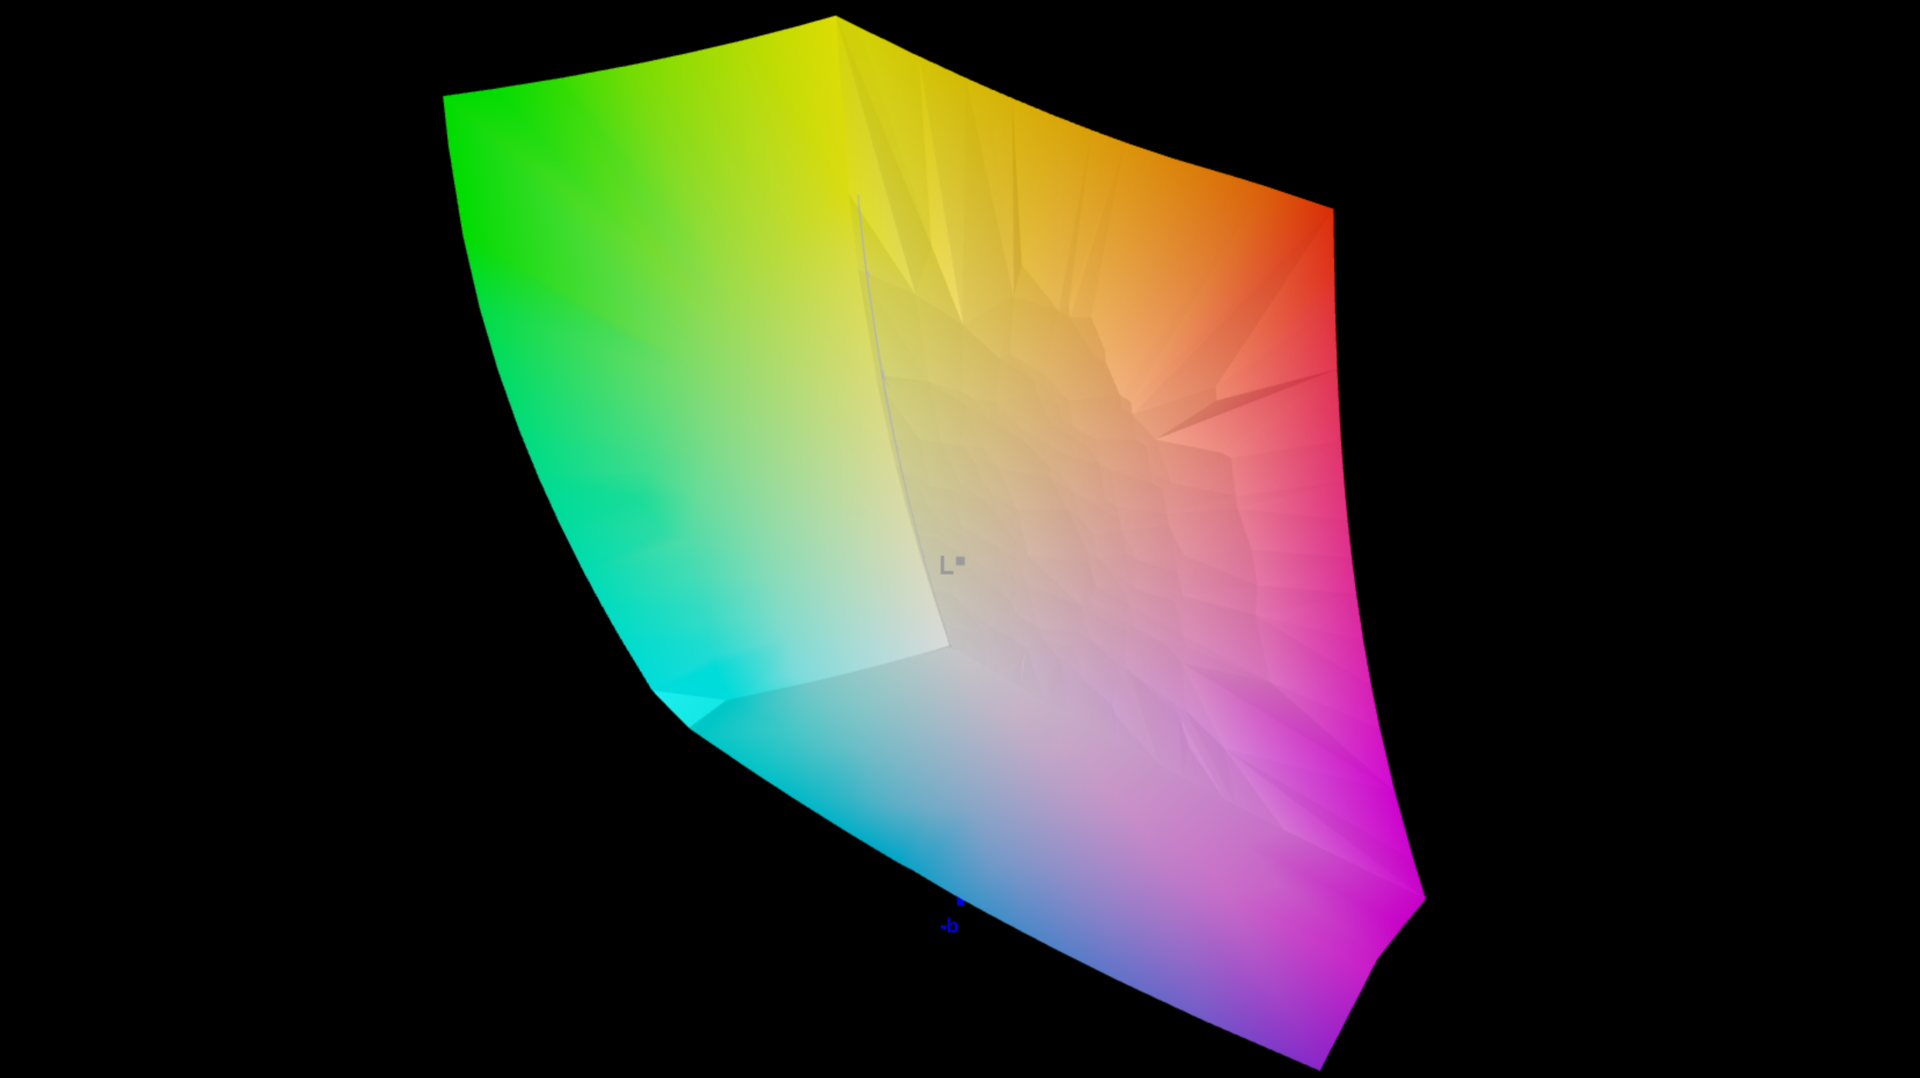
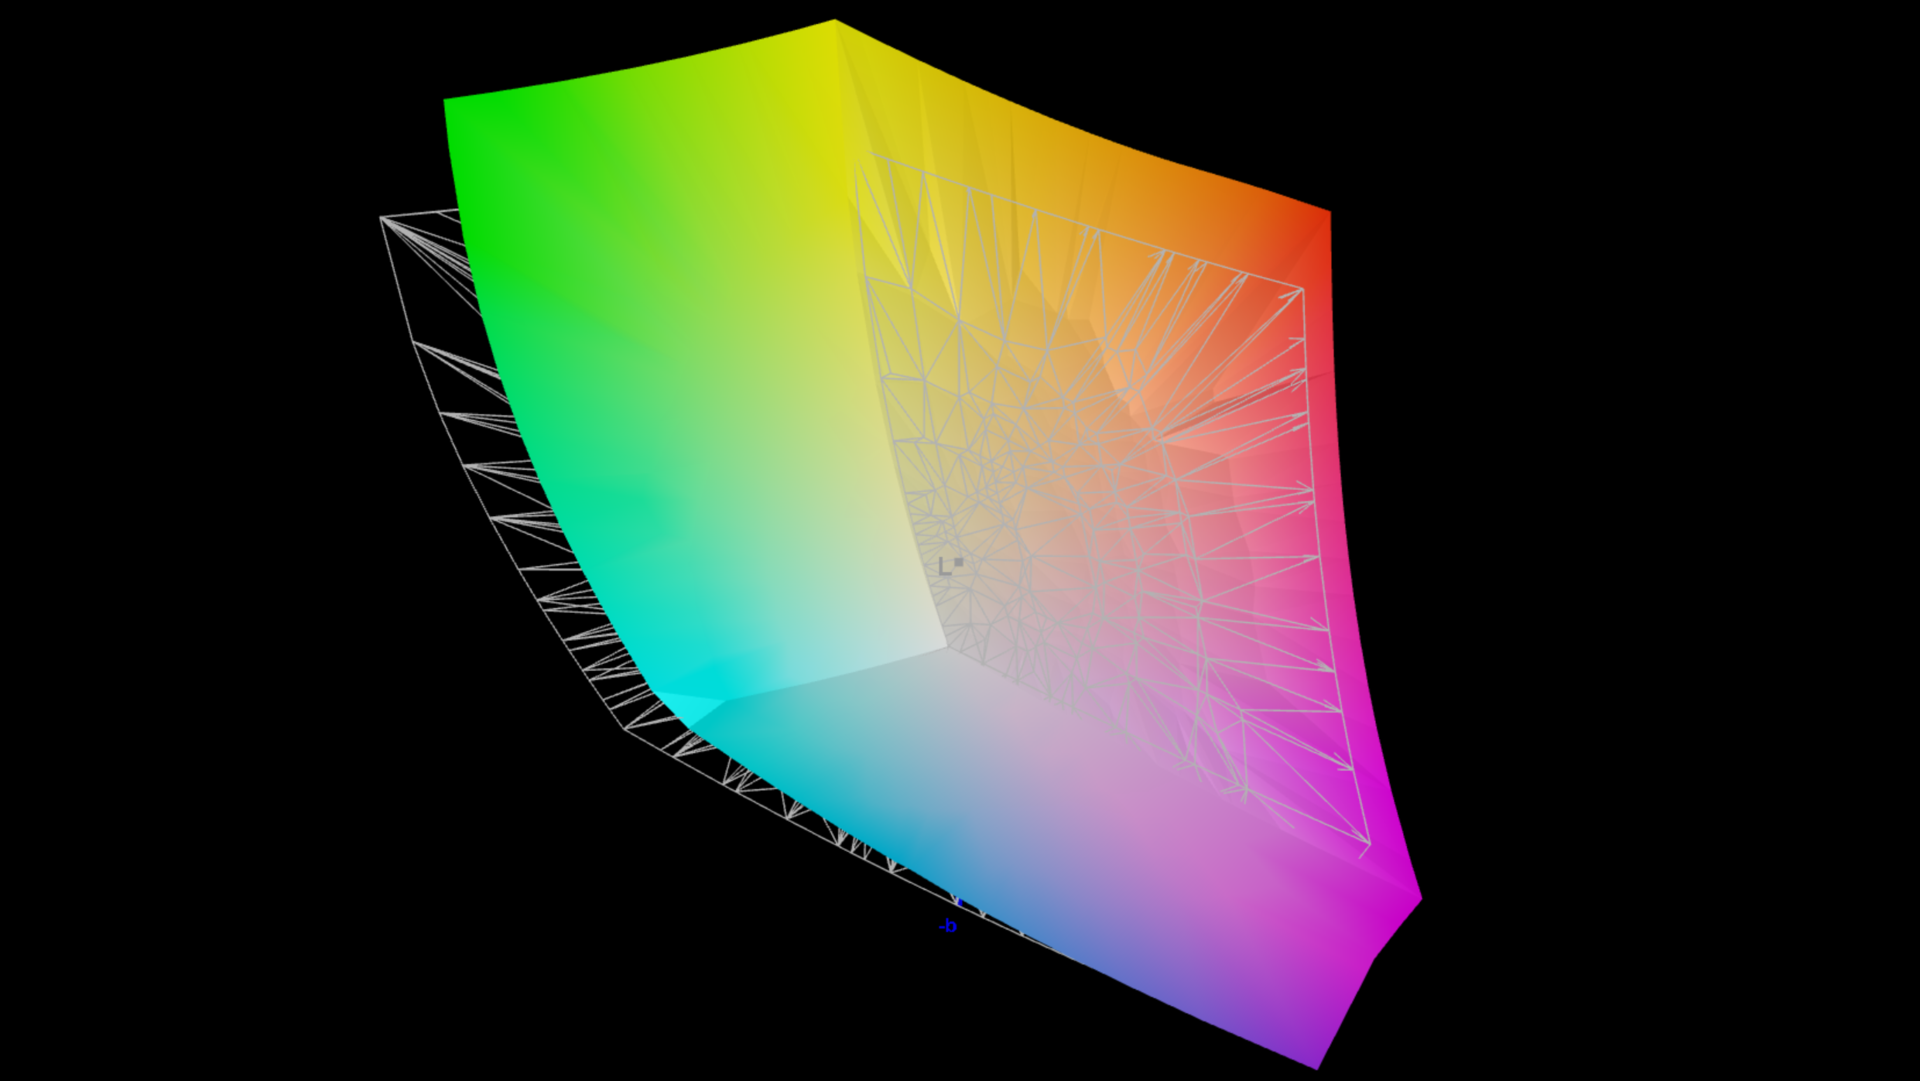
除了我们熟悉的 IPS 显示屏外,XMG 现在还可以选配频率为 300 Hz 的微型 LED 面板。其分辨率仍为 2,560 x 1,600 像素,但目前内部显示屏不支持 G-Sync。更多信息请访问XMG 官方网站了解更多信息(外接显示屏支持 G-Sync)。从主观上看,雾面面板的画质非常出色,即使是明亮的表面也不会出现颗粒感,此外,如果需要,你还可以关闭局部调光功能。虽然我们注意到持续闪烁,但其频率超过 20 kHz,频率极高。这种闪烁也让我们难以确定屏幕的准确响应时间,但据制造商称,其响应时间与前代机型相当,因此非常快。

新面板的亮度尤其令人印象深刻,我们的测试设备在测试过程中明显超过了制造商的规格(750/1000 尼特),在 SDR 模式下平均亮度约为 860 cd/m²,在 HDR 模式(全屏)下超过 1700 cd/m²。当局部调光激活时,它的黑阶为 0,从而产生了巨大的对比度。

纯黑色,激活局部调光(全 SDR 亮度)
停用局部调光功能(全 SDR 亮度)时,背光出血现象几乎不可见
865
cd/m²
857
cd/m²
839
cd/m²
881
cd/m²
888
cd/m²
853
cd/m²
853
cd/m²
855
cd/m²
837
cd/m²
Distribution of brightness
NE160QDM-NM9 tested with X-Rite i1Pro 3
Maximum: 888 cd/m² (Nits) Average: 858.7 cd/m² Minimum: 15.5 cd/m²
Brightness Distribution: 94 %
Center on Battery: 888 cd/m²
Contrast: ∞:1 (Black: 0 cd/m²)
ΔE Color 3.3 | 0.5-29.43 Ø4.86, calibrated: 1.5
ΔE Greyscale 3.8 | 0.09-98 Ø5.1
88.5% AdobeRGB 1998 (Argyll 2.2.0 3D)
100% sRGB (Argyll 2.2.0 3D)
99.9% Display P3 (Argyll 2.2.0 3D)
Gamma: 2.46
SCHENKER XMG Neo 16 E25 RTX 5090 Laptop
NE160QDM-NM9, Mini-LED, 2560x1600, 16", 300 Hz
Asus ROG Strix Scar 16 2025
NE160QDM-NM8, Mini-LED, 2560x1600, 16", 240 Hz
Lenovo Legion Pro 7i 16 Gen 10
Samsung ATNA60HU01-0, OLED, 2560x1600, 16", 240 Hz
HP Omen Max 16 ah000
Samsung ATNA60DL02-0, OLED, 2560x1600, 16", 240 Hz
Aorus MASTER 16 AM6H
ATNA60DL03-0 (SDC41AB), OLED, 2560x1600, 16", 240 Hz
SCHENKER XMG Neo 16 (Early 24)
BOE NE160QDM-NZA, IPS, 2560x1600, 16", 240 Hz
Display
0%
2%
4%
0%
-17%
Display P3 Coverage
99.9
99.9
0%
99.5
0%
99.7
0%
95.3
-5%
70.2
-30%
sRGB Coverage
100
100
0%
100
0%
100
0%
98.8
-1%
98
-2%
AdobeRGB 1998 Coverage
88.5
88.4
0%
94.4
7%
98.2
11%
94.1
6%
70.6
-20%
Response Times
32%
34%
33%
34%
49%
Response Time Grey 50% / Grey 80% *
17.4 ?(8.4, 9)
7 ?(5, 2)
60%
0.28 ?(0.14, 0.14)
98%
0.29 ?(0.15, 0.14)
98%
0.24 ?(0.12, 0.12)
99%
11.2 ?(5.2, 6)
36%
Response Time Black / White *
13 ?(4.6, 8.4)
8.4 ?(4, 4.4)
35%
0.43 ?(0.22, 0.21)
97%
0.47 ?(0.25, 0.22)
96%
0.43 ?(0.18, 0.25)
97%
5.1 ?(1.6, 3.5)
61%
PWM Frequency
20253
20555 ?(100)
1%
1438 ?(100)
-93%
960 ?(100)
-95%
960
-95%
Screen
30%
4%
-7%
-11%
-14%
Brightness middle
888
754
-15%
490.4
-45%
376.5
-58%
435
-51%
530
-40%
Brightness
859
773
-10%
498
-42%
382
-56%
437
-49%
497
-42%
Brightness Distribution
94
91
-3%
97
3%
96
2%
96
2%
85
-10%
Black Level *
0.07
0.08
0.53
Colorchecker dE 2000 *
3.3
1
70%
3.2
3%
3.67
-11%
2.42
27%
3.21
3%
Colorchecker dE 2000 max. *
5.5
2
64%
6.04
-10%
7.24
-32%
4.81
13%
5.8
-5%
Colorchecker dE 2000 calibrated *
1.5
0.84
44%
0.94
37%
2.03
-35%
1.44
4%
Greyscale dE 2000 *
3.8
1
74%
1
74%
1.1
71%
3.11
18%
4.2
-11%
Gamma
2.46 89%
2.14 103%
2.24 98%
2.25 98%
2.48 89%
2.226 99%
CCT
6267 104%
6493 100%
6373 102%
6319 103%
6270 104%
6448 101%
Contrast
10771
5438
1000
Total Average (Program / Settings)
21% / 23%
13% / 10%
10% / 5%
8% / 2%
6% / -5%

* ... smaller is better

CalMAN 灰度(配置文件:默认,目标色彩空间:P3)
CalMAN 饱和度(配置文件:默认,目标色彩空间:P3)
CalMAN ColorChecker(配置文件:默认,目标色彩空间:P3)
CalMAN 灰度(配置文件:P3,目标色彩空间:P3)
CalMAN 饱和度(配置文件:P3,目标色彩空间:P3)
CalMAN ColorChecker(配置文件:P3,目标色彩空间:P3)
CalMAN 灰度(配置文件:sRGB,目标色彩空间:sRGB)
CalMAN 饱和度(配置文件:sRGB,目标色彩空间:sRGB)
CalMAN ColorChecker(配置文件:sRGB,目标色彩空间:sRGB)

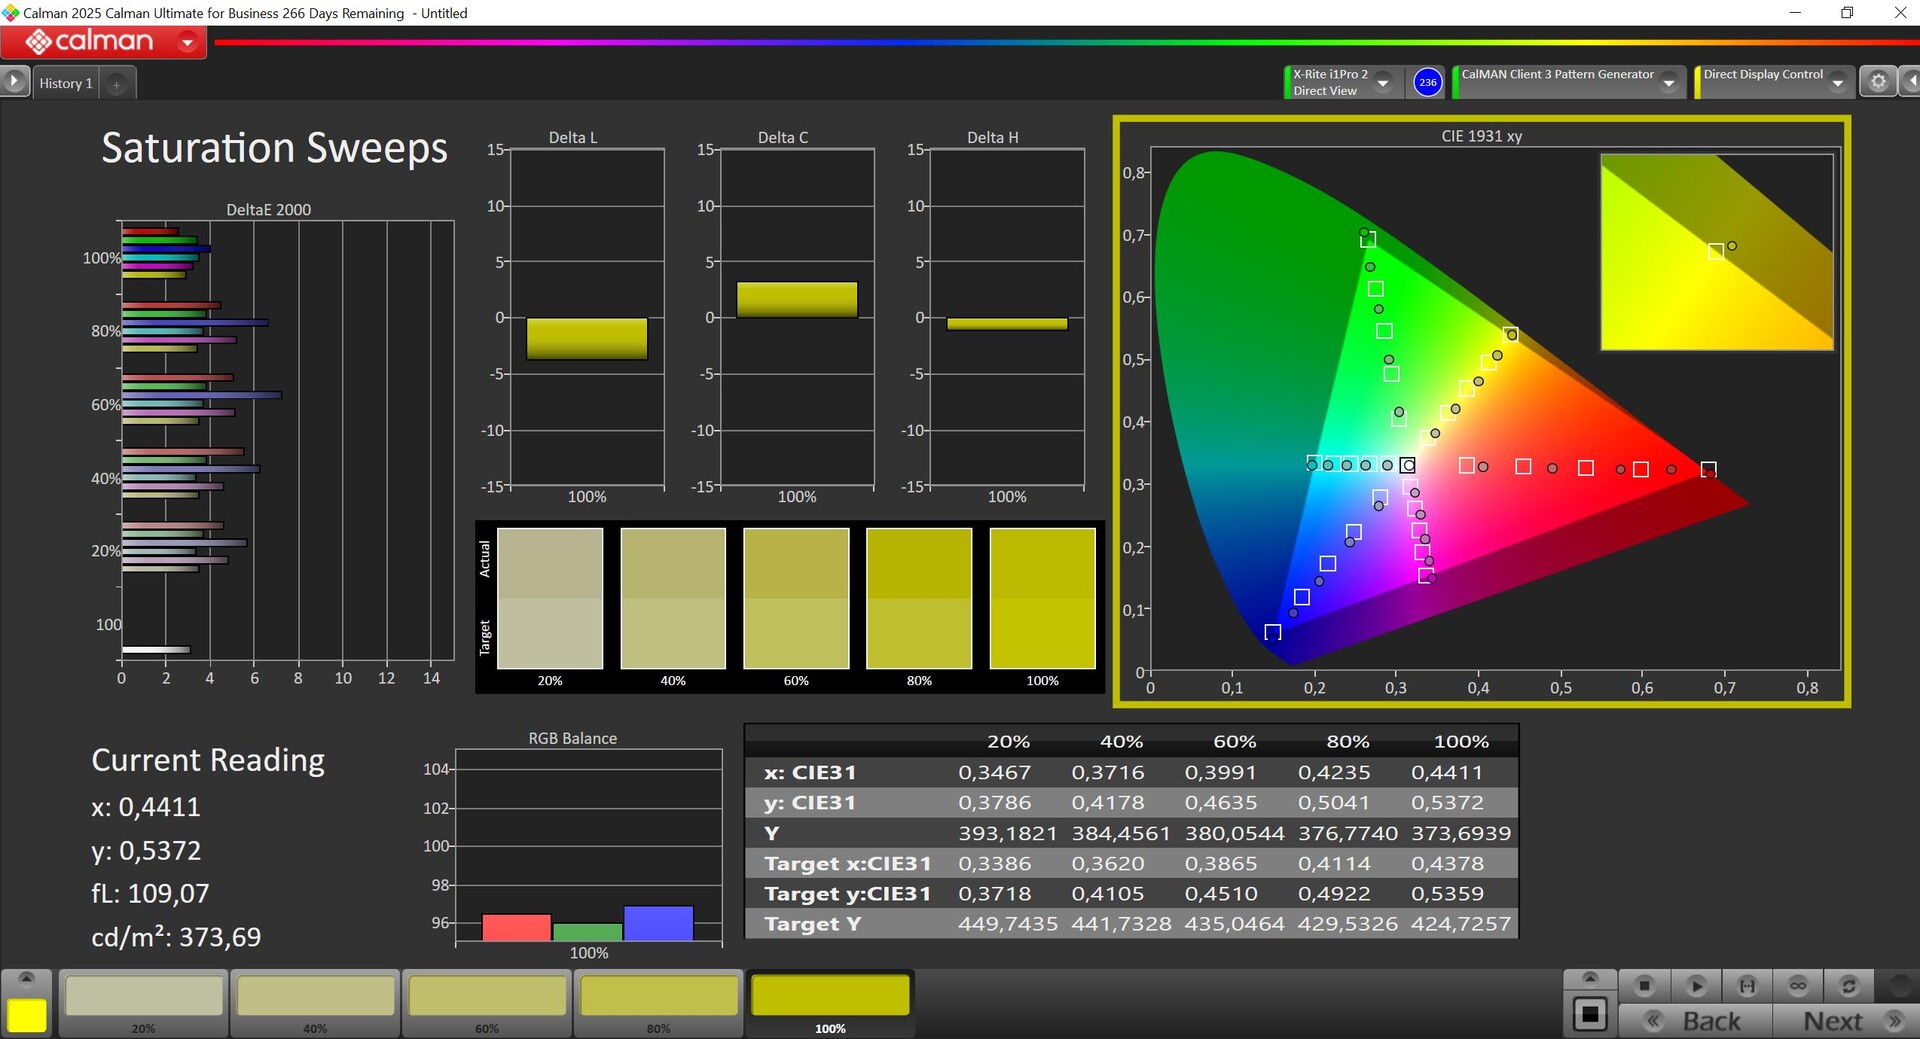
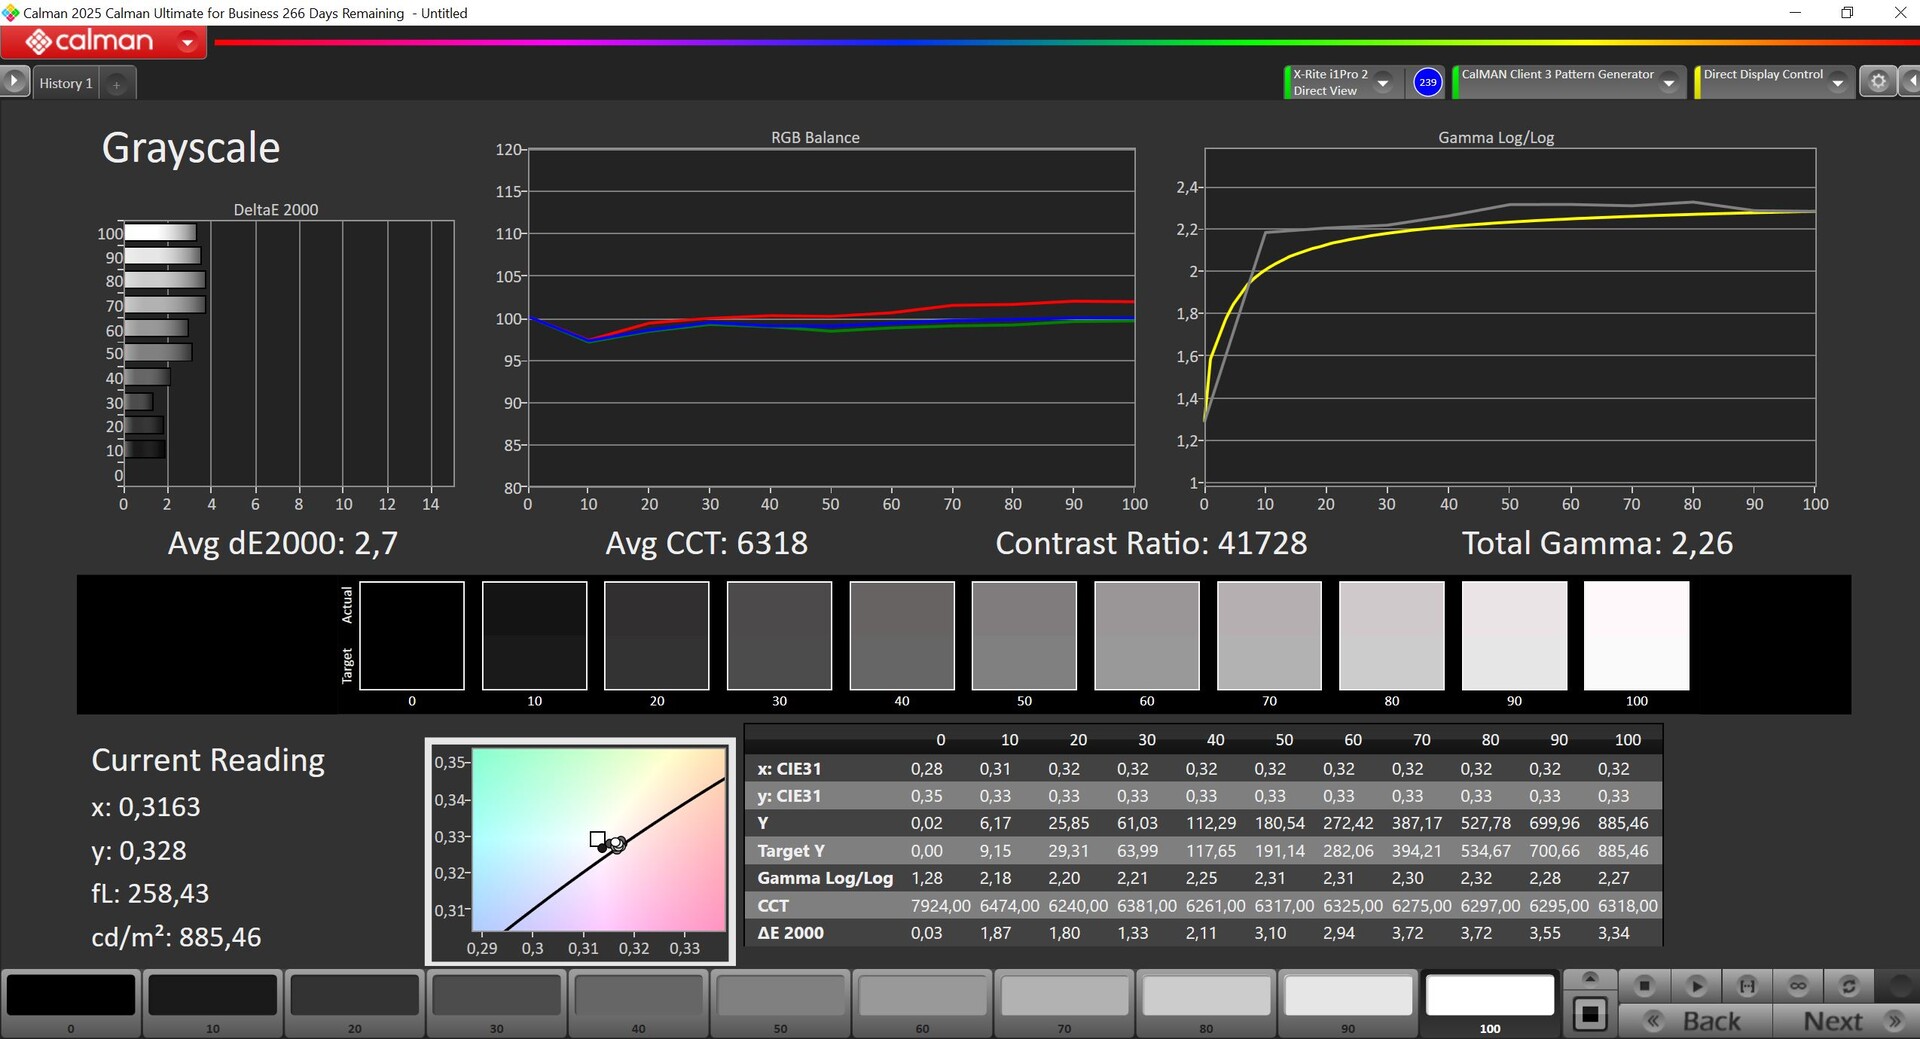
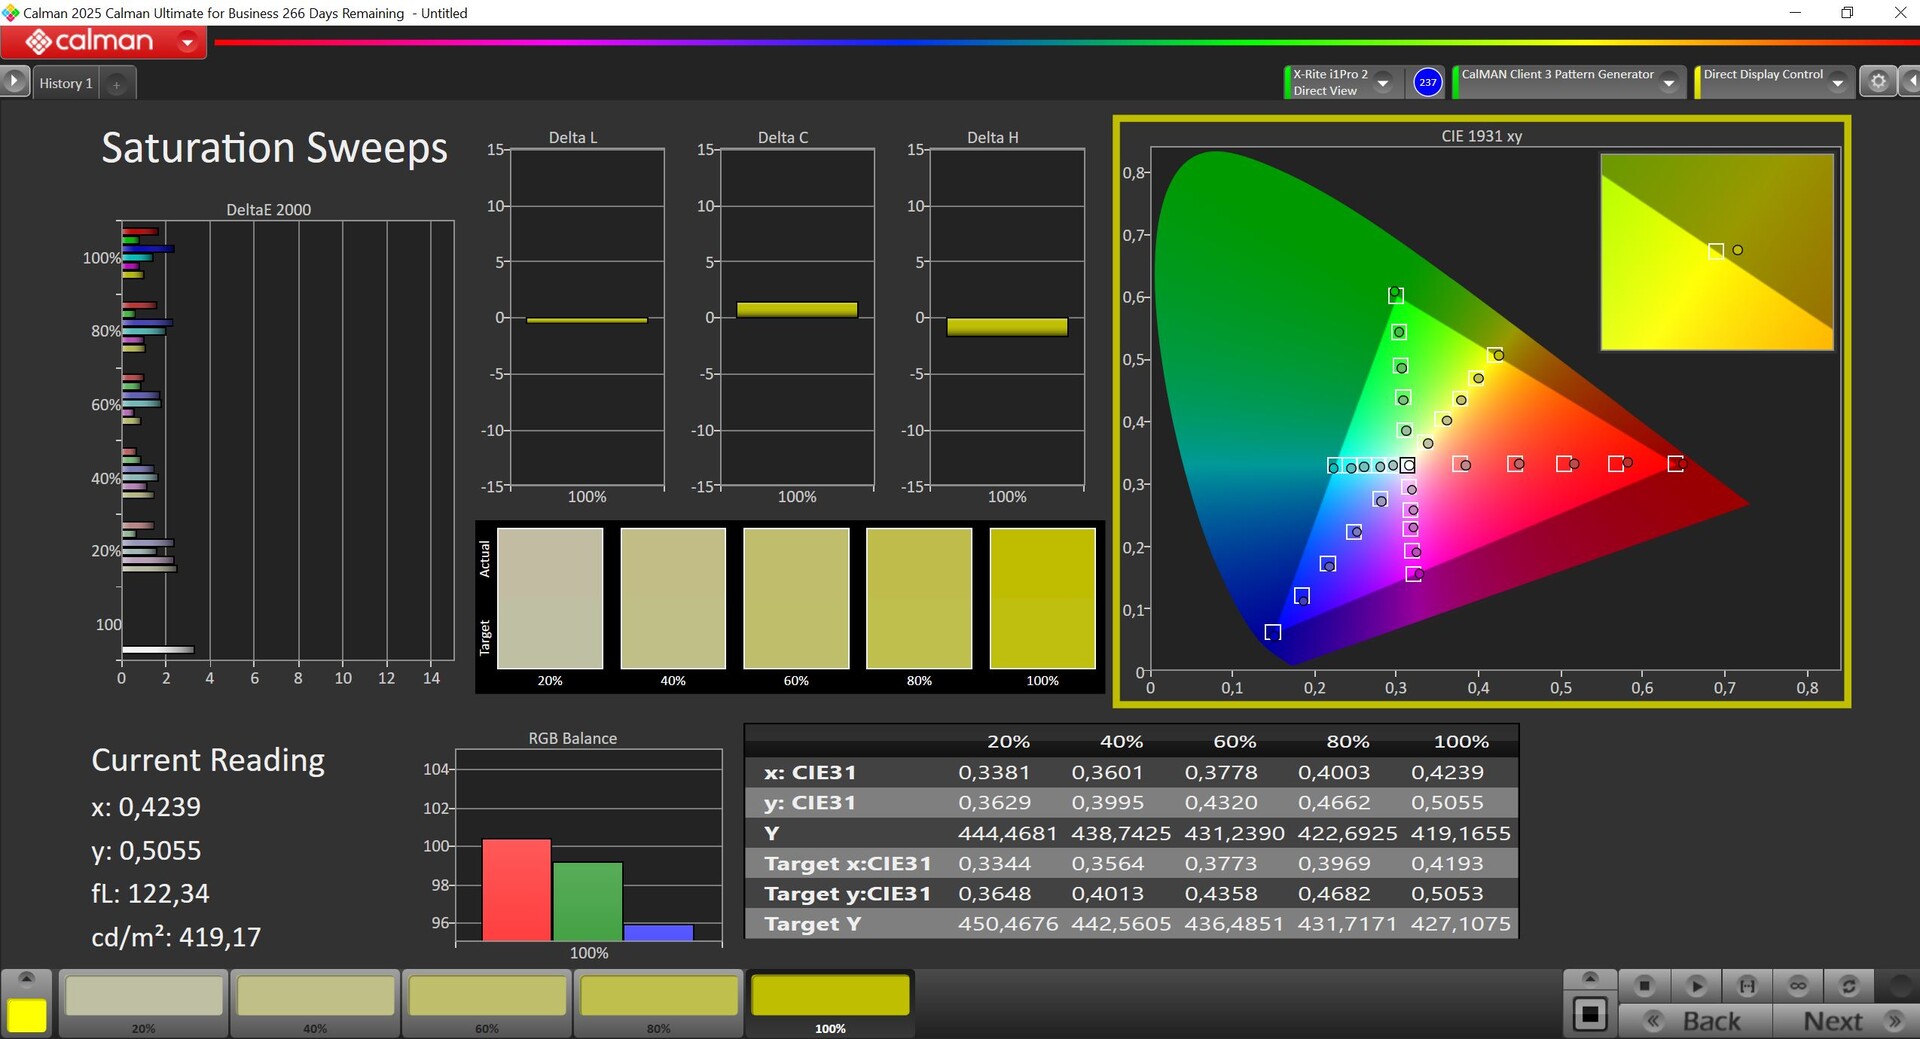
面板完全覆盖了 sRGB 和 P3 色彩空间,但提供的两个 P3 配置文件并不是最好的,灰度和色彩的偏差相对较大。只有通过我们自己的校准(配置文件可在上面免费下载),我们才能充分发挥屏幕的潜力,但只有 100% 的蓝色仍未达到 3 的目标值。

CalMAN 灰度(配置文件:校准,目标色彩空间:P3)
CalMAN 饱和度(配置文件:校准,目标色彩空间:P3)
CalMAN ColorChecker(配置文件:校准,目标色彩空间:P3)
对比 sRGB
对比 sRGB
对 P3
对 P3
对比 AdobeRGB
对比 AdobeRGB

Display Response Times

Display response times show how fast the screen is able to change from one color to the next. Slow response times can lead to afterimages and can cause moving objects to appear blurry (ghosting). Gamers of fast-paced 3D titles should pay special attention to fast response times.
       Response Time Black to White
13 ms ... rise ↗ and fall ↘ combined↗ 4.6 ms rise
↘ 8.4 ms fall
The screen shows good response rates in our tests, but may be too slow for competitive gamers.
In comparison, all tested devices range from 0.1 (minimum) to 240 (maximum) ms. » 31 % of all devices are better.
This means that the measured response time is better than the average of all tested devices (20.7 ms).
       Response Time 50% Grey to 80% Grey
17.4 ms ... rise ↗ and fall ↘ combined↗ 8.4 ms rise
↘ 9 ms fall
The screen shows good response rates in our tests, but may be too slow for competitive gamers.
In comparison, all tested devices range from 0.165 (minimum) to 636 (maximum) ms. » 29 % of all devices are better.
This means that the measured response time is better than the average of all tested devices (32.4 ms).

Screen Flickering / PWM (Pulse-Width Modulation)

To dim the screen, some notebooks will simply cycle the backlight on and off in rapid succession - a method called Pulse Width Modulation (PWM) . This cycling frequency should ideally be undetectable to the human eye. If said frequency is too low, users with sensitive eyes may experience strain or headaches or even notice the flickering altogether.
Screen flickering / PWM detected 20253 Hz
Amplitude: 75 %

The display backlight flickers at 20253 Hz (worst case, e.g., utilizing PWM) .

The frequency of 20253 Hz is quite high, so most users sensitive to PWM should not notice any flickering.

In comparison: 53 % of all tested devices do not use PWM to dim the display. If PWM was detected, an average of 8437 (minimum: 5 - maximum: 343500) Hz was measured.

PWM 闪烁(亮度为 0)
PWM 闪烁(亮度为 0)
PWM 闪烁(亮度为 20)
PWM 闪烁(亮度为 20)
PWM 闪烁(亮度为 40)
PWM 闪烁(亮度为 40)
PWM 闪烁(亮度为 60)
PWM 闪烁(亮度为 60)
PWM 闪烁(亮度为 80)
PWM 闪烁(亮度为 80)
PWM 闪烁(亮度为 100)
PWM 闪烁(亮度为 100)
在阳光下
在阳光下
室外(晴天,无阳光直射)
室外(晴天,无阳光直射)
视角稳定性
视角稳定性

性能 - Arrow Lake-HX 最高 128GB 内存

Neo 16 可配备 英特尔酷睿 Ultra 9 275HX或两款 AMD 芯片 Ryzen 9 9955HX/9955HX3D并可与最高 128 GB 内存(AMD:96 GB)组合使用。RTX 5070 Ti/5080/5090 笔记本电脑显卡可用作 GPU。


测试条件

XMG 在笔记本电脑的控制中心提供各种能耗配置文件和超级广泛的手动模式。由于 "高级优化 "模式尚不支持,我们在基准测试和测量中使用了超频模式和专用 GPU 模式(更多信息请参见 XMG 官方网站)。

能源概况 CPU TDP CB 2024 Multi GPU TGP Time Spy 图形 CP 2077 QHD Ultra 最大风扇噪音排放
平衡型 45 瓦 1,450 点 150 瓦 22,518 点 97fps 45.3 dB(A)
发烧级 85 瓦 1,909 分 150 瓦 22,656 分 102.4fps 48.6 dB(A)
Overboost 200/185 瓦 2,254 分 175 瓦 25,040 分 108.3fps 55.4 dB(A)
Overboost + Oasis 210 瓦 2,288 分 175 瓦 24,408 分 111.4fps 50.5 dB(A)
电池(发烧友) 42 瓦 1,347 分 60 瓦 11,505 分 17.4fps 33.4 dB(A)

处理器 - Core Ultra 9 275HX

酷睿 Ultra 9 275HX Core Ultra 9 275HXNeo 16 中的 Core Ultra 9 275HX 因其高功耗限制而被证明比竞争对手稍快,而且在我们的测试过程中其性能保持非常稳定。不过,对比设备之间的差异并不大,在游戏时也不会很明显。此外,与 酷睿 i9-14900HX的平均优势仅为 4%。使用 Oasis 水冷系统后,它的性能略有提高,也更加稳定。

Cinebench R15 Multi continuous test

03156309451260157518902205252028353150346537804095441047255040535556705985Tooltip
SCHENKER XMG Neo 16 E25 RTX 5090 Laptop Intel Core Ultra 9 275HX, : Ø6151 (6038.65-6270.58)
Asus ROG Strix Scar 16 2025 Intel Core Ultra 9 275HX, : Ø5832 (5537.87-5930.32)
Lenovo Legion Pro 7i 16 Gen 10 Intel Core Ultra 9 275HX, : Ø5698 (5601.46-5746.3)
HP Omen Max 16 ah000 Intel Core Ultra 9 275HX, : Ø5145 (5108.56-5171.97)
Aorus MASTER 16 AM6H Intel Core Ultra 9 275HX, Aorus Master 16: Ø5596 (5505.09-5679.4)
SCHENKER XMG Neo 16 (Early 24) Intel Core i9-14900HX, : Ø5001 (4861.45-5267.14)
SCHENKER XMG Neo 16 E25 RTX 5090 Laptop Intel Core Ultra 9 275HX, XMG Neo 16 E25 RTX 5090 Laptop Oasis: Ø6238 (6207.32-6270.58)
CPU Performance Rating: Percent
Cinebench 2024: CPU Multi Core | CPU Single Core
Cinebench R23: Multi Core | Single Core
Cinebench R20: CPU (Multi Core) | CPU (Single Core)
Cinebench R15: CPU Multi 64Bit | CPU Single 64Bit
Blender: v2.79 BMW27 CPU
7-Zip 18.03: 7z b 4 | 7z b 4 -mmt1
Geekbench 6.4: Multi-Core | Single-Core
Geekbench 5.5: Multi-Core | Single-Core
HWBOT x265 Benchmark v2.2: 4k Preset
LibreOffice : 20 Documents To PDF
R Benchmark 2.5: Overall mean
CPU Performance Rating
SCHENKER XMG Neo 16 E25 RTX 5090 Laptop
Intel Core Ultra 9 275HX, XMG Neo 16 E25 RTX 5090 Laptop Oasis
86.9 pt
SCHENKER XMG Neo 16 E25 RTX 5090 Laptop
Intel Core Ultra 9 275HX,
86.3 pt
Asus ROG Strix Scar 16 2025
Intel Core Ultra 9 275HX,
82.9 pt
SCHENKER XMG Neo 16 (Early 24)
Intel Core i9-14900HX,
81.9 pt
Lenovo Legion Pro 7i 16 Gen 10
Intel Core Ultra 9 275HX,
81.1 pt
Average Intel Core Ultra 9 275HX
 
81 pt
Aorus MASTER 16 AM6H -2!
Intel Core Ultra 9 275HX, Aorus Master 16
78.2 pt
HP Omen Max 16 ah000
Intel Core Ultra 9 275HX,
74.8 pt
Average of class Gaming
 
59.7 pt
Cinebench 2024 / CPU Multi Core
SCHENKER XMG Neo 16 E25 RTX 5090 Laptop
Intel Core Ultra 9 275HX, XMG Neo 16 E25 RTX 5090 Laptop Oasis
2288 Points +2%
SCHENKER XMG Neo 16 E25 RTX 5090 Laptop
Intel Core Ultra 9 275HX,
2254 Points
Asus ROG Strix Scar 16 2025
Intel Core Ultra 9 275HX,
2196 Points -3%
Average Intel Core Ultra 9 275HX
  (1597 - 2288, n=9)
2088 Points -7%
Lenovo Legion Pro 7i 16 Gen 10
Intel Core Ultra 9 275HX,
2060 Points -9%
SCHENKER XMG Neo 16 (Early 24)
Intel Core i9-14900HX,
1940 Points -14%
HP Omen Max 16 ah000
Intel Core Ultra 9 275HX,
1913 Points -15%
Average of class Gaming
  (331 - 2298, n=68, last 2 years)
1371 Points -39%
Cinebench 2024 / CPU Single Core
SCHENKER XMG Neo 16 E25 RTX 5090 Laptop
Intel Core Ultra 9 275HX,
138.2 Points
SCHENKER XMG Neo 16 E25 RTX 5090 Laptop
Intel Core Ultra 9 275HX, XMG Neo 16 E25 RTX 5090 Laptop Oasis
137.9 Points 0%
Average Intel Core Ultra 9 275HX
  (130.5 - 138.2, n=9)
135.2 Points -2%
Lenovo Legion Pro 7i 16 Gen 10
Intel Core Ultra 9 275HX,
134 Points -3%
SCHENKER XMG Neo 16 (Early 24)
Intel Core i9-14900HX,
131.7 Points -5%
HP Omen Max 16 ah000
Intel Core Ultra 9 275HX,
130.7 Points -5%
Asus ROG Strix Scar 16 2025
Intel Core Ultra 9 275HX,
130.5 Points -6%
Average of class Gaming
  (68.2 - 138.2, n=69, last 2 years)
118.5 Points -14%
Cinebench R23 / Multi Core
SCHENKER XMG Neo 16 E25 RTX 5090 Laptop
Intel Core Ultra 9 275HX, XMG Neo 16 E25 RTX 5090 Laptop Oasis
40970 Points 0%
SCHENKER XMG Neo 16 E25 RTX 5090 Laptop
Intel Core Ultra 9 275HX,
40951 Points
Asus ROG Strix Scar 16 2025
Intel Core Ultra 9 275HX,
38039 Points -7%
Lenovo Legion Pro 7i 16 Gen 10
Intel Core Ultra 9 275HX,
36597 (34151.5min - 36596.9max) Points -11%
Average Intel Core Ultra 9 275HX
  (31513 - 40970, n=11)
36524 Points -11%
Aorus MASTER 16 AM6H
Intel Core Ultra 9 275HX, Aorus Master 16
36329 Points -11%
SCHENKER XMG Neo 16 (Early 24)
Intel Core i9-14900HX,
36249 Points -11%
HP Omen Max 16 ah000
Intel Core Ultra 9 275HX,
33449 (32761.6min - 33449.1max) Points -18%
Average of class Gaming
  (5668 - 40970, n=146, last 2 years)
22794 Points -44%
Cinebench R23 / Single Core
SCHENKER XMG Neo 16 E25 RTX 5090 Laptop
Intel Core Ultra 9 275HX, XMG Neo 16 E25 RTX 5090 Laptop Oasis
2267 Points 0%
SCHENKER XMG Neo 16 E25 RTX 5090 Laptop
Intel Core Ultra 9 275HX,
2260 Points
Aorus MASTER 16 AM6H
Intel Core Ultra 9 275HX, Aorus Master 16
2216 Points -2%
SCHENKER XMG Neo 16 (Early 24)
Intel Core i9-14900HX,
2209 Points -2%
Average Intel Core Ultra 9 275HX
  (2126 - 2267, n=11)
2207 Points -2%
Lenovo Legion Pro 7i 16 Gen 10
Intel Core Ultra 9 275HX,
2195 Points -3%
Asus ROG Strix Scar 16 2025
Intel Core Ultra 9 275HX,
2141 Points -5%
HP Omen Max 16 ah000
Intel Core Ultra 9 275HX,
2128 Points -6%
Average of class Gaming
  (1136 - 2267, n=146, last 2 years)
1916 Points -15%
Cinebench R20 / CPU (Multi Core)
SCHENKER XMG Neo 16 E25 RTX 5090 Laptop
Intel Core Ultra 9 275HX, XMG Neo 16 E25 RTX 5090 Laptop Oasis
16108 Points +1%
SCHENKER XMG Neo 16 E25 RTX 5090 Laptop
Intel Core Ultra 9 275HX,
15881 Points
Asus ROG Strix Scar 16 2025
Intel Core Ultra 9 275HX,
14828 Points -7%
Average Intel Core Ultra 9 275HX
  (12302 - 16108, n=11)
14346 Points -10%
Aorus MASTER 16 AM6H
Intel Core Ultra 9 275HX, Aorus Master 16
14307 Points -10%
Lenovo Legion Pro 7i 16 Gen 10
Intel Core Ultra 9 275HX,
14183 Points -11%
SCHENKER XMG Neo 16 (Early 24)
Intel Core i9-14900HX,
13824 Points -13%
HP Omen Max 16 ah000
Intel Core Ultra 9 275HX,
13178 Points -17%
Average of class Gaming
  (2179 - 16108, n=146, last 2 years)
8768 Points -45%
Cinebench R20 / CPU (Single Core)
SCHENKER XMG Neo 16 E25 RTX 5090 Laptop
Intel Core Ultra 9 275HX, XMG Neo 16 E25 RTX 5090 Laptop Oasis
870 Points 0%
SCHENKER XMG Neo 16 E25 RTX 5090 Laptop
Intel Core Ultra 9 275HX,
869 Points
Aorus MASTER 16 AM6H
Intel Core Ultra 9 275HX, Aorus Master 16
854 Points -2%
Average Intel Core Ultra 9 275HX
  (811 - 870, n=11)
850 Points -2%
SCHENKER XMG Neo 16 (Early 24)
Intel Core i9-14900HX,
844 Points -3%
Asus ROG Strix Scar 16 2025
Intel Core Ultra 9 275HX,
843 Points -3%
Lenovo Legion Pro 7i 16 Gen 10
Intel Core Ultra 9 275HX,
831 Points -4%
HP Omen Max 16 ah000
Intel Core Ultra 9 275HX,
811 Points -7%
Average of class Gaming
  (439 - 870, n=146, last 2 years)
737 Points -15%
Cinebench R15 / CPU Multi 64Bit
SCHENKER XMG Neo 16 E25 RTX 5090 Laptop
Intel Core Ultra 9 275HX,
6271 (6038.65min - 6270.58max) Points
SCHENKER XMG Neo 16 E25 RTX 5090 Laptop
Intel Core Ultra 9 275HX, XMG Neo 16 E25 RTX 5090 Laptop Oasis
6271 (6207.32min - 6270.58max) Points 0%
Asus ROG Strix Scar 16 2025
Intel Core Ultra 9 275HX,
5930 (5537.87min - 5930.32max) Points -5%
Lenovo Legion Pro 7i 16 Gen 10
Intel Core Ultra 9 275HX,
5746 (5601.46min - 5746.3max) Points -8%
Average Intel Core Ultra 9 275HX
  (4853 - 6271, n=11)
5691 Points -9%
Aorus MASTER 16 AM6H
Intel Core Ultra 9 275HX, Aorus Master 16
5679 (5505.09min - 5679.4max) Points -9%
SCHENKER XMG Neo 16 (Early 24)
Intel Core i9-14900HX,
5267 Points -16%
HP Omen Max 16 ah000
Intel Core Ultra 9 275HX,
5172 (5108.56min - 5171.97max) Points -18%
Average of class Gaming
  (1537 - 6271, n=149, last 2 years)
3515 Points -44%
Cinebench R15 / CPU Single 64Bit
SCHENKER XMG Neo 16 E25 RTX 5090 Laptop
Intel Core Ultra 9 275HX, XMG Neo 16 E25 RTX 5090 Laptop Oasis
343 Points +1%
Asus ROG Strix Scar 16 2025
Intel Core Ultra 9 275HX,
341 Points 0%
SCHENKER XMG Neo 16 E25 RTX 5090 Laptop
Intel Core Ultra 9 275HX,
340 Points
Lenovo Legion Pro 7i 16 Gen 10
Intel Core Ultra 9 275HX,
336 Points -1%
Average Intel Core Ultra 9 275HX
  (317 - 343, n=11)
336 Points -1%
Aorus MASTER 16 AM6H
Intel Core Ultra 9 275HX, Aorus Master 16
331 Points -3%
HP Omen Max 16 ah000
Intel Core Ultra 9 275HX,
317 Points -7%
SCHENKER XMG Neo 16 (Early 24)
Intel Core i9-14900HX,
310 Points -9%
Average of class Gaming
  (191.9 - 343, n=146, last 2 years)
283 Points -17%
Blender / v2.79 BMW27 CPU
Average of class Gaming
  (80 - 517, n=140, last 2 years)
166.7 Seconds * -101%
HP Omen Max 16 ah000
Intel Core Ultra 9 275HX,
102 Seconds * -23%
SCHENKER XMG Neo 16 (Early 24)
Intel Core i9-14900HX,
95 Seconds * -14%
Aorus MASTER 16 AM6H
Intel Core Ultra 9 275HX, Aorus Master 16
93 Seconds * -12%
Average Intel Core Ultra 9 275HX
  (82 - 116, n=11)
92.6 Seconds * -12%
Lenovo Legion Pro 7i 16 Gen 10
Intel Core Ultra 9 275HX,
90 Seconds * -8%
Asus ROG Strix Scar 16 2025
Intel Core Ultra 9 275HX,
87 Seconds * -5%
SCHENKER XMG Neo 16 E25 RTX 5090 Laptop
Intel Core Ultra 9 275HX,
83 Seconds *
SCHENKER XMG Neo 16 E25 RTX 5090 Laptop
Intel Core Ultra 9 275HX, XMG Neo 16 E25 RTX 5090 Laptop Oasis
82 Seconds * +1%
7-Zip 18.03 / 7z b 4
SCHENKER XMG Neo 16 (Early 24)
Intel Core i9-14900HX,
135229 MIPS +9%
SCHENKER XMG Neo 16 E25 RTX 5090 Laptop
Intel Core Ultra 9 275HX,
124155 MIPS
SCHENKER XMG Neo 16 E25 RTX 5090 Laptop
Intel Core Ultra 9 275HX, XMG Neo 16 E25 RTX 5090 Laptop Oasis
123497 MIPS -1%
Asus ROG Strix Scar 16 2025
Intel Core Ultra 9 275HX,
121092 MIPS -2%
Lenovo Legion Pro 7i 16 Gen 10
Intel Core Ultra 9 275HX,
117940 MIPS -5%
Average Intel Core Ultra 9 275HX
  (99248 - 124155, n=11)
115611 MIPS -7%
Aorus MASTER 16 AM6H
Intel Core Ultra 9 275HX, Aorus Master 16
112410 MIPS -9%
HP Omen Max 16 ah000
Intel Core Ultra 9 275HX,
104686 MIPS -16%
Average of class Gaming
  (23795 - 144064, n=144, last 2 years)
85910 MIPS -31%
7-Zip 18.03 / 7z b 4 -mmt1
SCHENKER XMG Neo 16 (Early 24)
Intel Core i9-14900HX,
7406 MIPS +4%
SCHENKER XMG Neo 16 E25 RTX 5090 Laptop
Intel Core Ultra 9 275HX,
7114 MIPS
SCHENKER XMG Neo 16 E25 RTX 5090 Laptop
Intel Core Ultra 9 275HX, XMG Neo 16 E25 RTX 5090 Laptop Oasis
6970 MIPS -2%
Average Intel Core Ultra 9 275HX
  (6186 - 7114, n=11)
6836 MIPS -4%
Aorus MASTER 16 AM6H
Intel Core Ultra 9 275HX, Aorus Master 16
6669 MIPS -6%
Asus ROG Strix Scar 16 2025
Intel Core Ultra 9 275HX,
6654 MIPS -6%
Lenovo Legion Pro 7i 16 Gen 10
Intel Core Ultra 9 275HX,
6607 MIPS -7%
Average of class Gaming
  (4199 - 7573, n=144, last 2 years)
6311 MIPS -11%
HP Omen Max 16 ah000
Intel Core Ultra 9 275HX,
6186 MIPS -13%
Geekbench 6.4 / Multi-Core
SCHENKER XMG Neo 16 E25 RTX 5090 Laptop
Intel Core Ultra 9 275HX, XMG Neo 16 E25 RTX 5090 Laptop Oasis
21156 Points +1%
Asus ROG Strix Scar 16 2025
Intel Core Ultra 9 275HX,
20902 Points 0%
SCHENKER XMG Neo 16 E25 RTX 5090 Laptop
Intel Core Ultra 9 275HX,
20890 Points
Average Intel Core Ultra 9 275HX
  (16033 - 21668, n=12)
19517 Points -7%
SCHENKER XMG Neo 16 (Early 24)
Intel Core i9-14900HX,
19451 Points -7%
Aorus MASTER 16 AM6H
Intel Core Ultra 9 275HX, Aorus Master 16
19299 Points -8%
Lenovo Legion Pro 7i 16 Gen 10
Intel Core Ultra 9 275HX,
19081 Points -9%
HP Omen Max 16 ah000
Intel Core Ultra 9 275HX,
18322 Points -12%
Average of class Gaming
  (5340 - 22104, n=130, last 2 years)
14857 Points -29%
Geekbench 6.4 / Single-Core
SCHENKER XMG Neo 16 E25 RTX 5090 Laptop
Intel Core Ultra 9 275HX, XMG Neo 16 E25 RTX 5090 Laptop Oasis
3160 Points +2%
SCHENKER XMG Neo 16 (Early 24)
Intel Core i9-14900HX,
3129 Points +1%
SCHENKER XMG Neo 16 E25 RTX 5090 Laptop
Intel Core Ultra 9 275HX,
3109 Points
Asus ROG Strix Scar 16 2025
Intel Core Ultra 9 275HX,
3072 Points -1%
Average Intel Core Ultra 9 275HX
  (2917 - 3160, n=12)
3070 Points -1%
Lenovo Legion Pro 7i 16 Gen 10
Intel Core Ultra 9 275HX,
3052 Points -2%
Aorus MASTER 16 AM6H
Intel Core Ultra 9 275HX, Aorus Master 16
3046 Points -2%
HP Omen Max 16 ah000
Intel Core Ultra 9 275HX,
2917 Points -6%
Average of class Gaming
  (1490 - 3219, n=130, last 2 years)
2711 Points -13%
Geekbench 5.5 / Multi-Core
SCHENKER XMG Neo 16 E25 RTX 5090 Laptop
Intel Core Ultra 9 275HX,
25599 Points
SCHENKER XMG Neo 16 E25 RTX 5090 Laptop
Intel Core Ultra 9 275HX, XMG Neo 16 E25 RTX 5090 Laptop Oasis
25580 Points 0%
Asus ROG Strix Scar 16 2025
Intel Core Ultra 9 275HX,
24285 Points -5%
Average Intel Core Ultra 9 275HX
  (19105 - 25855, n=11)
23292 Points -9%
SCHENKER XMG Neo 16 (Early 24)
Intel Core i9-14900HX,
23086 Points -10%
Lenovo Legion Pro 7i 16 Gen 10
Intel Core Ultra 9 275HX,
22414 Points -12%
Aorus MASTER 16 AM6H
Intel Core Ultra 9 275HX, Aorus Master 16
22218 Points -13%
HP Omen Max 16 ah000
Intel Core Ultra 9 275HX,
21195 Points -17%
Average of class Gaming
  (4557 - 27010, n=143, last 2 years)
15449 Points -40%
Geekbench 5.5 / Single-Core
SCHENKER XMG Neo 16 E25 RTX 5090 Laptop
Intel Core Ultra 9 275HX, XMG Neo 16 E25 RTX 5090 Laptop Oasis
2286 Points +1%
SCHENKER XMG Neo 16 E25 RTX 5090 Laptop
Intel Core Ultra 9 275HX,
2264 Points
Asus ROG Strix Scar 16 2025
Intel Core Ultra 9 275HX,
2235 Points -1%
Average Intel Core Ultra 9 275HX
  (2034 - 2292, n=11)
2218 Points -2%
Aorus MASTER 16 AM6H
Intel Core Ultra 9 275HX, Aorus Master 16
2214 Points -2%
Lenovo Legion Pro 7i 16 Gen 10
Intel Core Ultra 9 275HX,
2199 Points -3%
SCHENKER XMG Neo 16 (Early 24)
Intel Core i9-14900HX,
2195 Points -3%
HP Omen Max 16 ah000
Intel Core Ultra 9 275HX,
2034 Points -10%
Average of class Gaming
  (986 - 2423, n=143, last 2 years)
1932 Points -15%
HWBOT x265 Benchmark v2.2 / 4k Preset
SCHENKER XMG Neo 16 E25 RTX 5090 Laptop
Intel Core Ultra 9 275HX, XMG Neo 16 E25 RTX 5090 Laptop Oasis
43.8 fps +1%
SCHENKER XMG Neo 16 E25 RTX 5090 Laptop
Intel Core Ultra 9 275HX,
43.2 fps
Asus ROG Strix Scar 16 2025
Intel Core Ultra 9 275HX,
40.4 fps -6%
Lenovo Legion Pro 7i 16 Gen 10
Intel Core Ultra 9 275HX,
38.9 fps -10%
Average Intel Core Ultra 9 275HX
  (32.6 - 43.8, n=11)
38.8 fps -10%
Aorus MASTER 16 AM6H
Intel Core Ultra 9 275HX, Aorus Master 16
36 fps -17%
SCHENKER XMG Neo 16 (Early 24)
Intel Core i9-14900HX,
35.3 fps -18%
HP Omen Max 16 ah000
Intel Core Ultra 9 275HX,
35 fps -19%
Average of class Gaming
  (7.7 - 44.3, n=144, last 2 years)
24.7 fps -43%
LibreOffice / 20 Documents To PDF
Average of class Gaming
  (19 - 96.6, n=142, last 2 years)
47.5 s * -17%
Average Intel Core Ultra 9 275HX
  (36.9 - 62.1, n=11)
43.6 s * -7%
HP Omen Max 16 ah000
Intel Core Ultra 9 275HX,
41.4 s * -2%
SCHENKER XMG Neo 16 E25 RTX 5090 Laptop
Intel Core Ultra 9 275HX,
40.7 s *
Asus ROG Strix Scar 16 2025
Intel Core Ultra 9 275HX,
40.5 s * -0%
Aorus MASTER 16 AM6H
Intel Core Ultra 9 275HX, Aorus Master 16
40.46 s * +1%
SCHENKER XMG Neo 16 E25 RTX 5090 Laptop
Intel Core Ultra 9 275HX, XMG Neo 16 E25 RTX 5090 Laptop Oasis
39.4 s * +3%
Lenovo Legion Pro 7i 16 Gen 10
Intel Core Ultra 9 275HX,
36.9 s * +9%
SCHENKER XMG Neo 16 (Early 24)
Intel Core i9-14900HX,
32.9 s * +19%
R Benchmark 2.5 / Overall mean
HP Omen Max 16 ah000
Intel Core Ultra 9 275HX,
0.4568 sec * -13%
Average of class Gaming
  (0.3551 - 0.759, n=145, last 2 years)
0.4359 sec * -8%
Aorus MASTER 16 AM6H
Intel Core Ultra 9 275HX, Aorus Master 16
0.43 sec * -6%
Asus ROG Strix Scar 16 2025
Intel Core Ultra 9 275HX,
0.4141 sec * -2%
Lenovo Legion Pro 7i 16 Gen 10
Intel Core Ultra 9 275HX,
0.4132 sec * -2%
Average Intel Core Ultra 9 275HX
  (0.3943 - 0.4568, n=11)
0.4124 sec * -2%
SCHENKER XMG Neo 16 E25 RTX 5090 Laptop
Intel Core Ultra 9 275HX,
0.4053 sec *
SCHENKER XMG Neo 16 E25 RTX 5090 Laptop
Intel Core Ultra 9 275HX, XMG Neo 16 E25 RTX 5090 Laptop Oasis
0.4045 sec * -0%
SCHENKER XMG Neo 16 (Early 24)
Intel Core i9-14900HX,
0.3658 sec * +10%

* ... smaller is better

Cinebench R15 CPU Multi 64Bit
6271 Points
Cinebench R15 OpenGL 64Bit
292 fps
Cinebench R15 Ref. Match 64Bit
99.6 %
Cinebench R15 CPU Single 64Bit
340 Points
Cinebench R20 CPU (Multi Core)
15881 Points
Cinebench R20 CPU (Single Core)
869 Points
Cinebench R23 Single Core
2260 Points
Cinebench R23 Multi Core
40951 Points
Cinebench 2024 CPU Single Core
138.2 Points
Cinebench 2024 CPU Multi Core
2254 Points
Help
Performance Rating
SCHENKER XMG Neo 16 E25 RTX 5090 Laptop
Intel Core Ultra 9 275HX, GeForce RTX 5090 Laptop
96.1 pt
Asus ROG Strix Scar 16 2025
Intel Core Ultra 9 275HX, GeForce RTX 5090 Laptop
95.2 pt
Aorus MASTER 16 AM6H
Intel Core Ultra 9 275HX, GeForce RTX 5090 Laptop
90.8 pt
Lenovo Legion Pro 7i 16 Gen 10
Intel Core Ultra 9 275HX, GeForce RTX 5080 Laptop
90.6 pt
Average Intel Core Ultra 9 275HX
 
89 pt
SCHENKER XMG Neo 16 (Early 24)
Intel Core i9-14900HX, NVIDIA GeForce RTX 4090 Laptop GPU
87 pt
HP Omen Max 16 ah000
Intel Core Ultra 9 275HX, GeForce RTX 5090 Laptop
84 pt
Average of class Gaming
 
65.4 pt
AIDA64 / FP32 Ray-Trace
SCHENKER XMG Neo 16 E25 RTX 5090 Laptop
Intel Core Ultra 9 275HX, GeForce RTX 5090 Laptop
39895 KRay/s
Asus ROG Strix Scar 16 2025
Intel Core Ultra 9 275HX, GeForce RTX 5090 Laptop
39551 KRay/s -1%
Aorus MASTER 16 AM6H
Intel Core Ultra 9 275HX, GeForce RTX 5090 Laptop
38066 KRay/s -5%
Average Intel Core Ultra 9 275HX
  (29330 - 39895, n=10)
36268 KRay/s -9%
Lenovo Legion Pro 7i 16 Gen 10
Intel Core Ultra 9 275HX, GeForce RTX 5080 Laptop
35760 KRay/s -10%
HP Omen Max 16 ah000
Intel Core Ultra 9 275HX, GeForce RTX 5090 Laptop
34180 KRay/s -14%
SCHENKER XMG Neo 16 (Early 24)
Intel Core i9-14900HX, NVIDIA GeForce RTX 4090 Laptop GPU
30829 KRay/s -23%
Average of class Gaming
  (7192 - 85542, n=143, last 2 years)
24367 KRay/s -39%
AIDA64 / FPU Julia
SCHENKER XMG Neo 16 E25 RTX 5090 Laptop
Intel Core Ultra 9 275HX, GeForce RTX 5090 Laptop
198802 Points
Asus ROG Strix Scar 16 2025
Intel Core Ultra 9 275HX, GeForce RTX 5090 Laptop
191476 Points -4%
Aorus MASTER 16 AM6H
Intel Core Ultra 9 275HX, GeForce RTX 5090 Laptop
189130 Points -5%
Lenovo Legion Pro 7i 16 Gen 10
Intel Core Ultra 9 275HX, GeForce RTX 5080 Laptop
183428 Points -8%
Average Intel Core Ultra 9 275HX
  (140254 - 198802, n=10)
180575 Points -9%
HP Omen Max 16 ah000
Intel Core Ultra 9 275HX, GeForce RTX 5090 Laptop
173656 Points -13%
SCHENKER XMG Neo 16 (Early 24)
Intel Core i9-14900HX, NVIDIA GeForce RTX 4090 Laptop GPU
150728 Points -24%
Average of class Gaming
  (35040 - 252486, n=143, last 2 years)
114789 Points -42%
AIDA64 / CPU SHA3
SCHENKER XMG Neo 16 E25 RTX 5090 Laptop
Intel Core Ultra 9 275HX, GeForce RTX 5090 Laptop
9734 MB/s
Asus ROG Strix Scar 16 2025
Intel Core Ultra 9 275HX, GeForce RTX 5090 Laptop
9480 MB/s -3%
Aorus MASTER 16 AM6H
Intel Core Ultra 9 275HX, GeForce RTX 5090 Laptop
9025 MB/s -7%
Lenovo Legion Pro 7i 16 Gen 10
Intel Core Ultra 9 275HX, GeForce RTX 5080 Laptop
8828 MB/s -9%
Average Intel Core Ultra 9 275HX
  (6998 - 9734, n=10)
8765 MB/s -10%
HP Omen Max 16 ah000
Intel Core Ultra 9 275HX, GeForce RTX 5090 Laptop
8315 MB/s -15%
SCHENKER XMG Neo 16 (Early 24)
Intel Core i9-14900HX, NVIDIA GeForce RTX 4090 Laptop GPU
7588 MB/s -22%
Average of class Gaming
  (1728 - 10389, n=143, last 2 years)
5236 MB/s -46%
AIDA64 / CPU Queen
SCHENKER XMG Neo 16 (Early 24)
Intel Core i9-14900HX, NVIDIA GeForce RTX 4090 Laptop GPU
148966 Points +6%
SCHENKER XMG Neo 16 E25 RTX 5090 Laptop
Intel Core Ultra 9 275HX, GeForce RTX 5090 Laptop
140695 Points
Asus ROG Strix Scar 16 2025
Intel Core Ultra 9 275HX, GeForce RTX 5090 Laptop
138882 Points -1%
Lenovo Legion Pro 7i 16 Gen 10
Intel Core Ultra 9 275HX, GeForce RTX 5080 Laptop
137820 Points -2%
Aorus MASTER 16 AM6H
Intel Core Ultra 9 275HX, GeForce RTX 5090 Laptop
135378 Points -4%
Average Intel Core Ultra 9 275HX
  (113887 - 140695, n=10)
132930 Points -6%
HP Omen Max 16 ah000
Intel Core Ultra 9 275HX, GeForce RTX 5090 Laptop
128670 Points -9%
Average of class Gaming
  (50699 - 200651, n=143, last 2 years)
116266 Points -17%
AIDA64 / FPU SinJulia
SCHENKER XMG Neo 16 (Early 24)
Intel Core i9-14900HX, NVIDIA GeForce RTX 4090 Laptop GPU
18114 Points +26%
SCHENKER XMG Neo 16 E25 RTX 5090 Laptop
Intel Core Ultra 9 275HX, GeForce RTX 5090 Laptop
14382 Points
Lenovo Legion Pro 7i 16 Gen 10
Intel Core Ultra 9 275HX, GeForce RTX 5080 Laptop
13969 Points -3%
Asus ROG Strix Scar 16 2025
Intel Core Ultra 9 275HX, GeForce RTX 5090 Laptop
13955 Points -3%
Average of class Gaming
  (5020 - 32988, n=143, last 2 years)
13581 Points -6%
Aorus MASTER 16 AM6H
Intel Core Ultra 9 275HX, GeForce RTX 5090 Laptop
13522 Points -6%
Average Intel Core Ultra 9 275HX
  (11172 - 14382, n=10)
13466 Points -6%
HP Omen Max 16 ah000
Intel Core Ultra 9 275HX, GeForce RTX 5090 Laptop
12272 Points -15%
AIDA64 / FPU Mandel
Asus ROG Strix Scar 16 2025
Intel Core Ultra 9 275HX, GeForce RTX 5090 Laptop
102630 Points 0%
SCHENKER XMG Neo 16 E25 RTX 5090 Laptop
Intel Core Ultra 9 275HX, GeForce RTX 5090 Laptop
102544 Points
Aorus MASTER 16 AM6H
Intel Core Ultra 9 275HX, GeForce RTX 5090 Laptop
98724 Points -4%
Lenovo Legion Pro 7i 16 Gen 10
Intel Core Ultra 9 275HX, GeForce RTX 5080 Laptop
95742 Points -7%
Average Intel Core Ultra 9 275HX
  (72596 - 104057, n=10)
94867 Points -7%
HP Omen Max 16 ah000
Intel Core Ultra 9 275HX, GeForce RTX 5090 Laptop
90980 Points -11%
SCHENKER XMG Neo 16 (Early 24)
Intel Core i9-14900HX, NVIDIA GeForce RTX 4090 Laptop GPU
76668 Points -25%
Average of class Gaming
  (17585 - 134044, n=143, last 2 years)
58638 Points -43%
AIDA64 / CPU AES
SCHENKER XMG Neo 16 (Early 24)
Intel Core i9-14900HX, NVIDIA GeForce RTX 4090 Laptop GPU
145389 MB/s +6%
SCHENKER XMG Neo 16 E25 RTX 5090 Laptop
Intel Core Ultra 9 275HX, GeForce RTX 5090 Laptop
136847 MB/s
Lenovo Legion Pro 7i 16 Gen 10
Intel Core Ultra 9 275HX, GeForce RTX 5080 Laptop
134042 MB/s -2%
Asus ROG Strix Scar 16 2025
Intel Core Ultra 9 275HX, GeForce RTX 5090 Laptop
134008 MB/s -2%
Aorus MASTER 16 AM6H
Intel Core Ultra 9 275HX, GeForce RTX 5090 Laptop
129745 MB/s -5%
Average Intel Core Ultra 9 275HX
  (107858 - 136847, n=10)
127858 MB/s -7%
HP Omen Max 16 ah000
Intel Core Ultra 9 275HX, GeForce RTX 5090 Laptop
118108 MB/s -14%
Average of class Gaming
  (19065 - 328679, n=143, last 2 years)
108305 MB/s -21%
AIDA64 / CPU ZLib
SCHENKER XMG Neo 16 E25 RTX 5090 Laptop
Intel Core Ultra 9 275HX, GeForce RTX 5090 Laptop
2263 MB/s
SCHENKER XMG Neo 16 (Early 24)
Intel Core i9-14900HX, NVIDIA GeForce RTX 4090 Laptop GPU
2239 MB/s -1%
Asus ROG Strix Scar 16 2025
Intel Core Ultra 9 275HX, GeForce RTX 5090 Laptop
2179 MB/s -4%
Aorus MASTER 16 AM6H
Intel Core Ultra 9 275HX, GeForce RTX 5090 Laptop
2076 MB/s -8%
Lenovo Legion Pro 7i 16 Gen 10
Intel Core Ultra 9 275HX, GeForce RTX 5080 Laptop
2067 MB/s -9%
Average Intel Core Ultra 9 275HX
  (1757 - 2263, n=10)
2057 MB/s -9%
HP Omen Max 16 ah000
Intel Core Ultra 9 275HX, GeForce RTX 5090 Laptop
1896 MB/s -16%
Average of class Gaming
  (373 - 2531, n=143, last 2 years)
1411 MB/s -38%
AIDA64 / FP64 Ray-Trace
Asus ROG Strix Scar 16 2025
Intel Core Ultra 9 275HX, GeForce RTX 5090 Laptop
21185 KRay/s +1%
SCHENKER XMG Neo 16 E25 RTX 5090 Laptop
Intel Core Ultra 9 275HX, GeForce RTX 5090 Laptop
20910 KRay/s
Aorus MASTER 16 AM6H
Intel Core Ultra 9 275HX, GeForce RTX 5090 Laptop
20602 KRay/s -1%
Lenovo Legion Pro 7i 16 Gen 10
Intel Core Ultra 9 275HX, GeForce RTX 5080 Laptop
19630 KRay/s -6%
Average Intel Core Ultra 9 275HX
  (14847 - 21372, n=10)
19433 KRay/s -7%
HP Omen Max 16 ah000
Intel Core Ultra 9 275HX, GeForce RTX 5090 Laptop
18490 KRay/s -12%
SCHENKER XMG Neo 16 (Early 24)
Intel Core i9-14900HX, NVIDIA GeForce RTX 4090 Laptop GPU
16655 KRay/s -20%
Average of class Gaming
  (3856 - 45446, n=143, last 2 years)
13074 KRay/s -37%
AIDA64 / CPU PhotoWorxx
Asus ROG Strix Scar 16 2025
Intel Core Ultra 9 275HX, GeForce RTX 5090 Laptop
56613 MPixel/s +6%
SCHENKER XMG Neo 16 E25 RTX 5090 Laptop
Intel Core Ultra 9 275HX, GeForce RTX 5090 Laptop
53630 MPixel/s
Lenovo Legion Pro 7i 16 Gen 10
Intel Core Ultra 9 275HX, GeForce RTX 5080 Laptop
53522 MPixel/s 0%
Average Intel Core Ultra 9 275HX
  (47726 - 56613, n=10)
51635 MPixel/s -4%
SCHENKER XMG Neo 16 (Early 24)
Intel Core i9-14900HX, NVIDIA GeForce RTX 4090 Laptop GPU
49305 MPixel/s -8%
HP Omen Max 16 ah000
Intel Core Ultra 9 275HX, GeForce RTX 5090 Laptop
49039 MPixel/s -9%
Aorus MASTER 16 AM6H
Intel Core Ultra 9 275HX, GeForce RTX 5090 Laptop
48187 MPixel/s -10%
Average of class Gaming
  (10805 - 62274, n=143, last 2 years)
41022 MPixel/s -24%

系统性能

Neo 16 在系统基准测试和日常使用中都给人留下了非常好的印象,尽管对比设备之间还是没有明显的差异。

Performance Rating: Percent
PCMark 10: Score | Essentials | Productivity | Digital Content Creation
CrossMark: Overall | Productivity | Creativity | Responsiveness
WebXPRT 3: Overall
WebXPRT 4: Overall
Mozilla Kraken 1.1: Total
Performance Rating
SCHENKER XMG Neo 16 (Early 24)
NVIDIA GeForce RTX 4090 Laptop GPU, i9-14900HX, Samsung 990 Pro 1 TB
88.2 pt
SCHENKER XMG Neo 16 E25 RTX 5090 Laptop
GeForce RTX 5090 Laptop, Ultra 9 275HX, Samsung 9100 Pro 1 TB
88 pt
Average Intel Core Ultra 9 275HX, Nvidia GeForce RTX 5090 Laptop
 
85.6 pt
Aorus MASTER 16 AM6H
GeForce RTX 5090 Laptop, Ultra 9 275HX, Kingston OM8PGP41024Q-A0
85.5 pt
Asus ROG Strix Scar 16 2025
GeForce RTX 5090 Laptop, Ultra 9 275HX, WD PC SN8000S 2TB
85.2 pt
Lenovo Legion Pro 7i 16 Gen 10
GeForce RTX 5080 Laptop, Ultra 9 275HX, SK Hynix HFS001TEJ9X115N
84.9 pt
HP Omen Max 16 ah000 -1!
GeForce RTX 5090 Laptop, Ultra 9 275HX, WDC PC SN810 2TB
81.7 pt
Average of class Gaming
 
75.1 pt
PCMark 10 / Score
Lenovo Legion Pro 7i 16 Gen 10
GeForce RTX 5080 Laptop, Ultra 9 275HX, SK Hynix HFS001TEJ9X115N
9153 Points +1%
SCHENKER XMG Neo 16 E25 RTX 5090 Laptop
GeForce RTX 5090 Laptop, Ultra 9 275HX, Samsung 9100 Pro 1 TB
9032 Points
SCHENKER XMG Neo 16 (Early 24)
NVIDIA GeForce RTX 4090 Laptop GPU, i9-14900HX, Samsung 990 Pro 1 TB
9017 Points 0%
Asus ROG Strix Scar 16 2025
GeForce RTX 5090 Laptop, Ultra 9 275HX, WD PC SN8000S 2TB
8819 Points -2%
HP Omen Max 16 ah000
GeForce RTX 5090 Laptop, Ultra 9 275HX, WDC PC SN810 2TB
8794 Points -3%
Average Intel Core Ultra 9 275HX, Nvidia GeForce RTX 5090 Laptop
  (8241 - 9032, n=6)
8686 Points -4%
Aorus MASTER 16 AM6H
GeForce RTX 5090 Laptop, Ultra 9 275HX, Kingston OM8PGP41024Q-A0
8241 Points -9%
Average of class Gaming
  (5776 - 9852, n=130, last 2 years)
7940 Points -12%
PCMark 10 / Essentials
Lenovo Legion Pro 7i 16 Gen 10
GeForce RTX 5080 Laptop, Ultra 9 275HX, SK Hynix HFS001TEJ9X115N
11215 Points 0%
SCHENKER XMG Neo 16 E25 RTX 5090 Laptop
GeForce RTX 5090 Laptop, Ultra 9 275HX, Samsung 9100 Pro 1 TB
11162 Points
Asus ROG Strix Scar 16 2025
GeForce RTX 5090 Laptop, Ultra 9 275HX, WD PC SN8000S 2TB
11103 Points -1%
SCHENKER XMG Neo 16 (Early 24)
NVIDIA GeForce RTX 4090 Laptop GPU, i9-14900HX, Samsung 990 Pro 1 TB
11065 Points -1%
HP Omen Max 16 ah000
GeForce RTX 5090 Laptop, Ultra 9 275HX, WDC PC SN810 2TB
10969 Points -2%
Average Intel Core Ultra 9 275HX, Nvidia GeForce RTX 5090 Laptop
  (9994 - 11162, n=6)
10879 Points -3%
Average of class Gaming
  (9057 - 12600, n=130, last 2 years)
10761 Points -4%
Aorus MASTER 16 AM6H
GeForce RTX 5090 Laptop, Ultra 9 275HX, Kingston OM8PGP41024Q-A0
9994 Points -10%
PCMark 10 / Productivity
SCHENKER XMG Neo 16 (Early 24)
NVIDIA GeForce RTX 4090 Laptop GPU, i9-14900HX, Samsung 990 Pro 1 TB
11681 Points +25%
Average of class Gaming
  (6662 - 14612, n=130, last 2 years)
9873 Points +6%
Lenovo Legion Pro 7i 16 Gen 10
GeForce RTX 5080 Laptop, Ultra 9 275HX, SK Hynix HFS001TEJ9X115N
9590 Points +3%
SCHENKER XMG Neo 16 E25 RTX 5090 Laptop
GeForce RTX 5090 Laptop, Ultra 9 275HX, Samsung 9100 Pro 1 TB
9317 Points
Aorus MASTER 16 AM6H
GeForce RTX 5090 Laptop, Ultra 9 275HX, Kingston OM8PGP41024Q-A0
9300 Points 0%
Average Intel Core Ultra 9 275HX, Nvidia GeForce RTX 5090 Laptop
  (9122 - 9444, n=6)
9275 Points 0%
Asus ROG Strix Scar 16 2025
GeForce RTX 5090 Laptop, Ultra 9 275HX, WD PC SN8000S 2TB
9164 Points -2%
HP Omen Max 16 ah000
GeForce RTX 5090 Laptop, Ultra 9 275HX, WDC PC SN810 2TB
9122 Points -2%
PCMark 10 / Digital Content Creation
Lenovo Legion Pro 7i 16 Gen 10
GeForce RTX 5080 Laptop, Ultra 9 275HX, SK Hynix HFS001TEJ9X115N
19351 Points +1%
SCHENKER XMG Neo 16 E25 RTX 5090 Laptop
GeForce RTX 5090 Laptop, Ultra 9 275HX, Samsung 9100 Pro 1 TB
19227 Points
HP Omen Max 16 ah000
GeForce RTX 5090 Laptop, Ultra 9 275HX, WDC PC SN810 2TB
18445 Points -4%
Asus ROG Strix Scar 16 2025
GeForce RTX 5090 Laptop, Ultra 9 275HX, WD PC SN8000S 2TB
18293 Points -5%
Average Intel Core Ultra 9 275HX, Nvidia GeForce RTX 5090 Laptop
  (16344 - 19227, n=6)
17650 Points -8%
Aorus MASTER 16 AM6H
GeForce RTX 5090 Laptop, Ultra 9 275HX, Kingston OM8PGP41024Q-A0
16344 Points -15%
SCHENKER XMG Neo 16 (Early 24)
NVIDIA GeForce RTX 4090 Laptop GPU, i9-14900HX, Samsung 990 Pro 1 TB
15394 Points -20%
Average of class Gaming
  (7440 - 19351, n=130, last 2 years)
12959 Points -33%
CrossMark / Overall
SCHENKER XMG Neo 16 (Early 24)
NVIDIA GeForce RTX 4090 Laptop GPU, i9-14900HX, Samsung 990 Pro 1 TB
2344 Points +4%
Aorus MASTER 16 AM6H
GeForce RTX 5090 Laptop, Ultra 9 275HX, Kingston OM8PGP41024Q-A0
2253 Points 0%
SCHENKER XMG Neo 16 E25 RTX 5090 Laptop
GeForce RTX 5090 Laptop, Ultra 9 275HX, Samsung 9100 Pro 1 TB
2249 Points
Average Intel Core Ultra 9 275HX, Nvidia GeForce RTX 5090 Laptop
  (1995 - 2282, n=6)
2191 Points -3%
Asus ROG Strix Scar 16 2025
GeForce RTX 5090 Laptop, Ultra 9 275HX, WD PC SN8000S 2TB
2144 Points -5%
Lenovo Legion Pro 7i 16 Gen 10
GeForce RTX 5080 Laptop, Ultra 9 275HX, SK Hynix HFS001TEJ9X115N
2017 Points -10%
HP Omen Max 16 ah000
GeForce RTX 5090 Laptop, Ultra 9 275HX, WDC PC SN810 2TB
1995 Points -11%
Average of class Gaming
  (1247 - 2344, n=109, last 2 years)
1923 Points -14%
CrossMark / Productivity
SCHENKER XMG Neo 16 (Early 24)
NVIDIA GeForce RTX 4090 Laptop GPU, i9-14900HX, Samsung 990 Pro 1 TB
2162 Points +5%
Aorus MASTER 16 AM6H
GeForce RTX 5090 Laptop, Ultra 9 275HX, Kingston OM8PGP41024Q-A0
2106 Points +2%
SCHENKER XMG Neo 16 E25 RTX 5090 Laptop
GeForce RTX 5090 Laptop, Ultra 9 275HX, Samsung 9100 Pro 1 TB
2062 Points
Average Intel Core Ultra 9 275HX, Nvidia GeForce RTX 5090 Laptop
  (1847 - 2119, n=6)
2018 Points -2%
Asus ROG Strix Scar 16 2025
GeForce RTX 5090 Laptop, Ultra 9 275HX, WD PC SN8000S 2TB
1948 Points -6%
Lenovo Legion Pro 7i 16 Gen 10
GeForce RTX 5080 Laptop, Ultra 9 275HX, SK Hynix HFS001TEJ9X115N
1922 Points -7%
HP Omen Max 16 ah000
GeForce RTX 5090 Laptop, Ultra 9 275HX, WDC PC SN810 2TB
1847 Points -10%
Average of class Gaming
  (1299 - 2204, n=109, last 2 years)
1820 Points -12%
CrossMark / Creativity
SCHENKER XMG Neo 16 (Early 24)
NVIDIA GeForce RTX 4090 Laptop GPU, i9-14900HX, Samsung 990 Pro 1 TB
2660 Points +2%
SCHENKER XMG Neo 16 E25 RTX 5090 Laptop
GeForce RTX 5090 Laptop, Ultra 9 275HX, Samsung 9100 Pro 1 TB
2612 Points
Asus ROG Strix Scar 16 2025
GeForce RTX 5090 Laptop, Ultra 9 275HX, WD PC SN8000S 2TB
2556 Points -2%
Average Intel Core Ultra 9 275HX, Nvidia GeForce RTX 5090 Laptop
  (2285 - 2612, n=6)
2501 Points -4%
Aorus MASTER 16 AM6H
GeForce RTX 5090 Laptop, Ultra 9 275HX, Kingston OM8PGP41024Q-A0
2452 Points -6%
Lenovo Legion Pro 7i 16 Gen 10
GeForce RTX 5080 Laptop, Ultra 9 275HX, SK Hynix HFS001TEJ9X115N
2288 Points -12%
HP Omen Max 16 ah000
GeForce RTX 5090 Laptop, Ultra 9 275HX, WDC PC SN810 2TB
2285 Points -13%
Average of class Gaming
  (1275 - 2660, n=109, last 2 years)
2119 Points -19%
CrossMark / Responsiveness
Aorus MASTER 16 AM6H
GeForce RTX 5090 Laptop, Ultra 9 275HX, Kingston OM8PGP41024Q-A0
2139 Points +15%
SCHENKER XMG Neo 16 (Early 24)
NVIDIA GeForce RTX 4090 Laptop GPU, i9-14900HX, Samsung 990 Pro 1 TB
2045 Points +10%
Average Intel Core Ultra 9 275HX, Nvidia GeForce RTX 5090 Laptop
  (1673 - 2181, n=6)
1893 Points +2%
SCHENKER XMG Neo 16 E25 RTX 5090 Laptop
GeForce RTX 5090 Laptop, Ultra 9 275HX, Samsung 9100 Pro 1 TB
1864 Points
Average of class Gaming
  (1030 - 2330, n=109, last 2 years)
1710 Points -8%
Asus ROG Strix Scar 16 2025
GeForce RTX 5090 Laptop, Ultra 9 275HX, WD PC SN8000S 2TB
1686 Points -10%
HP Omen Max 16 ah000
GeForce RTX 5090 Laptop, Ultra 9 275HX, WDC PC SN810 2TB
1673 Points -10%
Lenovo Legion Pro 7i 16 Gen 10
GeForce RTX 5080 Laptop, Ultra 9 275HX, SK Hynix HFS001TEJ9X115N
1597 Points -14%
WebXPRT 3 / Overall
HP Omen Max 16 ah000
GeForce RTX 5090 Laptop, Ultra 9 275HX, WDC PC SN810 2TB
359 Points +3%
Lenovo Legion Pro 7i 16 Gen 10
GeForce RTX 5080 Laptop, Ultra 9 275HX, SK Hynix HFS001TEJ9X115N
359 Points +3%
SCHENKER XMG Neo 16 E25 RTX 5090 Laptop
GeForce RTX 5090 Laptop, Ultra 9 275HX, Samsung 9100 Pro 1 TB
349 Points
Aorus MASTER 16 AM6H
GeForce RTX 5090 Laptop, Ultra 9 275HX, Kingston OM8PGP41024Q-A0
346 Points -1%
Asus ROG Strix Scar 16 2025
GeForce RTX 5090 Laptop, Ultra 9 275HX, WD PC SN8000S 2TB
344 Points -1%
Average Intel Core Ultra 9 275HX, Nvidia GeForce RTX 5090 Laptop
  (315 - 359, n=6)
343 Points -2%
SCHENKER XMG Neo 16 (Early 24)
NVIDIA GeForce RTX 4090 Laptop GPU, i9-14900HX, Samsung 990 Pro 1 TB
336 Points -4%
Average of class Gaming
  (215 - 480, n=123, last 2 years)
306 Points -12%
WebXPRT 4 / Overall
Asus ROG Strix Scar 16 2025
GeForce RTX 5090 Laptop, Ultra 9 275HX, WD PC SN8000S 2TB
337 Points +1%
Aorus MASTER 16 AM6H
GeForce RTX 5090 Laptop, Ultra 9 275HX, Kingston OM8PGP41024Q-A0
333 Points 0%
Lenovo Legion Pro 7i 16 Gen 10
GeForce RTX 5080 Laptop, Ultra 9 275HX, SK Hynix HFS001TEJ9X115N
333 Points 0%
SCHENKER XMG Neo 16 E25 RTX 5090 Laptop
GeForce RTX 5090 Laptop, Ultra 9 275HX, Samsung 9100 Pro 1 TB
333 Points
Average Intel Core Ultra 9 275HX, Nvidia GeForce RTX 5090 Laptop
  (317 - 337, n=5)
331 Points -1%
SCHENKER XMG Neo 16 (Early 24)
NVIDIA GeForce RTX 4090 Laptop GPU, i9-14900HX, Samsung 990 Pro 1 TB
306 Points -8%
Average of class Gaming
  (176.4 - 341, n=110, last 2 years)
271 Points -19%
Mozilla Kraken 1.1 / Total
Average of class Gaming
  (404 - 674, n=134, last 2 years)
494 ms * -22%
SCHENKER XMG Neo 16 (Early 24)
NVIDIA GeForce RTX 4090 Laptop GPU, i9-14900HX, Samsung 990 Pro 1 TB
428 ms * -6%
HP Omen Max 16 ah000
GeForce RTX 5090 Laptop, Ultra 9 275HX, WDC PC SN810 2TB
420 ms * -4%
Average Intel Core Ultra 9 275HX, Nvidia GeForce RTX 5090 Laptop
  (404 - 420, n=6)
413 ms * -2%
Asus ROG Strix Scar 16 2025
GeForce RTX 5090 Laptop, Ultra 9 275HX, WD PC SN8000S 2TB
412 ms * -2%
Aorus MASTER 16 AM6H
GeForce RTX 5090 Laptop, Ultra 9 275HX, Kingston OM8PGP41024Q-A0
411 ms * -2%
Lenovo Legion Pro 7i 16 Gen 10
GeForce RTX 5080 Laptop, Ultra 9 275HX, SK Hynix HFS001TEJ9X115N
408 ms * -1%
SCHENKER XMG Neo 16 E25 RTX 5090 Laptop
GeForce RTX 5090 Laptop, Ultra 9 275HX, Samsung 9100 Pro 1 TB
404 ms *

* ... smaller is better

PCMark 10 Score
9032 points
Help
AIDA64 / Memory Copy
SCHENKER XMG Neo 16 E25 RTX 5090 Laptop
Intel Core Ultra 9 275HX, GeForce RTX 5090 Laptop
86978 MB/s
Lenovo Legion Pro 7i 16 Gen 10
Intel Core Ultra 9 275HX, GeForce RTX 5080 Laptop
85644 MB/s -2%
Asus ROG Strix Scar 16 2025
Intel Core Ultra 9 275HX, GeForce RTX 5090 Laptop
84020 MB/s -3%
Average Intel Core Ultra 9 275HX
  (74558 - 86978, n=10)
81923 MB/s -6%
SCHENKER XMG Neo 16 (Early 24)
Intel Core i9-14900HX, NVIDIA GeForce RTX 4090 Laptop GPU
78897 MB/s -9%
HP Omen Max 16 ah000
Intel Core Ultra 9 275HX, GeForce RTX 5090 Laptop
77500 MB/s -11%
Aorus MASTER 16 AM6H
Intel Core Ultra 9 275HX, GeForce RTX 5090 Laptop
75982 MB/s -13%
Average of class Gaming
  (21750 - 97515, n=143, last 2 years)
67765 MB/s -22%
AIDA64 / Memory Read
SCHENKER XMG Neo 16 E25 RTX 5090 Laptop
Intel Core Ultra 9 275HX, GeForce RTX 5090 Laptop
97151 MB/s
Lenovo Legion Pro 7i 16 Gen 10
Intel Core Ultra 9 275HX, GeForce RTX 5080 Laptop
95542 MB/s -2%
Asus ROG Strix Scar 16 2025
Intel Core Ultra 9 275HX, GeForce RTX 5090 Laptop
87760 MB/s -10%
Average Intel Core Ultra 9 275HX
  (74094 - 97151, n=10)
87450 MB/s -10%
SCHENKER XMG Neo 16 (Early 24)
Intel Core i9-14900HX, NVIDIA GeForce RTX 4090 Laptop GPU
86939 MB/s -11%
HP Omen Max 16 ah000
Intel Core Ultra 9 275HX, GeForce RTX 5090 Laptop
84473 MB/s -13%
Aorus MASTER 16 AM6H
Intel Core Ultra 9 275HX, GeForce RTX 5090 Laptop
82625 MB/s -15%
Average of class Gaming
  (22956 - 102937, n=143, last 2 years)
70806 MB/s -27%
AIDA64 / Memory Write
SCHENKER XMG Neo 16 E25 RTX 5090 Laptop
Intel Core Ultra 9 275HX, GeForce RTX 5090 Laptop
85648 MB/s
Lenovo Legion Pro 7i 16 Gen 10
Intel Core Ultra 9 275HX, GeForce RTX 5080 Laptop
84581 MB/s -1%
Asus ROG Strix Scar 16 2025
Intel Core Ultra 9 275HX, GeForce RTX 5090 Laptop
82159 MB/s -4%
Average Intel Core Ultra 9 275HX
  (72929 - 85648, n=10)
79370 MB/s -7%
HP Omen Max 16 ah000
Intel Core Ultra 9 275HX, GeForce RTX 5090 Laptop
77637 MB/s -9%
SCHENKER XMG Neo 16 (Early 24)
Intel Core i9-14900HX, NVIDIA GeForce RTX 4090 Laptop GPU
77562 MB/s -9%
Aorus MASTER 16 AM6H
Intel Core Ultra 9 275HX, GeForce RTX 5090 Laptop
73095 MB/s -15%
Average of class Gaming
  (22297 - 108954, n=143, last 2 years)
69909 MB/s -18%
AIDA64 / Memory Latency
HP Omen Max 16 ah000
Intel Core Ultra 9 275HX, GeForce RTX 5090 Laptop
118.7 ns * -10%
Average Intel Core Ultra 9 275HX
  (105.8 - 125.1, n=10)
112.1 ns * -4%
Aorus MASTER 16 AM6H
Intel Core Ultra 9 275HX, GeForce RTX 5090 Laptop
111.9 ns * -4%
Asus ROG Strix Scar 16 2025
Intel Core Ultra 9 275HX, GeForce RTX 5090 Laptop
111.2 ns * -3%
Lenovo Legion Pro 7i 16 Gen 10
Intel Core Ultra 9 275HX, GeForce RTX 5080 Laptop
109.3 ns * -1%
SCHENKER XMG Neo 16 E25 RTX 5090 Laptop
Intel Core Ultra 9 275HX, GeForce RTX 5090 Laptop
107.7 ns *
Average of class Gaming
  (59.5 - 259, n=143, last 2 years)
98.2 ns * +9%
SCHENKER XMG Neo 16 (Early 24)
Intel Core i9-14900HX, NVIDIA GeForce RTX 4090 Laptop GPU
76.1 ns * +29%

* ... smaller is better

DPC 延迟

在我们的标准化延迟测试(上网、4K YouTube 播放、CPU 负载)中,我们的测试设备在使用实时音频应用程序时,其当前 BIOS 版本显示出轻微的限制。

LatencyMon - 概述
LatencyMon - 概述
LatencyMon - 驱动程序
LatencyMon - 驱动程序
DPC Latencies / LatencyMon - interrupt to process latency (max), Web, Youtube, Prime95
SCHENKER XMG Neo 16 (Early 24)
NVIDIA GeForce RTX 4090 Laptop GPU, i9-14900HX, Samsung 990 Pro 1 TB
2478.6 μs * -69%
Asus ROG Strix Scar 16 2025
GeForce RTX 5090 Laptop, Ultra 9 275HX, WD PC SN8000S 2TB
2296.5 μs * -57%
Aorus MASTER 16 AM6H
GeForce RTX 5090 Laptop, Ultra 9 275HX, Kingston OM8PGP41024Q-A0
1637.7 μs * -12%
HP Omen Max 16 ah000
GeForce RTX 5090 Laptop, Ultra 9 275HX, WDC PC SN810 2TB
1516.1 μs * -3%
SCHENKER XMG Neo 16 E25 RTX 5090 Laptop
GeForce RTX 5090 Laptop, Ultra 9 275HX, Samsung 9100 Pro 1 TB
1465.8 μs *
Lenovo Legion Pro 7i 16 Gen 10
GeForce RTX 5080 Laptop, Ultra 9 275HX, SK Hynix HFS001TEJ9X115N
464.2 μs * +68%

* ... smaller is better

存储设备

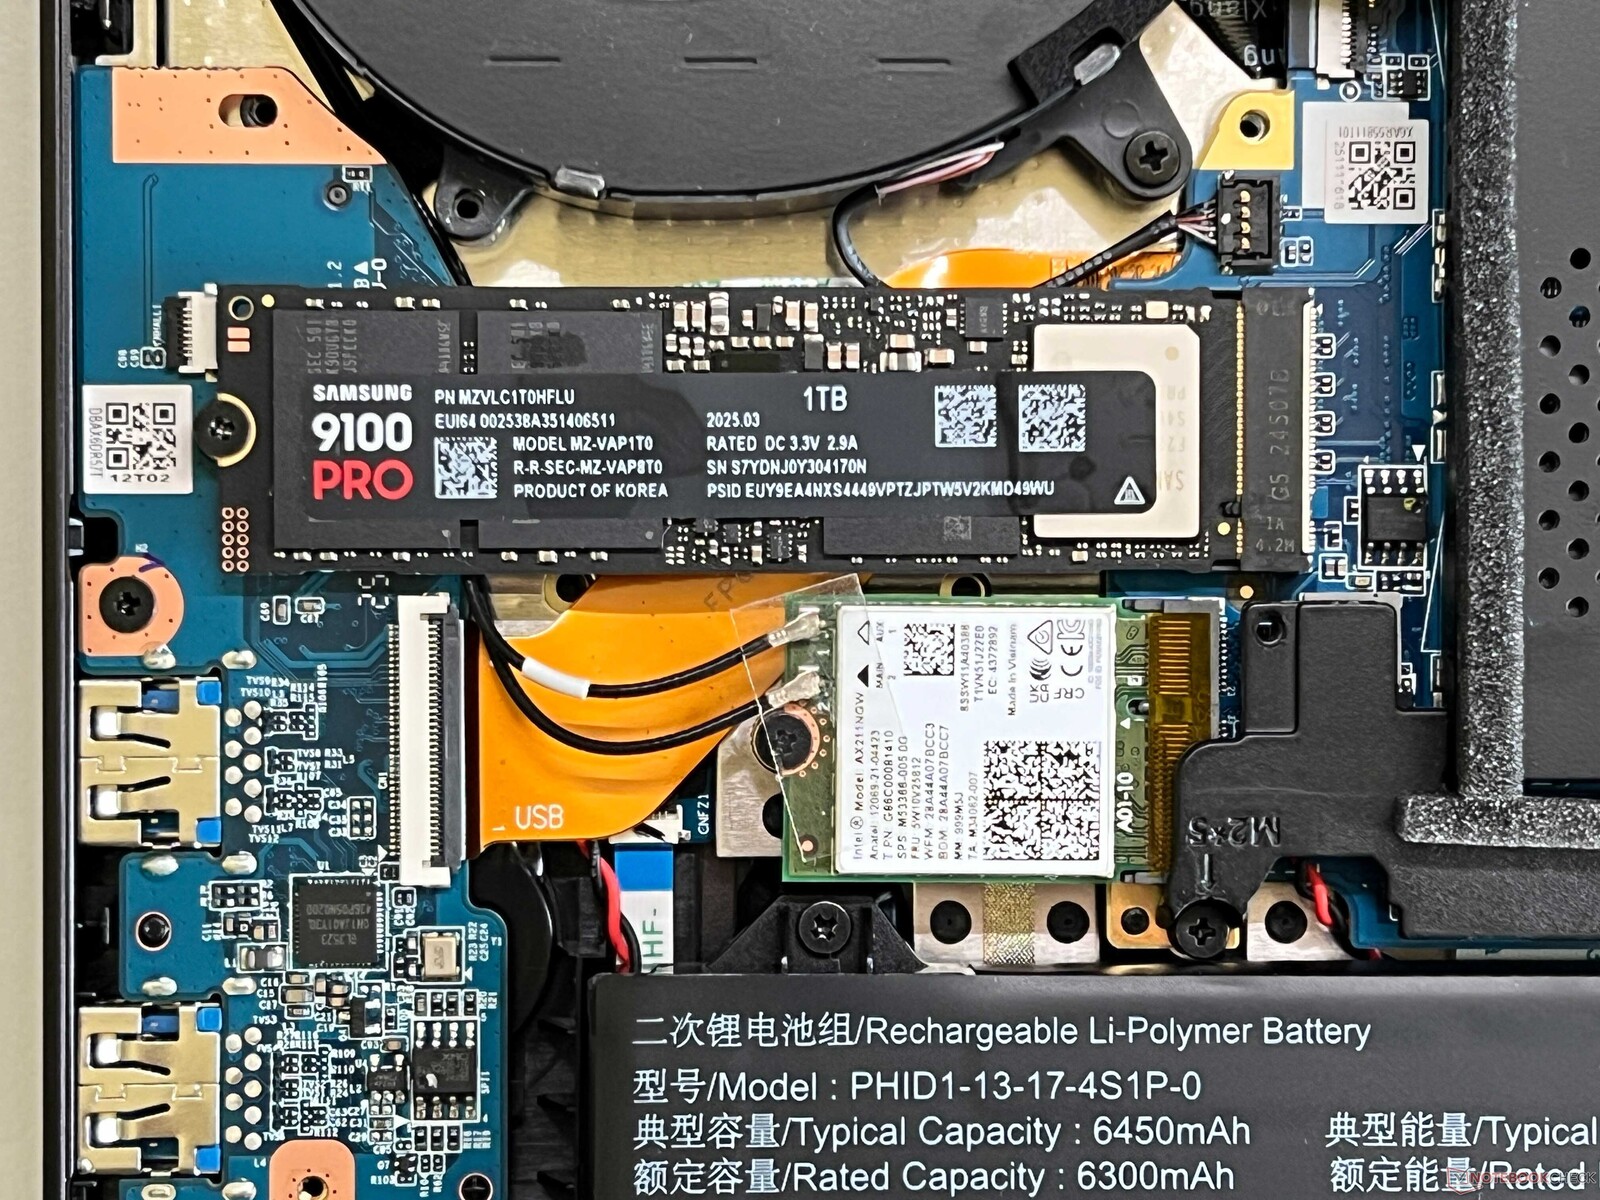
两个 M.2 2280 插槽中的一个已经支持 PCIe 5.0 连接,我们的测试设备配备了相应的三星 9100 Pro 固态硬盘。其存储容量为 1 TB,用户首次启动设备后可使用 870 GB。在我们的测试中,其传输速率超过了 10 GB/s,即使在长期负载的情况下也能保持稳定。

Samsung 9100 Pro 1 TB
CDM 5/6 Read Seq Q32T1: 10986 MB/s
CDM 5/6 Write Seq Q32T1: 6242 MB/s
CDM 5/6 Read 4K Q32T1: 545 MB/s
CDM 5/6 Write 4K Q32T1: 488 MB/s
CDM 5/6 Read 4K: 84.8 MB/s
CDM 5/6 Write 4K: 151.4 MB/s
CDM 6 Write 4K Q8T8: 465 MB/s
CDM 6 Read 4K Q8T8: 1077 MB/s
Drive Performance Rating - Percent
SCHENKER XMG Neo 16 (Early 24)
Samsung 990 Pro 1 TB
81.1 pt
SCHENKER XMG Neo 16 E25 RTX 5090 Laptop
Samsung 9100 Pro 1 TB
77.2 pt
Average Samsung 9100 Pro 1 TB
 
76.4 pt
Aorus MASTER 16 AM6H
Kingston OM8PGP41024Q-A0
64.6 pt
Lenovo Legion Pro 7i 16 Gen 10
SK Hynix HFS001TEJ9X115N
63.8 pt
Average of class Gaming
 
61.6 pt
Asus ROG Strix Scar 16 2025
WD PC SN8000S 2TB
56.1 pt
HP Omen Max 16 ah000
WDC PC SN810 2TB
49.3 pt
DiskSpd
seq read
SCHENKER XMG Neo 16 E25 RTX 5090 Laptop
Samsung 9100 Pro 1 TB
5861 (5825.98min - 5861.12max) MB/s
Average Samsung 9100 Pro 1 TB
  (5359 - 5861, n=2)
5610 MB/s -4%
Lenovo Legion Pro 7i 16 Gen 10
SK Hynix HFS001TEJ9X115N
3998 (3658.3min - 3998.4max) MB/s -32%
HP Omen Max 16 ah000
WDC PC SN810 2TB
3415 (3349.37min - 3415.42max) MB/s -42%
Average of class Gaming
  (281 - 7045, n=126, last 2 years)
3410 MB/s -42%
Aorus MASTER 16 AM6H
Kingston OM8PGP41024Q-A0
3268 (3226.52min - 3267.96max) MB/s -44%
SCHENKER XMG Neo 16 (Early 24)
Samsung 990 Pro 1 TB
3015 (2943.98min - 3014.55max) MB/s -49%
Asus ROG Strix Scar 16 2025
WD PC SN8000S 2TB
331 (68.02min - 331.14max) MB/s -94%
seq write
SCHENKER XMG Neo 16 (Early 24)
Samsung 990 Pro 1 TB
4826 (4760.33min - 4825.54max) MB/s +10%
SCHENKER XMG Neo 16 E25 RTX 5090 Laptop
Samsung 9100 Pro 1 TB
4387 (4285.53min - 4387.28max) MB/s
Average Samsung 9100 Pro 1 TB
  (4147 - 4387, n=2)
4267 MB/s -3%
Aorus MASTER 16 AM6H
Kingston OM8PGP41024Q-A0
3906 (3851.27min - 3906.37max) MB/s -11%
Average of class Gaming
  (535 - 9307, n=126, last 2 years)
3806 MB/s -13%
Asus ROG Strix Scar 16 2025
WD PC SN8000S 2TB
3016 (2843.5min - 3016.38max) MB/s -31%
HP Omen Max 16 ah000
WDC PC SN810 2TB
2570 (2187.36min - 2569.74max) MB/s -41%
Lenovo Legion Pro 7i 16 Gen 10
SK Hynix HFS001TEJ9X115N
1922 (1819.62min - 1921.76max) MB/s -56%
seq q8 t1 read
SCHENKER XMG Neo 16 E25 RTX 5090 Laptop
Samsung 9100 Pro 1 TB
13091 (10532.2min - 13090.8max) MB/s
Average Samsung 9100 Pro 1 TB
  (12505 - 13091, n=2)
12798 MB/s -2%
SCHENKER XMG Neo 16 (Early 24)
Samsung 990 Pro 1 TB
7140 (5903.9min - 7139.54max) MB/s -45%
Lenovo Legion Pro 7i 16 Gen 10
SK Hynix HFS001TEJ9X115N
7069 (5962.41min - 7069.08max) MB/s -46%
Asus ROG Strix Scar 16 2025
WD PC SN8000S 2TB
6880 (6106.07min - 6880.21max) MB/s -47%
HP Omen Max 16 ah000
WDC PC SN810 2TB
6766 (5345.22min - 6765.62max) MB/s -48%
Average of class Gaming
  (2594 - 15056, n=126, last 2 years)
6407 MB/s -51%
Aorus MASTER 16 AM6H
Kingston OM8PGP41024Q-A0
4799 (4213.14min - 4799.33max) MB/s -63%
seq q8 t1 write
Average Samsung 9100 Pro 1 TB
  (7264 - 7451, n=2)
7358 MB/s +1%
SCHENKER XMG Neo 16 E25 RTX 5090 Laptop
Samsung 9100 Pro 1 TB
7264 (5656.44min - 7264.06max) MB/s
SCHENKER XMG Neo 16 (Early 24)
Samsung 990 Pro 1 TB
6860 (6824.33min - 6859.91max) MB/s -6%
Lenovo Legion Pro 7i 16 Gen 10
SK Hynix HFS001TEJ9X115N
6169 (6112.09min - 6168.56max) MB/s -15%
Asus ROG Strix Scar 16 2025
WD PC SN8000S 2TB
5275 (5153.09min - 5274.69max) MB/s -27%
HP Omen Max 16 ah000
WDC PC SN810 2TB
5187 (5110.55min - 5187.31max) MB/s -29%
Average of class Gaming
  (539 - 11581, n=126, last 2 years)
4966 MB/s -32%
Aorus MASTER 16 AM6H
Kingston OM8PGP41024Q-A0
3905 (3856.71min - 3905.27max) MB/s -46%
4k q1 t1 read
Average Samsung 9100 Pro 1 TB
  (77.4 - 77.6, n=2)
77.5 MB/s 0%
SCHENKER XMG Neo 16 E25 RTX 5090 Laptop
Samsung 9100 Pro 1 TB
77.4 (77.02min - 77.43max) MB/s
Asus ROG Strix Scar 16 2025
WD PC SN8000S 2TB
69.6 (64.94min - 69.55max) MB/s -10%
Aorus MASTER 16 AM6H
Kingston OM8PGP41024Q-A0
68.4 (66.54min - 68.38max) MB/s -12%
Lenovo Legion Pro 7i 16 Gen 10
SK Hynix HFS001TEJ9X115N
68.3 (67.41min - 68.26max) MB/s -12%
Average of class Gaming
  (32.9 - 95.9, n=126, last 2 years)
67 MB/s -13%
SCHENKER XMG Neo 16 (Early 24)
Samsung 990 Pro 1 TB
60.5 (49.54min - 60.46max) MB/s -22%
HP Omen Max 16 ah000
WDC PC SN810 2TB
57.4 (57.08min - 57.42max) MB/s -26%
4k q1 t1 write
Aorus MASTER 16 AM6H
Kingston OM8PGP41024Q-A0
317 (306.21min - 316.5max) MB/s +102%
Average of class Gaming
  (78 - 397, n=126, last 2 years)
219 MB/s +39%
SCHENKER XMG Neo 16 (Early 24)
Samsung 990 Pro 1 TB
174.4 (160.08min - 174.38max) MB/s +11%
Asus ROG Strix Scar 16 2025
WD PC SN8000S 2TB
159.4 (153.59min - 159.38max) MB/s +2%
SCHENKER XMG Neo 16 E25 RTX 5090 Laptop
Samsung 9100 Pro 1 TB
157 (155.82min - 156.95max) MB/s
Average Samsung 9100 Pro 1 TB
  (156.5 - 157, n=2)
156.8 MB/s 0%
Lenovo Legion Pro 7i 16 Gen 10
SK Hynix HFS001TEJ9X115N
153.8 (106.82min - 153.79max) MB/s -2%
HP Omen Max 16 ah000
WDC PC SN810 2TB
149.4 (92.02min - 149.43max) MB/s -5%
4k q32 t16 read
SCHENKER XMG Neo 16 (Early 24)
Samsung 990 Pro 1 TB
4920 (4883.21min - 4920.02max) MB/s +412%
Lenovo Legion Pro 7i 16 Gen 10
SK Hynix HFS001TEJ9X115N
4760 (4699.8min - 4760.03max) MB/s +395%
Aorus MASTER 16 AM6H
Kingston OM8PGP41024Q-A0
2809 (2804.8min - 2809.03max) MB/s +192%
Average of class Gaming
  (417 - 6172, n=126, last 2 years)
2517 MB/s +162%
HP Omen Max 16 ah000
WDC PC SN810 2TB
982 (747.27min - 982.13max) MB/s +2%
Average Samsung 9100 Pro 1 TB
  (961 - 979, n=2)
970 MB/s +1%
SCHENKER XMG Neo 16 E25 RTX 5090 Laptop
Samsung 9100 Pro 1 TB
961 (945.93min - 961.25max) MB/s
Asus ROG Strix Scar 16 2025
WD PC SN8000S 2TB
679 (591.01min - 678.88max) MB/s -29%
4k q32 t16 write
SCHENKER XMG Neo 16 (Early 24)
Samsung 990 Pro 1 TB
4522 (4451.05min - 4521.93max) MB/s +731%
Lenovo Legion Pro 7i 16 Gen 10
SK Hynix HFS001TEJ9X115N
4433 (4354.58min - 4433.43max) MB/s +715%
Aorus MASTER 16 AM6H
Kingston OM8PGP41024Q-A0
3711 (3674.85min - 3711.4max) MB/s +582%
Average of class Gaming
  (162.3 - 5588, n=126, last 2 years)
2065 MB/s +280%
Average Samsung 9100 Pro 1 TB
  (544 - 563, n=2)
554 MB/s +2%
SCHENKER XMG Neo 16 E25 RTX 5090 Laptop
Samsung 9100 Pro 1 TB
544 (523.14min - 543.91max) MB/s
HP Omen Max 16 ah000
WDC PC SN810 2TB
520 (486.41min - 520.16max) MB/s -4%
Asus ROG Strix Scar 16 2025
WD PC SN8000S 2TB
505 (461.27min - 504.83max) MB/s -7%
AS SSD
Score Total
SCHENKER XMG Neo 16 (Early 24)
Samsung 990 Pro 1 TB
9365 Points +6%
SCHENKER XMG Neo 16 E25 RTX 5090 Laptop
Samsung 9100 Pro 1 TB
8857 Points
Average Samsung 9100 Pro 1 TB
  (8609 - 8857, n=2)
8733 Points -1%
Asus ROG Strix Scar 16 2025
WD PC SN8000S 2TB
7590 Points -14%
Average of class Gaming
  (2271 - 13854, n=119, last 2 years)
6771 Points -24%
Aorus MASTER 16 AM6H
Kingston OM8PGP41024Q-A0
6720 Points -24%
Lenovo Legion Pro 7i 16 Gen 10
SK Hynix HFS001TEJ9X115N
6515 Points -26%
HP Omen Max 16 ah000
WDC PC SN810 2TB
5355 Points -40%
Score Read
SCHENKER XMG Neo 16 (Early 24)
Samsung 990 Pro 1 TB
3496 Points +70%
Lenovo Legion Pro 7i 16 Gen 10
SK Hynix HFS001TEJ9X115N
3234 Points +57%
Aorus MASTER 16 AM6H
Kingston OM8PGP41024Q-A0
2761 Points +34%
Average of class Gaming
  (776 - 4721, n=119, last 2 years)
2400 Points +17%
SCHENKER XMG Neo 16 E25 RTX 5090 Laptop
Samsung 9100 Pro 1 TB
2056 Points
Average Samsung 9100 Pro 1 TB
  (1964 - 2056, n=2)
2010 Points -2%
HP Omen Max 16 ah000
WDC PC SN810 2TB
1569 Points -24%
Asus ROG Strix Scar 16 2025
WD PC SN8000S 2TB
1541 Points -25%
Score Write
SCHENKER XMG Neo 16 E25 RTX 5090 Laptop
Samsung 9100 Pro 1 TB
5936 Points
Average Samsung 9100 Pro 1 TB
  (5809 - 5936, n=2)
5873 Points -1%
Asus ROG Strix Scar 16 2025
WD PC SN8000S 2TB
5263 Points -11%
SCHENKER XMG Neo 16 (Early 24)
Samsung 990 Pro 1 TB
4062 Points -32%
Average of class Gaming
  (515 - 7208, n=119, last 2 years)
3210 Points -46%
HP Omen Max 16 ah000
WDC PC SN810 2TB
3074 Points -48%
Aorus MASTER 16 AM6H
Kingston OM8PGP41024Q-A0
2588 Points -56%
Lenovo Legion Pro 7i 16 Gen 10
SK Hynix HFS001TEJ9X115N
1837 Points -69%
Seq Read
SCHENKER XMG Neo 16 E25 RTX 5090 Laptop
Samsung 9100 Pro 1 TB
9653 MB/s
Average Samsung 9100 Pro 1 TB
  (9199 - 9653, n=2)
9426 MB/s -2%
Lenovo Legion Pro 7i 16 Gen 10
SK Hynix HFS001TEJ9X115N
5688.57 MB/s -41%
SCHENKER XMG Neo 16 (Early 24)
Samsung 990 Pro 1 TB
5684.15 MB/s -41%
HP Omen Max 16 ah000
WDC PC SN810 2TB
5105.48 MB/s -47%
Average of class Gaming
  (2260 - 9653, n=119, last 2 years)
4969 MB/s -49%
Asus ROG Strix Scar 16 2025
WD PC SN8000S 2TB
4260 MB/s -56%
Aorus MASTER 16 AM6H
Kingston OM8PGP41024Q-A0
4092 MB/s -58%
Seq Write
Average Samsung 9100 Pro 1 TB
  (5562 - 5793, n=2)
5678 MB/s +2%
SCHENKER XMG Neo 16 (Early 24)
Samsung 990 Pro 1 TB
5612.29 MB/s +1%
SCHENKER XMG Neo 16 E25 RTX 5090 Laptop
Samsung 9100 Pro 1 TB
5562 MB/s
Asus ROG Strix Scar 16 2025
WD PC SN8000S 2TB
3812 MB/s -31%
Average of class Gaming
  (495 - 9486, n=119, last 2 years)
3787 MB/s -32%
HP Omen Max 16 ah000
WDC PC SN810 2TB
3100.36 MB/s -44%
Aorus MASTER 16 AM6H
Kingston OM8PGP41024Q-A0
3060 MB/s -45%
Lenovo Legion Pro 7i 16 Gen 10
SK Hynix HFS001TEJ9X115N
1587.46 MB/s -71%
4K Read
Aorus MASTER 16 AM6H
Kingston OM8PGP41024Q-A0
85 MB/s +4%
SCHENKER XMG Neo 16 E25 RTX 5090 Laptop
Samsung 9100 Pro 1 TB
81.6 MB/s
Asus ROG Strix Scar 16 2025
WD PC SN8000S 2TB
75.6 MB/s -7%
Average Samsung 9100 Pro 1 TB
  (49.2 - 81.6, n=2)
65.4 MB/s -20%
Average of class Gaming
  (27.8 - 112.1, n=119, last 2 years)
65.4 MB/s -20%
Lenovo Legion Pro 7i 16 Gen 10
SK Hynix HFS001TEJ9X115N
63.16 MB/s -23%
SCHENKER XMG Neo 16 (Early 24)
Samsung 990 Pro 1 TB
59.28 MB/s -27%
HP Omen Max 16 ah000
WDC PC SN810 2TB
54.74 MB/s -33%
4K Write
Aorus MASTER 16 AM6H
Kingston OM8PGP41024Q-A0
271 MB/s +20%
Lenovo Legion Pro 7i 16 Gen 10
SK Hynix HFS001TEJ9X115N
250.73 MB/s +11%
Asus ROG Strix Scar 16 2025
WD PC SN8000S 2TB
249 MB/s +10%
SCHENKER XMG Neo 16 (Early 24)
Samsung 990 Pro 1 TB
248.48 MB/s +10%
SCHENKER XMG Neo 16 E25 RTX 5090 Laptop
Samsung 9100 Pro 1 TB
226 MB/s
Average Samsung 9100 Pro 1 TB
  (226 - 226, n=2)
226 MB/s 0%
Average of class Gaming
  (79.4 - 512, n=119, last 2 years)
216 MB/s -4%
HP Omen Max 16 ah000
WDC PC SN810 2TB
185.44 MB/s -18%
4K-64 Read
SCHENKER XMG Neo 16 (Early 24)
Samsung 990 Pro 1 TB
2933.61 MB/s +190%
Lenovo Legion Pro 7i 16 Gen 10
SK Hynix HFS001TEJ9X115N
2602.02 MB/s +158%
Aorus MASTER 16 AM6H
Kingston OM8PGP41024Q-A0
2266 MB/s +124%
Average of class Gaming
  (451 - 3630, n=119, last 2 years)
1830 MB/s +81%
Asus ROG Strix Scar 16 2025
WD PC SN8000S 2TB
1039 MB/s +3%
SCHENKER XMG Neo 16 E25 RTX 5090 Laptop
Samsung 9100 Pro 1 TB
1010 MB/s
HP Omen Max 16 ah000
WDC PC SN810 2TB
1004.03 MB/s -1%
Average Samsung 9100 Pro 1 TB
  (995 - 1010, n=2)
1003 MB/s -1%
4K-64 Write
SCHENKER XMG Neo 16 E25 RTX 5090 Laptop
Samsung 9100 Pro 1 TB
5155 MB/s
Average Samsung 9100 Pro 1 TB
  (5004 - 5155, n=2)
5080 MB/s -1%
Asus ROG Strix Scar 16 2025
WD PC SN8000S 2TB
4633 MB/s -10%
SCHENKER XMG Neo 16 (Early 24)
Samsung 990 Pro 1 TB
3252.43 MB/s -37%
Average of class Gaming
  (277 - 5909, n=119, last 2 years)
2619 MB/s -49%
HP Omen Max 16 ah000
WDC PC SN810 2TB
2578.56 MB/s -50%
Aorus MASTER 16 AM6H
Kingston OM8PGP41024Q-A0
2011 MB/s -61%
Lenovo Legion Pro 7i 16 Gen 10
SK Hynix HFS001TEJ9X115N
1427.9 MB/s -72%
Access Time Read
Asus ROG Strix Scar 16 2025
WD PC SN8000S 2TB
0.116 ms * -123%
Aorus MASTER 16 AM6H
Kingston OM8PGP41024Q-A0
0.092 ms * -77%
Average of class Gaming
  (0.016 - 0.379, n=118, last 2 years)
0.05753 ms * -11%
HP Omen Max 16 ah000
WDC PC SN810 2TB
0.054 ms * -4%
SCHENKER XMG Neo 16 E25 RTX 5090 Laptop
Samsung 9100 Pro 1 TB
0.052 ms *
Average Samsung 9100 Pro 1 TB
  (0.018 - 0.052, n=2)
0.035 ms * +33%
Lenovo Legion Pro 7i 16 Gen 10
SK Hynix HFS001TEJ9X115N
0.033 ms * +37%
SCHENKER XMG Neo 16 (Early 24)
Samsung 990 Pro 1 TB
0.024 ms * +54%
Access Time Write
Lenovo Legion Pro 7i 16 Gen 10
SK Hynix HFS001TEJ9X115N
0.073 ms * -329%
HP Omen Max 16 ah000
WDC PC SN810 2TB
0.06 ms * -253%
Average of class Gaming
  (0.011 - 1.028, n=119, last 2 years)
0.04966 ms * -192%
Aorus MASTER 16 AM6H
Kingston OM8PGP41024Q-A0
0.04 ms * -135%
SCHENKER XMG Neo 16 E25 RTX 5090 Laptop
Samsung 9100 Pro 1 TB
0.017 ms *
Average Samsung 9100 Pro 1 TB
  (0.016 - 0.017, n=2)
0.0165 ms * +3%
SCHENKER XMG Neo 16 (Early 24)
Samsung 990 Pro 1 TB
0.016 ms * +6%
Asus ROG Strix Scar 16 2025
WD PC SN8000S 2TB
0.016 ms * +6%

* ... smaller is better

Reading continuous performance: DiskSpd Read Loop, Queue Depth 8

06651330199526603325399046555320598566507315798086459310997510640113051197012635Tooltip
SCHENKER XMG Neo 16 E25 RTX 5090 Laptop; diskspd 2.0.17 f: Ø12826 (9538.48-13255.8)

GPU

我们的 Neo 16 测试设备配备了 GeForce RTX 5090 笔记本电脑,这是最快的版本,TGP 为 175 瓦(150 瓦 + 25 瓦 Dynamic Boost)。不过,在撰写本文时,它还不支持高级 Optimus 图形切换,这与它的显示屏有关。XMG 在自己的网站上提供了大量相关信息,虽然目前正在进行验证,但目前还不能保证以后会支持高级 Optimus。为了最大限度地发挥 GPU 性能,可以通过 MUX 开关停用 iGPU,但这需要重新启动。

在合成测试中,Neo 16 的表现非常出色,在所有测试中都名列前茅。与配备了 RTX 4090 笔记本电脑的优势约为 12%,即使在持续负载下(Time Spy 压力测试:97.8%),其性能也保持稳定。

3DMark Performance Rating - Percent
SCHENKER XMG Neo 16 E25 RTX 5090 Laptop
Nvidia GeForce RTX 5090 Laptop, Intel Core Ultra 9 275HX
100 pt
HP Omen Max 16 ah000 -1!
Nvidia GeForce RTX 5090 Laptop, Intel Core Ultra 9 275HX
96.8 pt
Average Nvidia GeForce RTX 5090 Laptop
 
94.1 pt
Aorus MASTER 16 AM6H -1!
Nvidia GeForce RTX 5090 Laptop, Intel Core Ultra 9 275HX
93.7 pt
Asus ROG Strix Scar 16 2025
Nvidia GeForce RTX 5090 Laptop, Intel Core Ultra 9 275HX
93 pt
Lenovo Legion Pro 7i 16 Gen 10 -1!
Nvidia GeForce RTX 5080 Laptop, Intel Core Ultra 9 275HX
92.3 pt
SCHENKER XMG Neo 16 (Early 24)
NVIDIA GeForce RTX 4090 Laptop GPU, Intel Core i9-14900HX
89.5 pt
Average of class Gaming
 
58.6 pt
3DMark 11 - 1280x720 Performance GPU
SCHENKER XMG Neo 16 E25 RTX 5090 Laptop
Nvidia GeForce RTX 5090 Laptop, Intel Core Ultra 9 275HX
73596 Points
HP Omen Max 16 ah000
Nvidia GeForce RTX 5090 Laptop, Intel Core Ultra 9 275HX
72215 Points -2%
Lenovo Legion Pro 7i 16 Gen 10
Nvidia GeForce RTX 5080 Laptop, Intel Core Ultra 9 275HX
71866 Points -2%
Aorus MASTER 16 AM6H
Nvidia GeForce RTX 5090 Laptop, Intel Core Ultra 9 275HX
70815 Points -4%
SCHENKER XMG Neo 16 (Early 24)
NVIDIA GeForce RTX 4090 Laptop GPU, Intel Core i9-14900HX
69606 Points -5%
Average Nvidia GeForce RTX 5090 Laptop
  (54052 - 73596, n=9)
68233 Points -7%
Asus ROG Strix Scar 16 2025
Nvidia GeForce RTX 5090 Laptop, Intel Core Ultra 9 275HX
63549 Points -14%
Average of class Gaming
  (10741 - 73596, n=137, last 2 years)
45116 Points -39%
3DMark
1920x1080 Fire Strike Graphics
SCHENKER XMG Neo 16 E25 RTX 5090 Laptop
Nvidia GeForce RTX 5090 Laptop, Intel Core Ultra 9 275HX
54791 Points
SCHENKER XMG Neo 16 (Early 24)
NVIDIA GeForce RTX 4090 Laptop GPU, Intel Core i9-14900HX
51946 Points -5%
Average Nvidia GeForce RTX 5090 Laptop
  (42516 - 60880, n=10)
50323 Points -8%
Asus ROG Strix Scar 16 2025
Nvidia GeForce RTX 5090 Laptop, Intel Core Ultra 9 275HX
49297 Points -10%
Lenovo Legion Pro 7i 16 Gen 10
Nvidia GeForce RTX 5080 Laptop, Intel Core Ultra 9 275HX
49153 Points -10%
HP Omen Max 16 ah000
Nvidia GeForce RTX 5090 Laptop, Intel Core Ultra 9 275HX
49115 Points -10%
Aorus MASTER 16 AM6H
Nvidia GeForce RTX 5090 Laptop, Intel Core Ultra 9 275HX
47034 Points -14%
Average of class Gaming
  (2913 - 56116, n=150, last 2 years)
32501 Points -41%
2560x1440 Time Spy Graphics
SCHENKER XMG Neo 16 E25 RTX 5090 Laptop
Nvidia GeForce RTX 5090 Laptop, Intel Core Ultra 9 275HX
25040 Points
HP Omen Max 16 ah000
Nvidia GeForce RTX 5090 Laptop, Intel Core Ultra 9 275HX
24873 Points -1%
Aorus MASTER 16 AM6H
Nvidia GeForce RTX 5090 Laptop, Intel Core Ultra 9 275HX
24563 Points -2%
Average Nvidia GeForce RTX 5090 Laptop
  (19216 - 25129, n=10)
23623 Points -6%
Asus ROG Strix Scar 16 2025
Nvidia GeForce RTX 5090 Laptop, Intel Core Ultra 9 275HX
23600 Points -6%
Lenovo Legion Pro 7i 16 Gen 10
Nvidia GeForce RTX 5080 Laptop, Intel Core Ultra 9 275HX
23003 Points -8%
SCHENKER XMG Neo 16 (Early 24)
NVIDIA GeForce RTX 4090 Laptop GPU, Intel Core i9-14900HX
22134 Points -12%
Average of class Gaming
  (2295 - 25040, n=146, last 2 years)
13734 Points -45%
Steel Nomad Score
SCHENKER XMG Neo 16 E25 RTX 5090 Laptop
Nvidia GeForce RTX 5090 Laptop, Intel Core Ultra 9 275HX
6151 Points
Asus ROG Strix Scar 16 2025
Nvidia GeForce RTX 5090 Laptop, Intel Core Ultra 9 275HX
6008 Points -2%
Average Nvidia GeForce RTX 5090 Laptop
  (4791 - 6163, n=8)
5829 Points -5%
Aorus MASTER 16 AM6H
Nvidia GeForce RTX 5090 Laptop, Intel Core Ultra 9 275HX
5828 Points -5%
SCHENKER XMG Neo 16 (Early 24)
NVIDIA GeForce RTX 4090 Laptop GPU, Intel Core i9-14900HX
5102 Points -17%
Average of class Gaming
  (1522 - 6163, n=39, last 2 years)
3632 Points -41%
2560x1440 Port Royal Graphics
SCHENKER XMG Neo 16 E25 RTX 5090 Laptop
Nvidia GeForce RTX 5090 Laptop, Intel Core Ultra 9 275HX
16250 Points
HP Omen Max 16 ah000
Nvidia GeForce RTX 5090 Laptop, Intel Core Ultra 9 275HX
16245 Points 0%
Asus ROG Strix Scar 16 2025
Nvidia GeForce RTX 5090 Laptop, Intel Core Ultra 9 275HX
15721 Points -3%
Average Nvidia GeForce RTX 5090 Laptop
  (12749 - 17063, n=8)
15704 Points -3%
Lenovo Legion Pro 7i 16 Gen 10
Nvidia GeForce RTX 5080 Laptop, Intel Core Ultra 9 275HX
14620 Points -10%
SCHENKER XMG Neo 16 (Early 24)
NVIDIA GeForce RTX 4090 Laptop GPU, Intel Core i9-14900HX
14107 Points -13%
Average of class Gaming
  (984 - 16250, n=80, last 2 years)
9517 Points -41%
3DMark 11 Performance
52067 points
3DMark Fire Strike Score
42543 points
3DMark Time Spy Score
23199 points
3DMark Steel Nomad Score
6151 points
3DMark Steel Nomad Light Score
25981 points
3DMark Steel Nomad Light Unlimited Score
25214 points
Help
Blender / v3.3 Classroom OPTIX/RTX
Average of class Gaming
  (9.9 - 95, n=137, last 2 years)
20.4 Seconds * -78%
Asus ROG Strix Scar 16 2025
Nvidia GeForce RTX 5090 Laptop, Intel Core Ultra 9 275HX
15.3 Seconds * -33%
SCHENKER XMG Neo 16 (Early 24)
NVIDIA GeForce RTX 4090 Laptop GPU, Intel Core i9-14900HX
13 Seconds * -13%
Average Nvidia GeForce RTX 5090 Laptop
  (9.9 - 15.3, n=10)
12.1 Seconds * -5%
HP Omen Max 16 ah000
Nvidia GeForce RTX 5090 Laptop, Intel Core Ultra 9 275HX
12 Seconds * -5%
Lenovo Legion Pro 7i 16 Gen 10
Nvidia GeForce RTX 5080 Laptop, Intel Core Ultra 9 275HX
12 Seconds * -5%
SCHENKER XMG Neo 16 E25 RTX 5090 Laptop
Nvidia GeForce RTX 5090 Laptop, Intel Core Ultra 9 275HX
11.47 Seconds *
Aorus MASTER 16 AM6H
Nvidia GeForce RTX 5090 Laptop, Intel Core Ultra 9 275HX
11 Seconds * +4%
Blender / v3.3 Classroom CUDA
Average of class Gaming
  (15 - 110, n=138, last 2 years)
34.5 Seconds * -115%
Asus ROG Strix Scar 16 2025
Nvidia GeForce RTX 5090 Laptop, Intel Core Ultra 9 275HX
19.4 Seconds * -21%
Lenovo Legion Pro 7i 16 Gen 10
Nvidia GeForce RTX 5080 Laptop, Intel Core Ultra 9 275HX
18 Seconds * -12%
SCHENKER XMG Neo 16 (Early 24)
NVIDIA GeForce RTX 4090 Laptop GPU, Intel Core i9-14900HX
17 Seconds * -6%
Average Nvidia GeForce RTX 5090 Laptop
  (15 - 19.4, n=8)
16.9 Seconds * -5%
SCHENKER XMG Neo 16 E25 RTX 5090 Laptop
Nvidia GeForce RTX 5090 Laptop, Intel Core Ultra 9 275HX
16.04 Seconds *
Aorus MASTER 16 AM6H
Nvidia GeForce RTX 5090 Laptop, Intel Core Ultra 9 275HX
16 Seconds * -0%
HP Omen Max 16 ah000
Nvidia GeForce RTX 5090 Laptop, Intel Core Ultra 9 275HX
15 Seconds * +6%
Blender / v3.3 Classroom CPU
Average of class Gaming
  (122 - 962, n=143, last 2 years)
285 Seconds * -113%
SCHENKER XMG Neo 16 (Early 24)
NVIDIA GeForce RTX 4090 Laptop GPU, Intel Core i9-14900HX
167 Seconds * -25%
HP Omen Max 16 ah000
Nvidia GeForce RTX 5090 Laptop, Intel Core Ultra 9 275HX
162 Seconds * -21%
Average Nvidia GeForce RTX 5090 Laptop
  (125 - 259, n=10)
160.8 Seconds * -20%
Aorus MASTER 16 AM6H
Nvidia GeForce RTX 5090 Laptop, Intel Core Ultra 9 275HX
149 Seconds * -11%
Lenovo Legion Pro 7i 16 Gen 10
Nvidia GeForce RTX 5080 Laptop, Intel Core Ultra 9 275HX
148 Seconds * -10%
Asus ROG Strix Scar 16 2025
Nvidia GeForce RTX 5090 Laptop, Intel Core Ultra 9 275HX
138 Seconds * -3%
SCHENKER XMG Neo 16 E25 RTX 5090 Laptop
Nvidia GeForce RTX 5090 Laptop, Intel Core Ultra 9 275HX
134 Seconds *

* ... smaller is better

游戏性能

在我们的测试中,它的游戏性能同样令人印象深刻,尽管 Neo 并不总是处于领先地位。与所有其他 RTX 5000 笔记本电脑新机型一样,其驱动程序也发挥了作用,不同版本之间可能存在明显差异。另外,自 RTX 5090 笔记本电脑推出以来,已经进行了多次更新,其中一些更新导致了稳定性问题和不同的性能值。至少在稳定性方面,我们在使用当前的 576.28 和 576.40 两个版本时不再遇到任何问题。

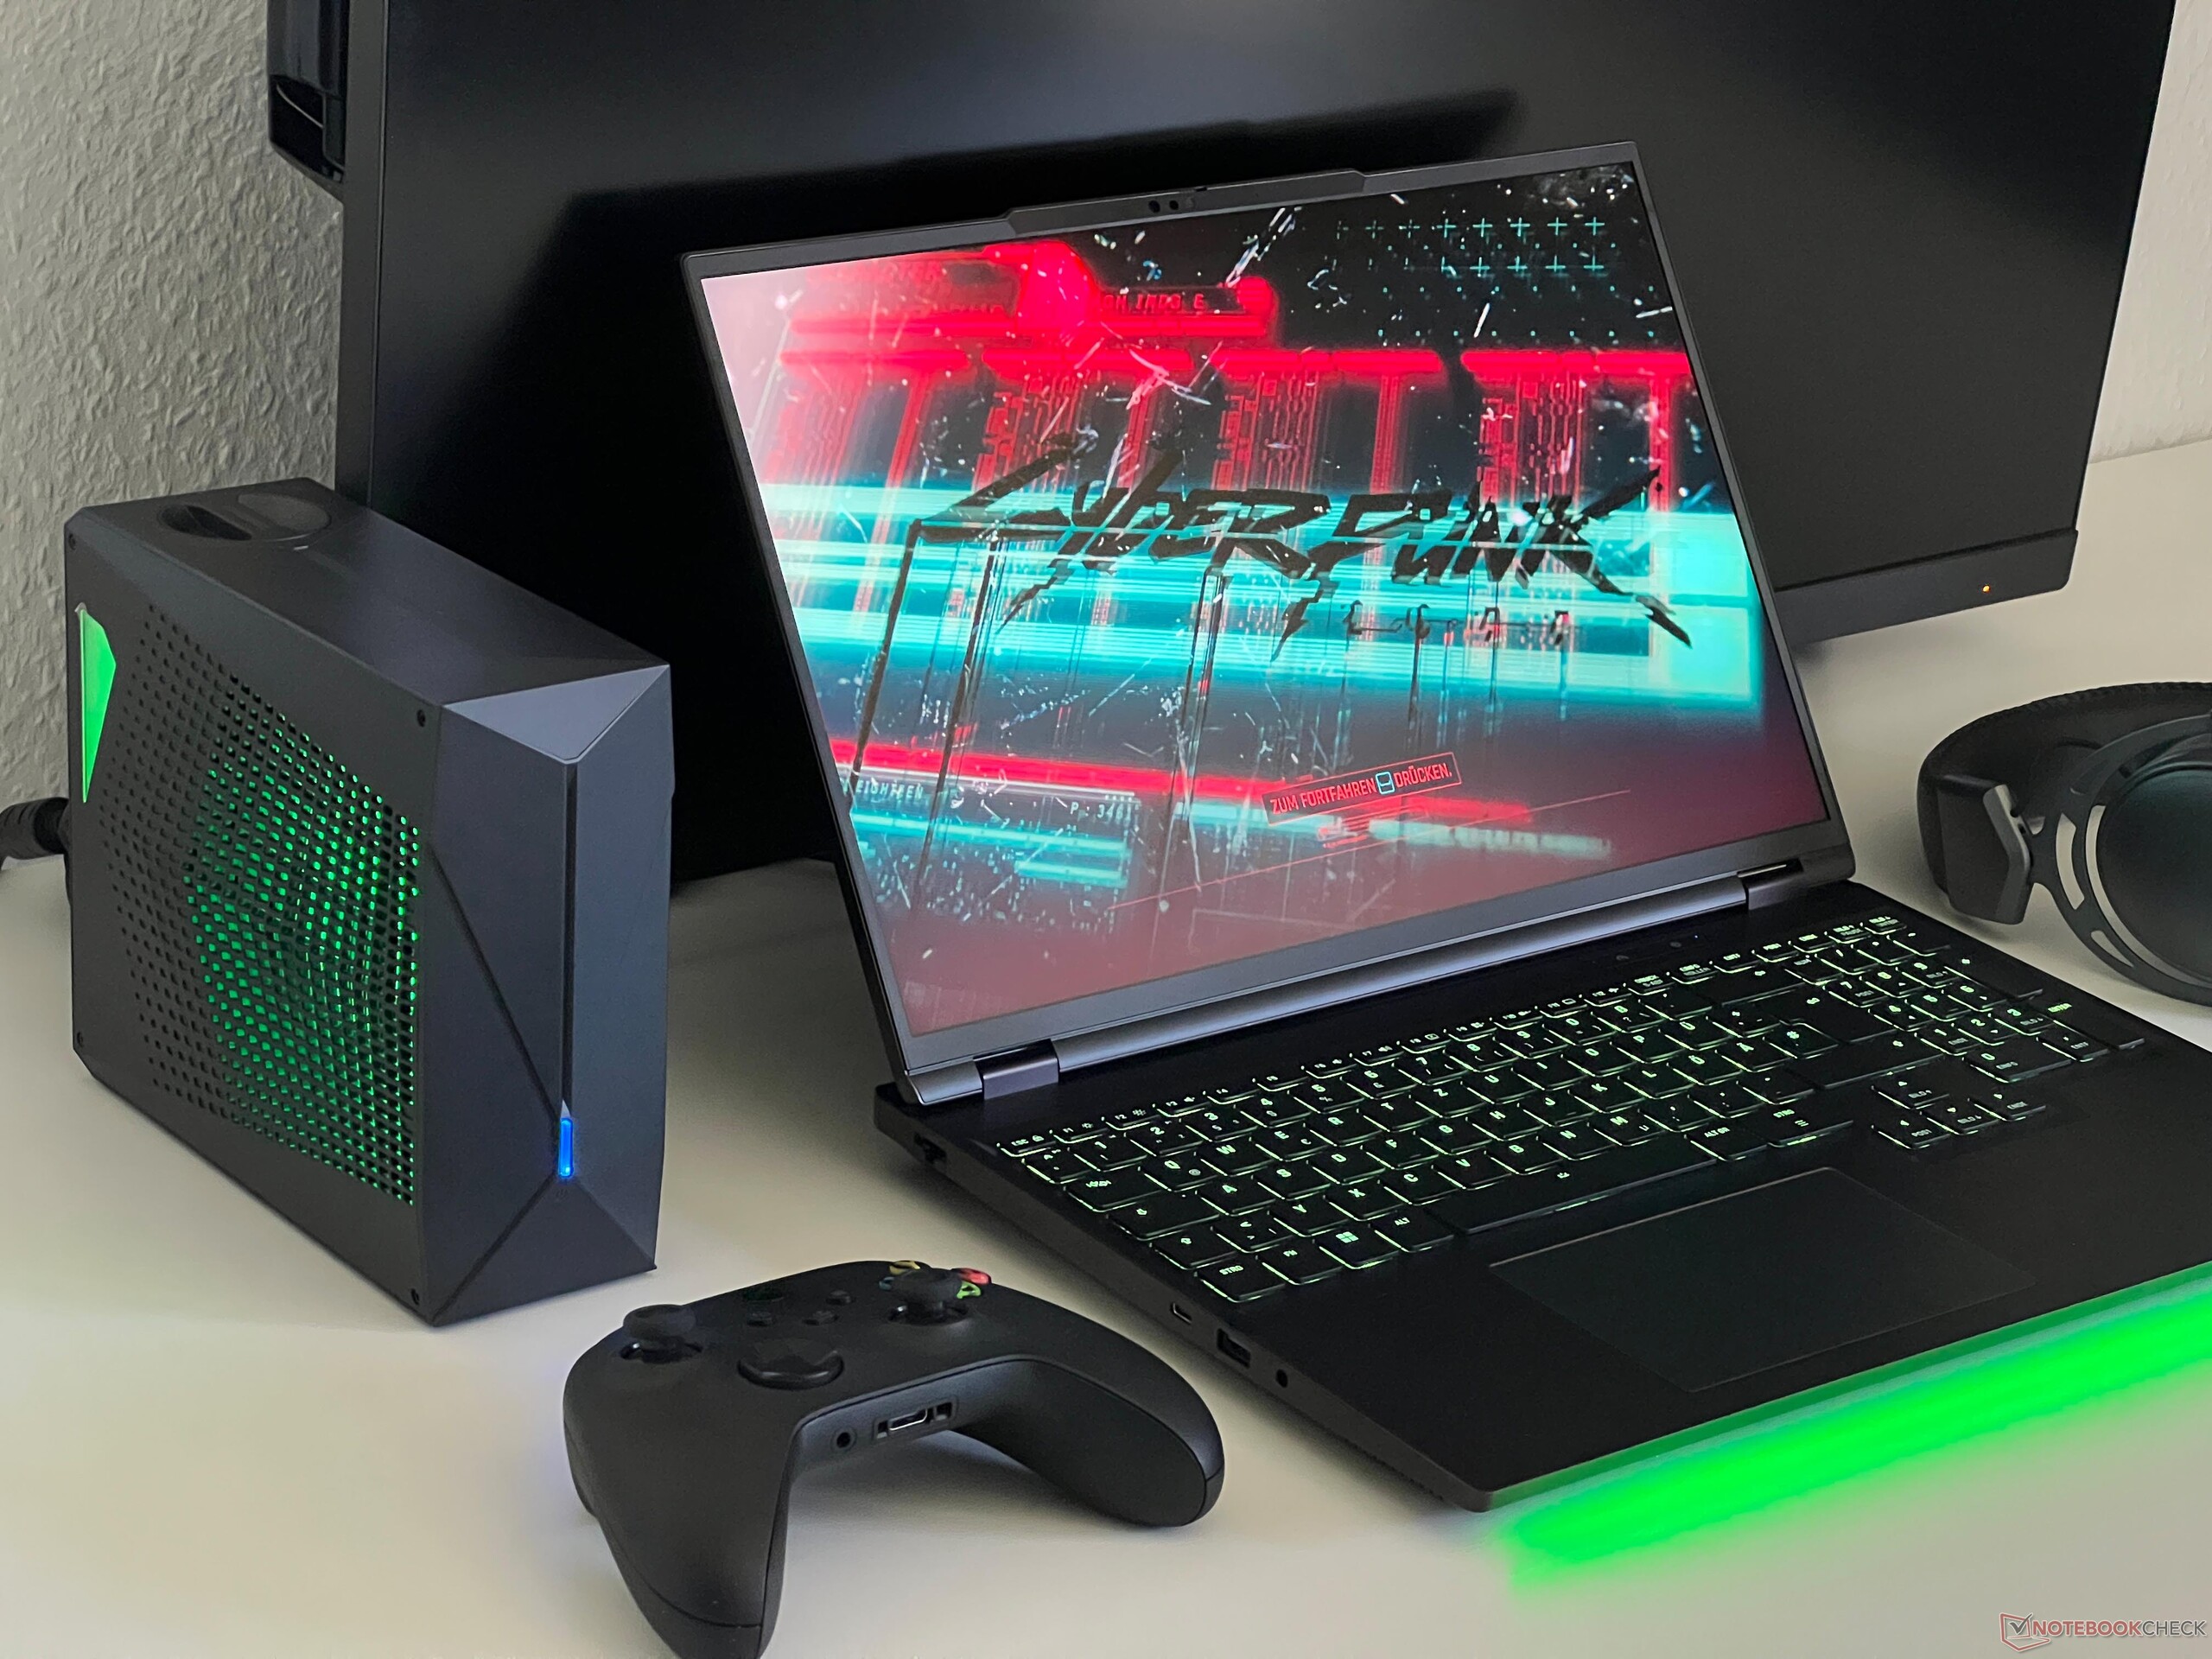
在我们的标准 1080p 测试过程中,新款 RTX 5090 笔记本电脑还不能真正展现出它的性能,但在 QHD 中,它比旧款 Neo 16 与 4090 笔记本电脑的领先优势往往要高出 10-20%。当然,新款 RTX 5090 笔记本电脑还支持当前的 DLSS4 和多帧生成技术,不过这些技术只有在极端情况下才会需要,例如在运行《赛博朋克 2077》时选择了 Raytracing Overdrive。在下表中,我们测试了它在运行《赛博朋克》和《艾伦-威克 2》时的升频性能。即使其结果非常高,特别是使用帧生成技术,用户的主观印象仍可能因游戏而异。

Gaming Performance 2560 x 1.600
设置 Cyberpunk 2077 Phantom Liberty
RT Overdrive
Alan Wake 2 自定义
(所有高/超高速 + PT)
原生 24fps 36.1fps
DLSS 质量 48.5fps 59fps
DLSS 性能 72.1fps 78.8fps
DLSS 质量 MFG x2 88.6fps 105.1fps
DLSS 质量 MFG x4 153.6fps 182.3fps

在连接水冷散热器的情况下,其游戏性能通常是相同的,因为即使没有 Oasis,它也能使用 175 瓦的全部功率(尽管 RTX 5090 笔记本电脑无法在每款游戏中都使用 175 瓦的功率)。由于 CPU 的余量更大一些,这方面可能会略有改善。

Cyberpunk 2077 2.2 Phantom Liberty - 2560x1440 Ultra Preset (FSR off)
SCHENKER XMG Neo 16 E25 RTX 5090 Laptop
Intel Core Ultra 9 275HX, Nvidia GeForce RTX 5090 Laptop, XMG Neo 16 E25 RTX 5090 Laptop Oasis
111.4 (94.1min) fps +3%
HP Omen Max 16 ah000
Intel Core Ultra 9 275HX, Nvidia GeForce RTX 5090 Laptop,
111.3 (93.2min, 89.7P1) fps +3%
Aorus MASTER 16 AM6H
Intel Core Ultra 9 275HX, Nvidia GeForce RTX 5090 Laptop, Aorus Master 16
109.7 (90.9min) fps +1%
SCHENKER XMG Neo 16 E25 RTX 5090 Laptop
Intel Core Ultra 9 275HX, Nvidia GeForce RTX 5090 Laptop,
108.3 (91.2min) fps
Asus ROG Strix Scar 16 2025
Intel Core Ultra 9 275HX, Nvidia GeForce RTX 5090 Laptop,
107.7 (90.1min) fps -1%
Average Nvidia GeForce RTX 5090 Laptop
  (83.2 - 111.4, n=12)
105.9 fps -2%
Lenovo Legion Pro 7i 16 Gen 10
Intel Core Ultra 9 275HX, Nvidia GeForce RTX 5080 Laptop,
99.8 (85.5min, 81.6P1) fps -8%
SCHENKER XMG Neo 16 (Early 24)
Intel Core i9-14900HX, NVIDIA GeForce RTX 4090 Laptop GPU,
93.8 (53.7min) fps -13%
Average of class Gaming
  (24.8 - 111.4, n=84, last 2 years)
70.3 fps -35%
Baldur's Gate 3 - 2560x1440 Ultra Preset AA:T
Lenovo Legion Pro 7i 16 Gen 10
Intel Core Ultra 9 275HX, Nvidia GeForce RTX 5080 Laptop,
155.8 fps +7%
Aorus MASTER 16 AM6H
Intel Core Ultra 9 275HX, Nvidia GeForce RTX 5090 Laptop, Aorus Master 16
151 fps +3%
SCHENKER XMG Neo 16 E25 RTX 5090 Laptop
Intel Core Ultra 9 275HX, Nvidia GeForce RTX 5090 Laptop, XMG Neo 16 E25 RTX 5090 Laptop Oasis
149.5 fps +2%
SCHENKER XMG Neo 16 E25 RTX 5090 Laptop
Intel Core Ultra 9 275HX, Nvidia GeForce RTX 5090 Laptop,
146 fps
Average Nvidia GeForce RTX 5090 Laptop
  (103.1 - 158.4, n=10)
142.4 fps -2%
Asus ROG Strix Scar 16 2025
Intel Core Ultra 9 275HX, Nvidia GeForce RTX 5090 Laptop,
141.7 fps -3%
SCHENKER XMG Neo 16 (Early 24)
Intel Core i9-14900HX, NVIDIA GeForce RTX 4090 Laptop GPU,
133.2 fps -9%
Average of class Gaming
  (44 - 175.5, n=56, last 2 years)
101 fps -31%
F1 24 - 2560x1440 Ultra High Preset AA:T AF:16x
HP Omen Max 16 ah000
Intel Core Ultra 9 275HX, Nvidia GeForce RTX 5090 Laptop,
104.3 (74min, 81P1) fps +1%
SCHENKER XMG Neo 16 E25 RTX 5090 Laptop
Intel Core Ultra 9 275HX, Nvidia GeForce RTX 5090 Laptop, XMG Neo 16 E25 RTX 5090 Laptop Oasis
104 (77min, 80P1) fps +1%
SCHENKER XMG Neo 16 E25 RTX 5090 Laptop
Intel Core Ultra 9 275HX, Nvidia GeForce RTX 5090 Laptop,
103.3 (73min, 80P1) fps
Asus ROG Strix Scar 16 2025
Intel Core Ultra 9 275HX, Nvidia GeForce RTX 5090 Laptop,
97.8 (70min, 75P1) fps -5%
Average Nvidia GeForce RTX 5090 Laptop
  (72.5 - 105.5, n=11)
97.1 fps -6%
Aorus MASTER 16 AM6H
Intel Core Ultra 9 275HX, Nvidia GeForce RTX 5090 Laptop, Aorus Master 16
90 fps -13%
SCHENKER XMG Neo 16 (Early 24)
Intel Core i9-14900HX, NVIDIA GeForce RTX 4090 Laptop GPU,
84.7 (69min, 68P1) fps -18%
Average of class Gaming
  (36.7 - 104.3, n=28, last 2 years)
75.1 fps -27%
Assassin's Creed Shadows - 2560x1440 Ultra High
SCHENKER XMG Neo 16 E25 RTX 5090 Laptop
Intel Core Ultra 9 275HX, Nvidia GeForce RTX 5090 Laptop, XMG Neo 16 E25 RTX 5090 Laptop Oasis
57 fps +4%
Aorus MASTER 16 AM6H
Intel Core Ultra 9 275HX, Nvidia GeForce RTX 5090 Laptop, Aorus Master 16
56 fps +2%
HP Omen Max 16 ah000
Intel Core Ultra 9 275HX, Nvidia GeForce RTX 5090 Laptop,
55 (45min) fps 0%
Lenovo Legion Pro 7i 16 Gen 10
Intel Core Ultra 9 275HX, Nvidia GeForce RTX 5080 Laptop,
55 (41min) fps 0%
SCHENKER XMG Neo 16 E25 RTX 5090 Laptop
Intel Core Ultra 9 275HX, Nvidia GeForce RTX 5090 Laptop,
55 fps
Average Nvidia GeForce RTX 5090 Laptop
  (37 - 59, n=9)
52.7 fps -4%
Average of class Gaming
  (30 - 57, n=18, last 2 years)
48.2 fps -12%
Indiana Jones and the Great Circle - 2560x1440 Very Ultra Preset
HP Omen Max 16 ah000
Intel Core Ultra 9 275HX, Nvidia GeForce RTX 5090 Laptop,
115.9 fps +14%
SCHENKER XMG Neo 16 E25 RTX 5090 Laptop
Intel Core Ultra 9 275HX, Nvidia GeForce RTX 5090 Laptop, XMG Neo 16 E25 RTX 5090 Laptop Oasis
102.6 fps +1%
Lenovo Legion Pro 7i 16 Gen 10
Intel Core Ultra 9 275HX, Nvidia GeForce RTX 5080 Laptop,
102.4 fps +1%
Aorus MASTER 16 AM6H
Intel Core Ultra 9 275HX, Nvidia GeForce RTX 5090 Laptop, Aorus Master 16
102 fps +1%
SCHENKER XMG Neo 16 E25 RTX 5090 Laptop
Intel Core Ultra 9 275HX, Nvidia GeForce RTX 5090 Laptop,
101.3 fps
Average Nvidia GeForce RTX 5090 Laptop
  (66.1 - 115.9, n=11)
100.9 fps 0%
Asus ROG Strix Scar 16 2025
Intel Core Ultra 9 275HX, Nvidia GeForce RTX 5090 Laptop,
99.1 fps -2%
Average of class Gaming
  (66.1 - 115.9, n=16, last 2 years)
96.3 fps -5%
Call of Duty Black Ops 6 - 2560x1440 Extreme Preset
SCHENKER XMG Neo 16 E25 RTX 5090 Laptop
Intel Core Ultra 9 275HX, Nvidia GeForce RTX 5090 Laptop,
116 fps
Average Nvidia GeForce RTX 5090 Laptop
  (92 - 123, n=4)
112 fps -3%
Average of class Gaming
  (60 - 119, n=10, last 2 years)
92.2 fps -21%
Asus ROG Strix Scar 16 2025
Intel Core Ultra 9 275HX, Nvidia GeForce RTX 5090 Laptop,
92 fps -21%
Alan Wake 2 - 2560x1440 High Preset
SCHENKER XMG Neo 16 E25 RTX 5090 Laptop
Intel Core Ultra 9 275HX, Nvidia GeForce RTX 5090 Laptop,
88.5 fps
SCHENKER XMG Neo 16 E25 RTX 5090 Laptop
Intel Core Ultra 9 275HX, Nvidia GeForce RTX 5090 Laptop, XMG Neo 16 E25 RTX 5090 Laptop Oasis
88.4 fps 0%
SCHENKER XMG Neo 16 (Early 24)
Intel Core i9-14900HX, NVIDIA GeForce RTX 4090 Laptop GPU,
87.1 (51.7min, 55.3P0.1, 66.2P1) fps -2%
Lenovo Legion Pro 7i 16 Gen 10
Intel Core Ultra 9 275HX, Nvidia GeForce RTX 5080 Laptop,
83.8 fps -5%
Asus ROG Strix Scar 16 2025
Intel Core Ultra 9 275HX, Nvidia GeForce RTX 5090 Laptop,
83.4 fps -6%
HP Omen Max 16 ah000
Intel Core Ultra 9 275HX, Nvidia GeForce RTX 5090 Laptop,
82.9 fps -6%
Average Nvidia GeForce RTX 5090 Laptop
  (57.6 - 88.5, n=10)
81.4 fps -8%
Aorus MASTER 16 AM6H
Intel Core Ultra 9 275HX, Nvidia GeForce RTX 5090 Laptop, Aorus Master 16
81.1 fps -8%
Average of class Gaming
  (22.5 - 88.5, n=29, last 2 years)
69.7 fps -21%
Performance Rating - Percent
Lenovo Legion Pro 7i 16 Gen 10 -1!
Intel Core Ultra 9 275HX, Nvidia GeForce RTX 5080 Laptop
97.2 pt
SCHENKER XMG Neo 16 E25 RTX 5090 Laptop
Intel Core Ultra 9 275HX, Nvidia GeForce RTX 5090 Laptop
95.6 pt
SCHENKER XMG Neo 16 (Early 24)
Intel Core i9-14900HX, NVIDIA GeForce RTX 4090 Laptop GPU
93.8 pt
Asus ROG Strix Scar 16 2025
Intel Core Ultra 9 275HX, Nvidia GeForce RTX 5090 Laptop
90.6 pt
HP Omen Max 16 ah000 -2!
Intel Core Ultra 9 275HX, Nvidia GeForce RTX 5090 Laptop
88.5 pt
Aorus MASTER 16 AM6H
Intel Core Ultra 9 275HX, Nvidia GeForce RTX 5090 Laptop
88.5 pt
Average of class Gaming
 
65 pt
Cyberpunk 2077 2.2 Phantom Liberty - 1920x1080 Ultra Preset (FSR off)
Lenovo Legion Pro 7i 16 Gen 10
Intel Core Ultra 9 275HX, Nvidia GeForce RTX 5080 Laptop
156.2 (125.7min, 114.4P1) fps +1%
SCHENKER XMG Neo 16 E25 RTX 5090 Laptop
Intel Core Ultra 9 275HX, Nvidia GeForce RTX 5090 Laptop
154.8 (123.7min) fps
Asus ROG Strix Scar 16 2025
Intel Core Ultra 9 275HX, Nvidia GeForce RTX 5090 Laptop
153.6 (124.2min) fps -1%
HP Omen Max 16 ah000
Intel Core Ultra 9 275HX, Nvidia GeForce RTX 5090 Laptop
151.9 (117.7min, 106.2P1) fps -2%
Aorus MASTER 16 AM6H
Intel Core Ultra 9 275HX, Nvidia GeForce RTX 5090 Laptop
137.5 (102min) fps -11%
SCHENKER XMG Neo 16 (Early 24)
Intel Core i9-14900HX, NVIDIA GeForce RTX 4090 Laptop GPU
131.5 (62.2min) fps -15%
Average of class Gaming
  (6.76 - 158, n=102, last 2 years)
95.3 fps -38%
Baldur's Gate 3 - 1920x1080 Ultra Preset AA:T
Lenovo Legion Pro 7i 16 Gen 10
Intel Core Ultra 9 275HX, Nvidia GeForce RTX 5080 Laptop
211.5 fps +5%
SCHENKER XMG Neo 16 E25 RTX 5090 Laptop
Intel Core Ultra 9 275HX, Nvidia GeForce RTX 5090 Laptop
201 fps
Aorus MASTER 16 AM6H
Intel Core Ultra 9 275HX, Nvidia GeForce RTX 5090 Laptop
194 fps -3%
Asus ROG Strix Scar 16 2025
Intel Core Ultra 9 275HX, Nvidia GeForce RTX 5090 Laptop
193.3 fps -4%
SCHENKER XMG Neo 16 (Early 24)
Intel Core i9-14900HX, NVIDIA GeForce RTX 4090 Laptop GPU
187 fps -7%
Average of class Gaming
  (34.5 - 246, n=68, last 2 years)
126 fps -37%
GTA V - 1920x1080 Highest Settings possible AA:4xMSAA + FX AF:16x
SCHENKER XMG Neo 16 E25 RTX 5090 Laptop
Intel Core Ultra 9 275HX, Nvidia GeForce RTX 5090 Laptop
164.1 (3.7min, 100P1) fps
Asus ROG Strix Scar 16 2025
Intel Core Ultra 9 275HX, Nvidia GeForce RTX 5090 Laptop
162.8 (3.33min, 111.1P1) fps -1%
SCHENKER XMG Neo 16 (Early 24)
Intel Core i9-14900HX, NVIDIA GeForce RTX 4090 Laptop GPU
159.3 (3.25min, 125P1) fps -3%
Aorus MASTER 16 AM6H
Intel Core Ultra 9 275HX, Nvidia GeForce RTX 5090 Laptop
140.9 (3.56min, 90.9P1) fps -14%
Average of class Gaming
  (12.1 - 168.2, n=123, last 2 years)
116.1 fps -29%
Final Fantasy XV Benchmark - 1920x1080 High Quality
Lenovo Legion Pro 7i 16 Gen 10
Intel Core Ultra 9 275HX, Nvidia GeForce RTX 5080 Laptop
210 fps +3%
HP Omen Max 16 ah000
Intel Core Ultra 9 275HX, Nvidia GeForce RTX 5090 Laptop
203 fps 0%
SCHENKER XMG Neo 16 E25 RTX 5090 Laptop
Intel Core Ultra 9 275HX, Nvidia GeForce RTX 5090 Laptop
203 fps
Aorus MASTER 16 AM6H
Intel Core Ultra 9 275HX, Nvidia GeForce RTX 5090 Laptop
201 fps -1%
SCHENKER XMG Neo 16 (Early 24)
Intel Core i9-14900HX, NVIDIA GeForce RTX 4090 Laptop GPU
196.9 fps -3%
Asus ROG Strix Scar 16 2025
Intel Core Ultra 9 275HX, Nvidia GeForce RTX 5090 Laptop
194.6 fps -4%
Average of class Gaming
  (19.2 - 210, n=139, last 2 years)
123.6 fps -39%
Strange Brigade - 1920x1080 ultra AA:ultra AF:16
Lenovo Legion Pro 7i 16 Gen 10
Intel Core Ultra 9 275HX, Nvidia GeForce RTX 5080 Laptop
434 (21.5min, 322P1) fps 0%
SCHENKER XMG Neo 16 E25 RTX 5090 Laptop
Intel Core Ultra 9 275HX, Nvidia GeForce RTX 5090 Laptop
434 (79.1min, 306P1) fps
Aorus MASTER 16 AM6H
Intel Core Ultra 9 275HX, Nvidia GeForce RTX 5090 Laptop
408 (11.4min, 274P1) fps -6%
SCHENKER XMG Neo 16 (Early 24)
Intel Core i9-14900HX, NVIDIA GeForce RTX 4090 Laptop GPU
403 (101.2min, 295P1) fps -7%
HP Omen Max 16 ah000
Intel Core Ultra 9 275HX, Nvidia GeForce RTX 5090 Laptop
382 (118.7min, 248P1) fps -12%
Asus ROG Strix Scar 16 2025
Intel Core Ultra 9 275HX, Nvidia GeForce RTX 5090 Laptop
375 (147.7min, 218P1) fps -14%
Average of class Gaming
  (38.9 - 434, n=135, last 2 years)
238 fps -45%
Dota 2 Reborn - 1920x1080 ultra (3/3) best looking
SCHENKER XMG Neo 16 (Early 24)
Intel Core i9-14900HX, NVIDIA GeForce RTX 4090 Laptop GPU
194.6 (165.7min) fps +5%
Lenovo Legion Pro 7i 16 Gen 10
Intel Core Ultra 9 275HX, Nvidia GeForce RTX 5080 Laptop
188.9 (155.7min) fps +2%
SCHENKER XMG Neo 16 E25 RTX 5090 Laptop
Intel Core Ultra 9 275HX, Nvidia GeForce RTX 5090 Laptop
185.6 (154.7min) fps
Asus ROG Strix Scar 16 2025
Intel Core Ultra 9 275HX, Nvidia GeForce RTX 5090 Laptop
167.2 (136.1min) fps -10%
Aorus MASTER 16 AM6H
Intel Core Ultra 9 275HX, Nvidia GeForce RTX 5090 Laptop
166.4 (141.2min) fps -10%
HP Omen Max 16 ah000
Intel Core Ultra 9 275HX, Nvidia GeForce RTX 5090 Laptop
161 (134.6min) fps -13%
Average of class Gaming
  (65.1 - 220, n=142, last 2 years)
150.7 fps -19%
X-Plane 11.11 - 1920x1080 high (fps_test=3)
SCHENKER XMG Neo 16 (Early 24)
Intel Core i9-14900HX, NVIDIA GeForce RTX 4090 Laptop GPU
144.5 fps +21%
Lenovo Legion Pro 7i 16 Gen 10
Intel Core Ultra 9 275HX, Nvidia GeForce RTX 5080 Laptop
124.5 fps +4%
SCHENKER XMG Neo 16 E25 RTX 5090 Laptop
Intel Core Ultra 9 275HX, Nvidia GeForce RTX 5090 Laptop
119.5 fps
Asus ROG Strix Scar 16 2025
Intel Core Ultra 9 275HX, Nvidia GeForce RTX 5090 Laptop
115.9 fps -3%
Aorus MASTER 16 AM6H
Intel Core Ultra 9 275HX, Nvidia GeForce RTX 5090 Laptop
113.2 fps -5%
HP Omen Max 16 ah000
Intel Core Ultra 9 275HX, Nvidia GeForce RTX 5090 Laptop
112.6 fps -6%
Average of class Gaming
  (33.4 - 166.2, n=145, last 2 years)
104.6 fps -12%
赛博朋克 2077》1080p 超清版(红色:Neo 16,绿色:带 Oasis 的 Neo 16)

Cyberpunk 2077 ultra FPS diagram

0102030405060708090100110120130140150Tooltip
SCHENKER XMG Neo 16 E25 RTX 5090 Laptop Ultra 9 275HX, GeForce RTX 5090 Laptop: Ø148.8 (139-150.3)
lowmed.highultraQHD DLSSQHD4K DLSS4K
GTA V (2015) 164.1 163.1
Dota 2 Reborn (2015) 234 207 197.3 185.6 178.5
Final Fantasy XV Benchmark (2018) 234 233 203 170.7 102.9
X-Plane 11.11 (2018) 149.2 155.6 119.5 100
Strange Brigade (2018) 601 478 457 434 336 168
Baldur's Gate 3 (2023) 260.8 229.6 203.7 201 146 124.9 81.7
Cyberpunk 2077 2.2 Phantom Liberty (2023) 194.9 191 170.2 154.8 119 108.3 53.5
Alan Wake 2 (2023) 135.7 137.7 129.7 88.5 46.8
F1 24 (2024) 361 342 341 154.9 103.3 50.5
Call of Duty Black Ops 6 (2024) 215 200 157 151 116 71
Indiana Jones and the Great Circle (2024) 192.6 142.6 128.6 101.3 63.5
Assassin's Creed Shadows (2025) 112 104 90 70 65 55 53 41

排放 - Oasis 可帮助解决体积和温度问题

噪音排放

Neo 16 在空转和低负载时是一个超级安静的伙伴,因为它发出的 26 dB(A)几乎听不见。然而,在玩游戏或高负荷运转时,它的声音就会变得很大,根据不同的模式,我们测得的分贝在 45-55 dB(A)之间,声音太大了,尤其是在玩安静的游戏时。在这种情况下,您一定要使用耳机。在连接了 Oasis 水冷系统后,Neo 16 的噪音会小一些(43.8-50.5 dB(A)),不过偶尔也能听到水泵的声音。我们的测试设备上没有其他电子噪音。

Lüfterlautstärke Cyberpunk 2077
平衡 发烧友 超增压
风冷 45.3 dB(A) 48.6 dB(A) 55.4 dB(A)
Oasis 水冷却 43.8 dB(A) 46 dB(A) 50.5 dB(A)

Noise Level

Idle
26 / 26 / 26 dB(A)
Load
52.4 / 55.4 dB(A)
  red to green bar
 
 
30 dB
silent
40 dB(A)
audible
50 dB(A)
loud
 
min: dark, med: mid, max: light   Earthworks M23R, Arta (15 cm distance)   environment noise: 24 dB(A)
dB(A) 0102030405060708090Deep BassMiddle BassHigh BassLower RangeMidsHigher MidsLower HighsMid HighsUpper HighsSuper Highs2040.841.341.837.833.736.340.52530.533.536.934.630.428.732.43128.231.93030.128.227.127.64028.330.528.733.831.428.727.35027.828.127.227.423.524.4256329.332.728.731.22423.424.68031.826.324.730.520.919.821.310028.628.92529.720.118.419.812532.628.325.934.11917.31816031.227.424.727.517.517.915.320034.43028.731.420.218.318.925034.530.928.532.418.917.918.831537.533.330.634.417.215.915.340039.835.631.637.215.212.212.550041.33632.838.715.311.111.363042.236.734.438.814.910.110.880043.338.636.440.715.510.510.4100044.138.836.141.714.910.410.9125045.138.935.443.314.310.710.8160045.638.335.442.313.110.710.6200045.438.134.342.514.110.611.1250044.937.933.64213.111.411.7315043.835.531.739.912.912.311.9400042.834.831.638.712.812.412.2500040.733.930.437.612.612.212.2630041.434.130.537.812.812.212.4800041.332.326.237.912.812.312.51000038.427.322.132.712.812.412.5125003523.919.429.212.712.212.31600030.620.217.125.212.111.711.9SPL55.448.645.352.4262424.1N10.56.65.18.50.80.50.6median 41.3median 34.1median 30.6median 37.8median 14.3median 12.2median 12.2Delta4.64.74.34.62.22.32.1hearing rangehide median Fan NoiseSCHENKER XMG Neo 16 E25 RTX 5090 Laptop
SCHENKER XMG Neo 16 E25 RTX 5090 Laptop
GeForce RTX 5090 Laptop, Ultra 9 275HX, Samsung 9100 Pro 1 TB
Asus ROG Strix Scar 16 2025
GeForce RTX 5090 Laptop, Ultra 9 275HX, WD PC SN8000S 2TB
Lenovo Legion Pro 7i 16 Gen 10
GeForce RTX 5080 Laptop, Ultra 9 275HX, SK Hynix HFS001TEJ9X115N
HP Omen Max 16 ah000
GeForce RTX 5090 Laptop, Ultra 9 275HX, WDC PC SN810 2TB
Aorus MASTER 16 AM6H
GeForce RTX 5090 Laptop, Ultra 9 275HX, Kingston OM8PGP41024Q-A0
SCHENKER XMG Neo 16 (Early 24)
NVIDIA GeForce RTX 4090 Laptop GPU, i9-14900HX, Samsung 990 Pro 1 TB
Noise
-1%
11%
-4%
7%
-8%
off / environment *
24
23.8
1%
22.9
5%
22.8
5%
23
4%
26
-8%
Idle Minimum *
26
29
-12%
22.9
12%
29
-12%
23
12%
28
-8%
Idle Average *
26
29
-12%
22.9
12%
29
-12%
23
12%
29
-12%
Idle Maximum *
26
29
-12%
26.3
-1%
29
-12%
23
12%
31
-19%
Load Average *
52.4
40.5
23%
27.8
47%
47.7
9%
40.46
23%
51
3%
Cyberpunk 2077 ultra *
55.4
53.6
3%
54.2
2%
54.8
1%
59.75
-8%
Load Maximum *
55.4
53.6
3%
53.9
3%
61.1
-10%
59.75
-8%
56
-1%
Witcher 3 ultra *
54

* ... smaller is better

温度

在日常使用中,笔记本的金属外壳非常凉爽,但在游戏和压力测试时,其表面会明显发热。这在键盘中间区域尤为明显。不过,其温度从未达到临界值(测量值均未超过 48 °C)。使用 Oasis 水冷系统后,其表面温度降低了 4-5 °C。

Neo 16 在压力测试中表现出色,性能保持稳定。连接 Oasis 后,处理器可以消耗更多电能,GPU 的温度明显降低。

CPU/GPU 数据压力测试(红色:Neo 16,绿色:配备 Oasis 的 Neo 16)
Max. Load
 45.3 °C47.8 °C42.3 °C 
 46.9 °C46.7 °C38.5 °C 
 32.4 °C34.6 °C33.7 °C 
Maximum: 47.8 °C
Average: 40.9 °C
43.5 °C46.7 °C42.1 °C
38.3 °C43.5 °C43.9 °C
33.6 °C34.9 °C35.2 °C
Maximum: 46.7 °C
Average: 40.2 °C
Power Supply (max.)  62.3 °C | Room Temperature 21.9 °C | Fluke t3000FC (calibrated), Voltcraft IR-900
(-) The average temperature for the upper side under maximal load is 40.9 °C / 106 F, compared to the average of 33.9 °C / 93 F for the devices in the class Gaming.
(-) The maximum temperature on the upper side is 47.8 °C / 118 F, compared to the average of 40.4 °C / 105 F, ranging from 21.2 to 68.8 °C for the class Gaming.
(-) The bottom heats up to a maximum of 46.7 °C / 116 F, compared to the average of 43.3 °C / 110 F
(+) In idle usage, the average temperature for the upper side is 27.8 °C / 82 F, compared to the device average of 33.9 °C / 93 F.
(-) 3: The average temperature for the upper side is 39.8 °C / 104 F, compared to the average of 33.9 °C / 93 F for the class Gaming.
(+) The palmrests and touchpad are reaching skin temperature as a maximum (34.6 °C / 94.3 F) and are therefore not hot.
(-) The average temperature of the palmrest area of similar devices was 28.9 °C / 84 F (-5.7 °C / -10.3 F).
表面温度应力测试(顶部)
表面温度应力测试(顶部)
表面温度应力测试(底部)
表面温度应力测试(底部)
SCHENKER XMG Neo 16 E25 RTX 5090 Laptop
Intel Core Ultra 9 275HX, Nvidia GeForce RTX 5090 Laptop
Asus ROG Strix Scar 16 2025
Intel Core Ultra 9 275HX, Nvidia GeForce RTX 5090 Laptop
Lenovo Legion Pro 7i 16 Gen 10
Intel Core Ultra 9 275HX, Nvidia GeForce RTX 5080 Laptop
HP Omen Max 16 ah000
Intel Core Ultra 9 275HX, Nvidia GeForce RTX 5090 Laptop
Aorus MASTER 16 AM6H
Intel Core Ultra 9 275HX, Nvidia GeForce RTX 5090 Laptop
SCHENKER XMG Neo 16 (Early 24)
Intel Core i9-14900HX, NVIDIA GeForce RTX 4090 Laptop GPU
Heat
-9%
-1%
4%
-12%
-2%
Maximum Upper Side *
47.8
44.2
8%
42.6
11%
42.8
10%
39
18%
47
2%
Maximum Bottom *
46.7
48.1
-3%
41.2
12%
50.2
-7%
51
-9%
56
-20%
Idle Upper Side *
28.4
33
-16%
32.6
-15%
27.6
3%
36
-27%
27
5%
Idle Bottom *
28.9
36.1
-25%
32.4
-12%
26.2
9%
38
-31%
27
7%

* ... smaller is better

发言人

它的立体声扬声器经过再次改进,现在拥有丰富的音效。

dB(A) 0102030405060708090Deep BassMiddle BassHigh BassLower RangeMidsHigher MidsLower HighsMid HighsUpper HighsSuper Highs2036.344.52528.735.23127.129.54028.728.75024.431.96323.435.58019.841.810018.452.412517.35716017.955.420018.362.125017.963.731515.96740012.268.350011.172.663010.176.380010.577.8100010.474.5125010.773.8160010.772.7200010.671.8250011.463.1315012.365.4400012.469.8500012.267.8630012.270.6800012.366.31000012.464.91250012.259.31600011.755.8SPL2483.8N0.561.3median 12.2median 67Delta2.35.643.841.63130.526.326.831.725.926.82521.626.318.438.119.74617.453.518.352.419.262.718.865.215.567.412.566.711.468.911.273.611.274.110.873.310.371.710.470.91169.710.96511.264.811.365.811.462.211.765.111.76711.767.411.663.31152.623.881.40.553.9median 11.4median 65.823.833.231.533.225.322.825.32223.52226.521.126.521.921.521.929.12329.140.12240.145.717.645.752.314.352.36114.96167.113.267.167.612.667.664.312.764.368.411.368.471.910.571.974.211.374.274.89.374.868.49.268.468.49.568.470.71070.772.410.272.467.210.767.263.81163.86512.36565146563.512.763.568.613.668.666.713.766.764.114.564.159.116.559.181.423.981.455.10.555.1median 67.1median 12.6median 67.12.51.82.532.929.332.922.625.522.620.519.320.518.918.618.923.421.423.421.828.421.826.818.426.835.51835.545.218.345.256.52156.56020.26063.818.963.864.118.464.165.21865.265.419.765.463.620.663.667.118.967.16917.86967.118.667.164.817.864.867.816.367.864.417.564.46616.2666815.36863.813.463.864.313.364.361.21361.260.512.660.560.312.360.360.411.560.477.92977.944.71.144.7median 64.1median 17.8median 64.13.21.93.231.530.231.539.731.539.738.932.138.925.532.425.529.53329.531.622.531.634.81434.833.515.833.538.613.838.647.713.447.753.115.853.15918.45959.119.259.160.711.660.763.99.663.966.87.866.86686664.78.464.761.18.361.164.19.264.163.39.663.362.810.662.859.710.859.761.111.461.164.511.664.565.311.965.362.912.362.961.11361.156.612.156.646.612.246.675.423.375.438.50.538.5median 61.1median 11.6median 61.15.92.45.938.136.532.836.844.146.527.830.520.533.626.43217.438.721.549.818.447.619.255.422.260.819.163.217.561.71664.515.570.913.475.21275.113.275.612.875.91475.613.373.212.873.113.174.713.273.21377.813.574.913.972.714.465.31360.612.555.525.986.40.871.1median 13.5median 72.727.1hearing rangehide median Pink NoiseSCHENKER XMG Neo 16 E25 RTX 5090 LaptopAsus ROG Strix Scar 16 2025Lenovo Legion Pro 7i 16 Gen 10HP Omen Max 16 ah000Aorus MASTER 16 AM6HSCHENKER XMG Neo 16 (Early 24)
Frequency diagram (checkboxes can be checked and unchecked to compare devices)
SCHENKER XMG Neo 16 E25 RTX 5090 Laptop audio analysis

(+) | speakers can play relatively loud (83.8 dB)
Bass 100 - 315 Hz
(±) | reduced bass - on average 7.3% lower than median
(±) | linearity of bass is average (8.6% delta to prev. frequency)
Mids 400 - 2000 Hz
(±) | higher mids - on average 6.5% higher than median
(+) | mids are linear (3.8% delta to prev. frequency)
Highs 2 - 16 kHz
(+) | balanced highs - only 2.2% away from median
(+) | highs are linear (6.8% delta to prev. frequency)
Overall 100 - 16.000 Hz
(+) | overall sound is linear (11.2% difference to median)
Compared to same class
» 8% of all tested devices in this class were better, 4% similar, 88% worse
» The best had a delta of 6%, average was 18%, worst was 132%
Compared to all devices tested
» 6% of all tested devices were better, 2% similar, 92% worse
» The best had a delta of 4%, average was 24%, worst was 134%

Asus ROG Strix Scar 16 2025 audio analysis

(±) | speaker loudness is average but good (81.4 dB)
Bass 100 - 315 Hz
(±) | reduced bass - on average 8.4% lower than median
(±) | linearity of bass is average (9.7% delta to prev. frequency)
Mids 400 - 2000 Hz
(±) | higher mids - on average 5.4% higher than median
(+) | mids are linear (2.9% delta to prev. frequency)
Highs 2 - 16 kHz
(+) | balanced highs - only 1.3% away from median
(+) | highs are linear (3.8% delta to prev. frequency)
Overall 100 - 16.000 Hz
(+) | overall sound is linear (10.7% difference to median)
Compared to same class
» 7% of all tested devices in this class were better, 2% similar, 91% worse
» The best had a delta of 6%, average was 18%, worst was 132%
Compared to all devices tested
» 5% of all tested devices were better, 2% similar, 94% worse
» The best had a delta of 4%, average was 24%, worst was 134%

Lenovo Legion Pro 7i 16 Gen 10 audio analysis

(±) | speaker loudness is average but good (81.4 dB)
Bass 100 - 315 Hz
(±) | reduced bass - on average 7.6% lower than median
(±) | linearity of bass is average (9.4% delta to prev. frequency)
Mids 400 - 2000 Hz
(+) | balanced mids - only 4.1% away from median
(+) | mids are linear (4.8% delta to prev. frequency)
Highs 2 - 16 kHz
(+) | balanced highs - only 1.9% away from median
(+) | highs are linear (4.8% delta to prev. frequency)
Overall 100 - 16.000 Hz
(+) | overall sound is linear (9.4% difference to median)
Compared to same class
» 3% of all tested devices in this class were better, 2% similar, 95% worse
» The best had a delta of 6%, average was 18%, worst was 132%
Compared to all devices tested
» 3% of all tested devices were better, 1% similar, 96% worse
» The best had a delta of 4%, average was 24%, worst was 134%

HP Omen Max 16 ah000 audio analysis

(±) | speaker loudness is average but good (77.9 dB)
Bass 100 - 315 Hz
(±) | reduced bass - on average 9.9% lower than median
(±) | linearity of bass is average (13.4% delta to prev. frequency)
Mids 400 - 2000 Hz
(+) | balanced mids - only 2.3% away from median
(+) | mids are linear (4.3% delta to prev. frequency)
Highs 2 - 16 kHz
(+) | balanced highs - only 1.9% away from median
(+) | highs are linear (4.8% delta to prev. frequency)
Overall 100 - 16.000 Hz
(+) | overall sound is linear (11.4% difference to median)
Compared to same class
» 9% of all tested devices in this class were better, 3% similar, 88% worse
» The best had a delta of 6%, average was 18%, worst was 132%
Compared to all devices tested
» 6% of all tested devices were better, 2% similar, 92% worse
» The best had a delta of 4%, average was 24%, worst was 134%

Aorus MASTER 16 AM6H audio analysis

(±) | speaker loudness is average but good (75.36 dB)
Bass 100 - 315 Hz
(±) | reduced bass - on average 12.6% lower than median
(±) | linearity of bass is average (9% delta to prev. frequency)
Mids 400 - 2000 Hz
(+) | balanced mids - only 2.8% away from median
(+) | mids are linear (4.4% delta to prev. frequency)
Highs 2 - 16 kHz
(+) | balanced highs - only 1.8% away from median
(+) | highs are linear (3.8% delta to prev. frequency)
Overall 100 - 16.000 Hz
(+) | overall sound is linear (13.5% difference to median)
Compared to same class
» 19% of all tested devices in this class were better, 7% similar, 74% worse
» The best had a delta of 6%, average was 18%, worst was 132%
Compared to all devices tested
» 13% of all tested devices were better, 4% similar, 84% worse
» The best had a delta of 4%, average was 24%, worst was 134%

SCHENKER XMG Neo 16 (Early 24) audio analysis

(+) | speakers can play relatively loud (86 dB)
Bass 100 - 315 Hz
(-) | nearly no bass - on average 16.3% lower than median
(±) | linearity of bass is average (8.6% delta to prev. frequency)
Mids 400 - 2000 Hz
(+) | balanced mids - only 3% away from median
(+) | mids are linear (3.6% delta to prev. frequency)
Highs 2 - 16 kHz
(+) | balanced highs - only 2.5% away from median
(+) | highs are linear (4.9% delta to prev. frequency)
Overall 100 - 16.000 Hz
(+) | overall sound is linear (12.4% difference to median)
Compared to same class
» 14% of all tested devices in this class were better, 3% similar, 82% worse
» The best had a delta of 6%, average was 18%, worst was 132%
Compared to all devices tested
» 9% of all tested devices were better, 2% similar, 88% worse
» The best had a delta of 4%, average was 24%, worst was 134%

能源管理 - 电池寿命长

耗电量

420 瓦电源
420 瓦电源

闲置时,Neo 16 可以从默认激活的局部调光功能中获益,尤其是在结合深色背景图像的情况下,我们测得的最大 15.8 瓦耗电量真的很省钱。另一方面,在显示白色图片或停用局部调光时,我们测得的功耗接近 30 瓦。在负载测试中,我们测得笔记本电脑的最大功率为 415 瓦,随后稳定在 280 瓦左右。在连接 Oasis 的情况下,最大值为 480 瓦,然后稳定在 360 瓦。在空闲模式下,Oasis 使笔记本电脑的功耗增加了约 1.7 瓦。

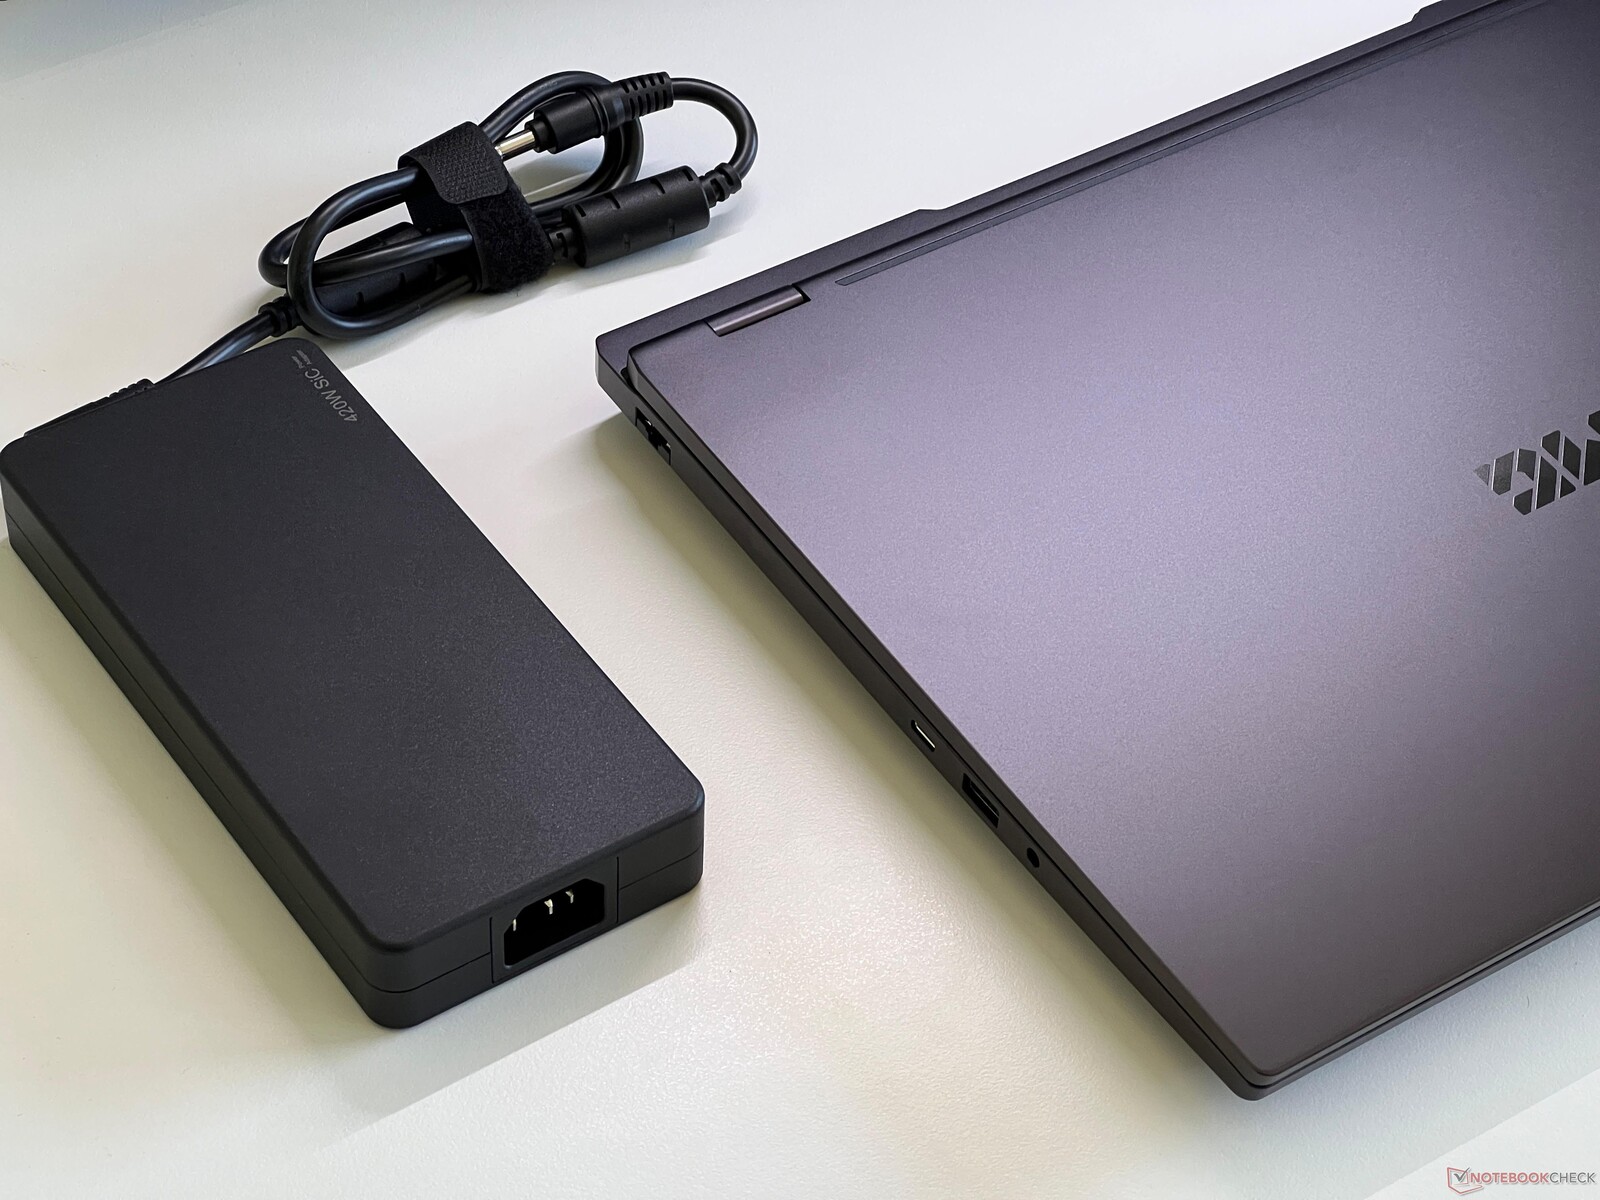
所提供的 420 瓦电源装置体积足够大,但温度很高,而且从电源装置到笔记本电脑的电缆很短(80 厘米)。在大多数情况下,这根线不够长,无法将电源装置放在地板上。

Power Consumption
Off / Standbydarklight 0.26 / 2.2 Watt
Idledarkmidlight 11.8 / 15.1 / 15.8 Watt
Load midlight 165.3 / 415.5 Watt
 color bar
Key: min: dark, med: mid, max: light        Metrahit Energy
SCHENKER XMG Neo 16 E25 RTX 5090 Laptop
Ultra 9 275HX, GeForce RTX 5090 Laptop, Samsung 9100 Pro 1 TB, Mini-LED, 2560x1600, 16"
Asus ROG Strix Scar 16 2025
Ultra 9 275HX, GeForce RTX 5090 Laptop, WD PC SN8000S 2TB, Mini-LED, 2560x1600, 16"
Lenovo Legion Pro 7i 16 Gen 10
Ultra 9 275HX, GeForce RTX 5080 Laptop, SK Hynix HFS001TEJ9X115N, OLED, 2560x1600, 16"
HP Omen Max 16 ah000
Ultra 9 275HX, GeForce RTX 5090 Laptop, WDC PC SN810 2TB, OLED, 2560x1600, 16"
Aorus MASTER 16 AM6H
Ultra 9 275HX, GeForce RTX 5090 Laptop, Kingston OM8PGP41024Q-A0, OLED, 2560x1600, 16"
SCHENKER XMG Neo 16 (Early 24)
i9-14900HX, NVIDIA GeForce RTX 4090 Laptop GPU, Samsung 990 Pro 1 TB, IPS, 2560x1600, 16"
Average Nvidia GeForce RTX 5090 Laptop
 
Average of class Gaming
 
Power Consumption
-44%
-68%
-25%
-35%
0%
-33%
-9%
Idle Minimum *
11.8
22.5
-91%
28.5
-142%
9.9
16%
25
-112%
6
49%
16.2 ?(9.4 - 29, n=8)
-37%
Idle Average *
15.1
32.2
-113%
38.8
-157%
28.6
-89%
29.4
-95%
16
-6%
25.6 ?(13.5 - 39.2, n=8)
-70%
Idle Maximum *
15.8
34.3
-117%
45.6
-189%
47.1
-198%
31
-96%
28
-77%
30.7 ?(13.7 - 48, n=8)
-94%
Load Average *
165.3
169.3
-2%
132.2
20%
141.8
14%
109
34%
130
21%
140.4 ?(109 - 169.3, n=8)
15%
Cyberpunk 2077 ultra *
296
294
1%
318
-7%
253
15%
290
2%
Cyberpunk 2077 ultra external monitor *
289
288
-0%
319
-10%
230
20%
292
-1%
Load Maximum *
415.5
371.5
11%
384
8%
233
44%
325
22%
361
13%
322 ?(217 - 431, n=8)
23%
Witcher 3 ultra *
302

* ... smaller is better

Power consumption Cyberpunk / stress test

0255075100125150175200225250275300325350375400Tooltip
SCHENKER XMG Neo 16 E25 RTX 5090 Laptop; 1280x720 Prime95 28.10 and Furmark 1.25: Ø285 (243-415)
SCHENKER XMG Neo 16 E25 RTX 5090 Laptop; Idle 150cd/m2: Ø12.6 (10.6-15.2)
SCHENKER XMG Neo 16 E25 RTX 5090 Laptop; Cyberpunk 2077 FHD ultra no FSR 150cd: Ø296 (288-307)

Power consumption with external monitor

0153045607590105120135150165180195210225240255270285Tooltip
SCHENKER XMG Neo 16 E25 RTX 5090 Laptop; Prime95 V2810 Stress (external Monitor): Ø239 (231-266)
SCHENKER XMG Neo 16 E25 RTX 5090 Laptop; Cinebench R15 Multi (external Monitor): Ø259 (251-266)
SCHENKER XMG Neo 16 E25 RTX 5090 Laptop; Cinebench R23 Single (external Monitor): Ø38.8 (32.6-61.9)
SCHENKER XMG Neo 16 E25 RTX 5090 Laptop; Cinebench R23 Multi (external Monitor): Ø255 (247-260)
SCHENKER XMG Neo 16 E25 RTX 5090 Laptop; 1280x720 FurMark 1.19 GPU Stress Test (external Monitor): Ø221 (215-279)
SCHENKER XMG Neo 16 E25 RTX 5090 Laptop; Idle 1min (external Monitor): Ø11.3 (8.2-16.5)
SCHENKER XMG Neo 16 E25 RTX 5090 Laptop; Cyberpunk 2077 FHD ultra no FSR (external Monitor): Ø289 (284-297)

运行时间

在运行时间测试中,Neo 16 的表现同样出色,尤其是在 150 cd/m² 和 60 Hz 的 WLAN 测试中,它的运行时间长达 9.5 小时。不过,在全亮度条件下,你将不得不为笔记本电脑的明亮显示屏付出代价,它只能维持不到 4 个小时。播放视频的时间略高于 7.5 小时。

电池信息
电池信息
充电过程
充电过程
Battery Runtime
WiFi Websurfing
9h 32min
WiFi Websurfing max. Brightness
3h 53min
Big Buck Bunny H.264 1080p
7h 40min
Load (maximum brightness)
2h 01min
SCHENKER XMG Neo 16 E25 RTX 5090 Laptop
Ultra 9 275HX, GeForce RTX 5090 Laptop, 99.8 Wh
Asus ROG Strix Scar 16 2025
Ultra 9 275HX, GeForce RTX 5090 Laptop, 90 Wh
Lenovo Legion Pro 7i 16 Gen 10
Ultra 9 275HX, GeForce RTX 5080 Laptop, 99 Wh
HP Omen Max 16 ah000
Ultra 9 275HX, GeForce RTX 5090 Laptop, 83 Wh
Aorus MASTER 16 AM6H
Ultra 9 275HX, GeForce RTX 5090 Laptop, 99 Wh
SCHENKER XMG Neo 16 (Early 24)
i9-14900HX, NVIDIA GeForce RTX 4090 Laptop GPU, 99.8 Wh
Average of class Gaming
 
Battery Runtime
-32%
-52%
-40%
-21%
-16%
-21%
H.264
460
346
-25%
418
-9%
WiFi v1.3
572
388
-32%
323
-44%
350
-39%
404
-29%
350
-39%
Load
121
48
-60%
71
-41%
110
-9%
122
1%

Notebookcheck 总评分

SCHENKER XMG Neo 16 E25 RTX 5090 Laptop - 05/14/2025 v8
Andreas Osthoff

Chassis
88 / 98 → 89%
Keyboard
89%
Pointing Device
86%
Connectivity
79 / 80 → 99%
Weight
58 / 10-68 → 82%
Battery
84 / 95 → 88%
Display
92%
Games Performance
94%
Application Performance
96%
Temperature
85 / 95 → 90%
Noise
69 / 90 → 76%
Audio
84%
Camera
37 / 75 → 49%
Average
63%
90%
Gaming - Weighted Average
CO2 Emissions
No Data
Materials
0%
Packaging
50%
Power Use
73.1%
Repairability
40%
Software Updates
22.3%
Recycle Logo Total Sustainability Score: 30.9%

可能的替代品比较

Benchmark Comparison Plugin: ERROR, Layout "57" not supported!

Transparency

The selection of devices to be reviewed is made by our editorial team. The test sample was provided to the author as a loan by the manufacturer or retailer for the purpose of this review. The lender had no influence on this review, nor did the manufacturer receive a copy of this review before publication. There was no obligation to publish this review. We never accept compensation or payment in return for our reviews. As an independent media company, Notebookcheck is not subjected to the authority of manufacturers, retailers or publishers.

This is how Notebookcheck is testing

Every year, Notebookcheck independently reviews hundreds of laptops and smartphones using standardized procedures to ensure that all results are comparable. We have continuously developed our test methods for around 20 years and set industry standards in the process. In our test labs, high-quality measuring equipment is utilized by experienced technicians and editors. These tests involve a multi-stage validation process. Our complex rating system is based on hundreds of well-founded measurements and benchmarks, which maintains objectivity. Further information on our test methods can be found here.

Please share our article, every link counts!
Mail Logo
> Notebookcheck中文版(NBC中国) > 评测 > 得益于 300 Hz mini LED,最快的游戏笔记本电脑现在更出色了 - XMG Neo 16 E25 RTX 5090 笔记本电脑评测
Andreas Osthoff, 2025-05-16 (Update: 2025-05-16)