Schenker XMG Pro 15 (RTX 3080 Ti)笔记本电脑评测。全能型笔记本电脑中的迈克-泰森
在今年年初,我们回顾了采用 CPU的前代产品。 前代产品的Tiger Lake CPU和 RTX 3080.现在,申克创造了一个新的案例,并将硬件更新为桤木湖和 RTX 3080 Ti.这一次,我们评测的是采用QHD IPS显示屏而不是4K OLED屏幕的变体。
除了前辈之外,其他具有类似硬件的15英寸笔记本电脑也被用于比较,包括MSI Raider GE66 12UHS以及 Razer Blade 15。我们还将其性能与内部的 XMG Neo 15,有无XMG Oasis液体冷却系统。.
潜在的竞争对手比较
Rating | Date | Model | Weight | Height | Size | Resolution | Price |
|---|---|---|---|---|---|---|---|
| 86.9 % v7 (old) | 07 / 2022 | Schenker XMG Pro 15 (i7-12700H, RTX 3080 Ti) i7-12700H, GeForce RTX 3080 Ti Laptop GPU | 2.4 kg | 25 mm | 15.60" | 2560x1440 | |
| 84.6 % v7 (old) | 01 / 2022 | Schenker XMG Pro 15 (Late 2021) i7-11800H, GeForce RTX 3080 Laptop GPU | 2 kg | 19.8 mm | 15.60" | 3840x2160 | |
| 88.4 % v7 (old) | 07 / 2022 | Schenker XMG Neo 15 (i7-12700H, RTX 3080 Ti) i7-12700H, GeForce RTX 3080 Ti Laptop GPU | 2.3 kg | 26.6 mm | 15.60" | 2560x1440 | |
| 87.4 % v7 (old) | 06 / 2022 | MSI Raider GE66 12UHS i9-12900HK, GeForce RTX 3080 Ti Laptop GPU | 2.4 kg | 23.4 mm | 15.60" | 3840x2160 | |
| 89.1 % v7 (old) | 03 / 2022 | Razer Blade 15 2022 i7-12800H, GeForce RTX 3080 Ti Laptop GPU | 2.1 kg | 16.99 mm | 15.60" | 2560x1440 |
箱子:更厚更重了
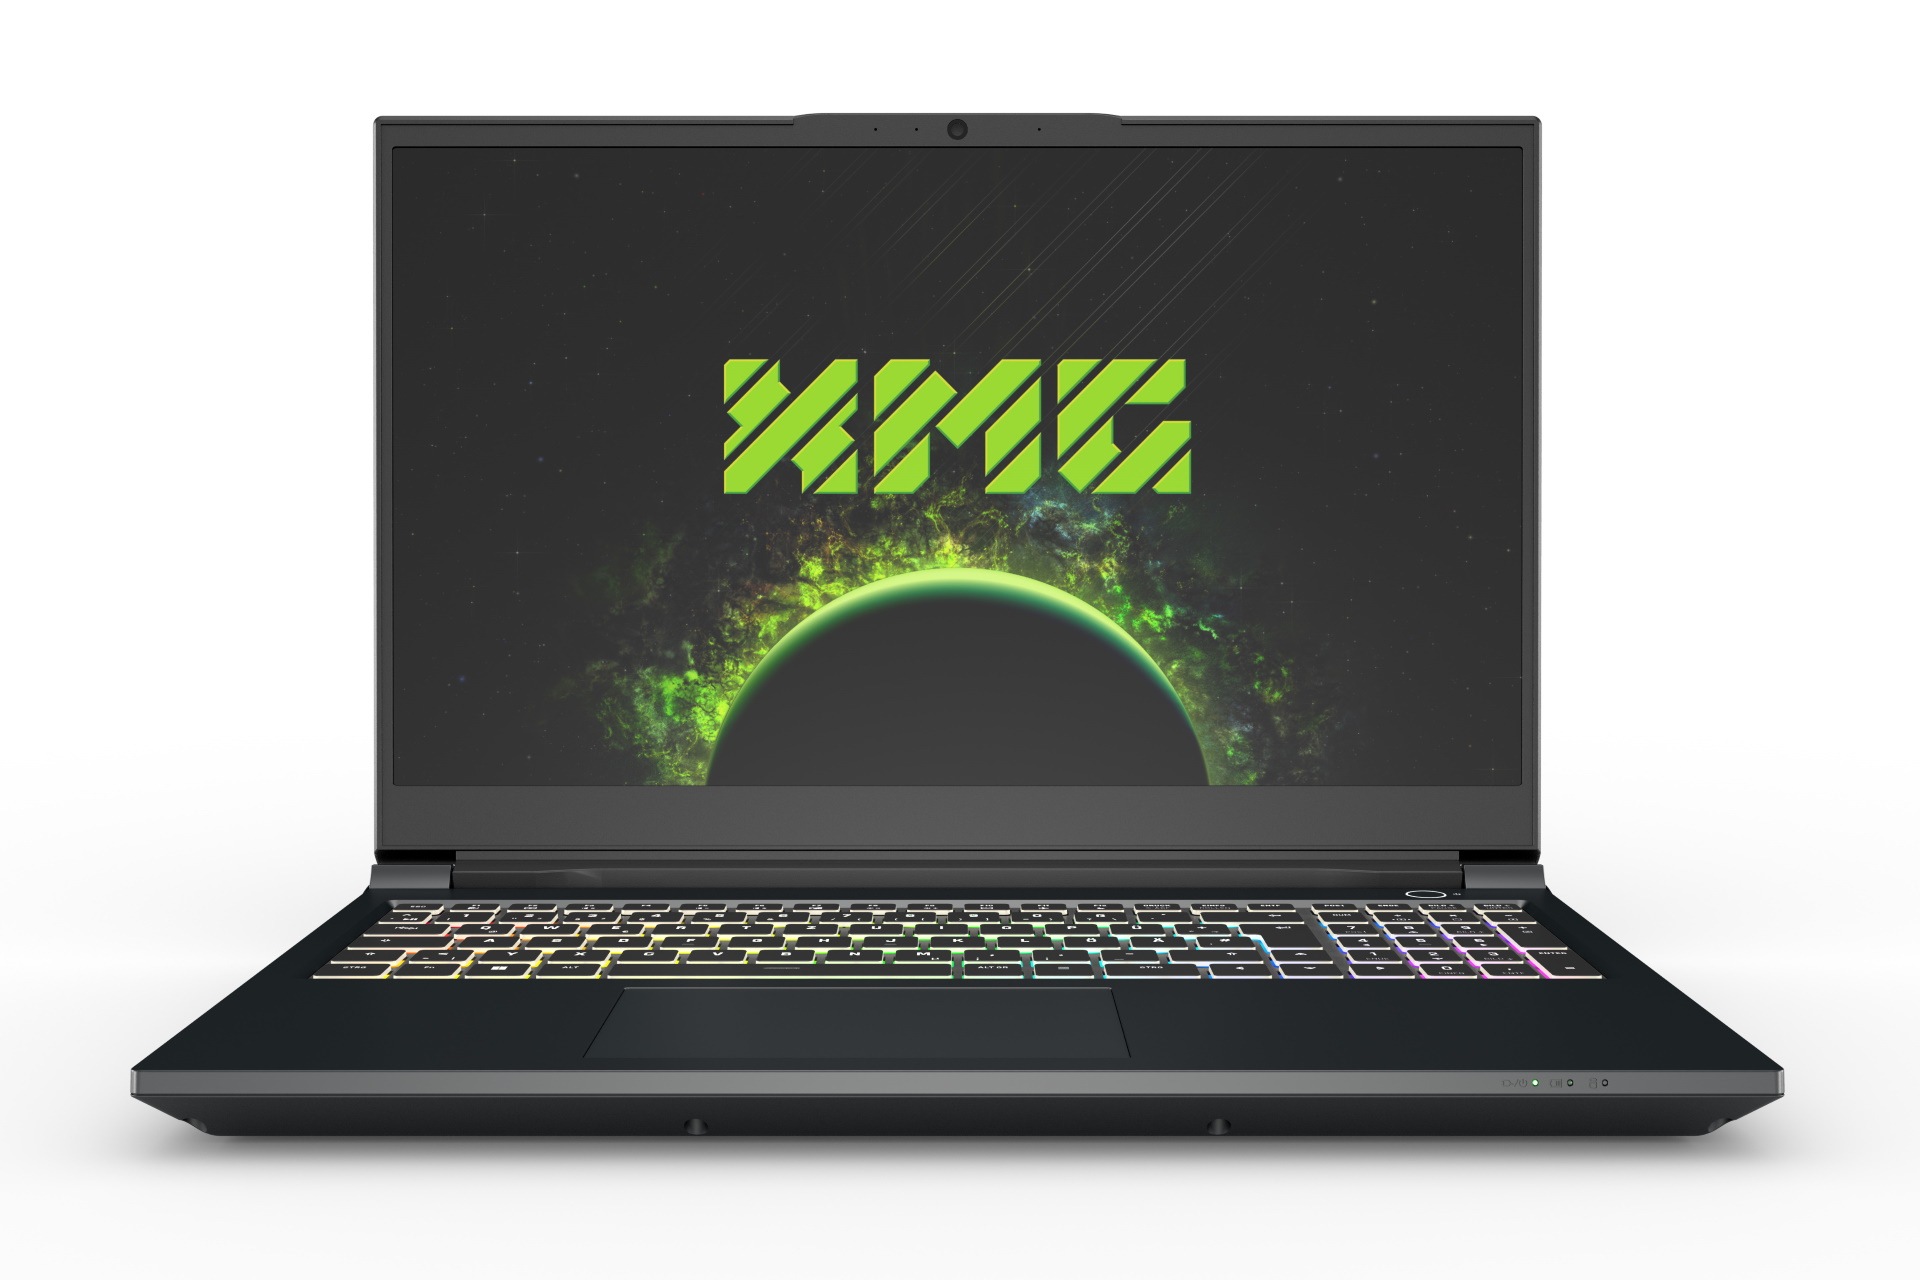
Schenker使用了一个新的箱子,即Clevo PD50PNT。显示屏盖和底壳仍然由铝制成,而显示屏边框和顶壳则由塑料制成。显示屏盖和底座在扭转时发出轻微的吱吱声,但仍然给人足够坚固的印象,尤其是底座。没有发现不平整的缝隙,做工也处于良好水平。
设计相对简单,并保持黑色,这也应该对内容创作者有吸引力。XMG的标志在盖子上几乎看不到,因为它也是深色的。表面上的指纹和油渍痕迹很吸引人。
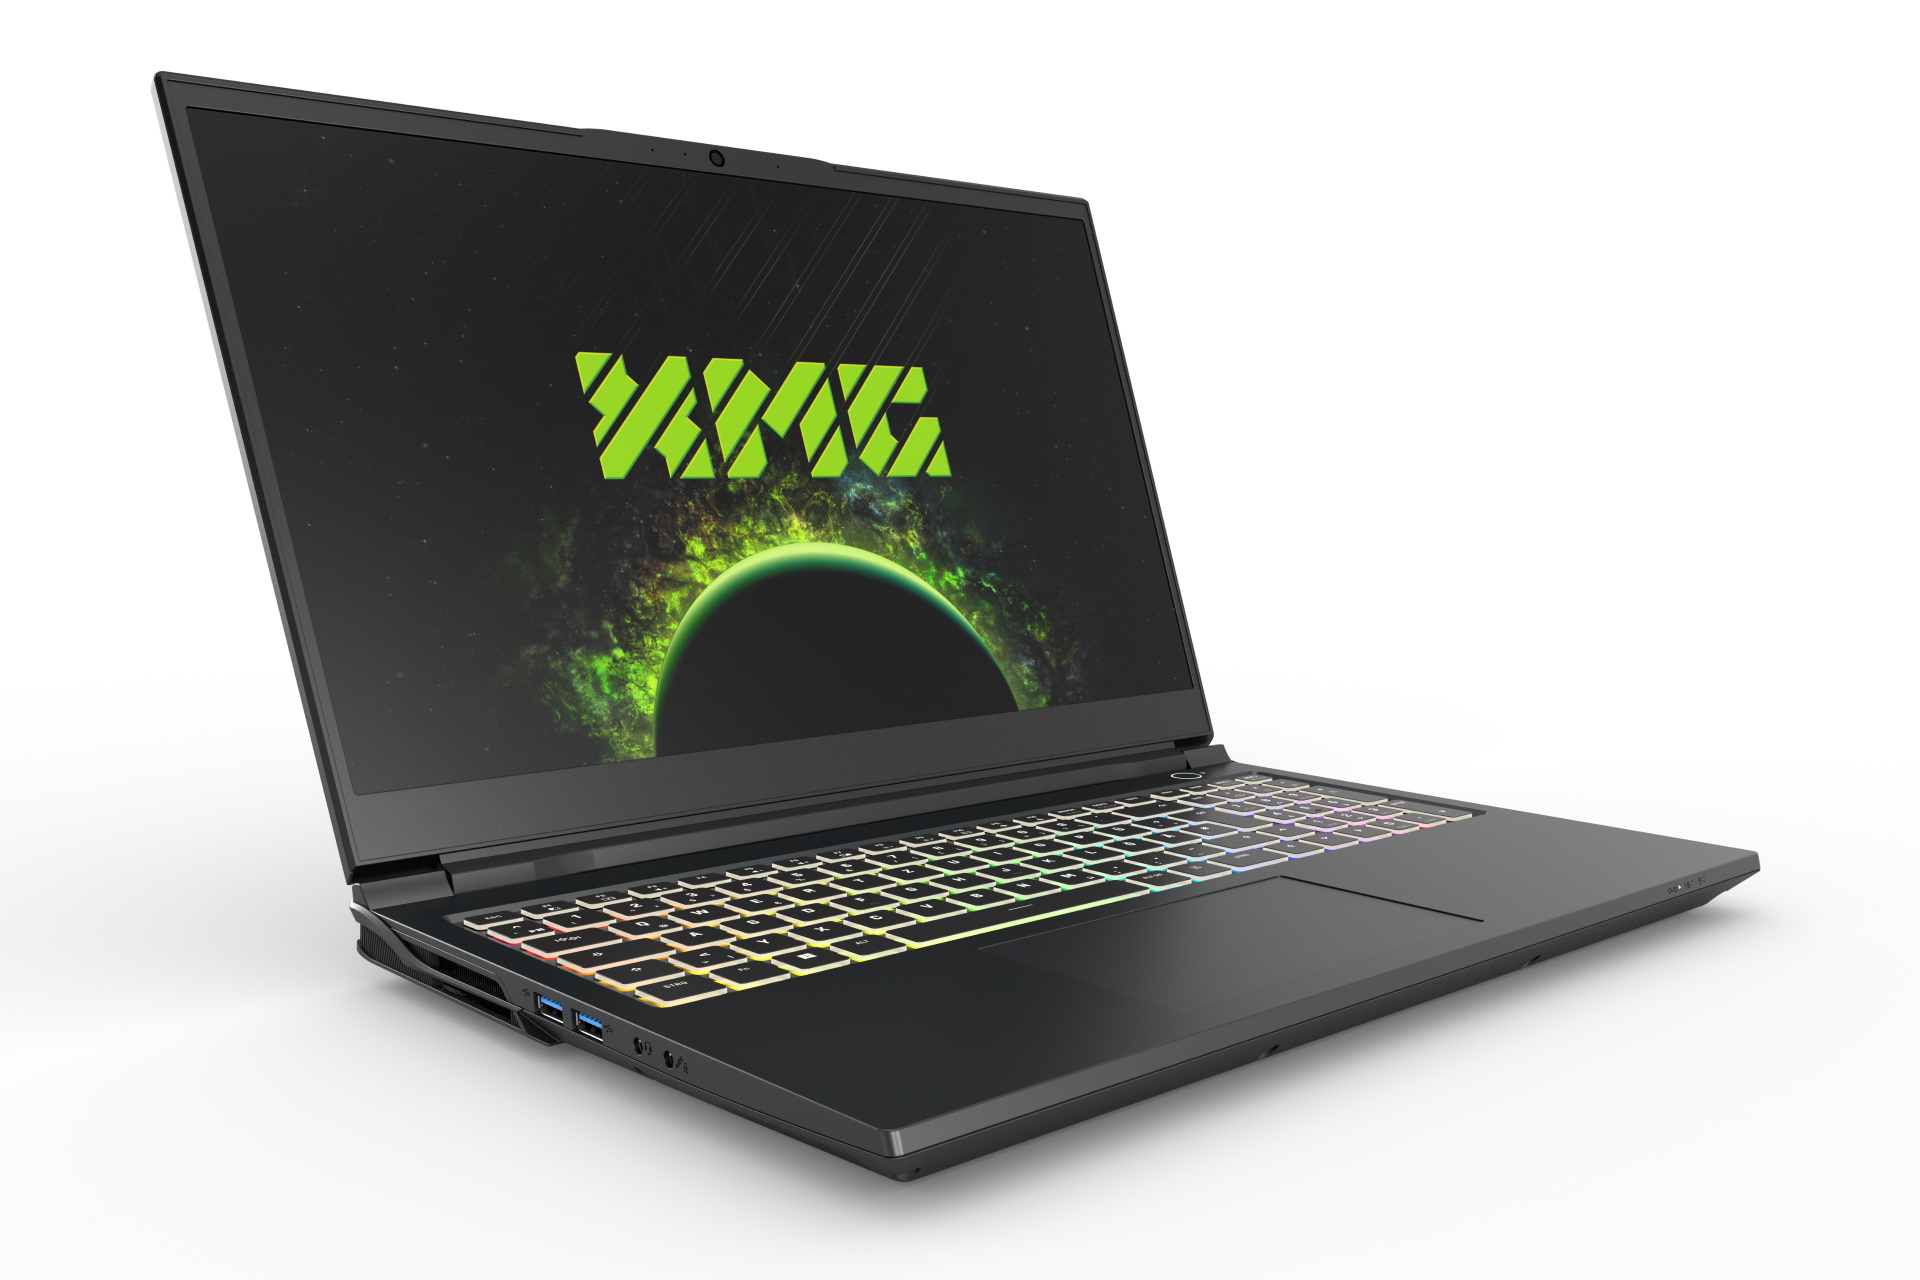
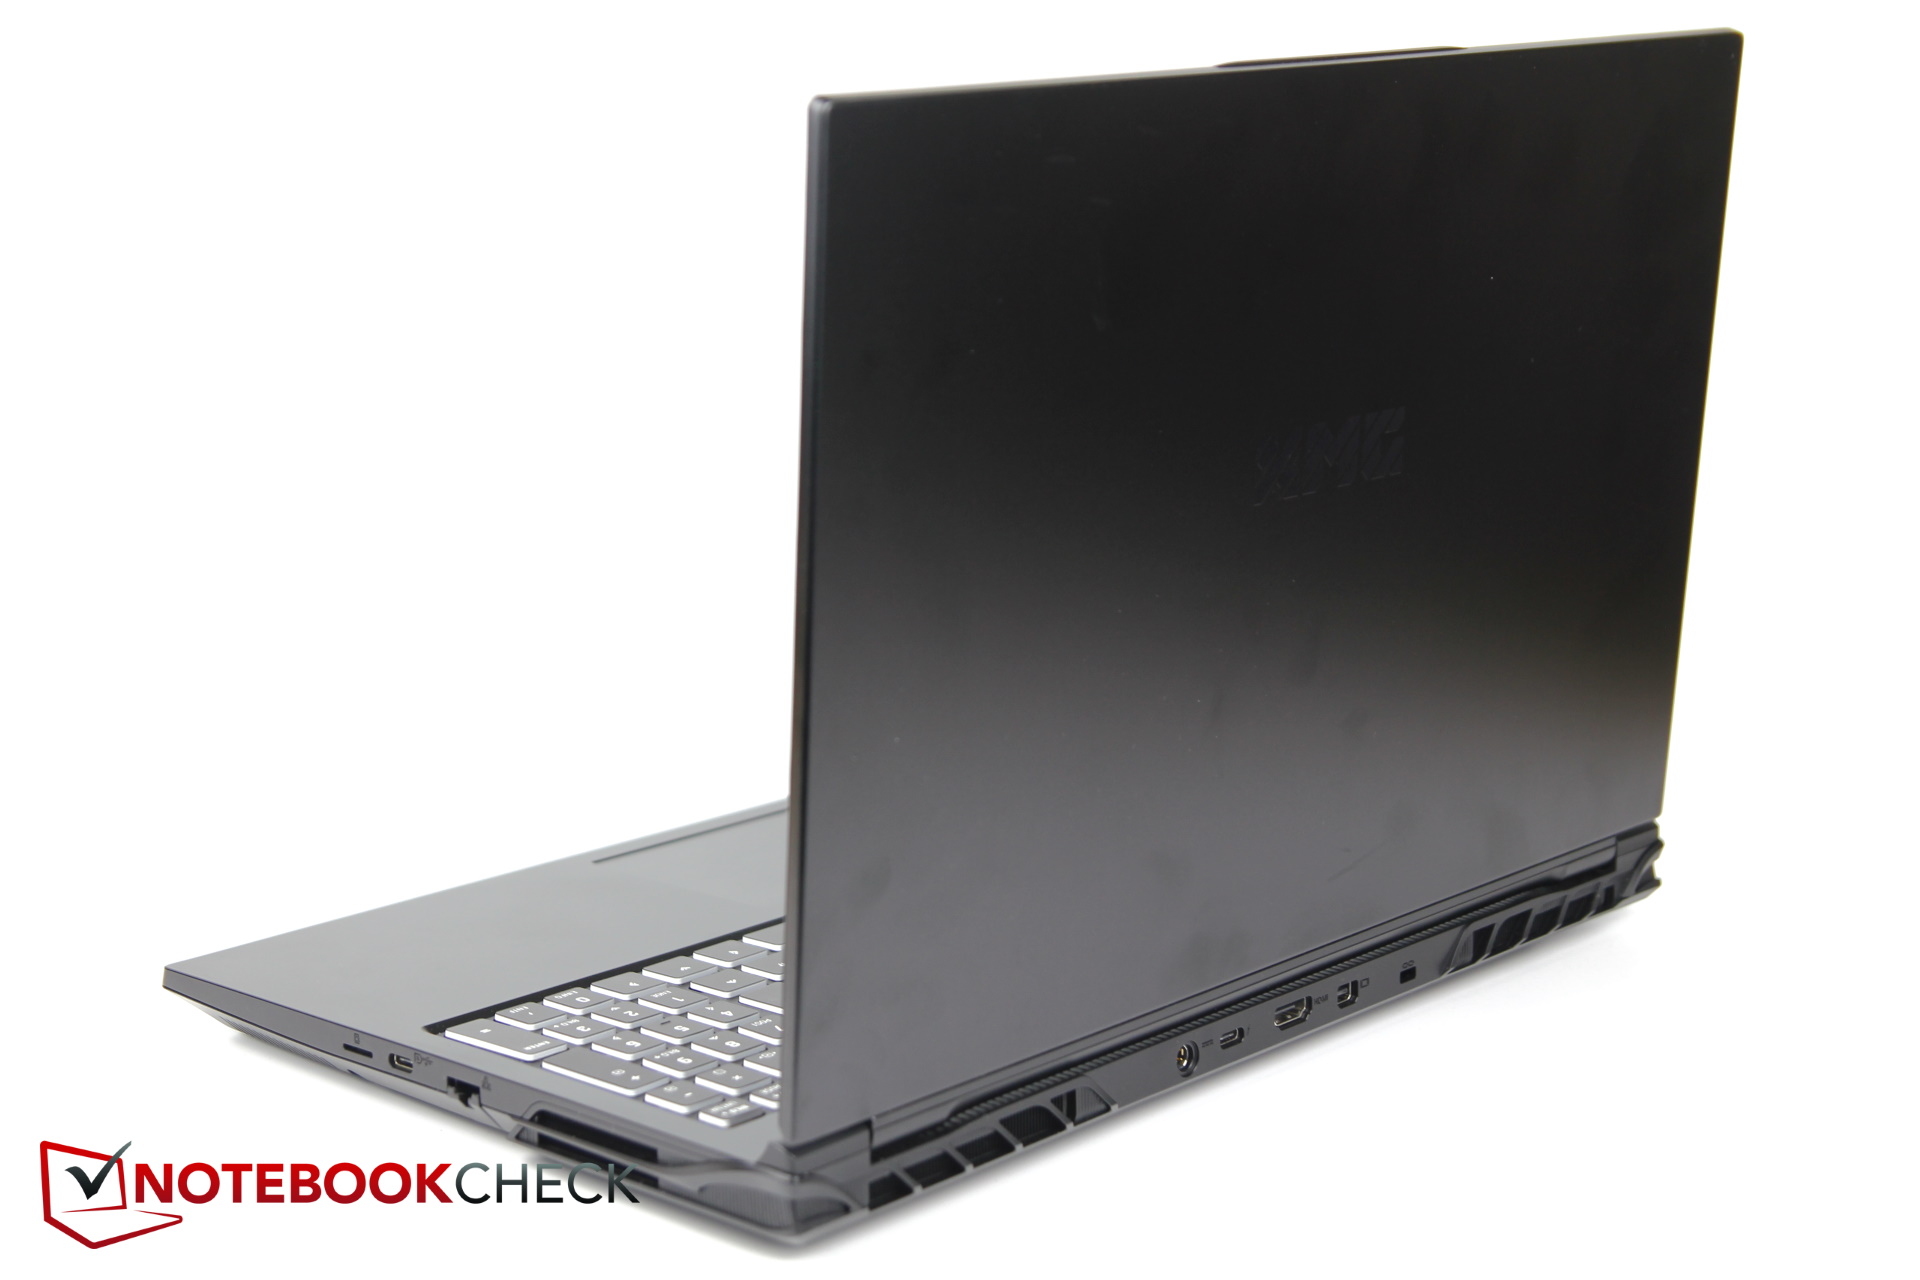
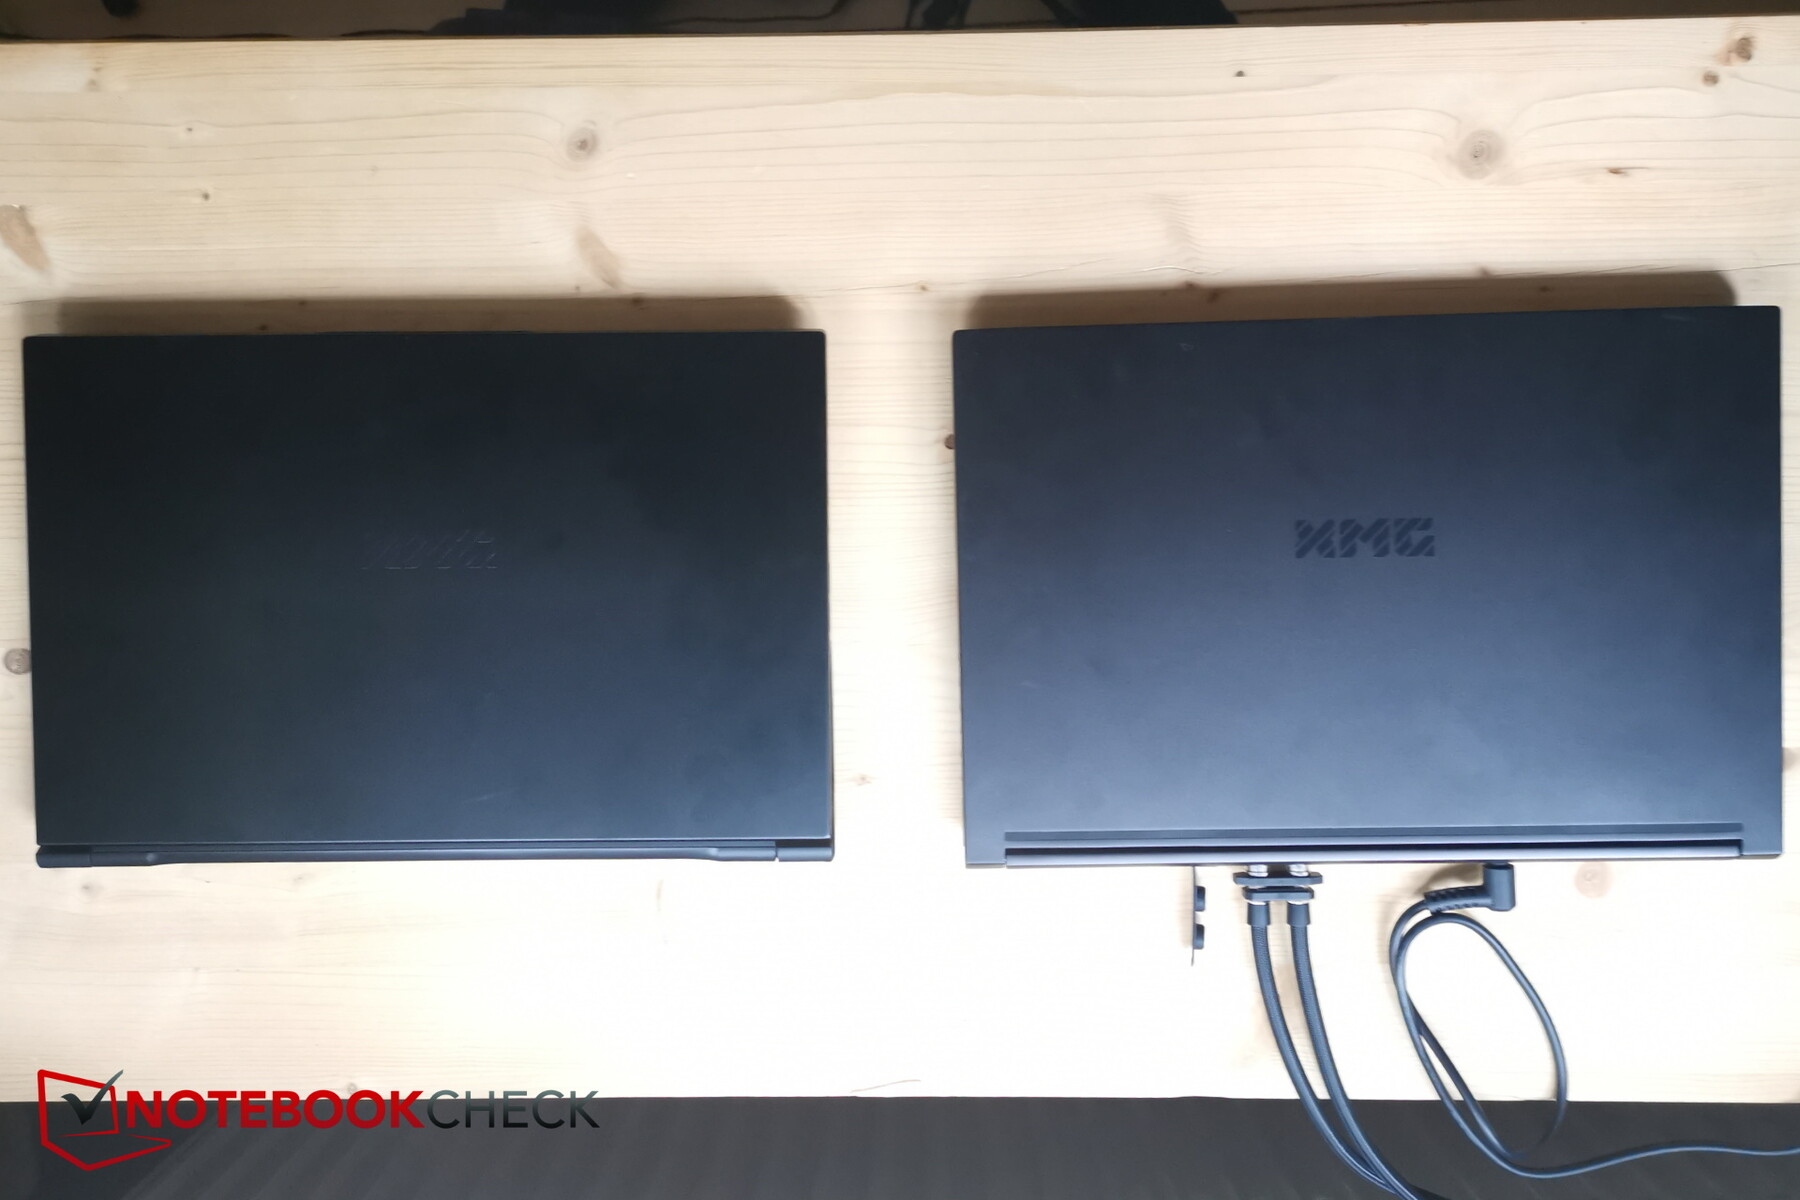
有趣的是,新的Pro 15比它的直接前辈(19.8毫米)略厚(约25毫米),而且更重。另一方面,宽度和深度几乎保持不变,但重量却增加了约300克。
这使它更接近XMG Neo 15(26.6毫米),因此不再属于试图达到Razer Blade 15(约17毫米)尺寸的极薄设备。
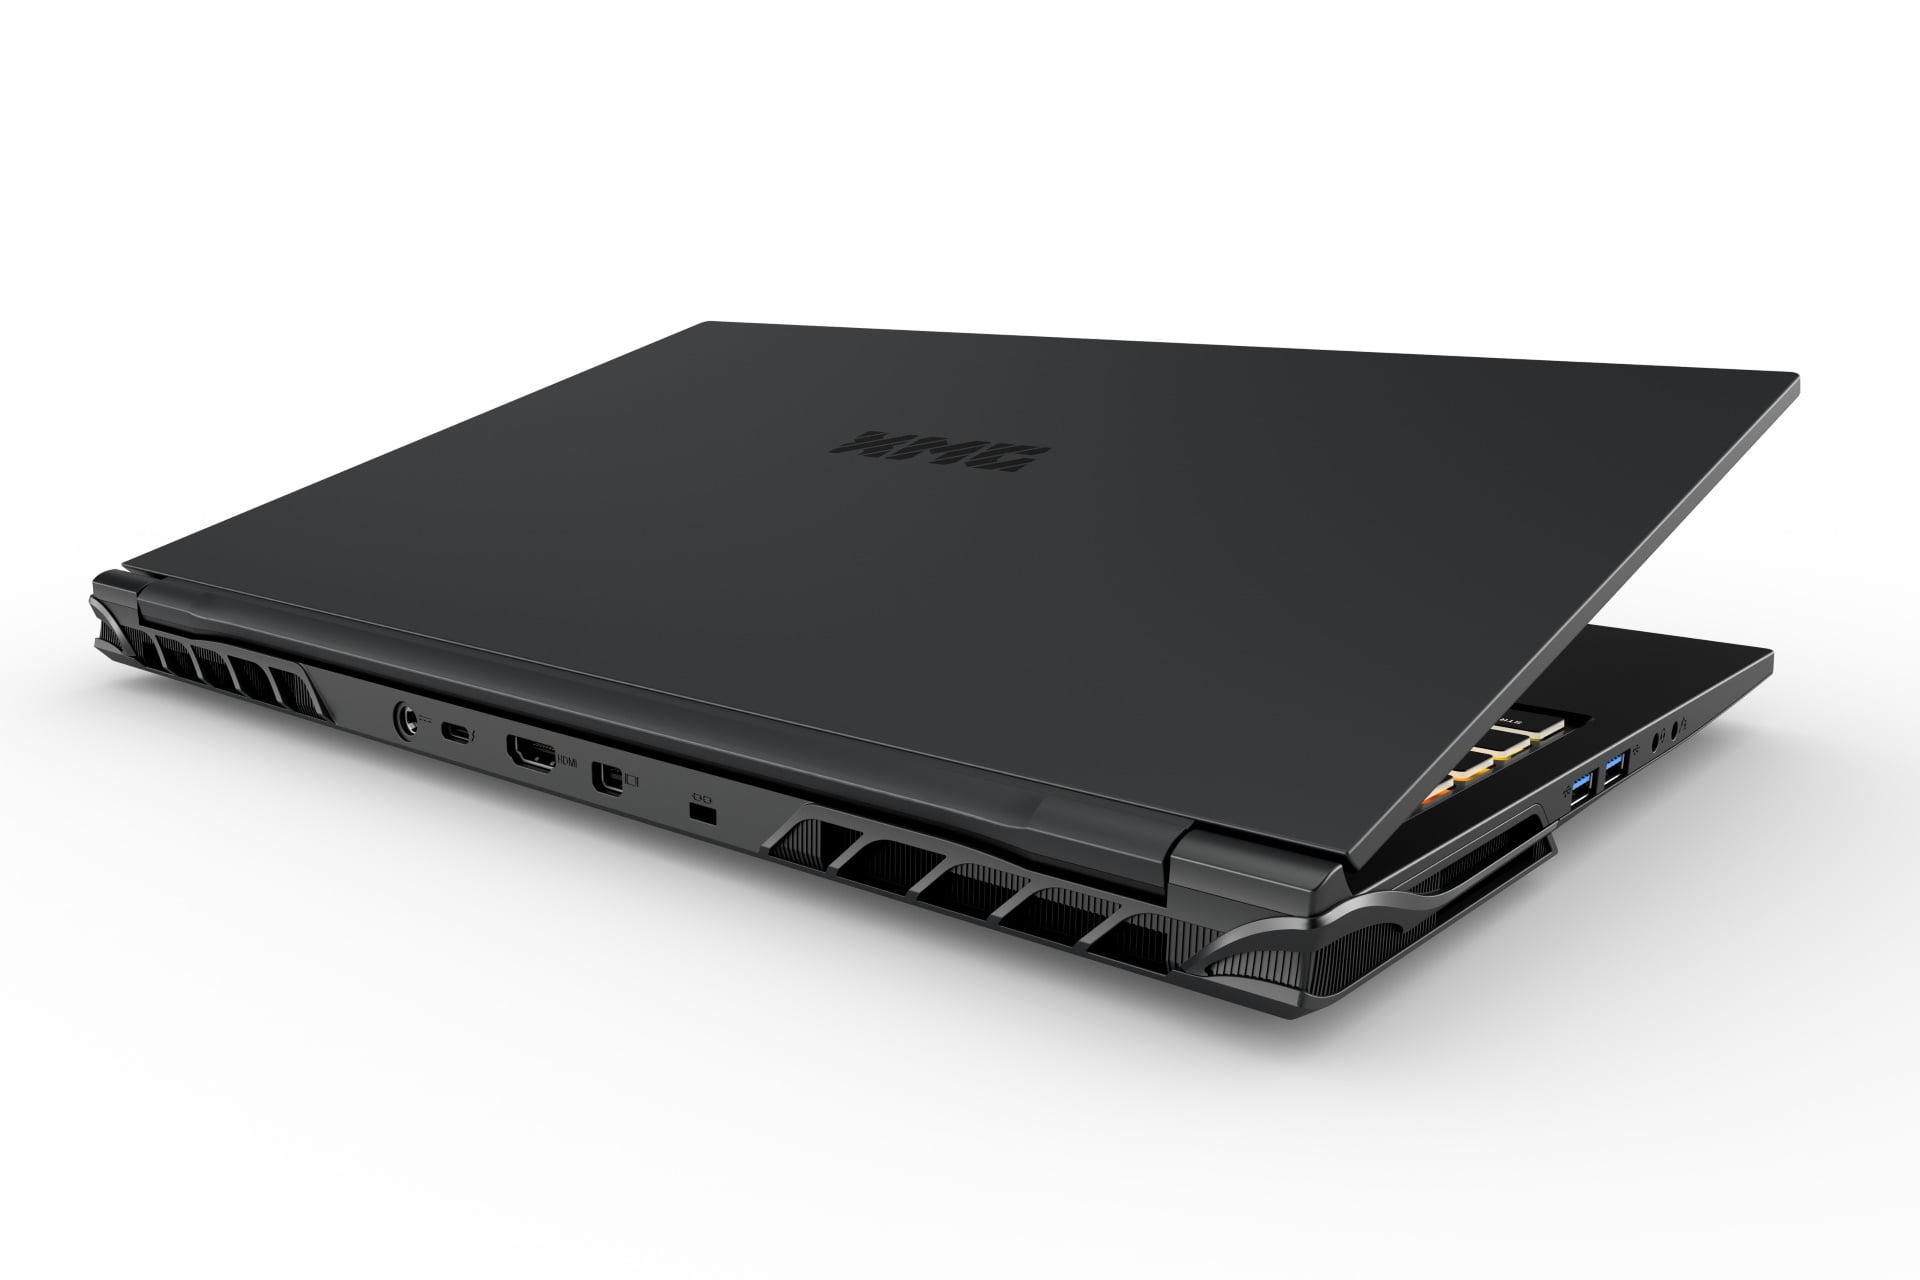
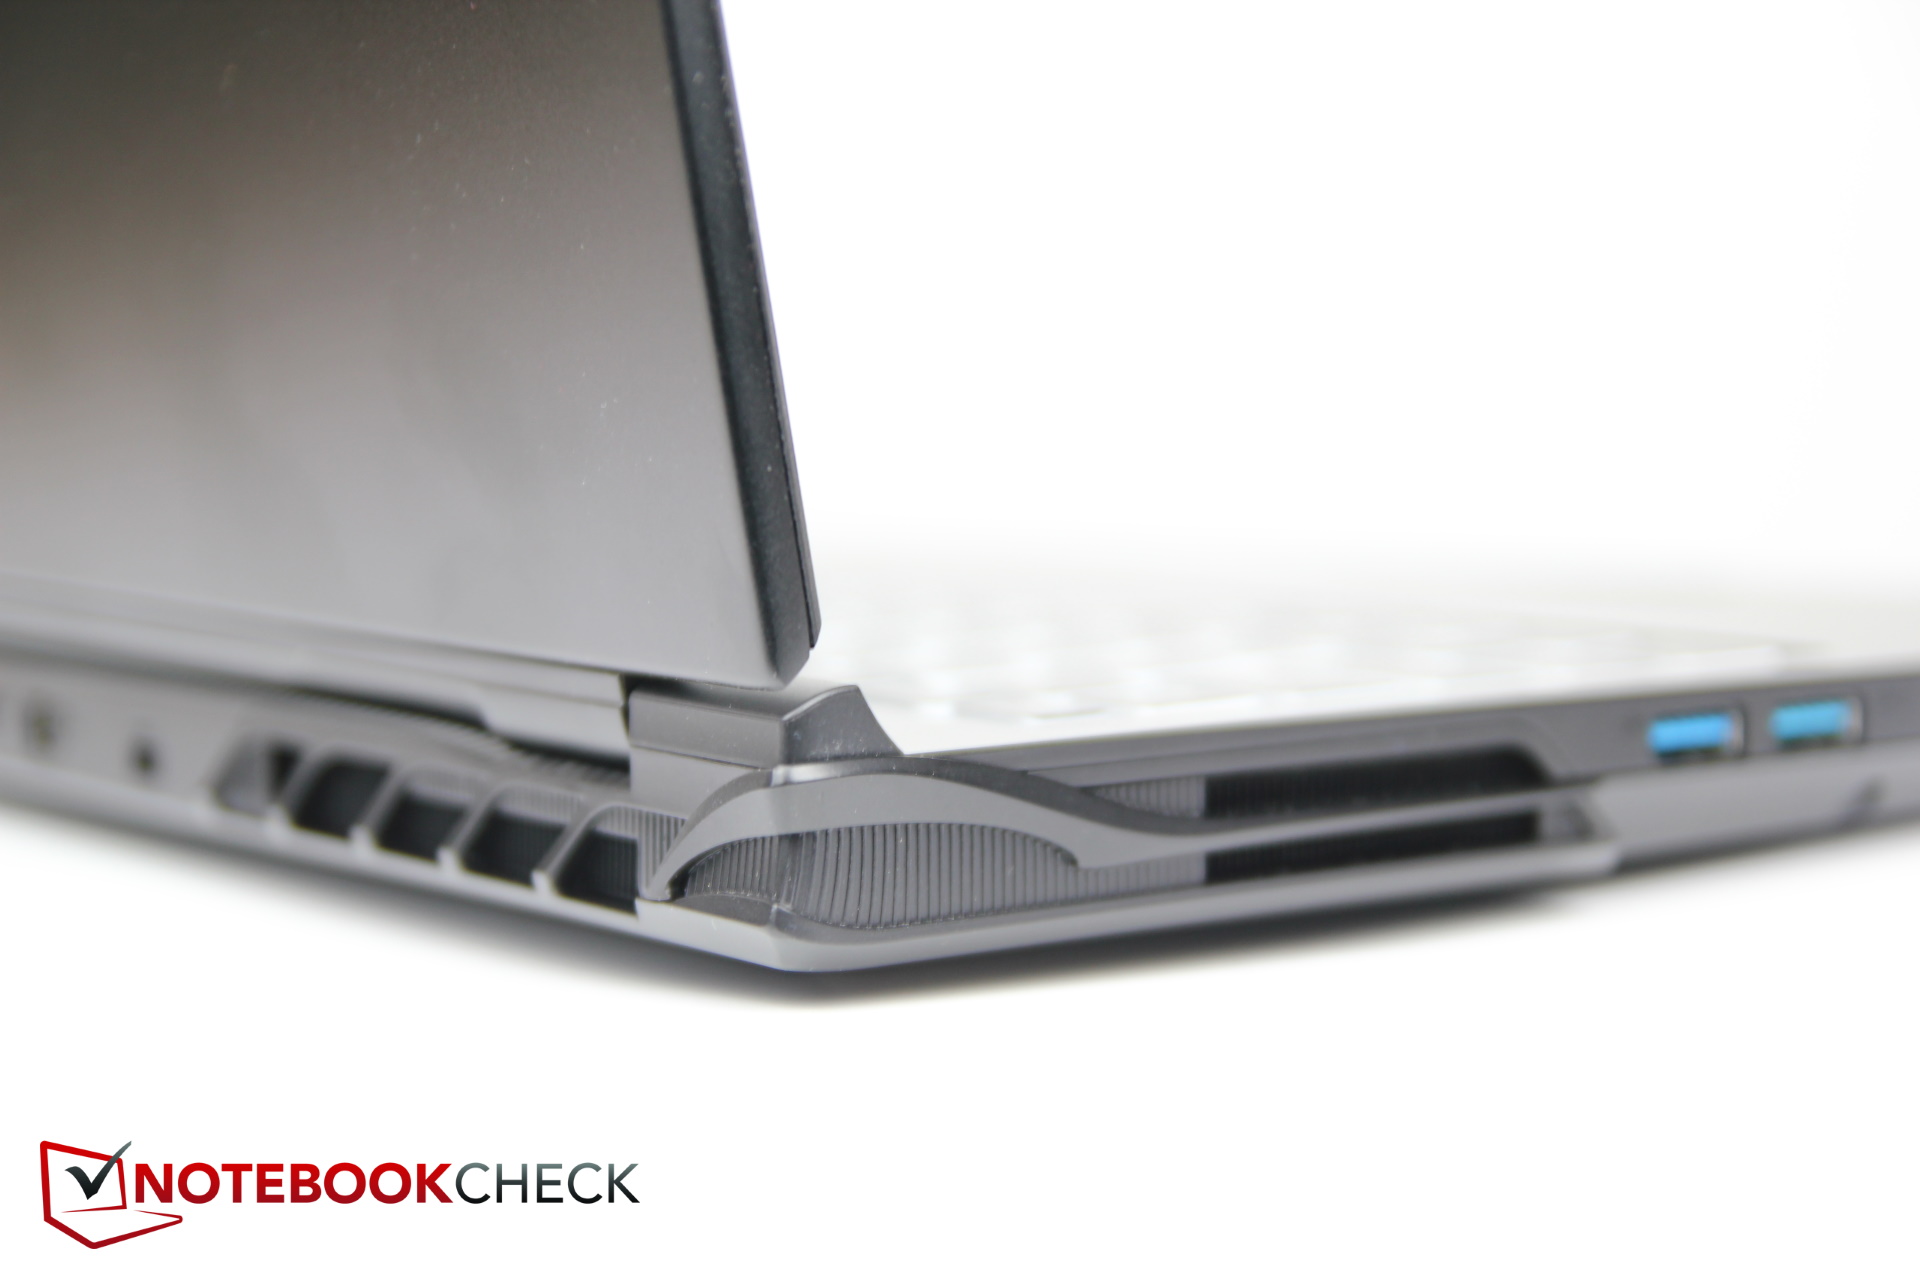
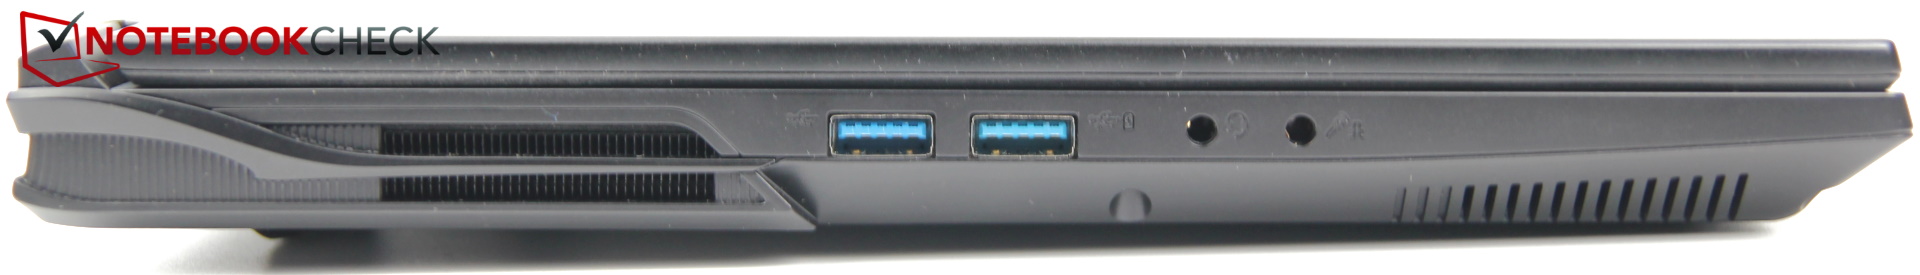
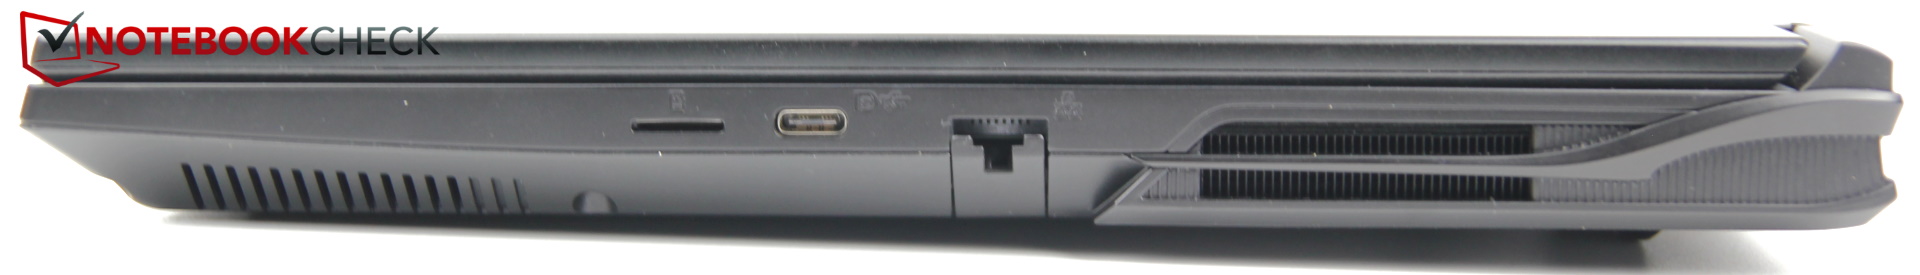
设备。准备好VR和MicroSD
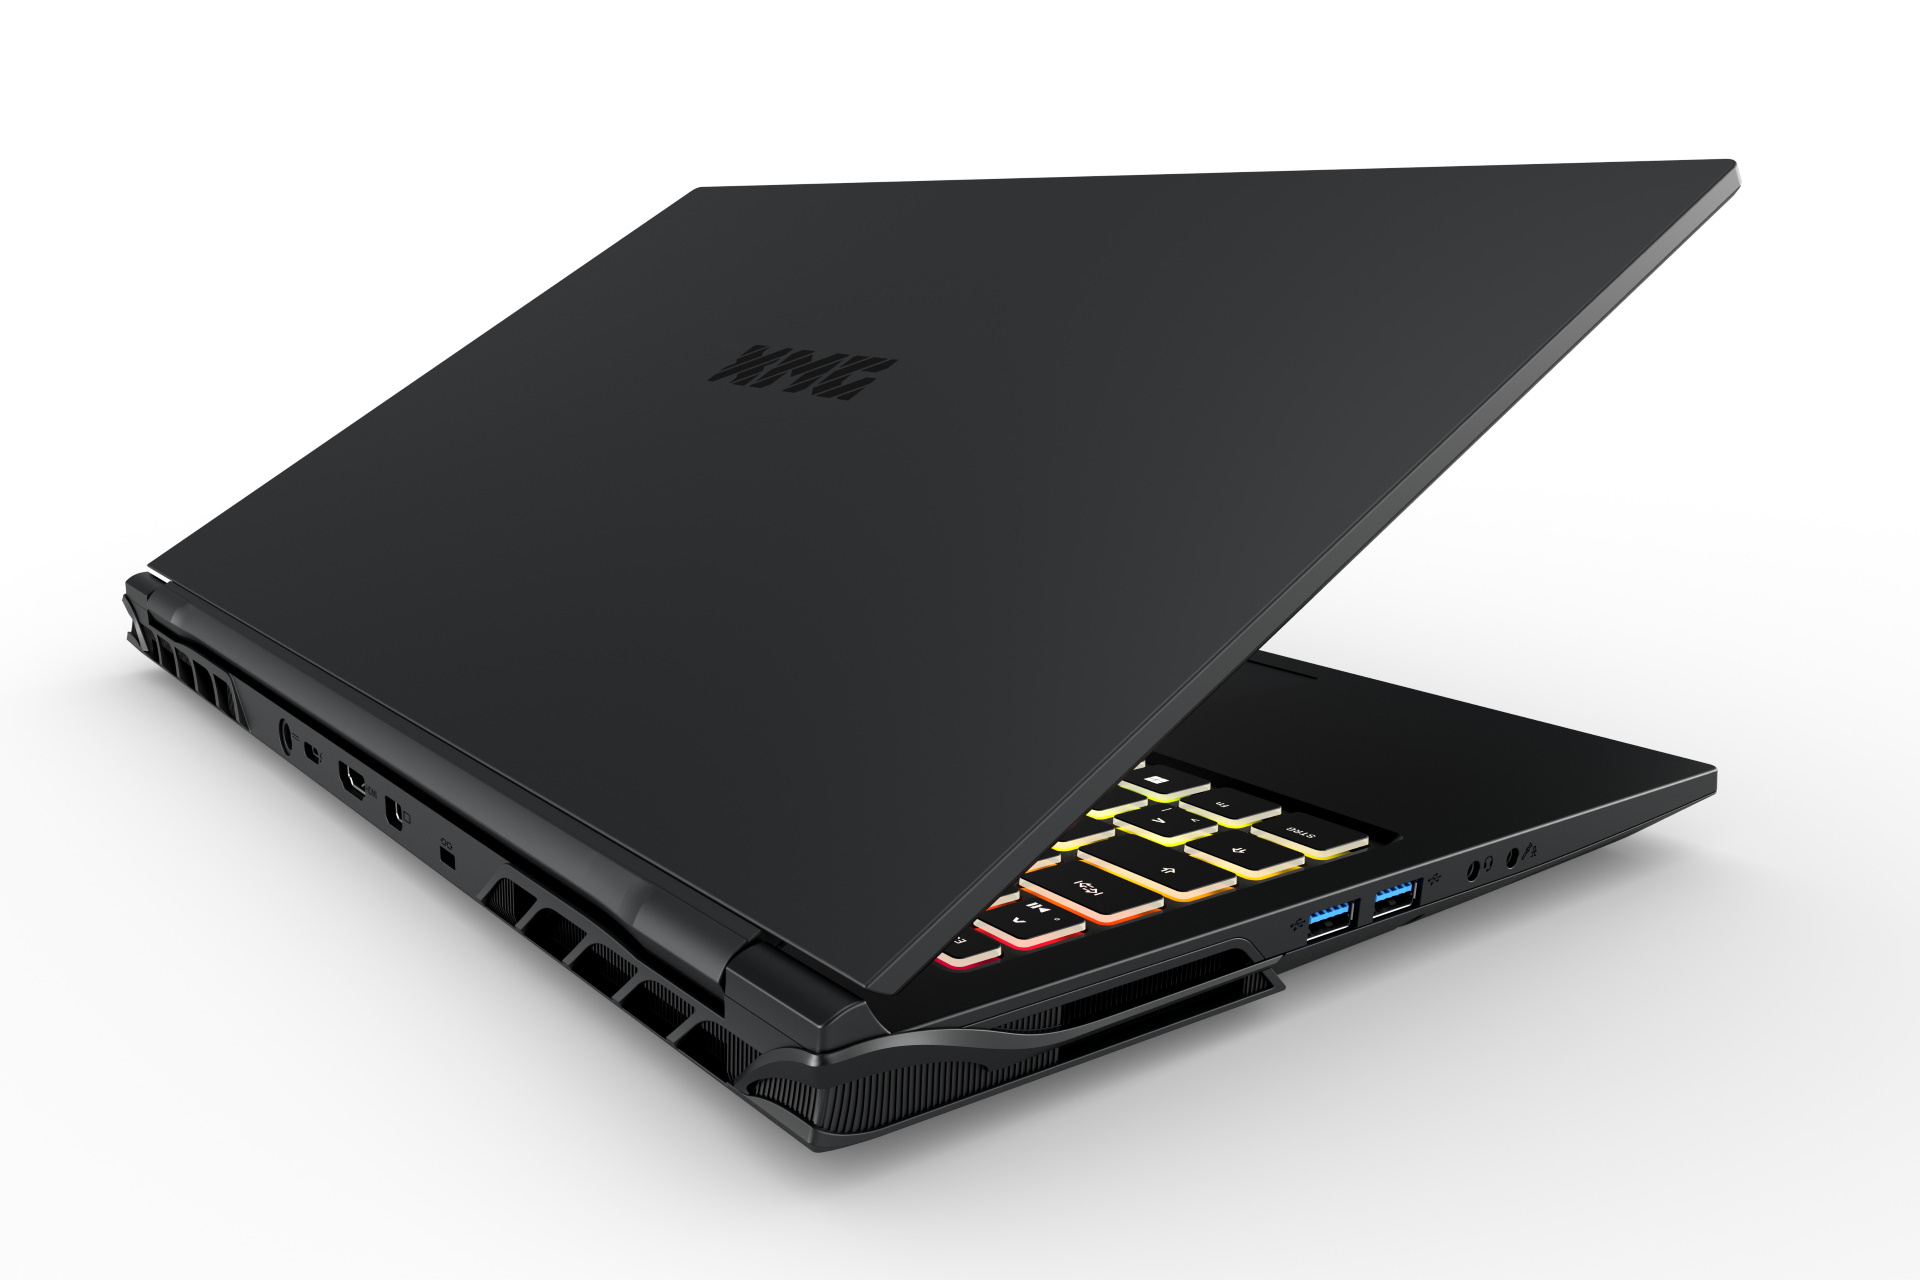
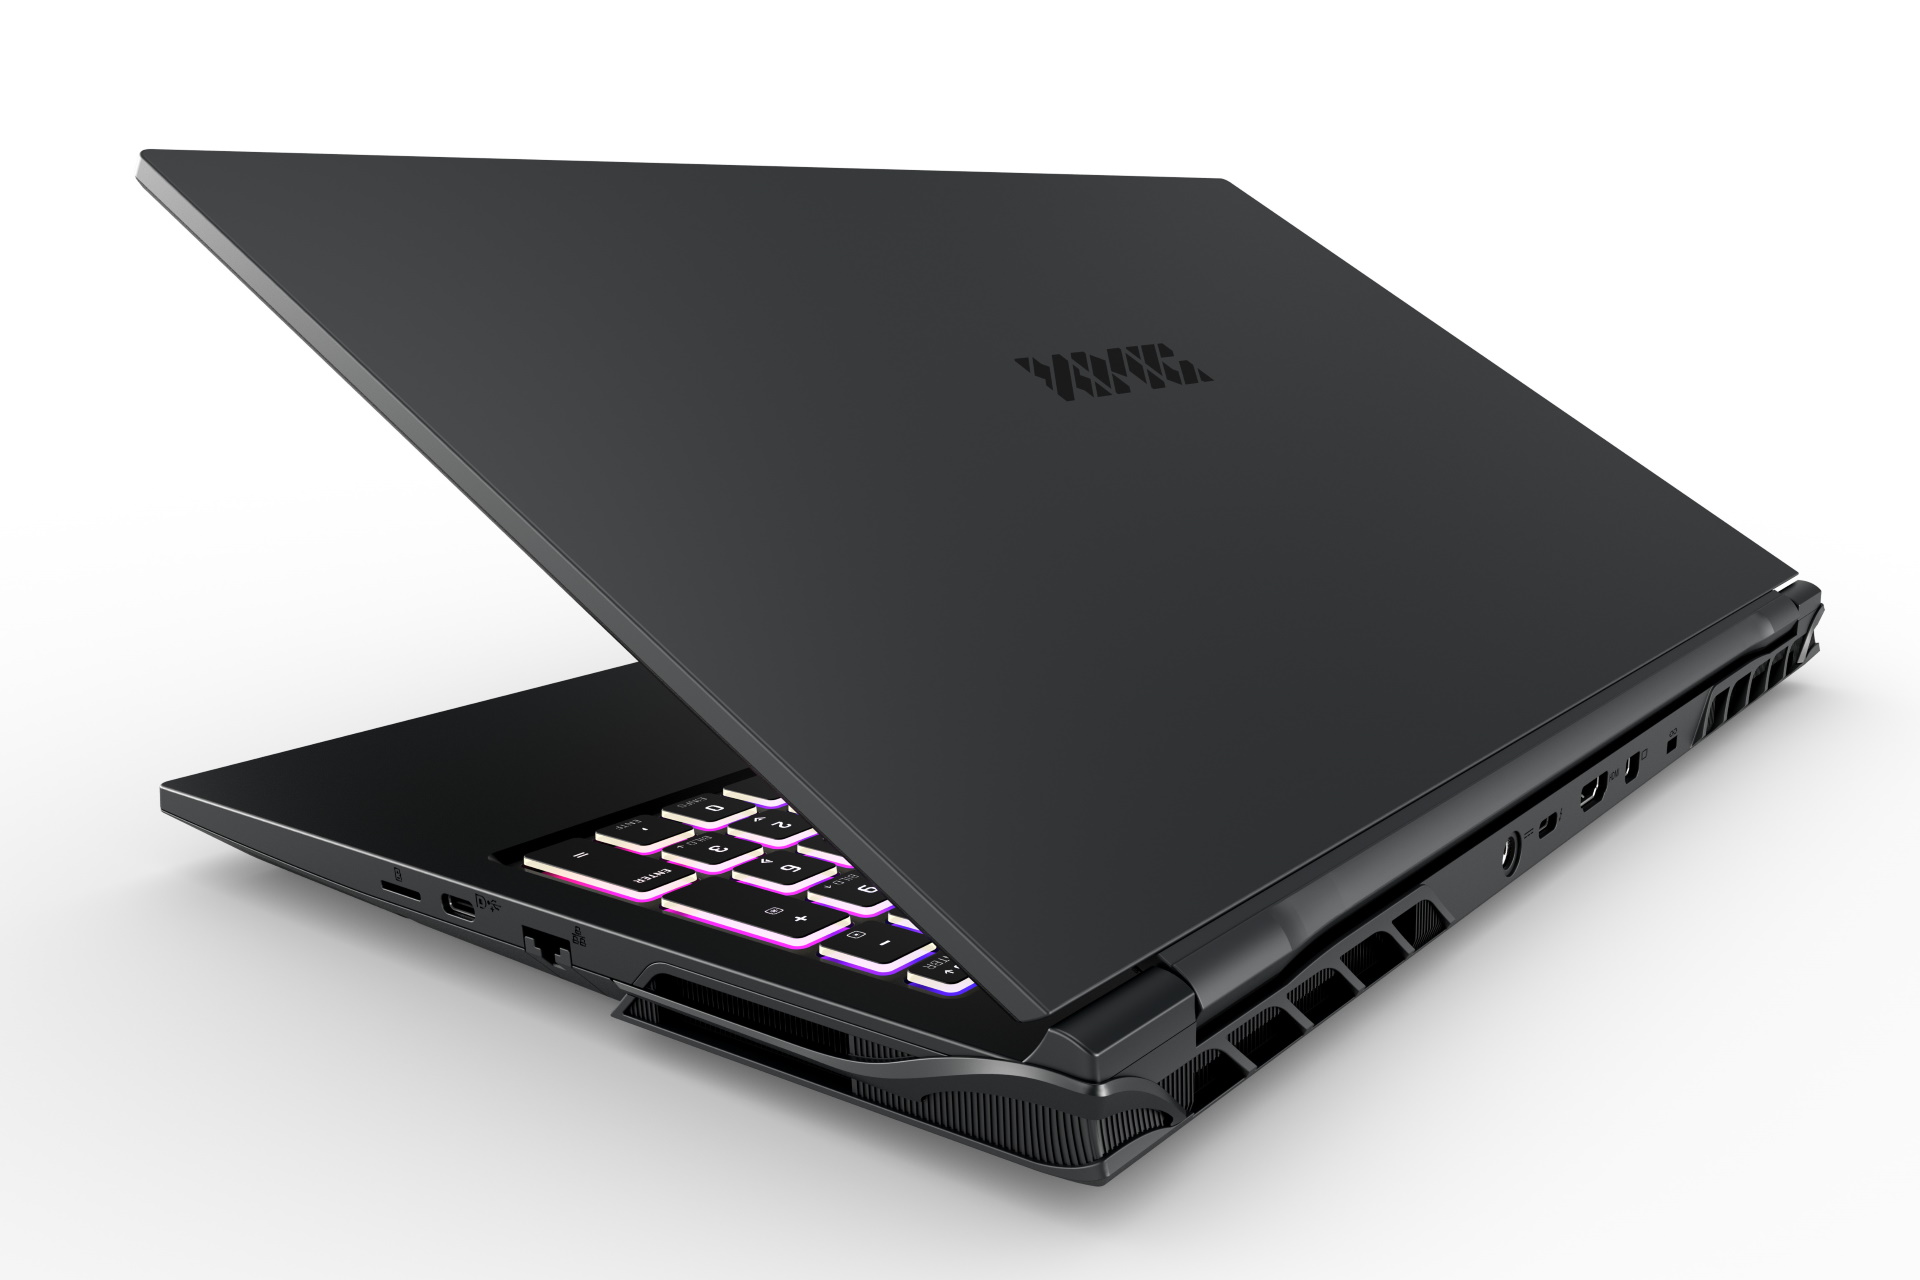
申克公司重新引入了读卡器,但只有MicroSD格式;前代产品没有SD读卡器。这也改变了USB端口的分布。两个USB-A端口现在在左边,而除了microSD读卡器外,一个USB-C端口位于右边。

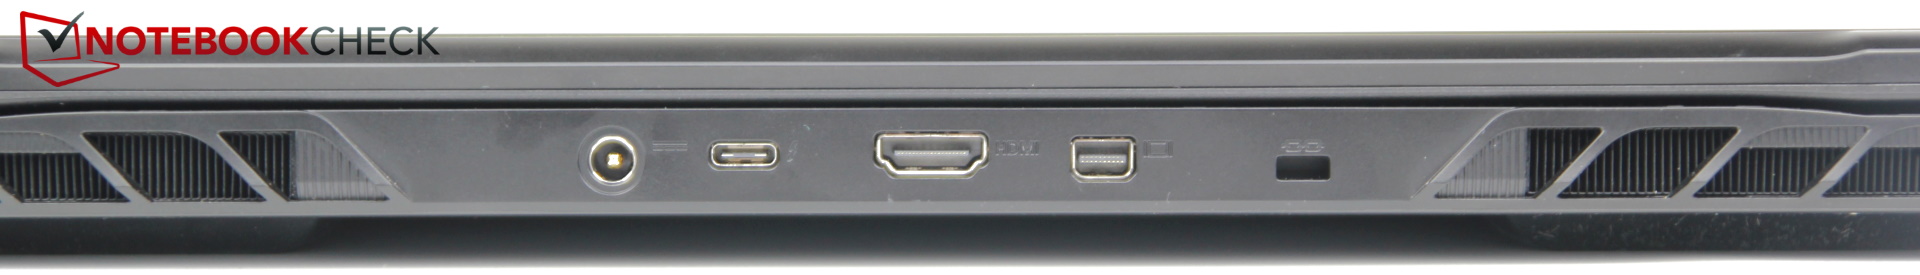
再加上背面的MiniDP,这使得Pro 15具备了VR功能。
指纹传感器已被集成到触摸板的左上角。
端口的分布是可以接受的,但一根粗大的网线可能会妨碍到右边的鼠标手。
SD卡阅读器
MicroSD读卡器有一个卡入机制,所以卡几乎不伸出来。然而,使用我们的AV PRO microSD 128 GB V60测试卡的速度低于平均值。Razer Blade的读卡器的速度是其两倍。
| SD Card Reader | |
| average JPG Copy Test (av. of 3 runs) | |
| Razer Blade 15 2022 (Toshiba Exceria Pro SDXC 64 GB UHS-II) | |
| Average of class Gaming (20.9 - 210, n=54, last 2 years) | |
| Schenker XMG Neo 15 (i7-12700H, RTX 3080 Ti) | |
| MSI Raider GE66 12UHS (AV PRO microSD 128 GB V60) | |
| Schenker XMG Pro 15 (i7-12700H, RTX 3080 Ti) | |
| maximum AS SSD Seq Read Test (1GB) | |
| Razer Blade 15 2022 (Toshiba Exceria Pro SDXC 64 GB UHS-II) | |
| Average of class Gaming (25.5 - 261, n=51, last 2 years) | |
| Schenker XMG Pro 15 (i7-12700H, RTX 3080 Ti) | |
| Schenker XMG Neo 15 (i7-12700H, RTX 3080 Ti) | |
沟通
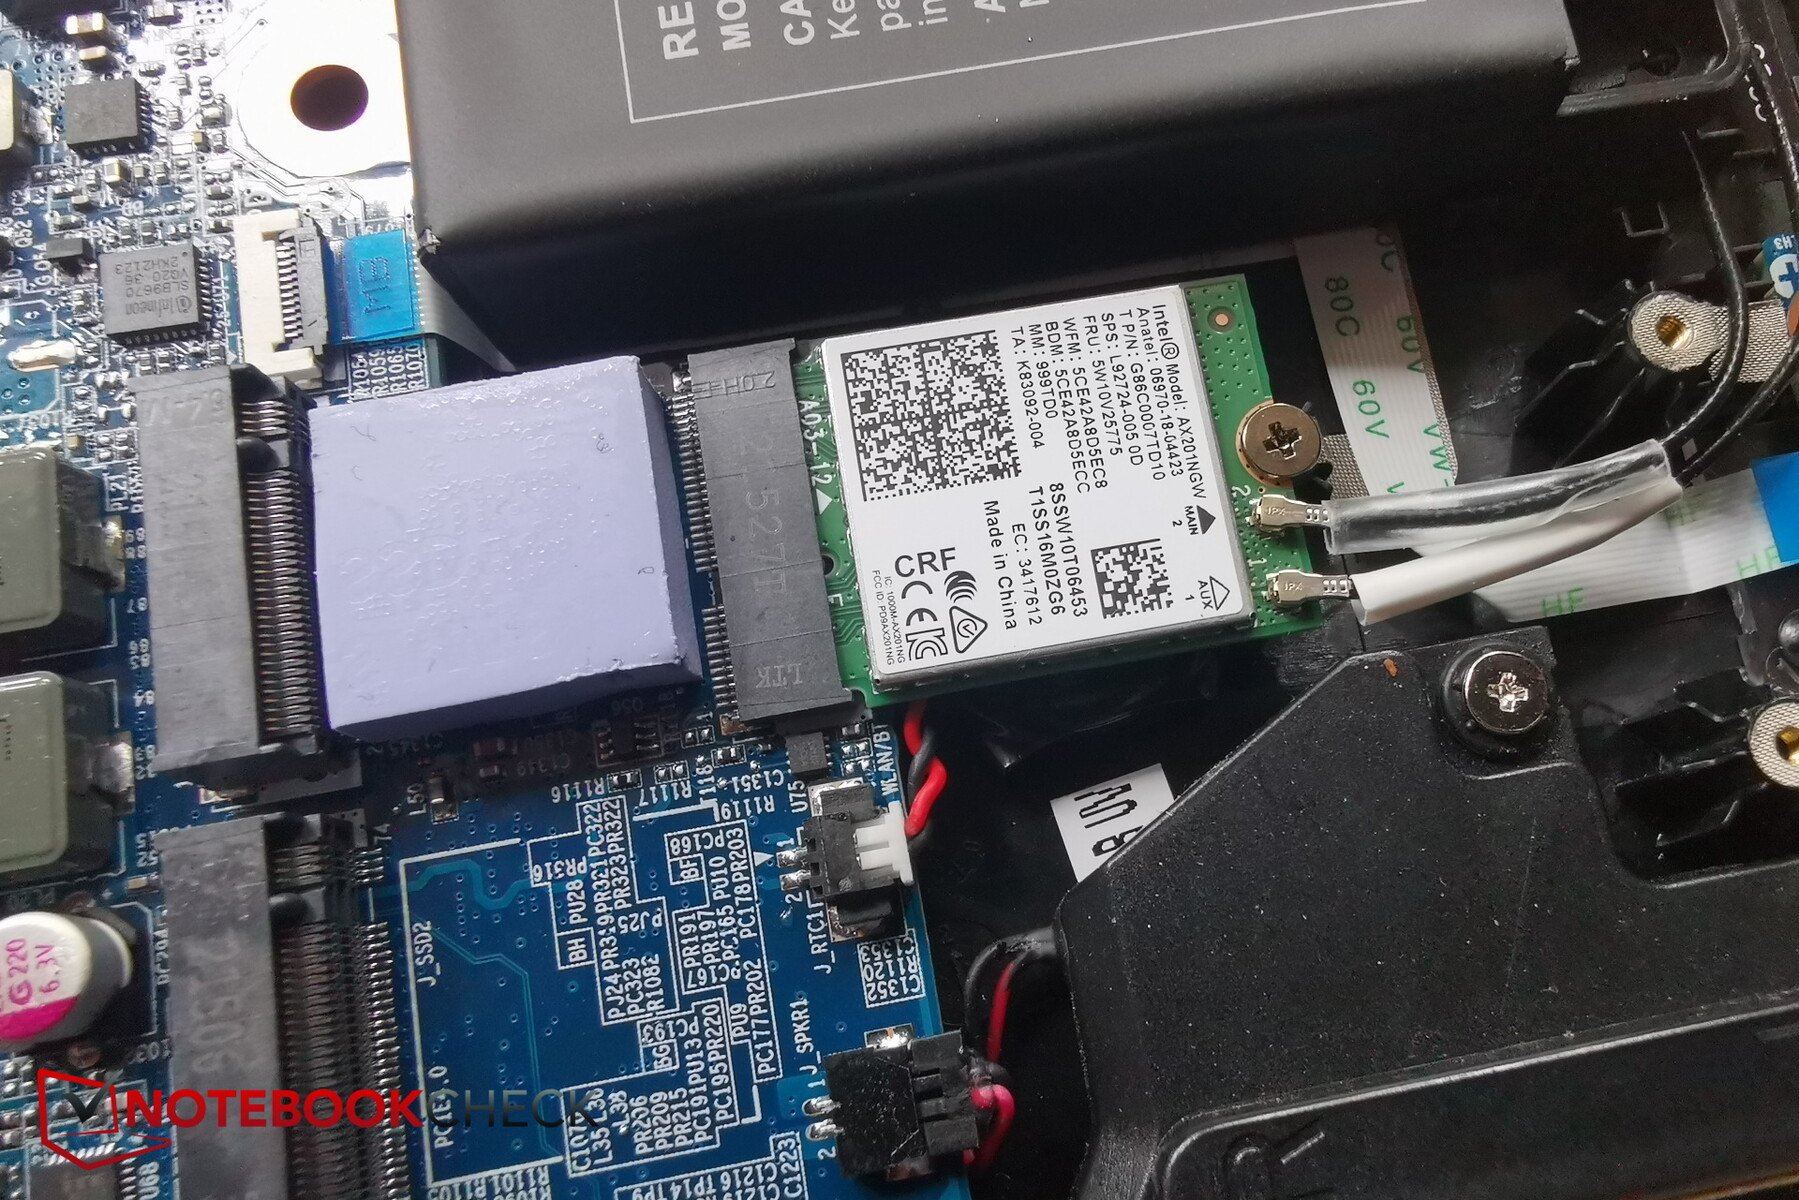
制造商选择了流行的英特尔AX201 WiFi模块,它还不支持Wi-Fi 6e,但可以连接到5GHz网络。
Pro 15的传输速率始终处于较高的范围。
网络摄像头
网络摄像头也得到了升级,即从720p到1080p,这是全高清。我们测量了可接受的色彩偏差,但尽管是全高清,图片看起来还是有点颗粒感(室外,阴影)和苍白。

 GeForce RTX 3080 Ti Laptop GPU, i7-12700H, Samsung SSD 980 Pro 1TB MZ-V8P1T0BW")
 GeForce RTX 3080 Ti Laptop GPU, i7-12700H, Samsung SSD 980 Pro 1TB MZ-V8P1T0BW")
安全问题
Pro 15提供一个Kensington端口、TPM和一个指纹传感器。
该传感器与Windows Hello的整合工作可靠,登录速度非常快。
配件和保修
典型的Schenker配件,如带有驱动程序的U盘或鼠标垫,在Pro中都没有,它只配有CD驱动程序。
申克公司在德国提供24个月的保修。
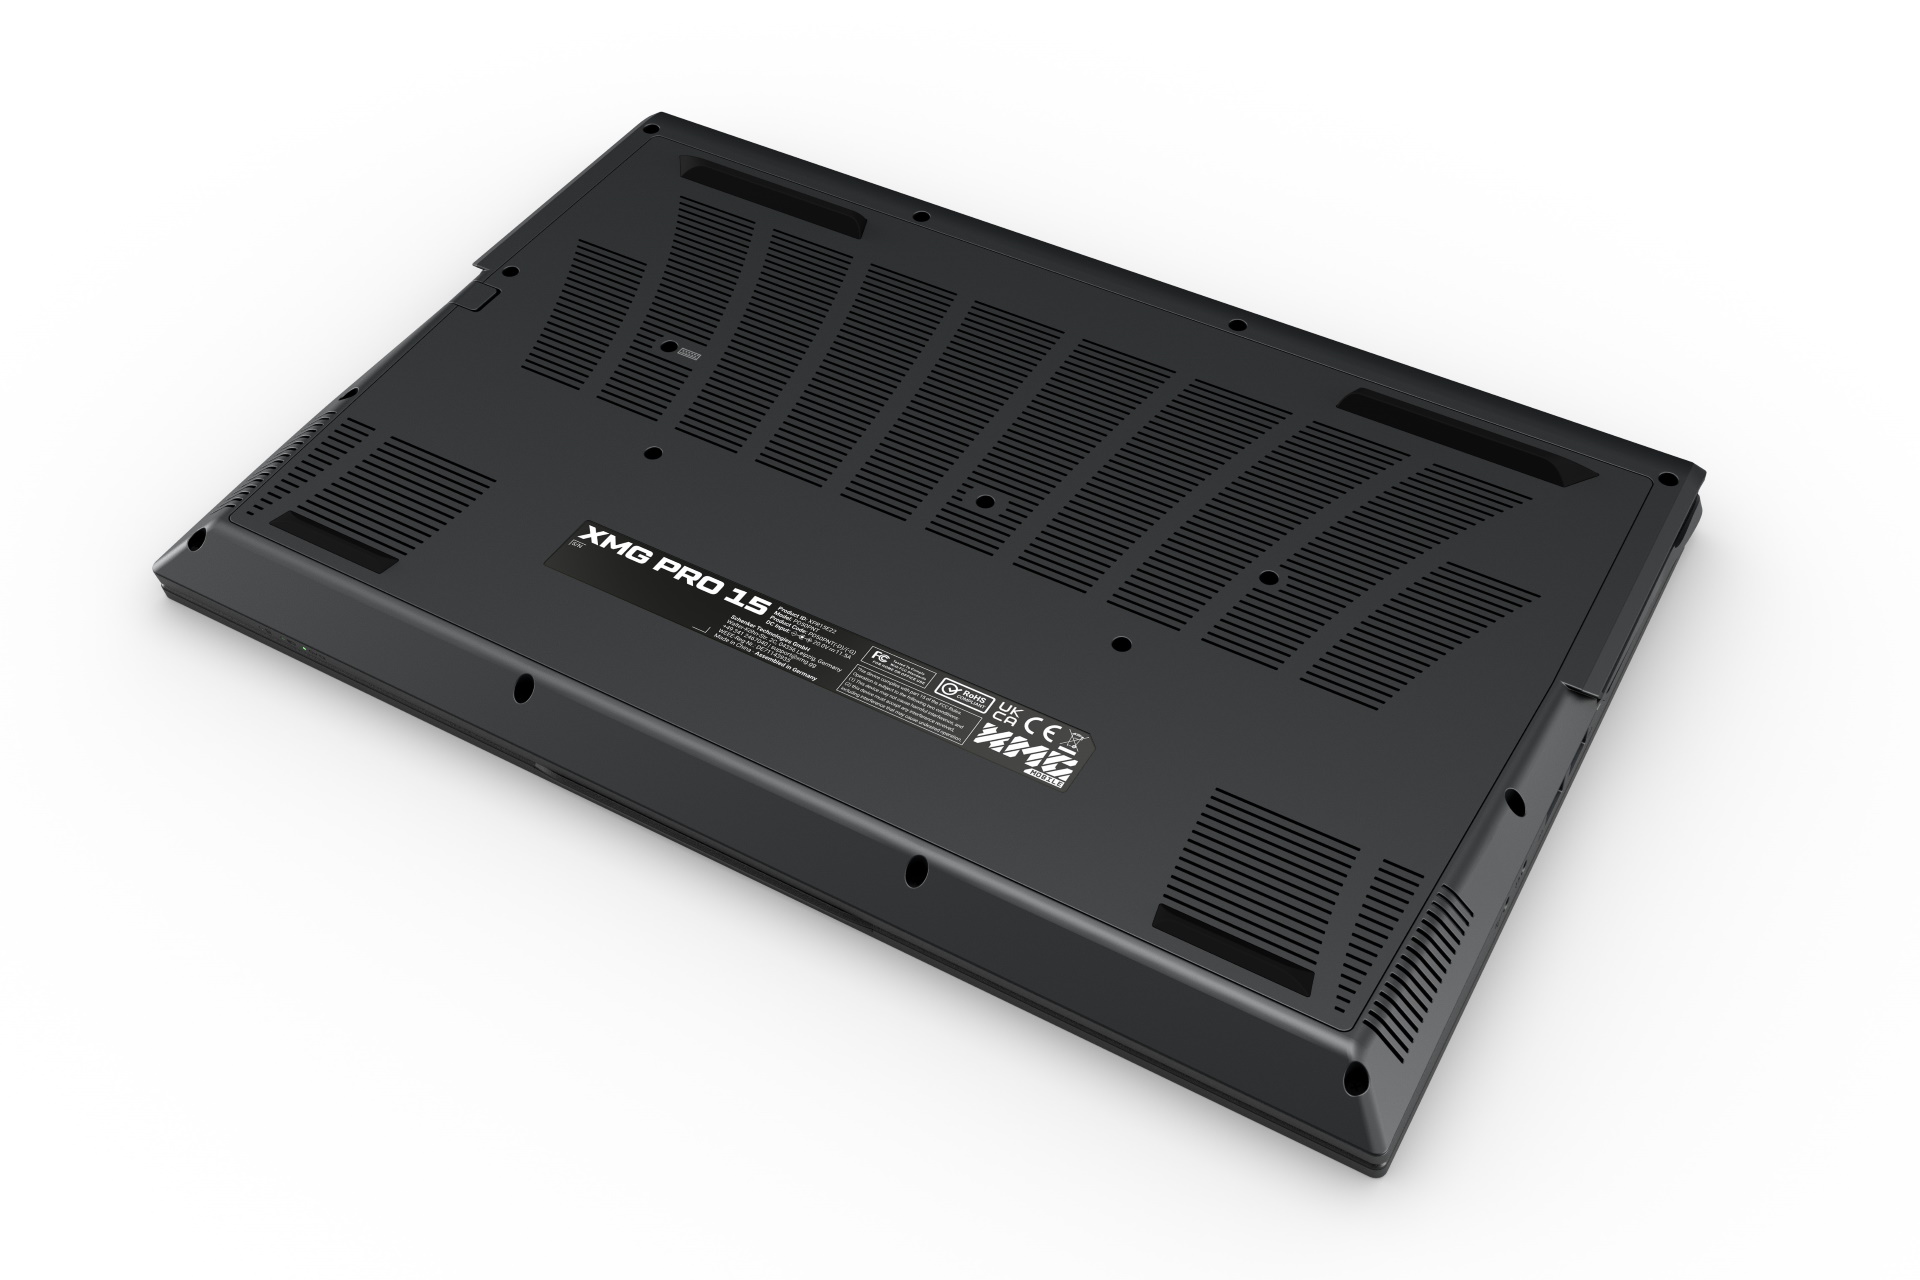
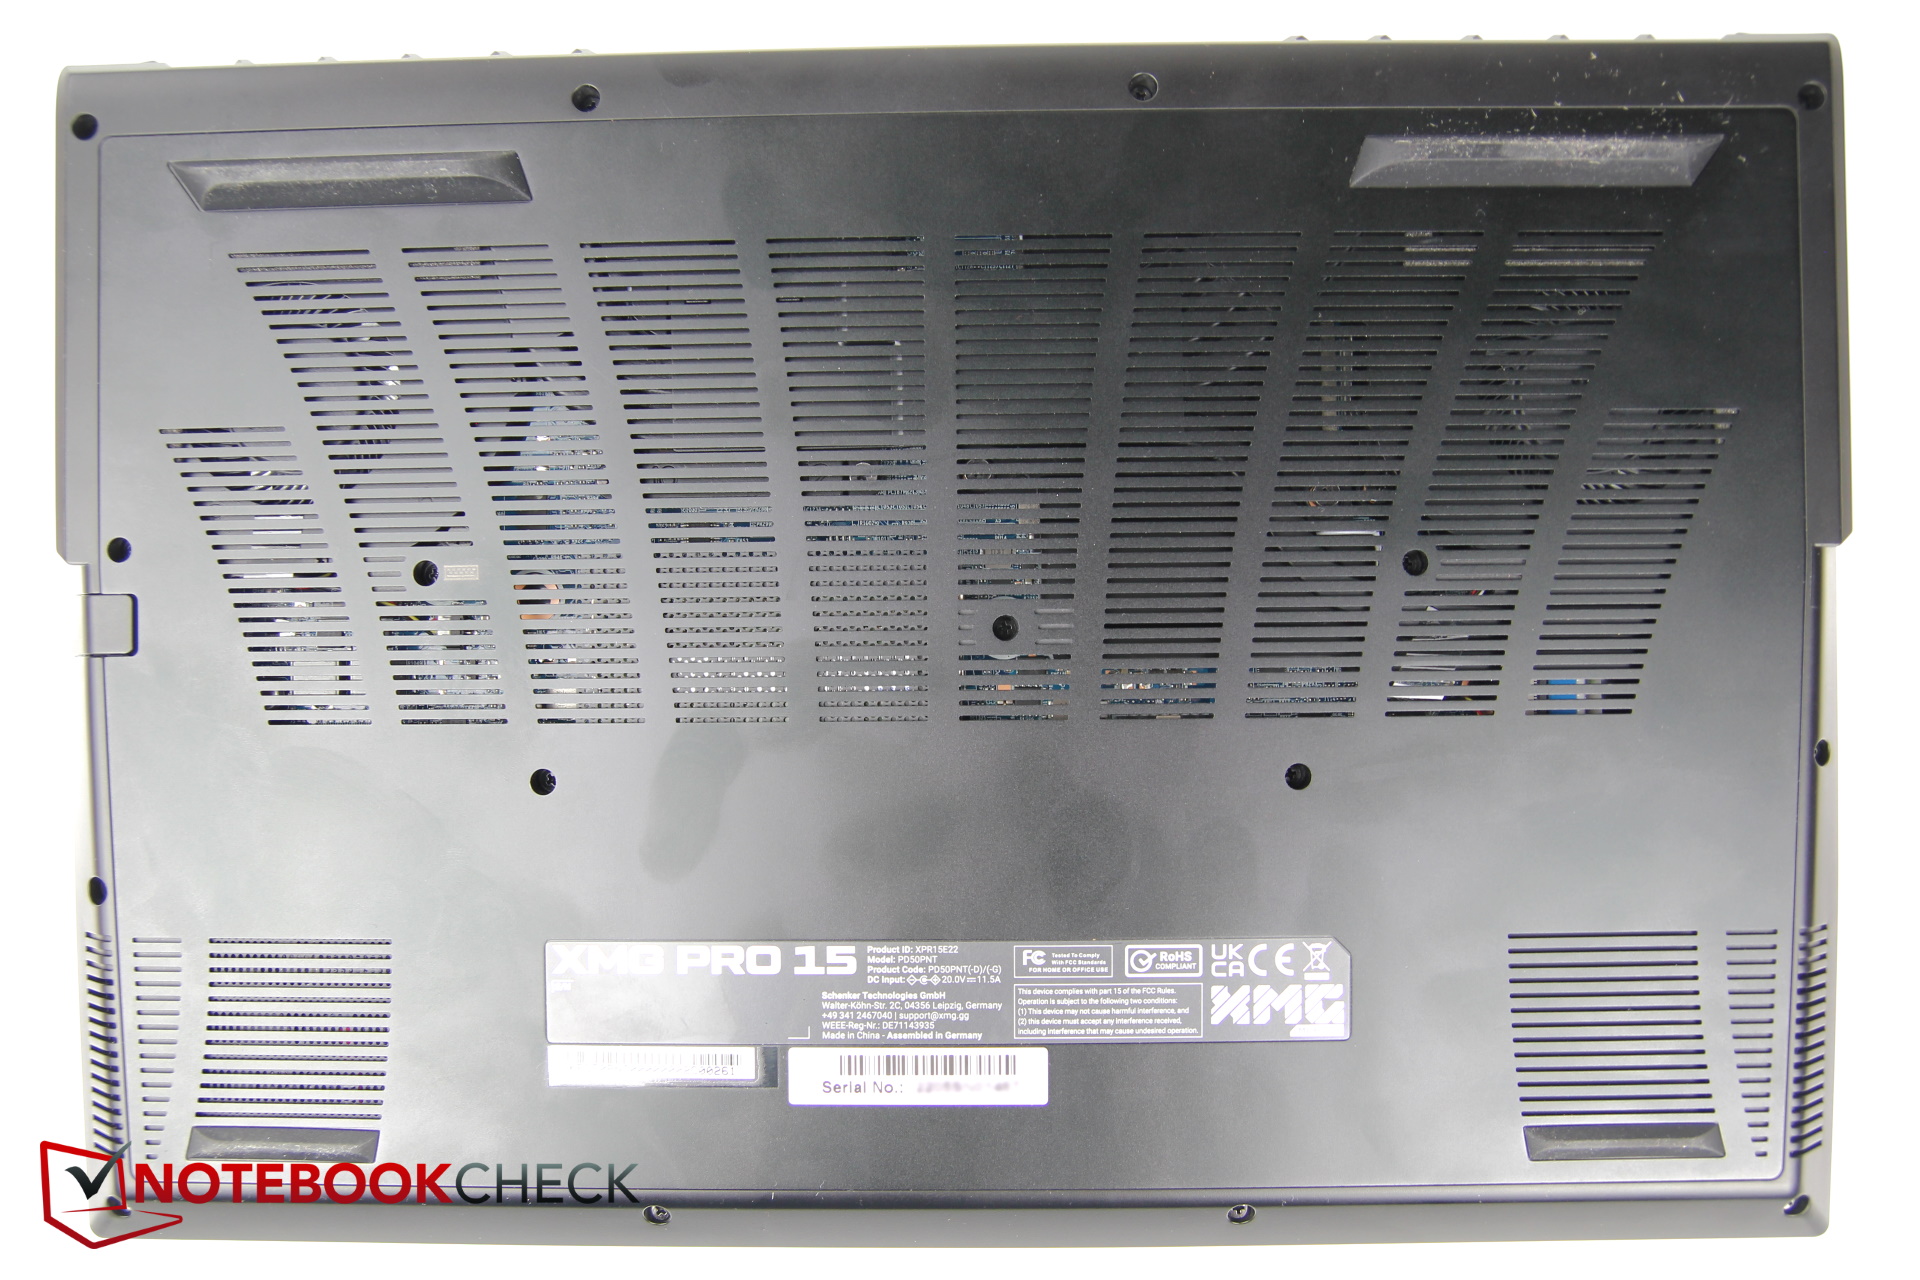
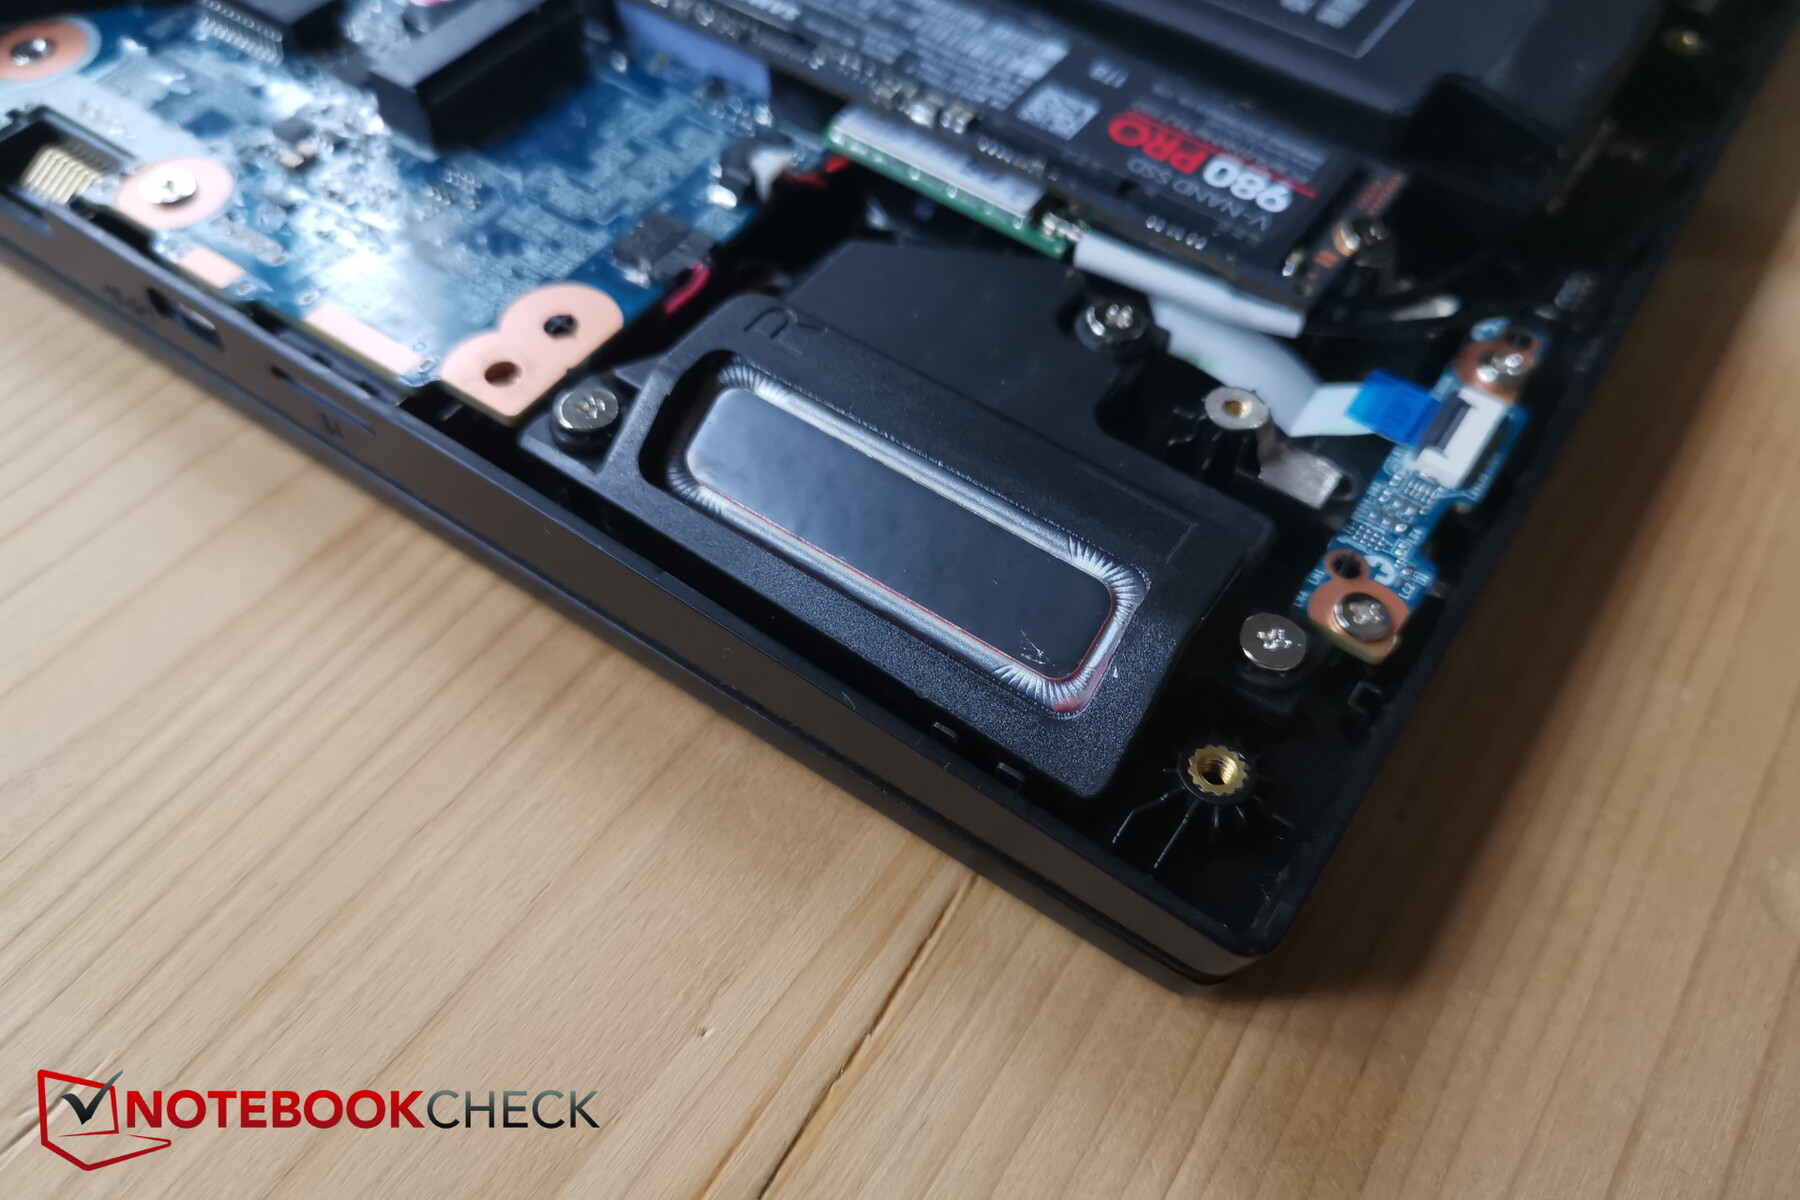
维护
铝制的底面由16颗十字螺丝固定。即使是有水口的Neo也没有这么多(14个)。幸运的是,所有的螺丝都有相同的长度,所以不会有任何混淆。
然后,底板可以非常容易地被卸下,不需要任何额外的工具,你可以接触到电池、风扇、两个M.2插槽和内存。只有WiFi模块被隐藏起来,也就是在固态硬盘的下面,这在散热方面也许不是那么理想。
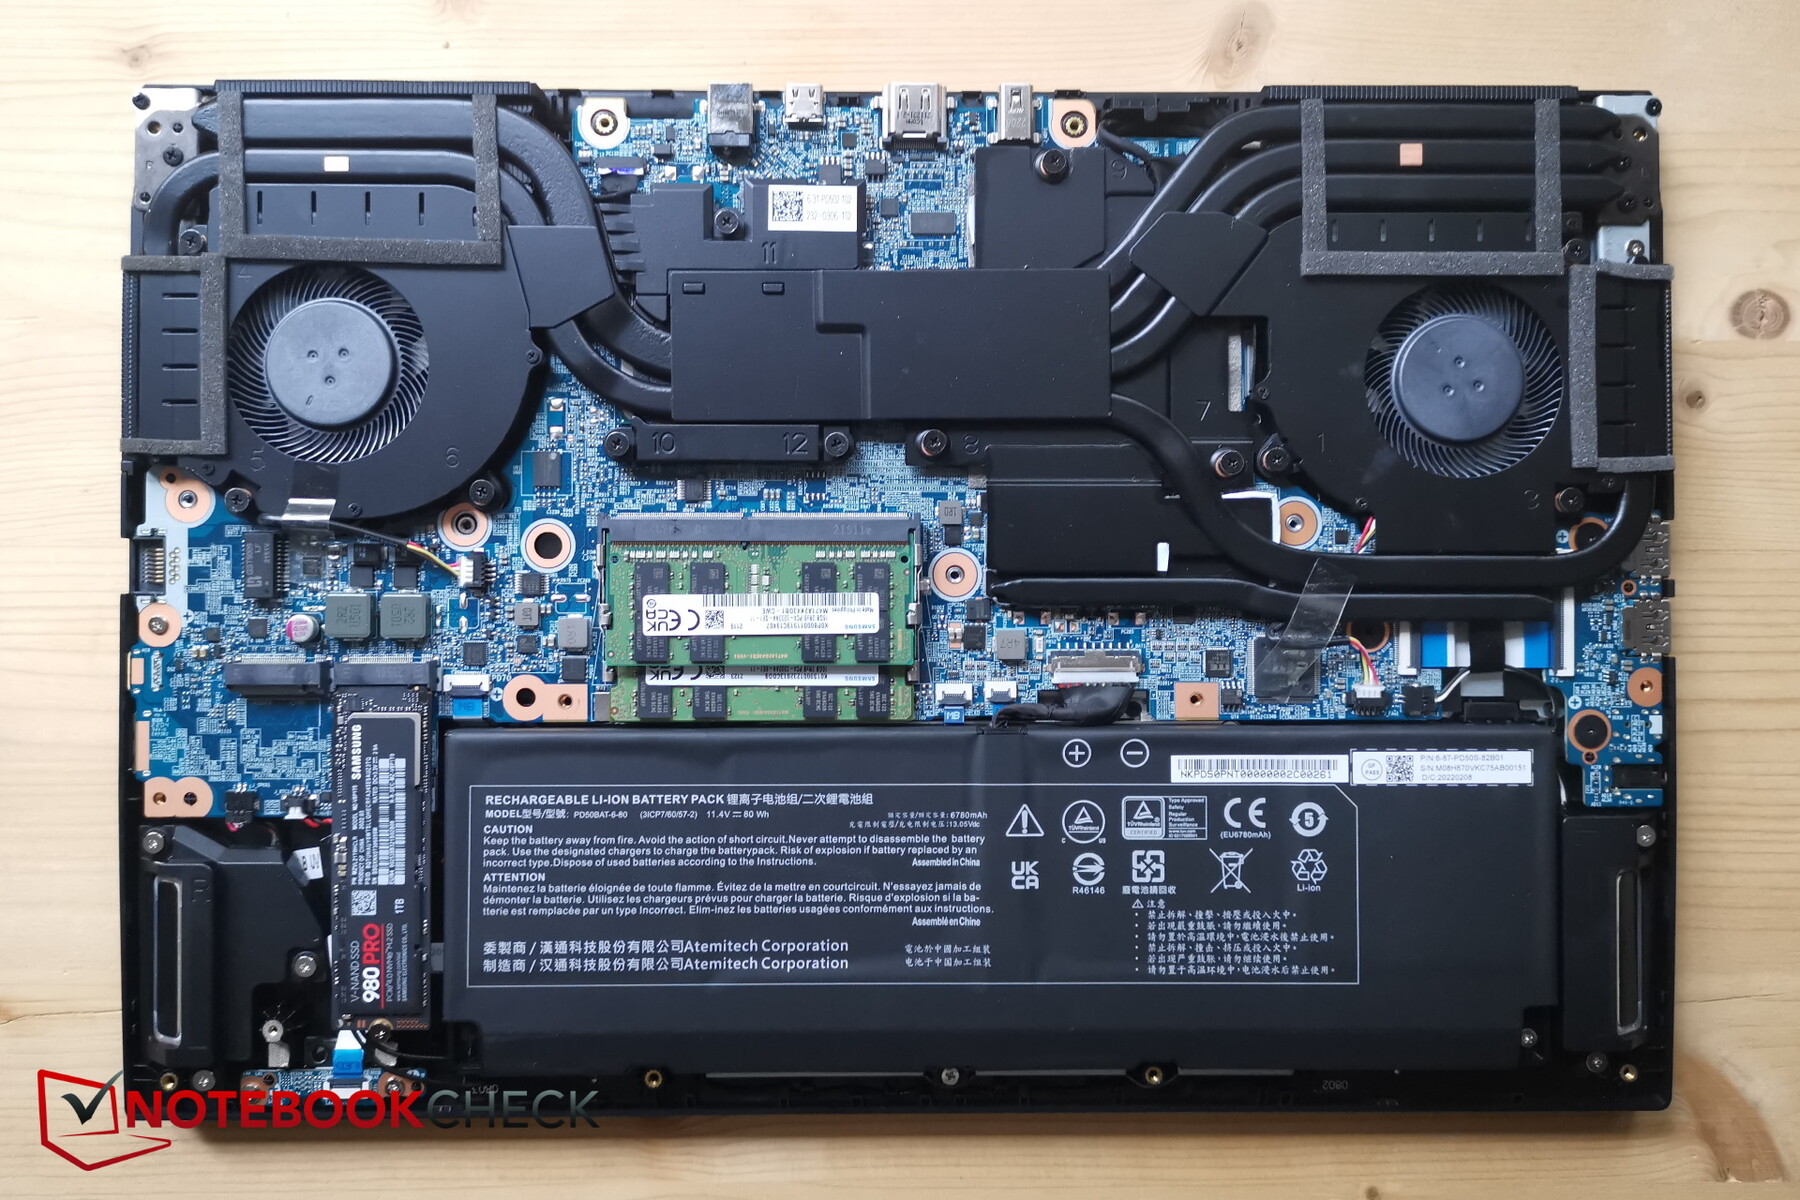
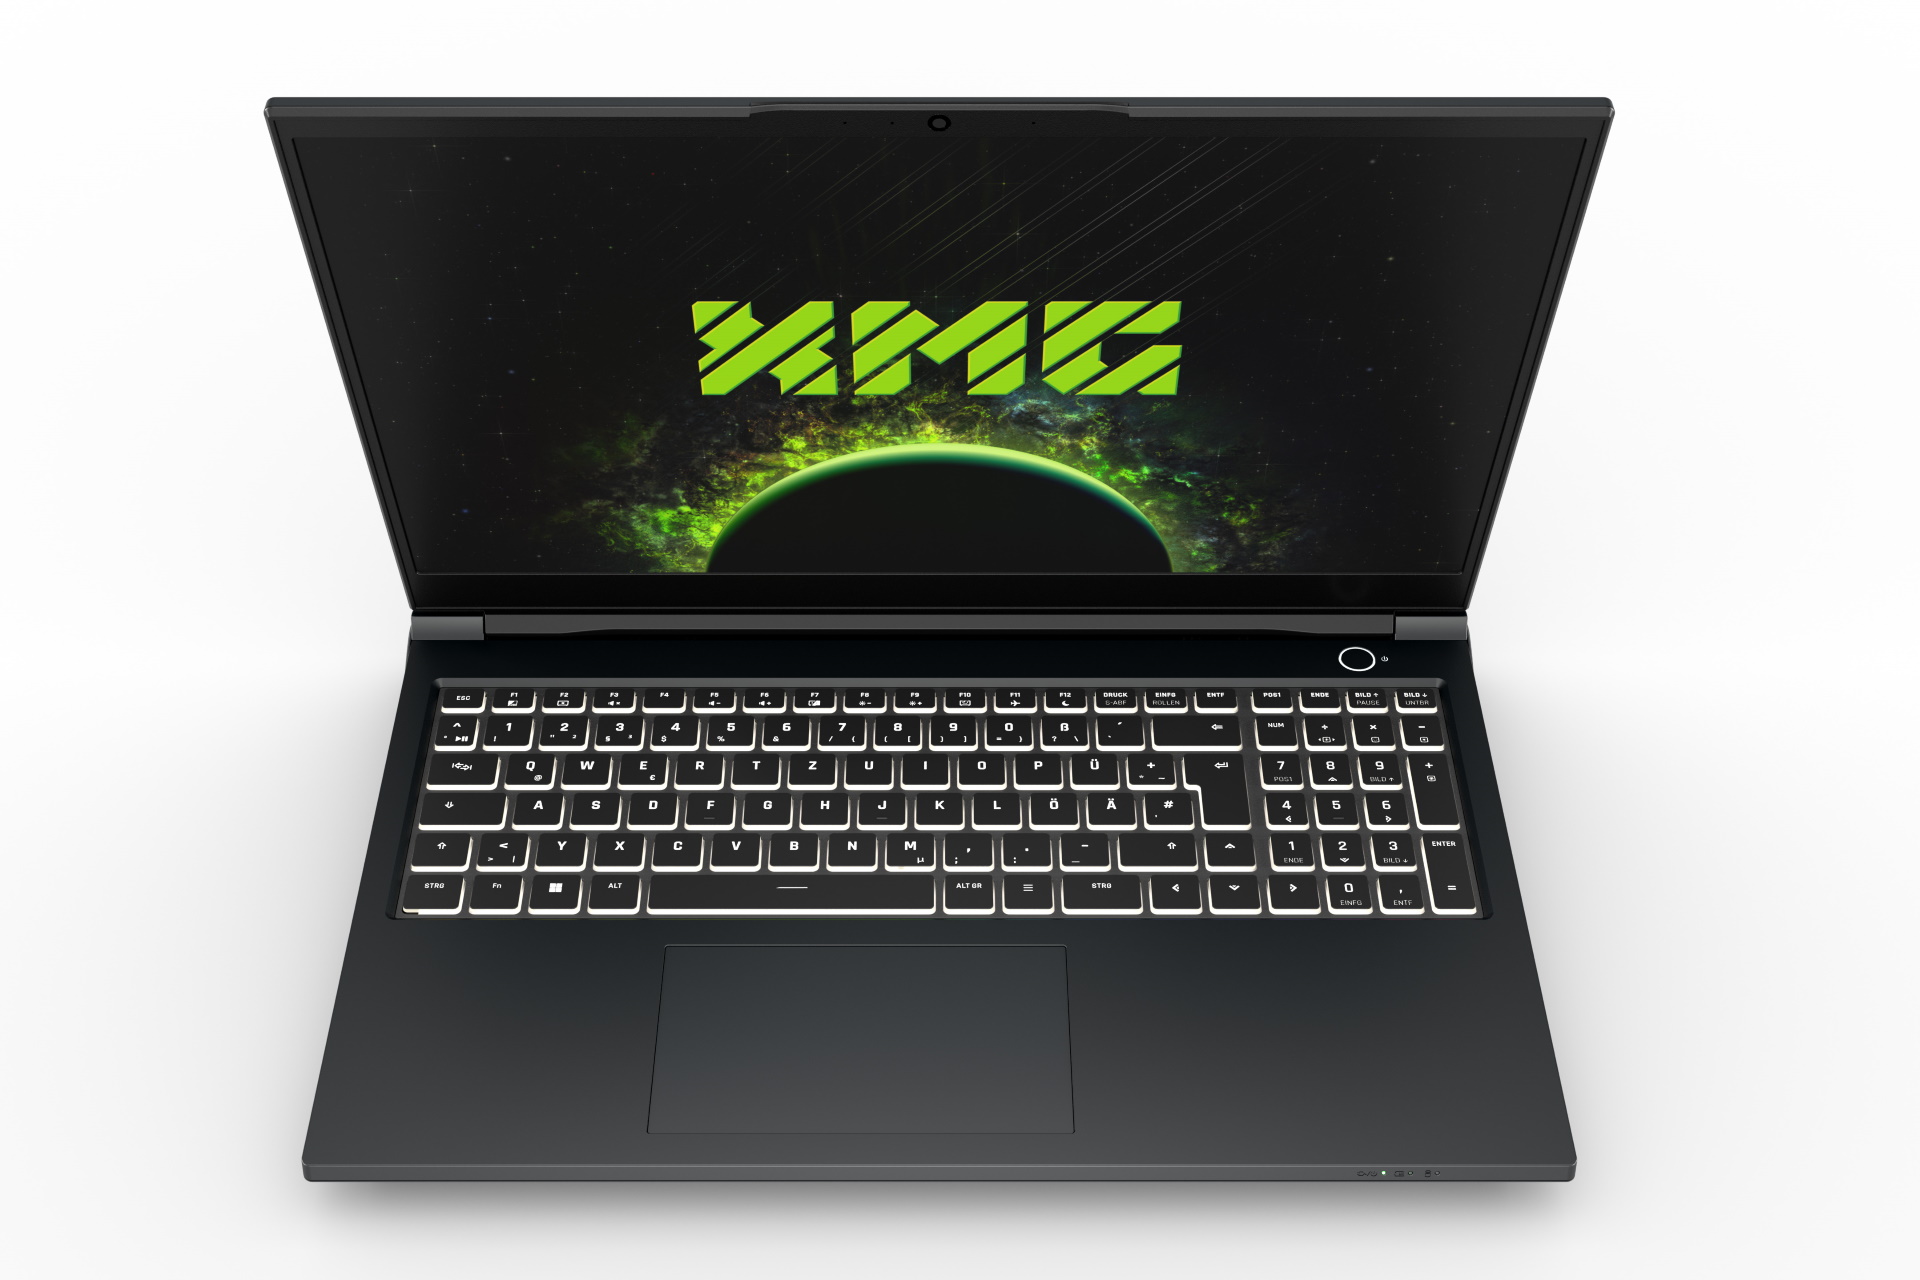
输入设备。每键RGB
键盘
Schenker没有像Neo 15那样使用光学机械键盘,而是在Pro 15中使用了一个 "普通 "的Chiclet键盘,每个键都有RGB背景光。
其布局非常整齐。虽然按键的设计很小,但它们的间距很好,而且右侧还有空间容纳一个小键盘。
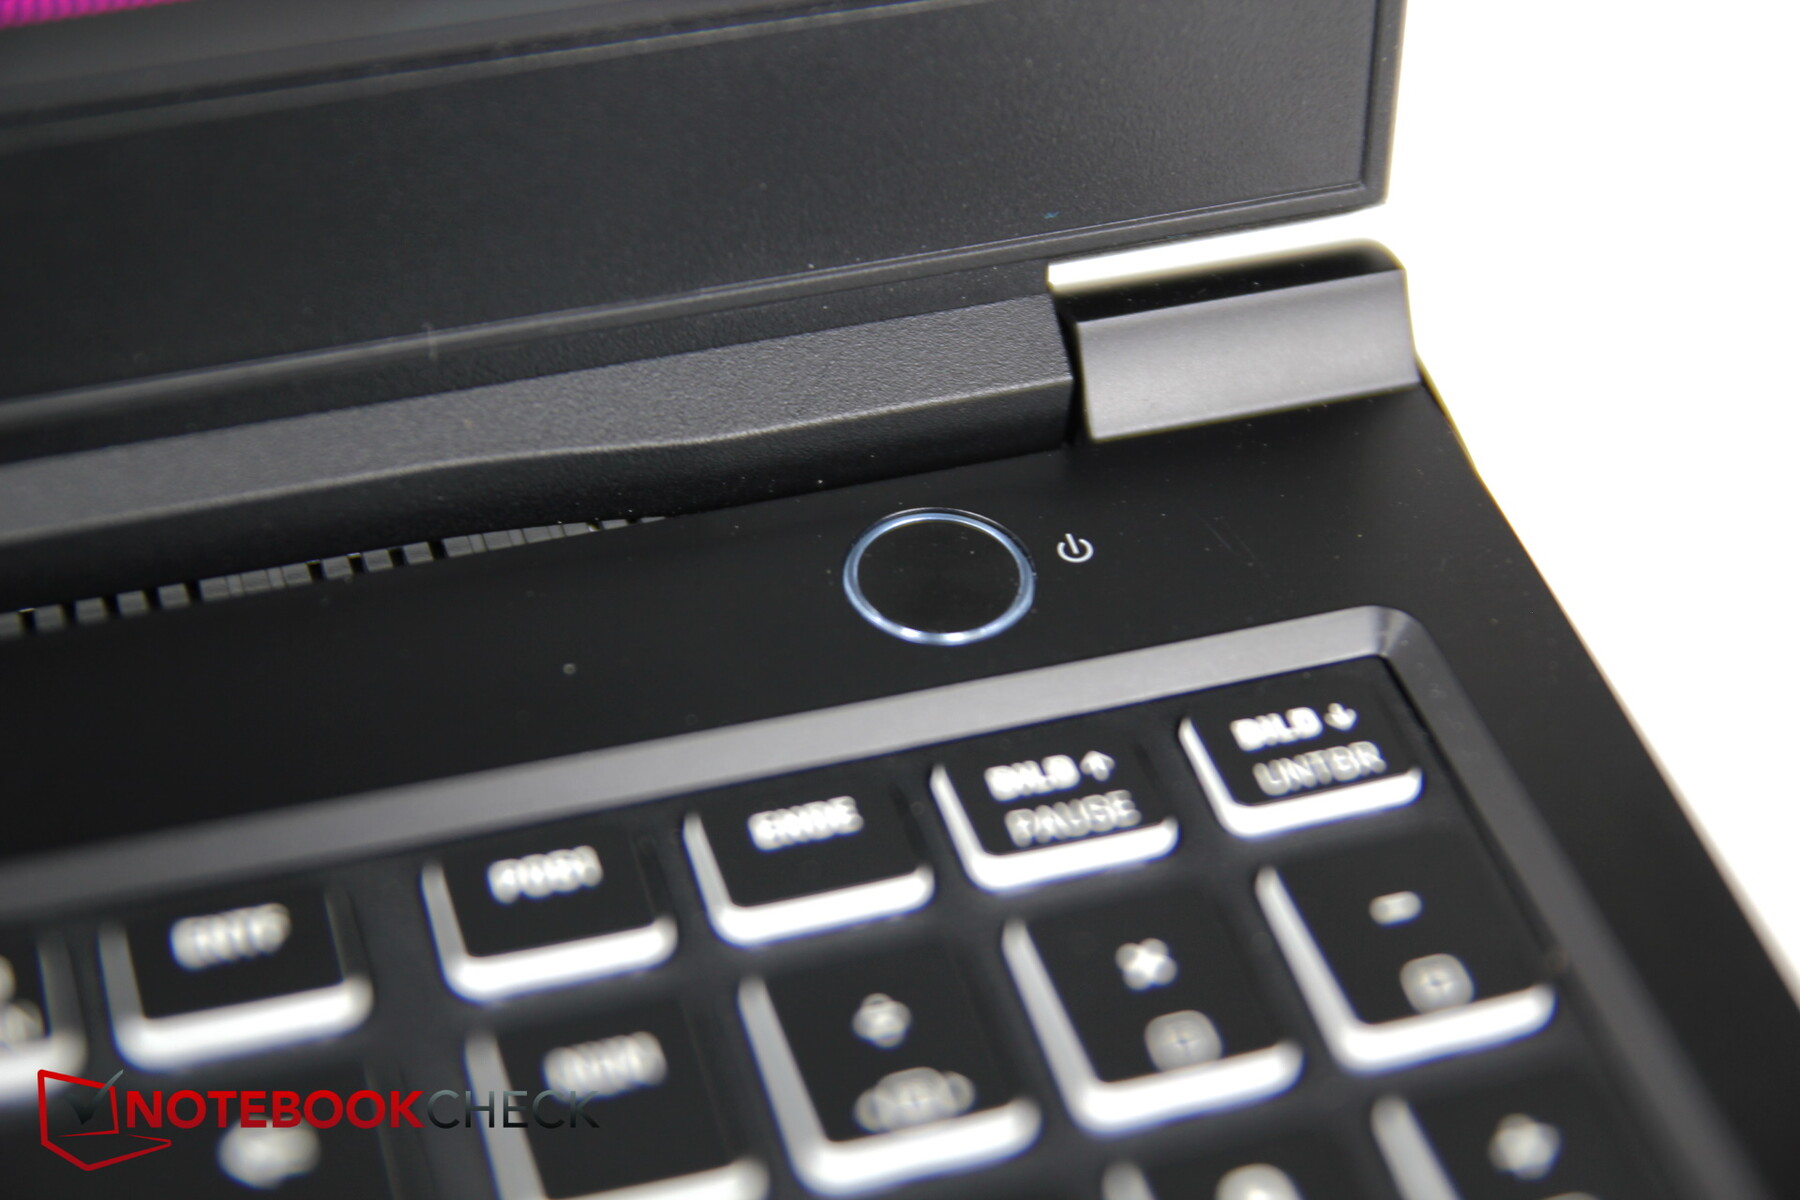
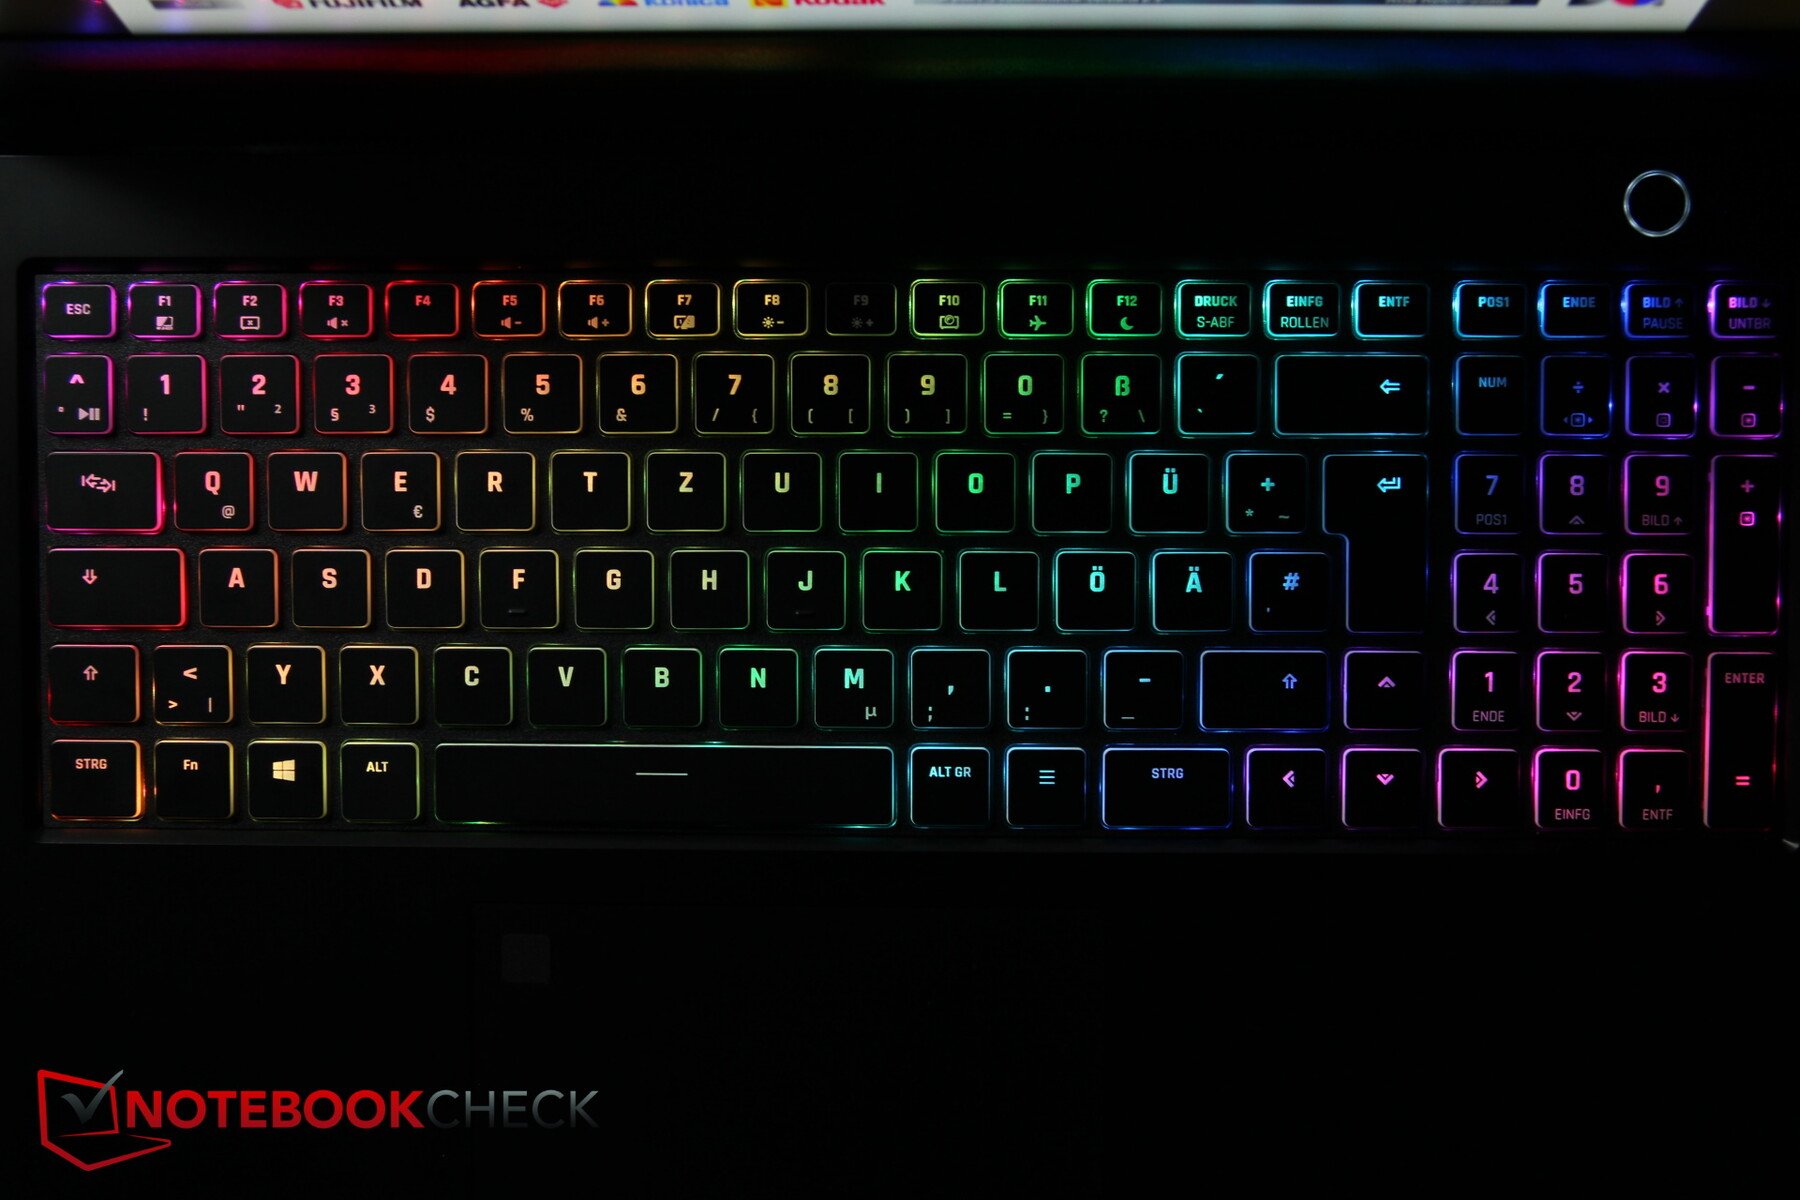

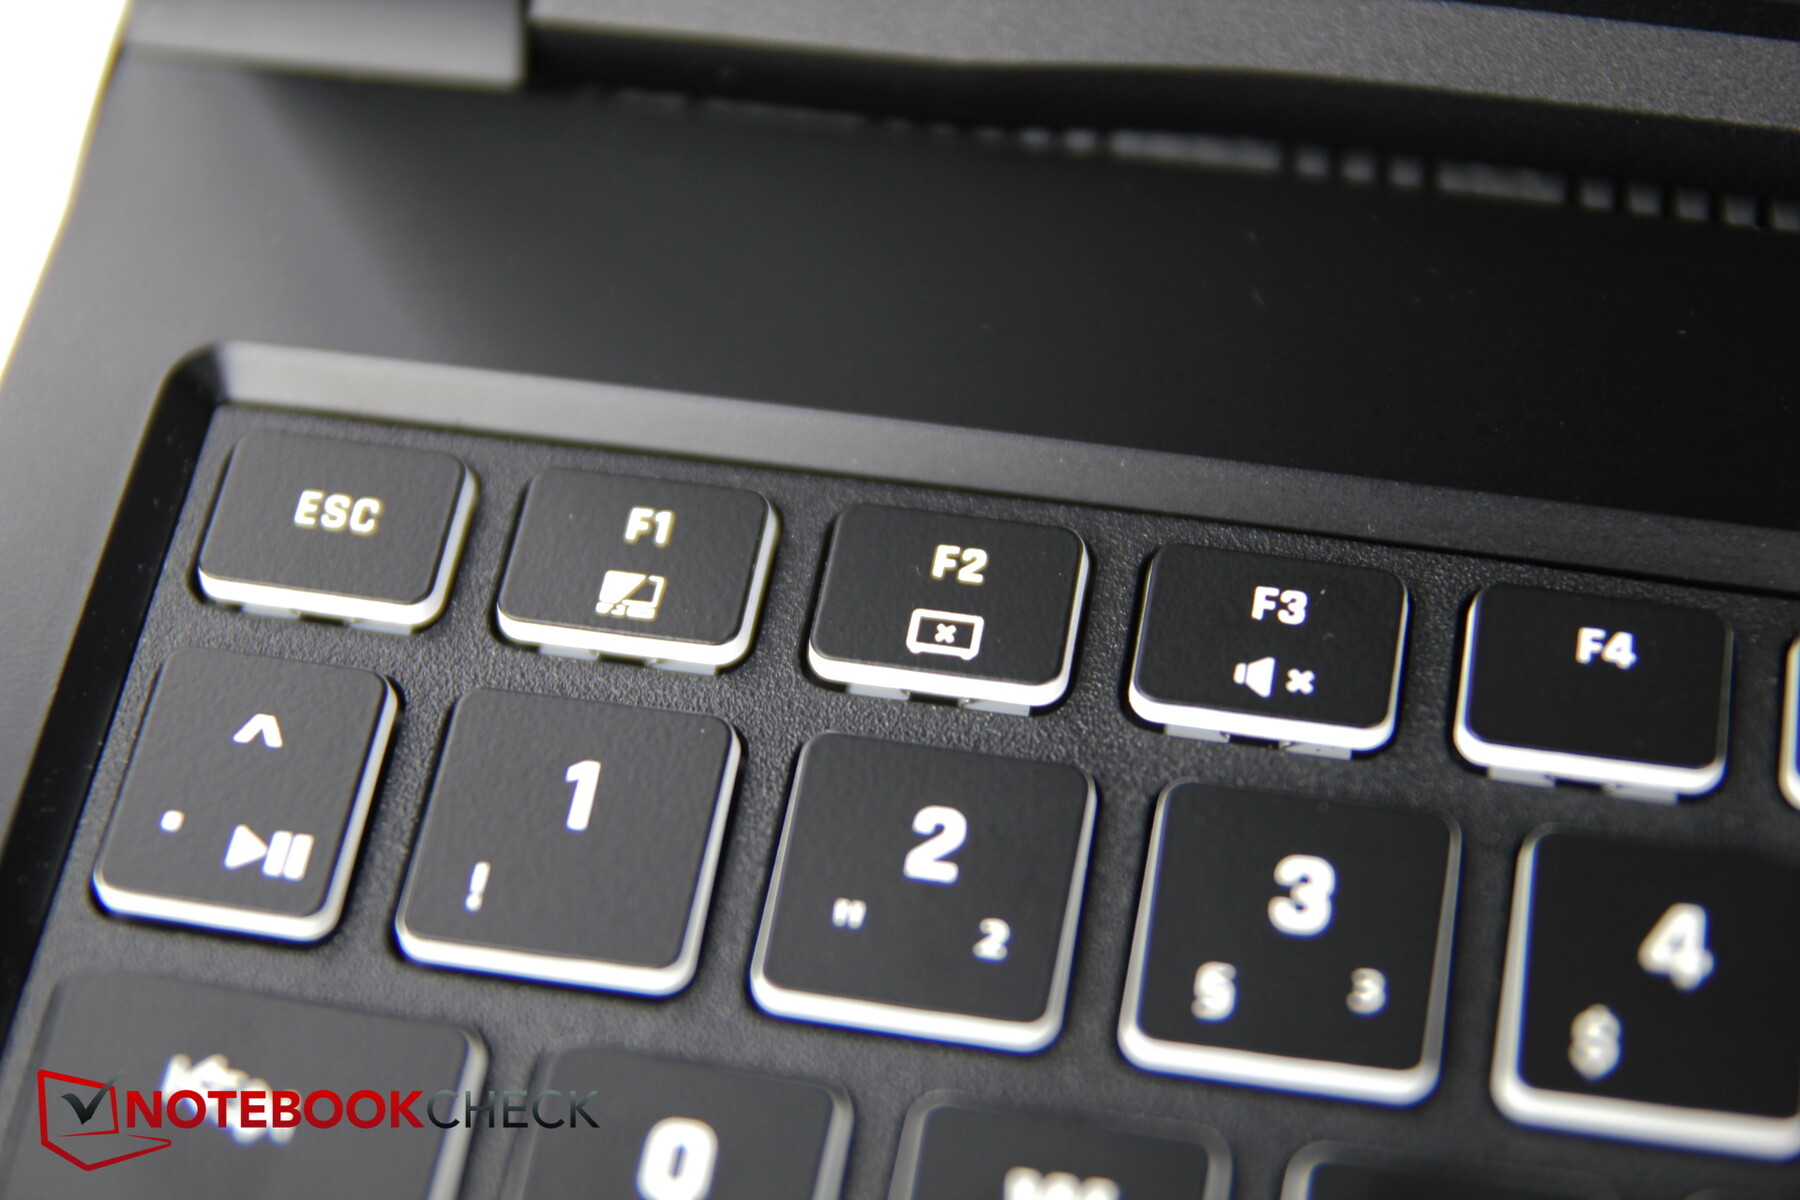
电源键被安装为键盘上方的一个额外的键,而方向键的尺寸也很正常。只有F键的高度被减半。字母不是很大,但由于是透明的白色,所以很容易阅读。
打字不复杂,速度也很快,键程可以接受,键的反馈也很明显。击键噪音适中。
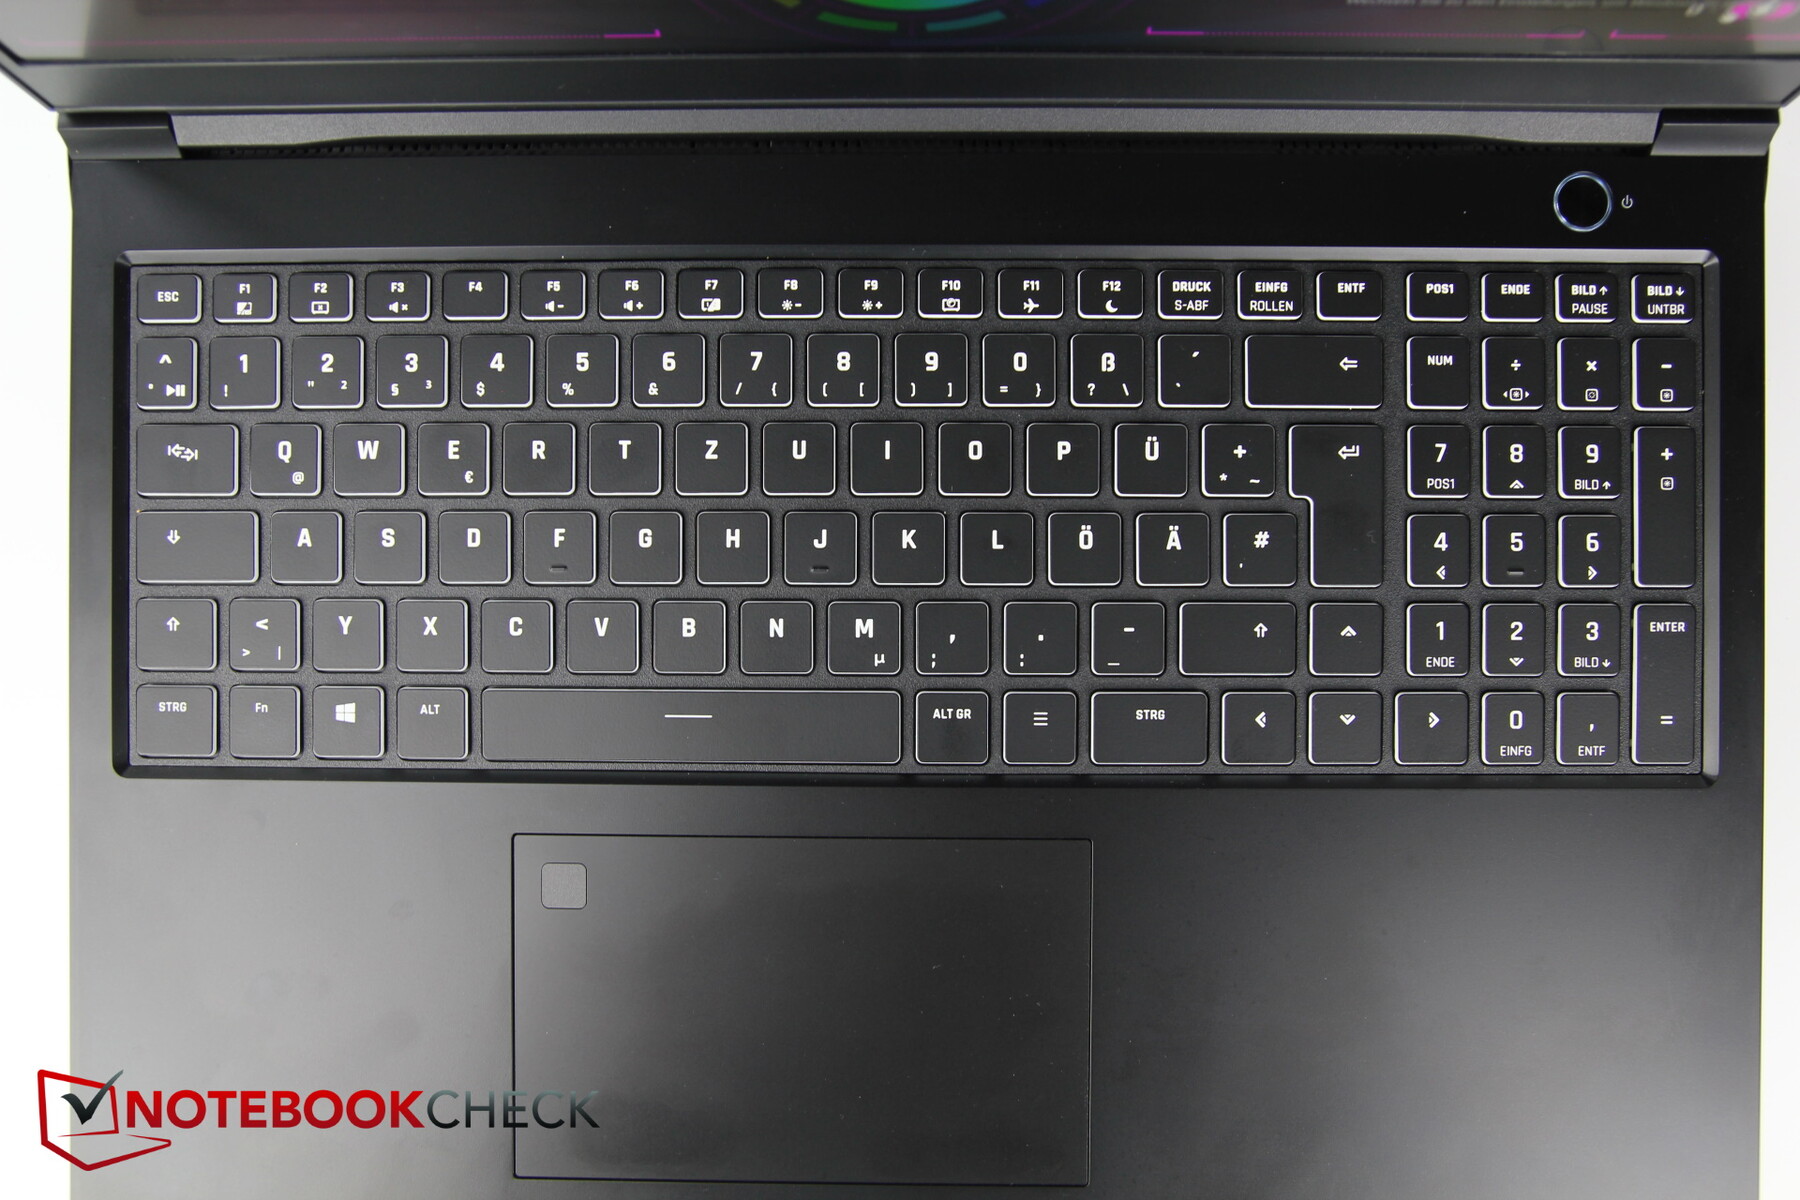
触摸板

宽大的触摸板(约12.1 x 7.3厘米)具有良好的滑行性能;只有在非常缓慢的移动过程中才会出现轻微的颤动。遗憾的是,前代产品的专用鼠标按钮已经成为历史。集成式按钮的点击声短促、清脆、可靠,噪音适中到中等。
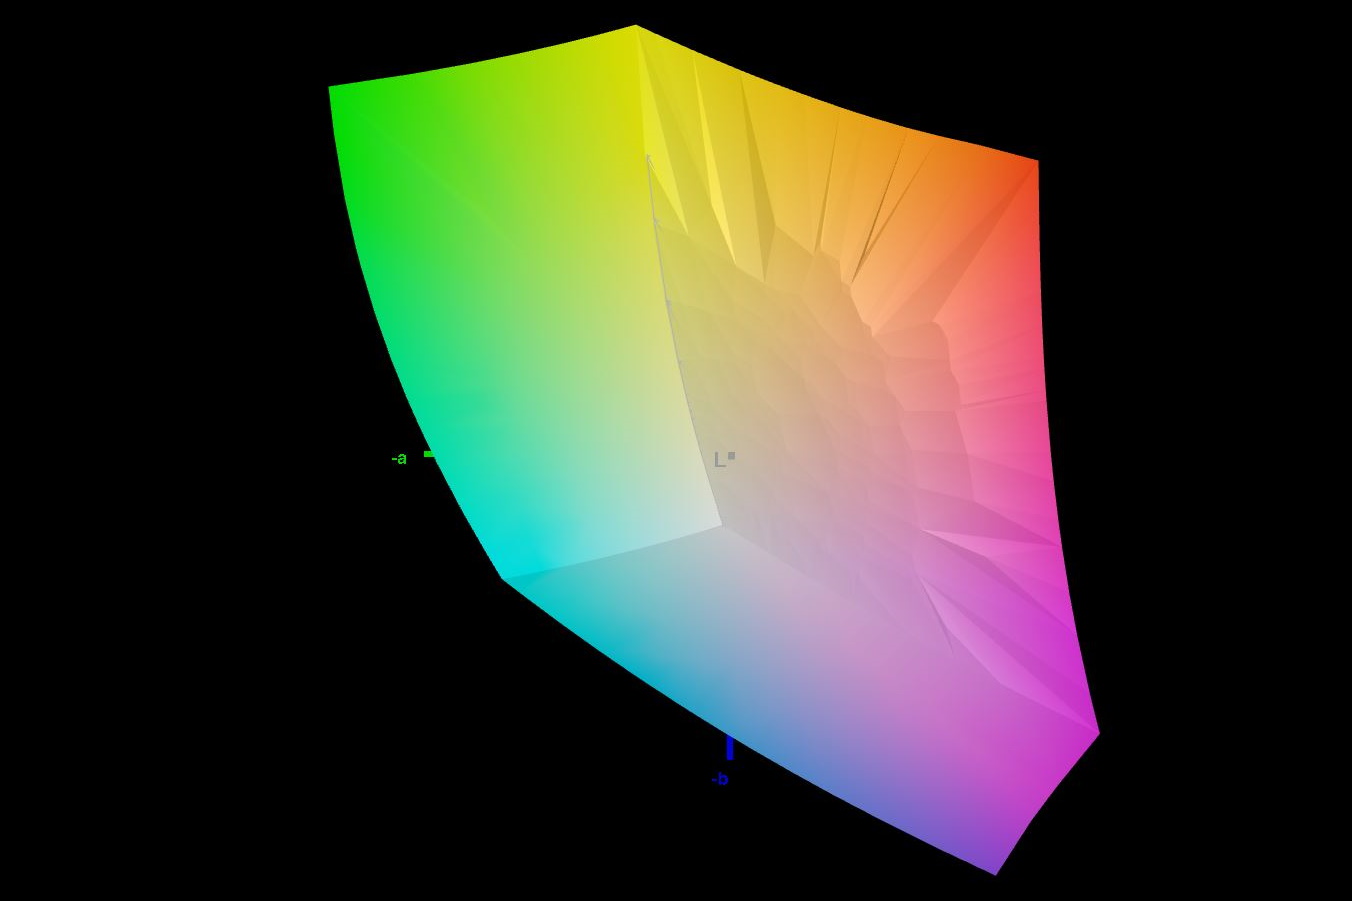
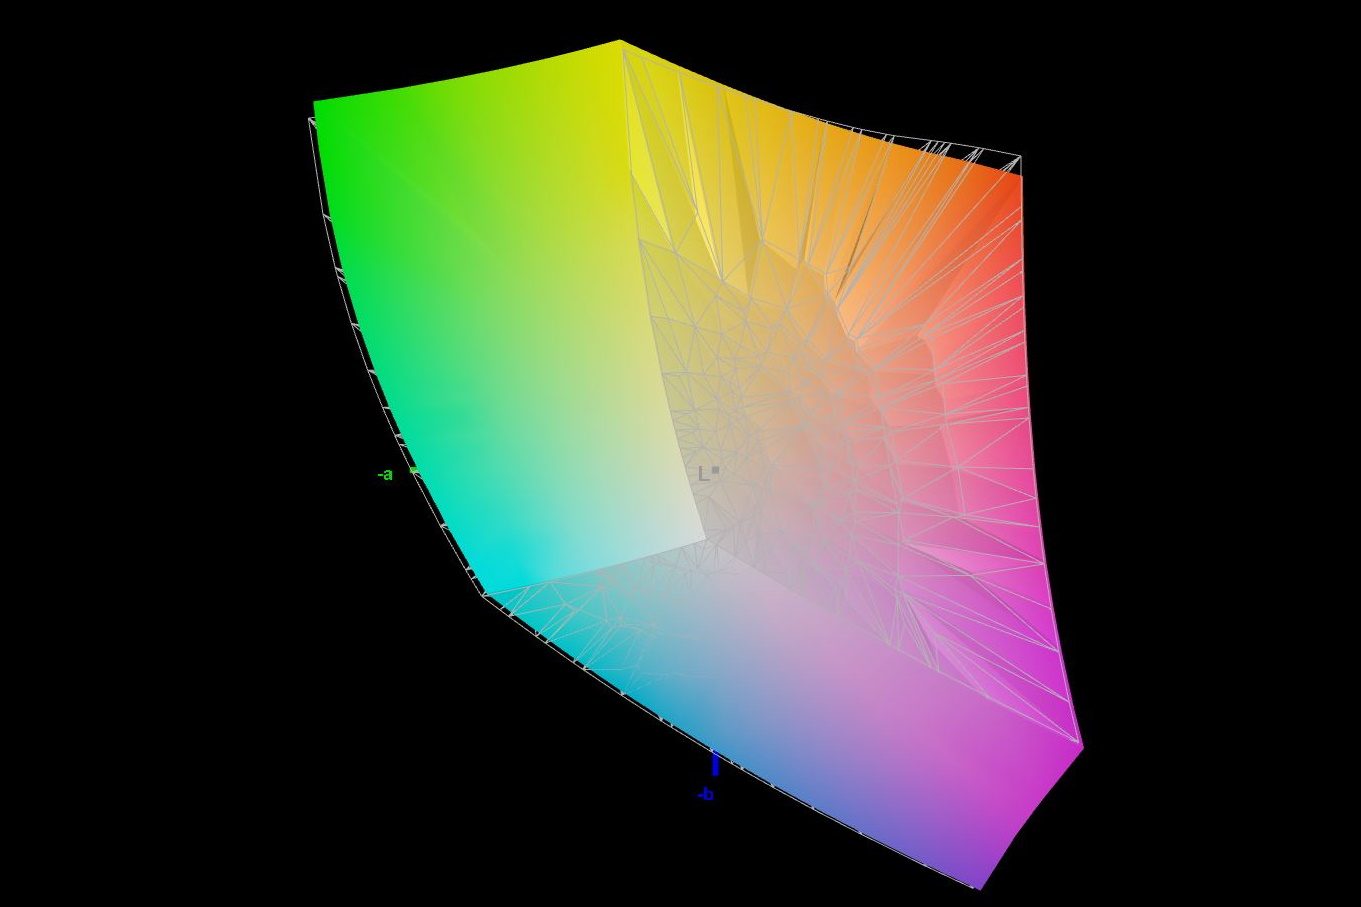
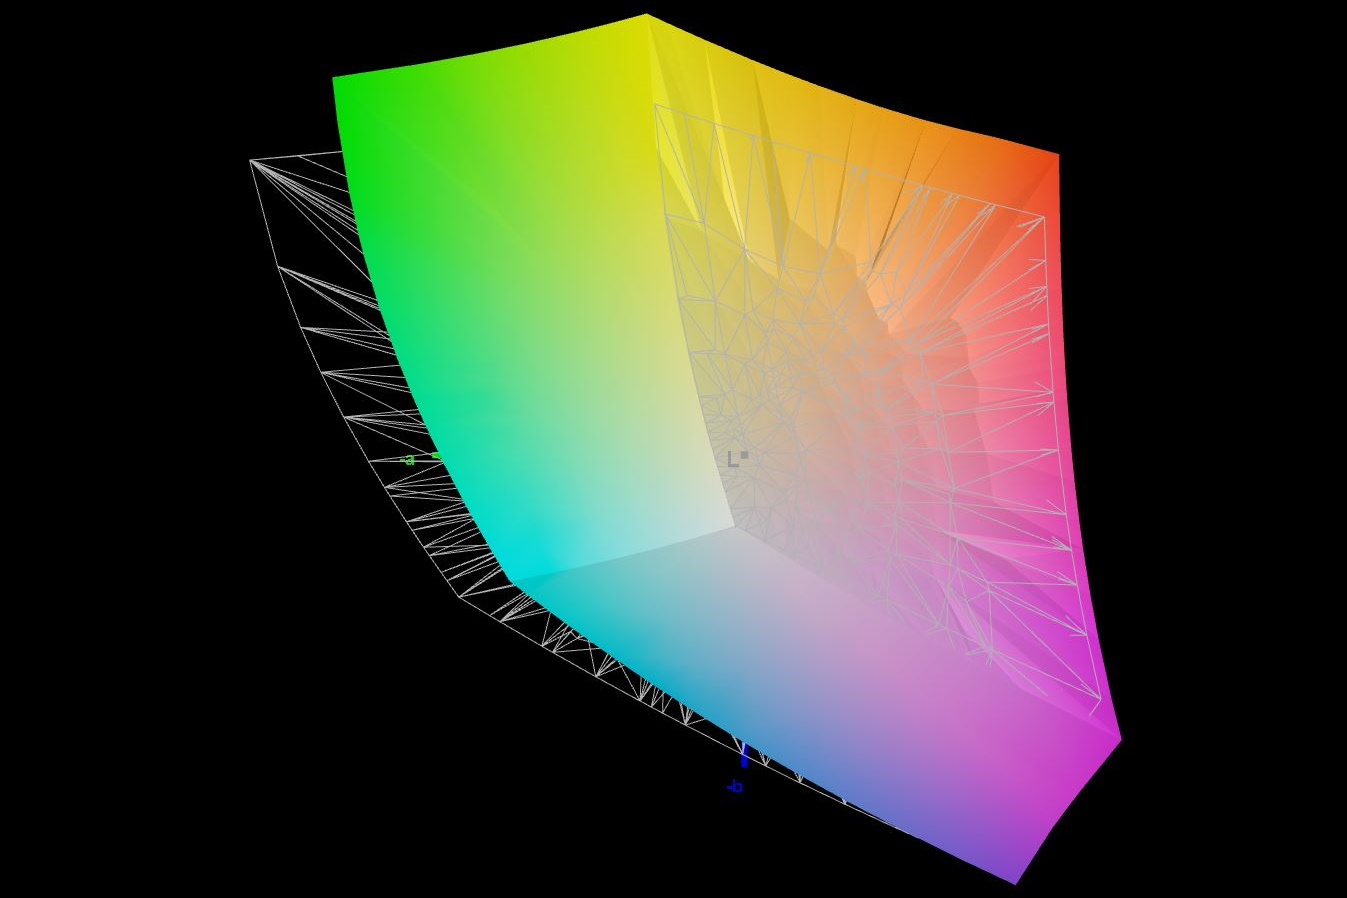
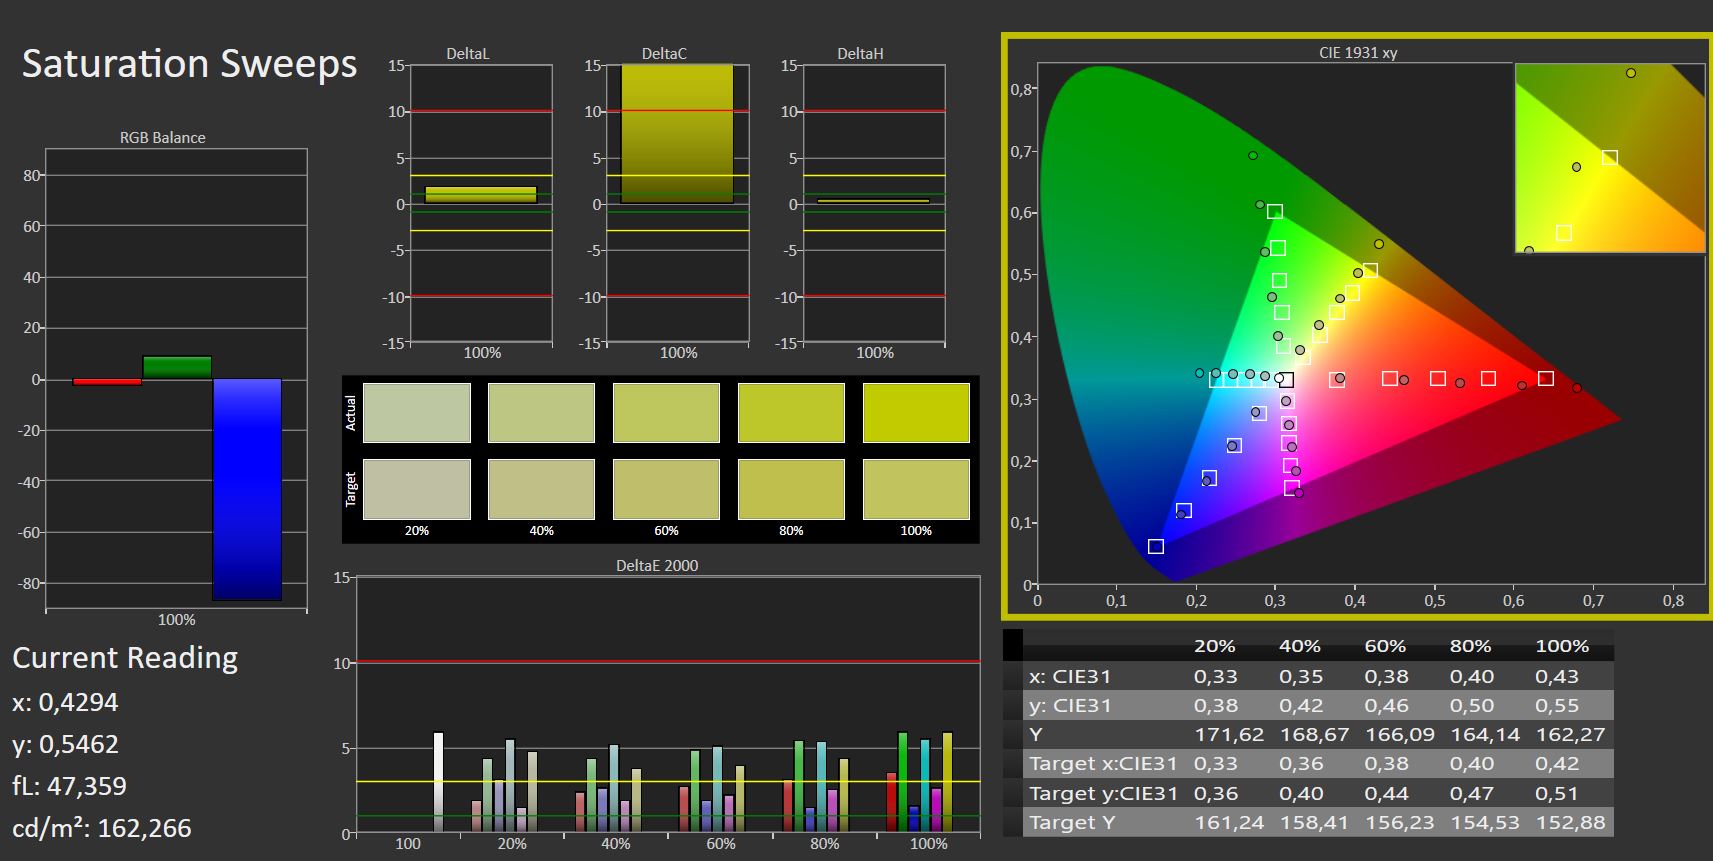
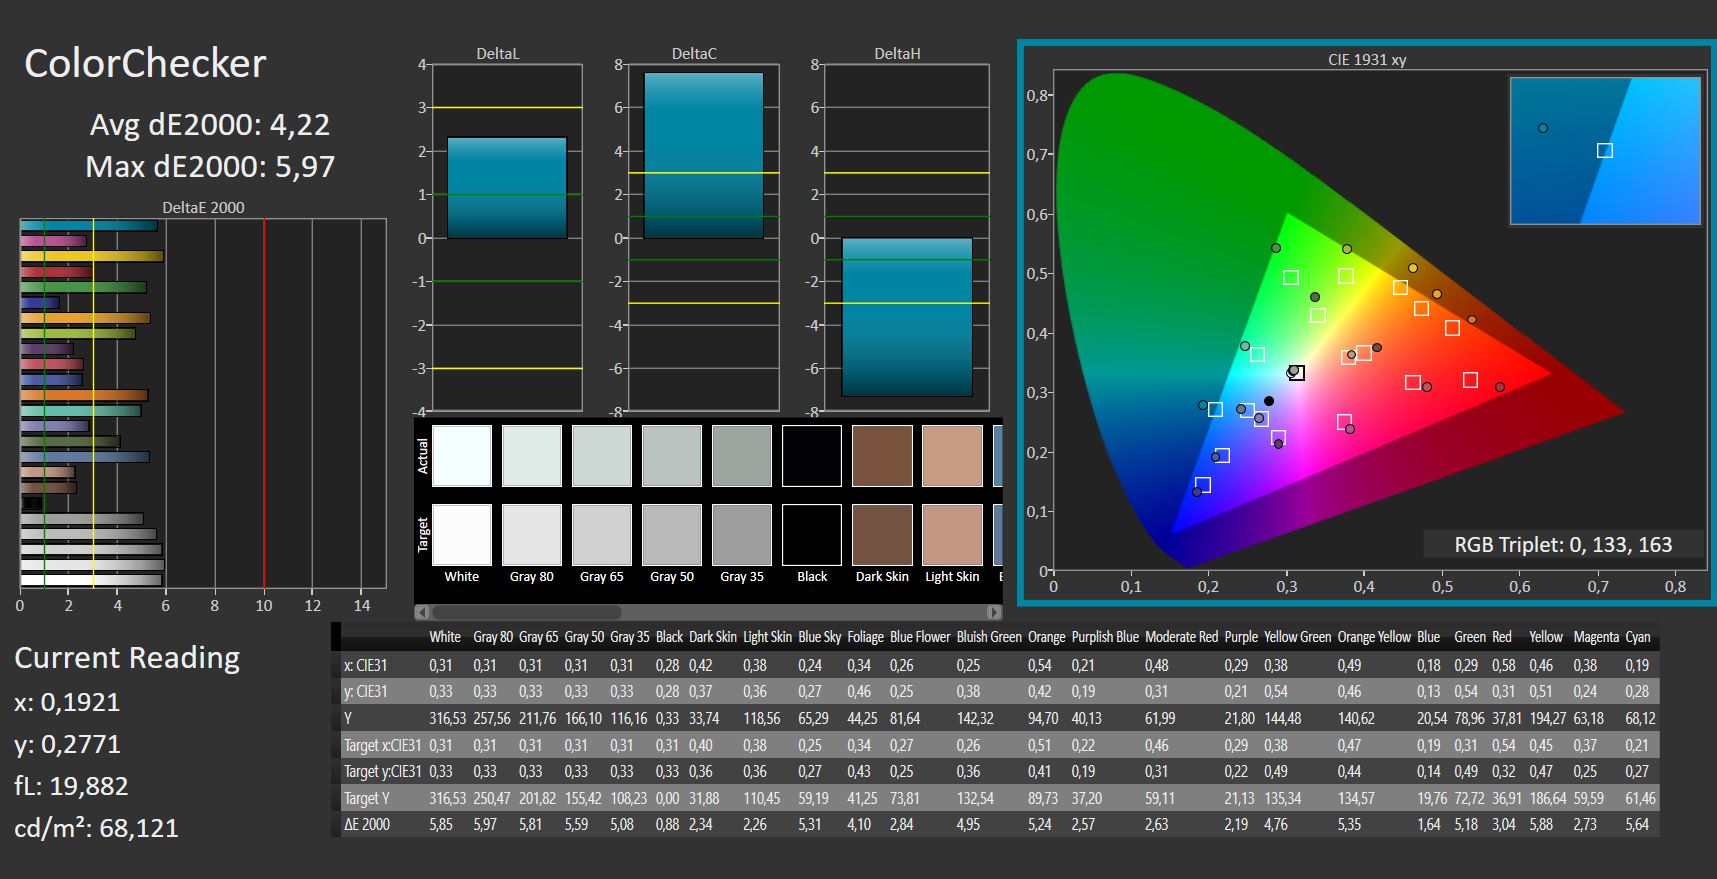
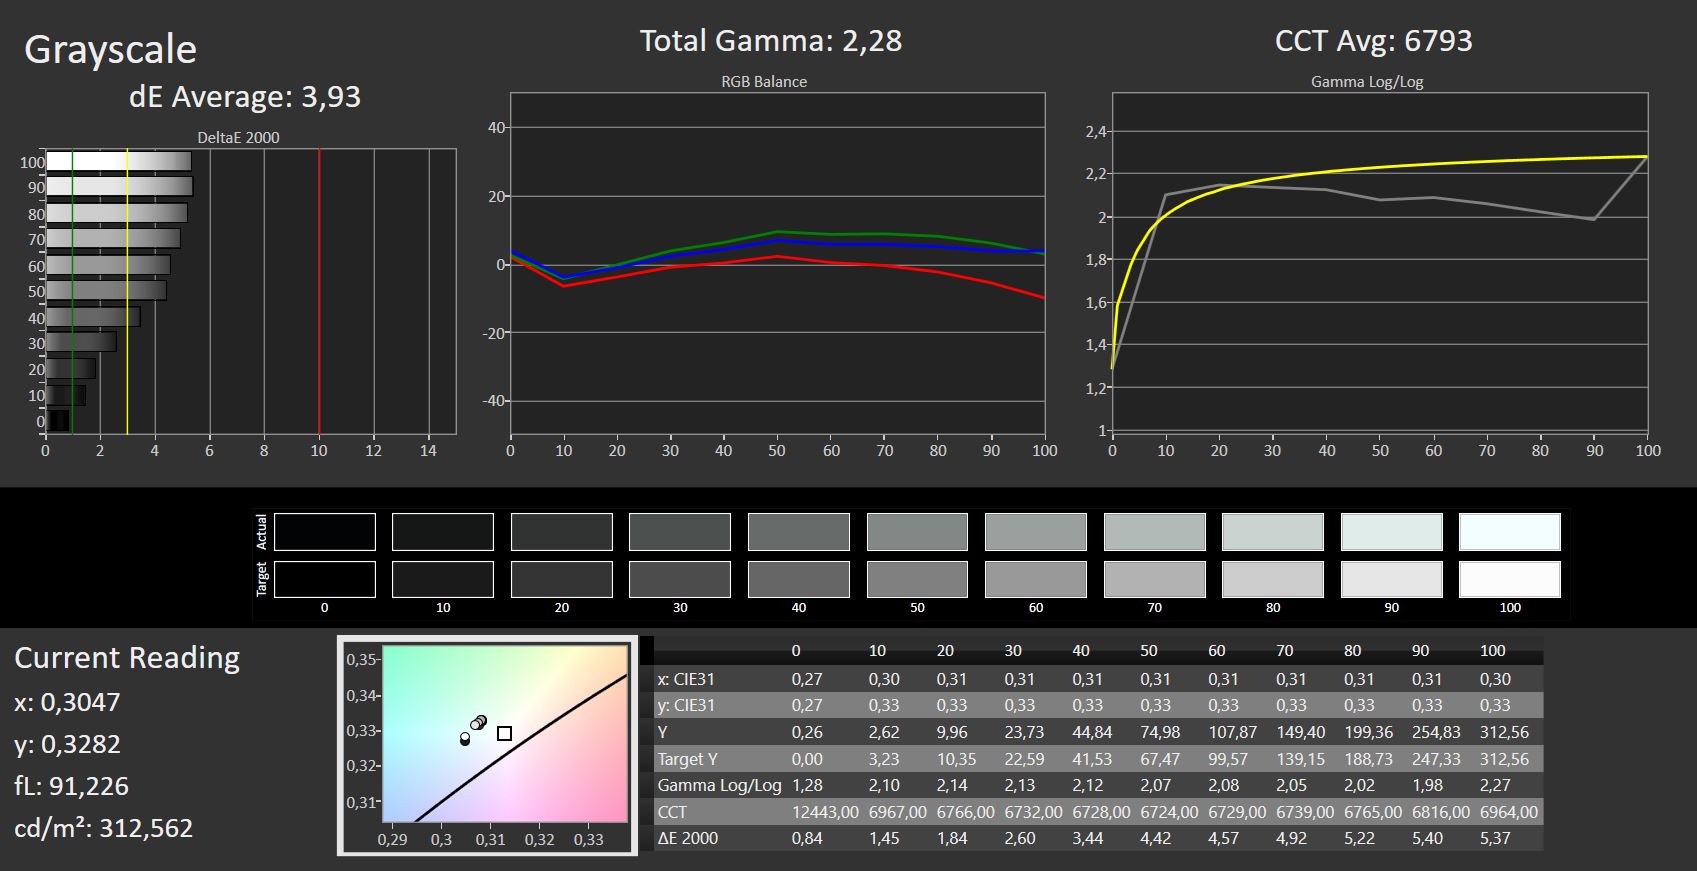
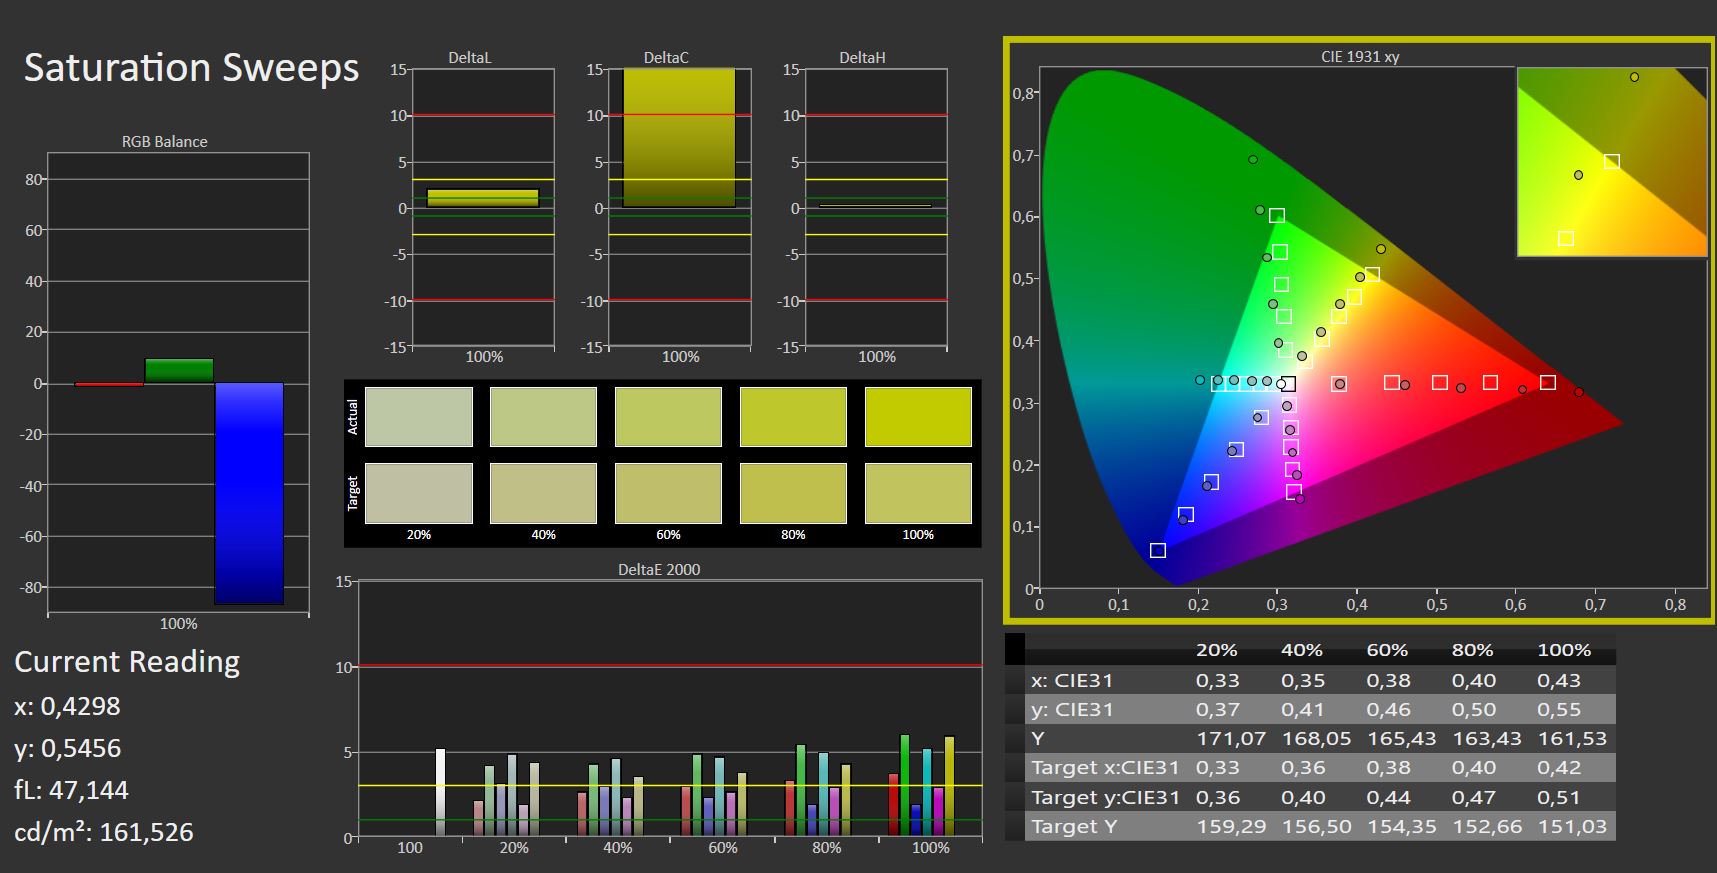
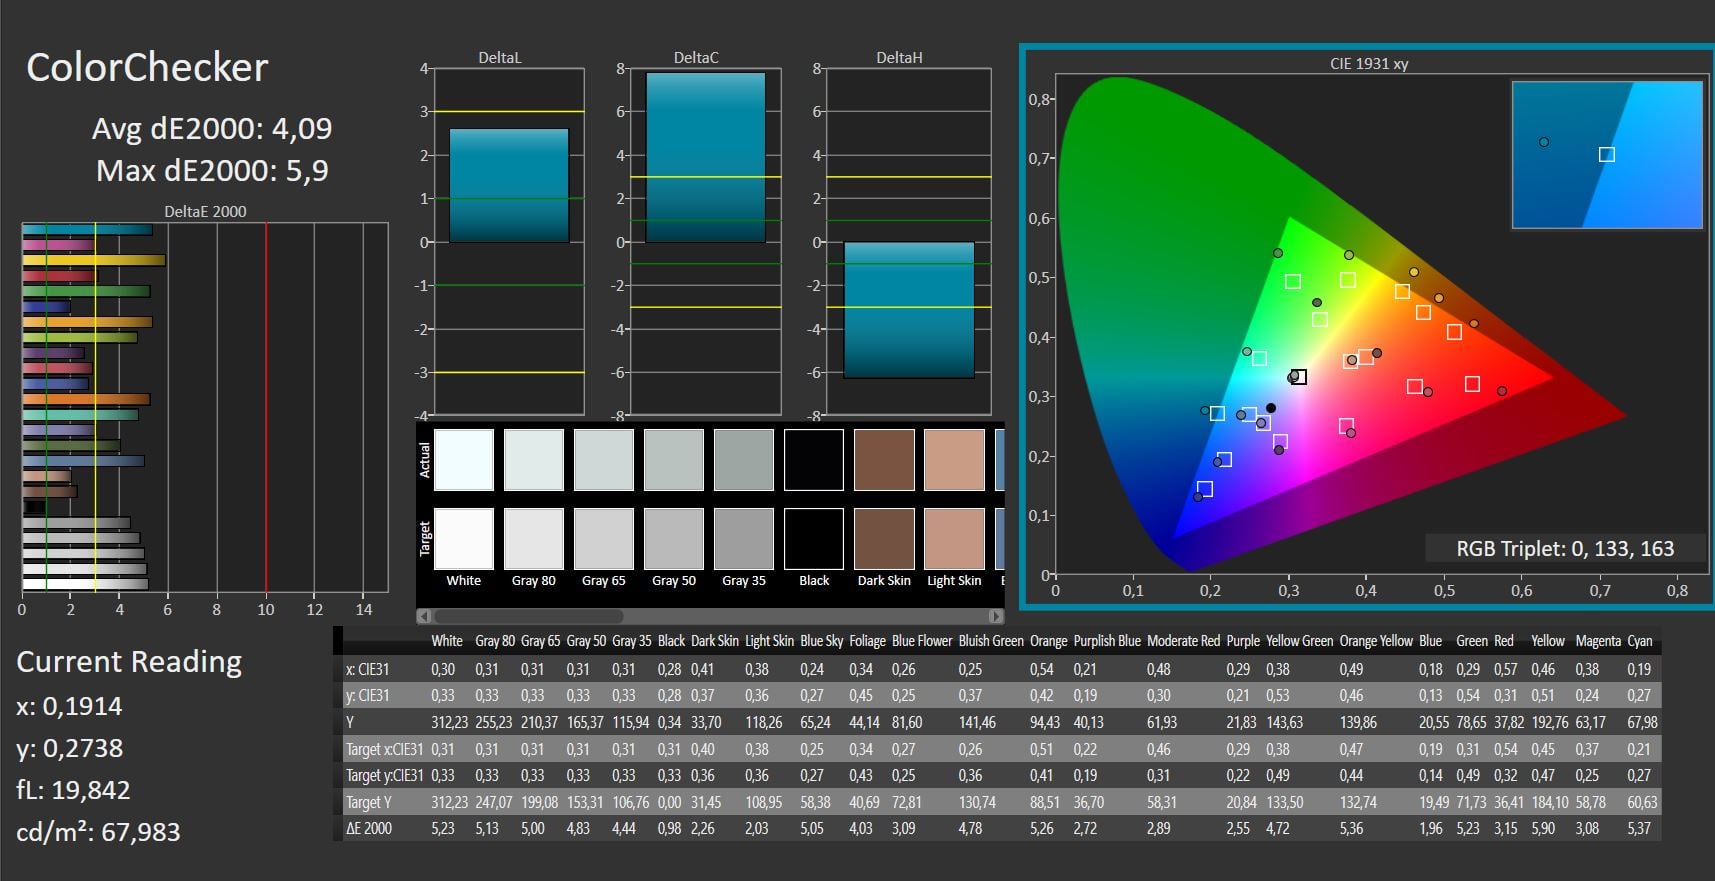
显示。良好的色彩空间覆盖率
Schenker使用京东方的哑光QHD IPS面板(2560 x 1440),频率为165 Hz。另外,还可以选择上一代产品的高质量4K OLED,以及色彩空间覆盖较差的全高清面板。
由于照度不够均匀,亮度略低于300尼特。对比度也可以再高一点,但还可以。总的来说,这款显示器没有提供顶级的数值,但它总体上是很全面的:良好的响应时间,可接受的亮度和良好的色彩空间覆盖。
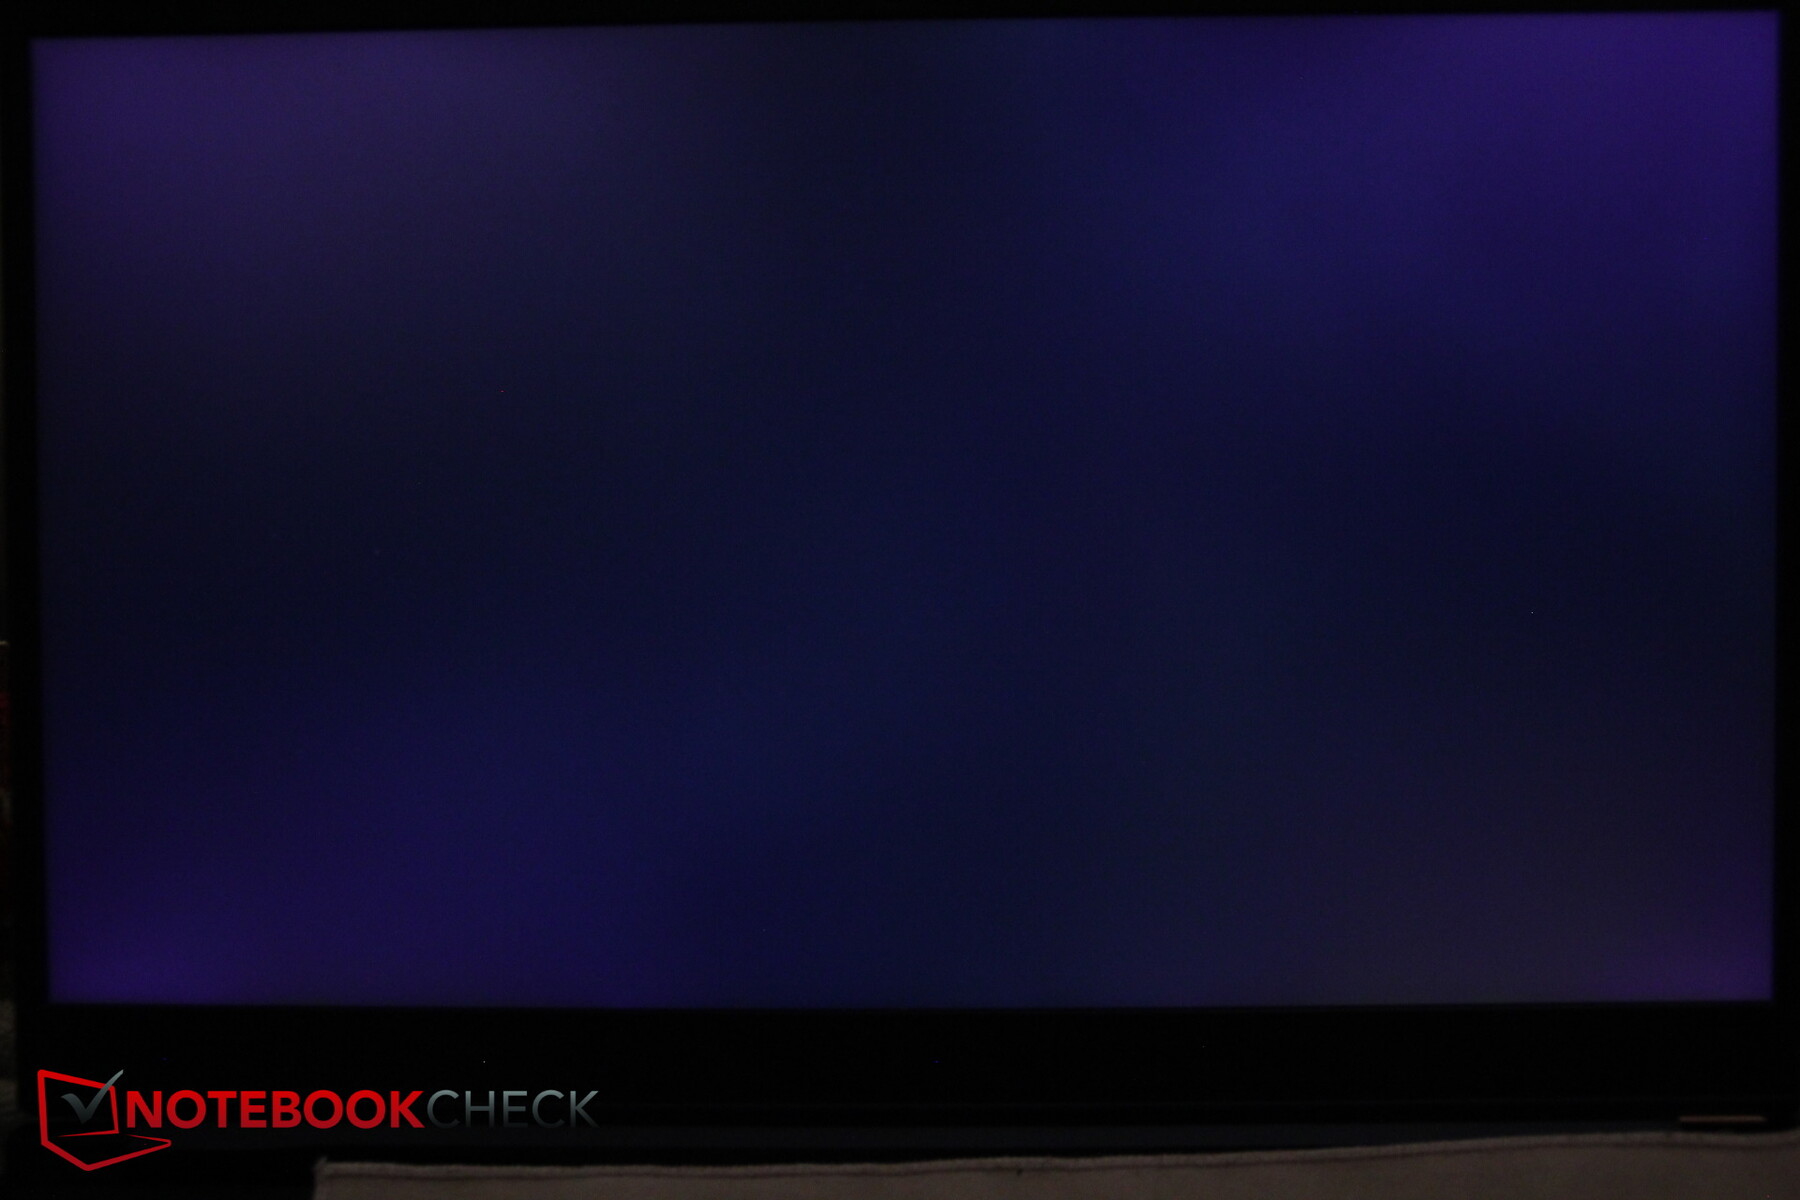
PWM不用于亮度控制。屏幕出血量极小,即使在黑暗环境中也几乎看不出来。
| |||||||||||||||||||||||||
Brightness Distribution: 83 %
Center on Battery: 319 cd/m²
Contrast: 991:1 (Black: 0.32 cd/m²)
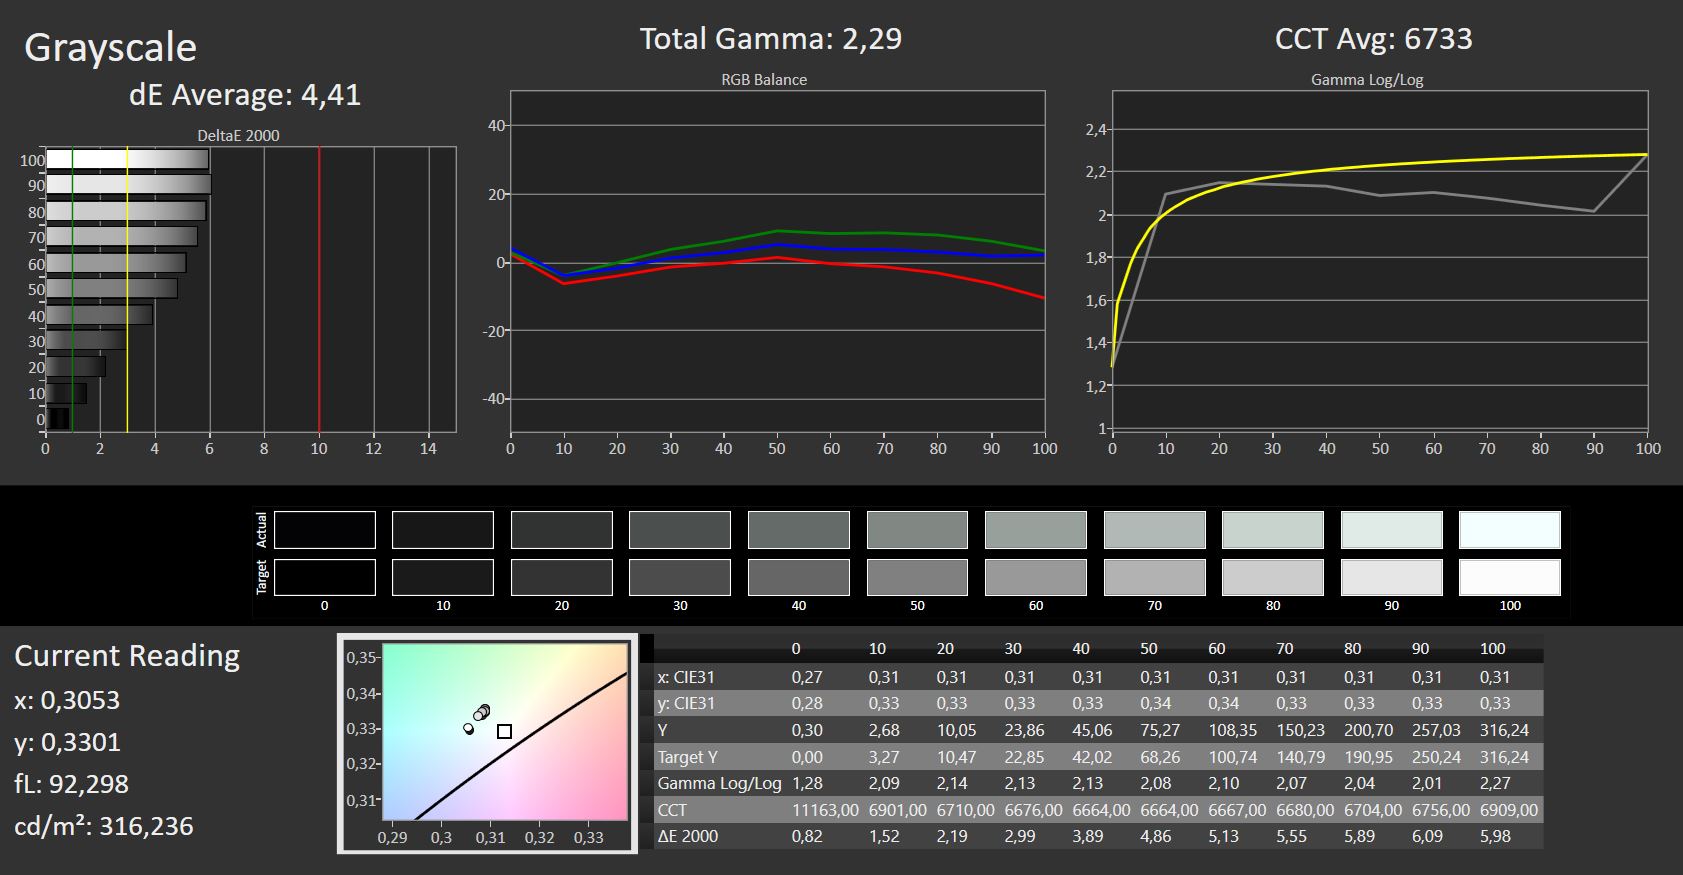
ΔE ColorChecker Calman: 4.22 | ∀{0.5-29.43 Ø4.71}
calibrated: 4.09
ΔE Greyscale Calman: 4.41 | ∀{0.09-98 Ø4.96}
85.2% AdobeRGB 1998 (Argyll 3D)
99.9% sRGB (Argyll 3D)
97.5% Display P3 (Argyll 3D)
Gamma: 2.29
CCT: 6733 K
| Schenker XMG Pro 15 (i7-12700H, RTX 3080 Ti) BOE09C2 (BOE CQ NE156QHM-NY1), IPS, 2560x1440, 15.6" | Schenker XMG Pro 15 (Late 2021) Samsung ATNA56WR14-0, OLED, 3840x2160, 15.6" | Schenker XMG Neo 15 (i7-12700H, RTX 3080 Ti) BOE0A67, IPS, 2560x1440, 15.6" | MSI Raider GE66 12UHS AUO51EB, IPS, 3840x2160, 15.6" | Razer Blade 15 2022 Sharp LQ156T1JW03, IPS, 2560x1440, 15.6" | |
|---|---|---|---|---|---|
| Display | -5% | -17% | -3% | 1% | |
| Display P3 Coverage (%) | 97.5 | 81.2 -17% | 68.2 -30% | 80.4 -18% | 99.1 2% |
| sRGB Coverage (%) | 99.9 | 97.7 -2% | 97.2 -3% | 98.4 -2% | 99.9 0% |
| AdobeRGB 1998 Coverage (%) | 85.2 | 89.1 5% | 69.4 -19% | 94.7 11% | 86.8 2% |
| Response Times | 79% | 3% | -44% | -21% | |
| Response Time Grey 50% / Grey 80% * (ms) | 13.2 ? | 3.2 ? 76% | 12.4 ? 6% | 18.8 ? -42% | 14.4 ? -9% |
| Response Time Black / White * (ms) | 8.8 ? | 1.6 ? 82% | 8.8 ? -0% | 12.8 ? -45% | 11.6 ? -32% |
| PWM Frequency (Hz) | 60 ? | ||||
| Screen | 294% | 35% | 13% | 21% | |
| Brightness middle (cd/m²) | 317 | 443 40% | 365 15% | 351 11% | 286 -10% |
| Brightness (cd/m²) | 294 | 434 48% | 335 14% | 347 18% | 271 -8% |
| Brightness Distribution (%) | 83 | 94 13% | 81 -2% | 90 8% | 89 7% |
| Black Level * (cd/m²) | 0.32 | 0.02 94% | 0.32 -0% | 0.35 -9% | 0.25 22% |
| Contrast (:1) | 991 | 22150 2135% | 1141 15% | 1003 1% | 1144 15% |
| Colorchecker dE 2000 * | 4.22 | 3.73 12% | 1.38 67% | 2.54 40% | 2.74 35% |
| Colorchecker dE 2000 max. * | 5.97 | 8.12 -36% | 2.01 66% | 8.36 -40% | 5.21 13% |
| Colorchecker dE 2000 calibrated * | 4.09 | 1.22 70% | 0.67 84% | 2.52 38% | |
| Greyscale dE 2000 * | 4.41 | 2.5 43% | 1.36 69% | 4.1 7% | 1.1 75% |
| Gamma | 2.29 96% | 2.001 110% | 2.48 89% | 2.089 105% | 2.2 100% |
| CCT | 6733 97% | 6522 100% | 6412 101% | 7036 92% | 6408 101% |
| Total Average (Program / Settings) | 123% /
192% | 7% /
19% | -11% /
2% | 0% /
11% |
* ... smaller is better
Pro 15的面板完全覆盖了sRGB和DCI-P3的97%以上,AdobeRGB的85%。与Neo不同,该面板因此适用于编辑照片和视频。
显示器在出厂前已被正确校准;手动校准几乎不改变平均颜色偏差值。
Display Response Times
| ↔ Response Time Black to White | ||
|---|---|---|
| 8.8 ms ... rise ↗ and fall ↘ combined | ↗ 4.2 ms rise | 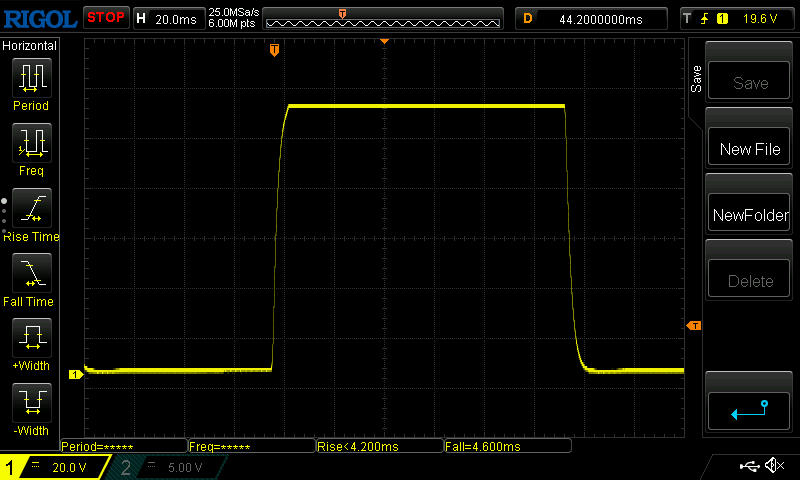 |
| ↘ 4.6 ms fall | ||
| The screen shows fast response rates in our tests and should be suited for gaming. In comparison, all tested devices range from 0.1 (minimum) to 240 (maximum) ms. » 25 % of all devices are better. This means that the measured response time is better than the average of all tested devices (19.8 ms). | ||
| ↔ Response Time 50% Grey to 80% Grey | ||
| 13.2 ms ... rise ↗ and fall ↘ combined | ↗ 6.2 ms rise | 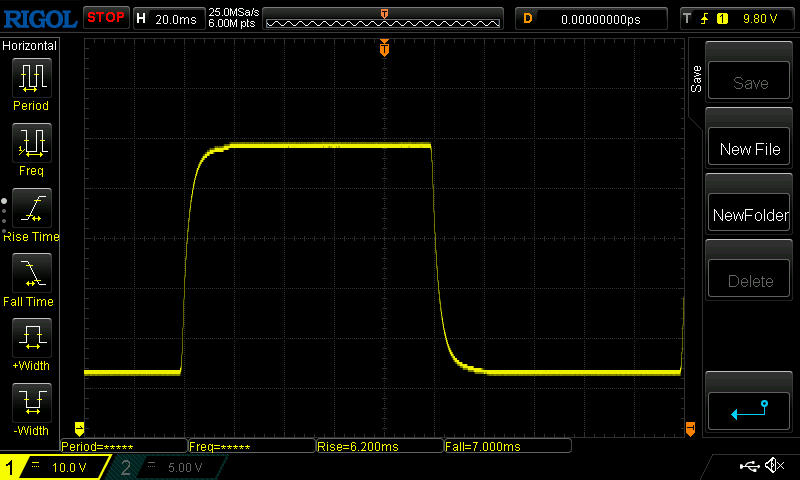 |
| ↘ 7 ms fall | ||
| The screen shows good response rates in our tests, but may be too slow for competitive gamers. In comparison, all tested devices range from 0.165 (minimum) to 636 (maximum) ms. » 27 % of all devices are better. This means that the measured response time is better than the average of all tested devices (30.9 ms). | ||
Screen Flickering / PWM (Pulse-Width Modulation)
| Screen flickering / PWM not detected | 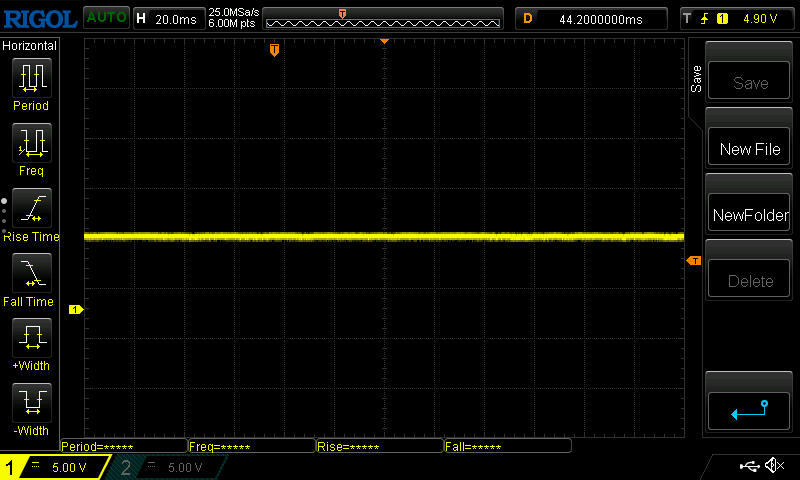 | ||
In comparison: 52 % of all tested devices do not use PWM to dim the display. If PWM was detected, an average of 7744 (minimum: 5 - maximum: 343500) Hz was measured. | |||
哑光表面消除了户外的许多反射。然而,由于亮度相当平均,对比度不高,你应该呆在阴凉处,并确保直接正面观看。
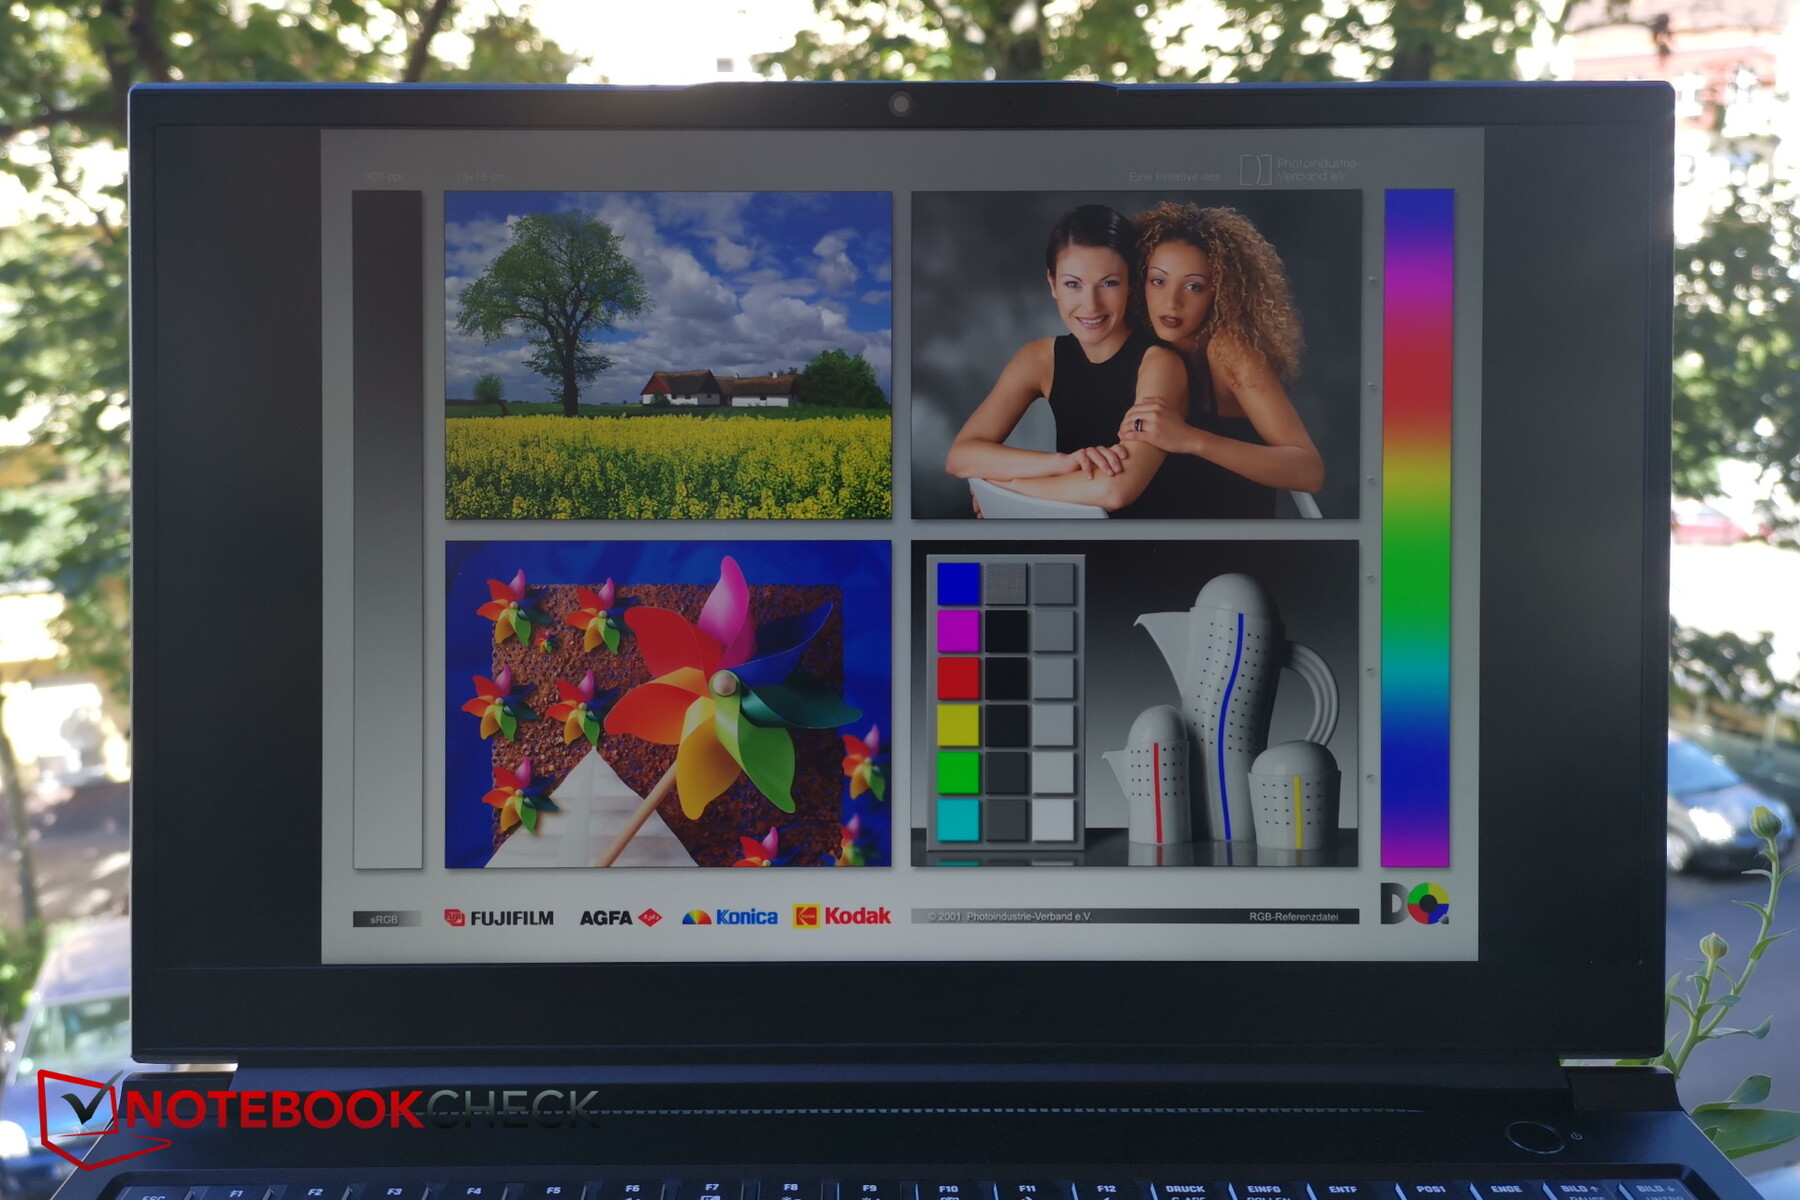
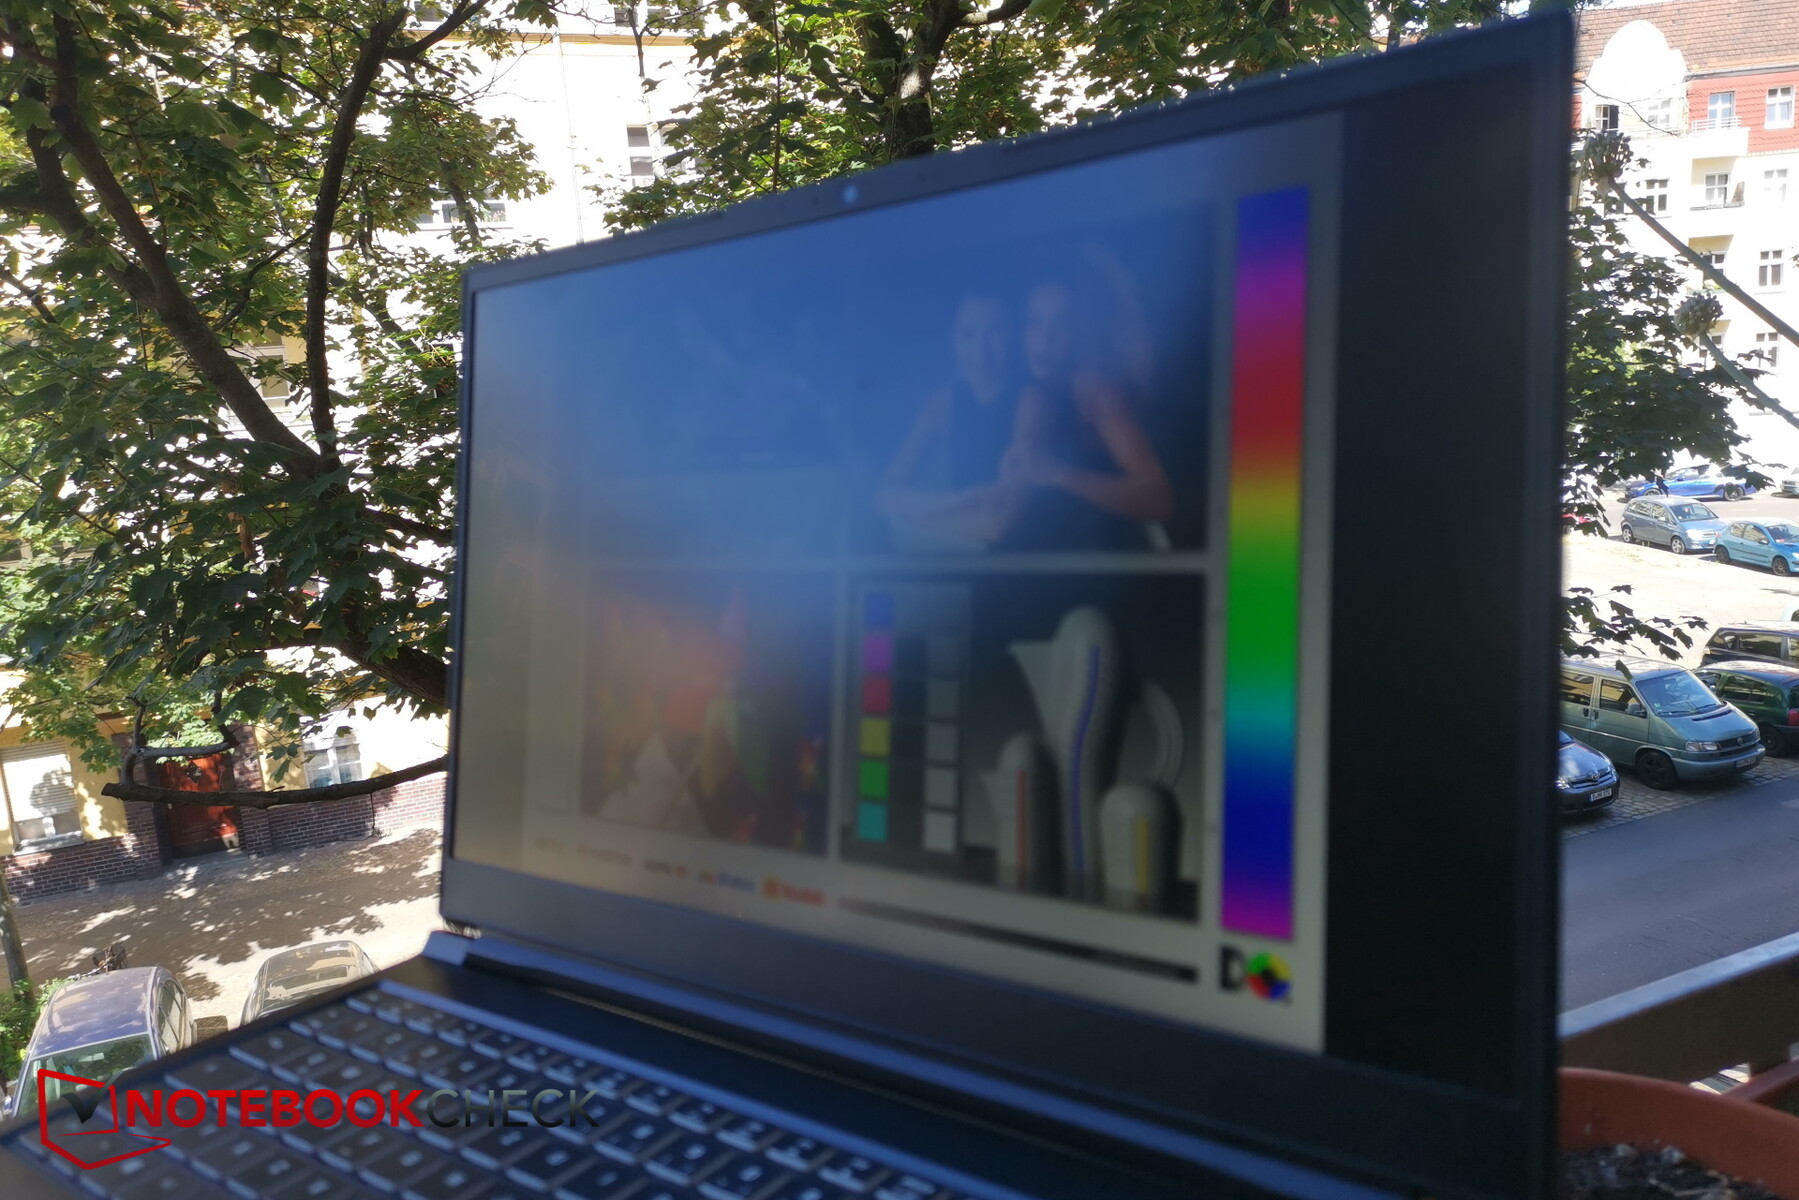
作为IPS的典型,视角的稳定性非常好。只有在极端的可视角度下,亮度和色彩才会受到一点影响。

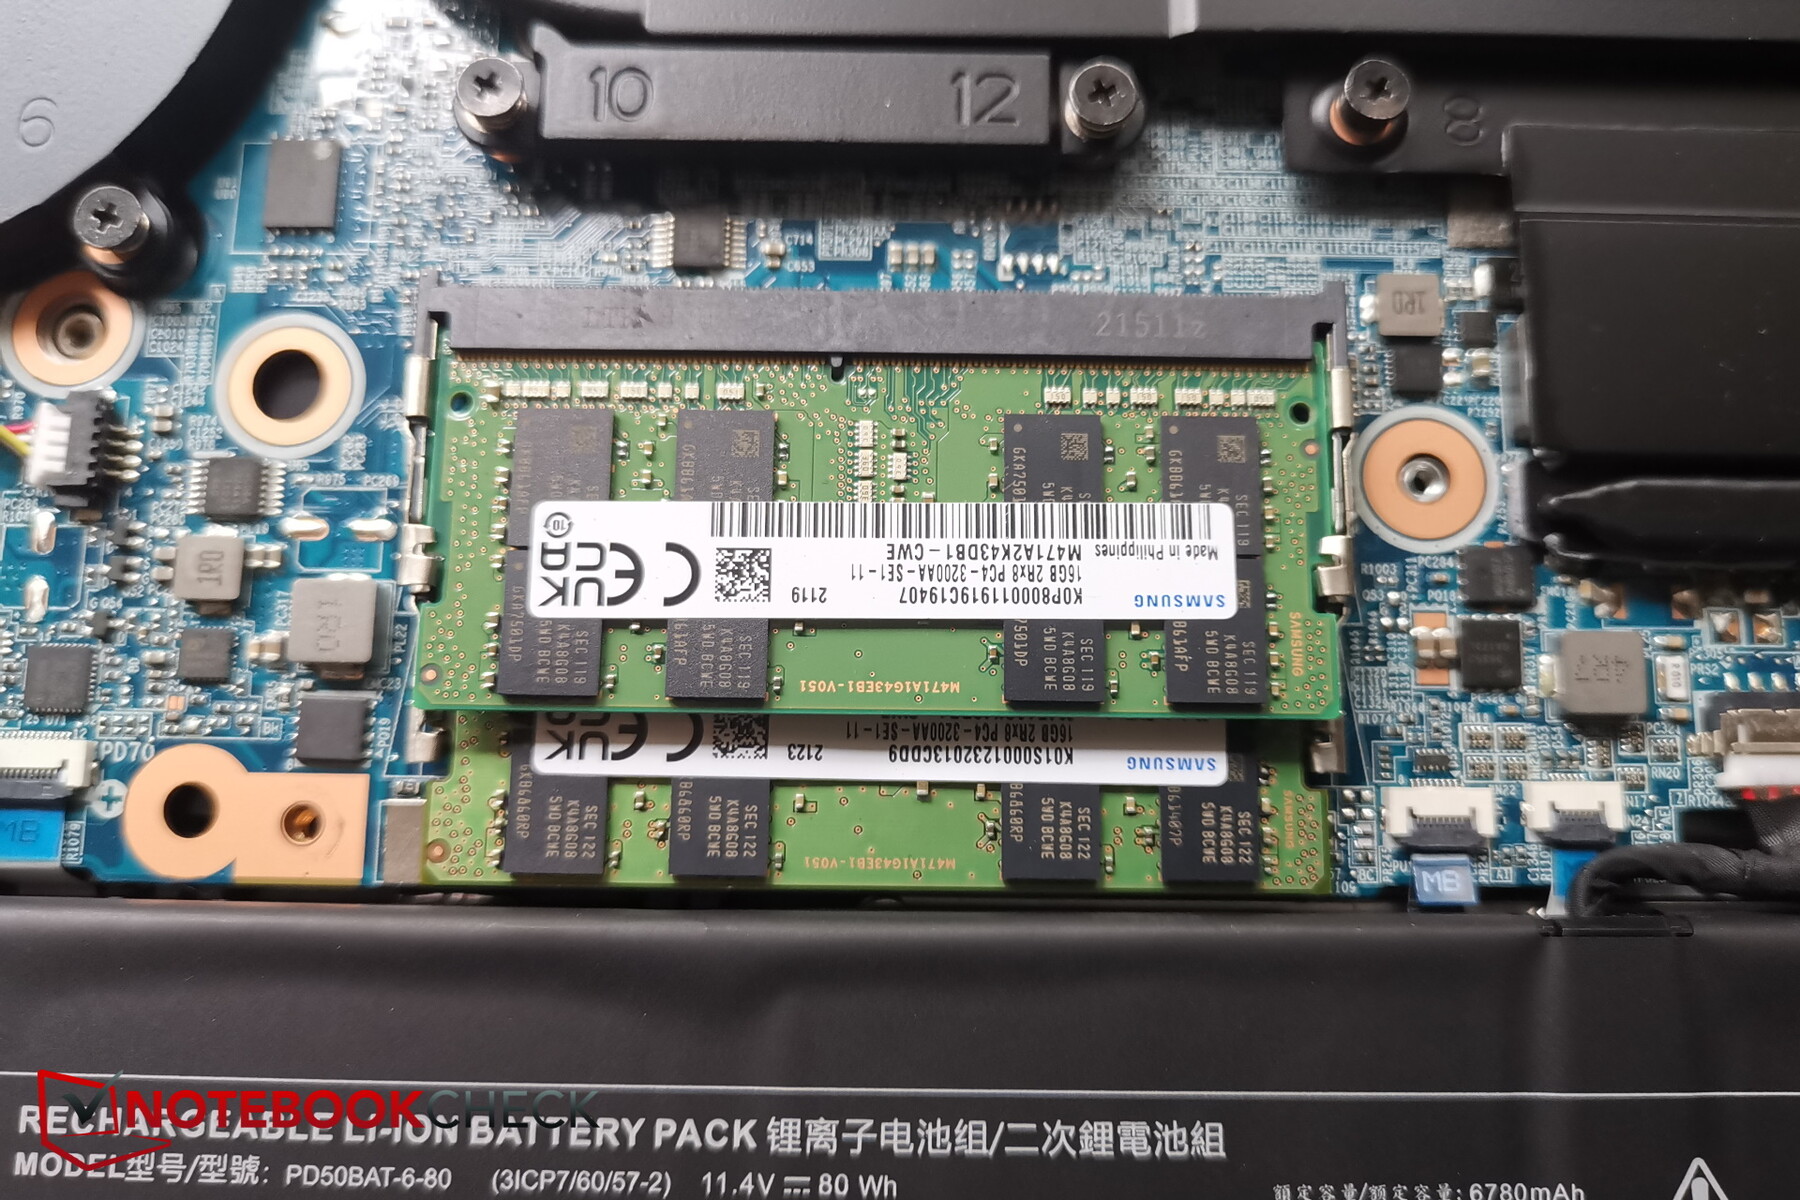
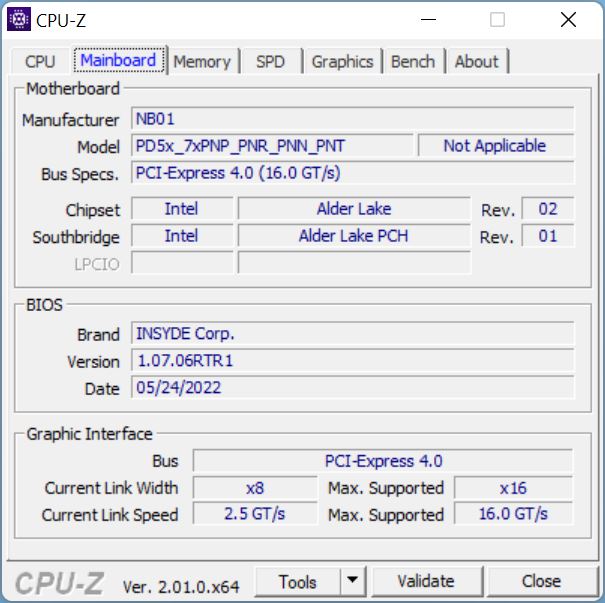
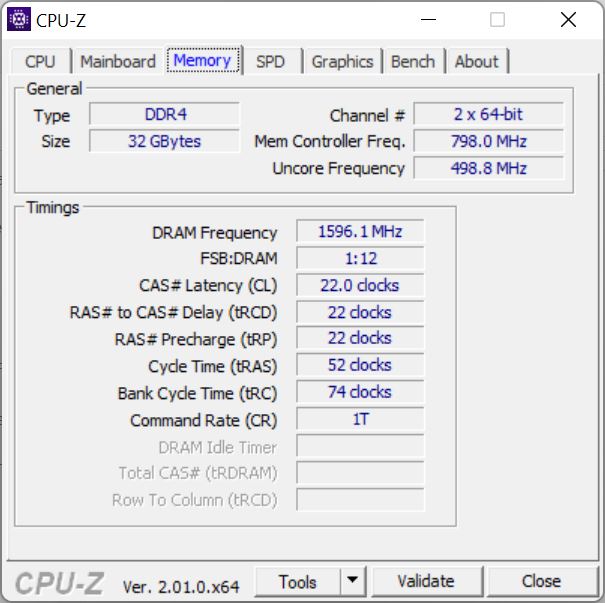
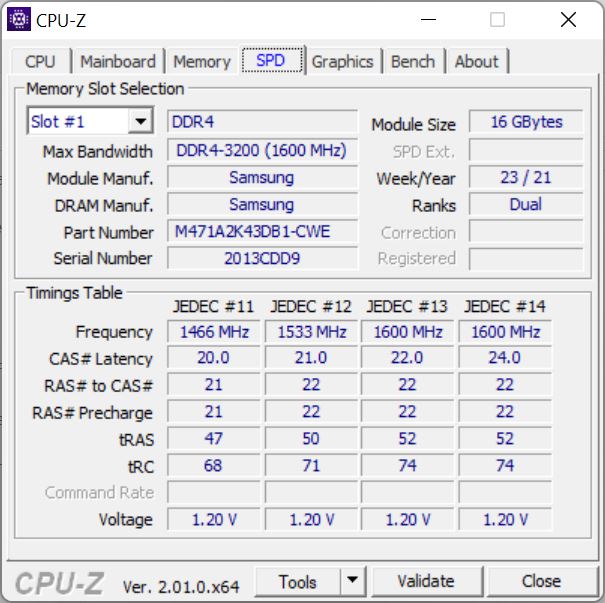
性能。高性能,没有DDR5
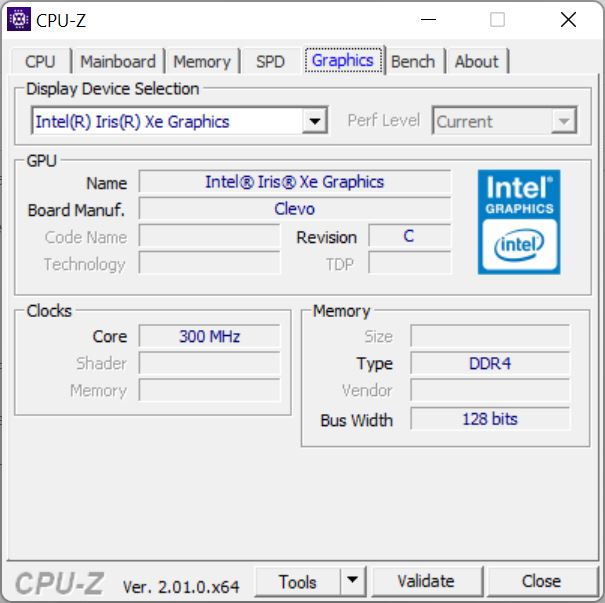
XMG Pro 15针对的是游戏玩家以及内容创作者,这一方面体现在时尚的设计和强大的硬件(i7-12700H和RTX 3080 Ti),另一方面体现在QHD显示屏的良好色彩空间覆盖。慷慨的32GB内存也使双方受益,但不幸的是,这里只有DDR4版本,与Neo不同。
测试条件
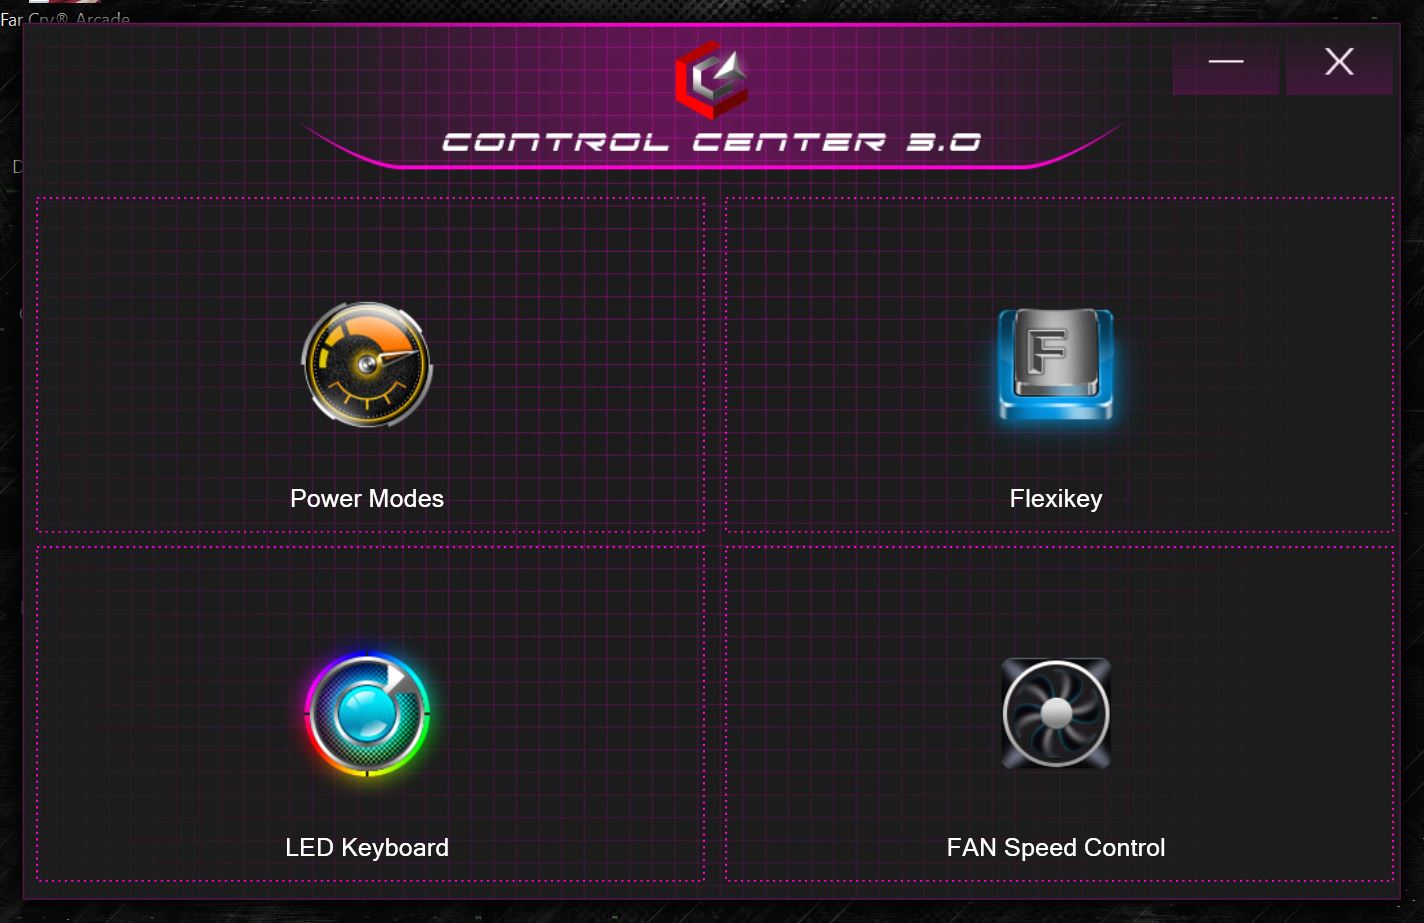
所有重要的性能设置都在XMG控制中心调整;Schenker在这里使用的软件与XMG Neo不同。偏移值或动态提升的手动设置基本没有。只有风扇曲线可以手动调整。
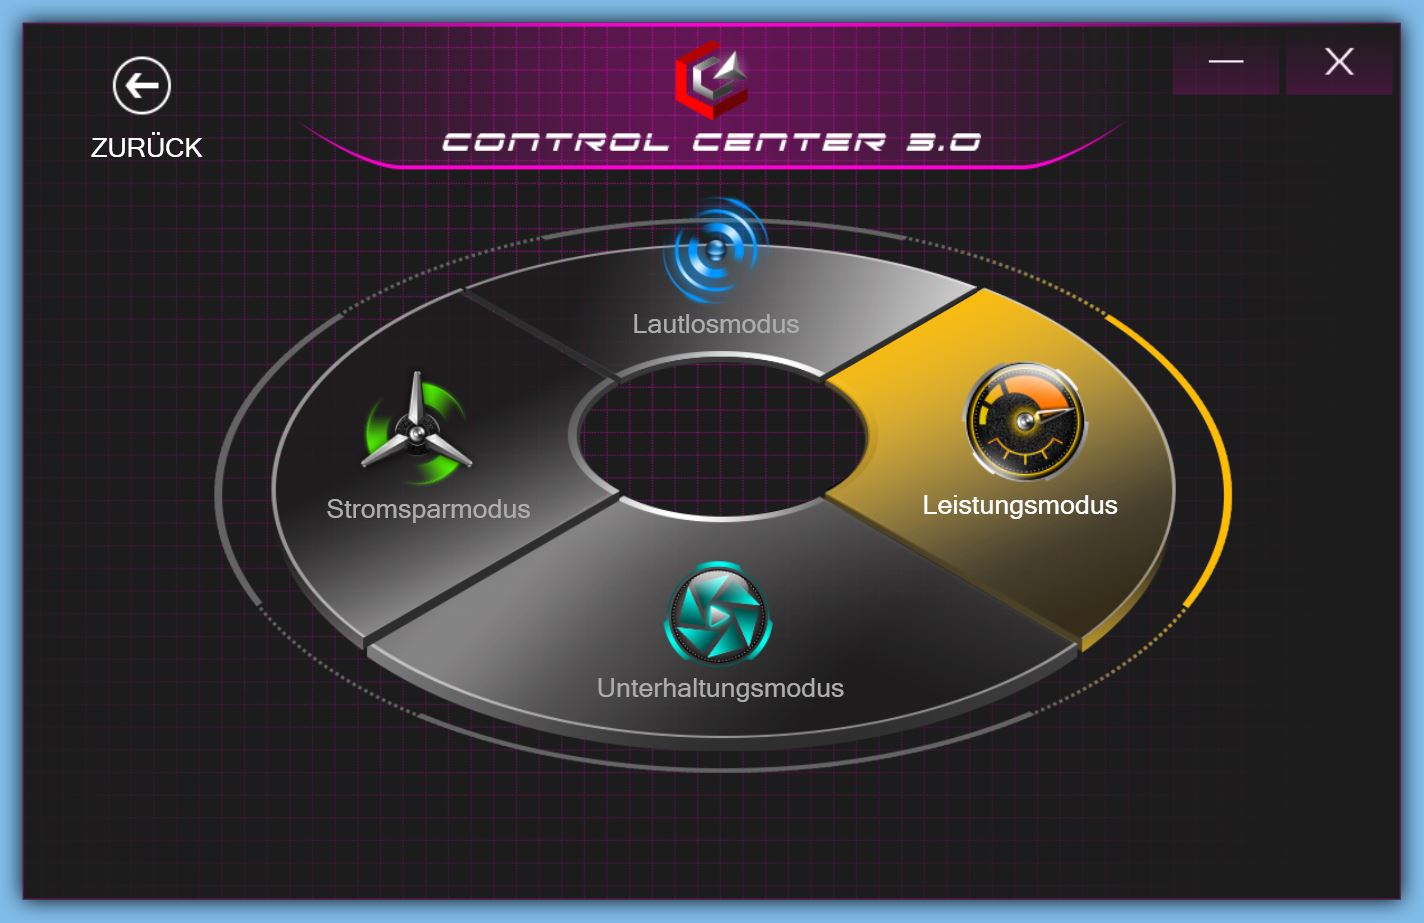
另一方面,可以选择四种性能模式。静音、省电、娱乐和性能。为了获得最佳的基准测试结果,我们在最强大的模式下进行了测试,也就是性能模式。然而,申克公司推荐娱乐模式,该模式旨在成为性能和噪音之间的一个良好折衷。
处理器
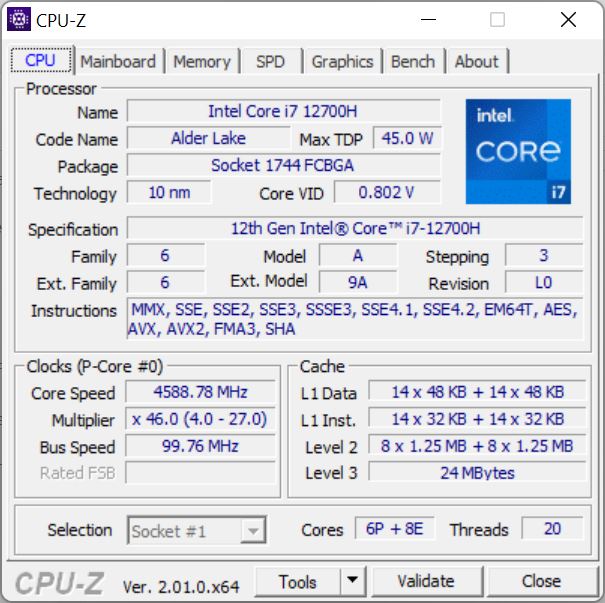
一个 英特尔酷睿i7-12700H 被用作CPU(14个核心,20个线程)。E核和P核的组合频率大致在1.8至4.7GHz之间。该CPU非常强大,在许多英特尔游戏笔记本电脑中使用。
在Cinebench循环中,随着时间的推移,性能略有下降。尽管如此,该曲线与微星Raider GE66的曲线相当,其 i9-12900H但同样的i7-12700H在Neo 15中甚至更快。
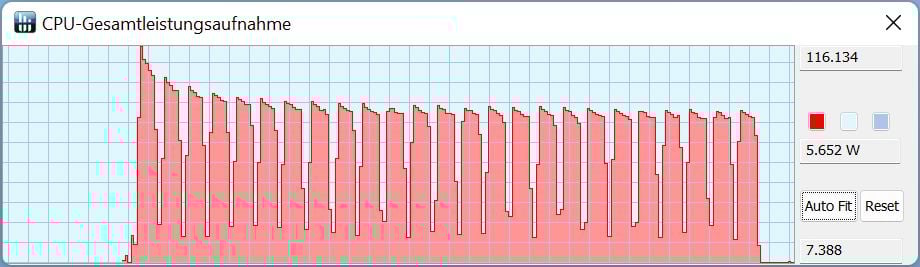
TDP在第一次运行时只短暂地抽取了116W,之后下降并稳定在80至85W左右。
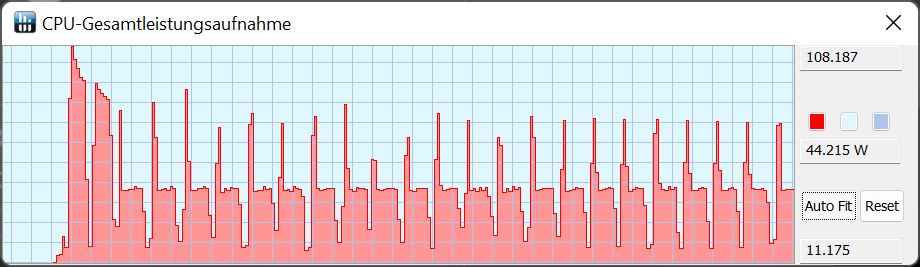
在娱乐模式(而不是性能模式)下,TDP在第一次运行时短暂地提取了108W,然后也下降并稳定在45W,初始峰值非常短,为55至80W。
Pro 15比i7-11800H比前代产品的i7-11800H高出约30%。总的来说,Neo 15和MSI Raider的CPU性能要好几个百分点,但Pro 15仍然处于一个非常好的水平,即略高于预期的速率。
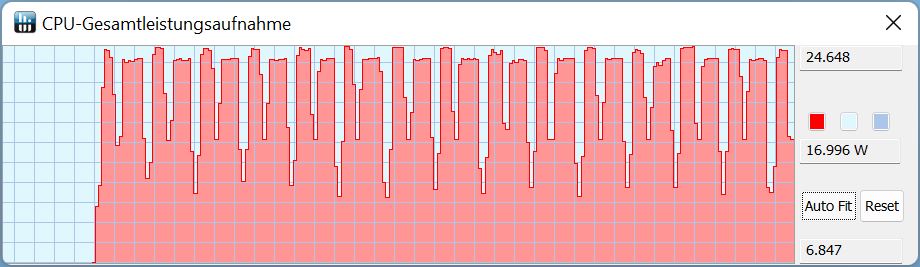
在电池模式下,最大功耗只有25瓦,在Cinebench运行期间,TDP有时下降到16瓦。性能也相应降低,与插电式性能模式相比,降低了约57%。
Cinebench R15 Multi Sustained Load
Cinebench R23: Multi Core | Single Core
Cinebench R20: CPU (Multi Core) | CPU (Single Core)
Cinebench R15: CPU Multi 64Bit | CPU Single 64Bit
Blender: v2.79 BMW27 CPU
7-Zip 18.03: 7z b 4 | 7z b 4 -mmt1
Geekbench 5.5: Multi-Core | Single-Core
HWBOT x265 Benchmark v2.2: 4k Preset
LibreOffice : 20 Documents To PDF
R Benchmark 2.5: Overall mean
| CPU Performance rating | |
| Average of class Gaming | |
| MSI Raider GE66 12UHS | |
| Schenker XMG Neo 15 (i7-12700H, RTX 3080 Ti) | |
| Schenker XMG Pro 15 (i7-12700H, RTX 3080 Ti) | |
| Average Intel Core i7-12700H | |
| Razer Blade 15 2022 | |
| Schenker XMG Pro 15 (Late 2021) | |
| Cinebench R23 / Multi Core | |
| Average of class Gaming (10488 - 42661, n=104, last 2 years) | |
| Schenker XMG Neo 15 (i7-12700H, RTX 3080 Ti) | |
| MSI Raider GE66 12UHS | |
| Schenker XMG Pro 15 (i7-12700H, RTX 3080 Ti) | |
| Average Intel Core i7-12700H (4032 - 19330, n=64) | |
| Razer Blade 15 2022 | |
| Schenker XMG Pro 15 (Late 2021) | |
| Cinebench R23 / Single Core | |
| Average of class Gaming (1601 - 2415, n=104, last 2 years) | |
| MSI Raider GE66 12UHS | |
| Schenker XMG Pro 15 (i7-12700H, RTX 3080 Ti) | |
| Schenker XMG Neo 15 (i7-12700H, RTX 3080 Ti) | |
| Razer Blade 15 2022 | |
| Average Intel Core i7-12700H (778 - 1826, n=63) | |
| Schenker XMG Pro 15 (Late 2021) | |
| Cinebench R20 / CPU (Multi Core) | |
| Average of class Gaming (4029 - 16433, n=103, last 2 years) | |
| Schenker XMG Neo 15 (i7-12700H, RTX 3080 Ti) | |
| MSI Raider GE66 12UHS | |
| Schenker XMG Pro 15 (i7-12700H, RTX 3080 Ti) | |
| Average Intel Core i7-12700H (1576 - 7407, n=64) | |
| Razer Blade 15 2022 | |
| Schenker XMG Pro 15 (Late 2021) | |
| Cinebench R20 / CPU (Single Core) | |
| Average of class Gaming (622 - 913, n=103, last 2 years) | |
| MSI Raider GE66 12UHS | |
| Schenker XMG Pro 15 (i7-12700H, RTX 3080 Ti) | |
| Razer Blade 15 2022 | |
| Schenker XMG Neo 15 (i7-12700H, RTX 3080 Ti) | |
| Average Intel Core i7-12700H (300 - 704, n=64) | |
| Schenker XMG Pro 15 (Late 2021) | |
| Cinebench R15 / CPU Multi 64Bit | |
| Average of class Gaming (1578 - 6330, n=102, last 2 years) | |
| Schenker XMG Neo 15 (i7-12700H, RTX 3080 Ti) | |
| Schenker XMG Pro 15 (i7-12700H, RTX 3080 Ti) | |
| MSI Raider GE66 12UHS | |
| Average Intel Core i7-12700H (1379 - 2916, n=70) | |
| Razer Blade 15 2022 | |
| Schenker XMG Pro 15 (Late 2021) | |
| Cinebench R15 / CPU Single 64Bit | |
| Average of class Gaming (188.8 - 350, n=103, last 2 years) | |
| MSI Raider GE66 12UHS | |
| Schenker XMG Pro 15 (i7-12700H, RTX 3080 Ti) | |
| Schenker XMG Neo 15 (i7-12700H, RTX 3080 Ti) | |
| Razer Blade 15 2022 | |
| Average Intel Core i7-12700H (113 - 263, n=65) | |
| Schenker XMG Pro 15 (Late 2021) | |
| Blender / v2.79 BMW27 CPU | |
| Schenker XMG Pro 15 (Late 2021) | |
| Razer Blade 15 2022 | |
| Average Intel Core i7-12700H (168 - 732, n=63) | |
| Schenker XMG Pro 15 (i7-12700H, RTX 3080 Ti) | |
| MSI Raider GE66 12UHS | |
| Schenker XMG Neo 15 (i7-12700H, RTX 3080 Ti) | |
| Average of class Gaming (79 - 330, n=101, last 2 years) | |
| 7-Zip 18.03 / 7z b 4 | |
| Average of class Gaming (33491 - 148086, n=102, last 2 years) | |
| Schenker XMG Neo 15 (i7-12700H, RTX 3080 Ti) | |
| MSI Raider GE66 12UHS | |
| Schenker XMG Pro 15 (i7-12700H, RTX 3080 Ti) | |
| Razer Blade 15 2022 | |
| Average Intel Core i7-12700H (22844 - 73067, n=63) | |
| Schenker XMG Pro 15 (Late 2021) | |
| 7-Zip 18.03 / 7z b 4 -mmt1 | |
| Average of class Gaming (4824 - 7436, n=102, last 2 years) | |
| MSI Raider GE66 12UHS | |
| Schenker XMG Neo 15 (i7-12700H, RTX 3080 Ti) | |
| Schenker XMG Pro 15 (i7-12700H, RTX 3080 Ti) | |
| Razer Blade 15 2022 | |
| Average Intel Core i7-12700H (2743 - 5972, n=63) | |
| Schenker XMG Pro 15 (Late 2021) | |
| Geekbench 5.5 / Multi-Core | |
| Average of class Gaming (6460 - 28263, n=102, last 2 years) | |
| MSI Raider GE66 12UHS | |
| Schenker XMG Neo 15 (i7-12700H, RTX 3080 Ti) | |
| Razer Blade 15 2022 | |
| Schenker XMG Pro 15 (i7-12700H, RTX 3080 Ti) | |
| Average Intel Core i7-12700H (5144 - 13745, n=64) | |
| Schenker XMG Pro 15 (Late 2021) | |
| Geekbench 5.5 / Single-Core | |
| Average of class Gaming (1403 - 2474, n=102, last 2 years) | |
| MSI Raider GE66 12UHS | |
| Schenker XMG Pro 15 (i7-12700H, RTX 3080 Ti) | |
| Razer Blade 15 2022 | |
| Schenker XMG Neo 15 (i7-12700H, RTX 3080 Ti) | |
| Average Intel Core i7-12700H (803 - 1851, n=64) | |
| Schenker XMG Pro 15 (Late 2021) | |
| HWBOT x265 Benchmark v2.2 / 4k Preset | |
| Average of class Gaming (11.5 - 44.4, n=102, last 2 years) | |
| Schenker XMG Neo 15 (i7-12700H, RTX 3080 Ti) | |
| MSI Raider GE66 12UHS | |
| Schenker XMG Pro 15 (i7-12700H, RTX 3080 Ti) | |
| Razer Blade 15 2022 | |
| Average Intel Core i7-12700H (4.67 - 21.8, n=64) | |
| Schenker XMG Pro 15 (Late 2021) | |
| LibreOffice / 20 Documents To PDF | |
| Razer Blade 15 2022 | |
| Average of class Gaming (33.2 - 88.8, n=102, last 2 years) | |
| Schenker XMG Pro 15 (i7-12700H, RTX 3080 Ti) | |
| Schenker XMG Pro 15 (Late 2021) | |
| Schenker XMG Neo 15 (i7-12700H, RTX 3080 Ti) | |
| Average Intel Core i7-12700H (34.2 - 95.3, n=63) | |
| MSI Raider GE66 12UHS | |
| R Benchmark 2.5 / Overall mean | |
| Schenker XMG Pro 15 (Late 2021) | |
| Average Intel Core i7-12700H (0.4441 - 1.052, n=63) | |
| Razer Blade 15 2022 | |
| Schenker XMG Neo 15 (i7-12700H, RTX 3080 Ti) | |
| Schenker XMG Pro 15 (i7-12700H, RTX 3080 Ti) | |
| MSI Raider GE66 12UHS | |
| Average of class Gaming (0.3439 - 0.59, n=102, last 2 years) | |
* ... smaller is better
AIDA64: FP32 Ray-Trace | FPU Julia | CPU SHA3 | CPU Queen | FPU SinJulia | FPU Mandel | CPU AES | CPU ZLib | FP64 Ray-Trace | CPU PhotoWorxx
| Performance rating | |
| Average of class Gaming | |
| Schenker XMG Pro 15 (Late 2021) | |
| MSI Raider GE66 12UHS | |
| Schenker XMG Neo 15 (i7-12700H, RTX 3080 Ti) | |
| Average Intel Core i7-12700H | |
| Schenker XMG Pro 15 (i7-12700H, RTX 3080 Ti) | |
| Razer Blade 15 2022 | |
| AIDA64 / FP32 Ray-Trace | |
| Average of class Gaming (10227 - 85542, n=102, last 2 years) | |
| Schenker XMG Pro 15 (Late 2021) | |
| Average Intel Core i7-12700H (2585 - 17957, n=64) | |
| Schenker XMG Neo 15 (i7-12700H, RTX 3080 Ti) | |
| Schenker XMG Pro 15 (i7-12700H, RTX 3080 Ti) | |
| MSI Raider GE66 12UHS | |
| Razer Blade 15 2022 | |
| AIDA64 / FPU Julia | |
| Average of class Gaming (51376 - 372155, n=102, last 2 years) | |
| Schenker XMG Pro 15 (Late 2021) | |
| Average Intel Core i7-12700H (12439 - 90760, n=64) | |
| Schenker XMG Neo 15 (i7-12700H, RTX 3080 Ti) | |
| Schenker XMG Pro 15 (i7-12700H, RTX 3080 Ti) | |
| MSI Raider GE66 12UHS | |
| Razer Blade 15 2022 | |
| AIDA64 / CPU SHA3 | |
| Average of class Gaming (2180 - 10115, n=102, last 2 years) | |
| Schenker XMG Pro 15 (Late 2021) | |
| Schenker XMG Neo 15 (i7-12700H, RTX 3080 Ti) | |
| Average Intel Core i7-12700H (833 - 4242, n=64) | |
| MSI Raider GE66 12UHS | |
| Schenker XMG Pro 15 (i7-12700H, RTX 3080 Ti) | |
| Razer Blade 15 2022 | |
| AIDA64 / CPU Queen | |
| Average of class Gaming (49785 - 173351, n=86, last 2 years) | |
| MSI Raider GE66 12UHS | |
| Schenker XMG Pro 15 (i7-12700H, RTX 3080 Ti) | |
| Schenker XMG Neo 15 (i7-12700H, RTX 3080 Ti) | |
| Average Intel Core i7-12700H (57923 - 103202, n=63) | |
| Razer Blade 15 2022 | |
| Schenker XMG Pro 15 (Late 2021) | |
| AIDA64 / FPU SinJulia | |
| Average of class Gaming (4424 - 33636, n=102, last 2 years) | |
| Schenker XMG Neo 15 (i7-12700H, RTX 3080 Ti) | |
| Schenker XMG Pro 15 (Late 2021) | |
| Schenker XMG Pro 15 (i7-12700H, RTX 3080 Ti) | |
| MSI Raider GE66 12UHS | |
| Razer Blade 15 2022 | |
| Average Intel Core i7-12700H (3249 - 9939, n=64) | |
| AIDA64 / FPU Mandel | |
| Average of class Gaming (25115 - 196829, n=102, last 2 years) | |
| Schenker XMG Pro 15 (Late 2021) | |
| Average Intel Core i7-12700H (7135 - 44760, n=64) | |
| Schenker XMG Neo 15 (i7-12700H, RTX 3080 Ti) | |
| Schenker XMG Pro 15 (i7-12700H, RTX 3080 Ti) | |
| MSI Raider GE66 12UHS | |
| Razer Blade 15 2022 | |
| AIDA64 / CPU AES | |
| Schenker XMG Pro 15 (Late 2021) | |
| Average of class Gaming (39258 - 247074, n=102, last 2 years) | |
| MSI Raider GE66 12UHS | |
| Average Intel Core i7-12700H (31839 - 144360, n=64) | |
| Schenker XMG Neo 15 (i7-12700H, RTX 3080 Ti) | |
| Schenker XMG Pro 15 (i7-12700H, RTX 3080 Ti) | |
| Razer Blade 15 2022 | |
| AIDA64 / CPU ZLib | |
| Average of class Gaming (574 - 2531, n=102, last 2 years) | |
| Schenker XMG Neo 15 (i7-12700H, RTX 3080 Ti) | |
| Schenker XMG Pro 15 (i7-12700H, RTX 3080 Ti) | |
| MSI Raider GE66 12UHS | |
| Average Intel Core i7-12700H (305 - 1171, n=64) | |
| Razer Blade 15 2022 | |
| Schenker XMG Pro 15 (Late 2021) | |
| AIDA64 / FP64 Ray-Trace | |
| Average of class Gaming (5509 - 45446, n=102, last 2 years) | |
| Schenker XMG Pro 15 (Late 2021) | |
| Average Intel Core i7-12700H (1437 - 9692, n=64) | |
| Schenker XMG Neo 15 (i7-12700H, RTX 3080 Ti) | |
| Schenker XMG Pro 15 (i7-12700H, RTX 3080 Ti) | |
| MSI Raider GE66 12UHS | |
| Razer Blade 15 2022 | |
| AIDA64 / CPU PhotoWorxx | |
| Average of class Gaming (12271 - 89891, n=102, last 2 years) | |
| Razer Blade 15 2022 | |
| MSI Raider GE66 12UHS | |
| Schenker XMG Neo 15 (i7-12700H, RTX 3080 Ti) | |
| Average Intel Core i7-12700H (12863 - 52207, n=64) | |
| Schenker XMG Pro 15 (i7-12700H, RTX 3080 Ti) | |
| Schenker XMG Pro 15 (Late 2021) | |
系统性能
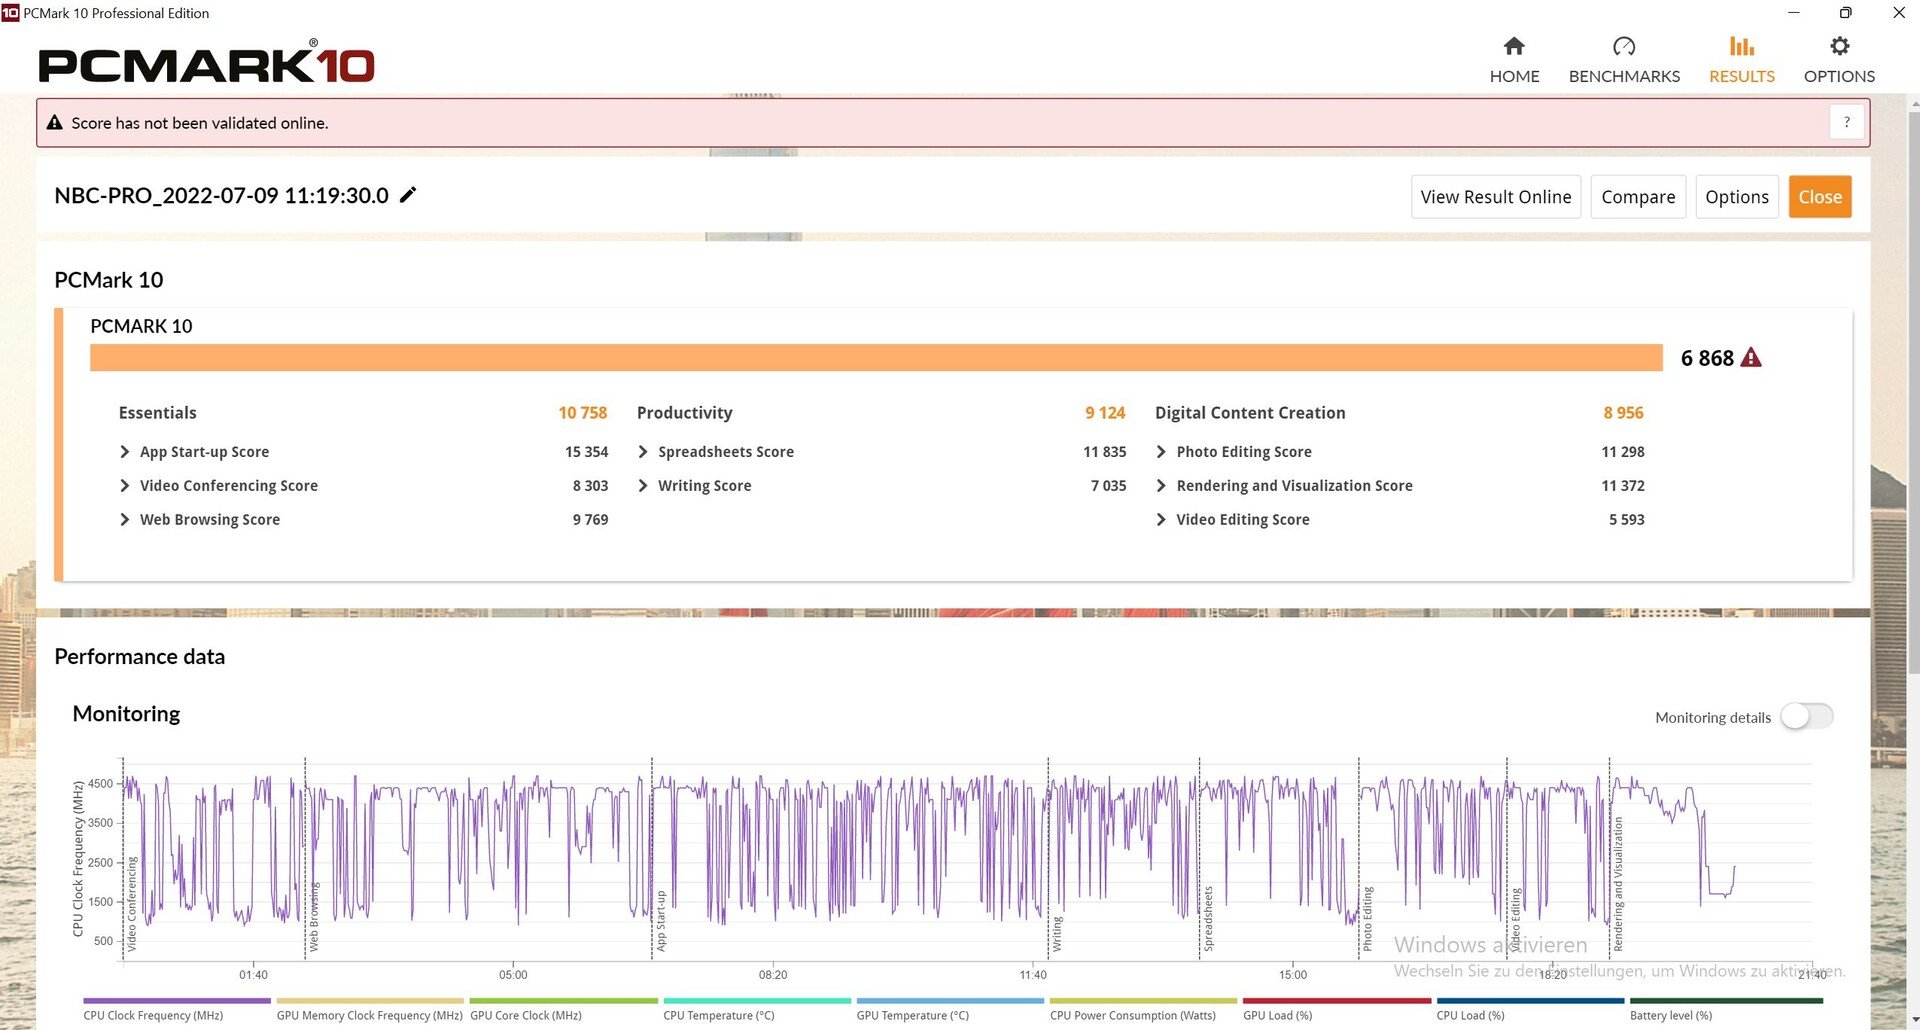
在PCMark 10中,基准值与预期水平基本持平,但在内容创建方面的性能急剧下降。

CrossMark: Overall | Productivity | Creativity | Responsiveness
| PCMark 10 / Score | |
| Average of class Gaming (5828 - 12414, n=93, last 2 years) | |
| MSI Raider GE66 12UHS | |
| Razer Blade 15 2022 | |
| Schenker XMG Neo 15 (i7-12700H, RTX 3080 Ti) | |
| Average Intel Core i7-12700H, NVIDIA GeForce RTX 3080 Ti Laptop GPU (6868 - 7638, n=7) | |
| Schenker XMG Pro 15 (i7-12700H, RTX 3080 Ti) | |
| Schenker XMG Pro 15 (Late 2021) | |
| PCMark 10 / Essentials | |
| MSI Raider GE66 12UHS | |
| Schenker XMG Pro 15 (i7-12700H, RTX 3080 Ti) | |
| Razer Blade 15 2022 | |
| Average of class Gaming (8810 - 11935, n=97, last 2 years) | |
| Schenker XMG Neo 15 (i7-12700H, RTX 3080 Ti) | |
| Average Intel Core i7-12700H, NVIDIA GeForce RTX 3080 Ti Laptop GPU (9987 - 11318, n=7) | |
| Schenker XMG Pro 15 (Late 2021) | |
| PCMark 10 / Productivity | |
| Average of class Gaming (6845 - 25323, n=95, last 2 years) | |
| MSI Raider GE66 12UHS | |
| Razer Blade 15 2022 | |
| Average Intel Core i7-12700H, NVIDIA GeForce RTX 3080 Ti Laptop GPU (8944 - 10726, n=7) | |
| Schenker XMG Pro 15 (i7-12700H, RTX 3080 Ti) | |
| Schenker XMG Neo 15 (i7-12700H, RTX 3080 Ti) | |
| Schenker XMG Pro 15 (Late 2021) | |
| PCMark 10 / Digital Content Creation | |
| Average of class Gaming (7602 - 19954, n=95, last 2 years) | |
| MSI Raider GE66 12UHS | |
| Schenker XMG Neo 15 (i7-12700H, RTX 3080 Ti) | |
| Razer Blade 15 2022 | |
| Average Intel Core i7-12700H, NVIDIA GeForce RTX 3080 Ti Laptop GPU (8956 - 12249, n=7) | |
| Schenker XMG Pro 15 (Late 2021) | |
| Schenker XMG Pro 15 (i7-12700H, RTX 3080 Ti) | |
| CrossMark / Overall | |
| Average of class Gaming (1366 - 2409, n=94, last 2 years) | |
| Average Intel Core i7-12700H, NVIDIA GeForce RTX 3080 Ti Laptop GPU (1761 - 1861, n=4) | |
| Schenker XMG Neo 15 (i7-12700H, RTX 3080 Ti) | |
| Schenker XMG Pro 15 (Late 2021) | |
| CrossMark / Productivity | |
| Average of class Gaming (1386 - 2254, n=94, last 2 years) | |
| Average Intel Core i7-12700H, NVIDIA GeForce RTX 3080 Ti Laptop GPU (1645 - 1800, n=4) | |
| Schenker XMG Neo 15 (i7-12700H, RTX 3080 Ti) | |
| Schenker XMG Pro 15 (Late 2021) | |
| CrossMark / Creativity | |
| Average of class Gaming (1343 - 2786, n=94, last 2 years) | |
| Schenker XMG Neo 15 (i7-12700H, RTX 3080 Ti) | |
| Average Intel Core i7-12700H, NVIDIA GeForce RTX 3080 Ti Laptop GPU (1936 - 2041, n=4) | |
| Schenker XMG Pro 15 (Late 2021) | |
| CrossMark / Responsiveness | |
| Average of class Gaming (1226 - 2334, n=94, last 2 years) | |
| Average Intel Core i7-12700H, NVIDIA GeForce RTX 3080 Ti Laptop GPU (1461 - 1868, n=4) | |
| Schenker XMG Pro 15 (Late 2021) | |
| Schenker XMG Neo 15 (i7-12700H, RTX 3080 Ti) | |
| PCMark 10 Score | 6868 points | |
Help | ||
| AIDA64 / Memory Copy | |
| Average of class Gaming (21750 - 129946, n=102, last 2 years) | |
| MSI Raider GE66 12UHS | |
| Schenker XMG Neo 15 (i7-12700H, RTX 3080 Ti) | |
| Razer Blade 15 2022 | |
| Average Intel Core i7-12700H (25615 - 80511, n=64) | |
| Schenker XMG Pro 15 (Late 2021) | |
| Schenker XMG Pro 15 (i7-12700H, RTX 3080 Ti) | |
| AIDA64 / Memory Read | |
| Average of class Gaming (22956 - 118858, n=102, last 2 years) | |
| MSI Raider GE66 12UHS | |
| Schenker XMG Neo 15 (i7-12700H, RTX 3080 Ti) | |
| Razer Blade 15 2022 | |
| Average Intel Core i7-12700H (25586 - 79442, n=64) | |
| Schenker XMG Pro 15 (Late 2021) | |
| Schenker XMG Pro 15 (i7-12700H, RTX 3080 Ti) | |
| AIDA64 / Memory Write | |
| Average of class Gaming (22297 - 135096, n=102, last 2 years) | |
| Razer Blade 15 2022 | |
| Schenker XMG Neo 15 (i7-12700H, RTX 3080 Ti) | |
| MSI Raider GE66 12UHS | |
| Average Intel Core i7-12700H (23679 - 88660, n=64) | |
| Schenker XMG Pro 15 (Late 2021) | |
| Schenker XMG Pro 15 (i7-12700H, RTX 3080 Ti) | |
| AIDA64 / Memory Latency | |
| Average of class Gaming (75.3 - 165.4, n=102, last 2 years) | |
| MSI Raider GE66 12UHS | |
| Schenker XMG Pro 15 (Late 2021) | |
| Average Intel Core i7-12700H (76.2 - 133.9, n=62) | |
| Razer Blade 15 2022 | |
* ... smaller is better
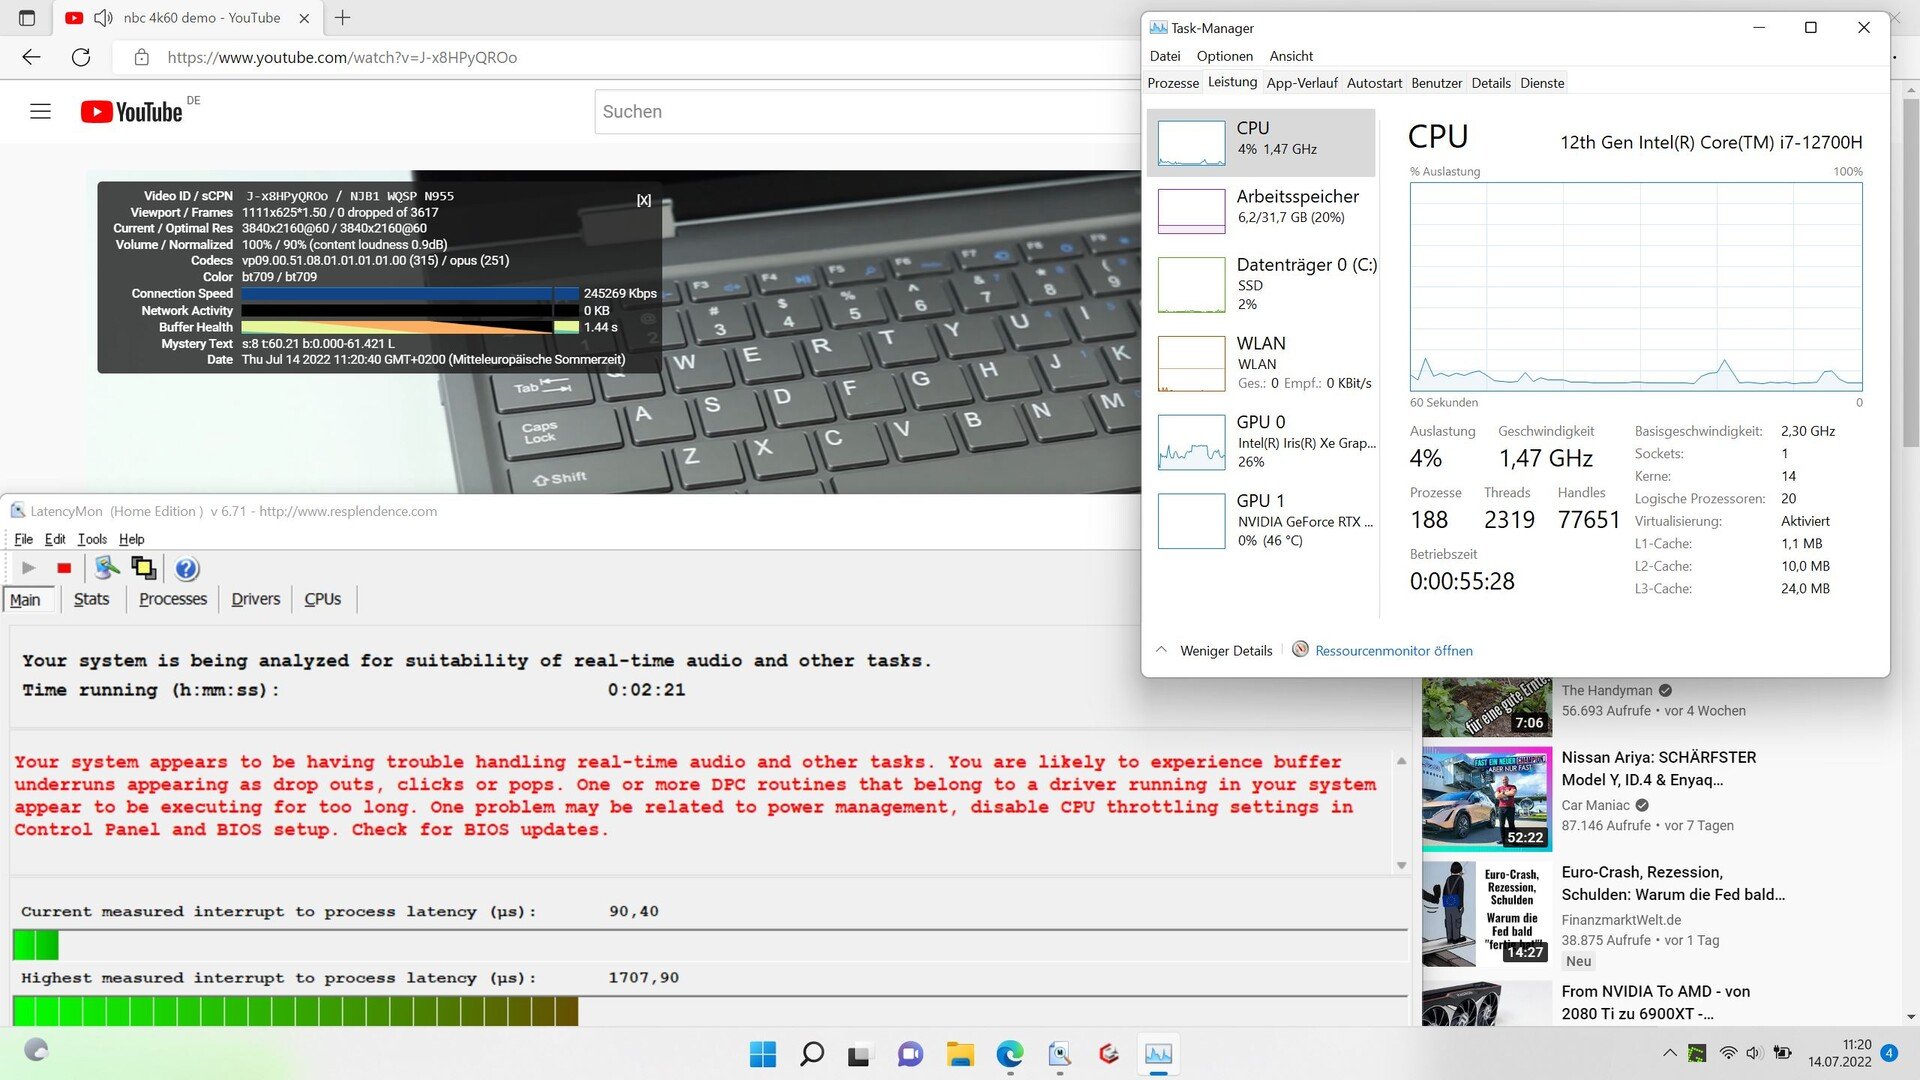
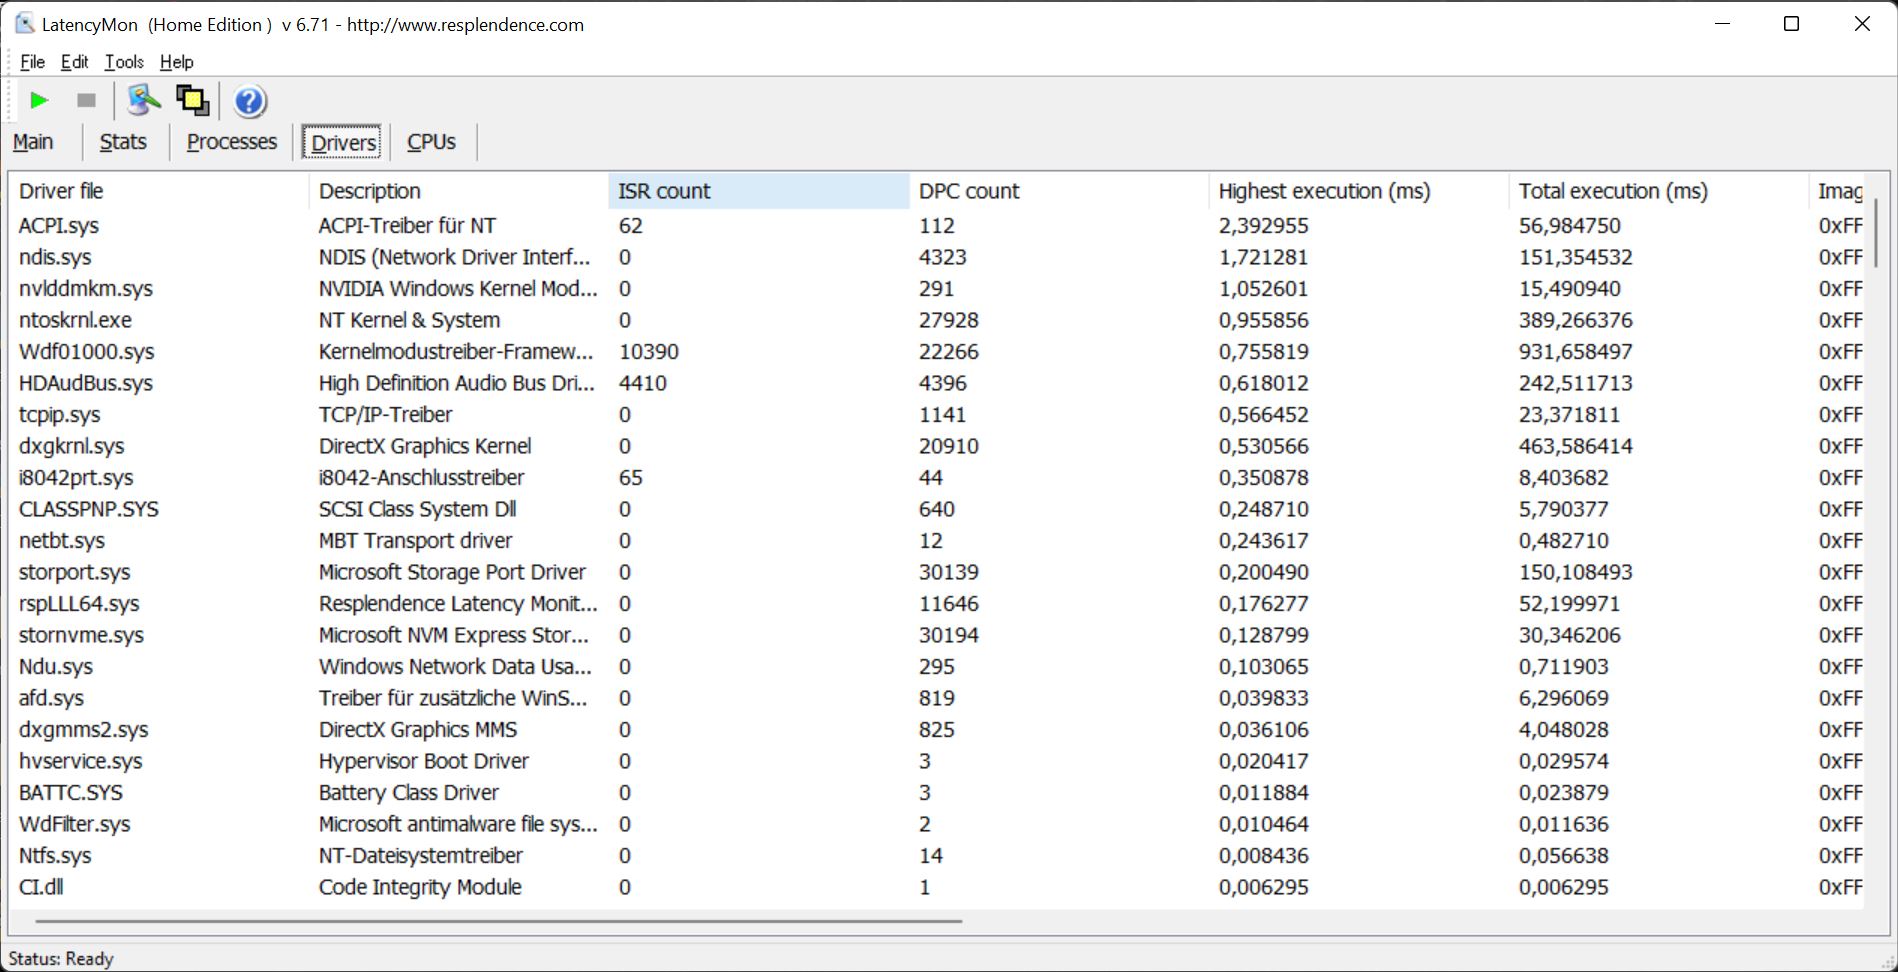
DPC延时
浏览器的打开没有造成任何问题,但在加载我们的网站时出现了问题。在打开多个标签和播放我们的4K/60帧的YouTube视频时,确定的延迟增加了。最起码,视频运行时没有丢帧,但延迟仍然相对相当高。

| DPC Latencies / LatencyMon - interrupt to process latency (max), Web, Youtube, Prime95 | |
| MSI Raider GE66 12UHS | |
| Schenker XMG Neo 15 (i7-12700H, RTX 3080 Ti) | |
| Schenker XMG Pro 15 (i7-12700H, RTX 3080 Ti) | |
| Razer Blade 15 2022 | |
| Schenker XMG Pro 15 (Late 2021) | |
* ... smaller is better
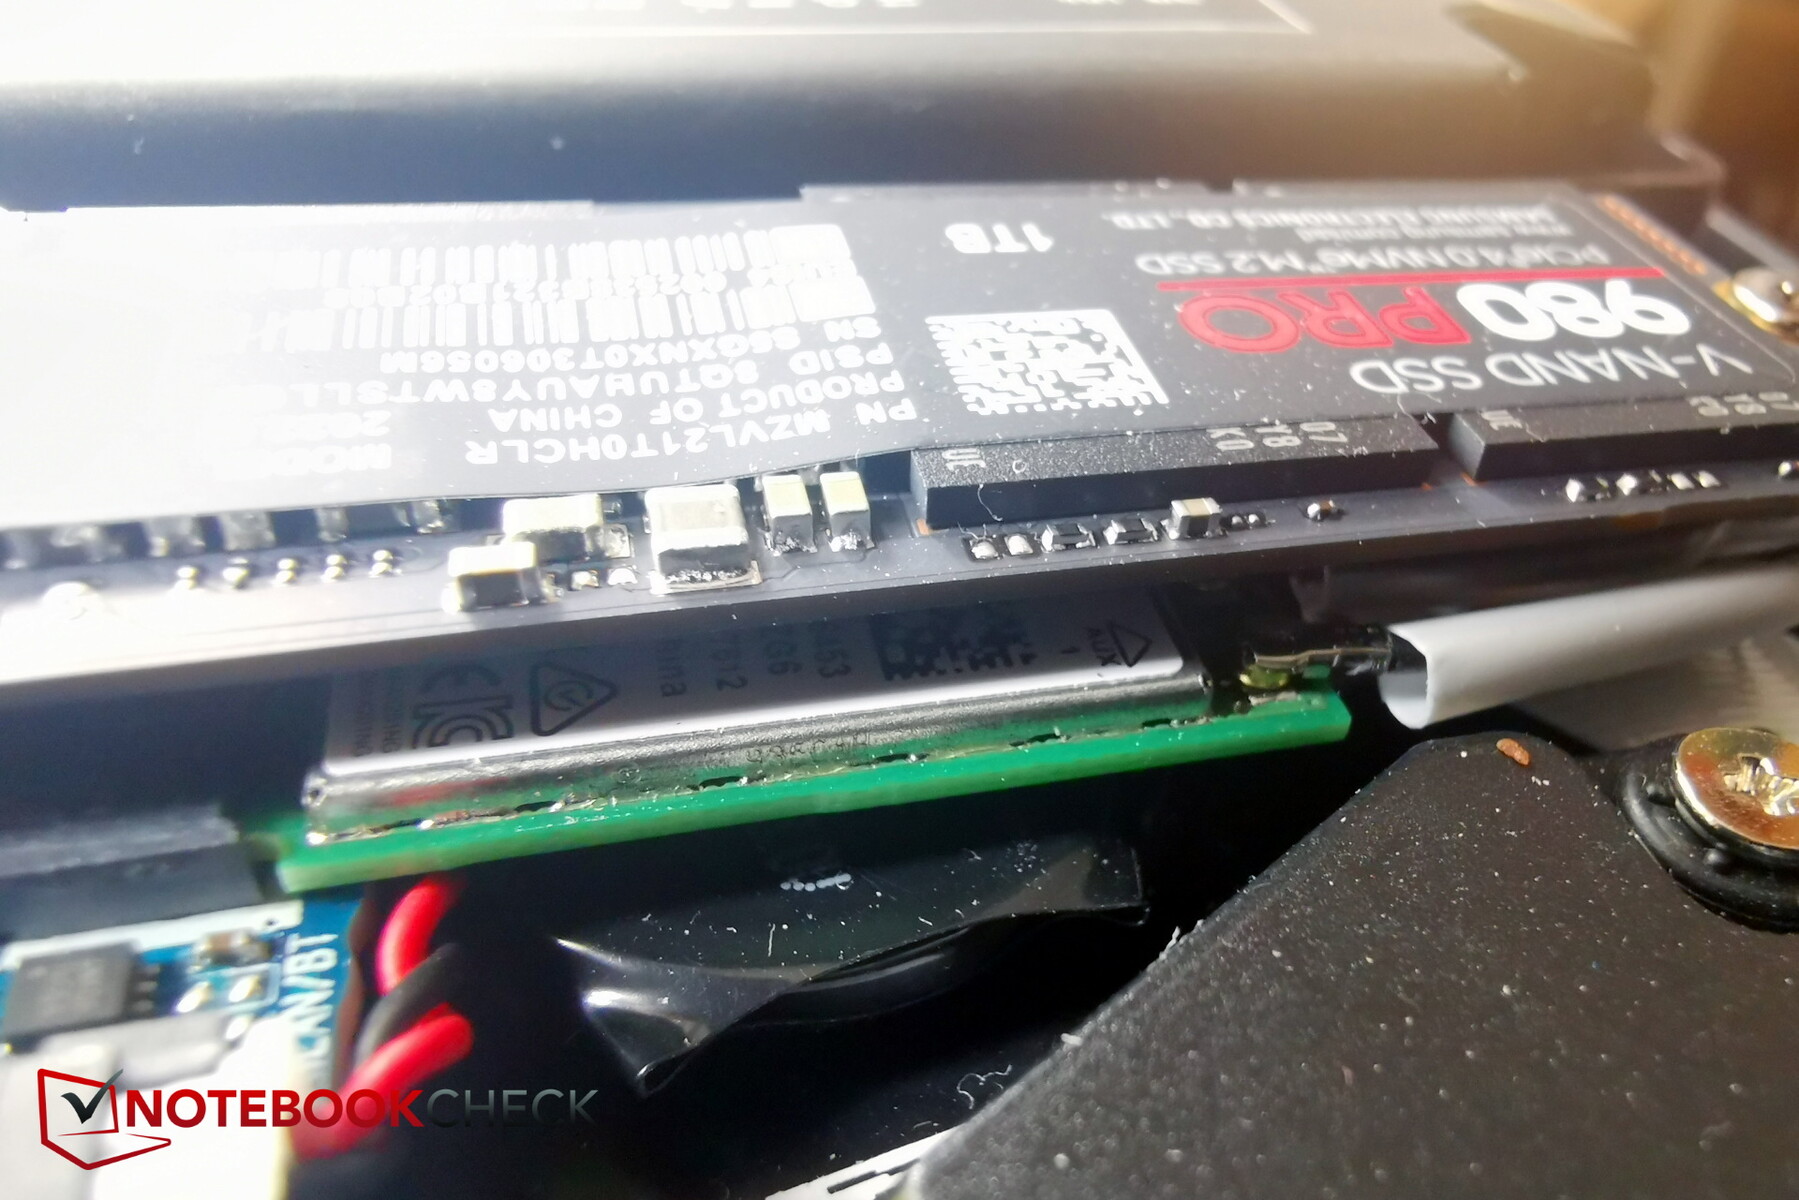
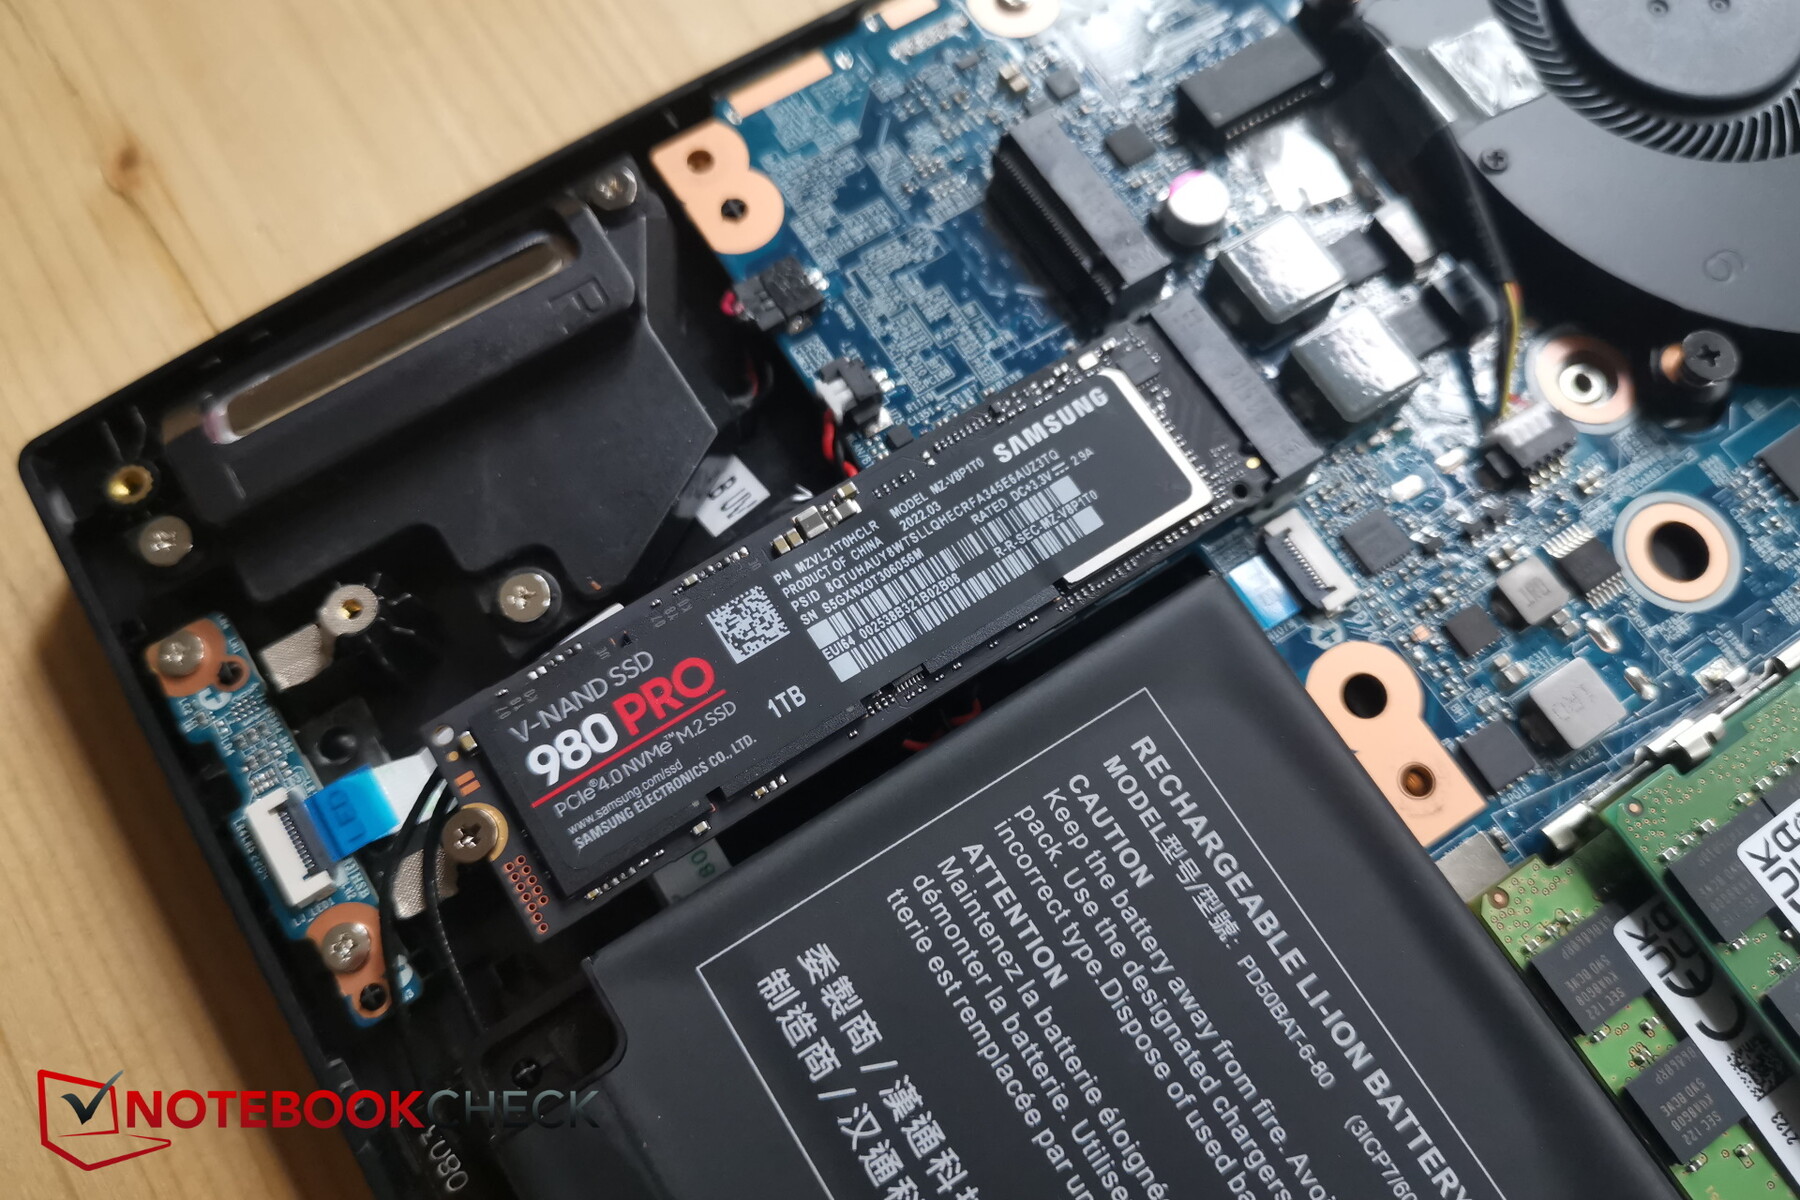
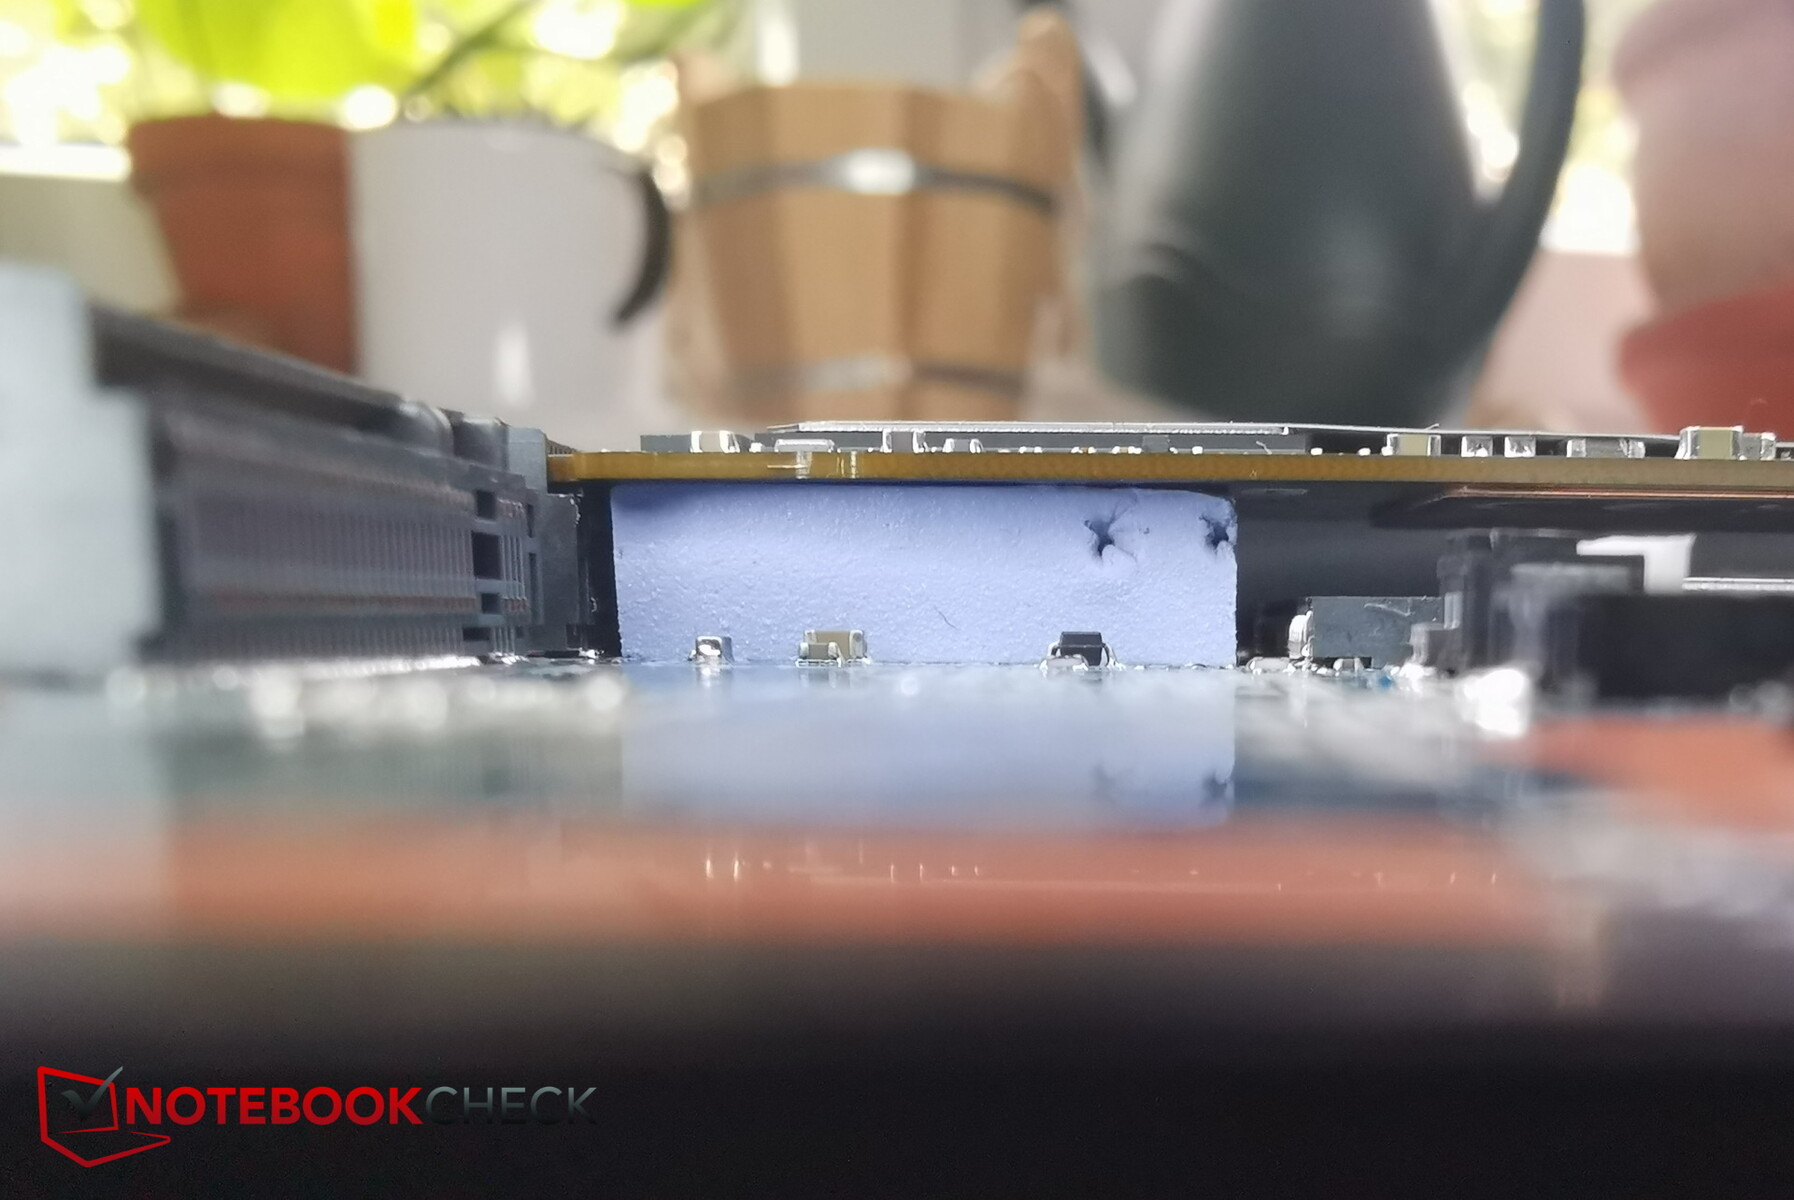
存储设备
安装了1TB和PCIe 4.0的三星固态硬盘980 Pro在我们的SSD/HDD最佳列表中排名第11位。它在Pro 15中的速度也相当快,但持续性能并不恒定,这意味着性能可能会大大降低。这可能表明这里可能存在冷却问题,这也可以解释PCMark10的低分数。
紧挨着三星固态硬盘的是另一个M.2插槽,用于辅助存储驱动器。
经询问,制造商表示,评测样品是在该系列机型内部发布之前由XMG发出的,据说有一个不正确的冷却垫,而该系列机型没有使用。然而,显然,冷却垫并没有什么异常。该 XMG Pro 17也显示了测试中的SSD的长期性能下降。

* ... smaller is better
Sustained Performance Read: DiskSpd Read Loop, Queue Depth 8
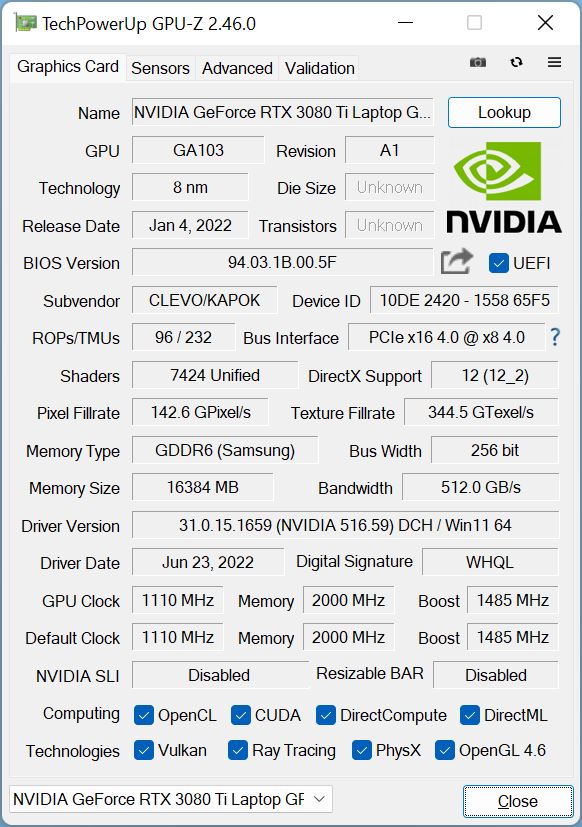
图形卡
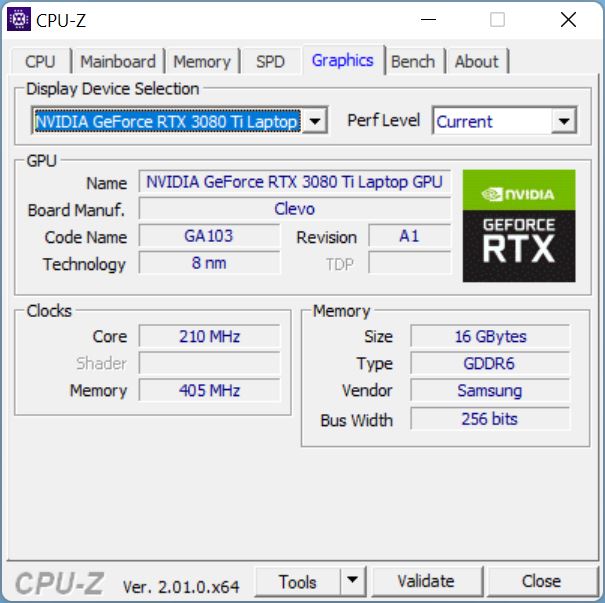
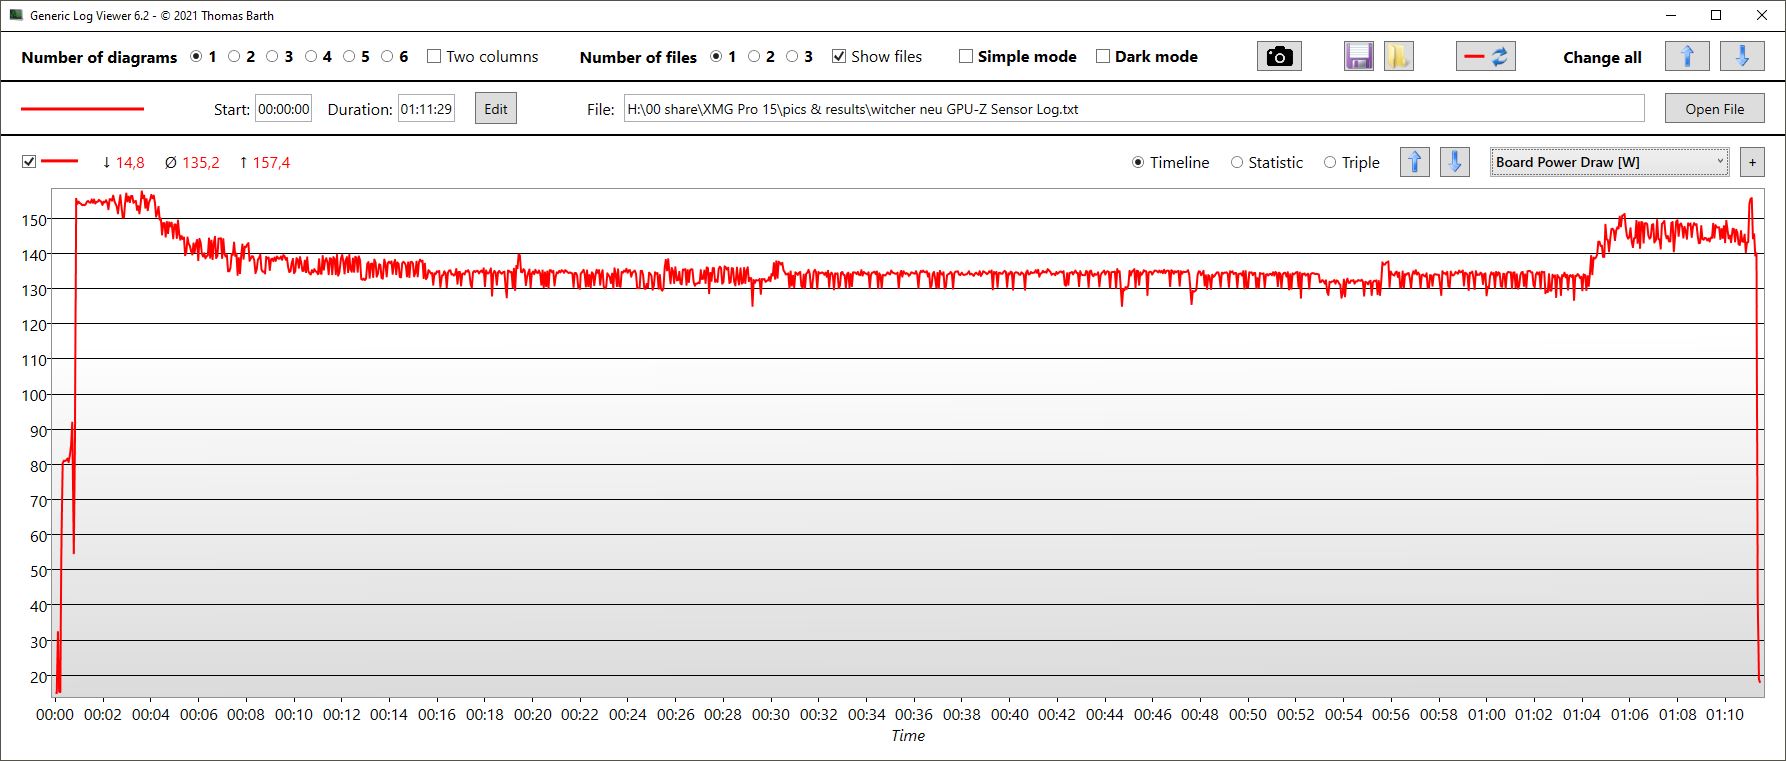
的 Nvidia Geforce RTX 3080 Ti是目前最强大的笔记本电脑显卡。然而,其性能在很大程度上取决于制造商设置的TGP。在Pro 15的情况下,GPU被允许高达155 W(包括动态提升)。根据Nvidia的说法,最高可以达到175瓦。尽管如此,在所有的应用程序中,3D性能应该是非常高的。
只有微星的Raider在3DMark 11中更快,而Neo 15在其他3DMarks中有时会超过Pro 15,但差异相当小。
在电池模式下,3D性能在另一个Time Spy ,降幅高达86%!
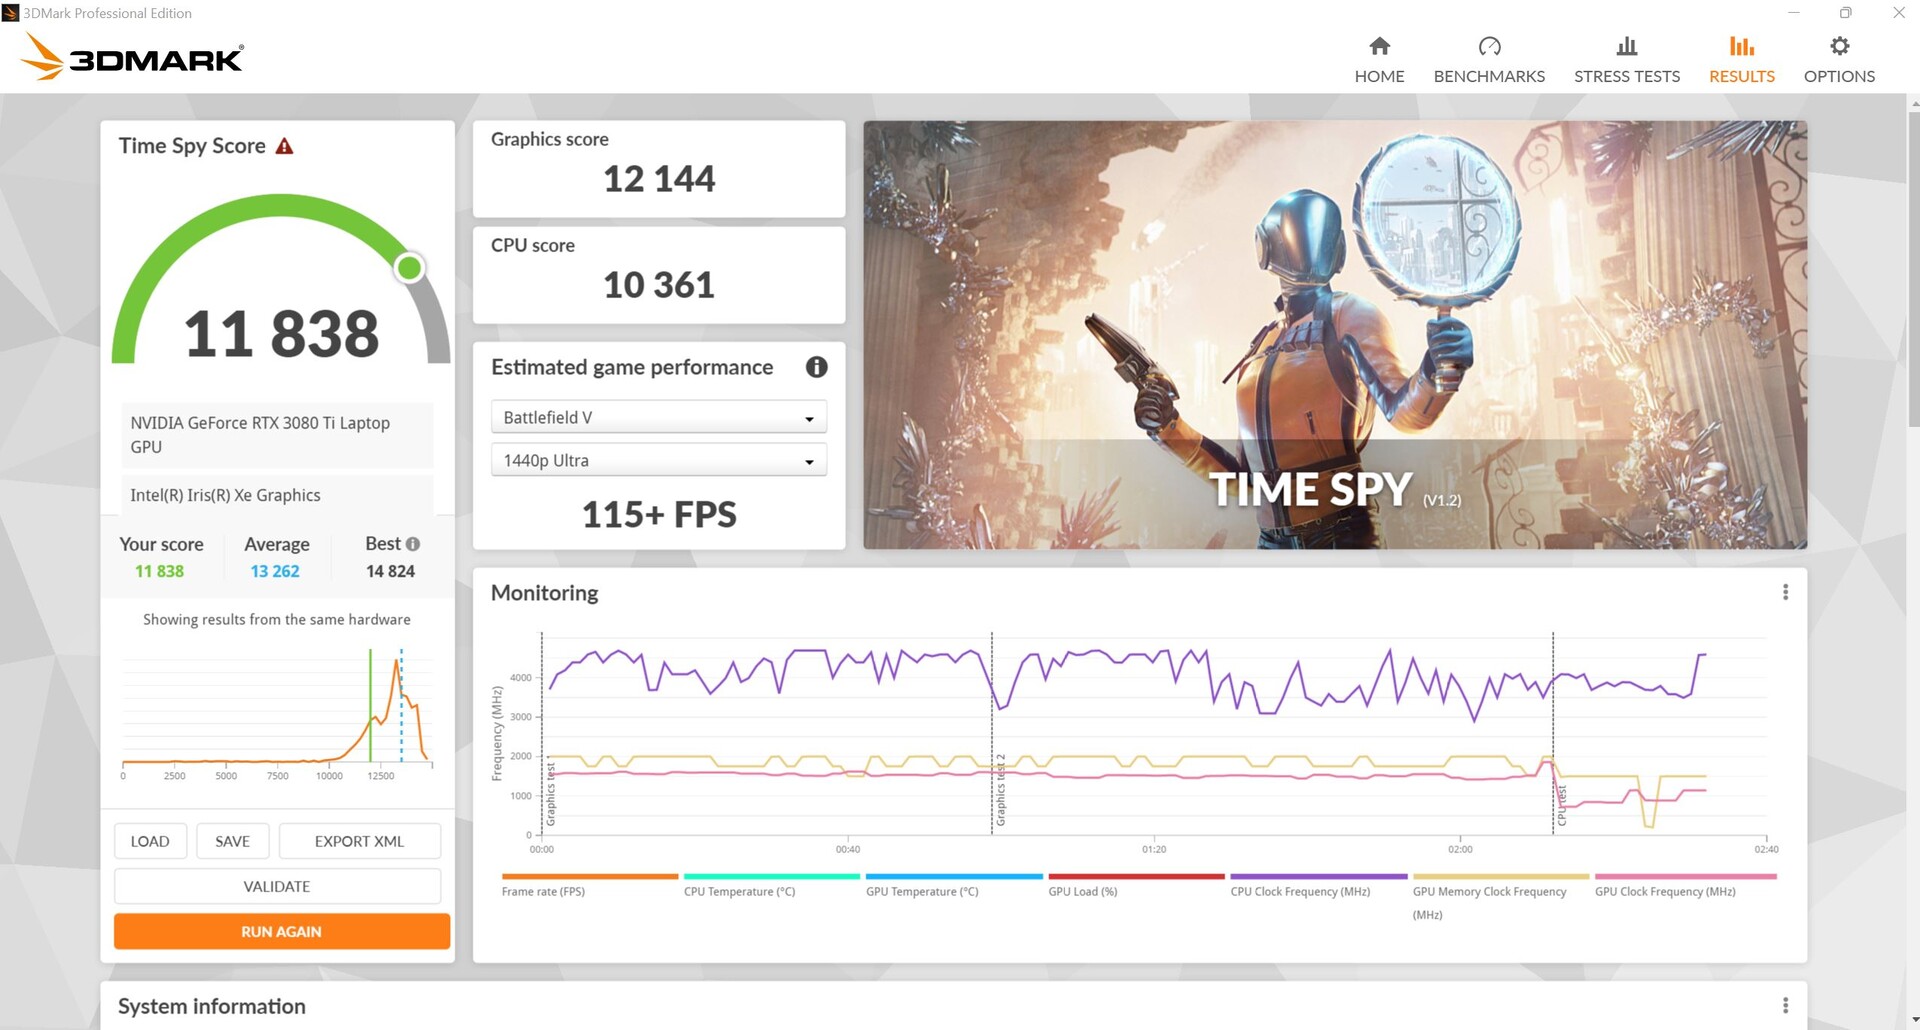

| 3DMark 11 Performance | 33321 points | |
| 3DMark Cloud Gate Standard Score | 60607 points | |
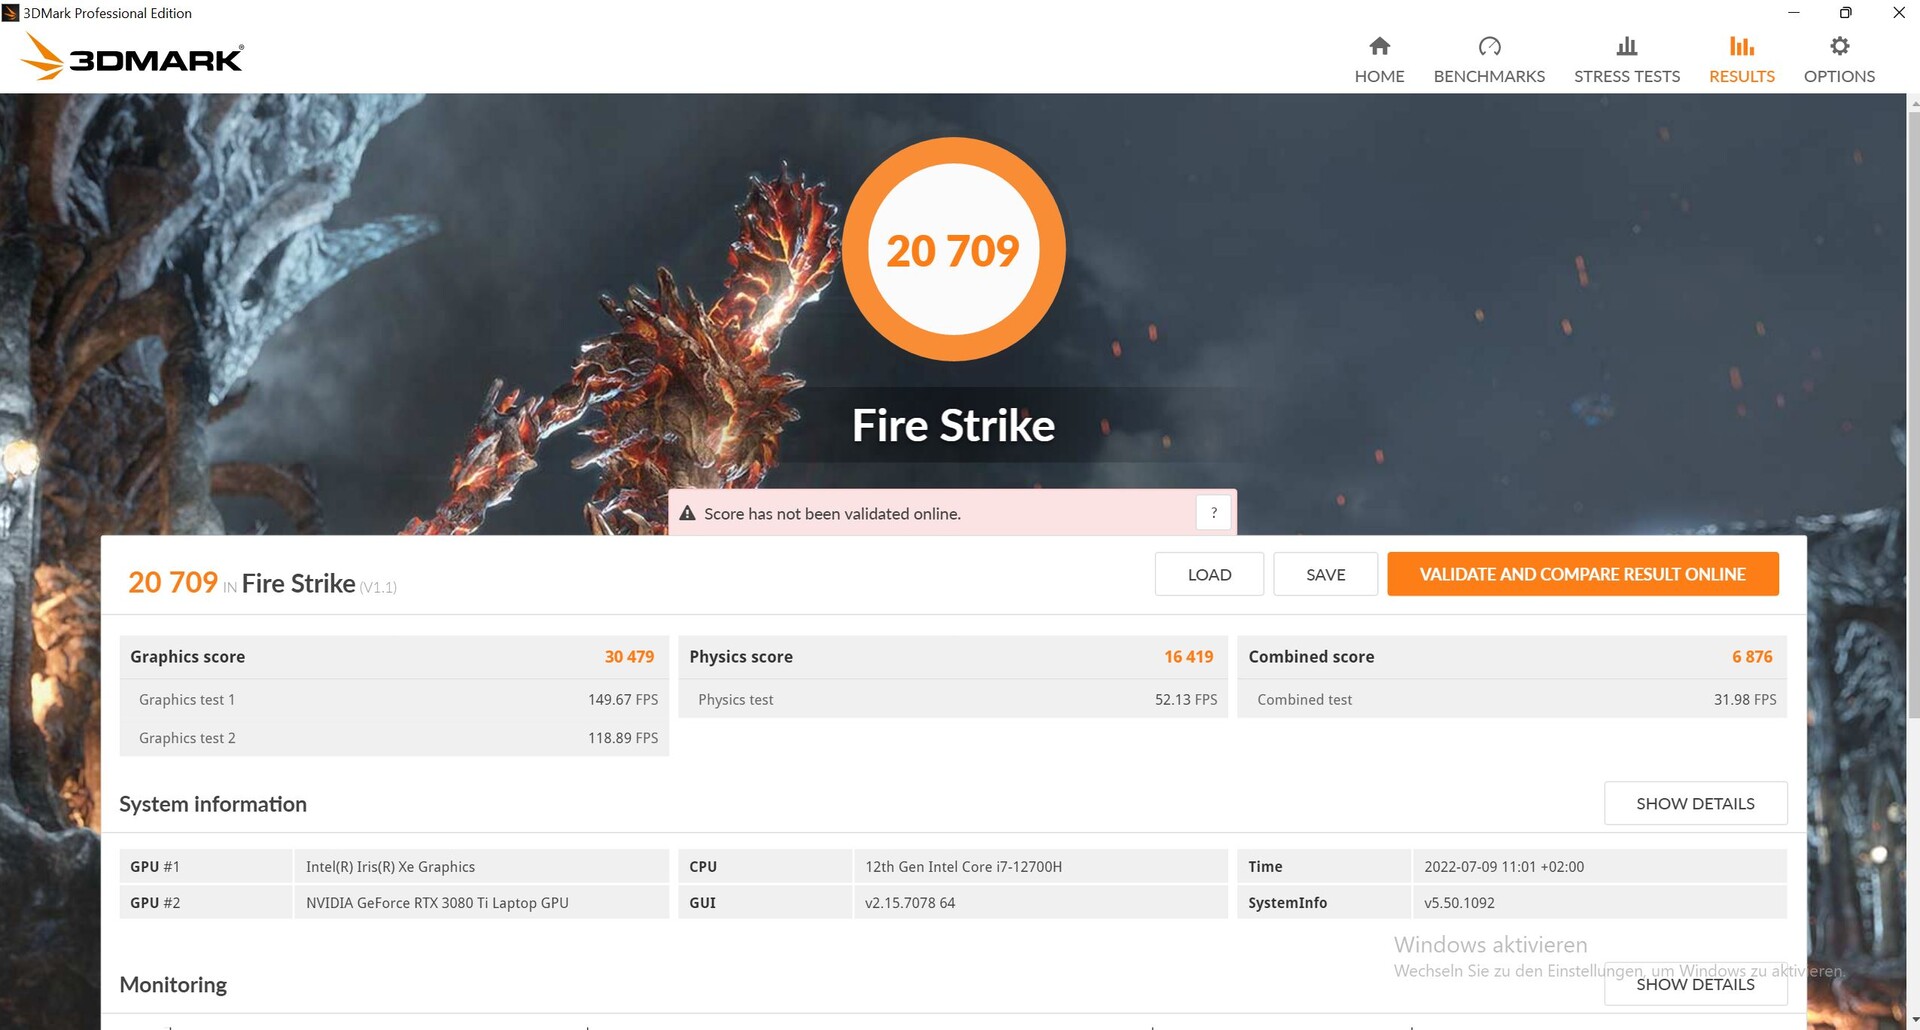
| 3DMark Fire Strike Score | 20709 points | |
| 3DMark Time Spy Score | 11838 points | |
Help | ||
游戏性能
Pro 15在低图形设置中往往仅低于平均水平,而在高细节中略高于平均水平。总体而言,游戏性能达到了预期水平。然而,特别是Neo 15和MSI Raider几乎总是更快,即使是在高细节方面。在《奇异旅团》中,Pro 15是最快的设备。
然而,在光线追踪方面,情况变得有点紧张,这取决于游戏和细节水平。在《毁灭之光2》中,在高光线追踪设置和全高清的情况下,Pro 15能达到38帧,但在原生QHD分辨率下,仅有20多帧就出现了停滞。但这在其他配备RTX 3080 Ti的笔记本电脑中并无不同。
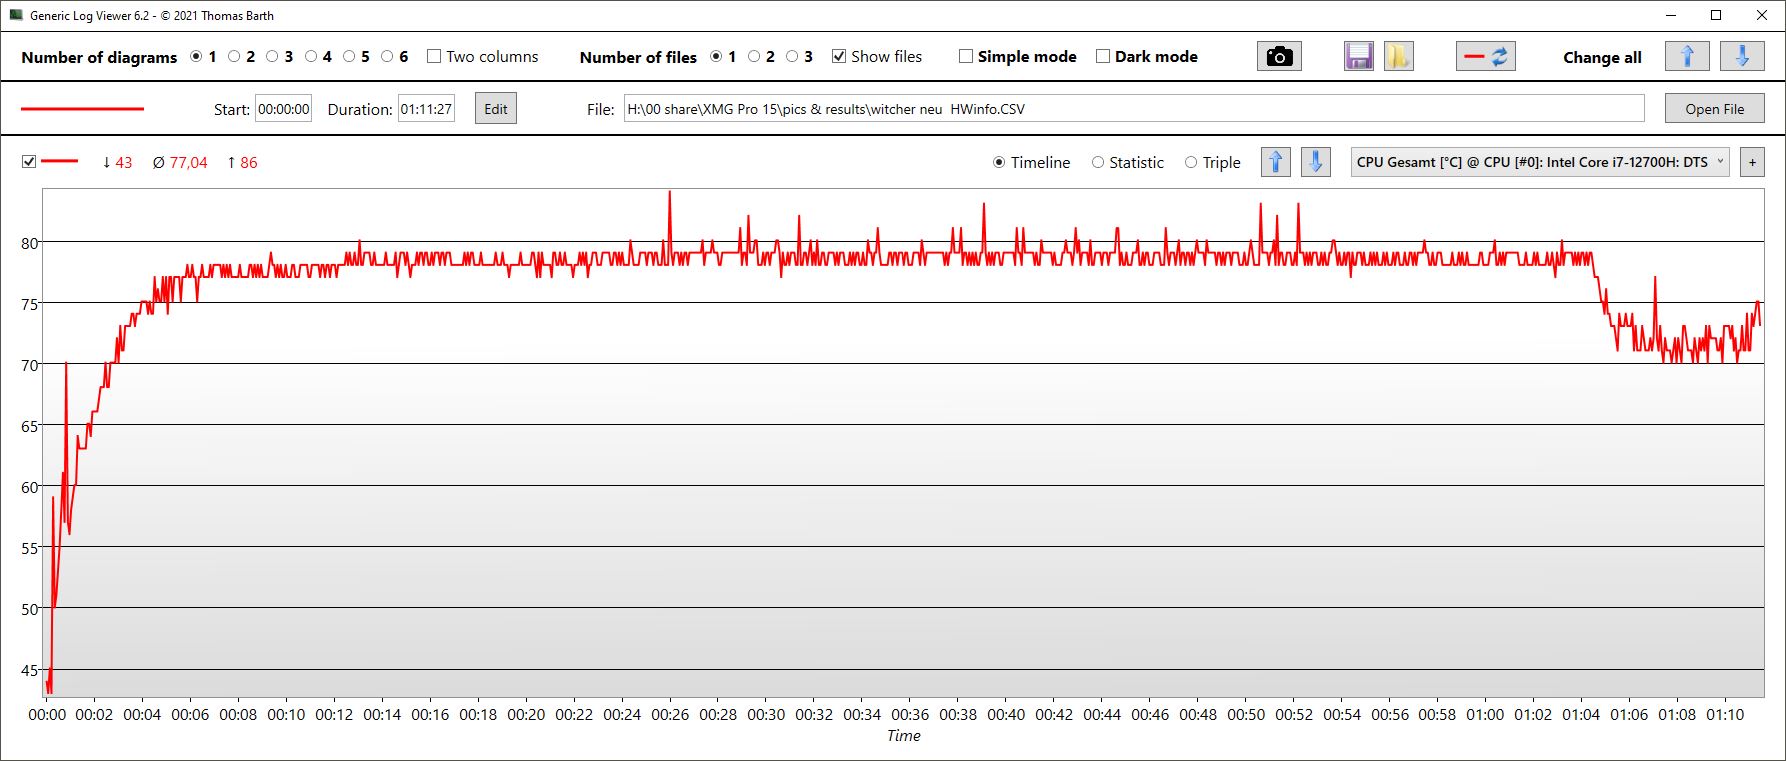
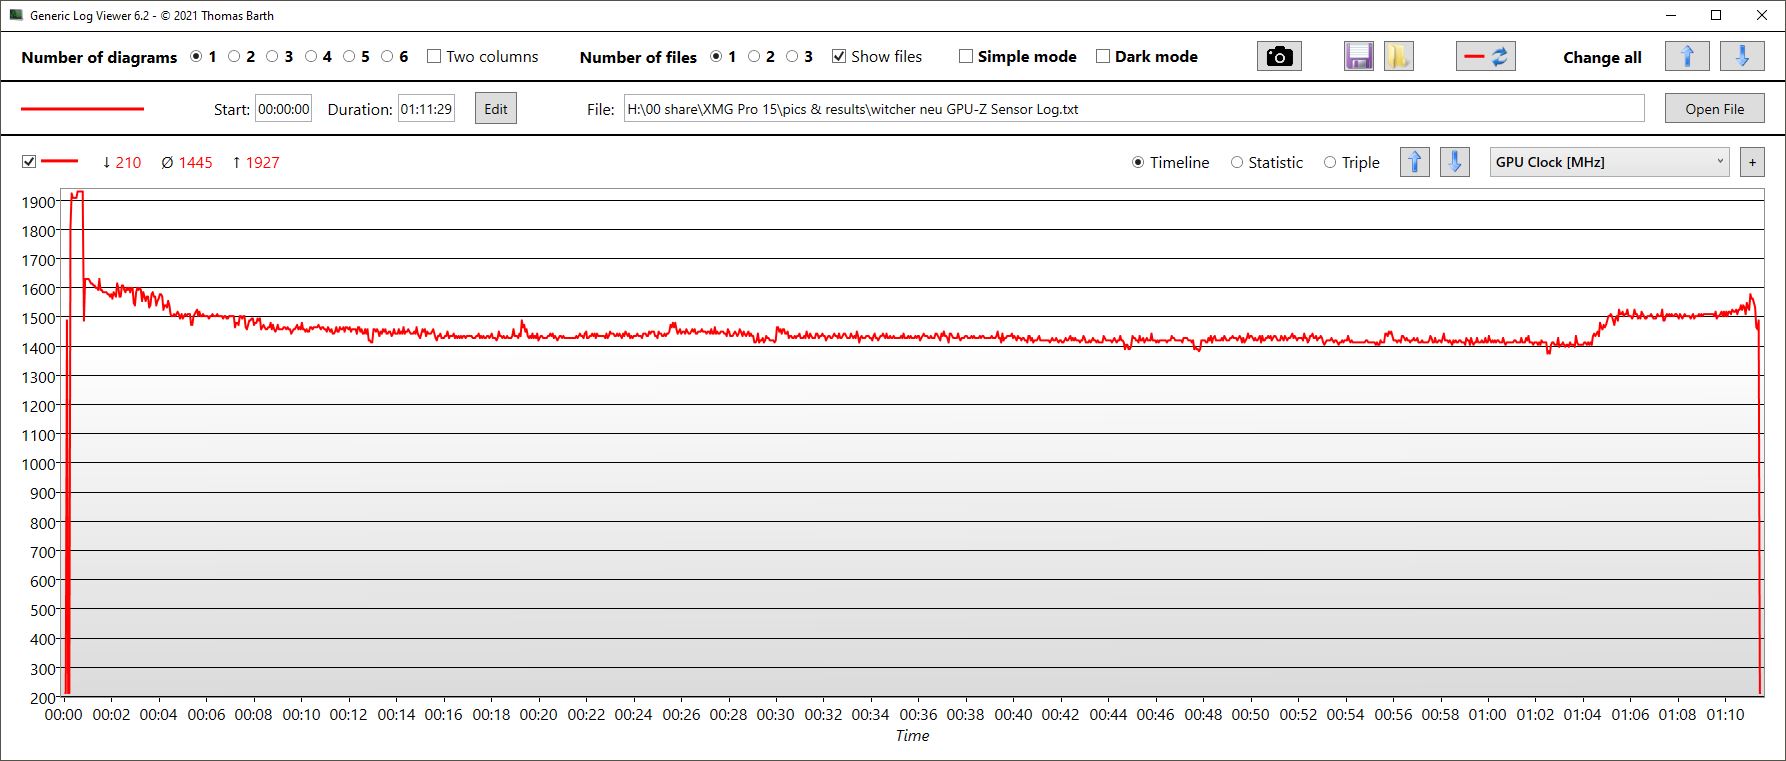
Witcher 3 Ultra的帧率在一个小时内相当稳定,在110至125帧之间波动。
CPU平均发热77℃,功耗只有28W,这也是因为Witcher 3 不能很好地利用较新的处理器,特别是英特尔CPU的新E和P核心。
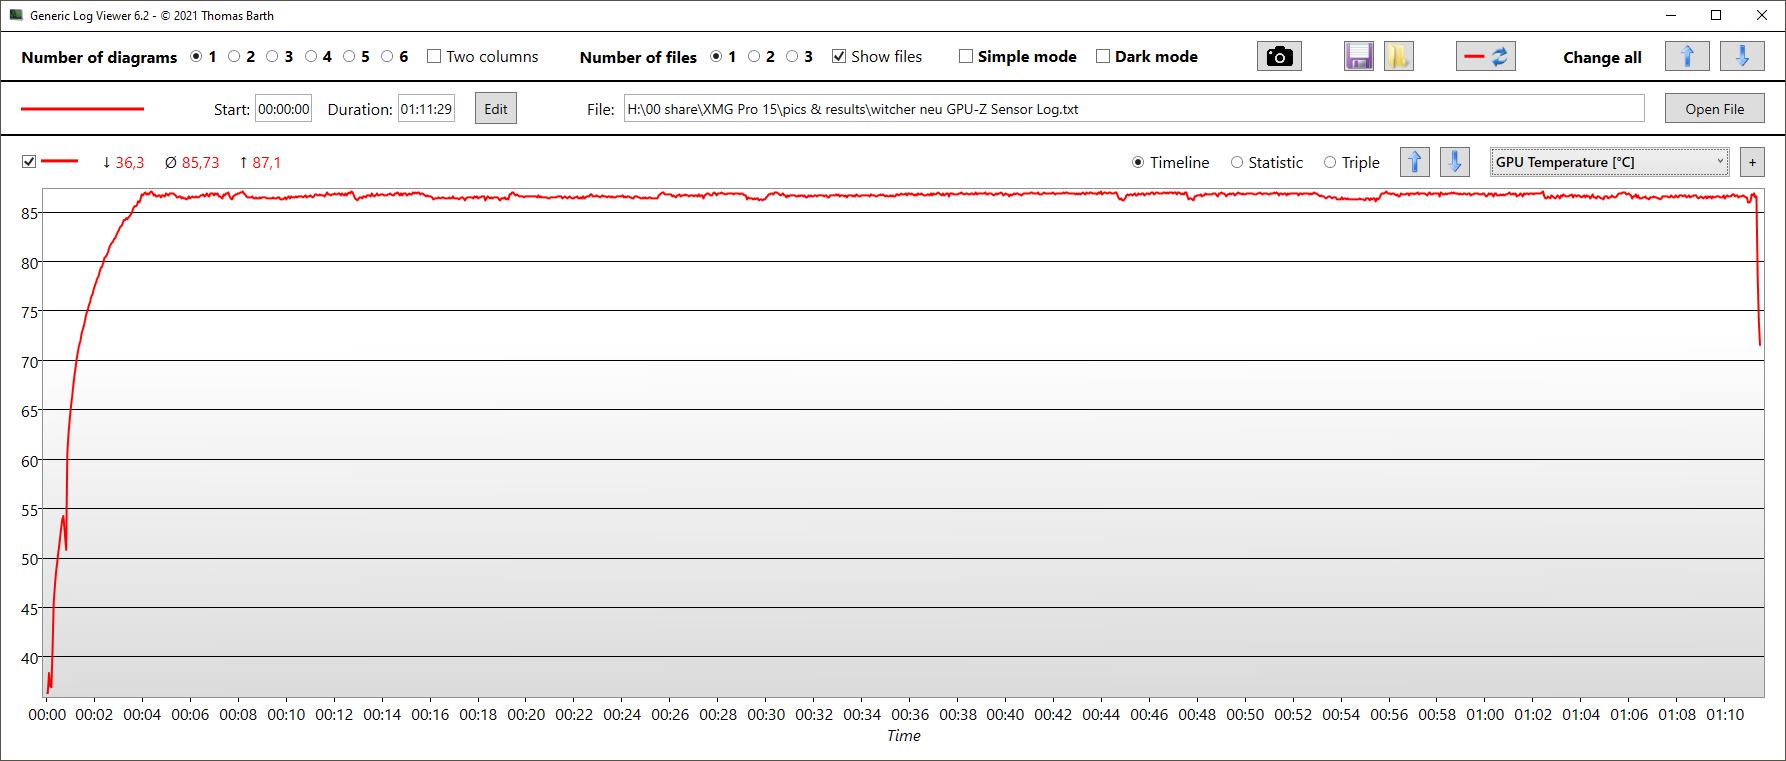
GPU的温度平均为86℃。它不能保持Turbo速率,时钟平均为1.4GHz。

Witcher 3 FPS Chart
| low | med. | high | ultra | QHD | |
|---|---|---|---|---|---|
| GTA V (2015) | 185 | 175.8 | 175.7 | 119.2 | 105.7 |
| The Witcher 3 (2015) | 366 | 319 | 211 | 119 | |
| Dota 2 Reborn (2015) | 161.1 | 148.4 | 138.9 | 131.7 | |
| Final Fantasy XV Benchmark (2018) | 177.5 | 148.3 | 110.4 | 88.8 | |
| X-Plane 11.11 (2018) | 140.2 | 125.2 | 100.1 | ||
| Far Cry 5 (2018) | 164 | 134 | 130 | 120 | 116 |
| Strange Brigade (2018) | 415.8 | 274 | 232 | 200 | 153.8 |
| Dying Light 2 (2022) | 123 | 99 | 84.4 | 59 |
排放。粉丝们很快就达到了他们的极限
系统噪音
Pro 15的风扇静止不动的情况也可能发生,但这种情况很少,即使在静音模式(空闲)下也是如此。有时,第二个风扇在娱乐或性能模式下也会安静地运行。尽管如此,这种风扇的行为已经比更大音量的前代产品有了改进。
总的来说,Pro 15的风扇转速相当高,而且非常快,也很难再慢下来。例如,在3DMark06中,风扇只转了16秒,40秒后达到最大。其他笔记本电脑保持安静的时间更长,而且在平均负载下不一定会转到最大音量。在娱乐模式下也是如此,但这里的最大音量是54.5分贝,而不是56.5分贝。Razer Blade甚至MSI Raider在负载下都明显更安静。
当启动3D程序如Witcher 3 或3DMark06时,我们会听到可能来自GPU的电子呼啸声。
Noise level
| Idle |
| 23 / 31.22 / 33.09 dB(A) |
| Load |
| 56.35 / 56.89 dB(A) |
 | ||
30 dB silent 40 dB(A) audible 50 dB(A) loud |
||
min: | ||
| Schenker XMG Pro 15 (i7-12700H, RTX 3080 Ti) GeForce RTX 3080 Ti Laptop GPU, i7-12700H, Samsung SSD 980 Pro 1TB MZ-V8P1T0BW | Schenker XMG Pro 15 (Late 2021) GeForce RTX 3080 Laptop GPU, i7-11800H, Samsung SSD 980 Pro 1TB MZ-V8P1T0BW | Schenker XMG Neo 15 (i7-12700H, RTX 3080 Ti) GeForce RTX 3080 Ti Laptop GPU, i7-12700H, Samsung SSD 980 Pro 1TB MZ-V8P1T0BW | MSI Raider GE66 12UHS GeForce RTX 3080 Ti Laptop GPU, i9-12900HK, Samsung PM9A1 MZVL22T0HBLB | Razer Blade 15 2022 GeForce RTX 3080 Ti Laptop GPU, i7-12800H, SSSTC CA6-8D1024 | |
|---|---|---|---|---|---|
| Noise | -11% | 8% | 2% | 8% | |
| off / environment * (dB) | 23 | 24 -4% | 23 -0% | 26 -13% | 25.4 -10% |
| Idle Minimum * (dB) | 23 | 31 -35% | 23 -0% | 27 -17% | 26.2 -14% |
| Idle Average * (dB) | 31.22 | 37 -19% | 26.39 15% | 30 4% | 26.2 16% |
| Idle Maximum * (dB) | 33.09 | 41 -24% | 26.39 20% | 39 -18% | 28.4 14% |
| Load Average * (dB) | 56.35 | 56 1% | 45.52 19% | 45 20% | 44.7 21% |
| Witcher 3 ultra * (dB) | 56.89 | 53 7% | 55.89 2% | 45 21% | 44.7 21% |
| Load Maximum * (dB) | 56.89 | 58 -2% | 55.89 2% | 47 17% | 51.9 9% |
* ... smaller is better
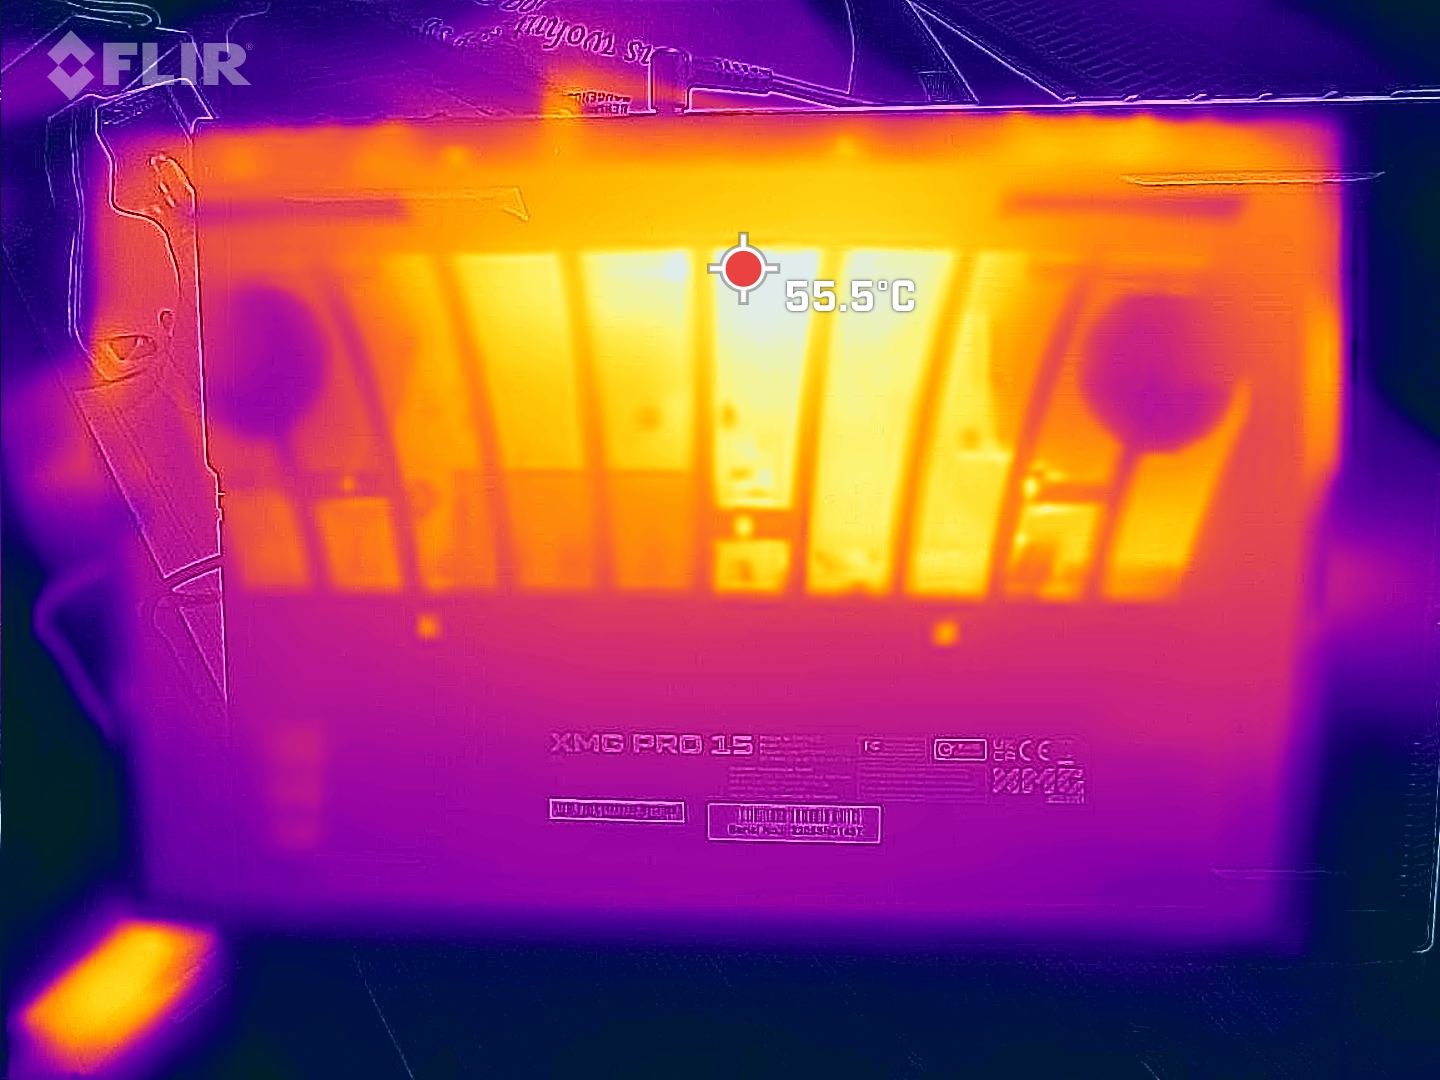
温度
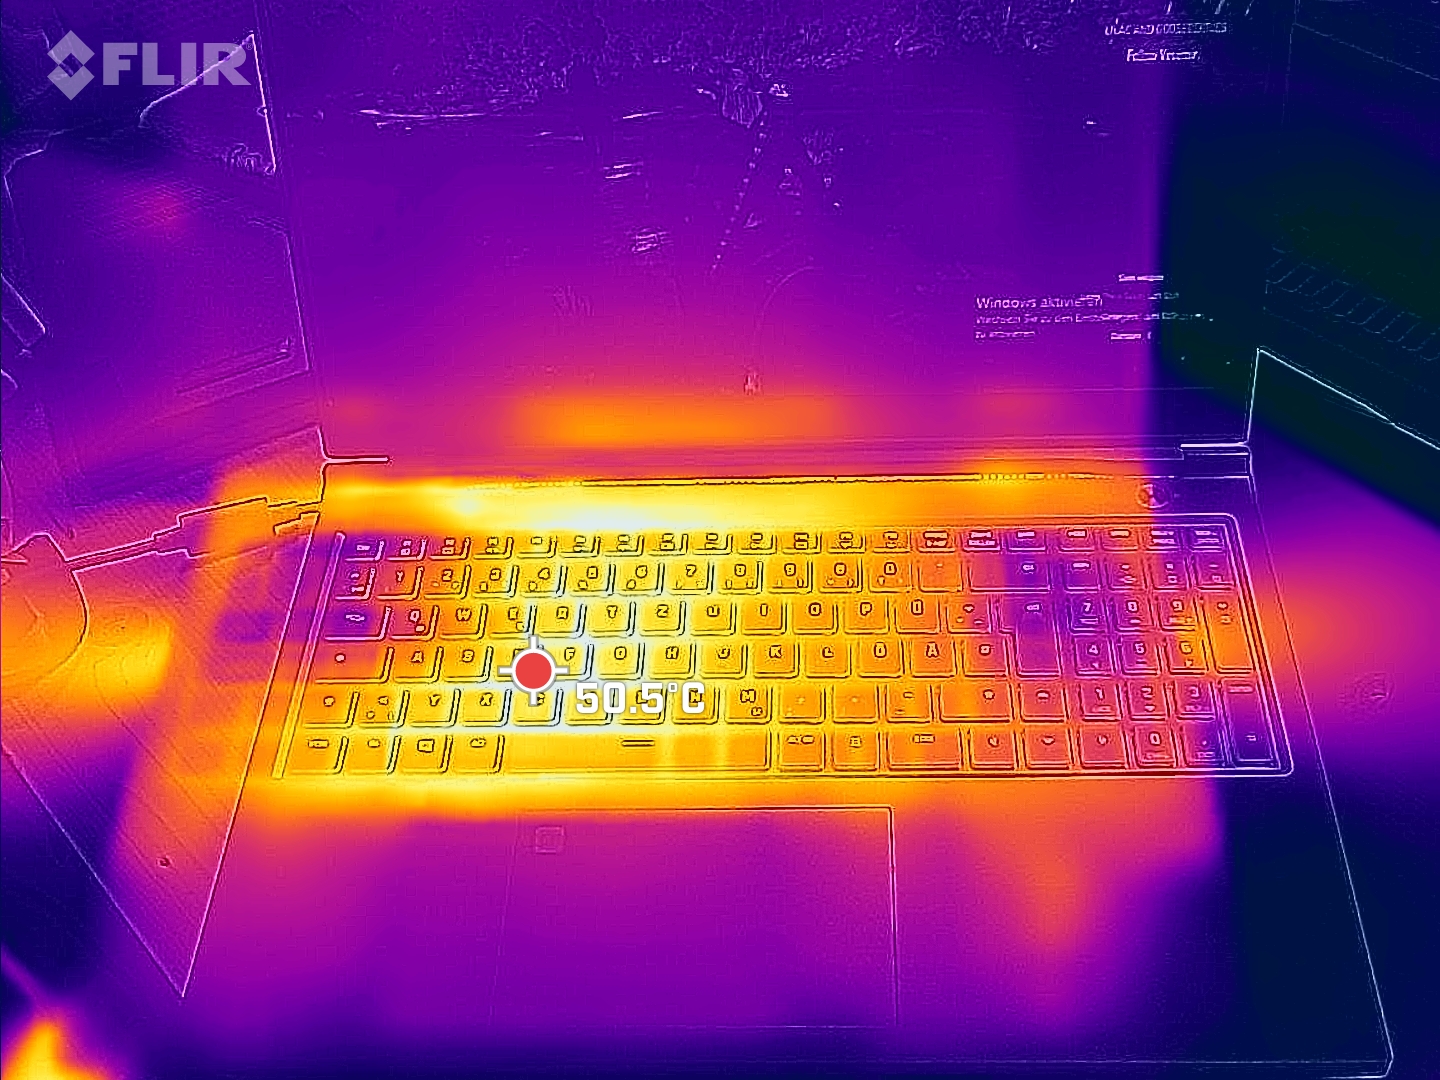
在游戏过程中,底部的温度可以达到60°C,而顶部的中心位置也没有多少温度。WASD键区域的记录约为52℃。Razer Blade的温度明显较低,而强劲的MSI Raider也会有类似的温度。
至少掌托保持在一个舒适的范围内。
(-) The maximum temperature on the upper side is 57 °C / 135 F, compared to the average of 40.4 °C / 105 F, ranging from 21.2 to 68.8 °C for the class Gaming.
(-) The bottom heats up to a maximum of 52 °C / 126 F, compared to the average of 43.2 °C / 110 F
(+) In idle usage, the average temperature for the upper side is 30 °C / 86 F, compared to the device average of 33.9 °C / 93 F.
(-) Playing The Witcher 3, the average temperature for the upper side is 44.7 °C / 112 F, compared to the device average of 33.9 °C / 93 F.
(+) The palmrests and touchpad are reaching skin temperature as a maximum (34 °C / 93.2 F) and are therefore not hot.
(-) The average temperature of the palmrest area of similar devices was 28.8 °C / 83.8 F (-5.2 °C / -9.4 F).
| Schenker XMG Pro 15 (i7-12700H, RTX 3080 Ti) Intel Core i7-12700H, NVIDIA GeForce RTX 3080 Ti Laptop GPU | Schenker XMG Pro 15 (Late 2021) Intel Core i7-11800H, NVIDIA GeForce RTX 3080 Laptop GPU | Schenker XMG Neo 15 (i7-12700H, RTX 3080 Ti) Intel Core i7-12700H, NVIDIA GeForce RTX 3080 Ti Laptop GPU | MSI Raider GE66 12UHS Intel Core i9-12900HK, NVIDIA GeForce RTX 3080 Ti Laptop GPU | Razer Blade 15 2022 Intel Core i7-12800H, NVIDIA GeForce RTX 3080 Ti Laptop GPU | |
|---|---|---|---|---|---|
| Heat | 4% | -6% | -4% | -2% | |
| Maximum Upper Side * (°C) | 57 | 44 23% | 44 23% | 54 5% | 50 12% |
| Maximum Bottom * (°C) | 52 | 60 -15% | 56 -8% | 65 -25% | 47 10% |
| Idle Upper Side * (°C) | 32 | 30 6% | 38 -19% | 30 6% | 37.4 -17% |
| Idle Bottom * (°C) | 34 | 34 -0% | 41 -21% | 35 -3% | 38.4 -13% |
* ... smaller is better
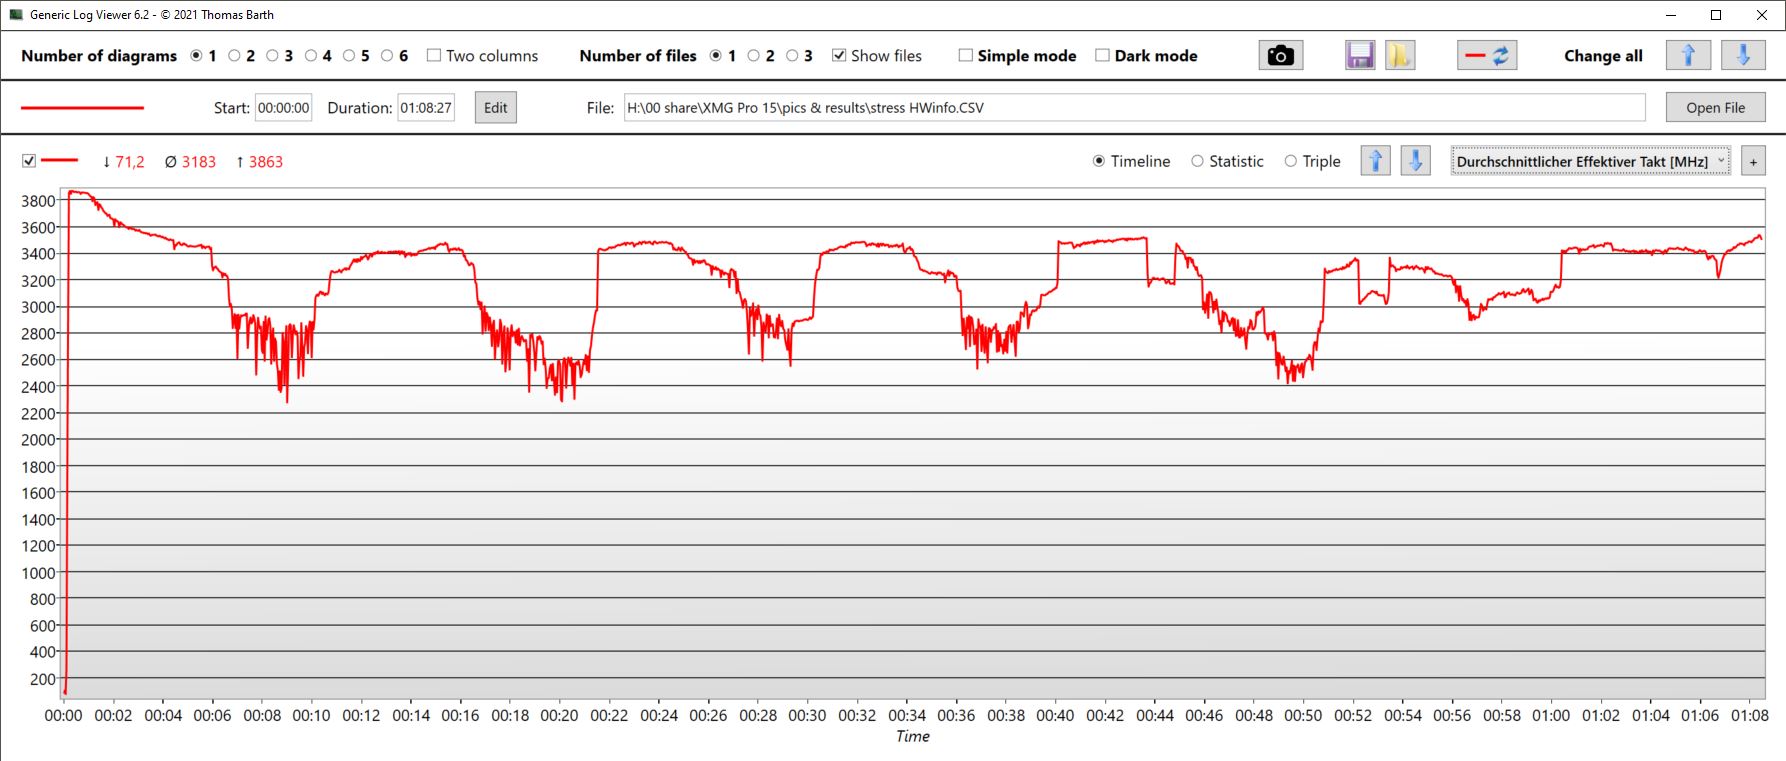
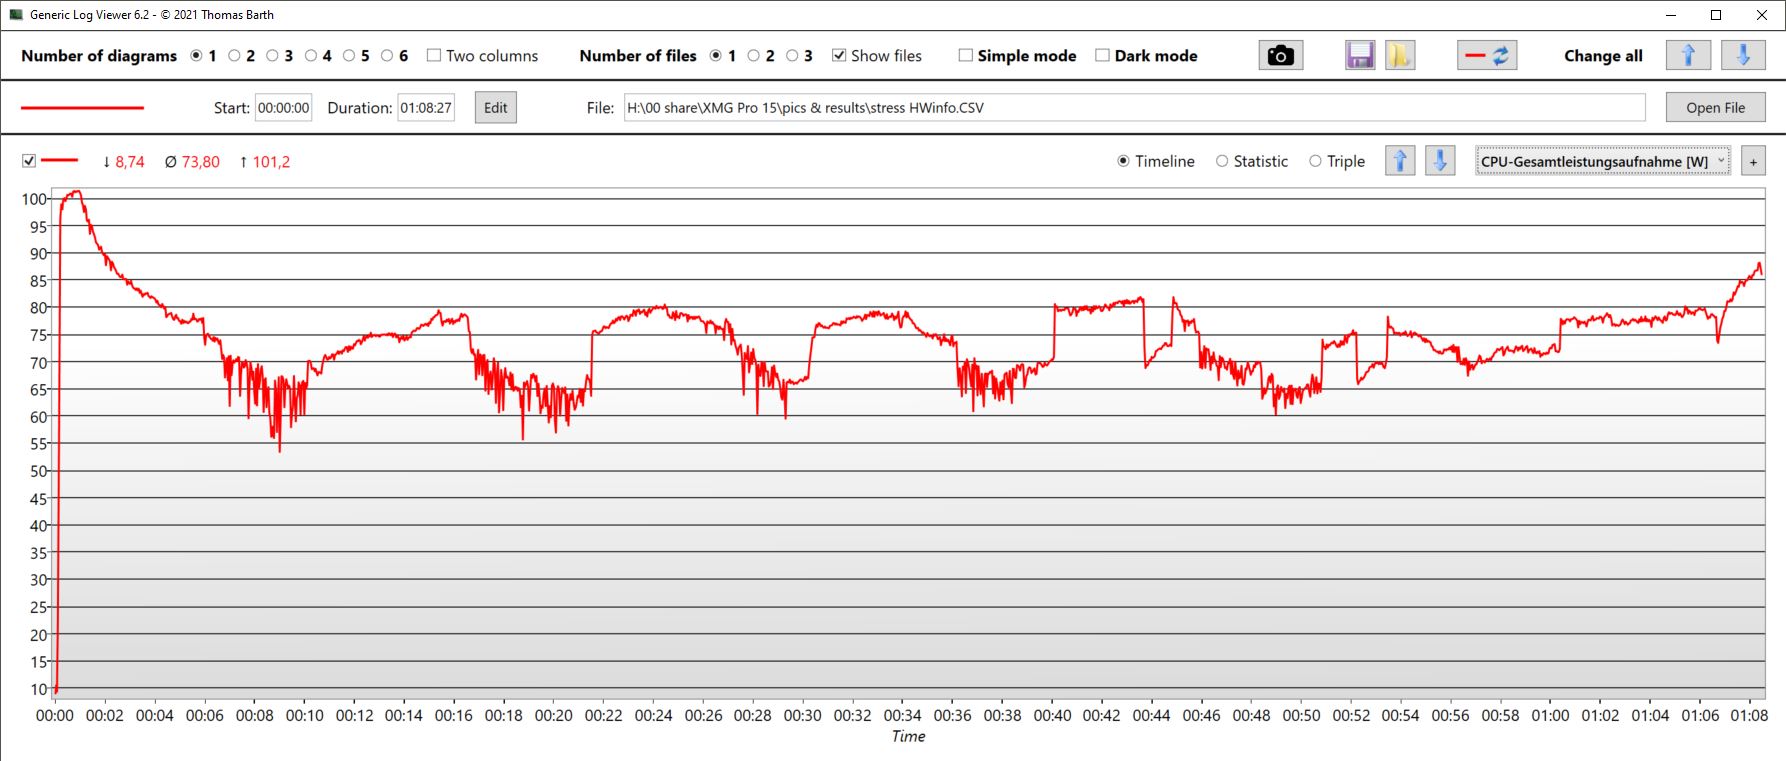
压力测试
核心在3.8GHz以上开始我们的压力测试。时钟频率慢慢下降,并有周期性的小幅下降,据此,Pro 15的热限制显然在很晚的时候才开始发挥作用。因此,平均核心温度高达95°C!同时,3.2GHz左右的相当高的平均时钟速率是可能的。
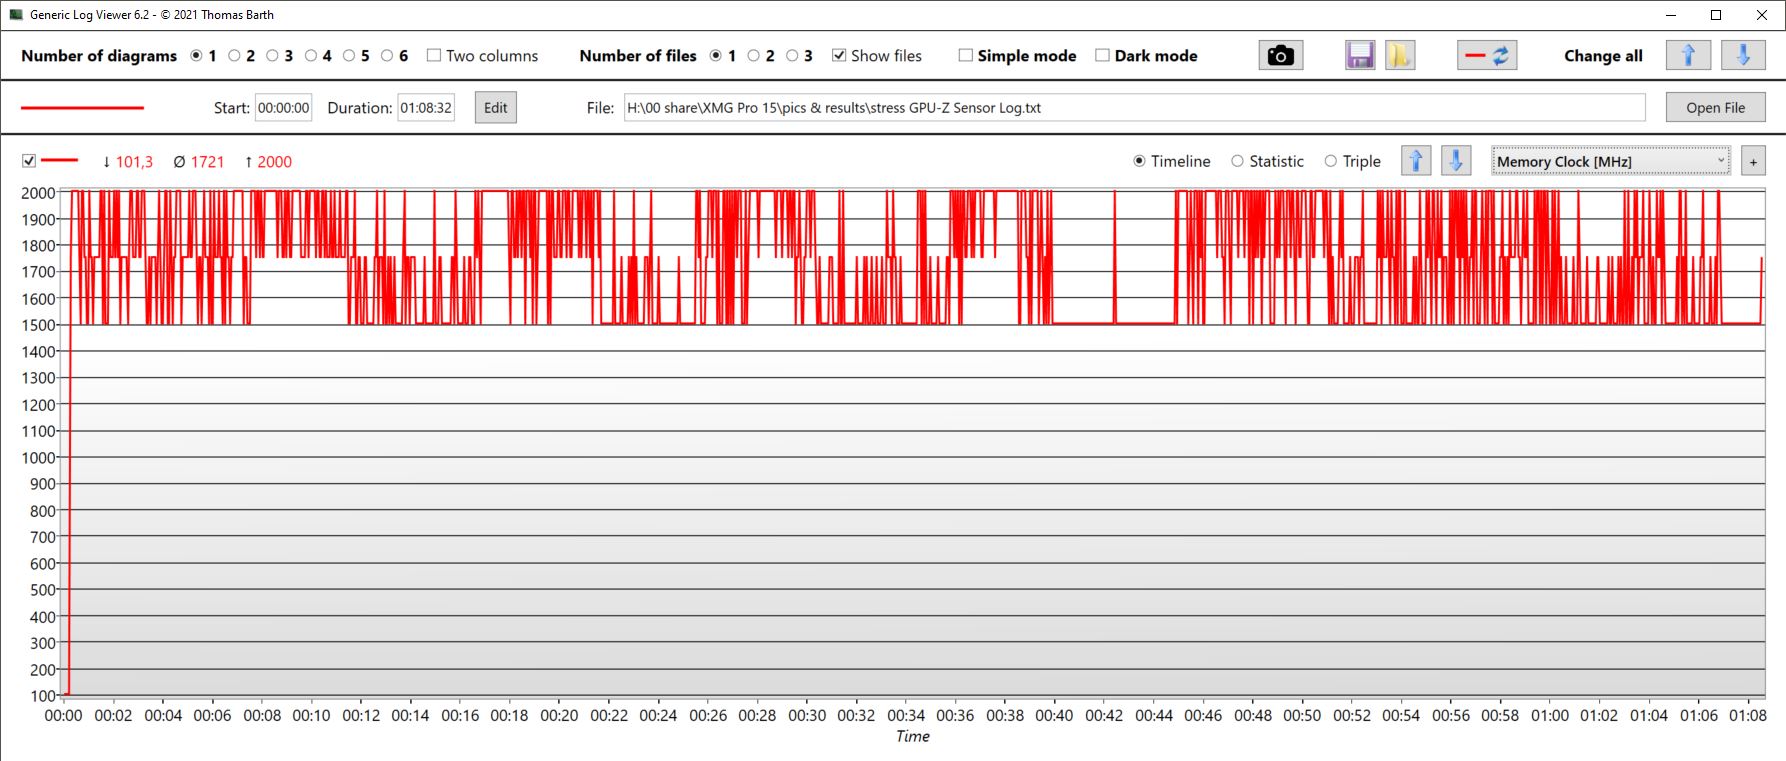
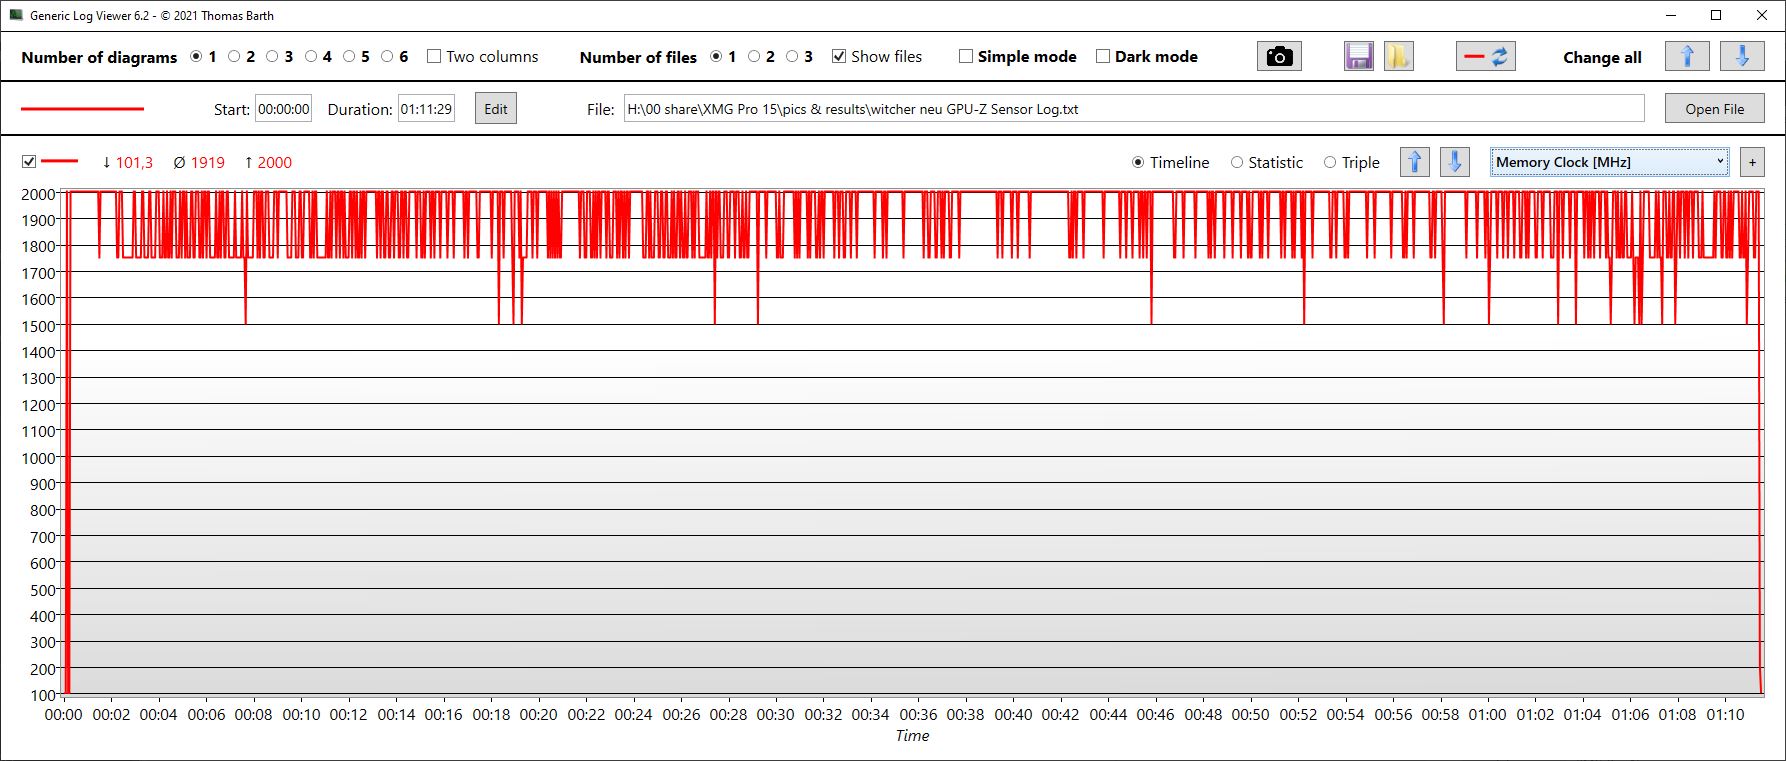
GPU发热较小(约69℃),但时钟波动很大(平均为1.2GHz)。内存时钟也在1.5和2GHz之间变化。该卡平均从电源中吸取约69瓦,只是偶尔达到150瓦,而且只是非常短暂的。
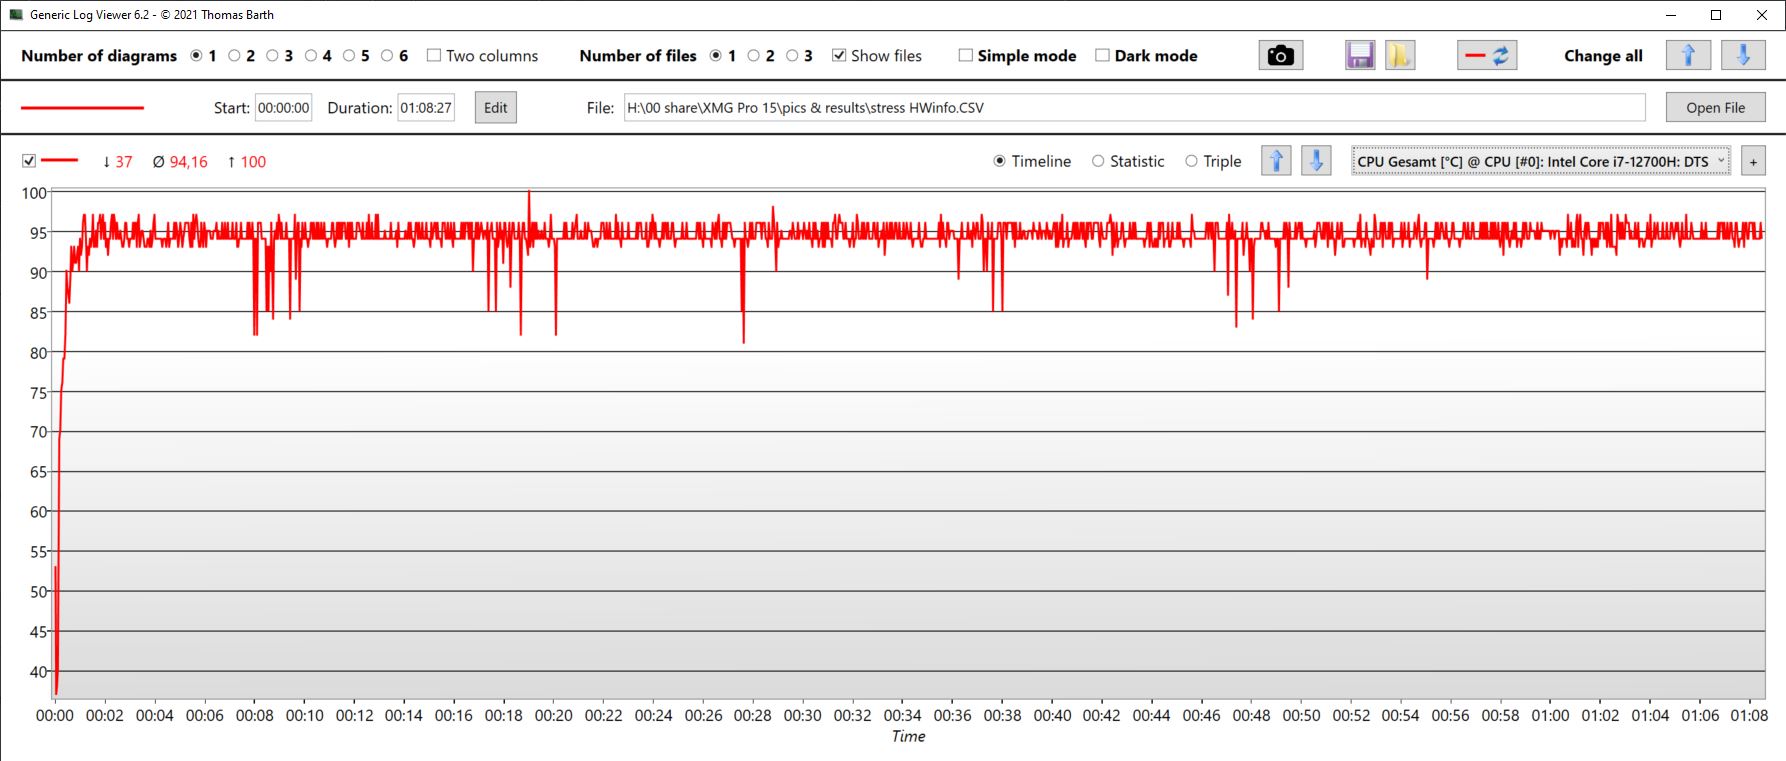
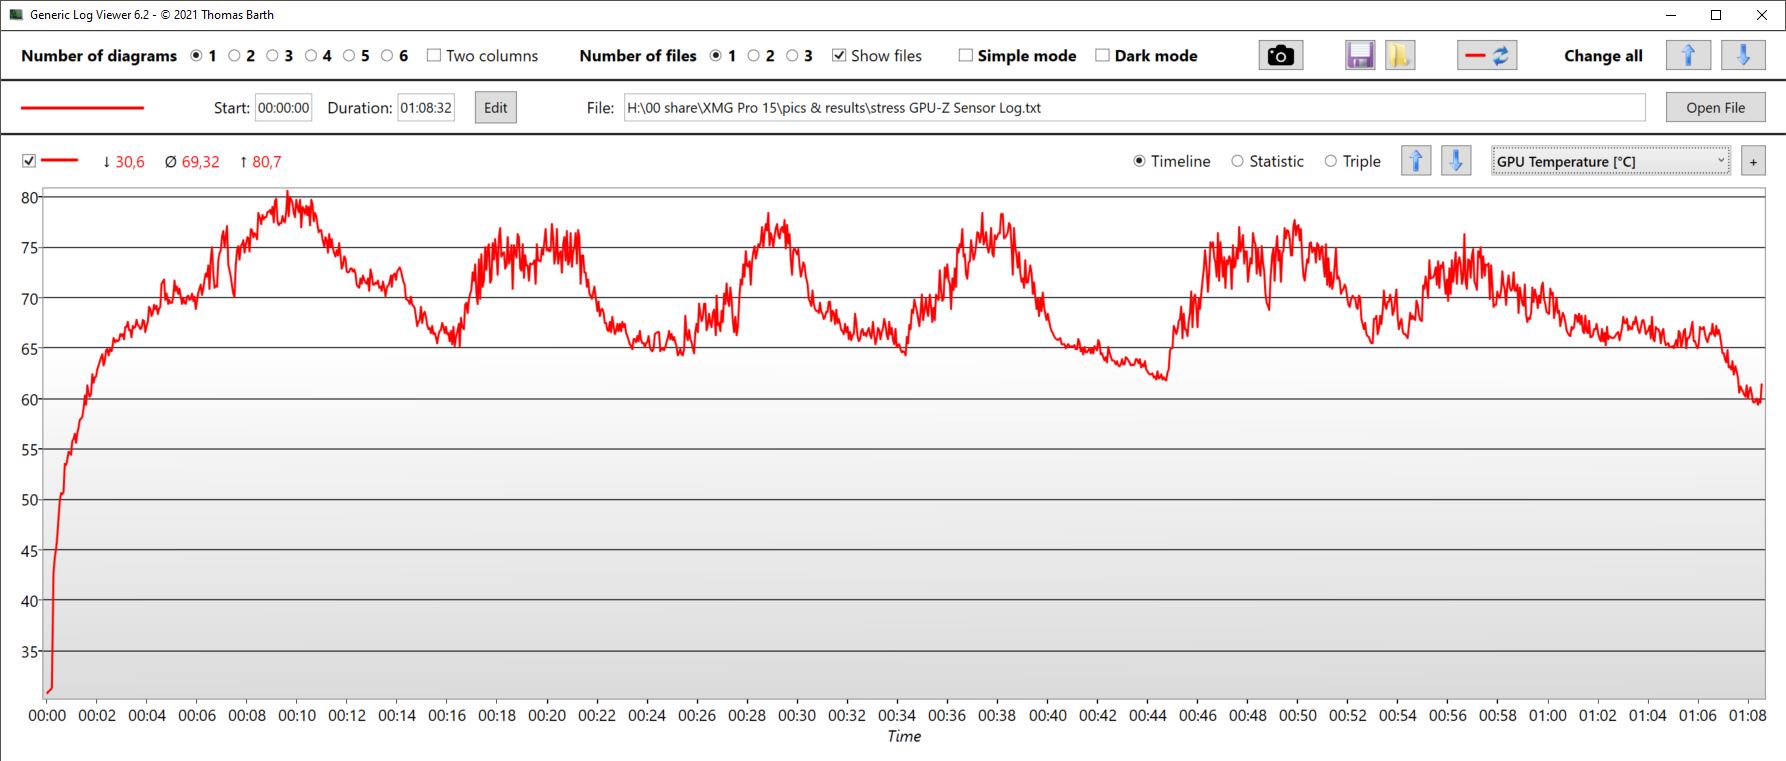
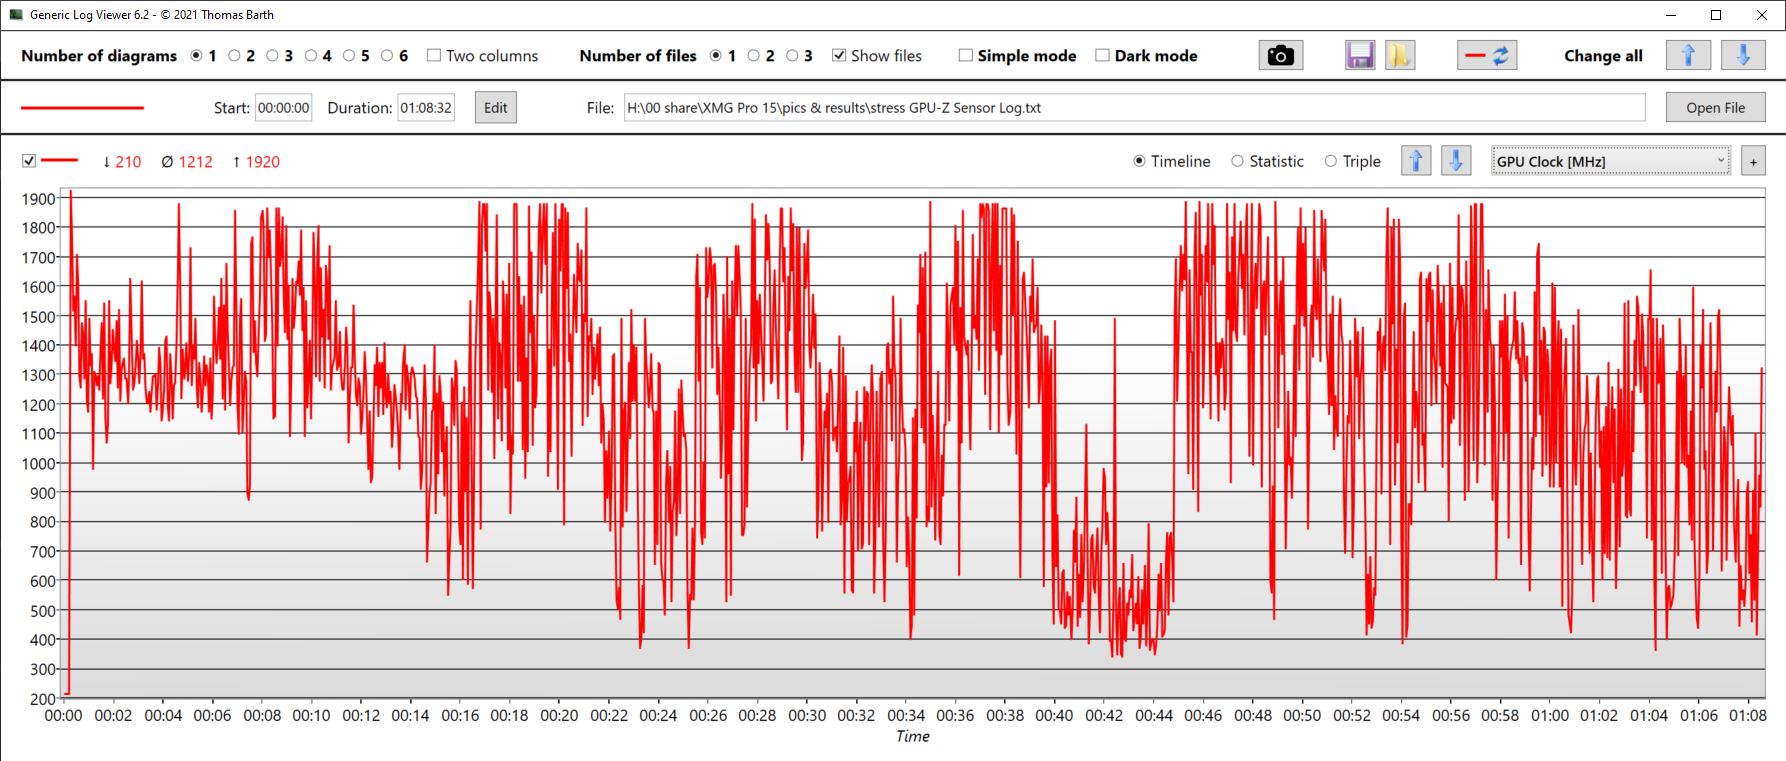
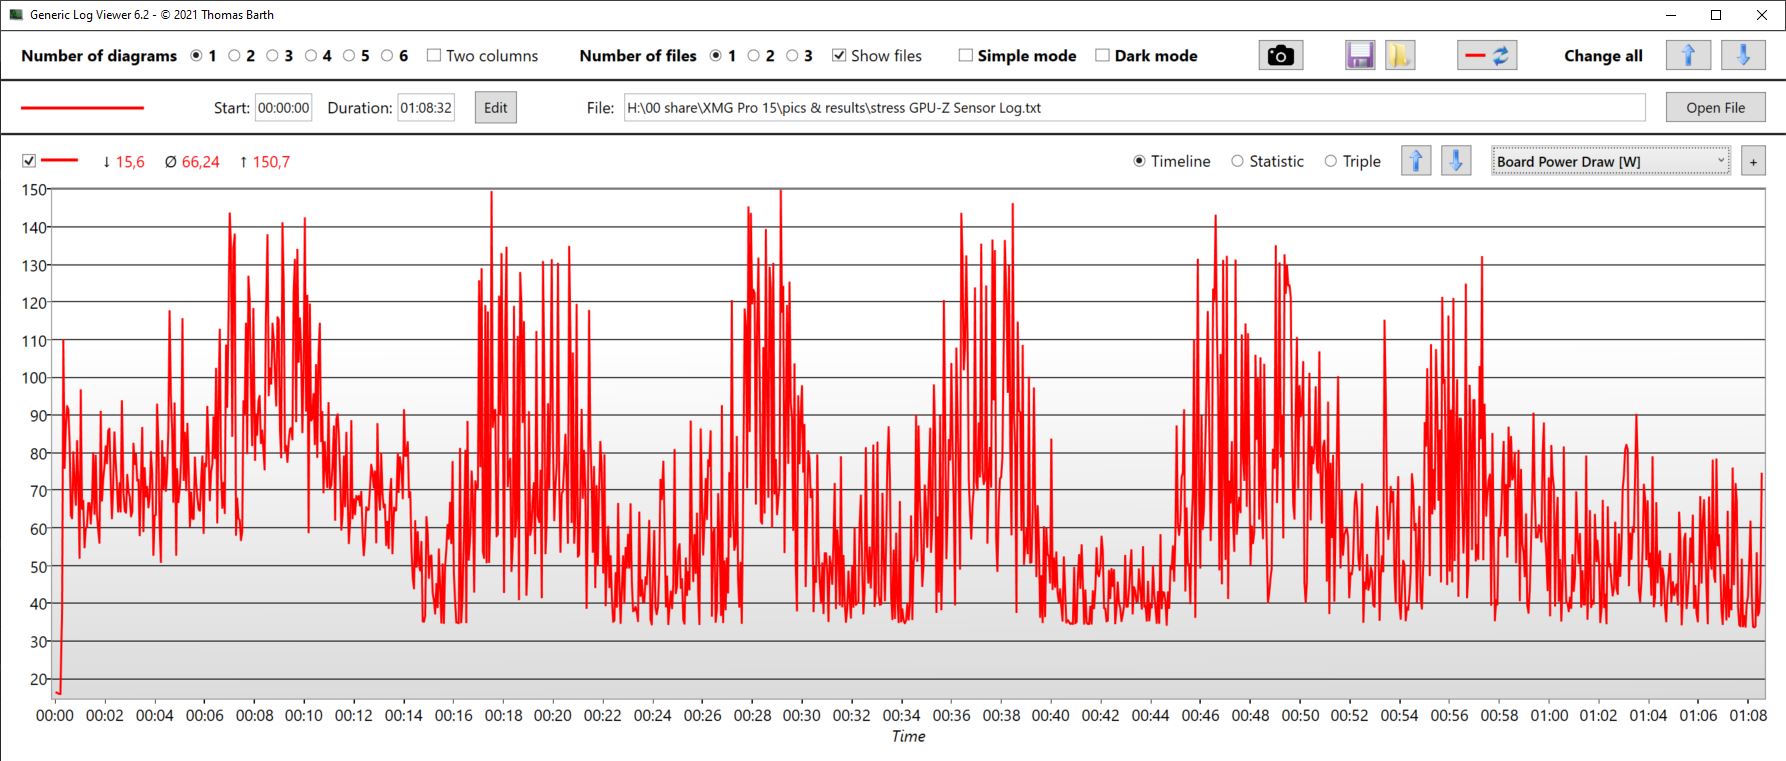
| CPU时钟(GHz) | GPU时钟(MHz) | CPU平均温度(℃) | GPU平均温度(℃) | |
| Prime95 + FurMark 压力 | 3,2 GHz | 1.212 | 95 | 69 |
| Witcher 3 应力 | 3,4 | 1.445 | 77 | 86 |
发言人
扬声器的声音不是特别大。至少,低音是平均的,而不是完全没有体现,而高音是平衡的。
外部模拟音频设备可以通过两个插口连接。
Schenker XMG Pro 15 (i7-12700H, RTX 3080 Ti) audio analysis
(±) | speaker loudness is average but good (75.82 dB)
Bass 100 - 315 Hz
(±) | reduced bass - on average 13% lower than median
(±) | linearity of bass is average (14.1% delta to prev. frequency)
Mids 400 - 2000 Hz
(+) | balanced mids - only 4.5% away from median
(+) | mids are linear (5.3% delta to prev. frequency)
Highs 2 - 16 kHz
(+) | balanced highs - only 3% away from median
(+) | highs are linear (5.6% delta to prev. frequency)
Overall 100 - 16.000 Hz
(±) | linearity of overall sound is average (16.3% difference to median)
Compared to same class
» 41% of all tested devices in this class were better, 6% similar, 53% worse
» The best had a delta of 6%, average was 18%, worst was 132%
Compared to all devices tested
» 27% of all tested devices were better, 6% similar, 67% worse
» The best had a delta of 4%, average was 23%, worst was 134%
MSI Raider GE66 12UHS audio analysis
(+) | speakers can play relatively loud (84 dB)
Bass 100 - 315 Hz
(-) | nearly no bass - on average 17% lower than median
(±) | linearity of bass is average (11% delta to prev. frequency)
Mids 400 - 2000 Hz
(±) | higher mids - on average 5.6% higher than median
(+) | mids are linear (3.9% delta to prev. frequency)
Highs 2 - 16 kHz
(+) | balanced highs - only 4.6% away from median
(+) | highs are linear (6.3% delta to prev. frequency)
Overall 100 - 16.000 Hz
(±) | linearity of overall sound is average (17.1% difference to median)
Compared to same class
» 46% of all tested devices in this class were better, 12% similar, 42% worse
» The best had a delta of 6%, average was 18%, worst was 132%
Compared to all devices tested
» 31% of all tested devices were better, 8% similar, 61% worse
» The best had a delta of 4%, average was 23%, worst was 134%
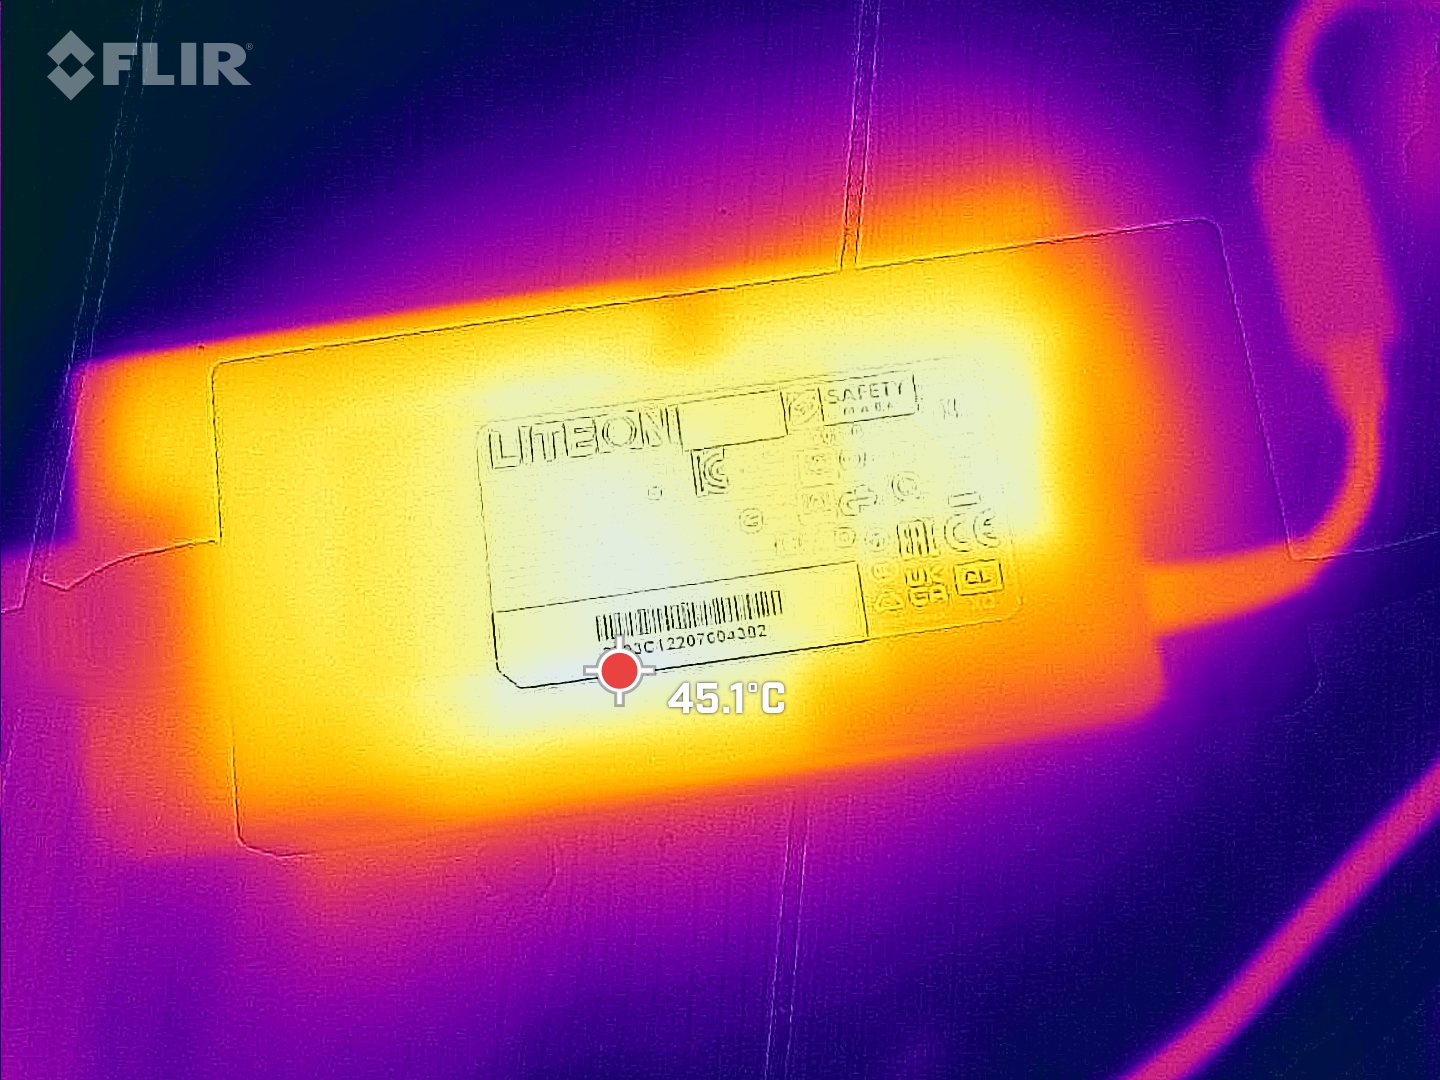
能源管理。闲置时令人震惊的电源行为
消耗功率
人们的印象是Pro 15的性能模式并没有完全优化。闲置时的消耗测量并不直接。在飞行模式下亮度最小的最低消耗量在节能模式下很难达到;测得的40W是非常高的。如果在其他相同的设置下切换到名义上更高的娱乐模式,那么消耗量在几秒钟内就会降到10W左右。切换回节能模式,一分钟后再次显示40瓦,没有任何明显的放缓。没有检测到烦人的后台进程。只有控制中心在中间被打开和关闭。而即使在性能模式下,空闲消耗也相当高,为35W。
游戏平均需要235瓦(墙面插座的输入功率),我们还在压力测试中测得非常短的负载峰值,最大为273瓦。230瓦的电源(输出功率,尺寸约为15.4 x 7.5厘米)在这里应该差不多够用了。
| Idle | |
| Load |
|
Key:
min: | |
| Schenker XMG Pro 15 (i7-12700H, RTX 3080 Ti) i7-12700H, GeForce RTX 3080 Ti Laptop GPU, Samsung SSD 980 Pro 1TB MZ-V8P1T0BW, IPS, 2560x1440, 15.6" | Schenker XMG Pro 15 (Late 2021) i7-11800H, GeForce RTX 3080 Laptop GPU, Samsung SSD 980 Pro 1TB MZ-V8P1T0BW, OLED, 3840x2160, 15.6" | Schenker XMG Neo 15 (i7-12700H, RTX 3080 Ti) i7-12700H, GeForce RTX 3080 Ti Laptop GPU, Samsung SSD 980 Pro 1TB MZ-V8P1T0BW, IPS, 2560x1440, 15.6" | MSI Raider GE66 12UHS i9-12900HK, GeForce RTX 3080 Ti Laptop GPU, Samsung PM9A1 MZVL22T0HBLB, IPS, 3840x2160, 15.6" | Razer Blade 15 2022 i7-12800H, GeForce RTX 3080 Ti Laptop GPU, SSSTC CA6-8D1024, IPS, 2560x1440, 15.6" | Average NVIDIA GeForce RTX 3080 Ti Laptop GPU | Average of class Gaming | |
|---|---|---|---|---|---|---|---|
| Power Consumption | -11% | -6% | -5% | -56% | -24% | -3% | |
| Idle Minimum * (Watt) | 10 | 20 -100% | 15 -50% | 16 -60% | 33.2 -232% | 17.2 ? -72% | 13.1 ? -31% |
| Idle Average * (Watt) | 15.2 | 22 -45% | 18 -18% | 19 -25% | 36.4 -139% | 23.3 ? -53% | 19 ? -25% |
| Idle Maximum * (Watt) | 35 | 26 26% | 18 49% | 26 26% | 37.6 -7% | 30.8 ? 12% | 24.6 ? 30% |
| Load Average * (Watt) | 116 | 103 11% | 123 -6% | 110 5% | 116.7 -1% | 121.2 ? -4% | 111.3 ? 4% |
| Witcher 3 ultra * (Watt) | 235 | 186 21% | 234 -0% | 202 14% | 172 27% | ||
| Load Maximum * (Watt) | 273 | 218 20% | 301 -10% | 242 11% | 228.6 16% | 276 ? -1% | 260 ? 5% |
* ... smaller is better
{
{
电池寿命
Schenker安装了一个80Wh的电池,与Razer的相同。微星Raider有相当多的储备,有99Wh。
浏览的时间在5.5到6小时之间,取决于亮度,看视频的时间约为5小时。相比之下,运行时间不是特别长;竞争对手的设备持续时间更长,特别是在观看视频时。Pro可以从Neo身上学到一些东西,它的93Wh电池有更多的耐力。
| Schenker XMG Pro 15 (i7-12700H, RTX 3080 Ti) i7-12700H, GeForce RTX 3080 Ti Laptop GPU, 80 Wh | Schenker XMG Pro 15 (Late 2021) i7-11800H, GeForce RTX 3080 Laptop GPU, 73 Wh | Schenker XMG Neo 15 (i7-12700H, RTX 3080 Ti) i7-12700H, GeForce RTX 3080 Ti Laptop GPU, 93 Wh | MSI Raider GE66 12UHS i9-12900HK, GeForce RTX 3080 Ti Laptop GPU, 99 Wh | Razer Blade 15 2022 i7-12800H, GeForce RTX 3080 Ti Laptop GPU, 80 Wh | Average of class Gaming | |
|---|---|---|---|---|---|---|
| Battery runtime | -5% | 17% | 9% | -16% | 20% | |
| H.264 (h) | 5.3 | 6.5 23% | 7.1 34% | 7.1 34% | 8.27 ? 56% | |
| WiFi v1.3 (h) | 5.8 | 5.2 -10% | 7.7 33% | 5.7 -2% | 4.9 -16% | 7.08 ? 22% |
| Load (h) | 1.8 | 1.3 -28% | 1.5 -17% | 1.7 -6% | 1.496 ? -17% | |
| Reader / Idle (h) | 10.6 | 7.84 ? |
Pros
Cons
评语:但是,但是,我亲爱的Pro 15
XMG Pro 15带来了很多功能,构成了一个好的游戏者或内容创作者的好的工作笔记本电脑。首先是QHD屏幕,响应速度快,色彩空间覆盖好。硬件也令人印象深刻,输入设备至少是体面的,WiFi非常快,总体性能也很高。
申克公司试图用更厚的外壳来抵消具有强大硬件的笔记本电脑的典型缺点,但这只在有限的范围内发挥作用。是的,新的Pro 15比旧的、更薄的Pro 15要安静一些,但它仍然是比较领域中最吵的设备之一,而且风扇很快就达到了极限。同时,温度也没有真正提高。
因此,Pro 15的许多优点都伴随着一些小的 "但是"。QHD显示屏从根本上说是体面的,但照明是不均匀的。申克公司安装了一个快速的三星980 Pro固态硬盘,但在持续的负载(发热)下会节流。性能非常高,但设备很快就变得非常响亮和热。一个SD读卡器又回来了,但它只能读取MicroSD卡,而且速度很慢。
XMG Pro 15是一台非常快速的游戏和工作电脑,具有许多良好的功能,然而,这些功能似乎经常失衡。
价格和可用性
Pro 15目前在制造商的祖国德国全国范围内无法获得。只有Schenker自己的商店bestware.com列出了该设备,但在我们的审查配置中没有;目前无法选择相应的显示器或RTX 3080 Ti。
配备OLED显示屏的机型价格为1978.99欧元(略低于2000美元),但RTX 3060较弱,16GB内存和500GB SSD。配备RTX 3070 Ti、32GB和1TB SSD的机型价格为2510欧元(约合2520美元)。
Schenker XMG Pro 15 (i7-12700H, RTX 3080 Ti)
- 07/21/2022 v7 (old)
Christian Hintze
Price comparison

