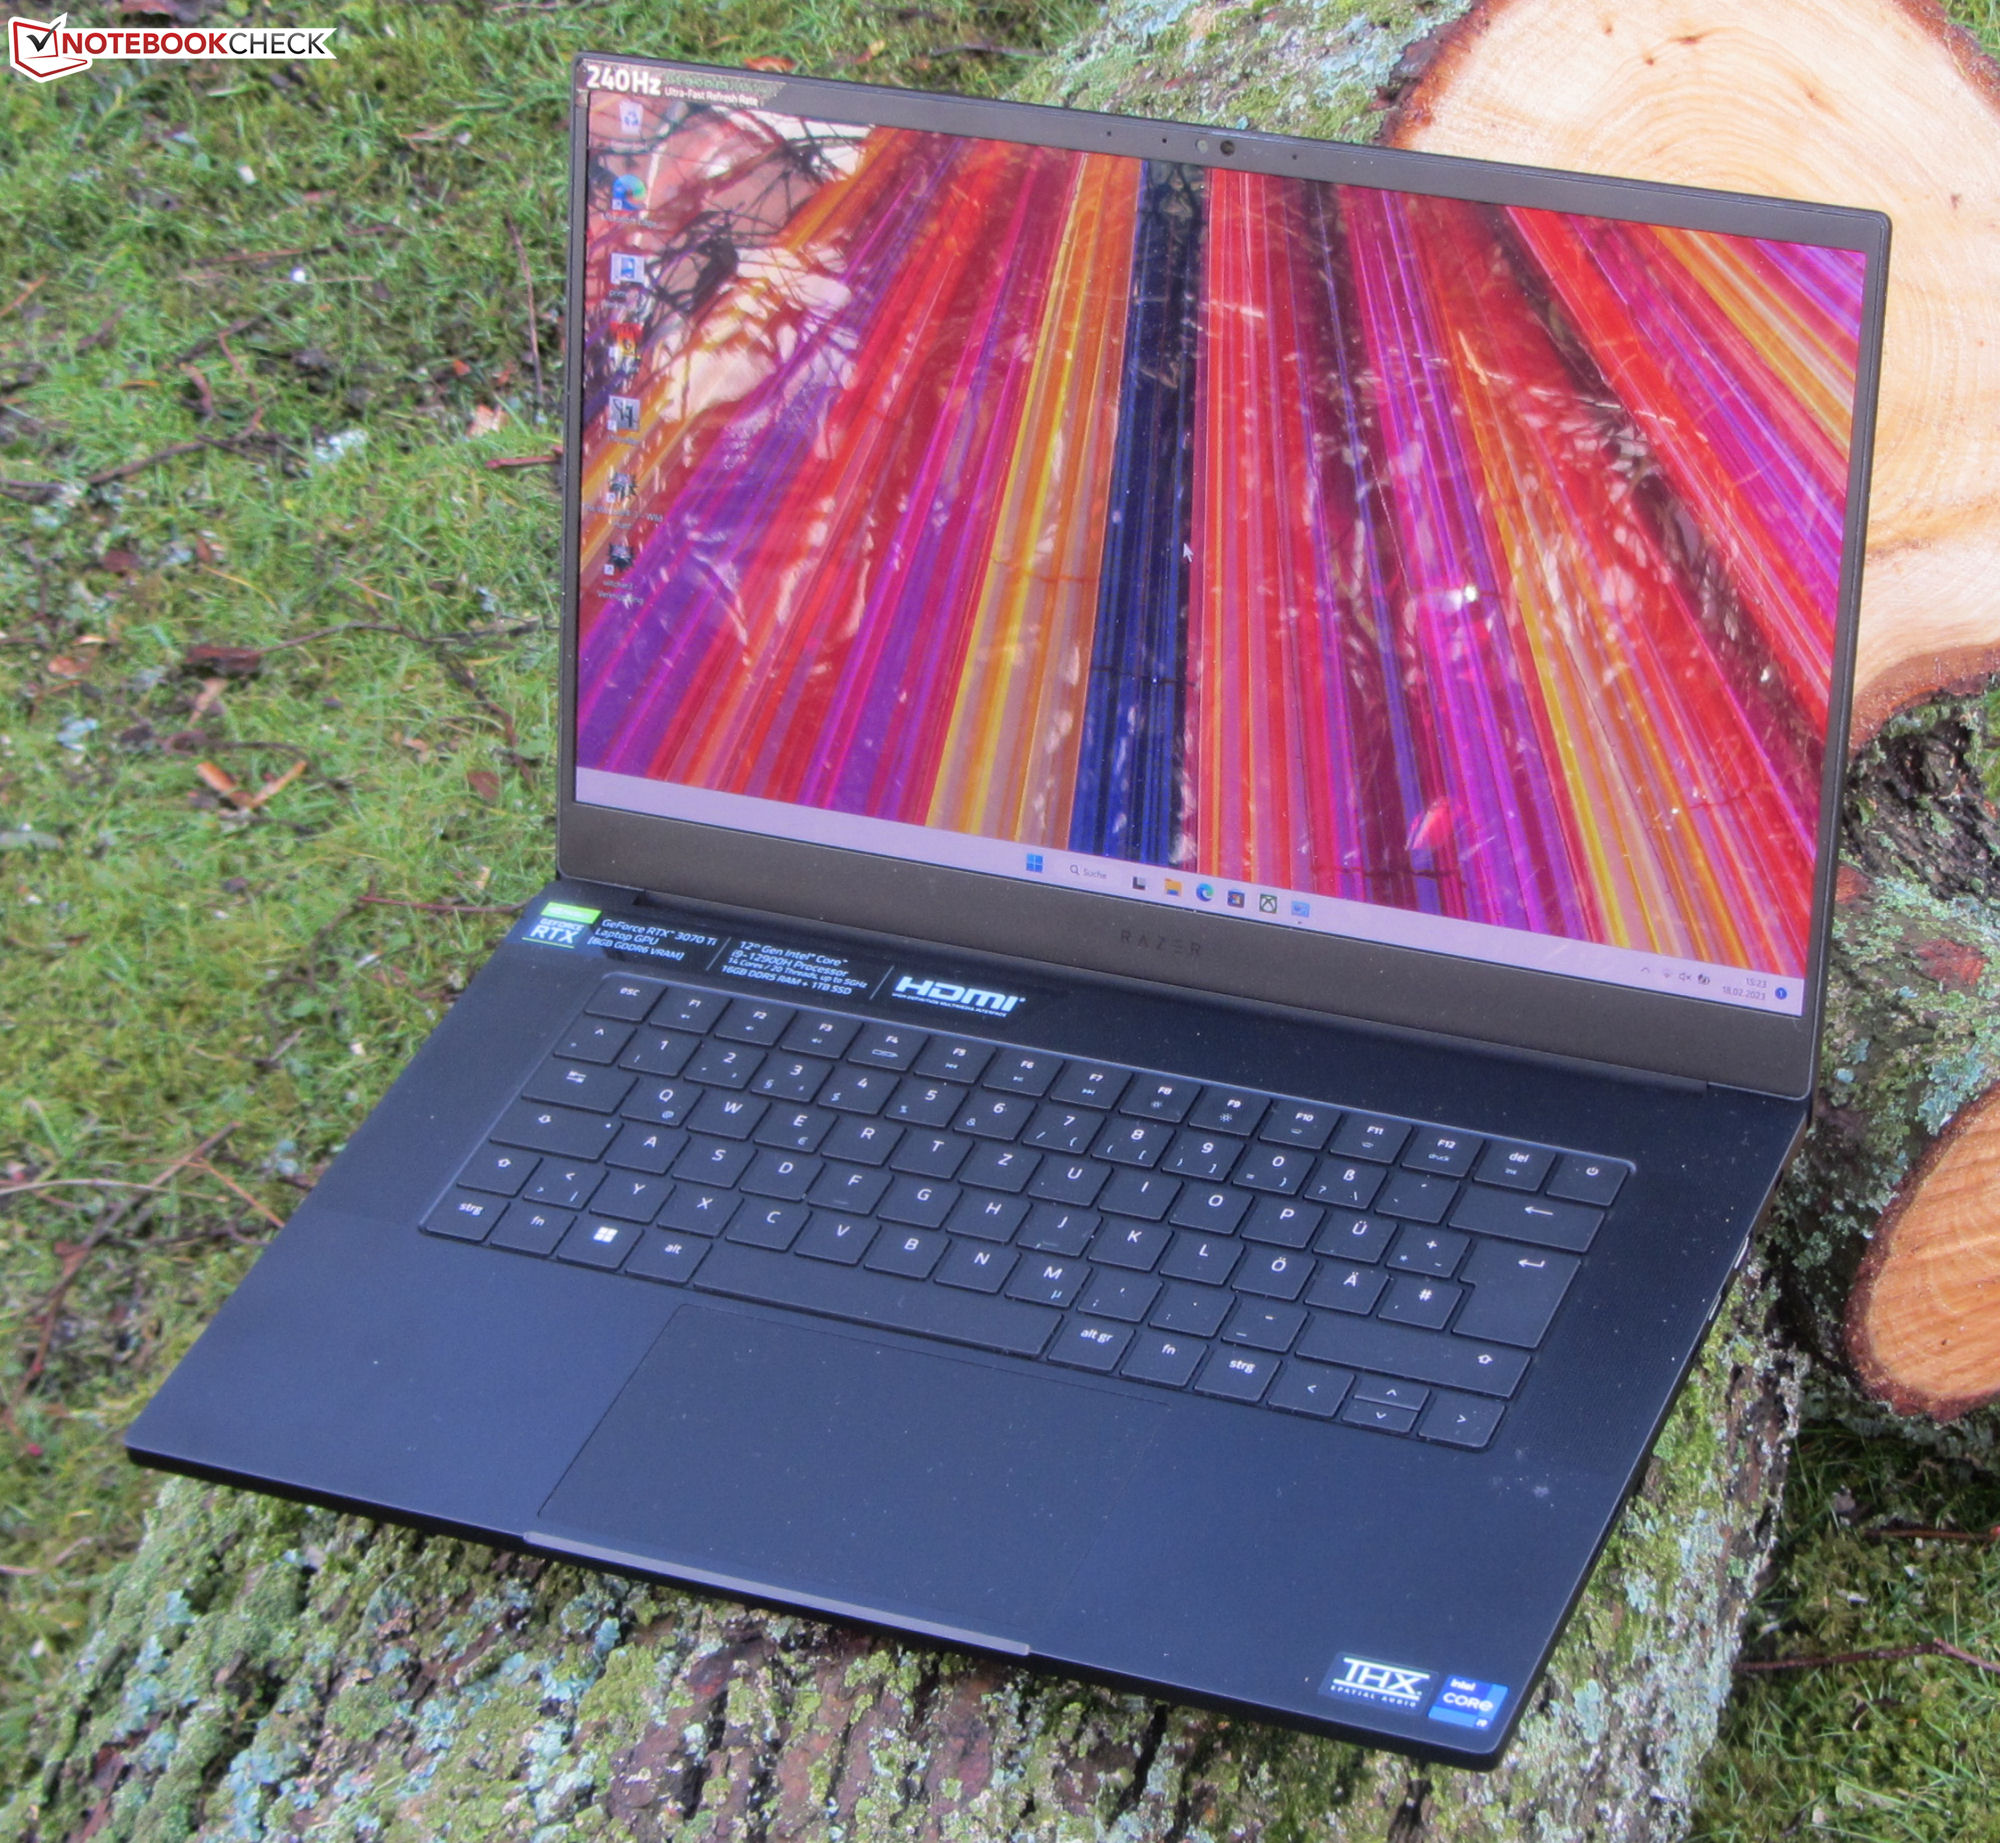
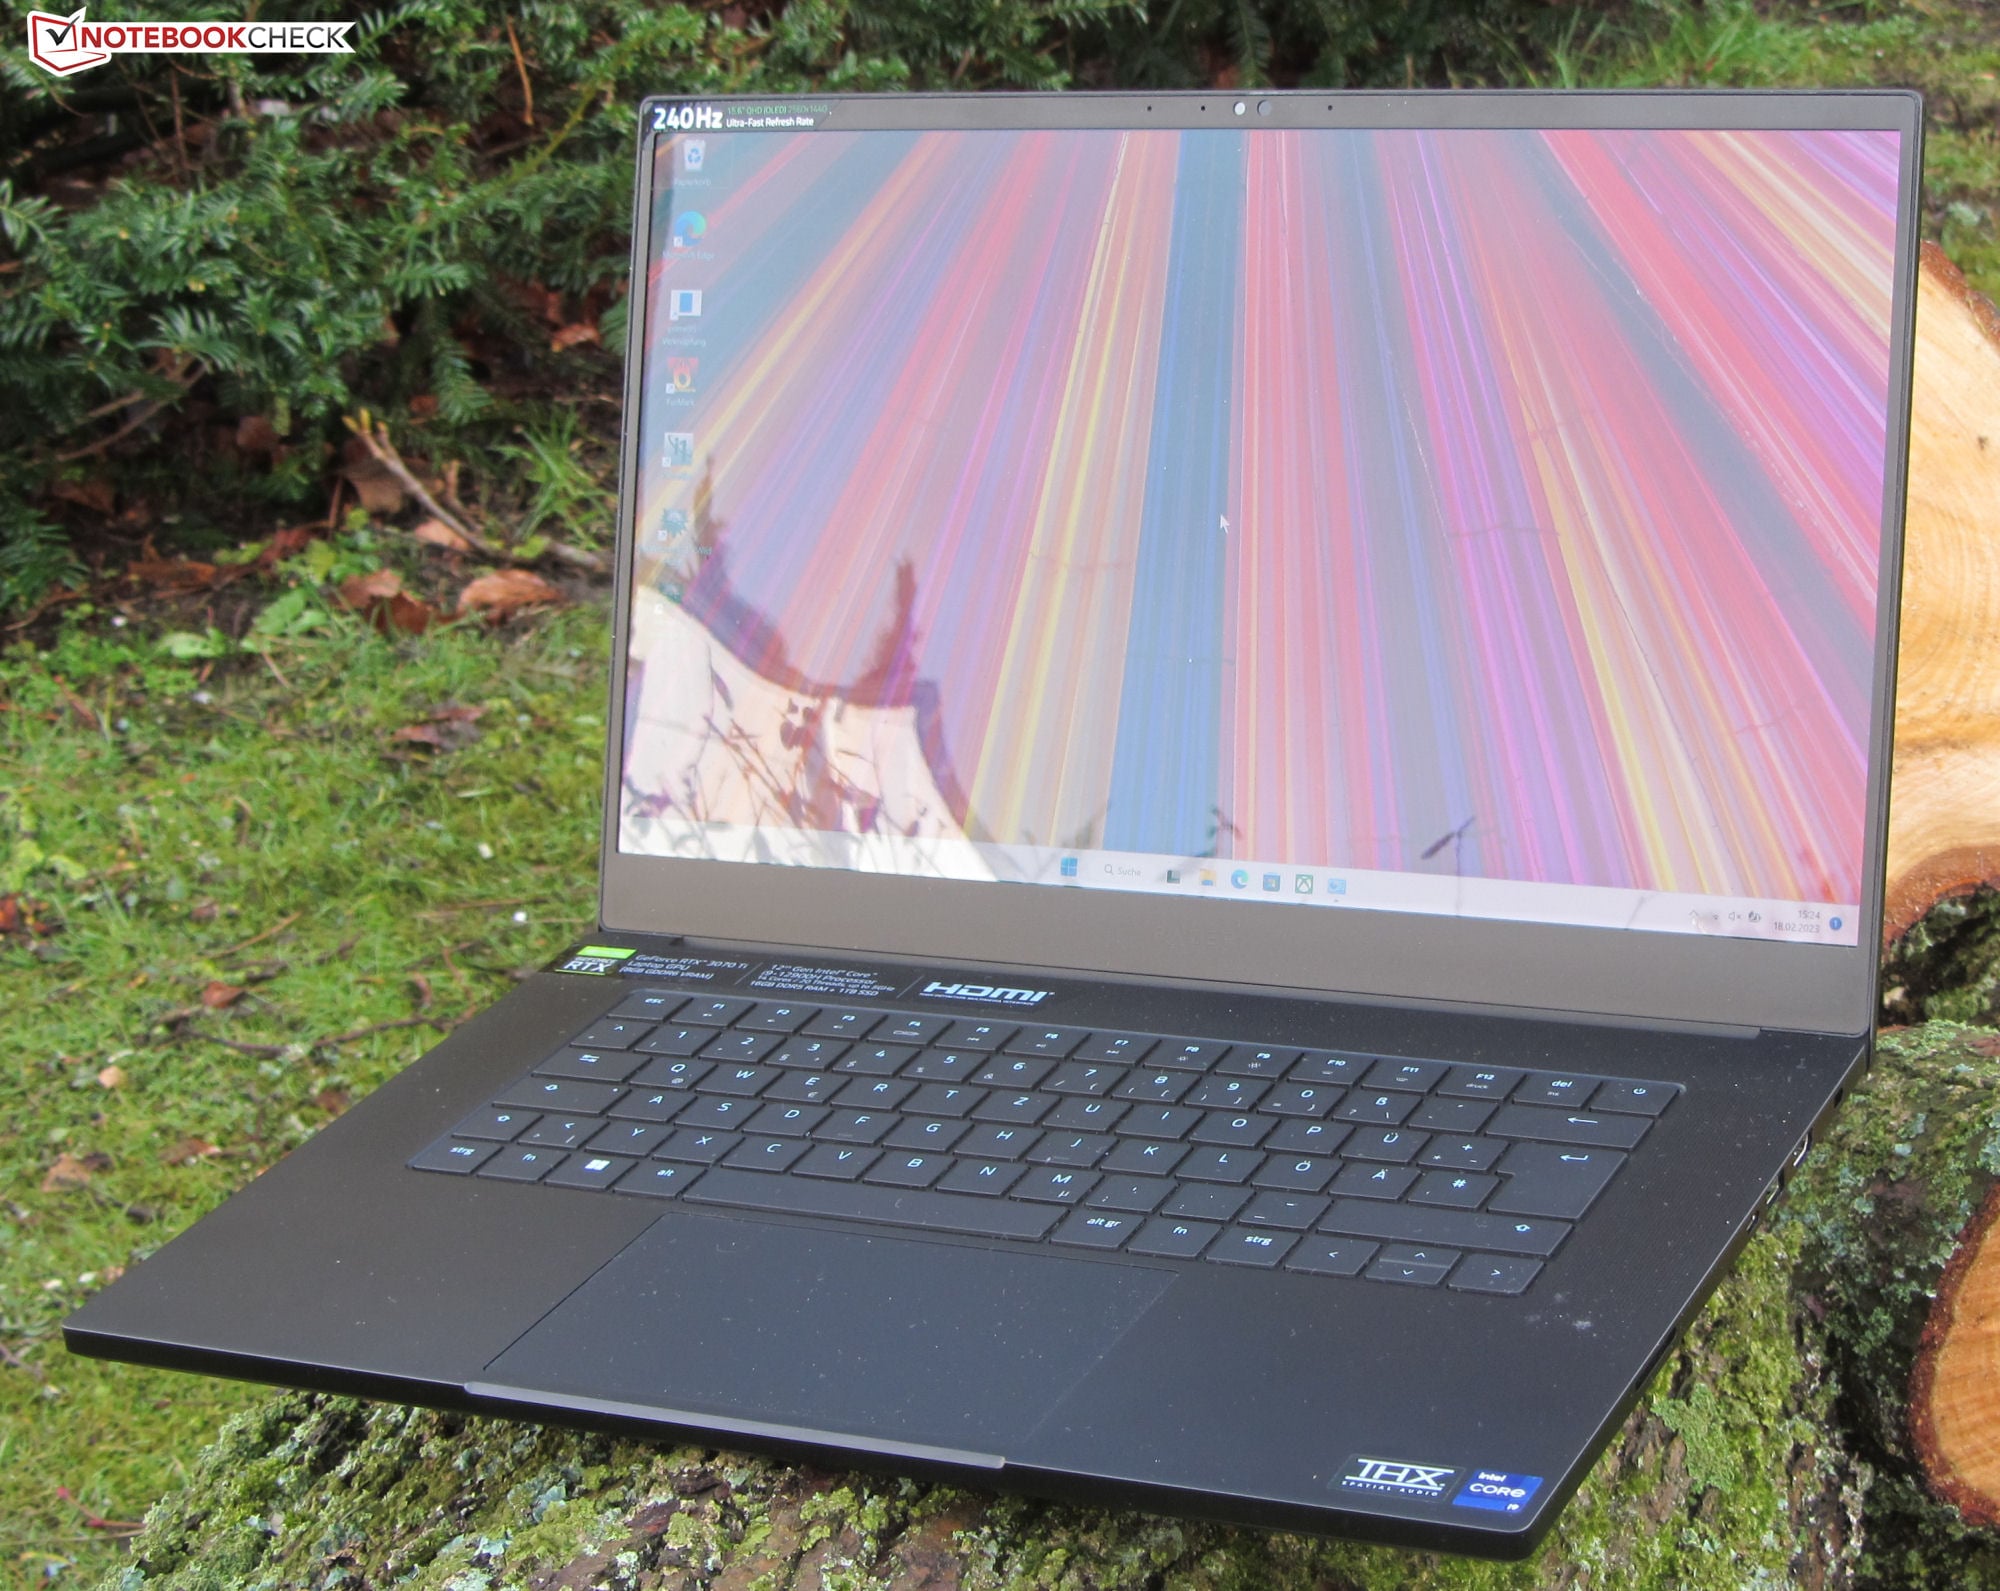
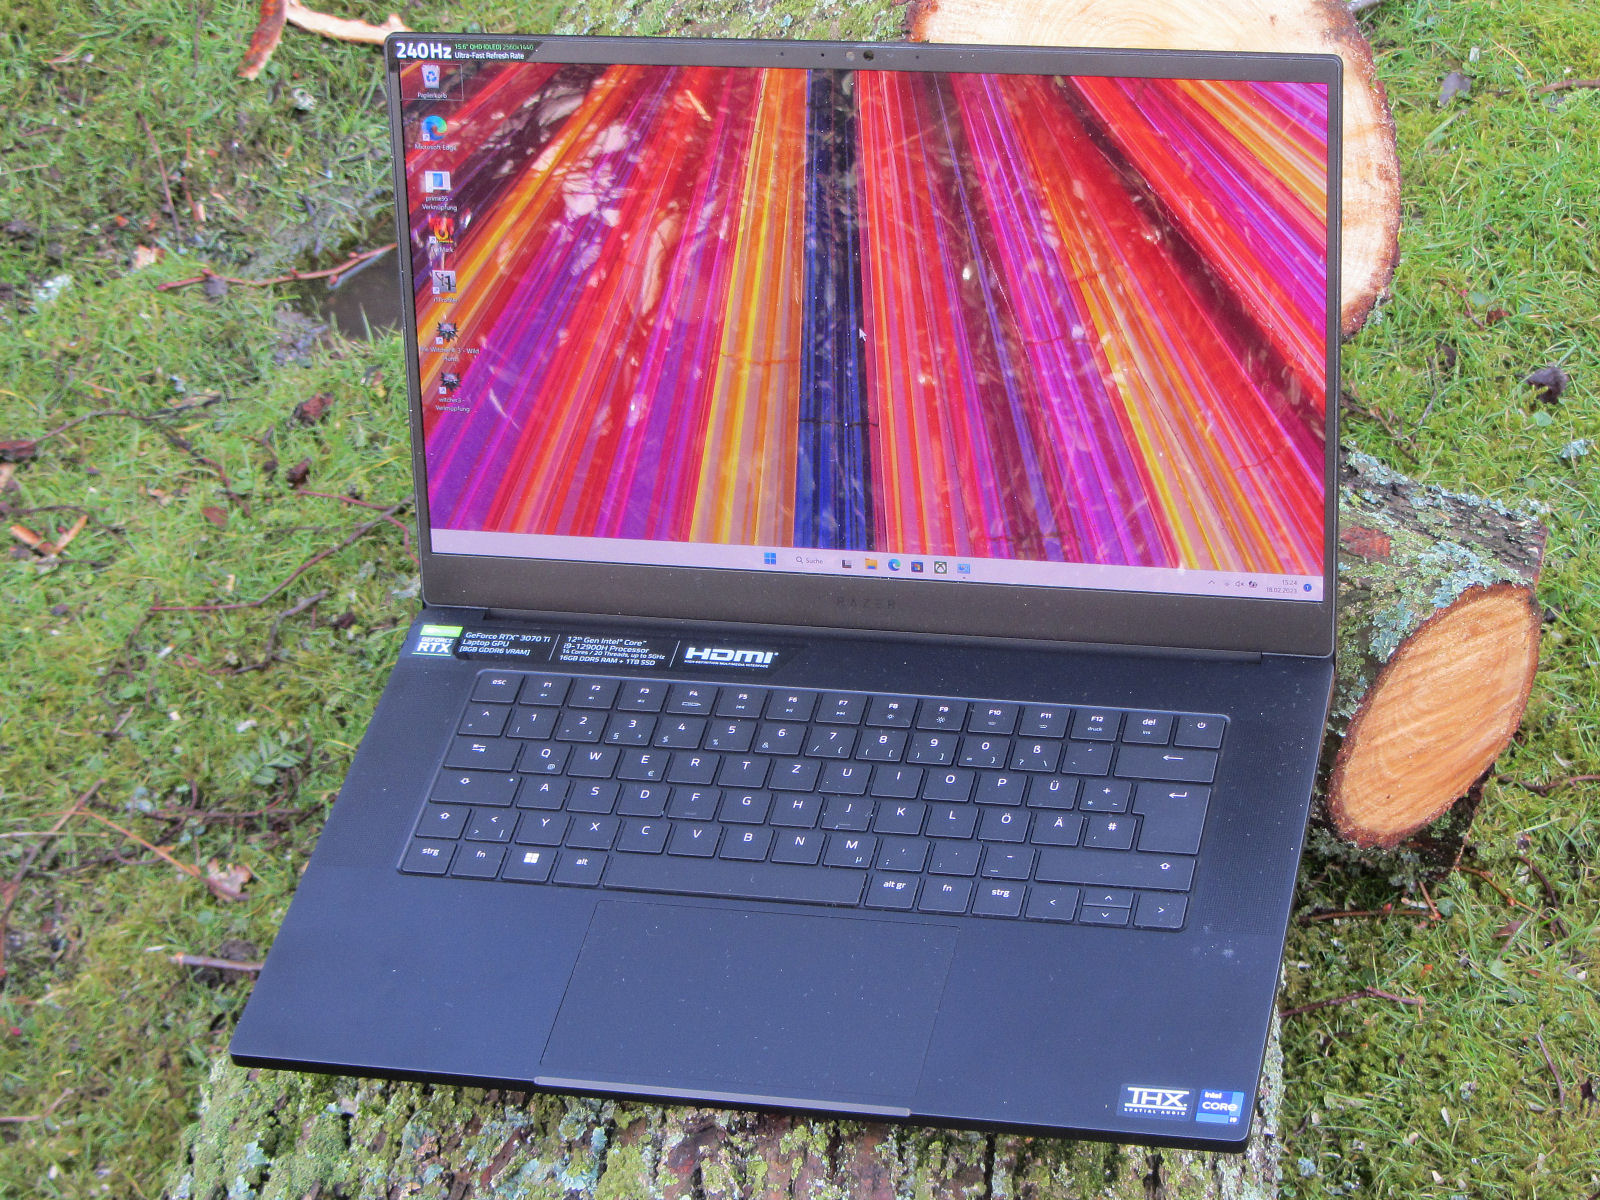
Razer Blade 15 OLED(2022年初)回顾。带有RTX 3070 Ti的紧凑型游戏笔记本电脑

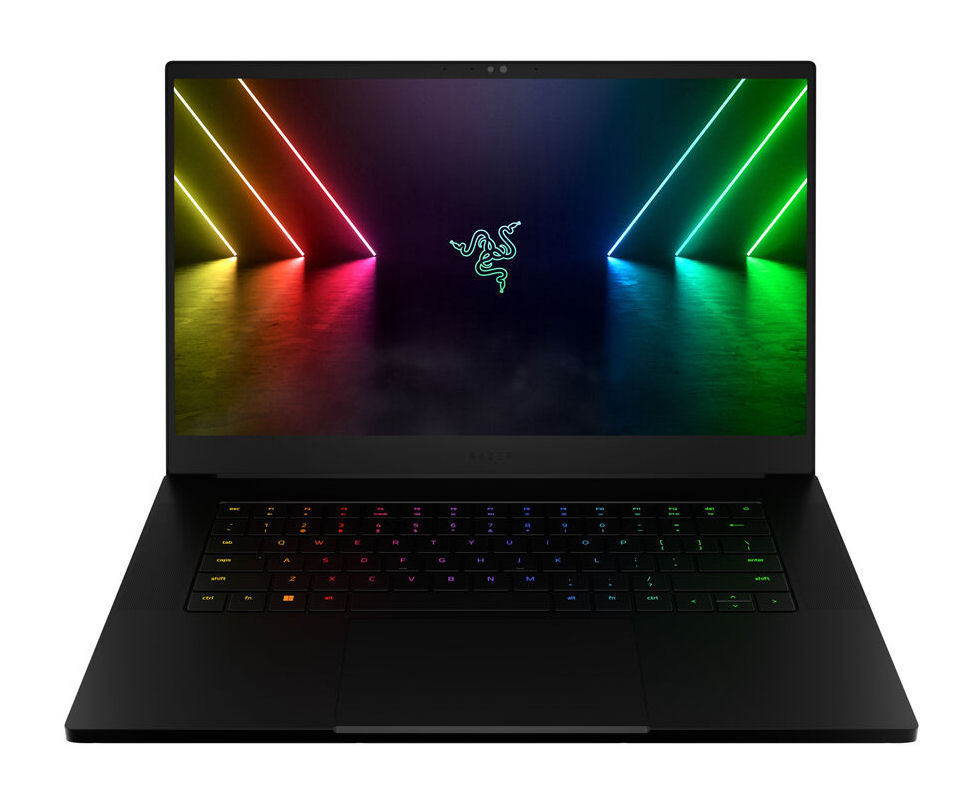
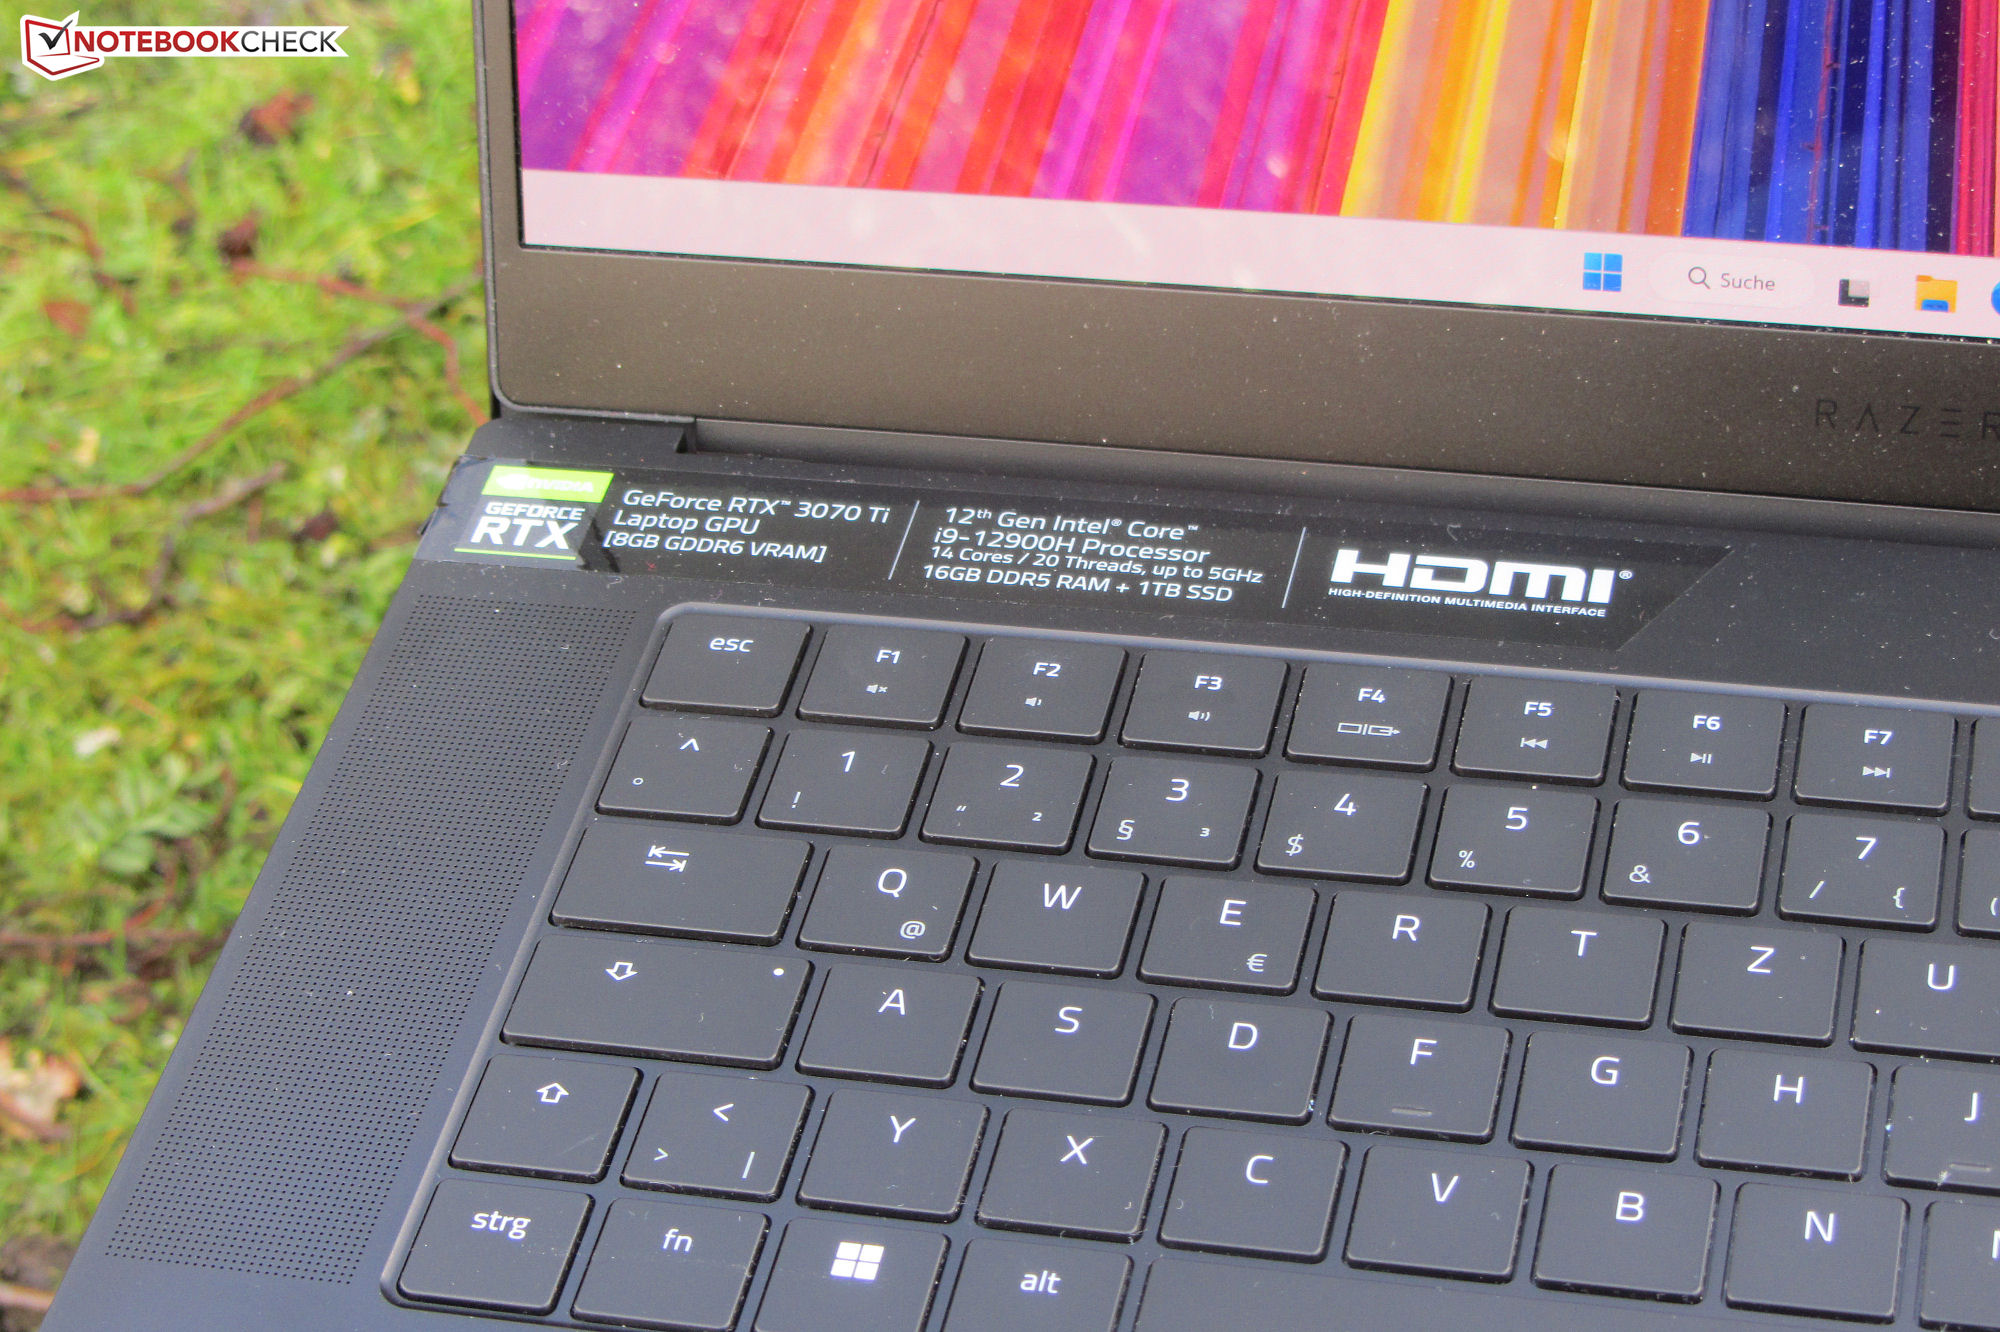
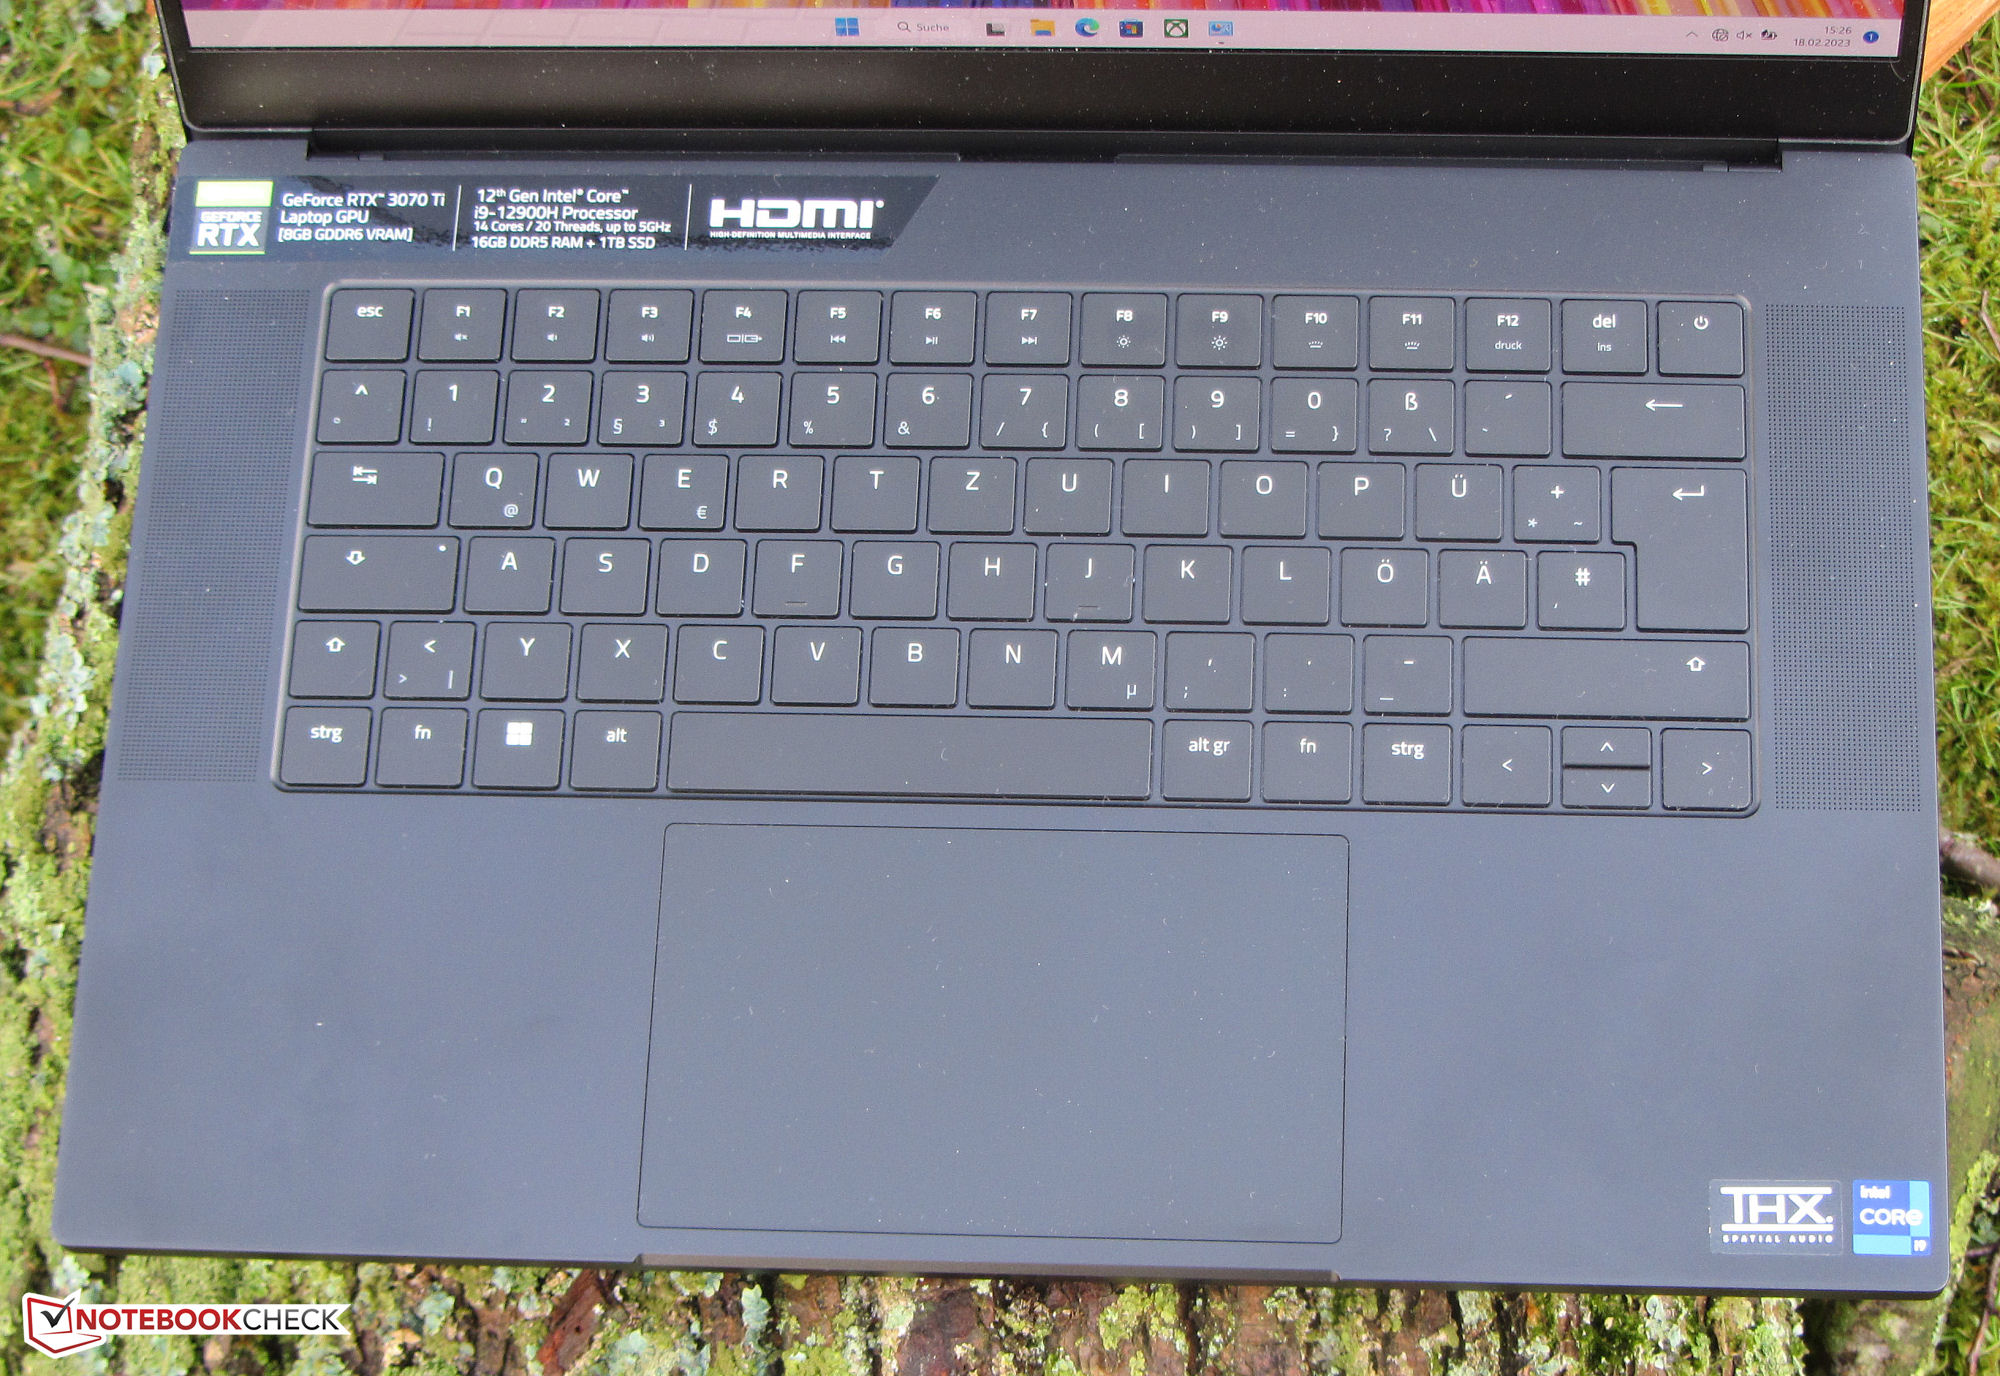
Razer Blade 15(2022年初)有野心成为游戏玩家和创意用户的笔记本电脑。合适的硬件已经上马。 酷睿i9-12900HCPU。 GeForce RTX 3070 Ti笔记本GPU和一个色彩准确的OLED显示屏(QHD)。类似的紧凑型竞争对手可以在以下形式中找到 申克XMG Fusion 15 (Mid 22),以及Aorus 15 XE5,以及HP Omen 16,以及华硕ROG Zephyrus M16 GU603Z.
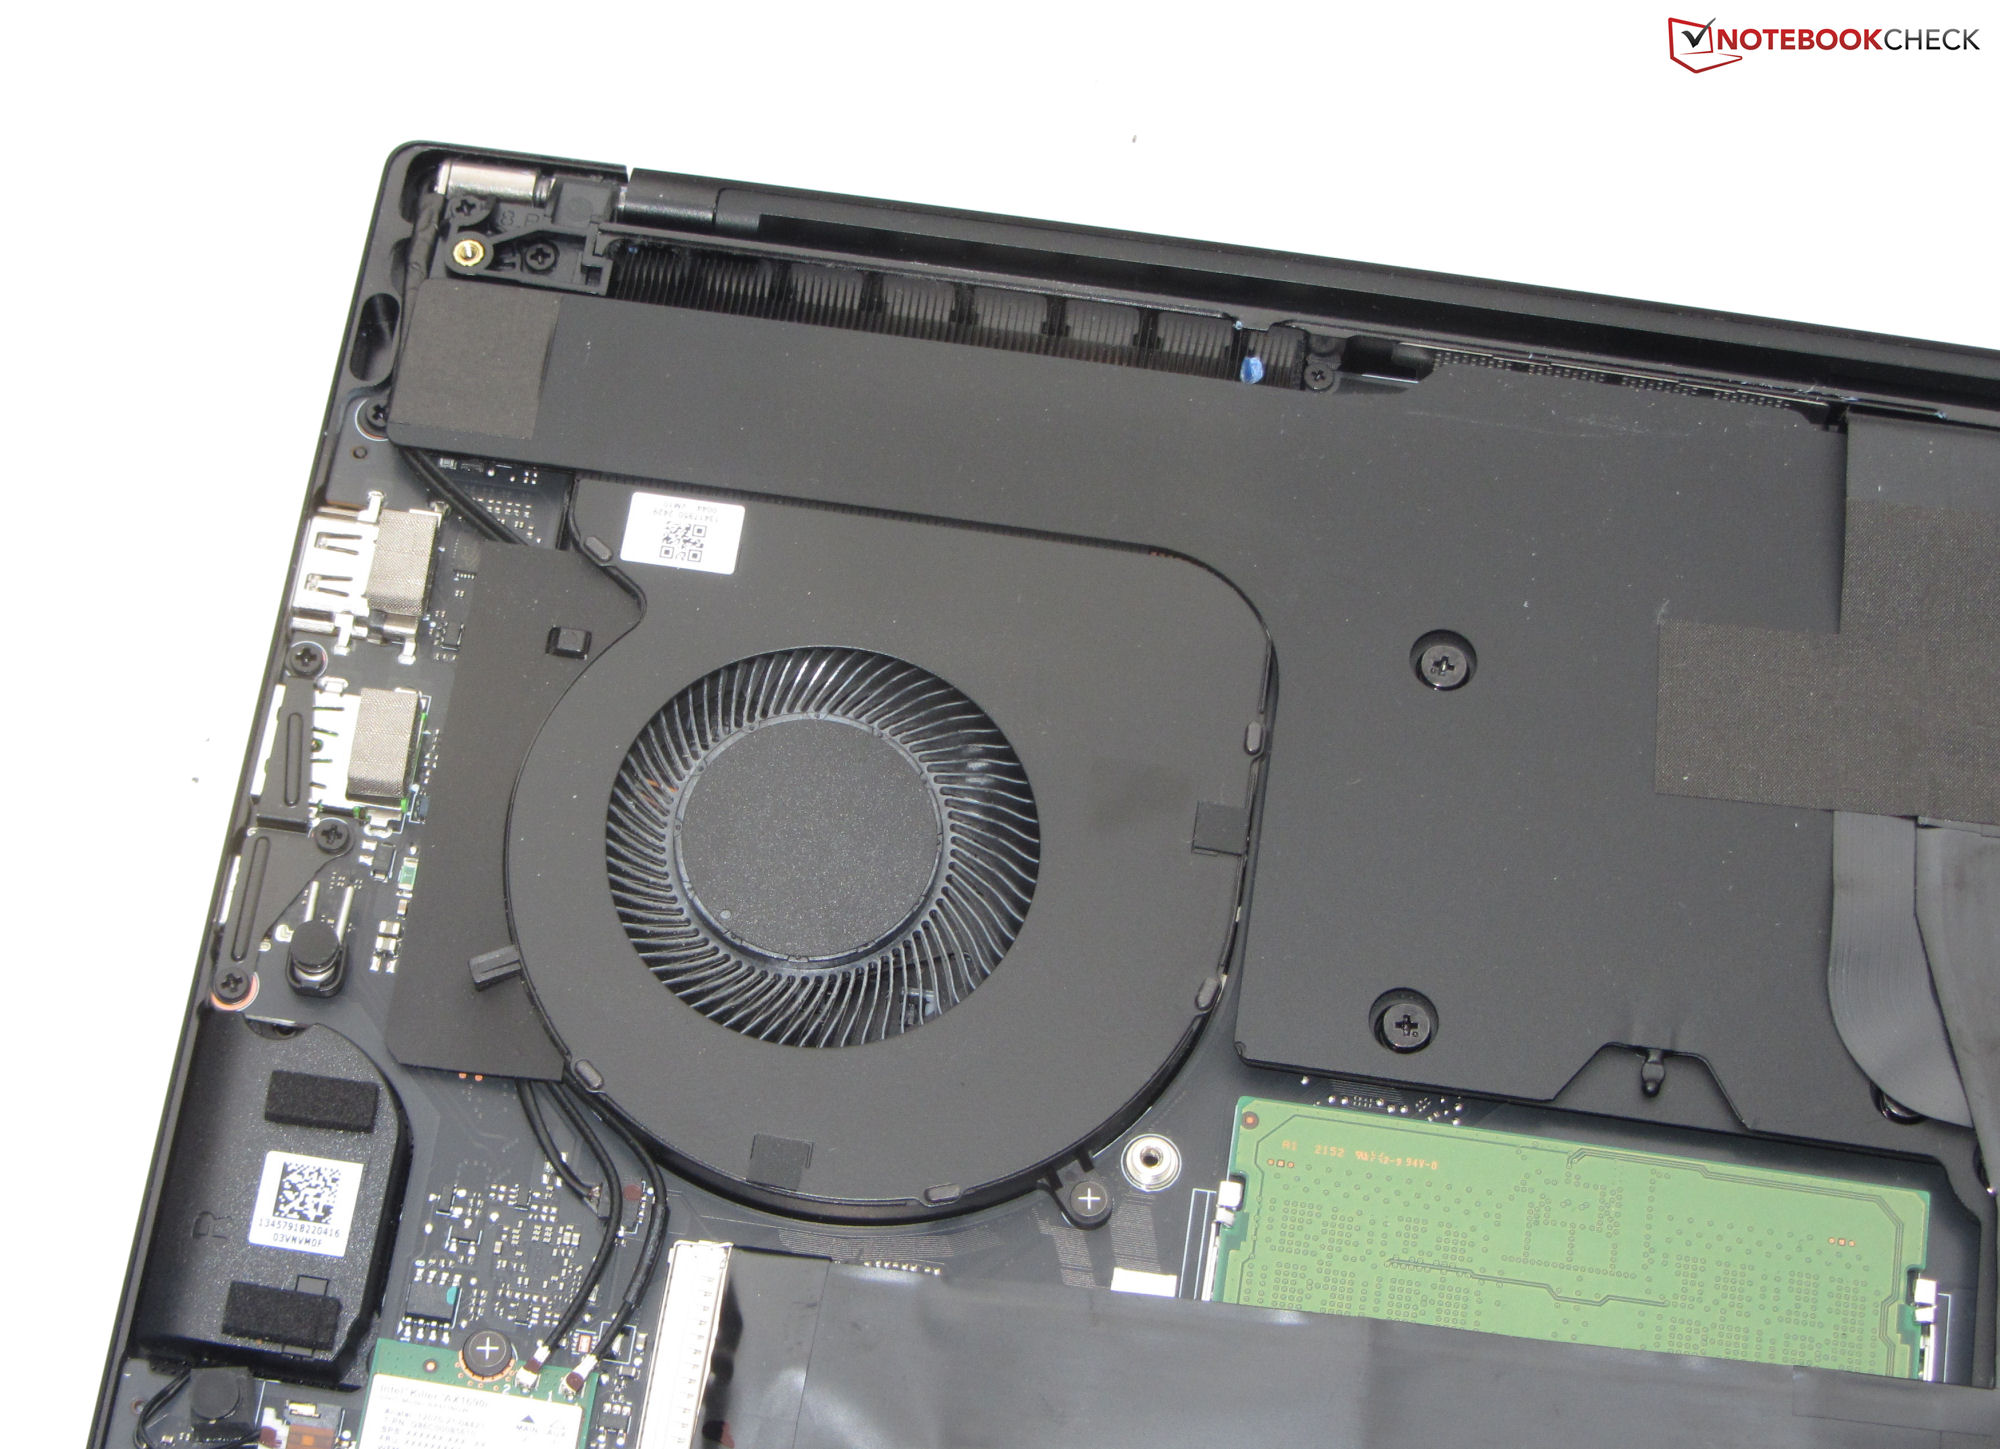
关于机箱、功能、输入设备和扬声器的信息已经在手边了 在我们对其兄弟姐妹的评论中, (12800H, RTX 3080 Ti).后者配备了LED面板(QHD)--这是与当前设备最相关的区别。
潜在的竞争对手比较
Rating | Date | Model | Weight | Height | Size | Resolution | Price |
|---|---|---|---|---|---|---|---|
| 89.9 % v7 (old) | 03 / 2023 | Razer Blade 15 OLED (Early 2022) i9-12900H, GeForce RTX 3070 Ti Laptop GPU | 2 kg | 16.99 mm | 15.60" | 2560x1440 | |
| 87.8 % v7 (old) | 02 / 2023 | Asus ROG Zephyrus M16 GU603Z i9-12900H, GeForce RTX 3070 Ti Laptop GPU | 2.1 kg | 19.9 mm | 16.00" | 2560x1600 | |
| 85.5 % v7 (old) | 12 / 2022 | Aorus 15 XE5 i7-12700H, GeForce RTX 3070 Ti Laptop GPU | 2.3 kg | 24 mm | 15.60" | 2560x1440 | |
| 87.4 % v7 (old) | 08 / 2022 | Schenker XMG Fusion 15 (Mid 22) i7-11800H, GeForce RTX 3070 Laptop GPU | 1.9 kg | 21.65 mm | 15.60" | 2560x1440 | |
| 85.5 % v7 (old) | 05 / 2022 | HP Omen 16-b1090ng i7-12700H, GeForce RTX 3070 Ti Laptop GPU | 2.3 kg | 23 mm | 16.10" | 2560x1440 |

| SD Card Reader | |
| average JPG Copy Test (av. of 3 runs) | |
| Razer Blade 15 2022 (Toshiba Exceria Pro SDXC 64 GB UHS-II) | |
| Asus ROG Zephyrus M16 GU603Z | |
| Average of class Gaming (20.9 - 210, n=55, last 2 years) | |
| Razer Blade 15 OLED (Early 2022) (AV Pro SD microSD 128 GB V60) | |
| Schenker XMG Fusion 15 (Mid 22) (AV PRO microSD 128 GB V60) | |
| HP Omen 16-b1090ng (AV PRO microSD 128 GB V60) | |
| maximum AS SSD Seq Read Test (1GB) | |
| Asus ROG Zephyrus M16 GU603Z | |
| Razer Blade 15 2022 (Toshiba Exceria Pro SDXC 64 GB UHS-II) | |
| Average of class Gaming (25.5 - 261, n=52, last 2 years) | |
| Razer Blade 15 OLED (Early 2022) (AV Pro SD microSD 128 GB V60) | |

 GeForce RTX 3070 Ti Laptop GPU, i9-12900H, Samsung PM9A1 MZVL21T0HCLR")
 GeForce RTX 3070 Ti Laptop GPU, i9-12900H, Samsung PM9A1 MZVL21T0HCLR")
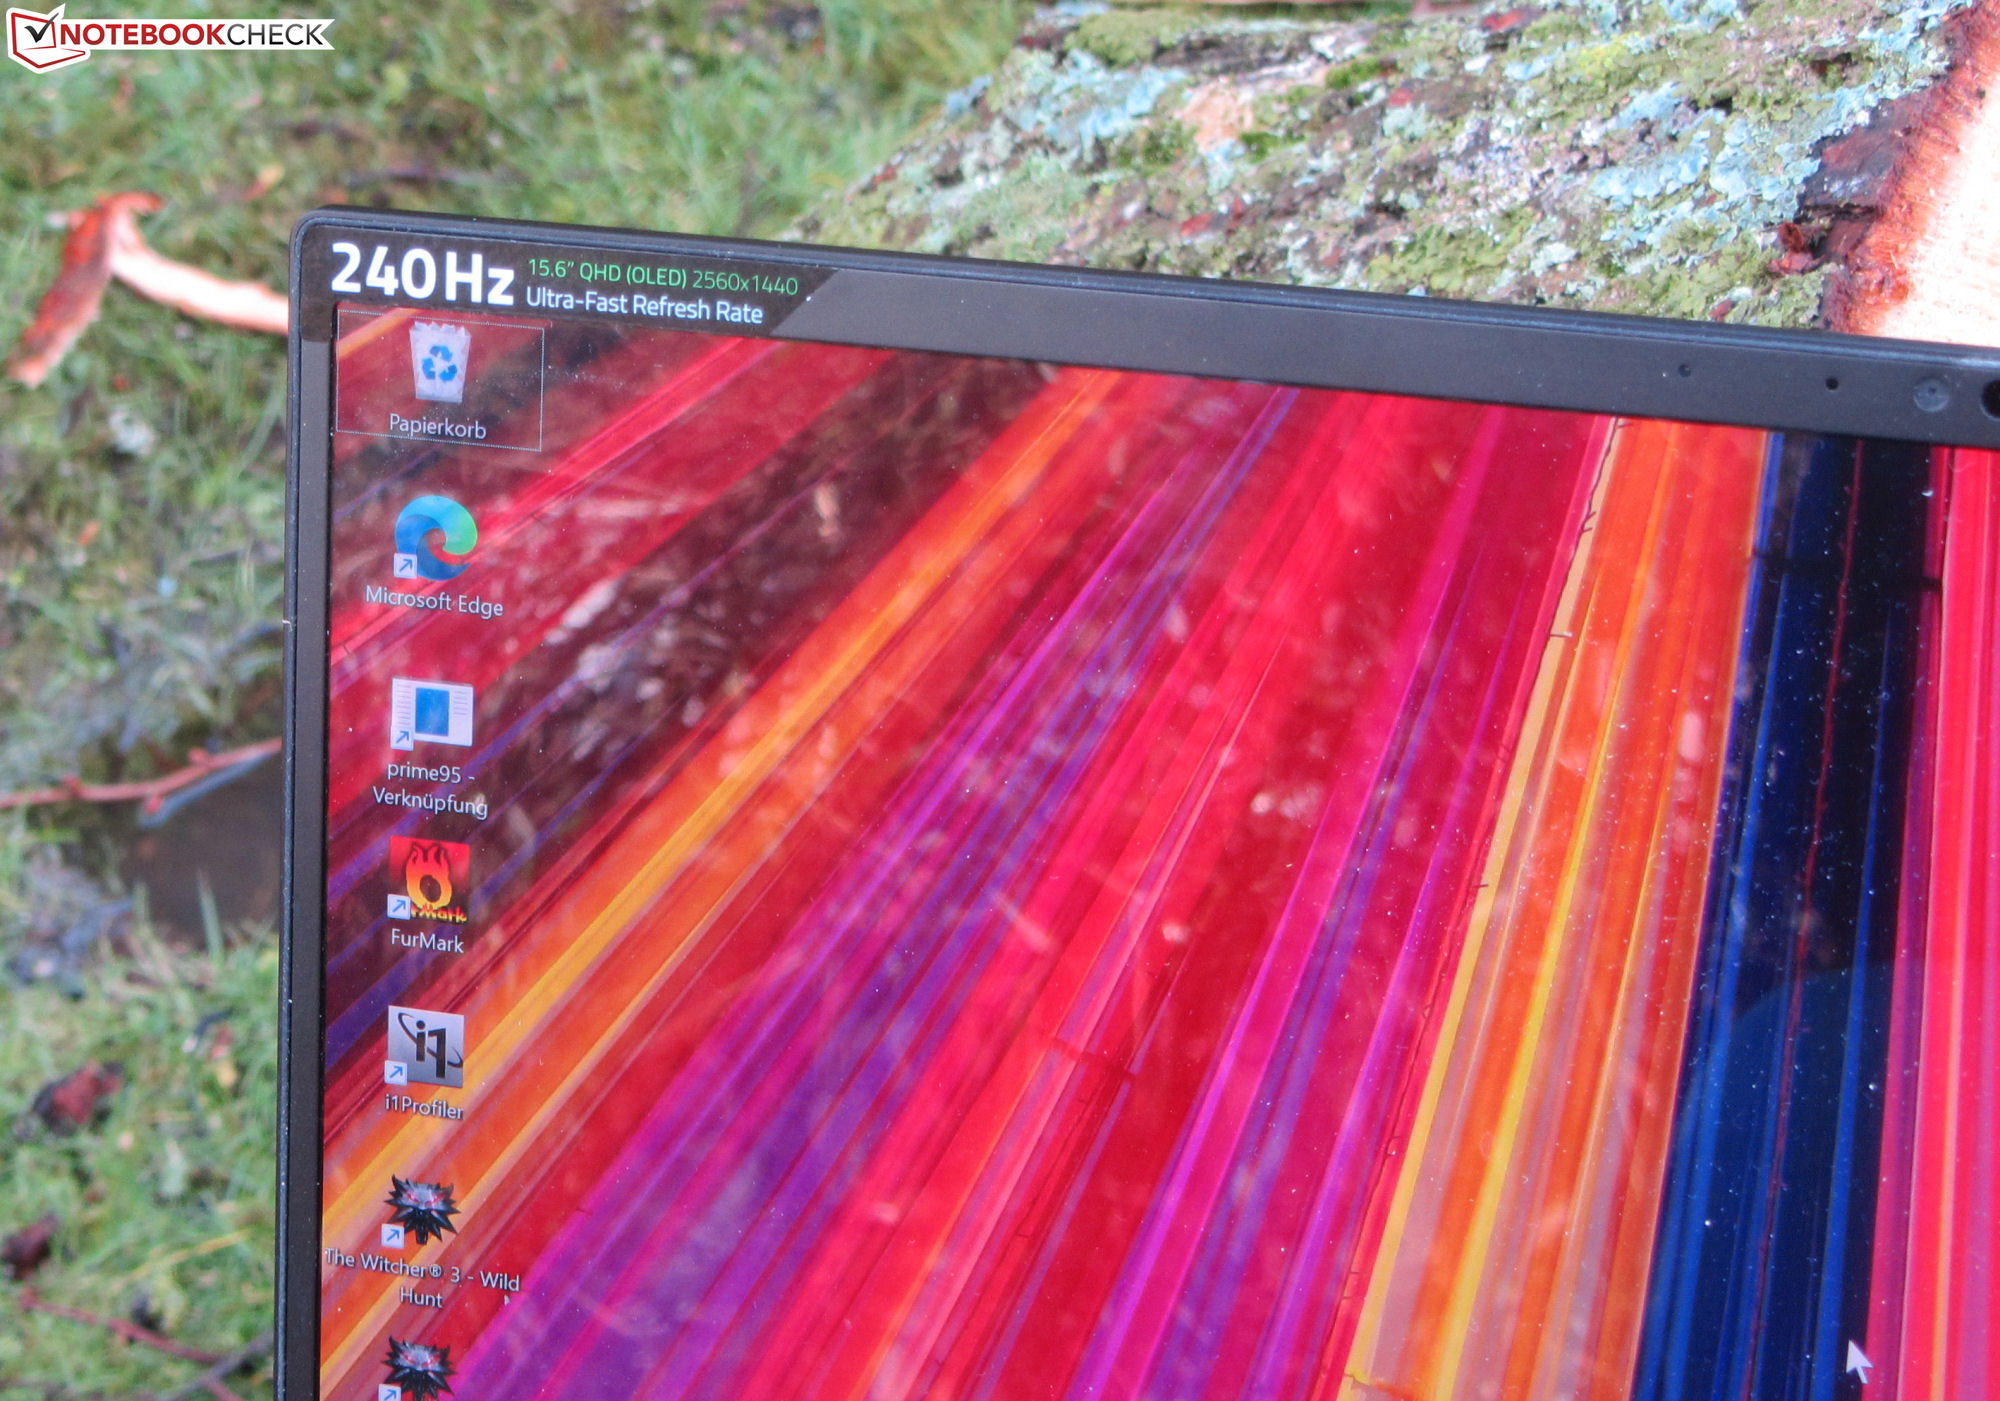
显示屏--移动的Razer电脑带来了一个OLED面板

OLED显示屏提供与LED显示屏兄弟姐妹相同的关键数据。分辨率为2560 x 1440像素(QHD),刷新率为240 Hz,直径为15.6英寸。
典型的OLED,该面板因精彩的黑色水平和快速响应时间而得分。此外,这还伴随着相对较高的最大亮度。这是其LED对应产品无法比拟的。
OLED面板的弱点。它有一个光亮的表面,在亮度设置为≤70%时,会以500Hz的频率闪烁。技术上引起的闪烁与面板的亮度调节有关。在这一点上。 其兄弟姐妹的哑光、无闪烁的LED面板在前面。
| |||||||||||||||||||||||||
Brightness Distribution: 99 %
Center on Battery: 381 cd/m²
Contrast: 12767:1 (Black: 0.03 cd/m²)
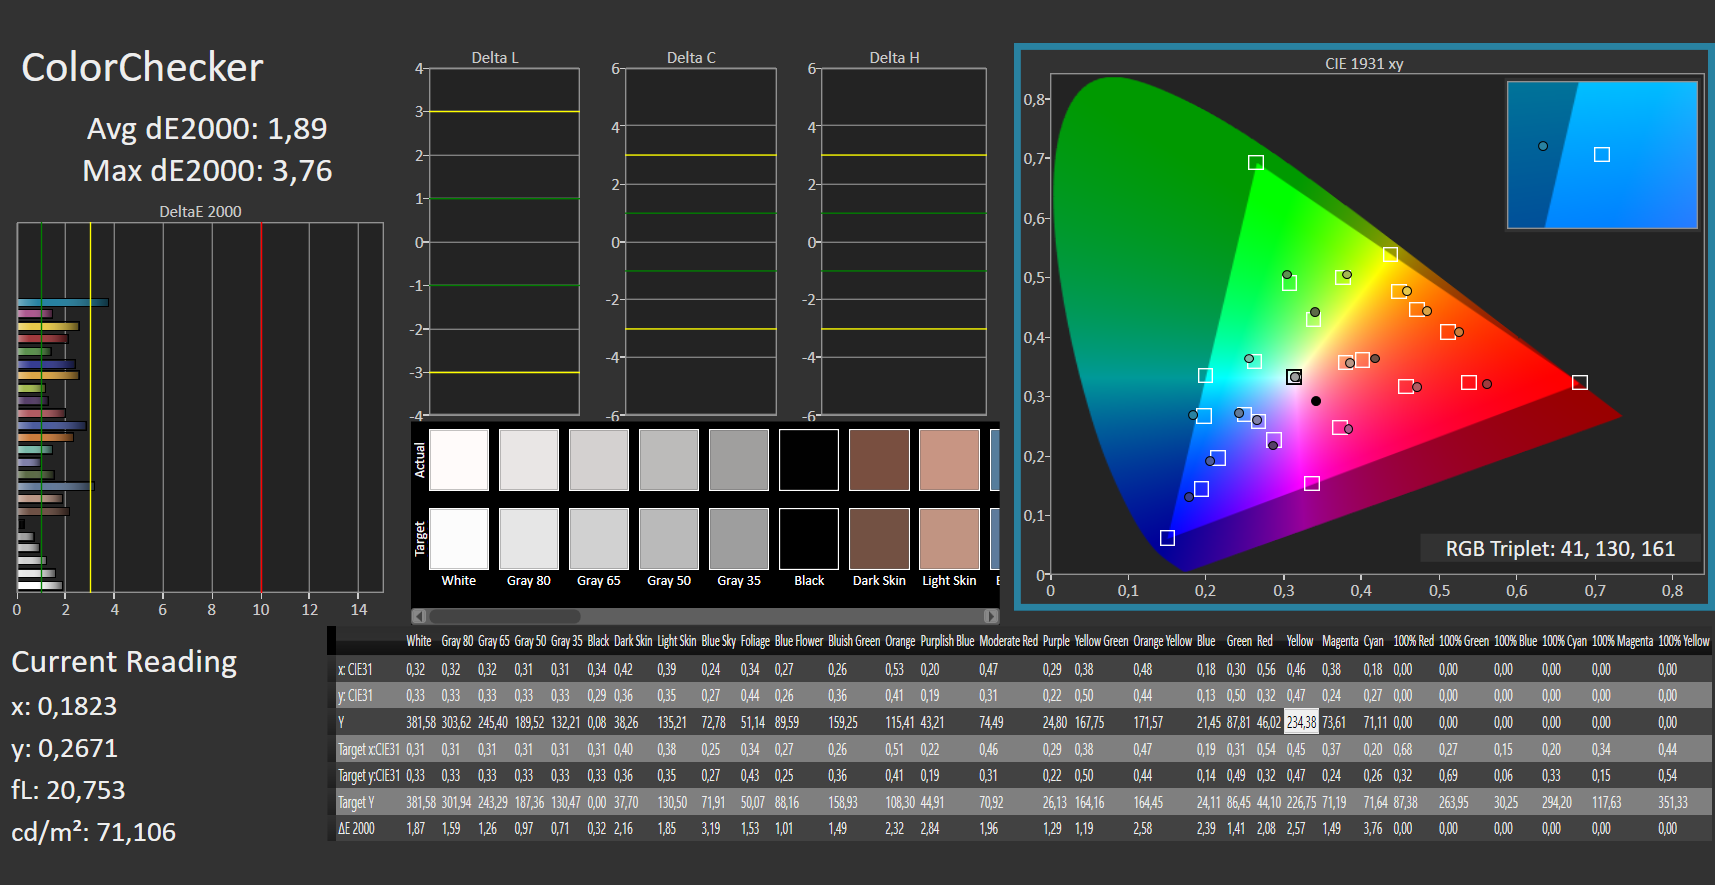
ΔE ColorChecker Calman: 1.89 | ∀{0.5-29.43 Ø4.71}
calibrated: 2.67
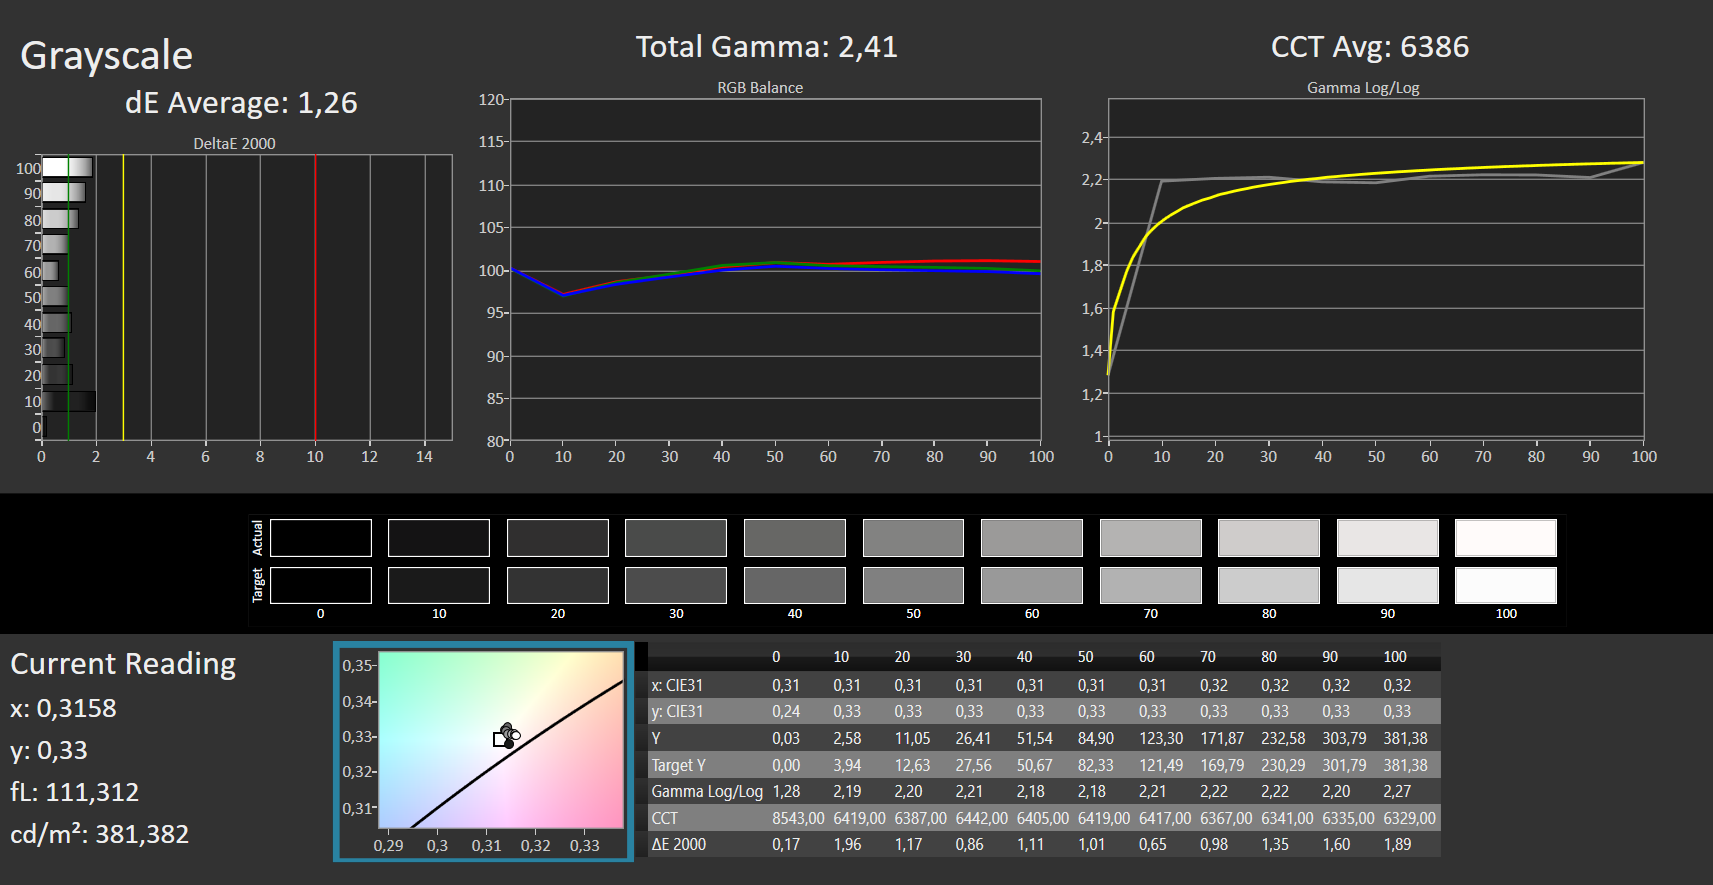
ΔE Greyscale Calman: 1.26 | ∀{0.09-98 Ø4.96}
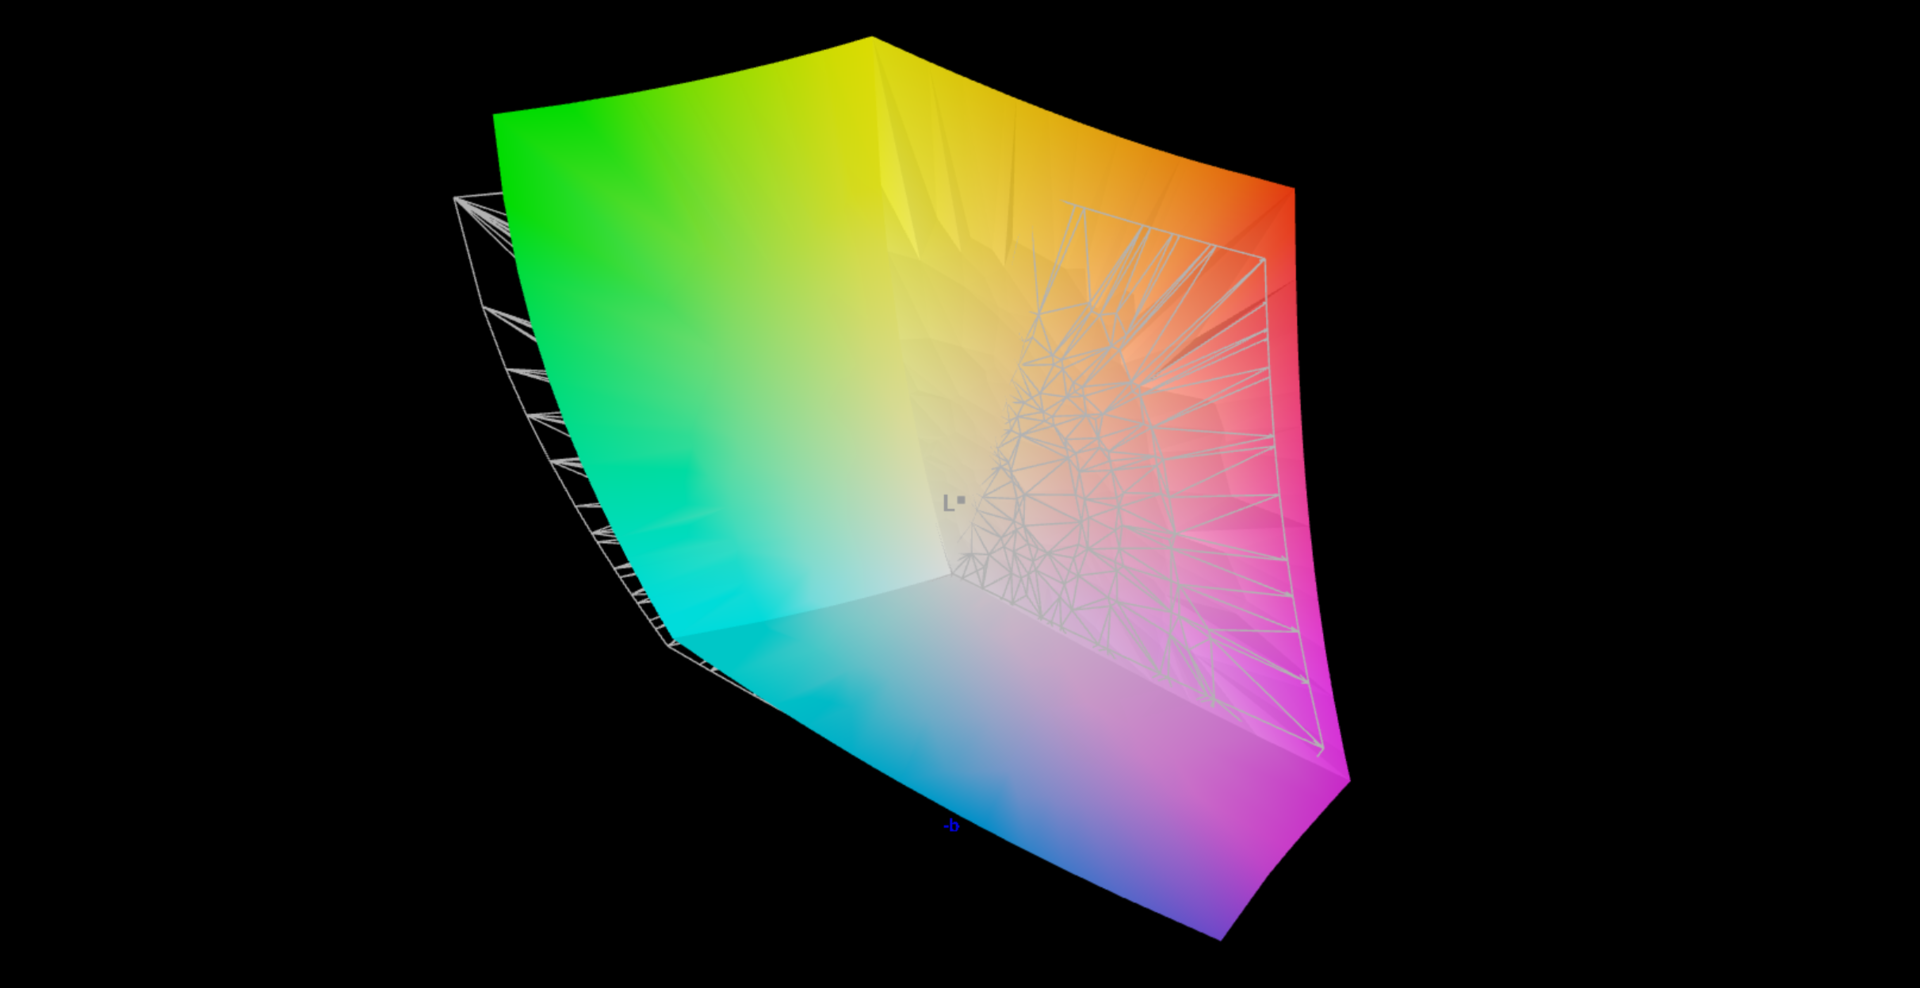
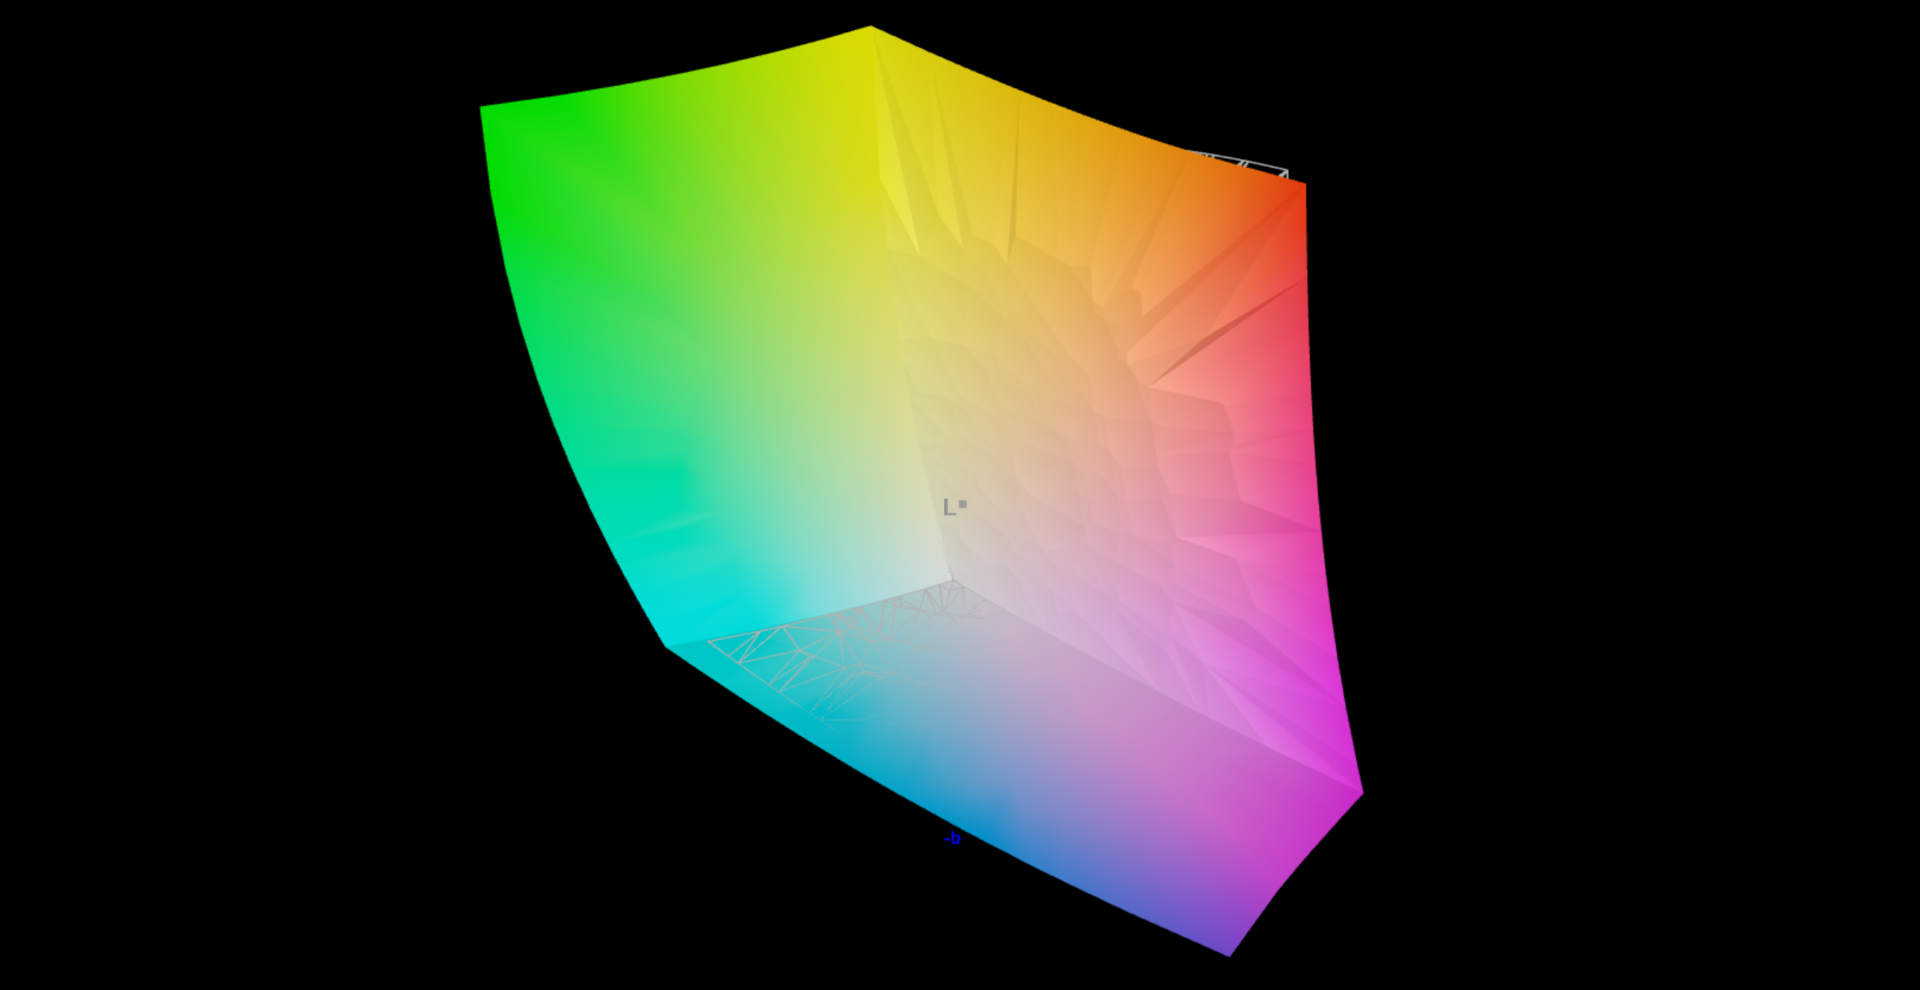
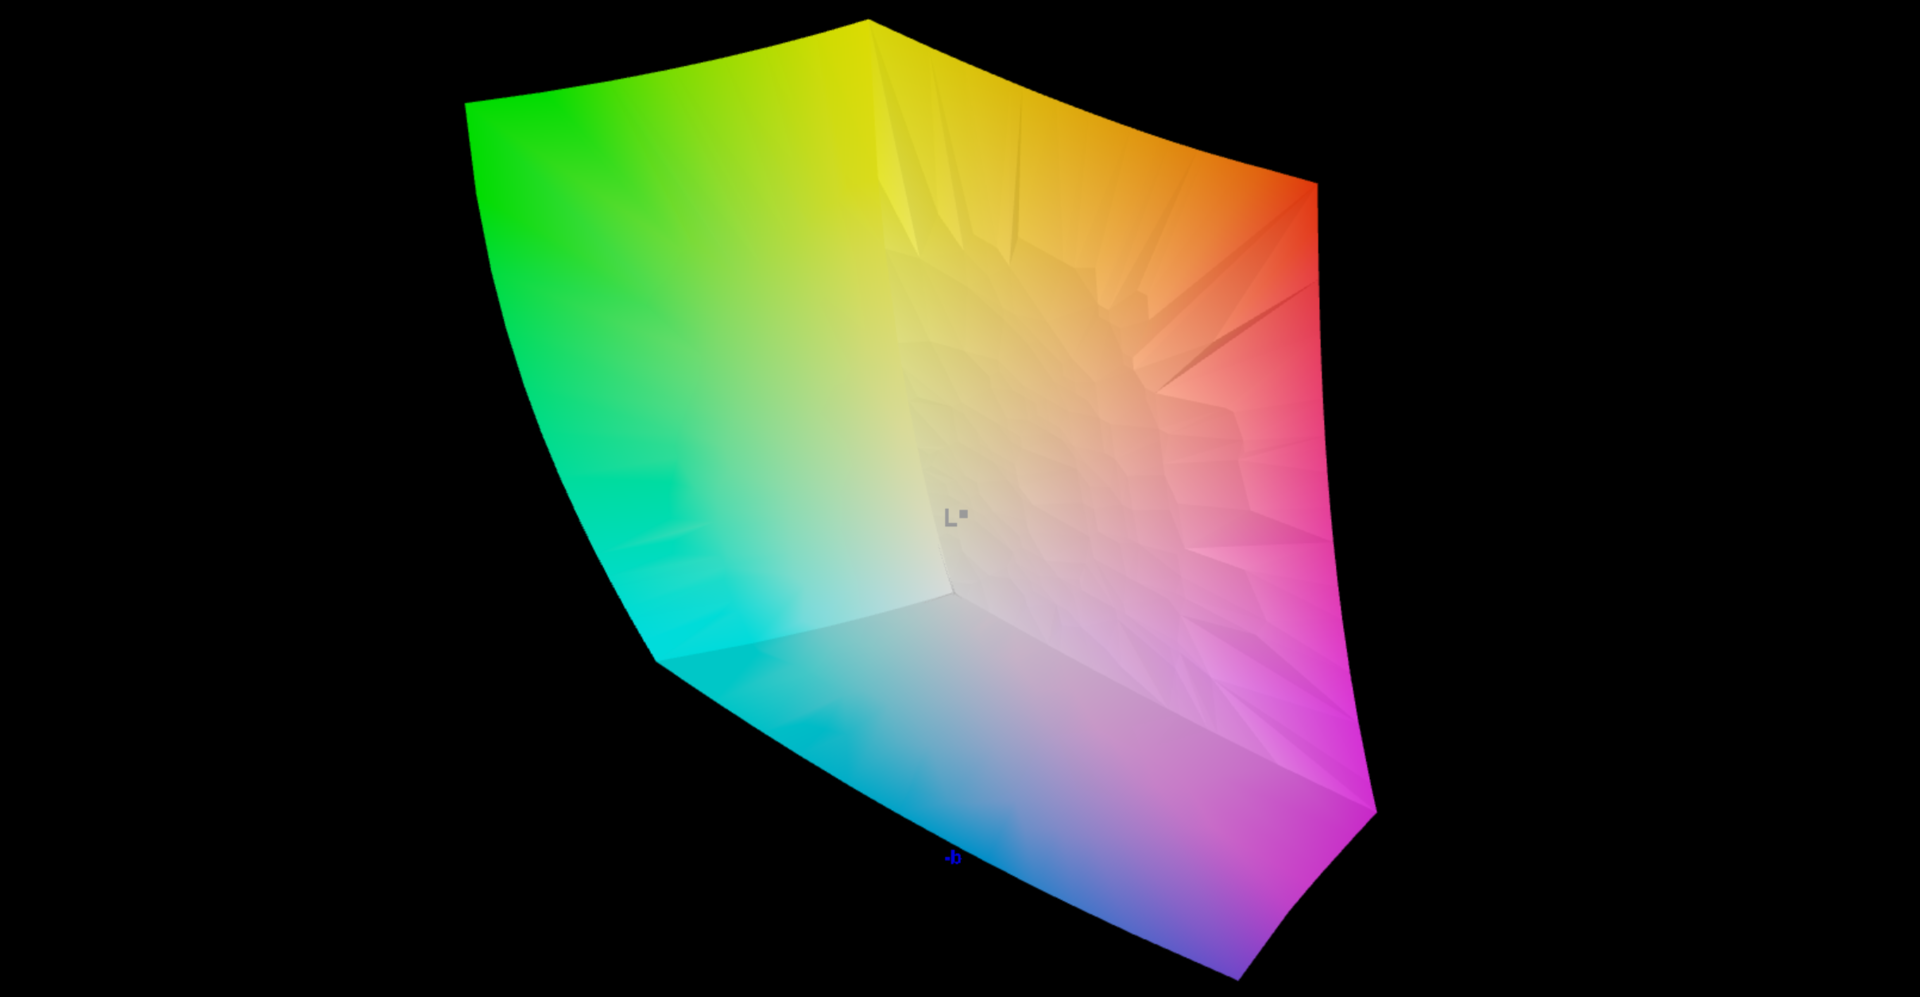
94% AdobeRGB 1998 (Argyll 3D)
99.4% sRGB (Argyll 3D)
97.6% Display P3 (Argyll 3D)
Gamma: 2.41
CCT: 6386 K
| Razer Blade 15 OLED (Early 2022) Samsung ATNA562P02-0, OLED, 2560x1440, 15.6" | Asus ROG Zephyrus M16 GU603Z BOE0A0B (BOE CQ NE160QDM-NY3), IPS, 2560x1600, 16" | Aorus 15 XE5 Chi Mei N156KME-GNA, IPS, 2560x1440, 15.6" | Schenker XMG Fusion 15 (Mid 22) BOE CQ NE156QHM-NY2, IPS, 2560x1440, 15.6" | HP Omen 16-b1090ng BOE09E5, IPS, 2560x1440, 16.1" | Razer Blade 15 2022 Sharp LQ156T1JW03, IPS, 2560x1440, 15.6" | |
|---|---|---|---|---|---|---|
| Display | -6% | -4% | -20% | -17% | -2% | |
| Display P3 Coverage (%) | 97.6 | 92.8 -5% | 95.2 -2% | 67.3 -31% | 71 -27% | 99.1 2% |
| sRGB Coverage (%) | 99.4 | 98.5 -1% | 99.9 1% | 96.7 -3% | 97.9 -2% | 99.9 1% |
| AdobeRGB 1998 Coverage (%) | 94 | 83.1 -12% | 84.5 -10% | 68.2 -27% | 73.3 -22% | 86.8 -8% |
| Response Times | -340% | -475% | -365% | -498% | -550% | |
| Response Time Grey 50% / Grey 80% * (ms) | 2 ? | 7.6 ? -280% | 14.4 ? -620% | 11.6 ? -480% | 14.5 ? -625% | 14.4 ? -620% |
| Response Time Black / White * (ms) | 2 ? | 10 ? -400% | 8.6 ? -330% | 7 ? -250% | 9.4 ? -370% | 11.6 ? -480% |
| PWM Frequency (Hz) | 500 ? | |||||
| Screen | -96% | -169% | -178% | -184% | -106% | |
| Brightness middle (cd/m²) | 383 | 497 30% | 336 -12% | 326 -15% | 335 -13% | 286 -25% |
| Brightness (cd/m²) | 384 | 481 25% | 316 -18% | 303 -21% | 319 -17% | 271 -29% |
| Brightness Distribution (%) | 99 | 82 -17% | 89 -10% | 89 -10% | 90 -9% | 89 -10% |
| Black Level * (cd/m²) | 0.03 | 0.21 -600% | 0.34 -1033% | 0.33 -1000% | 0.28 -833% | 0.25 -733% |
| Contrast (:1) | 12767 | 2367 -81% | 988 -92% | 988 -92% | 1196 -91% | 1144 -91% |
| Colorchecker dE 2000 * | 1.89 | 3.53 -87% | 3.36 -78% | 2.73 -44% | 4.38 -132% | 2.74 -45% |
| Colorchecker dE 2000 max. * | 3.76 | 6.15 -64% | 6.67 -77% | 9.54 -154% | 9.48 -152% | 5.21 -39% |
| Colorchecker dE 2000 calibrated * | 2.67 | 3.53 -32% | 0.74 72% | 1.36 49% | 1.33 50% | 2.52 6% |
| Greyscale dE 2000 * | 1.26 | 1.74 -38% | 4.7 -273% | 5.2 -313% | 7 -456% | 1.1 13% |
| Gamma | 2.41 91% | 2.2 100% | 2.244 98% | 2.074 106% | 2.103 105% | 2.2 100% |
| CCT | 6386 102% | 6418 101% | 6897 94% | 6911 94% | 6244 104% | 6408 101% |
| Total Average (Program / Settings) | -147% /
-112% | -216% /
-177% | -188% /
-171% | -233% /
-193% | -219% /
-147% |
* ... smaller is better
即使开箱即用,该显示器也能提供令人印象深刻的色彩再现。偏差为1.9,显然达到了目标(DeltaE<3)。校准并没有带来任何改进。色彩准确度是给定的。sRGB和DCI-P3色彩空间完全再现,几乎完全再现了AdobeRGB色彩空间的94%。该 兄弟姐妹的LED面板也提供了类似的好结果。
Display Response Times
| ↔ Response Time Black to White | ||
|---|---|---|
| 2 ms ... rise ↗ and fall ↘ combined | ↗ 1 ms rise |  |
| ↘ 1 ms fall | ||
| The screen shows very fast response rates in our tests and should be very well suited for fast-paced gaming. In comparison, all tested devices range from 0.1 (minimum) to 240 (maximum) ms. » 11 % of all devices are better. This means that the measured response time is better than the average of all tested devices (19.8 ms). | ||
| ↔ Response Time 50% Grey to 80% Grey | ||
| 2 ms ... rise ↗ and fall ↘ combined | ↗ 1 ms rise |  |
| ↘ 1 ms fall | ||
| The screen shows very fast response rates in our tests and should be very well suited for fast-paced gaming. In comparison, all tested devices range from 0.165 (minimum) to 636 (maximum) ms. » 10 % of all devices are better. This means that the measured response time is better than the average of all tested devices (30.9 ms). | ||
Screen Flickering / PWM (Pulse-Width Modulation)
| Screen flickering / PWM detected | 500 Hz | ≤ 70 % brightness setting |  |
The display backlight flickers at 500 Hz (worst case, e.g., utilizing PWM) Flickering detected at a brightness setting of 70 % and below. There should be no flickering or PWM above this brightness setting. The frequency of 500 Hz is relatively high, so most users sensitive to PWM should not notice any flickering. However, there are reports that some users are still sensitive to PWM at 500 Hz and above, so be aware. In comparison: 52 % of all tested devices do not use PWM to dim the display. If PWM was detected, an average of 7748 (minimum: 5 - maximum: 343500) Hz was measured. | |||
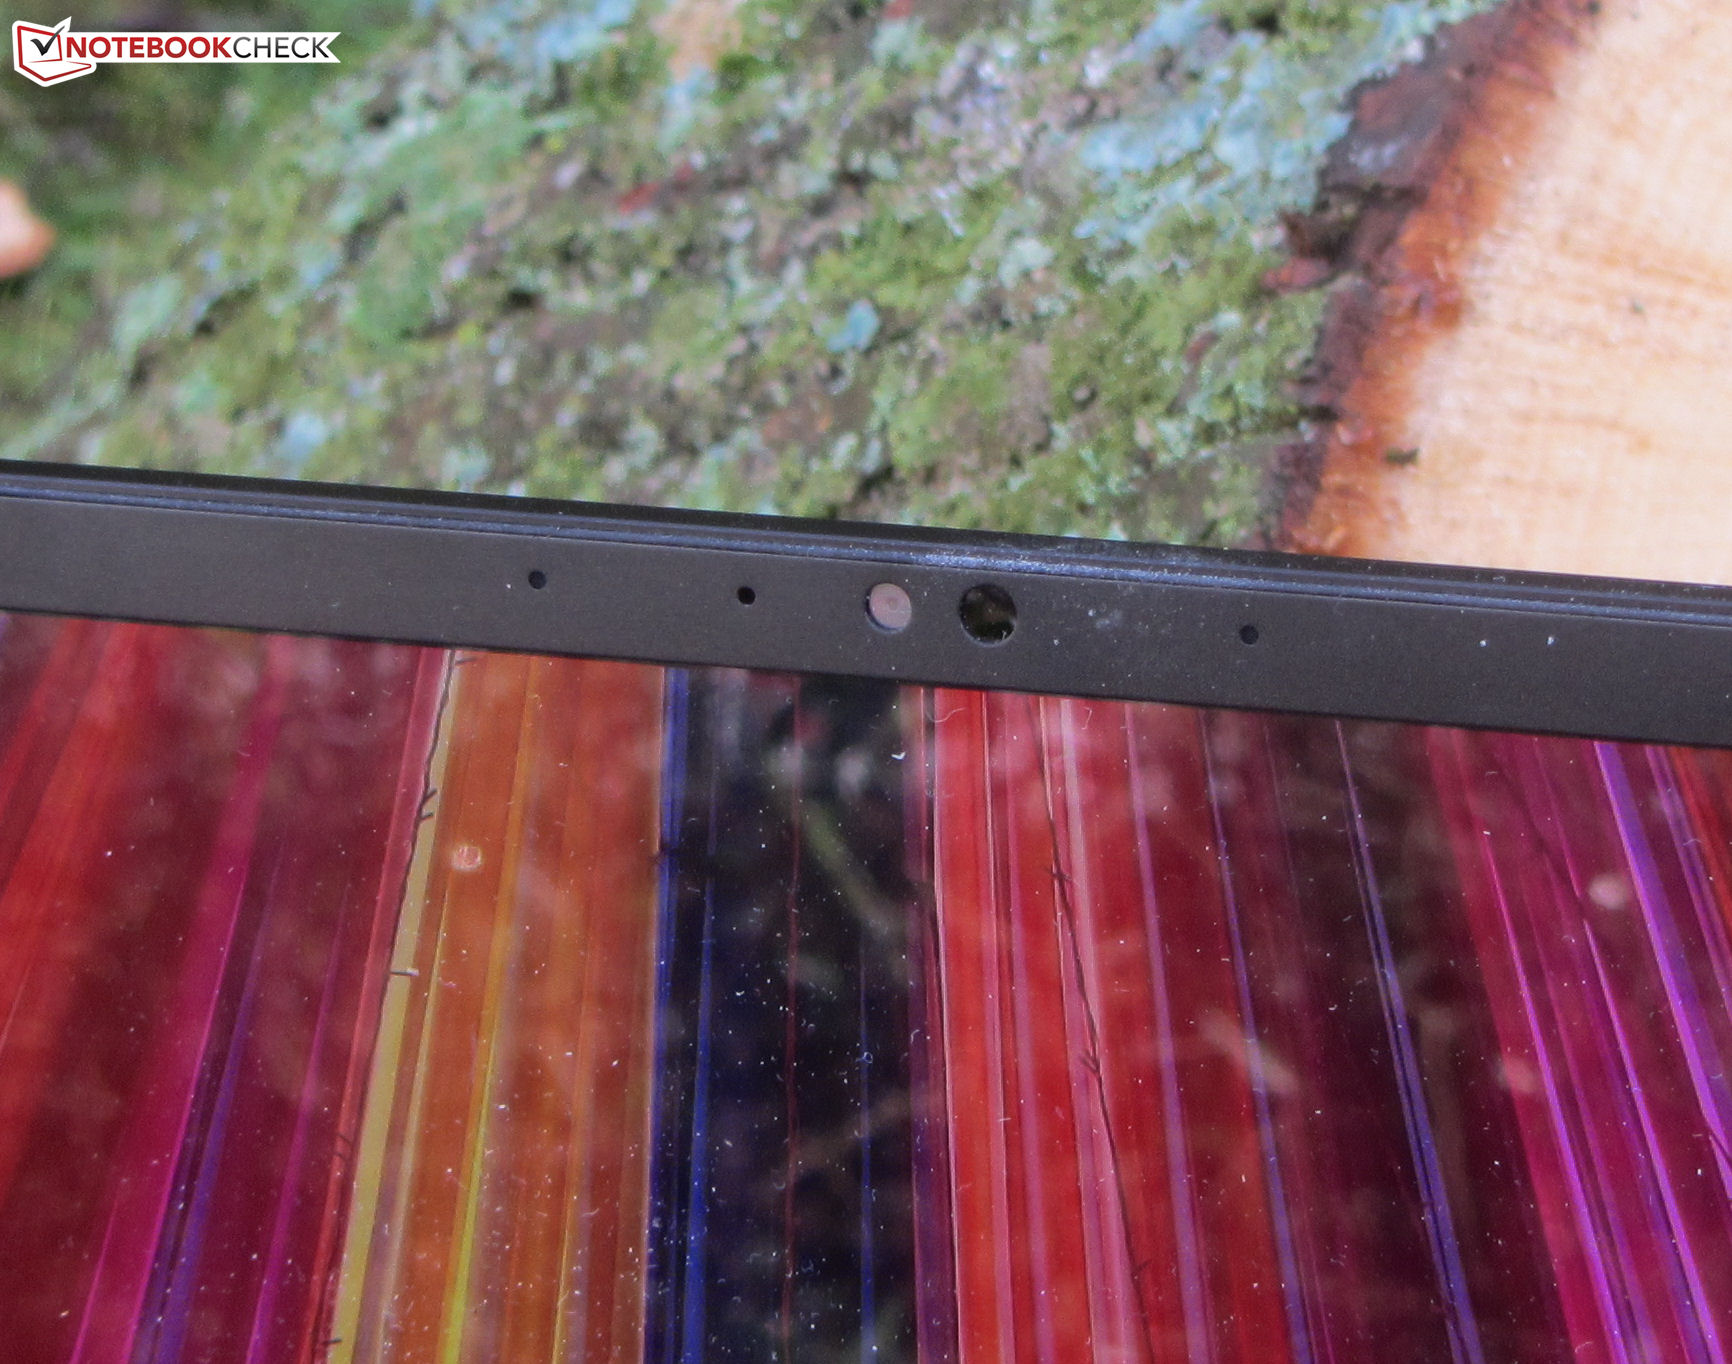
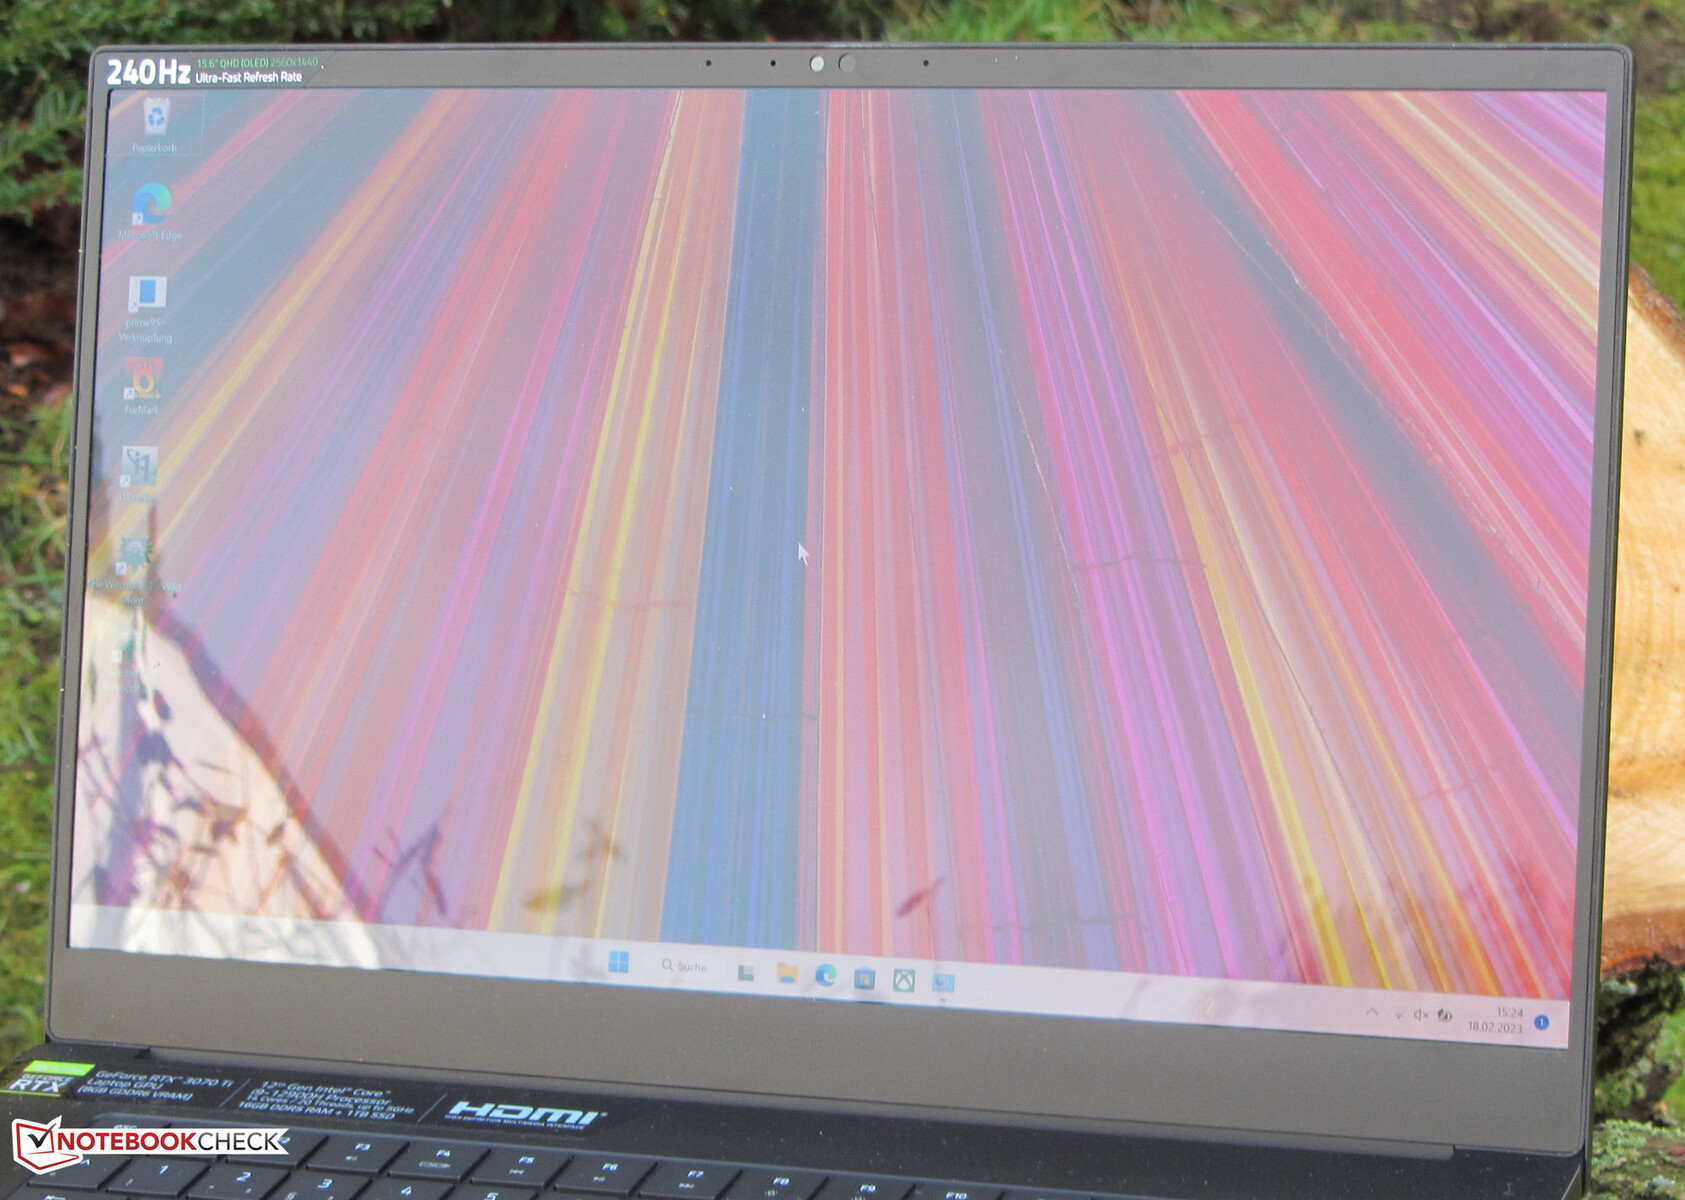
该面板具有很好的视角稳定性,从各个角度都能看清。然而,在户外,由于显示器的光泽、反射表面,这很难做到。

性能--刀片15是基于Alder Lake和Ampere的。
有了Blade 15(2022年初),Razer在其产品系列中拥有了一台专为QHD游戏(高至最大设置)设计的笔记本电脑,但它在视频编辑和渲染等领域也有不错的表现。这里评论的模型可以以大约1967美元的价格买到。
测试条件
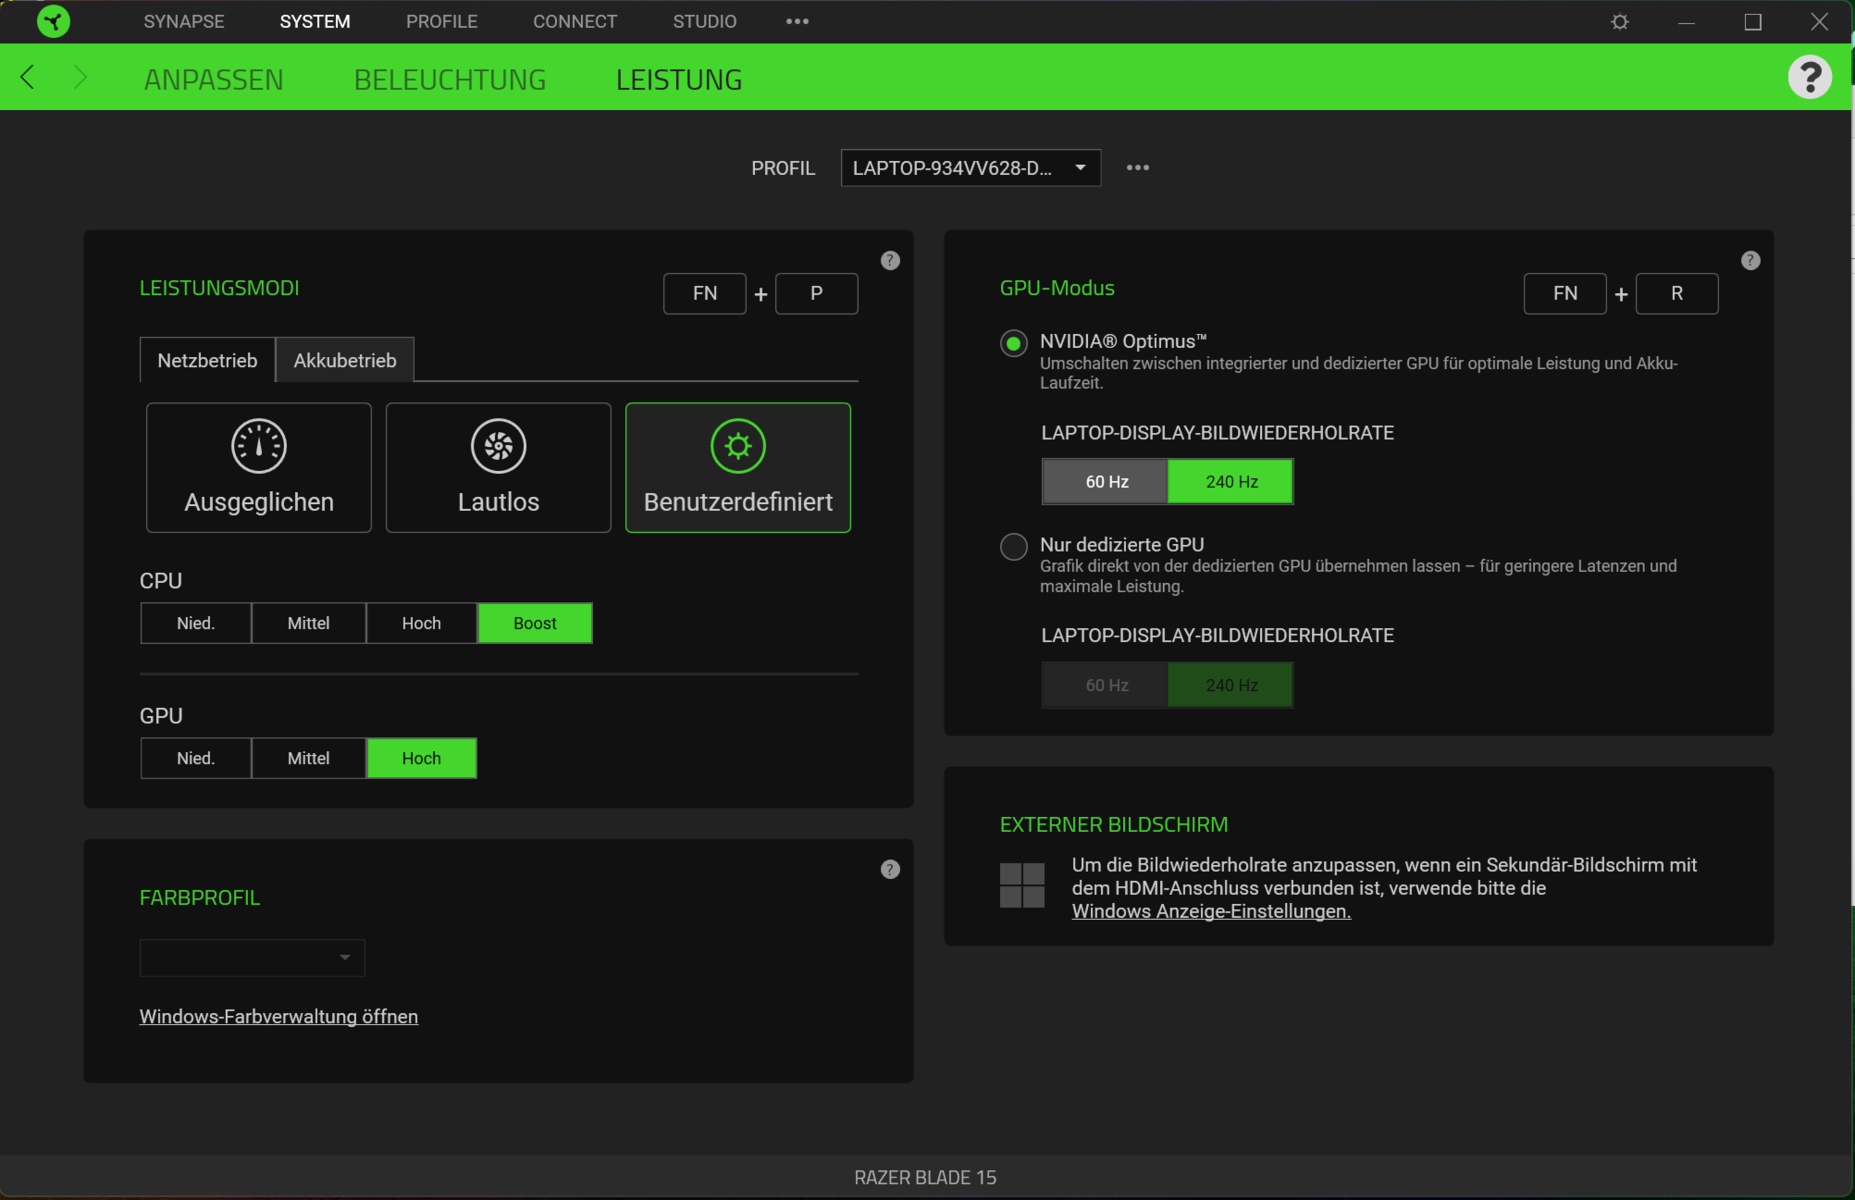
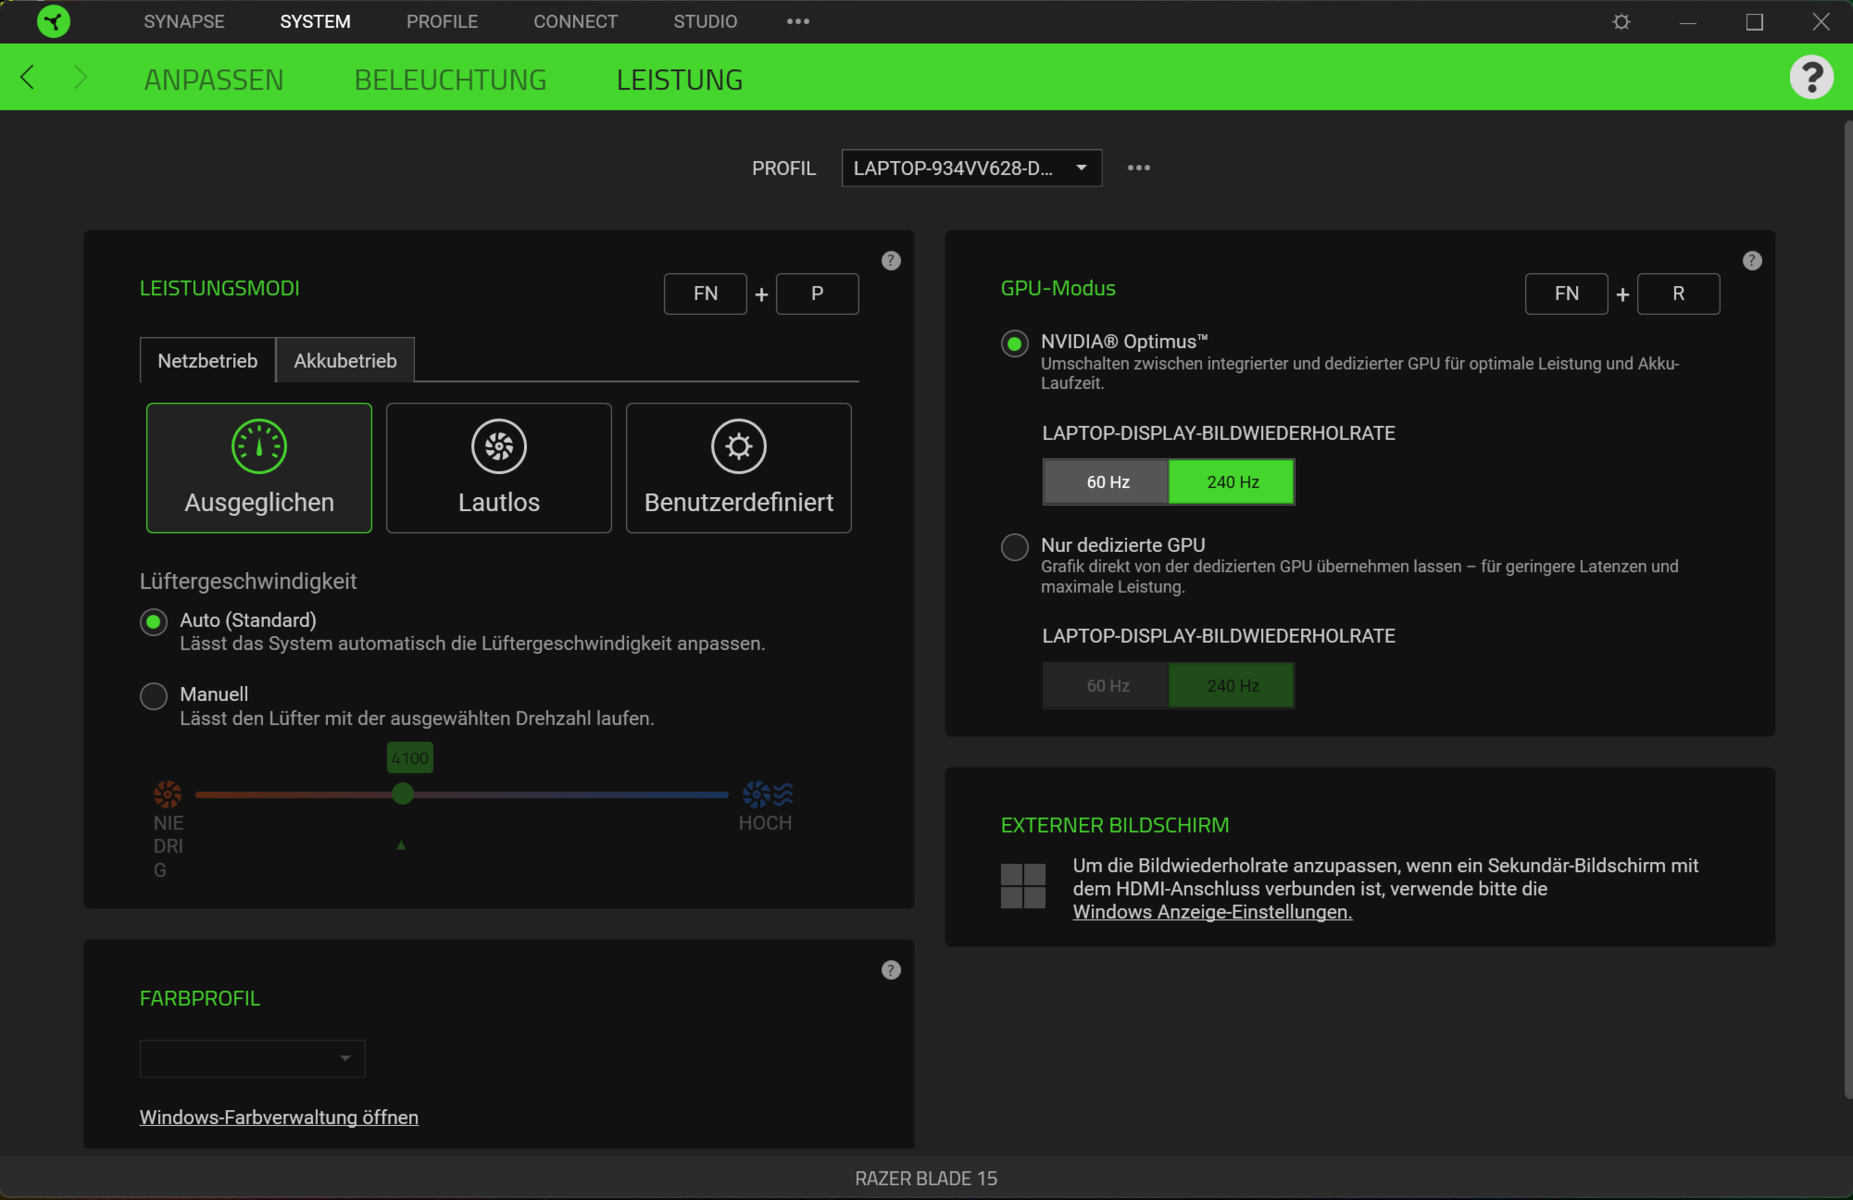
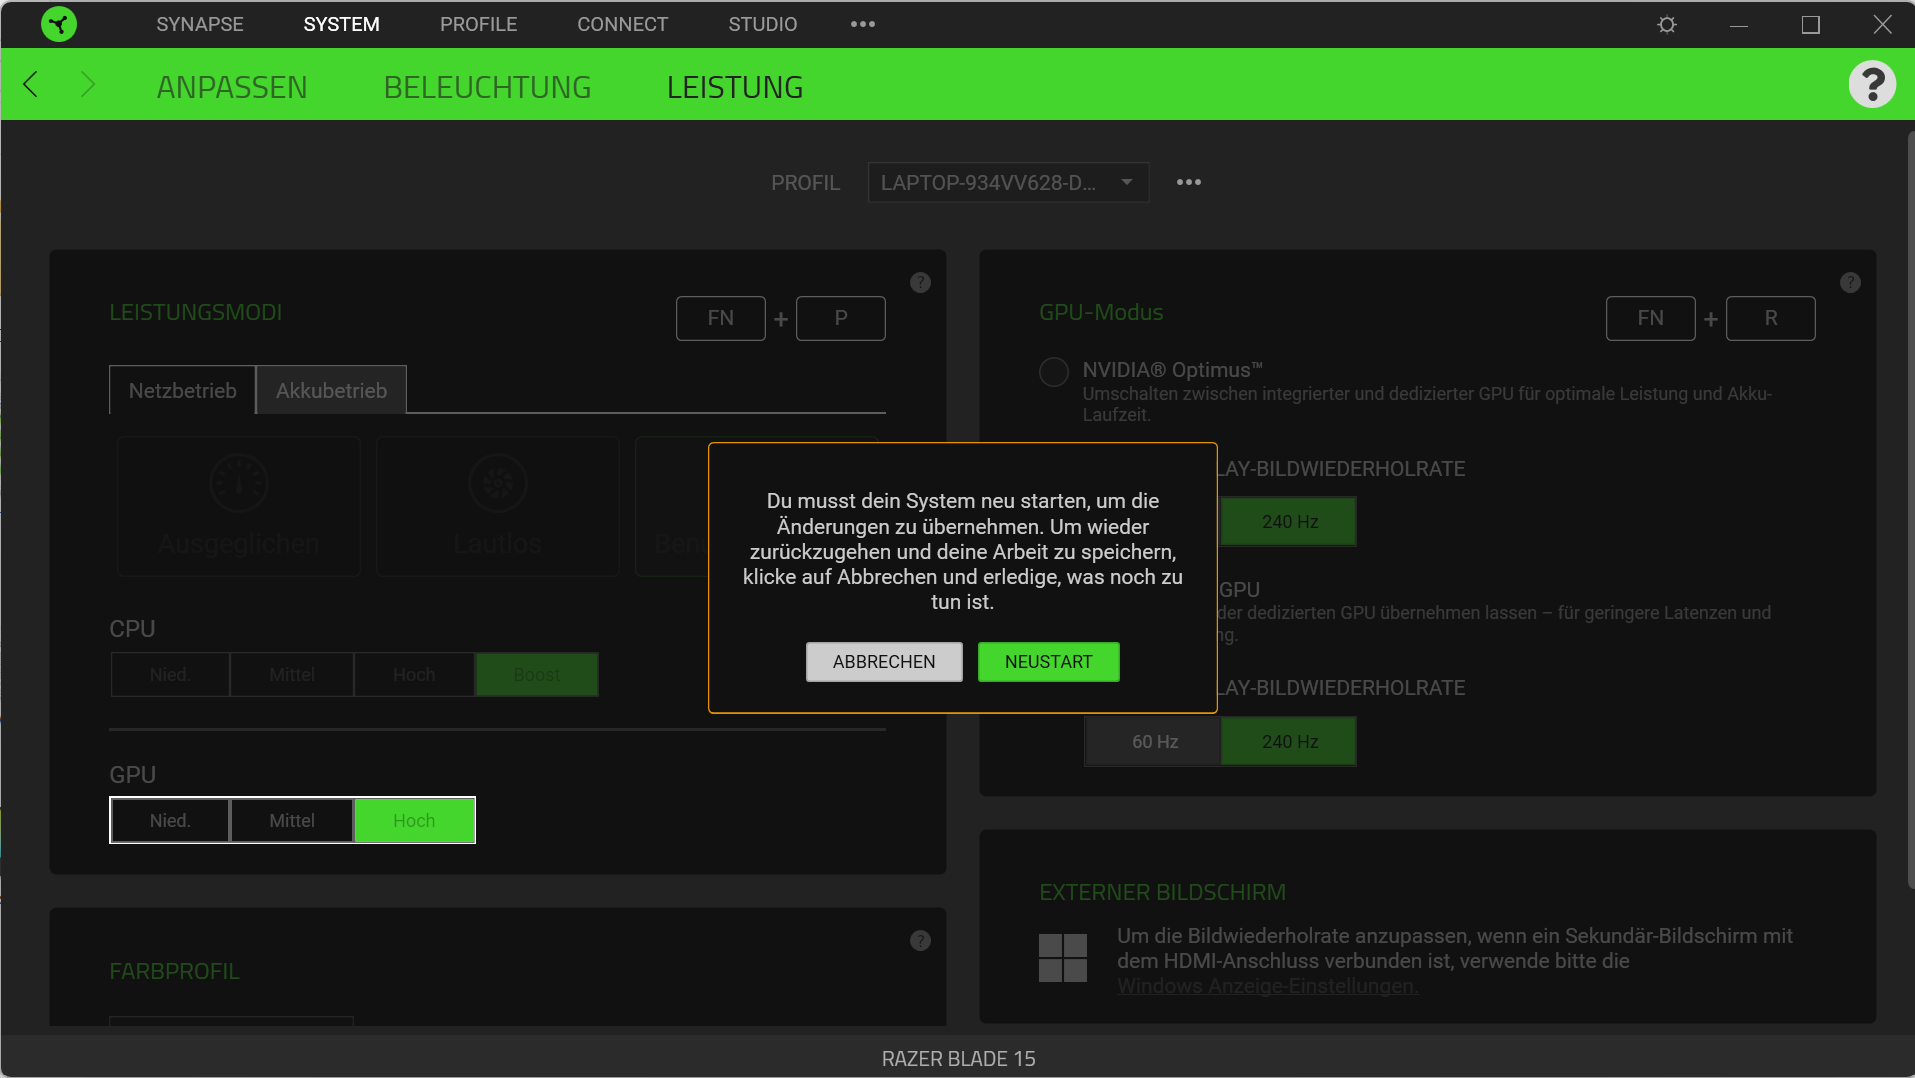
通过使用 "Fn "+"P "组合键,可以在三种性能模式("平衡"、"静音 "和 "用户定义")之间切换。用户定义 "配置文件允许对CPU("低"、"中"、"高"、"提升")和GPU("低"、"中"、"高")进行子预设设置 - 通过预装的Razer Synapse软件。在电池模式下,只有 "平衡 "配置文件是可用的。
基准测试是在最大设置(子预设 "Boost "和 "High")下使用活动的 "用户定义 "模式进行的。对于电池测试,使用了 "静音 "配置文件。
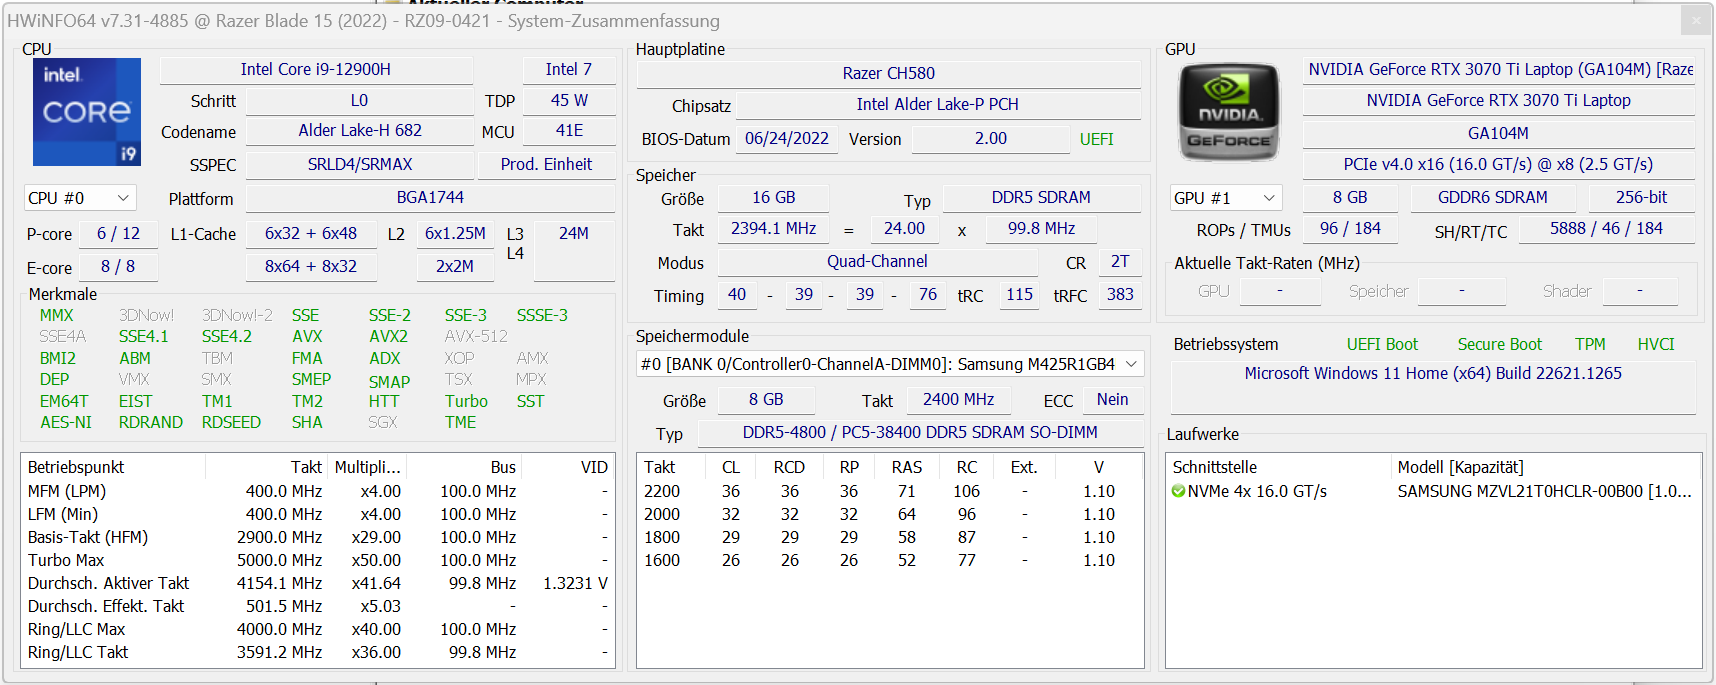
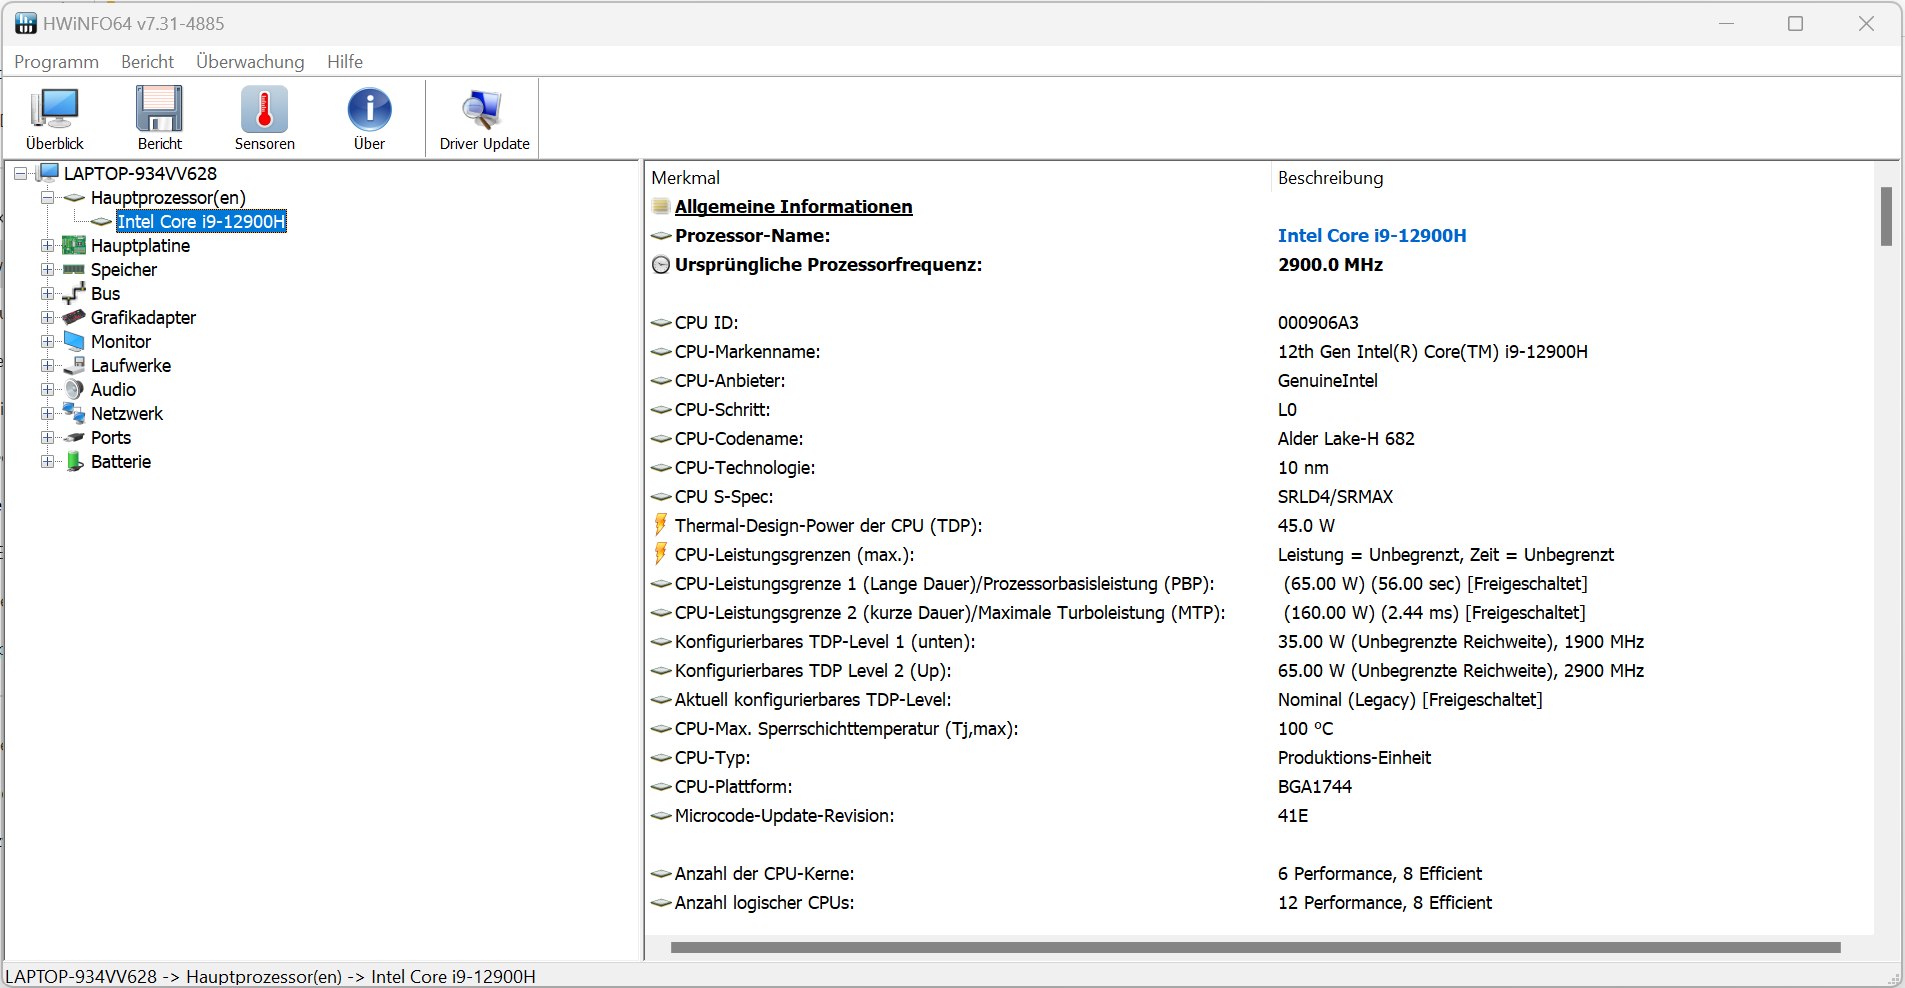
处理器
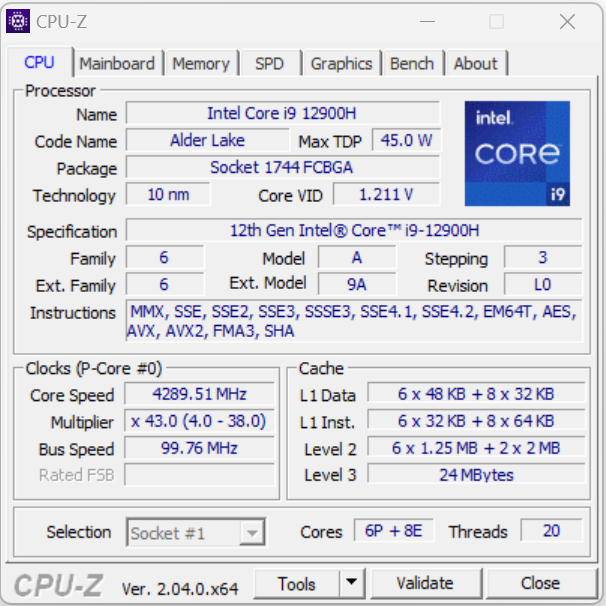
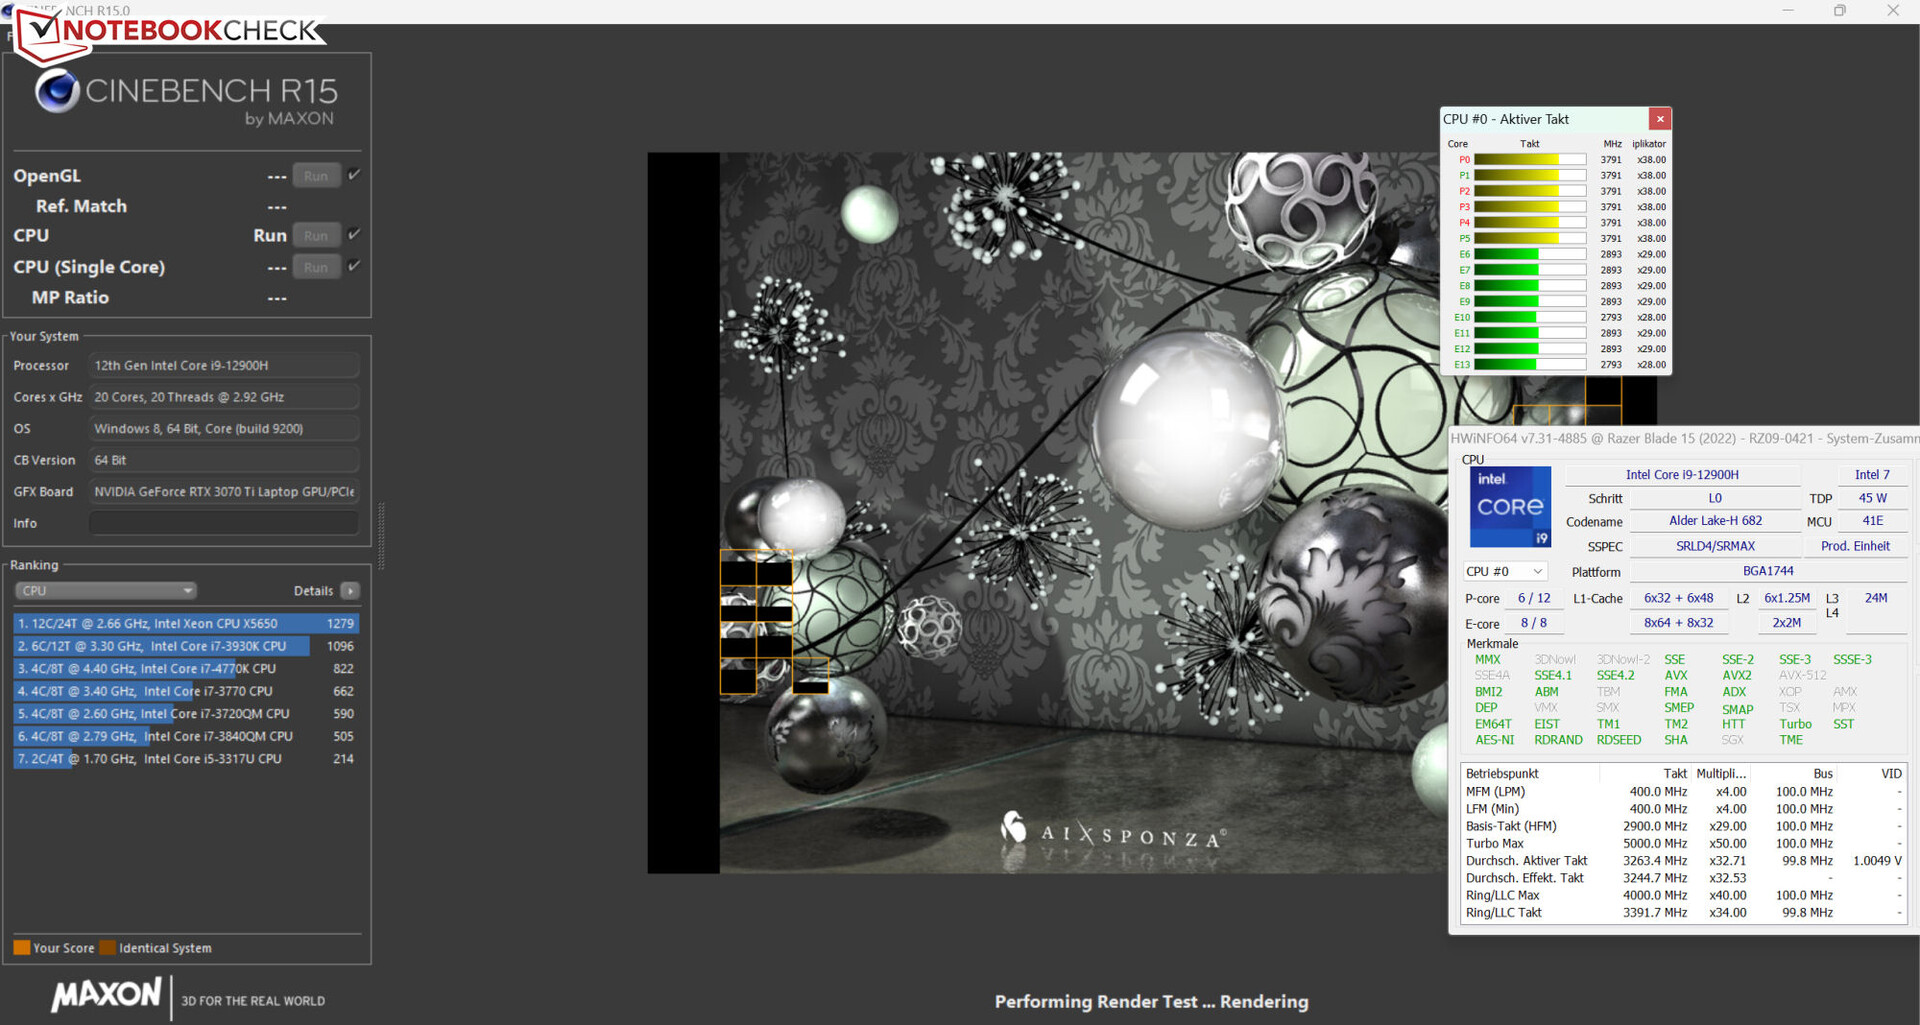
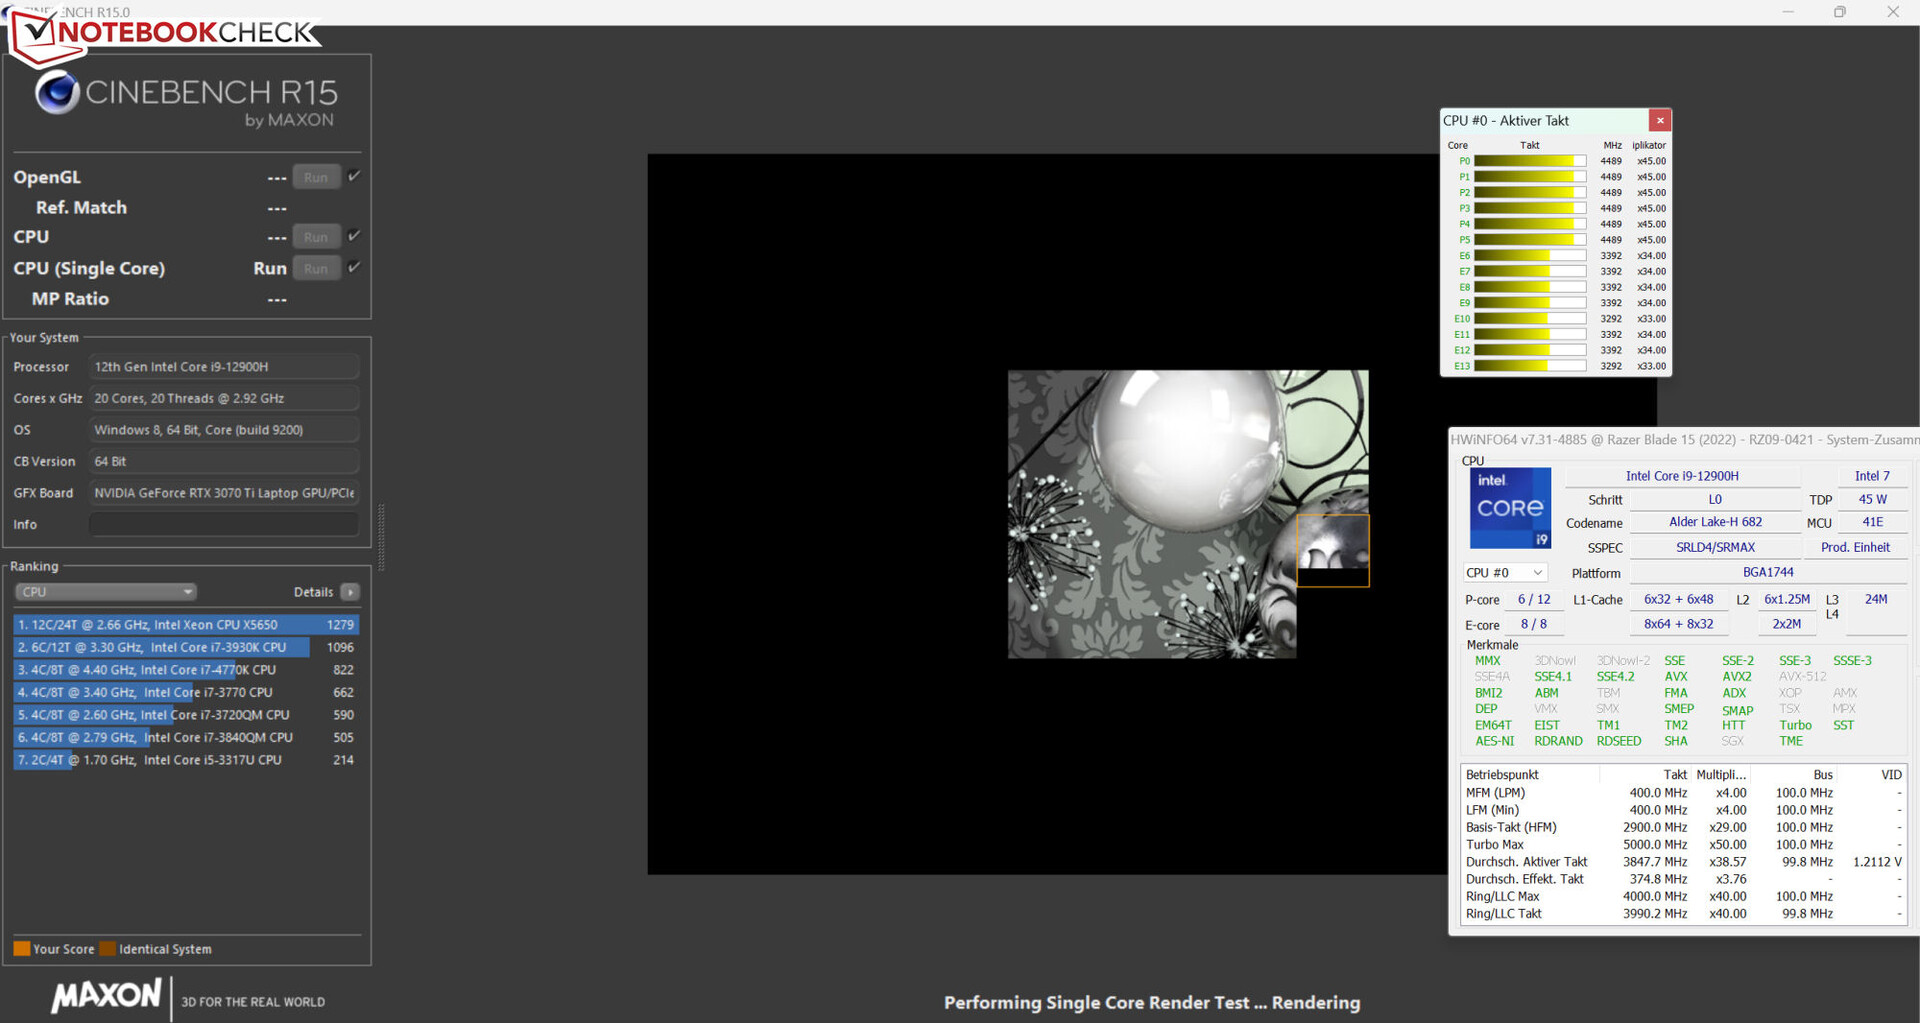
芯片酷睿i9-12900H处理器(Alder Lake)包括六个性能核心(超线程,2.5至5 GHz)和八个效率核心(无超线程,1.8至3.8 GHz)。总共有20个逻辑CPU核心。
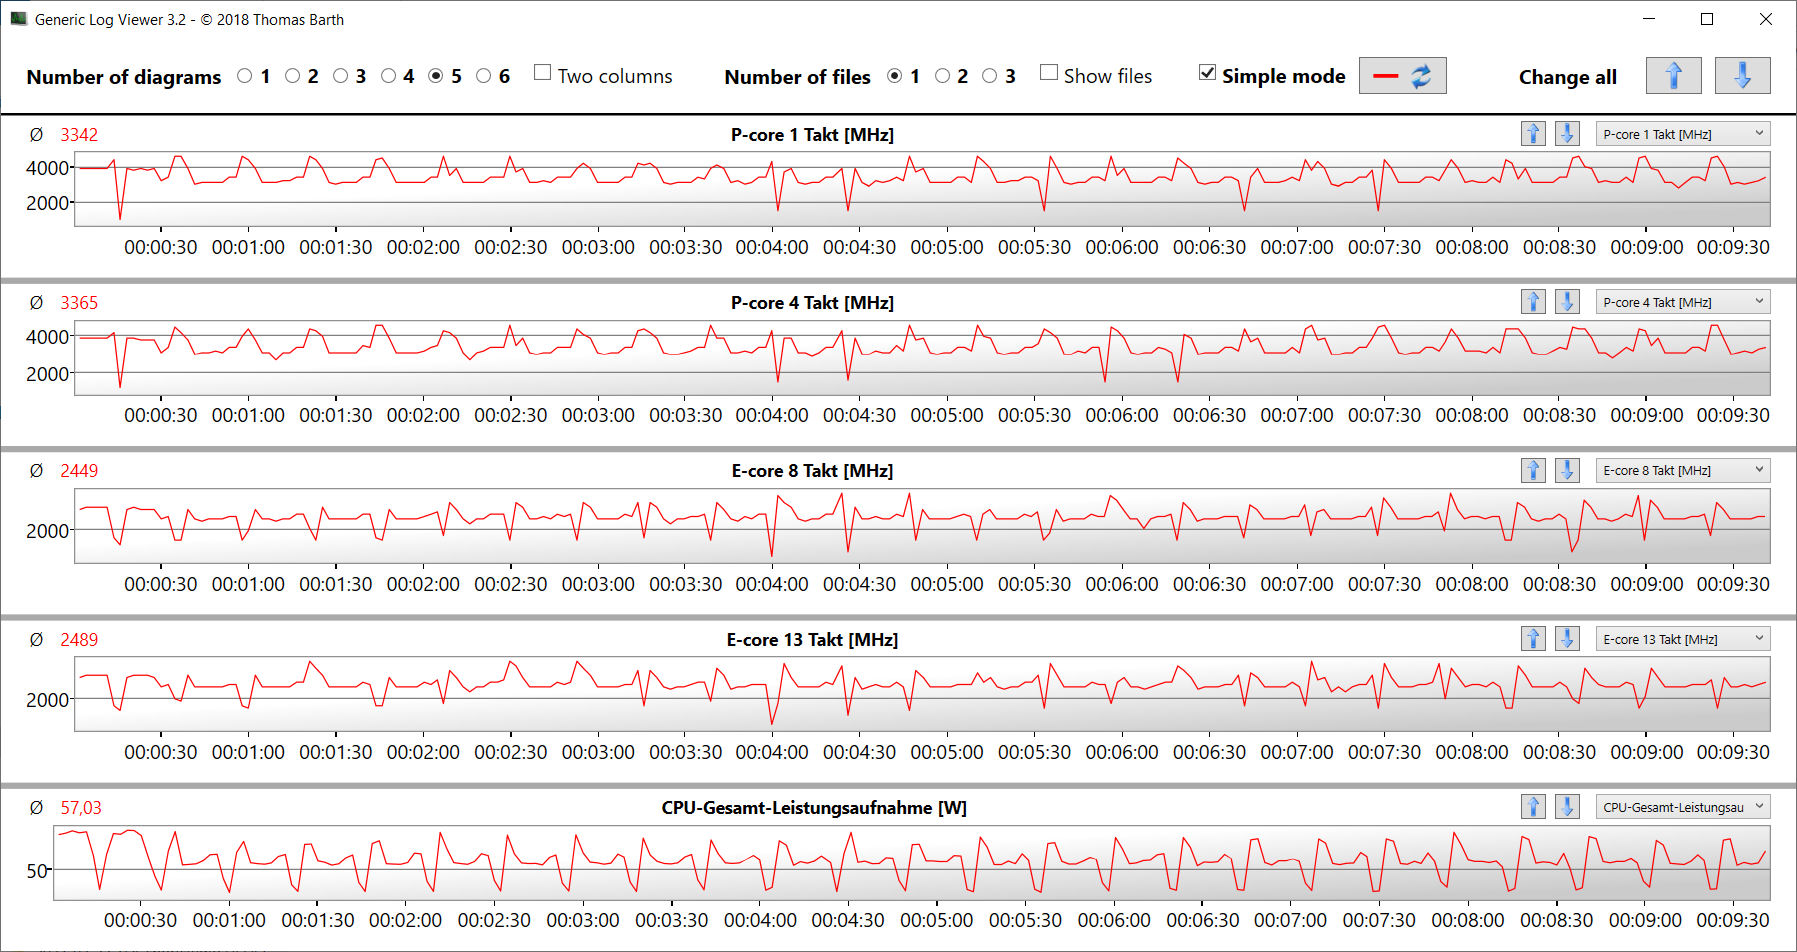
Cinebench R15基准多线程测试是在3.6至3.8 GHz(P-cores)和2.8至2.9 GHz(E-cores)下处理。我们分别以1.4至4.5GHz(P-cores)和1.5至3.5GHz(E-cores)进行单线程测试。在电池模式下,时钟速度更低。CB15的循环测试显示。多线程负载只在短时间内面临高涡轮增压时钟速度的情况。在30到40秒后,这些数值会下降到大致的基本时钟速度。
Cinebench R15 Multi Continuous Test
* ... smaller is better
AIDA64: FP32 Ray-Trace | FPU Julia | CPU SHA3 | CPU Queen | FPU SinJulia | FPU Mandel | CPU AES | CPU ZLib | FP64 Ray-Trace | CPU PhotoWorxx
| Performance rating | |
| Average of class Gaming | |
| Asus ROG Zephyrus M16 GU603Z | |
| Razer Blade 15 OLED (Early 2022) | |
| Aorus 15 XE5 | |
| Schenker XMG Fusion 15 (Mid 22) | |
| Average Intel Core i9-12900H | |
| HP Omen 16-b1090ng | |
| Razer Blade 15 2022 | |
| AIDA64 / FP32 Ray-Trace | |
| Average of class Gaming (10227 - 85542, n=106, last 2 years) | |
| Asus ROG Zephyrus M16 GU603Z | |
| Razer Blade 15 OLED (Early 2022) | |
| Aorus 15 XE5 | |
| Schenker XMG Fusion 15 (Mid 22) | |
| Average Intel Core i9-12900H (4074 - 18289, n=29) | |
| Razer Blade 15 2022 | |
| HP Omen 16-b1090ng | |
| AIDA64 / FPU Julia | |
| Average of class Gaming (51376 - 372155, n=106, last 2 years) | |
| Asus ROG Zephyrus M16 GU603Z | |
| Razer Blade 15 OLED (Early 2022) | |
| Aorus 15 XE5 | |
| Schenker XMG Fusion 15 (Mid 22) | |
| Average Intel Core i9-12900H (22307 - 93236, n=29) | |
| Razer Blade 15 2022 | |
| HP Omen 16-b1090ng | |
| AIDA64 / CPU SHA3 | |
| Average of class Gaming (2180 - 10115, n=106, last 2 years) | |
| Schenker XMG Fusion 15 (Mid 22) | |
| Asus ROG Zephyrus M16 GU603Z | |
| Razer Blade 15 OLED (Early 2022) | |
| Average Intel Core i9-12900H (1378 - 4215, n=29) | |
| Aorus 15 XE5 | |
| Razer Blade 15 2022 | |
| HP Omen 16-b1090ng | |
| AIDA64 / CPU Queen | |
| Average of class Gaming (49785 - 173351, n=90, last 2 years) | |
| Razer Blade 15 OLED (Early 2022) | |
| Asus ROG Zephyrus M16 GU603Z | |
| Aorus 15 XE5 | |
| Average Intel Core i9-12900H (78172 - 111241, n=28) | |
| HP Omen 16-b1090ng | |
| Razer Blade 15 2022 | |
| Schenker XMG Fusion 15 (Mid 22) | |
| AIDA64 / FPU SinJulia | |
| Average of class Gaming (4424 - 33636, n=106, last 2 years) | |
| Razer Blade 15 OLED (Early 2022) | |
| Asus ROG Zephyrus M16 GU603Z | |
| HP Omen 16-b1090ng | |
| Razer Blade 15 2022 | |
| Average Intel Core i9-12900H (5709 - 10410, n=29) | |
| Schenker XMG Fusion 15 (Mid 22) | |
| Aorus 15 XE5 | |
| AIDA64 / FPU Mandel | |
| Average of class Gaming (25115 - 196829, n=106, last 2 years) | |
| Schenker XMG Fusion 15 (Mid 22) | |
| Asus ROG Zephyrus M16 GU603Z | |
| Razer Blade 15 OLED (Early 2022) | |
| Aorus 15 XE5 | |
| Average Intel Core i9-12900H (11257 - 45581, n=29) | |
| Razer Blade 15 2022 | |
| HP Omen 16-b1090ng | |
| AIDA64 / CPU AES | |
| Schenker XMG Fusion 15 (Mid 22) | |
| Asus ROG Zephyrus M16 GU603Z | |
| Aorus 15 XE5 | |
| Average of class Gaming (39258 - 247074, n=106, last 2 years) | |
| Razer Blade 15 OLED (Early 2022) | |
| HP Omen 16-b1090ng | |
| Average Intel Core i9-12900H (31935 - 151546, n=29) | |
| Razer Blade 15 2022 | |
| AIDA64 / CPU ZLib | |
| Average of class Gaming (574 - 2531, n=106, last 2 years) | |
| Razer Blade 15 OLED (Early 2022) | |
| Asus ROG Zephyrus M16 GU603Z | |
| HP Omen 16-b1090ng | |
| Razer Blade 15 2022 | |
| Average Intel Core i9-12900H (449 - 1193, n=29) | |
| Aorus 15 XE5 | |
| Schenker XMG Fusion 15 (Mid 22) | |
| AIDA64 / FP64 Ray-Trace | |
| Average of class Gaming (5509 - 45446, n=106, last 2 years) | |
| Asus ROG Zephyrus M16 GU603Z | |
| Razer Blade 15 OLED (Early 2022) | |
| Schenker XMG Fusion 15 (Mid 22) | |
| Aorus 15 XE5 | |
| Average Intel Core i9-12900H (2235 - 10511, n=29) | |
| HP Omen 16-b1090ng | |
| Razer Blade 15 2022 | |
| AIDA64 / CPU PhotoWorxx | |
| Average of class Gaming (12271 - 89891, n=106, last 2 years) | |
| Asus ROG Zephyrus M16 GU603Z | |
| Razer Blade 15 2022 | |
| HP Omen 16-b1090ng | |
| Average Intel Core i9-12900H (20960 - 48269, n=30) | |
| Aorus 15 XE5 | |
| Razer Blade 15 OLED (Early 2022) | |
| Razer Blade 15 OLED (Early 2022) | |
| Schenker XMG Fusion 15 (Mid 22) | |
系统性能
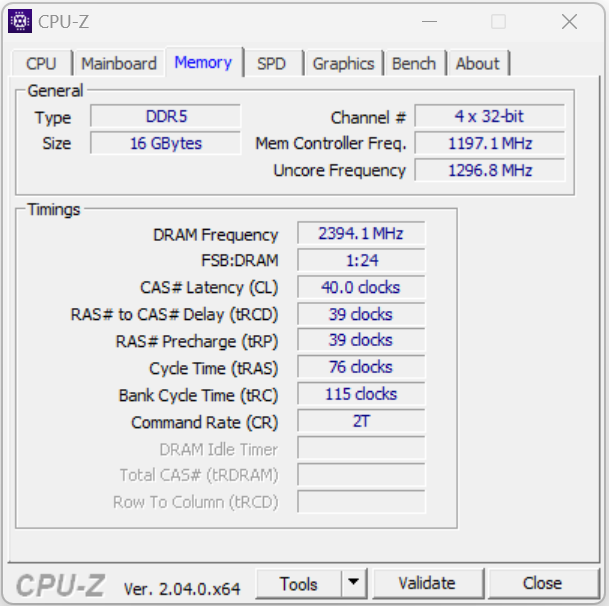
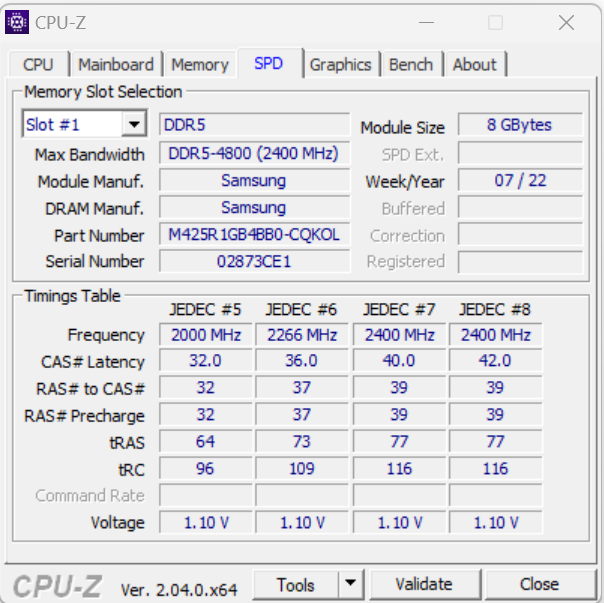
该系统运行平稳可靠,为渲染、视频编辑和游戏等苛刻的应用领域提供了足够的动力。对于DDR5-4800内存来说,内存的传输率处于正常水平,这与良好的PC-Mark结果相得益彰。
CrossMark: Overall | Productivity | Creativity | Responsiveness
| PCMark 10 / Score | |
| Average of class Gaming (5828 - 12414, n=94, last 2 years) | |
| Asus ROG Zephyrus M16 GU603Z | |
| Average Intel Core i9-12900H, NVIDIA GeForce RTX 3070 Ti Laptop GPU (7087 - 8072, n=6) | |
| Razer Blade 15 2022 | |
| Aorus 15 XE5 | |
| Razer Blade 15 OLED (Early 2022) | |
| HP Omen 16-b1090ng | |
| Schenker XMG Fusion 15 (Mid 22) | |
| PCMark 10 / Essentials | |
| Asus ROG Zephyrus M16 GU603Z | |
| Average Intel Core i9-12900H, NVIDIA GeForce RTX 3070 Ti Laptop GPU (10266 - 11663, n=6) | |
| Aorus 15 XE5 | |
| Razer Blade 15 2022 | |
| Average of class Gaming (8810 - 11935, n=98, last 2 years) | |
| Razer Blade 15 OLED (Early 2022) | |
| HP Omen 16-b1090ng | |
| Schenker XMG Fusion 15 (Mid 22) | |
| PCMark 10 / Productivity | |
| Average of class Gaming (6845 - 25323, n=96, last 2 years) | |
| Aorus 15 XE5 | |
| Asus ROG Zephyrus M16 GU603Z | |
| Average Intel Core i9-12900H, NVIDIA GeForce RTX 3070 Ti Laptop GPU (9402 - 10742, n=6) | |
| Razer Blade 15 OLED (Early 2022) | |
| Razer Blade 15 2022 | |
| HP Omen 16-b1090ng | |
| Schenker XMG Fusion 15 (Mid 22) | |
| PCMark 10 / Digital Content Creation | |
| Average of class Gaming (7602 - 19954, n=96, last 2 years) | |
| Razer Blade 15 2022 | |
| Asus ROG Zephyrus M16 GU603Z | |
| Average Intel Core i9-12900H, NVIDIA GeForce RTX 3070 Ti Laptop GPU (10009 - 12541, n=6) | |
| Aorus 15 XE5 | |
| HP Omen 16-b1090ng | |
| Razer Blade 15 OLED (Early 2022) | |
| Schenker XMG Fusion 15 (Mid 22) | |
| CrossMark / Overall | |
| Average of class Gaming (1366 - 2409, n=95, last 2 years) | |
| Aorus 15 XE5 | |
| Asus ROG Zephyrus M16 GU603Z | |
| Average Intel Core i9-12900H, NVIDIA GeForce RTX 3070 Ti Laptop GPU (1664 - 2044, n=6) | |
| Razer Blade 15 OLED (Early 2022) | |
| Schenker XMG Fusion 15 (Mid 22) | |
| CrossMark / Productivity | |
| Aorus 15 XE5 | |
| Average of class Gaming (1386 - 2254, n=95, last 2 years) | |
| Asus ROG Zephyrus M16 GU603Z | |
| Average Intel Core i9-12900H, NVIDIA GeForce RTX 3070 Ti Laptop GPU (1591 - 1968, n=6) | |
| Razer Blade 15 OLED (Early 2022) | |
| Schenker XMG Fusion 15 (Mid 22) | |
| CrossMark / Creativity | |
| Average of class Gaming (1343 - 2786, n=95, last 2 years) | |
| Asus ROG Zephyrus M16 GU603Z | |
| Average Intel Core i9-12900H, NVIDIA GeForce RTX 3070 Ti Laptop GPU (1797 - 2148, n=6) | |
| Aorus 15 XE5 | |
| Razer Blade 15 OLED (Early 2022) | |
| Schenker XMG Fusion 15 (Mid 22) | |
| CrossMark / Responsiveness | |
| Aorus 15 XE5 | |
| Asus ROG Zephyrus M16 GU603Z | |
| Average Intel Core i9-12900H, NVIDIA GeForce RTX 3070 Ti Laptop GPU (1514 - 2069, n=6) | |
| Average of class Gaming (1226 - 2334, n=95, last 2 years) | |
| Schenker XMG Fusion 15 (Mid 22) | |
| Razer Blade 15 OLED (Early 2022) | |
| PCMark 8 Home Score Accelerated v2 | 5101 points | |
| PCMark 8 Work Score Accelerated v2 | 5789 points | |
| PCMark 10 Score | 7336 points | |
Help | ||
| AIDA64 / Memory Copy | |
| Average of class Gaming (21750 - 129946, n=106, last 2 years) | |
| Asus ROG Zephyrus M16 GU603Z | |
| HP Omen 16-b1090ng | |
| Razer Blade 15 2022 | |
| Average Intel Core i9-12900H (34438 - 74264, n=29) | |
| Razer Blade 15 OLED (Early 2022) | |
| Aorus 15 XE5 | |
| Schenker XMG Fusion 15 (Mid 22) | |
| AIDA64 / Memory Read | |
| Average of class Gaming (22956 - 118858, n=106, last 2 years) | |
| Asus ROG Zephyrus M16 GU603Z | |
| HP Omen 16-b1090ng | |
| Razer Blade 15 2022 | |
| Average Intel Core i9-12900H (36365 - 74642, n=29) | |
| Razer Blade 15 OLED (Early 2022) | |
| Aorus 15 XE5 | |
| Schenker XMG Fusion 15 (Mid 22) | |
| AIDA64 / Memory Write | |
| Average of class Gaming (22297 - 135096, n=106, last 2 years) | |
| Asus ROG Zephyrus M16 GU603Z | |
| Razer Blade 15 2022 | |
| HP Omen 16-b1090ng | |
| Average Intel Core i9-12900H (32276 - 67858, n=29) | |
| Aorus 15 XE5 | |
| Razer Blade 15 OLED (Early 2022) | |
| Schenker XMG Fusion 15 (Mid 22) | |
| AIDA64 / Memory Latency | |
| Average of class Gaming (75.3 - 259, n=106, last 2 years) | |
| Razer Blade 15 OLED (Early 2022) | |
| Aorus 15 XE5 | |
| Schenker XMG Fusion 15 (Mid 22) | |
| HP Omen 16-b1090ng | |
| Asus ROG Zephyrus M16 GU603Z | |
| Average Intel Core i9-12900H (74.7 - 118.1, n=28) | |
| Razer Blade 15 2022 | |
* ... smaller is better
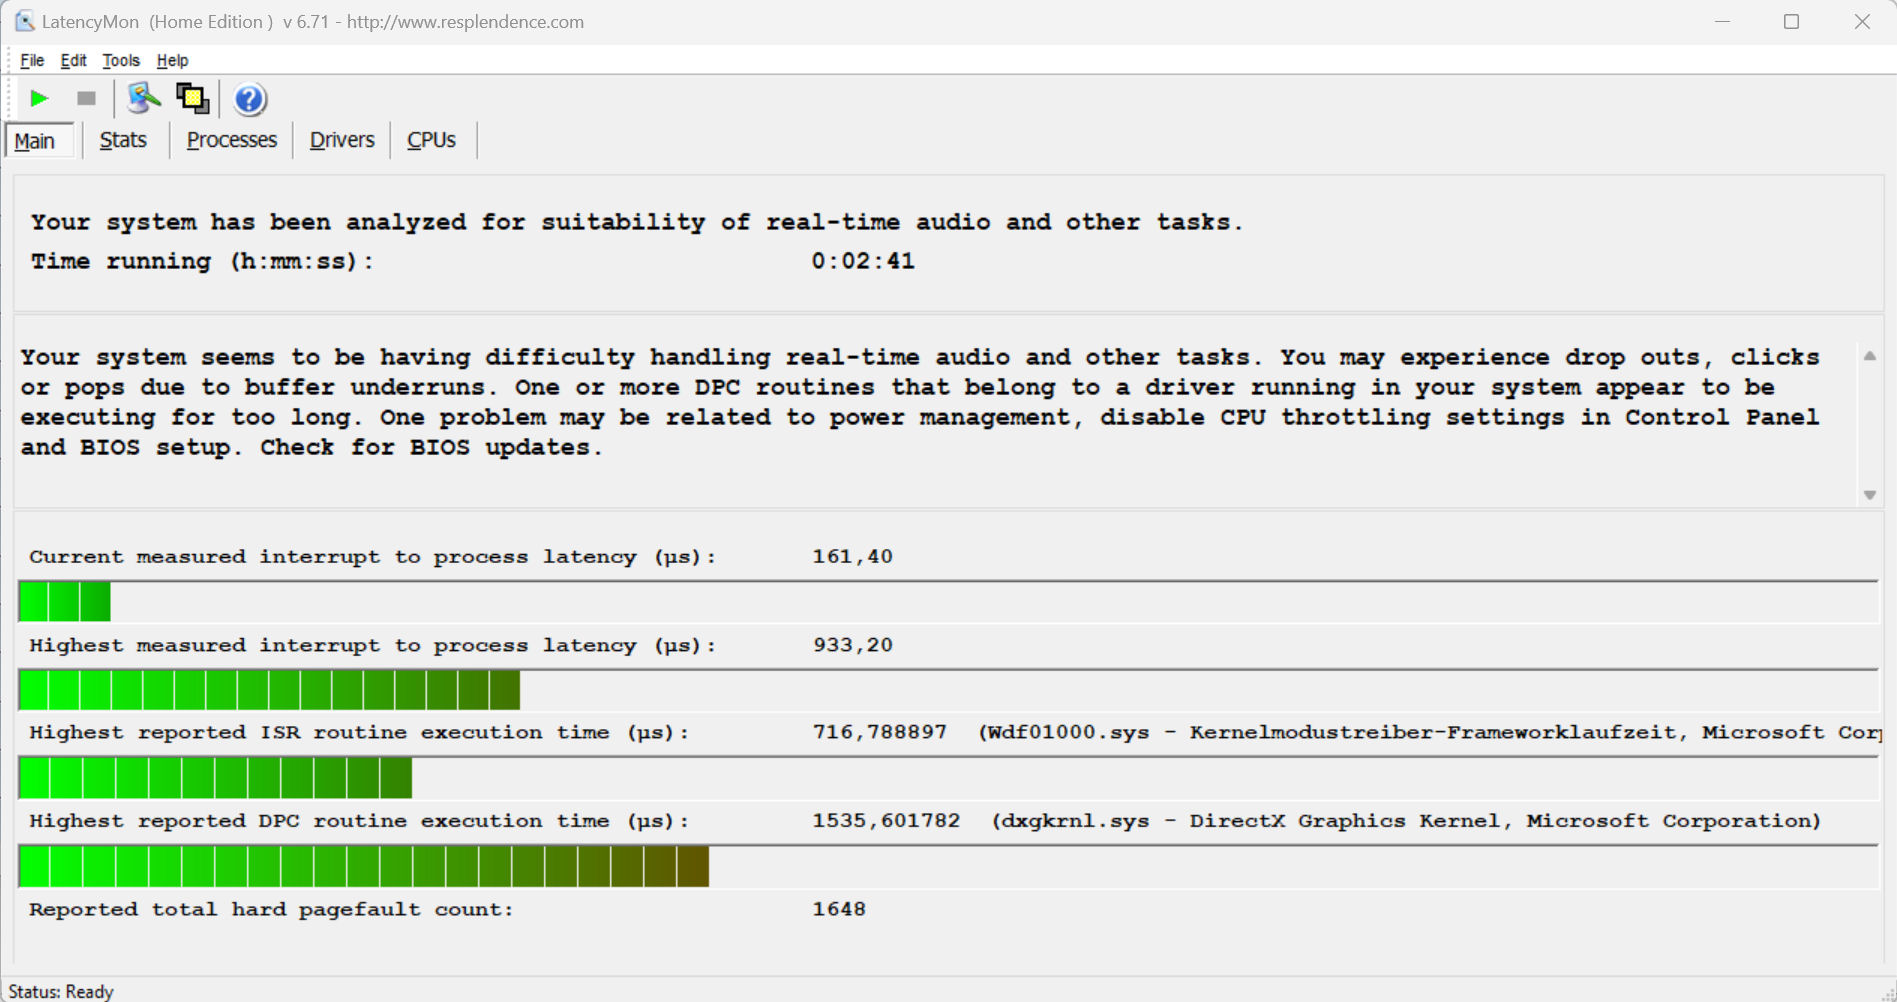
DPC延迟
标准化的延迟监测测试(互联网冲浪、4k视频播放、Prime95高负荷)发现了一些异常情况。该系统似乎不适合进行实时的视频和音频编辑。然而,未来的软件更新可能会导致性能的改善或恶化。
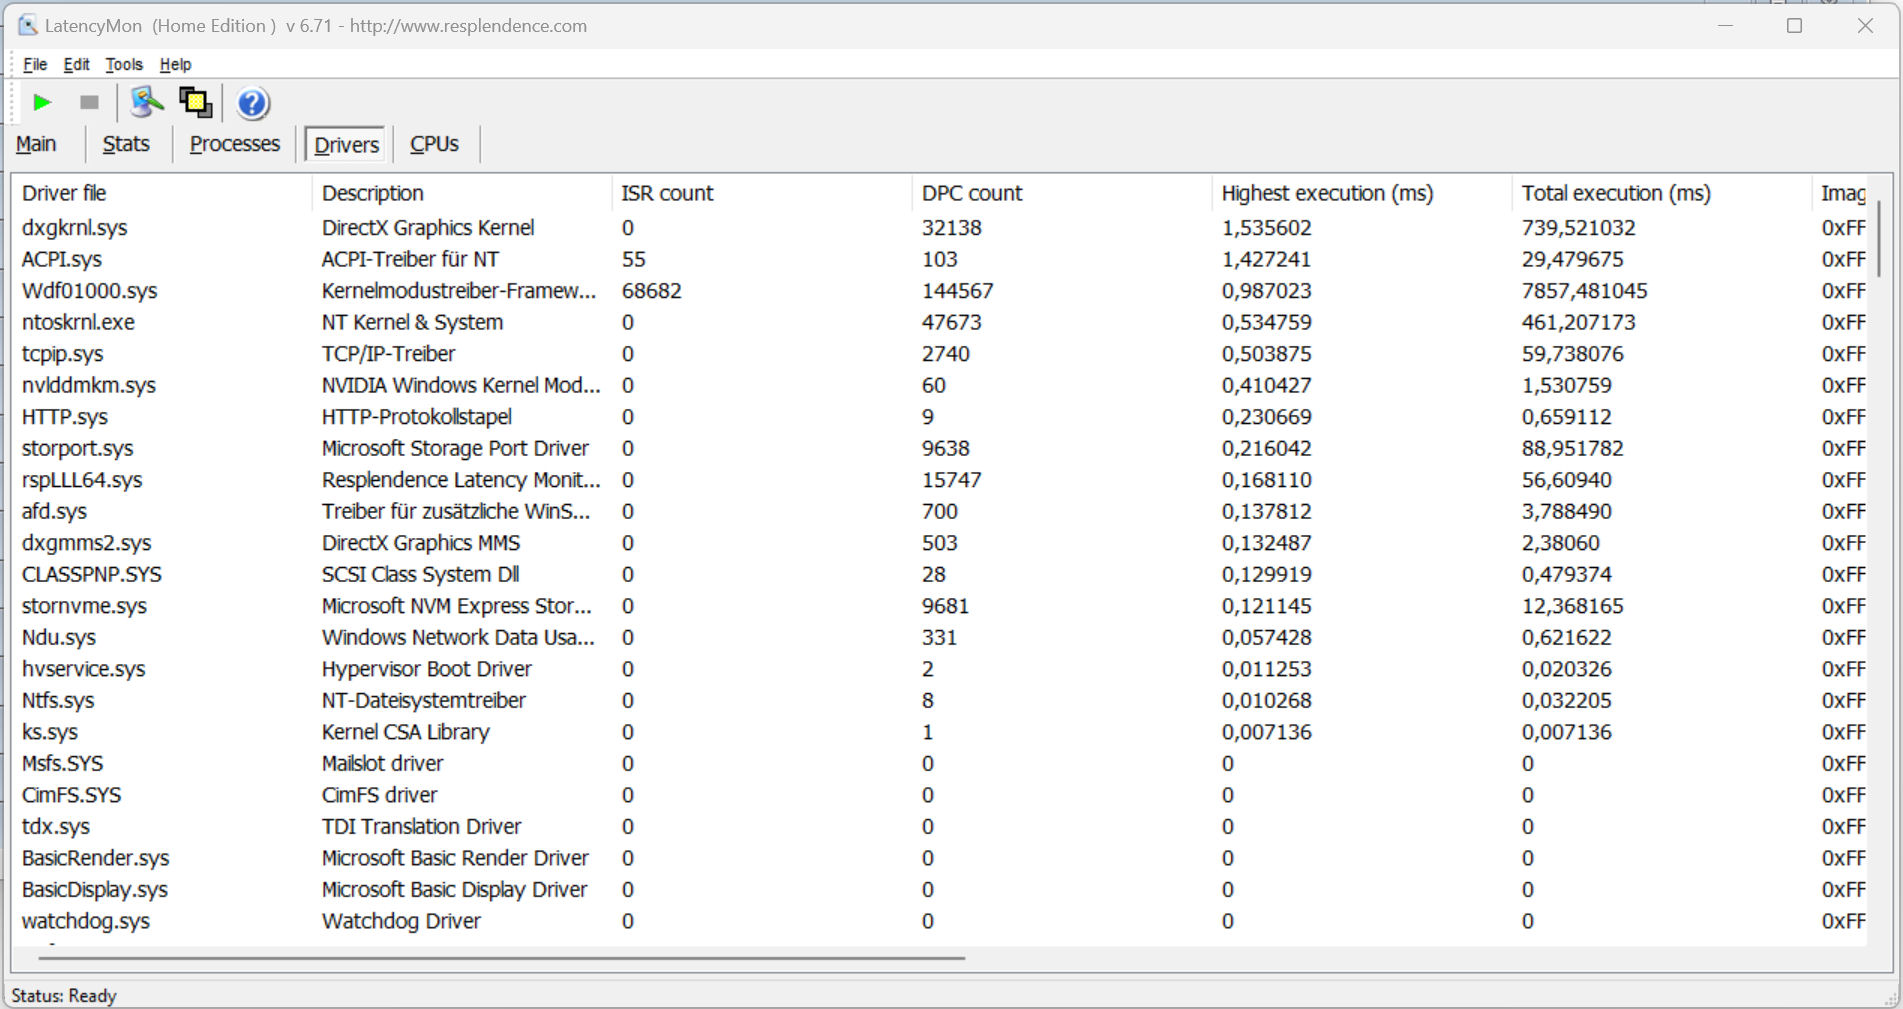
| DPC Latencies / LatencyMon - interrupt to process latency (max), Web, Youtube, Prime95 | |
| Schenker XMG Fusion 15 (Mid 22) | |
| Razer Blade 15 2022 | |
| Aorus 15 XE5 | |
| Asus ROG Zephyrus M16 GU603Z | |
| Razer Blade 15 OLED (Early 2022) | |
| HP Omen 16-b1090ng | |
* ... smaller is better
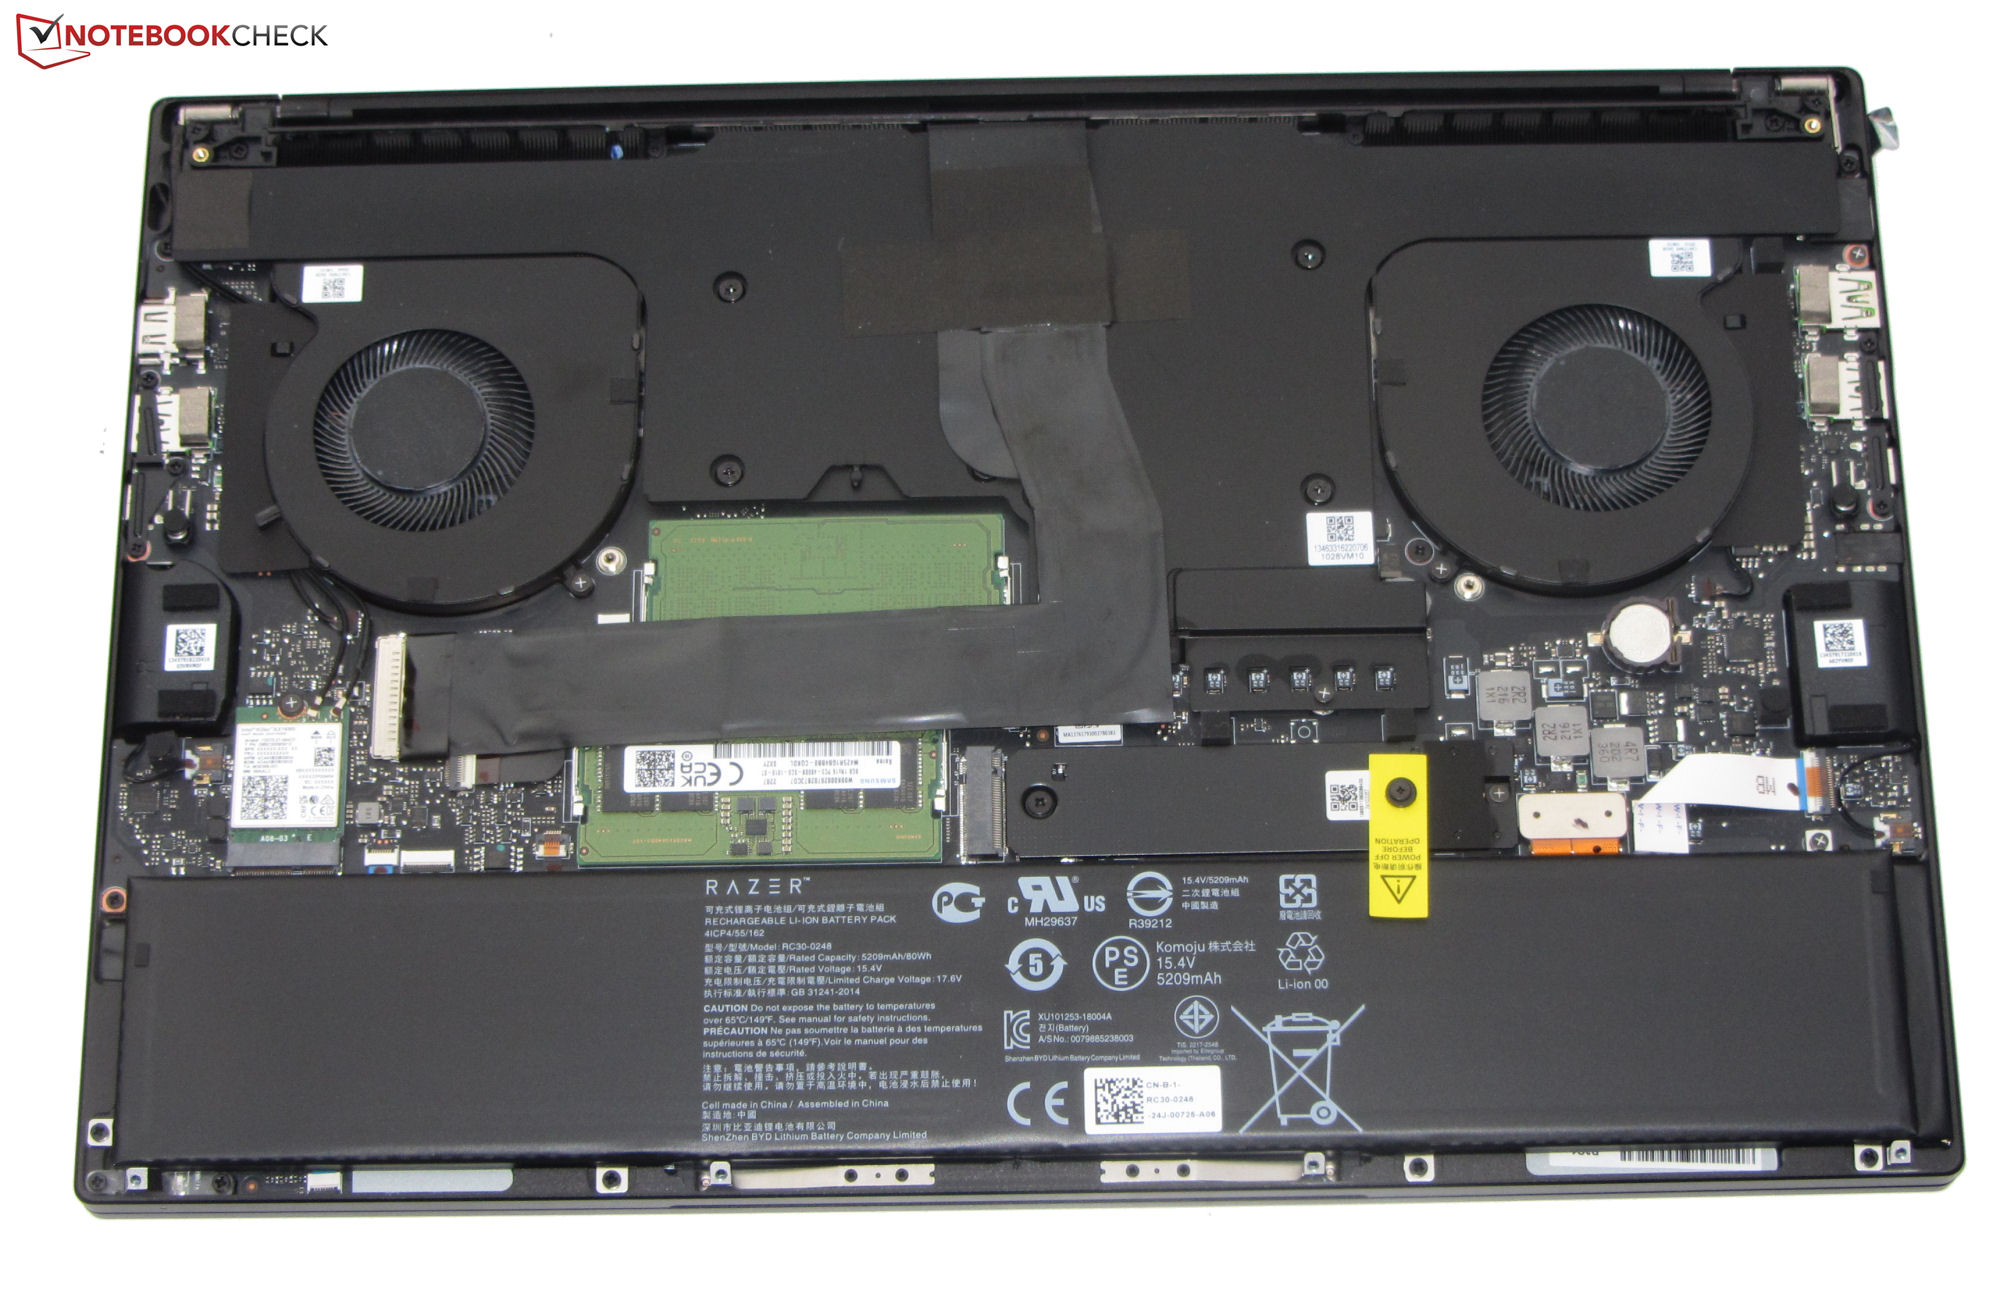
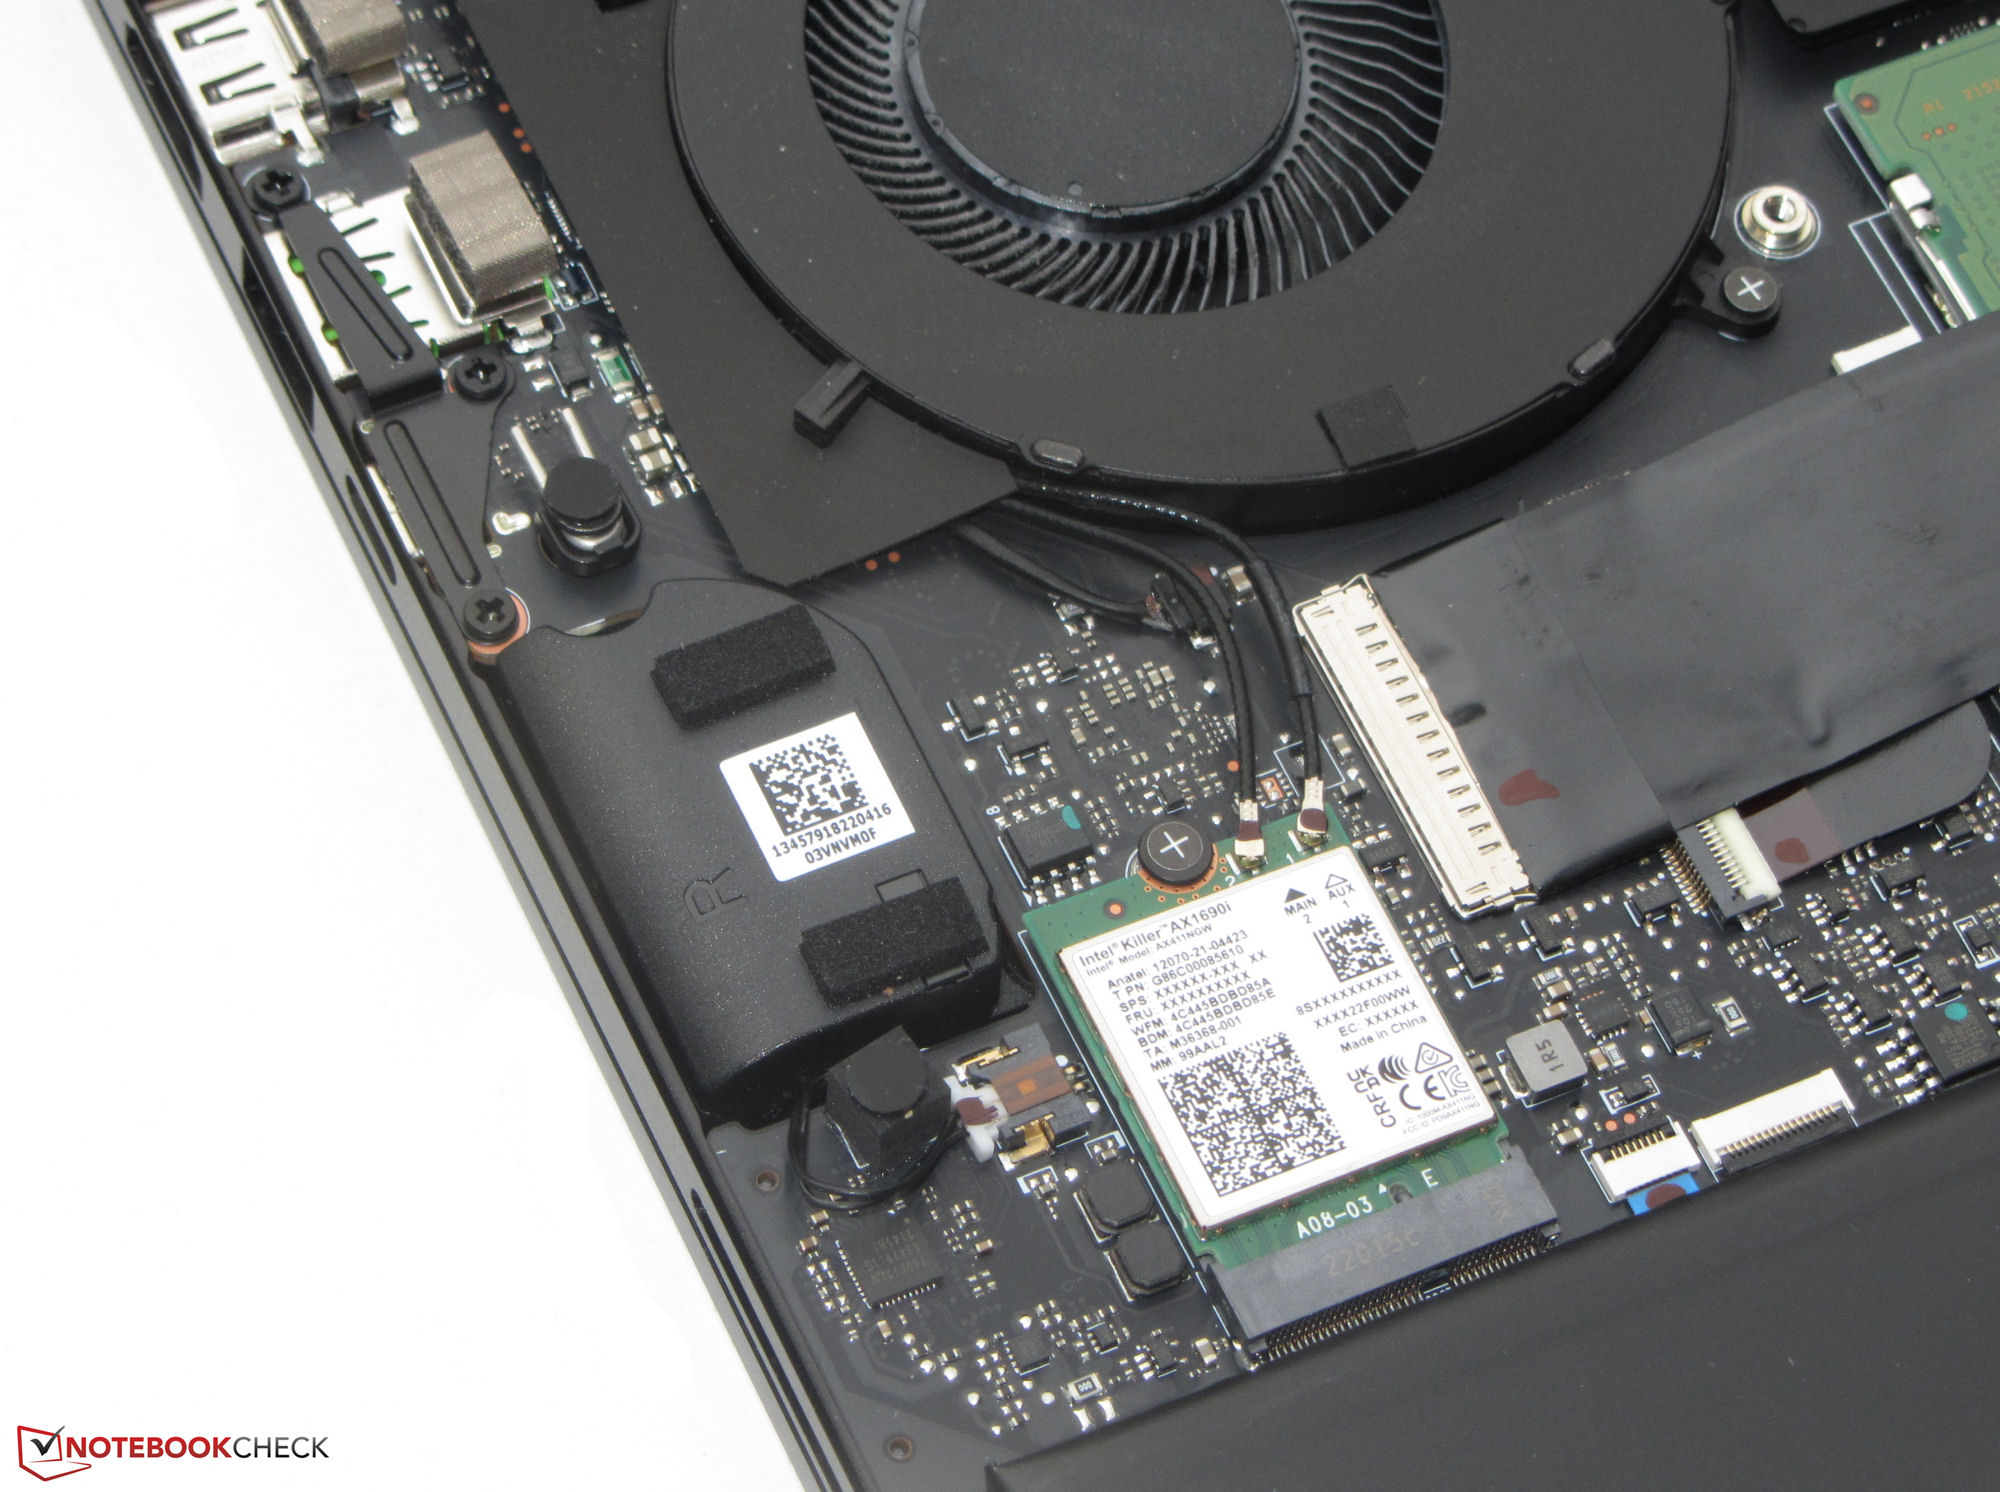
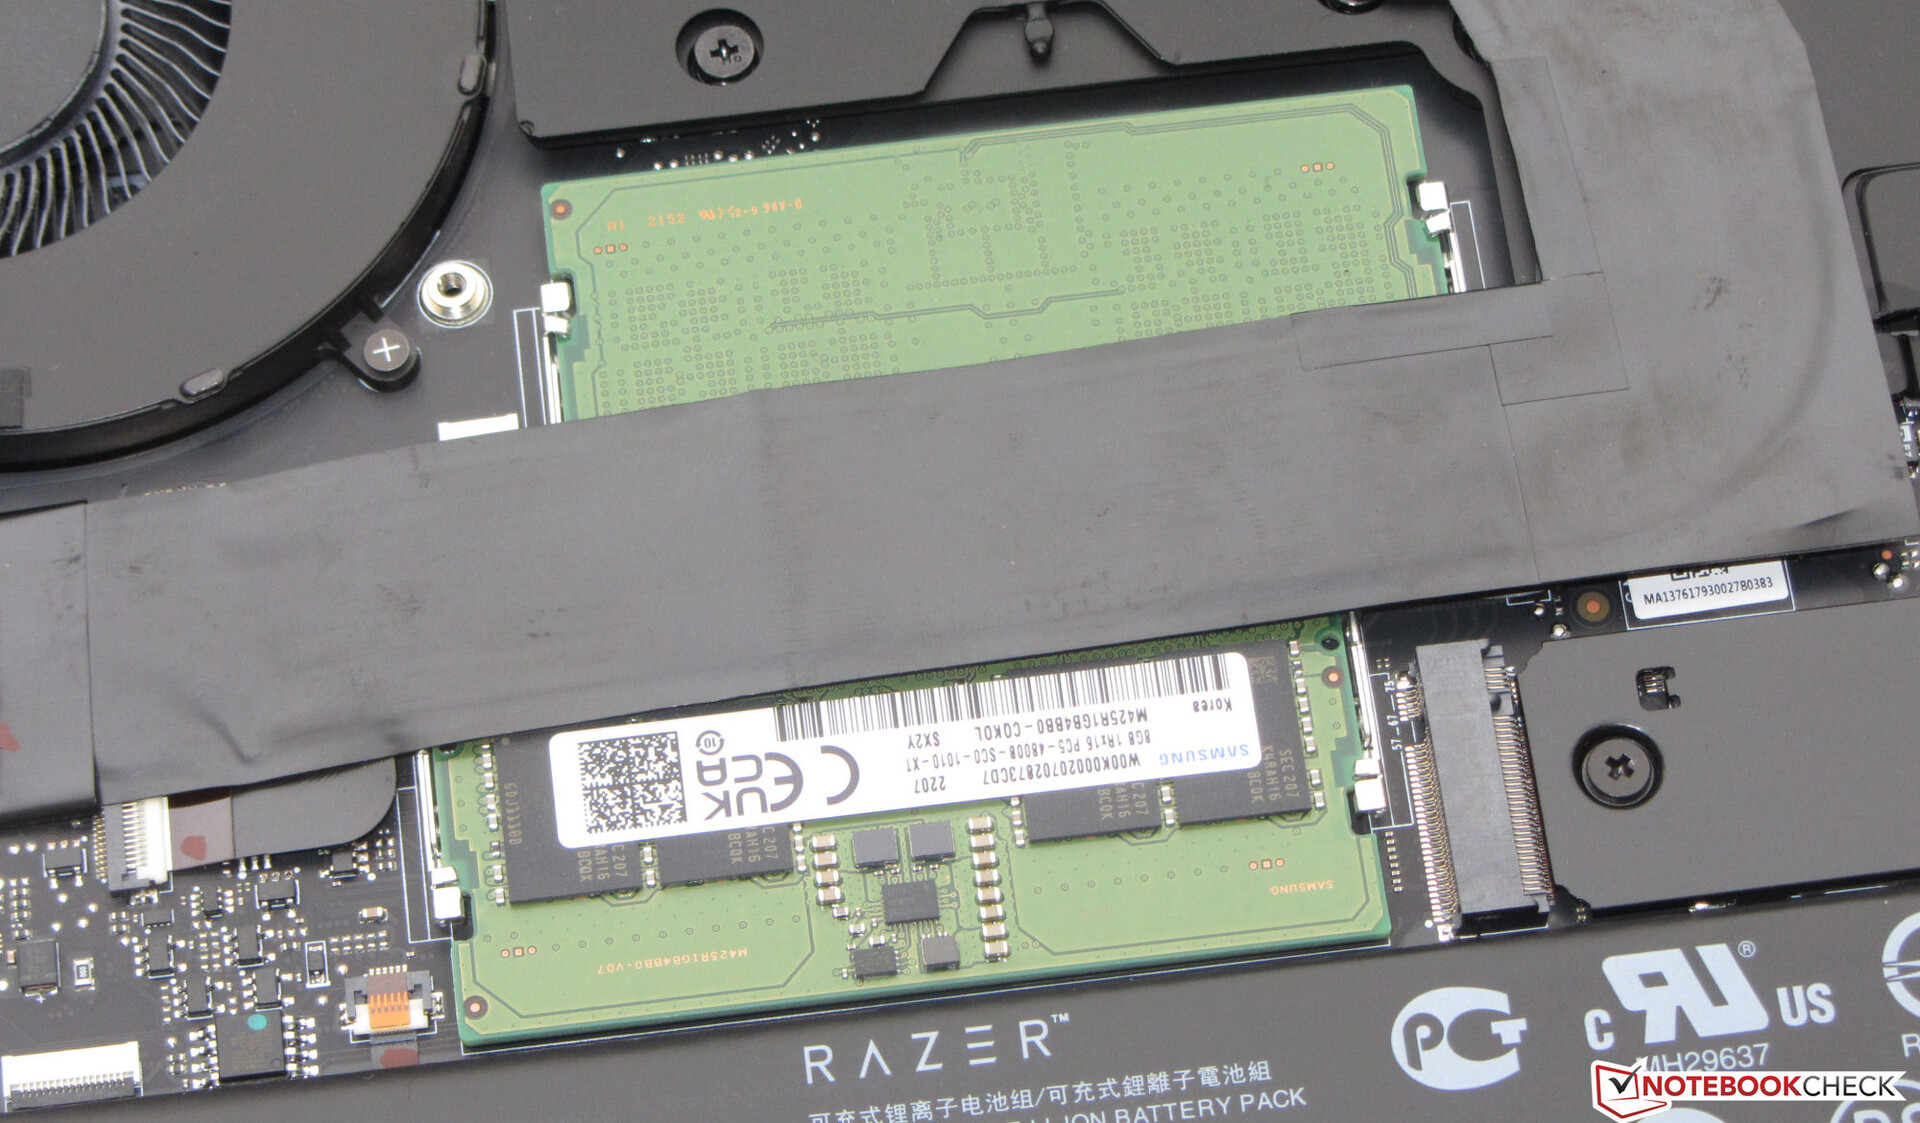
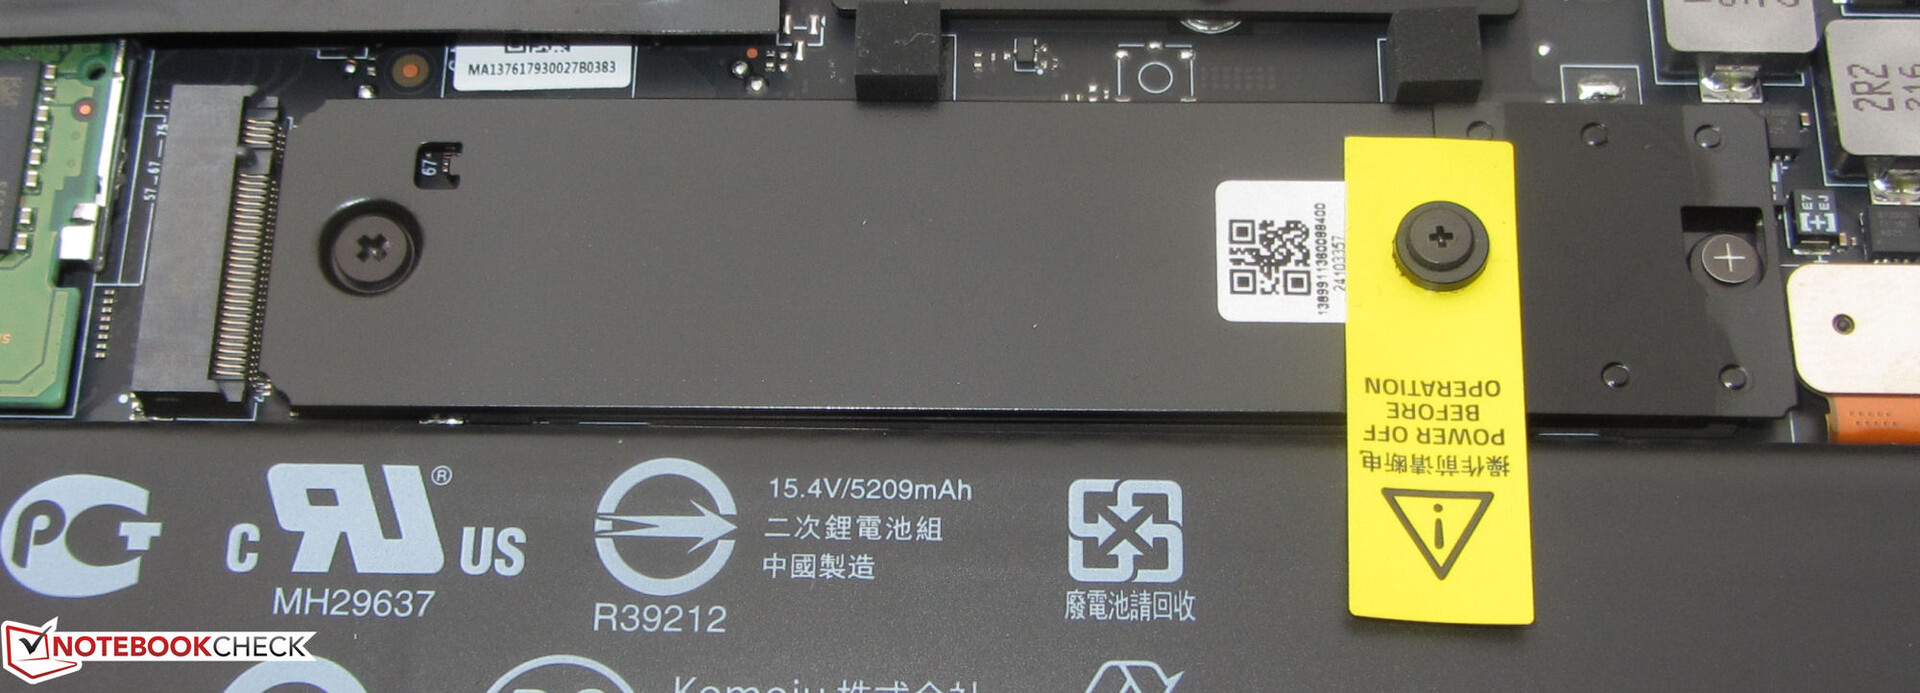
大容量存储
刀片有空间容纳两个M.2 2280格式的PCI-4固态硬盘。安装的三星PCI-4固态硬盘(1TB)提供了非常好的传输率。由于热节流导致的性能下降并不存在。

* ... smaller is better
Continuous Performance Read: DiskSpd Read Loop, Queue Depth 8
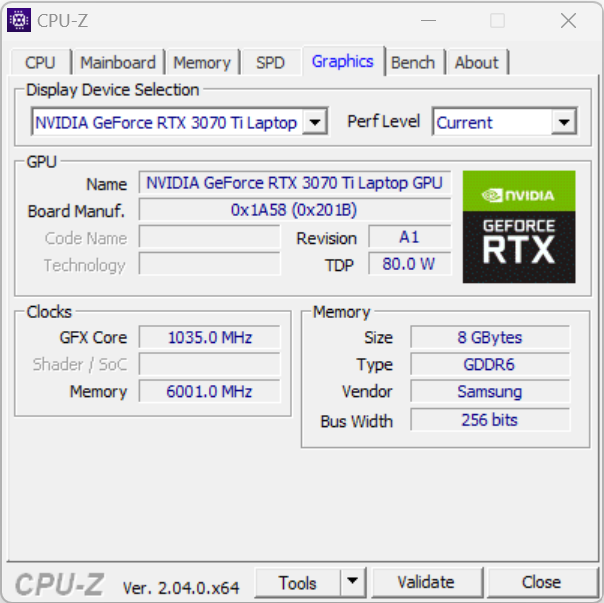
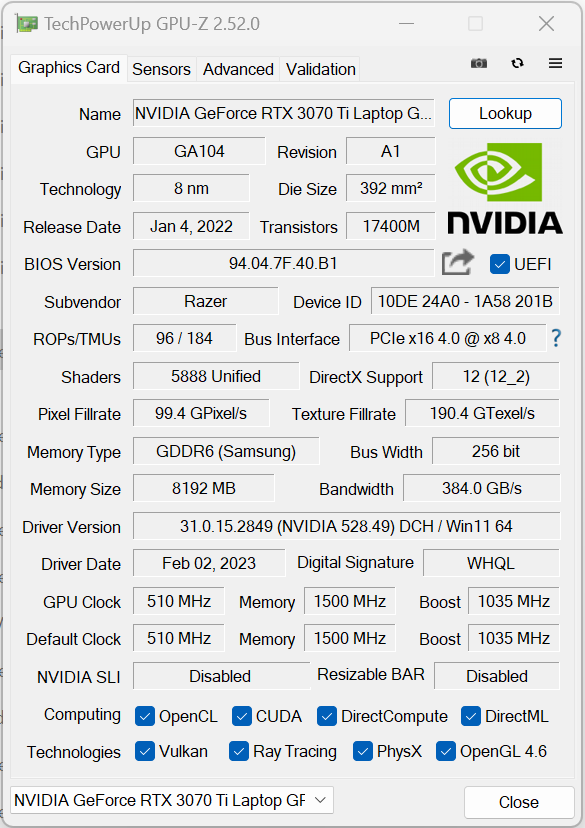
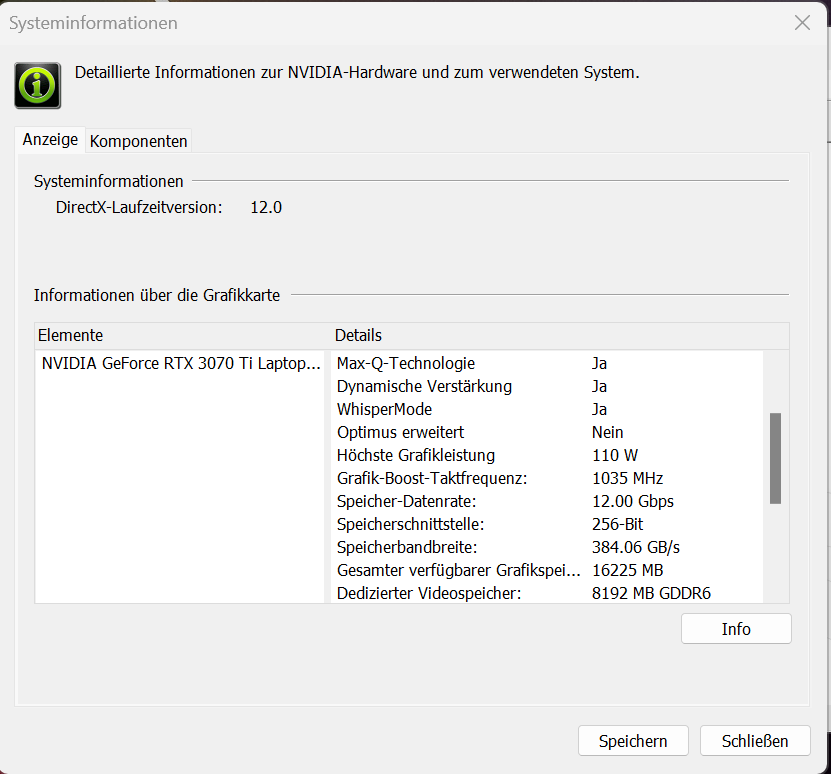
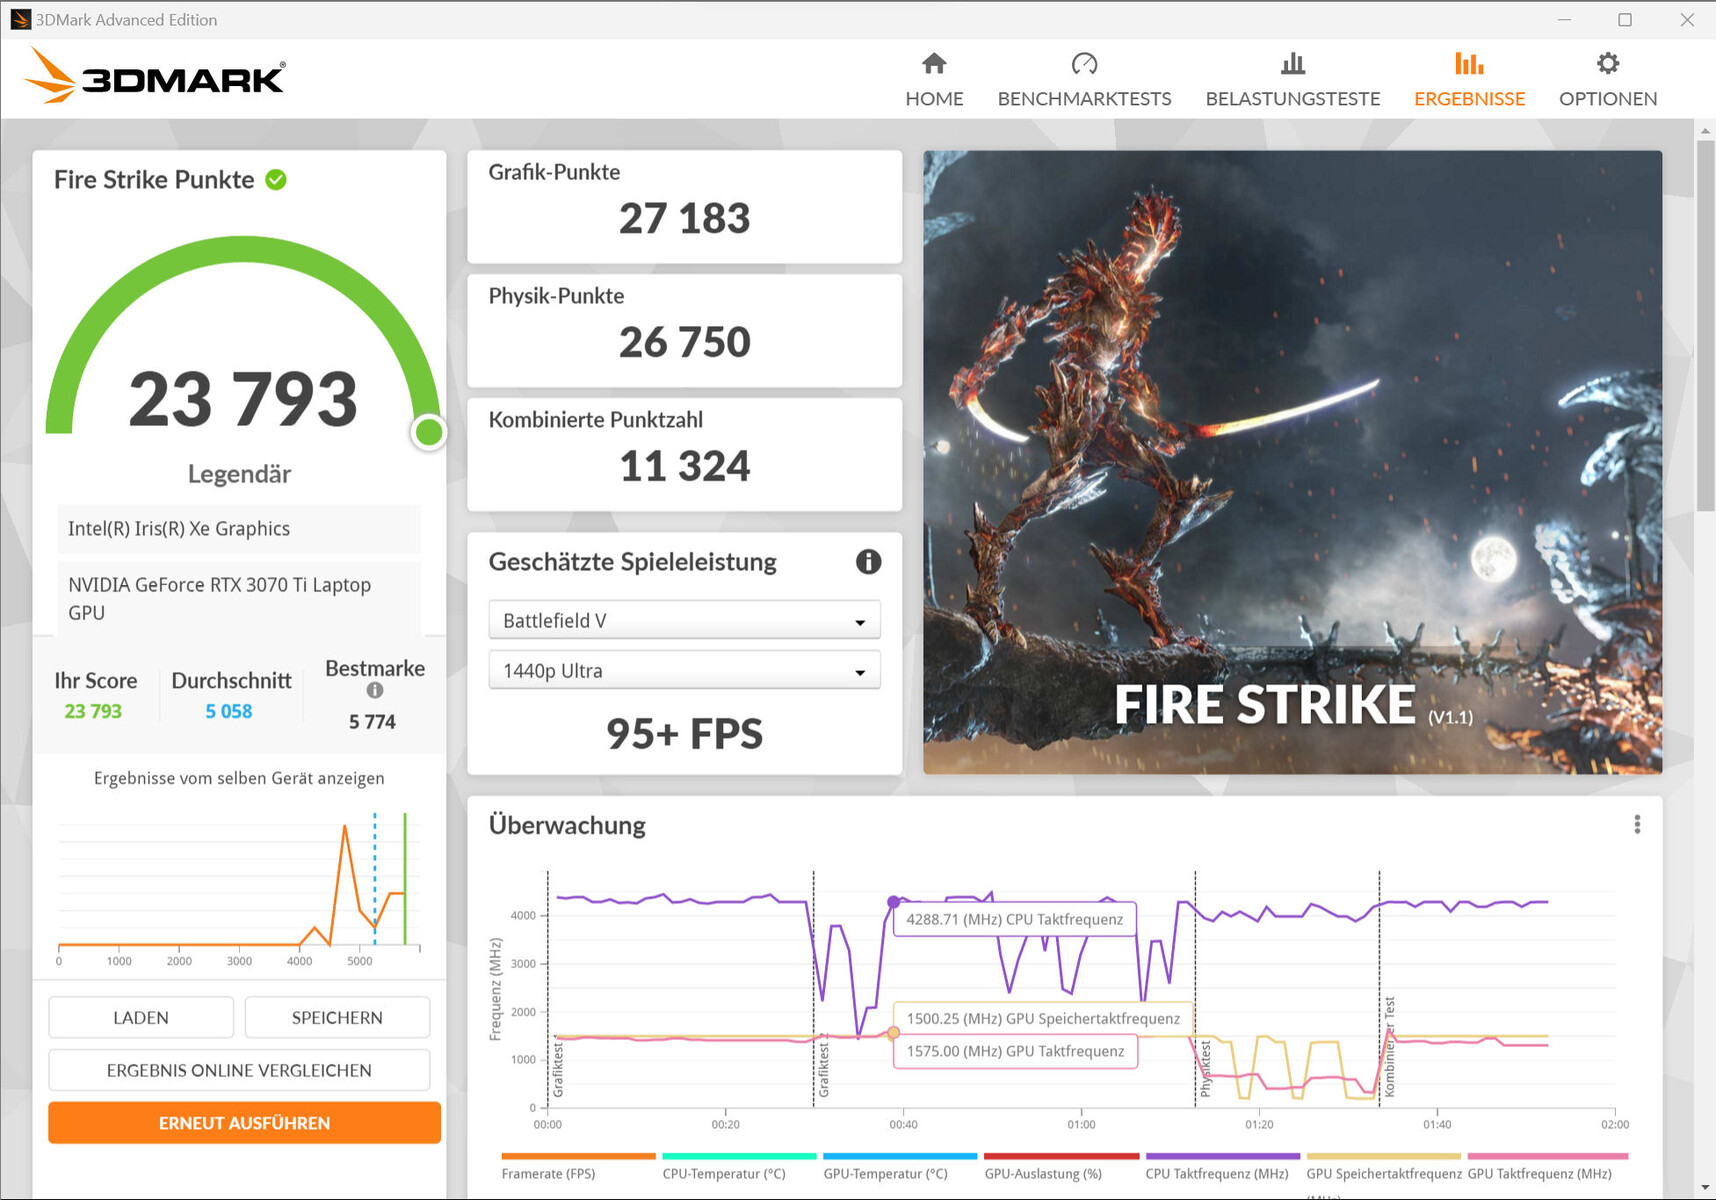
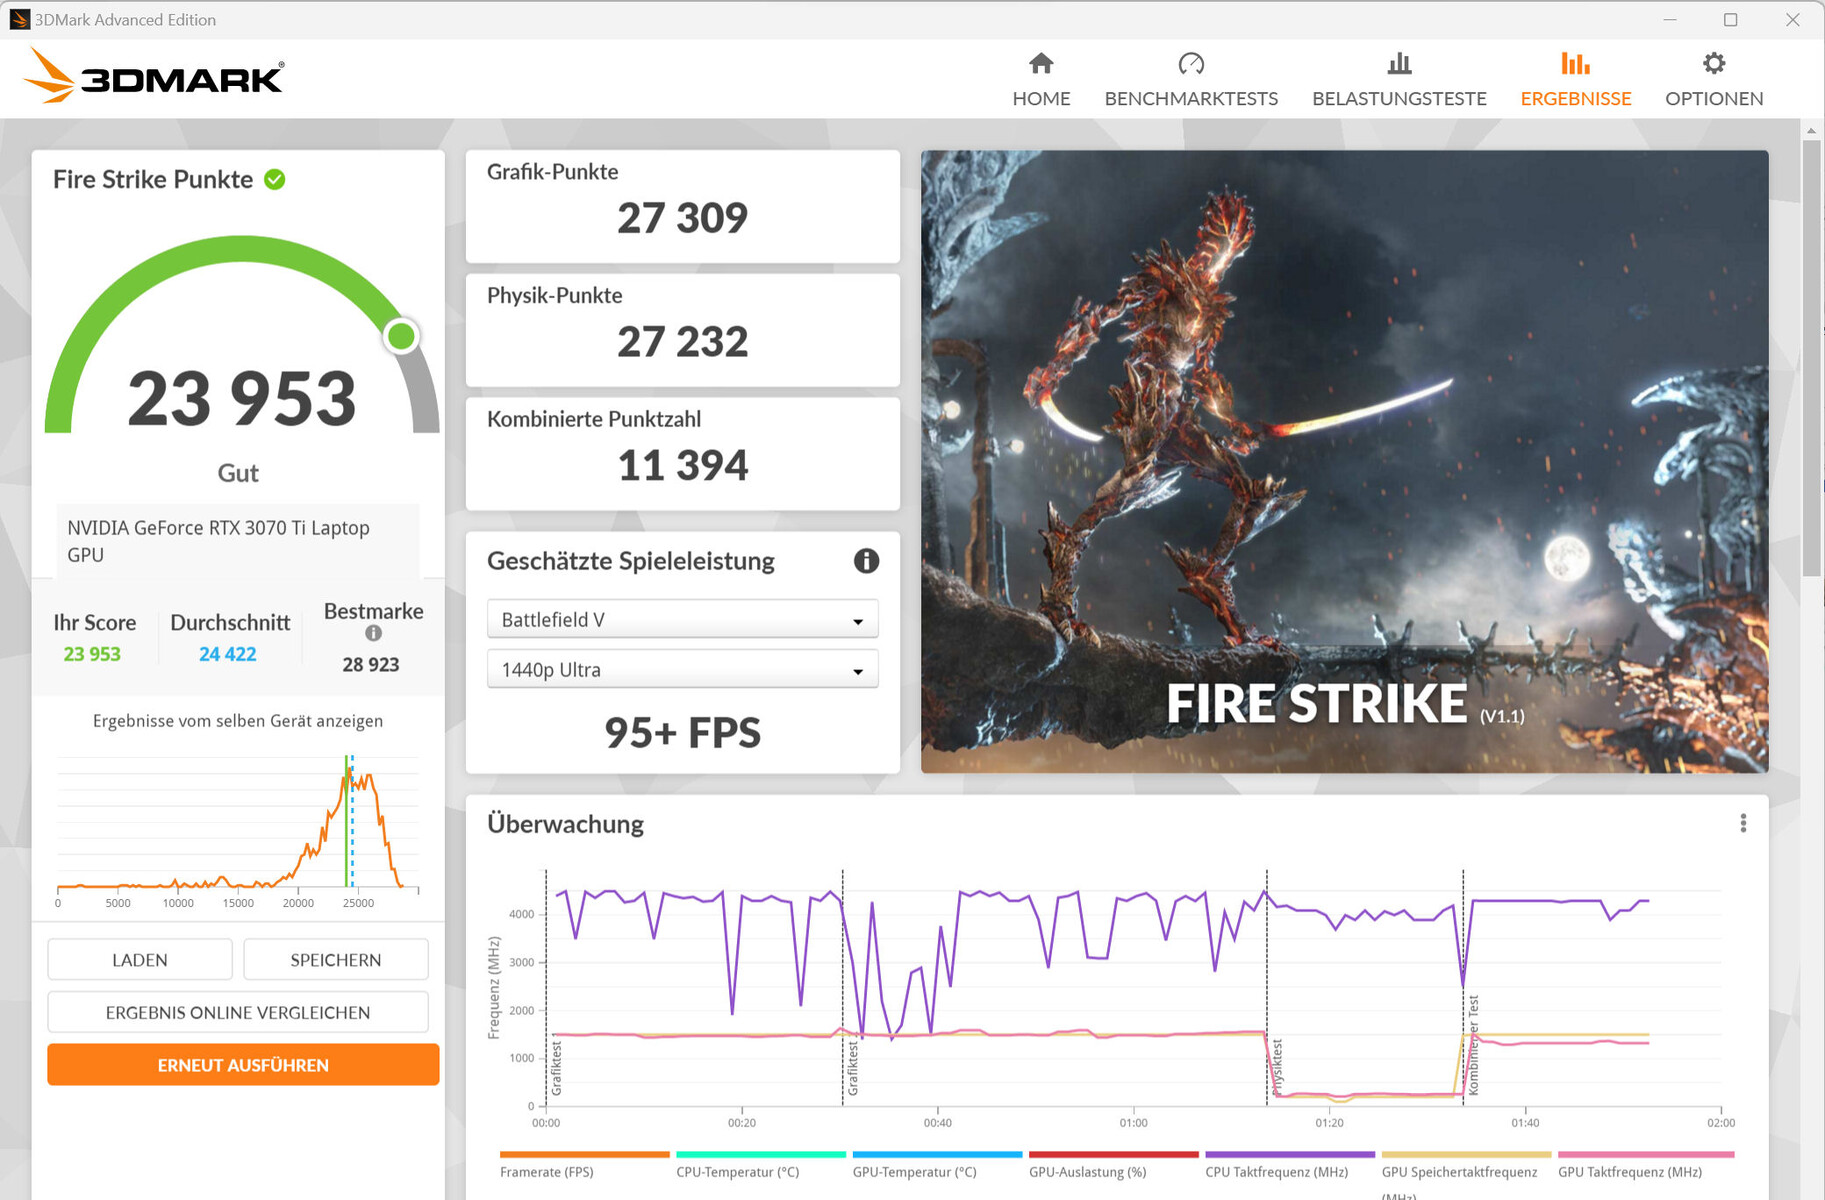
图形卡
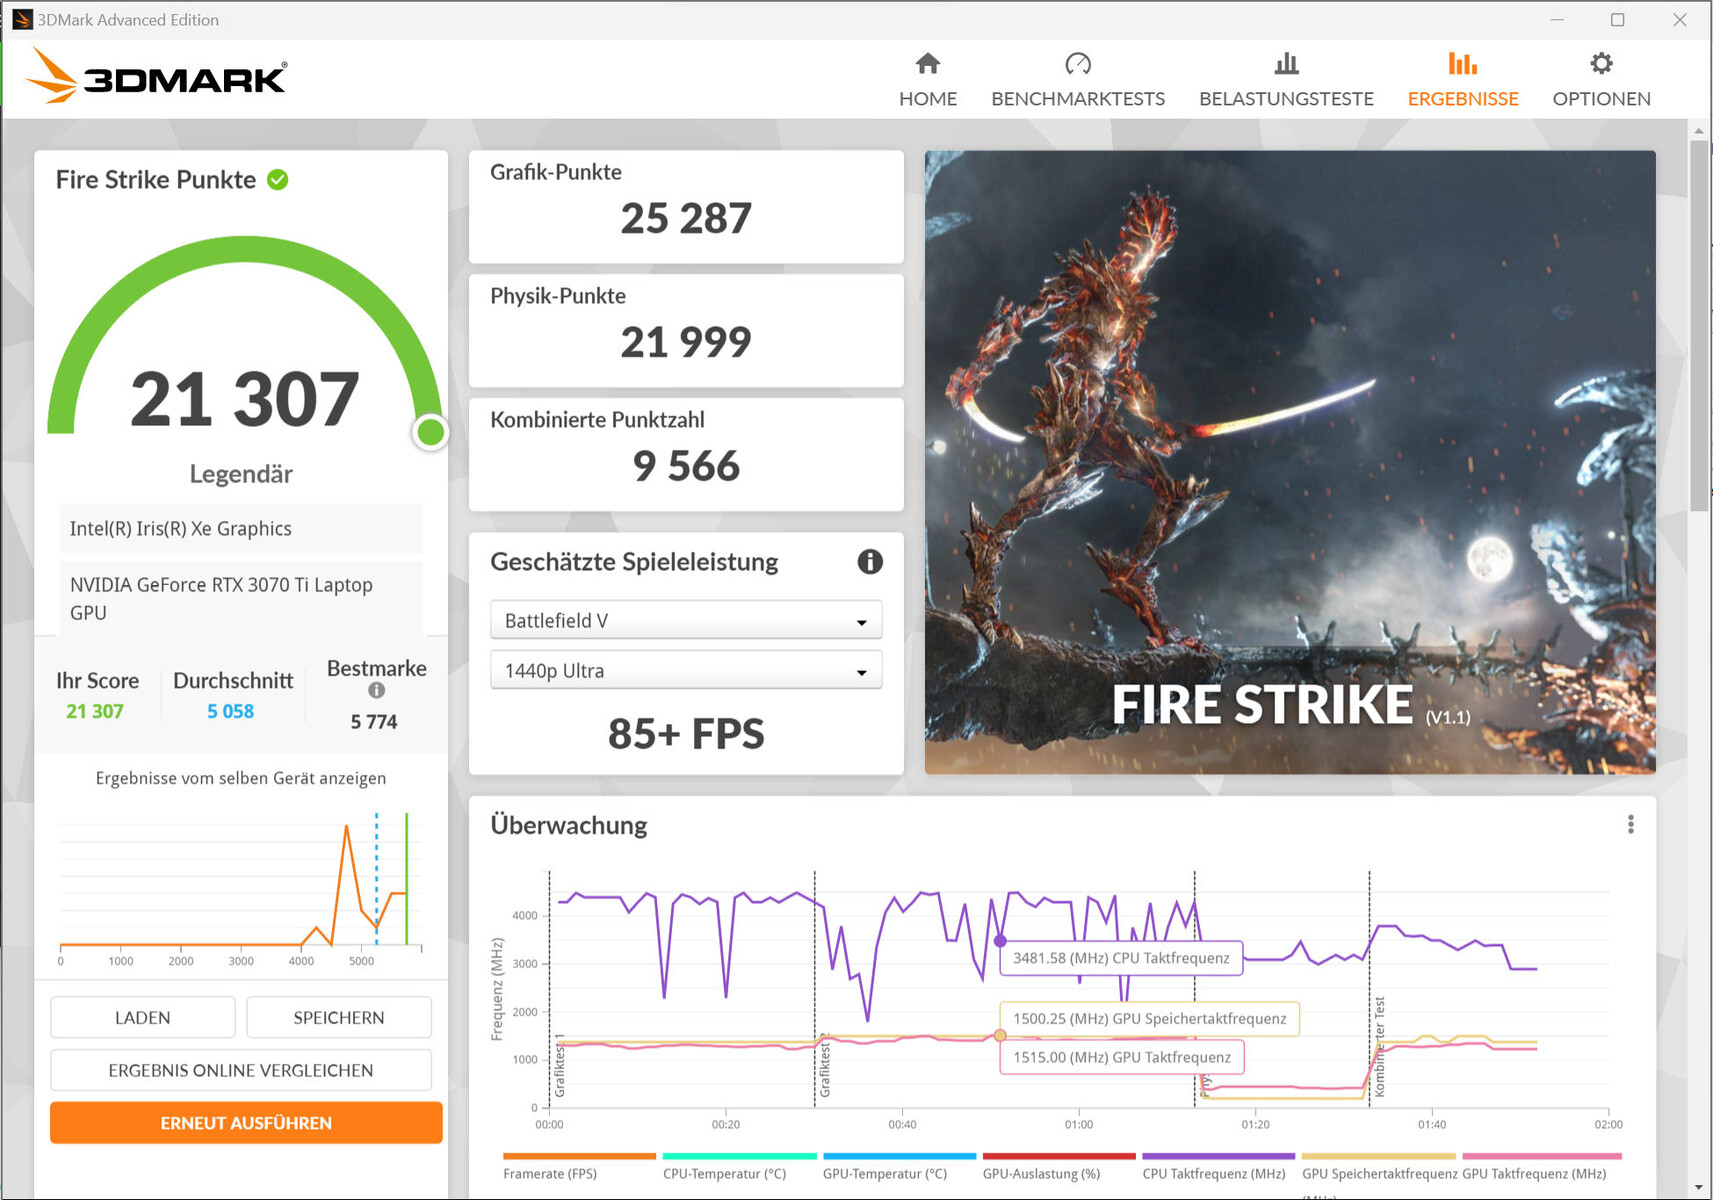
的GeForce RTX 3070 Ti笔记本电脑的GPU(VRAM:8192 MB GDDR6)以迄今为止确定的GPU平均水平提供3D-Mark结果,相对较低的最大TGP为110瓦,这一点很明显。通过GeForce GPU的直接图像输出导致图形性能的增加可以忽略不计。在Optimus和dGPU模式之间的切换是直接在BIOS中或通过Razer Synapse软件进行的。不支持高级Optimus。


| 3DMark Performance rating - Percent | |
| Average of class Gaming | |
| Razer Blade 15 2022 | |
| Razer Blade 15 OLED (Early 2022) | |
| Razer Blade 15 OLED (Early 2022) | |
| Average NVIDIA GeForce RTX 3070 Ti Laptop GPU | |
| HP Omen 16-b1090ng | |
| Aorus 15 XE5 -1! | |
| Asus ROG Zephyrus M16 GU603Z | |
| Schenker XMG Fusion 15 (Mid 22) | |
| 3DMark 11 - 1280x720 Performance GPU | |
| Average of class Gaming (21841 - 80022, n=105, last 2 years) | |
| Razer Blade 15 2022 | |
| Aorus 15 XE5 | |
| Razer Blade 15 OLED (Early 2022) | |
| Average NVIDIA GeForce RTX 3070 Ti Laptop GPU (13799 - 42569, n=36) | |
| Razer Blade 15 OLED (Early 2022) (dGPU) | |
| HP Omen 16-b1090ng | |
| Asus ROG Zephyrus M16 GU603Z | |
| Schenker XMG Fusion 15 (Mid 22) | |
| 3DMark 06 Standard Score | 48871 points | |
| 3DMark 11 Performance | 30645 points | |
| 3DMark Cloud Gate Standard Score | 59982 points | |
| 3DMark Fire Strike Score | 23793 points | |
| 3DMark Time Spy Score | 10342 points | |
Help | ||
| Blender | |
| v3.3 Classroom OPTIX/RTX | |
| Asus ROG Zephyrus M16 GU603Z (3.3.3) | |
| Razer Blade 15 OLED (Early 2022) (3.3.3) | |
| Razer Blade 15 OLED (Early 2022) (3.3.3, dGPU) | |
| Average NVIDIA GeForce RTX 3070 Ti Laptop GPU (22 - 30, n=15) | |
| Aorus 15 XE5 (3.3.0) | |
| Average of class Gaming (9 - 32, n=107, last 2 years) | |
| v3.3 Classroom CUDA | |
| Asus ROG Zephyrus M16 GU603Z (3.3.3) | |
| Razer Blade 15 OLED (Early 2022) (3.3.3) | |
| Razer Blade 15 OLED (Early 2022) (3.3.3, dGPU) | |
| Average NVIDIA GeForce RTX 3070 Ti Laptop GPU (36 - 46, n=16) | |
| Aorus 15 XE5 (3.3.0) | |
| Average of class Gaming (15 - 228, n=107, last 2 years) | |
| v3.3 Classroom CPU | |
| Schenker XMG Fusion 15 (Mid 22) | |
| Aorus 15 XE5 (3.3.0) | |
| Razer Blade 15 OLED (Early 2022) (3.3.3, dGPU) | |
| Razer Blade 15 OLED (Early 2022) (3.3.3) | |
| Average NVIDIA GeForce RTX 3070 Ti Laptop GPU (285 - 459, n=16) | |
| Asus ROG Zephyrus M16 GU603Z (3.3.3) | |
| Average of class Gaming (122 - 565, n=103, last 2 years) | |
| GPUScore: Sacred Path | |
| 2560x1440 Official VRS | |
| Razer Blade 15 OLED (Early 2022) (0.9.0 Vulkan 1.3) | |
| Razer Blade 15 OLED (Early 2022) (0.9.0 DirectX 12) | |
| Razer Blade 15 OLED (Early 2022) (0.9.0 Vulkan 1.3, dGPU) | |
| Razer Blade 15 OLED (Early 2022) (0.9.0 DirectX 12. dGPU) | |
| Average of class Gaming (13.8 - 330, n=139, last 2 years) | |
| Average NVIDIA GeForce RTX 3070 Ti Laptop GPU (17.9 - 134.8, n=4) | |
| 2560x1440 Official | |
| Razer Blade 15 OLED (Early 2022) (0.9.0 Vulkan 1.3, dGPU) | |
| Razer Blade 15 OLED (Early 2022) (0.9.0 DirectX 12, dGPU) | |
| Razer Blade 15 OLED (Early 2022) (0.9.0 Vulkan 1.3) | |
| Razer Blade 15 OLED (Early 2022) (0.9.0 DirectX 12) | |
| Average of class Gaming (11 - 331, n=233, last 2 years) | |
| Asus ROG Zephyrus M16 GU603Z (1.0.0 Vulkan 1.3) | |
| Average NVIDIA GeForce RTX 3070 Ti Laptop GPU (17 - 130.6, n=6) | |
| Geekbench 5.5 | |
| OpenCL Score | |
| Average of class Gaming (80702 - 277970, n=102, last 2 years) | |
| Razer Blade 15 2022 | |
| Aorus 15 XE5 | |
| Average NVIDIA GeForce RTX 3070 Ti Laptop GPU (100630 - 150471, n=38) | |
| Razer Blade 15 OLED (Early 2022) | |
| Asus ROG Zephyrus M16 GU603Z | |
| Schenker XMG Fusion 15 (Mid 22) | |
| Razer Blade 15 OLED (Early 2022) (dGPU) | |
| HP Omen 16-b1090ng | |
| Vulkan Score 5.5 | |
| Average of class Gaming (18857 - 246759, n=76, last 2 years) | |
| Razer Blade 15 OLED (Early 2022) (dGPU) | |
| Average NVIDIA GeForce RTX 3070 Ti Laptop GPU (52594 - 92020, n=10) | |
| Razer Blade 15 2022 | |
| Asus ROG Zephyrus M16 GU603Z | |
| Geekbench 6.0 | |
| GPU Vulkan 6.0 | |
| Average of class Gaming (22454 - 184611, n=3, last 2 years) | |
| Razer Blade 15 OLED (Early 2022) (dGPU) | |
| Average NVIDIA GeForce RTX 3070 Ti Laptop GPU (19109 - 96149, n=2) | |
| Razer Blade 15 OLED (Early 2022) | |
| GPU OpenCL 6.0 | |
| Average of class Gaming (155885 - 241981, n=3, last 2 years) | |
| Razer Blade 15 OLED (Early 2022) | |
| Average NVIDIA GeForce RTX 3070 Ti Laptop GPU (103225 - 104147, n=2) | |
| Razer Blade 15 OLED (Early 2022) (dGPU) | |
| V-Ray 5 Benchmark | |
| GPU RTX | |
| Average of class Gaming (1146 - 4363, n=33, last 2 years) | |
| Aorus 15 XE5 (5.0.1) | |
| Average NVIDIA GeForce RTX 3070 Ti Laptop GPU (1334 - 1847, n=15) | |
| Razer Blade 15 OLED (Early 2022) (5.0.1) | |
| Razer Blade 15 OLED (Early 2022) (5.0.1, dGPU) | |
| Schenker XMG Fusion 15 (Mid 22) (5.0.1) | |
| GPU CUDA | |
| Average of class Gaming (887 - 3288, n=33, last 2 years) | |
| Aorus 15 XE5 (5.0.1) | |
| Average NVIDIA GeForce RTX 3070 Ti Laptop GPU (1062 - 1391, n=14) | |
| Razer Blade 15 OLED (Early 2022) (5.0.1) | |
| Razer Blade 15 OLED (Early 2022) (5.0.1, dGPU) | |
| Schenker XMG Fusion 15 (Mid 22) (5.0.1) | |
| CPU | |
| Average of class Gaming (5864 - 30302, n=32, last 2 years) | |
| Razer Blade 15 OLED (Early 2022) (5.0.1, dGPU) | |
| Razer Blade 15 OLED (Early 2022) (5.0.1) | |
| Razer Blade 15 2022 (5.0.1) | |
| Average NVIDIA GeForce RTX 3070 Ti Laptop GPU (2880 - 11931, n=20) | |
| Aorus 15 XE5 (5.0.1) | |
| Schenker XMG Fusion 15 (Mid 22) (5.0.1) | |
| V-Ray Benchmark Next 4.10 | |
| GPU | |
| Average of class Gaming (427 - 1627, n=100, last 2 years) | |
| Aorus 15 XE5 (v4.10.07 ) | |
| Average NVIDIA GeForce RTX 3070 Ti Laptop GPU (277 - 559, n=33) | |
| Schenker XMG Fusion 15 (Mid 22) (v4.10.07 ) | |
| Razer Blade 15 OLED (Early 2022) (v4.10.07 ) | |
| Razer Blade 15 OLED (Early 2022) (v4.10.07, dGPU) | |
| HP Omen 16-b1090ng (v4.10.07 ) | |
| Asus ROG Zephyrus M16 GU603Z (v4.10.07 ) | |
| CPU | |
| Average of class Gaming (10048 - 45327, n=98, last 2 years) | |
| HP Omen 16-b1090ng (v4.10.07 ) | |
| Razer Blade 15 OLED (Early 2022) (v4.10.07, dGPU) | |
| Asus ROG Zephyrus M16 GU603Z (v4.10.07 ) | |
| Razer Blade 15 OLED (Early 2022) (v4.10.07 ) | |
| Average NVIDIA GeForce RTX 3070 Ti Laptop GPU (4722 - 19786, n=33) | |
| Aorus 15 XE5 (v4.10.07 ) | |
| Schenker XMG Fusion 15 (Mid 22) (v4.10.07 ) | |
* ... smaller is better
游戏性能
这款笔记本电脑是为QHD游戏在高到最大设置下设计的。更高的分辨率可以通过连接到合适的显示器来实现--尽管有时会降低设置。测试的标题的帧率是在一个典型的水平确定RTX 3070 Ti平均。通过GeForce GPU的直接图像输出可以导致--取决于游戏--帧率的最小增加。
| Performance rating - Percent | |
| Average of class Gaming | |
| Razer Blade 15 2022 | |
| Aorus 15 XE5 | |
| Asus ROG Zephyrus M16 GU603Z | |
| HP Omen 16-b1090ng | |
| Razer Blade 15 OLED (Early 2022) | |
| Average NVIDIA GeForce RTX 3070 Ti Laptop GPU | |
| Razer Blade 15 OLED (Early 2022) | |
| Schenker XMG Fusion 15 (Mid 22) | |
| The Witcher 3 - 1920x1080 Ultra Graphics & Postprocessing (HBAO+) | |
| Average of class Gaming (104.7 - 240, n=7, last 2 years) | |
| Razer Blade 15 2022 | |
| Average NVIDIA GeForce RTX 3070 Ti Laptop GPU (76.8 - 124.1, n=39) | |
| Aorus 15 XE5 | |
| Asus ROG Zephyrus M16 GU603Z | |
| HP Omen 16-b1090ng | |
| Razer Blade 15 OLED (Early 2022) (dGPU) | |
| Razer Blade 15 OLED (Early 2022) | |
| Schenker XMG Fusion 15 (Mid 22) | |
| GTA V - 1920x1080 Highest AA:4xMSAA + FX AF:16x | |
| Average of class Gaming (48.3 - 186.9, n=94, last 2 years) | |
| Razer Blade 15 2022 | |
| Aorus 15 XE5 | |
| Razer Blade 15 OLED (Early 2022) (dGPU) | |
| Razer Blade 15 OLED (Early 2022) | |
| HP Omen 16-b1090ng | |
| Asus ROG Zephyrus M16 GU603Z | |
| Average NVIDIA GeForce RTX 3070 Ti Laptop GPU (44 - 123.9, n=36) | |
| Schenker XMG Fusion 15 (Mid 22) | |
| Final Fantasy XV Benchmark - 1920x1080 High Quality | |
| Average of class Gaming (41 - 215, n=95, last 2 years) | |
| Razer Blade 15 2022 (1.3) | |
| Aorus 15 XE5 (1.3) | |
| Razer Blade 15 OLED (Early 2022) (1.3, dGPU) | |
| Razer Blade 15 OLED (Early 2022) (1.3) | |
| HP Omen 16-b1090ng | |
| Average NVIDIA GeForce RTX 3070 Ti Laptop GPU (49.5 - 122.4, n=35) | |
| Asus ROG Zephyrus M16 GU603Z (1.3) | |
| Schenker XMG Fusion 15 (Mid 22) (1.3) | |
| Strange Brigade - 1920x1080 ultra AA:ultra AF:16 | |
| Average of class Gaming (76.3 - 458, n=87, last 2 years) | |
| Aorus 15 XE5 (1.47.22.14 D3D12) | |
| Razer Blade 15 2022 (1.47.22.14 D3D12) | |
| Average NVIDIA GeForce RTX 3070 Ti Laptop GPU (109 - 221, n=37) | |
| Razer Blade 15 OLED (Early 2022) (1.47.22.14 D3D12, dGPU) | |
| Razer Blade 15 OLED (Early 2022) (1.47.22.14 D3D12) | |
| Schenker XMG Fusion 15 (Mid 22) (1.47.22.14 D3D12) | |
| Asus ROG Zephyrus M16 GU603Z (1.47.22.14 D3D12) | |
| HP Omen 16-b1090ng (1.47.22.14 D3D12) | |
| Dota 2 Reborn - 1920x1080 ultra (3/3) best looking | |
| Asus ROG Zephyrus M16 GU603Z | |
| Razer Blade 15 2022 | |
| Average of class Gaming (84.8 - 252, n=108, last 2 years) | |
| HP Omen 16-b1090ng | |
| Aorus 15 XE5 | |
| Average NVIDIA GeForce RTX 3070 Ti Laptop GPU (68.7 - 160.5, n=38) | |
| Razer Blade 15 OLED (Early 2022) (dGPU) | |
| Razer Blade 15 OLED (Early 2022) | |
| Schenker XMG Fusion 15 (Mid 22) | |
| X-Plane 11.11 - 1920x1080 high (fps_test=3) | |
| Asus ROG Zephyrus M16 GU603Z | |
| HP Omen 16-b1090ng | |
| Razer Blade 15 2022 | |
| Aorus 15 XE5 | |
| Razer Blade 15 OLED (Early 2022) (dGPU) | |
| Average of class Gaming (55.5 - 148.5, n=110, last 2 years) | |
| Average NVIDIA GeForce RTX 3070 Ti Laptop GPU (51.6 - 116.9, n=37) | |
| Razer Blade 15 OLED (Early 2022) | |
| Schenker XMG Fusion 15 (Mid 22) | |
为了检查帧率是否在较长时间内继续保持稳定,我们在全高清分辨率和最大质量设置下运行了 "TheWitcher 3" 游戏大约60分钟。游戏角色没有被移动,帧率也没有明显下降。
Witcher 3 FPS Diagram
| low | med. | high | ultra | QHD | |
|---|---|---|---|---|---|
| GTA V (2015) | 182.7 | 177.2 | 172.8 | 113 | 94.3 |
| The Witcher 3 (2015) | 365.8 | 288.5 | 176.6 | 96.4 | |
| Dota 2 Reborn (2015) | 162 | 148.2 | 143.4 | 133 | |
| Final Fantasy XV Benchmark (2018) | 174.2 | 133.3 | 100.3 | 75.1 | |
| X-Plane 11.11 (2018) | 133.3 | 121.6 | 95 | ||
| Far Cry 5 (2018) | 170 | 141 | 135 | 126 | 100 |
| Strange Brigade (2018) | 351 | 240 | 197.2 | 173.4 | 130.9 |
| Flight Simulator 2020 (2020) | 124.8 | 97.8 | 70.2 | 52.2 | 41.3 |
| F1 22 (2022) | 203 | 202 | 173.1 | 65.2 | 42.3 |
| FIFA 23 (2022) | 104.3 | ||||
| A Plague Tale Requiem (2022) | 101.6 | 84 | 73.3 | 62.9 | 50.5 |
| Uncharted Legacy of Thieves Collection (2022) | 78 | 75.2 | 71.8 | 69.3 | 56.2 |
| Call of Duty Modern Warfare 2 2022 (2022) | 126 | 112 | 89 | 85 | 63 |
| Spider-Man Miles Morales (2022) | 107 | 102.6 | 94.9 | 93.2 | 69.6 |
| The Callisto Protocol (2022) | 117 | 99.3 | 71 | 70.7 | 52.8 |
| Need for Speed Unbound (2022) | 112.8 | 106.9 | 93 | 84.6 | 66.7 |
| High On Life (2023) | 175.7 | 139.4 | 117.5 | 97.1 | 60.8 |
| The Witcher 3 v4 (2023) | 174.4 | 149.6 | 81.3 | 71.4 | 47.4 |
| Dead Space Remake (2023) | 82.1 | 74.6 | 68.1 | 66.8 | 47.2 |
| Hogwarts Legacy (2023) | 88.5 | 79 | 69.7 | 59.3 | 42.6 |
排放--Razer笔记本电脑不会过度发热
噪声排放
总而言之,对于一台游戏笔记本来说,噪音水平是适中的。在闲置和日常使用中(办公室和互联网),风扇以低速运行,几乎听不见。在满负荷情况下(压力测试,Witcher 3 测试),声压级可以上升到43.9 dB(A)。静音 "性能配置并不像其名称所暗示的那样,但它确实能够降低背景噪音--以牺牲计算能力为代价。
Noise level
| Idle |
| 28 / 28 / 28 dB(A) |
| Load |
| 38.5 / 43.9 dB(A) |
 | ||
30 dB silent 40 dB(A) audible 50 dB(A) loud |
||
min: | ||
| Razer Blade 15 OLED (Early 2022) GeForce RTX 3070 Ti Laptop GPU, i9-12900H, Samsung PM9A1 MZVL21T0HCLR | Asus ROG Zephyrus M16 GU603Z GeForce RTX 3070 Ti Laptop GPU, i9-12900H, Micron 3400 1TB MTFDKBA1T0TFH | Aorus 15 XE5 GeForce RTX 3070 Ti Laptop GPU, i7-12700H, Gigabyte AG470S1TB-SI B10 | Schenker XMG Fusion 15 (Mid 22) GeForce RTX 3070 Laptop GPU, i7-11800H, Samsung SSD 980 Pro 1TB MZ-V8P1T0BW | HP Omen 16-b1090ng GeForce RTX 3070 Ti Laptop GPU, i7-12700H, WDC PC SN810 1TB | Razer Blade 15 2022 GeForce RTX 3080 Ti Laptop GPU, i7-12800H, SSSTC CA6-8D1024 | |
|---|---|---|---|---|---|---|
| Noise | -10% | -6% | -5% | -16% | -4% | |
| off / environment * (dB) | 26 | 23 12% | 24 8% | 26 -0% | 26 -0% | 25.4 2% |
| Idle Minimum * (dB) | 28 | 23 18% | 26 7% | 26 7% | 30 -7% | 26.2 6% |
| Idle Average * (dB) | 28 | 24 14% | 28 -0% | 28 -0% | 31 -11% | 26.2 6% |
| Idle Maximum * (dB) | 28 | 47 -68% | 30 -7% | 31 -11% | 33 -18% | 28.4 -1% |
| Load Average * (dB) | 38.5 | 47.91 -24% | 48 -25% | 45 -17% | 49 -27% | 44.7 -16% |
| Load Maximum * (dB) | 43.9 | 50.25 -14% | 52 -18% | 48 -9% | 57 -30% | 51.9 -18% |
| Witcher 3 ultra * (dB) | 48.91 | 52 | 46 | 53 | 44.7 |
* ... smaller is better
温度
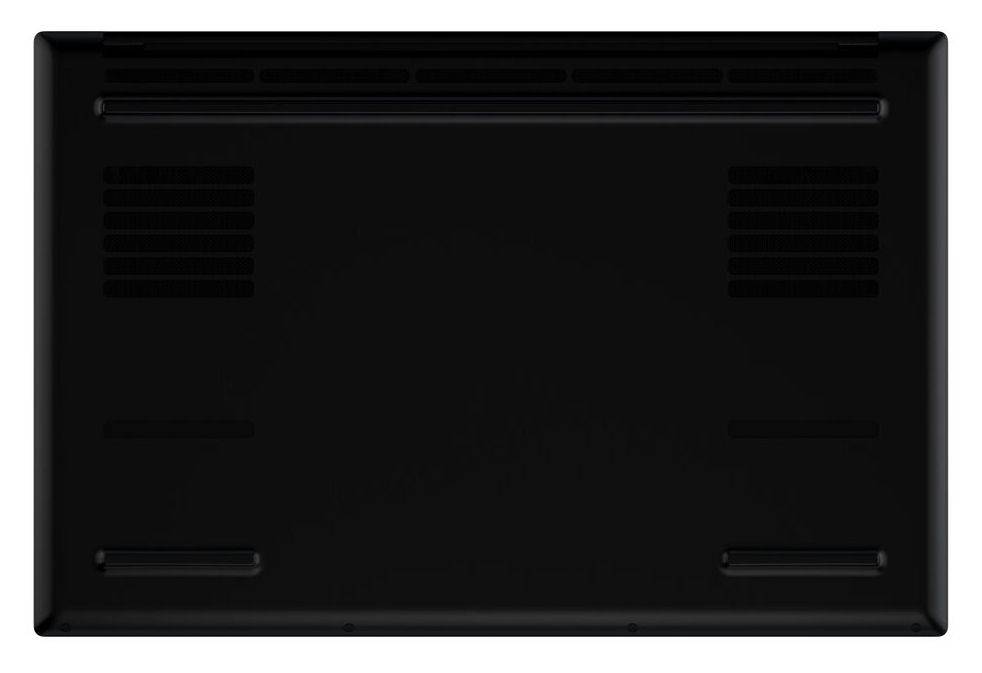
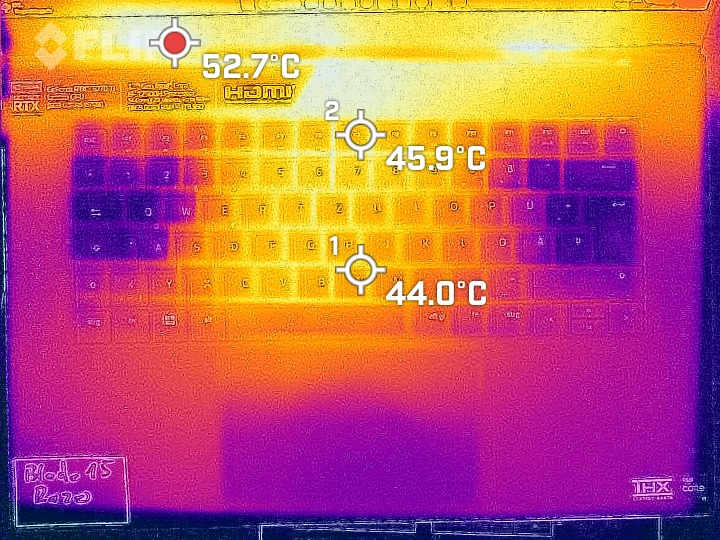
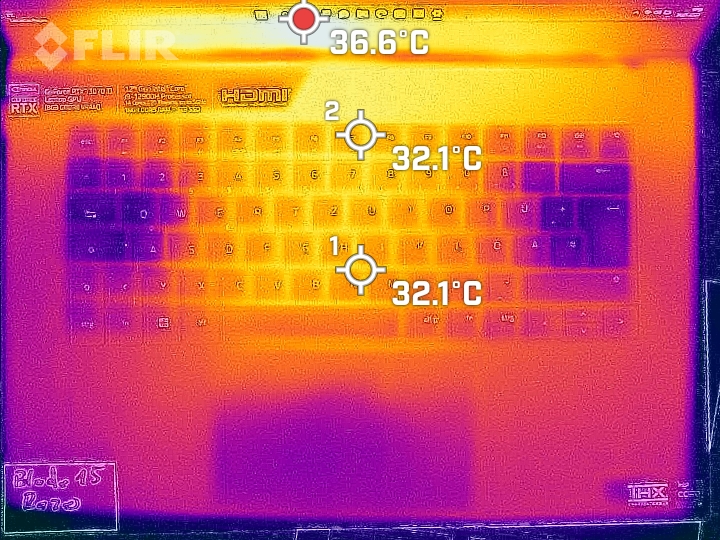
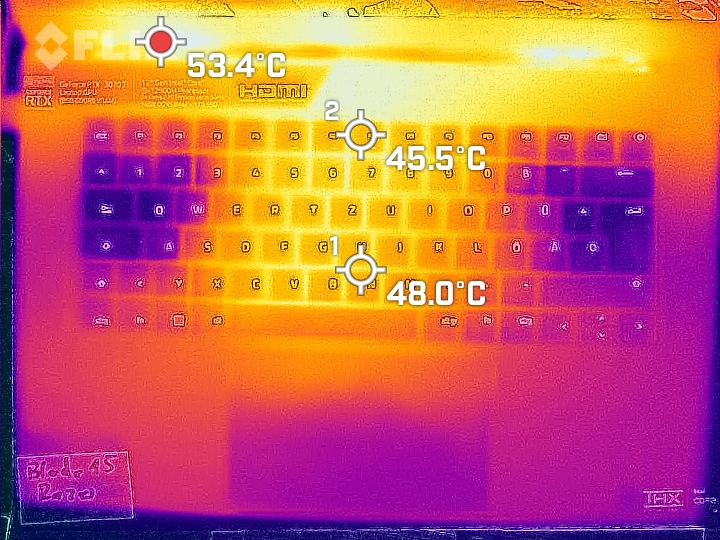
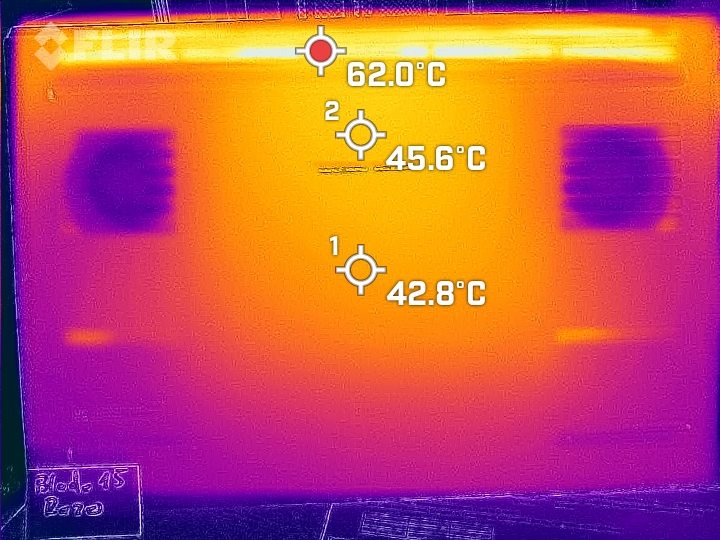
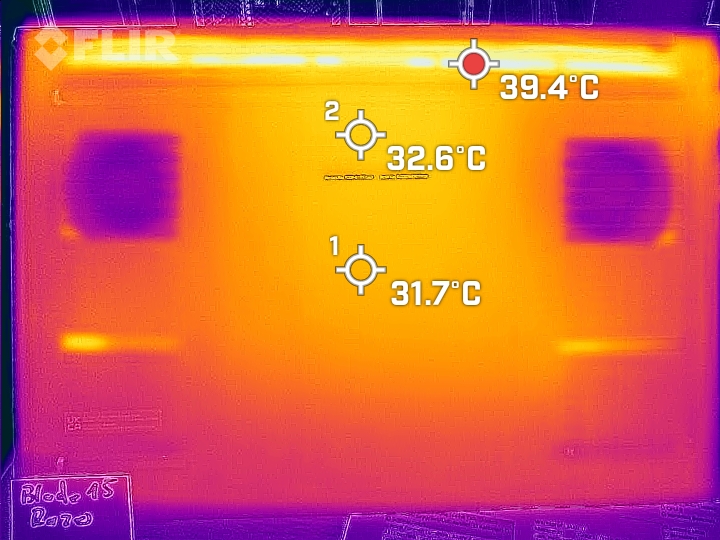
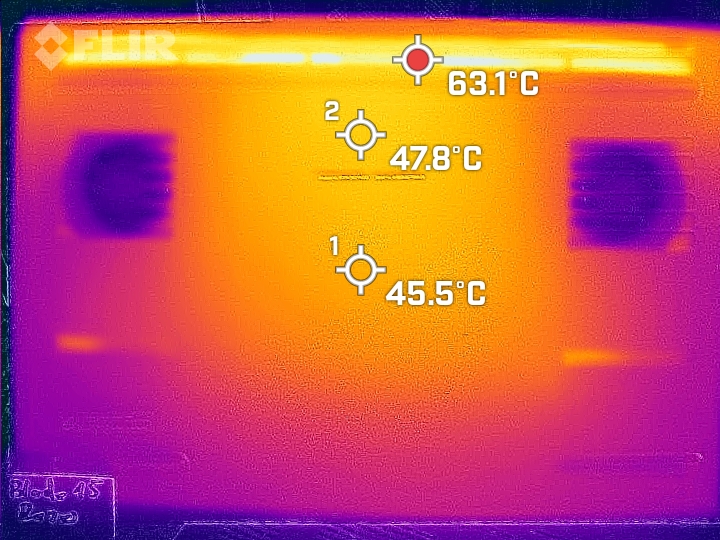
在日常使用中(办公室、互联网),机箱的温度保持在非常高的绿色区域。在负载情况下(压力测试,Witcher 3 测试),笔记本电脑明显发热,但不会过度。
(-) The maximum temperature on the upper side is 49.5 °C / 121 F, compared to the average of 40.4 °C / 105 F, ranging from 21.2 to 68.8 °C for the class Gaming.
(-) The bottom heats up to a maximum of 47.5 °C / 118 F, compared to the average of 43.2 °C / 110 F
(+) In idle usage, the average temperature for the upper side is 30 °C / 86 F, compared to the device average of 33.9 °C / 93 F.
(-) Playing The Witcher 3, the average temperature for the upper side is 40.3 °C / 105 F, compared to the device average of 33.9 °C / 93 F.
(±) The palmrests and touchpad can get very hot to the touch with a maximum of 38 °C / 100.4 F.
(-) The average temperature of the palmrest area of similar devices was 28.8 °C / 83.8 F (-9.2 °C / -16.6 F).
| Razer Blade 15 OLED (Early 2022) Intel Core i9-12900H, NVIDIA GeForce RTX 3070 Ti Laptop GPU | Asus ROG Zephyrus M16 GU603Z Intel Core i9-12900H, NVIDIA GeForce RTX 3070 Ti Laptop GPU | Aorus 15 XE5 Intel Core i7-12700H, NVIDIA GeForce RTX 3070 Ti Laptop GPU | Schenker XMG Fusion 15 (Mid 22) Intel Core i7-11800H, NVIDIA GeForce RTX 3070 Laptop GPU | HP Omen 16-b1090ng Intel Core i7-12700H, NVIDIA GeForce RTX 3070 Ti Laptop GPU | Razer Blade 15 2022 Intel Core i7-12800H, NVIDIA GeForce RTX 3080 Ti Laptop GPU | |
|---|---|---|---|---|---|---|
| Heat | 2% | -12% | -15% | 9% | -6% | |
| Maximum Upper Side * (°C) | 49.5 | 52 -5% | 46 7% | 52 -5% | 41 17% | 50 -1% |
| Maximum Bottom * (°C) | 47.5 | 51 -7% | 57 -20% | 63 -33% | 62 -31% | 47 1% |
| Idle Upper Side * (°C) | 33.4 | 29 13% | 38 -14% | 37 -11% | 25 25% | 37.4 -12% |
| Idle Bottom * (°C) | 35 | 33 6% | 42 -20% | 38 -9% | 26 26% | 38.4 -10% |
* ... smaller is better
压力测试
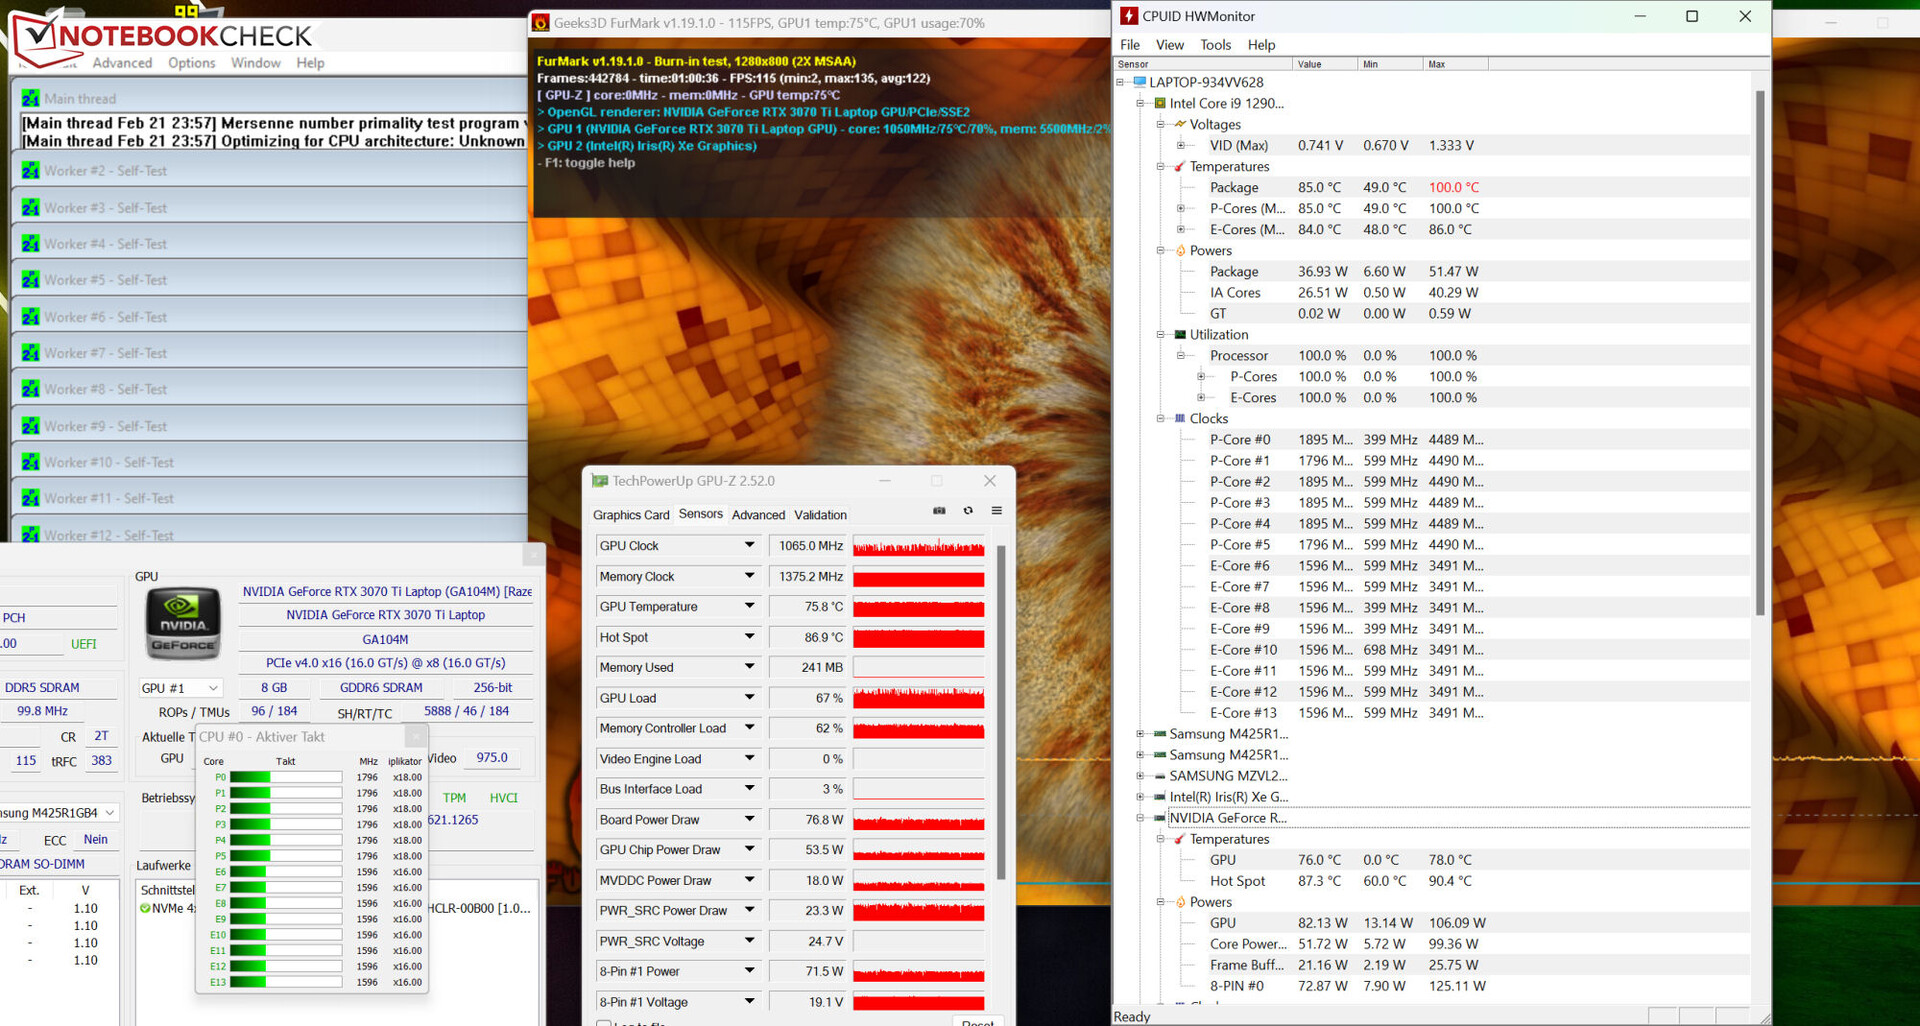
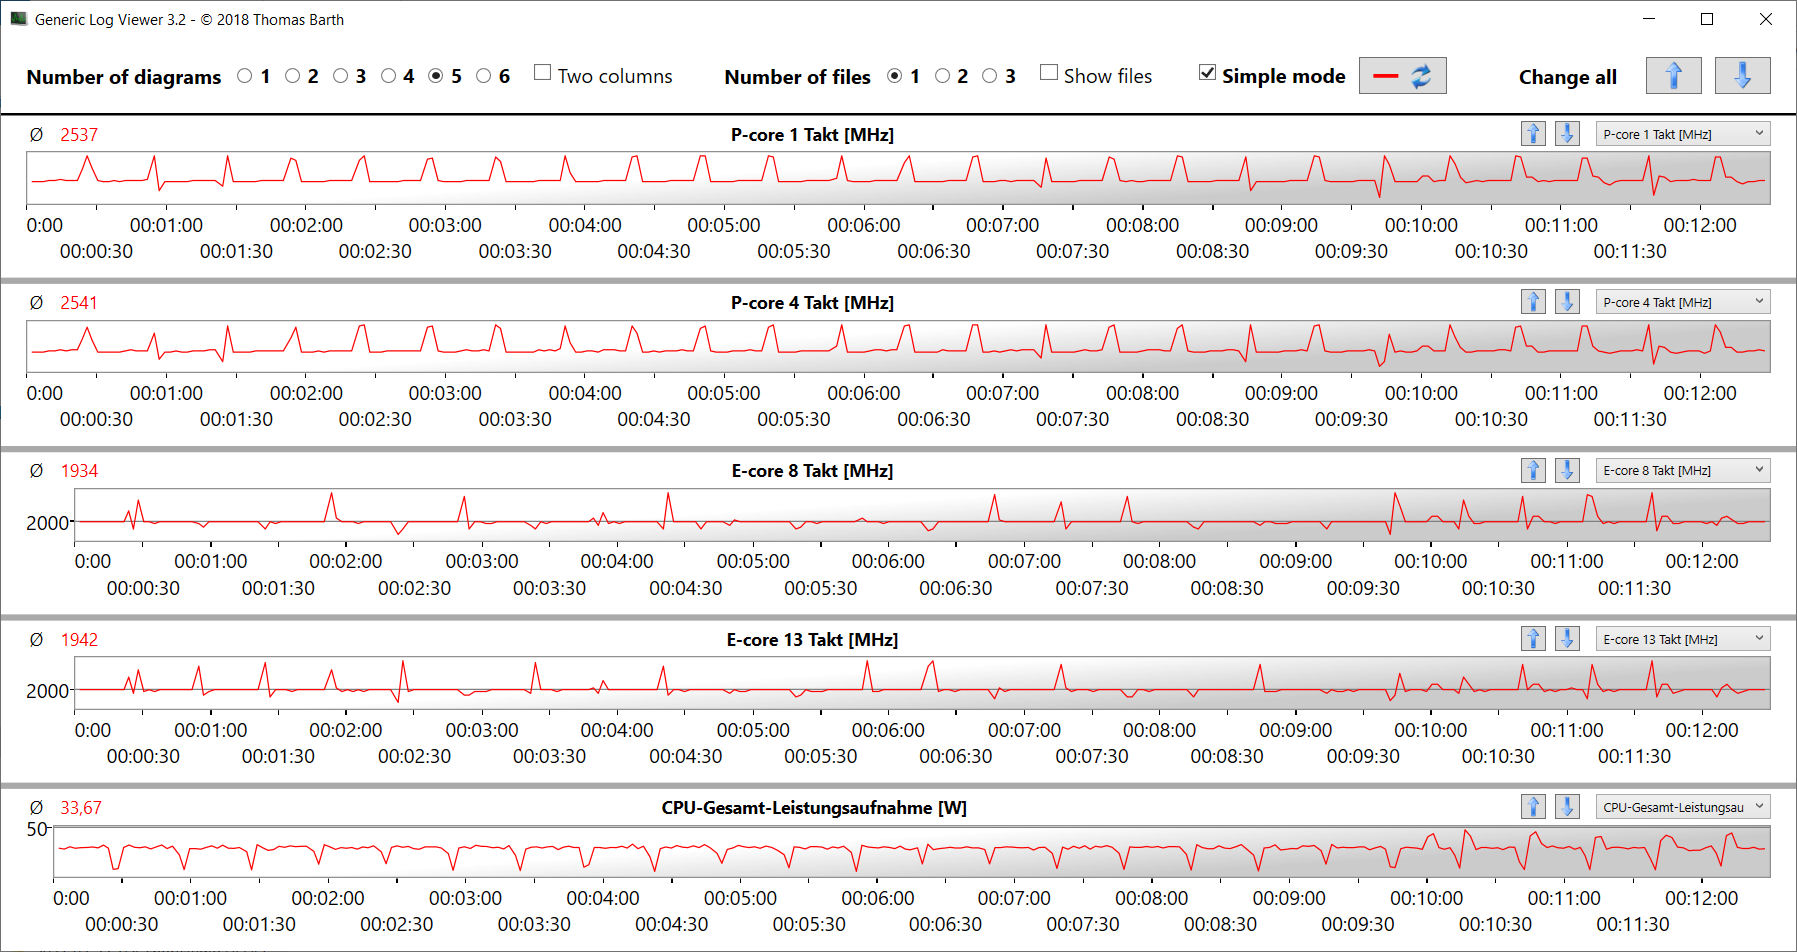
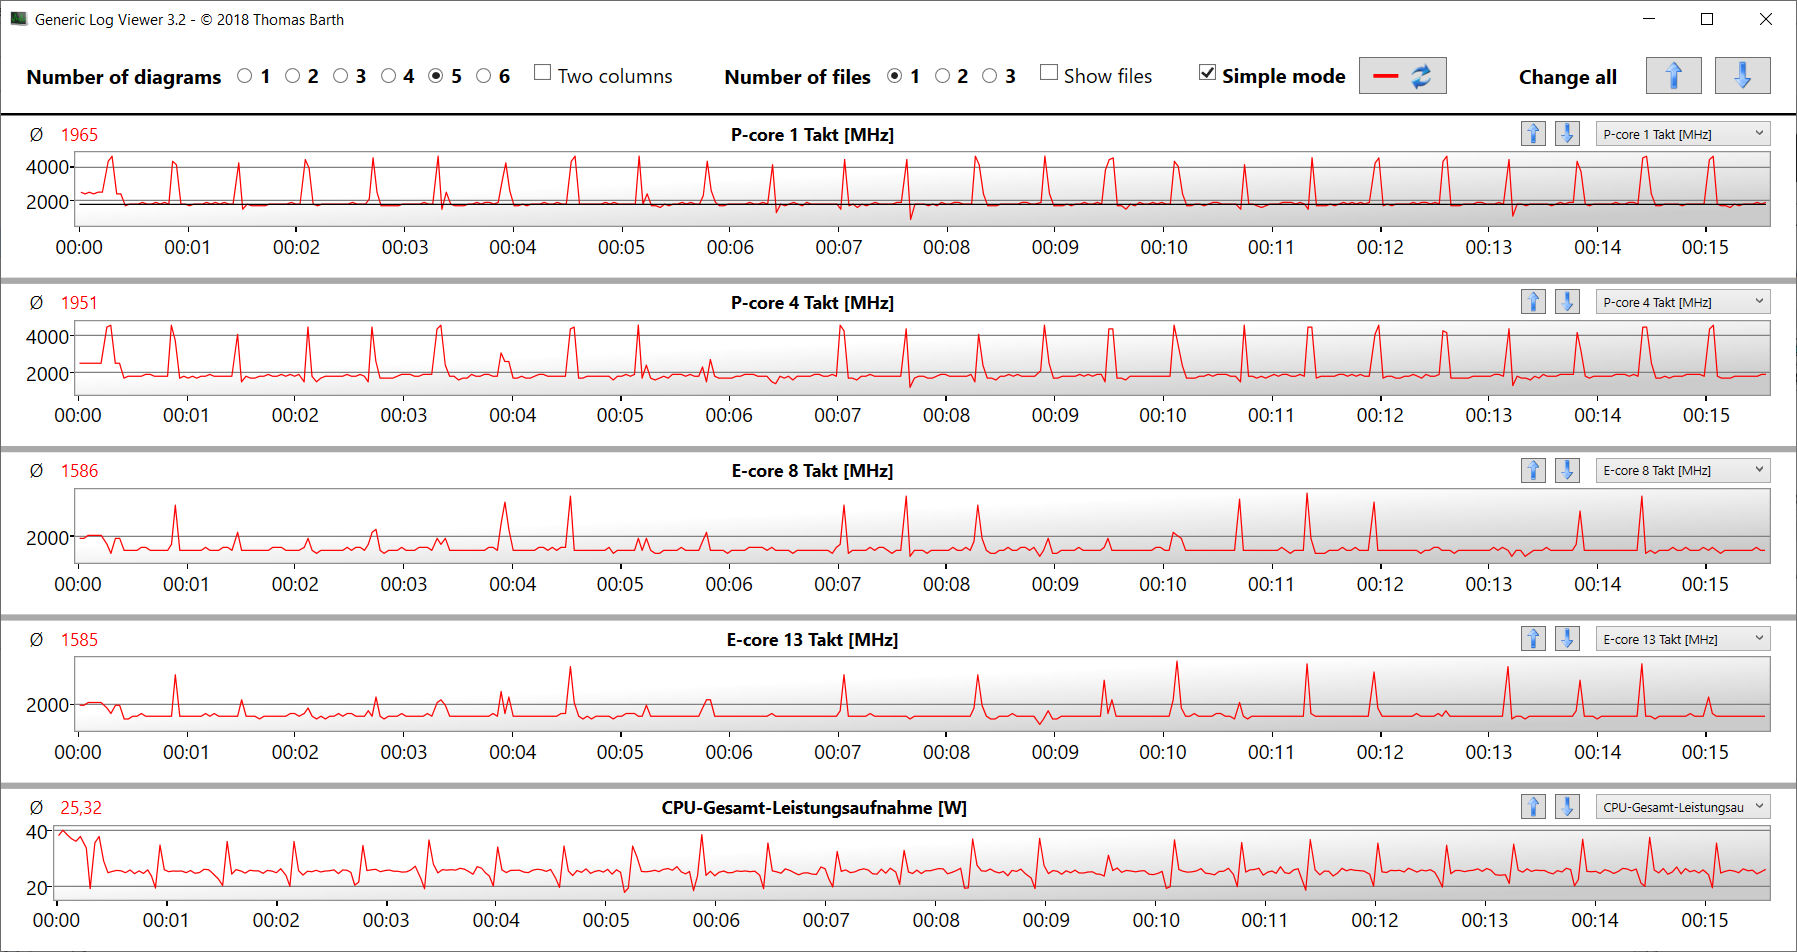
压力测试(Prime95和Furmark连续运行)提出了分析全负荷下系统稳定性的极端情况。在测试过程中,CPU时钟速度分别从2.5GHz(P-cores)和2.1GHz(E-cores)的起点下降到大约1.7GHz(P-cores)和1.5GHz(E-cores)。GPU的时钟速度在700至1300兆赫之间波动。
发言人
立体声扬声器产生了一个体面的声音,但缺乏低音。
Razer Blade 15 OLED (Early 2022) audio analysis
(+) | speakers can play relatively loud (89.2 dB)
Bass 100 - 315 Hz
(-) | nearly no bass - on average 24.8% lower than median
(±) | linearity of bass is average (12.7% delta to prev. frequency)
Mids 400 - 2000 Hz
(+) | balanced mids - only 3% away from median
(+) | mids are linear (4.3% delta to prev. frequency)
Highs 2 - 16 kHz
(+) | balanced highs - only 2.2% away from median
(+) | highs are linear (4.1% delta to prev. frequency)
Overall 100 - 16.000 Hz
(+) | overall sound is linear (14.1% difference to median)
Compared to same class
» 24% of all tested devices in this class were better, 8% similar, 68% worse
» The best had a delta of 6%, average was 18%, worst was 132%
Compared to all devices tested
» 17% of all tested devices were better, 4% similar, 79% worse
» The best had a delta of 4%, average was 23%, worst was 134%
Asus ROG Zephyrus M16 GU603Z audio analysis
(+) | speakers can play relatively loud (82.96 dB)
Bass 100 - 315 Hz
(±) | reduced bass - on average 11.6% lower than median
(±) | linearity of bass is average (9.2% delta to prev. frequency)
Mids 400 - 2000 Hz
(+) | balanced mids - only 4.3% away from median
(+) | mids are linear (5.7% delta to prev. frequency)
Highs 2 - 16 kHz
(+) | balanced highs - only 1.6% away from median
(+) | highs are linear (3.9% delta to prev. frequency)
Overall 100 - 16.000 Hz
(+) | overall sound is linear (10.1% difference to median)
Compared to same class
» 5% of all tested devices in this class were better, 2% similar, 93% worse
» The best had a delta of 6%, average was 18%, worst was 132%
Compared to all devices tested
» 5% of all tested devices were better, 2% similar, 94% worse
» The best had a delta of 4%, average was 23%, worst was 134%
能源管理--刀片在空闲使用时非常饥饿
消耗功率
在空闲使用时,能量需求(高达39瓦)相对较高。这似乎是在2022年的刀片型号中发现的一个普遍问题。 我们在许多场合遇到过.在负载情况下,消耗量对这种硬件来说是正常的。虽然Witcher 3 测试以恒定的功耗运行,但在压力测试期间要求突然下降--CPU被扼杀。电源装置(230瓦)的大小是合适的。
| Off / Standby | |
| Idle | |
| Load |
|
Key:
min: | |
| Razer Blade 15 OLED (Early 2022) i9-12900H, GeForce RTX 3070 Ti Laptop GPU, Samsung PM9A1 MZVL21T0HCLR, OLED, 2560x1440, 15.6" | Asus ROG Zephyrus M16 GU603Z i9-12900H, GeForce RTX 3070 Ti Laptop GPU, Micron 3400 1TB MTFDKBA1T0TFH, IPS, 2560x1600, 16" | Aorus 15 XE5 i7-12700H, GeForce RTX 3070 Ti Laptop GPU, Gigabyte AG470S1TB-SI B10, IPS, 2560x1440, 15.6" | Schenker XMG Fusion 15 (Mid 22) i7-11800H, GeForce RTX 3070 Laptop GPU, Samsung SSD 980 Pro 1TB MZ-V8P1T0BW, IPS, 2560x1440, 15.6" | HP Omen 16-b1090ng i7-12700H, GeForce RTX 3070 Ti Laptop GPU, WDC PC SN810 1TB, IPS, 2560x1440, 16.1" | Razer Blade 15 2022 i7-12800H, GeForce RTX 3080 Ti Laptop GPU, SSSTC CA6-8D1024, IPS, 2560x1440, 15.6" | Average NVIDIA GeForce RTX 3070 Ti Laptop GPU | Average of class Gaming | |
|---|---|---|---|---|---|---|---|---|
| Power Consumption | 26% | -18% | 24% | 29% | -8% | 18% | 20% | |
| Idle Minimum * (Watt) | 31.6 | 10.8 66% | 31 2% | 12 62% | 4 87% | 33.2 -5% | 14.2 ? 55% | 13 ? 59% |
| Idle Average * (Watt) | 33.3 | 17 49% | 35 -5% | 17 49% | 10 70% | 36.4 -9% | 19.9 ? 40% | 19 ? 43% |
| Idle Maximum * (Watt) | 38.6 | 17.8 54% | 46 -19% | 24 38% | 19 51% | 37.6 3% | 26.2 ? 32% | 24.5 ? 37% |
| Load Average * (Watt) | 149 | 116 22% | 120 19% | 106 29% | 114 23% | 116.7 22% | 125.8 ? 16% | 111.1 ? 25% |
| Witcher 3 ultra * (Watt) | 149.6 | 144 4% | 202 -35% | 159.9 -7% | 183.2 -22% | 172 -15% | ||
| Load Maximum * (Watt) | 160 | 220 -38% | 268 -68% | 208 -30% | 221 -38% | 228.6 -43% | 248 ? -55% | 260 ? -63% |
* ... smaller is better
Power consumption Witcher 3 / Stress test
Power consumption with an external monitor
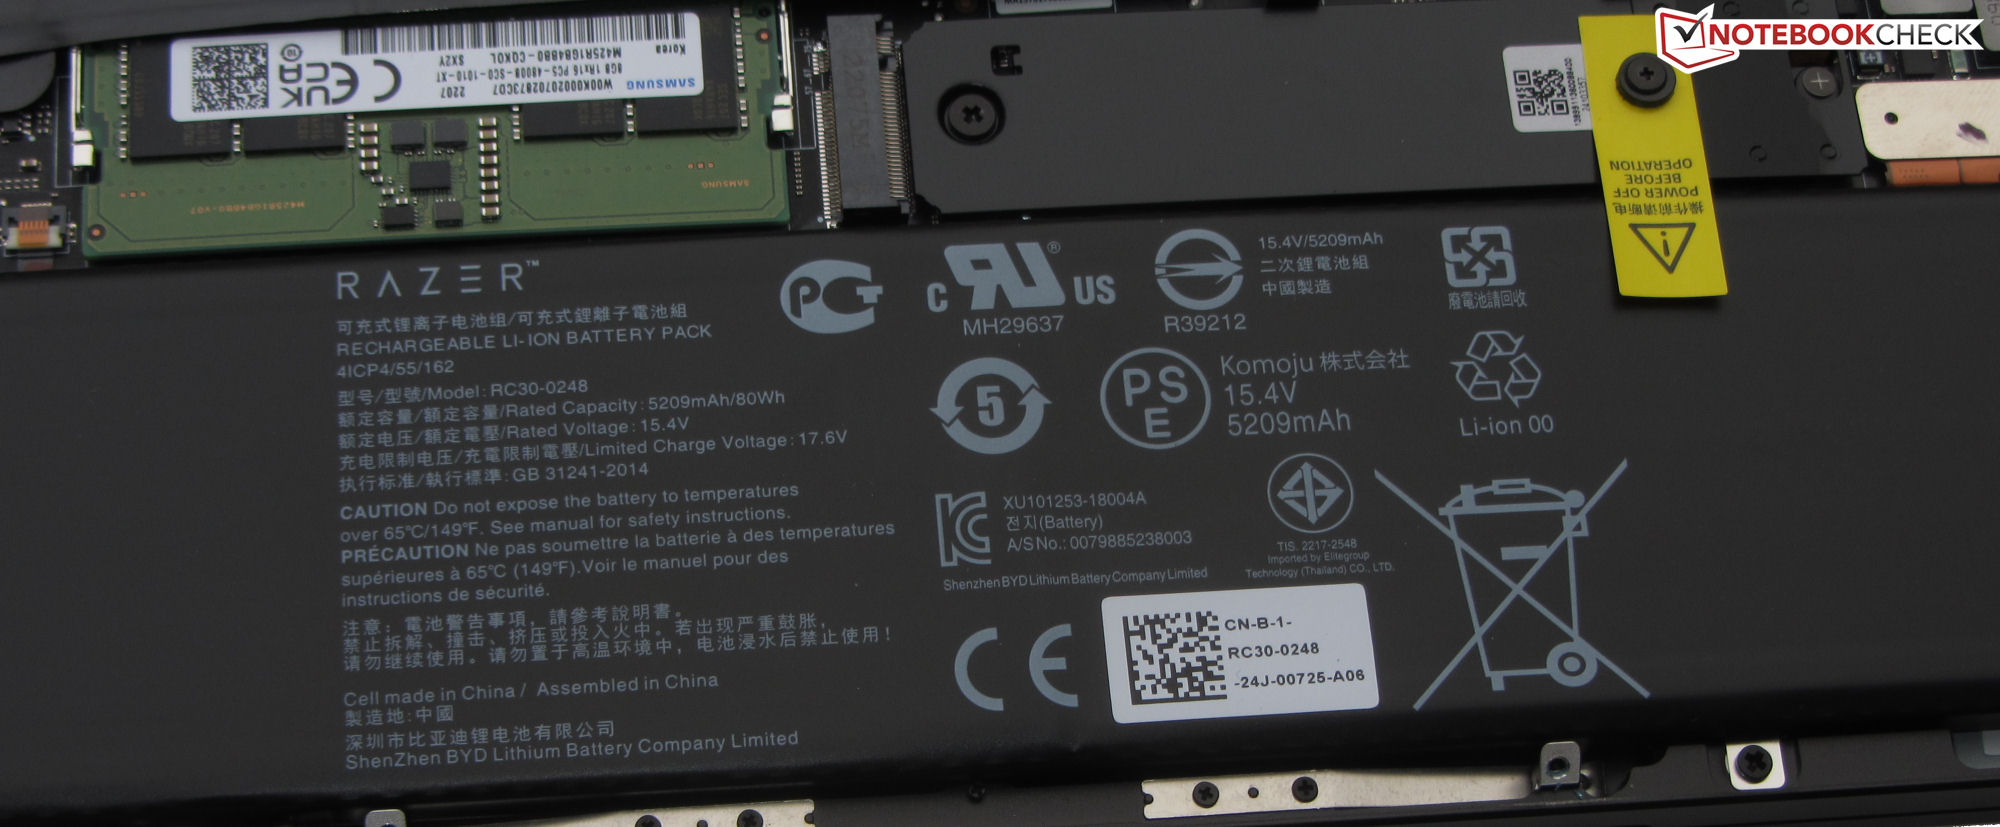
电池寿命
在WiFi测试(使用脚本打开网站)和视频测试(短片Big Buck Bunny(H.264编码,FHD)循环播放)中,15英寸设备的电池运行时间分别为4.34小时和5.52小时。在这两次测试中,笔记本电脑的节能功能被关闭,显示亮度被设置为150cd/m²。视频测试也是在关闭无线电模块的情况下进行的。
总而言之,刀锋战士没有能够提供令人印象深刻的电池寿命--即使对于一台强大的QHD笔记本电脑来说。从整体上看,竞争对手提供了更好的耐力--无论是从绝对值还是从计算的瓦特小时来看。
| Razer Blade 15 OLED (Early 2022) i9-12900H, GeForce RTX 3070 Ti Laptop GPU, 80 Wh | Asus ROG Zephyrus M16 GU603Z i9-12900H, GeForce RTX 3070 Ti Laptop GPU, 90 Wh | Aorus 15 XE5 i7-12700H, GeForce RTX 3070 Ti Laptop GPU, 99 Wh | Schenker XMG Fusion 15 (Mid 22) i7-11800H, GeForce RTX 3070 Laptop GPU, 93.48 Wh | HP Omen 16-b1090ng i7-12700H, GeForce RTX 3070 Ti Laptop GPU, 83 Wh | Razer Blade 15 2022 i7-12800H, GeForce RTX 3080 Ti Laptop GPU, 80 Wh | Average of class Gaming | |
|---|---|---|---|---|---|---|---|
| Battery runtime | 17% | 23% | 51% | 21% | 7% | 23% | |
| Reader / Idle (h) | 6.7 | 10 49% | 15.5 131% | 10.1 51% | 8.27 ? 23% | ||
| H.264 (h) | 5.9 | 7.3 24% | 6.2 5% | 7.5 27% | 8.32 ? 41% | ||
| WiFi v1.3 (h) | 4.6 | 7.4 61% | 6.8 48% | 7.4 61% | 5.6 22% | 4.9 7% | 7.11 ? 55% |
| Load (h) | 2.1 | 1.4 -33% | 1.9 -10% | 1.8 -14% | 1.9 -10% | 1.502 ? -28% |
Pros
Cons
评语--一个紧凑的动力源
刀片15的主要应用领域应该是视频编辑、渲染和游戏。它的Core-i9 12900HCPU和 GeForce RTX 3070 Ti笔记本GPU(TGP:110瓦)提供了必要的动力。一个快速的PCIe-4固态硬盘(1TB)确保了短的加载时间。
刀片15 OLED(2022年初)是游戏玩家和创意类型的强大工具。
重点不仅在于高性能。与之前评测的配备12900H或3070Ti的笔记本电脑相比,计算核心的最大结果是平均的。虽然热量的产生对于这种功率的笔记本电脑来说是典型的,但噪音排放相对适中。后者不能说是空闲使用时的功耗。刀片15帮助自己从瓶子里喝了一大口水。
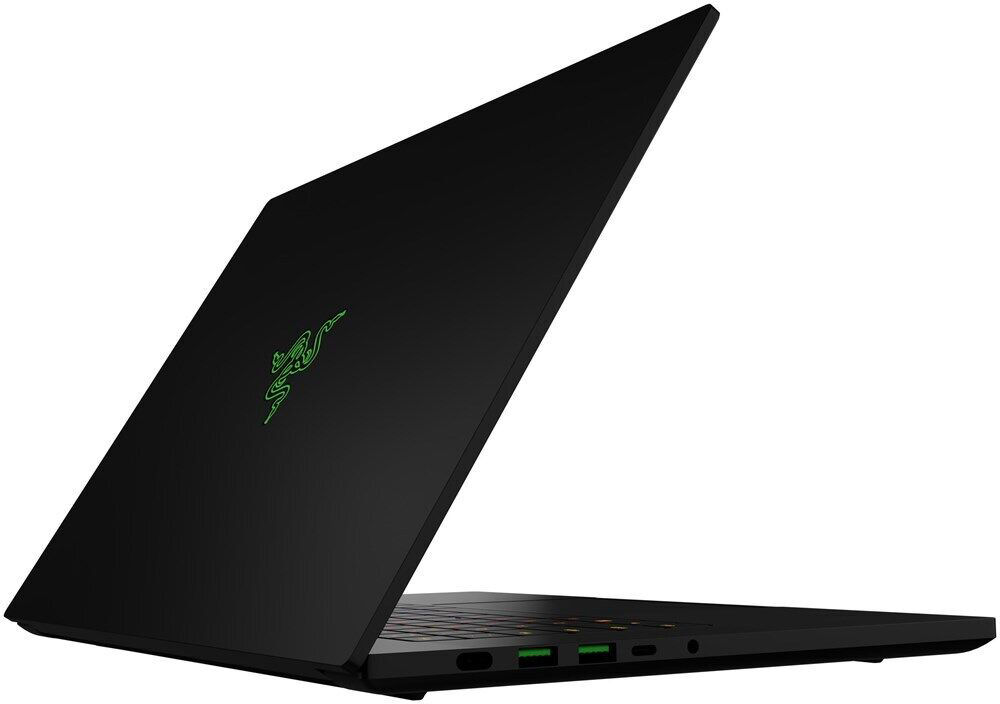
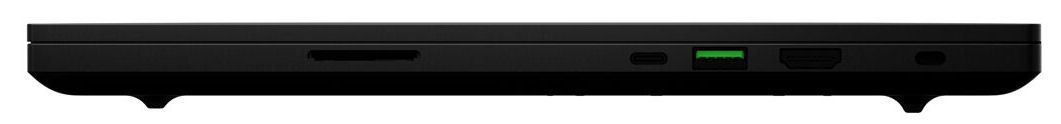
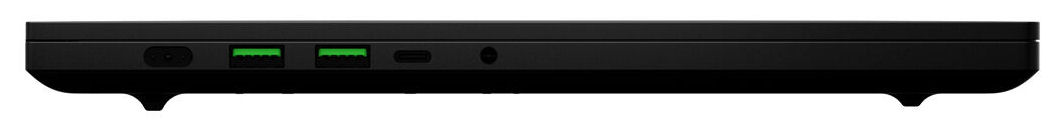
4至6小时的实际电池寿命未能给人留下深刻印象。在这方面,竞争对手有更多的机会。不过,电池可以通过一个通用的USB-C电源(最小65瓦,20伏)进行充电,两个USB-C端口(2个Thunderbolt)都支持Power Delivery(和Displayport)。
总的来说,反射式OLED面板(QHD)的得分比之前评测的Blade 2022型号中的传统LED面板(QHD)要好一些。两款显示器都提供良好的色彩空间覆盖率(sRGB:100%)和良好的色彩再现。当涉及到黑色水平、亮度和响应时间时,OLED型号在前面,而LED型号由于其哑光表面而得分。
该设备的一个可能的替代品可能是华硕ROG Zephyrus M16 GU603Z.从性能上看,该处理器与之相当,但由于它有一个更明亮的16:10格式的显示屏以及相当长的电池寿命而获得了额外的分数。一个预算的替代方案可能是Aorus 15 XE5.尽管这台机器的价格便宜了几百美元,但它提供了比刀片更多一点的动力和更好的电池寿命。
价格和可用性
评论规格Razer Blade 15 OLED (Early 22)可以在亚马逊上以1,967美元的价格得到。.
Razer Blade 15 OLED (Early 2022)
- 03/04/2023 v7 (old)
Sascha Mölck
Transparency
The selection of devices to be reviewed is made by our editorial team. The test sample was provided to the author as a loan by the manufacturer or retailer for the purpose of this review. The lender had no influence on this review, nor did the manufacturer receive a copy of this review before publication. There was no obligation to publish this review. As an independent media company, Notebookcheck is not subjected to the authority of manufacturers, retailers or publishers.
This is how Notebookcheck is testing
Every year, Notebookcheck independently reviews hundreds of laptops and smartphones using standardized procedures to ensure that all results are comparable. We have continuously developed our test methods for around 20 years and set industry standards in the process. In our test labs, high-quality measuring equipment is utilized by experienced technicians and editors. These tests involve a multi-stage validation process. Our complex rating system is based on hundreds of well-founded measurements and benchmarks, which maintains objectivity. Further information on our test methods can be found here.
Price comparison

