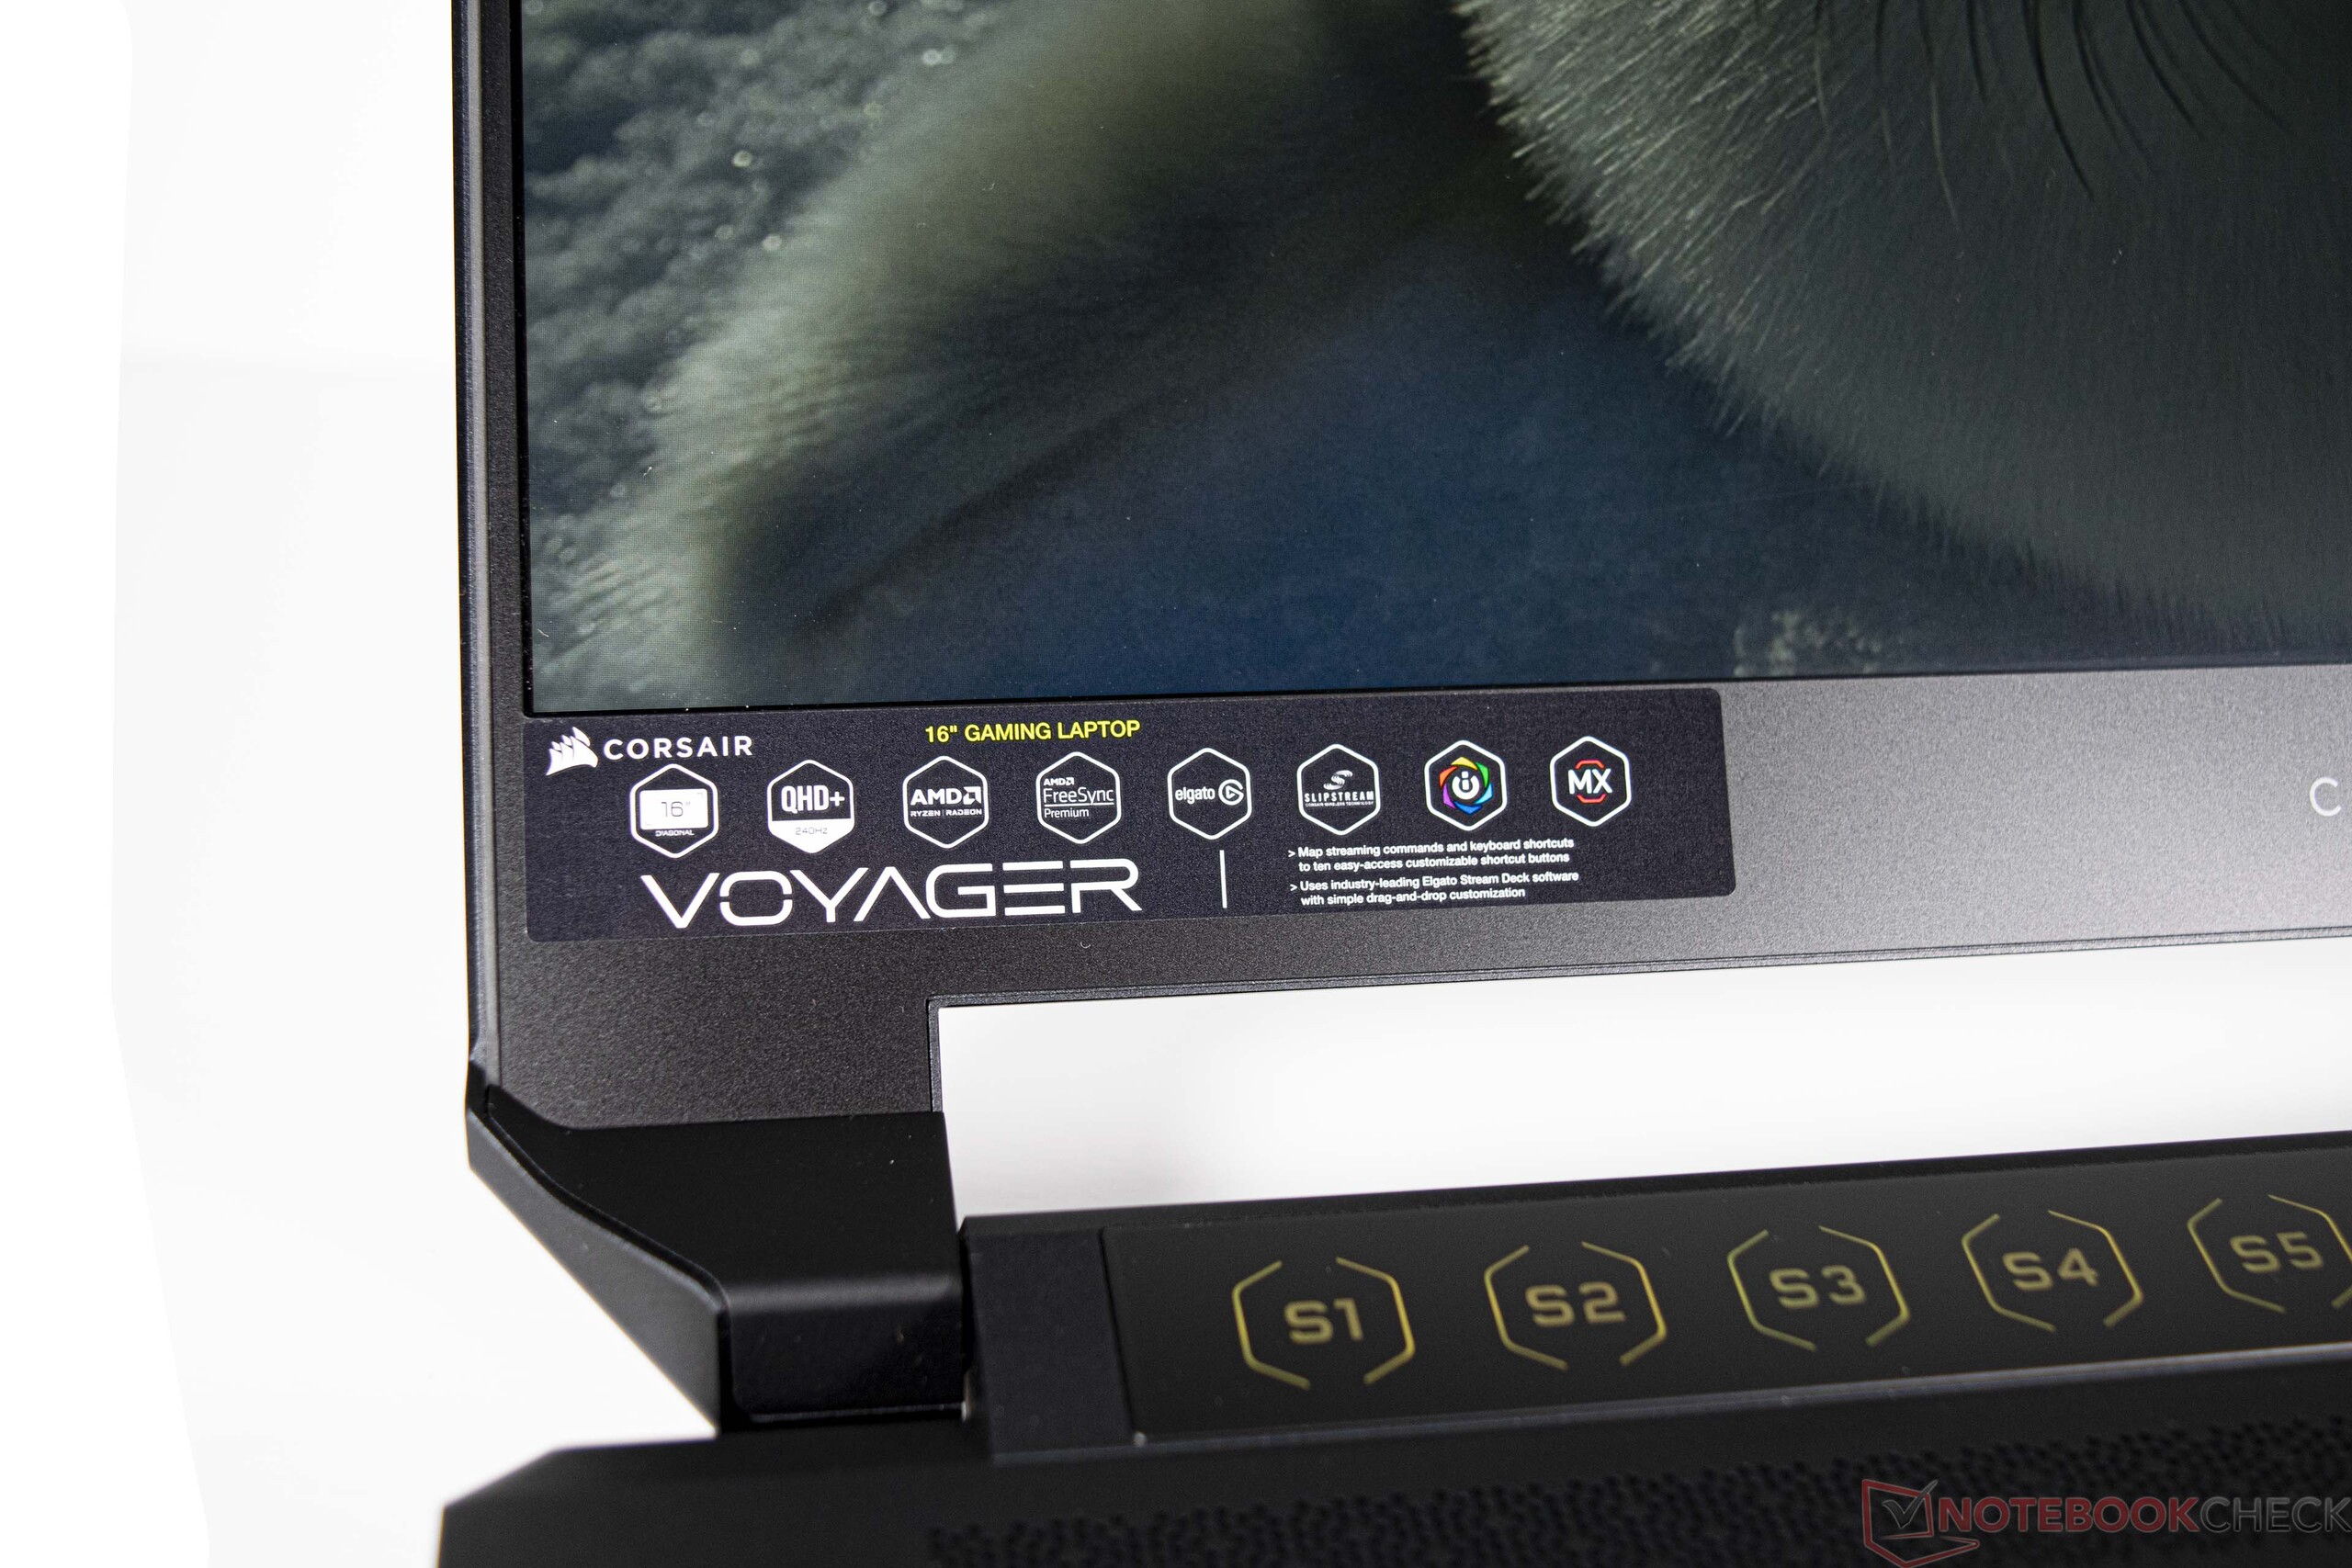
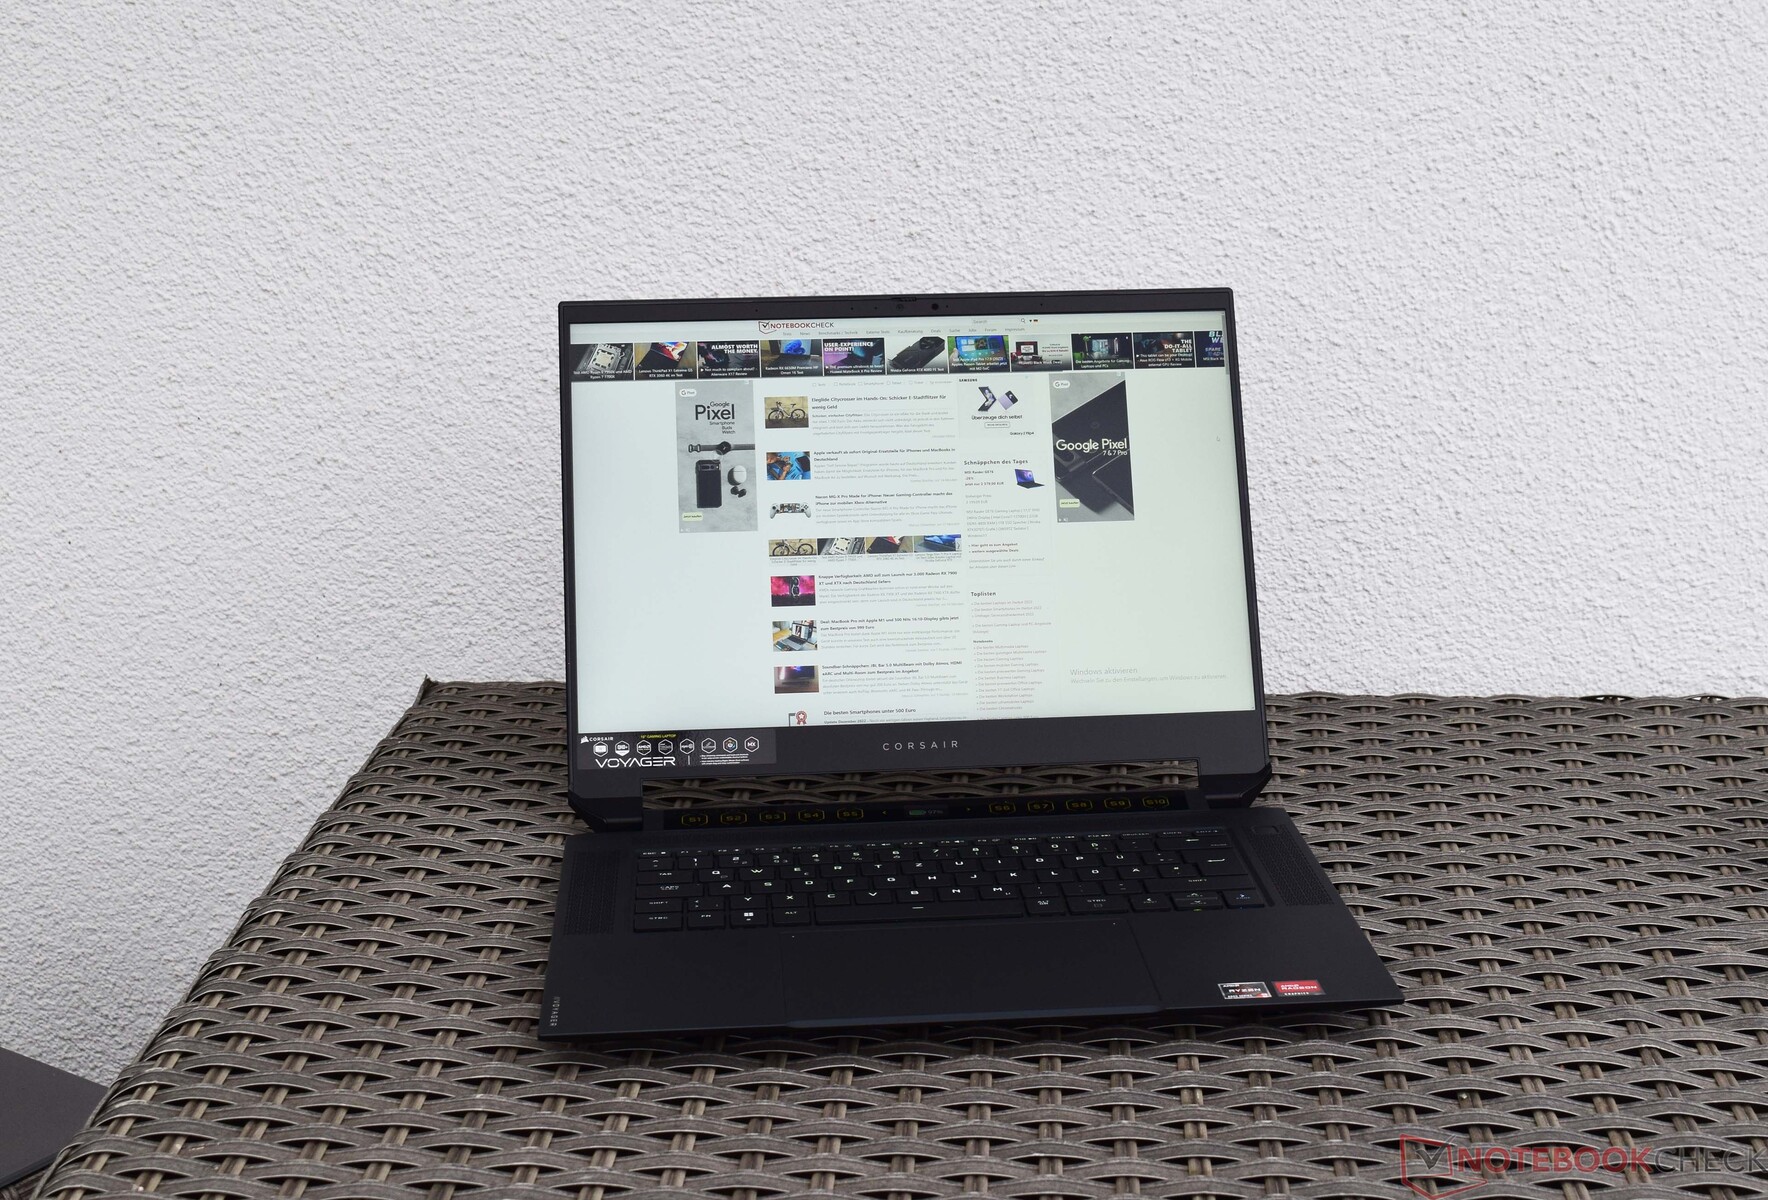
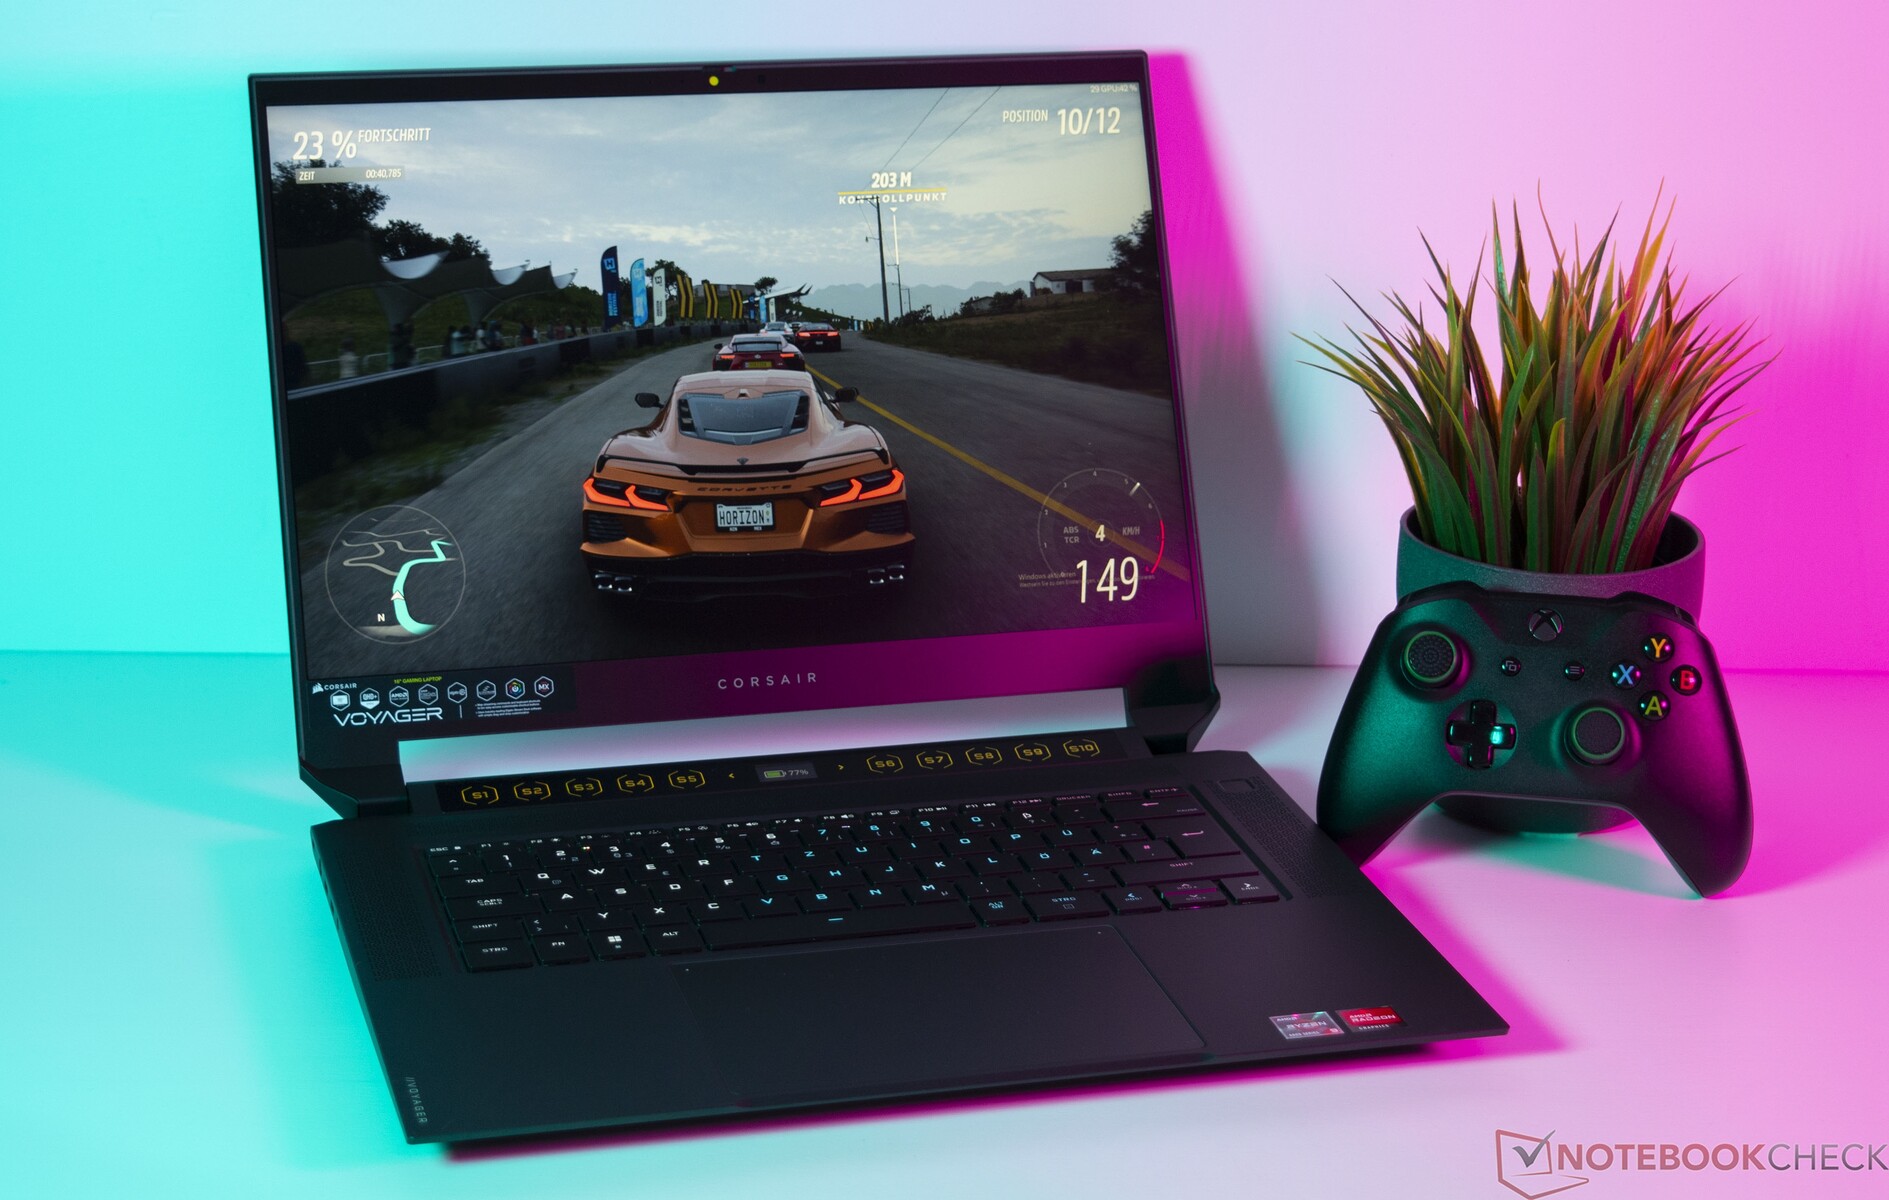
海盗船Voyager a1600笔记本电脑在审查。为游戏玩家、流媒体和创作者提供全面的AMD动力

当涉及到PC领域的配件时,海盗船是一个著名的名字:外围设备、电源、固态硬盘、机箱、显示器以及预制桌面系统,其中一些我们已经测试过,是制造商目前阵容的一部分。通过Voyager系列,海盗船现在也进入了笔记本领域,并希望通过Voyager a1600参与到游戏领域。起步的位置一点也不差,因为随着 AMD Ryzen 9 6900HS和一个专用的 AMD Radeon RX 6800M有一个很好的基础。在顶级配置中,你还可以期待32GB DDR5内存和2TB存储空间的SSD。另一方面,240赫兹的QHD面板,总是必须的。然而,3,550欧元的价格属于上层联盟的范畴。
如果你使用一个 AMD Ryzen 7 6800HS配有16GB内存和1TB SSD。在这里,目前应该是2600欧元。在测试中,海盗船Voyager a1600与当前游戏笔记本领域的强大对手竞争。更多的细节可以在下表中找到。
潜在的竞争对手比较
Rating | Date | Model | Weight | Height | Size | Resolution | Price |
|---|---|---|---|---|---|---|---|
| 86.6 % v7 (old) | 12 / 2022 | Corsair Voyager a1600 R9 6900HS, Radeon RX 6800M | 2.4 kg | 19.9 mm | 16.00" | 2560x1600 | |
| 89.5 % v7 (old) | 08 / 2022 | Asus ROG Flow X16 GV601RW-M5082W R9 6900HS, GeForce RTX 3070 Ti Laptop GPU | 2.1 kg | 19.4 mm | 16.10" | 2560x1600 | |
| 90.8 % v7 (old) | 09 / 2022 | Lenovo Legion 7 16ARHA7 R9 6900HX, Radeon RX 6850M XT | 2.6 kg | 19.4 mm | 16.00" | 2560x1600 | |
| 87.2 % v7 (old) | 06 / 2022 | Acer Predator Triton 500 SE PT516-52s-70KX i7-12700H, GeForce RTX 3080 Ti Laptop GPU | 2.3 kg | 19.9 mm | 16.00" | 2560x1600 | |
| 85.5 % v7 (old) | 05 / 2022 | HP Omen 16-b1090ng i7-12700H, GeForce RTX 3070 Ti Laptop GPU | 2.3 kg | 23 mm | 16.10" | 2560x1440 | |
| 88.9 % v7 (old) | 09 / 2022 | Lenovo Legion 7 16IAX7-82TD004SGE i9-12900HX, GeForce RTX 3080 Ti Laptop GPU | 2.6 kg | 20 mm | 16.00" | 2560x1600 |
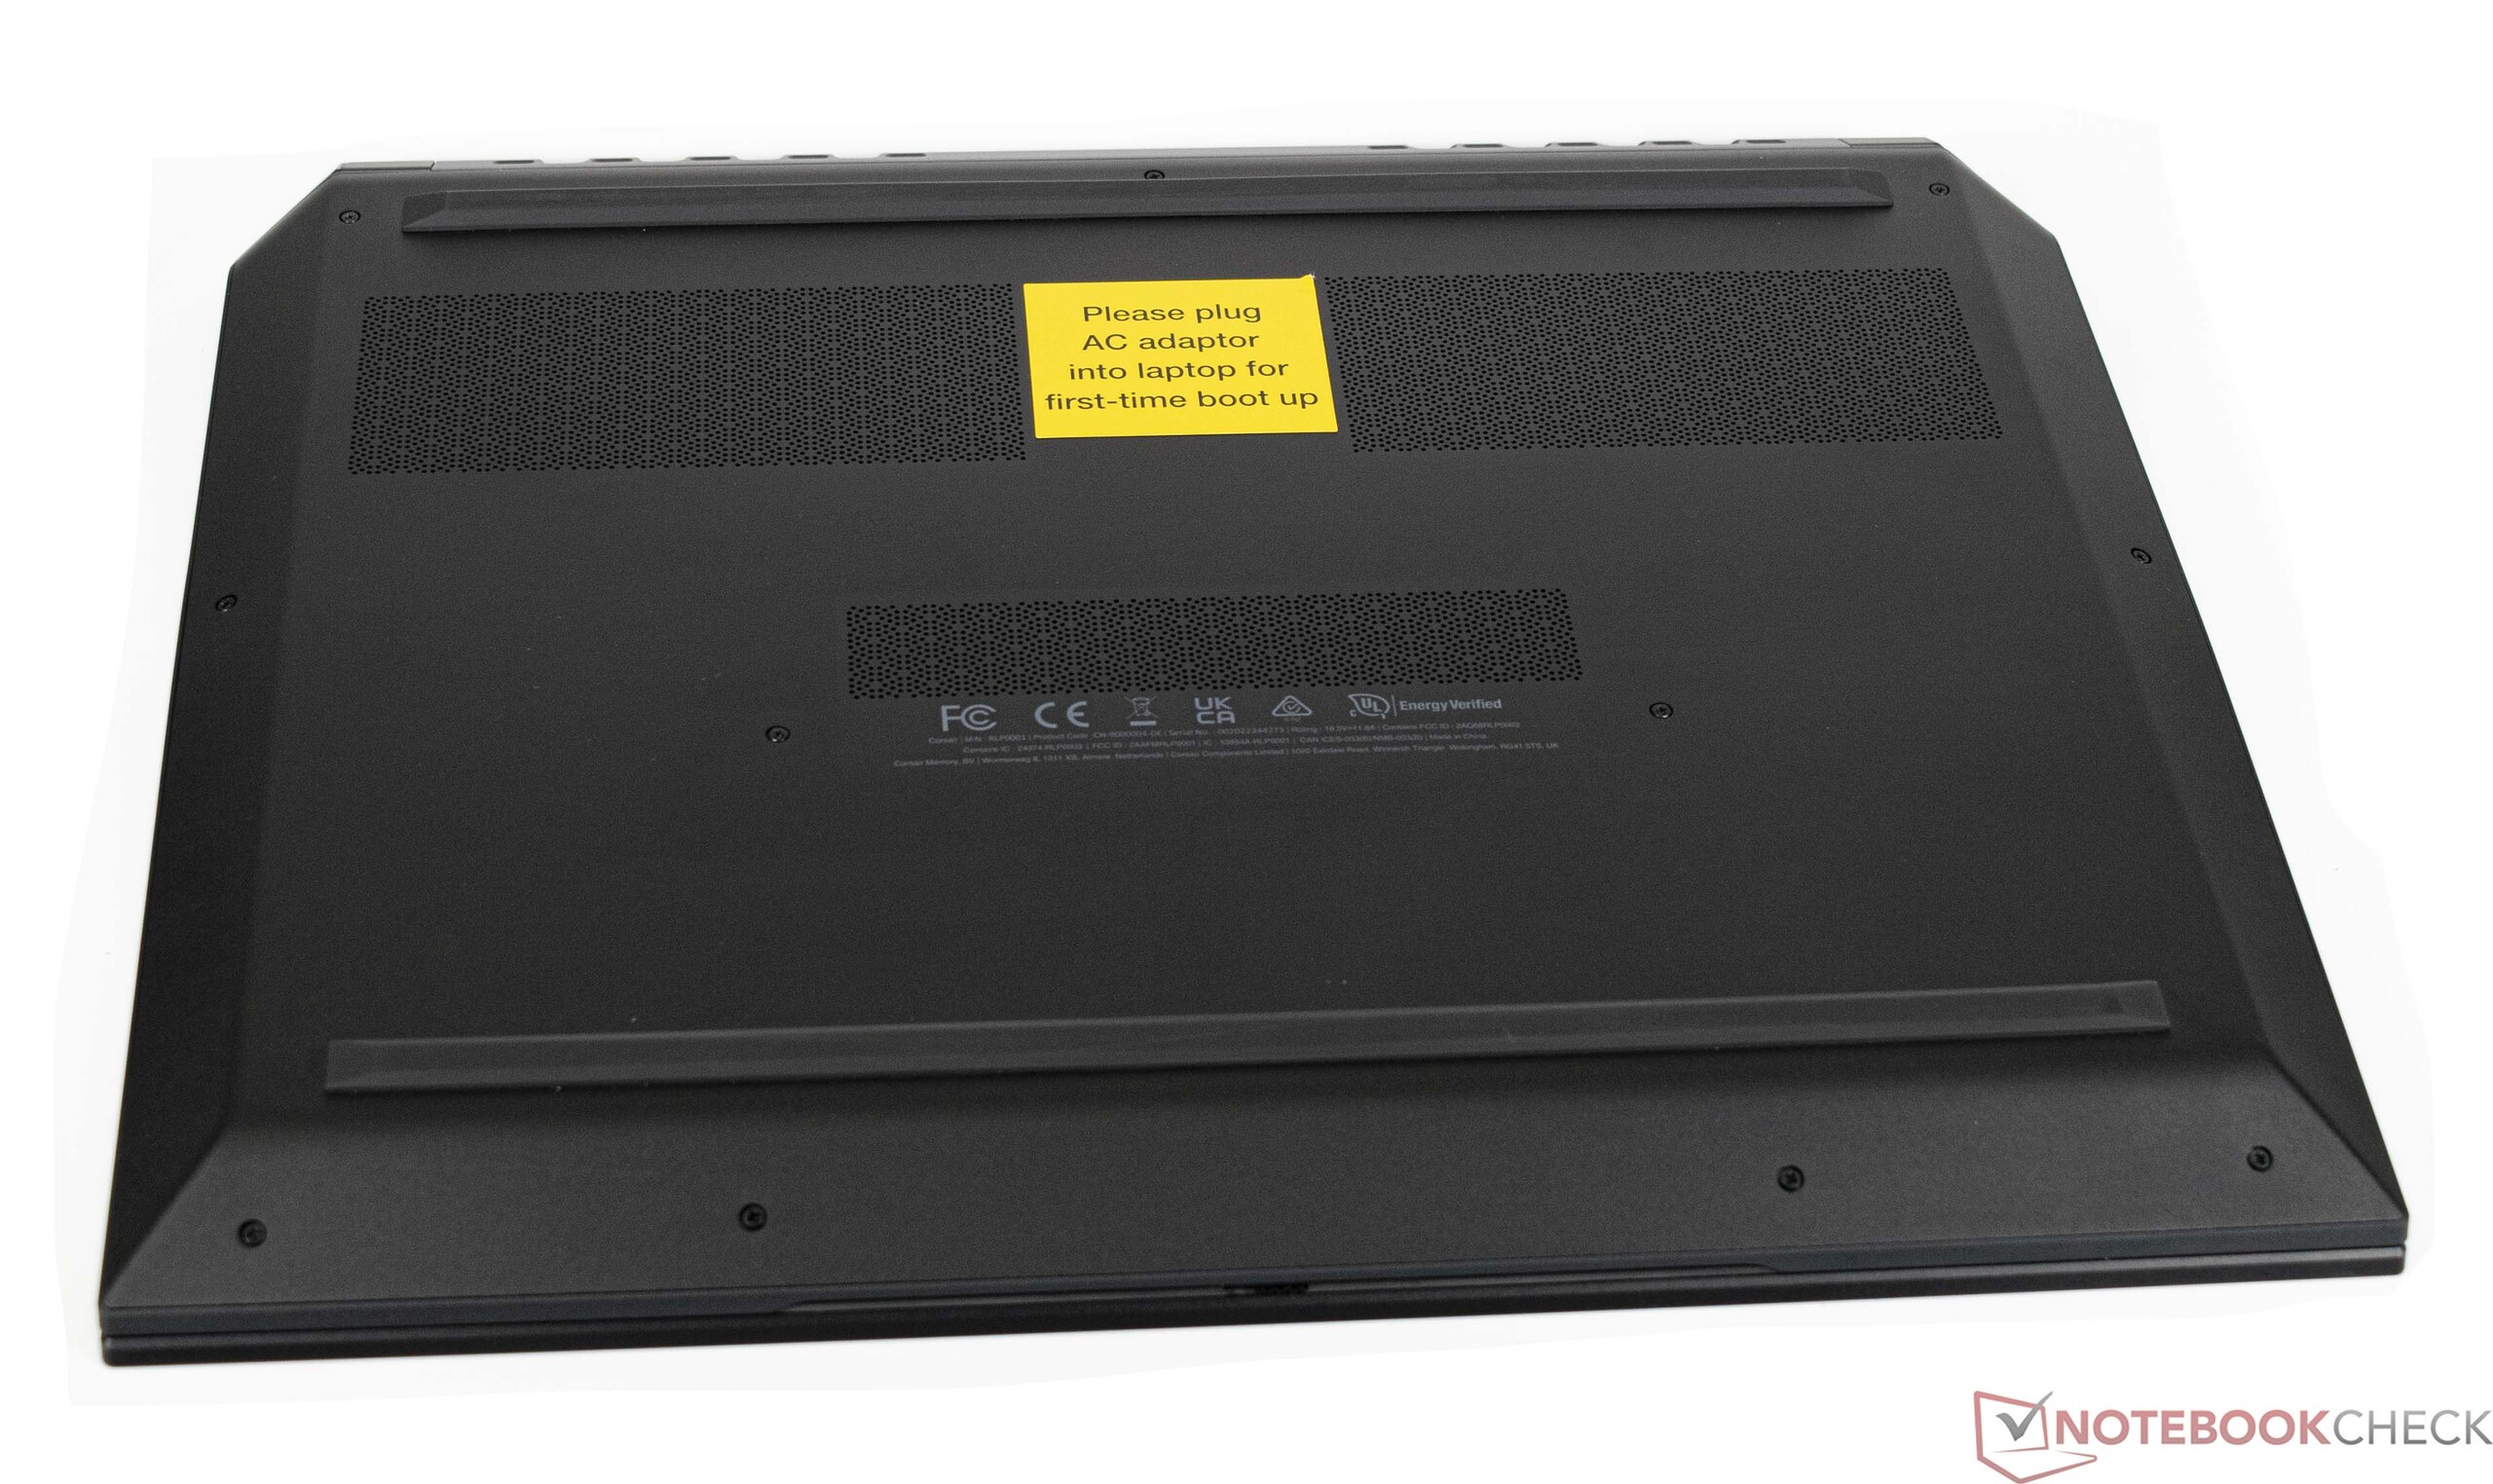
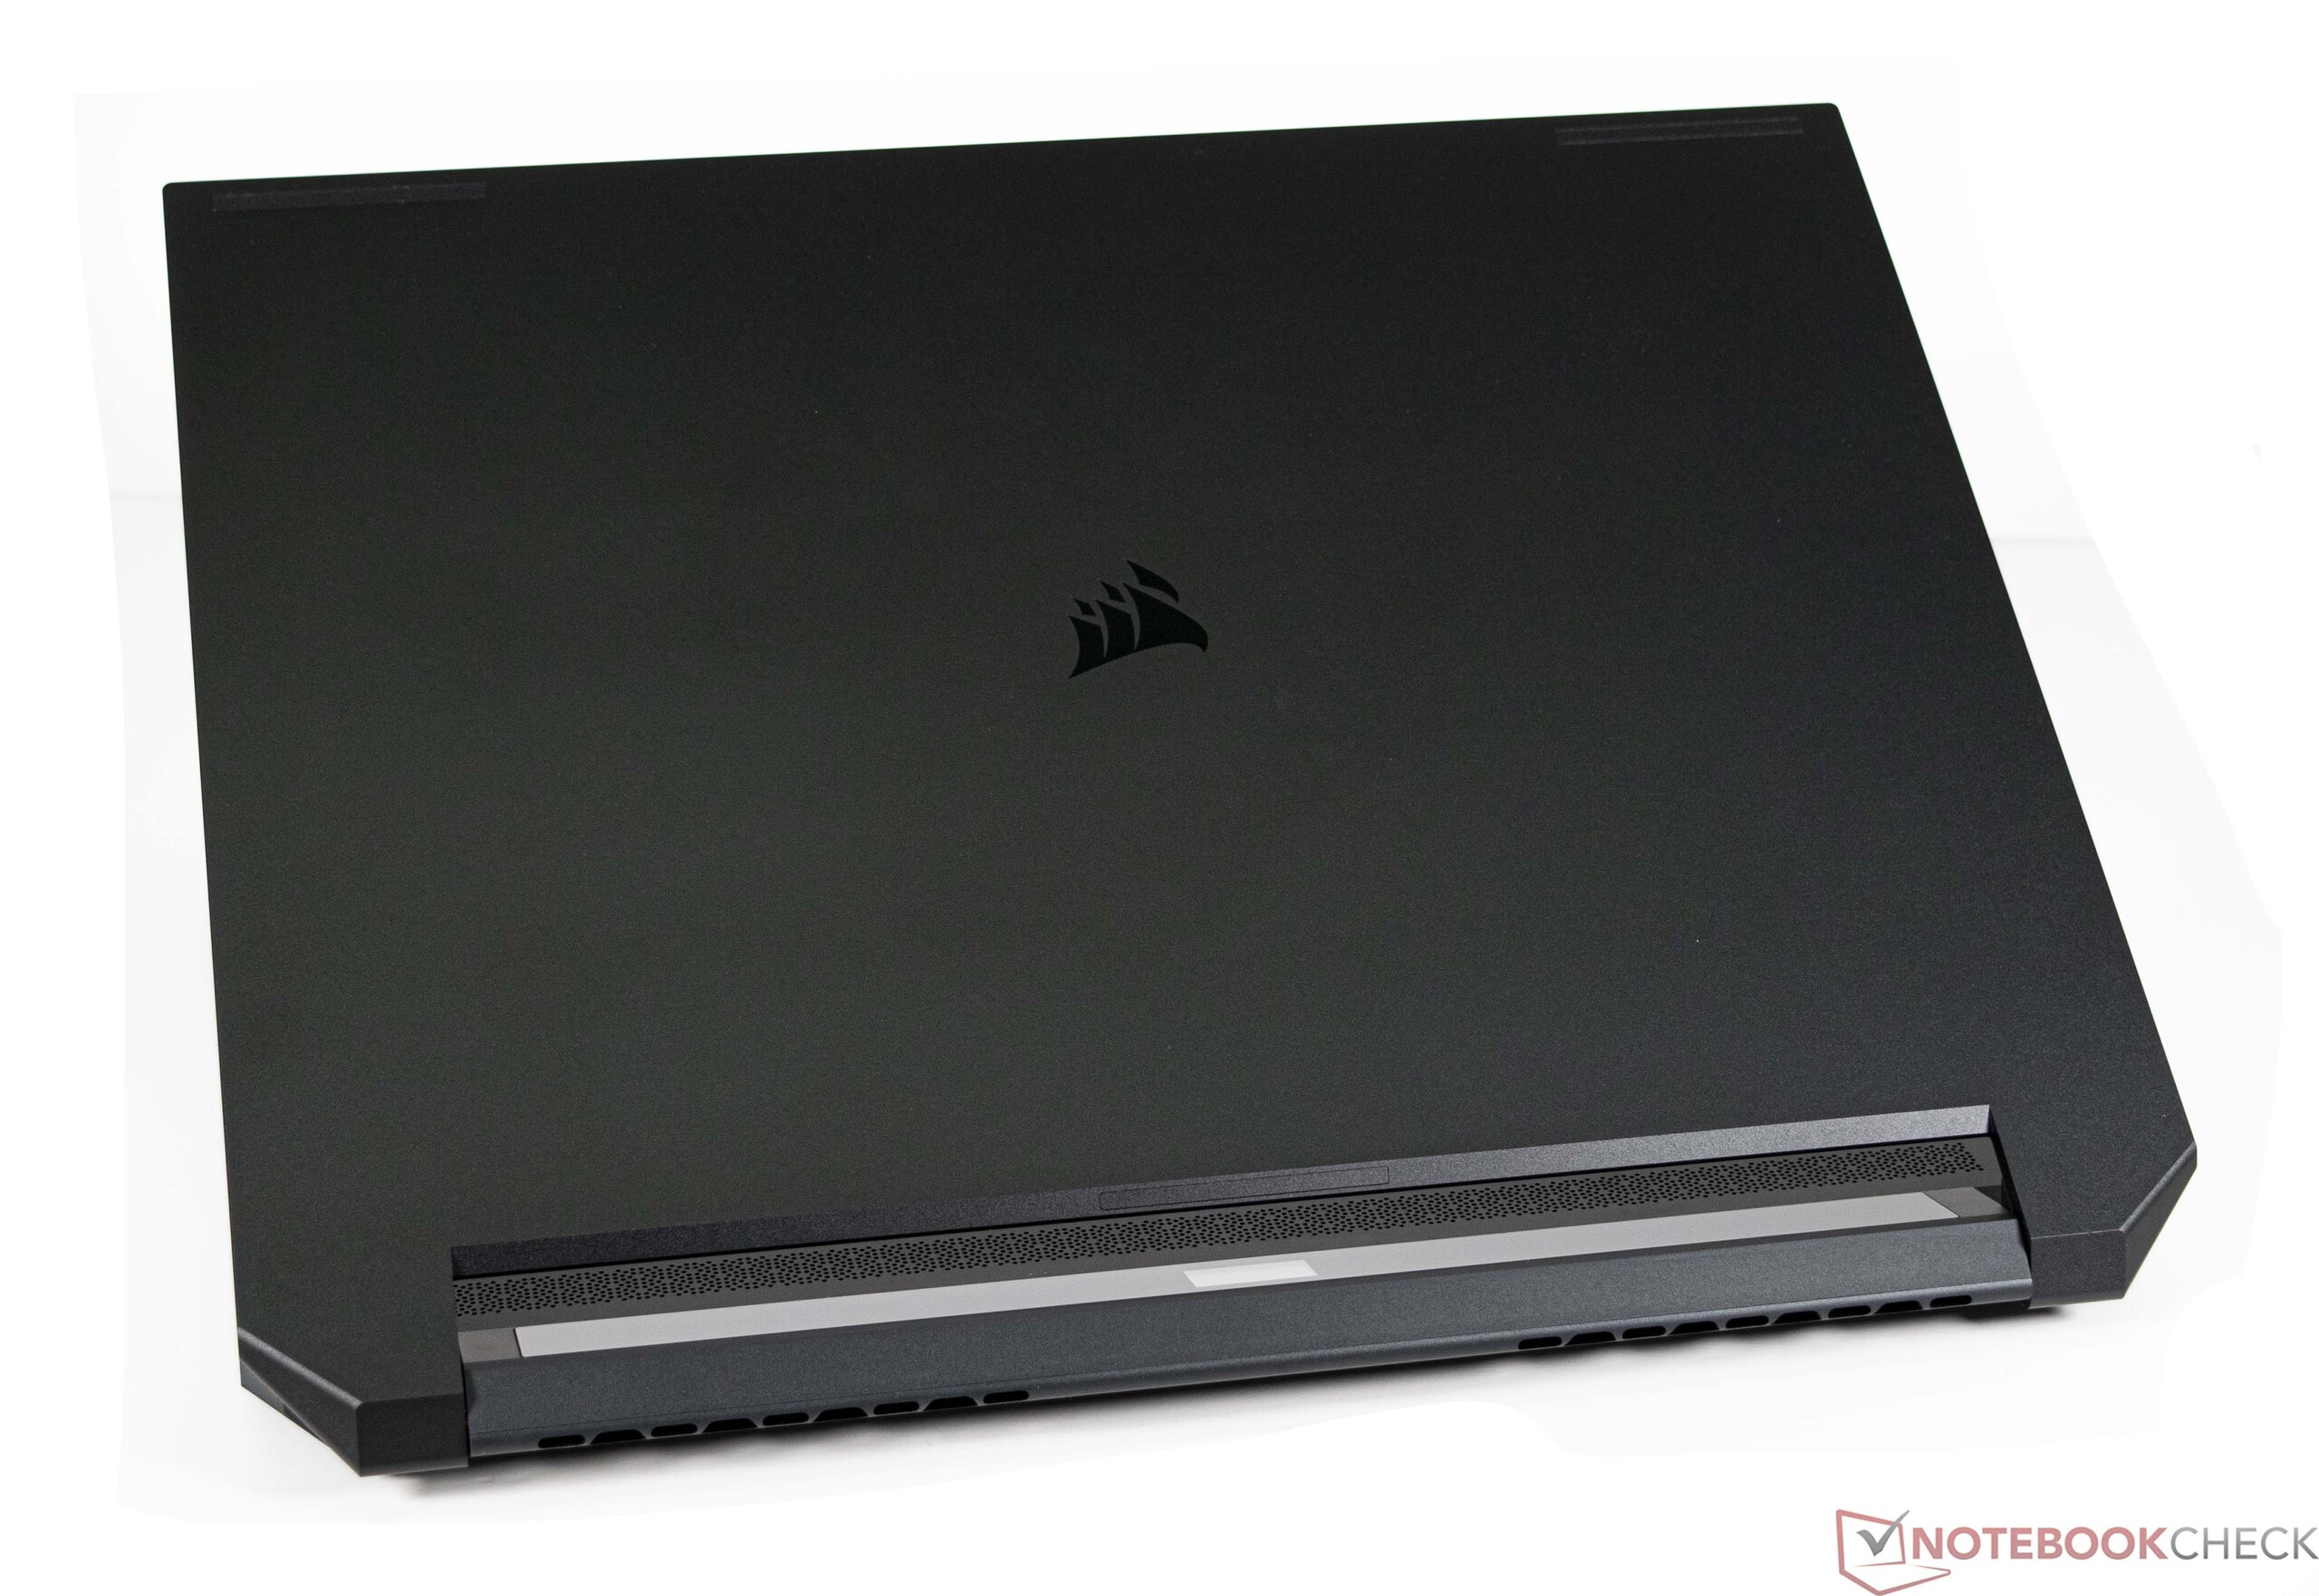
外壳和功能 - 薄而结实
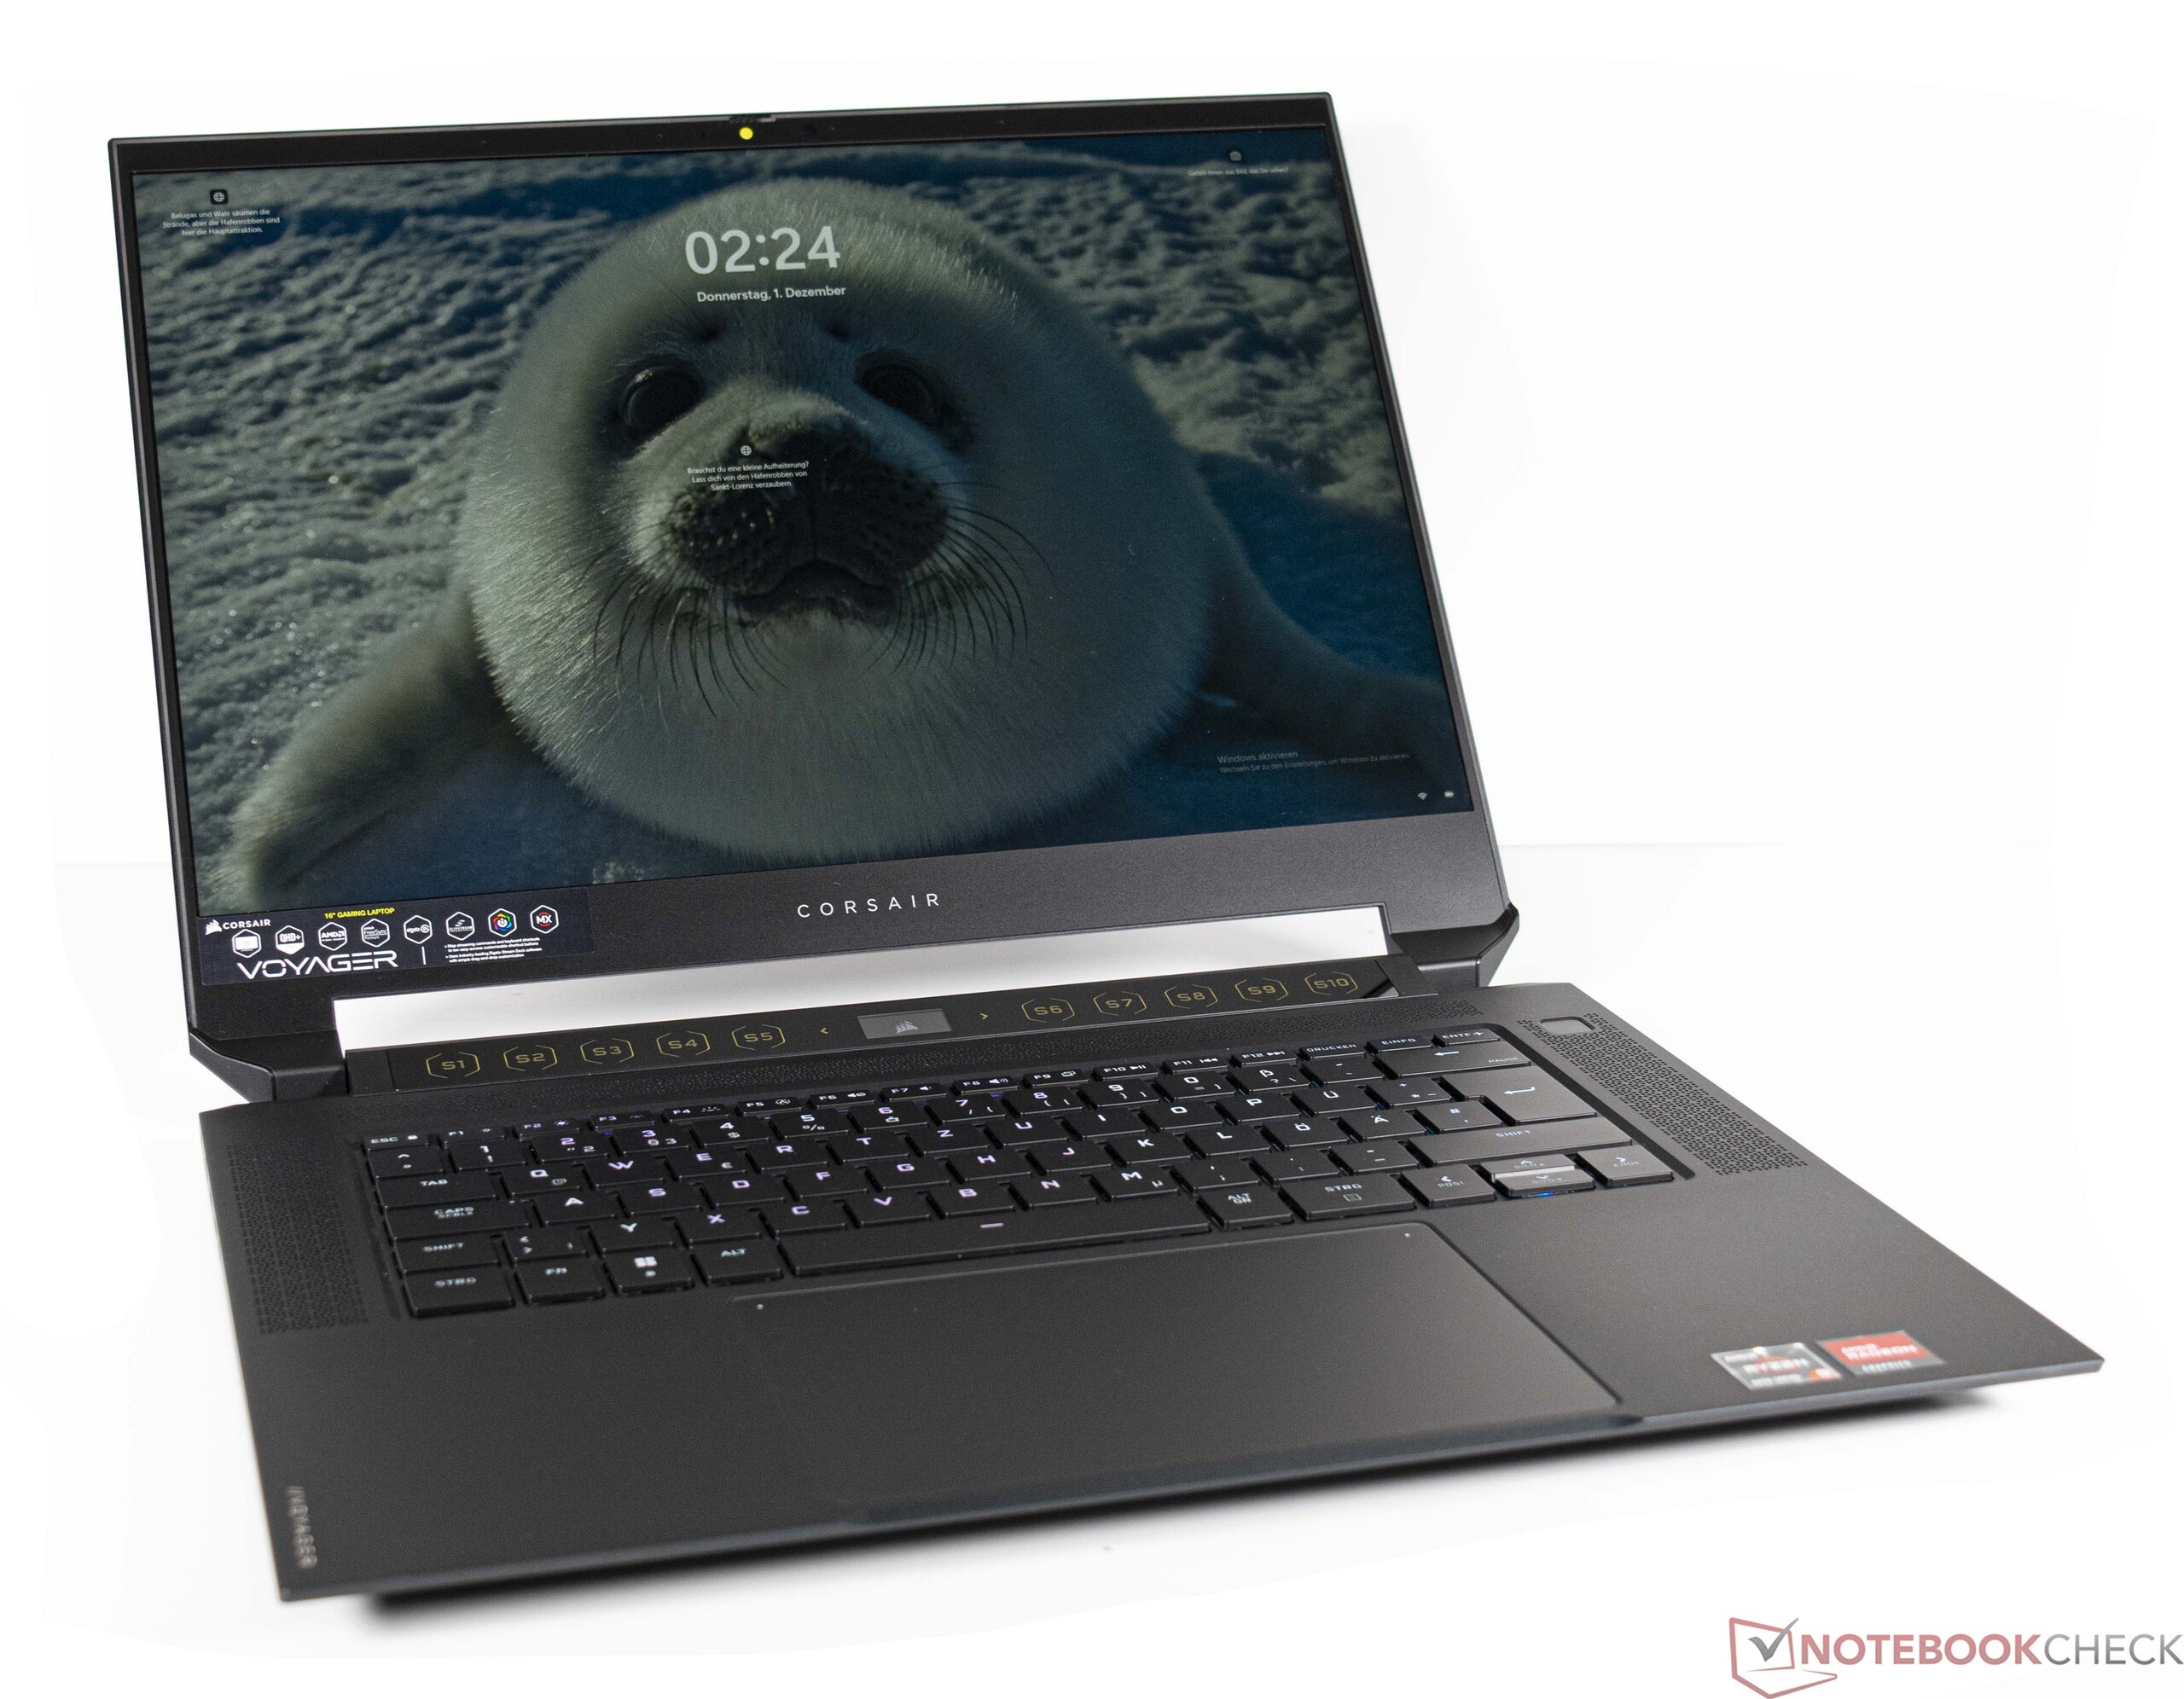
海盗船Voyager a1600的外壳是由铝制成的,因此使设备具有非常好的稳定性。在我们的扭转测试中,只有显示器的盖子稍微扭曲了一下。否则,这款游戏笔记本的外观相对适中,没有任何RGB照明,这是相当不错的。显示器由两个小铰链固定,不能完全防止弹跳。
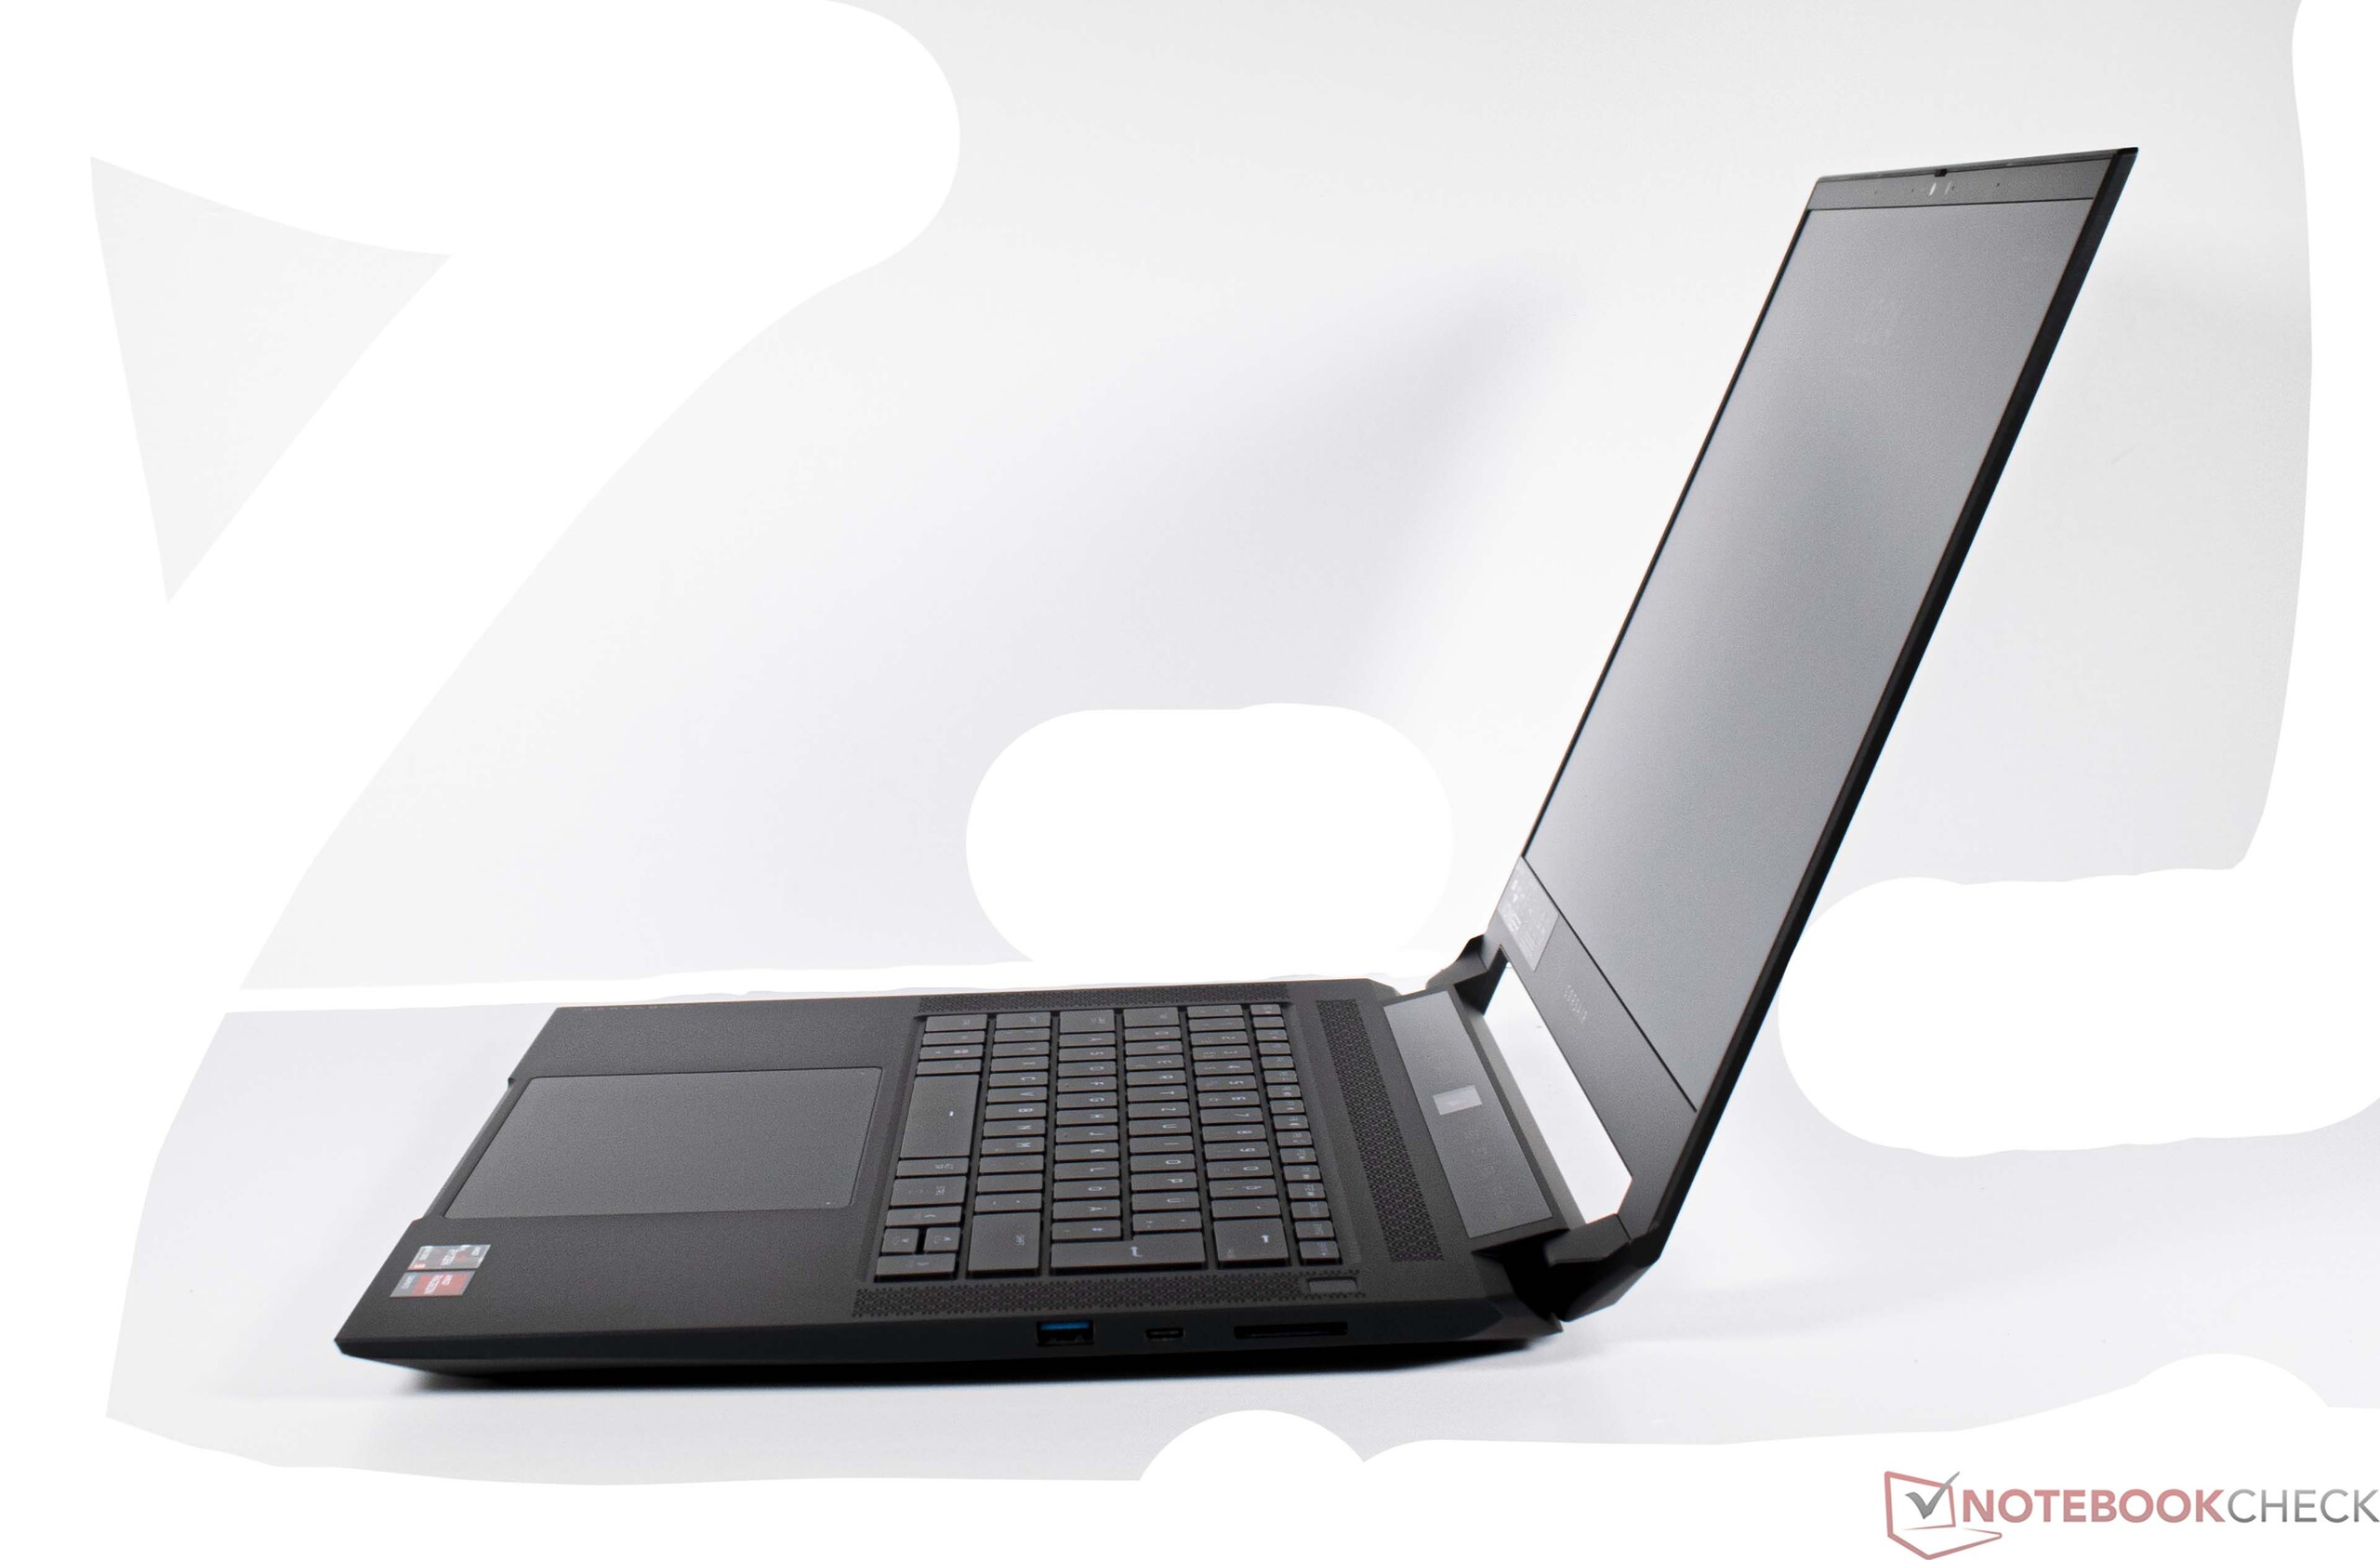
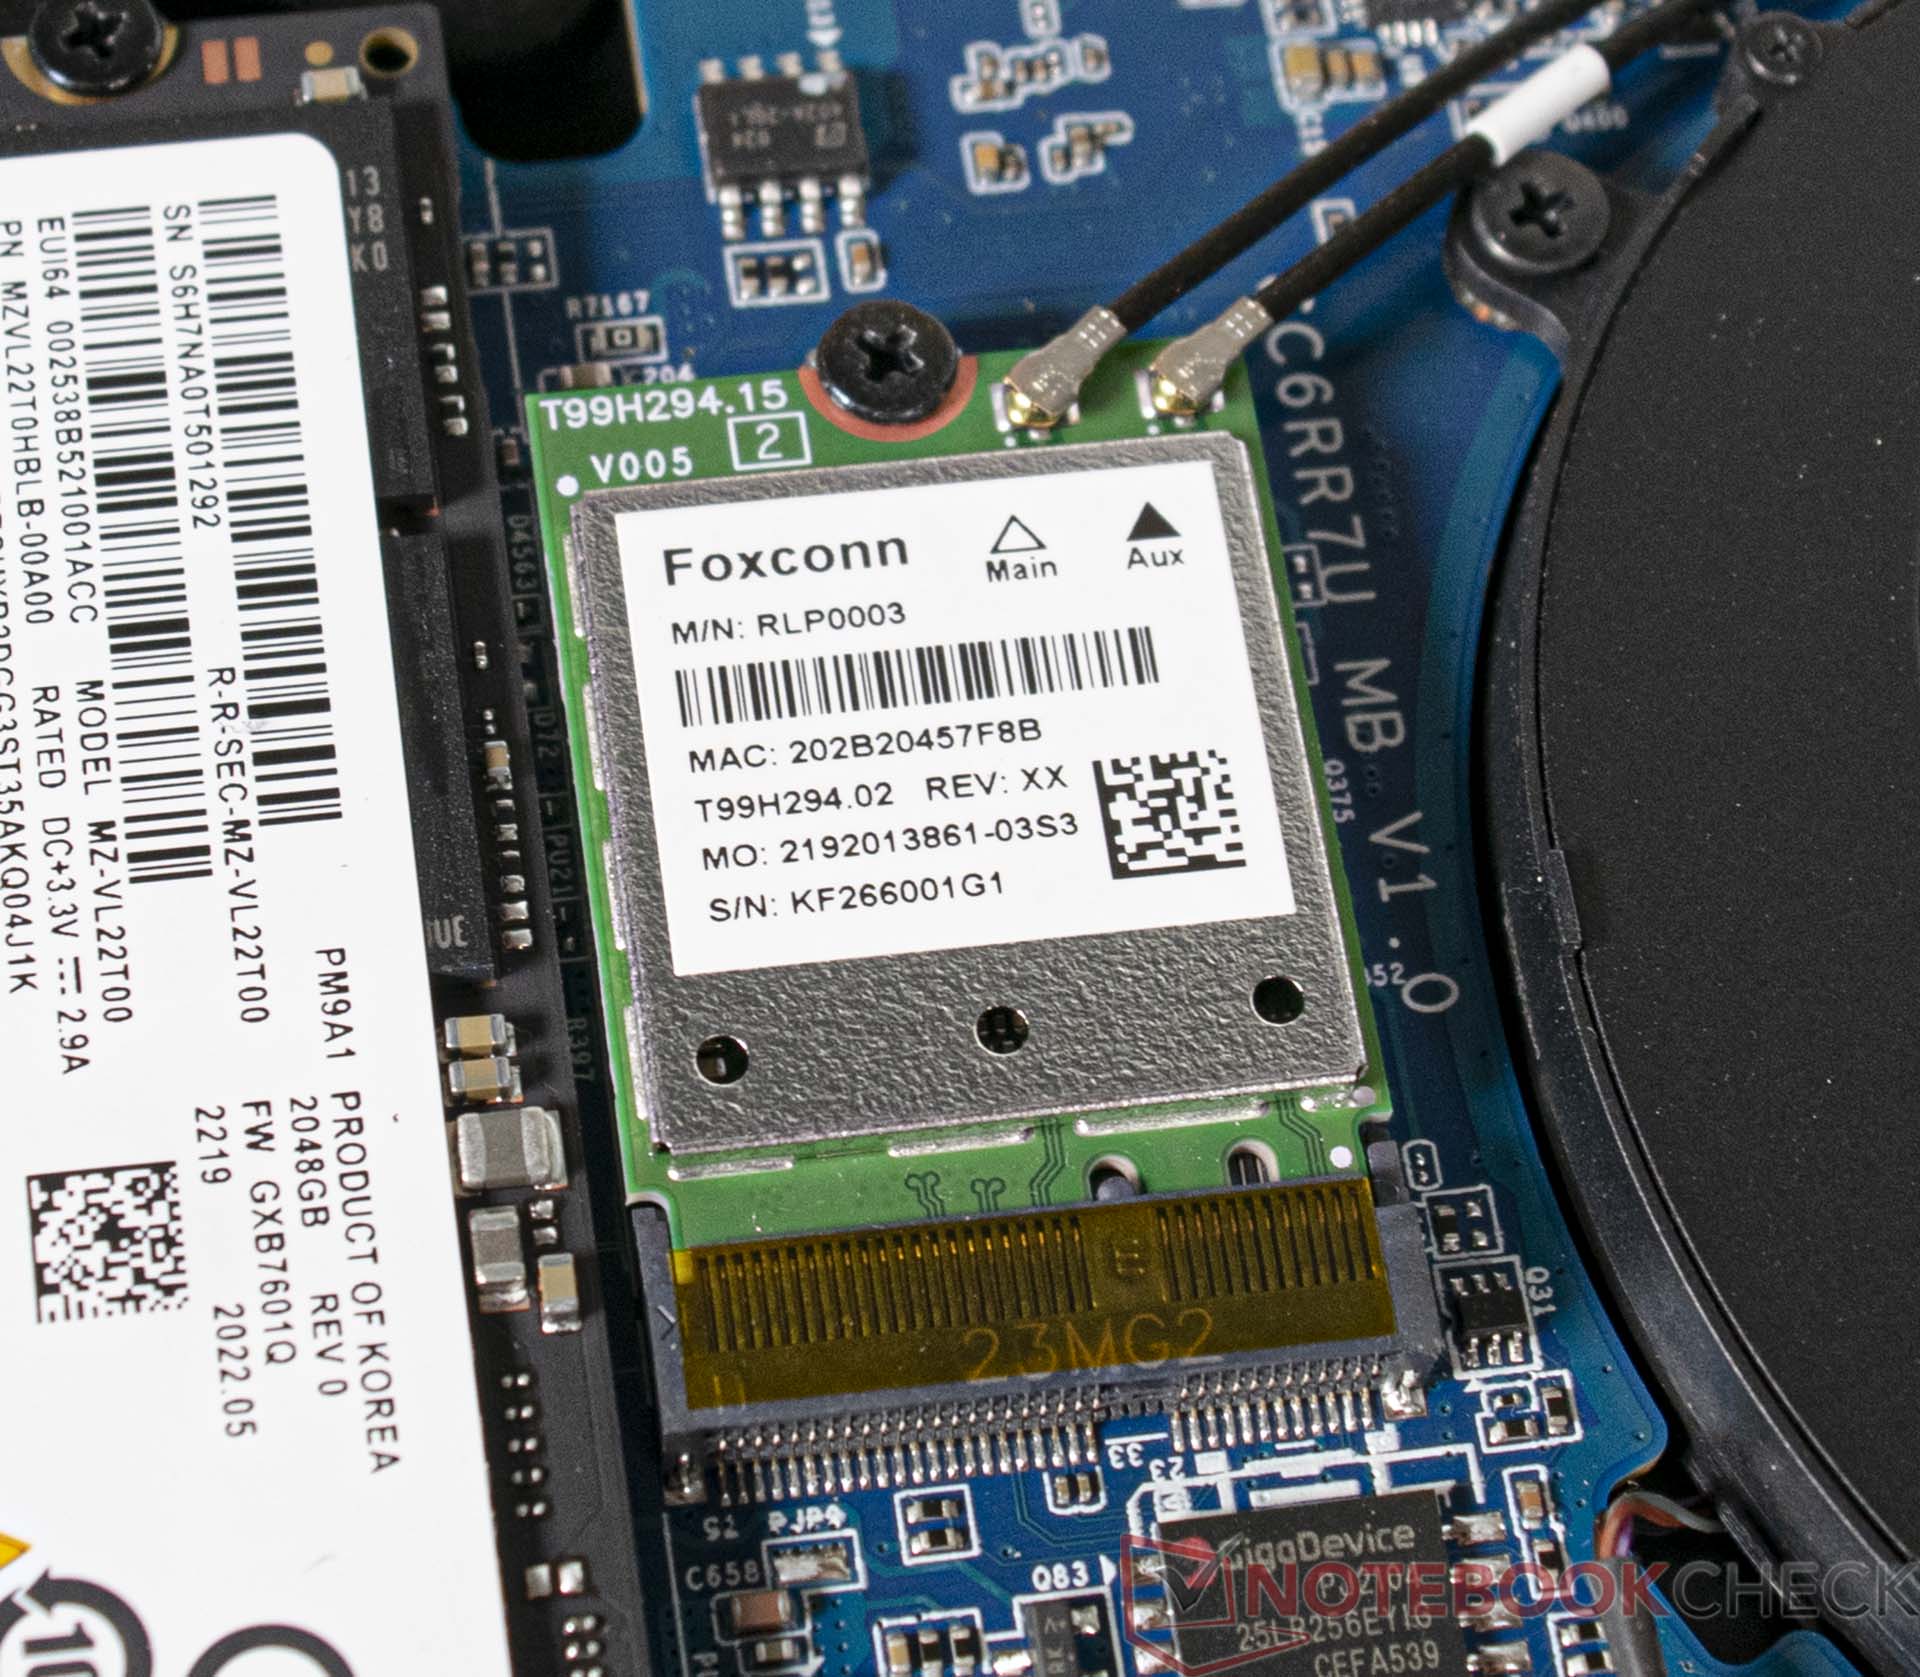
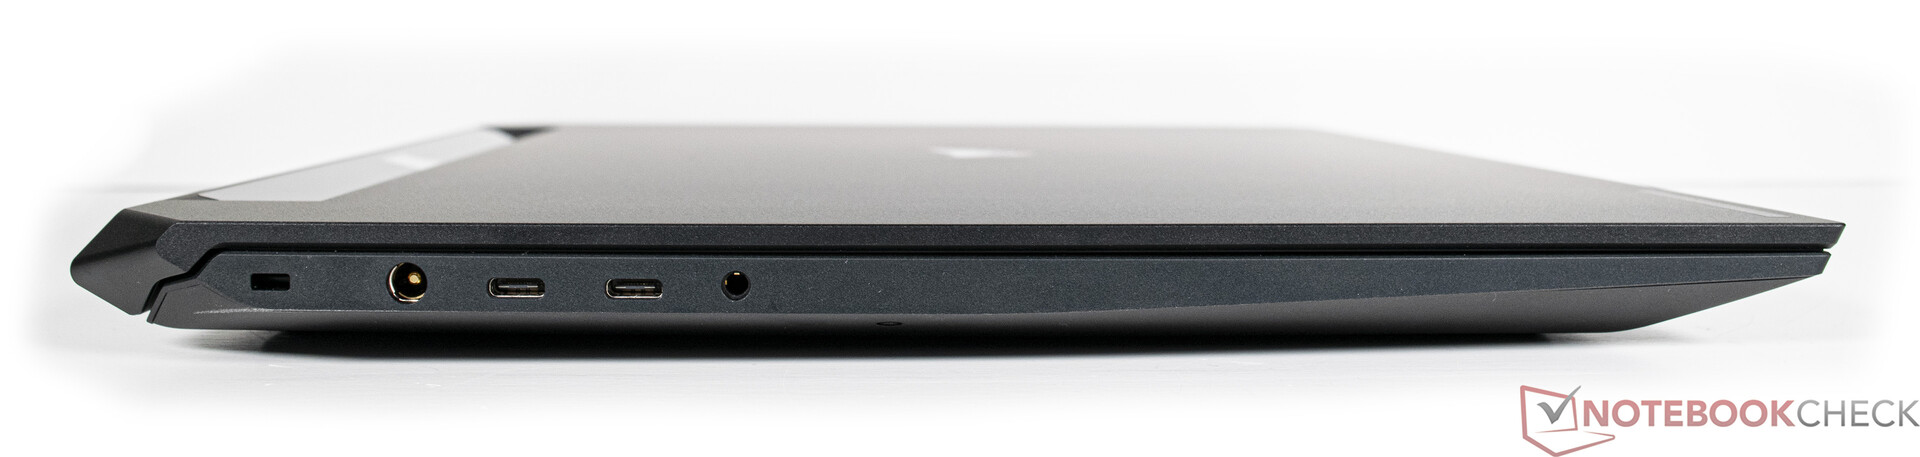
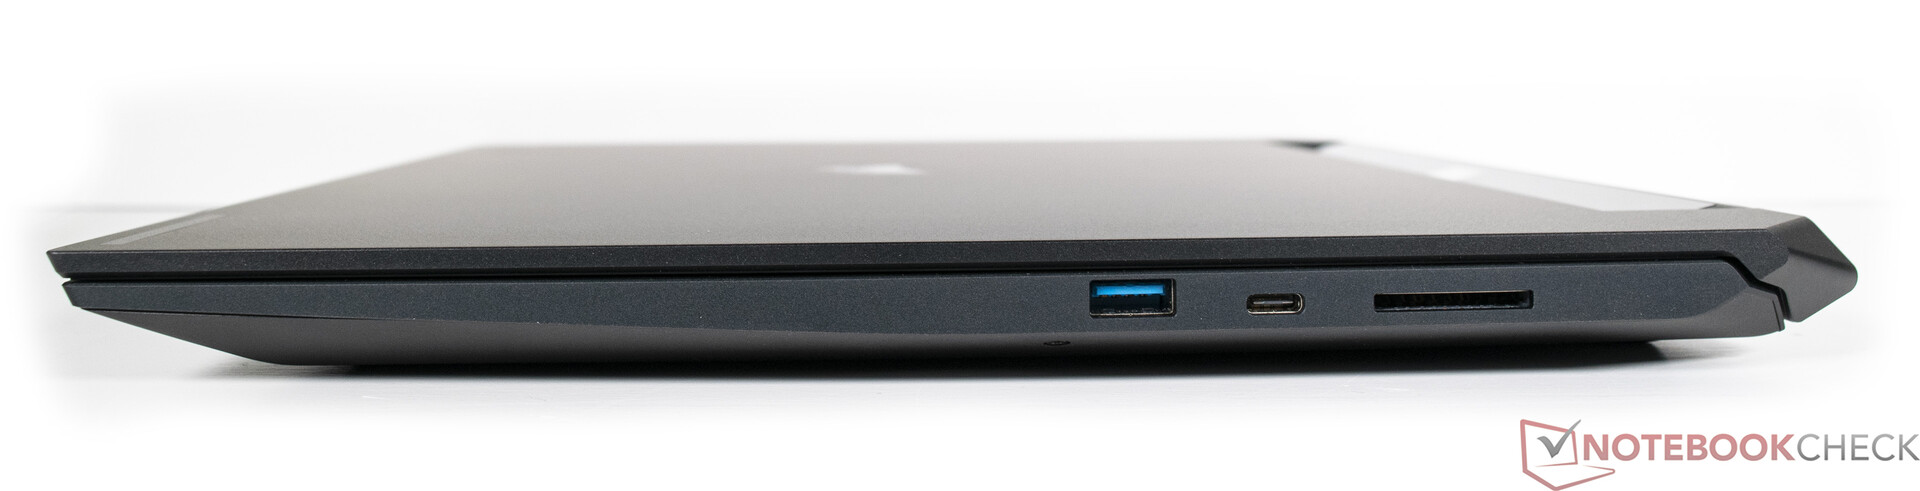
在连接方面,海盗船提供了现代接口,尽管数量非常可控。只有一个USB Type-A是很遗憾的,但有三个支持Thunderbolt的USB-C端口。因此,这台笔记本电脑为未来做好了准备。接口数量如此稀少可能是由于Slipstream功能,因为各种配件可以通过这种无线技术直接连接到笔记本上,不需要额外的加密狗。海盗船本身为此提供了自己的鼠标、键盘和耳机。Wi-Fi模块来自富士康,提供当前的Wi-Fi 6E标准。
作为流媒体笔记本电脑的预期用途需要一个好的网络摄像头。测试显示,内置的1080p摄像头的表现比竞争对手更好。尽管如此,我们建议在固定使用时使用外部摄像头。对于移动使用,你可以放心地使用集成的摄像头。
| SD Card Reader | |
| average JPG Copy Test (av. of 3 runs) | |
| Asus ROG Flow X16 GV601RW-M5082W (AV Pro SD microSD 128 GB V60) | |
| Average of class Gaming (20.9 - 210, n=54, last 2 years) | |
| Corsair Voyager a1600 (AV Pro SD microSD 128 GB V60) | |
| Acer Predator Triton 500 SE PT516-52s-70KX (AV PRO microSD 128 GB V60) | |
| HP Omen 16-b1090ng (AV PRO microSD 128 GB V60) | |
| maximum AS SSD Seq Read Test (1GB) | |
| Asus ROG Flow X16 GV601RW-M5082W (AV Pro SD microSD 128 GB V60) | |
| Average of class Gaming (25.5 - 261, n=51, last 2 years) | |
| Corsair Voyager a1600 (AV Pro SD microSD 128 GB V60) | |
| Acer Predator Triton 500 SE PT516-52s-70KX (AV PRO microSD 128 GB V60) | |


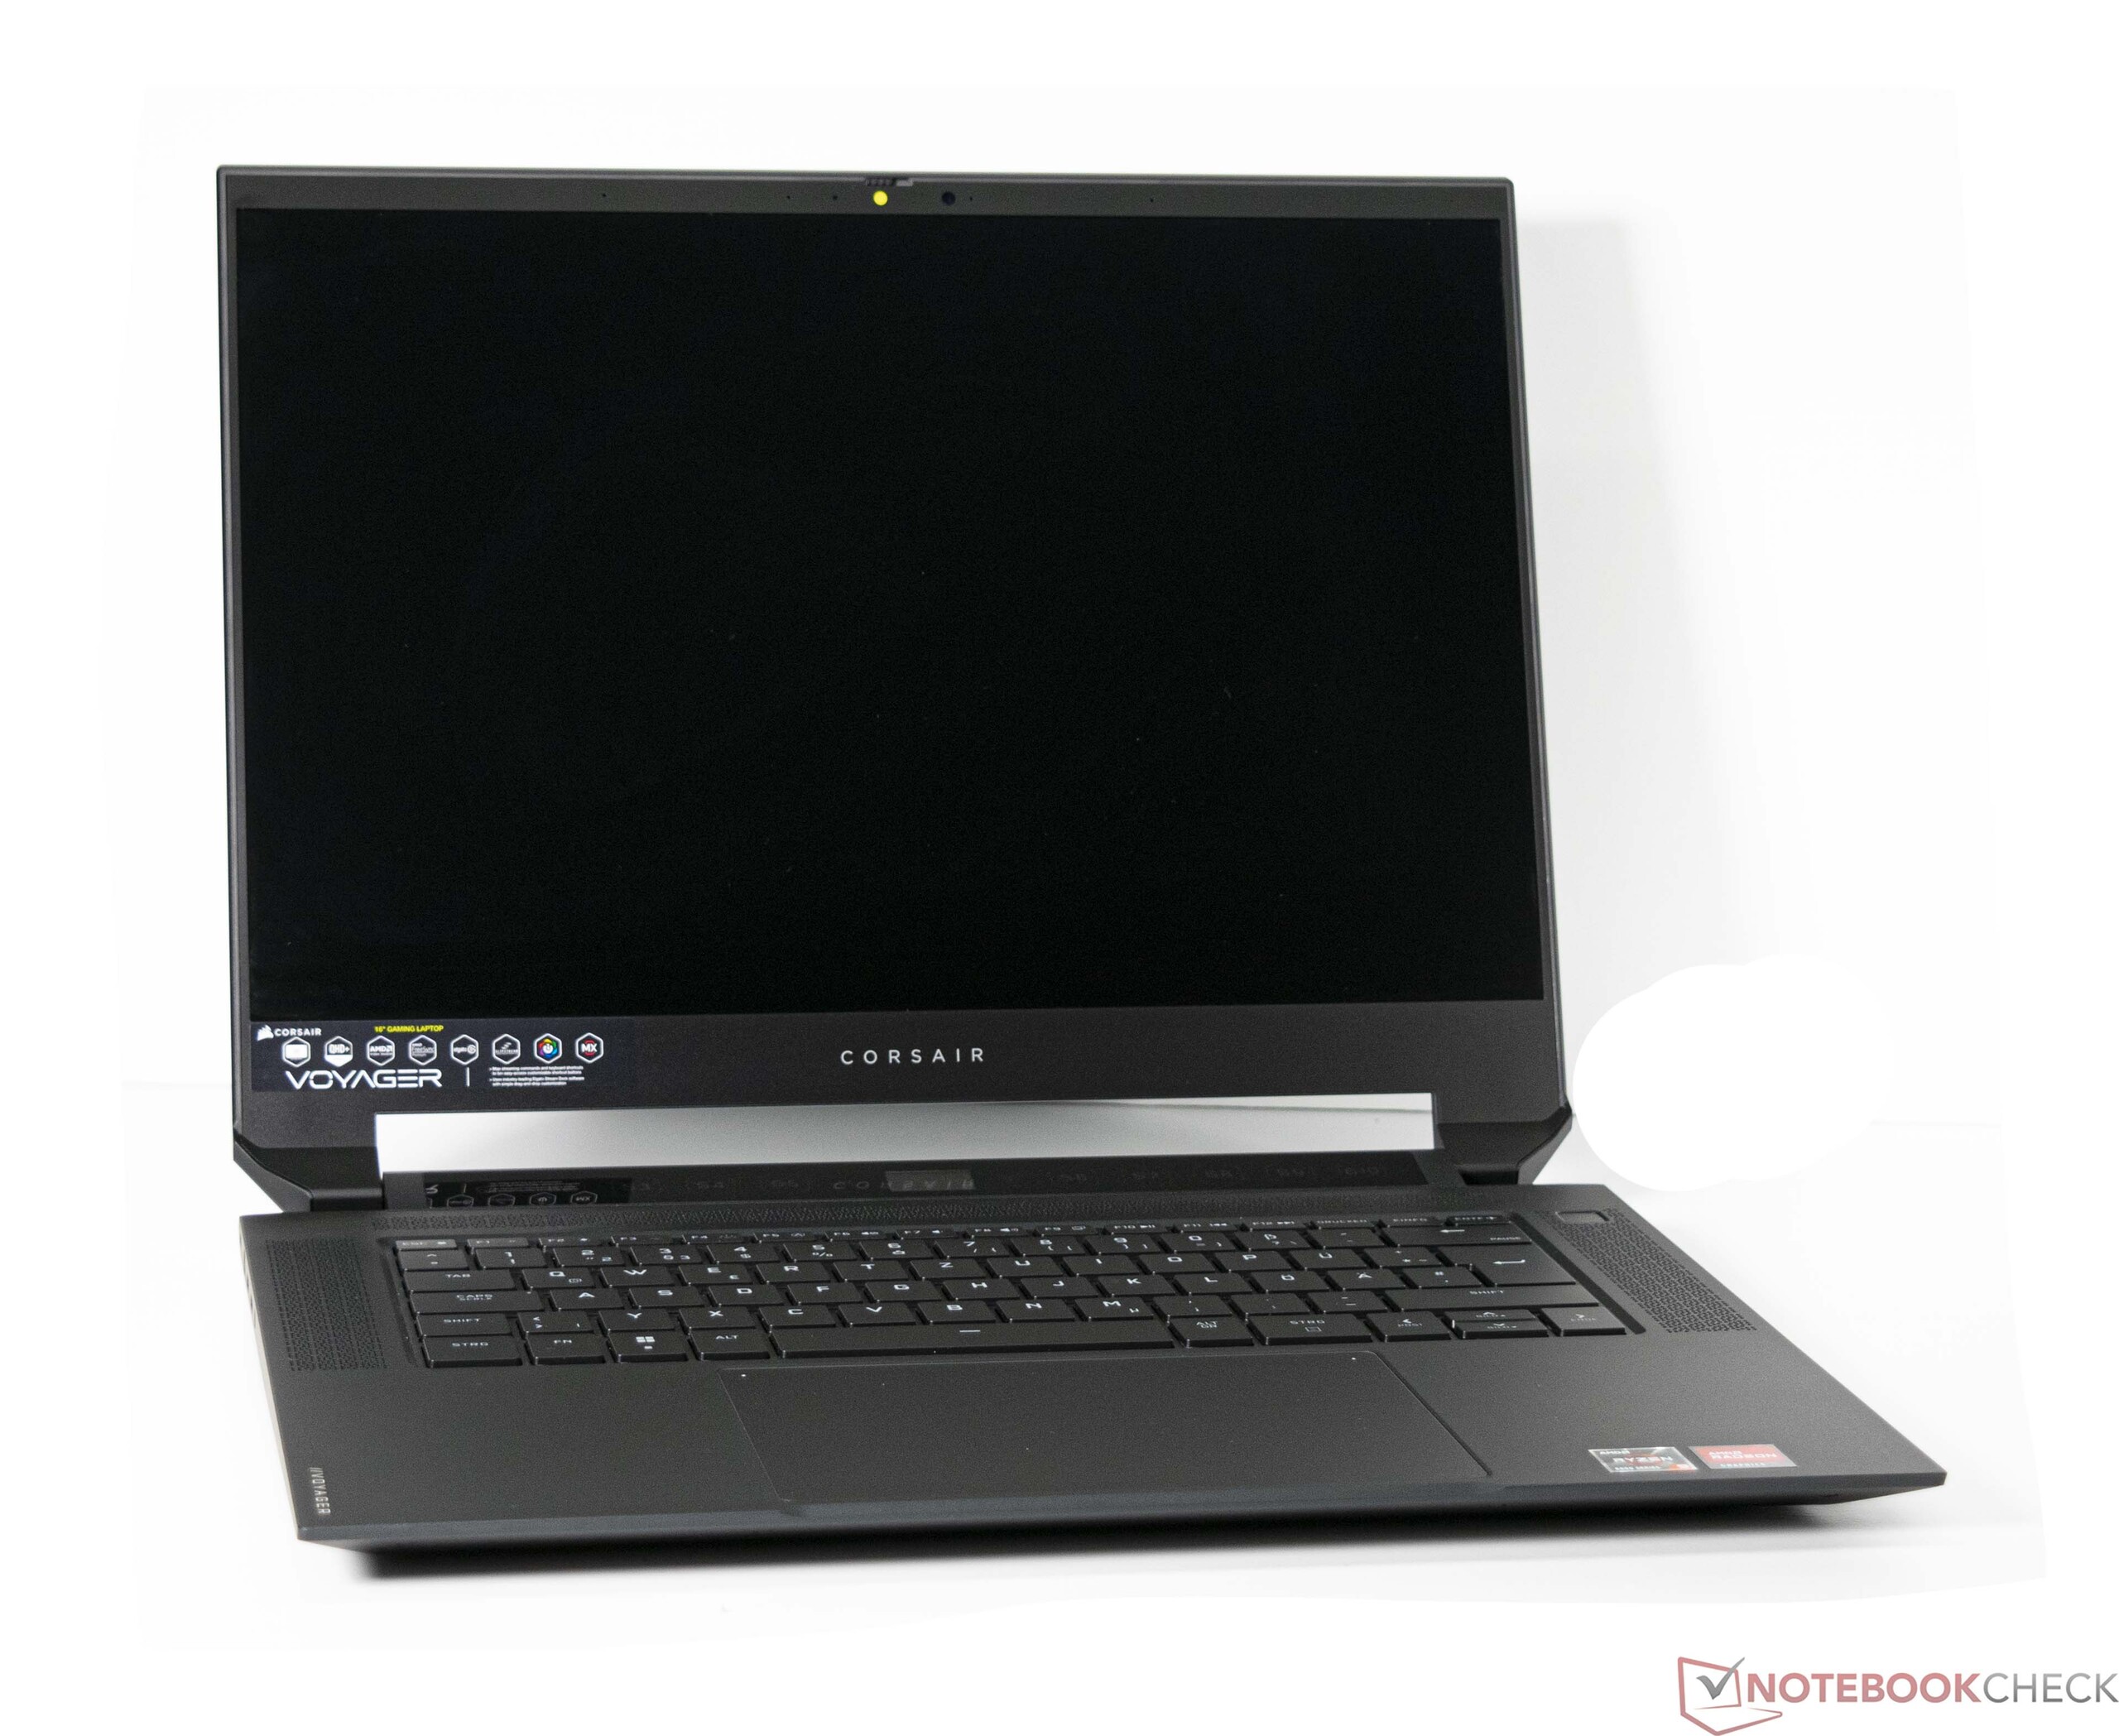
输入设备
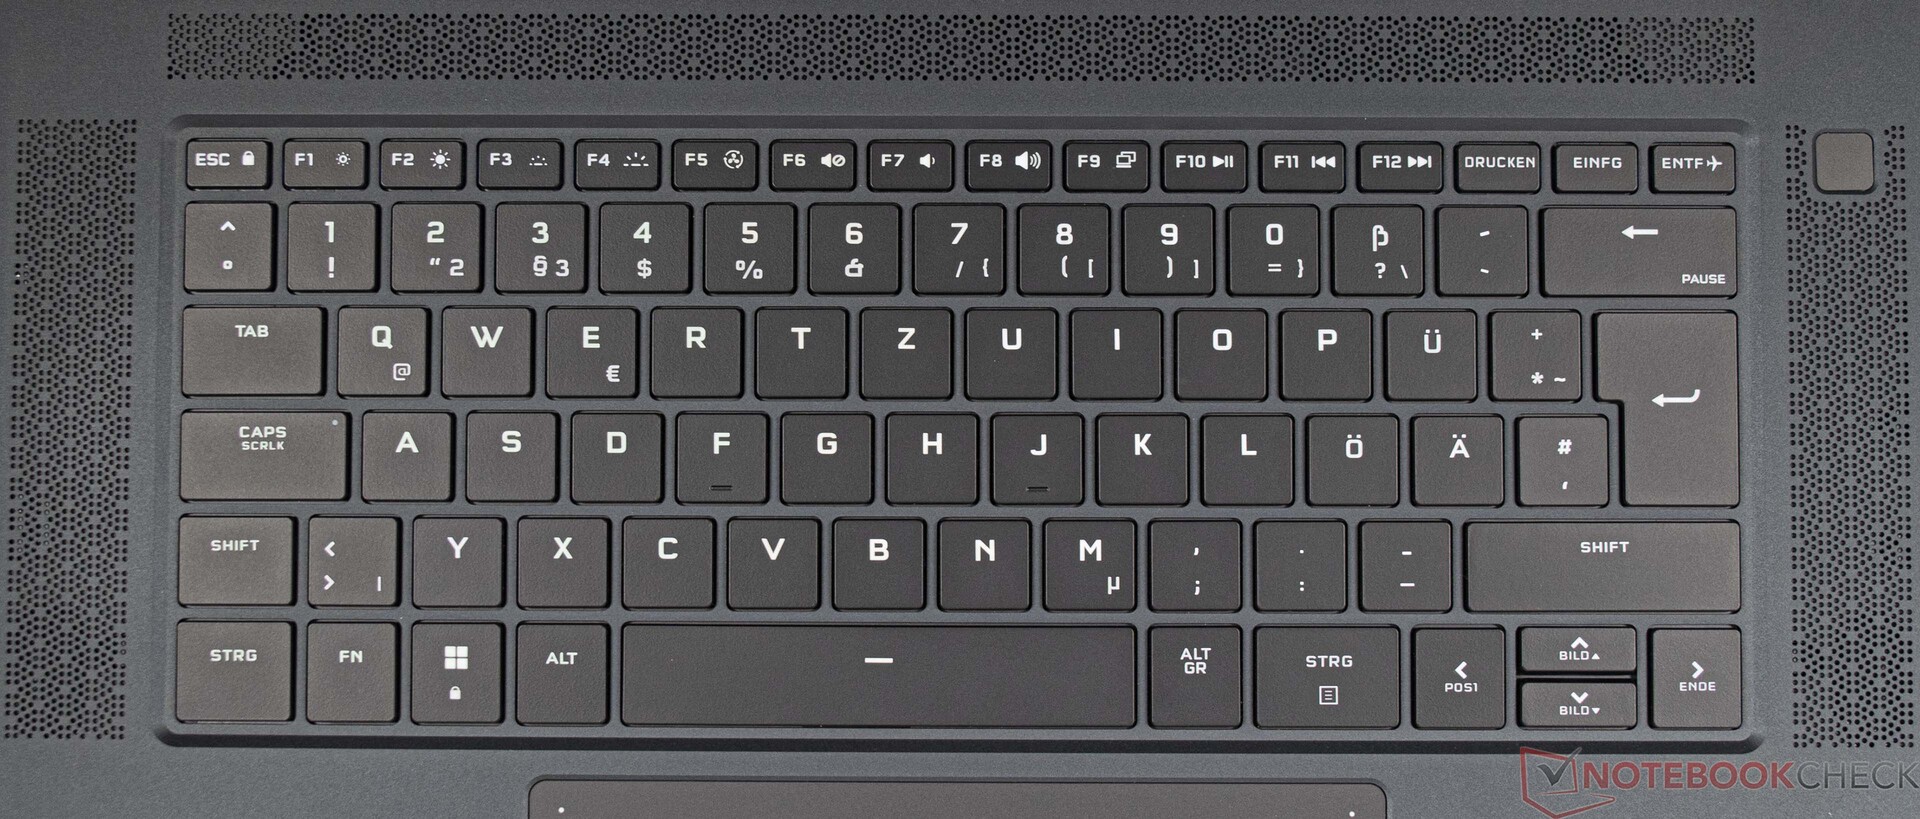
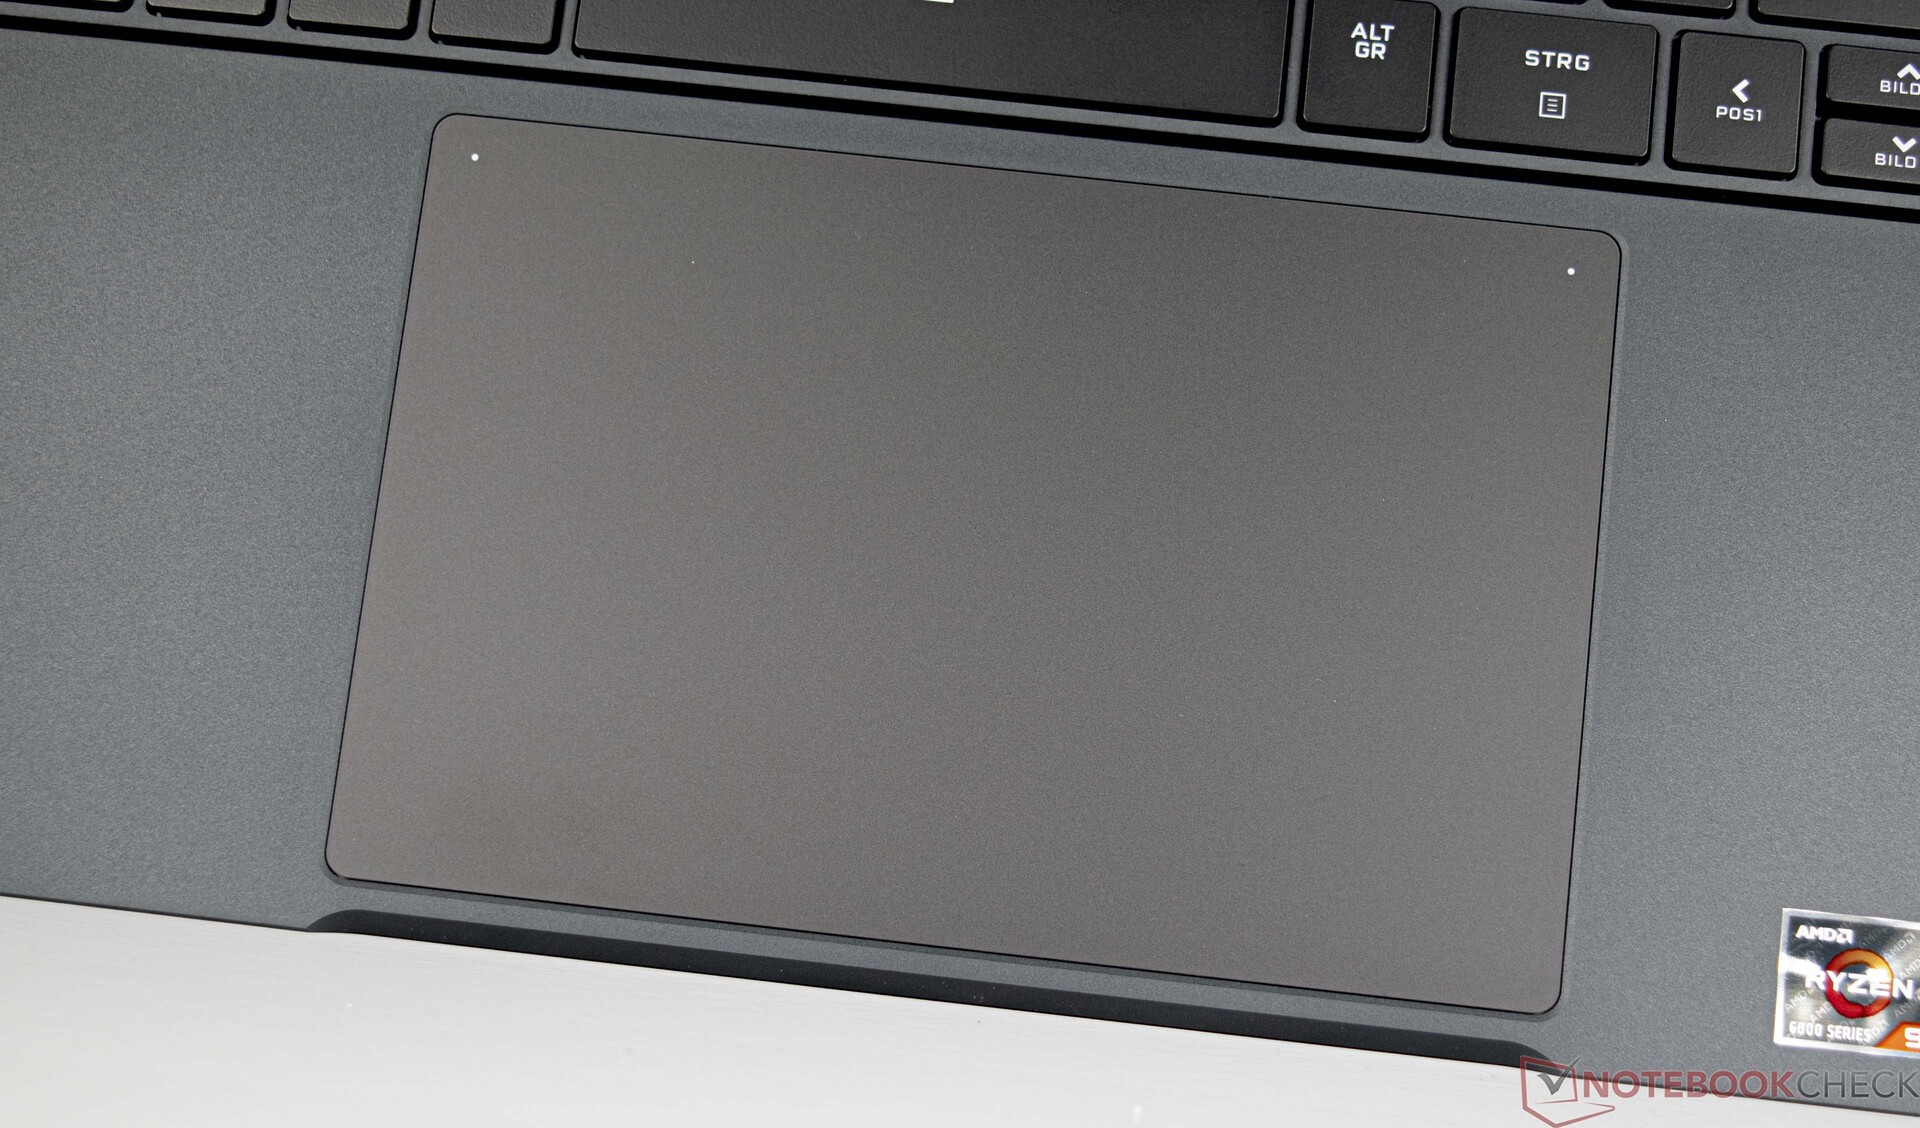
海盗船为Voyager a1600提供了一个基于Cherry MX开关的机械键盘。这些都是非常坚固的,设计的寿命非常长。非常短的行程和明显的压力点给了用户良好的触觉反馈。此外,行程没有阻尼,这防止了海绵状的输入感觉。
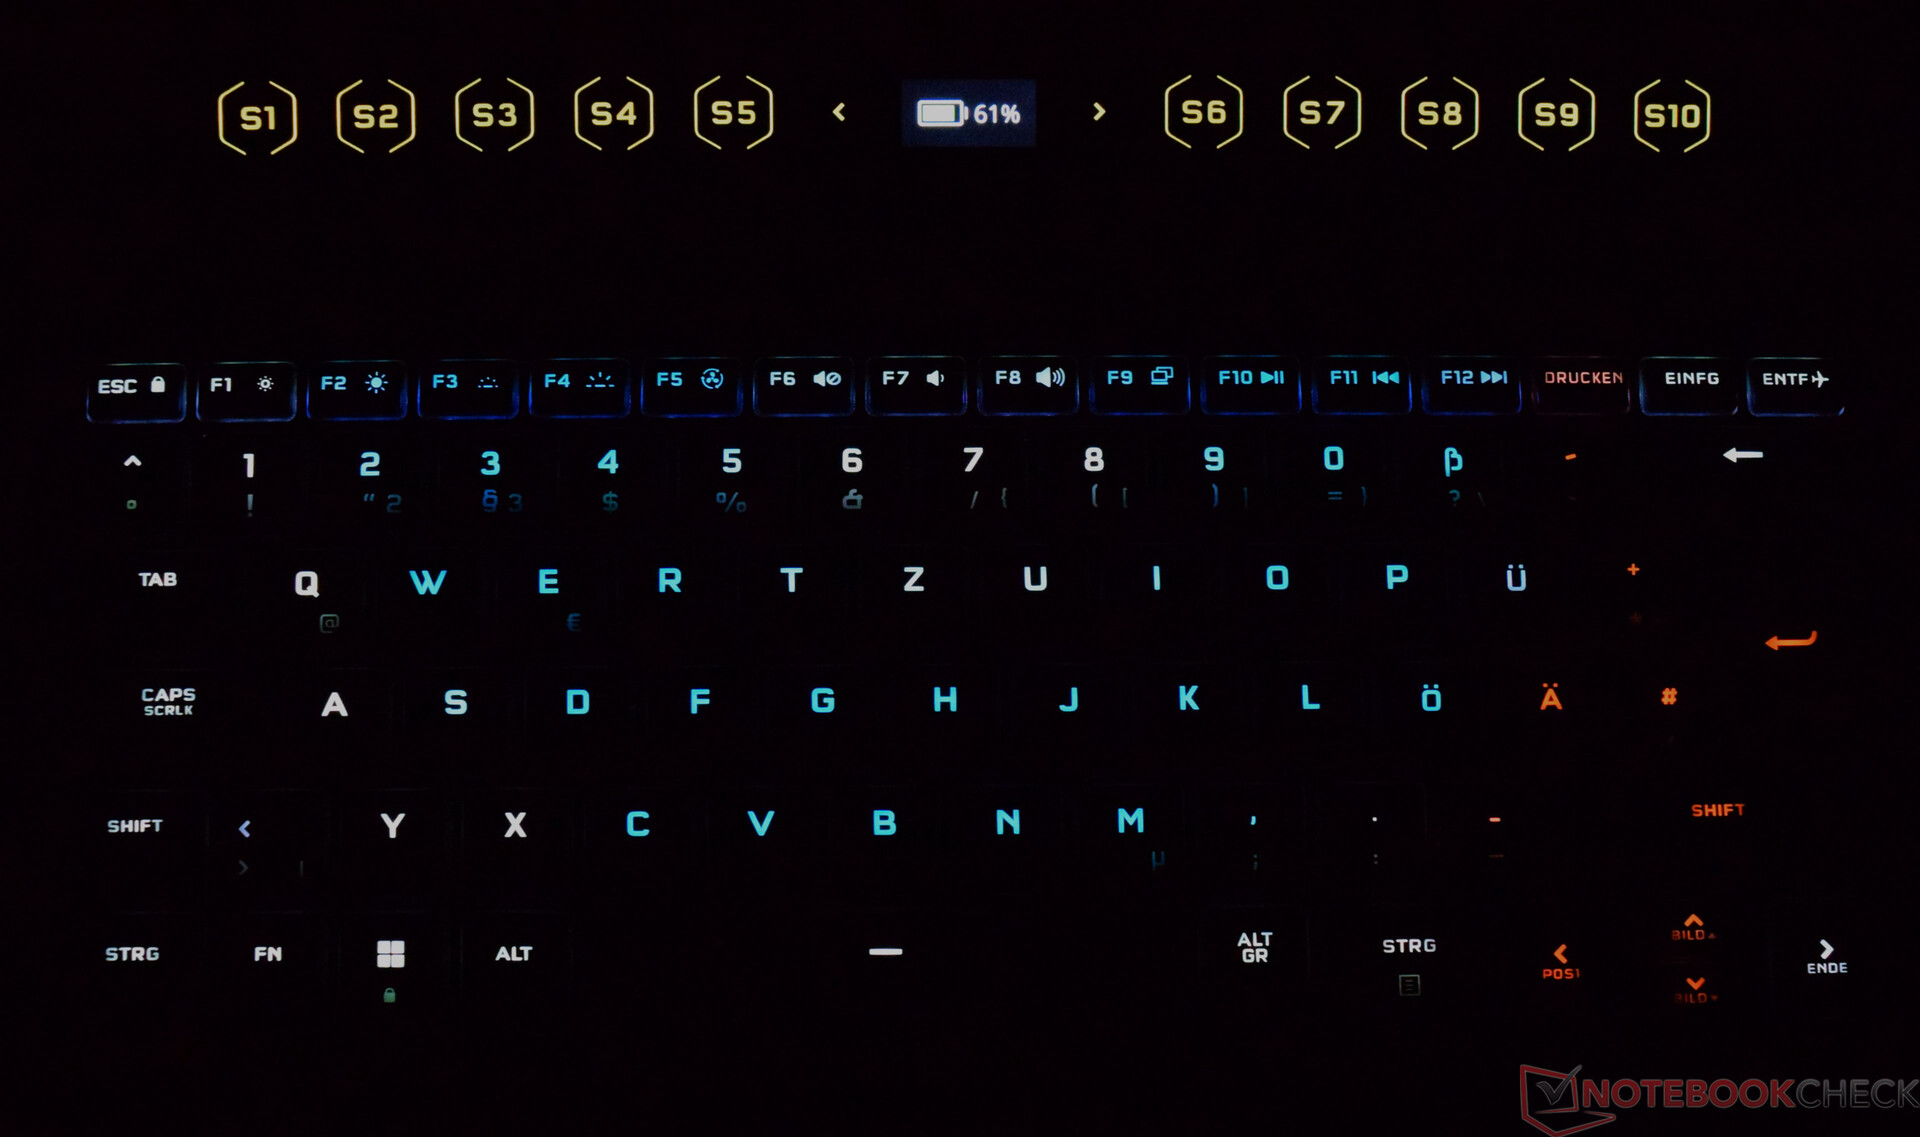
键盘的照明可以通过iCUE软件根据需要进行配置。用户可以获得不同的效果和完整的颜色调色板。此外,所有按键都可以单独配置。
触摸板的宽度为整整15.5厘米,深度为10厘米。因此,ClickPad非常大,在实践中最适合作为鼠标的替代品。如果你觉得活动输入区域太大,你可以通过双击左上角的白点来停用右侧。不过这个功能没有光学或触觉指示。玻璃表面有一种微妙的缎面效果,即使手指有点出汗,操作起来也很舒服。下方的两个输入键工作良好,按压时相当安静。
显示 - 快速16:10面板
海盗船Voyager a1600的显示屏是一个16英寸的IPS面板,频率为240赫兹。16:10的格式,其分辨率为2560 x 1600像素,提供了一个宽大的工作面。到目前为止,Voyager a1600还没有替代的显示屏变体。
在我们的测试中,安装的面板达到了340cd/m²的良好亮度。然而,相比之下,竞争者显然提供了更明亮的显示屏。由于黑值相对较高,对比度受到很大影响。因此,在我们的测试中,Voyager a1600只达到了670:1的对比度。
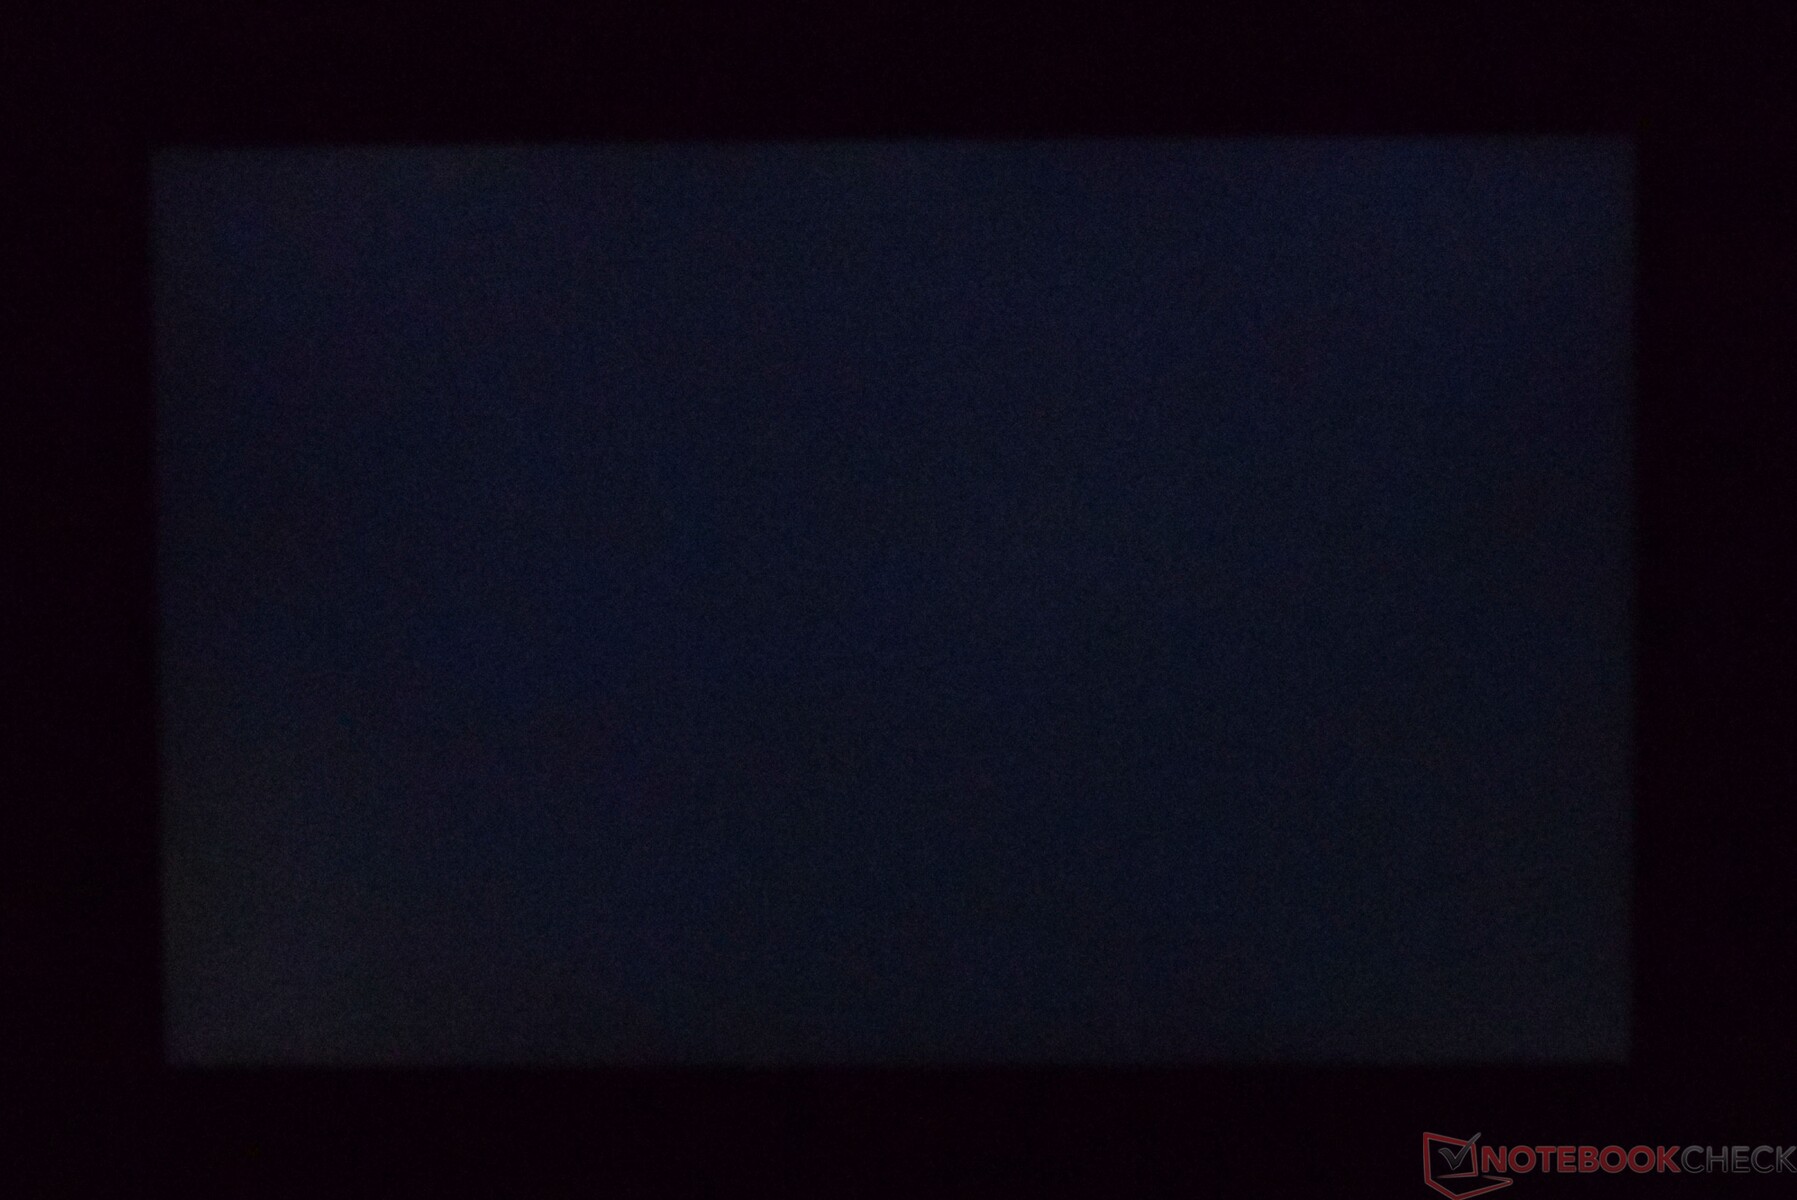
由于PWM导致的眼睛疲劳不应该是海盗船Voyager a1600的问题。背光出血在我们的设备上不是一个问题。
| |||||||||||||||||||||||||
Brightness Distribution: 91 %
Center on Battery: 328 cd/m²
Contrast: 670:1 (Black: 0.53 cd/m²)
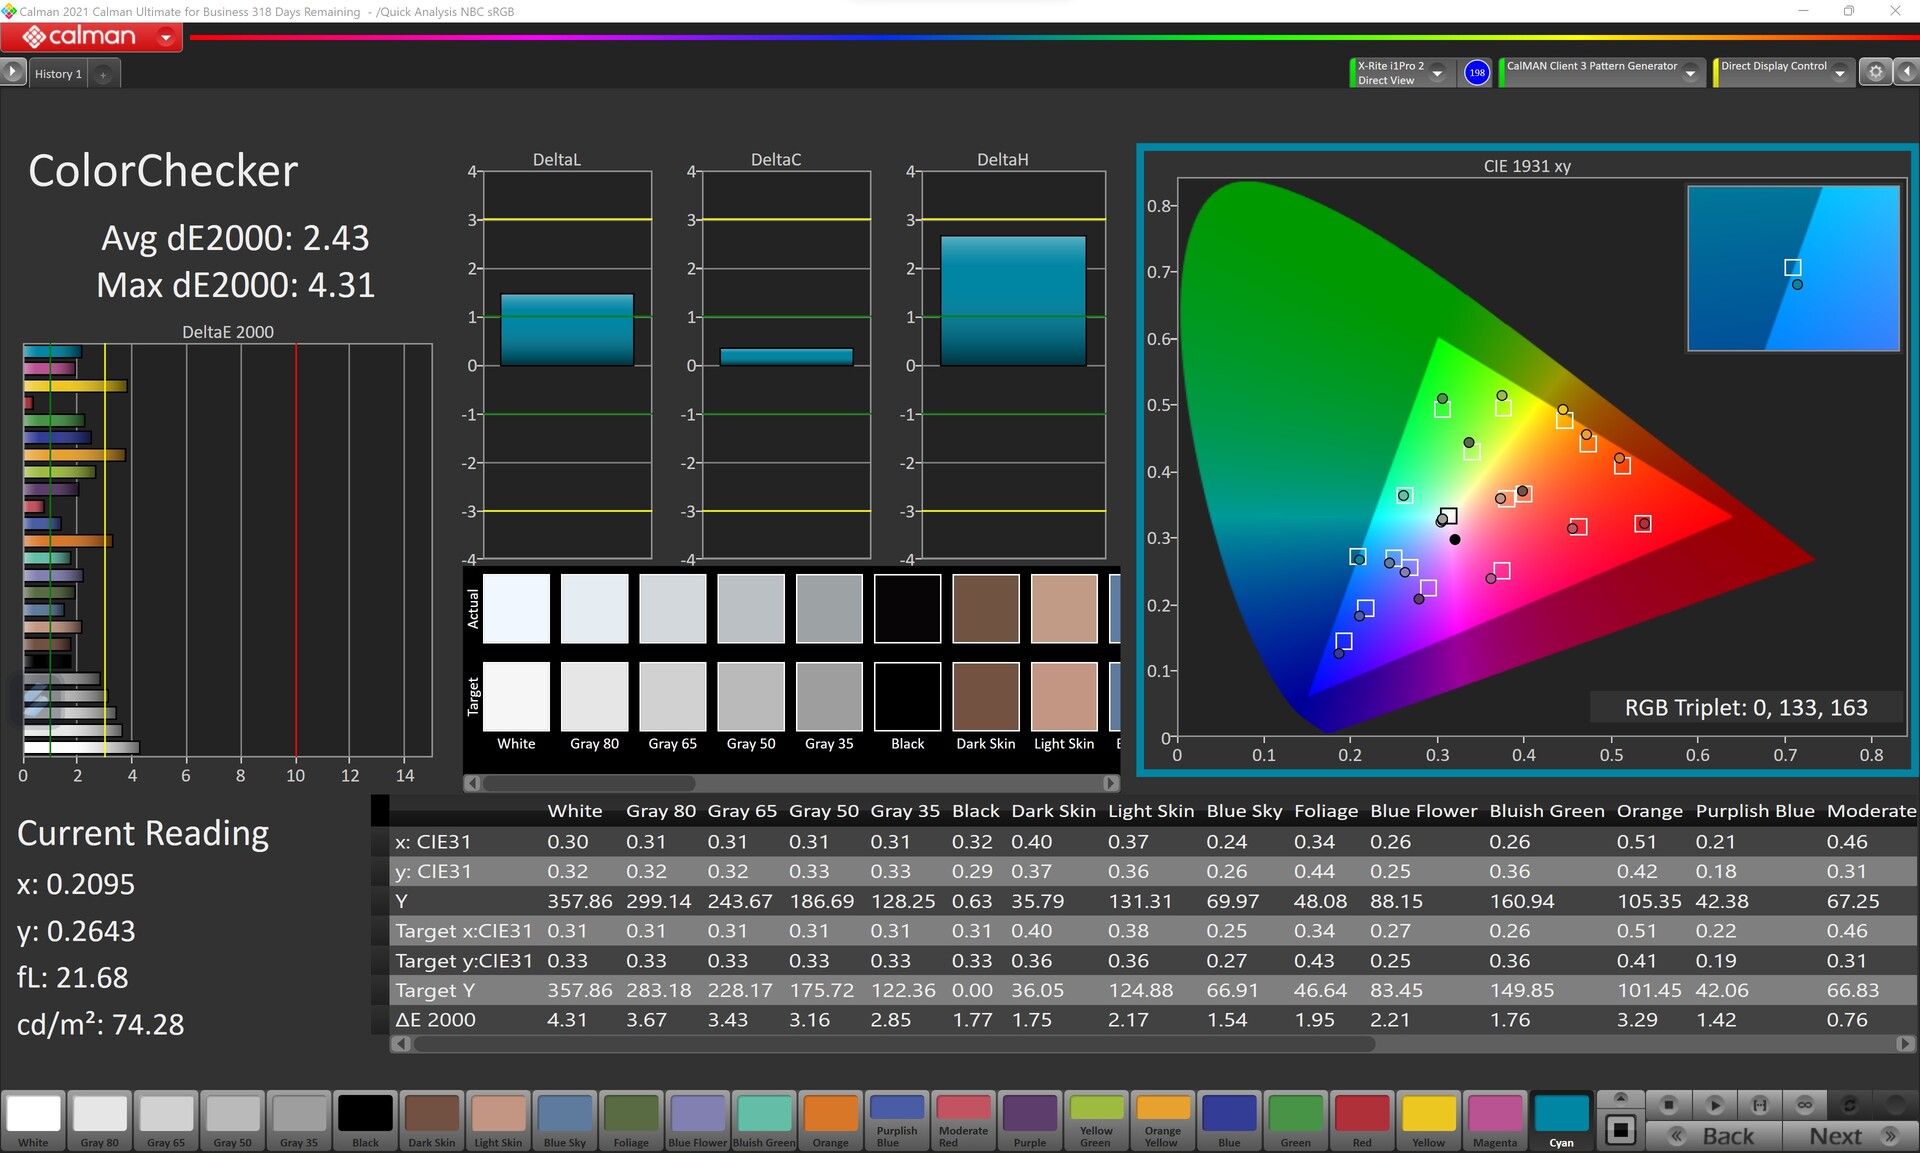
ΔE ColorChecker Calman: 2.43 | ∀{0.5-29.43 Ø4.71}
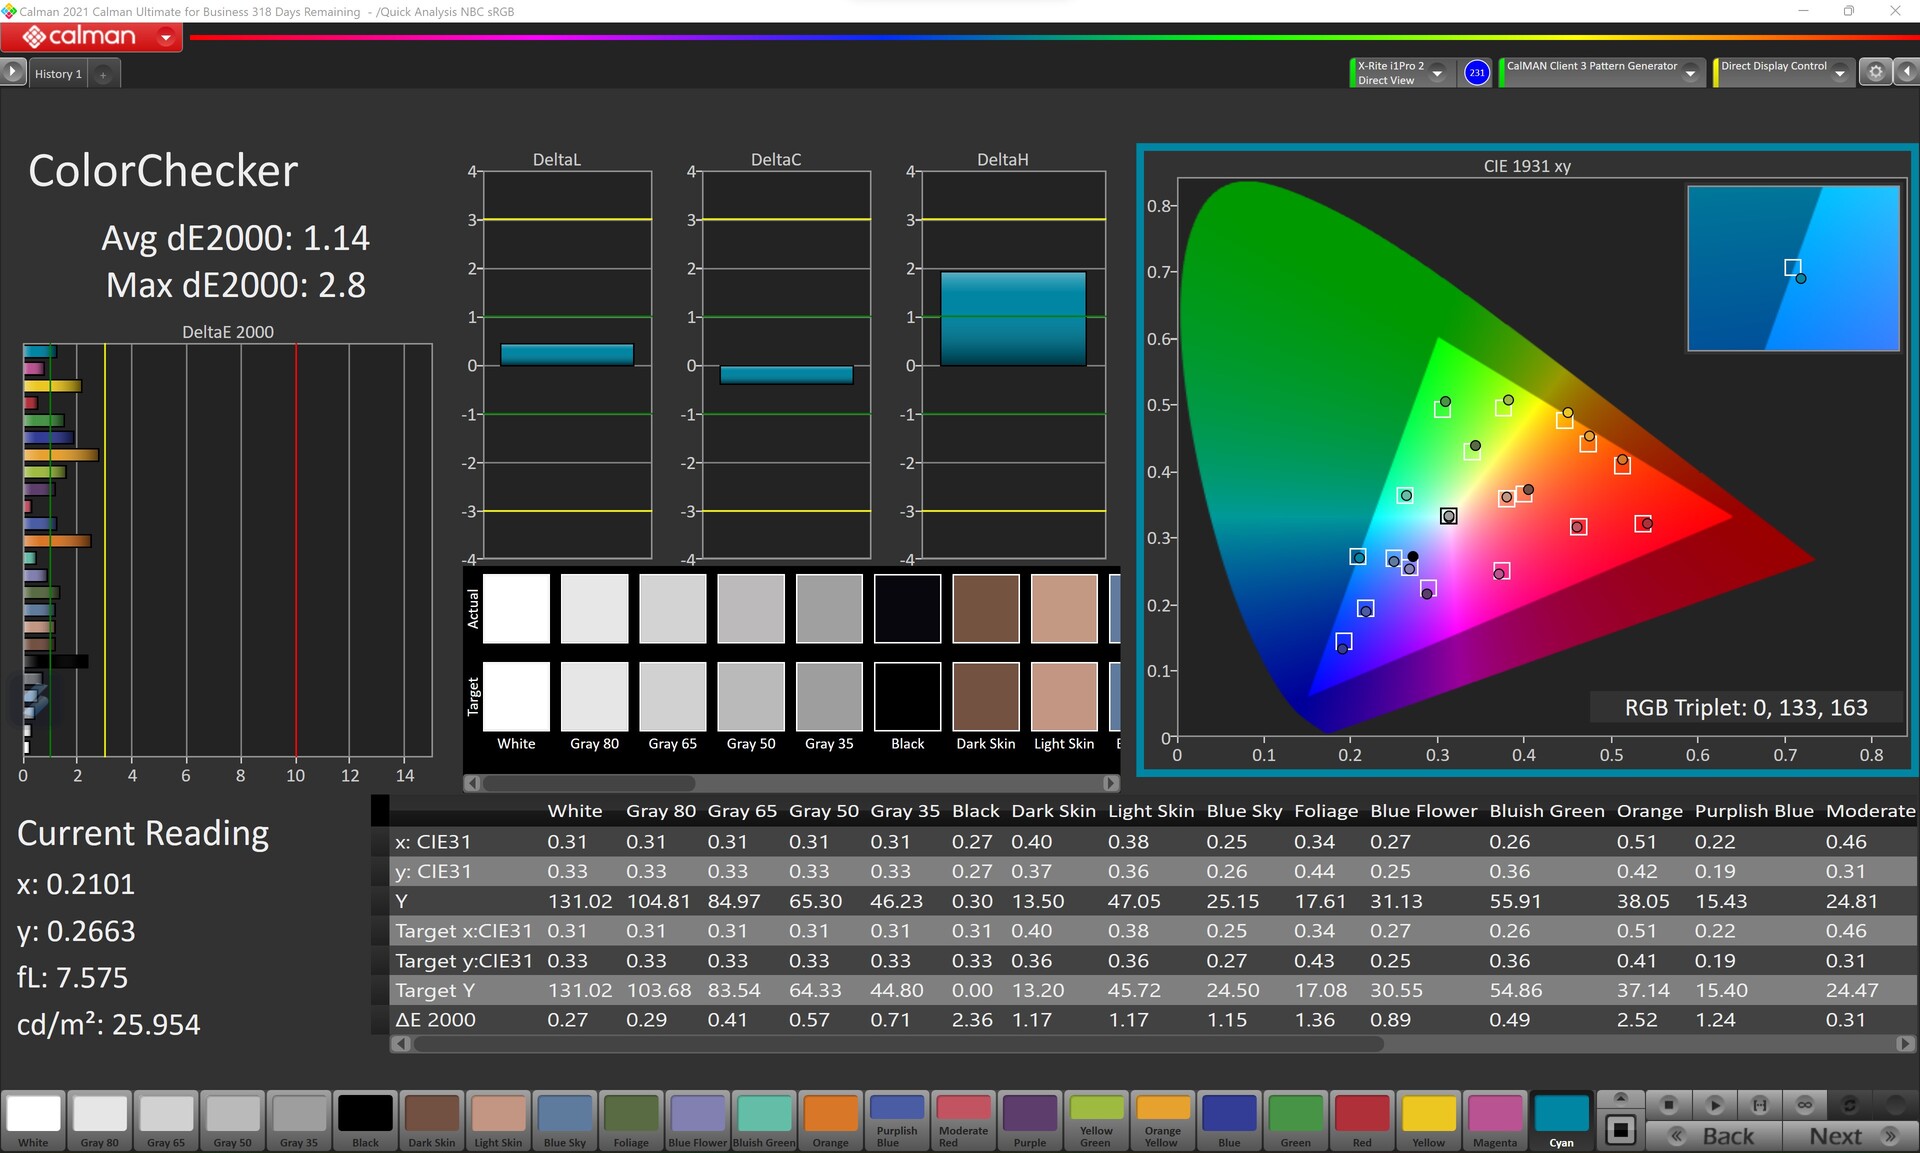
calibrated: 1.14
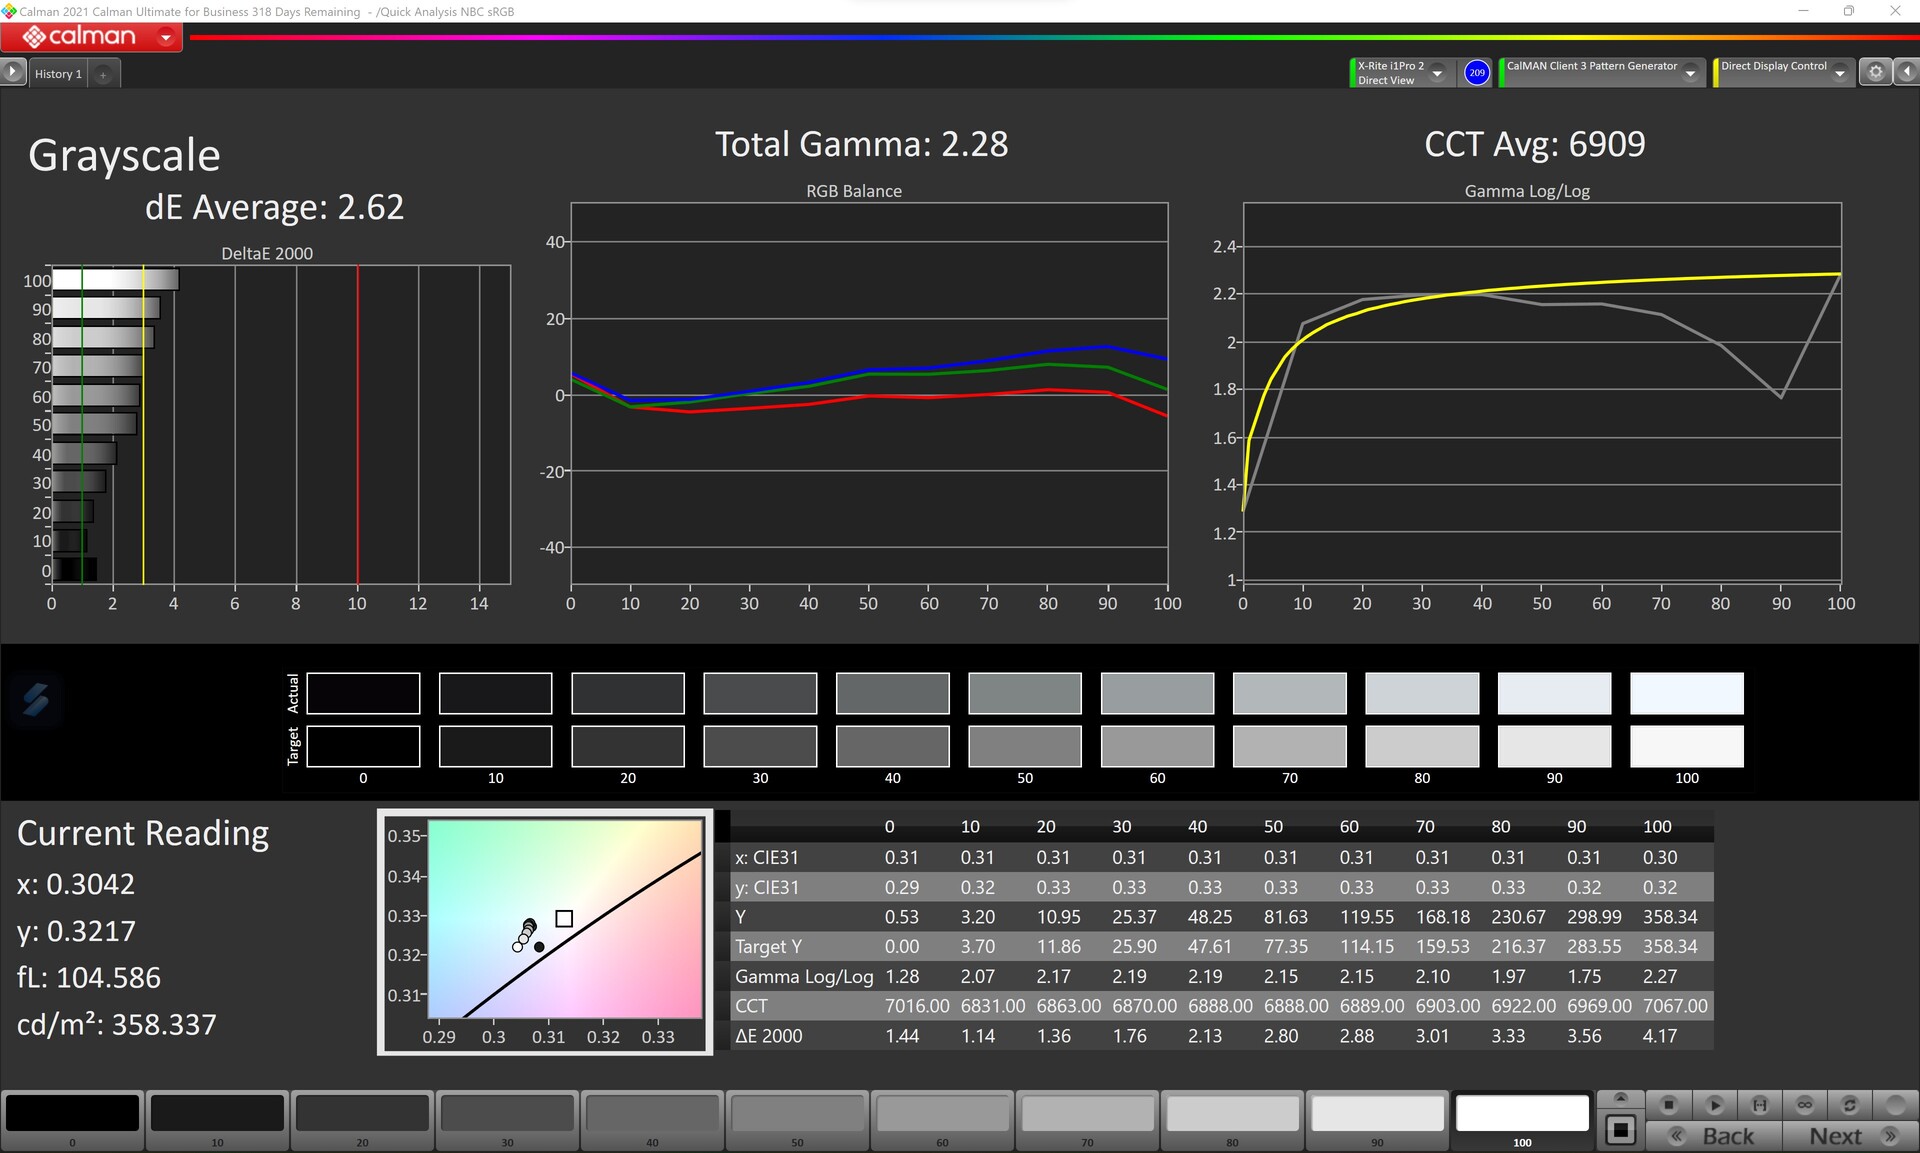
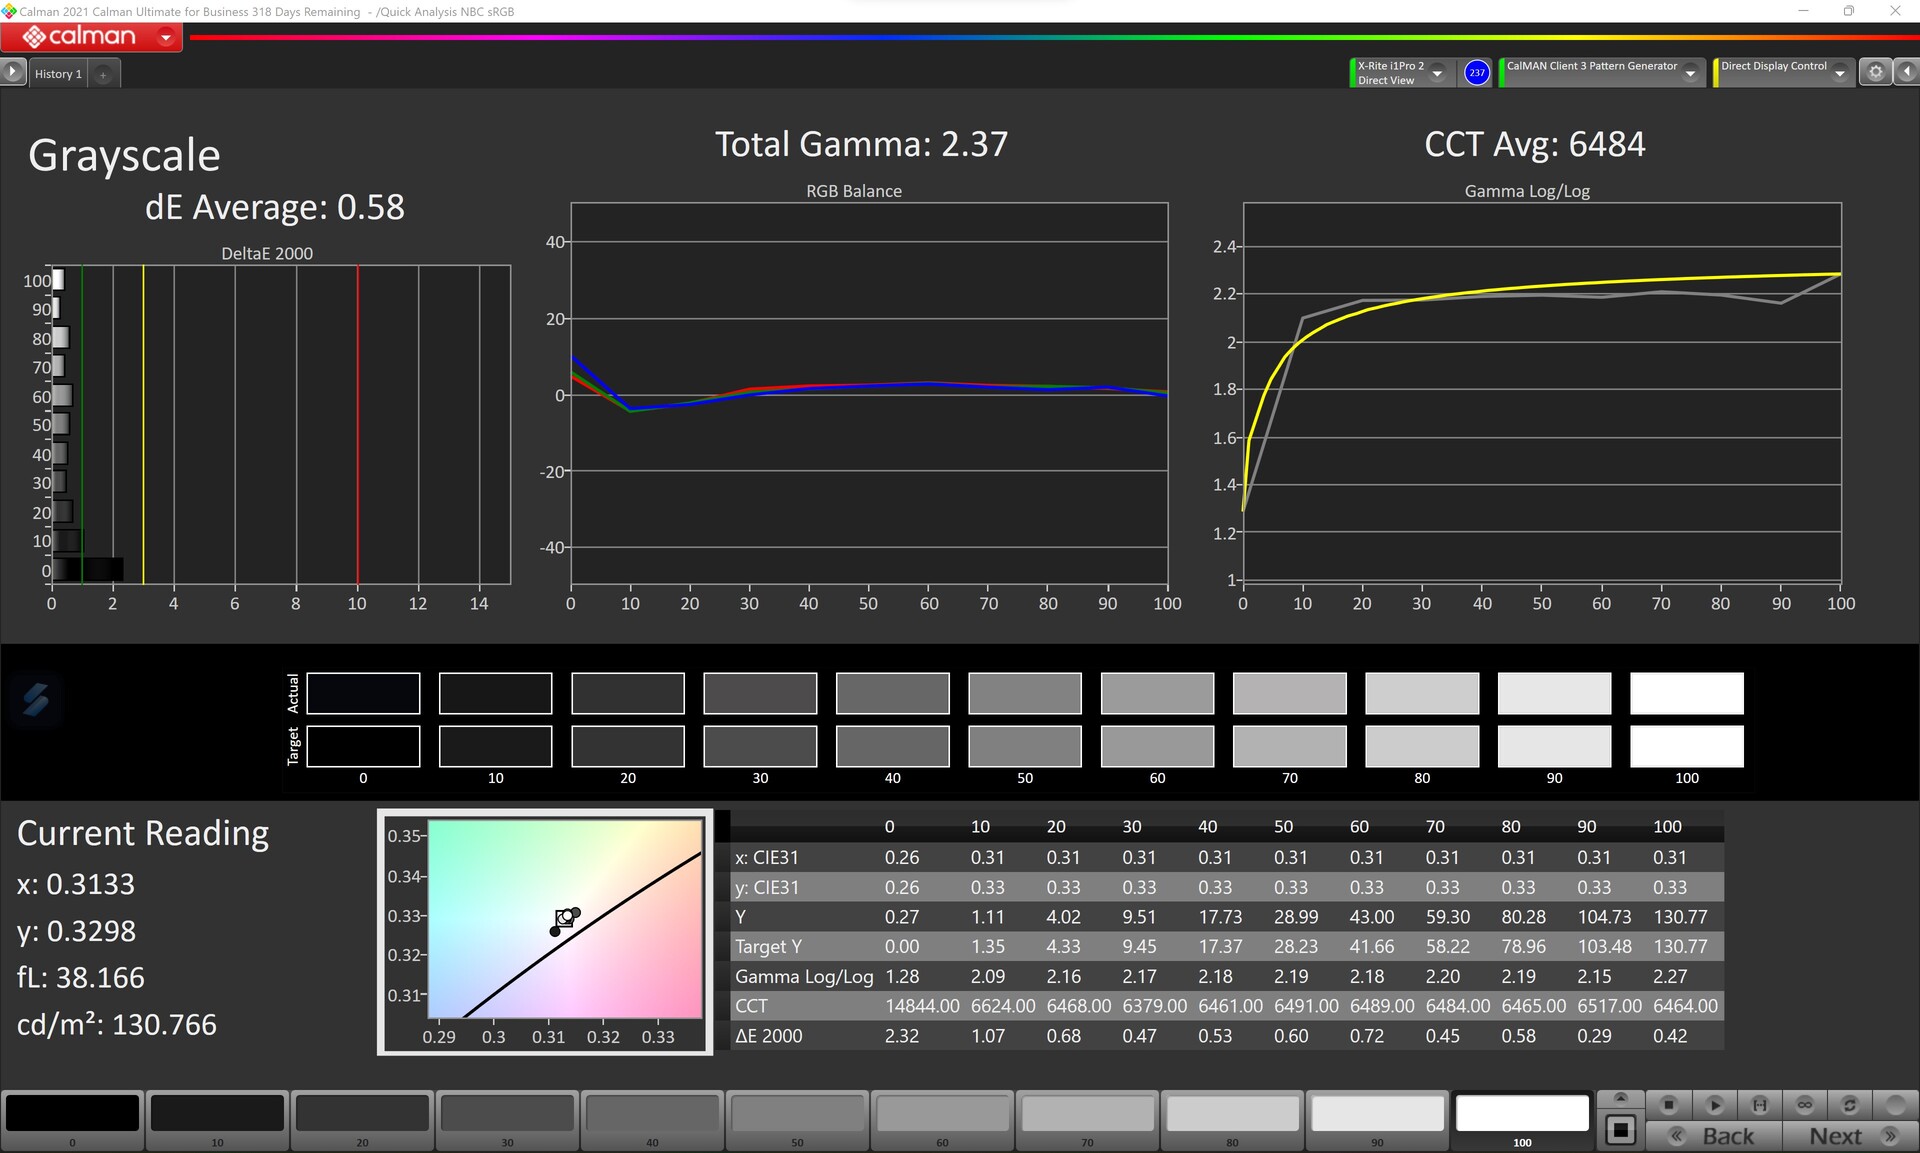
ΔE Greyscale Calman: 2.62 | ∀{0.09-98 Ø4.96}
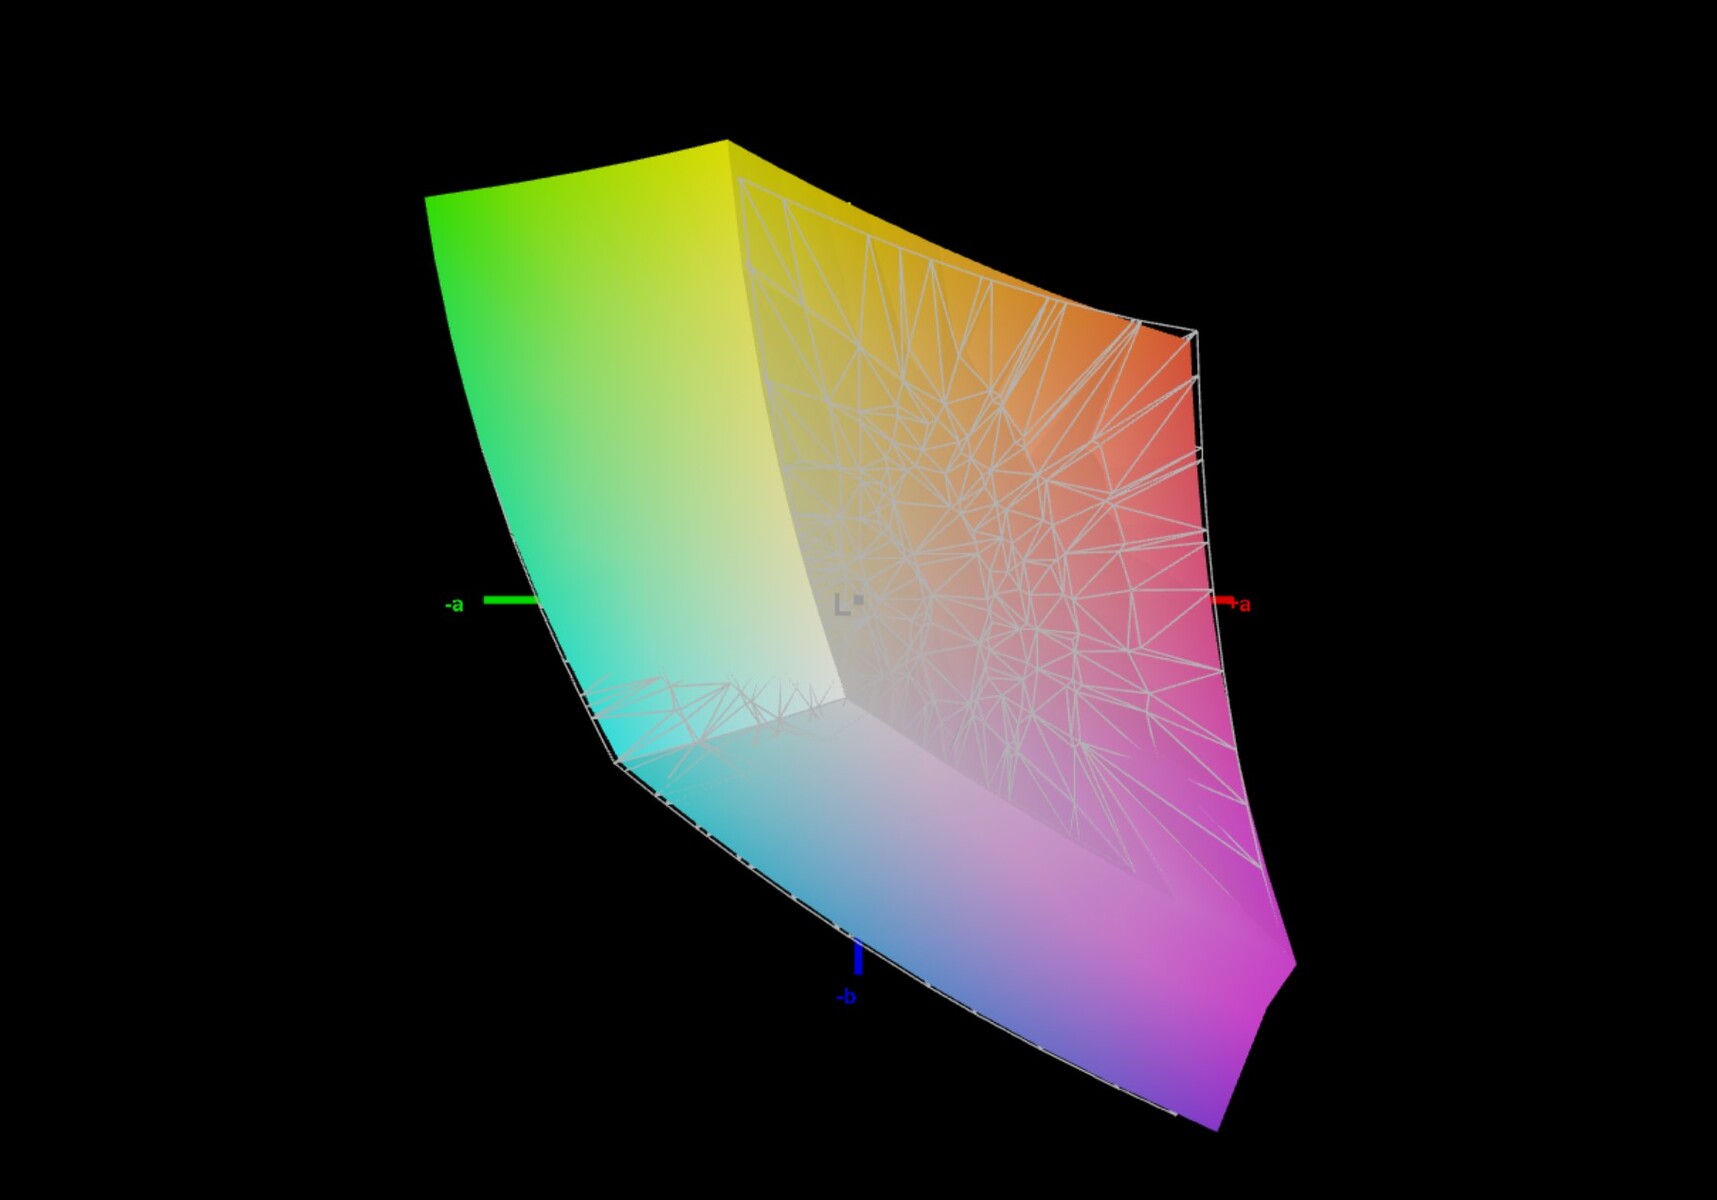
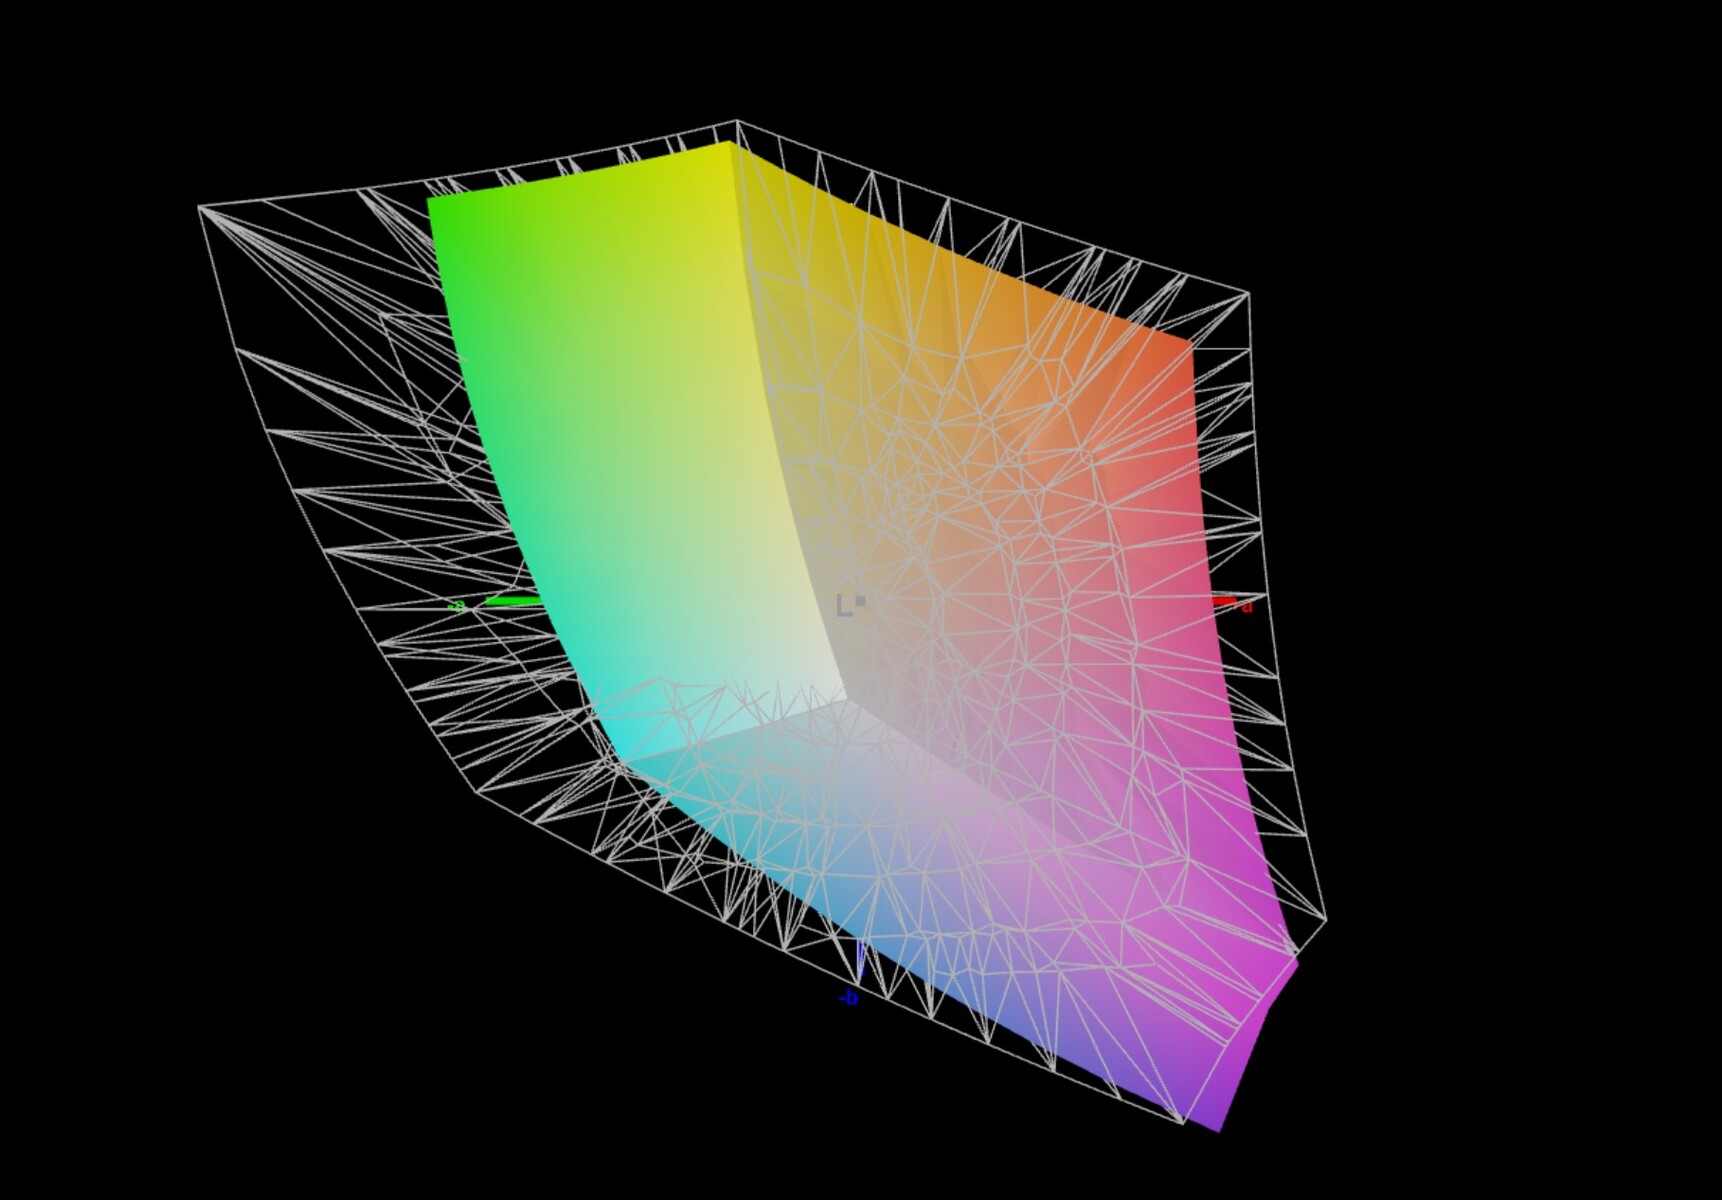
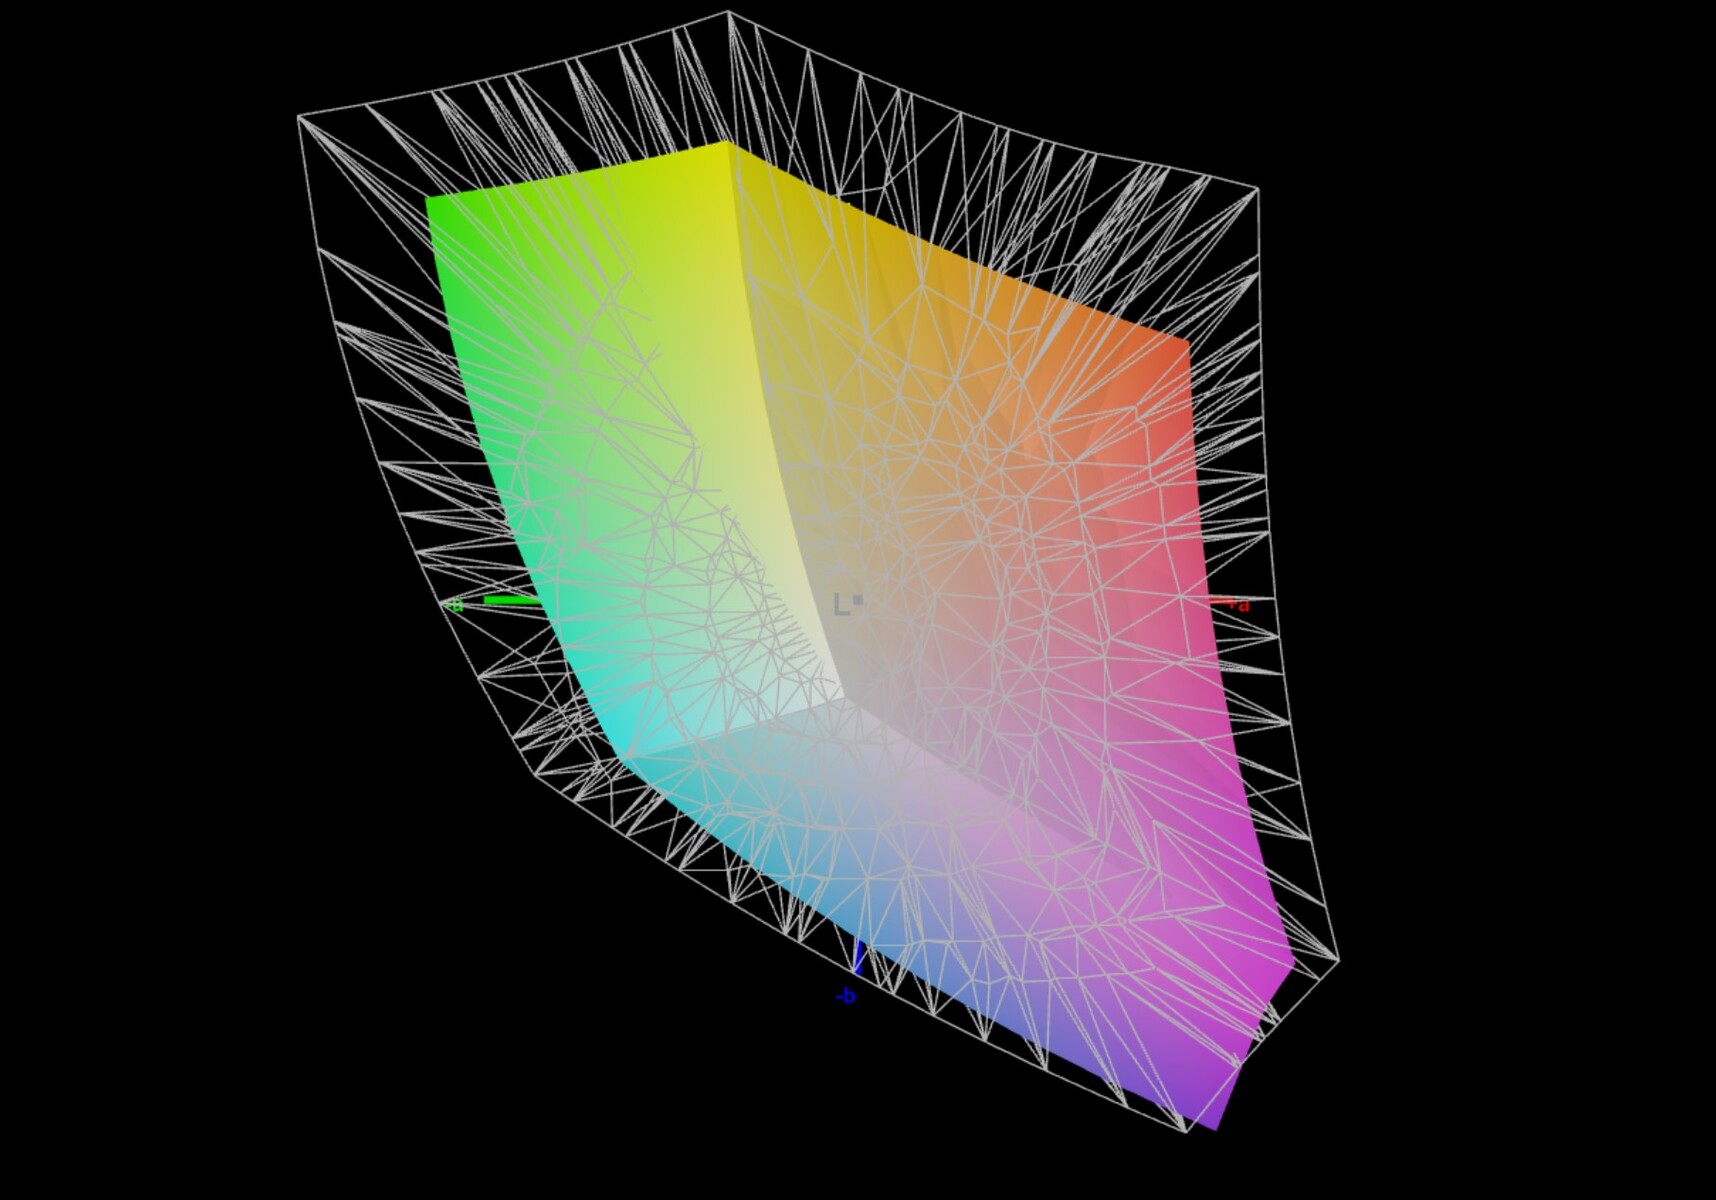
70.1% AdobeRGB 1998 (Argyll 3D)
98.2% sRGB (Argyll 3D)
68.7% Display P3 (Argyll 3D)
Gamma: 2.28
CCT: 6909 K
| Corsair Voyager a1600 BOE0A3B, IPS, 2560x1600, 16" | Asus ROG Flow X16 GV601RW-M5082W AUO B160QAN02.S, Mini LED, 2560x1600, 16.1" | Lenovo Legion 7 16ARHA7 BOE CQ NE160QDM-NY1, IPS, 2560x1600, 16" | Acer Predator Triton 500 SE PT516-52s-70KX NE160QDM-NZ2, IPS LED, 2560x1600, 16" | HP Omen 16-b1090ng BOE09E5, IPS, 2560x1440, 16.1" | Lenovo Legion 7 16IAX7-82TD004SGE NE160QDM-NY1, IPS, 2560x1600, 16" | |
|---|---|---|---|---|---|---|
| Display | 25% | -5% | 22% | 3% | 1% | |
| Display P3 Coverage (%) | 68.7 | 99.82 45% | 63.7 -7% | 97.3 42% | 71 3% | 69.3 1% |
| sRGB Coverage (%) | 98.2 | 99.99 2% | 95.3 -3% | 100 2% | 97.9 0% | 98.2 0% |
| AdobeRGB 1998 Coverage (%) | 70.1 | 90.21 29% | 65.7 -6% | 84.9 21% | 73.3 5% | 70.8 1% |
| Response Times | 3% | 17% | 15% | -3% | 24% | |
| Response Time Grey 50% / Grey 80% * (ms) | 13 ? | 11 ? 15% | 9.2 ? 29% | 13.8 ? -6% | 14.5 ? -12% | 12.6 ? 3% |
| Response Time Black / White * (ms) | 10 ? | 11 ? -10% | 9.6 ? 4% | 6.4 ? 36% | 9.4 ? 6% | 5.6 ? 44% |
| PWM Frequency (Hz) | 7400 ? | |||||
| Screen | 71% | 12% | 29% | -30% | 18% | |
| Brightness middle (cd/m²) | 355 | 498 40% | 478.8 35% | 498 40% | 335 -6% | 547 54% |
| Brightness (cd/m²) | 340 | 502 48% | 477 40% | 468 38% | 319 -6% | 523 54% |
| Brightness Distribution (%) | 91 | 94 3% | 90 -1% | 80 -12% | 90 -1% | 88 -3% |
| Black Level * (cd/m²) | 0.53 | 0.11 79% | 0.43 19% | 0.36 32% | 0.28 47% | 0.44 17% |
| Contrast (:1) | 670 | 4527 576% | 1113 66% | 1383 106% | 1196 79% | 1243 86% |
| Colorchecker dE 2000 * | 2.43 | 1.87 23% | 2.24 8% | 1.77 27% | 4.38 -80% | 2.1 14% |
| Colorchecker dE 2000 max. * | 4.31 | 6.15 -43% | 4.49 -4% | 5.24 -22% | 9.48 -120% | 7 -62% |
| Colorchecker dE 2000 calibrated * | 1.14 | 1.94 -70% | 1.89 -66% | 0.63 45% | 1.33 -17% | 0.9 21% |
| Greyscale dE 2000 * | 2.62 | 3.15 -20% | 2.3 12% | 2.4 8% | 7 -167% | 3.2 -22% |
| Gamma | 2.28 96% | 330.95 1% | 2.25 98% | 2.14 103% | 2.103 105% | 2.23 99% |
| CCT | 6909 94% | 7294 89% | 6955 93% | 7046 92% | 6244 104% | 6979 93% |
| Total Average (Program / Settings) | 33% /
51% | 8% /
9% | 22% /
26% | -10% /
-19% | 14% /
15% |
* ... smaller is better
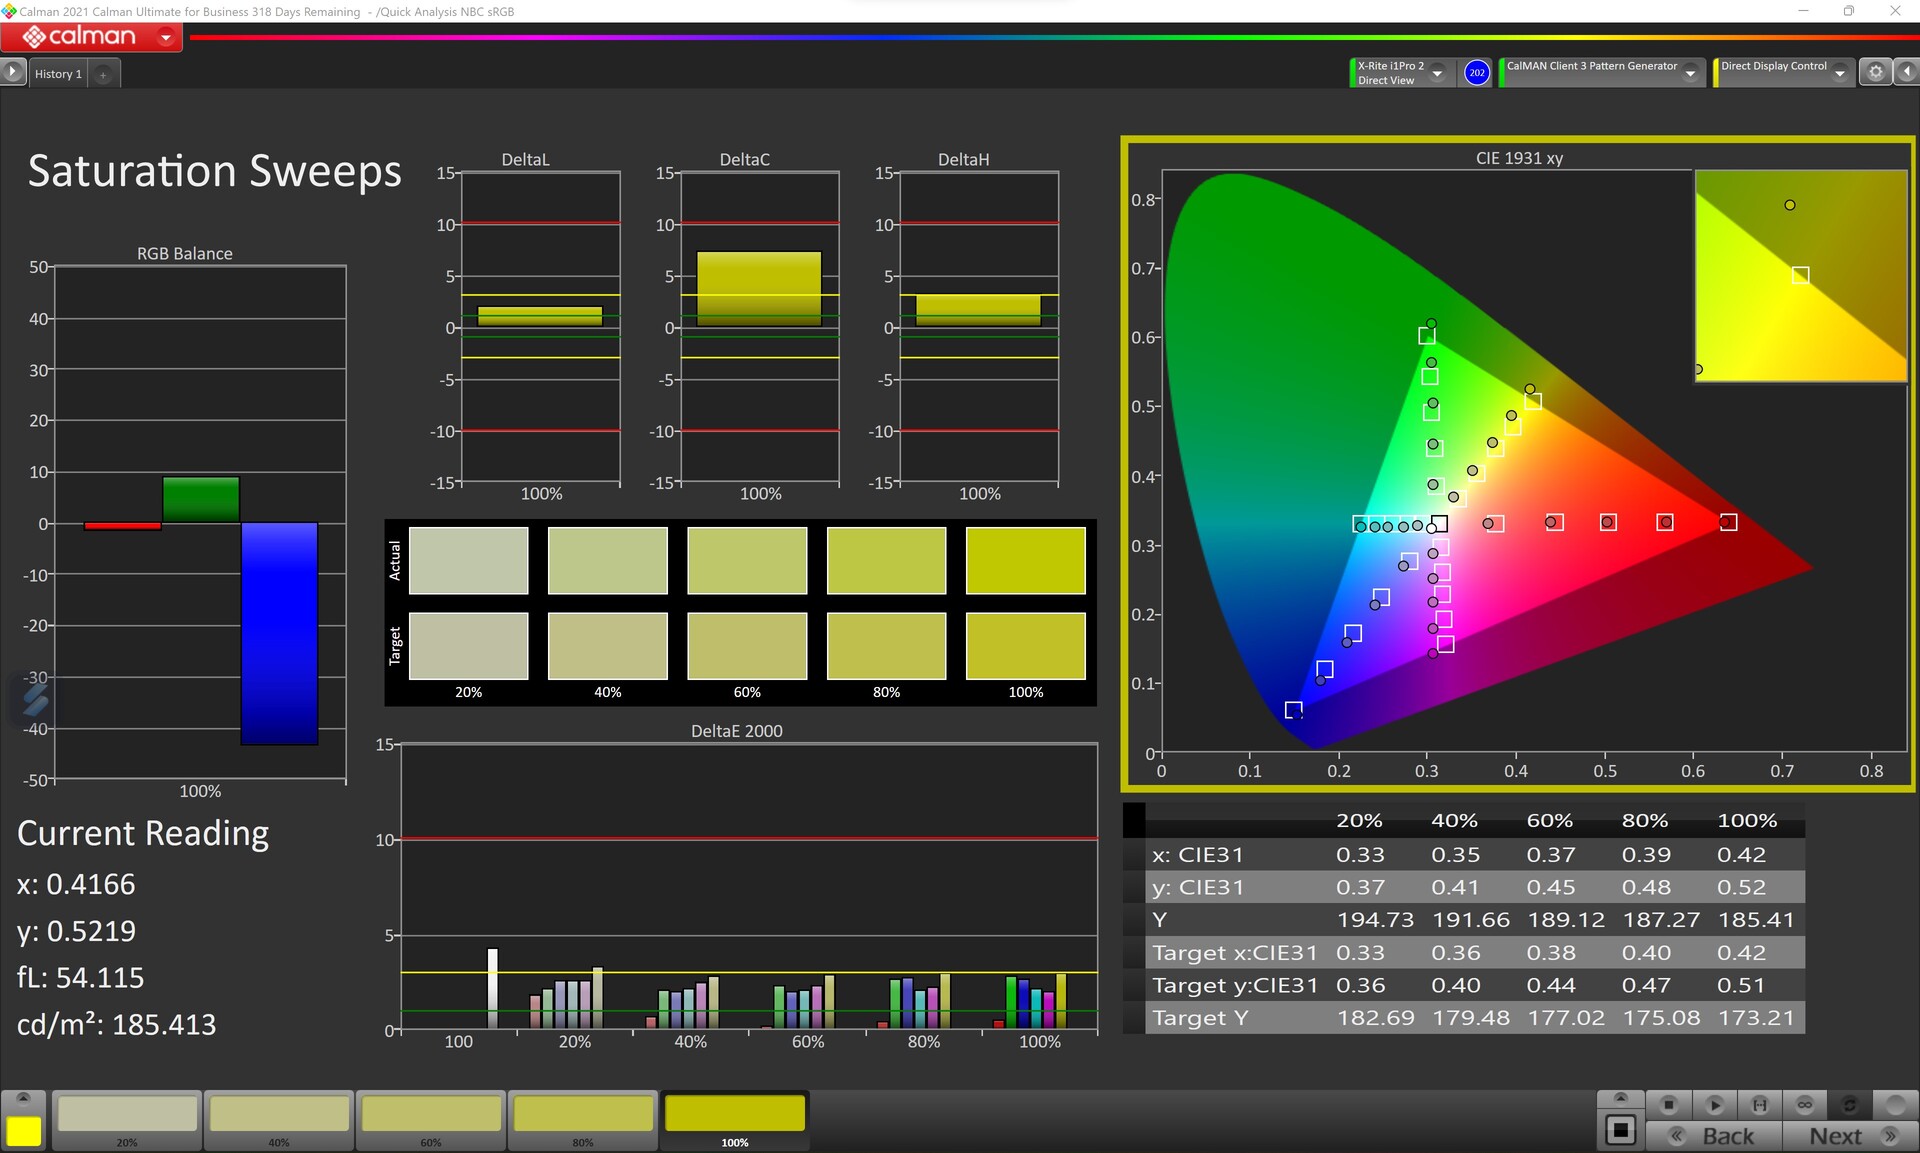
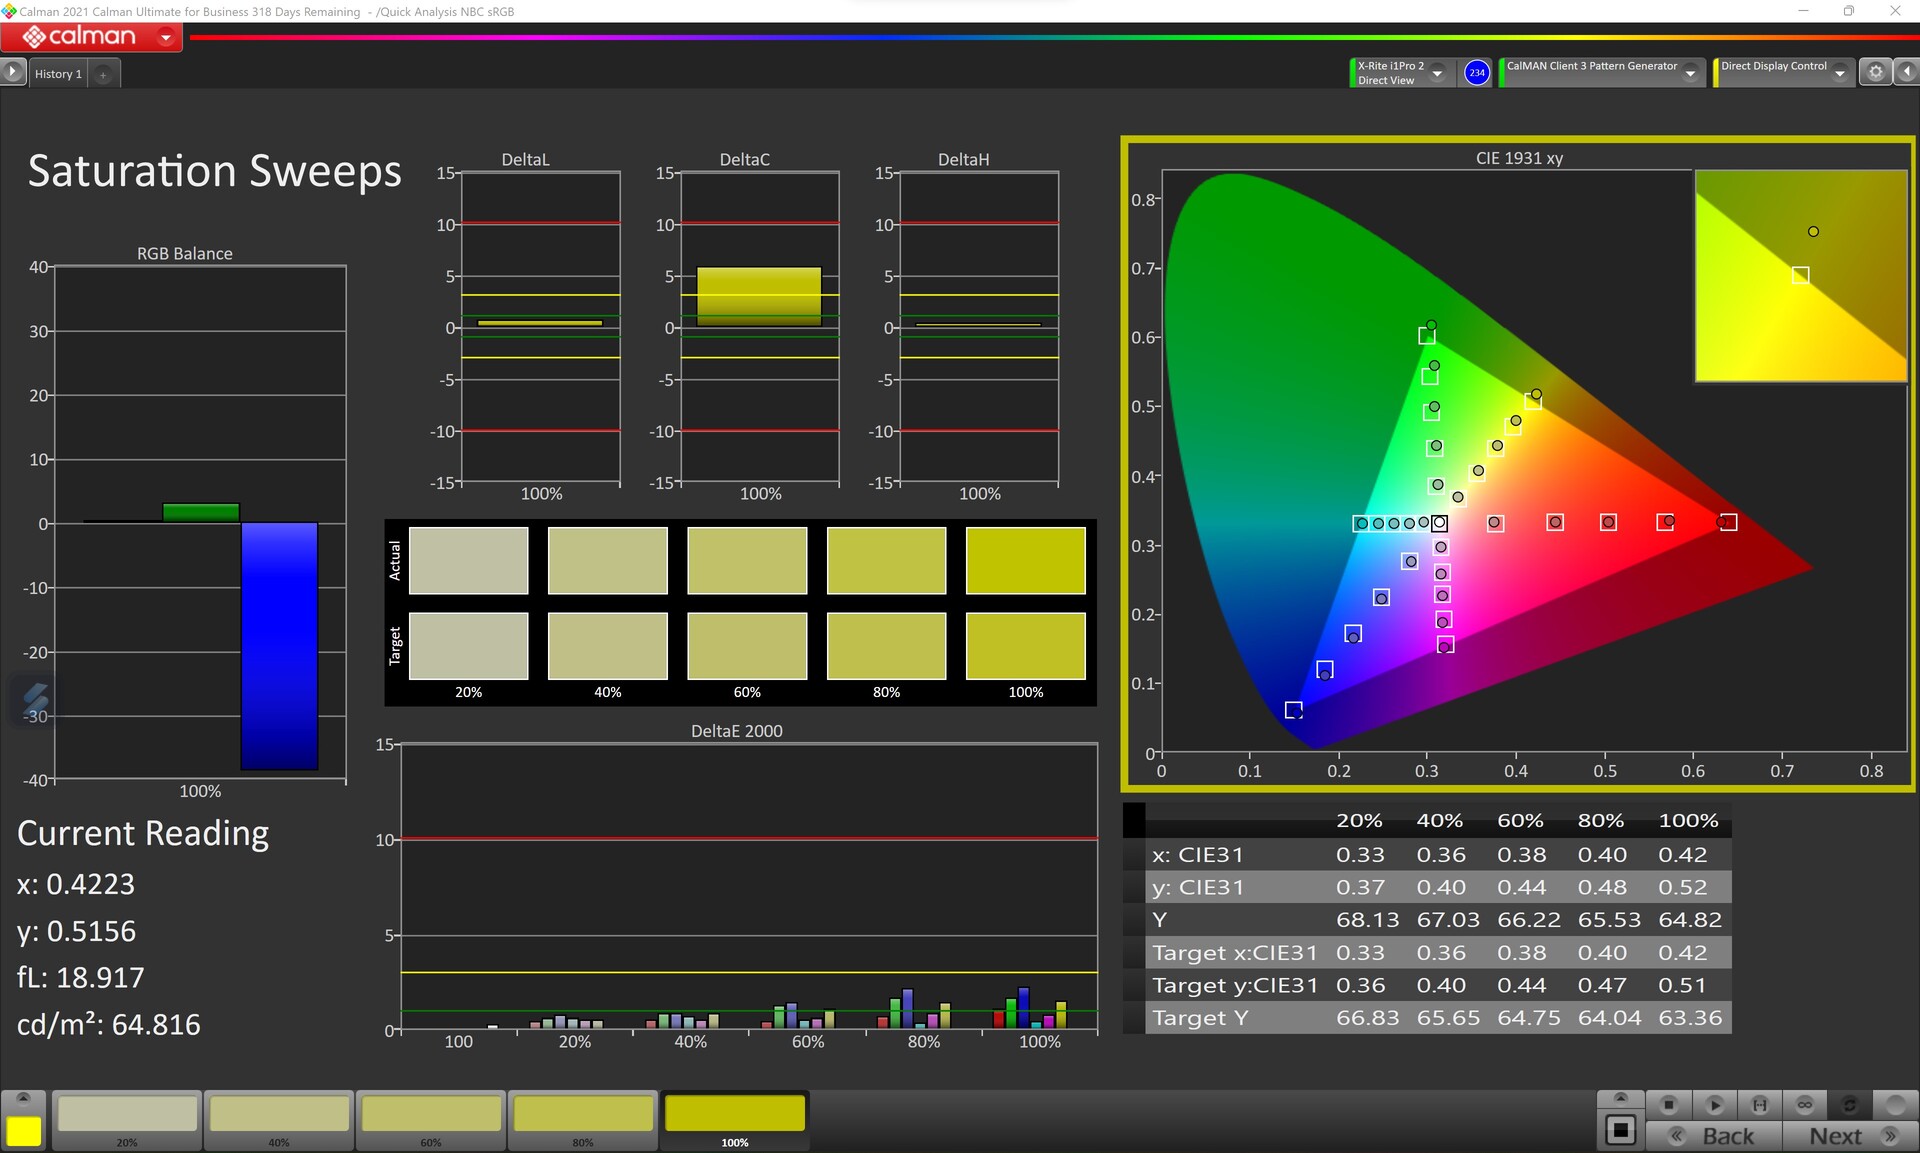
显示质量很好,色彩空间覆盖率也很高。然而,在这种比较中,竞争对手往往也能提供更好的比率。我们的评测样本在这个学科上只能击败联想的Legion 7。由于与sRGB色彩空间相比,灰度和色彩的Delta E-2000值很好,我们认为海盗船在运送该设备时使用了校准的显示器。手动校准又稍微改善了Delta E-2000值。然而,最大的显示器亮度受到影响。我们建议让显示器保持其交付状态。色彩空间的覆盖范围对于半专业的照片和视频编辑来说是足够的。
Display Response Times
| ↔ Response Time Black to White | ||
|---|---|---|
| 10 ms ... rise ↗ and fall ↘ combined | ↗ 5 ms rise | 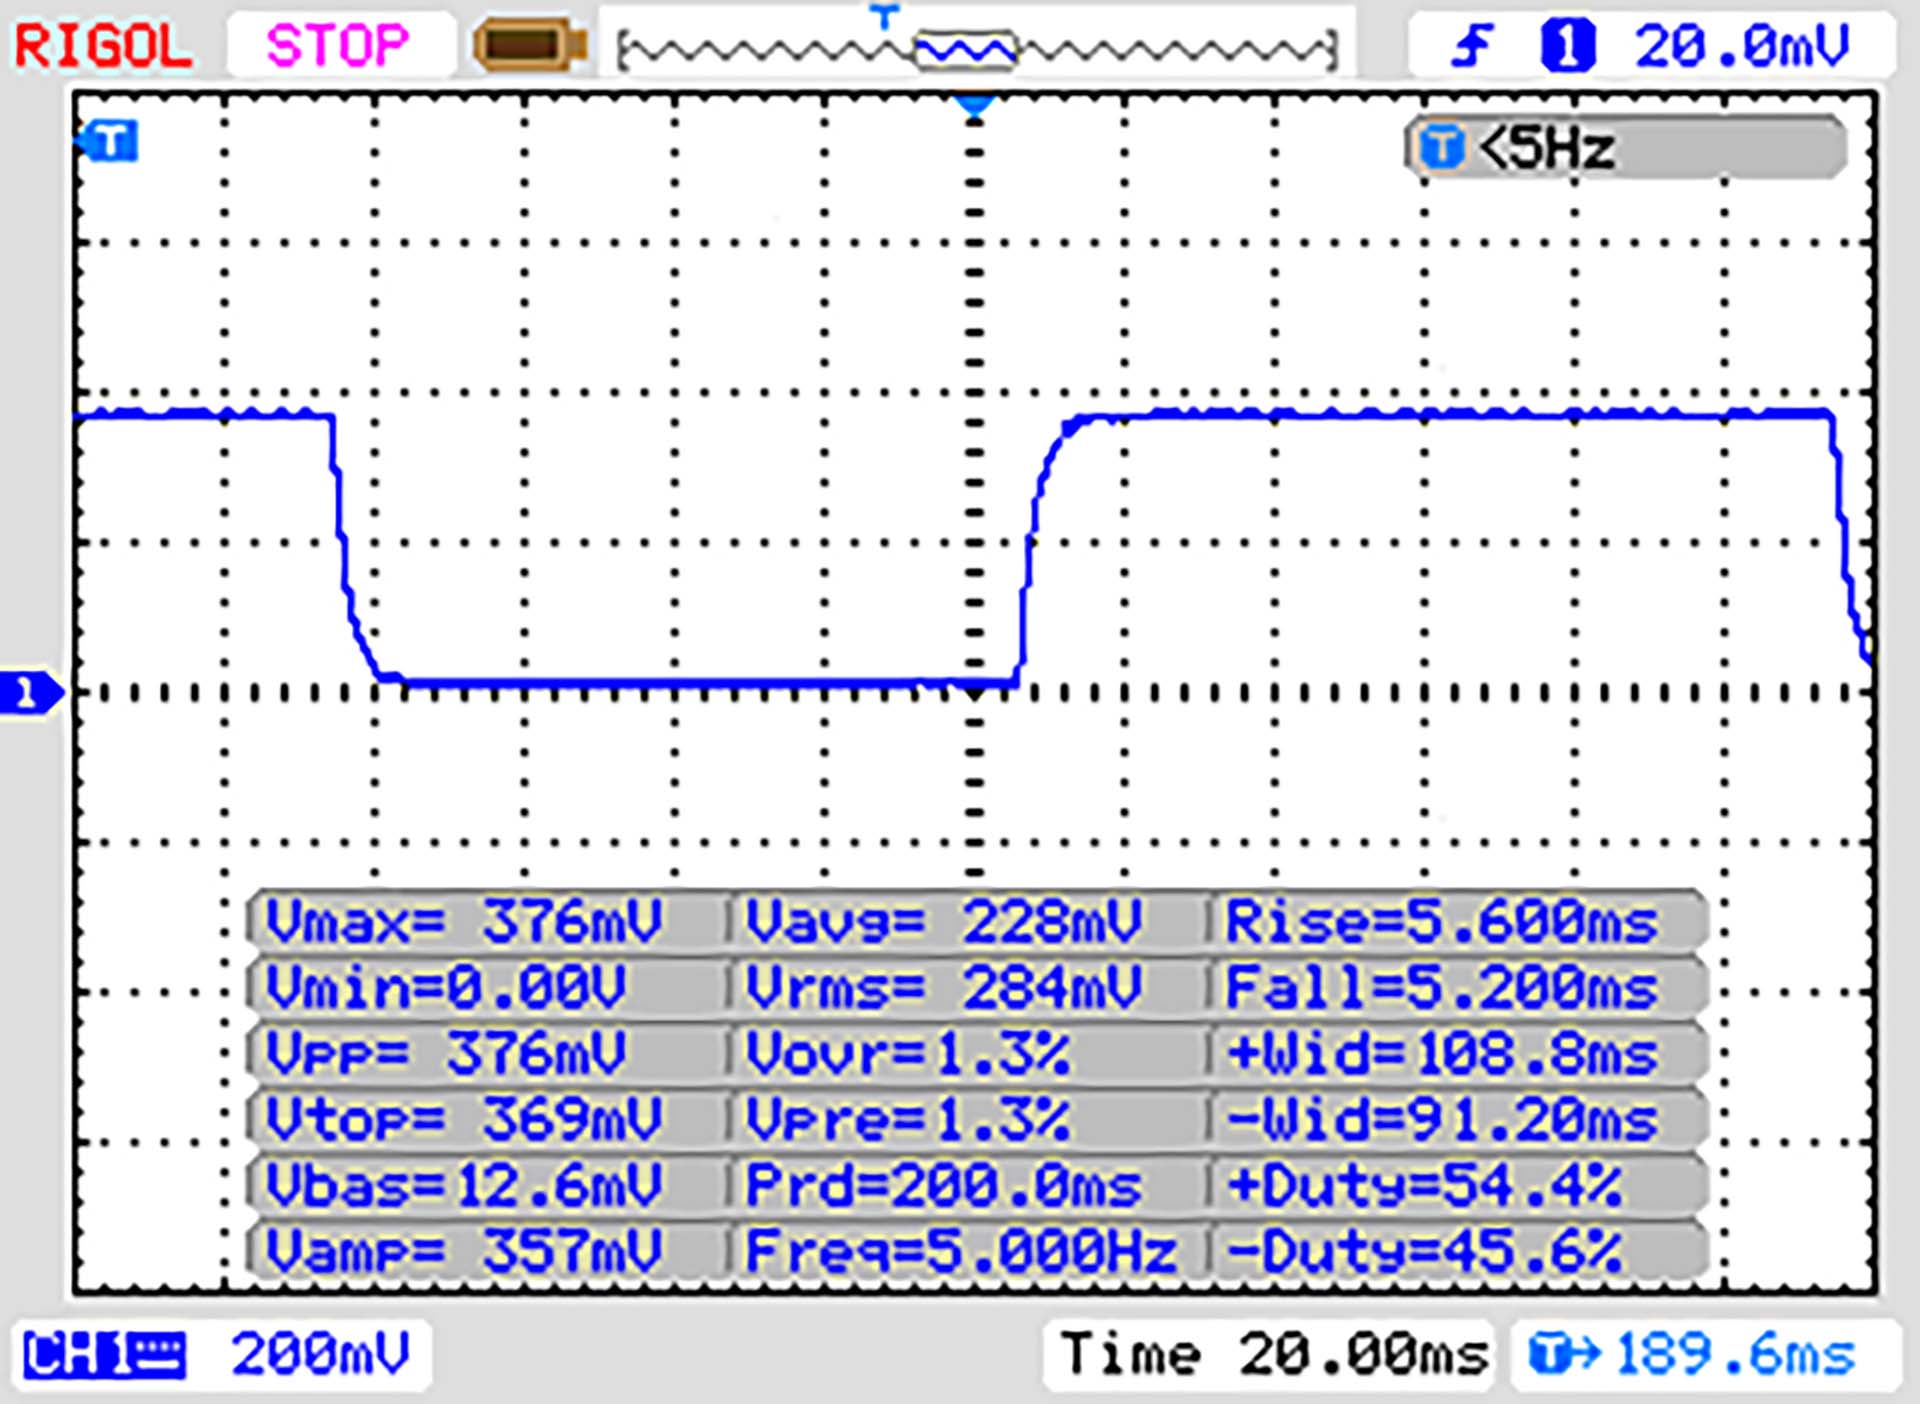 |
| ↘ 5 ms fall | ||
| The screen shows good response rates in our tests, but may be too slow for competitive gamers. In comparison, all tested devices range from 0.1 (minimum) to 240 (maximum) ms. » 27 % of all devices are better. This means that the measured response time is better than the average of all tested devices (19.8 ms). | ||
| ↔ Response Time 50% Grey to 80% Grey | ||
| 13 ms ... rise ↗ and fall ↘ combined | ↗ 7 ms rise | 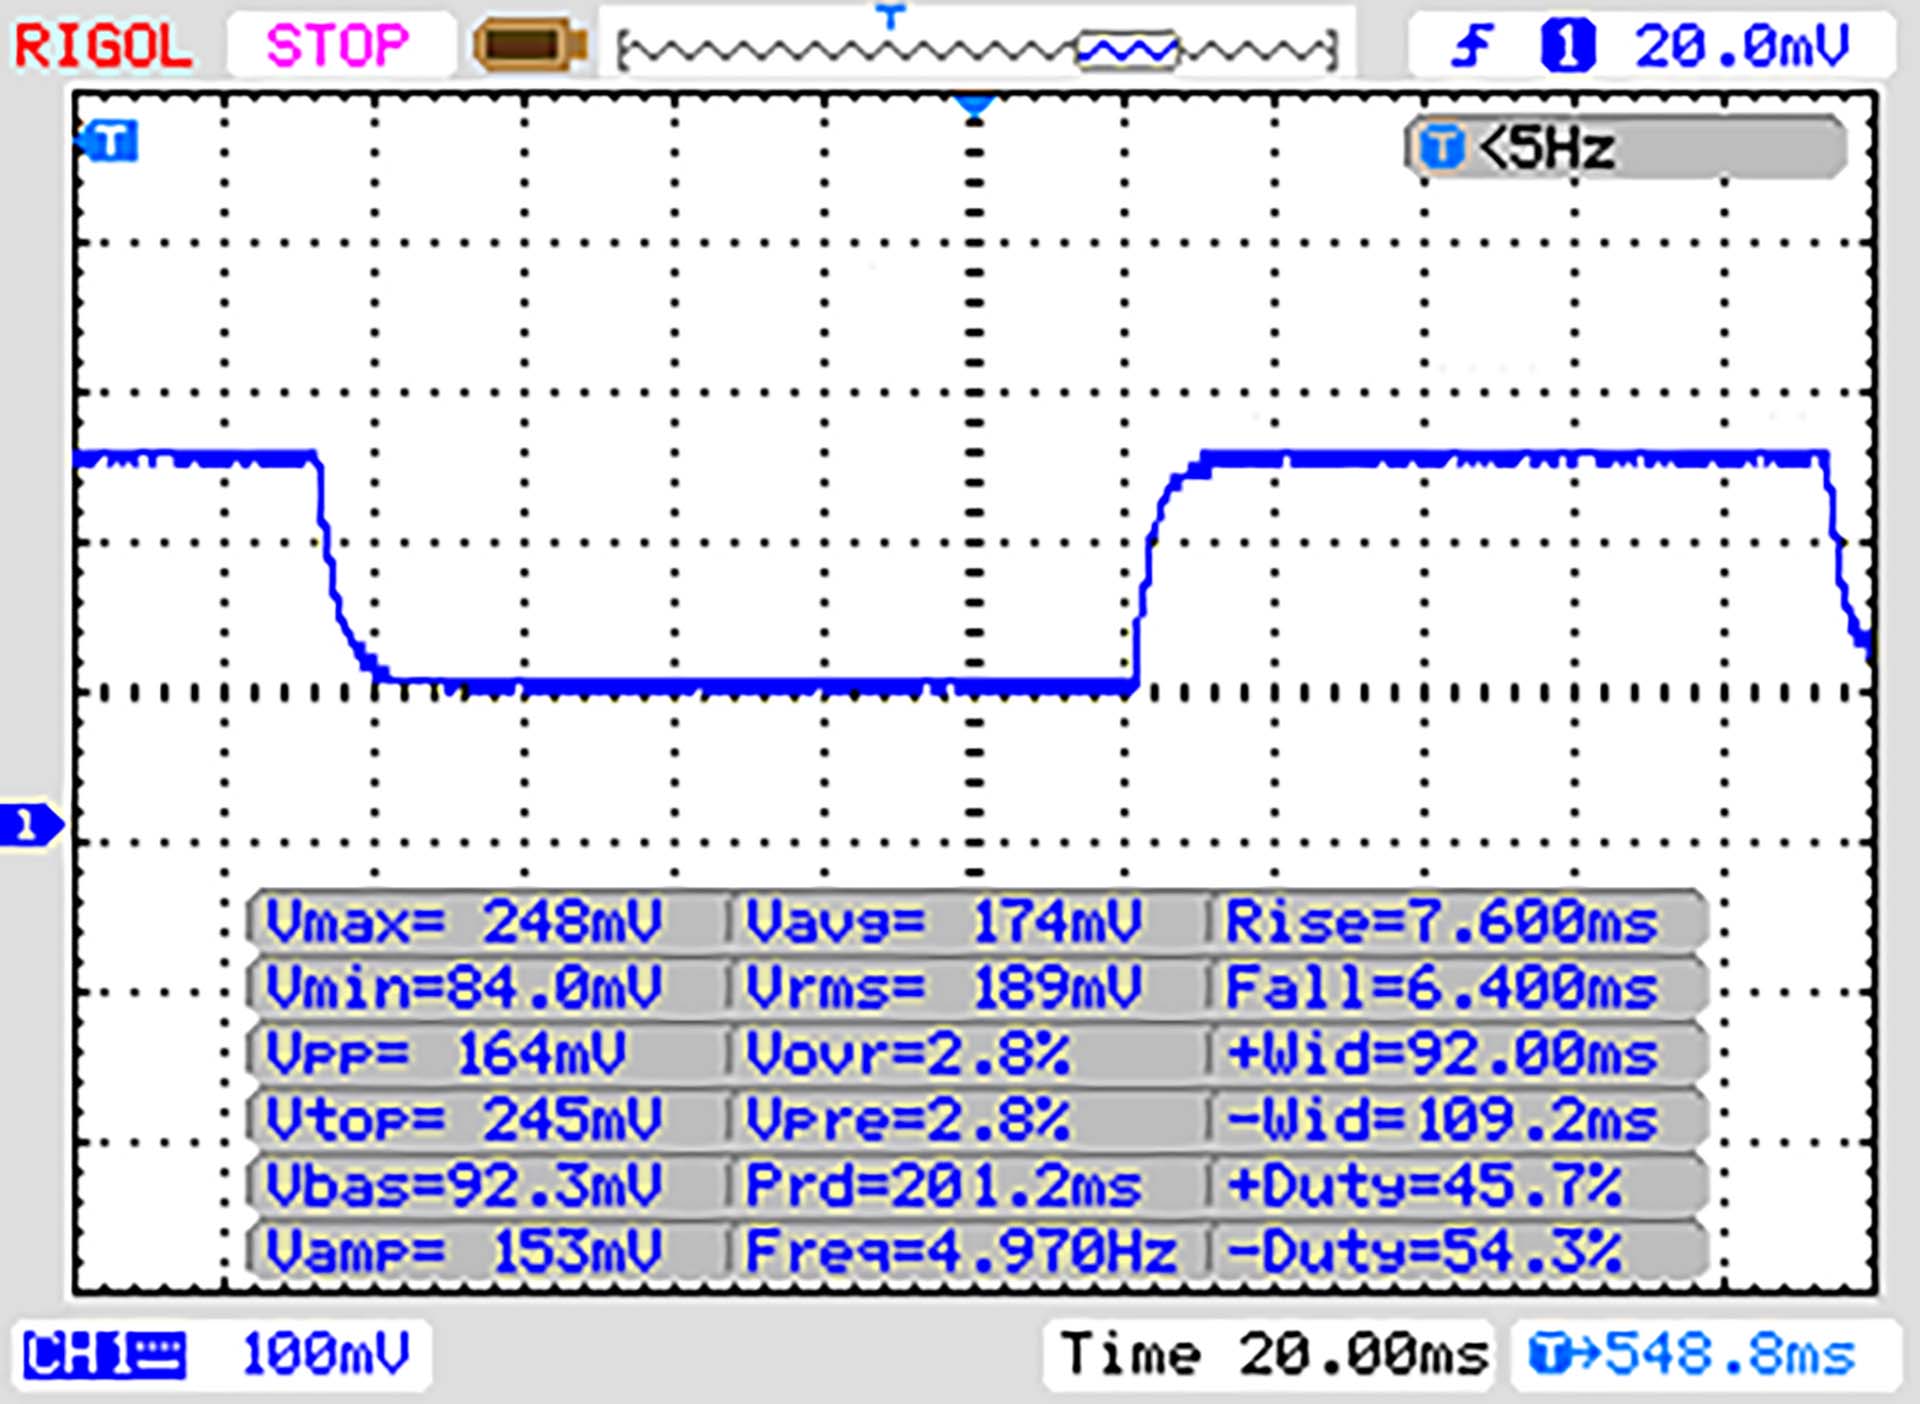 |
| ↘ 6 ms fall | ||
| The screen shows good response rates in our tests, but may be too slow for competitive gamers. In comparison, all tested devices range from 0.165 (minimum) to 636 (maximum) ms. » 27 % of all devices are better. This means that the measured response time is better than the average of all tested devices (30.9 ms). | ||
Screen Flickering / PWM (Pulse-Width Modulation)
| Screen flickering / PWM not detected | 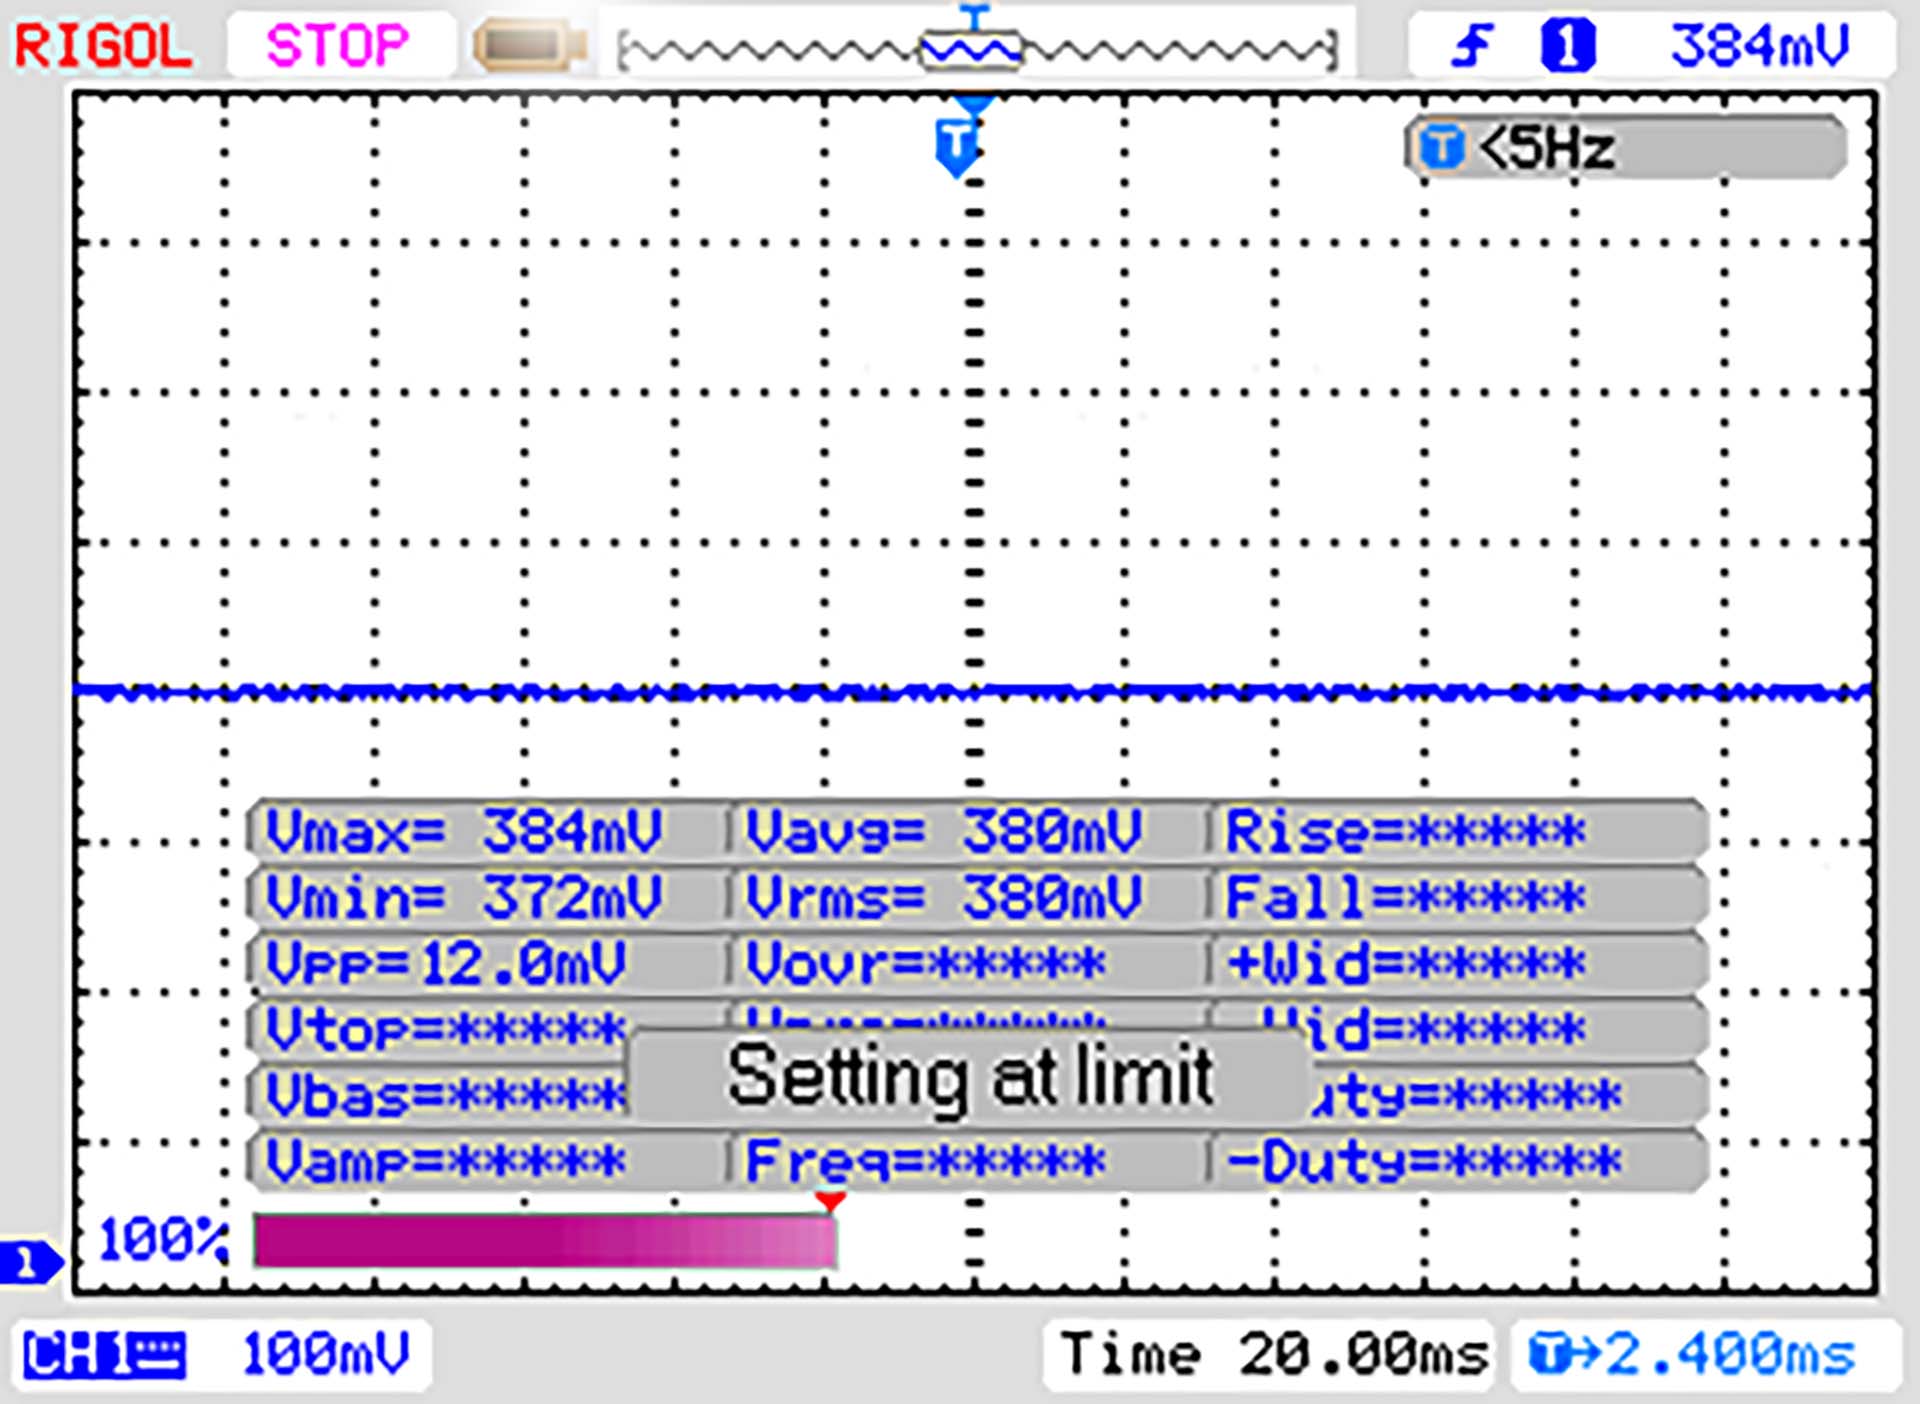 | ||
In comparison: 52 % of all tested devices do not use PWM to dim the display. If PWM was detected, an average of 7748 (minimum: 5 - maximum: 343500) Hz was measured. | |||
原则上,哑光显示的表面适合在户外使用。然而,相对较低的显示亮度对它不利。
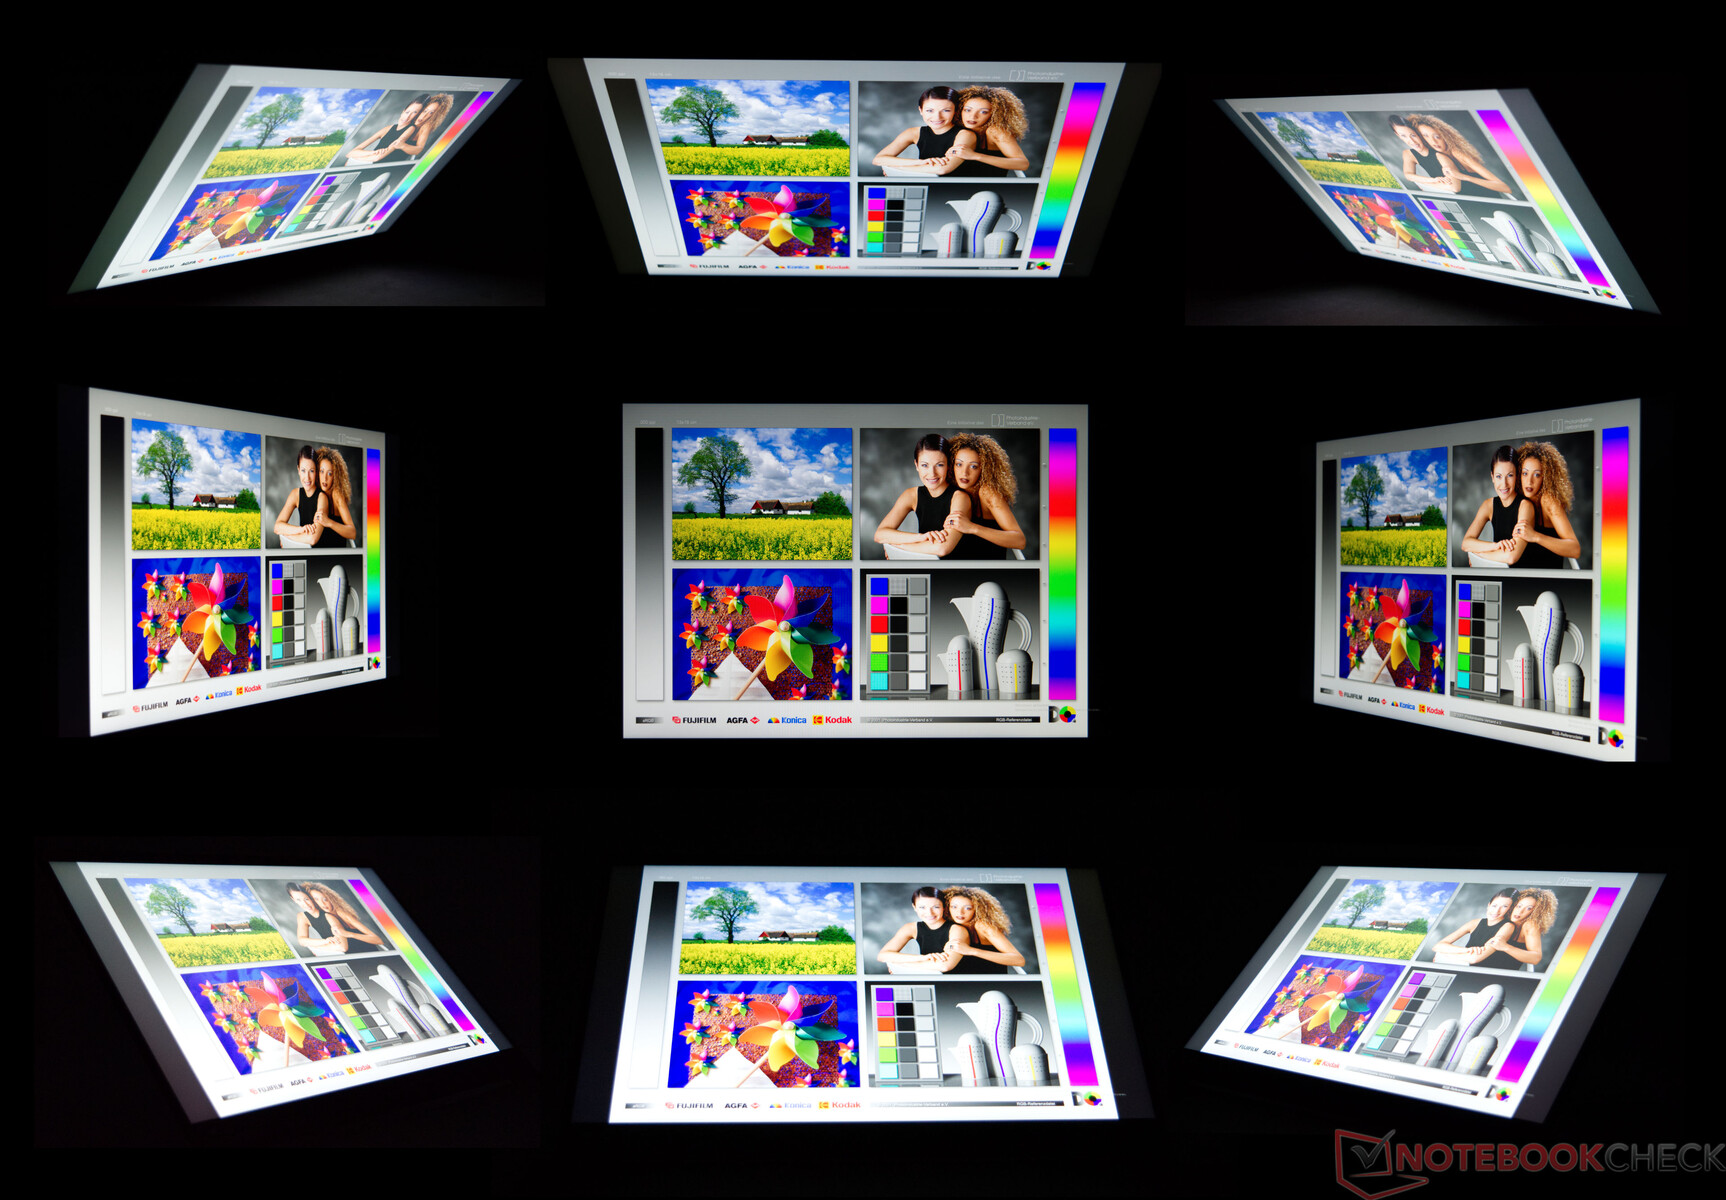
视角测试显示了一个典型的IPS面板的结果。在四个角落的图像中可以看到轻微的颜色变化,这不会导致正常使用中的任何限制。
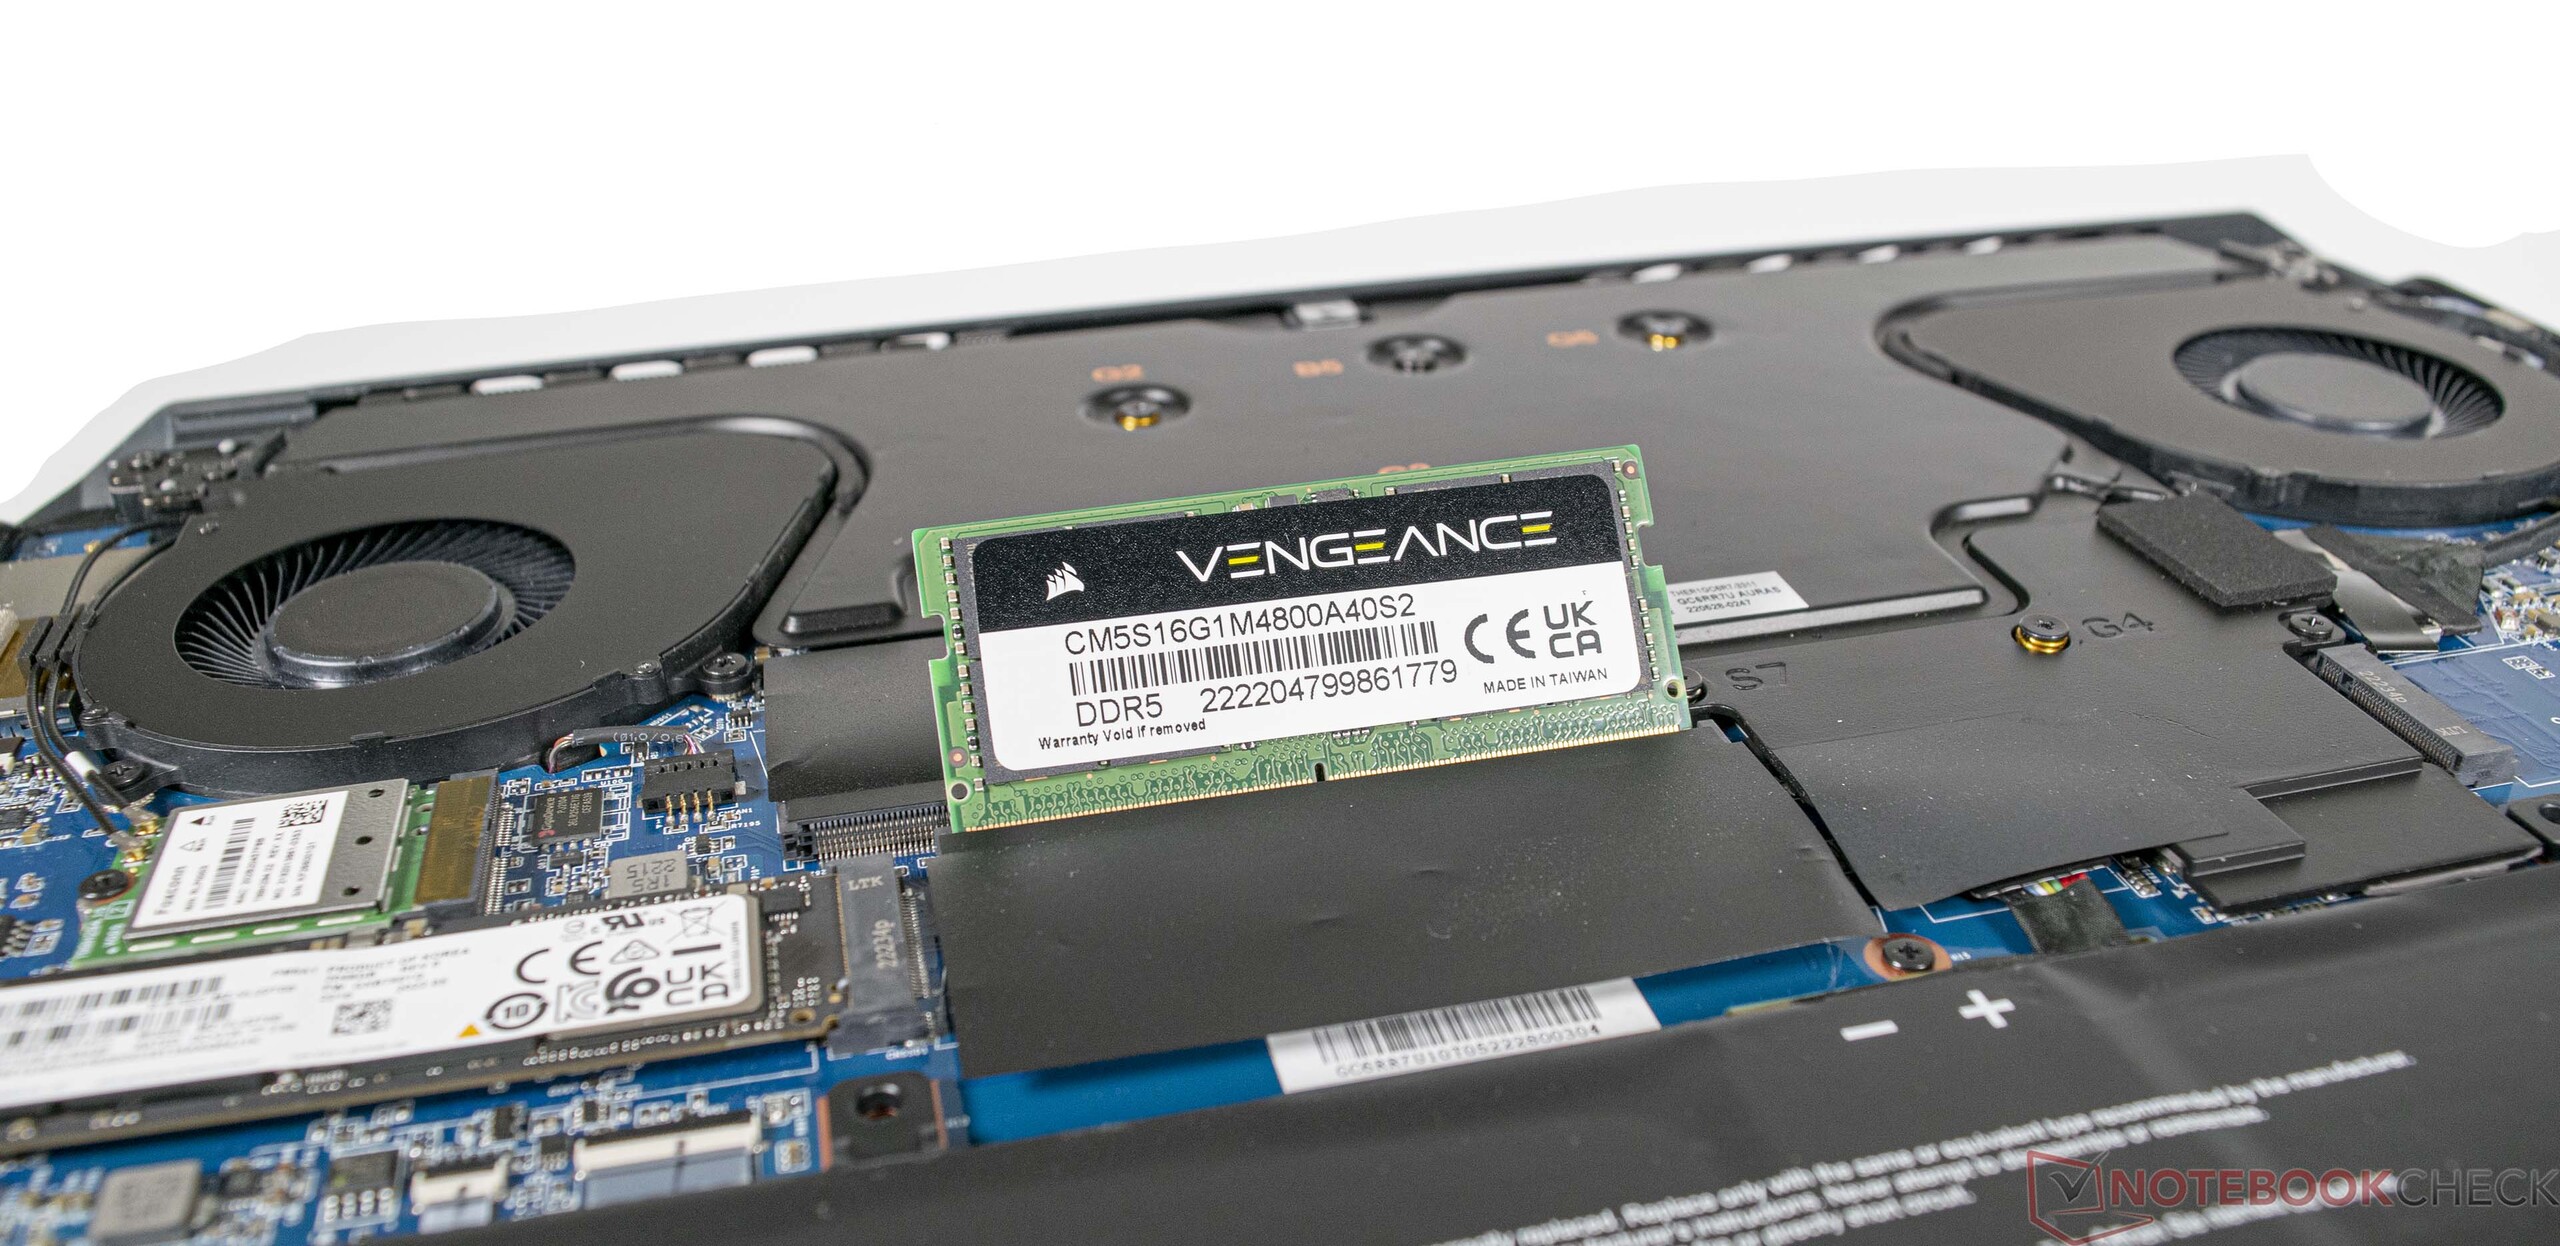
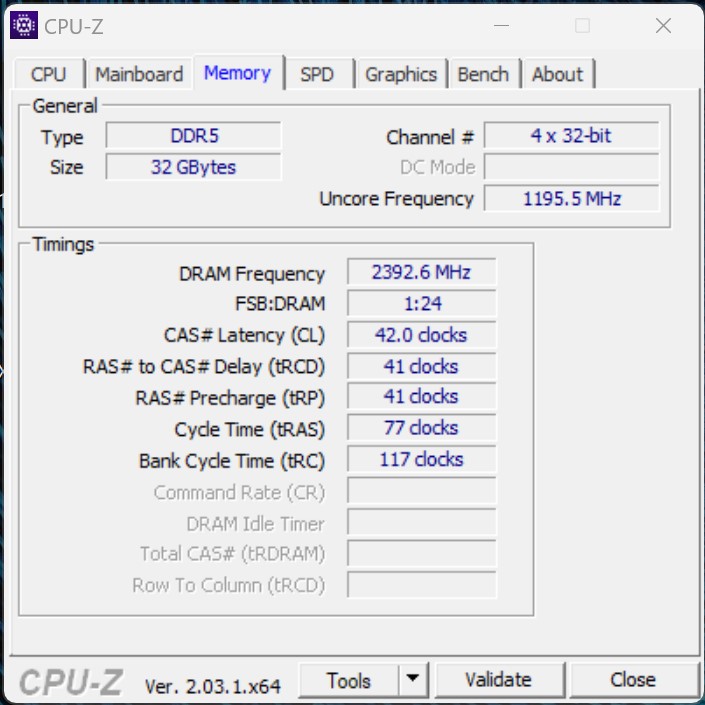
性能 - 伦勃朗基地有大量的内存和存储空间
海盗船Voyager a1600的组合为AMD Ryzen 9 6900HS和 AMD Radeon RX 6800M提供了一个非常好的基础上,目前的游戏与最大的细节在一台笔记本电脑。与32GB工作内存和2TB固态硬盘相连,用户在这里也得到了一个体面的性能。
测试条件
海盗船提供了在三种不同模式下使用该设备的可能性,可以通过iCUE软件进行切换。这些选项是安静
、平衡
和极端。
差异在于CPU和GPU的最大性能,即使与智能移位技术相结合。所有的性能测试都是在极限
模式下进行的。
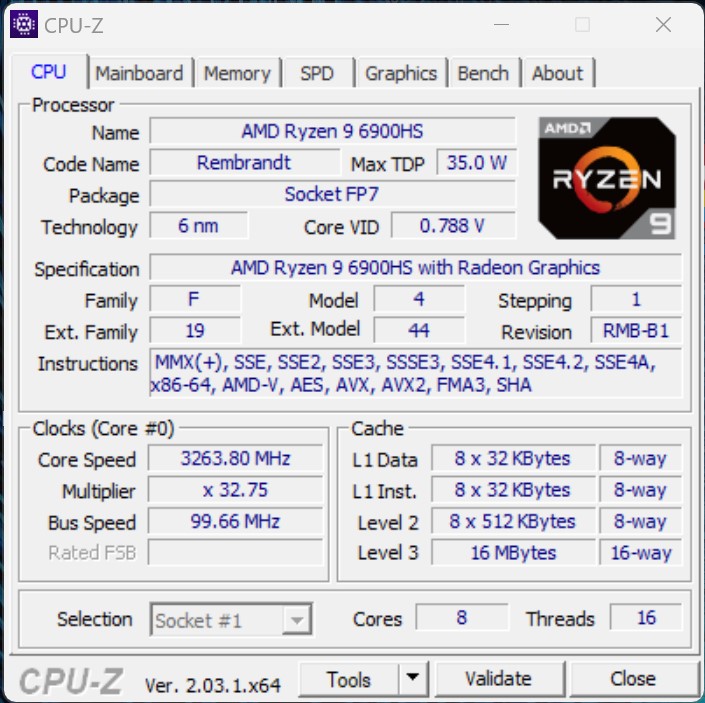
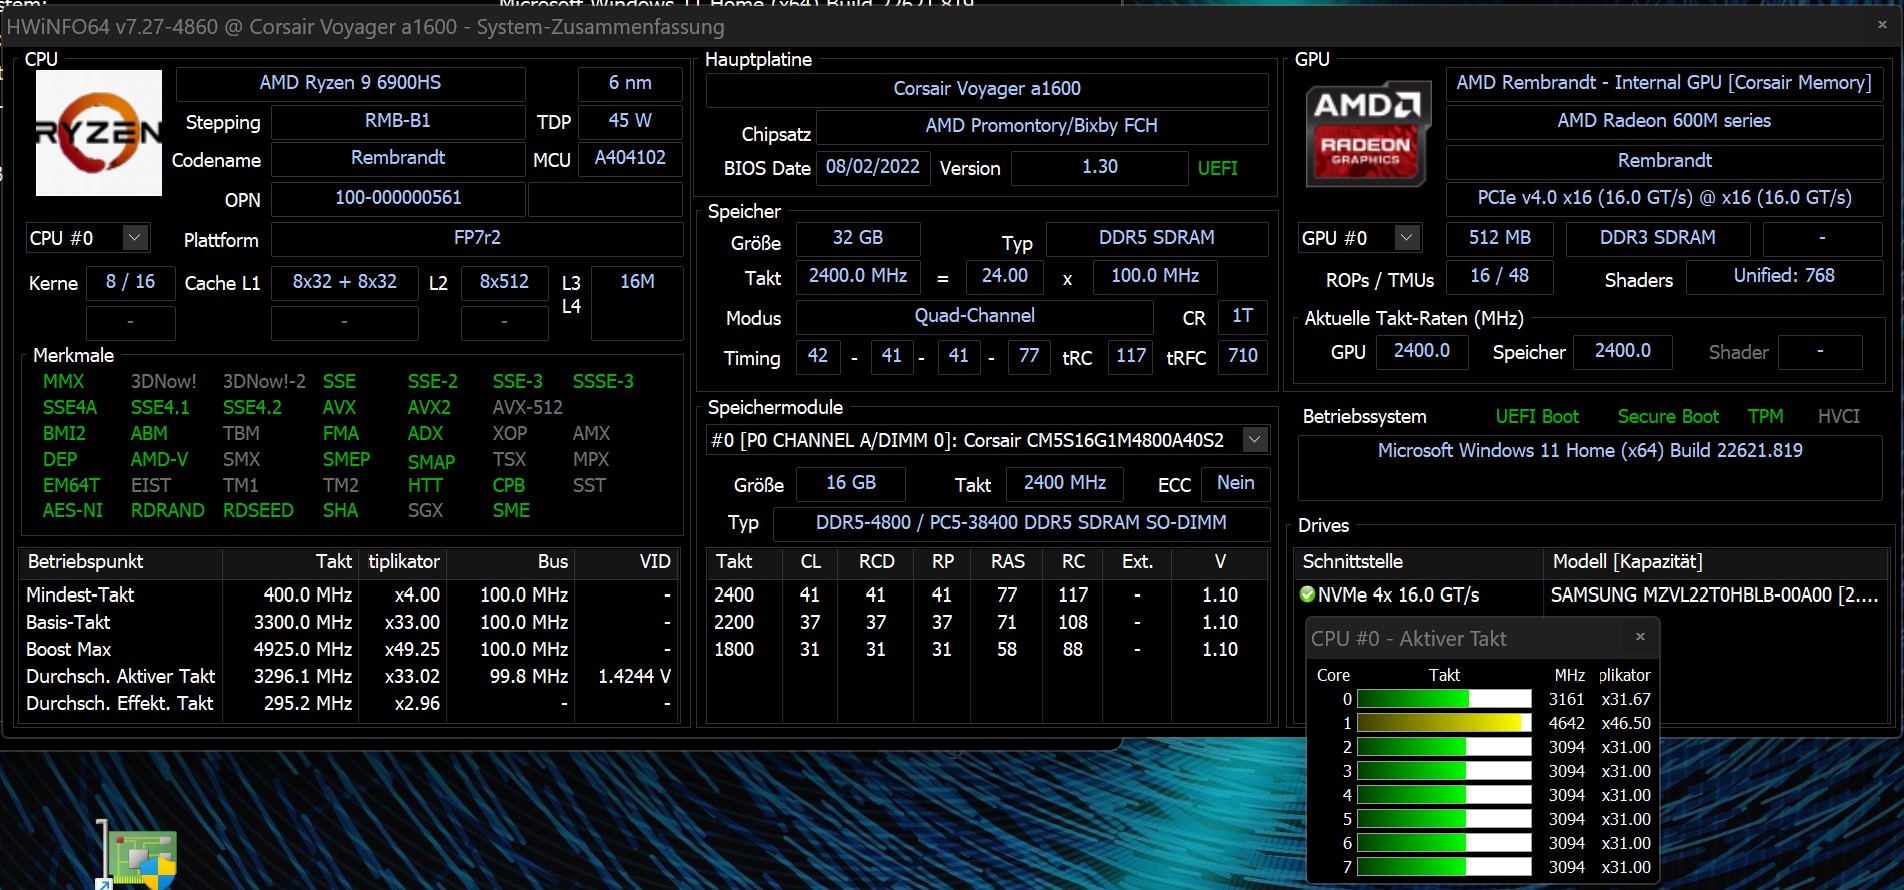
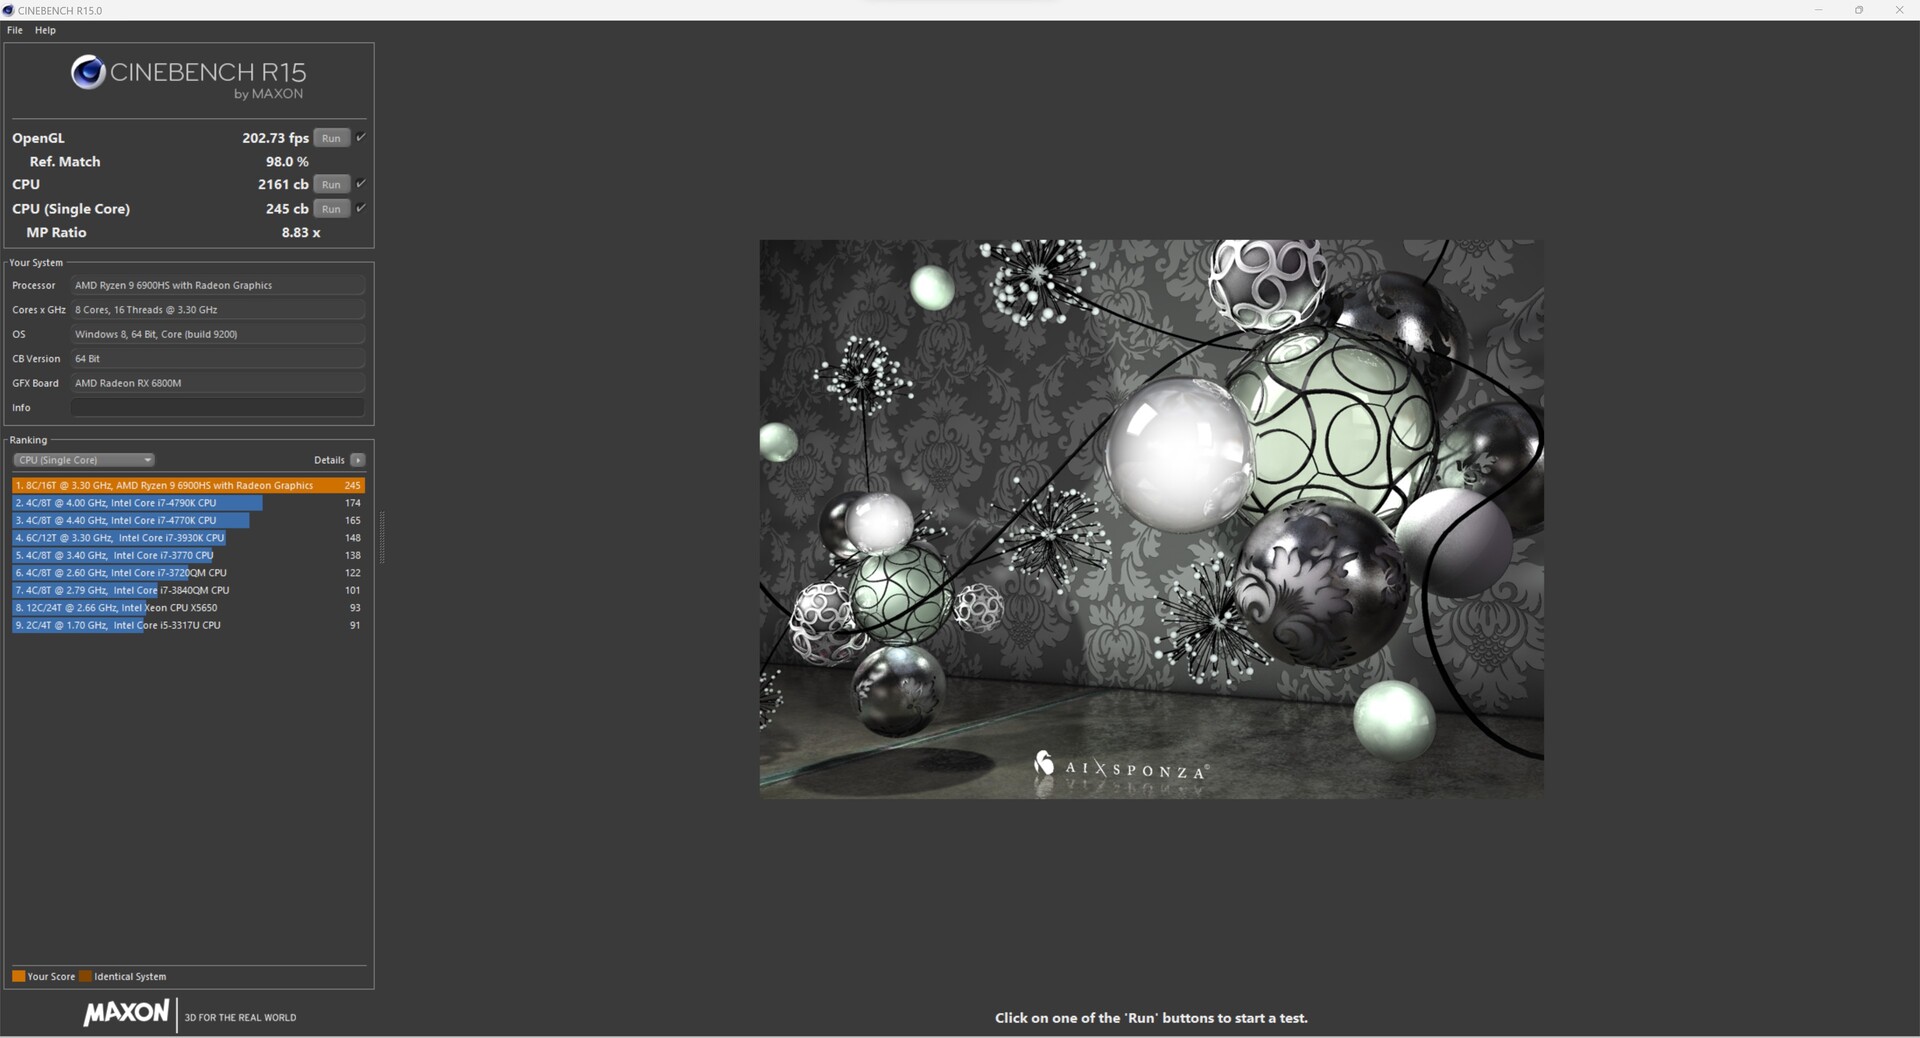
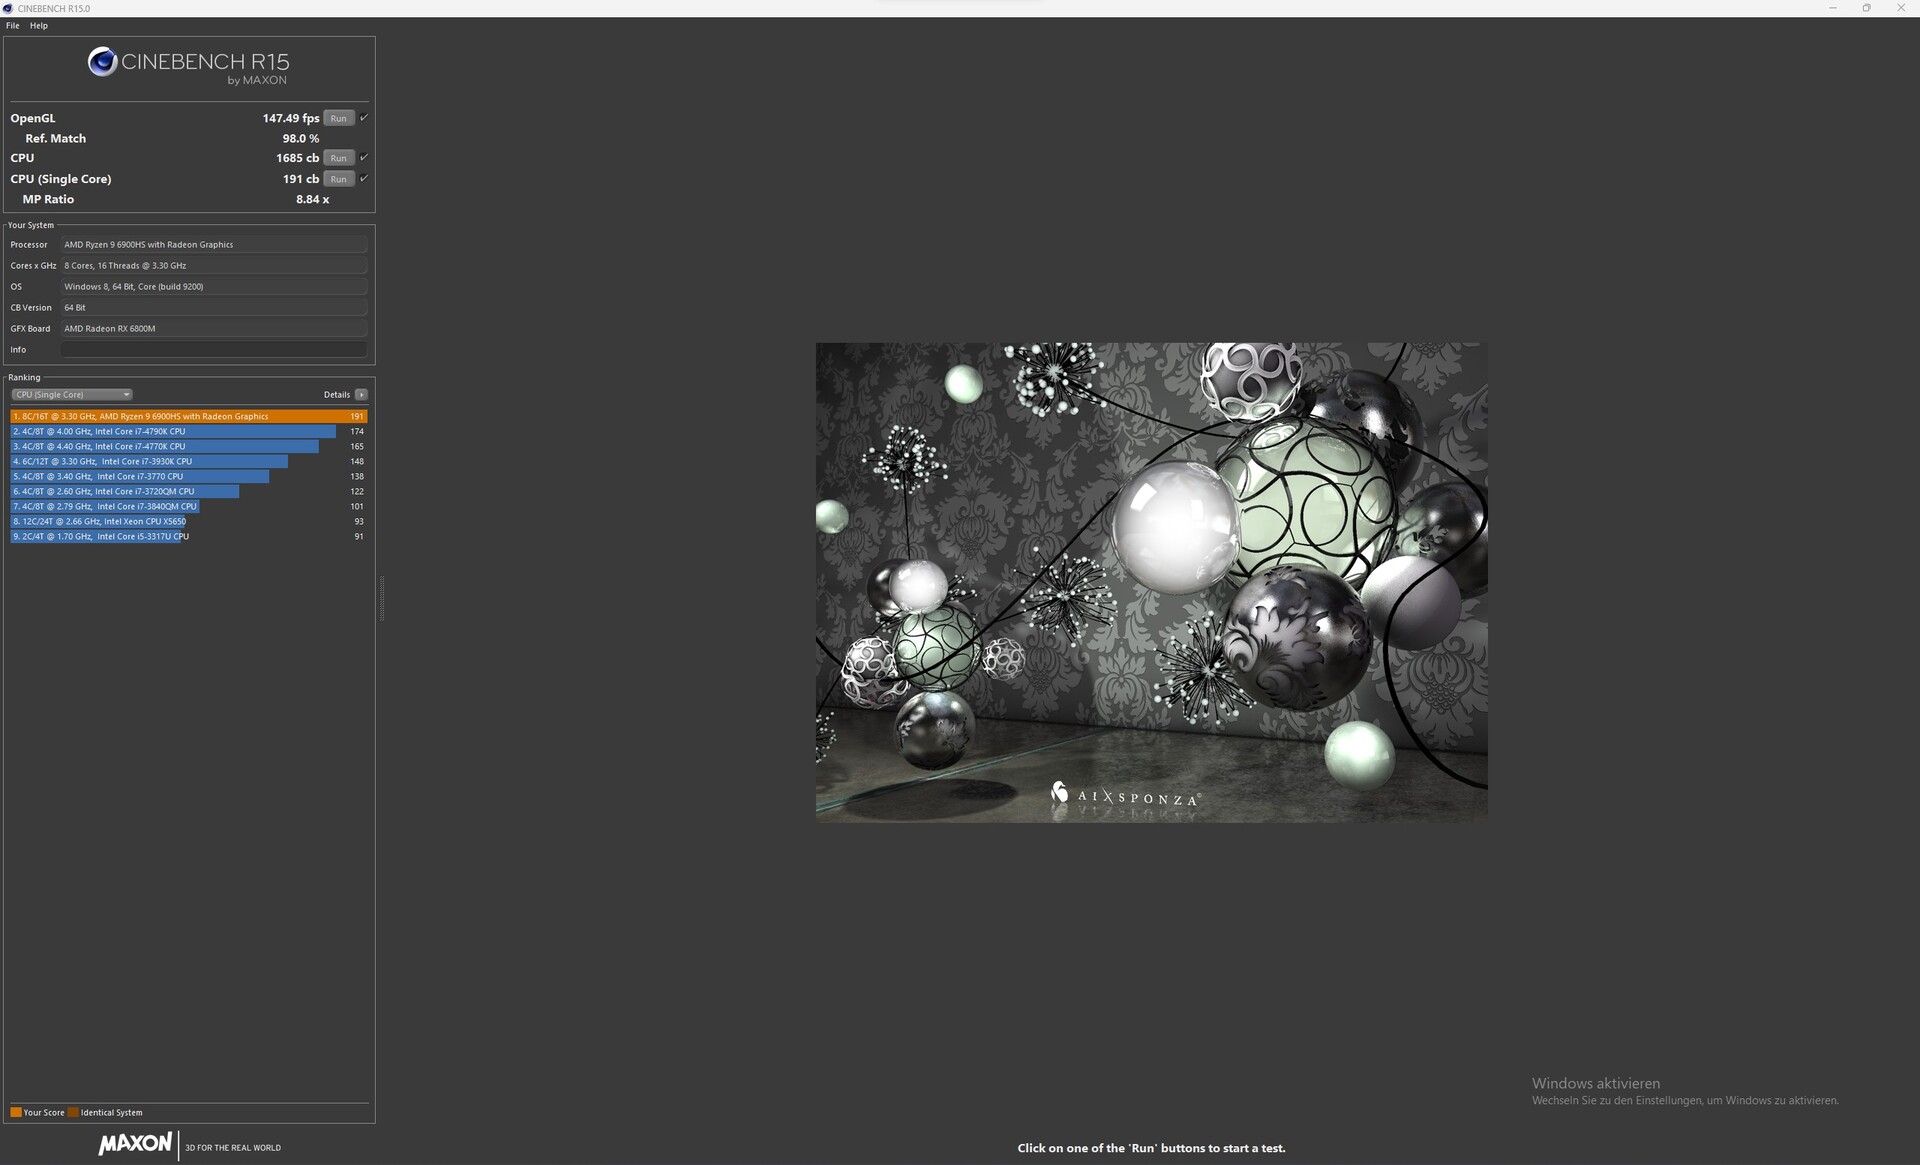
处理器
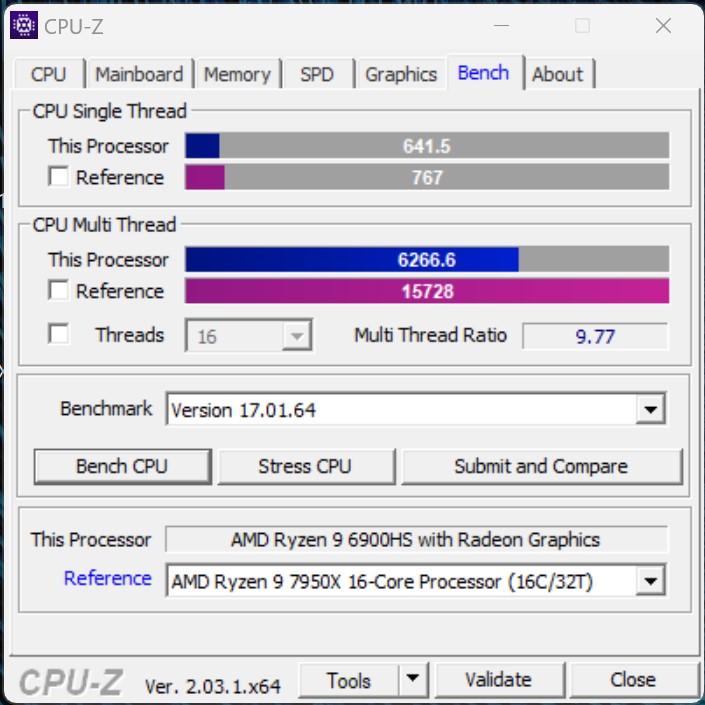
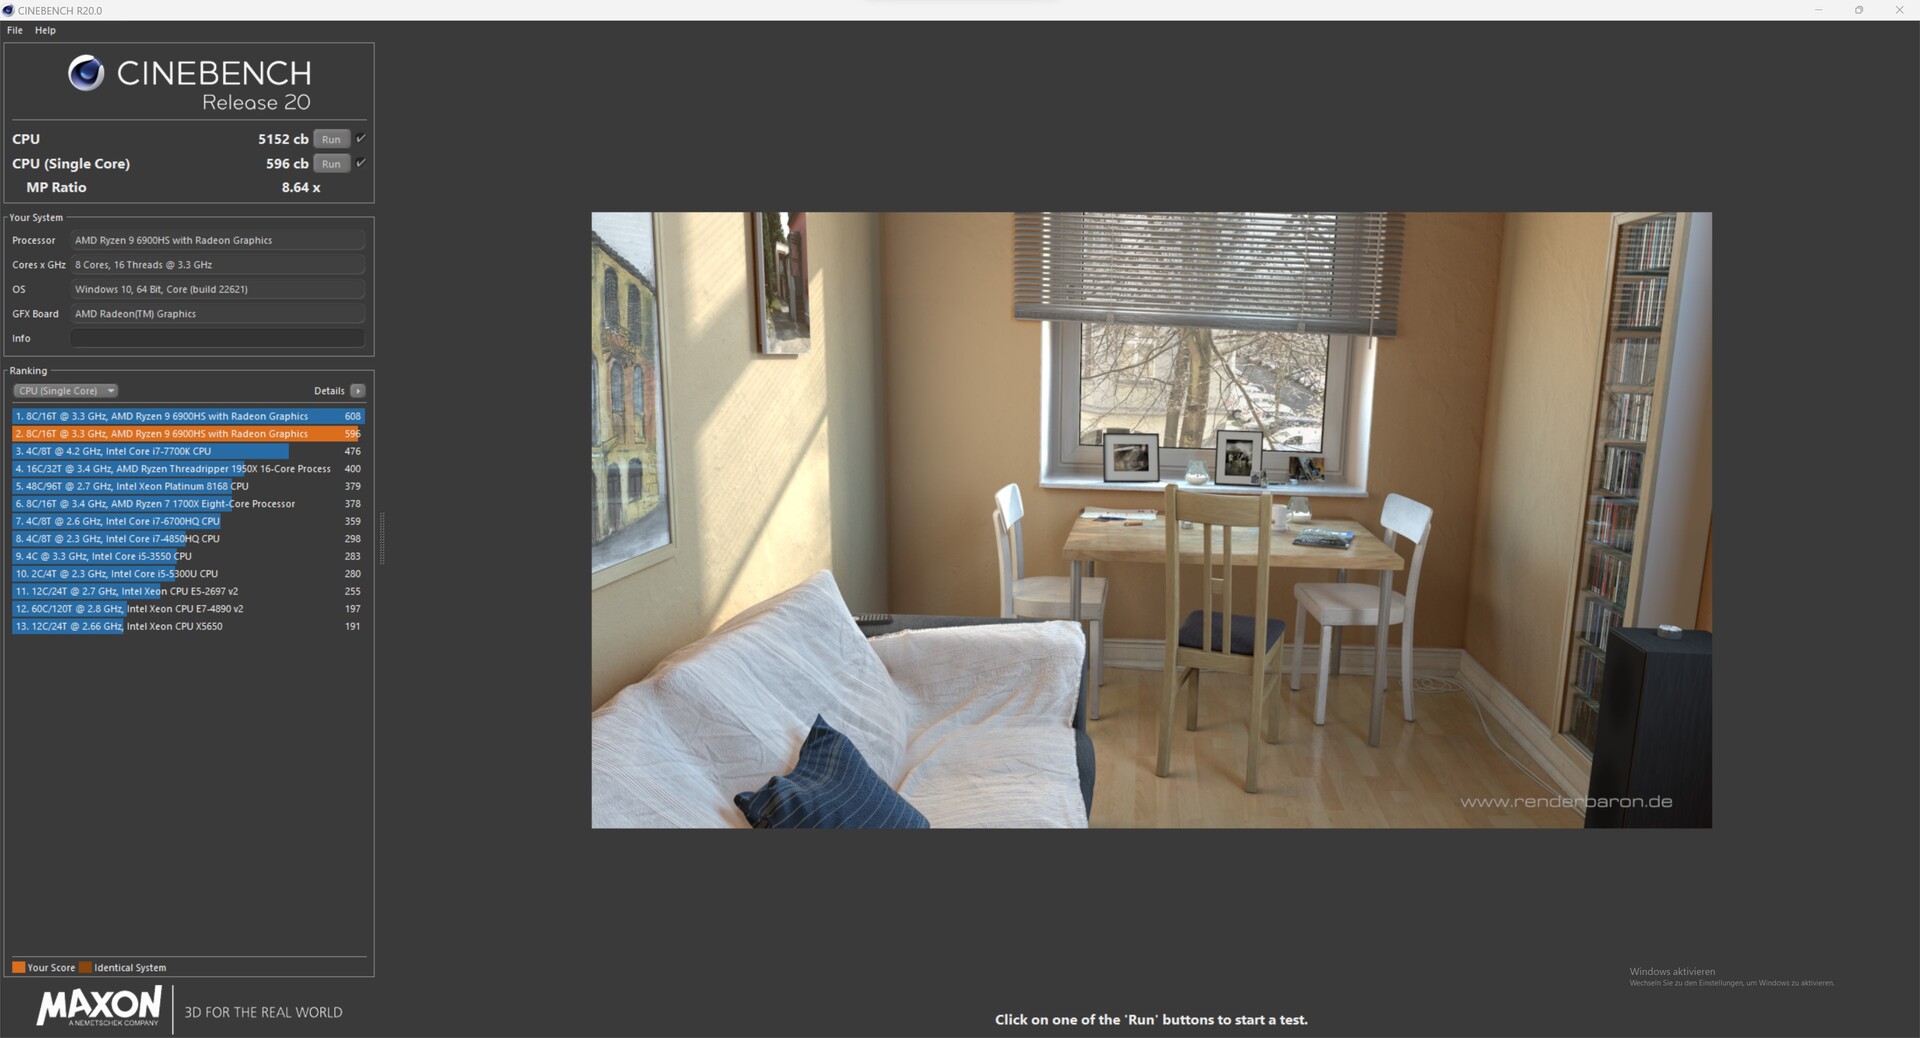
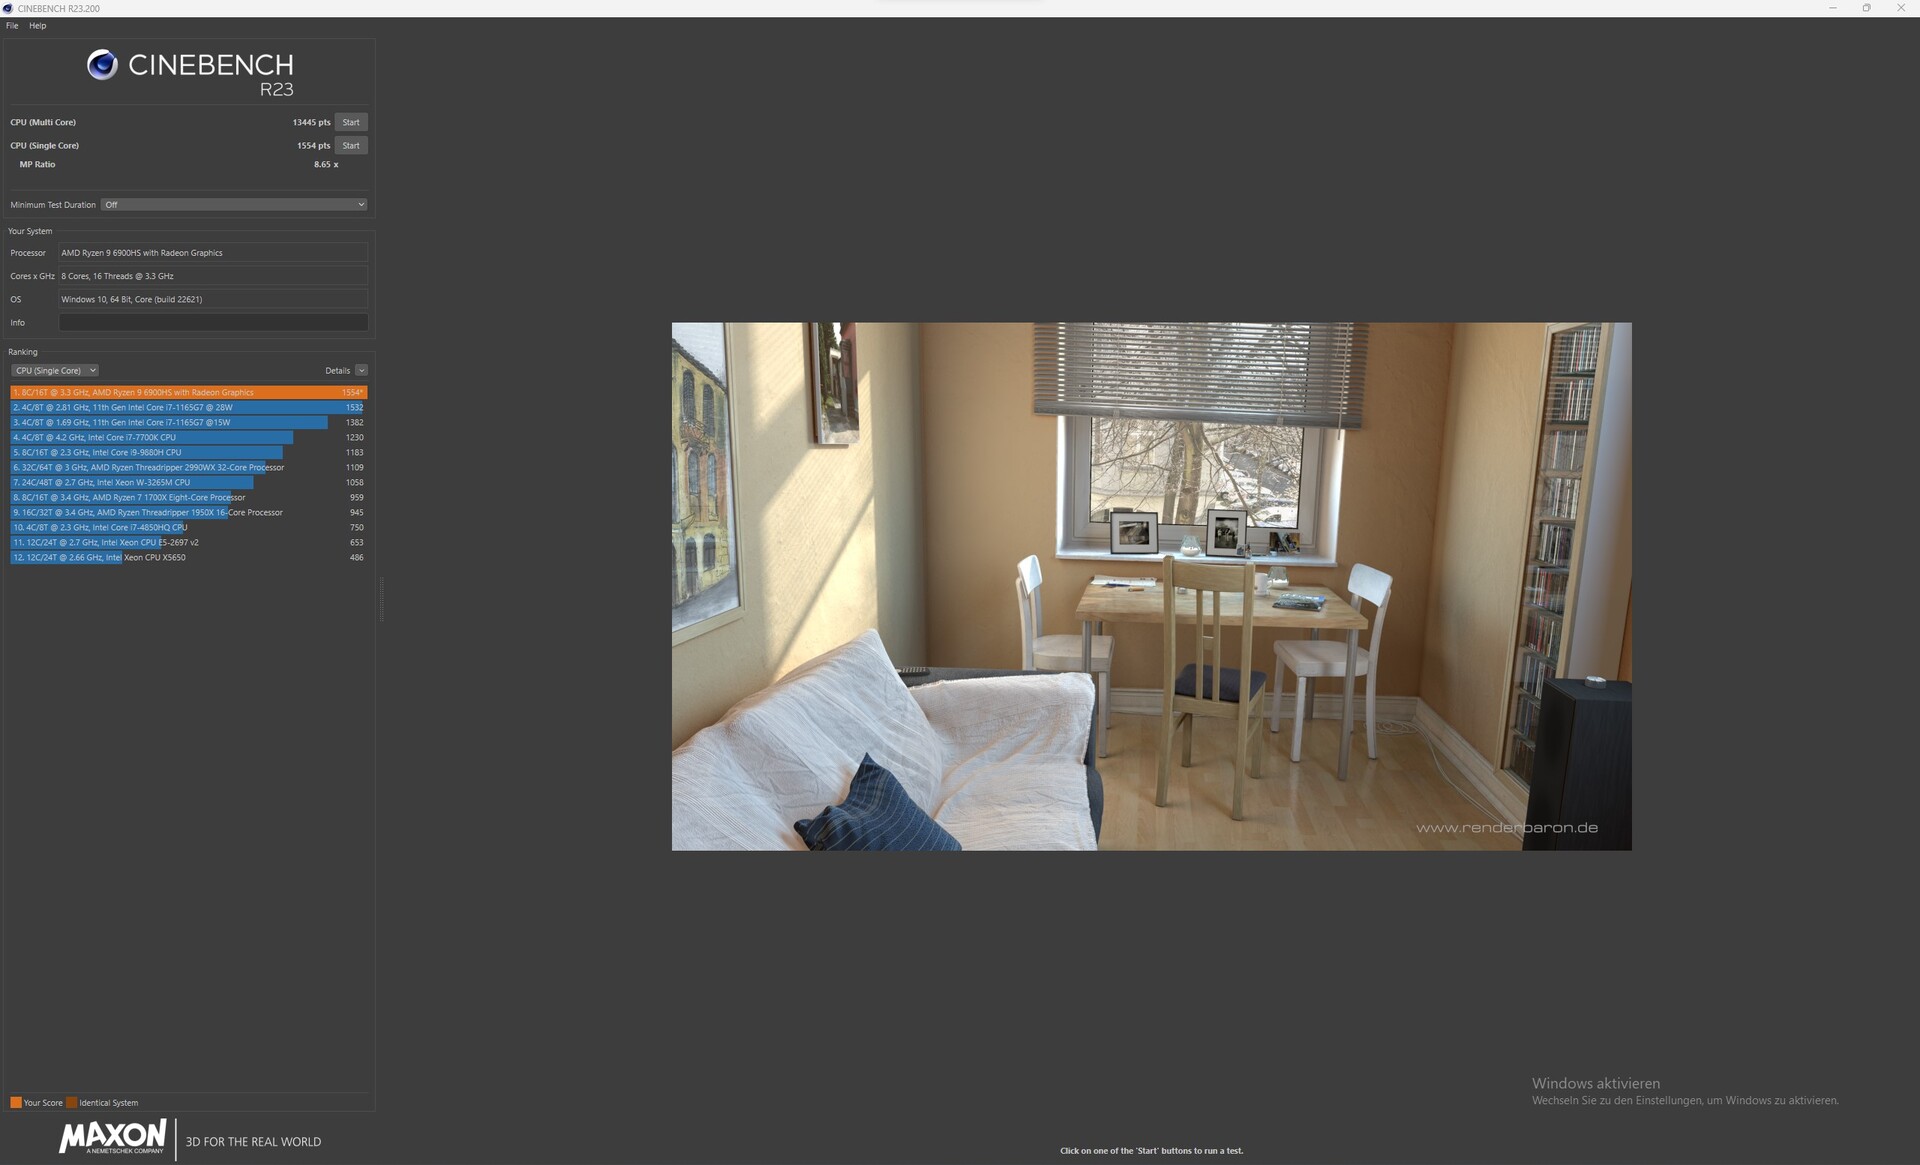
淘宝网AMD Ryzen 9 6900HS是一个八核处理器,基于目前的Rembrandt架构。该SoC在Boost状态下的时钟频率为3.3-4.9 GHz,并支持SMT,为用户提供总共16个线程。在与基于英特尔的竞争者的直接比较中,AMD Ryzen 9 6900HS很难保持自己的优势。然而,该测试样本在AIDA64测试中的表现要好一些,在排名中位居第三。
关于进一步的基准测试,我们建议你参考我们的CPU比较表.
Cinebench R15 Multi loop
Cinebench R23: Multi Core | Single Core
Cinebench R20: CPU (Multi Core) | CPU (Single Core)
Cinebench R15: CPU Multi 64Bit | CPU Single 64Bit
Blender: v2.79 BMW27 CPU
7-Zip 18.03: 7z b 4 | 7z b 4 -mmt1
Geekbench 5.5: Multi-Core | Single-Core
HWBOT x265 Benchmark v2.2: 4k Preset
LibreOffice : 20 Documents To PDF
R Benchmark 2.5: Overall mean
| CPU Performance rating | |
| Average of class Gaming | |
| Lenovo Legion 7 16IAX7-82TD004SGE | |
| HP Omen 16-b1090ng | |
| Acer Predator Triton 500 SE PT516-52s-70KX | |
| Lenovo Legion 7 16ARHA7 | |
| Asus ROG Flow X16 GV601RW-M5082W | |
| Average AMD Ryzen 9 6900HS | |
| Corsair Voyager a1600 | |
| Cinebench R23 / Multi Core | |
| Average of class Gaming (10488 - 42661, n=104, last 2 years) | |
| Lenovo Legion 7 16IAX7-82TD004SGE | |
| Acer Predator Triton 500 SE PT516-52s-70KX | |
| HP Omen 16-b1090ng | |
| Lenovo Legion 7 16ARHA7 | |
| Asus ROG Flow X16 GV601RW-M5082W | |
| Corsair Voyager a1600 | |
| Average AMD Ryzen 9 6900HS (12606 - 14403, n=5) | |
| Cinebench R23 / Single Core | |
| Average of class Gaming (1601 - 2415, n=104, last 2 years) | |
| Lenovo Legion 7 16IAX7-82TD004SGE | |
| HP Omen 16-b1090ng | |
| Acer Predator Triton 500 SE PT516-52s-70KX | |
| Lenovo Legion 7 16ARHA7 | |
| Corsair Voyager a1600 | |
| Average AMD Ryzen 9 6900HS (1526 - 1570, n=5) | |
| Asus ROG Flow X16 GV601RW-M5082W | |
| Cinebench R20 / CPU (Multi Core) | |
| Average of class Gaming (4029 - 16433, n=103, last 2 years) | |
| Lenovo Legion 7 16IAX7-82TD004SGE | |
| Acer Predator Triton 500 SE PT516-52s-70KX | |
| HP Omen 16-b1090ng | |
| Lenovo Legion 7 16ARHA7 | |
| Asus ROG Flow X16 GV601RW-M5082W | |
| Average AMD Ryzen 9 6900HS (4829 - 5552, n=5) | |
| Corsair Voyager a1600 | |
| Cinebench R20 / CPU (Single Core) | |
| Average of class Gaming (622 - 913, n=103, last 2 years) | |
| Lenovo Legion 7 16IAX7-82TD004SGE | |
| HP Omen 16-b1090ng | |
| Acer Predator Triton 500 SE PT516-52s-70KX | |
| Lenovo Legion 7 16ARHA7 | |
| Average AMD Ryzen 9 6900HS (596 - 620, n=5) | |
| Asus ROG Flow X16 GV601RW-M5082W | |
| Corsair Voyager a1600 | |
| Cinebench R15 / CPU Multi 64Bit | |
| Average of class Gaming (1578 - 6330, n=102, last 2 years) | |
| Lenovo Legion 7 16IAX7-82TD004SGE | |
| HP Omen 16-b1090ng | |
| Acer Predator Triton 500 SE PT516-52s-70KX | |
| Lenovo Legion 7 16ARHA7 | |
| Asus ROG Flow X16 GV601RW-M5082W | |
| Average AMD Ryzen 9 6900HS (2054 - 2342, n=5) | |
| Corsair Voyager a1600 | |
| Cinebench R15 / CPU Single 64Bit | |
| Average of class Gaming (188.8 - 350, n=103, last 2 years) | |
| Lenovo Legion 7 16IAX7-82TD004SGE | |
| HP Omen 16-b1090ng | |
| Lenovo Legion 7 16ARHA7 | |
| Corsair Voyager a1600 | |
| Average AMD Ryzen 9 6900HS (218 - 254, n=5) | |
| Asus ROG Flow X16 GV601RW-M5082W | |
| Acer Predator Triton 500 SE PT516-52s-70KX | |
| Blender / v2.79 BMW27 CPU | |
| Average AMD Ryzen 9 6900HS (220 - 277, n=5) | |
| Corsair Voyager a1600 | |
| Asus ROG Flow X16 GV601RW-M5082W | |
| Lenovo Legion 7 16ARHA7 | |
| Acer Predator Triton 500 SE PT516-52s-70KX | |
| HP Omen 16-b1090ng | |
| Lenovo Legion 7 16IAX7-82TD004SGE | |
| Average of class Gaming (79 - 330, n=101, last 2 years) | |
| 7-Zip 18.03 / 7z b 4 | |
| Average of class Gaming (33491 - 148086, n=102, last 2 years) | |
| Lenovo Legion 7 16IAX7-82TD004SGE | |
| HP Omen 16-b1090ng | |
| Acer Predator Triton 500 SE PT516-52s-70KX | |
| Lenovo Legion 7 16ARHA7 | |
| Corsair Voyager a1600 | |
| Asus ROG Flow X16 GV601RW-M5082W | |
| Average AMD Ryzen 9 6900HS (52948 - 63591, n=5) | |
| 7-Zip 18.03 / 7z b 4 -mmt1 | |
| Average of class Gaming (4824 - 7436, n=102, last 2 years) | |
| Lenovo Legion 7 16IAX7-82TD004SGE | |
| HP Omen 16-b1090ng | |
| Corsair Voyager a1600 | |
| Average AMD Ryzen 9 6900HS (5538 - 5958, n=5) | |
| Asus ROG Flow X16 GV601RW-M5082W | |
| Lenovo Legion 7 16ARHA7 | |
| Acer Predator Triton 500 SE PT516-52s-70KX | |
| Geekbench 5.5 / Multi-Core | |
| Average of class Gaming (6460 - 28263, n=102, last 2 years) | |
| Lenovo Legion 7 16IAX7-82TD004SGE | |
| HP Omen 16-b1090ng | |
| Acer Predator Triton 500 SE PT516-52s-70KX | |
| Corsair Voyager a1600 | |
| Lenovo Legion 7 16ARHA7 | |
| Average AMD Ryzen 9 6900HS (8381 - 10040, n=5) | |
| Asus ROG Flow X16 GV601RW-M5082W | |
| Geekbench 5.5 / Single-Core | |
| Average of class Gaming (1403 - 2474, n=102, last 2 years) | |
| Lenovo Legion 7 16IAX7-82TD004SGE | |
| HP Omen 16-b1090ng | |
| Acer Predator Triton 500 SE PT516-52s-70KX | |
| Lenovo Legion 7 16ARHA7 | |
| Average AMD Ryzen 9 6900HS (1480 - 1614, n=5) | |
| Asus ROG Flow X16 GV601RW-M5082W | |
| Corsair Voyager a1600 | |
| HWBOT x265 Benchmark v2.2 / 4k Preset | |
| Average of class Gaming (11.5 - 44.4, n=102, last 2 years) | |
| Lenovo Legion 7 16IAX7-82TD004SGE | |
| HP Omen 16-b1090ng | |
| Acer Predator Triton 500 SE PT516-52s-70KX | |
| Lenovo Legion 7 16ARHA7 | |
| Corsair Voyager a1600 | |
| Asus ROG Flow X16 GV601RW-M5082W | |
| Average AMD Ryzen 9 6900HS (14.2 - 17.9, n=5) | |
| LibreOffice / 20 Documents To PDF | |
| Corsair Voyager a1600 | |
| Asus ROG Flow X16 GV601RW-M5082W | |
| Lenovo Legion 7 16ARHA7 | |
| Average AMD Ryzen 9 6900HS (47.6 - 57.2, n=5) | |
| Average of class Gaming (33.2 - 88.8, n=102, last 2 years) | |
| Acer Predator Triton 500 SE PT516-52s-70KX | |
| HP Omen 16-b1090ng | |
| Lenovo Legion 7 16IAX7-82TD004SGE | |
| R Benchmark 2.5 / Overall mean | |
| Asus ROG Flow X16 GV601RW-M5082W | |
| Lenovo Legion 7 16ARHA7 | |
| Corsair Voyager a1600 | |
| Average AMD Ryzen 9 6900HS (0.4672 - 0.502, n=5) | |
| Acer Predator Triton 500 SE PT516-52s-70KX | |
| HP Omen 16-b1090ng | |
| Average of class Gaming (0.3439 - 0.59, n=102, last 2 years) | |
| Lenovo Legion 7 16IAX7-82TD004SGE | |
* ... smaller is better
AIDA64: FP32 Ray-Trace | FPU Julia | CPU SHA3 | CPU Queen | FPU SinJulia | FPU Mandel | CPU AES | CPU ZLib | FP64 Ray-Trace | CPU PhotoWorxx
| Performance rating | |
| Average of class Gaming | |
| Lenovo Legion 7 16ARHA7 | |
| Asus ROG Flow X16 GV601RW-M5082W | |
| Corsair Voyager a1600 | |
| Lenovo Legion 7 16IAX7-82TD004SGE | |
| Average AMD Ryzen 9 6900HS | |
| Acer Predator Triton 500 SE PT516-52s-70KX | |
| HP Omen 16-b1090ng | |
| AIDA64 / FP32 Ray-Trace | |
| Average of class Gaming (10227 - 85542, n=102, last 2 years) | |
| Lenovo Legion 7 16ARHA7 | |
| Asus ROG Flow X16 GV601RW-M5082W | |
| Corsair Voyager a1600 | |
| Average AMD Ryzen 9 6900HS (14212 - 16072, n=5) | |
| Lenovo Legion 7 16IAX7-82TD004SGE | |
| Acer Predator Triton 500 SE PT516-52s-70KX | |
| HP Omen 16-b1090ng | |
| AIDA64 / FPU Julia | |
| Average of class Gaming (51376 - 372155, n=102, last 2 years) | |
| Lenovo Legion 7 16ARHA7 | |
| Asus ROG Flow X16 GV601RW-M5082W | |
| Corsair Voyager a1600 | |
| Average AMD Ryzen 9 6900HS (90523 - 102881, n=5) | |
| Lenovo Legion 7 16IAX7-82TD004SGE | |
| Acer Predator Triton 500 SE PT516-52s-70KX | |
| HP Omen 16-b1090ng | |
| AIDA64 / CPU SHA3 | |
| Average of class Gaming (2180 - 10115, n=102, last 2 years) | |
| Lenovo Legion 7 16IAX7-82TD004SGE | |
| Lenovo Legion 7 16ARHA7 | |
| Asus ROG Flow X16 GV601RW-M5082W | |
| Corsair Voyager a1600 | |
| Acer Predator Triton 500 SE PT516-52s-70KX | |
| Average AMD Ryzen 9 6900HS (3035 - 3614, n=5) | |
| HP Omen 16-b1090ng | |
| AIDA64 / CPU Queen | |
| Average of class Gaming (49785 - 173351, n=86, last 2 years) | |
| Lenovo Legion 7 16ARHA7 | |
| Corsair Voyager a1600 | |
| Asus ROG Flow X16 GV601RW-M5082W | |
| Average AMD Ryzen 9 6900HS (97461 - 105203, n=5) | |
| Lenovo Legion 7 16IAX7-82TD004SGE | |
| HP Omen 16-b1090ng | |
| Acer Predator Triton 500 SE PT516-52s-70KX | |
| AIDA64 / FPU SinJulia | |
| Average of class Gaming (4424 - 33636, n=102, last 2 years) | |
| Lenovo Legion 7 16IAX7-82TD004SGE | |
| Corsair Voyager a1600 | |
| Lenovo Legion 7 16ARHA7 | |
| Asus ROG Flow X16 GV601RW-M5082W | |
| Average AMD Ryzen 9 6900HS (12548 - 13039, n=5) | |
| Acer Predator Triton 500 SE PT516-52s-70KX | |
| HP Omen 16-b1090ng | |
| AIDA64 / FPU Mandel | |
| Average of class Gaming (25115 - 196829, n=102, last 2 years) | |
| Lenovo Legion 7 16ARHA7 | |
| Asus ROG Flow X16 GV601RW-M5082W | |
| Corsair Voyager a1600 | |
| Average AMD Ryzen 9 6900HS (49657 - 56486, n=5) | |
| Lenovo Legion 7 16IAX7-82TD004SGE | |
| Acer Predator Triton 500 SE PT516-52s-70KX | |
| HP Omen 16-b1090ng | |
| AIDA64 / CPU AES | |
| Asus ROG Flow X16 GV601RW-M5082W | |
| Lenovo Legion 7 16ARHA7 | |
| Corsair Voyager a1600 | |
| Lenovo Legion 7 16IAX7-82TD004SGE | |
| Average AMD Ryzen 9 6900HS (51791 - 142686, n=5) | |
| Average of class Gaming (39258 - 247074, n=102, last 2 years) | |
| Acer Predator Triton 500 SE PT516-52s-70KX | |
| HP Omen 16-b1090ng | |
| AIDA64 / CPU ZLib | |
| Average of class Gaming (574 - 2531, n=102, last 2 years) | |
| Lenovo Legion 7 16IAX7-82TD004SGE | |
| Acer Predator Triton 500 SE PT516-52s-70KX | |
| HP Omen 16-b1090ng | |
| Lenovo Legion 7 16ARHA7 | |
| Asus ROG Flow X16 GV601RW-M5082W | |
| Corsair Voyager a1600 | |
| Average AMD Ryzen 9 6900HS (737 - 888, n=5) | |
| AIDA64 / FP64 Ray-Trace | |
| Average of class Gaming (5509 - 45446, n=102, last 2 years) | |
| Lenovo Legion 7 16ARHA7 | |
| Asus ROG Flow X16 GV601RW-M5082W | |
| Corsair Voyager a1600 | |
| Average AMD Ryzen 9 6900HS (7530 - 8981, n=5) | |
| Lenovo Legion 7 16IAX7-82TD004SGE | |
| Acer Predator Triton 500 SE PT516-52s-70KX | |
| HP Omen 16-b1090ng | |
| AIDA64 / CPU PhotoWorxx | |
| Average of class Gaming (12271 - 89891, n=102, last 2 years) | |
| HP Omen 16-b1090ng | |
| Lenovo Legion 7 16IAX7-82TD004SGE | |
| Acer Predator Triton 500 SE PT516-52s-70KX | |
| Lenovo Legion 7 16ARHA7 | |
| Corsair Voyager a1600 | |
| Asus ROG Flow X16 GV601RW-M5082W | |
| Average AMD Ryzen 9 6900HS (25757 - 30291, n=5) | |
系统性能
基准测试结果显示了良好的系统性能,尽管与基于英特尔的笔记本的明显区别再次明显。然而,主观上,海盗船Voyager a1600提供了非常好的系统性能,在日常使用中没有明显的延迟。
CrossMark: Overall | Productivity | Creativity | Responsiveness
| PCMark 10 / Score | |
| Lenovo Legion 7 16IAX7-82TD004SGE | |
| Average of class Gaming (5828 - 12414, n=93, last 2 years) | |
| Acer Predator Triton 500 SE PT516-52s-70KX | |
| Lenovo Legion 7 16ARHA7 | |
| HP Omen 16-b1090ng | |
| Corsair Voyager a1600 | |
| Average AMD Ryzen 9 6900HS, AMD Radeon RX 6800M (n=1) | |
| Asus ROG Flow X16 GV601RW-M5082W | |
| PCMark 10 / Essentials | |
| Lenovo Legion 7 16IAX7-82TD004SGE | |
| Acer Predator Triton 500 SE PT516-52s-70KX | |
| Average of class Gaming (8810 - 11935, n=97, last 2 years) | |
| Lenovo Legion 7 16ARHA7 | |
| HP Omen 16-b1090ng | |
| Corsair Voyager a1600 | |
| Average AMD Ryzen 9 6900HS, AMD Radeon RX 6800M (n=1) | |
| Asus ROG Flow X16 GV601RW-M5082W | |
| PCMark 10 / Productivity | |
| Average of class Gaming (6845 - 25323, n=95, last 2 years) | |
| Lenovo Legion 7 16IAX7-82TD004SGE | |
| Asus ROG Flow X16 GV601RW-M5082W | |
| Acer Predator Triton 500 SE PT516-52s-70KX | |
| HP Omen 16-b1090ng | |
| Lenovo Legion 7 16ARHA7 | |
| Corsair Voyager a1600 | |
| Average AMD Ryzen 9 6900HS, AMD Radeon RX 6800M (n=1) | |
| PCMark 10 / Digital Content Creation | |
| Lenovo Legion 7 16IAX7-82TD004SGE | |
| Average of class Gaming (7602 - 19954, n=95, last 2 years) | |
| Lenovo Legion 7 16ARHA7 | |
| Corsair Voyager a1600 | |
| Average AMD Ryzen 9 6900HS, AMD Radeon RX 6800M (n=1) | |
| Acer Predator Triton 500 SE PT516-52s-70KX | |
| HP Omen 16-b1090ng | |
| Asus ROG Flow X16 GV601RW-M5082W | |
| CrossMark / Overall | |
| Lenovo Legion 7 16IAX7-82TD004SGE | |
| Average of class Gaming (1366 - 2409, n=94, last 2 years) | |
| Acer Predator Triton 500 SE PT516-52s-70KX | |
| Asus ROG Flow X16 GV601RW-M5082W | |
| Lenovo Legion 7 16ARHA7 | |
| Corsair Voyager a1600 | |
| Average AMD Ryzen 9 6900HS, AMD Radeon RX 6800M (n=1) | |
| CrossMark / Productivity | |
| Lenovo Legion 7 16IAX7-82TD004SGE | |
| Average of class Gaming (1386 - 2254, n=94, last 2 years) | |
| Acer Predator Triton 500 SE PT516-52s-70KX | |
| Asus ROG Flow X16 GV601RW-M5082W | |
| Lenovo Legion 7 16ARHA7 | |
| Corsair Voyager a1600 | |
| Average AMD Ryzen 9 6900HS, AMD Radeon RX 6800M (n=1) | |
| CrossMark / Creativity | |
| Lenovo Legion 7 16IAX7-82TD004SGE | |
| Average of class Gaming (1343 - 2786, n=94, last 2 years) | |
| Acer Predator Triton 500 SE PT516-52s-70KX | |
| Asus ROG Flow X16 GV601RW-M5082W | |
| Lenovo Legion 7 16ARHA7 | |
| Corsair Voyager a1600 | |
| Average AMD Ryzen 9 6900HS, AMD Radeon RX 6800M (n=1) | |
| CrossMark / Responsiveness | |
| Lenovo Legion 7 16IAX7-82TD004SGE | |
| Acer Predator Triton 500 SE PT516-52s-70KX | |
| Average of class Gaming (1226 - 2334, n=94, last 2 years) | |
| Asus ROG Flow X16 GV601RW-M5082W | |
| Lenovo Legion 7 16ARHA7 | |
| Corsair Voyager a1600 | |
| Average AMD Ryzen 9 6900HS, AMD Radeon RX 6800M (n=1) | |
| PCMark 10 Score | 7208 points | |
Help | ||
| AIDA64 / Memory Copy | |
| Average of class Gaming (21750 - 129946, n=102, last 2 years) | |
| Lenovo Legion 7 16IAX7-82TD004SGE | |
| HP Omen 16-b1090ng | |
| Acer Predator Triton 500 SE PT516-52s-70KX | |
| Lenovo Legion 7 16ARHA7 | |
| Average AMD Ryzen 9 6900HS (49150 - 51517, n=5) | |
| Corsair Voyager a1600 | |
| Asus ROG Flow X16 GV601RW-M5082W | |
| AIDA64 / Memory Read | |
| Average of class Gaming (22956 - 118858, n=102, last 2 years) | |
| Lenovo Legion 7 16IAX7-82TD004SGE | |
| Acer Predator Triton 500 SE PT516-52s-70KX | |
| HP Omen 16-b1090ng | |
| Lenovo Legion 7 16ARHA7 | |
| Corsair Voyager a1600 | |
| Asus ROG Flow X16 GV601RW-M5082W | |
| Average AMD Ryzen 9 6900HS (43646 - 51838, n=5) | |
| AIDA64 / Memory Write | |
| Average of class Gaming (22297 - 135096, n=102, last 2 years) | |
| HP Omen 16-b1090ng | |
| Lenovo Legion 7 16IAX7-82TD004SGE | |
| Lenovo Legion 7 16ARHA7 | |
| Corsair Voyager a1600 | |
| Asus ROG Flow X16 GV601RW-M5082W | |
| Acer Predator Triton 500 SE PT516-52s-70KX | |
| Average AMD Ryzen 9 6900HS (15975 - 55235, n=5) | |
| AIDA64 / Memory Latency | |
| Acer Predator Triton 500 SE PT516-52s-70KX | |
| Average of class Gaming (75.3 - 165.4, n=102, last 2 years) | |
| Corsair Voyager a1600 | |
| Asus ROG Flow X16 GV601RW-M5082W | |
| Average AMD Ryzen 9 6900HS (79.2 - 110.9, n=5) | |
| HP Omen 16-b1090ng | |
| Lenovo Legion 7 16IAX7-82TD004SGE | |
| Lenovo Legion 7 16ARHA7 | |
* ... smaller is better
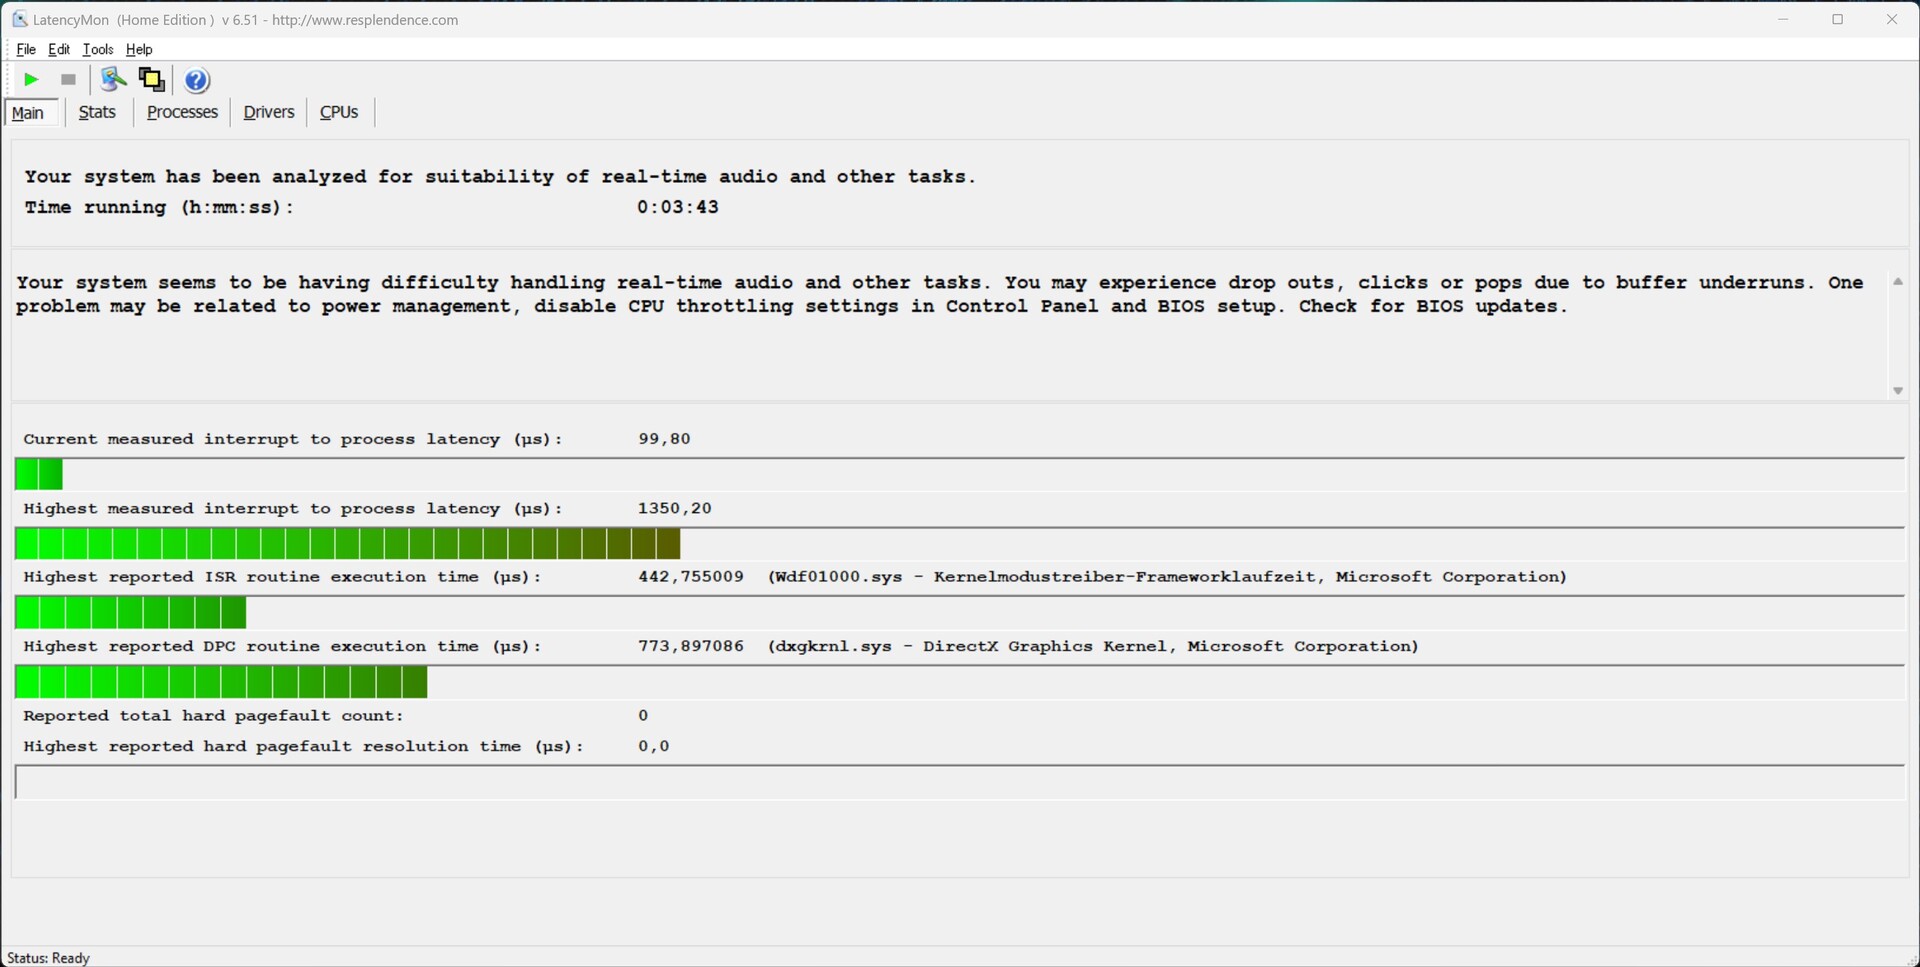
DPC延迟
在Edge中打开多个浏览器标签时,记录的延迟没有增加。Voyager a1600还掌握了4K YouTube视频的播放,没有问题。我们只看到在启动Prime95之后延迟略有增加。
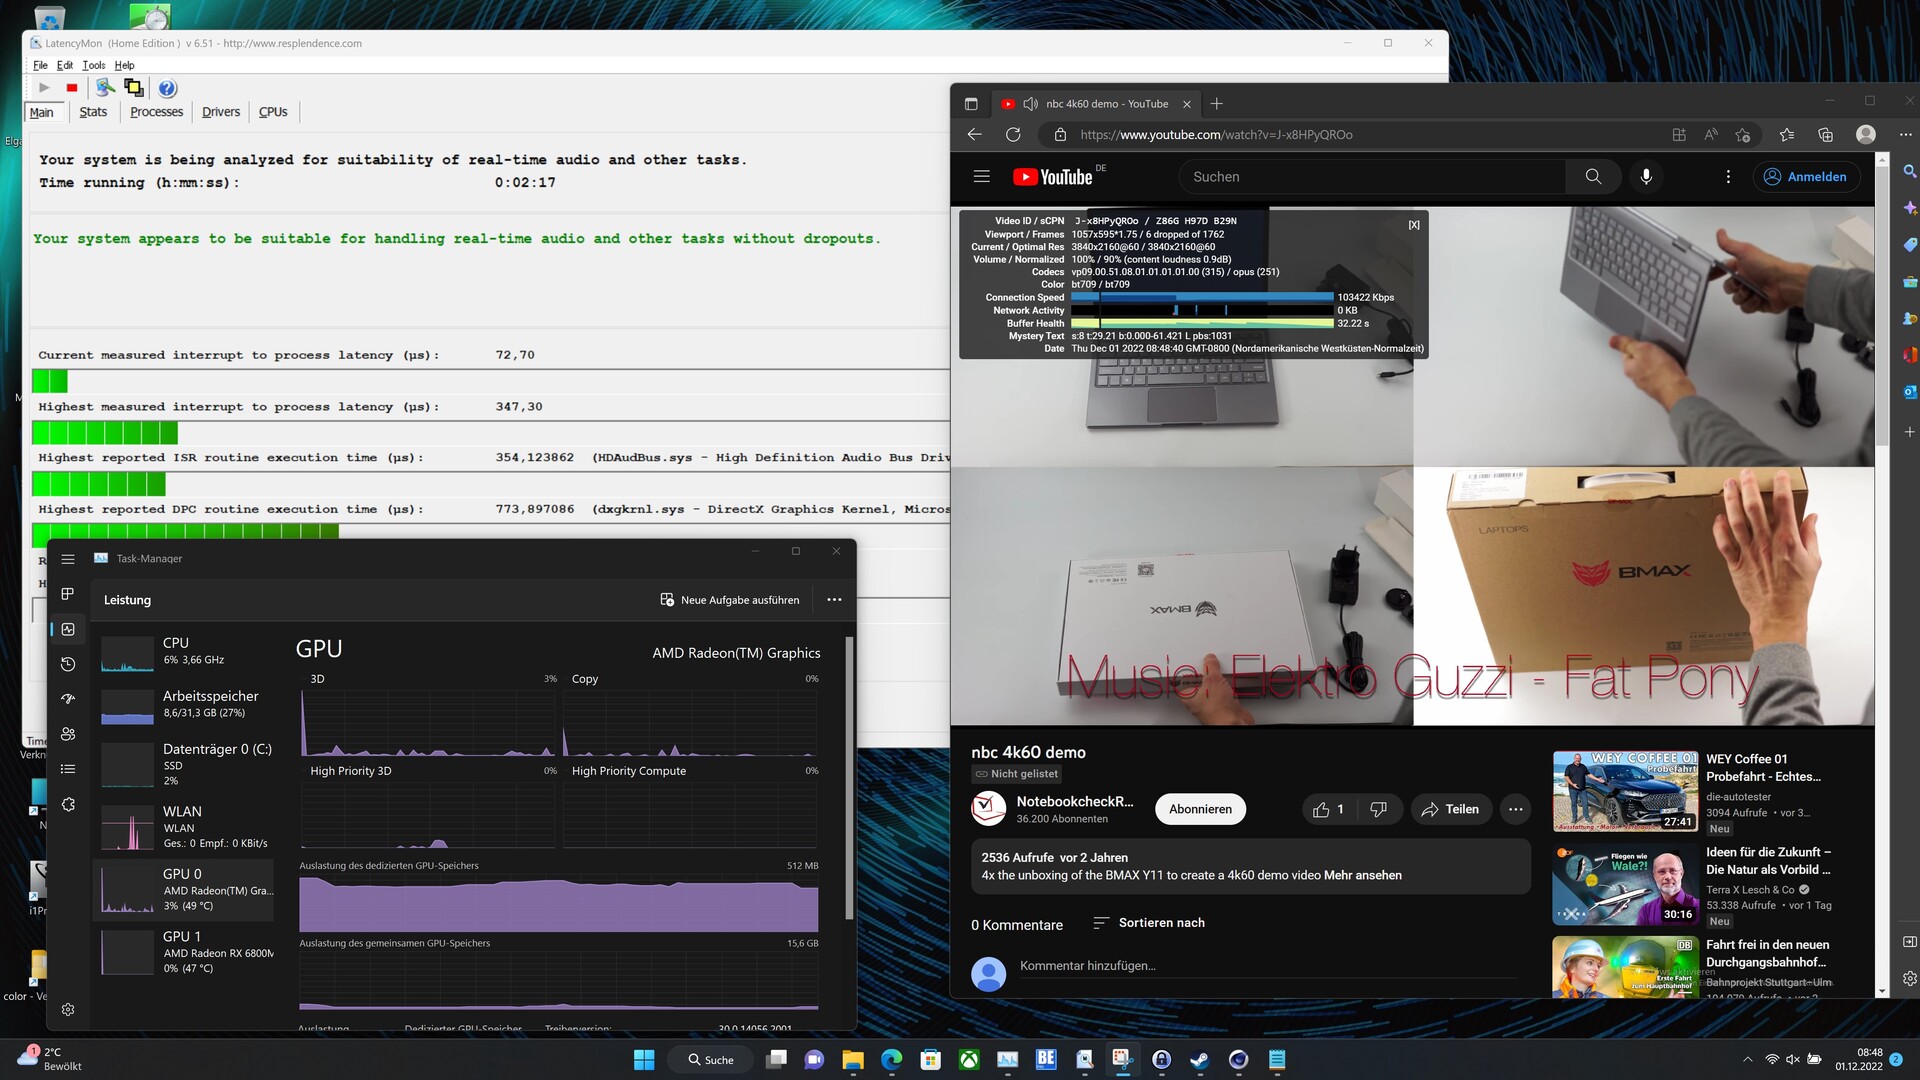
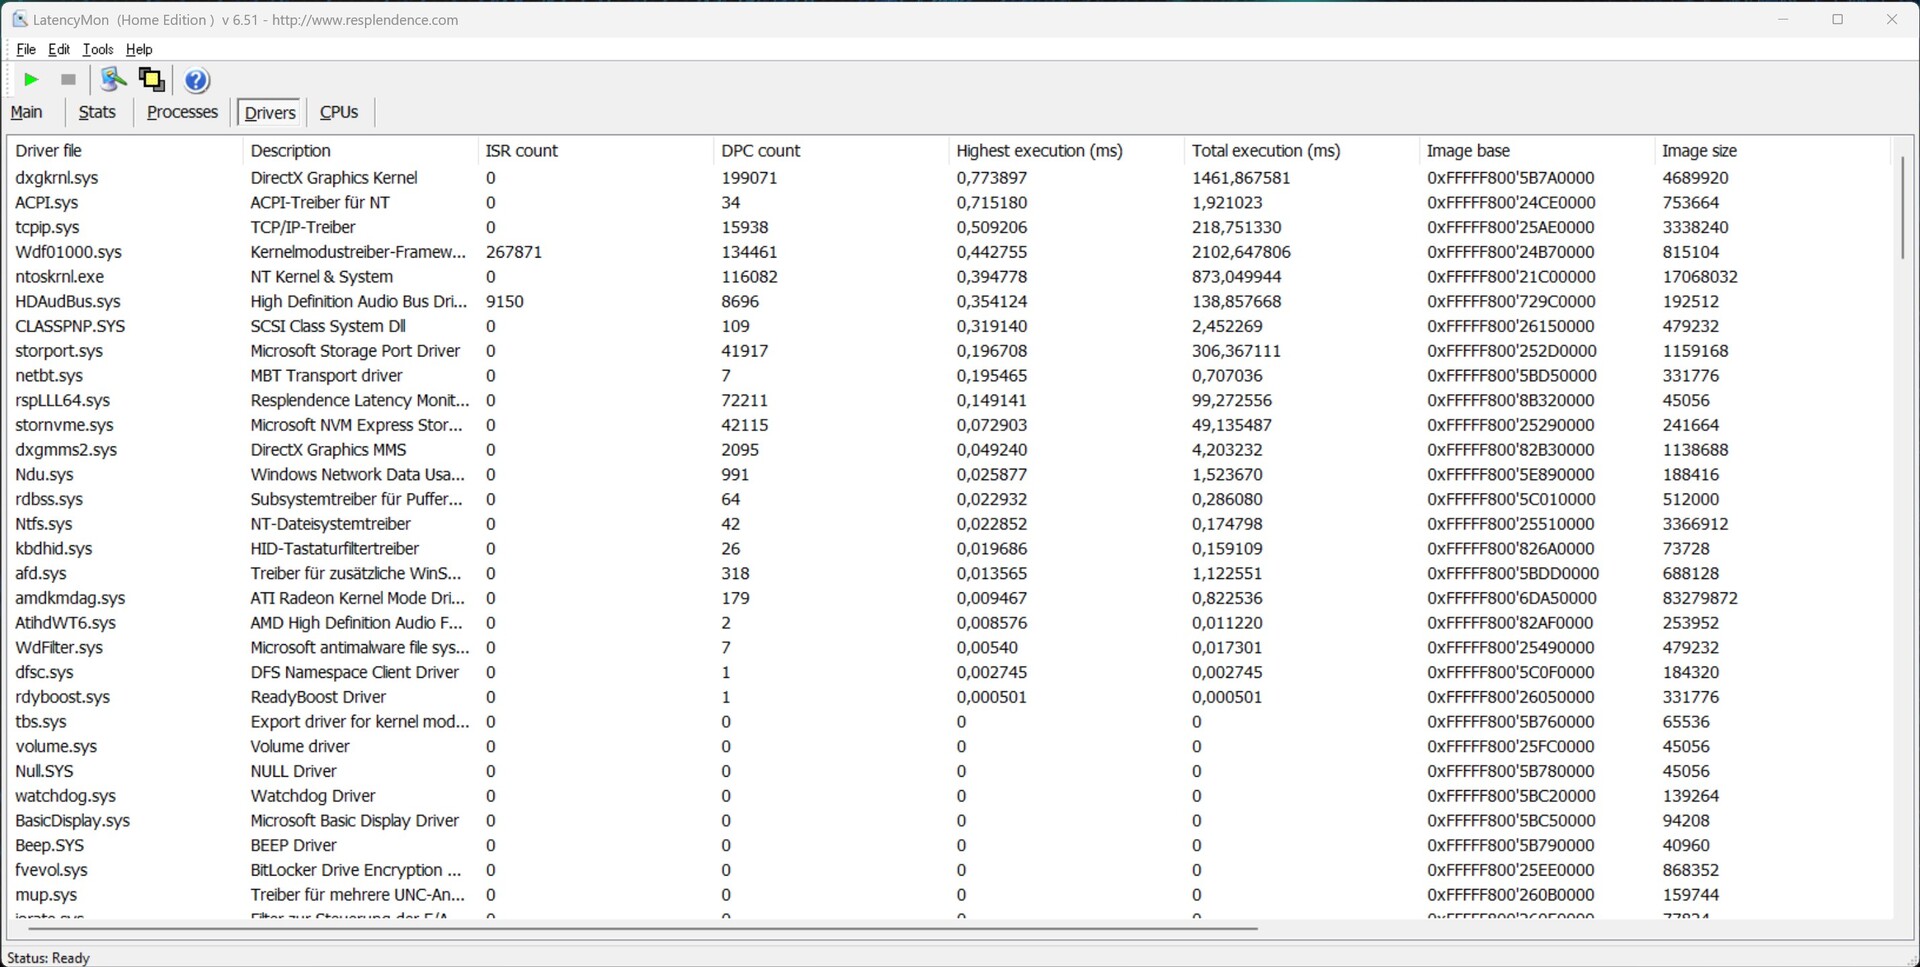
| DPC Latencies / LatencyMon - interrupt to process latency (max), Web, Youtube, Prime95 | |
| Acer Predator Triton 500 SE PT516-52s-70KX | |
| Lenovo Legion 7 16ARHA7 | |
| Asus ROG Flow X16 GV601RW-M5082W | |
| Lenovo Legion 7 16IAX7-82TD004SGE | |
| Corsair Voyager a1600 | |
| HP Omen 16-b1090ng | |
* ... smaller is better
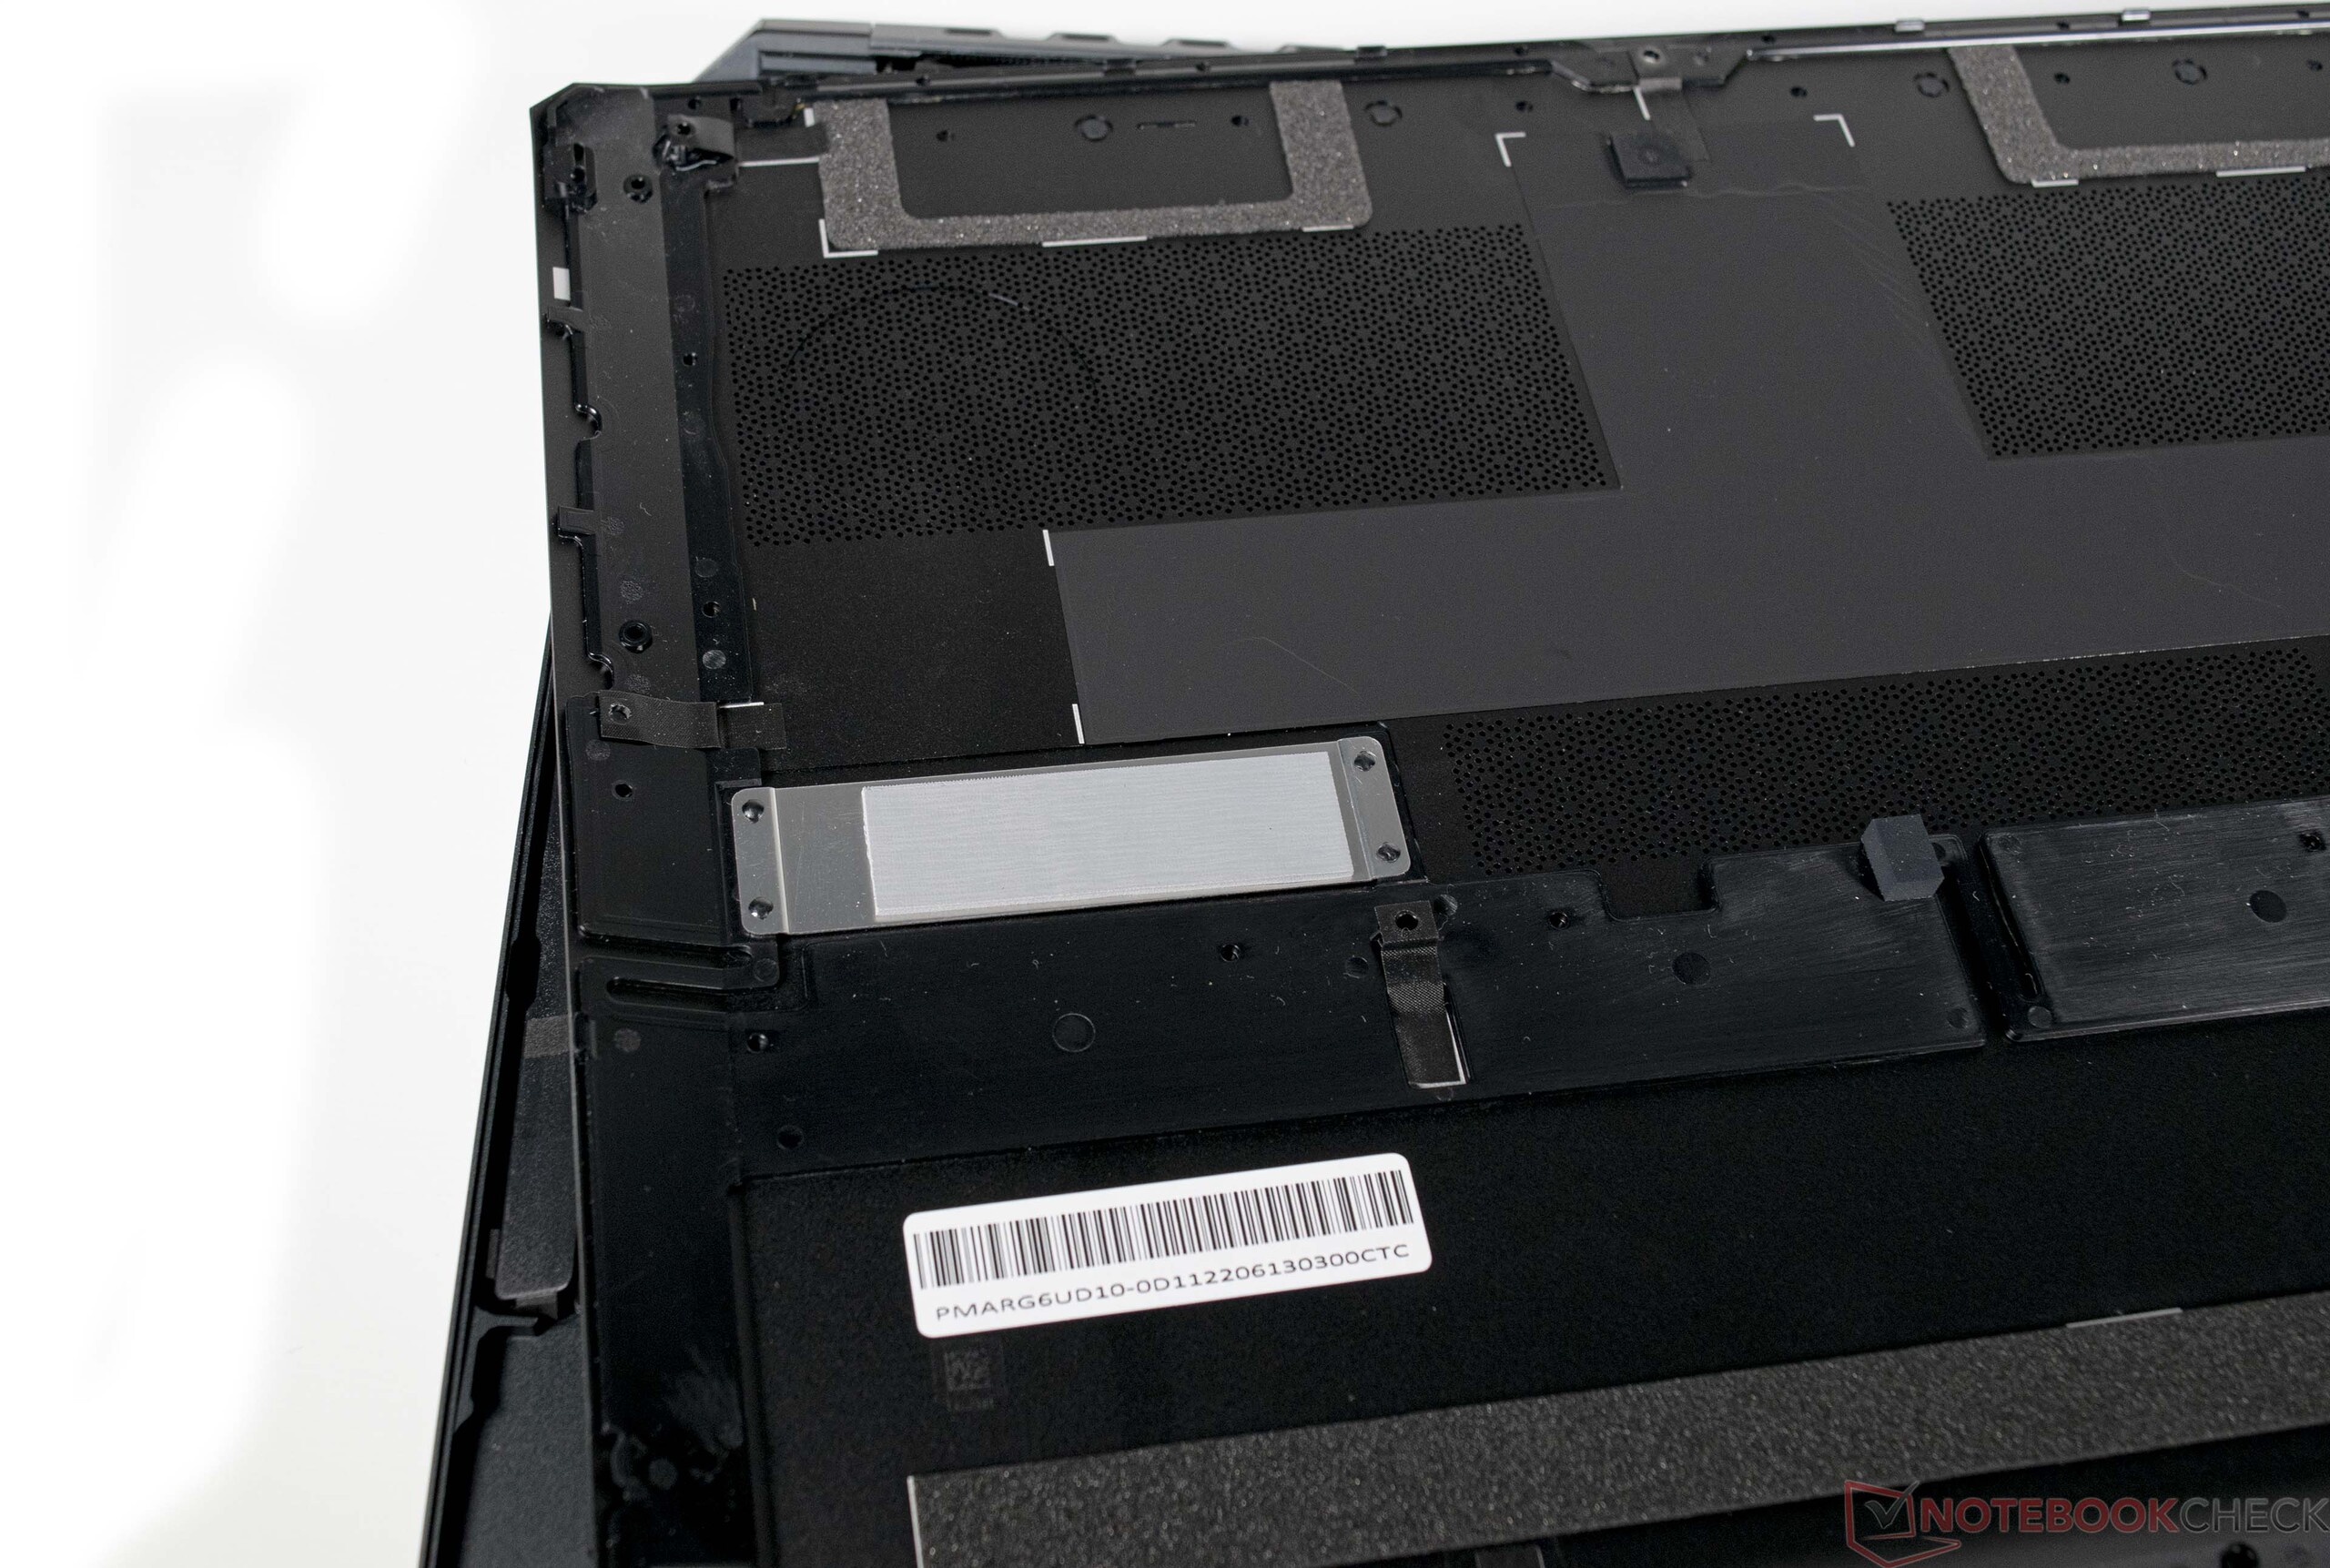
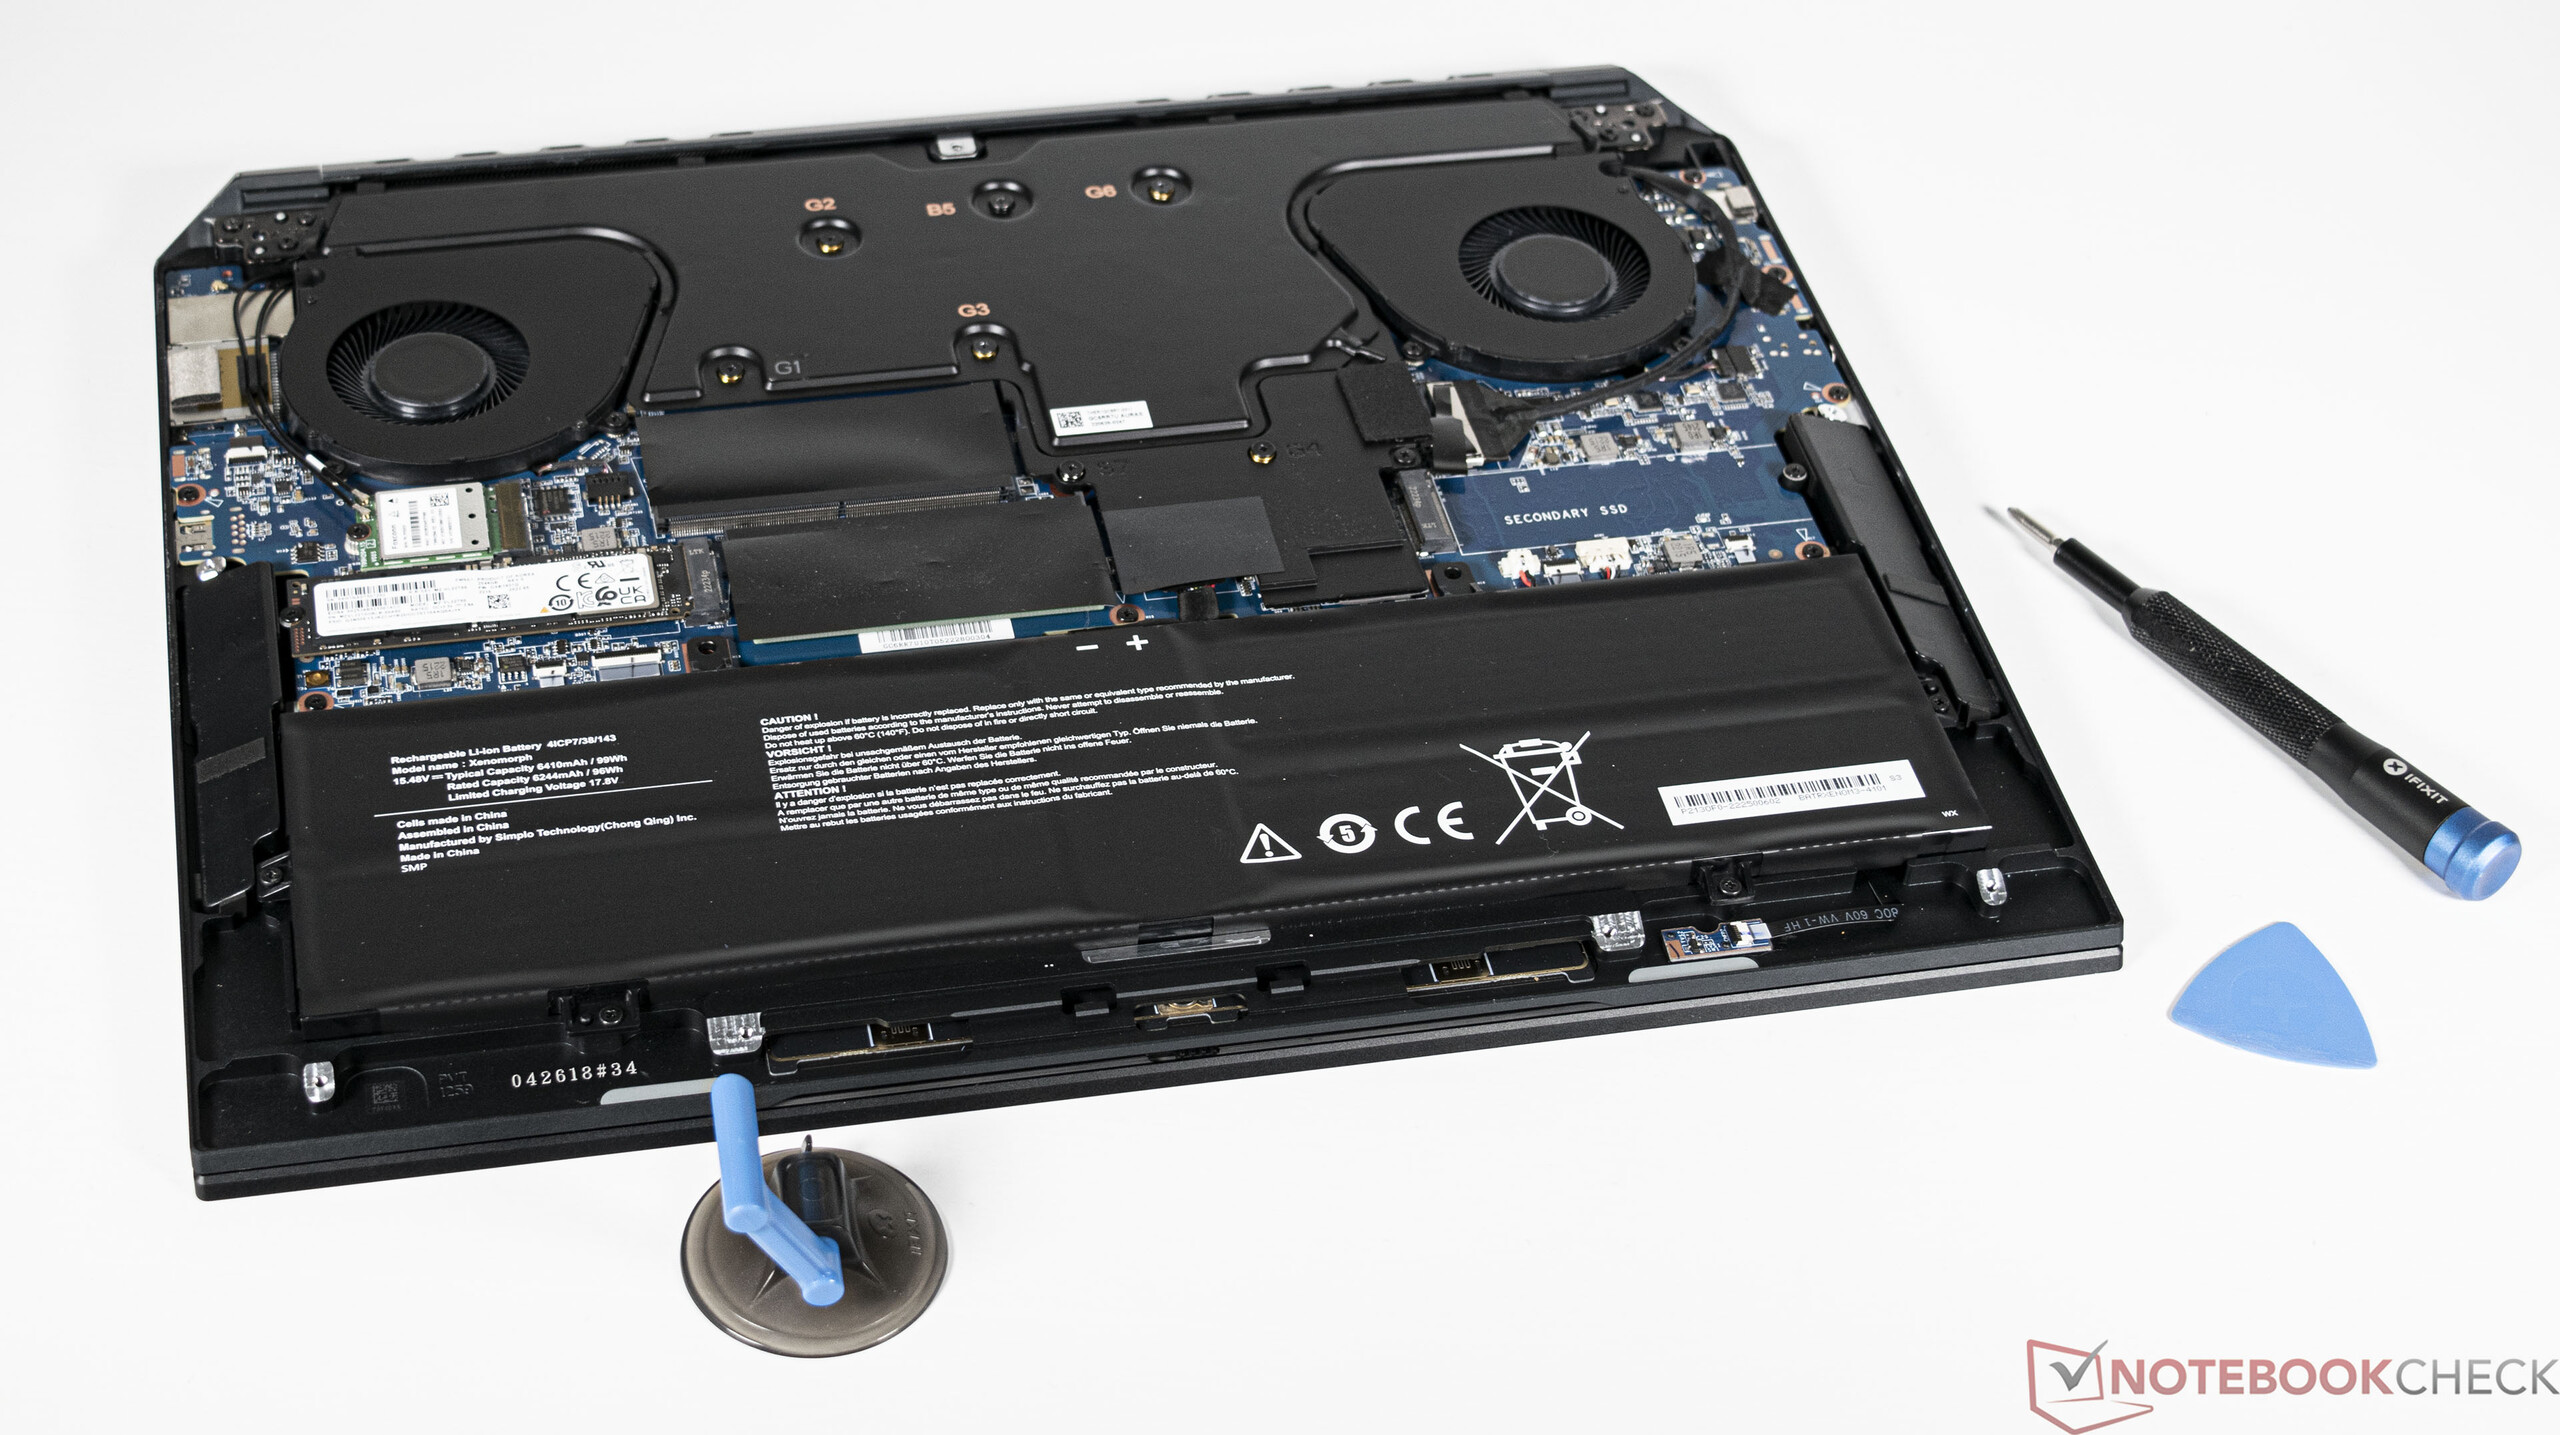
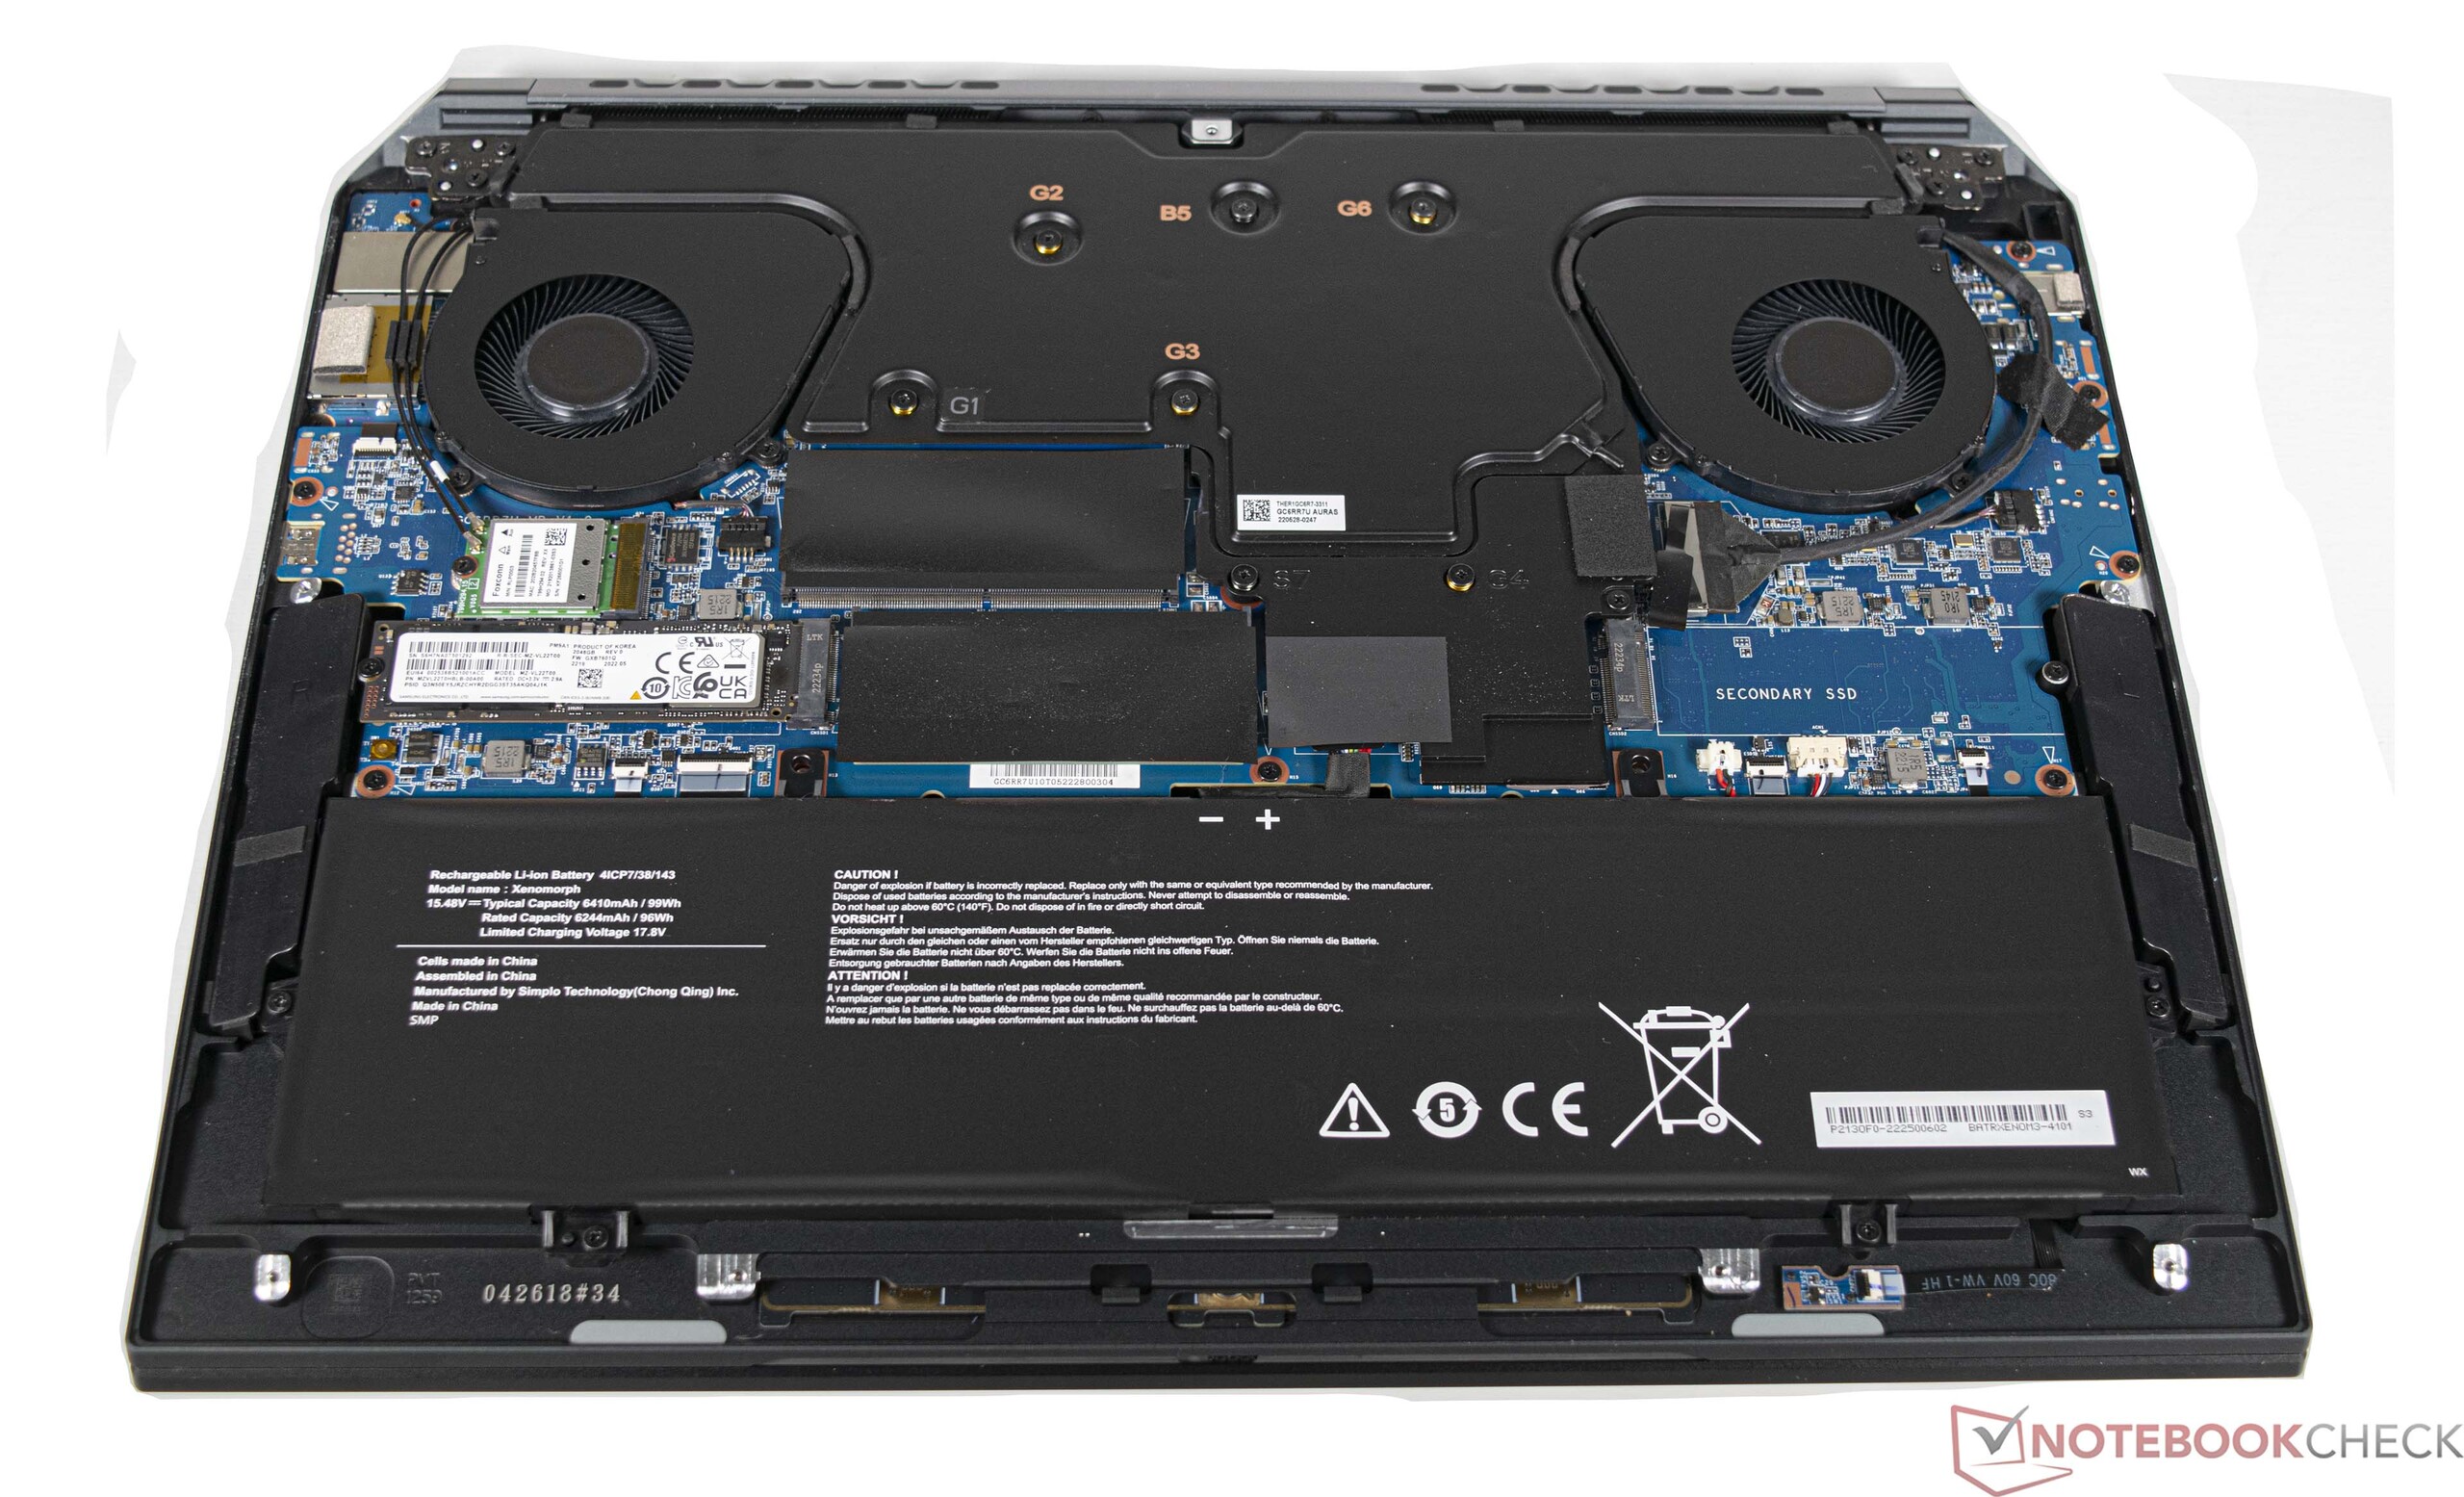
大容量存储
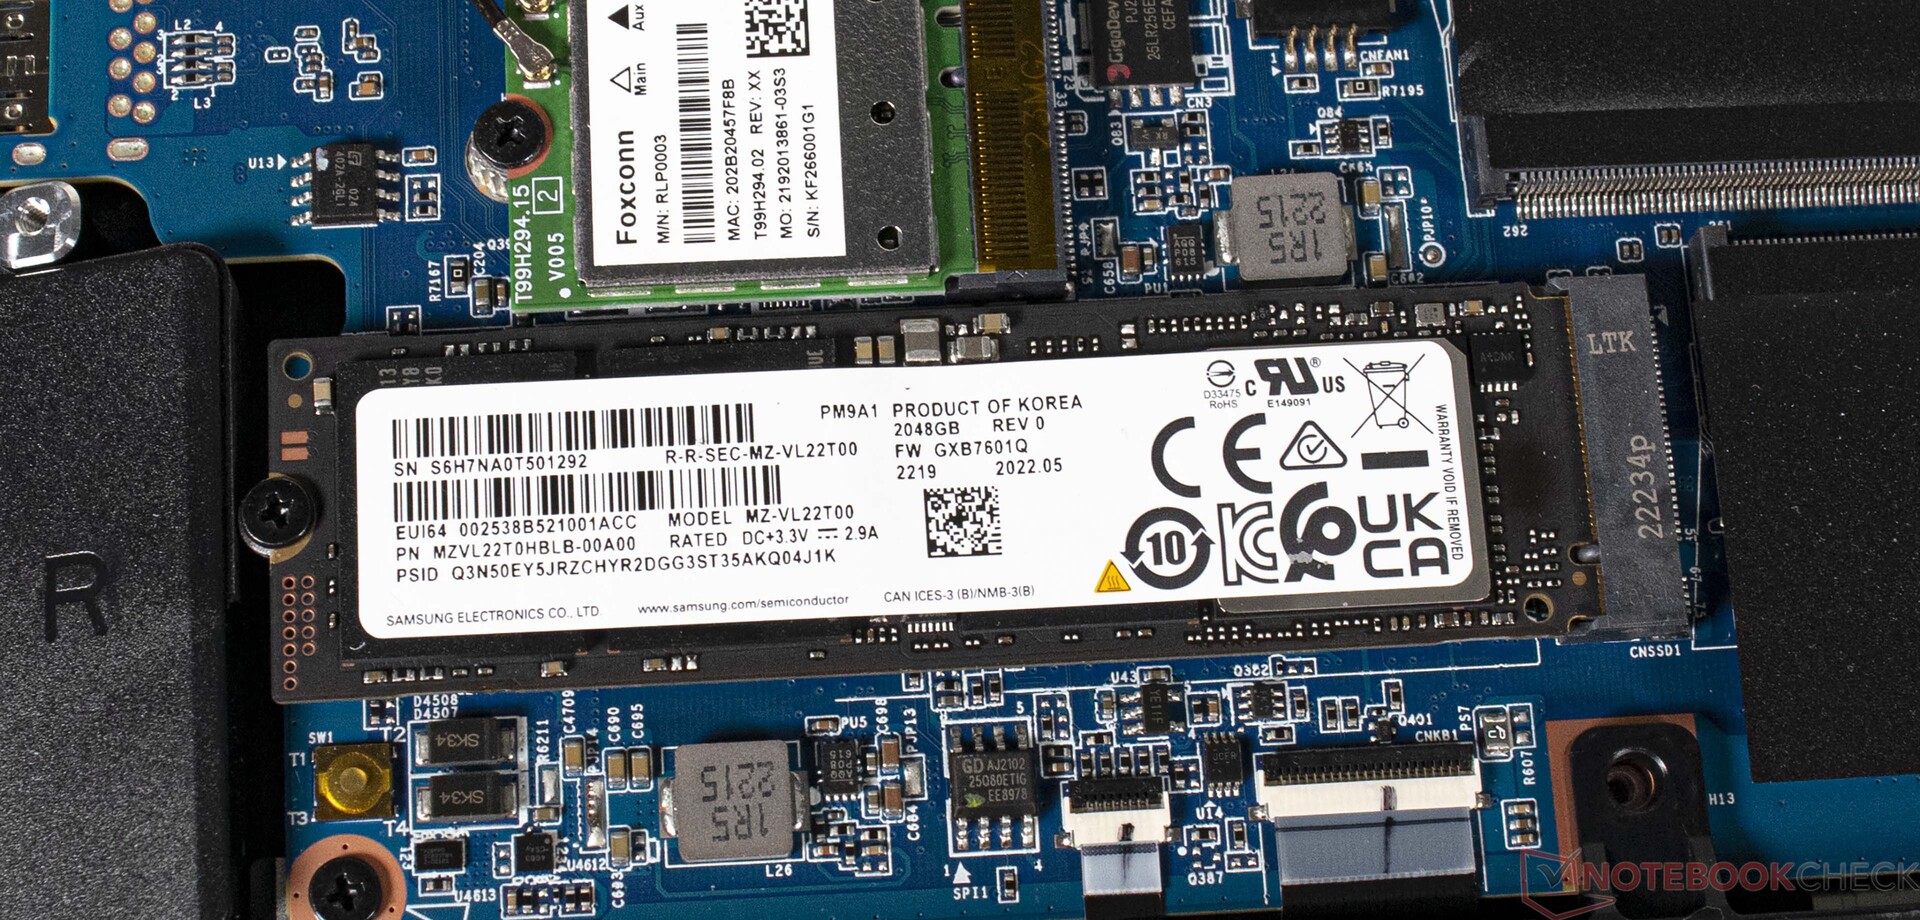
海盗船Voyager a1600拥有2TB固态硬盘,提供了大量的存储空间,由于其预期用途,这绝对是需要的。在基准测试中,已安装的模型不能跟上竞争者的步伐。尽管如此,对于大多数用户来说,其传输速率还是绰绰有余的。在负载测试中,固态硬盘的性能始终可以不受限制。顺便说一下,笔记本的底板起到了散热的作用。总共可以安装两个M.2-2280格式的大容量存储设备。
关于进一步的比较和基准,请参考我们的SSD/HDD 比较表.

* ... smaller is better
Continuous Read: DiskSpd Read Loop, Queue Depth 8
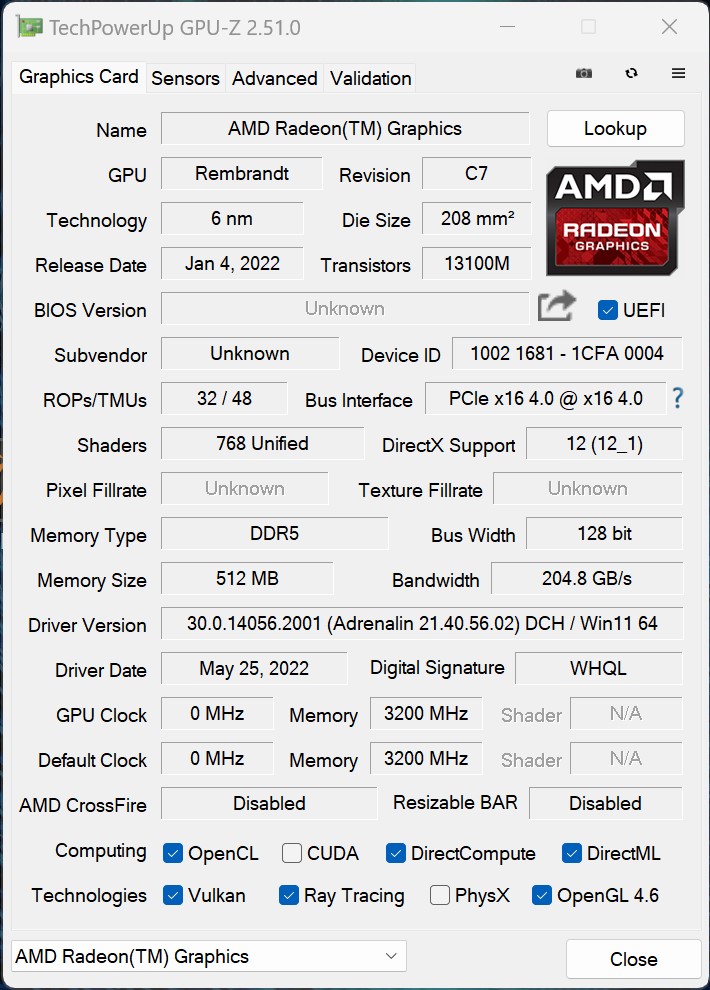
图形卡
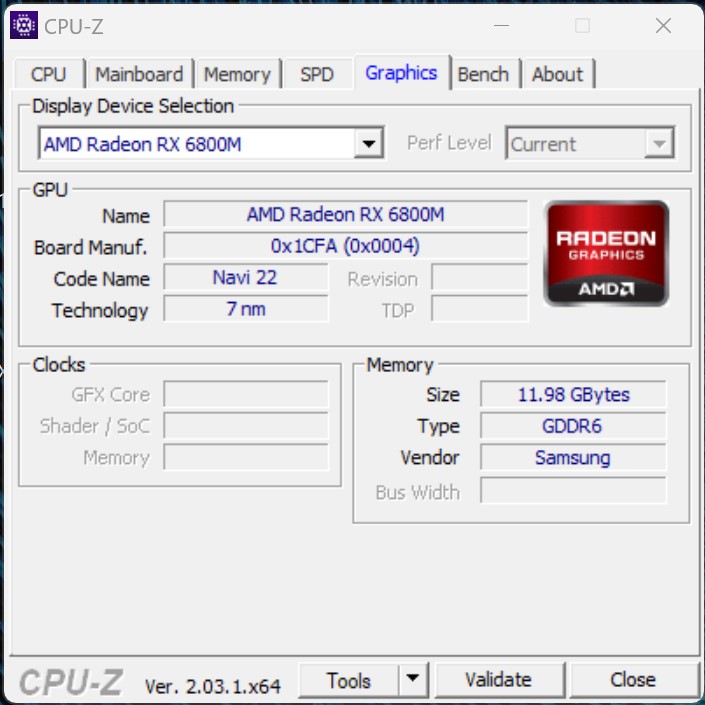
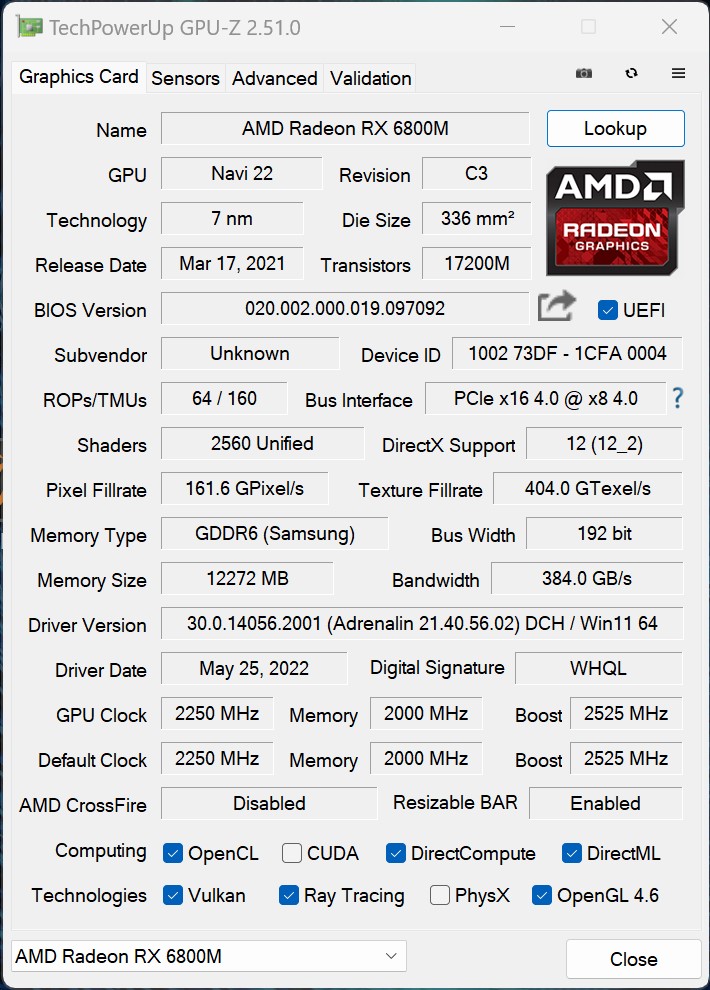
AMD Radeon RX 6800M 是一款配备了12GB VRAM的快速专用显卡。由于RDNA2的存在,AMD目前用于笔记本的6000系列还为光线追踪计算提供了独立的RT核心。在测试中,Corsair Voyager a1600可以拿出良好的3D性能。与拥有GeForce RTX 3080 Ti 图形芯片的竞争对手的差距部分很小。基本上,海盗船Voyager a1600提供足够的性能,目前足以将许多现代游戏流畅地呈现在屏幕上。通过AMD的智能移位技术,CPU总是能从GPU获得最佳性能。
在2D模式下,AMD Ryzen 9 6900HS的iGPU会做工作,从而节省能源。
| 3DMark 05 Standard | 57639 points | |
| 3DMark 06 Standard Score | 46732 points | |
| 3DMark Vantage P Result | 77244 points | |
| 3DMark 11 Performance | 30013 points | |
| 3DMark Ice Storm Standard Score | 209564 points | |
| 3DMark Cloud Gate Standard Score | 59585 points | |
| 3DMark Fire Strike Score | 25639 points | |
| 3DMark Fire Strike Extreme Score | 13599 points | |
| 3DMark Time Spy Score | 10391 points | |
Help | ||
* ... smaller is better
| The Witcher 3 | |
| 1920x1080 High Graphics & Postprocessing (Nvidia HairWorks Off) | |
| Average of class Gaming (341 - 404, n=2, last 2 years) | |
| Lenovo Legion 7 16IAX7-82TD004SGE | |
| Lenovo Legion 7 16ARHA7 | |
| Asus ROG Flow X16 GV601RW-M5082W | |
| Average AMD Radeon RX 6800M (177.8 - 199, n=2) | |
| HP Omen 16-b1090ng | |
| Acer Predator Triton 500 SE PT516-52s-70KX | |
| Corsair Voyager a1600 | |
| 1920x1080 Ultra Graphics & Postprocessing (HBAO+) | |
| Average of class Gaming (104.7 - 240, n=7, last 2 years) | |
| Lenovo Legion 7 16ARHA7 | |
| Lenovo Legion 7 16IAX7-82TD004SGE | |
| Average AMD Radeon RX 6800M (108 - 110, n=2) | |
| Corsair Voyager a1600 | |
| Acer Predator Triton 500 SE PT516-52s-70KX | |
| Asus ROG Flow X16 GV601RW-M5082W | |
| HP Omen 16-b1090ng | |
| F1 2021 | |
| 1920x1080 High Preset AA:T AF:16x | |
| Lenovo Legion 7 16ARHA7 | |
| Acer Predator Triton 500 SE PT516-52s-70KX | |
| Corsair Voyager a1600 | |
| Average AMD Radeon RX 6800M (187 - 231, n=2) | |
| Lenovo Legion 7 16IAX7-82TD004SGE | |
| 1920x1080 Ultra High Preset + Raytracing AA:T AF:16x | |
| Lenovo Legion 7 16ARHA7 | |
| Corsair Voyager a1600 | |
| Acer Predator Triton 500 SE PT516-52s-70KX | |
| Average AMD Radeon RX 6800M (114 - 124.1, n=2) | |
| Lenovo Legion 7 16IAX7-82TD004SGE | |
Witcher 3 FPS diagram
| low | med. | high | ultra | QHD | 4K | |
|---|---|---|---|---|---|---|
| GTA V (2015) | 177.1 | 172 | 156.2 | 92.8 | 84 | 85.4 |
| The Witcher 3 (2015) | 309 | 236 | 177.8 | 108 | 59.5 | |
| Dota 2 Reborn (2015) | 146.1 | 126.2 | 125.5 | 114.8 | 95.2 | |
| Final Fantasy XV Benchmark (2018) | 160.8 | 125.6 | 97.5 | 71 | 41.3 | |
| X-Plane 11.11 (2018) | 60 | 50.7 | 45.3 | 28.8 | ||
| Far Cry 5 (2018) | 129 | 113 | 109 | 101 | 100 | 61 |
| Strange Brigade (2018) | 394 | 258 | 229 | 206 | 145 | 77.2 |
| Shadow of the Tomb Raider (2018) | 143.9 | 119.7 | 112.8 | 106.1 | 80.5 | 43.2 |
| Far Cry New Dawn (2019) | 111 | 97 | 94 | 86 | 82 | 62 |
| Metro Exodus (2019) | 205 | 137.4 | 99.8 | 78.7 | 61.4 | 37.1 |
| Borderlands 3 (2019) | 116.1 | 100.1 | 89.2 | 77.6 | 57 | 30.3 |
| F1 2020 (2020) | 305 | 247 | 228 | 172.4 | 127.4 | 70.2 |
| Dirt 5 (2020) | 242 | 154 | 121 | 95 | 76 | 47 |
| F1 2021 (2021) | 342 | 277 | 231 | 124.1 | 88.2 | 47.6 |
| New World (2021) | 122.5 | 103 | 83.7 | 66.2 | 34.1 | |
| Forza Horizon 5 (2021) | 213 | 165 | 159 | 97 | 79 | 50 |
| God of War (2022) | 88.6 | 88.3 | 85.4 | 68.4 | 53 | 33.8 |
| GRID Legends (2022) | 233 | 205 | 171.2 | 144.1 | 115.8 | 72.8 |
| Cyberpunk 2077 1.6 (2022) | 122.5 | 95.5 | 82 | 76.9 | 48.1 | 22.1 |
| Tiny Tina's Wonderlands (2022) | 196.7 | 161.5 | 104.6 | 80.5 | 54.9 | 28.2 |
| F1 22 (2022) | 226 | 226 | 192.3 | 49.7 | 29.9 | 13.8 |
| A Plague Tale Requiem (2022) | 104.9 | 82.5 | 61.4 | 46 | 32.8 | 17.9 |
| Uncharted Legacy of Thieves Collection (2022) | 93.4 | 87.9 | 80.7 | 76.3 | 59.2 | 33.7 |
| Spider-Man Miles Morales (2022) | 90.8 | 94.2 | 88.6 | 82.5 | 63.2 | 38.1 |
排放与能源--不可忽视的问题
噪声排放
测量的噪声排放几乎显示了游戏笔记本电脑的典型结果。然而,测得的51.1 dB(A)很响,主观上认为明显更响。原因是非常高频率的风扇噪音。唯一的补救措施是选择平衡
或安静
的配置文件。在压力测试中,噪音水平分别下降到46和36 dB(A)。
Noise level
| Idle |
| 30.5 / 30.6 / 30.7 dB(A) |
| Load |
| 44.5 / 51.1 dB(A) |
 | ||
30 dB silent 40 dB(A) audible 50 dB(A) loud |
||
min: | ||
| Corsair Voyager a1600 Radeon RX 6800M, R9 6900HS, Samsung PM9A1 MZVL22T0HBLB | Asus ROG Flow X16 GV601RW-M5082W GeForce RTX 3070 Ti Laptop GPU, R9 6900HS, Micron 3400 1TB MTFDKBA1T0TFH | Lenovo Legion 7 16ARHA7 Radeon RX 6850M XT, R9 6900HX, Samsung PM9A1 MZVL22T0HBLB | Acer Predator Triton 500 SE PT516-52s-70KX GeForce RTX 3080 Ti Laptop GPU, i7-12700H, Micron 3400 1TB MTFDKBA1T0TFH | HP Omen 16-b1090ng GeForce RTX 3070 Ti Laptop GPU, i7-12700H, WDC PC SN810 1TB | Lenovo Legion 7 16IAX7-82TD004SGE GeForce RTX 3080 Ti Laptop GPU, i9-12900HX, Micron 3400 1TB MTFDKBA1T0TFH | |
|---|---|---|---|---|---|---|
| Noise | 7% | 22% | 0% | -3% | 5% | |
| off / environment * (dB) | 29.9 | 25.5 15% | 22.8 24% | 26 13% | 26 13% | 24.5 18% |
| Idle Minimum * (dB) | 30.5 | 25.5 16% | 23 25% | 26 15% | 30 2% | 24.5 20% |
| Idle Average * (dB) | 30.6 | 25.5 17% | 23 25% | 29 5% | 31 -1% | 30 2% |
| Idle Maximum * (dB) | 30.7 | 27.4 11% | 23 25% | 34 -11% | 33 -7% | 32.5 -6% |
| Load Average * (dB) | 44.5 | 49.9 -12% | 26.8 40% | 50 -12% | 49 -10% | 43.9 1% |
| Load Maximum * (dB) | 51.1 | 55 -8% | 54.2 -6% | 56 -10% | 57 -12% | 54.2 -6% |
| Witcher 3 ultra * (dB) | 54.3 | 53 | 53 | 48.8 |
* ... smaller is better
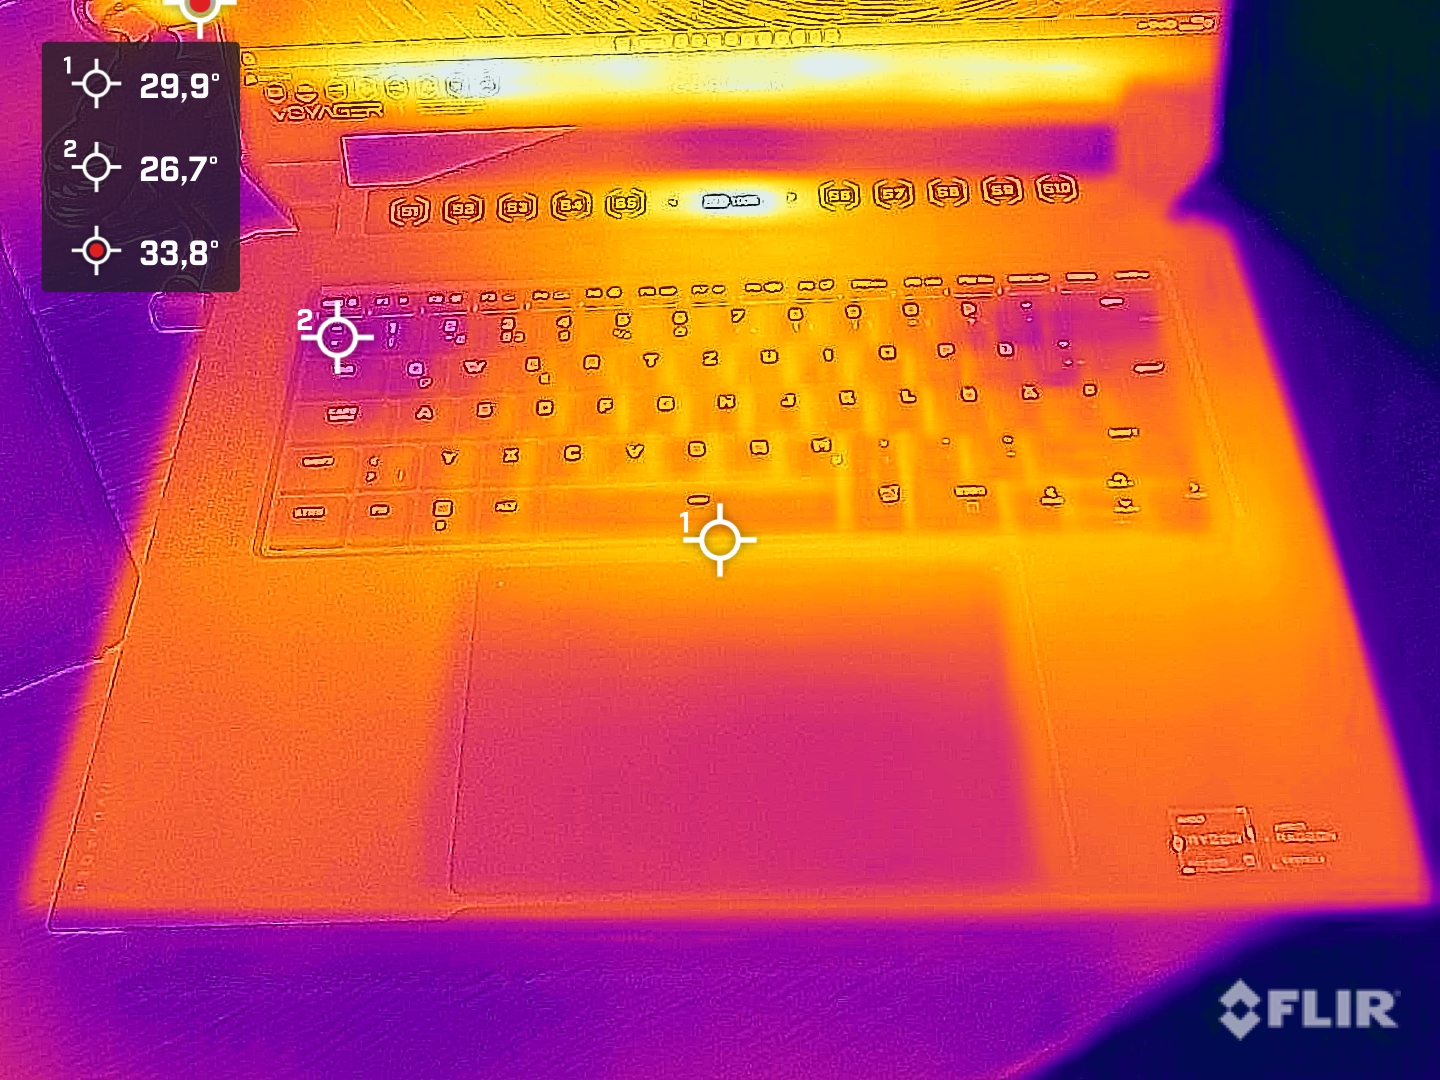
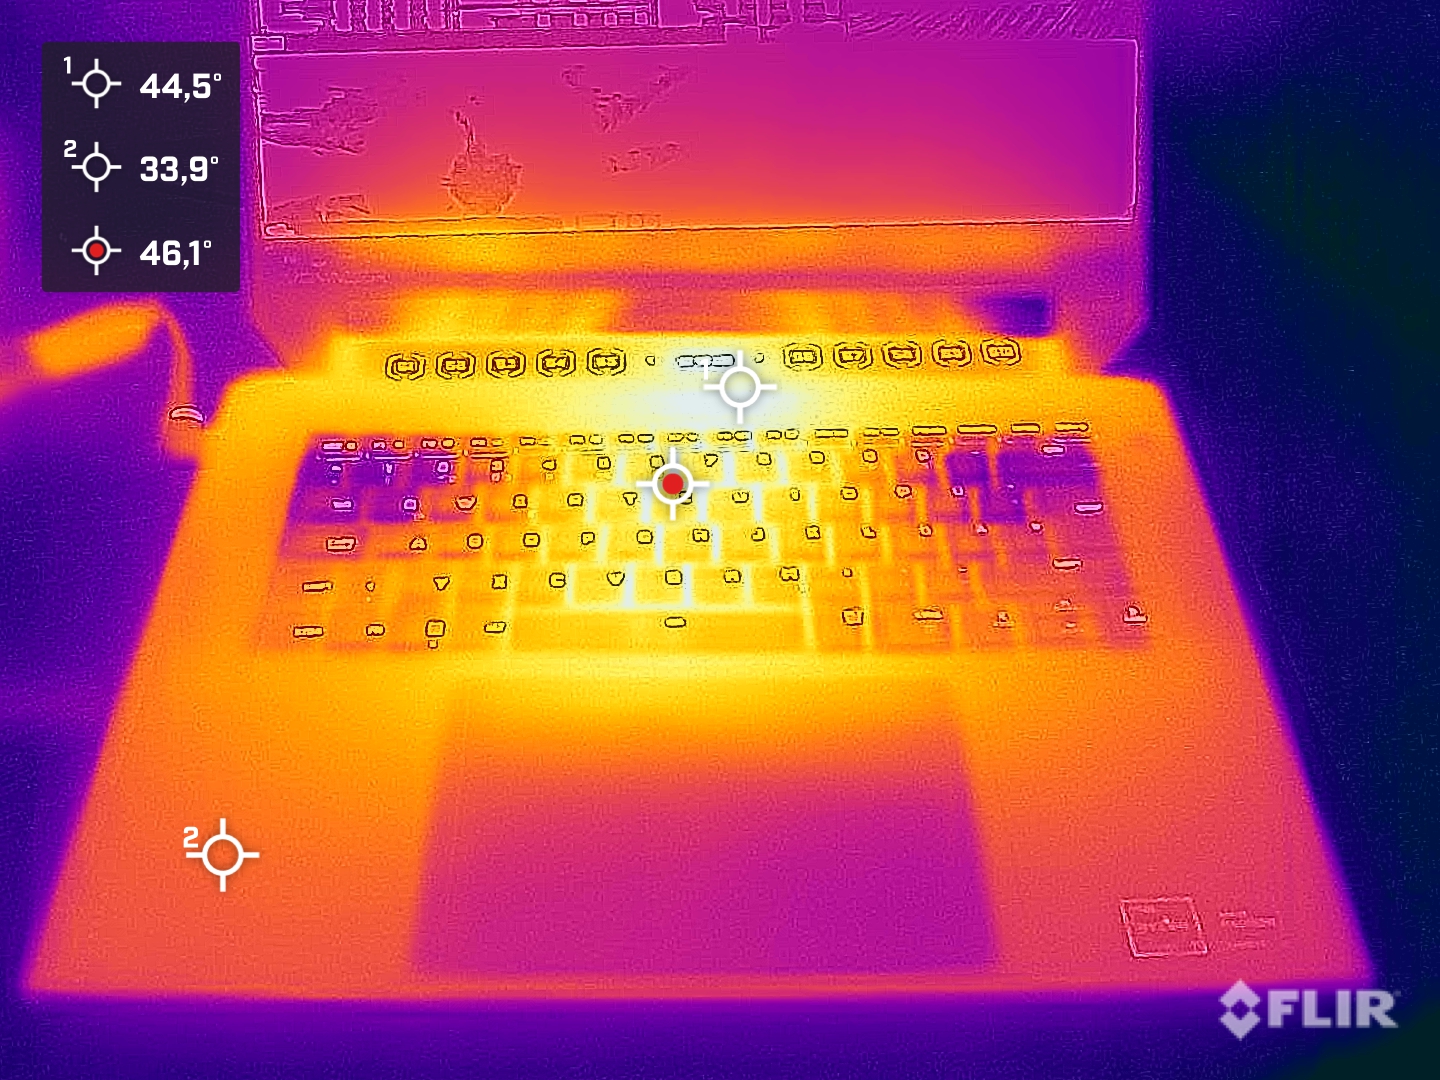
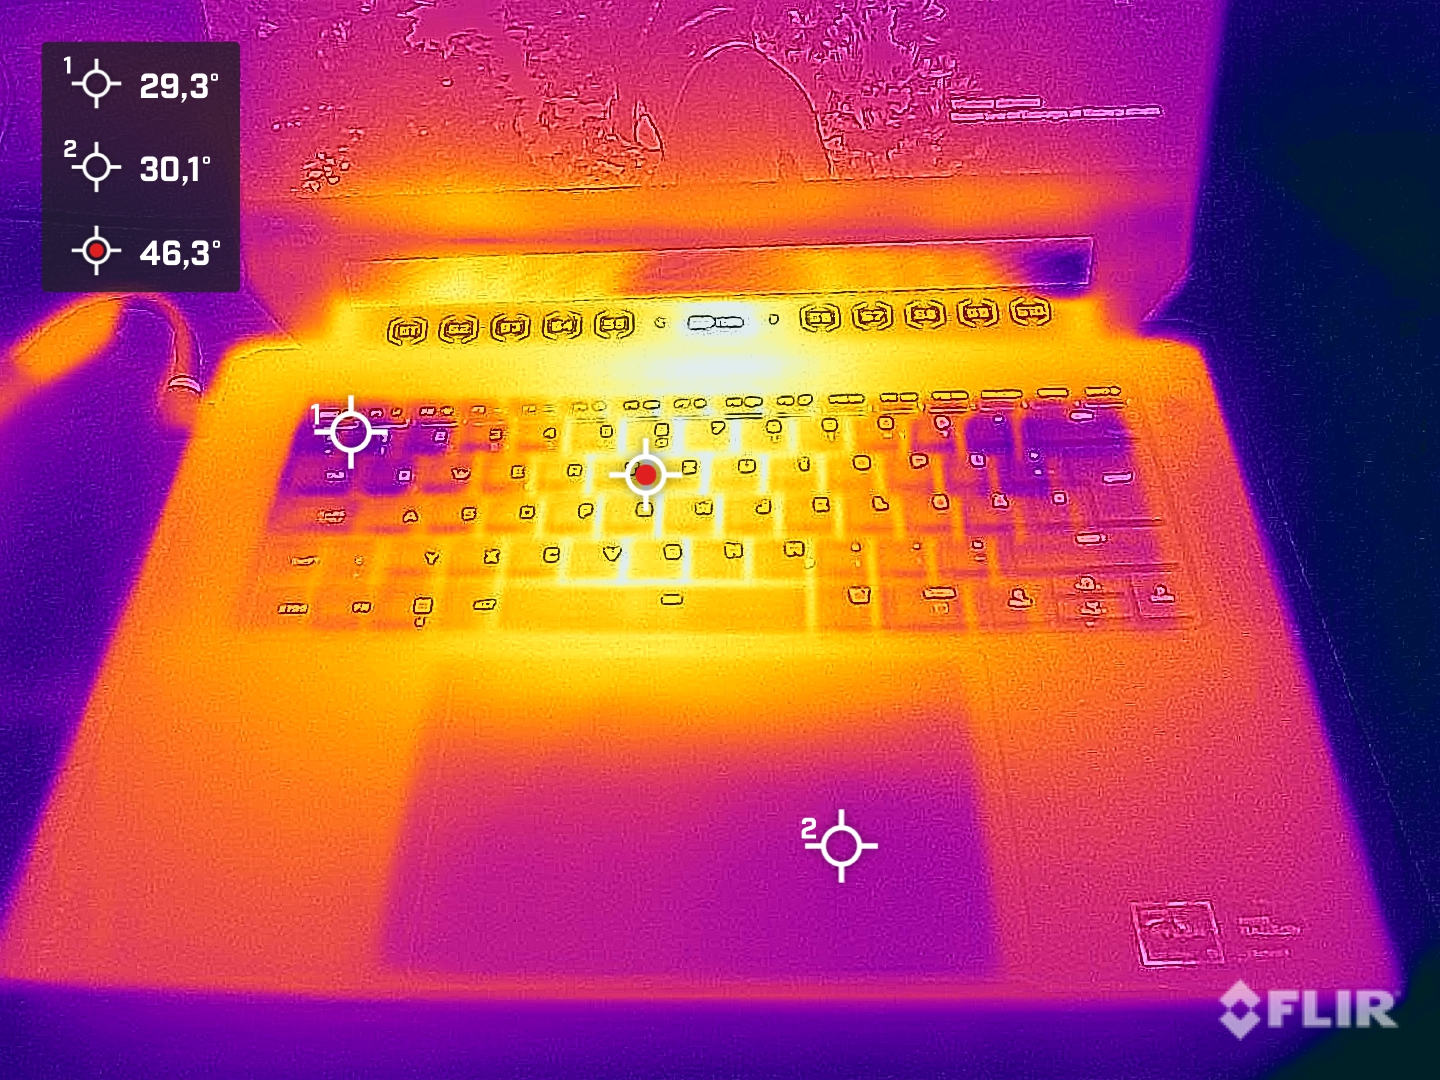
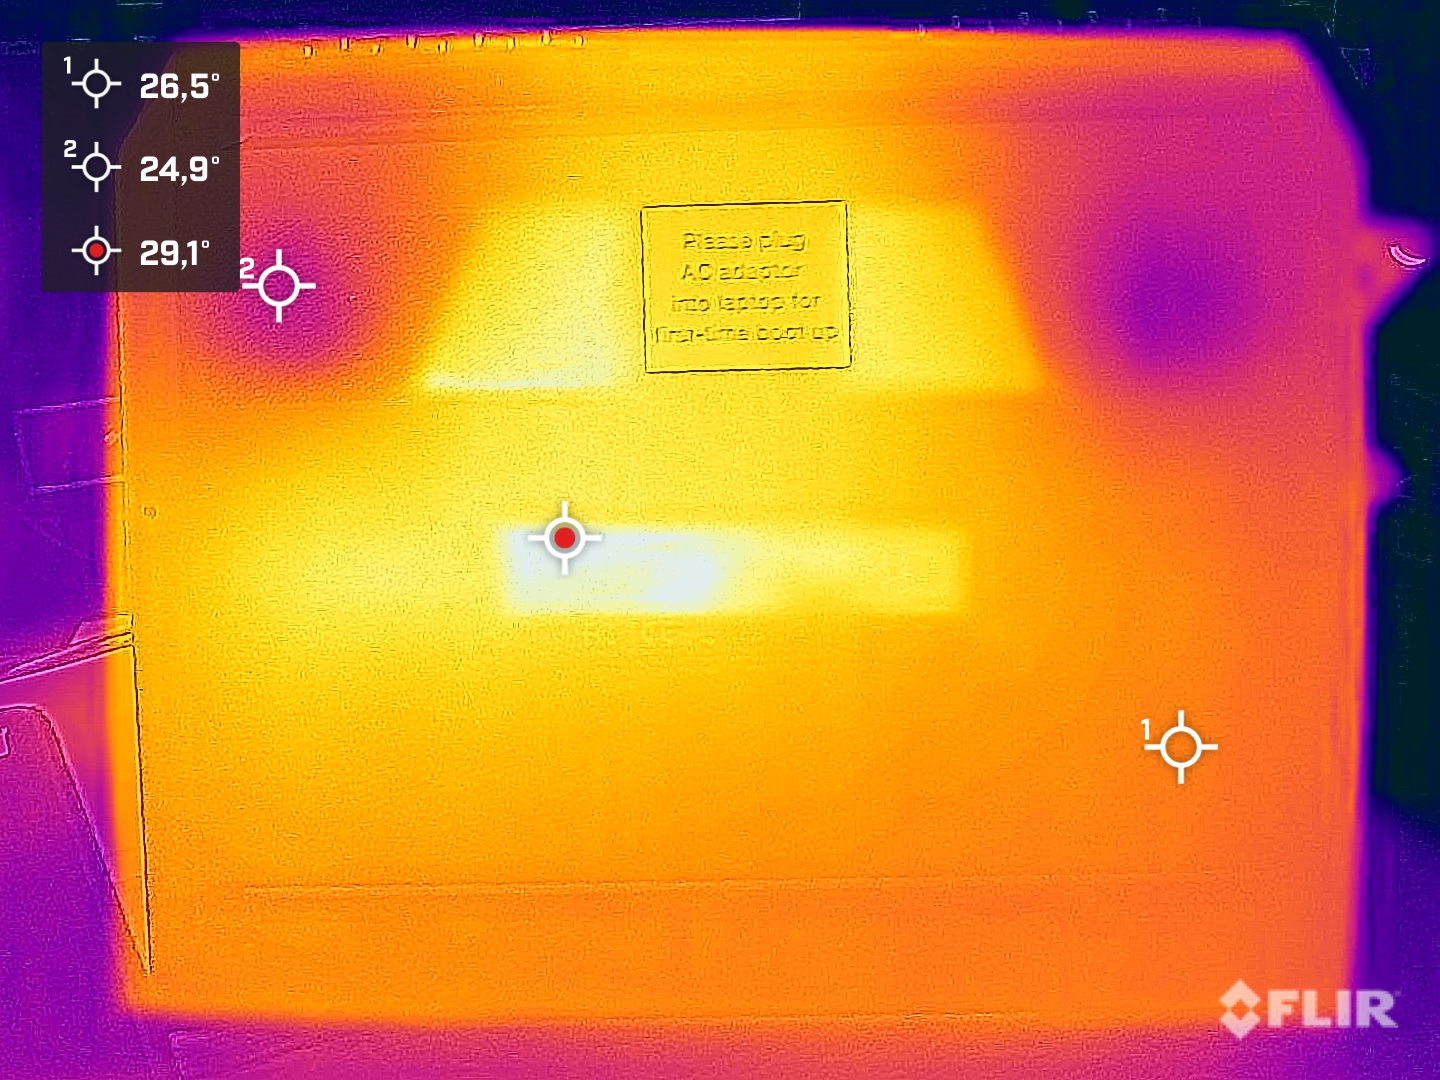
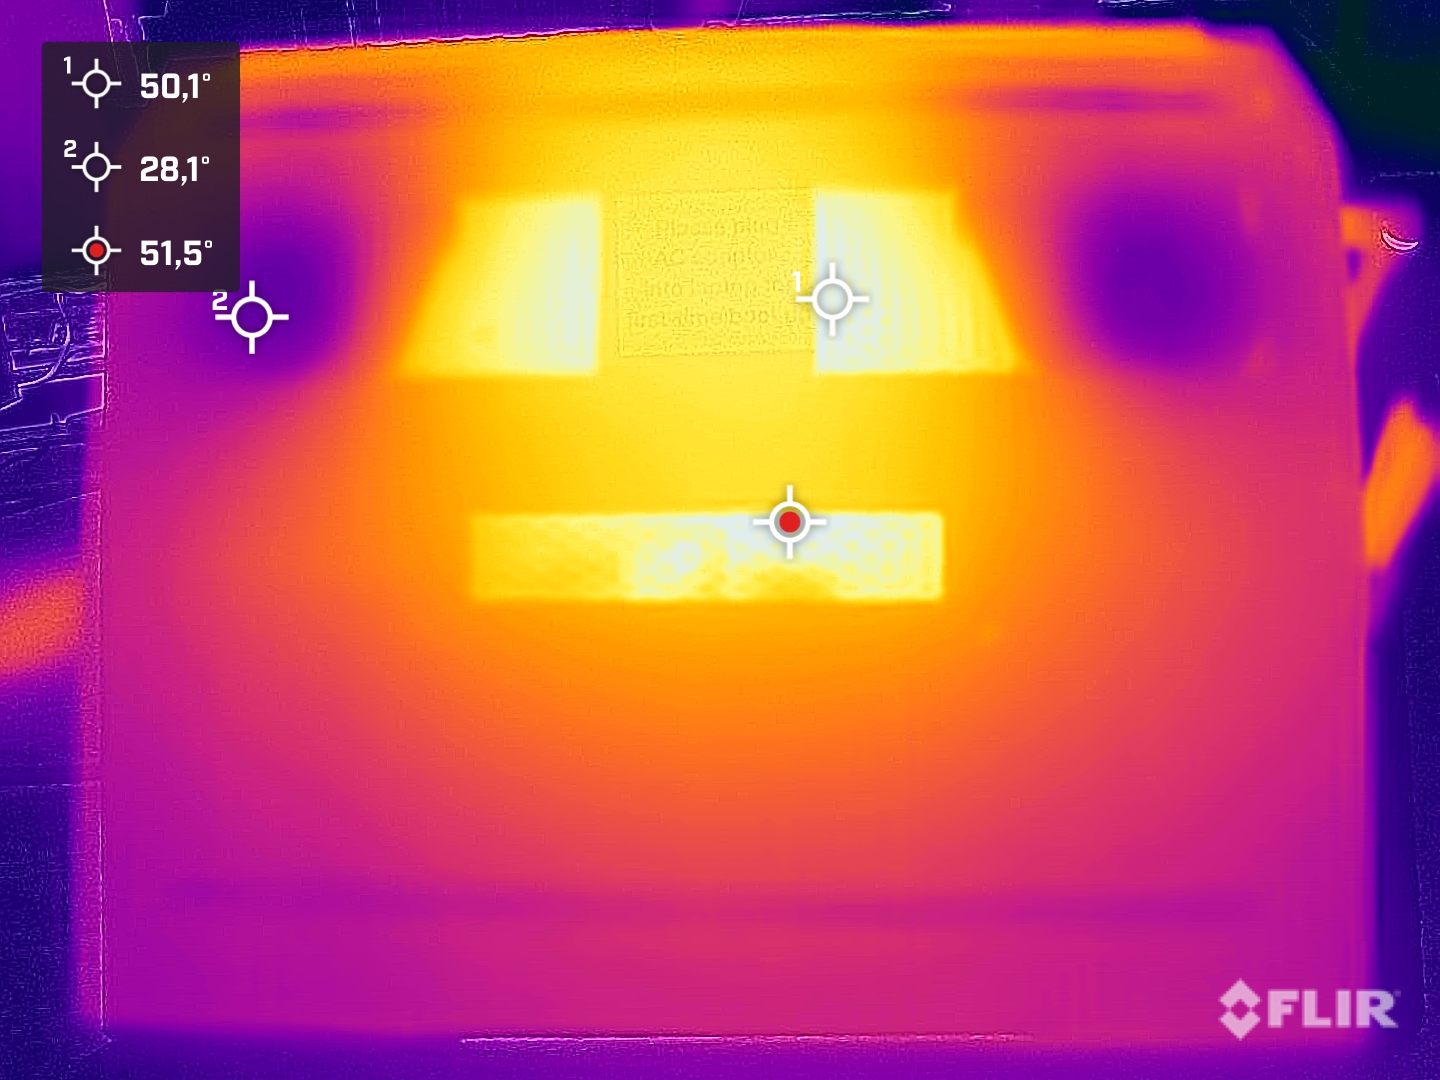
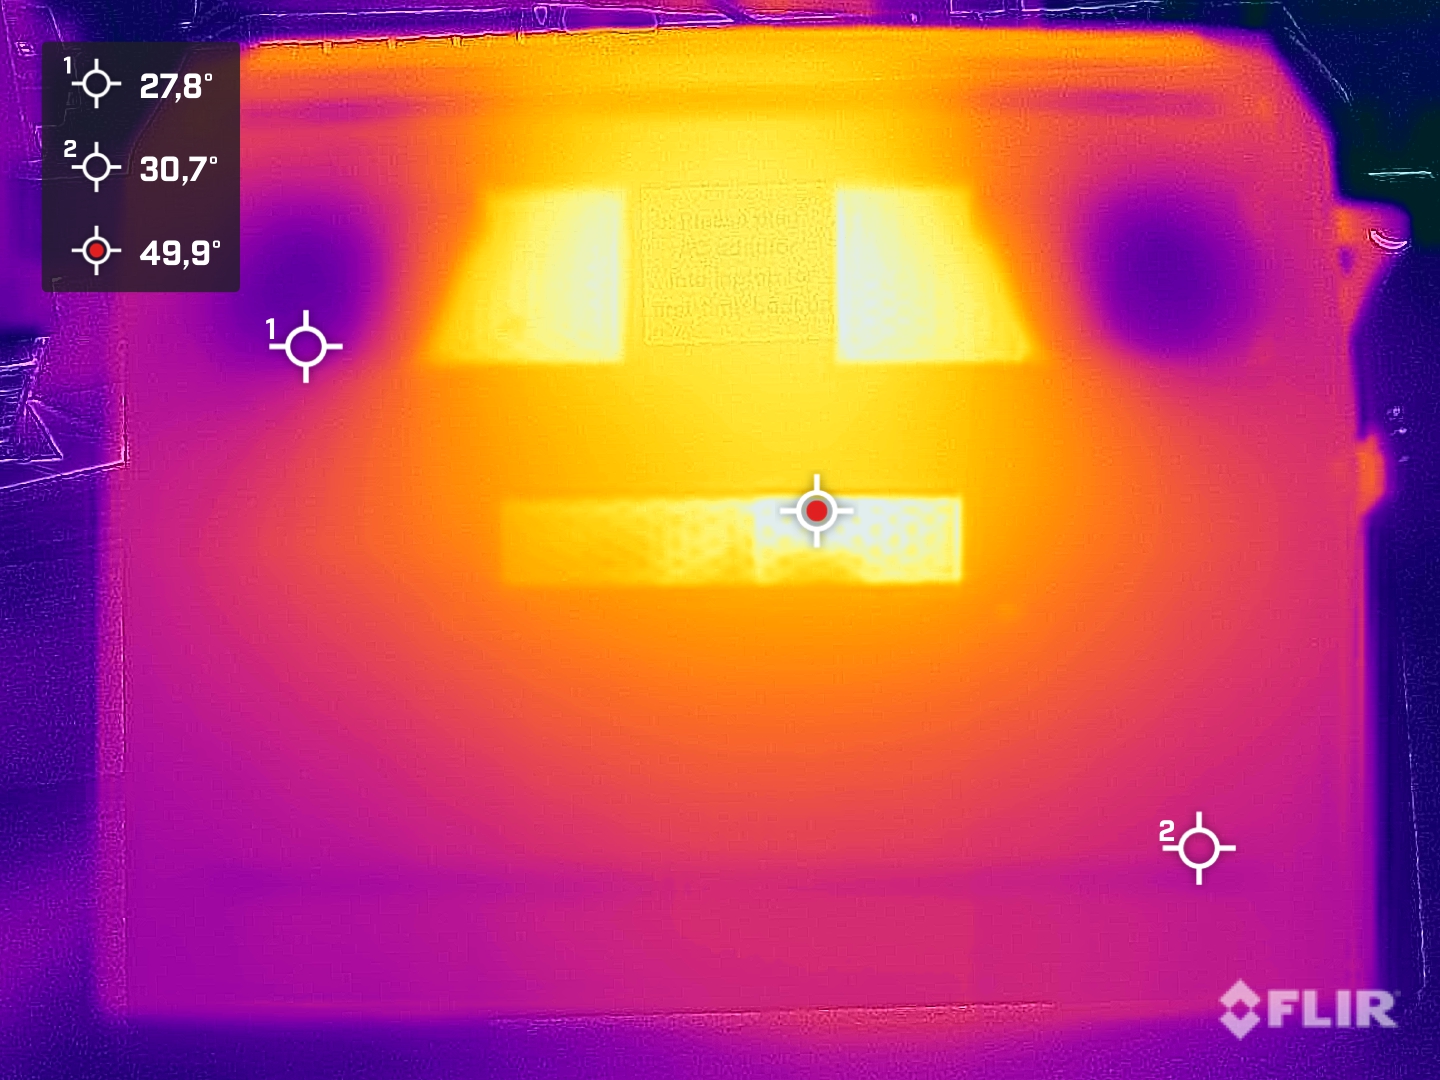
温度
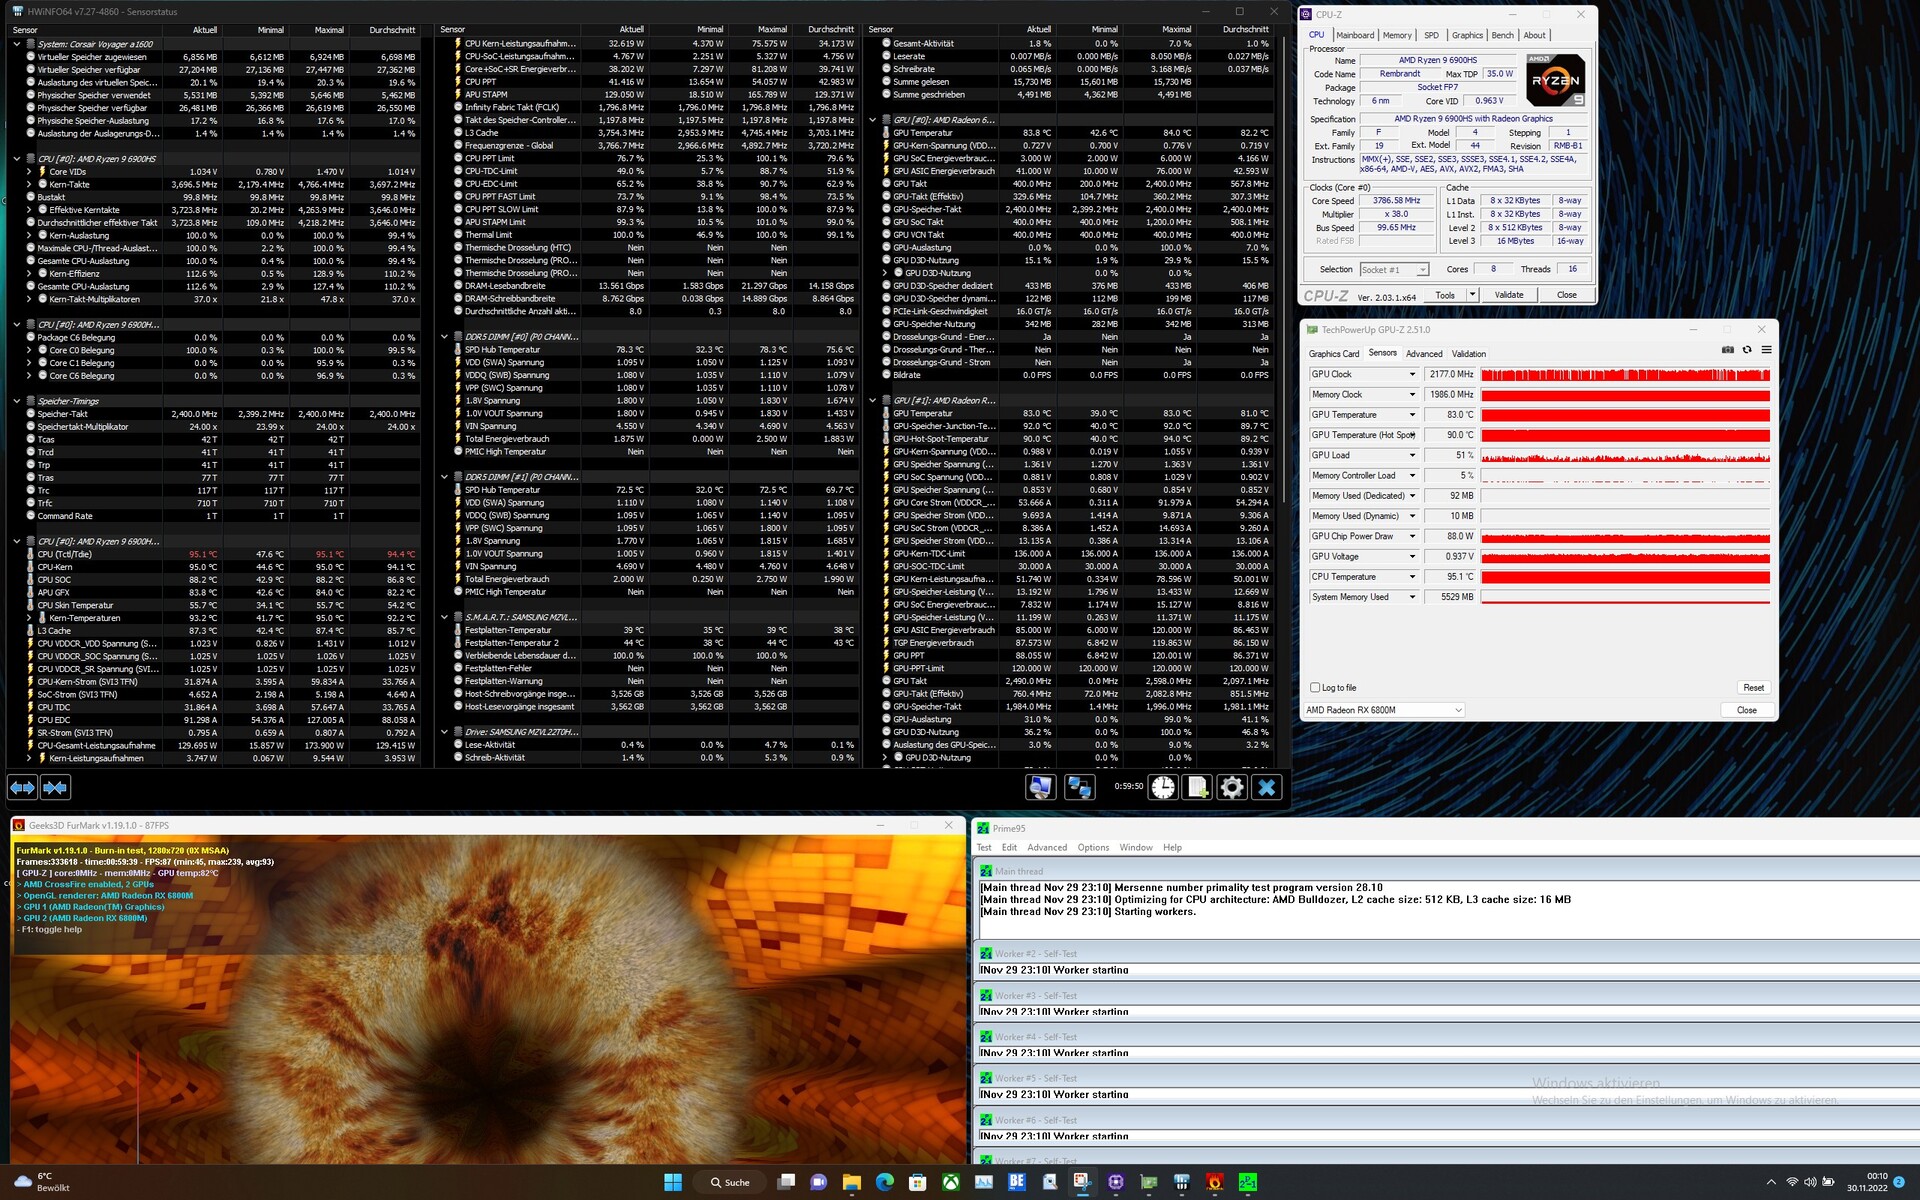
在压力测试中,我们测量了机箱底部的最热点,高达54℃。然而,机箱上部的温度也相当高,刚刚超过50℃。在游戏过程中,机箱温度只略微下降了1-2℃。
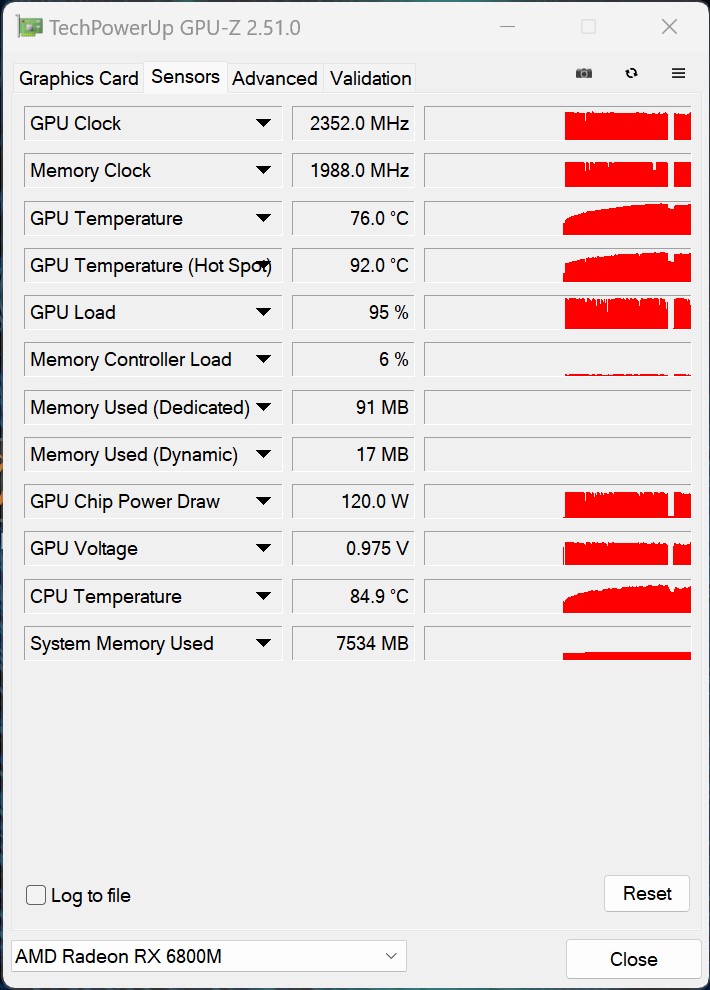
在压力测试中,CPU和GPU温度分别上升到95和83℃。然而,SoC的平均时钟频率仍然为3.7GHz。AMD的GPU也实现了高时钟频率,略低于2.2GHz。海盗船使用了一个带有蒸汽室和两个风扇的大型冷却系统。
(-) The maximum temperature on the upper side is 50.7 °C / 123 F, compared to the average of 40.4 °C / 105 F, ranging from 21.2 to 68.8 °C for the class Gaming.
(-) The bottom heats up to a maximum of 54.2 °C / 130 F, compared to the average of 43.2 °C / 110 F
(+) In idle usage, the average temperature for the upper side is 31.5 °C / 89 F, compared to the device average of 33.9 °C / 93 F.
(±) Playing The Witcher 3, the average temperature for the upper side is 36.6 °C / 98 F, compared to the device average of 33.9 °C / 93 F.
(+) The palmrests and touchpad are reaching skin temperature as a maximum (34 °C / 93.2 F) and are therefore not hot.
(-) The average temperature of the palmrest area of similar devices was 28.8 °C / 83.8 F (-5.2 °C / -9.4 F).
| Corsair Voyager a1600 AMD Ryzen 9 6900HS, AMD Radeon RX 6800M | Asus ROG Flow X16 GV601RW-M5082W AMD Ryzen 9 6900HS, NVIDIA GeForce RTX 3070 Ti Laptop GPU | Lenovo Legion 7 16ARHA7 AMD Ryzen 9 6900HX, AMD Radeon RX 6850M XT | Acer Predator Triton 500 SE PT516-52s-70KX Intel Core i7-12700H, NVIDIA GeForce RTX 3080 Ti Laptop GPU | HP Omen 16-b1090ng Intel Core i7-12700H, NVIDIA GeForce RTX 3070 Ti Laptop GPU | Lenovo Legion 7 16IAX7-82TD004SGE Intel Core i9-12900HX, NVIDIA GeForce RTX 3080 Ti Laptop GPU | |
|---|---|---|---|---|---|---|
| Heat | -3% | 14% | 8% | 14% | -3% | |
| Maximum Upper Side * (°C) | 50.7 | 55.1 -9% | 37.2 27% | 47 7% | 41 19% | 44.4 12% |
| Maximum Bottom * (°C) | 54.2 | 50.3 7% | 43 21% | 49 10% | 62 -14% | 60.8 -12% |
| Idle Upper Side * (°C) | 35.8 | 35.5 1% | 34 5% | 31 13% | 25 30% | 33.8 6% |
| Idle Bottom * (°C) | 33 | 36.1 -9% | 32.8 1% | 32 3% | 26 21% | 38.8 -18% |
* ... smaller is better
演讲者
两个扬声器位于掌托下方。然而,声音是从键盘旁边的扬声器栅栏中向上引出的。通常情况下,这两个扬声器缺乏低音,所以中音和高音明显占优势。然而,我们建议使用耳机进行游戏。这可以通过USB使用3.5毫米插孔或通过Slipstream连接到笔记本电脑上。
Corsair Voyager a1600 audio analysis
(-) | not very loud speakers (69 dB)
Bass 100 - 315 Hz
(±) | reduced bass - on average 10.2% lower than median
(±) | linearity of bass is average (13.7% delta to prev. frequency)
Mids 400 - 2000 Hz
(±) | higher mids - on average 7.8% higher than median
(±) | linearity of mids is average (7% delta to prev. frequency)
Highs 2 - 16 kHz
(+) | balanced highs - only 1.8% away from median
(±) | linearity of highs is average (11.4% delta to prev. frequency)
Overall 100 - 16.000 Hz
(±) | linearity of overall sound is average (25.5% difference to median)
Compared to same class
» 91% of all tested devices in this class were better, 2% similar, 7% worse
» The best had a delta of 6%, average was 18%, worst was 132%
Compared to all devices tested
» 78% of all tested devices were better, 4% similar, 17% worse
» The best had a delta of 4%, average was 23%, worst was 134%
Asus ROG Flow X16 GV601RW-M5082W audio analysis
(±) | speaker loudness is average but good (80.7 dB)
Bass 100 - 315 Hz
(±) | reduced bass - on average 12.7% lower than median
(±) | linearity of bass is average (13.8% delta to prev. frequency)
Mids 400 - 2000 Hz
(+) | balanced mids - only 1.3% away from median
(+) | mids are linear (4.7% delta to prev. frequency)
Highs 2 - 16 kHz
(±) | higher highs - on average 6.4% higher than median
(+) | highs are linear (6.8% delta to prev. frequency)
Overall 100 - 16.000 Hz
(+) | overall sound is linear (12.9% difference to median)
Compared to same class
» 17% of all tested devices in this class were better, 4% similar, 79% worse
» The best had a delta of 6%, average was 18%, worst was 132%
Compared to all devices tested
» 12% of all tested devices were better, 3% similar, 85% worse
» The best had a delta of 4%, average was 23%, worst was 134%
消耗功率
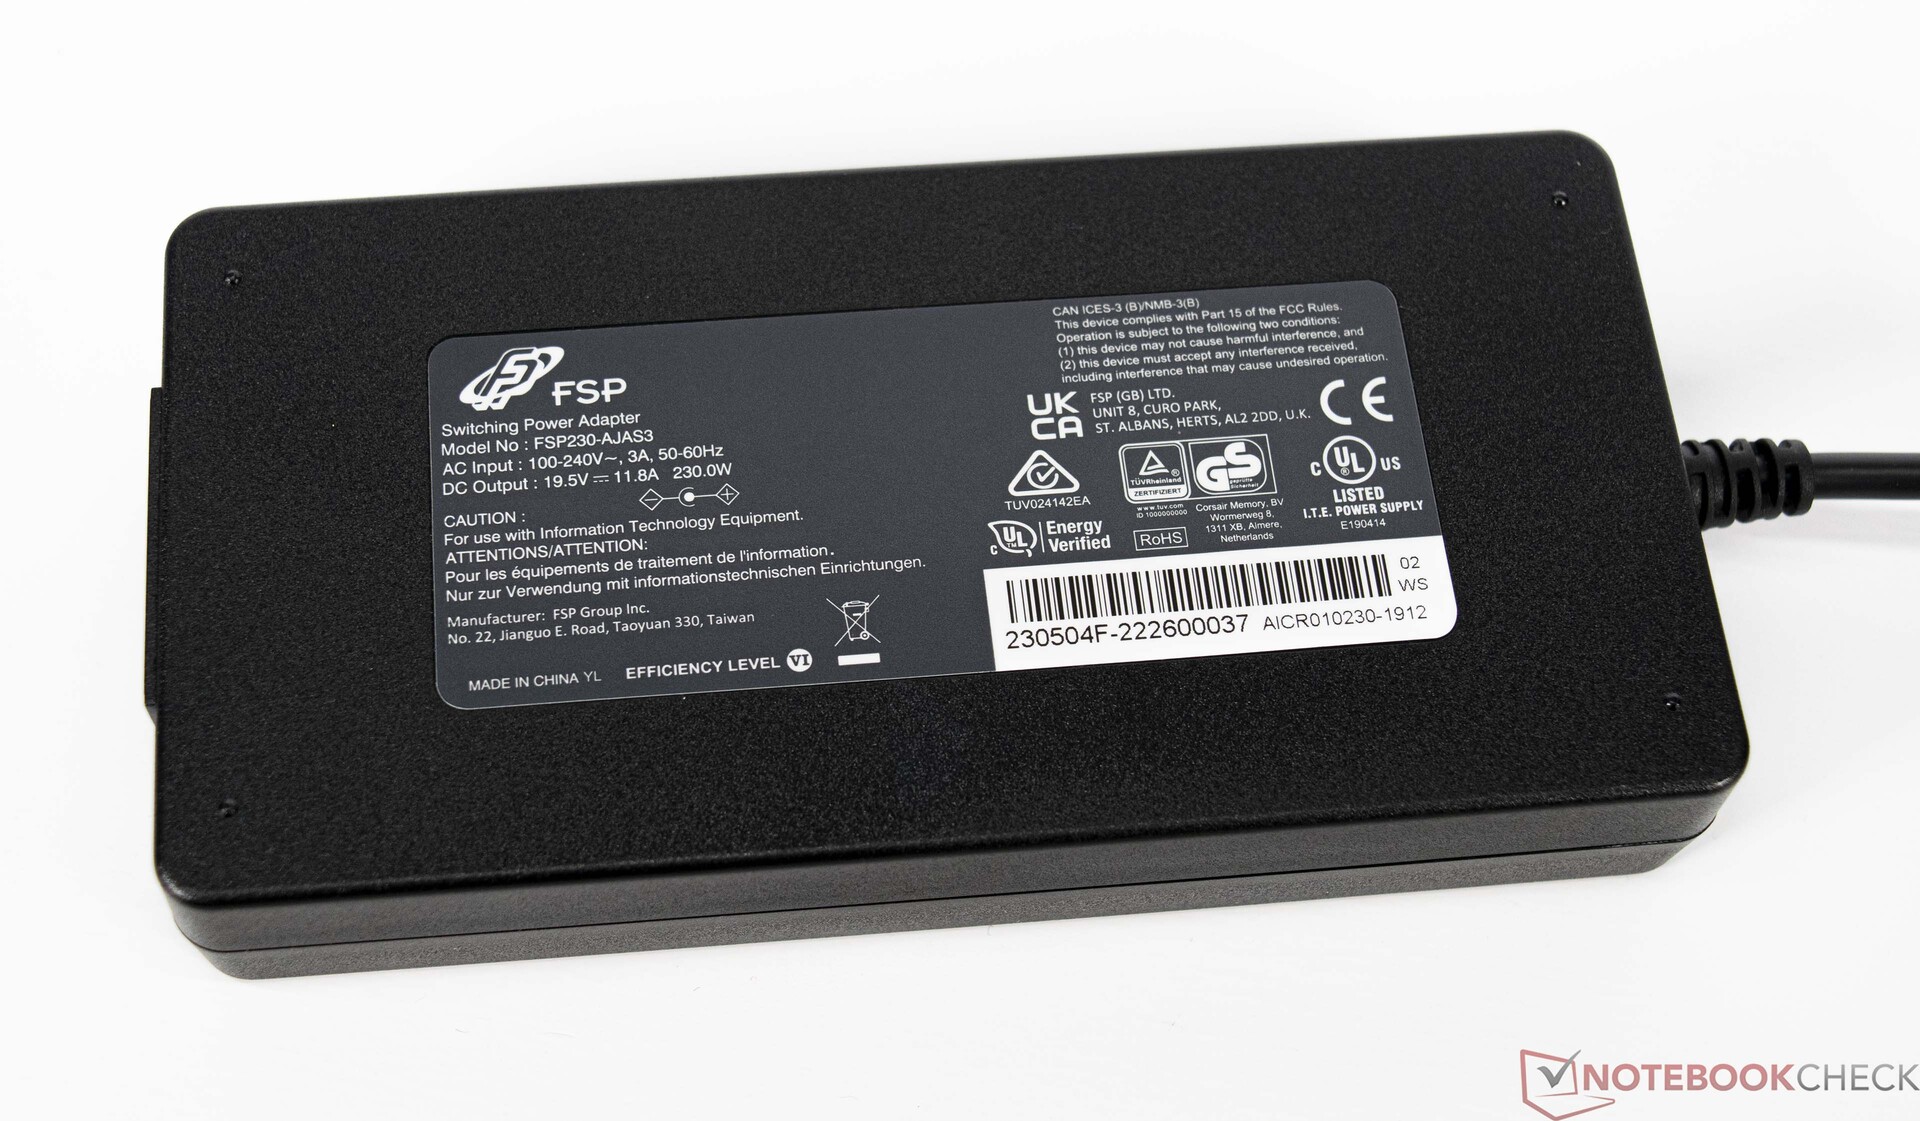
在功耗方面,我们测量了空闲时约16至22瓦的功率。在平均负载下,我们登记了大约133瓦,尽管峰值达到258瓦。根据规格,该电源可以提供230瓦。然而,在测试中,较高的负载峰值并没有导致问题。在压力测试期间,电池没有额外放电。
| Off / Standby | |
| Idle | |
| Load |
|
Key:
min: | |
Energy consumption Witcher 3 / stress test
Energy consumption with an external monitor
电池寿命
海盗船的电池容量为99Wh,在电池容量方面用尽了最大限度。由于闲置能耗相对较高,该设备在闲置时落后于竞争对手。然而,联想的Legion 7的得分更差。尽管如此,Voyager a1600在WLAN测试中取得了合格的运行时间,略低于6小时。在这项测试中,显示亮度为52%,相当于150cd/m²的一般条件。海盗船还在电池模式下明显地节制了CPU和GPU的性能。

| Corsair Voyager a1600 R9 6900HS, Radeon RX 6800M, 99 Wh | Asus ROG Flow X16 GV601RW-M5082W R9 6900HS, GeForce RTX 3070 Ti Laptop GPU, 90 Wh | Lenovo Legion 7 16ARHA7 R9 6900HX, Radeon RX 6850M XT, 99 Wh | Acer Predator Triton 500 SE PT516-52s-70KX i7-12700H, GeForce RTX 3080 Ti Laptop GPU, 99.98 Wh | HP Omen 16-b1090ng i7-12700H, GeForce RTX 3070 Ti Laptop GPU, 83 Wh | Lenovo Legion 7 16IAX7-82TD004SGE i9-12900HX, GeForce RTX 3080 Ti Laptop GPU, 99 Wh | Average of class Gaming | |
|---|---|---|---|---|---|---|---|
| Battery runtime | -30% | -6% | 13% | 10% | -35% | 11% | |
| Reader / Idle (h) | 7 | 4.9 -30% | 10.1 44% | 7.84 ? 12% | |||
| H.264 (h) | 6 | 8.2 37% | 5.1 -15% | 8.27 ? 38% | |||
| WiFi v1.3 (h) | 5.8 | 5.7 -2% | 7.3 26% | 5.7 -2% | 5.6 -3% | 4.5 -22% | 7.1 ? 22% |
| Load (h) | 2.1 | 0.9 -57% | 1.8 -14% | 2.2 5% | 1.9 -10% | 0.7 -67% | 1.496 ? -29% |
| Witcher 3 ultra (h) | 0.9 | 0.9 |
Pros
Cons
结论--多功能的笔记本游戏玩家和流媒体玩家
海盗船通过Voyager a1600创造了一个真正伟大的设备。AMD SoC和AMD GPU的组合很好,在测试中相当具有说服力。在与英特尔当前SoC的直接对决中,它往往不得不承认失败。然而,性能上的差异其实并不明显。由于材料的选择,Voyager a1600看起来特别高端,这也使该设备具有非常好的稳定性。该设备看起来一点都不笨重
乍一看,连接性变成了一个有点简陋的东西。然而,那些依靠Slipstream技术来连接外围设备的人几乎不会错过缺席的USB Type-A端口。
AMD的Ryzen 9 6900HS表现良好,在负载下持续快速,没有太大的性能损失。我们也可以证明AMD的Radeon RX 6800M也是如此。我们喜欢16:10格式的显示屏。唯一的缺点是亮度有点低,而且在AdobeRGB和P3色彩空间中的色彩空间覆盖率不是很完美,这就排除了用于视频或照片编辑的专业用途。然而,作为一台游戏笔记本电脑,海盗船Voyager a1600可以轻松地做到没有这些。
海盗船Voyager a1600不仅仅是一个纯粹的游戏笔记本,因为它的强大功能使它成为流媒体和内容创作者的完美设备。
然而,凭借独特的流媒体功能,Voyager a1600将被人记住。可以根据需要分配的快速启动按钮适合流媒体者,你可以不需要额外的流媒体平台。话虽如此,由于预期的用途,我们会希望有一个更高质量的摄像头,而不仅仅是作为一个移动应急解决方案。海盗船Voyager a1600的最大缺点是内置冷却装置。在负载情况下,温度仍然在限制范围内,这是毫无疑问的,但在最大性能下,测量的噪音水平仍然太高。那些放弃极限模式的人将得到低排放的回报,但同时也会放弃一些性能。
价格和可用性
海盗船Voyager a1600可以直接从海盗船商店购买。在那里你必须支付3550欧元的测试配置。另外,亚马逊销售相同的模型,目前为3540欧元.更便宜的配置是Ryzen 7 6800HS和16GB内存,也可以从亚马逊买到,2,725欧元。.
Corsair Voyager a1600
- 12/05/2022 v7 (old)
Sebastian Bade
Price comparison
