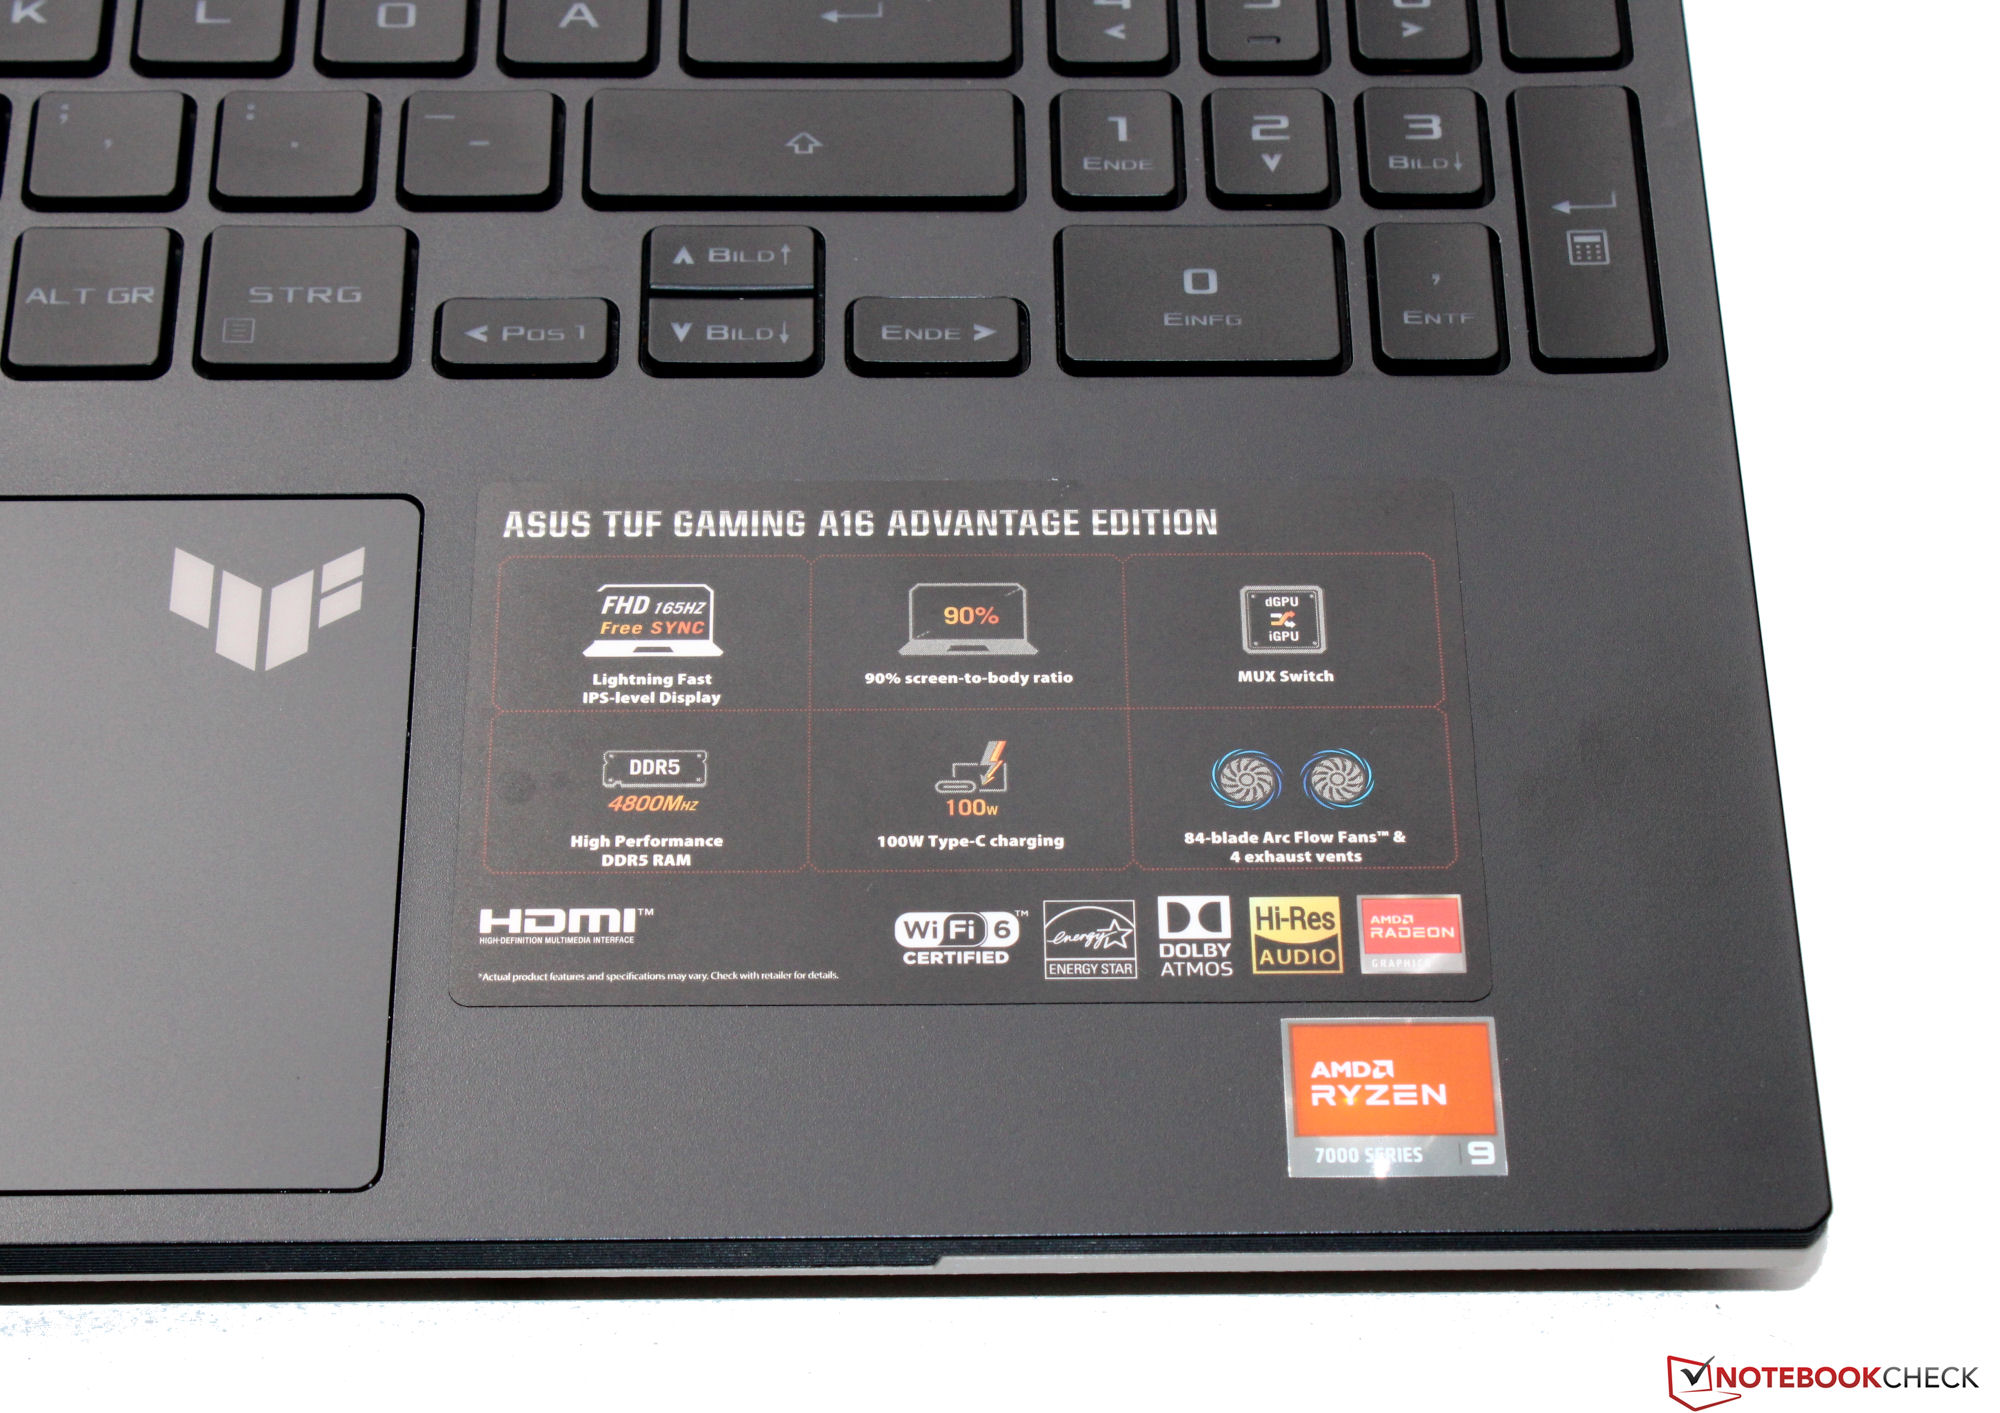
华硕TUF Gaming A16优势版FA617XS评测:拥有长达20小时运行时间的AMD笔记本电脑
华硕TUF Gaming A16优势版--一款中端游戏笔记本电脑--依赖于AMD的硬件:ARyzen-9-7940HSAPU和Radeon-RX-7600SGPU为该设备提供动力。竞争者包括联想Legion Pro 5 16IRX8,以及MSI Katana 15 B12VEK,以及Medion Erazer Defender P40和 技嘉G5 KE.
潜在的竞争对手比较
Rating | Date | Model | Weight | Height | Size | Resolution | Price |
|---|---|---|---|---|---|---|---|
| 86.9 % v7 (old) | 06 / 2023 | Asus TUF Gaming A16 FA617XS R9 7940HS, Radeon RX 7600S | 2.2 kg | 22.1 mm | 16.00" | 1920x1200 | |
| 87.9 % v7 (old) | 05 / 2023 | Lenovo Legion Pro 5 16IRX8 i7-13700HX, GeForce RTX 4060 Laptop GPU | 2.5 kg | 26.8 mm | 16.00" | 2560x1600 | |
| 82.9 % v7 (old) | 03 / 2023 | MSI Katana 15 B12VEK i7-12650H, GeForce RTX 4050 Laptop GPU | 2.3 kg | 24.9 mm | 15.60" | 1920x1080 | |
| 84.6 % v7 (old) | 05 / 2023 | Medion Erazer Defender P40 i7-13700HX, GeForce RTX 4060 Laptop GPU | 2.9 kg | 33 mm | 17.30" | 2560x1440 | |
| 81.8 % v7 (old) | 04 / 2023 | Gigabyte G5 KE i5-12500H, GeForce RTX 3060 Laptop GPU | 2 kg | 23.9 mm | 15.60" | 1920x1080 |
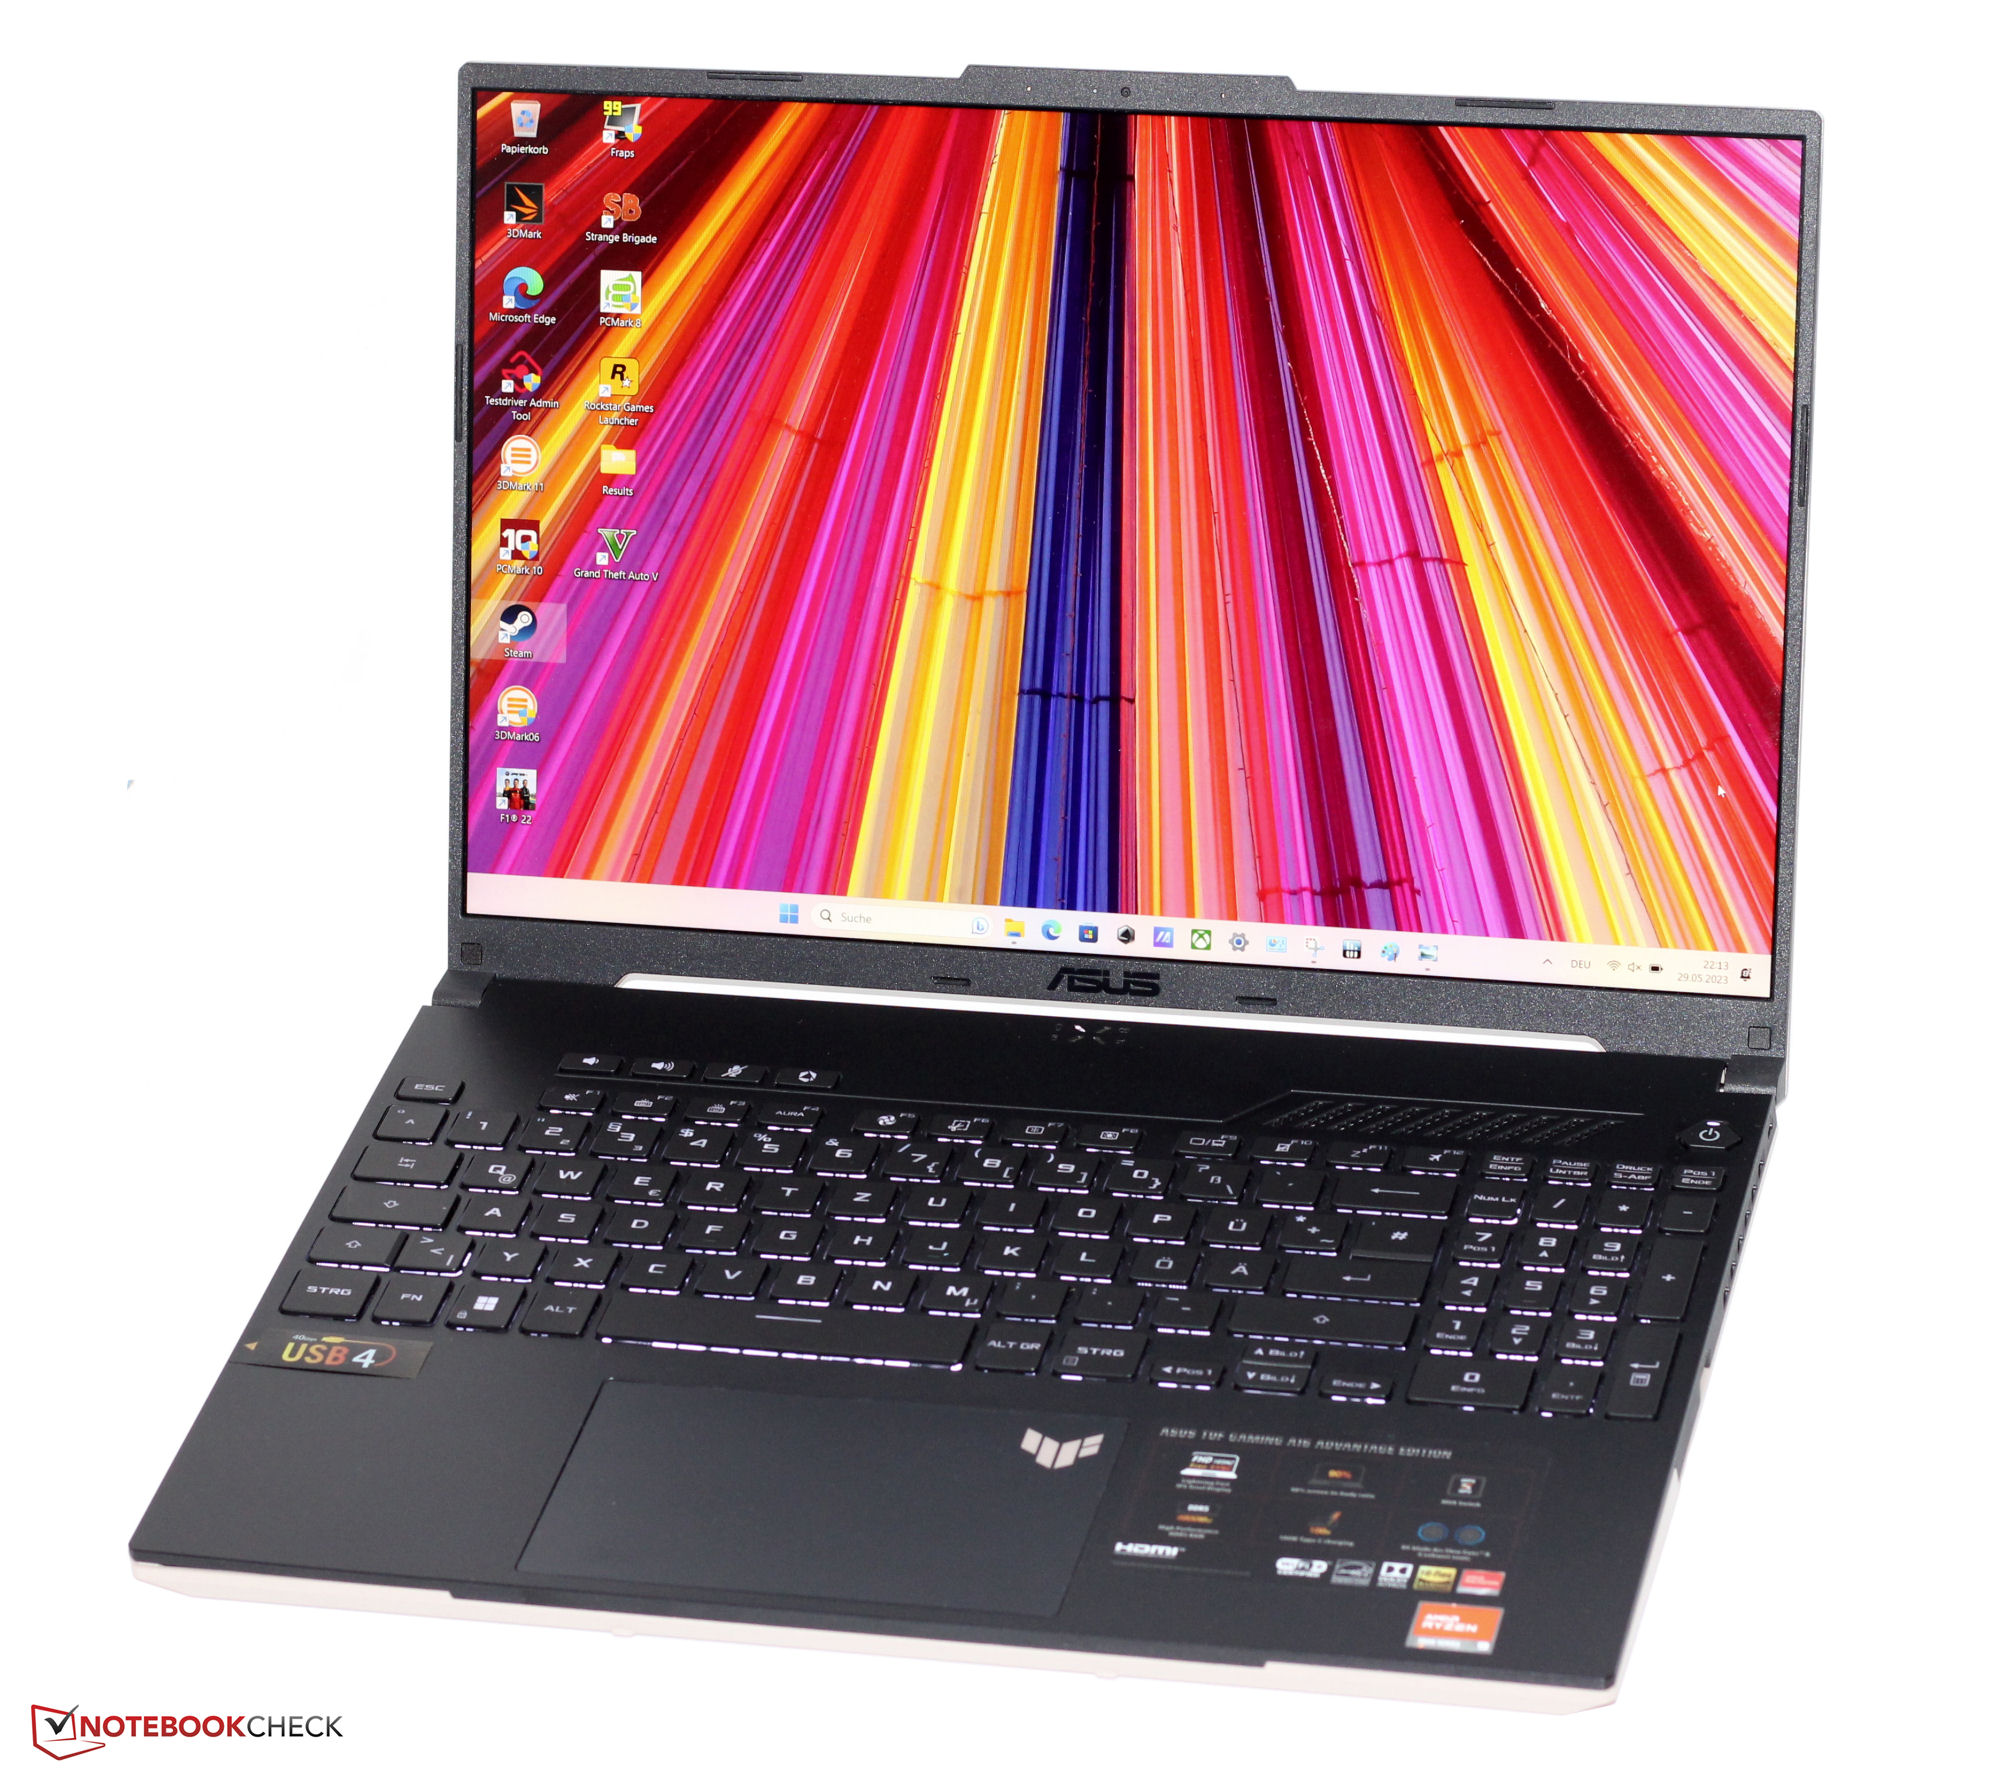
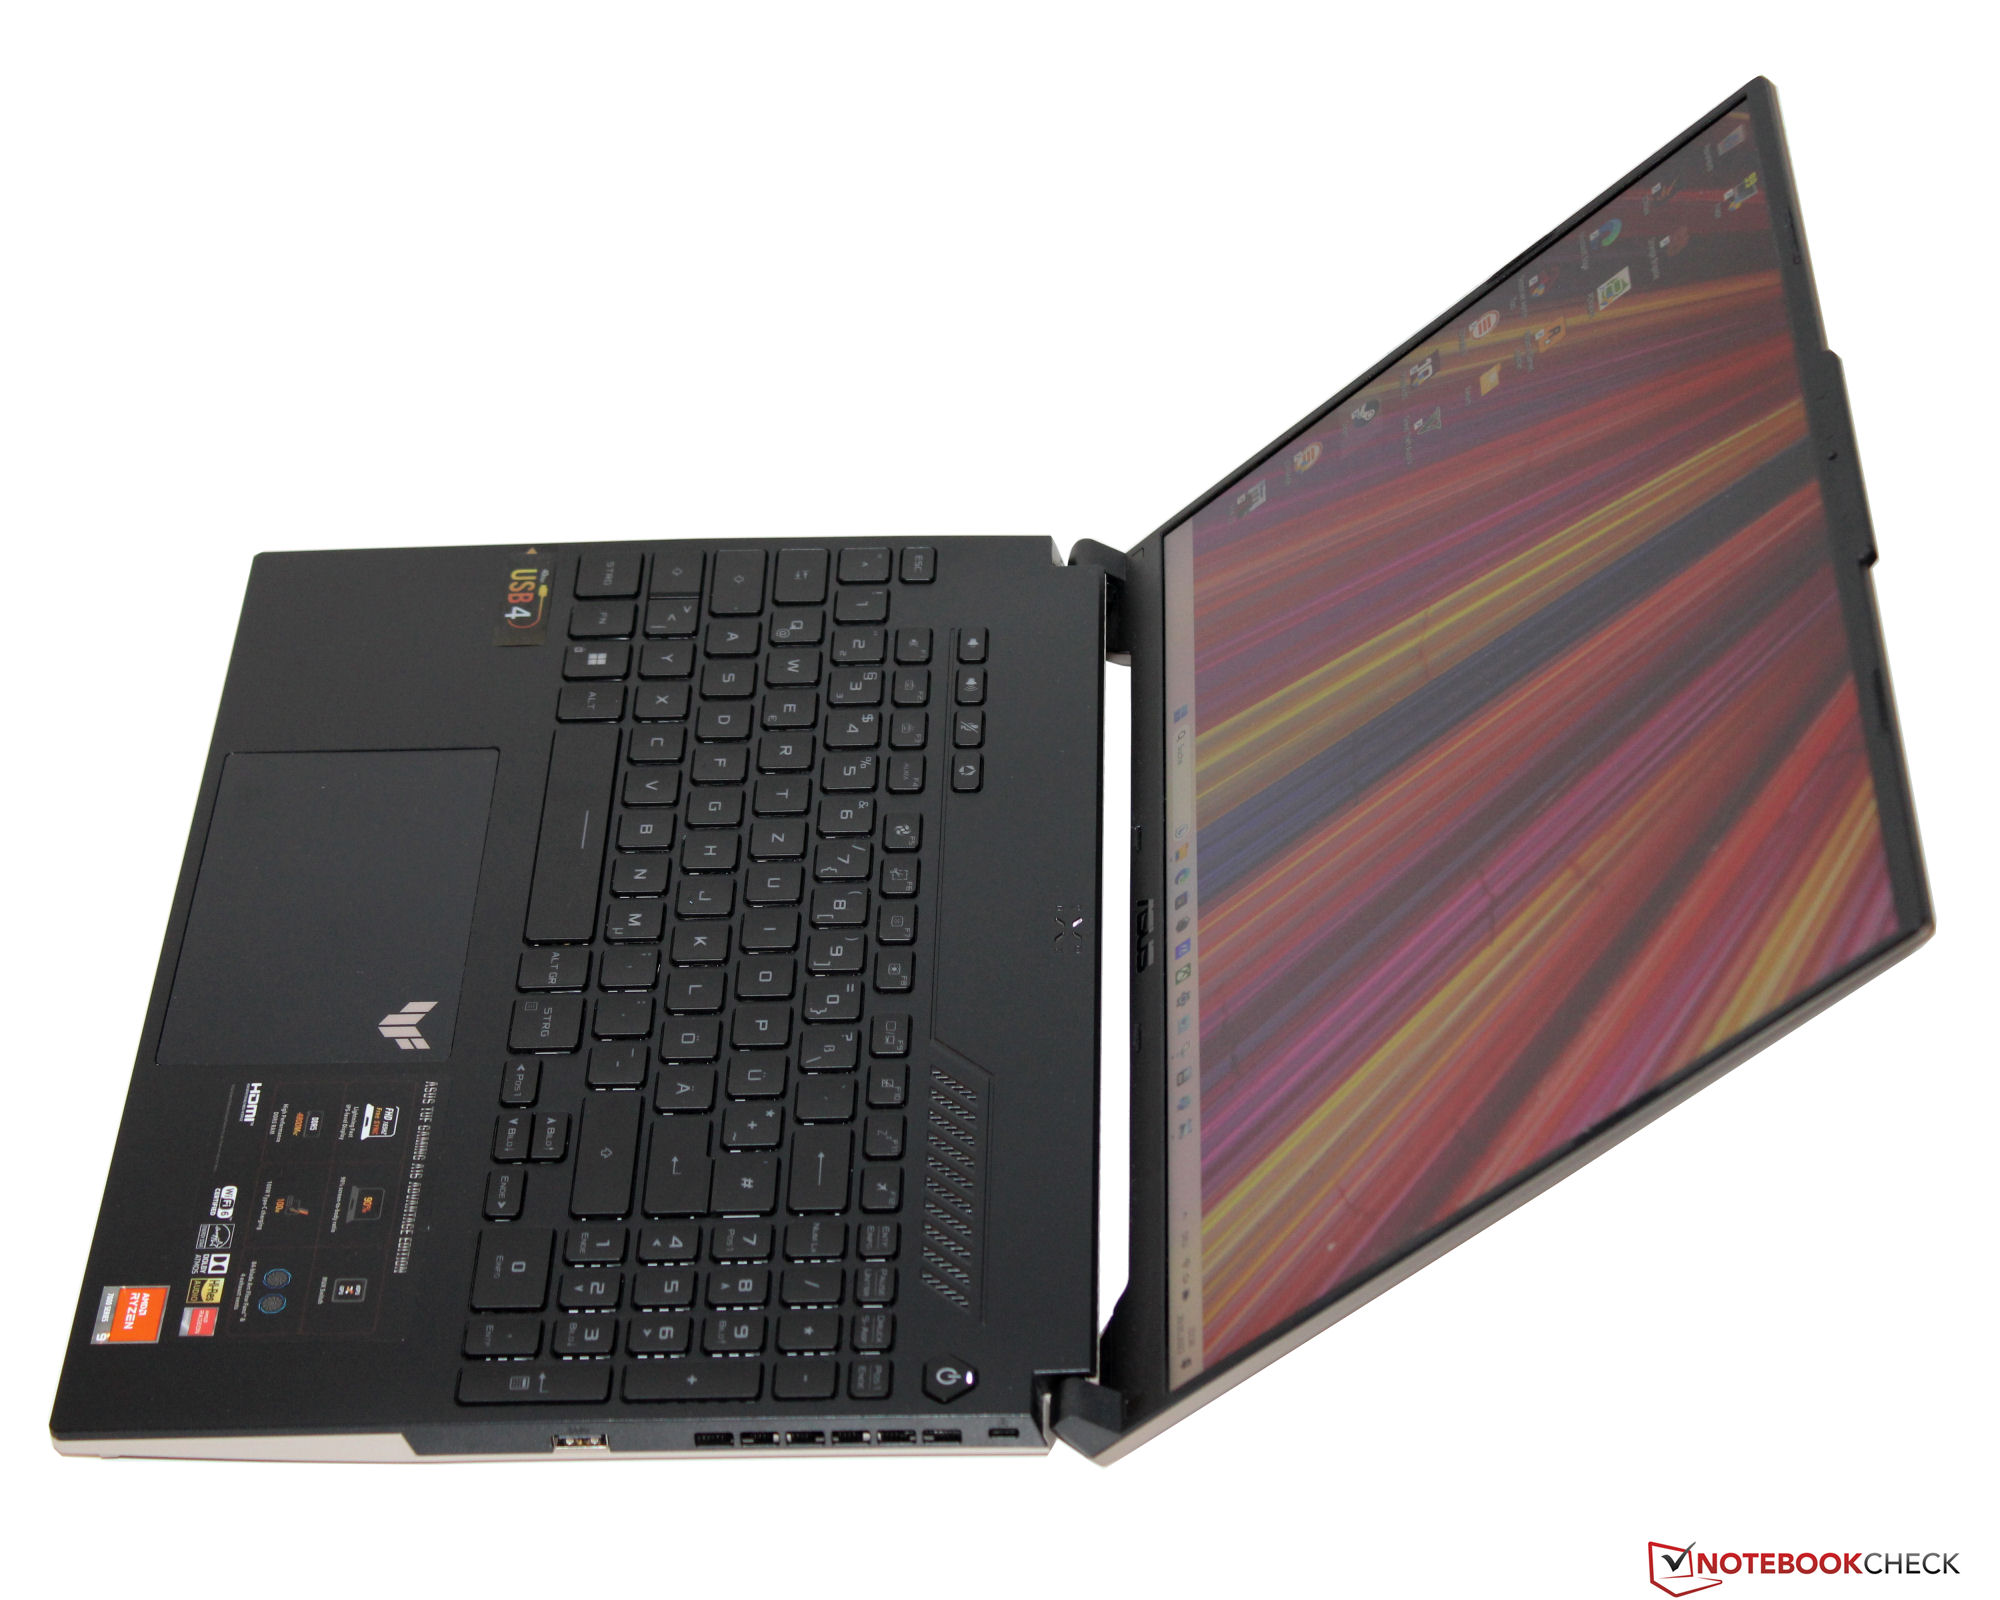
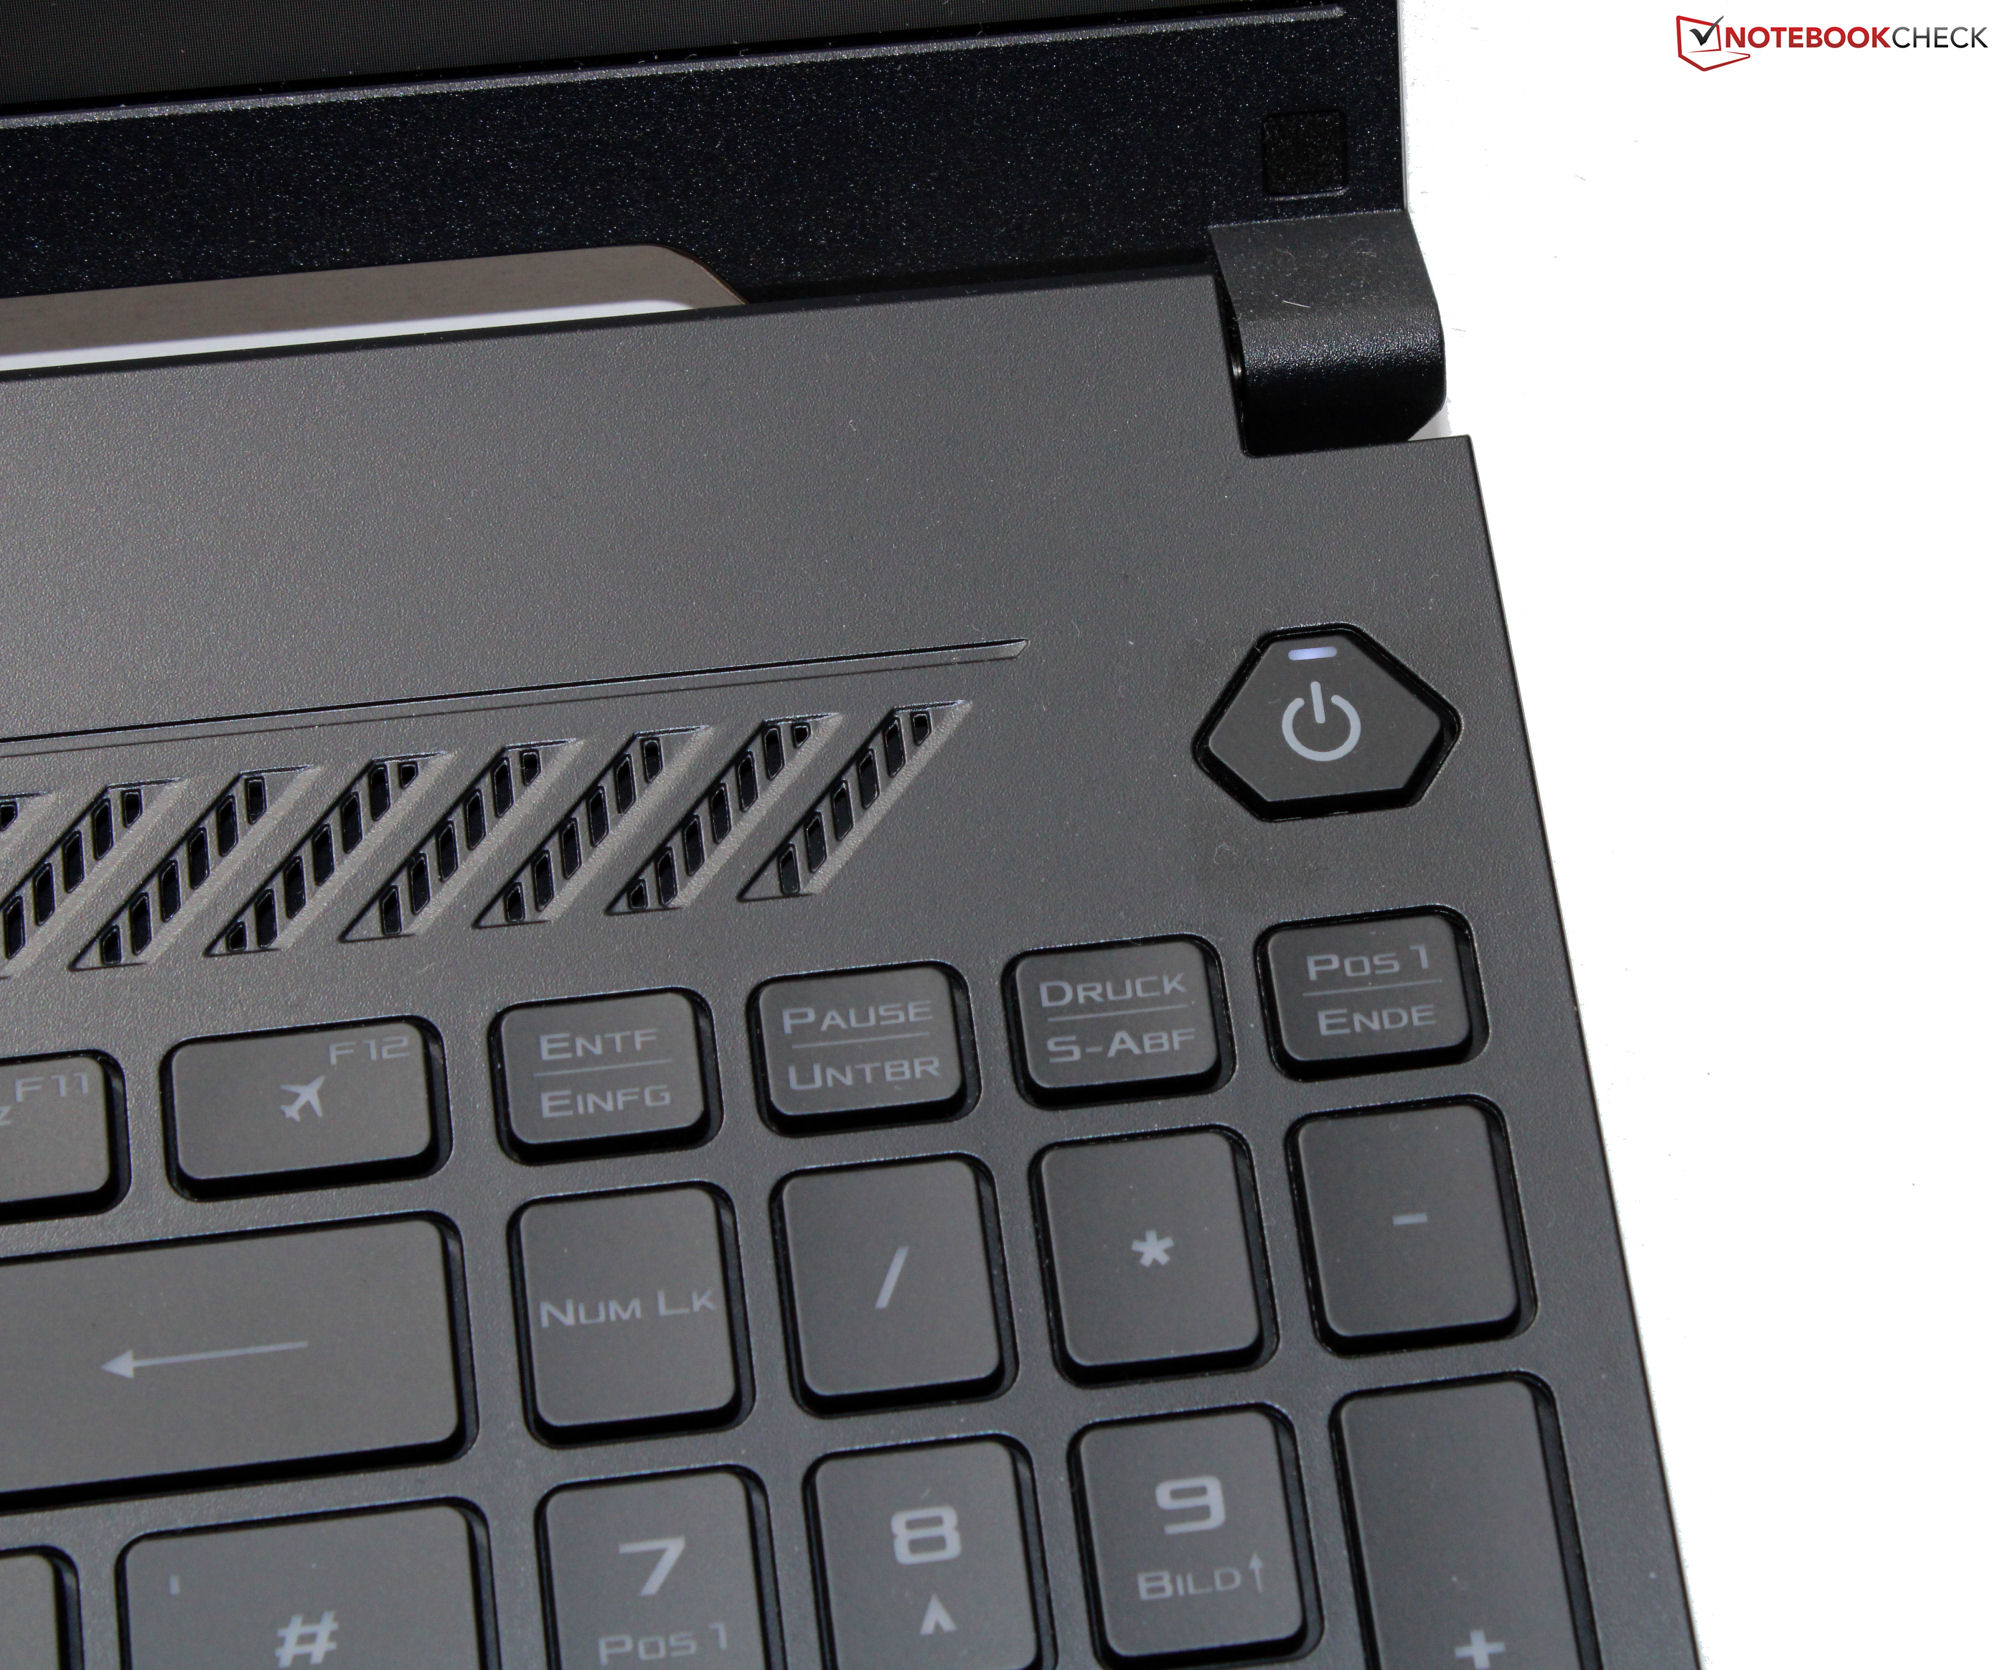
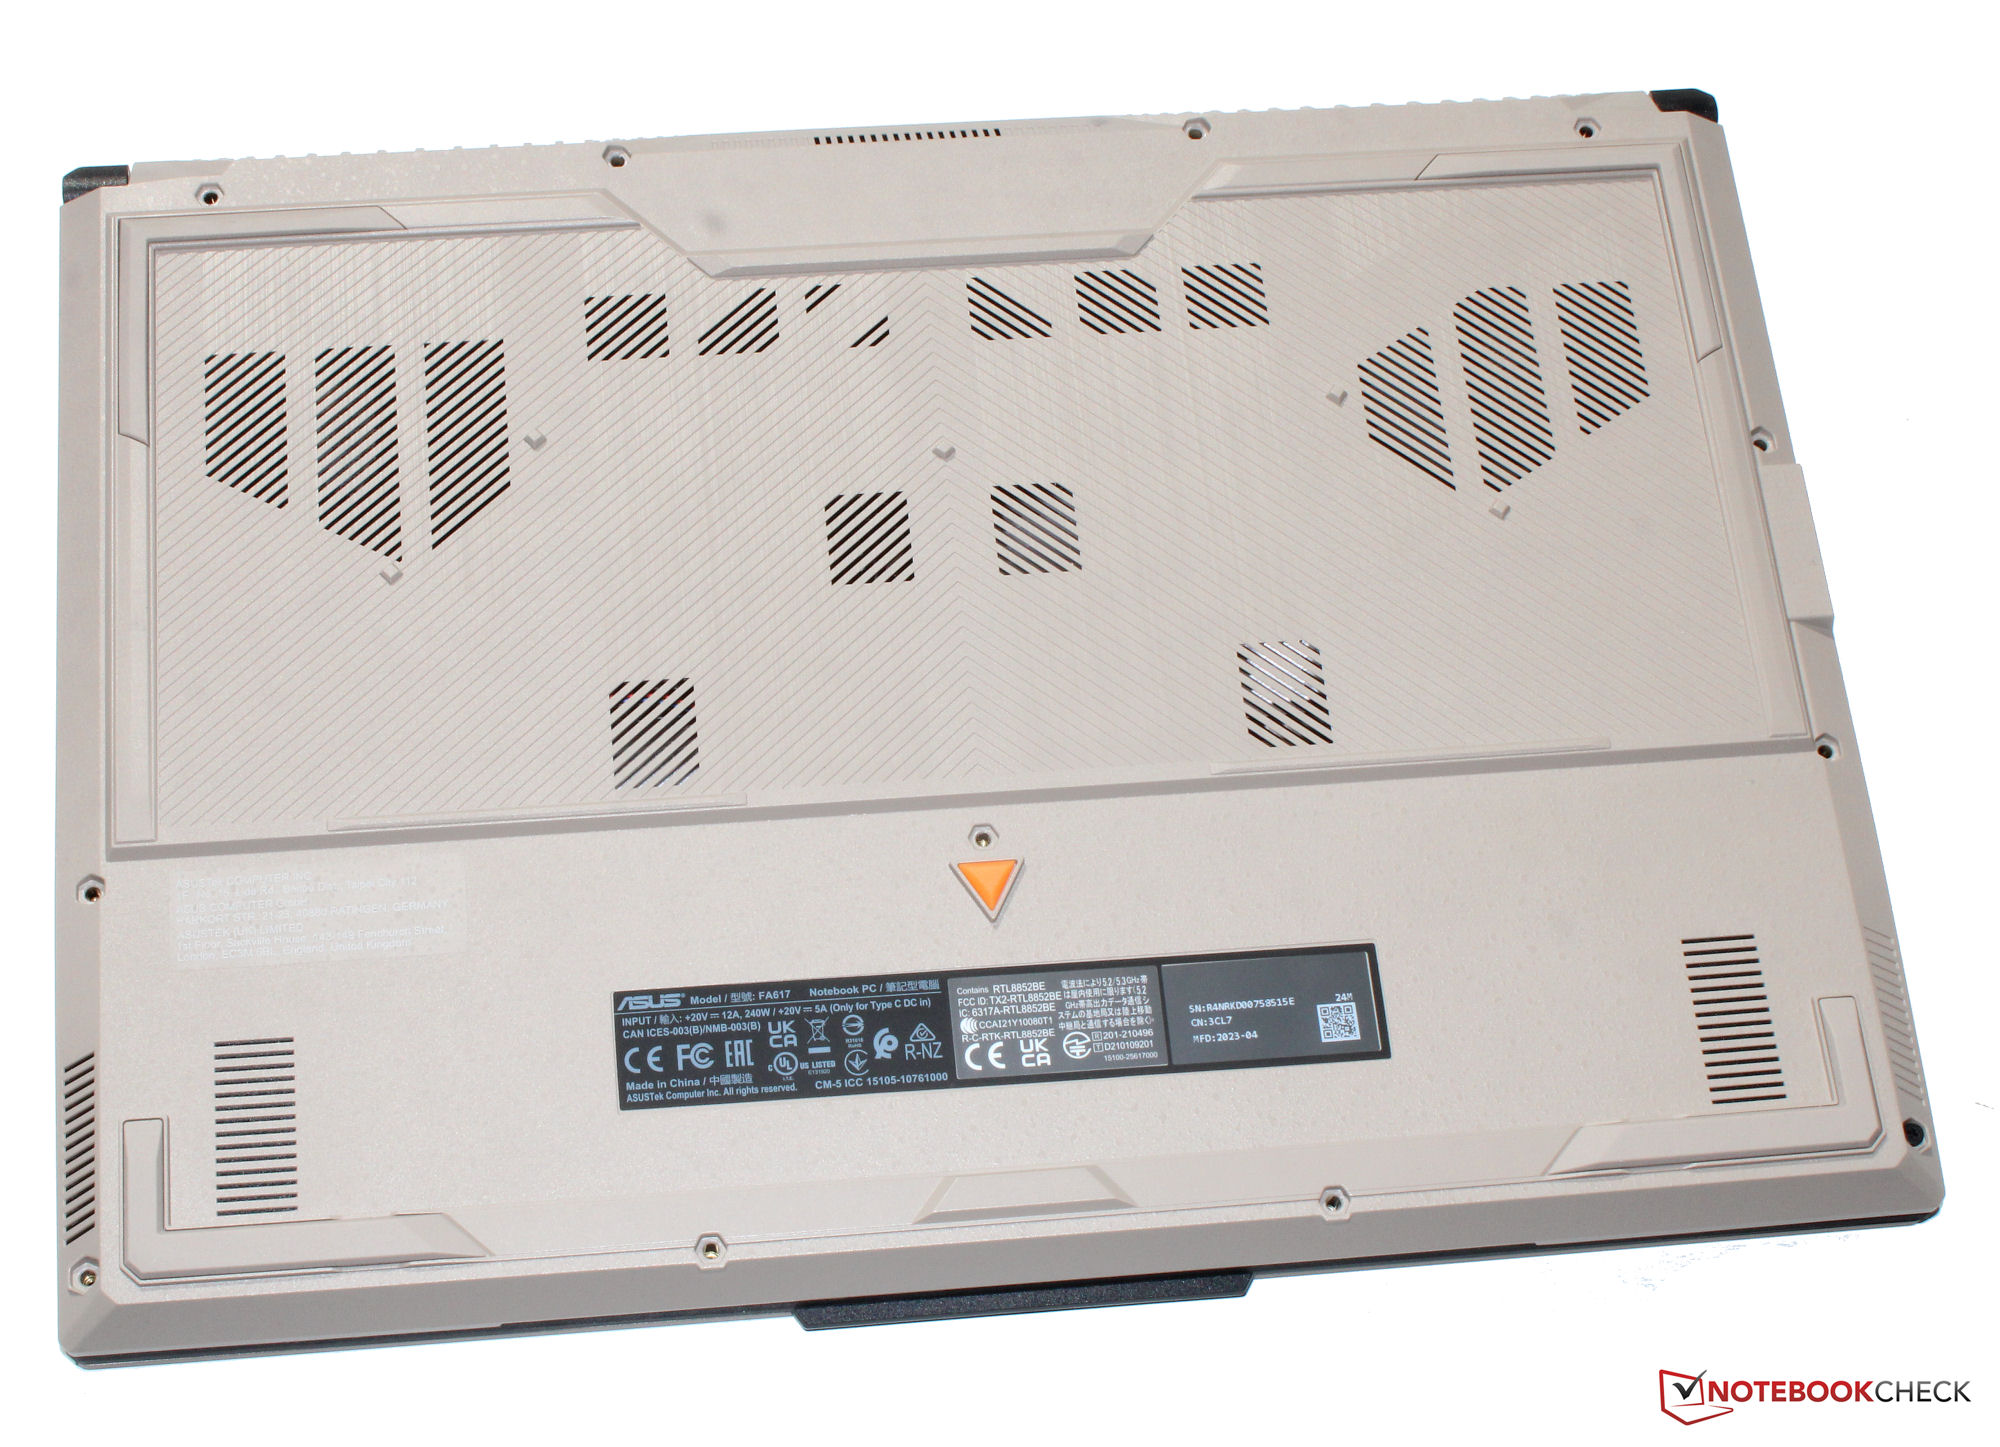
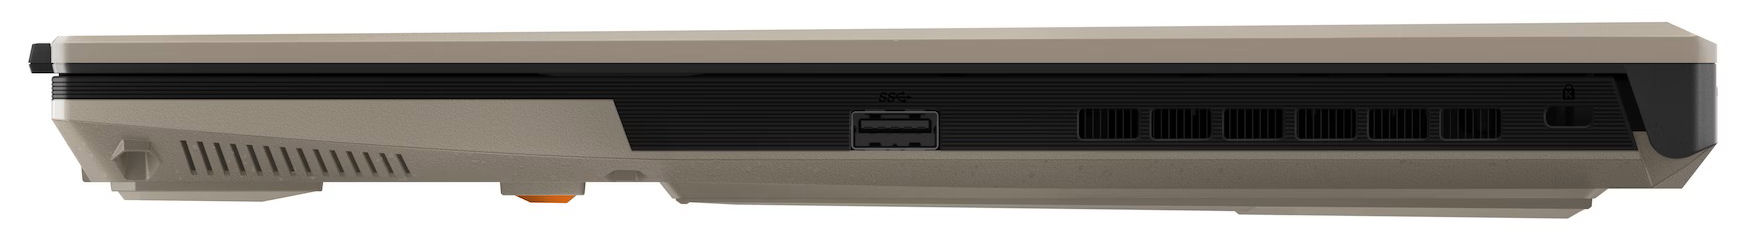
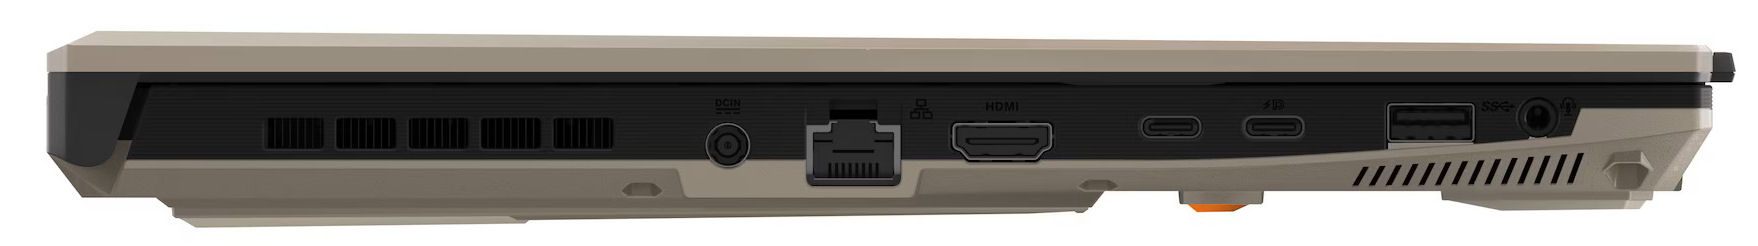
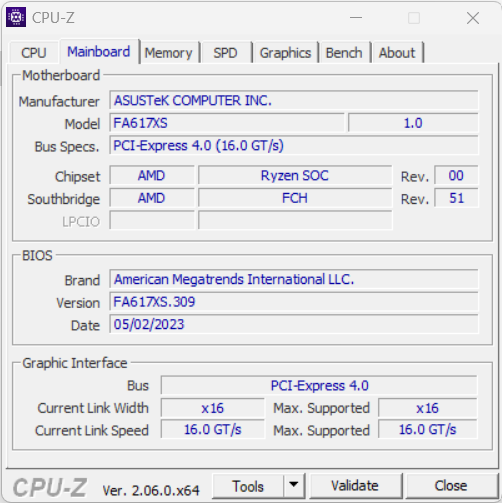
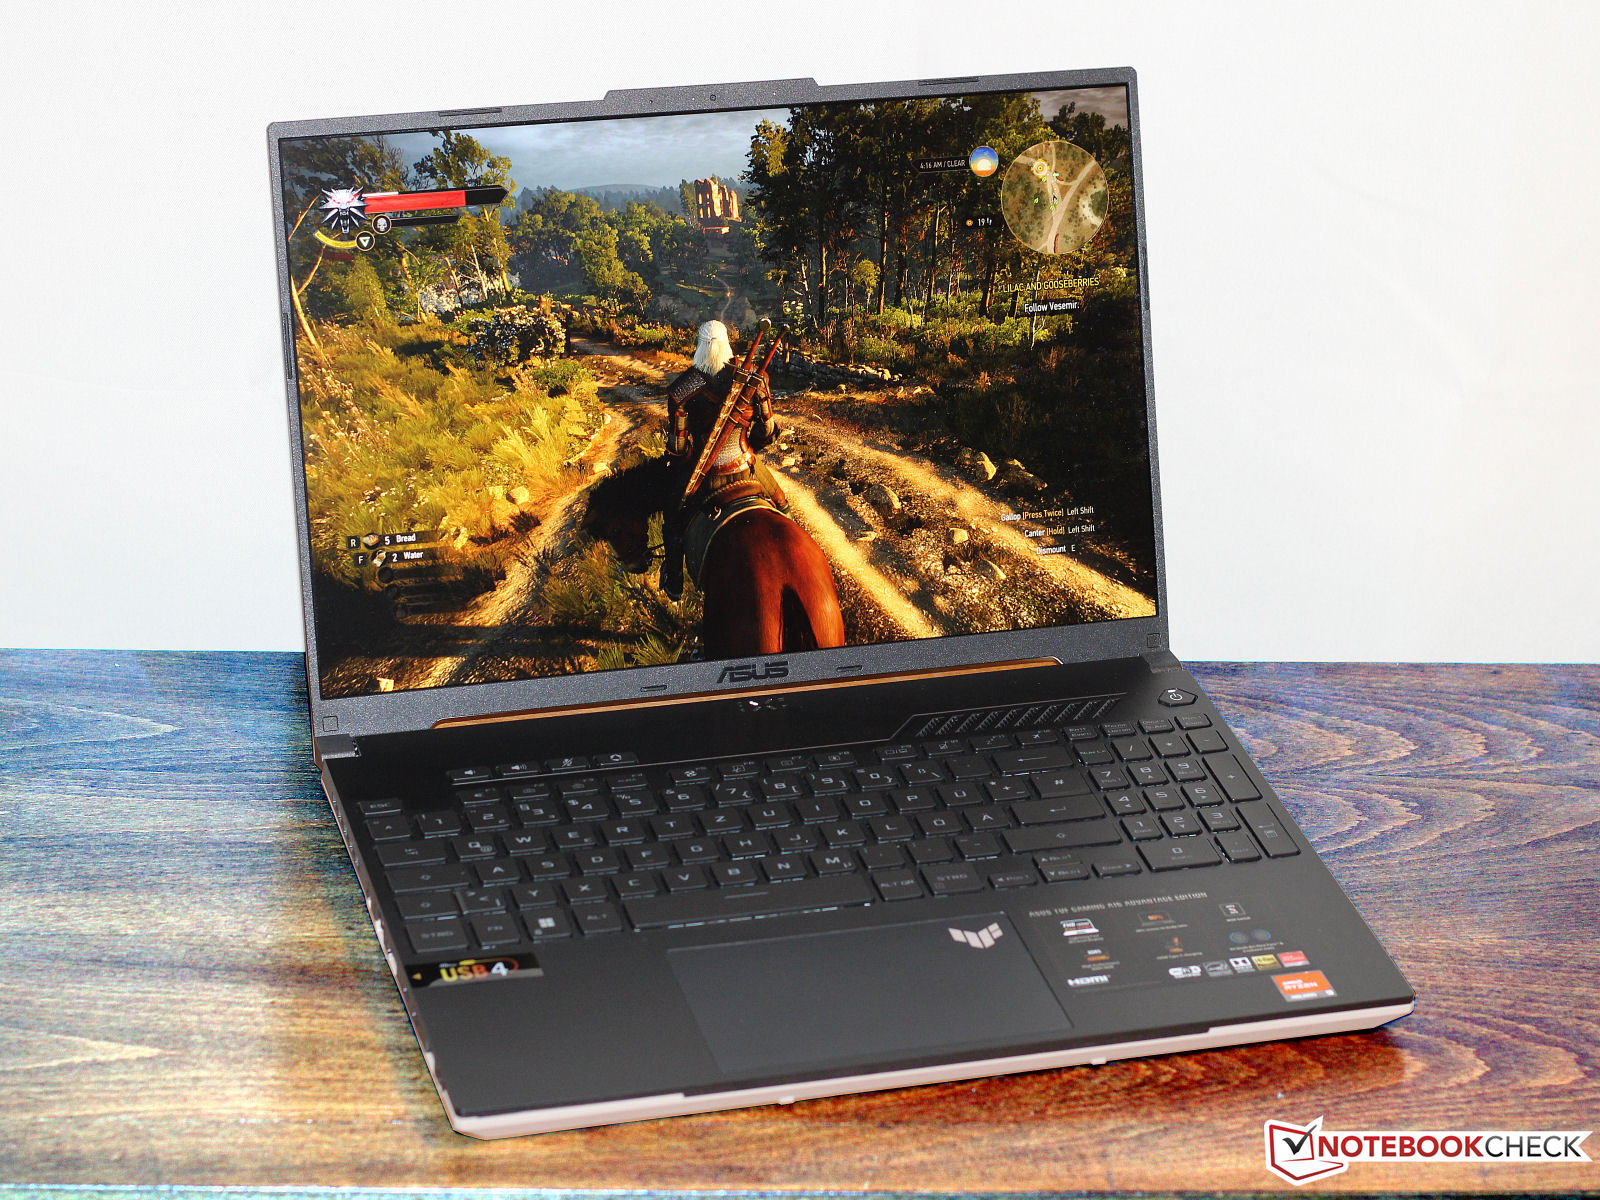
外壳和连接 - 与其姐妹型号相比,变化很小
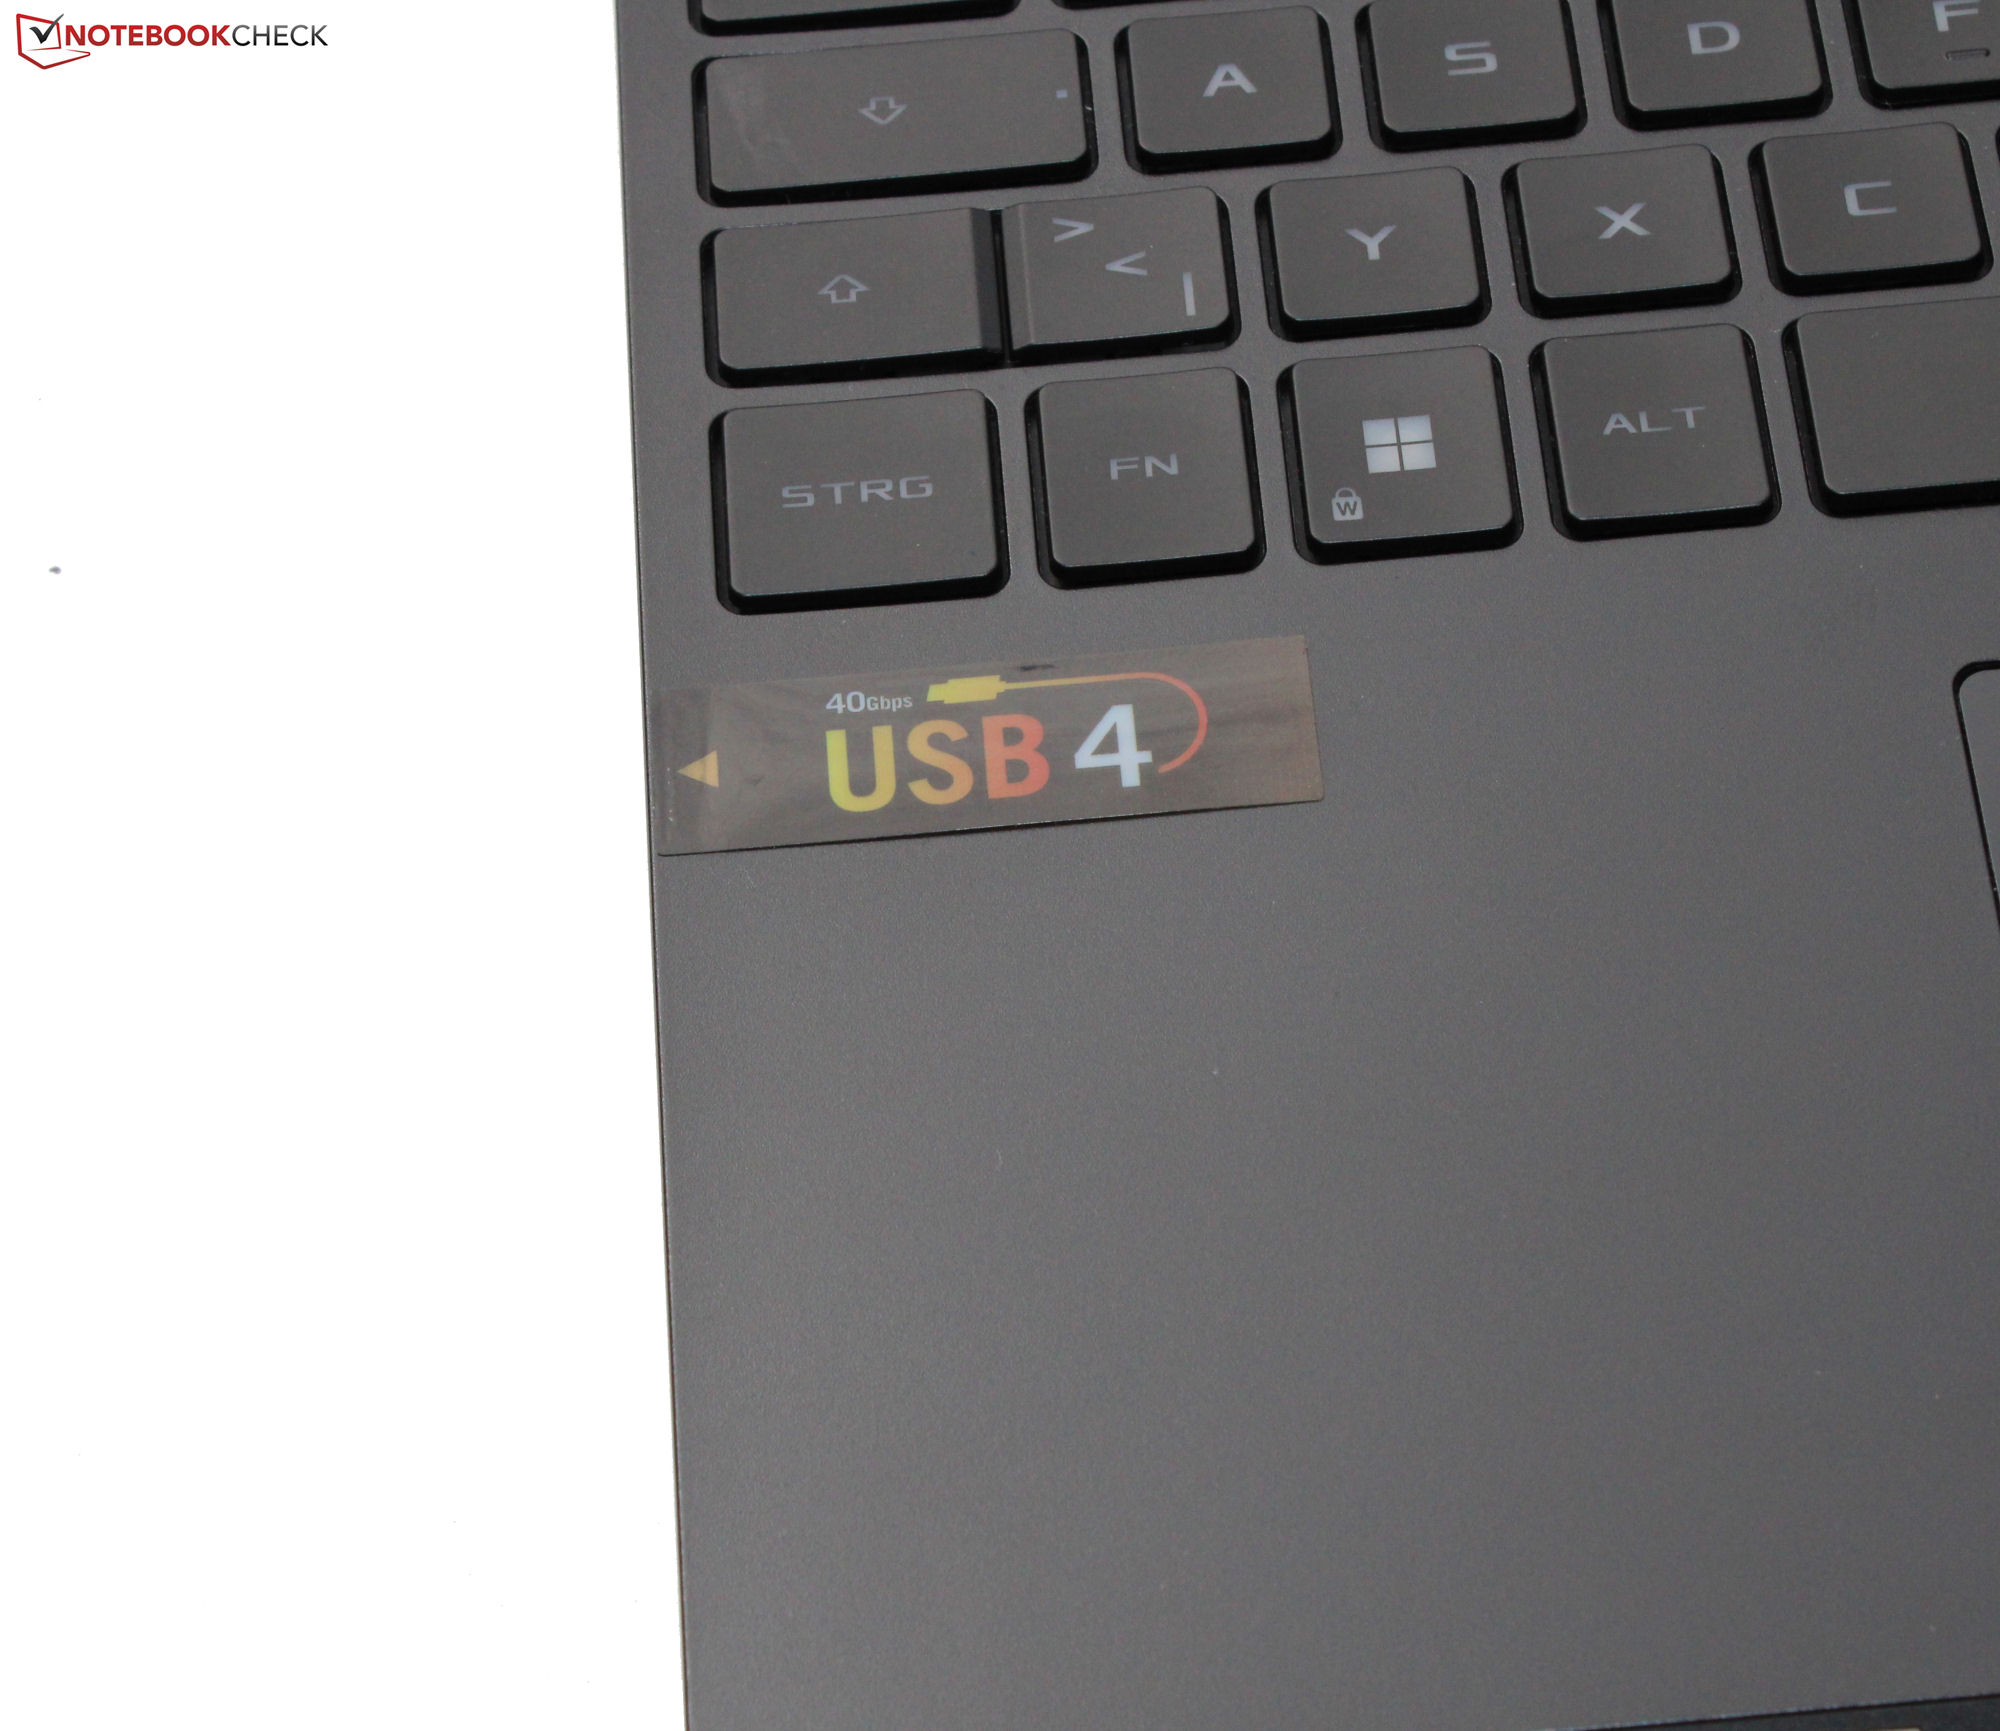
与其姐妹车型相比 姐妹型号的众所周知的黑色外壳,A16有一个双色调的外壳。机盖的背面和底部是沙色("Sandstorm")。连接选项也有一些不同:两个USB-C接口中的一个已经升级为USB-4标准。


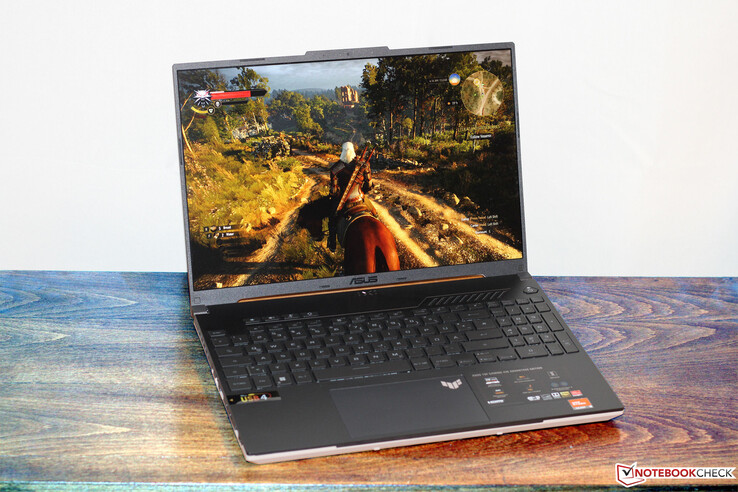
显示屏 - 16:10面板,具有sRGB覆盖率
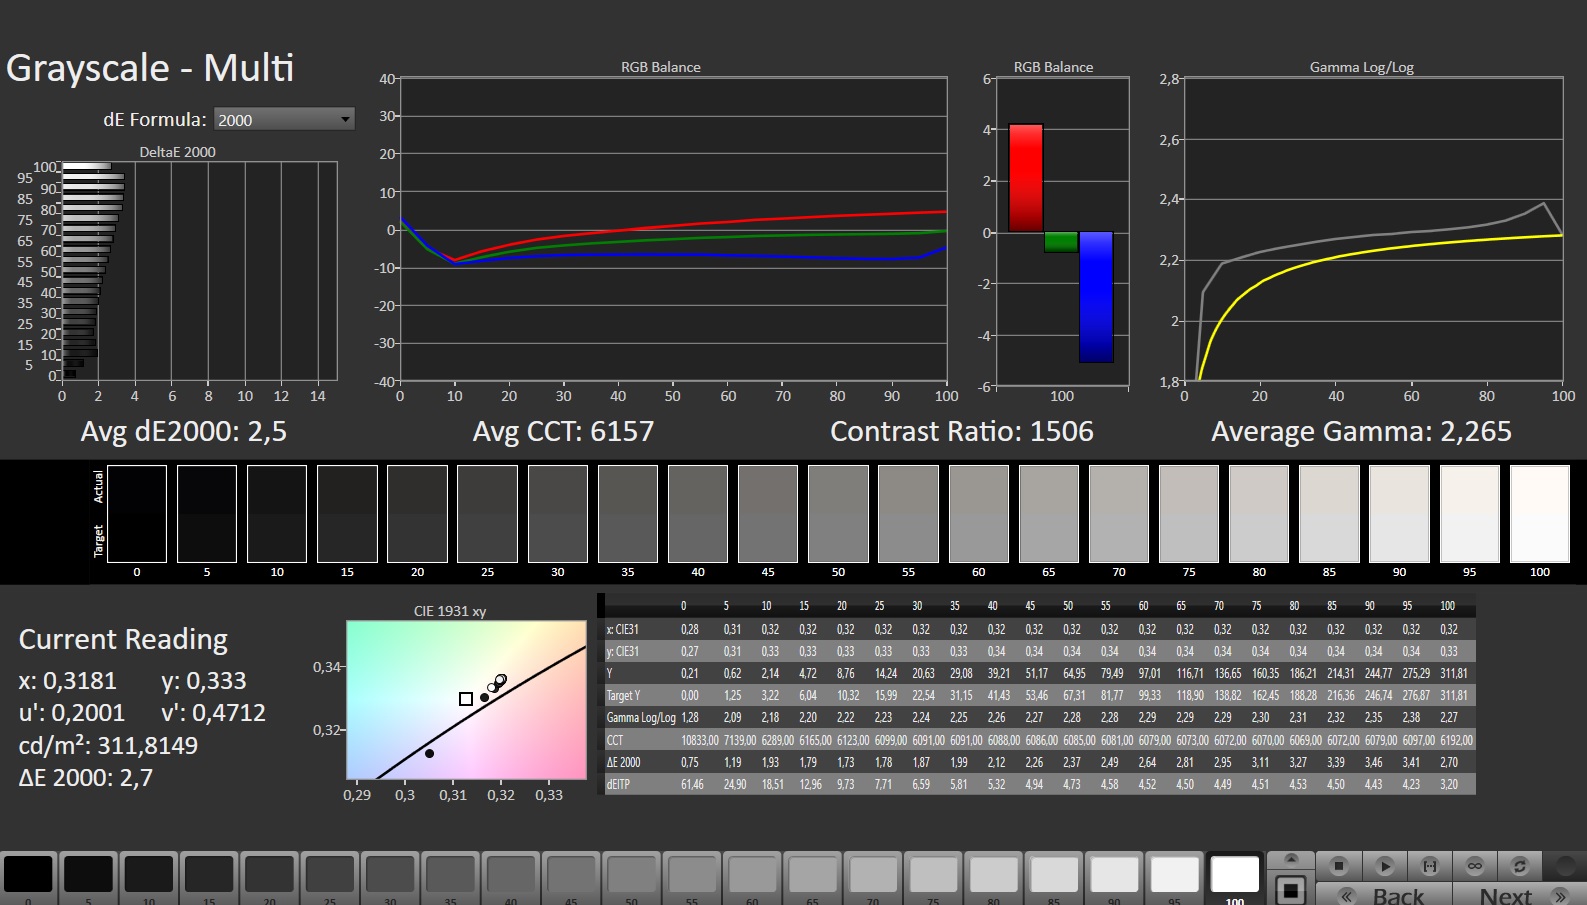
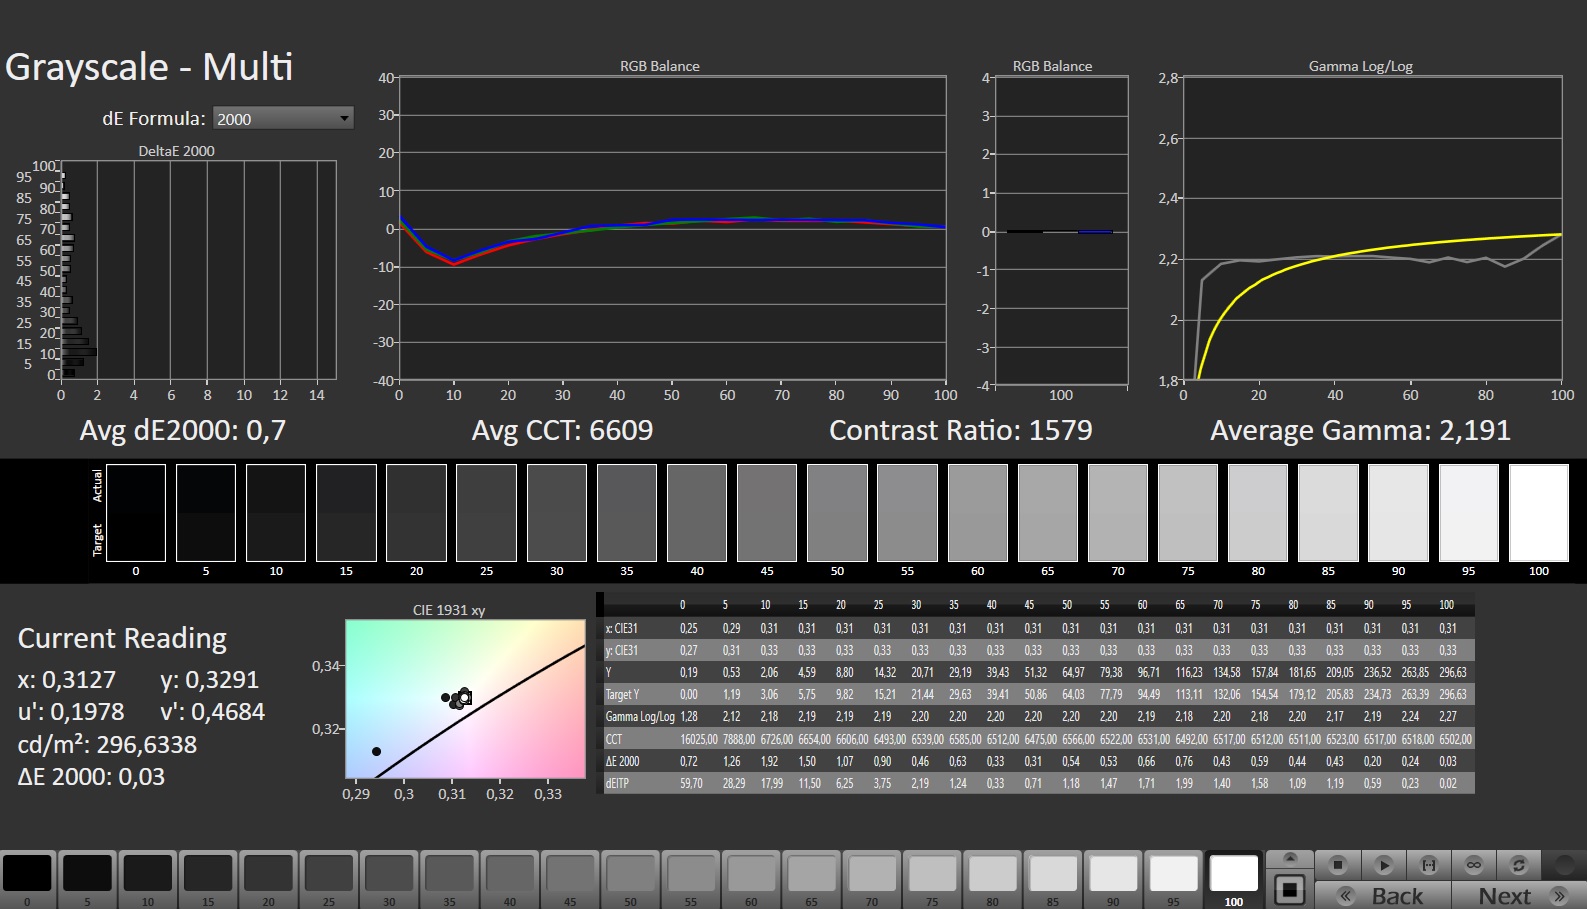
A16配备了与其姊妹型号相同的165-Hz面板,可在其上找到。 姐妹型号.它的哑光16英寸显示屏(1,920 x 1,200像素,IPS)采用16:10格式,由于支持FreeSync,没有PWM闪烁,反应速度快,所以得分很高。虽然它的对比度是可以接受的,但它的亮度可以做得更好一点。
| |||||||||||||||||||||||||
Brightness Distribution: 94 %
Center on Battery: 301 cd/m²
Contrast: 1433:1 (Black: 0.21 cd/m²)
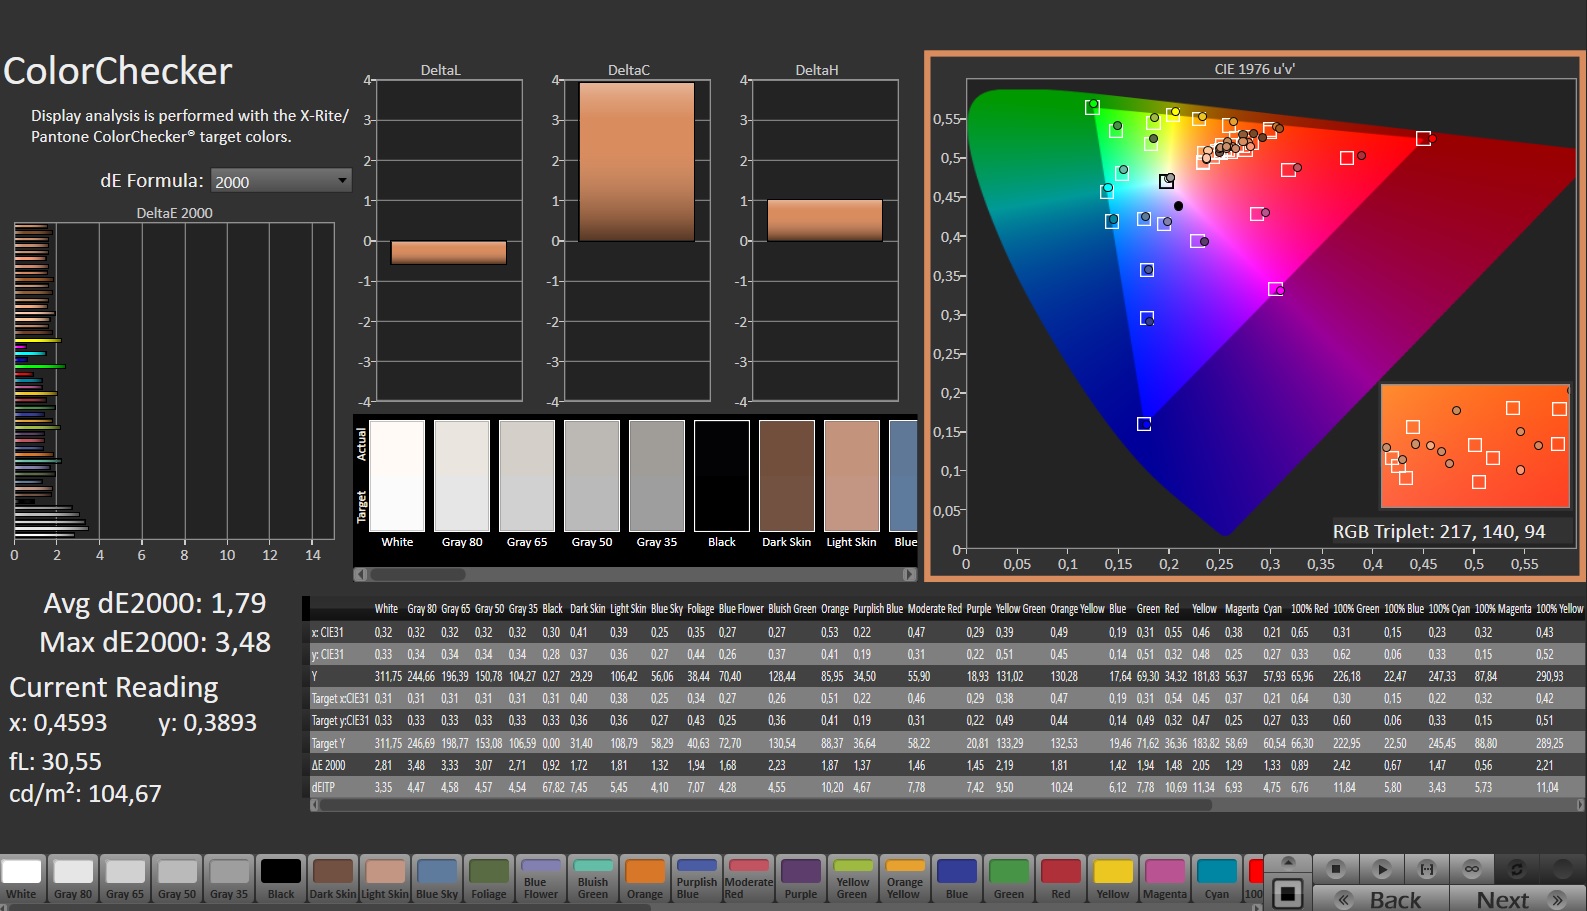
ΔE ColorChecker Calman: 1.79 | ∀{0.5-29.43 Ø4.71}
calibrated: 1.2
ΔE Greyscale Calman: 2.5 | ∀{0.09-98 Ø4.96}
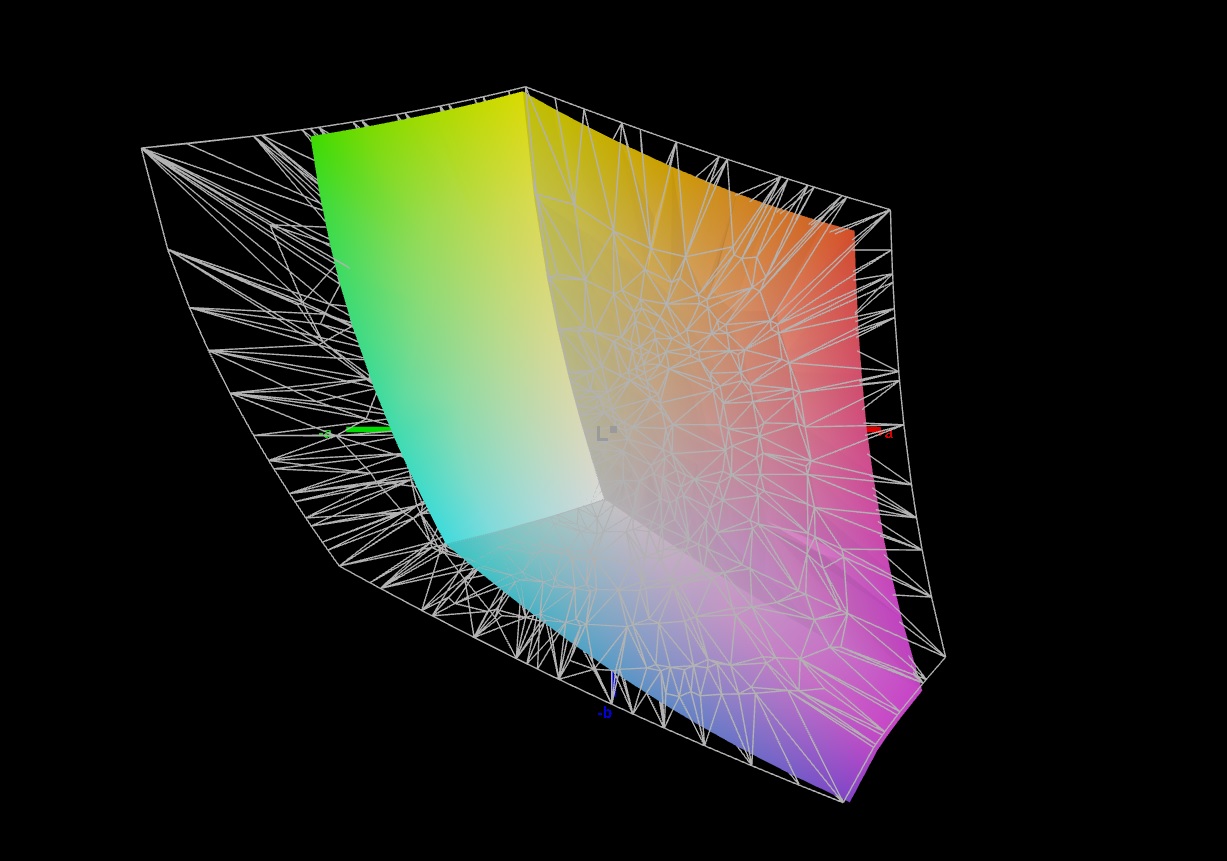
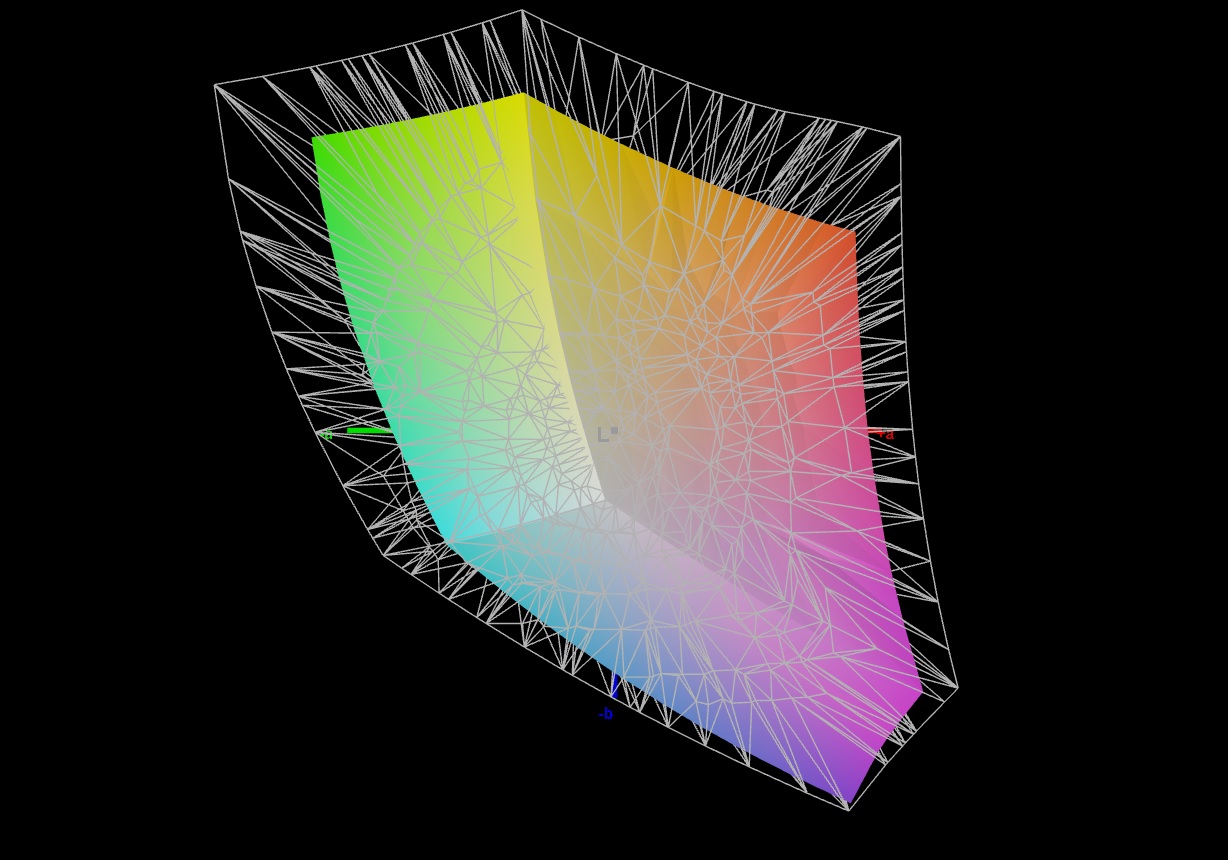
70.7% AdobeRGB 1998 (Argyll 3D)
97.3% sRGB (Argyll 3D)
69.3% Display P3 (Argyll 3D)
Gamma: 2.265
CCT: 6157 K
| Asus TUF Gaming A16 FA617XS BOE NE160WUM-NX2, IPS, 1920x1200, 16" | Lenovo Legion Pro 5 16IRX8 AU Optronics B160QAN03.1, IPS, 2560x1600, 16" | MSI Katana 15 B12VEK AUOAF90 (B156HAN08.4), IPS, 1920x1080, 15.6" | Medion Erazer Defender P40 BOE CQ NE173QHM-NZ3, IPS, 2560x1440, 17.3" | Gigabyte G5 KE Chi Mei N156HRA-EA1, IPS, 1920x1080, 15.6" | Asus TUF Gaming A16 FA617 NE160WUM-NX2 (BOE0B33), IPS-Level, 1920x1200, 16" | |
|---|---|---|---|---|---|---|
| Display | 3% | -44% | -0% | -39% | 0% | |
| Display P3 Coverage (%) | 69.3 | 71.2 3% | 38.1 -45% | 68.3 -1% | 40.7 -41% | 69.4 0% |
| sRGB Coverage (%) | 97.3 | 98.8 2% | 56.8 -42% | 98.1 1% | 61 -37% | 97.8 1% |
| AdobeRGB 1998 Coverage (%) | 70.7 | 73.3 4% | 39.3 -44% | 69.8 -1% | 42.1 -40% | 70.9 0% |
| Response Times | 2% | -159% | 10% | -79% | -5% | |
| Response Time Grey 50% / Grey 80% * (ms) | 15.6 ? | 14.5 ? 7% | 38.8 ? -149% | 14.6 ? 6% | 26.64 ? -71% | 17 ? -9% |
| Response Time Black / White * (ms) | 10 ? | 10.4 ? -4% | 26.8 ? -168% | 8.7 ? 13% | 18.65 ? -86% | 10.1 ? -1% |
| PWM Frequency (Hz) | ||||||
| Screen | 5% | -115% | 7% | -113% | 4% | |
| Brightness middle (cd/m²) | 301 | 405.7 35% | 261 -13% | 364 21% | 269 -11% | 308 2% |
| Brightness (cd/m²) | 294 | 368 25% | 258 -12% | 343 17% | 248 -16% | 293 0% |
| Brightness Distribution (%) | 94 | 87 -7% | 92 -2% | 86 -9% | 85 -10% | 90 -4% |
| Black Level * (cd/m²) | 0.21 | 0.38 -81% | 0.19 10% | 0.28 -33% | 0.5 -138% | 0.23 -10% |
| Contrast (:1) | 1433 | 1068 -25% | 1374 -4% | 1300 -9% | 538 -62% | 1339 -7% |
| Colorchecker dE 2000 * | 1.79 | 1.65 8% | 5.57 -211% | 1.67 7% | 4.54 -154% | 1.47 18% |
| Colorchecker dE 2000 max. * | 3.48 | 4.2 -21% | 20.6 -492% | 2.78 20% | 17.28 -397% | 2.98 14% |
| Colorchecker dE 2000 calibrated * | 1.2 | 0.53 56% | 4.63 -286% | 1.14 5% | 3.34 -178% | 1.02 15% |
| Greyscale dE 2000 * | 2.5 | 1.2 52% | 3.19 -28% | 1.4 44% | 3.8 -52% | 2.2 12% |
| Gamma | 2.265 97% | 2.3 96% | 2.45 90% | 2.091 105% | 2.17 101% | 2.228 99% |
| CCT | 6157 106% | 6453 101% | 6146 106% | 6568 99% | 7408 88% | 6228 104% |
| Total Average (Program / Settings) | 3% /
4% | -106% /
-106% | 6% /
6% | -77% /
-92% | -0% /
2% |
* ... smaller is better
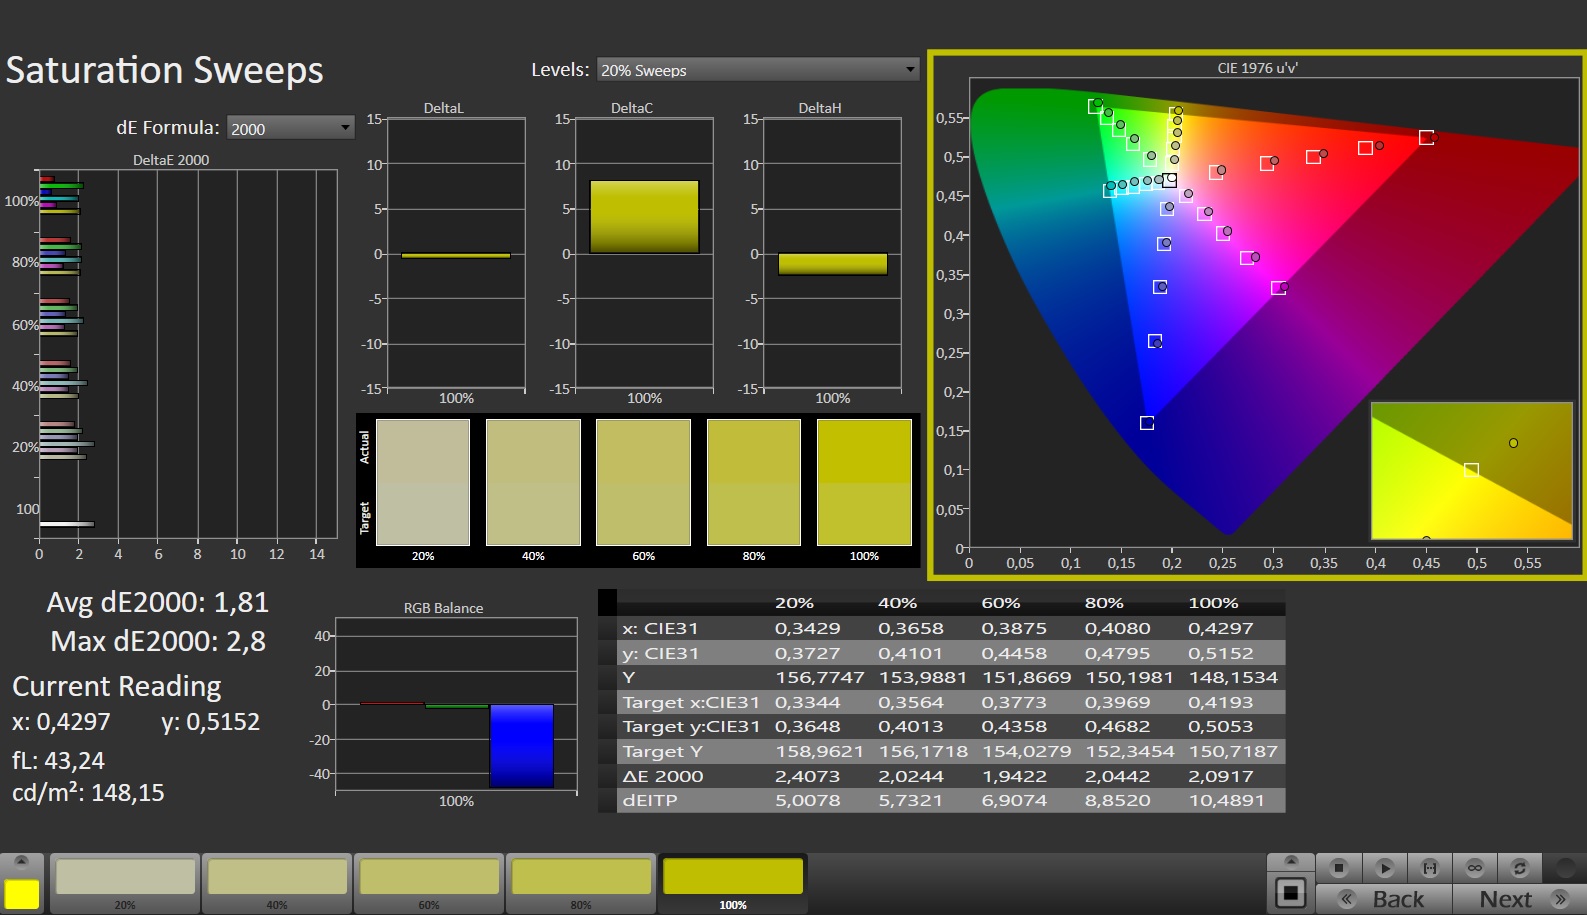
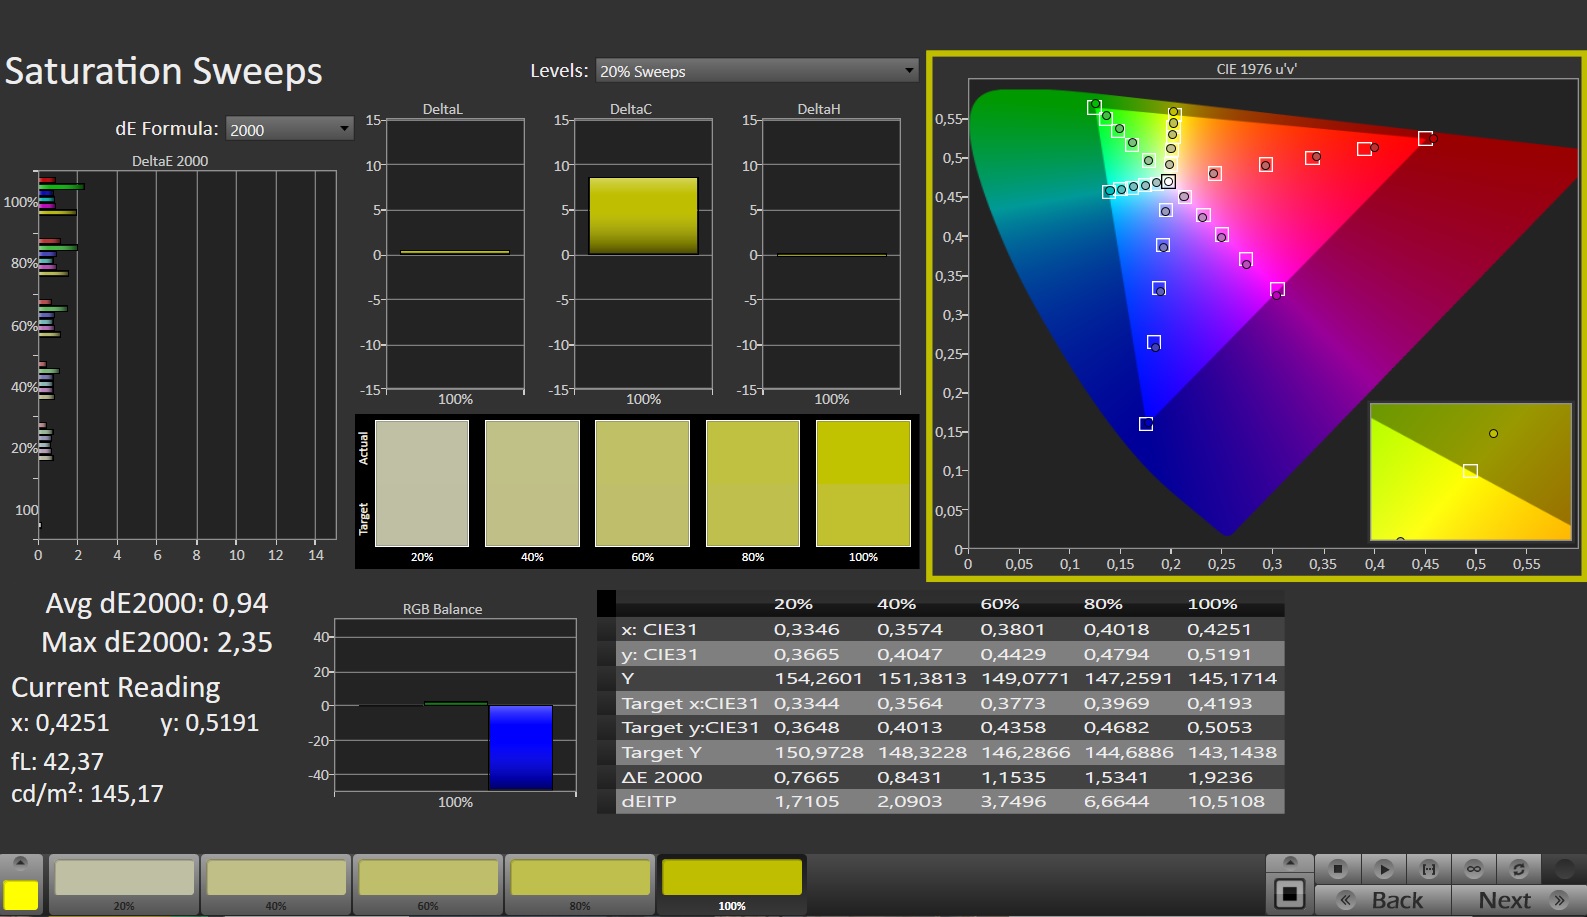
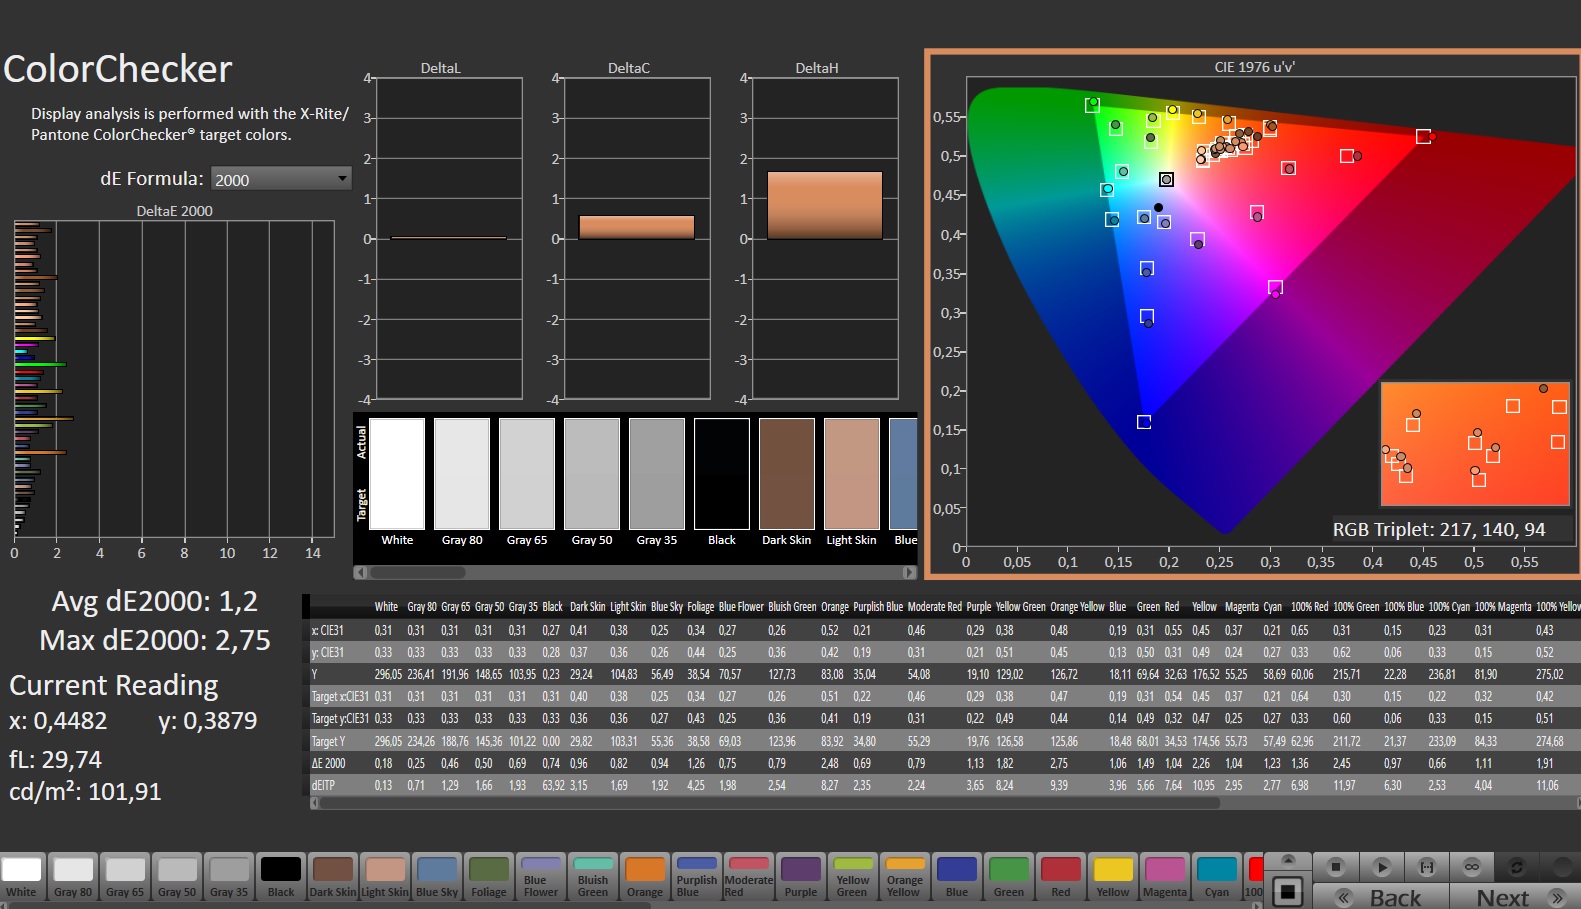
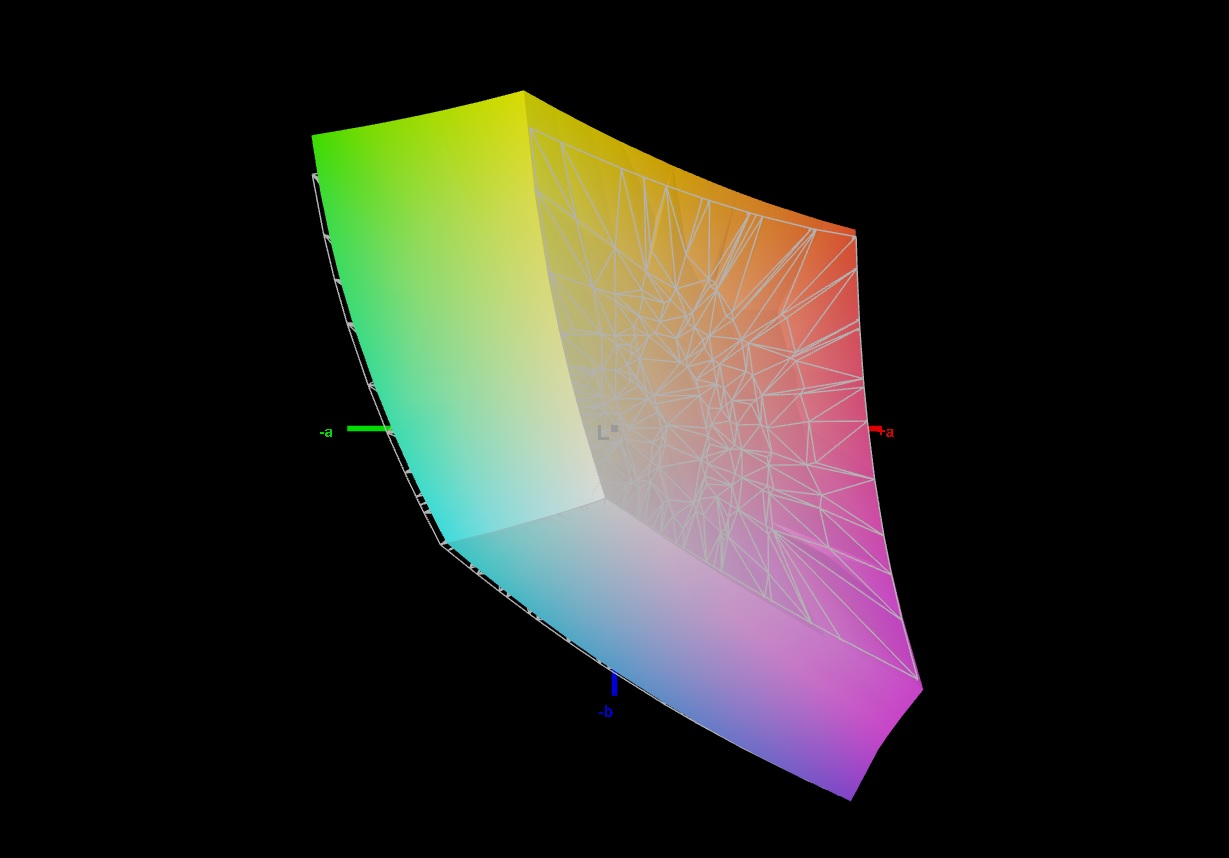
前工程,屏幕具有良好的色彩描绘:1.8左右的偏差是可以接受的(DeltaE<3)。校准将这一比率降低到1.2,并导致更平衡的灰色调。该面板可以描绘整个sRGB色彩空间,但不能描绘AdobeRGB和DCI P3空间。这与它的大多数竞争对手的显示器相似。
Display Response Times
| ↔ Response Time Black to White | ||
|---|---|---|
| 10 ms ... rise ↗ and fall ↘ combined | ↗ 5.7 ms rise | 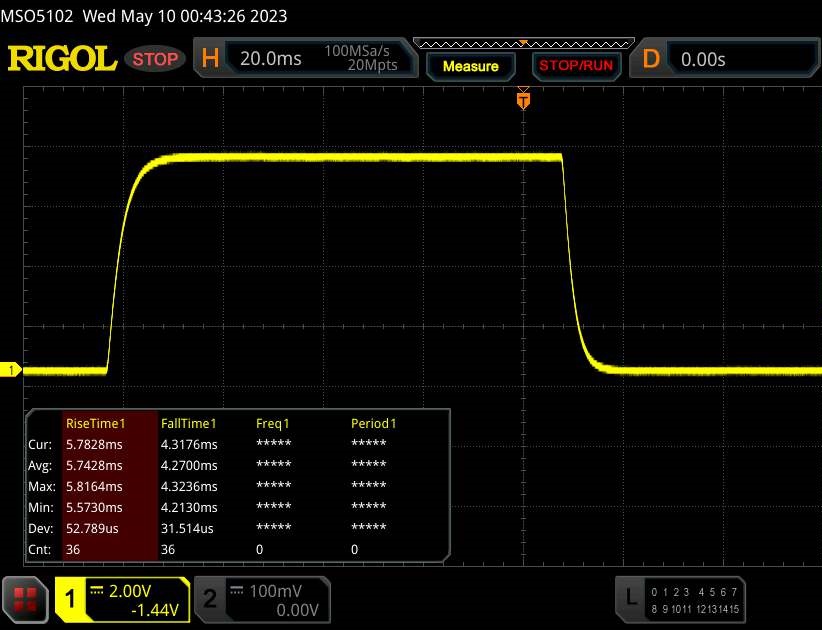 |
| ↘ 4.3 ms fall | ||
| The screen shows good response rates in our tests, but may be too slow for competitive gamers. In comparison, all tested devices range from 0.1 (minimum) to 240 (maximum) ms. » 27 % of all devices are better. This means that the measured response time is better than the average of all tested devices (19.8 ms). | ||
| ↔ Response Time 50% Grey to 80% Grey | ||
| 15.6 ms ... rise ↗ and fall ↘ combined | ↗ 7.3 ms rise | 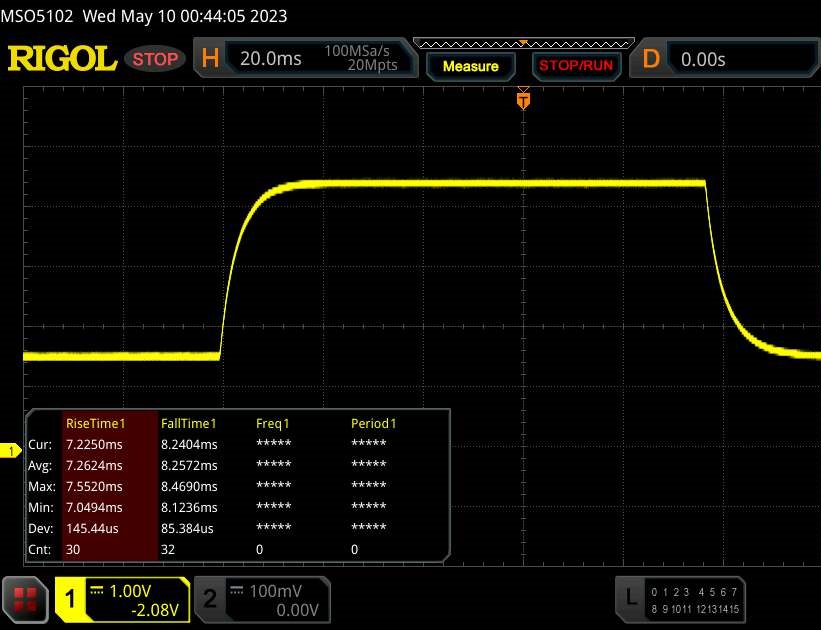 |
| ↘ 8.3 ms fall | ||
| The screen shows good response rates in our tests, but may be too slow for competitive gamers. In comparison, all tested devices range from 0.165 (minimum) to 636 (maximum) ms. » 30 % of all devices are better. This means that the measured response time is better than the average of all tested devices (31 ms). | ||
Screen Flickering / PWM (Pulse-Width Modulation)
| Screen flickering / PWM not detected | 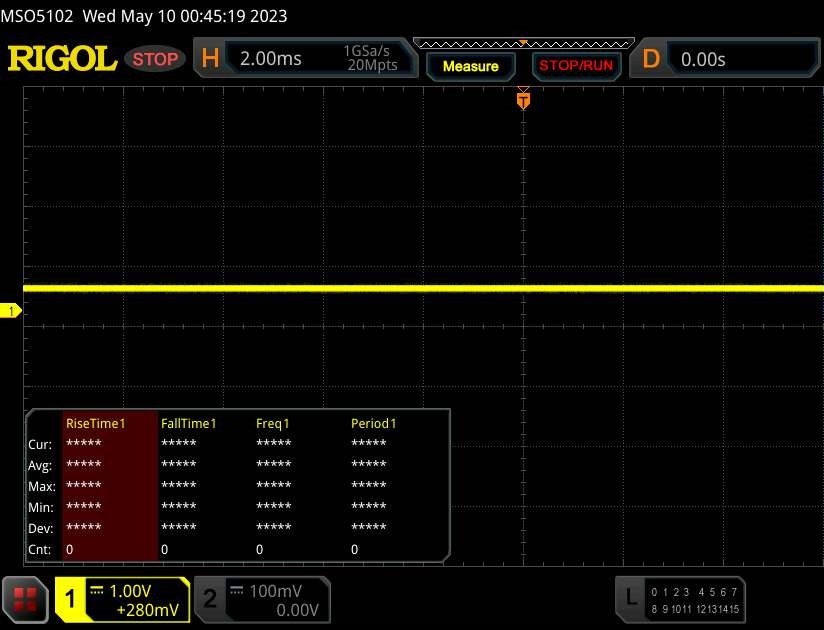 | ||
In comparison: 52 % of all tested devices do not use PWM to dim the display. If PWM was detected, an average of 7757 (minimum: 5 - maximum: 343500) Hz was measured. | |||
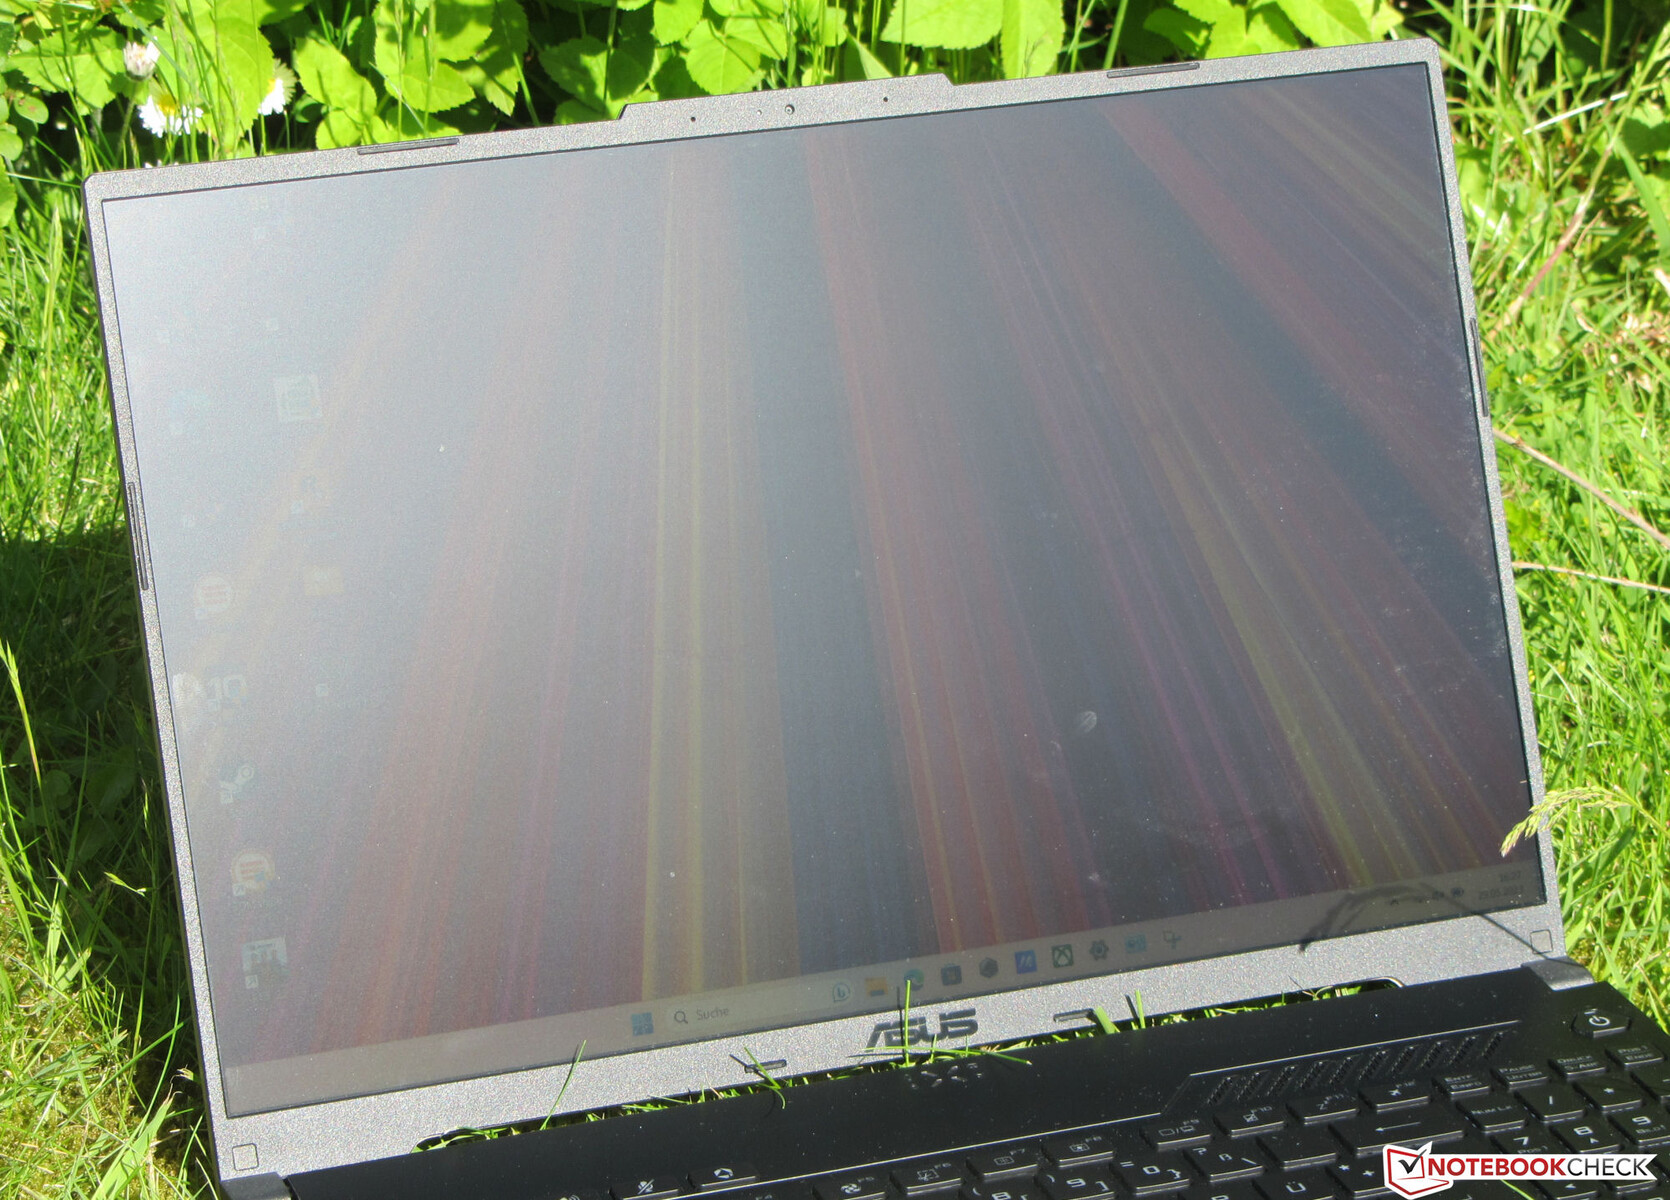
笔记本电脑的可视角度稳定的IPS面板从任何角度都能保持清晰。只要阳光不是太亮,就可以在室外观看面板。

性能--华硕利用了AMD的动力
华硕TUF Gaming A16优势版FA617XS是一款中端游戏笔记本电脑。AMD硬件提供了必要的计算能力。目前的模型可以以1700美元左右的价格购买。
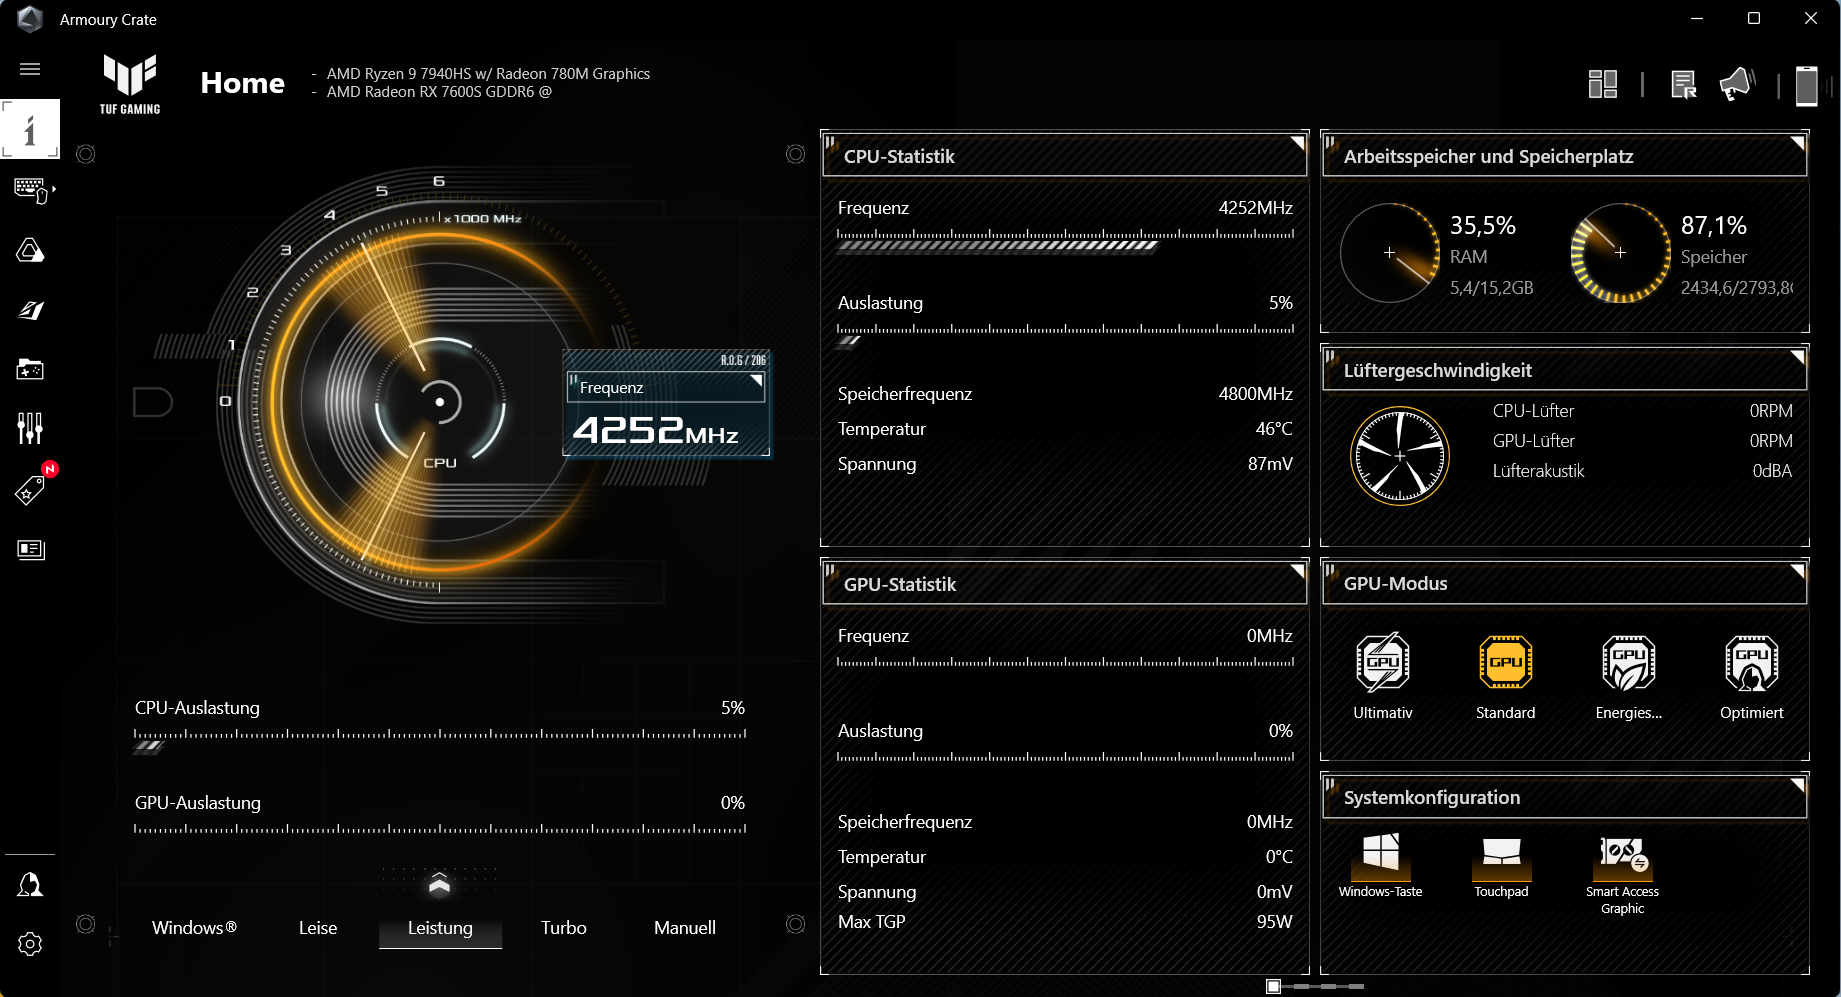
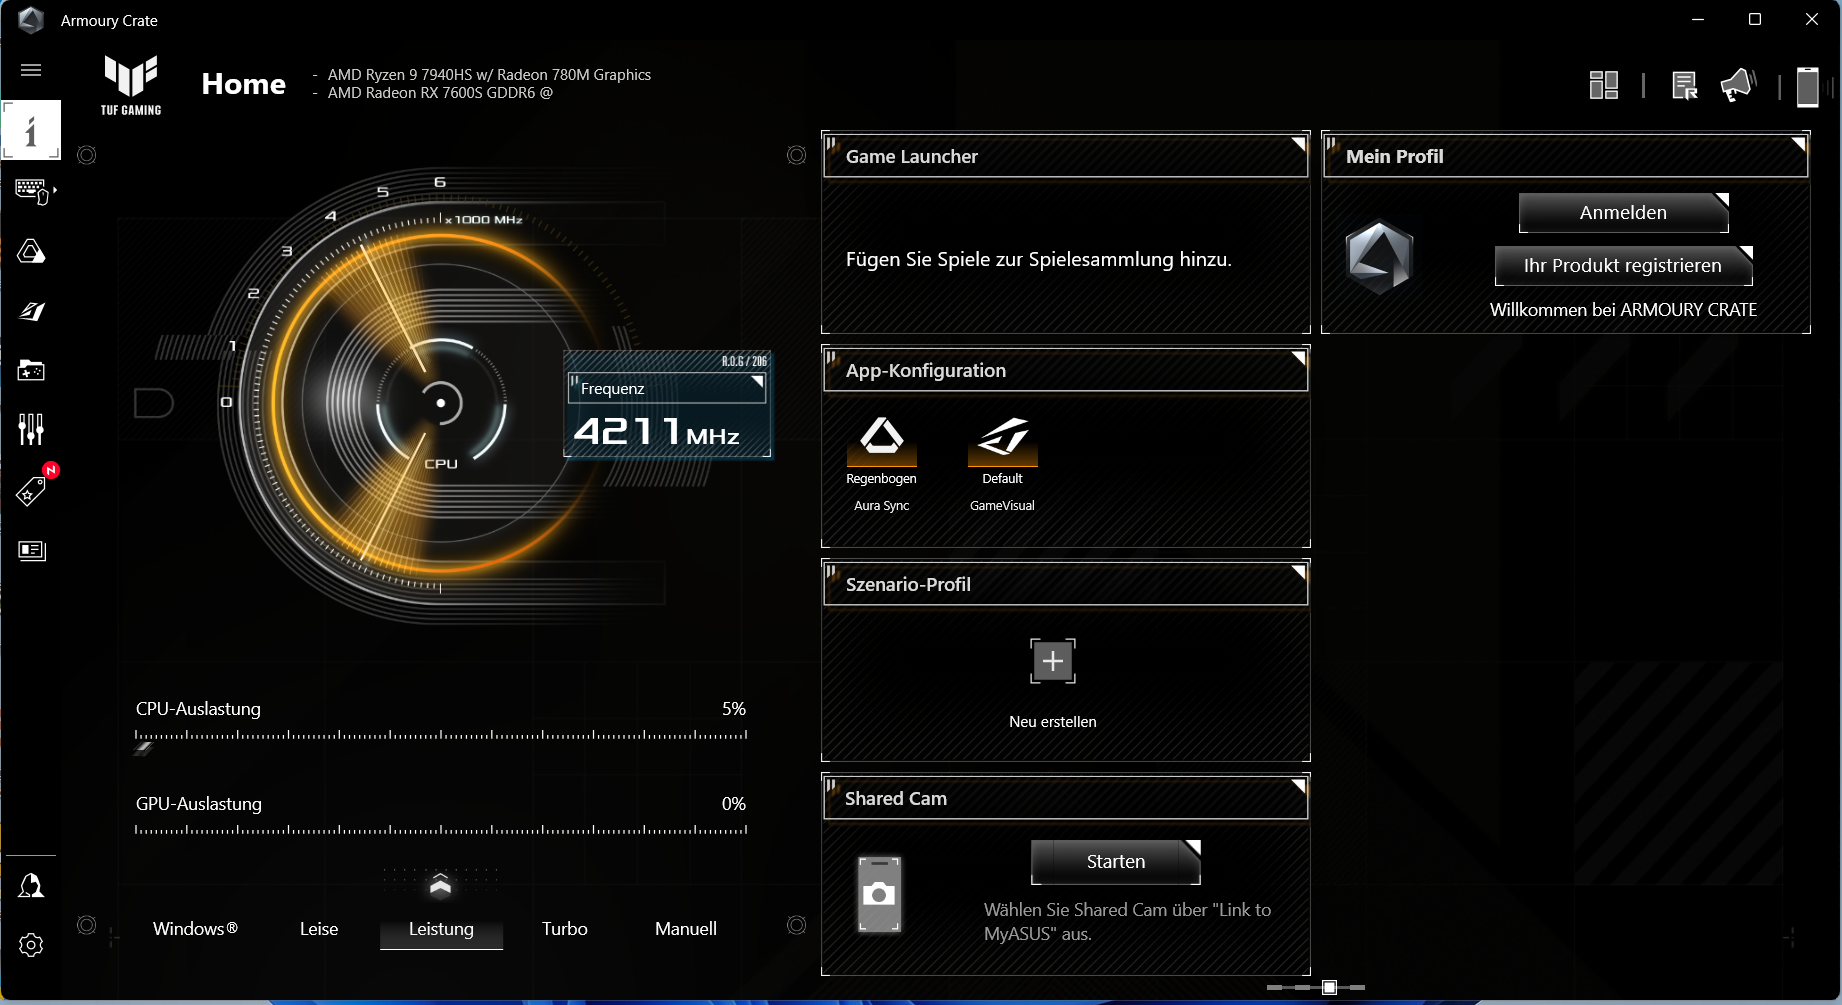
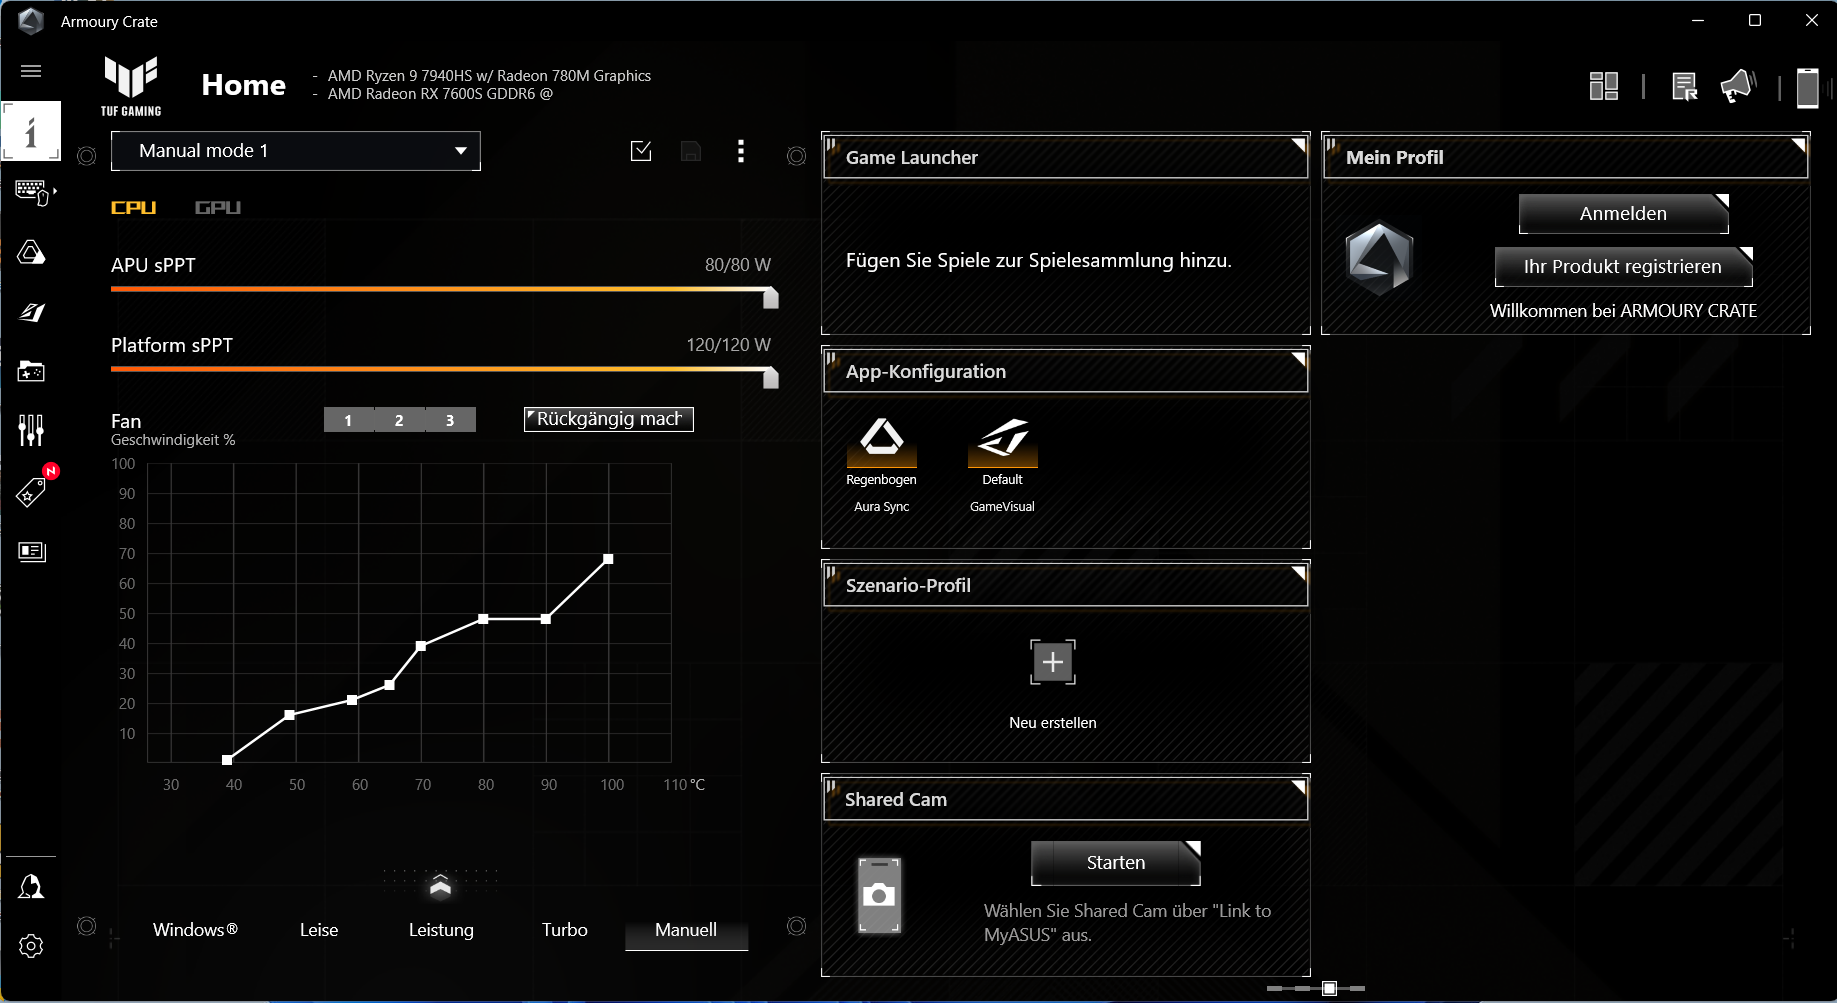
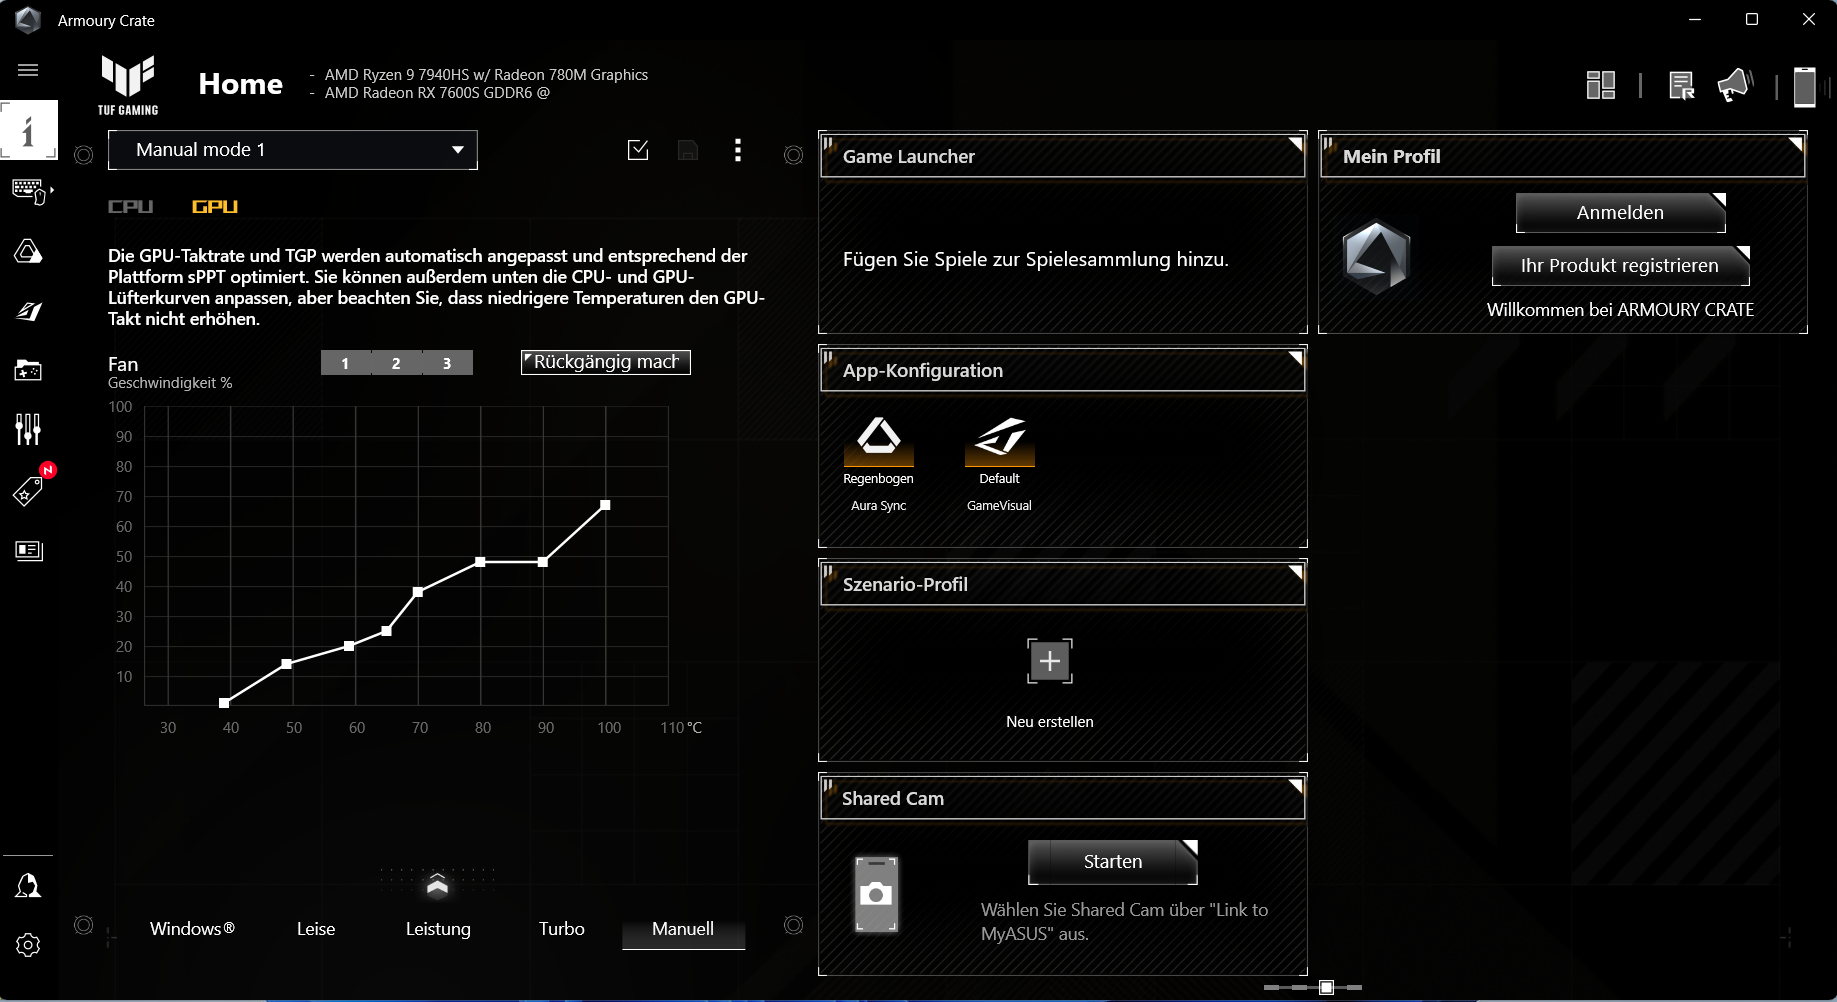
测试条件
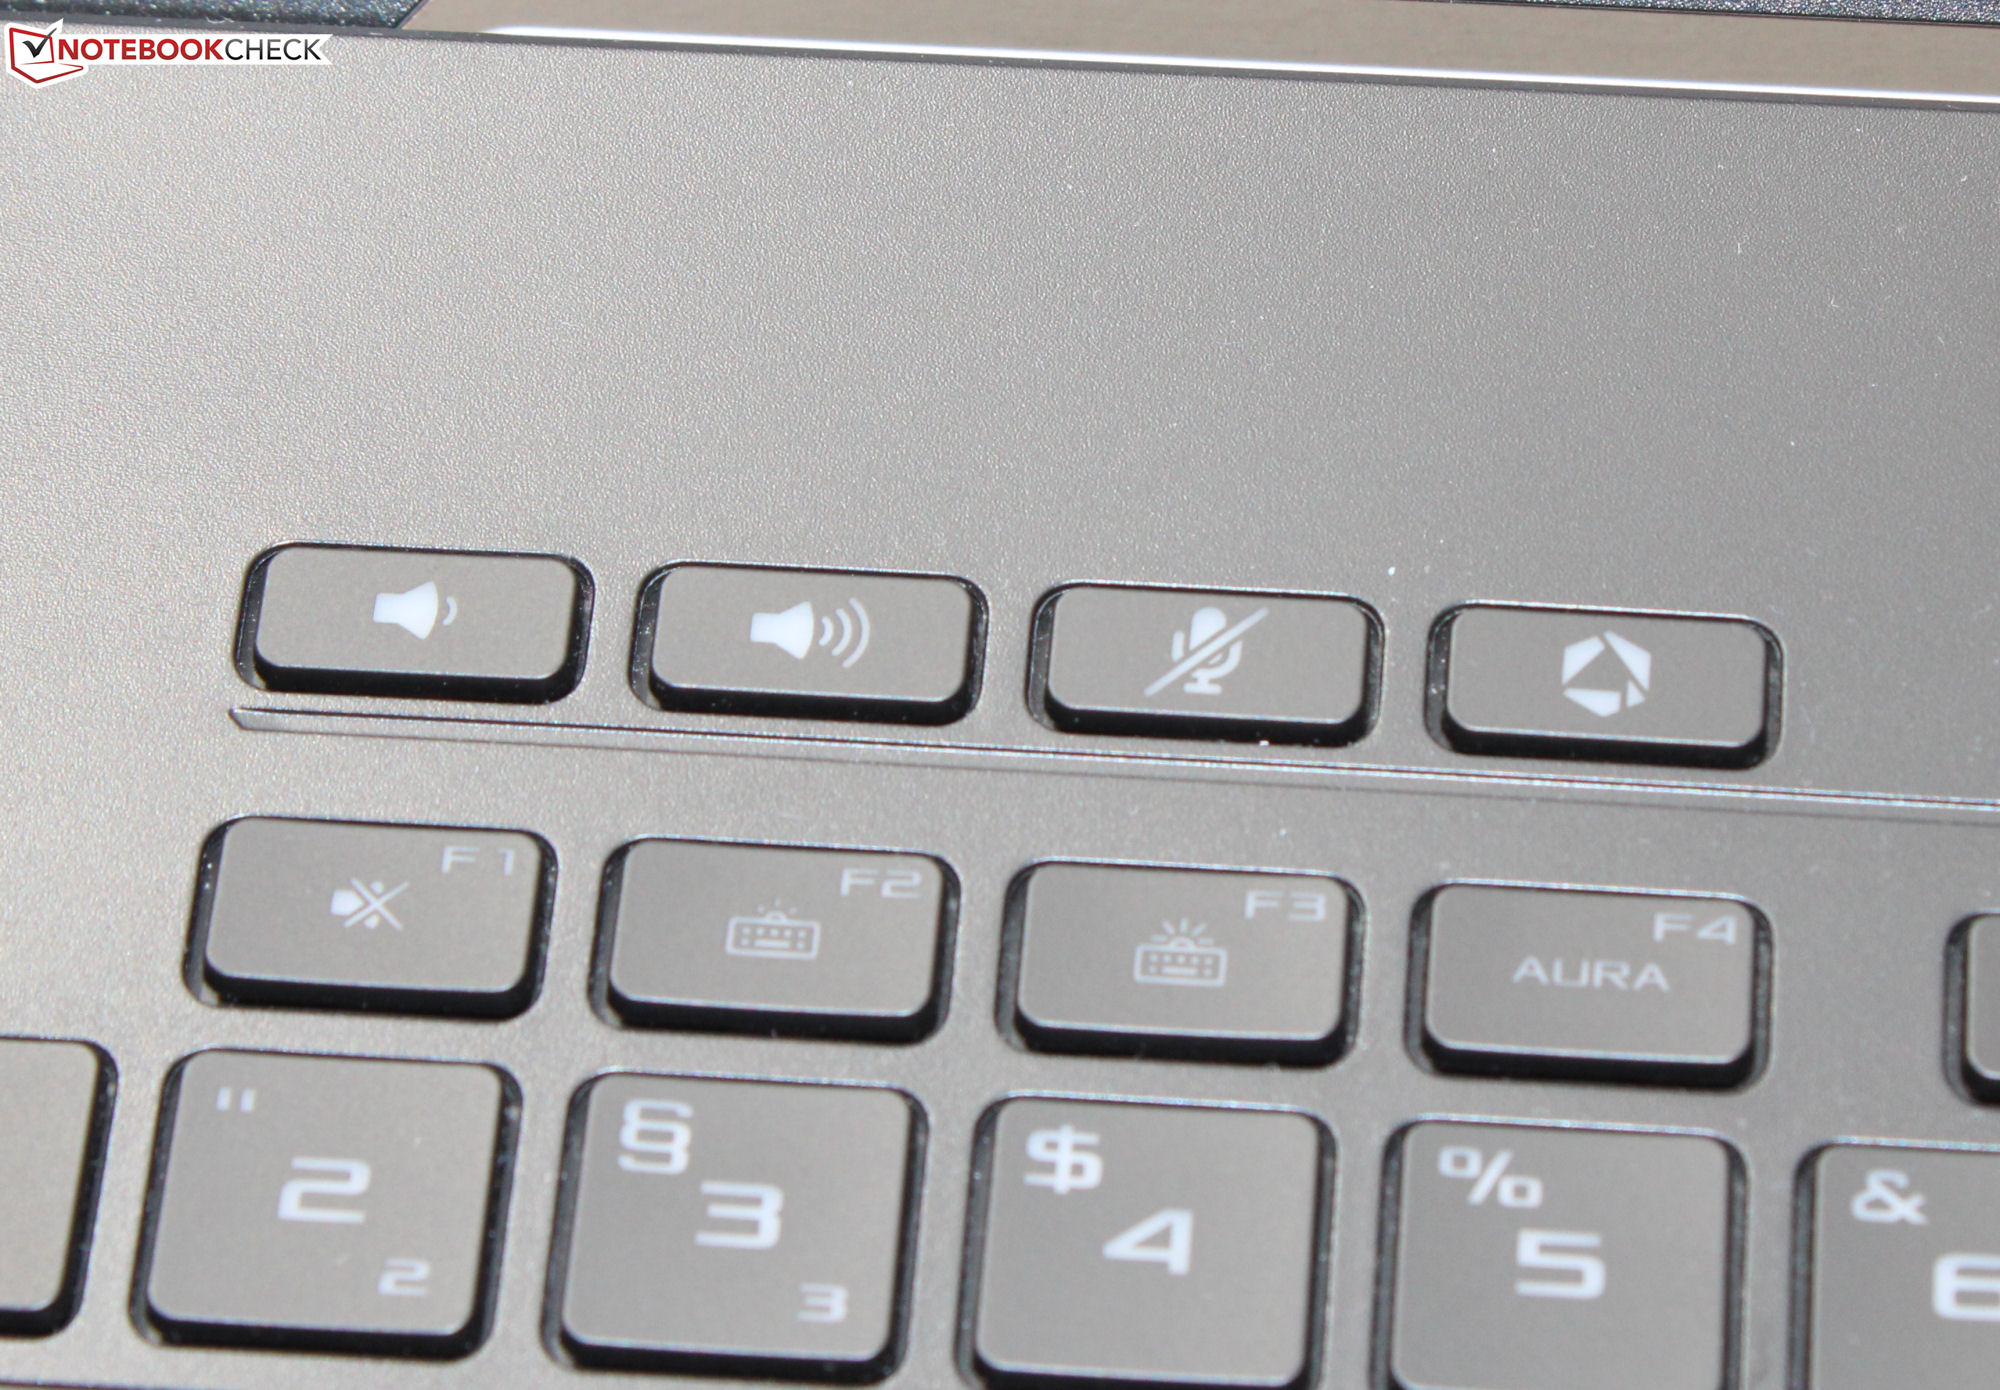
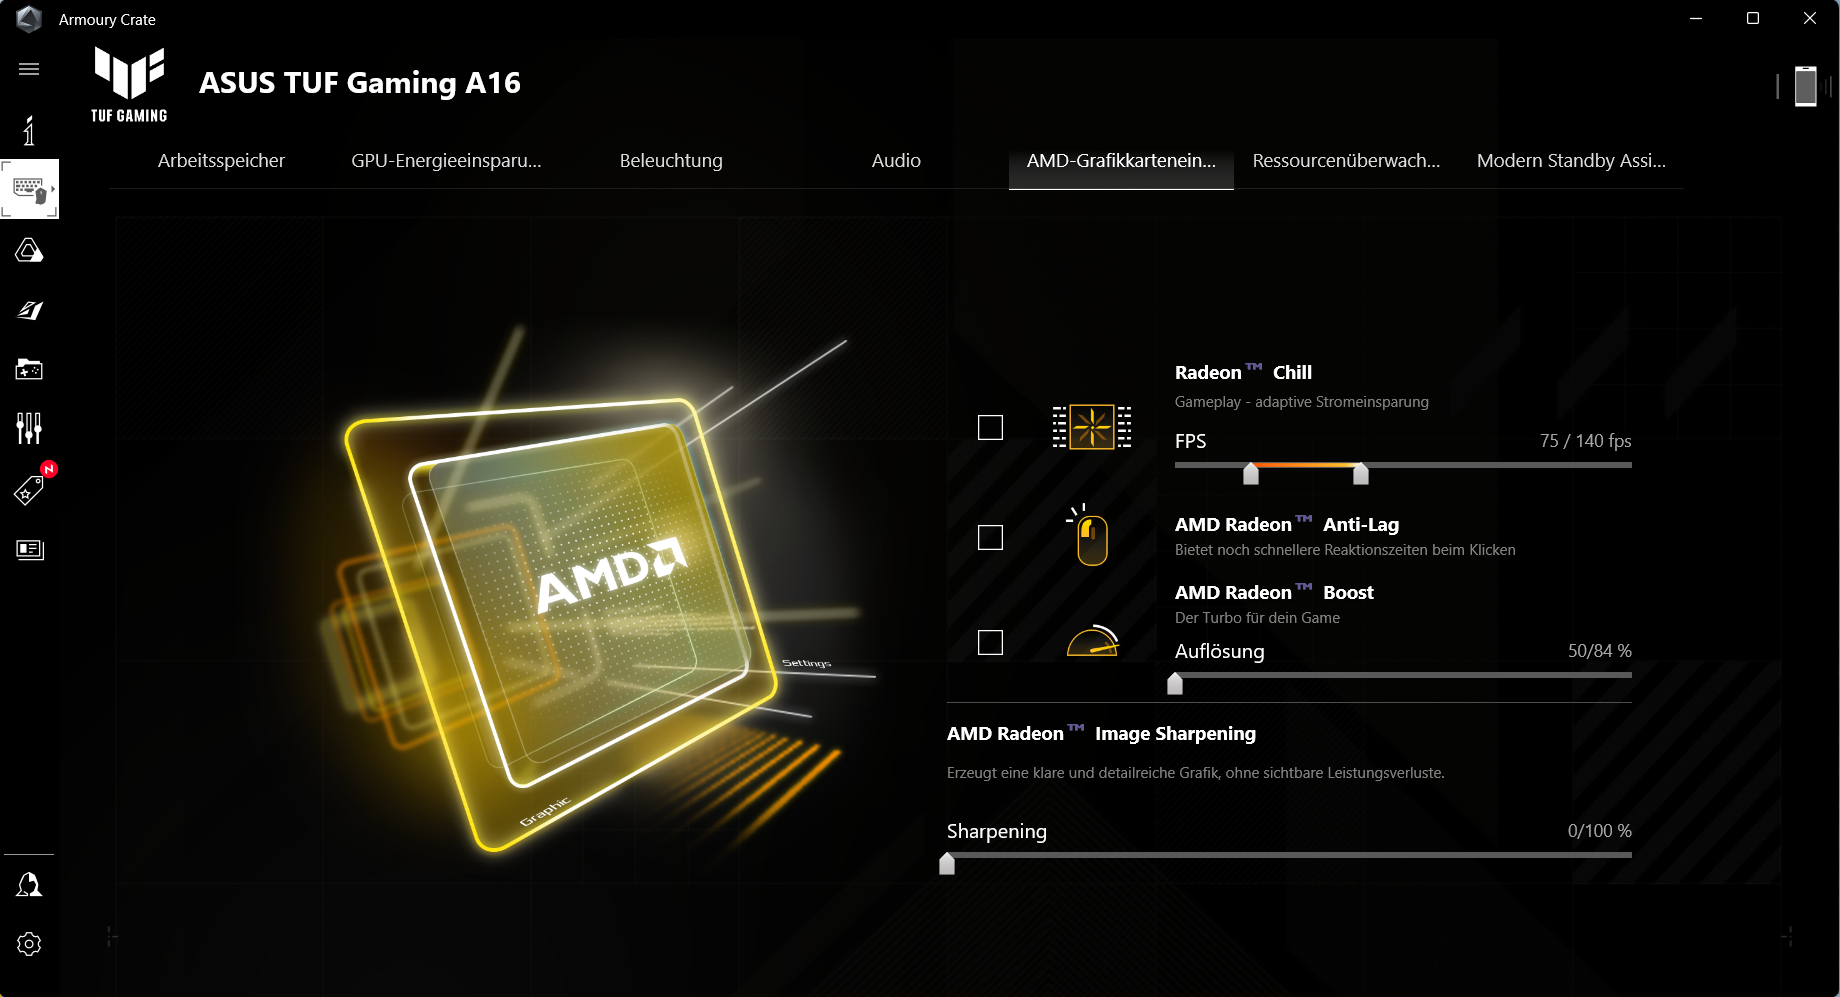
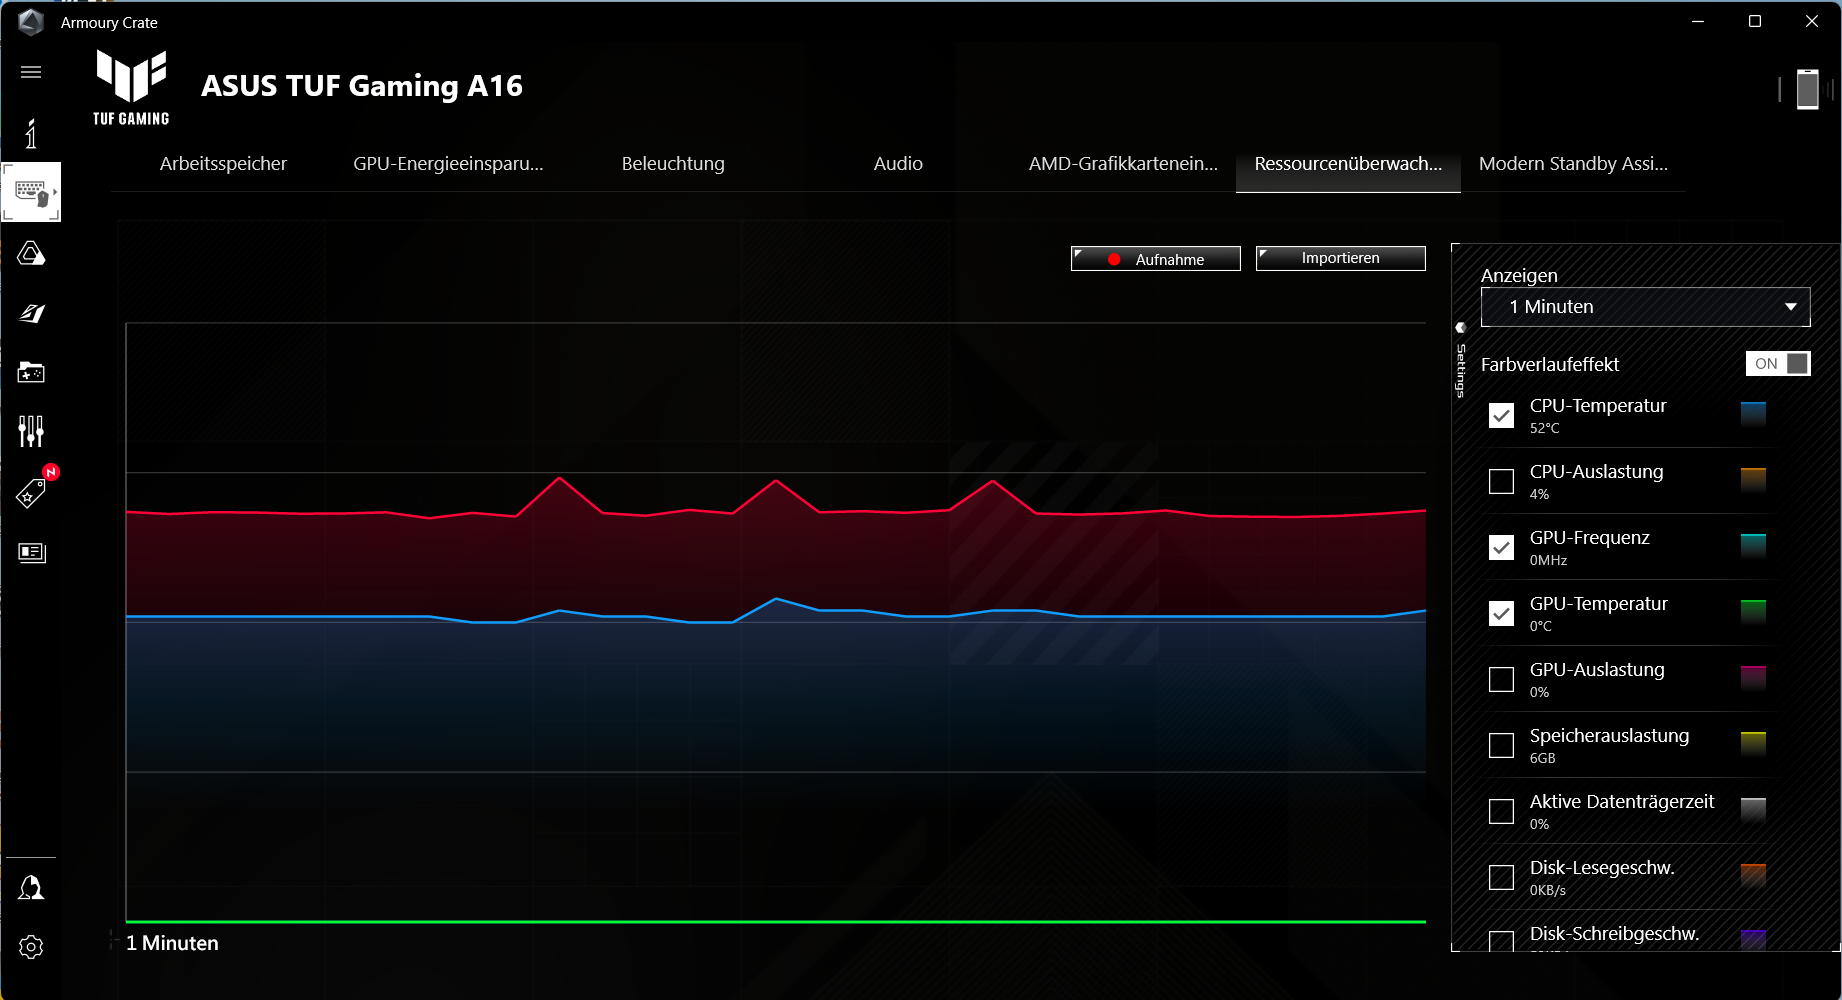
你可以通过组合键 "Fn "+"F5 "在三个制造商特定的性能配置文件之间切换(见表)。使用了 "性能"(基准测试)和 "安静"(电池测试)配置文件。GPU模式被设置为 "标准"(=切换图形)。笔记本的控制中心("Armoury Crate")允许你创建个人配置文件("手动"),其中包括设置PPT和风扇曲线。
| 涡轮增压 | 性能 | 静音 | |
|---|---|---|---|
| 功率限制 1 (HWInfo) | 120 瓦 | 105 瓦 | 75 瓦 |
| 功率限制2 (HWInfo) | 144瓦 | 114瓦 | 90瓦 |
| 噪音(Wichter 3) | 53 dB(A) | 51 dB(A) | 46 dB(A) |
| 性能 (Witcher 3) | ~100 fps | ~100 fps | ~94 fps |
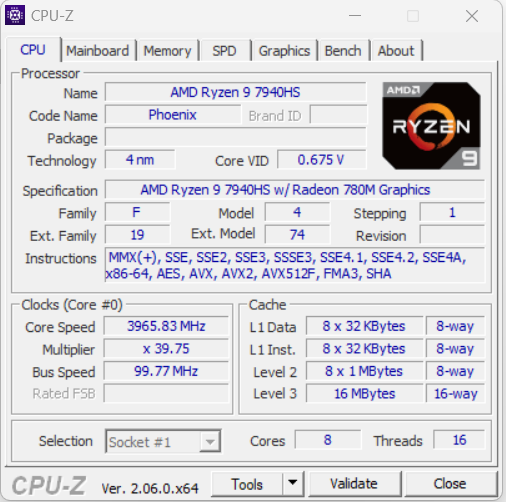
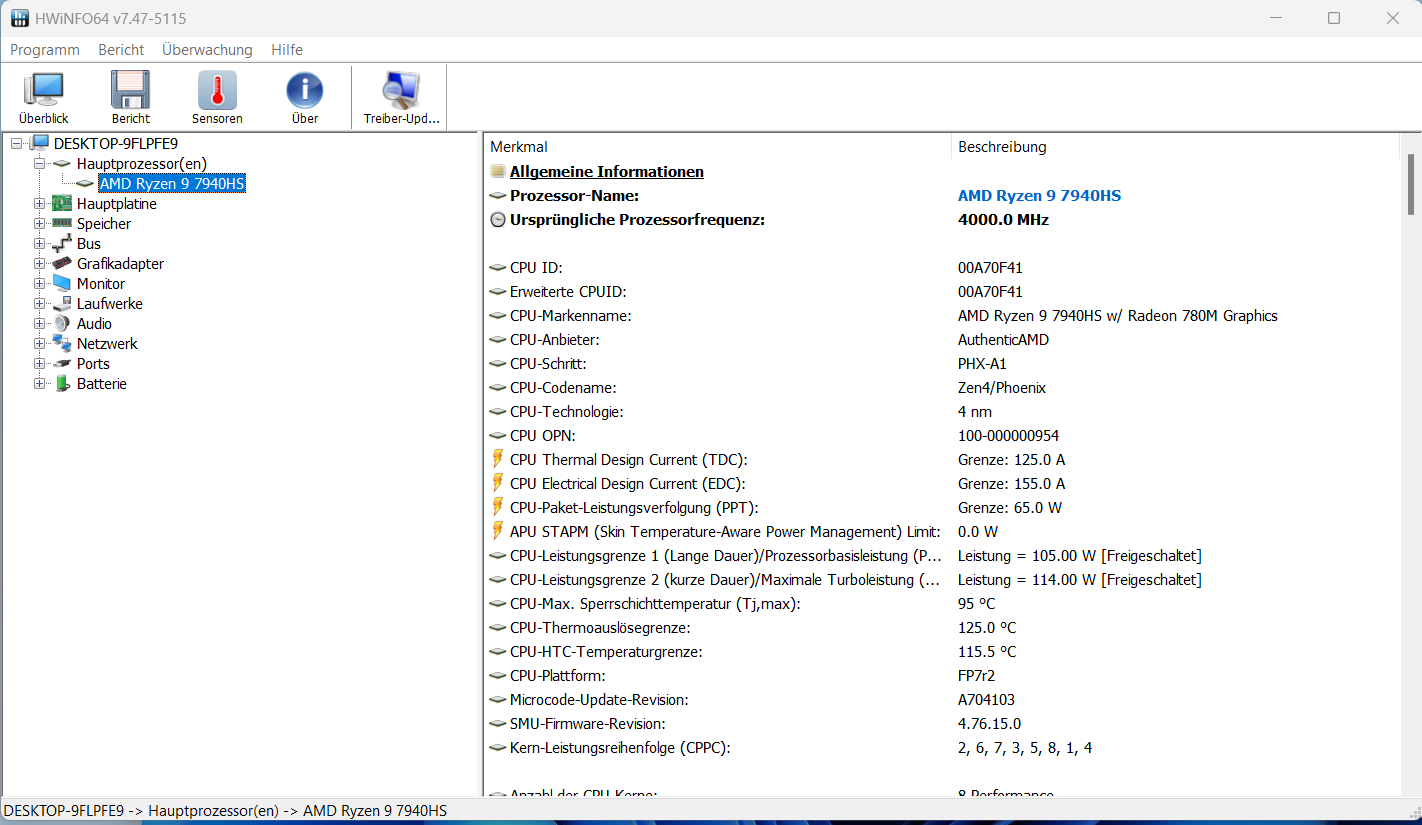
处理器
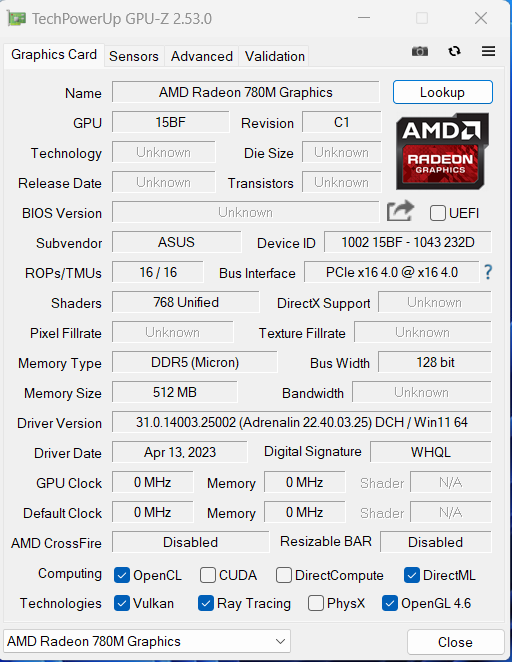
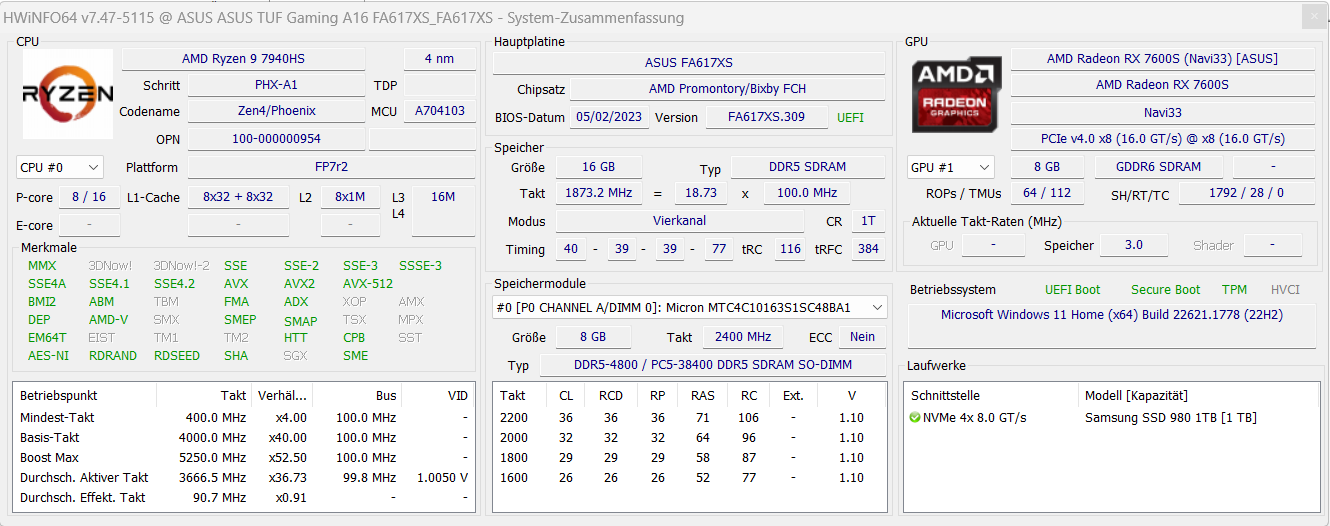
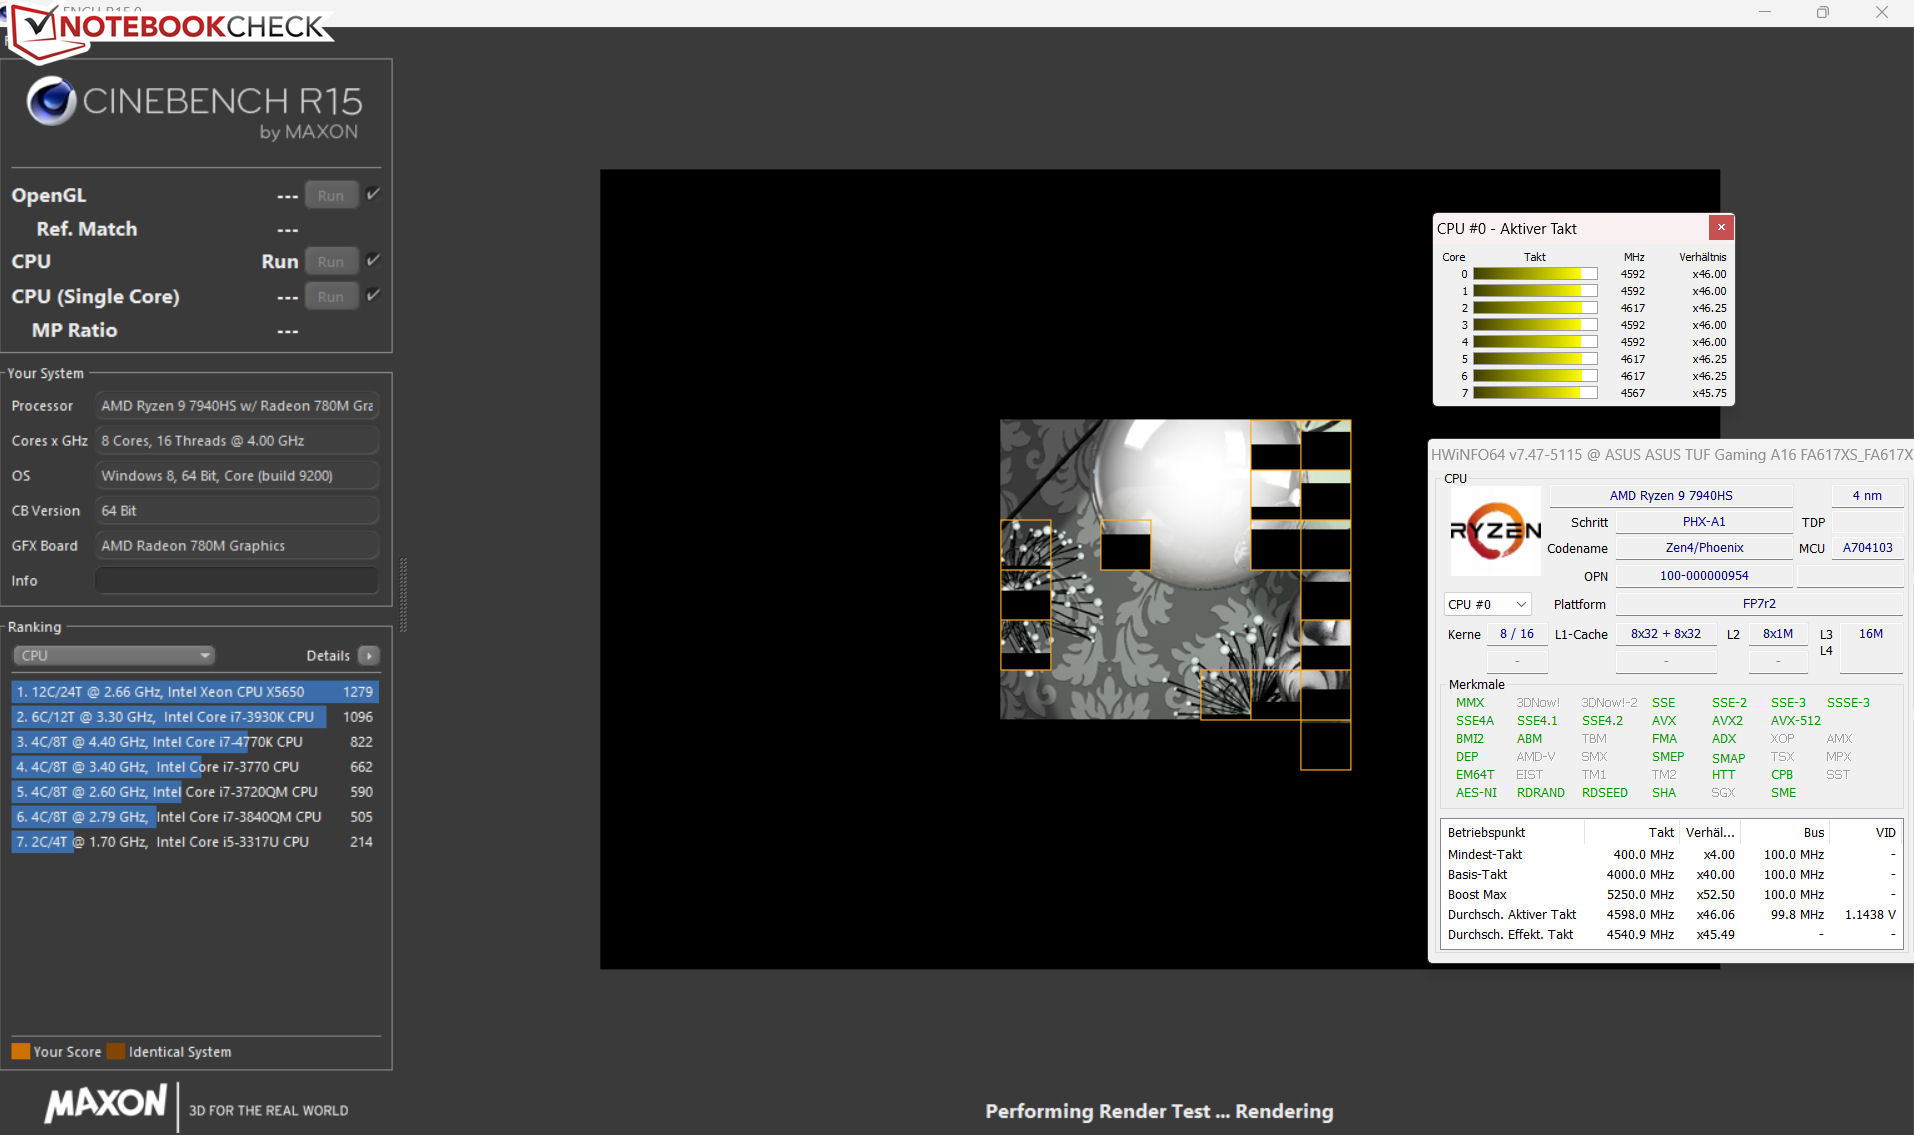
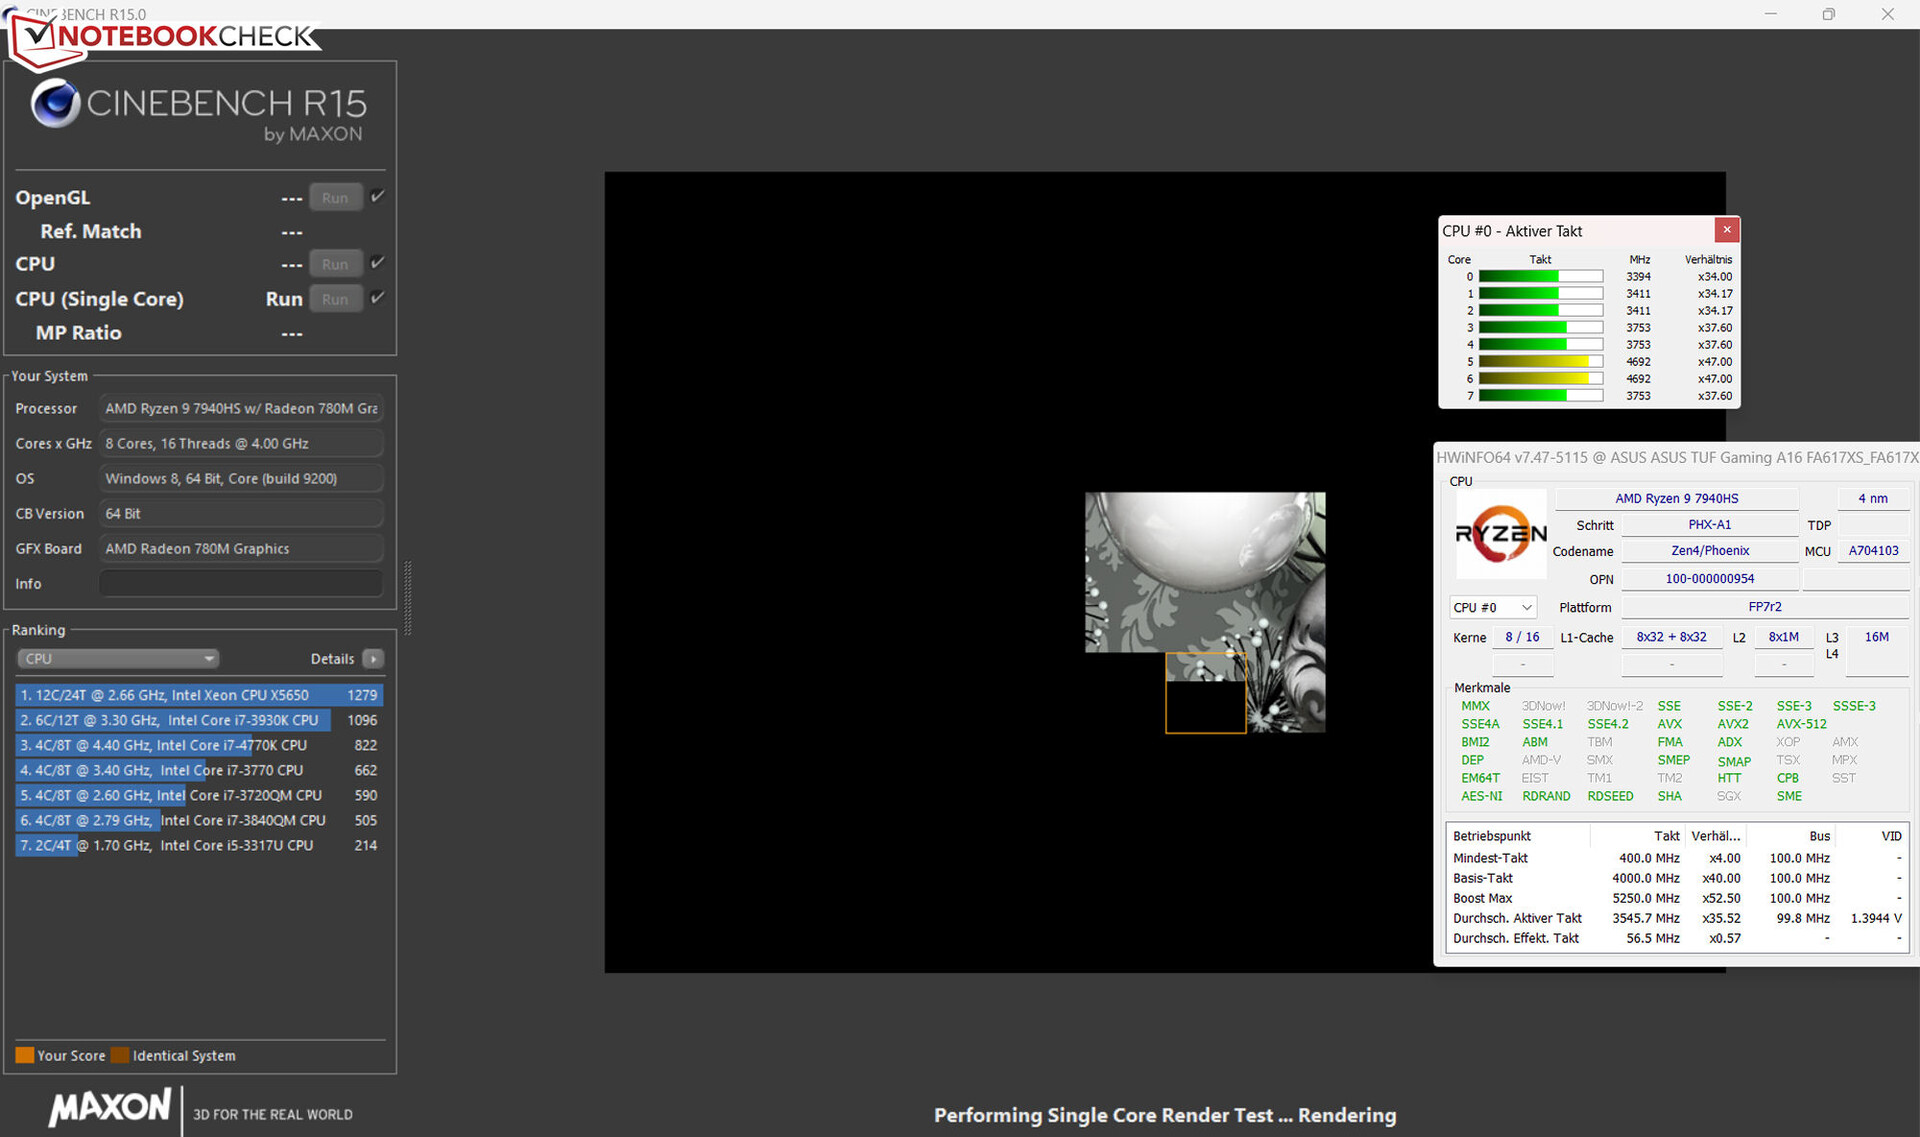
的CPU部分Ryzen-9-7940HS-APU(Phoenix, Zen 4)具有8个处理核心,16个线程。4GHz的基本时钟频率可以提高到5.25GHz(一个核心)。我们测量的基准结果与之前测试的7940HS笔记本电脑差不多。使用 "Turbo "配置文件会导致性能提高一点(4-5%)。
姐妹机型的 Ryzen-7-7735HS-APU (Rembrandt R,Zen 3+)明显被Ryzen 9击败,即使是在相同的核心数量和相同的功率限制下。由于其更好的架构和更高的时钟频率,其每瓦特性能更大。
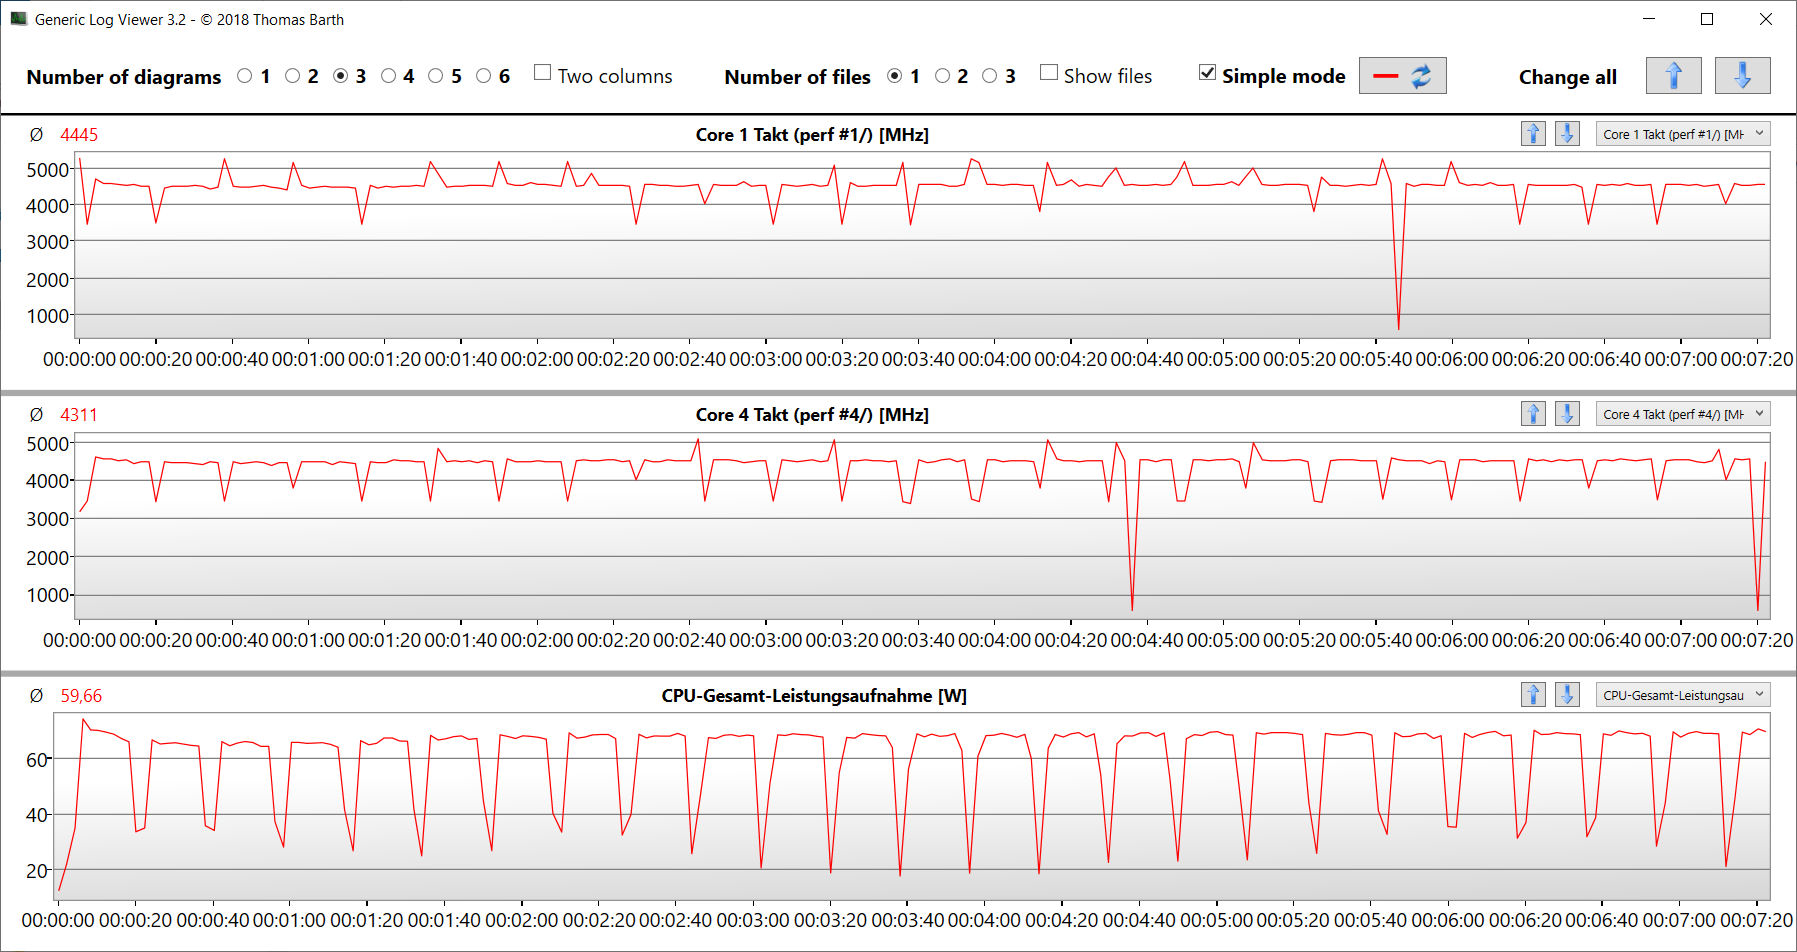
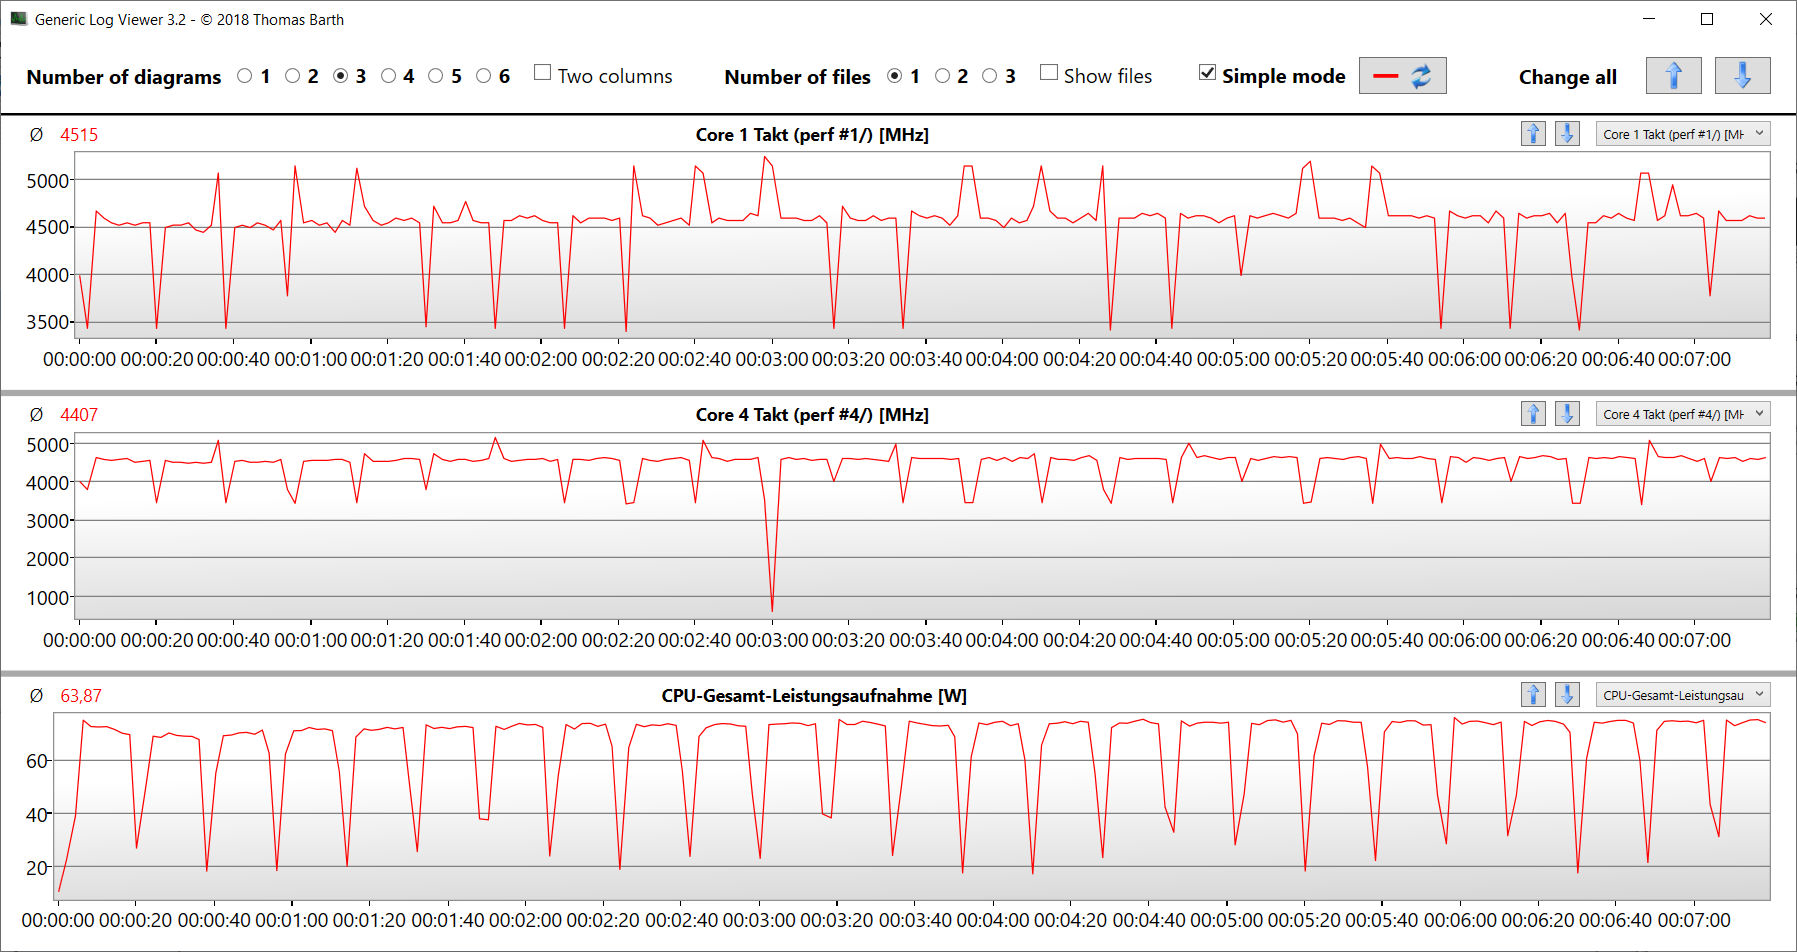
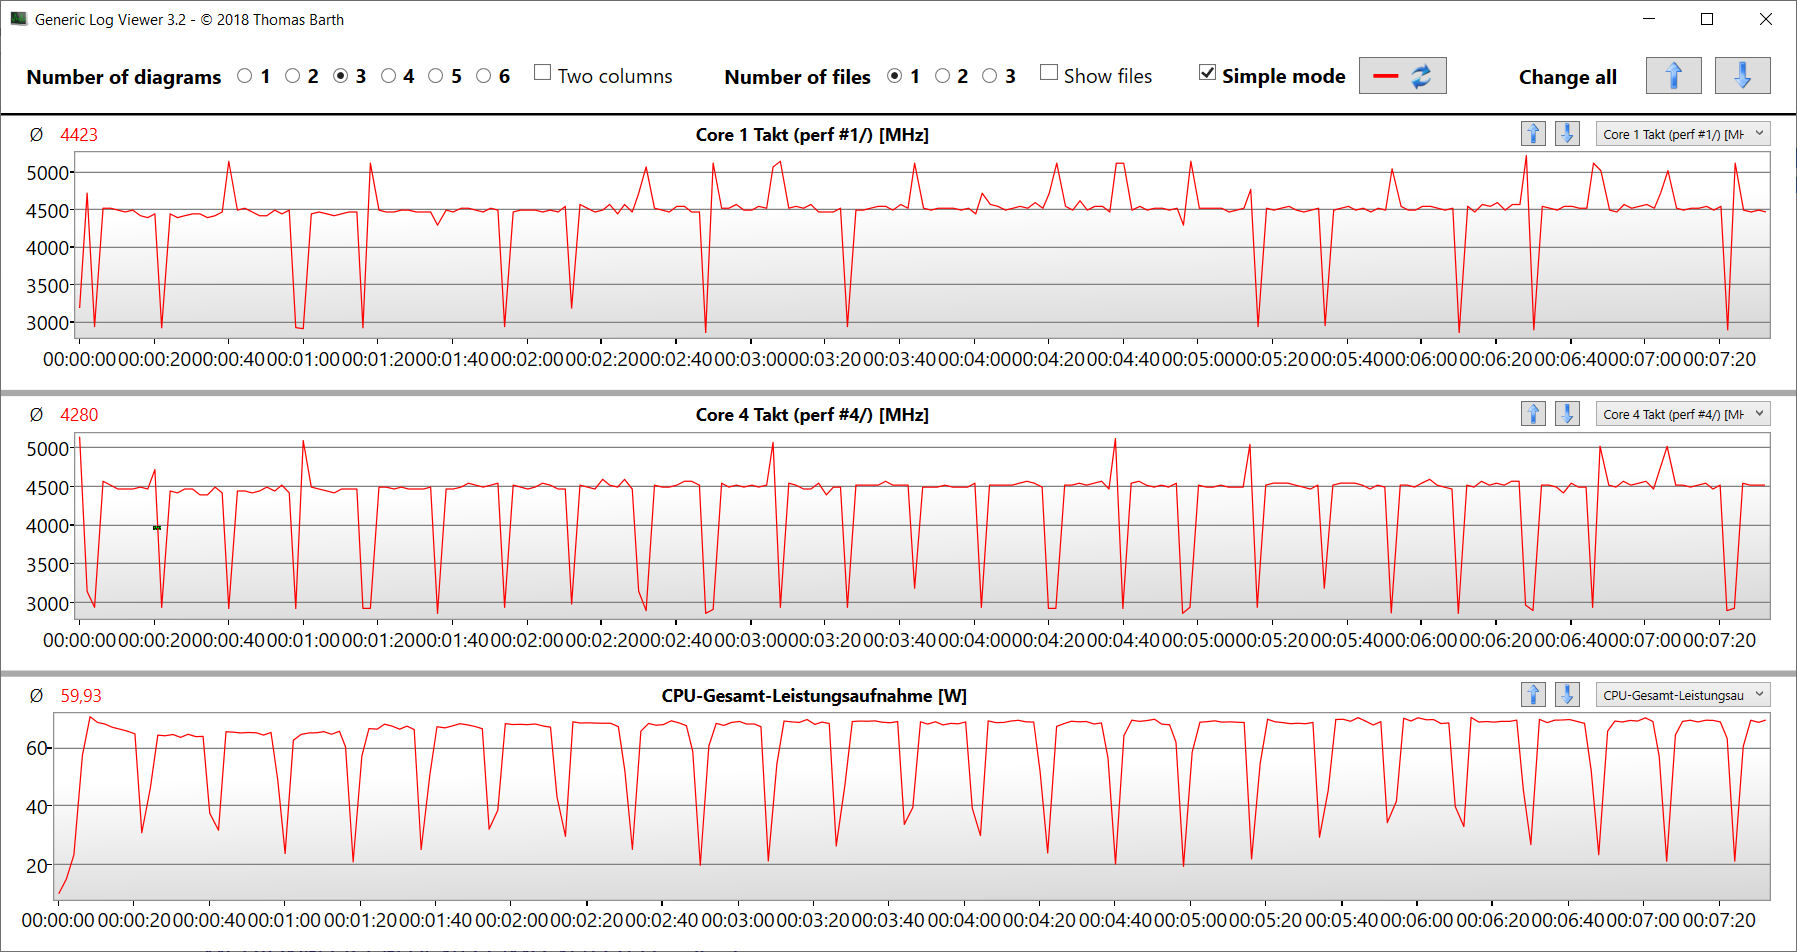
CB15的循环测试显示:连续的多线程负载导致CPU以持续的高涡轮增压时钟速率工作--无论选择何种性能配置。
请注意:关于安装的APU及其架构的详细信息可以在我们的Zen4分析文章中阅读 。
Cinebench R15 multi continuous test
* ... smaller is better
AIDA64: FP32 Ray-Trace | FPU Julia | CPU SHA3 | CPU Queen | FPU SinJulia | FPU Mandel | CPU AES | CPU ZLib | FP64 Ray-Trace | CPU PhotoWorxx
| Performance rating | |
| Average of class Gaming | |
| Average AMD Ryzen 9 7940HS | |
| Asus TUF Gaming A16 FA617XS | |
| Lenovo Legion Pro 5 16IRX8 | |
| Asus TUF Gaming A16 FA617 | |
| Medion Erazer Defender P40 | |
| MSI Katana 15 B12VEK | |
| Gigabyte G5 KE | |
| AIDA64 / FP32 Ray-Trace | |
| Average of class Gaming (10227 - 85542, n=105, last 2 years) | |
| Asus TUF Gaming A16 FA617XS (v6.75.6100) | |
| Average AMD Ryzen 9 7940HS (25226 - 29109, n=10) | |
| Lenovo Legion Pro 5 16IRX8 (v6.85.6300) | |
| Asus TUF Gaming A16 FA617 (v6.85.6300) | |
| MSI Katana 15 B12VEK (v6.85.6300) | |
| Medion Erazer Defender P40 (v6.75.6100) | |
| Gigabyte G5 KE (v6.75.6100) | |
| AIDA64 / FPU Julia | |
| Average of class Gaming (51376 - 238426, n=105, last 2 years) | |
| Asus TUF Gaming A16 FA617XS (v6.75.6100) | |
| Average AMD Ryzen 9 7940HS (106512 - 123214, n=10) | |
| Lenovo Legion Pro 5 16IRX8 (v6.85.6300) | |
| Asus TUF Gaming A16 FA617 (v6.85.6300) | |
| Medion Erazer Defender P40 (v6.75.6100) | |
| MSI Katana 15 B12VEK (v6.85.6300) | |
| Gigabyte G5 KE (v6.75.6100) | |
| AIDA64 / CPU SHA3 | |
| Average of class Gaming (2180 - 10115, n=105, last 2 years) | |
| Average AMD Ryzen 9 7940HS (4566 - 5119, n=10) | |
| Lenovo Legion Pro 5 16IRX8 (v6.85.6300) | |
| Asus TUF Gaming A16 FA617XS (v6.75.6100) | |
| Asus TUF Gaming A16 FA617 (v6.85.6300) | |
| Medion Erazer Defender P40 (v6.75.6100) | |
| MSI Katana 15 B12VEK (v6.85.6300) | |
| Gigabyte G5 KE (v6.75.6100) | |
| AIDA64 / CPU Queen | |
| Asus TUF Gaming A16 FA617XS (v6.75.6100) | |
| Average AMD Ryzen 9 7940HS (118174 - 124783, n=10) | |
| Average of class Gaming (49785 - 173351, n=90, last 2 years) | |
| Lenovo Legion Pro 5 16IRX8 (v6.85.6300) | |
| Medion Erazer Defender P40 (v6.75.6100) | |
| Asus TUF Gaming A16 FA617 (v6.85.6300) | |
| MSI Katana 15 B12VEK (v6.85.6300) | |
| Gigabyte G5 KE (v6.75.6100) | |
| AIDA64 / FPU SinJulia | |
| Asus TUF Gaming A16 FA617XS (v6.75.6100) | |
| Average AMD Ryzen 9 7940HS (14663 - 15551, n=10) | |
| Average of class Gaming (4424 - 33636, n=105, last 2 years) | |
| Lenovo Legion Pro 5 16IRX8 (v6.85.6300) | |
| Asus TUF Gaming A16 FA617 (v6.85.6300) | |
| Medion Erazer Defender P40 (v6.75.6100) | |
| MSI Katana 15 B12VEK (v6.85.6300) | |
| Gigabyte G5 KE (v6.75.6100) | |
| AIDA64 / FPU Mandel | |
| Average of class Gaming (25115 - 128721, n=105, last 2 years) | |
| Asus TUF Gaming A16 FA617XS (v6.75.6100) | |
| Average AMD Ryzen 9 7940HS (56839 - 66238, n=10) | |
| Asus TUF Gaming A16 FA617 (v6.85.6300) | |
| Lenovo Legion Pro 5 16IRX8 (v6.85.6300) | |
| Medion Erazer Defender P40 (v6.75.6100) | |
| MSI Katana 15 B12VEK (v6.85.6300) | |
| Gigabyte G5 KE (v6.75.6100) | |
| AIDA64 / CPU AES | |
| Average AMD Ryzen 9 7940HS (86309 - 171350, n=10) | |
| Gigabyte G5 KE (v6.75.6100) | |
| Average of class Gaming (39258 - 247074, n=105, last 2 years) | |
| Lenovo Legion Pro 5 16IRX8 (v6.85.6300) | |
| Asus TUF Gaming A16 FA617XS (v6.75.6100) | |
| Medion Erazer Defender P40 (v6.75.6100) | |
| MSI Katana 15 B12VEK (v6.85.6300) | |
| Asus TUF Gaming A16 FA617 (v6.85.6300) | |
| AIDA64 / CPU ZLib | |
| Average of class Gaming (574 - 2531, n=105, last 2 years) | |
| Lenovo Legion Pro 5 16IRX8 (v6.85.6300) | |
| Asus TUF Gaming A16 FA617XS (v6.75.6100) | |
| Average AMD Ryzen 9 7940HS (866 - 1152, n=10) | |
| Medion Erazer Defender P40 (v6.75.6100) | |
| Gigabyte G5 KE (v6.75.6100) | |
| Asus TUF Gaming A16 FA617 (v6.85.6300) | |
| MSI Katana 15 B12VEK (v6.85.6300) | |
| AIDA64 / FP64 Ray-Trace | |
| Average of class Gaming (5509 - 45446, n=105, last 2 years) | |
| Asus TUF Gaming A16 FA617XS (v6.75.6100) | |
| Average AMD Ryzen 9 7940HS (13175 - 15675, n=10) | |
| Lenovo Legion Pro 5 16IRX8 (v6.85.6300) | |
| Asus TUF Gaming A16 FA617 (v6.85.6300) | |
| MSI Katana 15 B12VEK (v6.85.6300) | |
| Medion Erazer Defender P40 (v6.75.6100) | |
| Gigabyte G5 KE (v6.75.6100) | |
| AIDA64 / CPU PhotoWorxx | |
| Average of class Gaming (12271 - 89891, n=105, last 2 years) | |
| MSI Katana 15 B12VEK (v6.85.6300) | |
| Lenovo Legion Pro 5 16IRX8 (v6.85.6300) | |
| Medion Erazer Defender P40 (v6.75.6100) | |
| Average AMD Ryzen 9 7940HS (22477 - 41567, n=10) | |
| Asus TUF Gaming A16 FA617XS (v6.75.6100) | |
| Gigabyte G5 KE (v6.75.6100) | |
| Asus TUF Gaming A16 FA617 (v6.85.6300) | |
系统性能
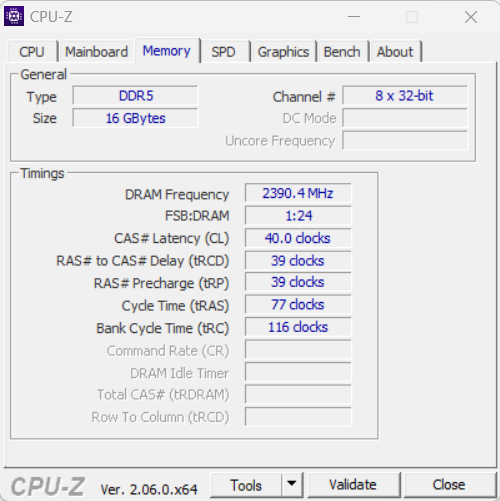
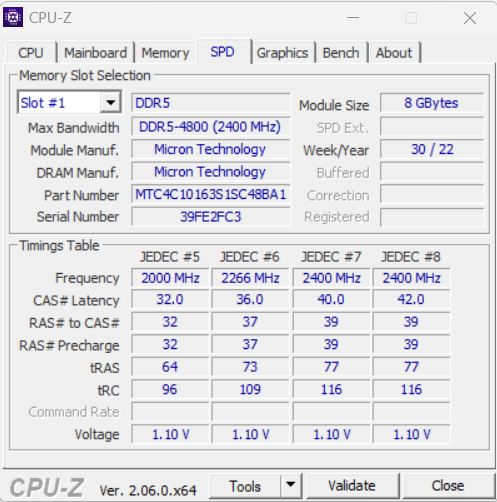
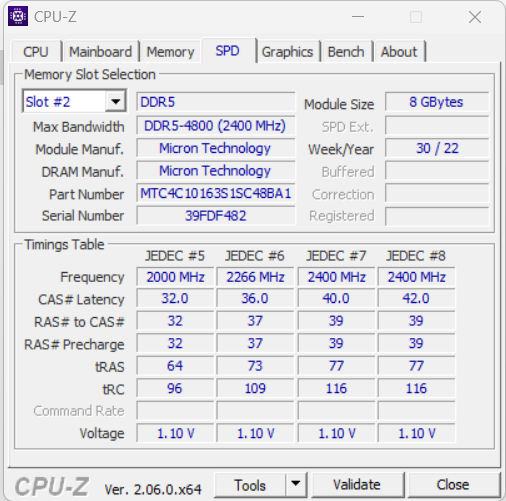
平稳运行的系统为苛刻的使用领域提供了足够的性能,如渲染、视频编辑和游戏--良好的PCMark结果可以证实这一点。对于DDR5 4800内存来说,内存的传输率处于正常水平。需要注意的是:dGPU和iGPU(智能访问图形)之间的自动切换总是需要一两秒钟。在这段时间里,系统会冻结。
CrossMark: Overall | Productivity | Creativity | Responsiveness
| PCMark 10 / Score | |
| Average of class Gaming (5828 - 12414, n=93, last 2 years) | |
| Asus TUF Gaming A16 FA617XS | |
| Average AMD Ryzen 9 7940HS, AMD Radeon RX 7600S (n=1) | |
| Lenovo Legion Pro 5 16IRX8 | |
| Asus TUF Gaming A16 FA617 | |
| Gigabyte G5 KE | |
| Medion Erazer Defender P40 | |
| MSI Katana 15 B12VEK | |
| PCMark 10 / Essentials | |
| Gigabyte G5 KE | |
| Lenovo Legion Pro 5 16IRX8 | |
| Asus TUF Gaming A16 FA617XS | |
| Average AMD Ryzen 9 7940HS, AMD Radeon RX 7600S (n=1) | |
| Average of class Gaming (8810 - 11935, n=97, last 2 years) | |
| Asus TUF Gaming A16 FA617 | |
| MSI Katana 15 B12VEK | |
| Medion Erazer Defender P40 | |
| PCMark 10 / Productivity | |
| Average of class Gaming (6845 - 25323, n=95, last 2 years) | |
| Asus TUF Gaming A16 FA617XS | |
| Average AMD Ryzen 9 7940HS, AMD Radeon RX 7600S (n=1) | |
| Medion Erazer Defender P40 | |
| MSI Katana 15 B12VEK | |
| Gigabyte G5 KE | |
| Asus TUF Gaming A16 FA617 | |
| Lenovo Legion Pro 5 16IRX8 | |
| PCMark 10 / Digital Content Creation | |
| Average of class Gaming (7602 - 19954, n=95, last 2 years) | |
| Lenovo Legion Pro 5 16IRX8 | |
| Asus TUF Gaming A16 FA617XS | |
| Average AMD Ryzen 9 7940HS, AMD Radeon RX 7600S (n=1) | |
| Asus TUF Gaming A16 FA617 | |
| Gigabyte G5 KE | |
| Medion Erazer Defender P40 | |
| MSI Katana 15 B12VEK | |
| CrossMark / Overall | |
| Average of class Gaming (1366 - 2409, n=94, last 2 years) | |
| Medion Erazer Defender P40 | |
| Asus TUF Gaming A16 FA617XS | |
| Average AMD Ryzen 9 7940HS, AMD Radeon RX 7600S (n=1) | |
| Gigabyte G5 KE | |
| MSI Katana 15 B12VEK | |
| Lenovo Legion Pro 5 16IRX8 | |
| CrossMark / Productivity | |
| Average of class Gaming (1386 - 2254, n=94, last 2 years) | |
| Gigabyte G5 KE | |
| Asus TUF Gaming A16 FA617XS | |
| Average AMD Ryzen 9 7940HS, AMD Radeon RX 7600S (n=1) | |
| MSI Katana 15 B12VEK | |
| Medion Erazer Defender P40 | |
| Lenovo Legion Pro 5 16IRX8 | |
| CrossMark / Creativity | |
| Average of class Gaming (1343 - 2786, n=94, last 2 years) | |
| Medion Erazer Defender P40 | |
| Asus TUF Gaming A16 FA617XS | |
| Average AMD Ryzen 9 7940HS, AMD Radeon RX 7600S (n=1) | |
| MSI Katana 15 B12VEK | |
| Gigabyte G5 KE | |
| Lenovo Legion Pro 5 16IRX8 | |
| CrossMark / Responsiveness | |
| Gigabyte G5 KE | |
| Average of class Gaming (1226 - 2334, n=94, last 2 years) | |
| Lenovo Legion Pro 5 16IRX8 | |
| Medion Erazer Defender P40 | |
| MSI Katana 15 B12VEK | |
| Asus TUF Gaming A16 FA617XS | |
| Average AMD Ryzen 9 7940HS, AMD Radeon RX 7600S (n=1) | |
| PCMark 8 Home Score Accelerated v2 | 5937 points | |
| PCMark 8 Work Score Accelerated v2 | 6458 points | |
| PCMark 10 Score | 7927 points | |
Help | ||
| AIDA64 / Memory Copy | |
| Average of class Gaming (21750 - 129946, n=105, last 2 years) | |
| Average AMD Ryzen 9 7940HS (35327 - 78739, n=10) | |
| Asus TUF Gaming A16 FA617XS | |
| Lenovo Legion Pro 5 16IRX8 | |
| Medion Erazer Defender P40 | |
| MSI Katana 15 B12VEK | |
| Asus TUF Gaming A16 FA617 | |
| Gigabyte G5 KE | |
| AIDA64 / Memory Read | |
| Average of class Gaming (22956 - 118858, n=105, last 2 years) | |
| Lenovo Legion Pro 5 16IRX8 | |
| Medion Erazer Defender P40 | |
| MSI Katana 15 B12VEK | |
| Asus TUF Gaming A16 FA617XS | |
| Average AMD Ryzen 9 7940HS (30769 - 61836, n=10) | |
| Asus TUF Gaming A16 FA617 | |
| Gigabyte G5 KE | |
| AIDA64 / Memory Write | |
| Average AMD Ryzen 9 7940HS (42217 - 91567, n=10) | |
| Average of class Gaming (22297 - 135096, n=105, last 2 years) | |
| Asus TUF Gaming A16 FA617XS | |
| Lenovo Legion Pro 5 16IRX8 | |
| Medion Erazer Defender P40 | |
| MSI Katana 15 B12VEK | |
| Asus TUF Gaming A16 FA617 | |
| Gigabyte G5 KE | |
| AIDA64 / Memory Latency | |
| Average of class Gaming (75.3 - 259, n=105, last 2 years) | |
| Gigabyte G5 KE | |
| MSI Katana 15 B12VEK | |
| Medion Erazer Defender P40 | |
| Average AMD Ryzen 9 7940HS (87.6 - 111.1, n=10) | |
| Asus TUF Gaming A16 FA617XS | |
| Asus TUF Gaming A16 FA617 | |
| Lenovo Legion Pro 5 16IRX8 | |
* ... smaller is better
DPC延时
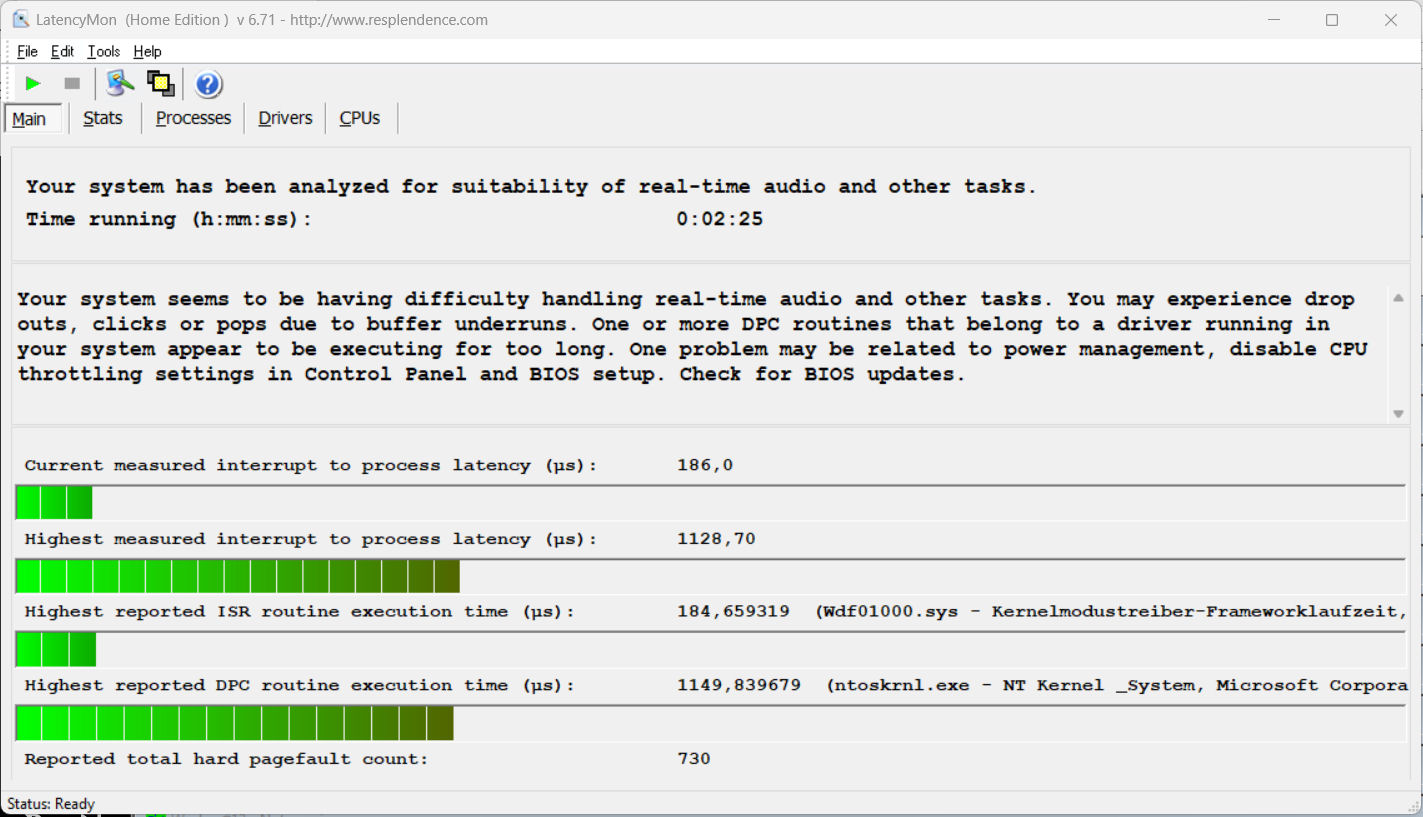
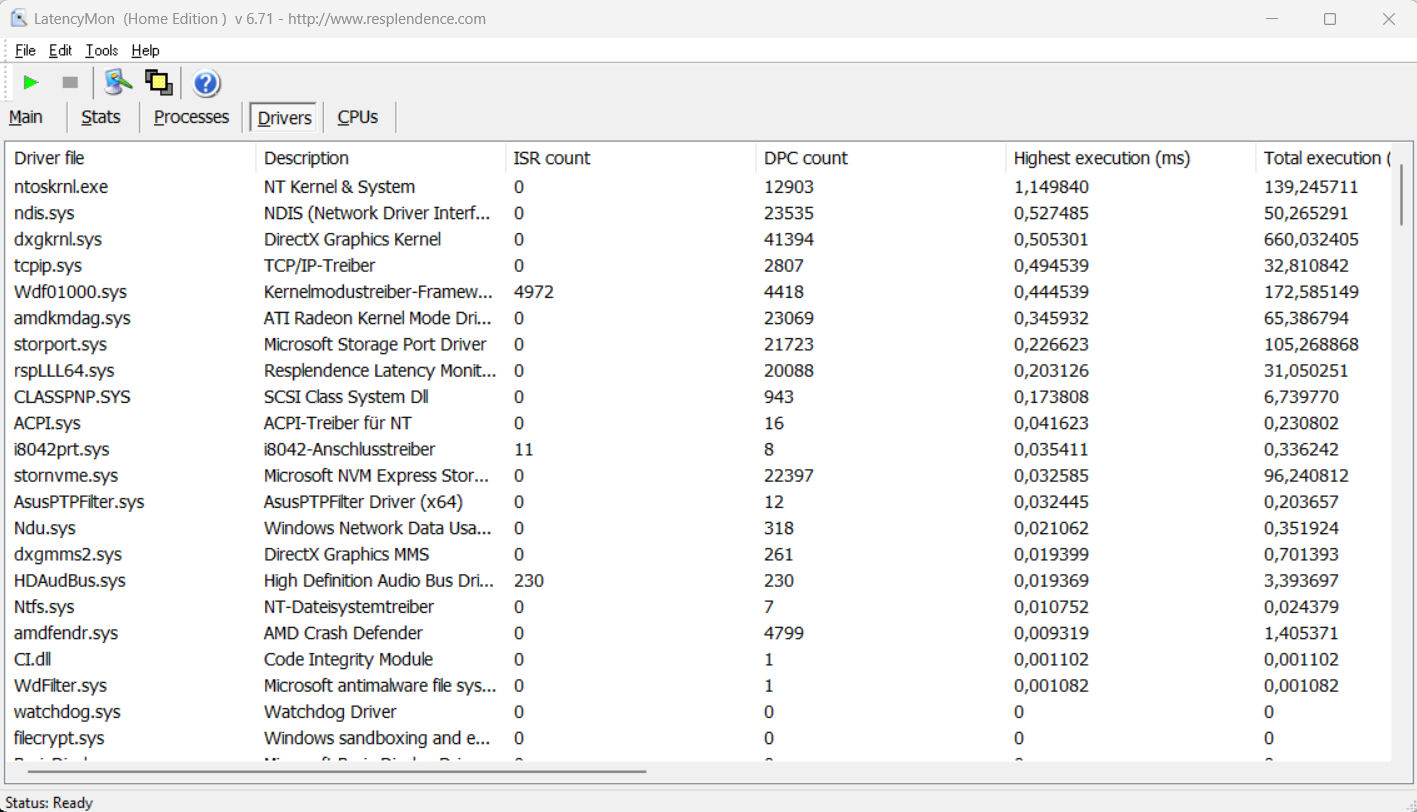
标准化的延迟监测测试(网络冲浪、4k视频播放、Prime95高负荷)发现了一些异常情况。该系统似乎不适合实时视频和音频编辑。未来的软件更新可能会导致改进,甚至是退化。
| DPC Latencies / LatencyMon - interrupt to process latency (max), Web, Youtube, Prime95 | |
| MSI Katana 15 B12VEK | |
| Medion Erazer Defender P40 | |
| Asus TUF Gaming A16 FA617XS | |
| Gigabyte G5 KE | |
| Lenovo Legion Pro 5 16IRX8 | |
| Asus TUF Gaming A16 FA617 | |
* ... smaller is better
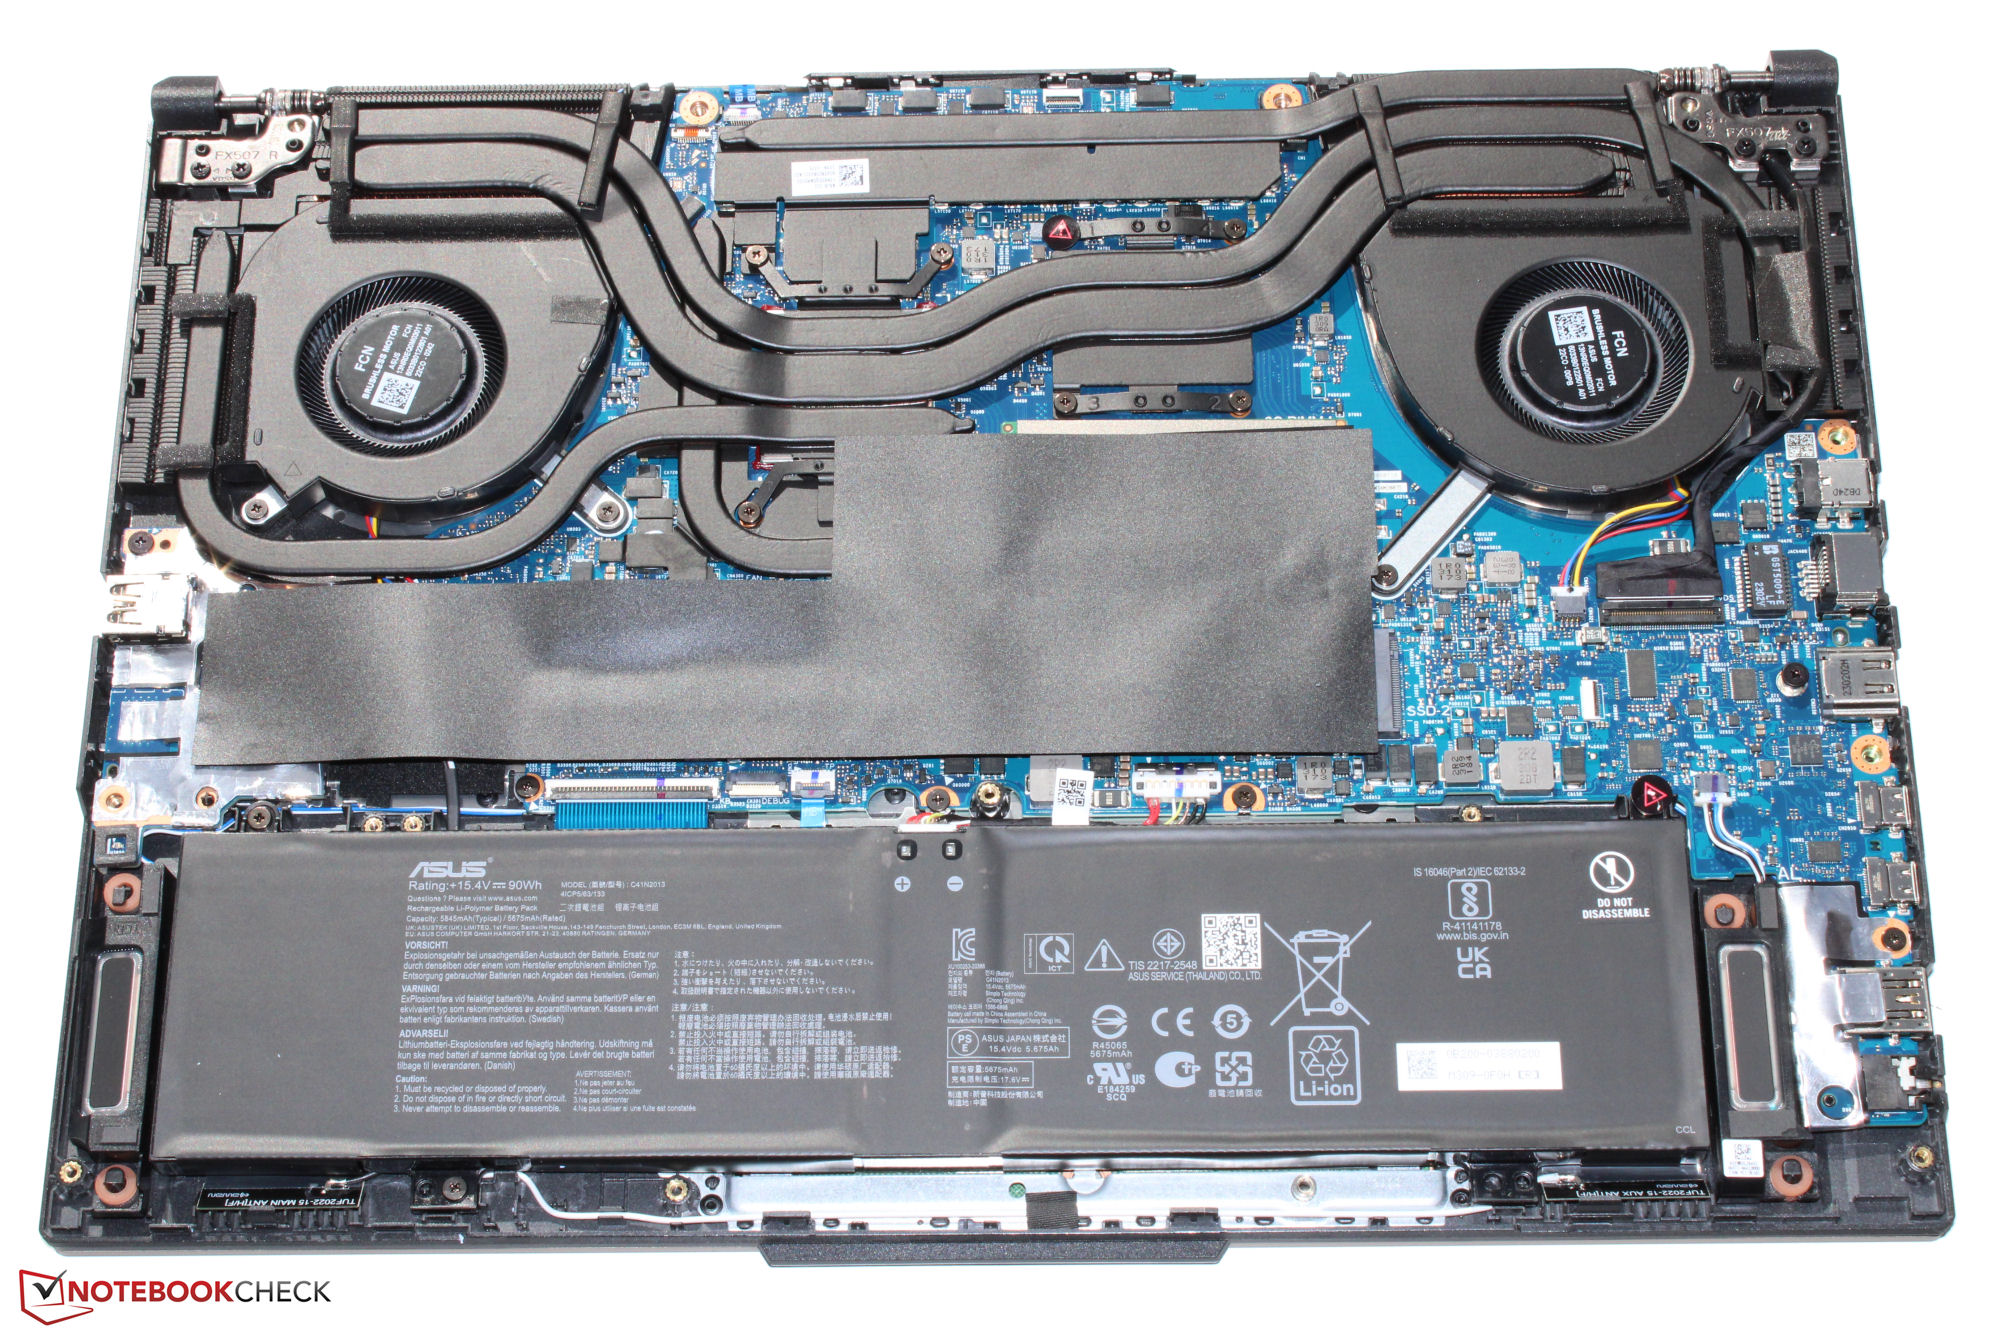
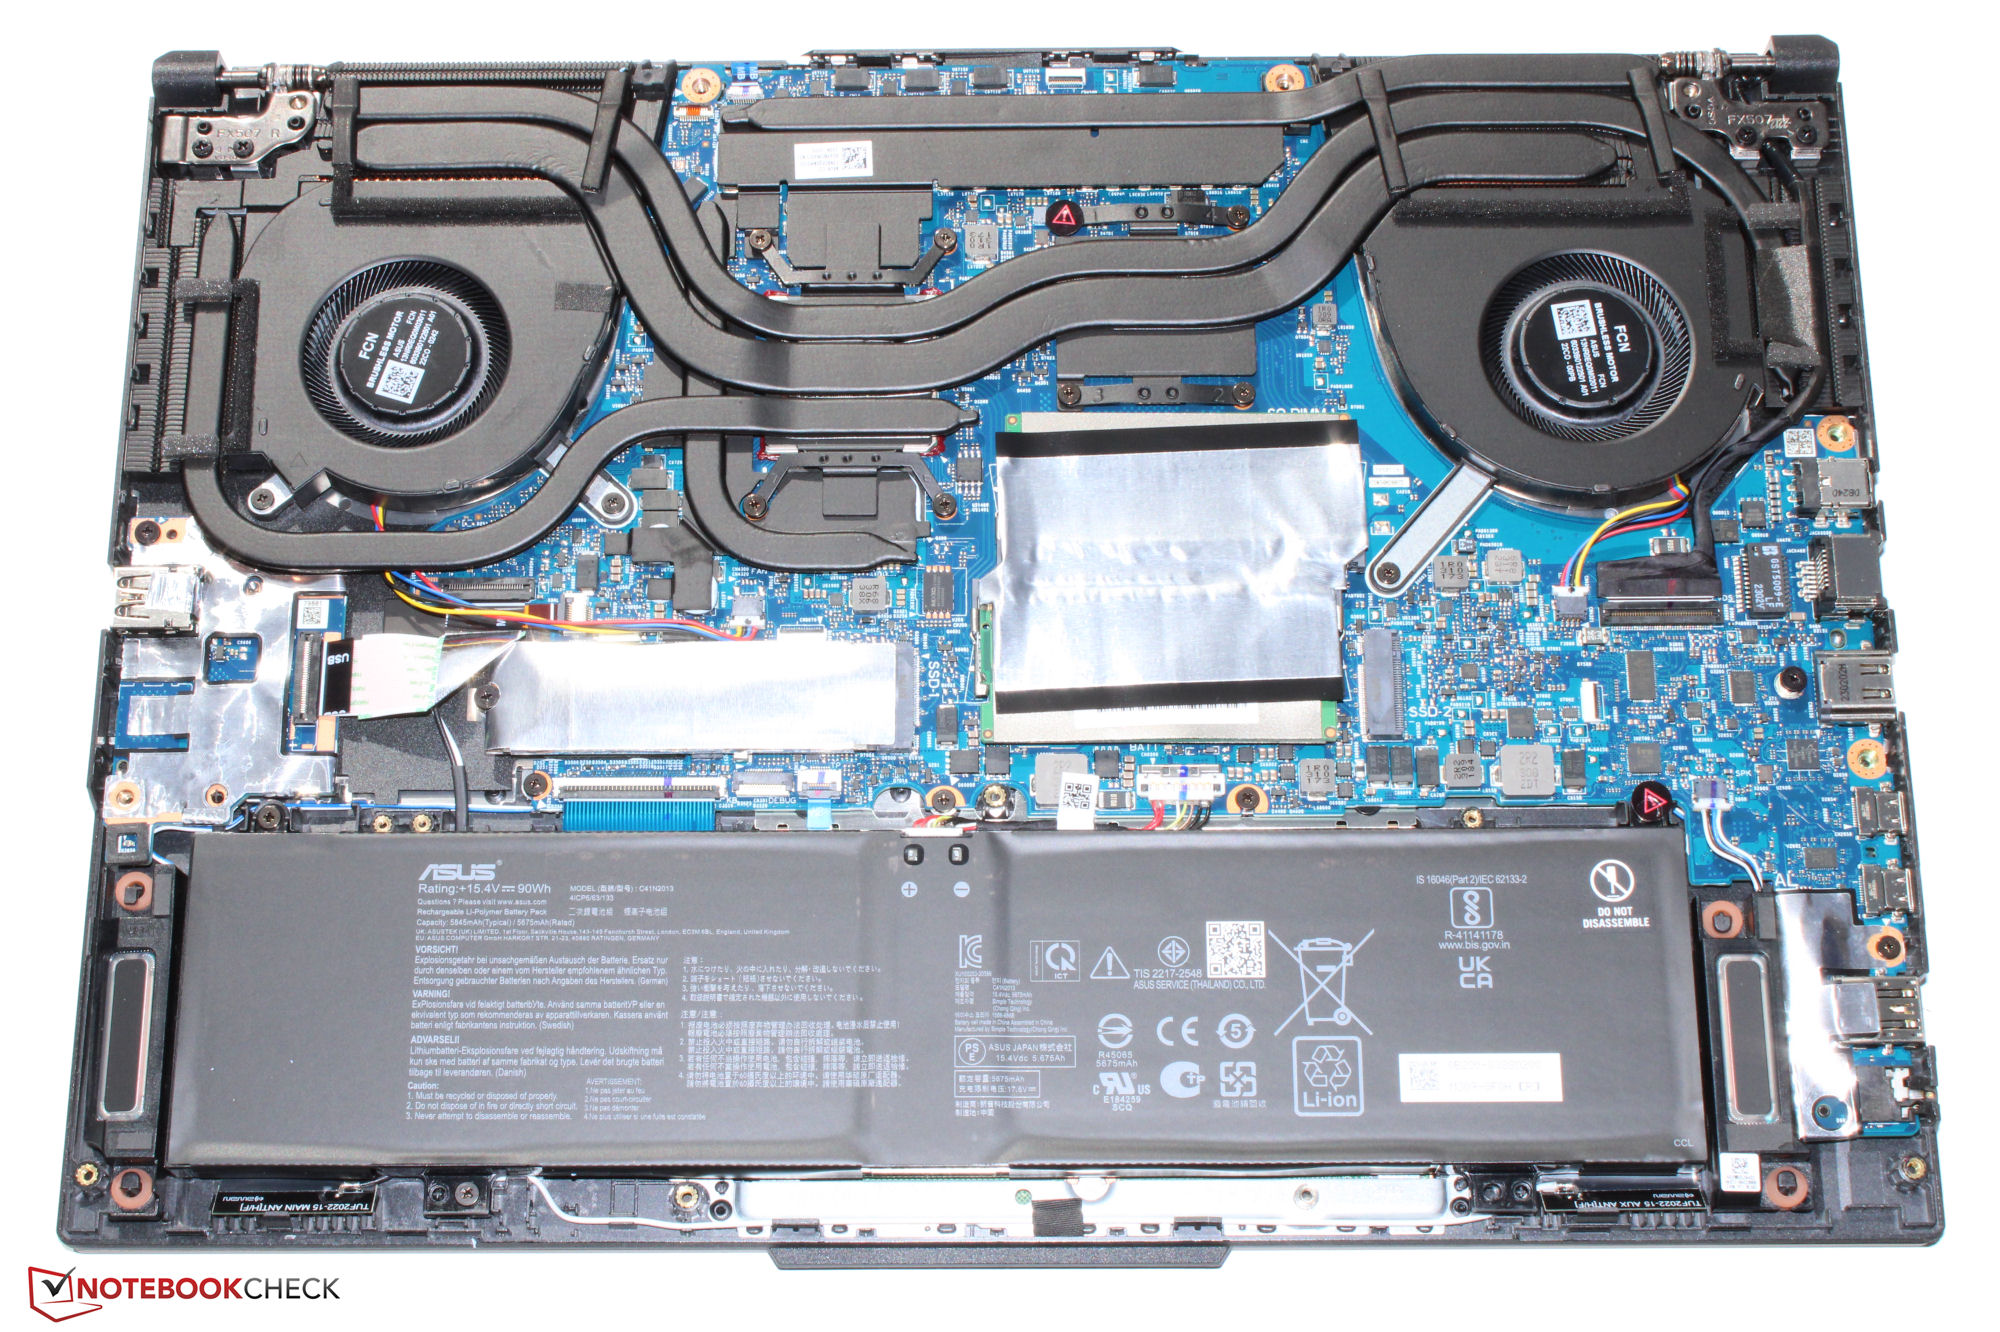
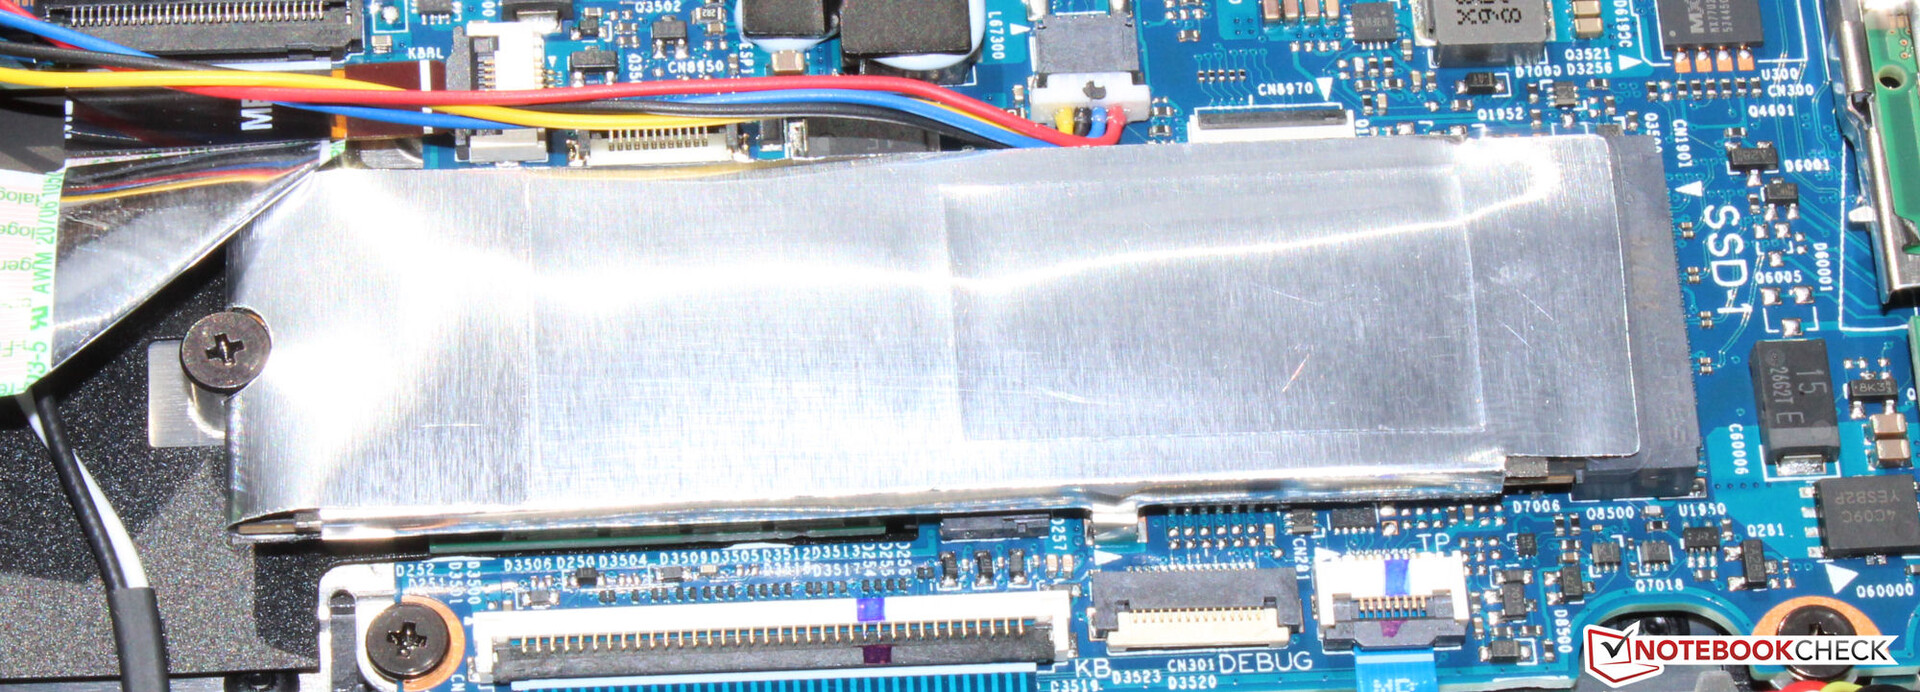
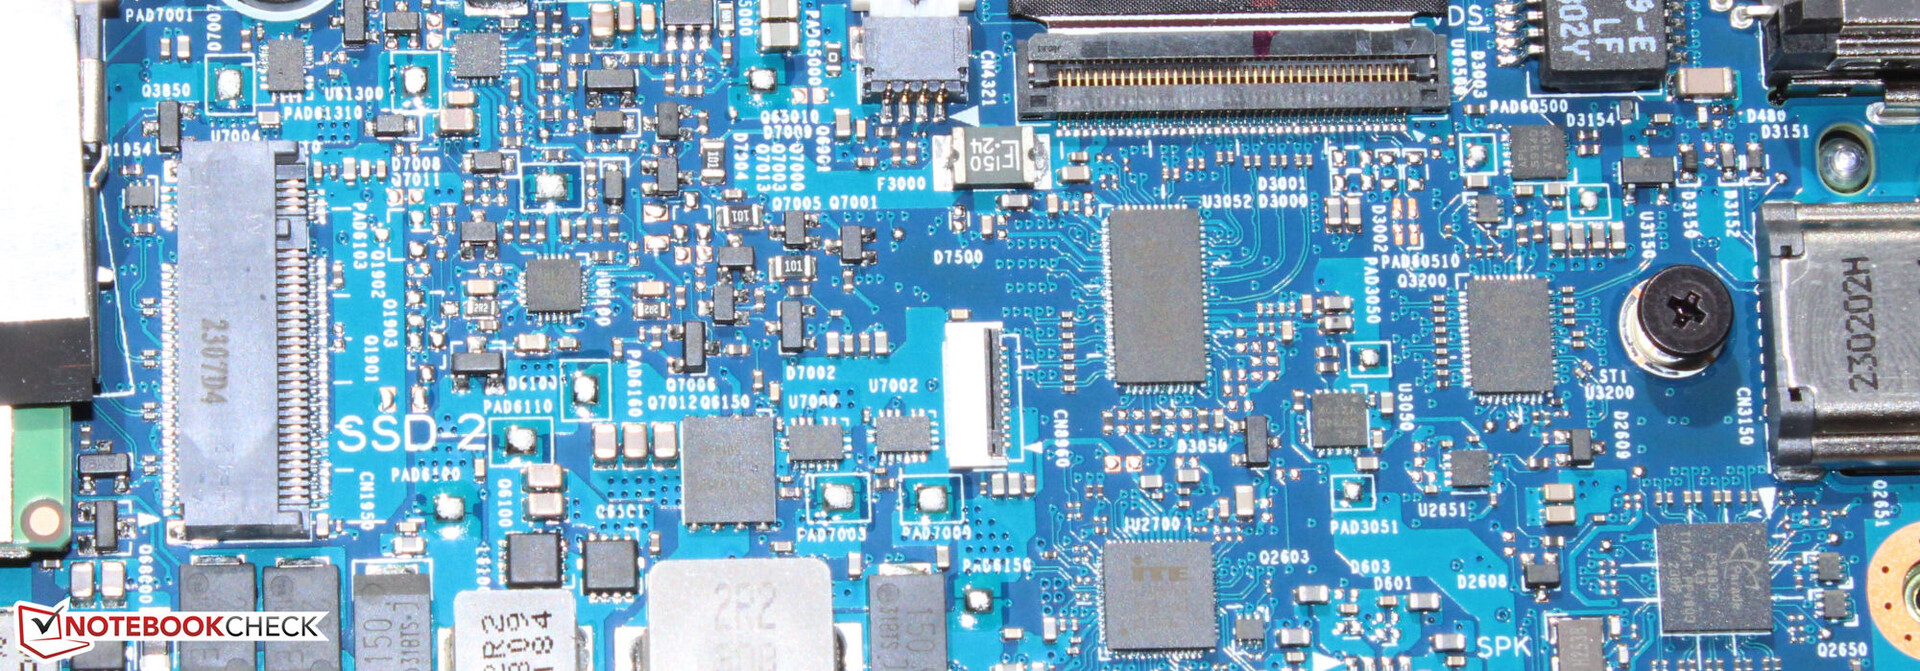
存储设备
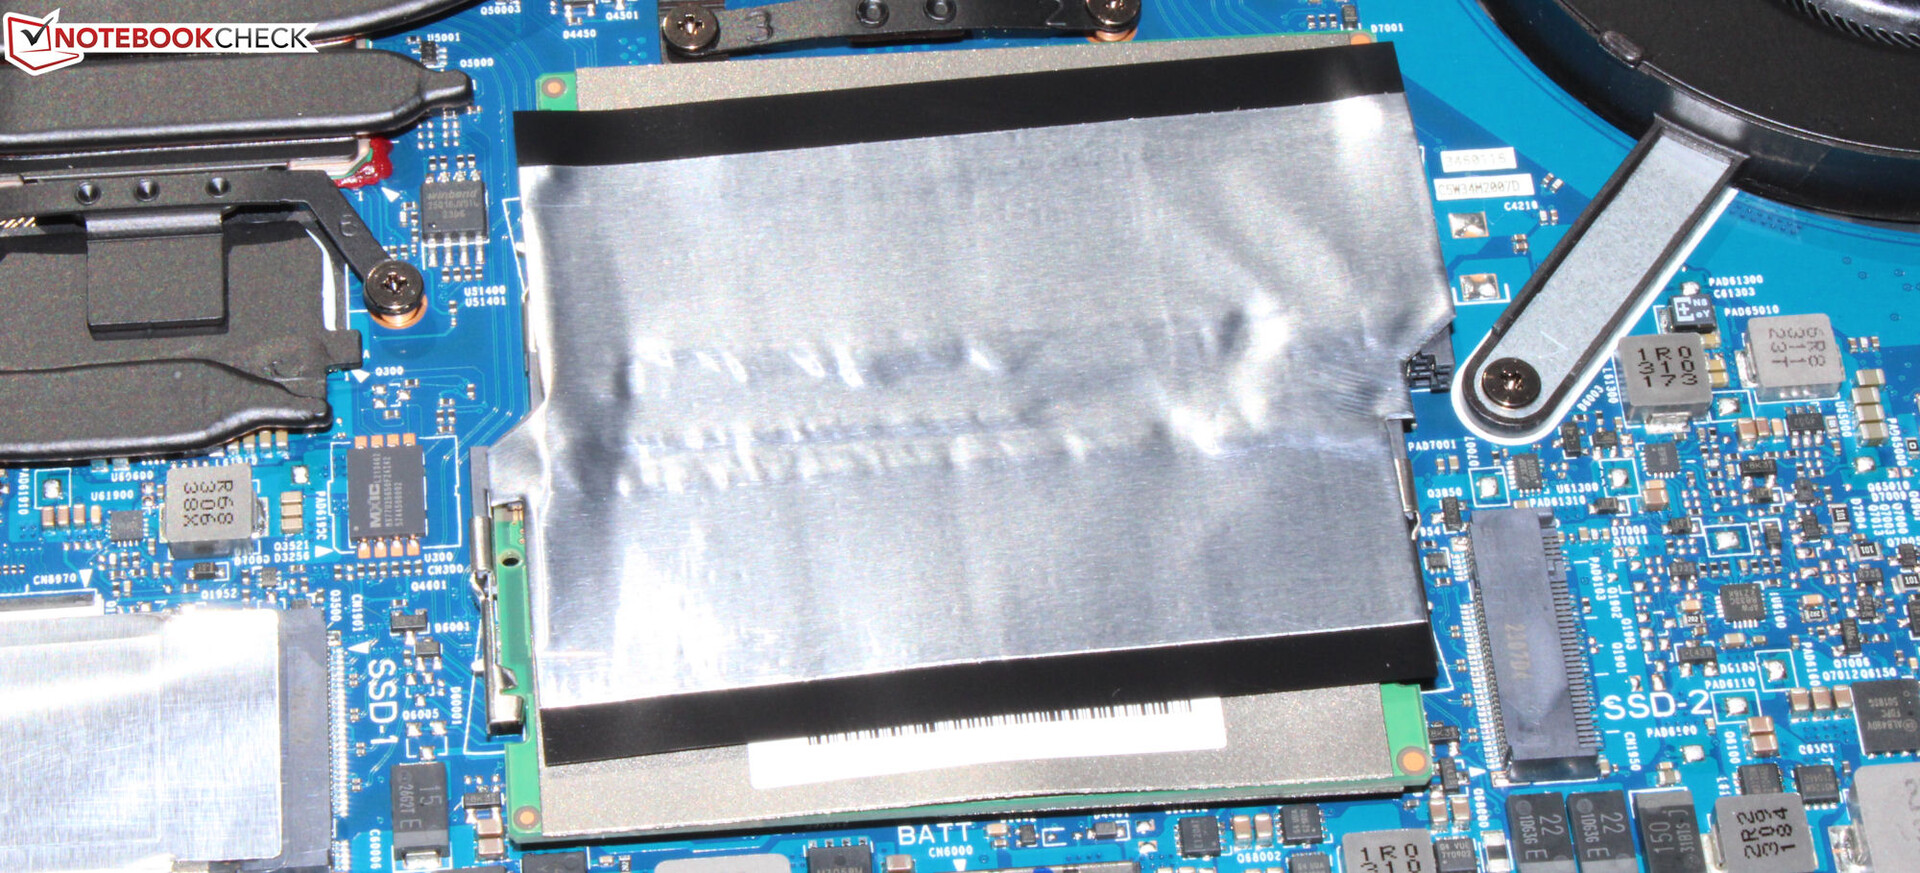
华硕为A16配备了美光的512GB固态硬盘(PCIe 4,M.2-2280)--对于游戏笔记本来说,存储空间太小。它提供了体面的数据速率,但在所有可用的固态硬盘中并不是顶级型号之一。尤其是写入率远远低于当今的可能性。

* ... smaller is better
reading continuous performance: DiskSpd Read Loop, Queue Depth 8
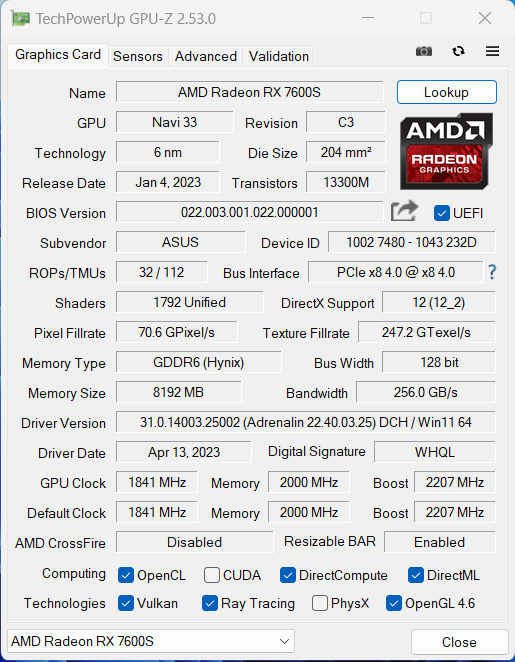
图形卡
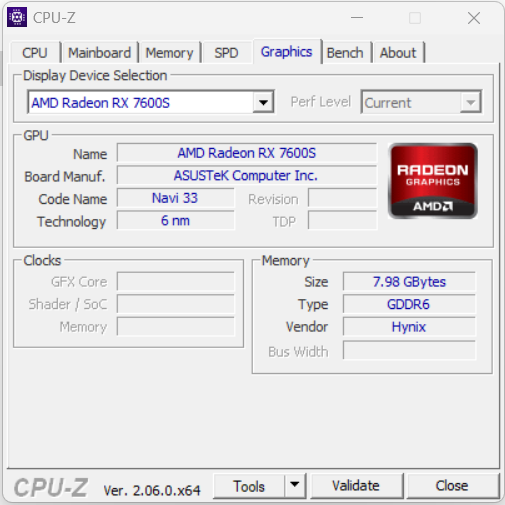
AMD的Radeon RX 7600S具有1,792个着色器、一条128位宽总线和快速GDDR6存储(8,192 MB)。根据测试,其最大的TGP(95瓦)并没有充分发挥其潜力。 Witcher 3测试。基准测试结果与预期完全一致,使用 "Turbo "配置文件并没有导致任何性能的提高。
中端GPU的竞争对手可以在GeForce 型号中找到 RTX 4060,RTX 4050和 RTX 3060的全部配置(=最大TGP)。虽然它不能完全跟上RTX 4060,但它在3DMark基准测试中仍然比其他两个GeForce ,表现得更好。在实际的游戏使用中,我们无法得到一个一致的画面:根据不同的游戏,有时一个GPU做得更好,有时另一个--至少在我们测试的游戏中。


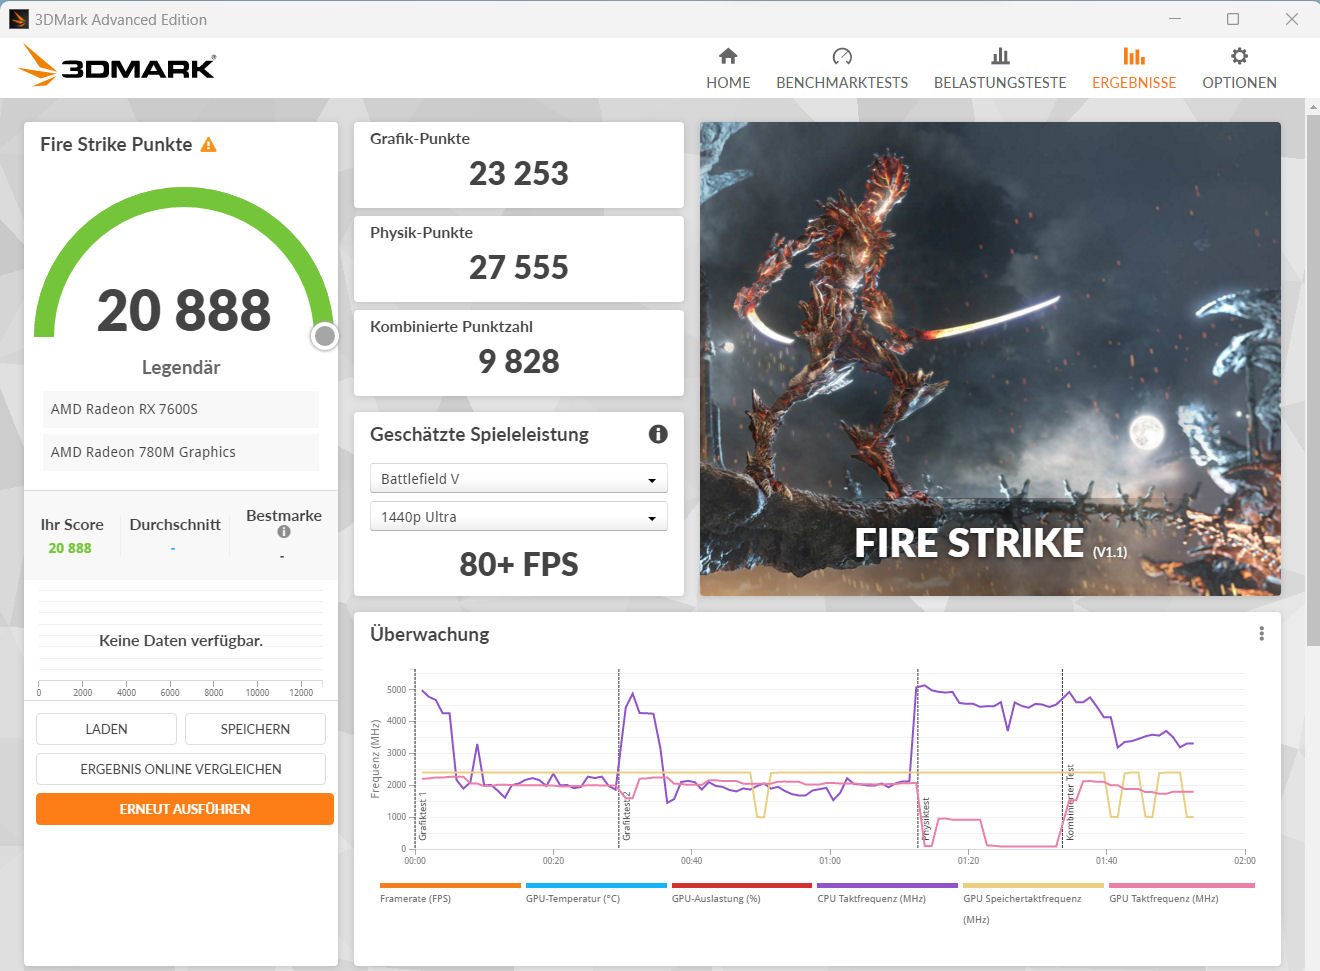
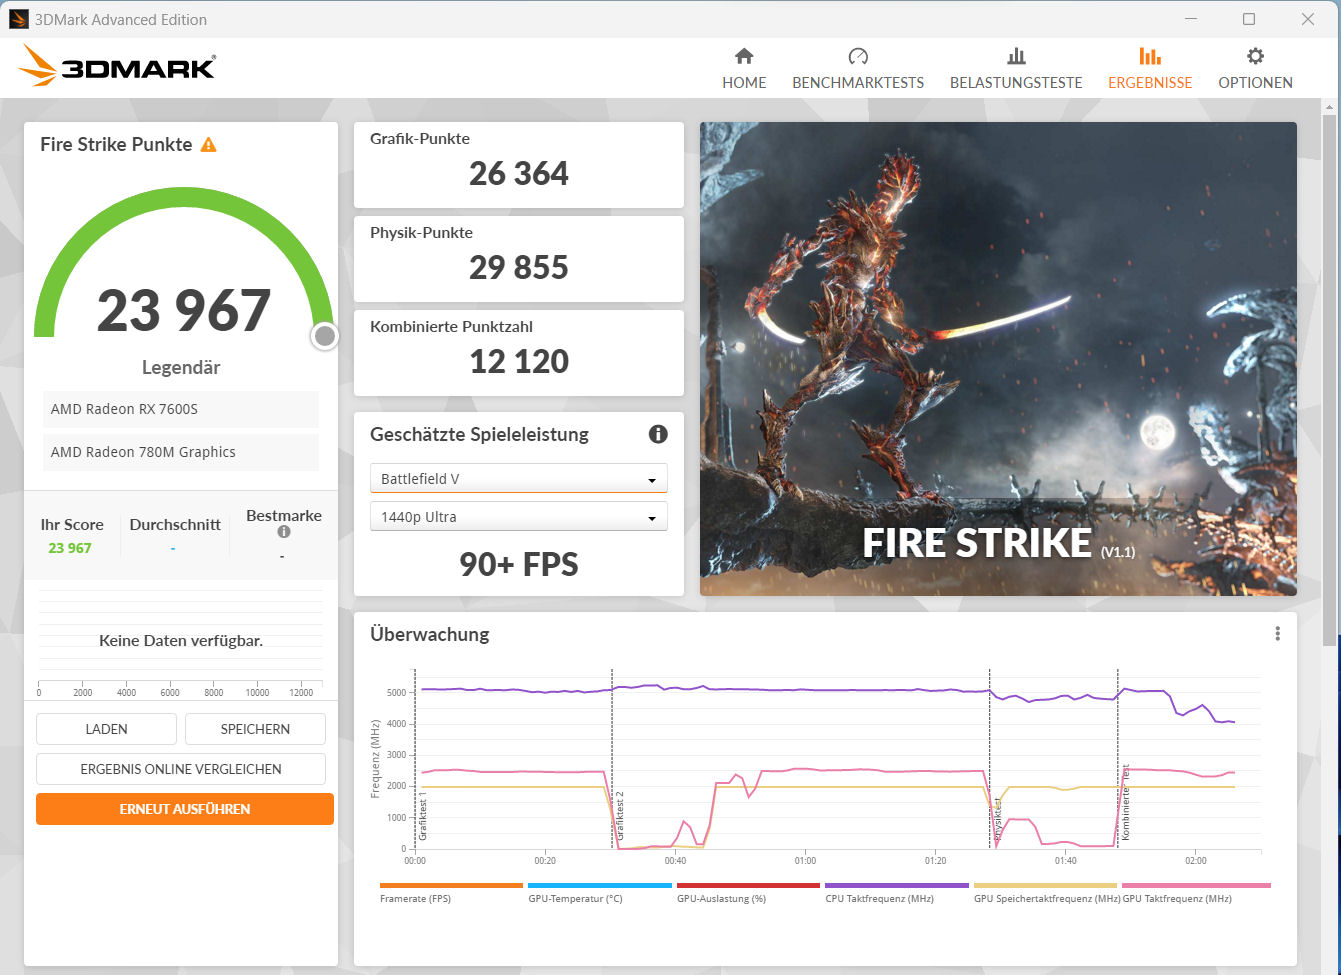
| 3DMark 06 Standard Score | 55435 points | |
| 3DMark 11 Performance | 28721 points | |
| 3DMark Cloud Gate Standard Score | 64441 points | |
| 3DMark Fire Strike Score | 23346 points | |
| 3DMark Time Spy Score | 9530 points | |
Help | ||
| V-Ray 5 Benchmark | |
| GPU RTX | |
| Average of class Gaming (1146 - 4363, n=33, last 2 years) | |
| Lenovo Legion Pro 5 16IRX8 (5.0.1) | |
| Medion Erazer Defender P40 (5.0.1) | |
| Gigabyte G7 KE (5.0.1) | |
| GPU CUDA | |
| Average of class Gaming (887 - 3288, n=33, last 2 years) | |
| Lenovo Legion Pro 5 16IRX8 (5.0.1) | |
| Medion Erazer Defender P40 (5.0.1) | |
| Gigabyte G7 KE (5.0.1) | |
| Asus TUF Gaming A16 FA617XS (5.0.1) | |
| Average AMD Radeon RX 7600S (n=1) | |
| CPU | |
| Average of class Gaming (5864 - 30302, n=32, last 2 years) | |
| Lenovo Legion Pro 5 16IRX8 (5.0.1) | |
| Medion Erazer Defender P40 (5.0.1) | |
| Asus TUF Gaming A16 FA617XS (5.0.1) | |
| Average AMD Radeon RX 7600S (n=1) | |
| Gigabyte G7 KE (5.0.1) | |
| V-Ray Benchmark Next 4.10 | |
| GPU | |
| Average of class Gaming (427 - 1627, n=99, last 2 years) | |
| Medion Erazer Defender P40 (v4.10.07 ) | |
| MSI Katana 15 B12VEK (v4.10.07 ) | |
| Gigabyte G5 KE (v4.10.07 ) | |
| Gigabyte G7 KE (v4.10.07 ) | |
| Asus TUF Gaming A16 FA617XS (v4.10.07 ) | |
| Average AMD Radeon RX 7600S (83 - 96, n=2) | |
| Asus TUF Gaming A16 FA617 (v4.10.07 ) | |
| CPU | |
| Average of class Gaming (10048 - 45327, n=97, last 2 years) | |
| Medion Erazer Defender P40 (v4.10.07 ) | |
| Asus TUF Gaming A16 FA617XS (v4.10.07 ) | |
| Average AMD Radeon RX 7600S (14759 - 17623, n=2) | |
| Asus TUF Gaming A16 FA617 (v4.10.07 ) | |
| Gigabyte G7 KE (v4.10.07 ) | |
| Gigabyte G5 KE (v4.10.07 ) | |
| MSI Katana 15 B12VEK (v4.10.07 ) | |
游戏性能
FA617是为高至最高设置的游戏而设计的。可以使用全屏分辨率(1,920 x 1,200像素)。当连接了相应的显示器时,更高的分辨率是可以使用的--部分降低了设置。Turbo "配置文件不会增加帧率。
| The Witcher 3 - 1920x1080 Ultra Graphics & Postprocessing (HBAO+) | |
| Average of class Gaming (104.7 - 240, n=7, last 2 years) | |
| Lenovo Legion Pro 5 16IRX8 | |
| Medion Erazer Defender P40 | |
| Asus TUF Gaming A16 FA617XS (neu) | |
| Average AMD Radeon RX 7600S (91 - 98.1, n=2) | |
| Asus TUF Gaming A16 FA617 | |
| Gigabyte G5 KE | |
| MSI Katana 15 B12VEK | |
| Final Fantasy XV Benchmark - 1920x1080 High Quality | |
| Average of class Gaming (41 - 215, n=95, last 2 years) | |
| Lenovo Legion Pro 5 16IRX8 (1.3) | |
| Medion Erazer Defender P40 (1.3) | |
| Gigabyte G5 KE (1.3) | |
| Asus TUF Gaming A16 FA617XS (1.3) | |
| MSI Katana 15 B12VEK (1.3) | |
| Average AMD Radeon RX 7600S (78.2 - 85.2, n=2) | |
| Asus TUF Gaming A16 FA617 (1.3) | |
| Strange Brigade - 1920x1080 ultra AA:ultra AF:16 | |
| Average of class Gaming (76.3 - 458, n=87, last 2 years) | |
| Medion Erazer Defender P40 (1.47.22.14 D3D12) | |
| Asus TUF Gaming A16 FA617XS (1.47.22.14 D3D12) | |
| Average AMD Radeon RX 7600S (162.7 - 163.3, n=2) | |
| Asus TUF Gaming A16 FA617 (1.47.22.14 D3D12) | |
| Gigabyte G5 KE (1.47.22.14 D3D12) | |
| MSI Katana 15 B12VEK (1.47.22.14 D3D12) | |
| Returnal | |
| 1920x1080 Epic Preset | |
| Lenovo Legion Pro 5 16IRX8 | |
| Asus TUF Gaming A16 FA617XS | |
| Average AMD Radeon RX 7600S (n=1) | |
| 1920x1080 Epic Preset + Epic Ray-Tracing | |
| Asus TUF Gaming A16 FA617XS | |
| Average AMD Radeon RX 7600S (n=1) | |
| Atomic Heart - 1920x1080 Atomic Preset | |
| Asus TUF Gaming A16 FA617XS | |
| Average AMD Radeon RX 7600S (n=1) | |
| Sons of the Forest - 1920x1080 Ultra Preset AA:T | |
| Asus TUF Gaming A16 FA617XS | |
| Average AMD Radeon RX 7600S (n=1) | |
| Resident Evil 4 Remake - 1920x1080 Max Preset | |
| Medion Erazer Defender P40 | |
| Asus TUF Gaming A16 FA617XS | |
| Average AMD Radeon RX 7600S (n=1) | |
| The Last of Us - 1920x1080 Ultra Preset | |
| Asus TUF Gaming A16 FA617XS | |
| Average AMD Radeon RX 7600S (n=1) | |
| Hogwarts Legacy | |
| 1920x1080 Ultra Preset AA:High T | |
| Average of class Gaming (n=1last 2 years) | |
| Asus TUF Gaming A16 FA617XS | |
| Average AMD Radeon RX 7600S (n=1) | |
| 1920x1080 Ultra Preset + Full Ray Tracing AA:High T | |
| Asus TUF Gaming A16 FA617XS | |
| Average AMD Radeon RX 7600S (n=1) | |
| Company of Heroes 3 - 1920x1080 Maximum Settings | |
| Asus TUF Gaming A16 FA617XS | |
| Average AMD Radeon RX 7600S (n=1) | |
| Dead Island 2 - 1920x1080 Ultra Preset AA:High T | |
| Medion Erazer Defender P40 | |
| Asus TUF Gaming A16 FA617XS | |
| Average AMD Radeon RX 7600S (n=1) | |
| Flight Simulator 2020 - 1920x1080 Ultra AA:TAA AF:16x | |
| Asus TUF Gaming A16 FA617XS | |
| Average AMD Radeon RX 7600S (n=1) | |
| Far Cry 6 | |
| 1920x1080 Ultra Graphics Quality + HD Textures AA:T | |
| Average of class Gaming (n=1last 2 years) | |
| Asus TUF Gaming A16 FA617XS | |
| Average AMD Radeon RX 7600S (n=1) | |
| 1920x1080 Ultra Graphics Quality + HD Textures + DXR AA:T | |
| Average of class Gaming (n=1last 2 years) | |
| Asus TUF Gaming A16 FA617XS | |
| Average AMD Radeon RX 7600S (n=1) | |
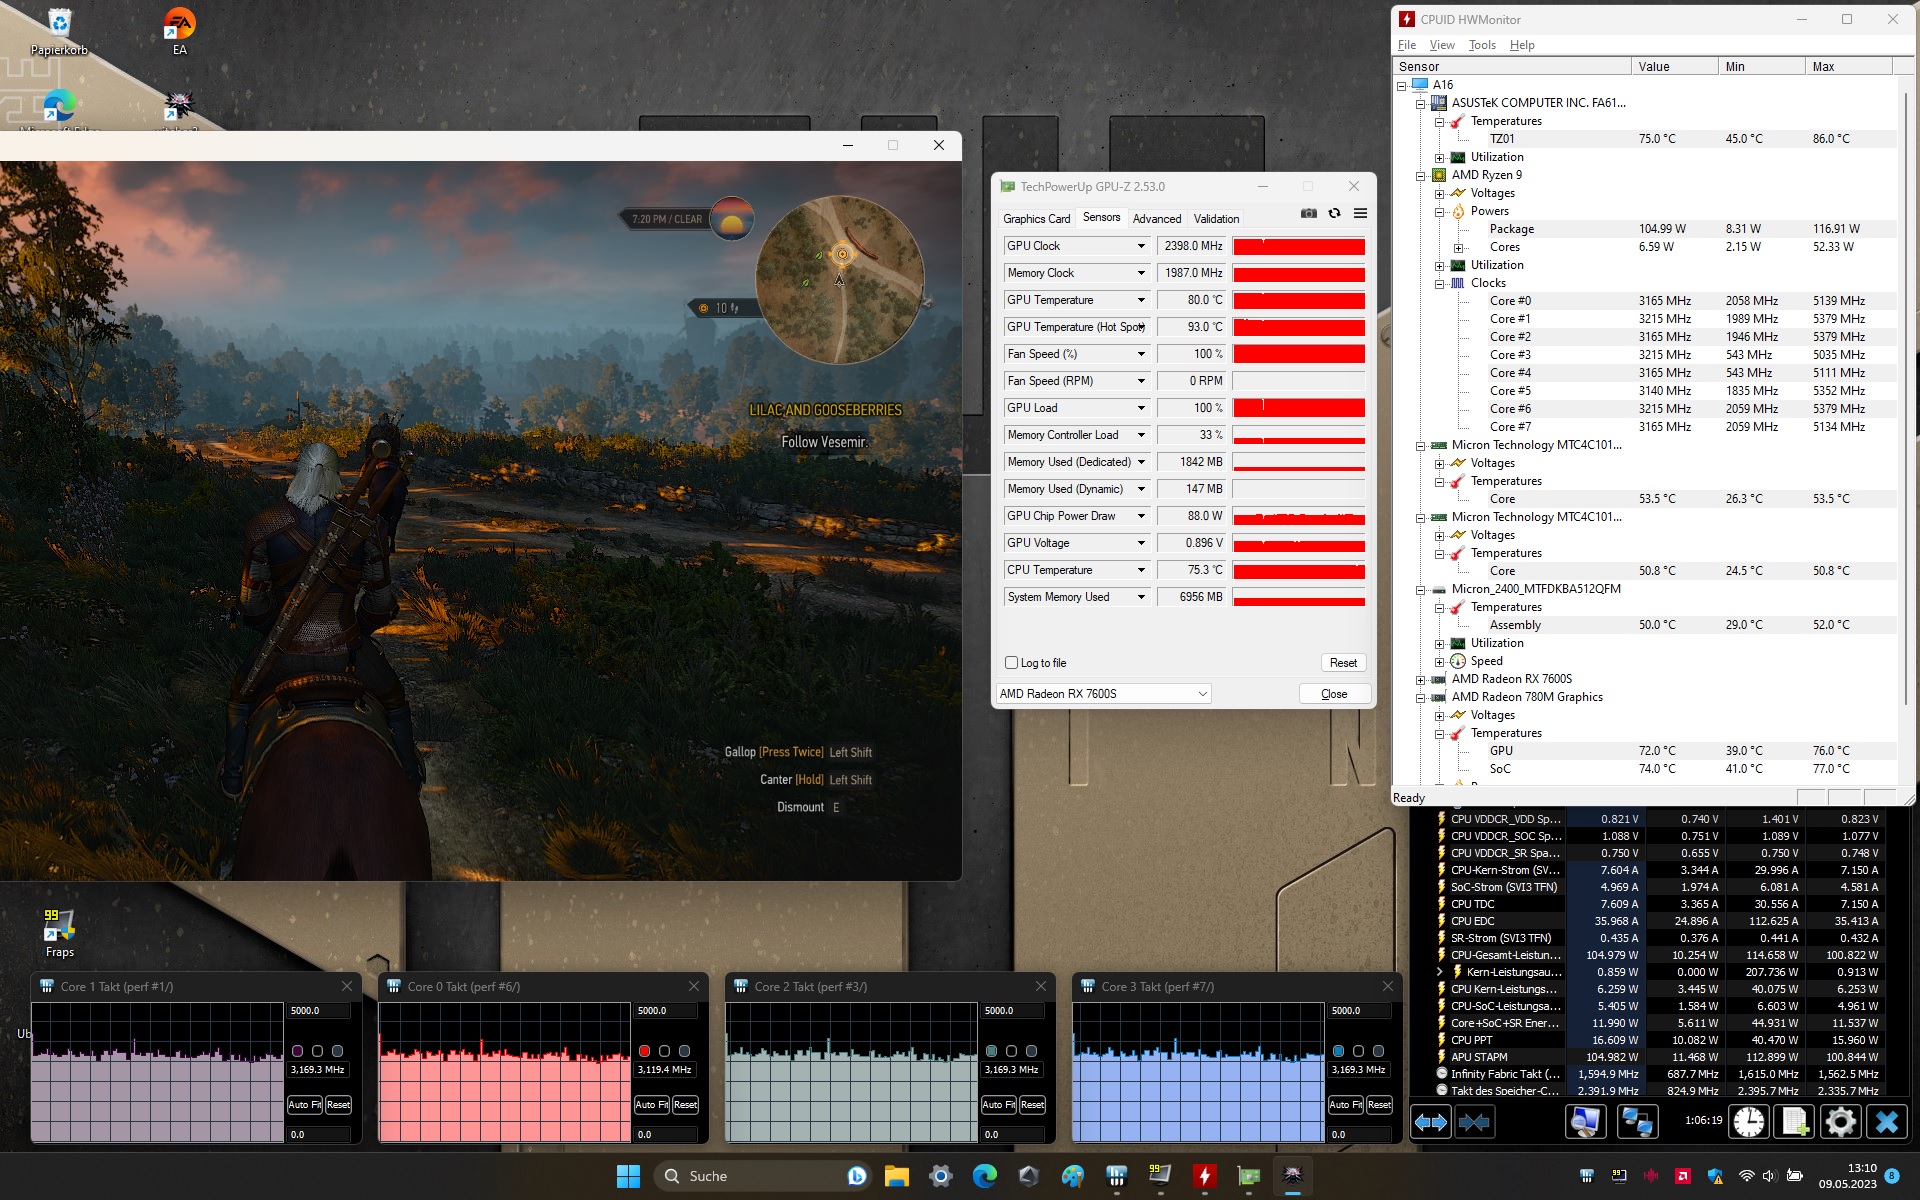
为了检查帧率是否在较长时间内基本保持不变,我们在全高清分辨率和最高质量设置下运行游戏《Witcher 3 》约60分钟。游戏角色没有被移动。没有注意到性能的下降。
Witcher 3 FPS diagram
| low | med. | high | ultra | |
|---|---|---|---|---|
| GTA V (2015) | 184.7 | 171.7 | 92.9 | |
| The Witcher 3 (2015) | 382 | 166.5 | 98.1 | |
| Dota 2 Reborn (2015) | 157.5 | 143.1 | 132.2 | 121.6 |
| Final Fantasy XV Benchmark (2018) | 215 | 117.2 | 85.2 | |
| X-Plane 11.11 (2018) | 85.1 | 72 | 57.3 | |
| Far Cry 5 (2018) | 135 | 120 | 115 | 108 |
| Strange Brigade (2018) | 440 | 228 | 190.8 | 163.3 |
| Metro Exodus (2019) | 187.3 | 116.5 | ||
| The Division 2 (2019) | 232 | 167 | 131 | 95 |
| Control (2019) | 235 | 116.6 | 83.5 | |
| Doom Eternal (2020) | 376 | 209 | 184.3 | 179 |
| Gears Tactics (2020) | 381.4 | 216.1 | 138.1 | 95.4 |
| Death Stranding (2020) | 189.5 | 144.1 | 133.6 | 129.6 |
| Flight Simulator 2020 (2020) | 134.9 | 85.5 | 60.1 | 42.7 |
| Crysis Remastered (2020) | 294 | 190.9 | 90.6 | 38.6 |
| Watch Dogs Legion (2020) | 122.6 | 118.5 | 106.6 | 69.5 |
| Assassin´s Creed Valhalla (2020) | 203 | 124 | 102 | 88 |
| Hitman 3 (2021) | 270 | 178.2 | 157.4 | 145.7 |
| Far Cry 6 (2021) | 151 | 133 | 119 | 104.7 |
| Forza Horizon 5 (2021) | 197 | 144 | 135 | 74 |
| GRID Legends (2022) | 214.9 | 182.8 | 156.5 | 129.3 |
| Tiny Tina's Wonderlands (2022) | 198.1 | 156.8 | 105.7 | 82.2 |
| F1 22 (2022) | 263 | 244 | 190 | 50.5 |
| A Plague Tale Requiem (2022) | 98.2 | 78 | 66.1 | 55.4 |
| Hogwarts Legacy (2023) | 118.4 | 88.7 | 72 | 55.4 |
| Returnal (2023) | 91 | 88 | 78 | 67 |
| Atomic Heart (2023) | 167.1 | 125.5 | 71.6 | 56.6 |
| Company of Heroes 3 (2023) | 143.4 | 125.9 | 97.4 | 97.2 |
| Sons of the Forest (2023) | 93.2 | 81.4 | 78 | 76.7 |
| Resident Evil 4 Remake (2023) | 107.4 | 83.2 | 78.9 | 52.3 |
| The Last of Us (2023) | 81.4 | 67.6 | 60.2 | 51.5 |
| Dead Island 2 (2023) | 201 | 168.1 | 122.7 | 113.1 |
排放 - FA617XS可以变得相当响亮
噪声排放
在日常使用中(办公室、互联网等),A16通常工作得很安静,经常是无声无息的--无论选择何种模式。在游戏模式下,声压级可以上升到53dB(A)("涡轮")或51dB(A)("性能")。通过使用 "静音 "配置文件,可以实现更低的噪音排放。然后,计算能力只减少到非常小的程度。
Noise level
| Idle |
| 25 / 26 / 28 dB(A) |
| Load |
| 43 / 53 dB(A) |
 | ||
30 dB silent 40 dB(A) audible 50 dB(A) loud |
||
min: | ||
| Asus TUF Gaming A16 FA617XS R9 7940HS, Radeon RX 7600S | Lenovo Legion Pro 5 16IRX8 i7-13700HX, GeForce RTX 4060 Laptop GPU | MSI Katana 15 B12VEK i7-12650H, GeForce RTX 4050 Laptop GPU | Medion Erazer Defender P40 i7-13700HX, GeForce RTX 4060 Laptop GPU | Gigabyte G5 KE i5-12500H, GeForce RTX 3060 Laptop GPU | Asus TUF Gaming A16 FA617 R7 7735HS, Radeon RX 7600S | |
|---|---|---|---|---|---|---|
| Noise | 8% | 7% | -11% | -11% | 3% | |
| off / environment * (dB) | 25 | 23 8% | 24 4% | 25 -0% | 19.52 22% | 24 4% |
| Idle Minimum * (dB) | 25 | 23.1 8% | 24 4% | 26 -4% | 31.05 -24% | 24 4% |
| Idle Average * (dB) | 26 | 23.1 11% | 24 8% | 27 -4% | 31.05 -19% | 25 4% |
| Idle Maximum * (dB) | 28 | 26.6 5% | 24 14% | 32 -14% | 31.05 -11% | 28 -0% |
| Load Average * (dB) | 43 | 34.7 19% | 37.71 12% | 53 -23% | 55.66 -29% | 42 2% |
| Witcher 3 ultra * (dB) | 51 | 47.6 7% | 45.75 10% | 56 -10% | 55.7 -9% | 50 2% |
| Load Maximum * (dB) | 53 | 54.8 -3% | 54.55 -3% | 64 -21% | 55.51 -5% | 50 6% |
* ... smaller is better
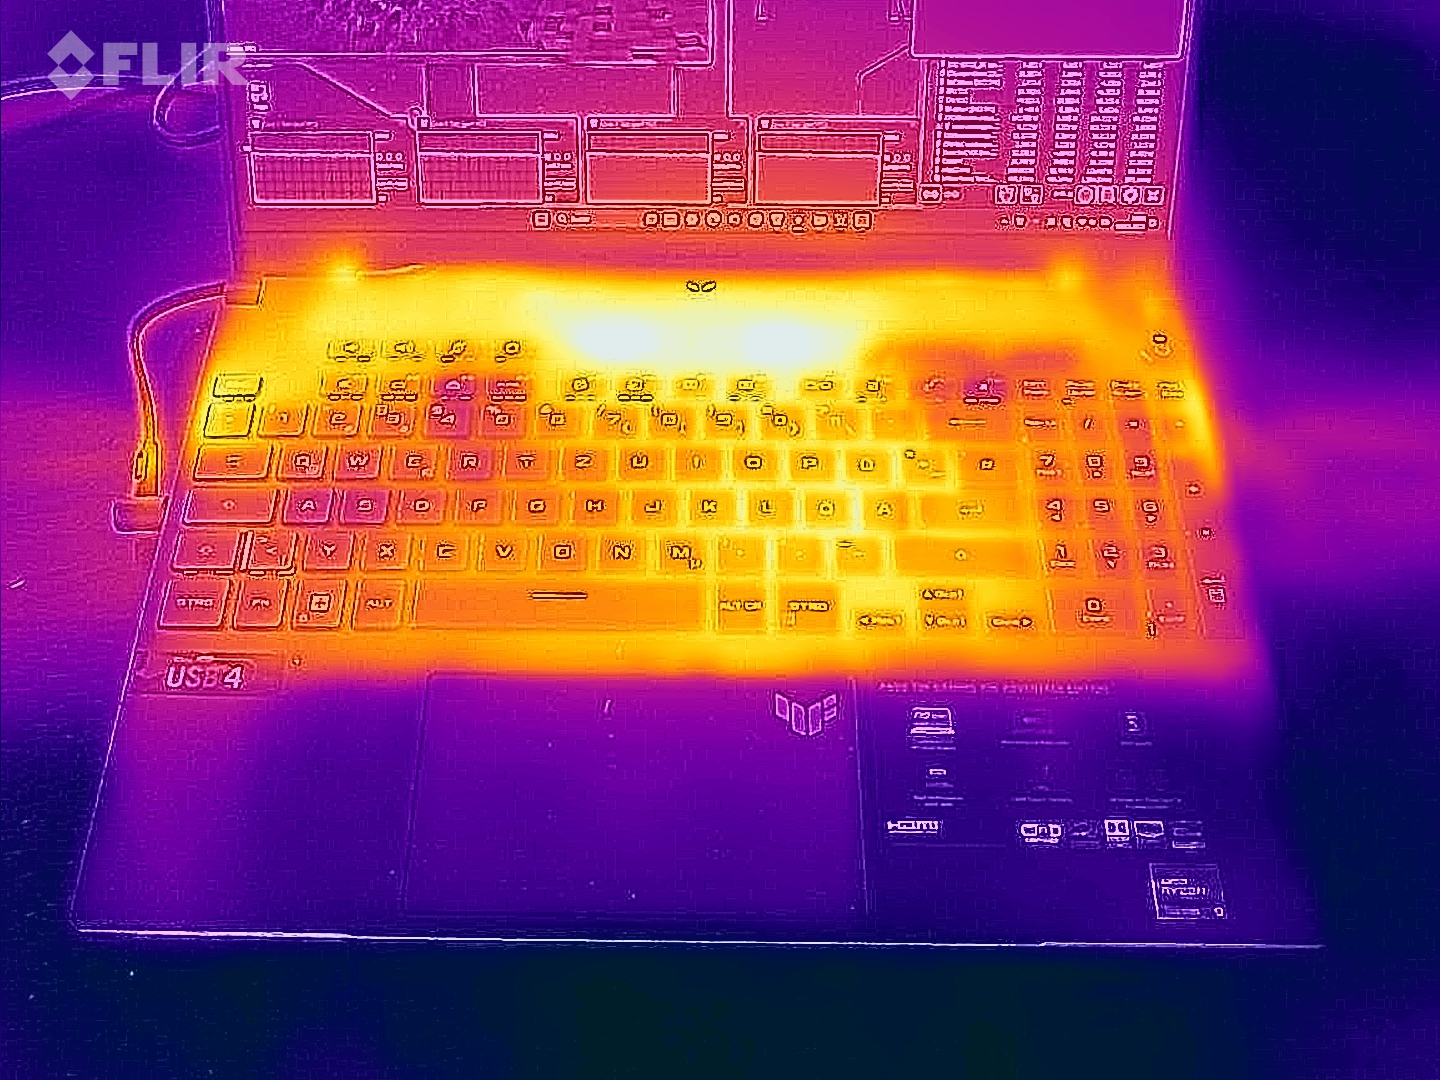
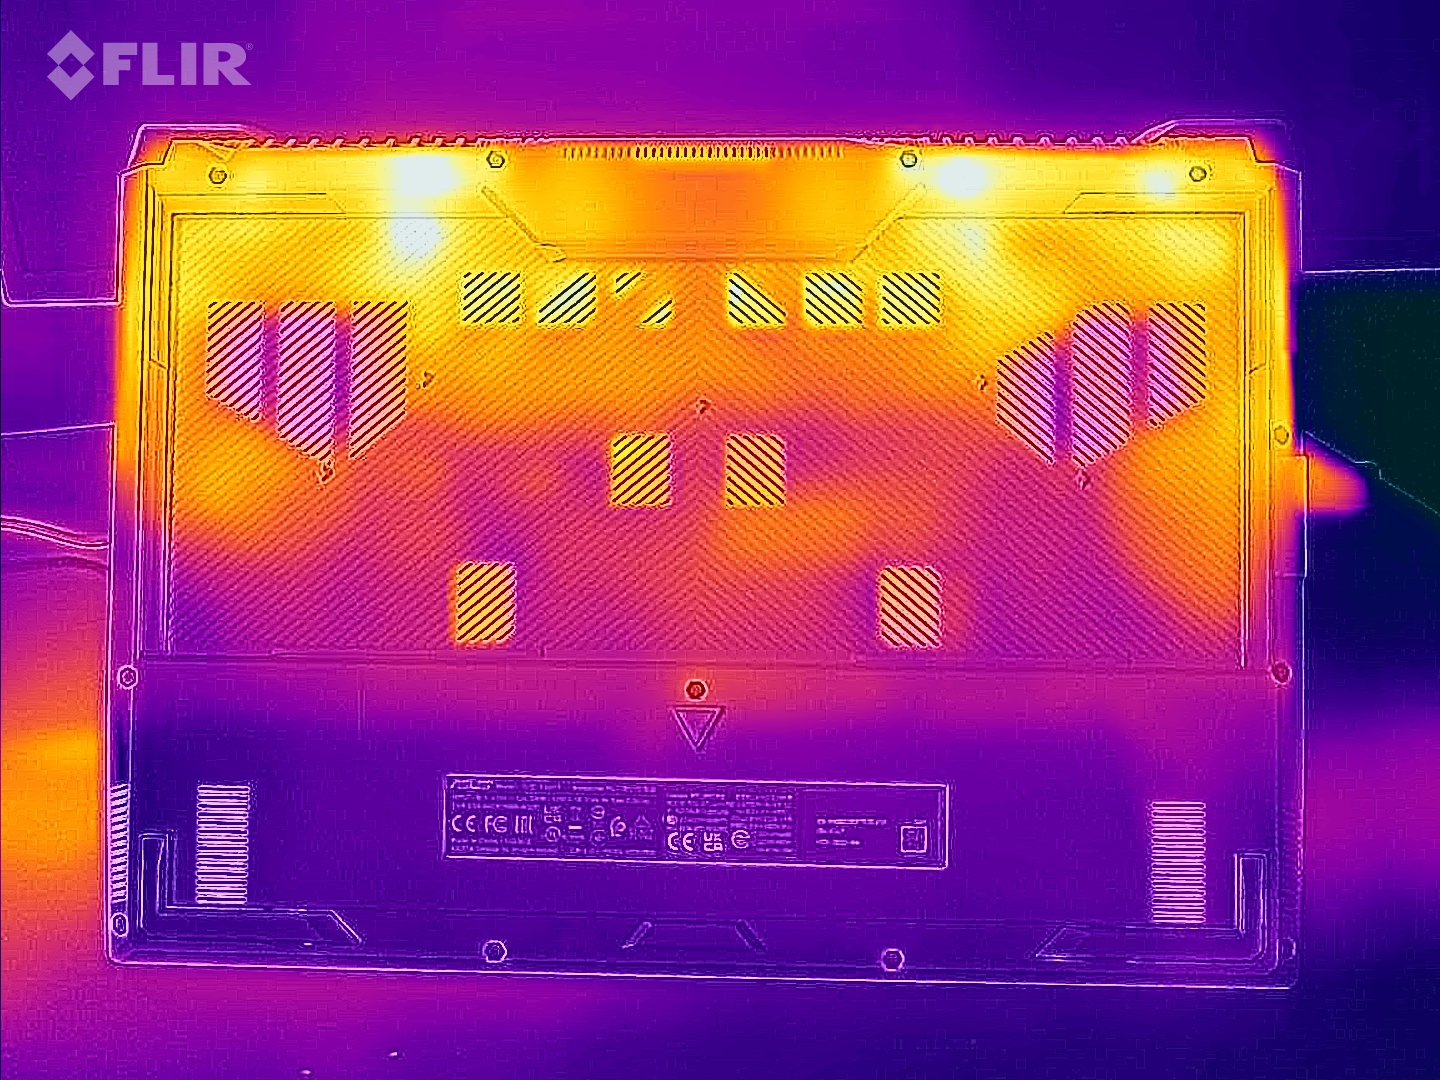
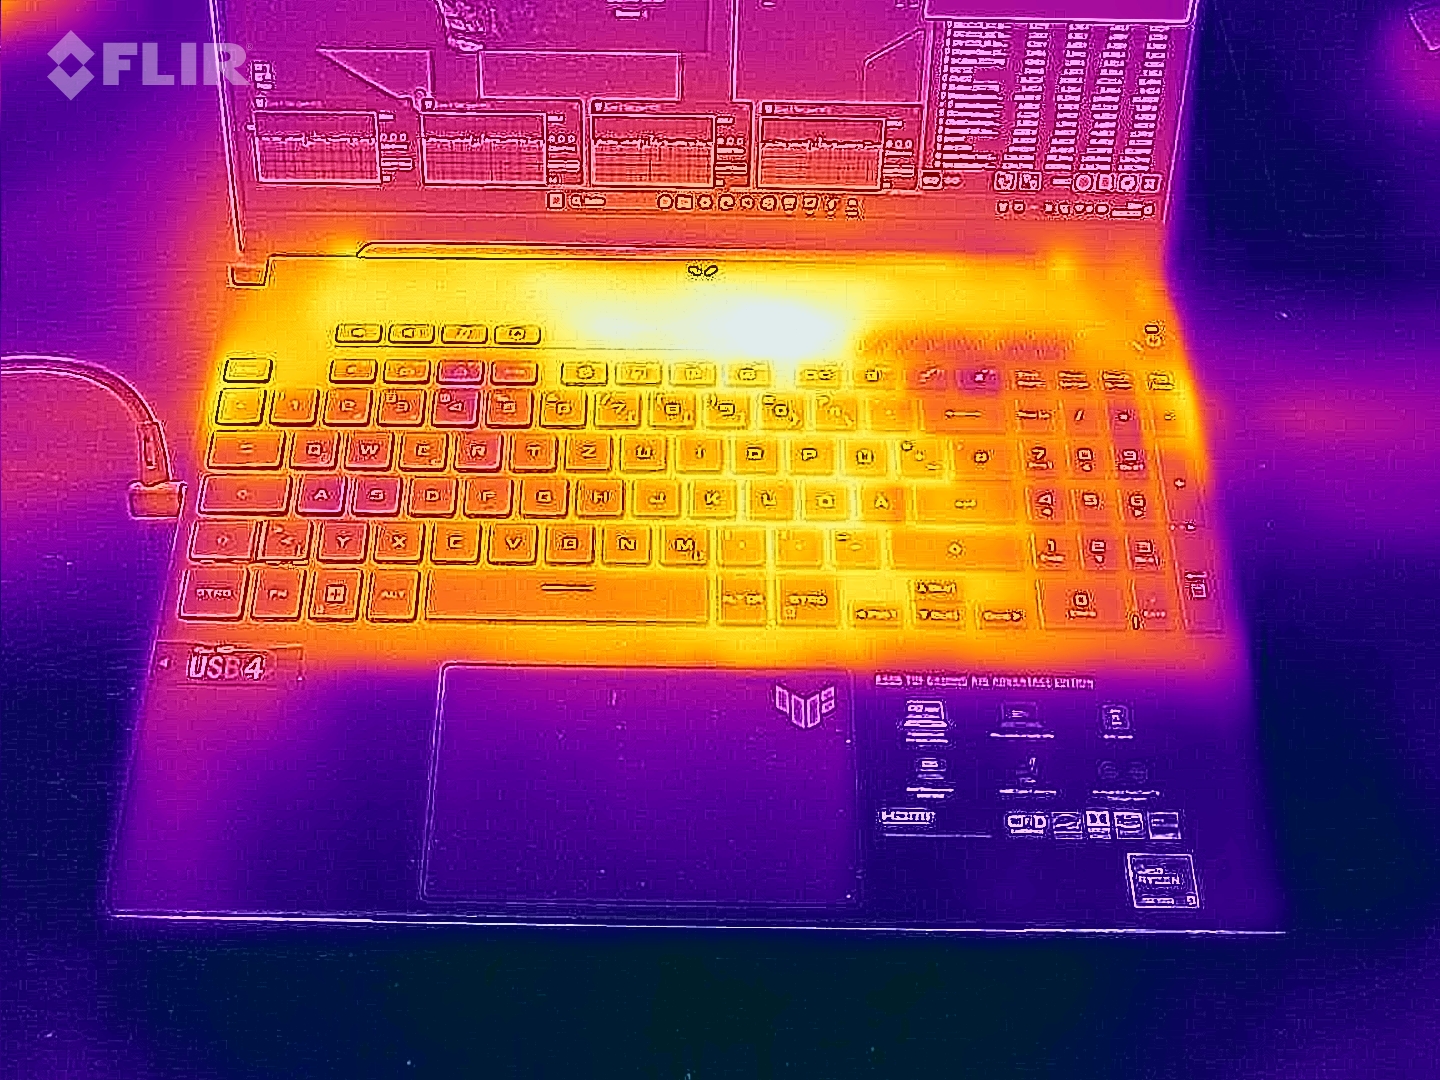
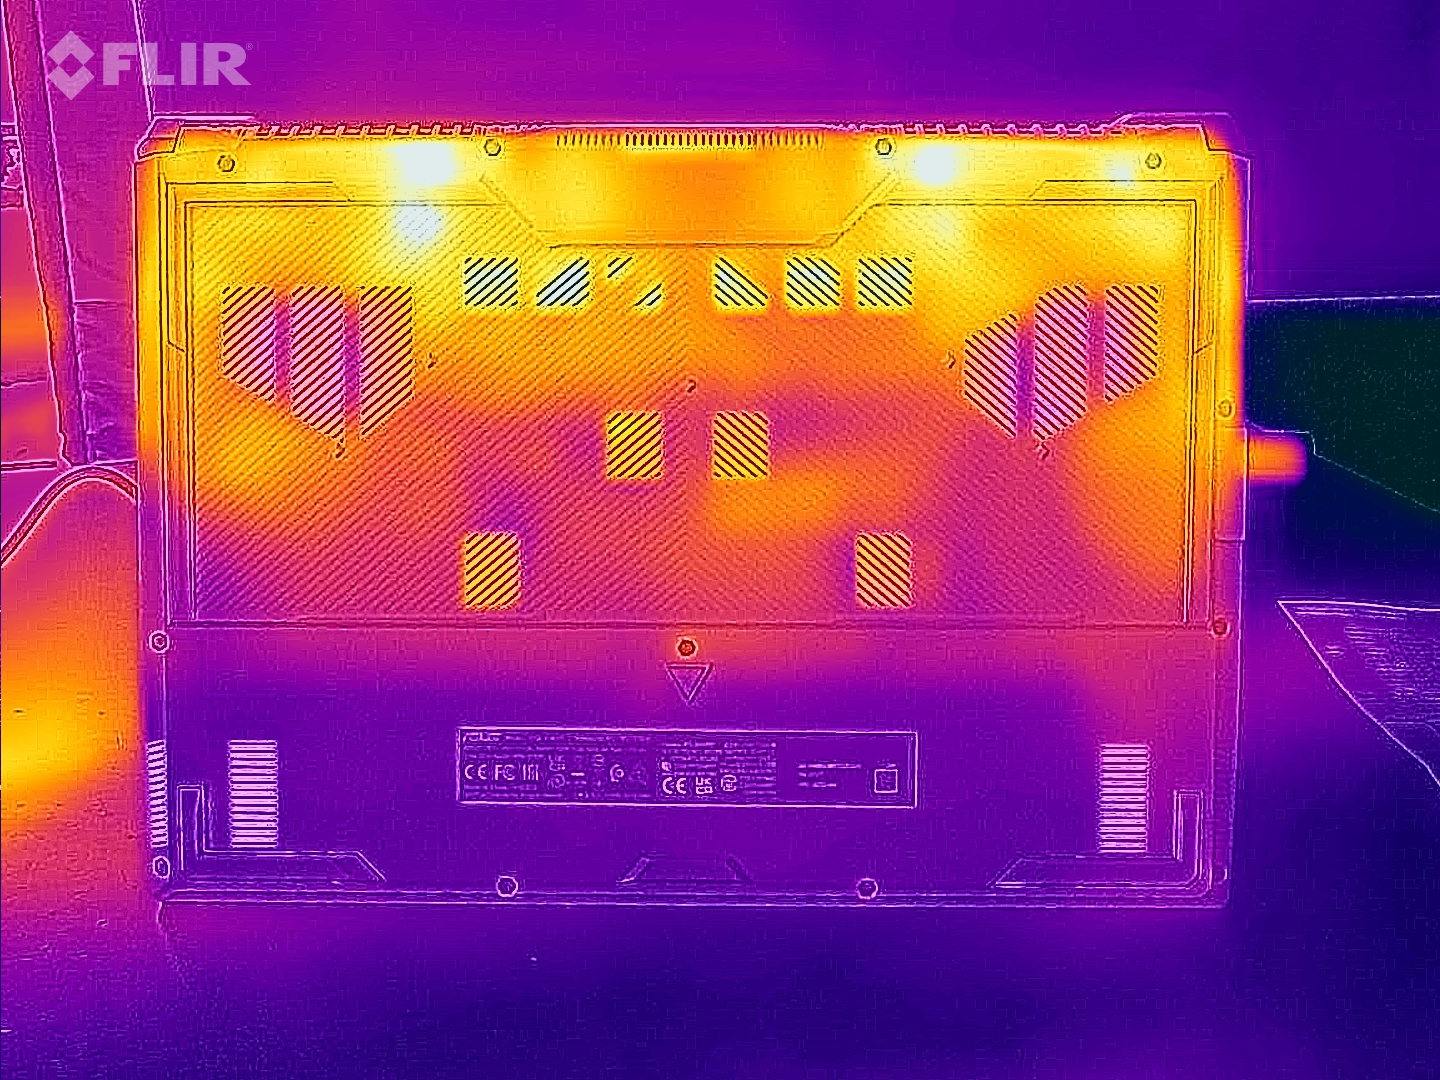
温度
笔记本在负载下会明显发热,但不会过度。在日常使用中,温度处于绿色区域内。后者不是在 姐妹型号- 我们认为这是设备的错误/缺陷。
(-) The maximum temperature on the upper side is 53 °C / 127 F, compared to the average of 40.4 °C / 105 F, ranging from 21.2 to 68.8 °C for the class Gaming.
(-) The bottom heats up to a maximum of 48 °C / 118 F, compared to the average of 43.2 °C / 110 F
(+) In idle usage, the average temperature for the upper side is 28.8 °C / 84 F, compared to the device average of 33.9 °C / 93 F.
(-) Playing The Witcher 3, the average temperature for the upper side is 40 °C / 104 F, compared to the device average of 33.9 °C / 93 F.
(±) The palmrests and touchpad can get very hot to the touch with a maximum of 38 °C / 100.4 F.
(-) The average temperature of the palmrest area of similar devices was 28.8 °C / 83.8 F (-9.2 °C / -16.6 F).
| Asus TUF Gaming A16 FA617XS AMD Ryzen 9 7940HS, AMD Radeon RX 7600S | Lenovo Legion Pro 5 16IRX8 Intel Core i7-13700HX, NVIDIA GeForce RTX 4060 Laptop GPU | MSI Katana 15 B12VEK Intel Core i7-12650H, NVIDIA GeForce RTX 4050 Laptop GPU | Medion Erazer Defender P40 Intel Core i7-13700HX, NVIDIA GeForce RTX 4060 Laptop GPU | Gigabyte G5 KE Intel Core i5-12500H, NVIDIA GeForce RTX 3060 Laptop GPU | Asus TUF Gaming A16 FA617 AMD Ryzen 7 7735HS, AMD Radeon RX 7600S | |
|---|---|---|---|---|---|---|
| Heat | 1% | -8% | 9% | -14% | -17% | |
| Maximum Upper Side * (°C) | 53 | 42.8 19% | 47 11% | 42 21% | 52.6 1% | 54 -2% |
| Maximum Bottom * (°C) | 48 | 50 -4% | 48 -0% | 45 6% | 62.4 -30% | 47 2% |
| Idle Upper Side * (°C) | 30 | 29.6 1% | 35 -17% | 28 7% | 33.6 -12% | 40 -33% |
| Idle Bottom * (°C) | 30 | 34 -13% | 38 -27% | 30 -0% | 34.8 -16% | 40 -33% |
* ... smaller is better
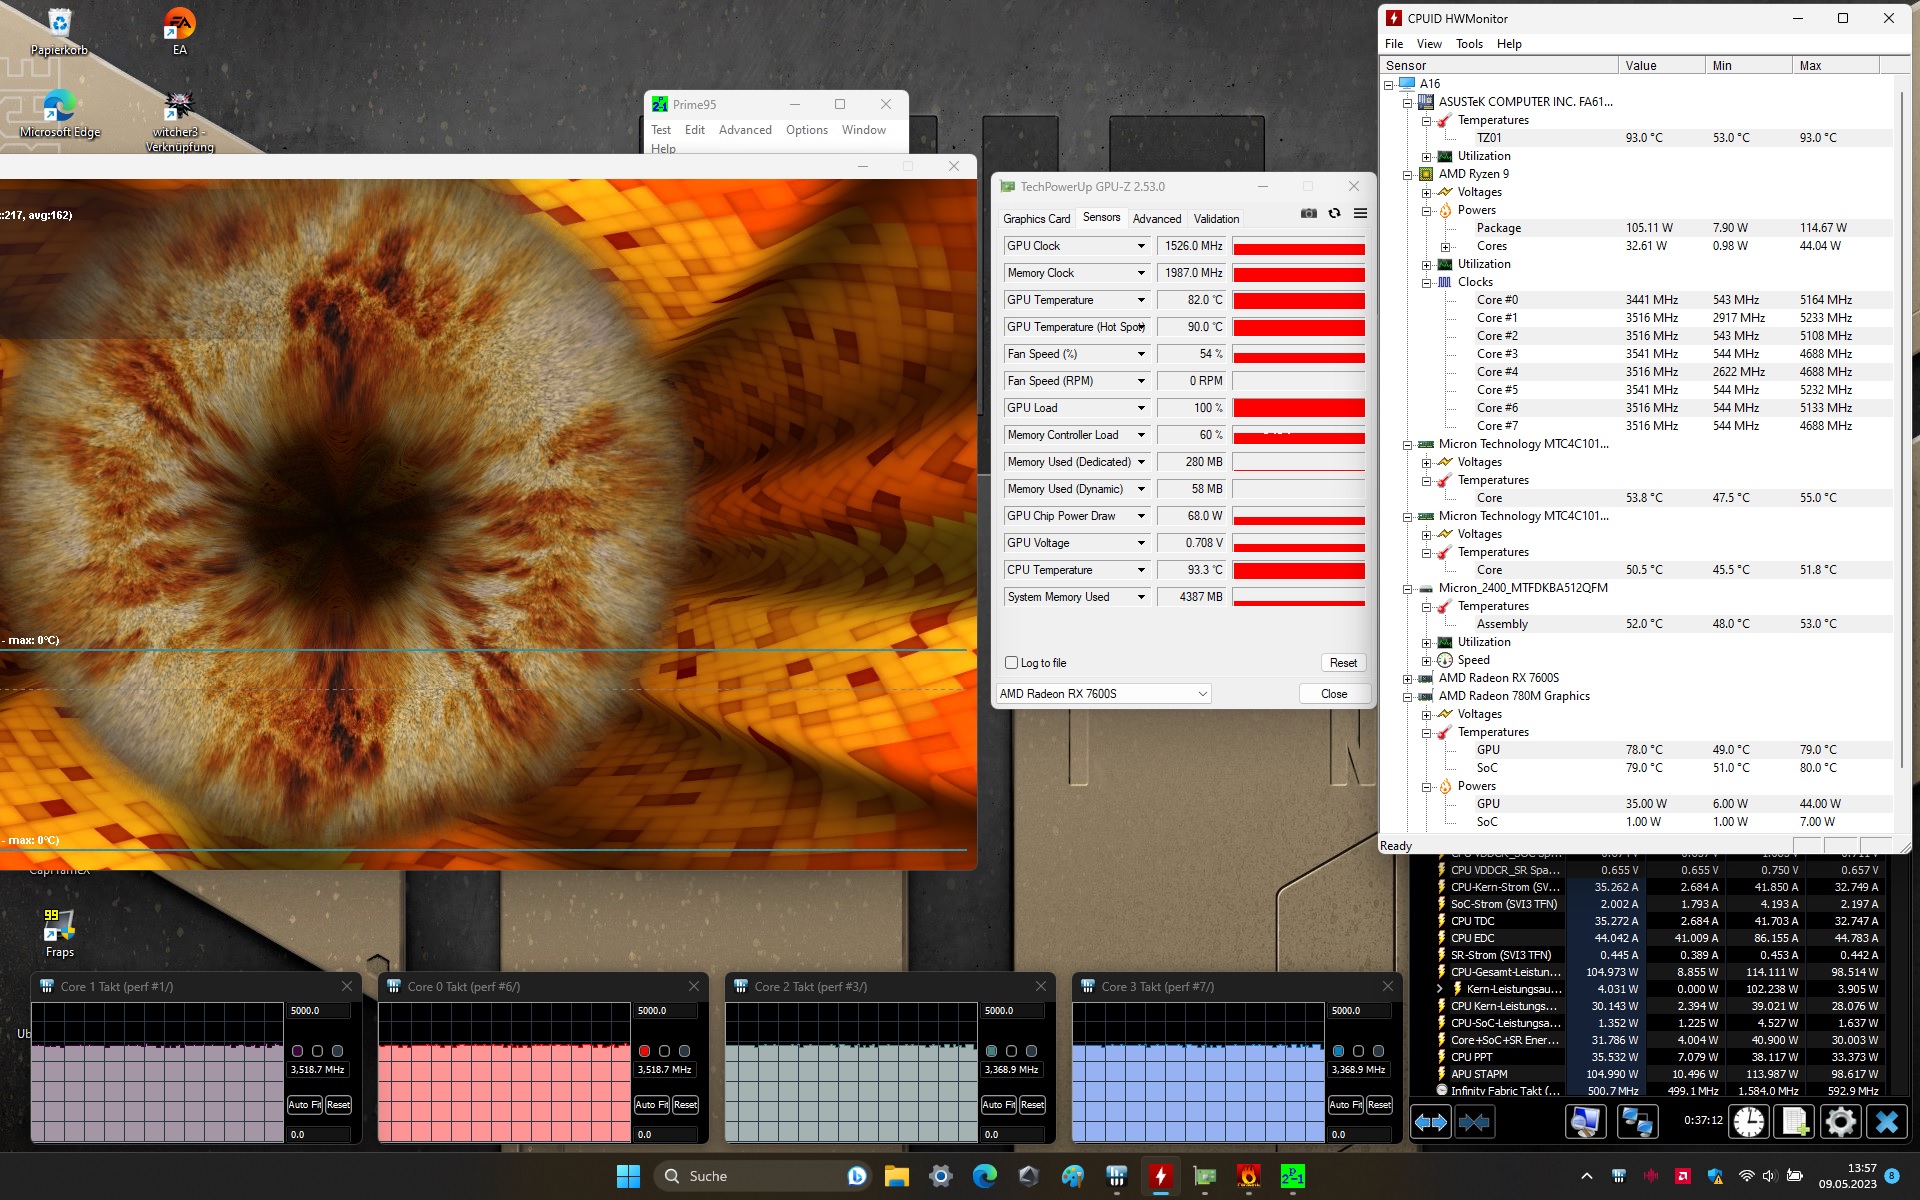
压力测试
压力测试(Prime95和Furmark连续运行)模拟了一种极端情况,以测试系统在全负荷下的稳定性。CPU(3.4至3.5 GHz)和GPU(~1,500 MHz)以低于各自基础时钟的时钟速率运行测试。
发言人
立体声扬声器总体上产生了一个体面的声音。
Asus TUF Gaming A16 FA617XS audio analysis
(±) | speaker loudness is average but good (79 dB)
Bass 100 - 315 Hz
(±) | reduced bass - on average 11.6% lower than median
(±) | linearity of bass is average (7% delta to prev. frequency)
Mids 400 - 2000 Hz
(±) | higher mids - on average 5.7% higher than median
(+) | mids are linear (3.8% delta to prev. frequency)
Highs 2 - 16 kHz
(+) | balanced highs - only 2.6% away from median
(+) | highs are linear (6.5% delta to prev. frequency)
Overall 100 - 16.000 Hz
(±) | linearity of overall sound is average (15.4% difference to median)
Compared to same class
» 34% of all tested devices in this class were better, 7% similar, 59% worse
» The best had a delta of 6%, average was 18%, worst was 132%
Compared to all devices tested
» 23% of all tested devices were better, 4% similar, 73% worse
» The best had a delta of 4%, average was 23%, worst was 134%
Lenovo Legion Pro 5 16IRX8 audio analysis
(±) | speaker loudness is average but good (72.7 dB)
Bass 100 - 315 Hz
(-) | nearly no bass - on average 23.7% lower than median
(±) | linearity of bass is average (10.7% delta to prev. frequency)
Mids 400 - 2000 Hz
(+) | balanced mids - only 3.8% away from median
(±) | linearity of mids is average (7.1% delta to prev. frequency)
Highs 2 - 16 kHz
(+) | balanced highs - only 3.7% away from median
(+) | highs are linear (6.7% delta to prev. frequency)
Overall 100 - 16.000 Hz
(±) | linearity of overall sound is average (21.9% difference to median)
Compared to same class
» 79% of all tested devices in this class were better, 6% similar, 16% worse
» The best had a delta of 6%, average was 18%, worst was 132%
Compared to all devices tested
» 63% of all tested devices were better, 7% similar, 30% worse
» The best had a delta of 4%, average was 23%, worst was 134%
电源管理--具有出色运行时间的游戏笔记本电脑
消耗功率
在耗电量方面没有任何异常。对于所安装的硬件来说,这些比率处于正常水平。压力测试和 Witcher 3测试是以恒定的功耗运行的。电源(240瓦)的大小是比较充分的。
| Off / Standby | |
| Idle | |
| Load |
|
Key:
min: | |
| Asus TUF Gaming A16 FA617XS R9 7940HS, Radeon RX 7600S | Lenovo Legion Pro 5 16IRX8 i7-13700HX, GeForce RTX 4060 Laptop GPU | MSI Katana 15 B12VEK i7-12650H, GeForce RTX 4050 Laptop GPU | Medion Erazer Defender P40 i7-13700HX, GeForce RTX 4060 Laptop GPU | Gigabyte G5 KE i5-12500H, GeForce RTX 3060 Laptop GPU | Asus TUF Gaming A16 FA617 R7 7735HS, Radeon RX 7600S | Average AMD Radeon RX 7600S | Average of class Gaming | |
|---|---|---|---|---|---|---|---|---|
| Power Consumption | -107% | 2% | -25% | -16% | -7% | -4% | -64% | |
| Idle Minimum * (Watt) | 7 | 24.5 -250% | 8.5 -21% | 8 -14% | 7.66 -9% | 8 -14% | 7.5 ? -7% | 13 ? -86% |
| Idle Average * (Watt) | 10 | 29.2 -192% | 10.2 -2% | 12 -20% | 10.3 -3% | 11 -10% | 10.5 ? -5% | 19 ? -90% |
| Idle Maximum * (Watt) | 15 | 34.3 -129% | 11.3 25% | 18 -20% | 16.05 -7% | 16 -7% | 15.5 ? -3% | 24.6 ? -64% |
| Load Average * (Watt) | 86 | 98.7 -15% | 84 2% | 101 -17% | 115.8 -35% | 97 -13% | 91.5 ? -6% | 110.7 ? -29% |
| Witcher 3 ultra * (Watt) | 160.6 | 178.6 -11% | 128 20% | 180.8 -13% | 168.7 -5% | 161.5 -1% | ||
| Load Maximum * (Watt) | 172 | 249.6 -45% | 189 -10% | 284 -65% | 234.6 -36% | 168 2% | 170 ? 1% | 259 ? -51% |
* ... smaller is better
power consumption Witcher 3 / stress test
power consumption with external monitor
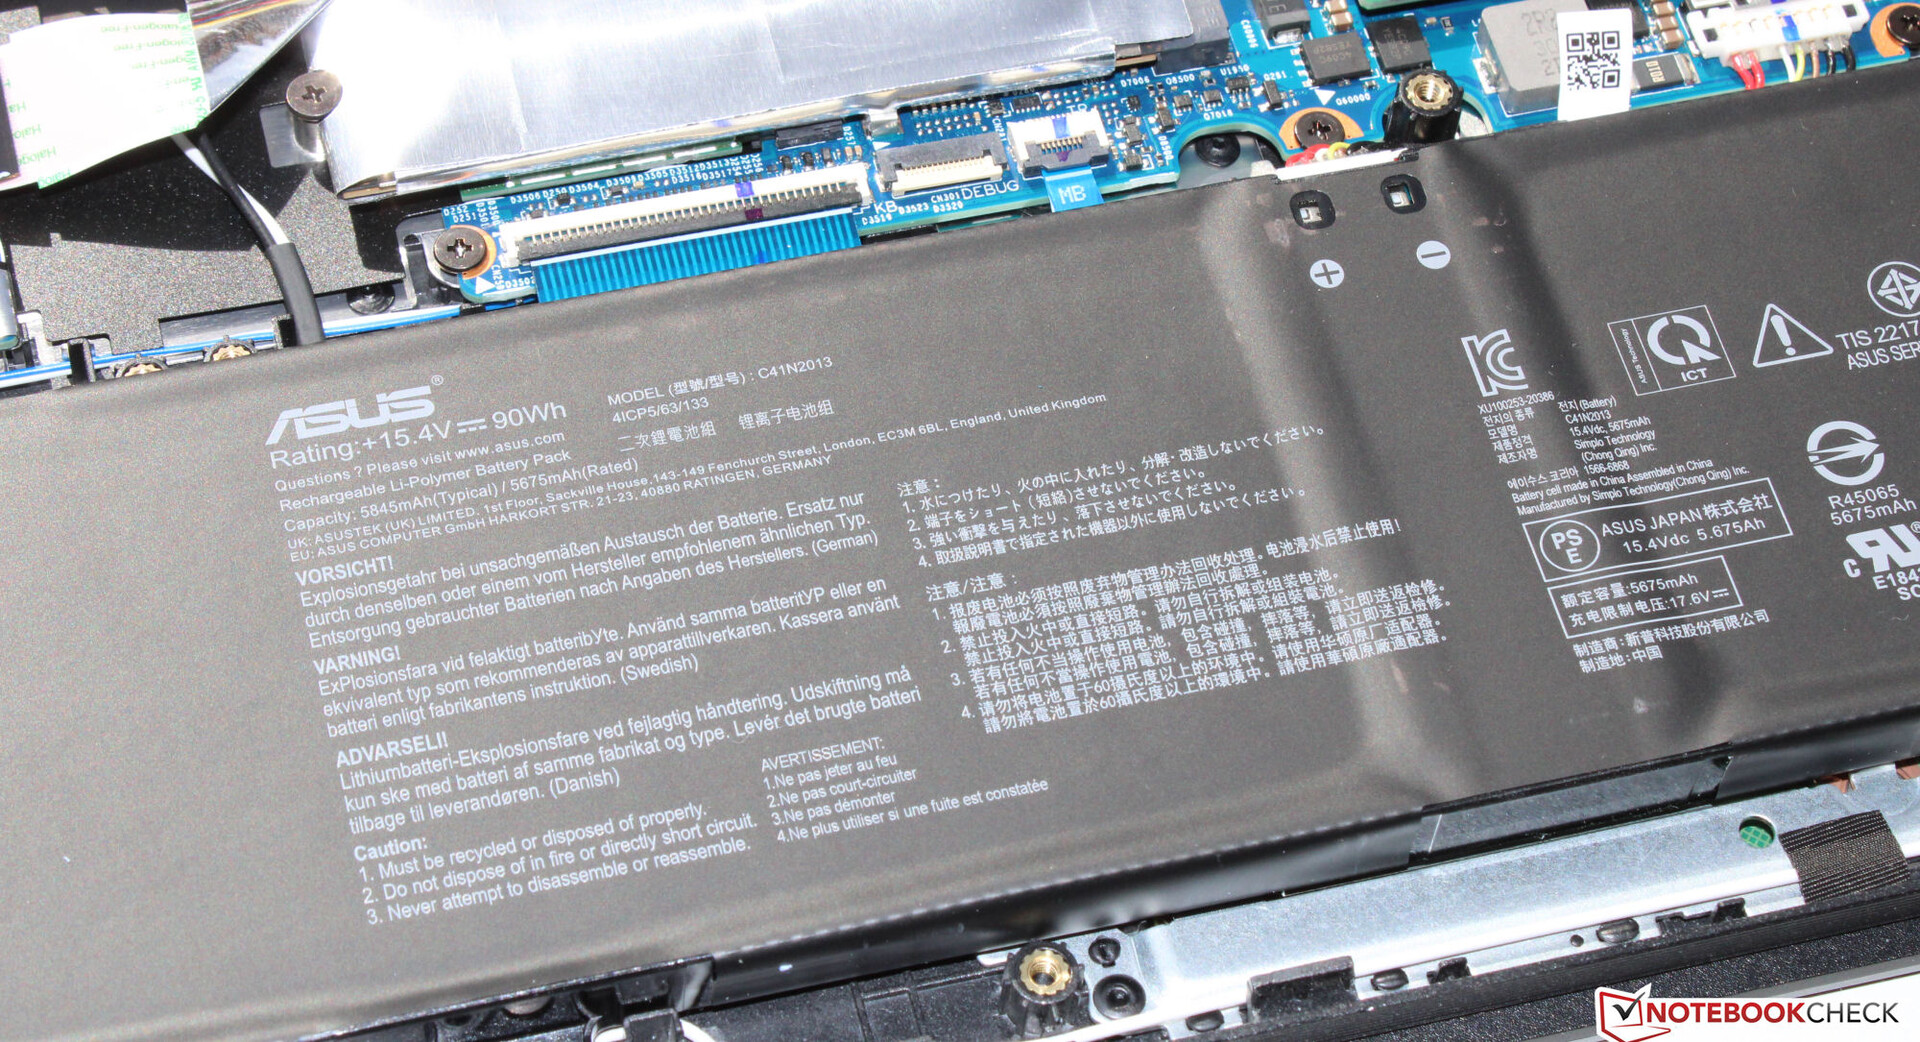
电池寿命
在我们的WLAN测试(通过脚本调用网站)和视频测试(循环播放短片Big Buck Bunny(H.264编码,FHD))中,这台16英寸设备的运行时间分别为12:25小时和12:26小时。在这两项测试中,笔记本电脑的节能功能被禁用,显示亮度被设置为大约150cd/m²。在视频测试中,无线模块也被禁用。
FA617提供了出色的运行时间,将竞争对手甩在了后面。节约型APU和大电池容量的组合在这里肯定会得到回报。
| Asus TUF Gaming A16 FA617XS R9 7940HS, Radeon RX 7600S, 90 Wh | Lenovo Legion Pro 5 16IRX8 i7-13700HX, GeForce RTX 4060 Laptop GPU, 80 Wh | MSI Katana 15 B12VEK i7-12650H, GeForce RTX 4050 Laptop GPU, 53.5 Wh | Medion Erazer Defender P40 i7-13700HX, GeForce RTX 4060 Laptop GPU, 73 Wh | Gigabyte G5 KE i5-12500H, GeForce RTX 3060 Laptop GPU, 54 Wh | Asus TUF Gaming A16 FA617 R7 7735HS, Radeon RX 7600S, 90 Wh | Average of class Gaming | |
|---|---|---|---|---|---|---|---|
| Battery runtime | -54% | -21% | -29% | -42% | 22% | -17% | |
| Reader / Idle (h) | 20.3 | 6.7 -67% | 8.8 -57% | 20.2 0% | 8.27 ? -59% | ||
| H.264 (h) | 12.4 | 4.4 -65% | 5.7 -54% | 2.2 -82% | 8.32 ? -33% | ||
| WiFi v1.3 (h) | 12.4 | 3.4 -73% | 4.3 -65% | 6.2 -50% | 5.7 -54% | 12.1 -2% | 7.11 ? -43% |
| Load (h) | 0.9 | 0.7 -22% | 1.5 67% | 1.3 44% | 1 11% | 1.5 67% | 1.502 ? 67% |
| Witcher 3 ultra (h) | 1.3 |
Pros
Cons
结论--华硕笔记本电脑的存储空间(太小)。
A16是为高至最高设置的WUXGA游戏而设置的,但它应该在许多其他领域,如视频编辑和渲染中发挥作用。由一个AMD团队组成的Ryzen 9 7940HS和Radeon RX 7600S为笔记本电脑提供了必要的性能。这两个组件以持续的高时钟速率运行。
华硕TUF游戏A16优势版是一款全面的中端游戏笔记本电脑,其令人印象深刻的电池运行时间是它的骄傲和喜悦。
相比之下Ryzen-7-7735HS中发现的APU姐妹型号7940HS-APU的CPU性能要好得多,尽管它有相同数量的内核和相同的功率限制。在这里,它的现代架构(Zen 4相对于Zen 3+)和更高的时钟速率使自己出名。
该设备惊人的运行时间当然是其独特的卖点:它的实际测量值约为12.5小时,这通常是许多其他办公笔记本电脑无法达到的。一个积极因素:电池可以用USB-C电源充电(最小65瓦,20伏)--一个USB-C端口支持Power Delivery。专用电源就不一定要随身携带了。
安装的IPS显示屏(16英寸,1,920 x 1,200像素)具有16:10的工作比例,总体上给我们留下了良好的印象--如果有的话,亮度可以再强一点。安装的入门级固态硬盘将完全适合于简单的办公笔记本电脑--但不适合1700美元的游戏笔记本电脑。提供的存储(512GB)和数据既没有达到用户的要求,也没有达到用户的期望。
这款Legion Pro 5 16IRX8可能是一个合适的替代品。它具有比A16更好的性能和更明亮的屏幕--但它显然没有提供同样令人印象深刻的运行时间。这款技嘉G5 KE可能是一个很好的预算替代品:你可以用更小的价格获得类似水平的图形性能。虽然如此:这款笔记本电脑没有预装Windows操作系统。
价格和可用性
配备16GB内存和512GB固态硬盘的A16版本可以在华硕的网站上购买购买,价格约为1,371美元。
Asus TUF Gaming A16 FA617XS
- 06/05/2023 v7 (old)
Sascha Mölck
Transparency
The selection of devices to be reviewed is made by our editorial team. The test sample was provided to the author as a loan by the manufacturer or retailer for the purpose of this review. The lender had no influence on this review, nor did the manufacturer receive a copy of this review before publication. There was no obligation to publish this review. As an independent media company, Notebookcheck is not subjected to the authority of manufacturers, retailers or publishers.
This is how Notebookcheck is testing
Every year, Notebookcheck independently reviews hundreds of laptops and smartphones using standardized procedures to ensure that all results are comparable. We have continuously developed our test methods for around 20 years and set industry standards in the process. In our test labs, high-quality measuring equipment is utilized by experienced technicians and editors. These tests involve a multi-stage validation process. Our complex rating system is based on hundreds of well-founded measurements and benchmarks, which maintains objectivity. Further information on our test methods can be found here.
Price comparison

