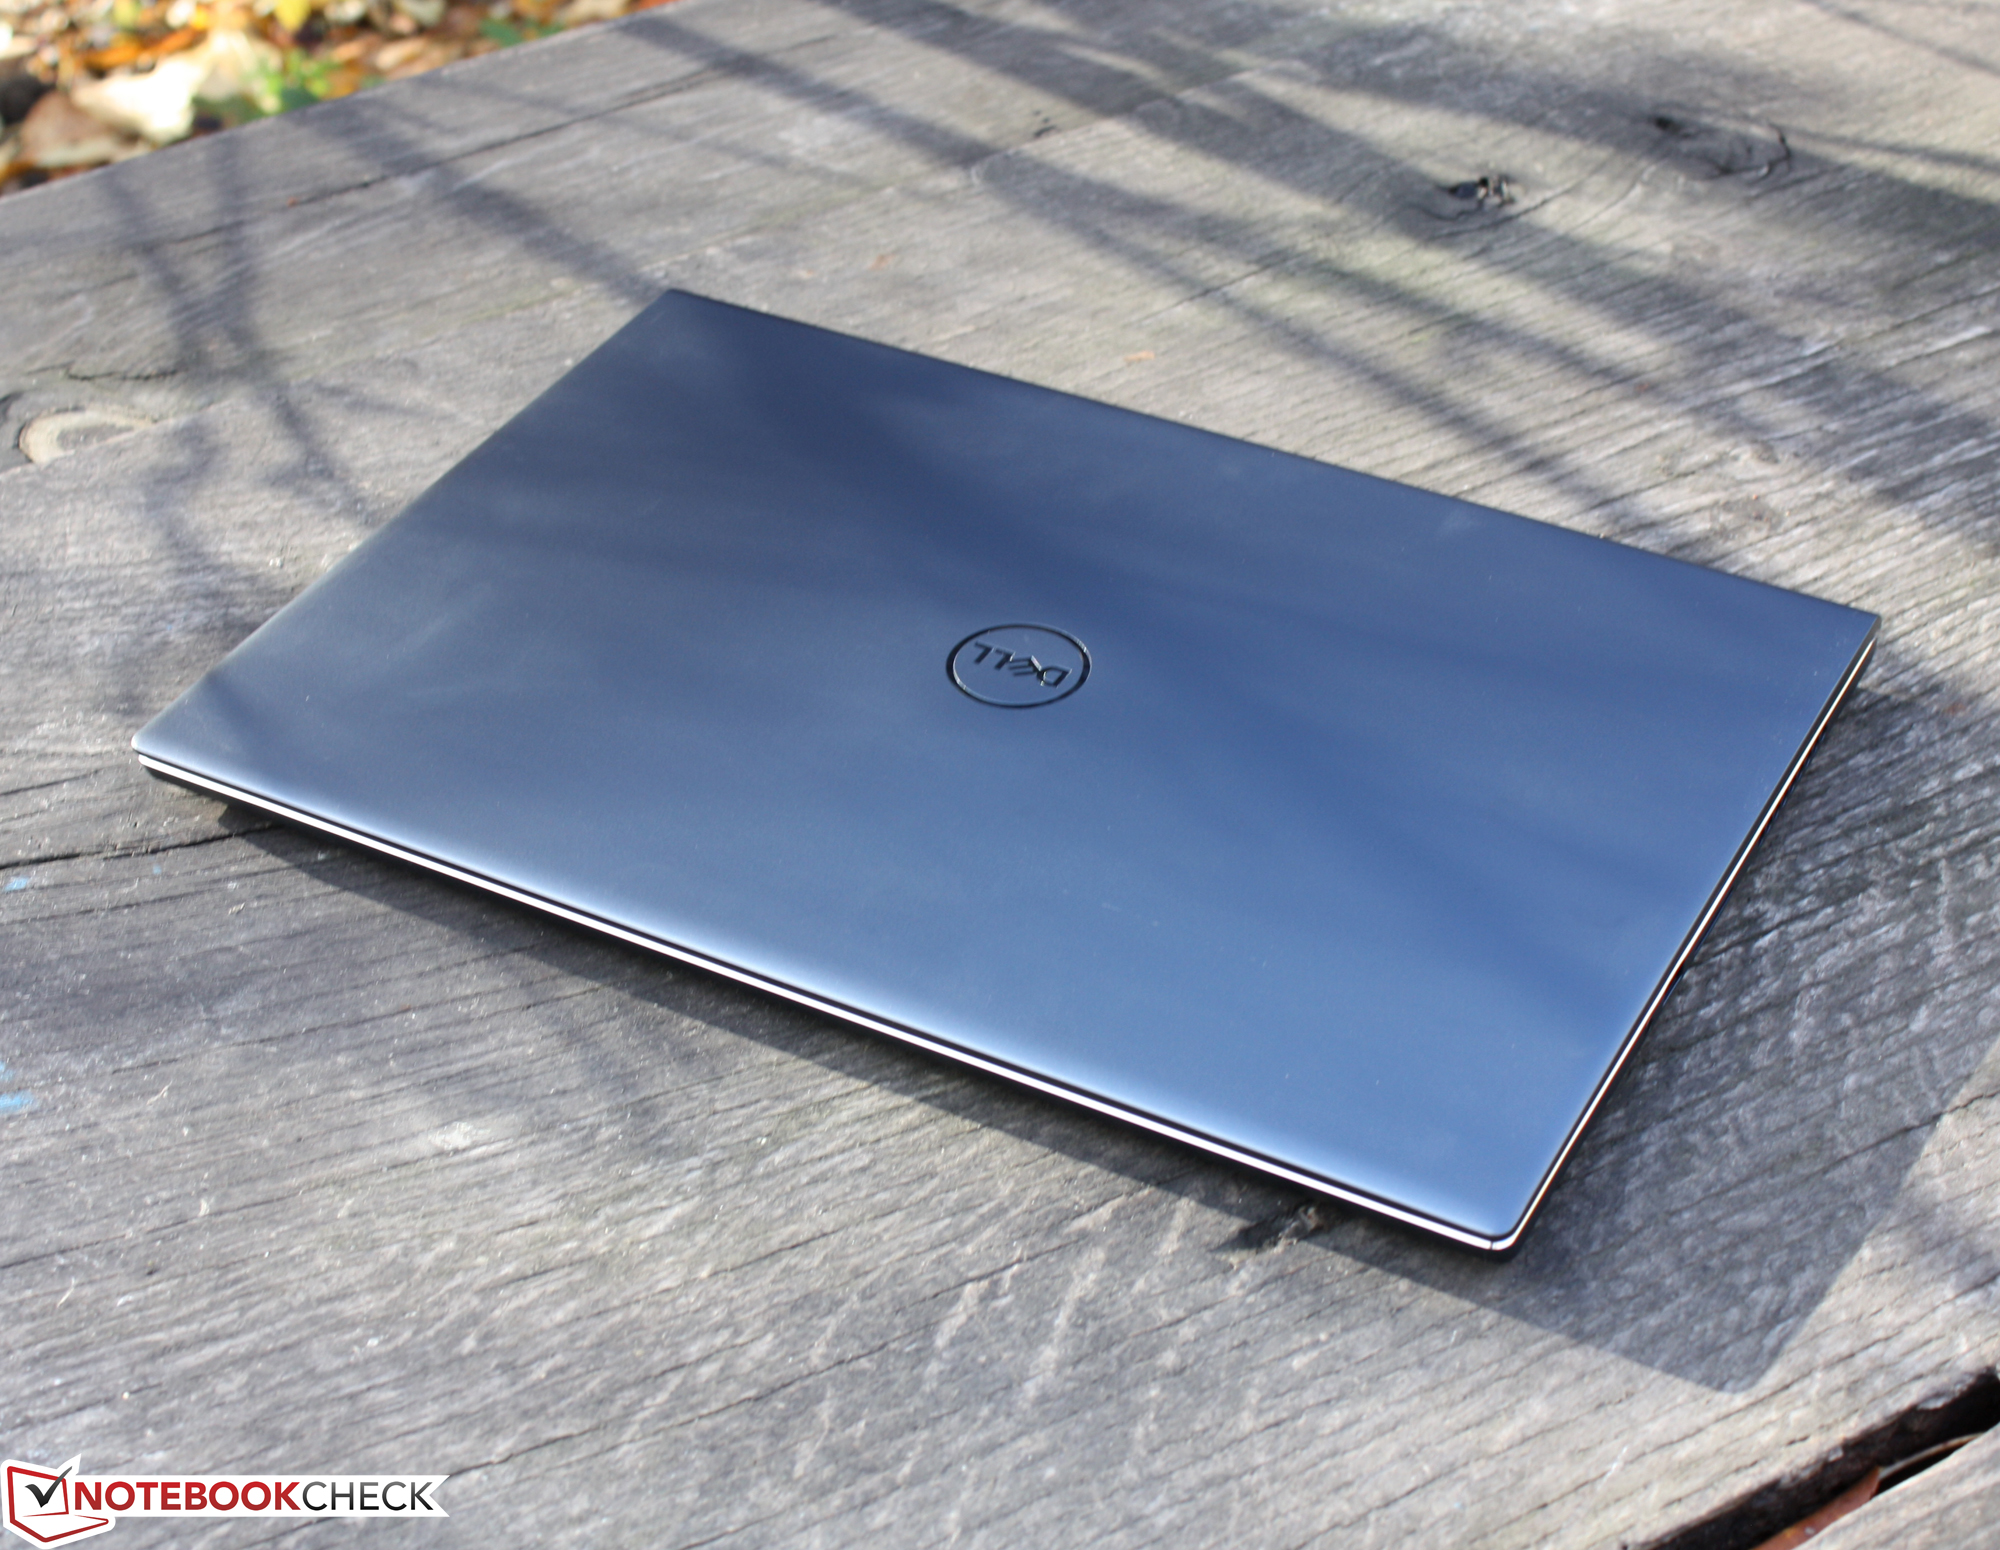
戴尔Inspiron 16 Plus 7610评论。没有Nvidia就有更多的性能?

没有Nvidia显卡的Inspiron 16 Plus 7610是否比dGPU版本更适合我这个非游戏玩家?我们购买了一台Inspiron 16 Plus 7610 MHJ8F,配置为i7-11800H16GB内存和512GB固态硬盘,正是为了回答这个问题。在测试中,我们发现在测试Inspiron 16 Plus 7610 with RTX我们的同事曾抱怨过该处理器的性能发展低于平均水平。那么,酷睿i7现在在冷却方面是否有更大的空间?热量的发展也许更低,电池寿命更长?我们在这次测试中找到了答案。
Possible Competitors in Comparison
Rating | Date | Model | Weight | Height | Size | Resolution | Price |
|---|---|---|---|---|---|---|---|
| 82.6 % v7 (old) | 11 / 2021 | Dell Inspiron 16 Plus 7610-MHJ8F i7-11800H, UHD Graphics Xe 32EUs (Tiger Lake-H) | 2 kg | 19 mm | 16.00" | 3072x1920 | |
| 86.7 % v7 (old) | 10 / 2021 | Dell Inspiron 16 Plus 7610 i7-11800H, GeForce RTX 3050 4GB Laptop GPU | 2 kg | 18.99 mm | 16.00" | 3072x1920 | |
| 86.3 % v7 (old) | 09 / 2021 | LG Gram 16 (2021) i7-1165G7, Iris Xe G7 96EUs | 1.2 kg | 16.8 mm | 16.00" | 2560x1600 | |
| 87.4 % v7 (old) | 08 / 2021 | Lenovo Legion 5 Pro 16ACH6H (82JQ001PGE) R7 5800H, GeForce RTX 3070 Laptop GPU | 2.6 kg | 26.85 mm | 16.00" | 2560x1600 | |
| 82.4 % v7 (old) | 02 / 2021 | Dell Inspiron 15 7000 7506 2-in-1 Black Edition i7-1165G7, Xe MAX | 1.9 kg | 17.94 mm | 15.60" | 3840x2160 | |
| 82.7 % v7 (old) | Acer Aspire 5 A517-52G-79Z5 i7-1165G7, GeForce MX350 | 2.2 kg | 19.9 mm | 17.30" | 1920x1080 |

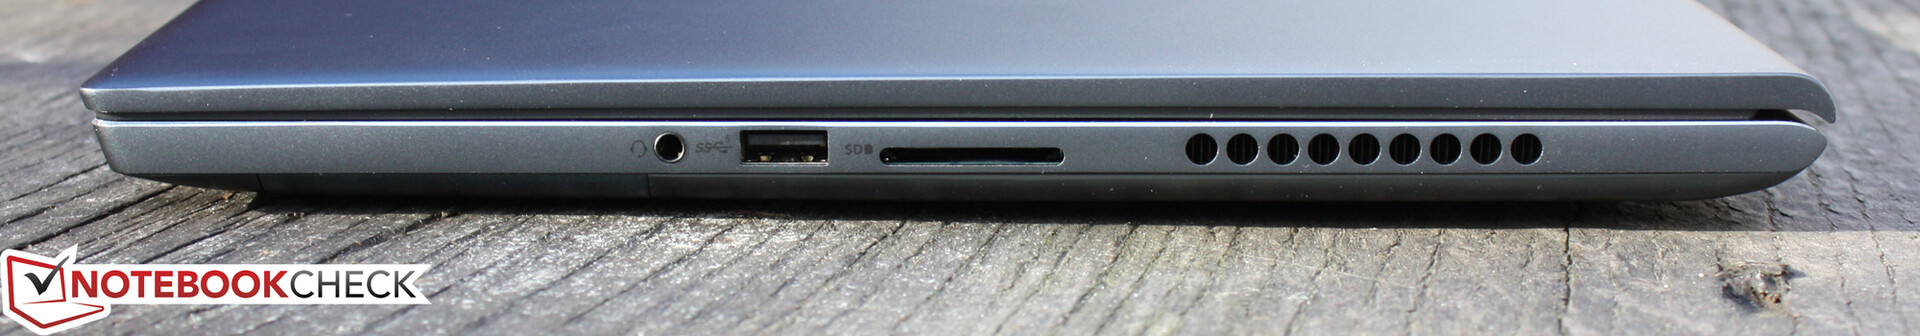
| SD Card Reader | |
| average JPG Copy Test (av. of 3 runs) | |
| Average of class Multimedia (23 - 531, n=43, last 2 years) | |
| LG Gram 16 (2021) (Toshiba Exceria Pro M501 microSDXC 64GB) | |
| Dell Inspiron 15 7000 7506 2-in-1 Black Edition (Toshiba Exceria Pro M501 microSDXC 32GB) | |
| Dell Inspiron 16 Plus 7610-MHJ8F (AV Pro SD microSD 128 GB V60) | |
| Dell Inspiron 16 Plus 7610 (AV PRO microSD 128 GB V60) | |
| maximum AS SSD Seq Read Test (1GB) | |
| Average of class Multimedia (27.9 - 1455, n=42, last 2 years) | |
| LG Gram 16 (2021) (Toshiba Exceria Pro M501 microSDXC 64GB) | |
| Dell Inspiron 15 7000 7506 2-in-1 Black Edition (Toshiba Exceria Pro M501 microSDXC 32GB) | |
| Dell Inspiron 16 Plus 7610-MHJ8F (AV Pro SD microSD 128 GB V60) | |
| Dell Inspiron 16 Plus 7610 (AV PRO microSD 128 GB V60) | |
| Networking | |
| iperf3 transmit AX12 | |
| Acer Aspire 5 A517-52G-79Z5 | |
| Dell Inspiron 16 Plus 7610-MHJ8F | |
| Average Intel Wi-Fi 6 AX201 (49.8 - 1775, n=324) | |
| Lenovo Legion 5 Pro 16ACH6H (82JQ001PGE) | |
| LG Gram 16 (2021) | |
| Dell Inspiron 16 Plus 7610 | |
| Dell Inspiron 15 7000 7506 2-in-1 Black Edition | |
| iperf3 receive AX12 | |
| Average Intel Wi-Fi 6 AX201 (136 - 1743, n=324) | |
| Dell Inspiron 16 Plus 7610-MHJ8F | |
| Dell Inspiron 16 Plus 7610 | |
| Lenovo Legion 5 Pro 16ACH6H (82JQ001PGE) | |
| Dell Inspiron 15 7000 7506 2-in-1 Black Edition | |
| Acer Aspire 5 A517-52G-79Z5 | |
| LG Gram 16 (2021) | |

, i7-11800H, OM3PDP3-AD NVMe KDI 512GB")
, i7-11800H, OM3PDP3-AD NVMe KDI 512GB")
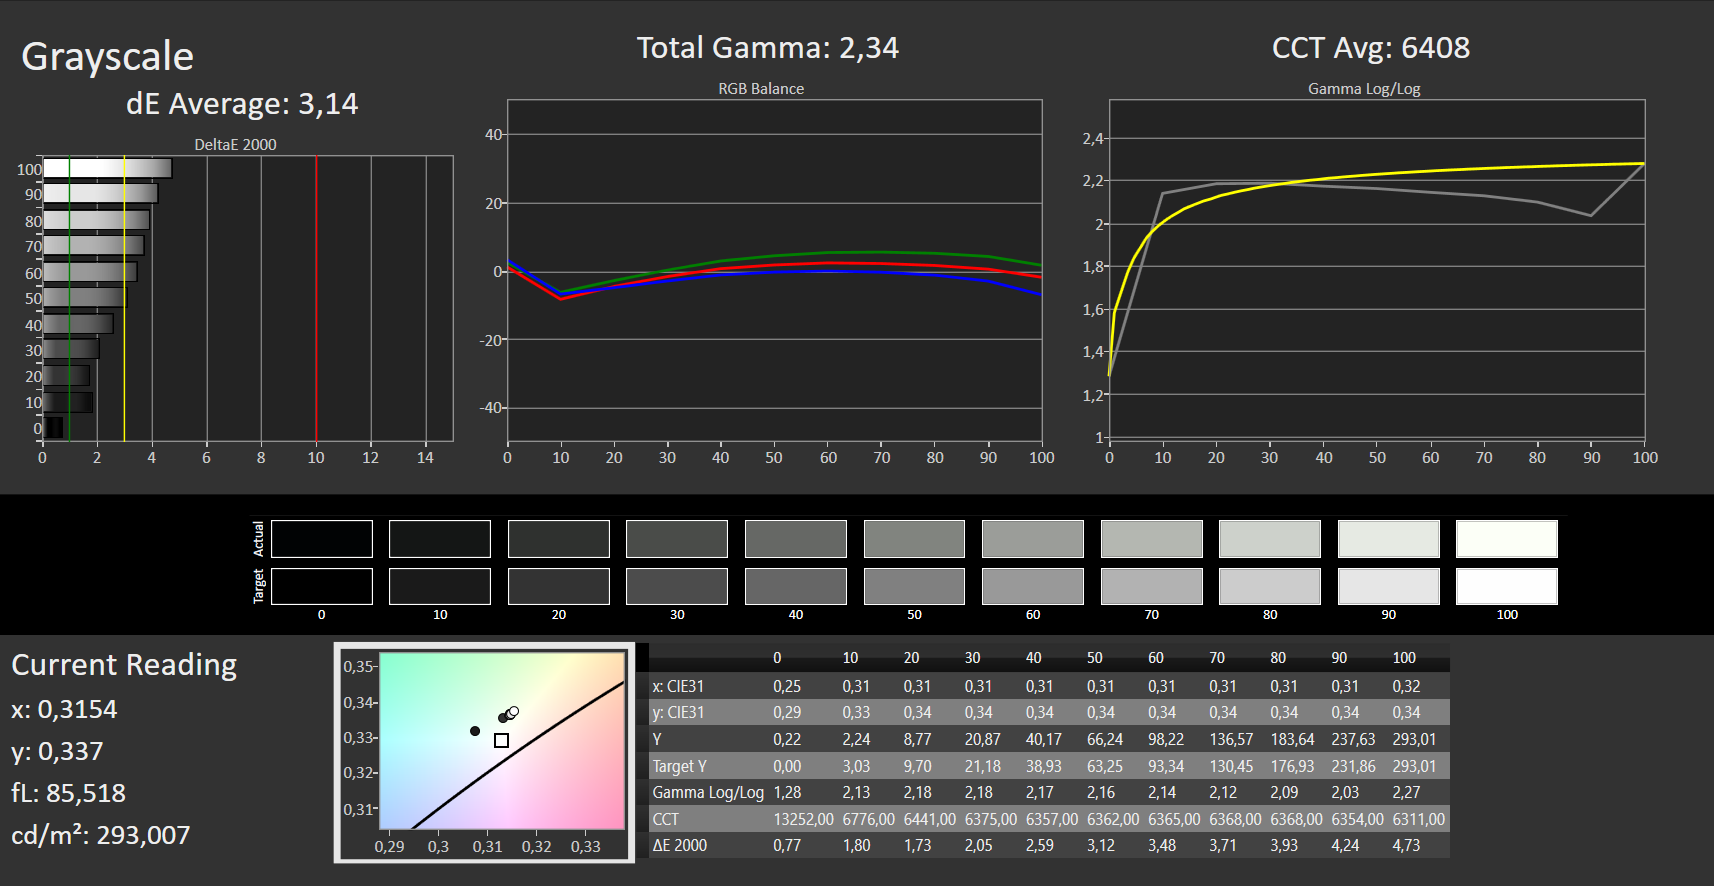
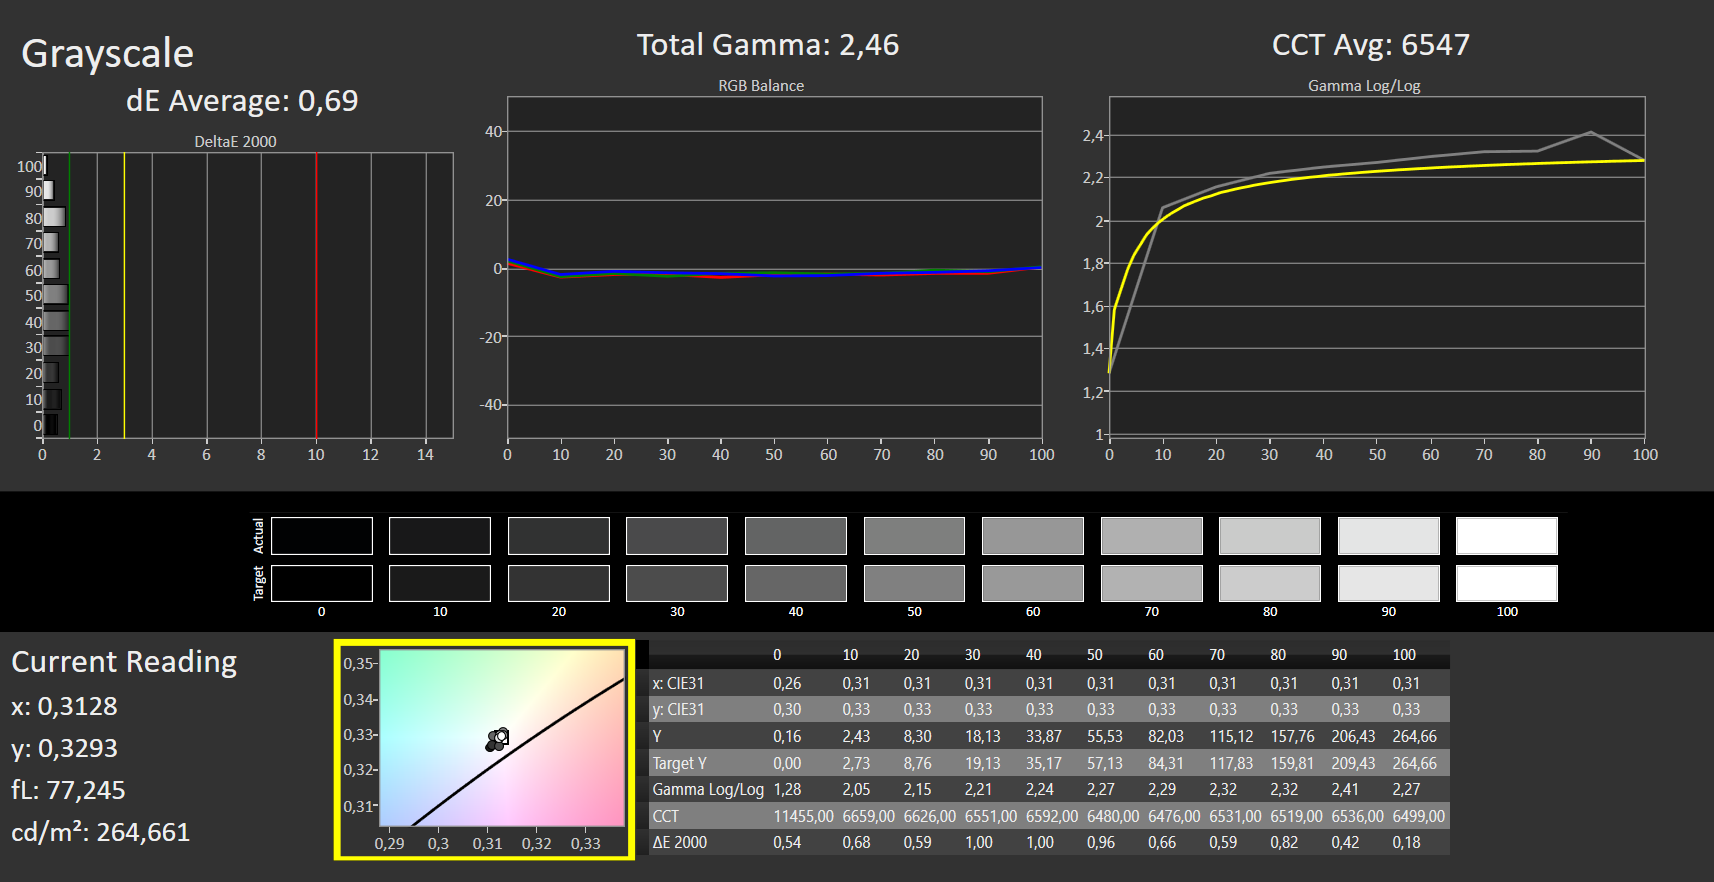
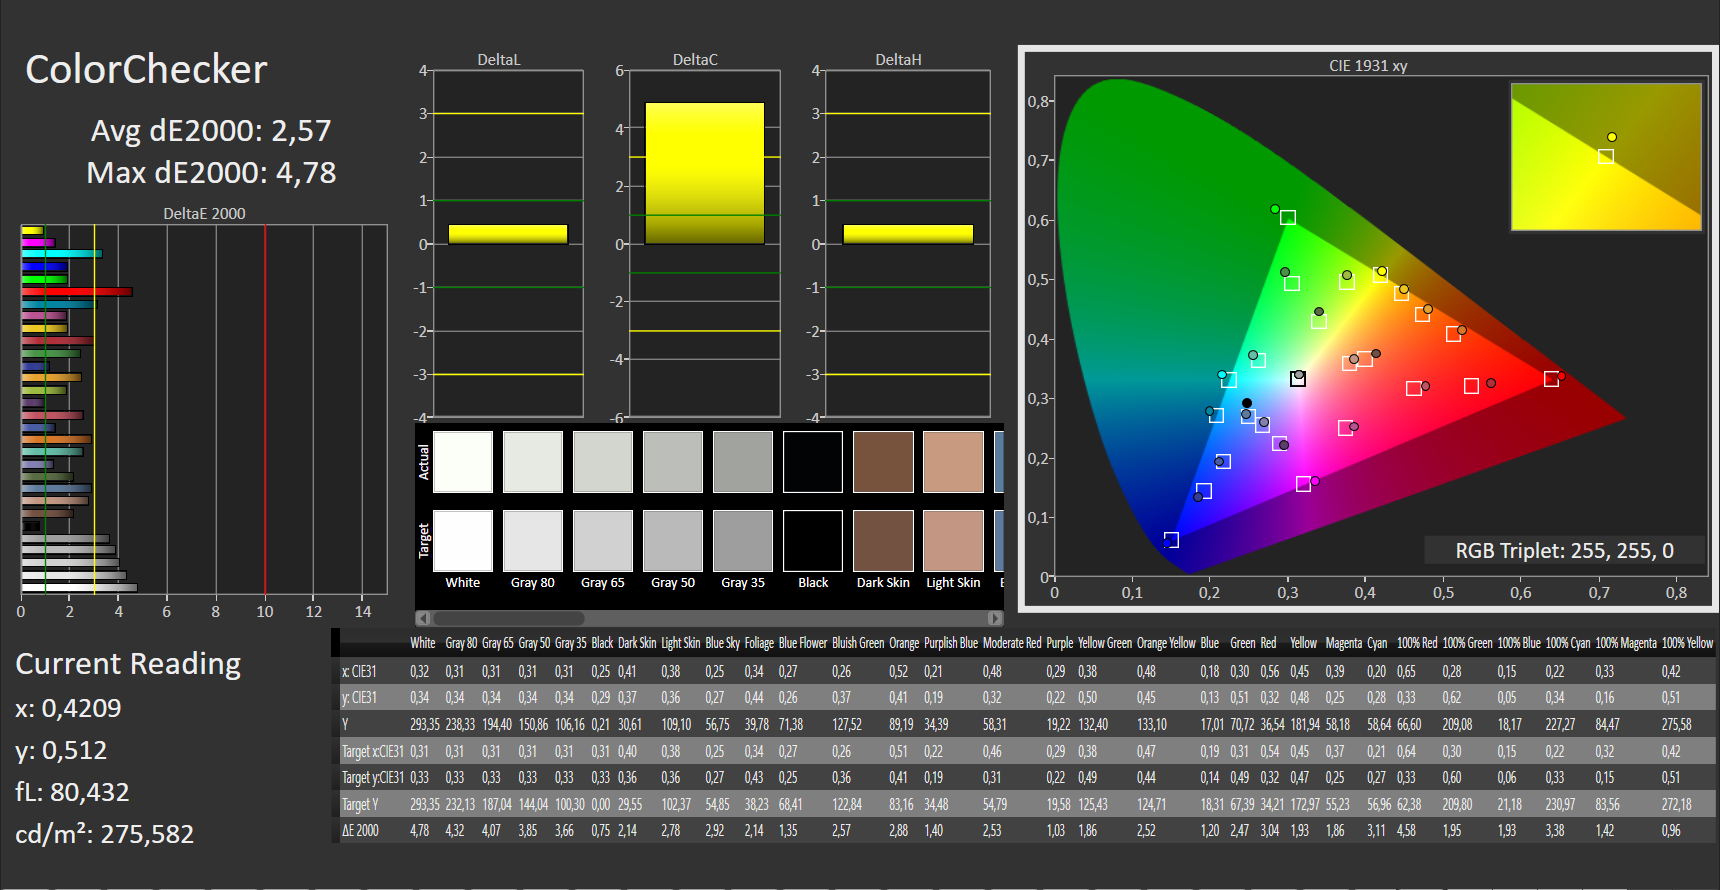
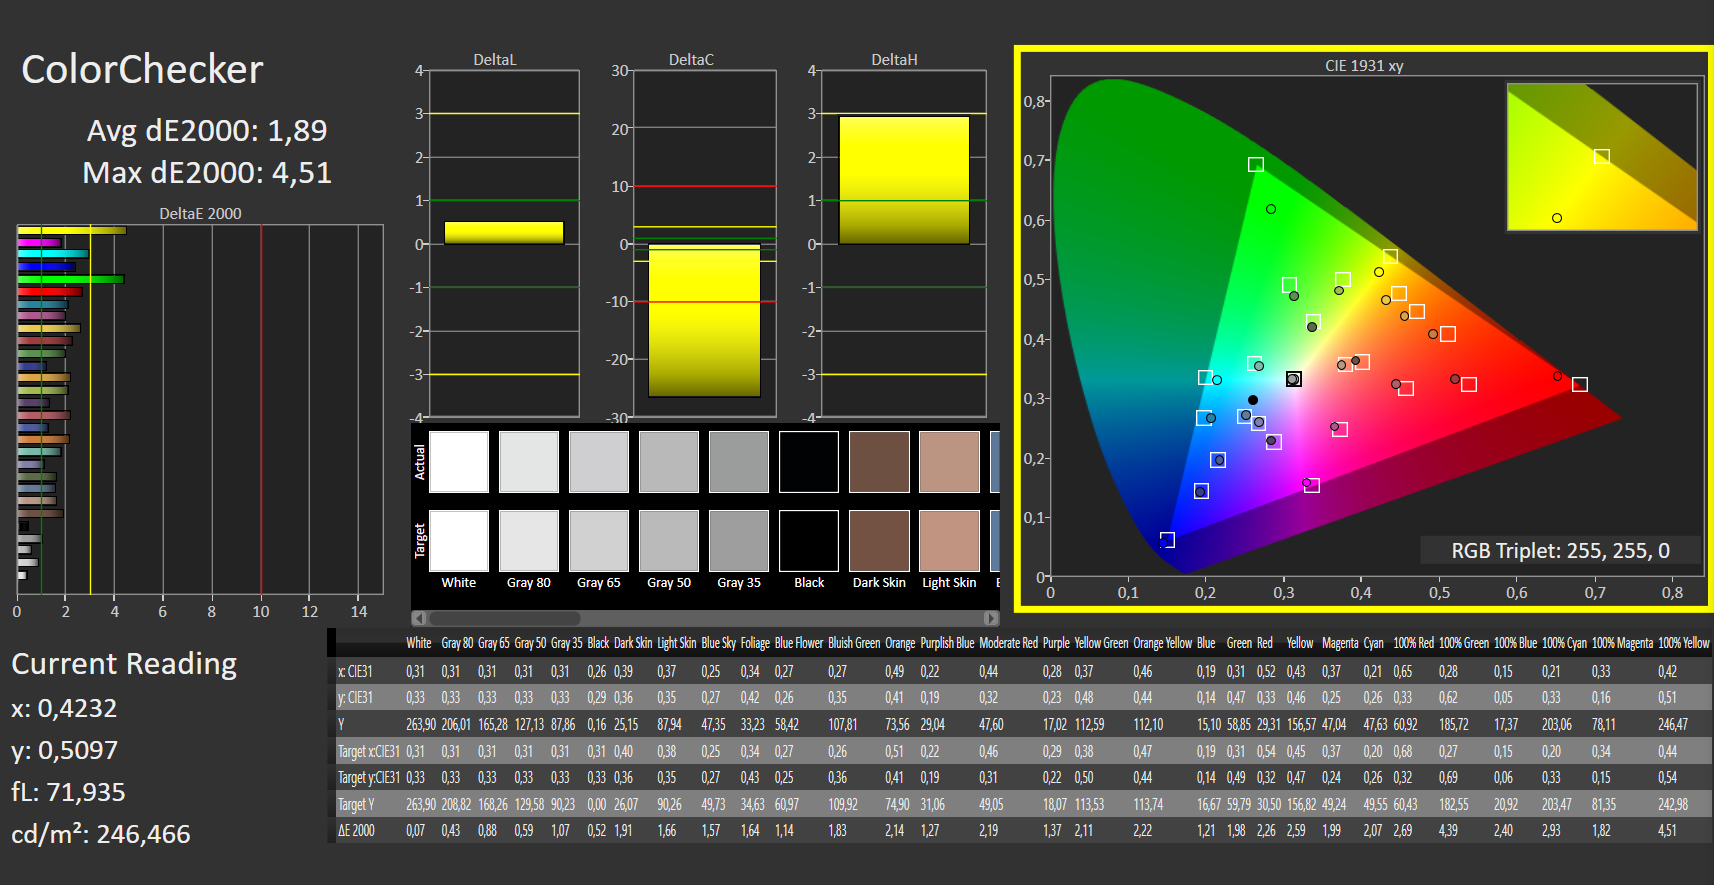
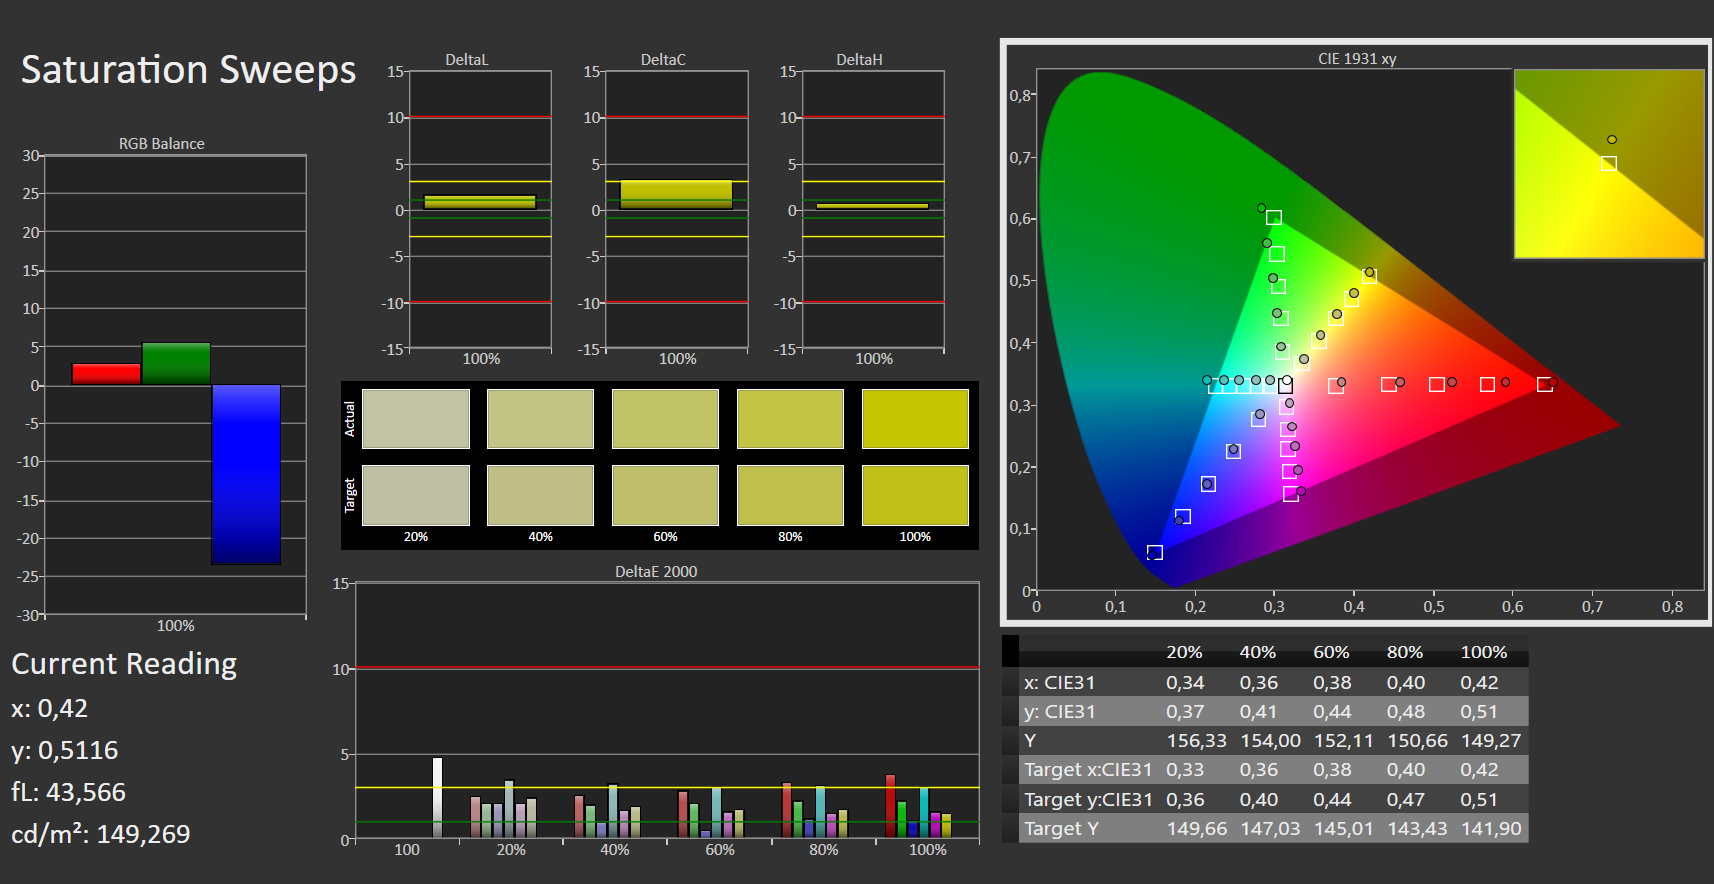
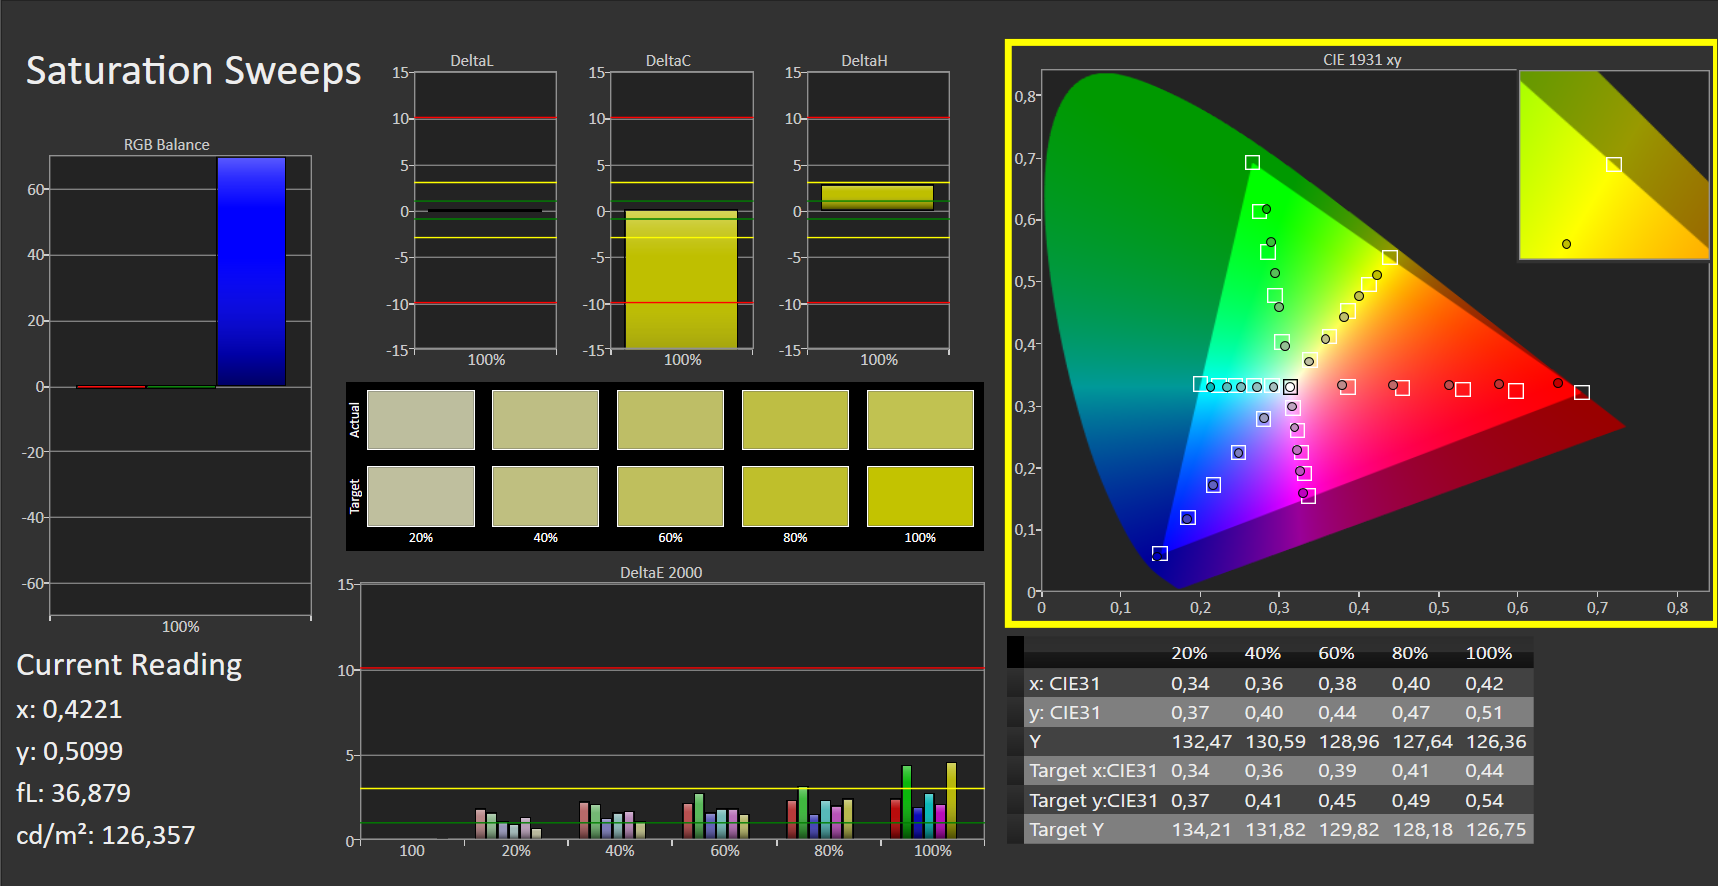
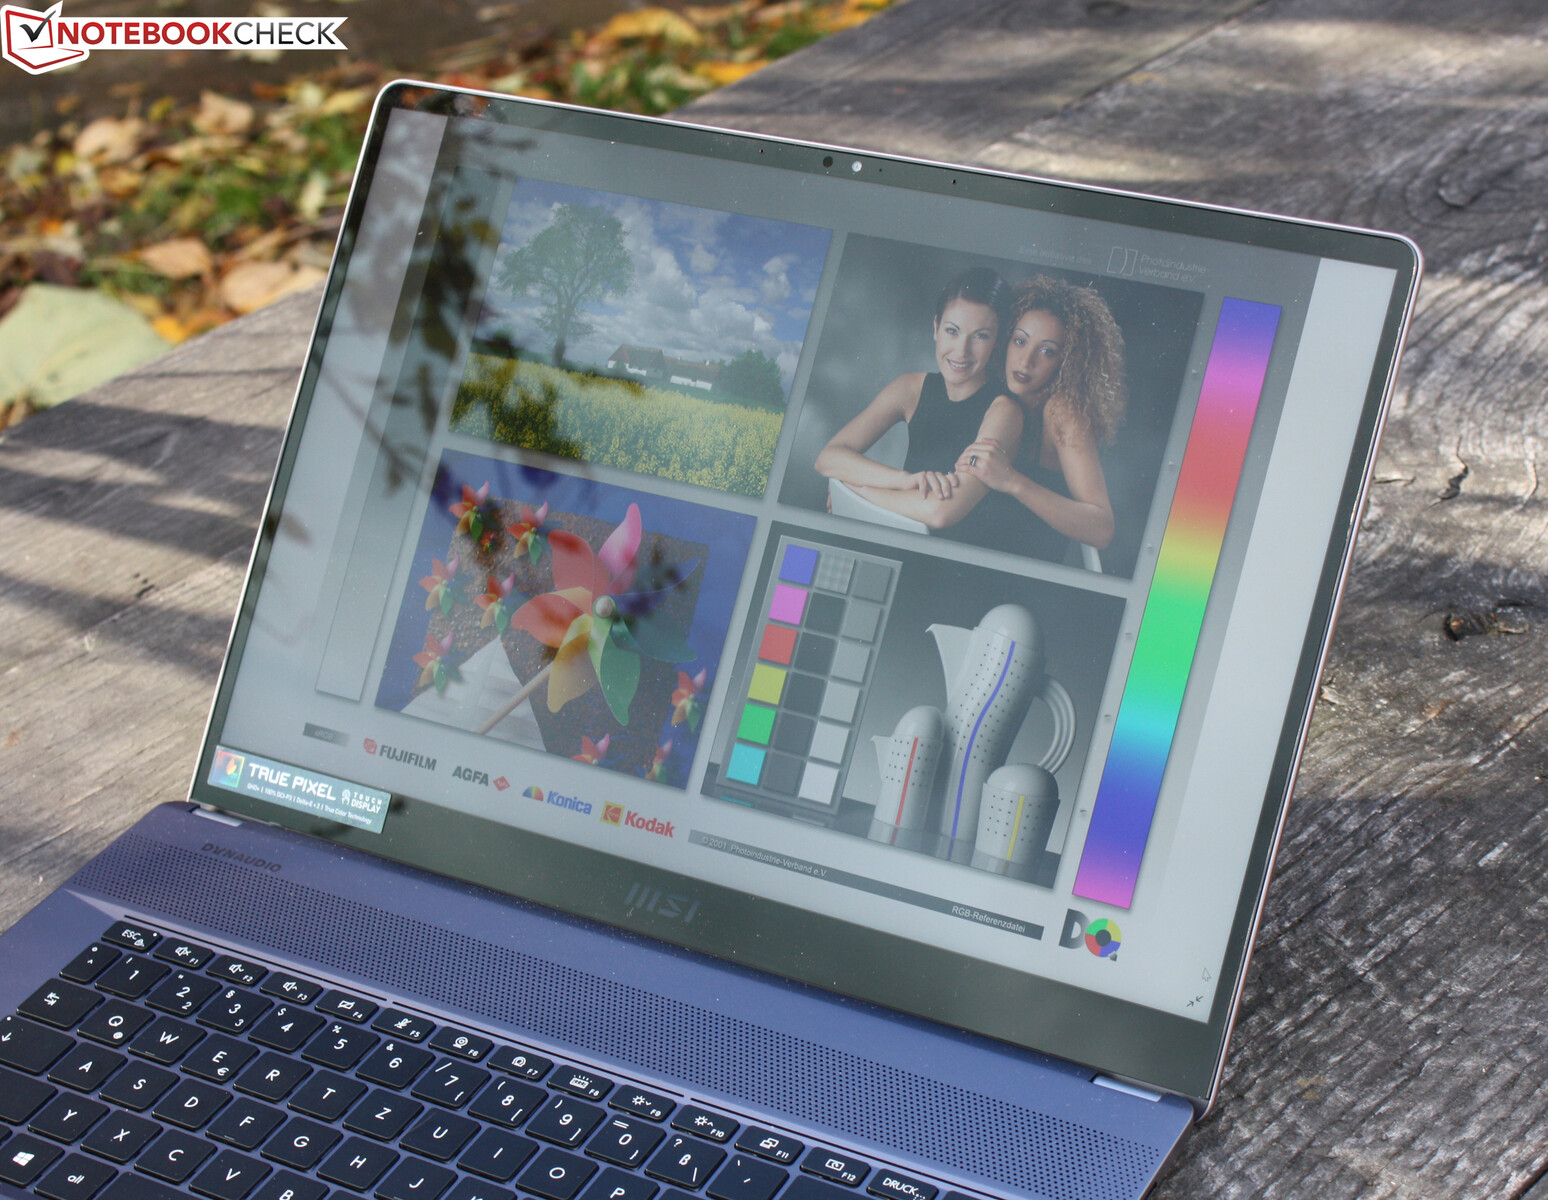
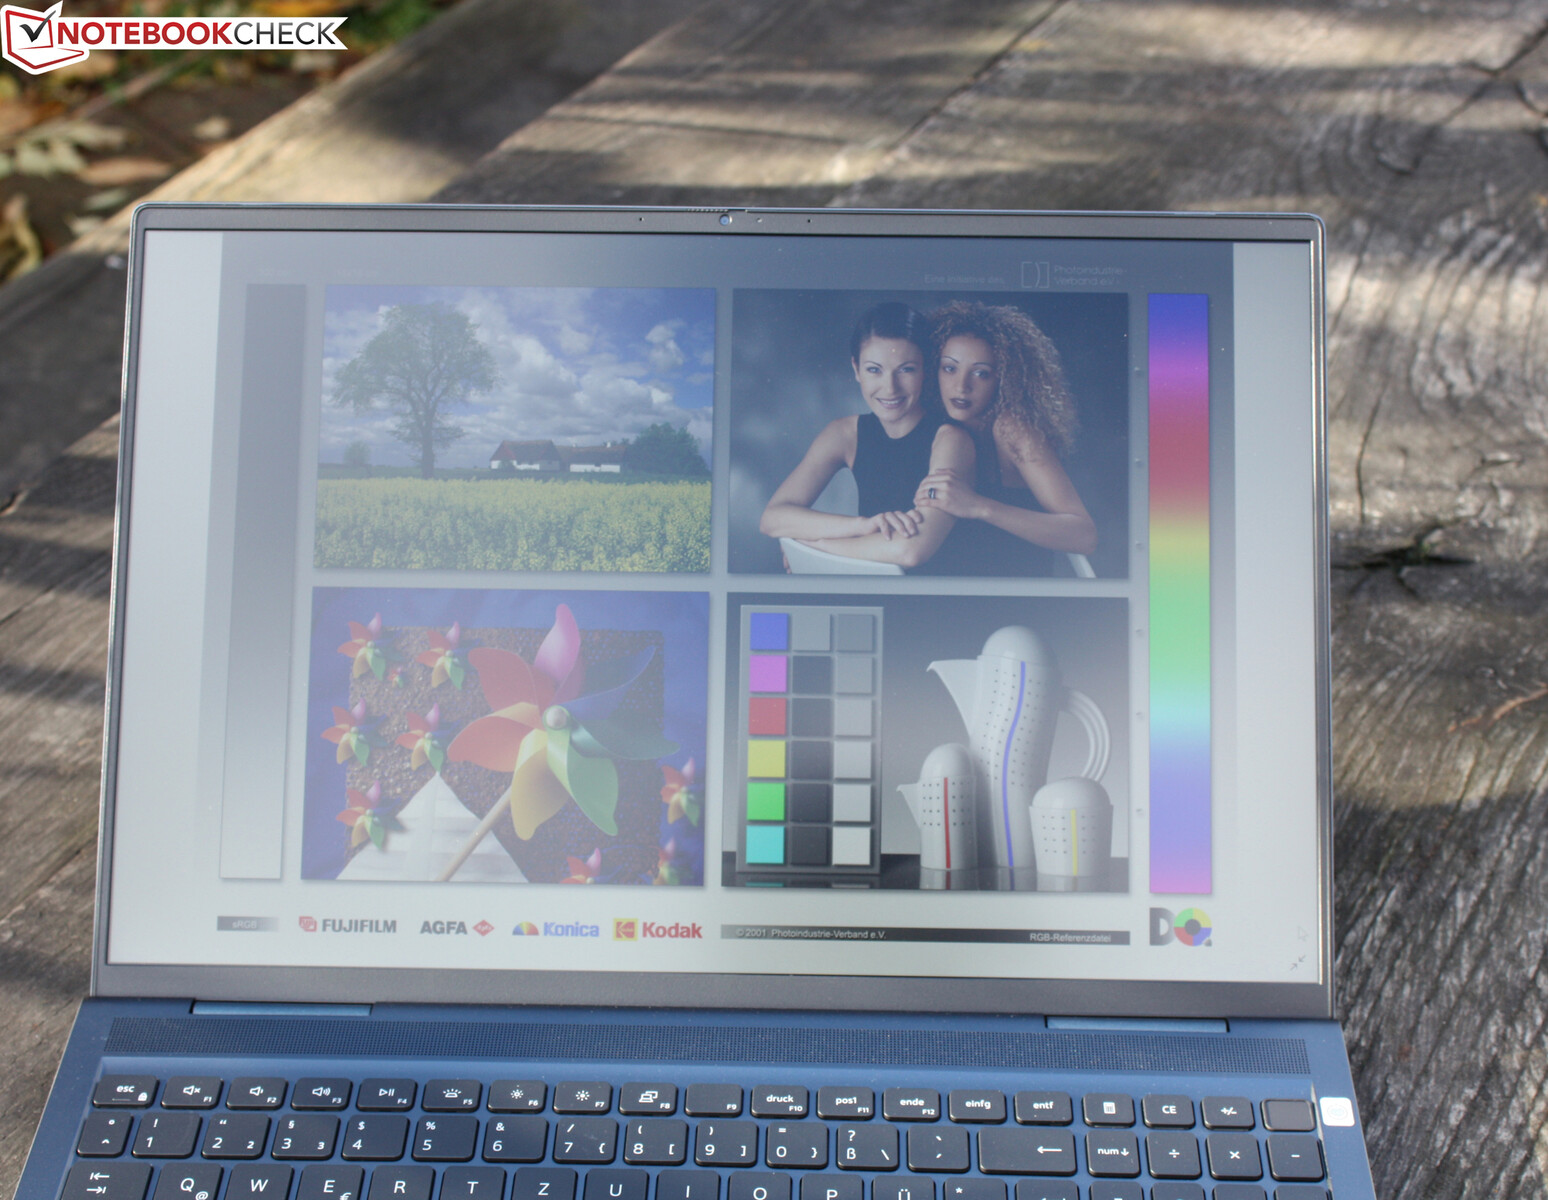
显示屏 - 色彩良好,亮度可以接受,响应时间较慢

我们的测试装置也使用了3K AU Optronics B160QAN IPS面板,这显然是所有7610机型的标准。该分辨率与MacBook Pro 16的分辨率相同。由于DPI几乎和4K显示器一样高,你可能需要调整你的文本缩放比例,以提高可读性。
由于面板的构造与Geforce型号相同,同样的观点在这里也是有效的:显示质量很好,但并不出色,对比度几乎为1400:1,DeltaE偏差很低,并且涵盖了sRGB--但不是Adobe色彩空间。Inspiron 16以其缓慢的反应时间区别于16英寸游戏笔记本,如Legion 5 Pro,后者的反应时间明显更快。与竞争对手相比,亮度适中,但分布均匀。没有PWM。
| |||||||||||||||||||||||||
Brightness Distribution: 88 %
Center on Battery: 275 cd/m²
Contrast: 1381:1 (Black: 0.21 cd/m²)
ΔE ColorChecker Calman: 2.57 | ∀{0.5-29.43 Ø4.73}
calibrated: 1.89
ΔE Greyscale Calman: 3.14 | ∀{0.09-98 Ø4.97}
76% AdobeRGB 1998 (Argyll 3D)
100% sRGB (Argyll 3D)
75% Display P3 (Argyll 3D)
Gamma: 2.34
CCT: 6408 K
| Dell Inspiron 16 Plus 7610-MHJ8F AU Optronics B160QAN, AUO9F91, IPS, 3072x1920, 16" | Dell Inspiron 16 Plus 7610 AU Optronics B160QAN, IPS, 3072x1920, 16" | LG Gram 16 (2021) LG Philips LP160WQ1-SPA1, IPS, 2560x1600, 16" | Lenovo Legion 5 Pro 16ACH6H (82JQ001PGE) CSOT T3 MNG007DA1-1, IPS, 2560x1600, 16" | Dell Inspiron 15 7000 7506 2-in-1 Black Edition AU Optronics B156ZAN, IPS, 3840x2160, 15.6" | Acer Aspire 5 A517-52G-79Z5 BOE084E, IPS, 1920x1080, 17.3" | |
|---|---|---|---|---|---|---|
| Display | -1% | 13% | -3% | -1% | -45% | |
| Display P3 Coverage (%) | 75 | 74.1 -1% | 95.8 28% | 74.3 -1% | 39.98 -47% | |
| sRGB Coverage (%) | 100 | 99.4 -1% | 99.8 0% | 99 -1% | 99 -1% | 59.3 -41% |
| AdobeRGB 1998 Coverage (%) | 76 | 75.8 0% | 83.8 10% | 73 -4% | 74.6 -2% | 41.3 -46% |
| Response Times | -3% | 28% | 84% | -4% | 75% | |
| Response Time Grey 50% / Grey 80% * (ms) | 54 ? | 49.2 ? 9% | 44 ? 19% | 9.2 ? 83% | 55.2 ? -2% | 14 ? 74% |
| Response Time Black / White * (ms) | 32 ? | 36.8 ? -15% | 20 ? 37% | 4.8 85% | 34 ? -6% | 8 ? 75% |
| PWM Frequency (Hz) | ||||||
| Screen | 3% | -39% | 13% | -33% | -24% | |
| Brightness middle (cd/m²) | 290 | 296.8 2% | 331 14% | 551 90% | 303.8 5% | 321 11% |
| Brightness (cd/m²) | 285 | 292 2% | 309 8% | 523 84% | 296 4% | 282 -1% |
| Brightness Distribution (%) | 88 | 87 -1% | 88 0% | 88 0% | 93 6% | 81 -8% |
| Black Level * (cd/m²) | 0.21 | 0.21 -0% | 0.22 -5% | 0.54 -157% | 0.24 -14% | 0.36 -71% |
| Contrast (:1) | 1381 | 1413 2% | 1505 9% | 1020 -26% | 1266 -8% | 892 -35% |
| Colorchecker dE 2000 * | 2.57 | 2.56 -0% | 4.64 -81% | 1.8 30% | 4.58 -78% | 4.3 -67% |
| Colorchecker dE 2000 max. * | 4.78 | 4.76 -0% | 9.82 -105% | 2.53 47% | 9.4 -97% | 7.1 -49% |
| Colorchecker dE 2000 calibrated * | 1.89 | 1.86 2% | 3.16 -67% | 1.66 12% | 2.17 -15% | |
| Greyscale dE 2000 * | 3.14 | 2.6 17% | 6.9 -120% | 1.85 41% | 6.4 -104% | 2.26 28% |
| Gamma | 2.34 94% | 2.07 106% | 2.34 94% | 2.3 96% | 2.3 96% | 2.36 93% |
| CCT | 6408 101% | 6628 98% | 7904 82% | 6338 103% | 7414 88% | 6650 98% |
| Color Space (Percent of AdobeRGB 1998) (%) | 75.1 | 72.81 | 66.7 | 38 | ||
| Color Space (Percent of sRGB) (%) | 100 | 99.41 | 99 | 59 | ||
| Total Average (Program / Settings) | -0% /
1% | 1% /
-18% | 31% /
22% | -13% /
-22% | 2% /
-14% |
* ... smaller is better
Display Response Times
| ↔ Response Time Black to White | ||
|---|---|---|
| 32 ms ... rise ↗ and fall ↘ combined | ↗ 15 ms rise |  |
| ↘ 17 ms fall | ||
| The screen shows slow response rates in our tests and will be unsatisfactory for gamers. In comparison, all tested devices range from 0.1 (minimum) to 240 (maximum) ms. » 86 % of all devices are better. This means that the measured response time is worse than the average of all tested devices (19.9 ms). | ||
| ↔ Response Time 50% Grey to 80% Grey | ||
| 54 ms ... rise ↗ and fall ↘ combined | ↗ 24 ms rise |  |
| ↘ 30 ms fall | ||
| The screen shows slow response rates in our tests and will be unsatisfactory for gamers. In comparison, all tested devices range from 0.165 (minimum) to 636 (maximum) ms. » 91 % of all devices are better. This means that the measured response time is worse than the average of all tested devices (31.1 ms). | ||
Screen Flickering / PWM (Pulse-Width Modulation)
| Screen flickering / PWM not detected |  | ||
In comparison: 52 % of all tested devices do not use PWM to dim the display. If PWM was detected, an average of 7798 (minimum: 5 - maximum: 343500) Hz was measured. | |||
业绩
作为标准,英特尔的Tiger Lake H CPU (11400H, 11800H)和可选的一个 GeForce RTX 3050或 RTX 3060被使用。虽然我们的测试装置没有dGPU,但它的16GB内存还不算低端。在测试时,没有AMD机型。
测试条件
基准是在主电源操作下使用最高性能的配置文件运行的。
处理器
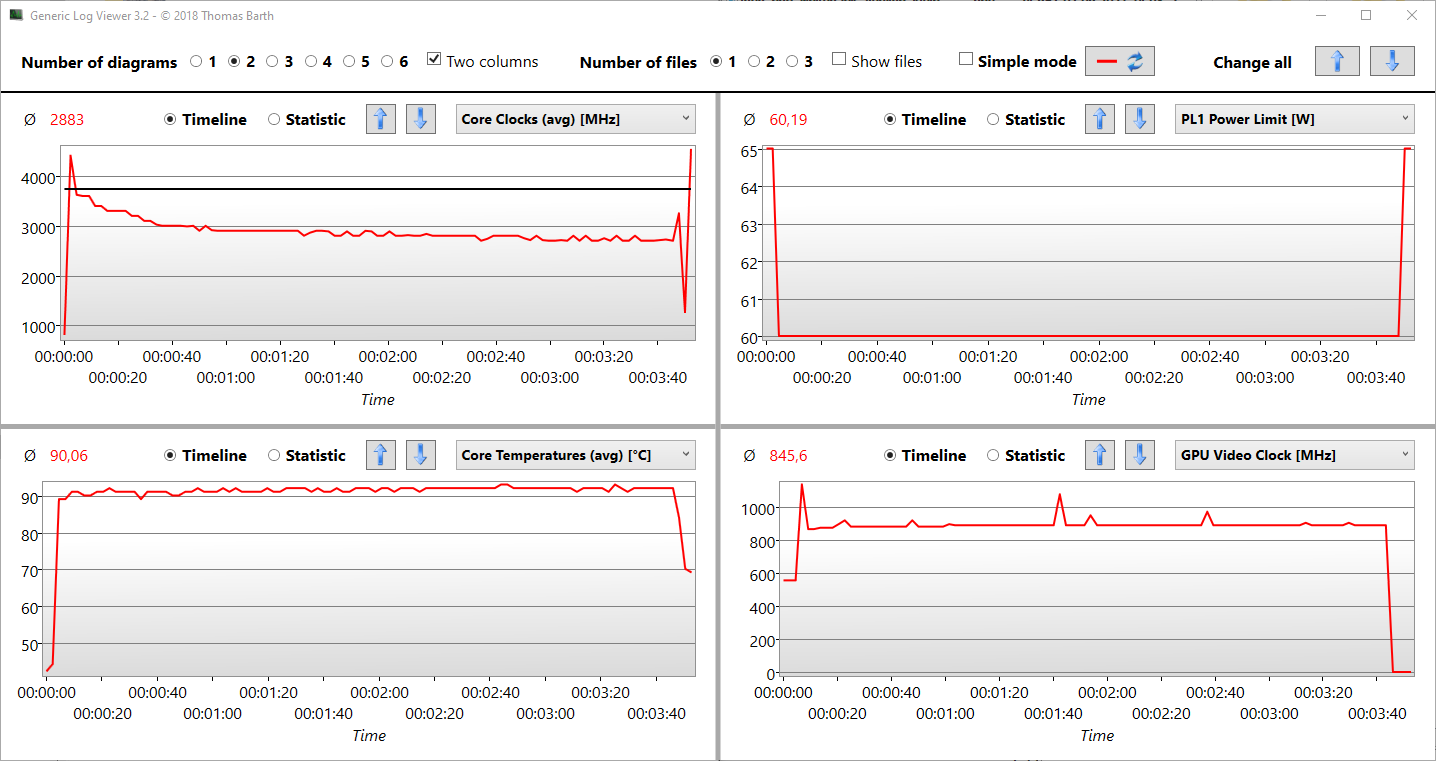
CPU的性能可以更好,Cinebench多线程的结果比配备普通笔记本电脑的结果落后5-20%。 酷睿i7-11800H.没有dGPU的Inspiron 16 Plus 7610在R15这一单一基准测试中只比配备Geforce的型号的相同SoC多出13%的分数。因此,看起来非DGPU的型号没有任何热能优势。单线程性能非常好,与我们在11800H上的预期相符。11800H.从第一次运行到第三次运行,R15循环显示了测试单元的优势,所以这里可能会有一些更多的散热空间,允许时钟速度在高水平上多保持几秒钟。图形日志15详细地显示了所发生的情况。在下降到3.6 GHz和PL1被降低5瓦之前,它短暂地擦过了4 GHz大关。但正如已经说过的,没有dGPU支持的i7-11800H在R15和Blender基准测试中只取得了更好的成绩。
Cinebench R15 Multi Constant Load Test
Cinebench R23: Multi Core | Single Core
Cinebench R20: CPU (Multi Core) | CPU (Single Core)
Cinebench R15: CPU Multi 64Bit | CPU Single 64Bit
Blender: v2.79 BMW27 CPU
7-Zip 18.03: 7z b 4 | 7z b 4 -mmt1
Geekbench 5.5: Multi-Core | Single-Core
HWBOT x265 Benchmark v2.2: 4k Preset
LibreOffice : 20 Documents To PDF
R Benchmark 2.5: Overall mean
| CPU Performance rating | |
| Average of class Multimedia | |
| Average Intel Core i7-11800H | |
| Lenovo Legion 5 Pro 16ACH6H (82JQ001PGE) | |
| Dell Inspiron 16 Plus 7610 -2! | |
| Dell Inspiron 16 Plus 7610-MHJ8F | |
| Acer Aspire 5 A517-52G-79Z5 | |
| Dell Inspiron 15 7000 7506 2-in-1 Black Edition -1! | |
| LG Gram 16 (2021) | |
| Cinebench R23 / Multi Core | |
| Average of class Multimedia (4861 - 33362, n=81, last 2 years) | |
| Lenovo Legion 5 Pro 16ACH6H (82JQ001PGE) | |
| Lenovo Legion 5 Pro 16ACH6H (82JQ001PGE) | |
| Average Intel Core i7-11800H (6508 - 14088, n=48) | |
| Dell Inspiron 16 Plus 7610-MHJ8F | |
| Dell Inspiron 16 Plus 7610 | |
| Acer Aspire 5 A517-52G-79Z5 | |
| Dell Inspiron 15 7000 7506 2-in-1 Black Edition | |
| LG Gram 16 (2021) | |
| Cinebench R23 / Single Core | |
| Average of class Multimedia (1128 - 2459, n=73, last 2 years) | |
| Dell Inspiron 16 Plus 7610 | |
| Acer Aspire 5 A517-52G-79Z5 | |
| Dell Inspiron 16 Plus 7610-MHJ8F | |
| Average Intel Core i7-11800H (1386 - 1522, n=45) | |
| Lenovo Legion 5 Pro 16ACH6H (82JQ001PGE) | |
| Lenovo Legion 5 Pro 16ACH6H (82JQ001PGE) | |
| LG Gram 16 (2021) | |
| Cinebench R20 / CPU (Multi Core) | |
| Average of class Multimedia (1887 - 12912, n=64, last 2 years) | |
| Lenovo Legion 5 Pro 16ACH6H (82JQ001PGE) | |
| Lenovo Legion 5 Pro 16ACH6H (82JQ001PGE) | |
| Average Intel Core i7-11800H (2498 - 5408, n=50) | |
| Dell Inspiron 16 Plus 7610 | |
| Dell Inspiron 16 Plus 7610-MHJ8F | |
| Acer Aspire 5 A517-52G-79Z5 | |
| Dell Inspiron 15 7000 7506 2-in-1 Black Edition | |
| LG Gram 16 (2021) | |
| Cinebench R20 / CPU (Single Core) | |
| Average of class Multimedia (425 - 853, n=64, last 2 years) | |
| Dell Inspiron 16 Plus 7610 | |
| Dell Inspiron 16 Plus 7610-MHJ8F | |
| Average Intel Core i7-11800H (520 - 586, n=47) | |
| Acer Aspire 5 A517-52G-79Z5 | |
| Lenovo Legion 5 Pro 16ACH6H (82JQ001PGE) | |
| Lenovo Legion 5 Pro 16ACH6H (82JQ001PGE) | |
| LG Gram 16 (2021) | |
| Dell Inspiron 15 7000 7506 2-in-1 Black Edition | |
| Cinebench R15 / CPU Multi 64Bit | |
| Average of class Multimedia (856 - 5224, n=68, last 2 years) | |
| Lenovo Legion 5 Pro 16ACH6H (82JQ001PGE) | |
| Average Intel Core i7-11800H (1342 - 2173, n=50) | |
| Dell Inspiron 16 Plus 7610-MHJ8F | |
| Dell Inspiron 16 Plus 7610 | |
| Acer Aspire 5 A517-52G-79Z5 | |
| LG Gram 16 (2021) | |
| Dell Inspiron 15 7000 7506 2-in-1 Black Edition | |
| Cinebench R15 / CPU Single 64Bit | |
| Average of class Multimedia (184.8 - 326, n=66, last 2 years) | |
| Lenovo Legion 5 Pro 16ACH6H (82JQ001PGE) | |
| Lenovo Legion 5 Pro 16ACH6H (82JQ001PGE) | |
| Dell Inspiron 16 Plus 7610 | |
| Dell Inspiron 16 Plus 7610-MHJ8F | |
| Average Intel Core i7-11800H (201 - 231, n=46) | |
| Acer Aspire 5 A517-52G-79Z5 | |
| LG Gram 16 (2021) | |
| Dell Inspiron 15 7000 7506 2-in-1 Black Edition | |
| Blender / v2.79 BMW27 CPU | |
| LG Gram 16 (2021) | |
| Dell Inspiron 15 7000 7506 2-in-1 Black Edition | |
| Acer Aspire 5 A517-52G-79Z5 | |
| Dell Inspiron 16 Plus 7610-MHJ8F | |
| Average Intel Core i7-11800H (217 - 454, n=46) | |
| Dell Inspiron 16 Plus 7610 | |
| Lenovo Legion 5 Pro 16ACH6H (82JQ001PGE) | |
| Lenovo Legion 5 Pro 16ACH6H (82JQ001PGE) | |
| Average of class Multimedia (100 - 557, n=65, last 2 years) | |
| 7-Zip 18.03 / 7z b 4 | |
| Average of class Multimedia (29095 - 130368, n=62, last 2 years) | |
| Lenovo Legion 5 Pro 16ACH6H (82JQ001PGE) | |
| Lenovo Legion 5 Pro 16ACH6H (82JQ001PGE) | |
| Average Intel Core i7-11800H (33718 - 56758, n=46) | |
| Dell Inspiron 16 Plus 7610 | |
| Dell Inspiron 16 Plus 7610-MHJ8F | |
| Acer Aspire 5 A517-52G-79Z5 | |
| Dell Inspiron 15 7000 7506 2-in-1 Black Edition | |
| LG Gram 16 (2021) | |
| 7-Zip 18.03 / 7z b 4 -mmt1 | |
| Average of class Multimedia (3666 - 7545, n=63, last 2 years) | |
| Dell Inspiron 16 Plus 7610 | |
| Lenovo Legion 5 Pro 16ACH6H (82JQ001PGE) | |
| Lenovo Legion 5 Pro 16ACH6H (82JQ001PGE) | |
| Average Intel Core i7-11800H (5138 - 5732, n=46) | |
| Acer Aspire 5 A517-52G-79Z5 | |
| Dell Inspiron 16 Plus 7610-MHJ8F | |
| Dell Inspiron 15 7000 7506 2-in-1 Black Edition | |
| LG Gram 16 (2021) | |
| Geekbench 5.5 / Multi-Core | |
| Average of class Multimedia (4652 - 20422, n=62, last 2 years) | |
| Average Intel Core i7-11800H (4655 - 9851, n=40) | |
| Lenovo Legion 5 Pro 16ACH6H (82JQ001PGE) | |
| Lenovo Legion 5 Pro 16ACH6H (82JQ001PGE) | |
| Dell Inspiron 16 Plus 7610-MHJ8F | |
| Dell Inspiron 16 Plus 7610-MHJ8F | |
| Dell Inspiron 16 Plus 7610-MHJ8F | |
| Dell Inspiron 15 7000 7506 2-in-1 Black Edition | |
| LG Gram 16 (2021) | |
| Acer Aspire 5 A517-52G-79Z5 | |
| Geekbench 5.5 / Single-Core | |
| Average of class Multimedia (805 - 2974, n=62, last 2 years) | |
| Dell Inspiron 16 Plus 7610-MHJ8F | |
| Dell Inspiron 16 Plus 7610-MHJ8F | |
| Dell Inspiron 16 Plus 7610-MHJ8F | |
| Acer Aspire 5 A517-52G-79Z5 | |
| Average Intel Core i7-11800H (1429 - 1625, n=40) | |
| LG Gram 16 (2021) | |
| Dell Inspiron 15 7000 7506 2-in-1 Black Edition | |
| Lenovo Legion 5 Pro 16ACH6H (82JQ001PGE) | |
| Lenovo Legion 5 Pro 16ACH6H (82JQ001PGE) | |
| HWBOT x265 Benchmark v2.2 / 4k Preset | |
| Average of class Multimedia (5.26 - 36.1, n=63, last 2 years) | |
| Lenovo Legion 5 Pro 16ACH6H (82JQ001PGE) | |
| Lenovo Legion 5 Pro 16ACH6H (82JQ001PGE) | |
| Average Intel Core i7-11800H (7.38 - 17.4, n=46) | |
| Dell Inspiron 16 Plus 7610 | |
| Dell Inspiron 16 Plus 7610-MHJ8F | |
| Dell Inspiron 15 7000 7506 2-in-1 Black Edition | |
| Acer Aspire 5 A517-52G-79Z5 | |
| LG Gram 16 (2021) | |
| LibreOffice / 20 Documents To PDF | |
| Lenovo Legion 5 Pro 16ACH6H (82JQ001PGE) | |
| Lenovo Legion 5 Pro 16ACH6H (82JQ001PGE) | |
| Acer Aspire 5 A517-52G-79Z5 | |
| Average of class Multimedia (23.9 - 146.7, n=64, last 2 years) | |
| Dell Inspiron 15 7000 7506 2-in-1 Black Edition | |
| Average Intel Core i7-11800H (38.6 - 59.9, n=45) | |
| Dell Inspiron 16 Plus 7610 | |
| LG Gram 16 (2021) | |
| Dell Inspiron 16 Plus 7610-MHJ8F | |
| R Benchmark 2.5 / Overall mean | |
| LG Gram 16 (2021) | |
| Dell Inspiron 15 7000 7506 2-in-1 Black Edition | |
| Dell Inspiron 16 Plus 7610-MHJ8F | |
| Acer Aspire 5 A517-52G-79Z5 | |
| Average Intel Core i7-11800H (0.548 - 0.615, n=46) | |
| Dell Inspiron 16 Plus 7610 | |
| Lenovo Legion 5 Pro 16ACH6H (82JQ001PGE) | |
| Lenovo Legion 5 Pro 16ACH6H (82JQ001PGE) | |
| Average of class Multimedia (0.3604 - 0.947, n=63, last 2 years) | |
* ... smaller is better
AIDA64: FP32 Ray-Trace | FPU Julia | CPU SHA3 | CPU Queen | FPU SinJulia | FPU Mandel | CPU AES | CPU ZLib | FP64 Ray-Trace | CPU PhotoWorxx
| Performance rating | |
| Average of class Multimedia | |
| Lenovo Legion 5 Pro 16ACH6H (82JQ001PGE) | |
| Average Intel Core i7-11800H | |
| Dell Inspiron 16 Plus 7610-MHJ8F | |
| LG Gram 16 (2021) | |
| Dell Inspiron 16 Plus 7610 -9! | |
| AIDA64 / FP32 Ray-Trace | |
| Average of class Multimedia (2214 - 50388, n=60, last 2 years) | |
| Lenovo Legion 5 Pro 16ACH6H (82JQ001PGE) | |
| Lenovo Legion 5 Pro 16ACH6H (82JQ001PGE) | |
| Average Intel Core i7-11800H (8772 - 15961, n=20) | |
| Dell Inspiron 16 Plus 7610-MHJ8F | |
| LG Gram 16 (2021) | |
| AIDA64 / FPU Julia | |
| Lenovo Legion 5 Pro 16ACH6H (82JQ001PGE) | |
| Lenovo Legion 5 Pro 16ACH6H (82JQ001PGE) | |
| Average of class Multimedia (12867 - 201874, n=61, last 2 years) | |
| Average Intel Core i7-11800H (39404 - 65636, n=20) | |
| Dell Inspiron 16 Plus 7610-MHJ8F | |
| LG Gram 16 (2021) | |
| AIDA64 / CPU SHA3 | |
| Average of class Multimedia (653 - 8623, n=61, last 2 years) | |
| Average Intel Core i7-11800H (2599 - 4439, n=20) | |
| Dell Inspiron 16 Plus 7610-MHJ8F | |
| Lenovo Legion 5 Pro 16ACH6H (82JQ001PGE) | |
| Lenovo Legion 5 Pro 16ACH6H (82JQ001PGE) | |
| LG Gram 16 (2021) | |
| AIDA64 / CPU Queen | |
| Lenovo Legion 5 Pro 16ACH6H (82JQ001PGE) | |
| Lenovo Legion 5 Pro 16ACH6H (82JQ001PGE) | |
| Dell Inspiron 16 Plus 7610-MHJ8F | |
| Average Intel Core i7-11800H (85233 - 91941, n=20) | |
| Average of class Multimedia (13483 - 181505, n=49, last 2 years) | |
| LG Gram 16 (2021) | |
| AIDA64 / FPU SinJulia | |
| Lenovo Legion 5 Pro 16ACH6H (82JQ001PGE) | |
| Lenovo Legion 5 Pro 16ACH6H (82JQ001PGE) | |
| Average Intel Core i7-11800H (6420 - 9792, n=20) | |
| Average of class Multimedia (1240 - 28794, n=61, last 2 years) | |
| Dell Inspiron 16 Plus 7610-MHJ8F | |
| LG Gram 16 (2021) | |
| AIDA64 / FPU Mandel | |
| Lenovo Legion 5 Pro 16ACH6H (82JQ001PGE) | |
| Lenovo Legion 5 Pro 16ACH6H (82JQ001PGE) | |
| Average of class Multimedia (6395 - 105740, n=60, last 2 years) | |
| Average Intel Core i7-11800H (23365 - 39464, n=20) | |
| Dell Inspiron 16 Plus 7610-MHJ8F | |
| LG Gram 16 (2021) | |
| AIDA64 / CPU AES | |
| Lenovo Legion 5 Pro 16ACH6H (82JQ001PGE) | |
| Lenovo Legion 5 Pro 16ACH6H (82JQ001PGE) | |
| Average Intel Core i7-11800H (74617 - 149388, n=20) | |
| Dell Inspiron 16 Plus 7610-MHJ8F | |
| Average of class Multimedia (13243 - 126790, n=61, last 2 years) | |
| LG Gram 16 (2021) | |
| AIDA64 / CPU ZLib | |
| Average of class Multimedia (167.2 - 2022, n=61, last 2 years) | |
| Lenovo Legion 5 Pro 16ACH6H (82JQ001PGE) | |
| Lenovo Legion 5 Pro 16ACH6H (82JQ001PGE) | |
| Dell Inspiron 16 Plus 7610-MHJ8F | |
| Average Intel Core i7-11800H (461 - 830, n=43) | |
| LG Gram 16 (2021) | |
| Dell Inspiron 16 Plus 7610 | |
| AIDA64 / FP64 Ray-Trace | |
| Average of class Multimedia (1014 - 26875, n=61, last 2 years) | |
| Lenovo Legion 5 Pro 16ACH6H (82JQ001PGE) | |
| Lenovo Legion 5 Pro 16ACH6H (82JQ001PGE) | |
| Average Intel Core i7-11800H (4545 - 8717, n=21) | |
| Dell Inspiron 16 Plus 7610-MHJ8F | |
| LG Gram 16 (2021) | |
| AIDA64 / CPU PhotoWorxx | |
| Average of class Multimedia (12860 - 88154, n=61, last 2 years) | |
| LG Gram 16 (2021) | |
| Average Intel Core i7-11800H (11898 - 26757, n=21) | |
| Lenovo Legion 5 Pro 16ACH6H (82JQ001PGE) | |
| Lenovo Legion 5 Pro 16ACH6H (82JQ001PGE) | |
| Dell Inspiron 16 Plus 7610-MHJ8F | |
系统性能
PCMark的得分因Geforce的缺失而受到影响,我们看到次级得分有25-50%的差异。然而,Essentials的情况并非如此,其结果甚至高于dGPU的结果。在电池运行中,性能略有下降,但幅度不大。
| PCMark 10 / Score | |
| Average of class Multimedia (4325 - 10386, n=58, last 2 years) | |
| Lenovo Legion 5 Pro 16ACH6H (82JQ001PGE) | |
| Dell Inspiron 16 Plus 7610 | |
| Acer Aspire 5 A517-52G-79Z5 | |
| Dell Inspiron 16 Plus 7610-MHJ8F | |
| Average Intel Core i7-11800H, Intel UHD Graphics Xe 32EUs (Tiger Lake-H) (5036 - 5067, n=2) | |
| Dell Inspiron 15 7000 7506 2-in-1 Black Edition | |
| LG Gram 16 (2021) | |
| PCMark 10 / Essentials | |
| Average of class Multimedia (8025 - 11664, n=57, last 2 years) | |
| LG Gram 16 (2021) | |
| Dell Inspiron 16 Plus 7610-MHJ8F | |
| Dell Inspiron 16 Plus 7610 | |
| Average Intel Core i7-11800H, Intel UHD Graphics Xe 32EUs (Tiger Lake-H) (9694 - 9847, n=2) | |
| Dell Inspiron 15 7000 7506 2-in-1 Black Edition | |
| Lenovo Legion 5 Pro 16ACH6H (82JQ001PGE) | |
| Acer Aspire 5 A517-52G-79Z5 | |
| PCMark 10 / Productivity | |
| Average of class Multimedia (7323 - 18233, n=57, last 2 years) | |
| Acer Aspire 5 A517-52G-79Z5 | |
| Lenovo Legion 5 Pro 16ACH6H (82JQ001PGE) | |
| Dell Inspiron 16 Plus 7610 | |
| LG Gram 16 (2021) | |
| Average Intel Core i7-11800H, Intel UHD Graphics Xe 32EUs (Tiger Lake-H) (6562 - 6723, n=2) | |
| Dell Inspiron 15 7000 7506 2-in-1 Black Edition | |
| Dell Inspiron 16 Plus 7610-MHJ8F | |
| PCMark 10 / Digital Content Creation | |
| Average of class Multimedia (3651 - 16240, n=57, last 2 years) | |
| Lenovo Legion 5 Pro 16ACH6H (82JQ001PGE) | |
| Dell Inspiron 16 Plus 7610 | |
| Dell Inspiron 16 Plus 7610-MHJ8F | |
| Dell Inspiron 15 7000 7506 2-in-1 Black Edition | |
| Average Intel Core i7-11800H, Intel UHD Graphics Xe 32EUs (Tiger Lake-H) (5318 - 5464, n=2) | |
| Acer Aspire 5 A517-52G-79Z5 | |
| LG Gram 16 (2021) | |
| PCMark 10 Score | 5067 points | |
Help | ||
| AIDA64 / Memory Copy | |
| Average of class Multimedia (21158 - 132135, n=61, last 2 years) | |
| LG Gram 16 (2021) | |
| Average Intel Core i7-11800H (24508 - 48144, n=21) | |
| Dell Inspiron 16 Plus 7610-MHJ8F | |
| Lenovo Legion 5 Pro 16ACH6H (82JQ001PGE) | |
| Lenovo Legion 5 Pro 16ACH6H (82JQ001PGE) | |
| AIDA64 / Memory Read | |
| Average of class Multimedia (19699 - 174586, n=61, last 2 years) | |
| LG Gram 16 (2021) | |
| Lenovo Legion 5 Pro 16ACH6H (82JQ001PGE) | |
| Lenovo Legion 5 Pro 16ACH6H (82JQ001PGE) | |
| Dell Inspiron 16 Plus 7610-MHJ8F | |
| Average Intel Core i7-11800H (25882 - 50365, n=20) | |
| AIDA64 / Memory Write | |
| Average of class Multimedia (17733 - 134998, n=61, last 2 years) | |
| LG Gram 16 (2021) | |
| Dell Inspiron 16 Plus 7610-MHJ8F | |
| Average Intel Core i7-11800H (22240 - 46214, n=20) | |
| Lenovo Legion 5 Pro 16ACH6H (82JQ001PGE) | |
| Lenovo Legion 5 Pro 16ACH6H (82JQ001PGE) | |
| AIDA64 / Memory Latency | |
| Average of class Multimedia (7 - 535, n=60, last 2 years) | |
| Dell Inspiron 16 Plus 7610-MHJ8F | |
| LG Gram 16 (2021) | |
| Lenovo Legion 5 Pro 16ACH6H (82JQ001PGE) | |
| Lenovo Legion 5 Pro 16ACH6H (82JQ001PGE) | |
| Average Intel Core i7-11800H (71.9 - 104.1, n=44) | |
| Dell Inspiron 16 Plus 7610 | |
* ... smaller is better
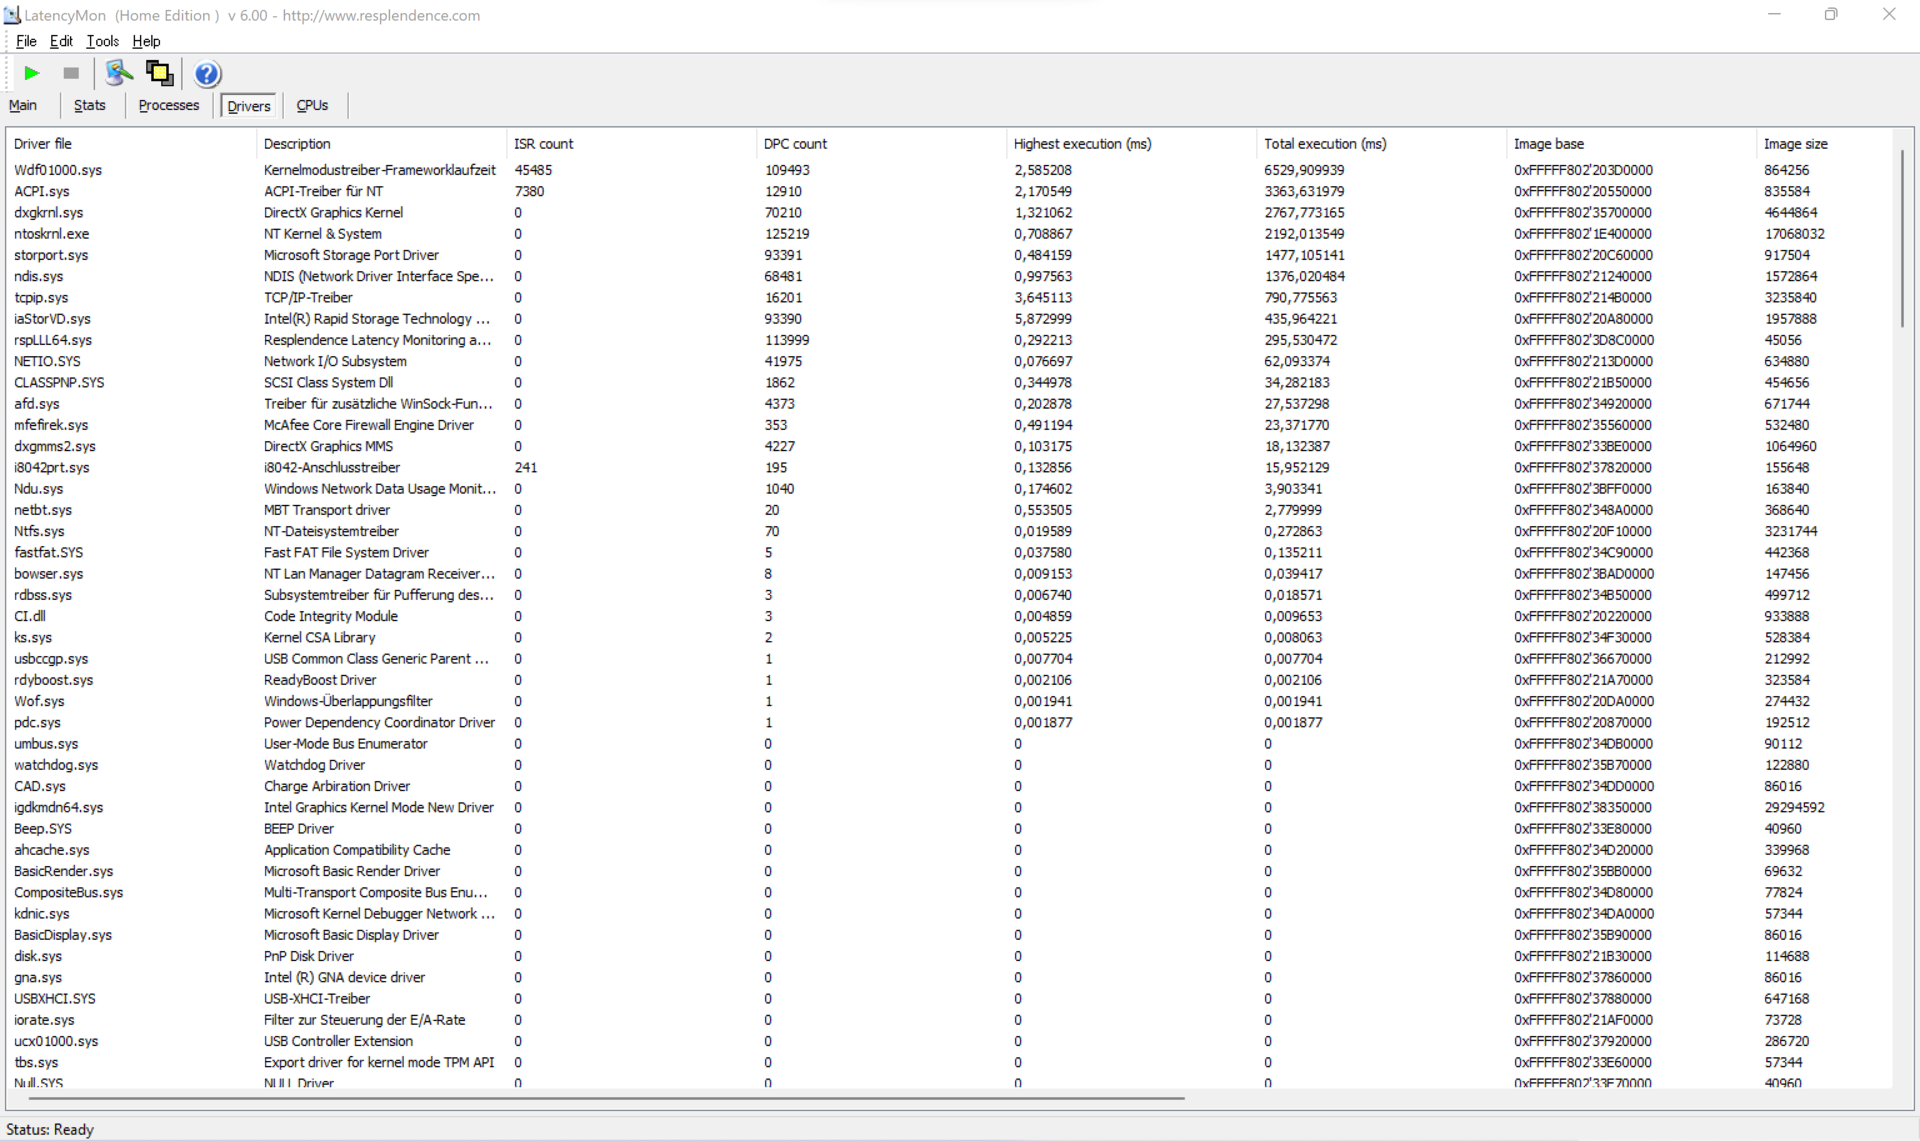
DPC延迟
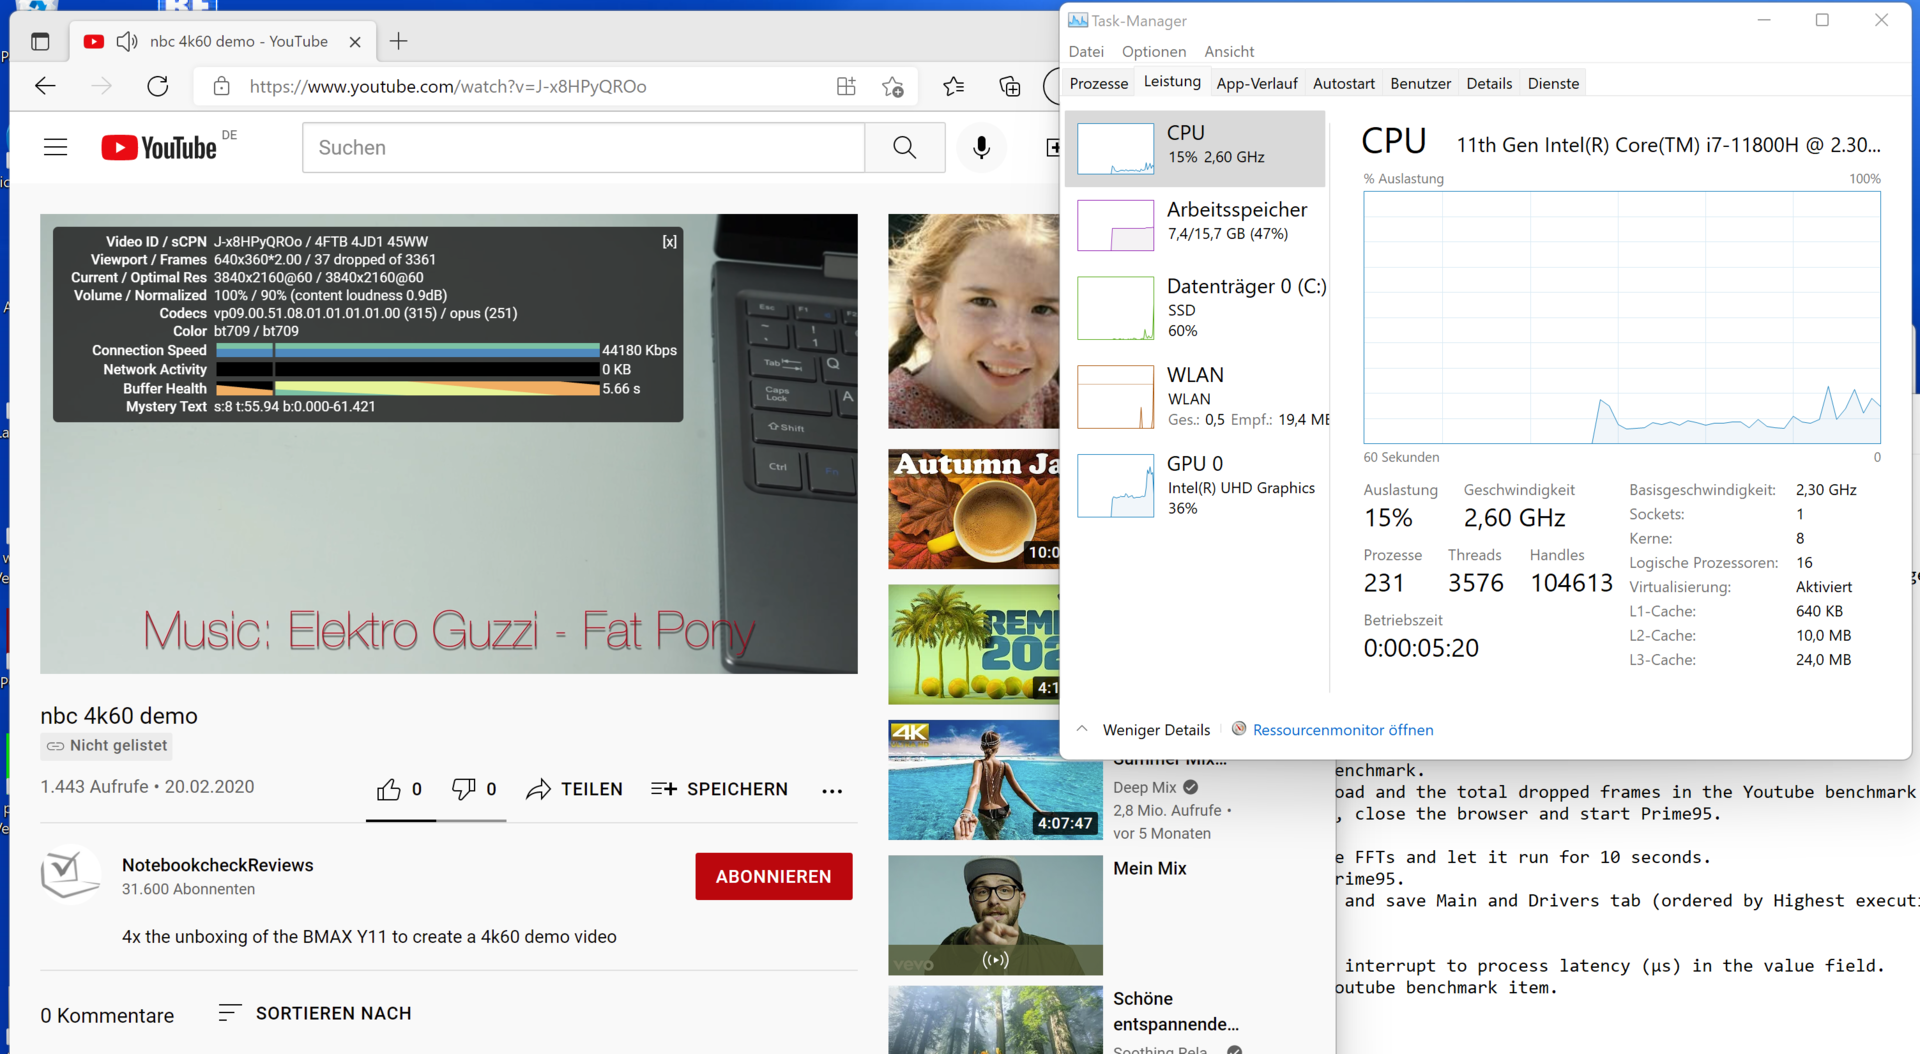
当在几个标签中打开我们的主页或运行Prime95时,LatencyMon报告了一些有问题的DPC延迟。4K视频的再现也不是完全无缝的,在运行60秒的视频时,有37帧被丢弃。原因在于内核和ACPI驱动。
| DPC Latencies / LatencyMon - interrupt to process latency (max), Web, Youtube, Prime95 | |
| Dell Inspiron 16 Plus 7610 | |
| Acer Aspire 5 A517-52G-79Z5 | |
| Lenovo Legion 5 Pro 16ACH6H (82JQ001PGE) | |
| LG Gram 16 (2021) | |
| Dell Inspiron 15 7000 7506 2-in-1 Black Edition | |
* ... smaller is better
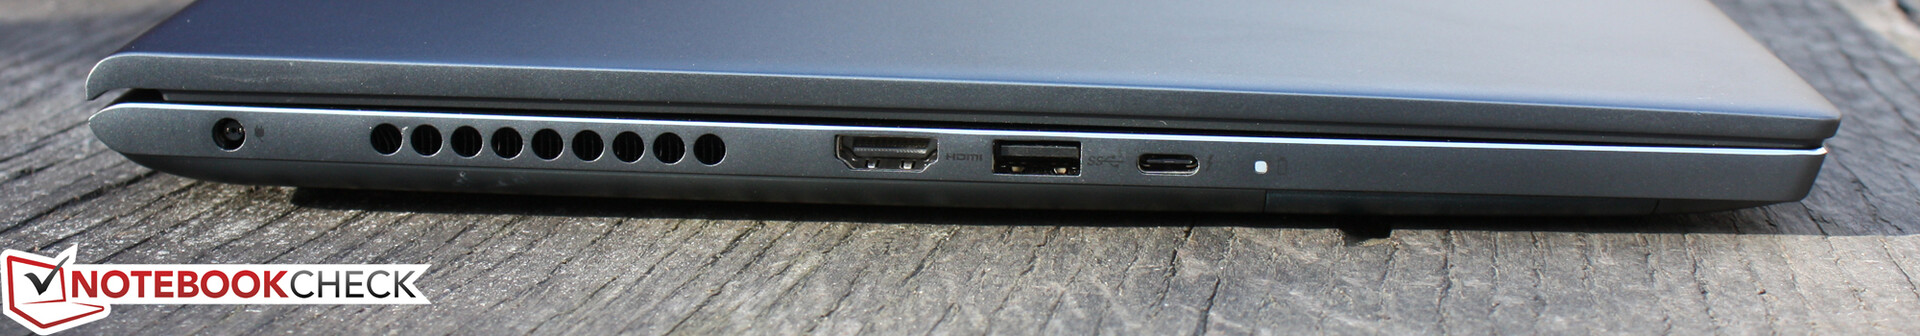
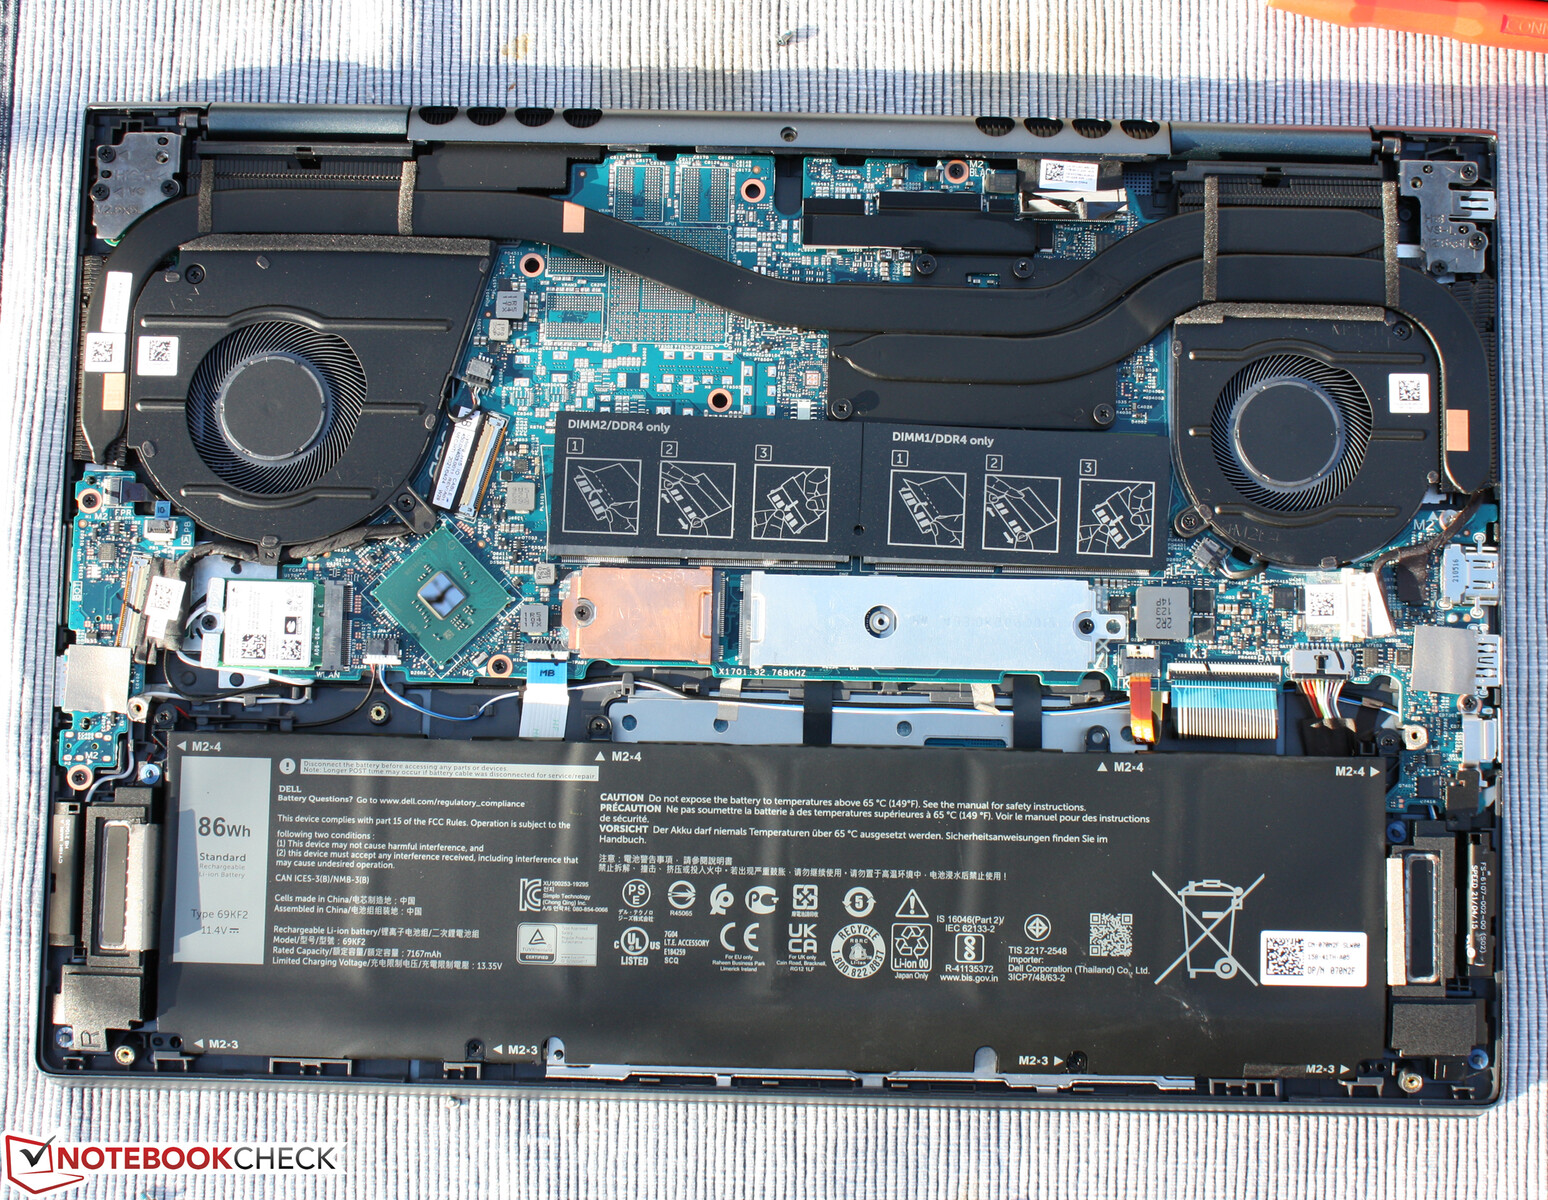
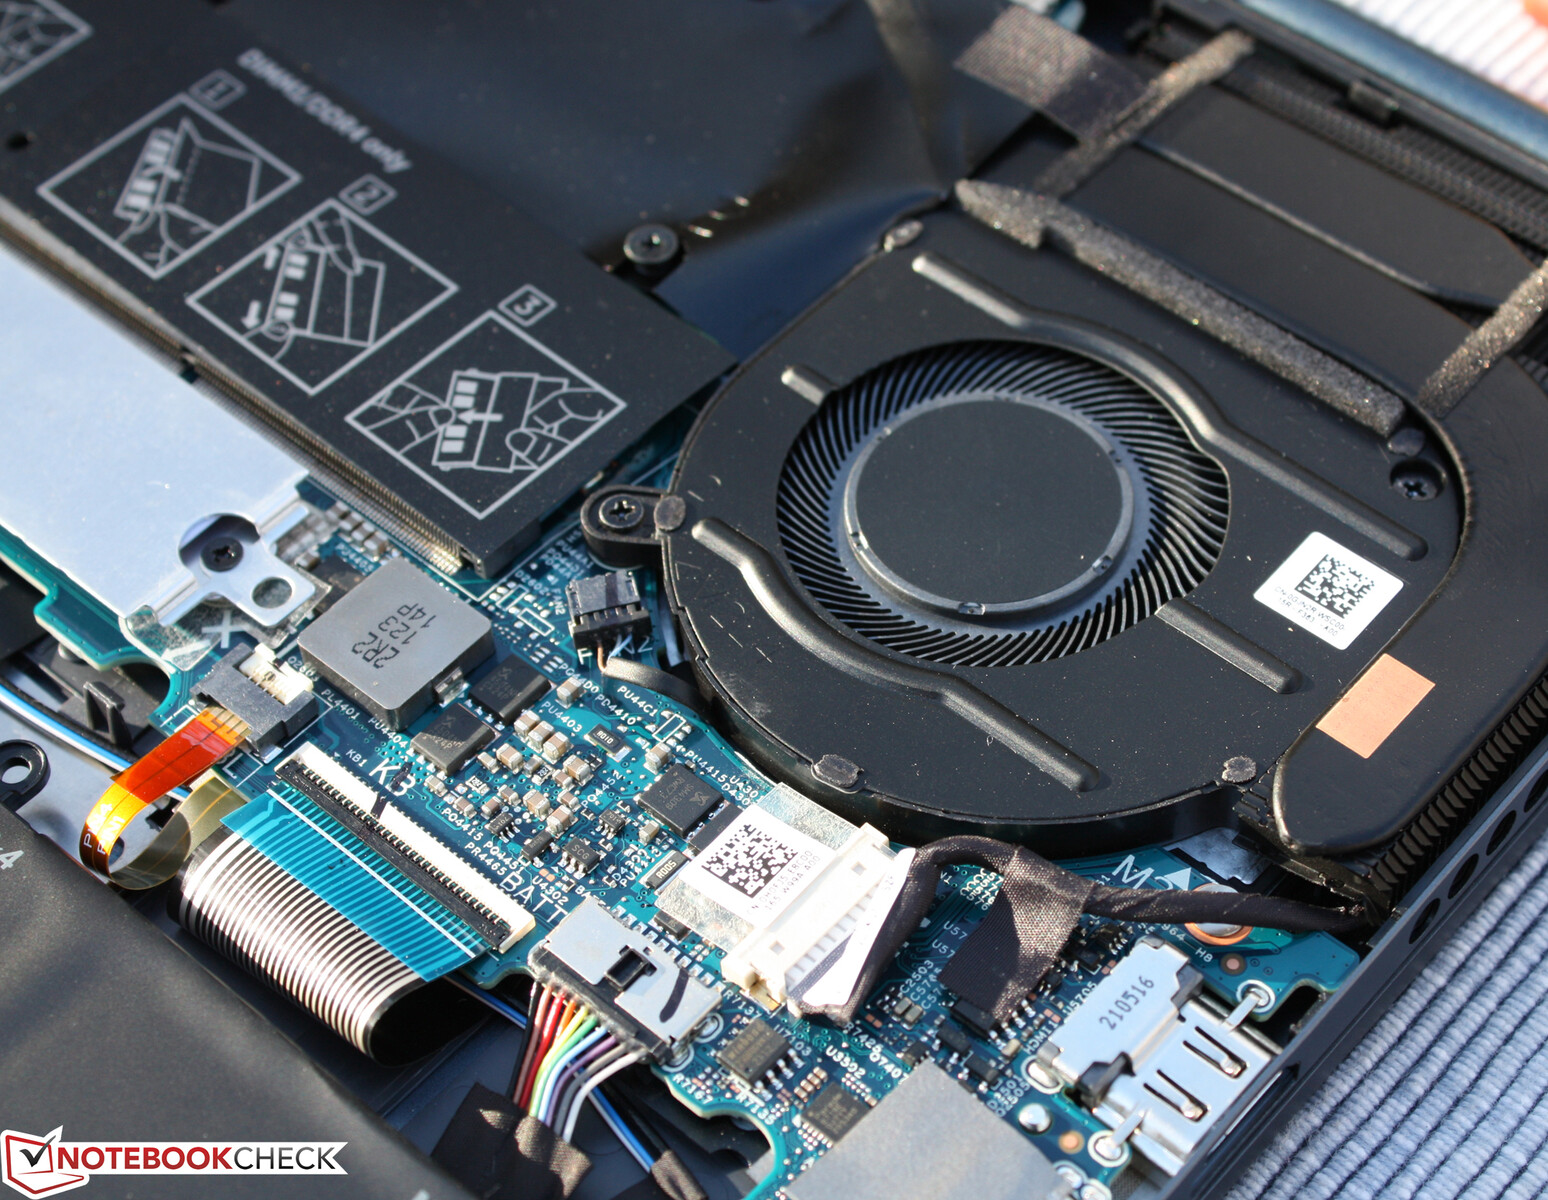
存储解决方案 - 一个内部驱动器
我们的7610型号配备了不寻常的金士顿OM3PDP3-AD NVMe SSD。与XPS 15 9510中的美光2300相比,其性能最多只有一半,其速度也很一般。由于戴尔从几家固态硬盘制造商那里获得驱动器,包括三星、美光、西部数据、东芝,显然还有金士顿,因此很难预测供应商提供的Inspiron笔记本电脑将配备哪种驱动器。
注意:虽然你可以插入最多两个内部驱动器,但其中至少有一个必须是较小的2230格式。

| Drive Performance rating - Percent | |
| Average of class Multimedia | |
| LG Gram 16 (2021) | |
| Dell Inspiron 15 7000 7506 2-in-1 Black Edition | |
| Acer Aspire 5 A517-52G-79Z5 | |
| Lenovo Legion 5 Pro 16ACH6H (82JQ001PGE) | |
| Dell Inspiron 16 Plus 7610-MHJ8F -1! | |
| Average OM3PDP3-AD NVMe KDI 512GB -1! | |
| Dell Inspiron 16 Plus 7610 | |
* ... smaller is better
Constant Performance Reading: DiskSpd Read Loop, Queue Depth 8
图形卡
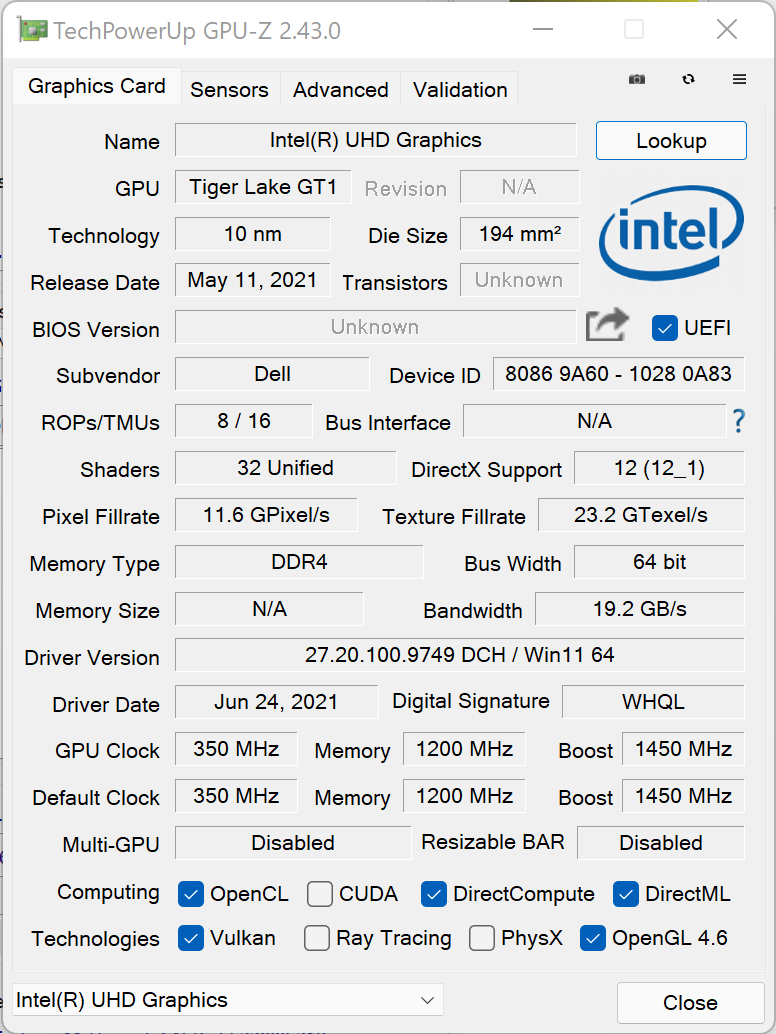
毫无疑问,但英特尔UHD Xe(32 EUs)并没有带来很多性能,这一点在所有的基准测试中都得到了证实。装备RTX的Inspiron 16 Plus 7610领先500%,而在游戏中,则在250%和几乎500%之间。
那些决定使用iGPU版本的人必须接受这样一个事实,即通过Nvidia的CUDA核心的硬件支持也将丢失。这将大大降低视频或图像处理过程中的渲染速度。 只有在一些选定的老游戏或要求不高的游戏中才能实现流畅的游戏。
| 3DMark Performance rating - Percent | |
| Lenovo Legion 5 Pro 16ACH6H (82JQ001PGE) -3! | |
| Average of class Multimedia | |
| Dell Inspiron 16 Plus 7610 | |
| Dell Inspiron 15 7000 7506 2-in-1 Black Edition | |
| LG Gram 16 (2021) | |
| Acer Aspire 5 A517-52G-79Z5 -1! | |
| Average Intel UHD Graphics Xe 32EUs (Tiger Lake-H) | |
| Dell Inspiron 16 Plus 7610-MHJ8F -1! | |
| 3DMark 11 Performance | 3691 points | |
| 3DMark Fire Strike Score | 2345 points | |
| 3DMark Time Spy Score | 805 points | |
Help | ||
| The Witcher 3 | |
| 1024x768 Low Graphics & Postprocessing | |
| Dell Inspiron 16 Plus 7610 | |
| Lenovo Legion 5 Pro 16ACH6H (82JQ001PGE) | |
| Average of class Multimedia (68 - 380, n=10, last 2 years) | |
| LG Gram 16 (2021) | |
| Acer Aspire 5 A517-52G-79Z5 | |
| Dell Inspiron 15 7000 7506 2-in-1 Black Edition | |
| Dell Inspiron 16 Plus 7610-MHJ8F | |
| Average Intel UHD Graphics Xe 32EUs (Tiger Lake-H) (47.3 - 50.1, n=4) | |
| 1366x768 Medium Graphics & Postprocessing | |
| Lenovo Legion 5 Pro 16ACH6H (82JQ001PGE) | |
| Dell Inspiron 16 Plus 7610 | |
| Average of class Multimedia (41 - 93, n=4, last 2 years) | |
| Dell Inspiron 15 7000 7506 2-in-1 Black Edition | |
| LG Gram 16 (2021) | |
| Acer Aspire 5 A517-52G-79Z5 | |
| Dell Inspiron 16 Plus 7610-MHJ8F | |
| Average Intel UHD Graphics Xe 32EUs (Tiger Lake-H) (29.8 - 31.1, n=2) | |
| low | med. | high | ultra | 4K | |
|---|---|---|---|---|---|
| The Witcher 3 (2015) | 50.1 | 31.1 | 15.8 | 7.5 | |
| Dota 2 Reborn (2015) | 126.2 | 76.6 | 36.3 | 33.3 | 12.1 |
| X-Plane 11.11 (2018) | 21.3 | 17.6 | 11.1 | 9.43 | |
| Strange Brigade (2018) | 56.7 | 21.7 | 16.9 | 16.2 |
排放和电源管理 - 一台很酷的戴尔笔记本电脑
噪声排放
Inspiron 16的风扇成功地保持了沉默,或者至少在很长一段时间内非常安静。在最佳省电模式下,风扇几乎从不打开。在平衡模式下,两个风扇会零星地运行几秒钟。这两种说法都是关于空闲时的操作。令人吃惊的是,即使在性能模式下,负载也不会导致风扇立即转动,而只是一个非常延迟的反应。例如,在3DMark中,它们在大约40秒后才变得明显。一旦它们的速度增加,在49 dB(A)时,笔记本很快就会变得和游戏笔记本一样响。最大值与Nvidia版本的笔记本电脑相同,风扇特性也相同。
Noise level
| Idle |
| 26.3 / 26.3 / dB(A) |
| Load |
| 33 / 49.2 dB(A) |
 | ||
30 dB silent 40 dB(A) audible 50 dB(A) loud |
||
min: | ||
| Dell Inspiron 16 Plus 7610-MHJ8F UHD Graphics Xe 32EUs (Tiger Lake-H), i7-11800H, OM3PDP3-AD NVMe KDI 512GB | Dell Inspiron 16 Plus 7610 GeForce RTX 3050 4GB Laptop GPU, i7-11800H, Kingston OM3PDP3512B | LG Gram 16 (2021) Iris Xe G7 96EUs, i7-1165G7, SK Hynix PC601 1TB HFS001TD9TNG | Lenovo Legion 5 Pro 16ACH6H (82JQ001PGE) GeForce RTX 3070 Laptop GPU, R7 5800H, WDC PC SN730 SDBPNTY-1T00 | Dell Inspiron 15 7000 7506 2-in-1 Black Edition Xe MAX, i7-1165G7, Micron 2300 1TB MTFDHBA1T0TDV | Acer Aspire 5 A517-52G-79Z5 GeForce MX350, i7-1165G7, WDC PC SN530 SDBPNPZ-1T00 | |
|---|---|---|---|---|---|---|
| Noise | -6% | 9% | 1% | -10% | -2% | |
| off / environment * (dB) | 26.3 | 24.4 7% | 26 1% | 23 13% | 27.3 -4% | 24.9 5% |
| Idle Minimum * (dB) | 26.3 | 24.4 7% | 26 1% | 25 5% | 27.3 -4% | 24.9 5% |
| Idle Average * (dB) | 26.3 | 24.4 7% | 26 1% | 25 5% | 27.3 -4% | 24.9 5% |
| Load Average * (dB) | 33 | 48.3 -46% | 30.8 7% | 35.5 -8% | 47.4 -44% | 44.1 -34% |
| Witcher 3 ultra * (dB) | 44 | 48.9 -11% | 46.67 -6% | 47.4 -8% | ||
| Load Maximum * (dB) | 49.2 | 48.9 1% | 31.1 37% | 50.35 -2% | 47.5 3% | 44.8 9% |
| Idle Maximum * (dB) | 24.4 | 26 | 25 | 27.3 | 27 |
* ... smaller is better
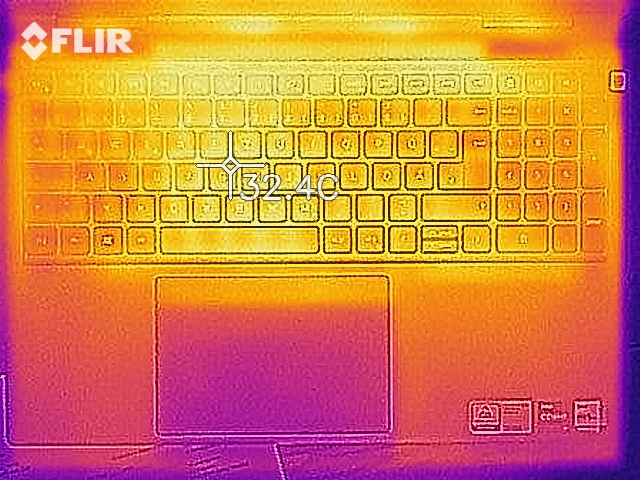
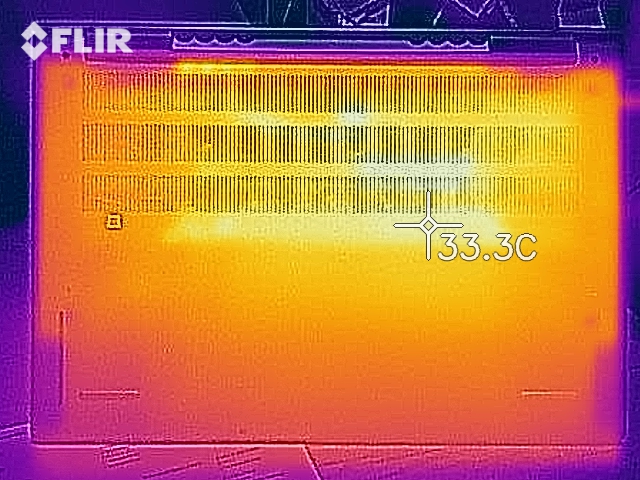
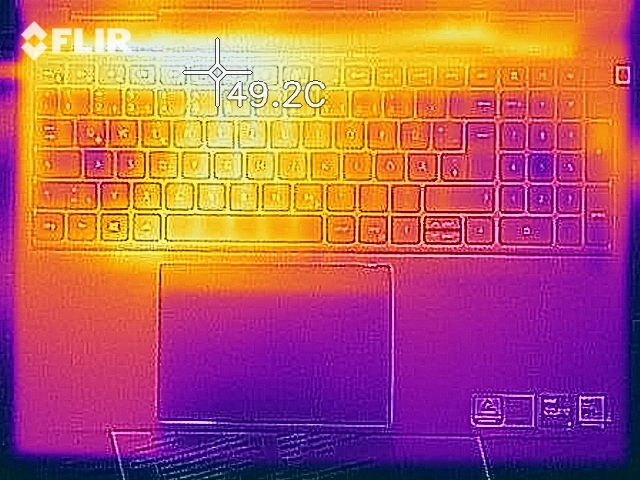
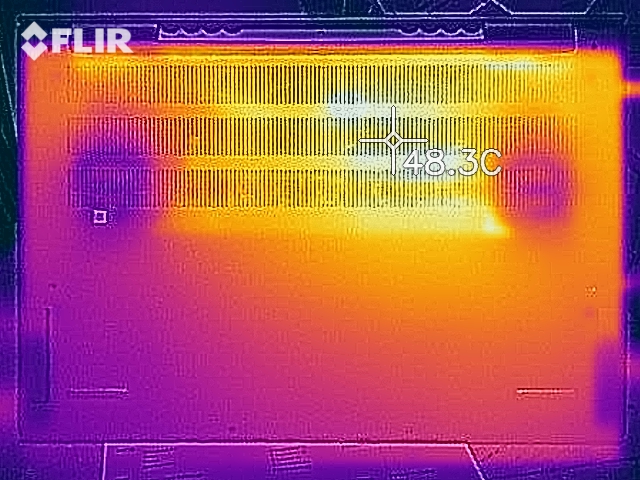
温度
尽管风扇很迟钝,但表面温度并不高,平均在29 ºC(约84 ºF)左右。dGPU模型的平均温度高出3ºC(约5 ºF),但只是在底部。正如预期的那样,在负载下有一个明显的差异。在底部的热点中,Geforce模型比iGPU版本的温度高10 ºC(约18 ºF)左右。
在Prime95的负载下,时钟速度增加到4.3GHz,持续一到两秒,之后核心温度达到90℃(194°F)。然后时钟速度下降到2.8至3.0GHz的范围,以保持90°C(194°F)左右的温度。不同的是,dGPU模型试图保持83°C(181°F),在2.4至3.2-GHz范围内趋于平缓。
(±) The maximum temperature on the upper side is 43.4 °C / 110 F, compared to the average of 36.8 °C / 98 F, ranging from 21 to 71 °C for the class Multimedia.
(-) The bottom heats up to a maximum of 45.1 °C / 113 F, compared to the average of 39.1 °C / 102 F
(+) In idle usage, the average temperature for the upper side is 28.4 °C / 83 F, compared to the device average of 31.3 °C / 88 F.
(+) The palmrests and touchpad are reaching skin temperature as a maximum (34.8 °C / 94.6 F) and are therefore not hot.
(-) The average temperature of the palmrest area of similar devices was 28.7 °C / 83.7 F (-6.1 °C / -10.9 F).
| Dell Inspiron 16 Plus 7610-MHJ8F Intel Core i7-11800H, Intel UHD Graphics Xe 32EUs (Tiger Lake-H) | Dell Inspiron 16 Plus 7610 Intel Core i7-11800H, NVIDIA GeForce RTX 3050 4GB Laptop GPU | LG Gram 16 (2021) Intel Core i7-1165G7, Intel Iris Xe Graphics G7 96EUs | Lenovo Legion 5 Pro 16ACH6H (82JQ001PGE) AMD Ryzen 7 5800H, NVIDIA GeForce RTX 3070 Laptop GPU | Dell Inspiron 15 7000 7506 2-in-1 Black Edition Intel Core i7-1165G7, Intel Iris Xe MAX Graphics | Acer Aspire 5 A517-52G-79Z5 Intel Core i7-1165G7, NVIDIA GeForce MX350 | |
|---|---|---|---|---|---|---|
| Heat | -13% | 7% | -17% | -9% | 16% | |
| Maximum Upper Side * (°C) | 43.4 | 46.4 -7% | 46.9 -8% | 50 -15% | 43 1% | 35 19% |
| Maximum Bottom * (°C) | 45.1 | 54.8 -22% | 45.1 -0% | 55 -22% | 48.8 -8% | 40 11% |
| Idle Upper Side * (°C) | 30.6 | 31.4 -3% | 26.4 14% | 34 -11% | 31.6 -3% | 25.6 16% |
| Idle Bottom * (°C) | 31.1 | 36.6 -18% | 24.1 23% | 37 -19% | 38.6 -24% | 25.3 19% |
* ... smaller is better
Dell Inspiron 16 Plus 7610-MHJ8F audio analysis
(±) | speaker loudness is average but good (73.2 dB)
Bass 100 - 315 Hz
(-) | nearly no bass - on average 19.5% lower than median
(±) | linearity of bass is average (11.1% delta to prev. frequency)
Mids 400 - 2000 Hz
(+) | balanced mids - only 4.6% away from median
(+) | mids are linear (6.4% delta to prev. frequency)
Highs 2 - 16 kHz
(±) | higher highs - on average 6.1% higher than median
(±) | linearity of highs is average (7.7% delta to prev. frequency)
Overall 100 - 16.000 Hz
(±) | linearity of overall sound is average (22.5% difference to median)
Compared to same class
» 80% of all tested devices in this class were better, 4% similar, 16% worse
» The best had a delta of 5%, average was 17%, worst was 45%
Compared to all devices tested
» 66% of all tested devices were better, 6% similar, 28% worse
» The best had a delta of 4%, average was 24%, worst was 134%
LG Gram 16 (2021) audio analysis
(±) | speaker loudness is average but good (76.1 dB)
Bass 100 - 315 Hz
(-) | nearly no bass - on average 18.8% lower than median
(±) | linearity of bass is average (12.2% delta to prev. frequency)
Mids 400 - 2000 Hz
(+) | balanced mids - only 2.2% away from median
(+) | mids are linear (5.4% delta to prev. frequency)
Highs 2 - 16 kHz
(+) | balanced highs - only 2.5% away from median
(+) | highs are linear (3.7% delta to prev. frequency)
Overall 100 - 16.000 Hz
(+) | overall sound is linear (14.7% difference to median)
Compared to same class
» 12% of all tested devices in this class were better, 4% similar, 84% worse
» The best had a delta of 7%, average was 21%, worst was 53%
Compared to all devices tested
» 19% of all tested devices were better, 4% similar, 77% worse
» The best had a delta of 4%, average was 24%, worst was 134%
电源管理
消耗功率
在空闲运行期间,笔记本电脑在最低亮度水平和最省电的性能配置下的耗电量略高于5瓦。闲置期间的最大值为14瓦,这是一个适度的数值。在类似情况下,LG Gram 16仅消耗4至11瓦。相应的配备Geforce的Inspiron 16 Plus 7610消耗8至17瓦,尽管其dGPU被Optimus切换关闭。
在负载下,差异自然很大。在极高的负载下,我们测得130瓦的电源的最大消耗量仅为76瓦。如下图所示,iGPU模型能够消耗更多的电力(用Prime95和Furmark进行压力测试),达到100瓦。在压力测试中,它的功率达到了90瓦的水平。运行TheWitcher 3 Ultra,它的平均功率在44瓦左右。
| Off / Standby | |
| Idle | |
| Load |
|
Key:
min: | |
Power Consumption The Witcher 3 / Stress Test
| Dell Inspiron 16 Plus 7610-MHJ8F i7-11800H, UHD Graphics Xe 32EUs (Tiger Lake-H), OM3PDP3-AD NVMe KDI 512GB, IPS, 3072x1920, 16" | Dell Inspiron 16 Plus 7610 i7-11800H, GeForce RTX 3050 4GB Laptop GPU, Kingston OM3PDP3512B, IPS, 3072x1920, 16" | LG Gram 16 (2021) i7-1165G7, Iris Xe G7 96EUs, SK Hynix PC601 1TB HFS001TD9TNG, IPS, 2560x1600, 16" | Lenovo Legion 5 Pro 16ACH6H (82JQ001PGE) R7 5800H, GeForce RTX 3070 Laptop GPU, WDC PC SN730 SDBPNTY-1T00, IPS, 2560x1600, 16" | Dell Inspiron 15 7000 7506 2-in-1 Black Edition i7-1165G7, Xe MAX, Micron 2300 1TB MTFDHBA1T0TDV, IPS, 3840x2160, 15.6" | Acer Aspire 5 A517-52G-79Z5 i7-1165G7, GeForce MX350, WDC PC SN530 SDBPNPZ-1T00, IPS, 1920x1080, 17.3" | |
|---|---|---|---|---|---|---|
| Power Consumption | -69% | 24% | -129% | -17% | 16% | |
| Idle Minimum * (Watt) | 5.4 | 7.7 -43% | 3.8 30% | 10.45 -94% | 4 26% | 4.1 24% |
| Idle Average * (Watt) | 9.8 | 10.7 -9% | 9 8% | 14.92 -52% | 15.5 -58% | 7.8 20% |
| Idle Maximum * (Watt) | 14 | 16.8 -20% | 11.3 19% | 16.02 -14% | 16.2 -16% | 10 29% |
| Load Average * (Watt) | 44 | 100.39 -128% | 35.2 20% | 119.65 -172% | 49.7 -13% | 47 -7% |
| Witcher 3 ultra * (Watt) | 44 | 108 -145% | 174.9 -298% | 52.2 -19% | ||
| Load Maximum * (Watt) | 76.8 | 129 -68% | 43.5 43% | 187.26 -144% | 92.7 -21% | 64.7 16% |
* ... smaller is better
电池寿命
在WiFi测试中,iGPU和dGPU版本的电池寿命差异很小,Geforce型号在这里甚至能多持续几分钟。另一方面,在负载下,iGPU型号能够多持续50分钟(Battery Eater Classic)。iGPU模型在闲置电池寿命方面也胜出,120分钟的加法使测试装置能够持续22:30小时。然而,这个数值并不真正现实,因为它是在最低亮度和飞行模式下测量的。两款机型的86Wh是相同的。
| Dell Inspiron 16 Plus 7610-MHJ8F i7-11800H, UHD Graphics Xe 32EUs (Tiger Lake-H), 86 Wh | Dell Inspiron 16 Plus 7610 i7-11800H, GeForce RTX 3050 4GB Laptop GPU, 86 Wh | LG Gram 16 (2021) i7-1165G7, Iris Xe G7 96EUs, 80 Wh | Lenovo Legion 5 Pro 16ACH6H (82JQ001PGE) R7 5800H, GeForce RTX 3070 Laptop GPU, 80 Wh | Dell Inspiron 15 7000 7506 2-in-1 Black Edition i7-1165G7, Xe MAX, 68 Wh | Acer Aspire 5 A517-52G-79Z5 i7-1165G7, GeForce MX350, 50.2 Wh | Average of class Multimedia | |
|---|---|---|---|---|---|---|---|
| Battery runtime | -8% | 32% | -56% | -16% | -36% | -7% | |
| Reader / Idle (h) | 22.5 | 20.5 -9% | 28.6 27% | 9.1 -60% | 25 11% | 13.8 -39% | 25.2 ? 12% |
| WiFi (h) | 9.5 | ||||||
| WiFi v1.3 (h) | 9.5 | 9.9 4% | 15.7 65% | 7 -26% | 9.7 2% | 7.4 -22% | 12 ? 26% |
| Load (h) | 4.1 | 3.3 -20% | 4.3 5% | 0.7 -83% | 1.6 -61% | 2.2 -46% | 1.675 ? -59% |
| H.264 (h) | 20.1 | 4.9 | 16.4 ? | ||||
| Witcher 3 ultra (h) | 1.3 |
Pros
Cons
结论 - 更酷,更有耐力

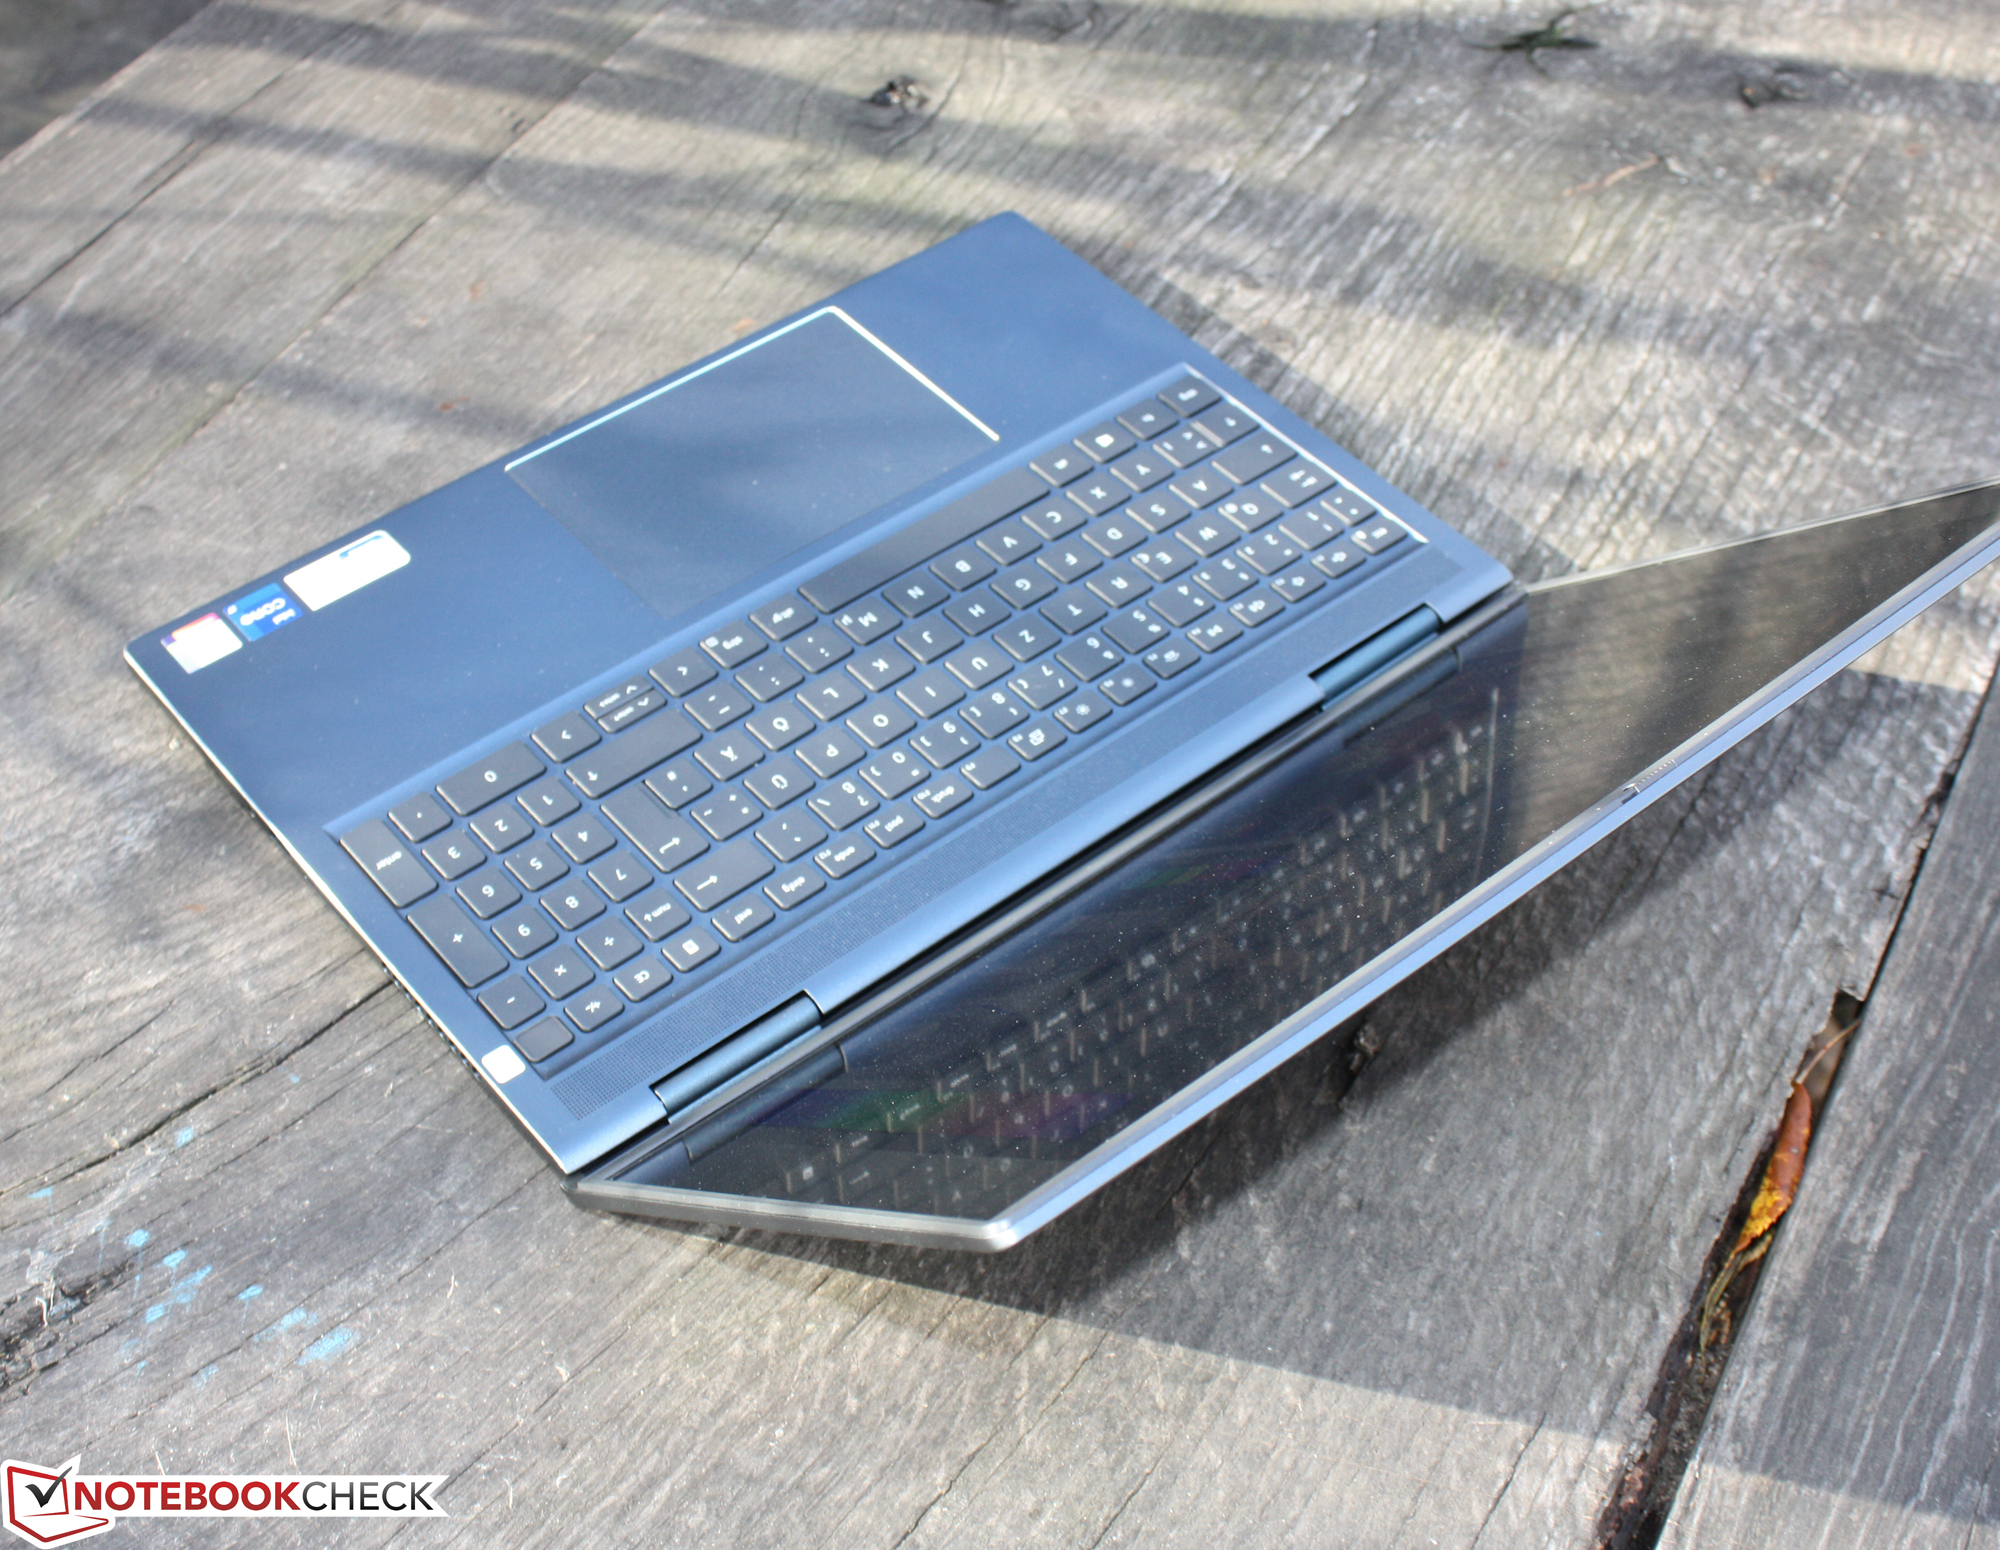
Inspiron 16是一款值得炫耀的笔记本电脑。沉重的金属外壳传达出的触觉质量接近于更昂贵的XPS 15。边框很薄,连接设备也很广泛。维护原来是很容易的,而哑光的3K显示屏完美地顶起了整个包装。
在性能方面,事情看起来并不那么好。与类似或几乎类似的竞争对手相比,CPU比预期的要慢,这也是iGPU模型的情况。然而,我们的测试装置能够在积分方面略微赶上,这意味着它最初的计算速度比配备Nvidia图形芯片的版本快。
虽然戴尔Inspiron 16 Plus 7610共享其兄弟机型的优势,但它放弃了Geforce图形的性能。这带来了更长的电池寿命,更低的功耗,以及更冷的外壳。
那些对Inspiron 16 Plus 7610总体上感到热心,但正在考虑更实惠的iGPU版本是否足够的人应该了解这一点。在WiFi电池寿命方面没有区别,这是在实践中最现实的测量。然而,测试装置在空闲操作或持续负载下持续时间更长。它的运行效率更高,而且在负载情况下不会有那么多的升温。因此,那些正在寻找具有良好3K显示屏的16英寸办公伴侣的人,不会对Inspiron 16 Plus 7610感到失望。
目前,我们的iGPU测试装置(1200欧元=~1348美元,i7,512GB,16GB,商店版)与配备RTX 3050但其他设备相似的最实惠的Geforce版本之间的价格差异为200欧元(~225美元)。如果你选择i5,则只有50欧元的差别(约56美元)。
戴尔的一个更强大、更实惠的替代品是Legion 5 Pro联想的产品,它拥有更强大的Ryzen 5000H,已经包括RTX 3050 Ti和165-Hz显示器,售价1300欧元(约1461美元)。该LG Gramm 16将重点放在低重量和相当长的电池寿命上,但性能较低。对那些所有这些都太贵的人来说,可以看看17英寸的 Acer Aspire 5 A517.只需800欧元(约合899美元),你就能得到比戴尔的iGPU更少的显示屏和更低的性能,而是一个入门级的dGPU。
价格和可用性
测试单元配置了一台 i7-11800H、16GB内存和512GB固态硬盘,目前可从戴尔购买,价格为999美元.
Dell Inspiron 16 Plus 7610-MHJ8F
- 11/22/2021 v7 (old)
Sebastian Jentsch
Price comparison

