结论 - 借助英特尔实现更快的性能
2025 联想 Ideapad Slim 5 16 有两种型号:AMD 或英特尔。在测试了 Ryzen AI 5 330和 酷睿 5 210H配置后,我们可以肯定地说,英特尔版本的多线程性能比 AMD 版本快 50%,游戏性能比 AMD 版本快 10% 至 30%,具体取决于游戏名称。运行苛刻负载时的功耗总体较高,因此每瓦性能并不一定比 AMD 高多少,但两者的 WLAN 电池续航时间相当接近。
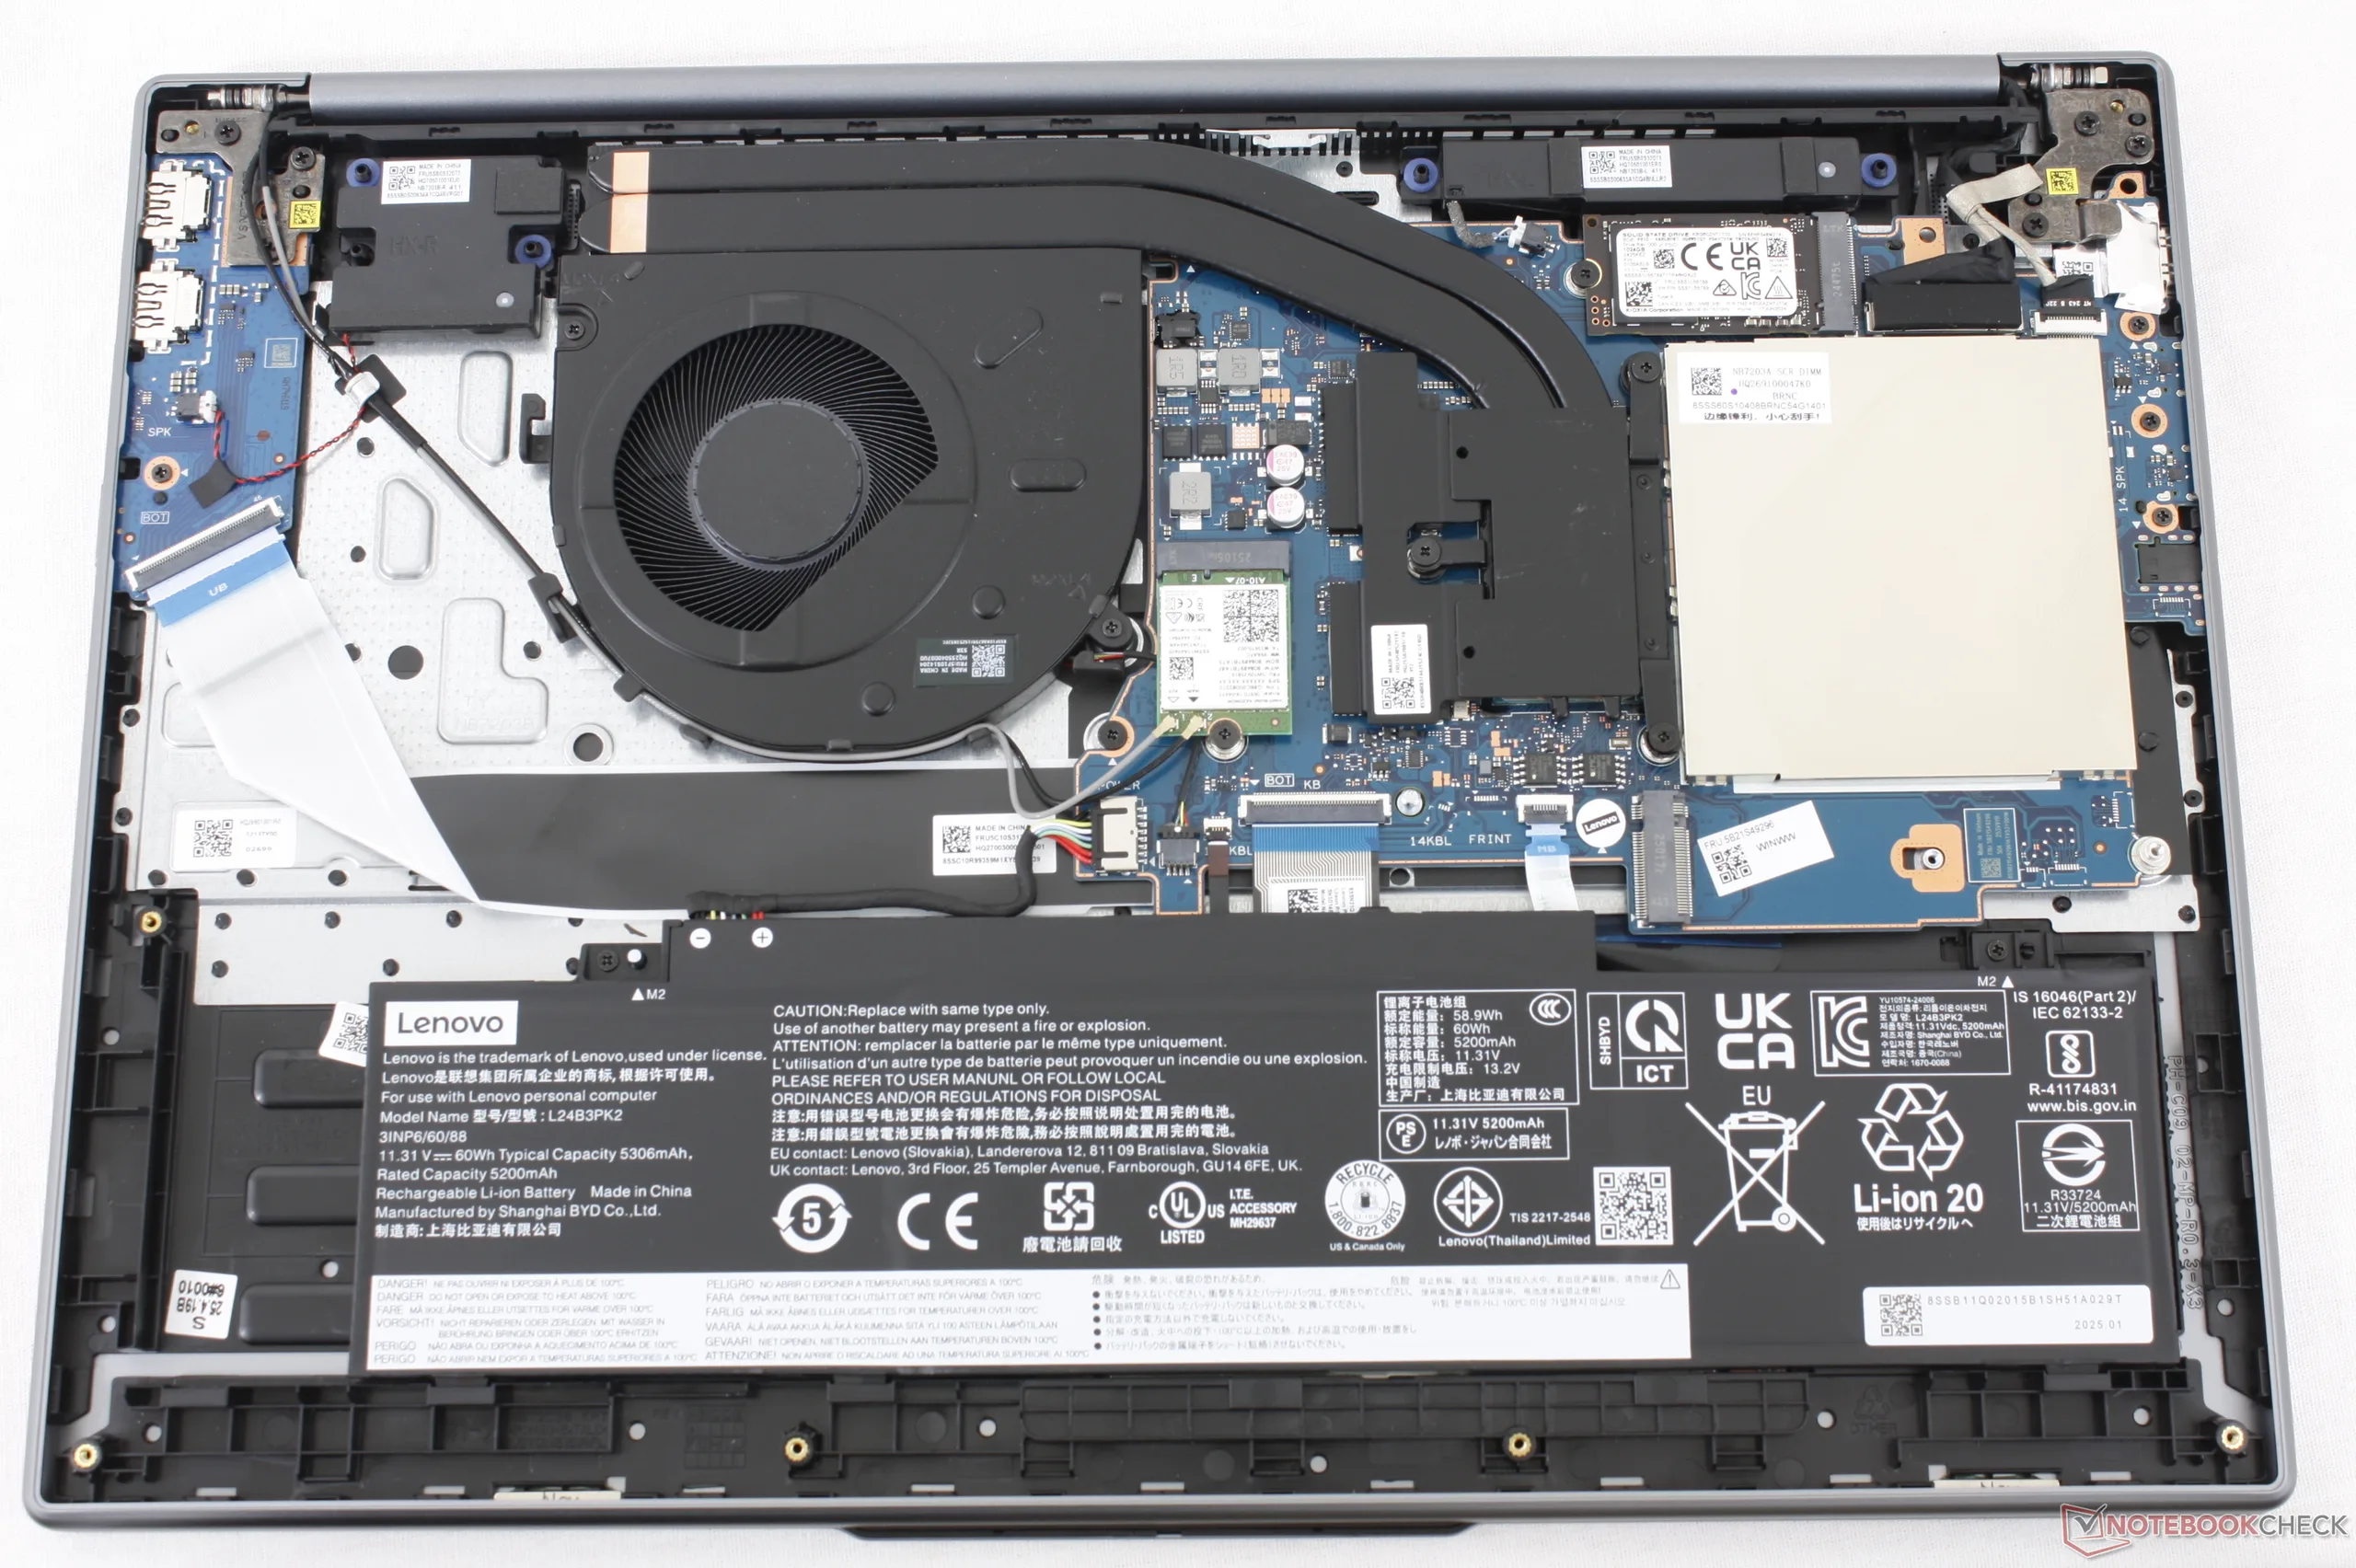
不打算使用 Ideapad 进行任何繁重工作的买家可能会发现,Ryzen AI 5 配置比酷睿 5 配置略微便宜一些。省下的钱可以用来购买额外的内存或存储设备,尤其是 IdeaPad Slim 5 16 可以同时支持多个硬盘和内存模块。否则,喜欢做一些编辑或休闲游戏的用户可能会发现英特尔配置更划算。
Pros
Cons
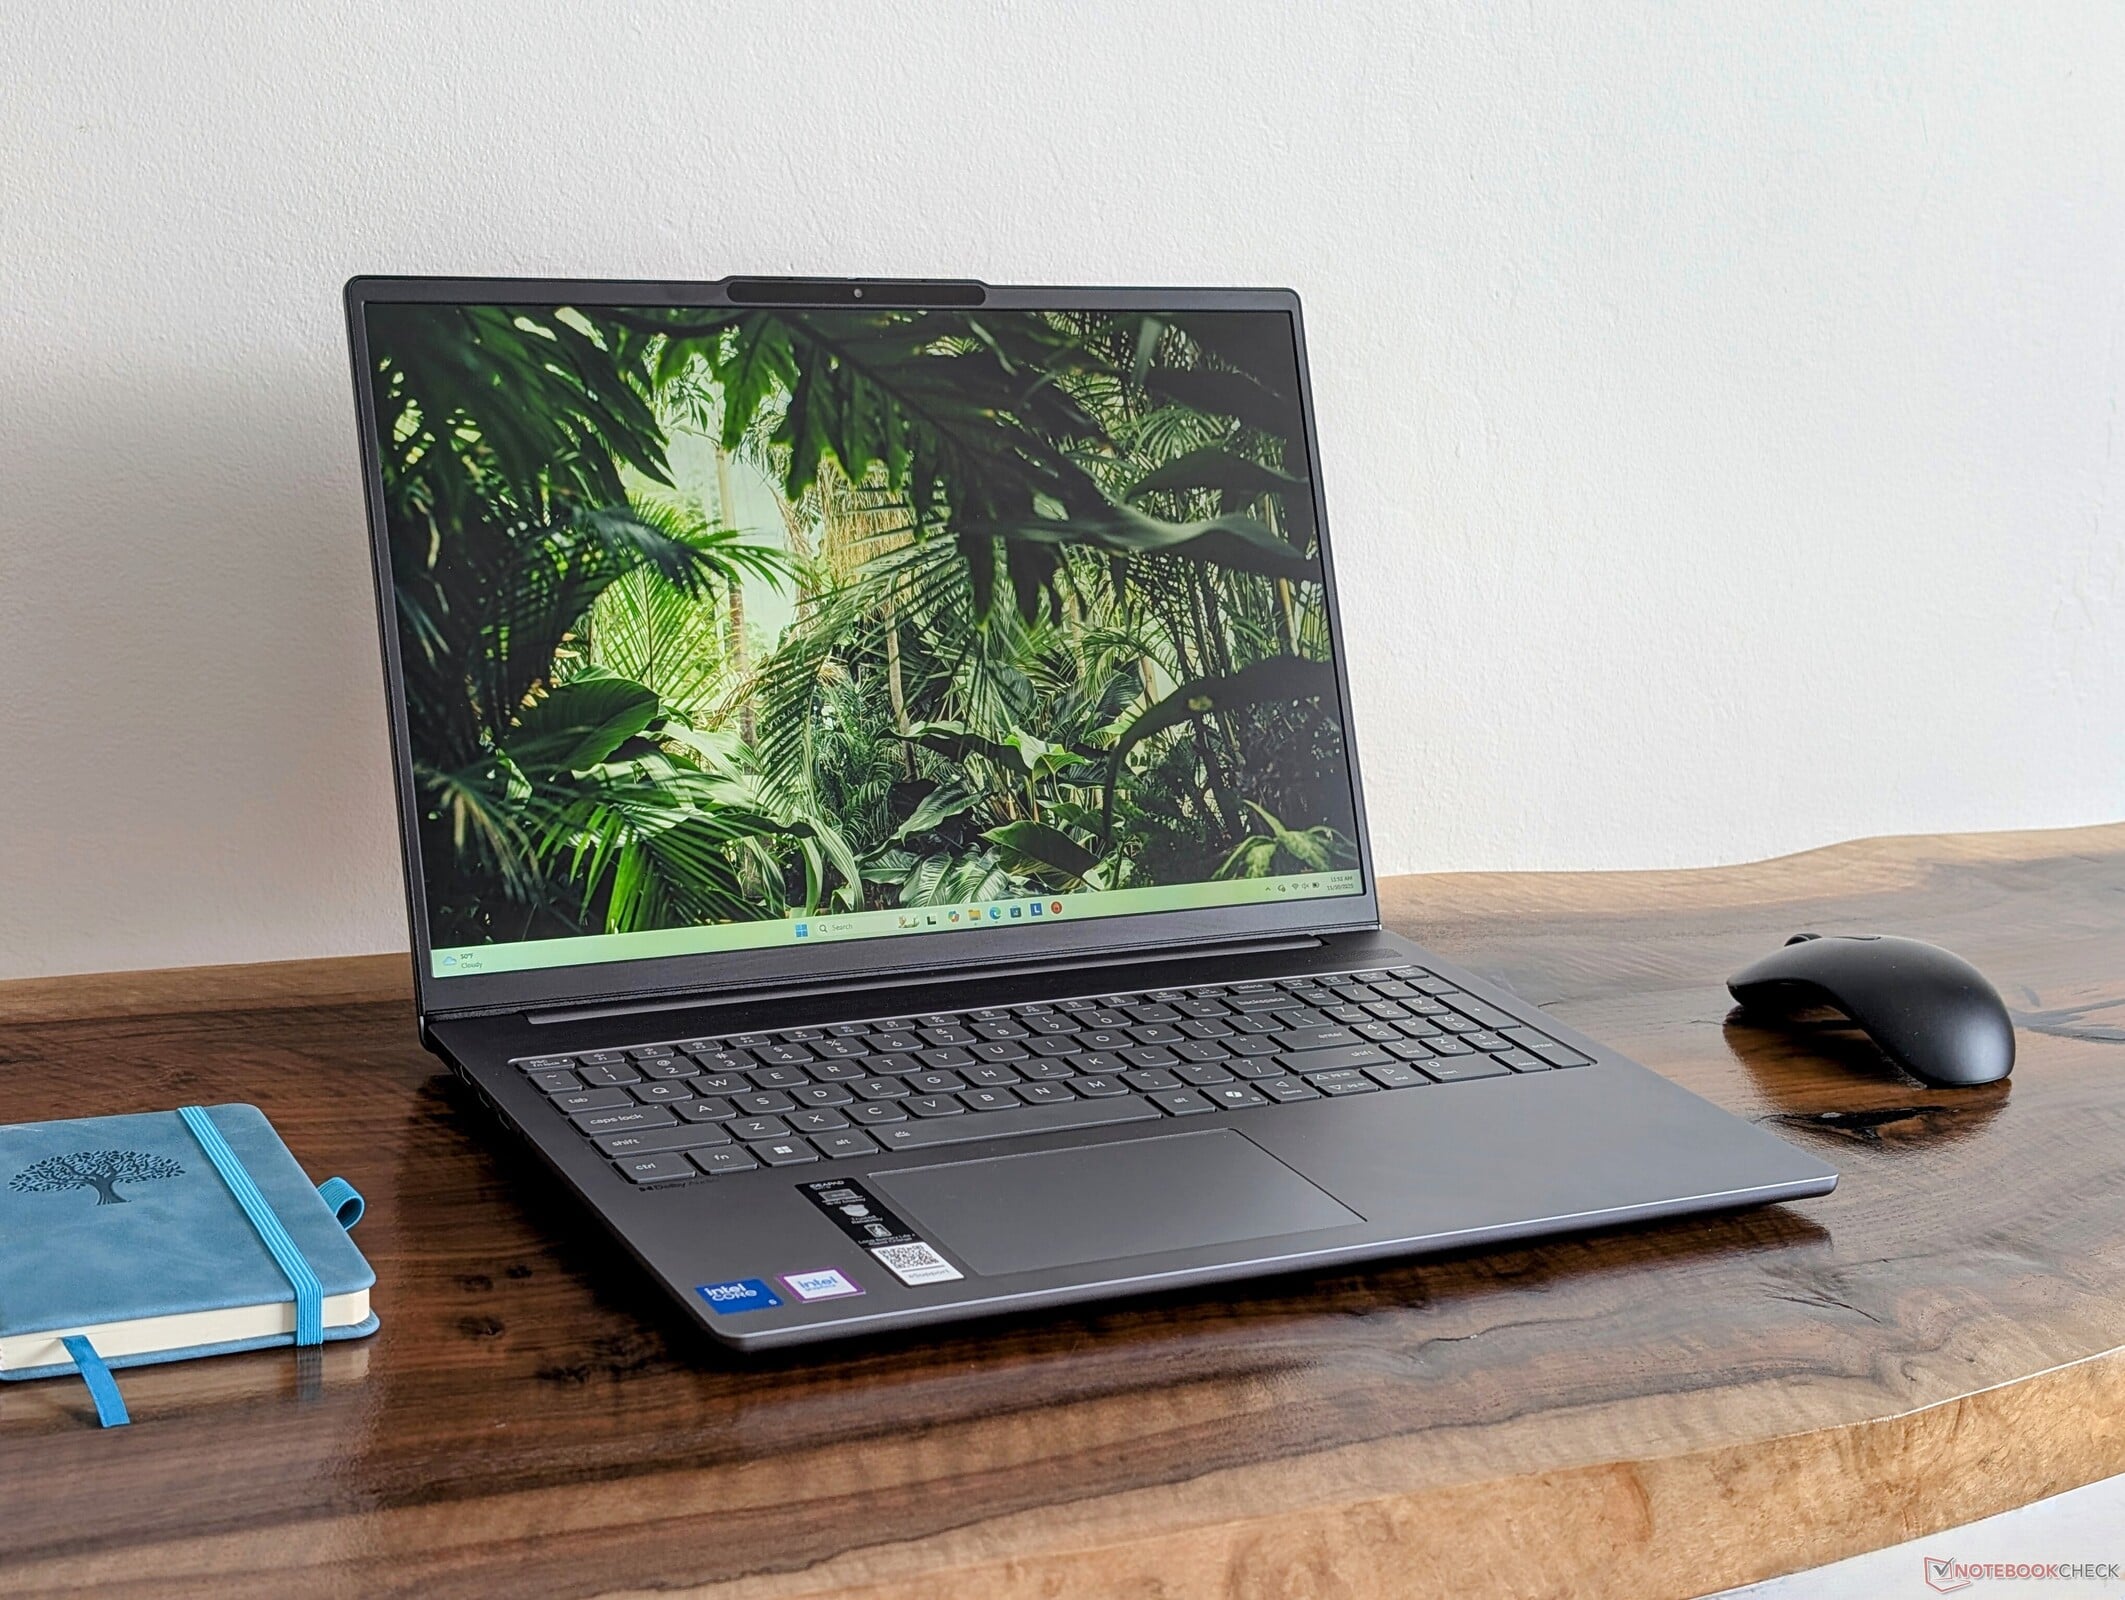
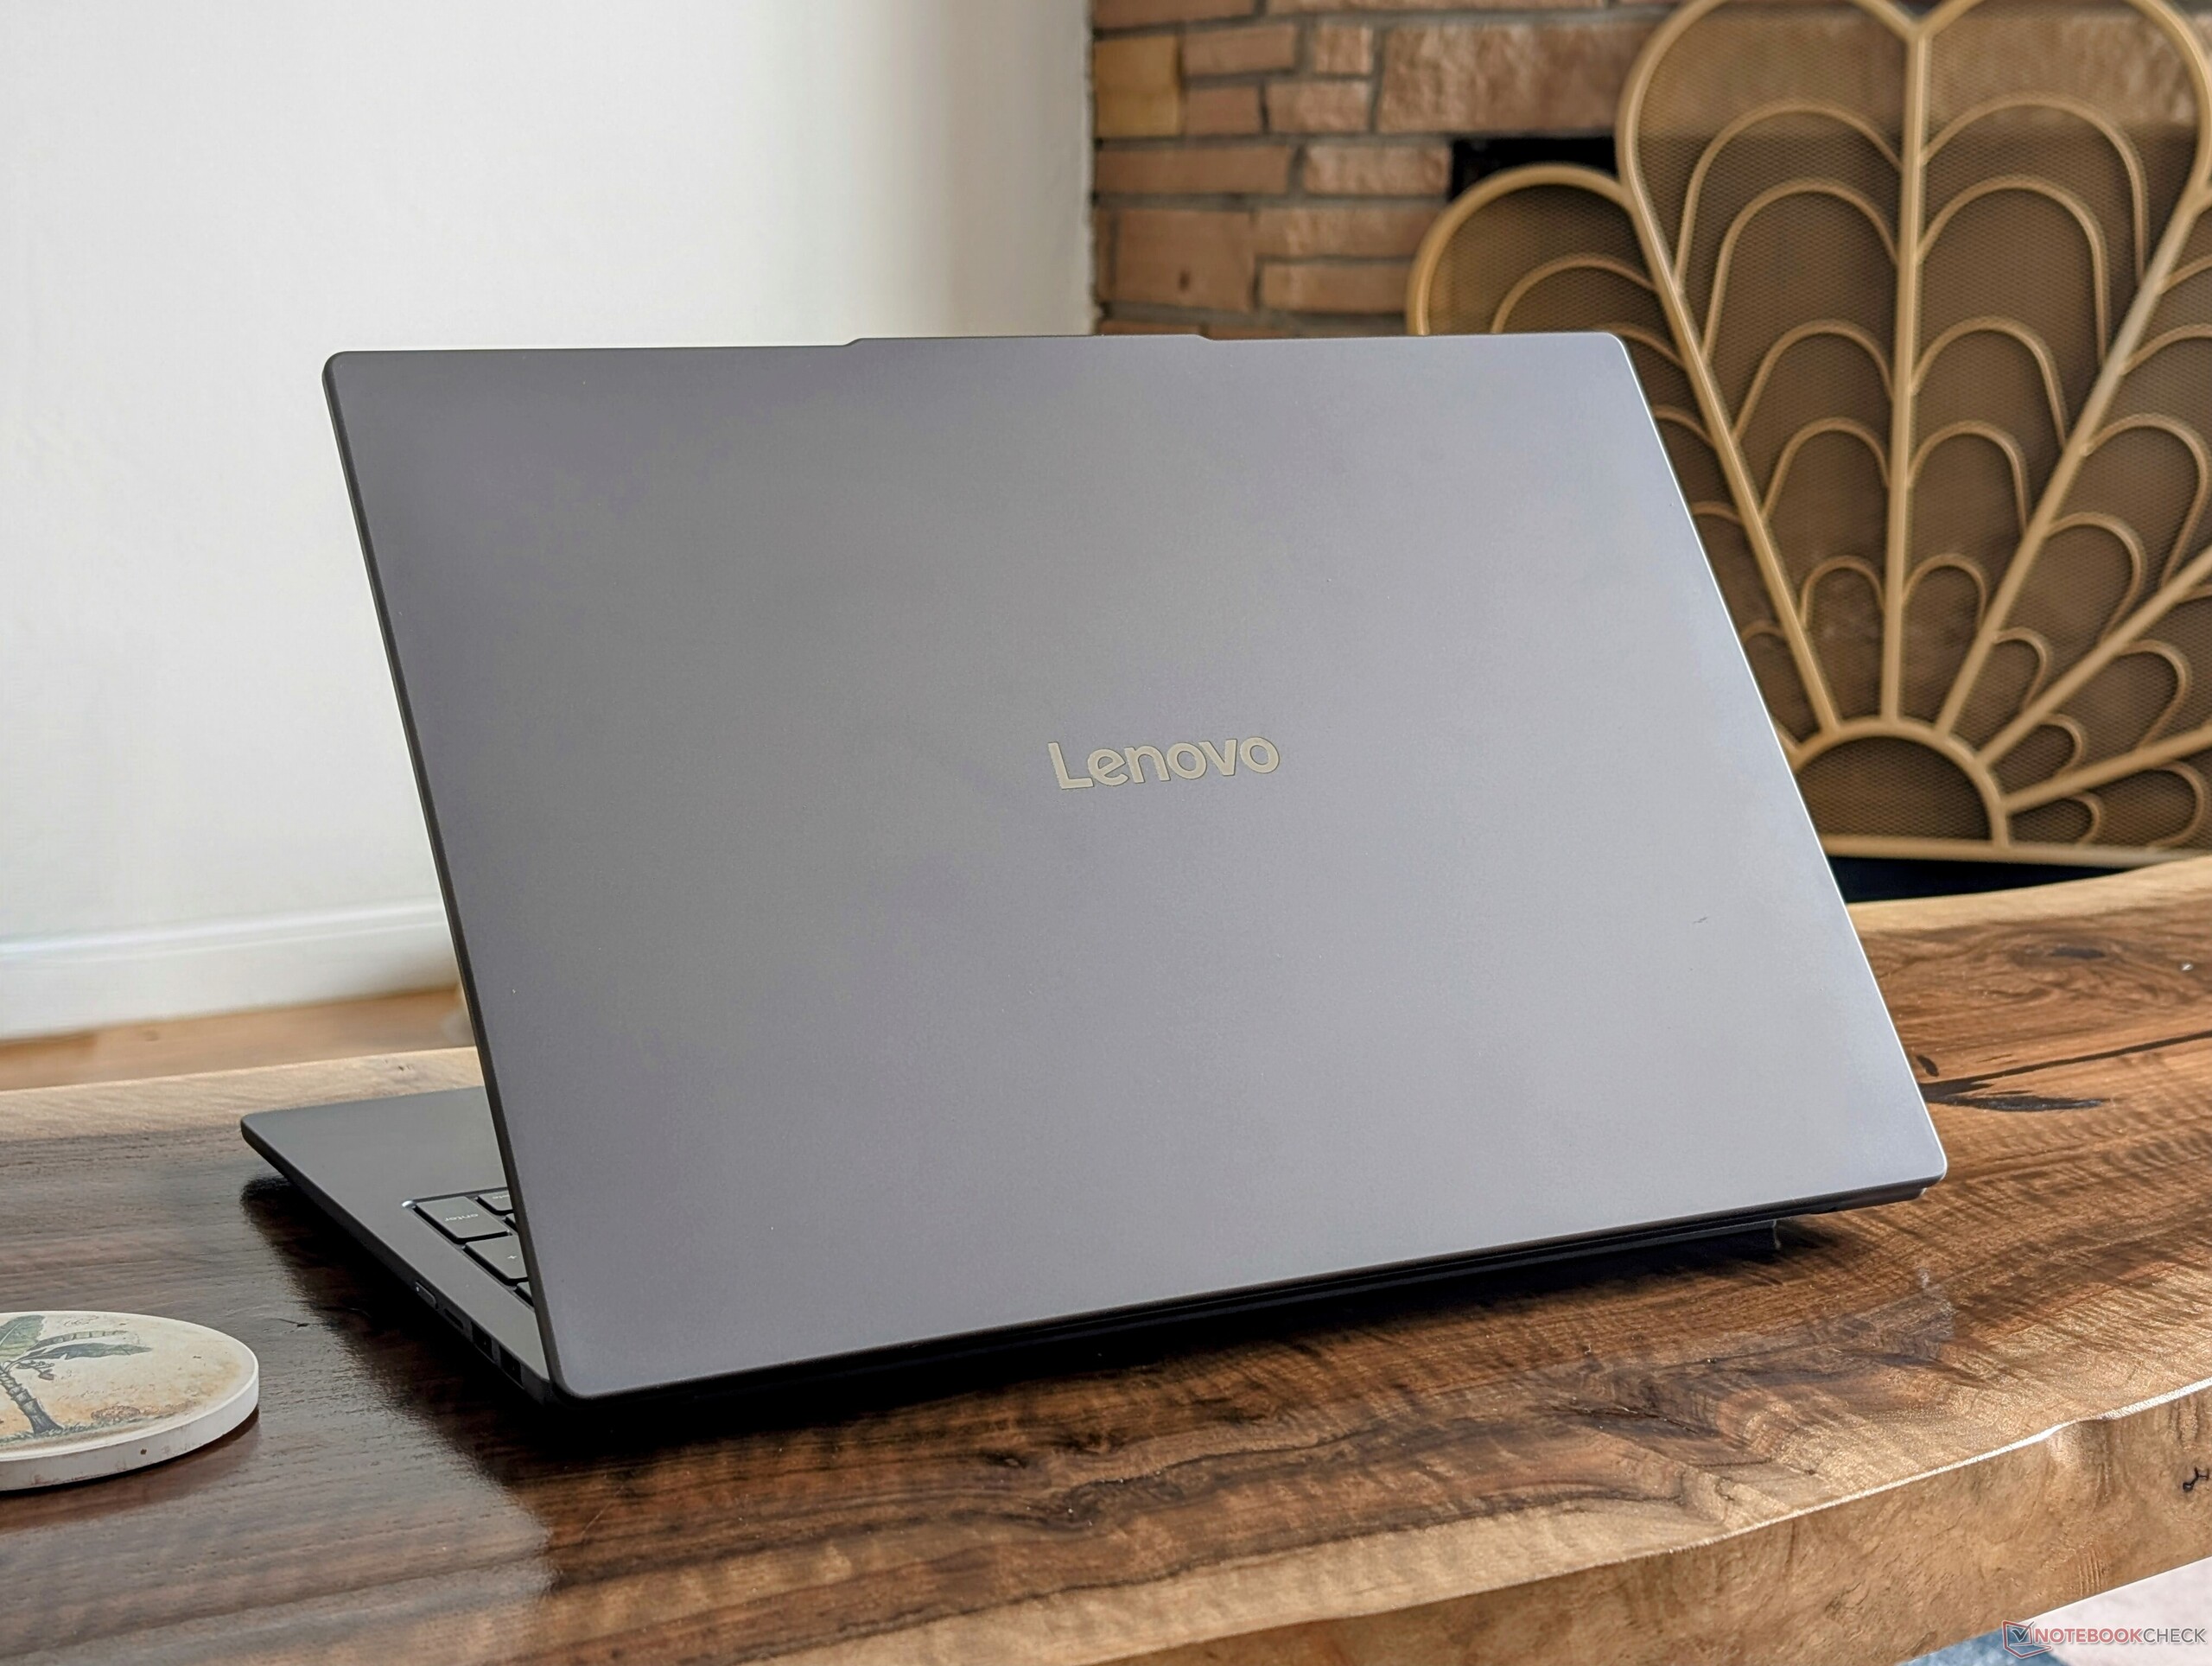
IdeaPad Slim 5 16 是联想最经济实惠的 16 英寸笔记本电脑之一,专为满足学生或基本多媒体需求而设计。该机型可配置 AMD 或英特尔处理器,外观设计完全相同。关于 IdeaPad Slim 5 16 物理特性的更多信息,我们建议查看我们现有的 AMD 配置评测。
我们的测试机是低端配置,配备酷睿 5 210H CPU 和基本的 1200p IPS 非触摸显示屏,售价约 800 美元。高端配置可能配备酷睿 7 250H 或 2.8K 1800p OLED 120 Hz 显示屏。该系统与其他面向预算的 16 英寸笔记本电脑竞争,如 华硕 Vivobook 16, 戴尔 16 Plus或 惠普Pavilion 16.
更多联想评论:
规格
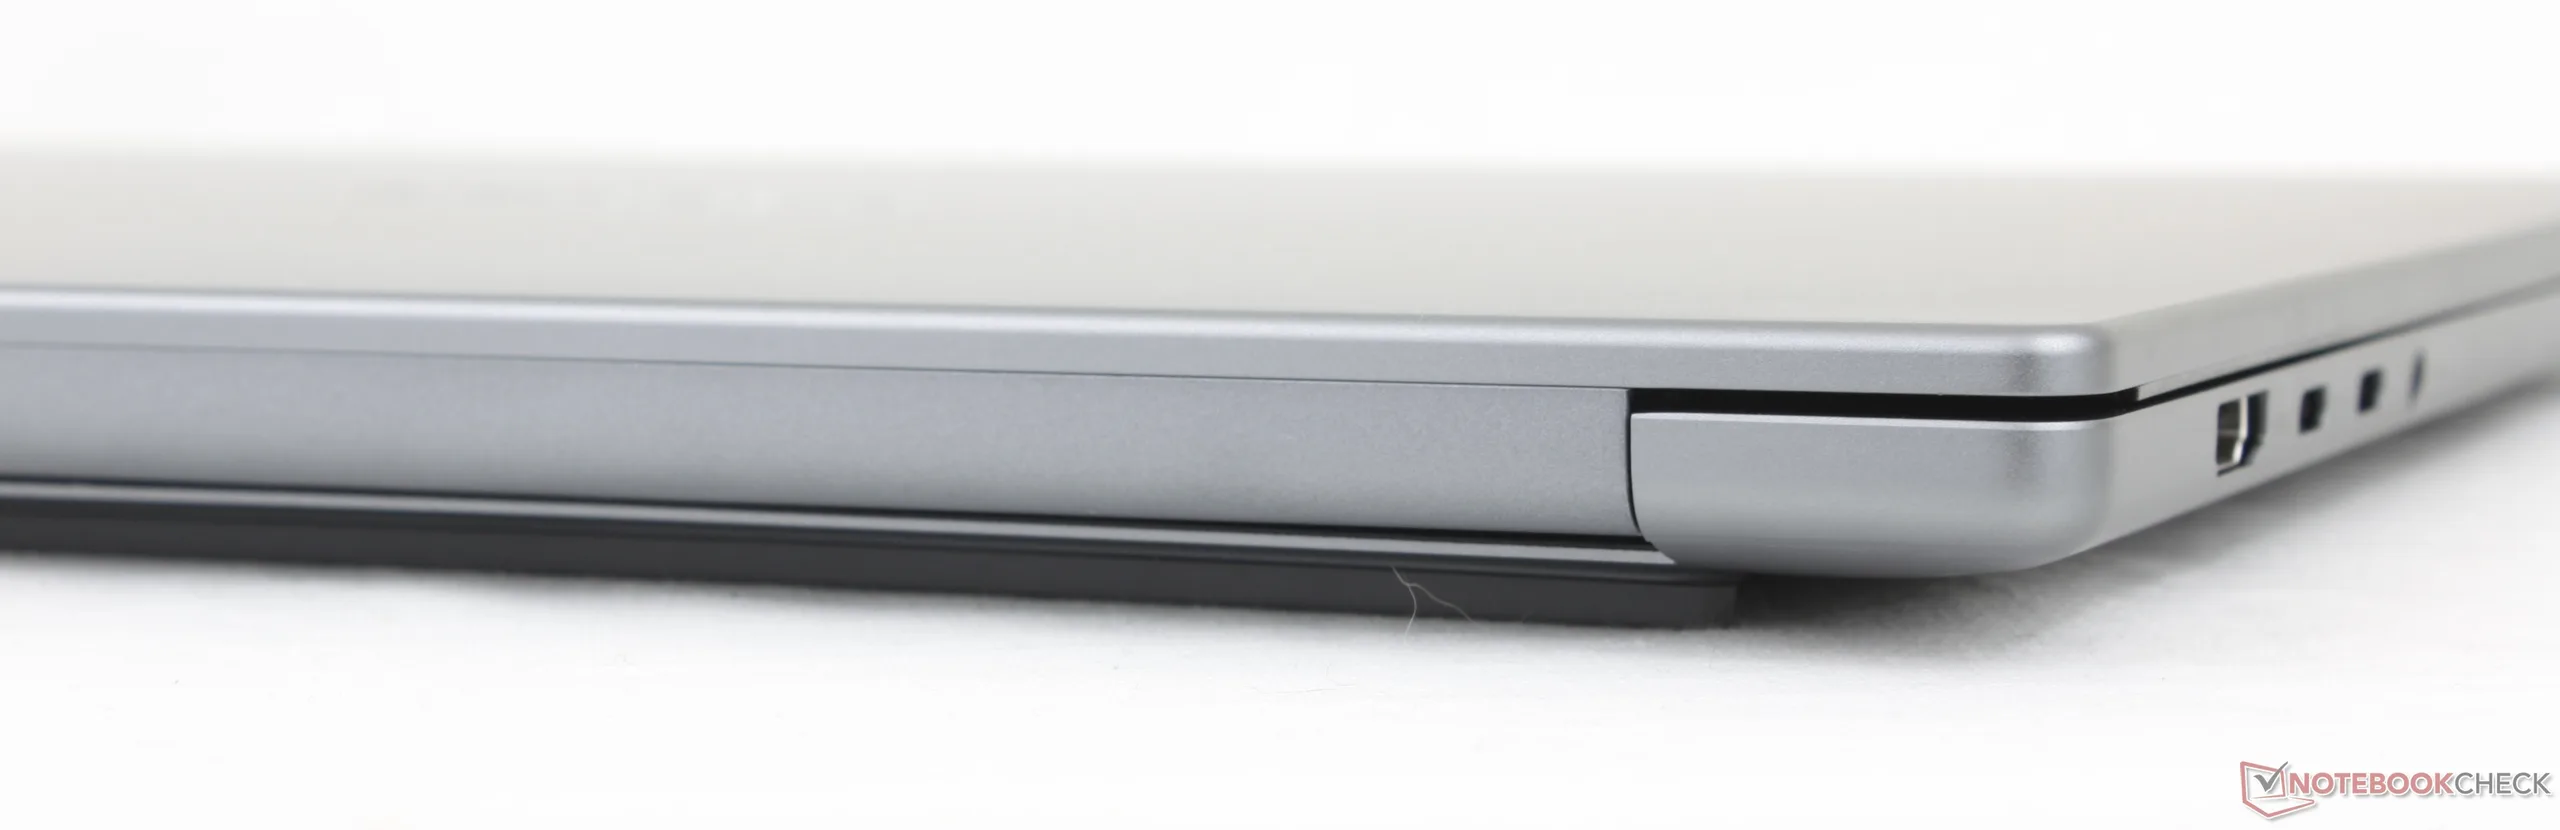
案例
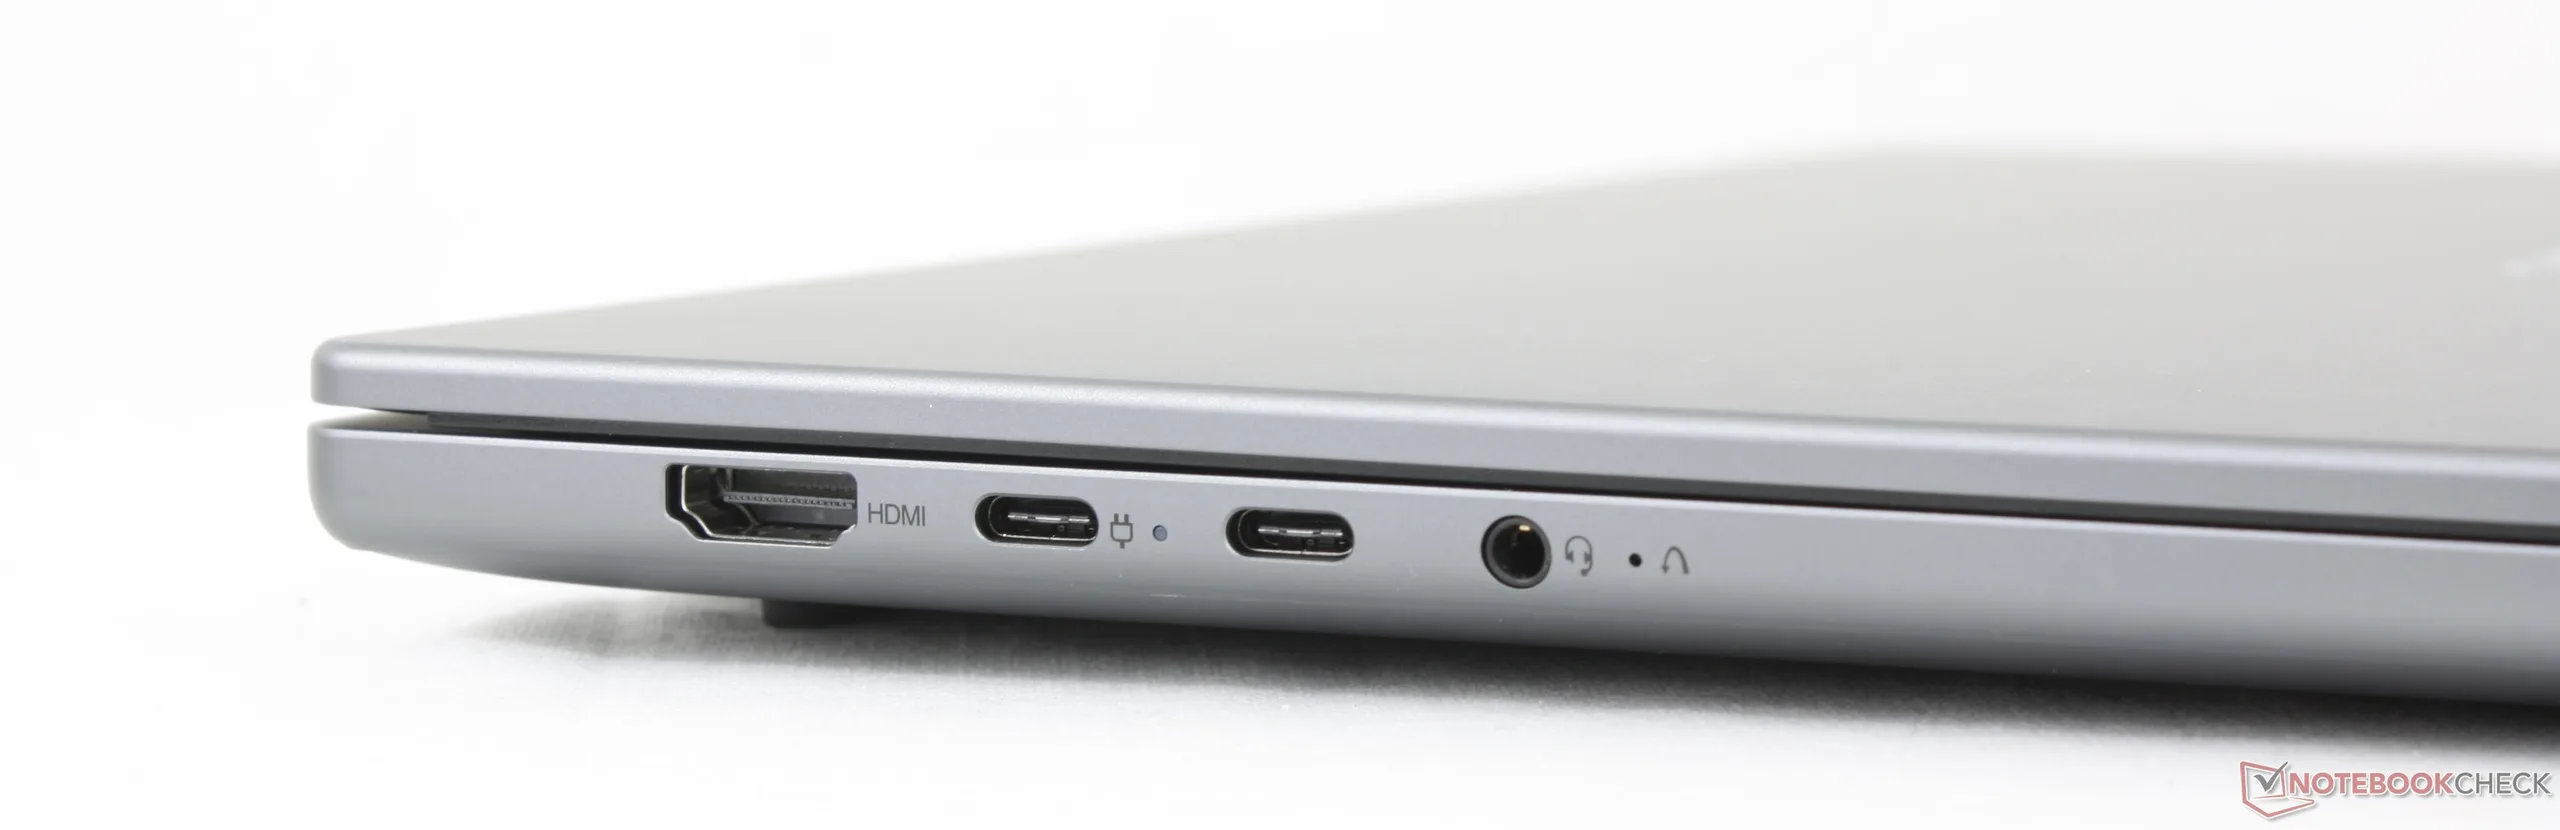
连接性
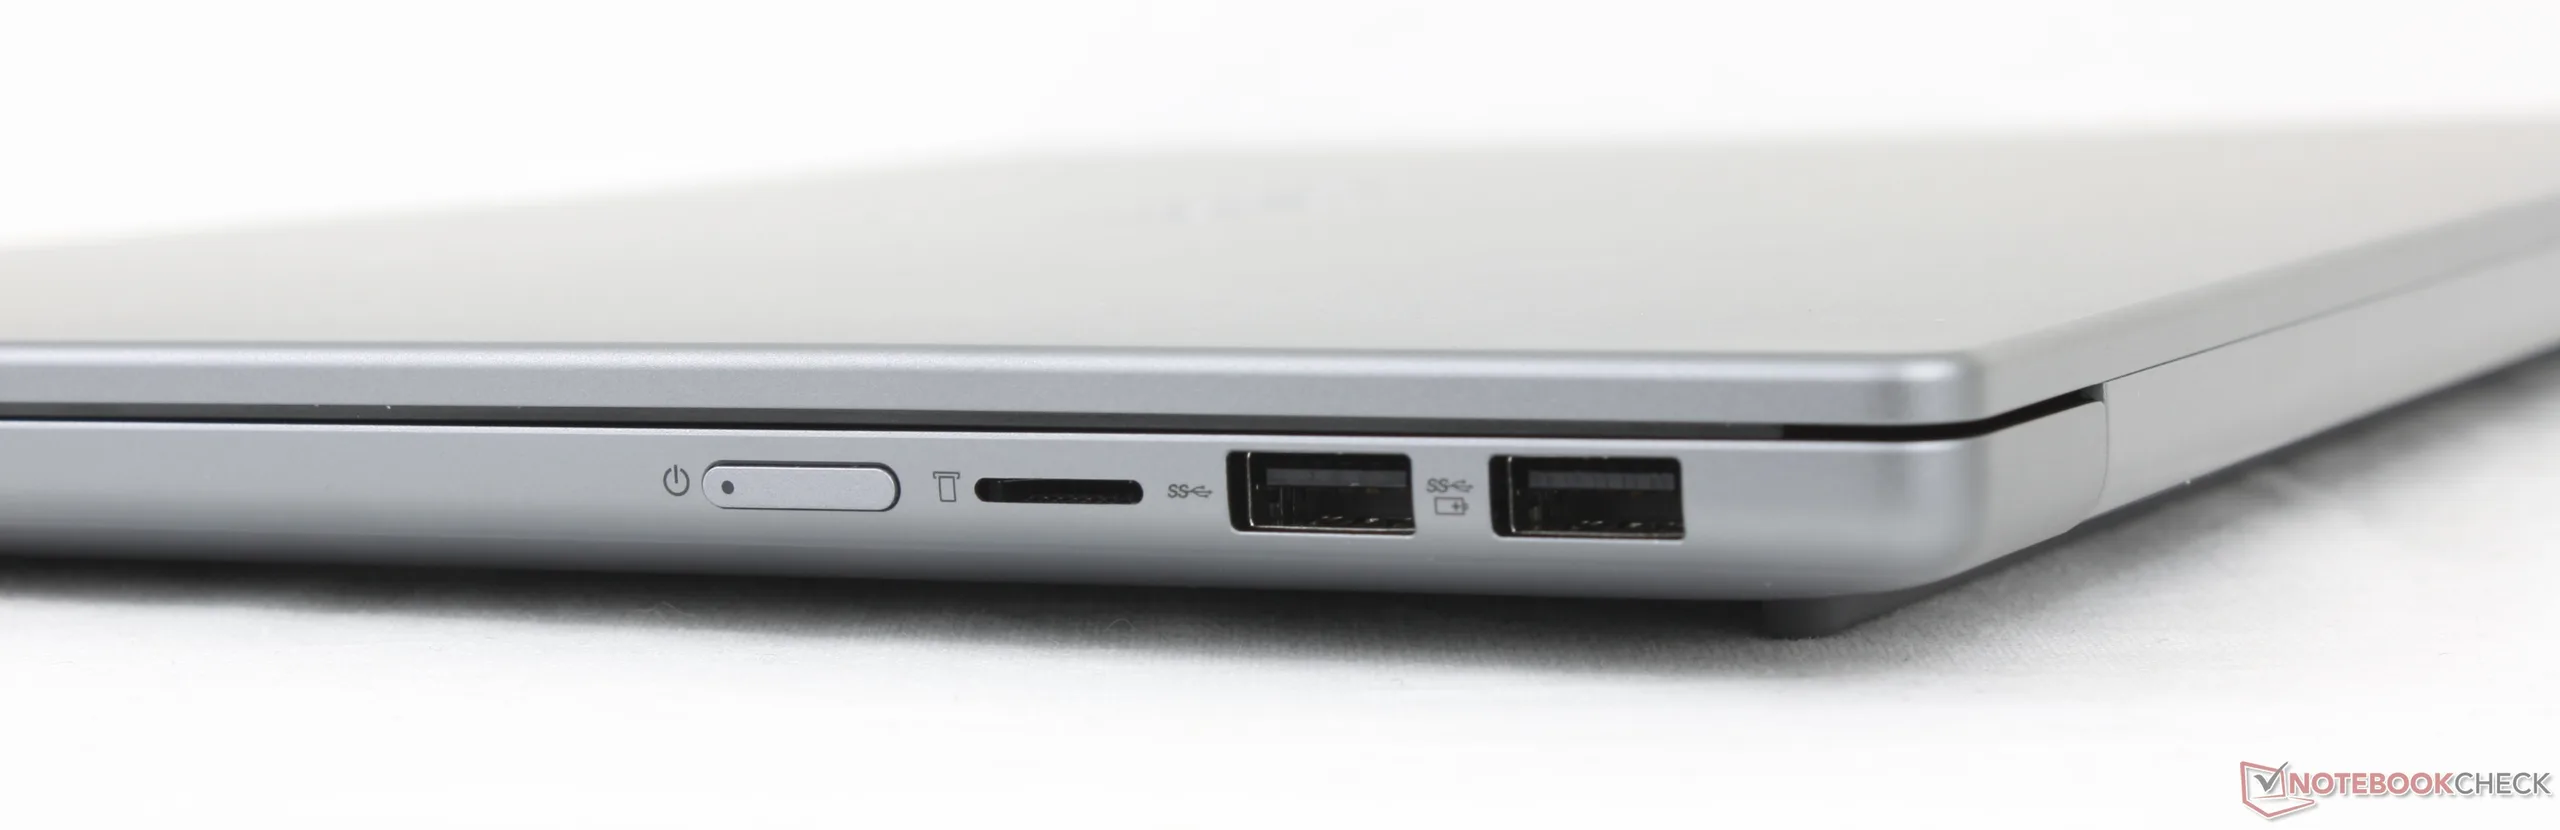
SD 读卡器
| SD Card Reader | |
| average JPG Copy Test (av. of 3 runs) | |
| Lenovo IdeaPad Slim 5 16AKP10 (AV PRO microSD 128 GB V60) | |
| Lenovo IdeaPad 5 2-in-1 16IAL10 (AV Pro SD microSD 128 GB V60) | |
| Lenovo Ideapad Slim 5 16IRH10R (AV Pro SD microSD 128 GB V60) | |
| maximum AS SSD Seq Read Test (1GB) | |
| Lenovo IdeaPad 5 2-in-1 16IAL10 (AV Pro SD microSD 128 GB V60) | |
| Lenovo IdeaPad Slim 5 16AKP10 (AV PRO microSD 128 GB V60) | |
| Lenovo Ideapad Slim 5 16IRH10R (AV Pro SD microSD 128 GB V60) | |
交流
| Networking | |
| iperf3 transmit AXE11000 | |
| Lenovo IdeaPad Slim 5 16AKP10 | |
| Dell 16 Plus | |
| Asus Vivobook 16 M1606K | |
| HP Pavilion 16-ag0057ng | |
| Lenovo Ideapad Slim 5 16IRH10R | |
| Lenovo IdeaPad 5 2-in-1 16IAL10 | |
| iperf3 receive AXE11000 | |
| Lenovo IdeaPad Slim 5 16AKP10 | |
| Dell 16 Plus | |
| Asus Vivobook 16 M1606K | |
| HP Pavilion 16-ag0057ng | |
| Lenovo IdeaPad 5 2-in-1 16IAL10 | |
| Lenovo Ideapad Slim 5 16IRH10R | |
| iperf3 transmit AXE11000 6GHz | |
| Dell 16 Plus | |
| iperf3 receive AXE11000 6GHz | |
| Dell 16 Plus | |
网络摄像头


维护
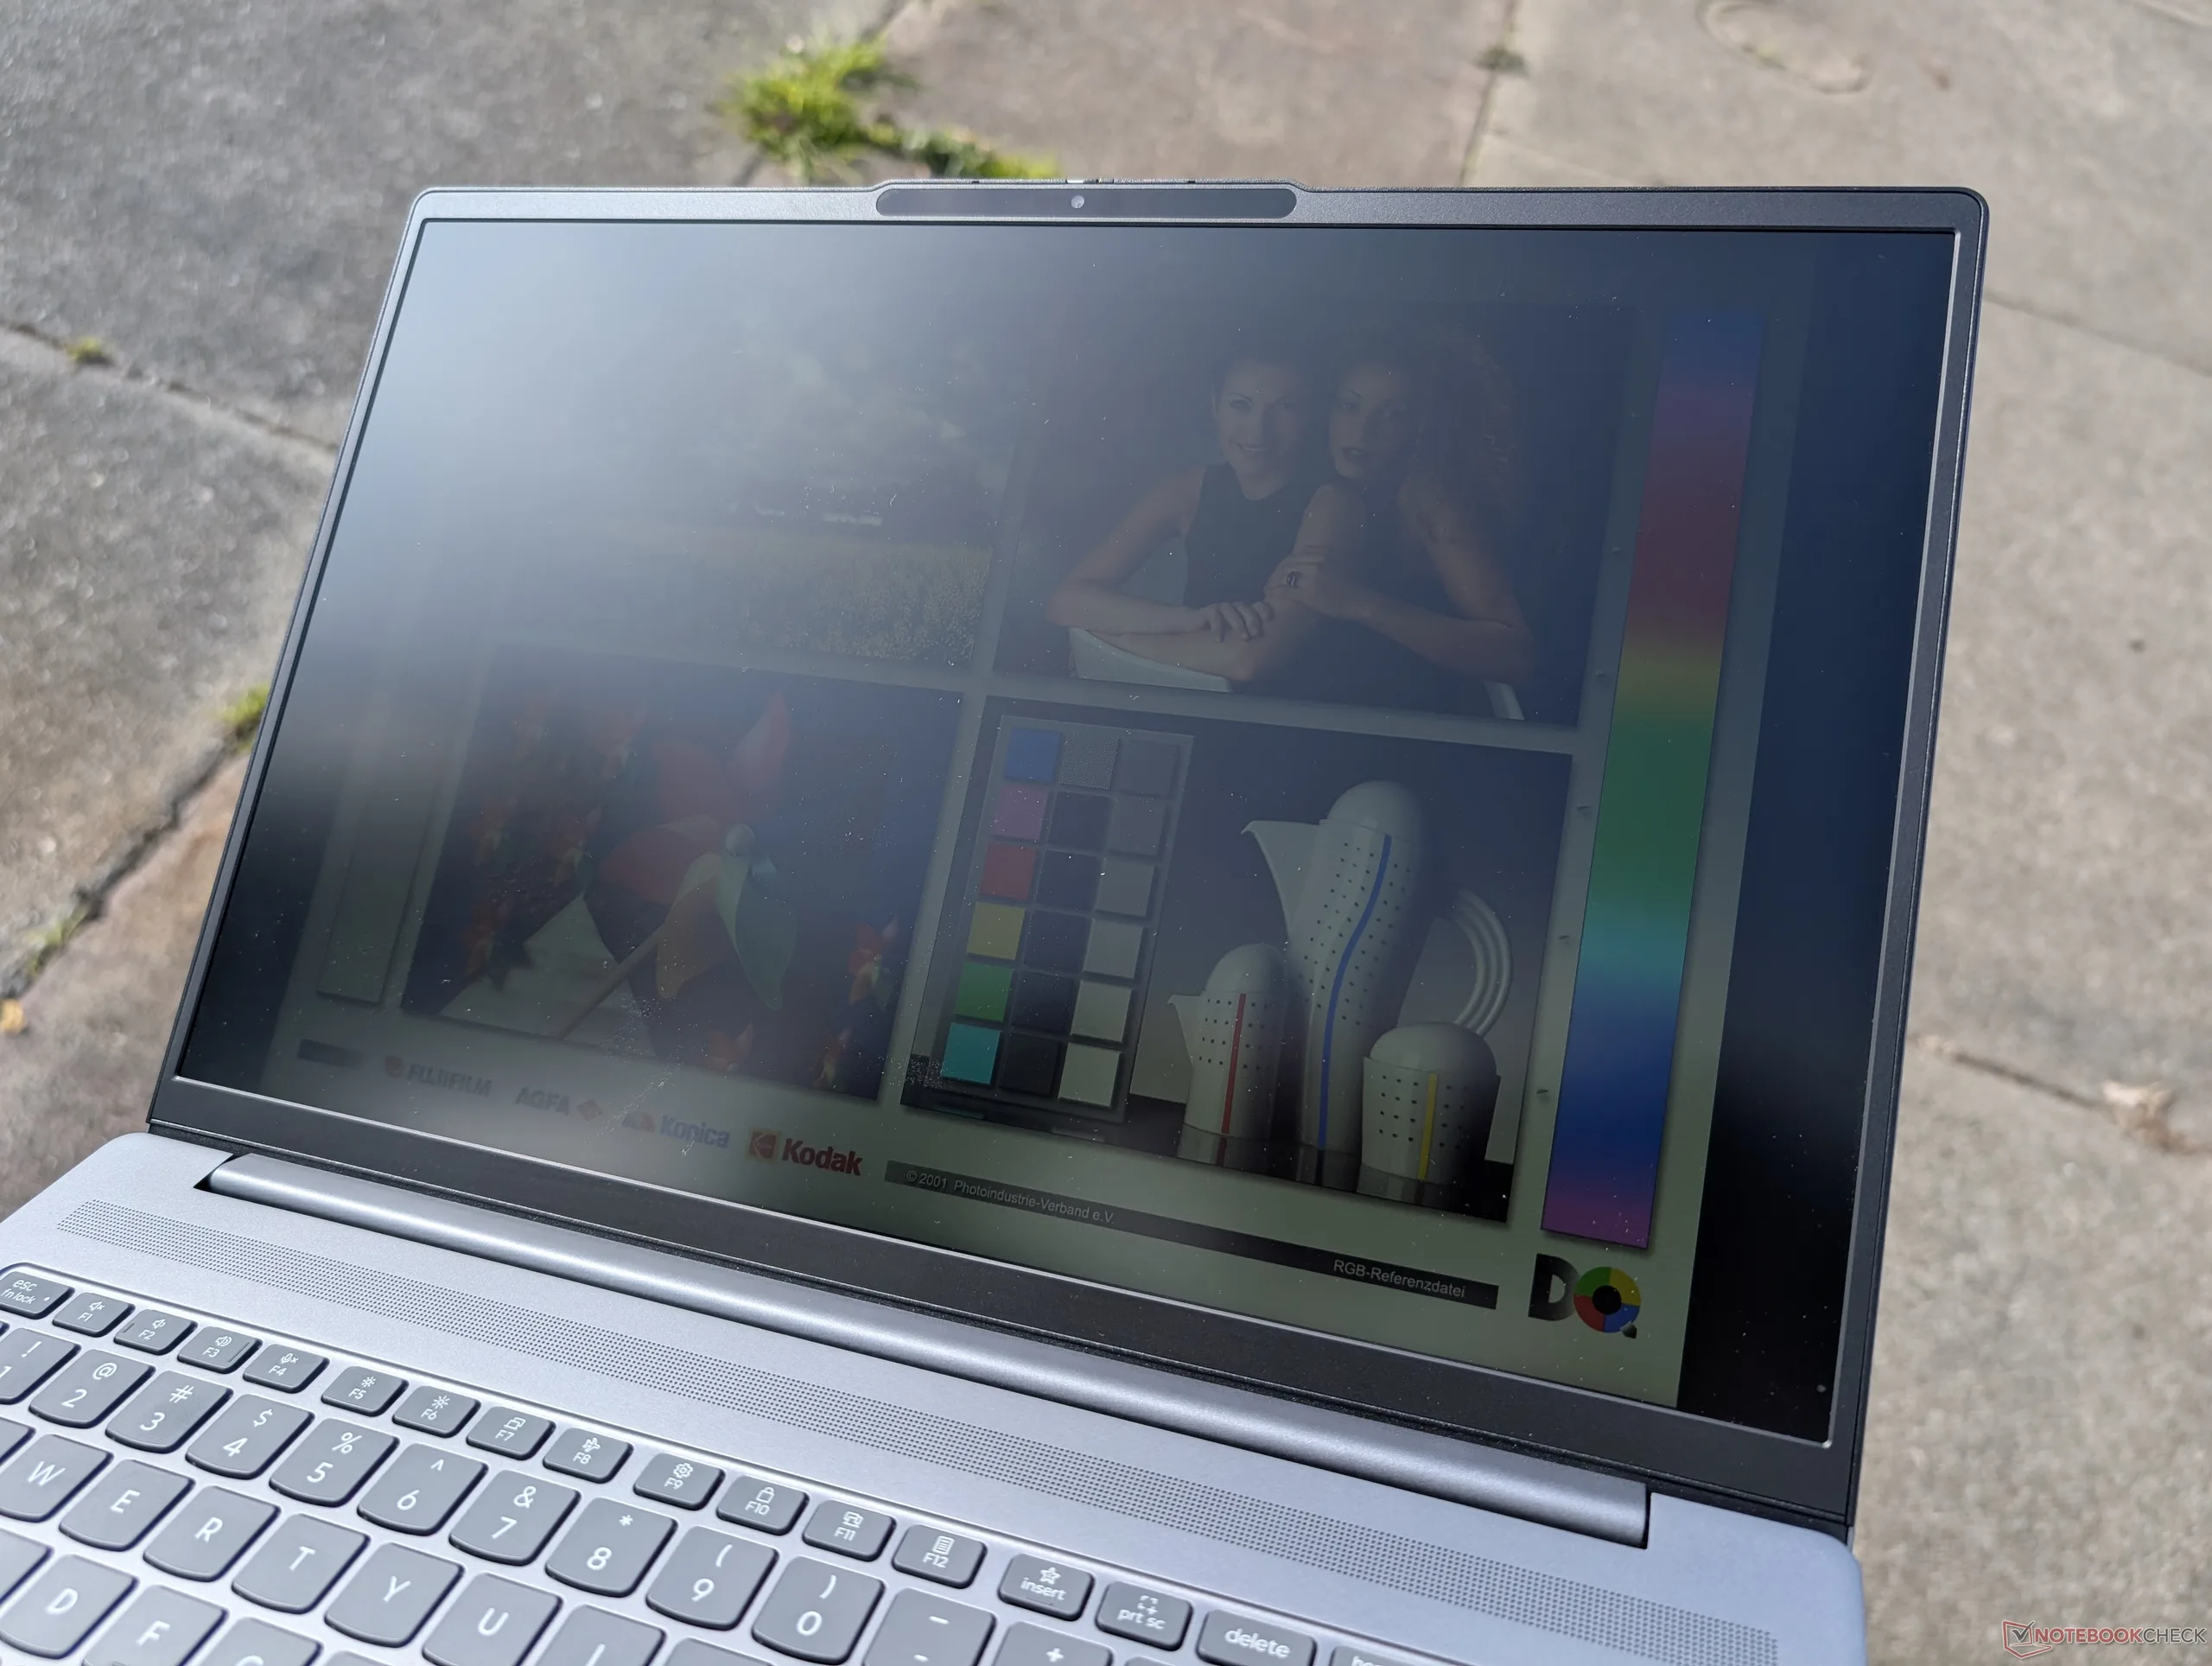
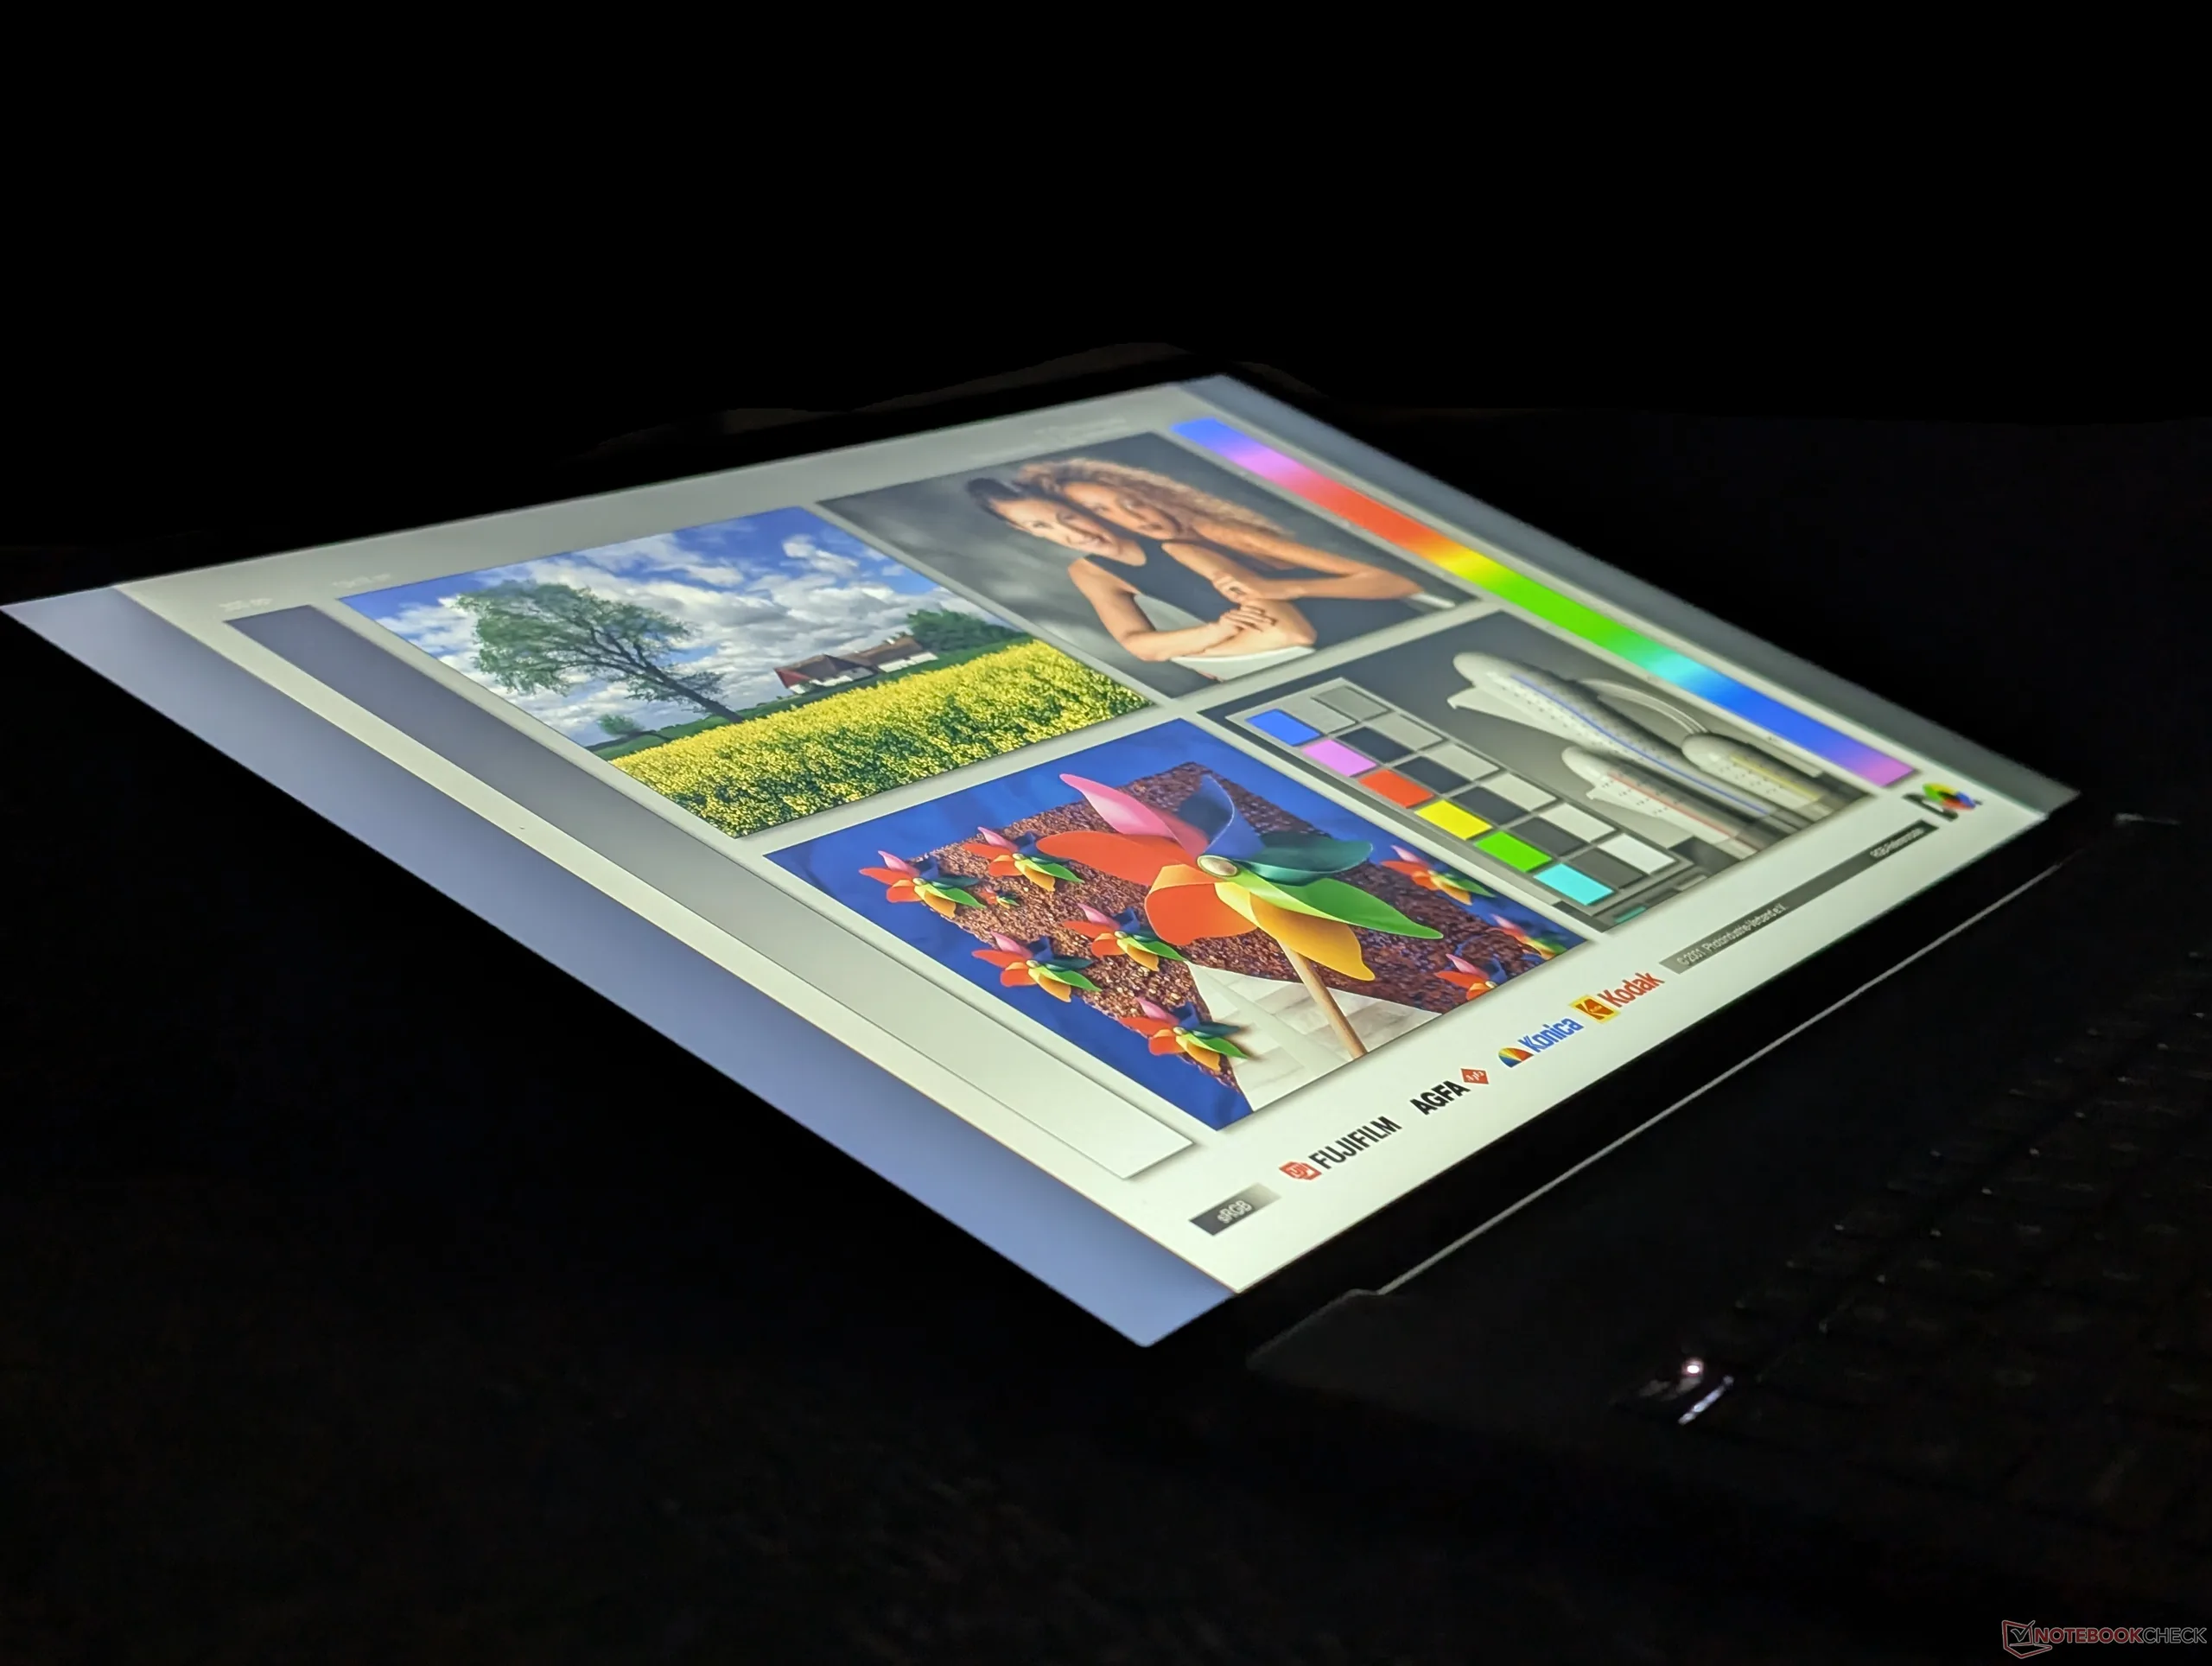
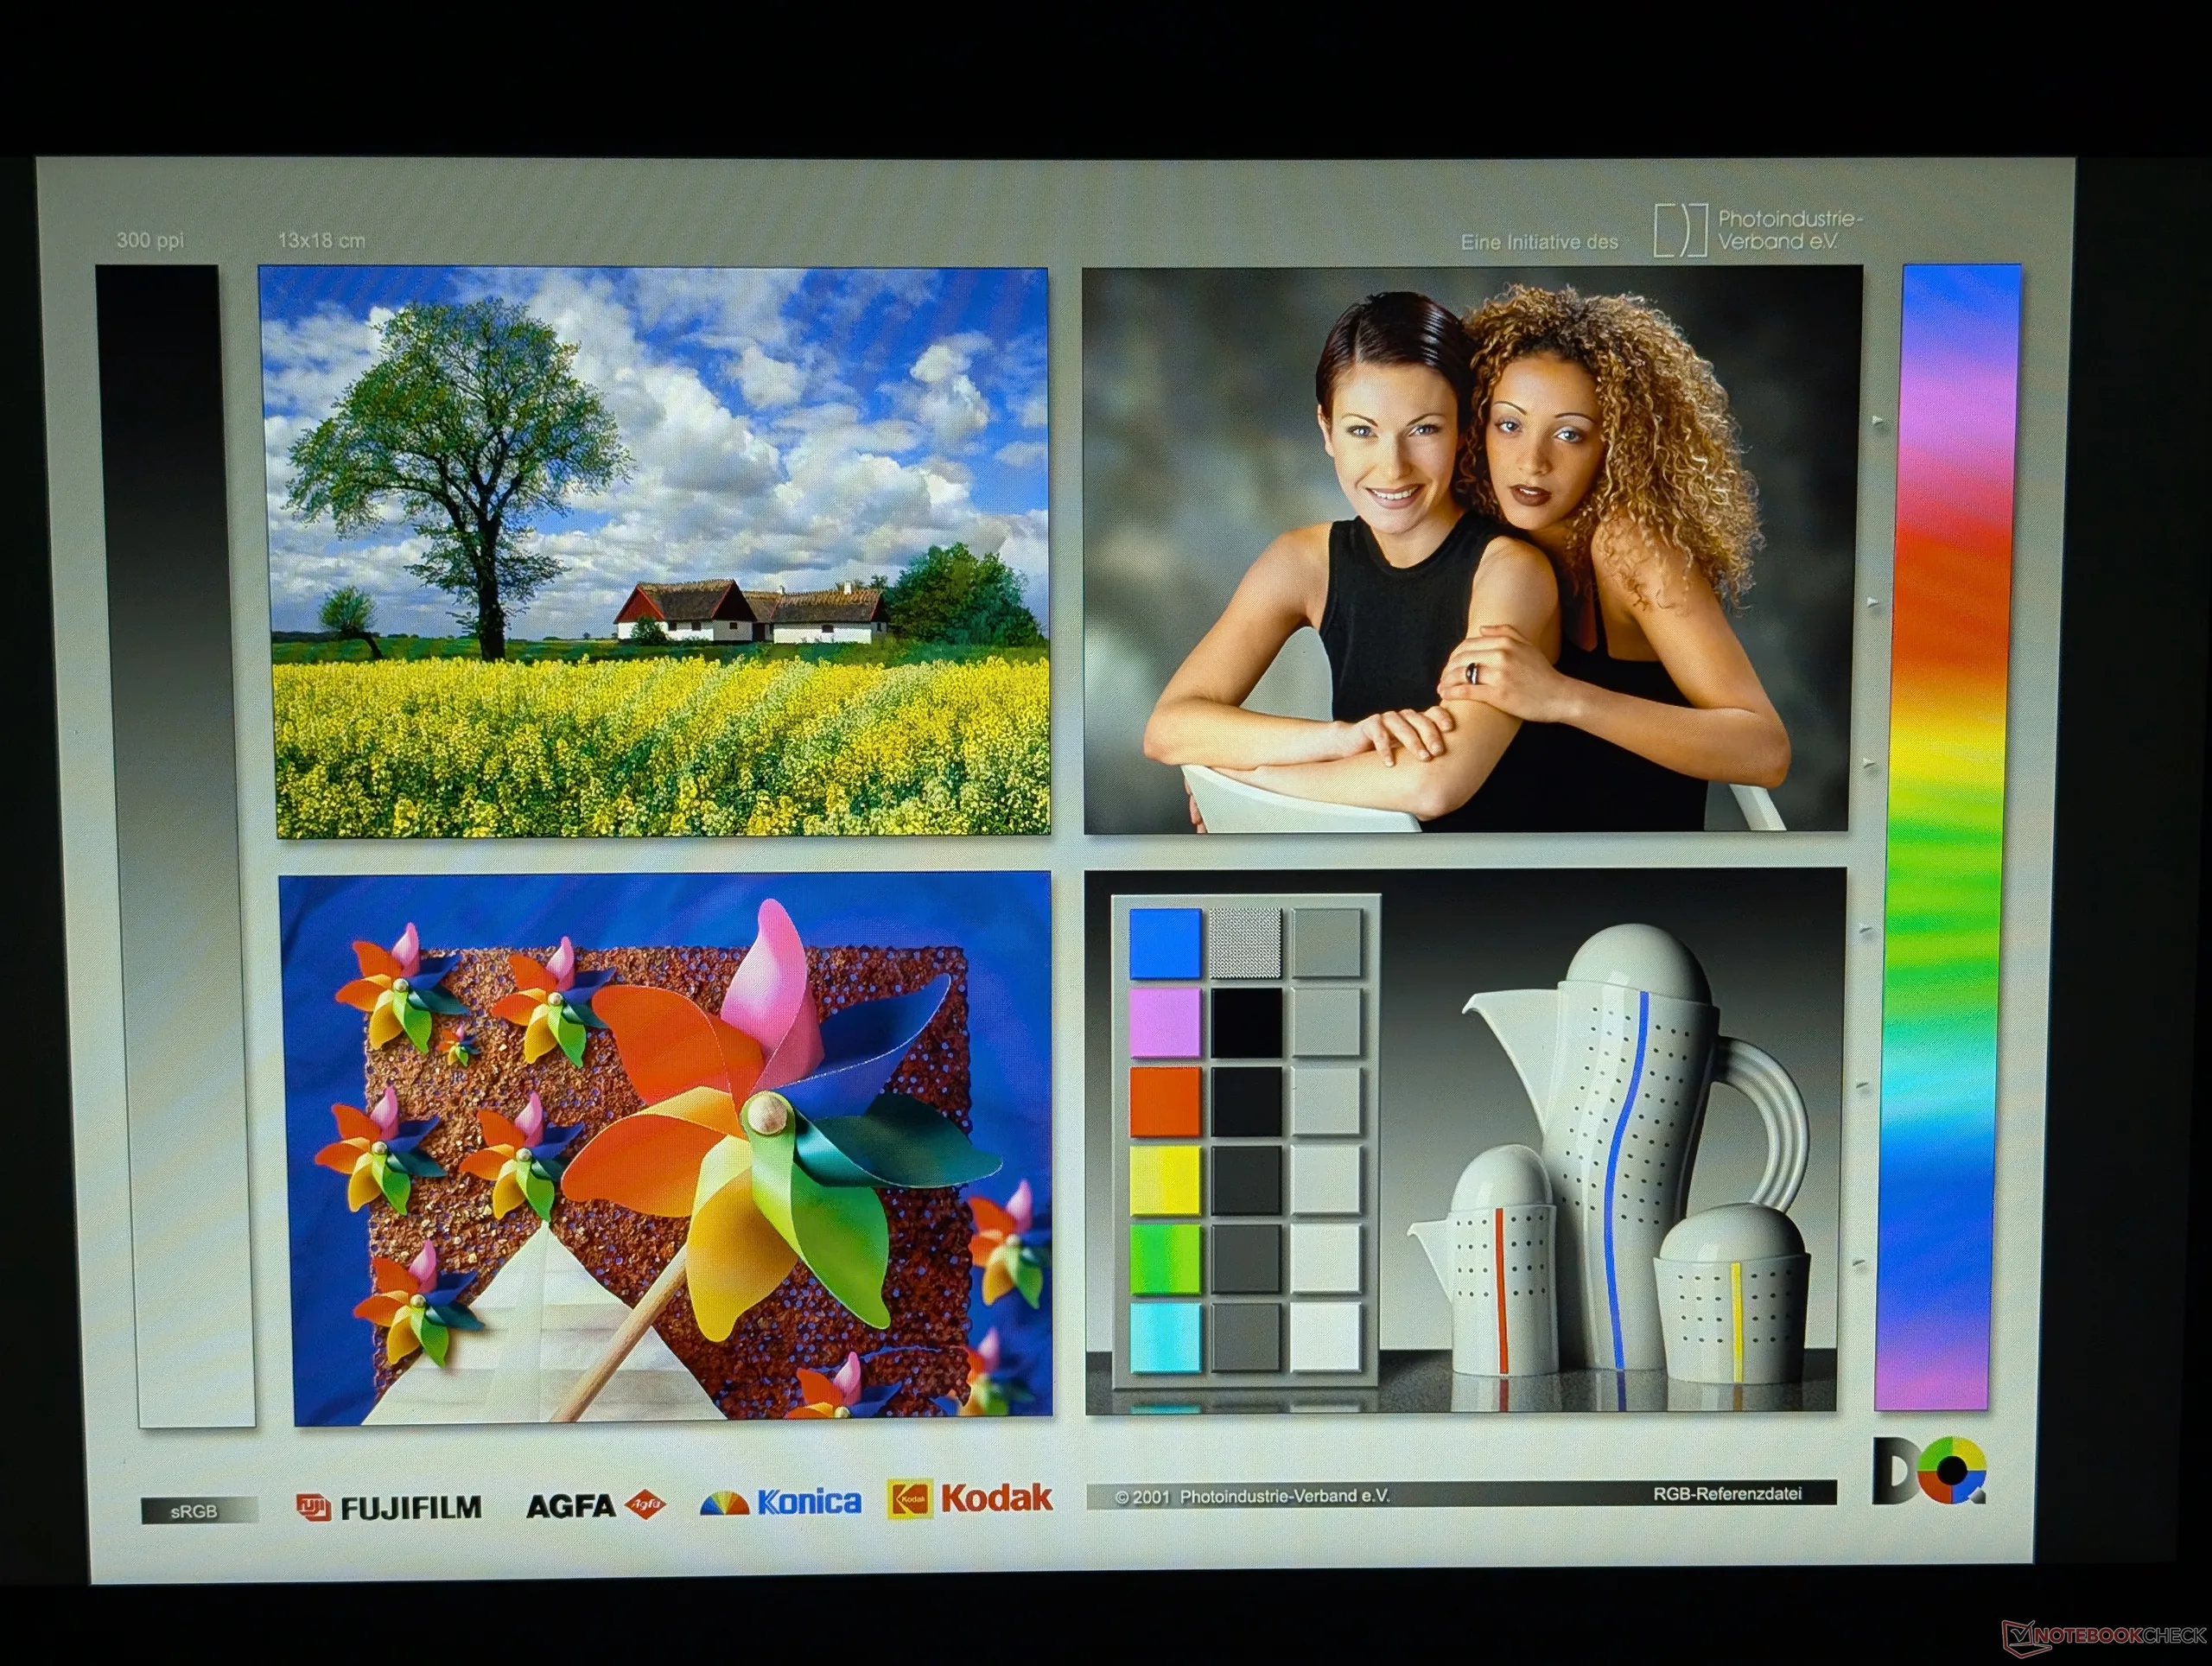
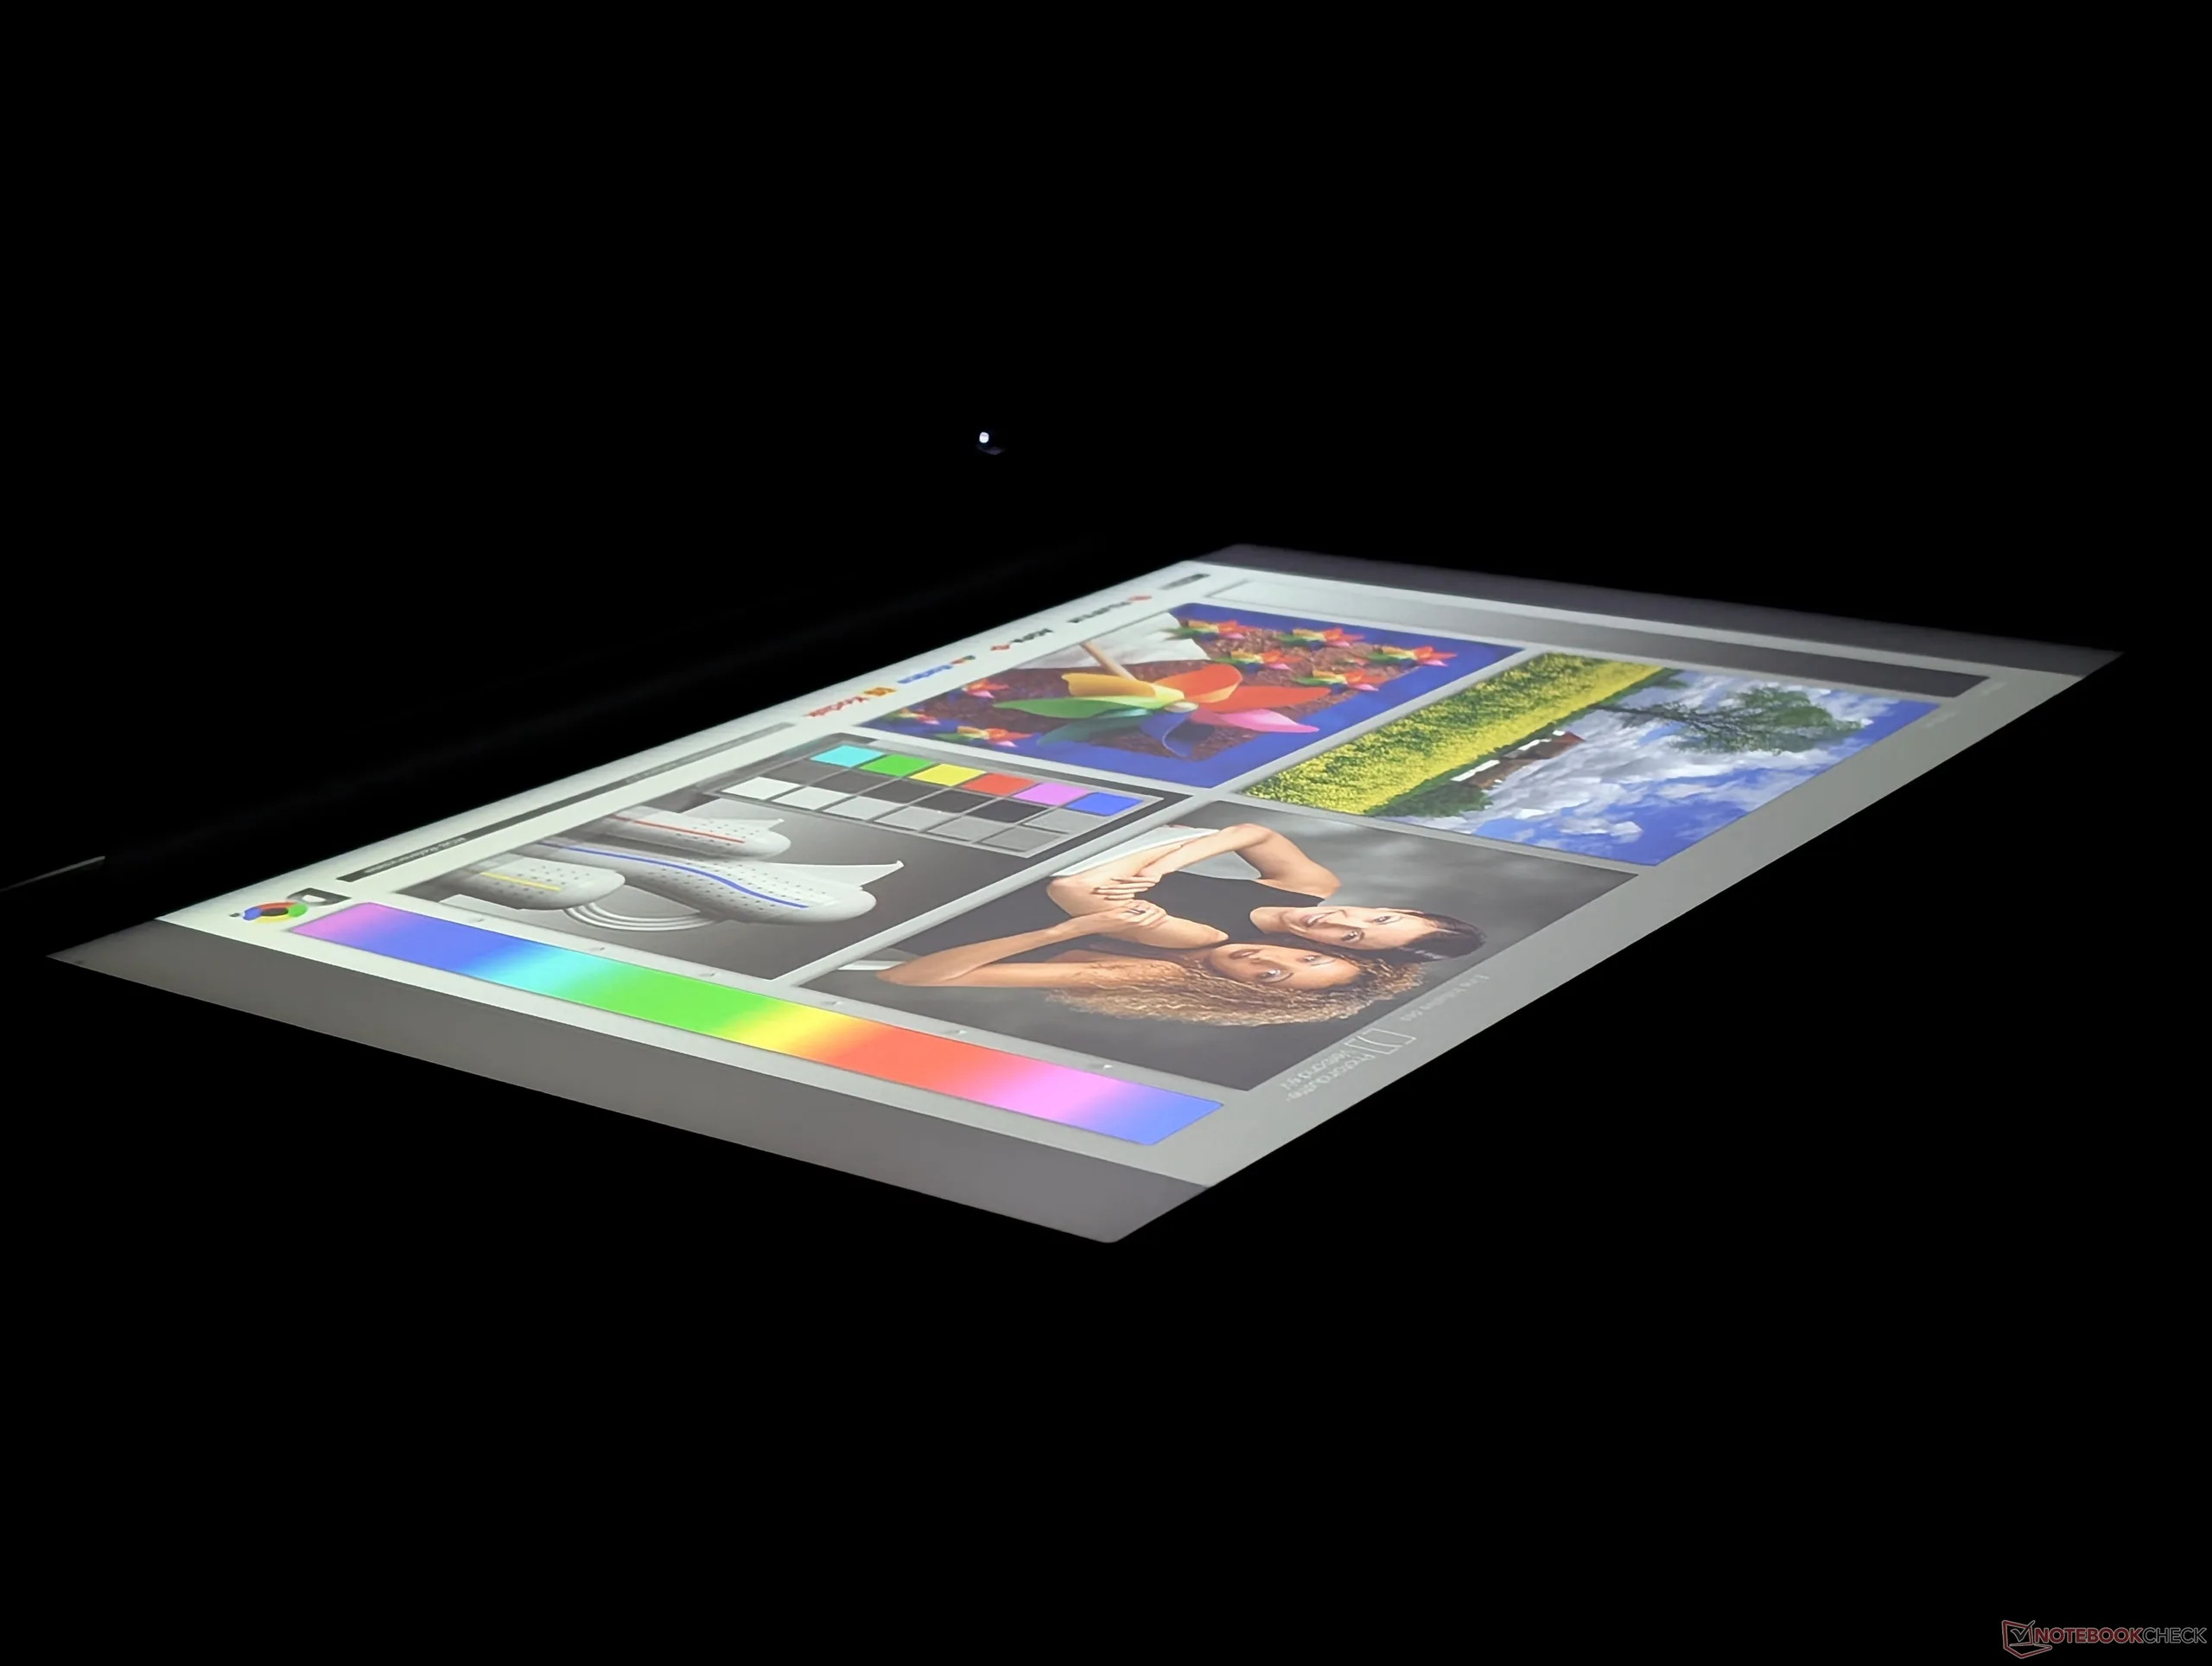
显示屏


| |||||||||||||||||||||||||
Brightness Distribution: 84 %
Center on Battery: 347.7 cd/m²
Contrast: 724:1 (Black: 0.48 cd/m²)
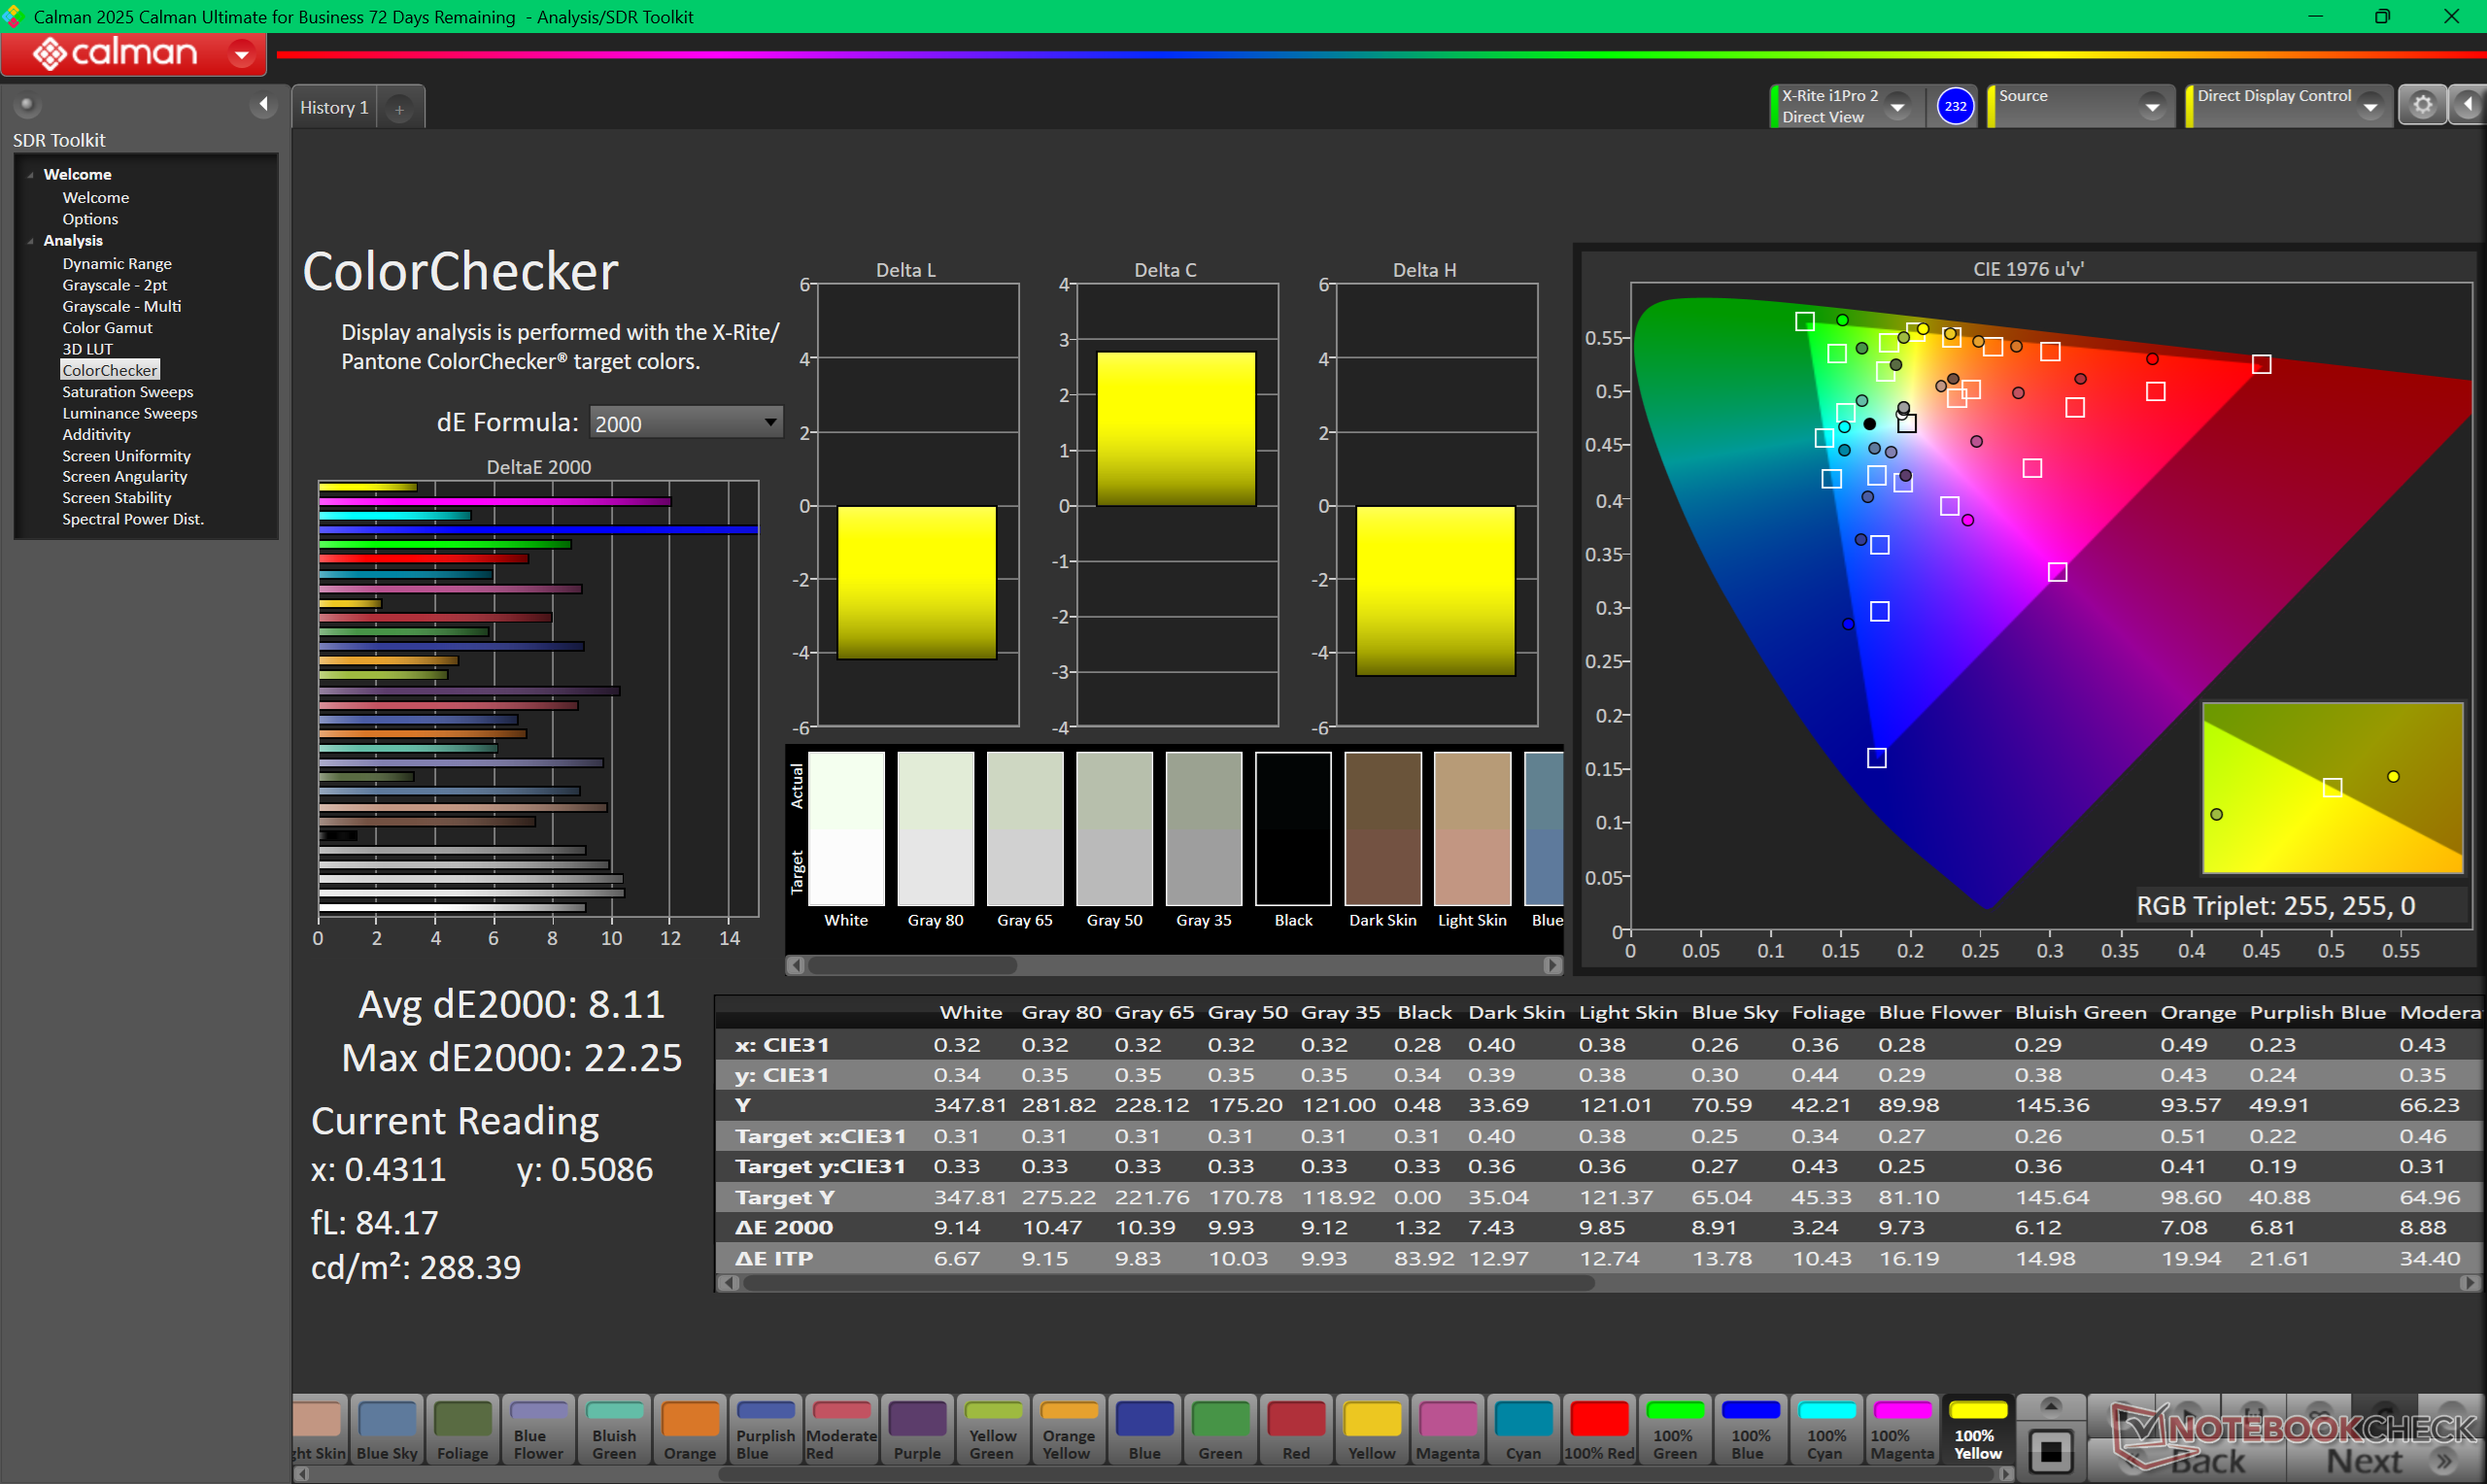
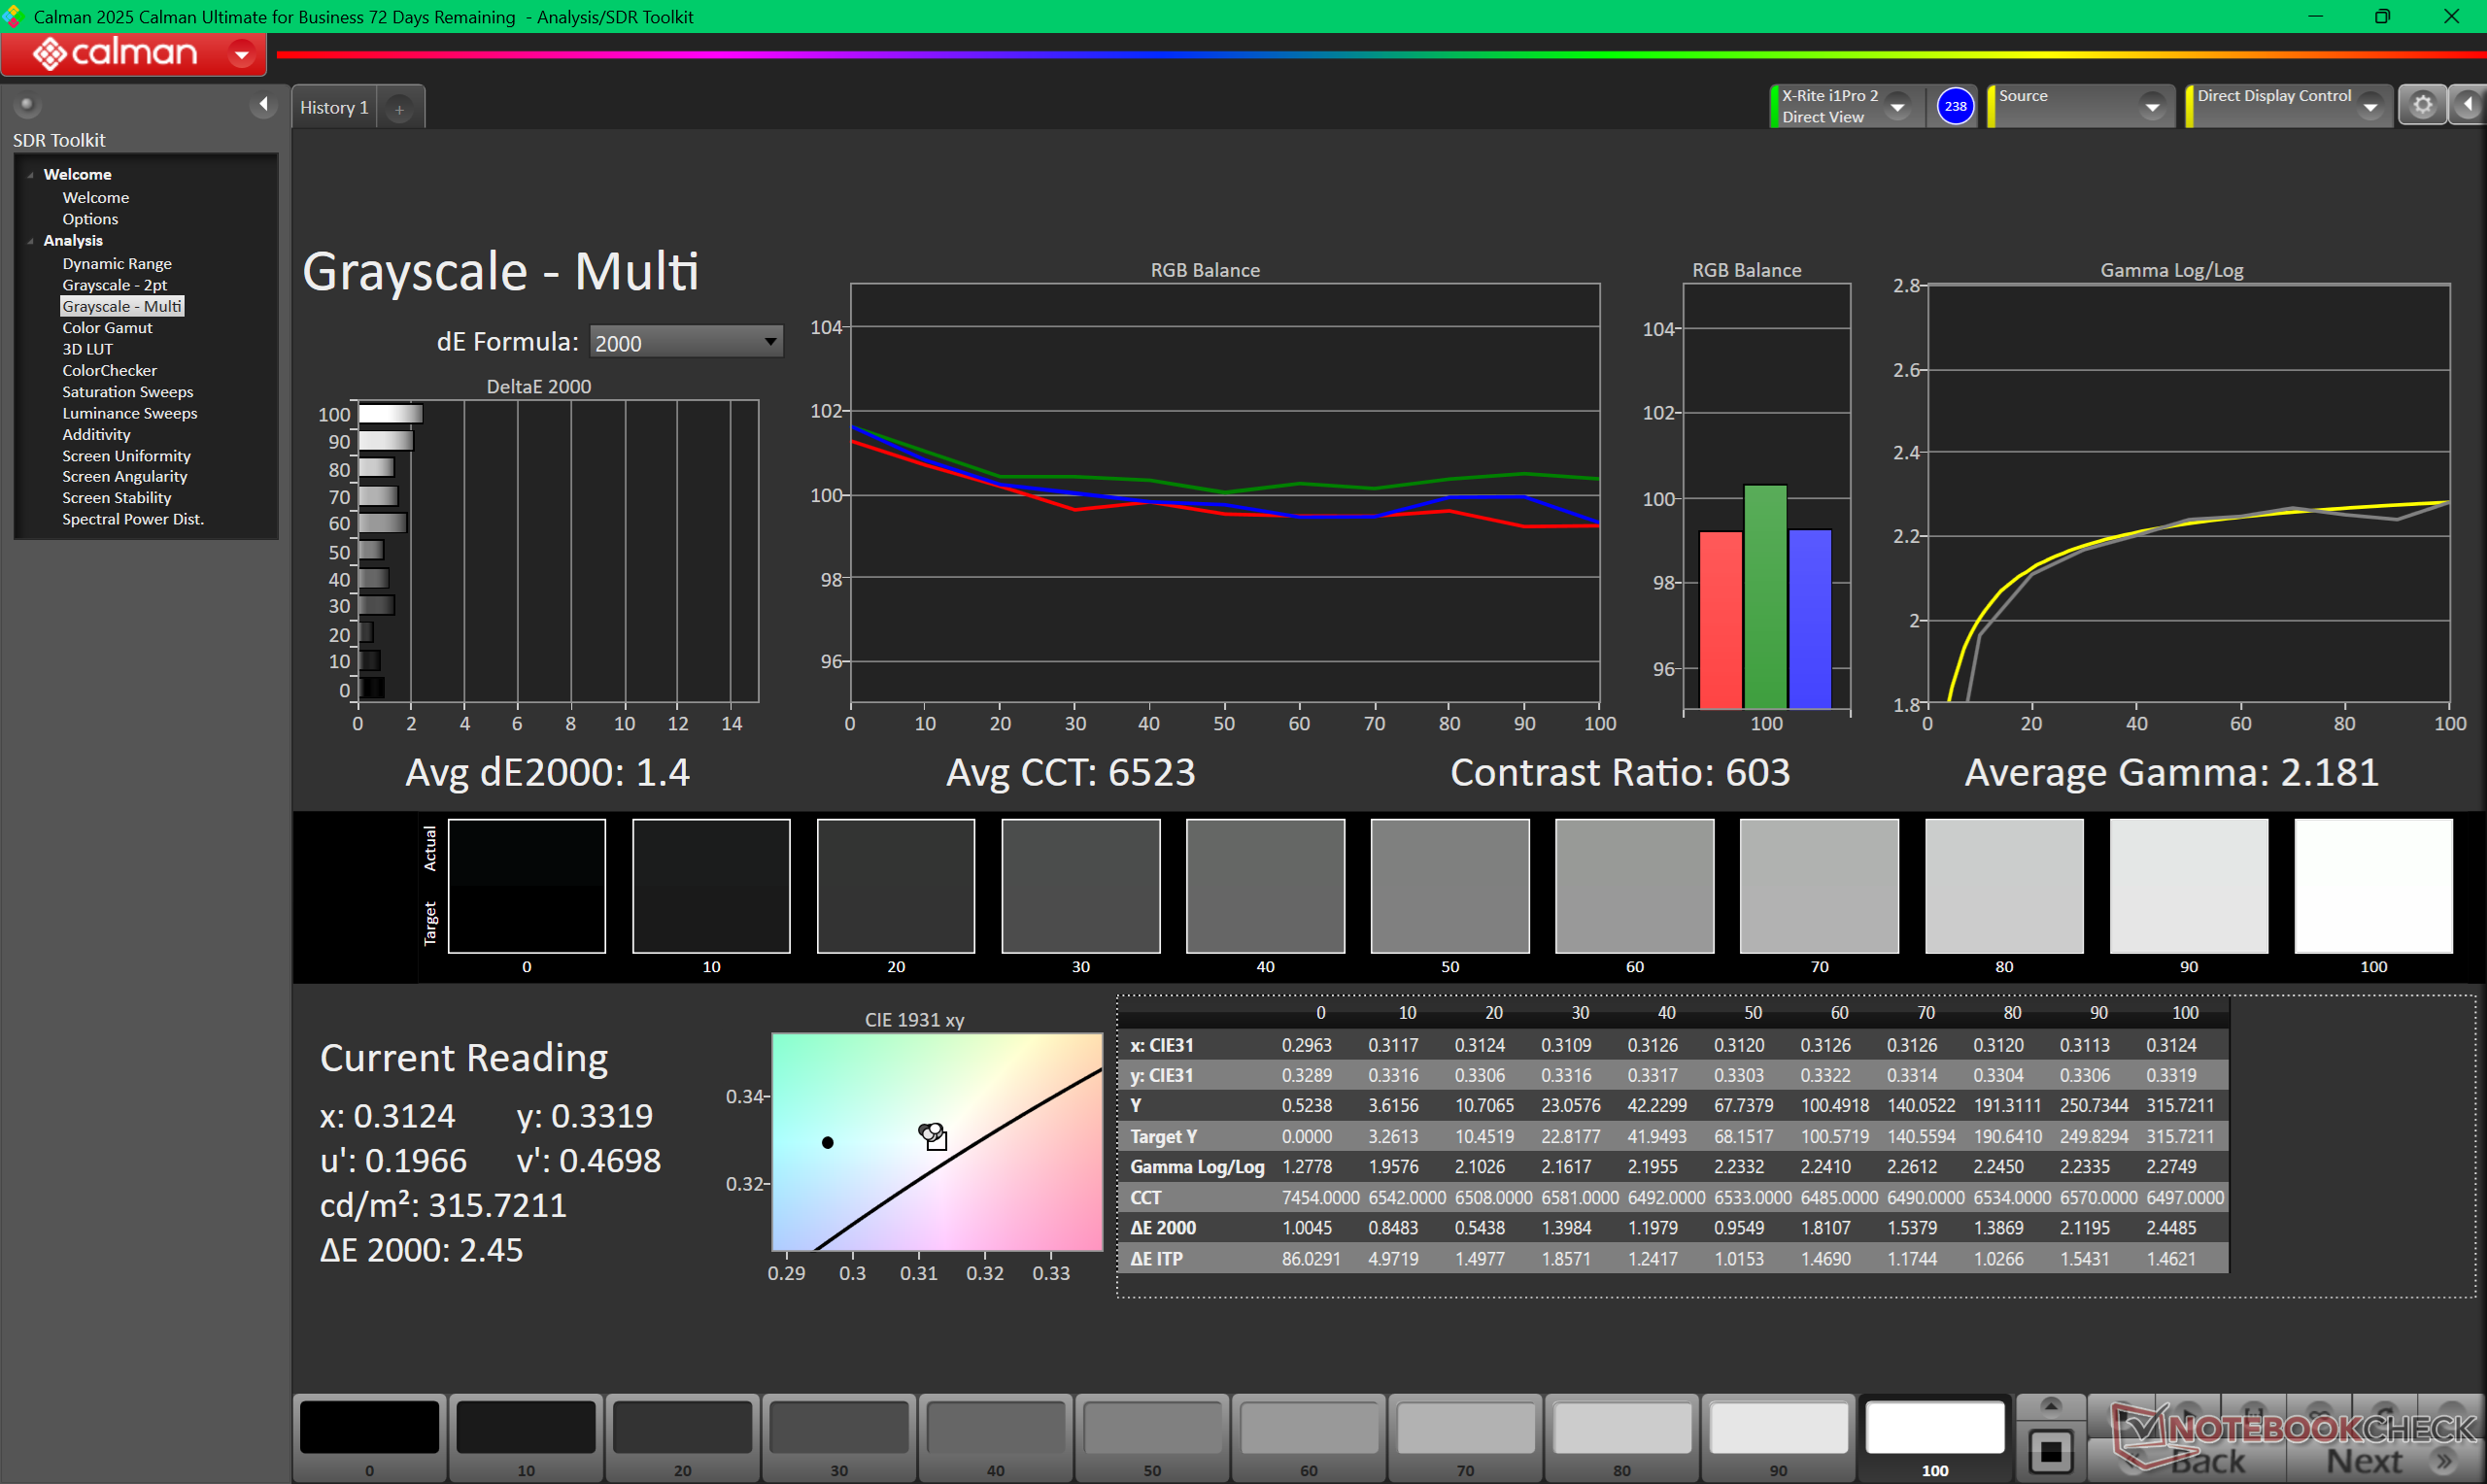
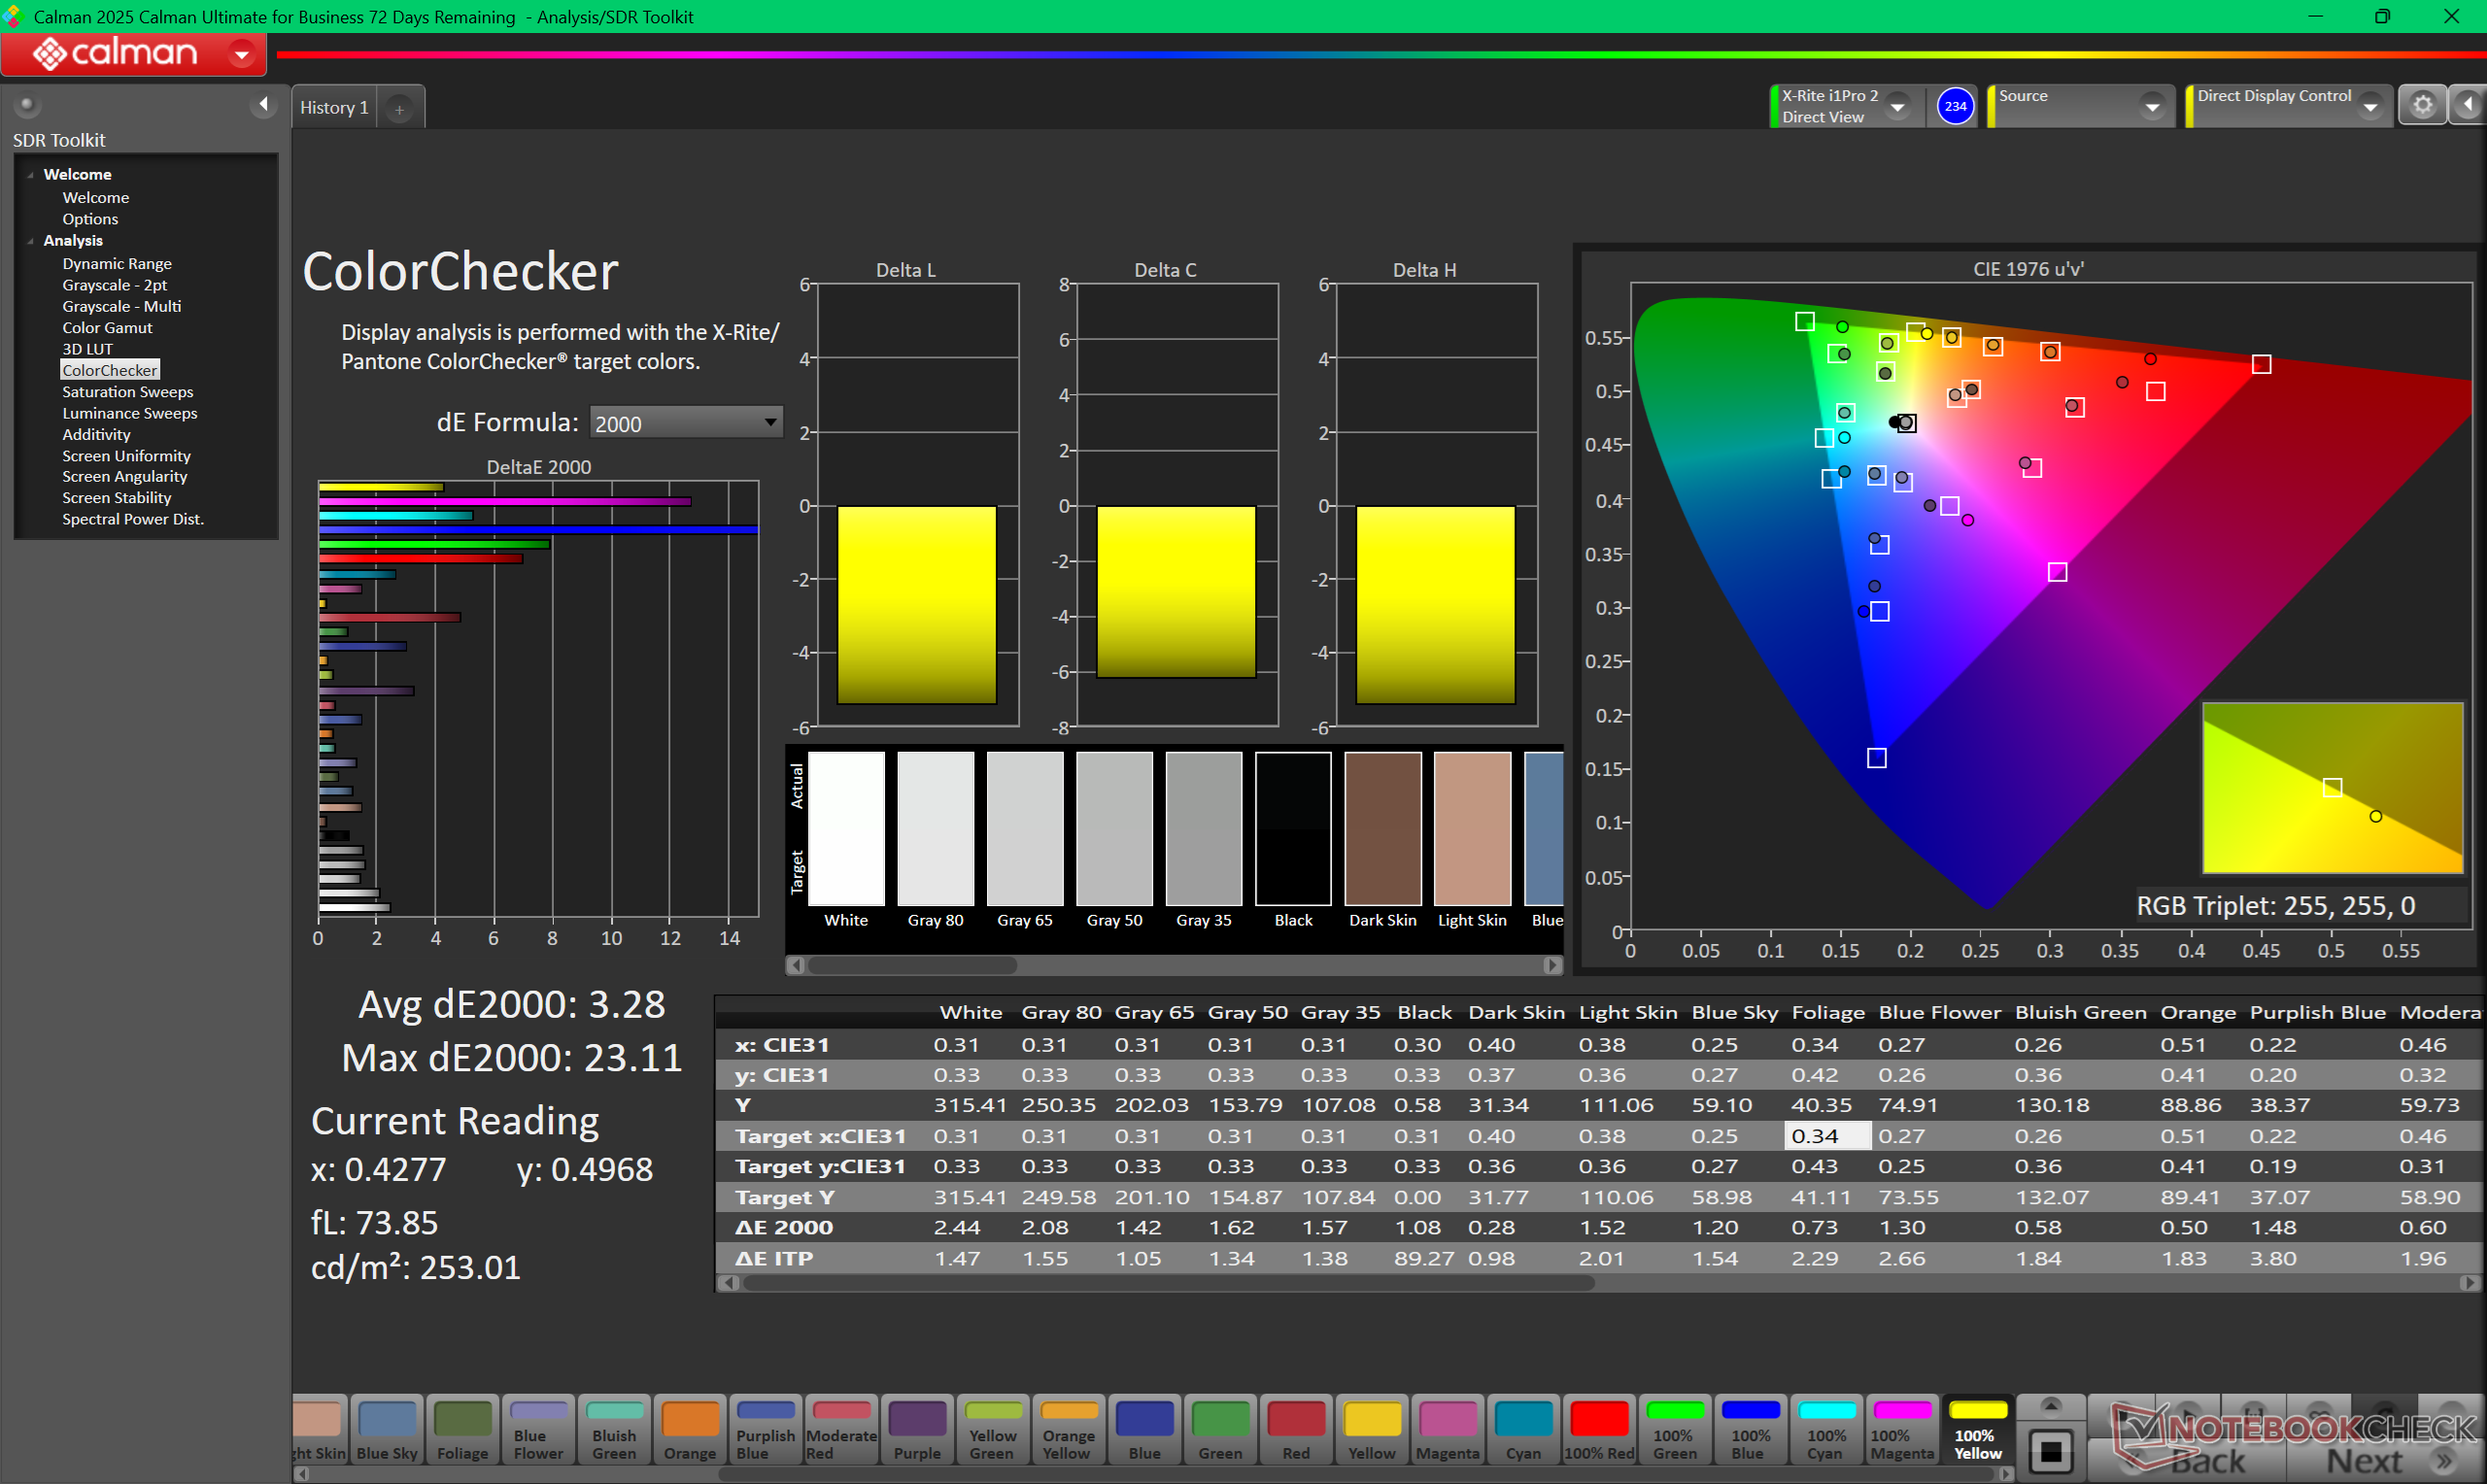
ΔE ColorChecker Calman: 8.11 | ∀{0.5-29.43 Ø4.72}
calibrated: 3.28
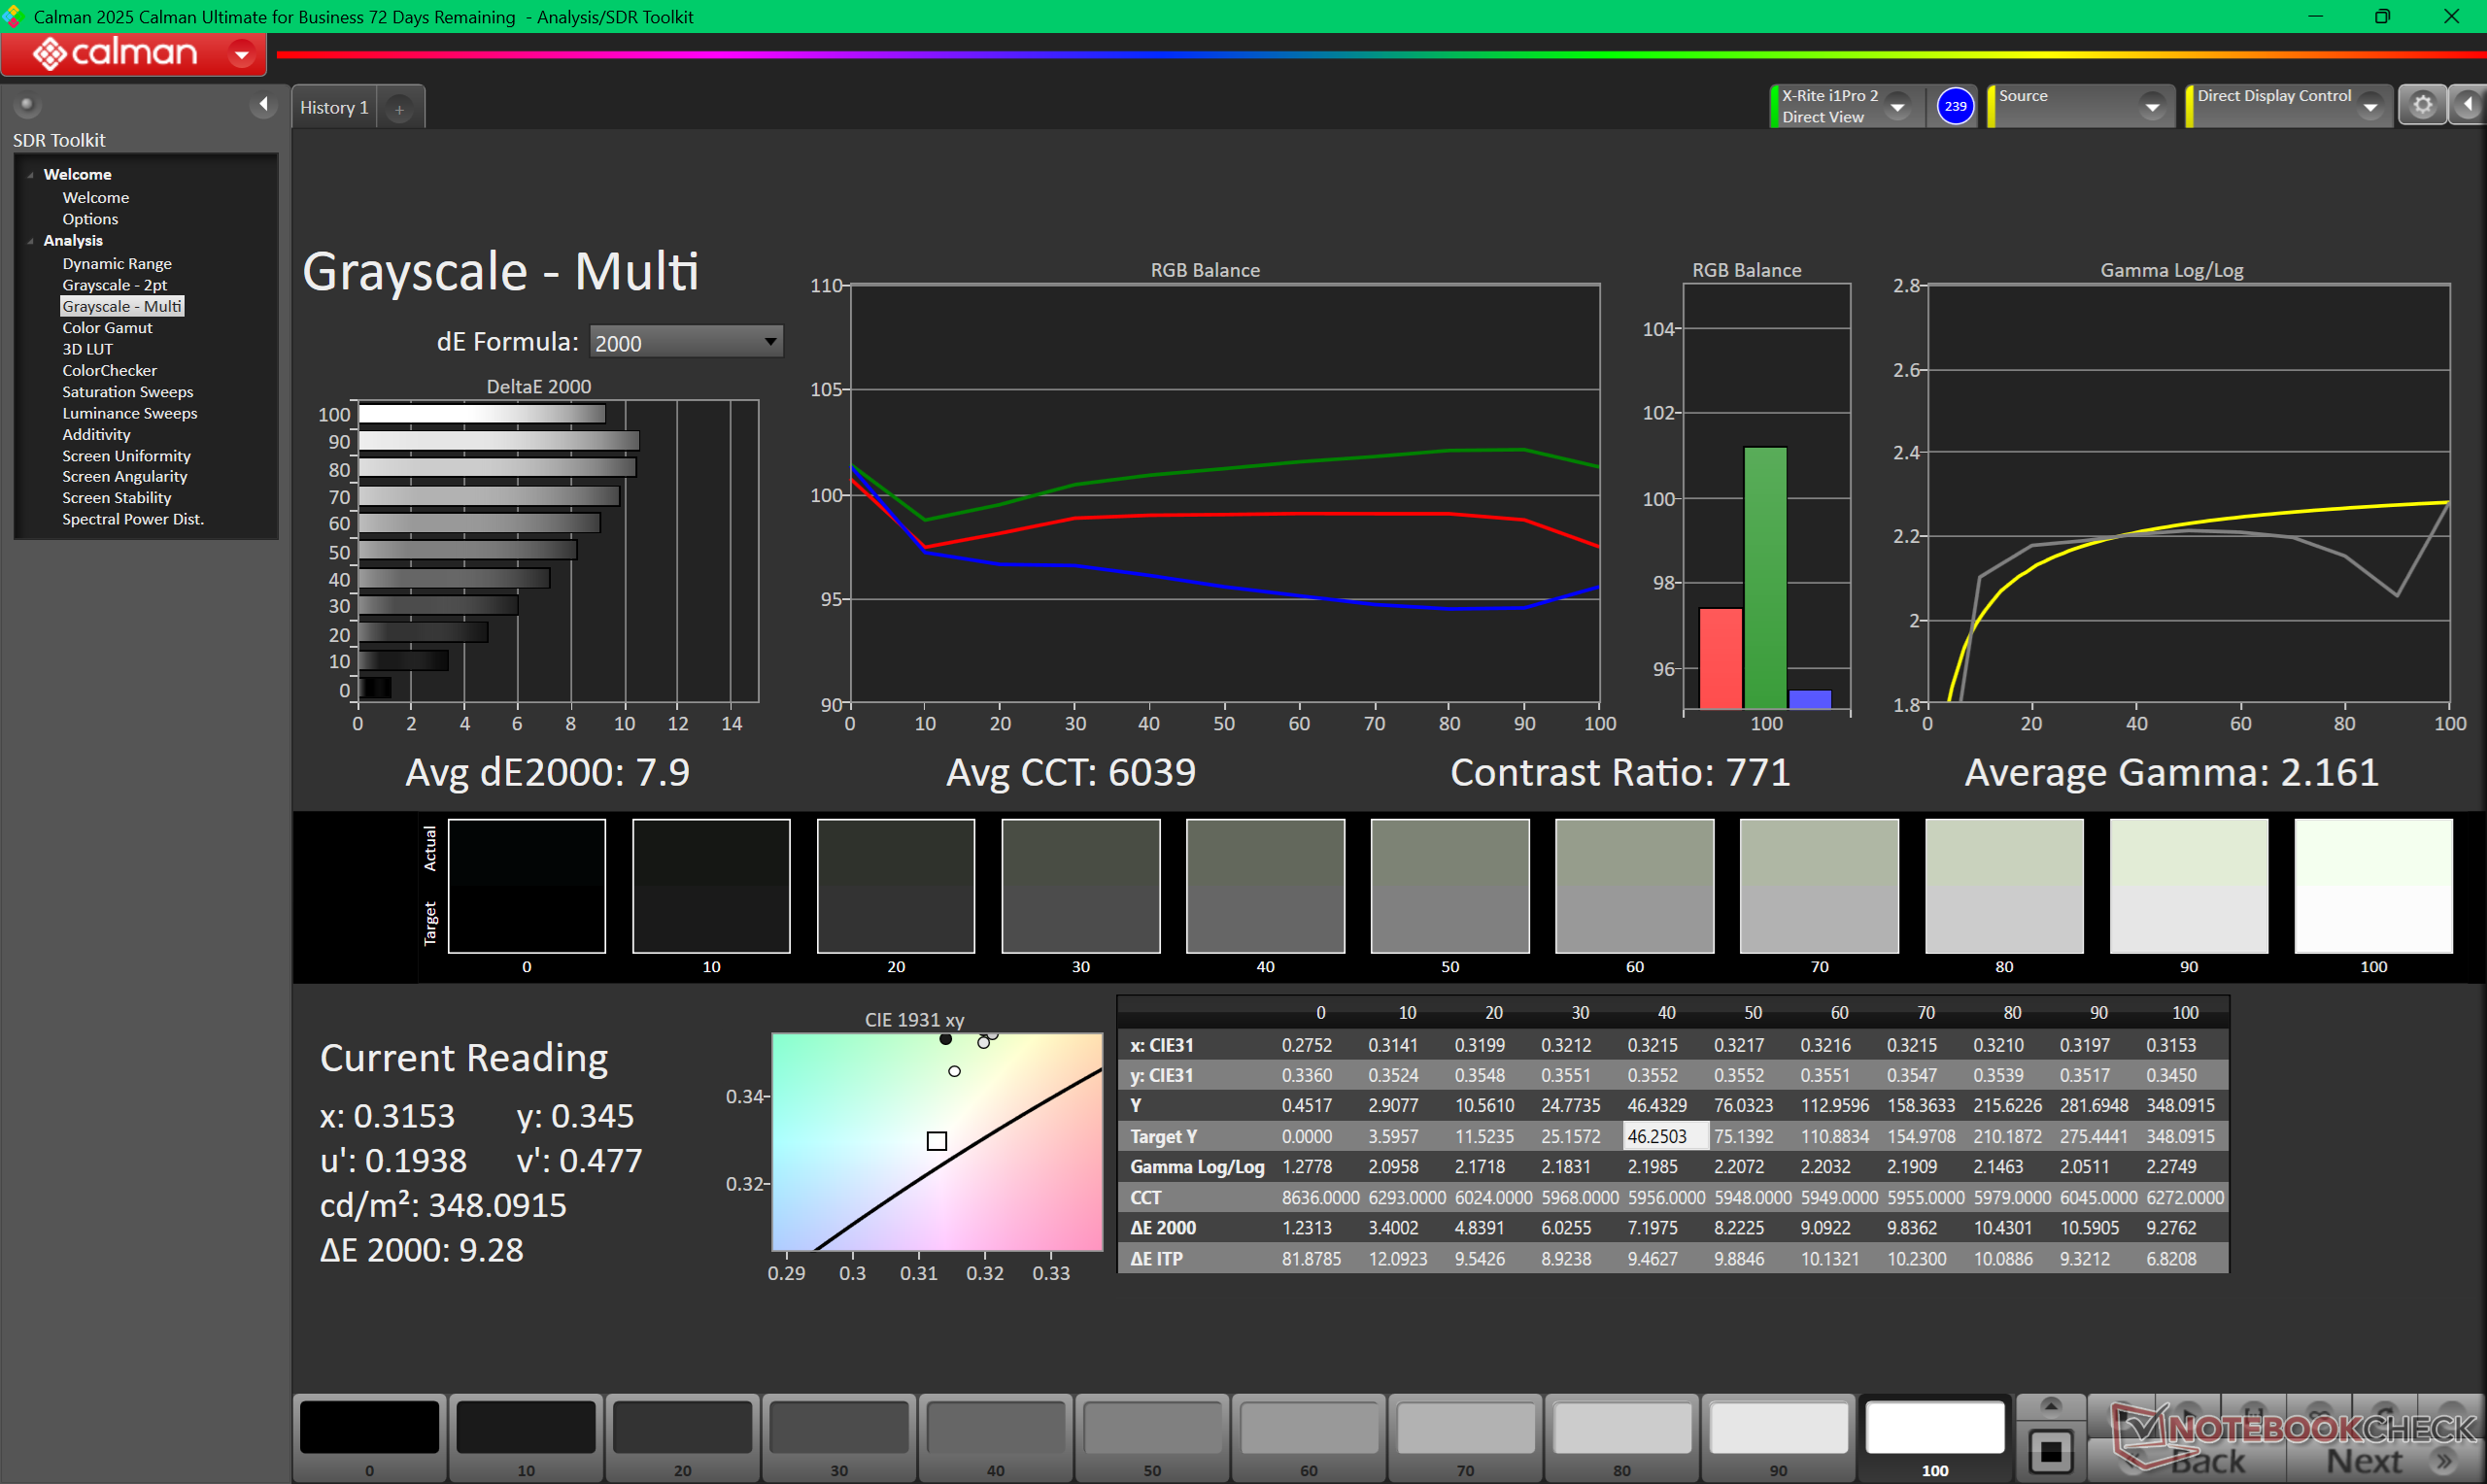
ΔE Greyscale Calman: 7.9 | ∀{0.09-98 Ø4.97}
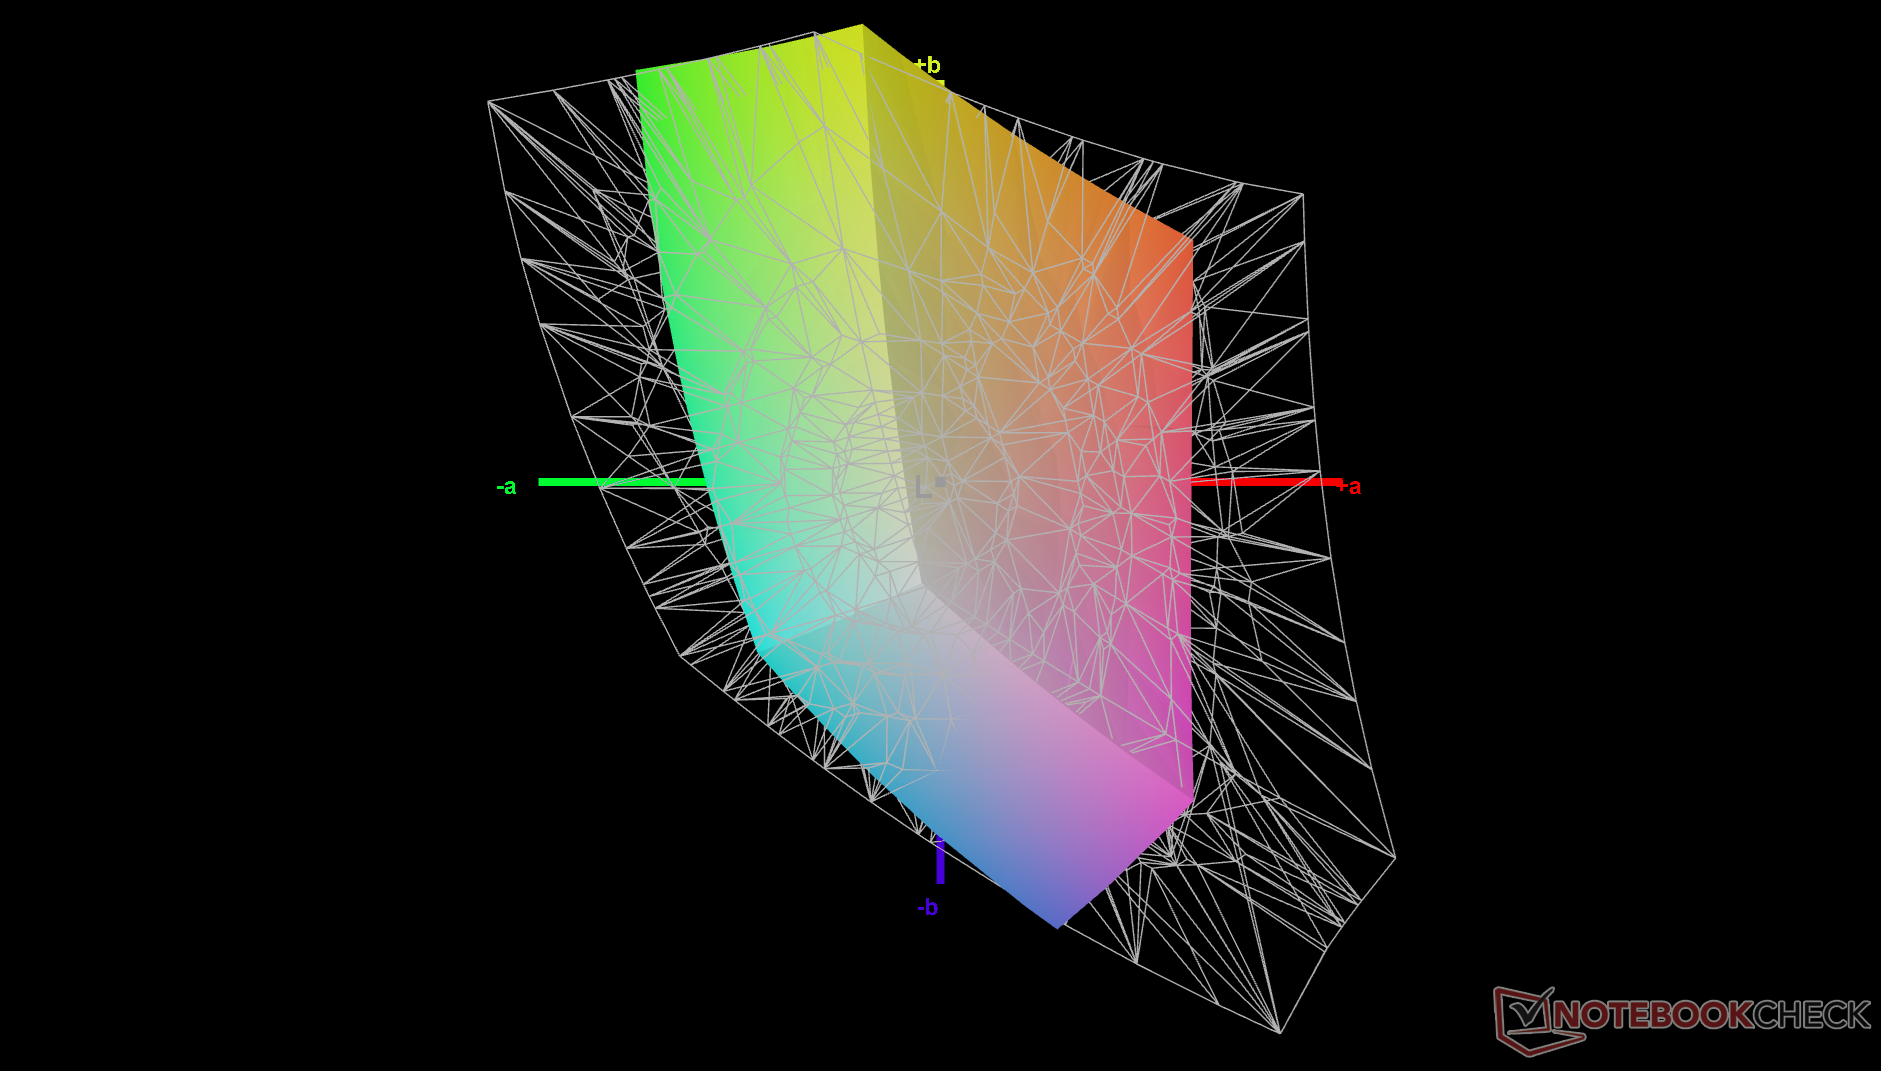
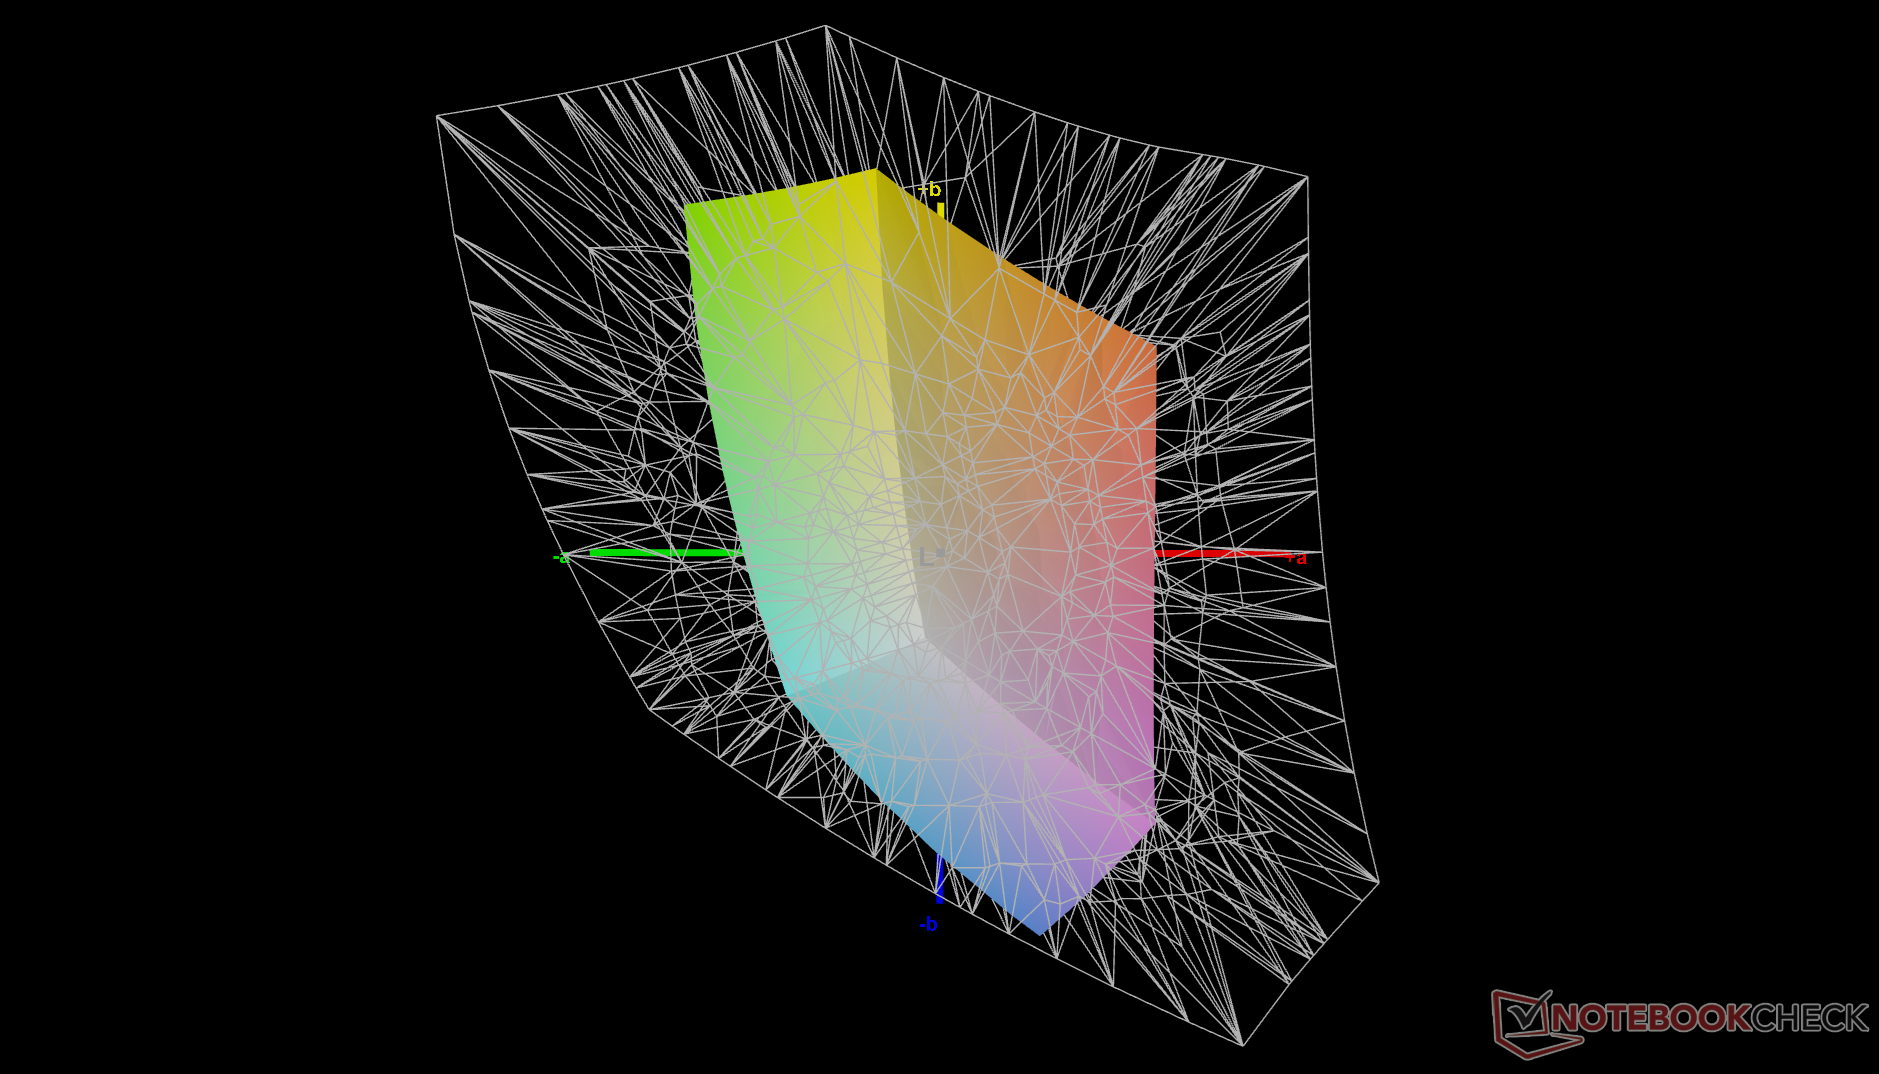
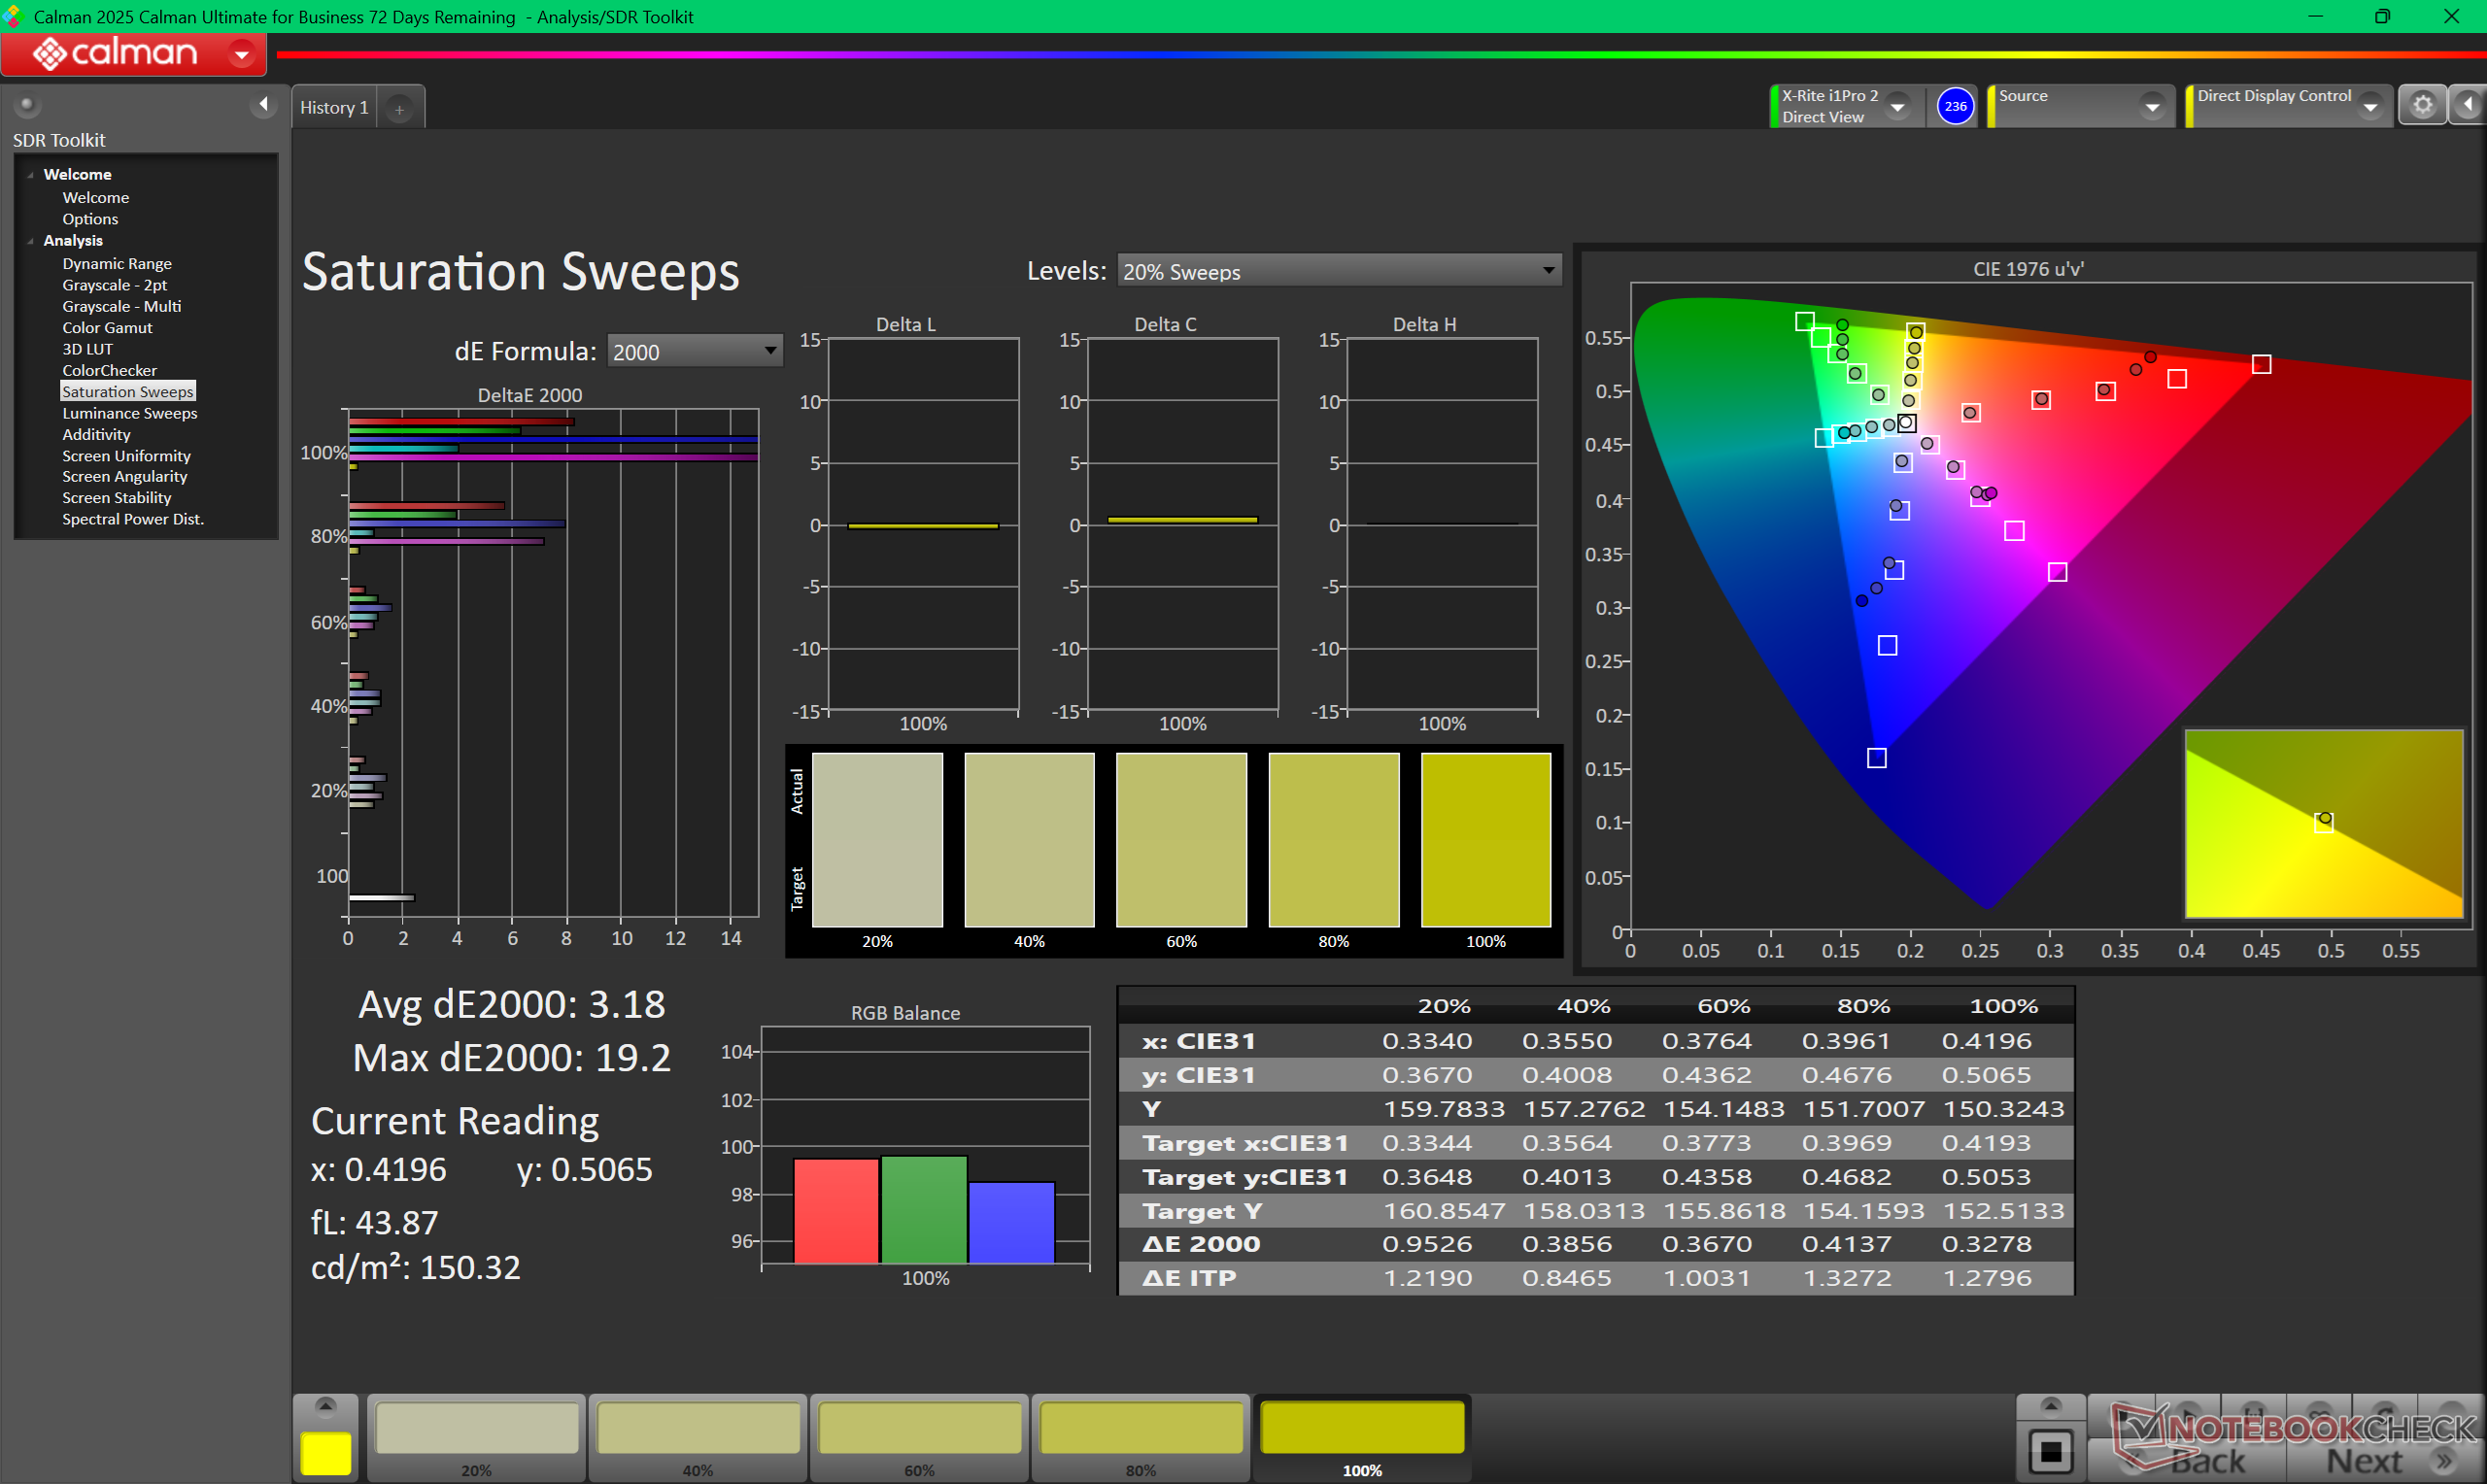
41% AdobeRGB 1998 (Argyll 3D)
57.7% sRGB (Argyll 3D)
39.7% Display P3 (Argyll 3D)
Gamma: 2.16
CCT: 6039 K
| Lenovo Ideapad Slim 5 16IRH10R Lenovo LEN160WUM, IPS, 1920x1200, 16", 60 Hz | Lenovo IdeaPad Slim 5 16AKP10 Lenovo LEN160WUM, IPS, 1920x1200, 16", 60 Hz | Lenovo IdeaPad 5 2-in-1 16IAL10 LEN160WUXGA, IPS, 1920x1200, 16", 60 Hz | Dell 16 Plus AU Optronics B160QAN, IPS, 2560x1600, 16", 120 Hz | Asus Vivobook 16 M1606K B160UAN04.3 (AUOA5AB), IPS, 1920x1200, 16", 60 Hz | HP Pavilion 16-ag0057ng CMN1640, IPS, 1920x1200, 16", 60 Hz | |
|---|---|---|---|---|---|---|
| Display | -1% | 4% | 86% | -6% | 6% | |
| Display P3 Coverage (%) | 39.7 | 39.1 -2% | 40.9 3% | 76.6 93% | 36.8 -7% | 41.6 5% |
| sRGB Coverage (%) | 57.7 | 57.6 0% | 60.4 5% | 99.8 73% | 55.3 -4% | 62.4 8% |
| AdobeRGB 1998 Coverage (%) | 41 | 40.4 -1% | 42.5 4% | 78.4 91% | 38 -7% | 43 5% |
| Response Times | 4% | 24% | -4% | -5% | 5% | |
| Response Time Grey 50% / Grey 80% * (ms) | 32.7 ? | 31.9 ? 2% | 24.3 ? 26% | 32.8 ? -0% | 36 ? -10% | 30.7 ? 6% |
| Response Time Black / White * (ms) | 21.7 ? | 20.6 ? 5% | 16.9 ? 22% | 23.4 ? -8% | 21.4 ? 1% | 20.8 ? 4% |
| PWM Frequency (Hz) | ||||||
| Screen | 17% | 17% | 41% | 18% | 32% | |
| Brightness middle (cd/m²) | 347.7 | 349 0% | 325.4 -6% | 335.6 -3% | 326 -6% | 324 -7% |
| Brightness (cd/m²) | 331 | 332 0% | 312 -6% | 308 -7% | 303 -8% | 295 -11% |
| Brightness Distribution (%) | 84 | 91 8% | 90 7% | 88 5% | 89 6% | 88 5% |
| Black Level * (cd/m²) | 0.48 | 0.33 31% | 0.26 46% | 0.22 54% | 0.24 50% | 0.2 58% |
| Contrast (:1) | 724 | 1058 46% | 1252 73% | 1525 111% | 1358 88% | 1620 124% |
| Colorchecker dE 2000 * | 8.11 | 5.57 31% | 7.35 9% | 4.15 49% | 6.48 20% | 5.13 37% |
| Colorchecker dE 2000 max. * | 22.25 | 19.96 10% | 25.37 -14% | 9.8 56% | 19.42 13% | 16.11 28% |
| Colorchecker dE 2000 calibrated * | 3.28 | 4.52 -38% | 2.75 16% | 0.44 87% | 4.92 -50% | 2.99 9% |
| Greyscale dE 2000 * | 7.9 | 2.7 66% | 6 24% | 6.7 15% | 3.85 51% | 4.24 46% |
| Gamma | 2.16 102% | 2.129 103% | 2.27 97% | 2.25 98% | 2.79 79% | 2.3 96% |
| CCT | 6039 108% | 6656 98% | 5735 113% | 6260 104% | 6739 96% | 7318 89% |
| Total Average (Program / Settings) | 7% /
11% | 15% /
15% | 41% /
44% | 2% /
10% | 14% /
23% |
* ... smaller is better
Display Response Times
| ↔ Response Time Black to White | ||
|---|---|---|
| 21.7 ms ... rise ↗ and fall ↘ combined | ↗ 11.3 ms rise | 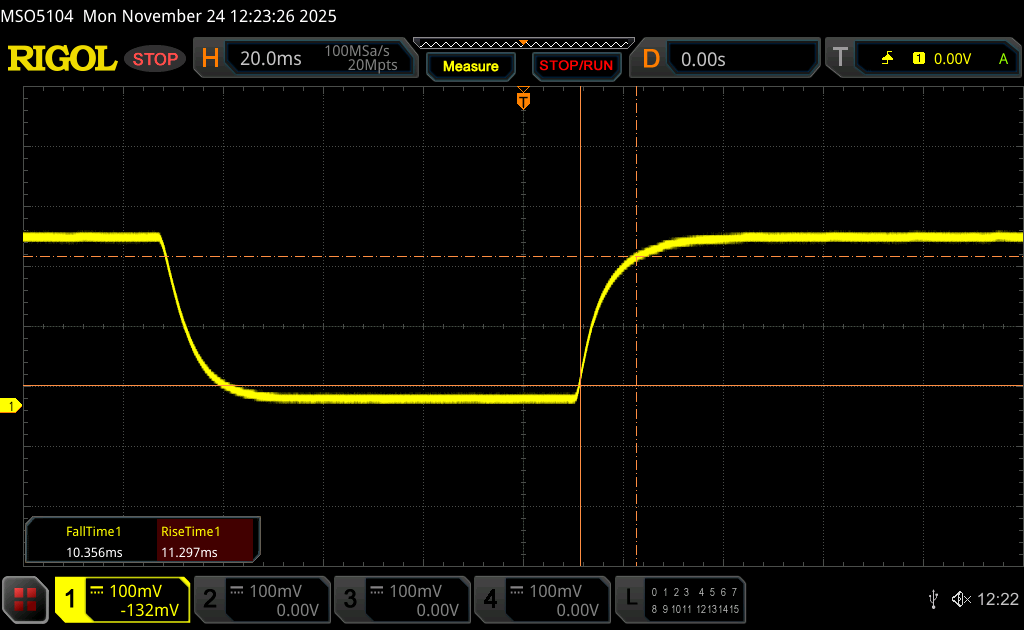 |
| ↘ 10.4 ms fall | ||
| The screen shows good response rates in our tests, but may be too slow for competitive gamers. In comparison, all tested devices range from 0.1 (minimum) to 240 (maximum) ms. » 48 % of all devices are better. This means that the measured response time is similar to the average of all tested devices (19.8 ms). | ||
| ↔ Response Time 50% Grey to 80% Grey | ||
| 32.7 ms ... rise ↗ and fall ↘ combined | ↗ 15.4 ms rise | 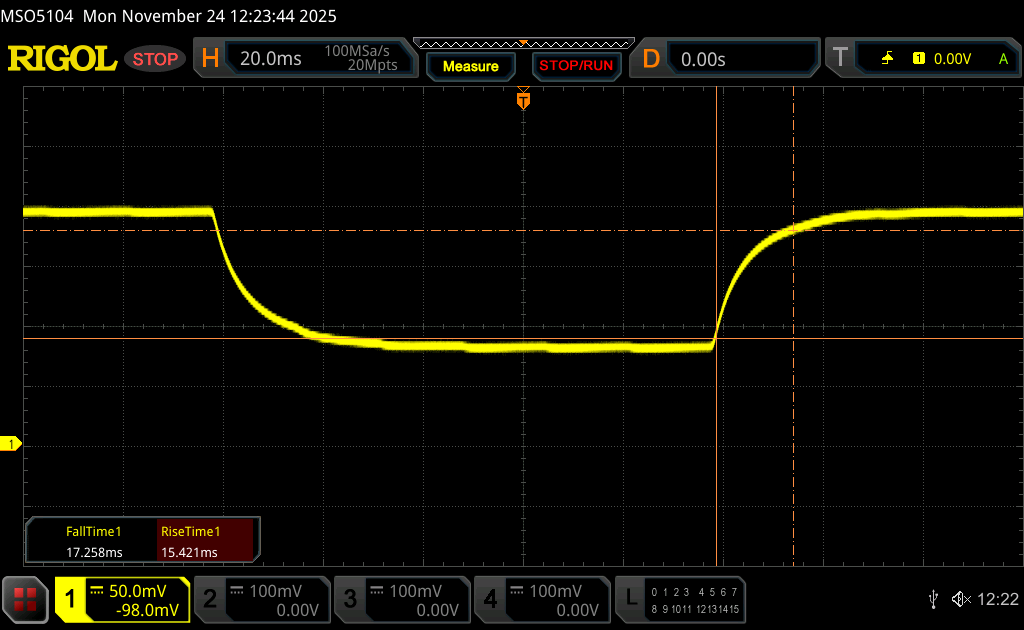 |
| ↘ 17.3 ms fall | ||
| The screen shows slow response rates in our tests and will be unsatisfactory for gamers. In comparison, all tested devices range from 0.165 (minimum) to 636 (maximum) ms. » 44 % of all devices are better. This means that the measured response time is similar to the average of all tested devices (31 ms). | ||
Screen Flickering / PWM (Pulse-Width Modulation)
| Screen flickering / PWM not detected |  | ||
In comparison: 52 % of all tested devices do not use PWM to dim the display. If PWM was detected, an average of 7753 (minimum: 5 - maximum: 343500) Hz was measured. | |||


性能


测试条件
在运行以下基准测试之前,我们将 Windows 设置为性能模式。
处理器
Cinebench R15 多回路运行
Cinebench R23: Multi Core | Single Core
Cinebench R20: CPU (Multi Core) | CPU (Single Core)
Cinebench R15: CPU Multi 64Bit | CPU Single 64Bit
Blender: v2.79 BMW27 CPU
7-Zip 18.03: 7z b 4 | 7z b 4 -mmt1
Geekbench 6.7: Multi-Core | Single-Core
Geekbench 5.5: Multi-Core | Single-Core
HWBOT x265 Benchmark v2.2: 4k Preset
LibreOffice : 20 Documents To PDF
R Benchmark 2.5: Overall mean
* ... smaller is better
AIDA64: FP32 Ray-Trace | FPU Julia | CPU SHA3 | CPU Queen | FPU SinJulia | FPU Mandel | CPU AES | CPU ZLib | FP64 Ray-Trace | CPU PhotoWorxx
| Performance rating | |
| Asus Vivobook 16 M1606K | |
| HP Pavilion 16-ag0057ng | |
| Lenovo Ideapad Slim 5 16IRH10R | |
| Average Intel Core 5 210H | |
| Dell 16 Plus | |
| Lenovo IdeaPad Slim 5 16AKP10 | |
| Lenovo IdeaPad 5 2-in-1 16IAL10 | |
| AIDA64 / FP32 Ray-Trace | |
| Asus Vivobook 16 M1606K | |
| HP Pavilion 16-ag0057ng | |
| Lenovo IdeaPad Slim 5 16AKP10 | |
| Lenovo Ideapad Slim 5 16IRH10R | |
| Average Intel Core 5 210H (7190 - 12857, n=3) | |
| Dell 16 Plus | |
| Lenovo IdeaPad 5 2-in-1 16IAL10 | |
| AIDA64 / FPU Julia | |
| Asus Vivobook 16 M1606K | |
| HP Pavilion 16-ag0057ng | |
| Lenovo Ideapad Slim 5 16IRH10R | |
| Average Intel Core 5 210H (36942 - 61679, n=3) | |
| Dell 16 Plus | |
| Lenovo IdeaPad Slim 5 16AKP10 | |
| Lenovo IdeaPad 5 2-in-1 16IAL10 | |
| AIDA64 / CPU SHA3 | |
| Asus Vivobook 16 M1606K | |
| HP Pavilion 16-ag0057ng | |
| Lenovo Ideapad Slim 5 16IRH10R | |
| Dell 16 Plus | |
| Average Intel Core 5 210H (1610 - 2562, n=3) | |
| Lenovo IdeaPad Slim 5 16AKP10 | |
| Lenovo IdeaPad 5 2-in-1 16IAL10 | |
| AIDA64 / CPU Queen | |
| Lenovo Ideapad Slim 5 16IRH10R | |
| Average Intel Core 5 210H (74258 - 77570, n=3) | |
| Asus Vivobook 16 M1606K | |
| HP Pavilion 16-ag0057ng | |
| Dell 16 Plus | |
| Lenovo IdeaPad Slim 5 16AKP10 | |
| Lenovo IdeaPad 5 2-in-1 16IAL10 | |
| AIDA64 / FPU SinJulia | |
| Asus Vivobook 16 M1606K | |
| HP Pavilion 16-ag0057ng | |
| Lenovo Ideapad Slim 5 16IRH10R | |
| Lenovo IdeaPad Slim 5 16AKP10 | |
| Average Intel Core 5 210H (5262 - 6923, n=3) | |
| Dell 16 Plus | |
| Lenovo IdeaPad 5 2-in-1 16IAL10 | |
| AIDA64 / FPU Mandel | |
| Asus Vivobook 16 M1606K | |
| HP Pavilion 16-ag0057ng | |
| Lenovo Ideapad Slim 5 16IRH10R | |
| Dell 16 Plus | |
| Lenovo IdeaPad Slim 5 16AKP10 | |
| Average Intel Core 5 210H (17880 - 29700, n=3) | |
| Lenovo IdeaPad 5 2-in-1 16IAL10 | |
| AIDA64 / CPU AES | |
| Asus Vivobook 16 M1606K | |
| HP Pavilion 16-ag0057ng | |
| Lenovo Ideapad Slim 5 16IRH10R | |
| Average Intel Core 5 210H (33605 - 51414, n=3) | |
| Dell 16 Plus | |
| Lenovo IdeaPad Slim 5 16AKP10 | |
| Lenovo IdeaPad 5 2-in-1 16IAL10 | |
| AIDA64 / CPU ZLib | |
| Asus Vivobook 16 M1606K | |
| Lenovo Ideapad Slim 5 16IRH10R | |
| HP Pavilion 16-ag0057ng | |
| Average Intel Core 5 210H (496 - 749, n=3) | |
| Dell 16 Plus | |
| Lenovo IdeaPad Slim 5 16AKP10 | |
| Lenovo IdeaPad 5 2-in-1 16IAL10 | |
| AIDA64 / FP64 Ray-Trace | |
| Asus Vivobook 16 M1606K | |
| HP Pavilion 16-ag0057ng | |
| Lenovo IdeaPad Slim 5 16AKP10 | |
| Lenovo Ideapad Slim 5 16IRH10R | |
| Dell 16 Plus | |
| Average Intel Core 5 210H (3837 - 6605, n=3) | |
| Lenovo IdeaPad 5 2-in-1 16IAL10 | |
| AIDA64 / CPU PhotoWorxx | |
| Dell 16 Plus | |
| Lenovo Ideapad Slim 5 16IRH10R | |
| Average Intel Core 5 210H (35563 - 39234, n=3) | |
| Lenovo IdeaPad Slim 5 16AKP10 | |
| HP Pavilion 16-ag0057ng | |
| Asus Vivobook 16 M1606K | |
| Lenovo IdeaPad 5 2-in-1 16IAL10 | |
系统性能

PCMark 10: Score | Essentials | Productivity | Digital Content Creation
CrossMark: Overall | Productivity | Creativity | Responsiveness
WebXPRT 3: Overall
WebXPRT 4: Overall
Mozilla Kraken 1.1: Total
Geekbench AI: Quantized GPU 1.7 | Half Precision GPU 1.7 | Single Precision GPU 1.7
| Performance rating | |
| Dell 16 Plus | |
| Asus Vivobook 16 M1606K -3! | |
| Lenovo IdeaPad 5 2-in-1 16IAL10 | |
| HP Pavilion 16-ag0057ng -7! | |
| Lenovo Ideapad Slim 5 16IRH10R | |
| Average Intel Core 5 210H, Intel UHD Graphics Xe G4 48EUs | |
| Lenovo IdeaPad Slim 5 16AKP10 -4! | |
| PCMark 10 / Score | |
| Dell 16 Plus | |
| Asus Vivobook 16 M1606K | |
| Lenovo IdeaPad 5 2-in-1 16IAL10 | |
| HP Pavilion 16-ag0057ng | |
| Lenovo Ideapad Slim 5 16IRH10R | |
| Average Intel Core 5 210H, Intel UHD Graphics Xe G4 48EUs (5657 - 5752, n=2) | |
| Lenovo IdeaPad Slim 5 16AKP10 | |
| PCMark 10 / Essentials | |
| Lenovo IdeaPad 5 2-in-1 16IAL10 | |
| Asus Vivobook 16 M1606K | |
| Average Intel Core 5 210H, Intel UHD Graphics Xe G4 48EUs (10254 - 10688, n=2) | |
| Dell 16 Plus | |
| Lenovo Ideapad Slim 5 16IRH10R | |
| HP Pavilion 16-ag0057ng | |
| Lenovo IdeaPad Slim 5 16AKP10 | |
| PCMark 10 / Productivity | |
| Asus Vivobook 16 M1606K | |
| Dell 16 Plus | |
| Lenovo IdeaPad Slim 5 16AKP10 | |
| Lenovo IdeaPad 5 2-in-1 16IAL10 | |
| HP Pavilion 16-ag0057ng | |
| Lenovo Ideapad Slim 5 16IRH10R | |
| Average Intel Core 5 210H, Intel UHD Graphics Xe G4 48EUs (7528 - 7818, n=2) | |
| PCMark 10 / Digital Content Creation | |
| Dell 16 Plus | |
| Asus Vivobook 16 M1606K | |
| Lenovo IdeaPad 5 2-in-1 16IAL10 | |
| HP Pavilion 16-ag0057ng | |
| Lenovo Ideapad Slim 5 16IRH10R | |
| Average Intel Core 5 210H, Intel UHD Graphics Xe G4 48EUs (6108 - 6443, n=2) | |
| Lenovo IdeaPad Slim 5 16AKP10 | |
| CrossMark / Overall | |
| Asus Vivobook 16 M1606K | |
| Dell 16 Plus | |
| Lenovo Ideapad Slim 5 16IRH10R | |
| Average Intel Core 5 210H, Intel UHD Graphics Xe G4 48EUs (n=1) | |
| Lenovo IdeaPad 5 2-in-1 16IAL10 | |
| Lenovo IdeaPad Slim 5 16AKP10 | |
| CrossMark / Productivity | |
| Asus Vivobook 16 M1606K | |
| Dell 16 Plus | |
| Lenovo Ideapad Slim 5 16IRH10R | |
| Average Intel Core 5 210H, Intel UHD Graphics Xe G4 48EUs (n=1) | |
| Lenovo IdeaPad 5 2-in-1 16IAL10 | |
| Lenovo IdeaPad Slim 5 16AKP10 | |
| CrossMark / Creativity | |
| Dell 16 Plus | |
| Asus Vivobook 16 M1606K | |
| Lenovo IdeaPad 5 2-in-1 16IAL10 | |
| Lenovo Ideapad Slim 5 16IRH10R | |
| Average Intel Core 5 210H, Intel UHD Graphics Xe G4 48EUs (n=1) | |
| Lenovo IdeaPad Slim 5 16AKP10 | |
| CrossMark / Responsiveness | |
| Lenovo Ideapad Slim 5 16IRH10R | |
| Average Intel Core 5 210H, Intel UHD Graphics Xe G4 48EUs (n=1) | |
| Asus Vivobook 16 M1606K | |
| Lenovo IdeaPad 5 2-in-1 16IAL10 | |
| Dell 16 Plus | |
| Lenovo IdeaPad Slim 5 16AKP10 | |
| WebXPRT 3 / Overall | |
| Dell 16 Plus | |
| Asus Vivobook 16 M1606K | |
| HP Pavilion 16-ag0057ng | |
| HP Pavilion 16-ag0057ng | |
| Lenovo Ideapad Slim 5 16IRH10R | |
| Lenovo IdeaPad 5 2-in-1 16IAL10 | |
| Average Intel Core 5 210H, Intel UHD Graphics Xe G4 48EUs (277 - 285, n=2) | |
| Lenovo IdeaPad Slim 5 16AKP10 | |
| WebXPRT 4 / Overall | |
| Dell 16 Plus | |
| Lenovo Ideapad Slim 5 16IRH10R | |
| Average Intel Core 5 210H, Intel UHD Graphics Xe G4 48EUs (254 - 256, n=2) | |
| Lenovo IdeaPad 5 2-in-1 16IAL10 | |
| Asus Vivobook 16 M1606K | |
| HP Pavilion 16-ag0057ng | |
| HP Pavilion 16-ag0057ng | |
| Mozilla Kraken 1.1 / Total | |
| Lenovo IdeaPad Slim 5 16AKP10 | |
| HP Pavilion 16-ag0057ng | |
| HP Pavilion 16-ag0057ng | |
| Lenovo IdeaPad 5 2-in-1 16IAL10 | |
| Lenovo Ideapad Slim 5 16IRH10R | |
| Average Intel Core 5 210H, Intel UHD Graphics Xe G4 48EUs (529 - 530, n=2) | |
| Dell 16 Plus | |
| Asus Vivobook 16 M1606K | |
| Geekbench AI / Quantized GPU 1.7 | |
| Dell 16 Plus | |
| Lenovo IdeaPad 5 2-in-1 16IAL10 | |
| Lenovo Ideapad Slim 5 16IRH10R | |
| Average Intel Core 5 210H, Intel UHD Graphics Xe G4 48EUs (n=1) | |
| Geekbench AI / Half Precision GPU 1.7 | |
| Dell 16 Plus | |
| Lenovo IdeaPad 5 2-in-1 16IAL10 | |
| Lenovo Ideapad Slim 5 16IRH10R | |
| Average Intel Core 5 210H, Intel UHD Graphics Xe G4 48EUs (n=1) | |
| Geekbench AI / Single Precision GPU 1.7 | |
| Dell 16 Plus | |
| Lenovo IdeaPad 5 2-in-1 16IAL10 | |
| Lenovo Ideapad Slim 5 16IRH10R | |
| Average Intel Core 5 210H, Intel UHD Graphics Xe G4 48EUs (n=1) | |
* ... smaller is better
| PCMark 10 Score | 5752 points | |
Help | ||
| AIDA64 / Memory Copy | |
| Dell 16 Plus | |
| HP Pavilion 16-ag0057ng | |
| Lenovo Ideapad Slim 5 16IRH10R | |
| Lenovo IdeaPad Slim 5 16AKP10 | |
| Average Intel Core 5 210H (56977 - 63817, n=3) | |
| Asus Vivobook 16 M1606K | |
| Lenovo IdeaPad 5 2-in-1 16IAL10 | |
| AIDA64 / Memory Read | |
| Dell 16 Plus | |
| Lenovo Ideapad Slim 5 16IRH10R | |
| Average Intel Core 5 210H (58128 - 72820, n=3) | |
| Lenovo IdeaPad Slim 5 16AKP10 | |
| HP Pavilion 16-ag0057ng | |
| Asus Vivobook 16 M1606K | |
| Lenovo IdeaPad 5 2-in-1 16IAL10 | |
| AIDA64 / Memory Write | |
| Dell 16 Plus | |
| HP Pavilion 16-ag0057ng | |
| Lenovo IdeaPad Slim 5 16AKP10 | |
| Lenovo Ideapad Slim 5 16IRH10R | |
| Average Intel Core 5 210H (58085 - 63140, n=3) | |
| Asus Vivobook 16 M1606K | |
| Lenovo IdeaPad 5 2-in-1 16IAL10 | |
| AIDA64 / Memory Latency | |
| Lenovo IdeaPad 5 2-in-1 16IAL10 | |
| HP Pavilion 16-ag0057ng | |
| Dell 16 Plus | |
| Lenovo IdeaPad Slim 5 16AKP10 | |
| Average Intel Core 5 210H (92.7 - 99.9, n=3) | |
| Lenovo Ideapad Slim 5 16IRH10R | |
| Asus Vivobook 16 M1606K | |
* ... smaller is better
DPC 延迟
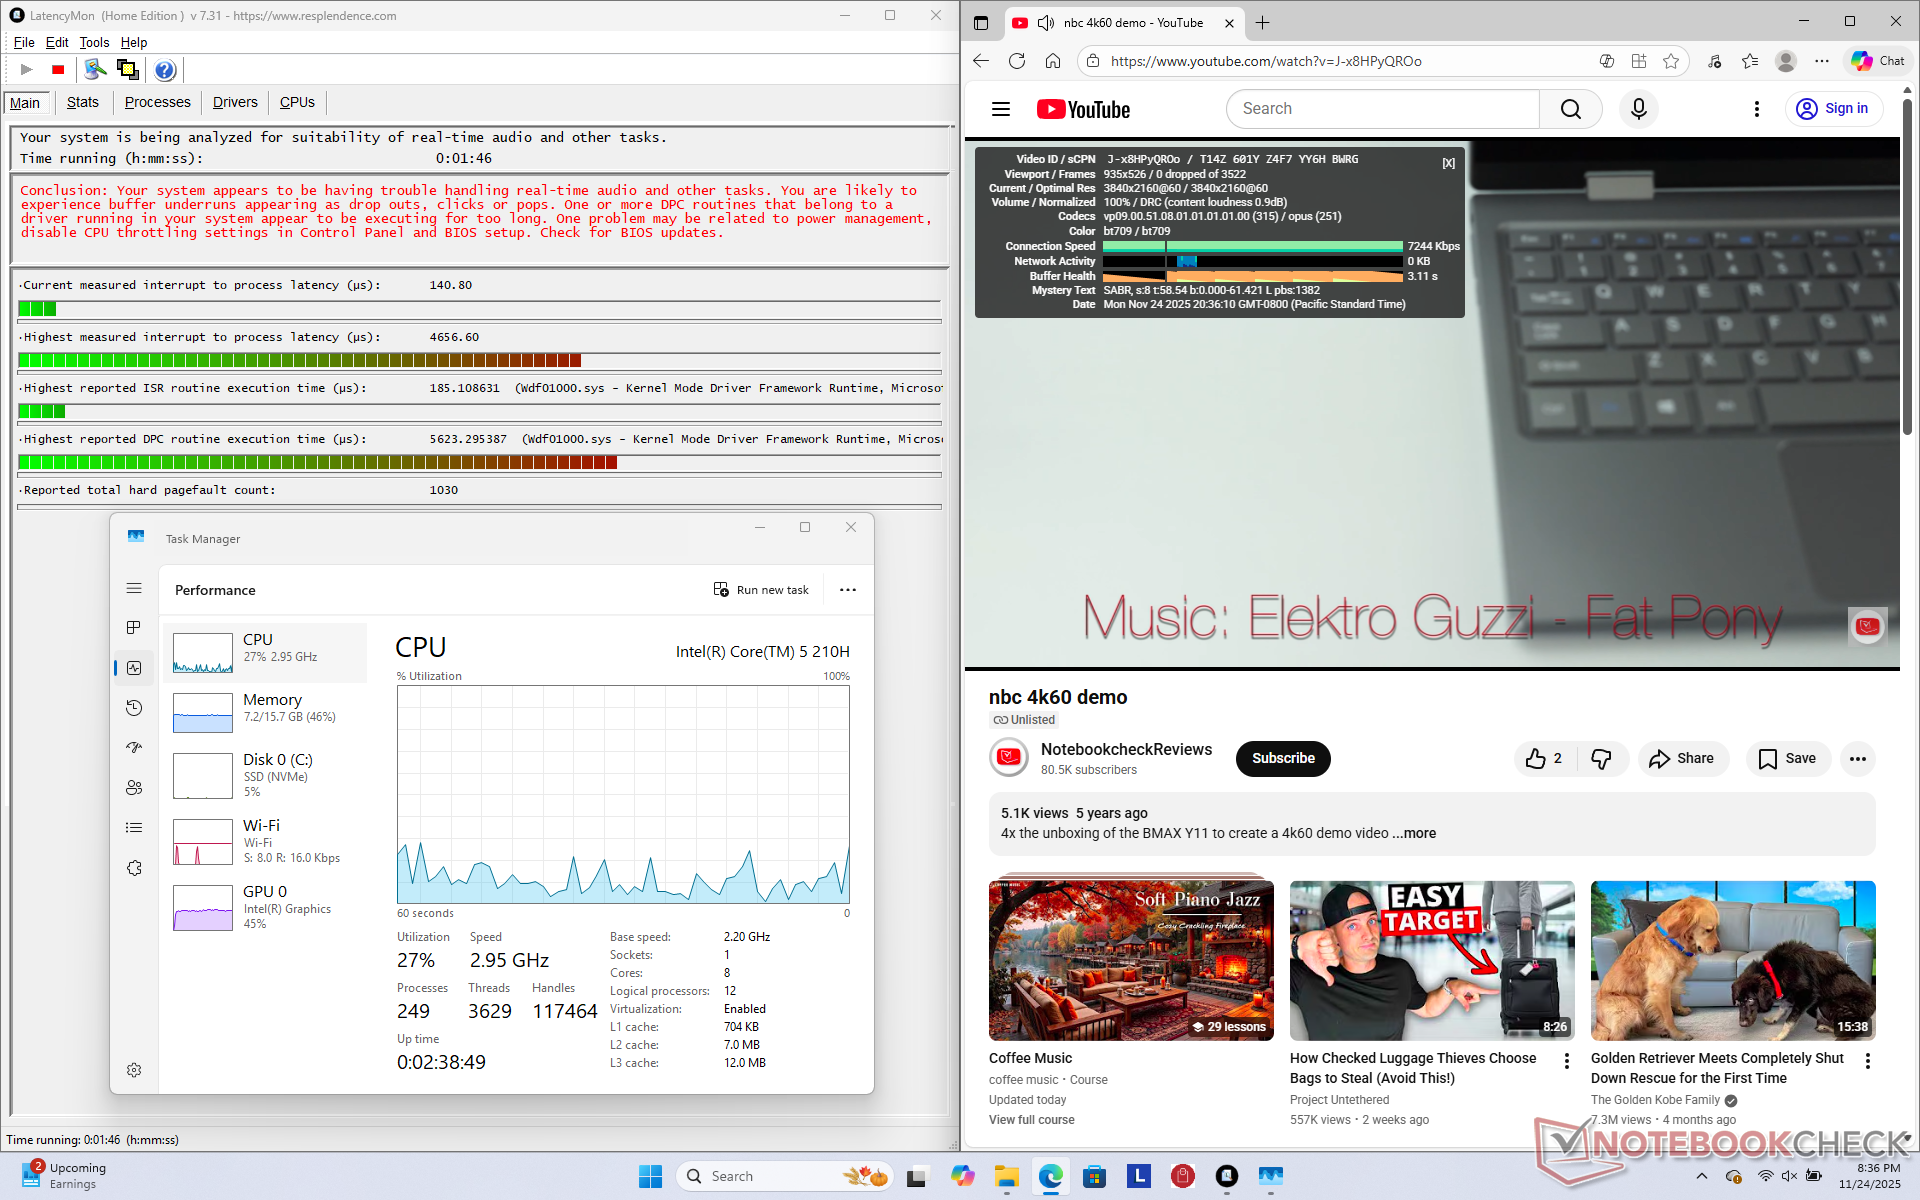
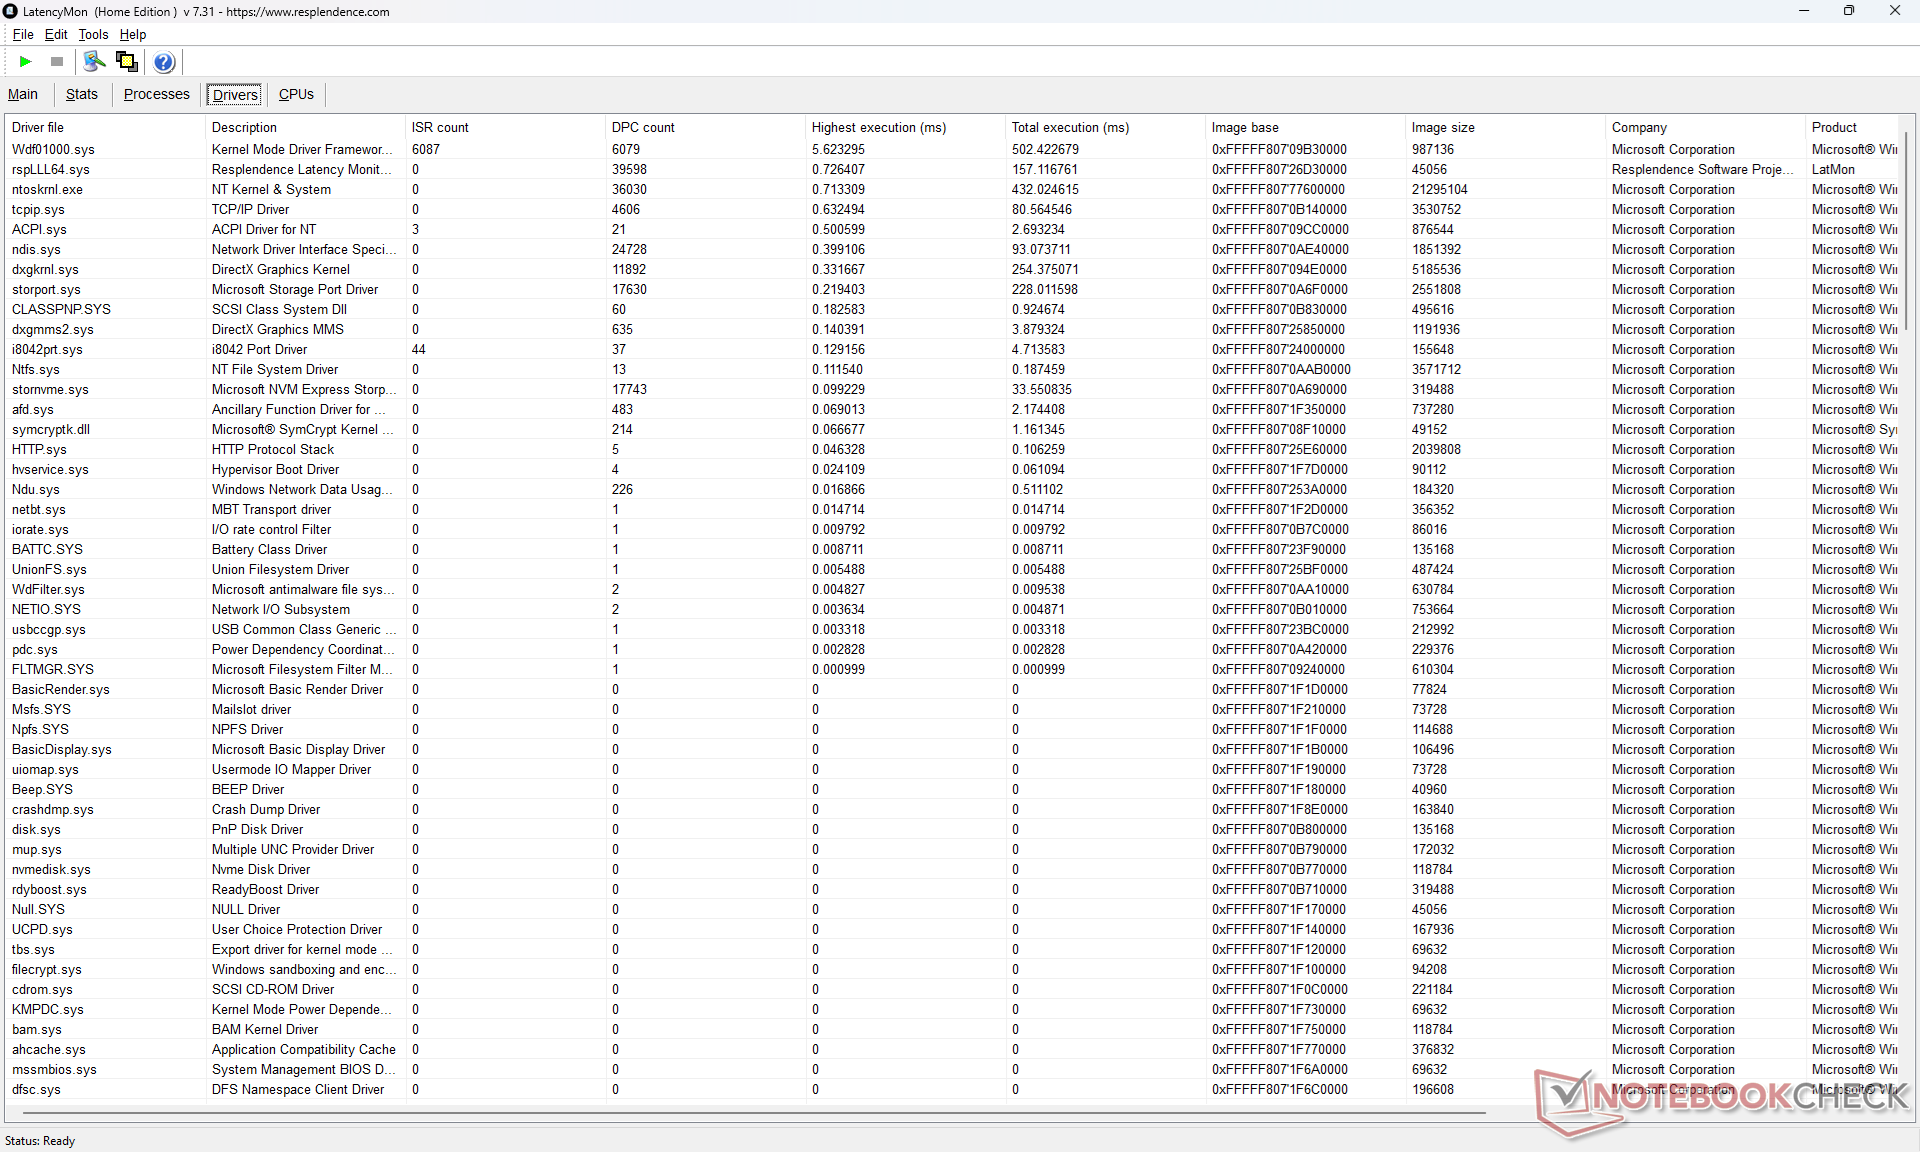
| DPC Latencies / LatencyMon - interrupt to process latency (max), Web, Youtube, Prime95 | |
| Lenovo IdeaPad Slim 5 16AKP10 | |
| Dell 16 Plus | |
| Lenovo Ideapad Slim 5 16IRH10R | |
| HP Pavilion 16-ag0057ng | |
| Lenovo IdeaPad 5 2-in-1 16IAL10 | |
| Asus Vivobook 16 M1606K | |
* ... smaller is better
存储设备
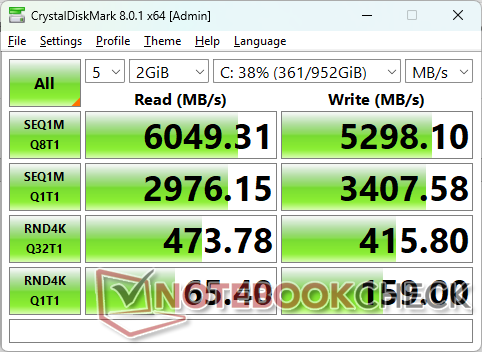


| Drive Performance rating - Percent | |
| Asus Vivobook 16 M1606K | |
| Lenovo Ideapad Slim 5 16IRH10R | |
| Lenovo IdeaPad 5 2-in-1 16IAL10 | |
| HP Pavilion 16-ag0057ng | |
| Lenovo IdeaPad Slim 5 16AKP10 | |
| Dell 16 Plus | |
* ... smaller is better
磁盘节流DiskSpd 读取循环,队列深度 8
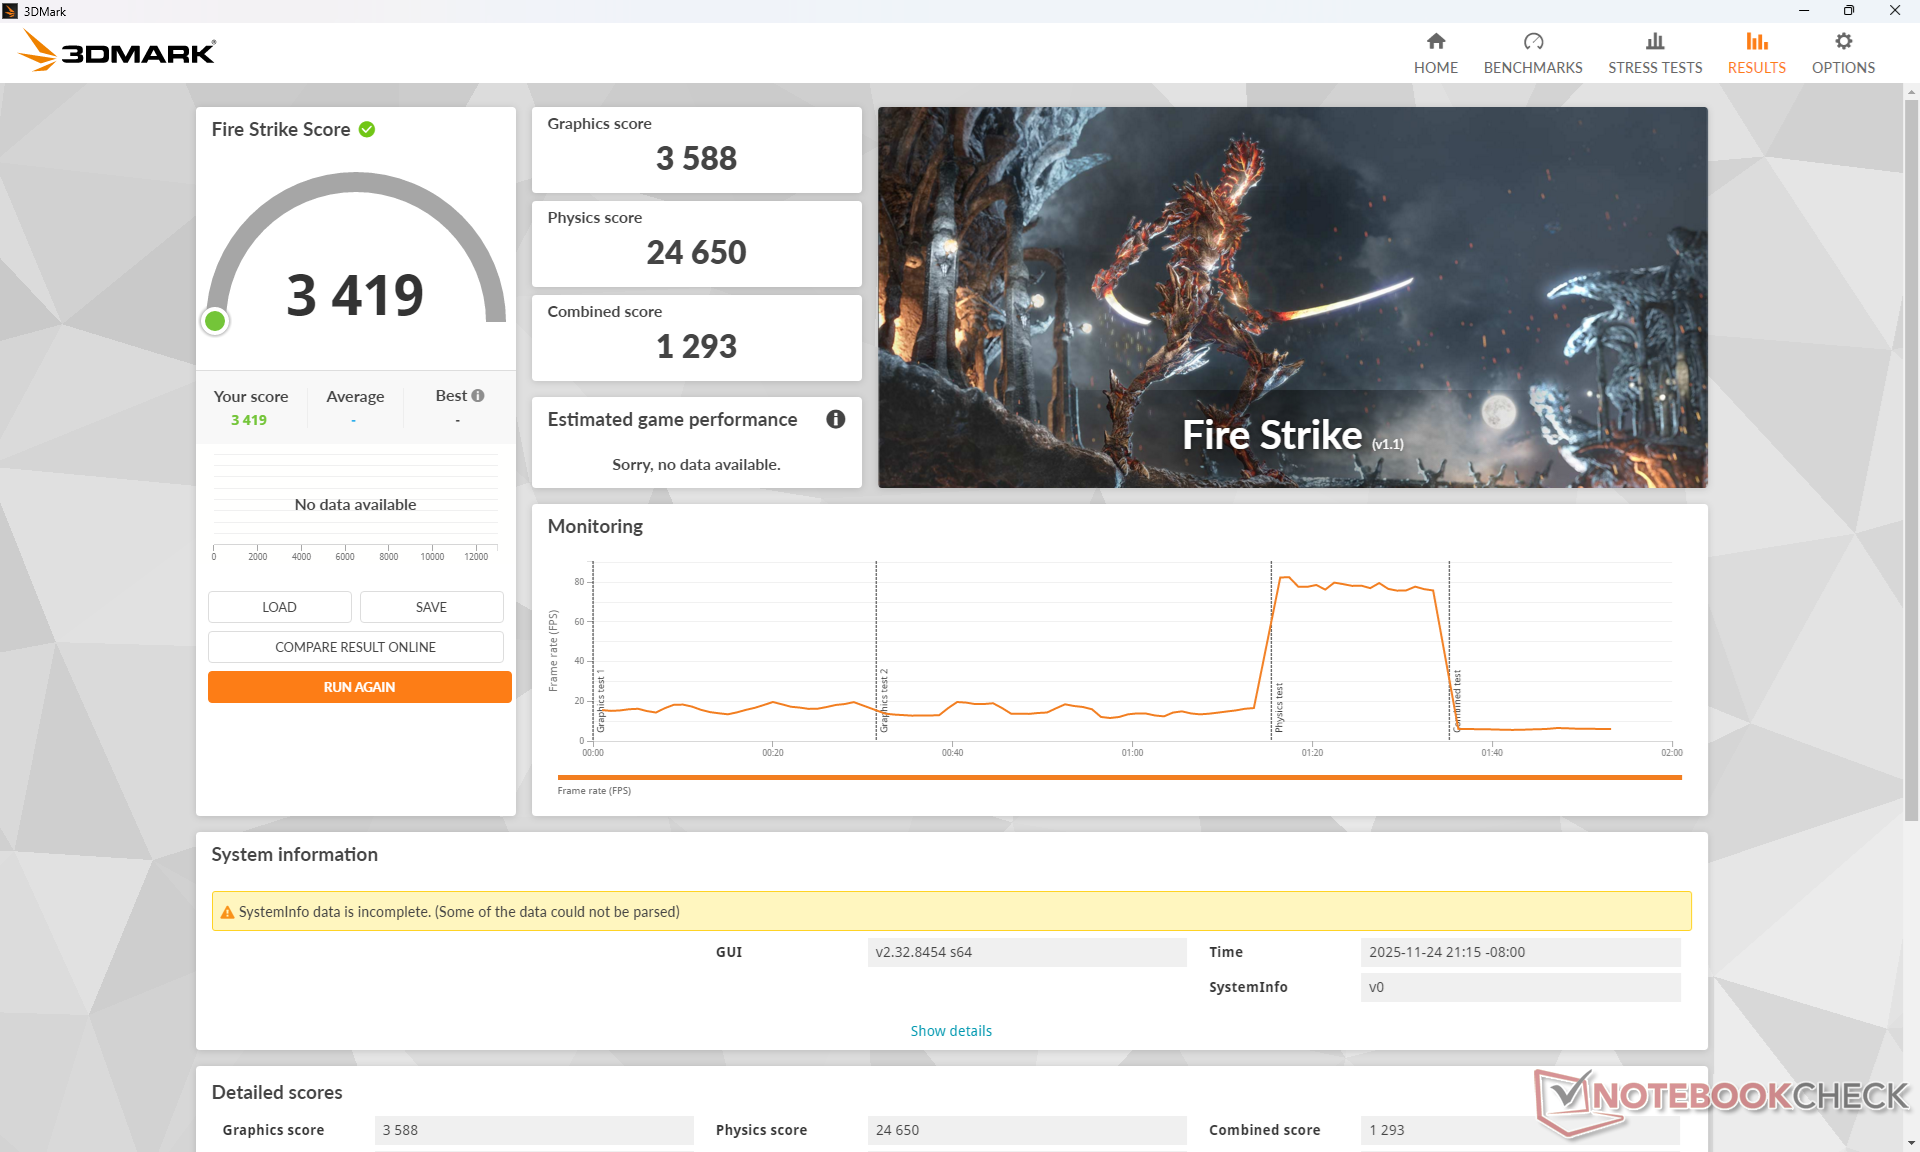
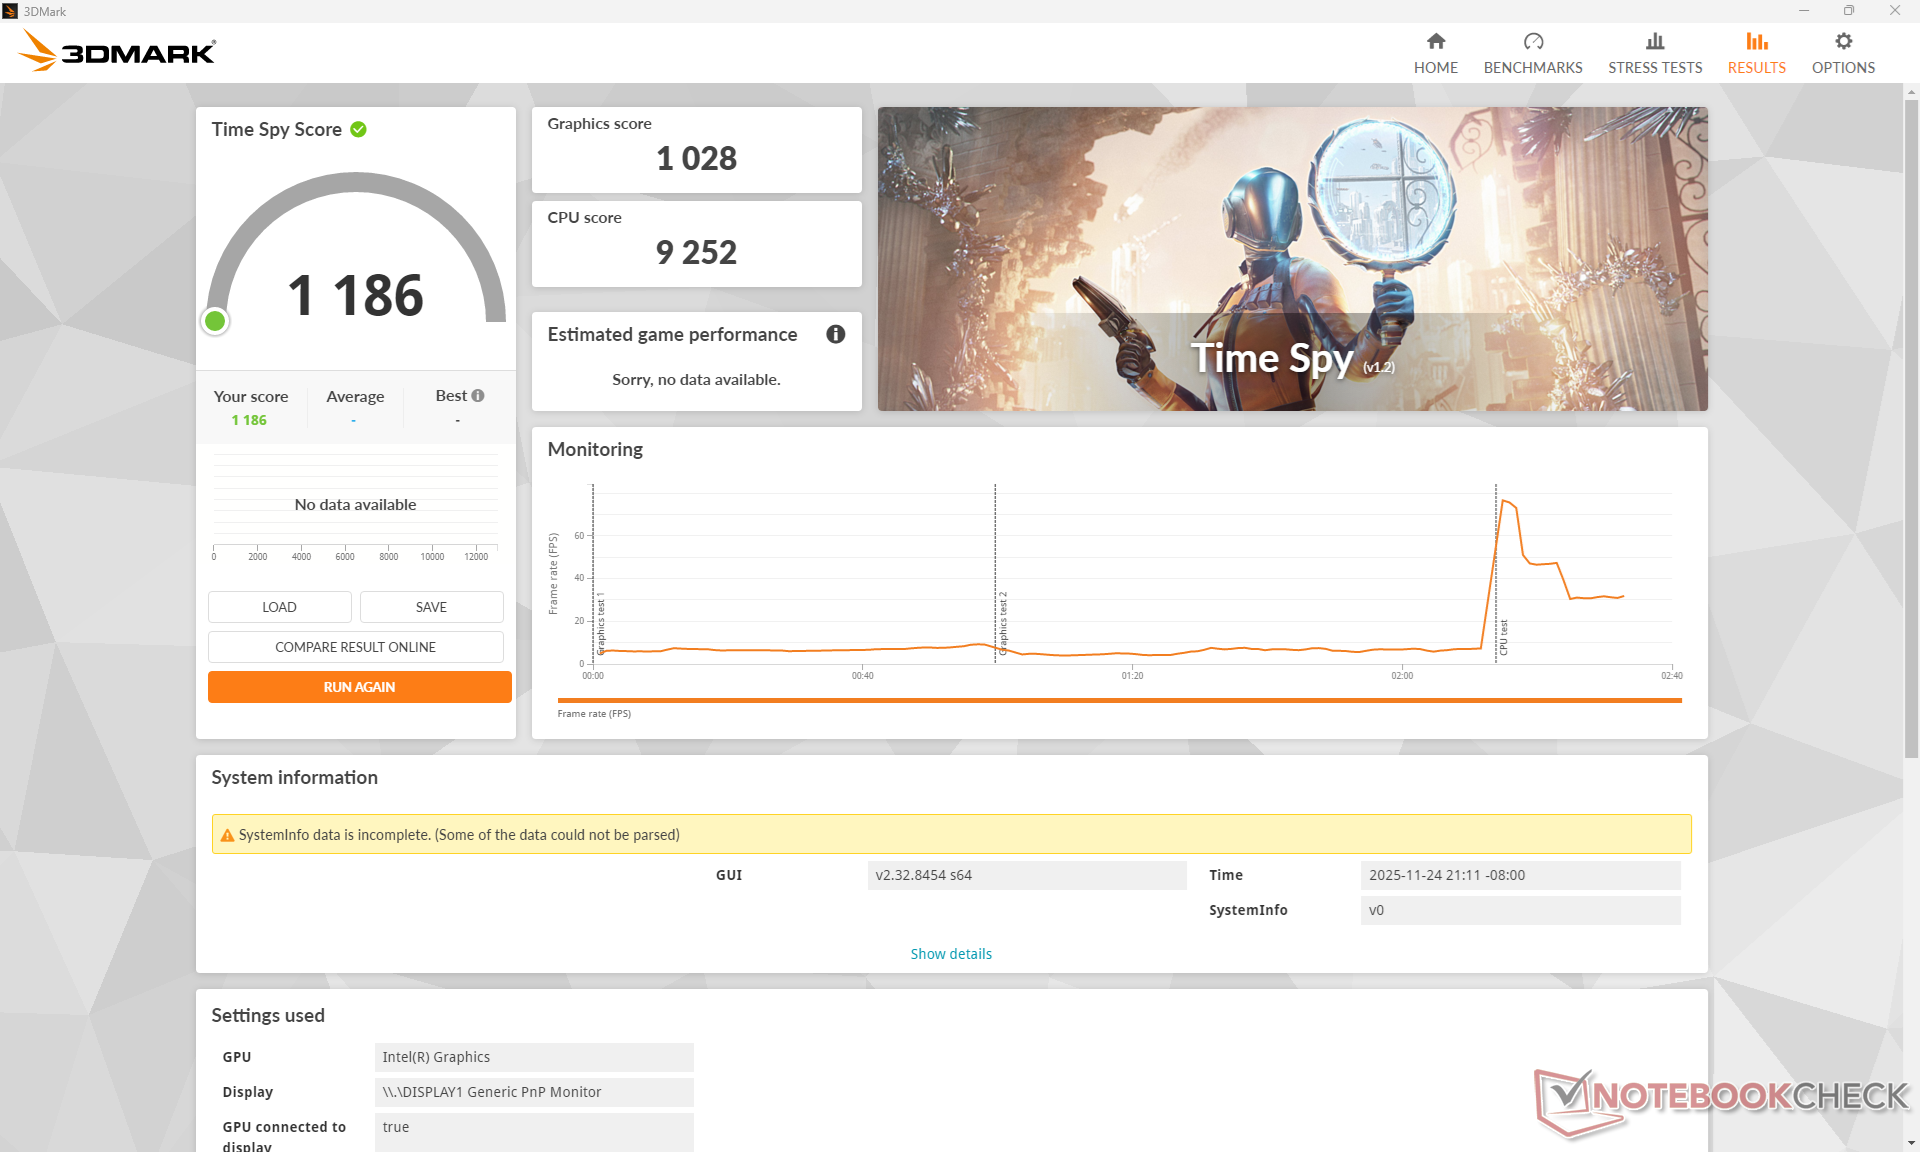
图形处理器性能
| 电源配置文件 | 图形得分 | 物理得分 | 综合得分 |
| 性能模式 | 3588 | 24650 | 1293 |
| 平衡模式 | 3587 | 24704 | 1291 |
| 电池供电 | 3431 | 21494 | 1247 |
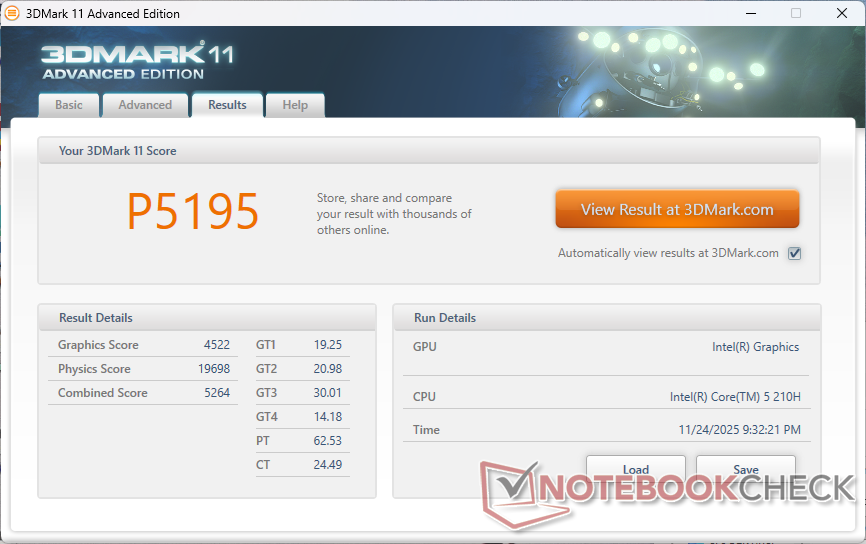

| 3DMark 11 Performance | 5195 points | |
| 3DMark Cloud Gate Standard Score | 22335 points | |
| 3DMark Fire Strike Score | 3419 points | |
| 3DMark Time Spy Score | 1186 points | |
Help | ||
* ... smaller is better
| Performance rating - Percent | |
| Dell 16 Plus -1! | |
| Asus Vivobook 16 M1606K | |
| Lenovo IdeaPad 5 2-in-1 16IAL10 | |
| HP Pavilion 16-ag0057ng | |
| Lenovo Ideapad Slim 5 16IRH10R | |
| Lenovo IdeaPad Slim 5 16AKP10 | |
| Cyberpunk 2077 - 1920x1080 Ultra Preset (FSR off) | |
| Dell 16 Plus | |
| Lenovo IdeaPad 5 2-in-1 16IAL10 | |
| Asus Vivobook 16 M1606K | |
| HP Pavilion 16-ag0057ng | |
| Lenovo Ideapad Slim 5 16IRH10R | |
| Lenovo IdeaPad Slim 5 16AKP10 | |
| Baldur's Gate 3 - 1920x1080 Ultra Preset AA:T | |
| Dell 16 Plus | |
| Asus Vivobook 16 M1606K | |
| Lenovo IdeaPad 5 2-in-1 16IAL10 | |
| HP Pavilion 16-ag0057ng | |
| Lenovo Ideapad Slim 5 16IRH10R | |
| Lenovo IdeaPad Slim 5 16AKP10 | |
| GTA V - 1920x1080 Highest AA:4xMSAA + FX AF:16x | |
| Asus Vivobook 16 M1606K | |
| HP Pavilion 16-ag0057ng | |
| Lenovo IdeaPad 5 2-in-1 16IAL10 | |
| Lenovo IdeaPad Slim 5 16AKP10 | |
| Lenovo Ideapad Slim 5 16IRH10R | |
| Final Fantasy XV Benchmark - 1920x1080 High Quality | |
| Dell 16 Plus | |
| Lenovo IdeaPad 5 2-in-1 16IAL10 | |
| HP Pavilion 16-ag0057ng | |
| Asus Vivobook 16 M1606K | |
| Lenovo Ideapad Slim 5 16IRH10R | |
| Lenovo IdeaPad Slim 5 16AKP10 | |
| Strange Brigade - 1920x1080 ultra AA:ultra AF:16 | |
| Dell 16 Plus | |
| HP Pavilion 16-ag0057ng | |
| Lenovo IdeaPad 5 2-in-1 16IAL10 | |
| Asus Vivobook 16 M1606K | |
| Lenovo Ideapad Slim 5 16IRH10R | |
| Lenovo IdeaPad Slim 5 16AKP10 | |
| Dota 2 Reborn - 1920x1080 ultra (3/3) best looking | |
| Dell 16 Plus | |
| Lenovo IdeaPad 5 2-in-1 16IAL10 | |
| HP Pavilion 16-ag0057ng | |
| Lenovo Ideapad Slim 5 16IRH10R | |
| Lenovo IdeaPad Slim 5 16AKP10 | |
| Asus Vivobook 16 M1606K | |
| X-Plane 11.11 - 1920x1080 high (fps_test=3) | |
| Dell 16 Plus | |
| Asus Vivobook 16 M1606K | |
| Lenovo Ideapad Slim 5 16IRH10R | |
| Lenovo IdeaPad 5 2-in-1 16IAL10 | |
| Lenovo IdeaPad Slim 5 16AKP10 | |
| HP Pavilion 16-ag0057ng | |
赛博朋克 2077》超 FPS 图表
| low | med. | high | ultra | |
|---|---|---|---|---|
| GTA V (2015) | 138 | 118.8 | 18.7 | 7.95 |
| Dota 2 Reborn (2015) | 121.3 | 66.2 | 56.3 | 52 |
| Final Fantasy XV Benchmark (2018) | 33.8 | 17.8 | 12.8 | |
| X-Plane 11.11 (2018) | 46.1 | 31.3 | 27.8 | |
| Strange Brigade (2018) | 75.8 | 30.8 | 24 | 19.5 |
| Baldur's Gate 3 (2023) | 13.1 | 10.8 | 9.02 | 8.82 |
| Cyberpunk 2077 (2023) | 12.6 | 9.64 | 8.3 | 7.15 |
| F1 24 (2024) | 28.7 | 26.1 | 18.4 |
排放量
系统噪音

Noise level
| Idle |
| 22.7 / 22.7 / 22.7 dB(A) |
| Load |
| 31.8 / 50.4 dB(A) |
 | ||
30 dB silent 40 dB(A) audible 50 dB(A) loud |
||
min: | ||
| Lenovo Ideapad Slim 5 16IRH10R Core 5 210H, UHD Graphics Xe G4 48EUs | Lenovo IdeaPad Slim 5 16AKP10 Ryzen AI 5 330, Radeon 820M | Lenovo IdeaPad 5 2-in-1 16IAL10 Ultra 7 255U, Graphics 4-Core iGPU (Arrow Lake) | Dell 16 Plus Core Ultra 7 256V, Arc 140V | Asus Vivobook 16 M1606K Ryzen AI 7 350, Radeon 860M | HP Pavilion 16-ag0057ng R5 8540U, Radeon 740M | |
|---|---|---|---|---|---|---|
| Noise | -12% | -6% | -5% | -3% | -6% | |
| off / environment * (dB) | 22.7 | 24 -6% | 23.1 -2% | 23.4 -3% | 23 -1% | 24 -6% |
| Idle Minimum * (dB) | 22.7 | 24 -6% | 23.1 -2% | 23.5 -4% | 23 -1% | 24 -6% |
| Idle Average * (dB) | 22.7 | 25 -10% | 23.1 -2% | 23.5 -4% | 23 -1% | 25 -10% |
| Idle Maximum * (dB) | 22.7 | 26 -15% | 23.1 -2% | 23.5 -4% | 24.67 -9% | 26 -15% |
| Load Average * (dB) | 31.8 | 43 -35% | 41.8 -31% | 31.9 -0% | 31.72 -0% | 38 -19% |
| Cyberpunk 2077 ultra * (dB) | 34 | 42 -24% | 41.8 -23% | 42.6 -25% | 41.53 -22% | 37 -9% |
| Load Maximum * (dB) | 50.4 | 43 15% | 41.8 17% | 46.9 7% | 42.51 16% | 39 23% |
* ... smaller is better
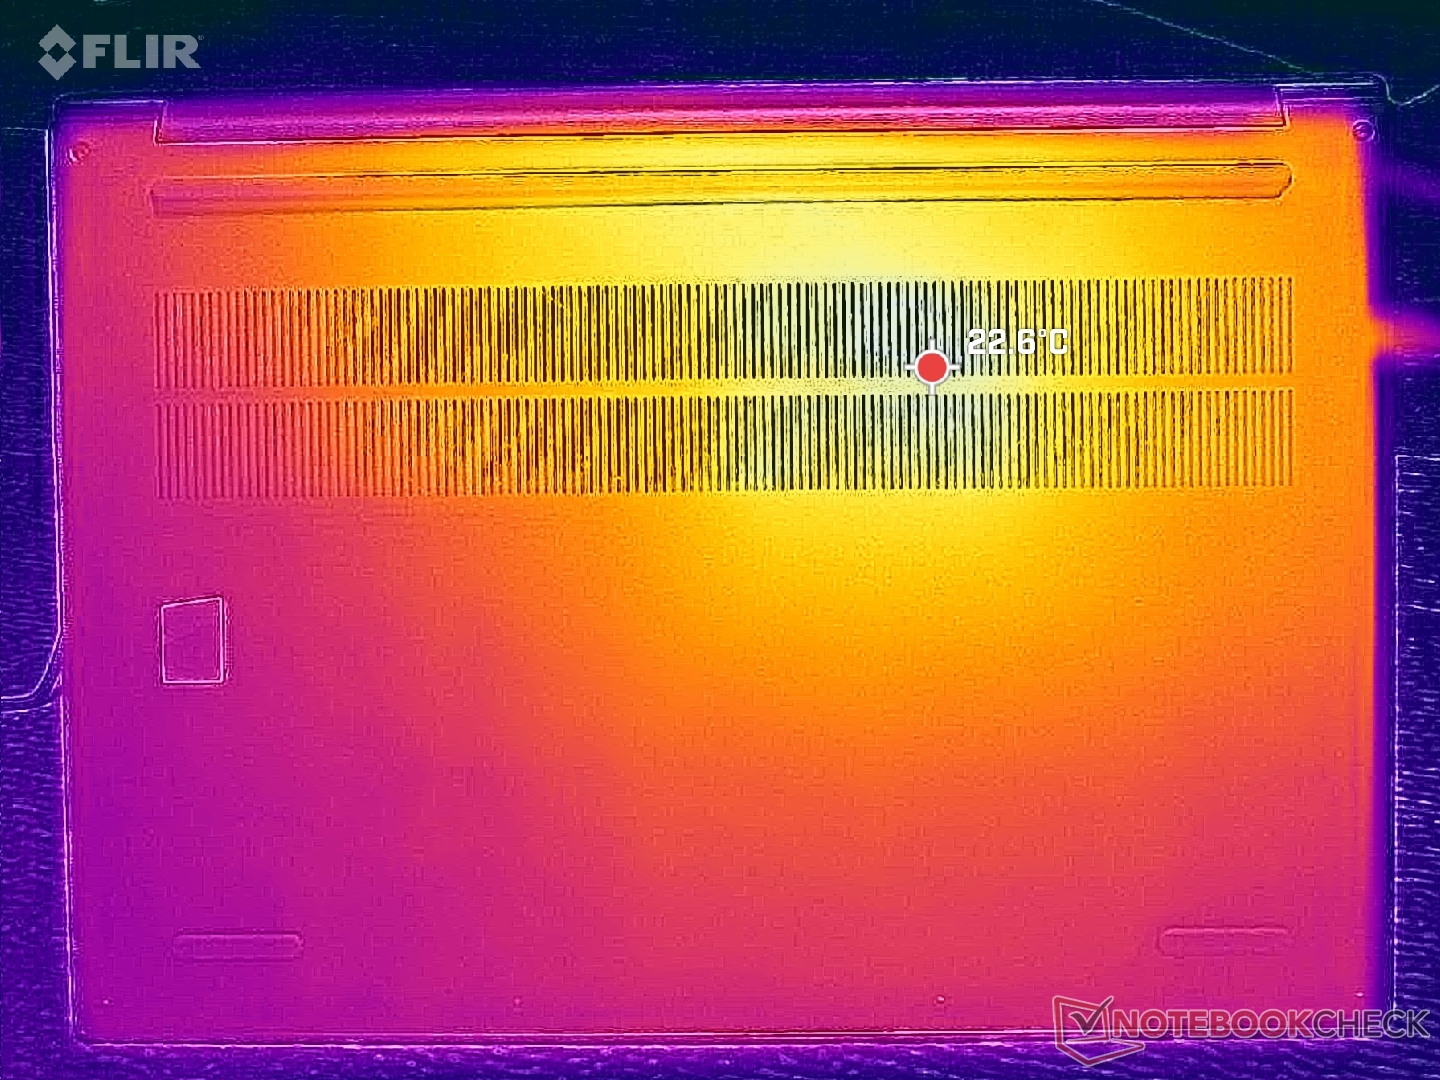
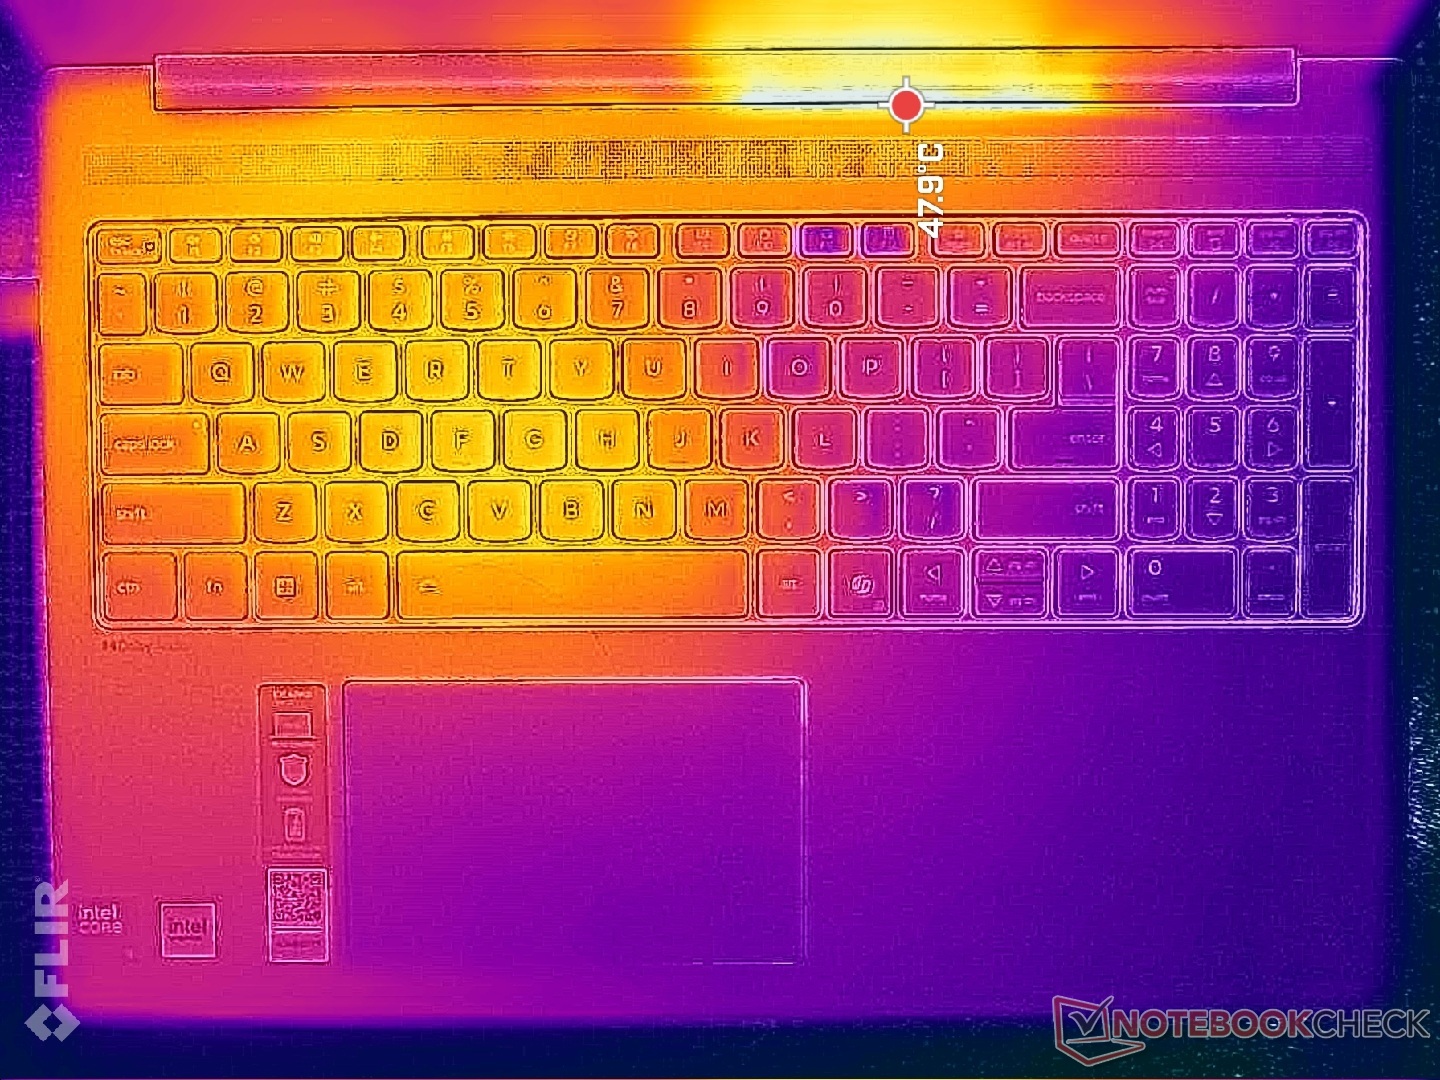
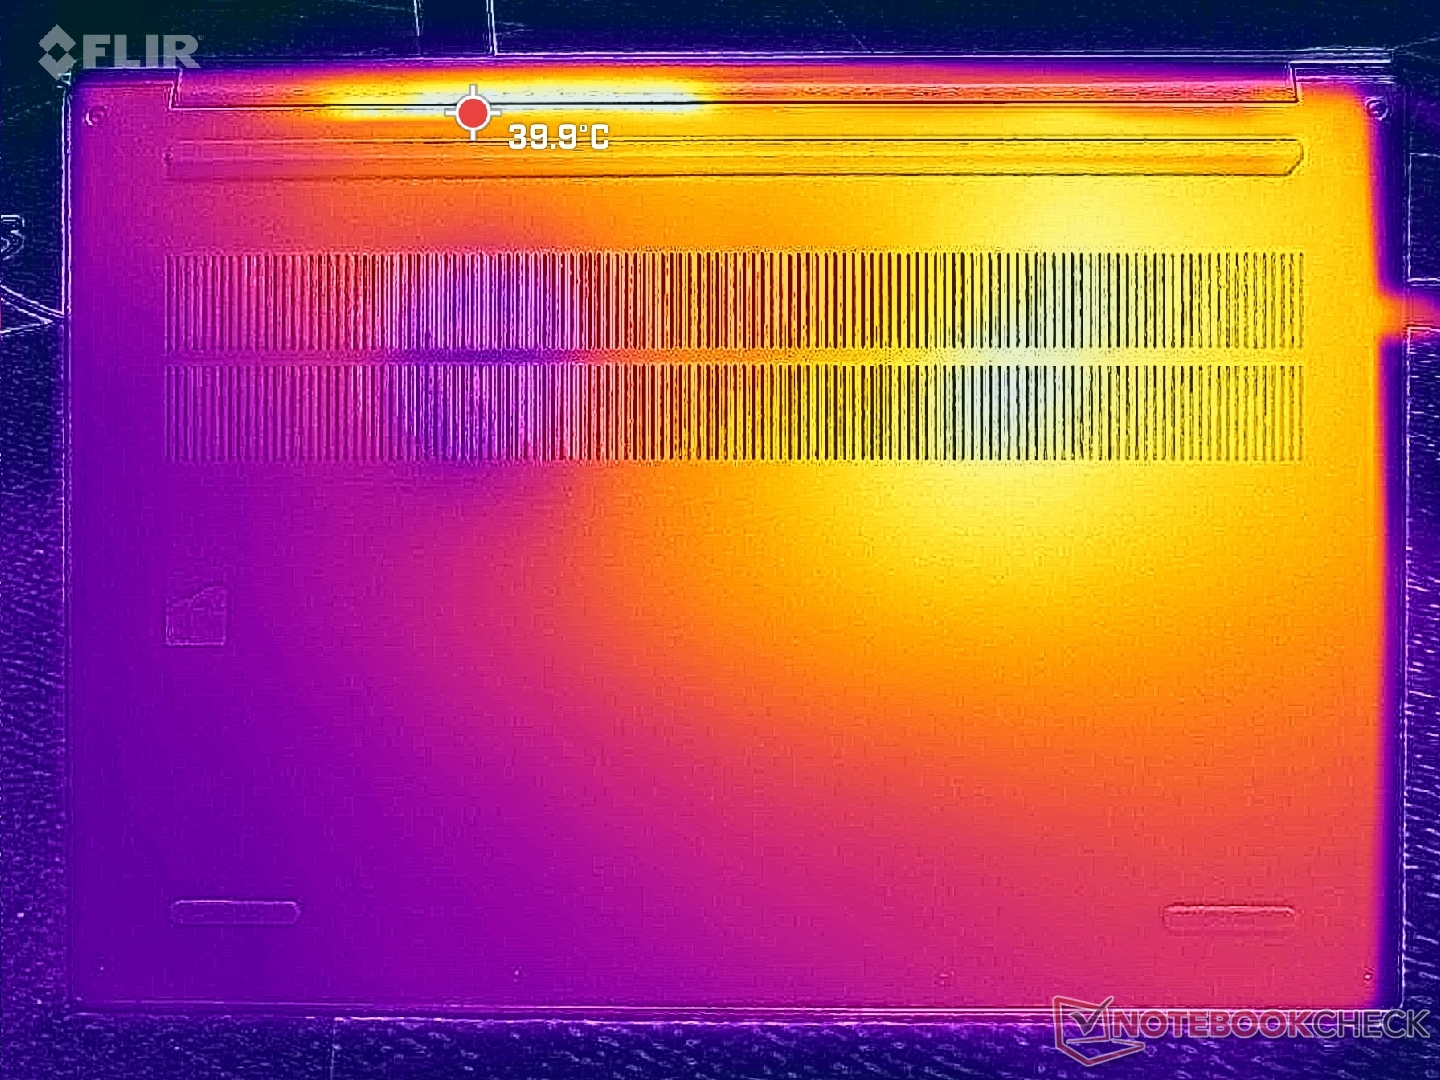
温度


(+) The maximum temperature on the upper side is 36 °C / 97 F, compared to the average of 34.3 °C / 94 F, ranging from 21.2 to 62.5 °C for the class Office.
(+) The bottom heats up to a maximum of 33.8 °C / 93 F, compared to the average of 36.8 °C / 98 F
(+) In idle usage, the average temperature for the upper side is 24.6 °C / 76 F, compared to the device average of 29.5 °C / 85 F.
(+) The palmrests and touchpad are cooler than skin temperature with a maximum of 26.6 °C / 79.9 F and are therefore cool to the touch.
(±) The average temperature of the palmrest area of similar devices was 27.5 °C / 81.5 F (+0.9 °C / 1.6 F).

| Lenovo Ideapad Slim 5 16IRH10R Core 5 210H, UHD Graphics Xe G4 48EUs | Lenovo IdeaPad Slim 5 16AKP10 Ryzen AI 5 330, Radeon 820M | Lenovo IdeaPad 5 2-in-1 16IAL10 Ultra 7 255U, Graphics 4-Core iGPU (Arrow Lake) | Dell 16 Plus Core Ultra 7 256V, Arc 140V | Asus Vivobook 16 M1606K Ryzen AI 7 350, Radeon 860M | HP Pavilion 16-ag0057ng R5 8540U, Radeon 740M | |
|---|---|---|---|---|---|---|
| Heat | 0% | -2% | -11% | -12% | -11% | |
| Maximum Upper Side * (°C) | 36 | 35 3% | 40.4 -12% | 40.6 -13% | 48 -33% | 42 -17% |
| Maximum Bottom * (°C) | 33.8 | 37 -9% | 35.6 -5% | 40 -18% | 51 -51% | 44 -30% |
| Idle Upper Side * (°C) | 27.4 | 26 5% | 26 5% | 29.2 -7% | 22 20% | 26 5% |
| Idle Bottom * (°C) | 27.2 | 27 1% | 26 4% | 28.6 -5% | 23 15% | 28 -3% |
* ... smaller is better
压力测试


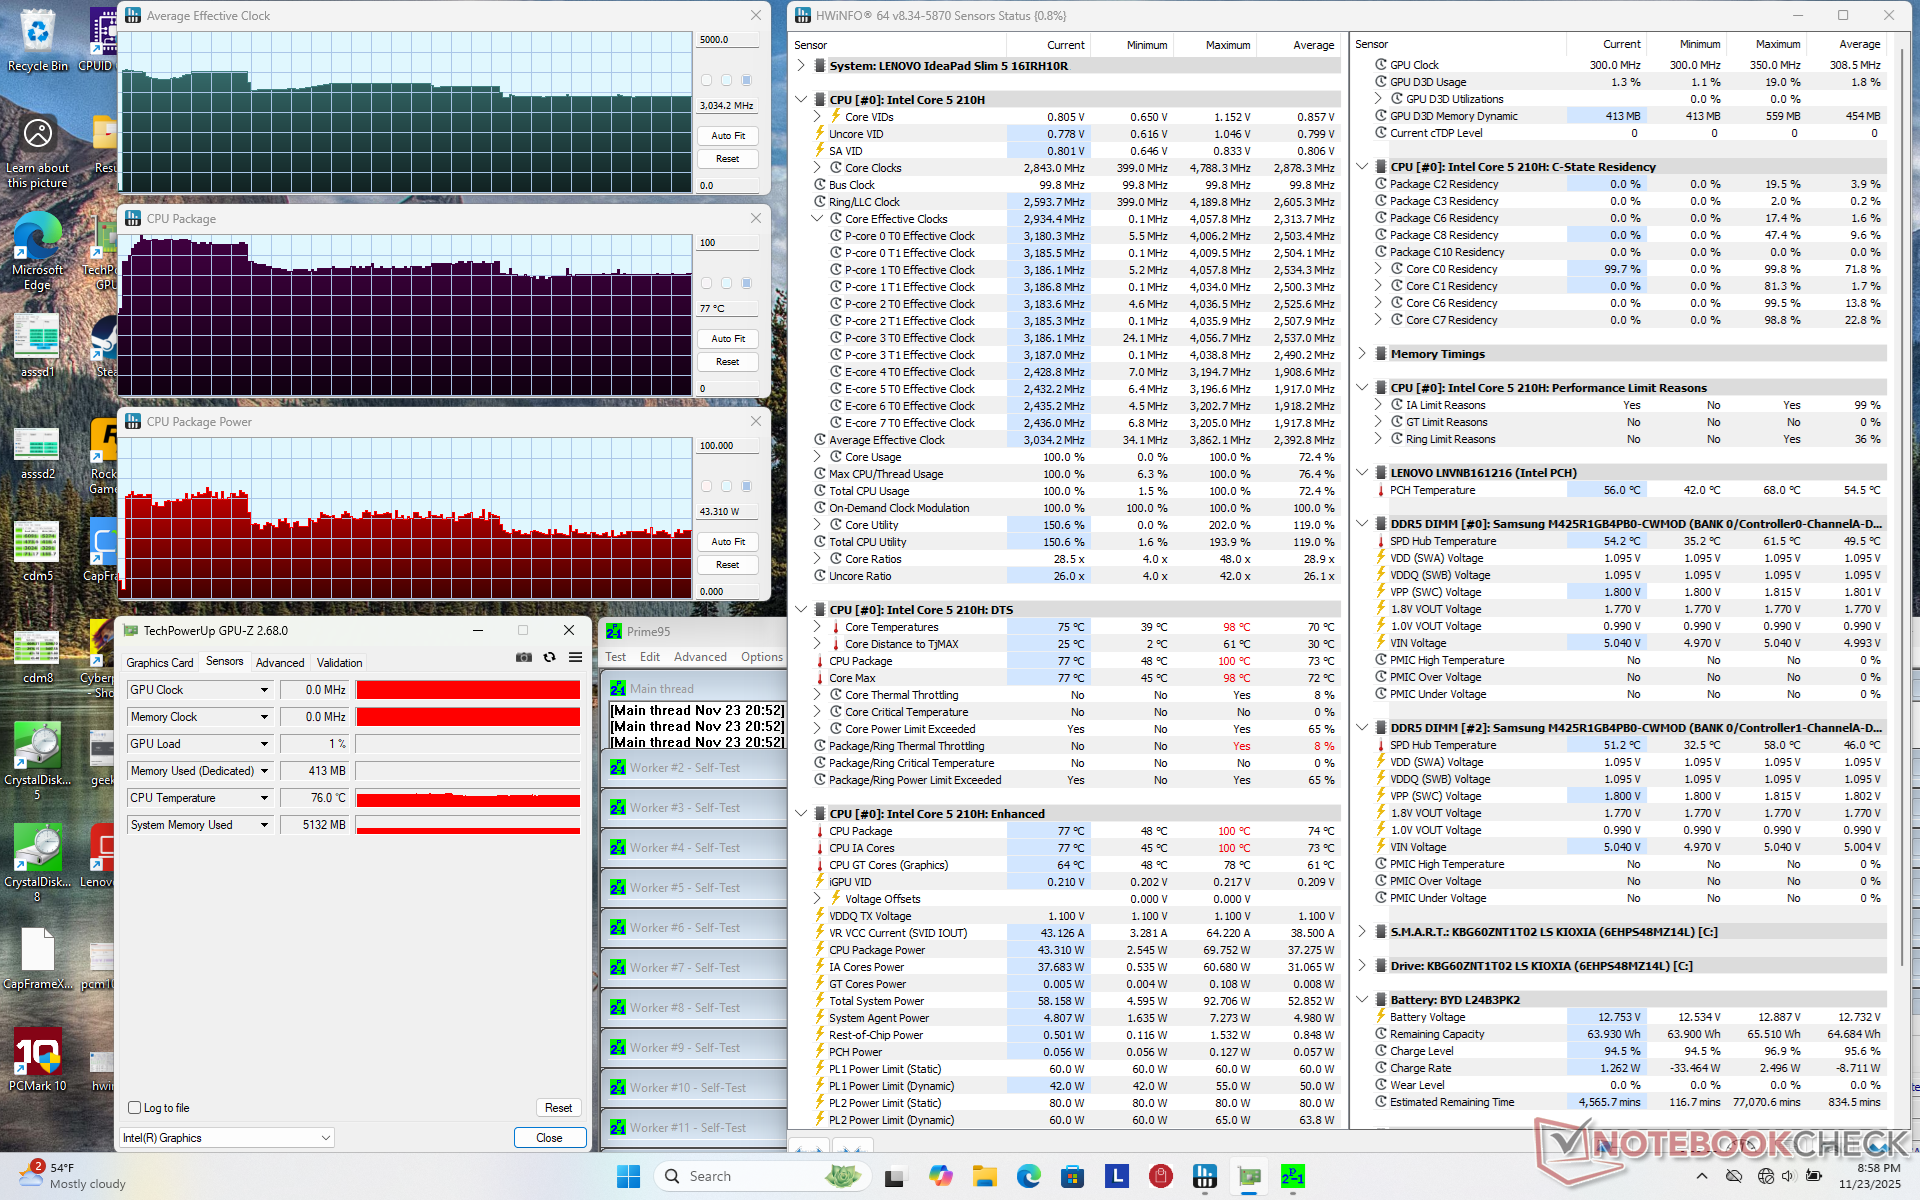

| CPU 平均时钟 (GHz) | GPU 时钟 (MHz) | CPU 平均温度 (°C) | |
| 系统闲置 | -- | -- | 49 |
| Prime95 压力 | 3.0 | -- | 77 |
| Prime95 + FurMark Stress | 2.1 | 1350 | 76 |
| 赛博朋克 2077》压力 | 0.9 | 1400 | 79 |
发言人
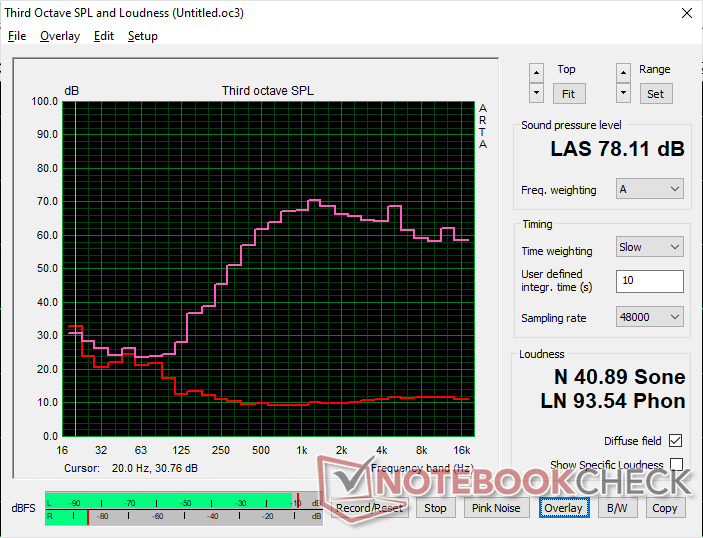
Lenovo Ideapad Slim 5 16IRH10R audio analysis
(±) | speaker loudness is average but good (78.1 dB)
Bass 100 - 315 Hz
(-) | nearly no bass - on average 24.5% lower than median
(±) | linearity of bass is average (8.9% delta to prev. frequency)
Mids 400 - 2000 Hz
(+) | balanced mids - only 4.8% away from median
(+) | mids are linear (5.8% delta to prev. frequency)
Highs 2 - 16 kHz
(+) | balanced highs - only 3.2% away from median
(+) | highs are linear (4.8% delta to prev. frequency)
Overall 100 - 16.000 Hz
(±) | linearity of overall sound is average (19.5% difference to median)
Compared to same class
» 40% of all tested devices in this class were better, 7% similar, 52% worse
» The best had a delta of 7%, average was 21%, worst was 53%
Compared to all devices tested
» 49% of all tested devices were better, 7% similar, 44% worse
» The best had a delta of 4%, average was 23%, worst was 134%
Apple MacBook Pro 16 2021 M1 Pro audio analysis
(+) | speakers can play relatively loud (84.7 dB)
Bass 100 - 315 Hz
(+) | good bass - only 3.8% away from median
(+) | bass is linear (5.2% delta to prev. frequency)
Mids 400 - 2000 Hz
(+) | balanced mids - only 1.3% away from median
(+) | mids are linear (2.1% delta to prev. frequency)
Highs 2 - 16 kHz
(+) | balanced highs - only 1.9% away from median
(+) | highs are linear (2.7% delta to prev. frequency)
Overall 100 - 16.000 Hz
(+) | overall sound is linear (4.6% difference to median)
Compared to same class
» 0% of all tested devices in this class were better, 0% similar, 100% worse
» The best had a delta of 5%, average was 17%, worst was 45%
Compared to all devices tested
» 0% of all tested devices were better, 0% similar, 100% worse
» The best had a delta of 4%, average was 23%, worst was 134%
能源管理
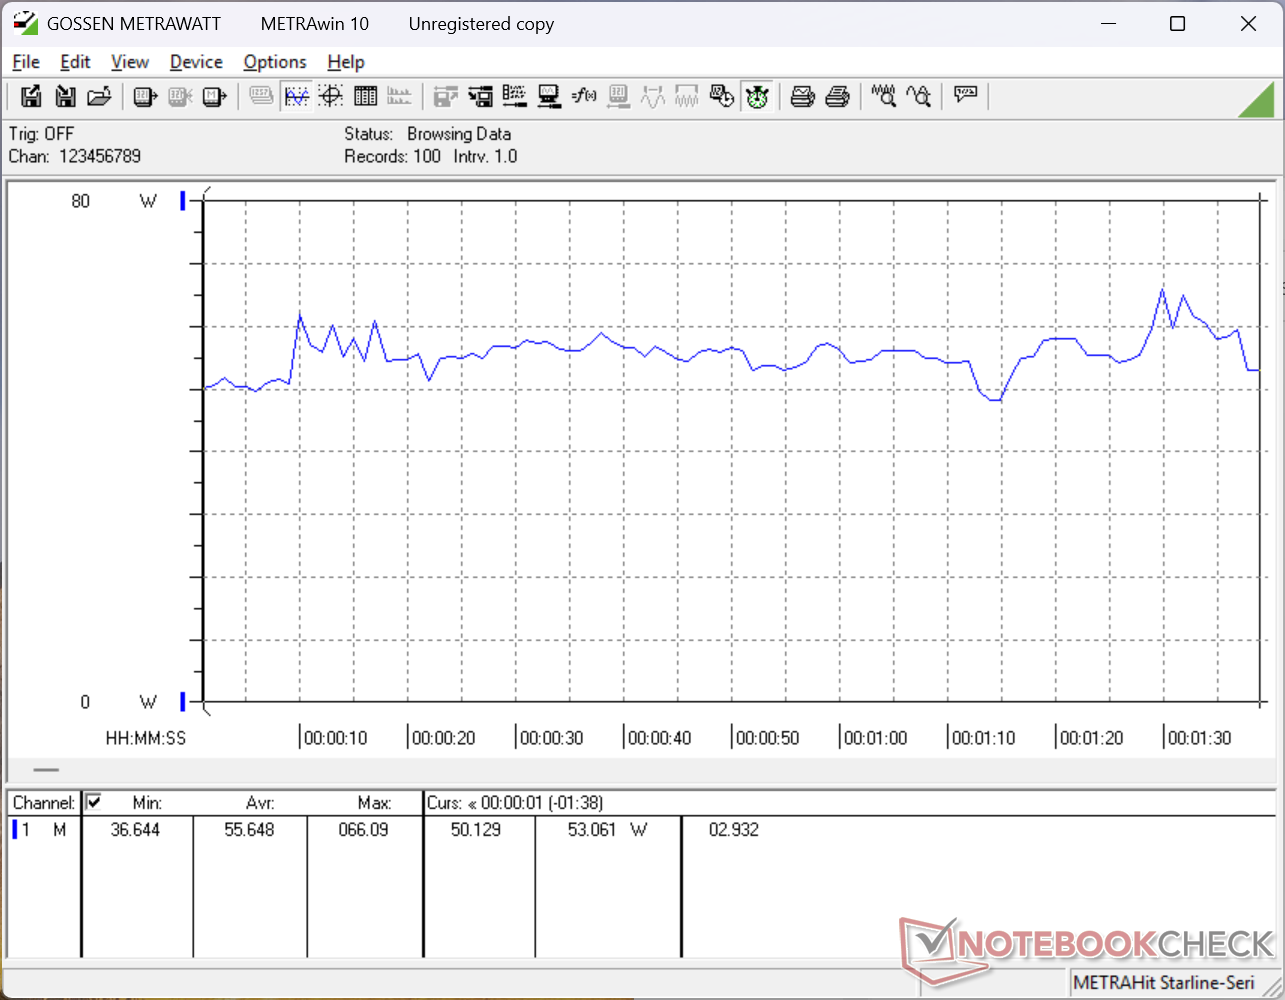
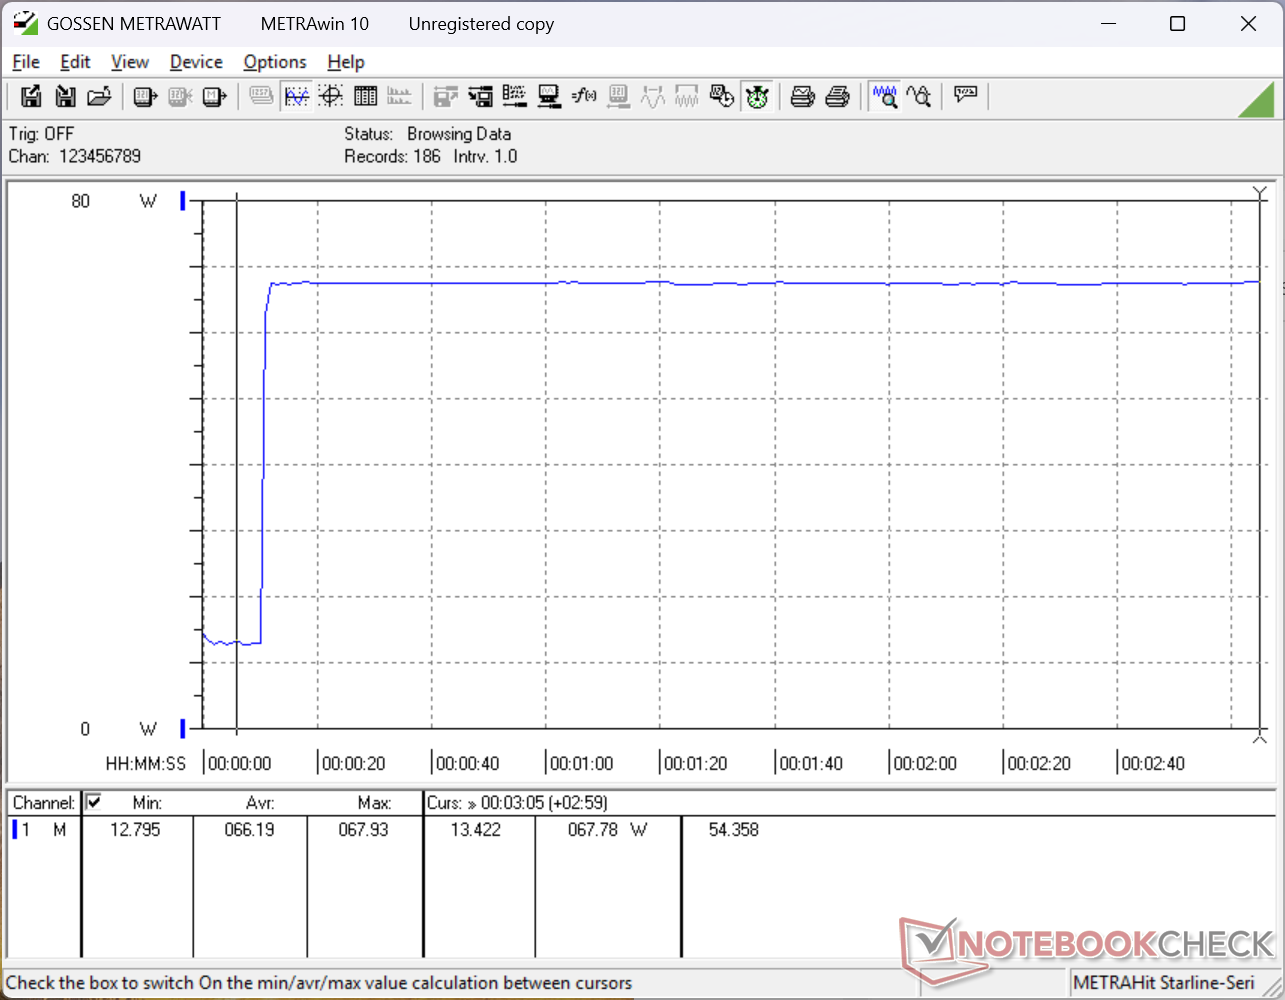
耗电量


| Off / Standby | |
| Idle | |
| Load |
|
Key:
min: | |
| Lenovo Ideapad Slim 5 16IRH10R Core 5 210H, UHD Graphics Xe G4 48EUs, , IPS, 1920x1200, 16" | Lenovo IdeaPad Slim 5 16AKP10 Ryzen AI 5 330, Radeon 820M, Western Digital PC SN5000S SDEPMSJ-512G, IPS, 1920x1200, 16" | Lenovo IdeaPad 5 2-in-1 16IAL10 Ultra 7 255U, Graphics 4-Core iGPU (Arrow Lake), , IPS, 1920x1200, 16" | Dell 16 Plus Core Ultra 7 256V, Arc 140V, Samsung BM9C1 1024GB, IPS, 2560x1600, 16" | Asus Vivobook 16 M1606K Ryzen AI 7 350, Radeon 860M, Micron 2500 1TB MTFDKBA1T0QGN, IPS, 1920x1200, 16" | HP Pavilion 16-ag0057ng R5 8540U, Radeon 740M, SK hynix BC901 HFS001TEJ4X164N, IPS, 1920x1200, 16" | |
|---|---|---|---|---|---|---|
| Power Consumption | 29% | 19% | 33% | 8% | 39% | |
| Idle Minimum * (Watt) | 8.1 | 5.2 36% | 4.8 41% | 3.4 58% | 4.7 42% | 4 51% |
| Idle Average * (Watt) | 11.9 | 6 50% | 8.7 27% | 6.9 42% | 8.2 31% | 5 58% |
| Idle Maximum * (Watt) | 12.4 | 7.7 38% | 9 27% | 7.4 40% | 9 27% | 6 52% |
| Load Average * (Watt) | 55.7 | 44 21% | 47.1 15% | 41.7 25% | 59 -6% | 40 28% |
| Cyberpunk 2077 ultra * (Watt) | 55.7 | 43 23% | 48.6 13% | 41.4 26% | 65 -17% | 43 23% |
| Cyberpunk 2077 ultra external monitor * (Watt) | 52.6 | 40.4 23% | 45.1 14% | 38 28% | 58 -10% | 39.1 26% |
| Load Maximum * (Watt) | 67.8 | 58 14% | 68.2 -1% | 62 9% | 74 -9% | 46 32% |
* ... smaller is better
功耗 赛博朋克/压力测试
外部显示器功耗
电池寿命
| Lenovo Ideapad Slim 5 16IRH10R Core 5 210H, UHD Graphics Xe G4 48EUs, 60 Wh | Lenovo IdeaPad Slim 5 16AKP10 Ryzen AI 5 330, Radeon 820M, 60 Wh | Lenovo IdeaPad 5 2-in-1 16IAL10 Ultra 7 255U, Graphics 4-Core iGPU (Arrow Lake), 57 Wh | Dell 16 Plus Core Ultra 7 256V, Arc 140V, 64 Wh | Asus Vivobook 16 M1606K Ryzen AI 7 350, Radeon 860M, 42 Wh | HP Pavilion 16-ag0057ng R5 8540U, Radeon 740M, 59 Wh | |
|---|---|---|---|---|---|---|
| Battery runtime | -7% | 10% | 25% | -40% | 1% | |
| WiFi v1.3 (h) | 11.3 | 10.5 -7% | 12.4 10% | 14.1 25% | 6.8 -40% | 11.4 1% |
| H.264 (h) | 6.8 | |||||
| Load (h) | 1.1 |
笔记本检查评级
宽敞且速度较快的 16 英寸 PC,专为家庭多媒体或预算有限的学生设计。
Lenovo Ideapad Slim 5 16IRH10R
- 12/01/2025 v8
Allen Ngo
 Total Sustainability Score:
 潜在竞争对手比较
Image | Model / Review | Price | Weight | Height | Display |
|---|---|---|---|---|---|
1. 79.9%  | Lenovo Ideapad Slim 5 16IRH10R Intel Core 5 210H ⎘ Intel UHD Graphics Xe G4 48EUs ⎘ 16 GB Memory | Amazon: List Price: 850 USD | 1.9 kg | 18.4 mm | 16.00" 1920x1200 142 PPI IPS |
2. 80.8%  | Lenovo IdeaPad Slim 5 16AKP10 AMD Ryzen AI 5 330 ⎘ AMD Radeon 820M ⎘ 16 GB Memory, 512 GB SSD | Amazon: List Price: 700 EUR | 1.9 kg | 18.4 mm | 16.00" 1920x1200 142 PPI IPS |
3. 78.8%  | Lenovo IdeaPad 5 2-in-1 16IAL10 Intel Core Ultra 7 255U ⎘ Intel Graphics 4-Core iGPU (Meteor / Arrow Lake) ⎘ 16 GB Memory | Amazon: | 2.1 kg | 18.4 mm | 16.00" 1920x1200 142 PPI IPS |
4. 81.8%  | Dell 16 Plus Intel Core Ultra 7 256V ⎘ Intel Arc Graphics 140V ⎘ 16 GB Memory, 1024 GB SSD | Amazon: List Price: 1150 USD | 1.8 kg | 16.99 mm | 16.00" 2560x1600 189 PPI IPS |
5. 77.6%  | Asus Vivobook 16 M1606K AMD Ryzen AI 7 350 ⎘ AMD Radeon 860M ⎘ 16 GB Memory, 1024 GB SSD | Amazon: 1. $129.00 Replacement Screen 16.0" for... 2. $123.00 16.0" WUXGA 1920(RGB)*1200 f... 3. $625.00 ASUS Vivobook 16" WUXGA Lapt... | 1.9 kg | 19.9 mm | 16.00" 1920x1200 142 PPI IPS |
6. 77.3%  | HP Pavilion 16-ag0057ng AMD Ryzen 5 8540U ⎘ AMD Radeon 740M ⎘ 16 GB Memory, 1024 GB SSD | Amazon: List Price: 730 EUR | 1.7 kg | 18.6 mm | 16.00" 1920x1200 142 PPI IPS |
Transparency
The selection of devices to be reviewed is made by our editorial team. The test sample was provided to the author as a loan by the manufacturer or retailer for the purpose of this review. The lender had no influence on this review, nor did the manufacturer receive a copy of this review before publication. There was no obligation to publish this review. As an independent media company, Notebookcheck is not subjected to the authority of manufacturers, retailers or publishers.
This is how Notebookcheck is testing
Every year, Notebookcheck independently reviews hundreds of laptops and smartphones using standardized procedures to ensure that all results are comparable. We have continuously developed our test methods for around 20 years and set industry standards in the process. In our test labs, high-quality measuring equipment is utilized by experienced technicians and editors. These tests involve a multi-stage validation process. Our complex rating system is based on hundreds of well-founded measurements and benchmarks, which maintains objectivity. Further information on our test methods can be found here.

