判决
比如 RTX 5080 变体联想Legion 9 18 的 RTX 5090 版(价格高得离谱,不到 6000 欧元)也在大多数类别中取得了不错甚至非常不错的性能。
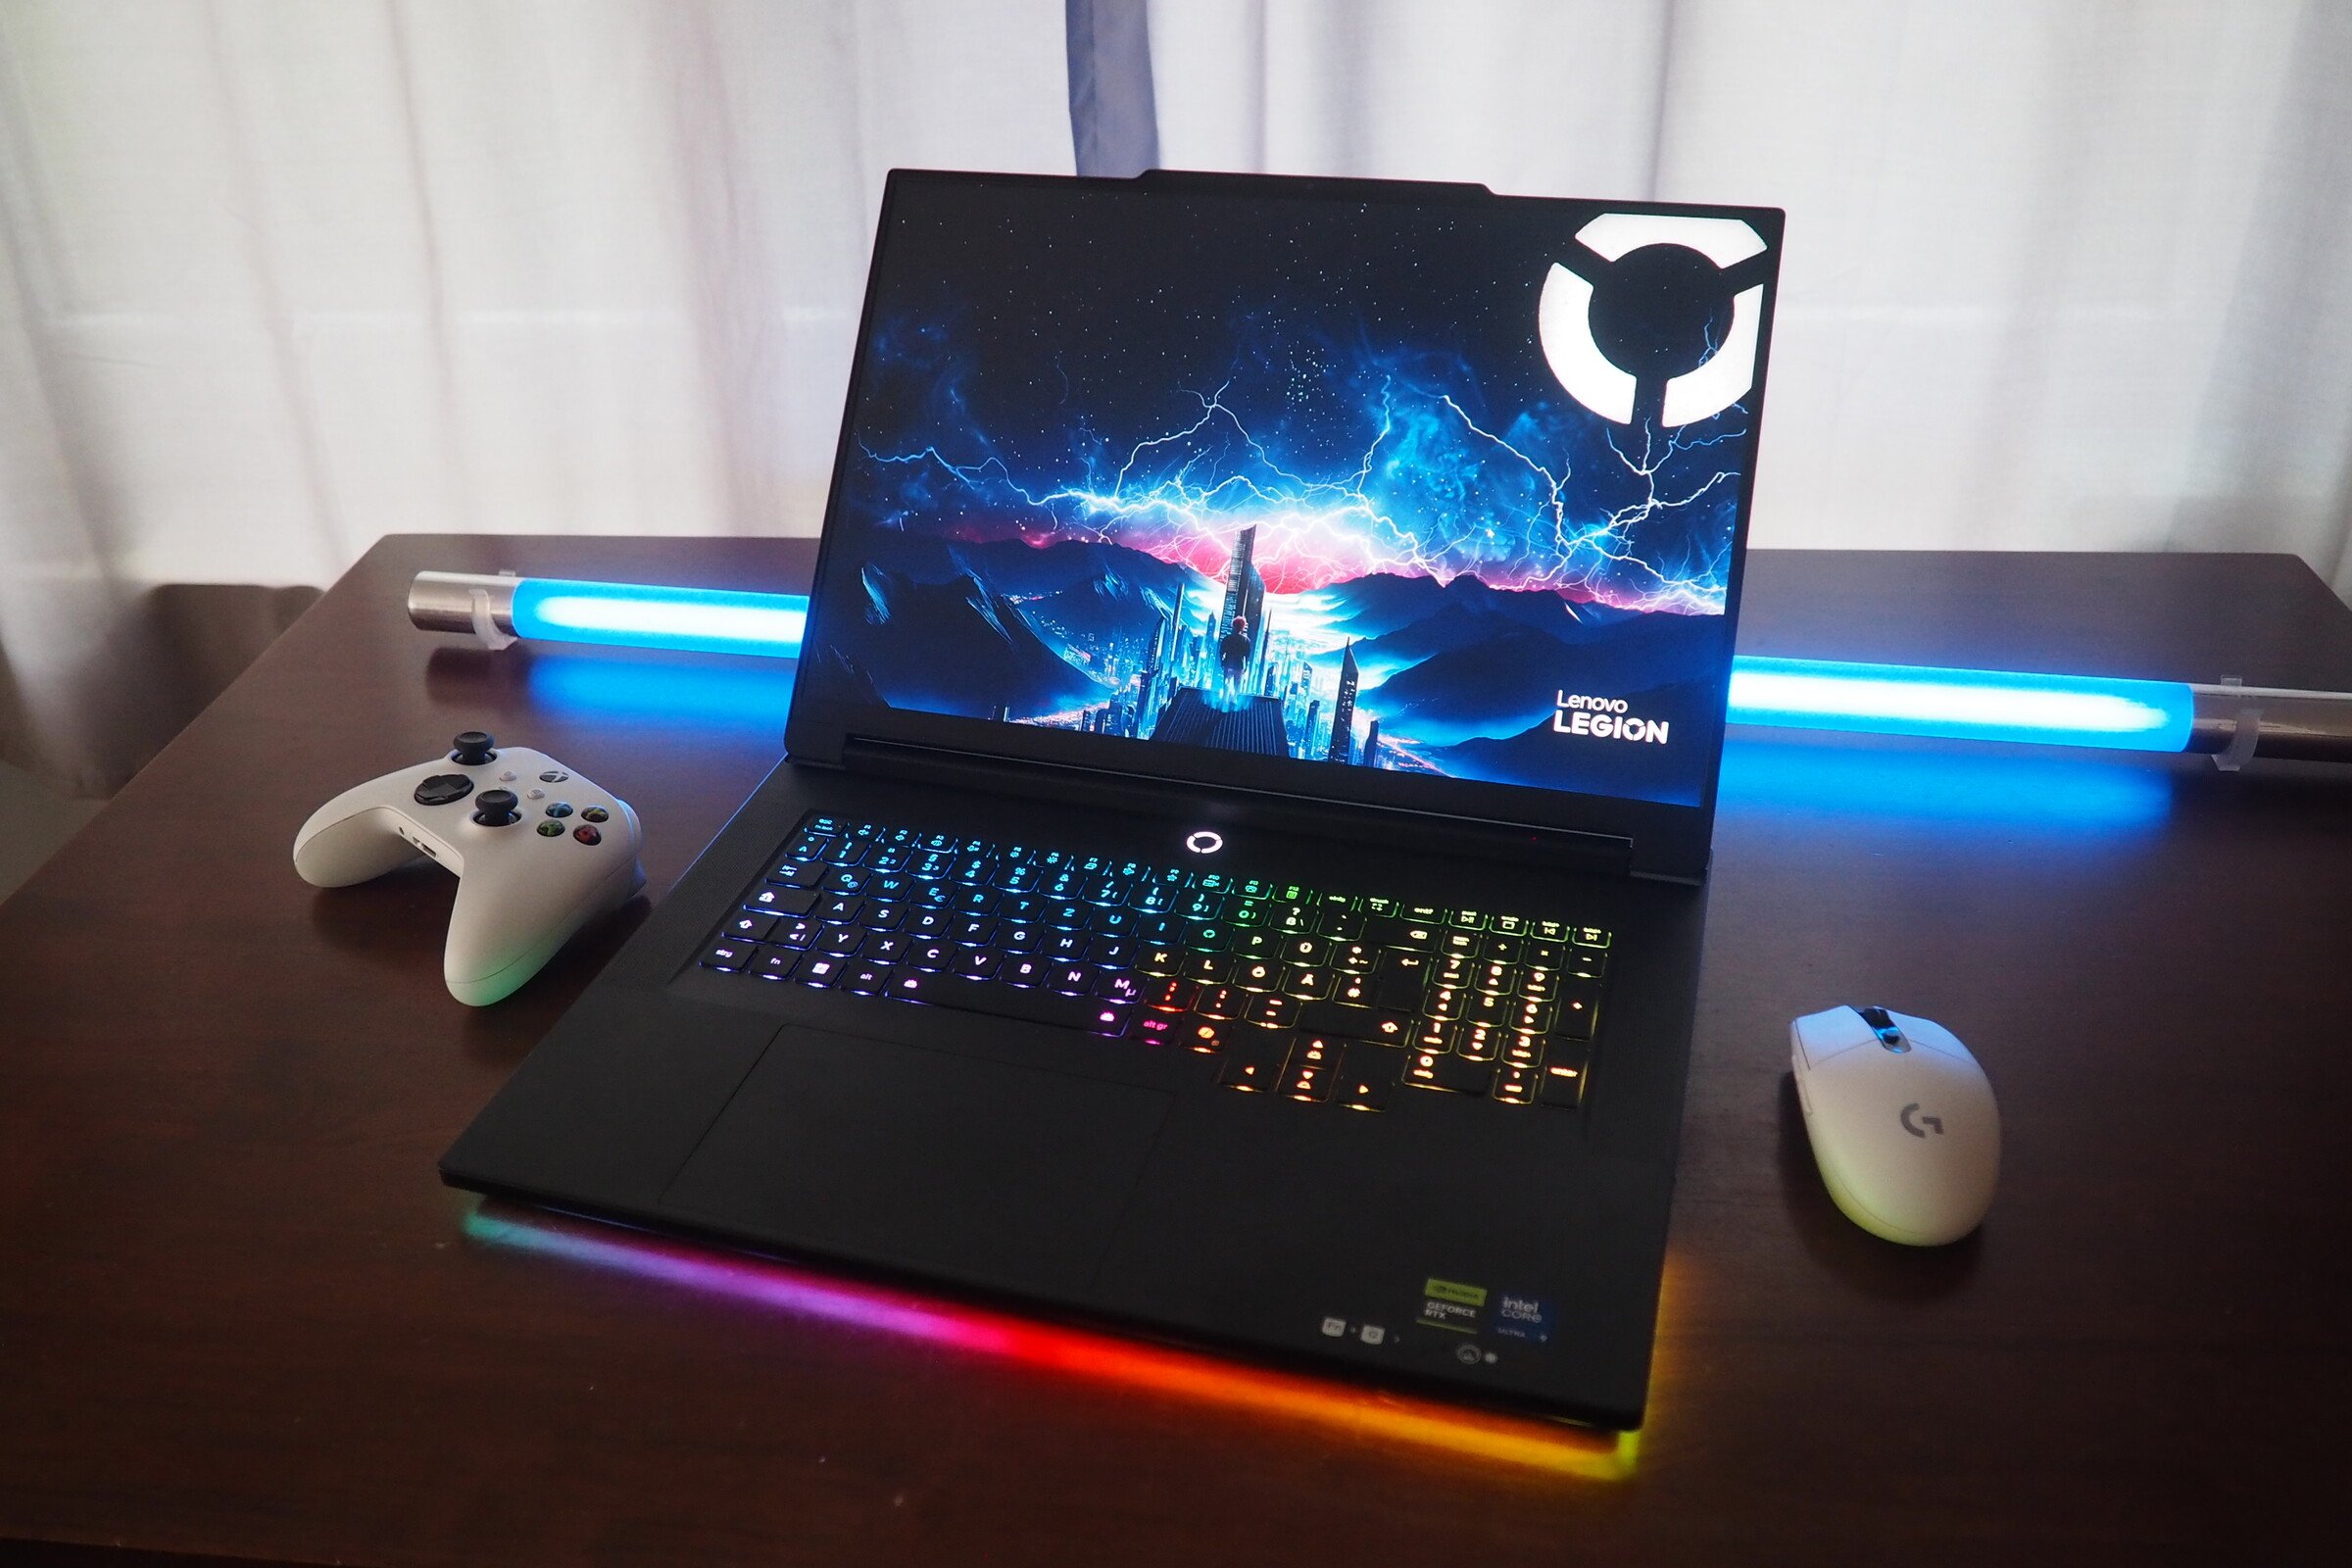
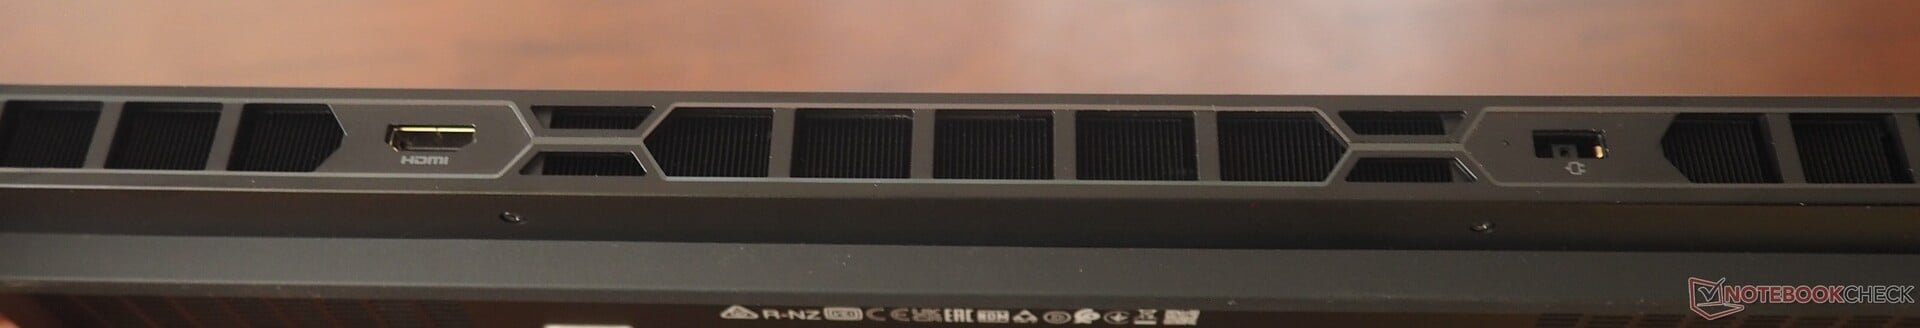
这款游戏巨兽的优势之一是其高品质的机箱,其时尚的设计和众多照明元素吸引了众多玩家。连接性也不赖,配备了两个 Thunderbolt 5 端口。
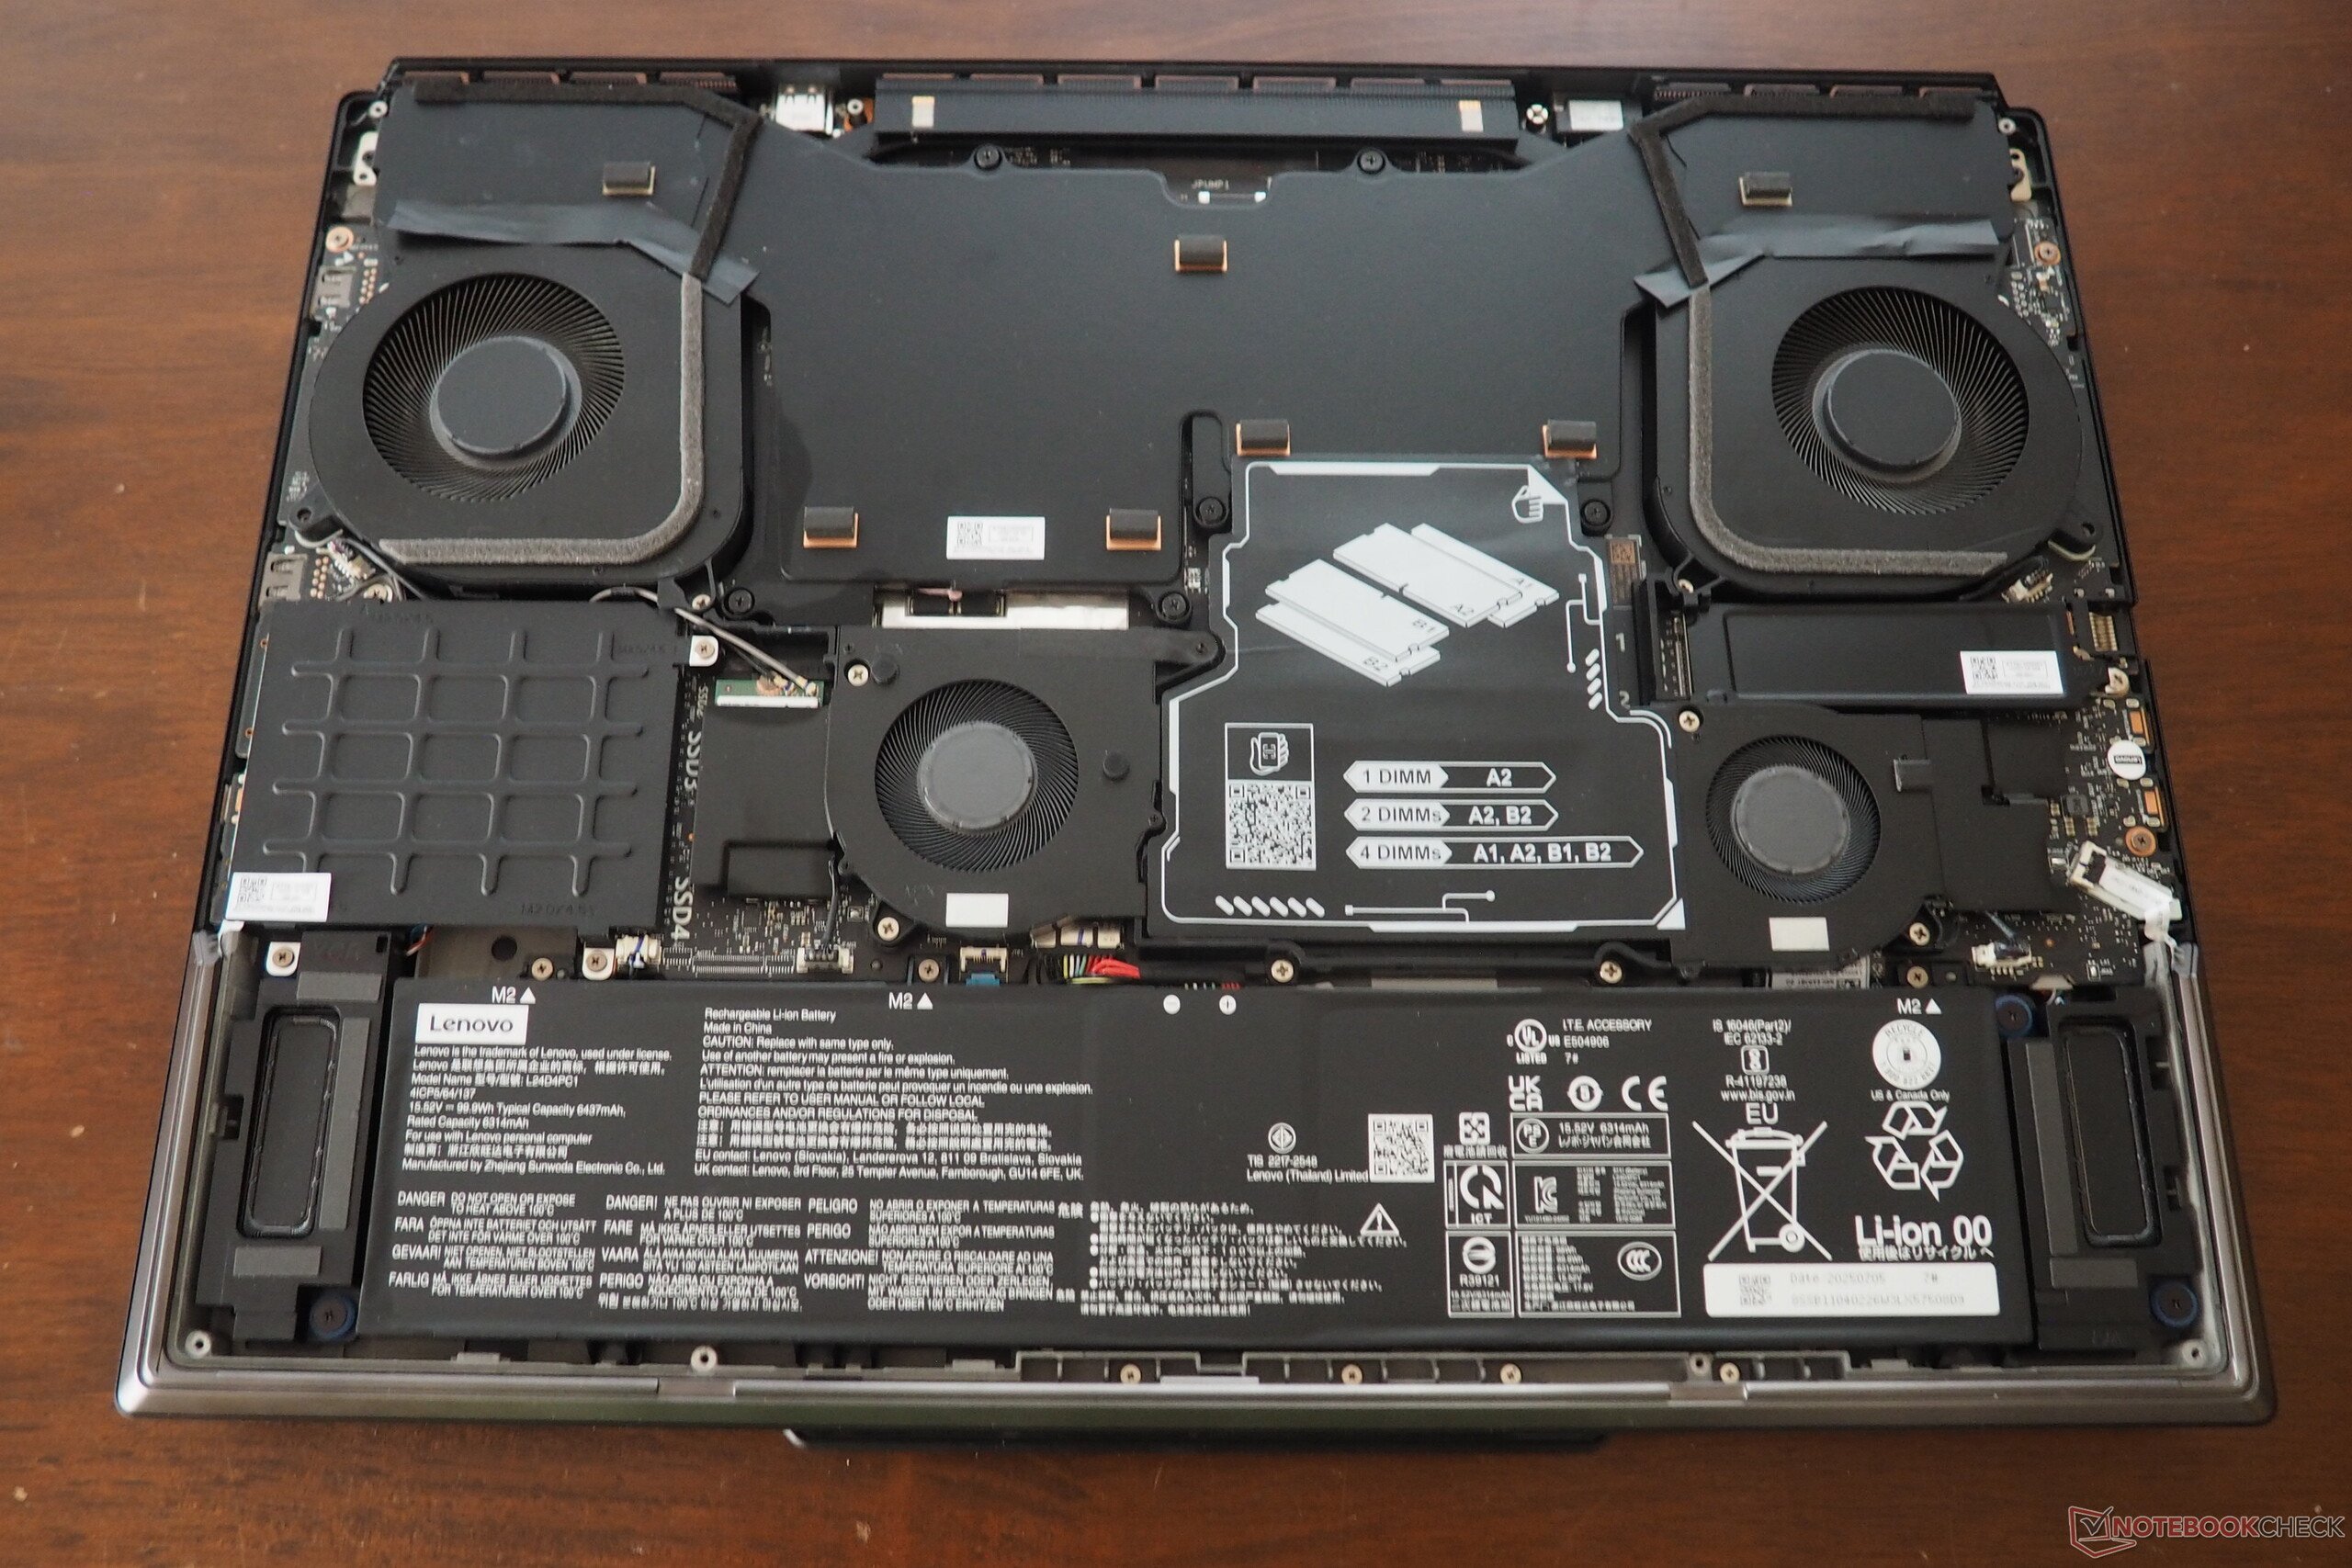
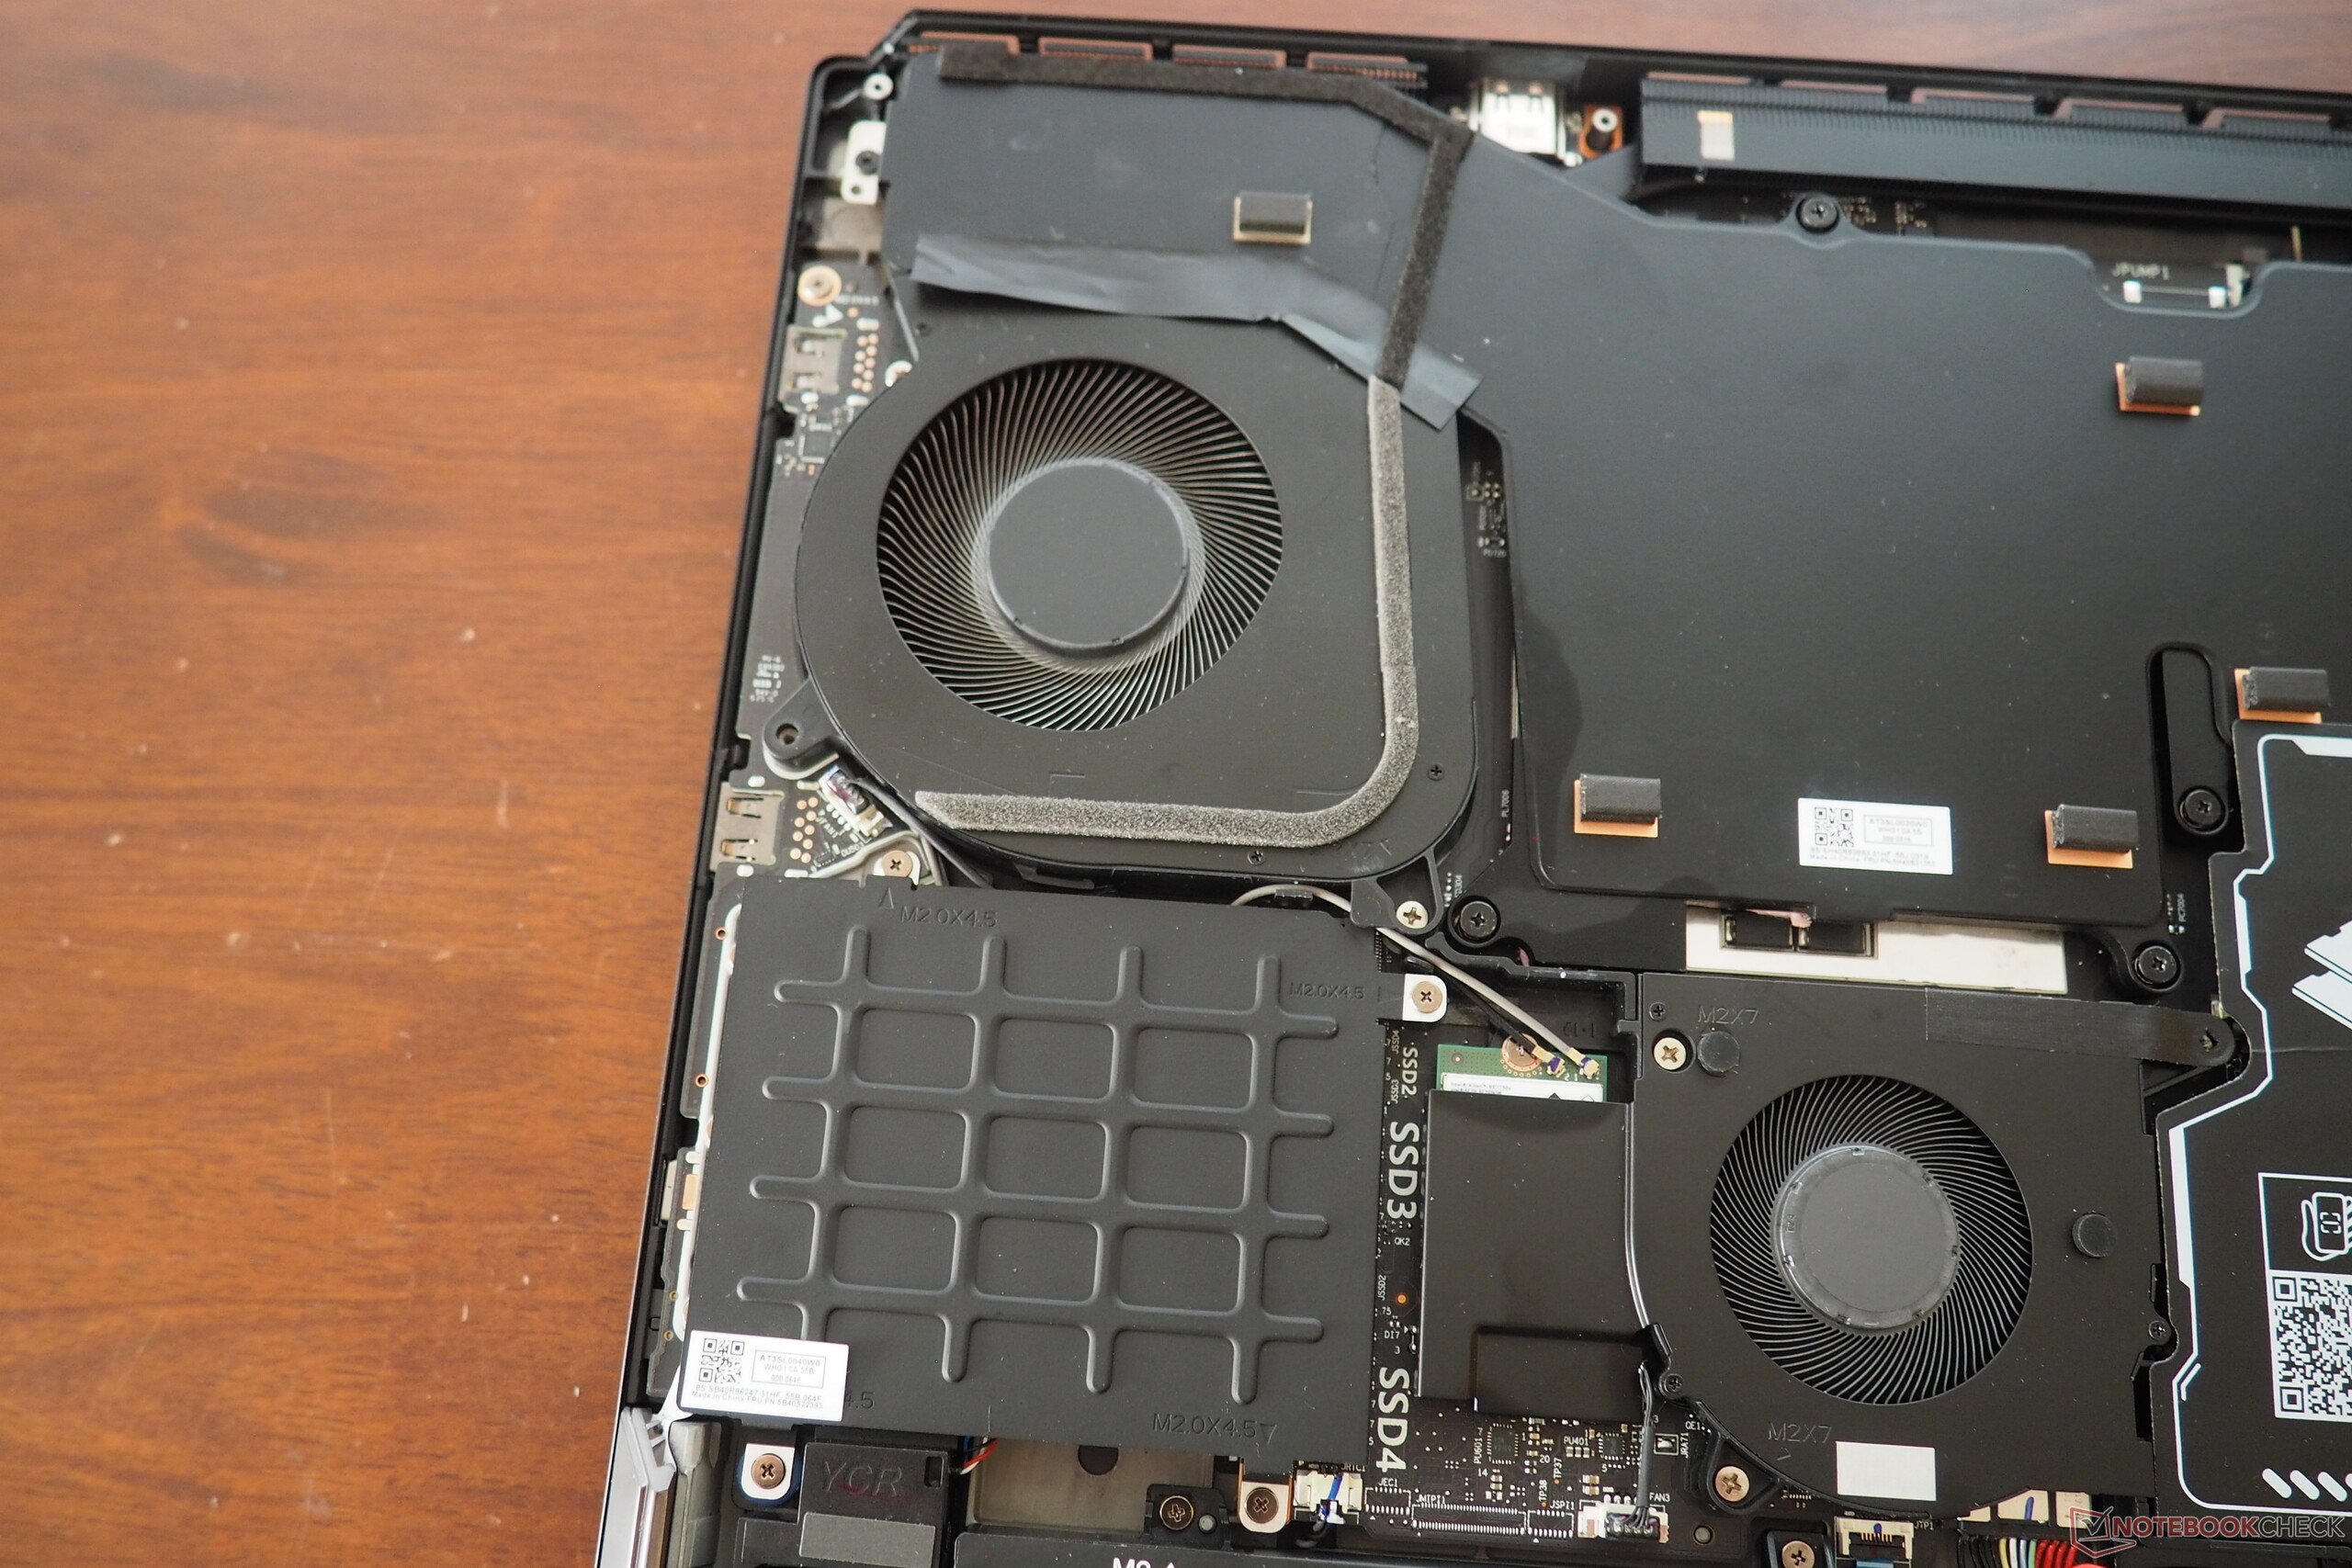
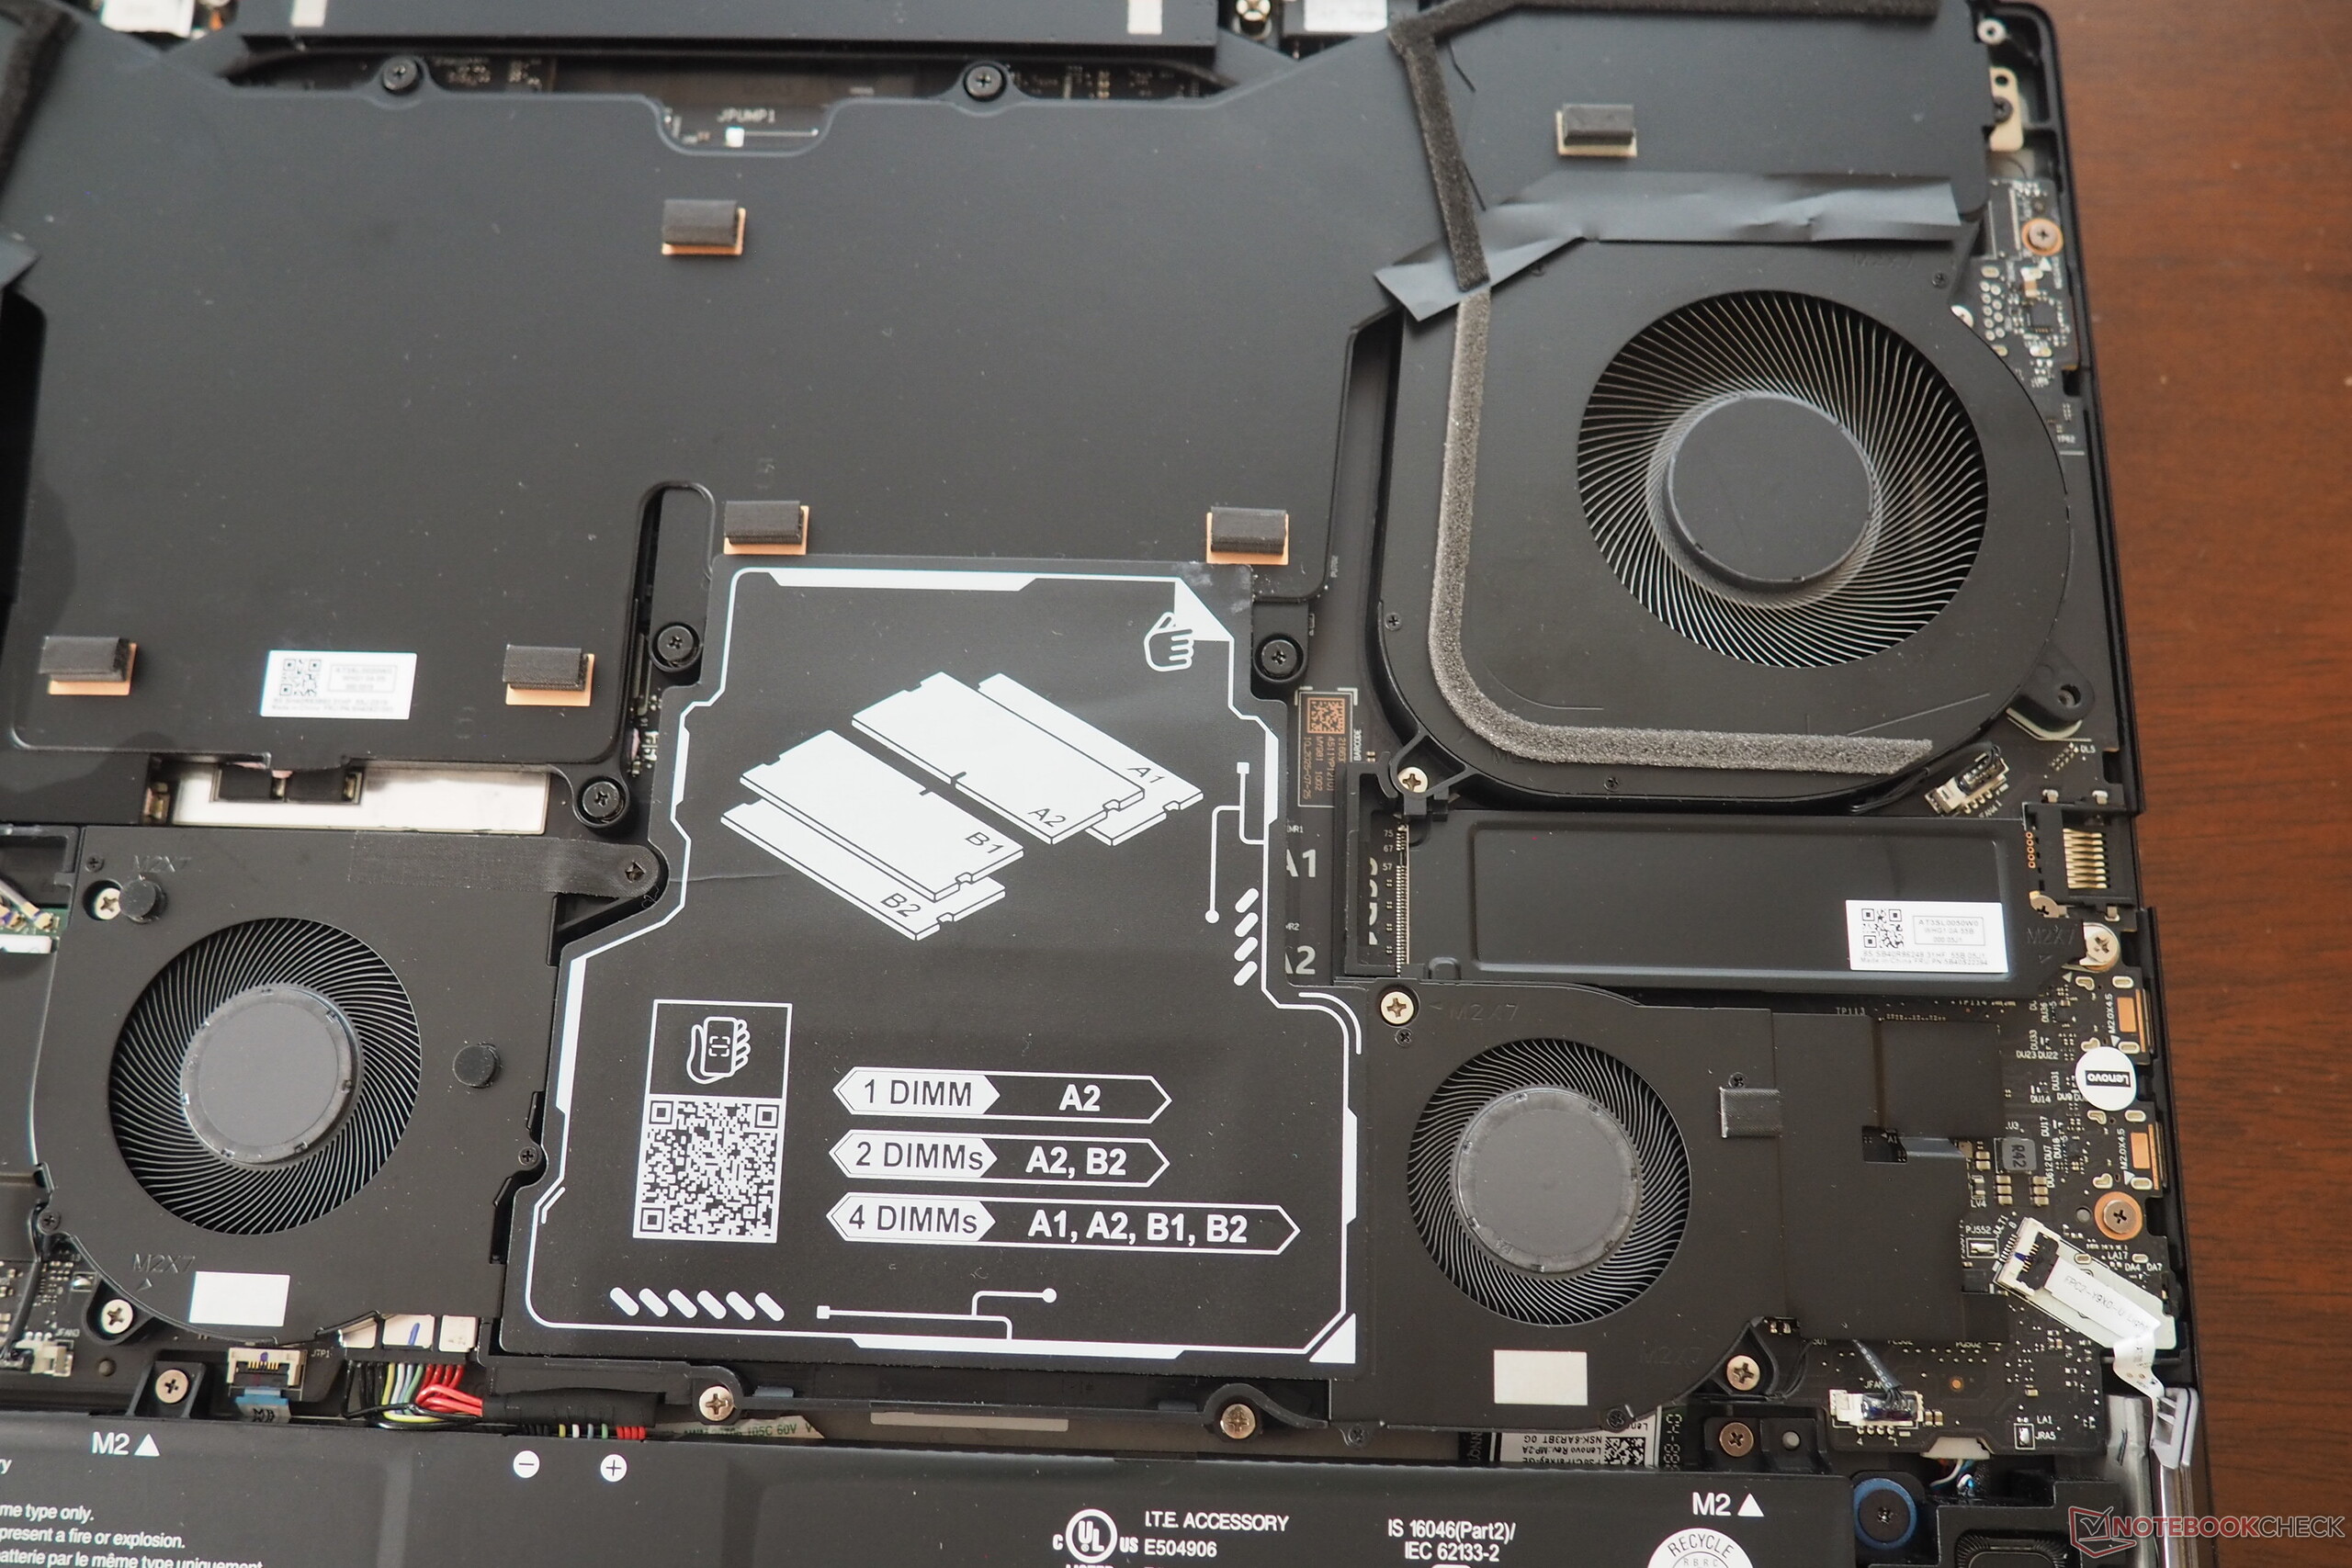
引擎盖下有 4 个风扇、4 组内存和 4 个固态硬盘插槽,相当豪华。音质也对得起它的高昂售价。
Legion 9 18 的性能无可挑剔。特别是由于 GPU 超频,Legion 9 18 在迄今为止测试的所有配备 RTX 5090 笔记本 GPU 的笔记本电脑中名列前茅。
不过,这个小家伙也有一些缺点。例如,附带的 400 W 电源装置非常笨重。
这款笔记本电脑需要大量电力,电池续航时间短,玩游戏时噪音大。
Legion 9 18 的 RTX 5080 虽然性能较低,但在这些方面略胜一筹。
Pros
Cons
价格和供应情况
联想Legion 9 18IAX10 配酷睿 Ultra 9 275HX 和GeForce RTX 5090 在德国亚马逊的售价略低于 6000 欧元。
这款笔记本电脑尚未在联想美国网站正式上市,但通过Lenovo.com 可以买到配备酷睿 Ultra 9 275HX 和 RTX 5080 的机型,起价为 3299.99 美元。
- $4,999.00Lenovo Legion 9i Gen 10 18" Gaming Laptop (2026 Model) Intel Core Ultra 9 275HX 24C, NVIDIA GeForce RTX 5090 24GB, 64GB RAM, 1TB Gen5 NVMe SSD, 18.0" 4K 520 nits 240Hz, Windows 11 Pro
- $4,869.00Lenovo Legion Pro 7i Gen 10 16" Gaming Laptop (2025 Model) Intel Core Ultra 9 275HX 24C, NVIDIA GeForce RTX 5090 24GB, 64GB RAM, 2TB (1TB+1TB) NVMe SSD, 16" WQXGA OLED 500 nits 240Hz, Windows 11 Home
- $5,250.00Lenovo Legion 9i Gen 10 18" Gaming Laptop (2026 Model) Intel Core Ultra 9 275HX 24C, NVIDIA GeForce RTX 5090 24GB, 64GB RAM, 4TB (2TB+2TB) NVMe SSD, 18.0" 4K 520 nits 240Hz, Windows 11 Pro
Legion 9 18 的竞争对手包括其他 18 英寸游戏笔记本电脑,包括 RTX 5090 笔记本电脑如 Alienware 18 Area-51以及 华硕 Strix Scar 18 G835和 Razer Blade 18 2025都作为对比设备出现在表格中。
规格
底盘
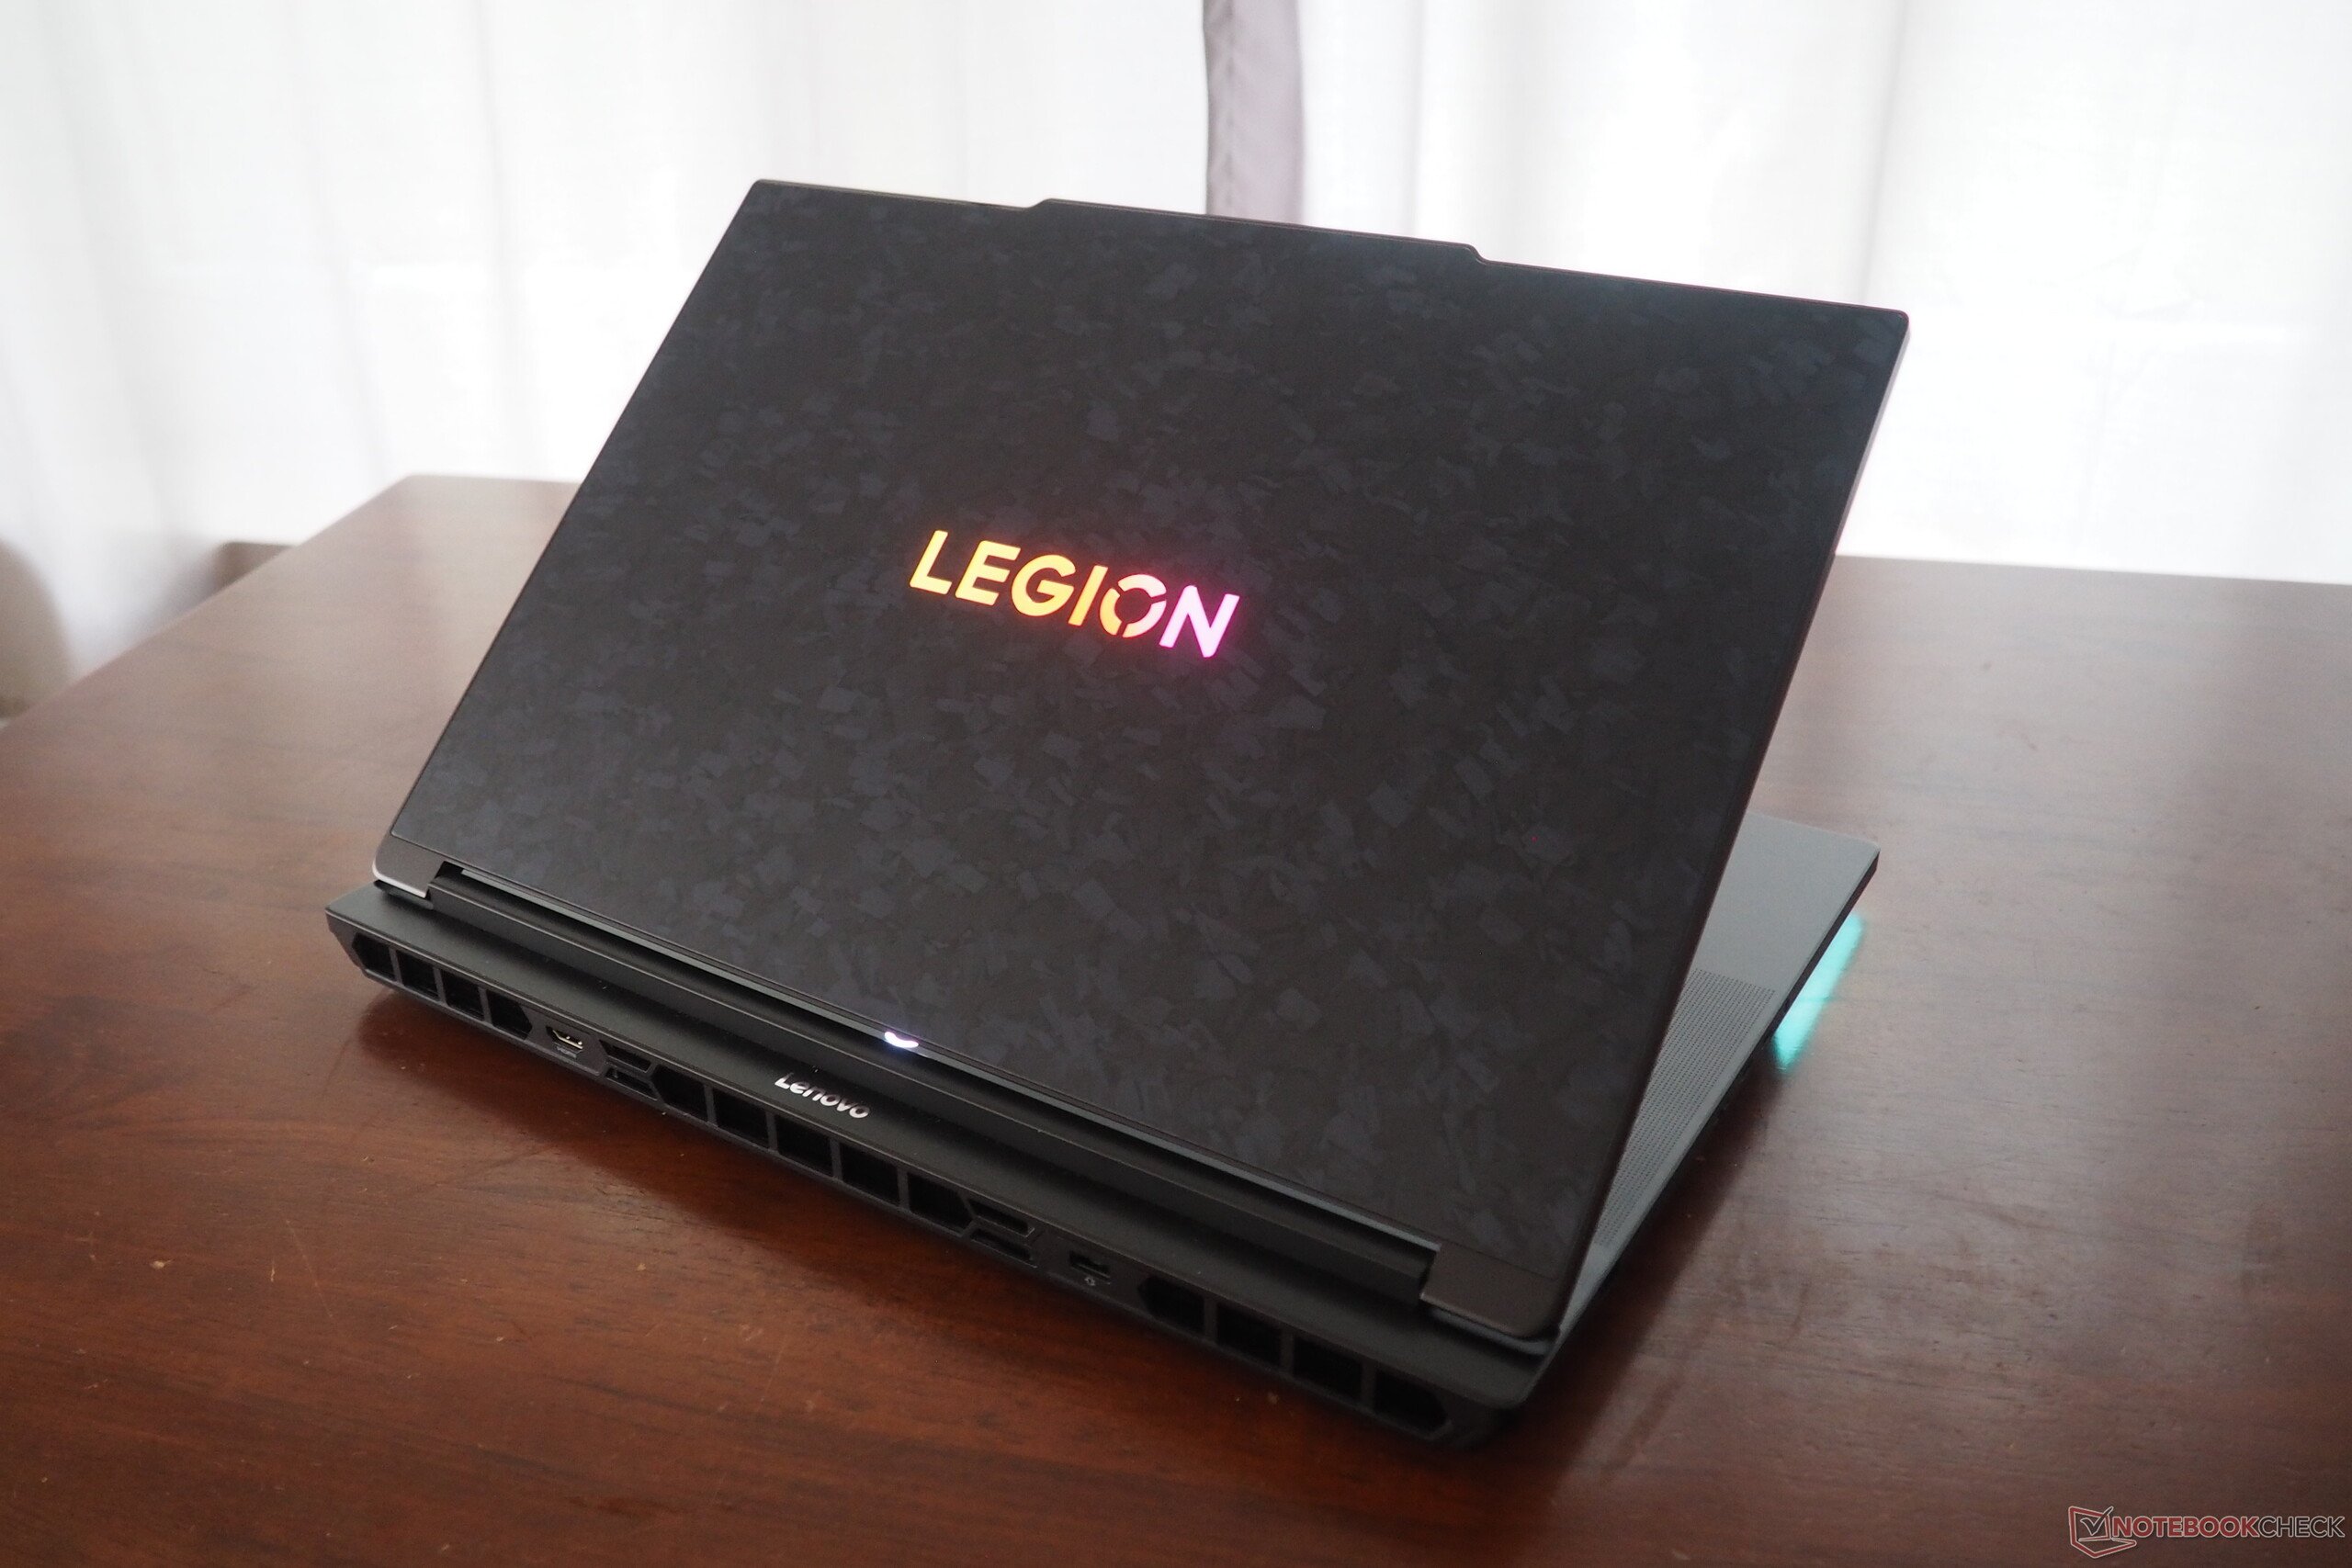
机箱不仅因其质感十足的盖子,还因其良好的稳定性和简洁的做工而令人印象深刻。 3.对于笔记本电脑来说,5 千克的重量相当可观,甚至超过了 Strix Scar 18 或 Blade 18(3.2-3.3 千克)。但是,正如 Alienware 18 Area-51(4.2 千克)所显示的,它还可以更重。
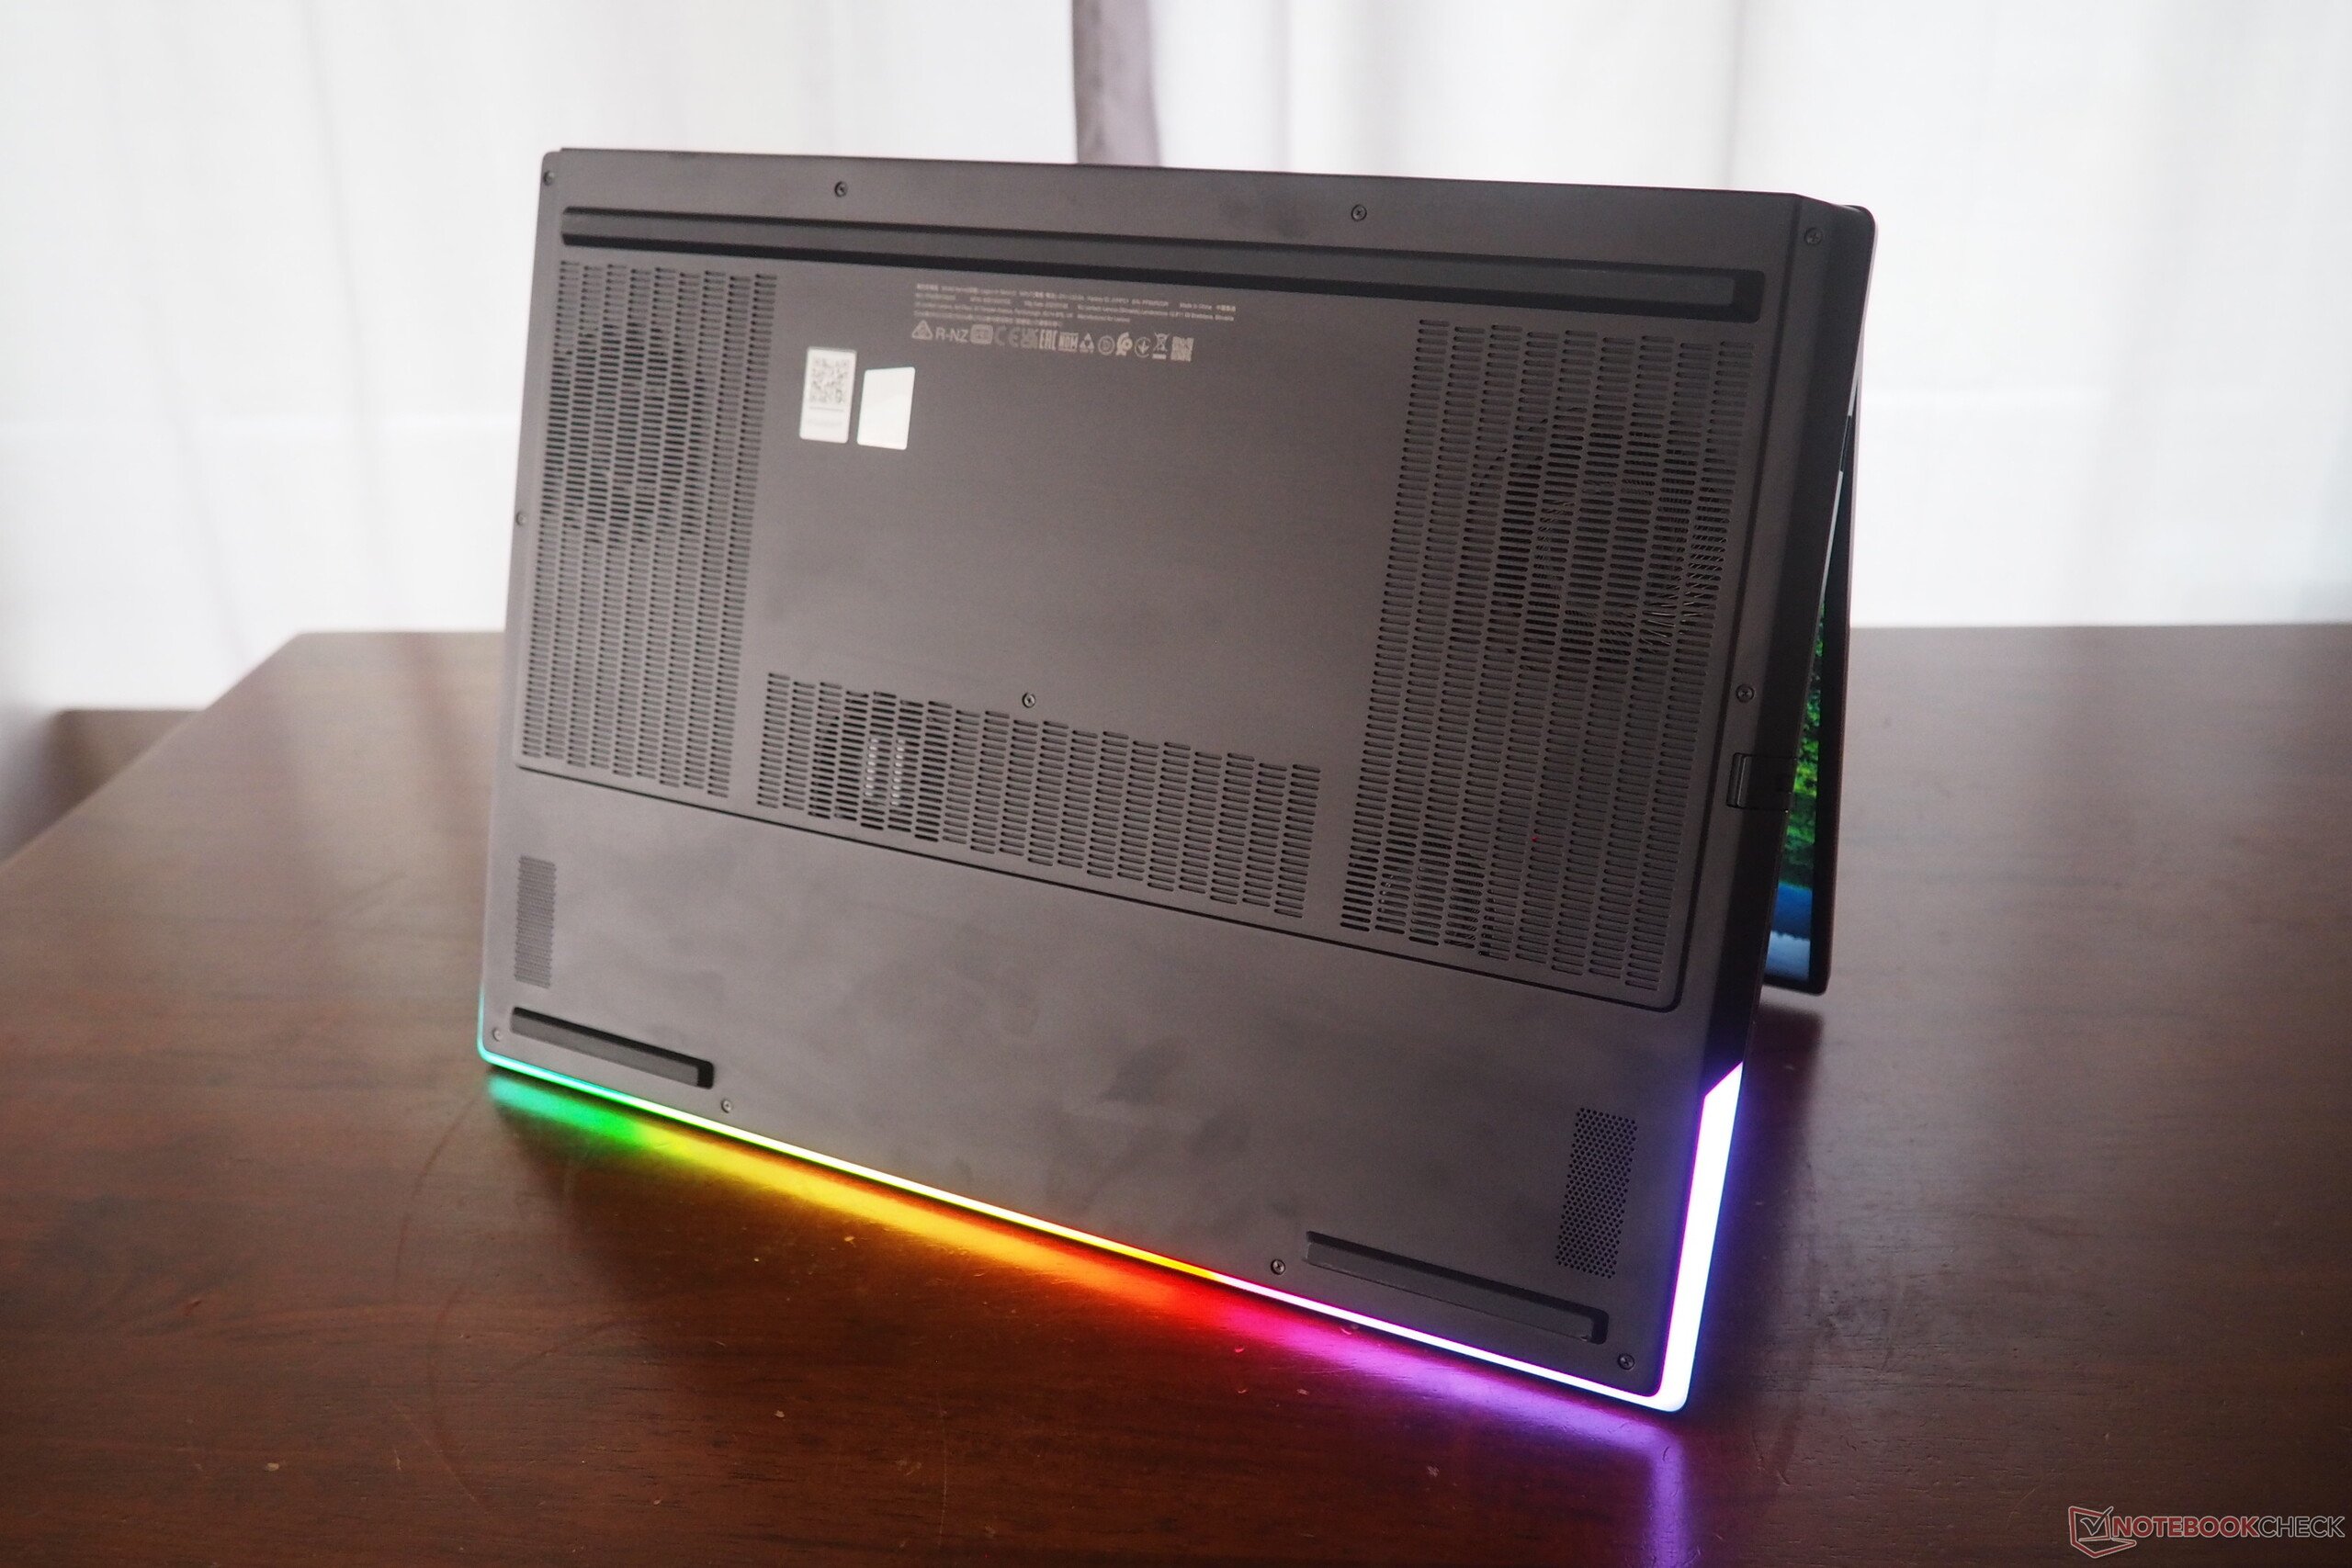
2.8 厘米的高度(不含脚垫)与 Blade 18 一致。我们尤其喜欢它 180° 的开合角度。

连接性
连接的数量和种类都无可挑剔,尤其是联想已经安装了现代接口(见下文)。有趣的是,读卡器的速度比 RTX 5080 版本要慢,而无线模块的效果则要好得多。500 万像素的网络摄像头提供电子快门功能,能拍摄出不错的图像。
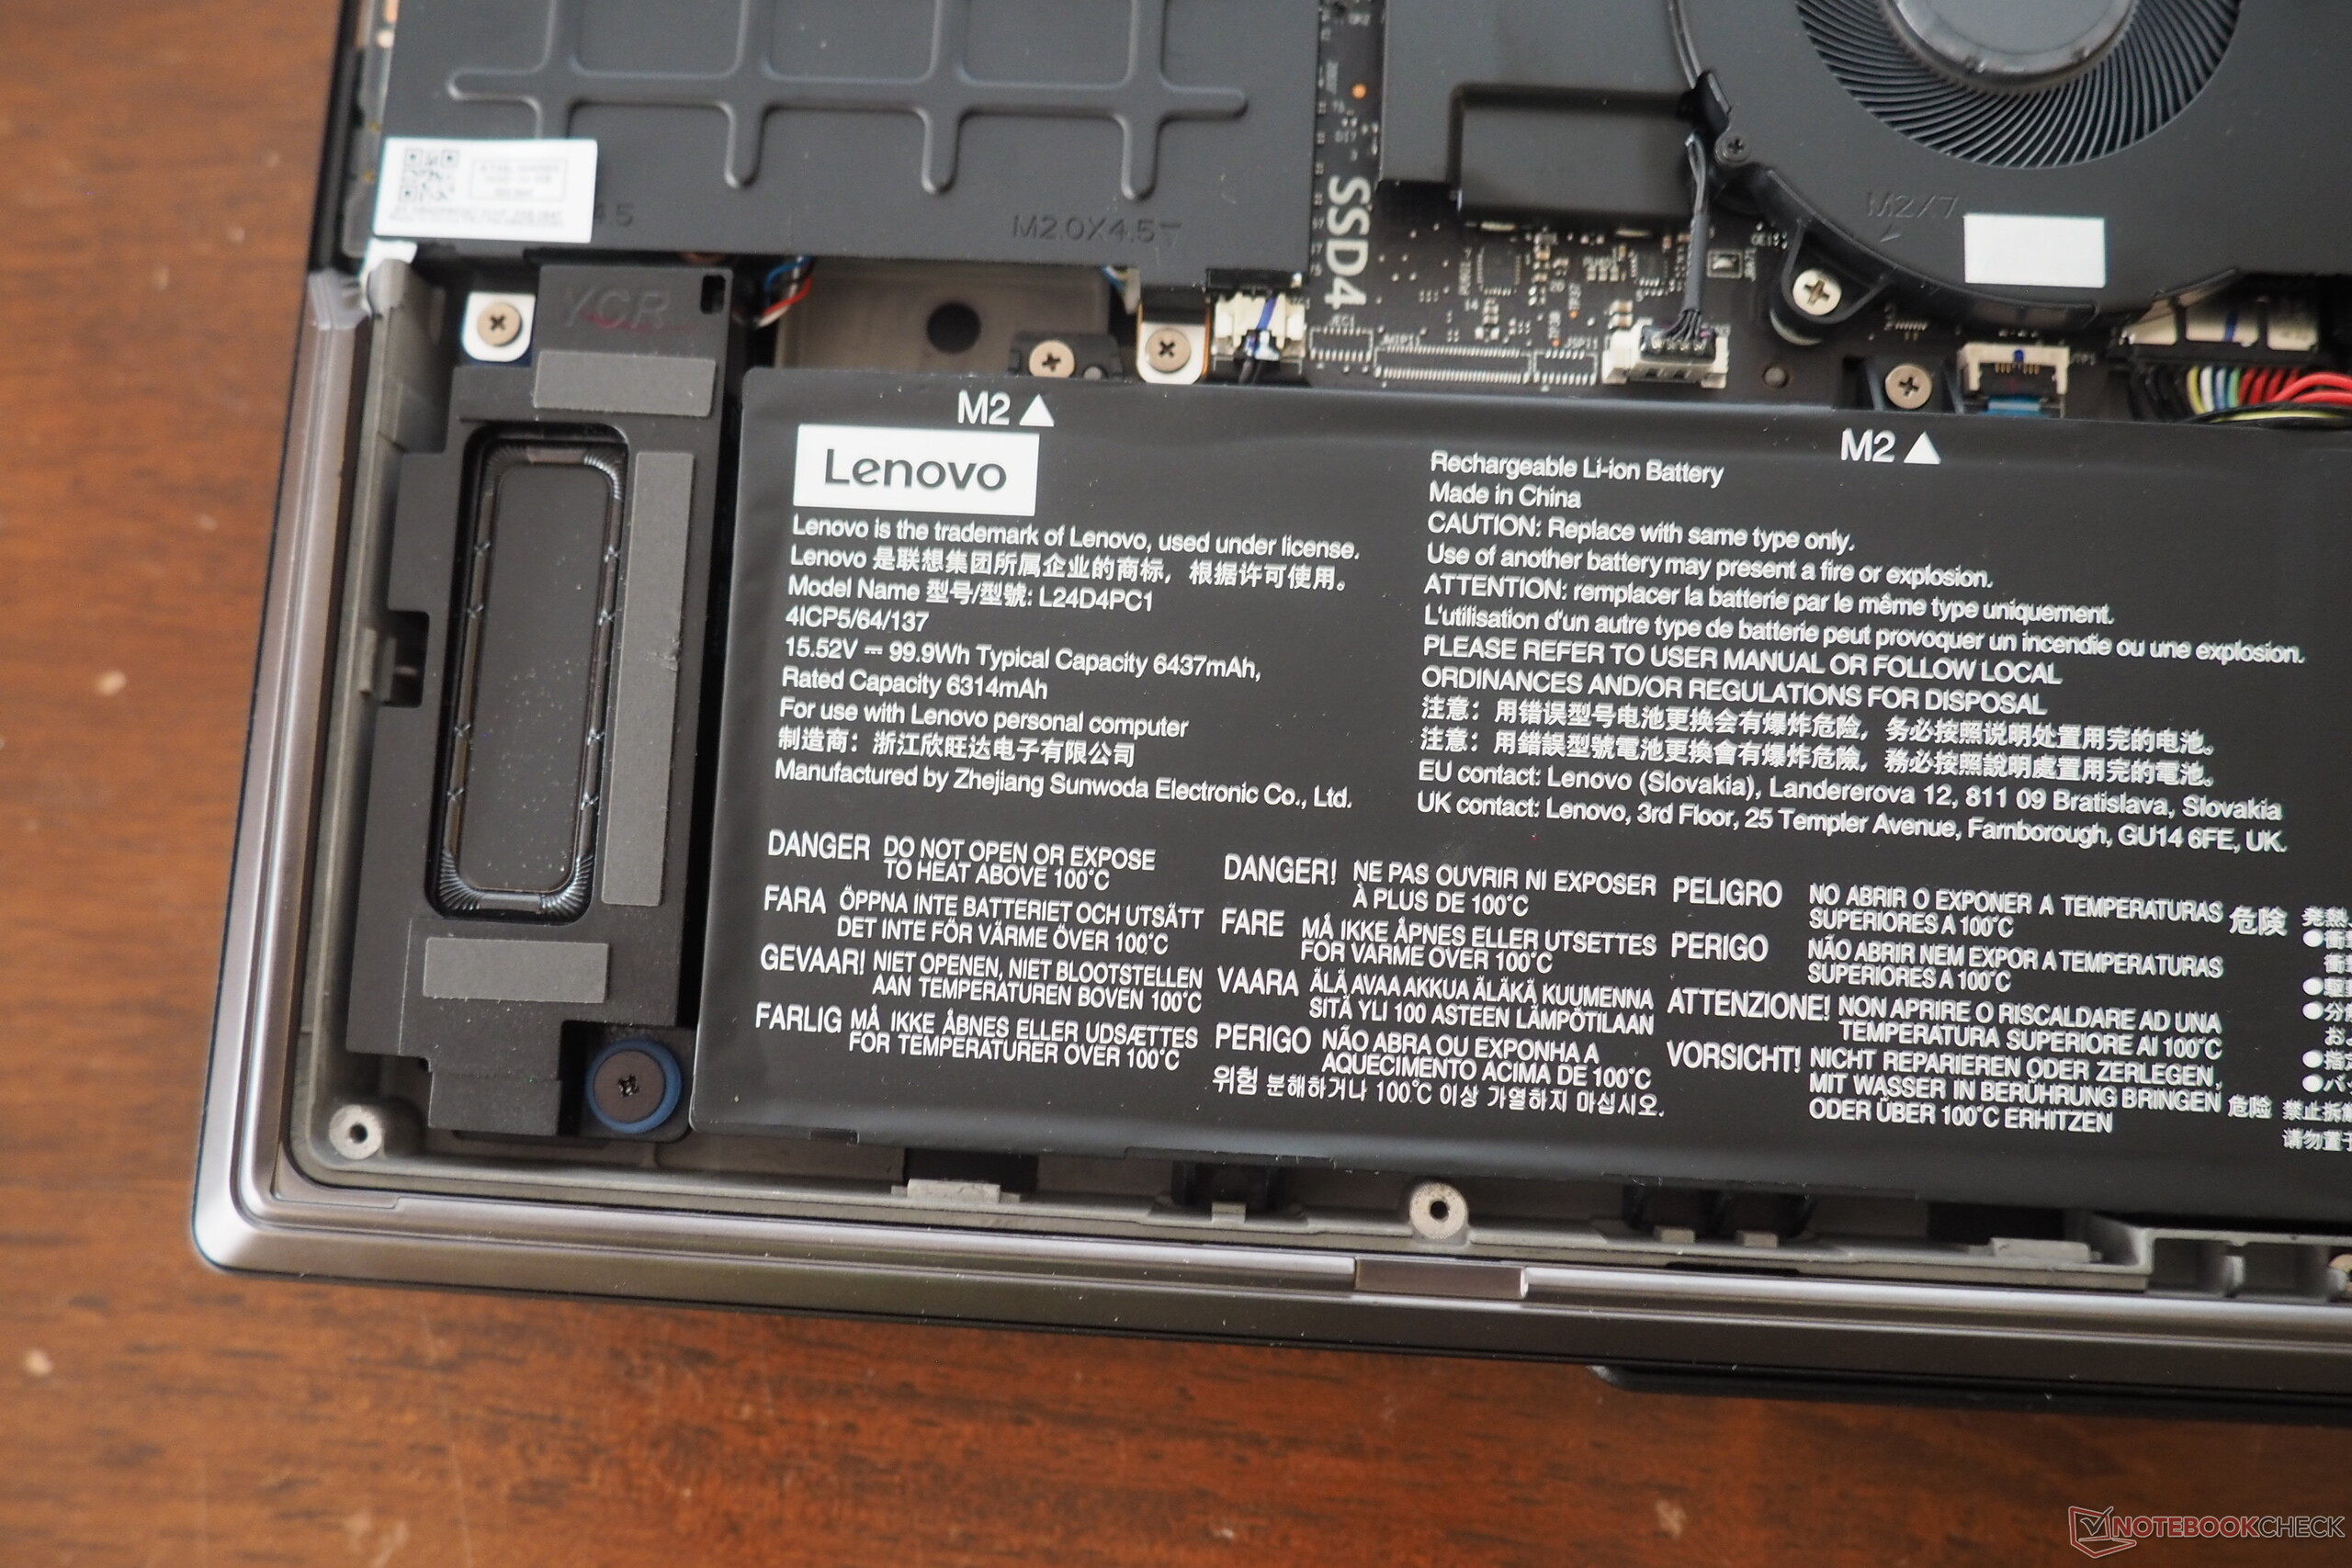
外壳的开口可以更方便维护。虽然 11 颗十字螺丝可以很容易地卸下,但底盖却非常紧,难以移开。


SD 读卡器
| SD Card Reader - average JPG Copy Test (av. of 3 runs) | |
| Lenovo Legion 9 18IAX10 (Toshiba Exceria Pro SDXC 64 GB UHS-II) | |
| Razer Blade 18 2025 RTX 5090 Laptop (Angelbird AV Pro V60) | |
| Alienware 18 Area-51 (Toshiba Exceria Pro SDXC 64 GB UHS-II) | |
| Average of class Gaming (20.9 - 210, n=54, last 2 years) | |
| Lenovo Legion 9 18IAX10 RTX 5090 (AV PRO microSD 128 GB V60) | |
交流
网络摄像头


维护
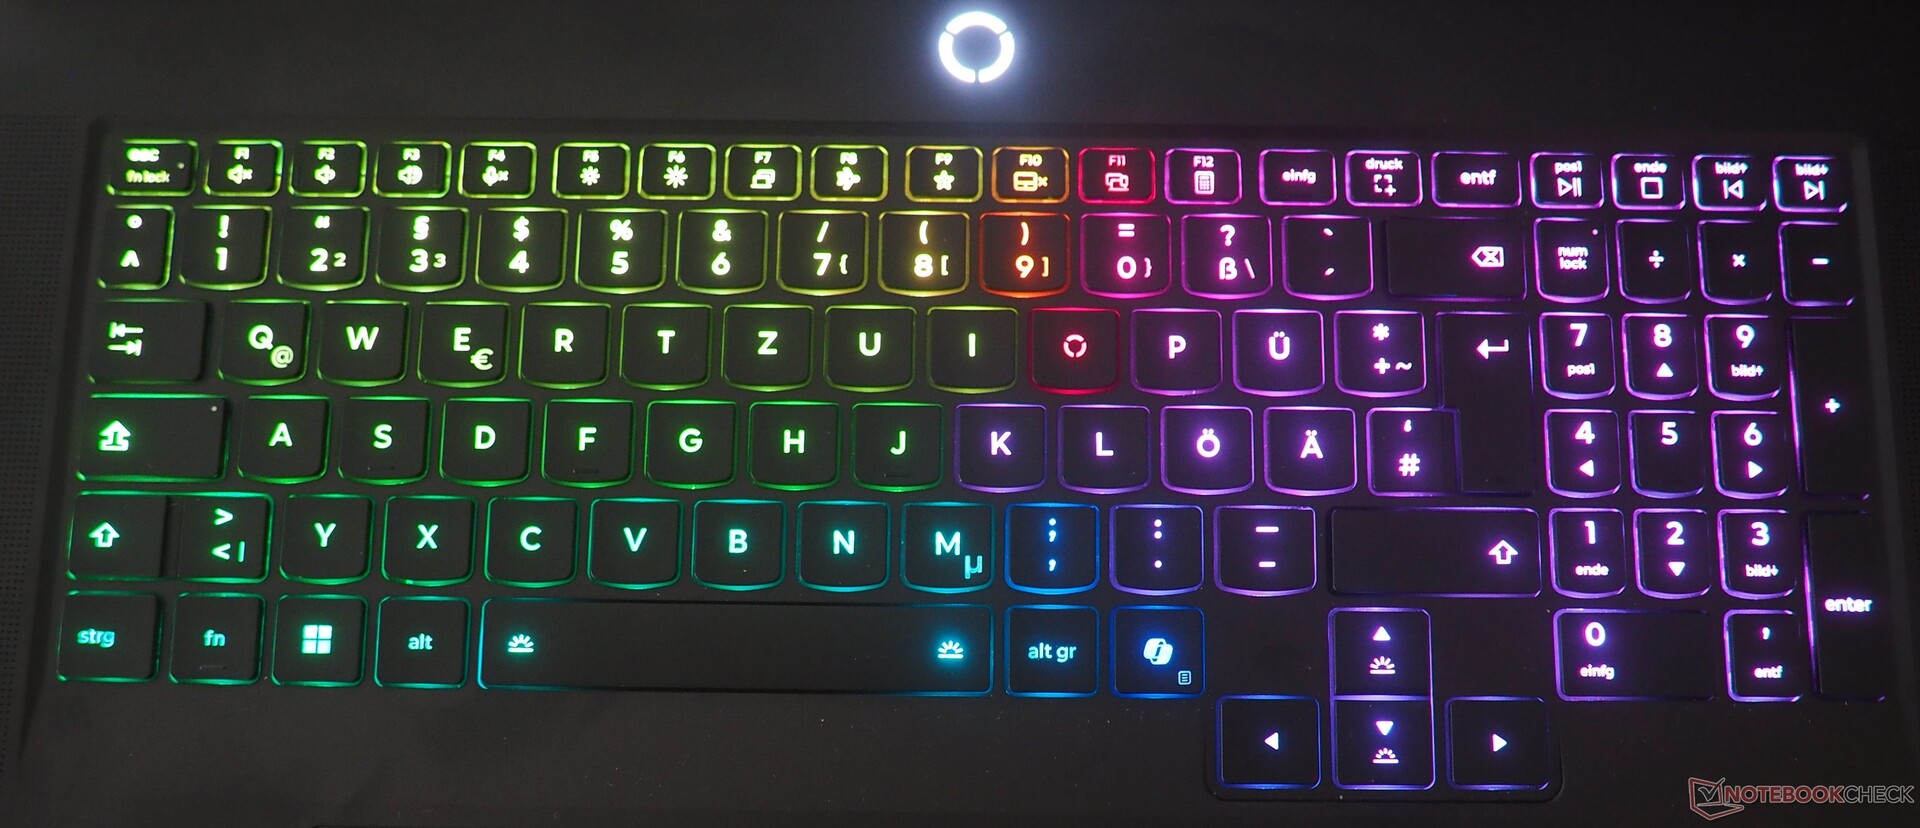
输入设备
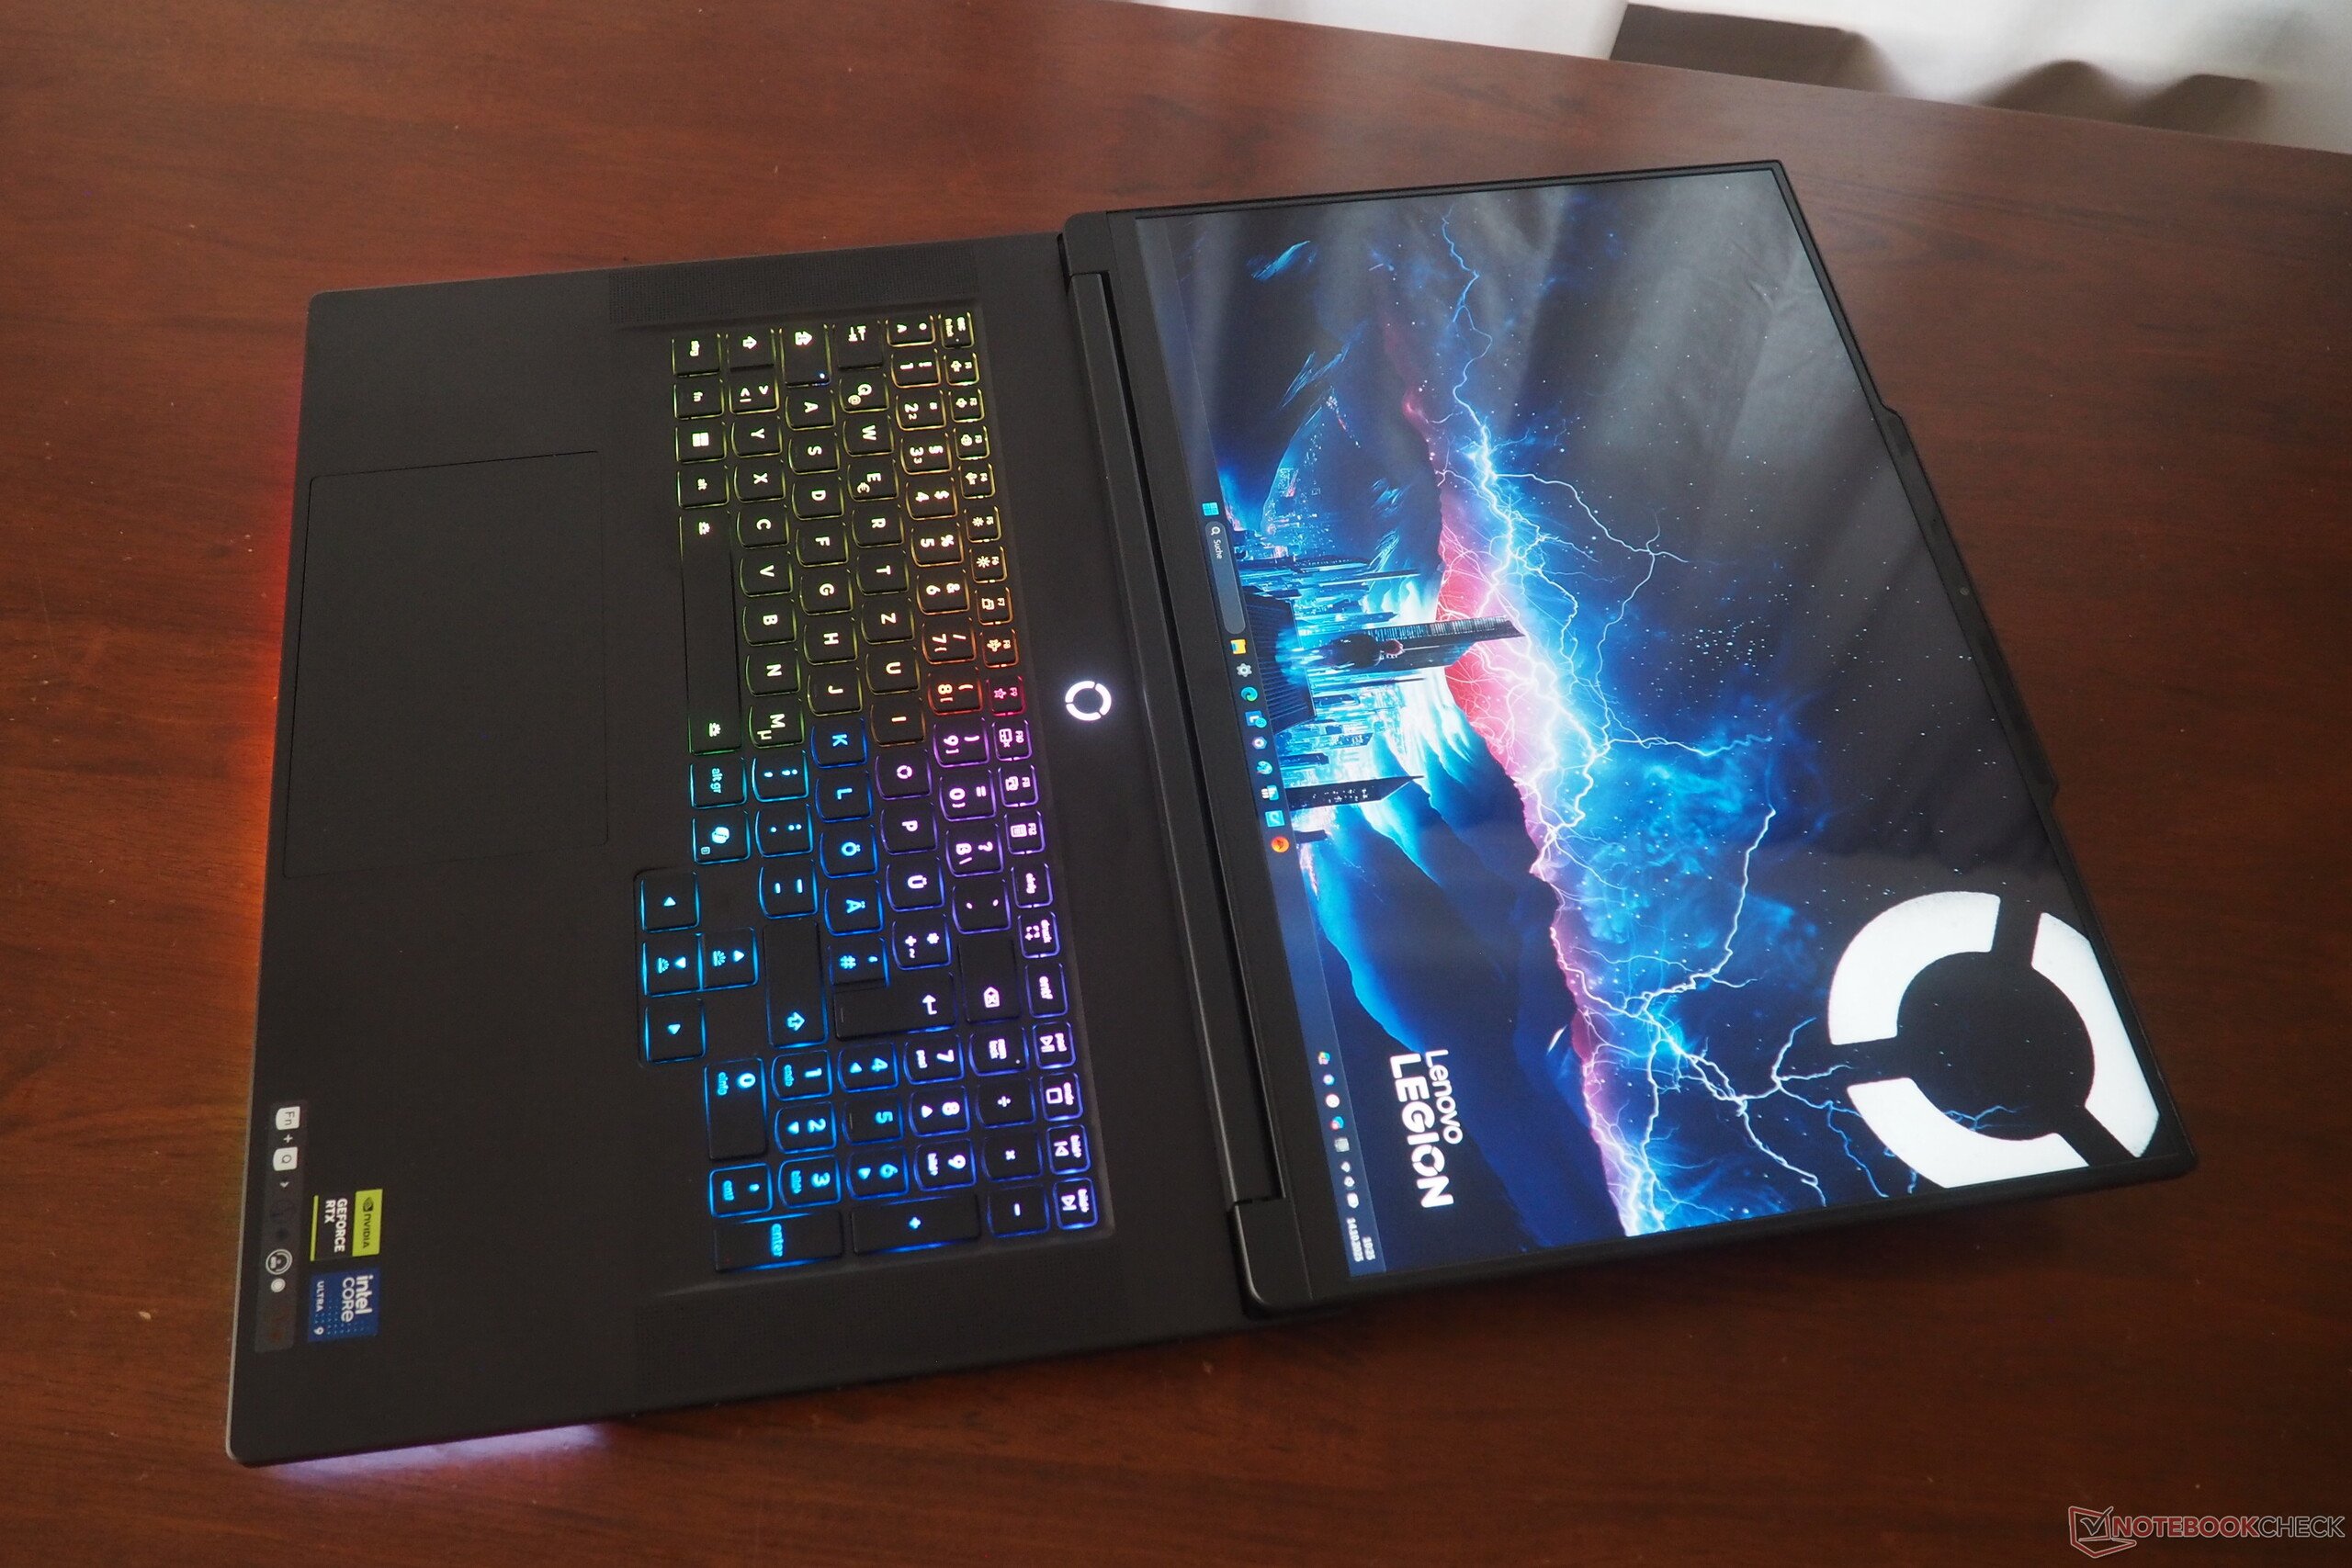
虽然联想没有使用机械键盘,但键盘输入体验令人印象深刻。除其他外,该键盘还具有密集的 RGB 灯光、高度实用的布局和令人愉悦的按键尺寸,尤其是方向键。
此外,还有一块精密触摸板,尺寸为 15 x 9.5 厘米,滑动性能相当不错。
显示屏
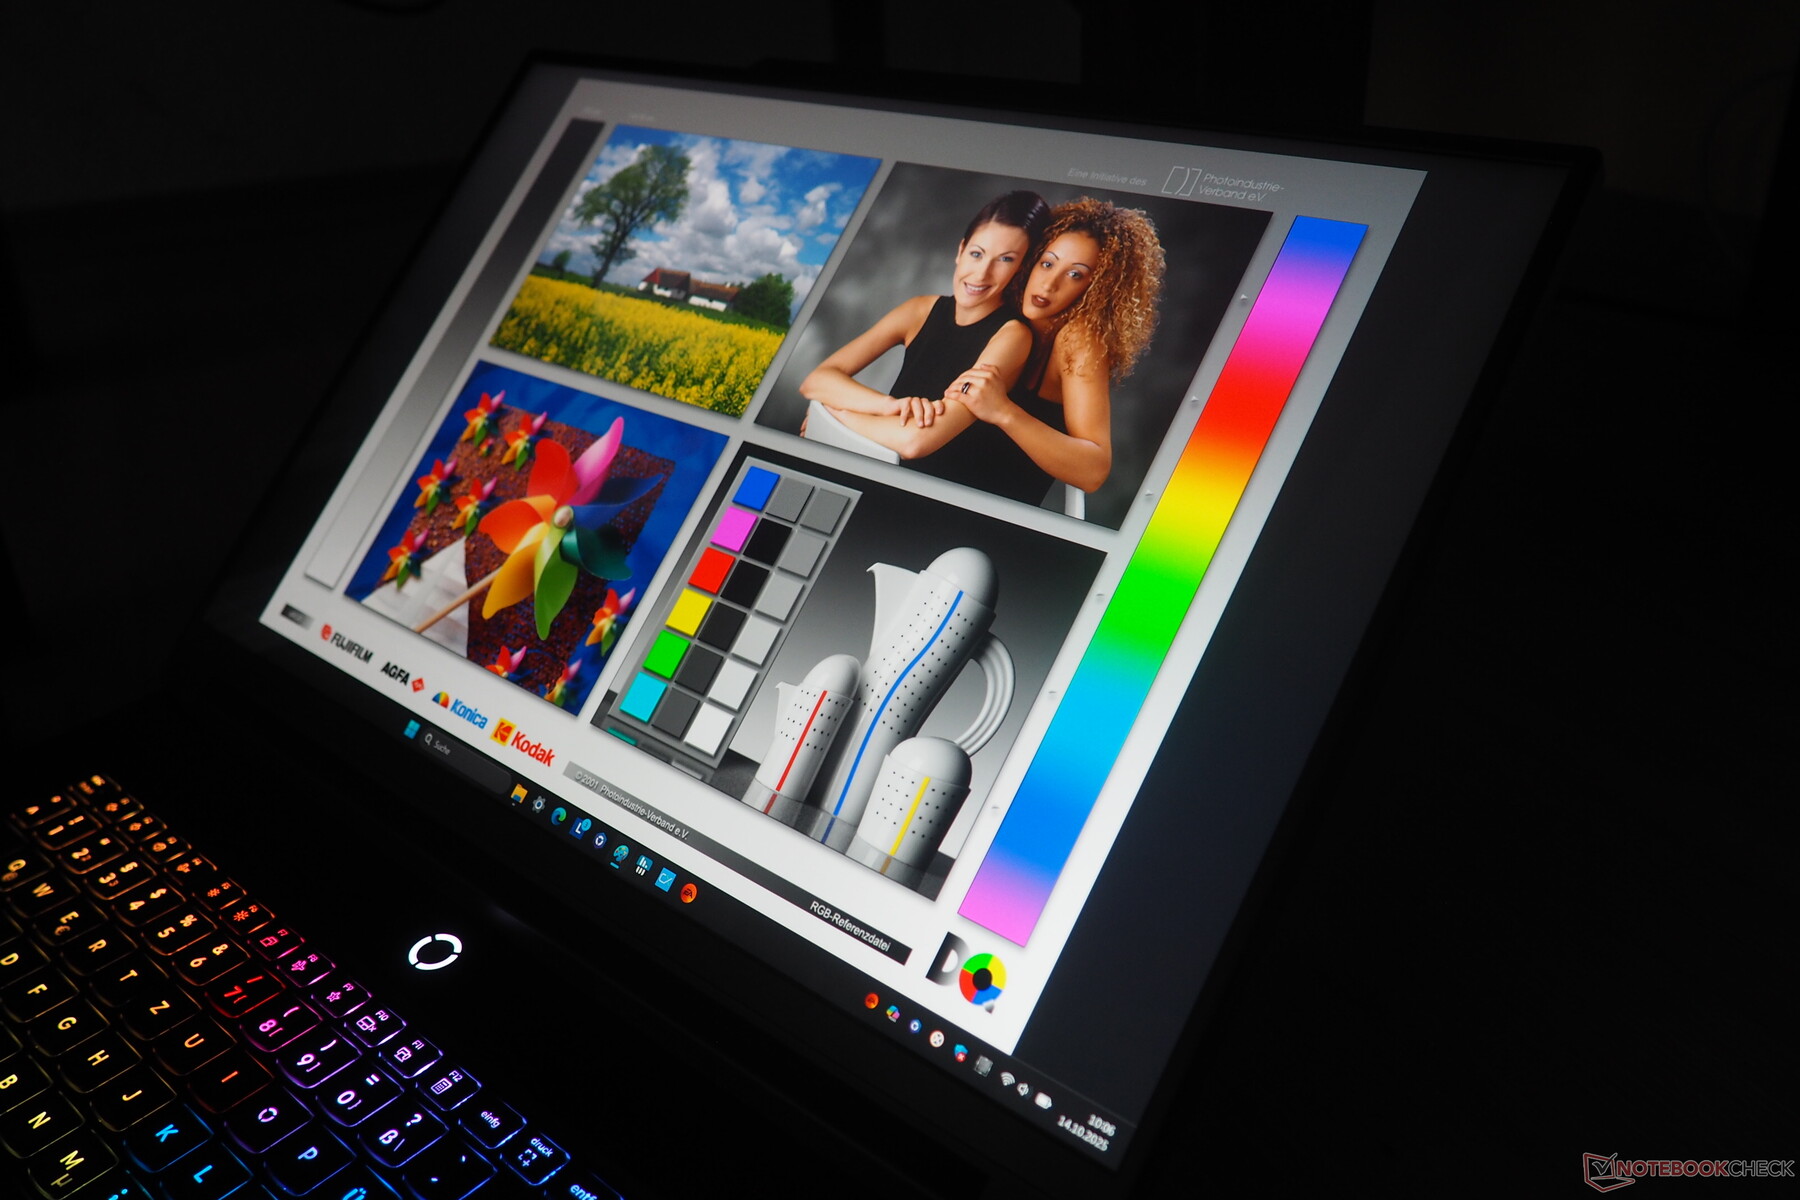
联想的显示屏决定有些令人费解。与 RTX 5080 版本类似,RTX 5090 SKU 也采用了光面 IPS 面板,而这种面板会因环境不同而产生高反光。
为了防止这种反光,IPS 机型通常安装的是哑光版,而 OLED 面板(有人会说很不幸)几乎全是亮光版。
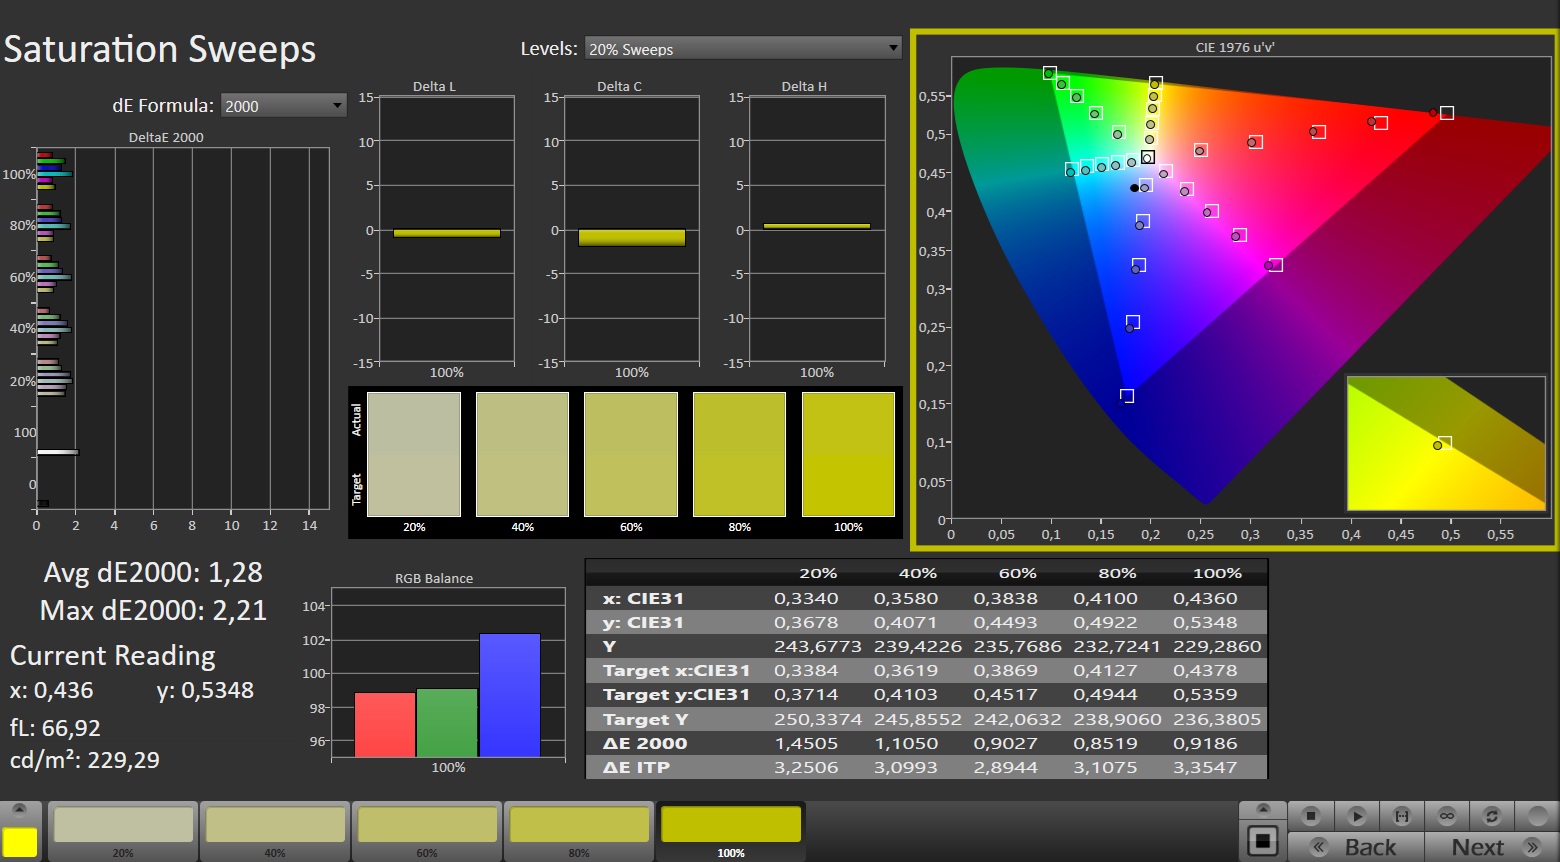
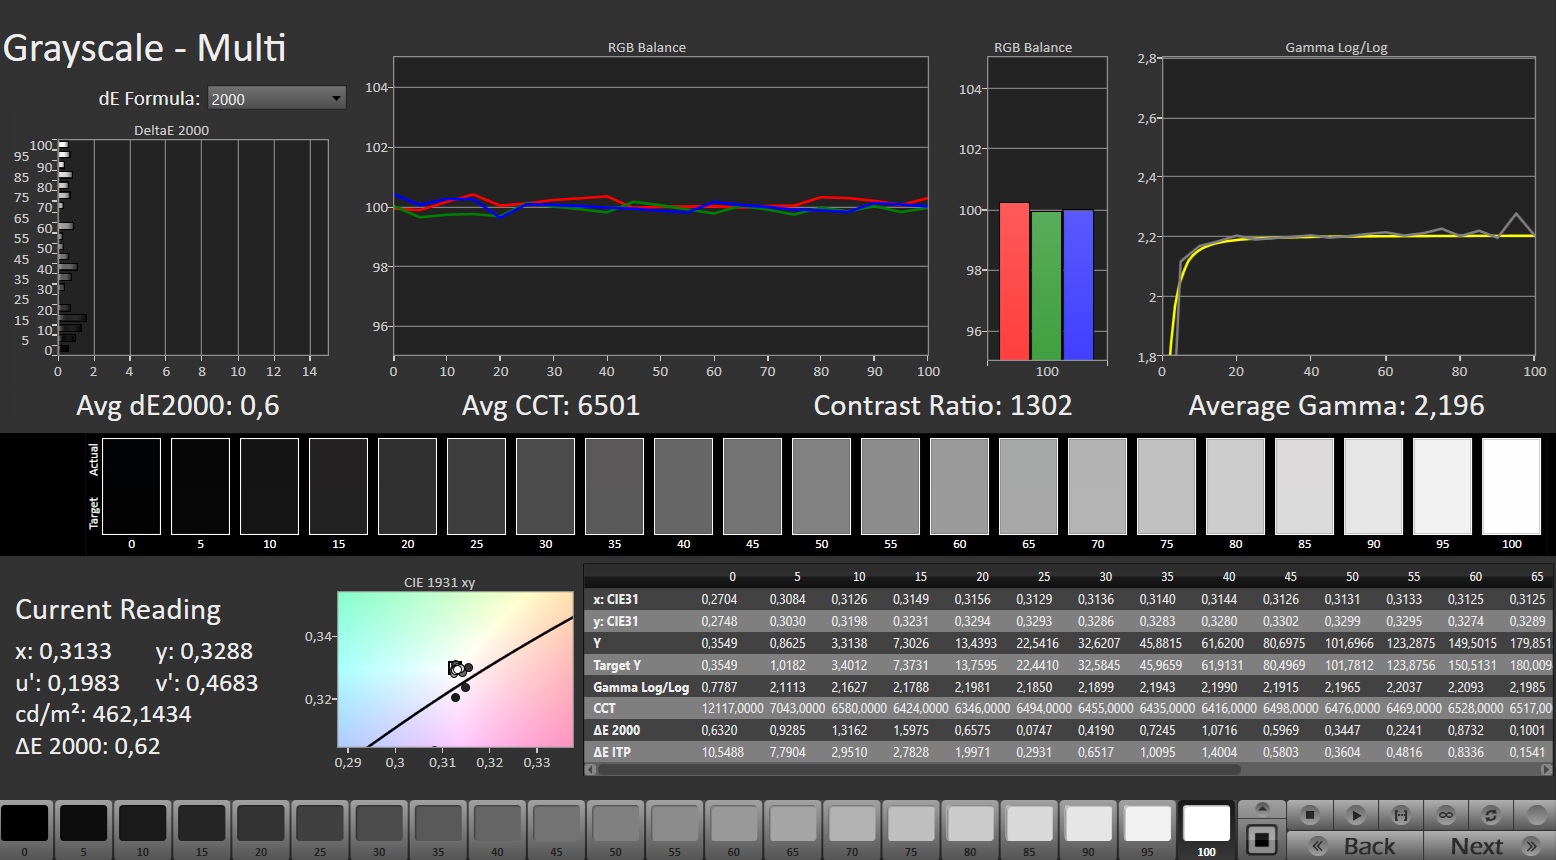
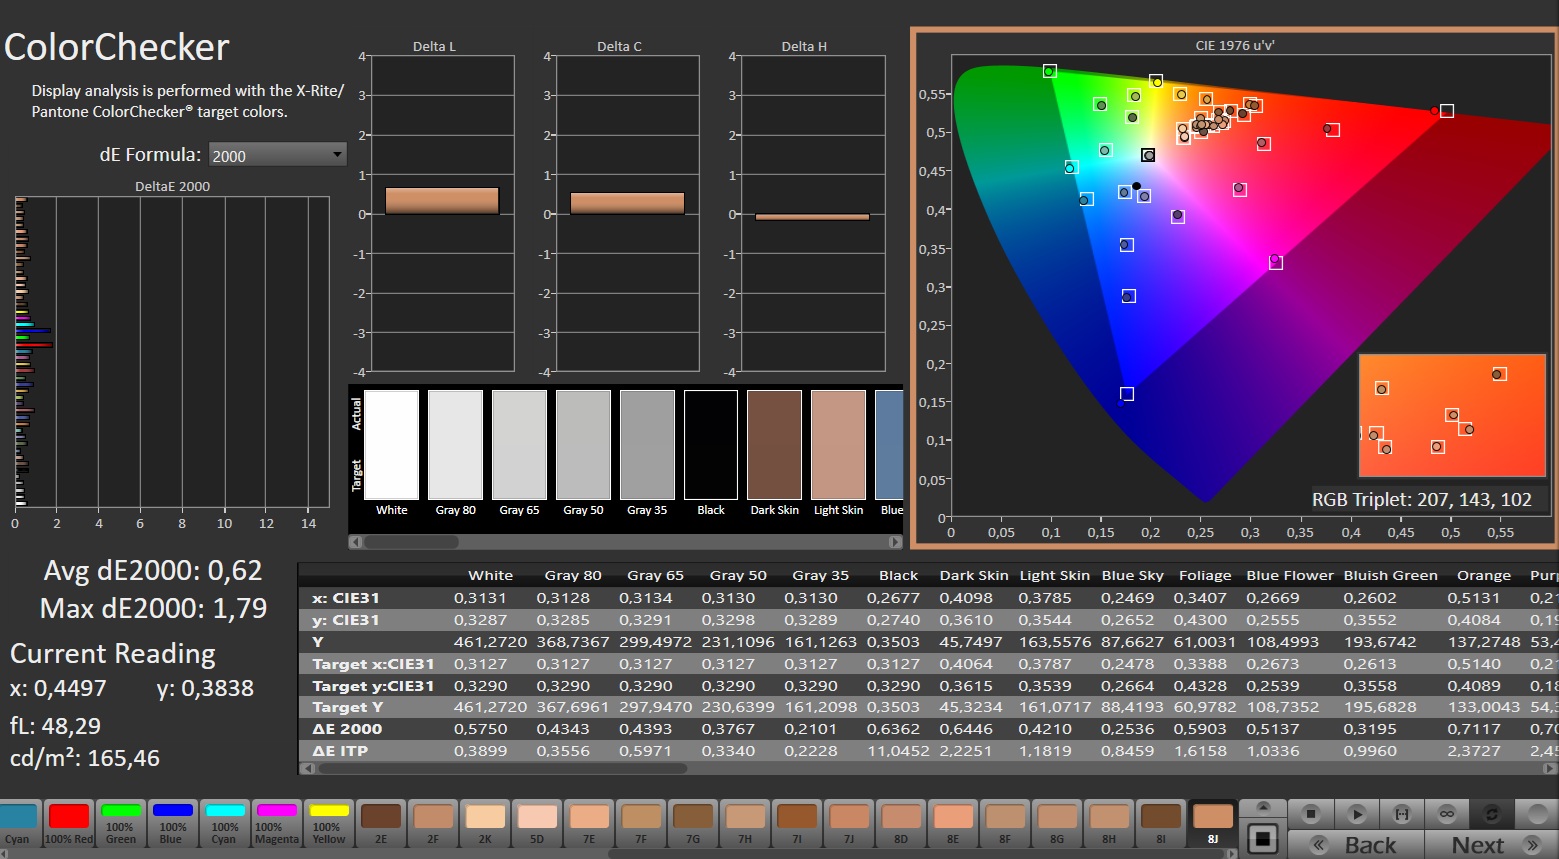
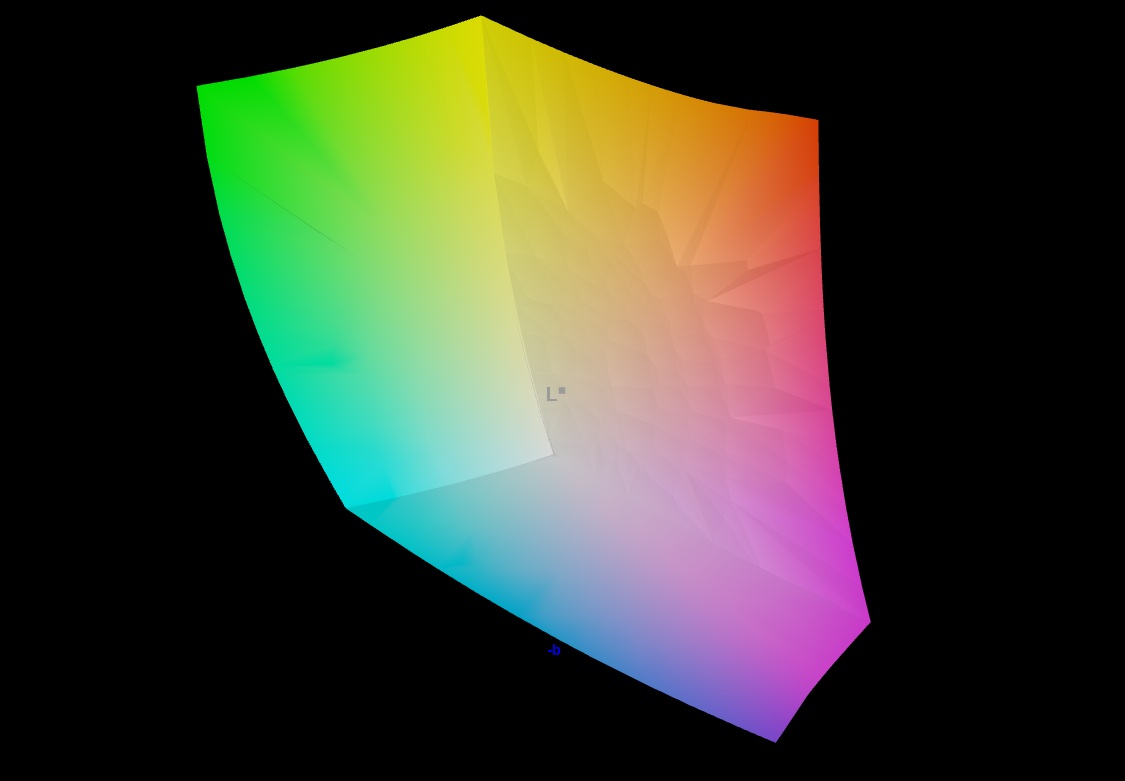
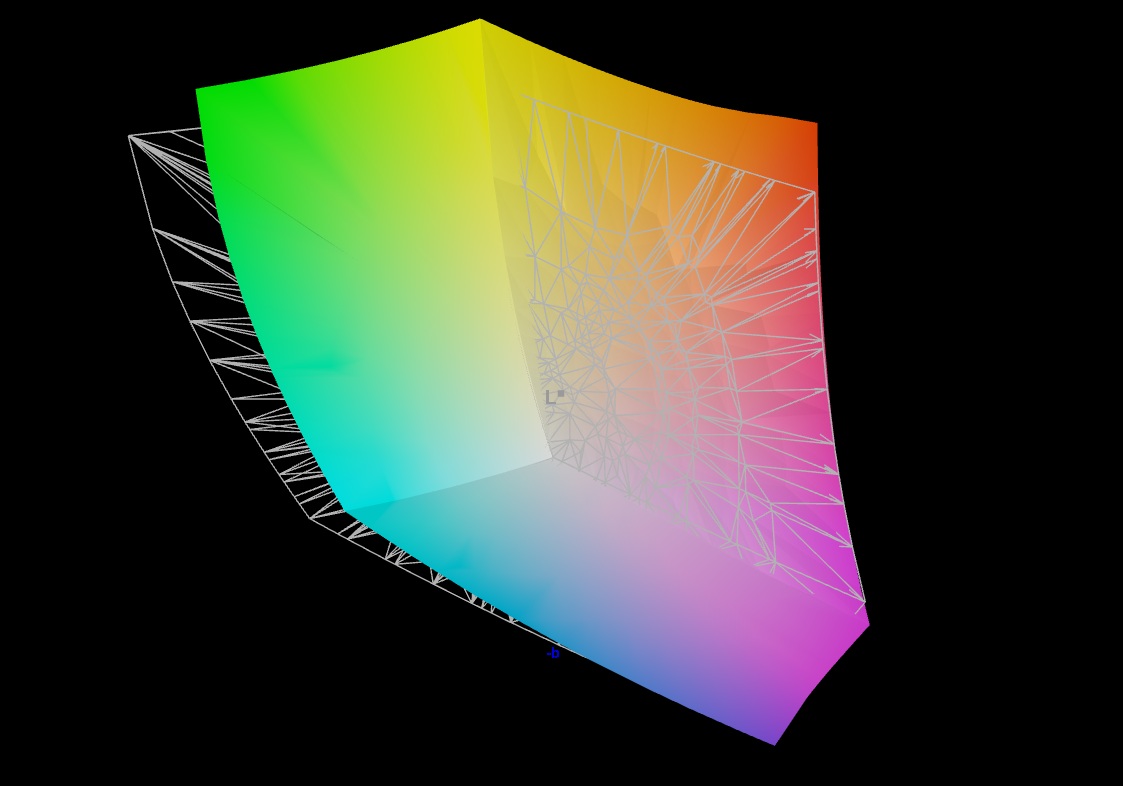
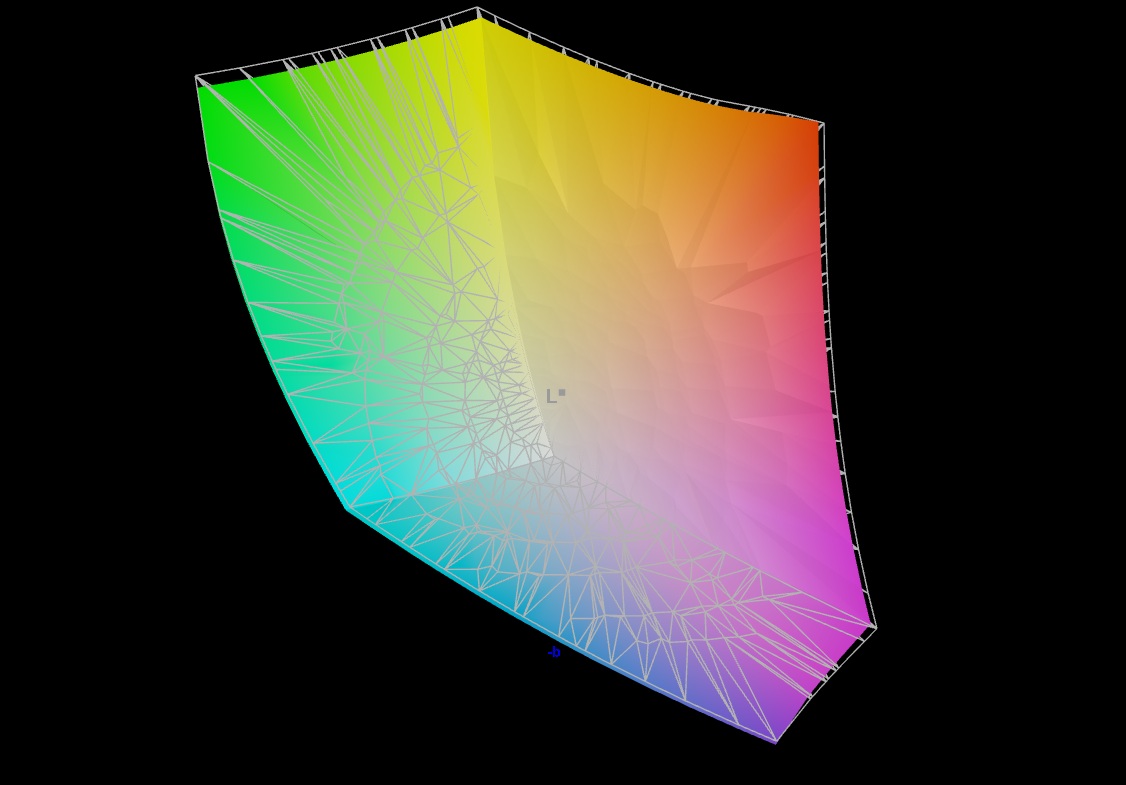
亮面面板的优点是色彩鲜艳,而且这种 240 Hz 面板的色域覆盖范围大。除了 Display P3,Adobe RGB 也几乎完全覆盖。
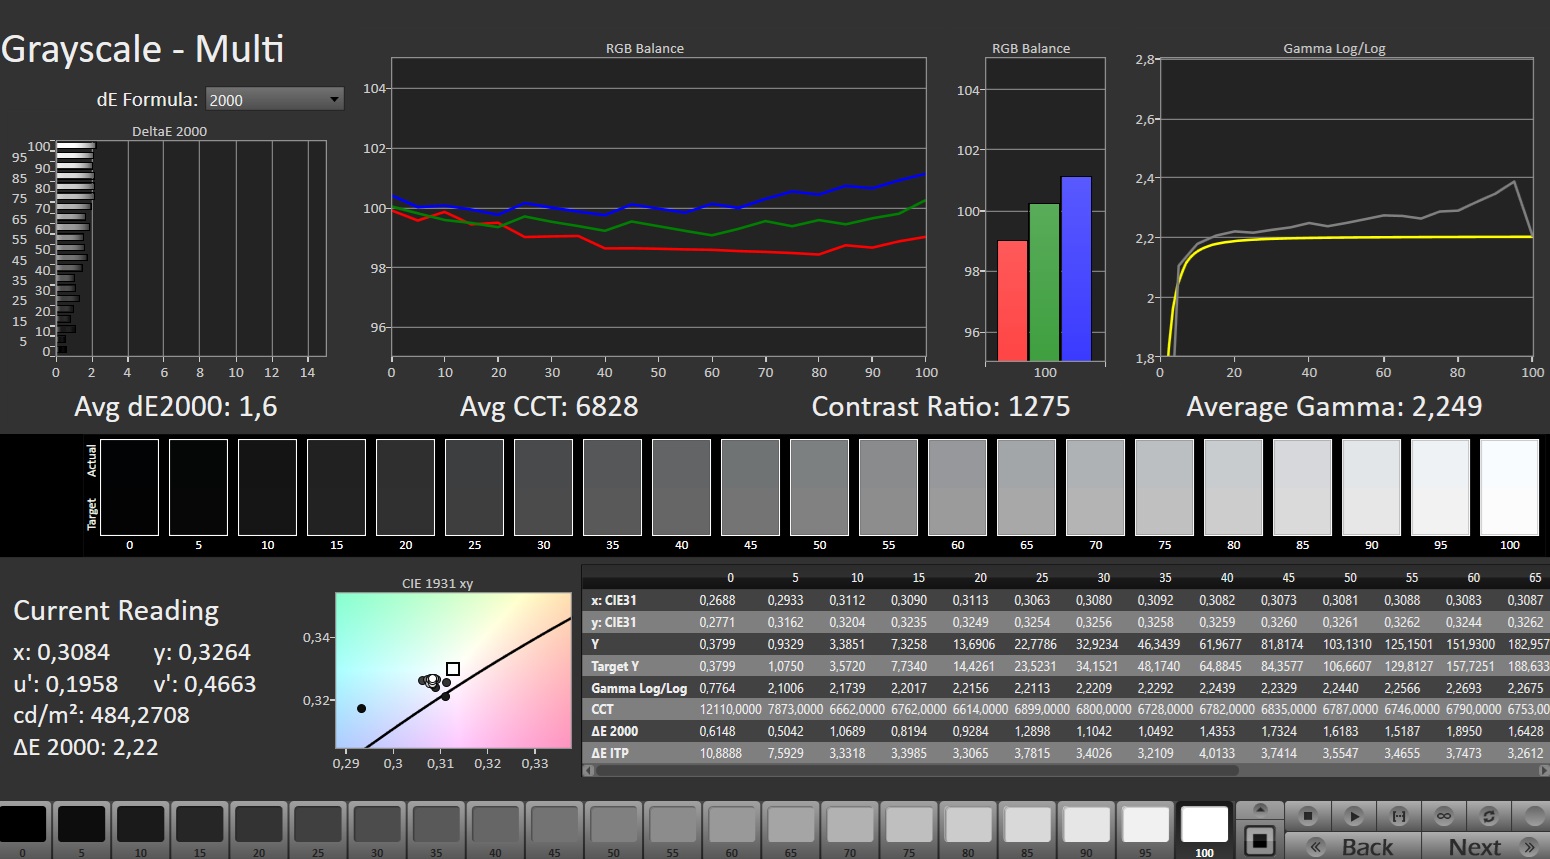
显示器在交付时已进行预校准,因此色彩准确度很高。按照 IPS 的标准,其数值也是不错的,没有被竞争对手超越。
440 cd/m² 的平均亮度和 0.27 cd/m² 的黑色值确保了低于 1,600:1 的对比度。在视角稳定性和响应时间方面也没有任何惊喜。
由于分辨率高达 3,840 x 2,400(16:10 格式),画面看起来相当清晰。
| |||||||||||||||||||||||||
Brightness Distribution: 84 %
Center on Battery: 439 cd/m²
Contrast: 1626:1 (Black: 0.27 cd/m²)
ΔE ColorChecker Calman: 0.99 | ∀{0.5-29.43 Ø4.71}
calibrated: 0.62
ΔE Greyscale Calman: 1.6 | ∀{0.09-98 Ø4.96}
88.9% AdobeRGB 1998 (Argyll 3D)
100% sRGB (Argyll 3D)
96.8% Display P3 (Argyll 3D)
Gamma: 2.249
CCT: 6828 K
| Lenovo Legion 9 18IAX10 RTX 5090 BOEhydis NE180QAM-NZ2 (BOE0D5B), IPS, 3840x2400, 18", 240 Hz | Alienware 18 Area-51 AU Optronics B180QAN, IPS, 2560x1600, 18", 300 Hz | Asus Strix Scar 18 G835LX N180QDM-NM2, Mini-LED, 2560x1600, 18", 240 Hz | Razer Blade 18 2025 RTX 5090 Laptop NE180QAM-NZ1, IPS, 3840x2400, 18", 240 Hz | Lenovo Legion 9 18IAX10 BOE NE180QAM-NZ2, IPS, 3840x2400, 18", 240 Hz | |
|---|---|---|---|---|---|
| Display | 0% | 0% | 0% | -0% | |
| Display P3 Coverage (%) | 96.8 | 96.1 -1% | 99 2% | 97 0% | 96 -1% |
| sRGB Coverage (%) | 100 | 100 0% | 100 0% | 100 0% | 100 0% |
| AdobeRGB 1998 Coverage (%) | 88.9 | 89.7 1% | 87.2 -2% | 89 0% | 88.8 0% |
| Response Times | -12% | -1% | 48% | 8% | |
| Response Time Grey 50% / Grey 80% * (ms) | 12.7 ? | 13 ? -2% | 7.4 ? 42% | 5.1 ? 60% | 9.7 ? 24% |
| Response Time Black / White * (ms) | 7.2 ? | 8.7 ? -21% | 10.4 ? -44% | 4.6 ? 36% | 7.8 ? -8% |
| PWM Frequency (Hz) | 20610 ? | ||||
| PWM Amplitude * (%) | 100 | ||||
| Screen | -80% | 69% | -56% | -67% | |
| Brightness middle (cd/m²) | 439 | 512.5 17% | 764 74% | 545 24% | 479.7 9% |
| Brightness (cd/m²) | 440 | 496 13% | 747 70% | 510 16% | 465 6% |
| Brightness Distribution (%) | 84 | 94 12% | 93 11% | 86 2% | 86 2% |
| Black Level * (cd/m²) | 0.27 | 0.41 -52% | 0.1 63% | 0.41 -52% | 0.27 -0% |
| Contrast (:1) | 1626 | 1250 -23% | 7640 370% | 1329 -18% | 1777 9% |
| Colorchecker dE 2000 * | 0.99 | 3.24 -227% | 1.2 -21% | 2.2 -122% | 3.14 -217% |
| Colorchecker dE 2000 max. * | 2.25 | 8.4 -273% | 2.8 -24% | 5.8 -158% | 6.48 -188% |
| Colorchecker dE 2000 calibrated * | 0.62 | 0.47 24% | 1.1 -77% | 1.17 -89% | |
| Greyscale dE 2000 * | 1.6 | 5 -213% | 1.5 6% | 3.5 -119% | 3.8 -137% |
| Gamma | 2.249 98% | 2.37 93% | 2.17 101% | 2.18 101% | 2.18 101% |
| CCT | 6828 95% | 6417 101% | 6556 99% | 7027 93% | 7301 89% |
| Total Average (Program / Settings) | -31% /
-53% | 23% /
42% | -3% /
-29% | -20% /
-42% |
* ... smaller is better


Display Response Times
| ↔ Response Time Black to White | ||
|---|---|---|
| 7.2 ms ... rise ↗ and fall ↘ combined | ↗ 3.3 ms rise | 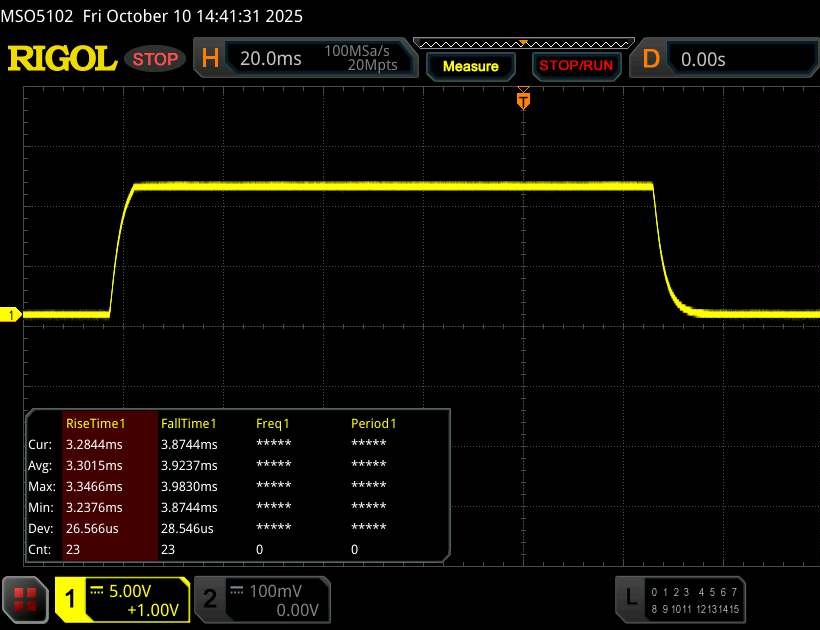 |
| ↘ 3.9 ms fall | ||
| The screen shows very fast response rates in our tests and should be very well suited for fast-paced gaming. In comparison, all tested devices range from 0.1 (minimum) to 240 (maximum) ms. » 22 % of all devices are better. This means that the measured response time is better than the average of all tested devices (19.8 ms). | ||
| ↔ Response Time 50% Grey to 80% Grey | ||
| 12.7 ms ... rise ↗ and fall ↘ combined | ↗ 6.2 ms rise | 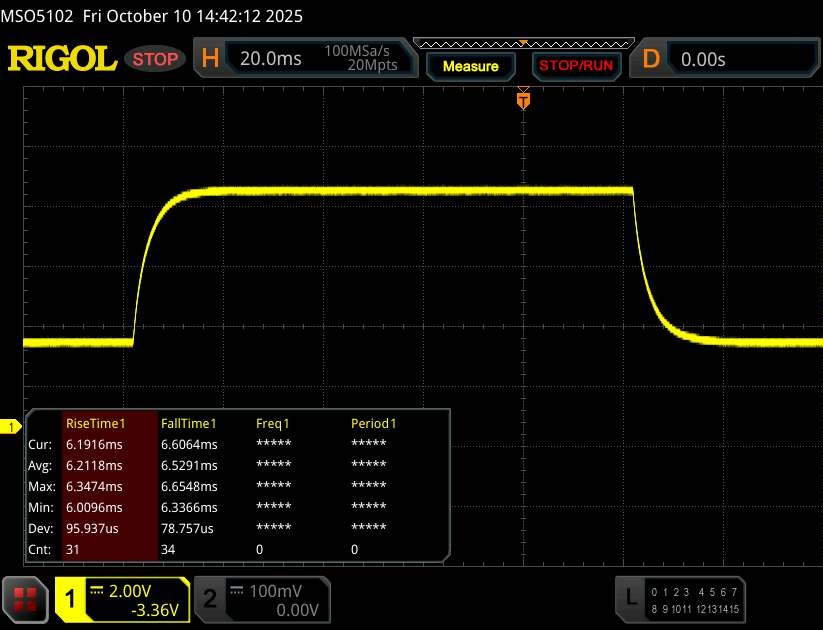 |
| ↘ 6.5 ms fall | ||
| The screen shows good response rates in our tests, but may be too slow for competitive gamers. In comparison, all tested devices range from 0.165 (minimum) to 636 (maximum) ms. » 26 % of all devices are better. This means that the measured response time is better than the average of all tested devices (31 ms). | ||
Screen Flickering / PWM (Pulse-Width Modulation)
| Screen flickering / PWM not detected |  | ||
In comparison: 52 % of all tested devices do not use PWM to dim the display. If PWM was detected, an average of 7747 (minimum: 5 - maximum: 343500) Hz was measured. | |||
性能
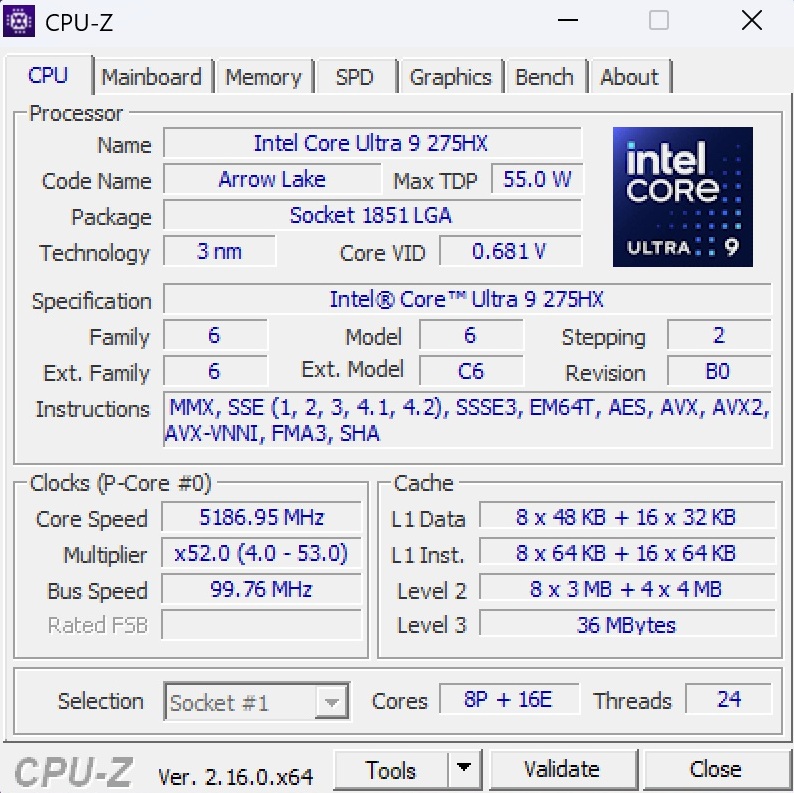
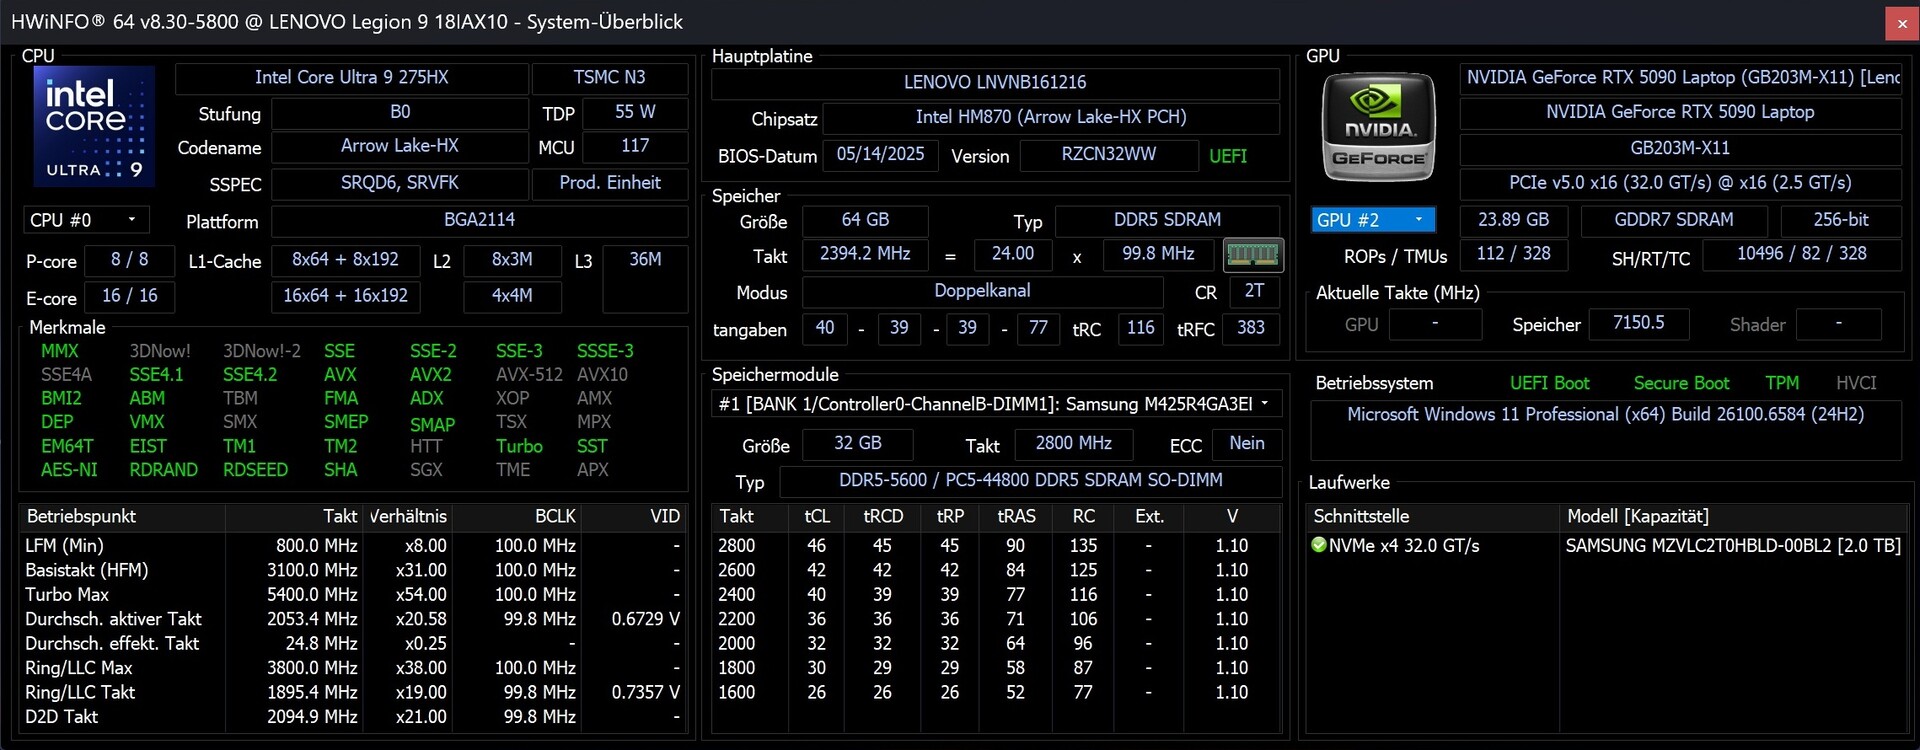
在硬件方面,尤其是 CPU 和 GPU,Legion 9 18IAX10 属于绝对的高端产品。
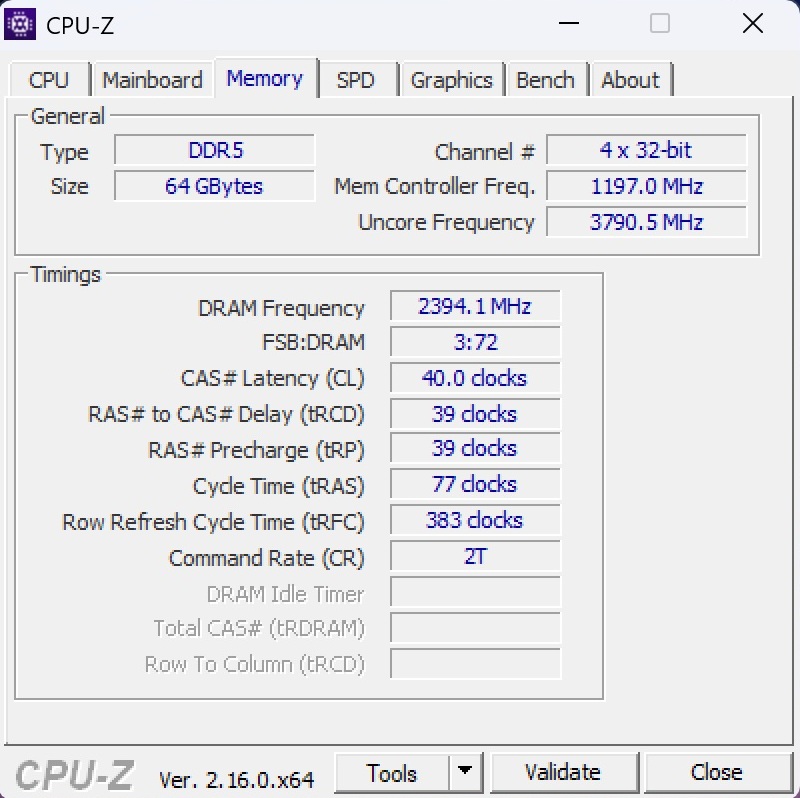
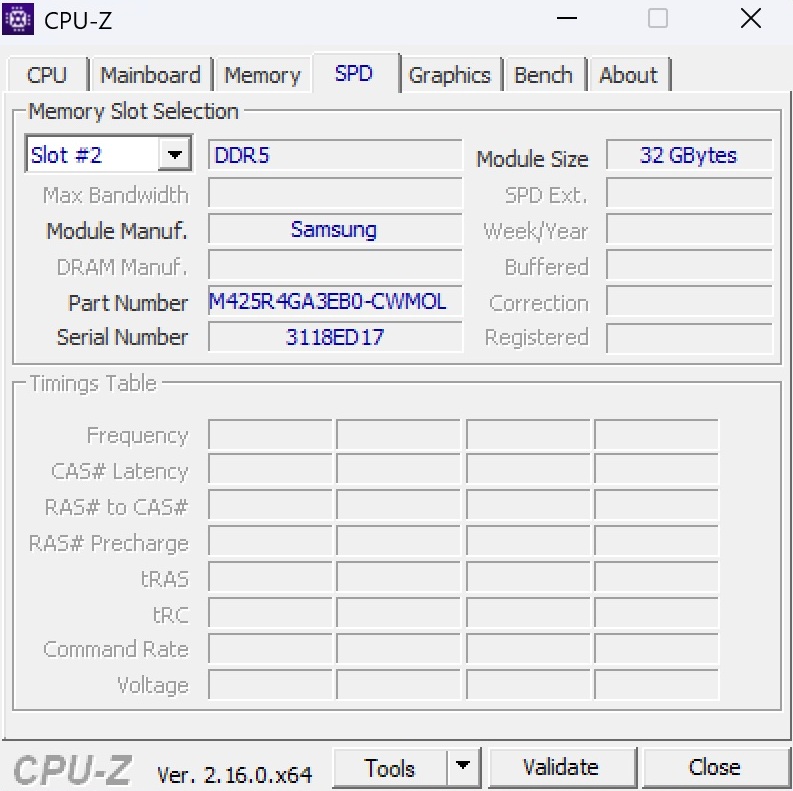
64 GB 内存对于大多数用户来说也不会很快达到极限,但考虑到测试配置的价格,内置的 2 TB SSD 可能会更大一些。
测试条件
运行模式可以通过Legion 软件进行切换,也可以通过 Fn + Q 组合键方便地进行切换。除非另有说明,否则我们的测量都是在启用 GPU 超频的性能配置文件下进行的。
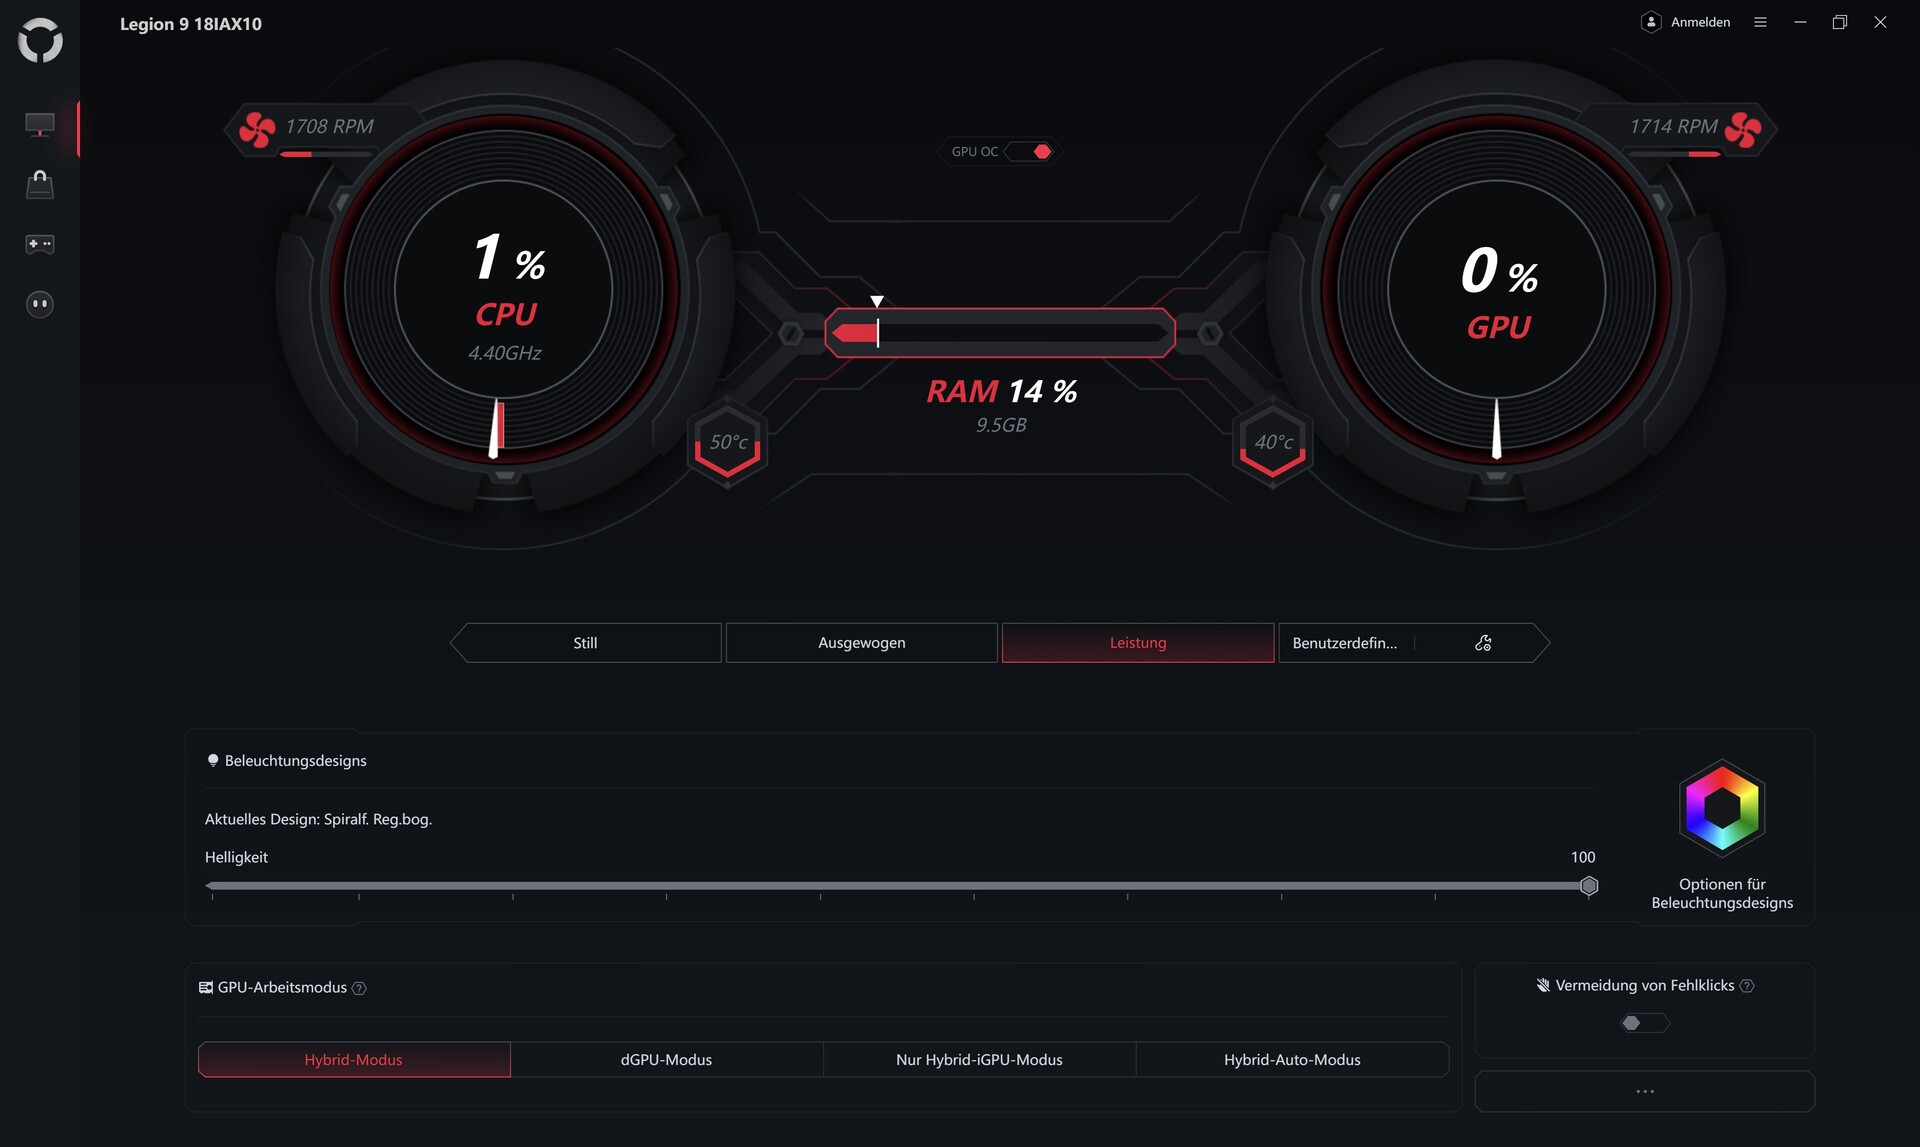
| 模式 | 静音 | 平衡 + GPU OC | 性能 + GPU OC |
| 赛博朋克 2077》噪音 | 41 dB(A) | 49 dB(A) | 56 dB(A) |
| 赛博朋克 2077》性能(FHD/超高清) | 114 fps | 136 fps | 170 fps |
| 赛博朋克 2077》GPU 功耗 | ~75 W | ~95 W | ~165 W |
| Cinebench R15 多重得分 | 4124 分 | 5040 分 | 6013 分 |
| CPU PL1 | 56 W | 91 W | 171 W |
| CPU PL2 | 65 W | 125 W | 205 W |
处理器
高 PL1 和 PL2 级别的 英特尔酷睿至尊 9 275HX这也适用于Legion 9 18 的竞争对手,它们也都配备了 275HX。
Cinebench R15 多核循环测试的结果也非常稳定,这说明散热效果良好。
Cinebench R15 多核环路
* ... smaller is better
AIDA64: FP32 Ray-Trace | FPU Julia | CPU SHA3 | CPU Queen | FPU SinJulia | FPU Mandel | CPU AES | CPU ZLib | FP64 Ray-Trace | CPU PhotoWorxx
| Performance rating | |
| Lenovo Legion 9 18IAX10 | |
| Alienware 18 Area-51 | |
| Asus Strix Scar 18 G835LX | |
| Lenovo Legion 9 18IAX10 RTX 5090 | |
| Razer Blade 18 2025 RTX 5090 Laptop | |
| Average Intel Core Ultra 9 275HX | |
| Average of class Gaming | |
| AIDA64 / FP32 Ray-Trace | |
| Lenovo Legion 9 18IAX10 | |
| Asus Strix Scar 18 G835LX | |
| Lenovo Legion 9 18IAX10 RTX 5090 | |
| Alienware 18 Area-51 | |
| Average Intel Core Ultra 9 275HX (28039 - 39895, n=30) | |
| Razer Blade 18 2025 RTX 5090 Laptop | |
| Average of class Gaming (10227 - 85542, n=103, last 2 years) | |
| AIDA64 / FPU Julia | |
| Alienware 18 Area-51 | |
| Lenovo Legion 9 18IAX10 | |
| Lenovo Legion 9 18IAX10 RTX 5090 | |
| Asus Strix Scar 18 G835LX | |
| Razer Blade 18 2025 RTX 5090 Laptop | |
| Average Intel Core Ultra 9 275HX (140254 - 200744, n=30) | |
| Average of class Gaming (51376 - 238426, n=103, last 2 years) | |
| AIDA64 / CPU SHA3 | |
| Lenovo Legion 9 18IAX10 | |
| Asus Strix Scar 18 G835LX | |
| Alienware 18 Area-51 | |
| Lenovo Legion 9 18IAX10 RTX 5090 | |
| Razer Blade 18 2025 RTX 5090 Laptop | |
| Average Intel Core Ultra 9 275HX (6710 - 9817, n=30) | |
| Average of class Gaming (2180 - 9817, n=103, last 2 years) | |
| AIDA64 / CPU Queen | |
| Alienware 18 Area-51 | |
| Lenovo Legion 9 18IAX10 | |
| Asus Strix Scar 18 G835LX | |
| Lenovo Legion 9 18IAX10 RTX 5090 | |
| Razer Blade 18 2025 RTX 5090 Laptop | |
| Average Intel Core Ultra 9 275HX (113887 - 140937, n=30) | |
| Average of class Gaming (49785 - 173351, n=89, last 2 years) | |
| AIDA64 / FPU SinJulia | |
| Average of class Gaming (4424 - 33636, n=103, last 2 years) | |
| Lenovo Legion 9 18IAX10 | |
| Lenovo Legion 9 18IAX10 RTX 5090 | |
| Asus Strix Scar 18 G835LX | |
| Alienware 18 Area-51 | |
| Razer Blade 18 2025 RTX 5090 Laptop | |
| Average Intel Core Ultra 9 275HX (11172 - 14425, n=30) | |
| AIDA64 / FPU Mandel | |
| Lenovo Legion 9 18IAX10 | |
| Alienware 18 Area-51 | |
| Asus Strix Scar 18 G835LX | |
| Lenovo Legion 9 18IAX10 RTX 5090 | |
| Razer Blade 18 2025 RTX 5090 Laptop | |
| Average Intel Core Ultra 9 275HX (72596 - 104508, n=30) | |
| Average of class Gaming (25115 - 128721, n=103, last 2 years) | |
| AIDA64 / CPU AES | |
| Lenovo Legion 9 18IAX10 | |
| Lenovo Legion 9 18IAX10 RTX 5090 | |
| Asus Strix Scar 18 G835LX | |
| Alienware 18 Area-51 | |
| Razer Blade 18 2025 RTX 5090 Laptop | |
| Average Intel Core Ultra 9 275HX (105608 - 247074, n=30) | |
| Average of class Gaming (39258 - 247074, n=103, last 2 years) | |
| AIDA64 / CPU ZLib | |
| Lenovo Legion 9 18IAX10 RTX 5090 | |
| Lenovo Legion 9 18IAX10 | |
| Asus Strix Scar 18 G835LX | |
| Alienware 18 Area-51 | |
| Razer Blade 18 2025 RTX 5090 Laptop | |
| Average Intel Core Ultra 9 275HX (1582 - 2263, n=30) | |
| Average of class Gaming (574 - 2531, n=103, last 2 years) | |
| AIDA64 / FP64 Ray-Trace | |
| Lenovo Legion 9 18IAX10 | |
| Alienware 18 Area-51 | |
| Lenovo Legion 9 18IAX10 RTX 5090 | |
| Asus Strix Scar 18 G835LX | |
| Average Intel Core Ultra 9 275HX (14847 - 21854, n=30) | |
| Razer Blade 18 2025 RTX 5090 Laptop | |
| Average of class Gaming (5509 - 45446, n=103, last 2 years) | |
| AIDA64 / CPU PhotoWorxx | |
| Alienware 18 Area-51 | |
| Razer Blade 18 2025 RTX 5090 Laptop | |
| Asus Strix Scar 18 G835LX | |
| Average Intel Core Ultra 9 275HX (37482 - 62916, n=30) | |
| Lenovo Legion 9 18IAX10 RTX 5090 | |
| Lenovo Legion 9 18IAX10 | |
| Average of class Gaming (12271 - 89891, n=103, last 2 years) | |
系统性能
在系统性能方面,Legion 9 18 与竞争对手也相差无几,这意味着在日常生产任务中几乎看不出任何差异。
PCMark 10: Essentials
CrossMark: Overall | Productivity | Creativity | Responsiveness
WebXPRT 3: Overall
WebXPRT 4: Overall
Mozilla Kraken 1.1: Total
| Performance rating | |
| Alienware 18 Area-51 | |
| Lenovo Legion 9 18IAX10 | |
| Razer Blade 18 2025 RTX 5090 Laptop | |
| Asus Strix Scar 18 G835LX | |
| Lenovo Legion 9 18IAX10 RTX 5090 | |
| Average Intel Core Ultra 9 275HX, NVIDIA GeForce RTX 5090 Laptop | |
| Average of class Gaming | |
| PCMark 10 / Essentials | |
| Lenovo Legion 9 18IAX10 | |
| Alienware 18 Area-51 | |
| Asus Strix Scar 18 G835LX | |
| Average Intel Core Ultra 9 275HX, NVIDIA GeForce RTX 5090 Laptop (9994 - 11369, n=12) | |
| Razer Blade 18 2025 RTX 5090 Laptop | |
| Lenovo Legion 9 18IAX10 RTX 5090 | |
| Average of class Gaming (8810 - 11935, n=96, last 2 years) | |
| CrossMark / Overall | |
| Alienware 18 Area-51 | |
| Razer Blade 18 2025 RTX 5090 Laptop | |
| Asus Strix Scar 18 G835LX | |
| Lenovo Legion 9 18IAX10 | |
| Average Intel Core Ultra 9 275HX, NVIDIA GeForce RTX 5090 Laptop (1995 - 2339, n=12) | |
| Lenovo Legion 9 18IAX10 RTX 5090 | |
| Average of class Gaming (1366 - 2409, n=93, last 2 years) | |
| CrossMark / Productivity | |
| Alienware 18 Area-51 | |
| Razer Blade 18 2025 RTX 5090 Laptop | |
| Lenovo Legion 9 18IAX10 | |
| Average Intel Core Ultra 9 275HX, NVIDIA GeForce RTX 5090 Laptop (1847 - 2211, n=12) | |
| Asus Strix Scar 18 G835LX | |
| Lenovo Legion 9 18IAX10 RTX 5090 | |
| Average of class Gaming (1386 - 2254, n=93, last 2 years) | |
| CrossMark / Creativity | |
| Razer Blade 18 2025 RTX 5090 Laptop | |
| Asus Strix Scar 18 G835LX | |
| Lenovo Legion 9 18IAX10 RTX 5090 | |
| Alienware 18 Area-51 | |
| Lenovo Legion 9 18IAX10 | |
| Average Intel Core Ultra 9 275HX, NVIDIA GeForce RTX 5090 Laptop (2170 - 2642, n=12) | |
| Average of class Gaming (1343 - 2729, n=93, last 2 years) | |
| CrossMark / Responsiveness | |
| Alienware 18 Area-51 | |
| Lenovo Legion 9 18IAX10 | |
| Razer Blade 18 2025 RTX 5090 Laptop | |
| Average Intel Core Ultra 9 275HX, NVIDIA GeForce RTX 5090 Laptop (1673 - 2217, n=12) | |
| Asus Strix Scar 18 G835LX | |
| Lenovo Legion 9 18IAX10 RTX 5090 | |
| Average of class Gaming (1226 - 2334, n=93, last 2 years) | |
| WebXPRT 3 / Overall | |
| Lenovo Legion 9 18IAX10 | |
| Lenovo Legion 9 18IAX10 RTX 5090 | |
| Alienware 18 Area-51 | |
| Razer Blade 18 2025 RTX 5090 Laptop | |
| Average Intel Core Ultra 9 275HX, NVIDIA GeForce RTX 5090 Laptop (315 - 372, n=12) | |
| Asus Strix Scar 18 G835LX | |
| Average of class Gaming (220 - 532, n=97, last 2 years) | |
| WebXPRT 4 / Overall | |
| Alienware 18 Area-51 | |
| Asus Strix Scar 18 G835LX | |
| Lenovo Legion 9 18IAX10 | |
| Lenovo Legion 9 18IAX10 RTX 5090 | |
| Average Intel Core Ultra 9 275HX, NVIDIA GeForce RTX 5090 Laptop (301 - 341, n=11) | |
| Razer Blade 18 2025 RTX 5090 Laptop | |
| Average of class Gaming (165 - 354, n=97, last 2 years) | |
| Mozilla Kraken 1.1 / Total | |
| Average of class Gaming (391 - 590, n=99, last 2 years) | |
| Lenovo Legion 9 18IAX10 | |
| Lenovo Legion 9 18IAX10 RTX 5090 | |
| Average Intel Core Ultra 9 275HX, NVIDIA GeForce RTX 5090 Laptop (402 - 424, n=12) | |
| Razer Blade 18 2025 RTX 5090 Laptop | |
| Asus Strix Scar 18 G835LX | |
| Alienware 18 Area-51 | |
* ... smaller is better
| AIDA64 / Memory Copy | |
| Alienware 18 Area-51 | |
| Asus Strix Scar 18 G835LX | |
| Razer Blade 18 2025 RTX 5090 Laptop | |
| Lenovo Legion 9 18IAX10 | |
| Average Intel Core Ultra 9 275HX (56003 - 94460, n=30) | |
| Lenovo Legion 9 18IAX10 RTX 5090 | |
| Average of class Gaming (21750 - 129946, n=103, last 2 years) | |
| AIDA64 / Memory Read | |
| Alienware 18 Area-51 | |
| Asus Strix Scar 18 G835LX | |
| Razer Blade 18 2025 RTX 5090 Laptop | |
| Average Intel Core Ultra 9 275HX (55795 - 97151, n=30) | |
| Lenovo Legion 9 18IAX10 | |
| Lenovo Legion 9 18IAX10 RTX 5090 | |
| Average of class Gaming (22956 - 118858, n=103, last 2 years) | |
| AIDA64 / Memory Write | |
| Razer Blade 18 2025 RTX 5090 Laptop | |
| Lenovo Legion 9 18IAX10 | |
| Alienware 18 Area-51 | |
| Asus Strix Scar 18 G835LX | |
| Average Intel Core Ultra 9 275HX (55663 - 116129, n=30) | |
| Average of class Gaming (22297 - 135096, n=103, last 2 years) | |
| Lenovo Legion 9 18IAX10 RTX 5090 | |
| AIDA64 / Memory Latency | |
| Lenovo Legion 9 18IAX10 | |
| Average Intel Core Ultra 9 275HX (105.8 - 161.6, n=30) | |
| Razer Blade 18 2025 RTX 5090 Laptop | |
| Lenovo Legion 9 18IAX10 RTX 5090 | |
| Alienware 18 Area-51 | |
| Asus Strix Scar 18 G835LX | |
| Average of class Gaming (75.3 - 259, n=103, last 2 years) | |
* ... smaller is better
DPC 延迟
在 DPC 延迟方面,偏差明显更大。通常情况下,确定的数值并不理想。
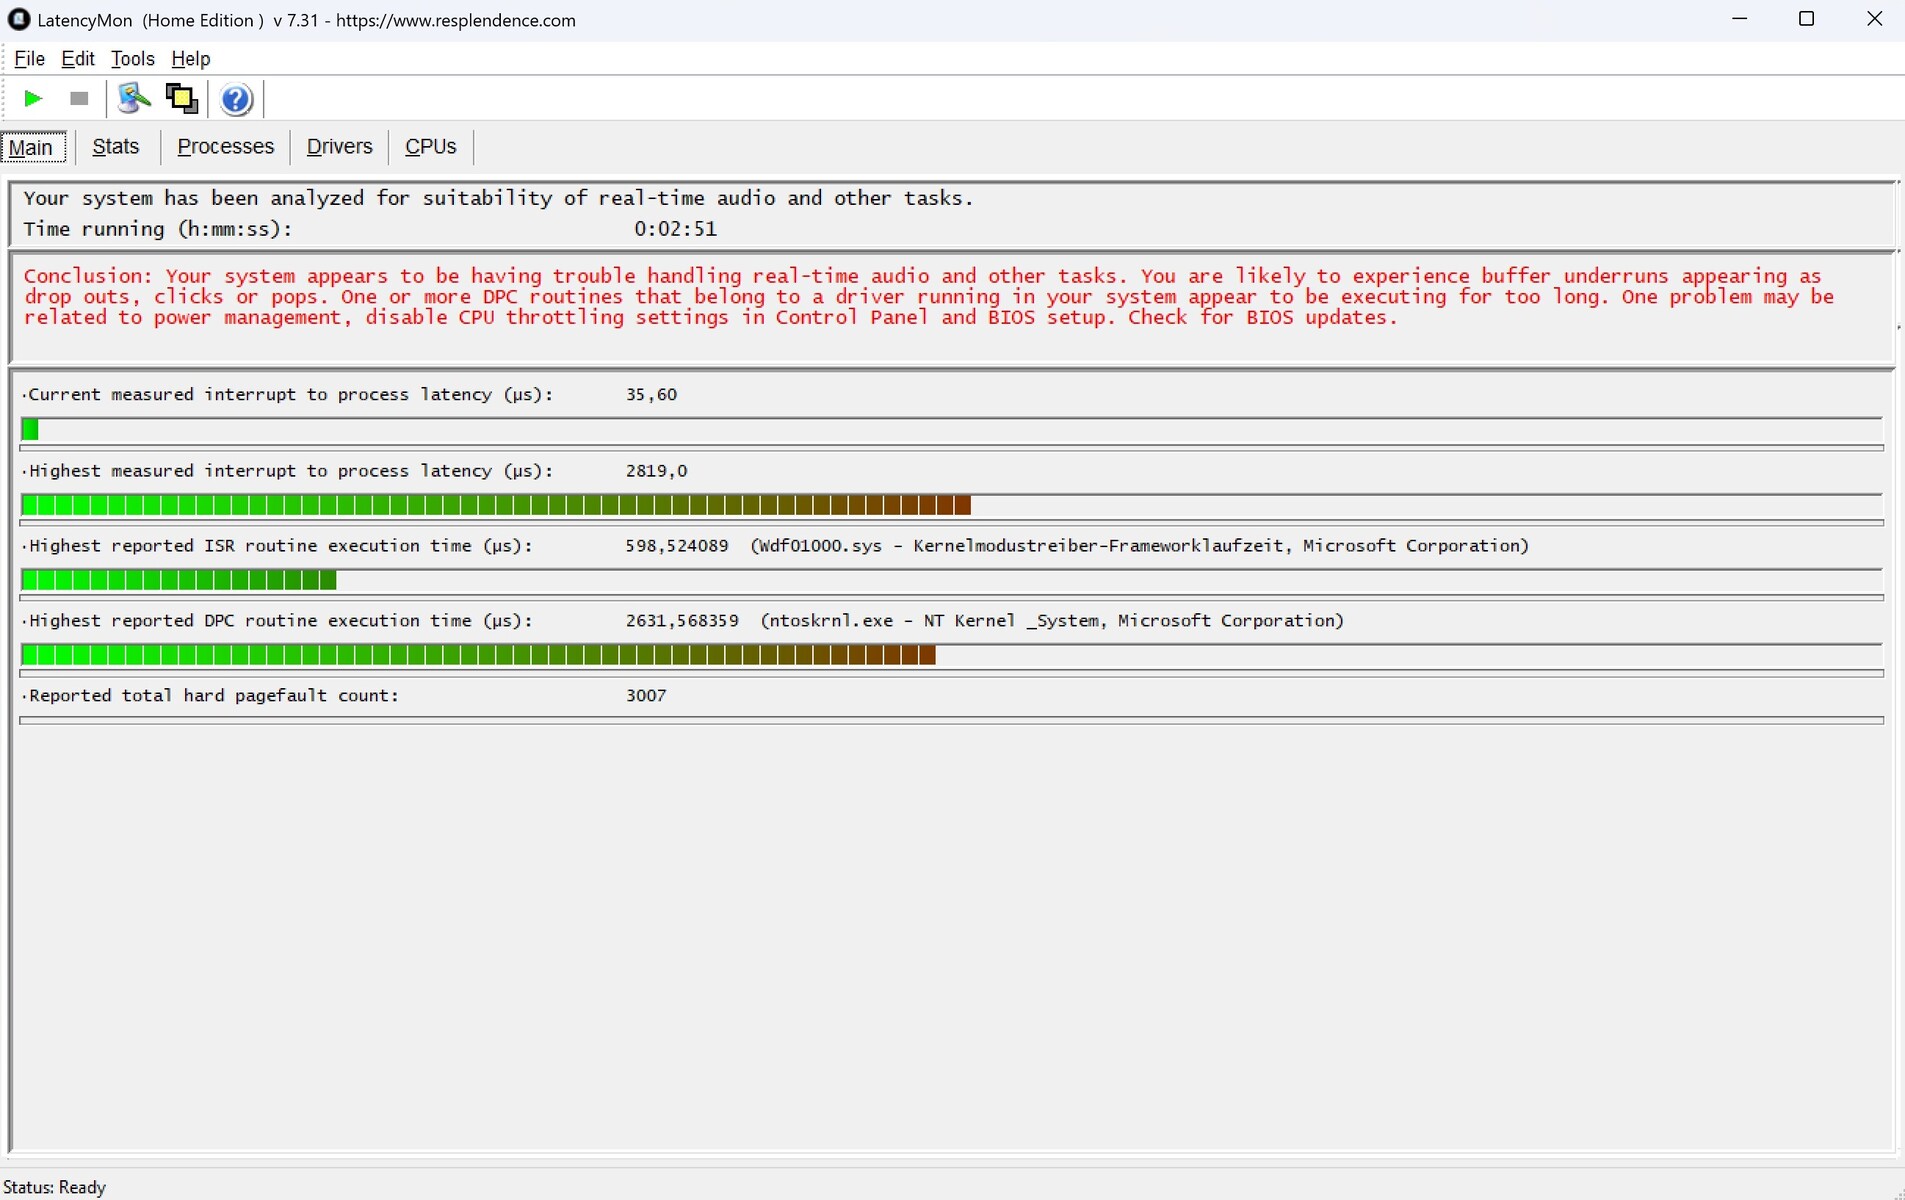
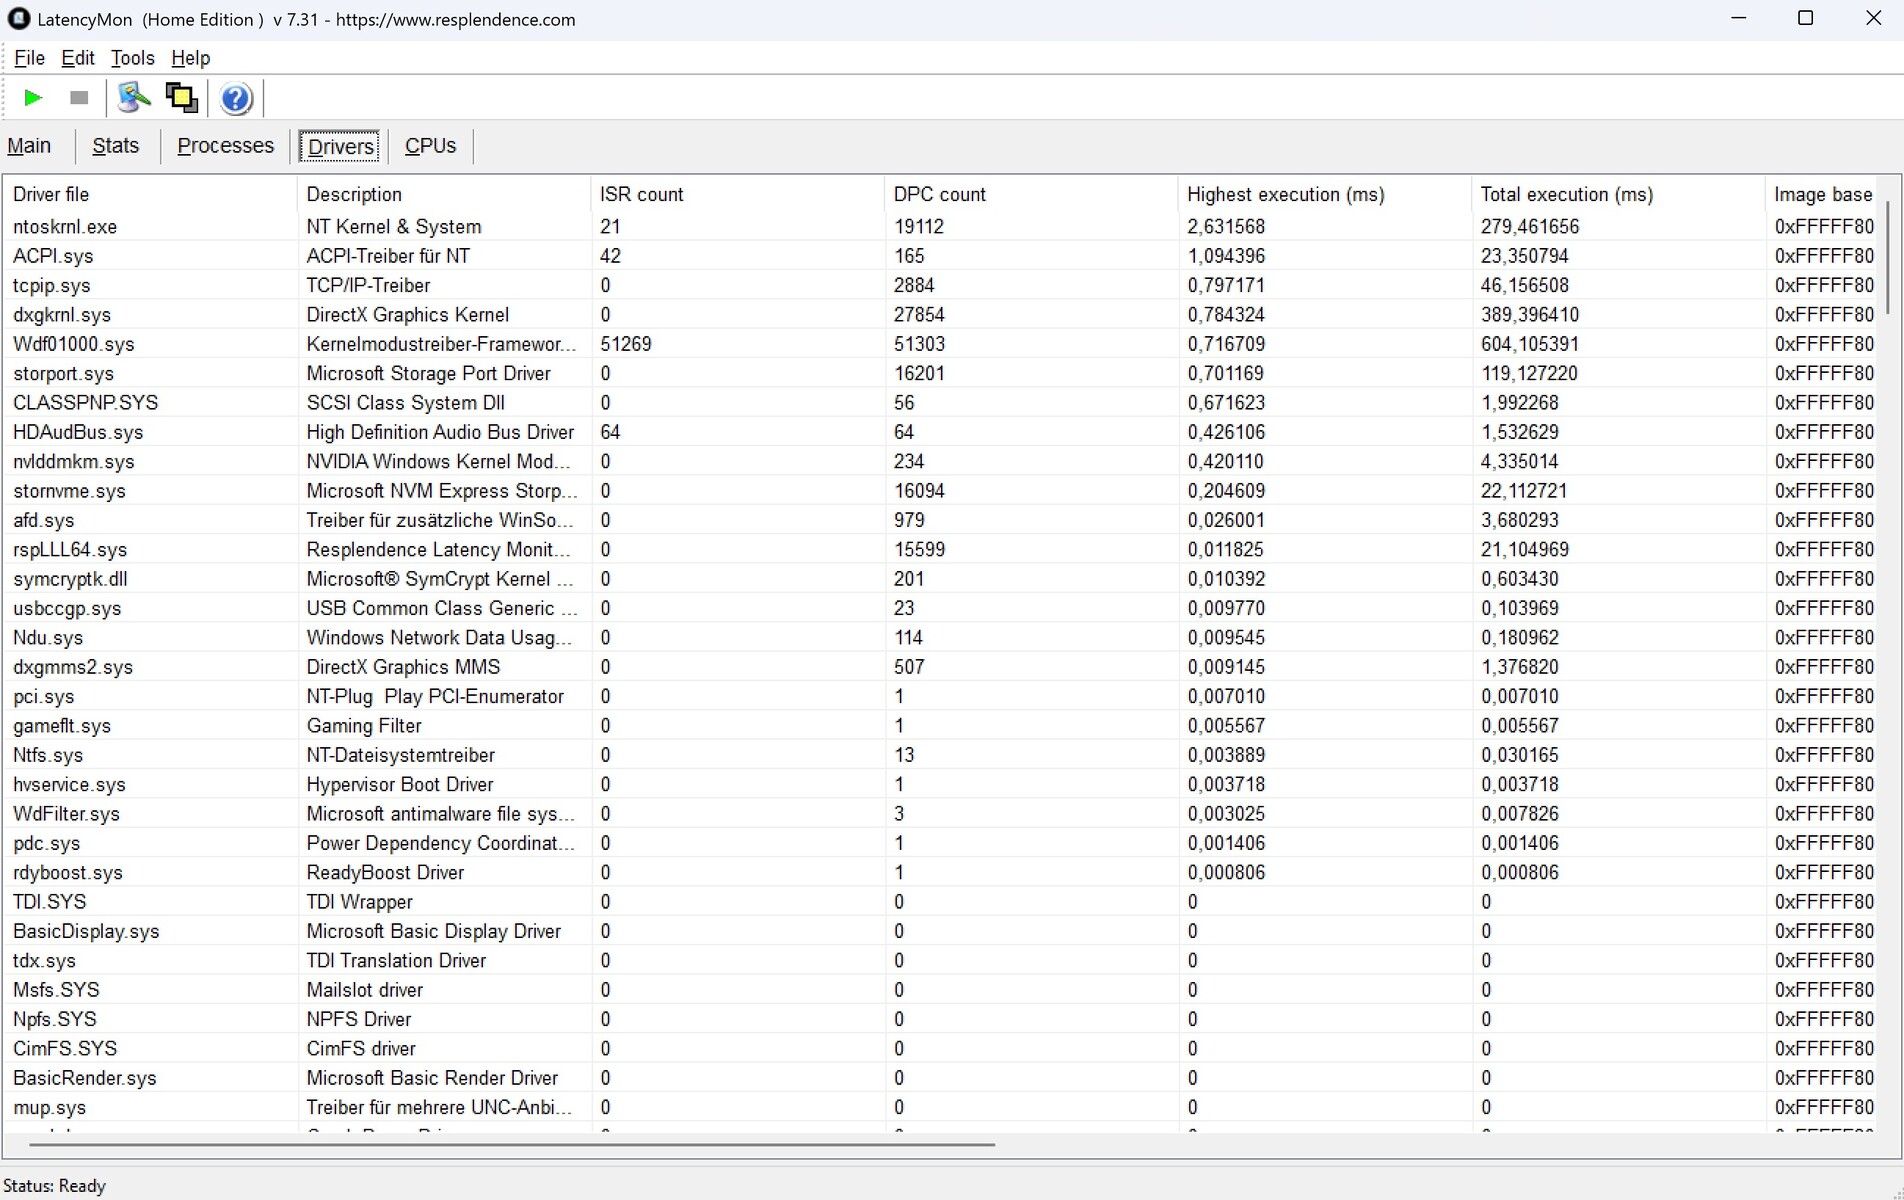
| DPC Latencies / LatencyMon - interrupt to process latency (max), Web, Youtube, Prime95 | |
| Alienware 18 Area-51 | |
| Lenovo Legion 9 18IAX10 RTX 5090 | |
| Lenovo Legion 9 18IAX10 | |
| Razer Blade 18 2025 RTX 5090 Laptop | |
| Asus Strix Scar 18 G835LX | |
* ... smaller is better
存储设备
附带的 2 TB 硬盘让我们喜忧参半。虽然三星的 NVMe 固态硬盘通常性能很好,最好能突破 10,000 MB/s 大关,但在我们的循环测试中,一段时间后就会出现节流现象,而竞争对手或 RTX 5080 版本的Legion 9 18 却没有出现这种情况。

* ... smaller is better
连续读取性能DiskSpd 读取循环,队列深度 8
图形处理器性能
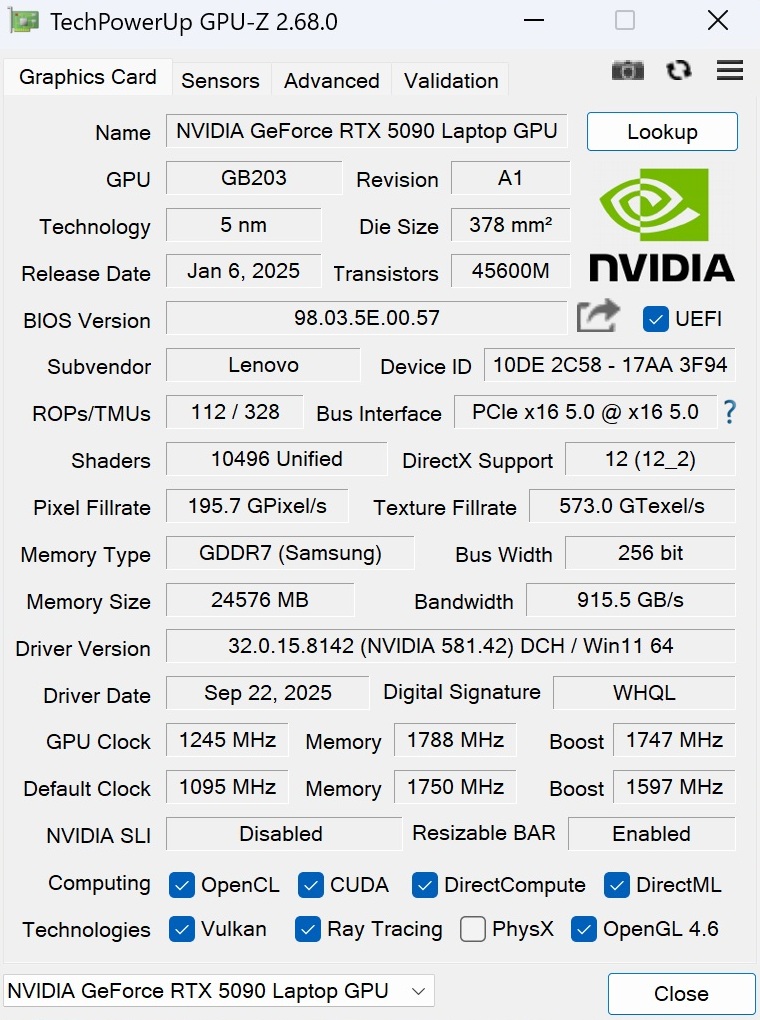
Legion 9 18 的 RTX 5090 笔记本电脑 GPU 被证明是最大的亮点。在整体 3DMark 测试中,Legion 9 的表现优于所有其他 RTX 5090 笔记本电脑,尽管其 RTX 5080 兄弟落后不到 10%。
不过,考虑到其 24GB GDDR7 VRAM,RTX 5090 具有更强的未来适应性。
| 3DMark 11 Performance | 54833 points | |
| 3DMark Cloud Gate Standard Score | 74154 points | |
| 3DMark Fire Strike Score | 41019 points | |
| 3DMark Time Spy Score | 23942 points | |
Help | ||
* ... smaller is better
游戏性能
| GTA V - 1920x1080 Highest AA:4xMSAA + FX AF:16x | |
| Lenovo Legion 9 18IAX10 RTX 5090 | |
| Razer Blade 18 2025 RTX 5090 Laptop | |
| Asus Strix Scar 18 G835LX | |
| Average NVIDIA GeForce RTX 5090 Laptop (102.9 - 186.9, n=18) | |
| Average of class Gaming (48.3 - 186.9, n=93, last 2 years) | |
| low | med. | high | ultra | QHD DLSS | QHD | 4K DLSS | 4K | |
|---|---|---|---|---|---|---|---|---|
| GTA V (2015) | 184.3 | 183.9 | 164.5 | 163.8 | ||||
| Dota 2 Reborn (2015) | 201 | 184.8 | 180.1 | |||||
| Final Fantasy XV Benchmark (2018) | 209 | 176.7 | 111.8 | |||||
| X-Plane 11.11 (2018) | 118.7 | 97.1 | ||||||
| Strange Brigade (2018) | 479 | 443 | 333 | 182.2 | ||||
| Baldur's Gate 3 (2023) | 209 | 209 | 158.3 | 88.5 | ||||
| Cyberpunk 2077 (2023) | 185 | 169.9 | 122.8 | 55.1 | ||||
| Horizon Forbidden West (2024) | 140.7 | 140.3 | 100.9 | 81 | 59.5 | |||
| Ghost of Tsushima (2024) | 115.1 | 108.1 | 100.3 | 94.4 | 62 | |||
| Senua's Saga Hellblade 2 (2024) | 86.1 | 63.1 | 61.8 | 37.5 | ||||
| Space Marine 2 (2024) | 108.5 | 108 | 107.4 | 94.7 | 69.6 | |||
| Until Dawn (2024) | 116.6 | 104 | 76.6 | 63.2 | 45.4 | |||
| Stalker 2 (2024) | 167.8 | 147.6 | 110.7 | 92.7 | 65.4 | |||
| The Elder Scrolls IV Oblivion Remastered (2025) | 111.8 | 61.9 | 45.9 | 41.6 | 27.3 | |||
| Doom: The Dark Ages (2025) | 133.2 | 128.9 | 92.2 | 75.6 | 52.2 | |||
| Borderlands 4 (2025) | 76.6 | 54 | 37.1 | 117.5 | 20.2 | |||
| Battlefield 6 (2025) | 181.4 | 169.4 | 159.9 | 145.8 | 136.7 | 108.5 | 82.5 | 59.7 |
| Borderlands 4 | |
| 3840x2160 Badass Preset AA:FX | |
| Lenovo Legion 9 18IAX10 RTX 5090 | |
| Average of class Gaming (n=1last 2 years) | |
| 3840x2160 Badass Preset + Quality DLSS + Max. FG | |
| Lenovo Legion 9 18IAX10 RTX 5090 | |
| Average of class Gaming (n=1last 2 years) | |
| Doom: The Dark Ages | |
| 3840x2160 Ultra Nightmare AA:T | |
| Lenovo Legion 9 18IAX10 RTX 5090 | |
| Average of class Gaming (11.7 - 52.2, n=6, last 2 years) | |
| 3840x2160 Ultra Nightmare - DLSS Quality | |
| Lenovo Legion 9 18IAX10 RTX 5090 | |
| Average of class Gaming (14.2 - 75.6, n=7, last 2 years) | |
| The Elder Scrolls IV Oblivion Remastered | |
| 3840x2160 Ultra Preset AA:T | |
| Lenovo Legion 9 18IAX10 RTX 5090 | |
| Average of class Gaming (17.9 - 27.3, n=2, last 2 years) | |
| 3840x2160 Ultra Preset + Quality DLSS | |
| Lenovo Legion 9 18IAX10 RTX 5090 | |
| Average of class Gaming (31.2 - 41.6, n=2, last 2 years) | |
| Stalker 2 | |
| 3840x2160 Epic Preset | |
| Lenovo Legion 9 18IAX10 RTX 5090 | |
| Average of class Gaming (28.2 - 65.4, n=2, last 2 years) | |
| 3840x2160 Epic Preset + Quality DLSS + FG | |
| Lenovo Legion 9 18IAX10 RTX 5090 | |
| Average of class Gaming (55.6 - 92.7, n=2, last 2 years) | |
| Until Dawn | |
| 3840x2160 Ultra Preset | |
| Lenovo Legion 9 18IAX10 RTX 5090 | |
| Average of class Gaming (n=1last 2 years) | |
| 3840x2160 Ultra Preset + Quality DLSS + Ray Tracing | |
| Lenovo Legion 9 18IAX10 RTX 5090 | |
| Average of class Gaming (n=1last 2 years) | |
| Space Marine 2 | |
| 3840x2160 Ultra Preset AA:T | |
| Lenovo Legion 9 18IAX10 RTX 5090 | |
| Average of class Gaming (n=1last 2 years) | |
| 3840x2160 Ultra Preset + Quality DLSS | |
| Lenovo Legion 9 18IAX10 RTX 5090 | |
| Average of class Gaming (n=1last 2 years) | |
| Senua's Saga Hellblade 2 | |
| 3840x2160 High Preset | |
| Lenovo Legion 9 18IAX10 RTX 5090 | |
| Average of class Gaming (n=1last 2 years) | |
| 3840x2160 High Preset + Quality DLSS | |
| Lenovo Legion 9 18IAX10 RTX 5090 | |
| Average of class Gaming (n=1last 2 years) | |
| Ghost of Tsushima | |
| 3840x2160 Very High Preset AA:T | |
| Lenovo Legion 9 18IAX10 RTX 5090 | |
| Average of class Gaming (n=1last 2 years) | |
| 3840x2160 Very High Preset + Quality DLSS | |
| Lenovo Legion 9 18IAX10 RTX 5090 | |
| Average of class Gaming (n=1last 2 years) | |
| Horizon Forbidden West | |
| 3840x2160 Very High Preset AA:T | |
| Lenovo Legion 9 18IAX10 RTX 5090 | |
| Average of class Gaming (n=1last 2 years) | |
| 3840x2160 Very High Preset + Quality DLSS | |
| Lenovo Legion 9 18IAX10 RTX 5090 | |
| Average of class Gaming (n=1last 2 years) | |
我们分析了 3D 性能在较长时间内的表现。 赛博朋克 2077.除了轻微的波动外,帧数值相对稳定。
赛博朋克 2077》超帧频图
排放量
噪音排放
高于平均水平的性能带来了高于平均水平的噪音。玩《赛博朋克 2077》时的 56 分贝(A)是我们观察到的最高值之一。
不过,竞争对手的噪音也相当大,达到 48 至 54 分贝(A),因此玩游戏时最好使用耳机。
空闲时,Legion 9 18 的风扇会保持更低的噪音,有时甚至会完全关闭。
Noise level
| Idle |
| 24 / 30 / 32 dB(A) |
| Load |
| 46 / 56 dB(A) |
 | ||
30 dB silent 40 dB(A) audible 50 dB(A) loud |
||
min: | ||
| Lenovo Legion 9 18IAX10 RTX 5090 Ultra 9 275HX, GeForce RTX 5090 Laptop | Alienware 18 Area-51 Ultra 9 275HX, GeForce RTX 5090 Laptop | Asus Strix Scar 18 G835LX Ultra 9 275HX, GeForce RTX 5090 Laptop | Razer Blade 18 2025 RTX 5090 Laptop Ultra 9 275HX, GeForce RTX 5090 Laptop | Lenovo Legion 9 18IAX10 Ultra 9 275HX, GeForce RTX 5080 Laptop | |
|---|---|---|---|---|---|
| Noise | 1% | 0% | 12% | 8% | |
| off / environment * (dB) | 24 | 23.4 2% | 23.3 3% | 23.4 2% | 23.3 3% |
| Idle Minimum * (dB) | 24 | 30.2 -26% | 29.8 -24% | 23.4 2% | 23.3 3% |
| Idle Average * (dB) | 30 | 30.6 -2% | 29.8 1% | 23.4 22% | 23.3 22% |
| Idle Maximum * (dB) | 32 | 30.6 4% | 29.8 7% | 23.4 27% | 29.1 9% |
| Load Average * (dB) | 46 | 38 17% | 42.9 7% | 40.4 12% | 46.8 -2% |
| Cyberpunk 2077 ultra * (dB) | 56 | 48.9 13% | 53.7 4% | 48.2 14% | 49.6 11% |
| Load Maximum * (dB) | 56 | 55.9 -0% | 53.7 4% | 53.5 4% | 49.6 11% |
* ... smaller is better
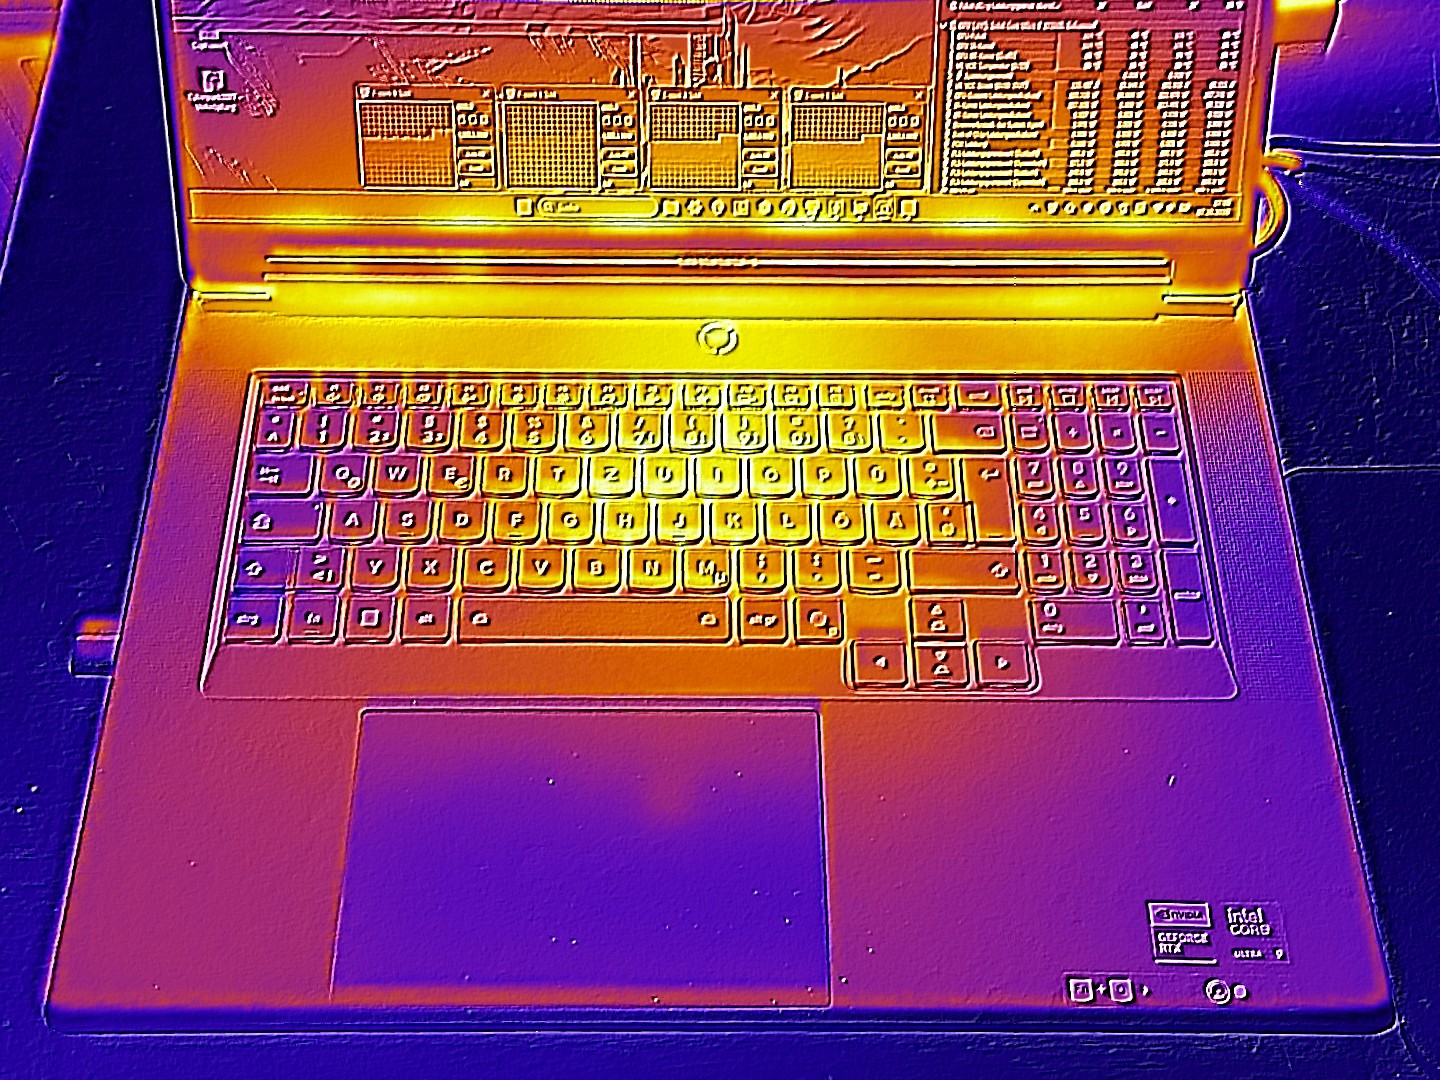
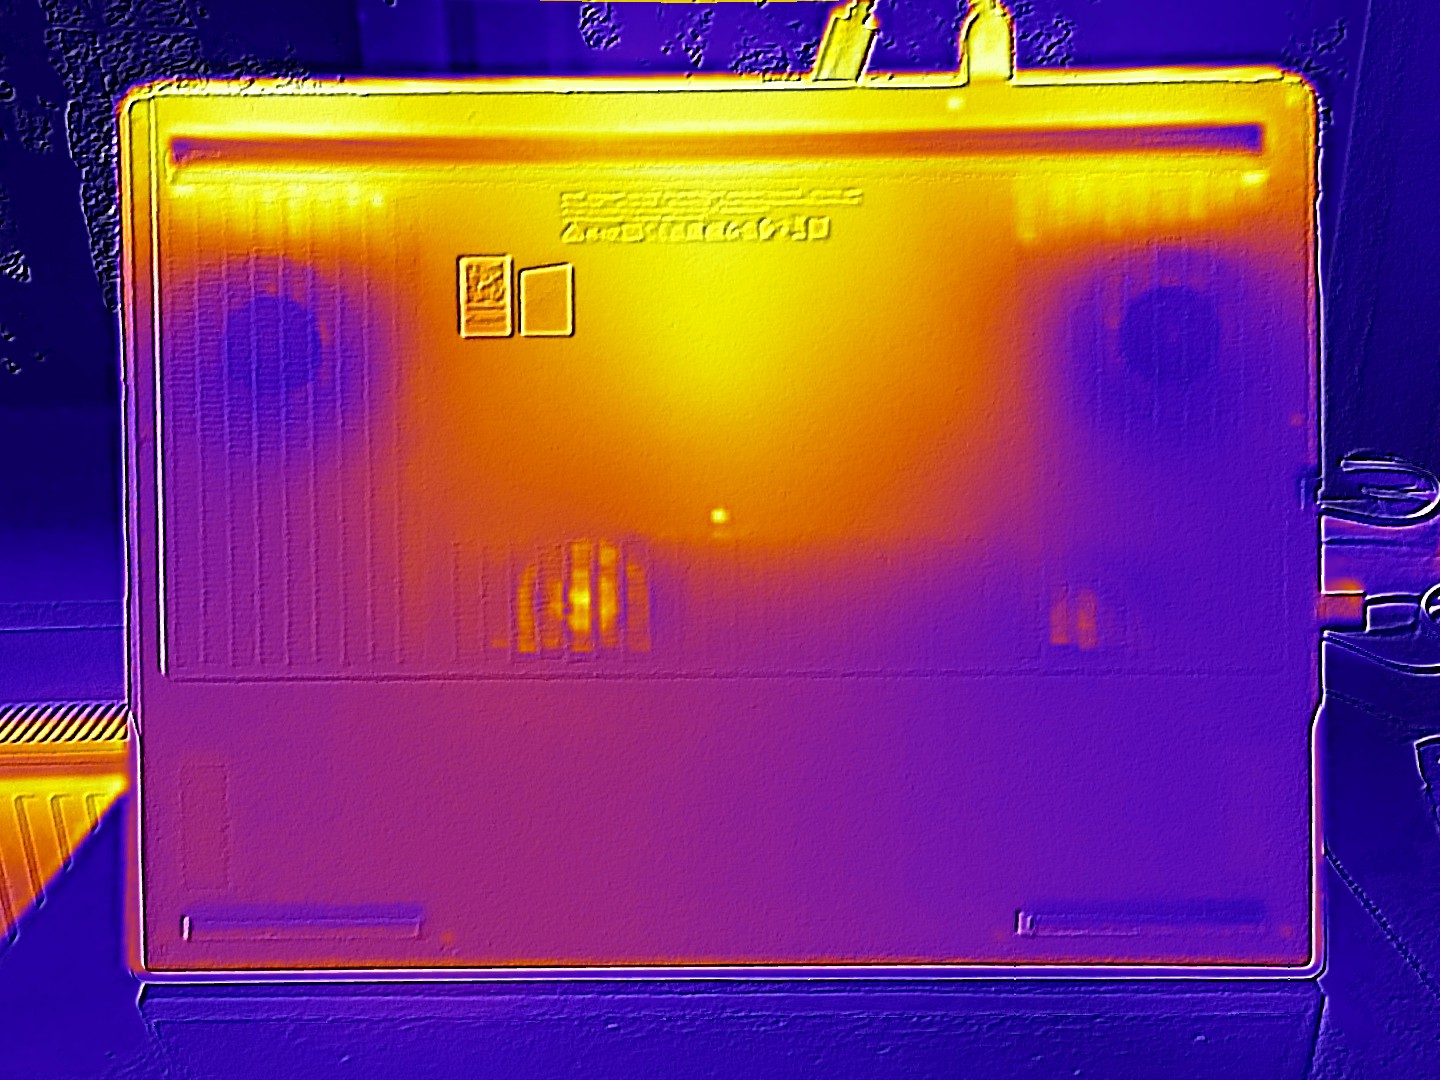
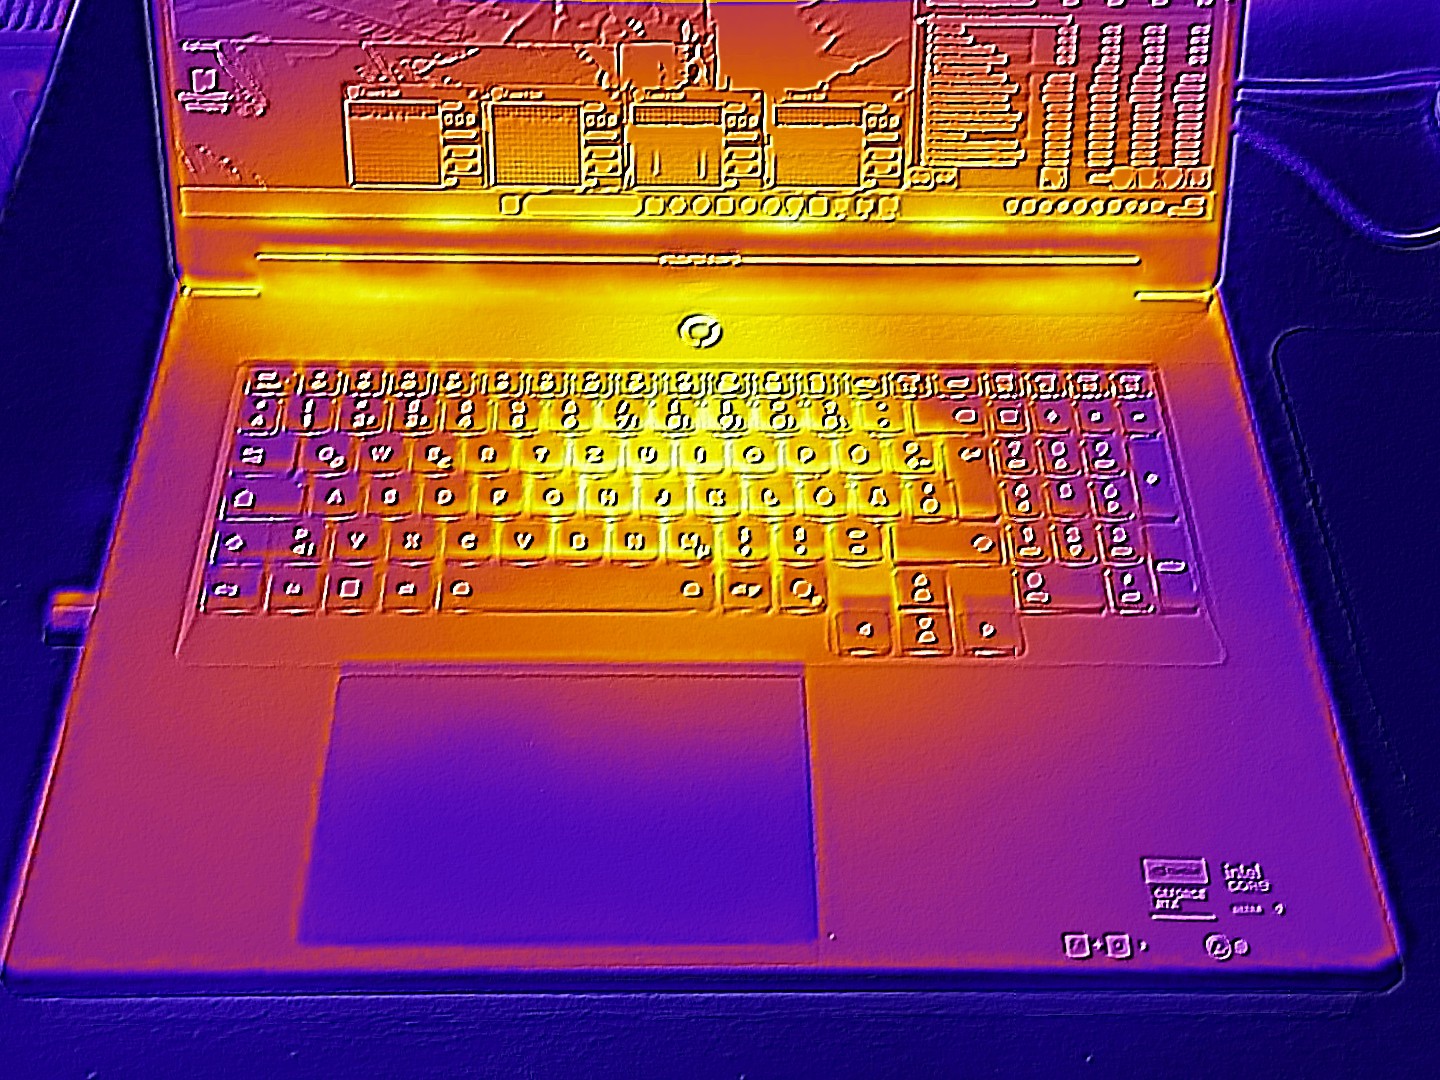
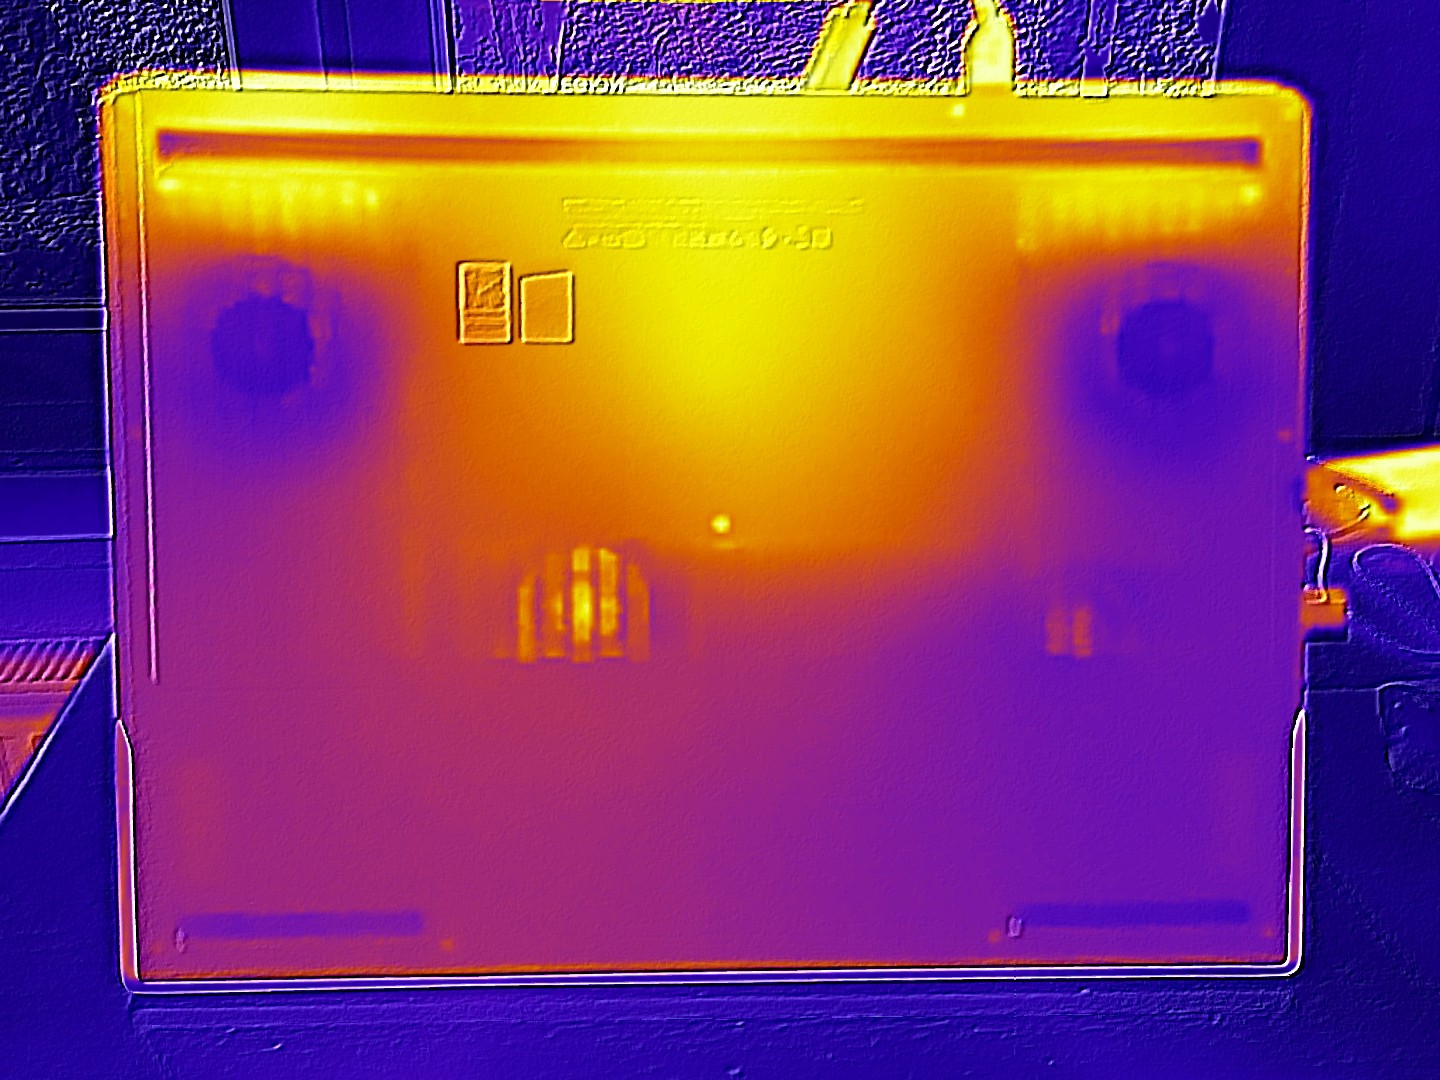
温度
与 RTX 5080 机型一样,温度的变化也有些奇怪。Legion 9 18 在空闲模式下温度已经相对较高,而在负载情况下机箱表面几乎不会发热,但有时会达到类似的数值。
(±) The maximum temperature on the upper side is 41 °C / 106 F, compared to the average of 40.4 °C / 105 F, ranging from 21.2 to 68.8 °C for the class Gaming.
(+) The bottom heats up to a maximum of 39 °C / 102 F, compared to the average of 43.2 °C / 110 F
(±) In idle usage, the average temperature for the upper side is 34.7 °C / 94 F, compared to the device average of 33.9 °C / 93 F.
(±) 3: The average temperature for the upper side is 33.1 °C / 92 F, compared to the average of 33.9 °C / 93 F for the class Gaming.
(+) The palmrests and touchpad are reaching skin temperature as a maximum (33 °C / 91.4 F) and are therefore not hot.
(-) The average temperature of the palmrest area of similar devices was 28.8 °C / 83.8 F (-4.2 °C / -7.6 F).
| Lenovo Legion 9 18IAX10 RTX 5090 Ultra 9 275HX, GeForce RTX 5090 Laptop | Alienware 18 Area-51 Ultra 9 275HX, GeForce RTX 5090 Laptop | Asus Strix Scar 18 G835LX Ultra 9 275HX, GeForce RTX 5090 Laptop | Razer Blade 18 2025 RTX 5090 Laptop Ultra 9 275HX, GeForce RTX 5090 Laptop | Lenovo Legion 9 18IAX10 Ultra 9 275HX, GeForce RTX 5080 Laptop | |
|---|---|---|---|---|---|
| Heat | 13% | 4% | 9% | -1% | |
| Maximum Upper Side * (°C) | 41 | 36.8 10% | 45.6 -11% | 44.3 -8% | 43 -5% |
| Maximum Bottom * (°C) | 39 | 35.8 8% | 46 -18% | 42 -8% | 41.8 -7% |
| Idle Upper Side * (°C) | 38 | 30.6 19% | 28.9 24% | 27.2 28% | 37 3% |
| Idle Bottom * (°C) | 36 | 30.8 14% | 29.2 19% | 27.5 24% | 34.2 5% |
* ... smaller is better
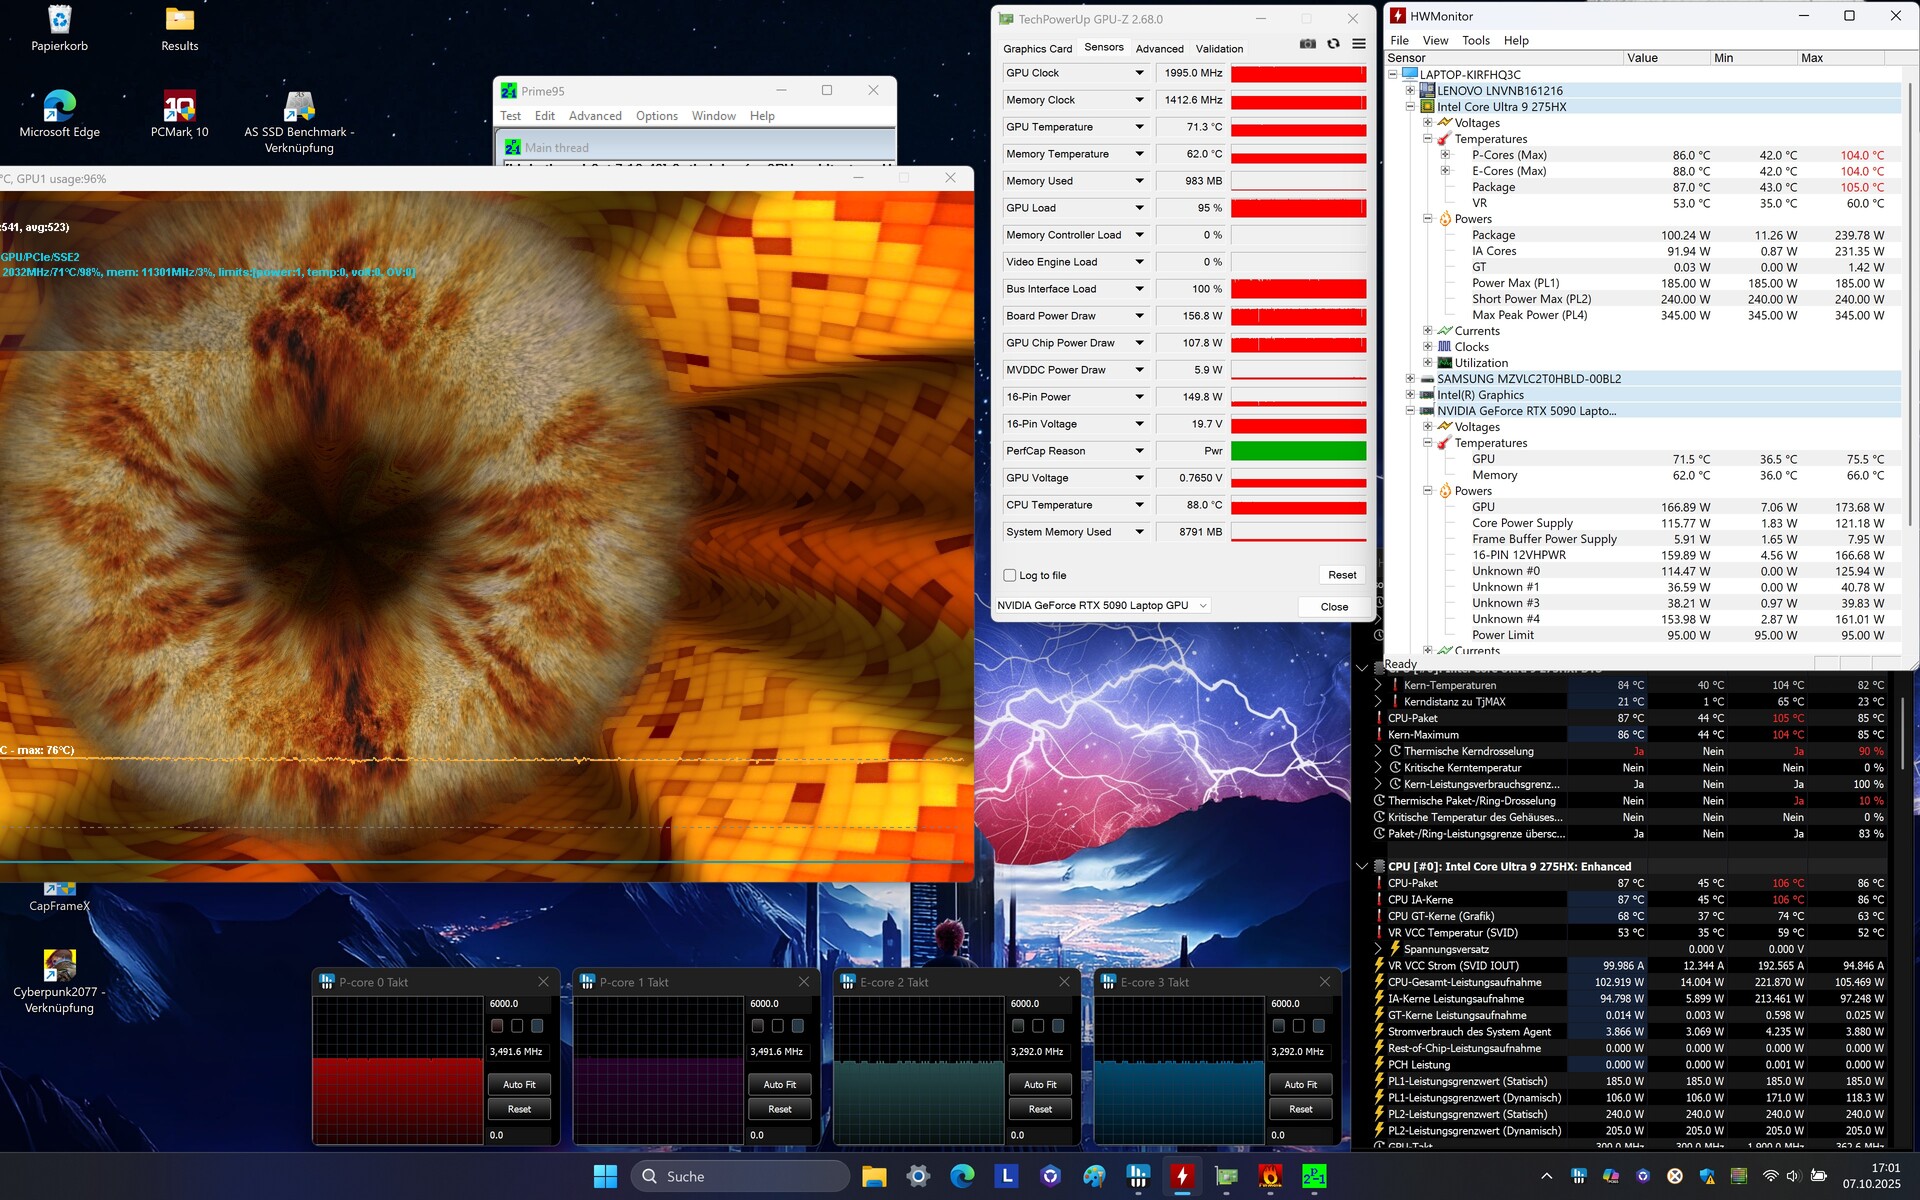
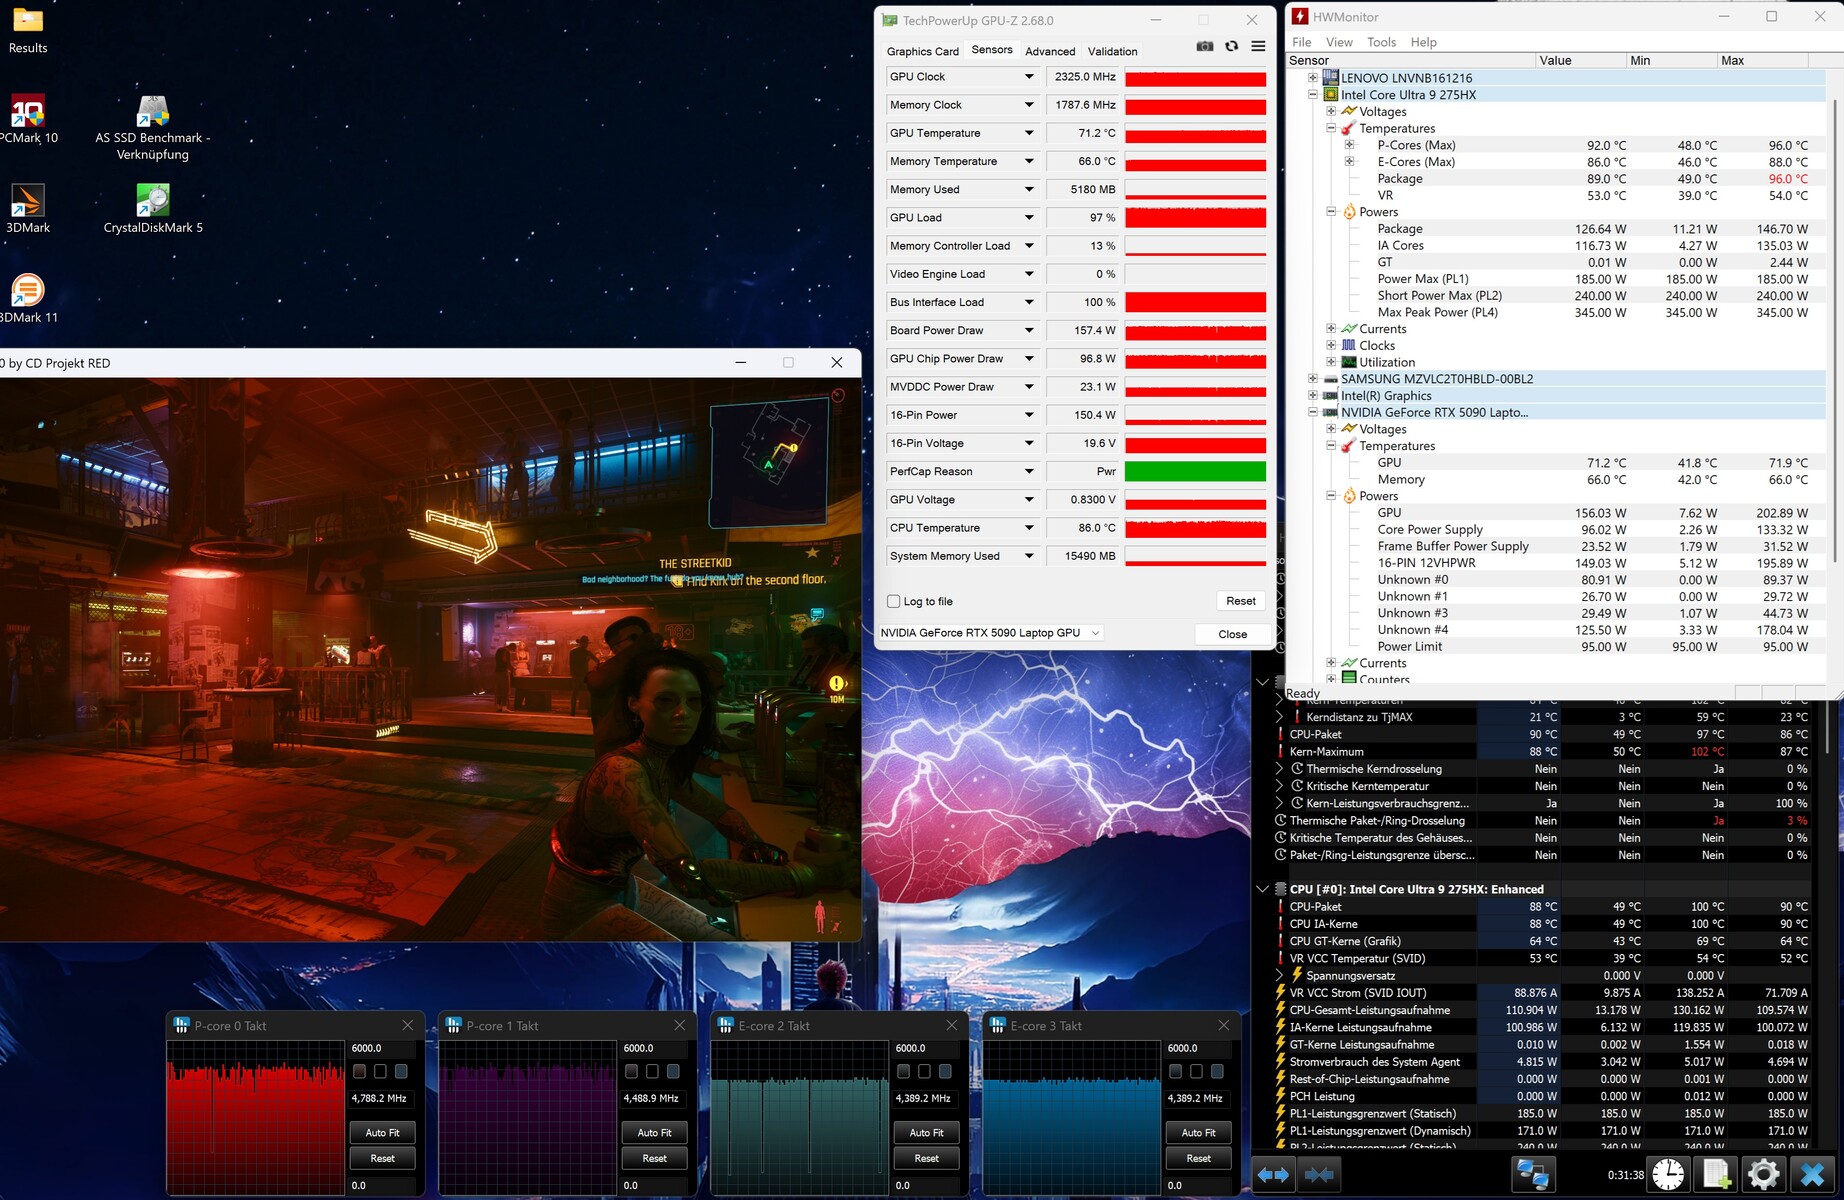
压力测试
在 FurMark 和 Prime95 的压力测试中,Core Ultra 9 275HX 的温度稳定在 87°C 左右,而 RTX 5090 的温度仅为 71°C。
扬声器
相反,音质却不必躲在竞争对手后面。Legion 9 18 的音响系统在笔记本电脑领域名列前茅,在低音响应方面也毫不逊色。
Lenovo Legion 9 18IAX10 RTX 5090 audio analysis
(±) | speaker loudness is average but good (81 dB)
Bass 100 - 315 Hz
(+) | good bass - only 3.6% away from median
(+) | bass is linear (6.4% delta to prev. frequency)
Mids 400 - 2000 Hz
(+) | balanced mids - only 3.1% away from median
(+) | mids are linear (5% delta to prev. frequency)
Highs 2 - 16 kHz
(±) | reduced highs - on average 8.7% lower than median
(+) | highs are linear (3% delta to prev. frequency)
Overall 100 - 16.000 Hz
(+) | overall sound is linear (11.2% difference to median)
Compared to same class
» 8% of all tested devices in this class were better, 4% similar, 88% worse
» The best had a delta of 6%, average was 18%, worst was 132%
Compared to all devices tested
» 7% of all tested devices were better, 2% similar, 91% worse
» The best had a delta of 4%, average was 23%, worst was 134%
Alienware 18 Area-51 audio analysis
(+) | speakers can play relatively loud (87.9 dB)
Bass 100 - 315 Hz
(-) | nearly no bass - on average 17.5% lower than median
(±) | linearity of bass is average (13.4% delta to prev. frequency)
Mids 400 - 2000 Hz
(+) | balanced mids - only 3.1% away from median
(+) | mids are linear (3.6% delta to prev. frequency)
Highs 2 - 16 kHz
(+) | balanced highs - only 2.9% away from median
(+) | highs are linear (2.9% delta to prev. frequency)
Overall 100 - 16.000 Hz
(+) | overall sound is linear (14.2% difference to median)
Compared to same class
» 25% of all tested devices in this class were better, 7% similar, 68% worse
» The best had a delta of 6%, average was 18%, worst was 132%
Compared to all devices tested
» 17% of all tested devices were better, 4% similar, 79% worse
» The best had a delta of 4%, average was 23%, worst was 134%
能源管理
能耗
在 3D 模式下,343 W(3DMark 06 平均值)至 393 W(压力测试最大值)的功耗要求与 RTX 5080 型号基本一致,后者的功耗对于笔记本电脑来说也很高。只要图形切换处于激活状态,笔记本电脑在闲置模式下的功耗仅为31 至 42 W。
| Off / Standby | |
| Idle | |
| Load |
|
Key:
min: | |
| Lenovo Legion 9 18IAX10 RTX 5090 Ultra 9 275HX, GeForce RTX 5090 Laptop | Alienware 18 Area-51 Ultra 9 275HX, GeForce RTX 5090 Laptop | Asus Strix Scar 18 G835LX Ultra 9 275HX, GeForce RTX 5090 Laptop | Razer Blade 18 2025 RTX 5090 Laptop Ultra 9 275HX, GeForce RTX 5090 Laptop | Lenovo Legion 9 18IAX10 Ultra 9 275HX, GeForce RTX 5080 Laptop | Average of class Gaming | |
|---|---|---|---|---|---|---|
| Power Consumption | -17% | 8% | 18% | -10% | 41% | |
| Idle Minimum * (Watt) | 30.9 | 38.4 -24% | 11.4 63% | 18.1 41% | 34.5 -12% | 13 ? 58% |
| Idle Average * (Watt) | 32.6 | 45.6 -40% | 39.2 -20% | 27.9 14% | 44.1 -35% | 18.7 ? 43% |
| Idle Maximum * (Watt) | 42.1 | 57.5 -37% | 40.2 5% | 28.7 32% | 53.3 -27% | 24.3 ? 42% |
| Load Average * (Watt) | 150 | 190.1 -27% | 161.2 -7% | 108.3 28% | 140.9 6% | 110.2 ? 27% |
| Cyberpunk 2077 ultra external monitor * (Watt) | 343 | 333 3% | 295 14% | 331 3% | 353 -3% | |
| Cyberpunk 2077 ultra * (Watt) | 348 | 340 2% | 303 13% | 338 3% | 360 -3% | |
| Load Maximum * (Watt) | 393 | 373.2 5% | 430.9 -10% | 366.7 7% | 367.5 6% | 258 ? 34% |
* ... smaller is better
能源消耗:赛博朋克 2077 / 压力测试
能耗:外部监控器
电池寿命
在电池模式下,能耗高于价格更低的Legion 9。
在 Wi-Fi 测试(平衡配置文件而不是性能)中,Legion 9 18 的能耗略低于 3 小时,超过了 Alienware 18 的 2 小时,但测量值仍然相当令人失望,尤其是考虑到其强大的 99 Wh 电池。
| Lenovo Legion 9 18IAX10 RTX 5090 Ultra 9 275HX, GeForce RTX 5090 Laptop, 99.9 Wh | Alienware 18 Area-51 Ultra 9 275HX, GeForce RTX 5090 Laptop, 96 Wh | Asus Strix Scar 18 G835LX Ultra 9 275HX, GeForce RTX 5090 Laptop, 90 Wh | Razer Blade 18 2025 RTX 5090 Laptop Ultra 9 275HX, GeForce RTX 5090 Laptop, 99.99 Wh | Lenovo Legion 9 18IAX10 Ultra 9 275HX, GeForce RTX 5080 Laptop, 99.9 Wh | Average of class Gaming | |
|---|---|---|---|---|---|---|
| Battery runtime | -31% | 90% | 169% | 93% | 147% | |
| WiFi v1.3 (h) | 2.9 | 2 -31% | 5.5 90% | 7.8 169% | 5.6 93% | 7.15 ? 147% |
| H.264 (h) | 5.8 | 8.64 ? | ||||
| Cyberpunk 2077 ultra 150cd (h) | 0.7 | |||||
| Load (h) | 1.2 | 1.502 ? |
Notebookcheck 对联想Legion 9 18IAX10 的总体印象
联想销售的Legion 9 18IAX10 台式机替代品价格极其昂贵,但质量非常高,速度惊人,其 RTX 5090 经常夺得性能桂冠。
Lenovo Legion 9 18IAX10 RTX 5090
- 10/10/2025 v8
Florian Glaser
 Total Sustainability Score:
 潜在替代品比较
Image | Model / Review | Price | Weight | Height | Display |
|---|---|---|---|---|---|
1. 87.1%  | Lenovo Legion 9 18IAX10 RTX 5090 Intel Core Ultra 9 275HX ⎘ NVIDIA GeForce RTX 5090 Laptop ⎘ 64 GB Memory, 2048 GB SSD | Amazon: List Price: 5900 EUR | 3.5 kg | 28 mm | 18.00" 3840x2400 252 PPI IPS |
2. 86.2%  | Alienware 18 Area-51 Intel Core Ultra 9 275HX ⎘ NVIDIA GeForce RTX 5090 Laptop ⎘ 64 GB Memory | Amazon: 1. $2,449.06 Alienware 18 Area-51 Gaming ... 2. $3,699.00 Dell Alienware 18 Area-51 Ga... 3. $3,811.64 Alienware 18 Area-51 Gaming ... List Price: 4400 USD | 4.2 kg | 24.32 mm | 18.00" 2560x1600 168 PPI IPS |
3. 88%  | Asus Strix Scar 18 G835LX Intel Core Ultra 9 275HX ⎘ NVIDIA GeForce RTX 5090 Laptop ⎘ 64 GB Memory, 2048 GB SSD | Amazon: List Price: 5799€ | 3.3 kg | 32 mm | 18.00" 2560x1600 168 PPI Mini-LED |
4. 89.5%  | Razer Blade 18 2025 RTX 5090 Laptop Intel Core Ultra 9 275HX ⎘ NVIDIA GeForce RTX 5090 Laptop ⎘ 64 GB Memory, 2048 GB SSD | Amazon: List Price: 5299€ | 3.2 kg | 27.9 mm | 18.00" 3840x2400 252 PPI IPS |
5. 89.1%  | Lenovo Legion 9 18IAX10 Intel Core Ultra 9 275HX ⎘ NVIDIA GeForce RTX 5080 Laptop ⎘ 64 GB Memory, 2048 GB SSD | Amazon: List Price: 3800 USD | 3.5 kg | 27.95 mm | 18.00" 3840x2400 252 PPI IPS |
Transparency
The selection of devices to be reviewed is made by our editorial team. The test sample was provided to the author as a loan by the manufacturer or retailer for the purpose of this review. The lender had no influence on this review, nor did the manufacturer receive a copy of this review before publication. There was no obligation to publish this review. As an independent media company, Notebookcheck is not subjected to the authority of manufacturers, retailers or publishers.
This is how Notebookcheck is testing
Every year, Notebookcheck independently reviews hundreds of laptops and smartphones using standardized procedures to ensure that all results are comparable. We have continuously developed our test methods for around 20 years and set industry standards in the process. In our test labs, high-quality measuring equipment is utilized by experienced technicians and editors. These tests involve a multi-stage validation process. Our complex rating system is based on hundreds of well-founded measurements and benchmarks, which maintains objectivity. Further information on our test methods can be found here.
