结论 - ThinkPad X13 做出了太多妥协
新款 ThinkPad X13 G6 是一款小巧的商务笔记本电脑,但它在注重移动性的同时也做出了一些妥协。其中包括机箱的刚性、键盘的质量和显示屏铰链。遗憾的是,这些正是 ThinkPad 老用户可能会感到失望的地方。
在功能方面,X13 AMD 的 Thunderbolt 4、智能卡读卡器、5G 和 Wi-Fi 7 给人留下了深刻印象,但竞争对手表明,在功耗和电池续航时间方面还可以做得更多。此外,它还只有一个 60 Hz 的全高清显示屏。
AMD 处理器的 CPU 性能整体上非常出色,领先于直接竞争对手,但从整套方案来看, 戴尔 Pro 13 Premium仍然是更强的选择。
Pros
Cons
价格和供应情况

ThinkPad X13 G6 AMD 评测机可从Campuspoint 购买。起价为 1,759 欧元,而联想目前提供的 ThinkPad X13 G6 配置机型起价约为 1,300 欧元。在美国,ThinkPad X13 G6 的可比 AMD 配置目前在CDW 等零售商的售价约为 1,349 美元。尽管价格会因地区和配置的不同而有所差异。
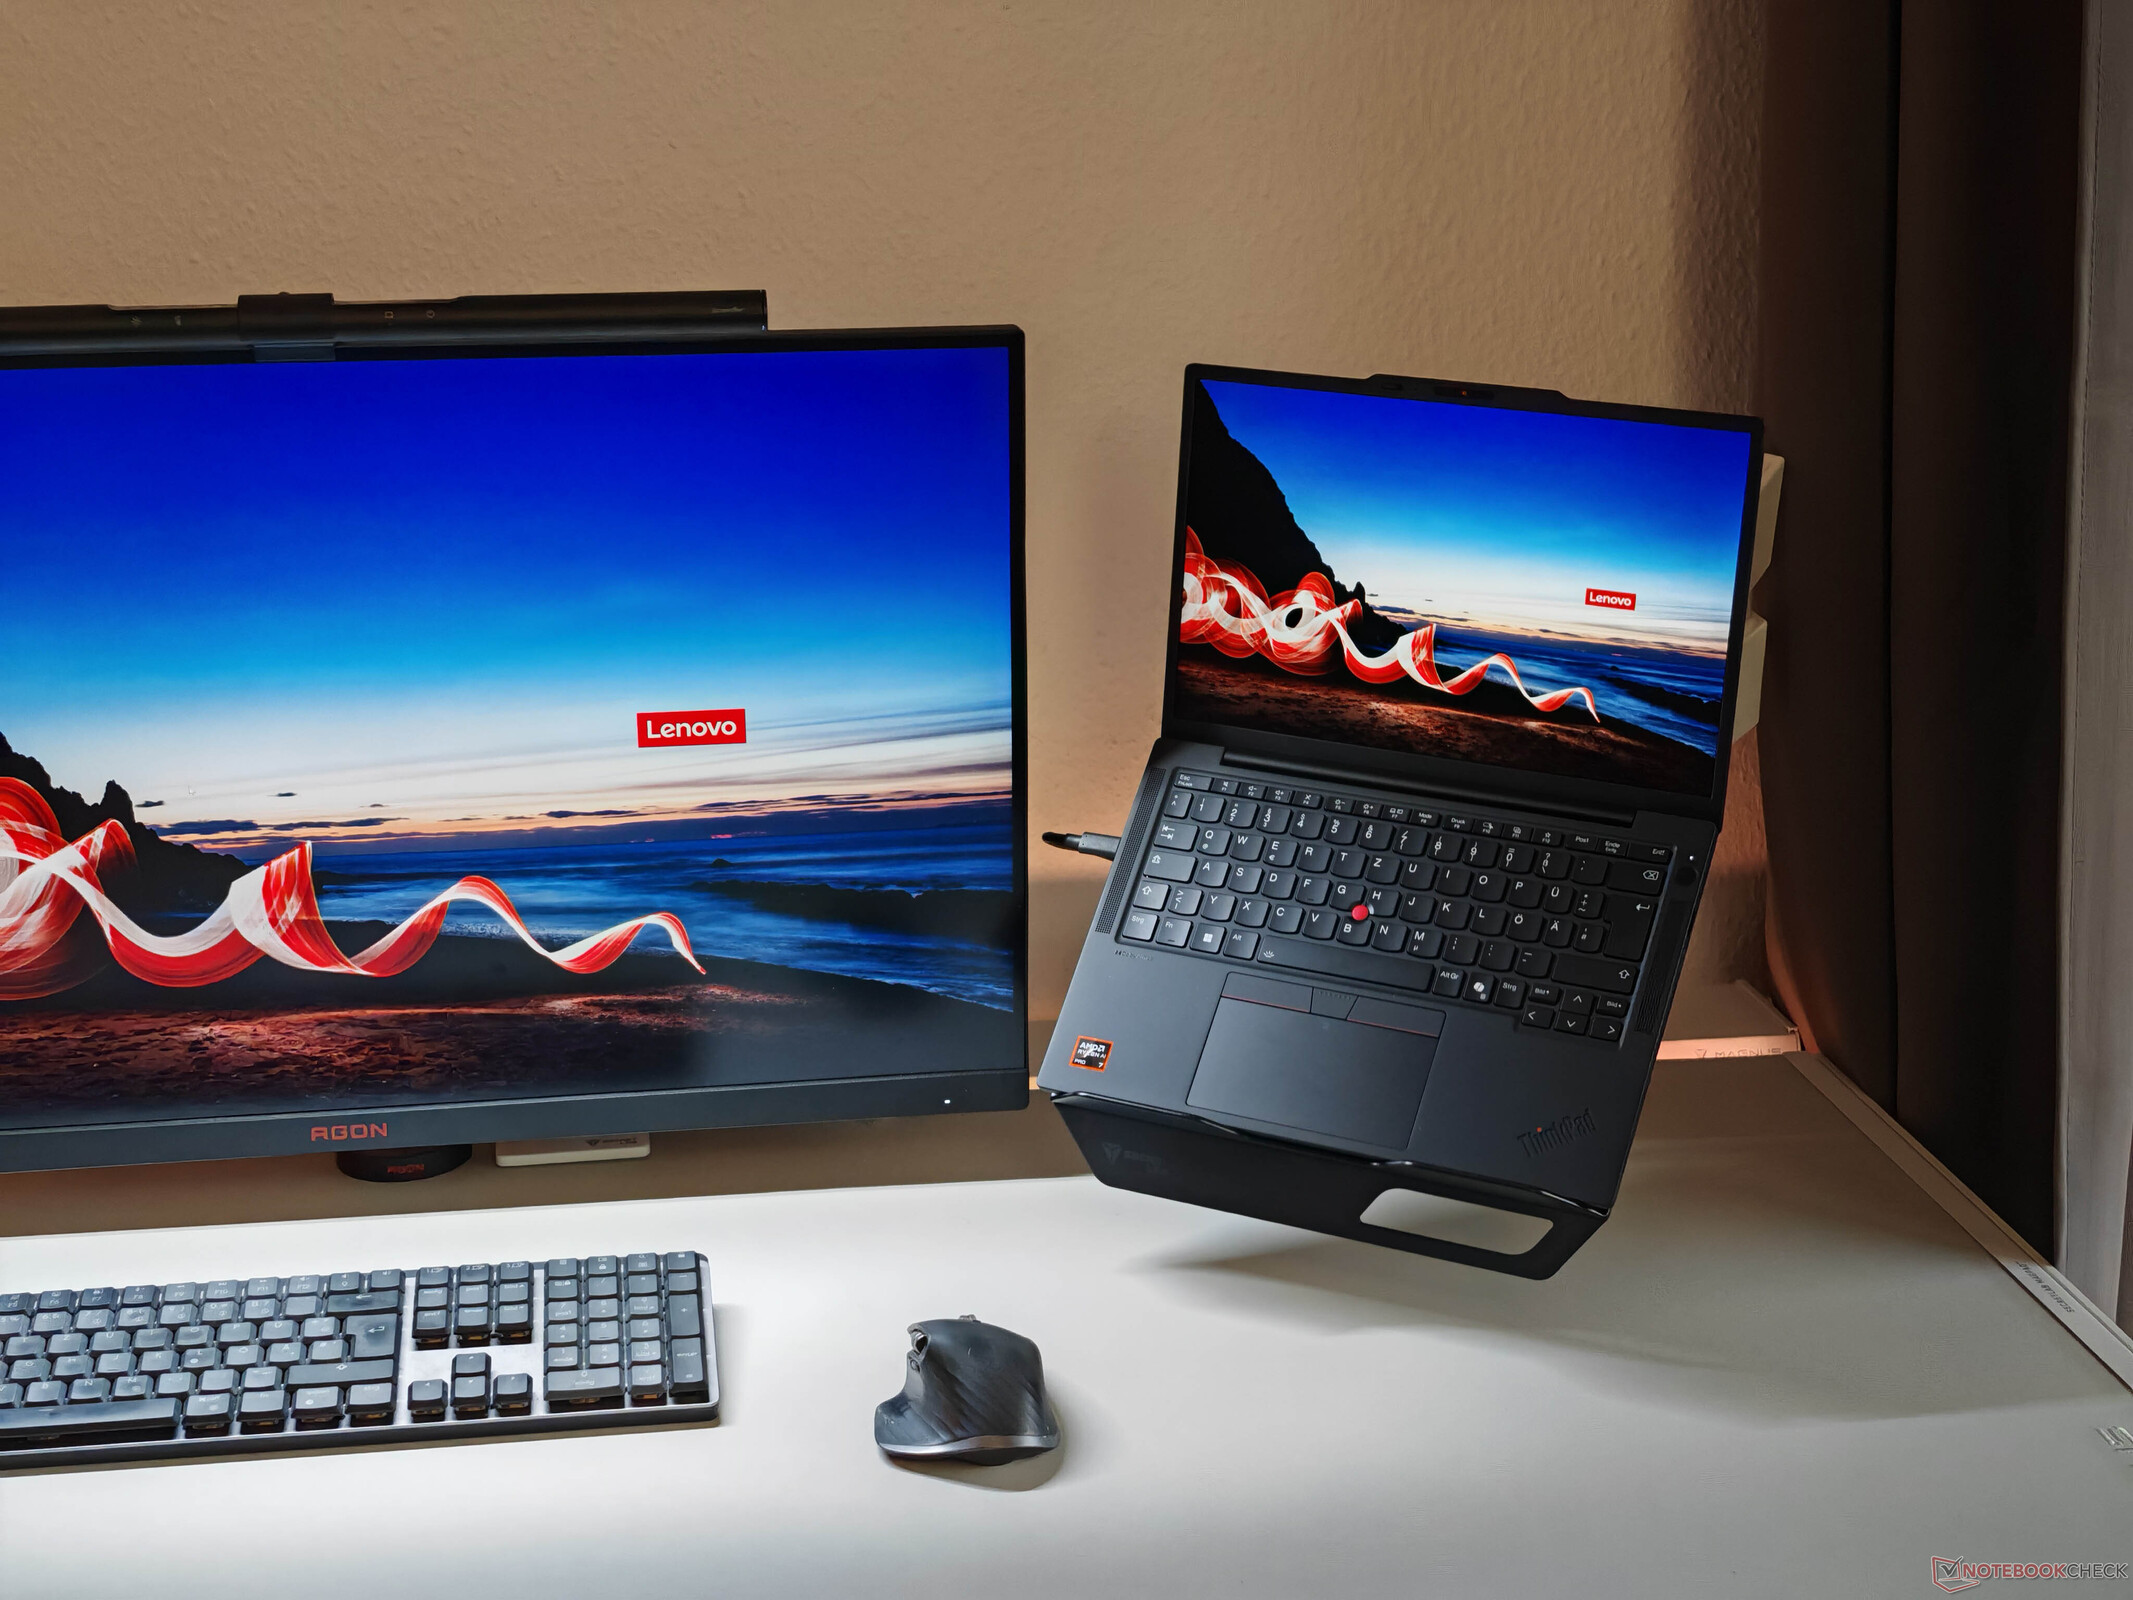
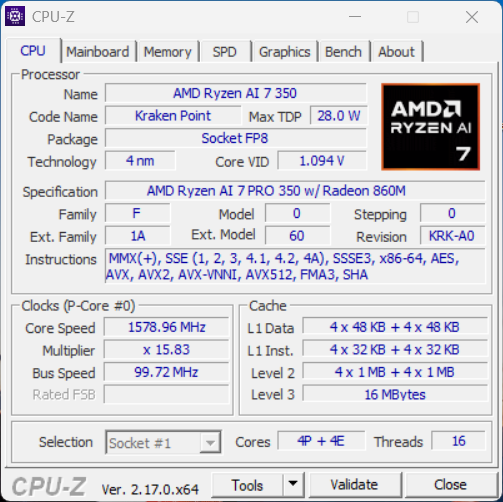
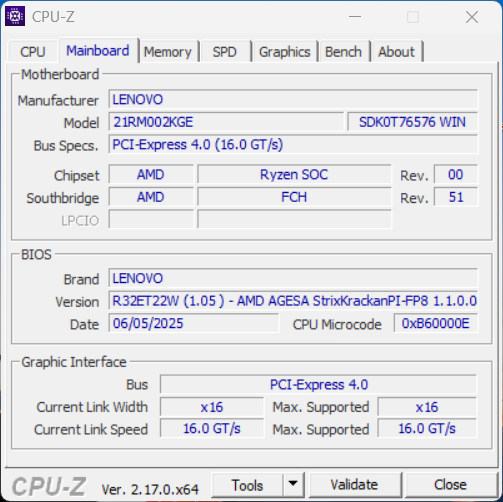
联想推出的 ThinkPad X13 是一款非常小巧的商务笔记本电脑,第六代产品对其进行了全新设计。现在的重点是提高移动性,配备英特尔处理器的机型重量不到 1 千克。为了避免与联想阵营中的 ThinkPad X1 Carbon 重叠,ThinkPad X13 的定价要低得多,起价约为 1,300 欧元。我们的评测机配备了 AMD Ryzen AI 7 PRO 35032 GB 内存、5G 模块和高能效全高清 IPS 显示屏,售价为 1,855 欧元(校园计划下为 1,759 欧元)。
规格
底盘和功能
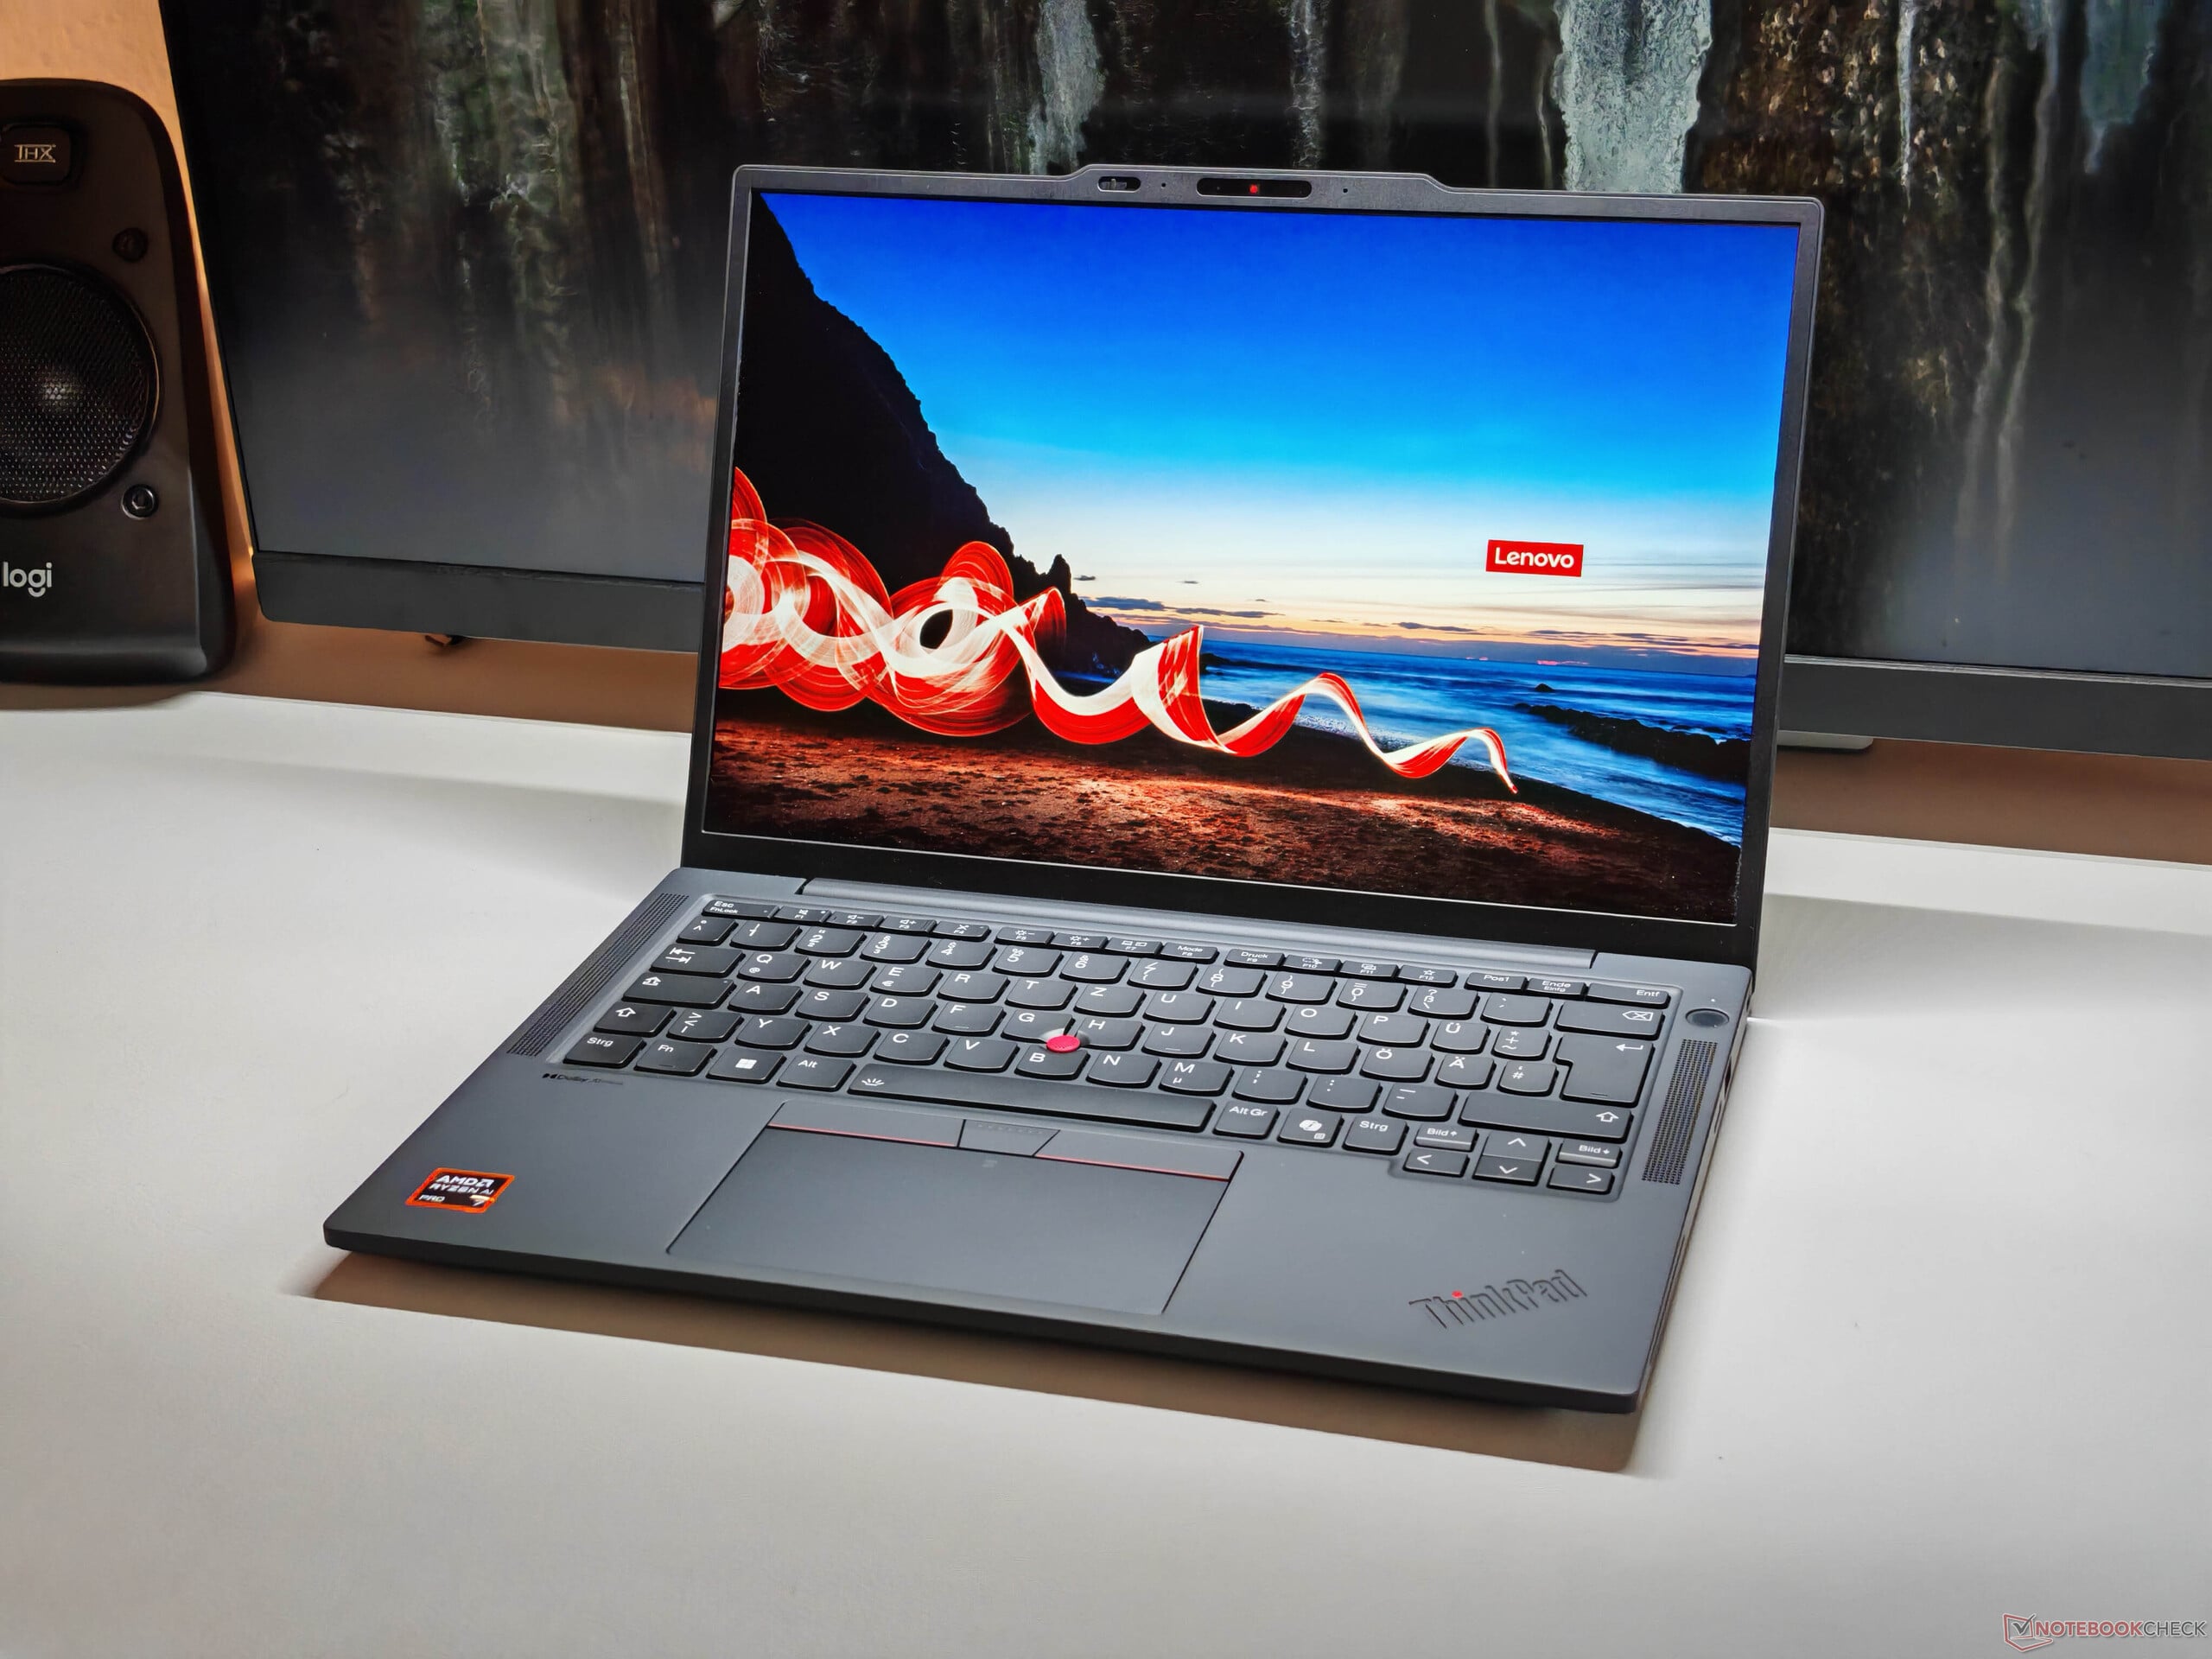
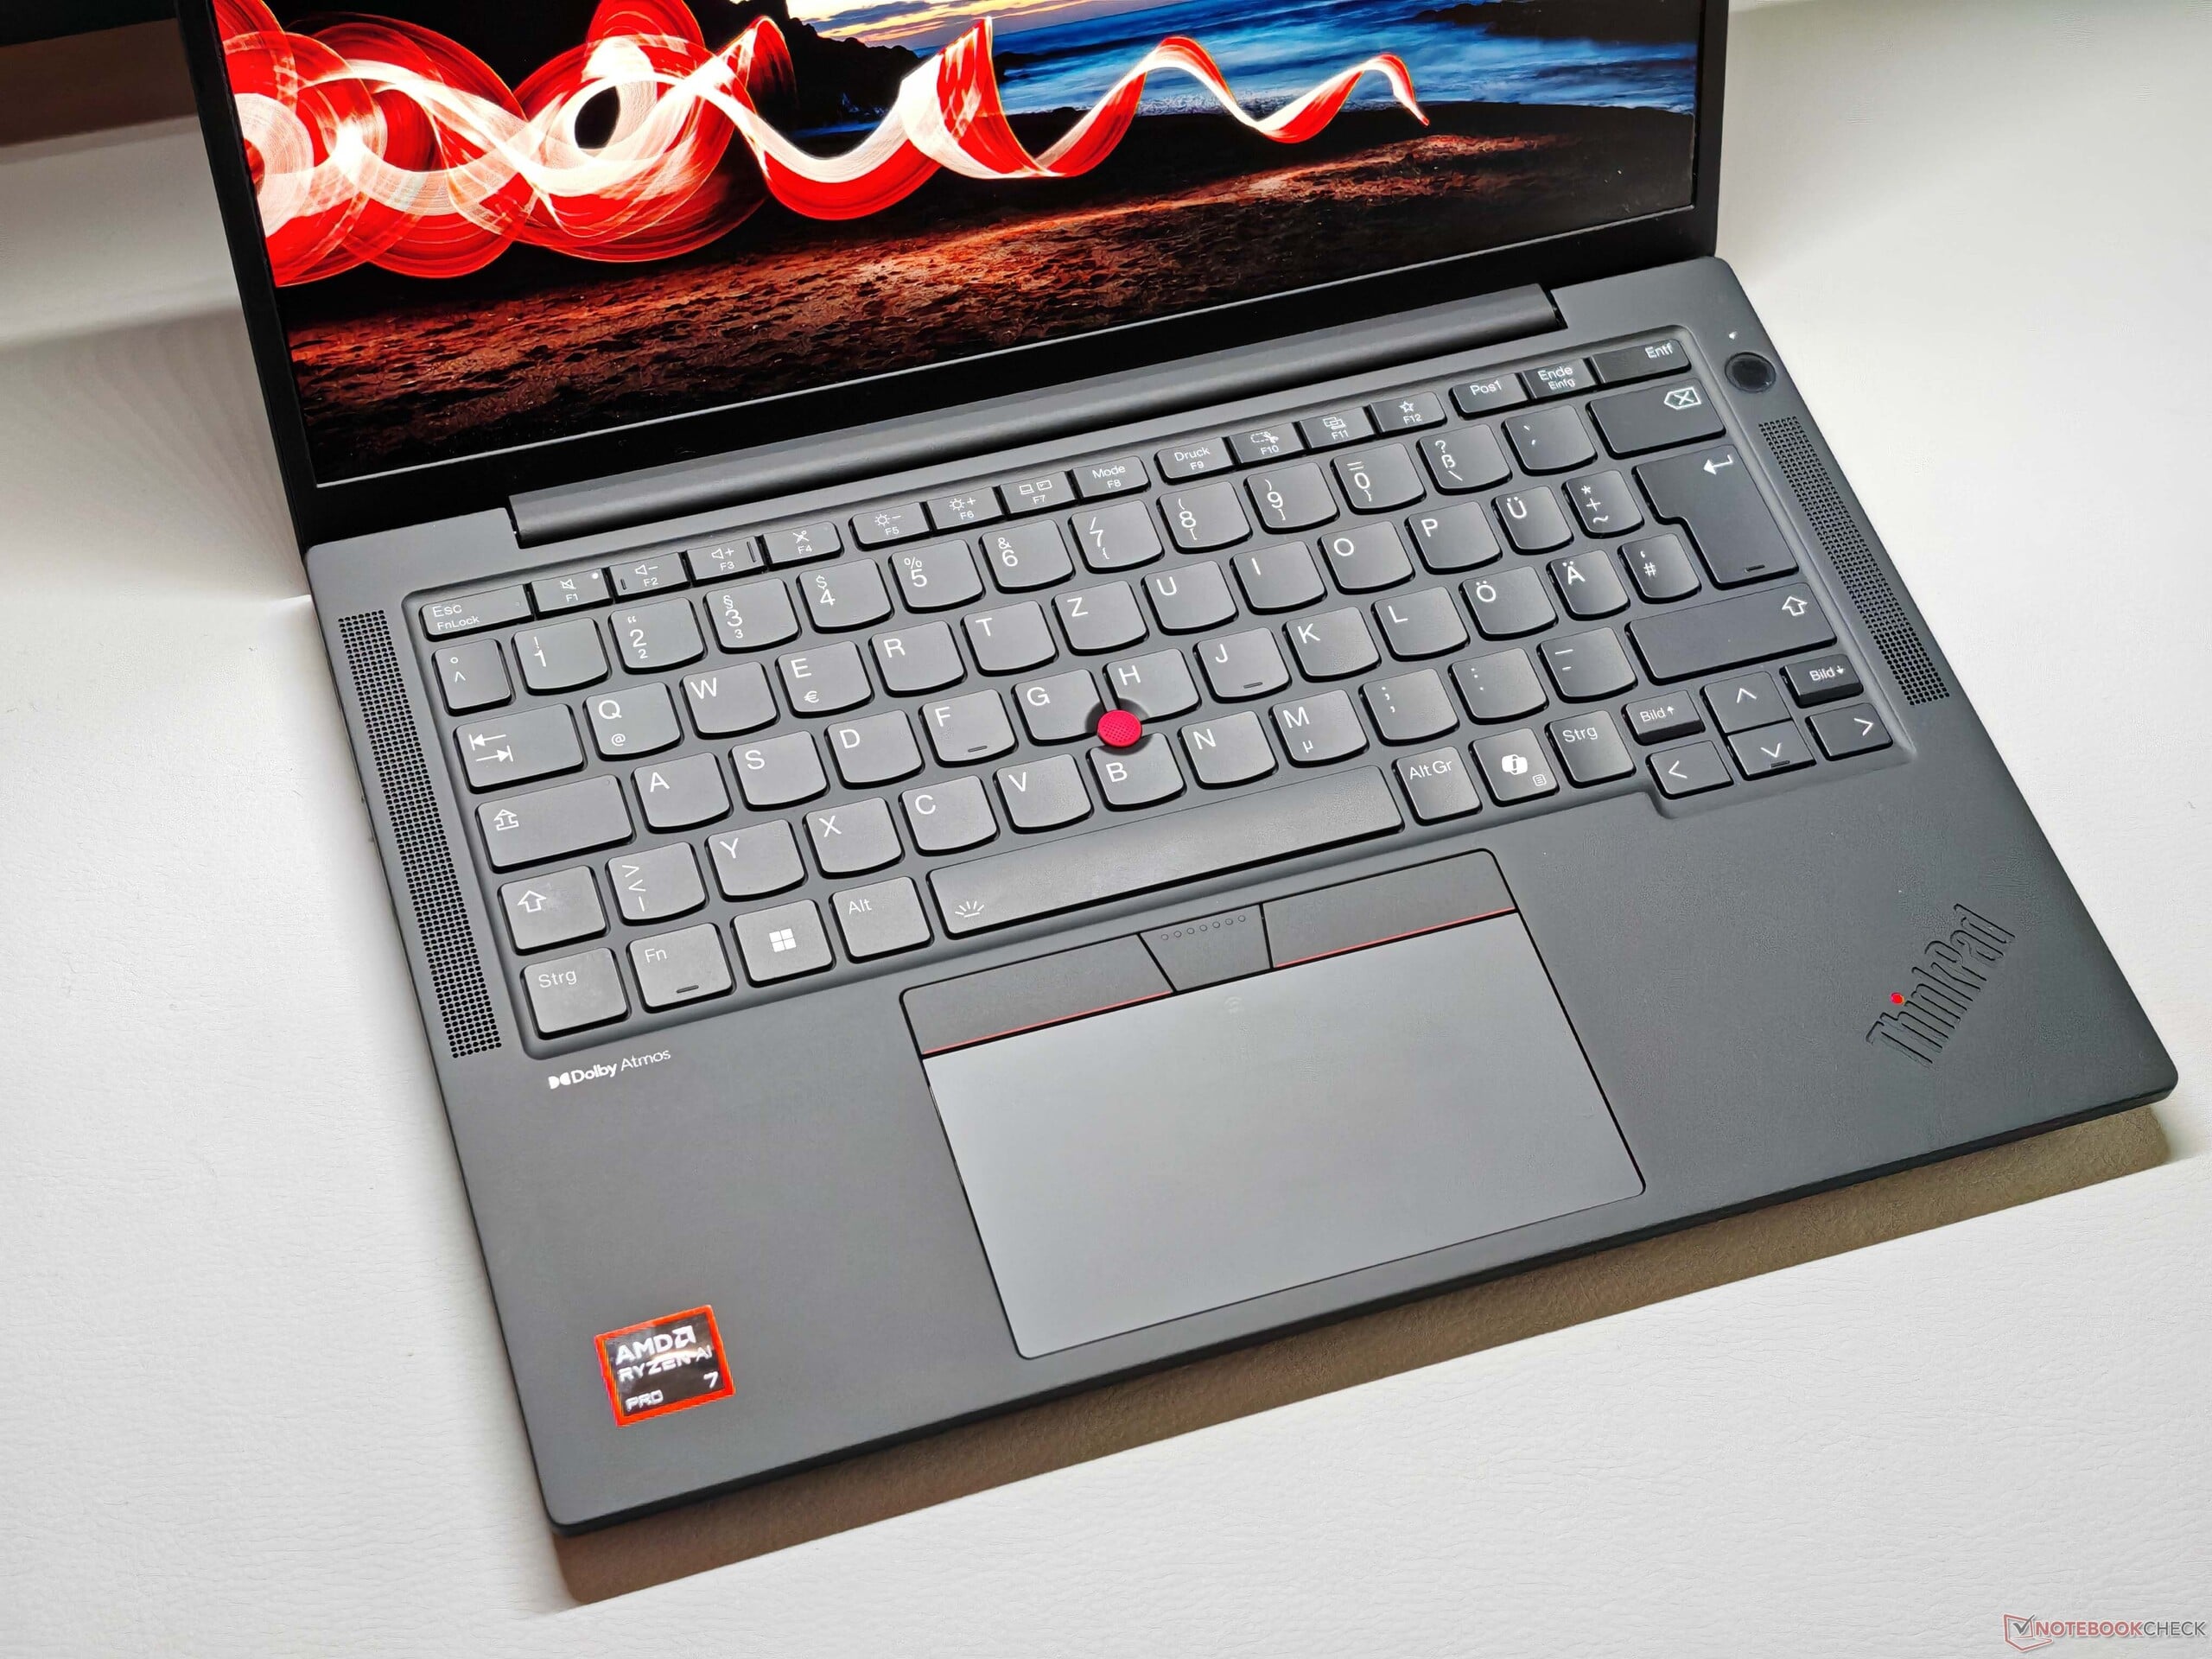
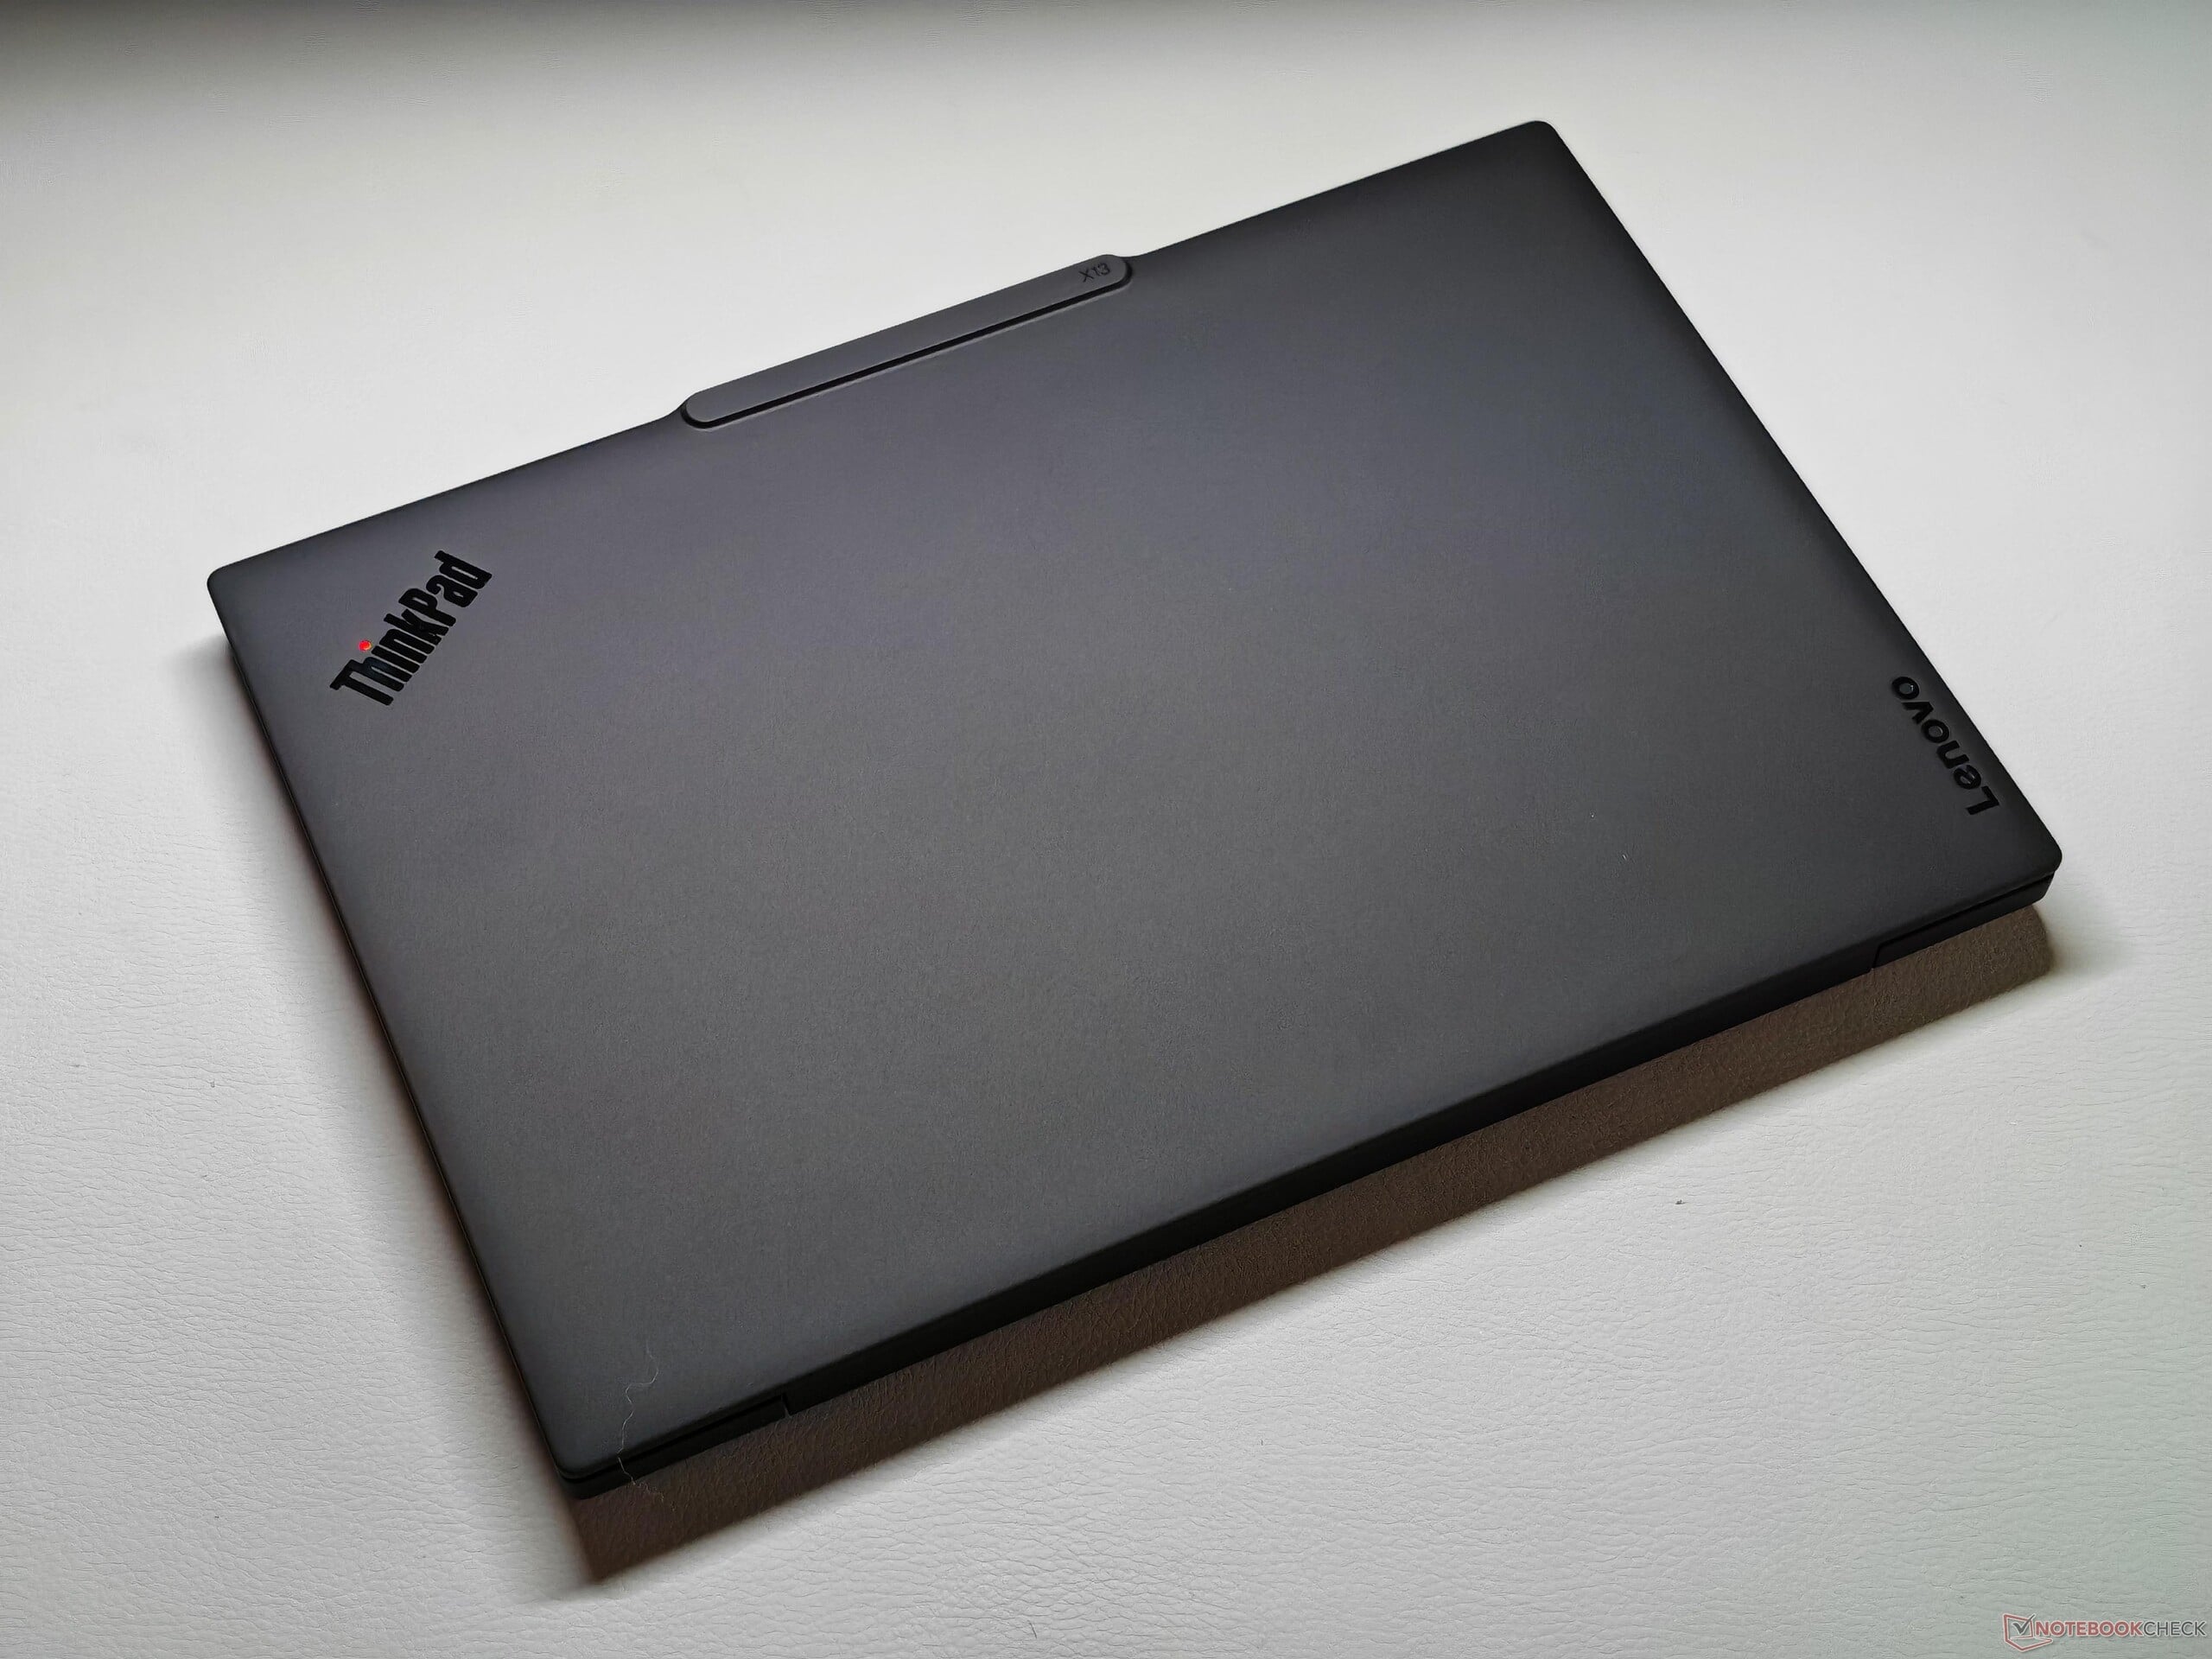
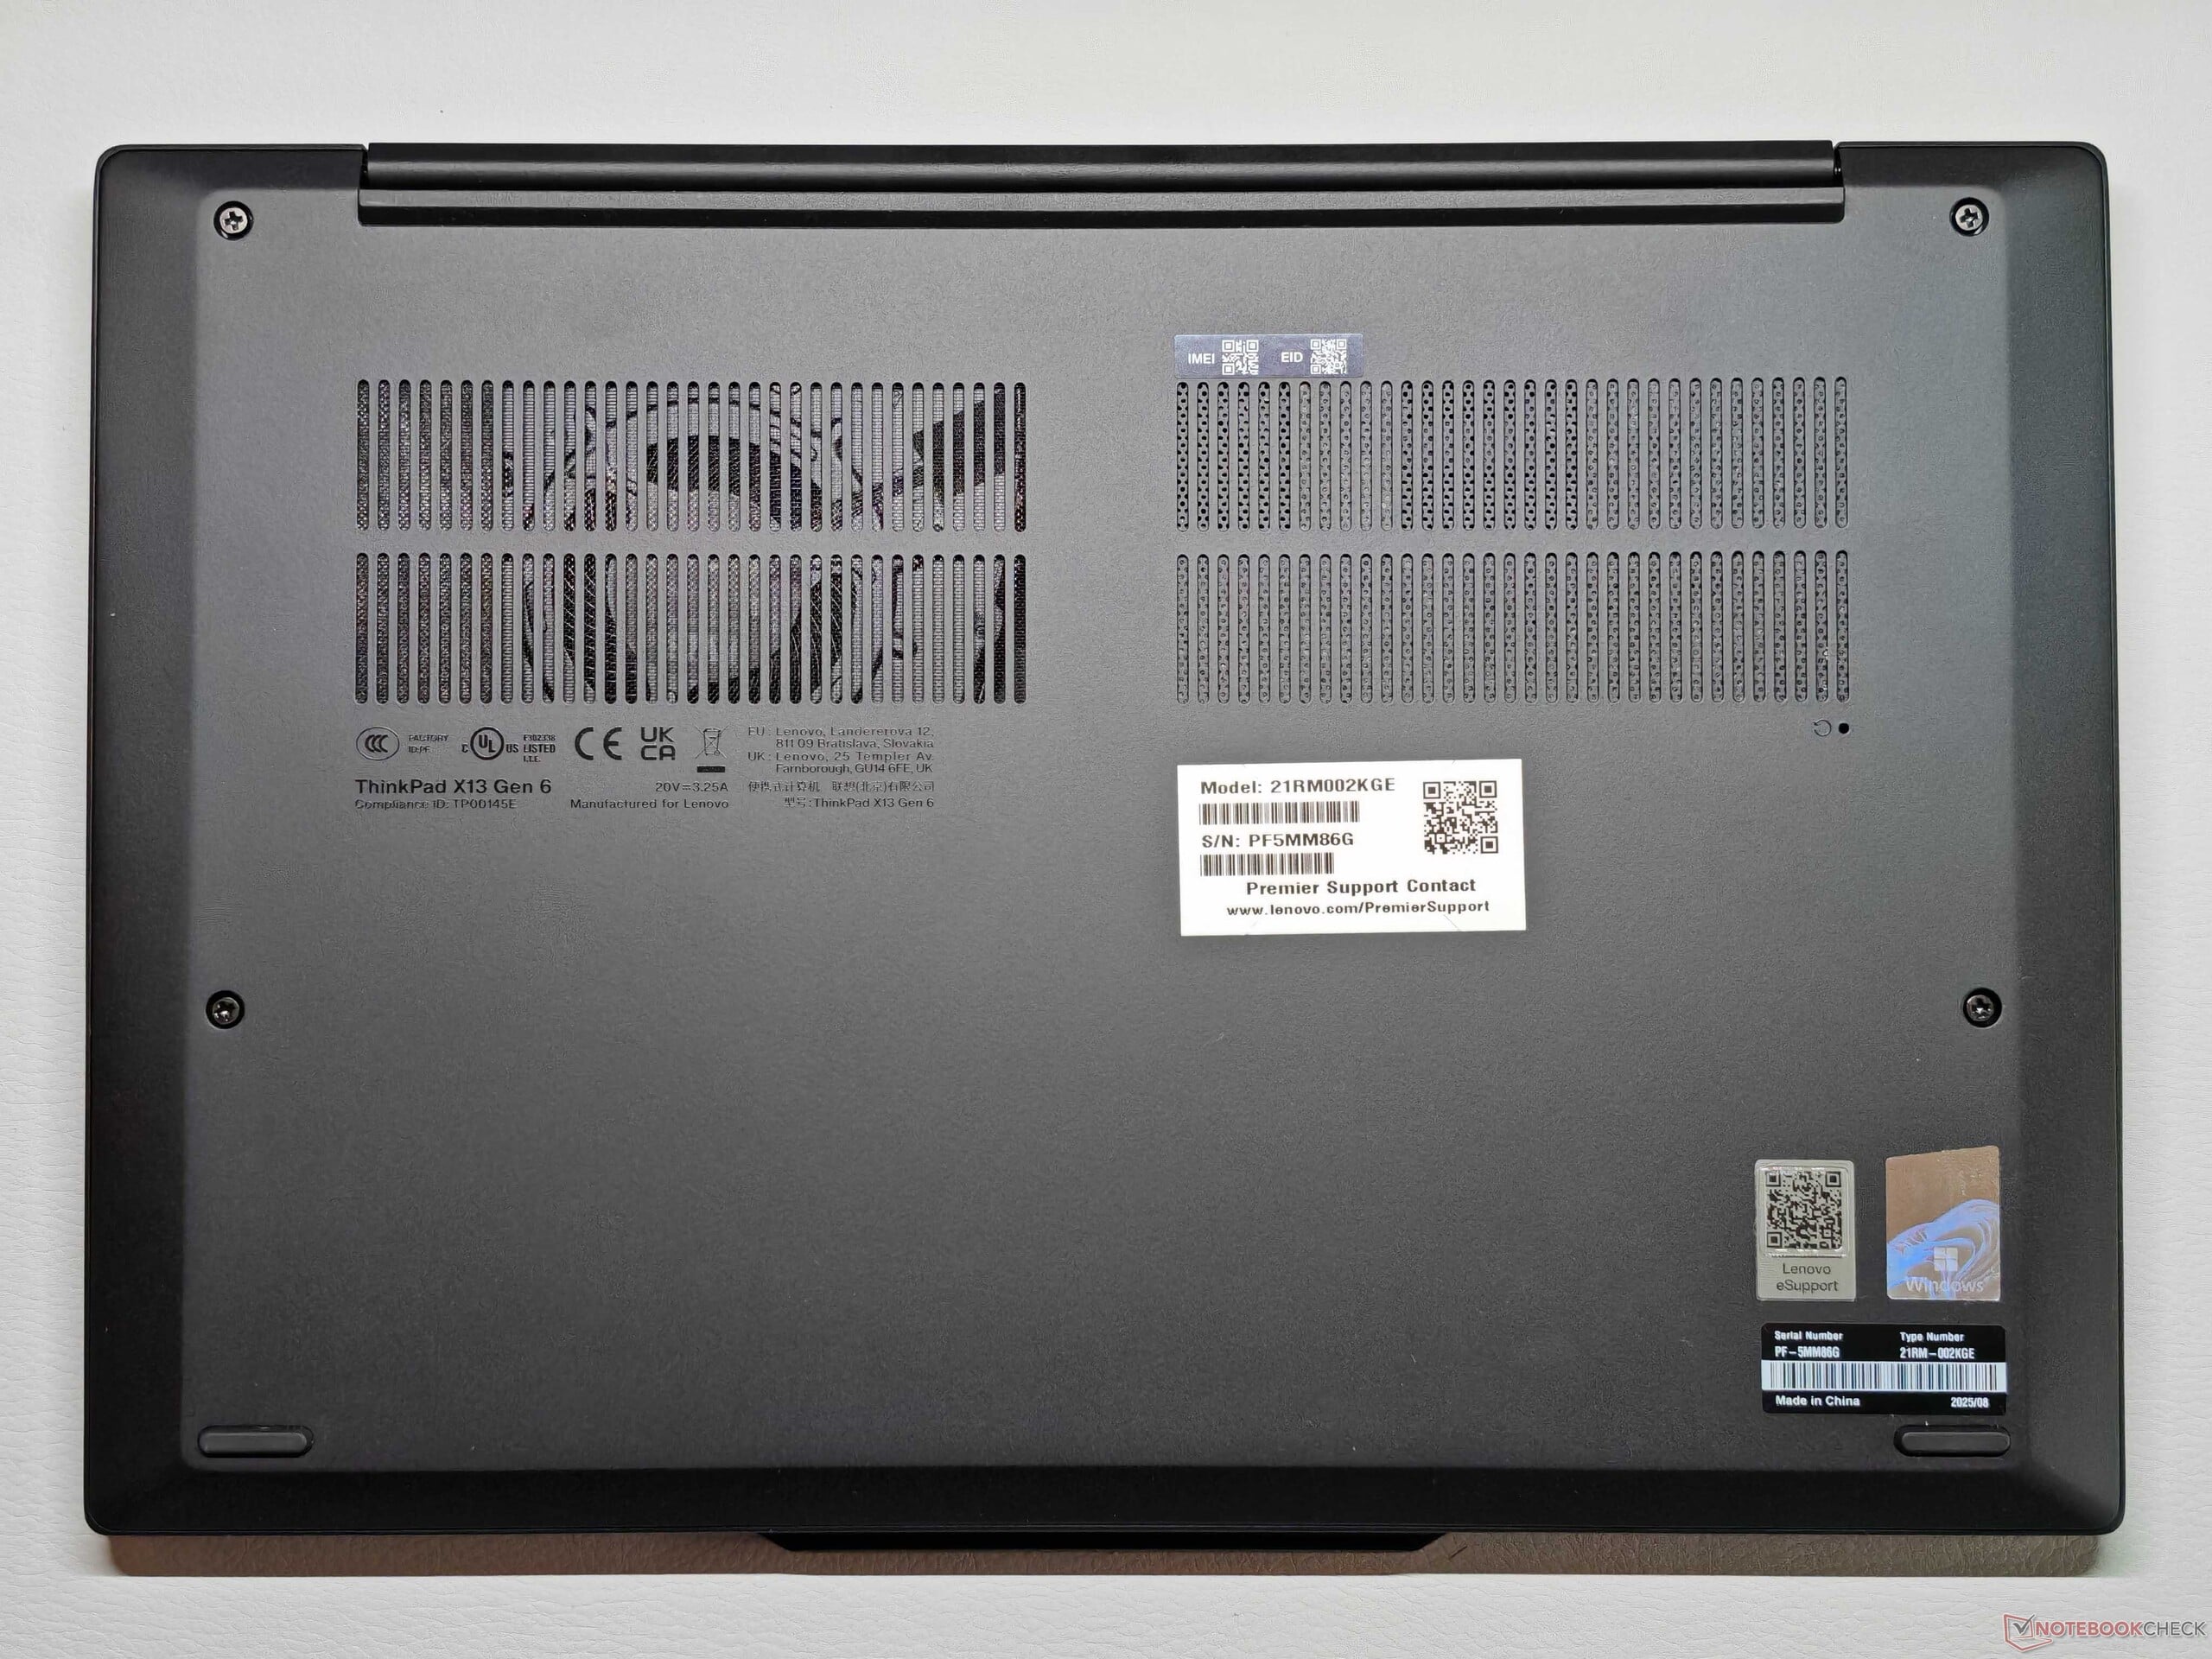
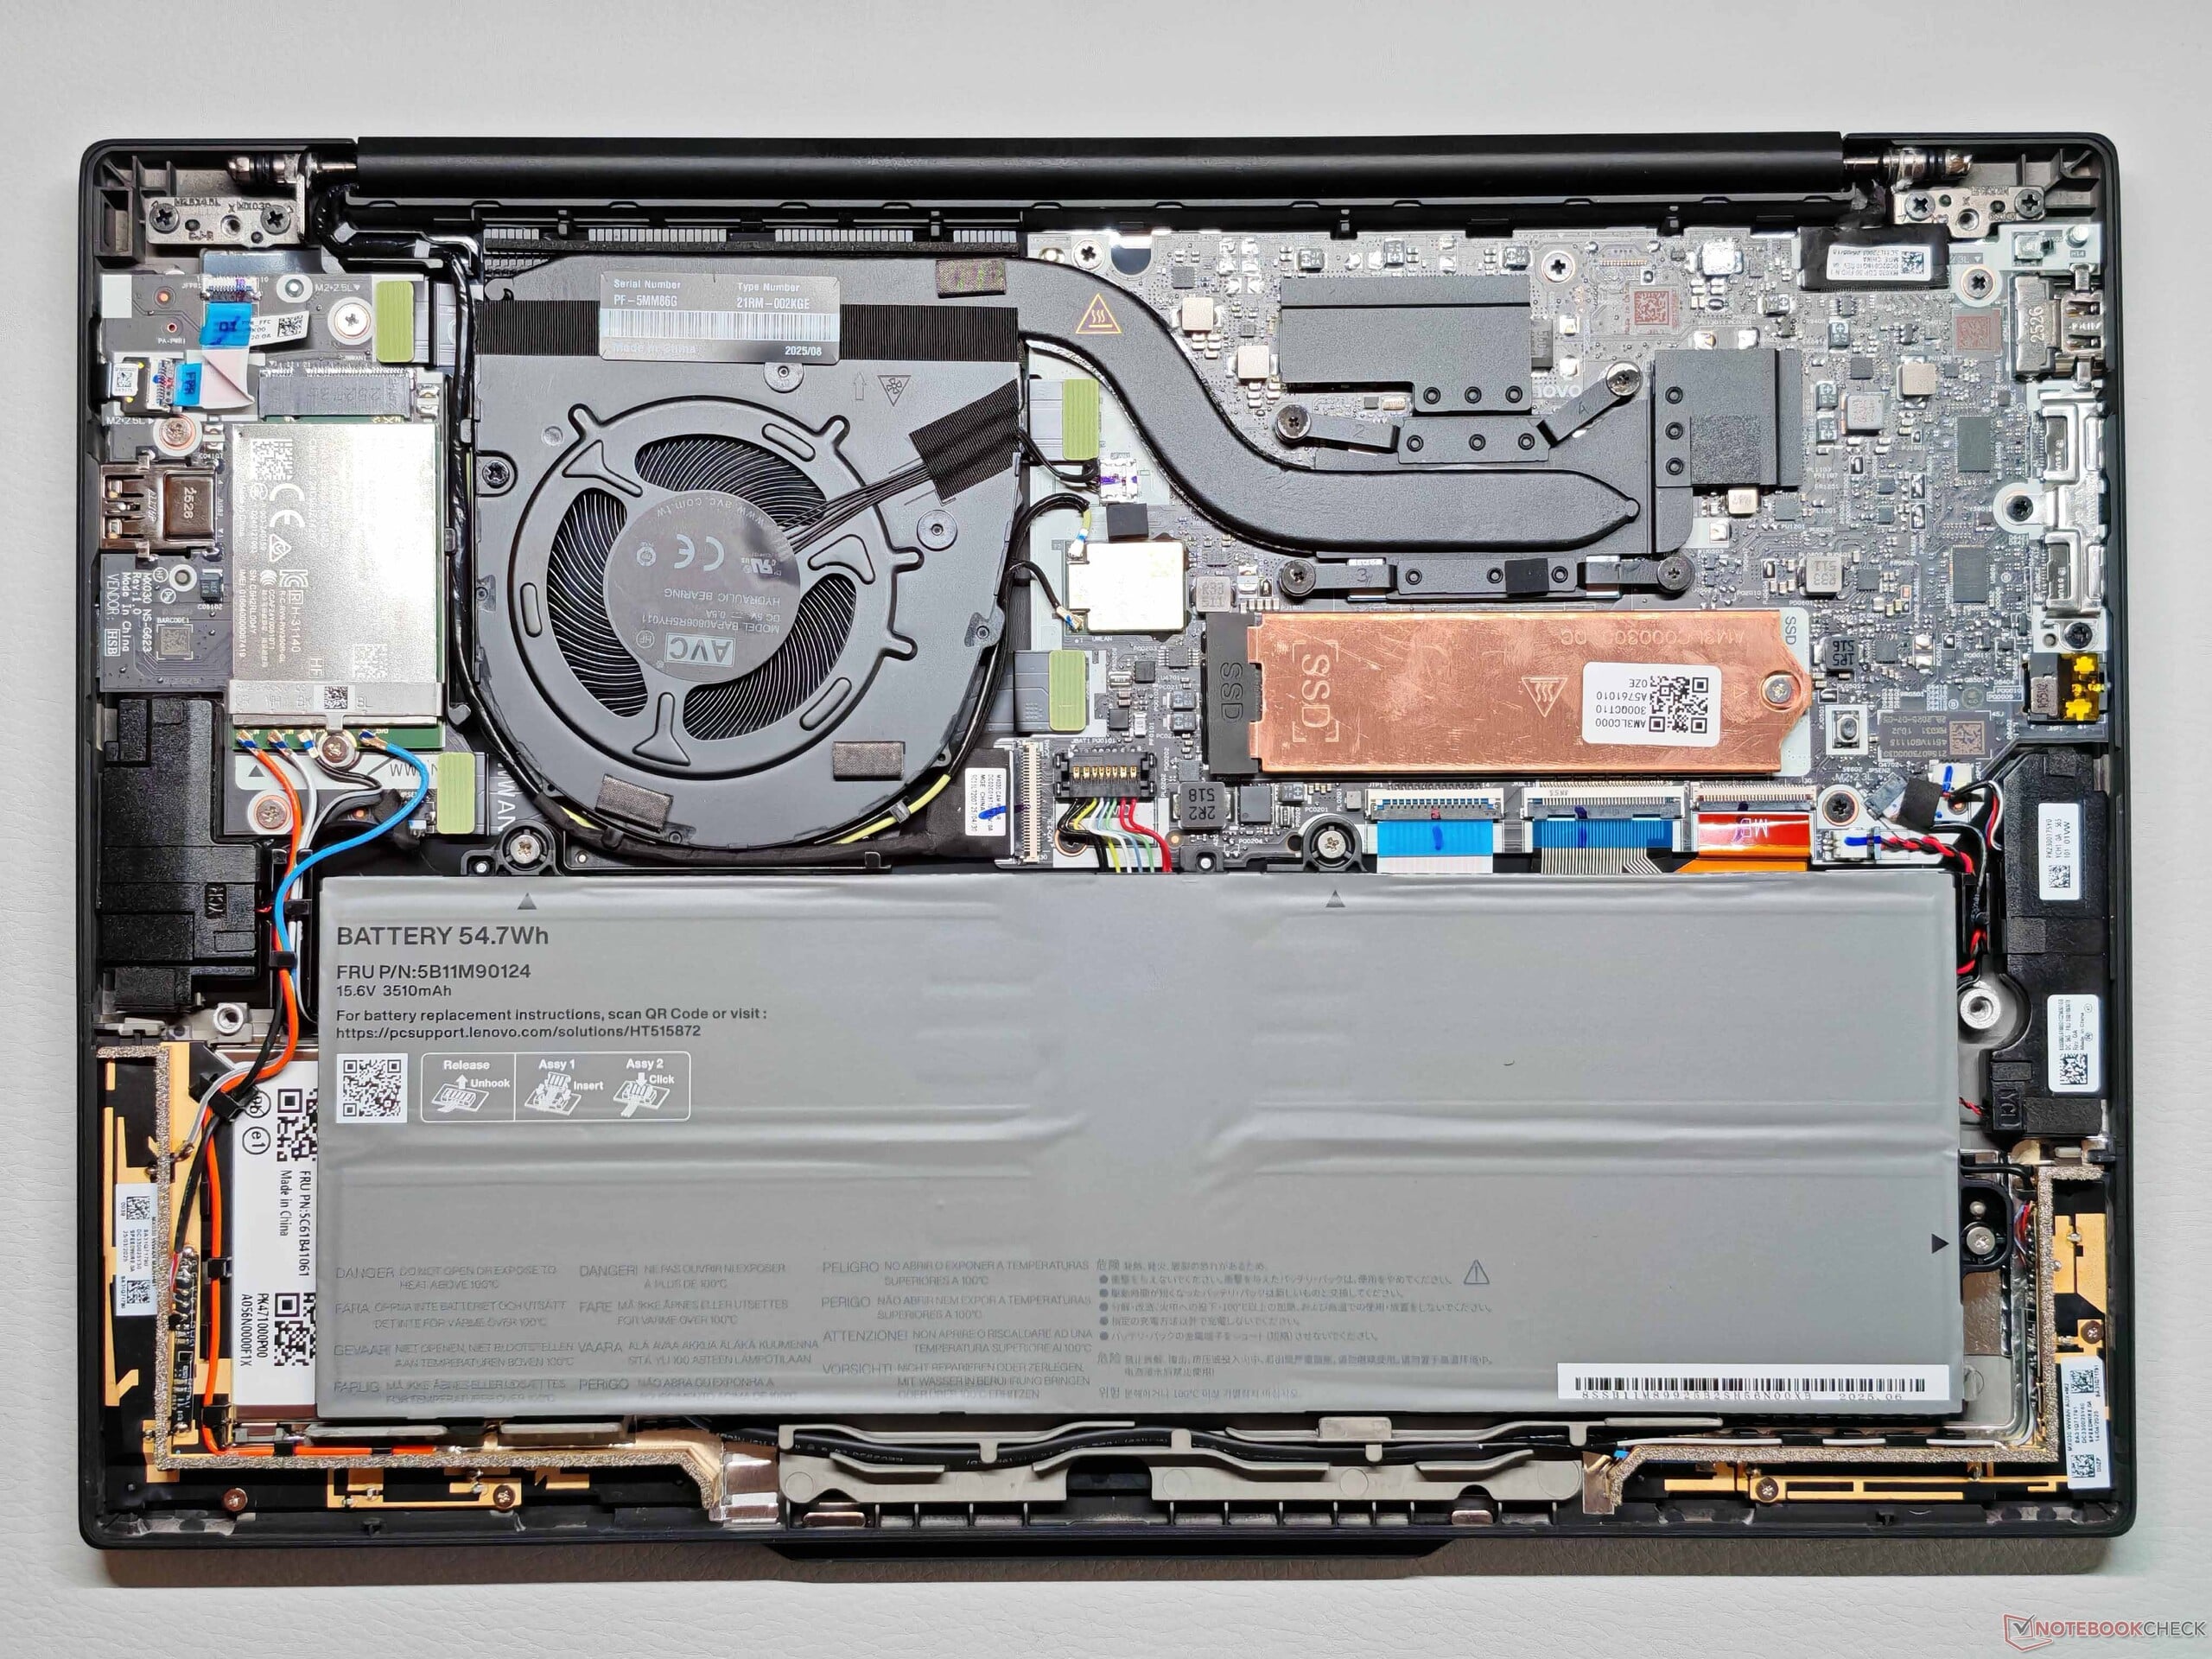
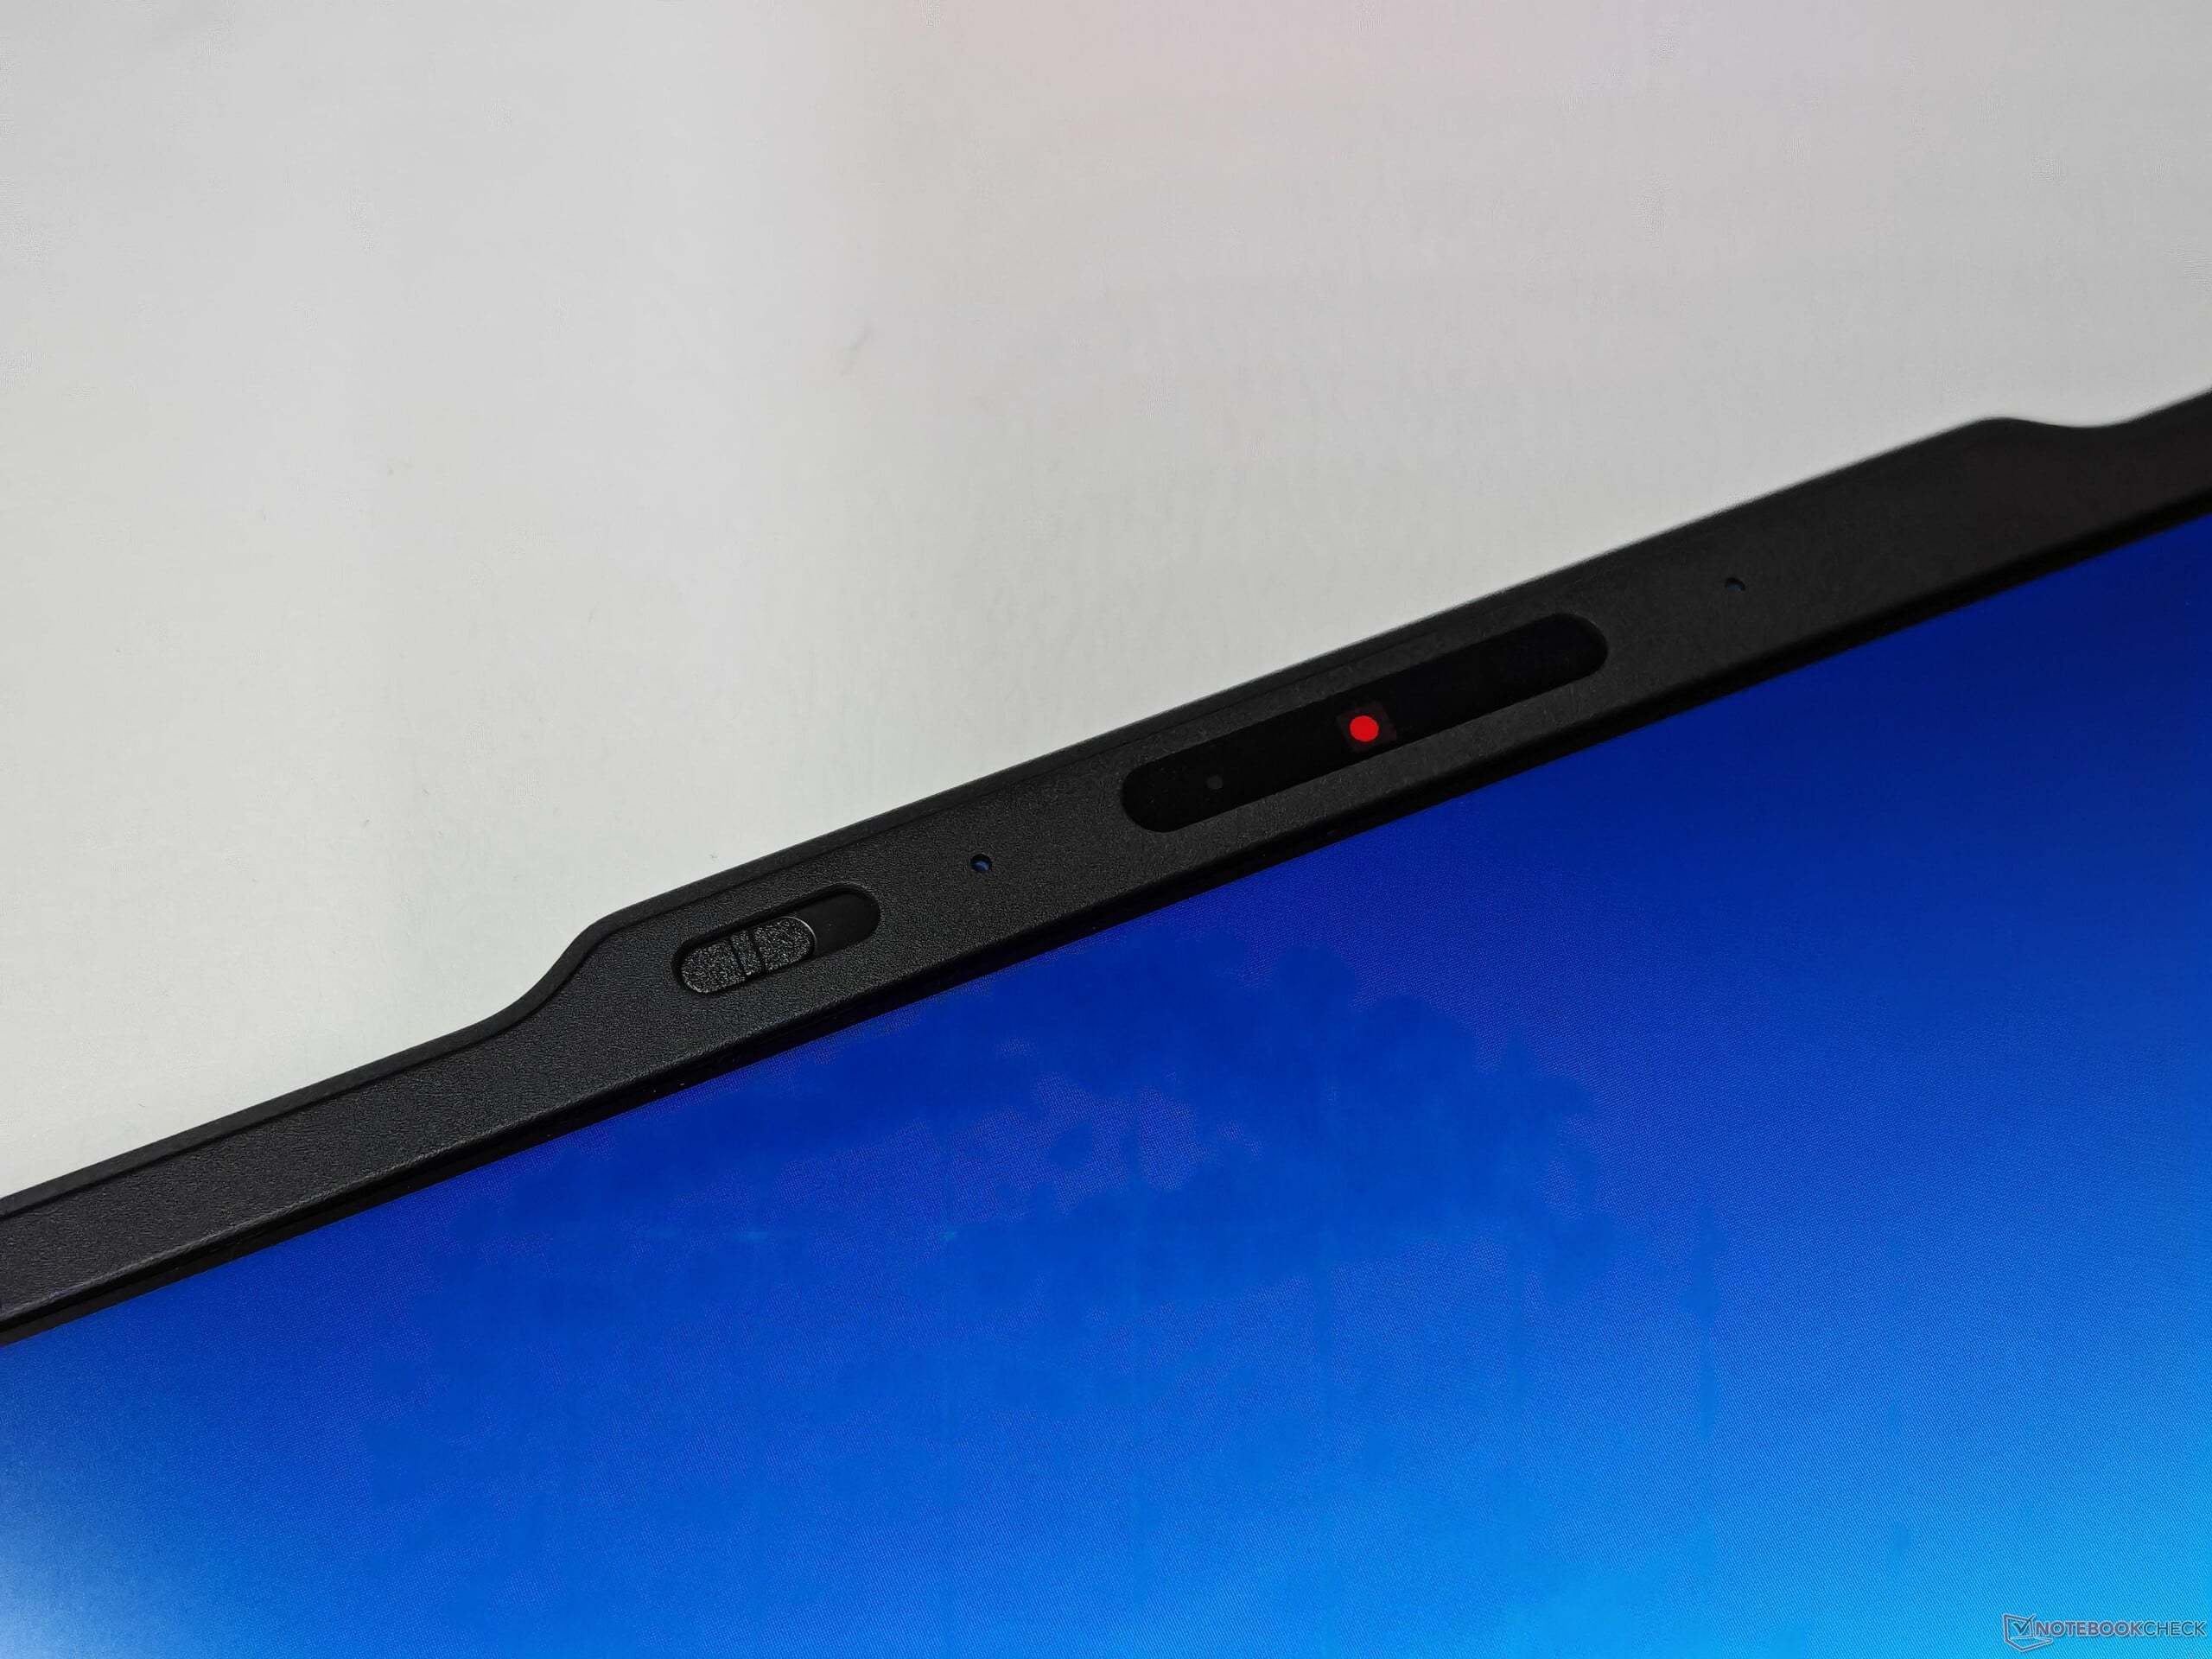
从外观上看,新款 X13 G6 无疑是一款 ThinkPad,它沿用了当前的设计语言,包括相当突出的摄像头外壳。在操作该设备时,一眼就能看出其小巧的体积和轻盈的重量。机身表面略有纹理,手感上乘,不易沾染指纹,而且相对容易清洁。盖子由碳纤维增强塑料制成,底座是铝制的。不过,对移动性的关注确实会影响到整体刚性。底座的中央区域可能会受到轻微挤压,扭动时会发出微弱的吱吱声。盖子本身还算坚固,但铰链是主要问题。最大开启角度为 180 度,但铰链有点太松,晃动得厉害。底盖只用四颗螺丝固定,很容易拆卸。风扇、电池、WWAN 模块和固态硬盘可以维修,但内存和 WLAN 模块是焊接的。
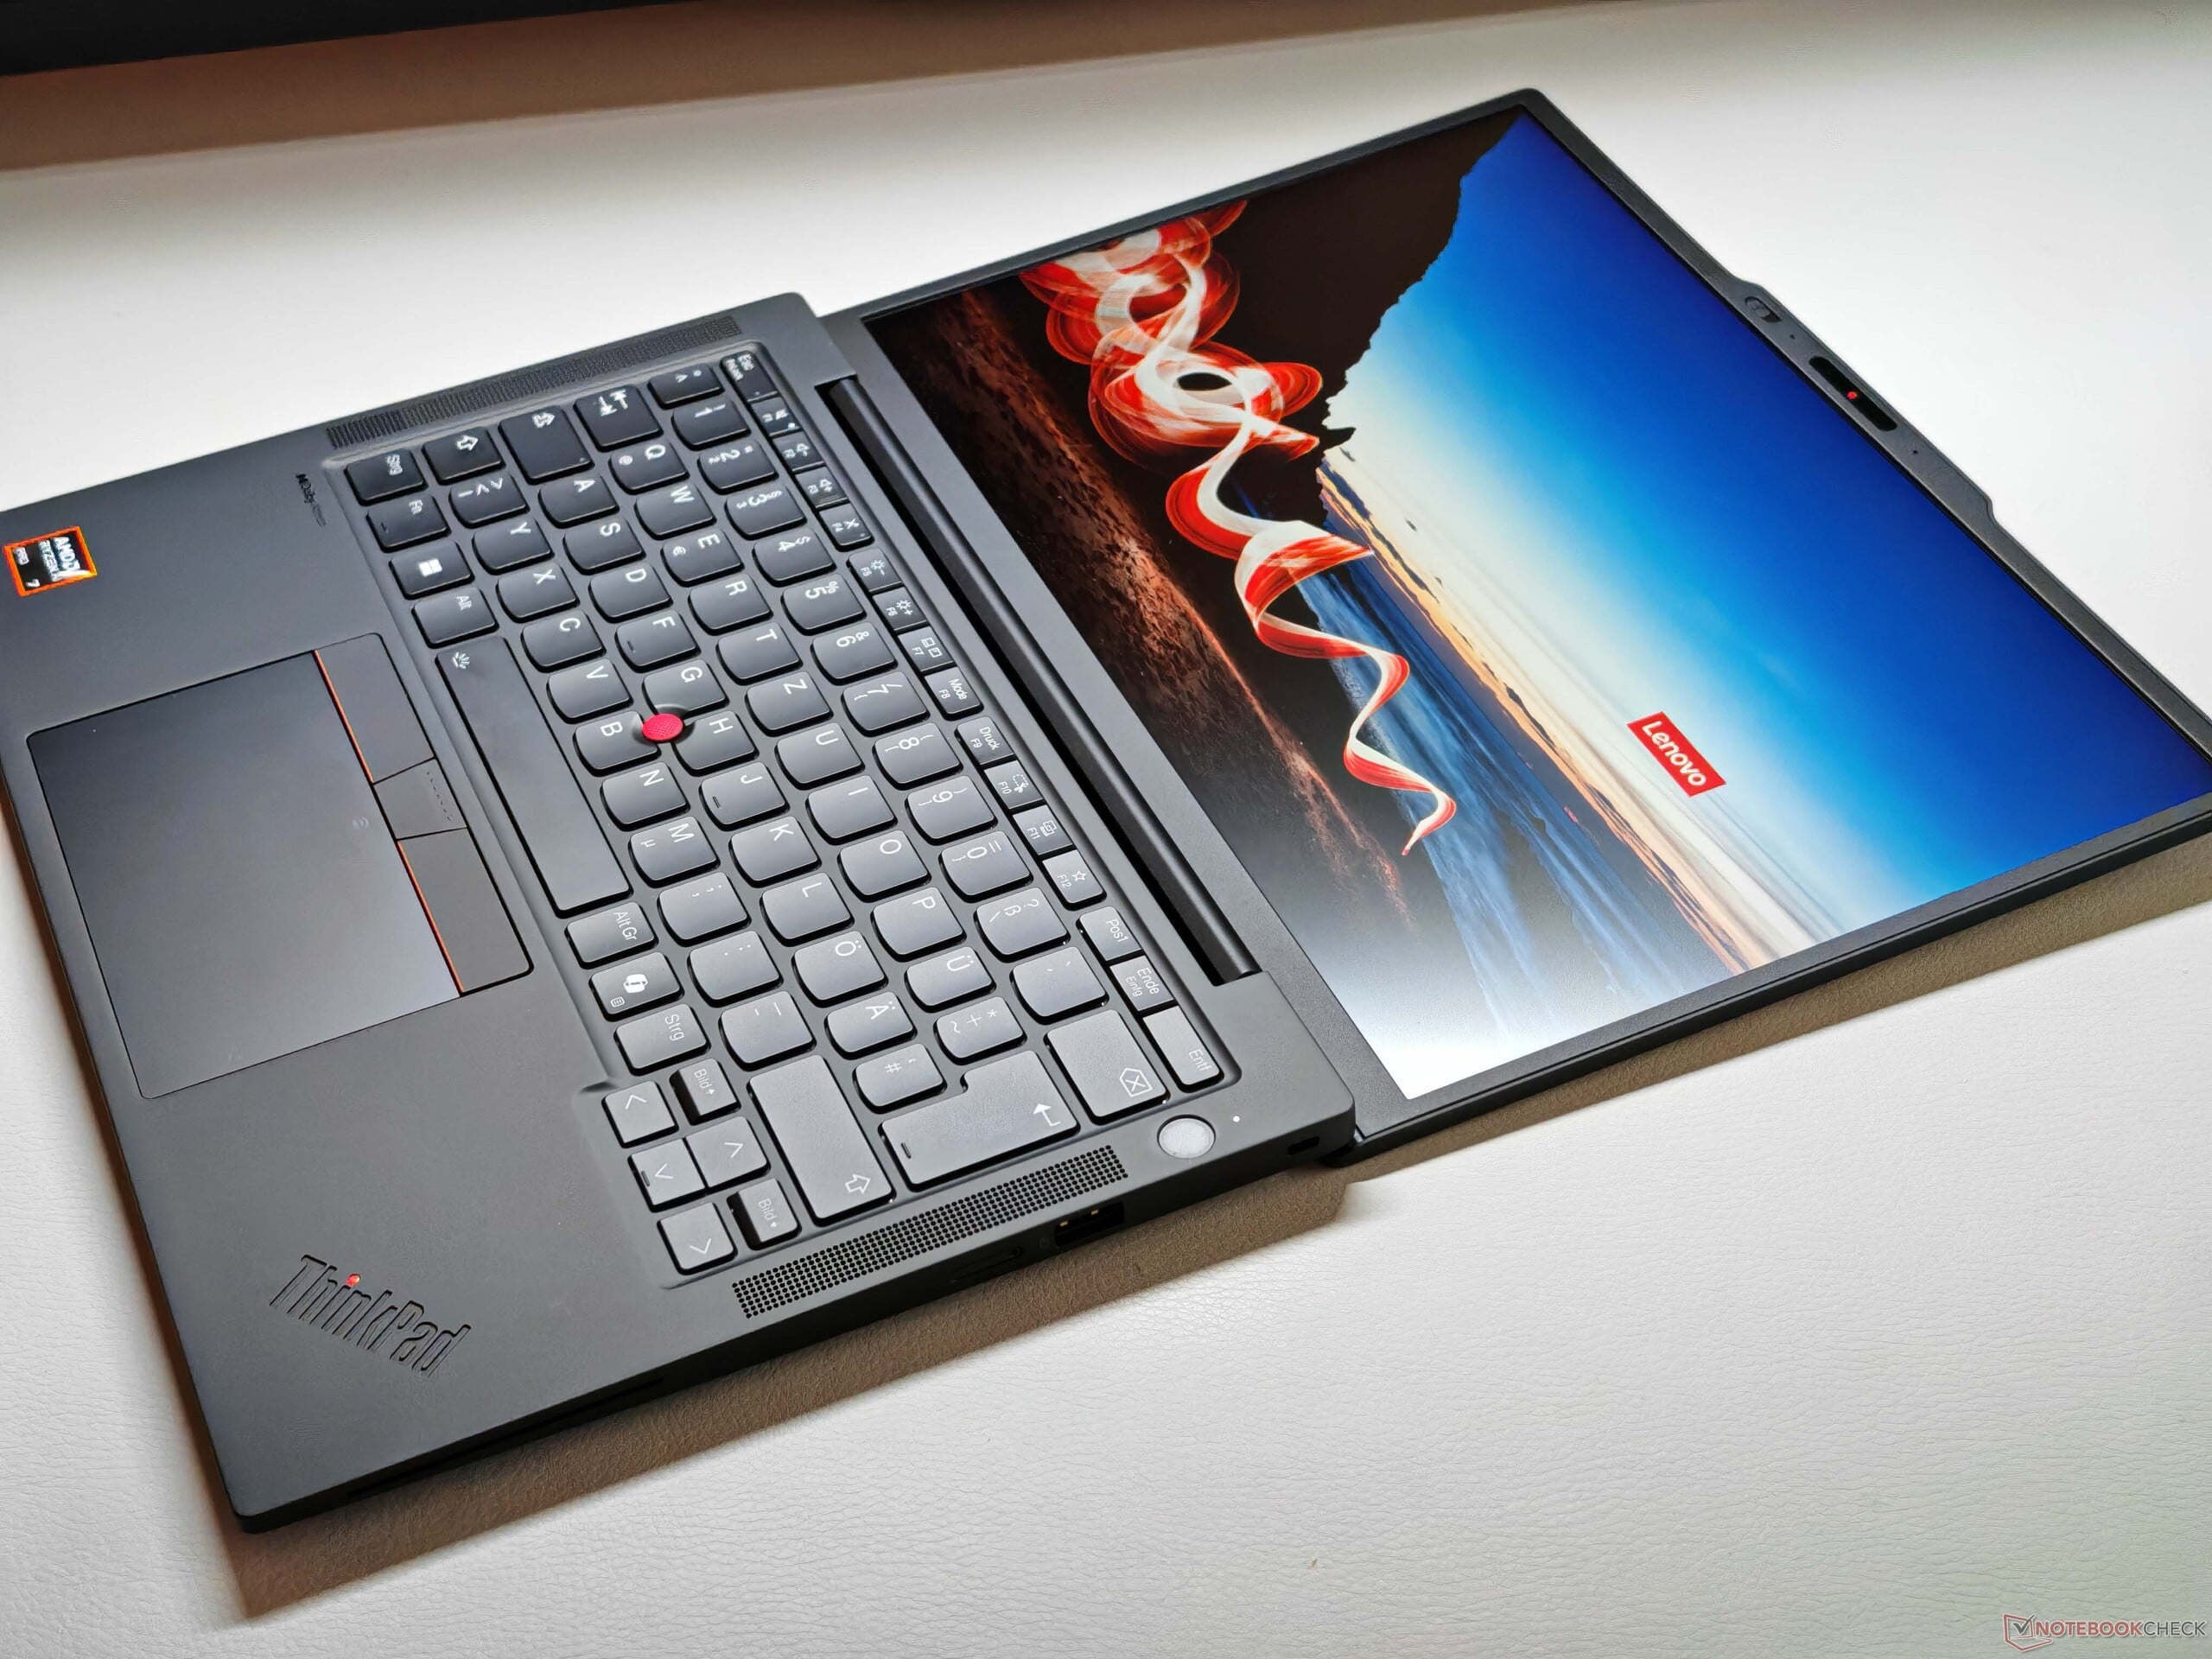
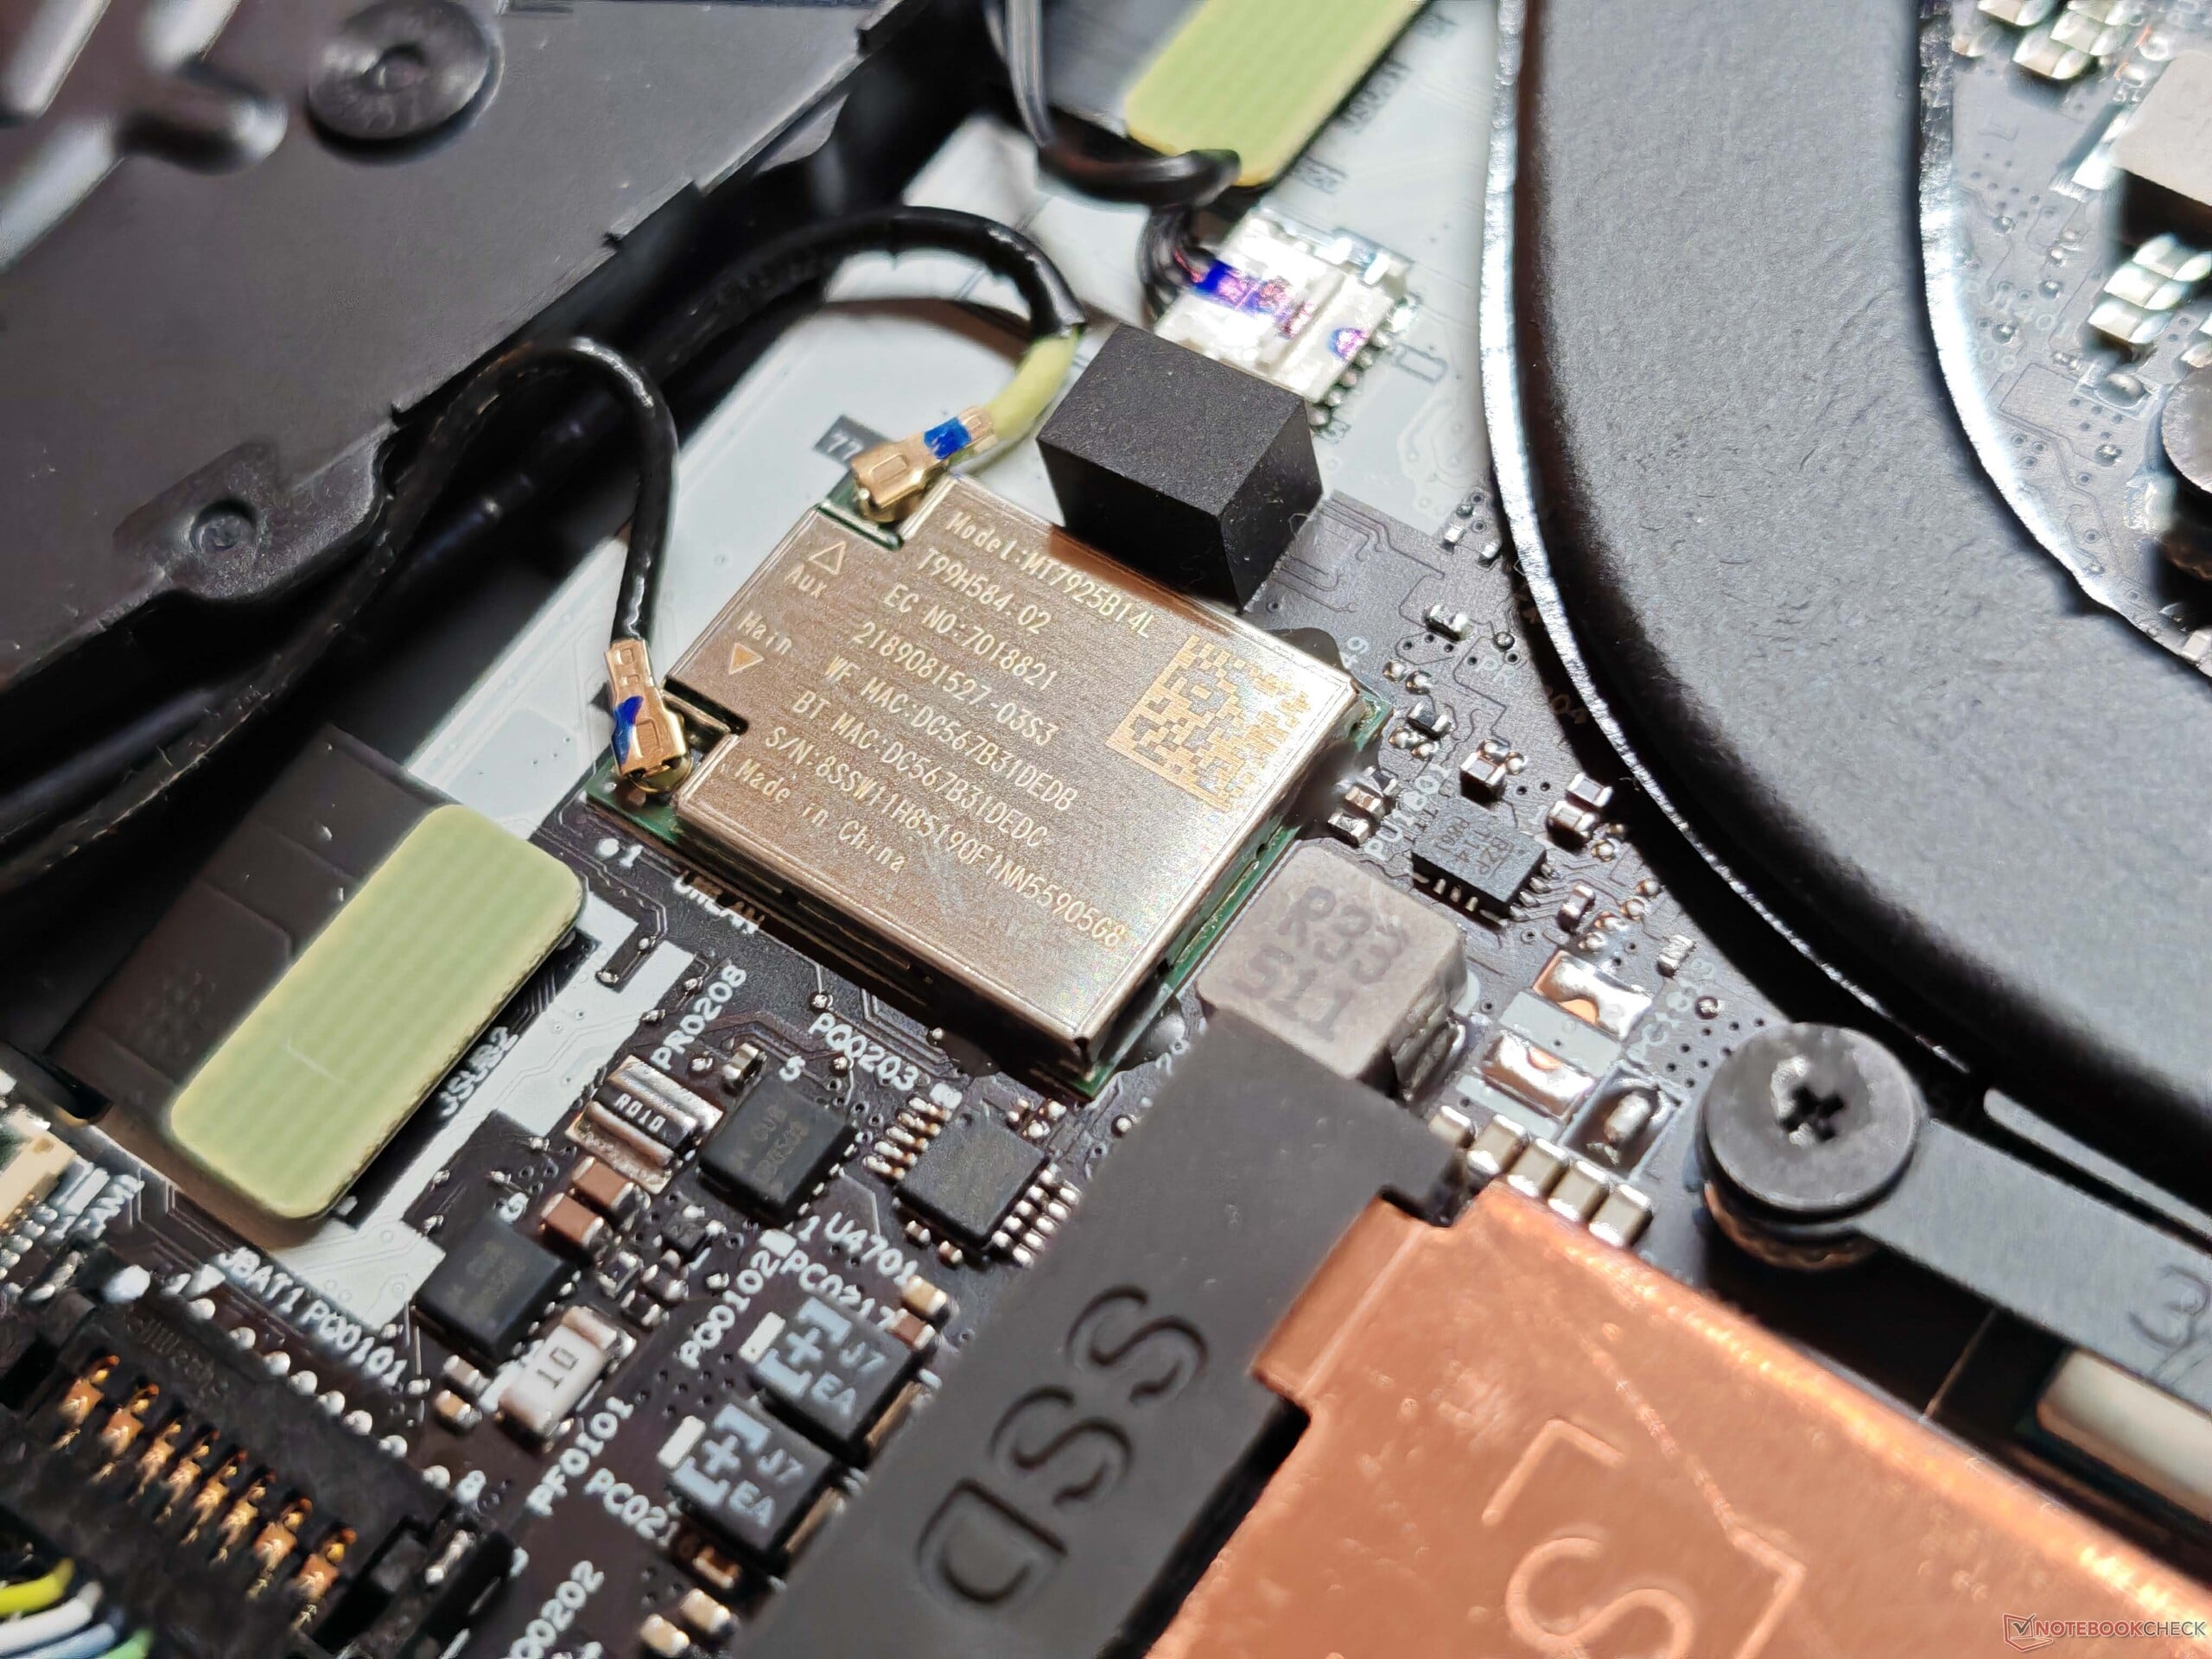
在端口方面,现在只有一个 USB-A 接口位于右侧,而包括 Thunderbolt 4 在内的两个 USB-C 端口位于左侧。WLAN 模块支持 Wi-Fi 7,传输速率非常高且稳定。500 万像素摄像头(包括红外摄像头)的成像质量尚可,采用机械快门。


| Networking | |
| Lenovo ThinkPad X13 G6 AMD | |
| iperf3 transmit AXE11000 | |
| iperf3 receive AXE11000 | |
| Dell Pro 13 Premium PA13250 | |
| iperf3 transmit AXE11000 | |
| iperf3 receive AXE11000 | |
| iperf3 transmit AXE11000 6GHz | |
| iperf3 receive AXE11000 6GHz | |
| MSI Prestige 13 AI Plus Evo A2VMG | |
| iperf3 transmit AXE11000 | |
| iperf3 receive AXE11000 | |
| iperf3 transmit AXE11000 6GHz | |
| iperf3 receive AXE11000 6GHz | |
| Microsoft Surface Laptop 7 13.8 Copilot+ | |
| iperf3 transmit AXE11000 | |
| iperf3 receive AXE11000 | |
| iperf3 transmit AXE11000 6GHz | |
| iperf3 receive AXE11000 6GHz | |
| Lenovo ThinkPad X1 Carbon Gen 13 21NS0010GE | |
| iperf3 transmit AXE11000 | |
| iperf3 receive AXE11000 | |
| iperf3 transmit AXE11000 6GHz | |
| iperf3 receive AXE11000 6GHz | |


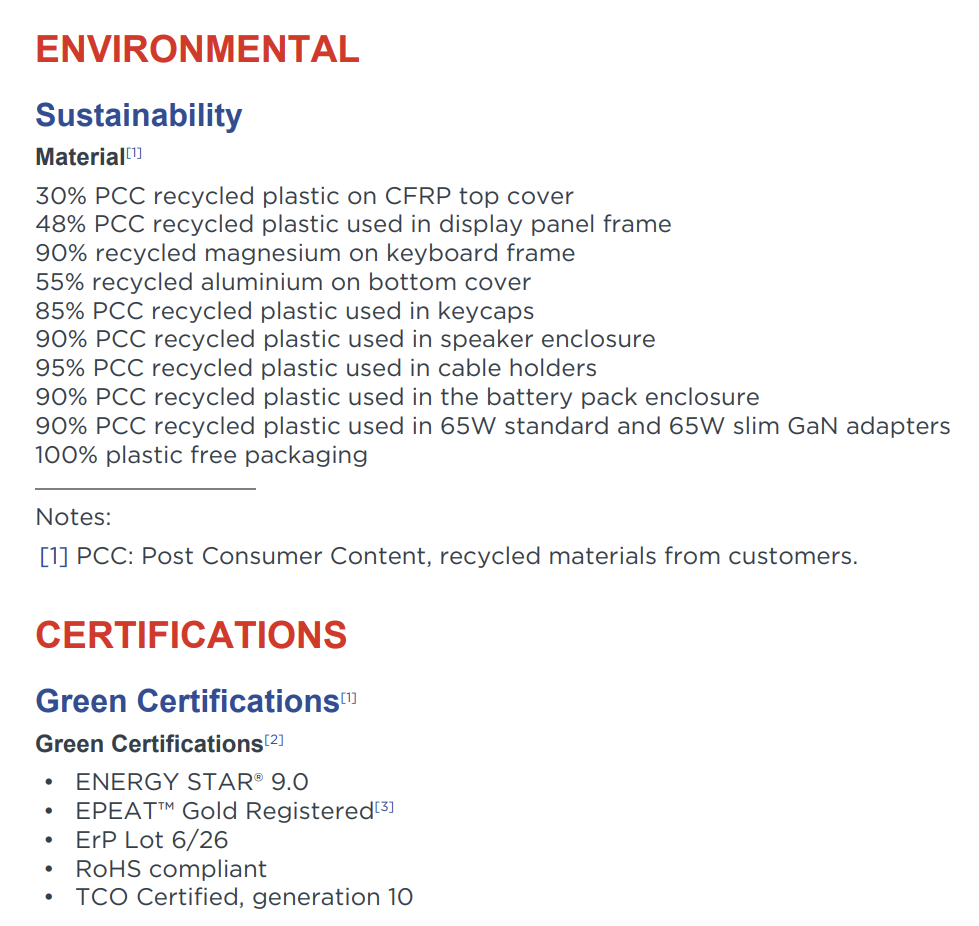
可持续性
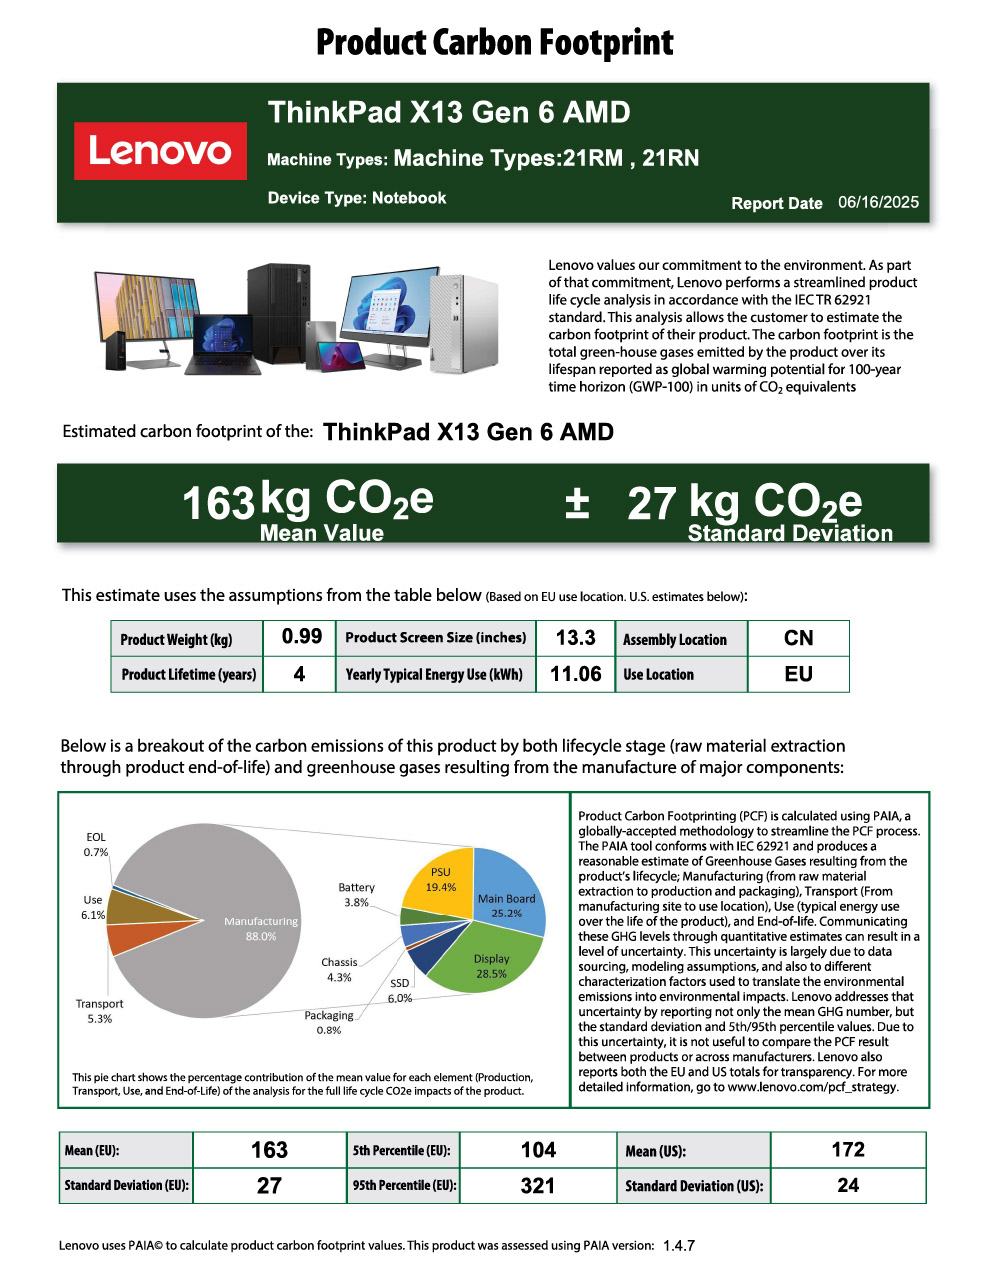
ThinkPad X13 G6 符合包括 "能源之星 "在内的多项环保标准,联想还提供了有关该设备碳足迹和使用可回收材料的大量信息。包装完全可回收,不含塑料。
输入设备 - 弱键盘
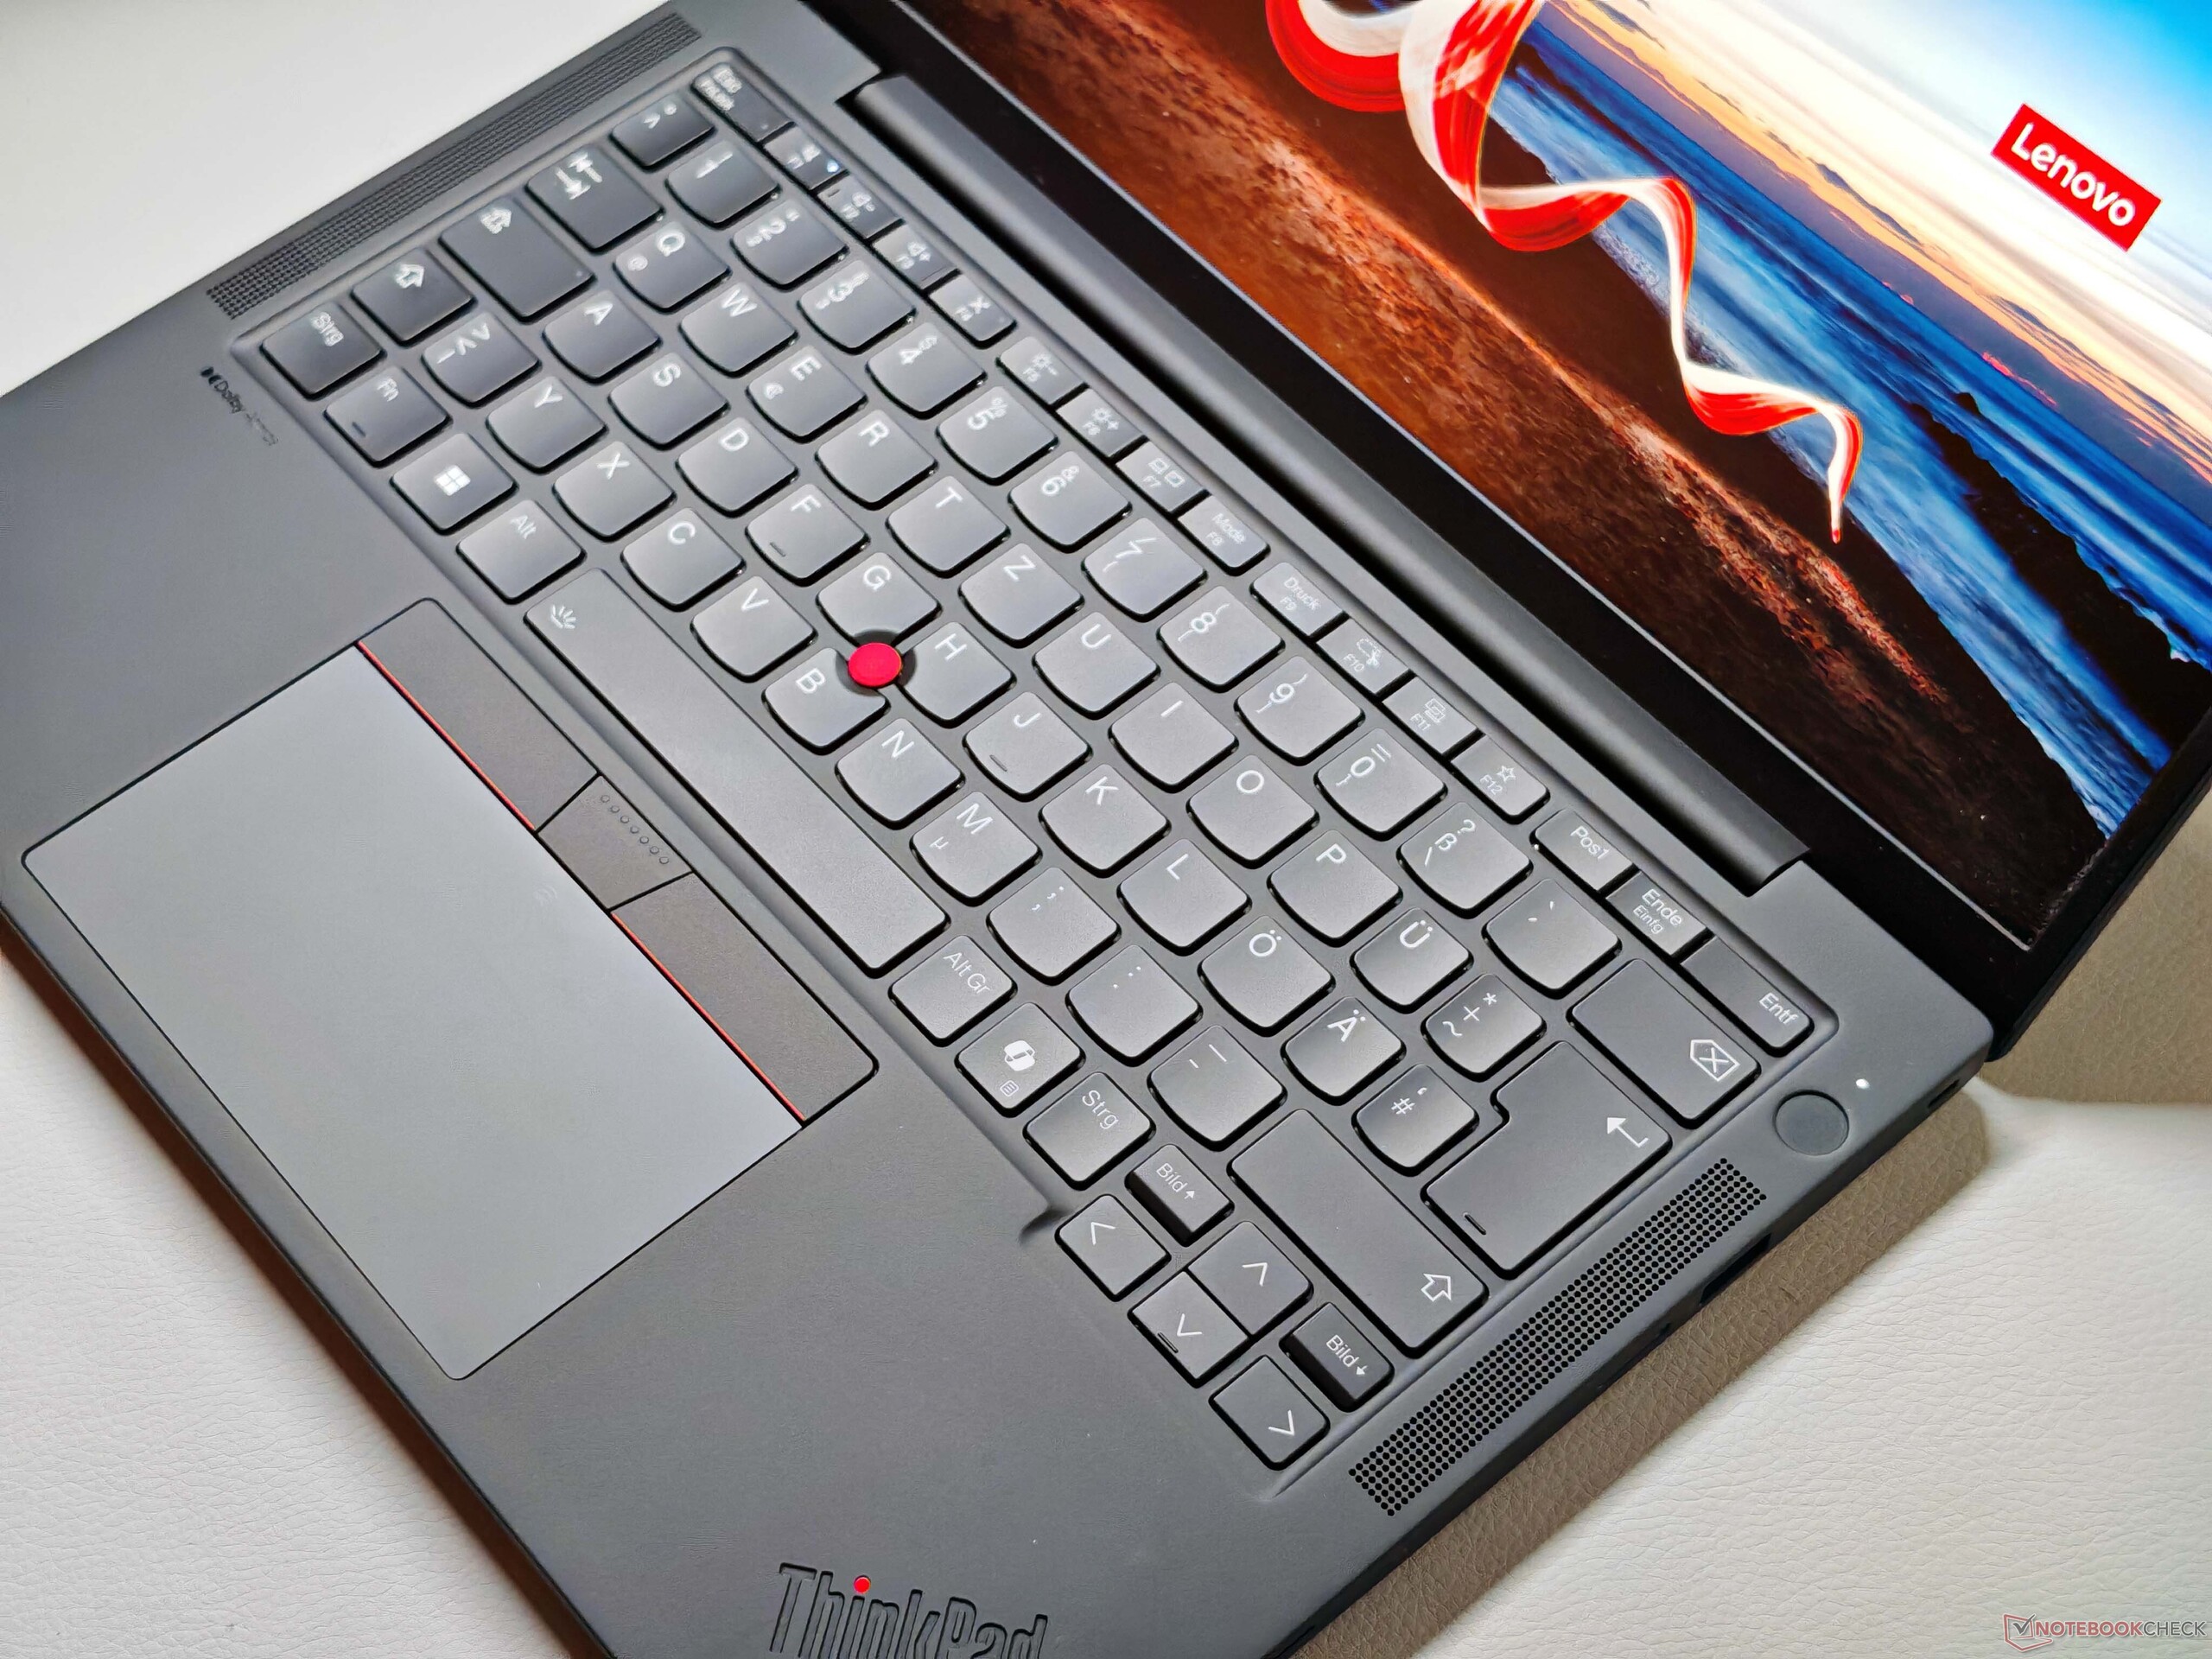
背光键盘的大部分按键行程为 1.5 毫米,而 G、H 和 B 键(位于 TrackPoint 旁边)以及功能键的行程仅为 1.35 毫米。总体而言,即使以现代 ThinkPad 的标准来衡量,打字体验也只能算一般,无法与旧机型相提并论,如 2018 年的 ThinkPad X1 Carbon G6.按键精准,但整体键入感觉并不特别舒适。


TrackPoint 运行良好,相关按钮也能提供令人满意的点击效果。相对较小的 ClickPad(11.5 × 7.4 厘米)性能符合预期,具有良好的滑动特性,不过下部区域的机械点击声有点大。
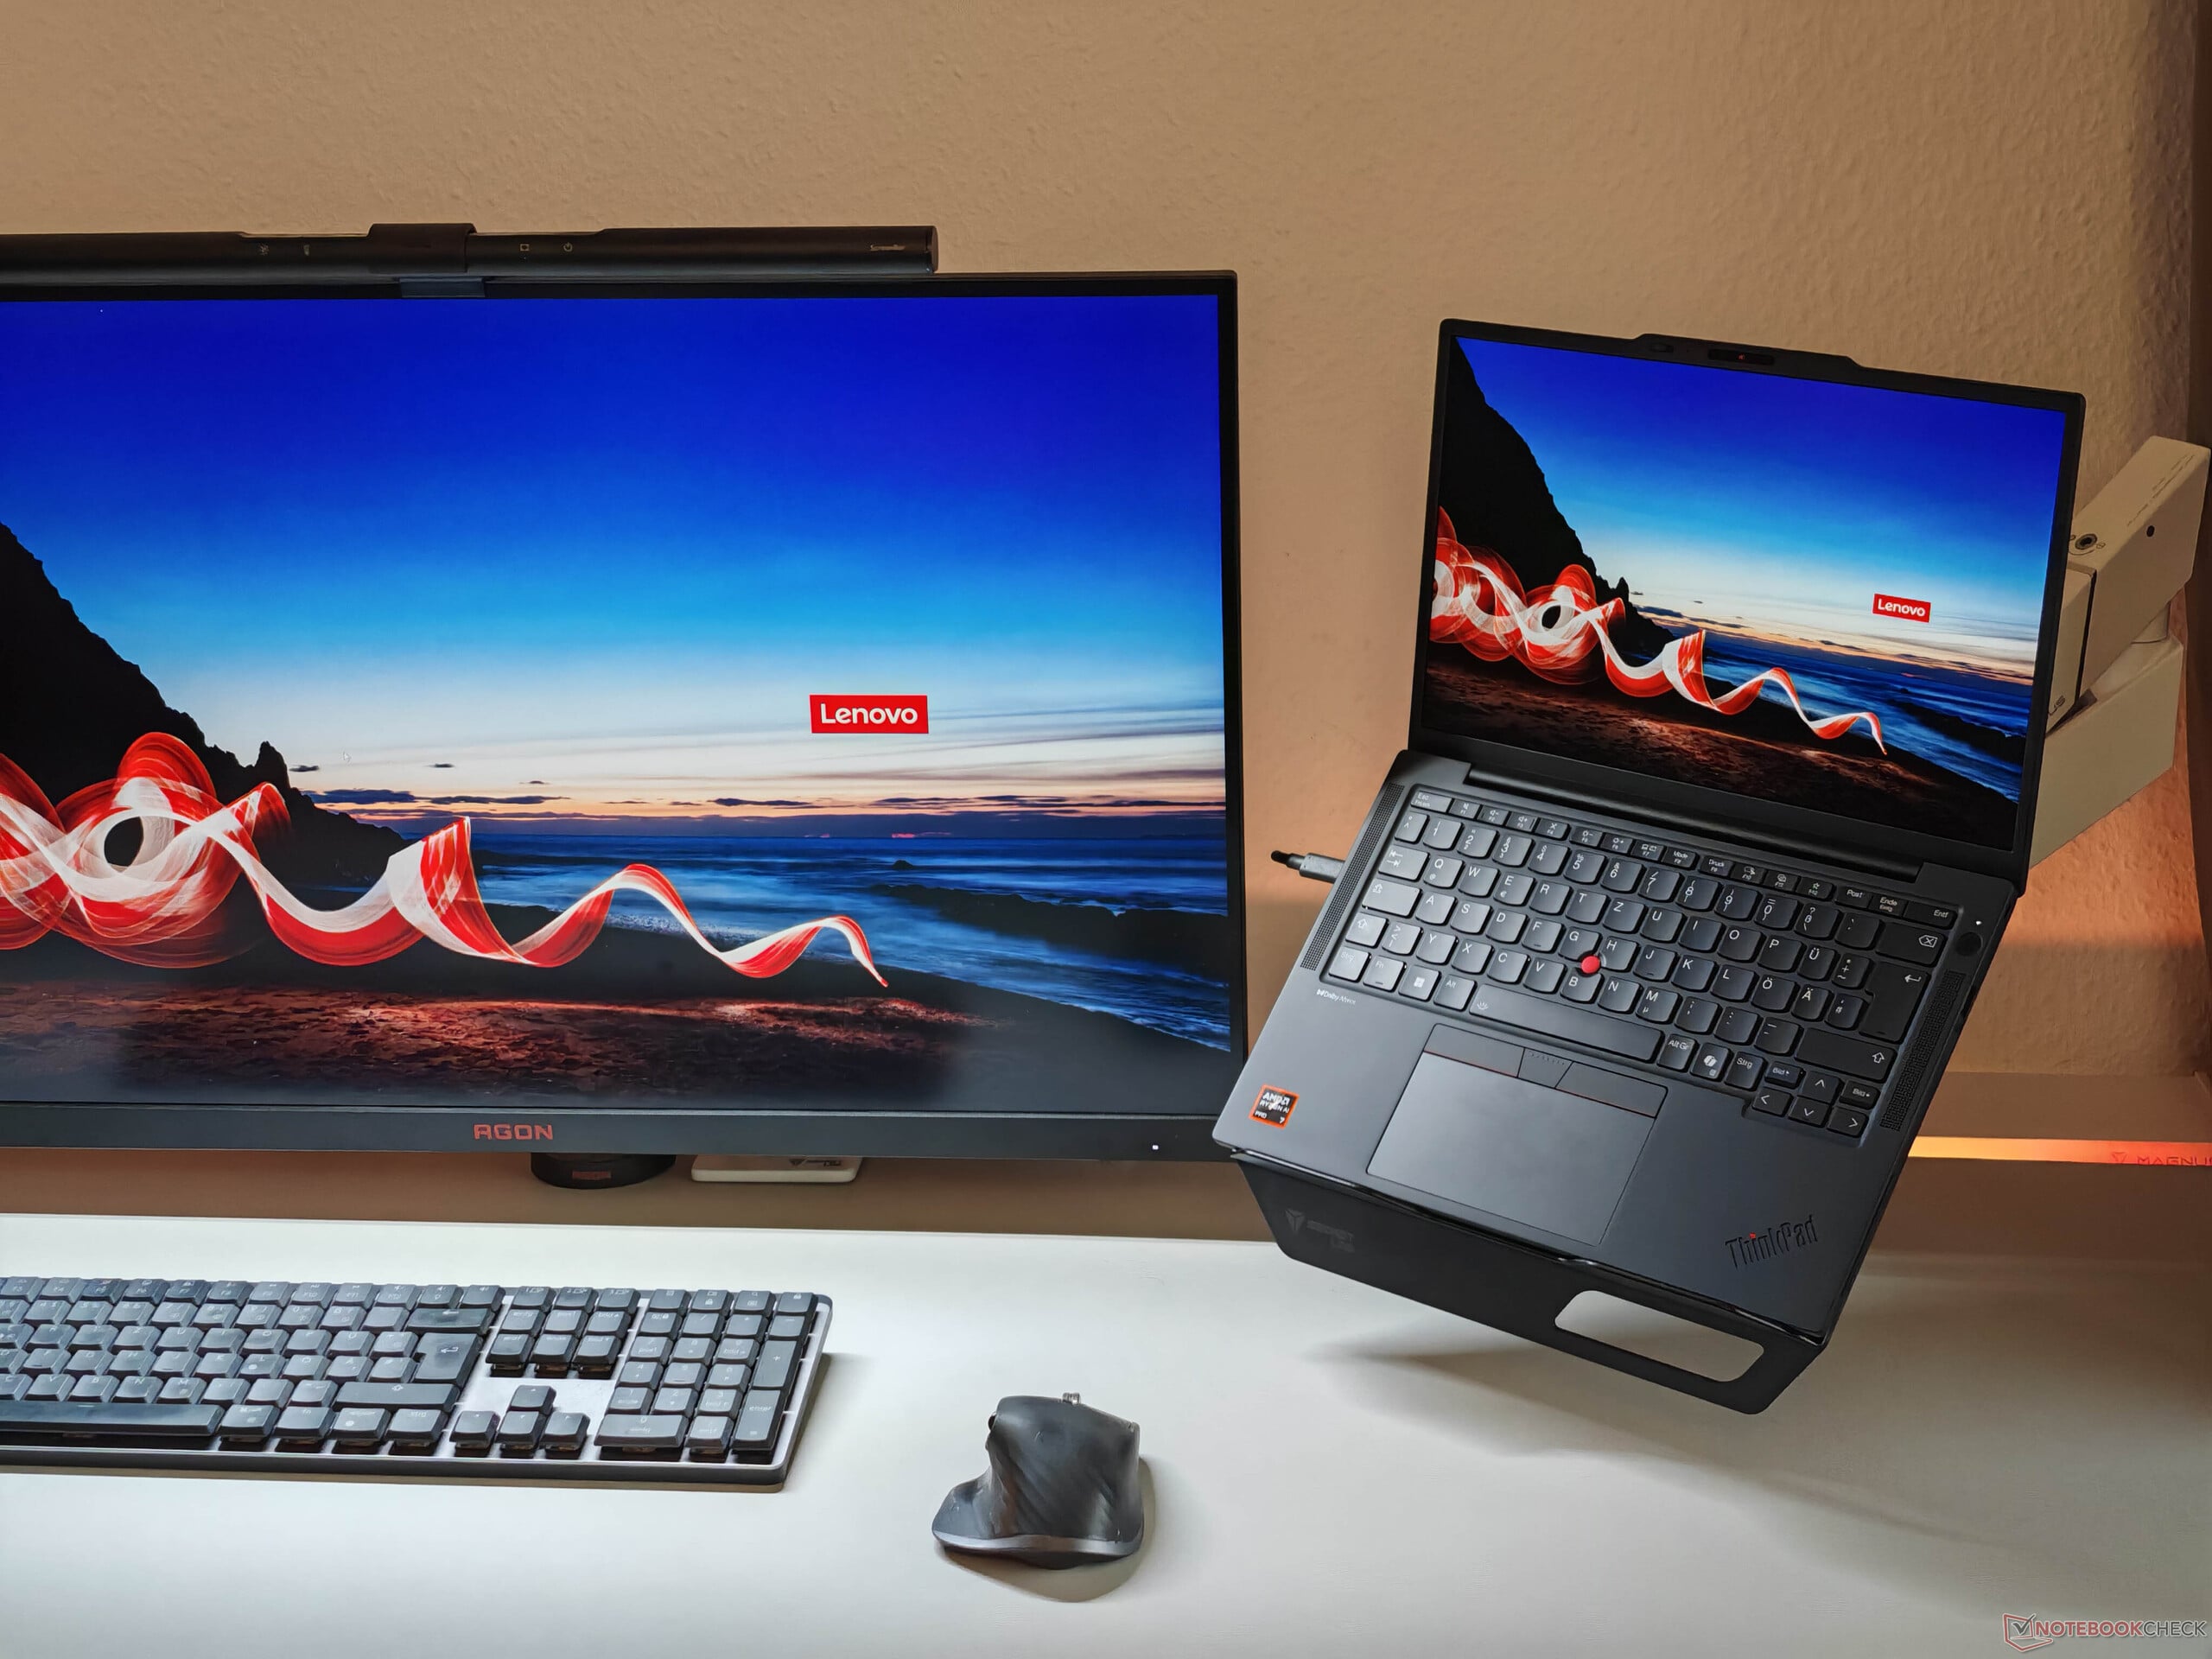
显示屏 - 低功耗 IPS

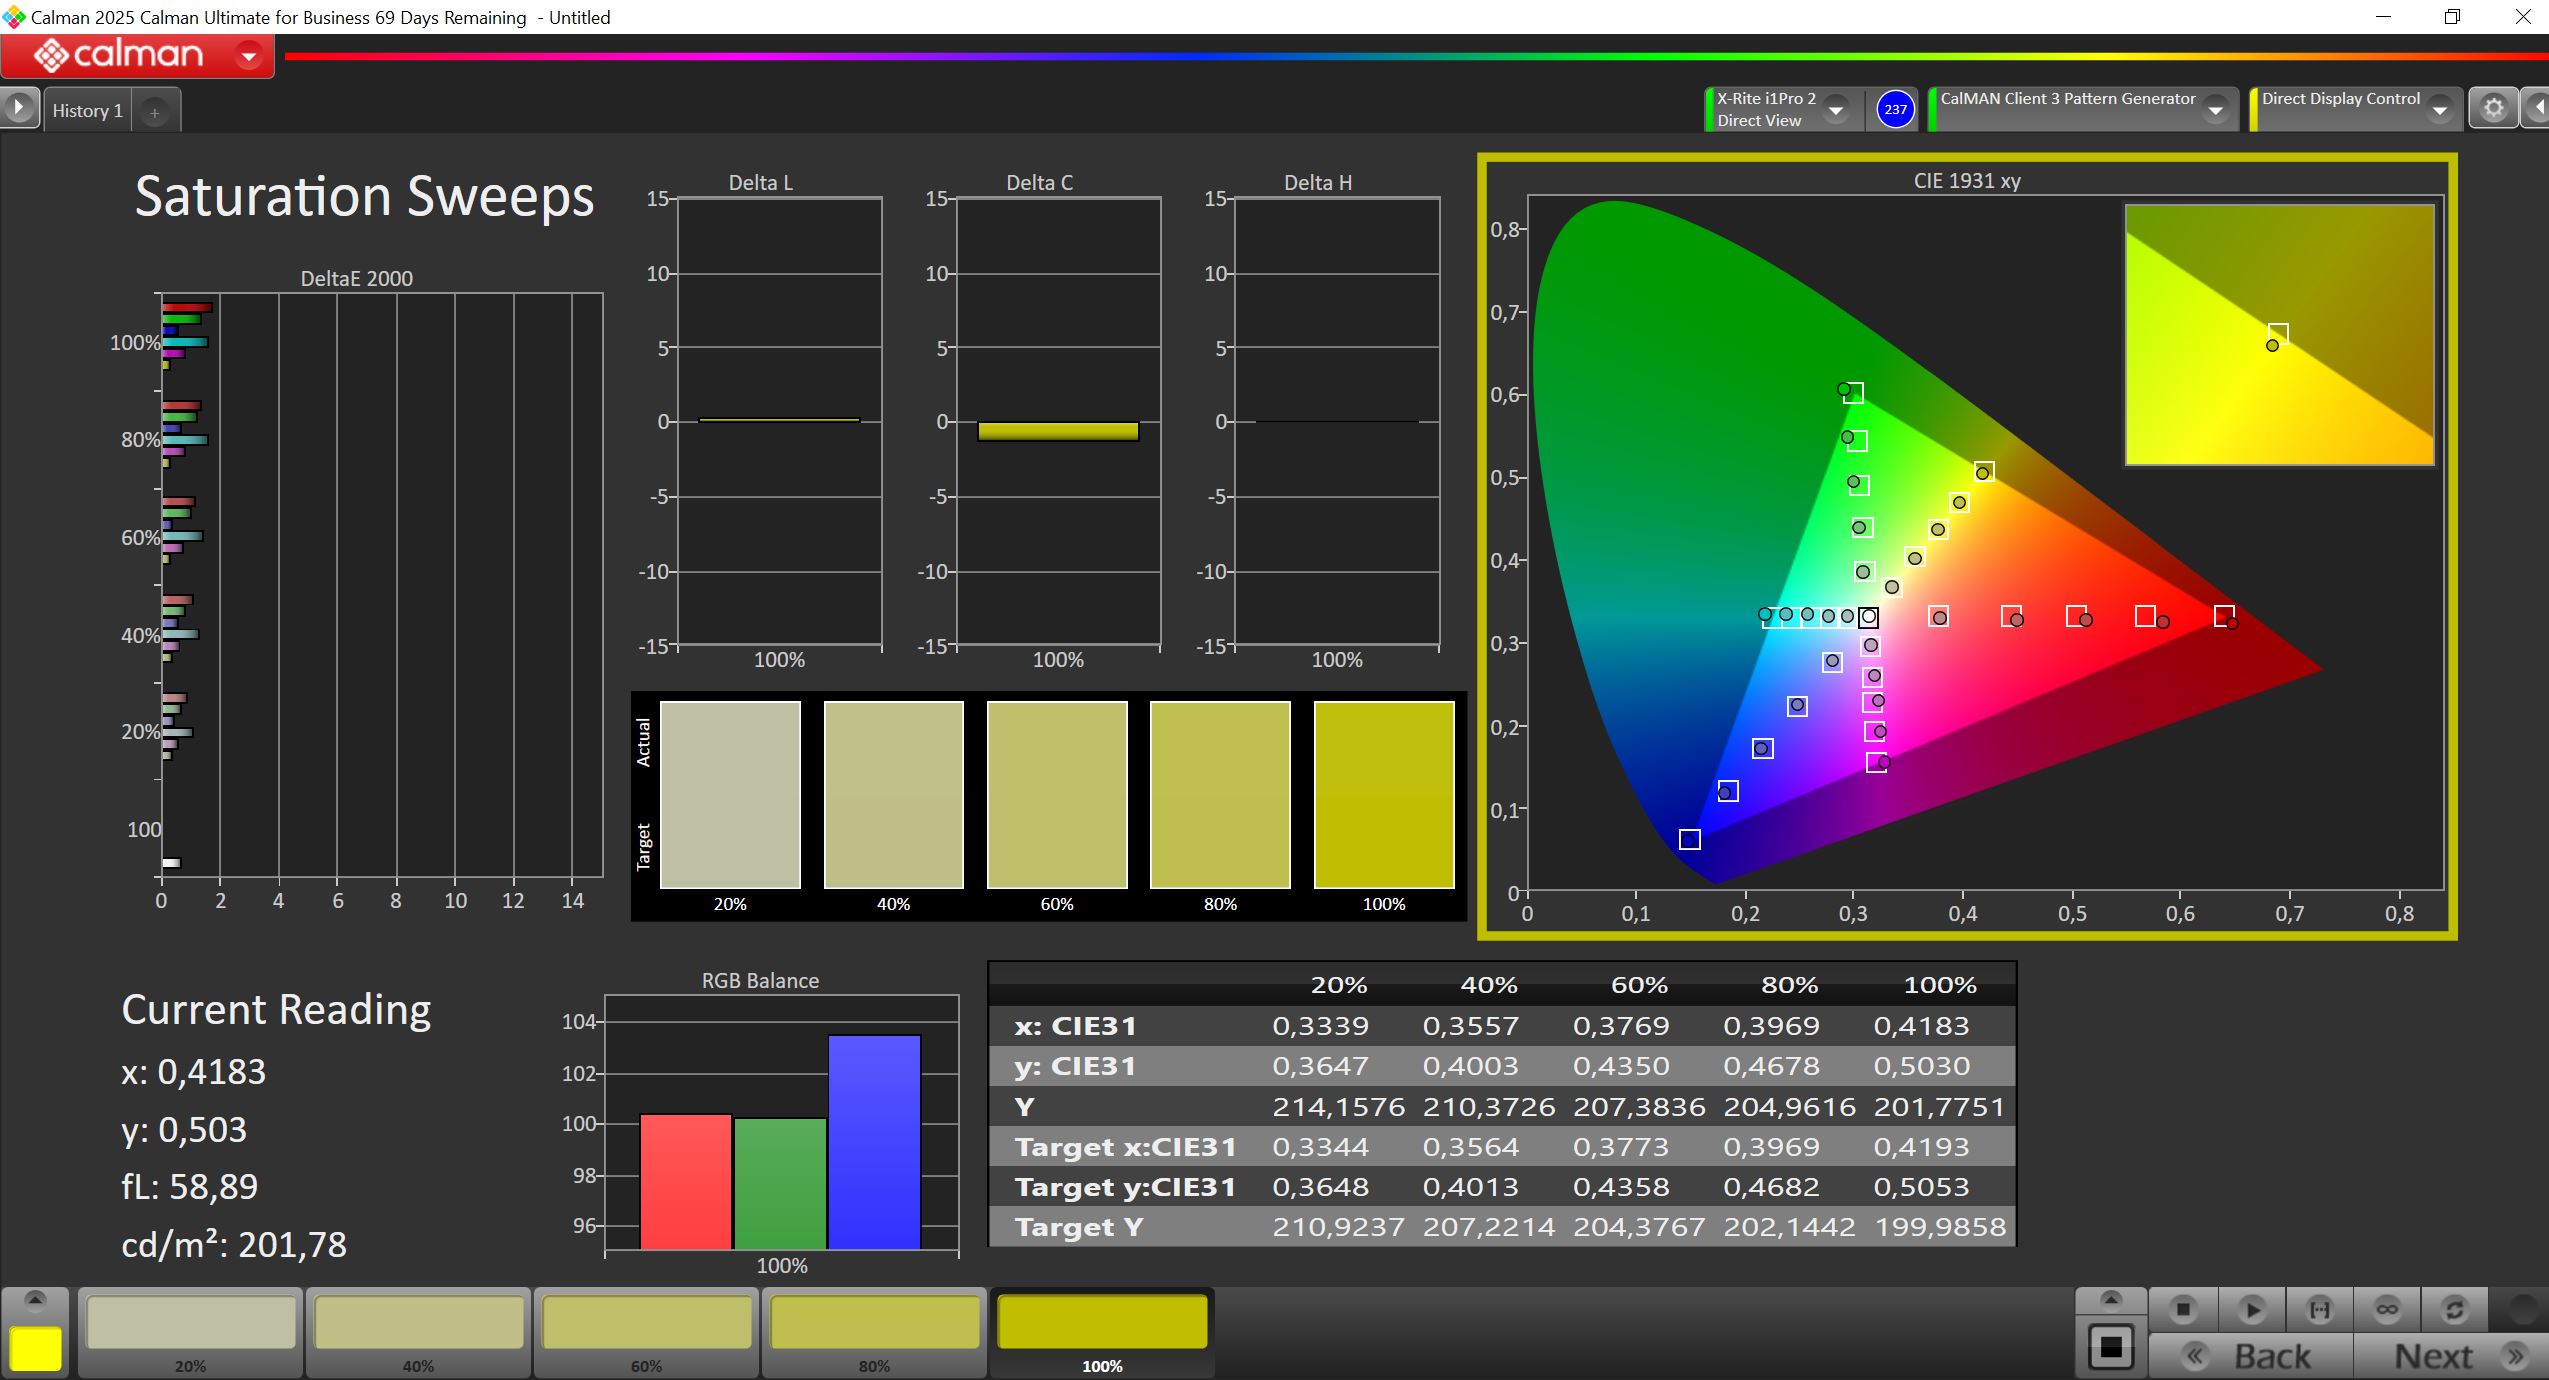
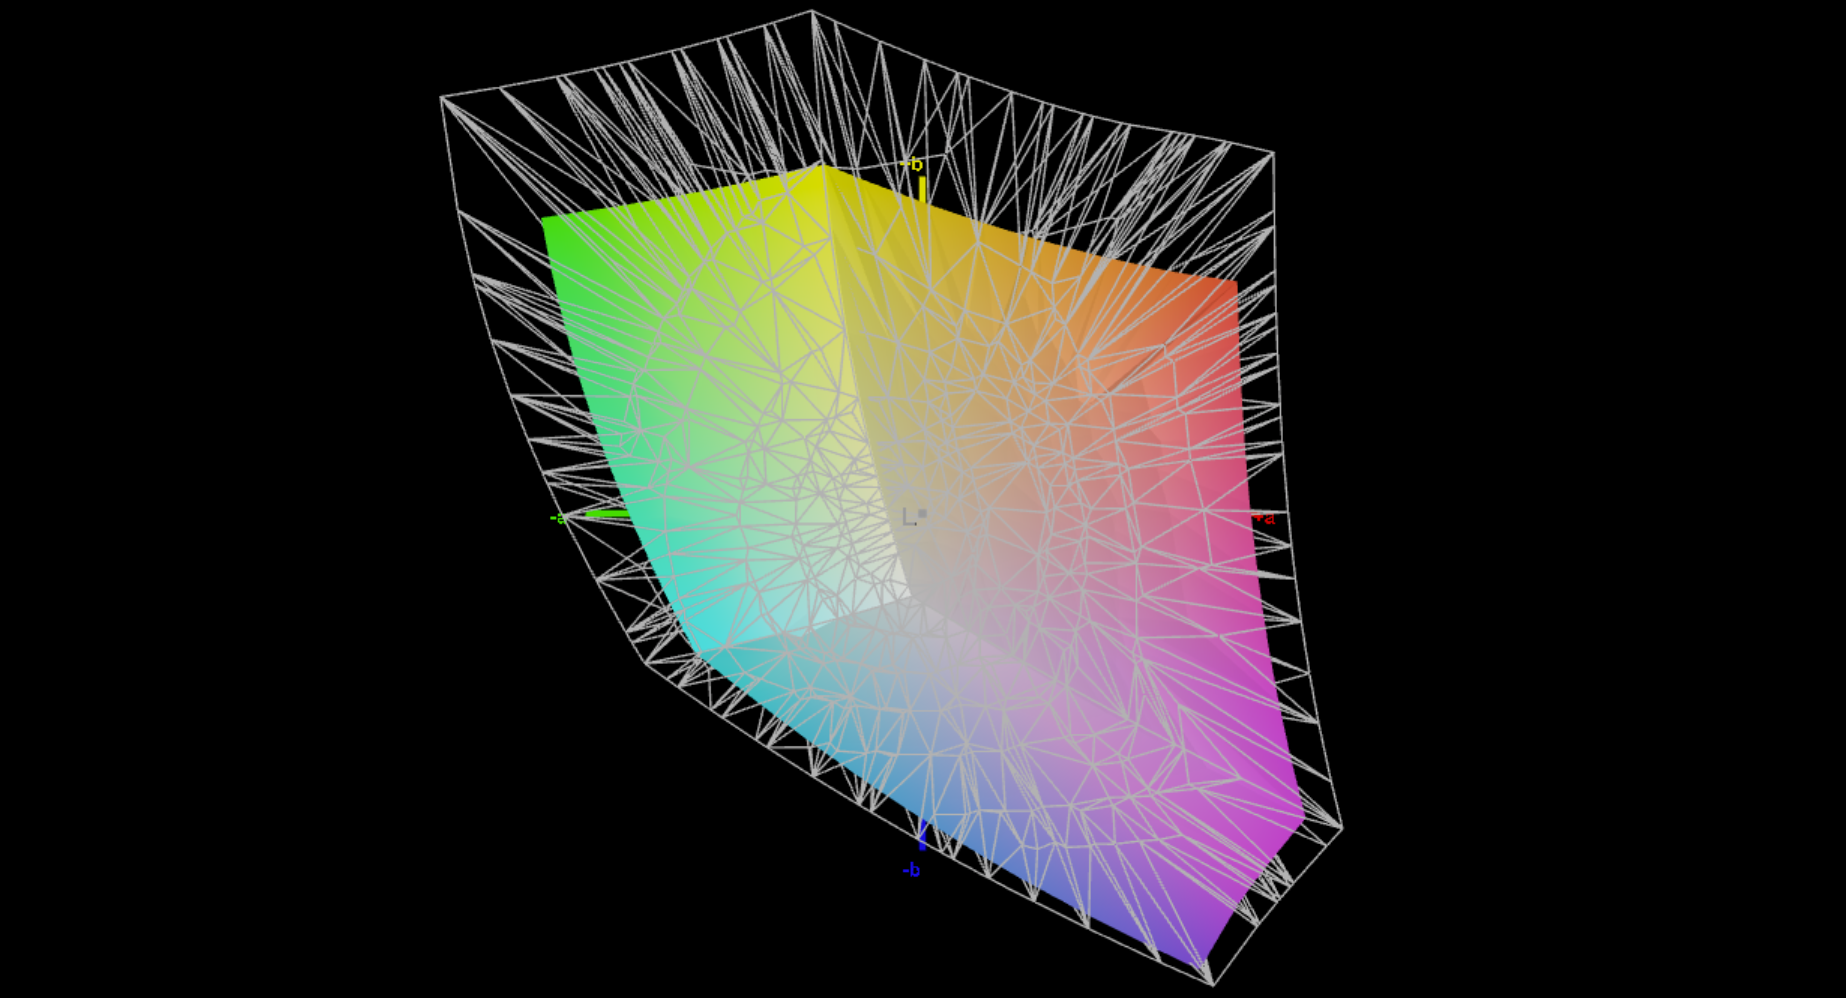
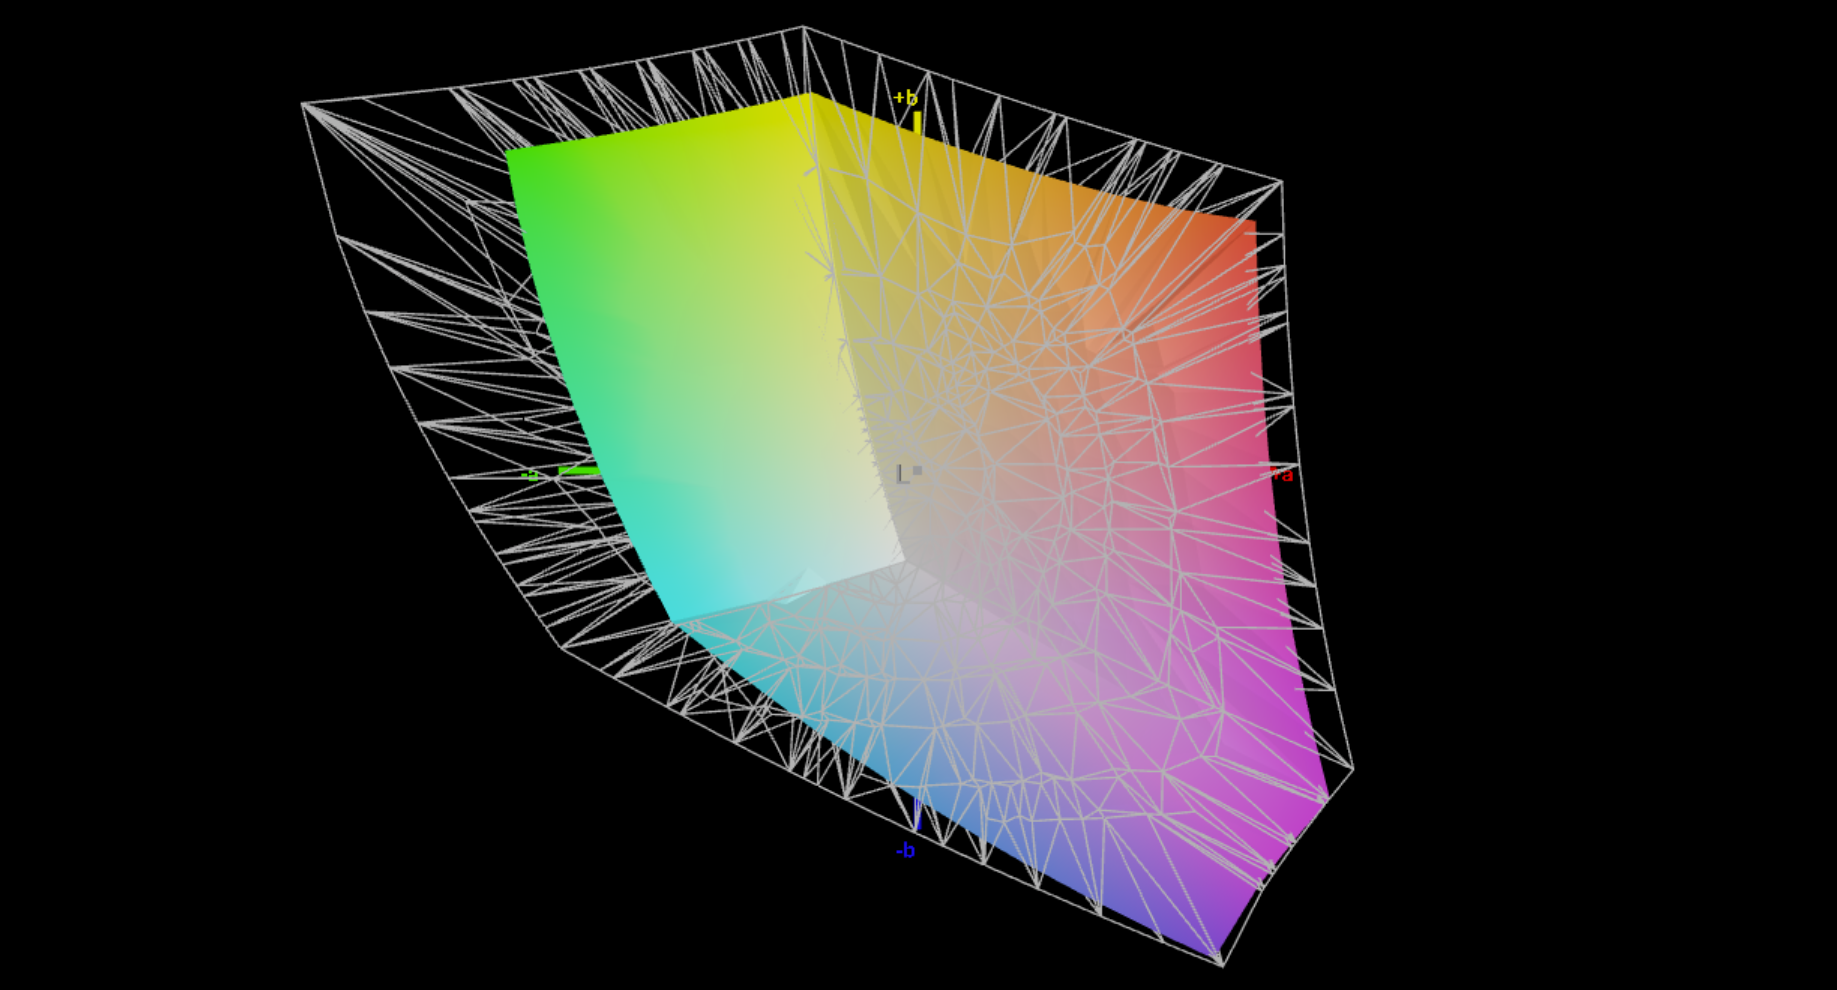
在显示屏方面,移动性也是优先考虑的因素,这就是为什么低功耗版本只提供哑光全高清面板(可选支持触摸功能)的原因。对于一款商务笔记本电脑来说,整体图像质量还算不错,色彩丰富,明亮区域没有颗粒感。也没有 PWM 闪烁。不过,刷新率仅限于 60 Hz,响应时间也不是特别快,因此会出现明显的重影。
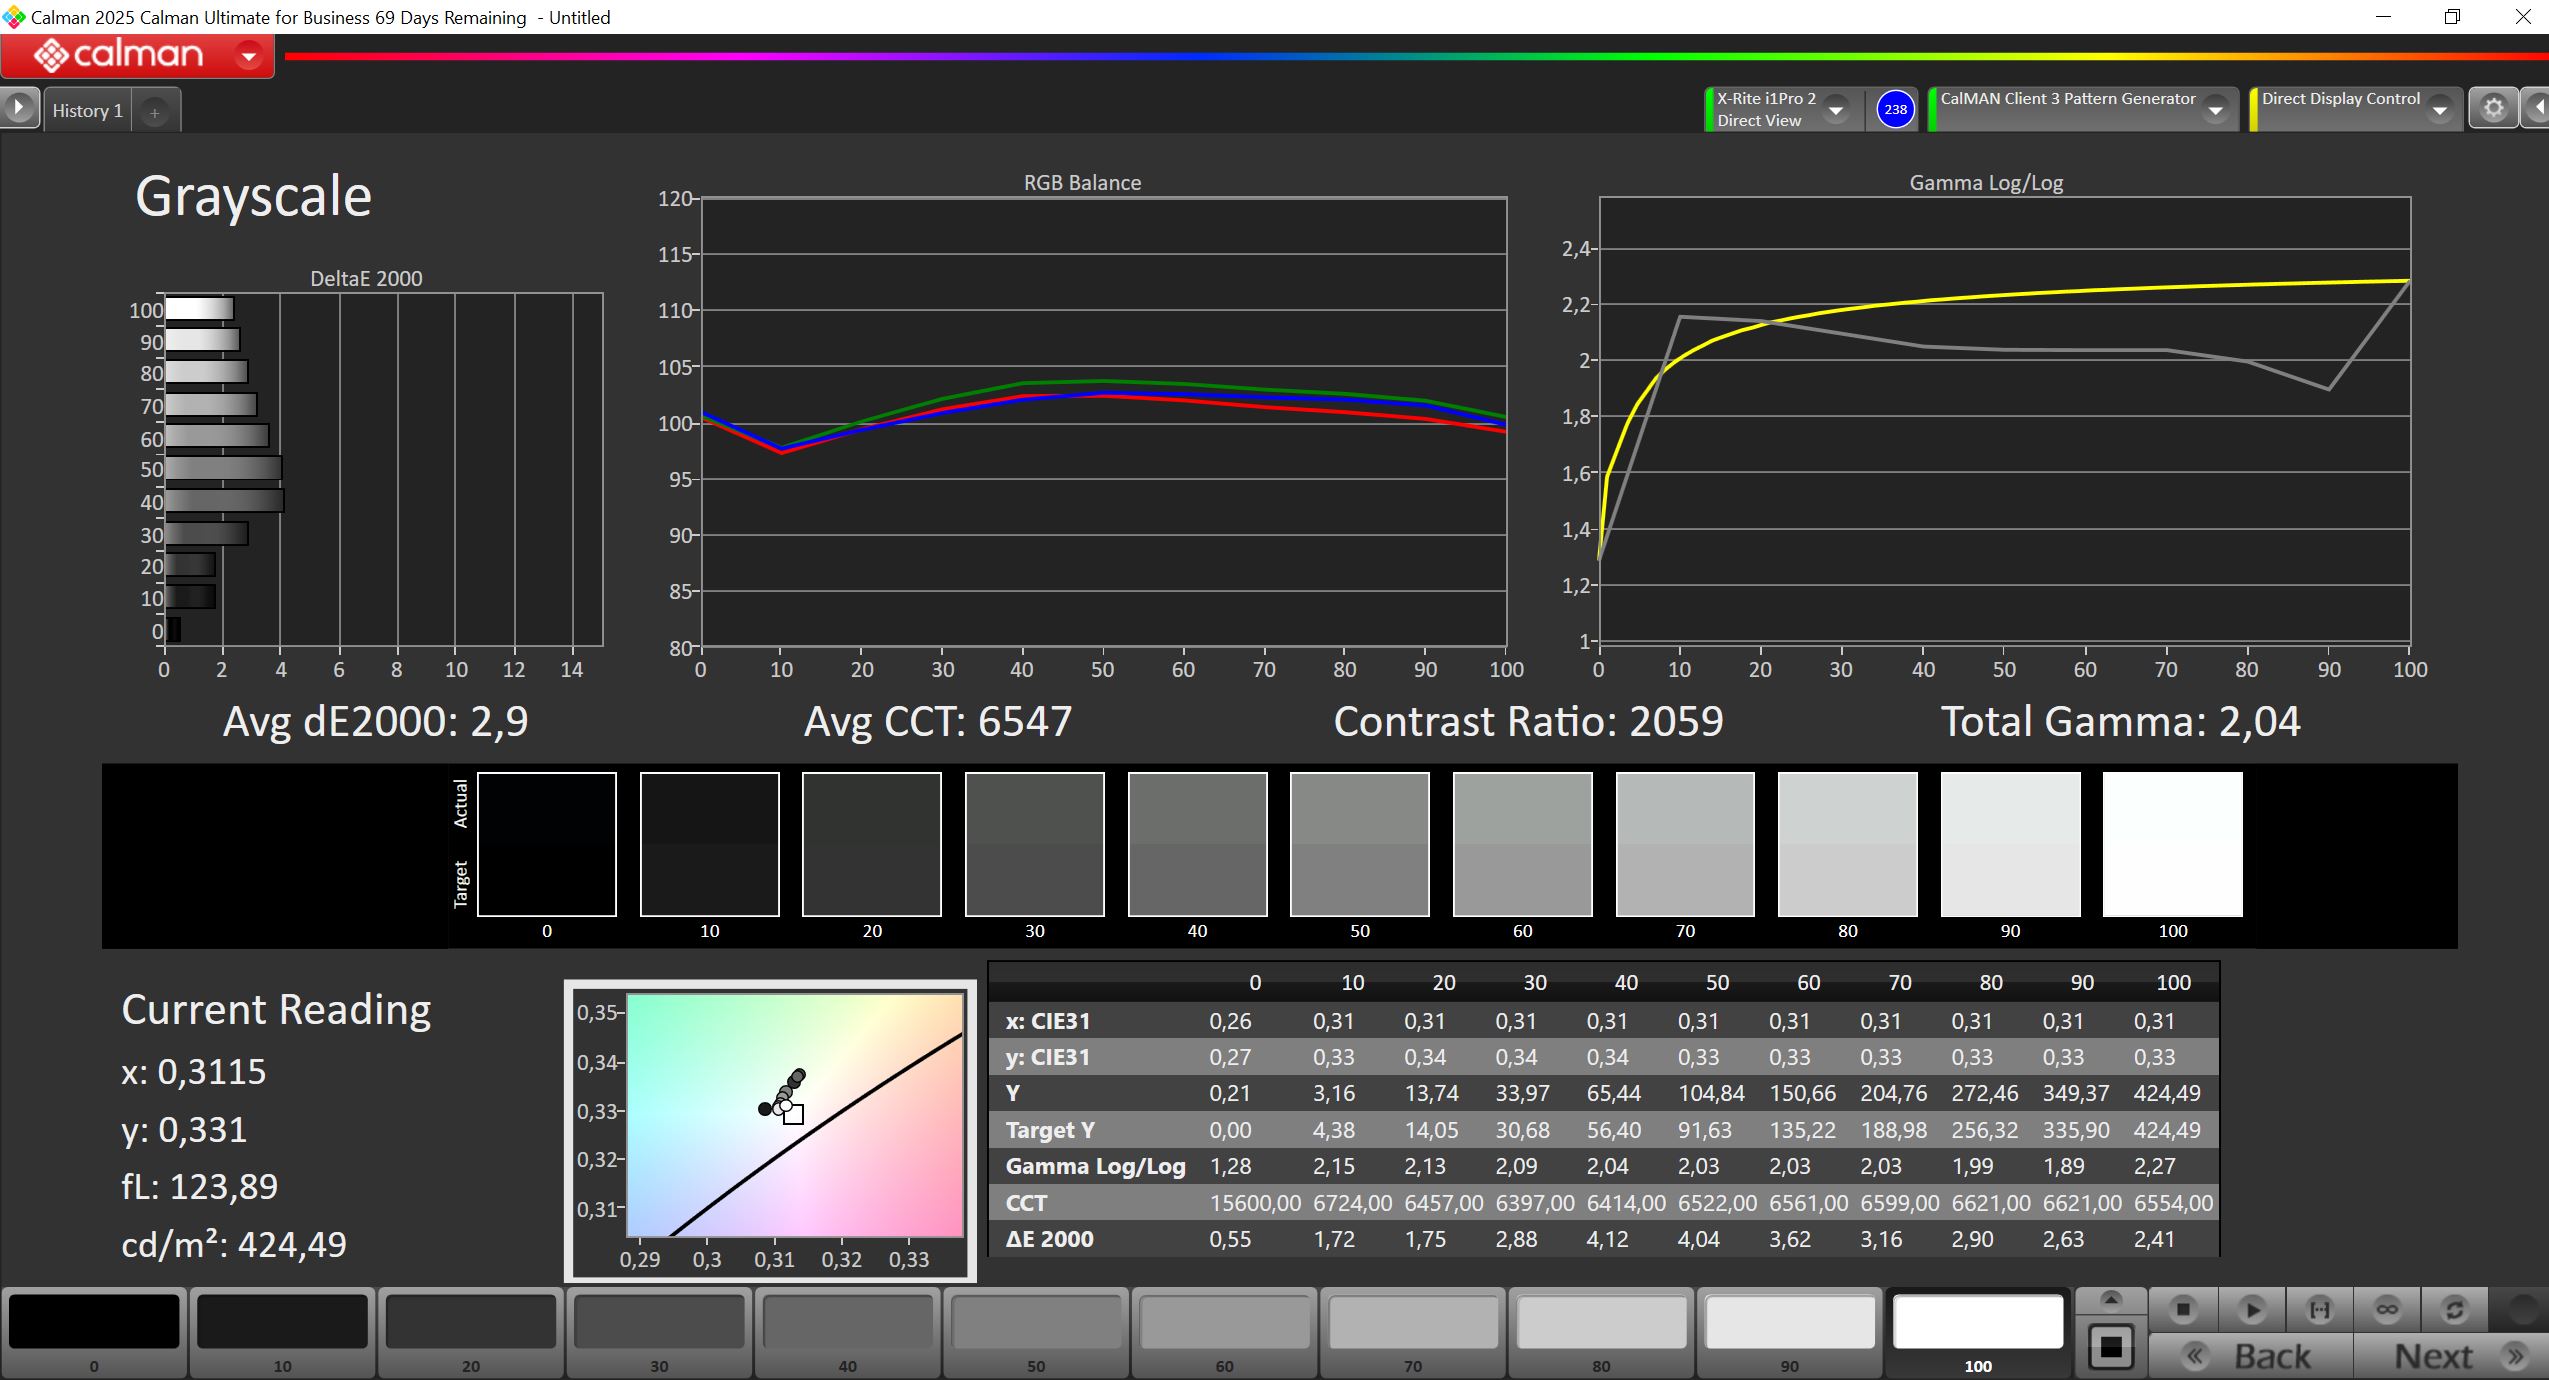
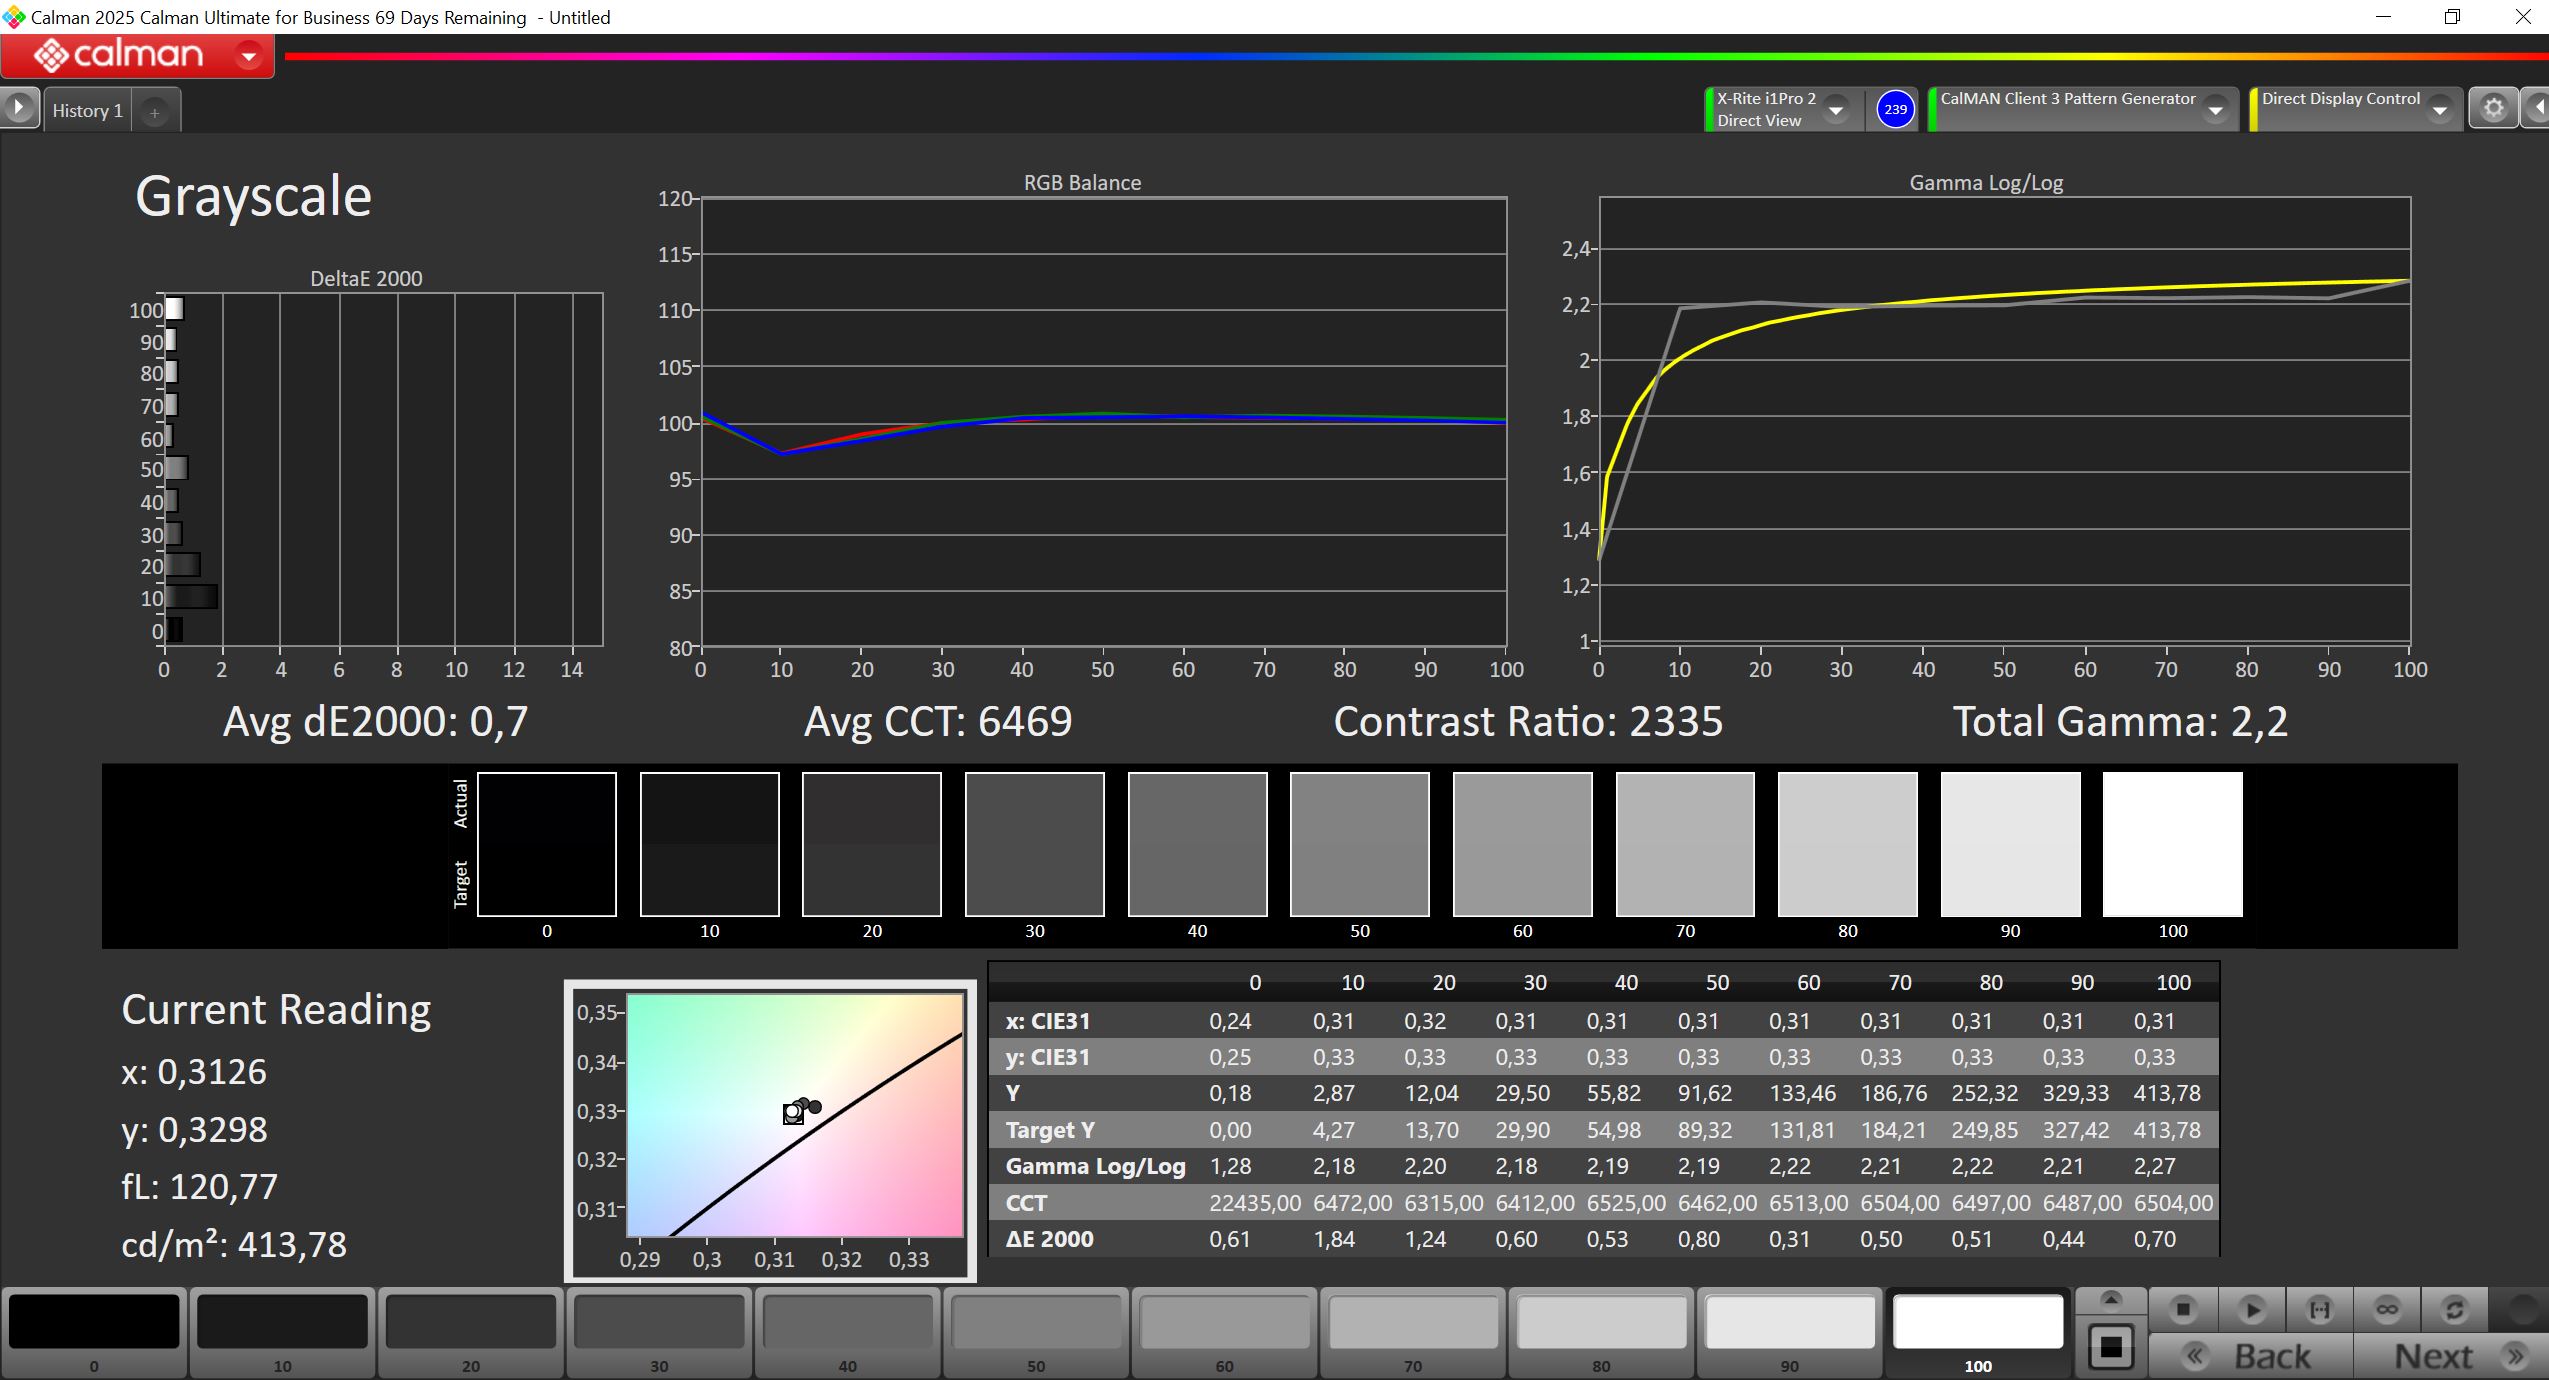
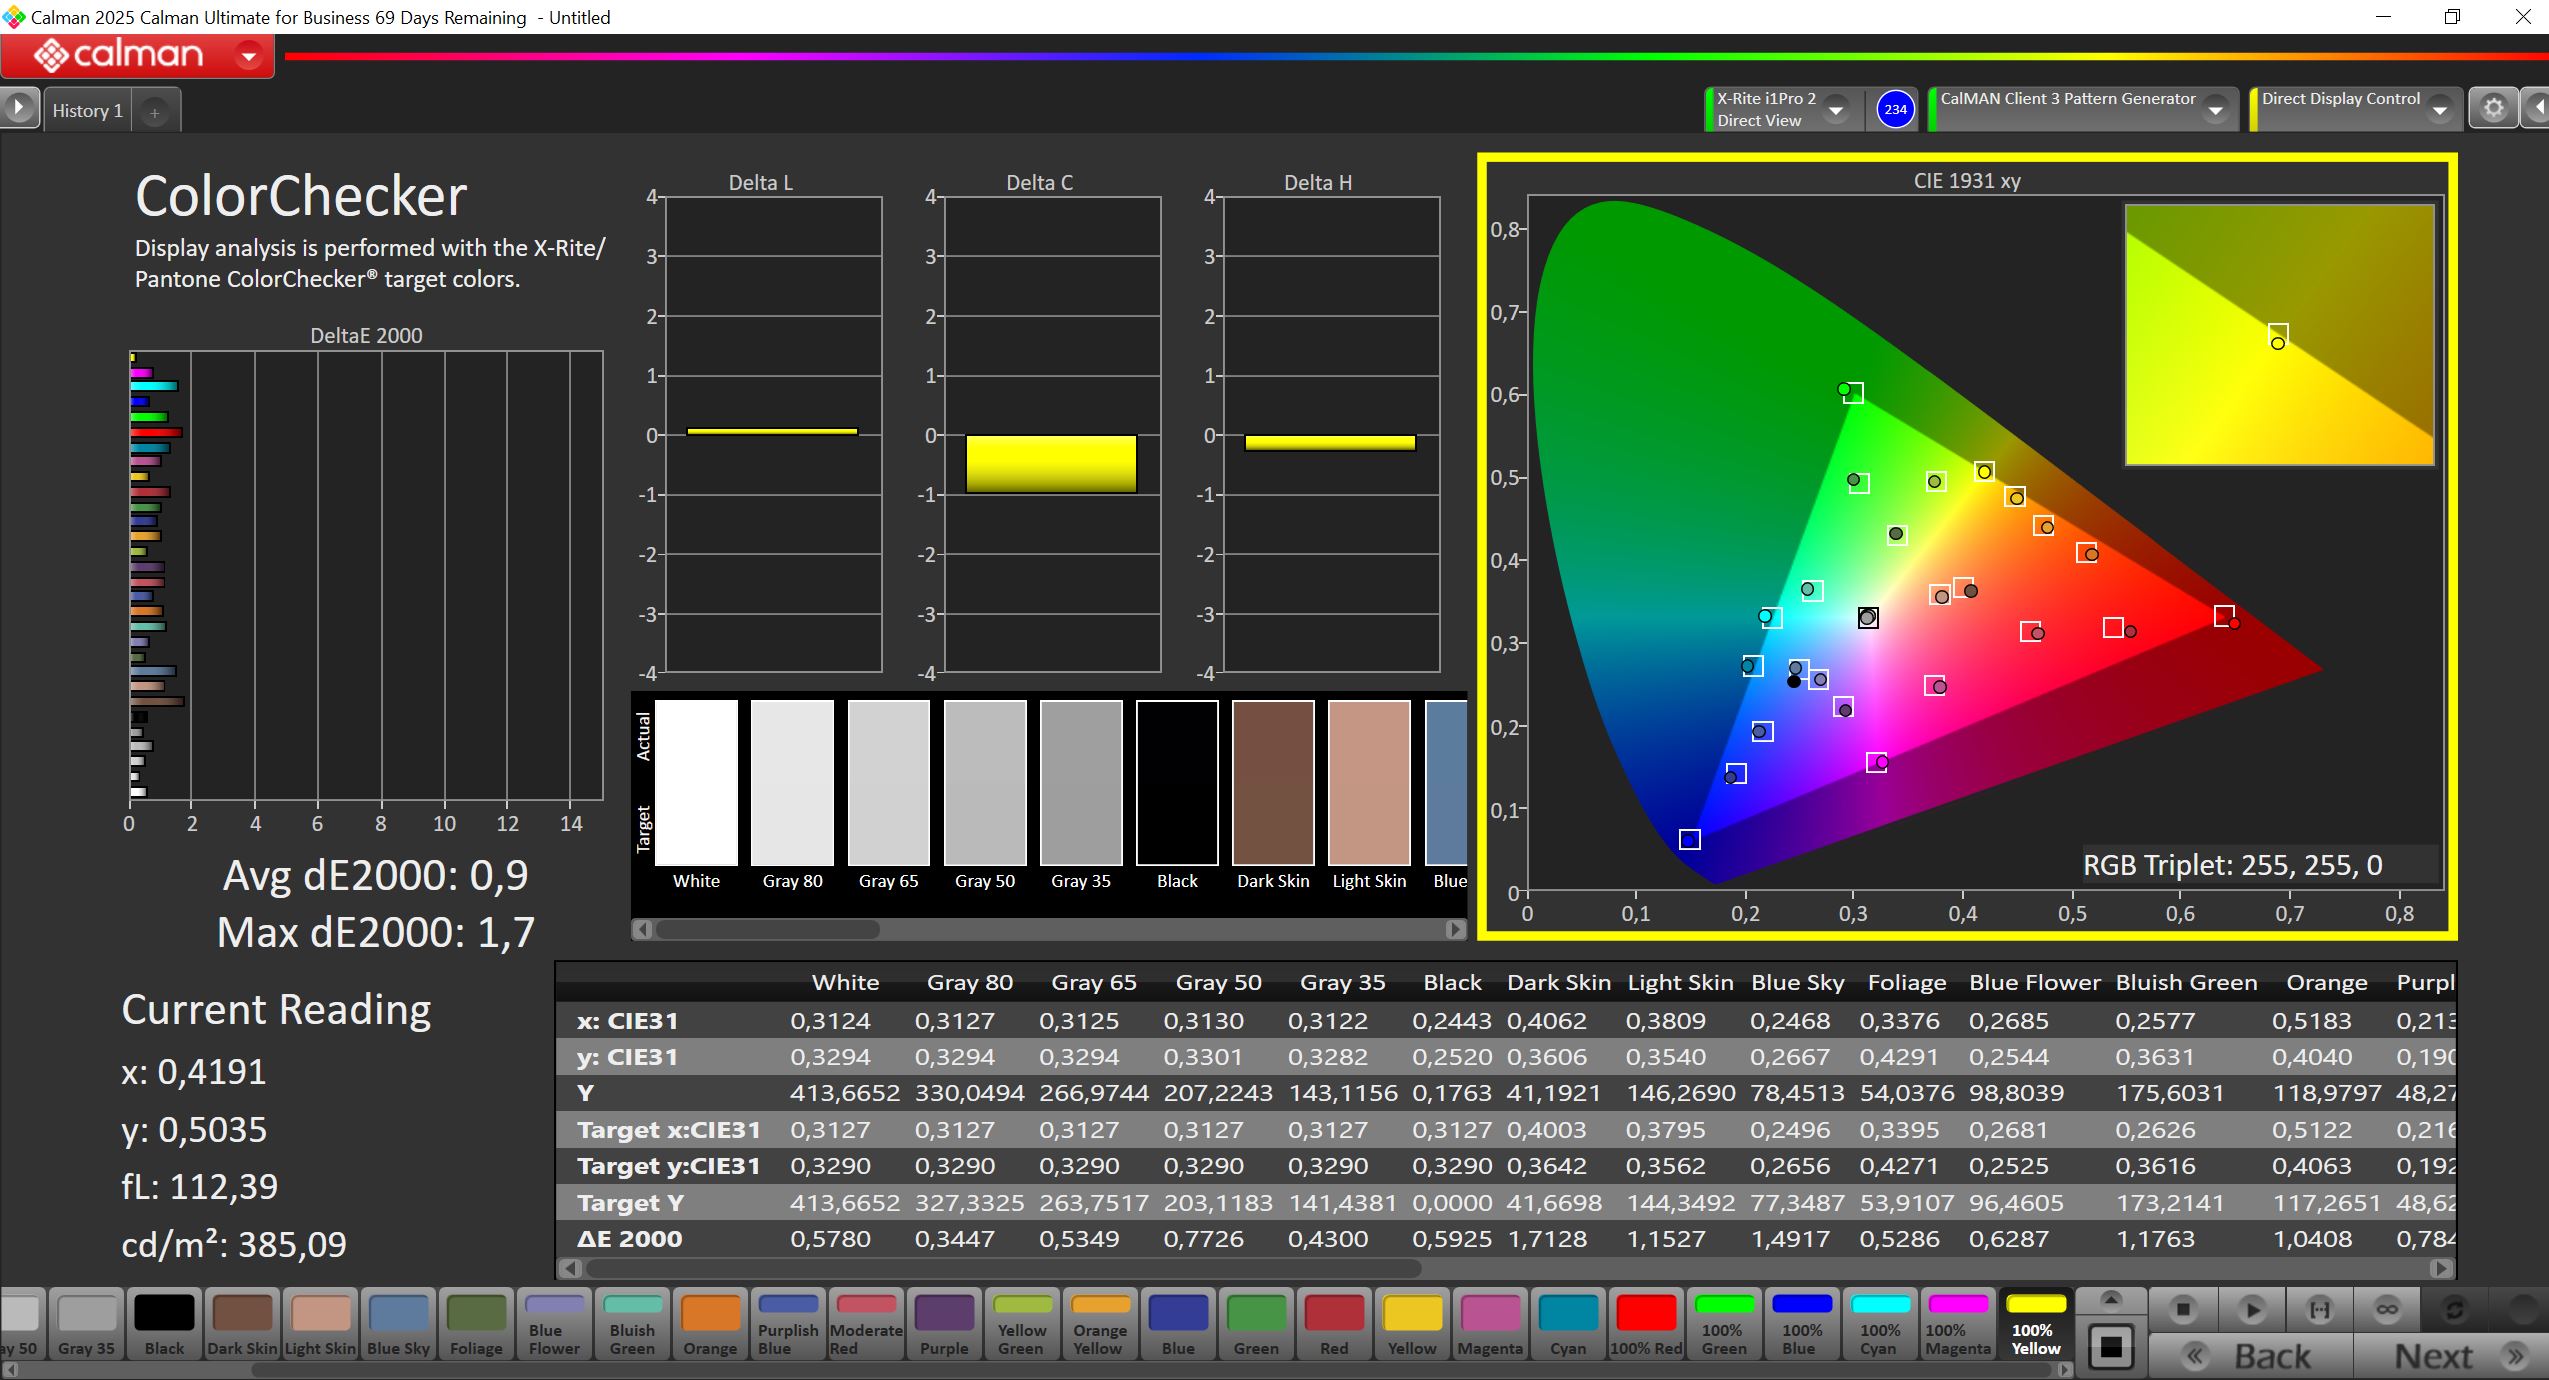
联想将该显示器的亮度定为 400 cd/m²,我们的评测机很容易就达到了这个值。黑阶也非常低,因此对比度非常高。在我们使用专业的 CalMAN 软件进行的分析中,出厂校准已经提供了可靠的结果,尽管我们自己的校准进一步提高了色彩准确度(配置文件可在右侧框中免费下载)。
| |||||||||||||||||||||||||
Brightness Distribution: 92 %
Center on Battery: 424 cd/m²
Contrast: 2019:1 (Black: 0.21 cd/m²)
ΔE ColorChecker Calman: 2.3 | ∀{0.5-29.43 Ø4.72}
calibrated: 0.9
ΔE Greyscale Calman: 2.9 | ∀{0.09-98 Ø4.97}
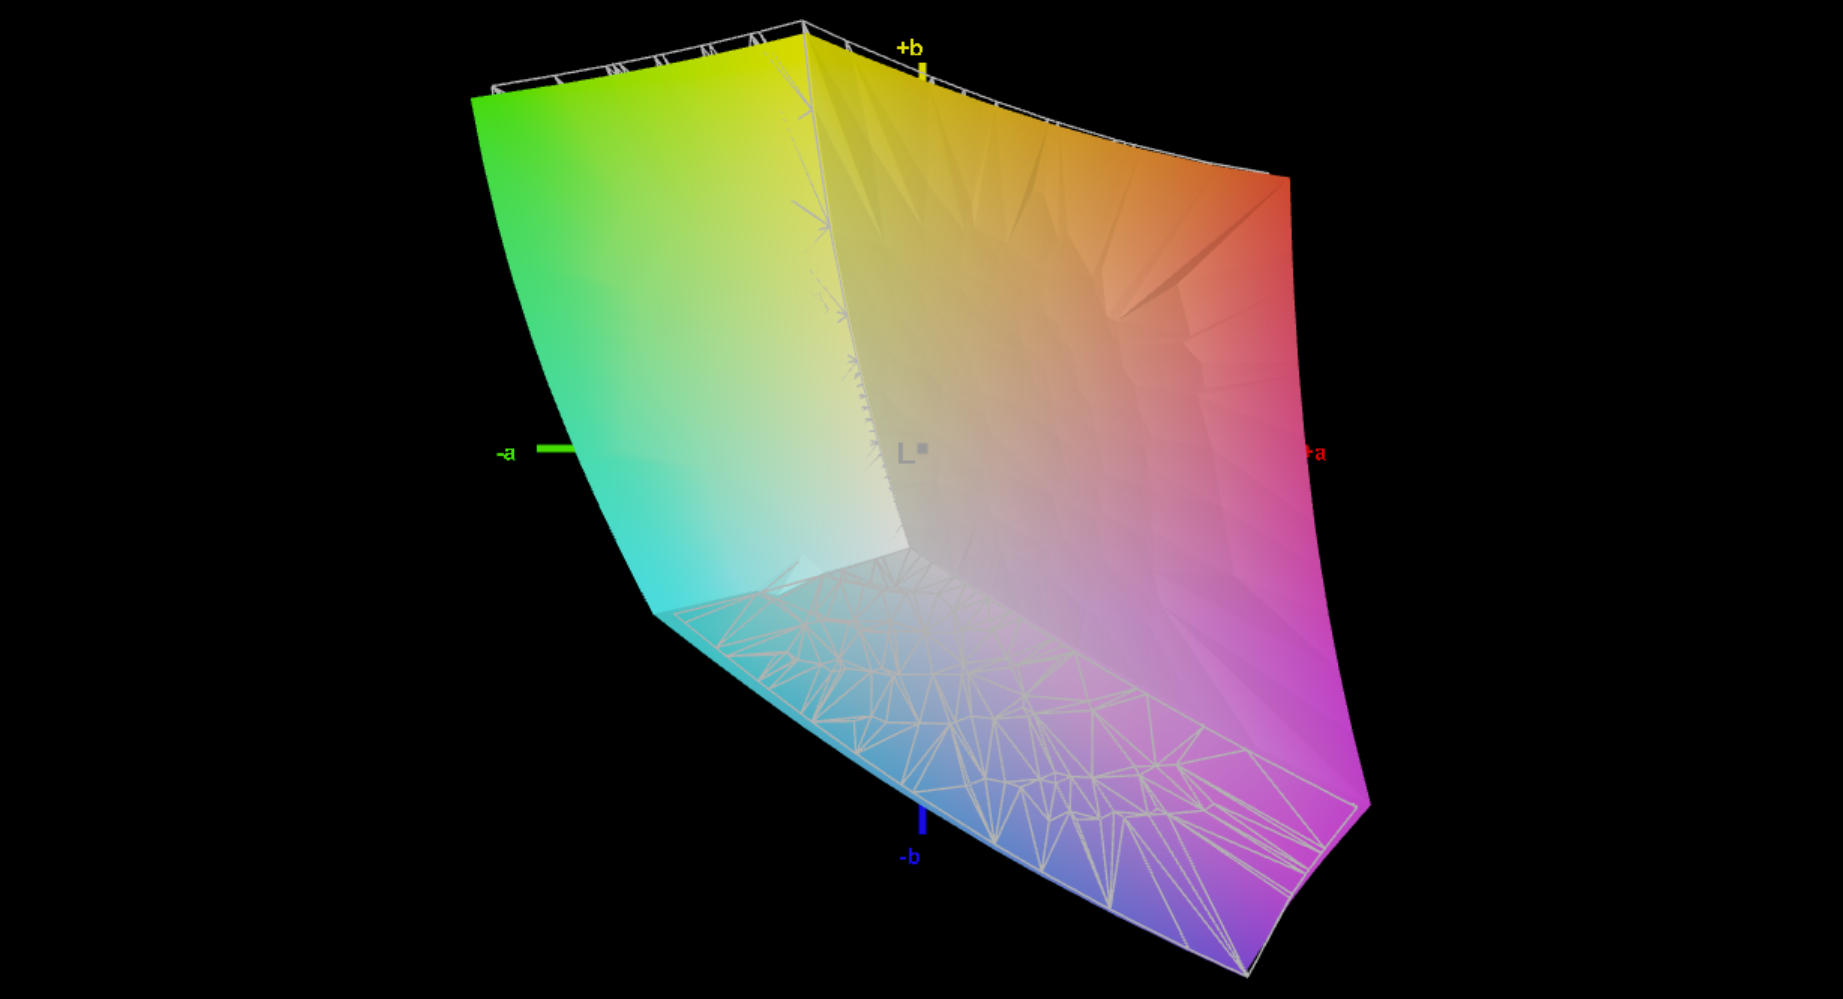
70.5% AdobeRGB 1998 (Argyll 3D)
98.4% sRGB (Argyll 3D)
69.6% Display P3 (Argyll 3D)
Gamma: 2.04
CCT: 6547 K
| Lenovo ThinkPad X13 G6 AMD NV133WUM-N6D, IPS, 1920x1200, 13.3", 60 Hz | Dell Pro 13 Premium PA13250 B133UAN (AUOBEB0), IPS, 1920x1200, 13.3", 60 Hz | MSI Prestige 13 AI Plus Evo A2VMG ATNA33AA07-0, OLED, 2880x1800, 13.3", 60 Hz | Microsoft Surface Laptop 7 13.8 Copilot+ LQ138P1JX61, IPS, 2304x1536, 13.8", 120 Hz | Lenovo ThinkPad X1 Carbon Gen 13 21NS0010GE ATNA40YK20-0, OLED, 2880x1800, 14", 120 Hz | |
|---|---|---|---|---|---|
| Display | 5% | 27% | 22% | 28% | |
| Display P3 Coverage (%) | 69.6 | 74.3 7% | 99.9 44% | 97.8 41% | 99.5 43% |
| sRGB Coverage (%) | 98.4 | 99.1 1% | 100 2% | 98.2 0% | 100 2% |
| AdobeRGB 1998 Coverage (%) | 70.5 | 75.9 8% | 95.8 36% | 87.3 24% | 97.1 38% |
| Response Times | -19% | 93% | 18% | 93% | |
| Response Time Grey 50% / Grey 80% * (ms) | 52.8 ? | 52.8 ? -0% | 1.94 ? 96% | 38.9 ? 26% | 2.4 ? 95% |
| Response Time Black / White * (ms) | 19.3 ? | 26.4 ? -37% | 2.02 ? 90% | 17.4 ? 10% | 1.9 ? 90% |
| PWM Frequency (Hz) | 60 ? | 240 ? | |||
| PWM Amplitude * (%) | 21.9 | 33 | |||
| Screen | -25% | 0% | 10% | -89% | |
| Brightness middle (cd/m²) | 424 | 456 8% | 382.4 -10% | 606 43% | 407 -4% |
| Brightness (cd/m²) | 409 | 460 12% | 383 -6% | 592 45% | 410 0% |
| Brightness Distribution (%) | 92 | 89 -3% | 99 8% | 94 2% | 99 8% |
| Black Level * (cd/m²) | 0.21 | 0.23 -10% | 0.43 -105% | ||
| Contrast (:1) | 2019 | 1983 -2% | 1409 -30% | ||
| Colorchecker dE 2000 * | 2.3 | 3.3 -43% | 3.84 -67% | 1.3 43% | 4.9 -113% |
| Colorchecker dE 2000 max. * | 4.3 | 6.47 -50% | 6.66 -55% | 2.1 51% | 9.1 -112% |
| Colorchecker dE 2000 calibrated * | 0.9 | 1.7 -89% | 0.41 54% | 4.7 -422% | |
| Greyscale dE 2000 * | 2.9 | 4.35 -50% | 0.7 76% | 2.1 28% | 2.3 21% |
| Gamma | 2.04 108% | 2.51 88% | 2.23 99% | 2.16 102% | 2.26 97% |
| CCT | 6547 99% | 6215 105% | 6475 100% | 6842 95% | 6310 103% |
| Total Average (Program / Settings) | -13% /
-18% | 40% /
22% | 17% /
14% | 11% /
-30% |
* ... smaller is better


Display Response Times
| ↔ Response Time Black to White | ||
|---|---|---|
| 19.3 ms ... rise ↗ and fall ↘ combined | ↗ 6.8 ms rise | 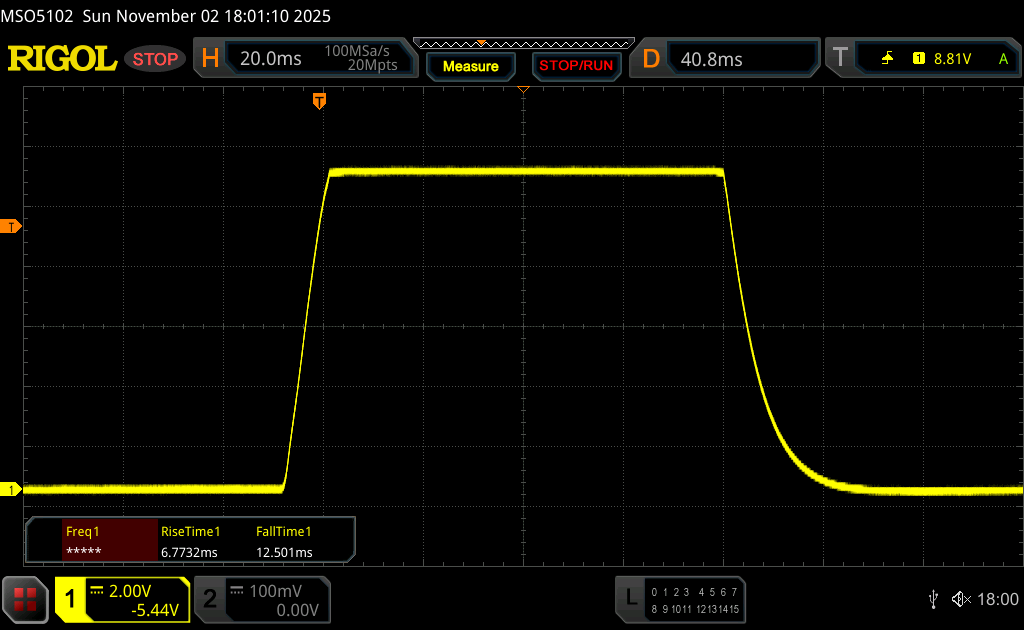 |
| ↘ 12.5 ms fall | ||
| The screen shows good response rates in our tests, but may be too slow for competitive gamers. In comparison, all tested devices range from 0.1 (minimum) to 240 (maximum) ms. » 43 % of all devices are better. This means that the measured response time is similar to the average of all tested devices (19.8 ms). | ||
| ↔ Response Time 50% Grey to 80% Grey | ||
| 52.8 ms ... rise ↗ and fall ↘ combined | ↗ 23 ms rise | 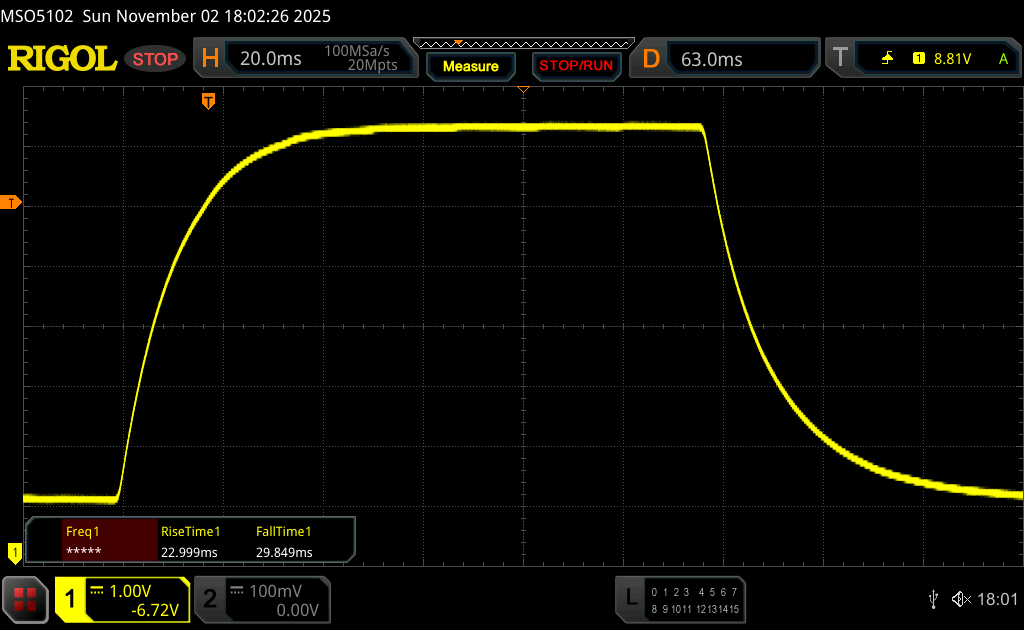 |
| ↘ 29.8 ms fall | ||
| The screen shows slow response rates in our tests and will be unsatisfactory for gamers. In comparison, all tested devices range from 0.165 (minimum) to 636 (maximum) ms. » 89 % of all devices are better. This means that the measured response time is worse than the average of all tested devices (31 ms). | ||
Screen Flickering / PWM (Pulse-Width Modulation)
| Screen flickering / PWM not detected |  | ||
In comparison: 52 % of all tested devices do not use PWM to dim the display. If PWM was detected, an average of 7750 (minimum: 5 - maximum: 343500) Hz was measured. | |||


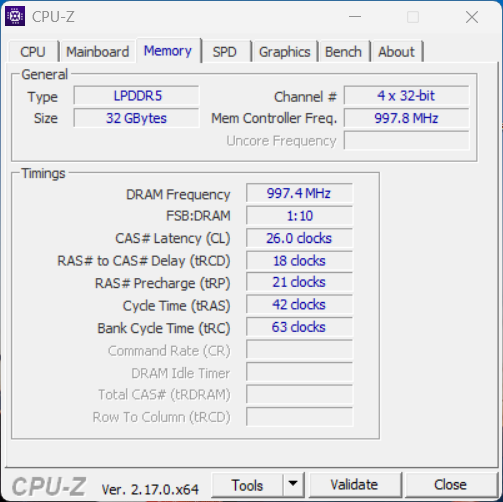
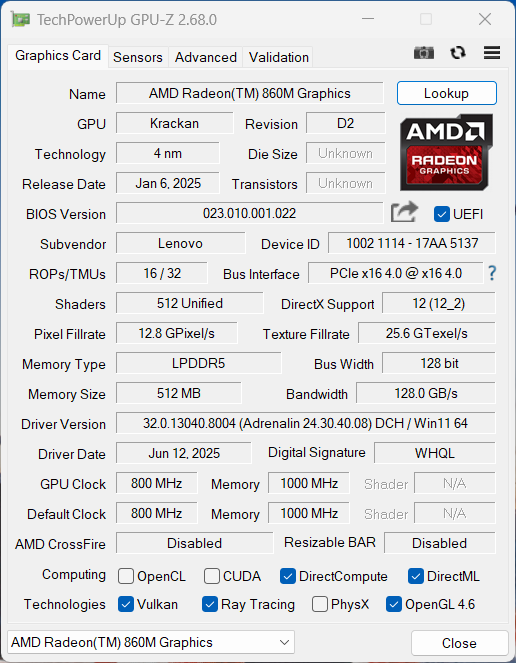
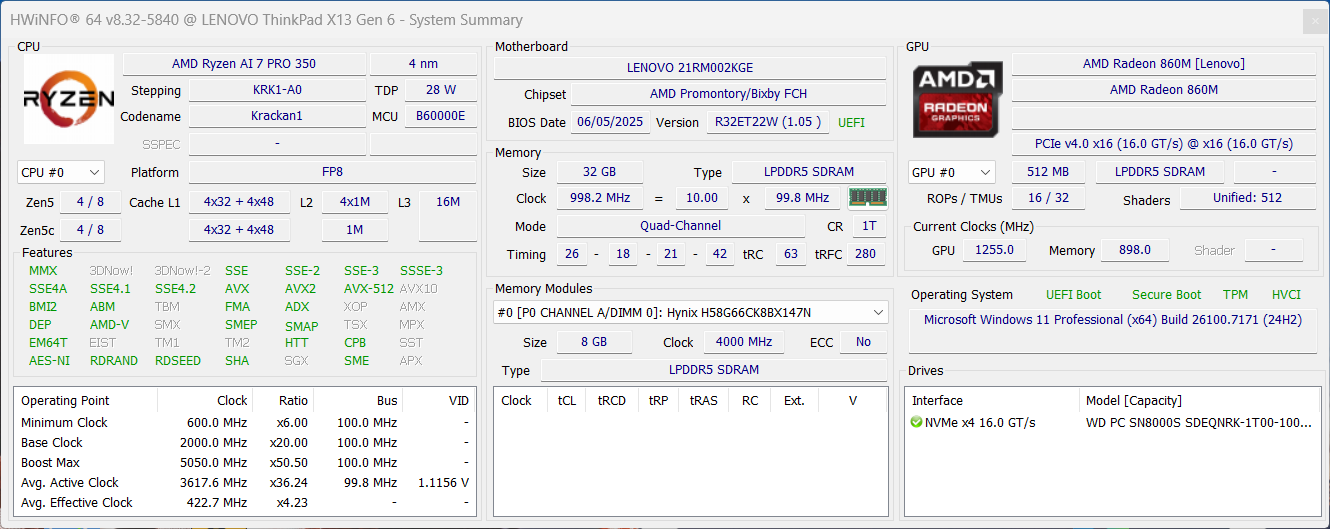
性能 - 配备 32GB 内存的 Zen 5
根据联想的官方规格,ThinkPad X13 G6 最高可配备 32 GB LPDDR5x-8000 内存,但不能升级。
测试条件
在 ThinkPad 设备上,联想的电源配置文件与 Windows 的电源设置直接相关。我们使用最佳性能模式进行了所有基准测试。
处理器
产品 AMD Ryzen AI 7 PRO 350(Krackan Point)目前用于许多笔记本电脑,采用 Zen 5 内核(4×Zen 5、4×Zen 5c),PRO 版本还提供额外的安全功能。在 X13 中,处理器允许消耗高达 40 瓦的功率,然后稳定在 35 瓦左右,考虑到设备的紧凑尺寸,这是一个不错的结果。因此,在 CPU 基准测试中,X13 明显优于直接竞争对手。在电池供电情况下,性能保持稳定。
Cinebench R15 多回路
Cinebench R23: Multi Core | Single Core
Cinebench R20: CPU (Multi Core) | CPU (Single Core)
Cinebench R15: CPU Multi 64Bit | CPU Single 64Bit
Blender: v2.79 BMW27 CPU
7-Zip 18.03: 7z b 4 | 7z b 4 -mmt1
Geekbench 6.7: Multi-Core | Single-Core
Geekbench 5.5: Multi-Core | Single-Core
HWBOT x265 Benchmark v2.2: 4k Preset
LibreOffice : 20 Documents To PDF
R Benchmark 2.5: Overall mean
| CPU Performance rating | |
| Lenovo ThinkPad X13 G6 AMD | |
| Average AMD Ryzen AI 7 PRO 350 | |
| Average of class Subnotebook | |
| Lenovo ThinkPad X1 Carbon Gen 13 21NS0010GE | |
| MSI Prestige 13 AI Plus Evo A2VMG | |
| Dell Pro 13 Premium PA13250 | |
| Microsoft Surface Laptop 7 13.8 Copilot+ -2! | |
| Cinebench R23 / Multi Core | |
| Lenovo ThinkPad X13 G6 AMD | |
| Average AMD Ryzen AI 7 PRO 350 (12684 - 15543, n=6) | |
| Average of class Subnotebook (1555 - 21812, n=59, last 2 years) | |
| MSI Prestige 13 AI Plus Evo A2VMG | |
| Lenovo ThinkPad X1 Carbon Gen 13 21NS0010GE | |
| Microsoft Surface Laptop 7 13.8 Copilot+ | |
| Dell Pro 13 Premium PA13250 | |
| Cinebench R23 / Single Core | |
| Dell Pro 13 Premium PA13250 | |
| Lenovo ThinkPad X13 G6 AMD | |
| Average AMD Ryzen AI 7 PRO 350 (1950 - 1960, n=6) | |
| Lenovo ThinkPad X1 Carbon Gen 13 21NS0010GE | |
| MSI Prestige 13 AI Plus Evo A2VMG | |
| Average of class Subnotebook (358 - 2213, n=60, last 2 years) | |
| Microsoft Surface Laptop 7 13.8 Copilot+ | |
| Cinebench R20 / CPU (Multi Core) | |
| Lenovo ThinkPad X13 G6 AMD | |
| Average AMD Ryzen AI 7 PRO 350 (4950 - 6071, n=6) | |
| Average of class Subnotebook (579 - 8541, n=56, last 2 years) | |
| MSI Prestige 13 AI Plus Evo A2VMG | |
| Lenovo ThinkPad X1 Carbon Gen 13 21NS0010GE | |
| Dell Pro 13 Premium PA13250 | |
| Microsoft Surface Laptop 7 13.8 Copilot+ | |
| Cinebench R20 / CPU (Single Core) | |
| Lenovo ThinkPad X13 G6 AMD | |
| Average AMD Ryzen AI 7 PRO 350 (763 - 773, n=6) | |
| Dell Pro 13 Premium PA13250 | |
| Lenovo ThinkPad X1 Carbon Gen 13 21NS0010GE | |
| MSI Prestige 13 AI Plus Evo A2VMG | |
| Average of class Subnotebook (128 - 832, n=56, last 2 years) | |
| Microsoft Surface Laptop 7 13.8 Copilot+ | |
| Cinebench R15 / CPU Multi 64Bit | |
| Average AMD Ryzen AI 7 PRO 350 (1969 - 2439, n=6) | |
| Lenovo ThinkPad X13 G6 AMD | |
| Microsoft Surface Laptop 7 13.8 Copilot+ | |
| Average of class Subnotebook (327 - 3345, n=56, last 2 years) | |
| MSI Prestige 13 AI Plus Evo A2VMG | |
| Dell Pro 13 Premium PA13250 | |
| Lenovo ThinkPad X1 Carbon Gen 13 21NS0010GE | |
| Cinebench R15 / CPU Single 64Bit | |
| Dell Pro 13 Premium PA13250 | |
| Lenovo ThinkPad X1 Carbon Gen 13 21NS0010GE | |
| Lenovo ThinkPad X13 G6 AMD | |
| MSI Prestige 13 AI Plus Evo A2VMG | |
| Average of class Subnotebook (72.4 - 322, n=56, last 2 years) | |
| Average AMD Ryzen AI 7 PRO 350 (198.4 - 299, n=6) | |
| Microsoft Surface Laptop 7 13.8 Copilot+ | |
| Blender / v2.79 BMW27 CPU | |
| Dell Pro 13 Premium PA13250 | |
| Average of class Subnotebook (159 - 2271, n=57, last 2 years) | |
| Lenovo ThinkPad X1 Carbon Gen 13 21NS0010GE | |
| Microsoft Surface Laptop 7 13.8 Copilot+ | |
| MSI Prestige 13 AI Plus Evo A2VMG | |
| Average AMD Ryzen AI 7 PRO 350 (206 - 251, n=6) | |
| Lenovo ThinkPad X13 G6 AMD | |
| 7-Zip 18.03 / 7z b 4 | |
| Lenovo ThinkPad X13 G6 AMD | |
| Average AMD Ryzen AI 7 PRO 350 (50709 - 57736, n=6) | |
| Microsoft Surface Laptop 7 13.8 Copilot+ | |
| Average of class Subnotebook (11668 - 77867, n=56, last 2 years) | |
| Lenovo ThinkPad X1 Carbon Gen 13 21NS0010GE | |
| MSI Prestige 13 AI Plus Evo A2VMG | |
| Dell Pro 13 Premium PA13250 | |
| 7-Zip 18.03 / 7z b 4 -mmt1 | |
| Dell Pro 13 Premium PA13250 | |
| Lenovo ThinkPad X1 Carbon Gen 13 21NS0010GE | |
| Lenovo ThinkPad X13 G6 AMD | |
| Average AMD Ryzen AI 7 PRO 350 (4445 - 6052, n=6) | |
| MSI Prestige 13 AI Plus Evo A2VMG | |
| Average of class Subnotebook (2643 - 6699, n=58, last 2 years) | |
| Microsoft Surface Laptop 7 13.8 Copilot+ | |
| Geekbench 6.7 / Multi-Core | |
| Microsoft Surface Laptop 7 13.8 Copilot+ | |
| Lenovo ThinkPad X13 G6 AMD | |
| Average AMD Ryzen AI 7 PRO 350 (11406 - 13566, n=7) | |
| Average of class Subnotebook (2244 - 20325, n=62, last 2 years) | |
| Lenovo ThinkPad X1 Carbon Gen 13 21NS0010GE | |
| MSI Prestige 13 AI Plus Evo A2VMG | |
| Dell Pro 13 Premium PA13250 | |
| Geekbench 6.7 / Single-Core | |
| Lenovo ThinkPad X13 G6 AMD | |
| Average AMD Ryzen AI 7 PRO 350 (2720 - 2881, n=7) | |
| Dell Pro 13 Premium PA13250 | |
| Microsoft Surface Laptop 7 13.8 Copilot+ | |
| Average of class Subnotebook (960 - 4195, n=61, last 2 years) | |
| Lenovo ThinkPad X1 Carbon Gen 13 21NS0010GE | |
| MSI Prestige 13 AI Plus Evo A2VMG | |
| Geekbench 5.5 / Multi-Core | |
| Lenovo ThinkPad X13 G6 AMD | |
| Average AMD Ryzen AI 7 PRO 350 (10537 - 11719, n=6) | |
| Average of class Subnotebook (2557 - 17218, n=47, last 2 years) | |
| Lenovo ThinkPad X1 Carbon Gen 13 21NS0010GE | |
| MSI Prestige 13 AI Plus Evo A2VMG | |
| Dell Pro 13 Premium PA13250 | |
| Geekbench 5.5 / Single-Core | |
| Average AMD Ryzen AI 7 PRO 350 (2070 - 2128, n=6) | |
| Lenovo ThinkPad X13 G6 AMD | |
| Lenovo ThinkPad X1 Carbon Gen 13 21NS0010GE | |
| Dell Pro 13 Premium PA13250 | |
| MSI Prestige 13 AI Plus Evo A2VMG | |
| Average of class Subnotebook (726 - 2224, n=47, last 2 years) | |
| HWBOT x265 Benchmark v2.2 / 4k Preset | |
| Lenovo ThinkPad X13 G6 AMD | |
| Average AMD Ryzen AI 7 PRO 350 (15.8 - 19.7, n=6) | |
| MSI Prestige 13 AI Plus Evo A2VMG | |
| Average of class Subnotebook (0.97 - 25.1, n=56, last 2 years) | |
| Lenovo ThinkPad X1 Carbon Gen 13 21NS0010GE | |
| Dell Pro 13 Premium PA13250 | |
| Microsoft Surface Laptop 7 13.8 Copilot+ | |
| LibreOffice / 20 Documents To PDF | |
| Microsoft Surface Laptop 7 13.8 Copilot+ | |
| Average AMD Ryzen AI 7 PRO 350 (50.7 - 93.1, n=6) | |
| Dell Pro 13 Premium PA13250 | |
| Average of class Subnotebook (39.9 - 220, n=55, last 2 years) | |
| Lenovo ThinkPad X13 G6 AMD | |
| MSI Prestige 13 AI Plus Evo A2VMG | |
| Lenovo ThinkPad X1 Carbon Gen 13 21NS0010GE | |
| R Benchmark 2.5 / Overall mean | |
| Microsoft Surface Laptop 7 13.8 Copilot+ | |
| Average of class Subnotebook (0.4024 - 1.456, n=57, last 2 years) | |
| Average AMD Ryzen AI 7 PRO 350 (0.4136 - 0.733, n=6) | |
| MSI Prestige 13 AI Plus Evo A2VMG | |
| Lenovo ThinkPad X1 Carbon Gen 13 21NS0010GE | |
| Lenovo ThinkPad X13 G6 AMD | |
| Dell Pro 13 Premium PA13250 | |
* ... smaller is better
AIDA64: FP32 Ray-Trace | FPU Julia | CPU SHA3 | CPU Queen | FPU SinJulia | FPU Mandel | CPU AES | CPU ZLib | FP64 Ray-Trace | CPU PhotoWorxx
| Performance rating | |
| Lenovo ThinkPad X13 G6 AMD | |
| Average AMD Ryzen AI 7 PRO 350 | |
| Average of class Subnotebook | |
| MSI Prestige 13 AI Plus Evo A2VMG | |
| Lenovo ThinkPad X1 Carbon Gen 13 21NS0010GE | |
| Dell Pro 13 Premium PA13250 | |
| Microsoft Surface Laptop 7 13.8 Copilot+ | |
| AIDA64 / FP32 Ray-Trace | |
| Lenovo ThinkPad X13 G6 AMD | |
| Average AMD Ryzen AI 7 PRO 350 (20019 - 24795, n=7) | |
| Average of class Subnotebook (1135 - 32888, n=57, last 2 years) | |
| MSI Prestige 13 AI Plus Evo A2VMG | |
| Dell Pro 13 Premium PA13250 | |
| Lenovo ThinkPad X1 Carbon Gen 13 21NS0010GE | |
| Microsoft Surface Laptop 7 13.8 Copilot+ | |
| AIDA64 / FPU Julia | |
| Lenovo ThinkPad X13 G6 AMD | |
| Average AMD Ryzen AI 7 PRO 350 (74210 - 94532, n=7) | |
| MSI Prestige 13 AI Plus Evo A2VMG | |
| Average of class Subnotebook (5218 - 123315, n=57, last 2 years) | |
| Lenovo ThinkPad X1 Carbon Gen 13 21NS0010GE | |
| Dell Pro 13 Premium PA13250 | |
| Microsoft Surface Laptop 7 13.8 Copilot+ | |
| AIDA64 / CPU SHA3 | |
| Lenovo ThinkPad X13 G6 AMD | |
| Average AMD Ryzen AI 7 PRO 350 (3434 - 4091, n=7) | |
| Average of class Subnotebook (444 - 5287, n=57, last 2 years) | |
| Microsoft Surface Laptop 7 13.8 Copilot+ | |
| MSI Prestige 13 AI Plus Evo A2VMG | |
| Lenovo ThinkPad X1 Carbon Gen 13 21NS0010GE | |
| Dell Pro 13 Premium PA13250 | |
| AIDA64 / CPU Queen | |
| Average AMD Ryzen AI 7 PRO 350 (73484 - 77055, n=6) | |
| Lenovo ThinkPad X13 G6 AMD | |
| Microsoft Surface Laptop 7 13.8 Copilot+ | |
| Average of class Subnotebook (10579 - 95002, n=49, last 2 years) | |
| MSI Prestige 13 AI Plus Evo A2VMG | |
| Lenovo ThinkPad X1 Carbon Gen 13 21NS0010GE | |
| Dell Pro 13 Premium PA13250 | |
| AIDA64 / FPU SinJulia | |
| Lenovo ThinkPad X13 G6 AMD | |
| Average AMD Ryzen AI 7 PRO 350 (12252 - 13653, n=7) | |
| Average of class Subnotebook (744 - 18418, n=57, last 2 years) | |
| MSI Prestige 13 AI Plus Evo A2VMG | |
| Dell Pro 13 Premium PA13250 | |
| Lenovo ThinkPad X1 Carbon Gen 13 21NS0010GE | |
| Microsoft Surface Laptop 7 13.8 Copilot+ | |
| AIDA64 / FPU Mandel | |
| Lenovo ThinkPad X13 G6 AMD | |
| Average AMD Ryzen AI 7 PRO 350 (39707 - 50597, n=7) | |
| MSI Prestige 13 AI Plus Evo A2VMG | |
| Average of class Subnotebook (3341 - 65433, n=57, last 2 years) | |
| Lenovo ThinkPad X1 Carbon Gen 13 21NS0010GE | |
| Dell Pro 13 Premium PA13250 | |
| Microsoft Surface Laptop 7 13.8 Copilot+ | |
| AIDA64 / CPU AES | |
| Lenovo ThinkPad X13 G6 AMD | |
| Average AMD Ryzen AI 7 PRO 350 (65710 - 82843, n=7) | |
| Microsoft Surface Laptop 7 13.8 Copilot+ | |
| Average of class Subnotebook (638 - 96917, n=57, last 2 years) | |
| MSI Prestige 13 AI Plus Evo A2VMG | |
| Lenovo ThinkPad X1 Carbon Gen 13 21NS0010GE | |
| Dell Pro 13 Premium PA13250 | |
| AIDA64 / CPU ZLib | |
| Lenovo ThinkPad X13 G6 AMD | |
| Average AMD Ryzen AI 7 PRO 350 (834 - 1029, n=7) | |
| Average of class Subnotebook (164.9 - 1379, n=57, last 2 years) | |
| Microsoft Surface Laptop 7 13.8 Copilot+ | |
| MSI Prestige 13 AI Plus Evo A2VMG | |
| Lenovo ThinkPad X1 Carbon Gen 13 21NS0010GE | |
| Dell Pro 13 Premium PA13250 | |
| AIDA64 / FP64 Ray-Trace | |
| Lenovo ThinkPad X13 G6 AMD | |
| Average AMD Ryzen AI 7 PRO 350 (10760 - 13384, n=7) | |
| Average of class Subnotebook (610 - 17495, n=57, last 2 years) | |
| MSI Prestige 13 AI Plus Evo A2VMG | |
| Dell Pro 13 Premium PA13250 | |
| Lenovo ThinkPad X1 Carbon Gen 13 21NS0010GE | |
| Microsoft Surface Laptop 7 13.8 Copilot+ | |
| AIDA64 / CPU PhotoWorxx | |
| MSI Prestige 13 AI Plus Evo A2VMG | |
| Lenovo ThinkPad X1 Carbon Gen 13 21NS0010GE | |
| Average of class Subnotebook (6569 - 85600, n=57, last 2 years) | |
| Dell Pro 13 Premium PA13250 | |
| Lenovo ThinkPad X13 G6 AMD | |
| Microsoft Surface Laptop 7 13.8 Copilot+ | |
| Average AMD Ryzen AI 7 PRO 350 (26358 - 43805, n=7) | |
系统性能
ThinkPad X13 G6 的响应速度非常快,我们在测试期间没有遇到任何稳定性问题。
PCMark 10: Score | Essentials | Productivity | Digital Content Creation
CrossMark: Overall | Productivity | Creativity | Responsiveness
WebXPRT 3: Overall
WebXPRT 4: Overall
Mozilla Kraken 1.1: Total
| Performance rating | |
| Lenovo ThinkPad X1 Carbon Gen 13 21NS0010GE -1! | |
| Lenovo ThinkPad X13 G6 AMD | |
| Average of class Subnotebook | |
| MSI Prestige 13 AI Plus Evo A2VMG | |
| Average AMD Ryzen AI 7 PRO 350, AMD Radeon 860M | |
| Dell Pro 13 Premium PA13250 | |
| Microsoft Surface Laptop 7 13.8 Copilot+ -4! | |
| PCMark 10 / Score | |
| Lenovo ThinkPad X13 G6 AMD | |
| Average AMD Ryzen AI 7 PRO 350, AMD Radeon 860M (6888 - 7626, n=6) | |
| Lenovo ThinkPad X1 Carbon Gen 13 21NS0010GE | |
| Average of class Subnotebook (4920 - 9939, n=44, last 2 years) | |
| MSI Prestige 13 AI Plus Evo A2VMG | |
| Dell Pro 13 Premium PA13250 | |
| PCMark 10 / Essentials | |
| Average AMD Ryzen AI 7 PRO 350, AMD Radeon 860M (10671 - 11594, n=6) | |
| Lenovo ThinkPad X13 G6 AMD | |
| Lenovo ThinkPad X1 Carbon Gen 13 21NS0010GE | |
| Average of class Subnotebook (8552 - 11646, n=44, last 2 years) | |
| MSI Prestige 13 AI Plus Evo A2VMG | |
| Dell Pro 13 Premium PA13250 | |
| PCMark 10 / Productivity | |
| Average AMD Ryzen AI 7 PRO 350, AMD Radeon 860M (9823 - 10925, n=6) | |
| Lenovo ThinkPad X13 G6 AMD | |
| Average of class Subnotebook (5435 - 16606, n=44, last 2 years) | |
| Lenovo ThinkPad X1 Carbon Gen 13 21NS0010GE | |
| Dell Pro 13 Premium PA13250 | |
| MSI Prestige 13 AI Plus Evo A2VMG | |
| PCMark 10 / Digital Content Creation | |
| Lenovo ThinkPad X1 Carbon Gen 13 21NS0010GE | |
| MSI Prestige 13 AI Plus Evo A2VMG | |
| Average of class Subnotebook (5722 - 13779, n=44, last 2 years) | |
| Lenovo ThinkPad X13 G6 AMD | |
| Dell Pro 13 Premium PA13250 | |
| Average AMD Ryzen AI 7 PRO 350, AMD Radeon 860M (8441 - 9503, n=6) | |
| CrossMark / Overall | |
| Lenovo ThinkPad X13 G6 AMD | |
| Lenovo ThinkPad X1 Carbon Gen 13 21NS0010GE | |
| MSI Prestige 13 AI Plus Evo A2VMG | |
| Average AMD Ryzen AI 7 PRO 350, AMD Radeon 860M (1426 - 1851, n=6) | |
| Average of class Subnotebook (365 - 2356, n=59, last 2 years) | |
| Dell Pro 13 Premium PA13250 | |
| Microsoft Surface Laptop 7 13.8 Copilot+ | |
| CrossMark / Productivity | |
| Lenovo ThinkPad X13 G6 AMD | |
| Lenovo ThinkPad X1 Carbon Gen 13 21NS0010GE | |
| MSI Prestige 13 AI Plus Evo A2VMG | |
| Average AMD Ryzen AI 7 PRO 350, AMD Radeon 860M (1256 - 1702, n=6) | |
| Dell Pro 13 Premium PA13250 | |
| Average of class Subnotebook (364 - 2277, n=59, last 2 years) | |
| Microsoft Surface Laptop 7 13.8 Copilot+ | |
| CrossMark / Creativity | |
| Lenovo ThinkPad X13 G6 AMD | |
| Average AMD Ryzen AI 7 PRO 350, AMD Radeon 860M (1734 - 2174, n=6) | |
| Lenovo ThinkPad X1 Carbon Gen 13 21NS0010GE | |
| MSI Prestige 13 AI Plus Evo A2VMG | |
| Dell Pro 13 Premium PA13250 | |
| Average of class Subnotebook (372 - 2743, n=59, last 2 years) | |
| Microsoft Surface Laptop 7 13.8 Copilot+ | |
| CrossMark / Responsiveness | |
| Lenovo ThinkPad X13 G6 AMD | |
| Average AMD Ryzen AI 7 PRO 350, AMD Radeon 860M (1161 - 1472, n=6) | |
| Average of class Subnotebook (312 - 1854, n=59, last 2 years) | |
| Microsoft Surface Laptop 7 13.8 Copilot+ | |
| Lenovo ThinkPad X1 Carbon Gen 13 21NS0010GE | |
| MSI Prestige 13 AI Plus Evo A2VMG | |
| Dell Pro 13 Premium PA13250 | |
| WebXPRT 3 / Overall | |
| Microsoft Surface Laptop 7 13.8 Copilot+ | |
| Average of class Subnotebook (156 - 530, n=55, last 2 years) | |
| MSI Prestige 13 AI Plus Evo A2VMG | |
| Average AMD Ryzen AI 7 PRO 350, AMD Radeon 860M (250 - 320, n=6) | |
| Dell Pro 13 Premium PA13250 | |
| Lenovo ThinkPad X13 G6 AMD | |
| WebXPRT 4 / Overall | |
| Microsoft Surface Laptop 7 13.8 Copilot+ | |
| MSI Prestige 13 AI Plus Evo A2VMG | |
| Lenovo ThinkPad X1 Carbon Gen 13 21NS0010GE | |
| Average of class Subnotebook (132 - 378, n=60, last 2 years) | |
| Dell Pro 13 Premium PA13250 | |
| Average AMD Ryzen AI 7 PRO 350, AMD Radeon 860M (166.3 - 270, n=6) | |
| Lenovo ThinkPad X13 G6 AMD | |
| Mozilla Kraken 1.1 / Total | |
| Average AMD Ryzen AI 7 PRO 350, AMD Radeon 860M (446 - 749, n=6) | |
| Lenovo ThinkPad X13 G6 AMD | |
| Dell Pro 13 Premium PA13250 | |
| Average of class Subnotebook (234 - 1104, n=60, last 2 years) | |
| MSI Prestige 13 AI Plus Evo A2VMG | |
| Lenovo ThinkPad X1 Carbon Gen 13 21NS0010GE | |
| Microsoft Surface Laptop 7 13.8 Copilot+ | |
* ... smaller is better
| PCMark 10 Score | 7271 points | |
Help | ||
| AIDA64 / Memory Copy | |
| Lenovo ThinkPad X1 Carbon Gen 13 21NS0010GE | |
| MSI Prestige 13 AI Plus Evo A2VMG | |
| Dell Pro 13 Premium PA13250 | |
| Average of class Subnotebook (14554 - 131023, n=57, last 2 years) | |
| Lenovo ThinkPad X13 G6 AMD | |
| Average AMD Ryzen AI 7 PRO 350 (36835 - 83623, n=7) | |
| Microsoft Surface Laptop 7 13.8 Copilot+ | |
| AIDA64 / Memory Read | |
| Microsoft Surface Laptop 7 13.8 Copilot+ | |
| Lenovo ThinkPad X1 Carbon Gen 13 21NS0010GE | |
| MSI Prestige 13 AI Plus Evo A2VMG | |
| Average of class Subnotebook (15948 - 127174, n=57, last 2 years) | |
| Dell Pro 13 Premium PA13250 | |
| Lenovo ThinkPad X13 G6 AMD | |
| Average AMD Ryzen AI 7 PRO 350 (42869 - 63536, n=7) | |
| AIDA64 / Memory Write | |
| Lenovo ThinkPad X1 Carbon Gen 13 21NS0010GE | |
| MSI Prestige 13 AI Plus Evo A2VMG | |
| Dell Pro 13 Premium PA13250 | |
| Lenovo ThinkPad X13 G6 AMD | |
| Average of class Subnotebook (15709 - 135141, n=57, last 2 years) | |
| Average AMD Ryzen AI 7 PRO 350 (39737 - 104146, n=7) | |
| Microsoft Surface Laptop 7 13.8 Copilot+ | |
| AIDA64 / Memory Latency | |
| Lenovo ThinkPad X13 G6 AMD | |
| Average AMD Ryzen AI 7 PRO 350 (103.2 - 119.1, n=7) | |
| Dell Pro 13 Premium PA13250 | |
| MSI Prestige 13 AI Plus Evo A2VMG | |
| Average of class Subnotebook (6.1 - 159.9, n=55, last 2 years) | |
| Lenovo ThinkPad X1 Carbon Gen 13 21NS0010GE | |
| Microsoft Surface Laptop 7 13.8 Copilot+ | |
* ... smaller is better
DPC 延迟
在我们的标准延迟测试(网页浏览、4K YouTube 播放、CPU 负载)中,评测设备在当前 BIOS 版本下的实时音频应用中表现出了局限性。
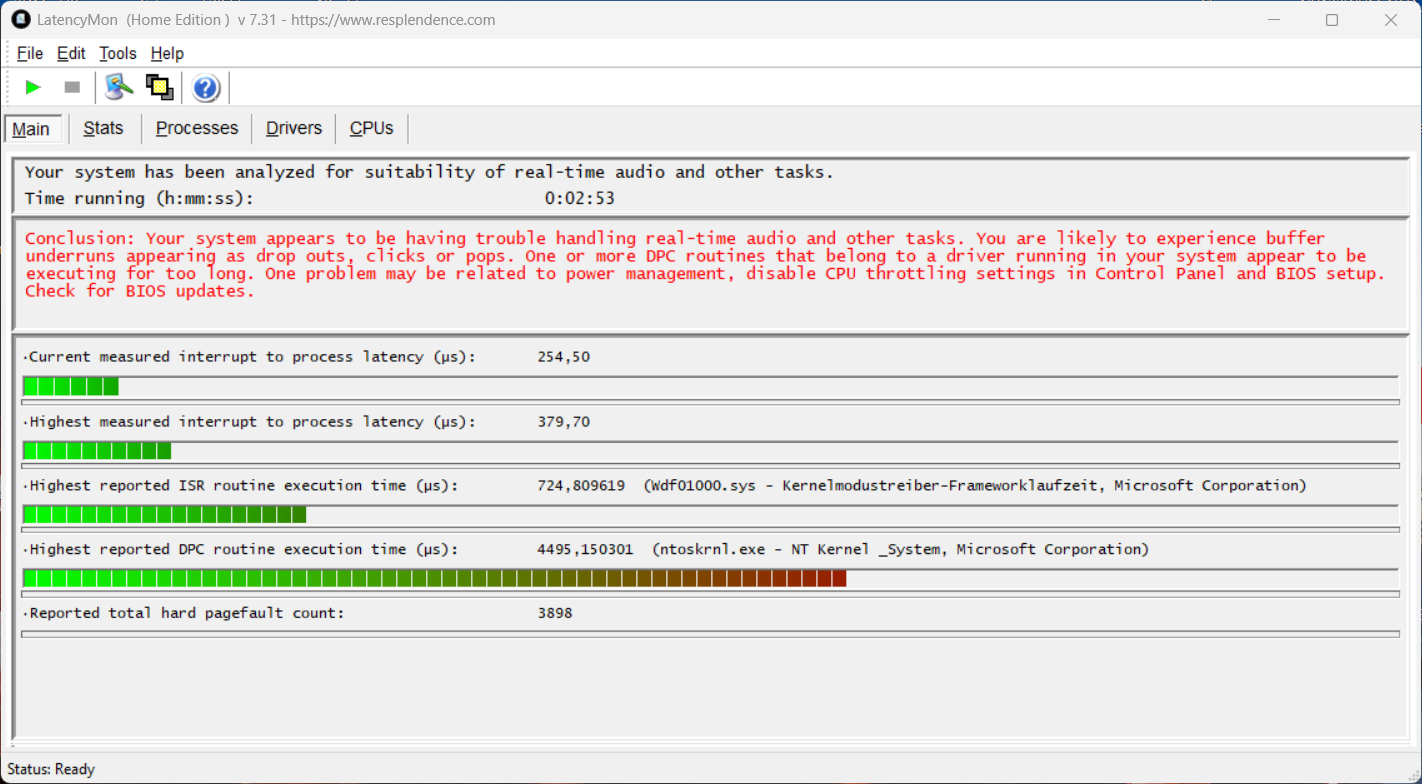
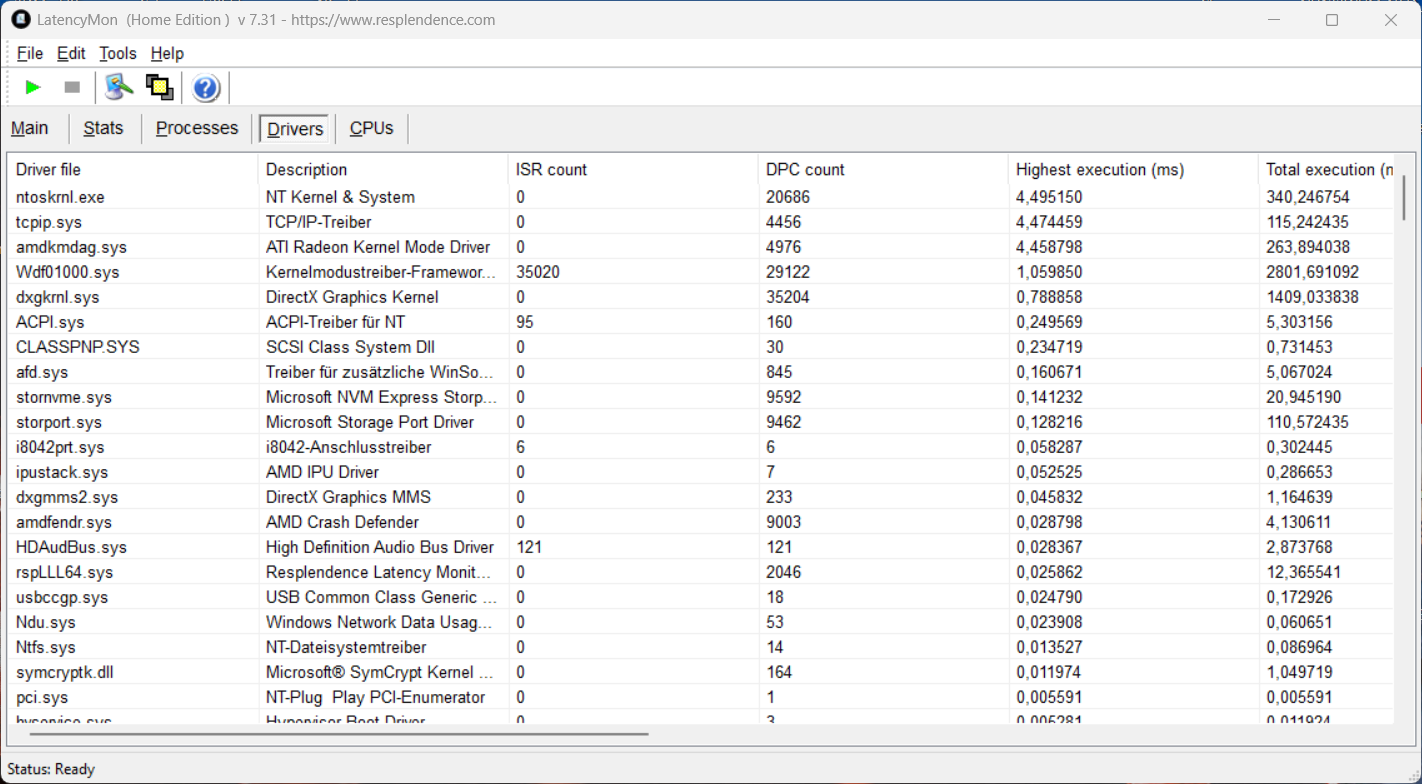
| DPC Latencies / LatencyMon - interrupt to process latency (max), Web, Youtube, Prime95 | |
| Dell Pro 13 Premium PA13250 | |
| Lenovo ThinkPad X1 Carbon Gen 13 21NS0010GE | |
| MSI Prestige 13 AI Plus Evo A2VMG | |
| Lenovo ThinkPad X13 G6 AMD | |
* ... smaller is better
存储
西部数据的 1 TB SSD(可用容量为 872 GB)具有很高的传输速率,但在持续负载情况下性能并不完全稳定。但在日常使用中,影响有限。

* ... smaller is better
持续读取性能:DiskSpd 读取循环,队列深度 8
图形处理器性能
图形输出由 AMD Radeon 860M负责图形输出,其性能可圈可点,但无法与 Lunar Lake 竞争对手媲美。GPU 性能在电池供电情况下保持稳定,但在持续负载情况下会略有下降(约-10%)。
| 3DMark 11 Performance | 10993 points | |
| 3DMark Fire Strike Score | 6707 points | |
| 3DMark Time Spy Score | 3129 points | |
| 3DMark Steel Nomad Score | 462 points | |
| 3DMark Steel Nomad Light Score | 2454 points | |
Help | ||
| Blender / v3.3 Classroom CPU | |
| Dell Pro 13 Premium PA13250 | |
| Lenovo ThinkPad X1 Carbon Gen 13 21NS0010GE | |
| Microsoft Surface Laptop 7 13.8 Copilot+ | |
| MSI Prestige 13 AI Plus Evo A2VMG | |
| Average of class Subnotebook (241 - 861, n=59, last 2 years) | |
| Lenovo ThinkPad X13 G6 AMD | |
| Average AMD Radeon 860M (280 - 427, n=21) | |
| Blender / v3.3 Classroom oneAPI/Intel | |
| Dell Pro 13 Premium PA13250 | |
| Average of class Subnotebook (105 - 396, n=11, last 2 years) | |
| Lenovo ThinkPad X1 Carbon Gen 13 21NS0010GE | |
| MSI Prestige 13 AI Plus Evo A2VMG | |
* ... smaller is better
| Strange Brigade - 1920x1080 ultra AA:ultra AF:16 | |
| Dell Pro 13 Premium PA13250 | |
| MSI Prestige 13 AI Plus Evo A2VMG | |
| Average of class Subnotebook (19 - 101.3, n=49, last 2 years) | |
| Lenovo ThinkPad X13 G6 AMD | |
| Microsoft Surface Laptop 7 13.8 Copilot+ | |
| X-Plane 11.11 - 1920x1080 high (fps_test=3) | |
| Lenovo ThinkPad X13 G6 AMD | |
| MSI Prestige 13 AI Plus Evo A2VMG | |
| Average of class Subnotebook (20.7 - 50.5, n=52, last 2 years) | |
| Dell Pro 13 Premium PA13250 | |
| Lenovo ThinkPad X1 Carbon Gen 13 21NS0010GE | |
赛博朋克 2077 Ultra - FPS 图表
| low | med. | high | ultra | |
|---|---|---|---|---|
| GTA V (2015) | 167.1 | 158.3 | 67 | 27.9 |
| Dota 2 Reborn (2015) | 155 | 133.6 | 77.2 | 69.6 |
| Final Fantasy XV Benchmark (2018) | 70.2 | 32.4 | 22.3 | |
| X-Plane 11.11 (2018) | 62.2 | 48 | 38.8 | |
| Strange Brigade (2018) | 161.1 | 62.8 | 52.1 | 41.7 |
| Baldur's Gate 3 (2023) | 31.7 | 25.2 | 20.4 | 19.8 |
| Cyberpunk 2077 (2023) | 32.4 | 24.9 | 20 | 16.4 |
| F1 24 (2024) | 60.4 | 56.8 | 42.1 | 8.82 |
排放和能源
噪音排放

总的来说,ThinkPad X13 是一款非常安静的机器。当需要CPU发挥最大性能时,风扇的声音会清晰可闻,略低于40 dB(A)。但在其他两种电源模式下,风扇的声音明显要小些(平衡模式:33.5 dB(A),最佳电源效率模式:29.3 dB(A))。我们在评测设备上没有发现任何其他电子噪音。
Noise level
| Idle |
| 24.1 / 24.1 / 25.5 dB(A) |
| Load |
| 32.8 / 39.7 dB(A) |
 | ||
30 dB silent 40 dB(A) audible 50 dB(A) loud |
||
min: | ||
| Lenovo ThinkPad X13 G6 AMD Ryzen AI 7 PRO 350, Radeon 860M | Dell Pro 13 Premium PA13250 Core Ultra 7 268V, Arc 140V | MSI Prestige 13 AI Plus Evo A2VMG Core Ultra 7 258V, Arc 140V | Microsoft Surface Laptop 7 13.8 Copilot+ SD X Elite X1E-80-100, Adreno X1-85 3.8 TFLOPS | Lenovo ThinkPad X1 Carbon Gen 13 21NS0010GE Core Ultra 7 258V, Arc 140V | |
|---|---|---|---|---|---|
| Noise | -1% | -9% | 7% | 3% | |
| off / environment * (dB) | 24.1 | 23 5% | 24.1 -0% | 23.8 1% | 23.2 4% |
| Idle Minimum * (dB) | 24.1 | 23 5% | 24.8 -3% | 23.8 1% | 23.2 4% |
| Idle Average * (dB) | 24.1 | 23 5% | 24.8 -3% | 23.8 1% | 23.2 4% |
| Idle Maximum * (dB) | 25.5 | 23 10% | 26.7 -5% | 23.8 7% | 23.2 9% |
| Load Average * (dB) | 32.8 | 37 -13% | 36.8 -12% | 26 21% | 29.9 9% |
| Cyberpunk 2077 ultra * (dB) | 39.7 | 42.74 -8% | 44.5 -12% | 31.5 21% | 43.3 -9% |
| Load Maximum * (dB) | 39.7 | 42.74 -8% | 50.8 -28% | 40.3 -2% | 40.5 -2% |
* ... smaller is better
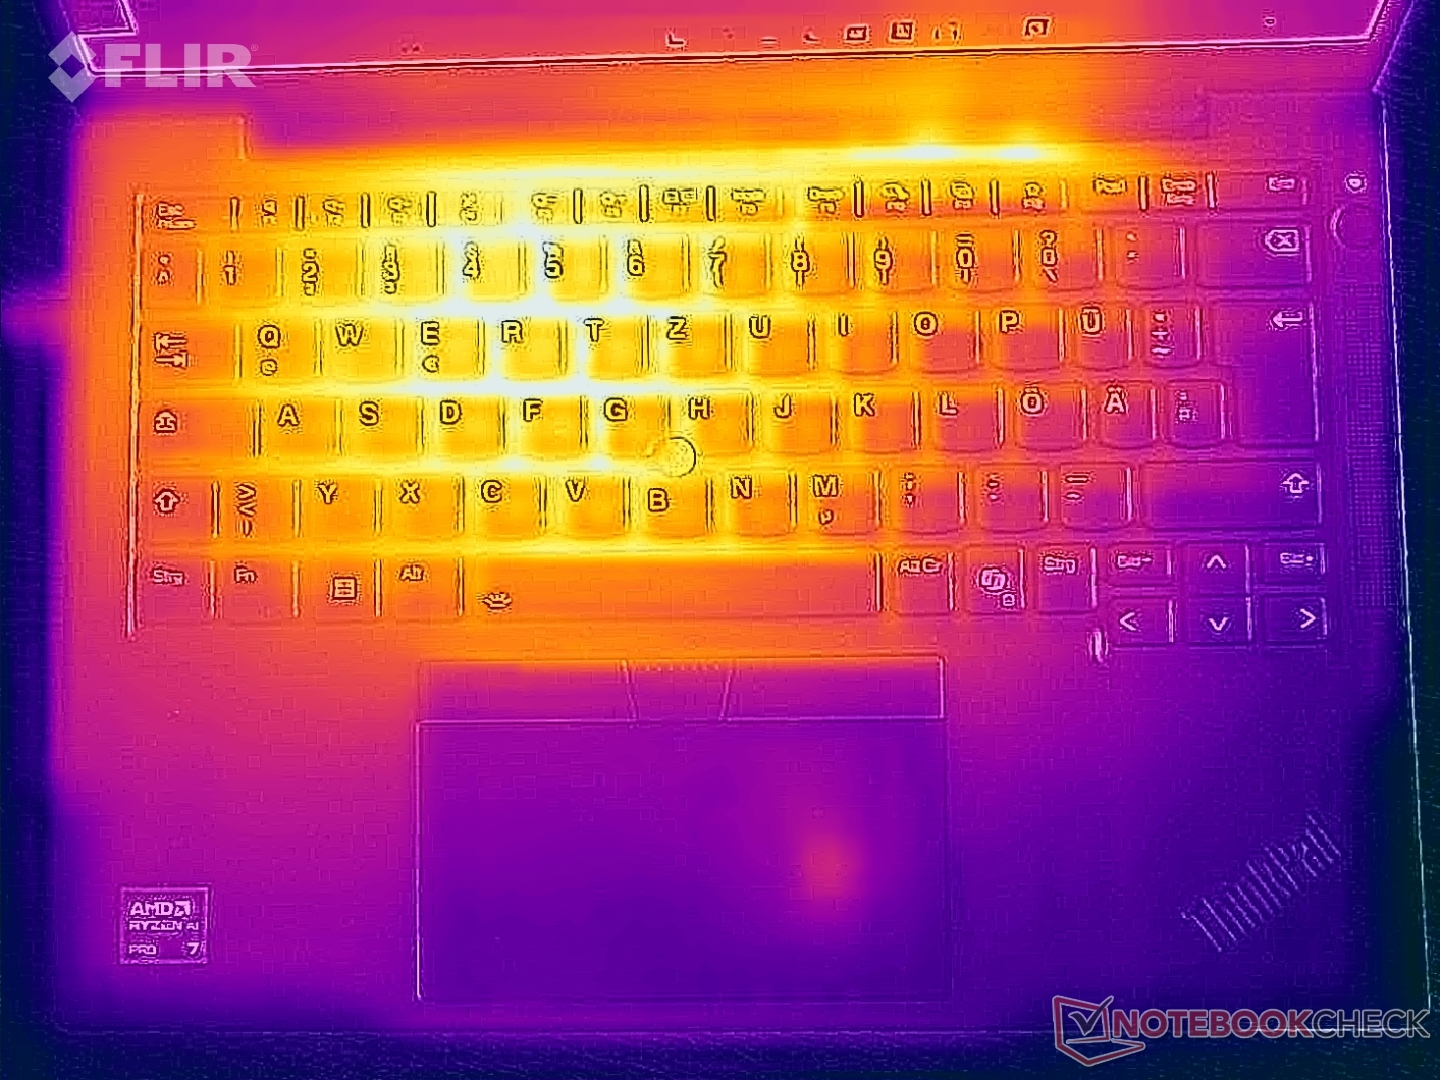
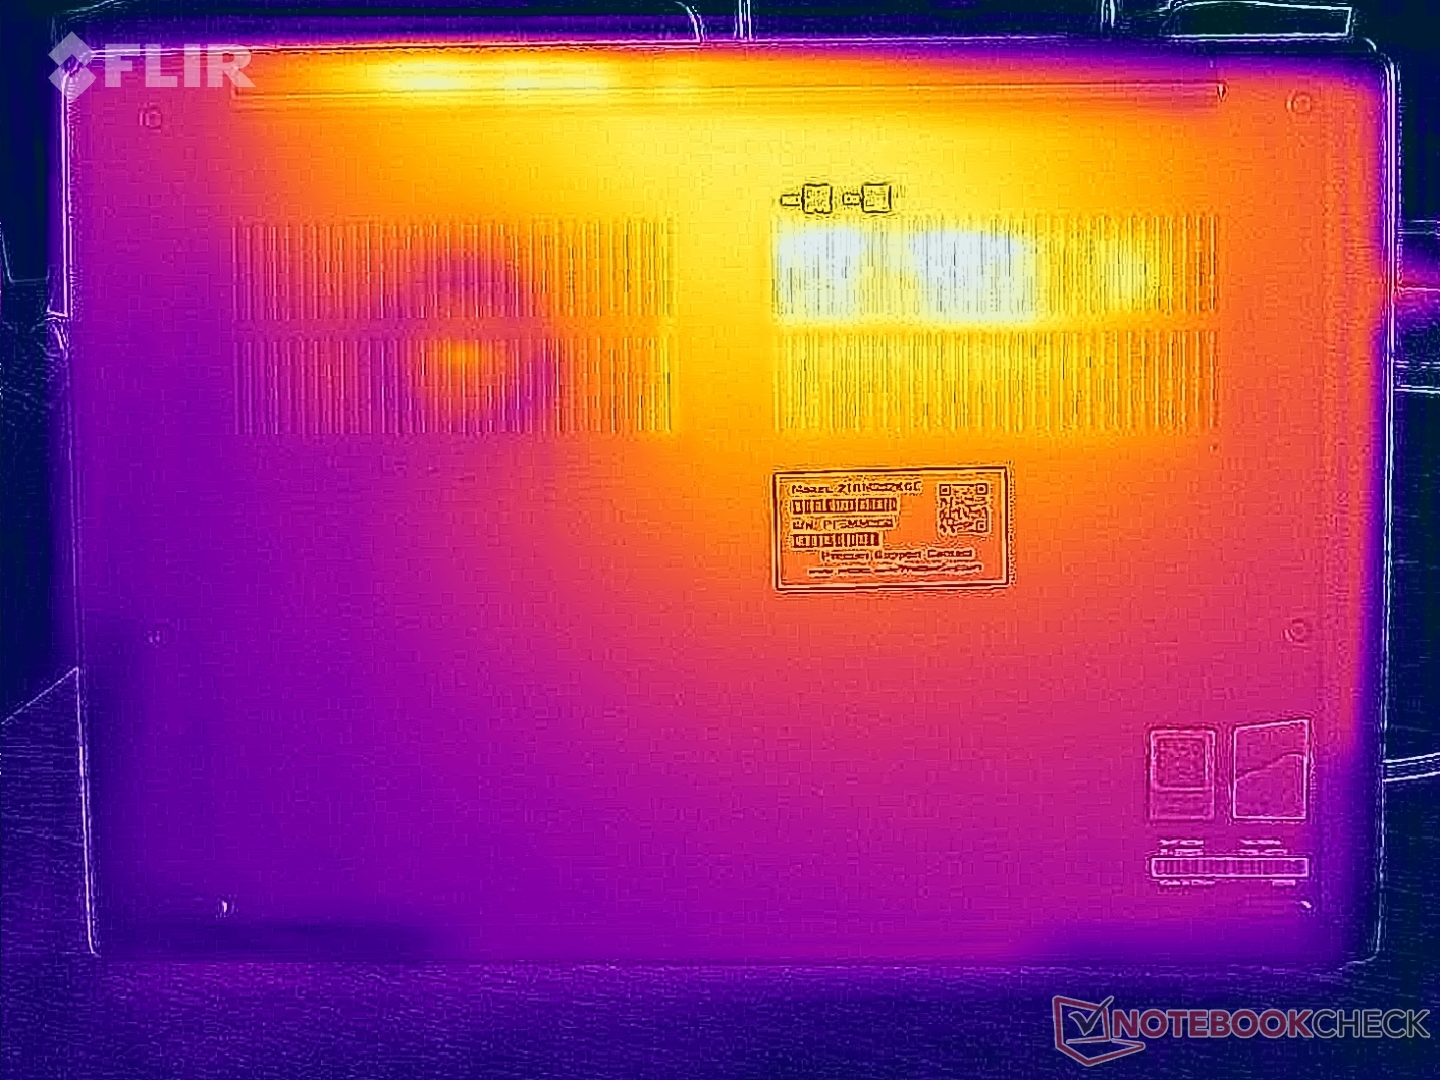
温度
无论是在日常使用还是最大负载情况下,表面温度都没有问题。在综合 CPU 和 GPU 负载的压力测试中,处理器很快就稳定在 22 瓦左右。

(±) The maximum temperature on the upper side is 43.5 °C / 110 F, compared to the average of 35.9 °C / 97 F, ranging from 21.4 to 59 °C for the class Subnotebook.
(-) The bottom heats up to a maximum of 45.9 °C / 115 F, compared to the average of 39.2 °C / 103 F
(+) In idle usage, the average temperature for the upper side is 23.5 °C / 74 F, compared to the device average of 30.8 °C / 87 F.
(±) 3: The average temperature for the upper side is 35.2 °C / 95 F, compared to the average of 30.8 °C / 87 F for the class Subnotebook.
(+) The palmrests and touchpad are cooler than skin temperature with a maximum of 27.8 °C / 82 F and are therefore cool to the touch.
(±) The average temperature of the palmrest area of similar devices was 28.2 °C / 82.8 F (+0.4 °C / 0.8 F).
| Lenovo ThinkPad X13 G6 AMD Ryzen AI 7 PRO 350, Radeon 860M | Dell Pro 13 Premium PA13250 Core Ultra 7 268V, Arc 140V | MSI Prestige 13 AI Plus Evo A2VMG Core Ultra 7 258V, Arc 140V | Microsoft Surface Laptop 7 13.8 Copilot+ SD X Elite X1E-80-100, Adreno X1-85 3.8 TFLOPS | Lenovo ThinkPad X1 Carbon Gen 13 21NS0010GE Core Ultra 7 258V, Arc 140V | |
|---|---|---|---|---|---|
| Heat | 16% | -1% | -2% | -4% | |
| Maximum Upper Side * (°C) | 43.5 | 31 29% | 43.4 -0% | 47.1 -8% | 42.3 3% |
| Maximum Bottom * (°C) | 45.9 | 31 32% | 42.4 8% | 44.6 3% | 40.1 13% |
| Idle Upper Side * (°C) | 23.9 | 24 -0% | 25.4 -6% | 24.7 -3% | 27.3 -14% |
| Idle Bottom * (°C) | 24.2 | 24 1% | 25.6 -6% | 24.5 -1% | 28.3 -17% |
* ... smaller is better
发言人
扬声器几乎没有什么值得兴奋的地方。人声重现还可以接受,但如果要重现其他声音,我们建议使用耳机或外置扬声器。
Lenovo ThinkPad X13 G6 AMD audio analysis
(±) | speaker loudness is average but good (78.2 dB)
Bass 100 - 315 Hz
(-) | nearly no bass - on average 15.8% lower than median
(±) | linearity of bass is average (9.3% delta to prev. frequency)
Mids 400 - 2000 Hz
(±) | higher mids - on average 6.9% higher than median
(+) | mids are linear (5.1% delta to prev. frequency)
Highs 2 - 16 kHz
(±) | higher highs - on average 6.2% higher than median
(+) | highs are linear (4.5% delta to prev. frequency)
Overall 100 - 16.000 Hz
(±) | linearity of overall sound is average (21.8% difference to median)
Compared to same class
» 73% of all tested devices in this class were better, 6% similar, 20% worse
» The best had a delta of 5%, average was 18%, worst was 53%
Compared to all devices tested
» 62% of all tested devices were better, 7% similar, 31% worse
» The best had a delta of 4%, average was 23%, worst was 134%
Dell Pro 13 Premium PA13250 audio analysis
(+) | speakers can play relatively loud (87.49 dB)
Bass 100 - 315 Hz
(-) | nearly no bass - on average 15.9% lower than median
(±) | linearity of bass is average (8.3% delta to prev. frequency)
Mids 400 - 2000 Hz
(+) | balanced mids - only 2.9% away from median
(+) | mids are linear (4.7% delta to prev. frequency)
Highs 2 - 16 kHz
(±) | reduced highs - on average 5.2% lower than median
(±) | linearity of highs is average (7.1% delta to prev. frequency)
Overall 100 - 16.000 Hz
(+) | overall sound is linear (12.2% difference to median)
Compared to same class
» 15% of all tested devices in this class were better, 5% similar, 81% worse
» The best had a delta of 5%, average was 18%, worst was 53%
Compared to all devices tested
» 10% of all tested devices were better, 2% similar, 88% worse
» The best had a delta of 4%, average was 23%, worst was 134%
MSI Prestige 13 AI Plus Evo A2VMG audio analysis
(+) | speakers can play relatively loud (84.5 dB)
Bass 100 - 315 Hz
(-) | nearly no bass - on average 19.4% lower than median
(±) | linearity of bass is average (9.6% delta to prev. frequency)
Mids 400 - 2000 Hz
(±) | higher mids - on average 6.4% higher than median
(+) | mids are linear (5.1% delta to prev. frequency)
Highs 2 - 16 kHz
(±) | higher highs - on average 6.1% higher than median
(+) | highs are linear (4.6% delta to prev. frequency)
Overall 100 - 16.000 Hz
(±) | linearity of overall sound is average (18.2% difference to median)
Compared to same class
» 52% of all tested devices in this class were better, 7% similar, 40% worse
» The best had a delta of 5%, average was 18%, worst was 53%
Compared to all devices tested
» 39% of all tested devices were better, 8% similar, 53% worse
» The best had a delta of 4%, average was 23%, worst was 134%
Microsoft Surface Laptop 7 13.8 Copilot+ audio analysis
(±) | speaker loudness is average but good (81.8 dB)
Bass 100 - 315 Hz
(±) | reduced bass - on average 12.7% lower than median
(±) | linearity of bass is average (9.8% delta to prev. frequency)
Mids 400 - 2000 Hz
(+) | balanced mids - only 4.1% away from median
(+) | mids are linear (2.4% delta to prev. frequency)
Highs 2 - 16 kHz
(+) | balanced highs - only 2.1% away from median
(+) | highs are linear (2.5% delta to prev. frequency)
Overall 100 - 16.000 Hz
(+) | overall sound is linear (12.1% difference to median)
Compared to same class
» 14% of all tested devices in this class were better, 5% similar, 81% worse
» The best had a delta of 5%, average was 18%, worst was 53%
Compared to all devices tested
» 9% of all tested devices were better, 2% similar, 88% worse
» The best had a delta of 4%, average was 23%, worst was 134%
Lenovo ThinkPad X1 Carbon Gen 13 21NS0010GE audio analysis
(+) | speakers can play relatively loud (84.8 dB)
Bass 100 - 315 Hz
(±) | reduced bass - on average 10.2% lower than median
(±) | linearity of bass is average (9.2% delta to prev. frequency)
Mids 400 - 2000 Hz
(±) | higher mids - on average 8.9% higher than median
(+) | mids are linear (3.6% delta to prev. frequency)
Highs 2 - 16 kHz
(+) | balanced highs - only 4.3% away from median
(+) | highs are linear (5.8% delta to prev. frequency)
Overall 100 - 16.000 Hz
(±) | linearity of overall sound is average (15% difference to median)
Compared to same class
» 33% of all tested devices in this class were better, 5% similar, 62% worse
» The best had a delta of 5%, average was 18%, worst was 53%
Compared to all devices tested
» 21% of all tested devices were better, 4% similar, 75% worse
» The best had a delta of 4%, average was 23%, worst was 134%
耗电量

尽管注重移动性,但功耗仍有改进的余地,尤其是在低负载时。戴尔 戴尔 Pro 13 Premium在这方面的效率明显更高。在负载情况下,我们记录到的峰值功率略低于 66 瓦,很快就稳定在 42 瓦左右。因此,非常紧凑的 65 瓦 GaN 电源适配器的尺寸是合适的。
| Off / Standby | |
| Idle | |
| Load |
|
Key:
min: | |
| Lenovo ThinkPad X13 G6 AMD Ryzen AI 7 PRO 350, Radeon 860M, Western Digital PC SN8000S SDEPNRK-1T00, IPS, 1920x1200, 13.3" | Dell Pro 13 Premium PA13250 Core Ultra 7 268V, Arc 140V, Micron 2550 1TB, IPS, 1920x1200, 13.3" | MSI Prestige 13 AI Plus Evo A2VMG Core Ultra 7 258V, Arc 140V, , OLED, 2880x1800, 13.3" | Microsoft Surface Laptop 7 13.8 Copilot+ SD X Elite X1E-80-100, Adreno X1-85 3.8 TFLOPS, Samsung MZ9L4512HBLU-00BMV, IPS, 2304x1536, 13.8" | Lenovo ThinkPad X1 Carbon Gen 13 21NS0010GE Core Ultra 7 258V, Arc 140V, SK hynix PCB01 HFS001TFM9X179N GL, OLED, 2880x1800, 14" | Average AMD Radeon 860M | Average of class Subnotebook | |
|---|---|---|---|---|---|---|---|
| Power Consumption | 19% | -12% | 19% | 1% | -20% | -11% | |
| Idle Minimum * (Watt) | 2.7 | 2 26% | 3.5 -30% | 1.4 48% | 4.7 -74% | 3.99 ? -48% | 3.78 ? -40% |
| Idle Average * (Watt) | 5.7 | 4.3 25% | 5.9 -4% | 6.3 -11% | 5.7 -0% | 6.72 ? -18% | 6.57 ? -15% |
| Idle Maximum * (Watt) | 6.3 | 4.75 25% | 10 -59% | 7.6 -21% | 6.1 3% | 7.32 ? -16% | 7.94 ? -26% |
| Load Average * (Watt) | 55.3 | 40 28% | 38.7 30% | 26.9 51% | 29.8 46% | 55.9 ? -1% | 41.9 ? 24% |
| Cyberpunk 2077 ultra * (Watt) | 41.2 | 36.4 12% | 46.3 -12% | 38.5 7% | 35.3 14% | ||
| Cyberpunk 2077 ultra external monitor * (Watt) | 39.1 | 38 3% | 45.6 -17% | 34.1 13% | |||
| Load Maximum * (Watt) | 65.6 | 57 13% | 61.5 6% | 40.7 38% | 60.1 8% | 75.4 ? -15% | 64.4 ? 2% |
* ... smaller is better
能耗 赛博朋克/压力测试
带外部监控器的能耗
电池寿命
电池容量为 54.7 瓦时,在 150 cd/m² 的 Wi-Fi 测试中,我们测得的良好运行时间略高于 12 小时(或最大亮度下 8 小时 20 分钟)。不过,几乎所有竞争对手的续航时间都更长,尤其是 戴尔.

Notebookcheck 总体评分
Lenovo ThinkPad X13 G6 AMD
- 11/30/2025 v8
Andreas Osthoff
 Total Sustainability Score:
 可比较的替代品
Image | Model / Review | Price | Weight | Height | Display |
|---|---|---|---|---|---|
1. 87.4%  | Lenovo ThinkPad X13 G6 AMD AMD Ryzen AI 7 PRO 350 ⎘ AMD Radeon 860M ⎘ 32 GB Memory, 1024 GB SSD | Amazon: List Price: 1855€ | 1.1 kg | 13 mm | 13.30" 1920x1200 170 PPI IPS |
2. 90%  | Dell Pro 13 Premium PA13250 Intel Core Ultra 7 268V ⎘ Intel Arc Graphics 140V ⎘ 32 GB Memory, 1024 GB SSD | Amazon: List Price: 2700 Euro | 1.1 kg | 17.2 mm | 13.30" 1920x1200 170 PPI IPS |
3. 85%  | MSI Prestige 13 AI Plus Evo A2VMG Intel Core Ultra 7 258V ⎘ Intel Arc Graphics 140V ⎘ 32 GB Memory | Amazon: 1. $1,149.49 msi Prestige 13 AI Evo Lapto... 2. $31.99 CPU Cooling Fan Replacement ... 3. $1,349.00 HIDevolution [2024] MSI Pres... List Price: 1400 USD | 970 g | 16.9 mm | 13.30" 2880x1800 255 PPI OLED |
4. 86.2%  | Microsoft Surface Laptop 7 13.8 Copilot+ Qualcomm Snapdragon X Elite X1E-80-100 ⎘ Qualcomm SD X Adreno X1-85 3.8 TFLOPS ⎘ 16 GB Memory, 512 GB SSD | Amazon: List Price: 1649€ | 1.3 kg | 17.5 mm | 13.80" 2304x1536 201 PPI IPS |
5. 89.9%  | Lenovo ThinkPad X1 Carbon Gen 13 21NS0010GE Intel Core Ultra 7 258V ⎘ Intel Arc Graphics 140V ⎘ 32 GB Memory, 1024 GB SSD | Amazon: 1. $1,699.99 Lenovo Gen 13 ThinkPad X1 Ca... 2. $1,899.00 Lenovo ThinkPad X1 Carbon Ge... 3. $1,599.99 Lenovo ThinkPad X1 Carbon Ge... List Price: 2700 Euro | 982 g | 16 mm | 14.00" 2880x1800 243 PPI OLED |
Transparency
The selection of devices to be reviewed is made by our editorial team. The test sample was provided to the author as a loan by the manufacturer or retailer for the purpose of this review. The lender had no influence on this review, nor did the manufacturer receive a copy of this review before publication. There was no obligation to publish this review. As an independent media company, Notebookcheck is not subjected to the authority of manufacturers, retailers or publishers.
This is how Notebookcheck is testing
Every year, Notebookcheck independently reviews hundreds of laptops and smartphones using standardized procedures to ensure that all results are comparable. We have continuously developed our test methods for around 20 years and set industry standards in the process. In our test labs, high-quality measuring equipment is utilized by experienced technicians and editors. These tests involve a multi-stage validation process. Our complex rating system is based on hundreds of well-founded measurements and benchmarks, which maintains objectivity. Further information on our test methods can be found here.
