Razer Blade 17 2022 Core i7 RTX 3080 Ti笔记本电脑评测。超强的性能
每当英特尔或英伟达的新一代处理器问世时,你可以指望雷蛇用最新的CPU或GPU选项更新其刀片系列。2022年的Blade 17是2021年Blade 17的内部更新,采用第12代英特尔Alder Lake-H CPU和GeForce RTX 3070 Ti和3080 Ti GPU,取代过去的第11代Tiger Lake-H和RTX 3070和3080选项。正如我们在 的概述中详细说明的。新的第12代CPU引入了高性能的P-cores和高效的E-cores,而移动GeForce Ti系列旨在从基本相同的Nvidia Ampere芯片组中榨取更多性能。
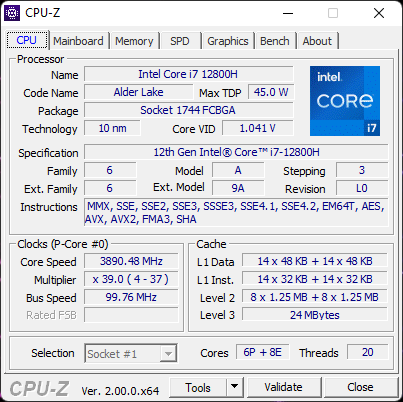
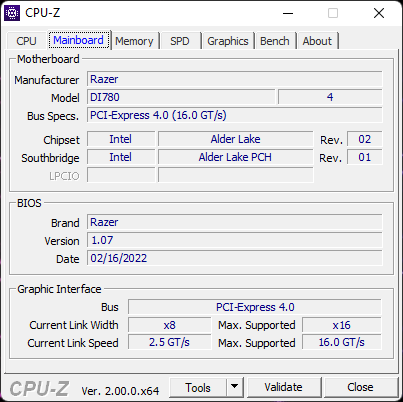
我们审查的Blade 17单元是一个高端配置,配备了Core i7-12800H、RTX 3080 Ti GPU和240 Hz QHD面板,价格约为4000美元。其他SKU可使用RTX 3060或RTX 3070 Ti GPU,FHD或UHD显示器,或Core i9-12900H CPU的不同起点。与第10代英特尔Blade 17的100瓦GPU或第11代Blade 17的130瓦GPU不同,第12代Blade 17的GPU的目标是165瓦的更高TGP,以获得潜在的更多性能。
刀锋17的替代品包括其他旗舰型超薄游戏笔记本电脑,如 微星GS76或GS77。 华硕Zephyrus S17, Aorus 17G, 艾利安华x17, 或 鹰眼Vector Pro.
更多Razer评论。
潜在的竞争对手比较
Rating | Date | Model | Weight | Height | Size | Resolution | Price |
|---|---|---|---|---|---|---|---|
| 91.2 % v7 (old) | 03 / 2022 | Razer Blade 17 RTX 3080 Ti i7-12800H, GeForce RTX 3080 Ti Laptop GPU | 2.7 kg | 19.9 mm | 17.30" | 2560x1440 | |
| 87.8 % v7 (old) | 09 / 2021 | Razer Blade Pro 17 2021 (QHD Touch) i7-10875H, GeForce RTX 3080 Laptop GPU | 3 kg | 19.9 mm | 17.30" | 3840x2160 | |
| 86.2 % v7 (old) | 09 / 2021 | MSI GS76 Stealth 11UH i9-11900H, GeForce RTX 3080 Laptop GPU | 2.4 kg | 20 mm | 17.30" | 3840x2160 | |
| 90.1 % v7 (old) | 08 / 2021 | Asus ROG Zephyrus S17 GX703HSD i9-11900H, GeForce RTX 3080 Laptop GPU | 2.8 kg | 19.9 mm | 17.30" | 2560x1440 | |
| 86 % v7 (old) | 06 / 2021 | Aorus 17G YD i7-11800H, GeForce RTX 3080 Laptop GPU | 2.8 kg | 26 mm | 17.30" | 1920x1080 | |
| 89 % v7 (old) | 09 / 2021 | Alienware x17 RTX 3080 P48E i7-11800H, GeForce RTX 3080 Laptop GPU | 3.2 kg | 21.4 mm | 17.30" | 3840x2160 |
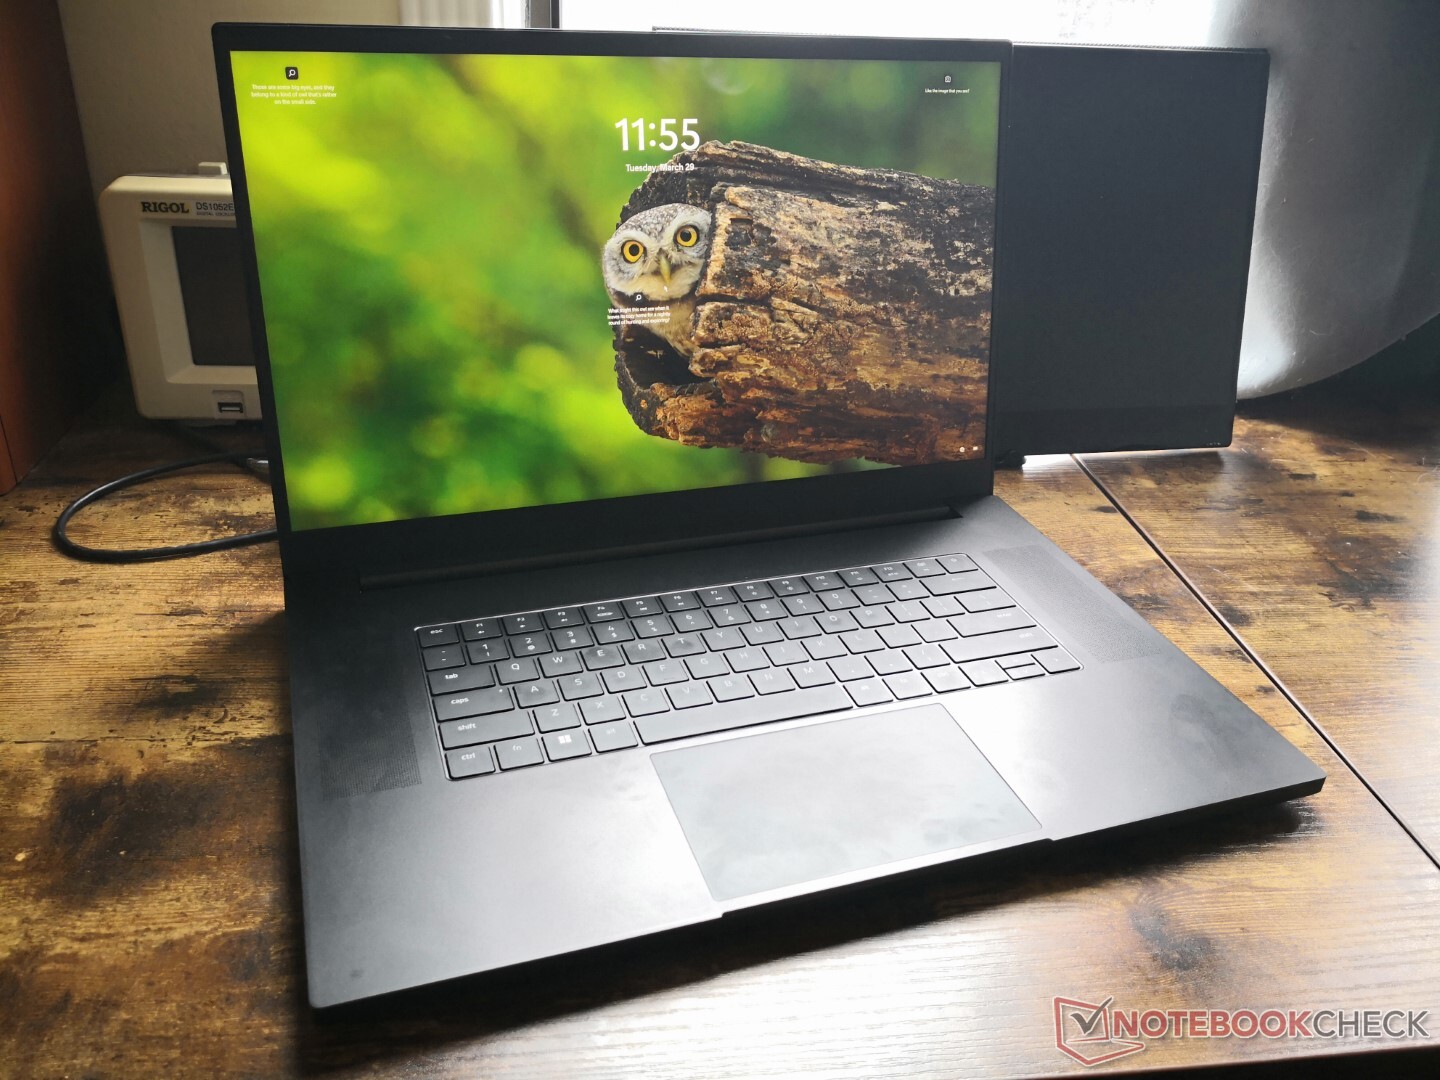
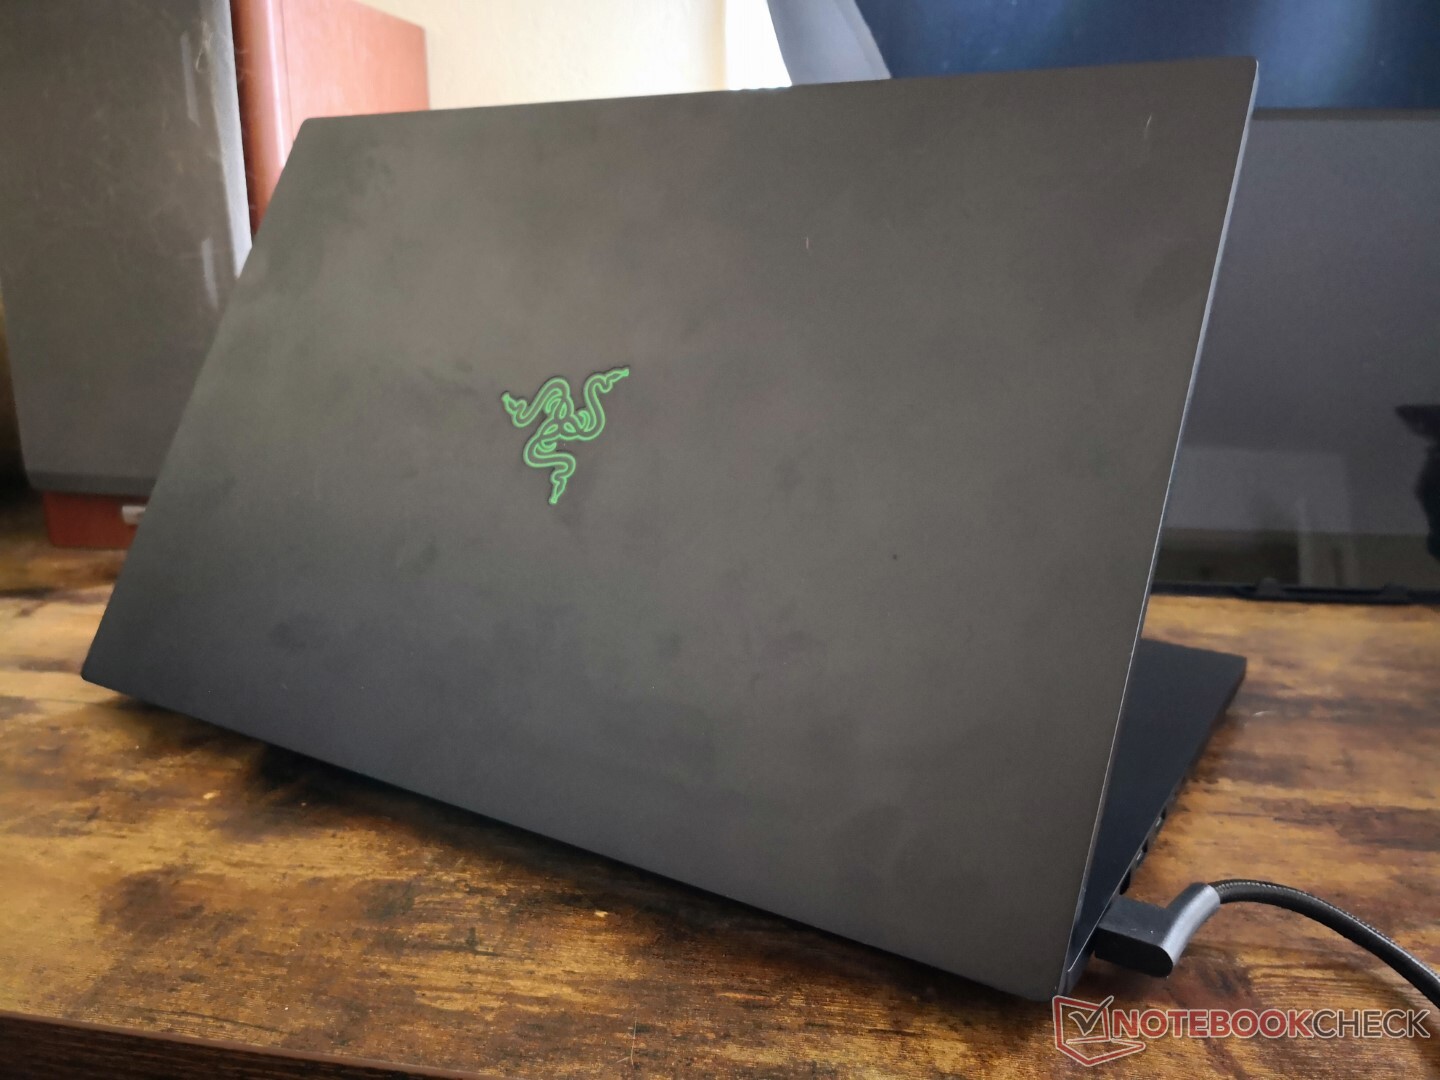
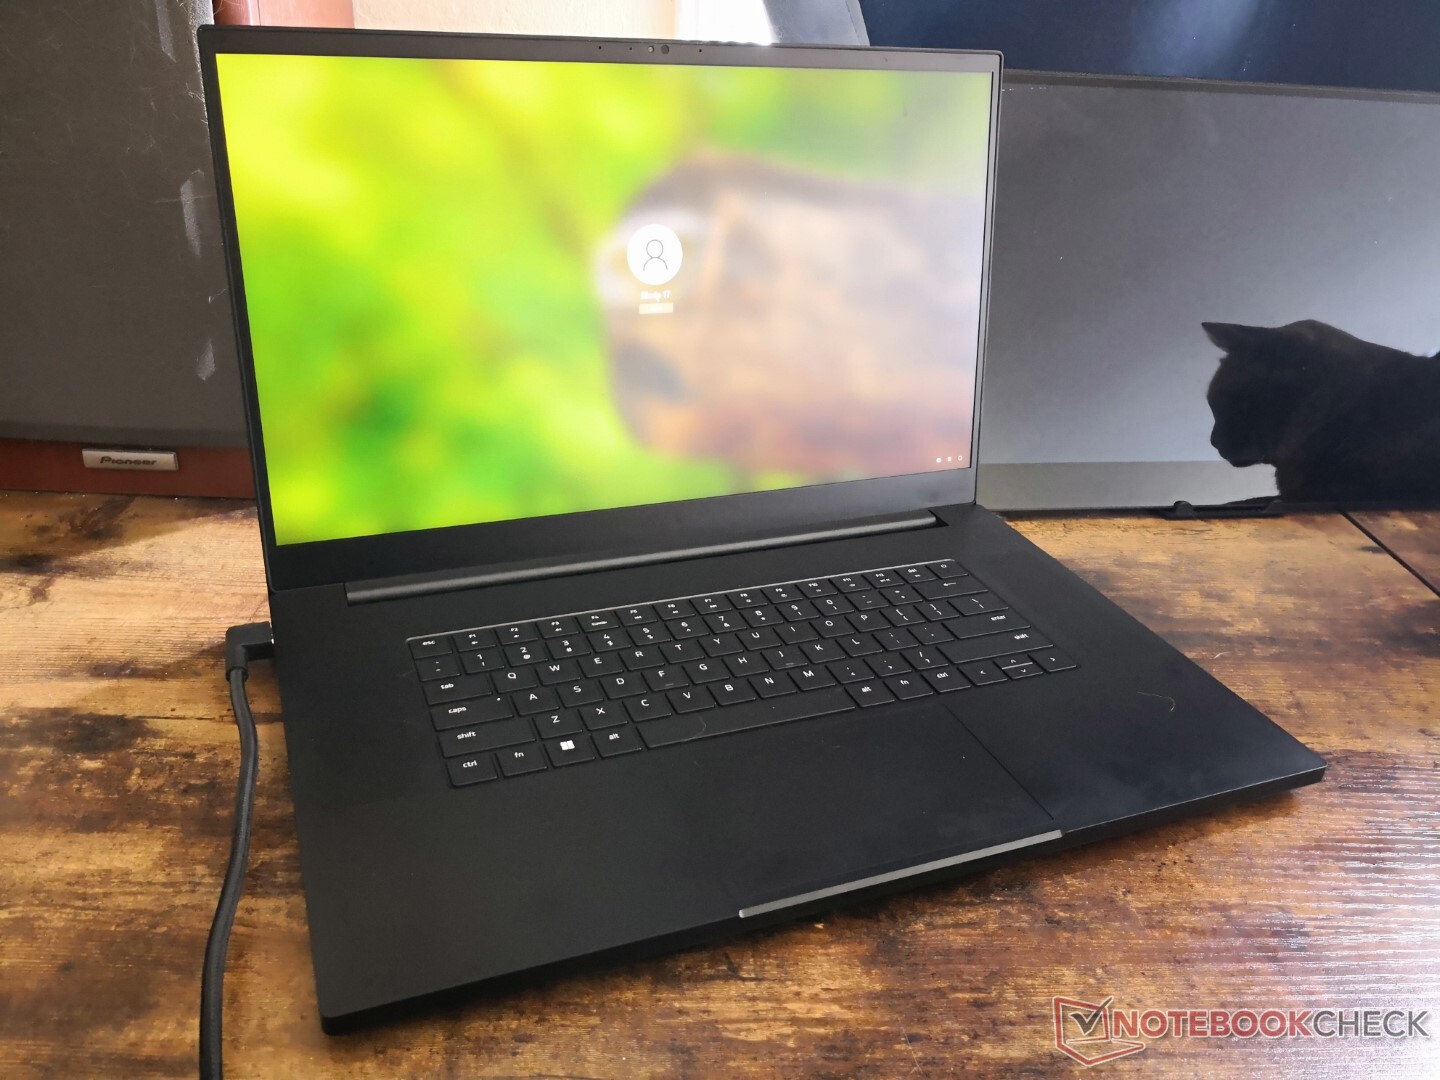
案例 - 相同,但不同
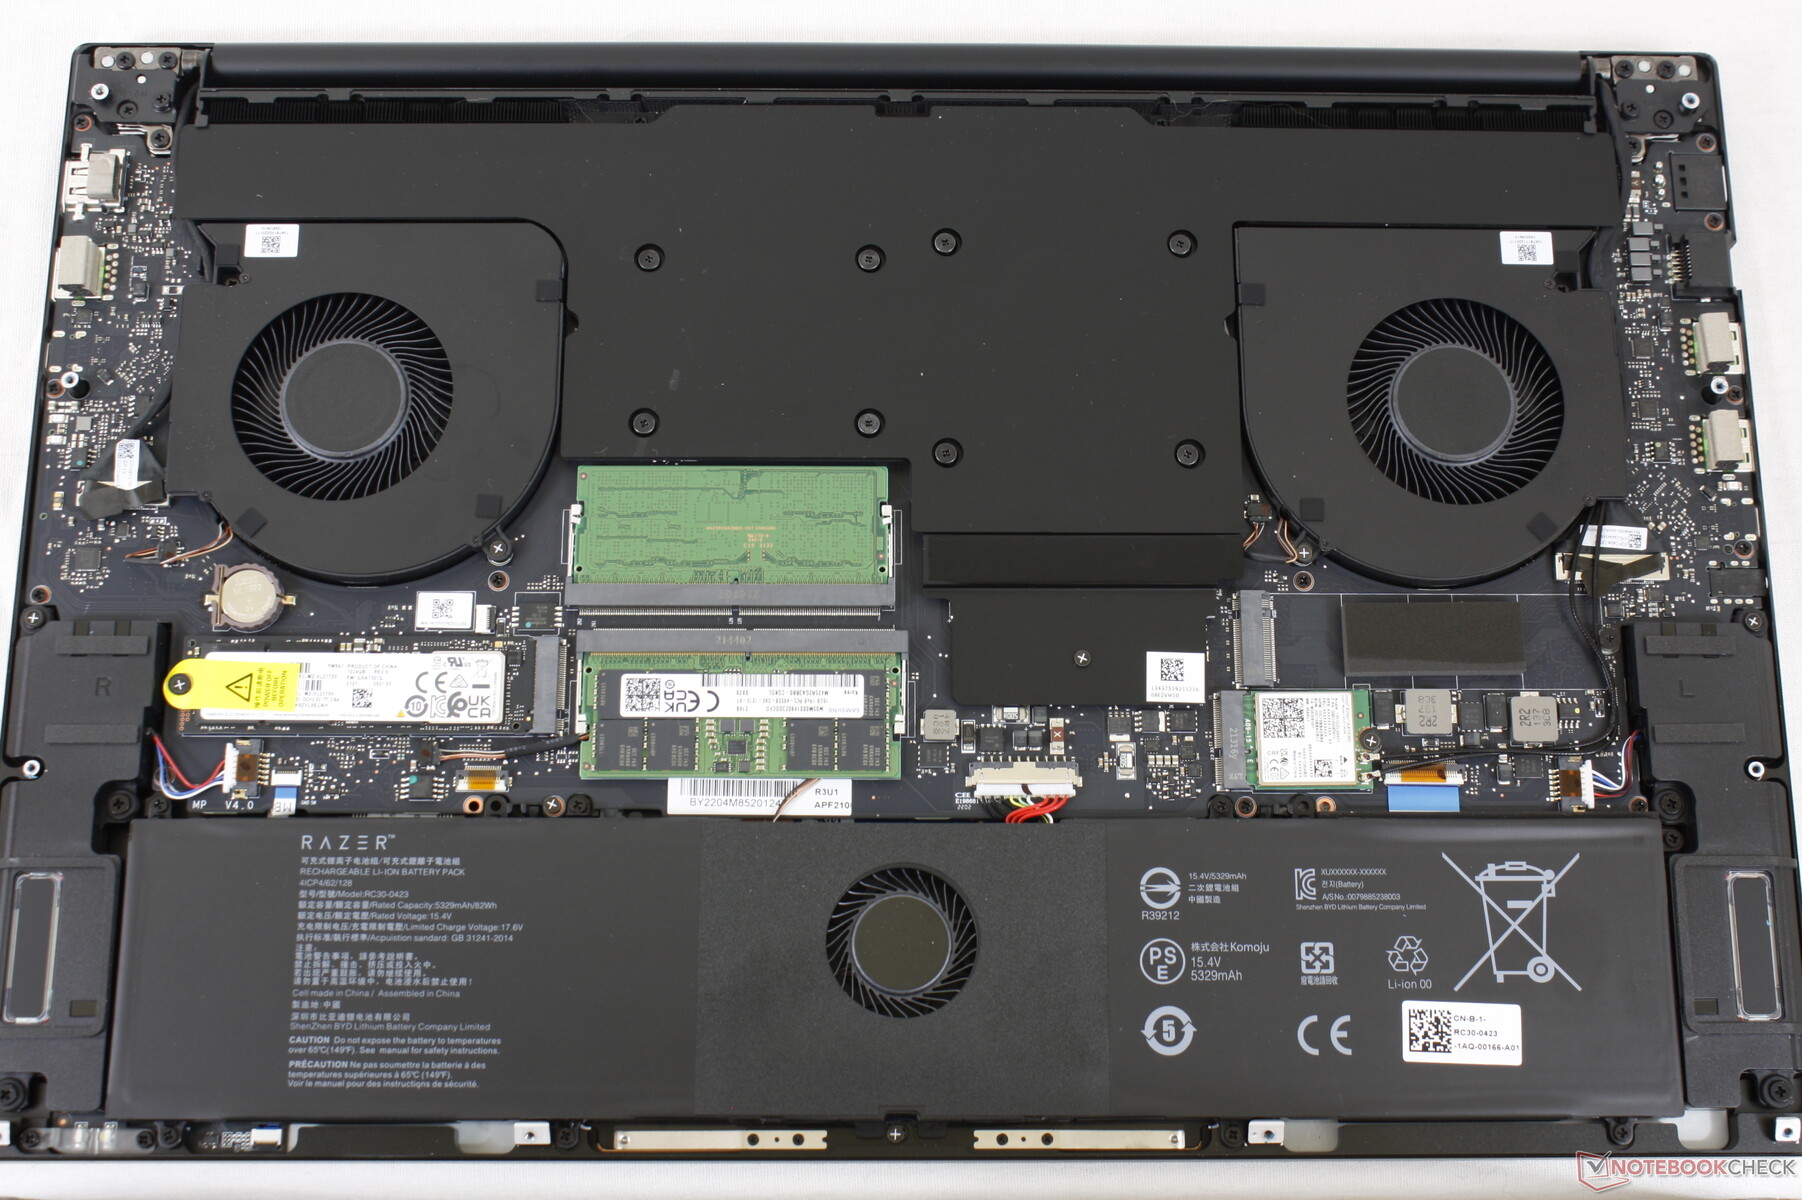
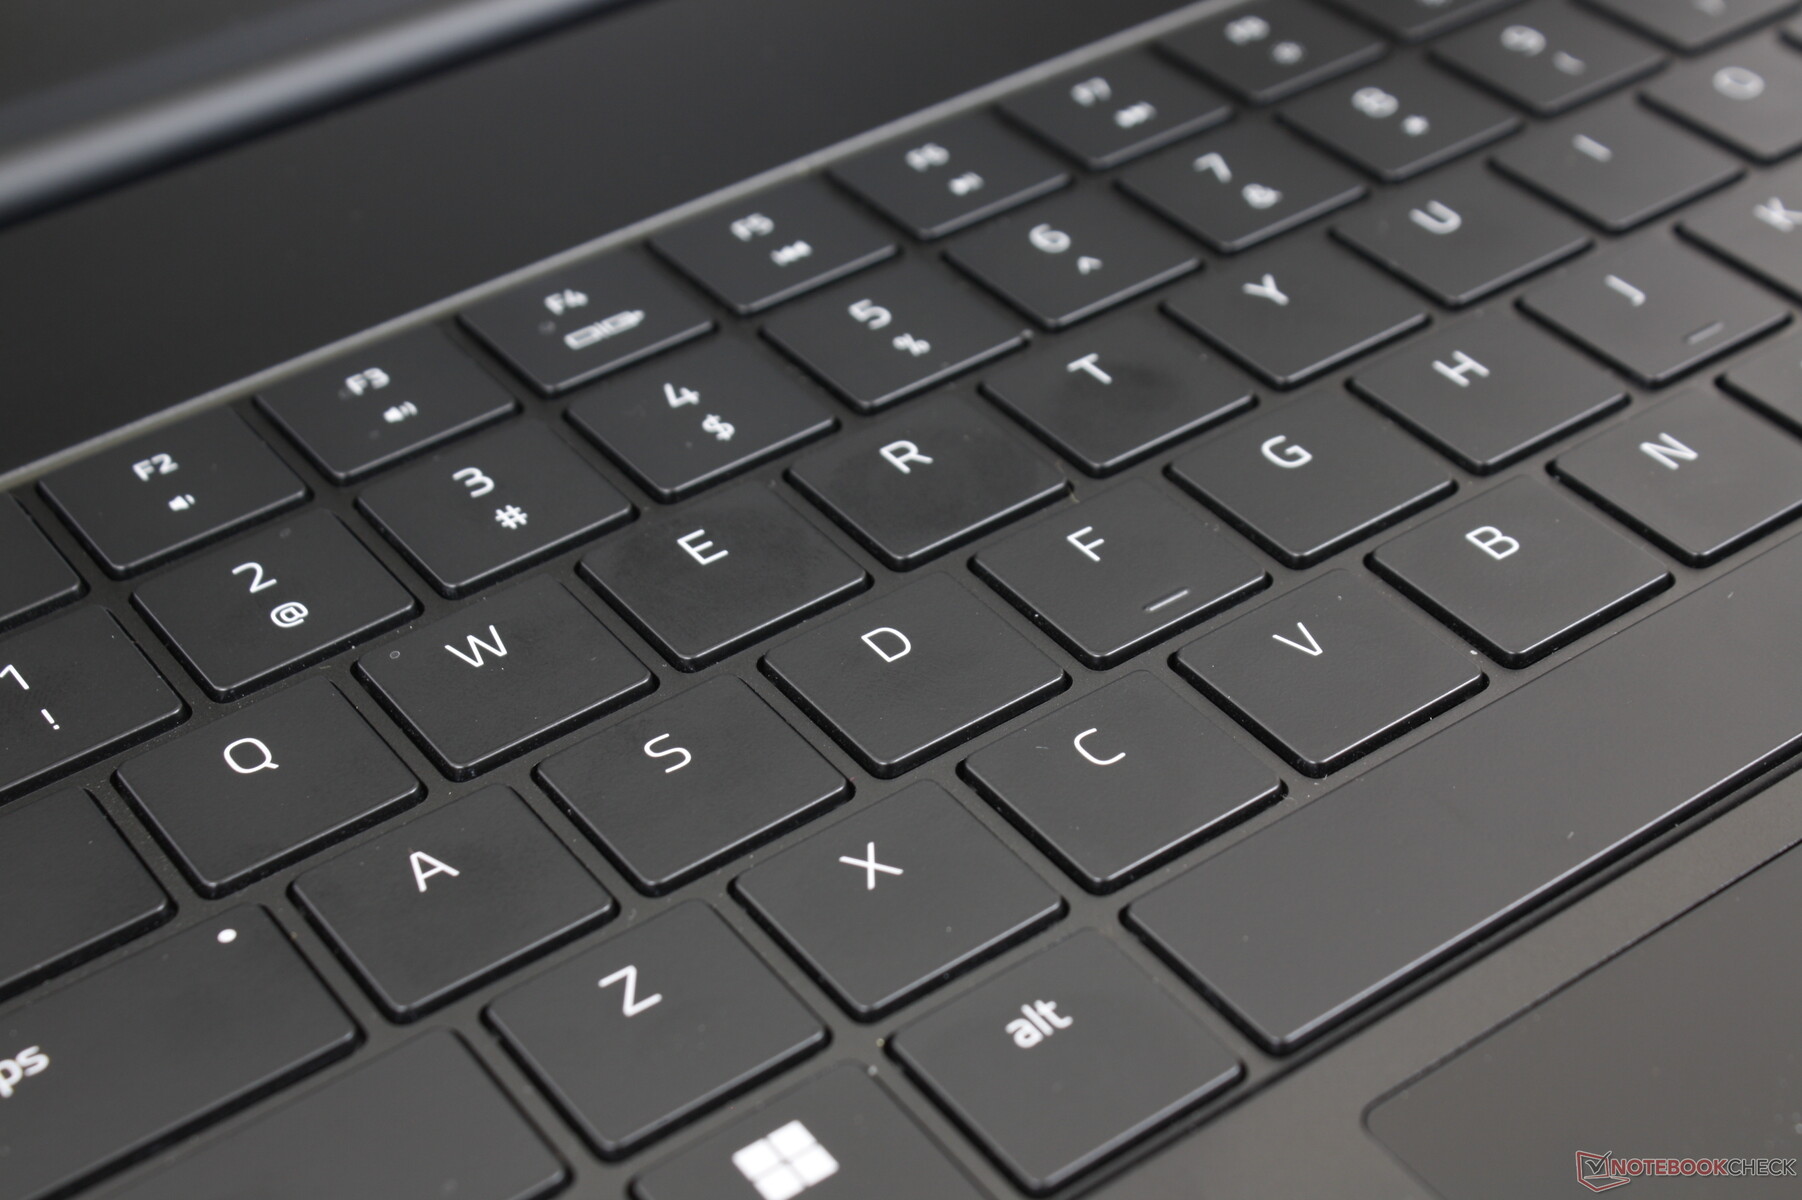
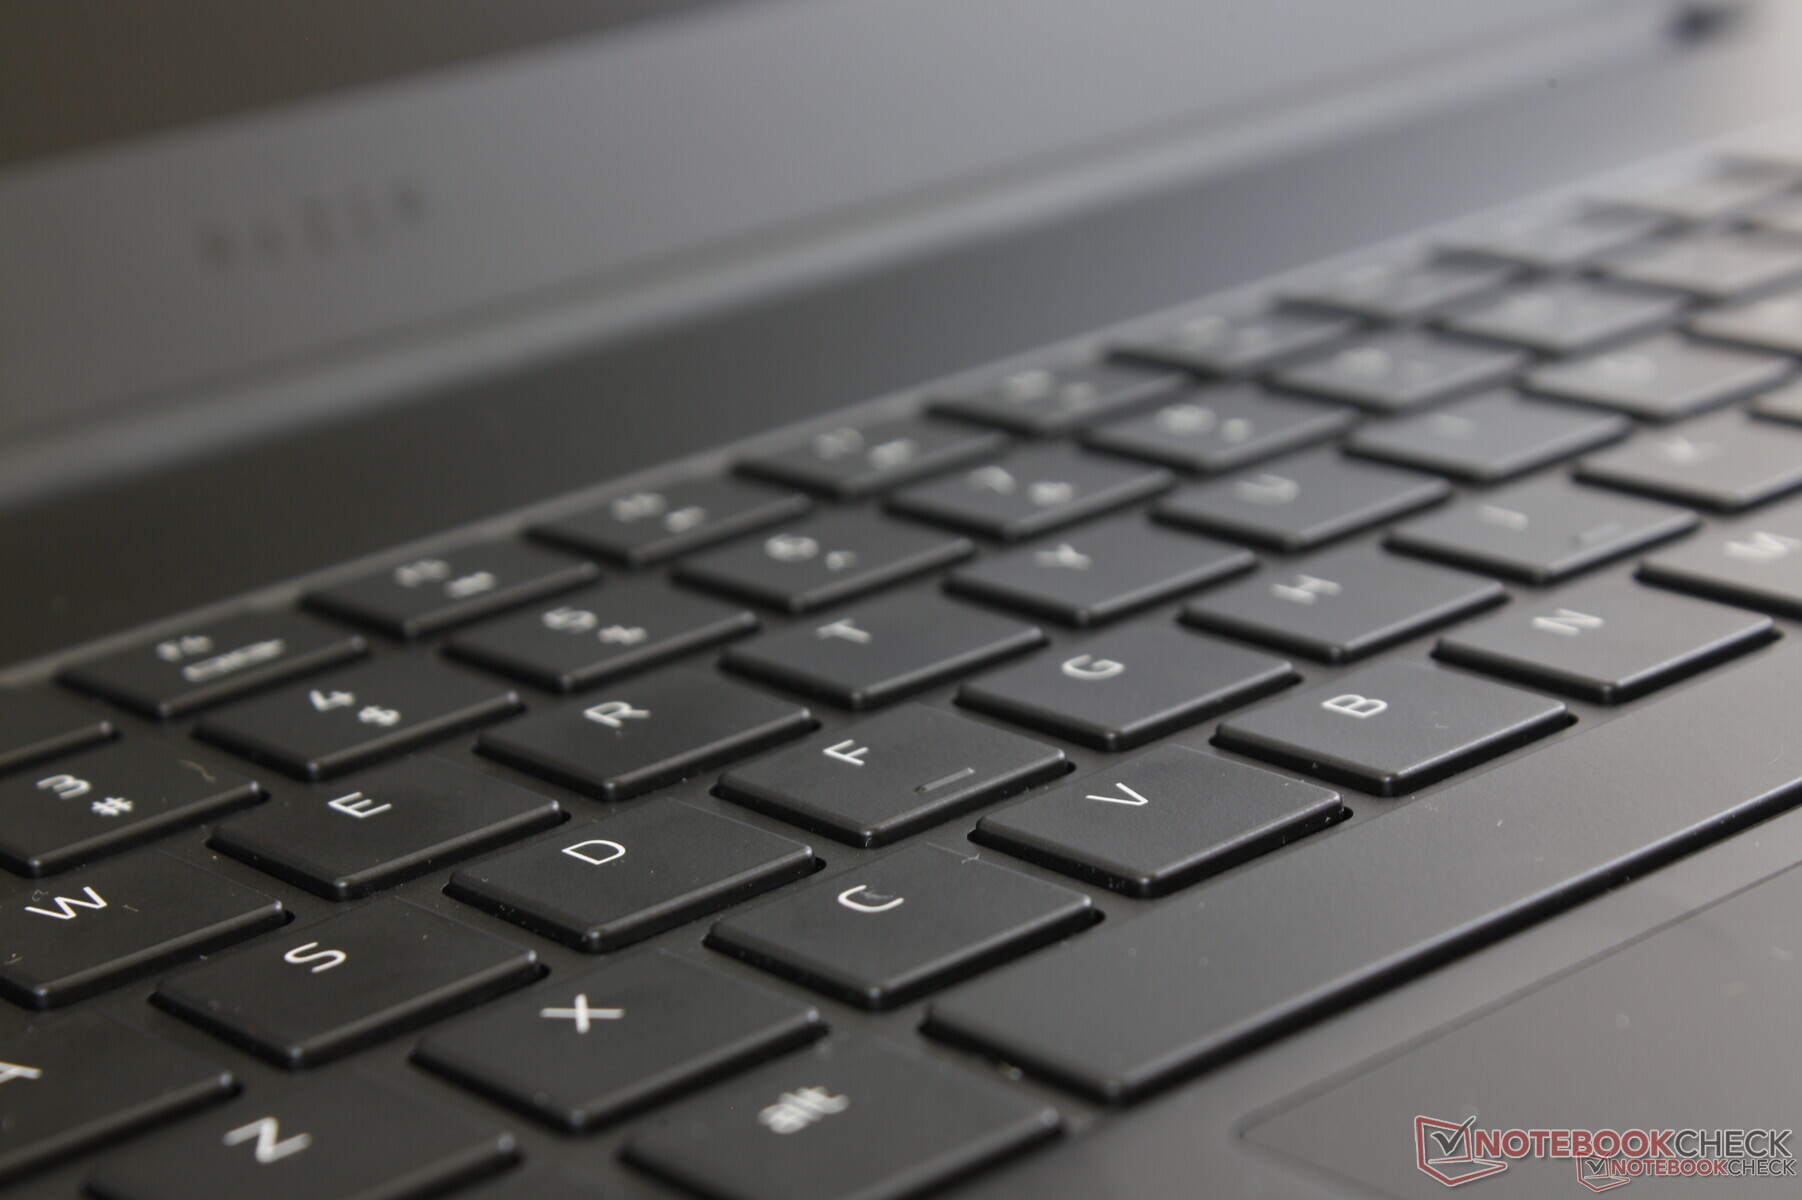
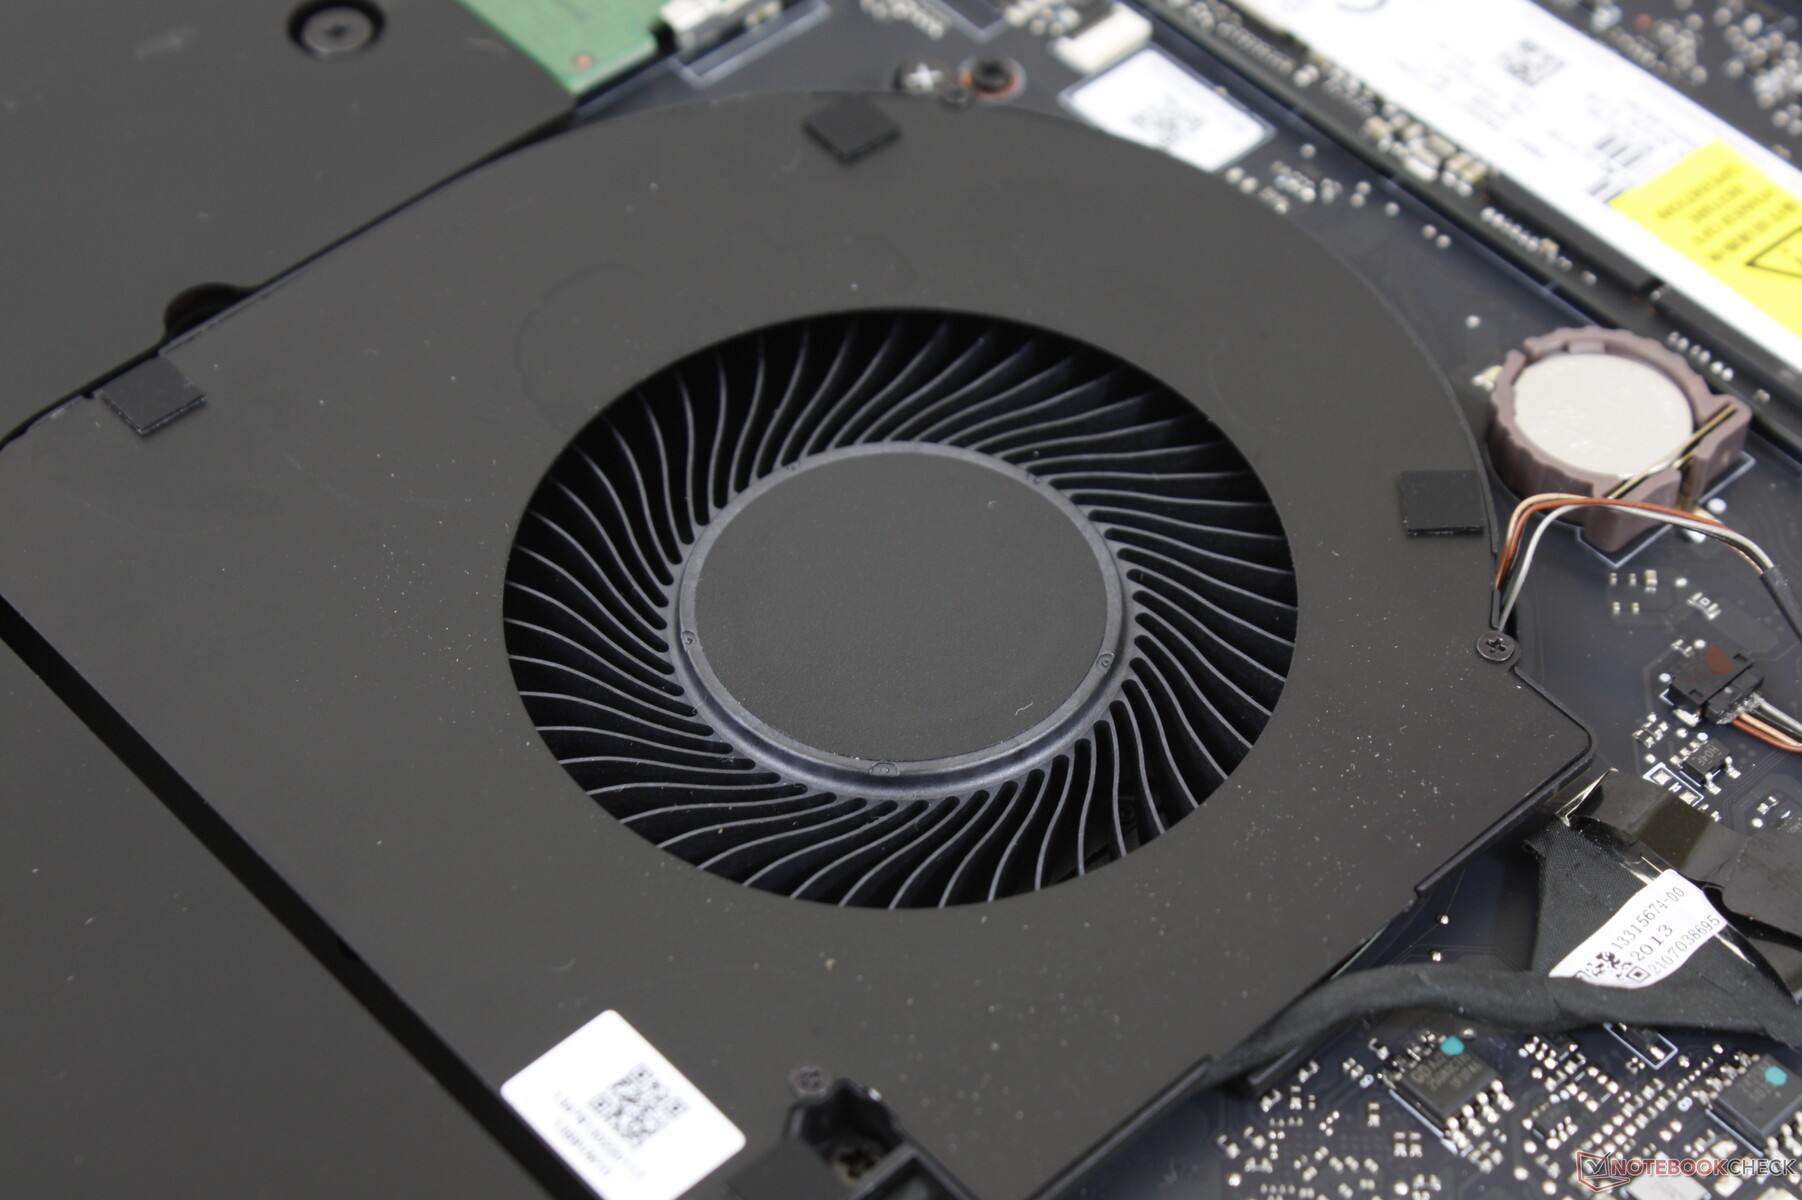
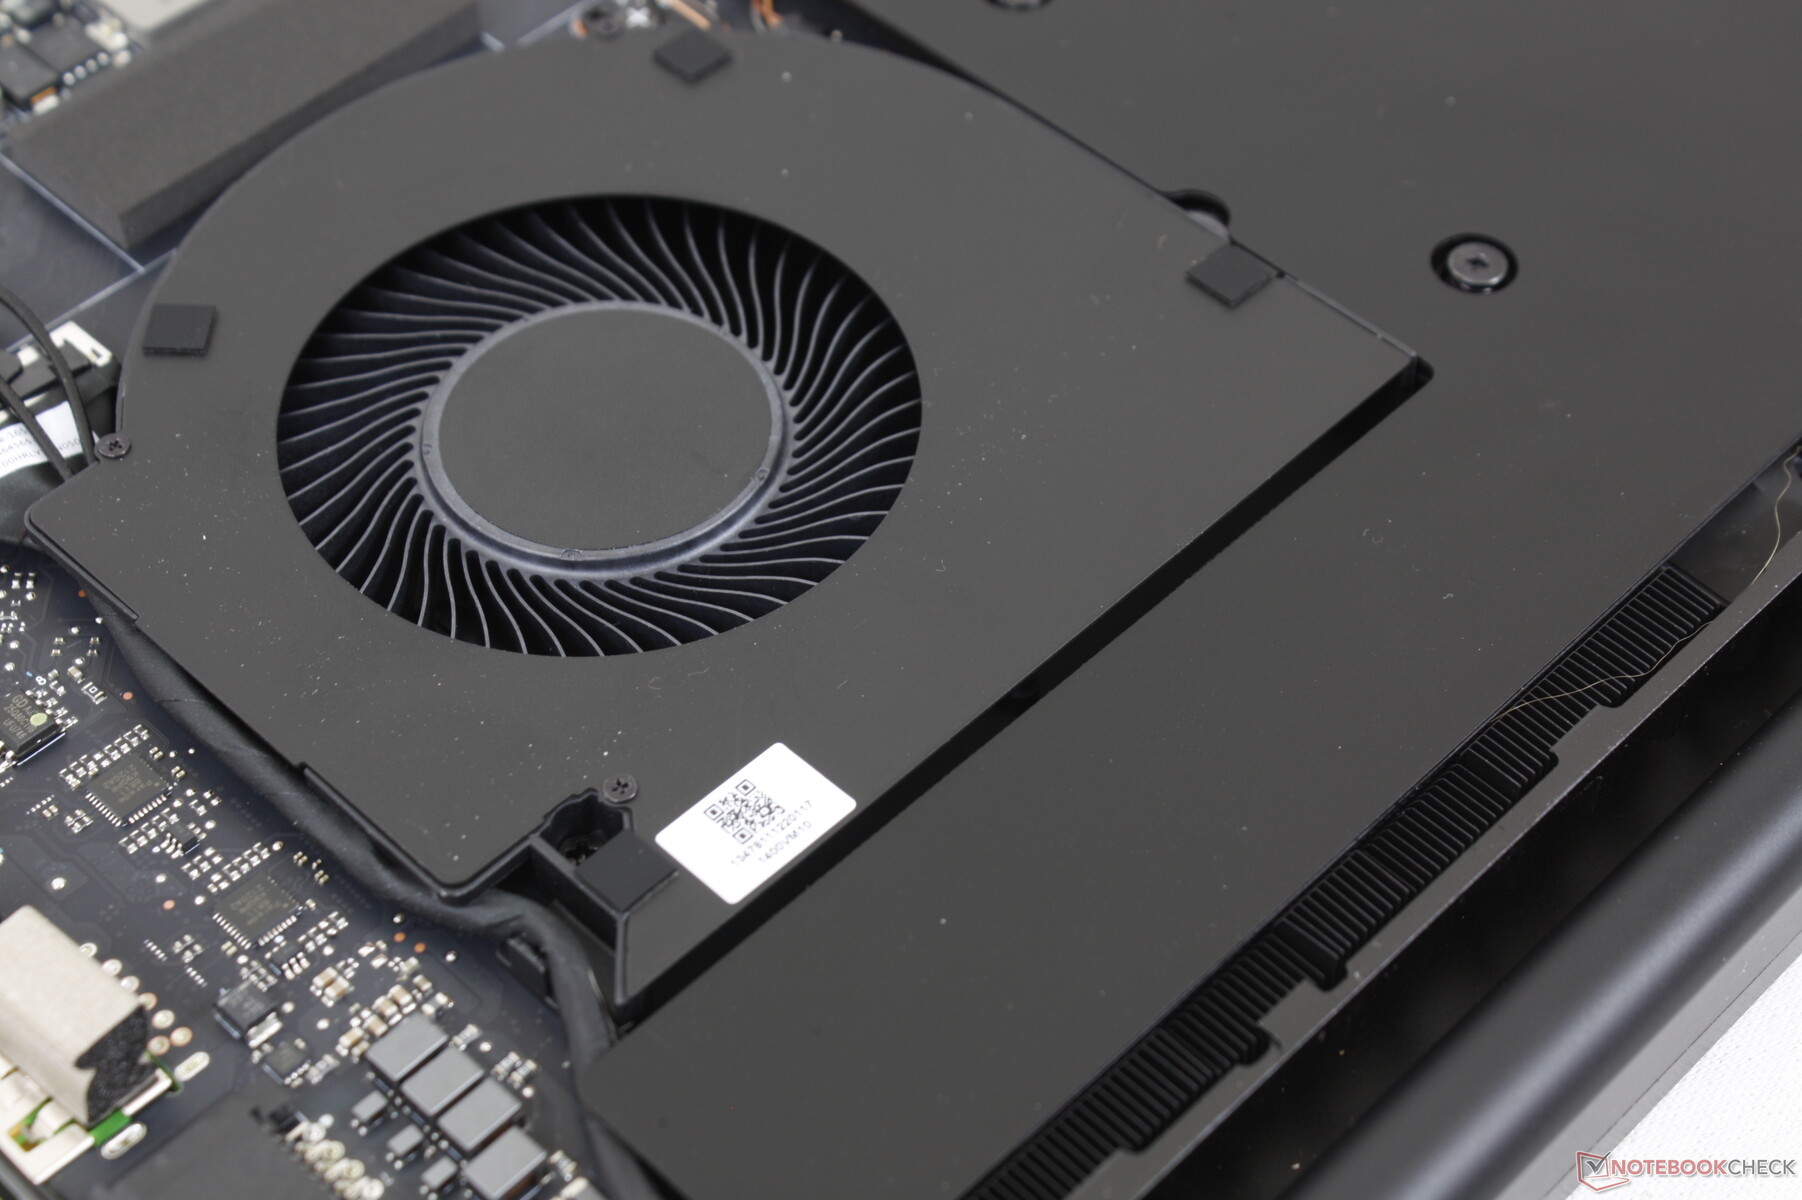
外部机箱与去年的型号相同,但有两个关键的视觉差异。首先,键盘的键帽现在比旧型号的大。其次,你现在只能通过设备底部的格栅看到三个风扇,而不是四个,因为雷蛇已经移除其中一个风扇。这些小变化对电池和整体温度有影响,我们的审查将显示。
连接性 - 现在有两个Thunderbolt 4端口
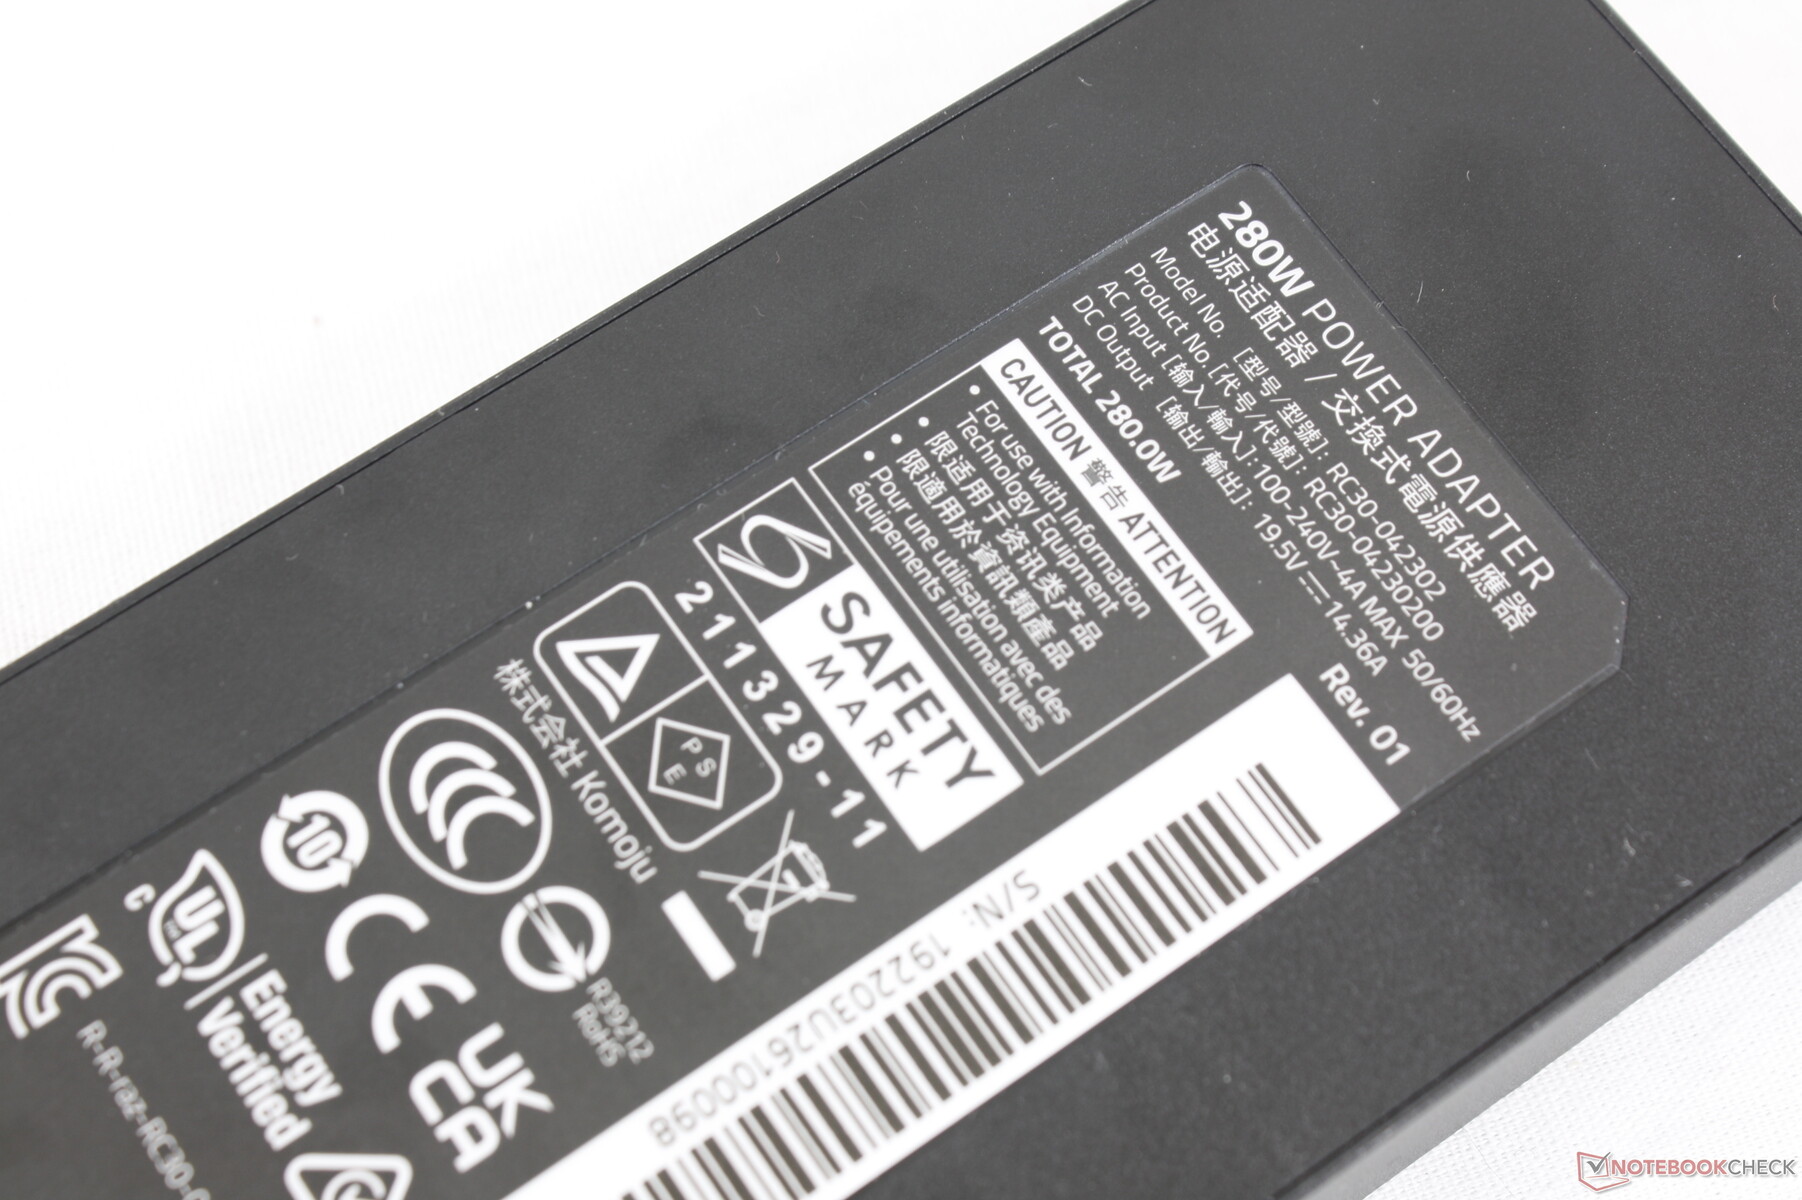
端口选项与第10代英特尔模型保持一致,除了一个关键区别:两个USB-C端口现在都支持Thunderbolt,而不是只有一个。新机型也兼容去年的交流适配器,但性能可能会受到影响,因为较新的2022年机型采用了容量更大的280瓦适配器。
SD卡阅读器
| SD Card Reader | |
| average JPG Copy Test (av. of 3 runs) | |
| Razer Blade Pro 17 2021 (QHD Touch) (Toshiba Exceria Pro SDXC 64 GB UHS-II) | |
| MSI GS76 Stealth 11UH (AV PRO microSD 128 GB V60) | |
| Aorus 17G YD (AV PRO microSD 128 GB V60) | |
| Asus ROG Zephyrus S17 GX703HSD | |
| Alienware x17 RTX 3080 P48E (AV Pro V60) | |
| Razer Blade 17 RTX 3080 Ti (AV Pro V60) | |
| maximum AS SSD Seq Read Test (1GB) | |
| Asus ROG Zephyrus S17 GX703HSD | |
| Alienware x17 RTX 3080 P48E (AV Pro V60) | |
| MSI GS76 Stealth 11UH (AV PRO microSD 128 GB V60) | |
| Aorus 17G YD (AV PRO microSD 128 GB V60) | |
| Razer Blade Pro 17 2021 (QHD Touch) (Toshiba Exceria Pro SDXC 64 GB UHS-II) | |
| Razer Blade 17 RTX 3080 Ti (AV Pro V60) | |
沟通
网络摄像头
网络摄像头是1080p或200万像素,与大多数其他笔记本电脑上的720p或100万像素网络摄像头不同,它的图像更清晰。也支持Windows Hello,但仍然没有隐私快门。


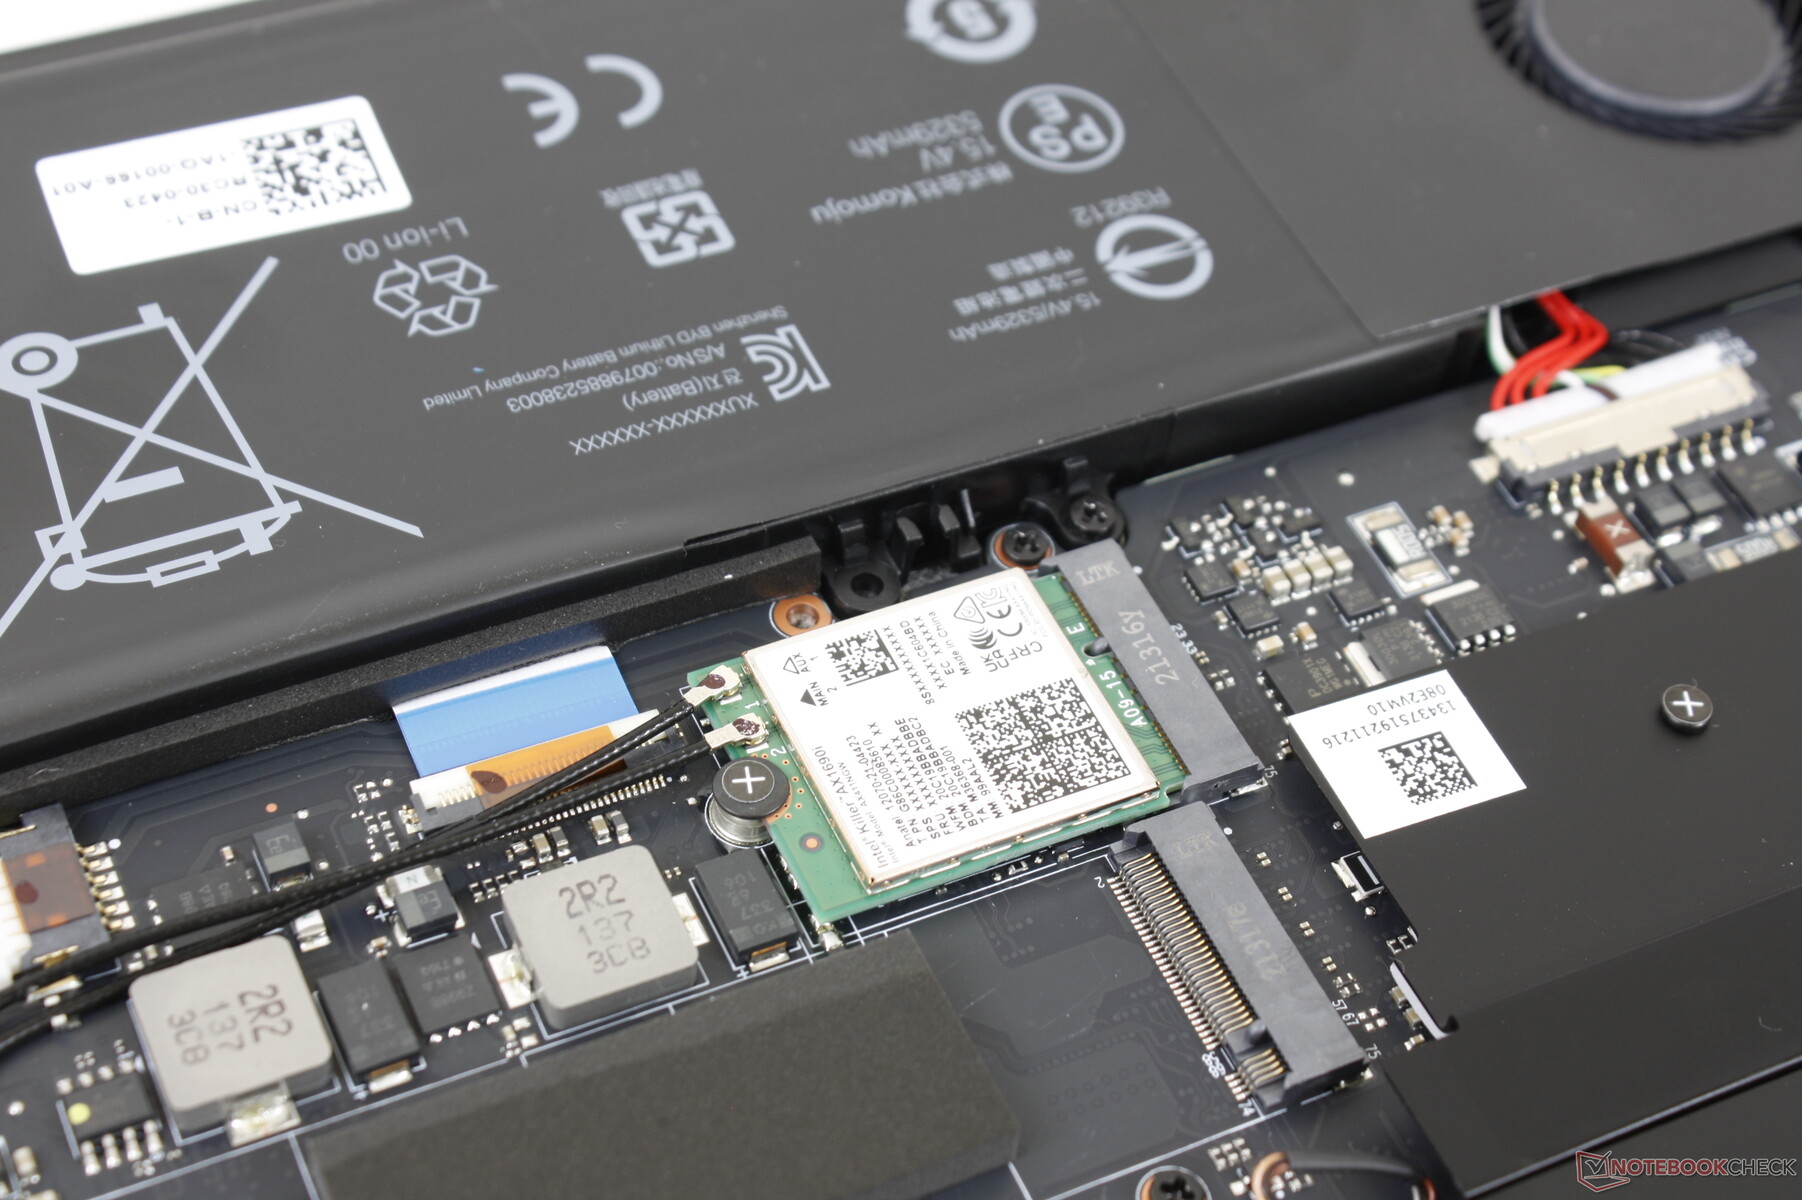
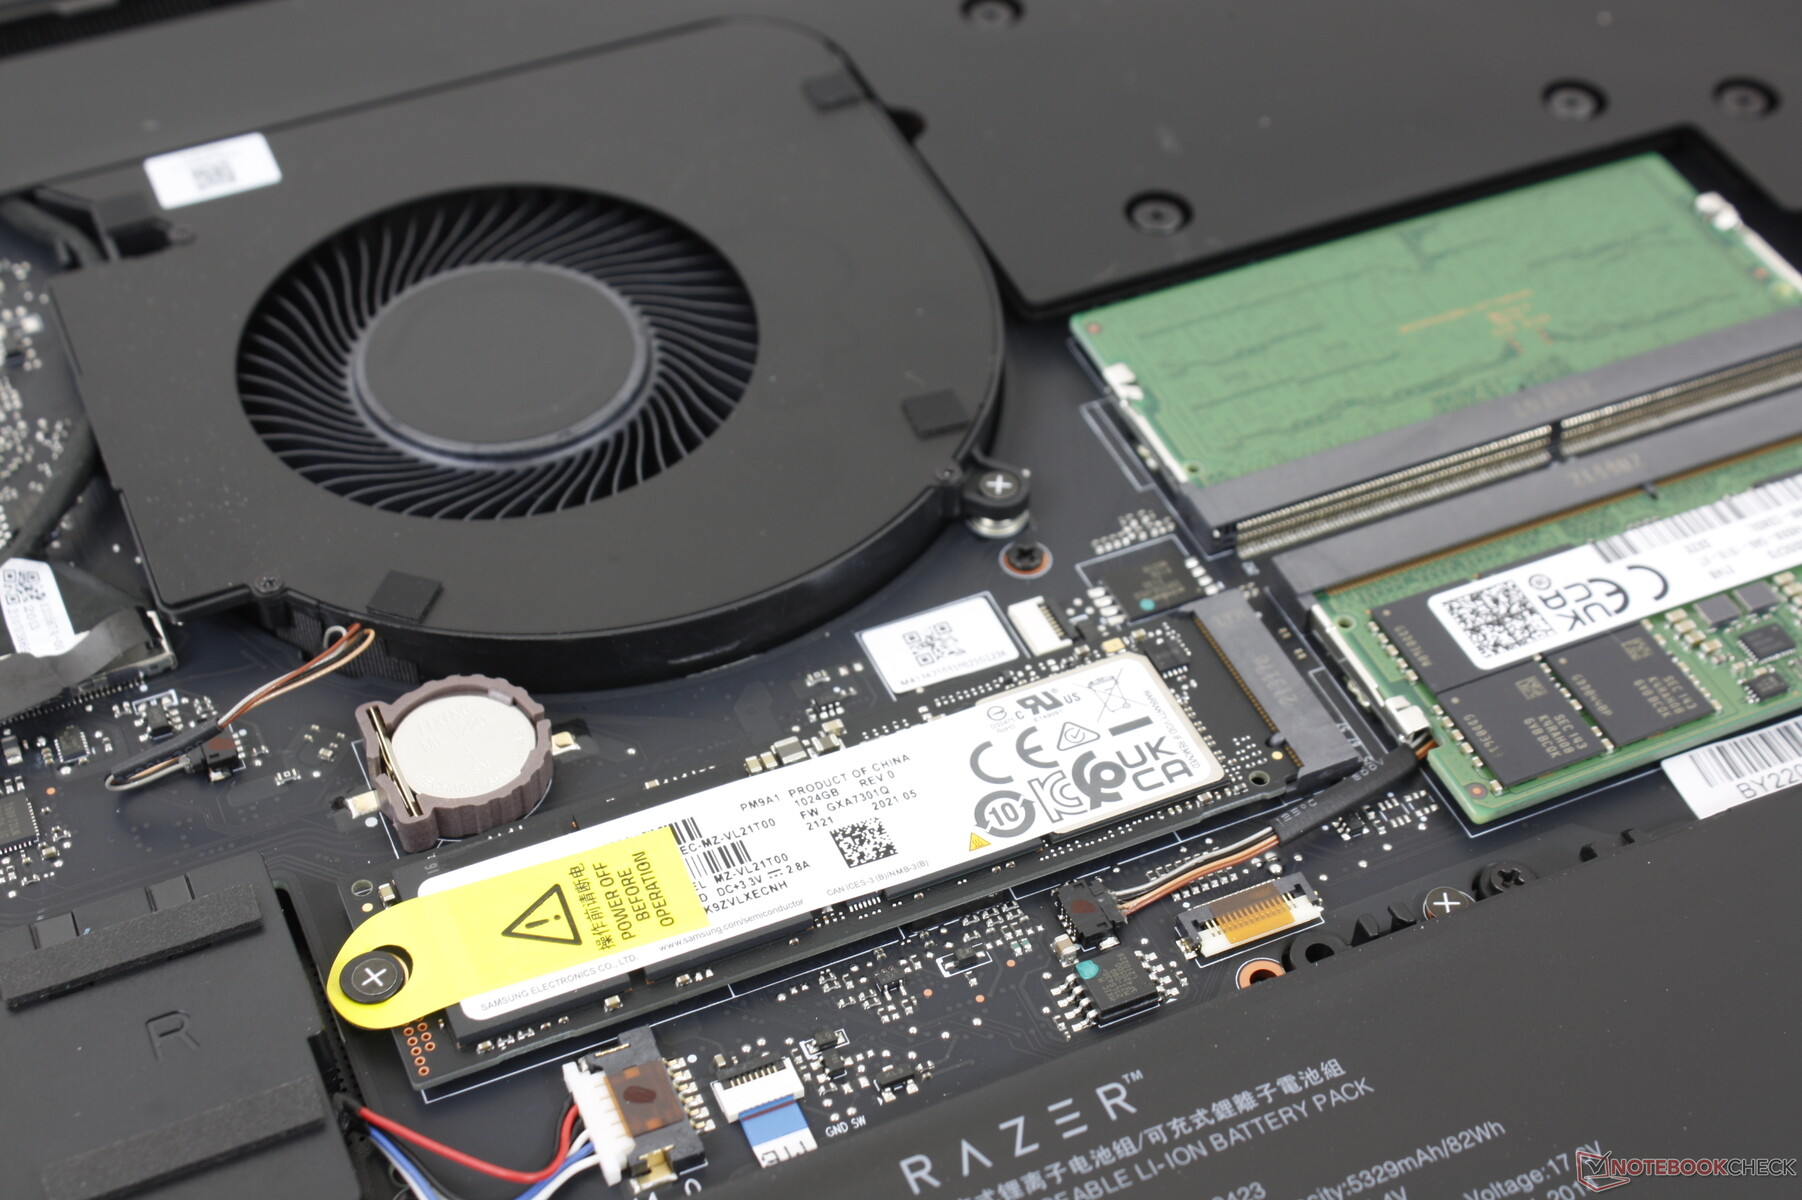
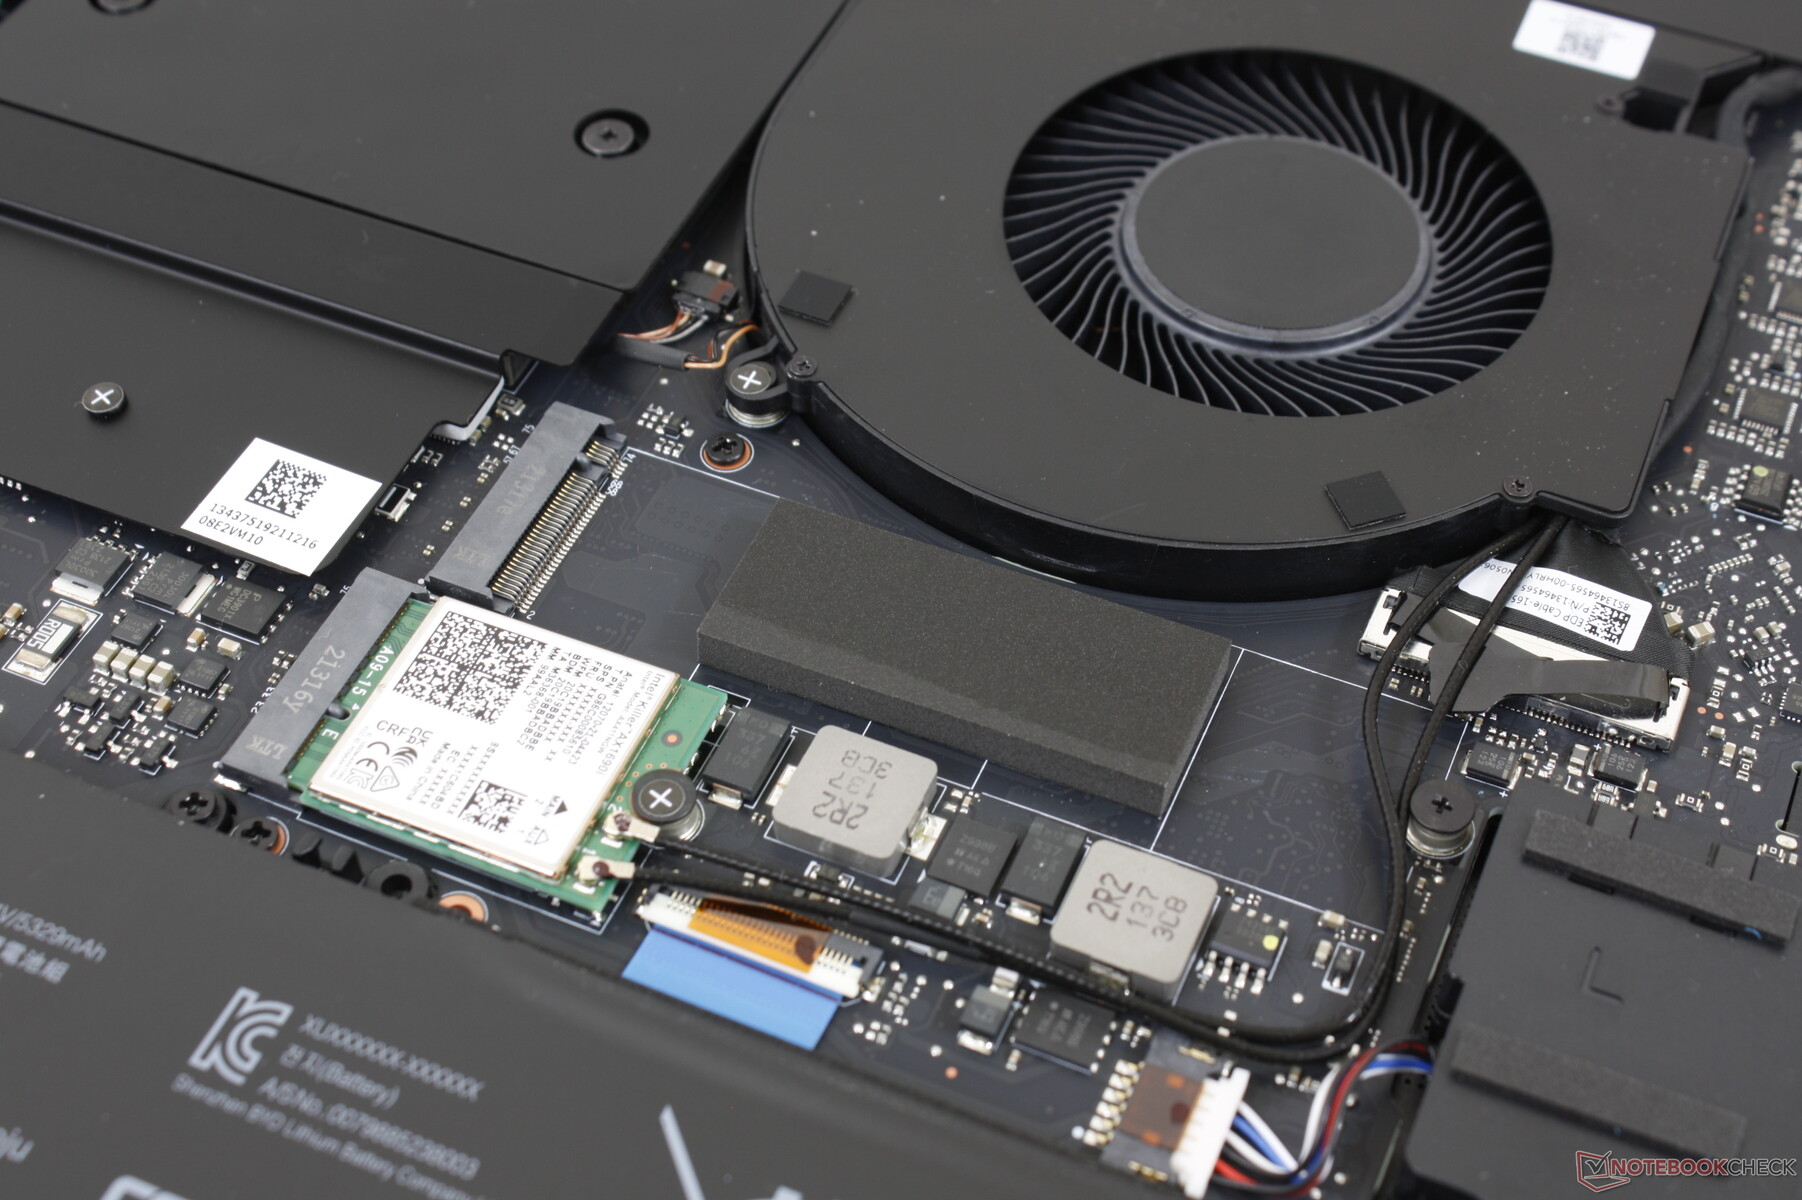
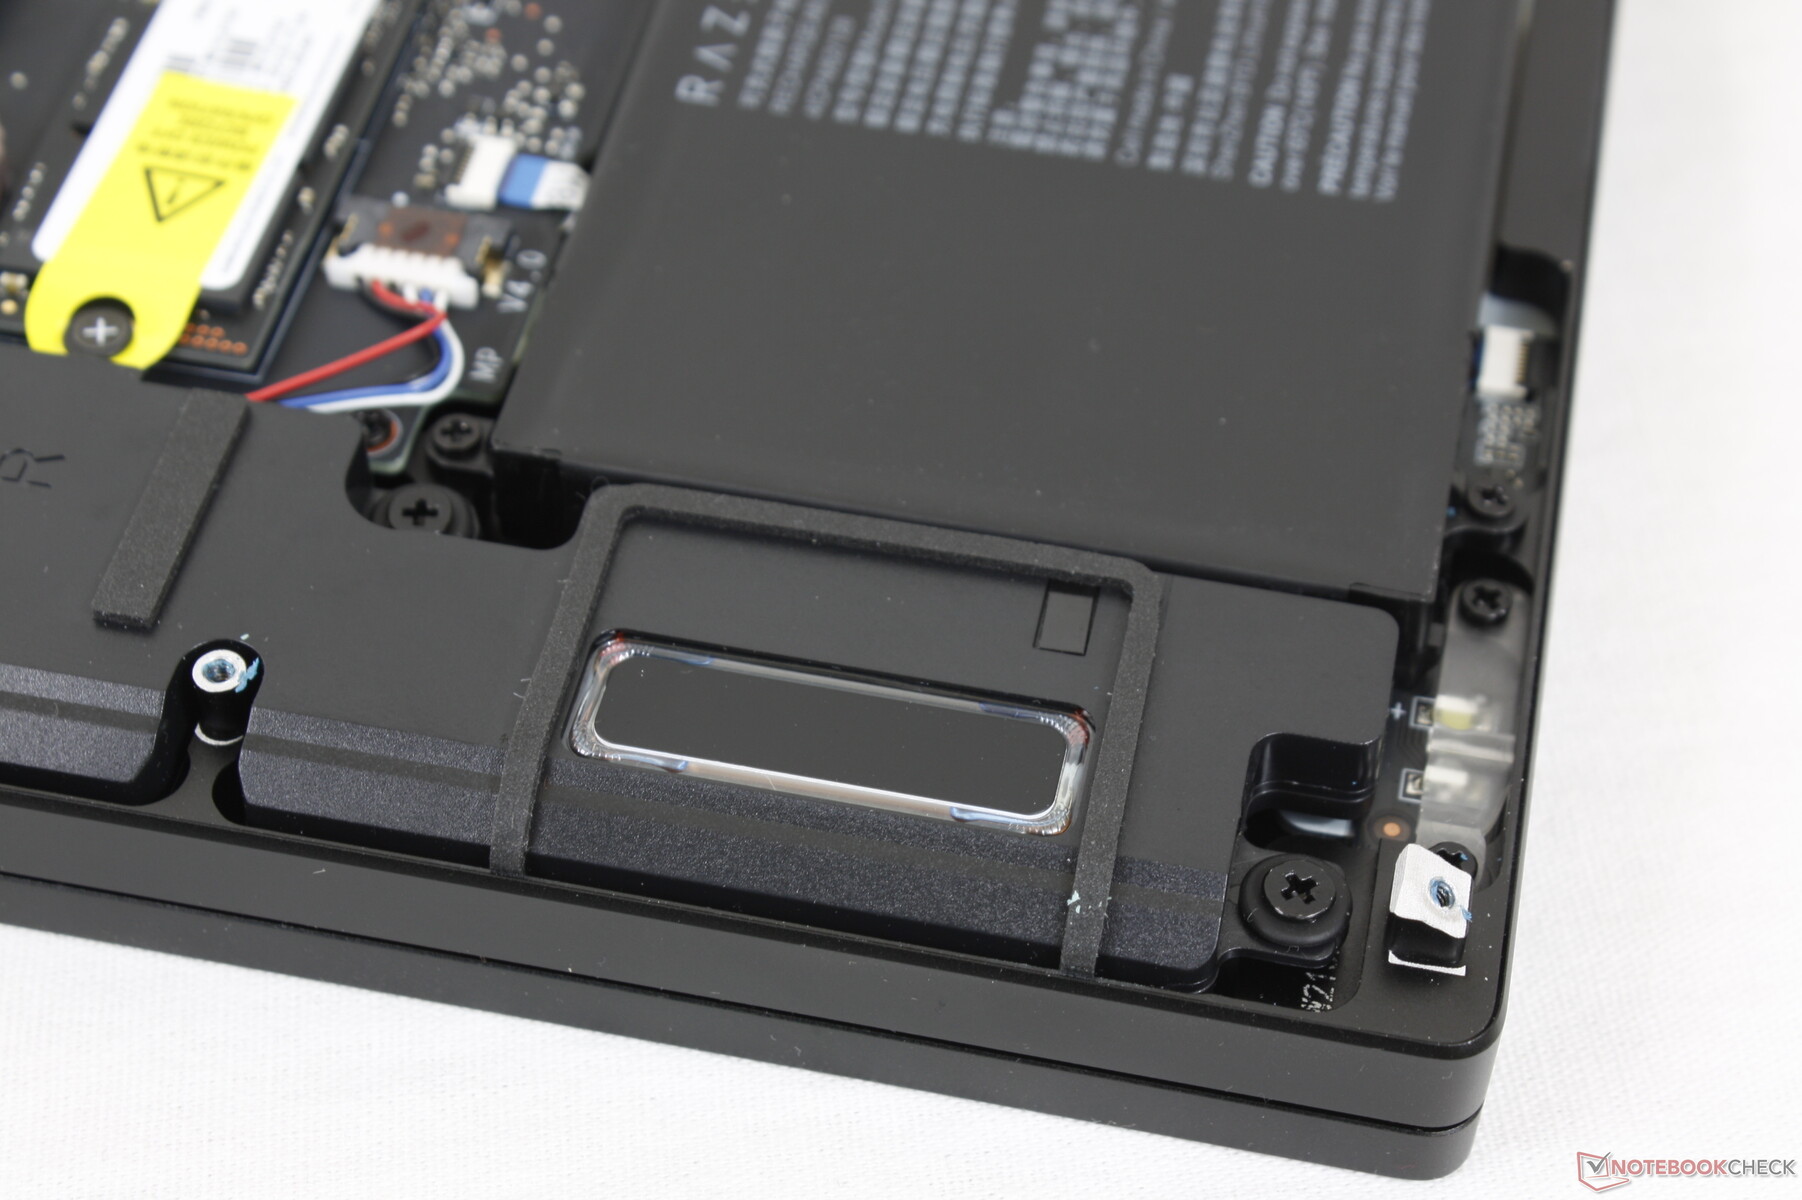
维护
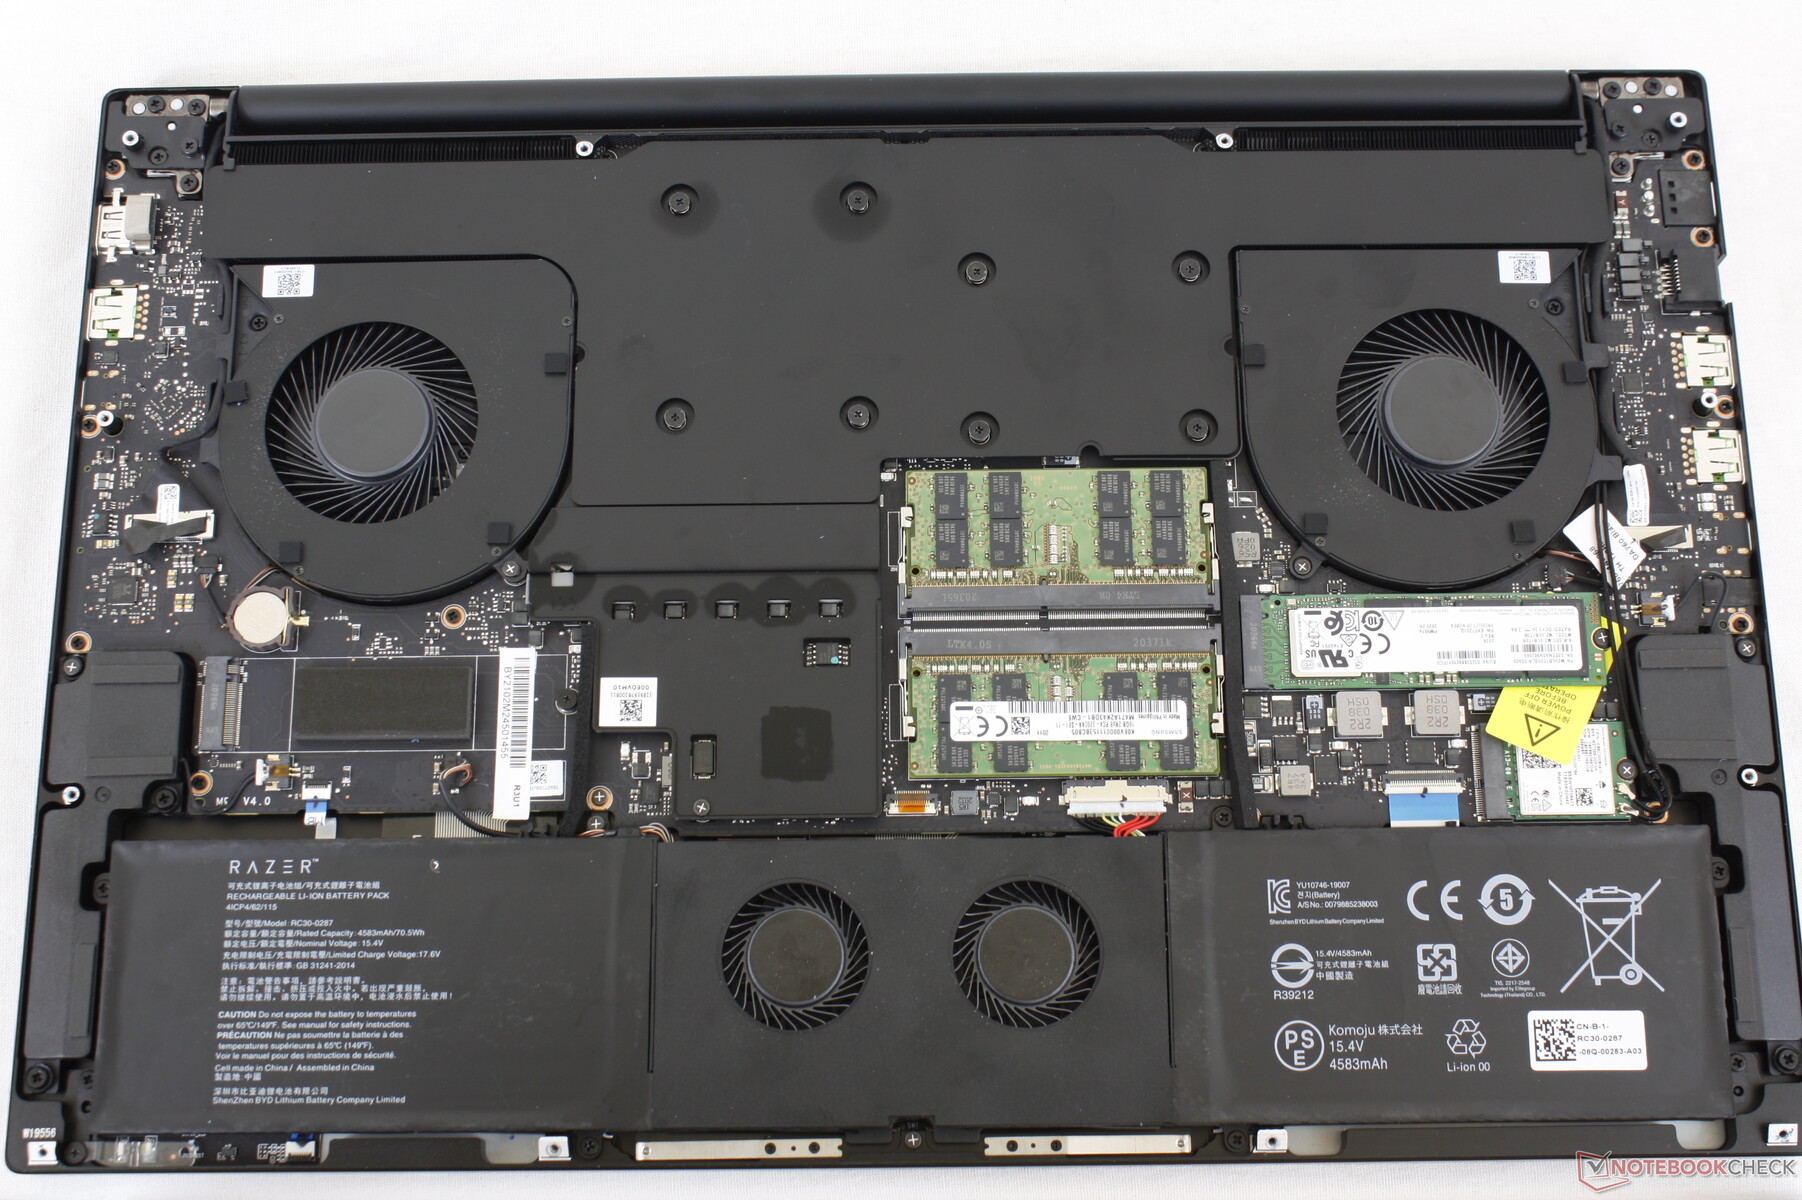
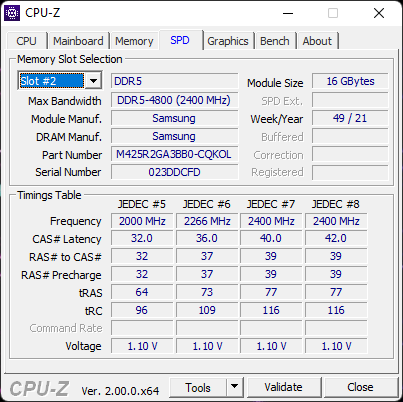
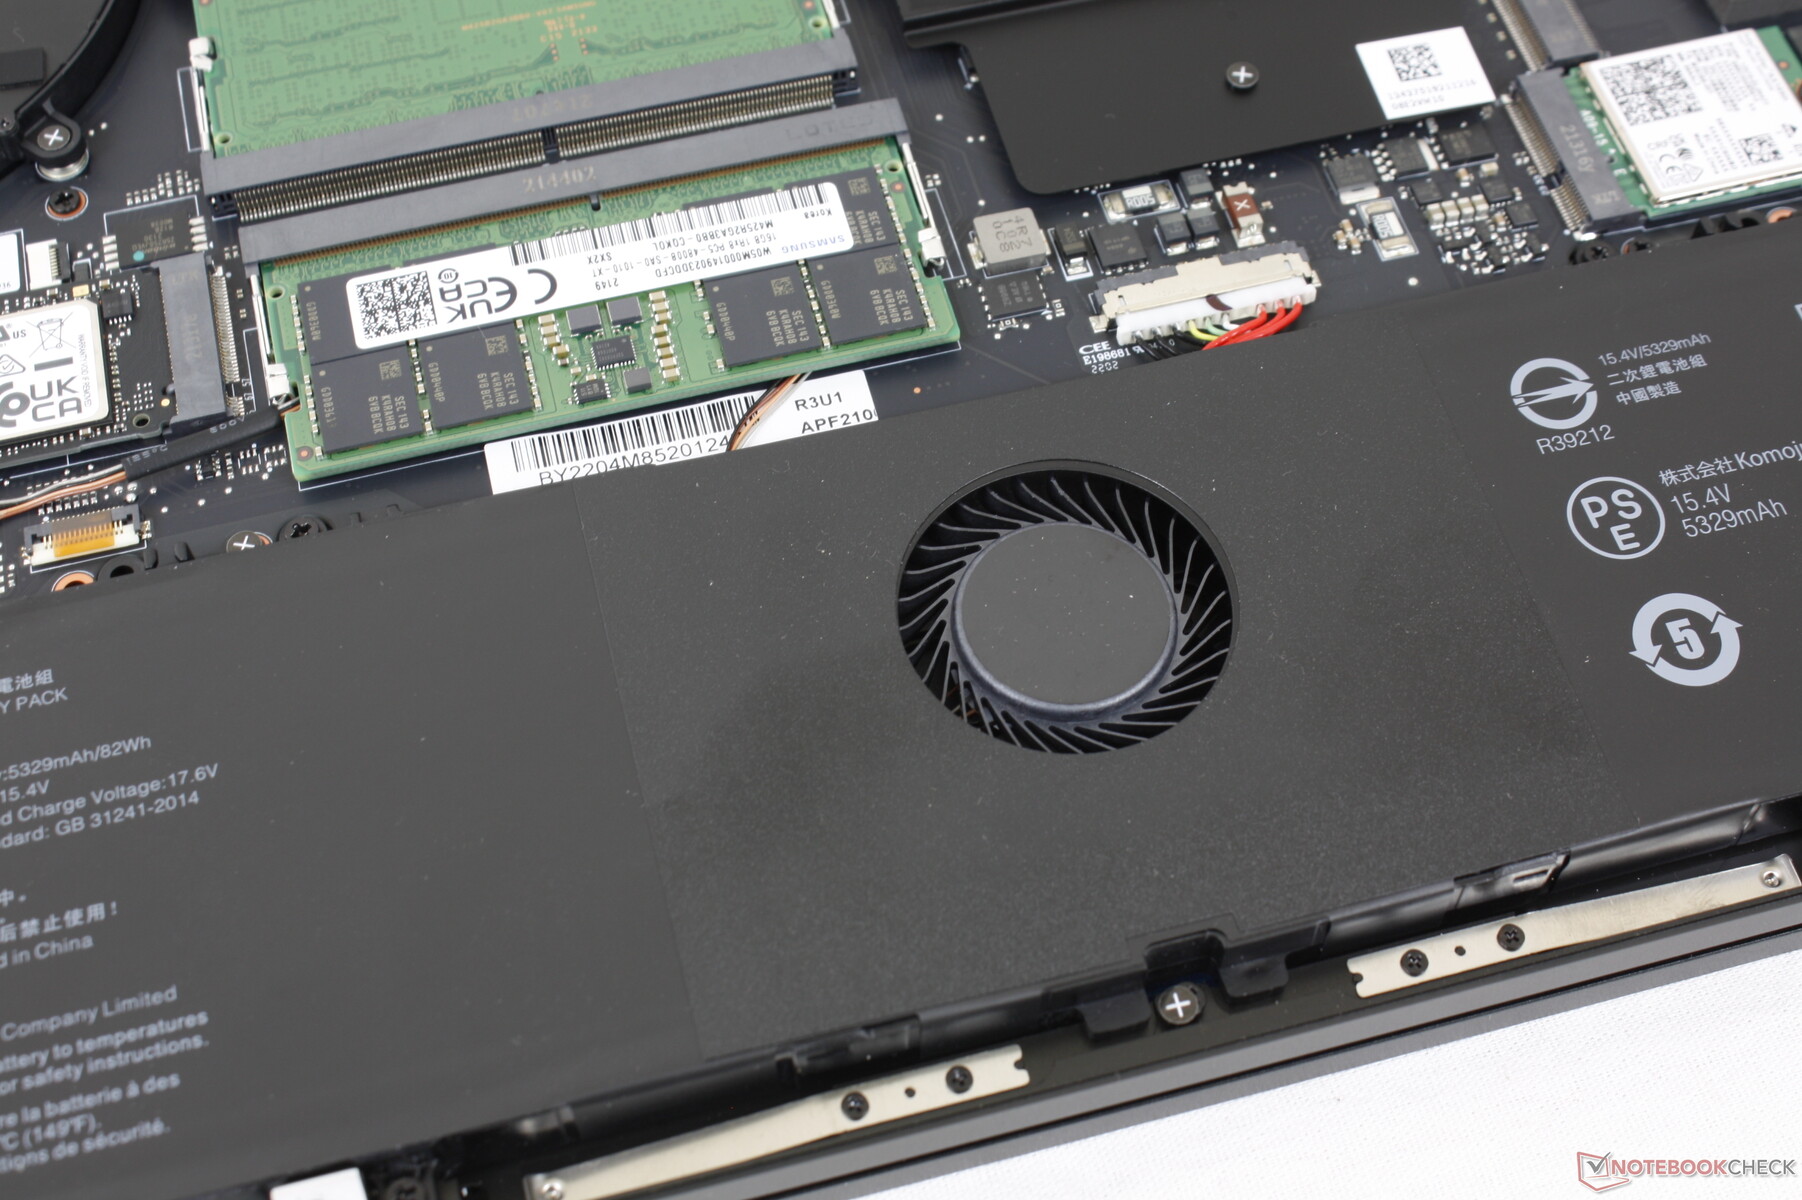
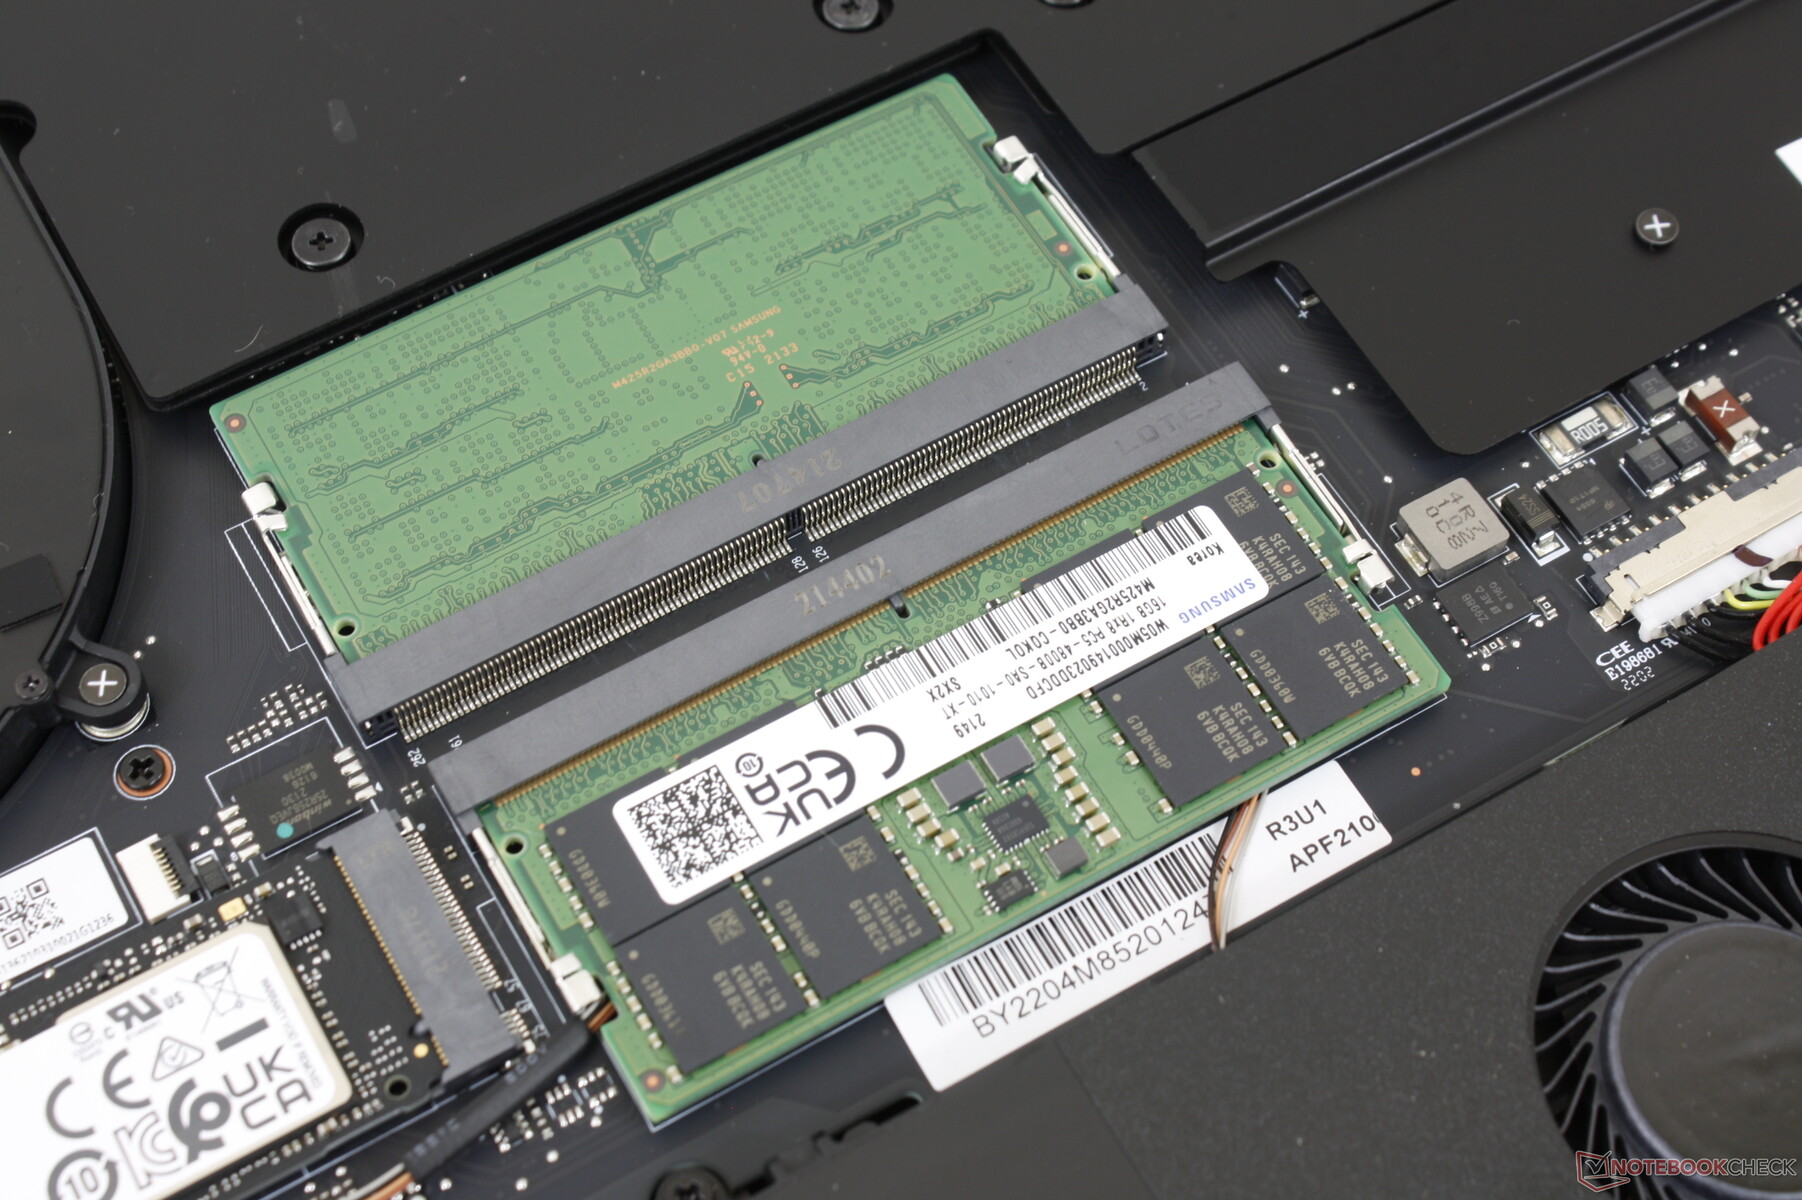
底部面板又是比较容易用T5 Torx扳手拆卸的。虽然用户可以直接访问2个DDR5 SODIMM插槽和2个M.2 PCIe4 SSD插槽,但主板的布局与去年的型号相比有明显的变化,如下图所示。
配件和保修
盒子里包括交流适配器、文件和一张Razer标志贴纸。Razer将两年的有限电池保修作为标准,与基本的一年有限笔记本保修一起,为每一个新购买的第12代Blade模型提供。
输入设备 - 较大的按键,相同的点击板
键盘
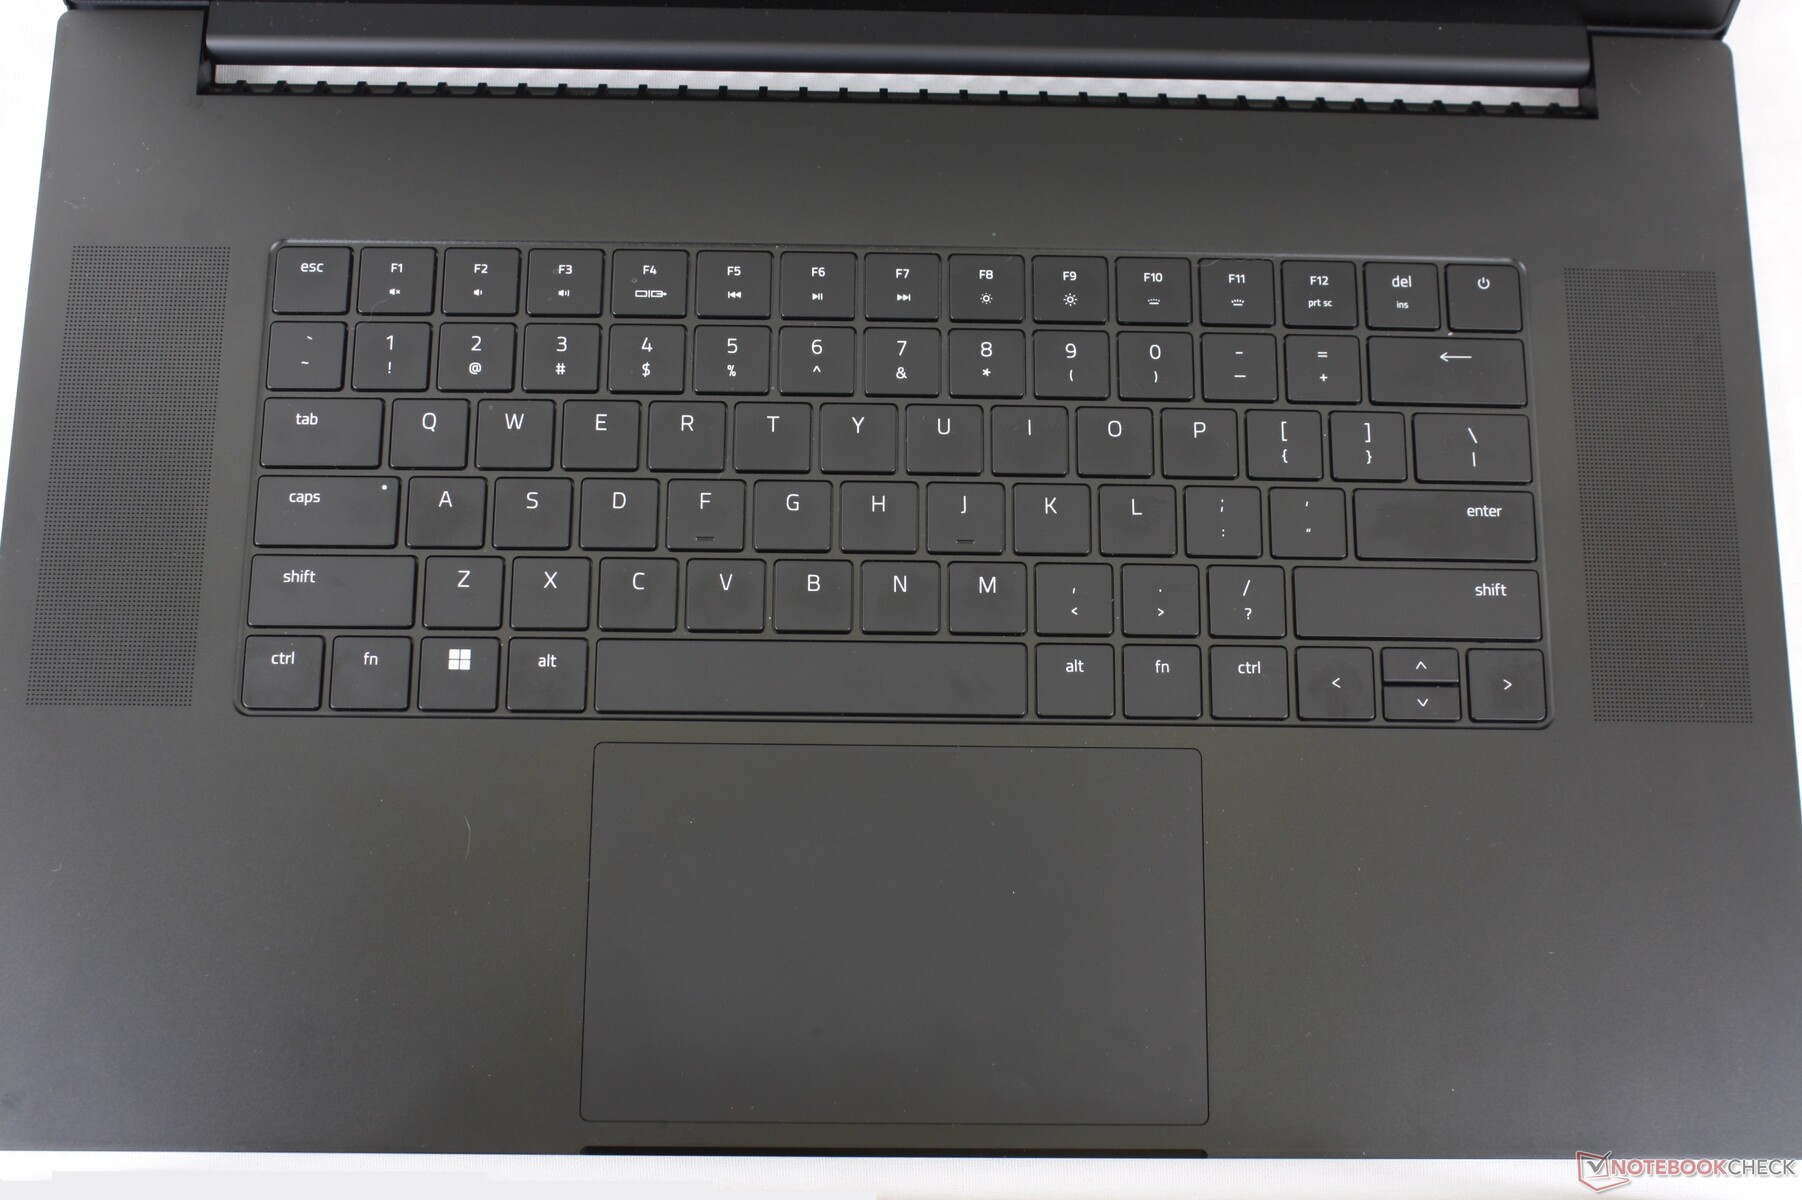
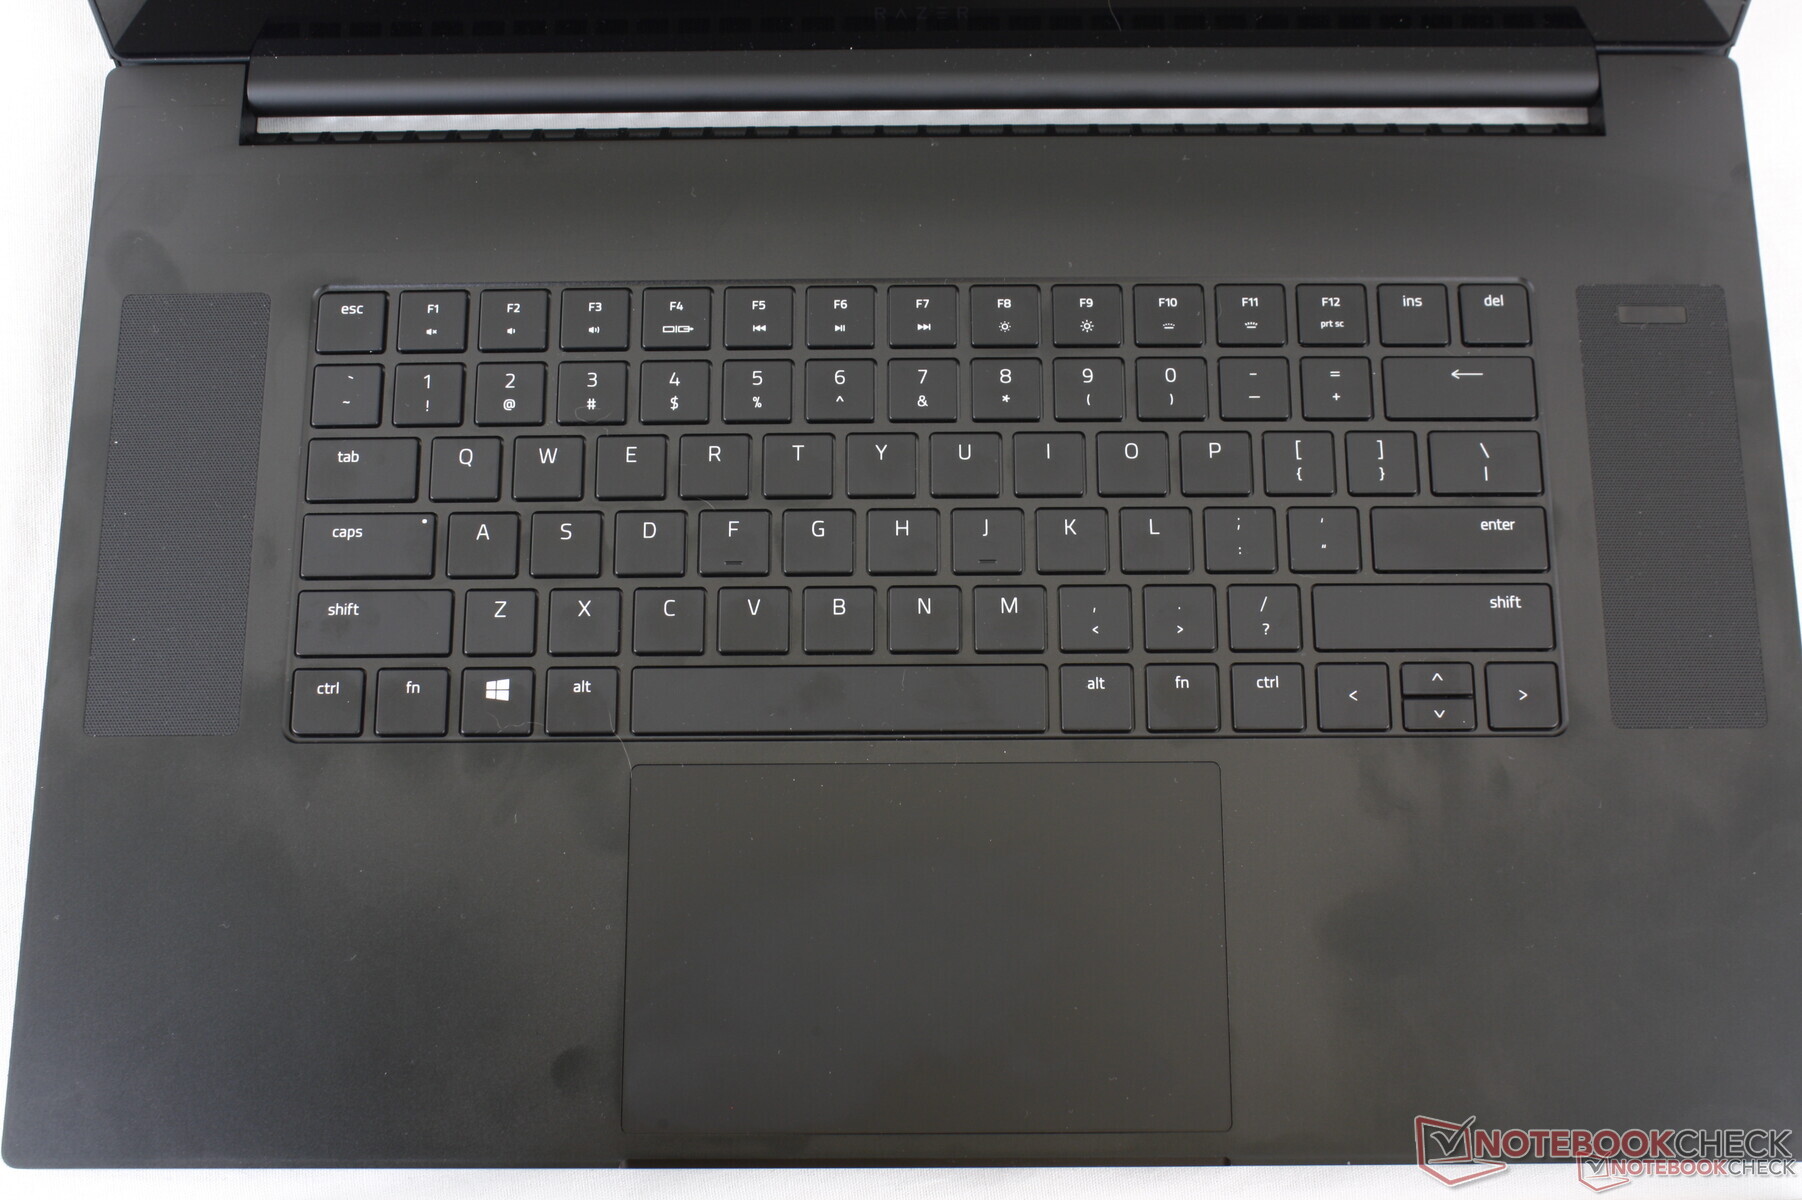
2022年刀片17与2022年刀片15上的键盘相同。 2022年刀片15.Razer增加了键帽的尺寸,同时保持键盘甲板的整体长度和宽度不变,以方便打字。尽管尺寸有变化,但反馈和行程与去年的型号相同。我们怀疑更多的用户会接受这种小的同比更新,而不是完全换成光学或机械键,这可能会使雷蛇的粉丝们产生分歧。
触摸板
触摸板没有任何变化,无论好坏。虽然我们喜欢宽敞的表面积(13 x 8厘米)和平滑的牵引力,但按下时的海绵状反馈仍然不令人满意。因此,与带有专用鼠标按钮的笔记本电脑相比,拖放动作更加困难,如 华硕TUF FX506系列。哑光的表面上也容易积聚难看的油脂。
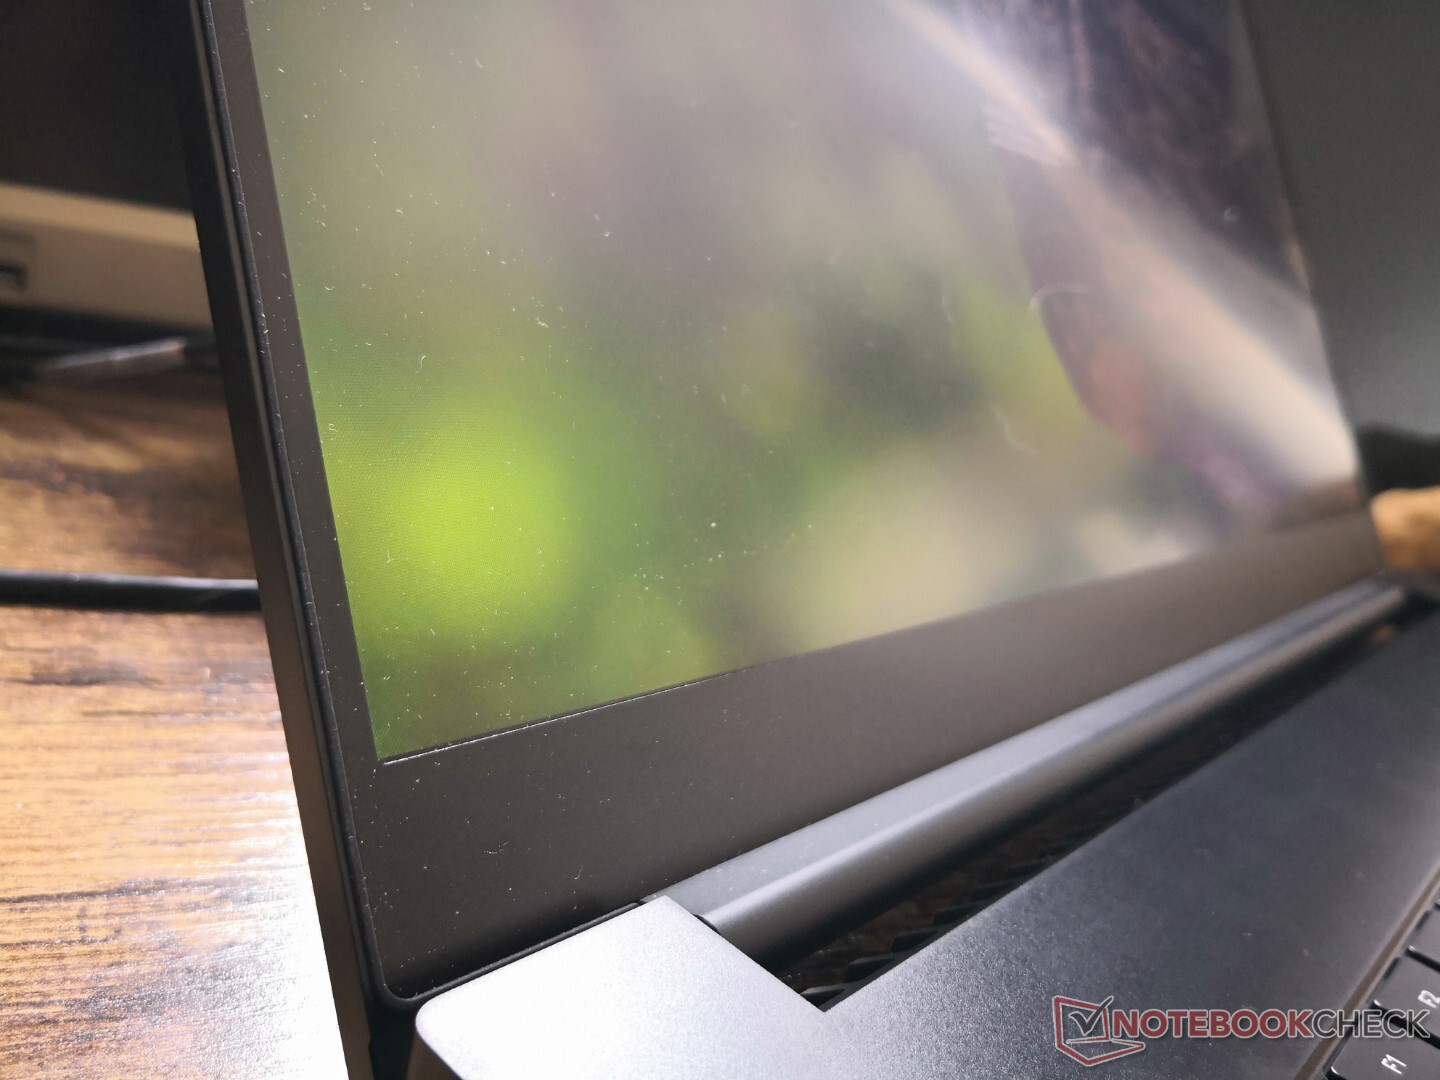
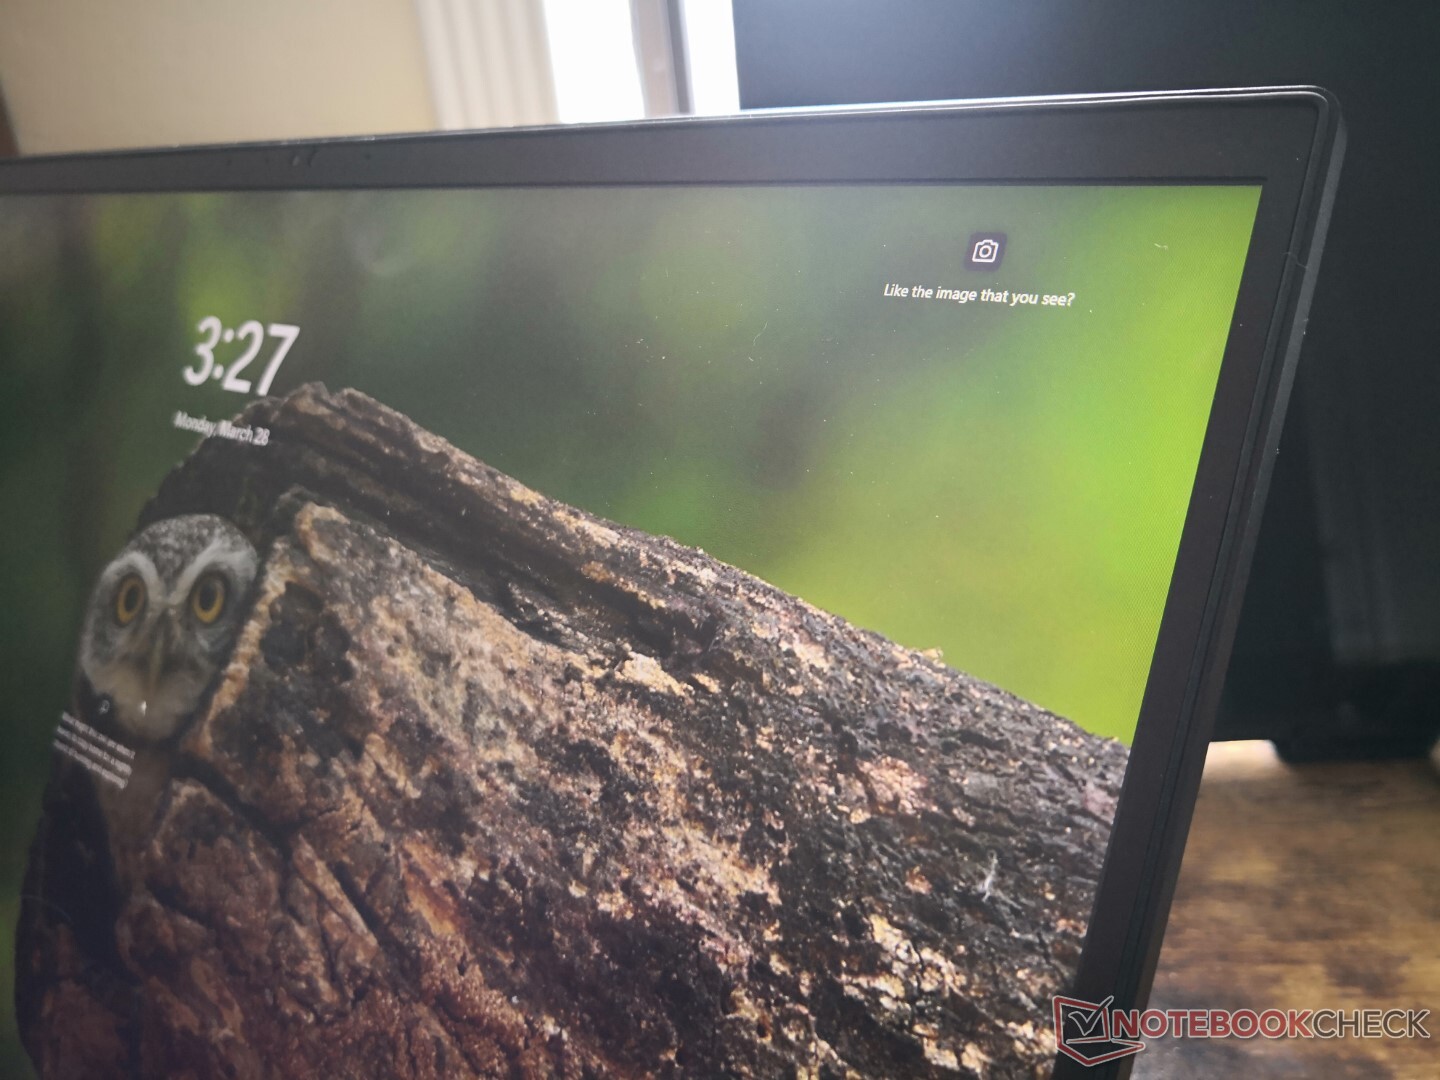
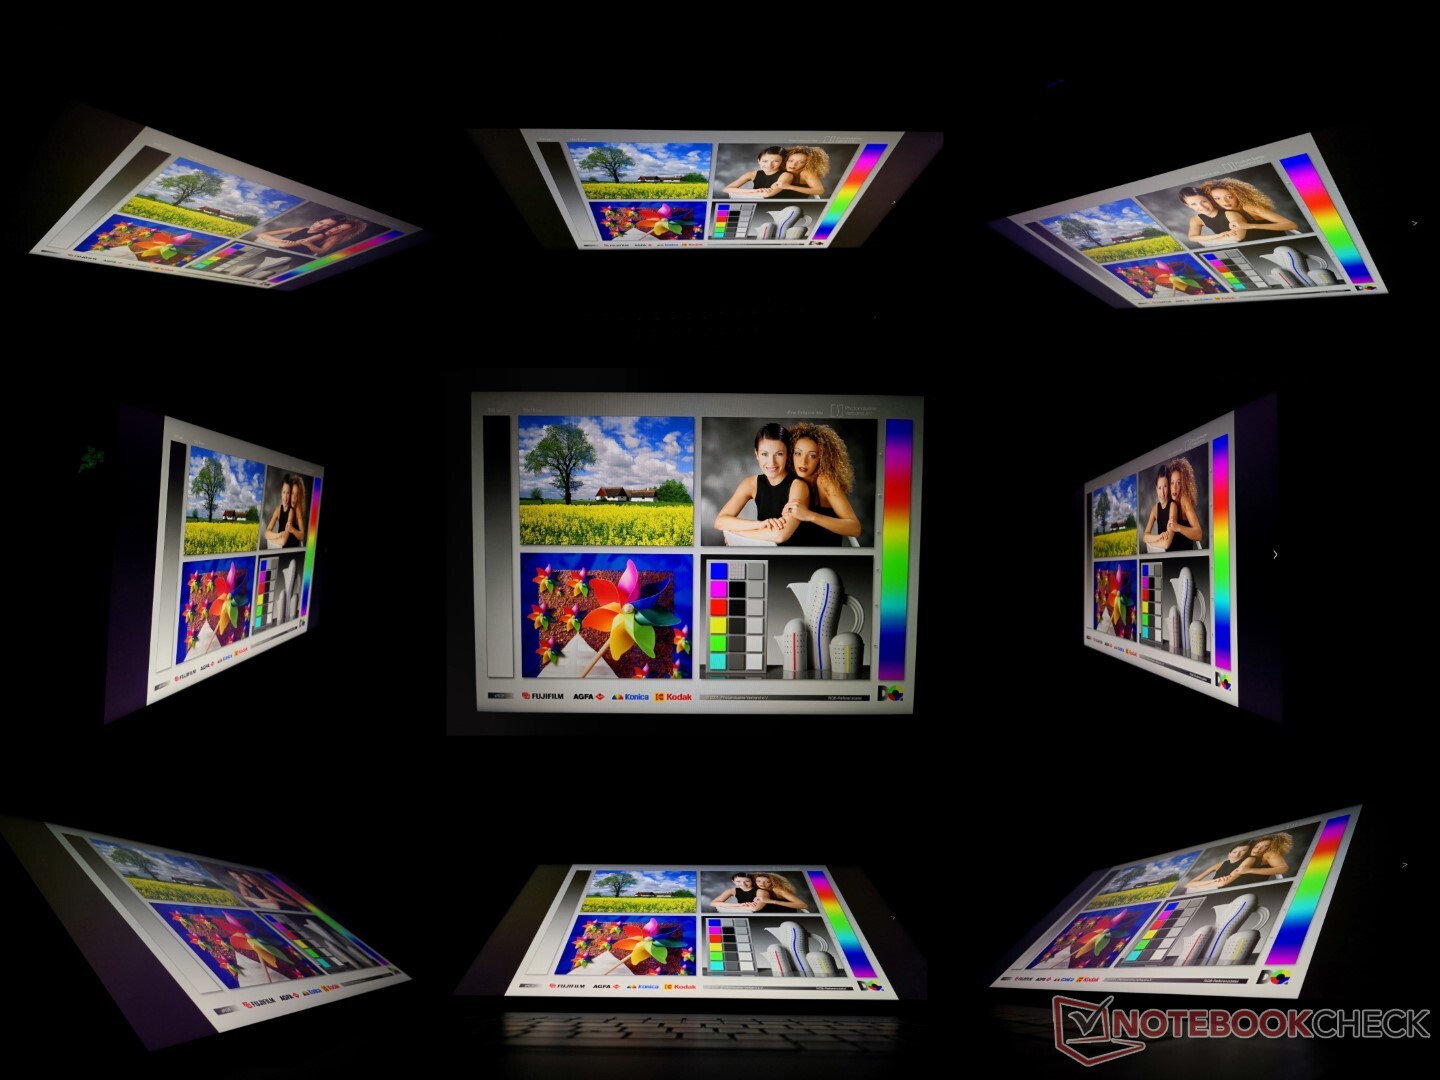
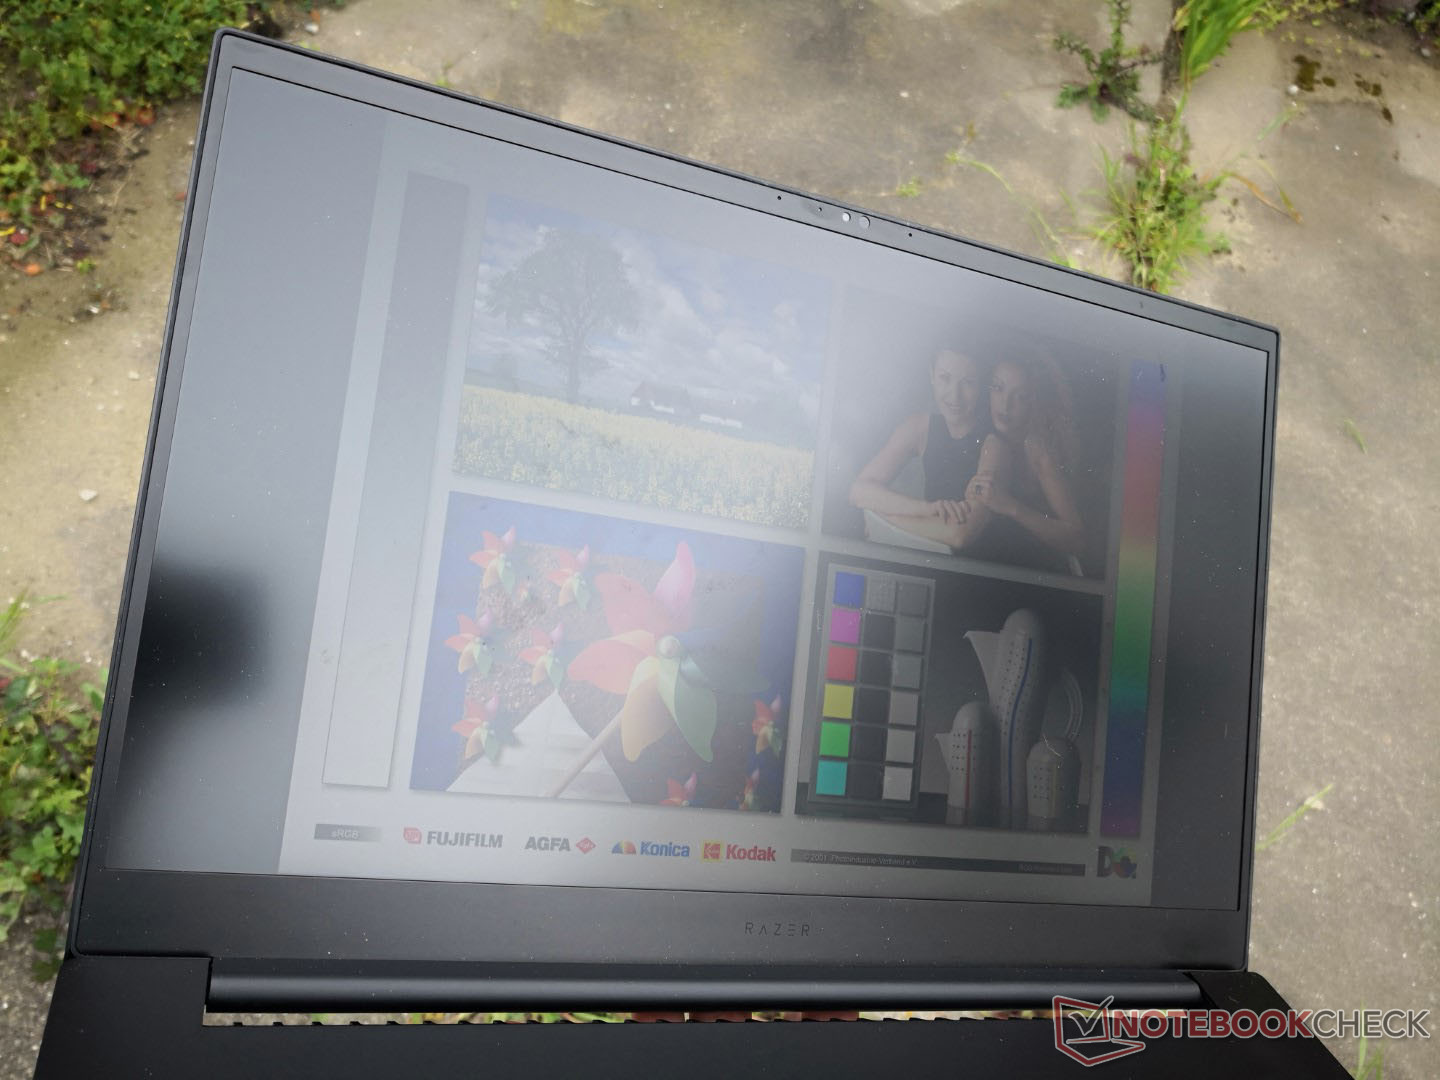
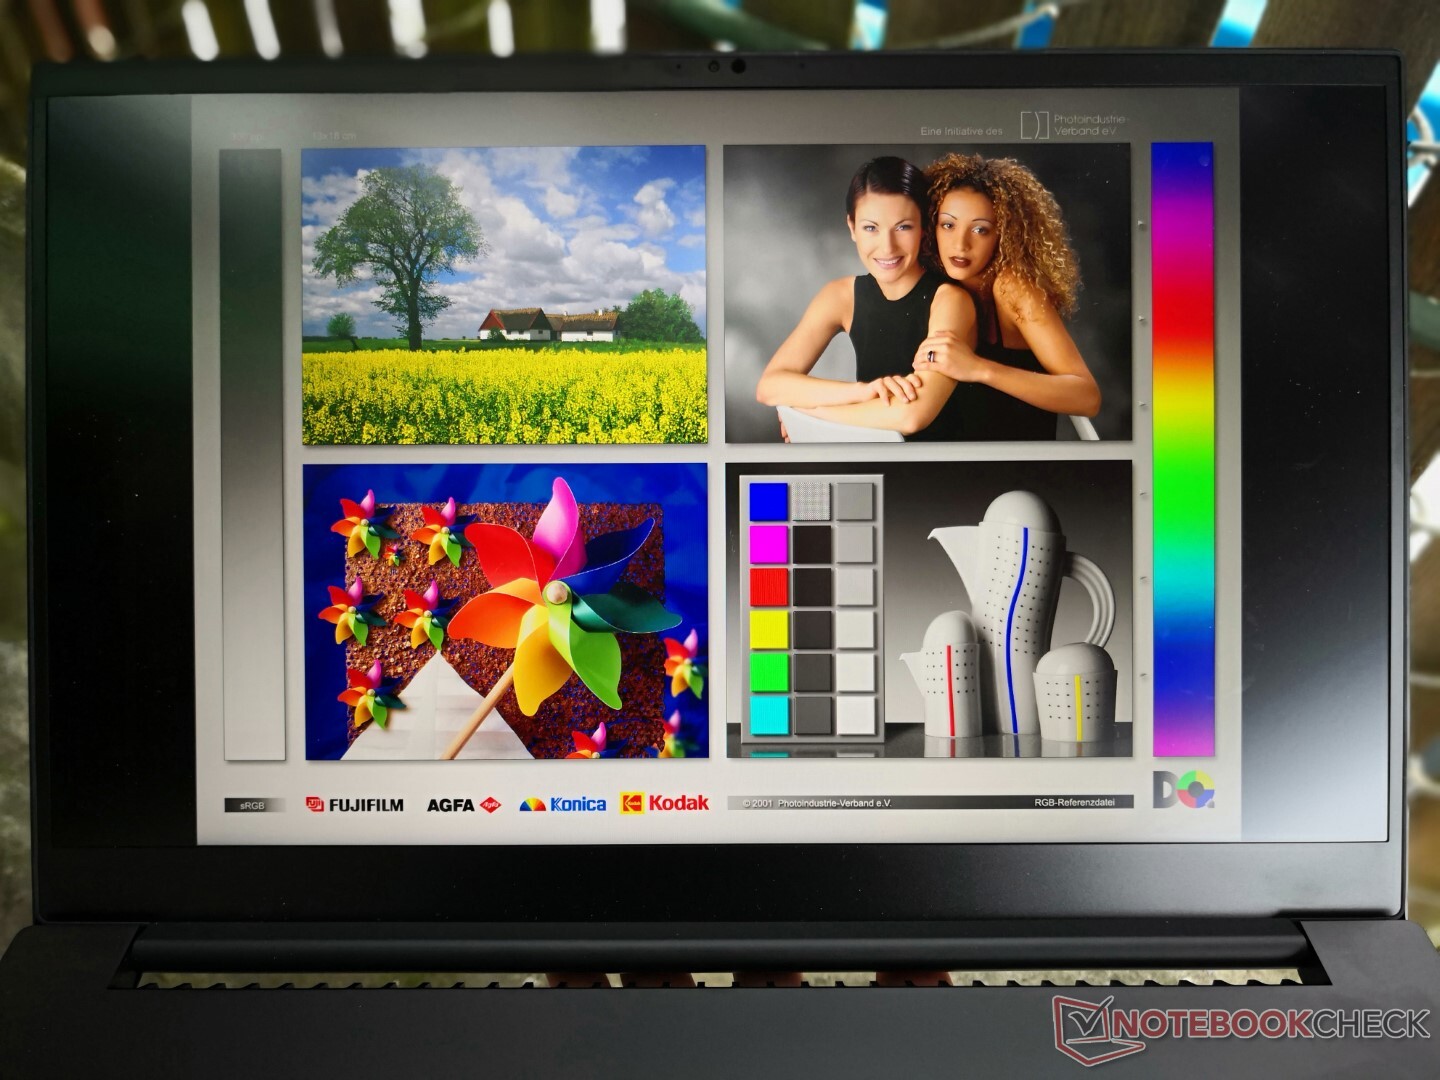
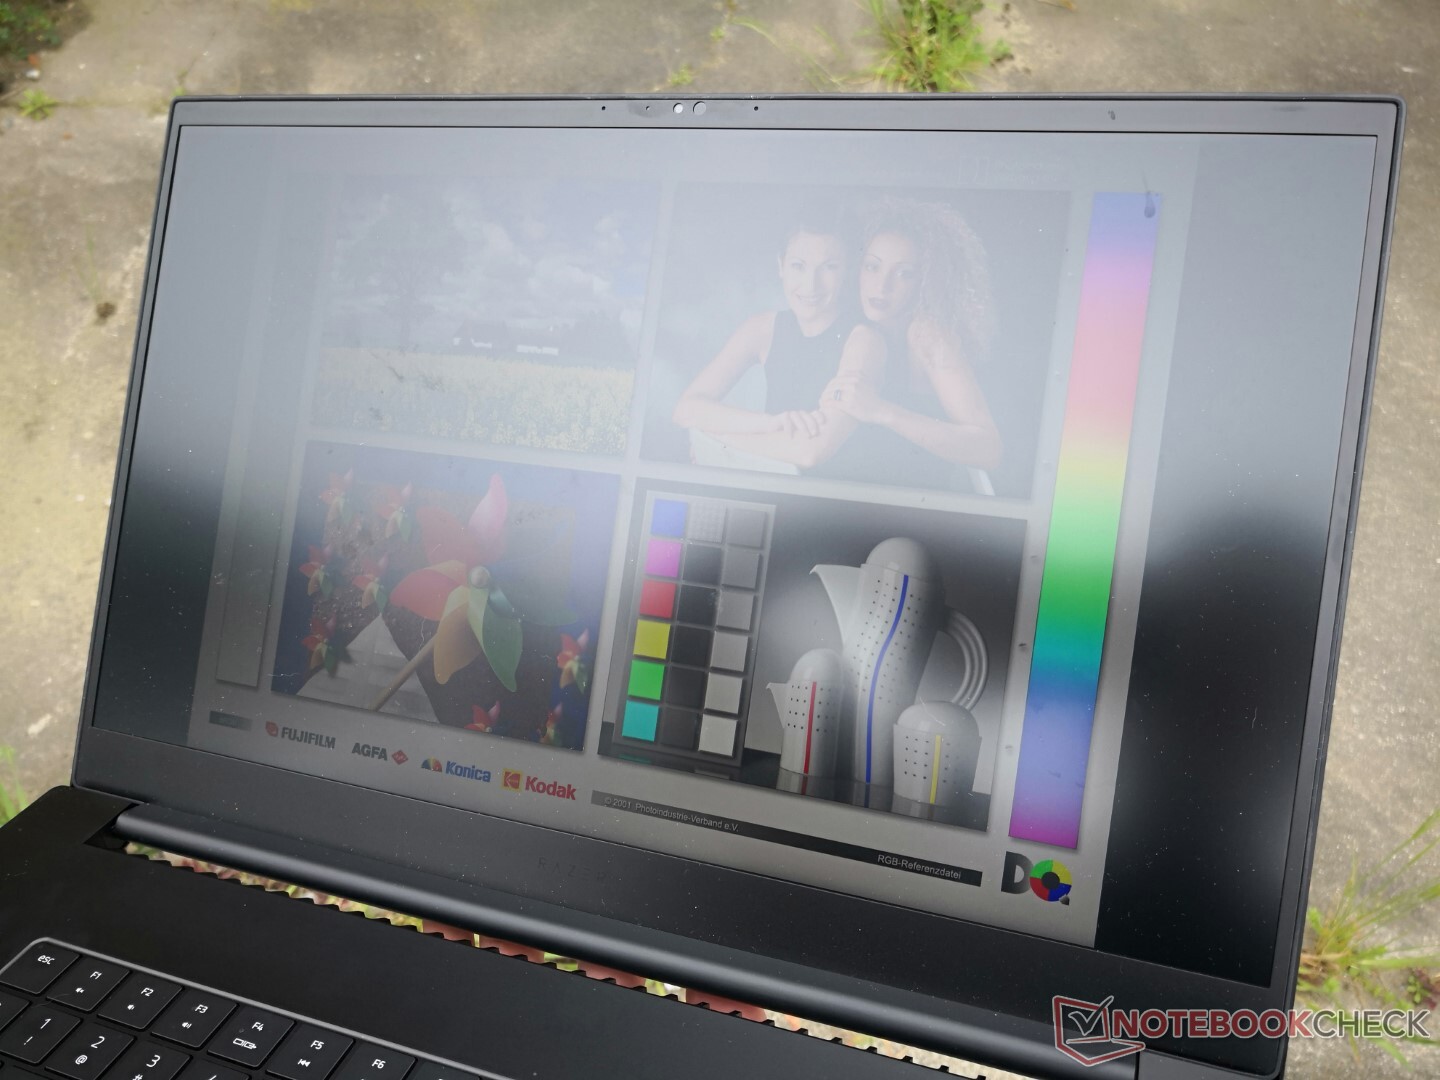
显示器 - 暂时没有OLED选项
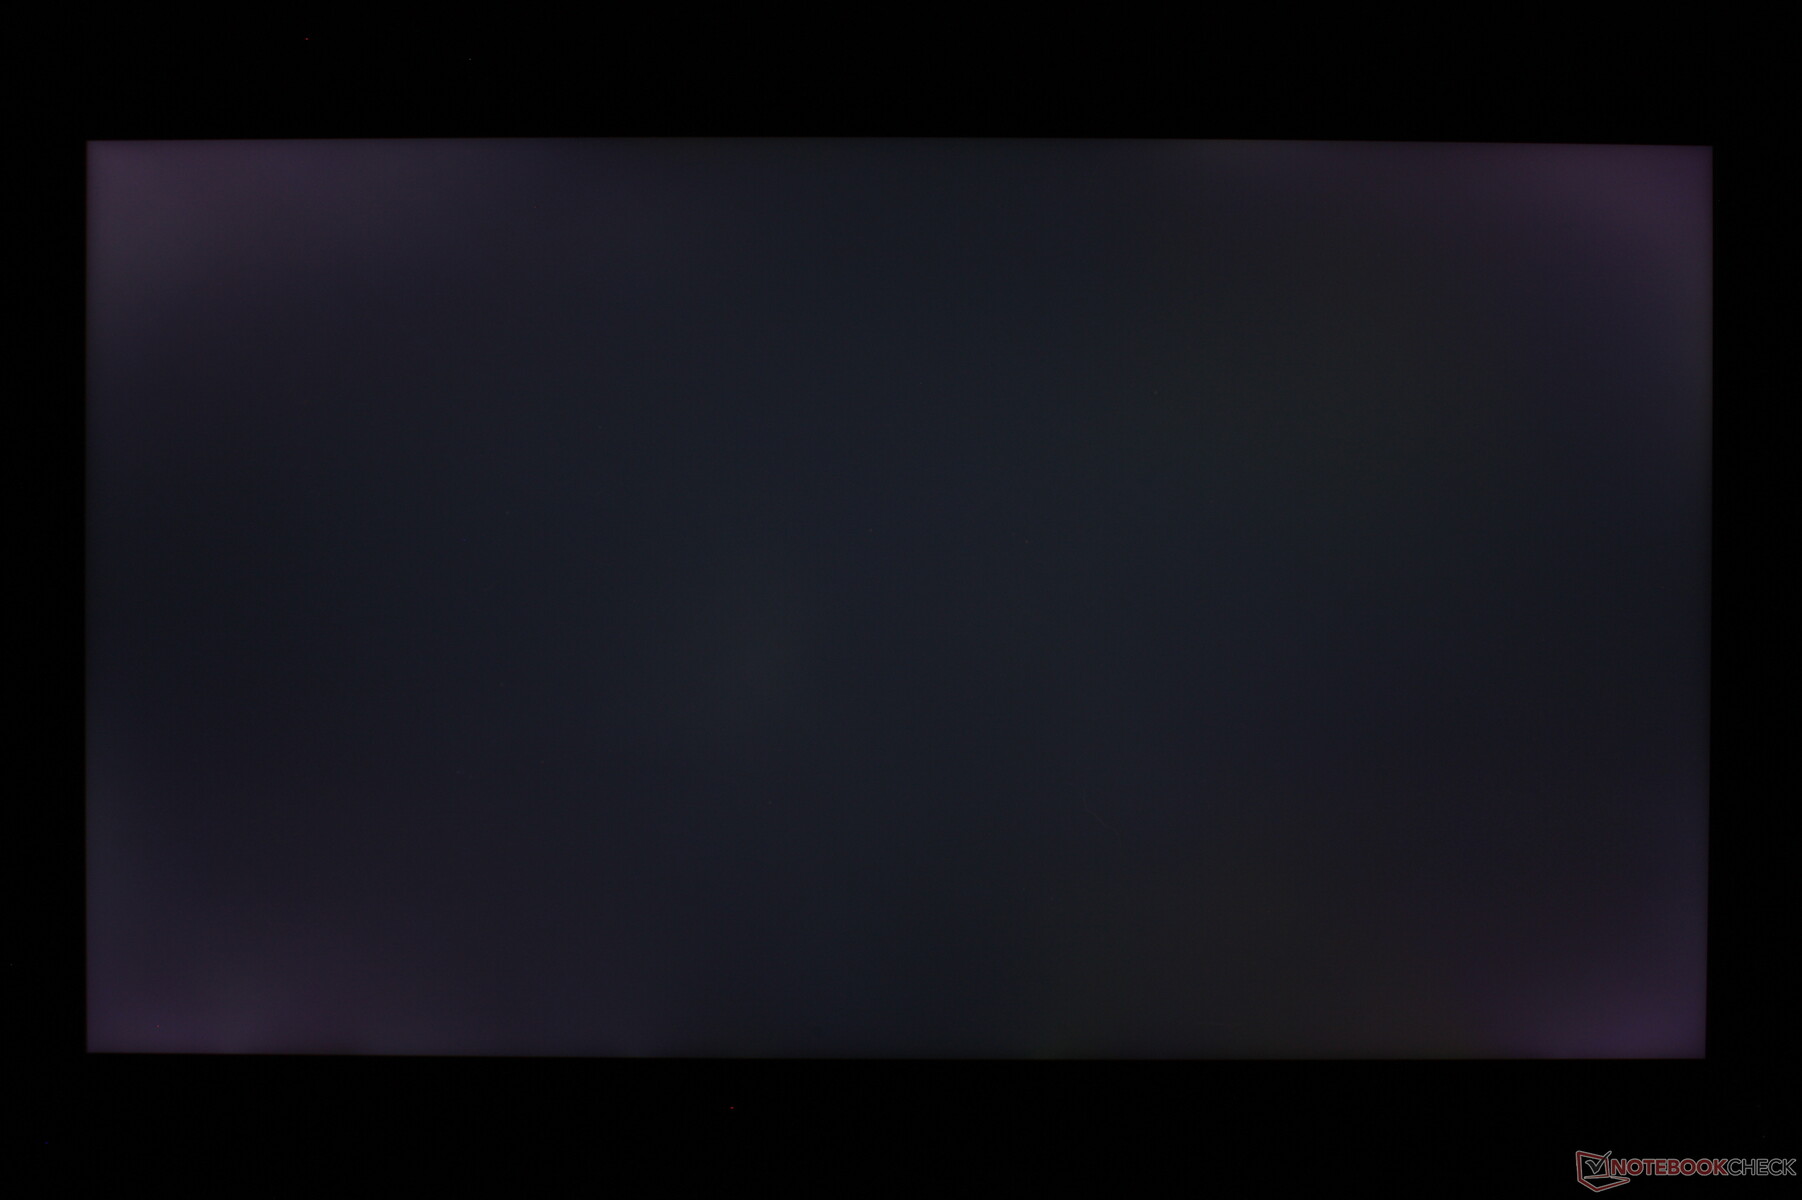
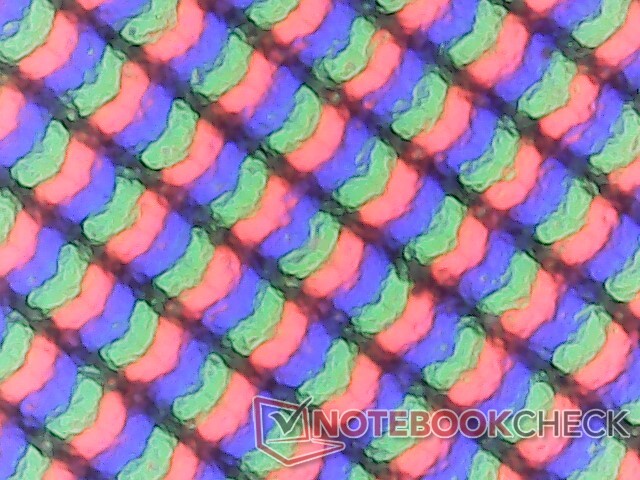
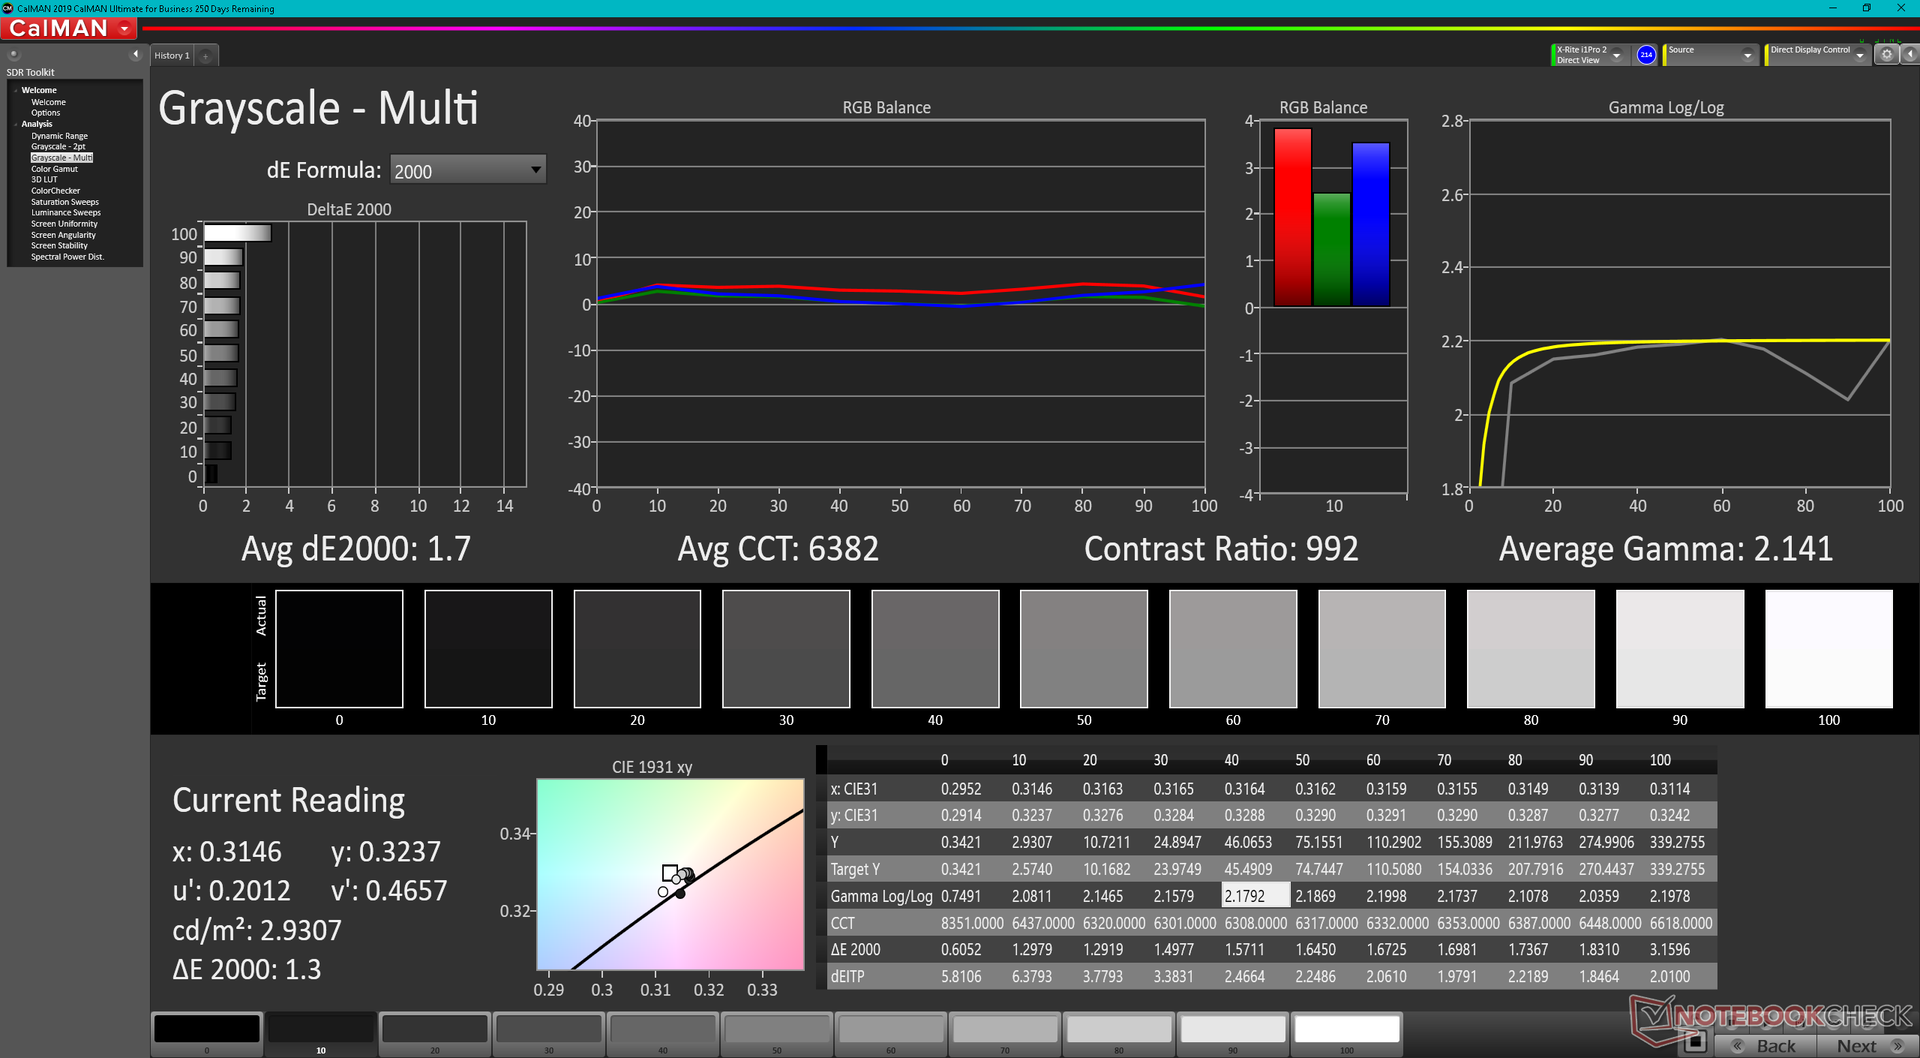
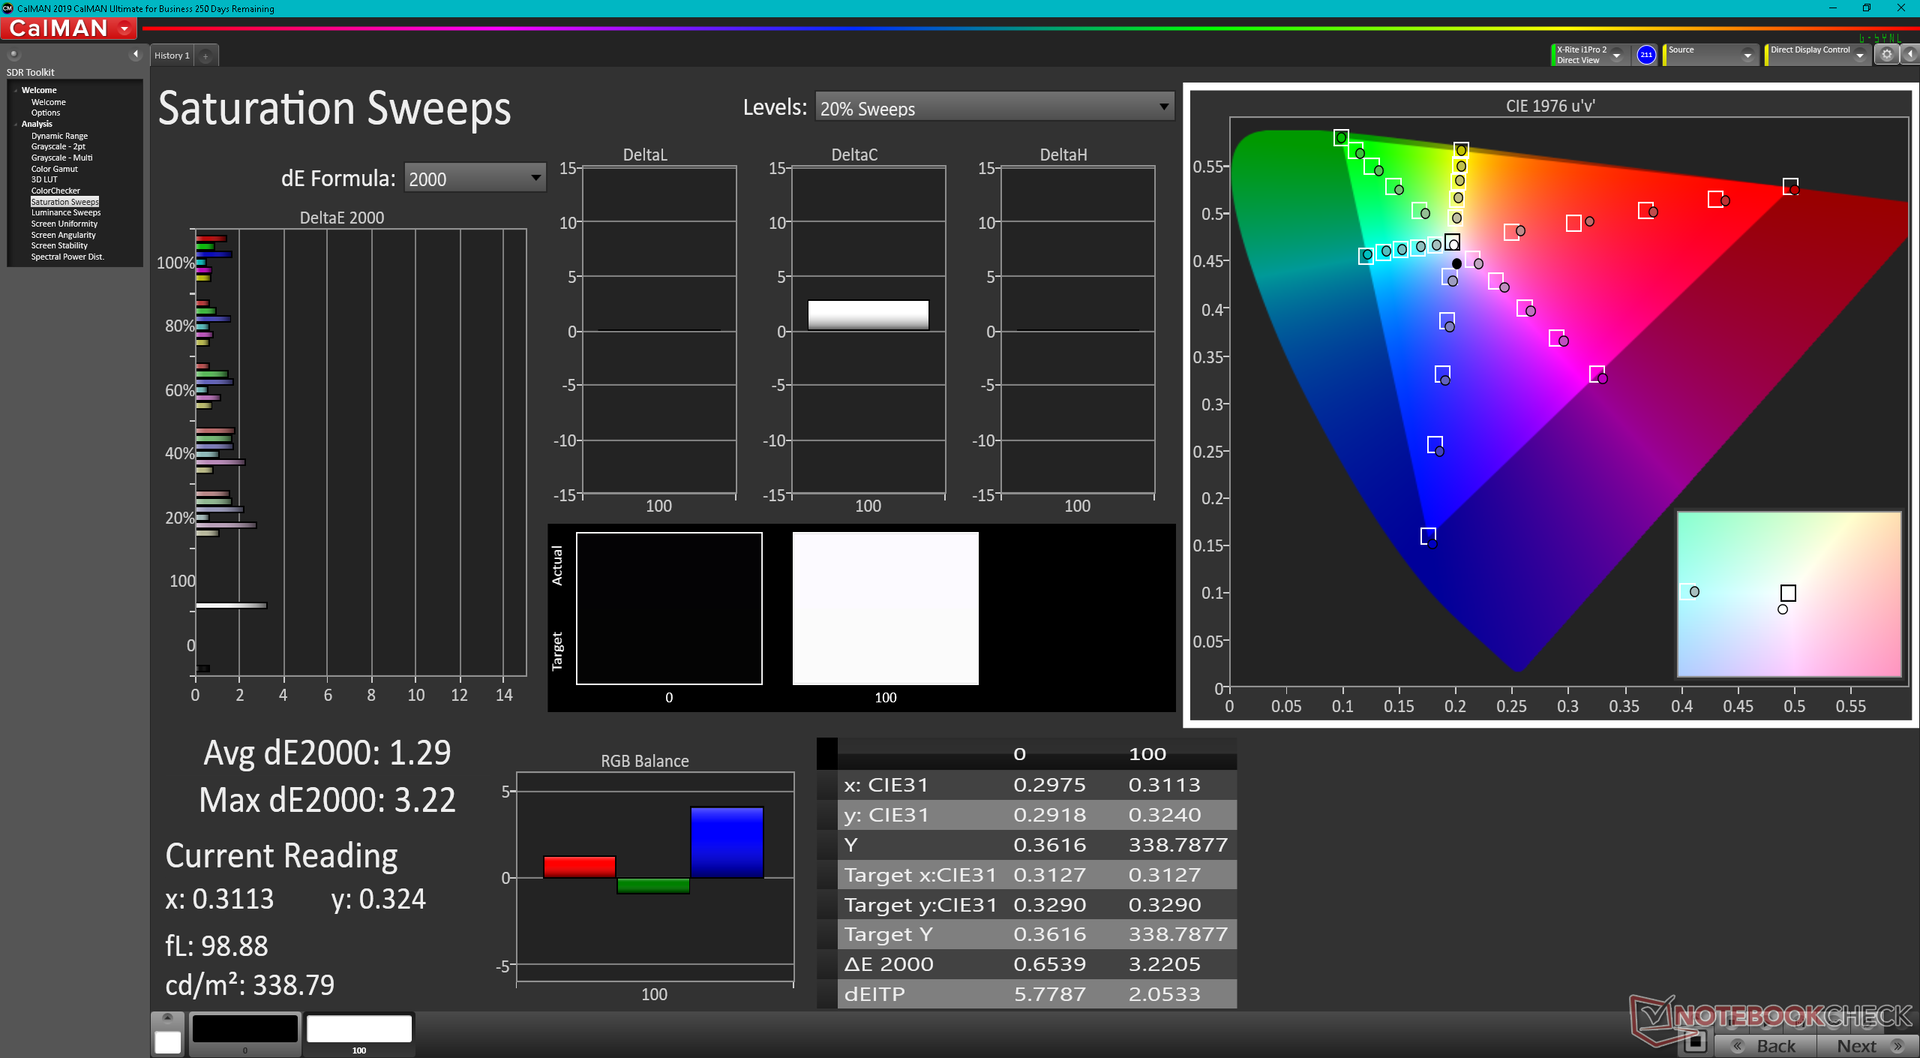
我们测试装置上的京东方NE173QHM-NZ1 IPS面板适合图形编辑和游戏用途。它完全覆盖了DCI-P3色域,以满足数字艺术家的需求,同时提供快速的黑白响应时间,快速刷新率,以及游戏玩家想要的G-Sync兼容性。对比度可以更好,特别是当与Razer在一些Blade 15单元上提供的OLED选项相比,但这是典型的IPS面板。
| |||||||||||||||||||||||||
Brightness Distribution: 75 %
Center on Battery: 335.8 cd/m²
Contrast: 884:1 (Black: 0.38 cd/m²)
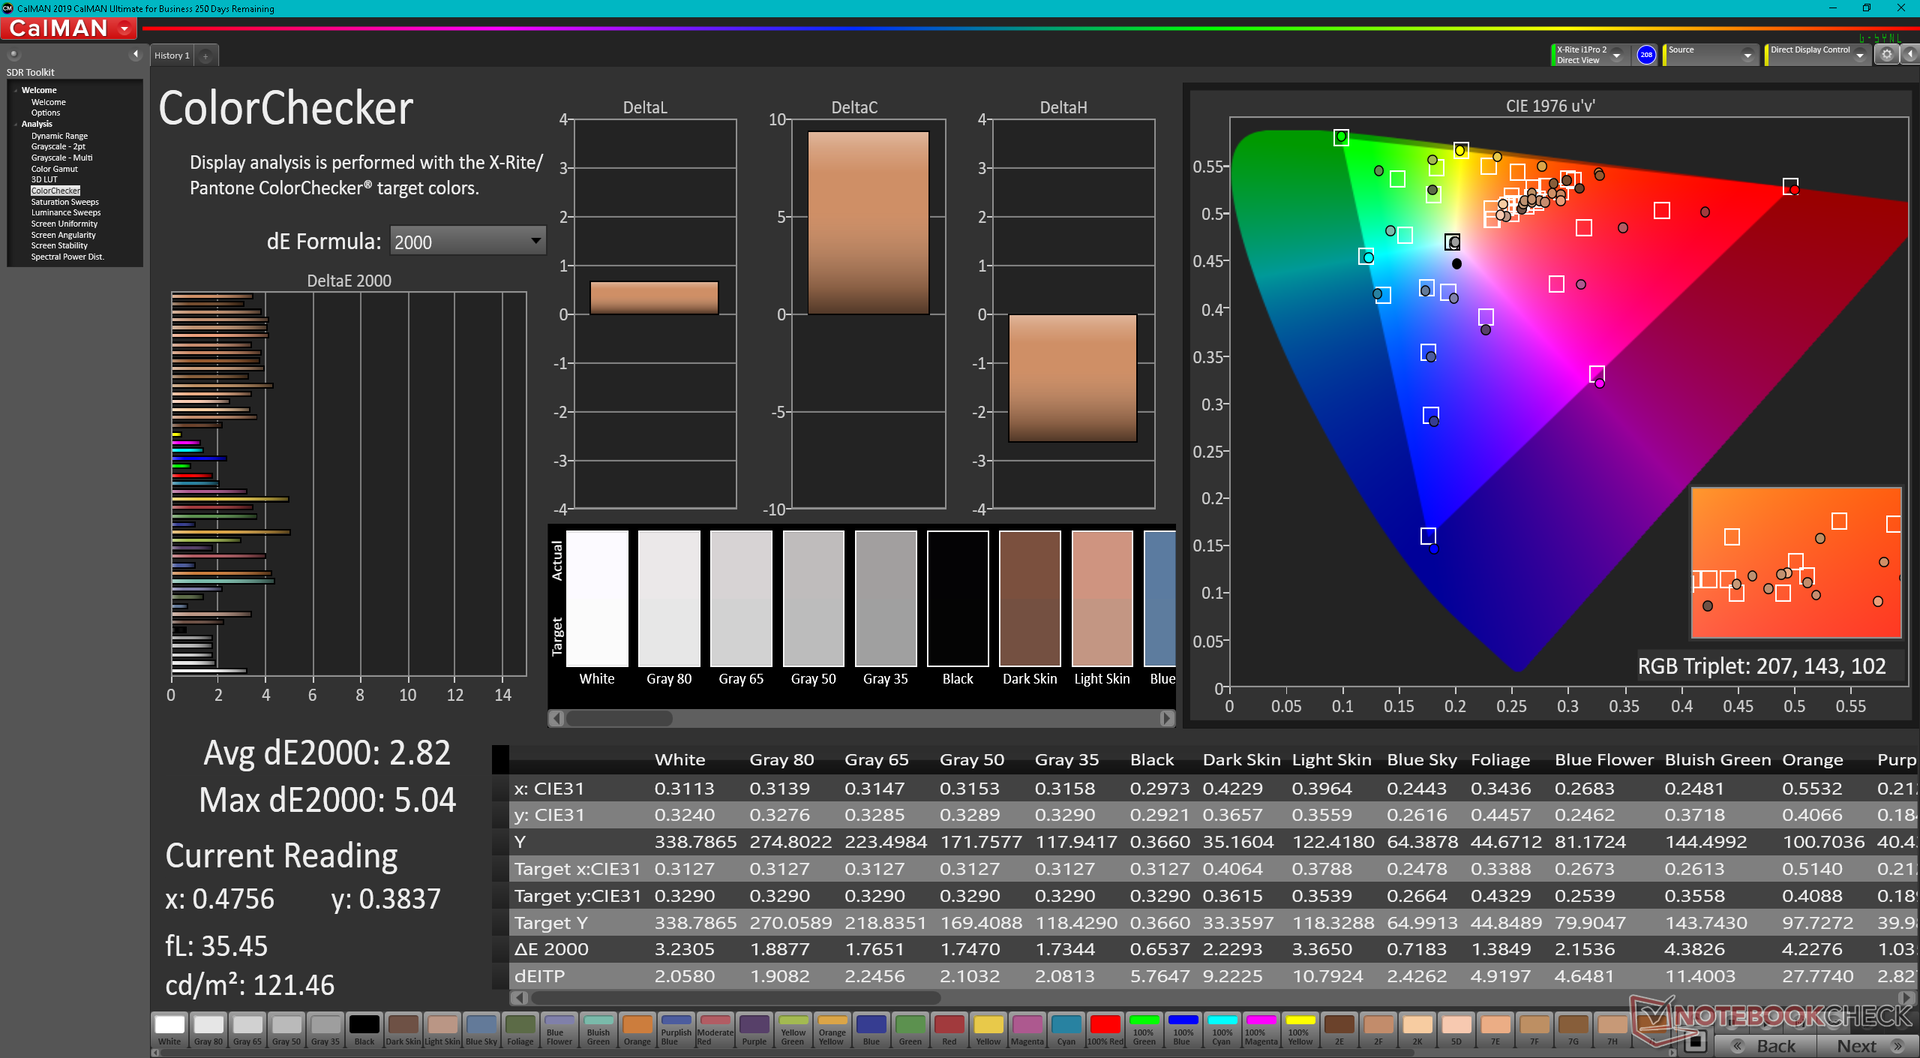
ΔE ColorChecker Calman: 2.82 | ∀{0.5-29.43 Ø4.71}
ΔE Greyscale Calman: 1.7 | ∀{0.09-98 Ø4.96}
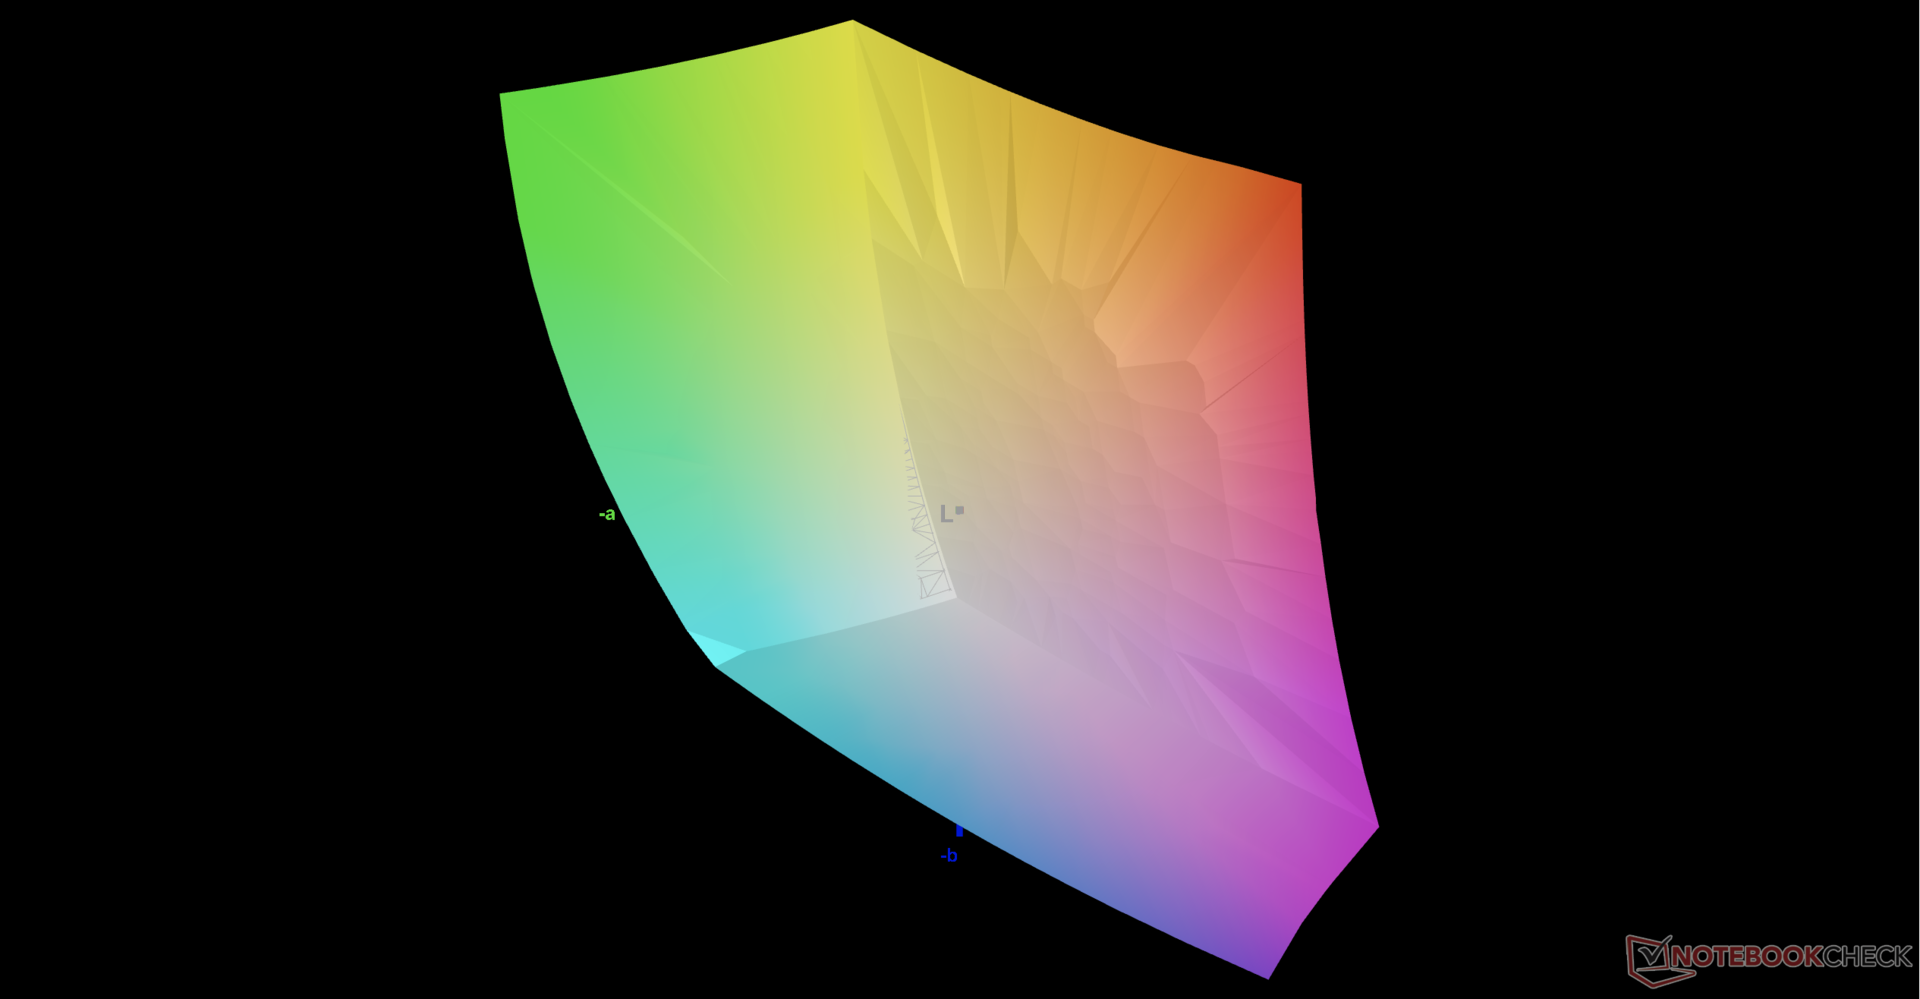
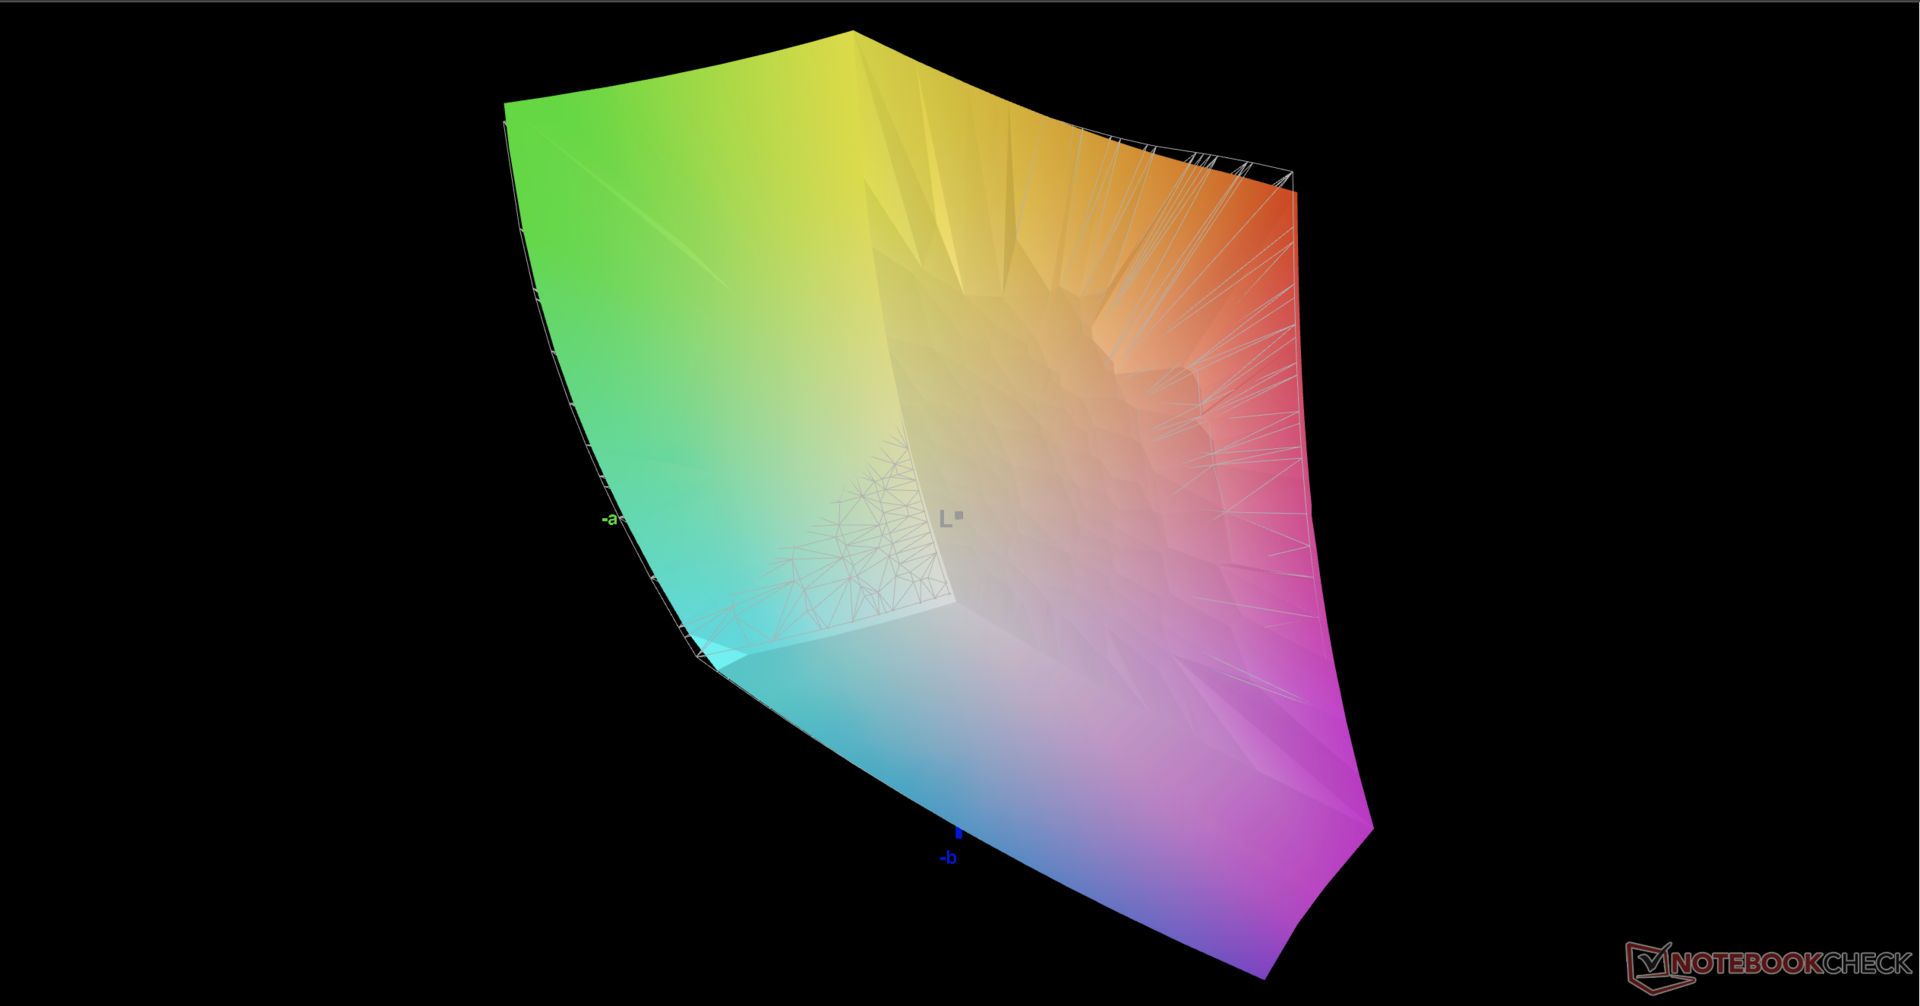
86.2% AdobeRGB 1998 (Argyll 3D)
99.9% sRGB (Argyll 3D)
98.7% Display P3 (Argyll 3D)
Gamma: 2.14
CCT: 6382 K
| Razer Blade 17 RTX 3080 Ti BOE NE173QHM-NZ1, IPS, 2560x1440, 17.3" | Razer Blade Pro 17 2021 (QHD Touch) AU Optronics B173ZAN03.3, IPS, 3840x2160, 17.3" | MSI GS76 Stealth 11UH AUO B173ZAN06.1 (AUODE95), IPS, 3840x2160, 17.3" | Asus ROG Zephyrus S17 GX703HSD BOE099D (BOE CQ NE173QHM-NY3), IPS, 2560x1440, 17.3" | Aorus 17G YD Sharp LQ173M1JW04, IPS, 1920x1080, 17.3" | Alienware x17 RTX 3080 P48E AU Optronics B173ZAN, IPS, 3840x2160, 17.3" | |
|---|---|---|---|---|---|---|
| Display | 2% | -22% | -3% | -14% | 2% | |
| Display P3 Coverage (%) | 98.7 | 88.6 -10% | 63 -36% | 94.2 -5% | 72.3 -27% | 88.3 -11% |
| sRGB Coverage (%) | 99.9 | 100 0% | 94.8 -5% | 98.7 -1% | 100 0% | 100 0% |
| AdobeRGB 1998 Coverage (%) | 86.2 | 99.9 16% | 65 -25% | 84.4 -2% | 73.7 -15% | 100 16% |
| Response Times | 5% | 47% | 52% | 21% | 14% | |
| Response Time Grey 50% / Grey 80% * (ms) | 17.6 ? | 15.2 ? 14% | 8.8 ? 50% | 4.8 73% | 13.6 ? 23% | 14.4 ? 18% |
| Response Time Black / White * (ms) | 11.4 ? | 12 ? -5% | 6.4 ? 44% | 8 30% | 9.2 ? 19% | 10.4 ? 9% |
| PWM Frequency (Hz) | ||||||
| Screen | -76% | 10% | -8% | -10% | -8% | |
| Brightness middle (cd/m²) | 335.9 | 407.2 21% | 474 41% | 322 -4% | 286 -15% | 438.7 31% |
| Brightness (cd/m²) | 294 | 403 37% | 454 54% | 288 -2% | 282 -4% | 435 48% |
| Brightness Distribution (%) | 75 | 90 20% | 88 17% | 72 -4% | 73 -3% | 91 21% |
| Black Level * (cd/m²) | 0.38 | 0.42 -11% | 0.46 -21% | 0.3 21% | 0.24 37% | 0.48 -26% |
| Contrast (:1) | 884 | 970 10% | 1030 17% | 1073 21% | 1192 35% | 914 3% |
| Colorchecker dE 2000 * | 2.82 | 7.25 -157% | 1.5 47% | 3.05 -8% | 2.79 1% | 4.34 -54% |
| Colorchecker dE 2000 max. * | 5.04 | 12.51 -148% | 5.59 -11% | 5.23 -4% | 6.23 -24% | 7.3 -45% |
| Greyscale dE 2000 * | 1.7 | 8.1 -376% | 2.8 -65% | 3.11 -83% | 3.5 -106% | 2.4 -41% |
| Gamma | 2.14 103% | 2.24 98% | 2.158 102% | 2.13 103% | 2.358 93% | 2.09 105% |
| CCT | 6382 102% | 5925 110% | 6597 99% | 6553 99% | 6147 106% | 6413 101% |
| Colorchecker dE 2000 calibrated * | 3.62 | 0.86 | 1.92 | 0.82 | 0.72 | |
| Color Space (Percent of AdobeRGB 1998) (%) | 88.1 | 84 | 74 | |||
| Color Space (Percent of sRGB) (%) | 100 | 99 | 96 | |||
| Total Average (Program / Settings) | -23% /
-45% | 12% /
8% | 14% /
2% | -1% /
-6% | 3% /
-2% |
* ... smaller is better
Razer在工厂对每台显示器进行校准,我们用X-Rite色度计进行的独立测量也证明了这一点。平均灰度和ColorChecker DeltaE值分别只有1.7和2.82,表明最终用户不需要校准。
Display Response Times
| ↔ Response Time Black to White | ||
|---|---|---|
| 11.4 ms ... rise ↗ and fall ↘ combined | ↗ 4.8 ms rise | 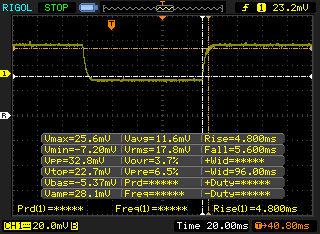 |
| ↘ 5.6 ms fall | ||
| The screen shows good response rates in our tests, but may be too slow for competitive gamers. In comparison, all tested devices range from 0.1 (minimum) to 240 (maximum) ms. » 31 % of all devices are better. This means that the measured response time is better than the average of all tested devices (19.8 ms). | ||
| ↔ Response Time 50% Grey to 80% Grey | ||
| 17.6 ms ... rise ↗ and fall ↘ combined | ↗ 8.4 ms rise | 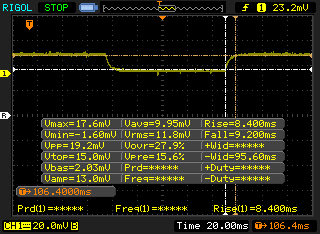 |
| ↘ 9.2 ms fall | ||
| The screen shows good response rates in our tests, but may be too slow for competitive gamers. In comparison, all tested devices range from 0.165 (minimum) to 636 (maximum) ms. » 32 % of all devices are better. This means that the measured response time is better than the average of all tested devices (31 ms). | ||
Screen Flickering / PWM (Pulse-Width Modulation)
| Screen flickering / PWM not detected | 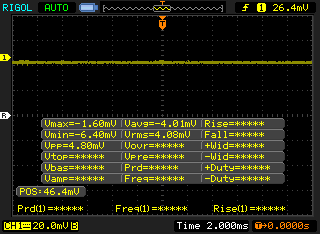 | ||
In comparison: 52 % of all tested devices do not use PWM to dim the display. If PWM was detected, an average of 7754 (minimum: 5 - maximum: 343500) Hz was measured. | |||
性能--165瓦图形与第12代英特尔
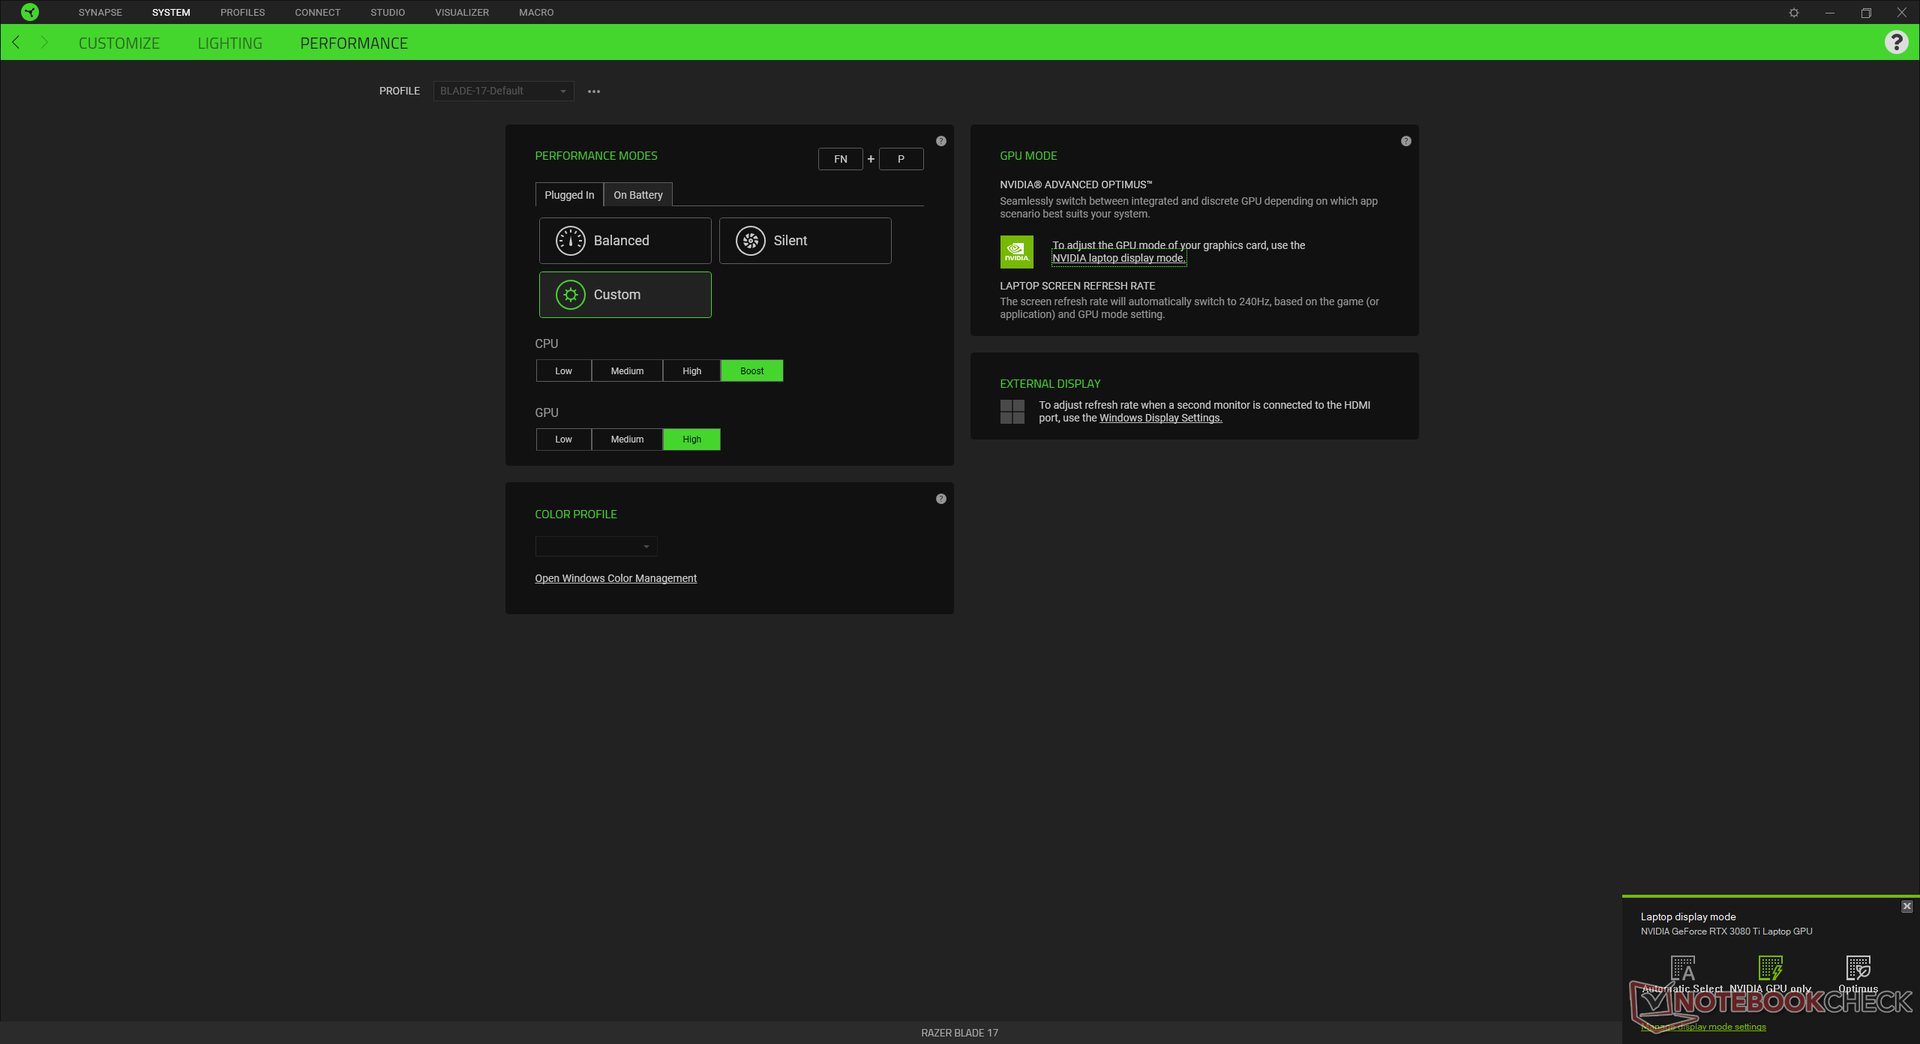
测试条件
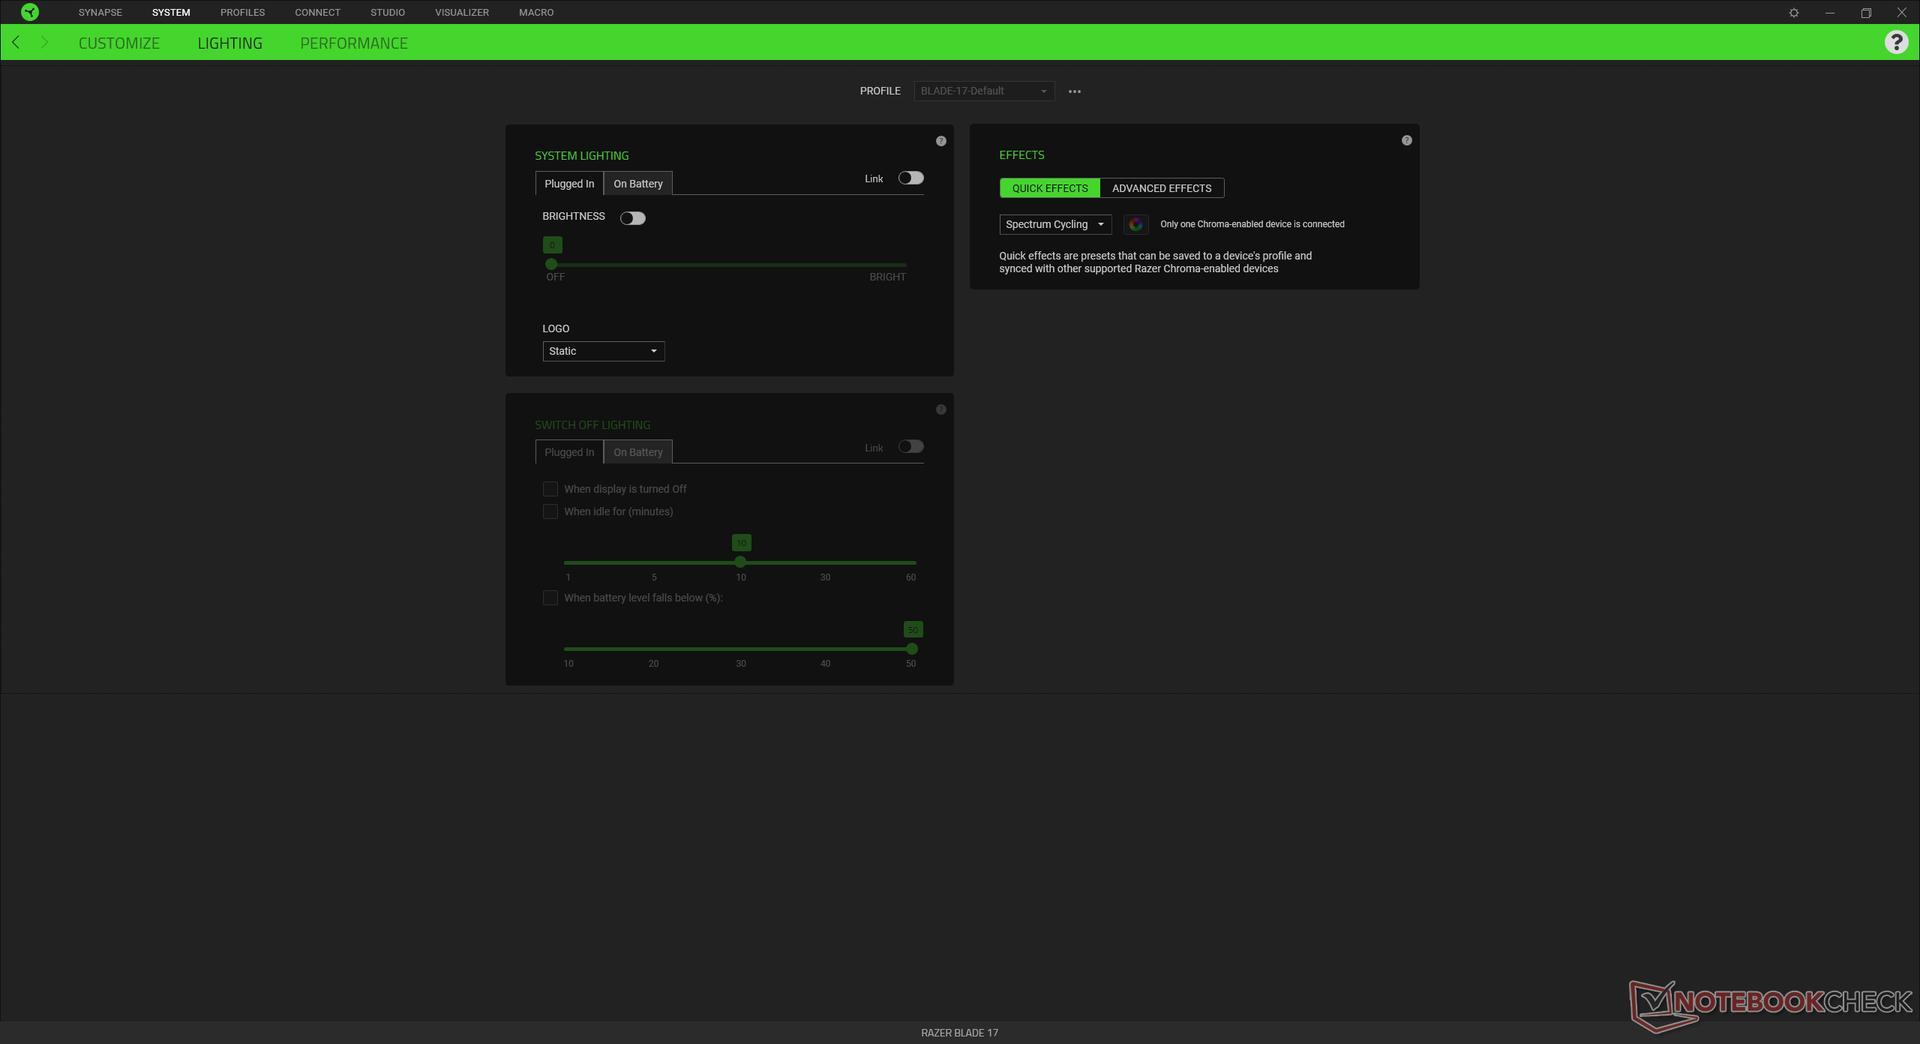
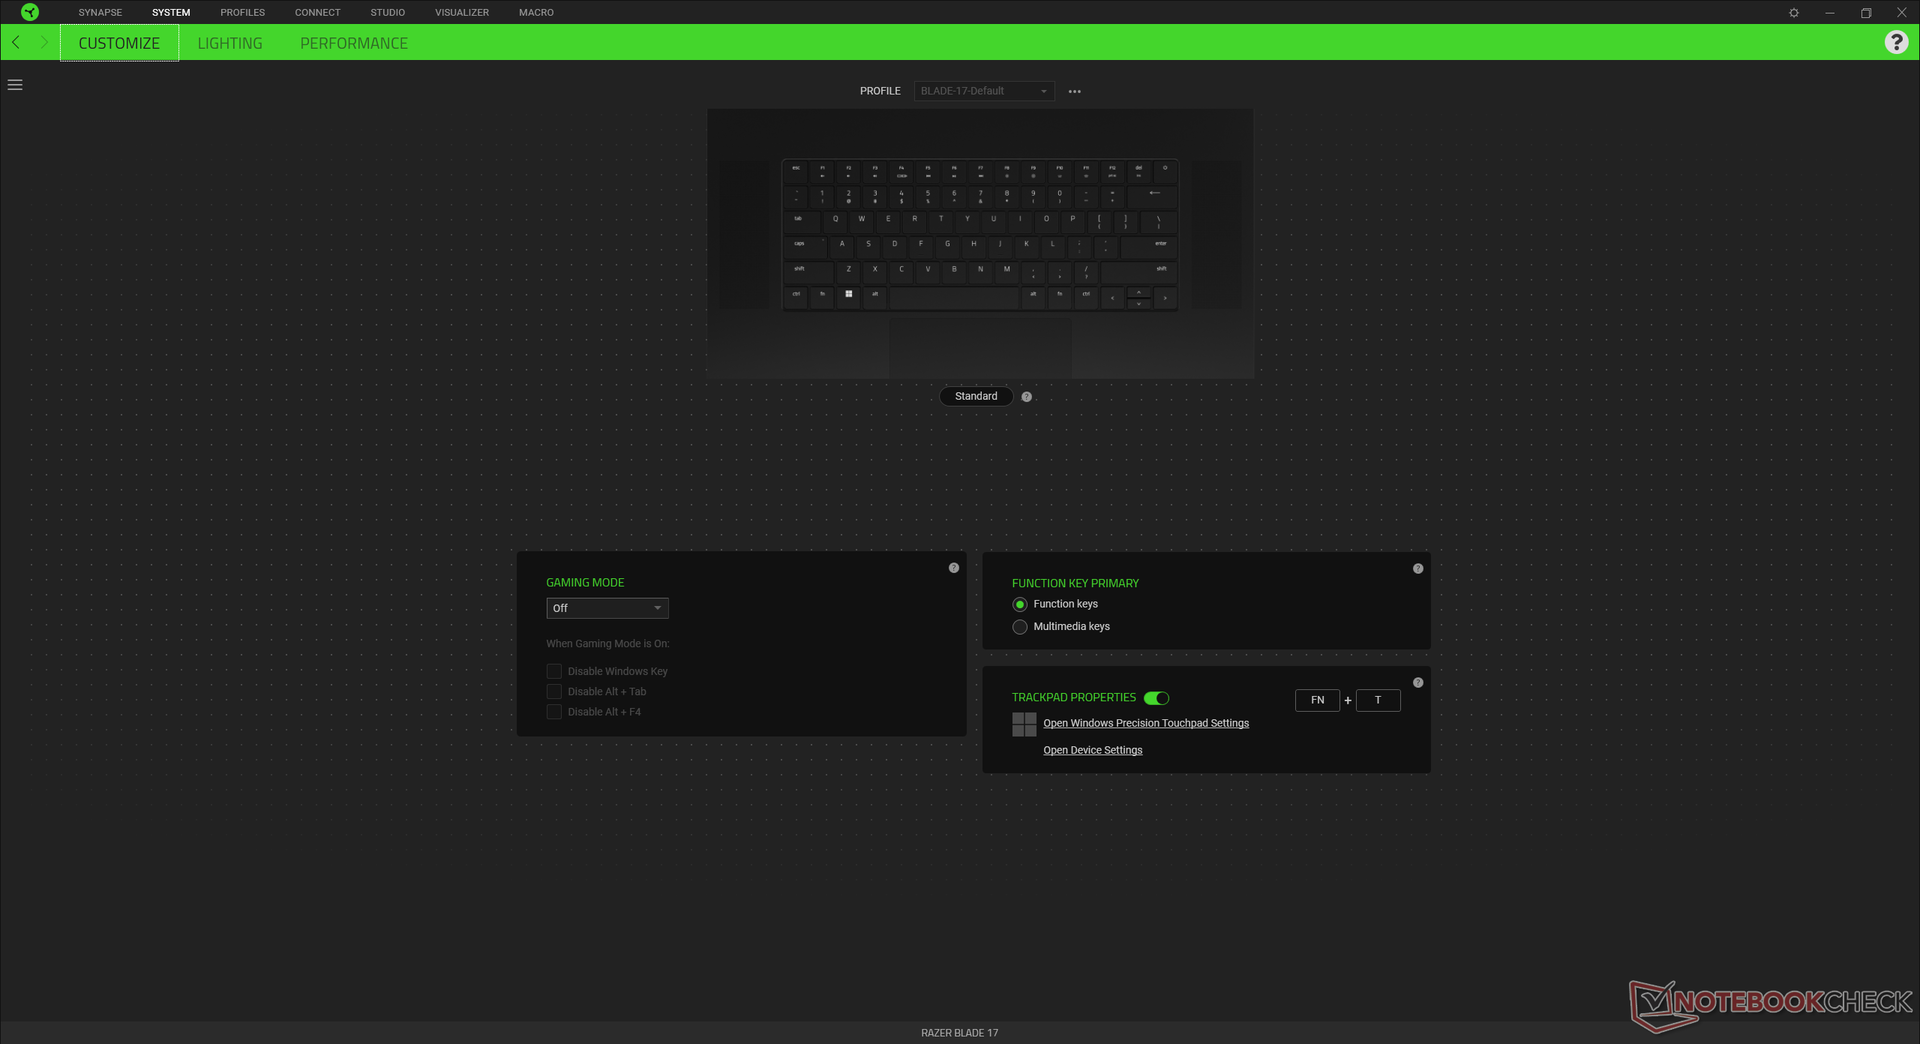
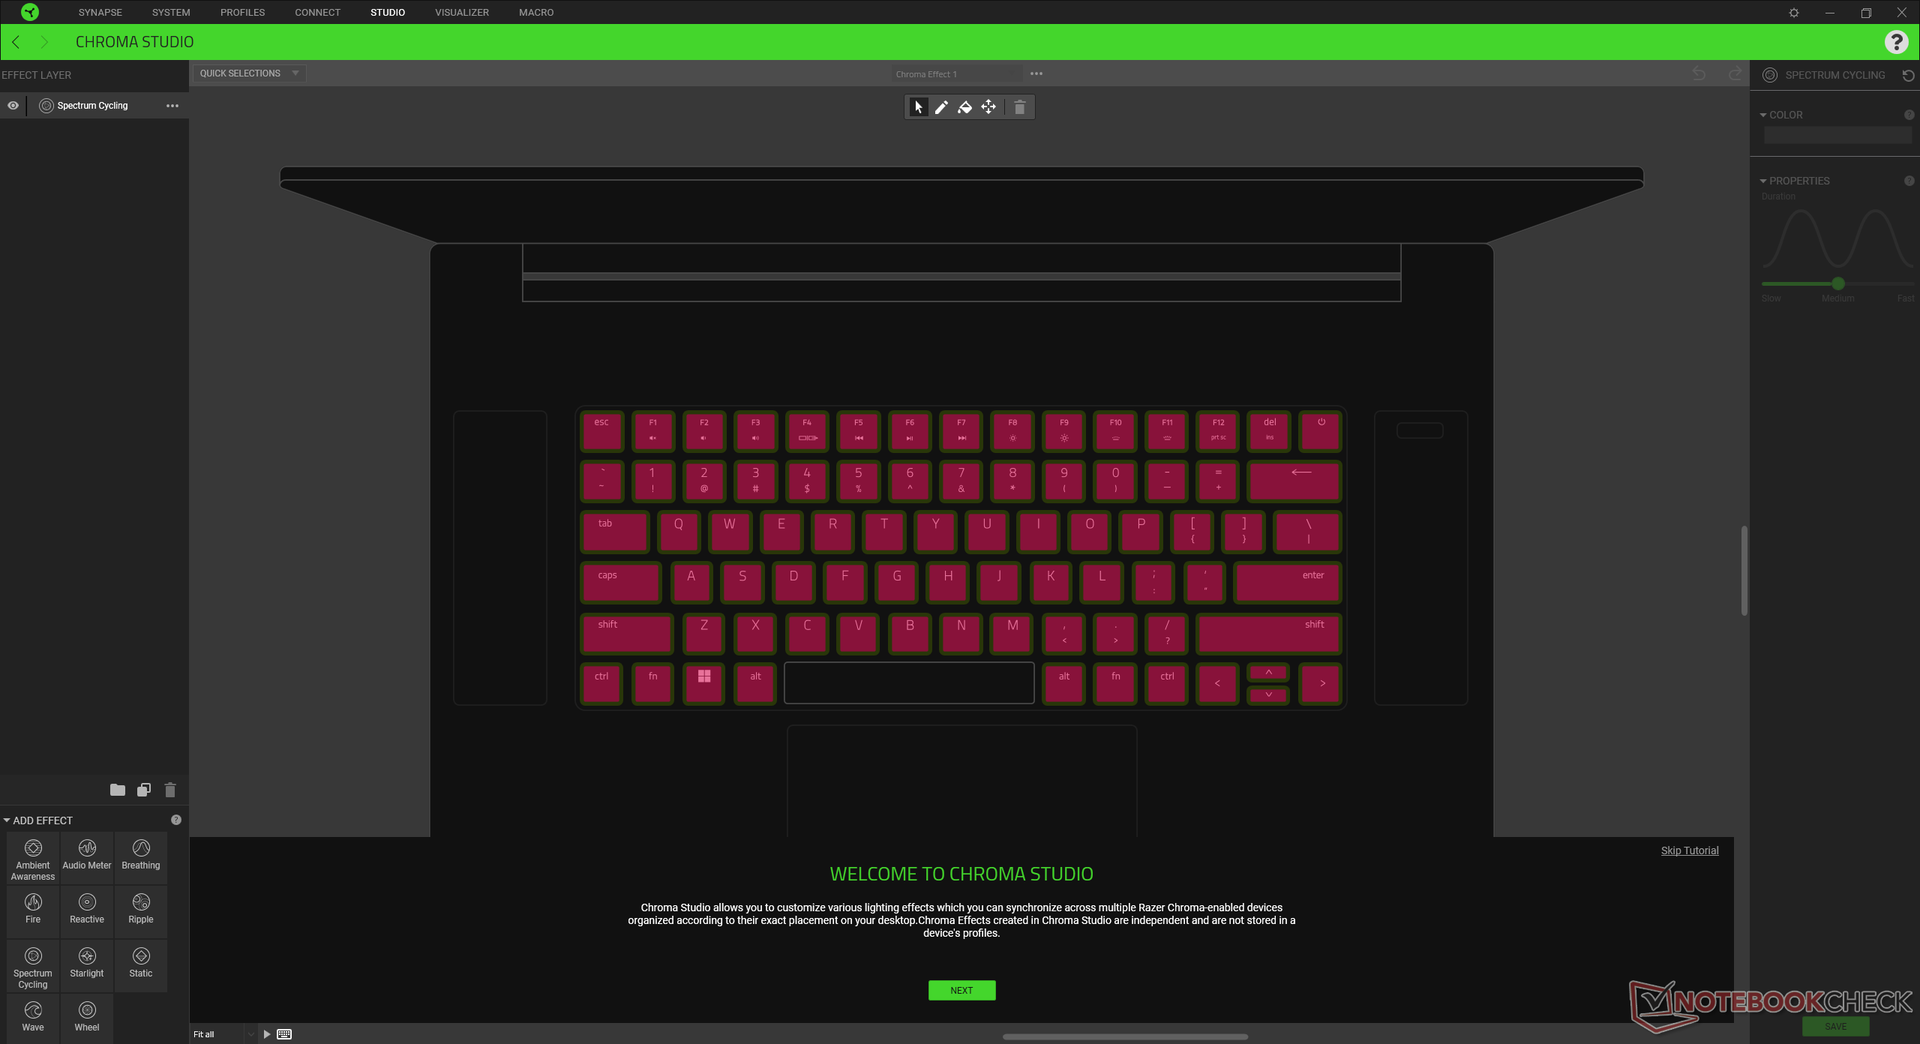
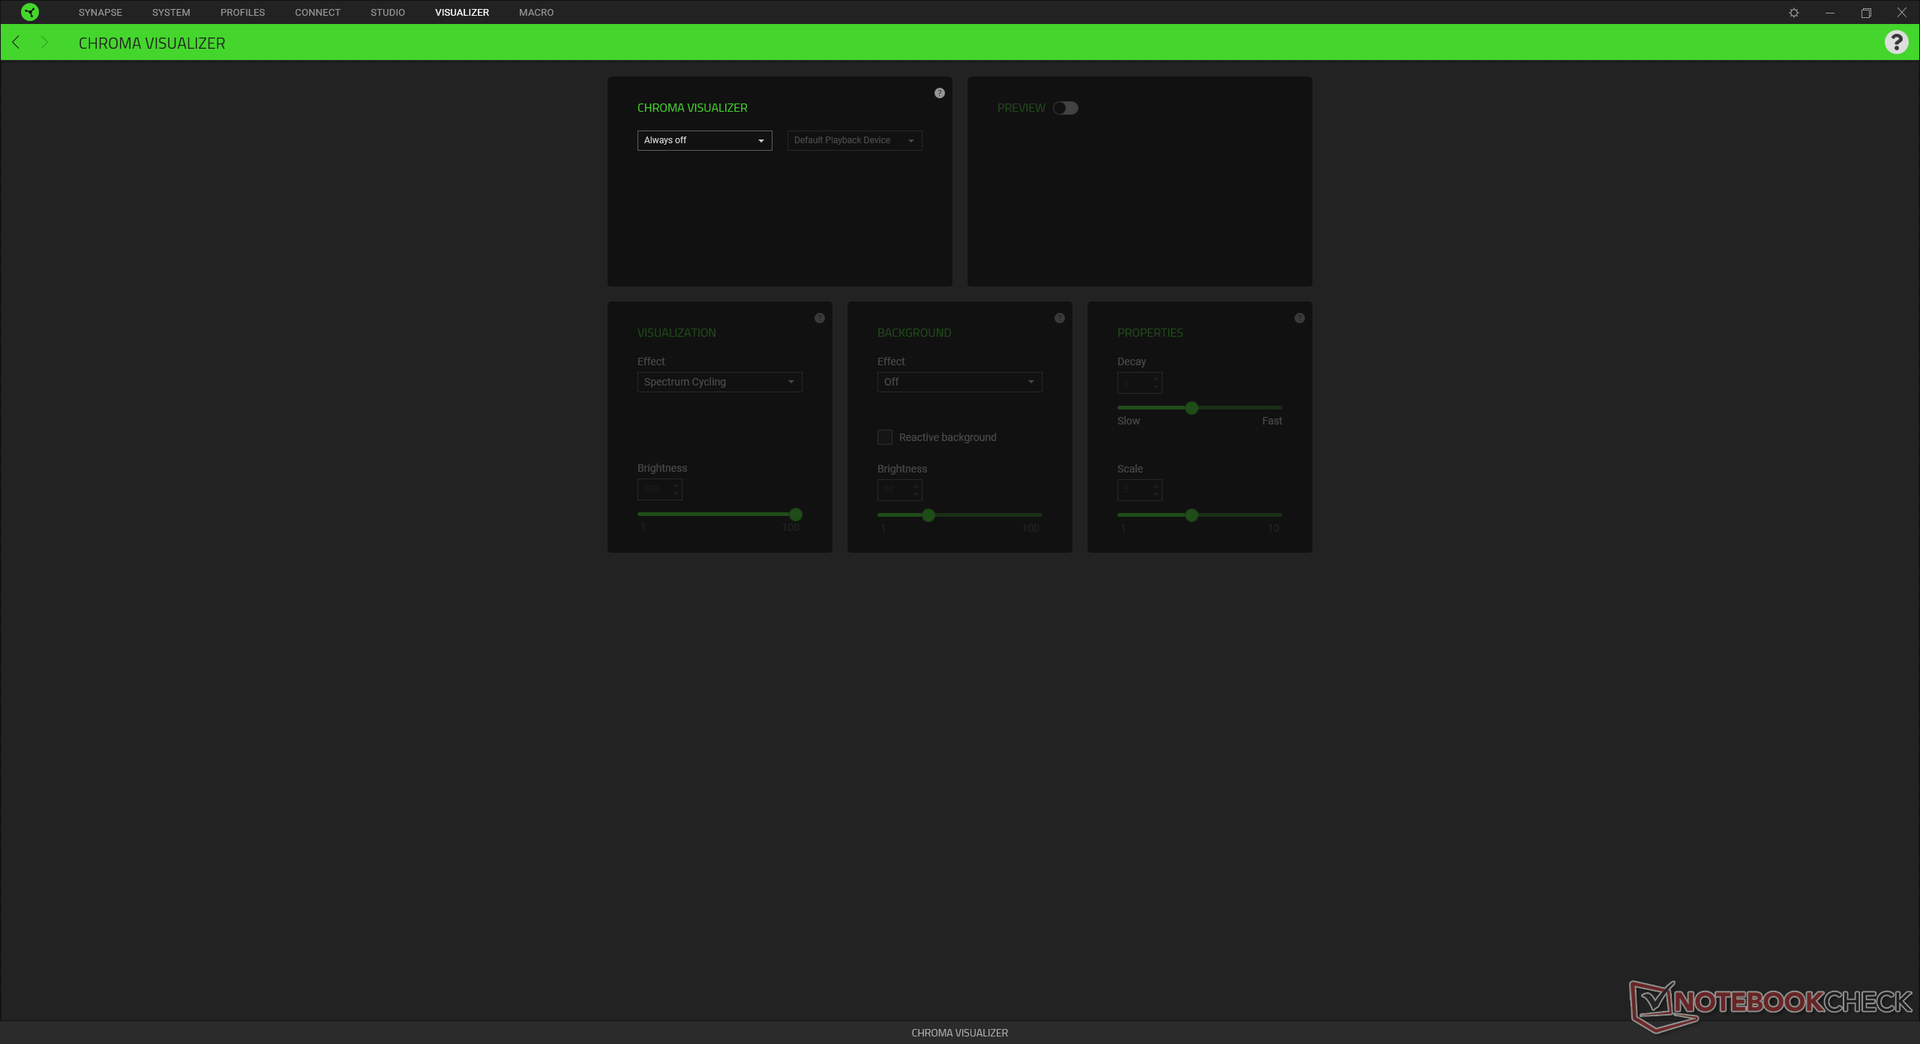
我们的设备被设置为手动模式,CPU和GPU分别处于Boost和High状态,以获得可能的最高基准分数。用户应该熟悉Synapse软件,因为它是系统特定功能和性能配置文件的控制中心。
刀锋17是少数支持高级优化的游戏笔记本电脑之一,这意味着用户可以在优化和dGPU G-Sync模式之间切换,而不需要重新启动。
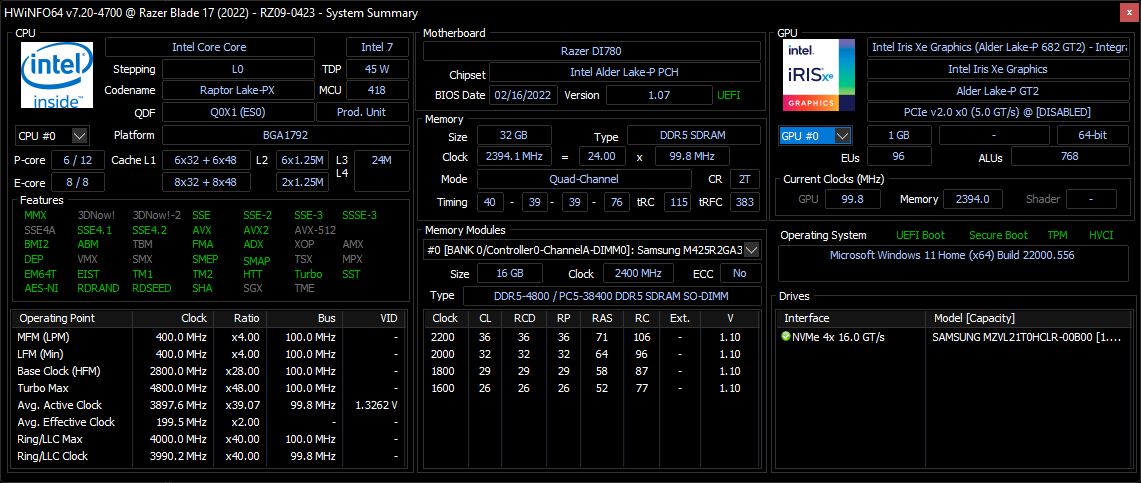
处理器
CPU的性能是我们所期望的,相对于其他运行在相同的笔记本电脑来说 酷睿i7-12800H处理器。原始性能比第11代酷睿i7-11800H处理器高出约20%至25%和50%至70%。 酷睿i7-11800H和第十代 酷睿i7-10875H,分别在老一代刀片17型号上。升级到酷睿i9-12900H SKU,预计只比我们的酷睿i7-12800H配置提供10%的性能提升。
性能的可持续性非常好,在循环运行CineBench R15 xT时,时钟速率没有大的下滑。
Cinebench R15 Multi Loop
Cinebench R20: CPU (Multi Core) | CPU (Single Core)
Cinebench R15: CPU Multi 64Bit | CPU Single 64Bit
Blender: v2.79 BMW27 CPU
7-Zip 18.03: 7z b 4 | 7z b 4 -mmt1
Geekbench 5.5: Multi-Core | Single-Core
HWBOT x265 Benchmark v2.2: 4k Preset
LibreOffice : 20 Documents To PDF
R Benchmark 2.5: Overall mean
| HWBOT x265 Benchmark v2.2 / 4k Preset | |
| MSI GE76 Raider | |
| Schenker Uniwill Technology GM7AG8P | |
| Razer Blade 17 RTX 3080 Ti | |
| Average Intel Core i7-12800H (11.7 - 19.4, n=5) | |
| Schenker XMG Apex 17 M21 | |
| Razer Blade 17 RTX 3070 | |
| Gigabyte A7 X1 | |
| MSI GE76 Raider 10UH | |
| Lenovo Legion 5 17ACH6H-82JY0003GE | |
| Razer Blade Pro 17 2021 (QHD Touch) | |
| Acer Nitro 5 AN517-53-54DQ | |
* ... smaller is better
AIDA64: FP32 Ray-Trace | FPU Julia | CPU SHA3 | CPU Queen | FPU SinJulia | FPU Mandel | CPU AES | CPU ZLib | FP64 Ray-Trace | CPU PhotoWorxx
| Performance rating | |
| Schenker XMG Pro 17 (Late 2021, RTX 3080) | |
| MSI GE76 Raider | |
| Lenovo Legion 5 17ACH6H-82JY0003GE | |
| Schenker Uniwill Technology GM7AG8P | |
| Average Intel Core i7-12800H | |
| Razer Blade 17 RTX 3080 Ti | |
| AIDA64 / FP32 Ray-Trace | |
| Schenker XMG Pro 17 (Late 2021, RTX 3080) | |
| Lenovo Legion 5 17ACH6H-82JY0003GE | |
| MSI GE76 Raider | |
| Average Intel Core i7-12800H (5839 - 15206, n=5) | |
| Schenker Uniwill Technology GM7AG8P | |
| Razer Blade 17 RTX 3080 Ti | |
| AIDA64 / FPU Julia | |
| Lenovo Legion 5 17ACH6H-82JY0003GE | |
| Schenker XMG Pro 17 (Late 2021, RTX 3080) | |
| Average Intel Core i7-12800H (27801 - 80002, n=5) | |
| MSI GE76 Raider | |
| Schenker Uniwill Technology GM7AG8P | |
| Razer Blade 17 RTX 3080 Ti | |
| AIDA64 / CPU SHA3 | |
| Schenker XMG Pro 17 (Late 2021, RTX 3080) | |
| MSI GE76 Raider | |
| Schenker Uniwill Technology GM7AG8P | |
| Average Intel Core i7-12800H (2013 - 3684, n=5) | |
| Lenovo Legion 5 17ACH6H-82JY0003GE | |
| Razer Blade 17 RTX 3080 Ti | |
| AIDA64 / CPU Queen | |
| MSI GE76 Raider | |
| Razer Blade 17 RTX 3080 Ti | |
| Schenker Uniwill Technology GM7AG8P | |
| Average Intel Core i7-12800H (85965 - 108084, n=5) | |
| Schenker XMG Pro 17 (Late 2021, RTX 3080) | |
| Lenovo Legion 5 17ACH6H-82JY0003GE | |
| AIDA64 / FPU SinJulia | |
| MSI GE76 Raider | |
| Schenker Uniwill Technology GM7AG8P | |
| Schenker XMG Pro 17 (Late 2021, RTX 3080) | |
| Lenovo Legion 5 17ACH6H-82JY0003GE | |
| Razer Blade 17 RTX 3080 Ti | |
| Average Intel Core i7-12800H (7027 - 9658, n=5) | |
| AIDA64 / FPU Mandel | |
| Lenovo Legion 5 17ACH6H-82JY0003GE | |
| Schenker XMG Pro 17 (Late 2021, RTX 3080) | |
| MSI GE76 Raider | |
| Average Intel Core i7-12800H (15765 - 38179, n=5) | |
| Schenker Uniwill Technology GM7AG8P | |
| Razer Blade 17 RTX 3080 Ti | |
| AIDA64 / CPU AES | |
| Schenker XMG Pro 17 (Late 2021, RTX 3080) | |
| MSI GE76 Raider | |
| Lenovo Legion 5 17ACH6H-82JY0003GE | |
| Schenker Uniwill Technology GM7AG8P | |
| Average Intel Core i7-12800H (55371 - 73928, n=5) | |
| Razer Blade 17 RTX 3080 Ti | |
| AIDA64 / CPU ZLib | |
| MSI GE76 Raider | |
| Schenker Uniwill Technology GM7AG8P | |
| Average Intel Core i7-12800H (701 - 1047, n=5) | |
| Razer Blade 17 RTX 3080 Ti | |
| Schenker XMG Pro 17 (Late 2021, RTX 3080) | |
| Lenovo Legion 5 17ACH6H-82JY0003GE | |
| AIDA64 / FP64 Ray-Trace | |
| Schenker XMG Pro 17 (Late 2021, RTX 3080) | |
| Lenovo Legion 5 17ACH6H-82JY0003GE | |
| MSI GE76 Raider | |
| Schenker Uniwill Technology GM7AG8P | |
| Average Intel Core i7-12800H (3257 - 8559, n=5) | |
| Razer Blade 17 RTX 3080 Ti | |
| AIDA64 / CPU PhotoWorxx | |
| Razer Blade 17 RTX 3080 Ti | |
| Schenker Uniwill Technology GM7AG8P | |
| MSI GE76 Raider | |
| Average Intel Core i7-12800H (31329 - 40992, n=5) | |
| Schenker XMG Pro 17 (Late 2021, RTX 3080) | |
| Lenovo Legion 5 17ACH6H-82JY0003GE | |
系统性能
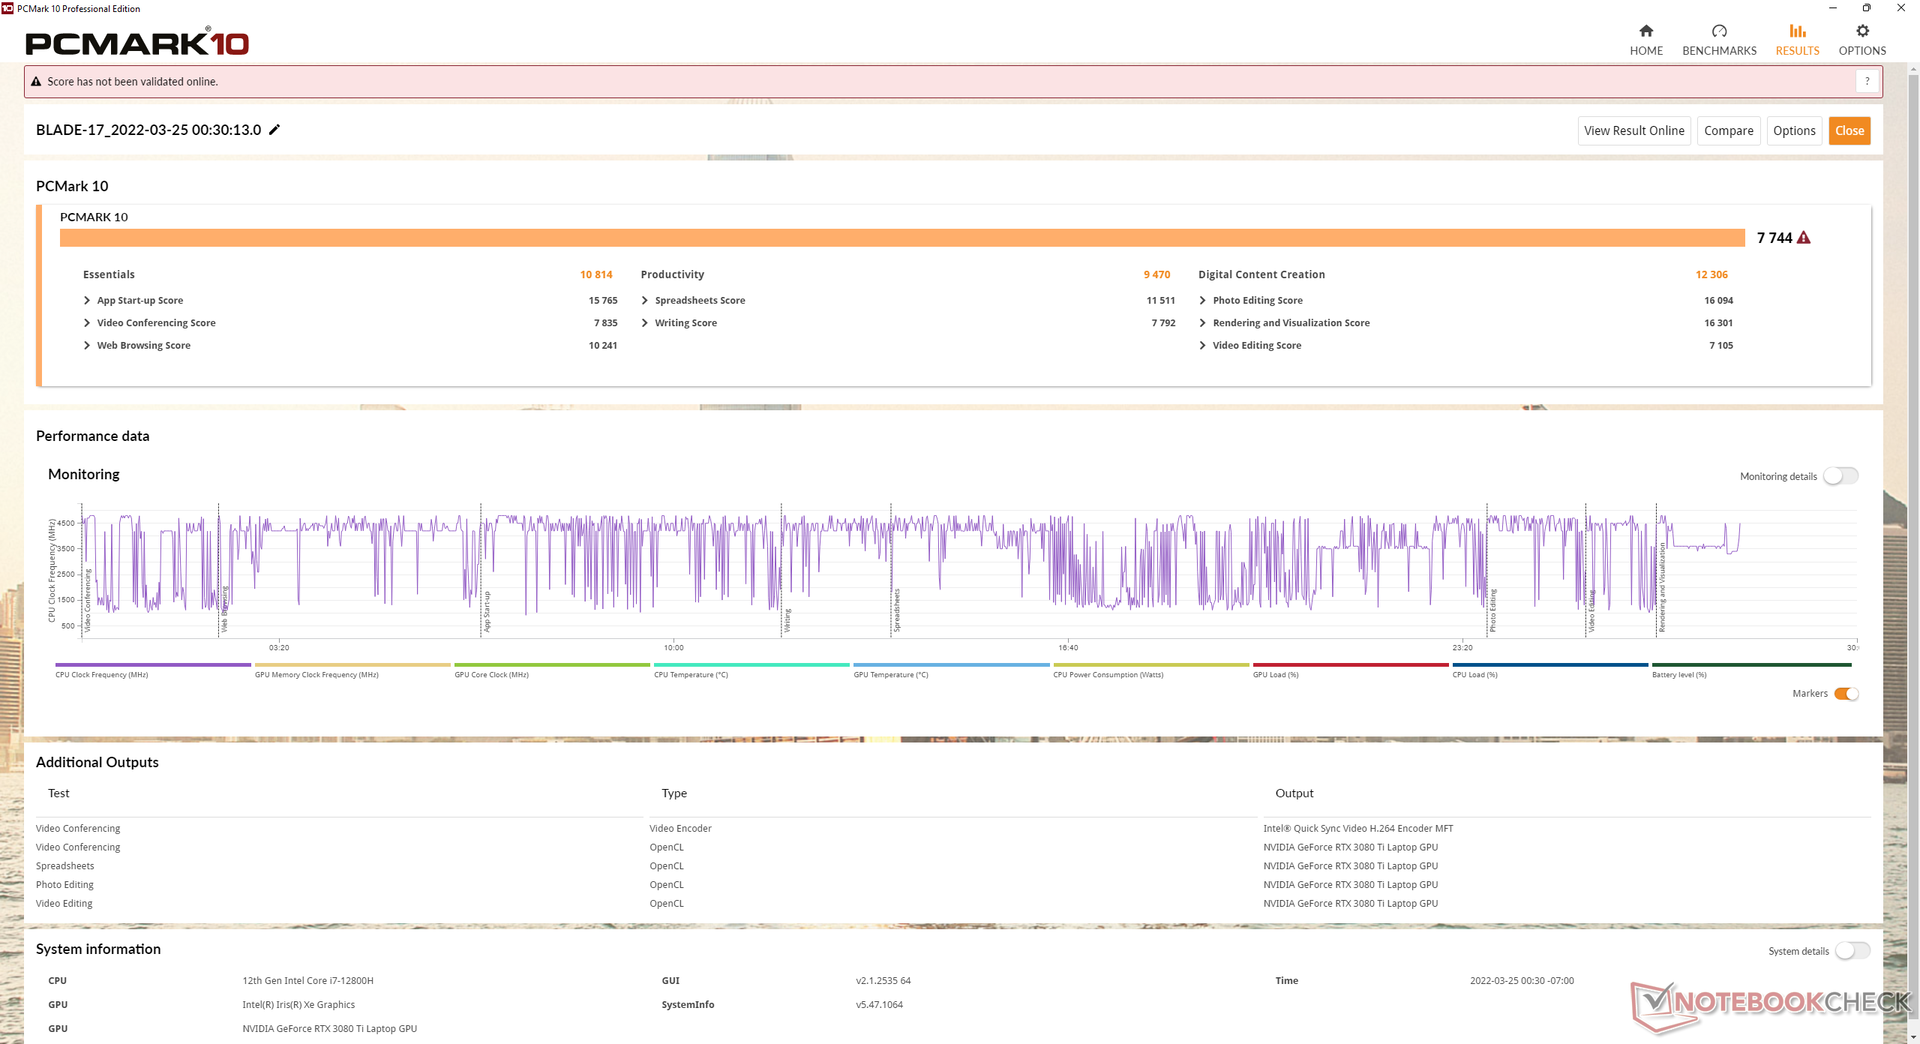
PCMark 10的结果一直高于我们在去年的模型上记录的结果,特别是在数字内容创作分测试中。Razer似乎还解决了与Synapse软件在未连接到互联网时无法启动的问题。
| PCMark 10 / Score | |
| Razer Blade 17 RTX 3080 Ti | |
| Average Intel Core i7-12800H, NVIDIA GeForce RTX 3080 Ti Laptop GPU (7313 - 7744, n=3) | |
| Alienware x17 RTX 3080 P48E | |
| Asus ROG Zephyrus S17 GX703HSD | |
| Aorus 17G YD | |
| MSI GS76 Stealth 11UH | |
| Razer Blade Pro 17 2021 (QHD Touch) | |
| PCMark 10 / Essentials | |
| Razer Blade 17 RTX 3080 Ti | |
| Average Intel Core i7-12800H, NVIDIA GeForce RTX 3080 Ti Laptop GPU (10597 - 10814, n=3) | |
| Asus ROG Zephyrus S17 GX703HSD | |
| Aorus 17G YD | |
| Alienware x17 RTX 3080 P48E | |
| Razer Blade Pro 17 2021 (QHD Touch) | |
| MSI GS76 Stealth 11UH | |
| PCMark 10 / Productivity | |
| Alienware x17 RTX 3080 P48E | |
| Average Intel Core i7-12800H, NVIDIA GeForce RTX 3080 Ti Laptop GPU (9470 - 9675, n=3) | |
| Razer Blade 17 RTX 3080 Ti | |
| Aorus 17G YD | |
| Asus ROG Zephyrus S17 GX703HSD | |
| MSI GS76 Stealth 11UH | |
| Razer Blade Pro 17 2021 (QHD Touch) | |
| PCMark 10 / Digital Content Creation | |
| Razer Blade 17 RTX 3080 Ti | |
| Average Intel Core i7-12800H, NVIDIA GeForce RTX 3080 Ti Laptop GPU (10351 - 12306, n=3) | |
| Alienware x17 RTX 3080 P48E | |
| Asus ROG Zephyrus S17 GX703HSD | |
| Aorus 17G YD | |
| MSI GS76 Stealth 11UH | |
| Razer Blade Pro 17 2021 (QHD Touch) | |
| PCMark 10 Score | 7744 points | |
Help | ||
| AIDA64 / Memory Copy | |
| MSI GE76 Raider | |
| Razer Blade 17 RTX 3080 Ti | |
| Schenker Uniwill Technology GM7AG8P | |
| Average Intel Core i7-12800H (48643 - 62522, n=5) | |
| Schenker XMG Pro 17 (Late 2021, RTX 3080) | |
| Schenker XMG Apex 17 M21 | |
| Lenovo Legion 5 17ACH6H-82JY0003GE | |
| AIDA64 / Memory Read | |
| Razer Blade 17 RTX 3080 Ti | |
| MSI GE76 Raider | |
| Schenker Uniwill Technology GM7AG8P | |
| Average Intel Core i7-12800H (56629 - 66199, n=5) | |
| Schenker XMG Pro 17 (Late 2021, RTX 3080) | |
| Schenker XMG Apex 17 M21 | |
| Lenovo Legion 5 17ACH6H-82JY0003GE | |
| AIDA64 / Memory Write | |
| Razer Blade 17 RTX 3080 Ti | |
| Schenker Uniwill Technology GM7AG8P | |
| MSI GE76 Raider | |
| Average Intel Core i7-12800H (50923 - 66074, n=5) | |
| Schenker XMG Apex 17 M21 | |
| Schenker XMG Pro 17 (Late 2021, RTX 3080) | |
| Lenovo Legion 5 17ACH6H-82JY0003GE | |
| AIDA64 / Memory Latency | |
| MSI GE76 Raider | |
| Schenker XMG Pro 17 (Late 2021, RTX 3080) | |
| Schenker XMG Apex 17 M21 | |
| Lenovo Legion 5 17ACH6H-82JY0003GE | |
| Average Intel Core i7-12800H (89.3 - 95.2, n=5) | |
| Schenker Uniwill Technology GM7AG8P | |
| Razer Blade 17 RTX 3080 Ti | |
* ... smaller is better
DPC延时
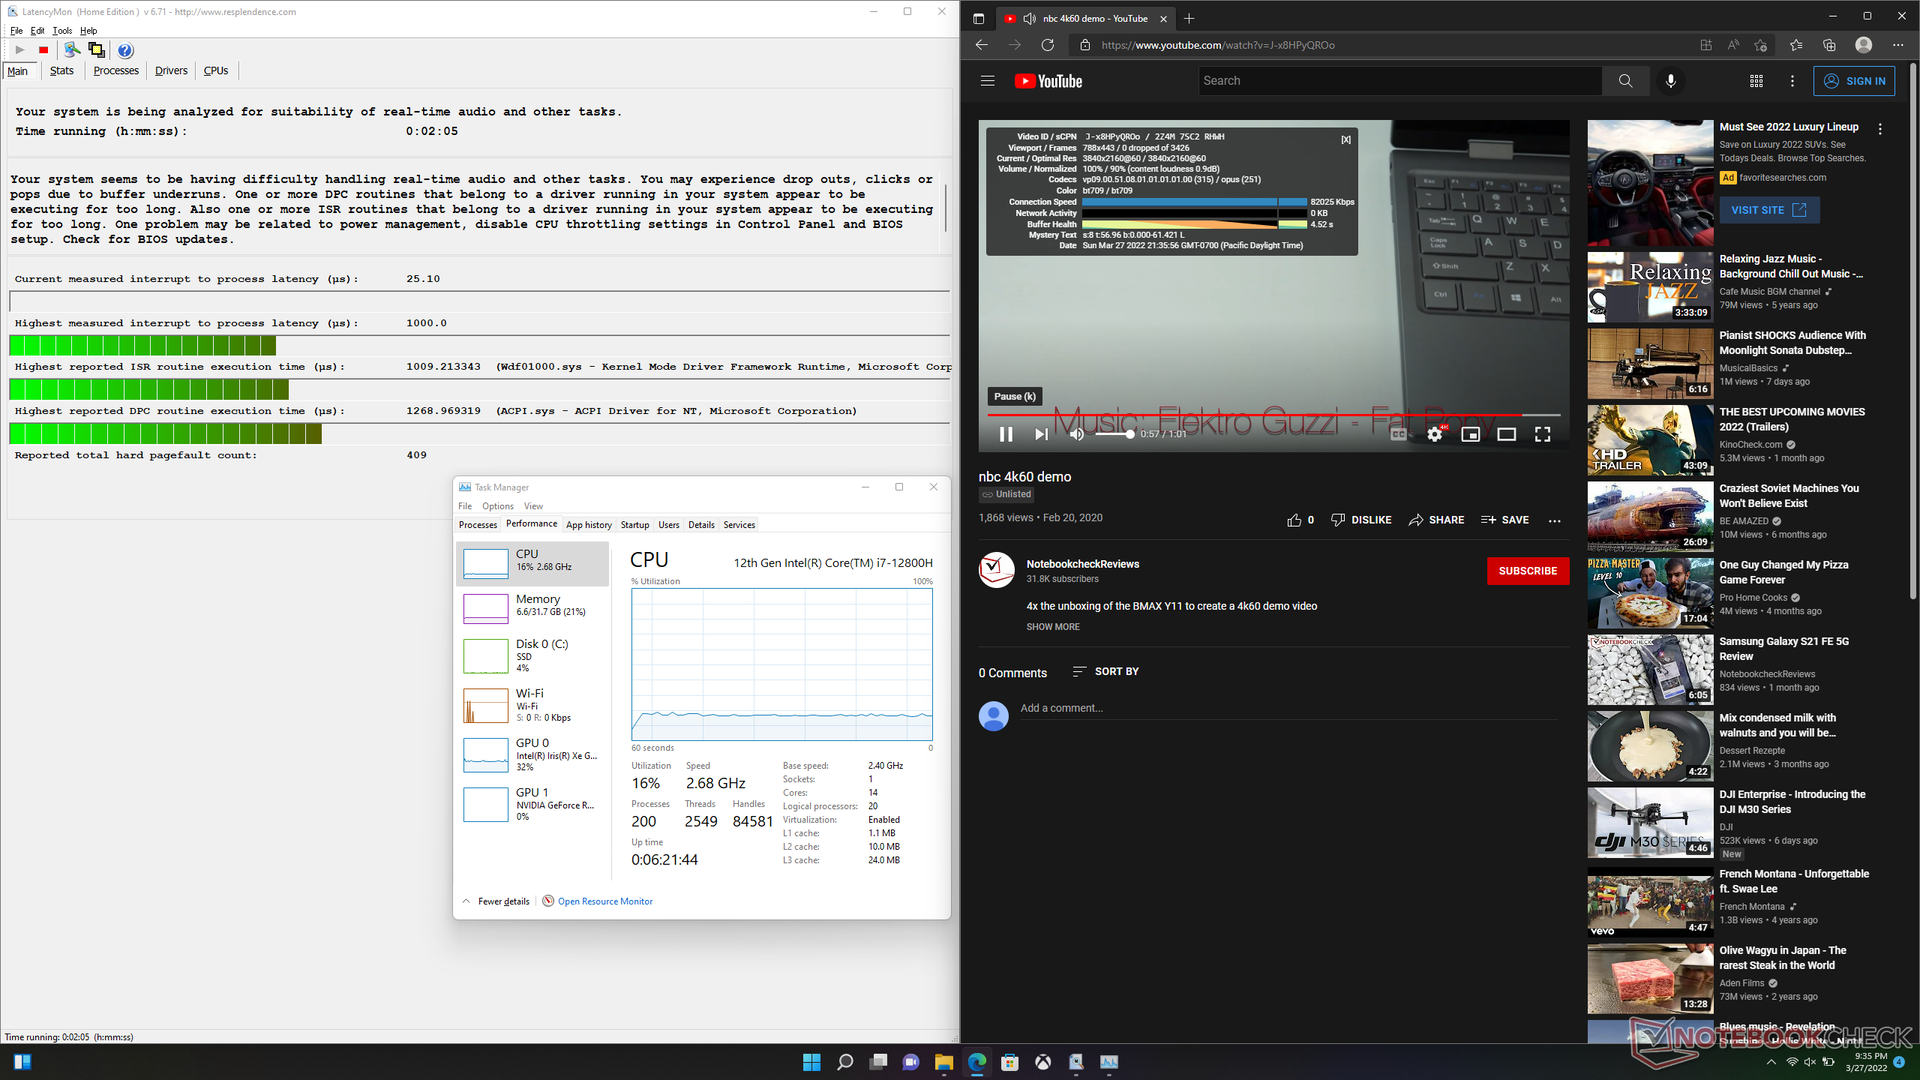
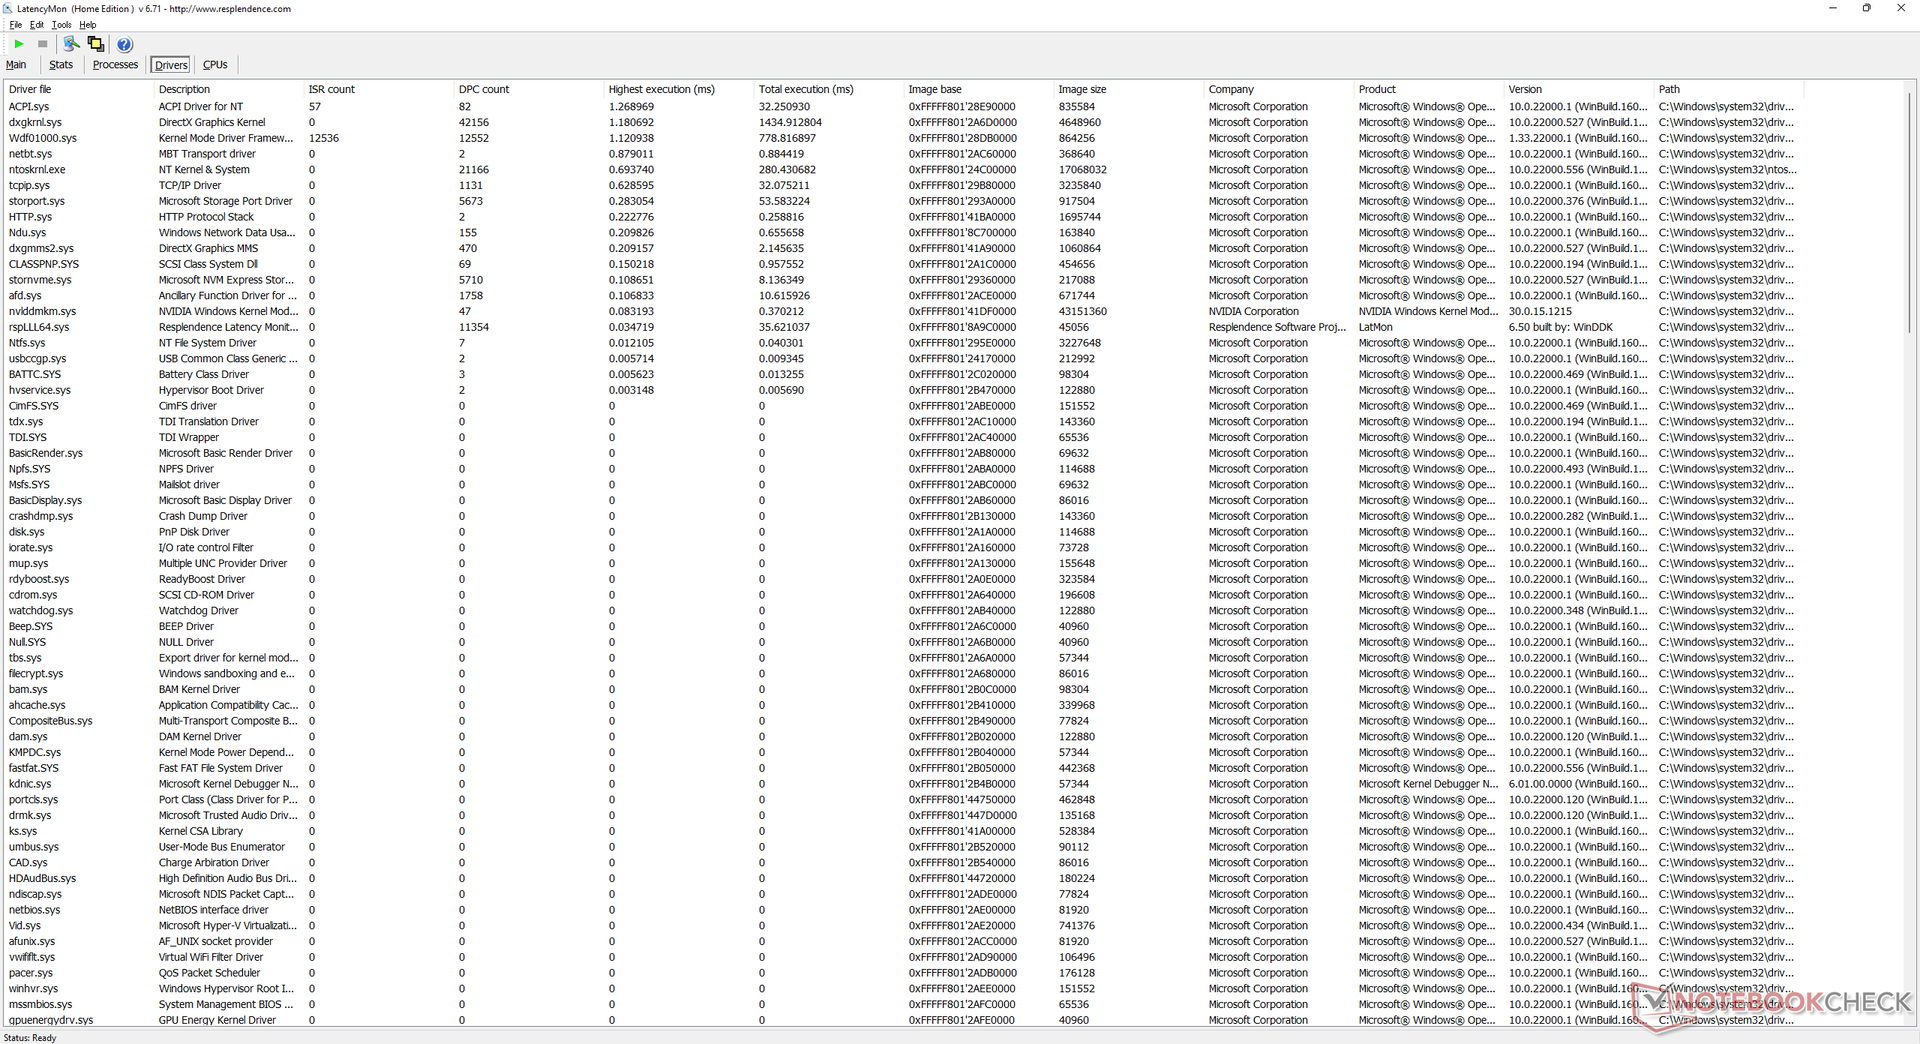
LatencyMon显示在我们的主页上打开多个浏览器标签时存在轻微的DPC问题。在60 FPS的情况下,4K视频播放是完美的,没有丢帧。
| DPC Latencies / LatencyMon - interrupt to process latency (max), Web, Youtube, Prime95 | |
| Alienware x17 RTX 3080 P48E | |
| Razer Blade Pro 17 2021 (QHD Touch) | |
| Asus ROG Zephyrus S17 GX703HSD | |
| Aorus 17G YD | |
| Razer Blade 17 RTX 3080 Ti | |
| MSI GS76 Stealth 11UH | |
* ... smaller is better
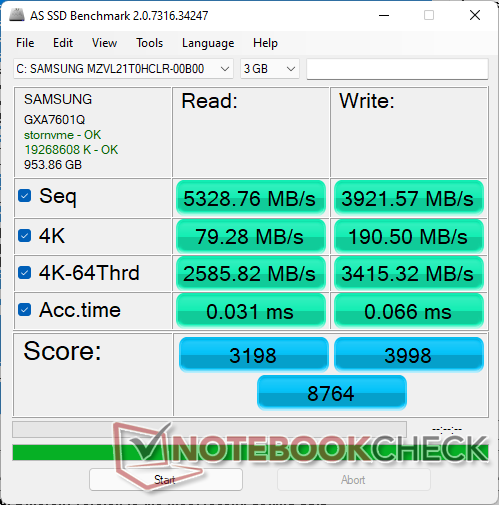
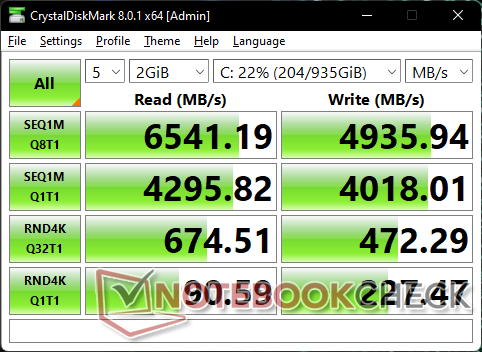
存储设备 - 多达两个M.2 PCIe4 x4固态硬盘
大多数,如果不是全部,Blade 17 SKU都配备了三星固态硬盘。我们的测试单元配备了三星PM9A1这是目前最快的消费级PCIe4 x4固态硬盘之一。该驱动器没有显示出任何问题,在我们的设备中维持了超过6600MB/s的非常快的传输率,表明其具有出色的散热能力,而不像在联合利华科技GM7AG8P.

* ... smaller is better
Disk Throttling: DiskSpd Read Loop, Queue Depth 8
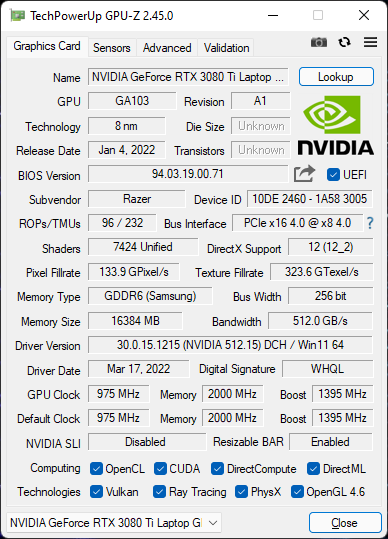
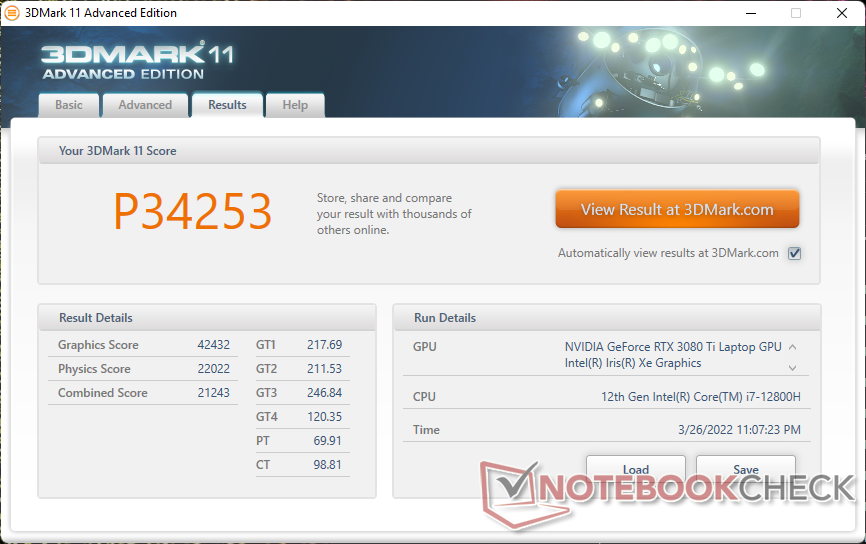
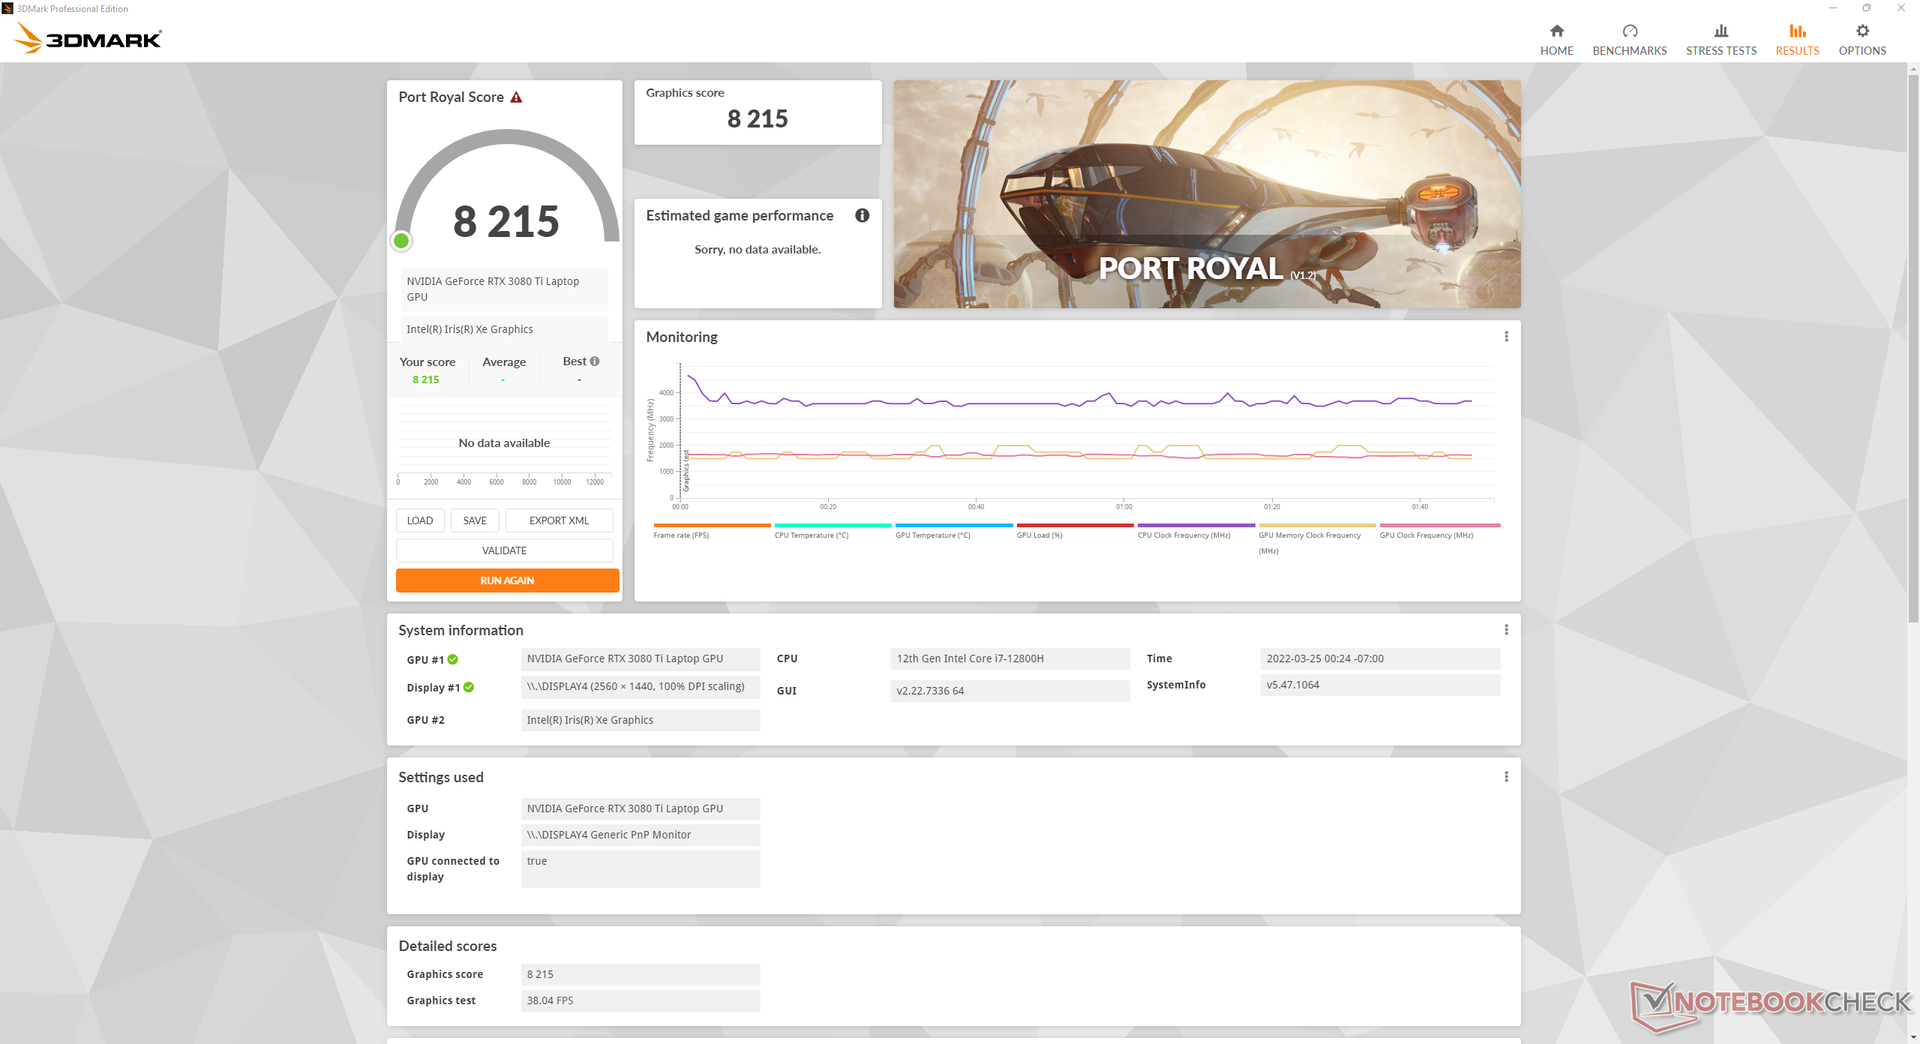
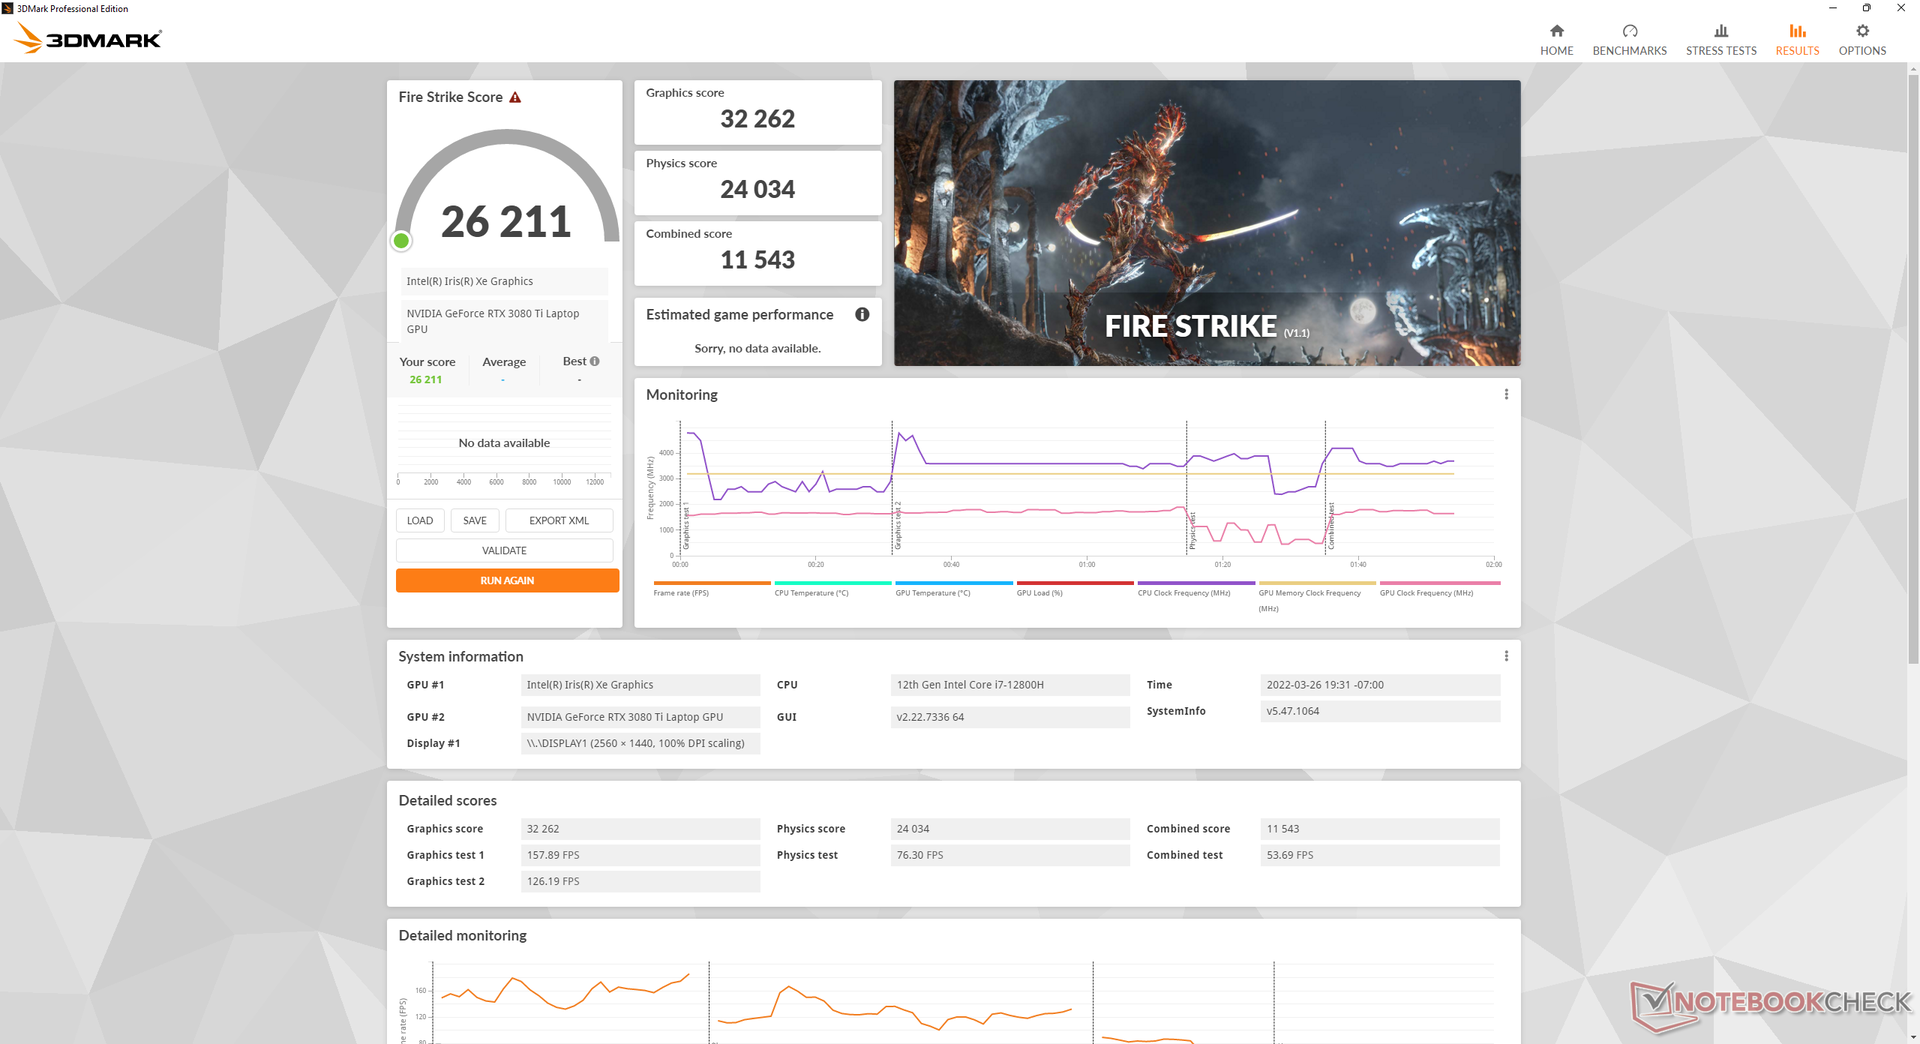
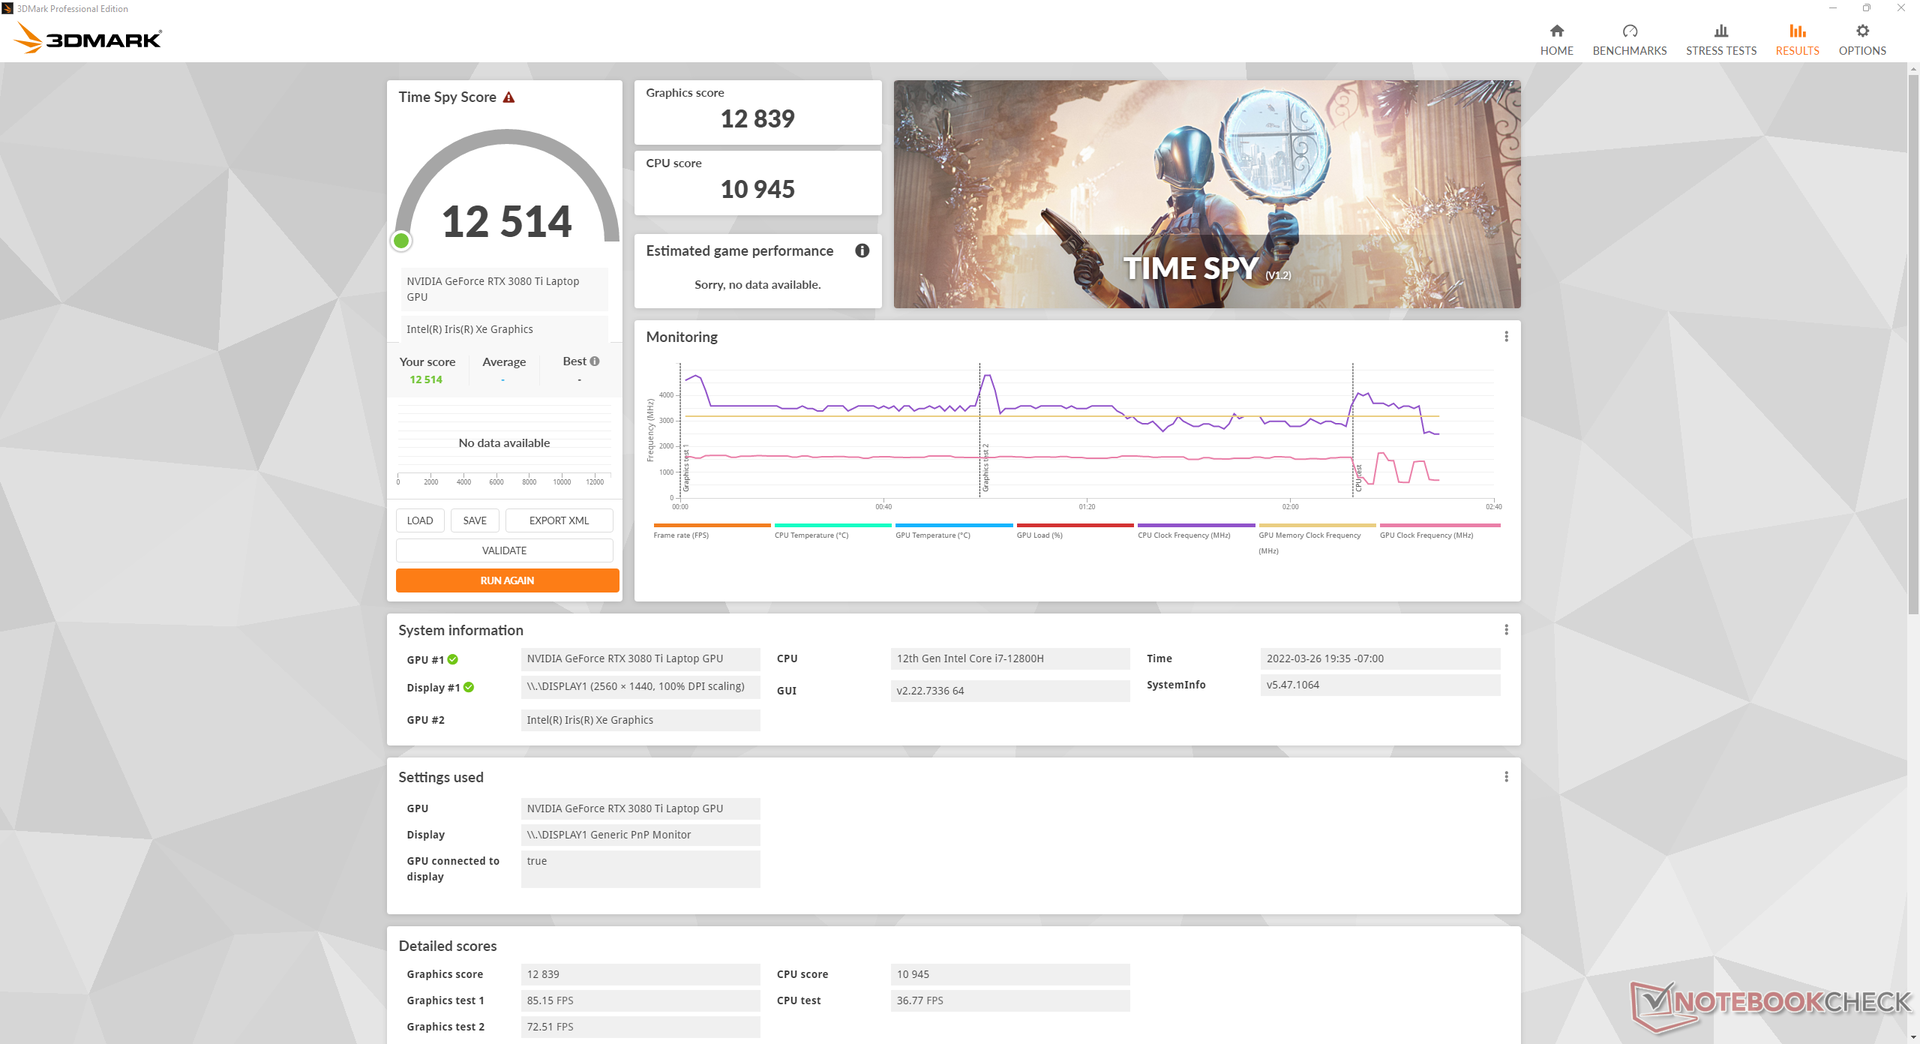
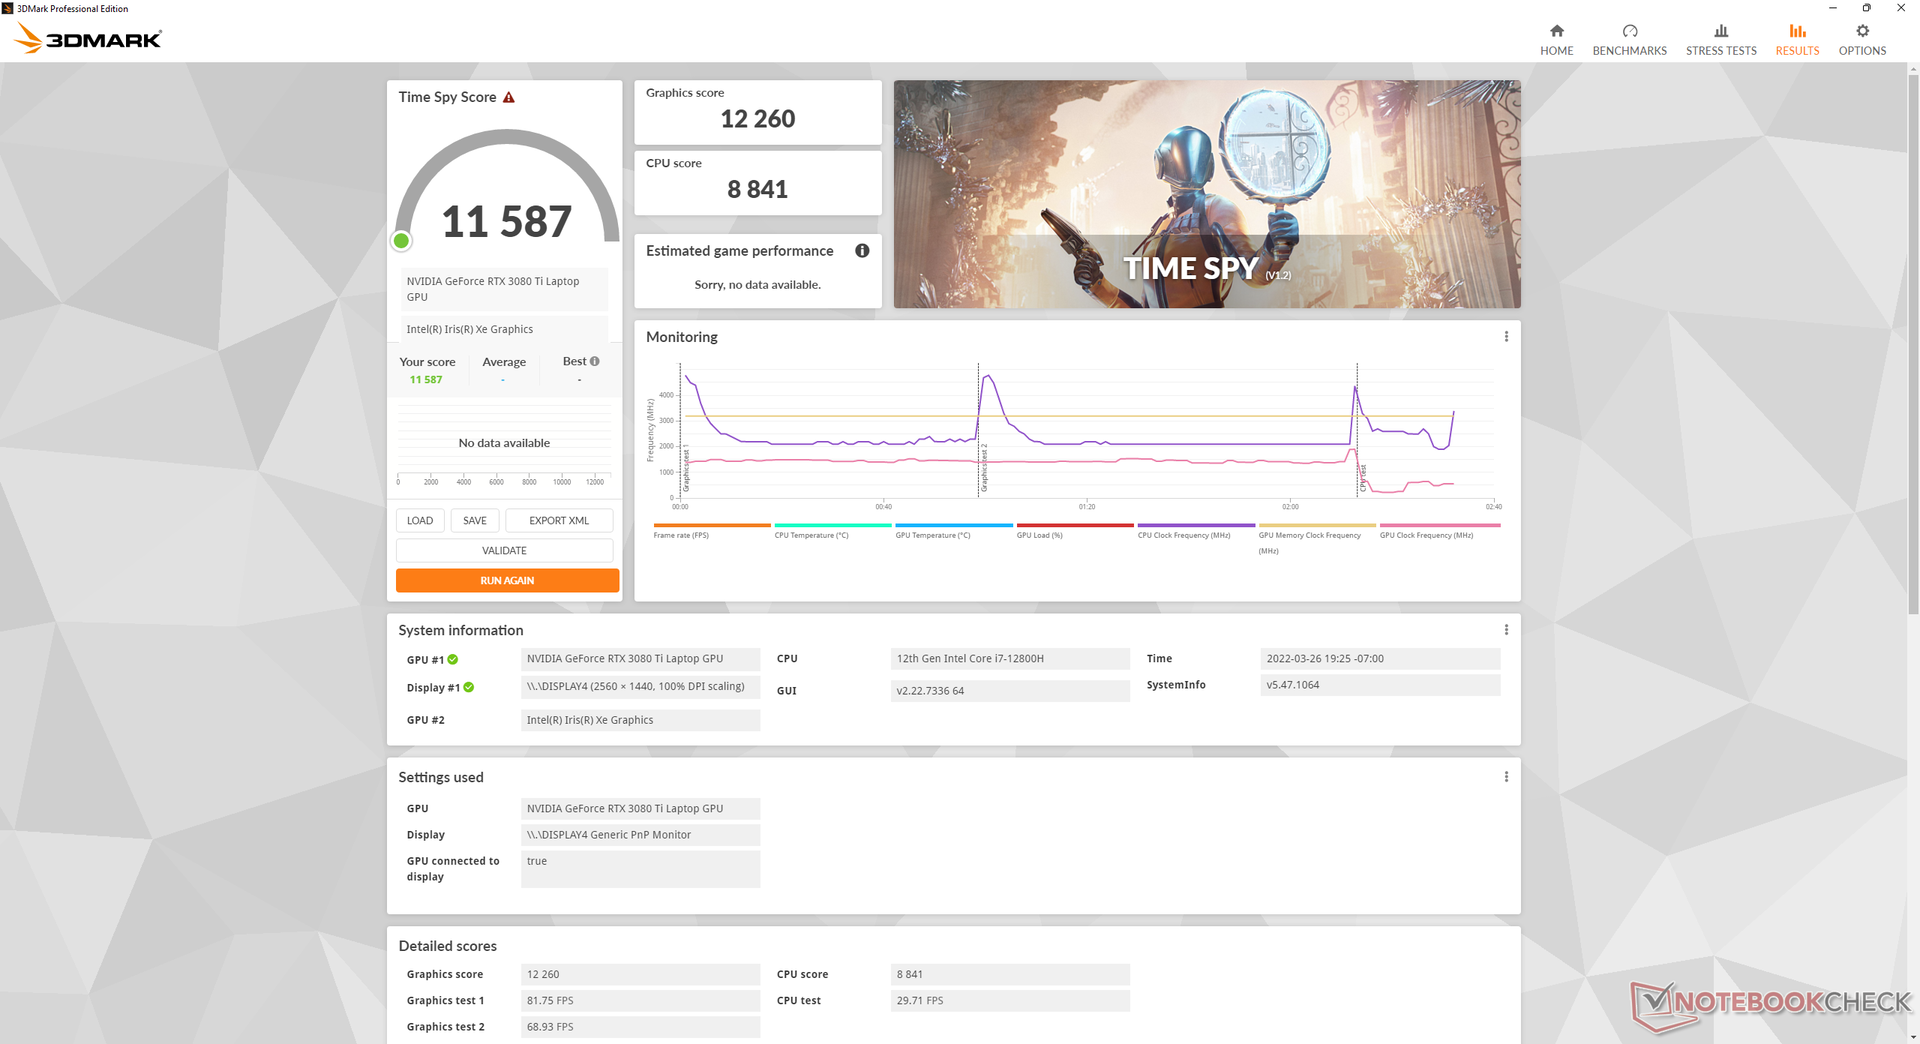
GPU性能
在测试了超过半打装有 移动GeForce RTX 3080 Ti图形,我们的Blade 17的性能舒适地高于平均水平,约为15%。165瓦的高TGP目标无疑是性能优势的一大原因,因为其他配备相同RTX 3080 Ti GPU的笔记本电脑,如 刀片15或 Gigabyte Aero 16 YE5倾向于追求更低的TGP目标,而不是100W左右。用户可以期待比第10代或第11代英特尔Blade 17的原始图形性能提升约20%,并配备常规的 移动RTX 3080图形。
在平衡dGPU模式而不是最高性能dGPU模式下运行系统,将导致图形性能下降约5%至7%。
降级到 移动RTX 3070 Ti我们的移动RTX 3080 Ti将导致只有约10%的性能赤字。
当然, "真正的 "RTX 3080 Ti仍将在GPU性能方面提供一个巨大的飞跃,比我们的移动版本高出近50%。


| 3DMark 11 - 1280x720 Performance GPU | |
| Corsair One i300 | |
| ASUS GeForce RTX 3080 ROG STRIX OC GAMING | |
| Razer Blade 17 RTX 3080 Ti | |
| MSI Vector GP66 12UGS | |
| Average NVIDIA GeForce RTX 3080 Ti Laptop GPU (13920 - 45841, n=45) | |
| Schenker XMG Apex 17 M21 | |
| Razer Blade Pro 17 2021 (QHD Touch) | |
| Alienware m17 R3 P45E | |
| Asus TUF Gaming F17 FX706HM | |
| MSI GS75 10SF-609US | |
| Eluktronics RP-17 | |
| Asus ROG Strix G17 G713QE-RB74 | |
| Asus TUF A17 FA706IU-AS76 | |
| 3DMark 11 Performance | 34253 points | |
| 3DMark Cloud Gate Standard Score | 62059 points | |
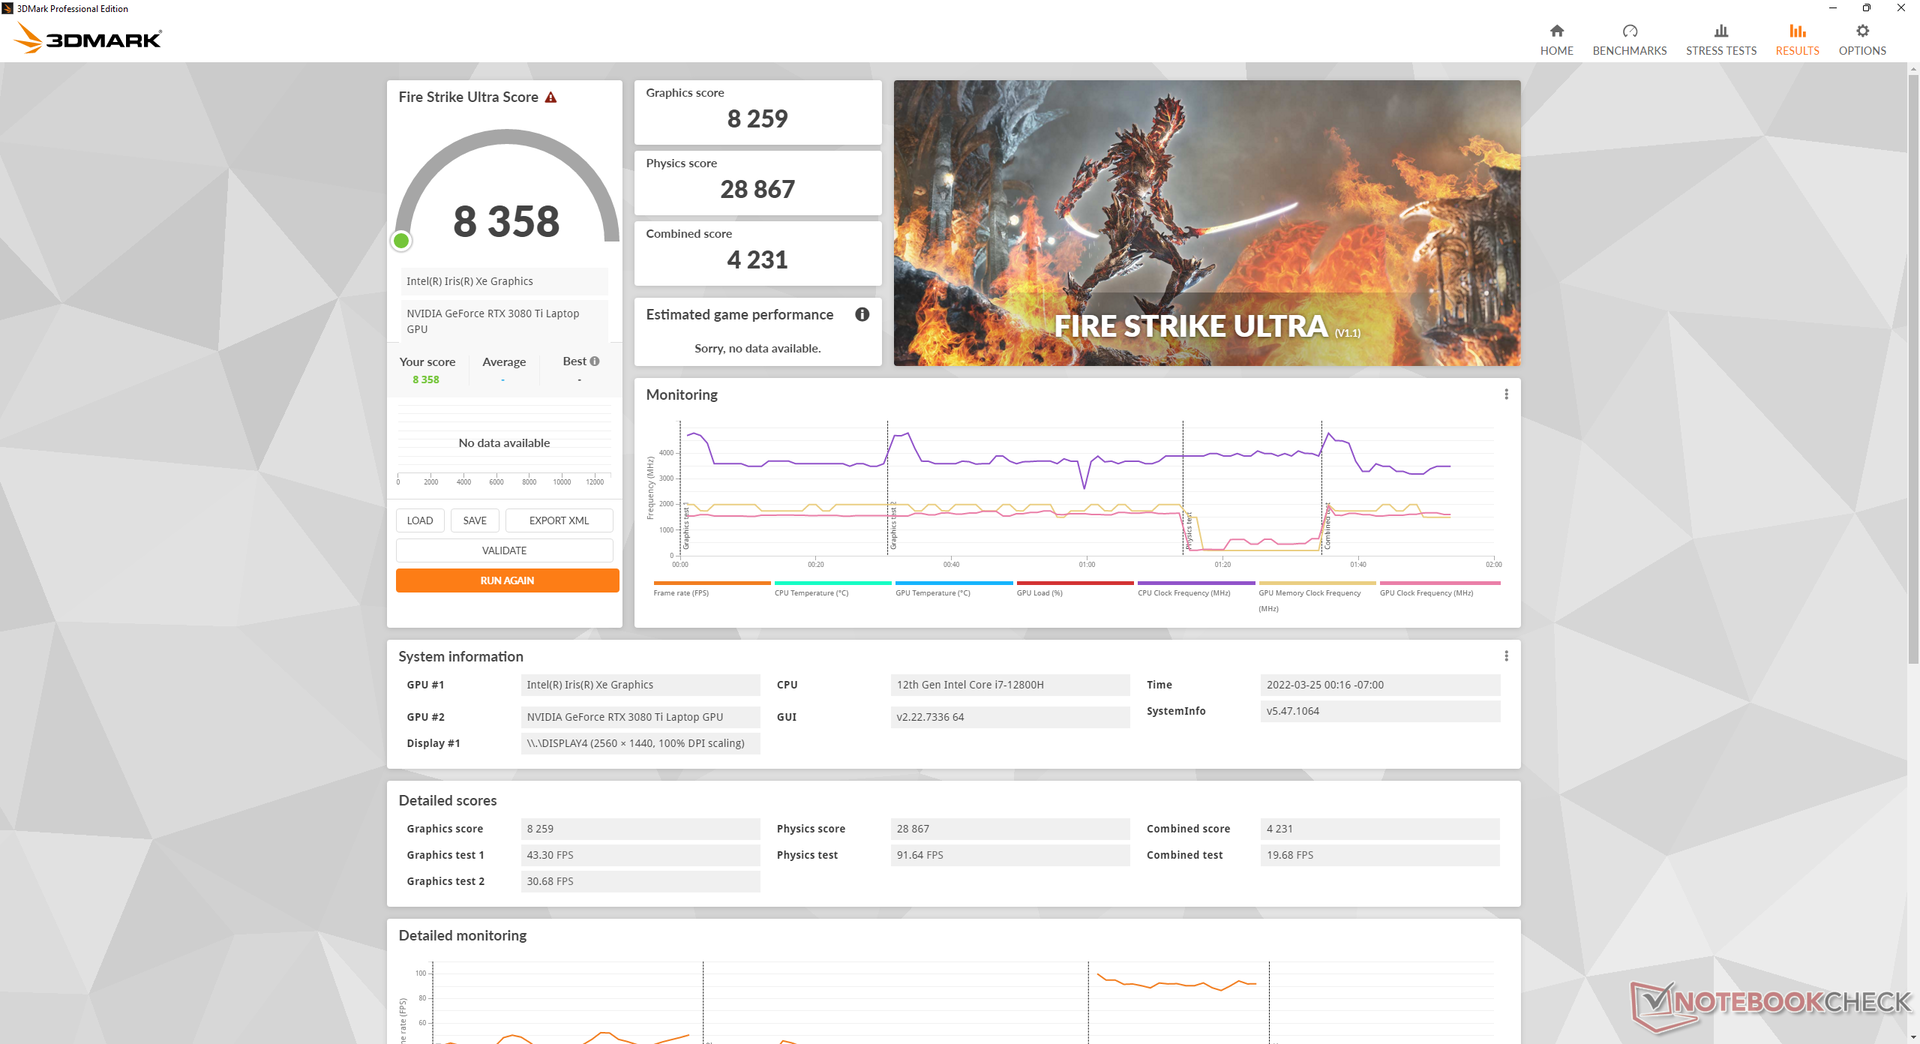
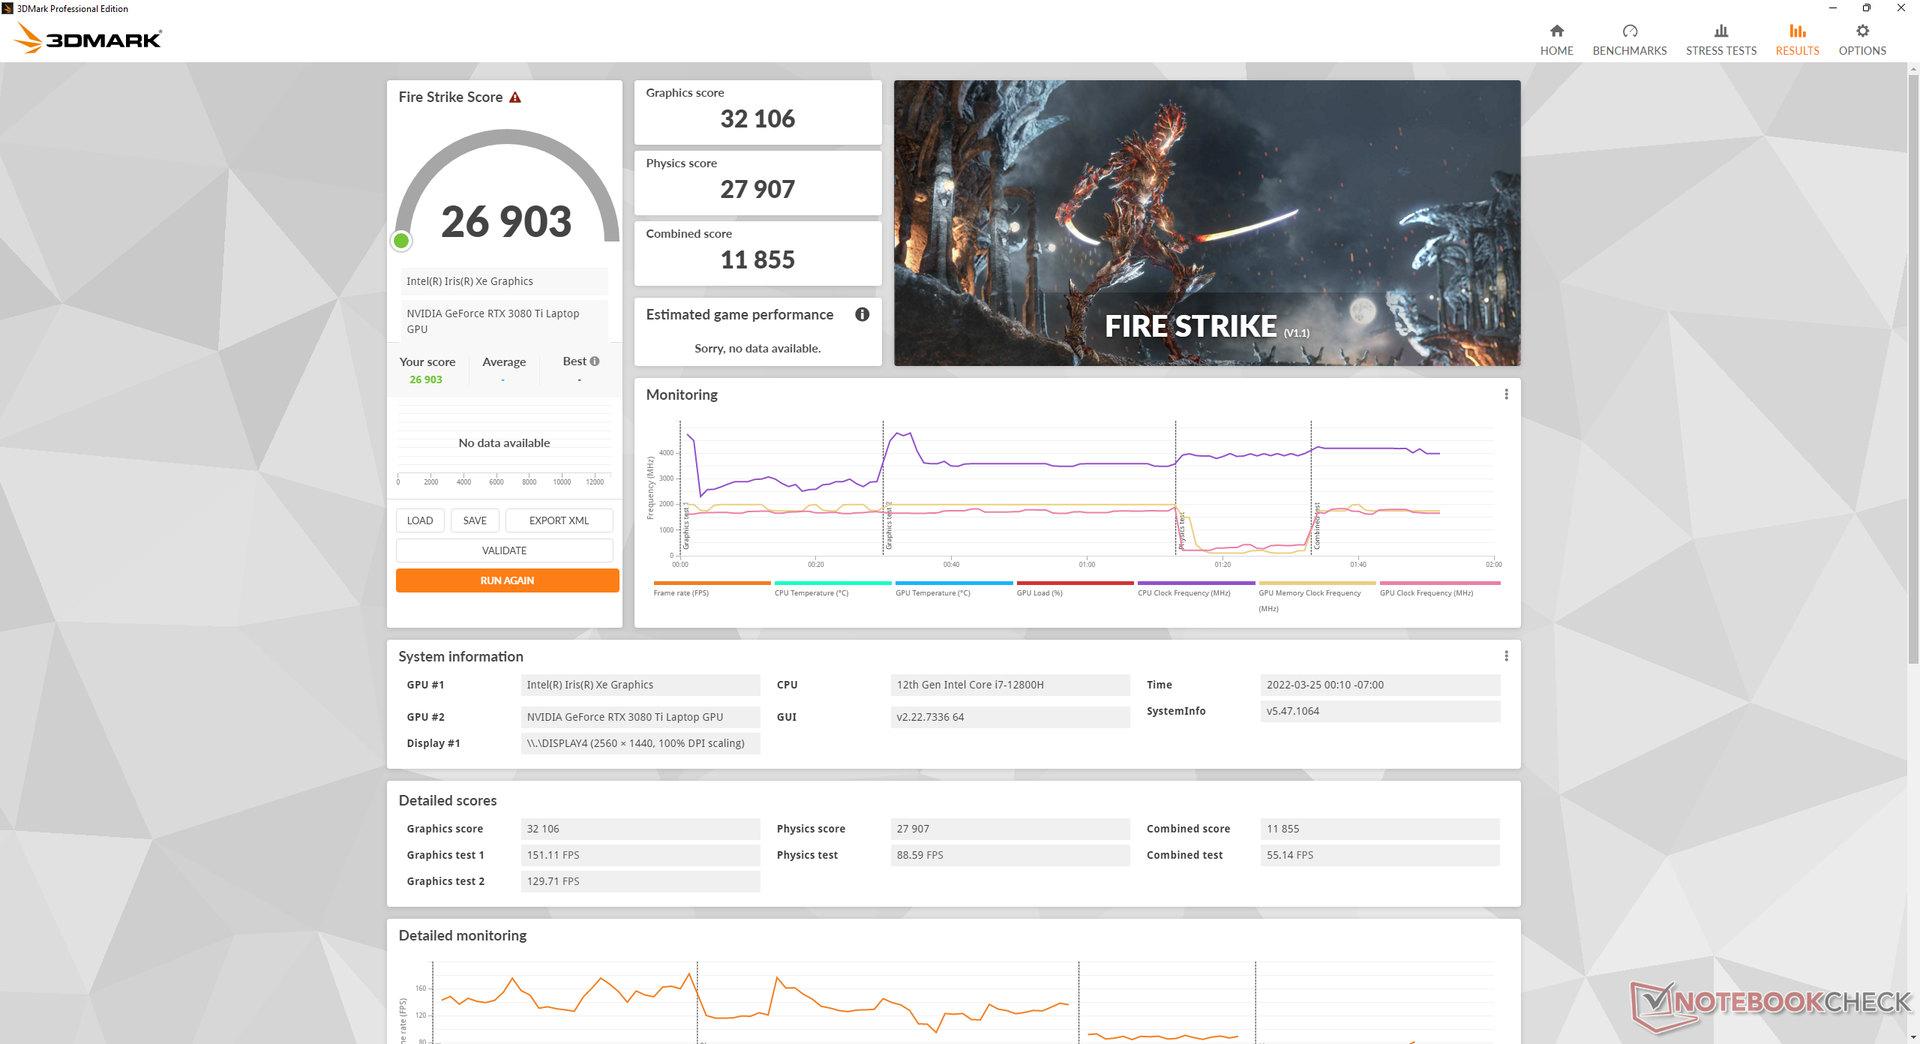
| 3DMark Fire Strike Score | 26903 points | |
| 3DMark Time Spy Score | 12913 points | |
Help | ||
Witcher 3 FPS Chart
| low | med. | high | ultra | QHD | |
|---|---|---|---|---|---|
| GTA V (2015) | 186 | 182 | 176 | 113 | 105 |
| The Witcher 3 (2015) | 459 | 340.9 | 250.4 | 124.6 | |
| Dota 2 Reborn (2015) | 183 | 171 | 165 | 157 | |
| Final Fantasy XV Benchmark (2018) | 168 | 152 | 121 | 93.3 | |
| X-Plane 11.11 (2018) | 158 | 139 | 111 | ||
| Far Cry 5 (2018) | 171 | 149 | 134 | 125 | 120 |
| Strange Brigade (2018) | 431 | 296 | 242 | 215 | 158 |
| Cyberpunk 2077 1.6 (2022) | 119.1 | 112.1 | 106 | 106.5 | 59.7 |
排放
系统噪音--只有在游戏时才会很响
尽管从四个风扇减少到三个,但风扇的噪音没有明显变化。用户在不运行任何高要求的应用程序时,将希望在省电模式或平衡模式下使用更安静的风扇。
在平衡模式下进行游戏时,风扇噪音约为43.2分贝(A),而在最高性能模式下进行游戏时,风扇噪音为50.9分贝(A),尽管有5%到7%的图形赤字。因此,如果用户担心风扇噪音,不妨考虑在平衡模式下进行游戏。
Noise level
| Idle |
| 23.3 / 23.3 / 26.3 dB(A) |
| Load |
| 38.2 / 49.1 dB(A) |
 | ||
30 dB silent 40 dB(A) audible 50 dB(A) loud |
||
min: | ||
| Razer Blade 17 RTX 3080 Ti GeForce RTX 3080 Ti Laptop GPU, i7-12800H, Samsung PM9A1 MZVL21T0HCLR | Razer Blade Pro 17 2021 (QHD Touch) GeForce RTX 3080 Laptop GPU, i7-10875H, Samsung PM981a MZVLB1T0HBLR | MSI GS76 Stealth 11UH GeForce RTX 3080 Laptop GPU, i9-11900H, Samsung PM9A1 MZVL22T0HBLB | Asus ROG Zephyrus S17 GX703HSD GeForce RTX 3080 Laptop GPU, i9-11900H, Samsung PM9A1 MZVL22T0HBLB | Aorus 17G YD GeForce RTX 3080 Laptop GPU, i7-11800H, Samsung PM9A1 MZVL2512HCJQ | Alienware x17 RTX 3080 P48E GeForce RTX 3080 Laptop GPU, i7-11800H, 2x WDC PC SN730 SDBPNTY-1T00 (RAID 0) | |
|---|---|---|---|---|---|---|
| Noise | -12% | -12% | 2% | -25% | -4% | |
| off / environment * (dB) | 23.3 | 26.1 -12% | 24 -3% | 23 1% | 25 -7% | 24.9 -7% |
| Idle Minimum * (dB) | 23.3 | 26.1 -12% | 24 -3% | 23 1% | 32 -37% | 24.9 -7% |
| Idle Average * (dB) | 23.3 | 26.5 -14% | 25 -7% | 23 1% | 33 -42% | 24.9 -7% |
| Idle Maximum * (dB) | 26.3 | 30.7 -17% | 42 -60% | 23 13% | 39 -48% | 29.6 -13% |
| Load Average * (dB) | 38.2 | 43.5 -14% | 46 -20% | 41 -7% | 43 -13% | 31.1 19% |
| Witcher 3 ultra * (dB) | 50.9 | 54 -6% | 48 6% | 45 12% | 52 -2% | 49.7 2% |
| Load Maximum * (dB) | 49.1 | 55 -12% | 48 2% | 52 -6% | 61 -24% | 54.8 -12% |
* ... smaller is better
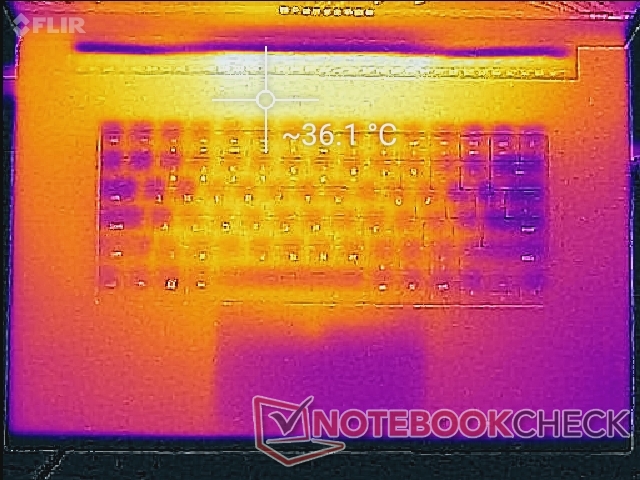
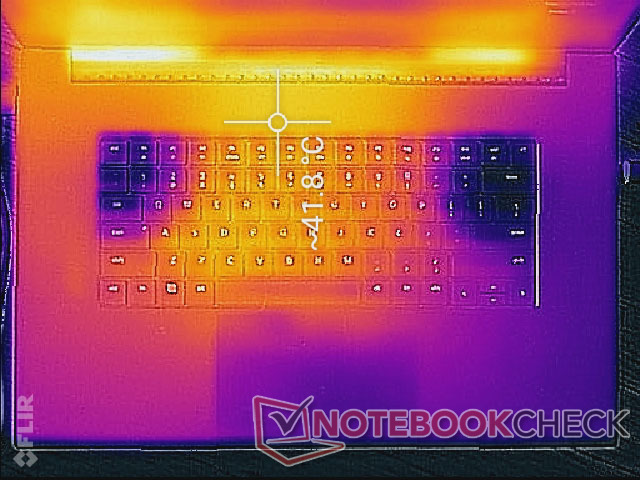
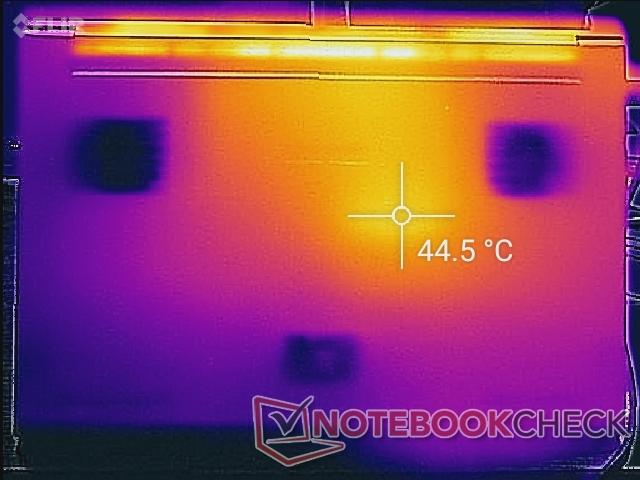
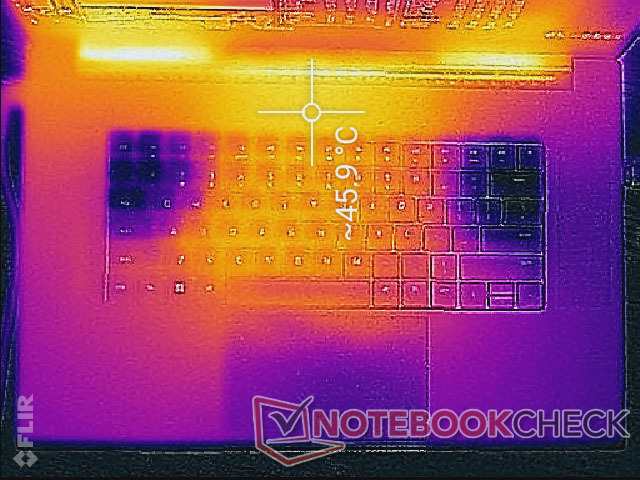
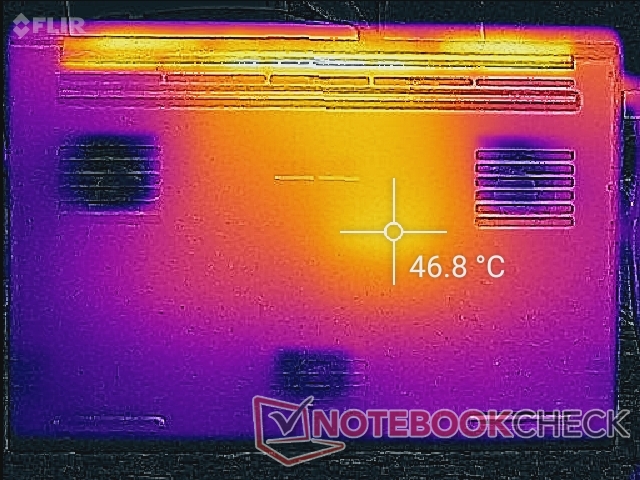
温度 - 比以前更暖和
与2021型号相比,2022型号的表面温度略高。游戏时,键盘中心的温度可以达到38摄氏度,而2021型号的同一位置会稍微凉一些。此外,在不运行任何高要求的负载时,系统仍然非常热,约为31摄氏度至35摄氏度,而微星GS76的温度只有27摄氏度至30摄氏度。 微星GS76.较高的皮肤温度是在低处理负荷时为整体更安静的风扇所付出的代价。
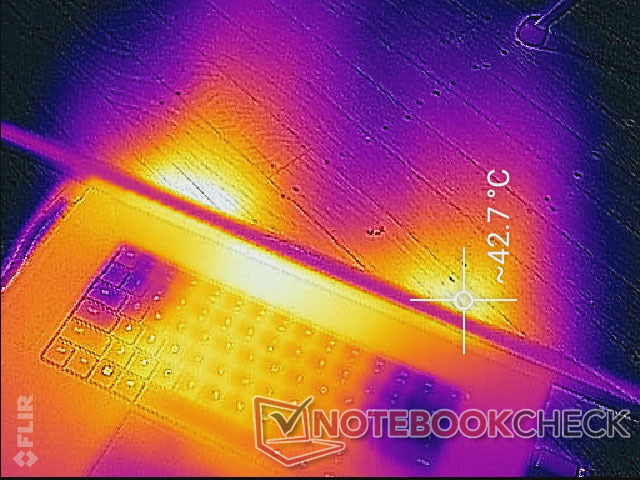
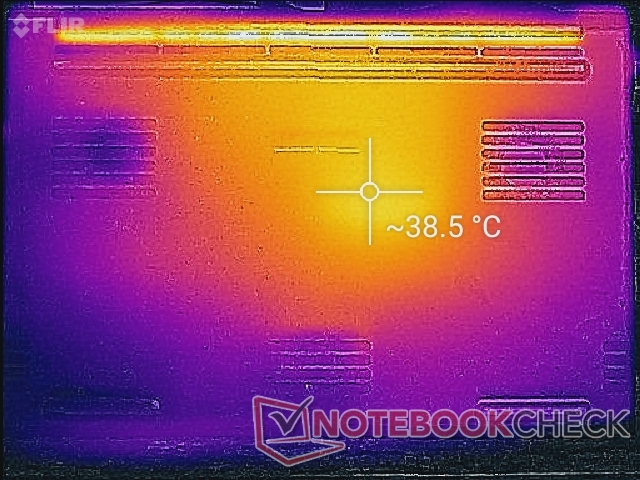
(-) The maximum temperature on the upper side is 46 °C / 115 F, compared to the average of 40.4 °C / 105 F, ranging from 21.2 to 68.8 °C for the class Gaming.
(-) The bottom heats up to a maximum of 46.8 °C / 116 F, compared to the average of 43.2 °C / 110 F
(+) In idle usage, the average temperature for the upper side is 31.5 °C / 89 F, compared to the device average of 33.9 °C / 93 F.
(±) Playing The Witcher 3, the average temperature for the upper side is 33.2 °C / 92 F, compared to the device average of 33.9 °C / 93 F.
(+) The palmrests and touchpad are reaching skin temperature as a maximum (32.4 °C / 90.3 F) and are therefore not hot.
(-) The average temperature of the palmrest area of similar devices was 28.8 °C / 83.8 F (-3.6 °C / -6.5 F).
| Razer Blade 17 RTX 3080 Ti Intel Core i7-12800H, NVIDIA GeForce RTX 3080 Ti Laptop GPU | Razer Blade Pro 17 2021 (QHD Touch) Intel Core i7-10875H, NVIDIA GeForce RTX 3080 Laptop GPU | MSI GS76 Stealth 11UH Intel Core i9-11900H, NVIDIA GeForce RTX 3080 Laptop GPU | Asus ROG Zephyrus S17 GX703HSD Intel Core i9-11900H, NVIDIA GeForce RTX 3080 Laptop GPU | Aorus 17G YD Intel Core i7-11800H, NVIDIA GeForce RTX 3080 Laptop GPU | Alienware x17 RTX 3080 P48E Intel Core i7-11800H, NVIDIA GeForce RTX 3080 Laptop GPU | |
|---|---|---|---|---|---|---|
| Heat | 10% | 4% | -7% | 12% | -4% | |
| Maximum Upper Side * (°C) | 46 | 38.2 17% | 49 -7% | 59 -28% | 36 22% | 58.4 -27% |
| Maximum Bottom * (°C) | 46.8 | 42.2 10% | 57 -22% | 53 -13% | 52 -11% | 49 -5% |
| Idle Upper Side * (°C) | 36.2 | 33.6 7% | 28 23% | 35 3% | 29 20% | 33.6 7% |
| Idle Bottom * (°C) | 38.6 | 36.2 6% | 30 22% | 35 9% | 33 15% | 34.6 10% |
* ... smaller is better
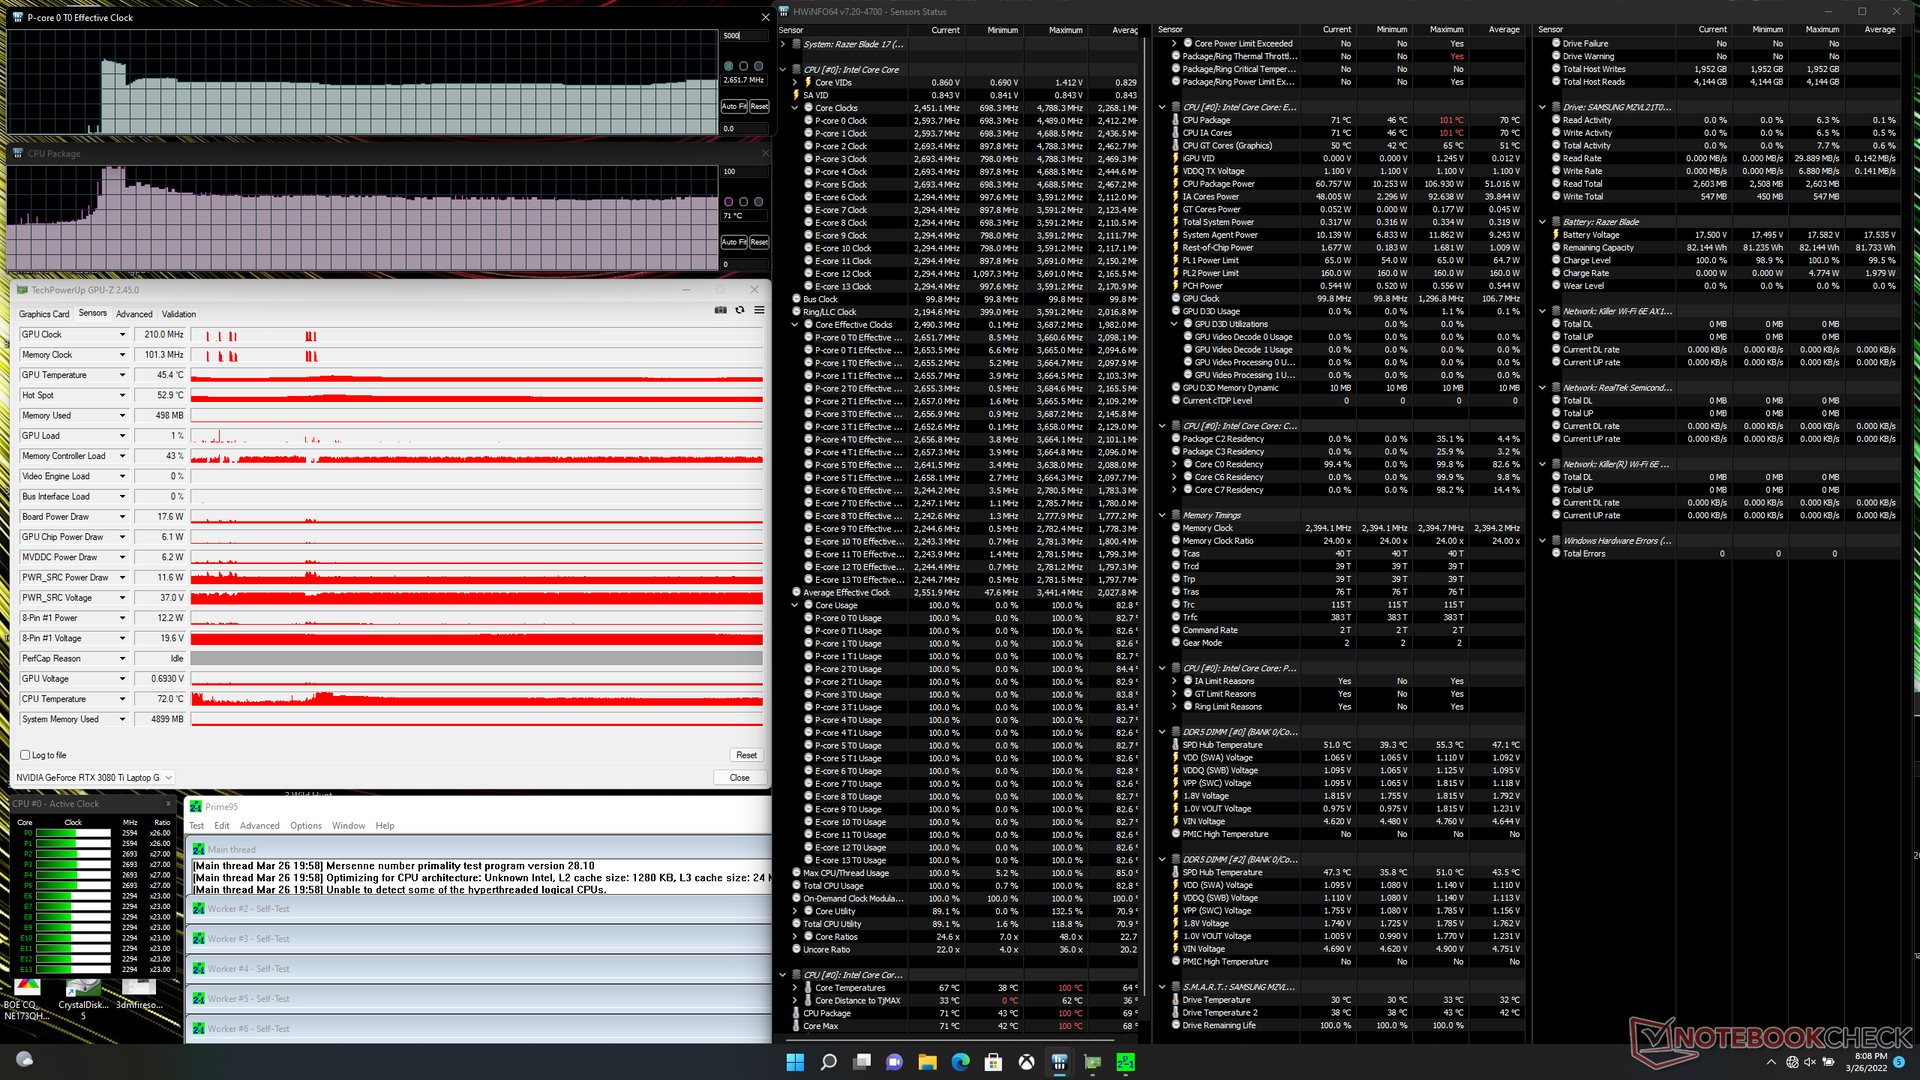
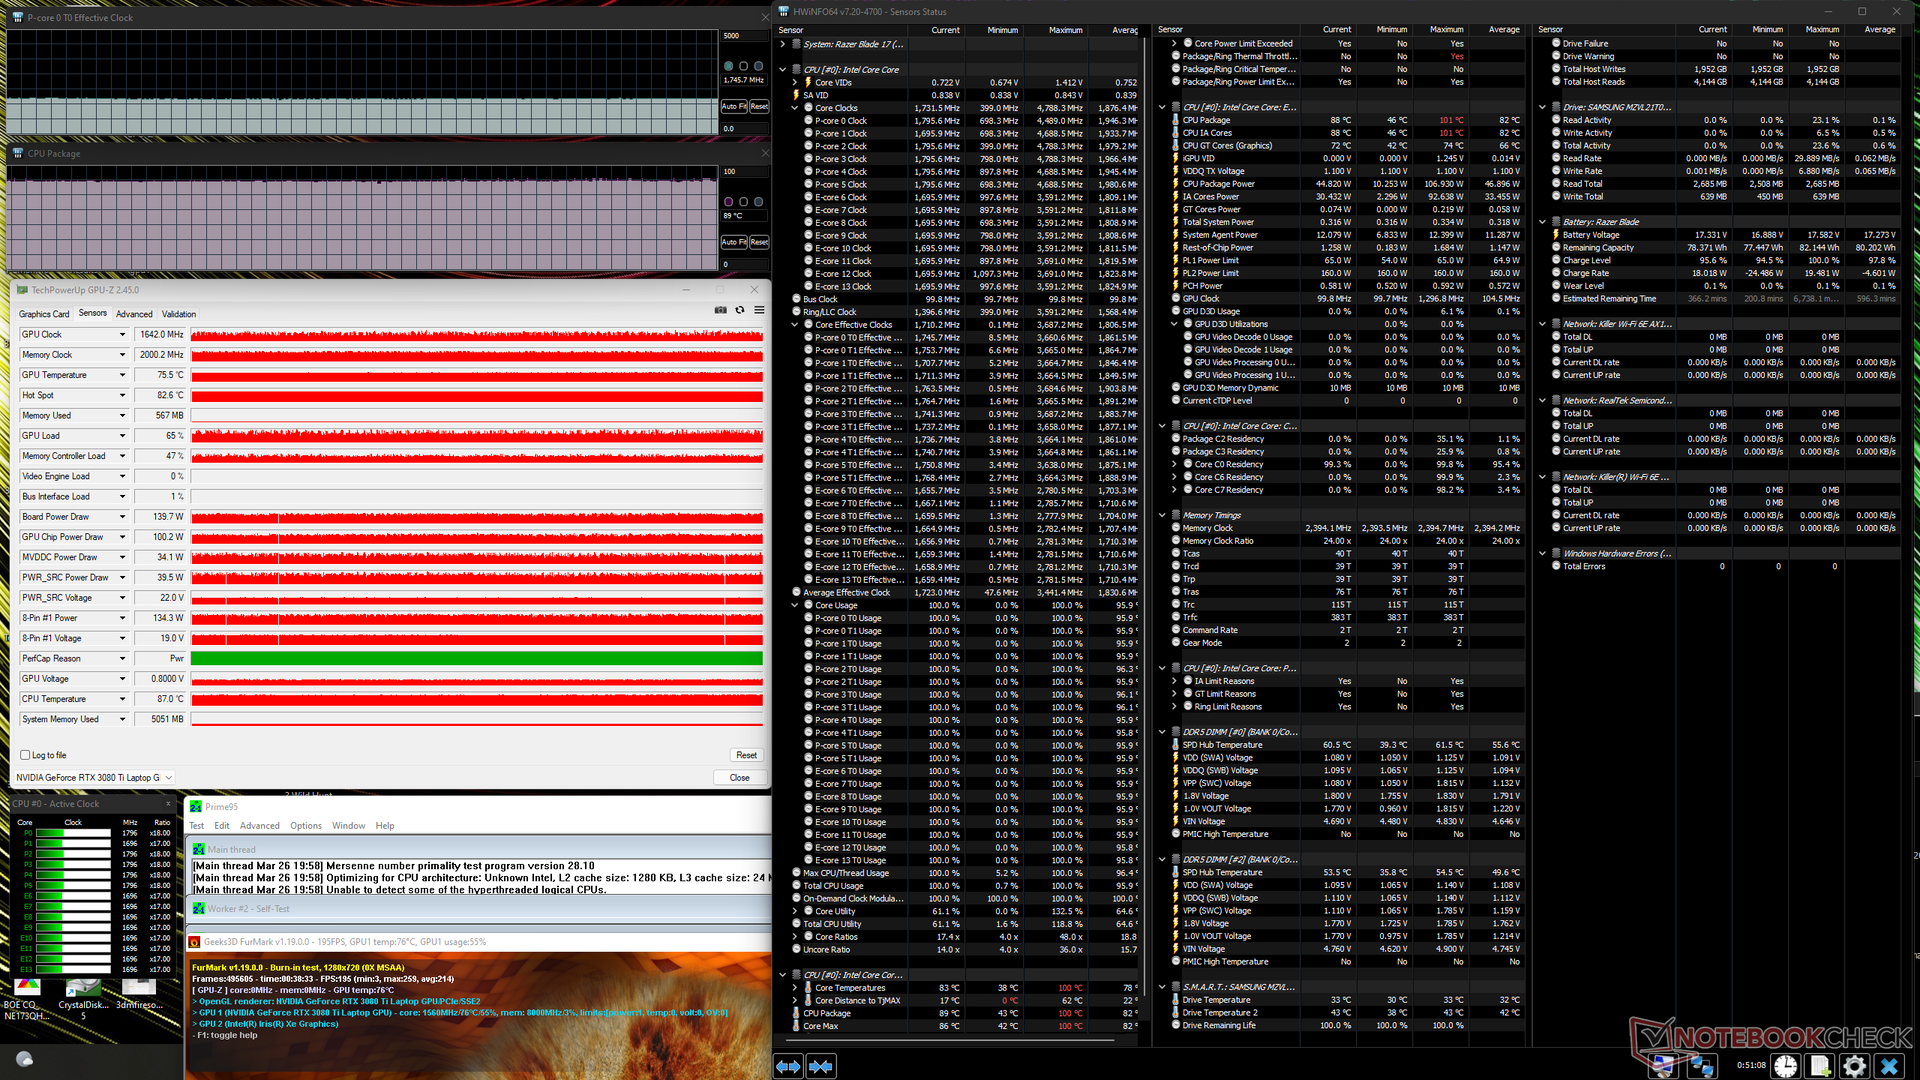
压力测试
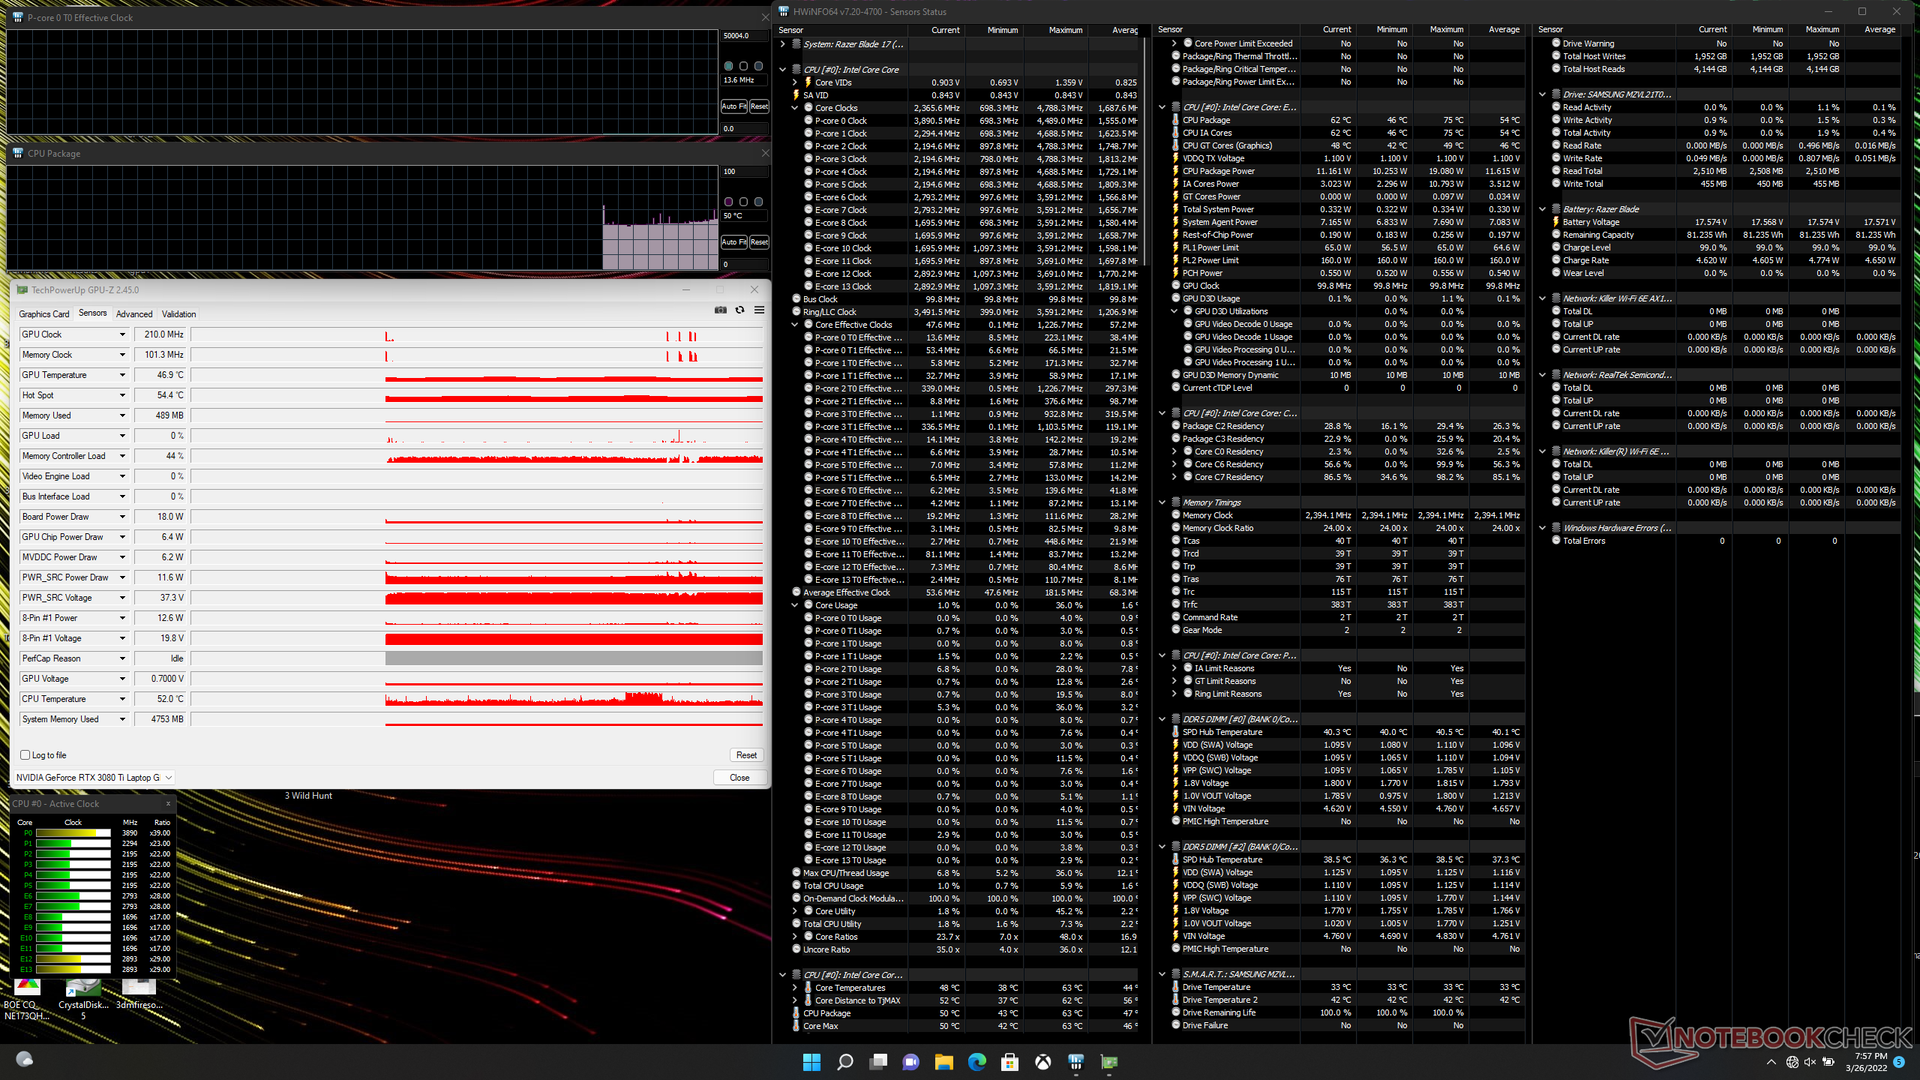
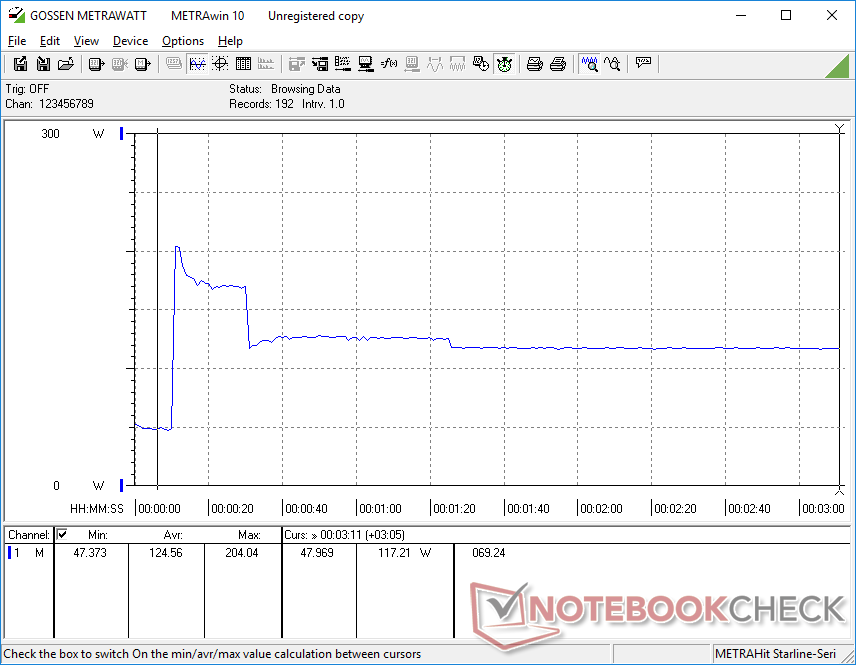
当用Prime95的最高性能模式进行压力测试时,CPU在最初的20秒左右会提升到3.6GHz,核心温度为99C。在压力测试开始时,CPU的封装功率将高达107W,然后稳定在61W,而第11代英特尔Blade 17的封装功率为90W和65W。
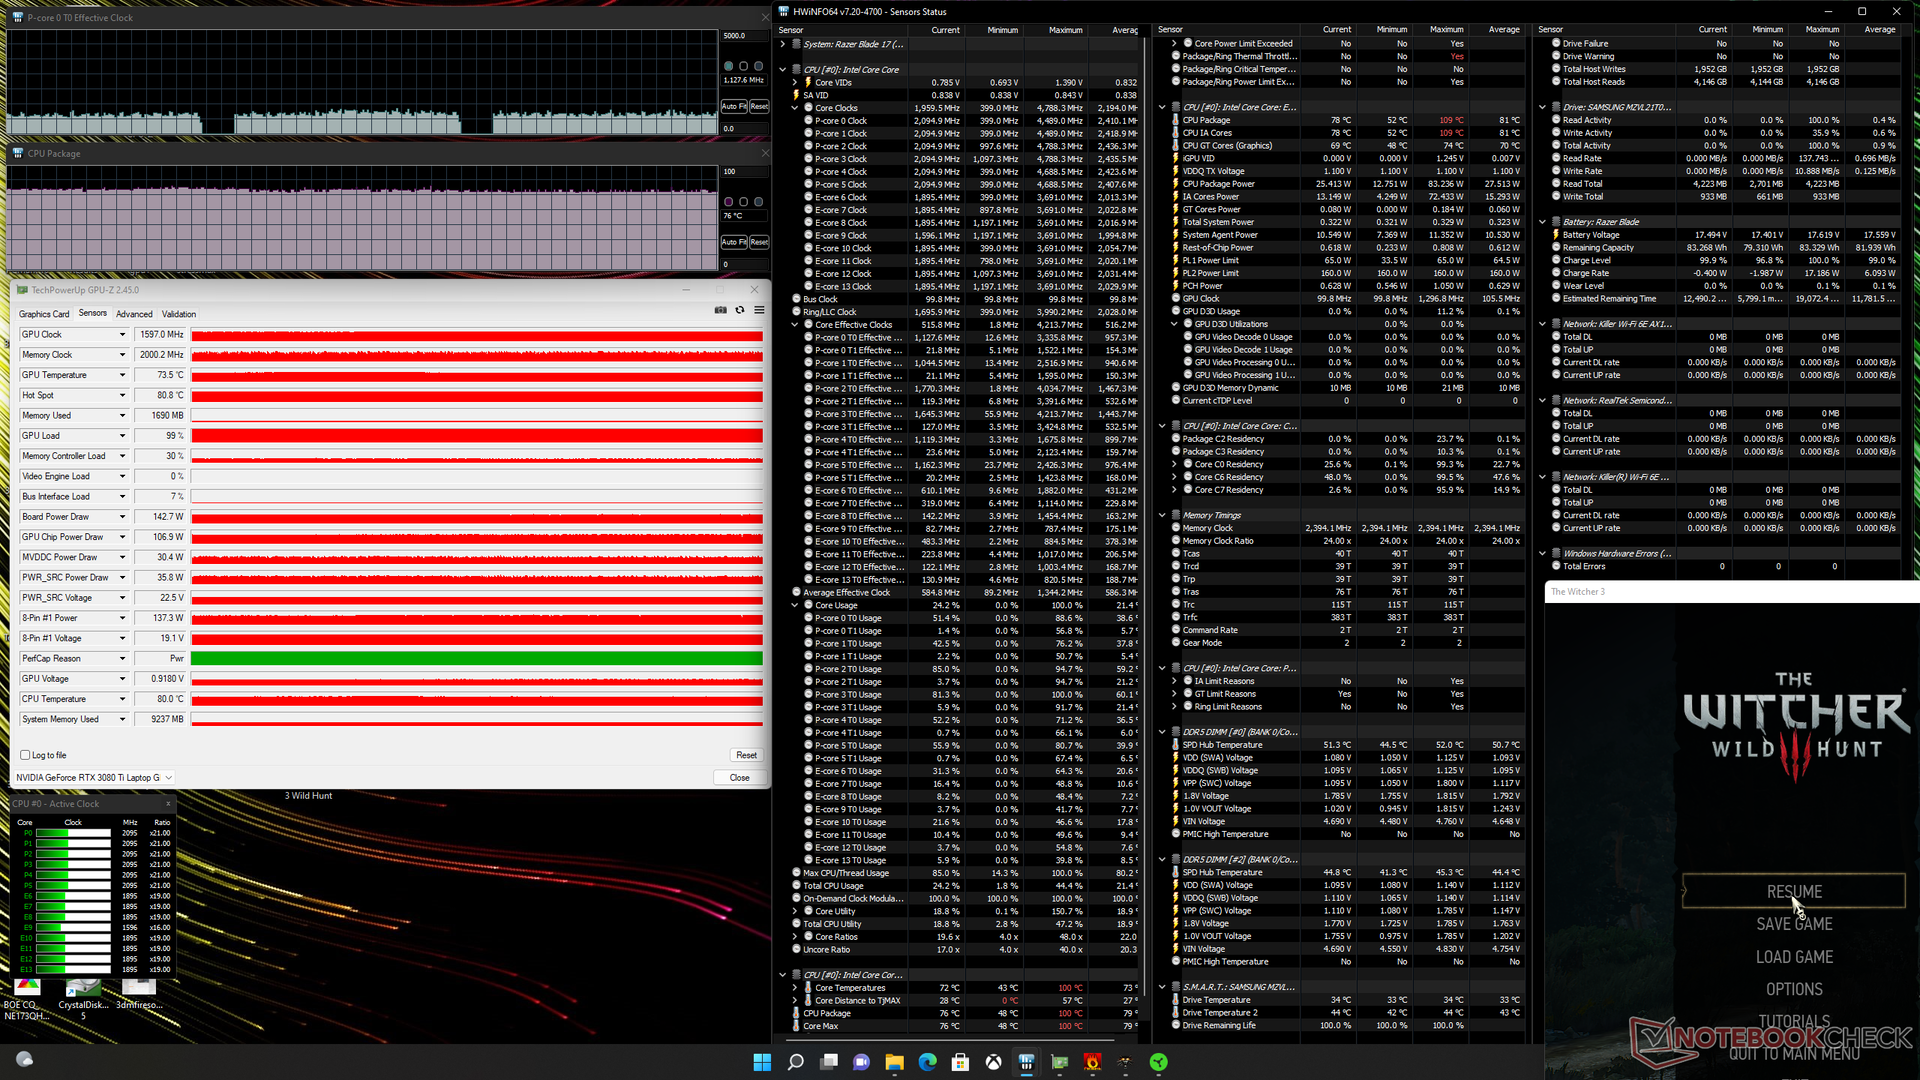
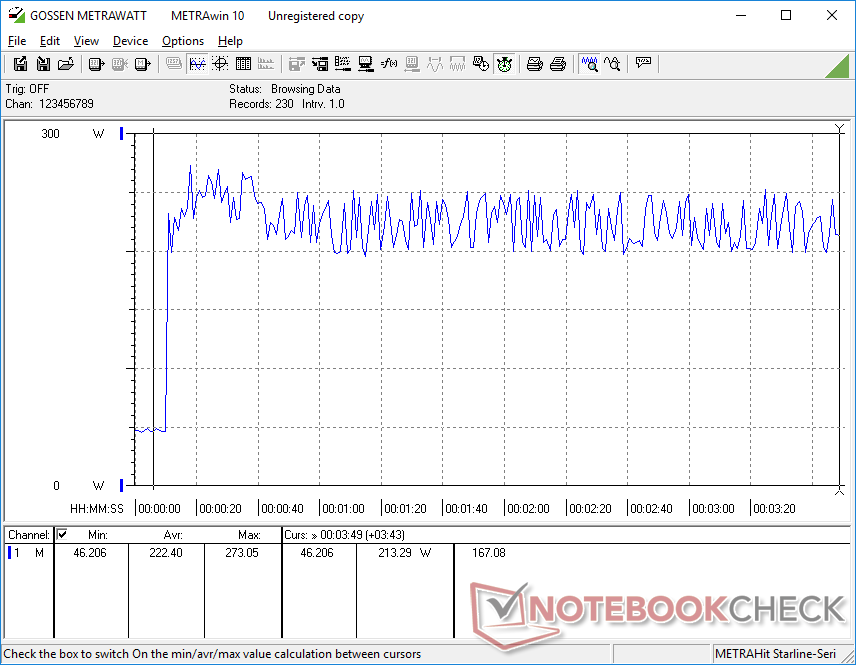
运行 Witcher 3在最大性能模式下运行将导致稳定的GPU板功耗为162W,而如果在平衡模式下则只有143W。因此,用户必须在最大性能设置下运行Blade 17,以便在游戏时尽可能多地提取性能。CPU和GPU温度将分别稳定在81℃和77℃,而配备RTX 3070显卡的第11代英特尔Blade 17的温度为79℃和72℃,或配备RTX 3080显卡的第10代英特尔Blade 17的温度为65℃和64℃。鉴于其更高的TDP和TGP目标,我们的第12代英特尔模型上更高的核心温度并不令人惊讶。
在电池上运行的性能受到很大限制,因为系统不能被设置为高于平衡功率配置文件的任何值。在电池上进行的Fire Strike ,物理学和图形学得分分别为11785和9465分,而在电源上则为27907和32106分。
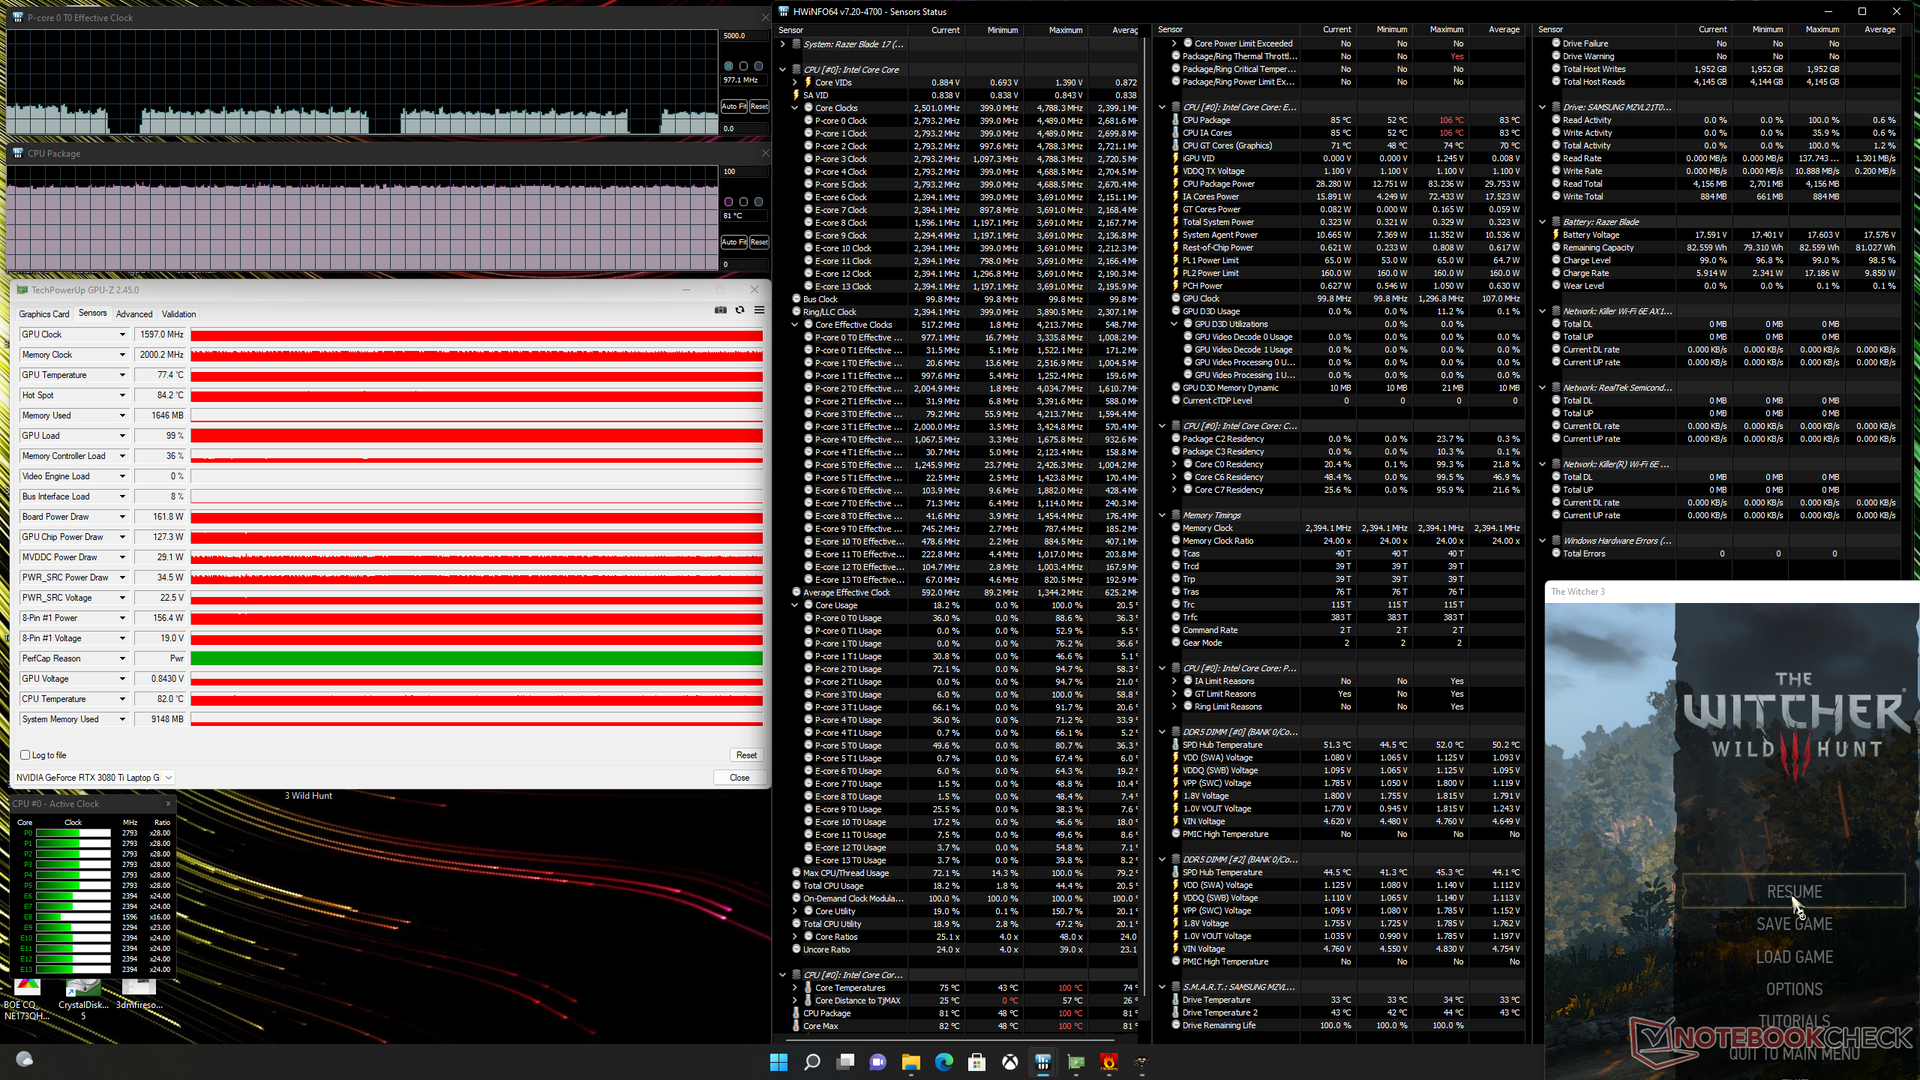
| CPU时钟(GHz) | GPU时钟(MHz) | CPU平均温度(℃) | GPU平均温度(℃) | |
| 系统空闲 | -- | -- | 50 | 47 |
| Prime95压力 | 2.4 - 2.6 | -- | 71 | 45 |
| Prime95 + FurMark 压力 | 1.8 | ~1642 | 89 | 76 |
| Witcher 3 压力(平衡模式) | ~1.1 | 1597 | 76 | 74 |
| Witcher 3 压力(最高性能模式) | ~1.1 | 1597 | 81 | 77 |
发言人
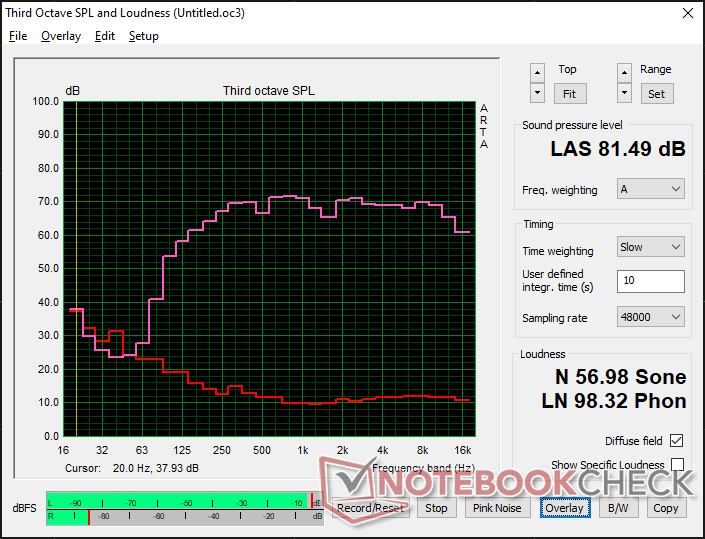
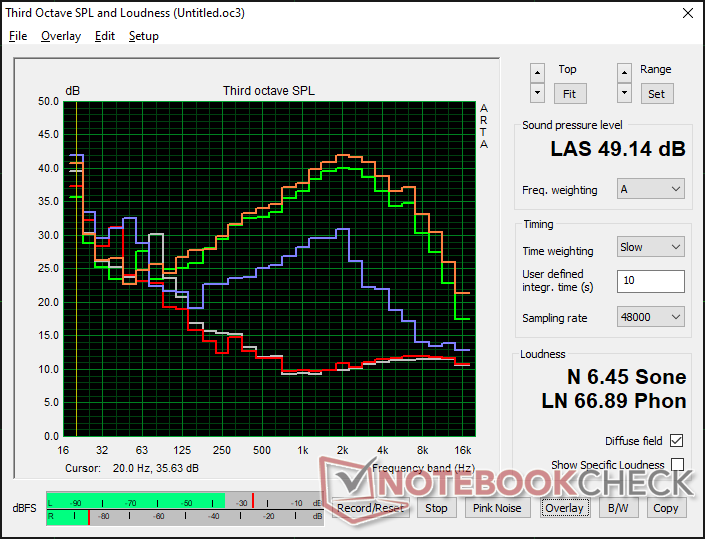
Razer Blade 17 RTX 3080 Ti audio analysis
(±) | speaker loudness is average but good (81.5 dB)
Bass 100 - 315 Hz
(±) | reduced bass - on average 6.7% lower than median
(±) | linearity of bass is average (8.3% delta to prev. frequency)
Mids 400 - 2000 Hz
(+) | balanced mids - only 2.1% away from median
(+) | mids are linear (4.3% delta to prev. frequency)
Highs 2 - 16 kHz
(+) | balanced highs - only 0.7% away from median
(+) | highs are linear (1.7% delta to prev. frequency)
Overall 100 - 16.000 Hz
(+) | overall sound is linear (6.8% difference to median)
Compared to same class
» 0% of all tested devices in this class were better, 0% similar, 99% worse
» The best had a delta of 6%, average was 18%, worst was 132%
Compared to all devices tested
» 1% of all tested devices were better, 0% similar, 99% worse
» The best had a delta of 4%, average was 23%, worst was 134%
Apple MacBook Pro 16 2021 M1 Pro audio analysis
(+) | speakers can play relatively loud (84.7 dB)
Bass 100 - 315 Hz
(+) | good bass - only 3.8% away from median
(+) | bass is linear (5.2% delta to prev. frequency)
Mids 400 - 2000 Hz
(+) | balanced mids - only 1.3% away from median
(+) | mids are linear (2.1% delta to prev. frequency)
Highs 2 - 16 kHz
(+) | balanced highs - only 1.9% away from median
(+) | highs are linear (2.7% delta to prev. frequency)
Overall 100 - 16.000 Hz
(+) | overall sound is linear (4.6% difference to median)
Compared to same class
» 0% of all tested devices in this class were better, 0% similar, 100% worse
» The best had a delta of 5%, average was 17%, worst was 45%
Compared to all devices tested
» 0% of all tested devices were better, 0% similar, 100% worse
» The best had a delta of 4%, average was 23%, worst was 134%
能源管理
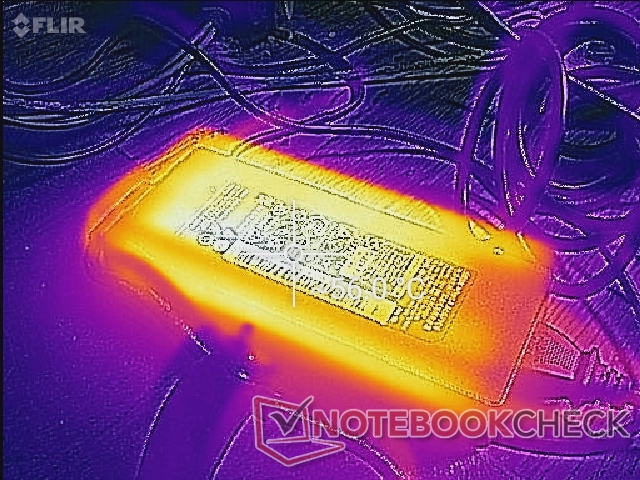
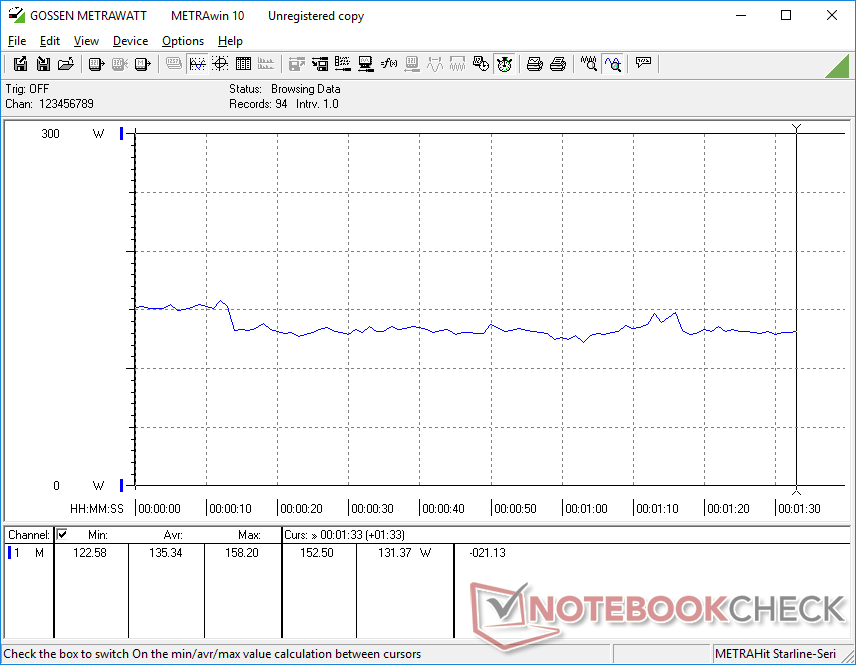
功耗 - 刀片系列迄今为止最高的功耗
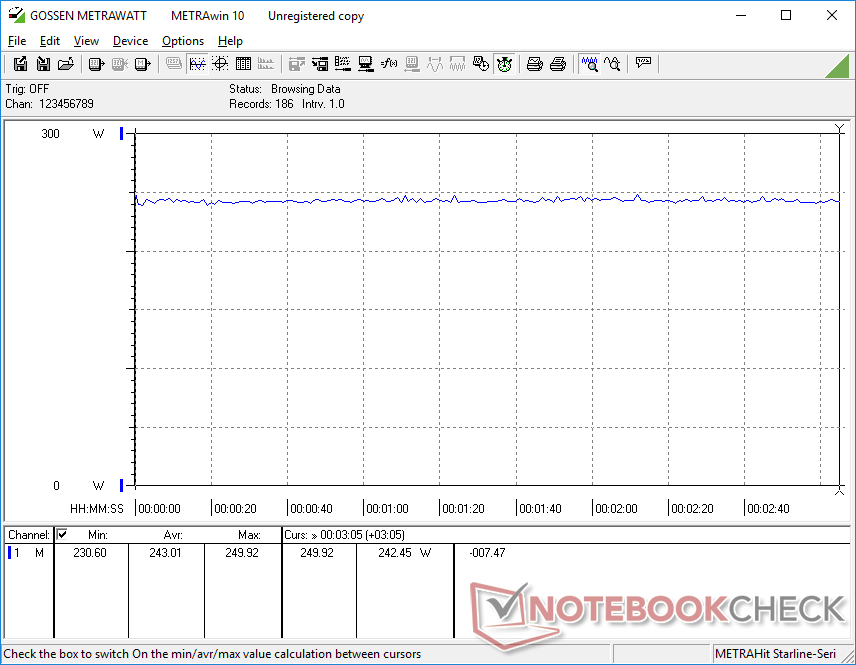
新机型比以前更耗电。仅仅在桌面上空转就会消耗30瓦到61瓦,这取决于亮度设置和电源配置文件,而2021年的Blade 17、微星GS76或华硕ROG Zephyrus S17的消耗量几乎只有一半。事实上,运行 Witcher 3将比2021年的Blade 17中的RTX 3070和Core i7-11800H的图形性能提升20%至25%,CPU性能提升25%。
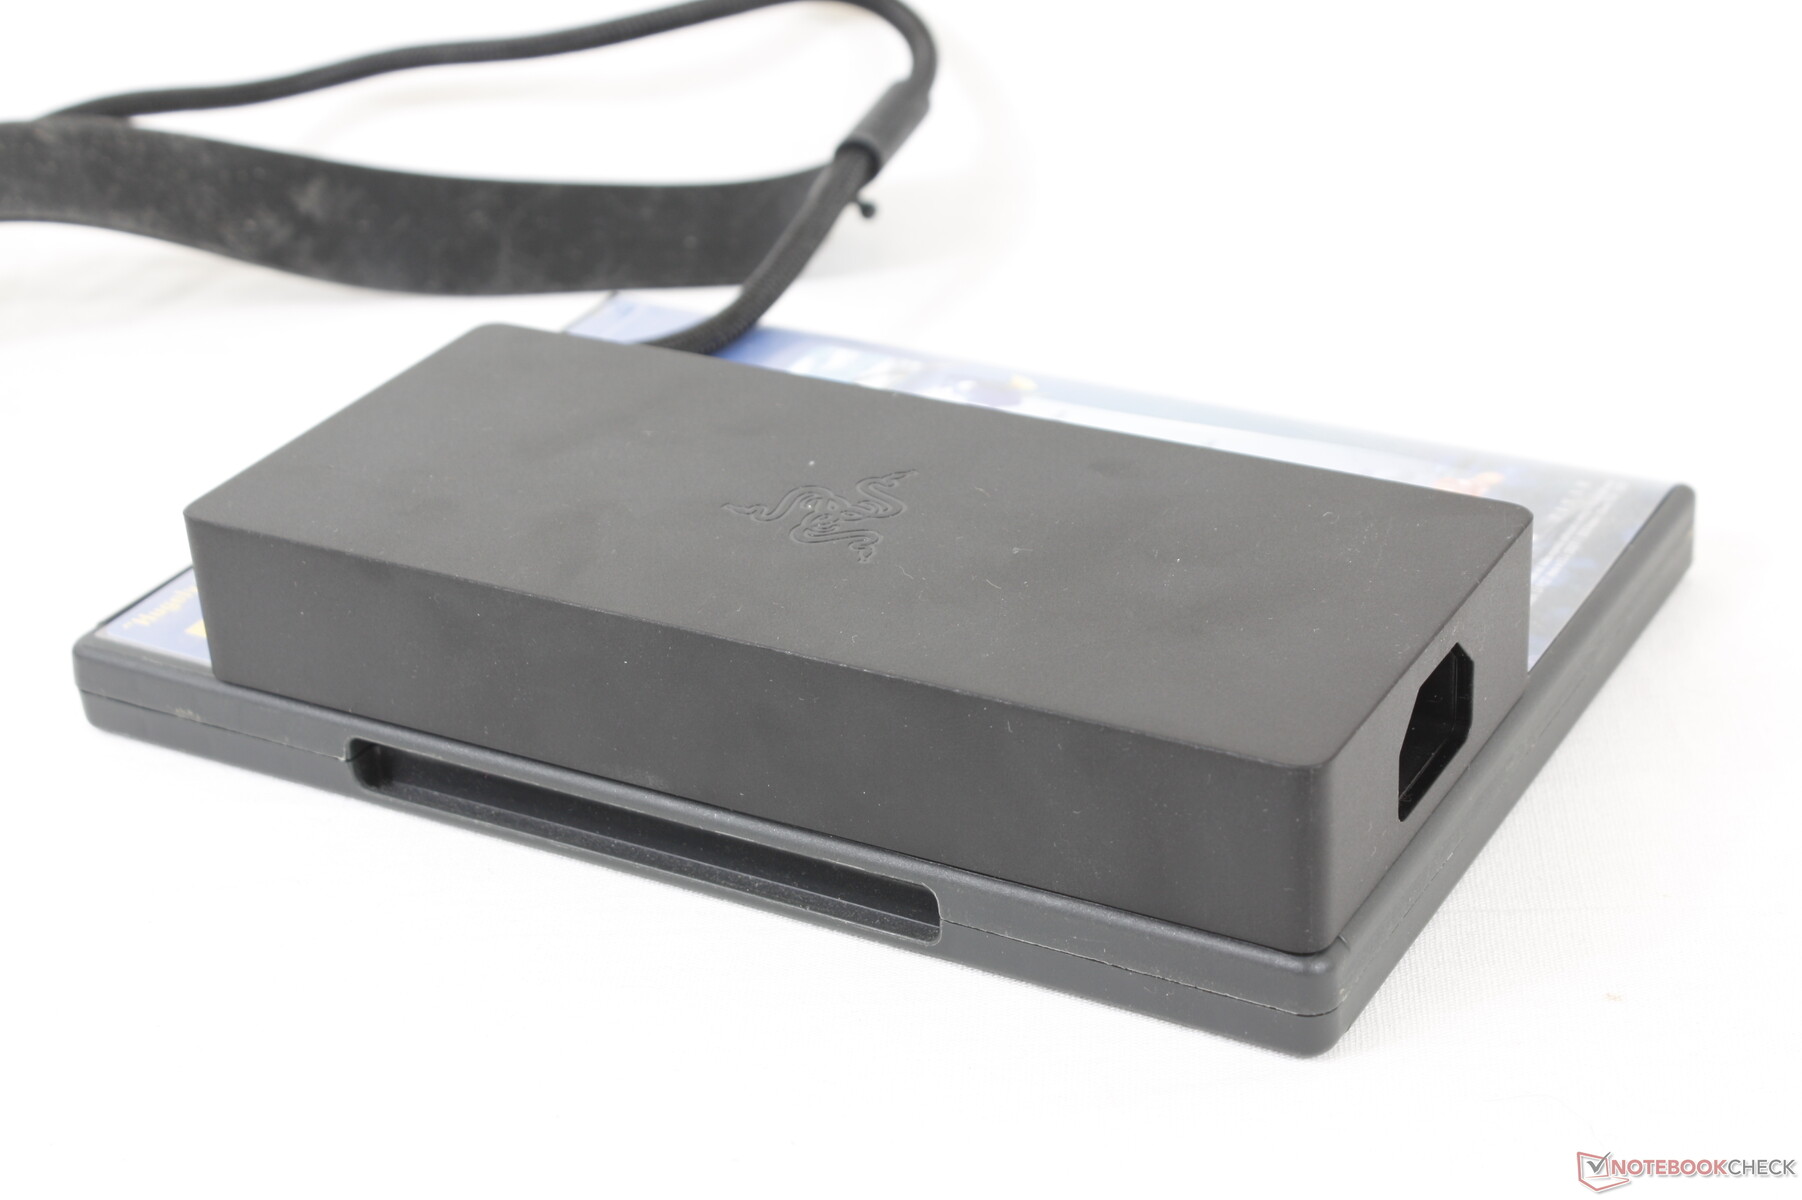
为了适应今年要求更高的处理器,2022年的Blade 17配备了更高容量的280瓦交流适配器,而2021年的机型配备的是230瓦交流适配器。幸运的是,尽管功率输出更高,但交流适配器的整体尺寸同比几乎保持不变(约16.4 x 7 x 2.5厘米对约17 x 7 x 2.5厘米)。
| Off / Standby | |
| Idle | |
| Load |
|
Key:
min: | |
| Razer Blade 17 RTX 3080 Ti i7-12800H, GeForce RTX 3080 Ti Laptop GPU, Samsung PM9A1 MZVL21T0HCLR, IPS, 2560x1440, 17.3" | Razer Blade Pro 17 2021 (QHD Touch) i7-10875H, GeForce RTX 3080 Laptop GPU, Samsung PM981a MZVLB1T0HBLR, IPS, 3840x2160, 17.3" | MSI GS76 Stealth 11UH i9-11900H, GeForce RTX 3080 Laptop GPU, Samsung PM9A1 MZVL22T0HBLB, IPS, 3840x2160, 17.3" | Asus ROG Zephyrus S17 GX703HSD i9-11900H, GeForce RTX 3080 Laptop GPU, Samsung PM9A1 MZVL22T0HBLB, IPS, 2560x1440, 17.3" | Aorus 17G YD i7-11800H, GeForce RTX 3080 Laptop GPU, Samsung PM9A1 MZVL2512HCJQ, IPS, 1920x1080, 17.3" | Alienware x17 RTX 3080 P48E i7-11800H, GeForce RTX 3080 Laptop GPU, 2x WDC PC SN730 SDBPNTY-1T00 (RAID 0), IPS, 3840x2160, 17.3" | |
|---|---|---|---|---|---|---|
| Power Consumption | 34% | 38% | 27% | 27% | 24% | |
| Idle Minimum * (Watt) | 29.8 | 15.2 49% | 14 53% | 21.7 27% | 24 19% | 10.2 66% |
| Idle Average * (Watt) | 37.1 | 20.3 45% | 19 49% | 27 27% | 26 30% | 21.2 43% |
| Idle Maximum * (Watt) | 60.8 | 37.3 39% | 31 49% | 33 46% | 38 37% | 48.4 20% |
| Load Average * (Watt) | 135.3 | 114.9 15% | 97 28% | 108 20% | 101 25% | 118.7 12% |
| Witcher 3 ultra * (Watt) | 243 | 158.4 35% | 156 36% | 195 20% | 164 33% | 249 -2% |
| Load Maximum * (Watt) | 273.1 | 223.7 18% | 231 15% | 210 23% | 230 16% | 262 4% |
* ... smaller is better
Power Consumption Witcher 3 / Stresstest
Power Consumption external Monitor
电池寿命 - 同比持平
由于取消了第四个风扇,电池容量比2021年的Blade 17大。然而,运行时间没有任何改善,因为这次更新的CPU和GPU要求更高。我们注意到2021年和2022年的刀片15之间有类似的结果。 2022年刀锋15型号之间也有类似的结果。
用附带的交流适配器从空电到满电大约需要90分钟。支持USB-C充电,这与华硕TUF游戏机F15不同。 华硕TUF游戏机F15.
| Razer Blade 17 RTX 3080 Ti i7-12800H, GeForce RTX 3080 Ti Laptop GPU, 82 Wh | Razer Blade Pro 17 2021 (QHD Touch) i7-10875H, GeForce RTX 3080 Laptop GPU, 70.5 Wh | MSI GS76 Stealth 11UH i9-11900H, GeForce RTX 3080 Laptop GPU, 99.9 Wh | Asus ROG Zephyrus S17 GX703HSD i9-11900H, GeForce RTX 3080 Laptop GPU, 90 Wh | Aorus 17G YD i7-11800H, GeForce RTX 3080 Laptop GPU, 99 Wh | Alienware x17 RTX 3080 P48E i7-11800H, GeForce RTX 3080 Laptop GPU, 87 Wh | |
|---|---|---|---|---|---|---|
| Battery runtime | 19% | 19% | 91% | 22% | -11% | |
| Reader / Idle (h) | 8 | 9.9 24% | 9.9 24% | 9 13% | 7 -12% | |
| WiFi v1.3 (h) | 5.5 | 5.9 7% | 6.4 16% | 7.5 36% | 6 9% | 5.9 7% |
| Load (h) | 1.1 | 1.4 27% | 1.3 18% | 2.7 145% | 1.6 45% | 0.8 -27% |
| H.264 (h) | 7.2 | 6.2 | ||||
| Witcher 3 ultra (h) | 1 |
Pros
Cons
结论 - 更多瓦特,更多力量
刀锋17设计是在2019年推出的,带有100WGeForce 图形。2022年的这次刷新携带了更强大的165 W GPU,而机箱的尺寸或设计没有任何重大变化。当然,性能有所提高,但总体上更高的功耗带来了更高的温度,更密集的电源砖,以及比之前采用旧处理器的Blade 17型号普遍更短的电池寿命。
幸运的是,雷蛇已经调整了2022年机型的某些方面,以抵消其更高的功耗要求。例如,内部电池更大,尽管牺牲了整个风扇,否则将有助于冷却。同时,经常被忽视的280瓦交流适配器与其他高容量适配器相比,是我们看到的最小和最轻的适配器之一,使带着Blade 17旅行更容易一些。制造商在开发过程中很清楚越来越多的耗电组件,并采取了措施来减轻一些不可避免的弊端。
通过如此强烈地关注性能,Razer中的165W GPU能够超越大多数其他配备相同GPU的笔记本电脑。其他超薄笔记本电脑的TGP目标往往比Blade 17低,性能始终较慢。因此,对于希望最大限度地提高移动图形性能而又不满足于微星GT系列或华硕ROG Chimera等更厚的选择的玩家来说,2022年的Blade 17是更好的推荐之一。也许未来的Blade 17型号可以加入液态金属冷却,以改善温度。
价格和可用性
Razer是,现在销售我们评论的配置大约为4000美元。截至目前,亚马逊和百思买还没有库存。
Razer Blade 17 RTX 3080 Ti
- 07/05/2022 v7 (old)
Allen Ngo
Price comparison

