联想Legion 5 17 with RTX 3060 in review:强大的游戏笔记本电脑,配备了当前版本的AMD Ryzen CPU

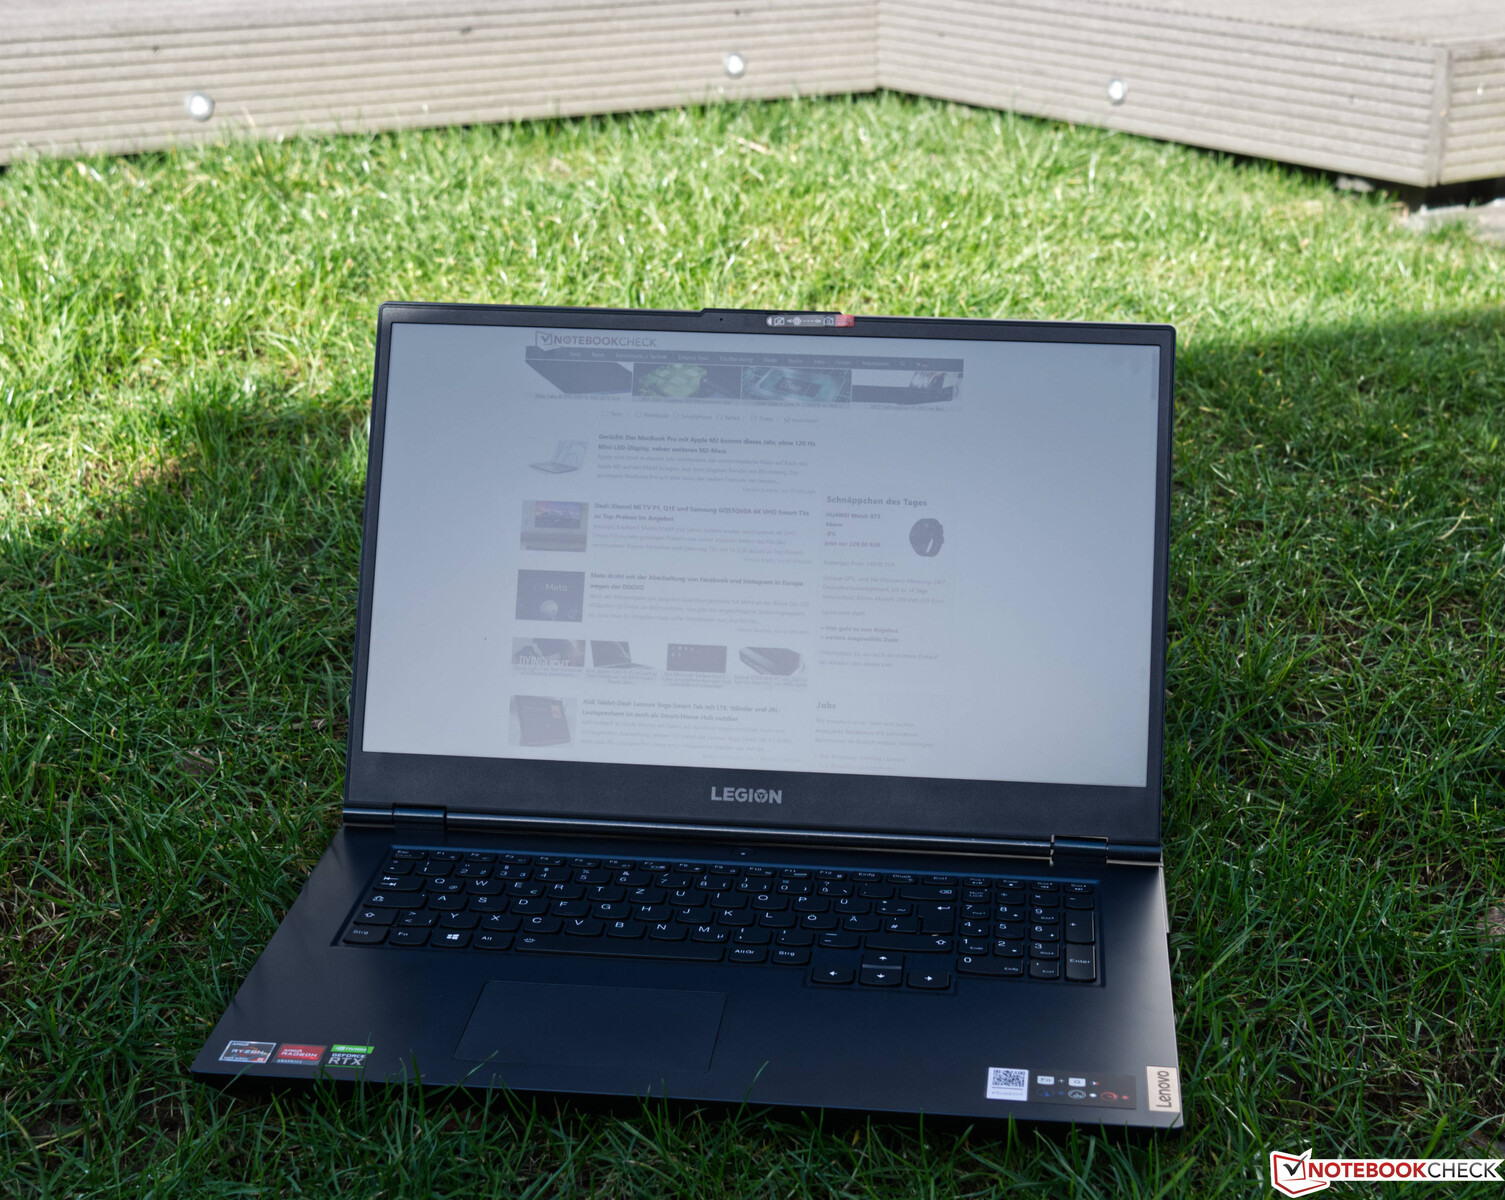
来自联想的Legion 系列在游戏领域已经有很长一段时间是家喻户晓的。Legion 5在视觉上绝非不起眼,因为其引人注目的设计也已经进入了最新的2022型号,它是基于AMD APU。
在上面的 AMD Ryzen 5 5600H和 AMD Ryzen 7 5800H,用户可以选择三种不同的Nvidia GPU。联想Legion 5 17的GeForce RTX 3050基本型号起价为1150美元,而我们的测试配置是GeForce RTX 3060移动GPU,价格约为1220美元。对于这个价格,用户还可以得到一个144Hz的1080p显示屏,16GB的内存和512GB的NVMe SSD。默认包括Windows 11家庭版。该系统可以通过联想的在线商店根据你的喜好进行配置。
我们使用装备相似的设备进行比较。下表显示了我们选择的竞争对手。
潜在的竞争对手比较
Rating | Date | Model | Weight | Height | Size | Resolution | Price |
|---|---|---|---|---|---|---|---|
| 85.2 % v7 (old) | 02 / 2022 | Lenovo Legion 5 17ACH6H-82JY0003GE R5 5600H, GeForce RTX 3060 Laptop GPU | 3.1 kg | 24.3 mm | 17.30" | 1920x1080 | |
| 83.9 % v7 (old) | Schenker XMG Core 17 (Early 2021) i7-10870H, GeForce RTX 3060 Laptop GPU | 2.5 kg | 30.05 mm | 17.30" | 2560x1440 | ||
| 82.8 % v7 (old) | 10 / 2021 | Asus TUF Gaming F17 FX706HM i9-11900H, GeForce RTX 3060 Laptop GPU | 2.7 kg | 26 mm | 17.30" | 1920x1080 | |
| 80.4 % v7 (old) | 09 / 2021 | MSI Katana GF76 11UE i7-11800H, GeForce RTX 3060 Laptop GPU | 2.7 kg | 25.2 mm | 17.30" | 1920x1080 | |
| 83.4 % v7 (old) | 11 / 2021 | Schenker XMG Apex 17 M21 R7 5800H, GeForce RTX 3070 Laptop GPU | 2.6 kg | 32.4 mm | 17.30" | 1920x1080 | |
| 83.2 % v7 (old) | 10 / 2021 | Gigabyte A7 X1 R9 5900HX, GeForce RTX 3070 Laptop GPU | 2.5 kg | 34 mm | 17.30" | 1920x1080 |
案例
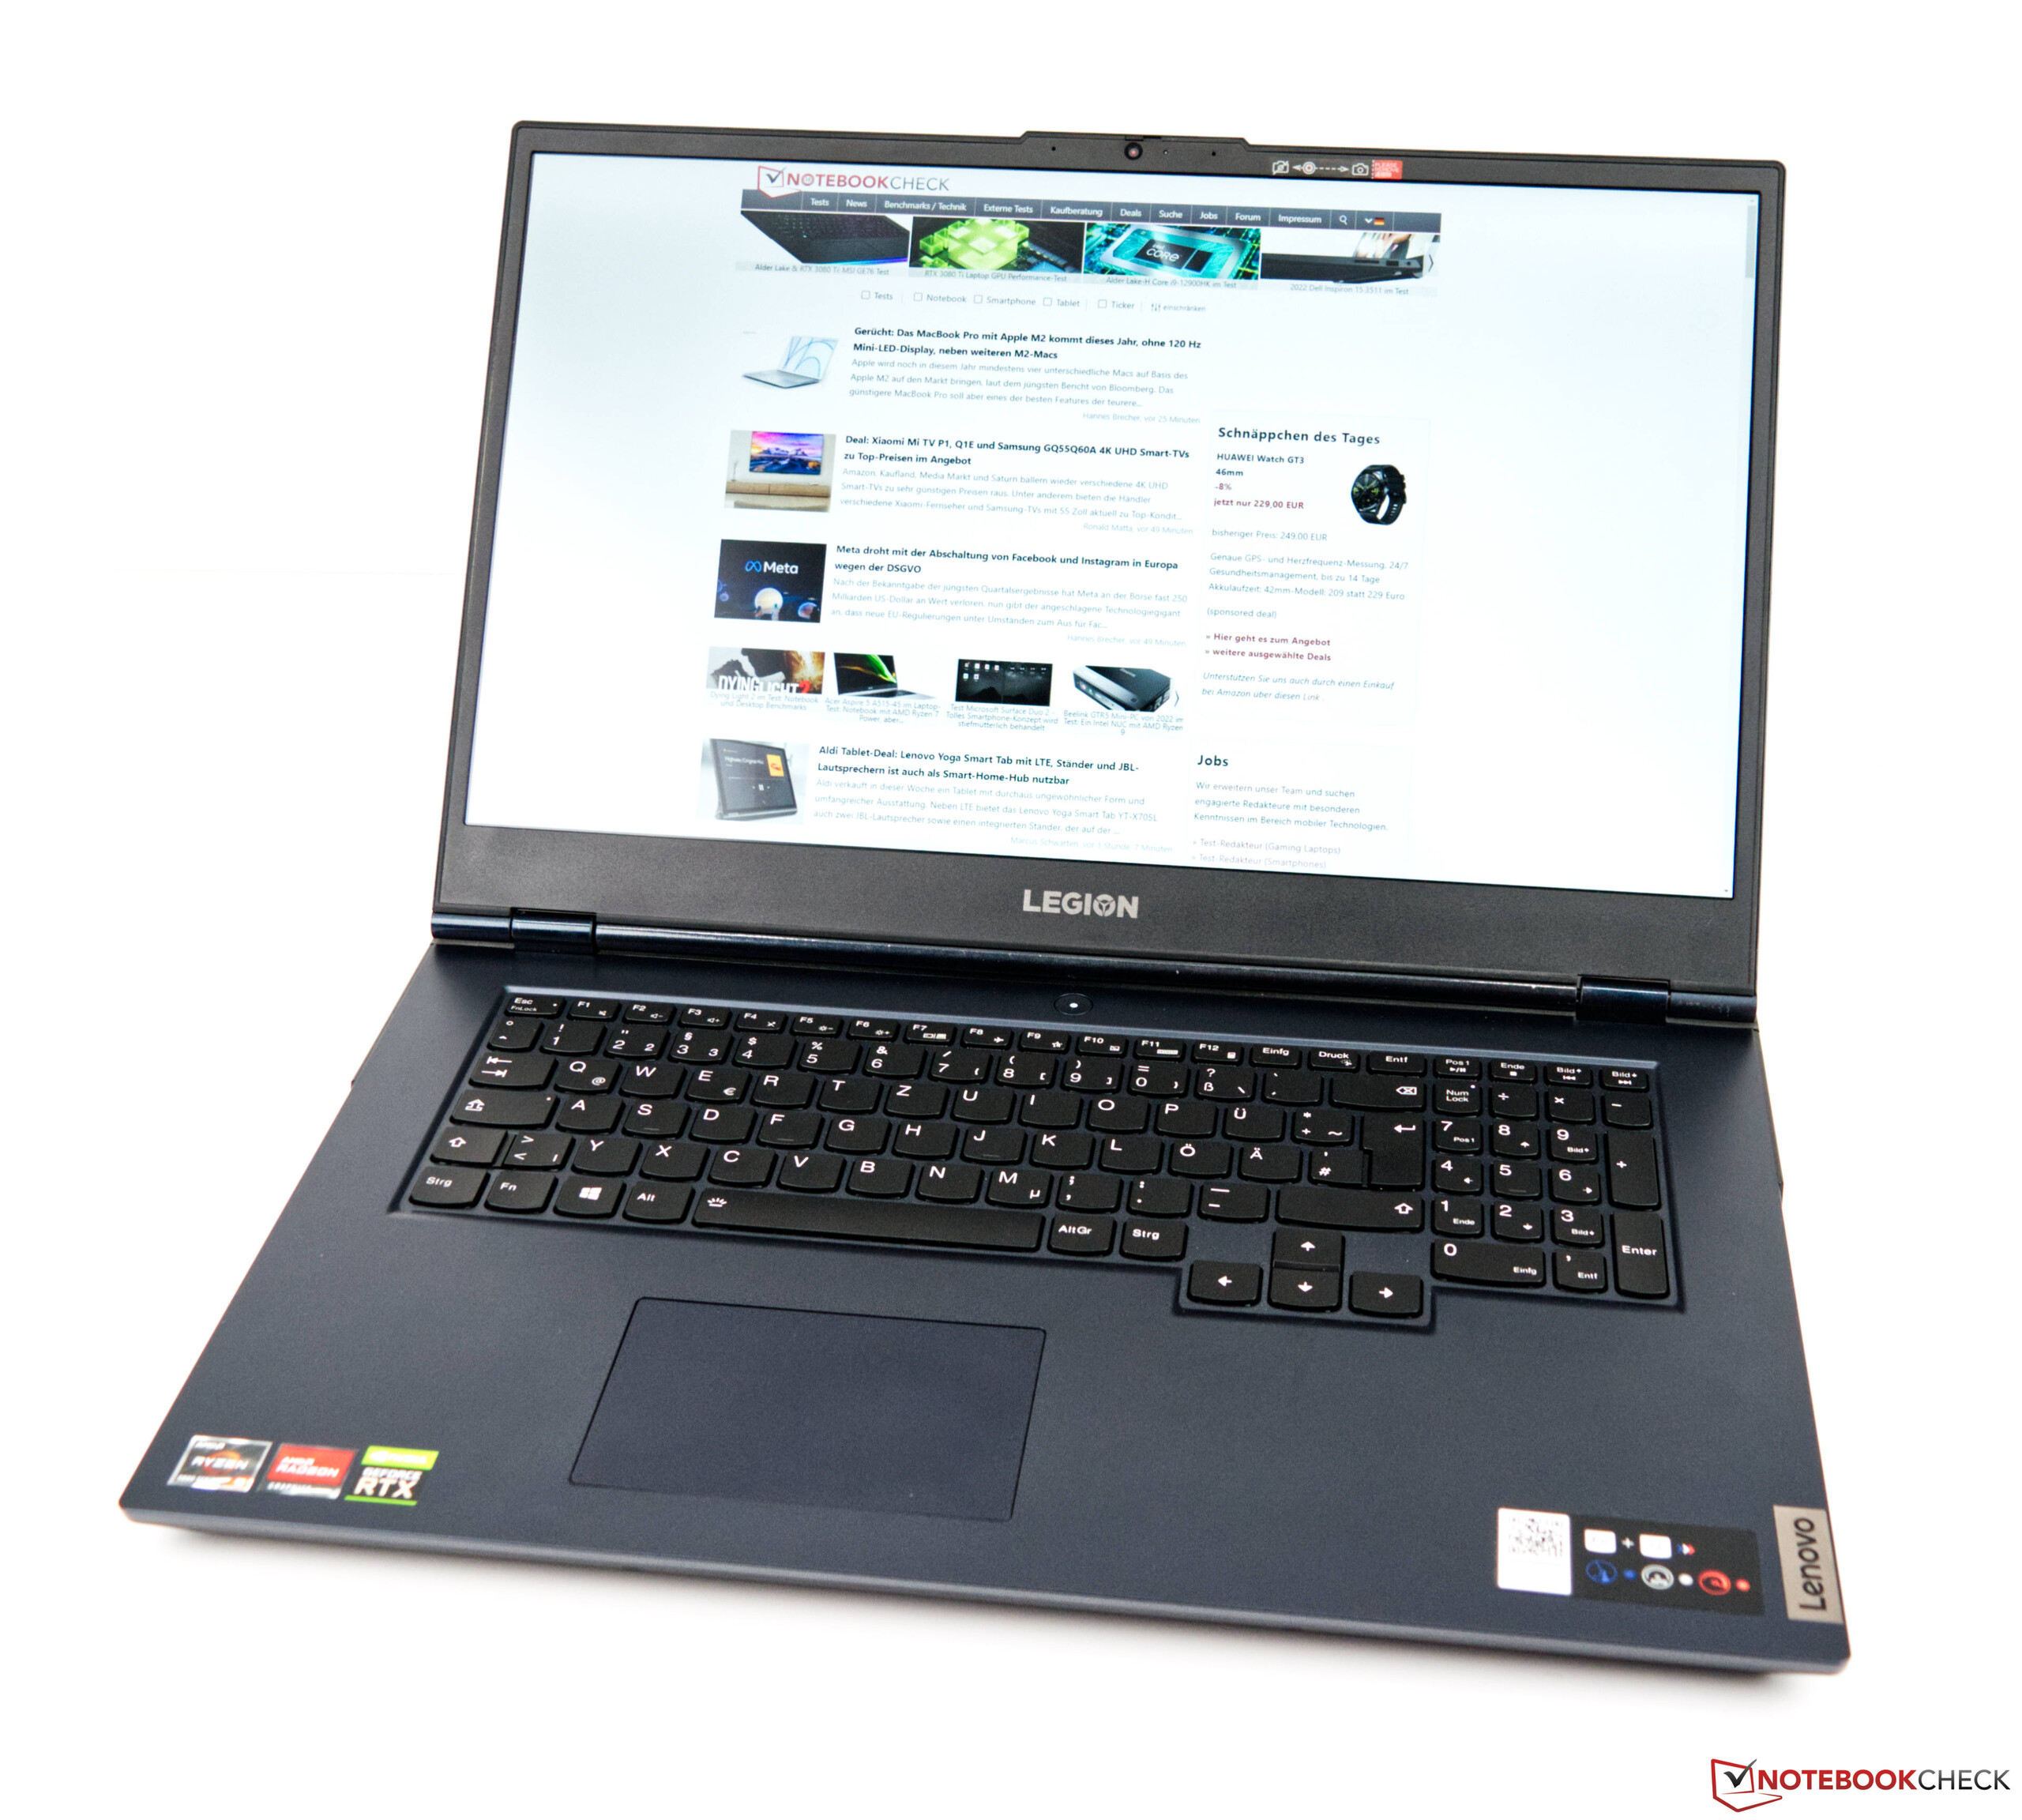
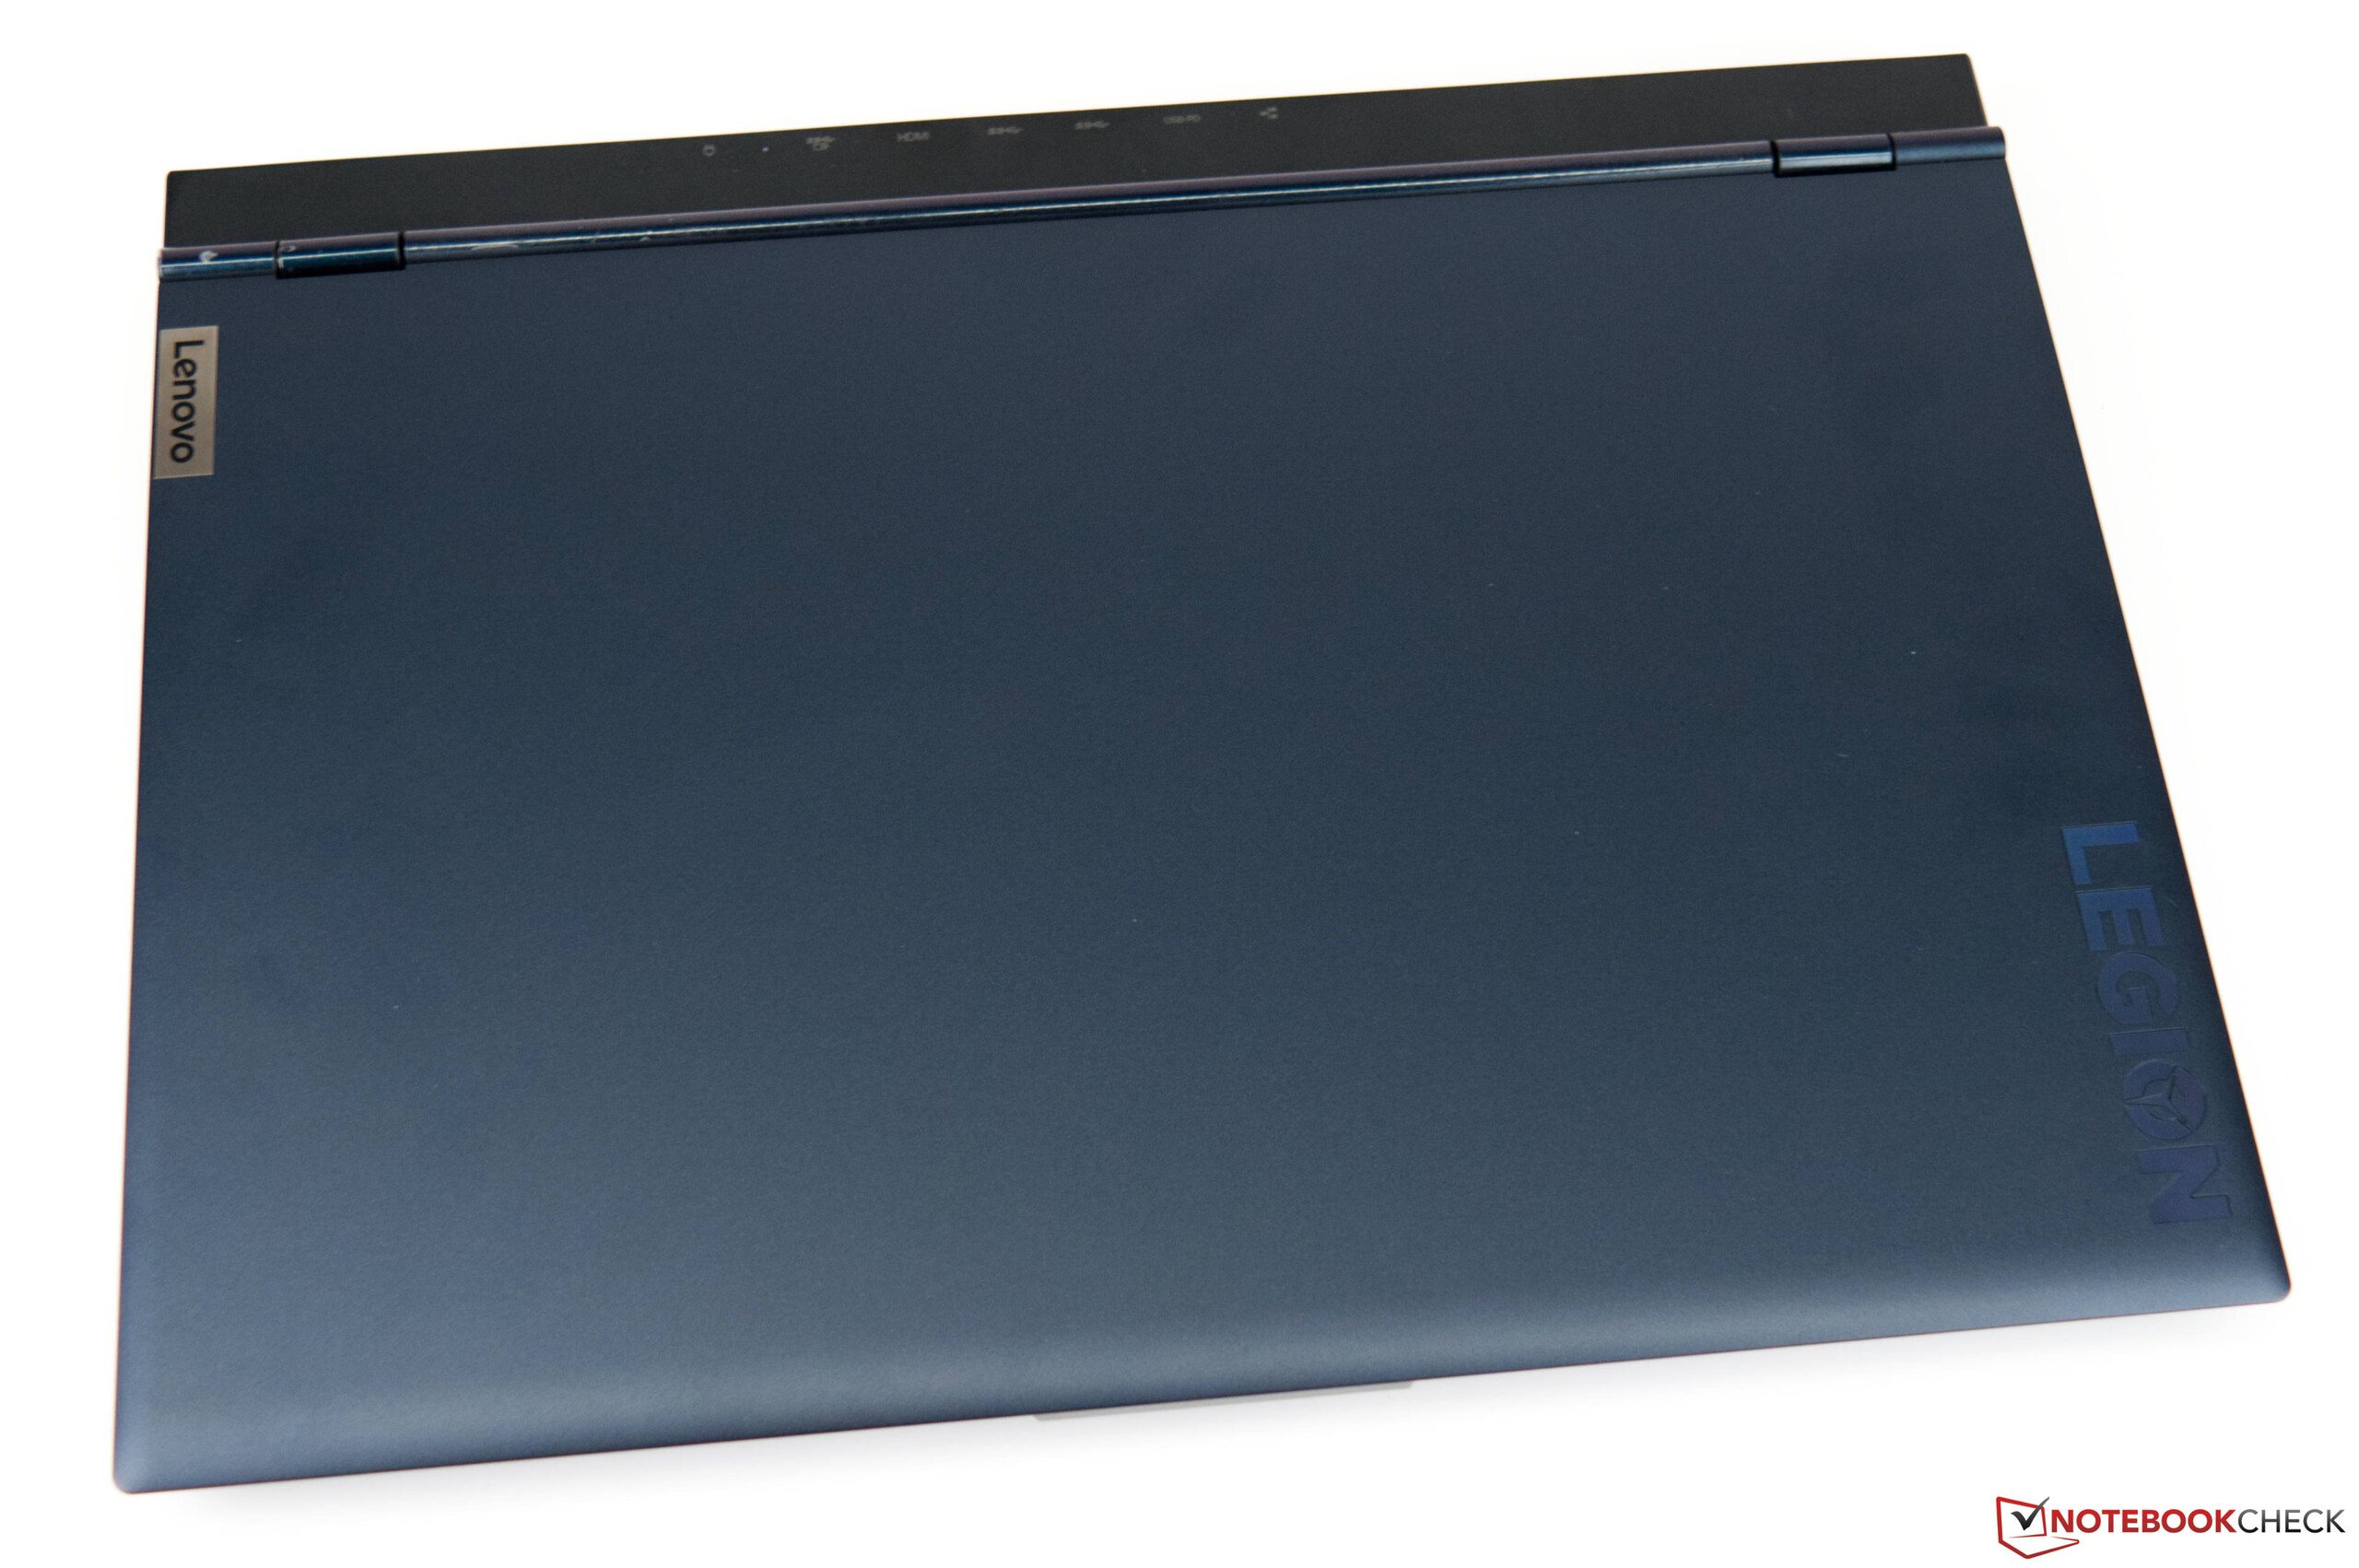
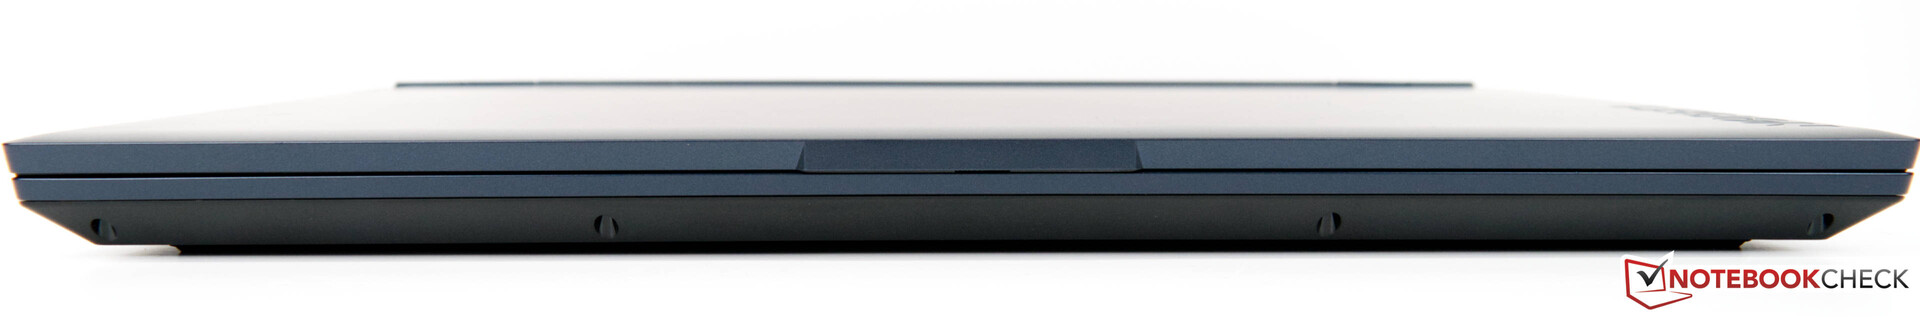
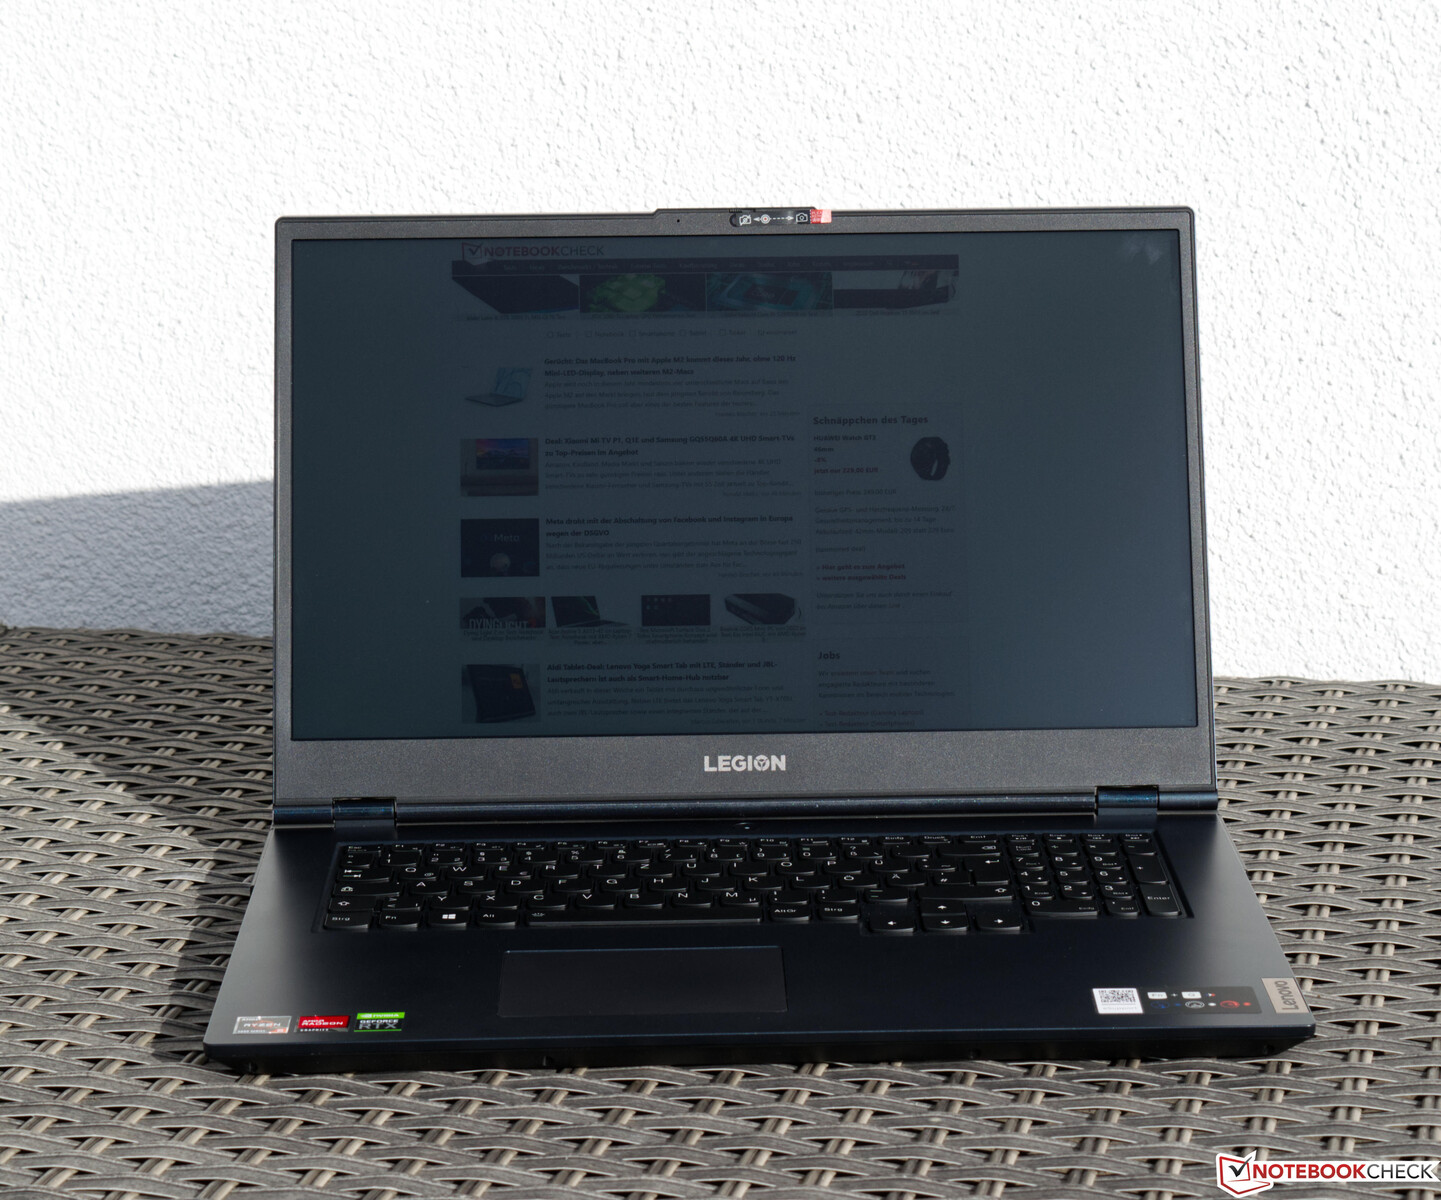
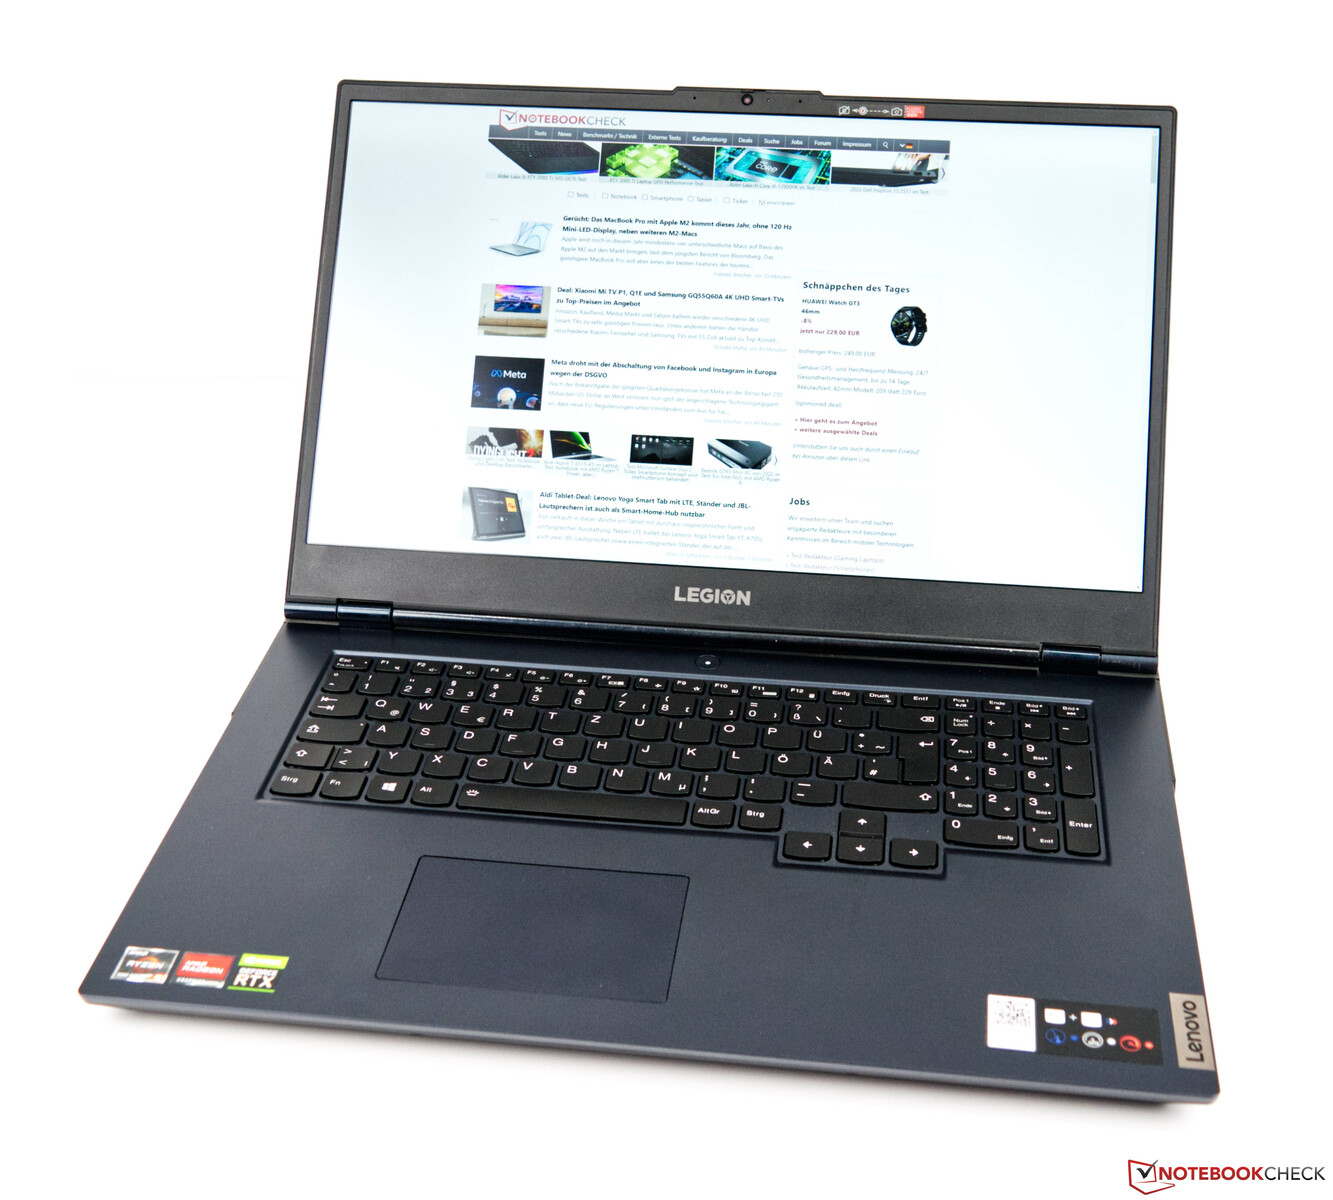
从美学角度看,联想Legion 5 17非常明显是一台游戏笔记本电脑。盖子上以Legion 徽标的形式装饰着视觉重点。联想Legion 5 17没有任何RGB照明。材料的选择很好,因为尽管是基于塑料的结构,但该设备感觉非常高级。虽然底座的刚性很好,但在压力下,键盘区域的中心略微弯曲。然而,这并不是非常明显的。我们希望看到盖子有类似的硬度,不幸的是,盖子很容易扭曲。至少,它对集中使用的压力有相当的抵抗力。盖子可以打开,最大角度为180°。两个铰链可靠地防止了摇晃。此外,底座足够重,可以单手打开。

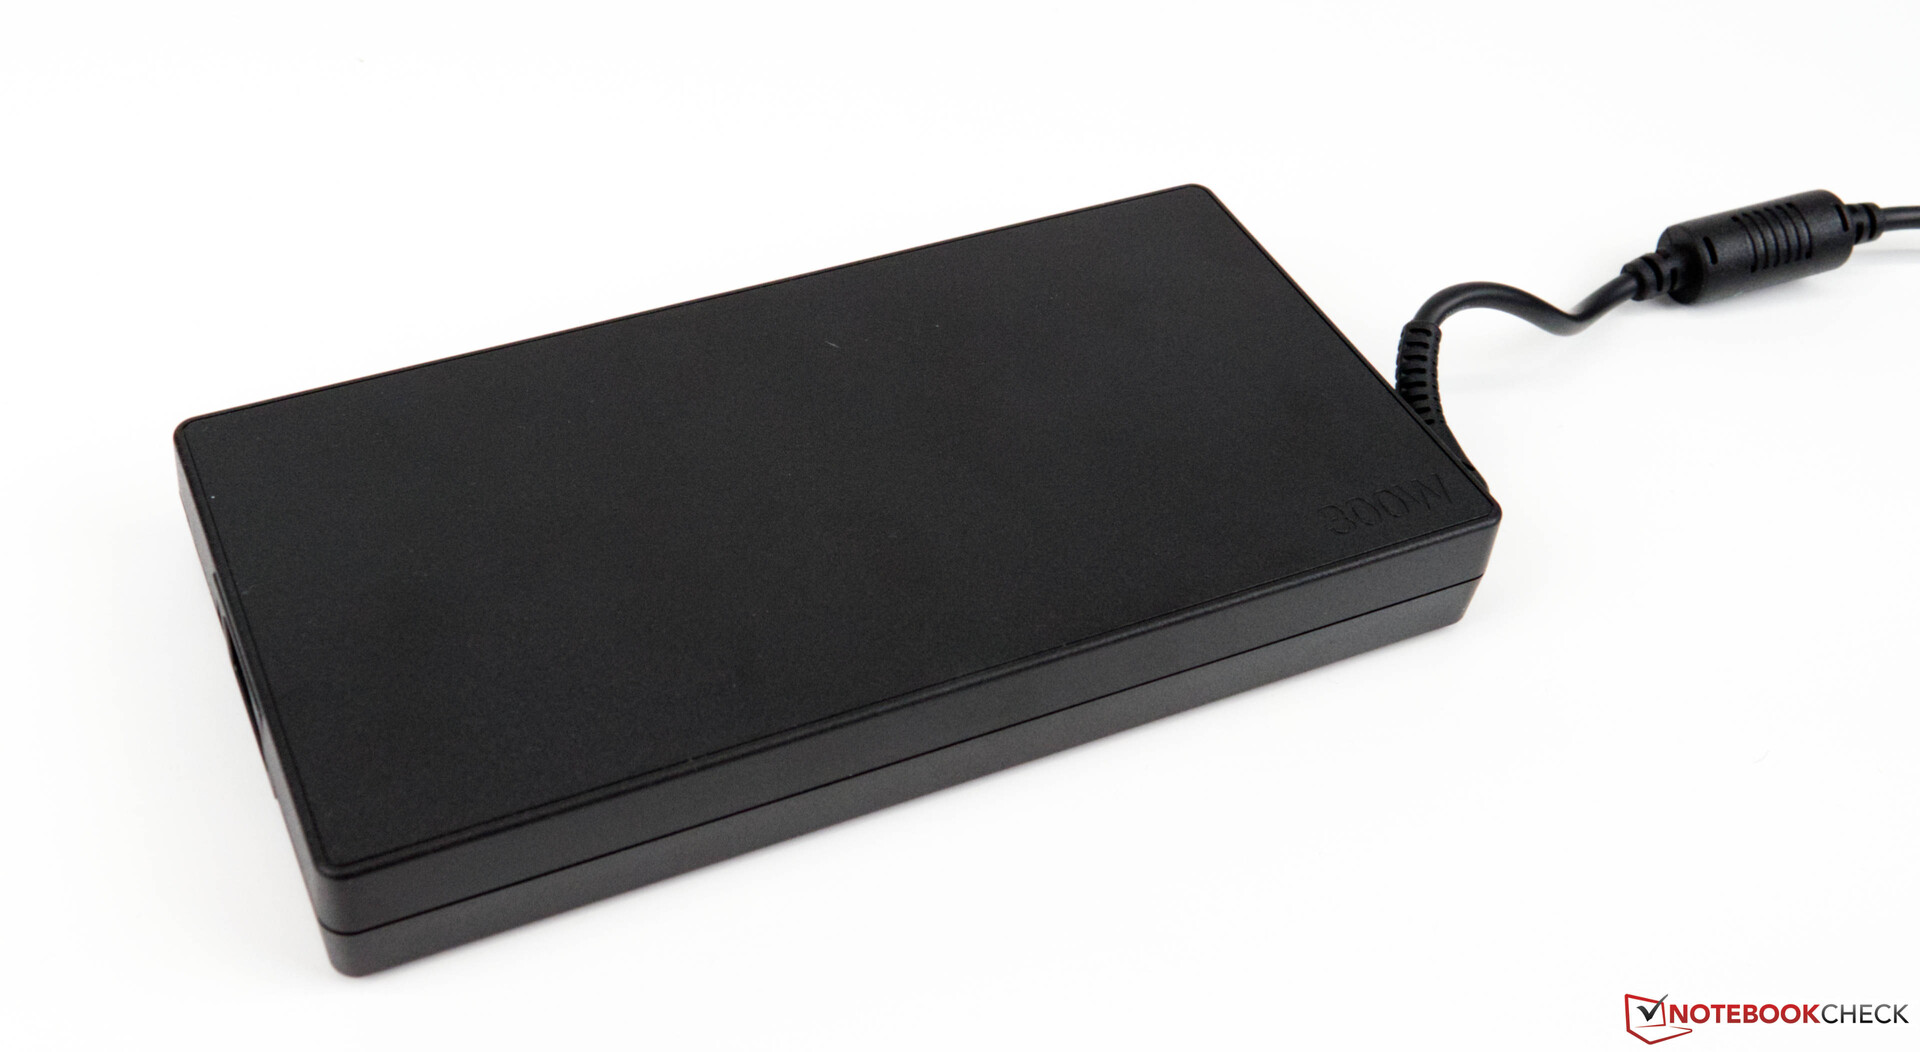
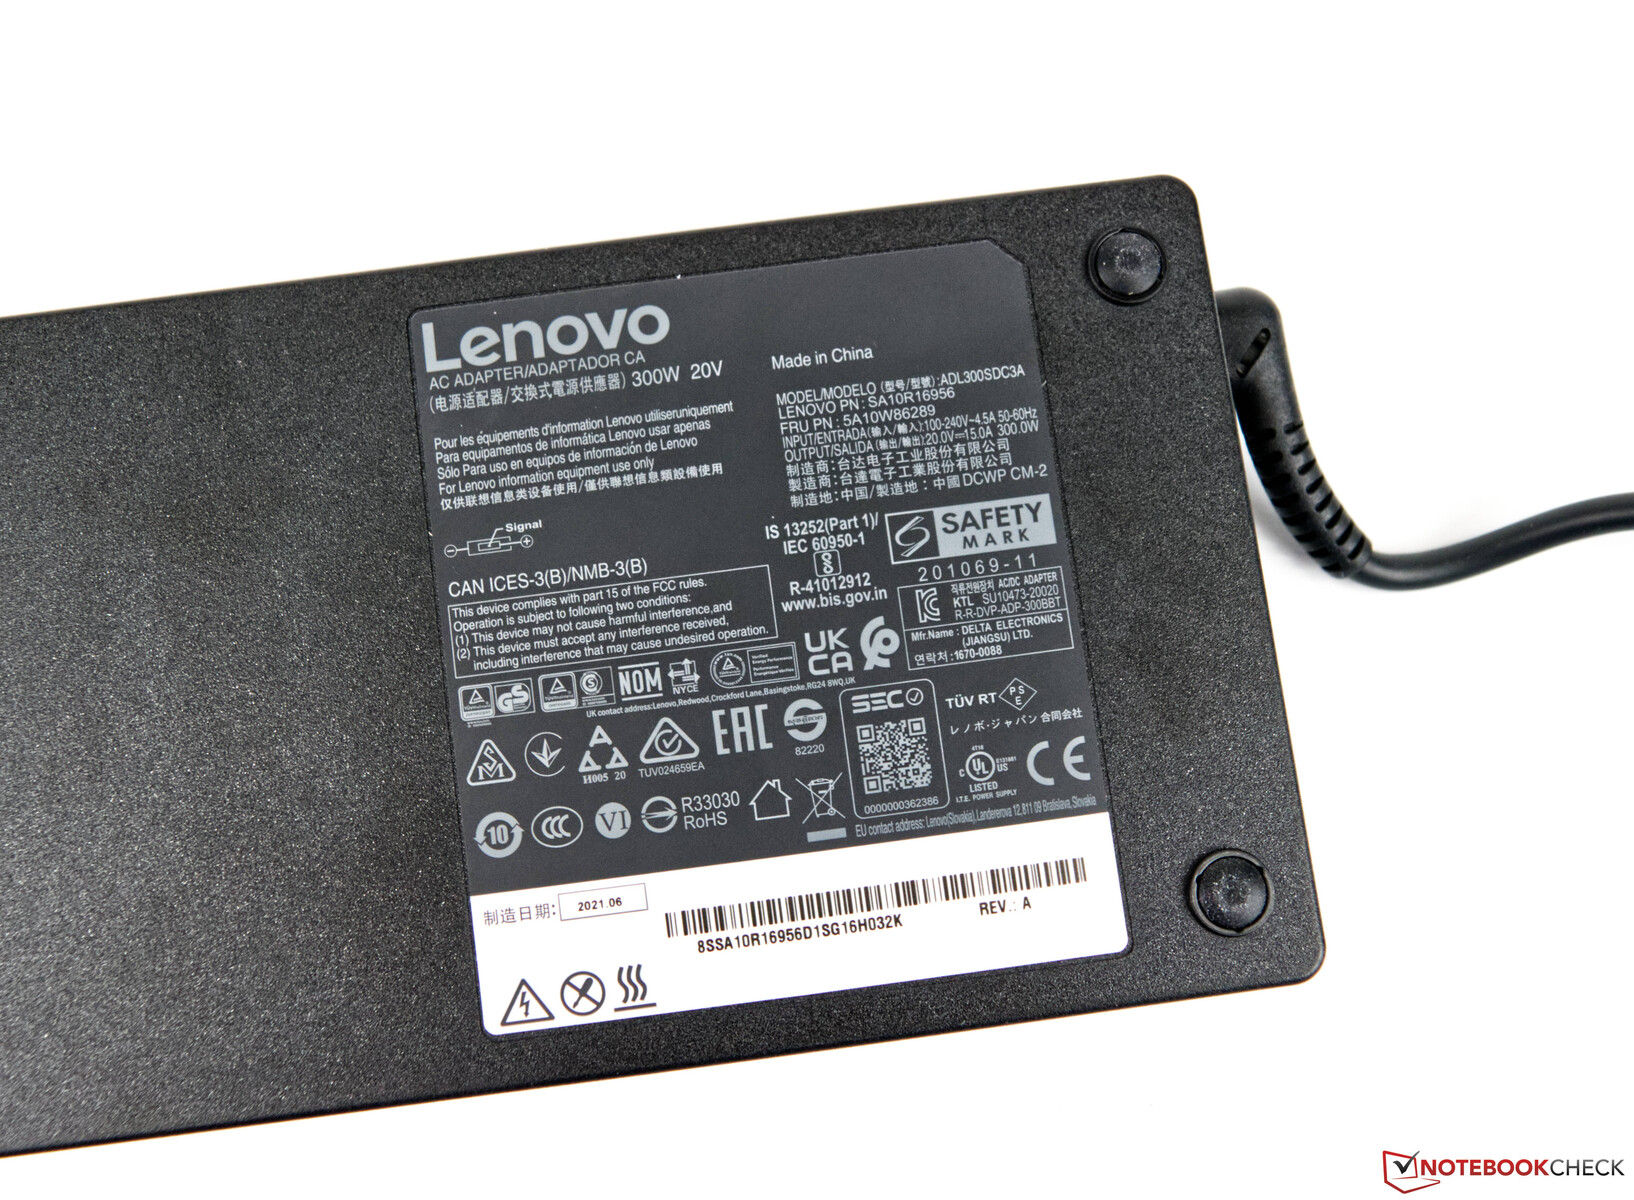
3.1公斤(约6.83磅),联想Legion 5 17明显比其竞争对手重。同样,我们测试设备的占地面积也较大。300瓦的交流适配器,既苗条又强大,重量刚刚超过一公斤(约2.2磅)。
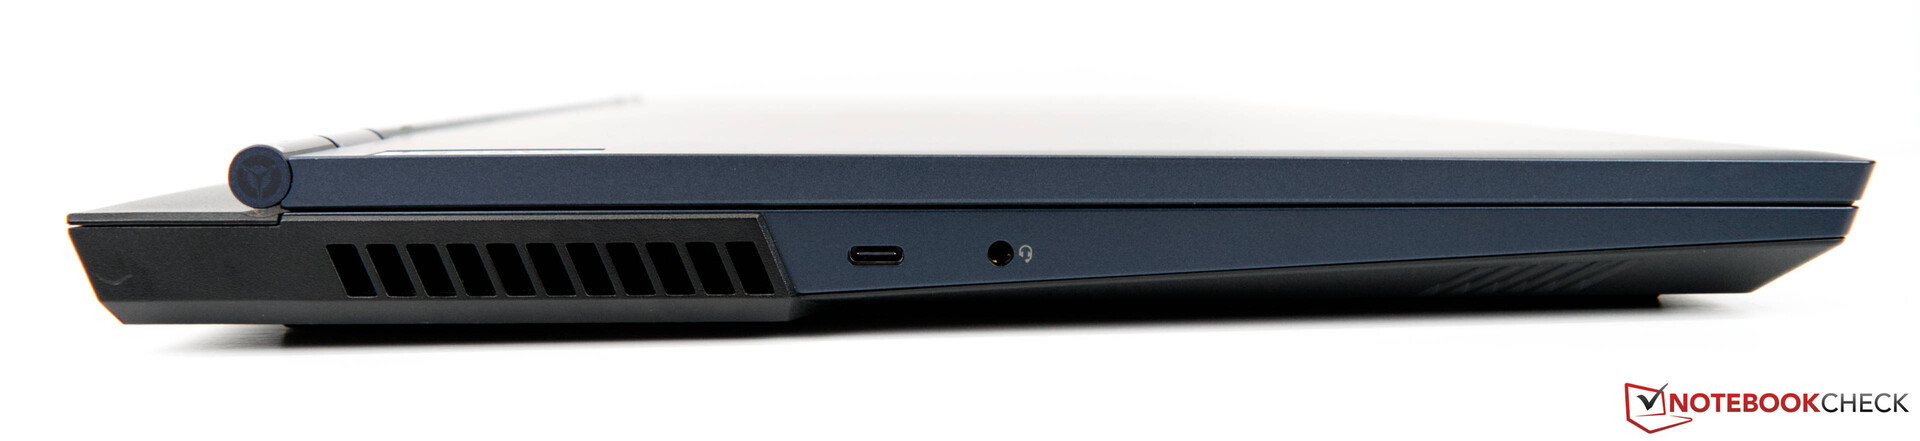
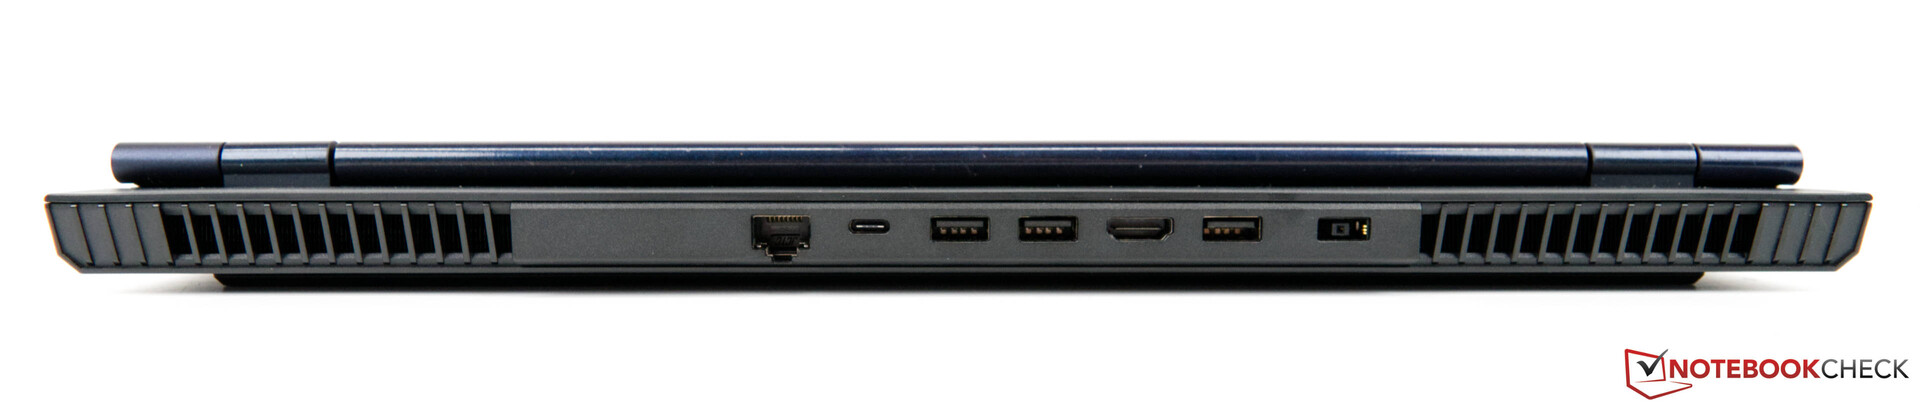
连接性
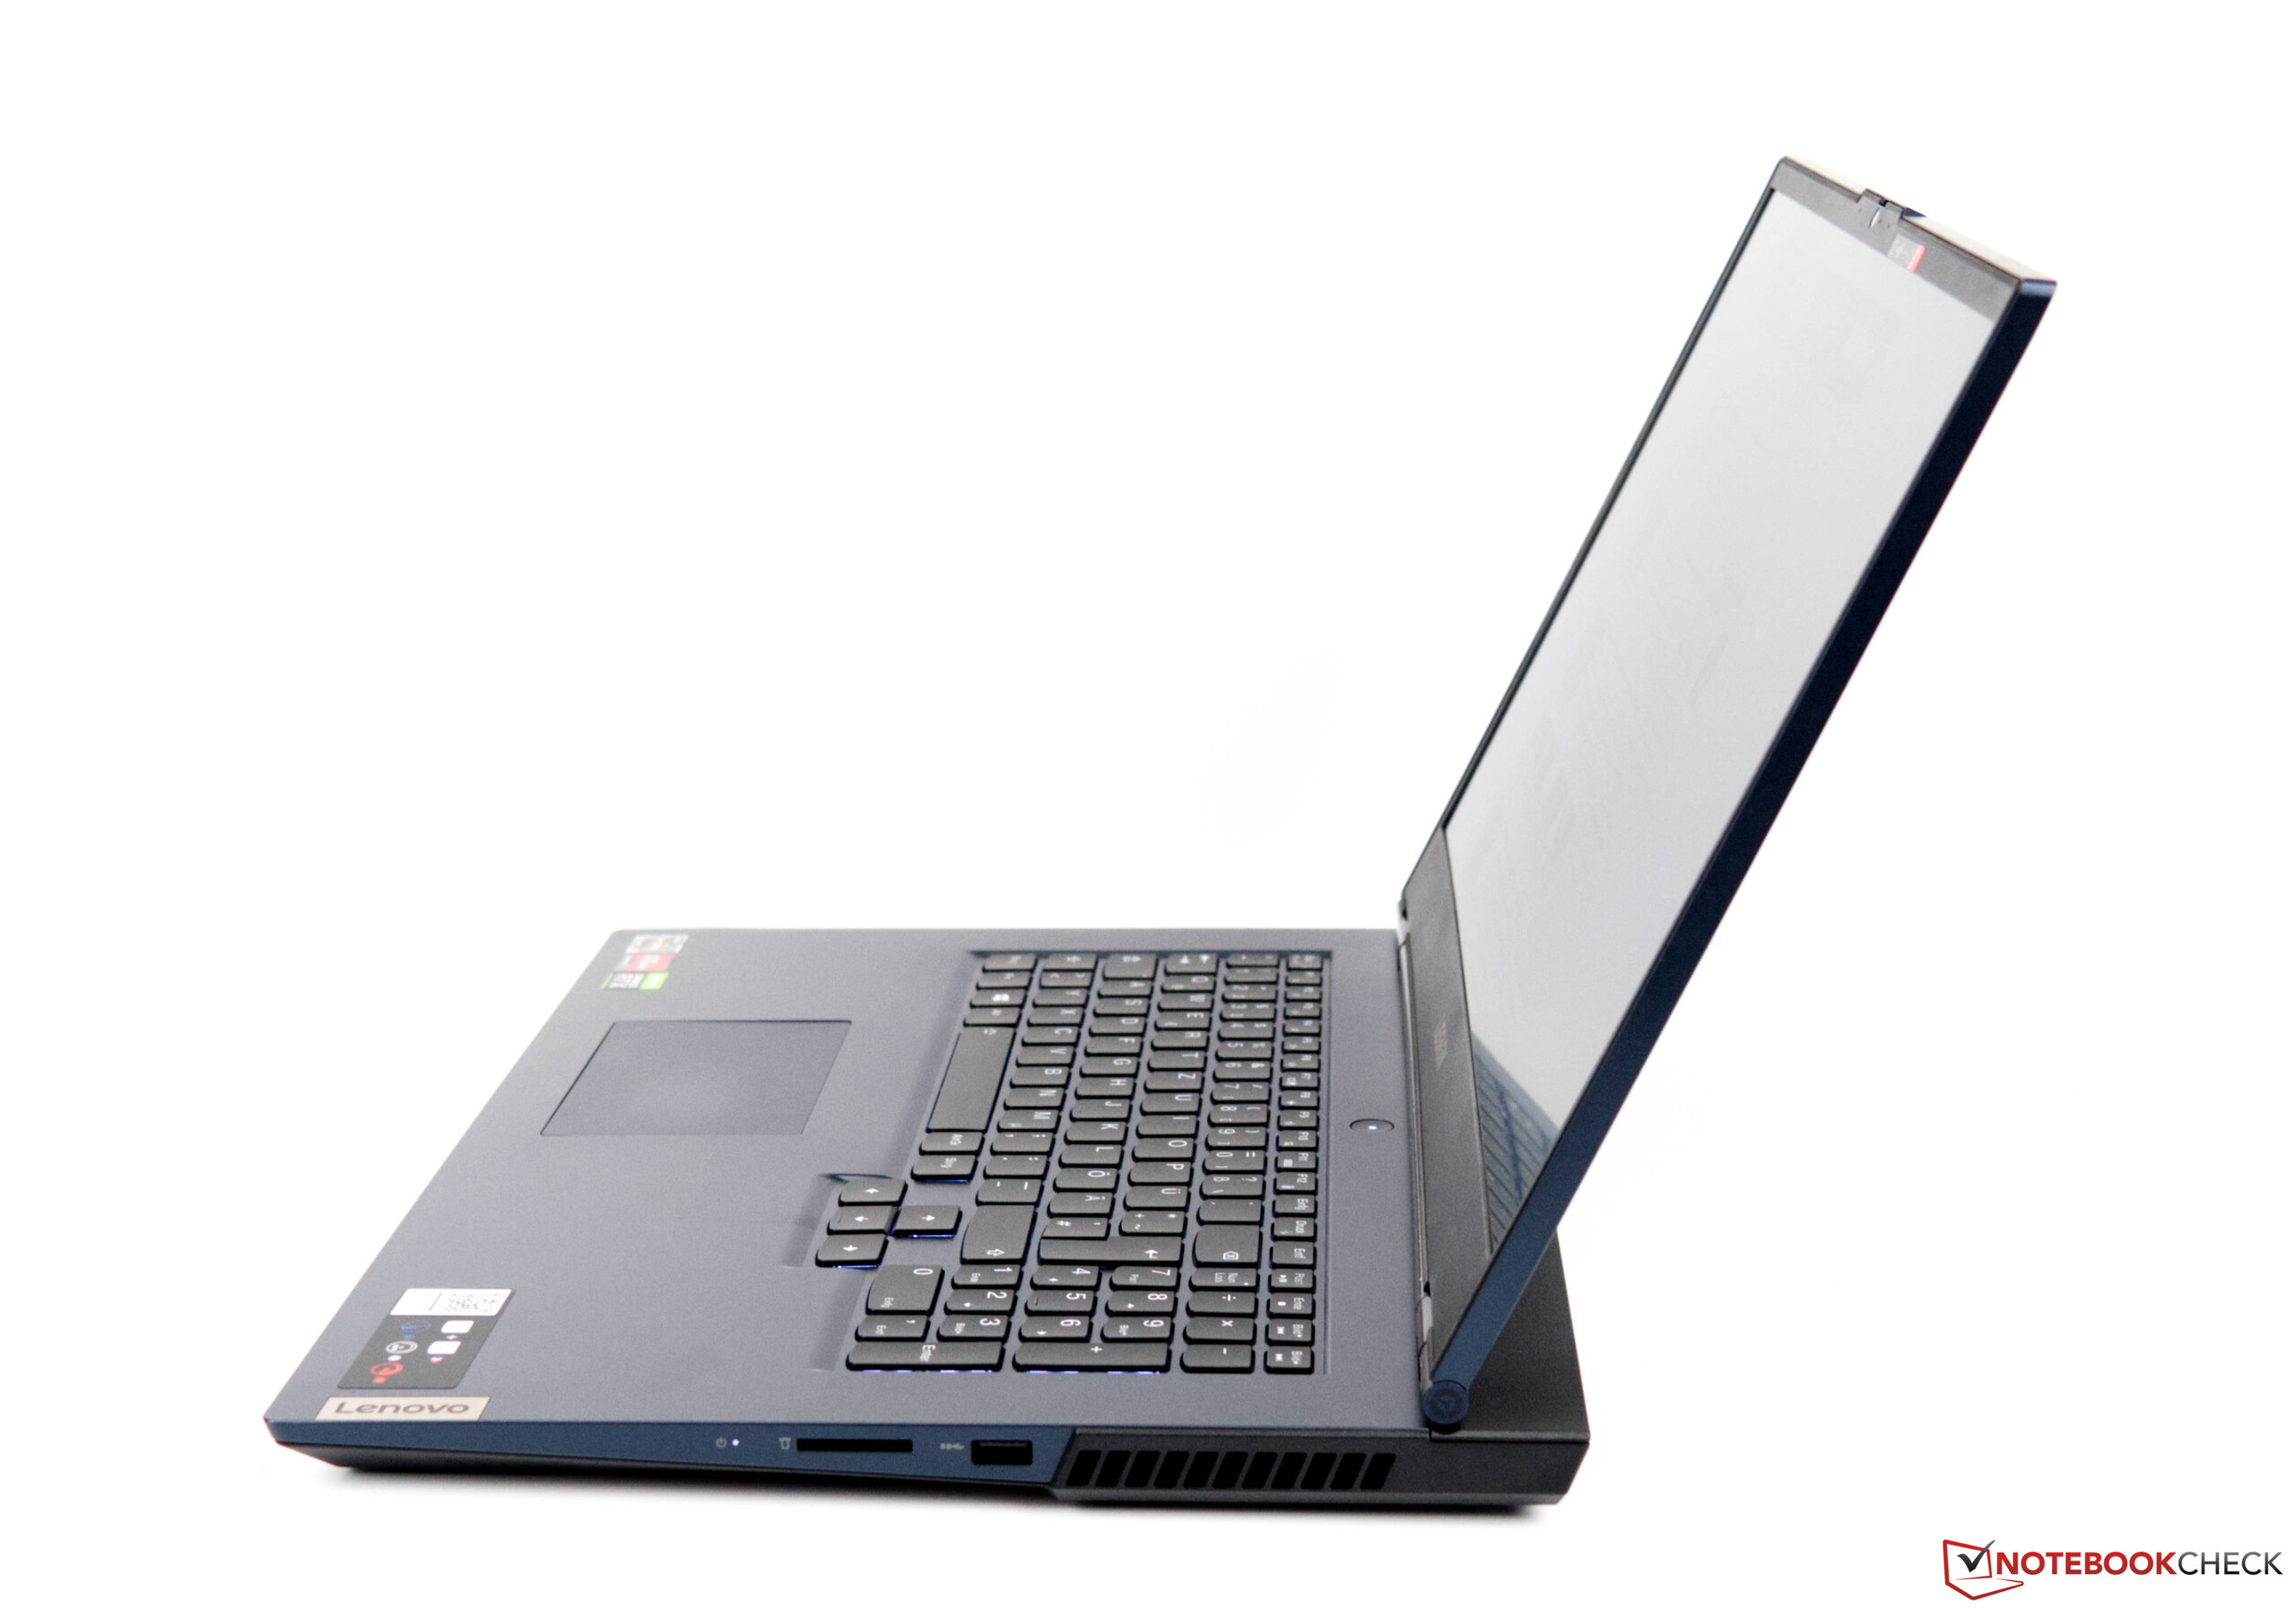
说到端口的选择,联想Legion 5 17提供了很好的端口种类和合理的布局。大部分的端口都在背面。然而,每侧仍有一个USB端口和一个SD读卡器。仍有一些改进的余地,因为设备背面的空间可以用来使端口进一步分开,特别是给USB端口稍微多一些呼吸的空间。
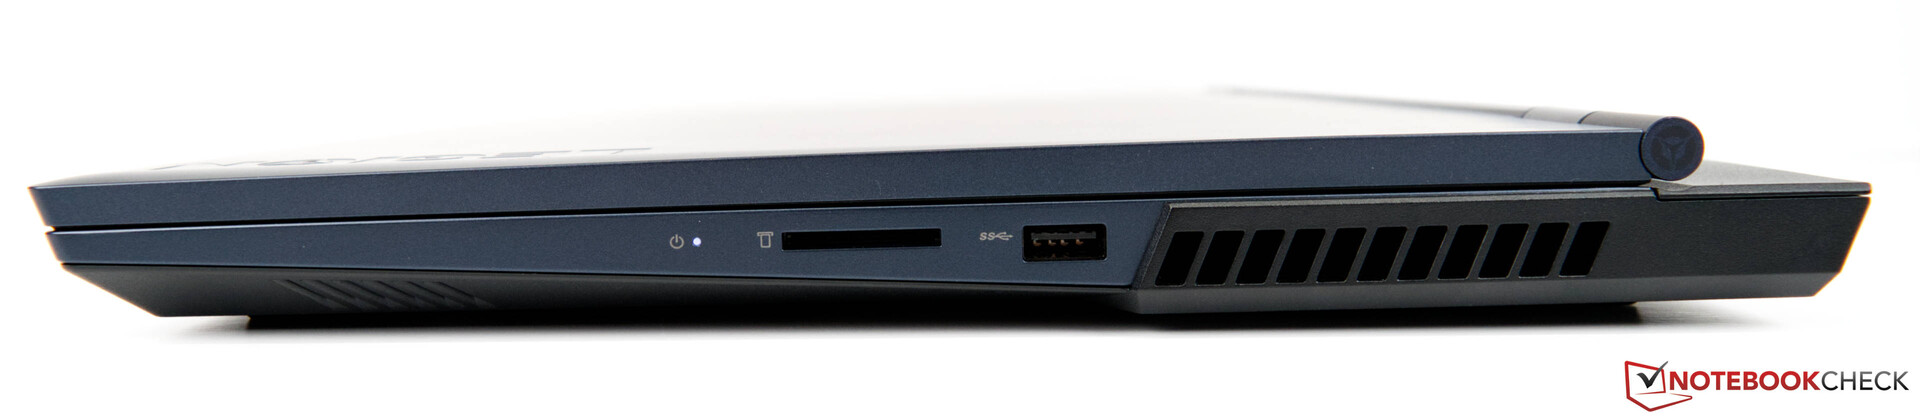
SD卡阅读器
与联想Legion Y740-17IRHg不同,联想再次为Legion 5 17配备了一个全尺寸的SD读卡器。它提供了USB 3.0的速度,在我们的连续读取基准测试中达到了接近90MB/s。为此,我们使用了我们的参考卡(Angelbird AV Pro V60)。
| SD Card Reader | |
| average JPG Copy Test (av. of 3 runs) | |
| Average of class Gaming (20.9 - 210, n=54, last 2 years) | |
| Lenovo Legion 5 17ACH6H-82JY0003GE (AV Pro SD microSD 128 GB V60) | |
| Schenker XMG Core 17 (Early 2021) (AV PRO microSD 128 GB V60) | |
| maximum AS SSD Seq Read Test (1GB) | |
| Average of class Gaming (25.5 - 261, n=51, last 2 years) | |
| Lenovo Legion 5 17ACH6H-82JY0003GE (AV Pro SD microSD 128 GB V60) | |
| Schenker XMG Core 17 (Early 2021) (AV PRO microSD 128 GB V60) | |
沟通
联想Legion 5 17配备了一个Realtek Wi-Fi模块。在我们的测试中,该Wi-Fi模块的表现足以满足日常使用。与配备快速英特尔模块的竞争对手相比,我们的测试样品的表现明显较差。总的来说,与游戏类的平均结果相比,Realtek Wi-Fi模块的性能落后了。
| Networking | |
| iperf3 transmit AX12 | |
| Schenker XMG Core 17 (Early 2021) | |
| MSI Katana GF76 11UE | |
| Gigabyte A7 X1 | |
| Lenovo Legion 5 17ACH6H-82JY0003GE | |
| Schenker XMG Apex 17 M21 | |
| Average RealTek Semiconductor RTL8852AE (424 - 928, n=20) | |
| Asus TUF Gaming F17 FX706HM | |
| iperf3 receive AX12 | |
| Schenker XMG Core 17 (Early 2021) | |
| Gigabyte A7 X1 | |
| MSI Katana GF76 11UE | |
| Schenker XMG Apex 17 M21 | |
| Average RealTek Semiconductor RTL8852AE (621 - 877, n=20) | |
| Lenovo Legion 5 17ACH6H-82JY0003GE | |
| Asus TUF Gaming F17 FX706HM | |
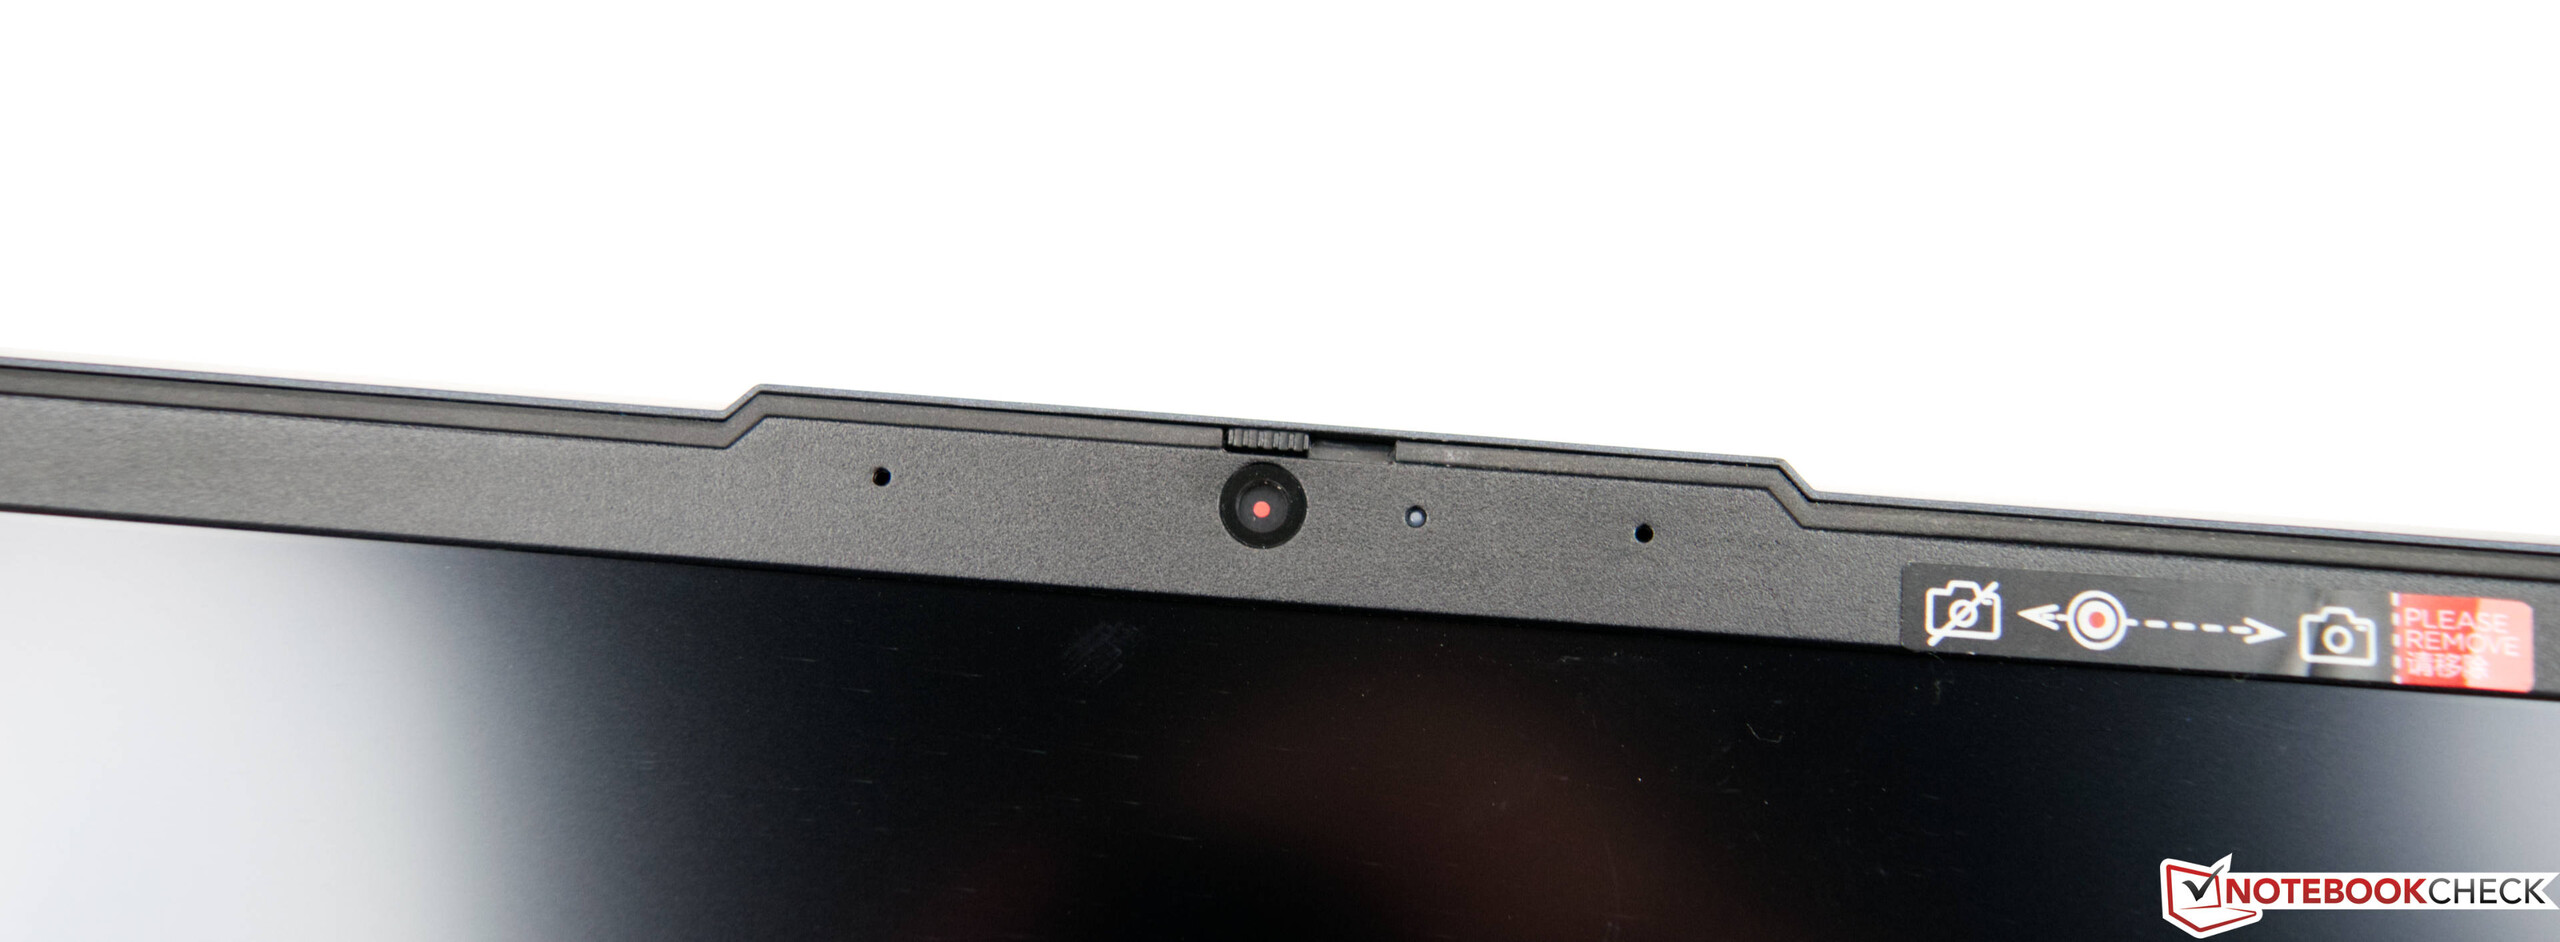
网络摄像头
目前,几乎没有任何游戏笔记本具有良好的网络摄像头质量。因此,联想Legion 5 17在色彩准确性和清晰度方面有所欠缺,如图片所示。


辅料
交付范围包括一个重达近1公斤(约2.2磅)的300瓦交流适配器和一些小册子。
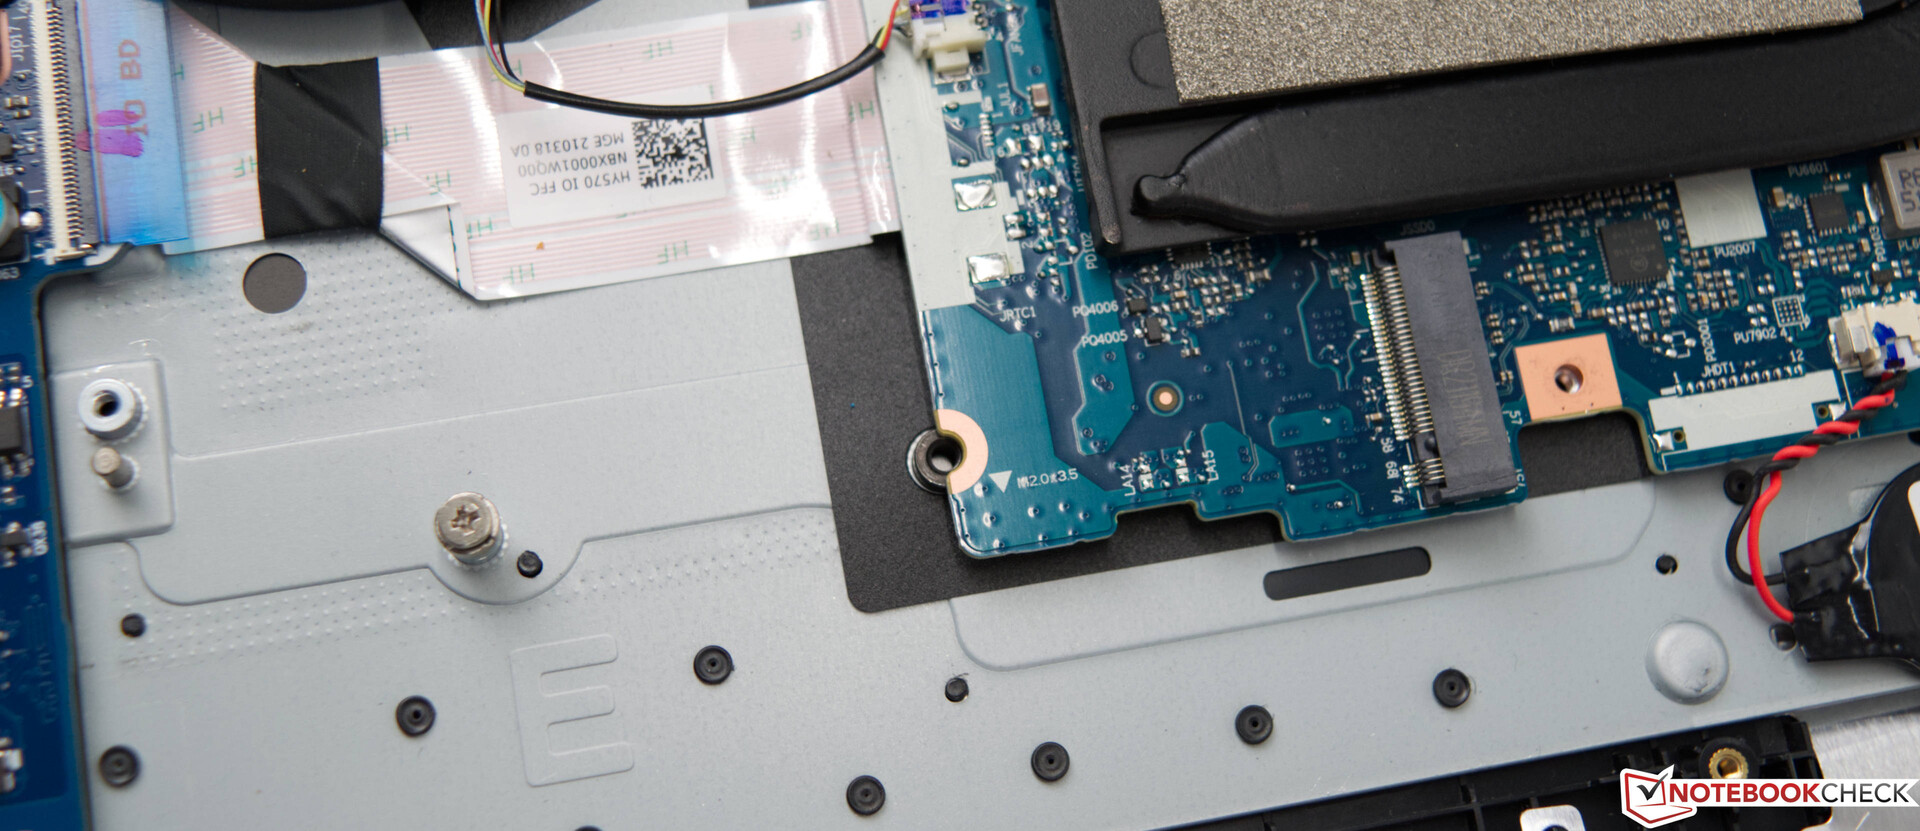
保养
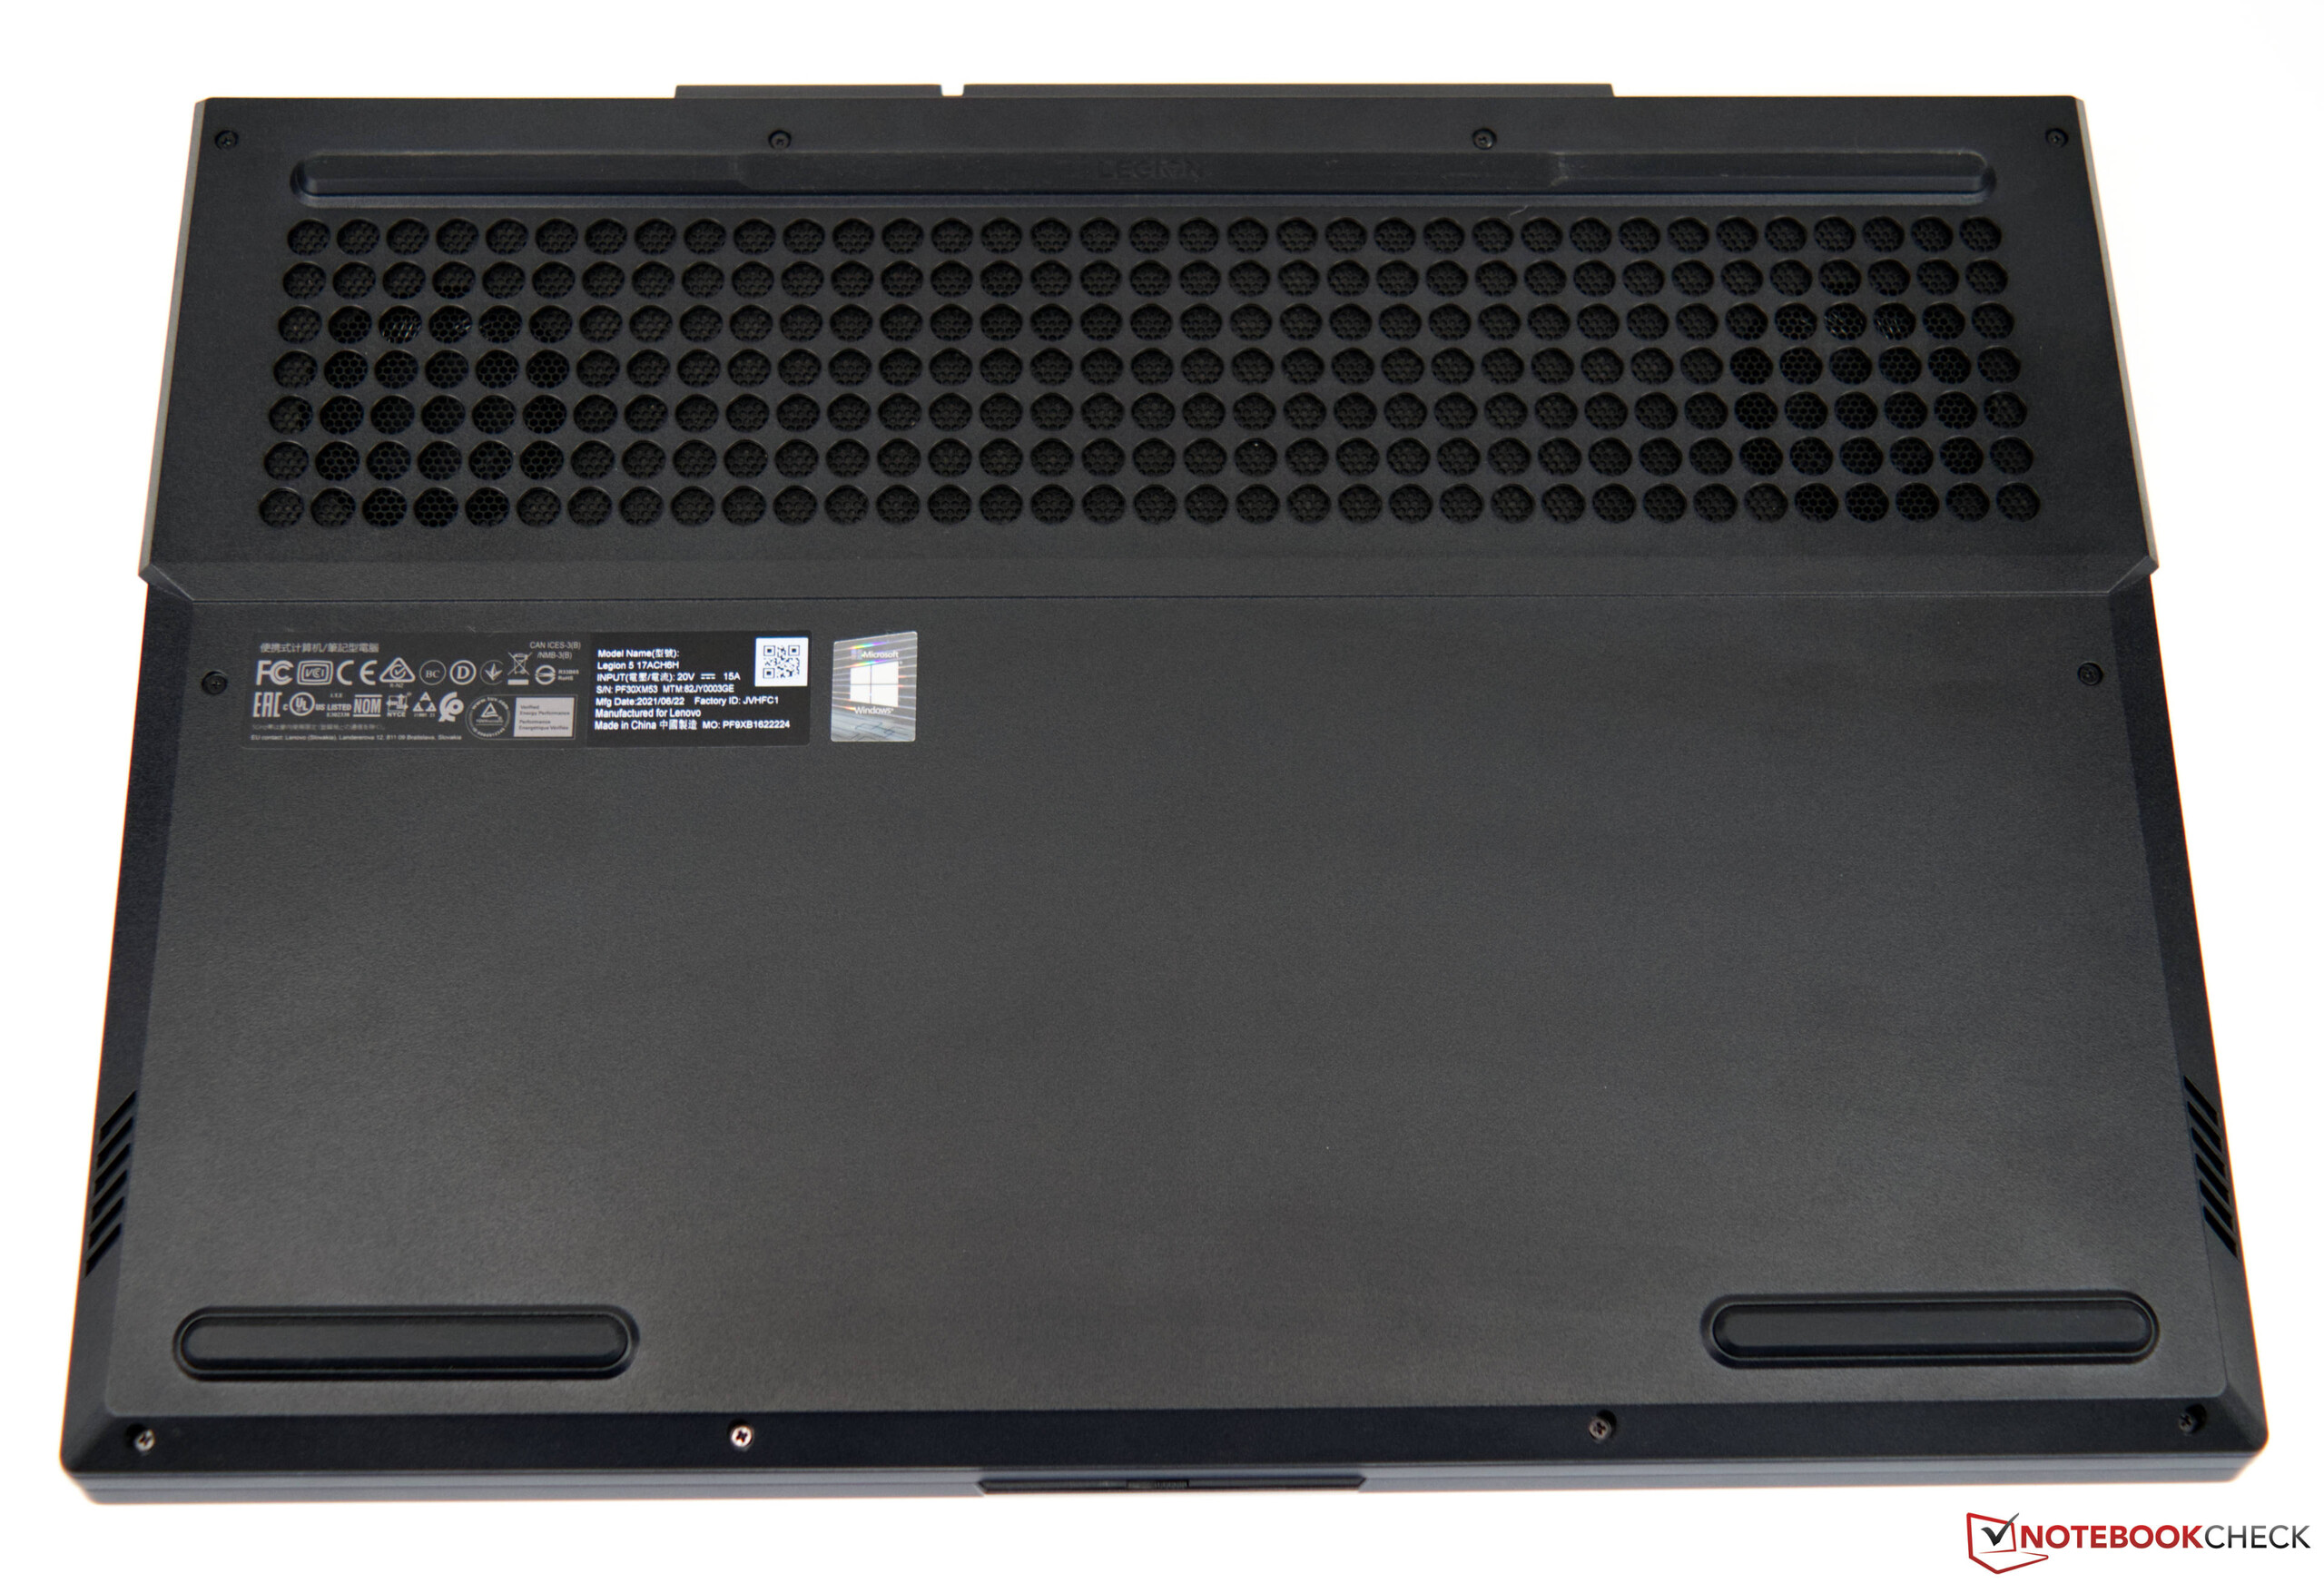
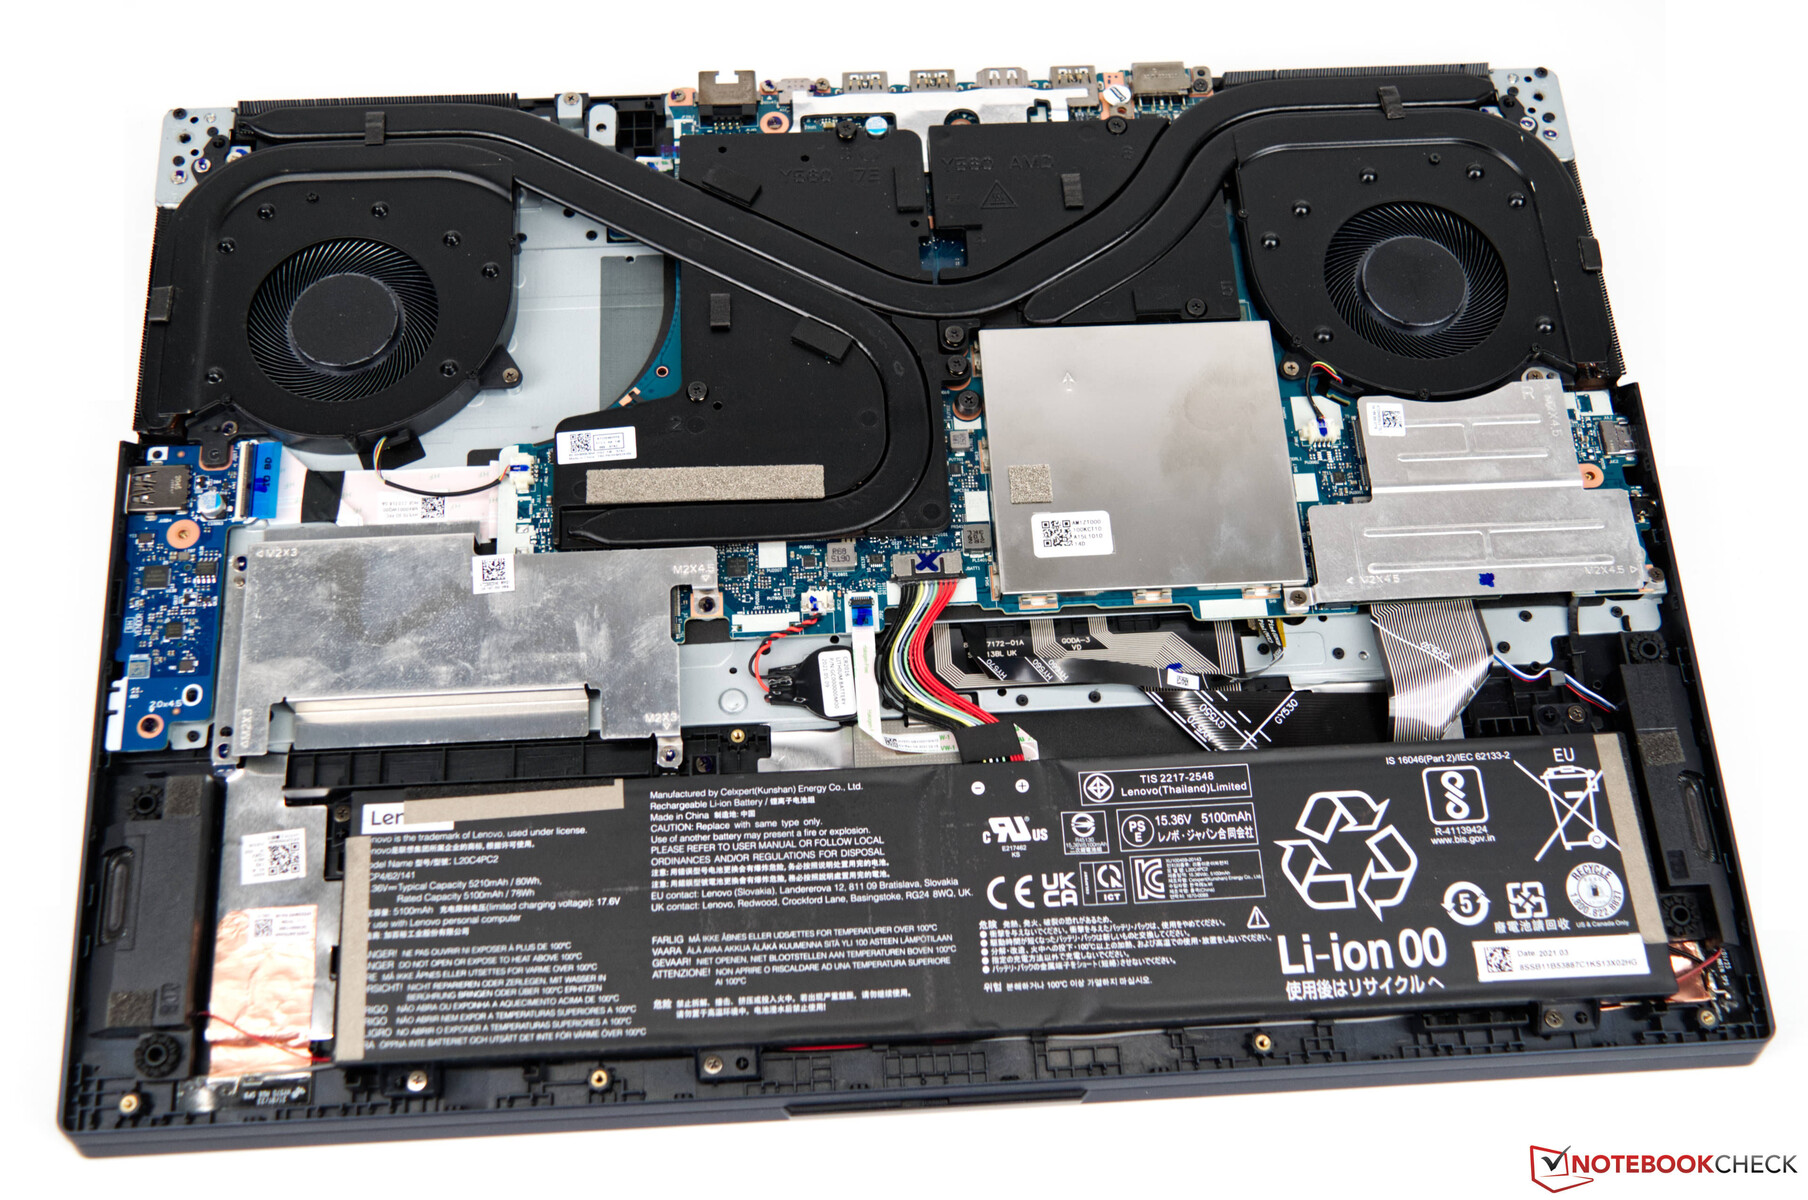
用户必须拆除底板才能接触到这些部件。建议使用适当的工具,以防止意外损坏笔记本电脑。一个额外的盖子可以保护两个内存模块和两个SSD插槽。80瓦时的电池和冷却解决方案,包括三个热管和两个风扇,占据了大部分空间。
担保
联想在其网上商店购买时,提供为期1年的车厂或携带式基本保修,并提供保修期延长选项。
输入设备
键盘
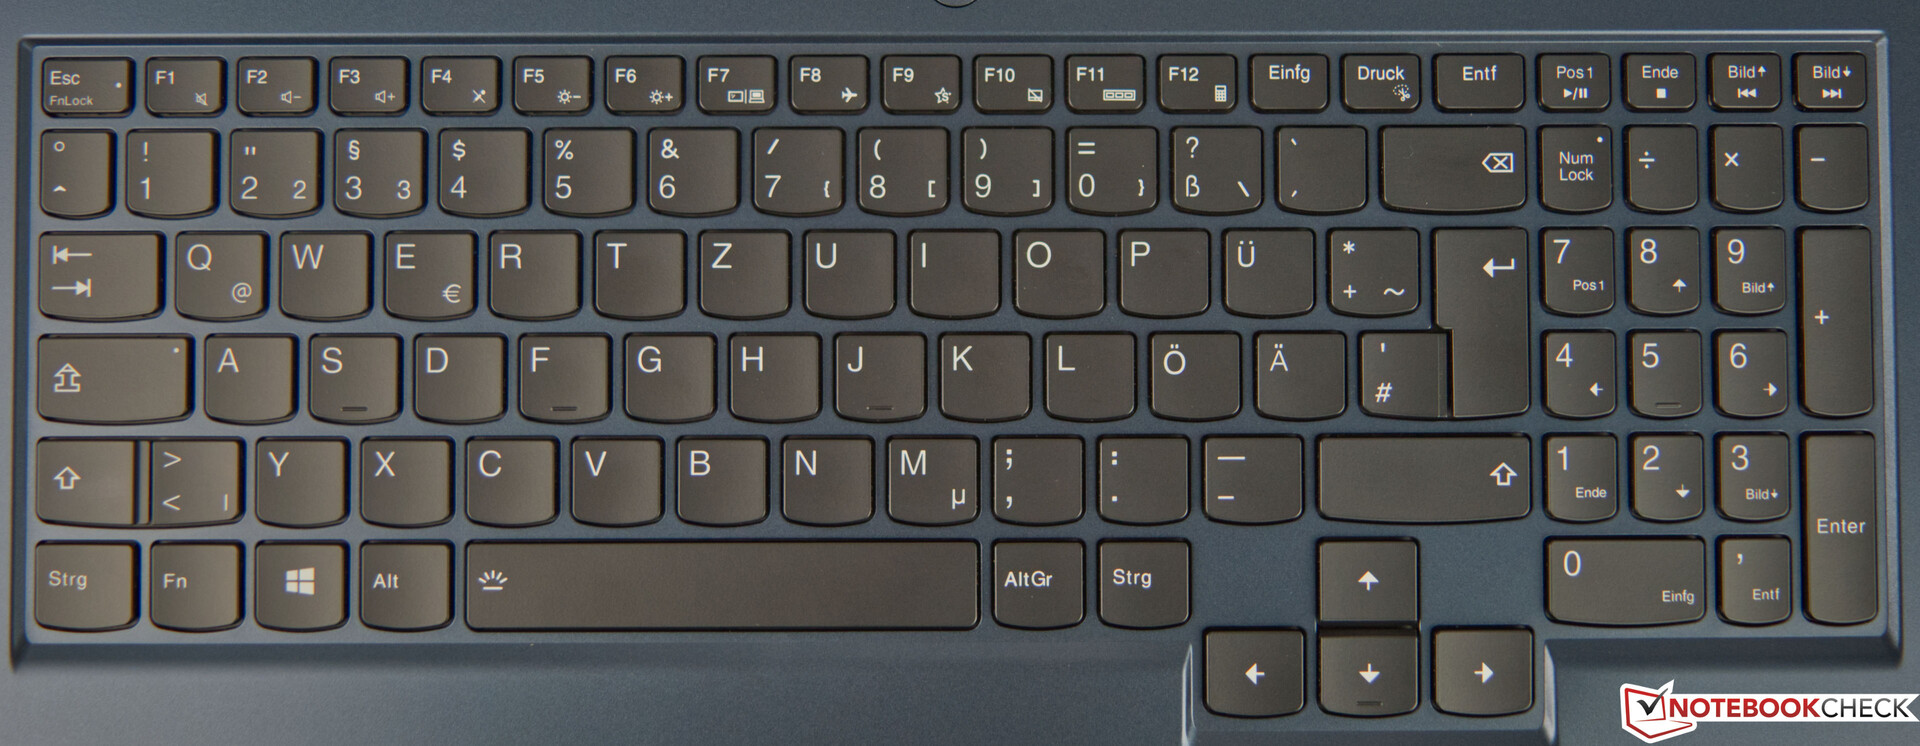
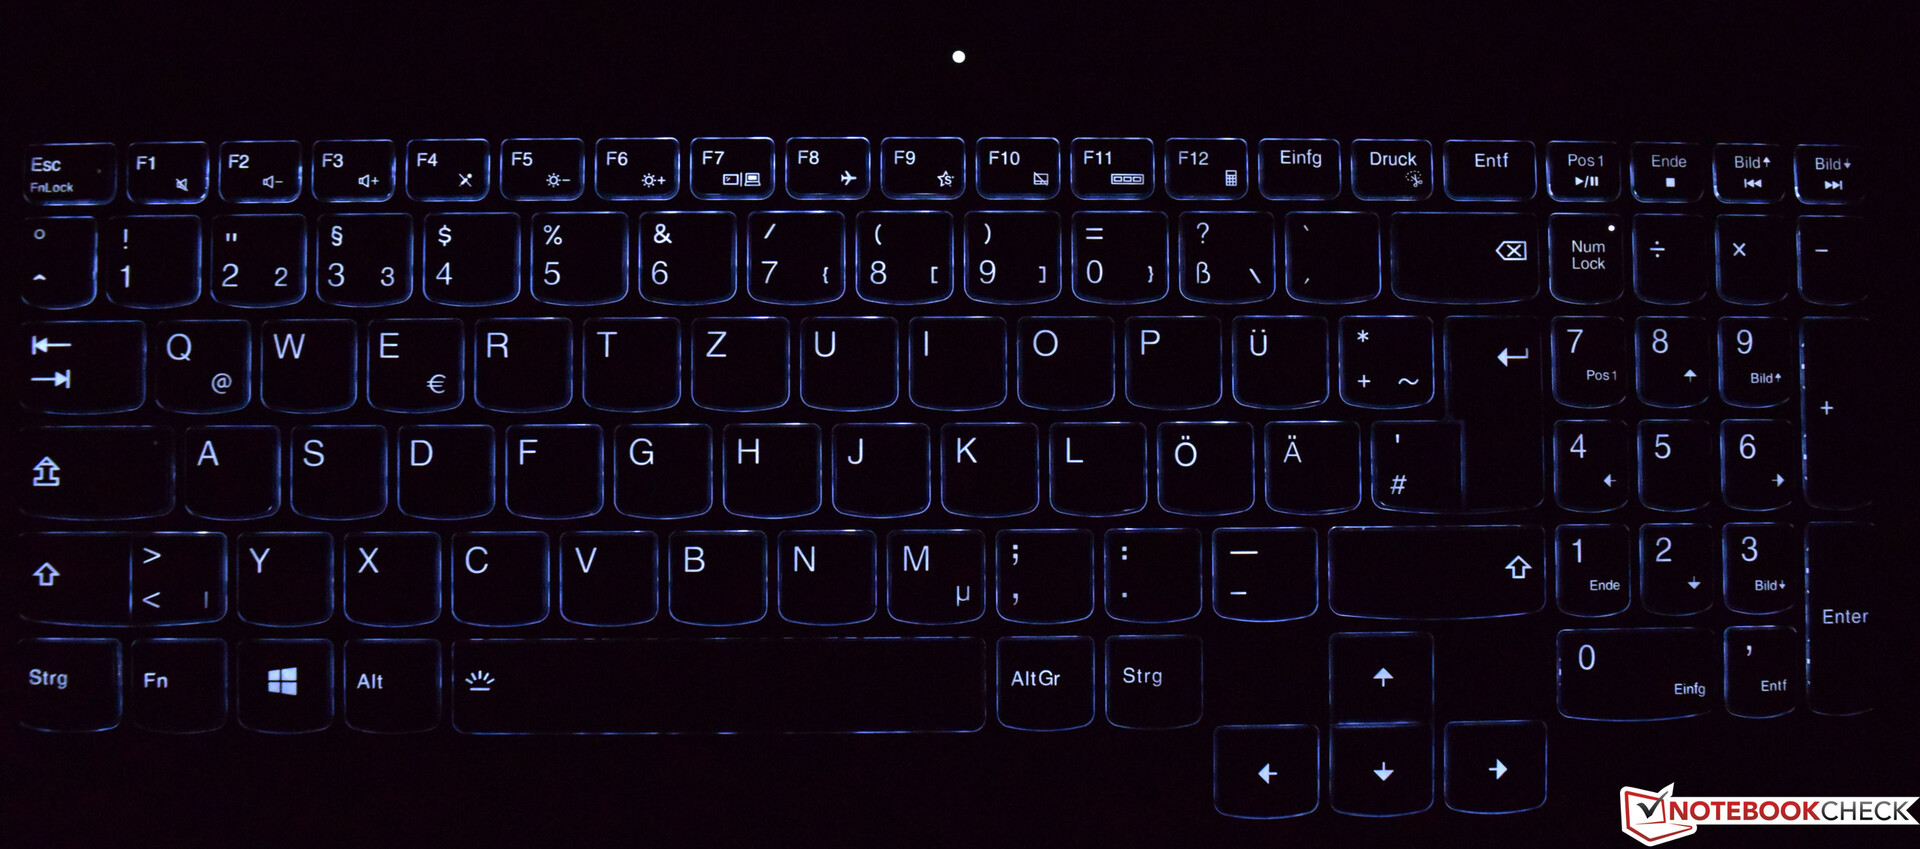
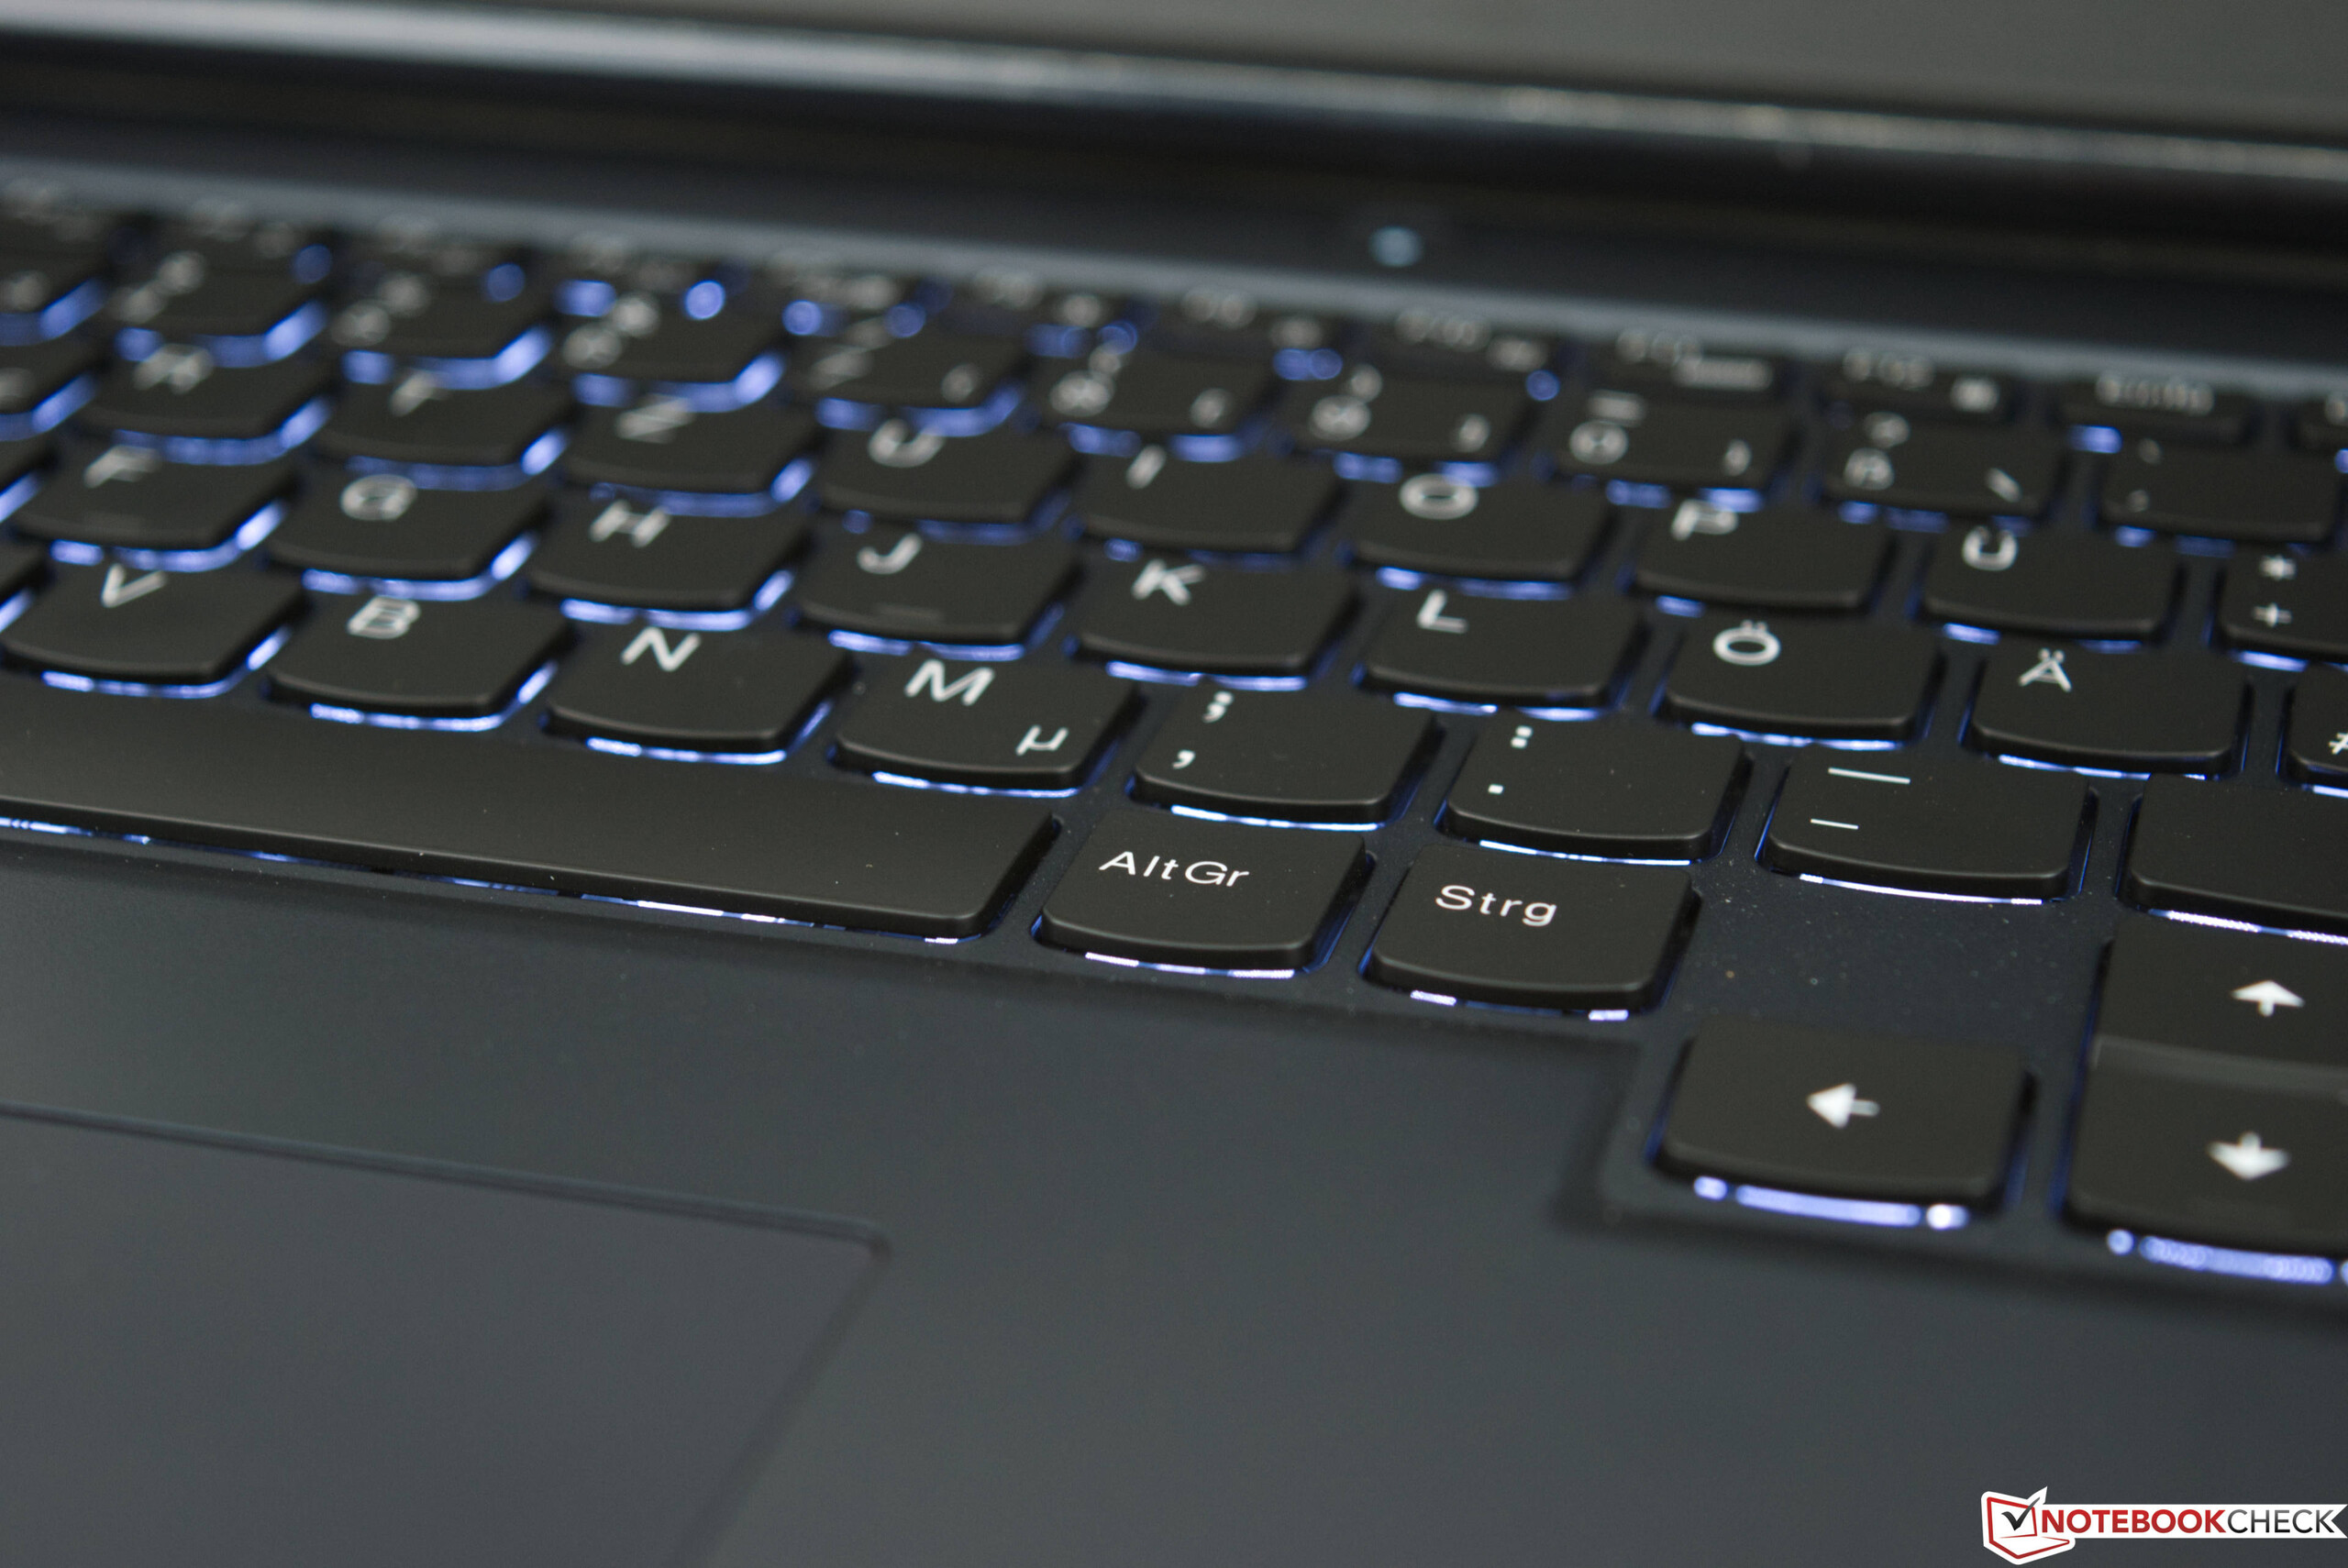
联想为Legion 5 17配备了一个6行的Chiclet键盘,带有微妙的背光和两个亮度级别。如果需要,也可以完全禁用背光。键盘足够大,方向键的大小也很正常。仅仅1.5毫米的浅行程伴随着有点沉闷的反馈和明显的启动点。因此,按键没有海绵感。
触摸板

集成的触摸板占据了7 x 10.5厘米(2.8 x 4.1英寸)的面积,在大掌托上看起来有些失落。光滑的表面反应非常灵敏,对输入的反应非常迅速。我们没有发现我们测试设备的触摸板的任何区域有不一致的行为。两个按钮位于底部,按下后会产生明显的点击声。我们发现触摸板的位置稍微偏向左边。在日常使用中,我们经常会不小心按下鼠标右键而不是左键。
显示 - 144 Hz和无PWM
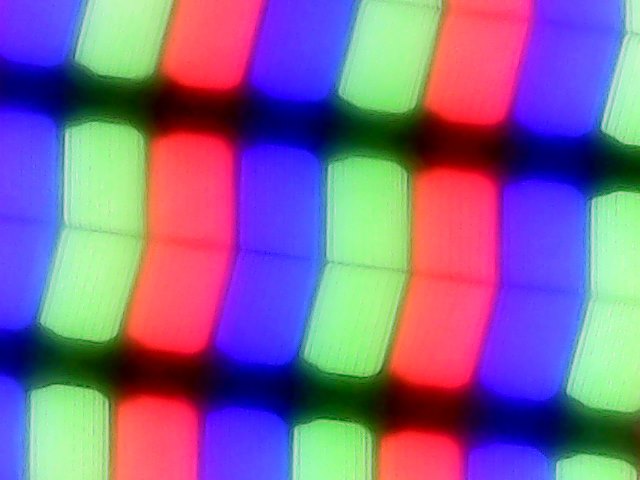
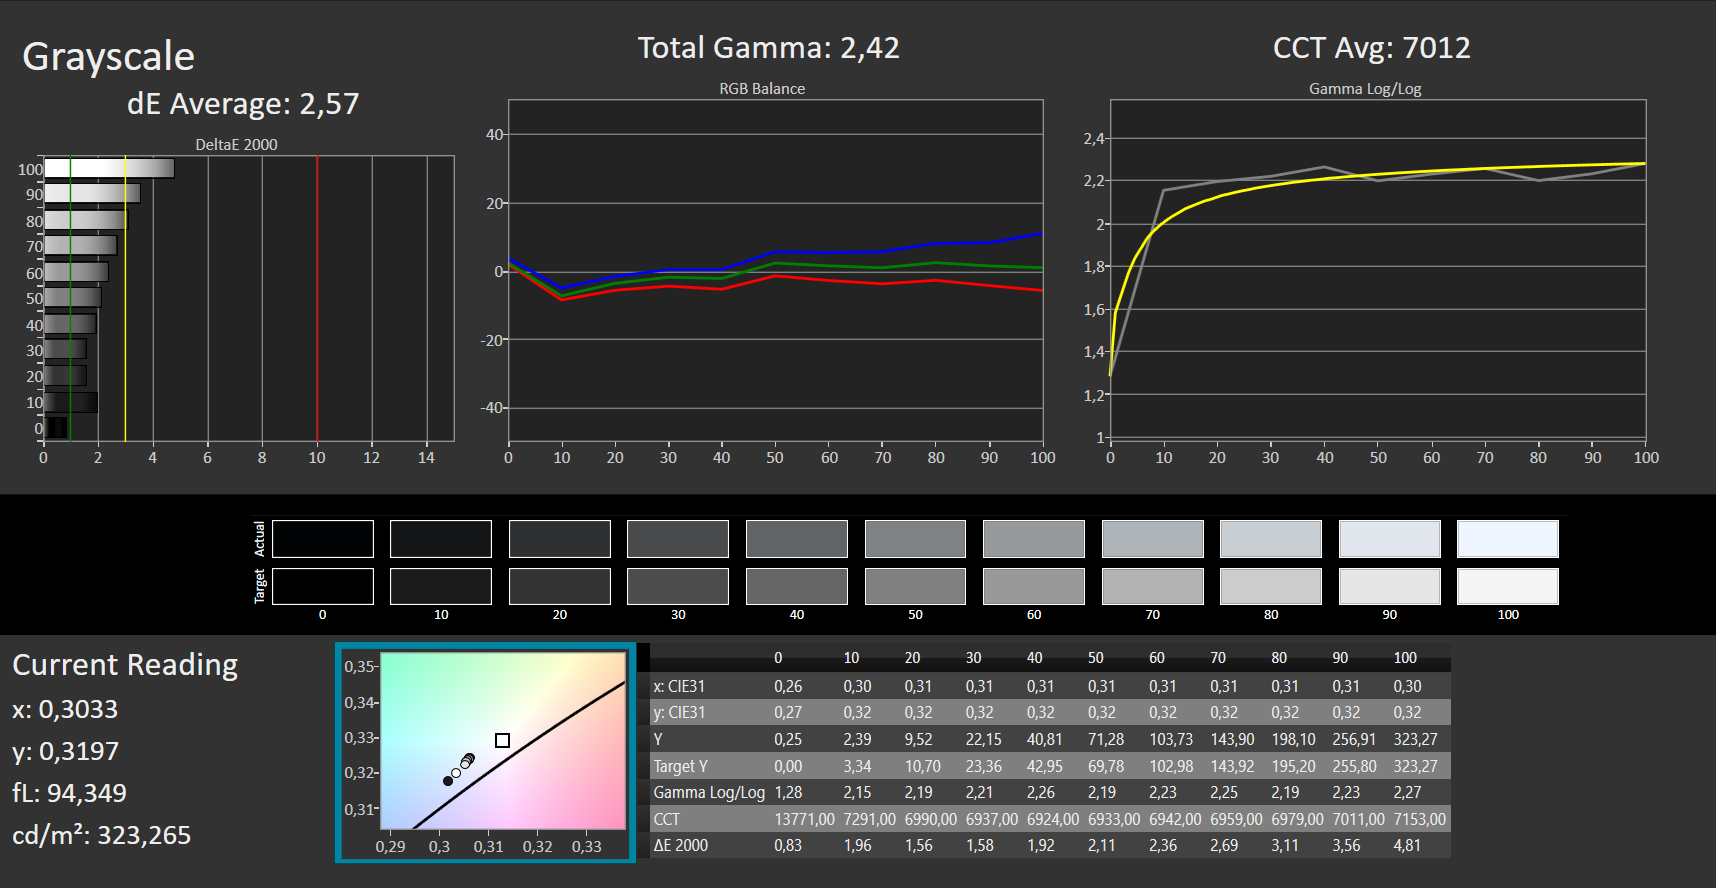
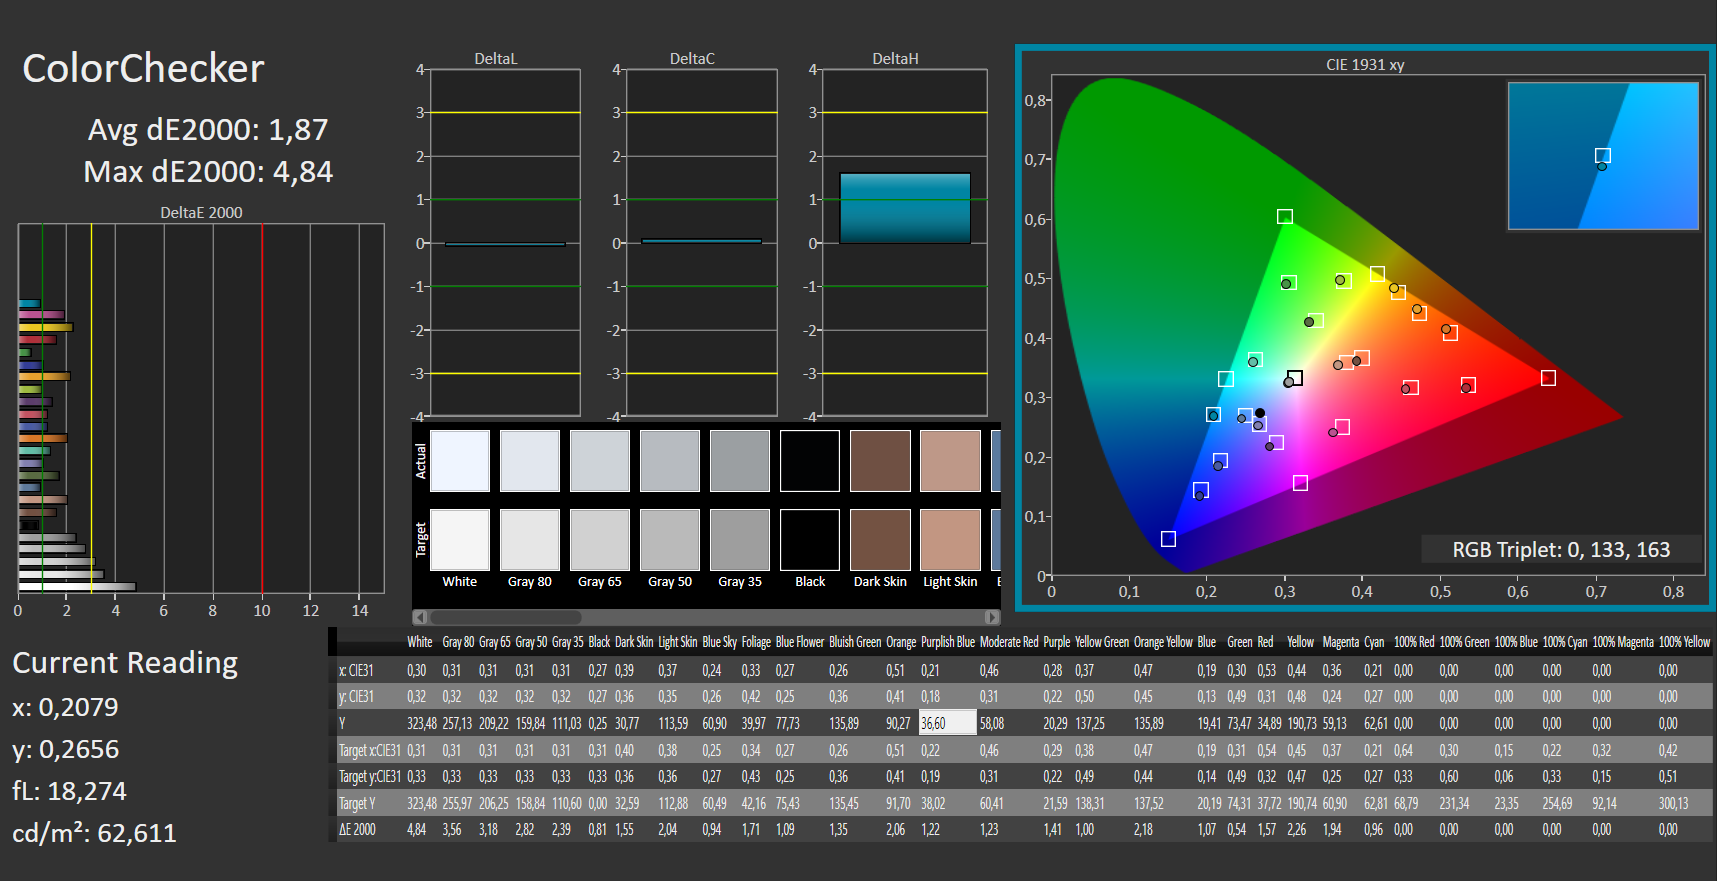
联想Legion 5 17配备了哑光杜比视界面板和144Hz刷新率。17英寸显示屏的原始分辨率为1920 x 1080像素,像素密度为127PPI。另外,Legion 5 17也可以使用传统的60-Hz面板。
我们能够通过自己的测量来确认面板的广告亮度。305尼特,只略微超过了承诺值(300尼特)。1292:1的对比度符合我们对IPS面板的期望。然而,竞争对手由于其略差的黑色数值而不能完全跟上。
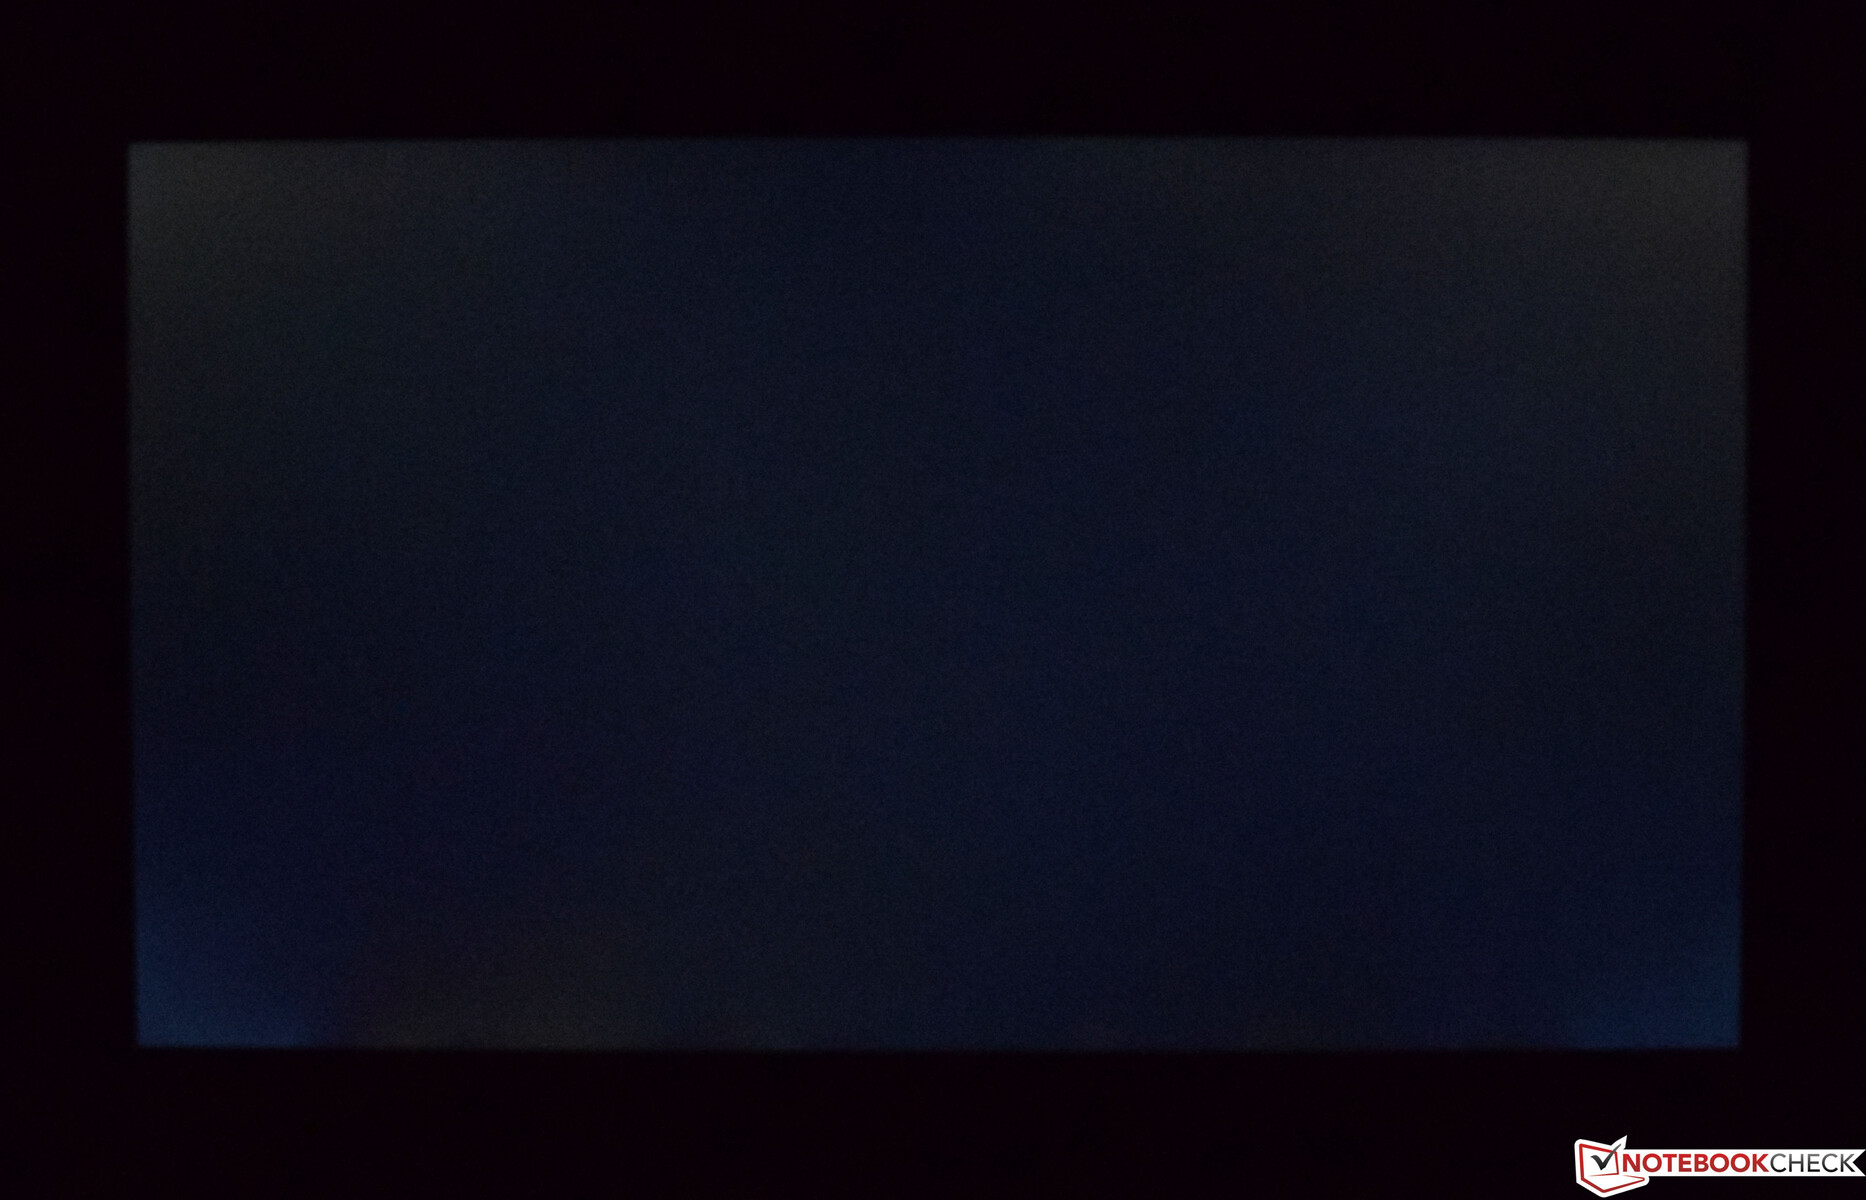
联想Legion 5 17的用户将不必担心PWM眼疲劳,因为它不依赖PWM来控制显示器的亮度。不幸的是,我们的测试设备受到背光出血的影响。在黑暗场景中,边缘有明显的屏幕出血现象。
| |||||||||||||||||||||||||
Brightness Distribution: 89 %
Center on Battery: 325 cd/m²
Contrast: 1292:1 (Black: 0.25 cd/m²)
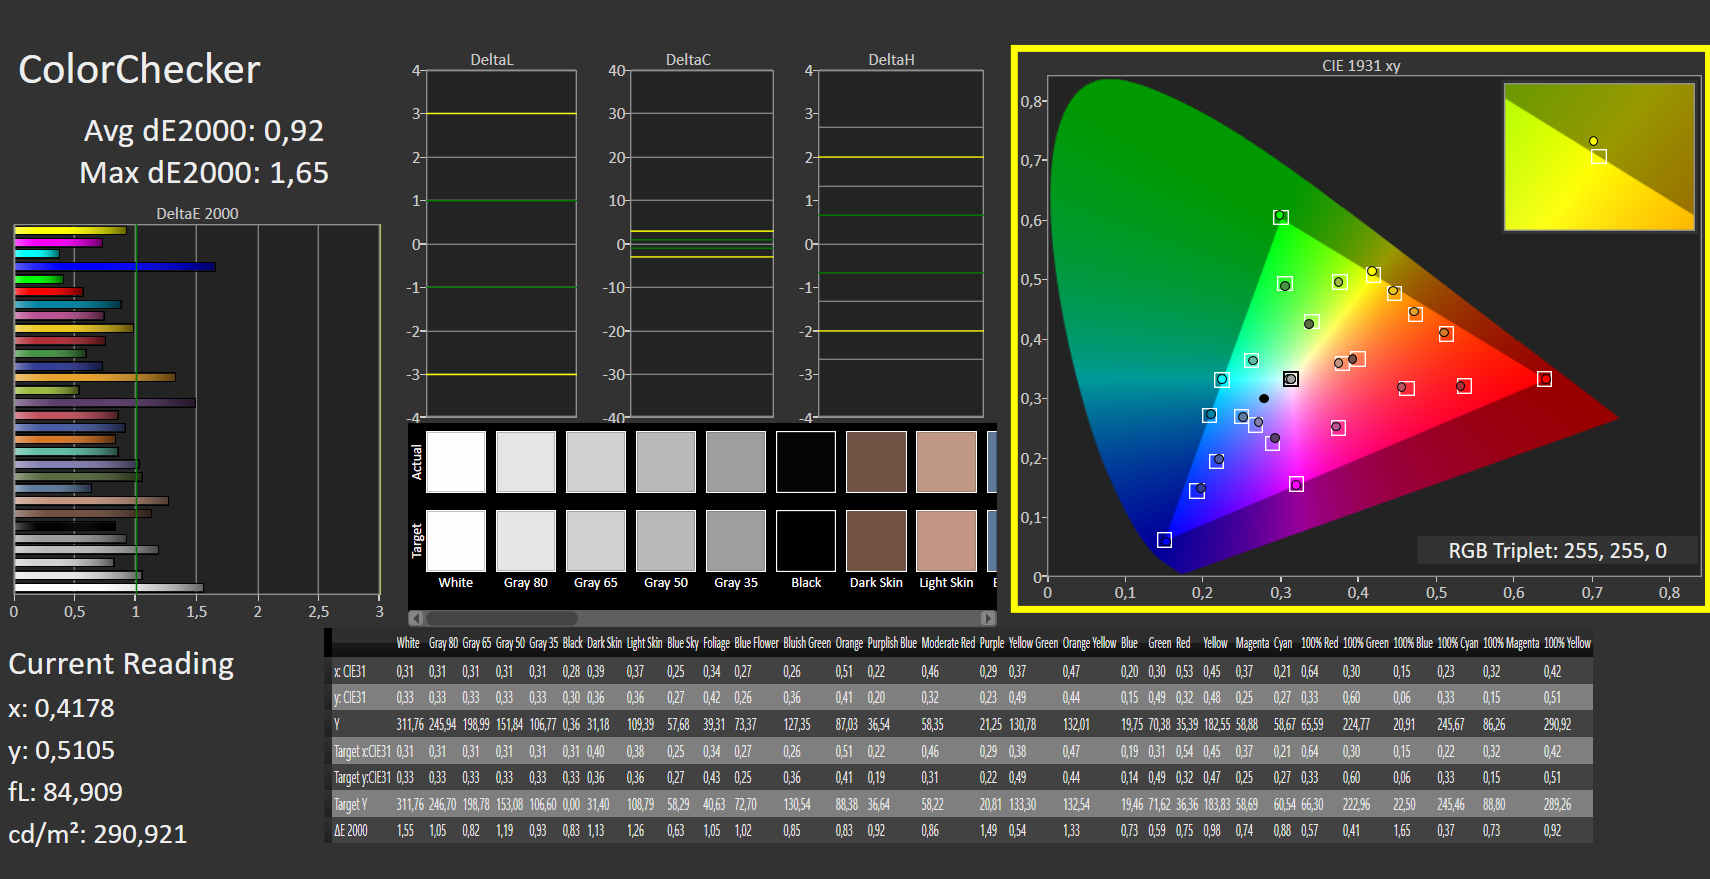
ΔE ColorChecker Calman: 1.87 | ∀{0.5-29.43 Ø4.71}
calibrated: 0.92
ΔE Greyscale Calman: 2.57 | ∀{0.09-98 Ø4.96}
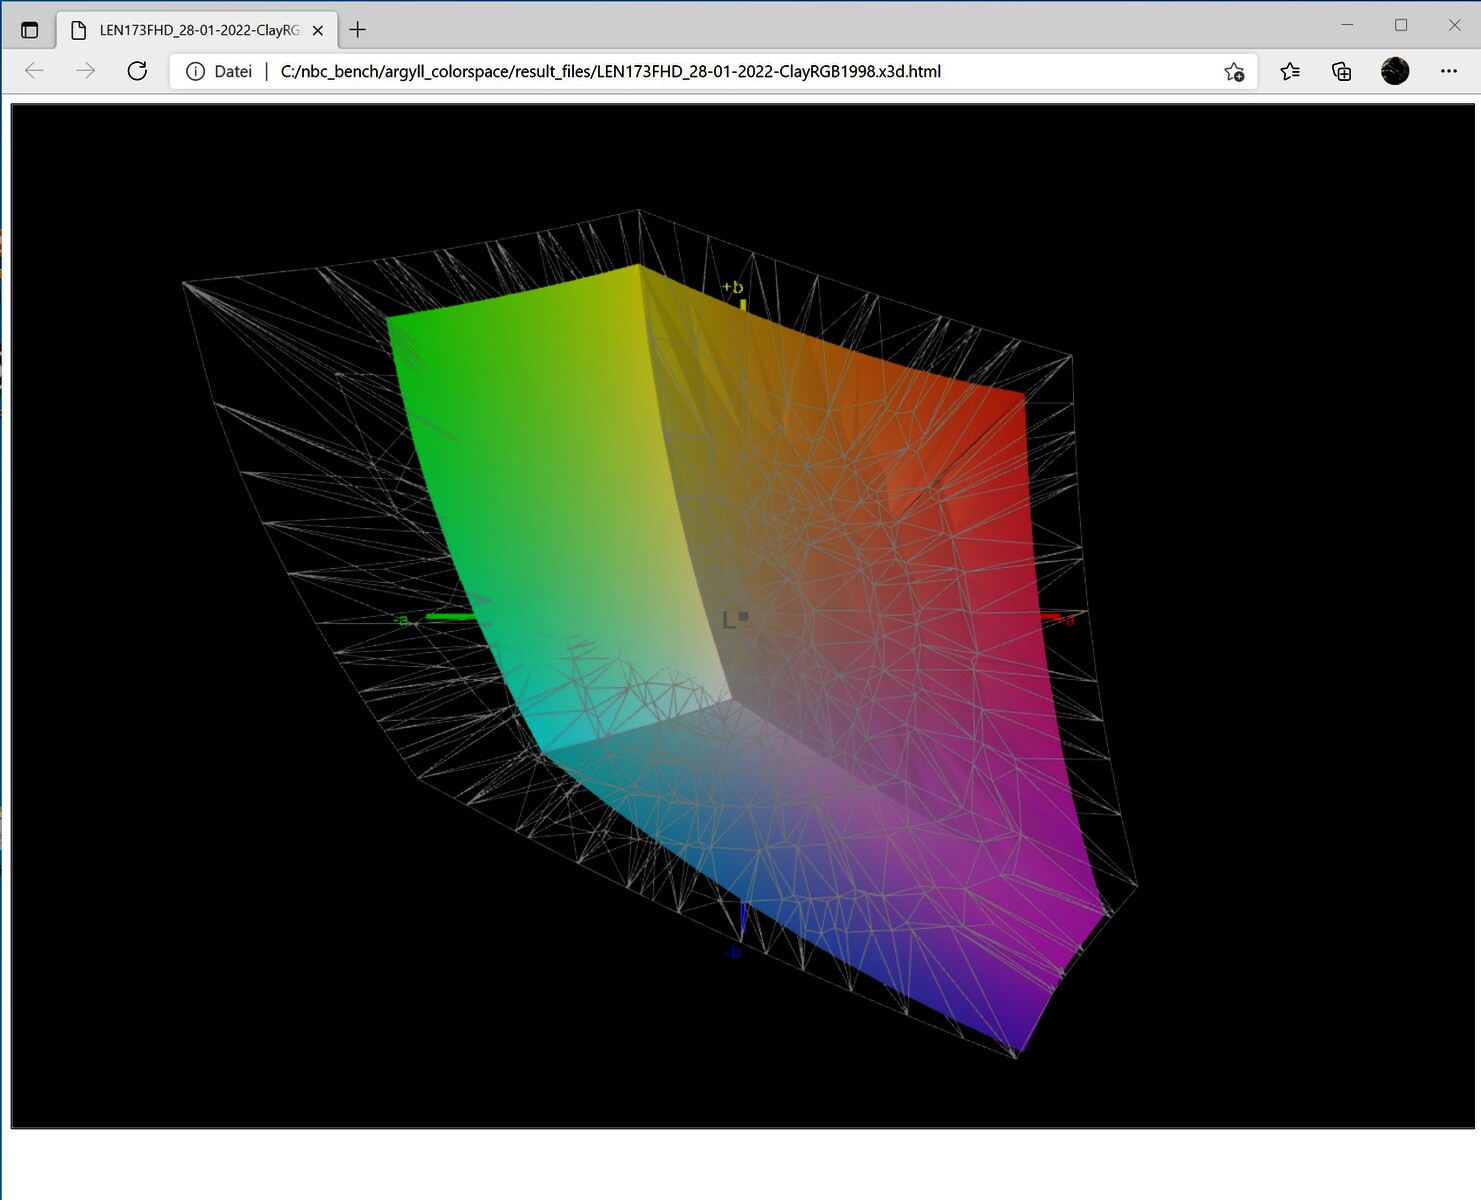
66.7% AdobeRGB 1998 (Argyll 3D)
97.2% sRGB (Argyll 3D)
64.8% Display P3 (Argyll 3D)
Gamma: 2.42
CCT: 7012 K
| Lenovo Legion 5 17ACH6H-82JY0003GE LEN173FHD, IPS, 1920x1080, 17.3" | Schenker XMG Core 17 (Early 2021) BOE CQ NE173QHM-NY2, IPS, 2560x1440, 17.3" | Asus TUF Gaming F17 FX706HM AU Optronics AUI8294 (B173HAN04.9), IPS, 1920x1080, 17.3" | MSI Katana GF76 11UE AU Optronics B173HAN04.9, IPS, 1920x1080, 17.3" | Schenker XMG Apex 17 M21 LG Philips LP173WFG-SPB3, IPS, 1920x1080, 17.3" | Gigabyte A7 X1 AU Optronics AUO8E8D, IPS, 1920x1080, 17.3" | |
|---|---|---|---|---|---|---|
| Display | 3% | -38% | -39% | -1% | -5% | |
| Display P3 Coverage (%) | 64.8 | 68.1 5% | 40.1 -38% | 39.8 -39% | 65 0% | 61.5 -5% |
| sRGB Coverage (%) | 97.2 | 98.5 1% | 60 -38% | 59.5 -39% | 95.9 -1% | 90.9 -6% |
| AdobeRGB 1998 Coverage (%) | 66.7 | 69.3 4% | 41.4 -38% | 41.12 -38% | 65.8 -1% | 63.2 -5% |
| Response Times | -12% | -133% | -167% | -9% | -14% | |
| Response Time Grey 50% / Grey 80% * (ms) | 15 ? | 16.8 ? -12% | 32.4 -116% | 36.8 ? -145% | 15.2 ? -1% | 16 ? -7% |
| Response Time Black / White * (ms) | 9 ? | 10 ? -11% | 22.4 -149% | 26 ? -189% | 10.4 ? -16% | 10.8 ? -20% |
| PWM Frequency (Hz) | ||||||
| Screen | -24% | -61% | -85% | -30% | -50% | |
| Brightness middle (cd/m²) | 323 | 370 15% | 266 -18% | 260 -20% | 292 -10% | 325 1% |
| Brightness (cd/m²) | 305 | 333 9% | 264 -13% | 251 -18% | 285 -7% | 318 4% |
| Brightness Distribution (%) | 89 | 84 -6% | 79 -11% | 85 -4% | 94 6% | 95 7% |
| Black Level * (cd/m²) | 0.25 | 0.38 -52% | 0.32 -28% | 0.26 -4% | 0.355 -42% | 0.29 -16% |
| Contrast (:1) | 1292 | 974 -25% | 831 -36% | 1000 -23% | 823 -36% | 1121 -13% |
| Colorchecker dE 2000 * | 1.87 | 2.41 -29% | 3.97 -112% | 3.9 -109% | 2.47 -32% | 4.33 -132% |
| Colorchecker dE 2000 max. * | 4.84 | 7.32 -51% | 8.93 -85% | 20.64 -326% | 8.69 -80% | 8.6 -78% |
| Colorchecker dE 2000 calibrated * | 0.92 | 1.19 -29% | 3.5 -280% | 3.71 -303% | 0.96 -4% | 1.95 -112% |
| Greyscale dE 2000 * | 2.57 | 3.9 -52% | 1.8 30% | 1.6 38% | 4.3 -67% | 5.5 -114% |
| Gamma | 2.42 91% | 2.287 96% | 2.31 95% | 2.068 106% | 2.298 96% | 2.142 103% |
| CCT | 7012 93% | 7302 89% | 6754 96% | 6511 100% | 7000 93% | 7893 82% |
| Color Space (Percent of AdobeRGB 1998) (%) | 69 | 41.4 | ||||
| Color Space (Percent of sRGB) (%) | 93 | 60 | ||||
| Total Average (Program / Settings) | -11% /
-17% | -77% /
-67% | -97% /
-87% | -13% /
-21% | -23% /
-35% |
* ... smaller is better
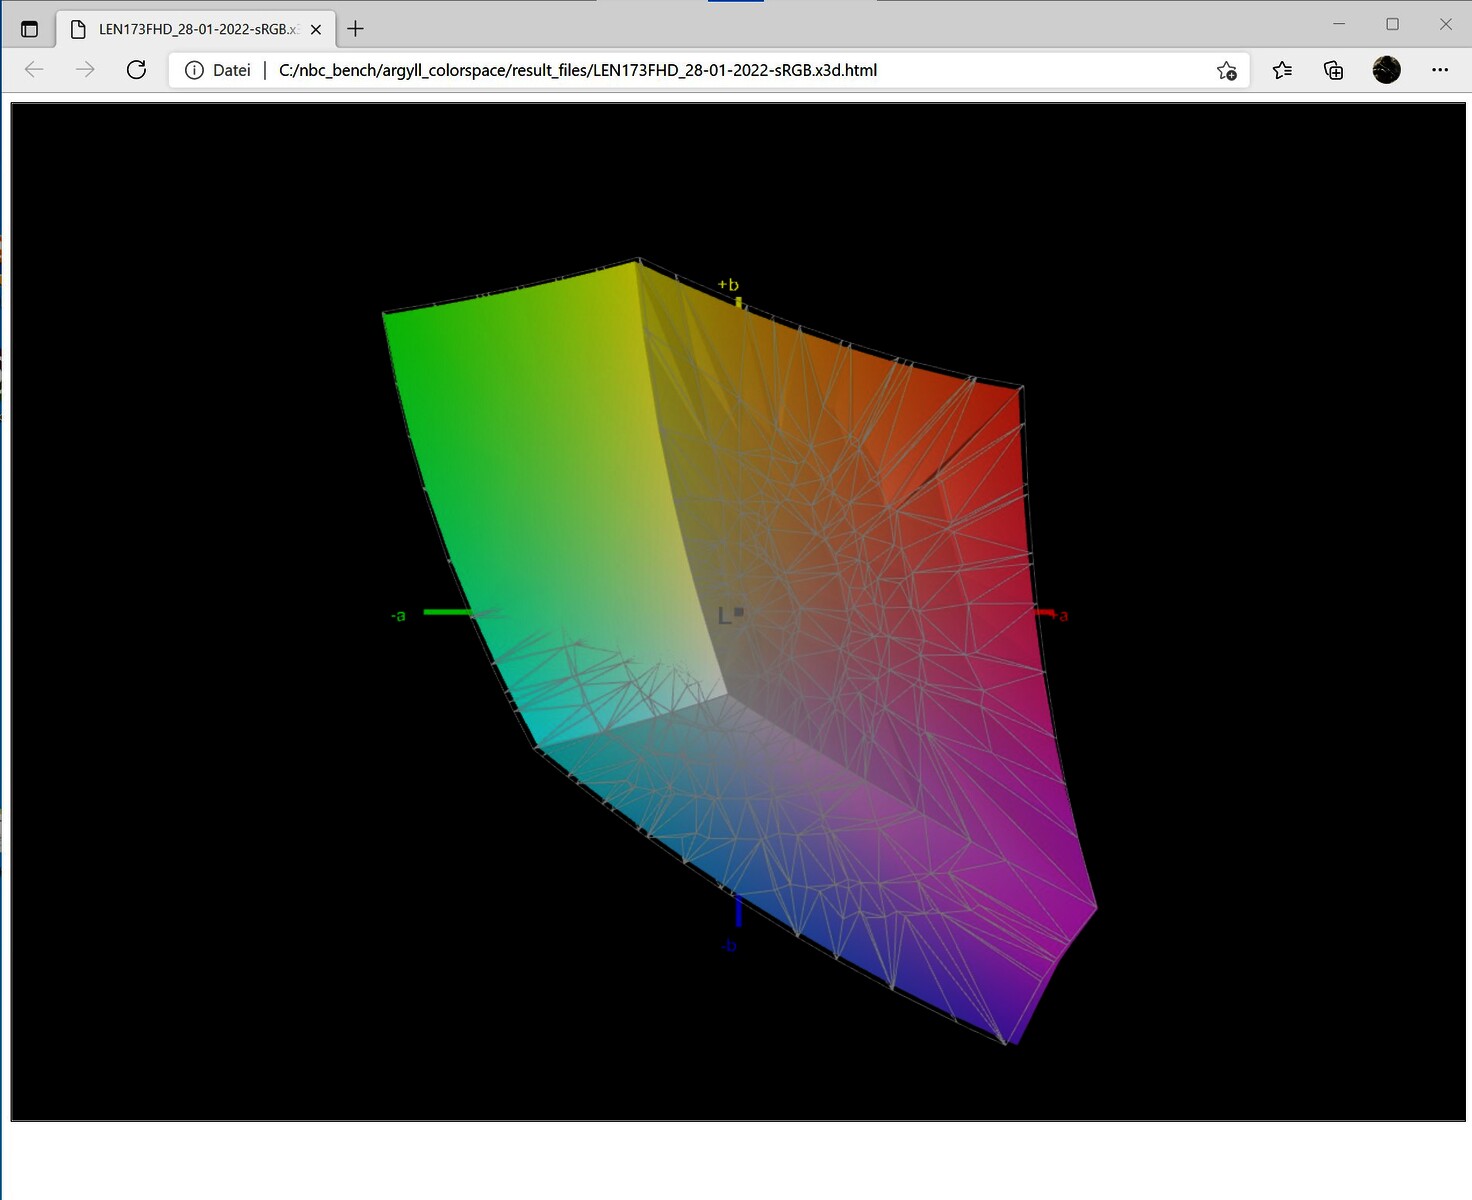
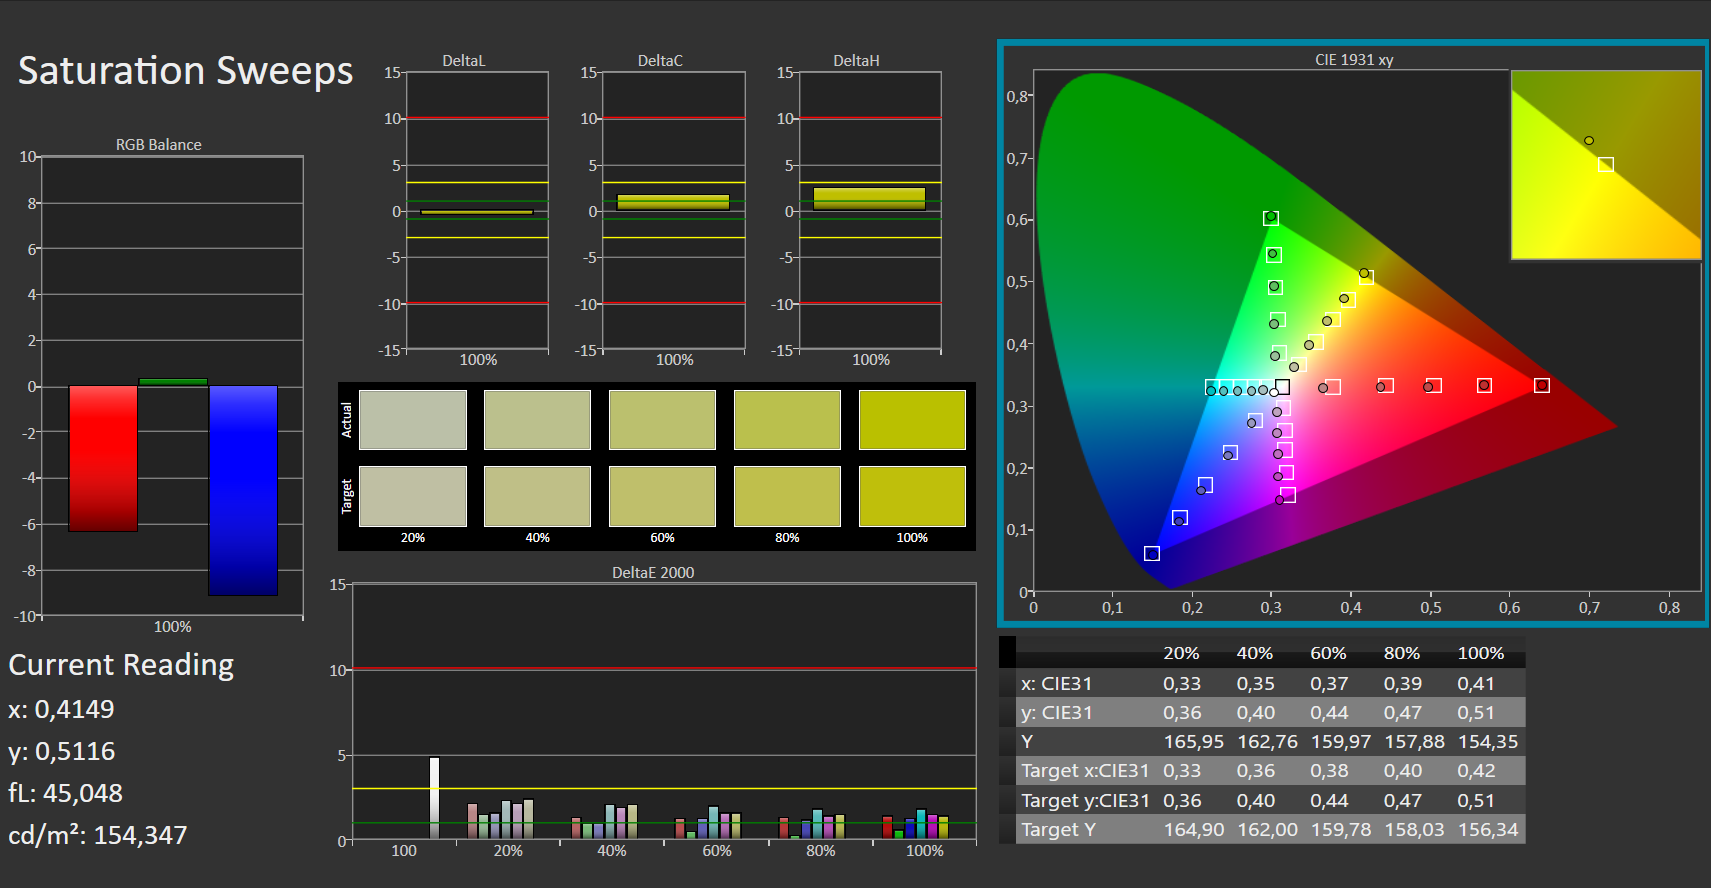
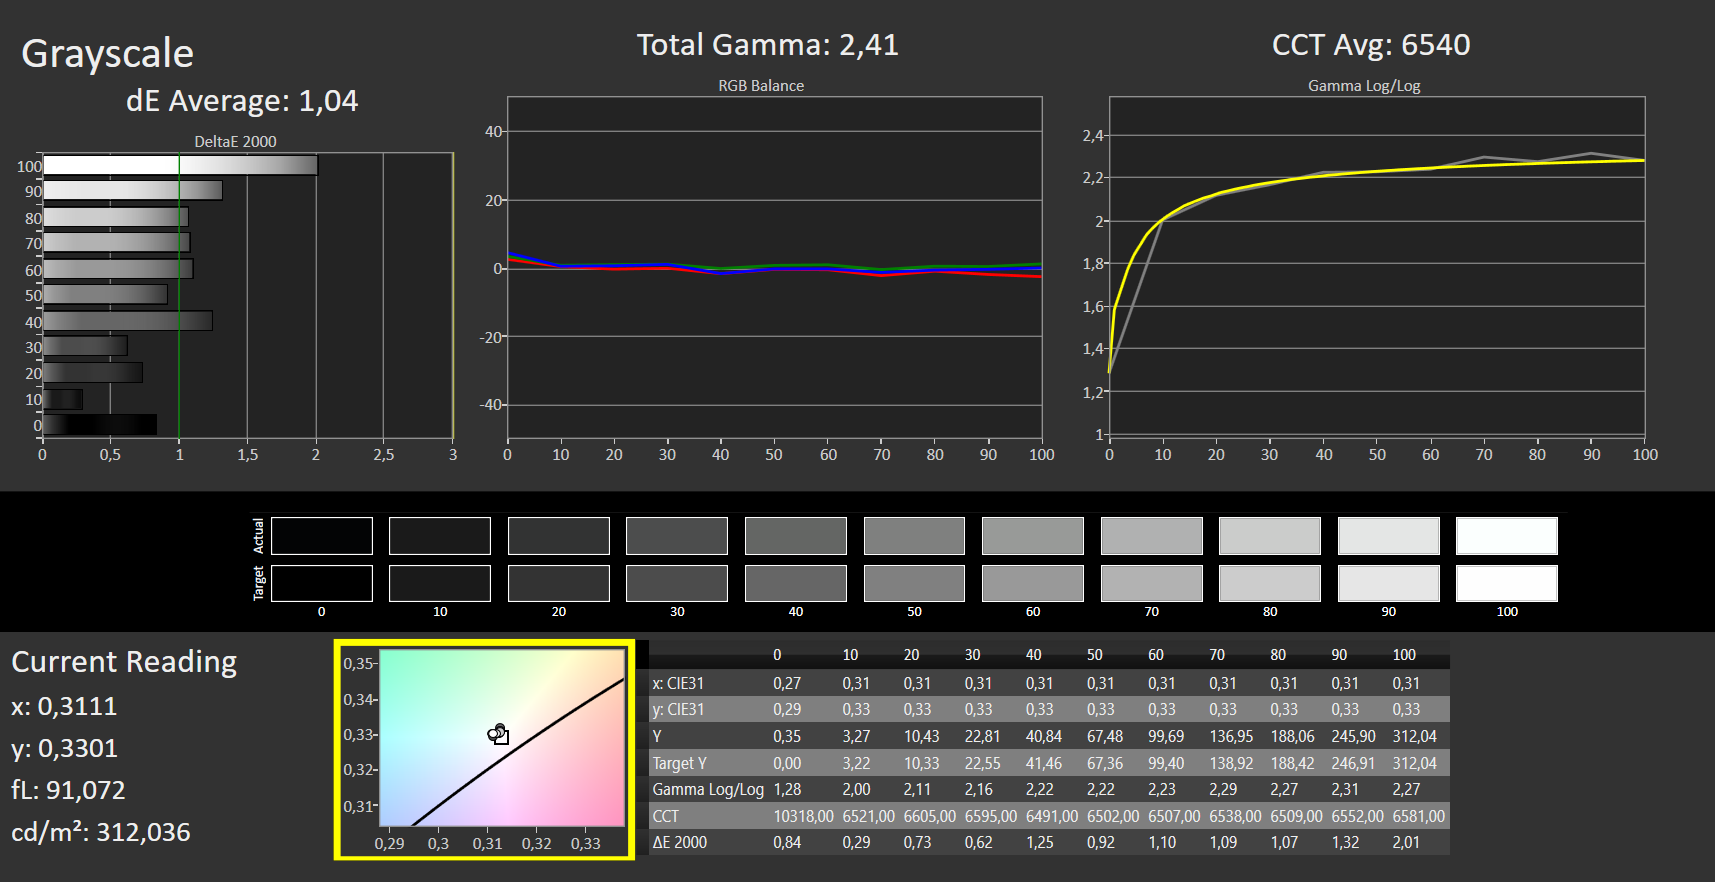
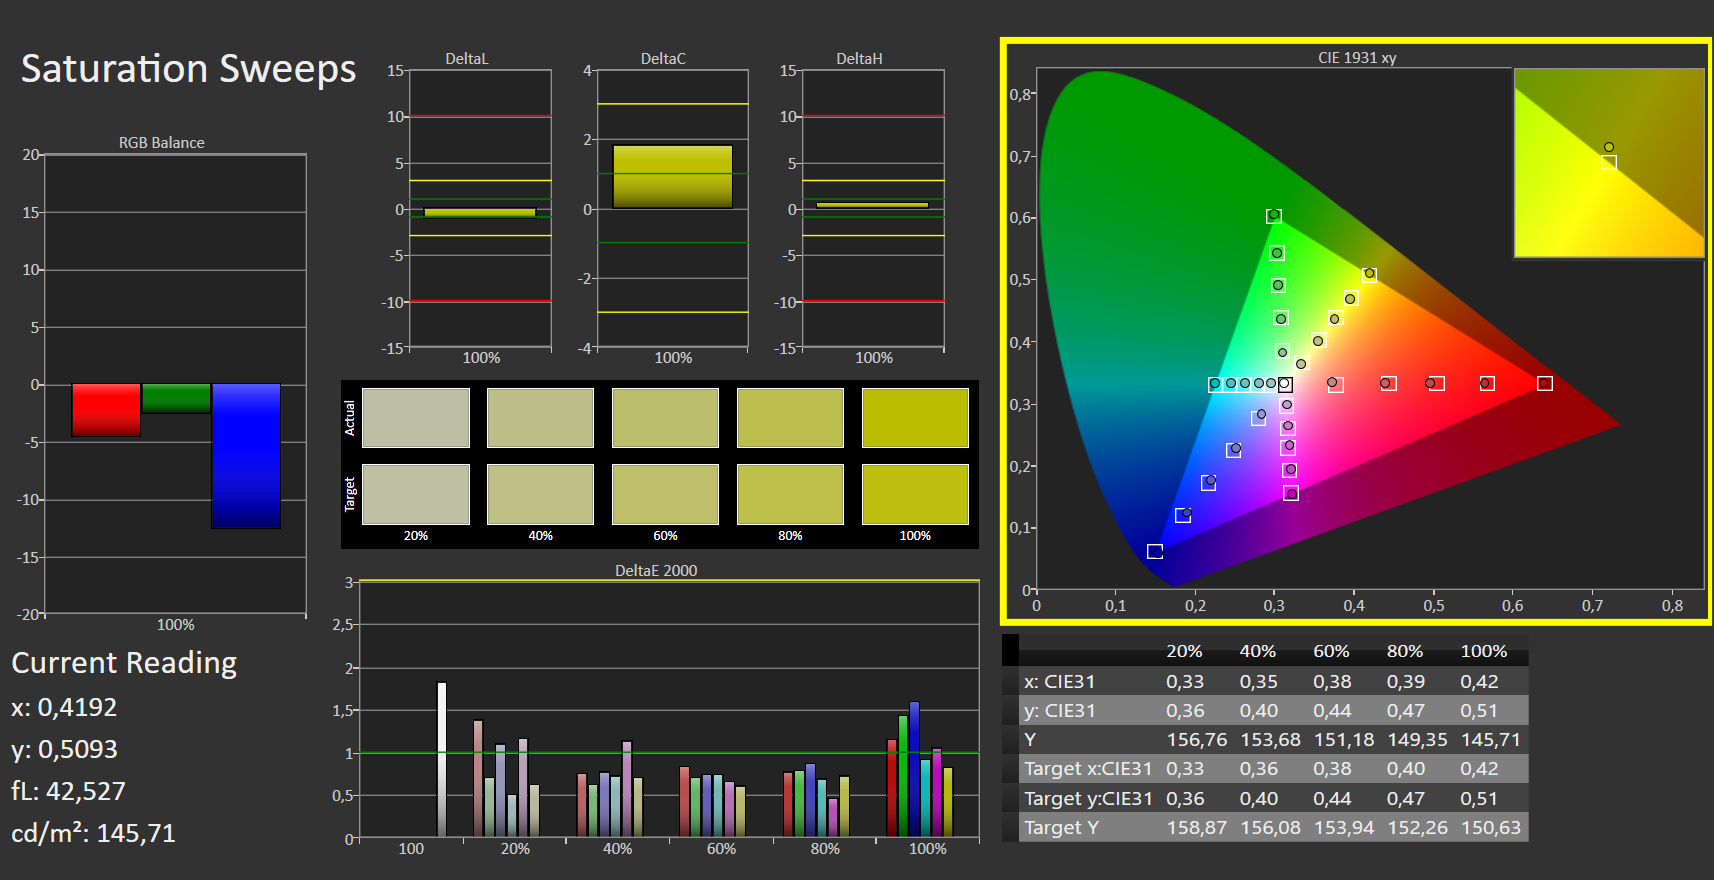
显示质量在各方面都持续良好。尽管是哑光表面,但没有颗粒感。此外,联想似乎对联想Legion 5 17的显示屏进行了预校准,因为相对于sRGB色彩空间,灰度和色彩的deltaE-2000值都在小于3的理想范围内。虽然有轻微的蓝色色调,但这对IPS屏幕来说是很常见的。不管怎么说,我们能够通过手动校准将其降至最低。此外,我们能够进一步改善低deltaE-2000值的小幅度。
Display Response Times
| ↔ Response Time Black to White | ||
|---|---|---|
| 9 ms ... rise ↗ and fall ↘ combined | ↗ 5 ms rise |  |
| ↘ 4 ms fall | ||
| The screen shows fast response rates in our tests and should be suited for gaming. In comparison, all tested devices range from 0.1 (minimum) to 240 (maximum) ms. » 25 % of all devices are better. This means that the measured response time is better than the average of all tested devices (19.8 ms). | ||
| ↔ Response Time 50% Grey to 80% Grey | ||
| 15 ms ... rise ↗ and fall ↘ combined | ↗ 7 ms rise |  |
| ↘ 8 ms fall | ||
| The screen shows good response rates in our tests, but may be too slow for competitive gamers. In comparison, all tested devices range from 0.165 (minimum) to 636 (maximum) ms. » 29 % of all devices are better. This means that the measured response time is better than the average of all tested devices (31 ms). | ||
Screen Flickering / PWM (Pulse-Width Modulation)
| Screen flickering / PWM not detected |  | ||
In comparison: 52 % of all tested devices do not use PWM to dim the display. If PWM was detected, an average of 7757 (minimum: 5 - maximum: 343500) Hz was measured. | |||
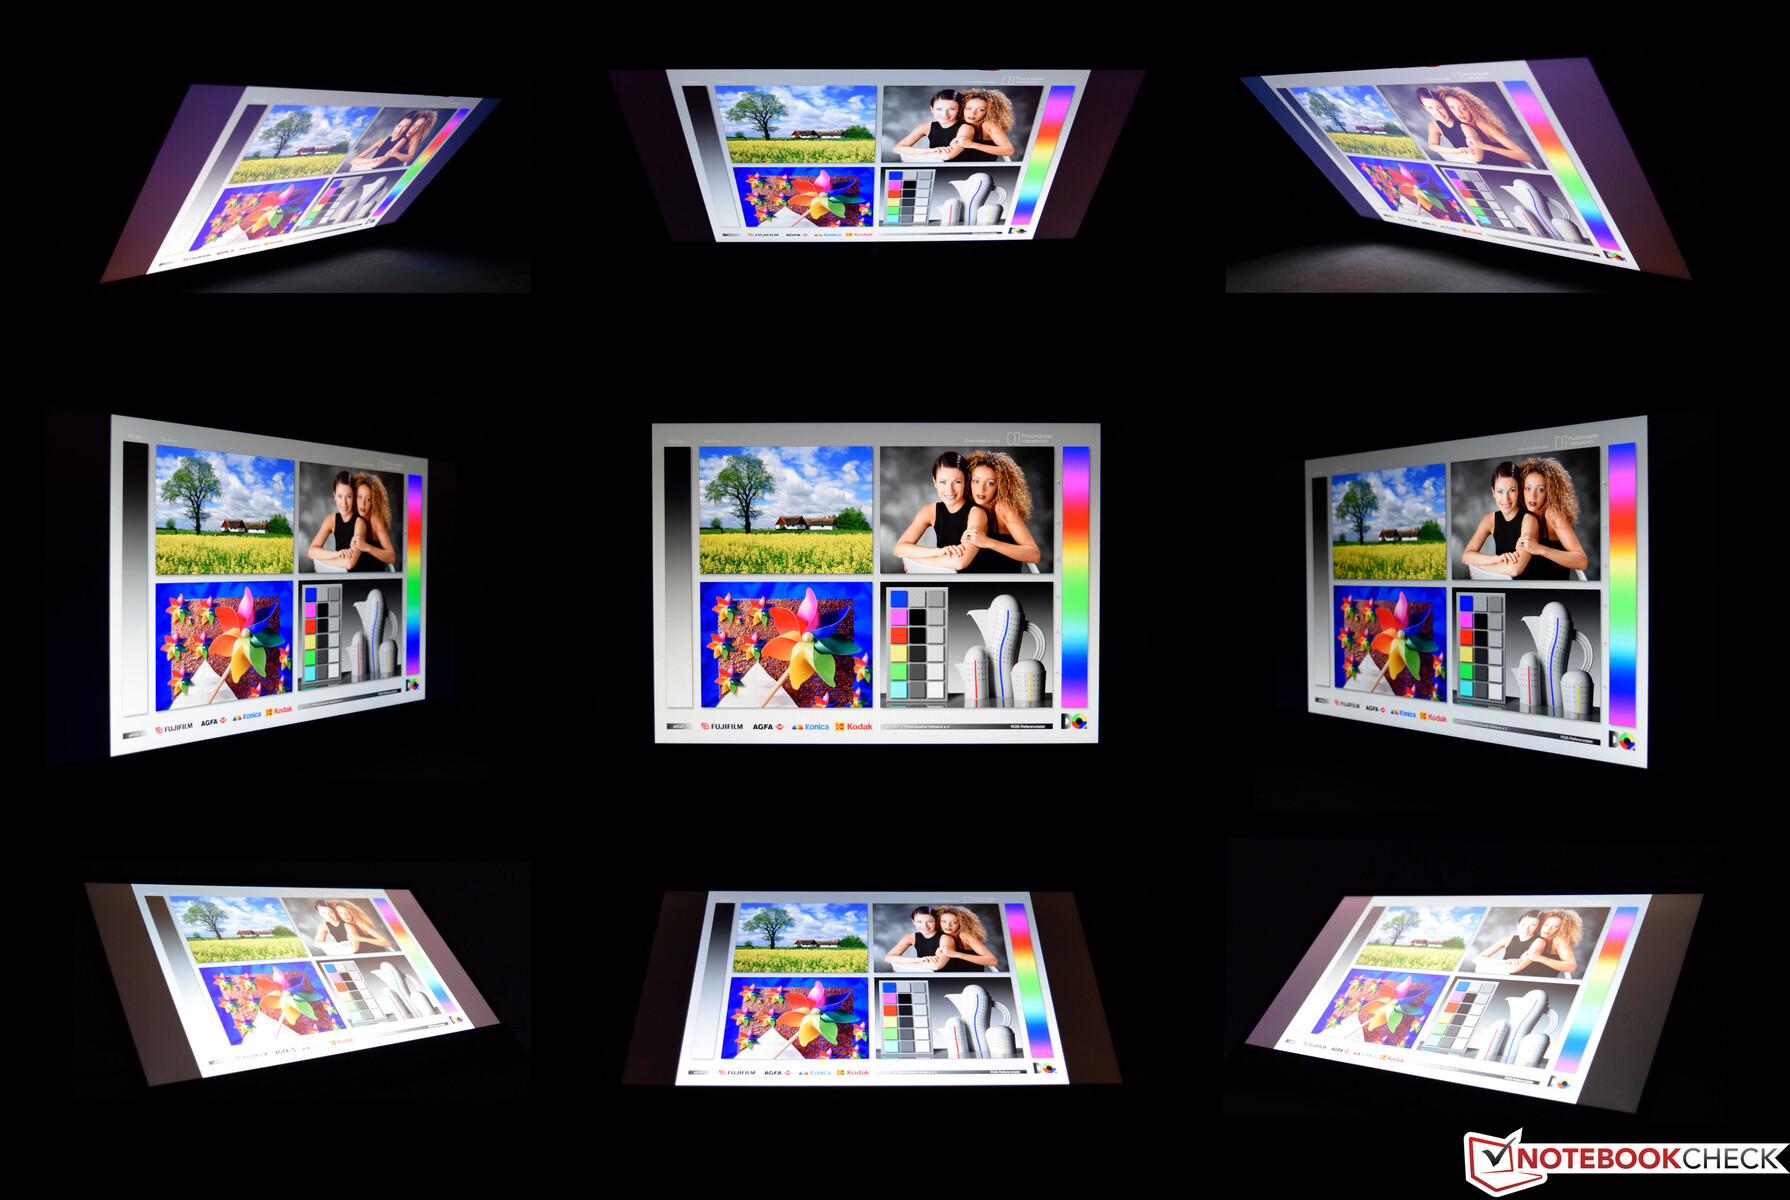
我们的联想Legion 5 17的户外适用性是有限的。如果你选择在外面使用笔记本电脑,建议呆在阴凉处。然后,亮度水平对大多数任务来说是足够的。我们的视角测试显示了一个典型的IPS面板的结果。只有四个角落的图片出现了一个微弱的面纱。在正常使用期间,这一点是不可见的。
业绩
对于一台游戏笔记本电脑来说,CPU和GPU的性能是最优先的。如果价格也是一个考虑因素,所有的道路最终都指向Legion 5 17,因为 AMD Ryzen 5 5600H和 NvidiaGeForce RTX 3060移动GPU配合得很好,具有坚实的游戏性能,完全可以满足原生1080p游戏的需要。那些仍在寻找更快的性能的人可以为联想Legion 5 17配置一个 AMD Ryzen 7 5800H和一个 NvidiaGeForce RTX 3070移动GPU.自然,这些选项的价格是有优势的。
测试条件
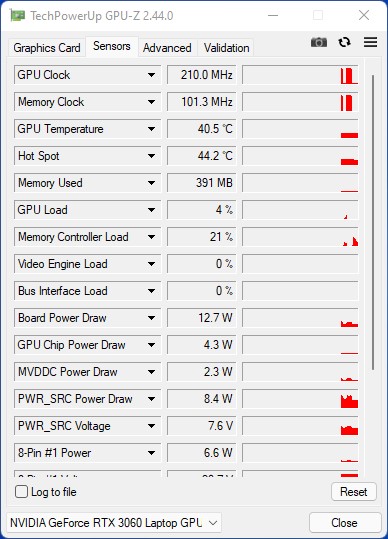
预装的联想Vantage中心允许用户定制各种系统设置。例如,可以用预定义的能源配置文件调整GPU的性能。所有基准测试都是在启用性能配置文件的情况下进行的。这使NvidiaGeForce RTX 3060能够获得其130瓦的全部功率预算。
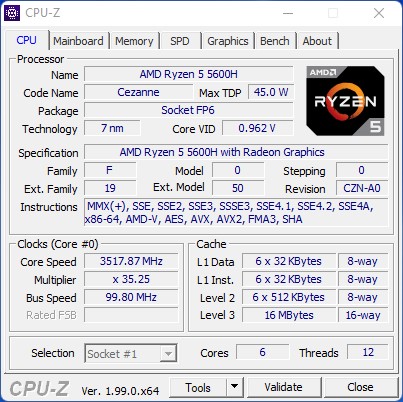
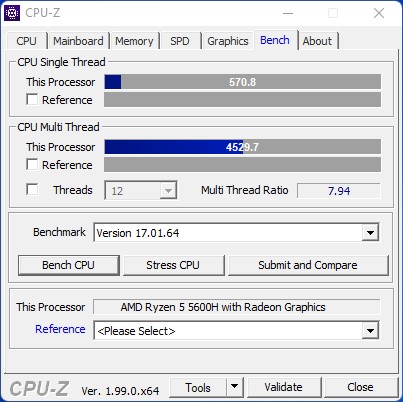
处理器
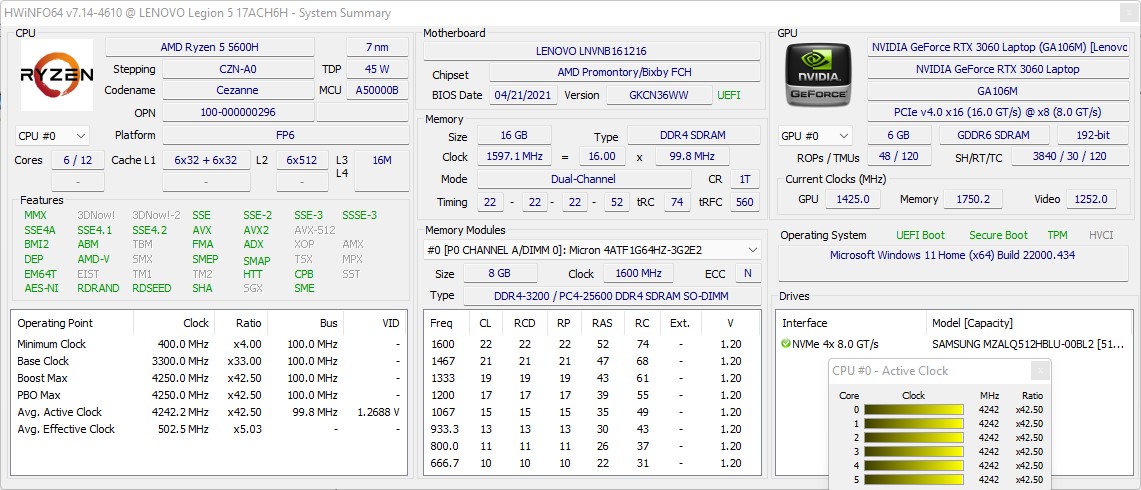
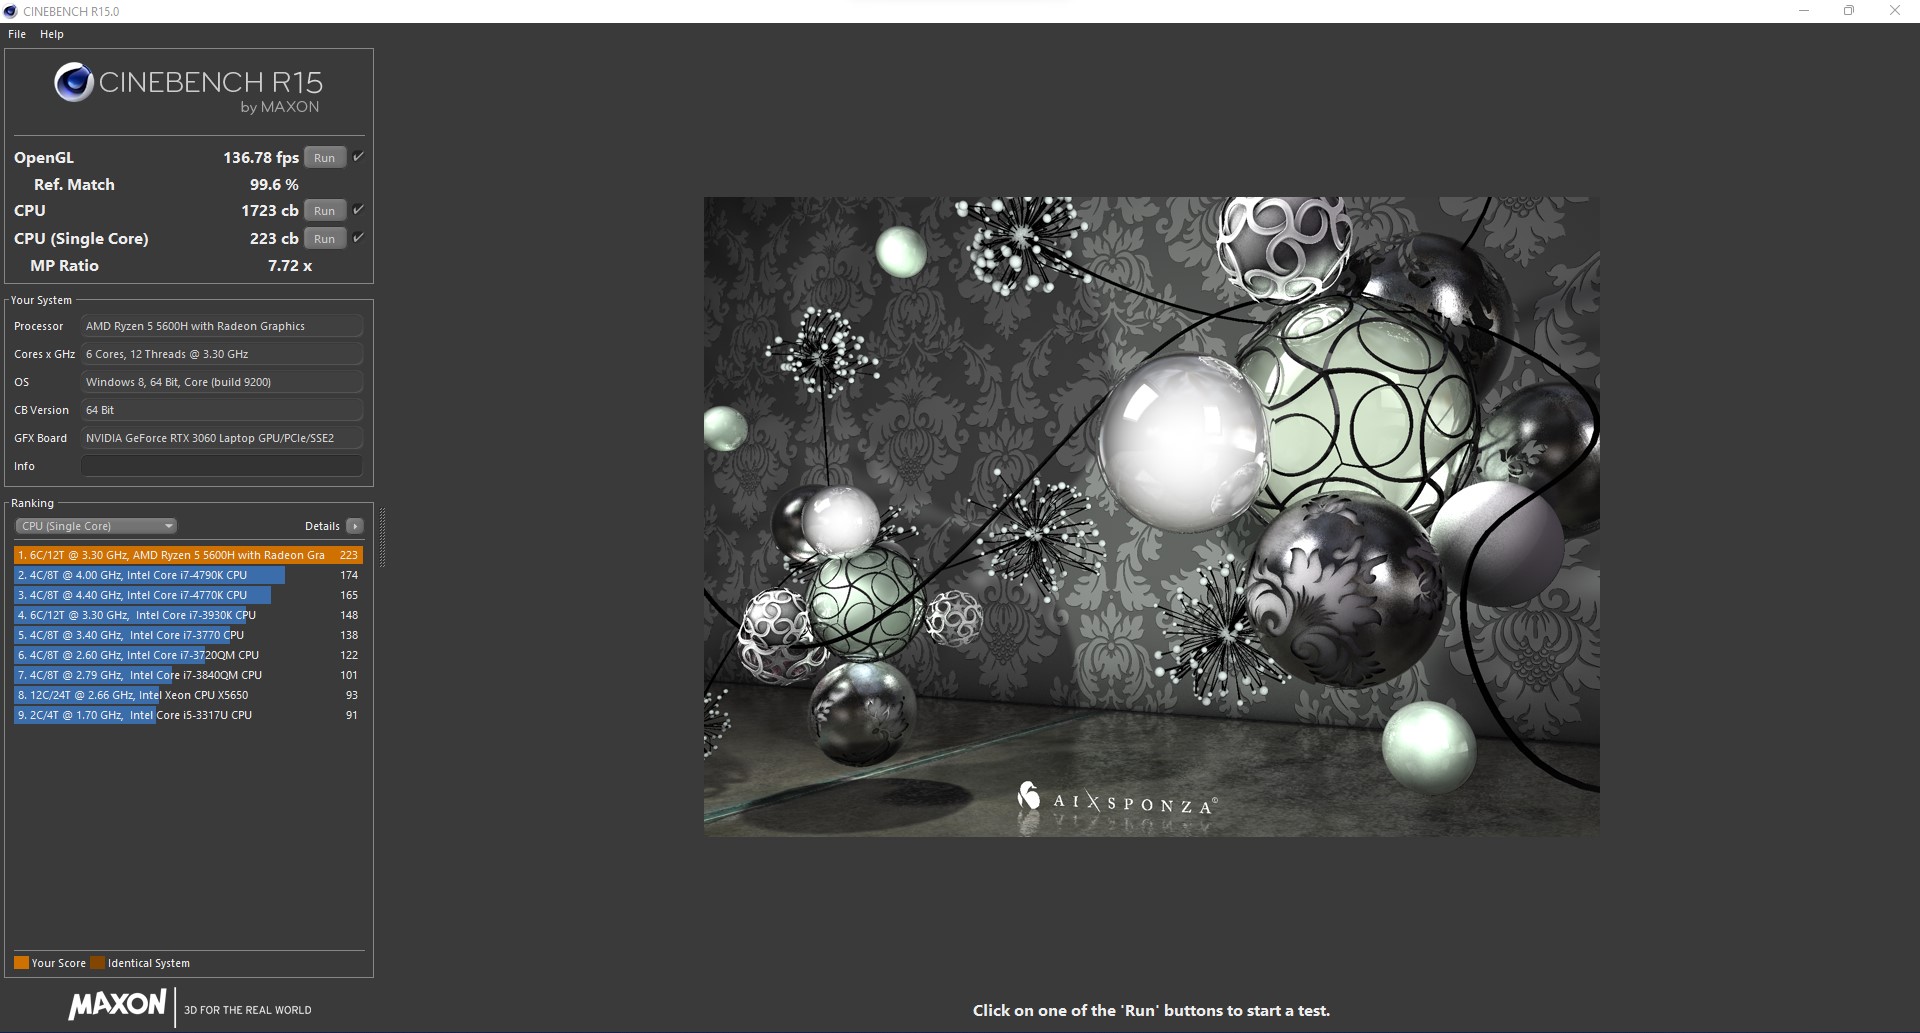
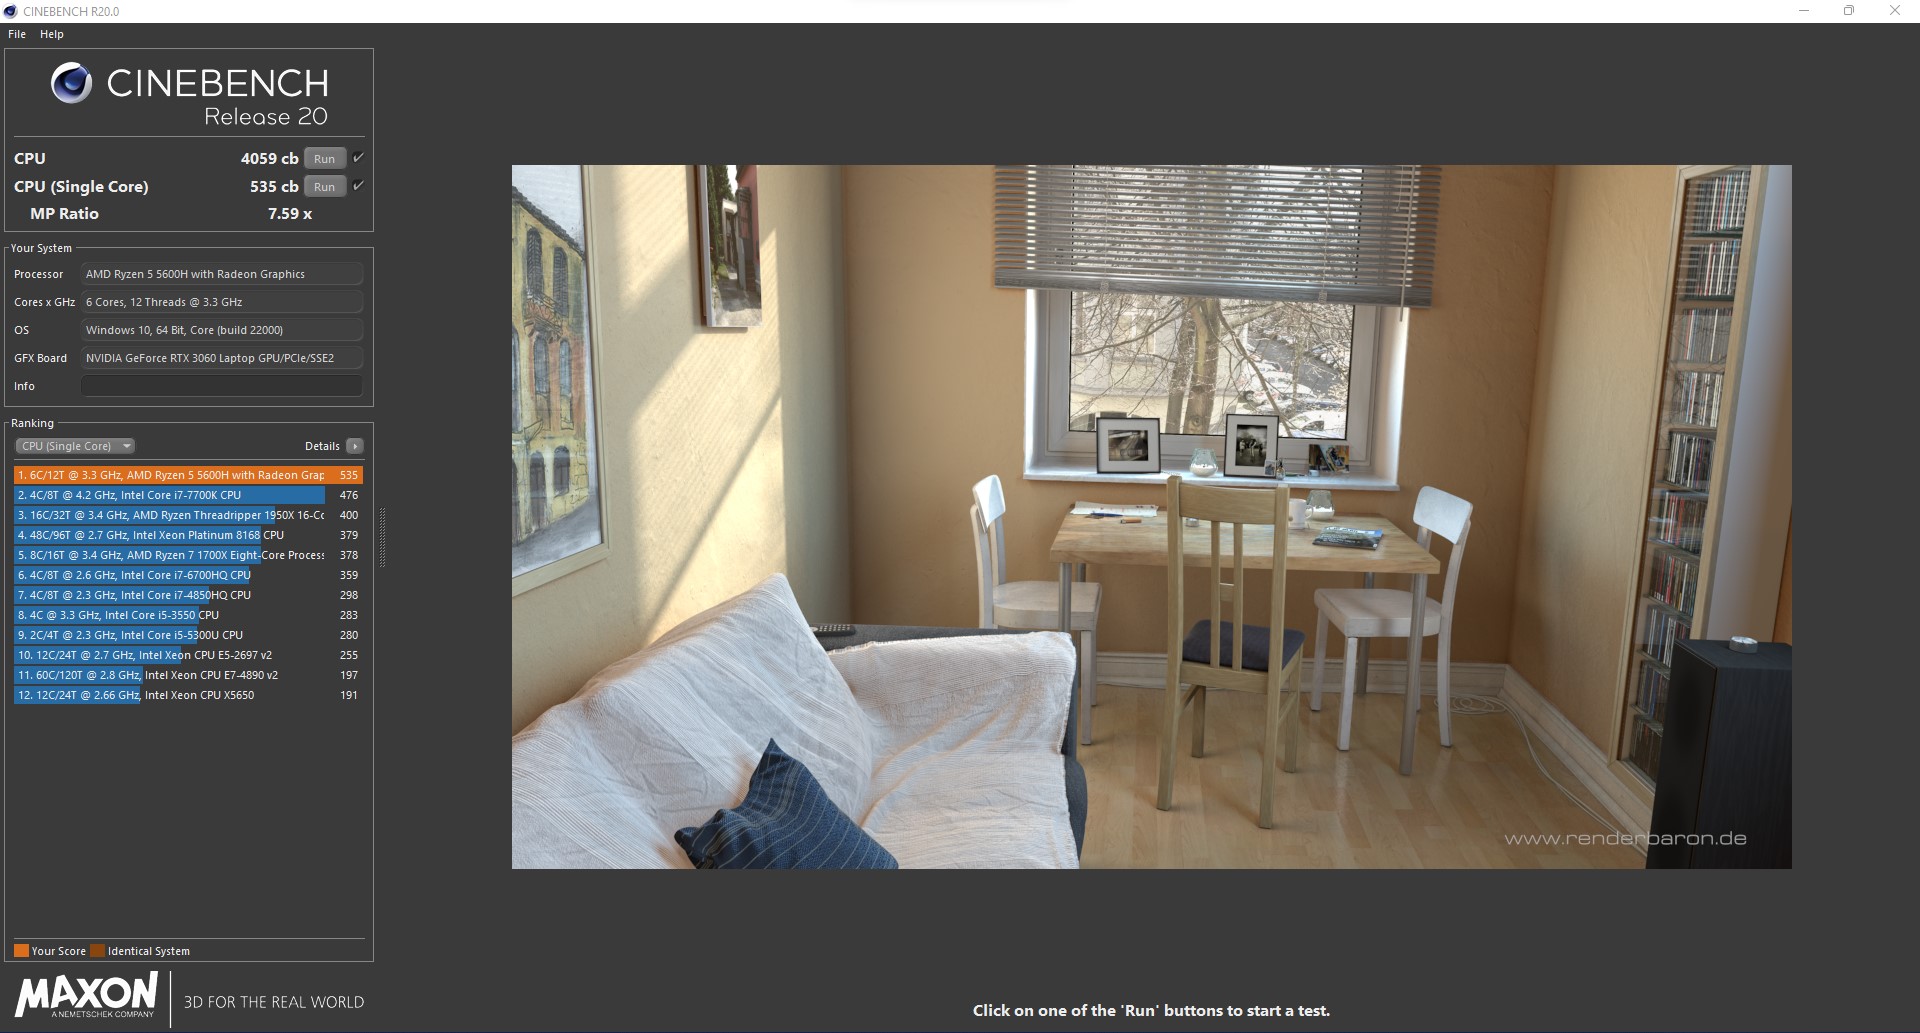
凭借六个核心和十二个线程, AMD Ryzen 5 5600H提供了相当快的性能。然而,联想Legion 5 17无法跟上其八核竞争对手。AMD Ryzen 5600H仍然表现良好,其结果高于该CPU的平均水平。
我们的联想Legion 5 17在我们的压力测试中表现相对较好,这包括循环运行Cinebench R15 multi。性能保持一致,我们没有观察到任何下降。
更多的比较和基准测试可以在我们的 CPU比较表.
Cinebench R15 Multi Loop
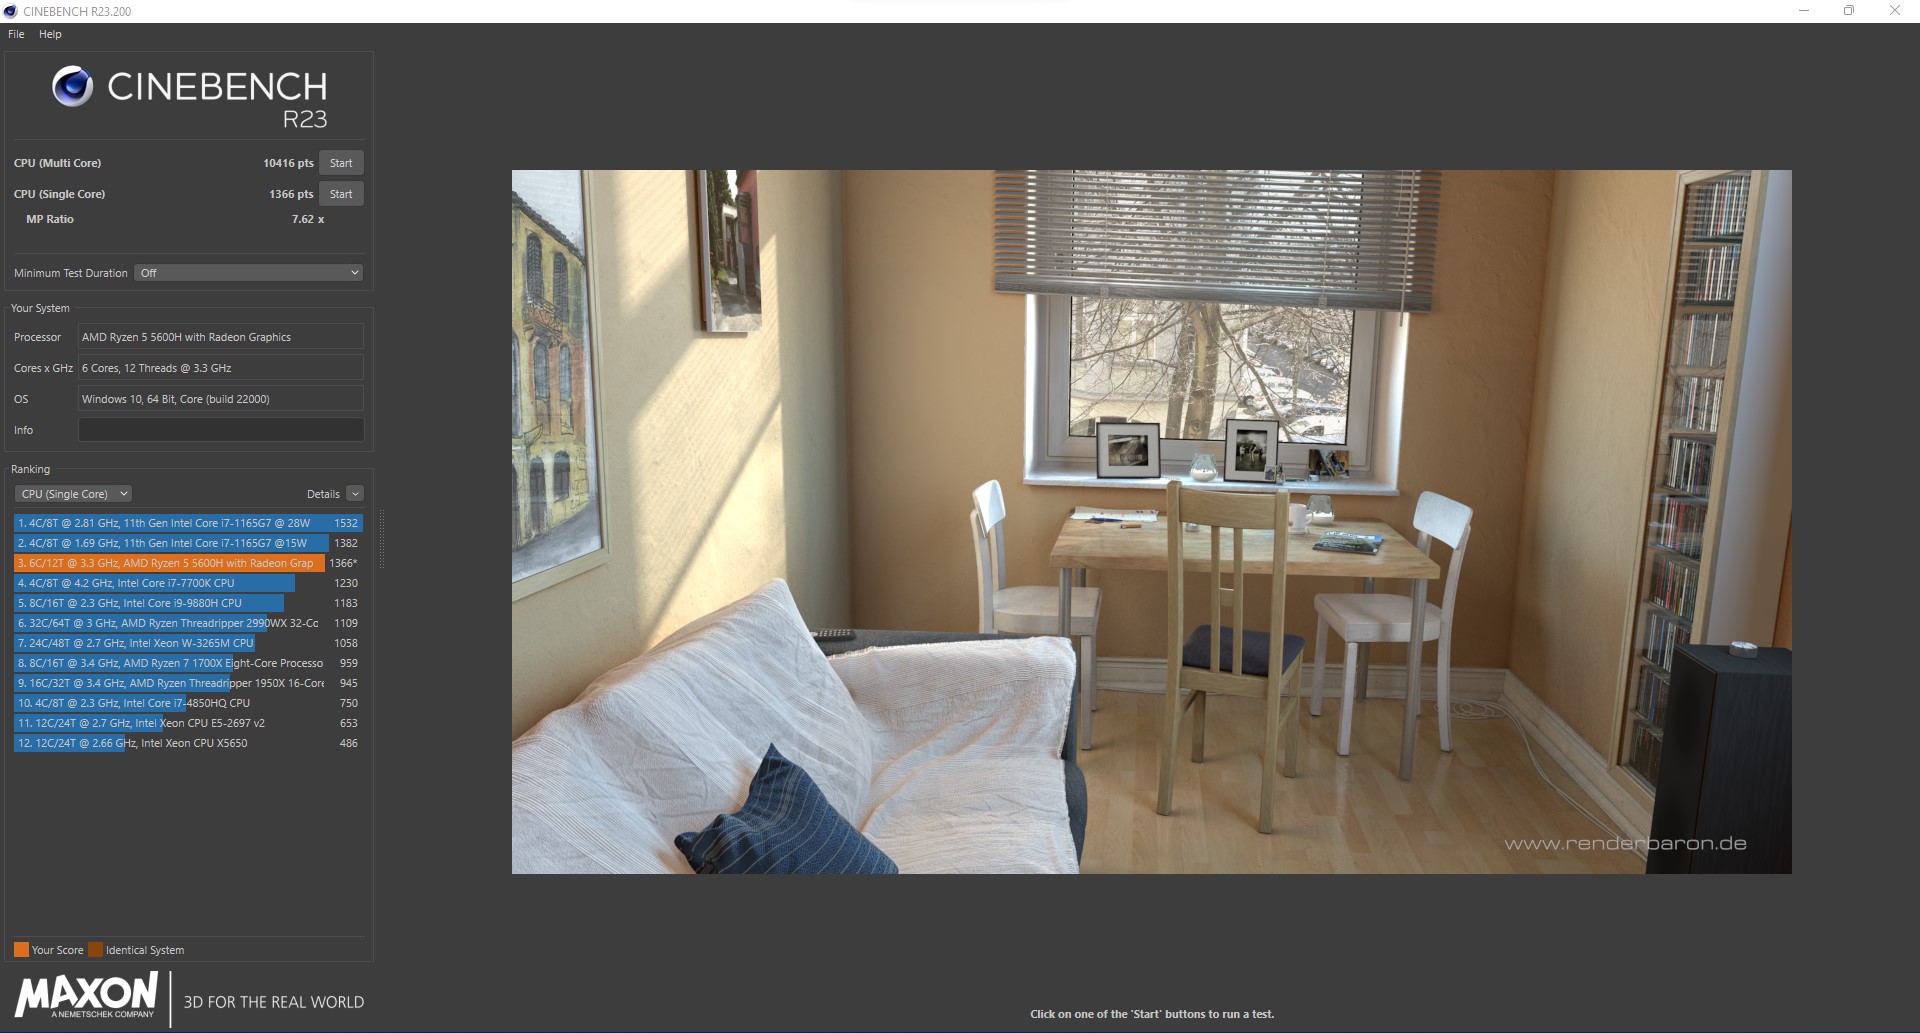
Cinebench R23: Multi Core | Single Core
Cinebench R20: CPU (Multi Core) | CPU (Single Core)
Cinebench R15: CPU Multi 64Bit | CPU Single 64Bit
Blender: v2.79 BMW27 CPU
7-Zip 18.03: 7z b 4 | 7z b 4 -mmt1
Geekbench 5.5: Multi-Core | Single-Core
HWBOT x265 Benchmark v2.2: 4k Preset
LibreOffice : 20 Documents To PDF
R Benchmark 2.5: Overall mean
| CPU Performance rating | |
| Average of class Gaming | |
| Schenker XMG Apex 17 M21 | |
| Asus TUF Gaming F17 FX706HM | |
| Gigabyte A7 X1 | |
| MSI Katana GF76 11UE | |
| Lenovo Legion 5 17ACH6H-82JY0003GE | |
| Average AMD Ryzen 5 5600H | |
| Schenker XMG Core 17 (Early 2021) | |
| Cinebench R23 / Multi Core | |
| Average of class Gaming (10488 - 42661, n=107, last 2 years) | |
| Schenker XMG Apex 17 M21 | |
| Gigabyte A7 X1 | |
| Asus TUF Gaming F17 FX706HM | |
| MSI Katana GF76 11UE | |
| Lenovo Legion 5 17ACH6H-82JY0003GE | |
| Average AMD Ryzen 5 5600H (7945 - 10416, n=13) | |
| Schenker XMG Core 17 (Early 2021) | |
| Cinebench R23 / Single Core | |
| Average of class Gaming (1166 - 2415, n=107, last 2 years) | |
| Asus TUF Gaming F17 FX706HM | |
| MSI Katana GF76 11UE | |
| Gigabyte A7 X1 | |
| Schenker XMG Apex 17 M21 | |
| Lenovo Legion 5 17ACH6H-82JY0003GE | |
| Average AMD Ryzen 5 5600H (1316 - 1381, n=13) | |
| Schenker XMG Core 17 (Early 2021) | |
| Cinebench R20 / CPU (Multi Core) | |
| Average of class Gaming (4029 - 16433, n=106, last 2 years) | |
| Schenker XMG Apex 17 M21 | |
| Gigabyte A7 X1 | |
| Asus TUF Gaming F17 FX706HM | |
| MSI Katana GF76 11UE | |
| Lenovo Legion 5 17ACH6H-82JY0003GE | |
| Average AMD Ryzen 5 5600H (3074 - 4059, n=16) | |
| Schenker XMG Core 17 (Early 2021) | |
| Cinebench R20 / CPU (Single Core) | |
| Average of class Gaming (442 - 913, n=106, last 2 years) | |
| Asus TUF Gaming F17 FX706HM | |
| Gigabyte A7 X1 | |
| MSI Katana GF76 11UE | |
| Schenker XMG Apex 17 M21 | |
| Lenovo Legion 5 17ACH6H-82JY0003GE | |
| Average AMD Ryzen 5 5600H (527 - 538, n=15) | |
| Schenker XMG Core 17 (Early 2021) | |
| Cinebench R15 / CPU Multi 64Bit | |
| Average of class Gaming (1578 - 6330, n=105, last 2 years) | |
| Gigabyte A7 X1 | |
| Schenker XMG Apex 17 M21 | |
| Asus TUF Gaming F17 FX706HM | |
| MSI Katana GF76 11UE | |
| Lenovo Legion 5 17ACH6H-82JY0003GE | |
| Average AMD Ryzen 5 5600H (1319 - 1723, n=16) | |
| Schenker XMG Core 17 (Early 2021) | |
| Cinebench R15 / CPU Single 64Bit | |
| Average of class Gaming (188.8 - 350, n=106, last 2 years) | |
| Asus TUF Gaming F17 FX706HM | |
| Gigabyte A7 X1 | |
| Schenker XMG Apex 17 M21 | |
| MSI Katana GF76 11UE | |
| Lenovo Legion 5 17ACH6H-82JY0003GE | |
| Average AMD Ryzen 5 5600H (218 - 225, n=14) | |
| Schenker XMG Core 17 (Early 2021) | |
| Blender / v2.79 BMW27 CPU | |
| Schenker XMG Core 17 (Early 2021) | |
| Average AMD Ryzen 5 5600H (300 - 384, n=14) | |
| Lenovo Legion 5 17ACH6H-82JY0003GE | |
| MSI Katana GF76 11UE | |
| Gigabyte A7 X1 | |
| Asus TUF Gaming F17 FX706HM | |
| Schenker XMG Apex 17 M21 | |
| Average of class Gaming (79 - 330, n=104, last 2 years) | |
| 7-Zip 18.03 / 7z b 4 | |
| Average of class Gaming (33491 - 148086, n=105, last 2 years) | |
| Schenker XMG Apex 17 M21 | |
| Gigabyte A7 X1 | |
| Asus TUF Gaming F17 FX706HM | |
| Lenovo Legion 5 17ACH6H-82JY0003GE | |
| MSI Katana GF76 11UE | |
| Average AMD Ryzen 5 5600H (36315 - 46562, n=14) | |
| Schenker XMG Core 17 (Early 2021) | |
| 7-Zip 18.03 / 7z b 4 -mmt1 | |
| Average of class Gaming (4199 - 7436, n=105, last 2 years) | |
| Asus TUF Gaming F17 FX706HM | |
| Gigabyte A7 X1 | |
| Schenker XMG Apex 17 M21 | |
| MSI Katana GF76 11UE | |
| Schenker XMG Core 17 (Early 2021) | |
| Lenovo Legion 5 17ACH6H-82JY0003GE | |
| Average AMD Ryzen 5 5600H (5213 - 5446, n=14) | |
| Geekbench 5.5 / Multi-Core | |
| Average of class Gaming (6460 - 28263, n=105, last 2 years) | |
| Schenker XMG Apex 17 M21 | |
| MSI Katana GF76 11UE | |
| Asus TUF Gaming F17 FX706HM | |
| Gigabyte A7 X1 | |
| Schenker XMG Core 17 (Early 2021) | |
| Lenovo Legion 5 17ACH6H-82JY0003GE | |
| Average AMD Ryzen 5 5600H (4990 - 7253, n=14) | |
| Geekbench 5.5 / Single-Core | |
| Average of class Gaming (986 - 2474, n=105, last 2 years) | |
| Asus TUF Gaming F17 FX706HM | |
| MSI Katana GF76 11UE | |
| Gigabyte A7 X1 | |
| Schenker XMG Apex 17 M21 | |
| Lenovo Legion 5 17ACH6H-82JY0003GE | |
| Average AMD Ryzen 5 5600H (1365 - 1445, n=14) | |
| Schenker XMG Core 17 (Early 2021) | |
| HWBOT x265 Benchmark v2.2 / 4k Preset | |
| Average of class Gaming (11.5 - 44.4, n=105, last 2 years) | |
| Schenker XMG Apex 17 M21 | |
| Asus TUF Gaming F17 FX706HM | |
| Gigabyte A7 X1 | |
| MSI Katana GF76 11UE | |
| Lenovo Legion 5 17ACH6H-82JY0003GE | |
| Average AMD Ryzen 5 5600H (9.92 - 13.3, n=14) | |
| Schenker XMG Core 17 (Early 2021) | |
| LibreOffice / 20 Documents To PDF | |
| Average AMD Ryzen 5 5600H (52.2 - 81.5, n=14) | |
| Gigabyte A7 X1 | |
| Schenker XMG Core 17 (Early 2021) | |
| Lenovo Legion 5 17ACH6H-82JY0003GE | |
| Average of class Gaming (33.2 - 88.8, n=105, last 2 years) | |
| MSI Katana GF76 11UE | |
| Schenker XMG Apex 17 M21 | |
| Asus TUF Gaming F17 FX706HM | |
| R Benchmark 2.5 / Overall mean | |
| Schenker XMG Core 17 (Early 2021) | |
| MSI Katana GF76 11UE | |
| Average AMD Ryzen 5 5600H (0.526 - 0.596, n=14) | |
| Lenovo Legion 5 17ACH6H-82JY0003GE | |
| Asus TUF Gaming F17 FX706HM | |
| Schenker XMG Apex 17 M21 | |
| Gigabyte A7 X1 | |
| Average of class Gaming (0.3439 - 0.759, n=106, last 2 years) | |
* ... smaller is better
AIDA64: FP32 Ray-Trace | FPU Julia | CPU SHA3 | CPU Queen | FPU SinJulia | FPU Mandel | CPU AES | CPU ZLib | FP64 Ray-Trace | CPU PhotoWorxx
| Performance rating | |
| Average of class Gaming | |
| Lenovo Legion 5 17ACH6H-82JY0003GE | |
| Average AMD Ryzen 5 5600H | |
| AIDA64 / FP32 Ray-Trace | |
| Average of class Gaming (10227 - 85542, n=105, last 2 years) | |
| Lenovo Legion 5 17ACH6H-82JY0003GE | |
| Average AMD Ryzen 5 5600H (9181 - 12636, n=14) | |
| AIDA64 / FPU Julia | |
| Average of class Gaming (51376 - 238426, n=105, last 2 years) | |
| Lenovo Legion 5 17ACH6H-82JY0003GE | |
| Average AMD Ryzen 5 5600H (51994 - 78250, n=14) | |
| AIDA64 / CPU SHA3 | |
| Average of class Gaming (2180 - 10115, n=105, last 2 years) | |
| Lenovo Legion 5 17ACH6H-82JY0003GE | |
| Average AMD Ryzen 5 5600H (1587 - 2675, n=14) | |
| AIDA64 / CPU Queen | |
| Average of class Gaming (49785 - 173351, n=90, last 2 years) | |
| Lenovo Legion 5 17ACH6H-82JY0003GE | |
| Average AMD Ryzen 5 5600H (66699 - 77213, n=14) | |
| AIDA64 / FPU SinJulia | |
| Average of class Gaming (4424 - 33636, n=105, last 2 years) | |
| Lenovo Legion 5 17ACH6H-82JY0003GE | |
| Average AMD Ryzen 5 5600H (8340 - 9159, n=14) | |
| AIDA64 / FPU Mandel | |
| Average of class Gaming (25115 - 128721, n=105, last 2 years) | |
| Lenovo Legion 5 17ACH6H-82JY0003GE | |
| Average AMD Ryzen 5 5600H (28268 - 43274, n=14) | |
| AIDA64 / CPU AES | |
| Average of class Gaming (39258 - 247074, n=105, last 2 years) | |
| Lenovo Legion 5 17ACH6H-82JY0003GE | |
| Average AMD Ryzen 5 5600H (39852 - 98939, n=14) | |
| AIDA64 / CPU ZLib | |
| Average of class Gaming (574 - 2531, n=105, last 2 years) | |
| Lenovo Legion 5 17ACH6H-82JY0003GE | |
| Average AMD Ryzen 5 5600H (507 - 649, n=14) | |
| AIDA64 / FP64 Ray-Trace | |
| Average of class Gaming (5509 - 45446, n=105, last 2 years) | |
| Lenovo Legion 5 17ACH6H-82JY0003GE | |
| Average AMD Ryzen 5 5600H (4811 - 6652, n=14) | |
| AIDA64 / CPU PhotoWorxx | |
| Average of class Gaming (12271 - 89891, n=105, last 2 years) | |
| Average AMD Ryzen 5 5600H (7419 - 24746, n=14) | |
| Lenovo Legion 5 17ACH6H-82JY0003GE | |
系统性能
在系统性能基准方面,联想Legion 5 17取得了良好的成绩。尽管与竞争对手相比,它缺乏核心,但它保持了令人钦佩的表现。在这里,性能再次明显快于同类平均水平。
CrossMark: Overall | Productivity | Creativity | Responsiveness
| PCMark 10 / Score | |
| Average of class Gaming (5828 - 12414, n=93, last 2 years) | |
| Schenker XMG Apex 17 M21 | |
| Asus TUF Gaming F17 FX706HM | |
| Gigabyte A7 X1 | |
| Lenovo Legion 5 17ACH6H-82JY0003GE | |
| MSI Katana GF76 11UE | |
| Average AMD Ryzen 5 5600H, NVIDIA GeForce RTX 3060 Laptop GPU (6341 - 6615, n=2) | |
| Schenker XMG Core 17 (Early 2021) | |
| PCMark 10 / Essentials | |
| Average of class Gaming (8810 - 11935, n=97, last 2 years) | |
| Asus TUF Gaming F17 FX706HM | |
| Schenker XMG Apex 17 M21 | |
| Gigabyte A7 X1 | |
| Average AMD Ryzen 5 5600H, NVIDIA GeForce RTX 3060 Laptop GPU (9639 - 10127, n=2) | |
| MSI Katana GF76 11UE | |
| Lenovo Legion 5 17ACH6H-82JY0003GE | |
| Schenker XMG Core 17 (Early 2021) | |
| PCMark 10 / Productivity | |
| Average of class Gaming (6845 - 25323, n=95, last 2 years) | |
| Gigabyte A7 X1 | |
| Schenker XMG Apex 17 M21 | |
| Asus TUF Gaming F17 FX706HM | |
| Lenovo Legion 5 17ACH6H-82JY0003GE | |
| Average AMD Ryzen 5 5600H, NVIDIA GeForce RTX 3060 Laptop GPU (8829 - 9027, n=2) | |
| MSI Katana GF76 11UE | |
| Schenker XMG Core 17 (Early 2021) | |
| PCMark 10 / Digital Content Creation | |
| Average of class Gaming (7602 - 19954, n=95, last 2 years) | |
| Schenker XMG Apex 17 M21 | |
| Gigabyte A7 X1 | |
| Asus TUF Gaming F17 FX706HM | |
| Lenovo Legion 5 17ACH6H-82JY0003GE | |
| MSI Katana GF76 11UE | |
| Average AMD Ryzen 5 5600H, NVIDIA GeForce RTX 3060 Laptop GPU (7740 - 9026, n=2) | |
| Schenker XMG Core 17 (Early 2021) | |
| CrossMark / Overall | |
| Average of class Gaming (1366 - 2409, n=94, last 2 years) | |
| Lenovo Legion 5 17ACH6H-82JY0003GE | |
| Average AMD Ryzen 5 5600H, NVIDIA GeForce RTX 3060 Laptop GPU (n=1) | |
| CrossMark / Productivity | |
| Average of class Gaming (1386 - 2254, n=94, last 2 years) | |
| Lenovo Legion 5 17ACH6H-82JY0003GE | |
| Average AMD Ryzen 5 5600H, NVIDIA GeForce RTX 3060 Laptop GPU (n=1) | |
| CrossMark / Creativity | |
| Average of class Gaming (1343 - 2786, n=94, last 2 years) | |
| Lenovo Legion 5 17ACH6H-82JY0003GE | |
| Average AMD Ryzen 5 5600H, NVIDIA GeForce RTX 3060 Laptop GPU (n=1) | |
| CrossMark / Responsiveness | |
| Average of class Gaming (1226 - 2334, n=94, last 2 years) | |
| Lenovo Legion 5 17ACH6H-82JY0003GE | |
| Average AMD Ryzen 5 5600H, NVIDIA GeForce RTX 3060 Laptop GPU (n=1) | |
| PCMark 10 Score | 6615 points | |
Help | ||
| AIDA64 / Memory Copy | |
| Average of class Gaming (21750 - 129946, n=105, last 2 years) | |
| Lenovo Legion 5 17ACH6H-82JY0003GE | |
| Average AMD Ryzen 5 5600H (20549 - 42141, n=14) | |
| AIDA64 / Memory Read | |
| Average of class Gaming (22956 - 118858, n=105, last 2 years) | |
| Lenovo Legion 5 17ACH6H-82JY0003GE | |
| Average AMD Ryzen 5 5600H (22917 - 47595, n=14) | |
| AIDA64 / Memory Write | |
| Average of class Gaming (22297 - 135096, n=105, last 2 years) | |
| Lenovo Legion 5 17ACH6H-82JY0003GE | |
| Average AMD Ryzen 5 5600H (20226 - 44872, n=14) | |
| AIDA64 / Memory Latency | |
| Average of class Gaming (75.3 - 259, n=105, last 2 years) | |
| Average AMD Ryzen 5 5600H (75 - 89.1, n=14) | |
| Lenovo Legion 5 17ACH6H-82JY0003GE | |
* ... smaller is better
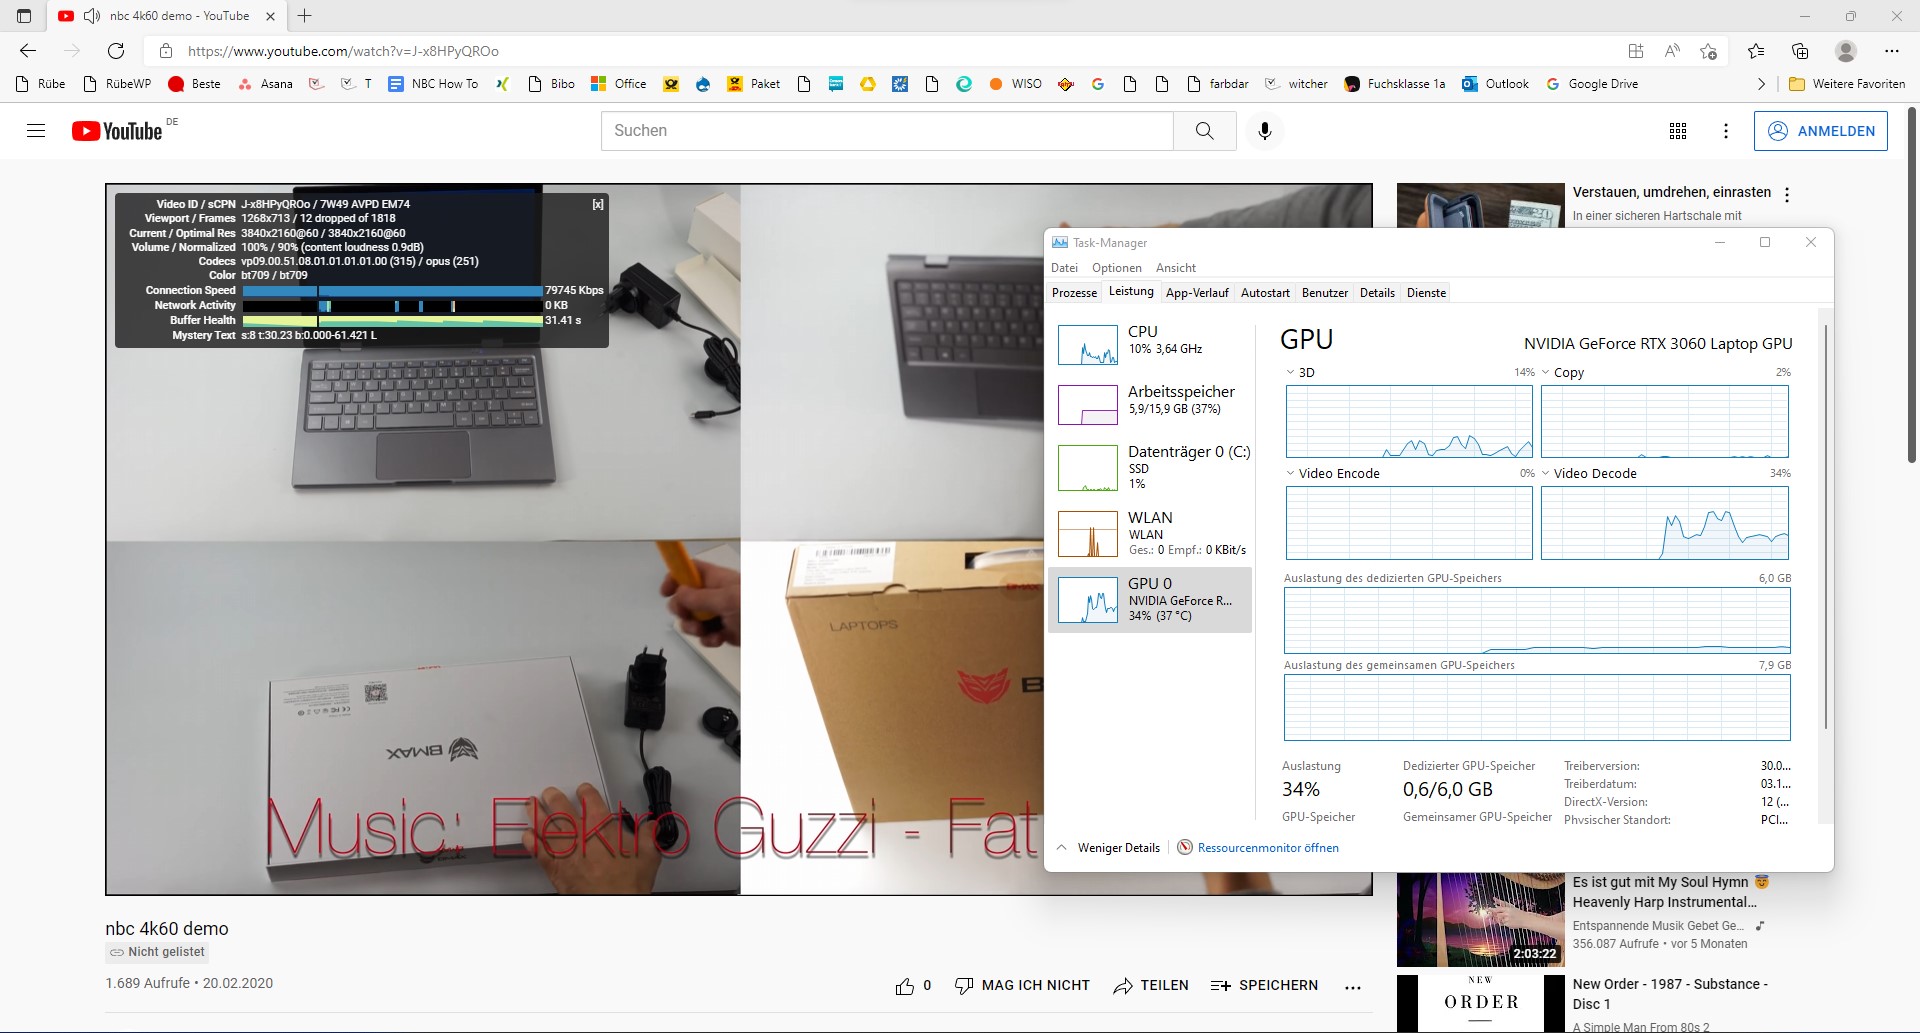
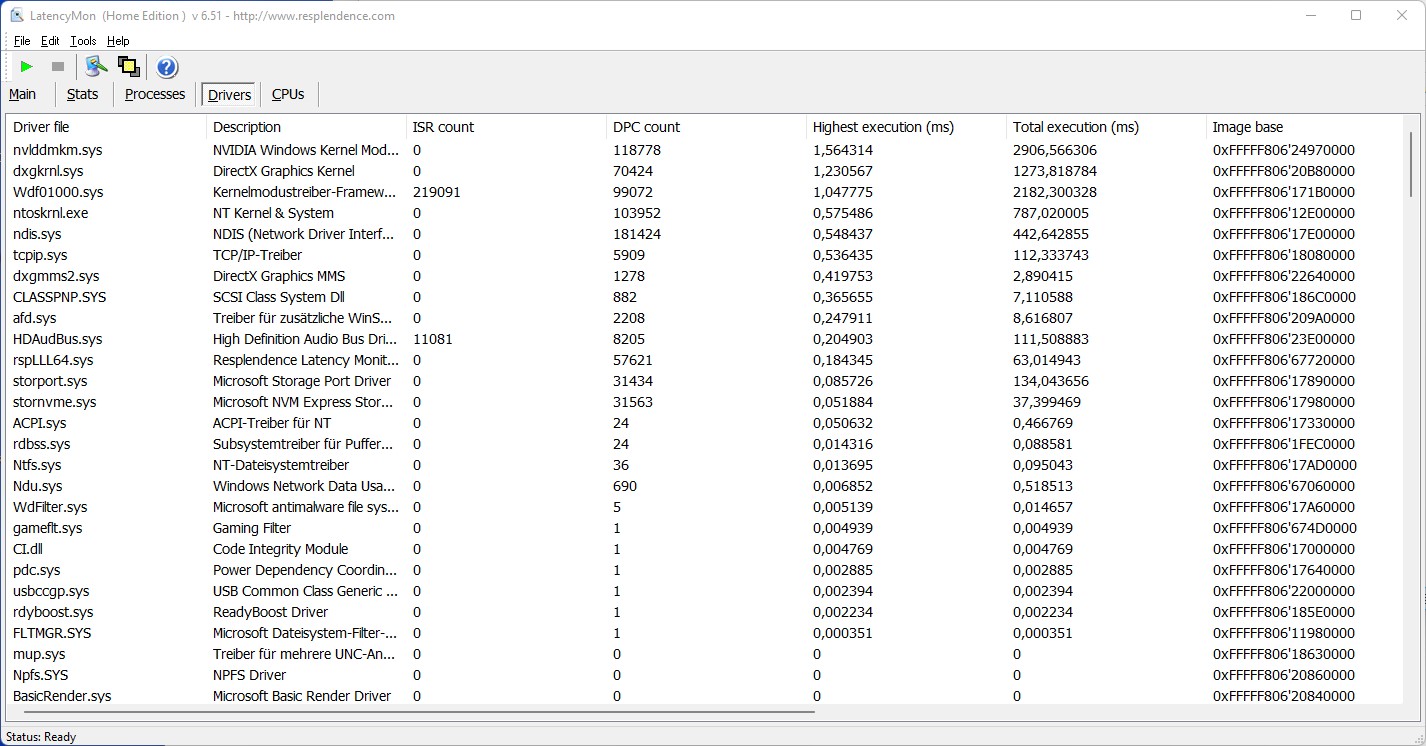
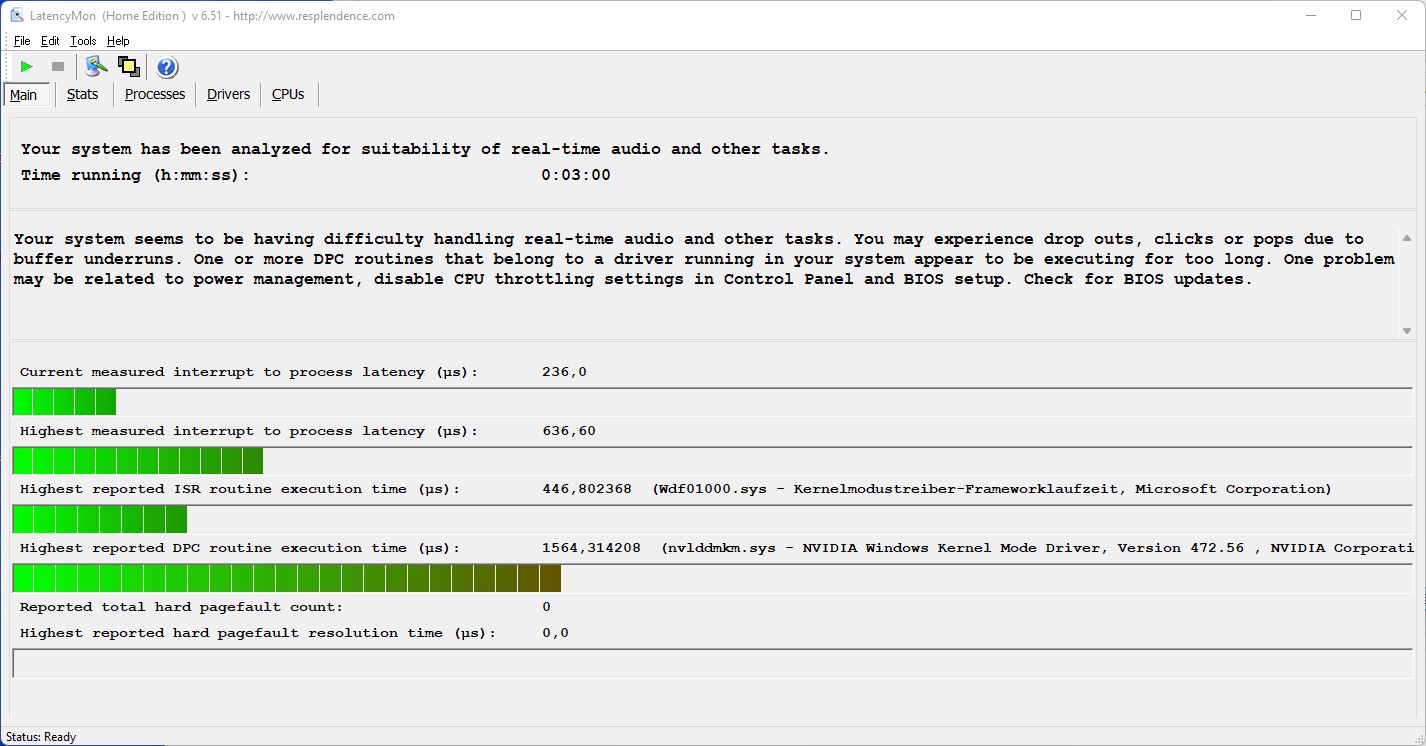
DPC延迟
在Edge中打开多个浏览器标签和播放4K YouTube视频并没有产生有问题的结果。运行Prime95后,延迟只是略有增加。在我们的测试viideo期间,GPU的负载大约是30%。
| DPC Latencies / LatencyMon - interrupt to process latency (max), Web, Youtube, Prime95 | |
| MSI Katana GF76 11UE | |
| Lenovo Legion 5 17ACH6H-82JY0003GE | |
| Schenker XMG Apex 17 M21 | |
| Asus TUF Gaming F17 FX706HM | |
| Gigabyte A7 X1 | |
| Schenker XMG Core 17 (Early 2021) | |
* ... smaller is better
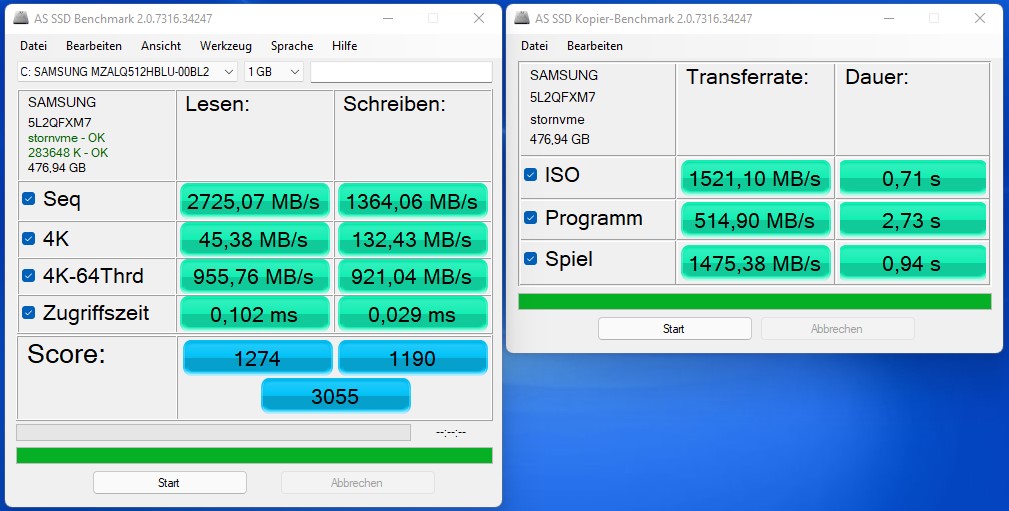
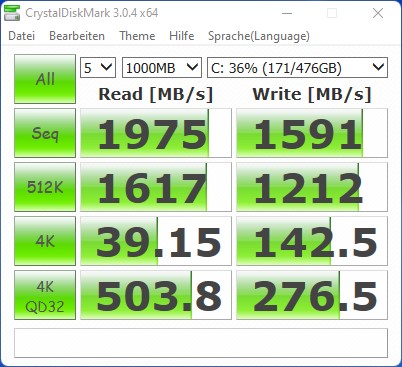
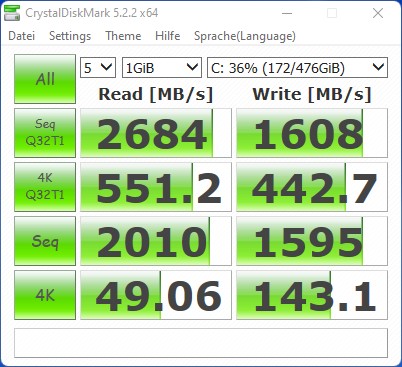
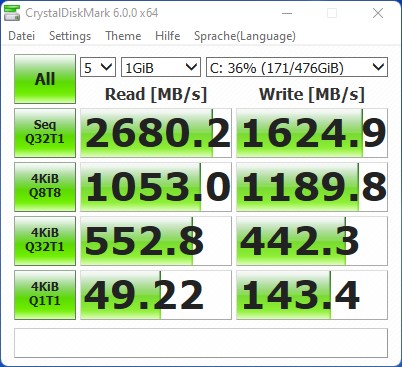
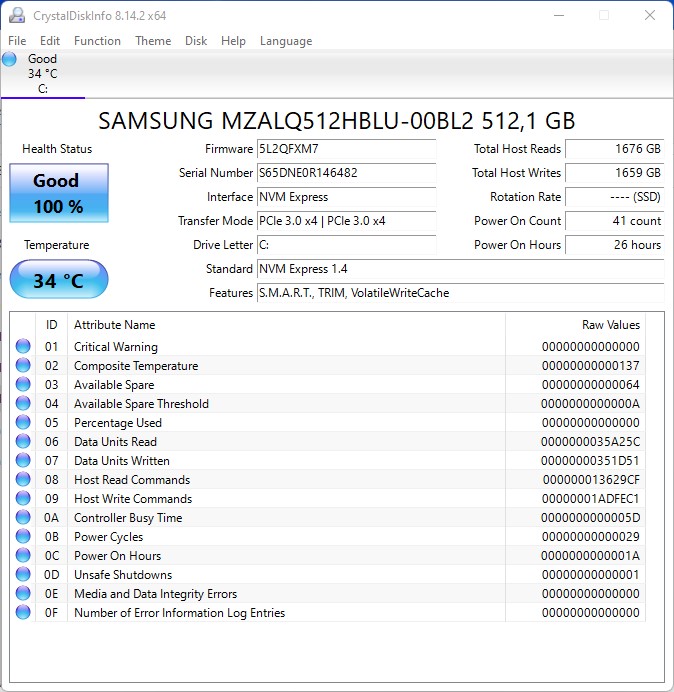
存储解决方案
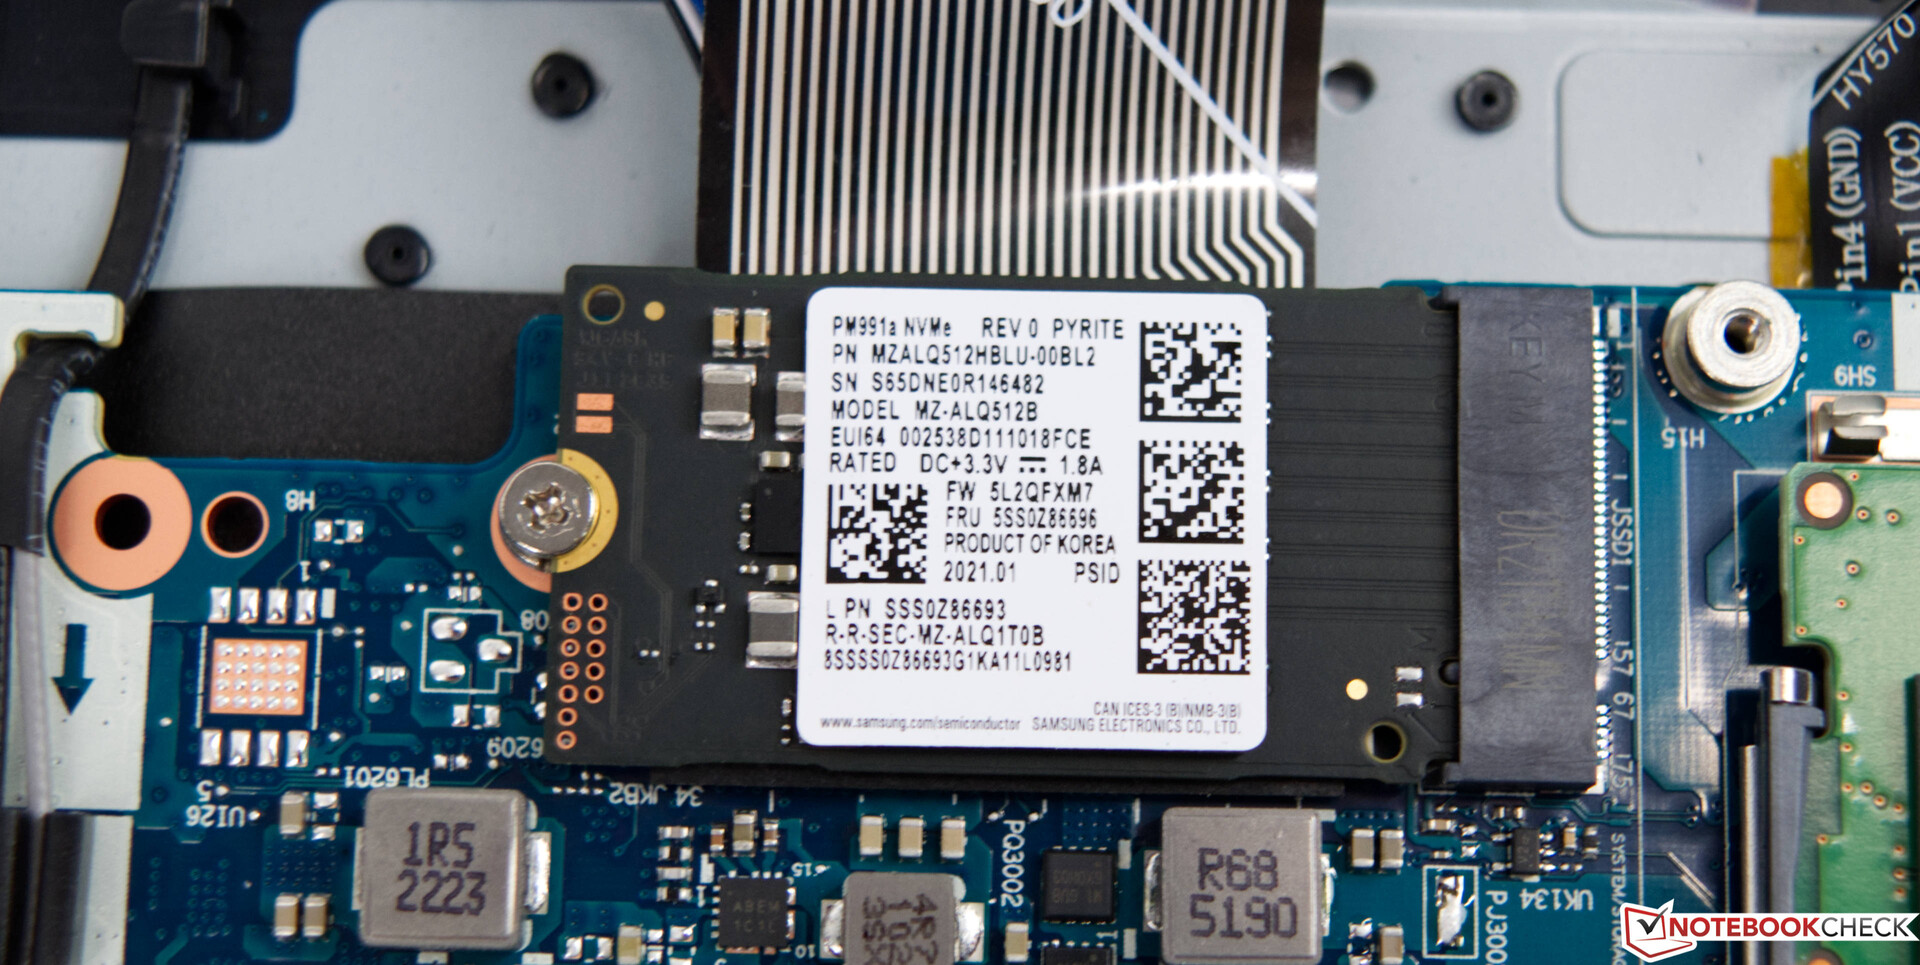
对于Legion 5 17,联想依靠的是快速的三星SSD。在这种情况下,它的容量为512GB,使用快速的M.2 PCIe接口进行数据传输。然而,正如我们的结果所示,这种设置不能完全跟上竞争的步伐。512GB的容量也不完全是巨大的。在一台游戏笔记本上,我们期望至少有1TB的存储空间。
更多的比较和基准可以在我们的 比较表.

| Drive Performance rating - Percent | |
| Average of class Gaming | |
| Schenker XMG Apex 17 M21 | |
| Schenker XMG Core 17 (Early 2021) | |
| Asus TUF Gaming F17 FX706HM | |
| Gigabyte A7 X1 | |
| Lenovo Legion 5 17ACH6H-82JY0003GE | |
| Average Samsung PM991a MZALQ512HBLU | |
| MSI Katana GF76 11UE | |
* ... smaller is better
Disk Throttling: DiskSpd Read Loop, Queue Depth 8
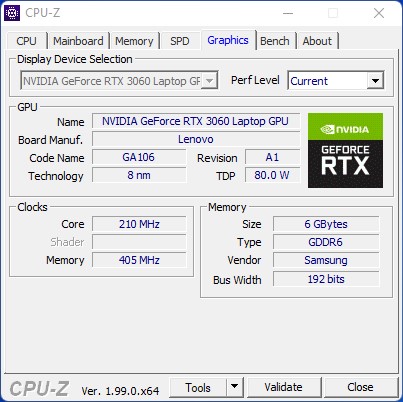
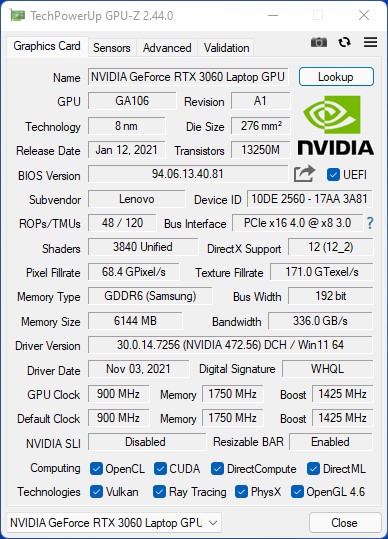
GPU性能
对于我们的测试装置, NvidiaGeForce RTX 3060移动GPU作为显卡。由于可配置的功率限制为80至130瓦,不同型号的性能会有很大差异。在这里,NvidiaGeForce RTX 3060移动GPU在通过联想Vantage工具设置为性能模式时,可以消耗高达130瓦的能量。因此,它在合成基准测试中取得了优异的成绩。与更强大的Legion 5 17相比,联想仅落后几个百分点 申克XMG Apex 17 M21.
| 3DMark Performance rating - Percent | |
| Average of class Gaming | |
| Gigabyte A7 X1 | |
| Schenker XMG Apex 17 M21 | |
| Lenovo Legion 5 17ACH6H-82JY0003GE | |
| Asus TUF Gaming F17 FX706HM | |
| MSI Katana GF76 11UE | |
| Average NVIDIA GeForce RTX 3060 Laptop GPU | |
| Schenker XMG Core 17 (Early 2021) | |
| 3DMark | |
| 1280x720 Cloud Gate Standard Graphics | |
| Average of class Gaming (86886 - 223650, n=60, last 2 years) | |
| Gigabyte A7 X1 | |
| Lenovo Legion 5 17ACH6H-82JY0003GE | |
| MSI Katana GF76 11UE | |
| Asus TUF Gaming F17 FX706HM | |
| Schenker XMG Core 17 (Early 2021) | |
| Schenker XMG Apex 17 M21 | |
| Average NVIDIA GeForce RTX 3060 Laptop GPU (33126 - 136826, n=38) | |
| 1920x1080 Fire Strike Graphics | |
| Average of class Gaming (12242 - 62849, n=115, last 2 years) | |
| Schenker XMG Apex 17 M21 | |
| Gigabyte A7 X1 | |
| Lenovo Legion 5 17ACH6H-82JY0003GE | |
| Average NVIDIA GeForce RTX 3060 Laptop GPU (16354 - 23109, n=49) | |
| Schenker XMG Core 17 (Early 2021) | |
| Asus TUF Gaming F17 FX706HM | |
| MSI Katana GF76 11UE | |
| 2560x1440 Time Spy Graphics | |
| Average of class Gaming (5012 - 26212, n=115, last 2 years) | |
| Schenker XMG Apex 17 M21 | |
| Gigabyte A7 X1 | |
| Lenovo Legion 5 17ACH6H-82JY0003GE | |
| Average NVIDIA GeForce RTX 3060 Laptop GPU (6285 - 9235, n=49) | |
| Schenker XMG Core 17 (Early 2021) | |
| Asus TUF Gaming F17 FX706HM | |
| MSI Katana GF76 11UE | |
| 3DMark Ice Storm Standard Score | 201496 points | |
| 3DMark Cloud Gate Standard Score | 44638 points | |
| 3DMark Fire Strike Score | 19801 points | |
| 3DMark Fire Strike Extreme Score | 10073 points | |
| 3DMark Time Spy Score | 8579 points | |
Help | ||
游戏性能
在游戏性能方面,联想5 17在我们的比较中落后于大多数设备。基于英特尔SoC的竞争者在游戏中似乎达到了更好的效果。不管怎么说,我们不想贬低我们测试设备的绝对性能。帧率很高,即使是目前的游戏,如《Far Cry 6》,也能在原生显示分辨率下顺利运行,并具有最大的细节。
| The Witcher 3 | |
| 1920x1080 High Graphics & Postprocessing (Nvidia HairWorks Off) | |
| Average of class Gaming (341 - 404, n=2, last 2 years) | |
| Schenker XMG Apex 17 M21 | |
| Average NVIDIA GeForce RTX 3060 Laptop GPU (81 - 186.8, n=41) | |
| Schenker XMG Core 17 (Early 2021) | |
| Asus TUF Gaming F17 FX706HM | |
| MSI Katana GF76 11UE | |
| Lenovo Legion 5 17ACH6H-82JY0003GE | |
| 1920x1080 Ultra Graphics & Postprocessing (HBAO+) | |
| Average of class Gaming (104.7 - 240, n=7, last 2 years) | |
| Schenker XMG Apex 17 M21 | |
| Gigabyte A7 X1 | |
| Lenovo Legion 5 17ACH6H-82JY0003GE | |
| Schenker XMG Core 17 (Early 2021) | |
| Average NVIDIA GeForce RTX 3060 Laptop GPU (58.2 - 91.5, n=48) | |
| Asus TUF Gaming F17 FX706HM | |
| MSI Katana GF76 11UE | |
在我们的《Witcher 3》压力测试中,其性能在超强设置下保持一致。因此,即使在长时间的游戏过程中,我们也不期望帧率下降到不可玩的水平。
Witcher 3 FPS Chart
| low | med. | high | ultra | |
|---|---|---|---|---|
| GTA V (2015) | 172 | 167 | 149 | 78.6 |
| The Witcher 3 (2015) | 281 | 221 | 125 | 81.4 |
| Dota 2 Reborn (2015) | 138.8 | 127.8 | 119.3 | 117.6 |
| Final Fantasy XV Benchmark (2018) | 157 | 113 | 85.2 | |
| X-Plane 11.11 (2018) | 95 | 86.3 | 71.3 | |
| Far Cry 5 (2018) | 125 | 111 | 106 | 99 |
| Strange Brigade (2018) | 353 | 225 | 180 | 155 |
| Far Cry New Dawn (2019) | 107 | 96 | 94 | 86 |
| Metro Exodus (2019) | 151 | 104 | 79.8 | 62.3 |
| Borderlands 3 (2019) | 116 | 102 | 90.3 | 74.3 |
| F1 2020 (2020) | 239 | 204 | 193 | 142 |
| F1 2021 (2021) | 257 | 233 | 198 | 107 |
| Far Cry 6 (2021) | 102 | 90.8 | 81.2 | 59.8 |
排放
系统噪音
对于游戏笔记本电脑来说,冷却解决方案的噪音水平往往是一个大问题。高性能的特点往往伴随着一个嘈杂的系统。联想Legioin 5 17取得了良好的平衡。由三根热管和两个风扇组成的冷却解决方案在大多数情况下是有效和相对安静的。在空转时,该设备通常是完全无声的。联想Legion 5 17的噪音为37.5 dB(A),是最安静的游戏笔记本电脑之一。在最坏的情况下,我们在压力测试中测得高达51分贝(A)。
Noise level
| Idle |
| 25 / 25 / 30.5 dB(A) |
| Load |
| 37.5 / 51 dB(A) |
 | ||
30 dB silent 40 dB(A) audible 50 dB(A) loud |
||
min: | ||
| Lenovo Legion 5 17ACH6H-82JY0003GE GeForce RTX 3060 Laptop GPU, R5 5600H, Samsung PM991a MZALQ512HBLU | Schenker XMG Core 17 (Early 2021) GeForce RTX 3060 Laptop GPU, i7-10870H, Samsung SSD 970 EVO Plus 1TB | Asus TUF Gaming F17 FX706HM GeForce RTX 3060 Laptop GPU, i9-11900H, SK Hynix HFM001TD3JX013N | MSI Katana GF76 11UE GeForce RTX 3060 Laptop GPU, i7-11800H, Kingston OM8PCP3512F-AB | Schenker XMG Apex 17 M21 GeForce RTX 3070 Laptop GPU, R7 5800H, Samsung SSD 970 EVO Plus 1TB | Gigabyte A7 X1 GeForce RTX 3070 Laptop GPU, R9 5900HX, ESR512GTLCG-EAC-4 | |
|---|---|---|---|---|---|---|
| Noise | -19% | -10% | -23% | -14% | -16% | |
| off / environment * (dB) | 25 | 25 -0% | 25 -0% | 25 -0% | 25 -0% | 24 4% |
| Idle Minimum * (dB) | 25 | 30 -20% | 26 -4% | 33 -32% | 25 -0% | 25 -0% |
| Idle Average * (dB) | 25 | 32 -28% | 31 -24% | 34 -36% | 28 -12% | 29 -16% |
| Idle Maximum * (dB) | 30.5 | 36 -18% | 33 -8% | 35 -15% | 31 -2% | 35 -15% |
| Load Average * (dB) | 37.5 | 53 -41% | 48 -28% | 53 -41% | 57 -52% | 58 -55% |
| Load Maximum * (dB) | 51 | 54 -6% | 49 4% | 57 -12% | 59 -16% | 59 -16% |
| Witcher 3 ultra * (dB) | 51 | 47 | 49 | 57 | 57 |
* ... smaller is better
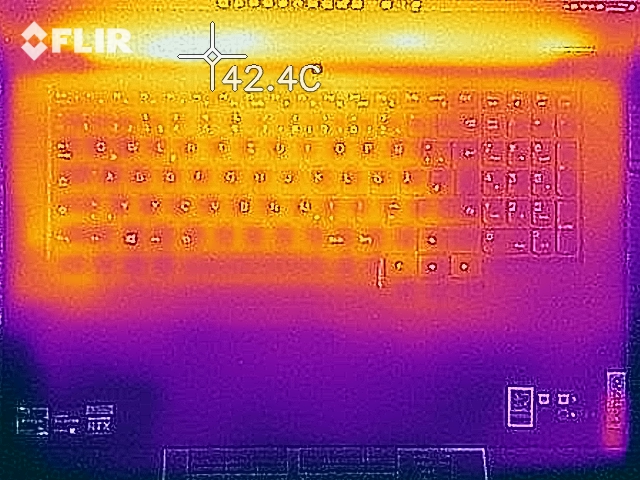
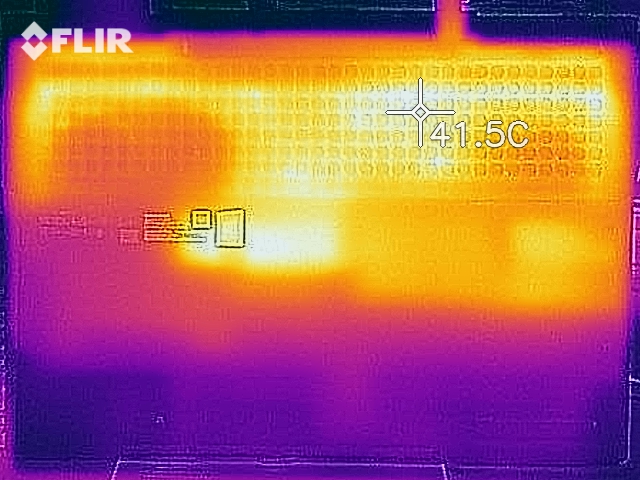
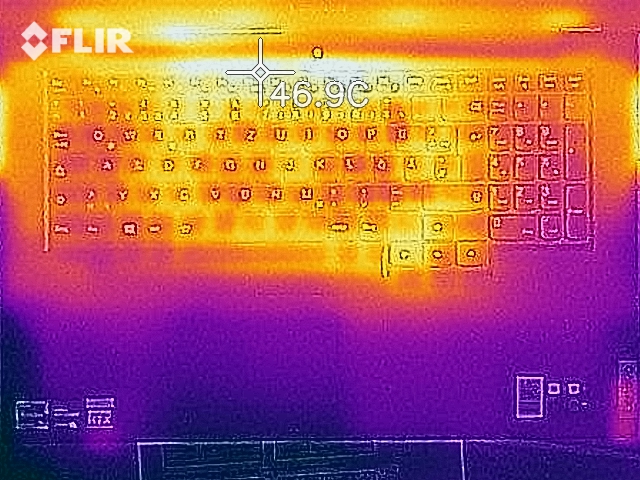
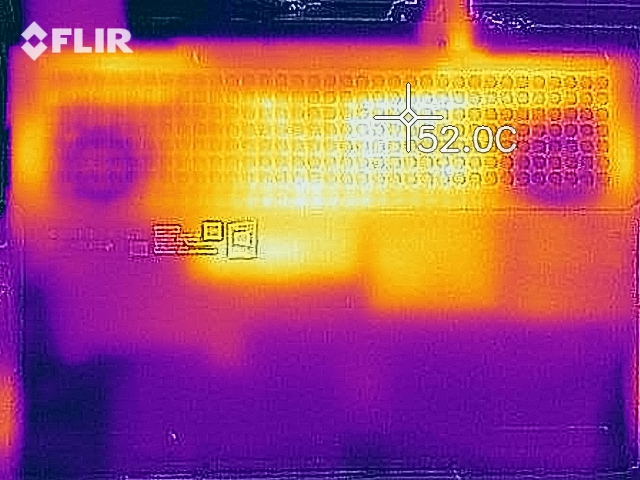
温度
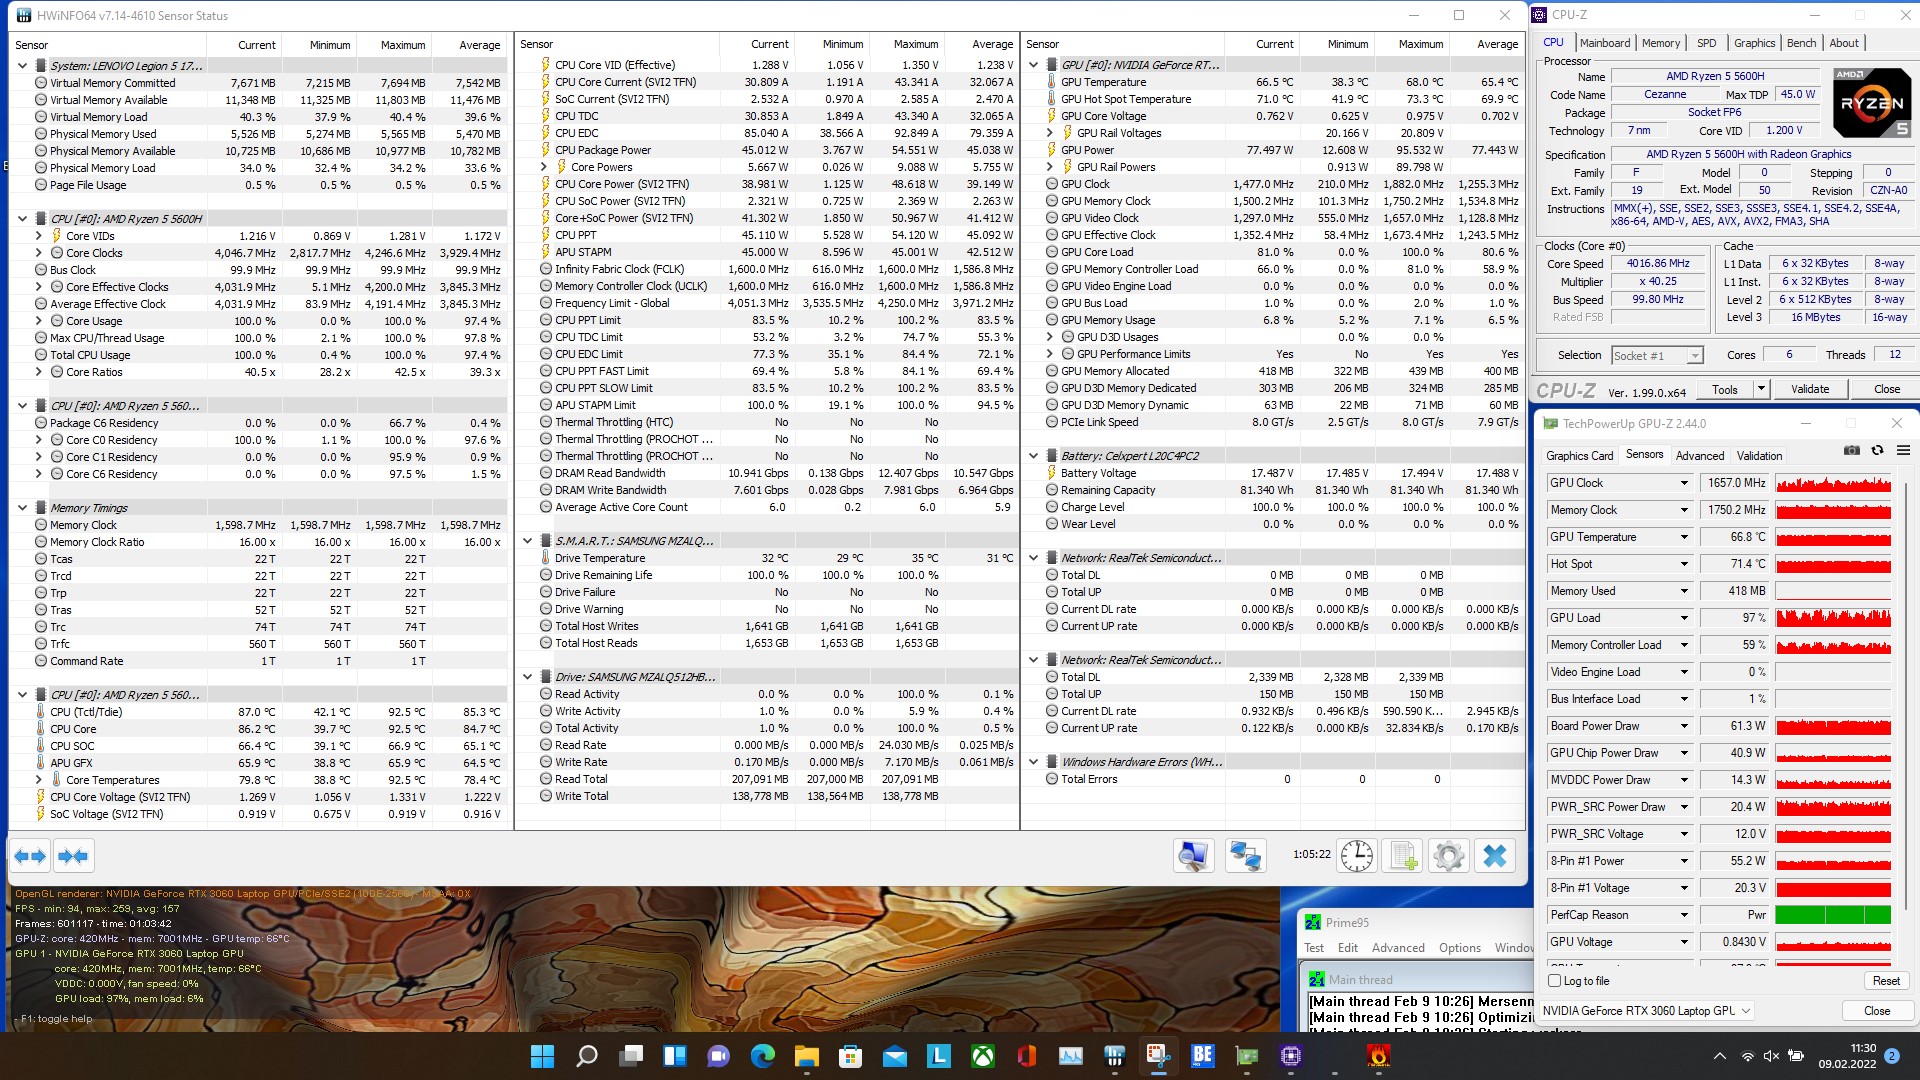
联想Legion 5 17总体上很好地处理了其热量发展。最高温度为51℃(123.8°F),表面温度也没有问题。我们在这个类别中见过更糟糕的情况。我们仍然建议不要在腿上使用该设备,因为这可能对气流产生不利影响。在我们的压力测试中,SoC和GPU分别达到92.5℃(198.5°F)和73.3℃(163.94°F)。所有这些数值都是非关键性的,这就解释了为什么联想Legion 5 17在我们的负载情况下没有必要节流(例如:Cinebench R15多循环和TheWitcher 3)。
(±) The maximum temperature on the upper side is 42.2 °C / 108 F, compared to the average of 40.4 °C / 105 F, ranging from 21.2 to 68.8 °C for the class Gaming.
(-) The bottom heats up to a maximum of 50.9 °C / 124 F, compared to the average of 43.2 °C / 110 F
(+) In idle usage, the average temperature for the upper side is 29.1 °C / 84 F, compared to the device average of 33.9 °C / 93 F.
(+) The palmrests and touchpad are cooler than skin temperature with a maximum of 25.6 °C / 78.1 F and are therefore cool to the touch.
(+) The average temperature of the palmrest area of similar devices was 28.8 °C / 83.8 F (+3.2 °C / 5.7 F).
| Lenovo Legion 5 17ACH6H-82JY0003GE AMD Ryzen 5 5600H, NVIDIA GeForce RTX 3060 Laptop GPU | Schenker XMG Core 17 (Early 2021) Intel Core i7-10870H, NVIDIA GeForce RTX 3060 Laptop GPU | Asus TUF Gaming F17 FX706HM Intel Core i9-11900H, NVIDIA GeForce RTX 3060 Laptop GPU | MSI Katana GF76 11UE Intel Core i7-11800H, NVIDIA GeForce RTX 3060 Laptop GPU | Schenker XMG Apex 17 M21 AMD Ryzen 7 5800H, NVIDIA GeForce RTX 3070 Laptop GPU | Gigabyte A7 X1 AMD Ryzen 9 5900HX, NVIDIA GeForce RTX 3070 Laptop GPU | |
|---|---|---|---|---|---|---|
| Heat | -1% | -22% | -2% | 6% | 7% | |
| Maximum Upper Side * (°C) | 42.2 | 44 -4% | 58.5 -39% | 51 -21% | 45 -7% | 44 -4% |
| Maximum Bottom * (°C) | 50.9 | 50 2% | 58.5 -15% | 52 -2% | 49 4% | 49 4% |
| Idle Upper Side * (°C) | 34.3 | 30 13% | 38 -11% | 32 7% | 27 21% | 27 21% |
| Idle Bottom * (°C) | 32 | 36 -13% | 39 -22% | 29 9% | 30 6% | 30 6% |
* ... smaller is better
发言人
该系统配备了两个立体声扬声器。声音总体上是平衡的,而且并不完全缺乏低音。不幸的是,联想决定不为Legion 5 17配备专用的重低音扬声器。为了获得理想的音频体验,我们建议使用耳机。适当的型号可以通过3.5毫米音频插孔或USB连接。
Lenovo Legion 5 17ACH6H-82JY0003GE audio analysis
(±) | speaker loudness is average but good (78.3 dB)
Bass 100 - 315 Hz
(-) | nearly no bass - on average 19.1% lower than median
(±) | linearity of bass is average (13.8% delta to prev. frequency)
Mids 400 - 2000 Hz
(+) | balanced mids - only 3% away from median
(+) | mids are linear (5% delta to prev. frequency)
Highs 2 - 16 kHz
(+) | balanced highs - only 4.8% away from median
(+) | highs are linear (6.7% delta to prev. frequency)
Overall 100 - 16.000 Hz
(±) | linearity of overall sound is average (15.8% difference to median)
Compared to same class
» 37% of all tested devices in this class were better, 7% similar, 56% worse
» The best had a delta of 6%, average was 18%, worst was 132%
Compared to all devices tested
» 24% of all tested devices were better, 5% similar, 70% worse
» The best had a delta of 4%, average was 23%, worst was 134%
Gigabyte A7 X1 audio analysis
(+) | speakers can play relatively loud (85 dB)
Bass 100 - 315 Hz
(-) | nearly no bass - on average 30.3% lower than median
(±) | linearity of bass is average (13.4% delta to prev. frequency)
Mids 400 - 2000 Hz
(±) | higher mids - on average 6.8% higher than median
(±) | linearity of mids is average (11.3% delta to prev. frequency)
Highs 2 - 16 kHz
(+) | balanced highs - only 4.4% away from median
(+) | highs are linear (5.4% delta to prev. frequency)
Overall 100 - 16.000 Hz
(±) | linearity of overall sound is average (23.5% difference to median)
Compared to same class
» 85% of all tested devices in this class were better, 5% similar, 10% worse
» The best had a delta of 6%, average was 18%, worst was 132%
Compared to all devices tested
» 70% of all tested devices were better, 6% similar, 24% worse
» The best had a delta of 4%, average was 23%, worst was 134%
能源管理
能源消耗
联想Legion 5 17在空闲时的功耗本可以大大改善。这最终使它在我们的排名中失去了重要的分数。这个类别的一个好例子是 华硕TUF游戏机F17.相比之下,Legion 5 17在负载和游戏时的经济性很好。我们测量的最大消耗为170瓦。这使得300瓦的交流适配器看起来几乎是过度的。
| Off / Standby | |
| Idle | |
| Load |
|
Key:
min: | |
| Lenovo Legion 5 17ACH6H-82JY0003GE R5 5600H, GeForce RTX 3060 Laptop GPU, Samsung PM991a MZALQ512HBLU, IPS, 1920x1080, 17.3" | Schenker XMG Core 17 (Early 2021) i7-10870H, GeForce RTX 3060 Laptop GPU, Samsung SSD 970 EVO Plus 1TB, IPS, 2560x1440, 17.3" | Asus TUF Gaming F17 FX706HM i9-11900H, GeForce RTX 3060 Laptop GPU, SK Hynix HFM001TD3JX013N, IPS, 1920x1080, 17.3" | MSI Katana GF76 11UE i7-11800H, GeForce RTX 3060 Laptop GPU, Kingston OM8PCP3512F-AB, IPS, 1920x1080, 17.3" | Schenker XMG Apex 17 M21 R7 5800H, GeForce RTX 3070 Laptop GPU, Samsung SSD 970 EVO Plus 1TB, IPS, 1920x1080, 17.3" | Gigabyte A7 X1 R9 5900HX, GeForce RTX 3070 Laptop GPU, ESR512GTLCG-EAC-4, IPS, 1920x1080, 17.3" | Average NVIDIA GeForce RTX 3060 Laptop GPU | Average of class Gaming | |
|---|---|---|---|---|---|---|---|---|
| Power Consumption | -3% | 19% | 16% | 2% | -1% | 13% | -3% | |
| Idle Minimum * (Watt) | 15.6 | 13 17% | 10.3 34% | 9 42% | 10 36% | 12 23% | 10.4 ? 33% | 13 ? 17% |
| Idle Average * (Watt) | 20.7 | 16 23% | 13.1 37% | 13 37% | 14 32% | 14 32% | 14.5 ? 30% | 19 ? 8% |
| Idle Maximum * (Watt) | 22.9 | 29 -27% | 14.1 38% | 20 13% | 20 13% | 19 17% | 21.4 ? 7% | 24.6 ? -7% |
| Load Average * (Watt) | 134 | 100 25% | 110 18% | 102 24% | 112 16% | 118 12% | 109.3 ? 18% | 110.7 ? 17% |
| Witcher 3 ultra * (Watt) | 135 | 173 -28% | 138 -2% | 149 -10% | 202 -50% | 205 -52% | ||
| Load Maximum * (Watt) | 170 | 213 -25% | 190 -12% | 187 -10% | 231 -36% | 229 -35% | 206 ? -21% | 259 ? -52% |
* ... smaller is better
Energy Consumption Witcher 3 / Stress test
Energy Consumption external Monitor
电池寿命
凭借其固定的80瓦时电池,联想Legion 5 17在我们的Wi-Fi测试中只持续了4.5小时。然而,几个竞争对手在这种情况下也没有做得更好。在这里,只有 华硕TUF游戏机F17能够以明显更长的电池寿命使自己脱颖而出。由于联想Legion 5 17配备了我们比较中第二大的电池,我们仍然期待更多。至少在充满电的情况下,电池寿命足以应付一个电影之夜。
应该注意的是,在电池模式下,CPU和GPU的性能会略有节流。不过,目前几乎所有的游戏笔记本电脑都是这种情况。

| Lenovo Legion 5 17ACH6H-82JY0003GE R5 5600H, GeForce RTX 3060 Laptop GPU, 80 Wh | Schenker XMG Core 17 (Early 2021) i7-10870H, GeForce RTX 3060 Laptop GPU, 62 Wh | Asus TUF Gaming F17 FX706HM i9-11900H, GeForce RTX 3060 Laptop GPU, 90 Wh | MSI Katana GF76 11UE i7-11800H, GeForce RTX 3060 Laptop GPU, 53 Wh | Schenker XMG Apex 17 M21 R7 5800H, GeForce RTX 3070 Laptop GPU, 49 Wh | Gigabyte A7 X1 R9 5900HX, GeForce RTX 3070 Laptop GPU, 48.96 Wh | Average of class Gaming | |
|---|---|---|---|---|---|---|---|
| Battery runtime | 13% | 83% | -13% | -3% | -15% | 57% | |
| Reader / Idle (h) | 5.5 | 7.7 40% | 4.8 -13% | 7 27% | 8.27 ? 50% | ||
| H.264 (h) | 3.5 | 4.7 34% | 8.5 143% | 3.9 11% | 8.32 ? 138% | ||
| WiFi v1.3 (h) | 4.4 | 4.9 11% | 7.6 73% | 3.7 -16% | 4.9 11% | 4.7 7% | 7.11 ? 62% |
| Load (h) | 1.9 | 1.3 -32% | 2.5 32% | 1.3 -32% | 1 -47% | 1.2 -37% | 1.502 ? -21% |
| Witcher 3 ultra (h) | 0.8 |
Pros
Cons
结论 - 坚实的游戏系统,没有主要的弱点
联想Legion 5 17是当前的17英寸游戏笔记本电脑,并配备了最新的AMD CPU和强大的GPU,设法发挥其全部潜力。该 AMD Ryzen 5 5600H是这款笔记本电脑的一个非常好的选择,能够长时间保持其性能水平。我们的测试模型只是在与通常配备8个核心和16个线程的竞争对手的直接比较中持续落后。尽管如此,Legion 5 17给人留下了极好的印象,在合成基准测试中几乎能够跟上NvidiaGeForce RTX 3070移动GPU,这要归功于其非限制性的 NvidiaGeForce RTX 3060移动GPU.我们对17英寸显示屏也很满意,它在出厂时就已经预校好了。这是我们希望看到的更多的东西。144赫兹的刷新率显然指定了联想用于游戏。然而,由于其低deltaE-2000值,它也很适合视频或照片编辑。
联想Legion 5 17是一款整体上很扎实的游戏笔记本电脑,拥有最新的AMD Ryzen CPU和NvidiaGeForce GPU,没有人为限制。
总的来说,联想Legion 5 17是一个坚实的游戏笔记本电脑,有大量的端口选择。不幸的是,缺少Thunderbolt,尽管快速的GPU性能可能会抵消这一点。其实并没有什么大的弱点。由于电池容量大,我们期待更多的电池寿命。触摸板的大小和位置有可能被重新审视。也就是说,触摸板可能只是一个事后的想法,因为大多数用户在大多数情况下都会连接一个外部鼠标。此外,该系统在负载下只产生适度的噪音水平。在这方面,我们已经习惯了更糟糕的结果。我们建议不要在存储选项方面过于吝啬。至少1TB的存储空间应该是游戏笔记本电脑的标准。值得庆幸的是,该设备有一个用于辅助驱动器的插槽。
价格和可用性
在写这篇文章的时候,这款笔记本正在销售,直接从联想的网上商店购买约1220美元,而不是约1500美元,并被列为 "高级 "型号。然而,应该注意的是,运输至少需要2个月。
Lenovo Legion 5 17ACH6H-82JY0003GE
- 02/21/2022 v7 (old)
Sebastian Bade
Price comparison

