英特尔酷睿i9-12900H首次亮相。联合利华科技GM7AG8P笔记本评测
英特尔终于以其第12代Alder Lake-H平台回应了AMD令人印象深刻的移动Zen 3 H系列。Schenker和Uniwill Technology为我们提供了首批搭载基于GM7AG8P机箱的12代酷睿i9-12900H的笔记本电脑之一。截至目前,Schenker还没有公开提供这种确切的配置,但零售选择可能会在以后出现。
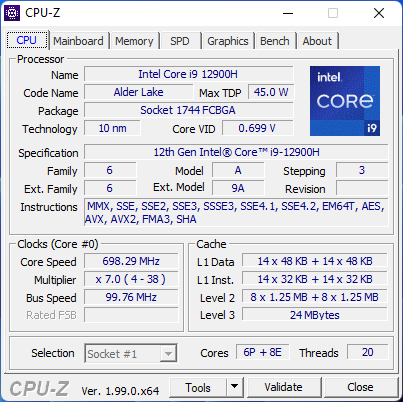
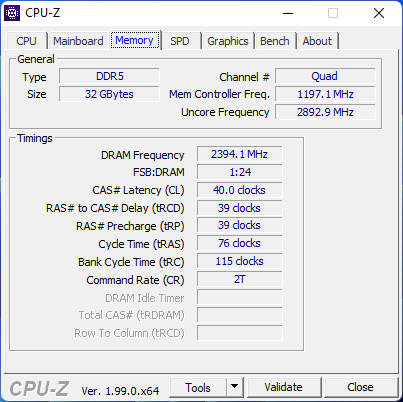
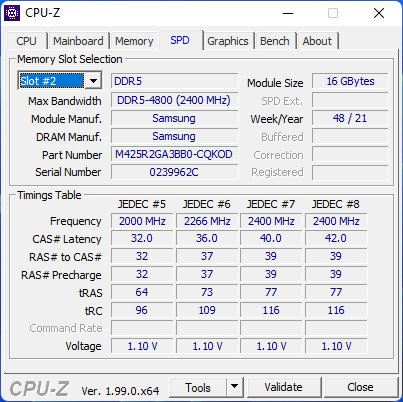
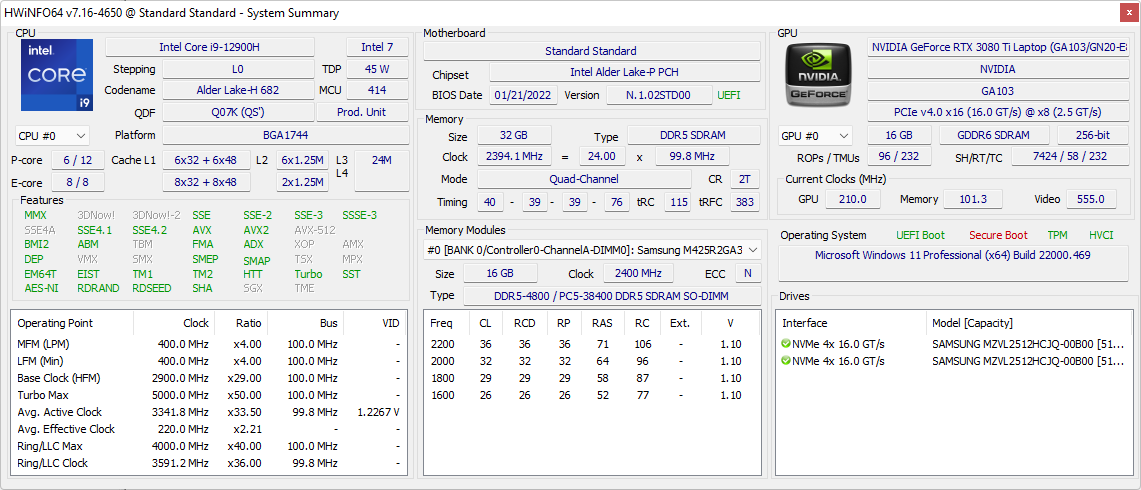
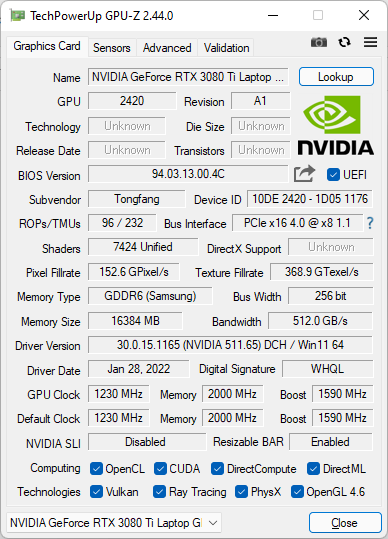
我们的测试装置配备了上述的Core i9 CPU,新的GeForce RTX 3080 Ti GPU,DDR5-4800内存,以及1440p(QHD)IPS 165 Hz显示屏。这篇评论将集中在性能方面,以显示用户在与各自的上一代同类产品相比时,可以对新的英特尔CPU和英伟达GPU有什么期待。
更多申克评论。
潜在的竞争对手比较
Rating | Date | Model | Weight | Height | Size | Resolution | Price |
|---|---|---|---|---|---|---|---|
| 86.9 % v7 (old) | 02 / 2022 | Schenker Uniwill Technology GM7AG8P i9-12900H, GeForce RTX 3080 Ti Laptop GPU | 2.3 kg | 20 mm | 17.30" | 2560x1440 | |
| 87.4 % v7 (old) | Schenker XMG NEO 17 GM7TG8S i7-11800H, GeForce RTX 3080 Laptop GPU | 2.6 kg | 27.45 mm | 17.30" | 2560x1440 | ||
| 89 % v7 (old) | 09 / 2021 | Alienware x17 RTX 3080 P48E i7-11800H, GeForce RTX 3080 Laptop GPU | 3.2 kg | 21.4 mm | 17.30" | 3840x2160 | |
| 89.4 % v7 (old) | 09 / 2021 | Razer Blade 17 RTX 3070 i7-11800H, GeForce RTX 3070 Laptop GPU | 2.8 kg | 19.9 mm | 17.30" | 1920x1080 | |
| 86.2 % v7 (old) | 09 / 2021 | MSI GS76 Stealth 11UH i9-11900H, GeForce RTX 3080 Laptop GPU | 2.4 kg | 20 mm | 17.30" | 3840x2160 | |
| 87.8 % v7 (old) | 09 / 2021 | Maingear Vector Pro MG-VCP17 i7-11800H, GeForce RTX 3080 Laptop GPU | 2.3 kg | 19.81 mm | 17.30" | 2560x1440 |
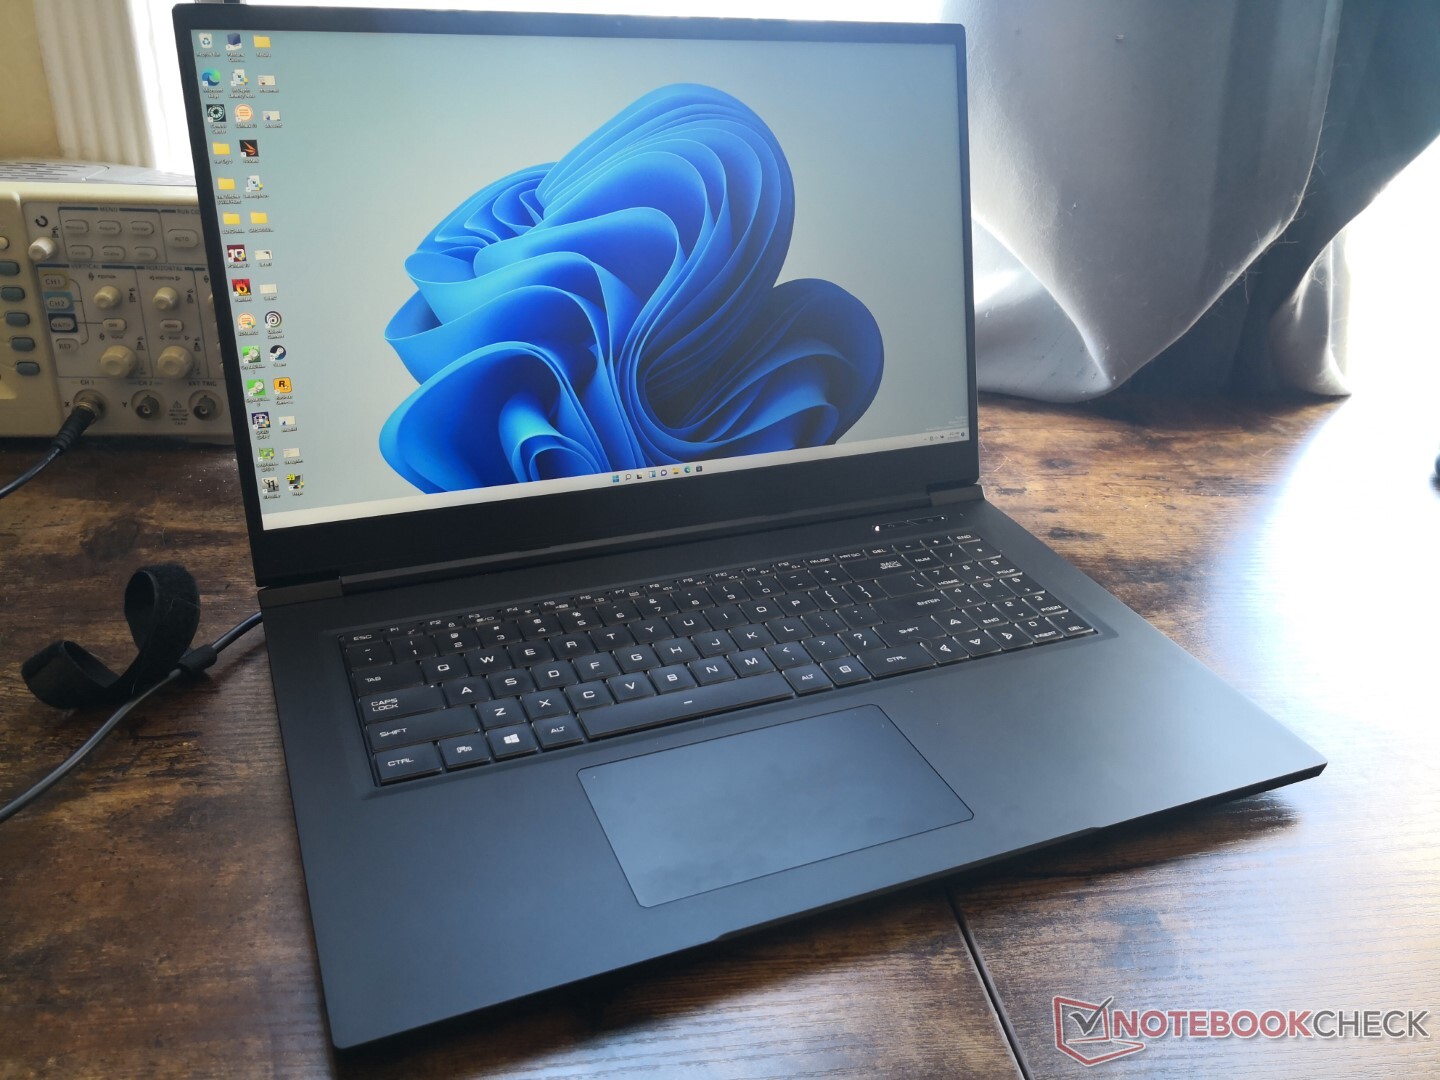
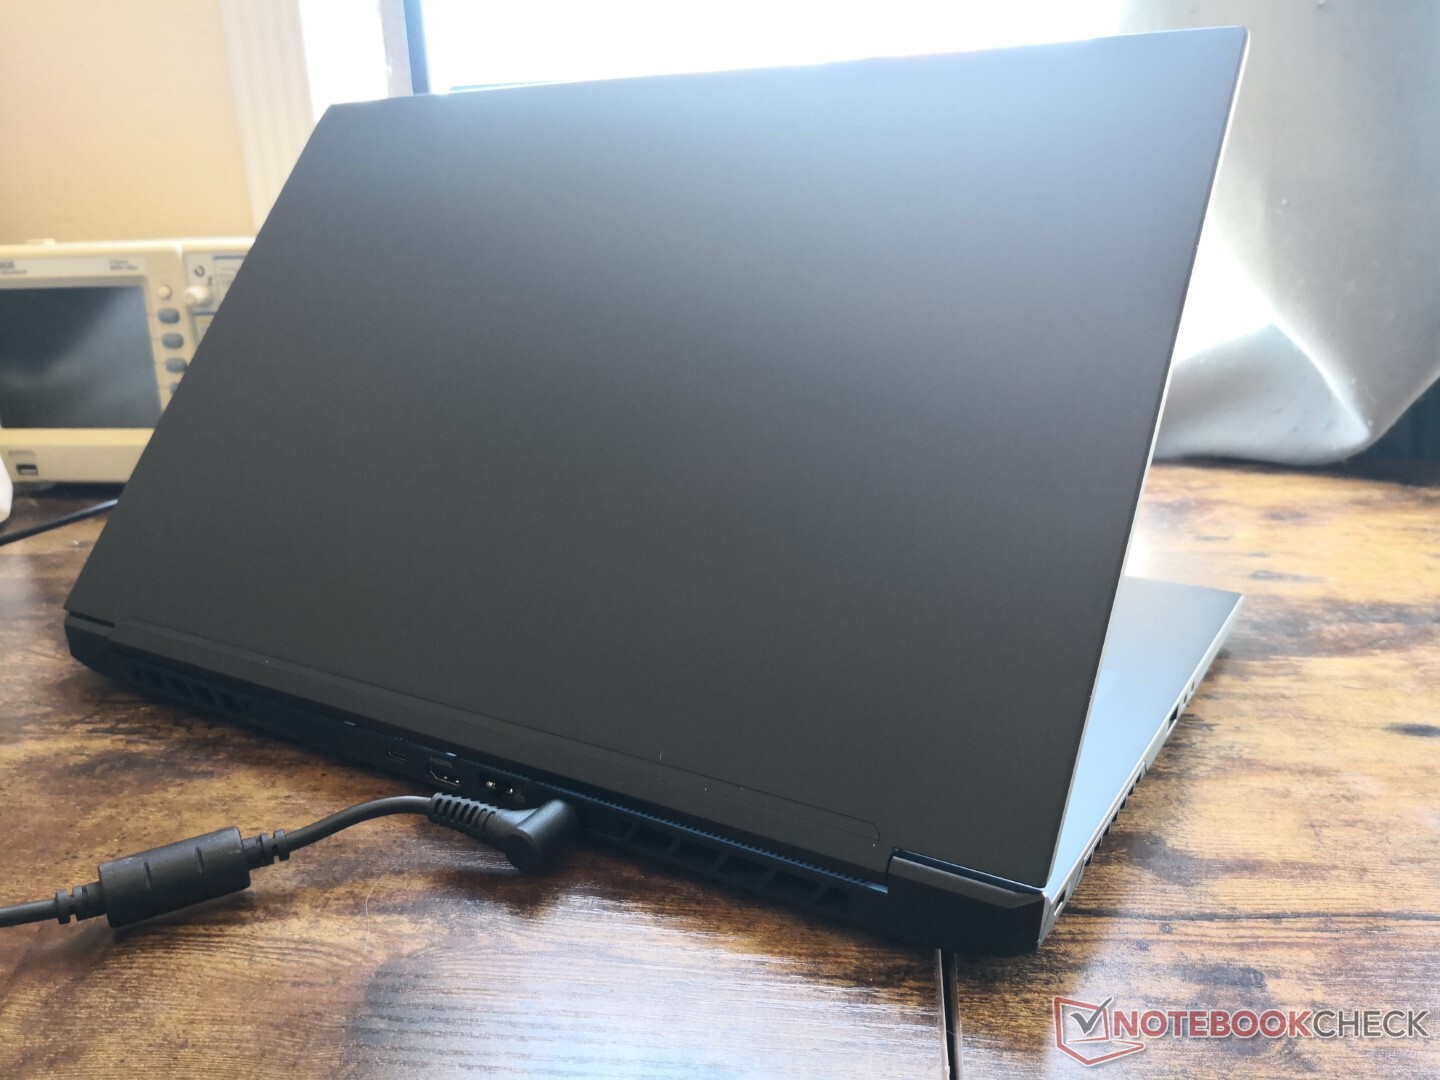
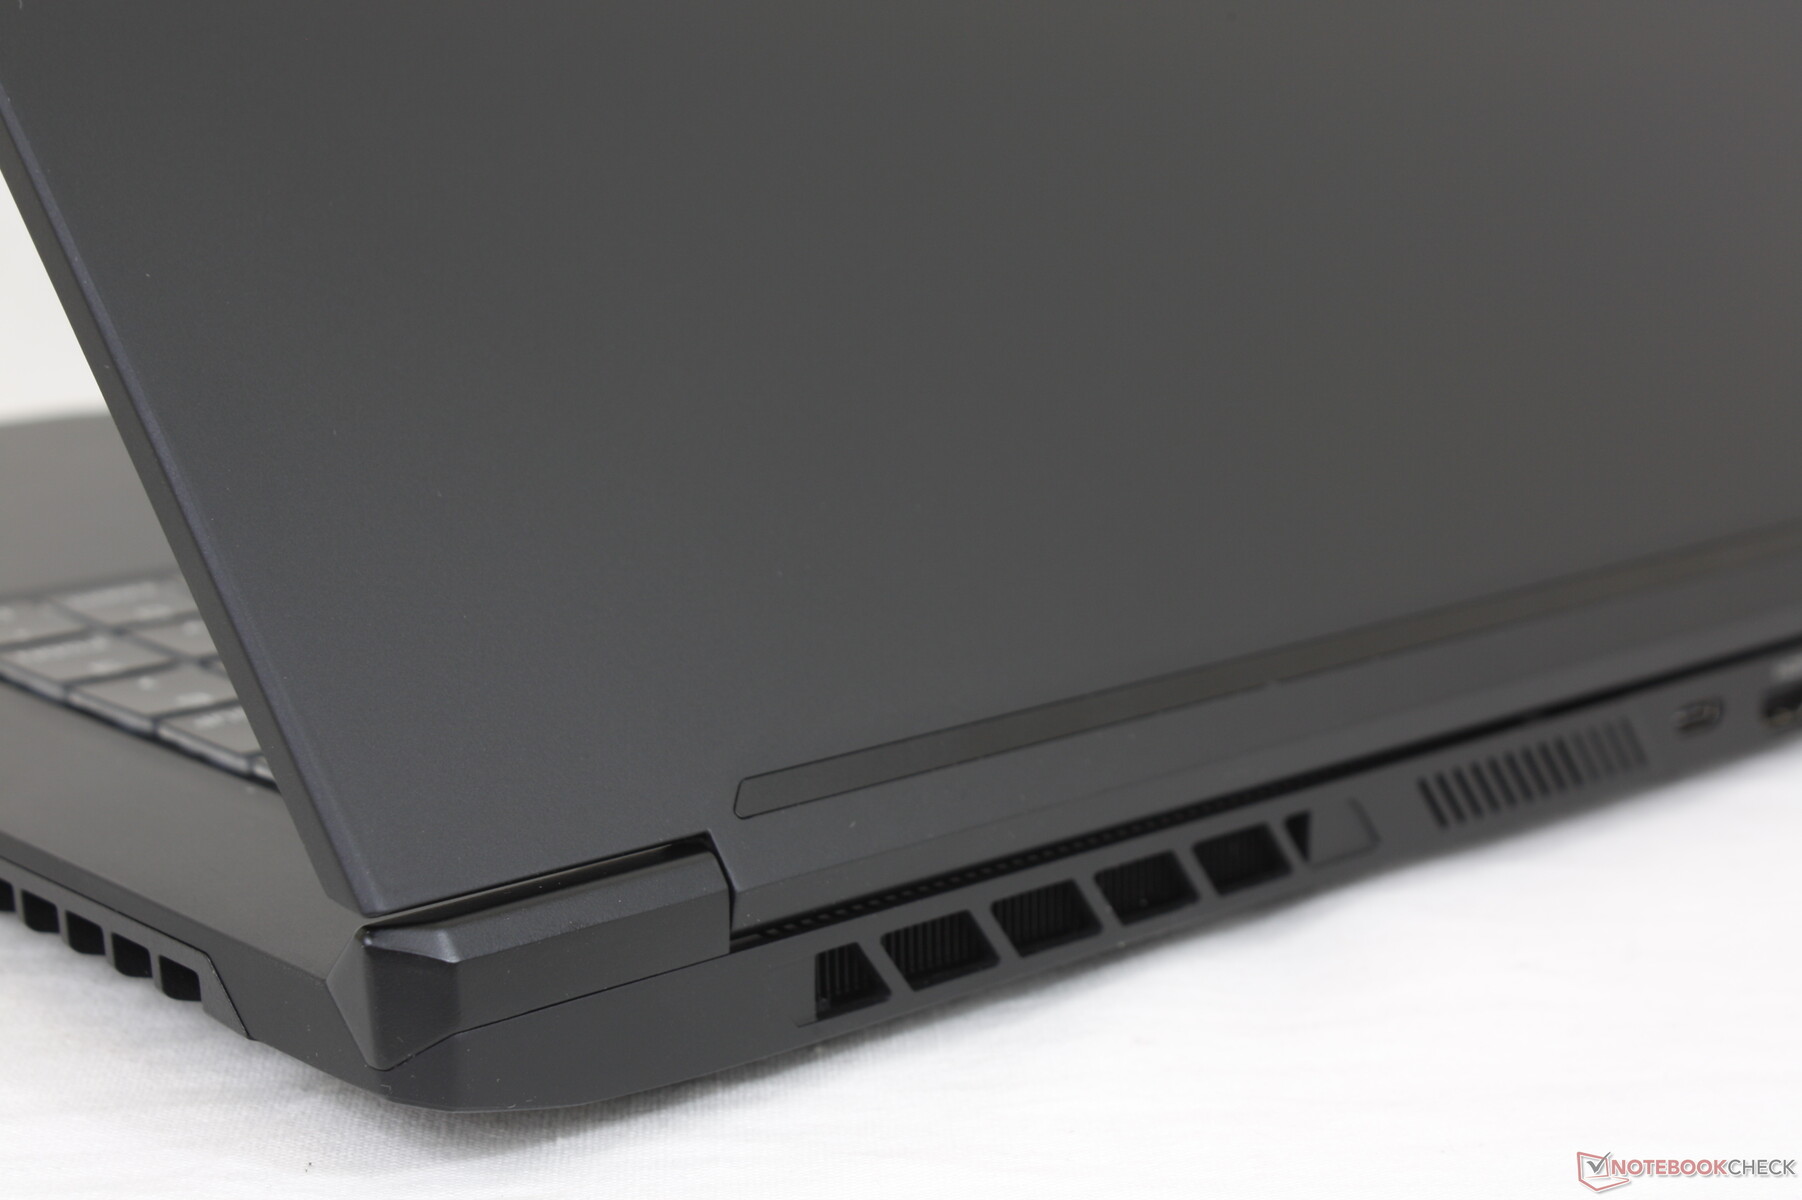
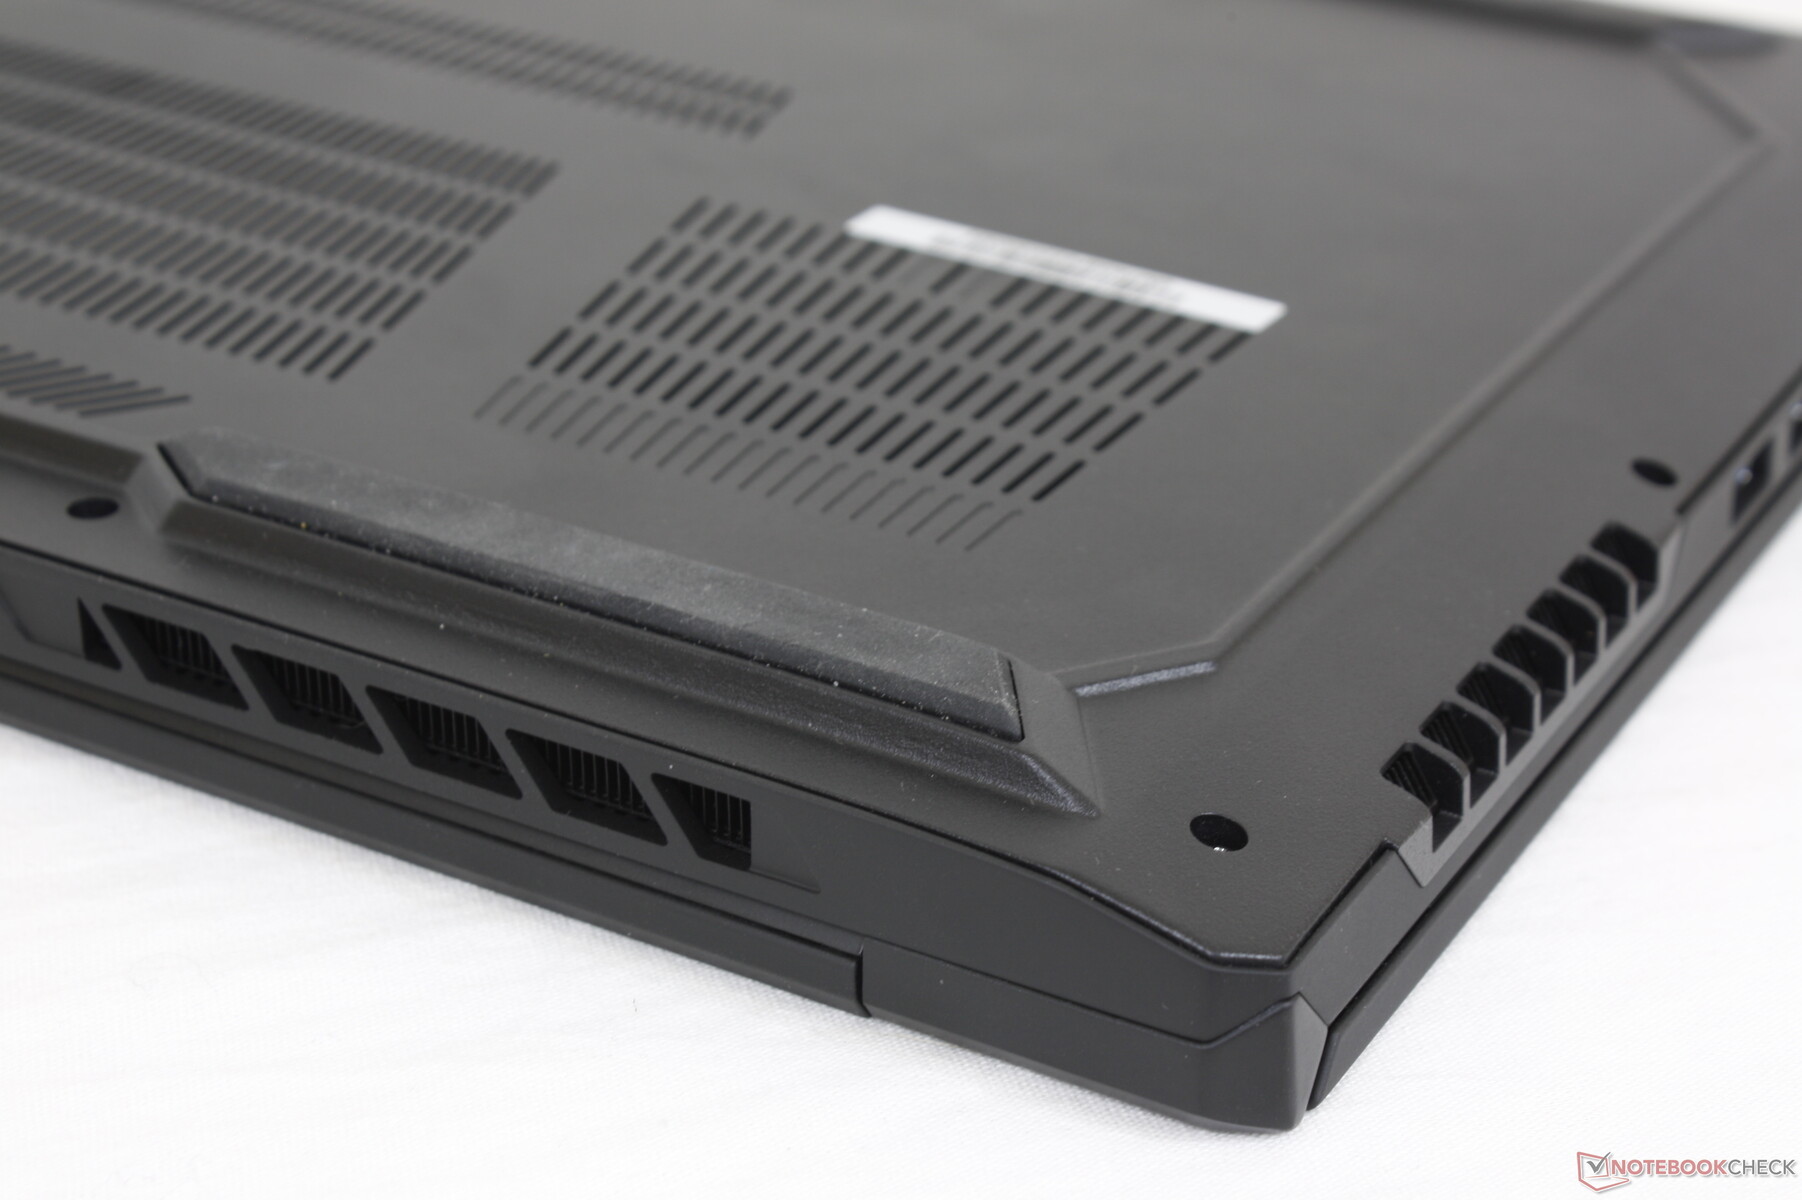
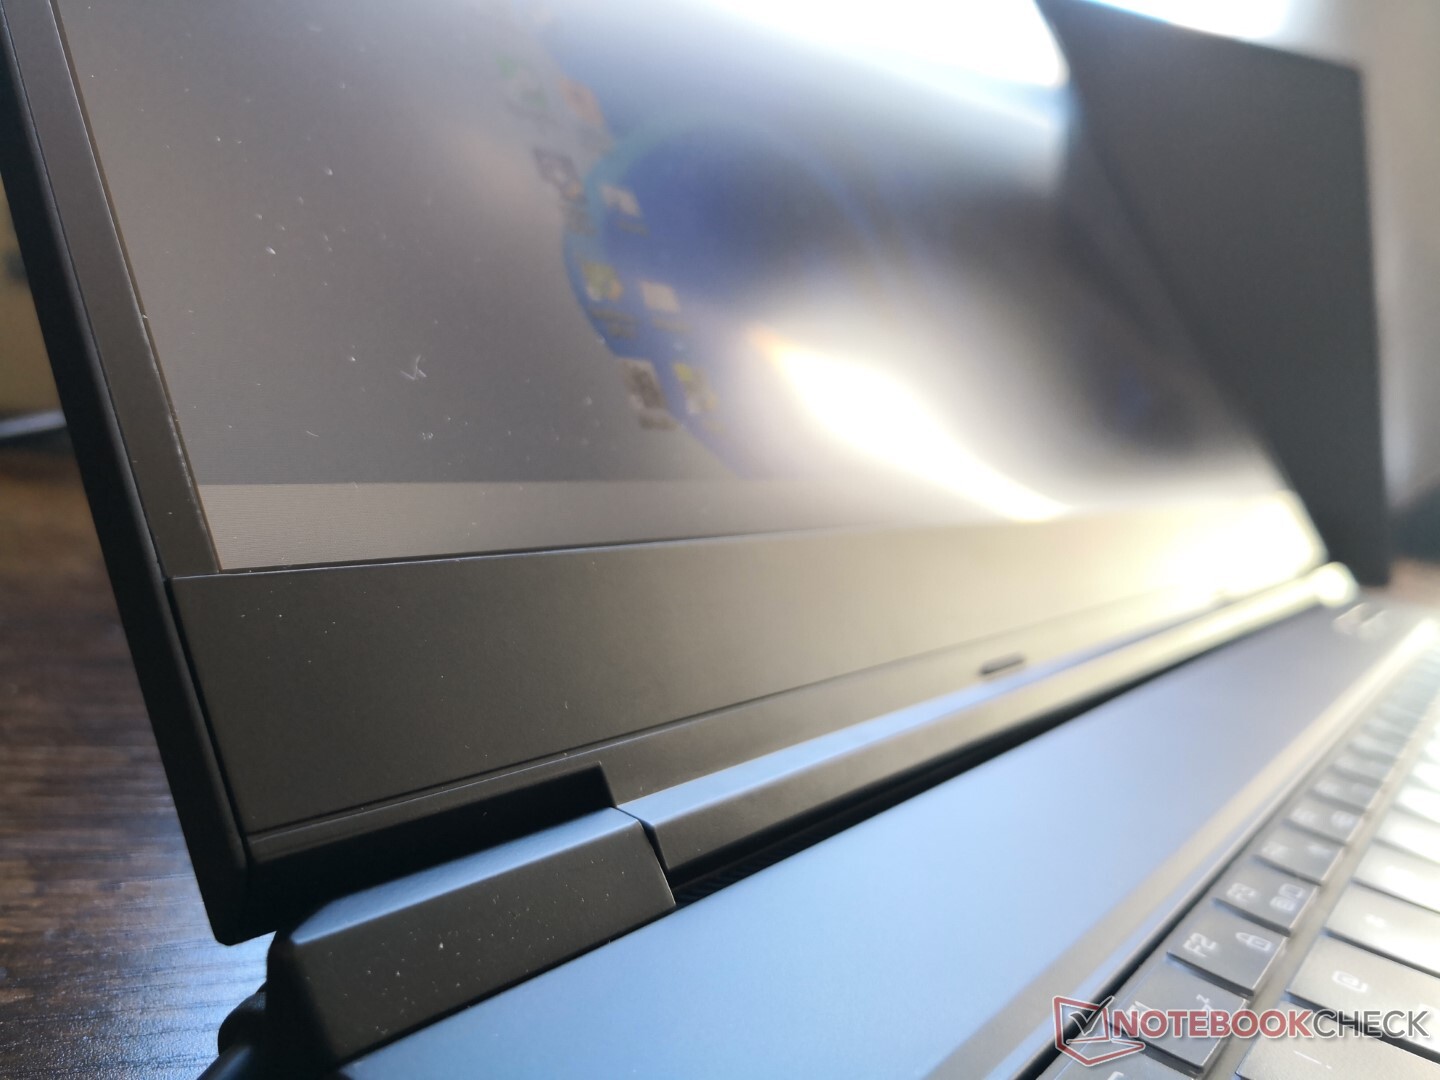
案例--典型的 "同方"。
前身为同方科技,同方科技在其许多游戏笔记本和移动工作站中使用了类似的材料和设计。在这种情况下,GM7AG8P与XMG Neo 17和XMG Pro 17在功能、硬度和质地方面有很多共同之处,即使它们的尺寸、外观和大小略有不同。整体尺寸与Razer Blade Pro 17几乎相同,而重量却少了500克,主要是因为GM7AG8P没有蒸汽室冷却器。
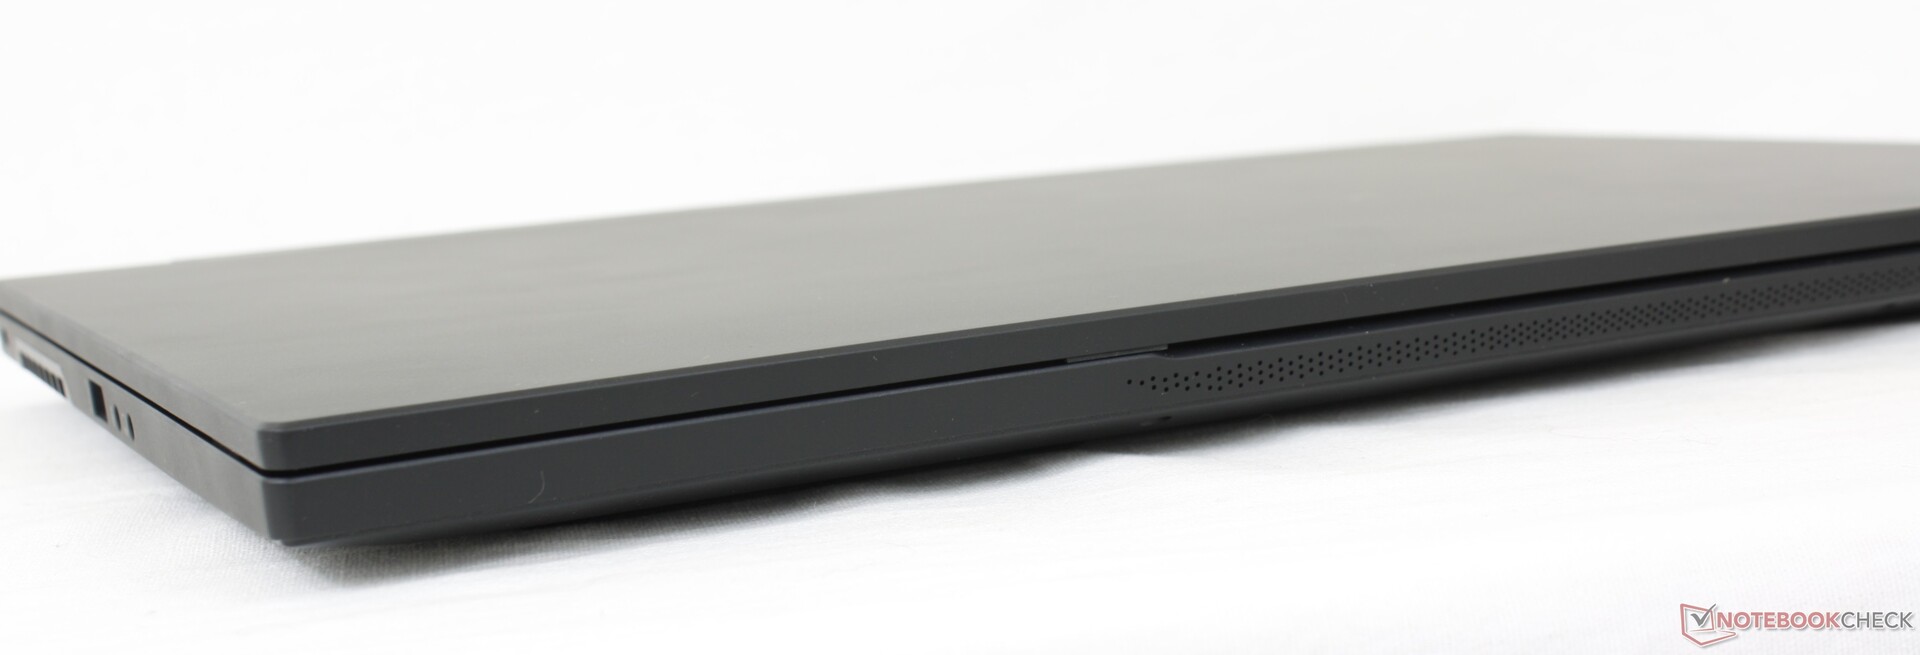
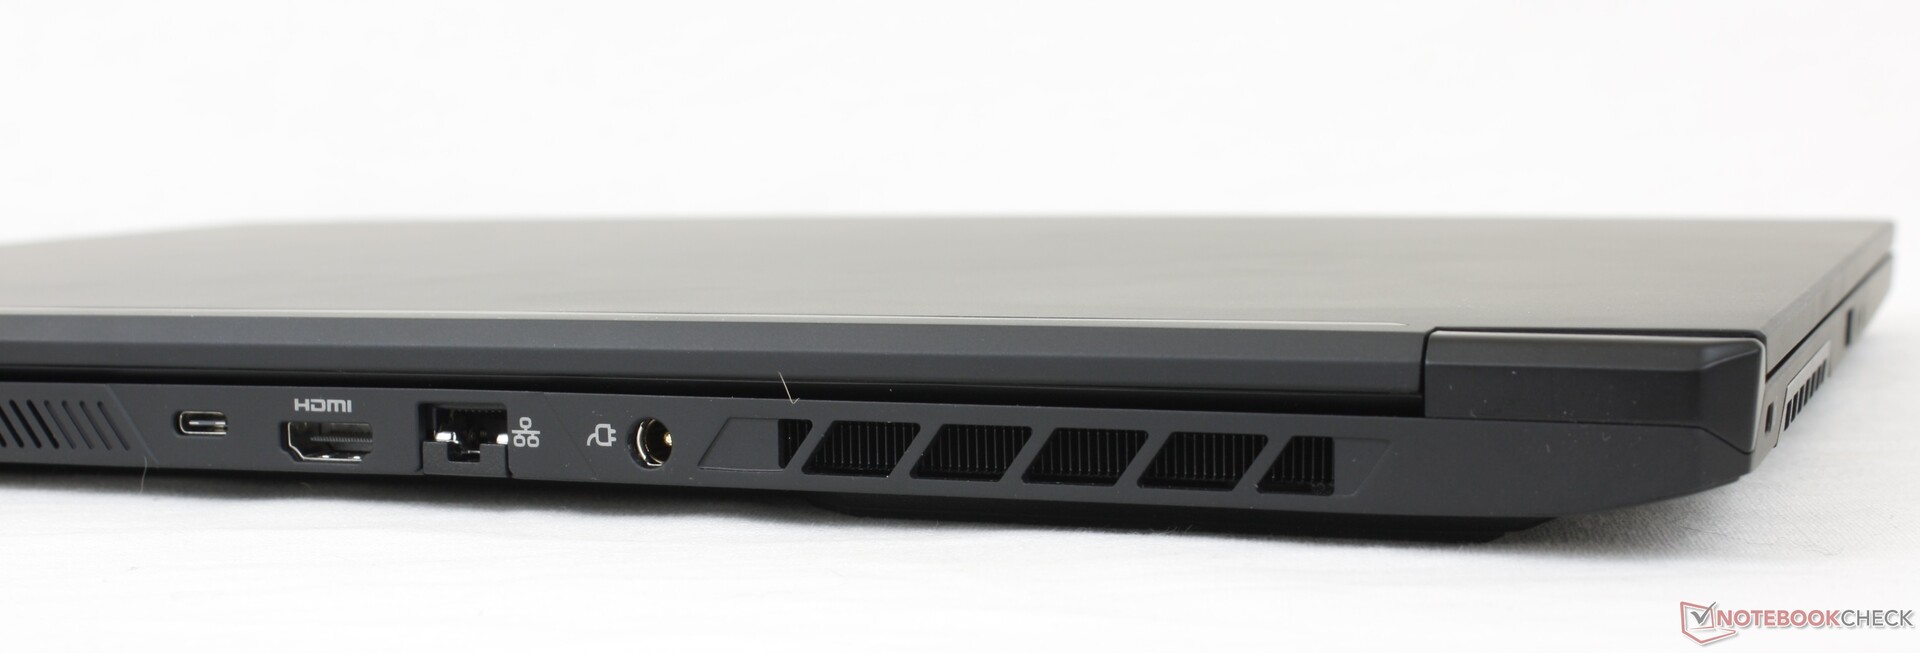
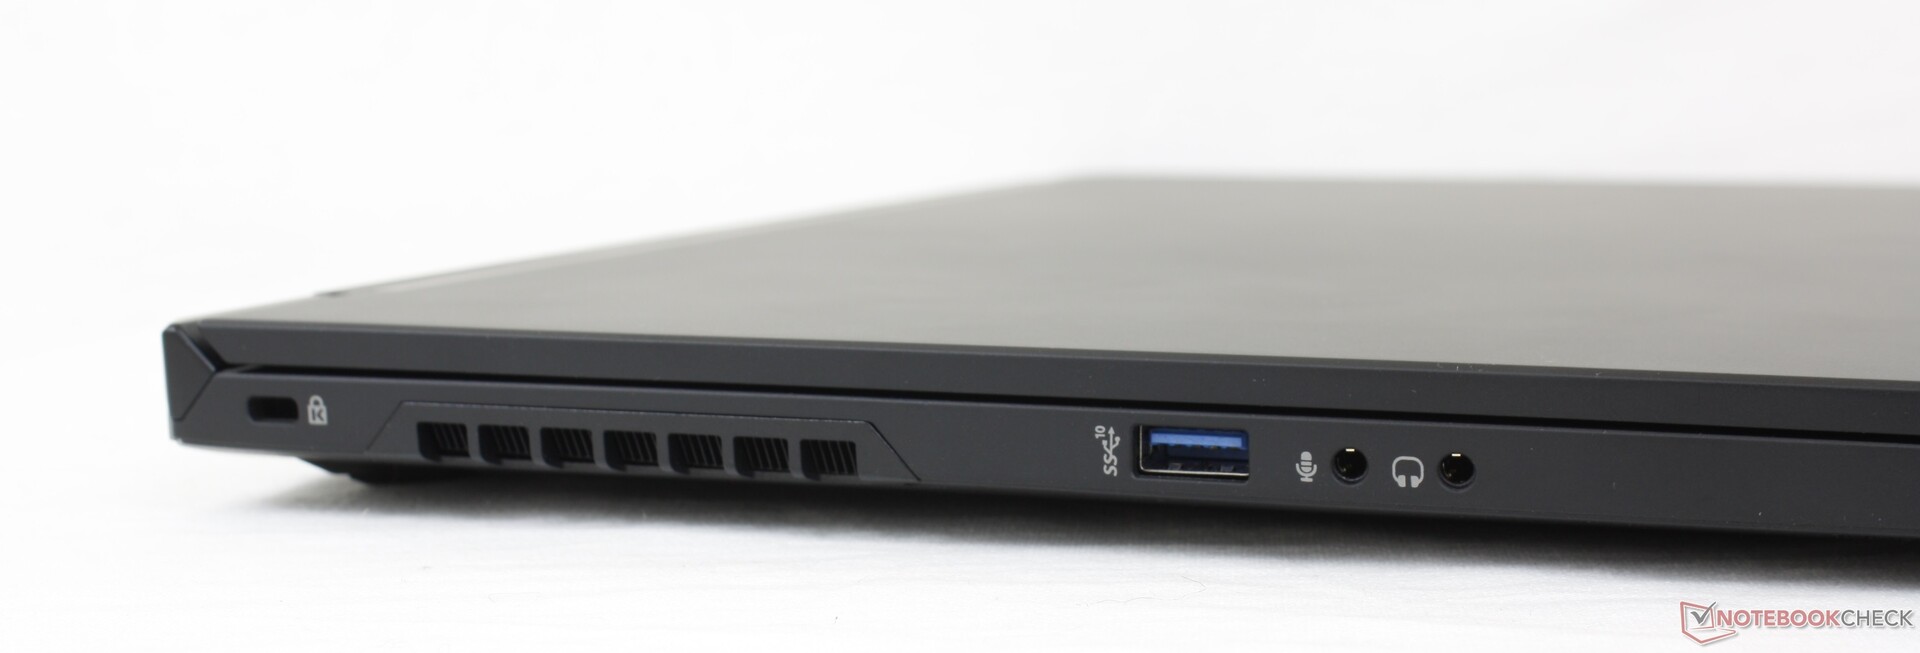
连接性 - Thunderbolt 4...有时
端口选项基本上与Schenker XMG Neo 17相同,但有几个重要的区别。例如,GM7AG8P使用较小的MicroSD读卡器,而Thunderbolt 4和外部G-Sync/Adaptive Sync兼容性只有在MSHybrid模式下运行时才会启用。
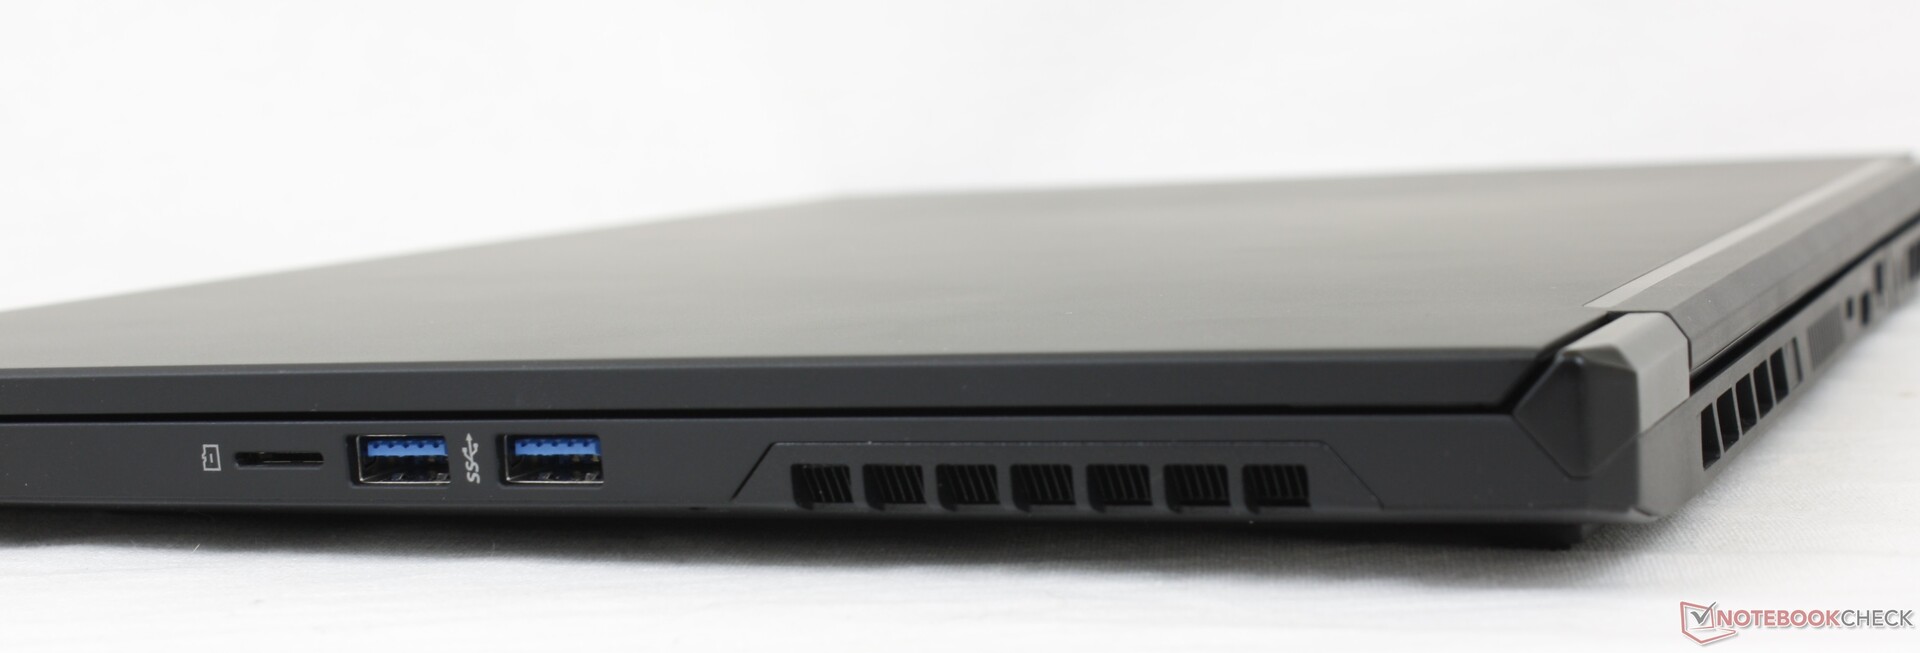
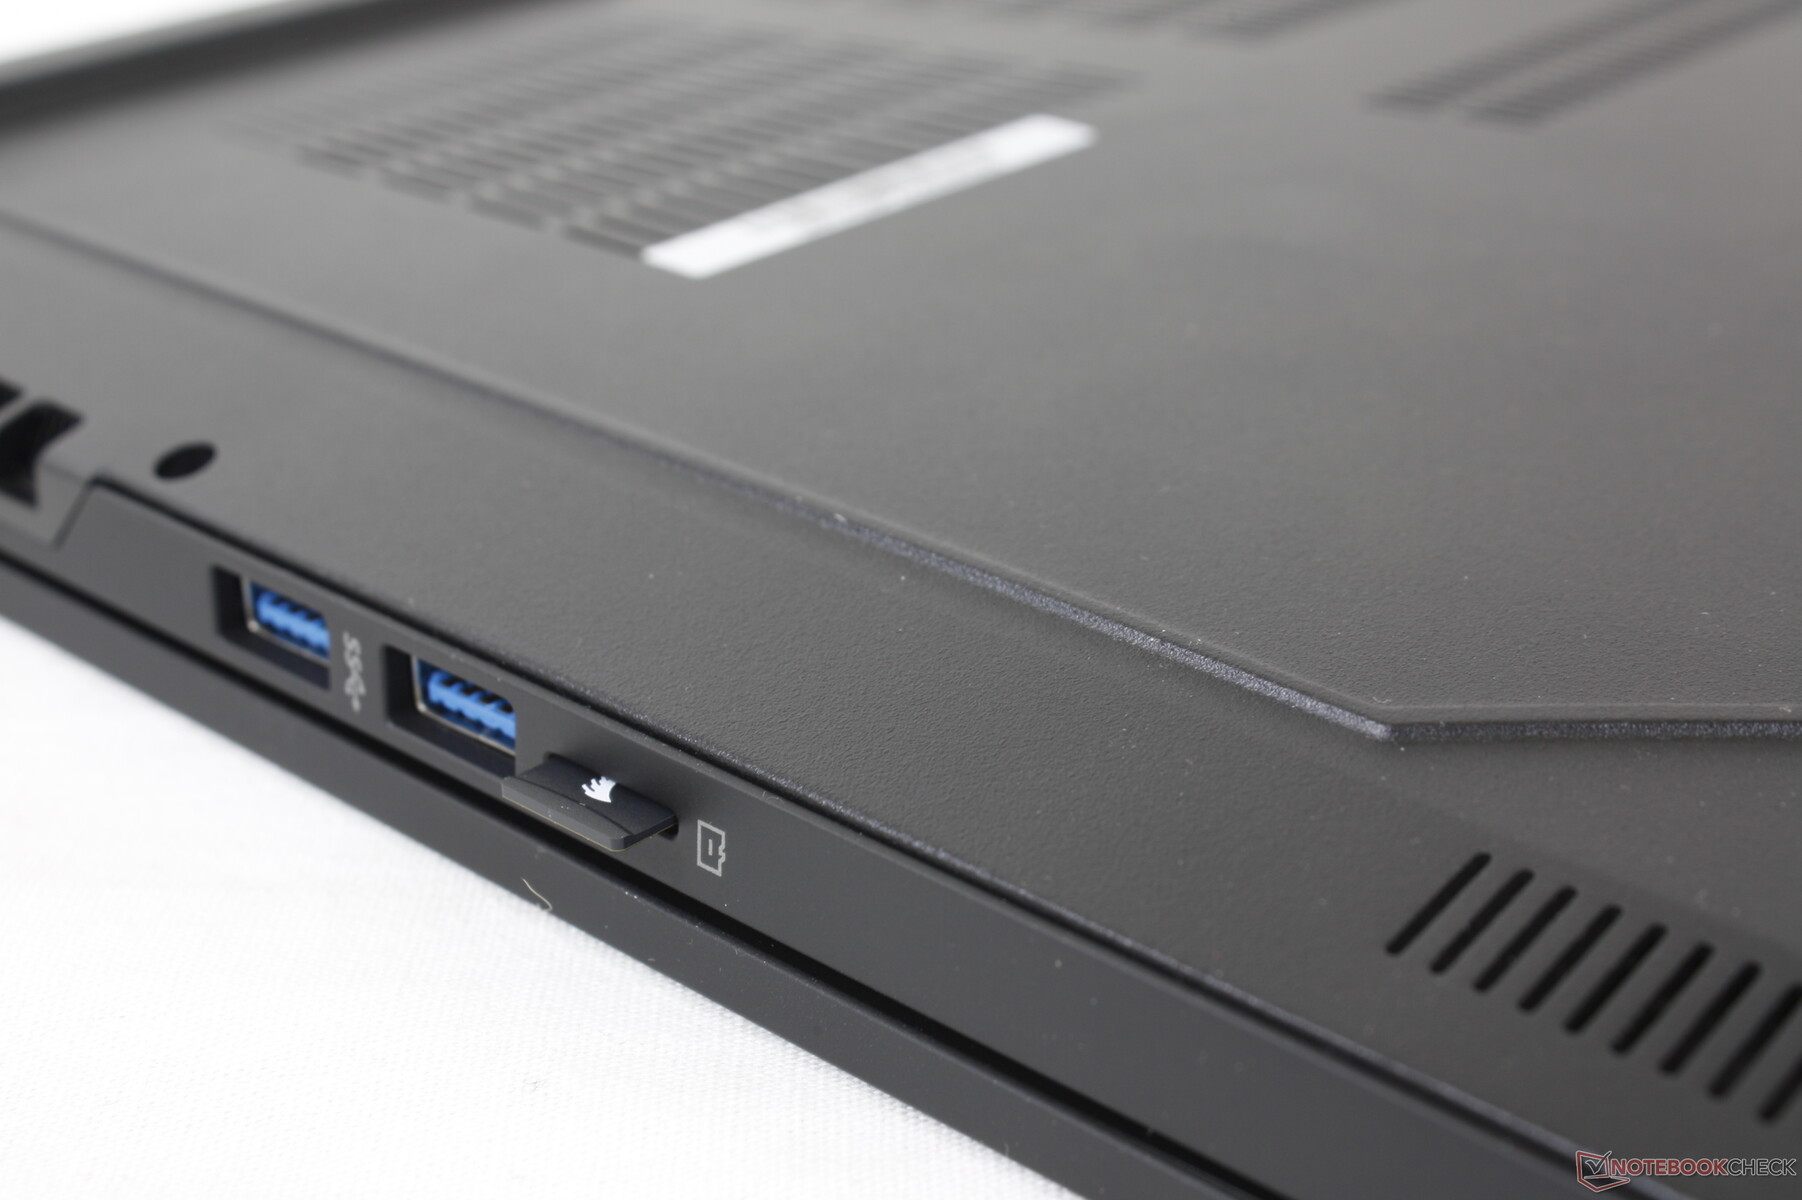
SD卡读卡器 - 仅限MicroSD
尽管有17.3英寸大的外形尺寸,该系统还是集成了一个MicroSD读卡器。此外,与其他大多数MicroSD读卡器不同,GM7AG8P上的读卡器不是弹簧式的,完全插入的卡也必须倒着插入。传输速率是平均的,因为从我们的UHS-II测试卡中移动1GB的图像需要大约15秒,而在最新的Razer Blade 17.
| SD Card Reader | |
| average JPG Copy Test (av. of 3 runs) | |
| Razer Blade 17 RTX 3070 (AV Pro V60) | |
| MSI GS76 Stealth 11UH (AV PRO microSD 128 GB V60) | |
| Alienware x17 RTX 3080 P48E (AV Pro V60) | |
| Maingear Vector Pro MG-VCP17 (AV Pro V60) | |
| Schenker XMG NEO 17 GM7TG8S | |
| Schenker Uniwill Technology GM7AG8P (AV Pro V60) | |
| maximum AS SSD Seq Read Test (1GB) | |
| Alienware x17 RTX 3080 P48E (AV Pro V60) | |
| MSI GS76 Stealth 11UH (AV PRO microSD 128 GB V60) | |
| Razer Blade 17 RTX 3070 (AV Pro V60) | |
| Schenker XMG NEO 17 GM7TG8S | |
| Maingear Vector Pro MG-VCP17 (AV Pro V60) | |
| Schenker Uniwill Technology GM7AG8P (AV Pro V60) | |
沟通
| Networking | |
| iperf3 transmit AX12 | |
| MSI GS76 Stealth 11UH | |
| Schenker Uniwill Technology GM7AG8P | |
| Razer Blade 17 RTX 3070 | |
| Alienware x17 RTX 3080 P48E | |
| Maingear Vector Pro MG-VCP17 | |
| Schenker XMG NEO 17 GM7TG8S | |
| iperf3 receive AX12 | |
| Razer Blade 17 RTX 3070 | |
| Schenker Uniwill Technology GM7AG8P | |
| Maingear Vector Pro MG-VCP17 | |
| MSI GS76 Stealth 11UH | |
| Alienware x17 RTX 3080 P48E | |
| Schenker XMG NEO 17 GM7TG8S | |
网络摄像头
尽管有200万像素的传感器,但相机质量很差。即使按照已经很低的笔记本网络摄像头标准,图像的颗粒度也比预期的要大。
红外线是内置的,用于支持Windows Hello。


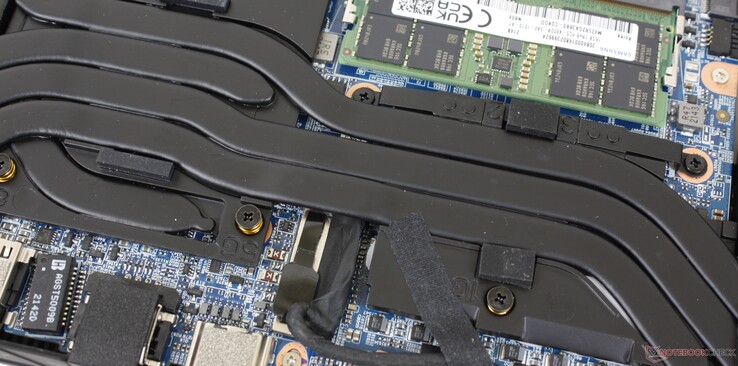
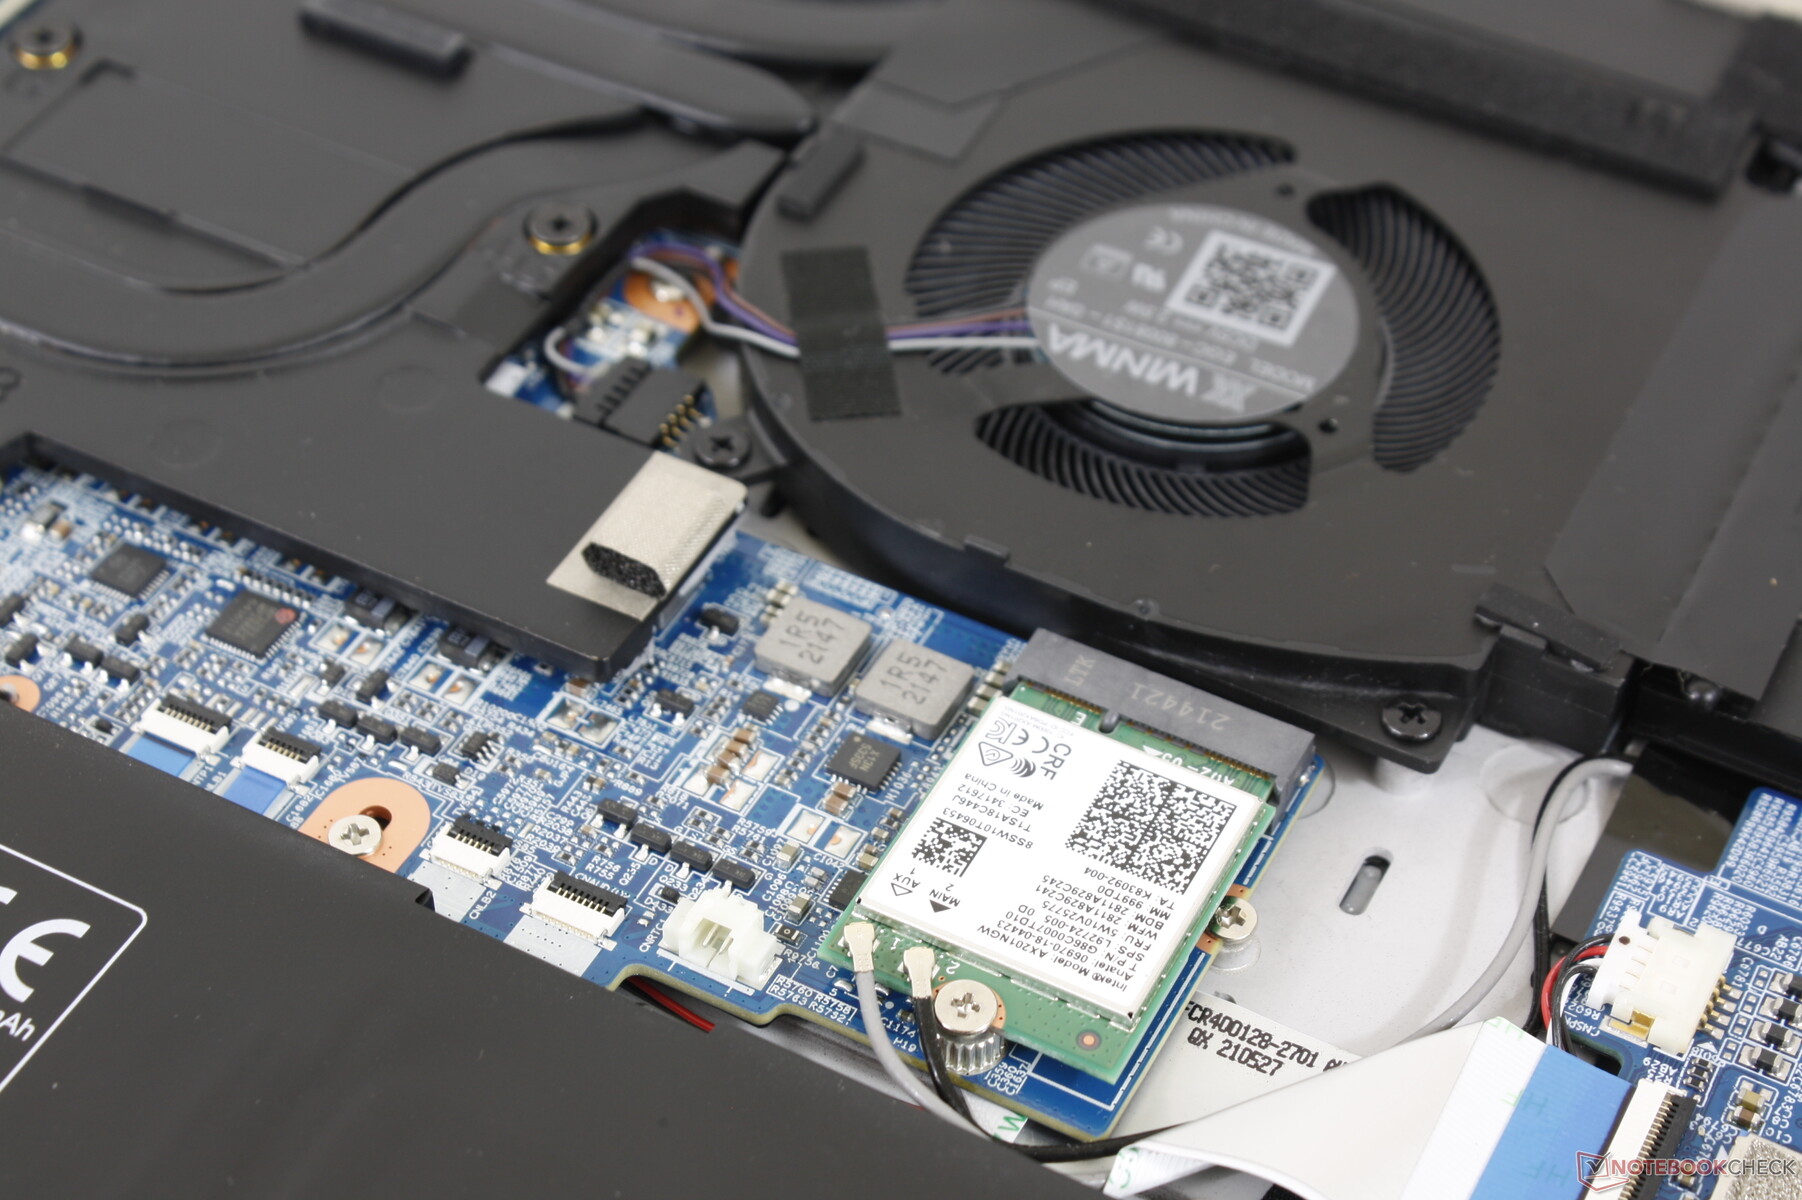
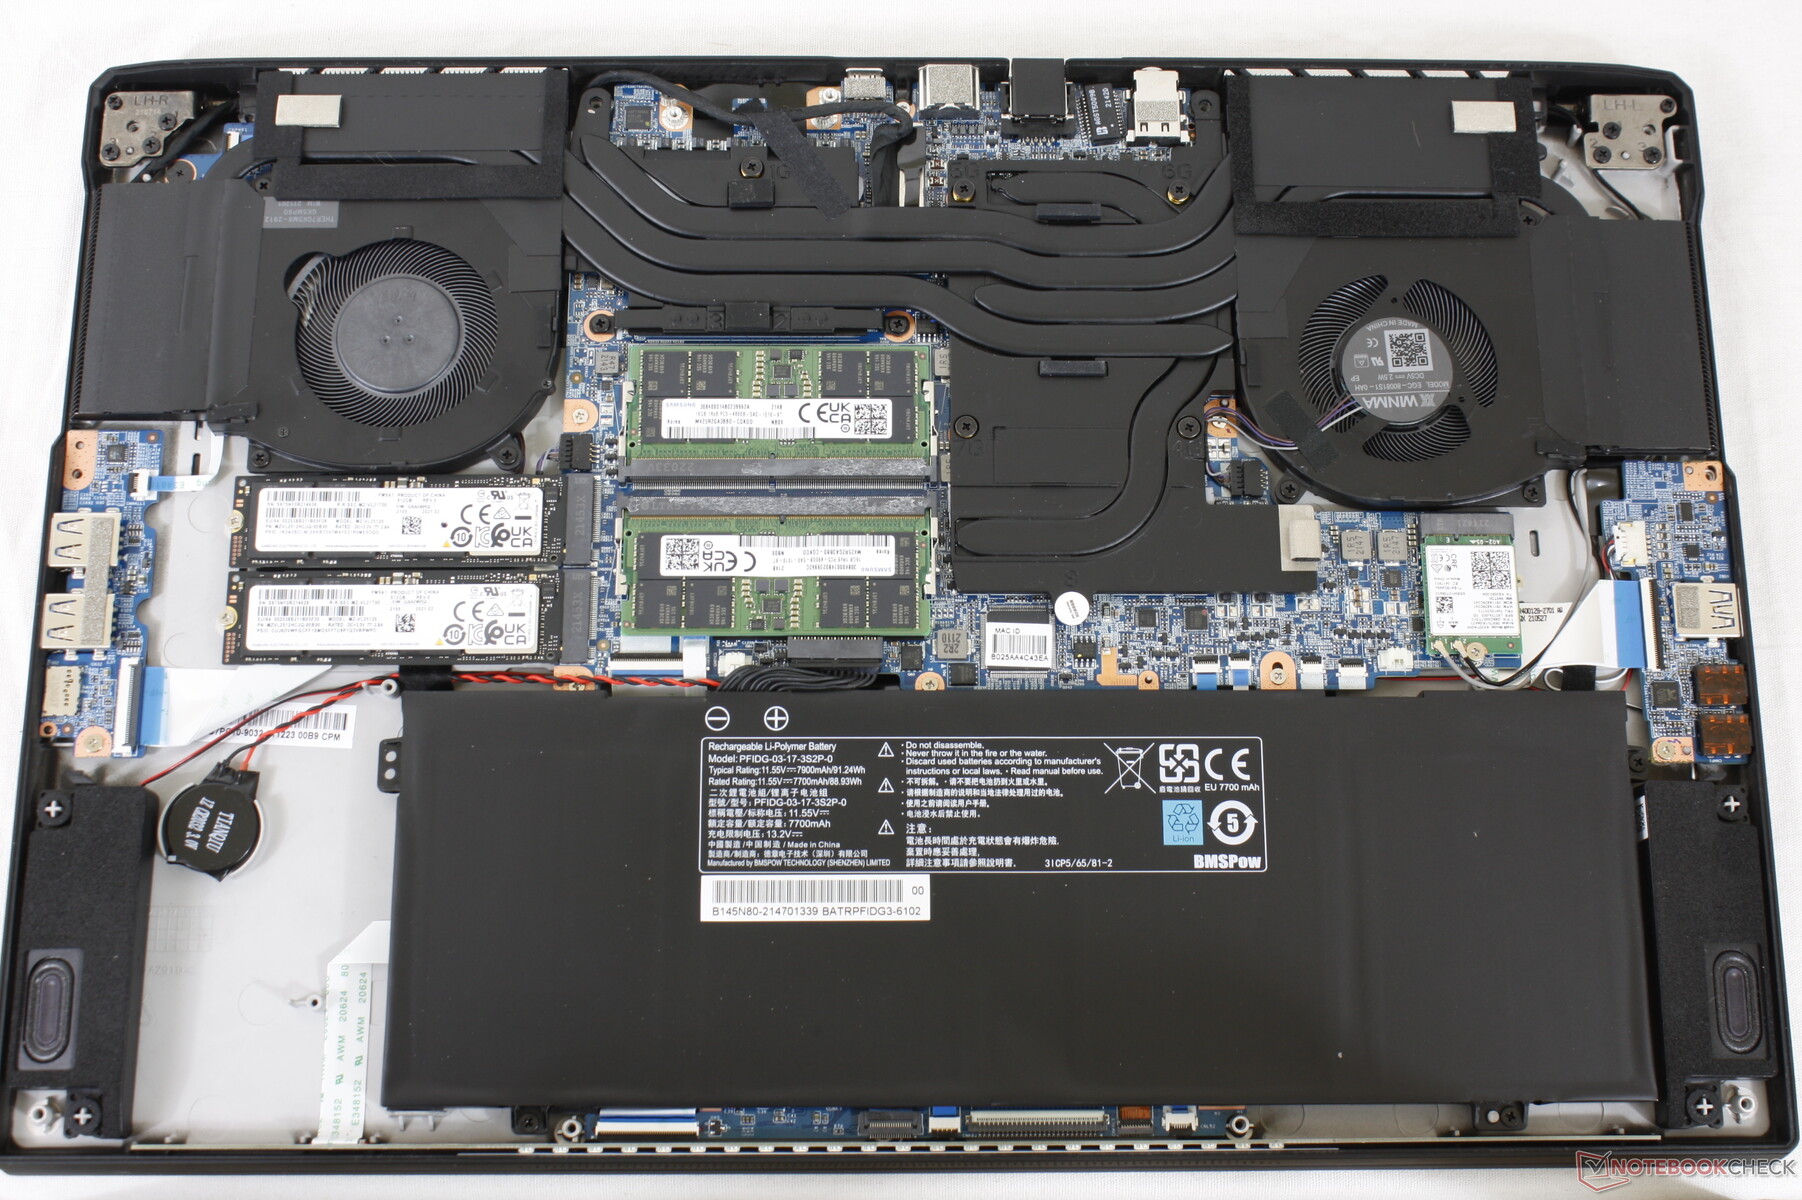
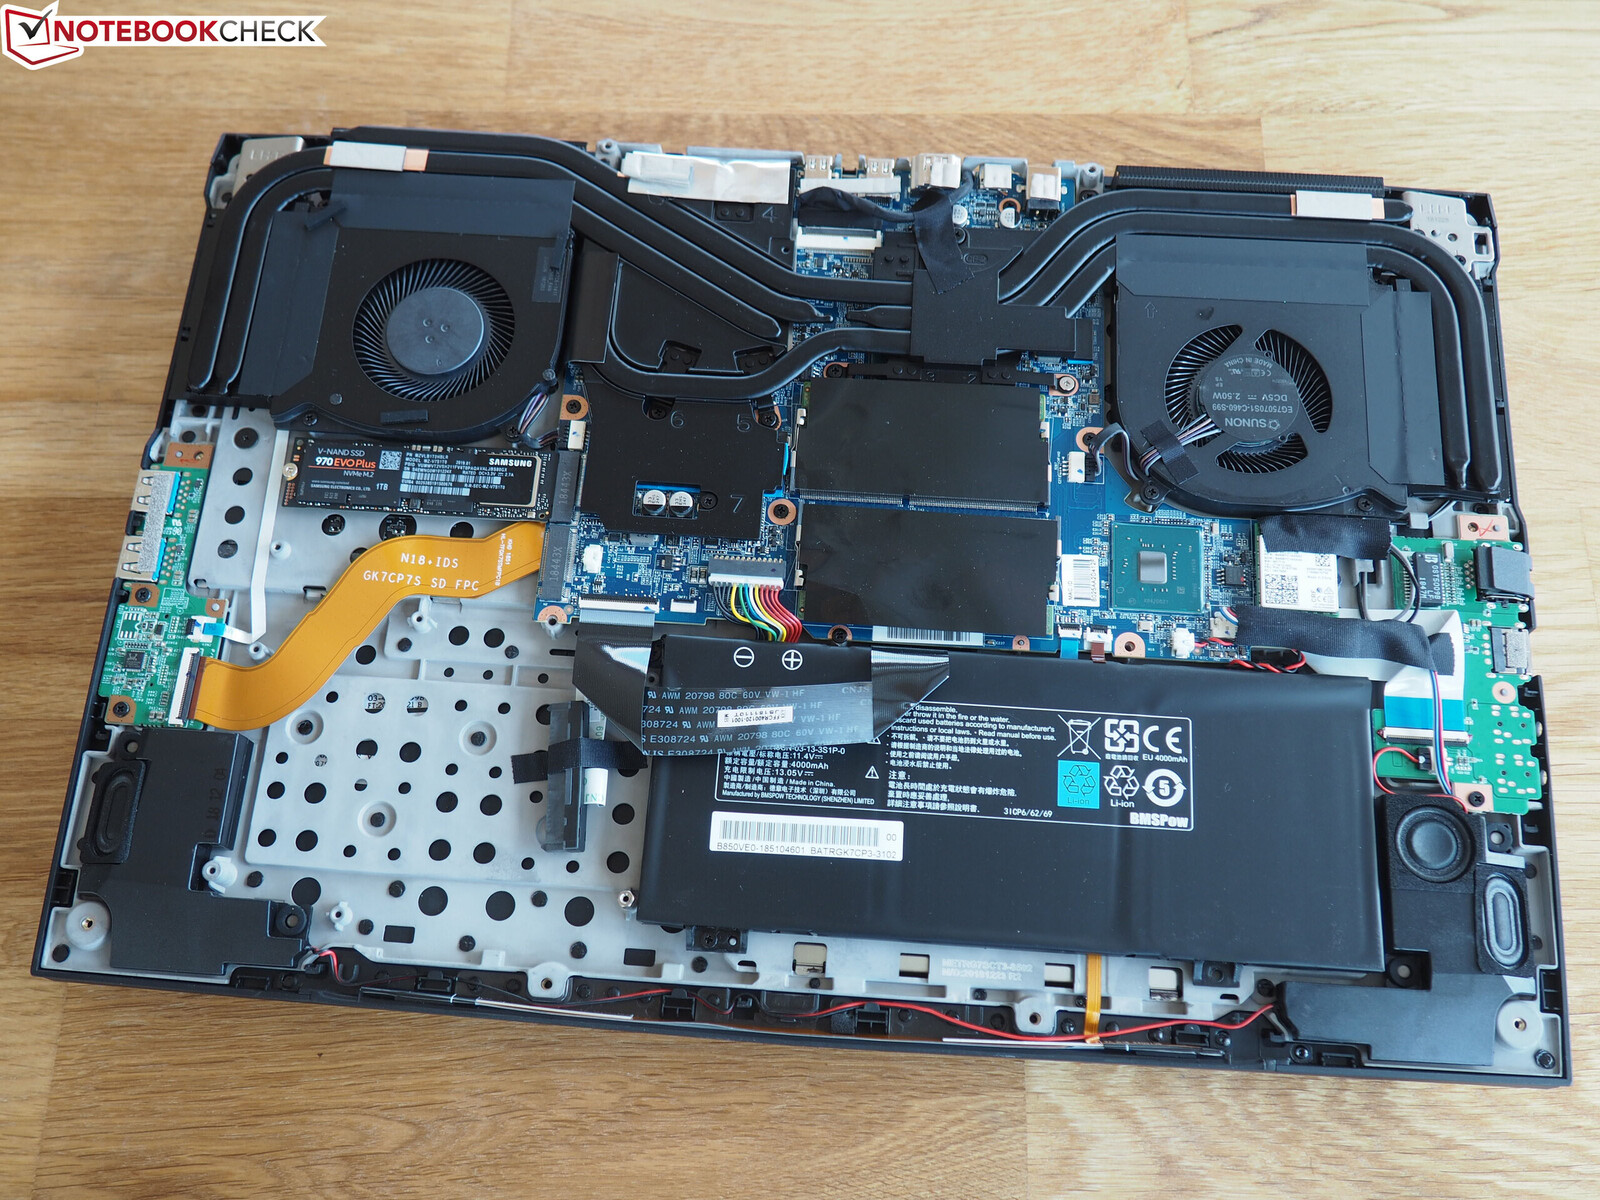
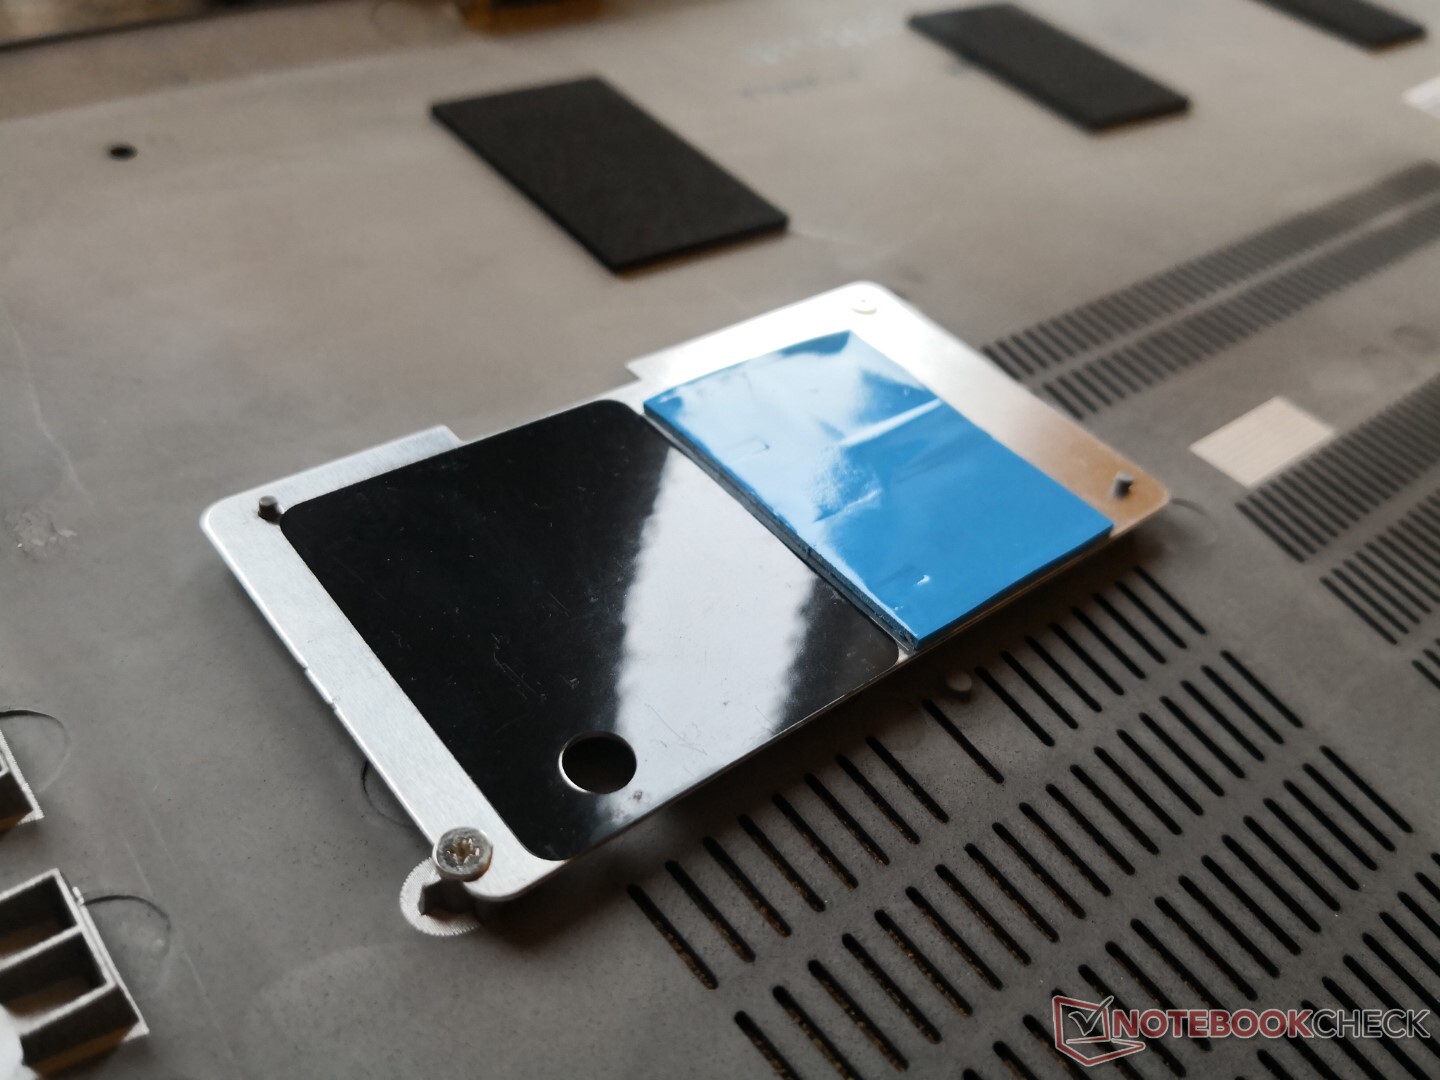
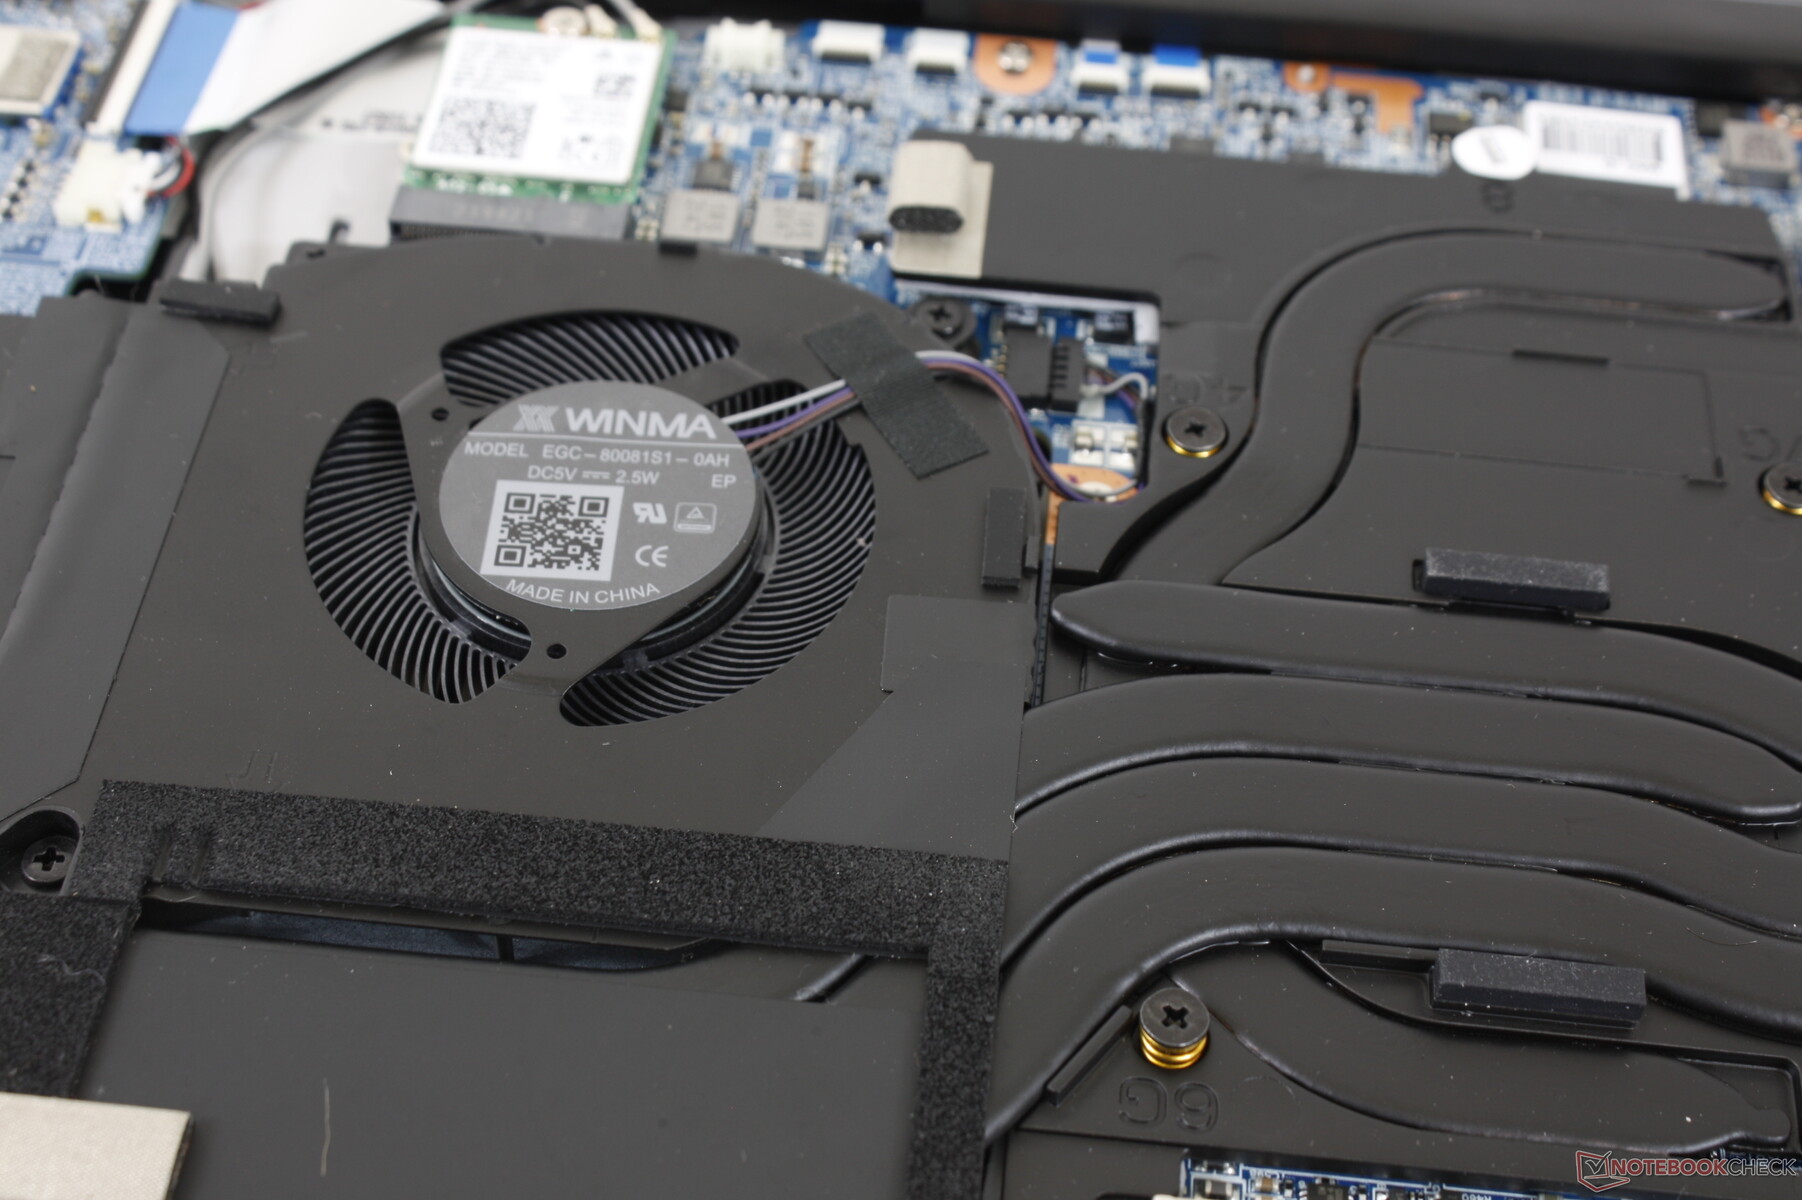
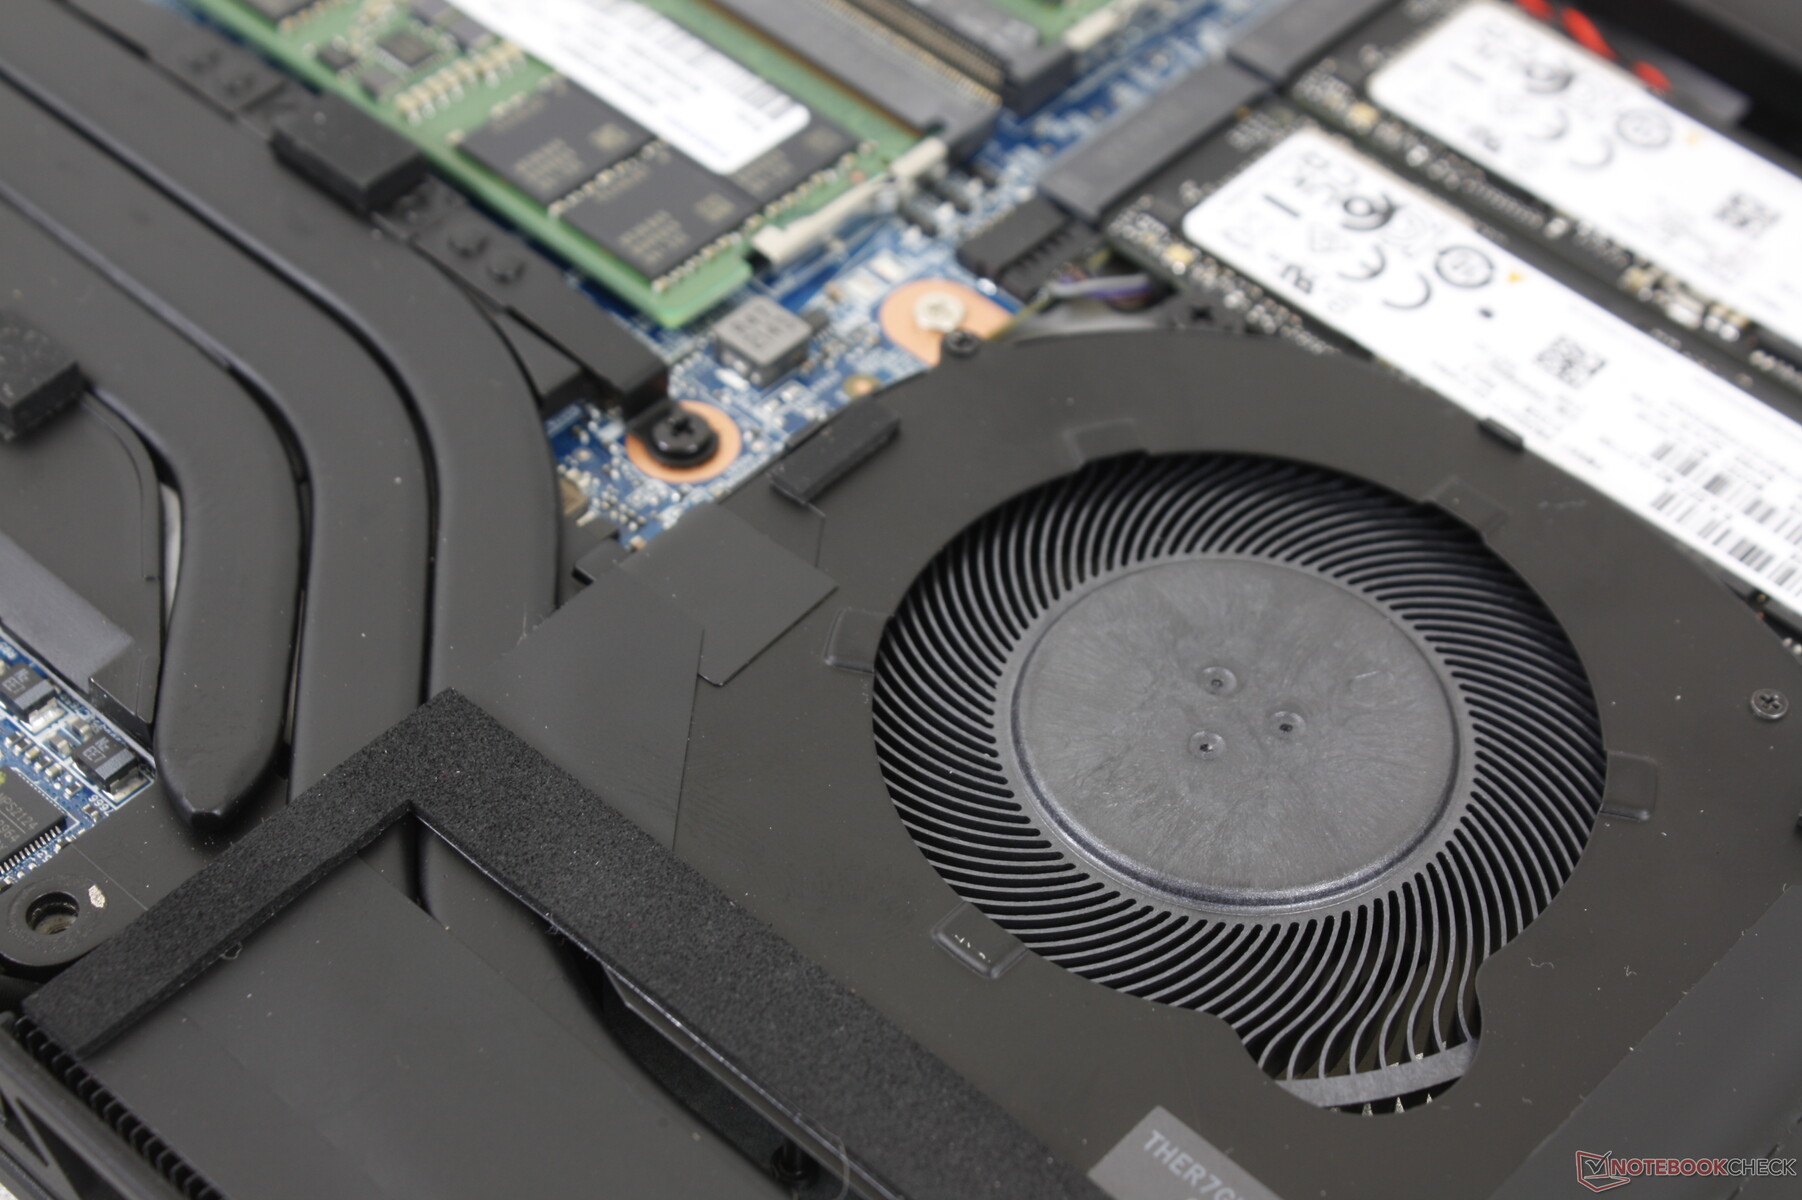
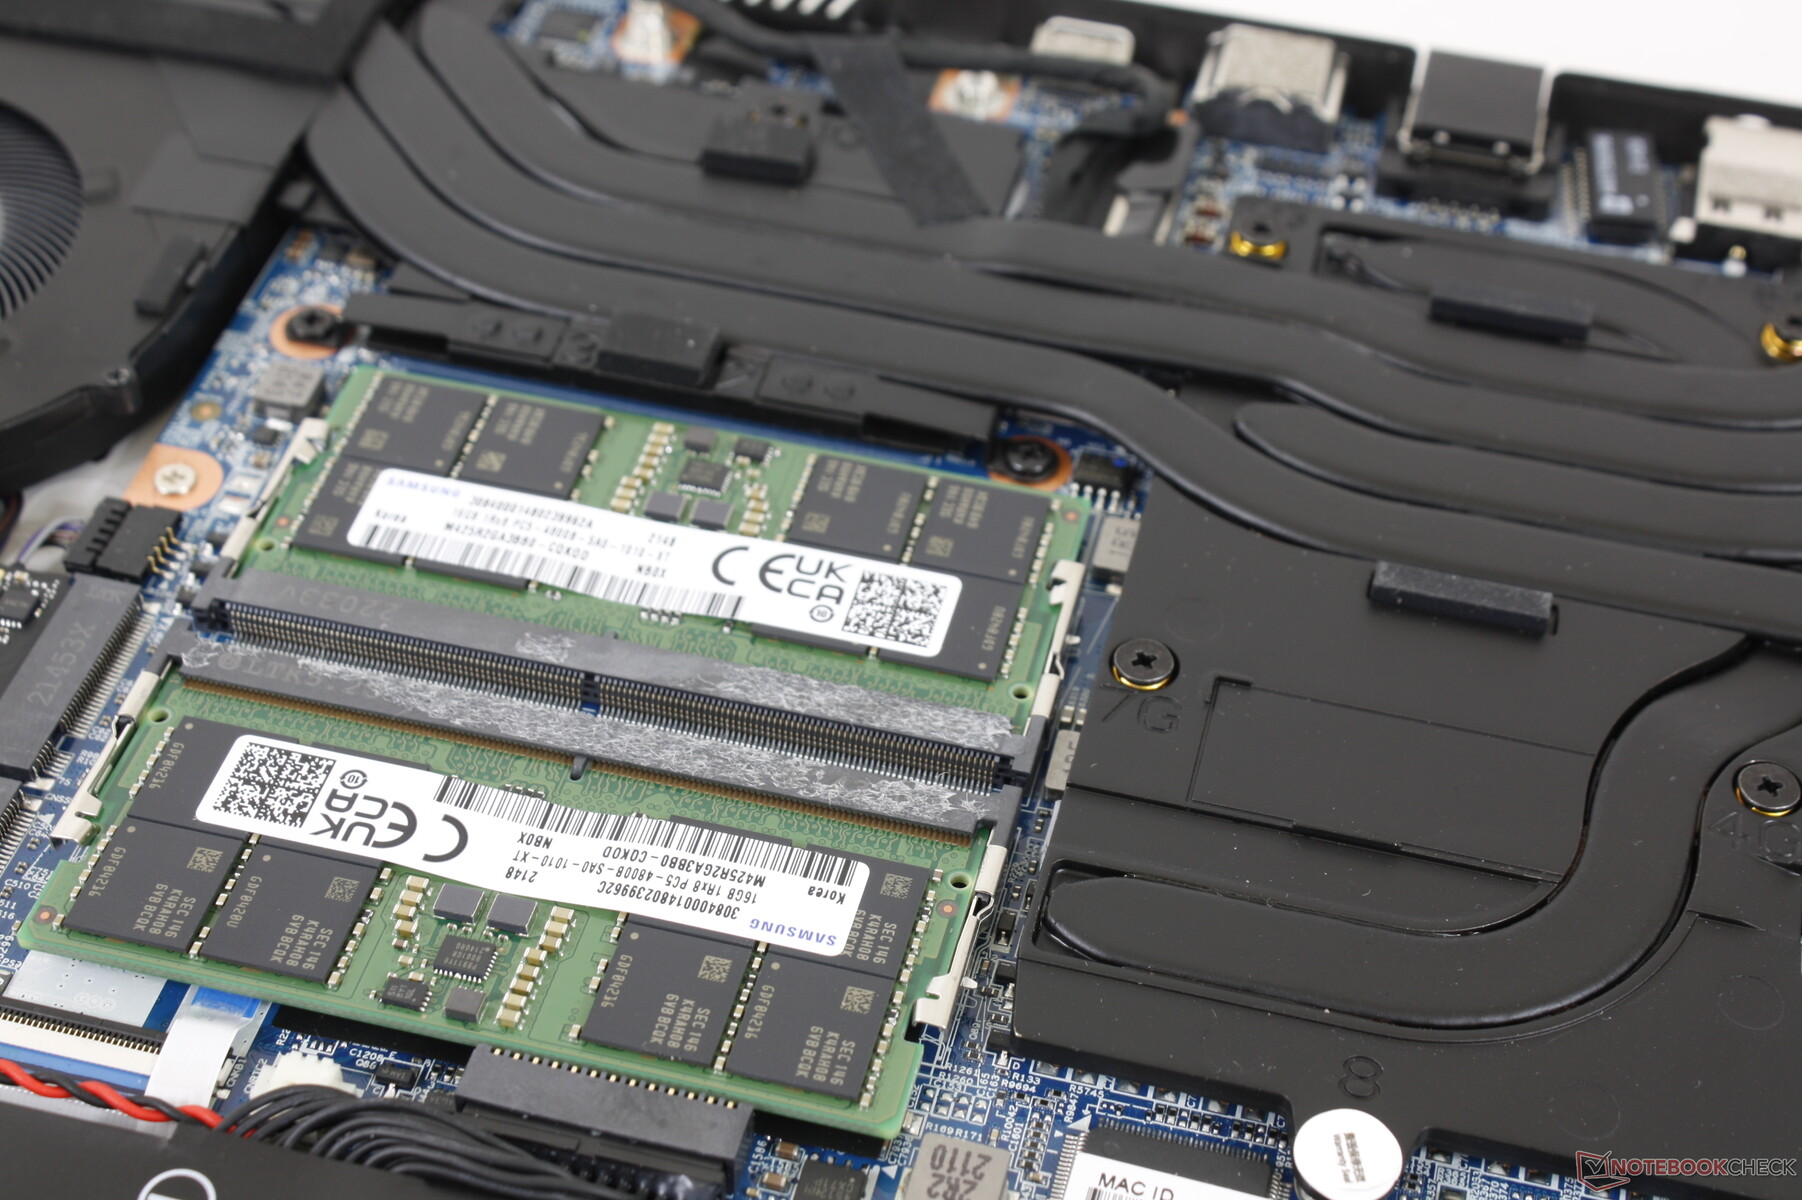
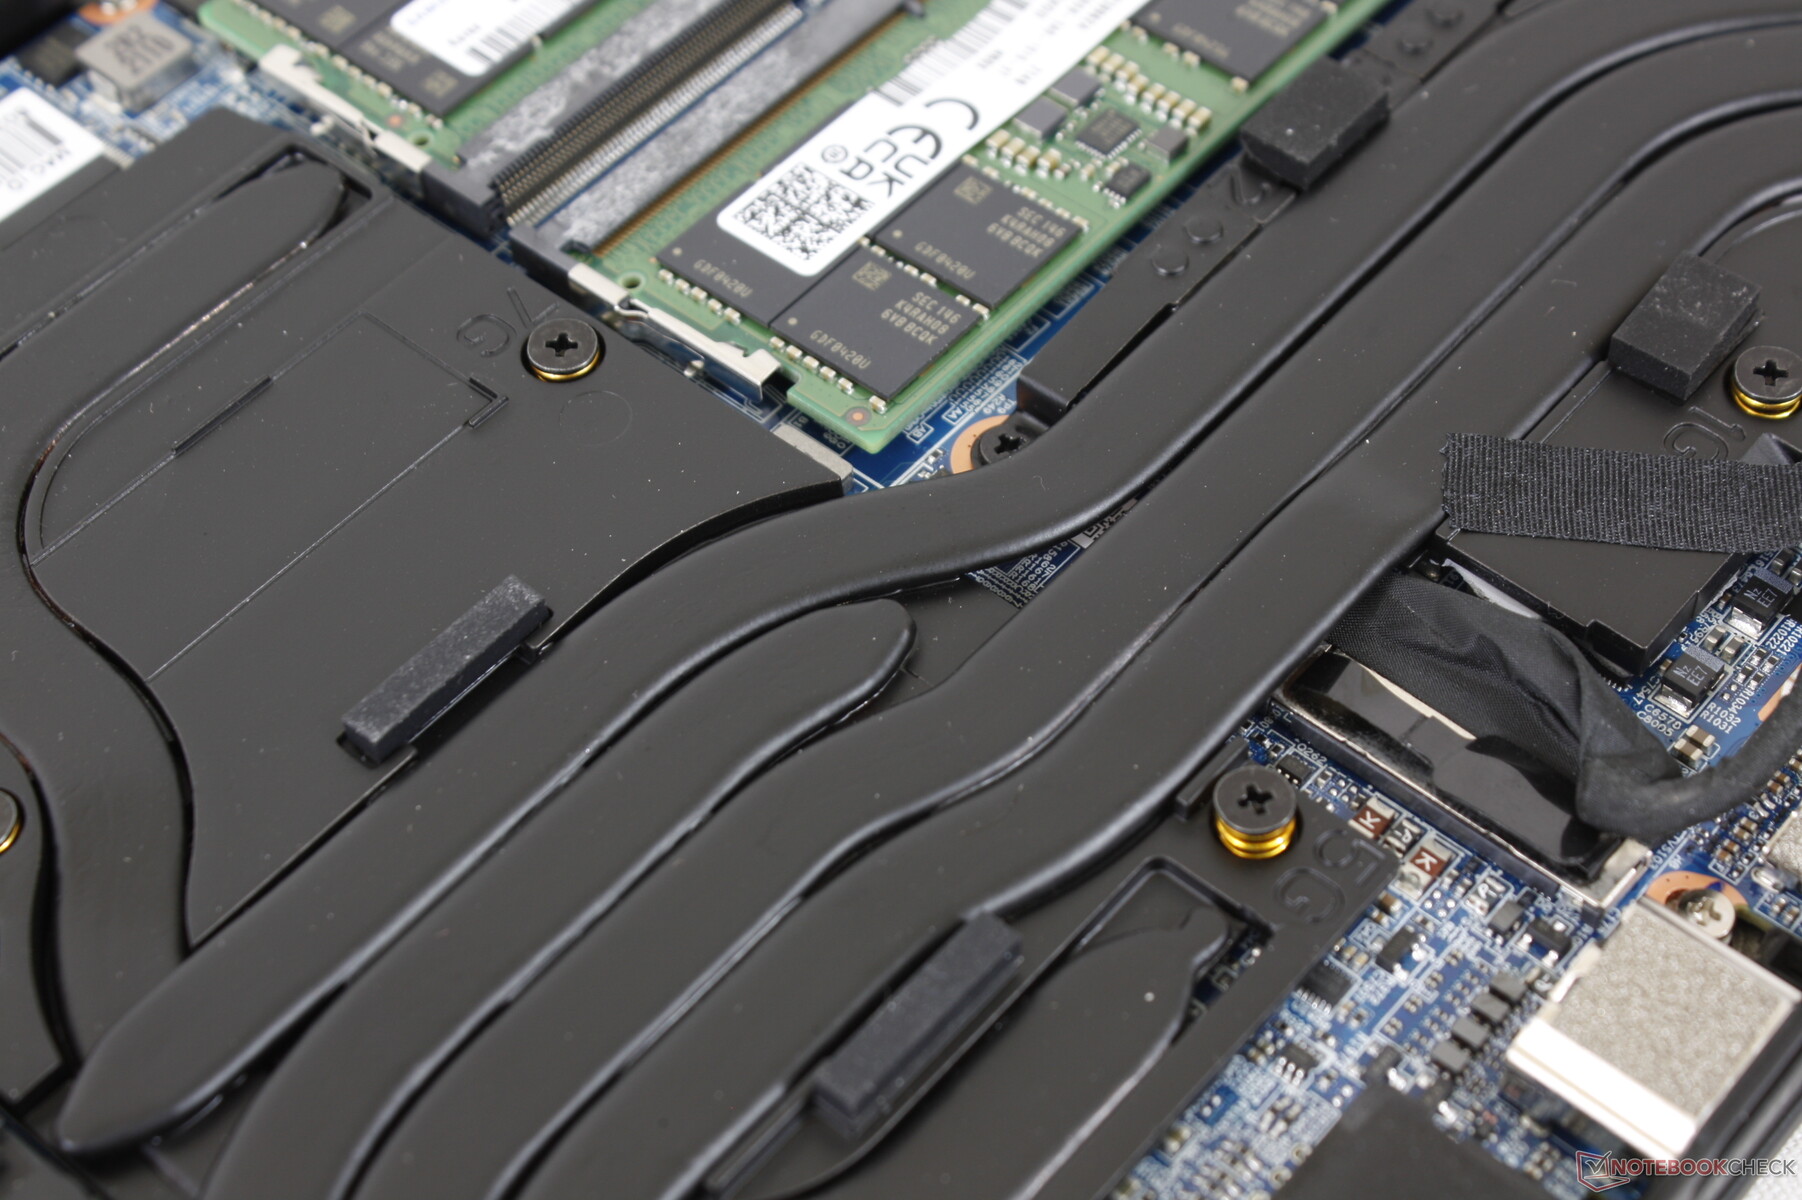
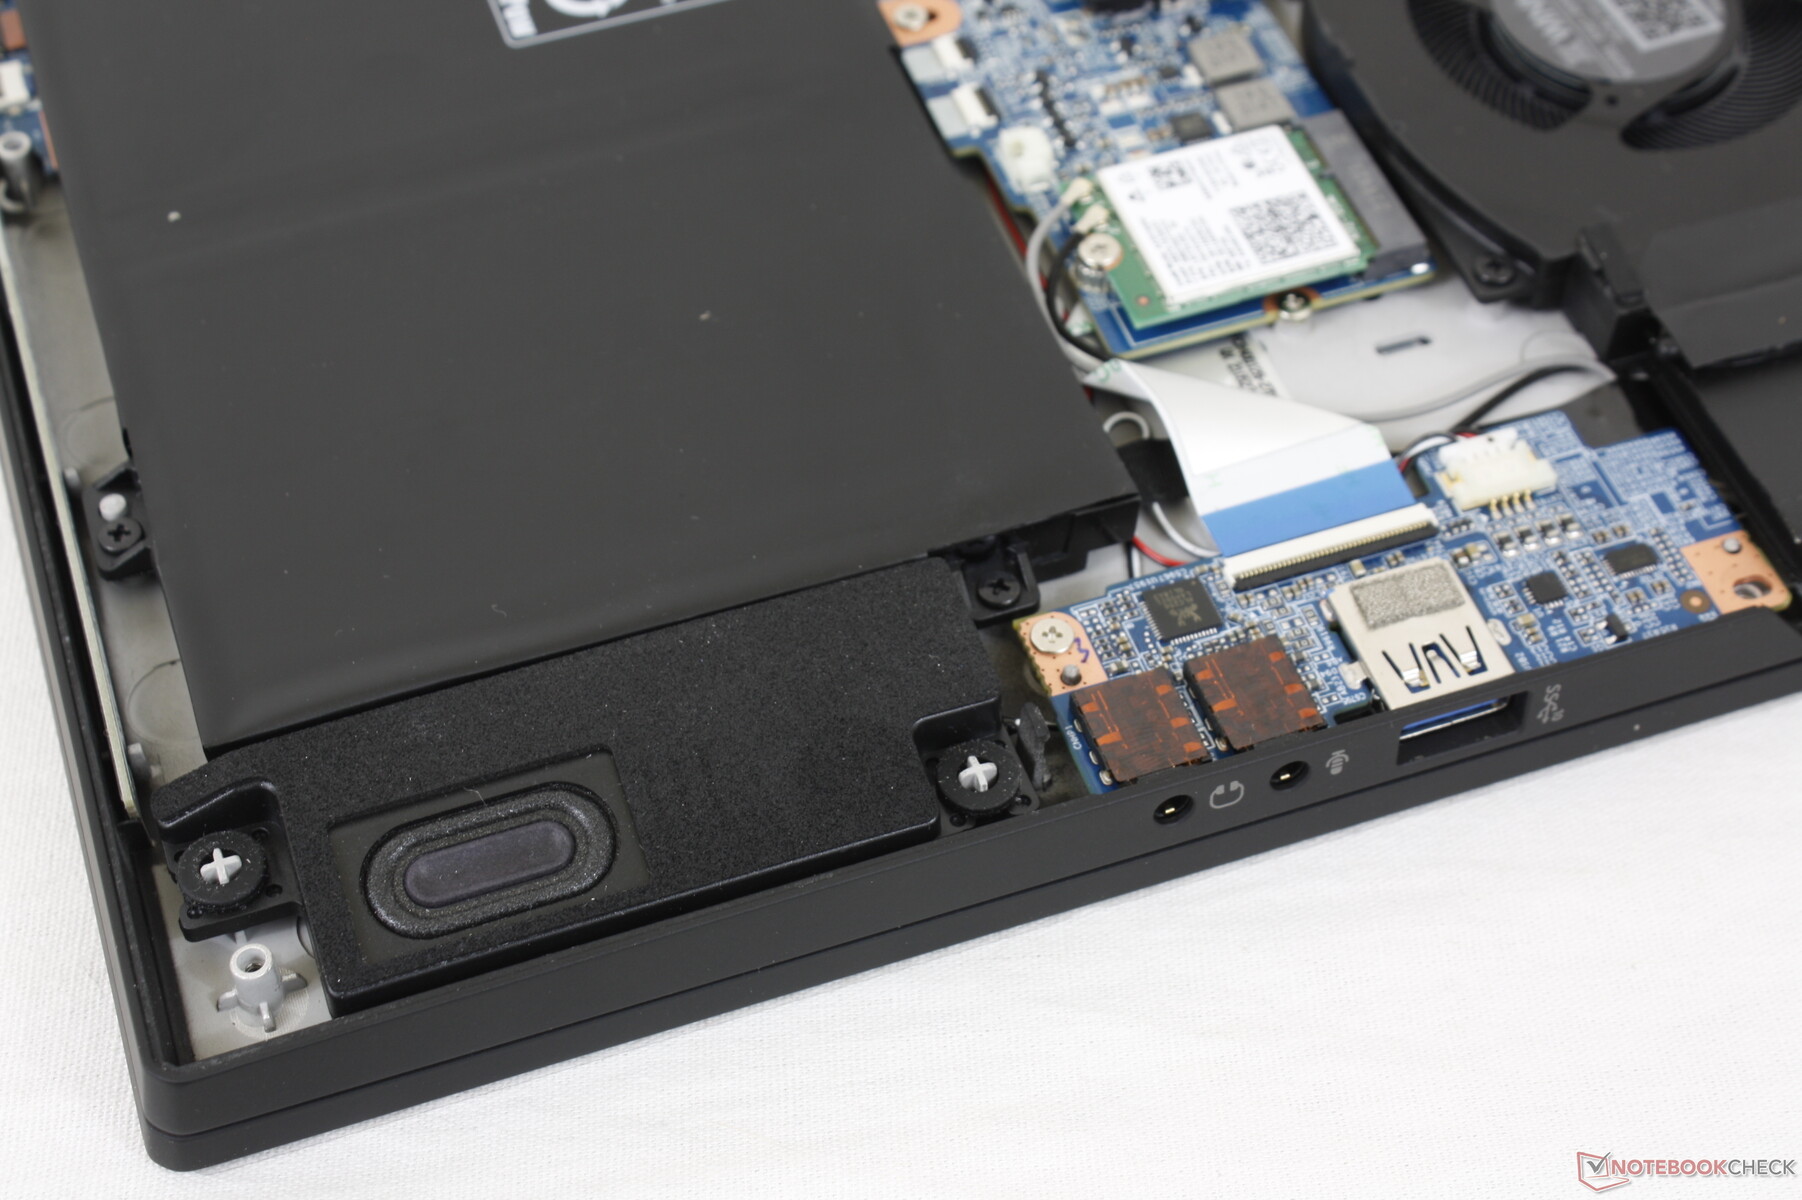
维护
底部面板由10颗飞利浦螺钉固定,便于维修。用户可以直接接触到两个M.2 2280存储托架、两个SODIMM插槽、主电池和WLAN模块。
配件和保修
除了交流电适配器和文件之外,盒子里没有任何额外的东西。制造商的标准保修期为1至2年,具体取决于地区。
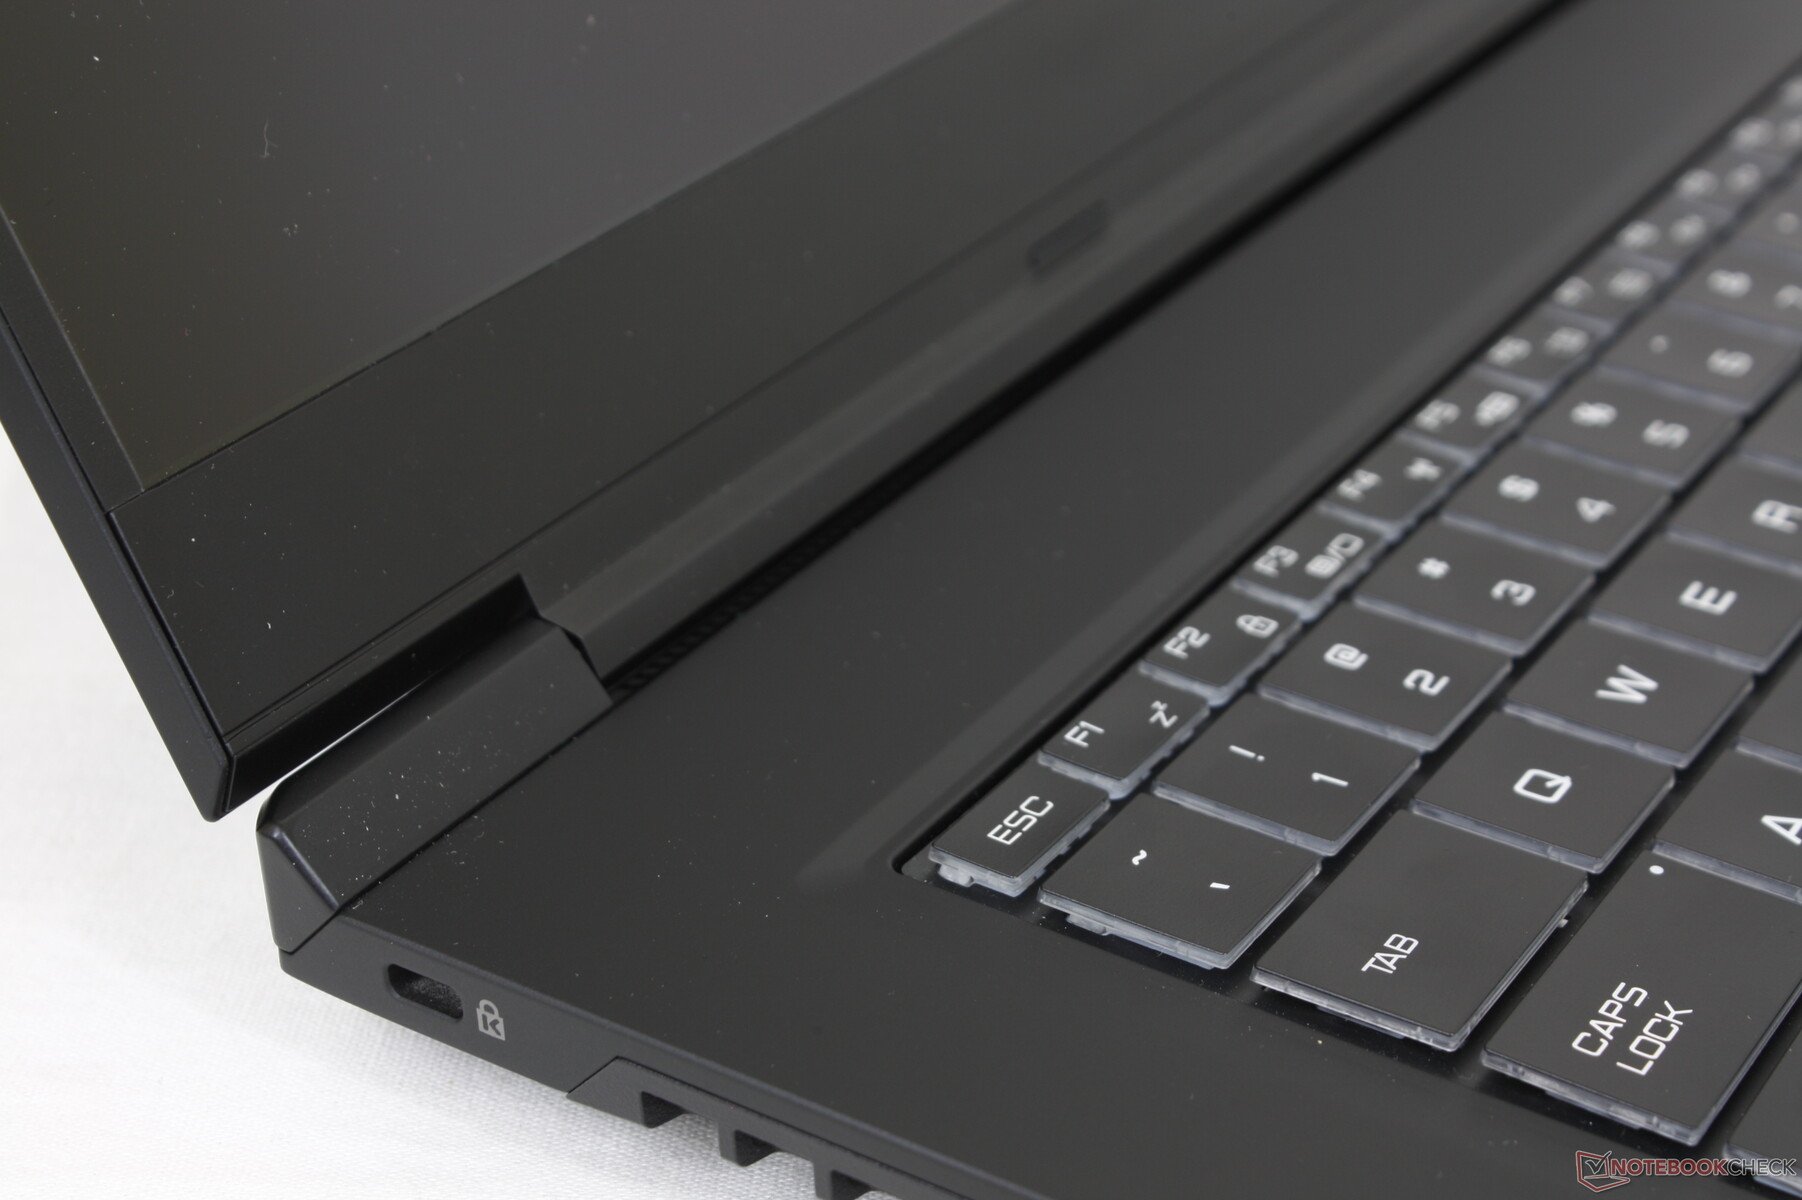
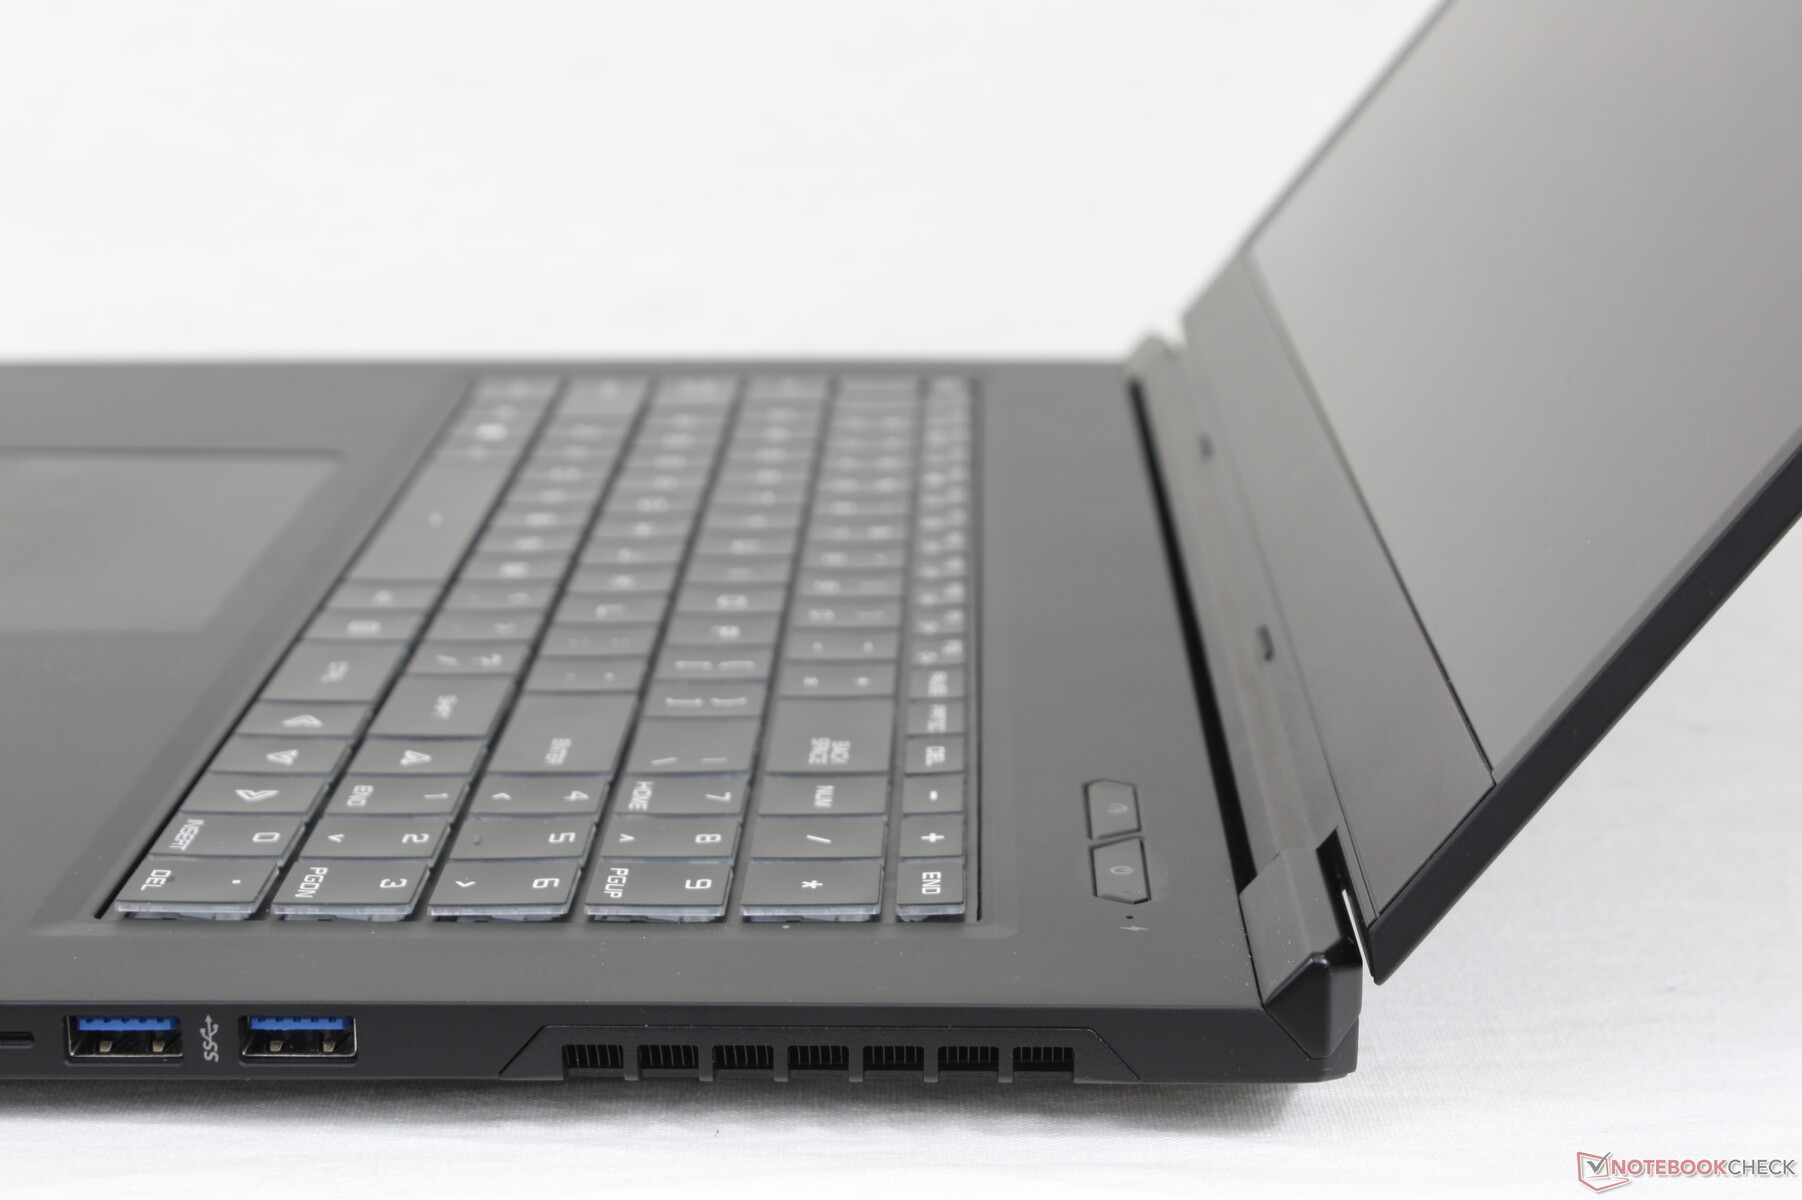
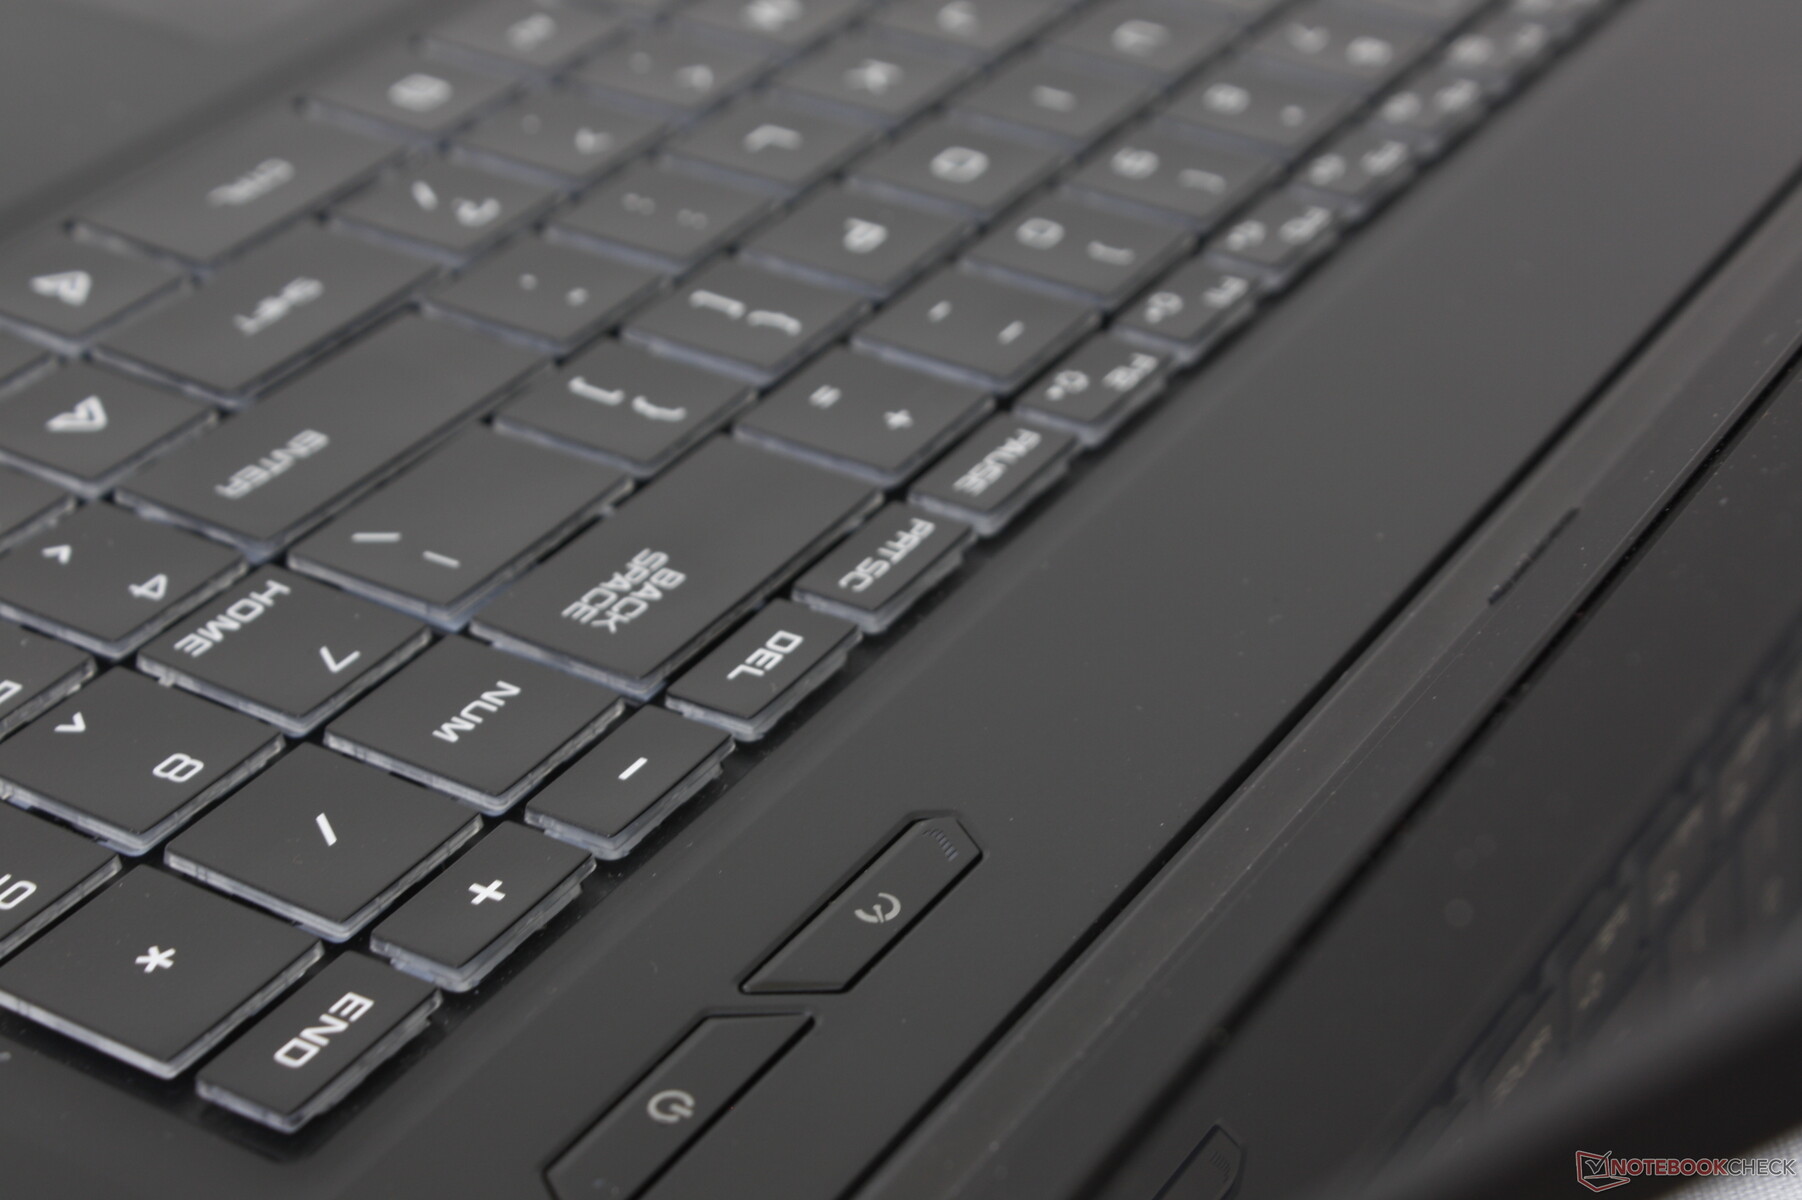
输入设备
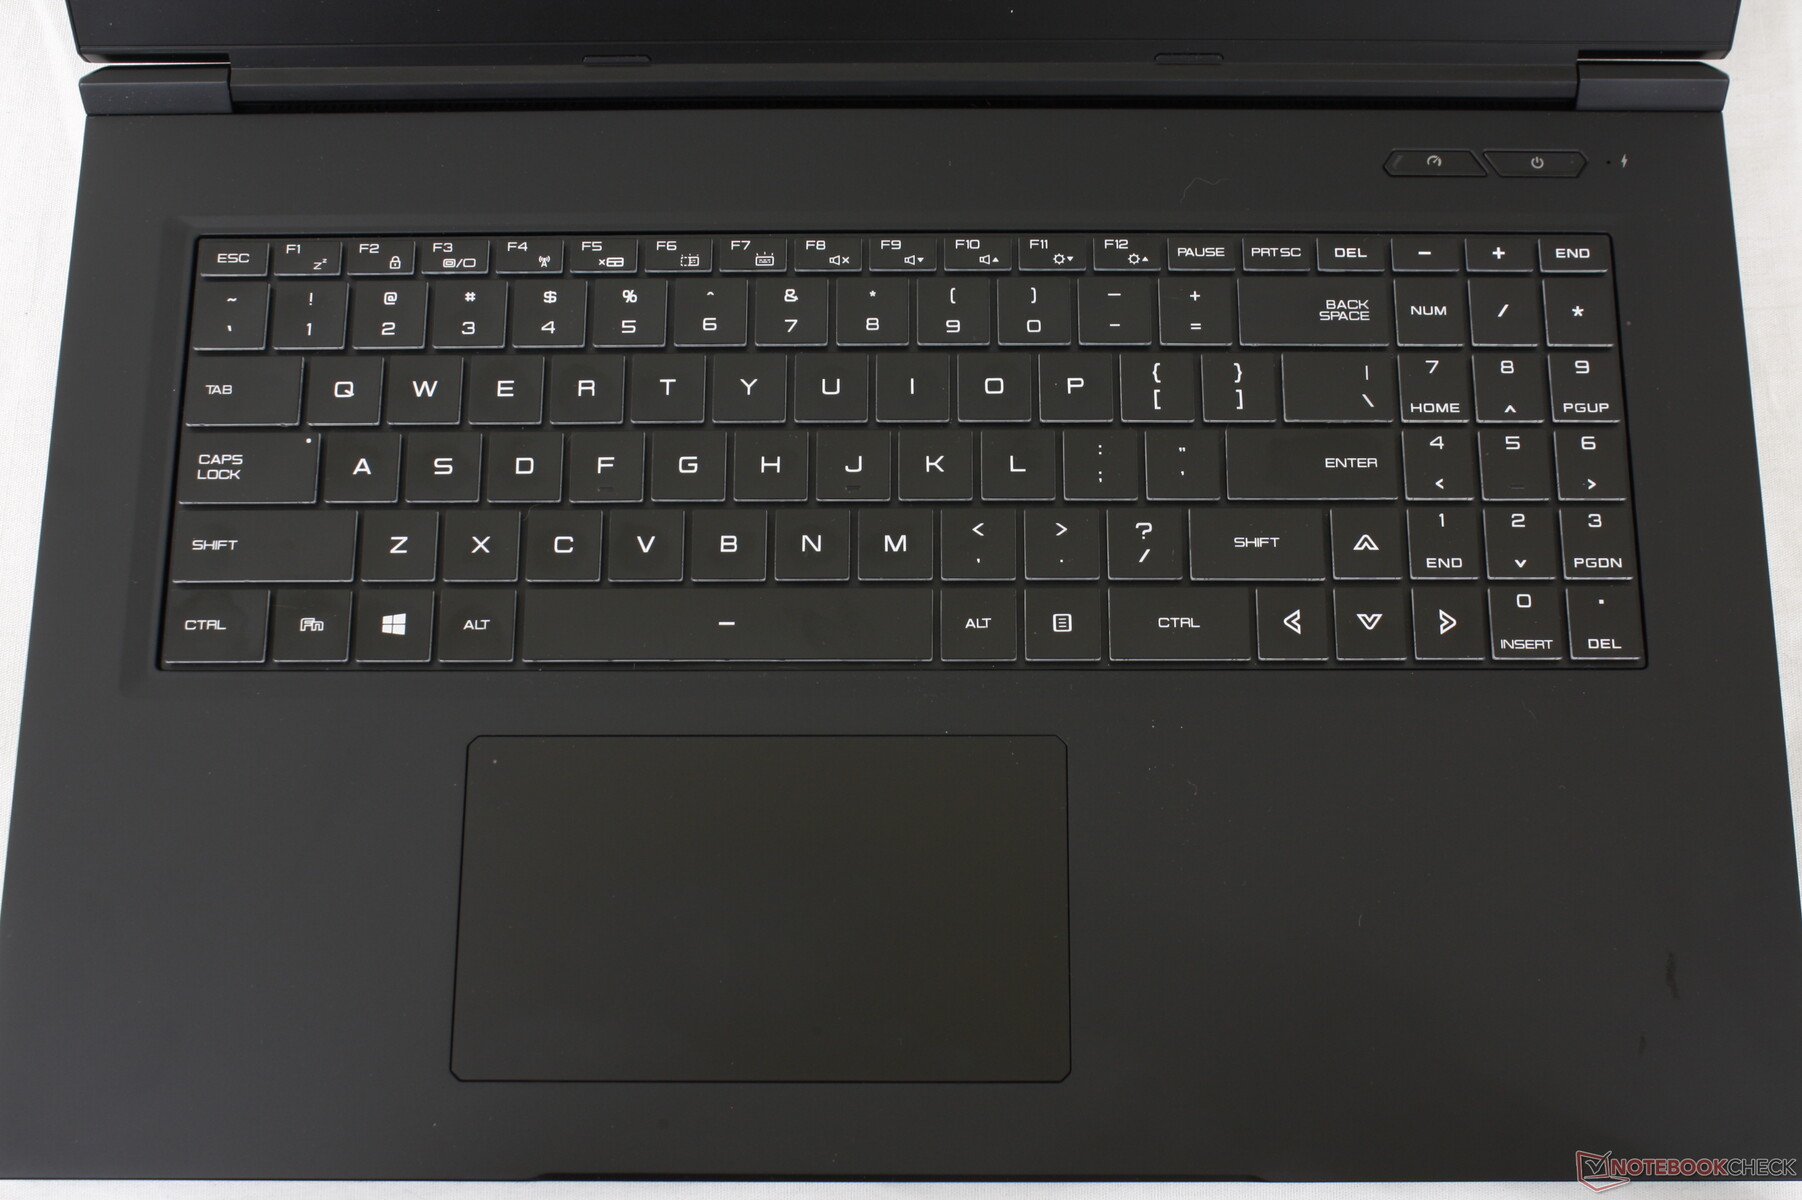
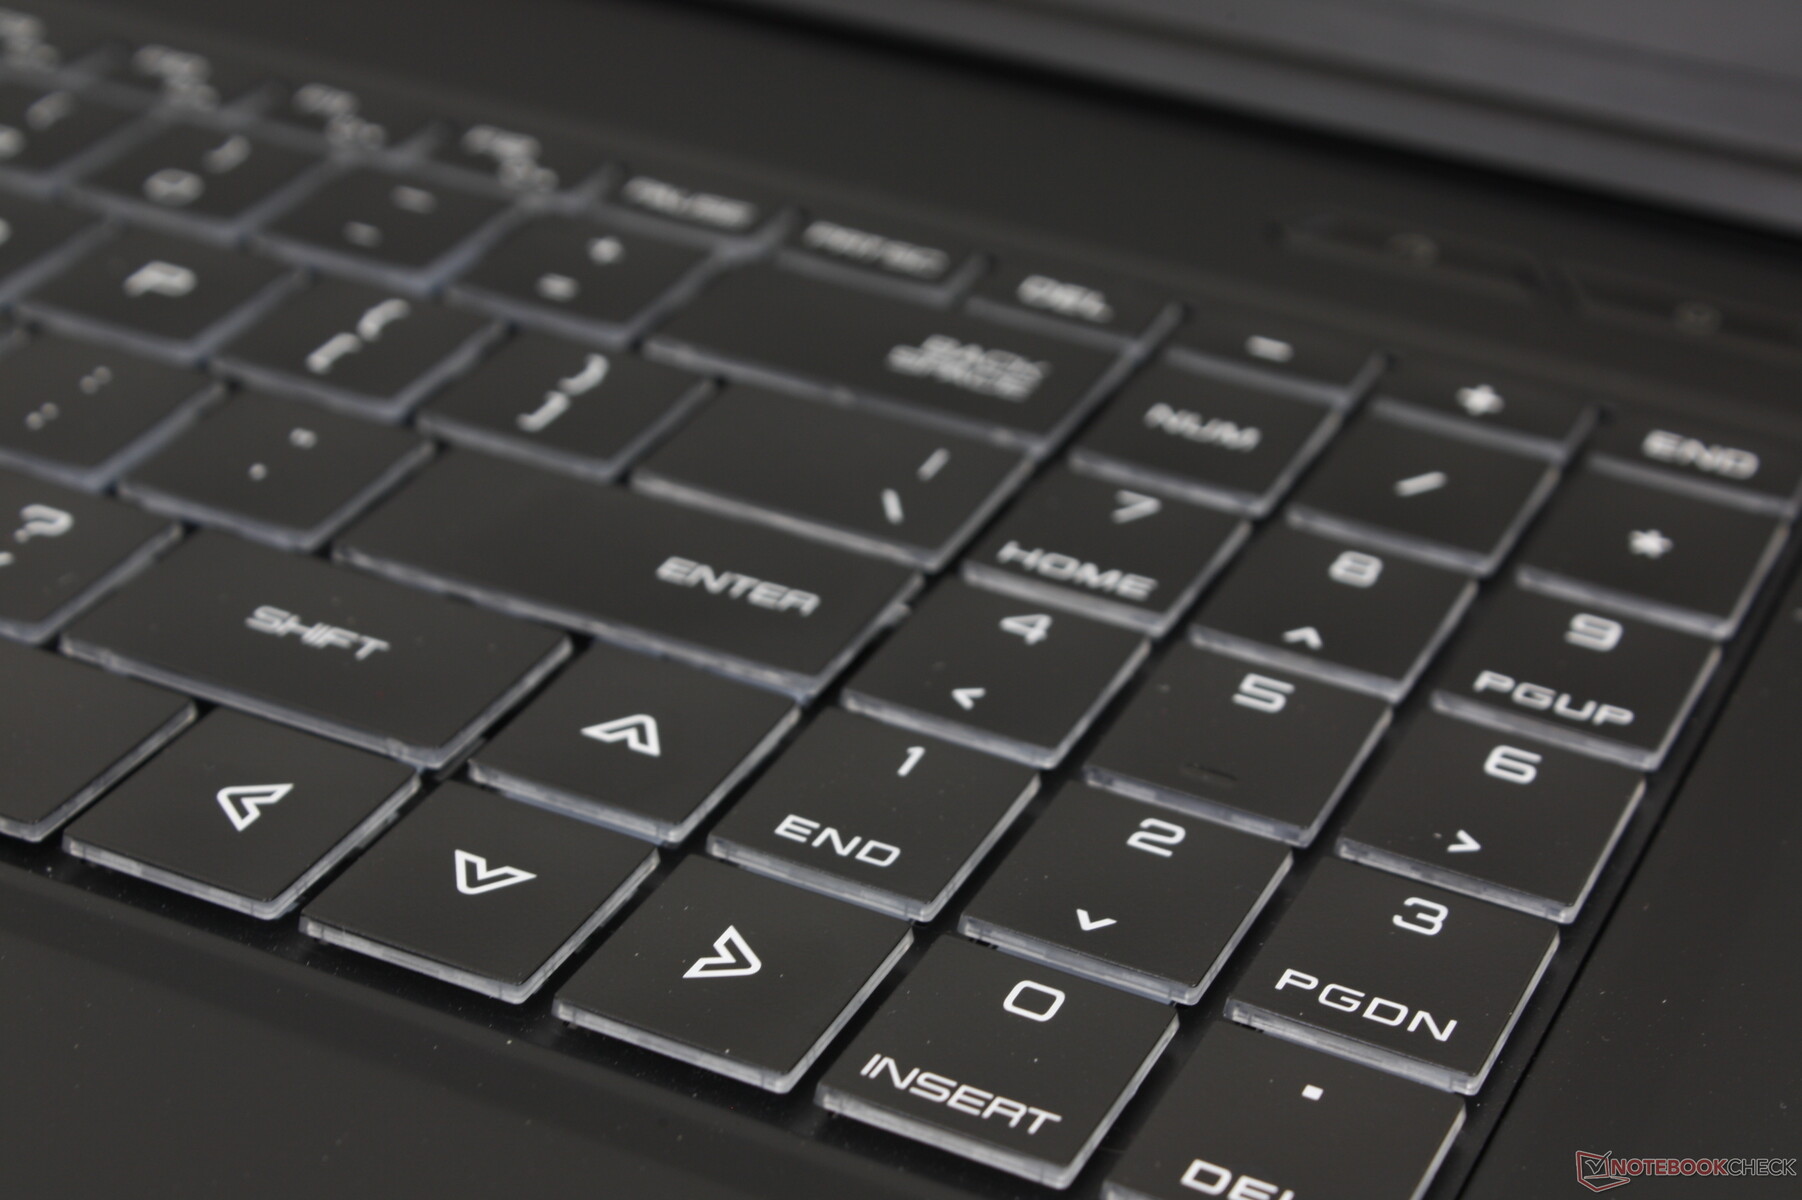
键盘
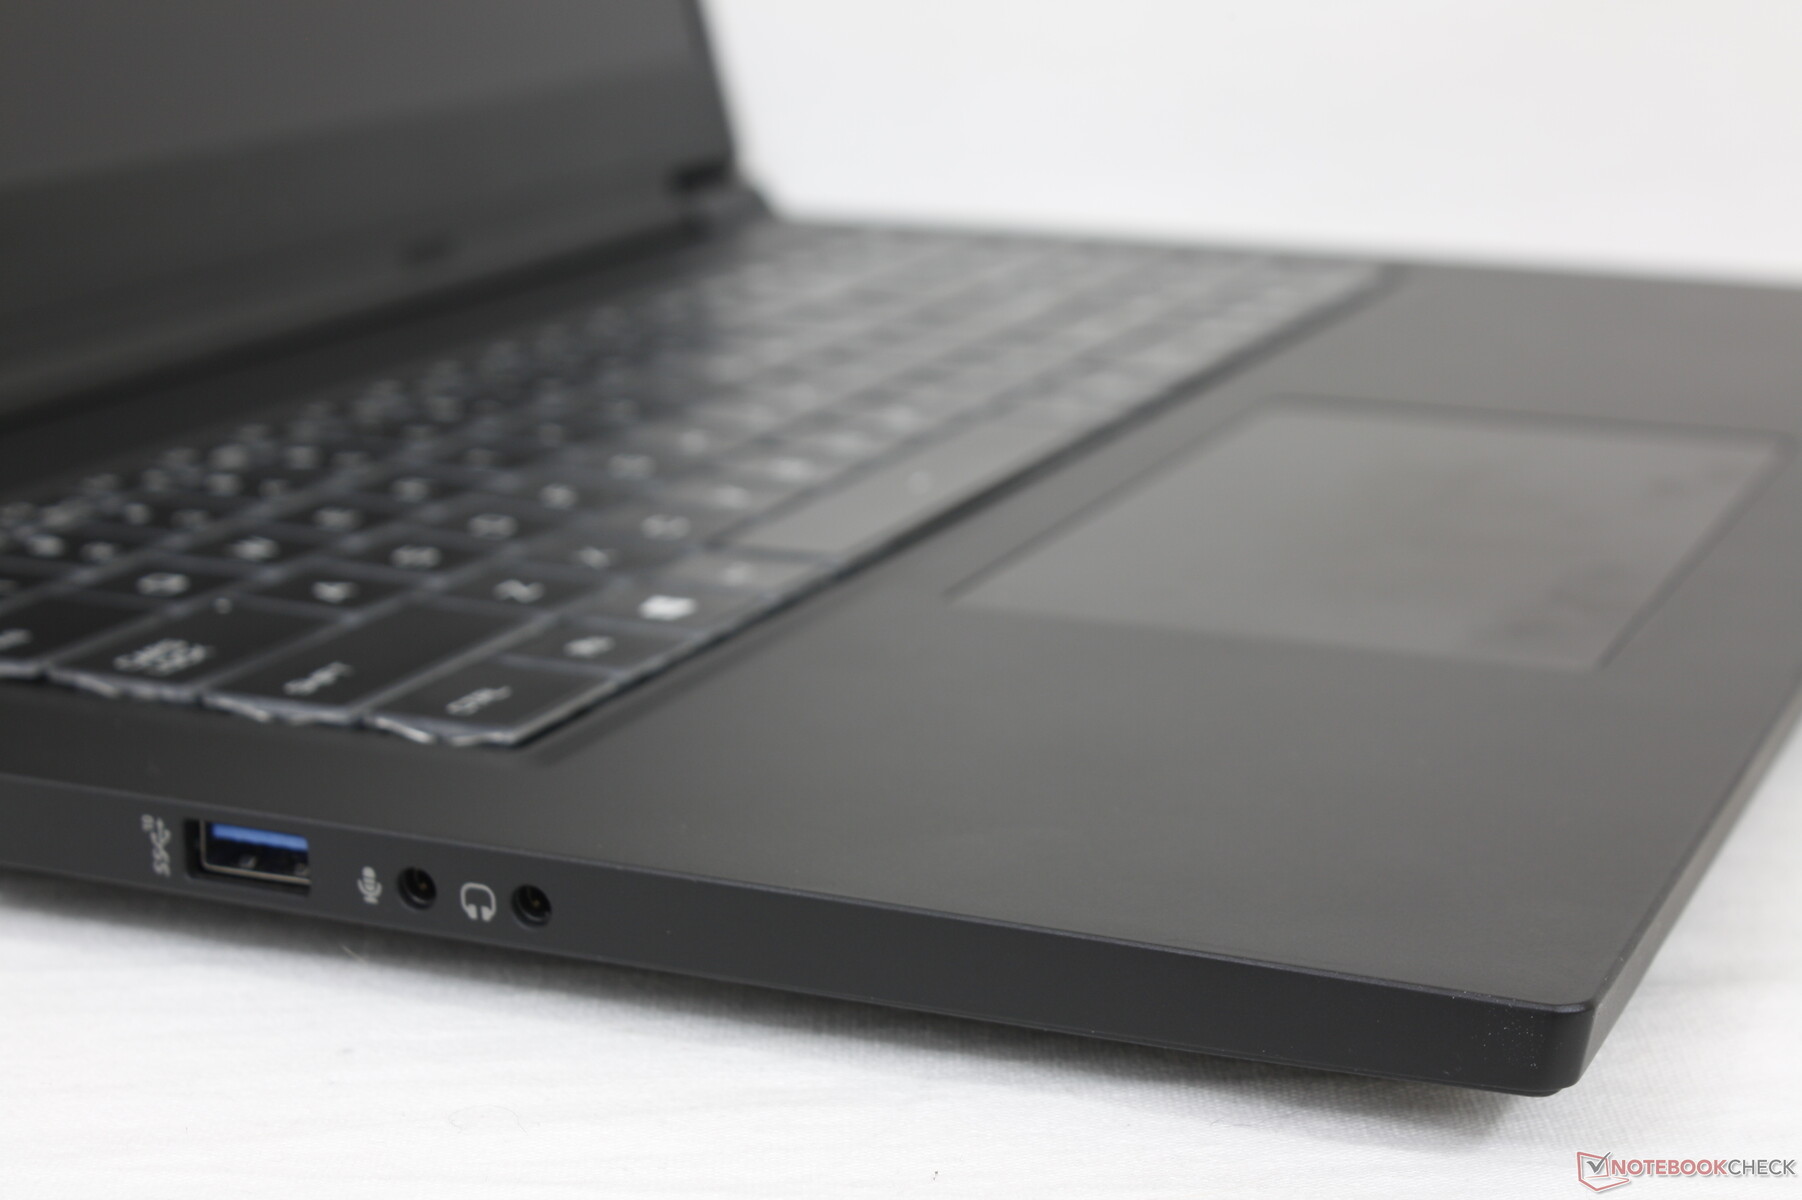
GM7AG8P使用了传统的基于膜的按键,更类似于XMG Core 17或XMG Pro 17,而不是XMG Neo 17的机械按键。然而,与XMG Core 17或XMG Pro 17的传统按键不同,这里的按键在物理上更大,更容易输入。键的反馈是统一的,所有的键之间都有相对安静的咔哒声,但我们确实希望行程和反馈整体上能更坚定。
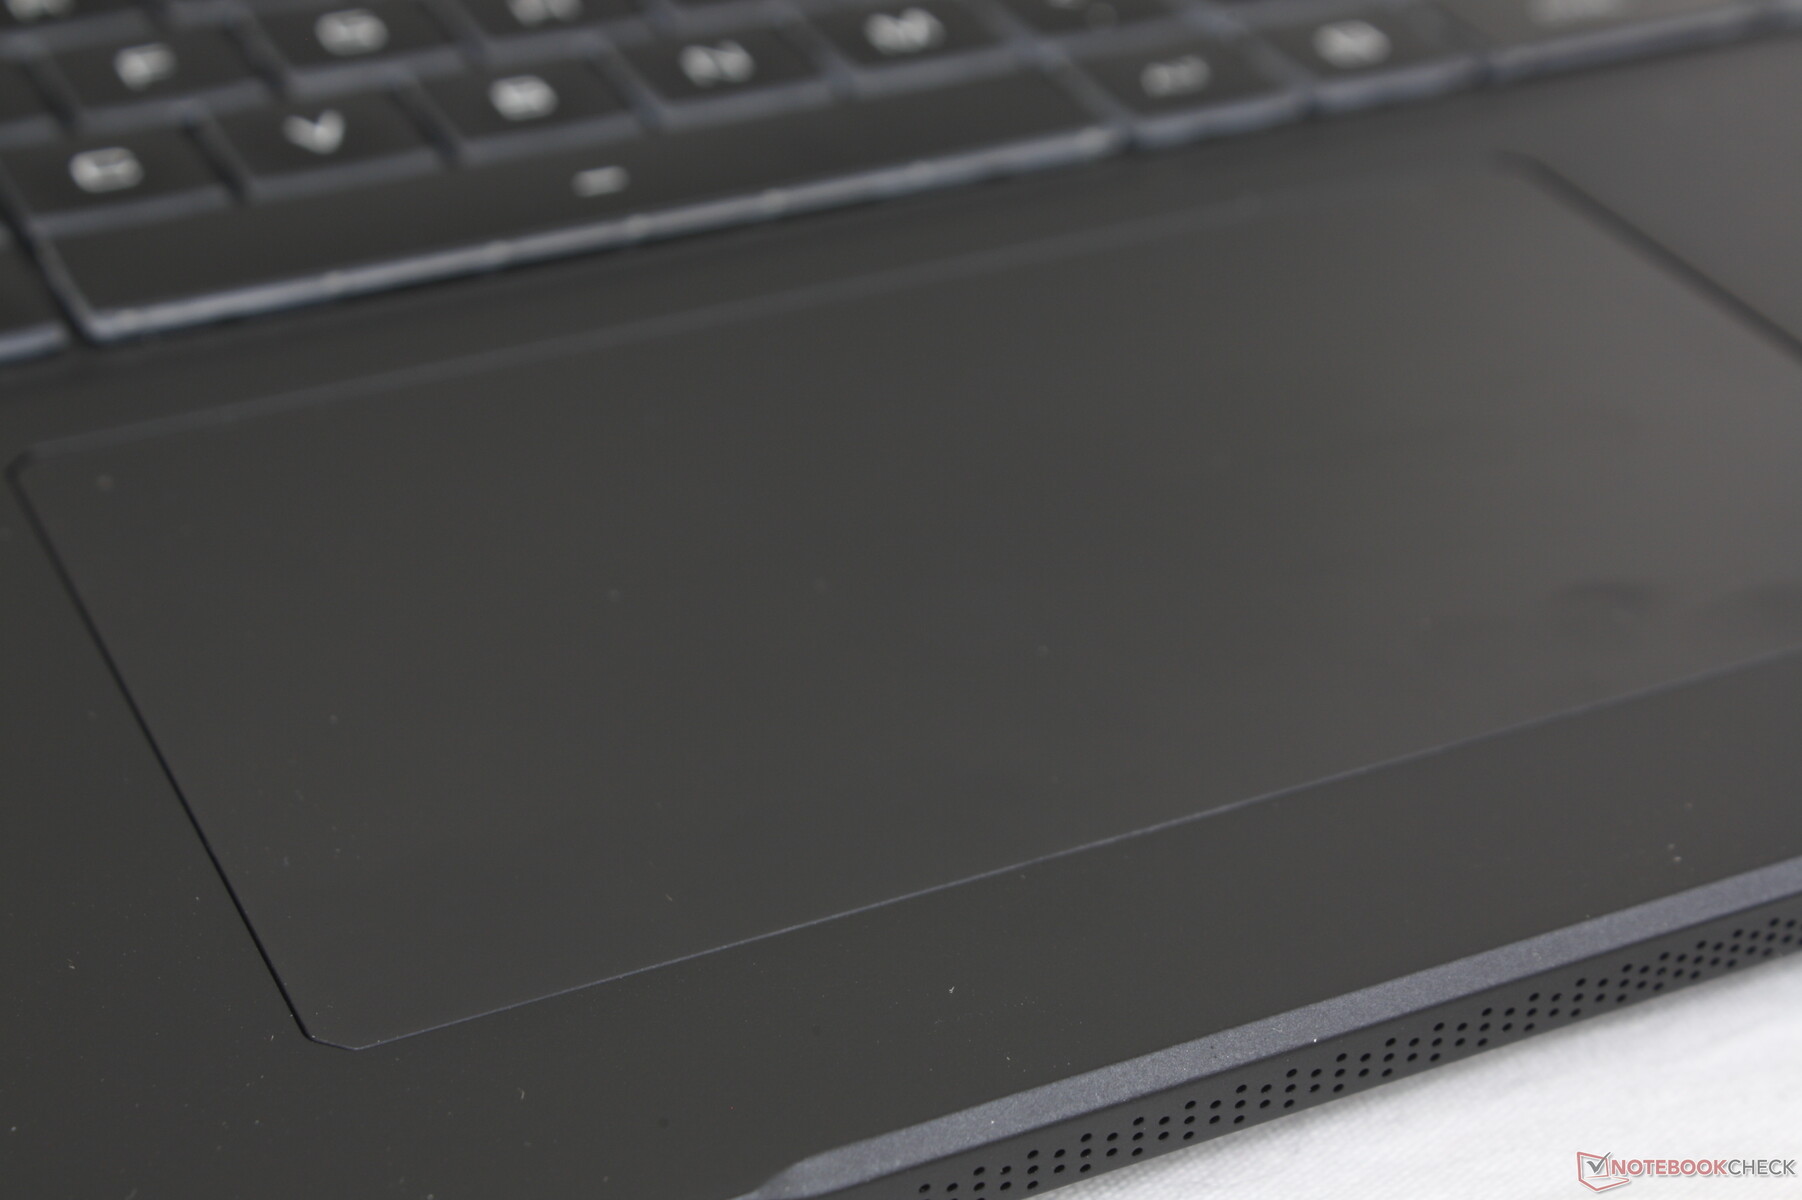
触摸板
点击板的大小与Blade Pro 17上的几乎一样(13.3 x 7.6厘米对13 x 8厘米),但按下时的点击声更坚定、更响亮。滑动性能平稳,即使以较慢的速度移动光标,也几乎没有粘连。

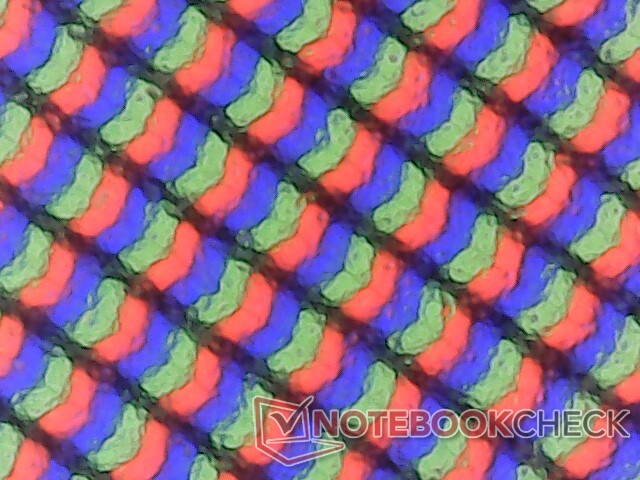
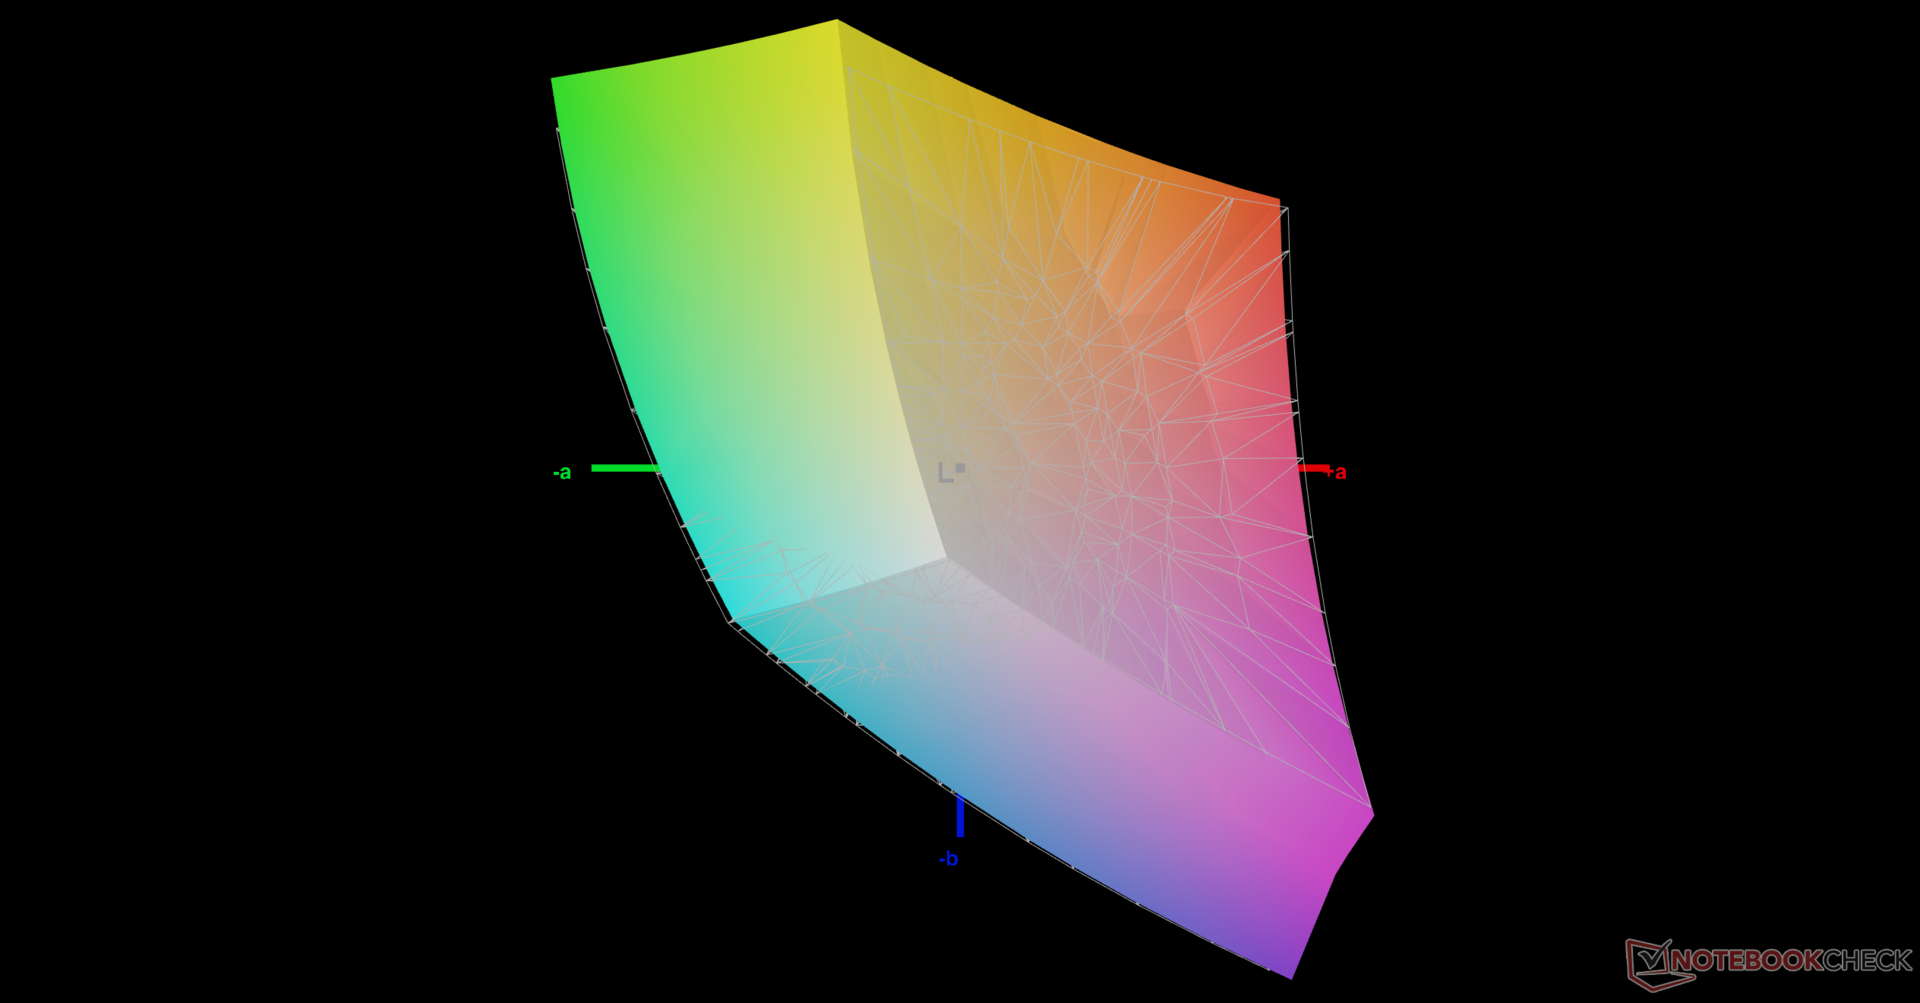
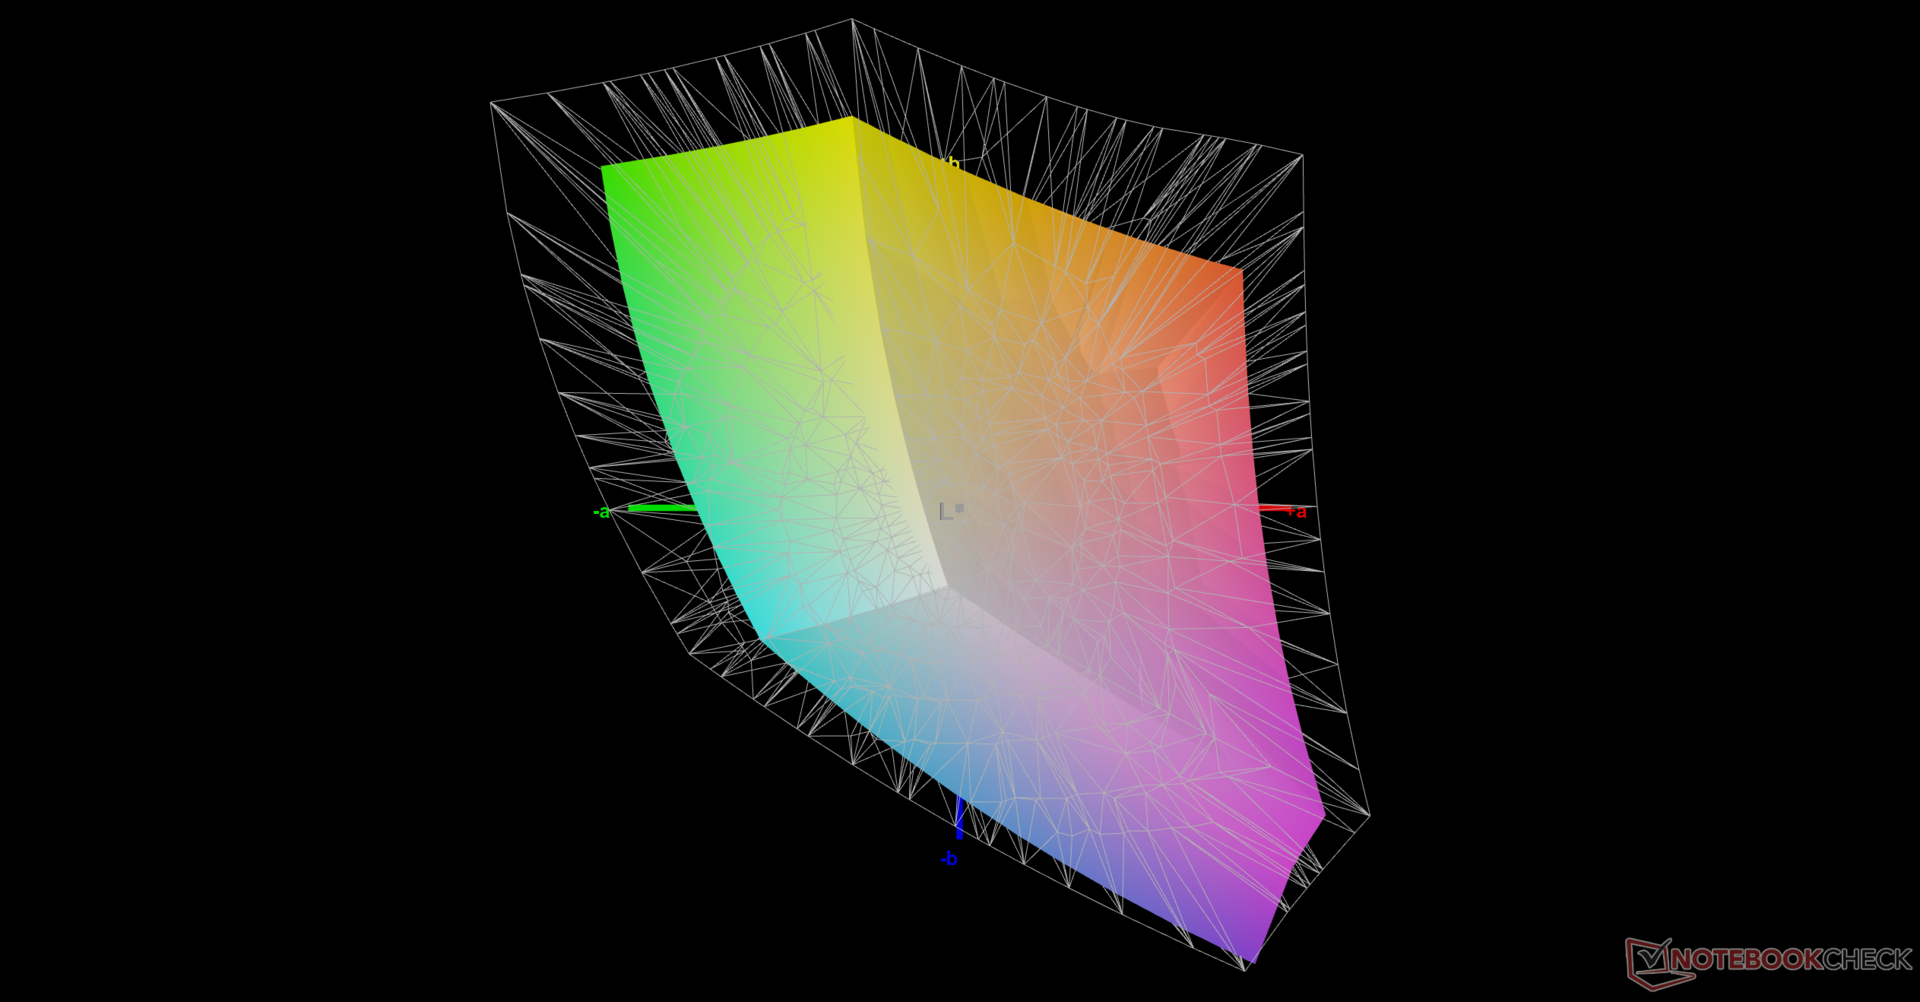
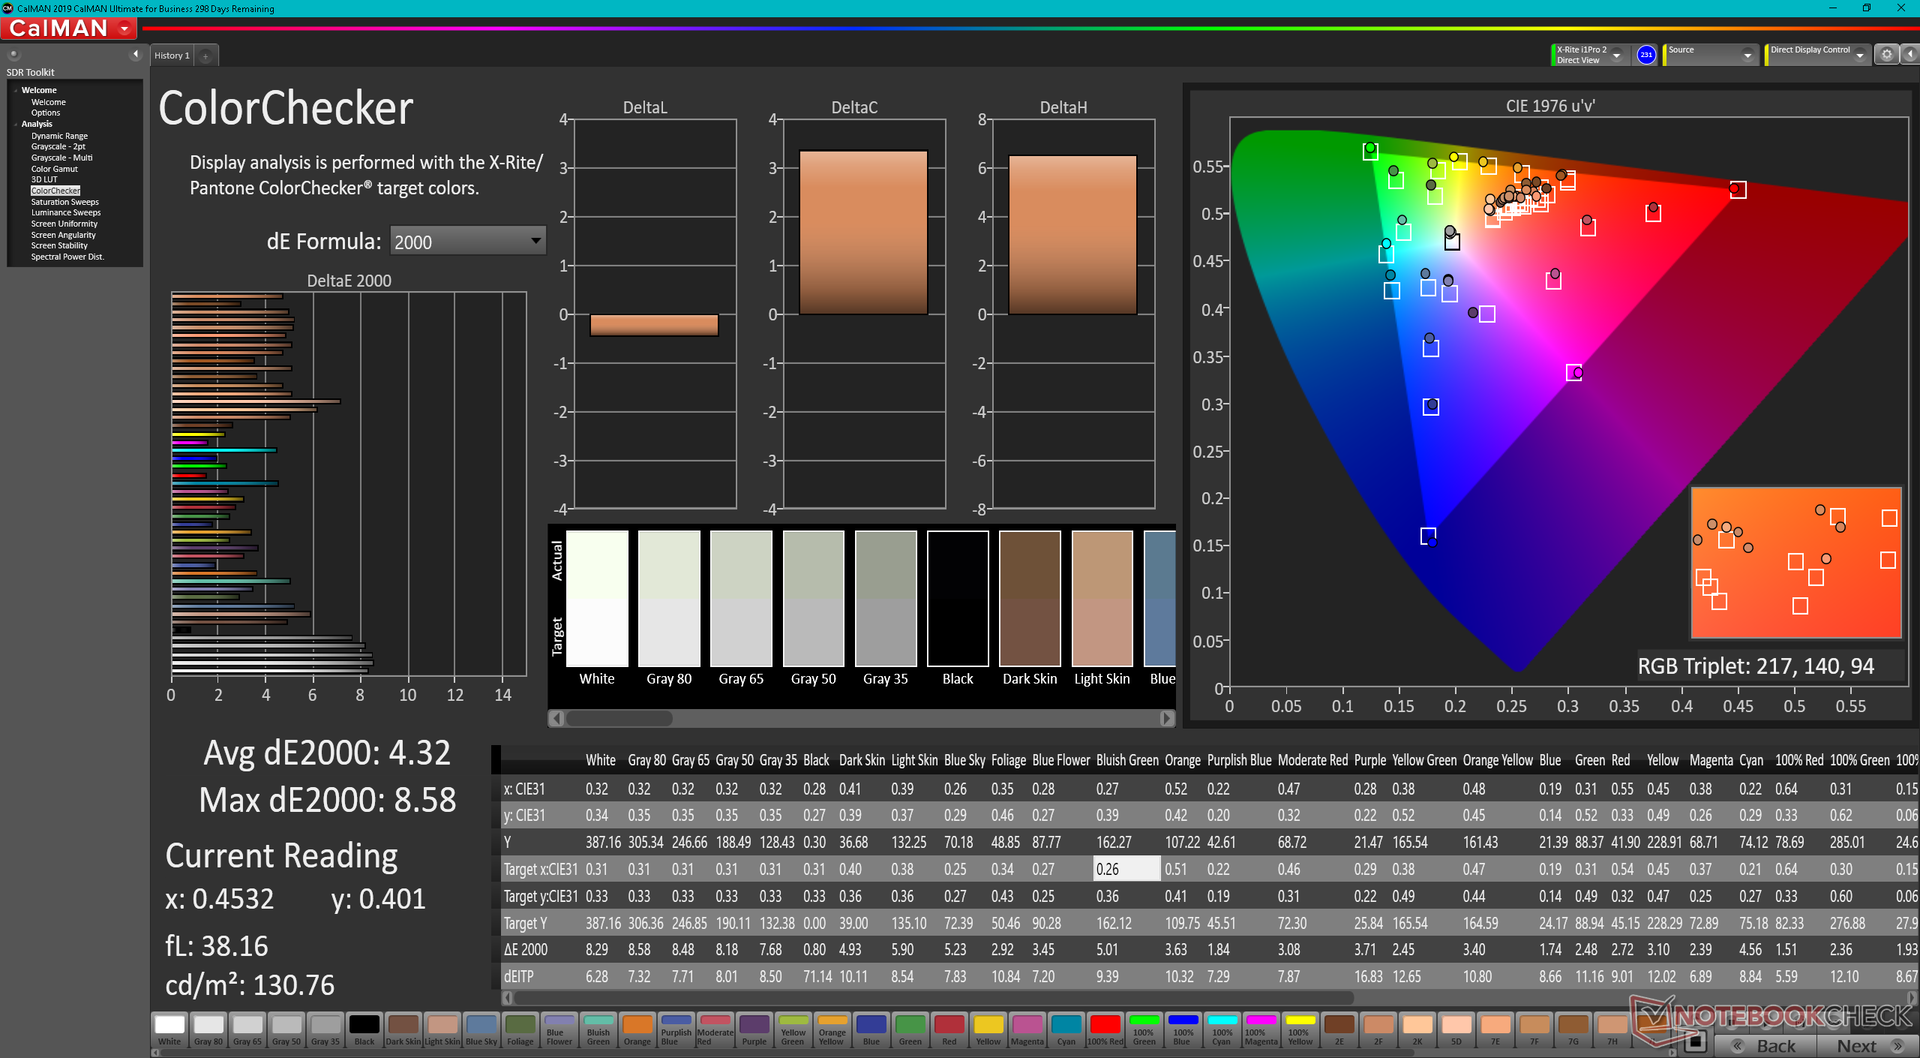
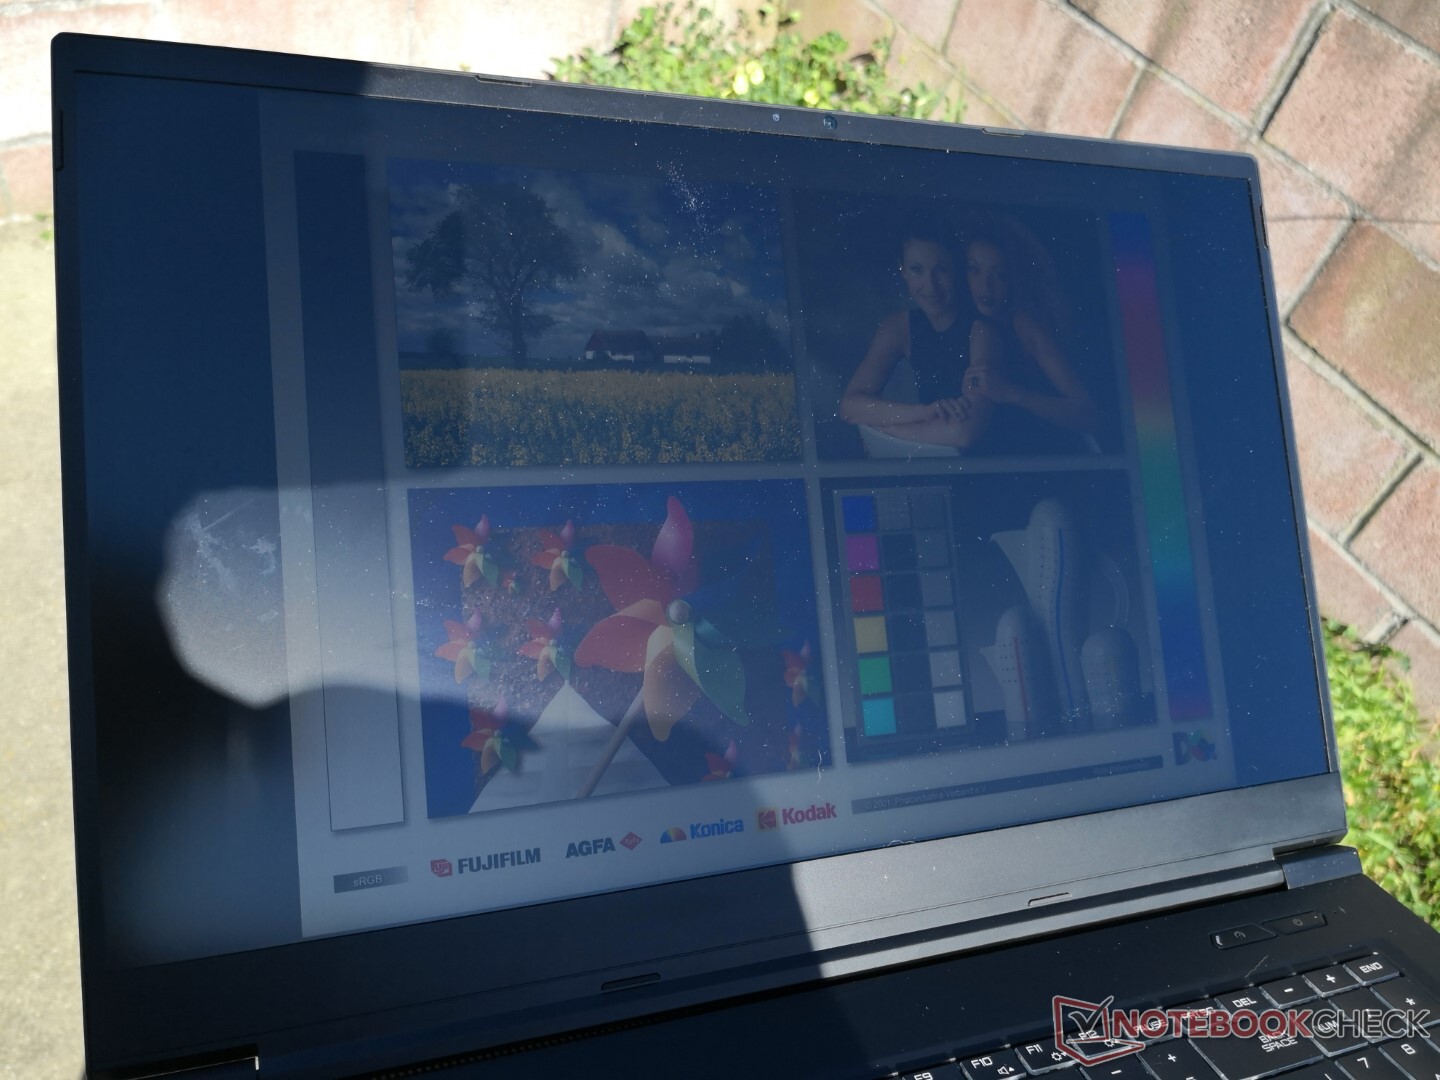
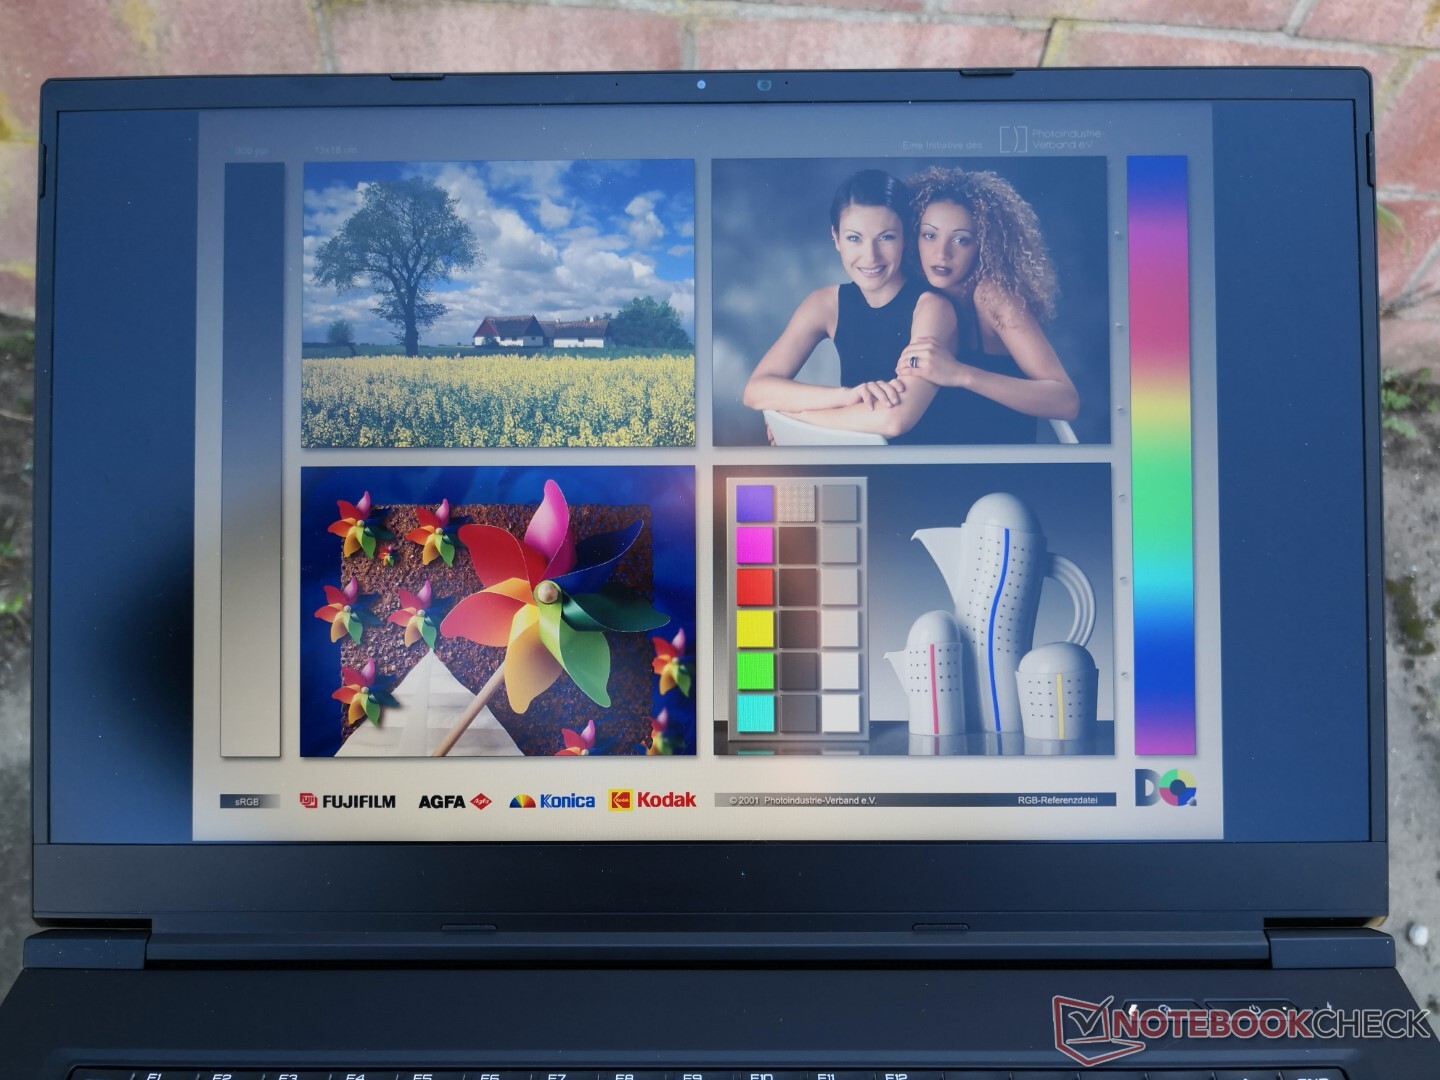
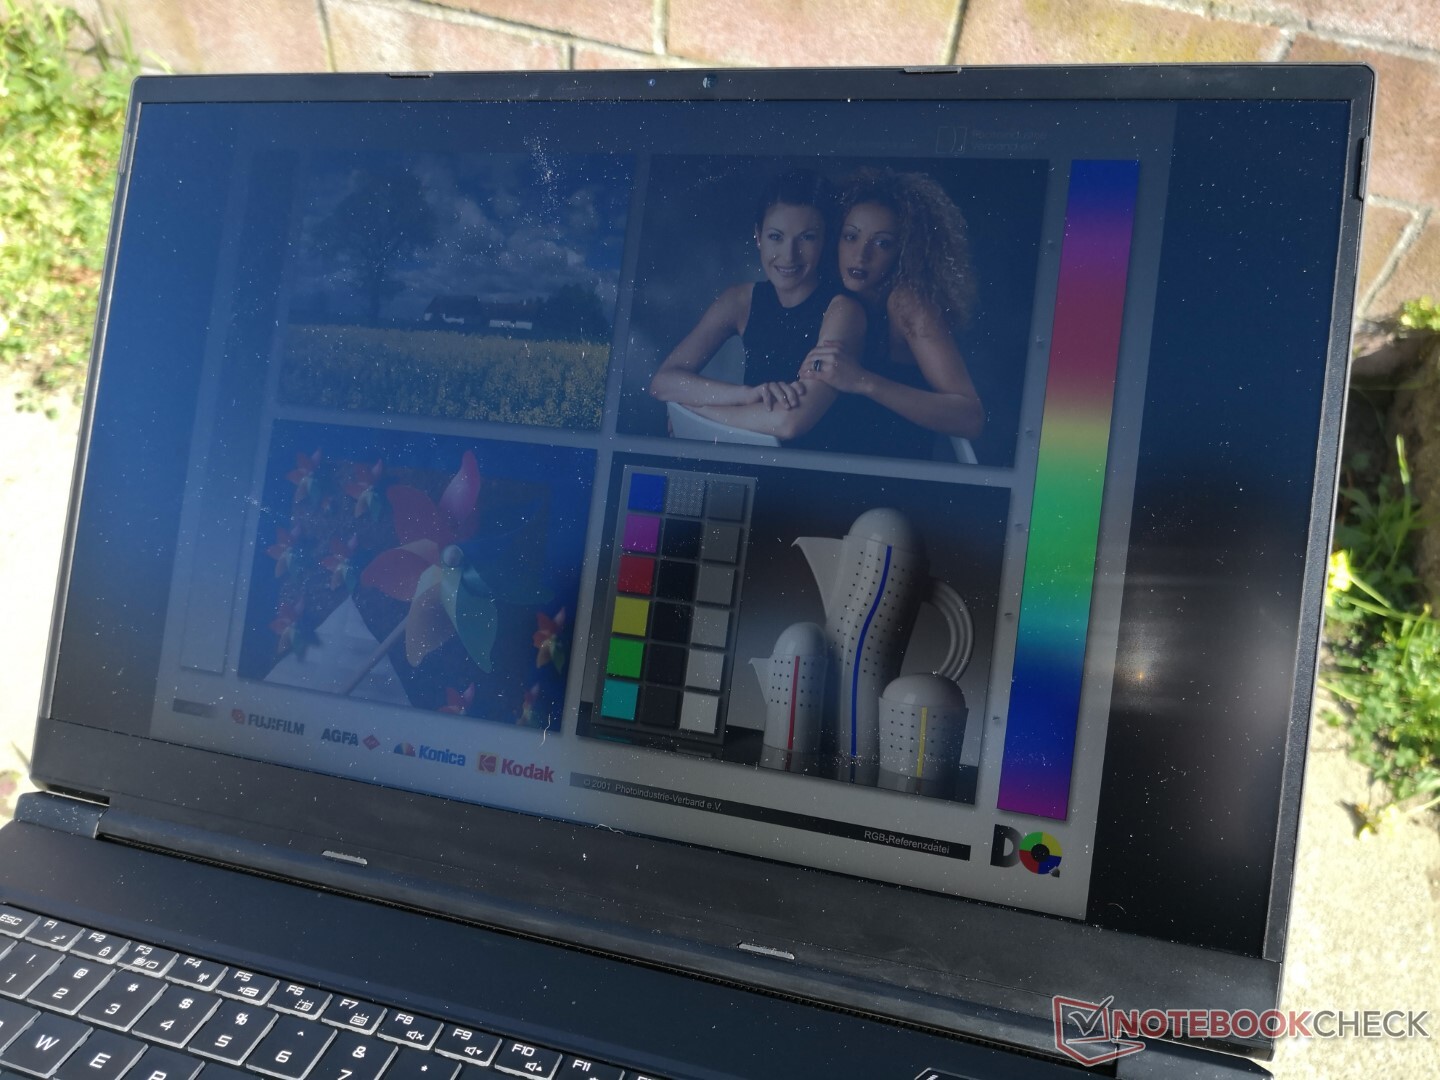
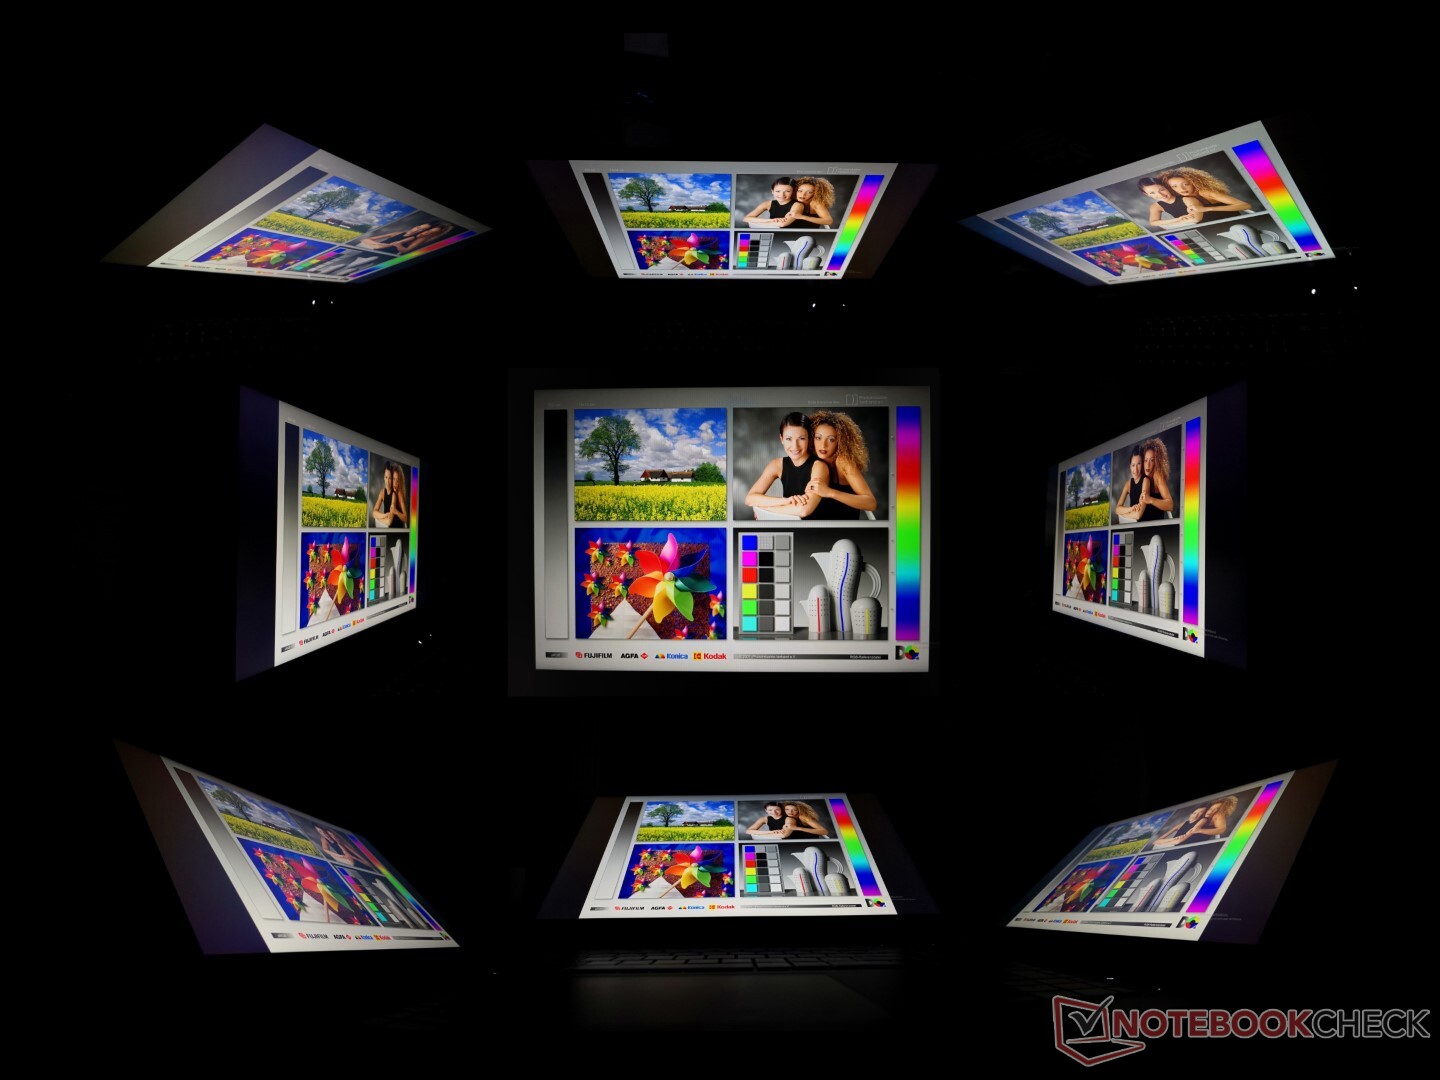
显示 - 快速和多彩
我们的GM7AG8P测试装置使用了与去年的GM7AG8P完全相同的BOE0977显示控制器和NE173QHM-NY2 IPS面板。申克XMG Neo 17 GM7TG8S.因此,这两台笔记本电脑之间的观看体验和显示属性非常相似,包括1440p原生分辨率、快速响应时间、~1000:1对比度、165赫兹刷新率和全sRGB覆盖。最大亮度也继续保持在400尼特以下。
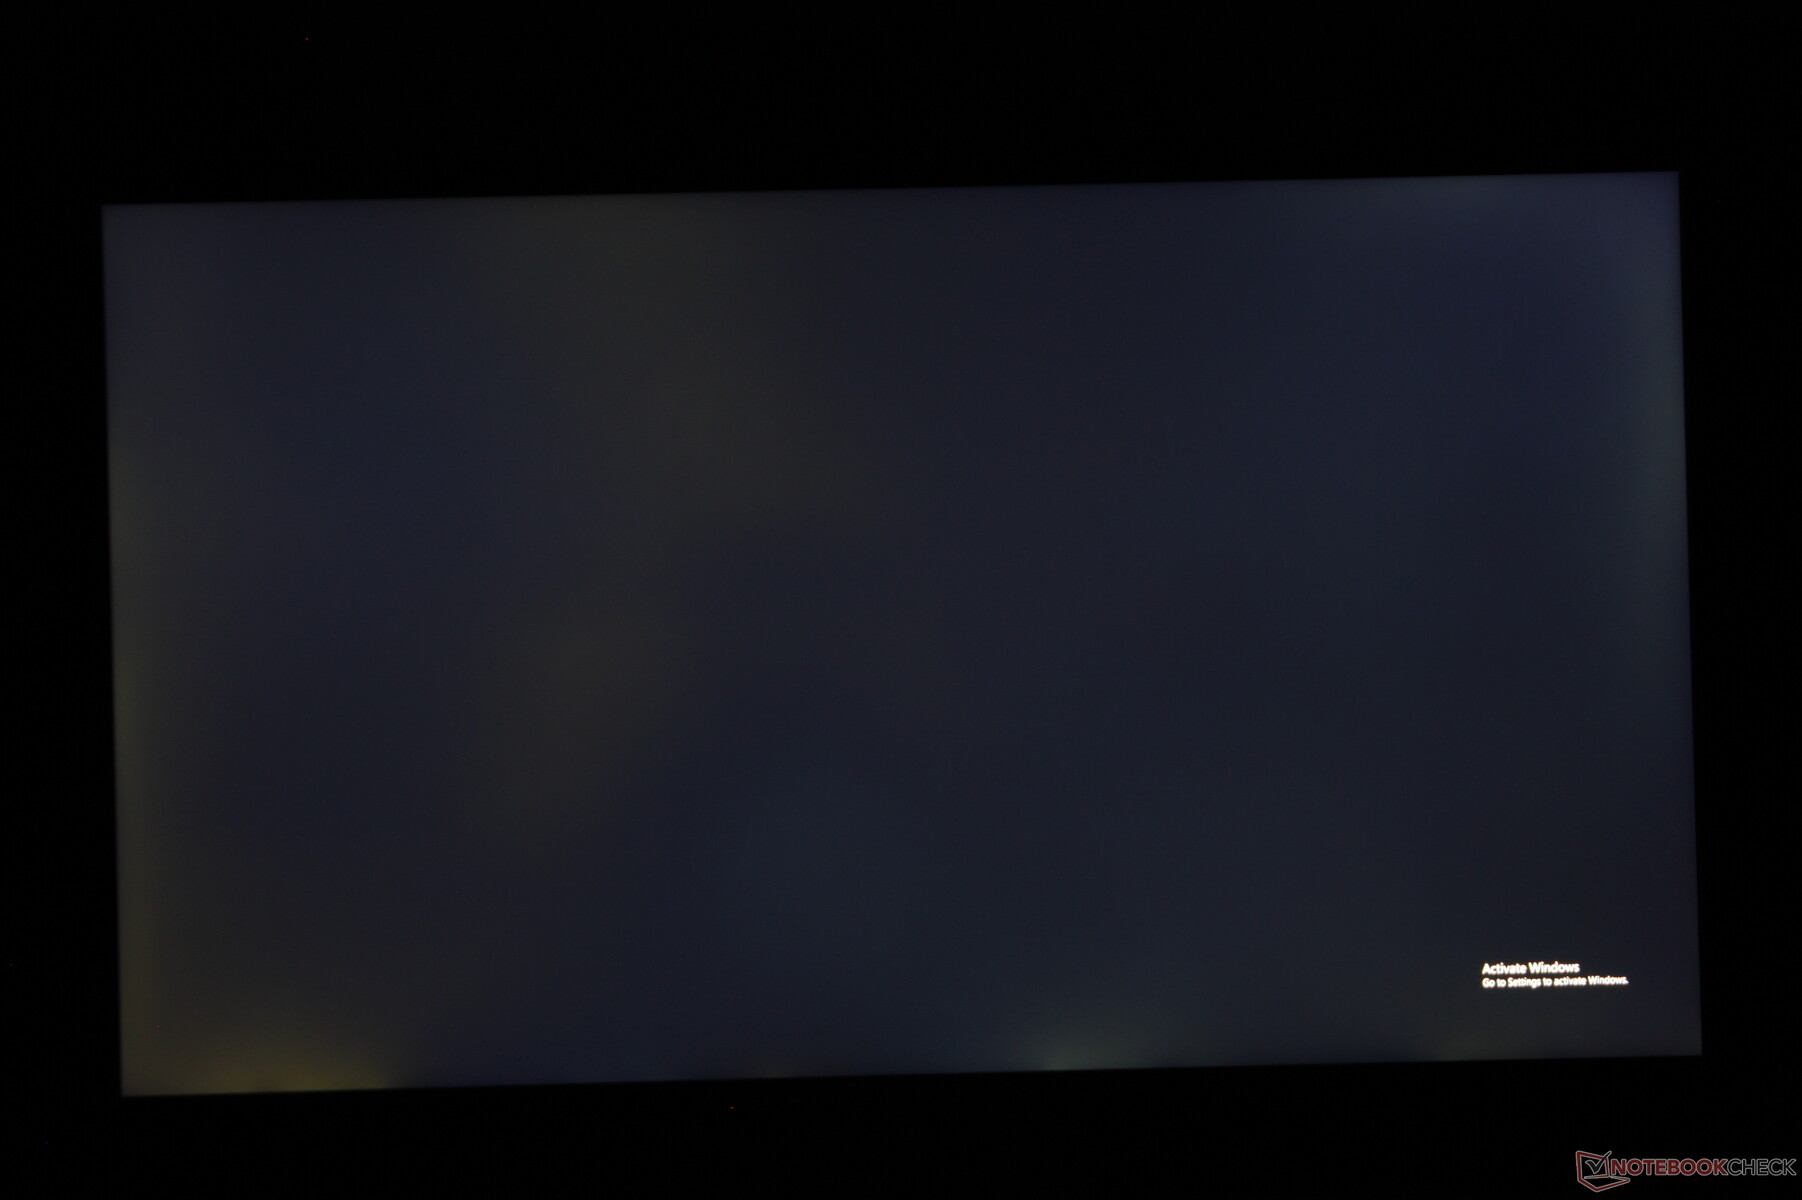
如下图所示,我们的特定测试设备上的背光出血可以得到改善。虽然一些出血是IPS的预期,但我们的设备表现出的出血比我们希望的要多。
| |||||||||||||||||||||||||
Brightness Distribution: 86 %
Center on Battery: 387.1 cd/m²
Contrast: 1210:1 (Black: 0.32 cd/m²)
ΔE ColorChecker Calman: 4.32 | ∀{0.5-29.43 Ø4.71}
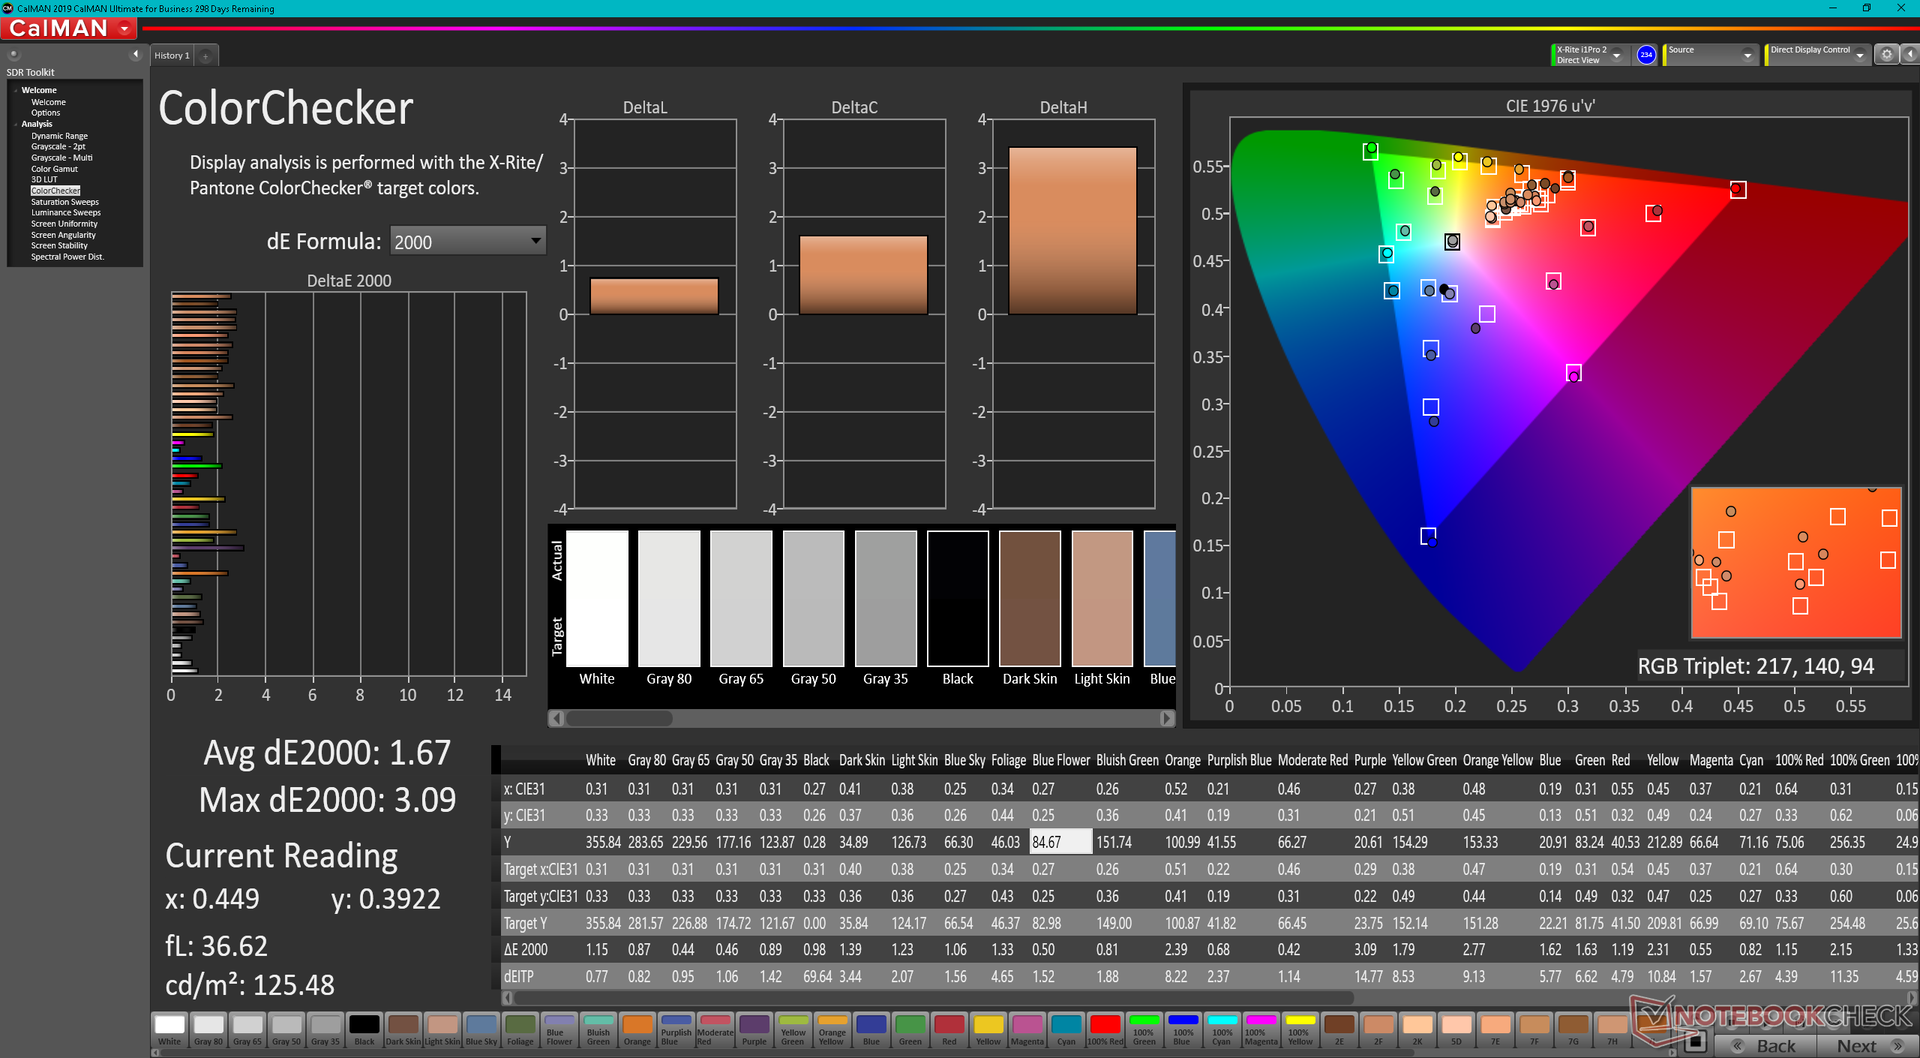
calibrated: 1.67
ΔE Greyscale Calman: 6.6 | ∀{0.09-98 Ø4.96}
70.7% AdobeRGB 1998 (Argyll 3D)
97.8% sRGB (Argyll 3D)
68.9% Display P3 (Argyll 3D)
Gamma: 2.24
CCT: 6114 K
| Schenker Uniwill Technology GM7AG8P BOE NE173QHM-NY2, IPS, 2560x1440, 17.3" | Schenker XMG NEO 17 GM7TG8S BOE0977 (NE173QHM-NY2), IPS, 2560x1440, 17.3" | Alienware x17 RTX 3080 P48E AU Optronics B173ZAN, IPS, 3840x2160, 17.3" | Razer Blade 17 RTX 3070 AU Optronics B173HAN05.4, IPS, 1920x1080, 17.3" | MSI GS76 Stealth 11UH AUO B173ZAN06.1 (AUODE95), IPS, 3840x2160, 17.3" | Maingear Vector Pro MG-VCP17 BOE NE173QHM-NY2, IPS, 2560x1440, 17.3" | |
|---|---|---|---|---|---|---|
| Display | -3% | 24% | 3% | -7% | 2% | |
| Display P3 Coverage (%) | 68.9 | 67.1 -3% | 88.3 28% | 71.7 4% | 63 -9% | 70.7 3% |
| sRGB Coverage (%) | 97.8 | 96.3 -2% | 100 2% | 98.8 1% | 94.8 -3% | 99.4 2% |
| AdobeRGB 1998 Coverage (%) | 70.7 | 68.6 -3% | 100 41% | 73.6 4% | 65 -8% | 71.7 1% |
| Response Times | 16% | 14% | 54% | 47% | 4% | |
| Response Time Grey 50% / Grey 80% * (ms) | 14.8 ? | 15.2 -3% | 14.4 ? 3% | 4.2 ? 72% | 8.8 ? 41% | 15.6 ? -5% |
| Response Time Black / White * (ms) | 13.6 ? | 8.8 35% | 10.4 ? 24% | 8.8 ? 35% | 6.4 ? 53% | 12 ? 12% |
| PWM Frequency (Hz) | ||||||
| Screen | 18% | 11% | -9% | 22% | 9% | |
| Brightness middle (cd/m²) | 387.1 | 396 2% | 438.7 13% | 323.3 -16% | 474 22% | 389.7 1% |
| Brightness (cd/m²) | 361 | 366 1% | 435 20% | 315 -13% | 454 26% | 363 1% |
| Brightness Distribution (%) | 86 | 82 -5% | 91 6% | 91 6% | 88 2% | 84 -2% |
| Black Level * (cd/m²) | 0.32 | 0.45 -41% | 0.48 -50% | 0.33 -3% | 0.46 -44% | 0.47 -47% |
| Contrast (:1) | 1210 | 880 -27% | 914 -24% | 980 -19% | 1030 -15% | 829 -31% |
| Colorchecker dE 2000 * | 4.32 | 1.43 67% | 4.34 -0% | 4.59 -6% | 1.5 65% | 1.93 55% |
| Colorchecker dE 2000 max. * | 8.58 | 2.2 74% | 7.3 15% | 10.82 -26% | 5.59 35% | 6.84 20% |
| Colorchecker dE 2000 calibrated * | 1.67 | 1.34 20% | 0.72 57% | 1.4 16% | 0.86 49% | 1.31 22% |
| Greyscale dE 2000 * | 6.6 | 1.8 73% | 2.4 64% | 7.9 -20% | 2.8 58% | 2.4 64% |
| Gamma | 2.24 98% | 2.4 92% | 2.09 105% | 2.28 96% | 2.158 102% | 2.12 104% |
| CCT | 6114 106% | 6489 100% | 6413 101% | 5941 109% | 6597 99% | 6658 98% |
| Total Average (Program / Settings) | 10% /
13% | 16% /
14% | 16% /
3% | 21% /
19% | 5% /
7% |
* ... smaller is better
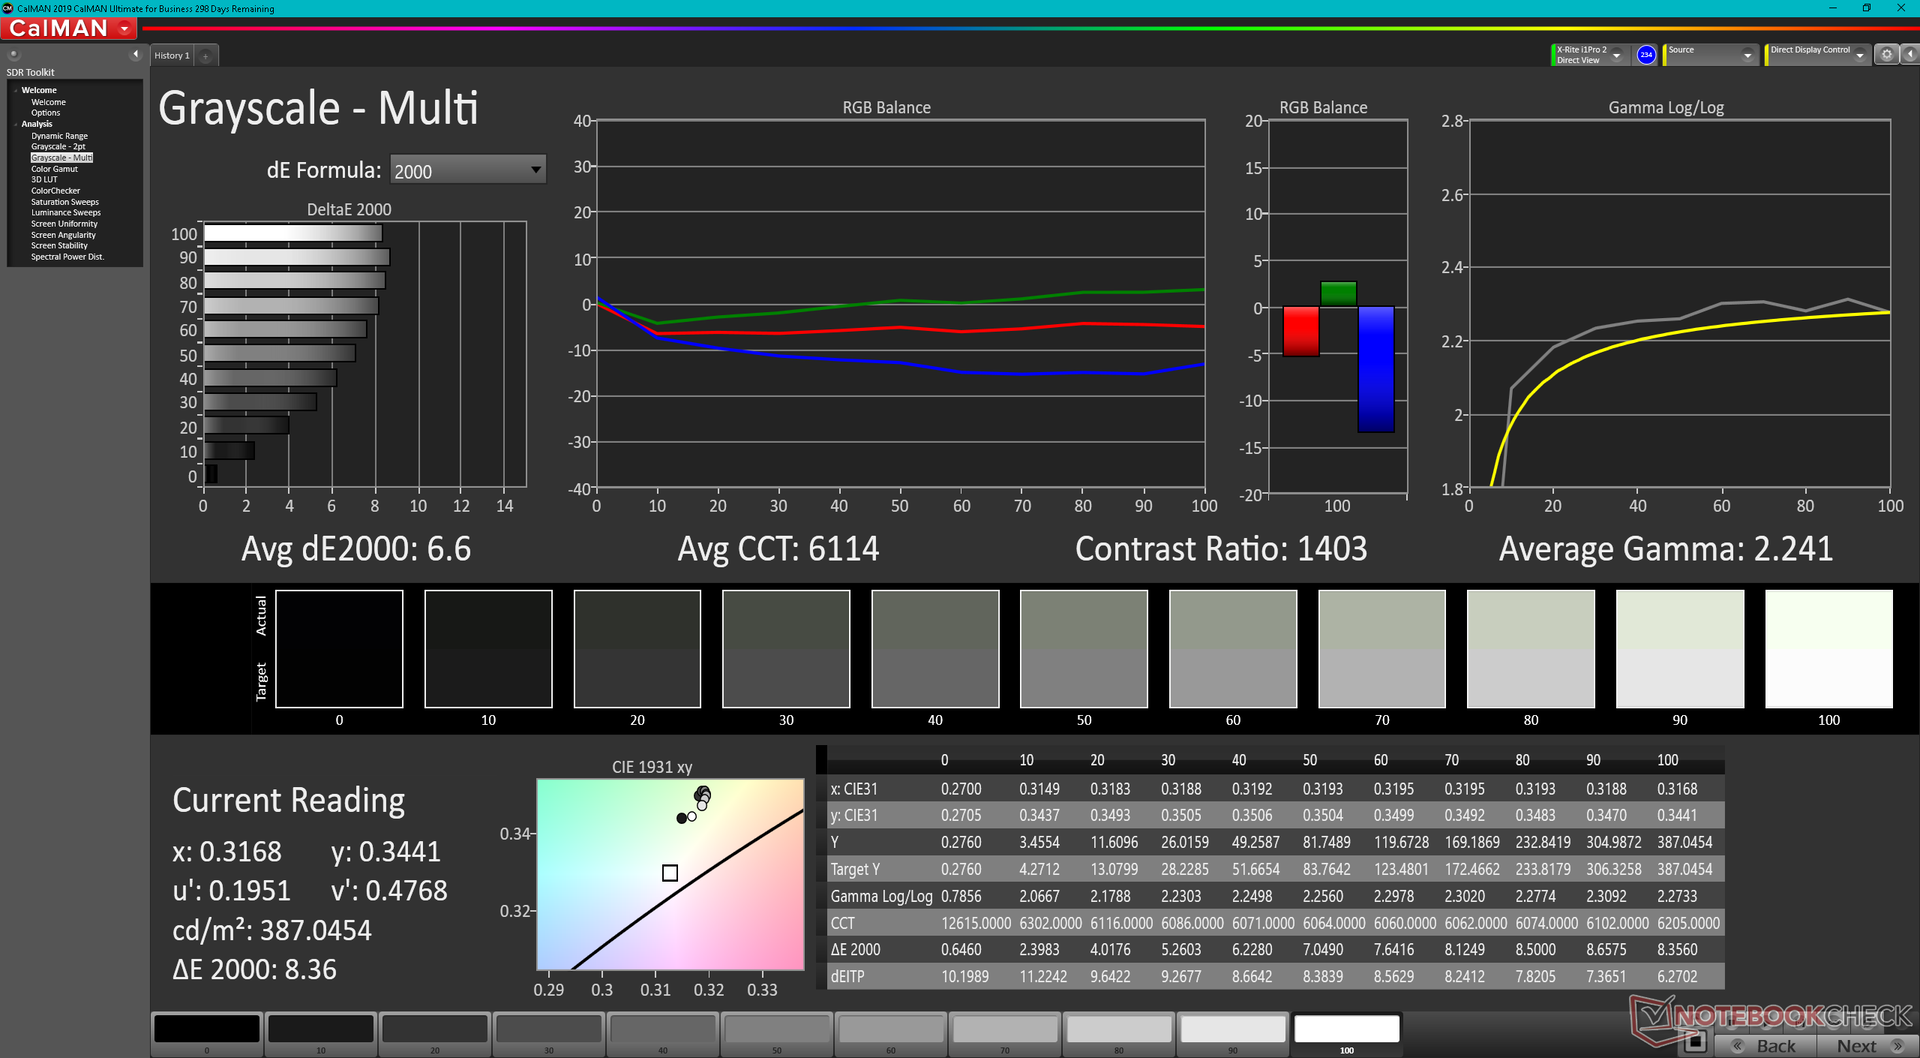
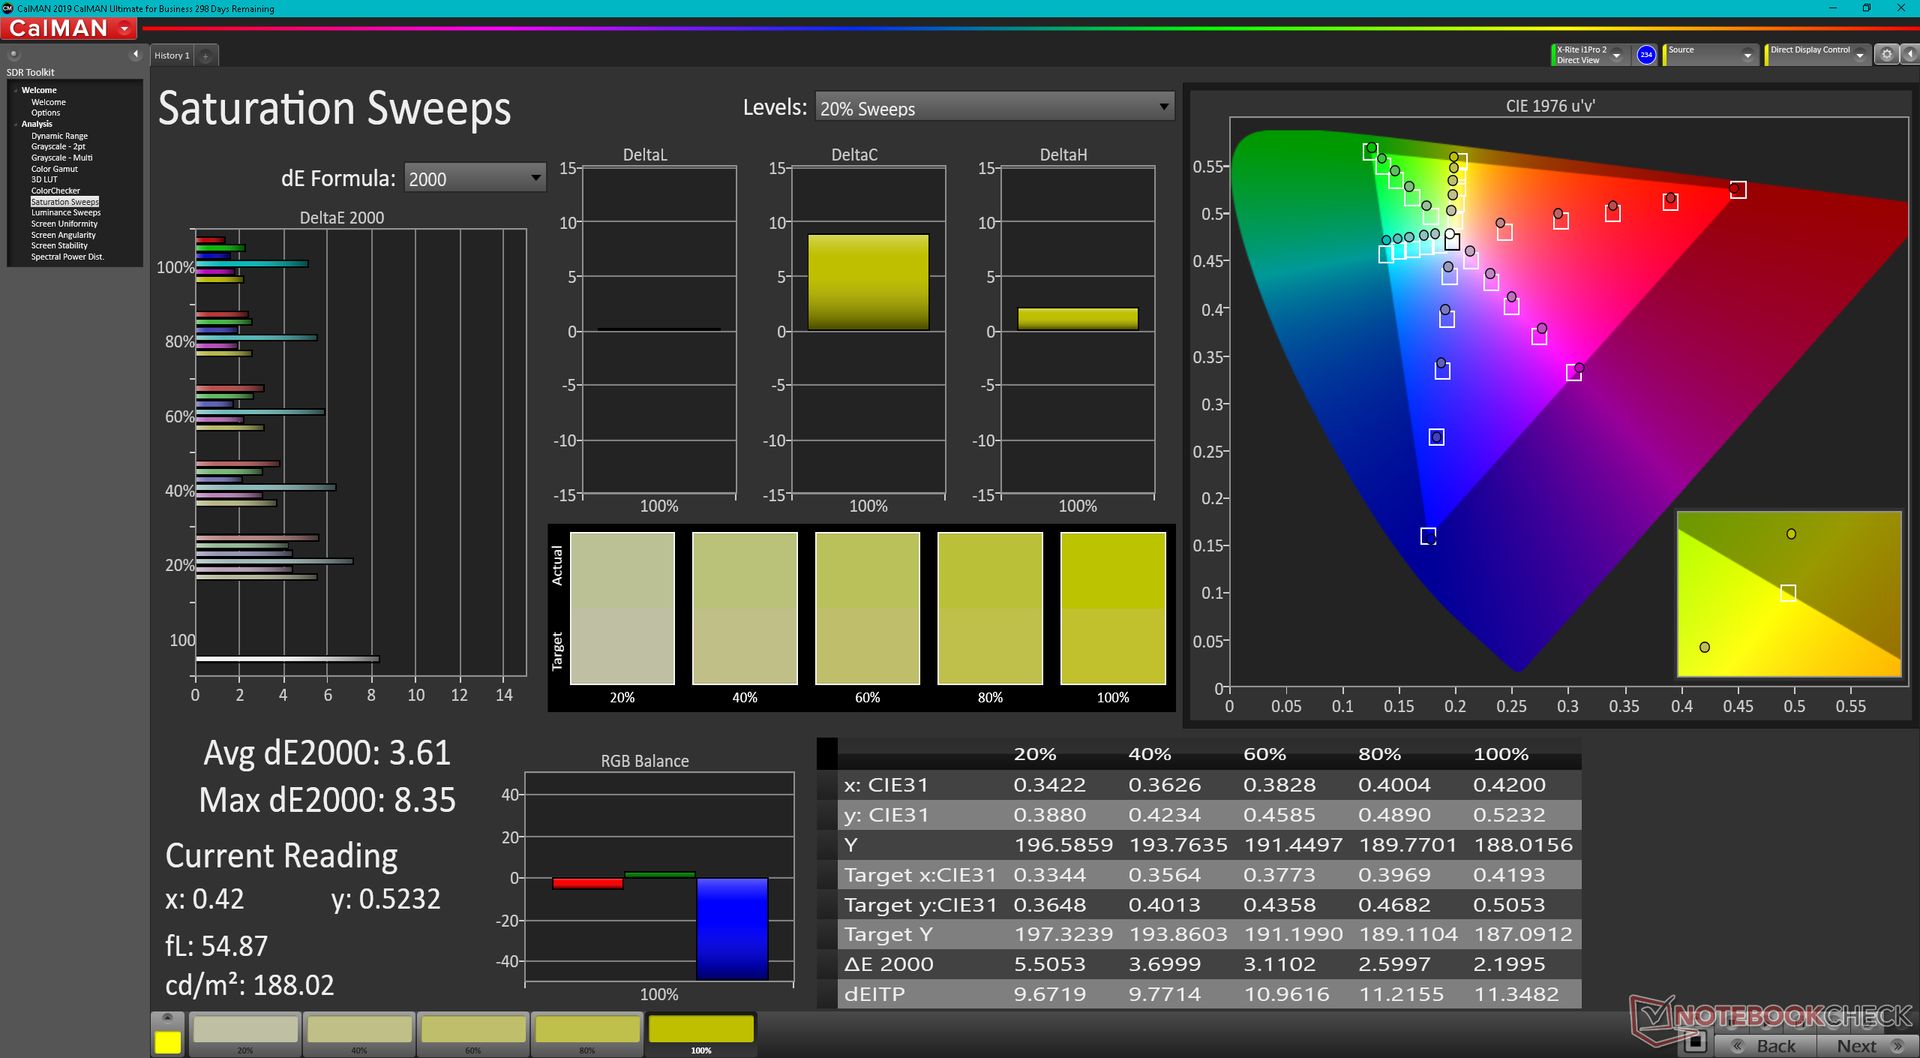
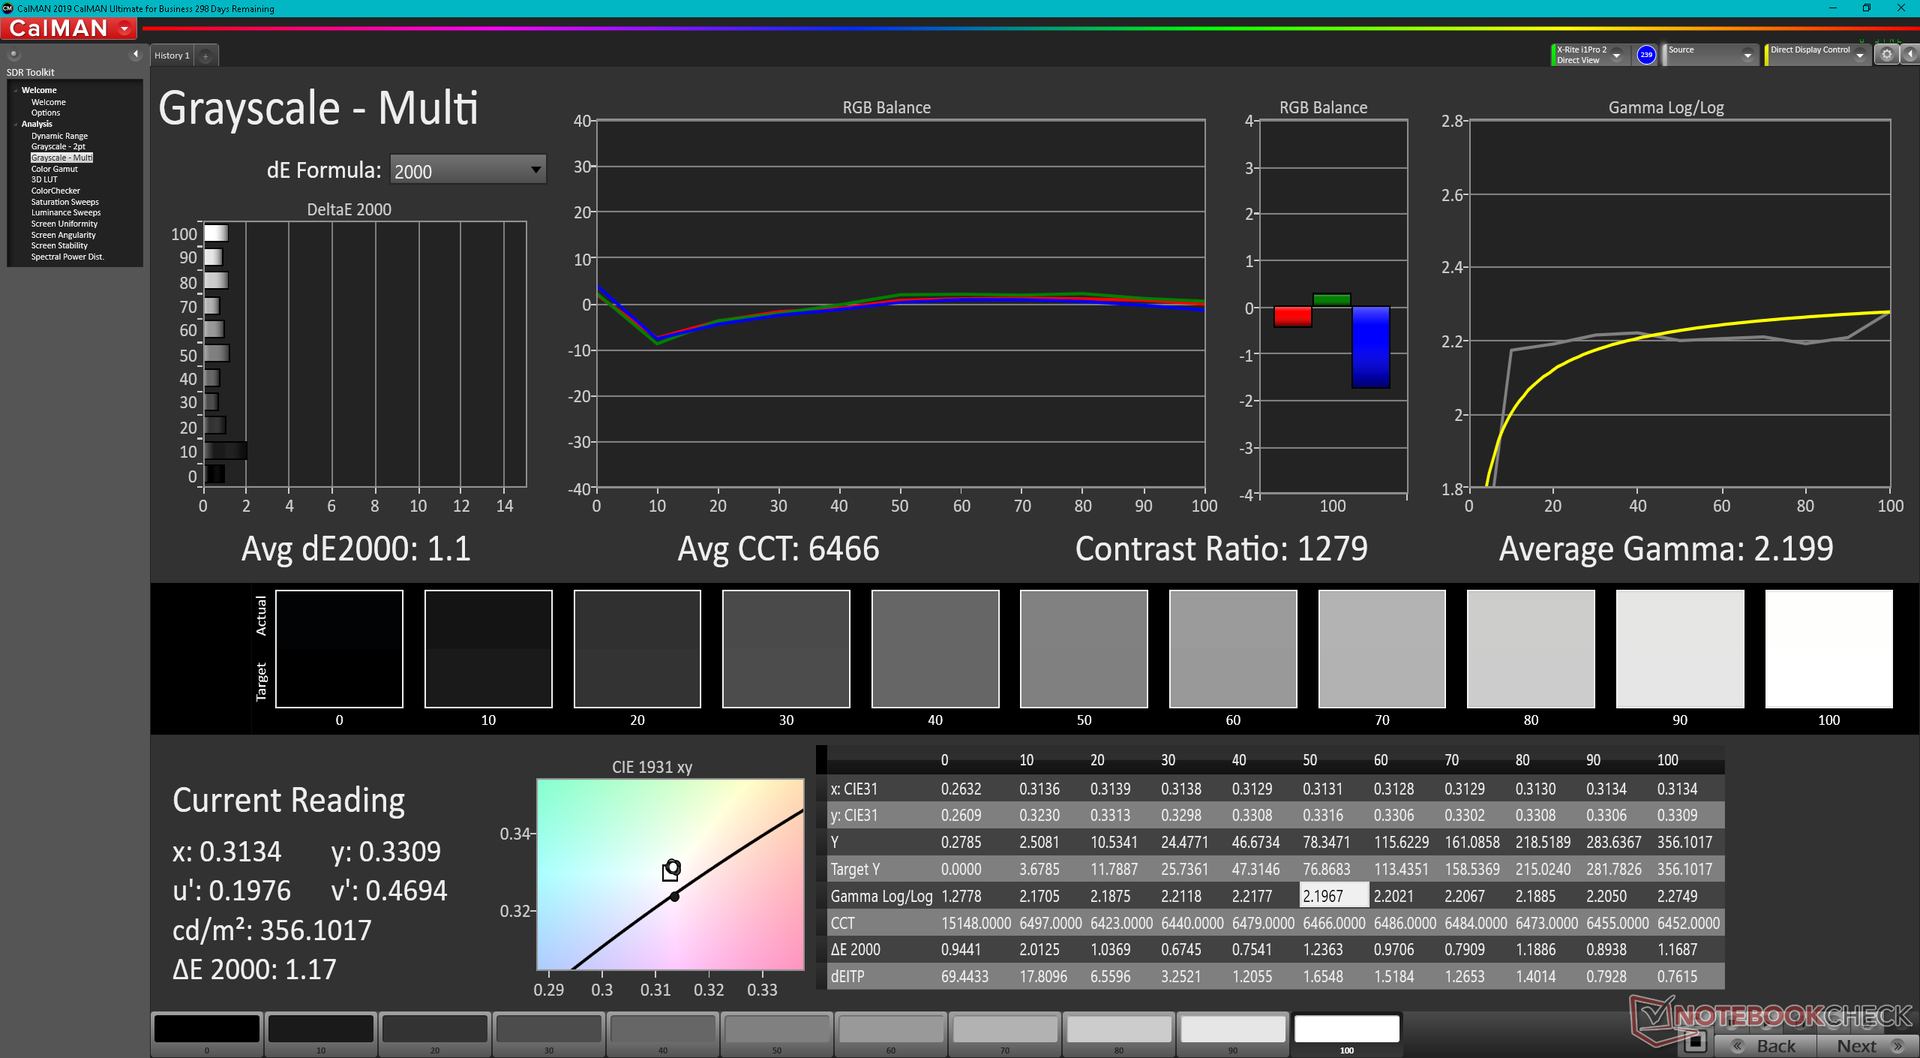
灰度在开箱后没有得到很好的校准,由于6100K左右的暖色温,其平均deltaE值相对较高,为6.6。一旦用X-Rite色度计进行校准,灰度和ColorChecker都会得到改善,最终的平均deltaE值分别只有1.1和1.67。
Display Response Times
| ↔ Response Time Black to White | ||
|---|---|---|
| 13.6 ms ... rise ↗ and fall ↘ combined | ↗ 7.6 ms rise | 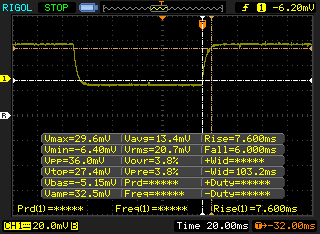 |
| ↘ 6 ms fall | ||
| The screen shows good response rates in our tests, but may be too slow for competitive gamers. In comparison, all tested devices range from 0.1 (minimum) to 240 (maximum) ms. » 34 % of all devices are better. This means that the measured response time is better than the average of all tested devices (19.8 ms). | ||
| ↔ Response Time 50% Grey to 80% Grey | ||
| 14.8 ms ... rise ↗ and fall ↘ combined | ↗ 8 ms rise | 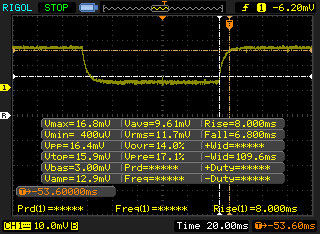 |
| ↘ 6.8 ms fall | ||
| The screen shows good response rates in our tests, but may be too slow for competitive gamers. In comparison, all tested devices range from 0.165 (minimum) to 636 (maximum) ms. » 29 % of all devices are better. This means that the measured response time is better than the average of all tested devices (31 ms). | ||
Screen Flickering / PWM (Pulse-Width Modulation)
| Screen flickering / PWM not detected | 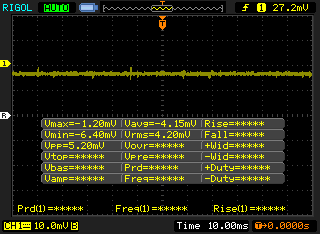 | ||
In comparison: 52 % of all tested devices do not use PWM to dim the display. If PWM was detected, an average of 7757 (minimum: 5 - maximum: 343500) Hz was measured. | |||
性能--对于尺寸来说是极端的
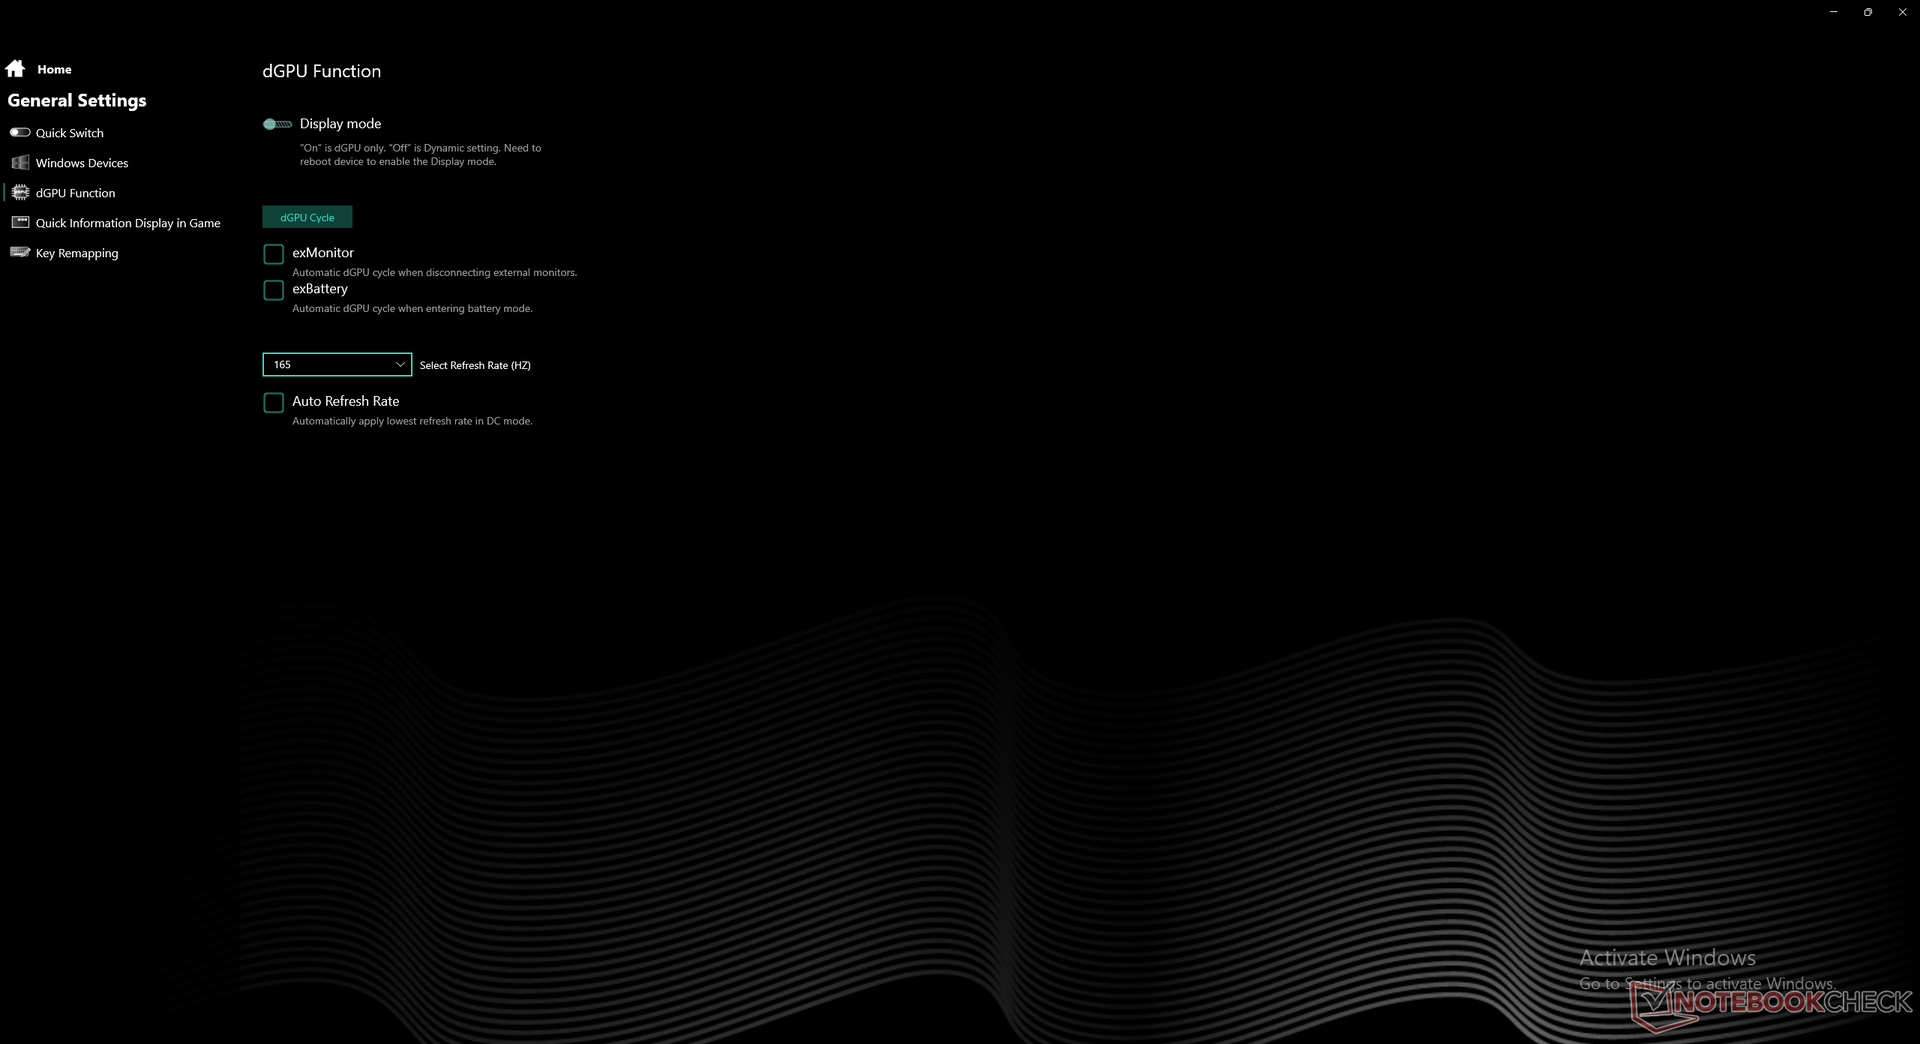
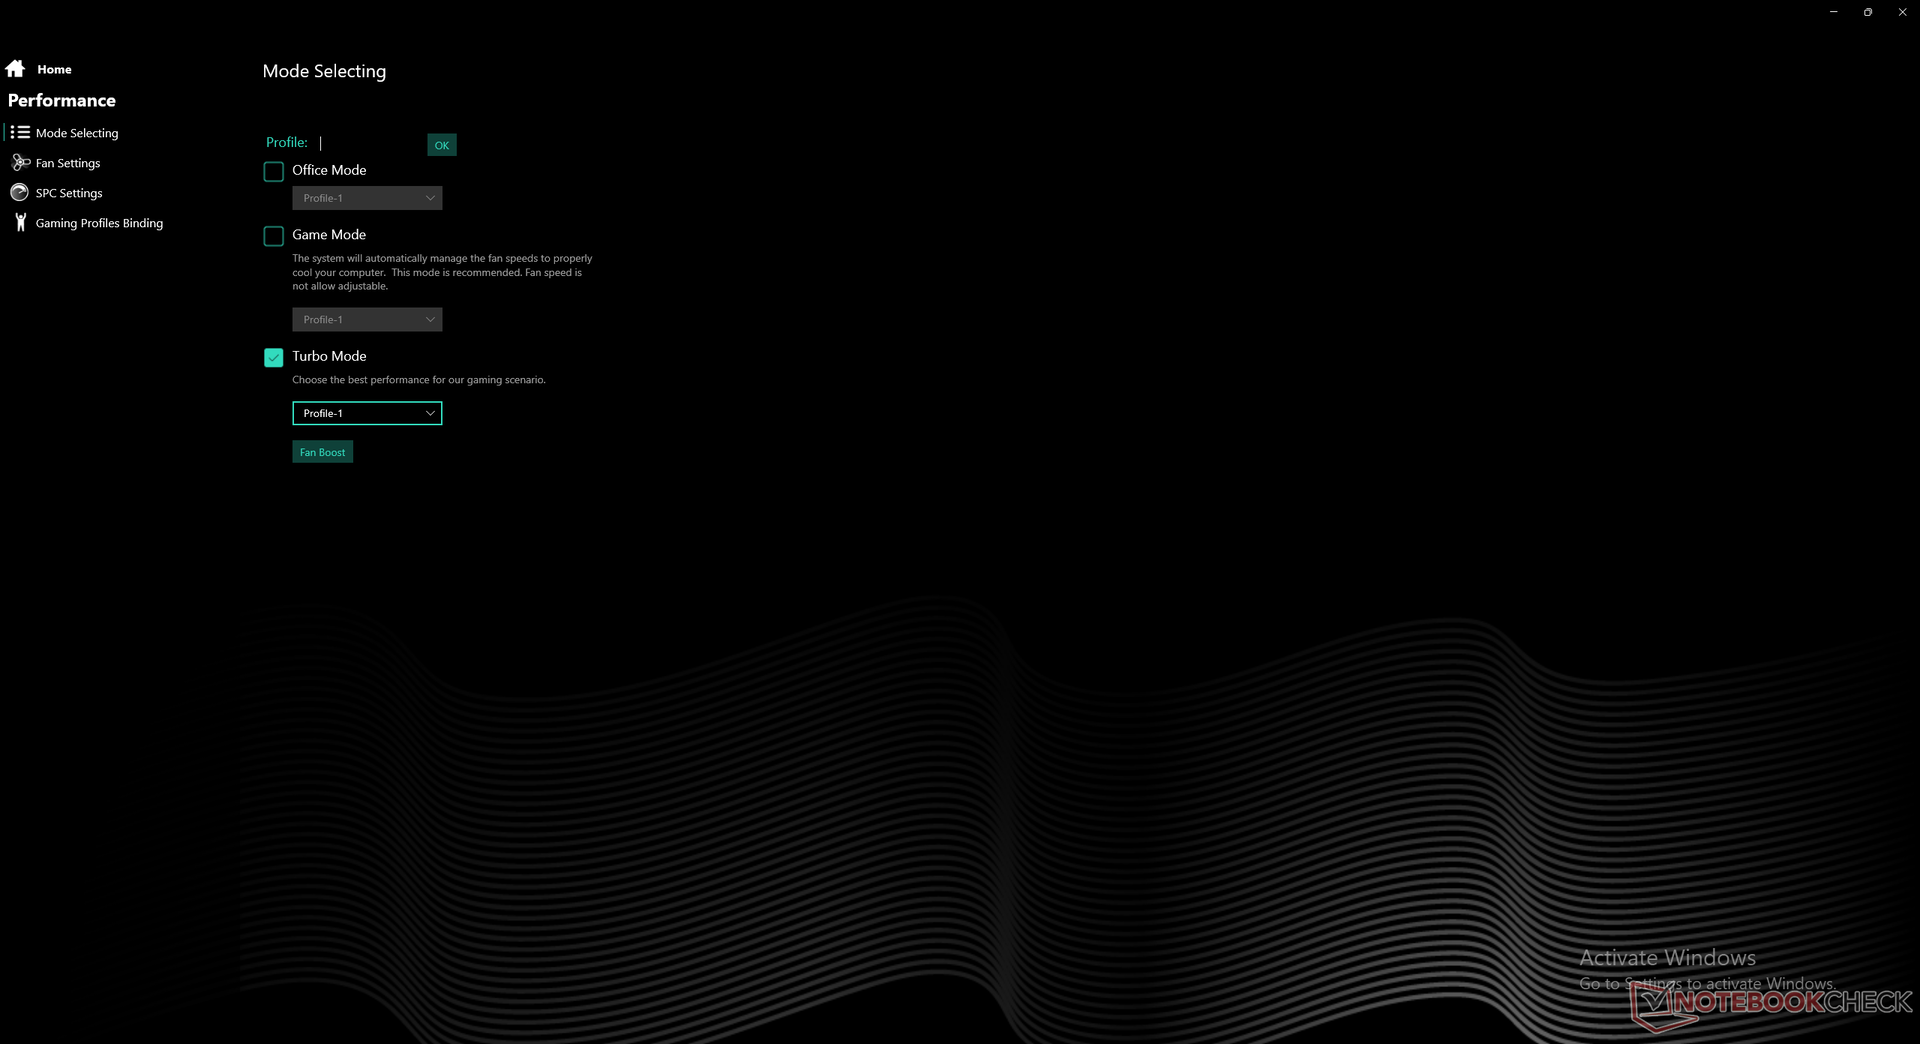
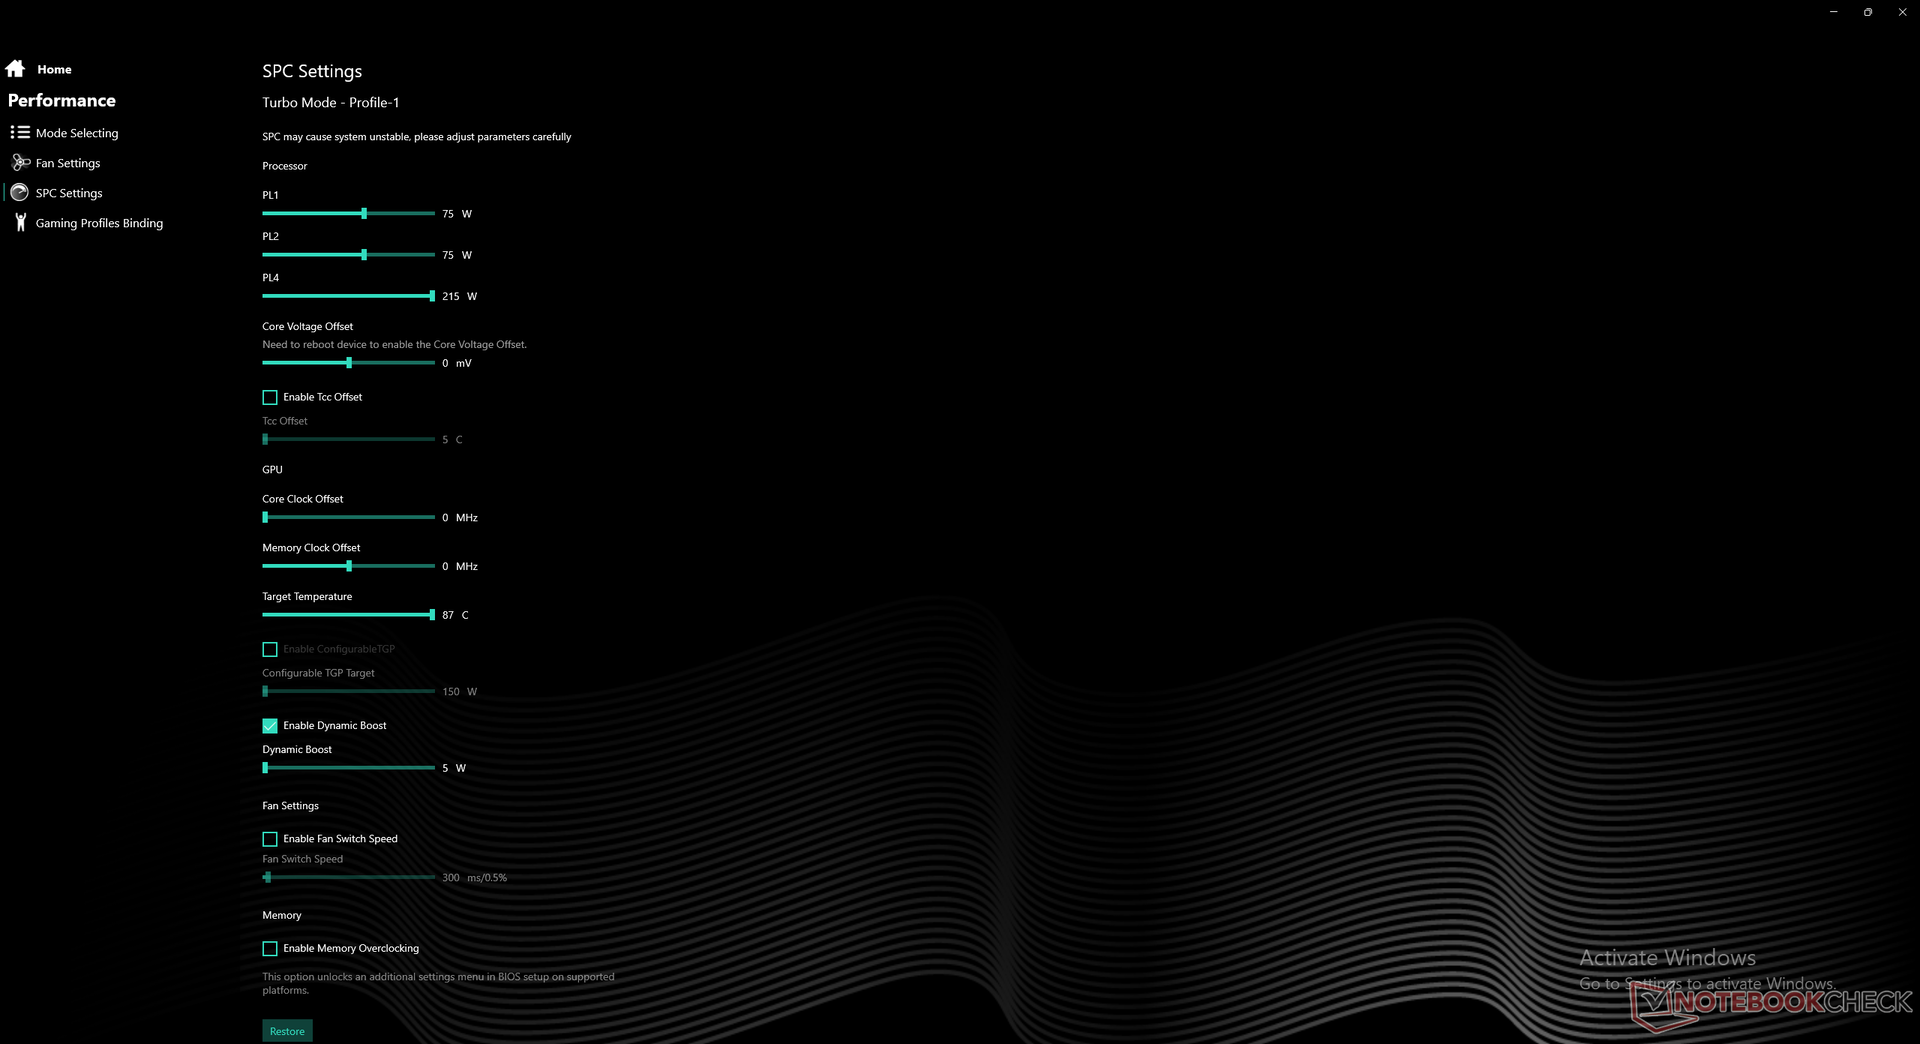
高级优化(或优化2.0)不可用,这意味着用户将不得不通过BIOS在独立GPU和MSHybrid之间手动切换。此外,请记住,GeForce RTX 3080 Ti GPU默认设置为150 W TGP,尽管Nvidia控制面板指出它能够达到175 W。用户必须通过附带的控制中心软件将GPU手动设置为175 W。
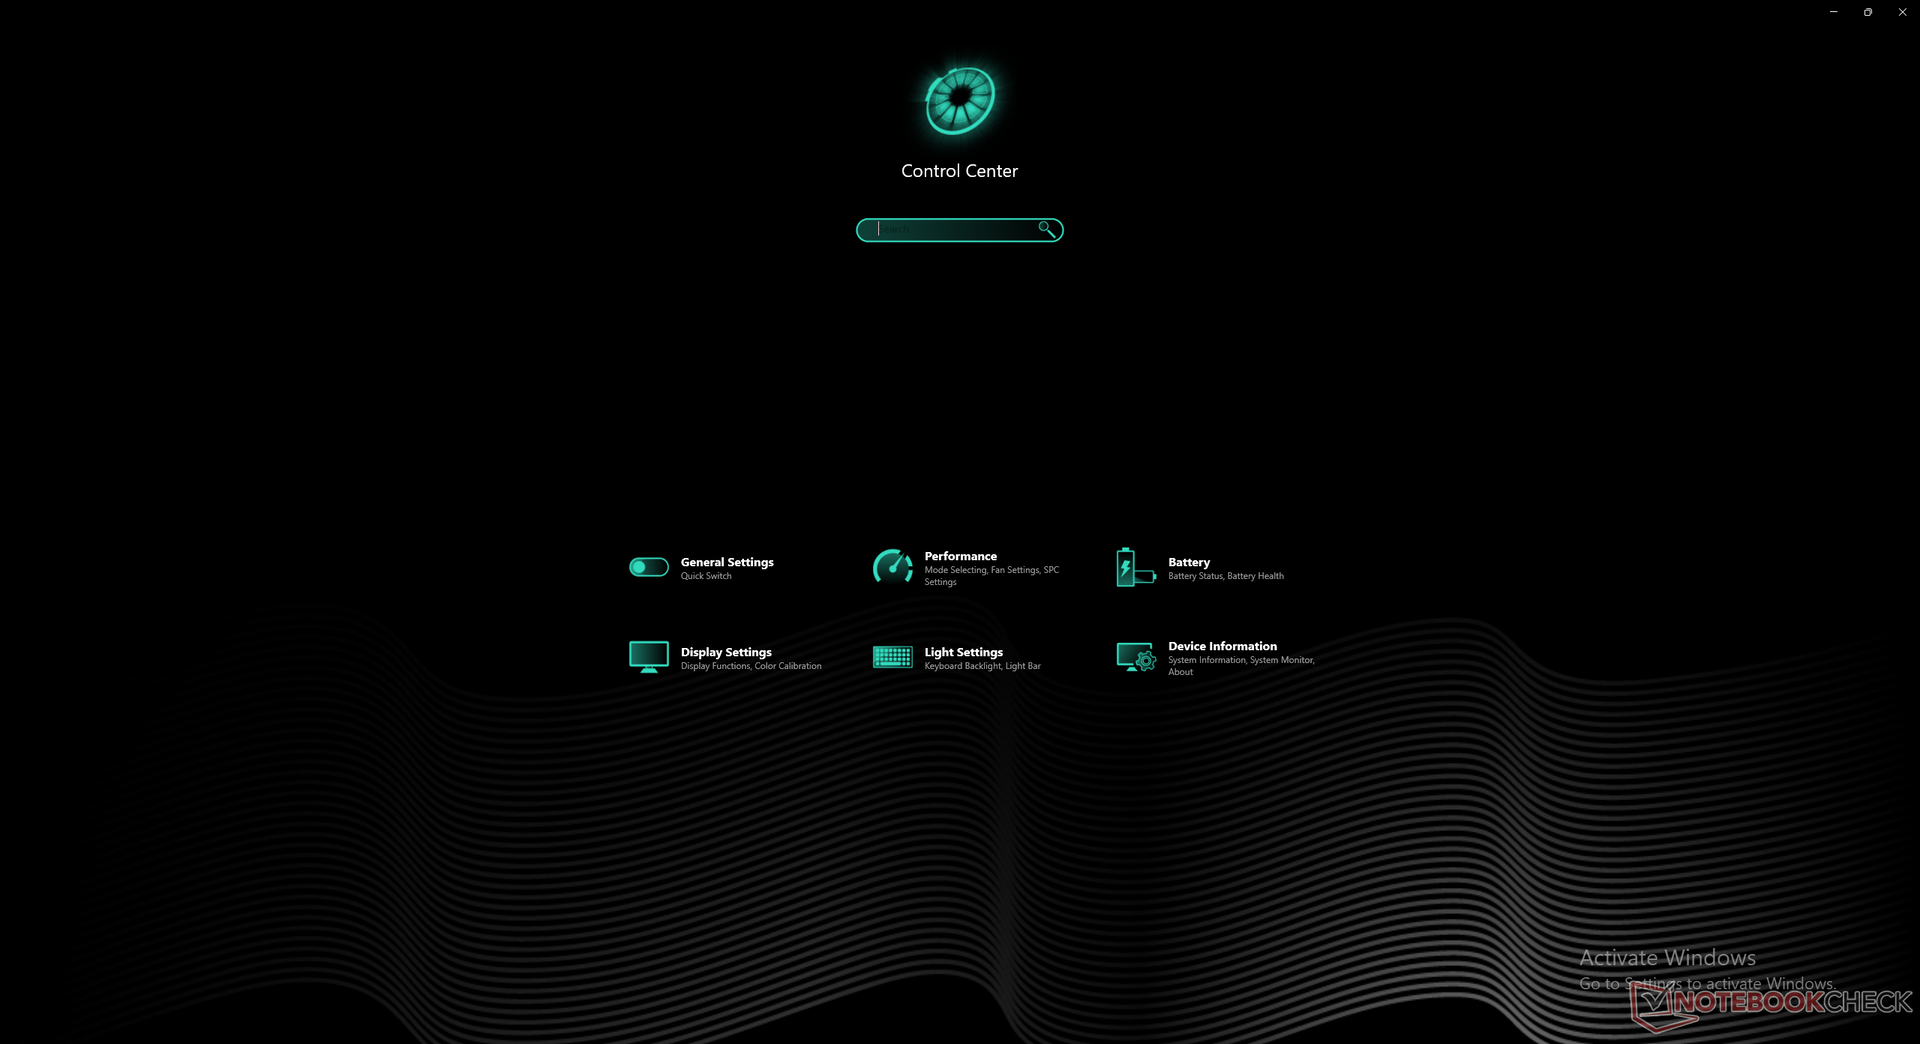
测试条件
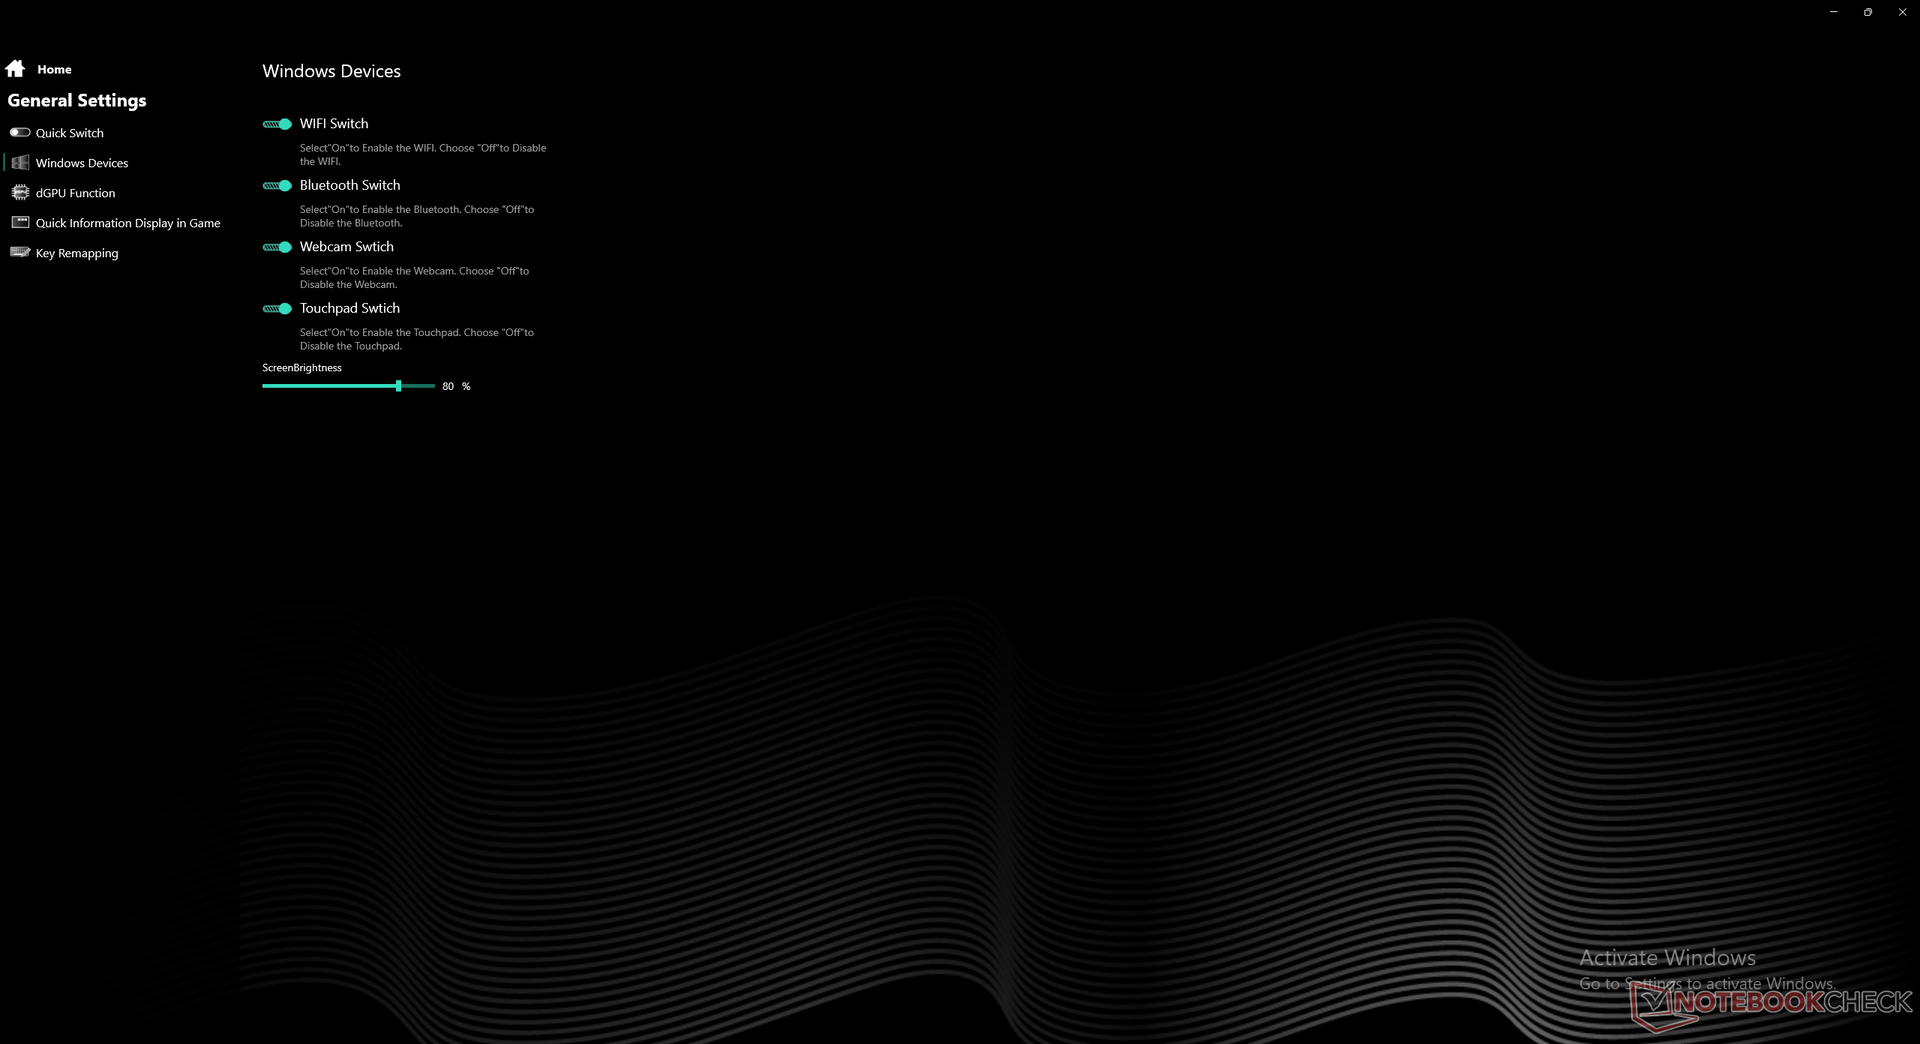
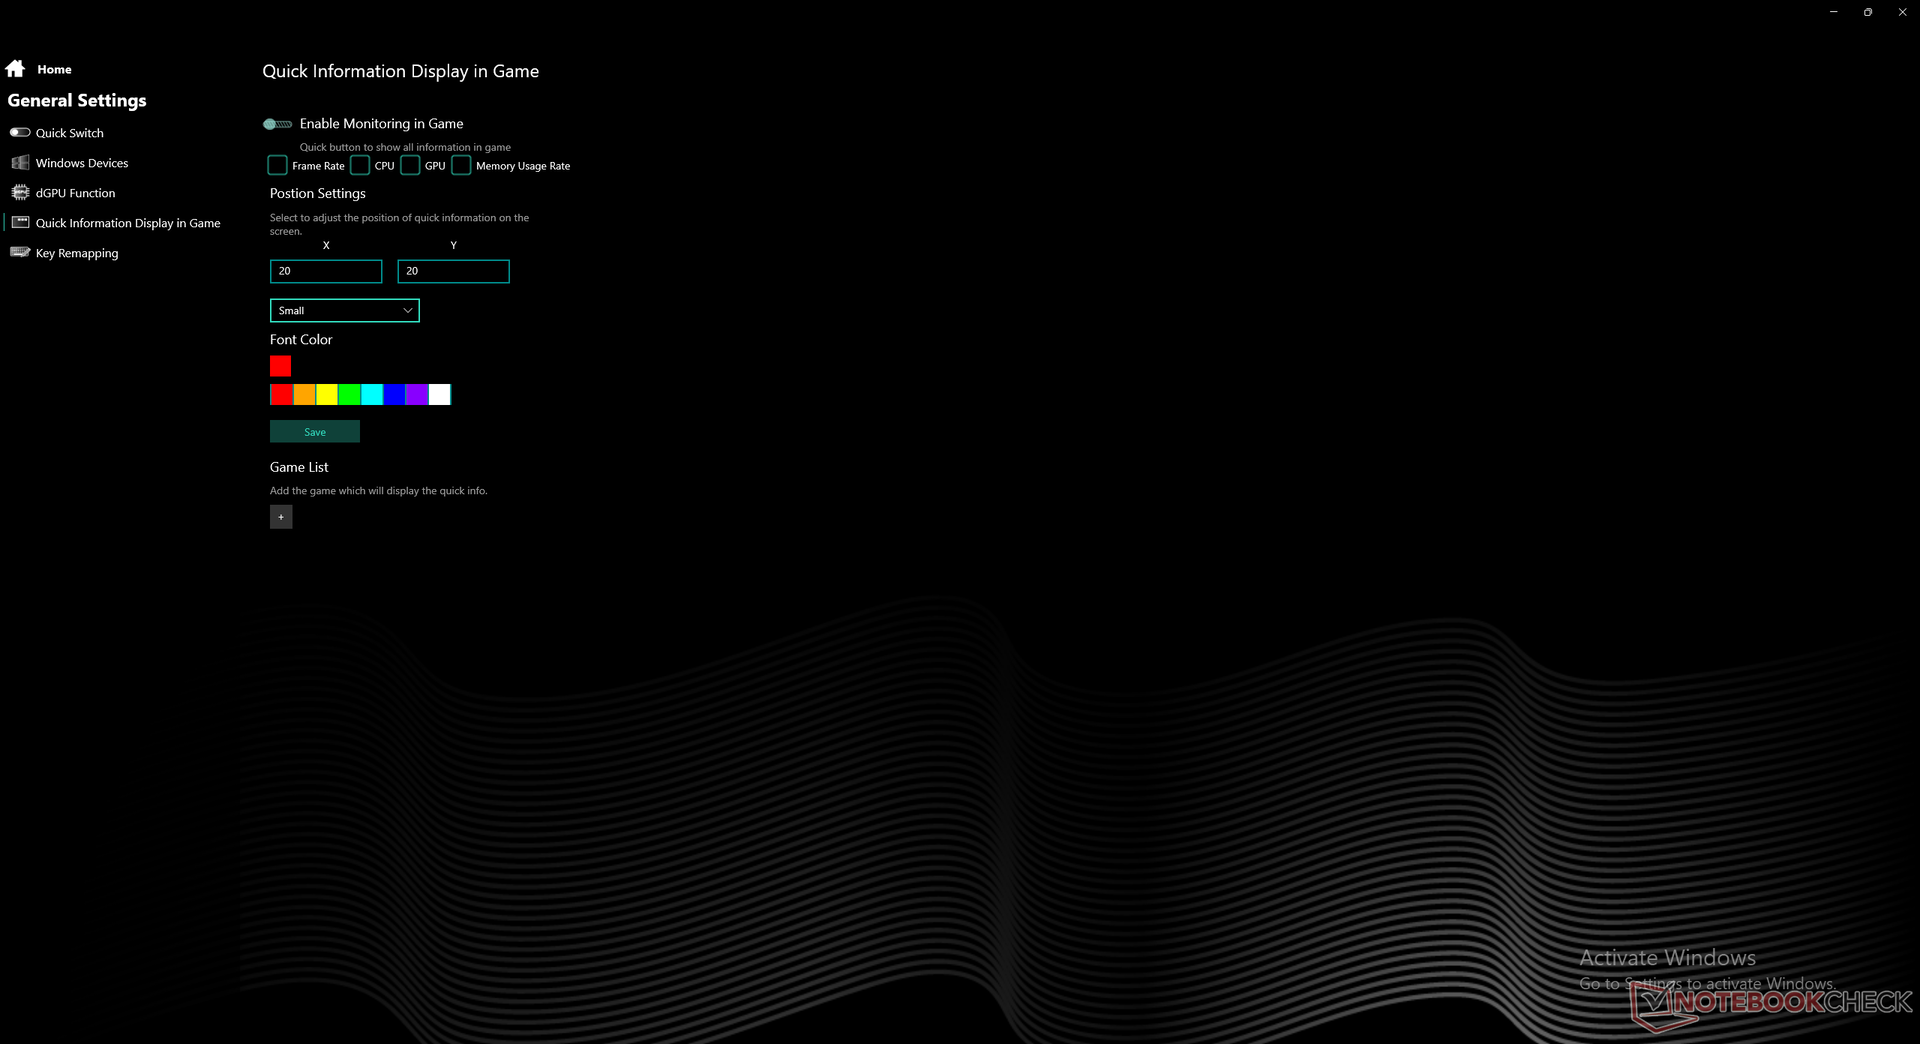
在运行以下任何性能基准测试之前,我们将我们的设备设置为默认的BIOS和控制中心设置,尽管涡轮增压电源配置文件处于激活状态。 我们强烈建议用户熟悉控制中心,因为重要的功能在这里被切换。

处理器--明显的跨代改进
原始的CPU性能只比普通的CPU慢大约9%。 酷睿i9-12900HK上发现的 微星GE76.当与上一代的 酷睿i9-11900H的情况下,该 酷睿i9-12900H直接取代,用户可以期待单线程和多线程性能分别提高约20%和30%。这一提升足以推动新的英特尔CPU高于 Ryzen 7 5800H和 Ryzen 9 5900HX它们是一些最快的移动Zen 3 CPU。
关于桤木湖平台的其他细节可以在我们的概述中找到 这里.
Cinebench R15 Multi Loop
Cinebench R23: Multi Core | Single Core
Cinebench R20: CPU (Multi Core) | CPU (Single Core)
Cinebench R15: CPU Multi 64Bit | CPU Single 64Bit
Blender: v2.79 BMW27 CPU
7-Zip 18.03: 7z b 4 | 7z b 4 -mmt1
Geekbench 5.5: Multi-Core | Single-Core
HWBOT x265 Benchmark v2.2: 4k Preset
LibreOffice : 20 Documents To PDF
R Benchmark 2.5: Overall mean
| CPU Performance rating | |
| Average of class Gaming | |
| MSI GE76 Raider | |
| Schenker Uniwill Technology GM7AG8P | |
| Average Intel Core i9-12900H | |
| Schenker XMG Ultra 17 Rocket Lake | |
| MSI WE76 11UM-456 -1! | |
| MSI GS76 Stealth 11UH | |
| Medion Erazer Beast X25 | |
| Schenker XMG Apex 17 M21 | |
| Gigabyte A7 X1 | |
| Maingear Vector Pro MG-VCP17 -2! | |
| Alienware m17 R4 | |
| Lenovo ThinkPad P73-20QR0030GE | |
| Schenker XMG Core 17 (Early 2021) | |
| Acer Aspire 5 A517-52G-79Z5 | |
| Cinebench R23 / Multi Core | |
| Average of class Gaming (10488 - 42661, n=107, last 2 years) | |
| MSI GE76 Raider | |
| Schenker Uniwill Technology GM7AG8P | |
| Average Intel Core i9-12900H (7359 - 19648, n=28) | |
| Schenker XMG Ultra 17 Rocket Lake | |
| MSI WE76 11UM-456 | |
| MSI GS76 Stealth 11UH | |
| Schenker XMG Apex 17 M21 | |
| Gigabyte A7 X1 | |
| Medion Erazer Beast X25 | |
| Maingear Vector Pro MG-VCP17 | |
| Alienware m17 R4 | |
| Lenovo ThinkPad P73-20QR0030GE | |
| Schenker XMG Core 17 (Early 2021) | |
| Acer Aspire 5 A517-52G-79Z5 | |
| Cinebench R23 / Single Core | |
| Average of class Gaming (1166 - 2415, n=107, last 2 years) | |
| Schenker Uniwill Technology GM7AG8P | |
| MSI GE76 Raider | |
| Average Intel Core i9-12900H (1634 - 1930, n=28) | |
| Schenker XMG Ultra 17 Rocket Lake | |
| MSI WE76 11UM-456 | |
| MSI GS76 Stealth 11UH | |
| Acer Aspire 5 A517-52G-79Z5 | |
| Maingear Vector Pro MG-VCP17 | |
| Medion Erazer Beast X25 | |
| Gigabyte A7 X1 | |
| Schenker XMG Apex 17 M21 | |
| Alienware m17 R4 | |
| Schenker XMG Core 17 (Early 2021) | |
| Lenovo ThinkPad P73-20QR0030GE | |
| Cinebench R20 / CPU (Multi Core) | |
| Average of class Gaming (4029 - 16433, n=106, last 2 years) | |
| MSI GE76 Raider | |
| Schenker Uniwill Technology GM7AG8P | |
| Average Intel Core i9-12900H (2681 - 7471, n=28) | |
| Schenker XMG Ultra 17 Rocket Lake | |
| Schenker XMG Apex 17 M21 | |
| MSI GS76 Stealth 11UH | |
| Gigabyte A7 X1 | |
| Medion Erazer Beast X25 | |
| Alienware m17 R4 | |
| MSI WE76 11UM-456 | |
| Maingear Vector Pro MG-VCP17 | |
| Schenker XMG Core 17 (Early 2021) | |
| Lenovo ThinkPad P73-20QR0030GE | |
| Acer Aspire 5 A517-52G-79Z5 | |
| Cinebench R20 / CPU (Single Core) | |
| Average of class Gaming (442 - 913, n=106, last 2 years) | |
| Schenker Uniwill Technology GM7AG8P | |
| MSI GE76 Raider | |
| Average Intel Core i9-12900H (624 - 738, n=28) | |
| Schenker XMG Ultra 17 Rocket Lake | |
| MSI WE76 11UM-456 | |
| MSI GS76 Stealth 11UH | |
| Medion Erazer Beast X25 | |
| Maingear Vector Pro MG-VCP17 | |
| Gigabyte A7 X1 | |
| Acer Aspire 5 A517-52G-79Z5 | |
| Schenker XMG Apex 17 M21 | |
| Alienware m17 R4 | |
| Schenker XMG Core 17 (Early 2021) | |
| Lenovo ThinkPad P73-20QR0030GE | |
| Cinebench R15 / CPU Multi 64Bit | |
| Average of class Gaming (1578 - 6330, n=105, last 2 years) | |
| MSI GE76 Raider | |
| Schenker Uniwill Technology GM7AG8P | |
| Average Intel Core i9-12900H (1395 - 3077, n=28) | |
| Schenker XMG Ultra 17 Rocket Lake | |
| MSI WE76 11UM-456 | |
| MSI GS76 Stealth 11UH | |
| Gigabyte A7 X1 | |
| Schenker XMG Apex 17 M21 | |
| Medion Erazer Beast X25 | |
| Maingear Vector Pro MG-VCP17 | |
| Alienware m17 R4 | |
| Lenovo ThinkPad P73-20QR0030GE | |
| Schenker XMG Core 17 (Early 2021) | |
| Acer Aspire 5 A517-52G-79Z5 | |
| Cinebench R15 / CPU Single 64Bit | |
| Average of class Gaming (188.8 - 350, n=106, last 2 years) | |
| MSI GE76 Raider | |
| Schenker Uniwill Technology GM7AG8P | |
| Average Intel Core i9-12900H (235 - 277, n=29) | |
| Schenker XMG Ultra 17 Rocket Lake | |
| MSI WE76 11UM-456 | |
| Gigabyte A7 X1 | |
| Medion Erazer Beast X25 | |
| MSI GS76 Stealth 11UH | |
| Schenker XMG Apex 17 M21 | |
| Maingear Vector Pro MG-VCP17 | |
| Acer Aspire 5 A517-52G-79Z5 | |
| Alienware m17 R4 | |
| Schenker XMG Core 17 (Early 2021) | |
| Lenovo ThinkPad P73-20QR0030GE | |
| Blender / v2.79 BMW27 CPU | |
| Acer Aspire 5 A517-52G-79Z5 | |
| Lenovo ThinkPad P73-20QR0030GE | |
| Schenker XMG Core 17 (Early 2021) | |
| Maingear Vector Pro MG-VCP17 | |
| Medion Erazer Beast X25 | |
| MSI GS76 Stealth 11UH | |
| Alienware m17 R4 | |
| Gigabyte A7 X1 | |
| Schenker XMG Apex 17 M21 | |
| Average Intel Core i9-12900H (160 - 451, n=28) | |
| Schenker XMG Ultra 17 Rocket Lake | |
| Schenker Uniwill Technology GM7AG8P | |
| MSI GE76 Raider | |
| Average of class Gaming (79 - 330, n=104, last 2 years) | |
| 7-Zip 18.03 / 7z b 4 | |
| Average of class Gaming (33491 - 148086, n=105, last 2 years) | |
| MSI GE76 Raider | |
| Schenker Uniwill Technology GM7AG8P | |
| Average Intel Core i9-12900H (34684 - 76677, n=28) | |
| Schenker XMG Apex 17 M21 | |
| Medion Erazer Beast X25 | |
| Schenker XMG Ultra 17 Rocket Lake | |
| Gigabyte A7 X1 | |
| Maingear Vector Pro MG-VCP17 | |
| MSI WE76 11UM-456 | |
| MSI GS76 Stealth 11UH | |
| Alienware m17 R4 | |
| Lenovo ThinkPad P73-20QR0030GE | |
| Schenker XMG Core 17 (Early 2021) | |
| Acer Aspire 5 A517-52G-79Z5 | |
| 7-Zip 18.03 / 7z b 4 -mmt1 | |
| Average of class Gaming (4199 - 7436, n=105, last 2 years) | |
| Schenker XMG Ultra 17 Rocket Lake | |
| MSI GE76 Raider | |
| Schenker Uniwill Technology GM7AG8P | |
| Average Intel Core i9-12900H (5302 - 6289, n=28) | |
| MSI WE76 11UM-456 | |
| Gigabyte A7 X1 | |
| Medion Erazer Beast X25 | |
| MSI GS76 Stealth 11UH | |
| Schenker XMG Apex 17 M21 | |
| Alienware m17 R4 | |
| Maingear Vector Pro MG-VCP17 | |
| Schenker XMG Core 17 (Early 2021) | |
| Acer Aspire 5 A517-52G-79Z5 | |
| Lenovo ThinkPad P73-20QR0030GE | |
| Geekbench 5.5 / Multi-Core | |
| Average of class Gaming (6460 - 28263, n=105, last 2 years) | |
| MSI GE76 Raider | |
| Schenker Uniwill Technology GM7AG8P | |
| Average Intel Core i9-12900H (8519 - 14376, n=31) | |
| Schenker XMG Ultra 17 Rocket Lake | |
| MSI WE76 11UM-456 | |
| MSI GS76 Stealth 11UH | |
| Medion Erazer Beast X25 | |
| Schenker XMG Apex 17 M21 | |
| Alienware m17 R4 | |
| Gigabyte A7 X1 | |
| Lenovo ThinkPad P73-20QR0030GE | |
| Schenker XMG Core 17 (Early 2021) | |
| Acer Aspire 5 A517-52G-79Z5 | |
| Geekbench 5.5 / Single-Core | |
| Average of class Gaming (986 - 2474, n=105, last 2 years) | |
| MSI GE76 Raider | |
| Schenker Uniwill Technology GM7AG8P | |
| Average Intel Core i9-12900H (1631 - 1897, n=31) | |
| Schenker XMG Ultra 17 Rocket Lake | |
| MSI WE76 11UM-456 | |
| MSI GS76 Stealth 11UH | |
| Acer Aspire 5 A517-52G-79Z5 | |
| Gigabyte A7 X1 | |
| Medion Erazer Beast X25 | |
| Schenker XMG Apex 17 M21 | |
| Alienware m17 R4 | |
| Schenker XMG Core 17 (Early 2021) | |
| Lenovo ThinkPad P73-20QR0030GE | |
| HWBOT x265 Benchmark v2.2 / 4k Preset | |
| Average of class Gaming (11.5 - 44.4, n=105, last 2 years) | |
| MSI GE76 Raider | |
| Schenker Uniwill Technology GM7AG8P | |
| Schenker XMG Ultra 17 Rocket Lake | |
| Average Intel Core i9-12900H (8.05 - 22.5, n=28) | |
| Schenker XMG Apex 17 M21 | |
| Medion Erazer Beast X25 | |
| MSI WE76 11UM-456 | |
| MSI GS76 Stealth 11UH | |
| Gigabyte A7 X1 | |
| Alienware m17 R4 | |
| Maingear Vector Pro MG-VCP17 | |
| Lenovo ThinkPad P73-20QR0030GE | |
| Schenker XMG Core 17 (Early 2021) | |
| Acer Aspire 5 A517-52G-79Z5 | |
| LibreOffice / 20 Documents To PDF | |
| Gigabyte A7 X1 | |
| Schenker XMG Core 17 (Early 2021) | |
| Acer Aspire 5 A517-52G-79Z5 | |
| Alienware m17 R4 | |
| Lenovo ThinkPad P73-20QR0030GE | |
| Average of class Gaming (33.2 - 88.8, n=105, last 2 years) | |
| Medion Erazer Beast X25 | |
| MSI GS76 Stealth 11UH | |
| Schenker XMG Apex 17 M21 | |
| MSI WE76 11UM-456 | |
| Maingear Vector Pro MG-VCP17 | |
| Schenker Uniwill Technology GM7AG8P | |
| Average Intel Core i9-12900H (36.8 - 59.8, n=28) | |
| Schenker XMG Ultra 17 Rocket Lake | |
| MSI GE76 Raider | |
| R Benchmark 2.5 / Overall mean | |
| Lenovo ThinkPad P73-20QR0030GE | |
| Schenker XMG Core 17 (Early 2021) | |
| Alienware m17 R4 | |
| Maingear Vector Pro MG-VCP17 | |
| Acer Aspire 5 A517-52G-79Z5 | |
| MSI WE76 11UM-456 | |
| MSI GS76 Stealth 11UH | |
| Schenker XMG Apex 17 M21 | |
| Gigabyte A7 X1 | |
| Schenker XMG Ultra 17 Rocket Lake | |
| Medion Erazer Beast X25 | |
| Average Intel Core i9-12900H (0.4218 - 0.506, n=28) | |
| Average of class Gaming (0.3439 - 0.759, n=106, last 2 years) | |
| Schenker Uniwill Technology GM7AG8P | |
| MSI GE76 Raider | |
Cinebench R23: Multi Core | Single Core
Cinebench R20: CPU (Multi Core) | CPU (Single Core)
Cinebench R15: CPU Multi 64Bit | CPU Single 64Bit
Blender: v2.79 BMW27 CPU
7-Zip 18.03: 7z b 4 | 7z b 4 -mmt1
Geekbench 5.5: Multi-Core | Single-Core
HWBOT x265 Benchmark v2.2: 4k Preset
LibreOffice : 20 Documents To PDF
R Benchmark 2.5: Overall mean
* ... smaller is better
| AIDA64 / FP32 Ray-Trace | |
| Schenker Uniwill Technology GM7AG8P | |
| AIDA64 / FPU Julia | |
| Schenker Uniwill Technology GM7AG8P | |
| AIDA64 / CPU SHA3 | |
| Schenker Uniwill Technology GM7AG8P | |
| AIDA64 / CPU Queen | |
| Schenker Uniwill Technology GM7AG8P | |
| AIDA64 / FPU SinJulia | |
| Schenker Uniwill Technology GM7AG8P | |
| AIDA64 / FPU Mandel | |
| Schenker Uniwill Technology GM7AG8P | |
| AIDA64 / CPU AES | |
| Schenker Uniwill Technology GM7AG8P | |
| AIDA64 / CPU ZLib | |
| Schenker Uniwill Technology GM7AG8P | |
| Schenker XMG NEO 17 GM7TG8S | |
| Maingear Vector Pro MG-VCP17 | |
| Razer Blade 17 RTX 3070 | |
| Alienware x17 RTX 3080 P48E | |
| AIDA64 / FP64 Ray-Trace | |
| Schenker Uniwill Technology GM7AG8P | |
| AIDA64 / CPU PhotoWorxx | |
| Schenker Uniwill Technology GM7AG8P | |
系统性能
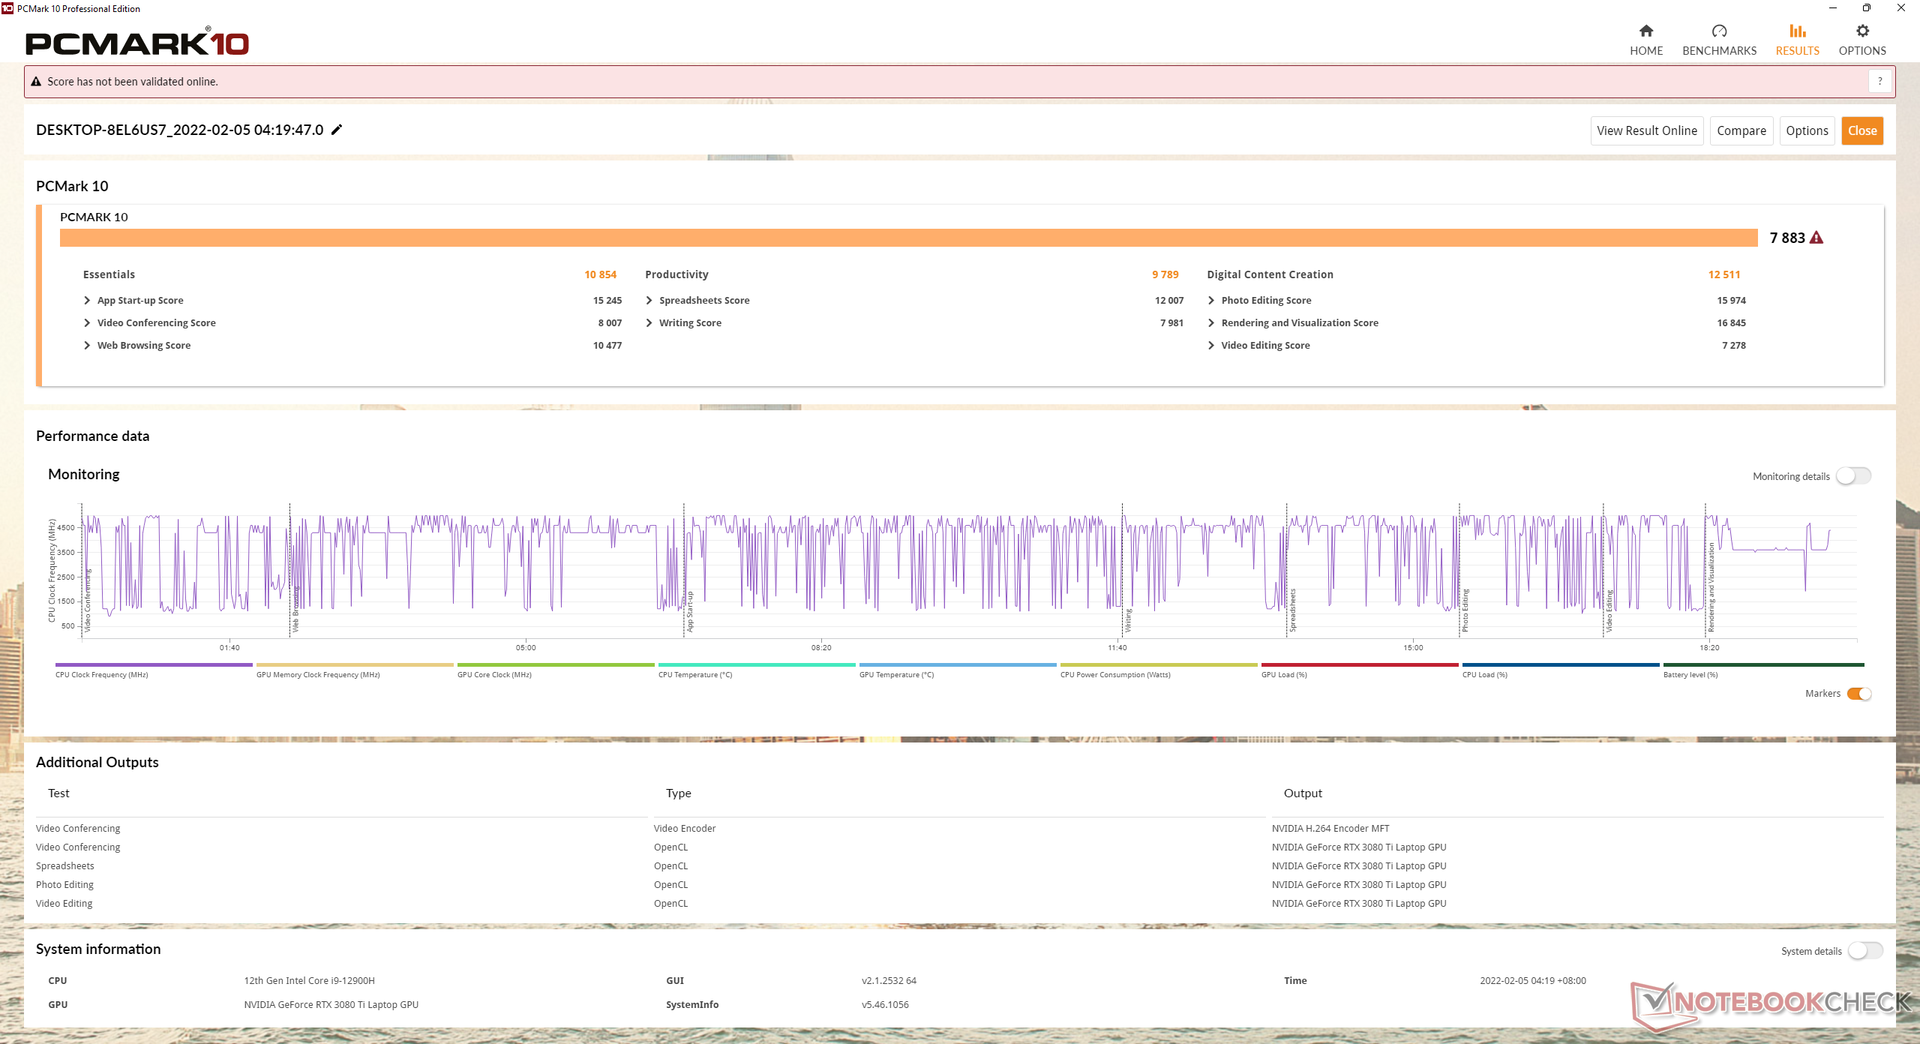
PCMark分数是我们数据库中最高的一些分数,基本上可以与配备台式机Core i9-11900K的Schenker XMG Ultra 17相媲美。
| PCMark 10 / Score | |
| Schenker XMG Ultra 17 Rocket Lake | |
| Schenker Uniwill Technology GM7AG8P | |
| Average Intel Core i9-12900H, NVIDIA GeForce RTX 3080 Ti Laptop GPU (7139 - 8083, n=6) | |
| Eurocom Sky X4C i9-9900KS | |
| Schenker XMG Ultra 17 Comet Lake | |
| Schenker XMG NEO 17 GM7TG8S | |
| Schenker XMG Apex 17 M21 | |
| PCMark 10 / Essentials | |
| Eurocom Sky X4C i9-9900KS | |
| Schenker XMG Ultra 17 Rocket Lake | |
| Schenker Uniwill Technology GM7AG8P | |
| Average Intel Core i9-12900H, NVIDIA GeForce RTX 3080 Ti Laptop GPU (10254 - 11178, n=6) | |
| Schenker XMG Ultra 17 Comet Lake | |
| Schenker XMG NEO 17 GM7TG8S | |
| Schenker XMG Apex 17 M21 | |
| PCMark 10 / Productivity | |
| Average Intel Core i9-12900H, NVIDIA GeForce RTX 3080 Ti Laptop GPU (9102 - 11186, n=6) | |
| Schenker XMG Ultra 17 Rocket Lake | |
| Schenker Uniwill Technology GM7AG8P | |
| Schenker XMG NEO 17 GM7TG8S | |
| Schenker XMG Apex 17 M21 | |
| Eurocom Sky X4C i9-9900KS | |
| Schenker XMG Ultra 17 Comet Lake | |
| PCMark 10 / Digital Content Creation | |
| Schenker Uniwill Technology GM7AG8P | |
| Schenker XMG Ultra 17 Rocket Lake | |
| Schenker XMG Ultra 17 Comet Lake | |
| Average Intel Core i9-12900H, NVIDIA GeForce RTX 3080 Ti Laptop GPU (9847 - 12627, n=6) | |
| Eurocom Sky X4C i9-9900KS | |
| Schenker XMG NEO 17 GM7TG8S | |
| Schenker XMG Apex 17 M21 | |
| PCMark 10 Score | 7883 points | |
Help | ||
| AIDA64 / Memory Copy | |
| MSI GE76 Raider | |
| Schenker Uniwill Technology GM7AG8P | |
| Schenker XMG Pro 17 (Late 2021, RTX 3080) | |
| Schenker XMG Apex 17 M21 | |
| AIDA64 / Memory Read | |
| MSI GE76 Raider | |
| Schenker Uniwill Technology GM7AG8P | |
| Schenker XMG Pro 17 (Late 2021, RTX 3080) | |
| Schenker XMG Apex 17 M21 | |
| AIDA64 / Memory Write | |
| Schenker Uniwill Technology GM7AG8P | |
| MSI GE76 Raider | |
| Schenker XMG Apex 17 M21 | |
| Schenker XMG Pro 17 (Late 2021, RTX 3080) | |
| AIDA64 / Memory Latency | |
| MSI GE76 Raider | |
| Schenker XMG Pro 17 (Late 2021, RTX 3080) | |
| Schenker XMG Apex 17 M21 | |
| Razer Blade 17 RTX 3070 | |
| Alienware x17 RTX 3080 P48E | |
| Schenker Uniwill Technology GM7AG8P | |
* ... smaller is better
DPC延时
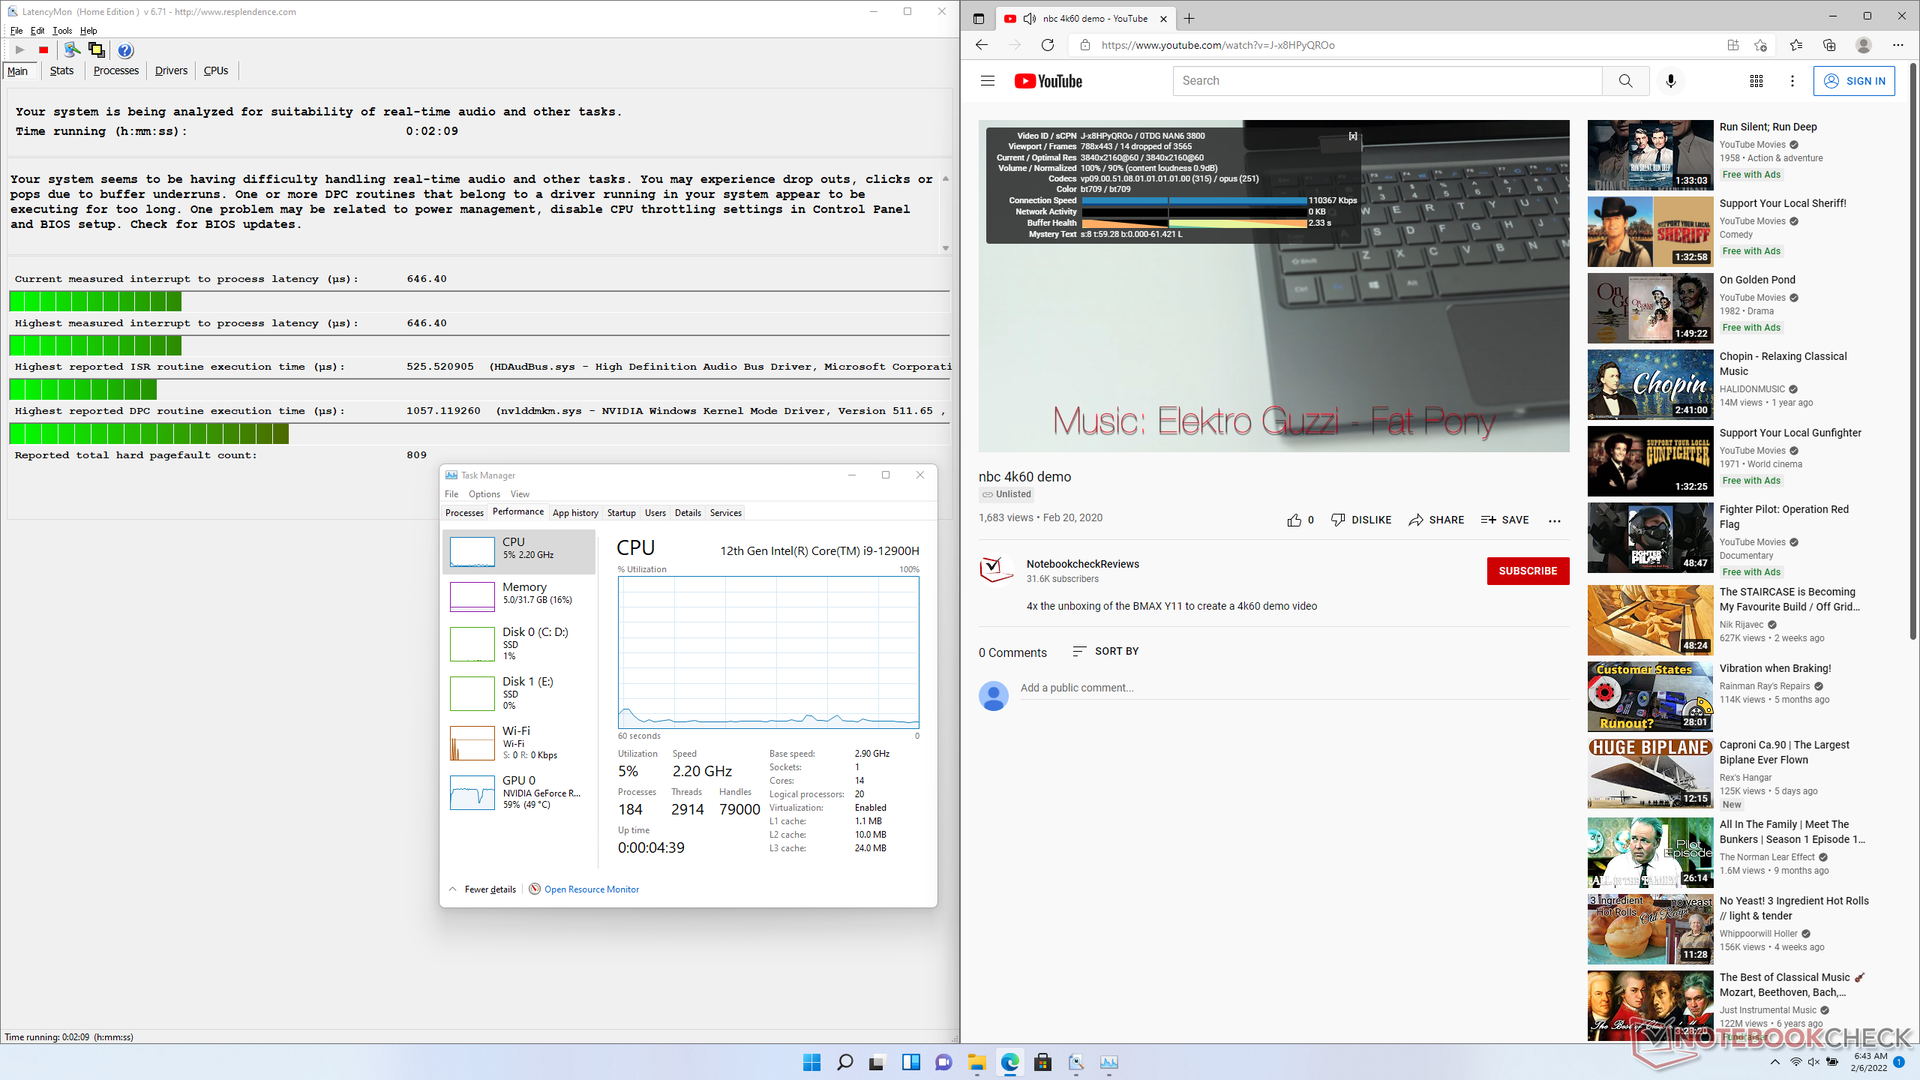
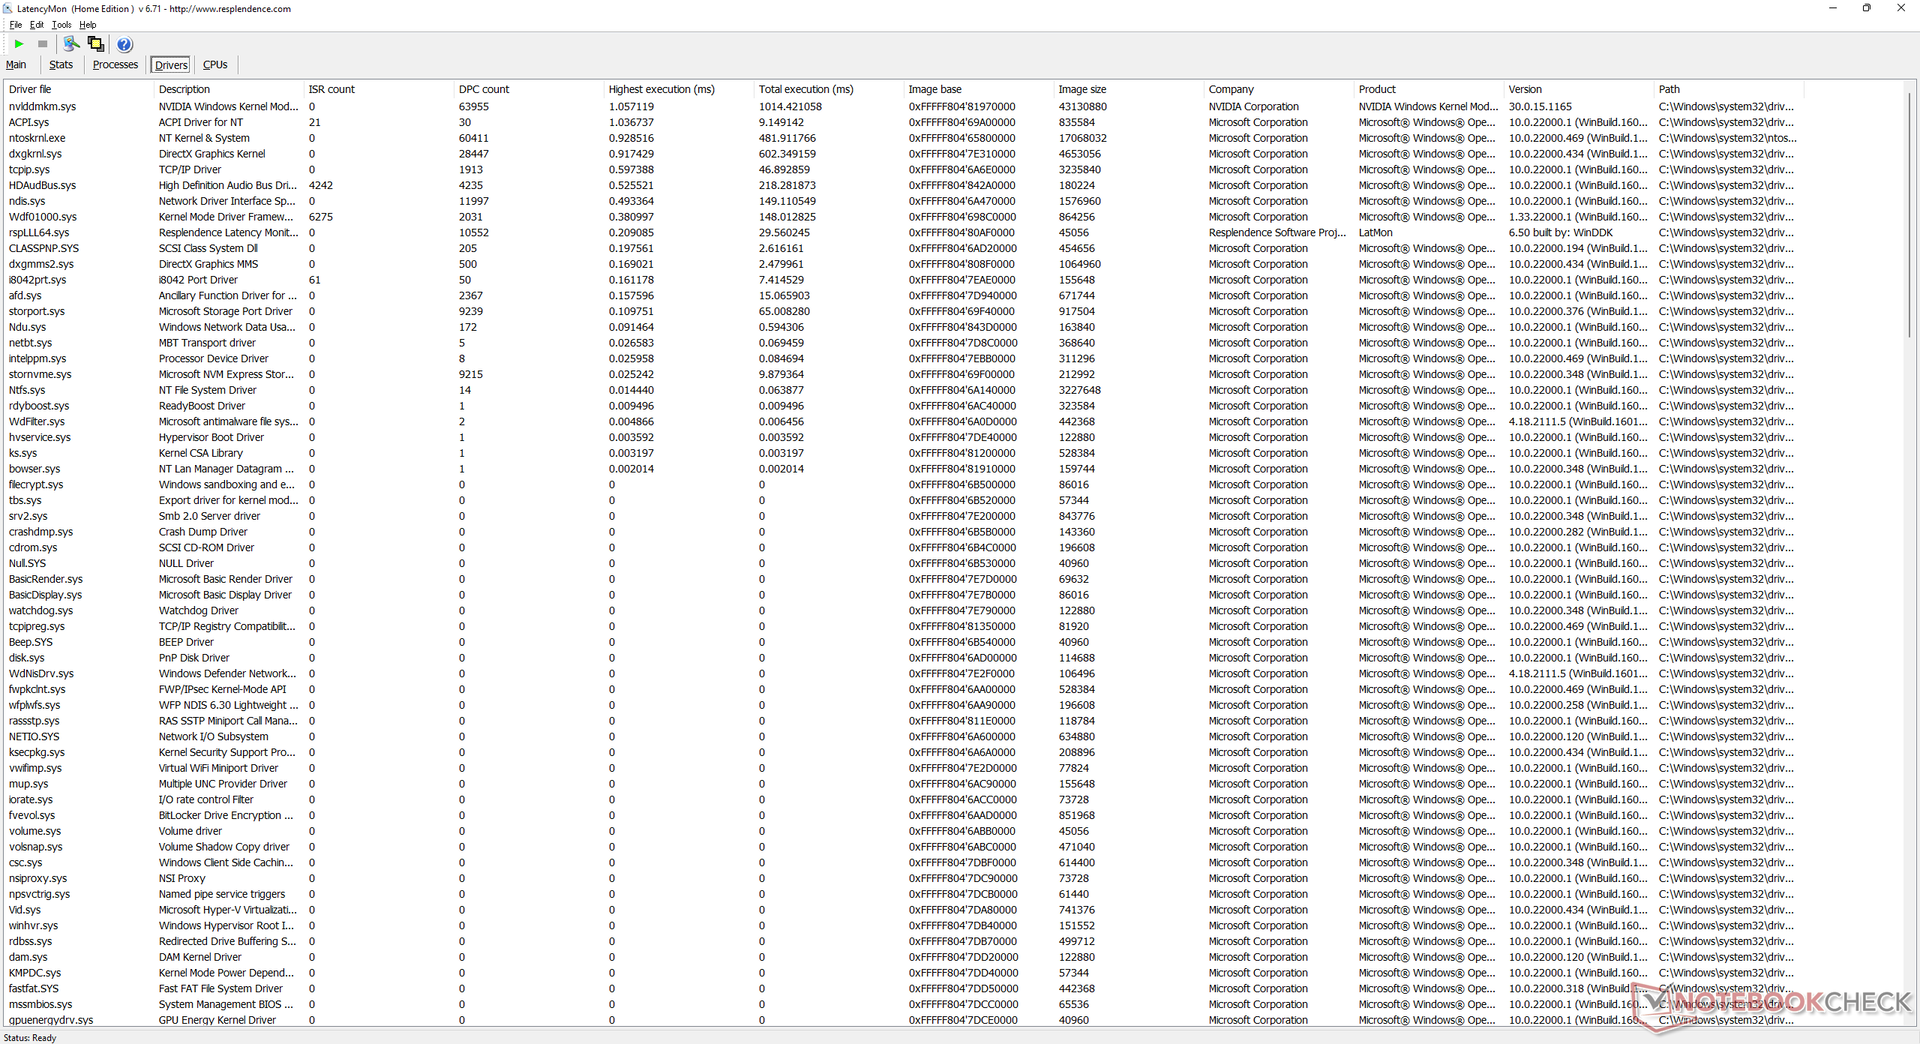
LatencyMon显示在我们的主页上打开多个标签时有轻微的DPC问题。在60 FPS下的4K视频播放很流畅,但并不完美,因为我们在长达一分钟的视频测试中能够记录到14个丢帧。
| DPC Latencies / LatencyMon - interrupt to process latency (max), Web, Youtube, Prime95 | |
| Schenker XMG NEO 17 GM7TG8S | |
| Alienware x17 RTX 3080 P48E | |
| MSI GS76 Stealth 11UH | |
| Schenker Uniwill Technology GM7AG8P | |
| Maingear Vector Pro MG-VCP17 | |
| Razer Blade 17 RTX 3070 | |
* ... smaller is better
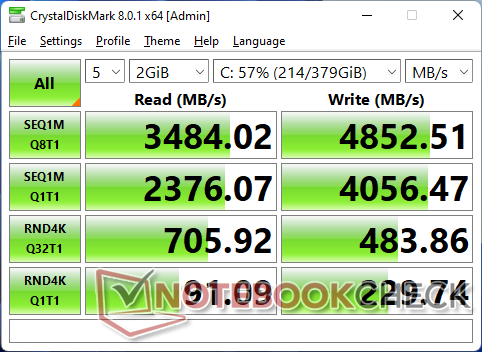
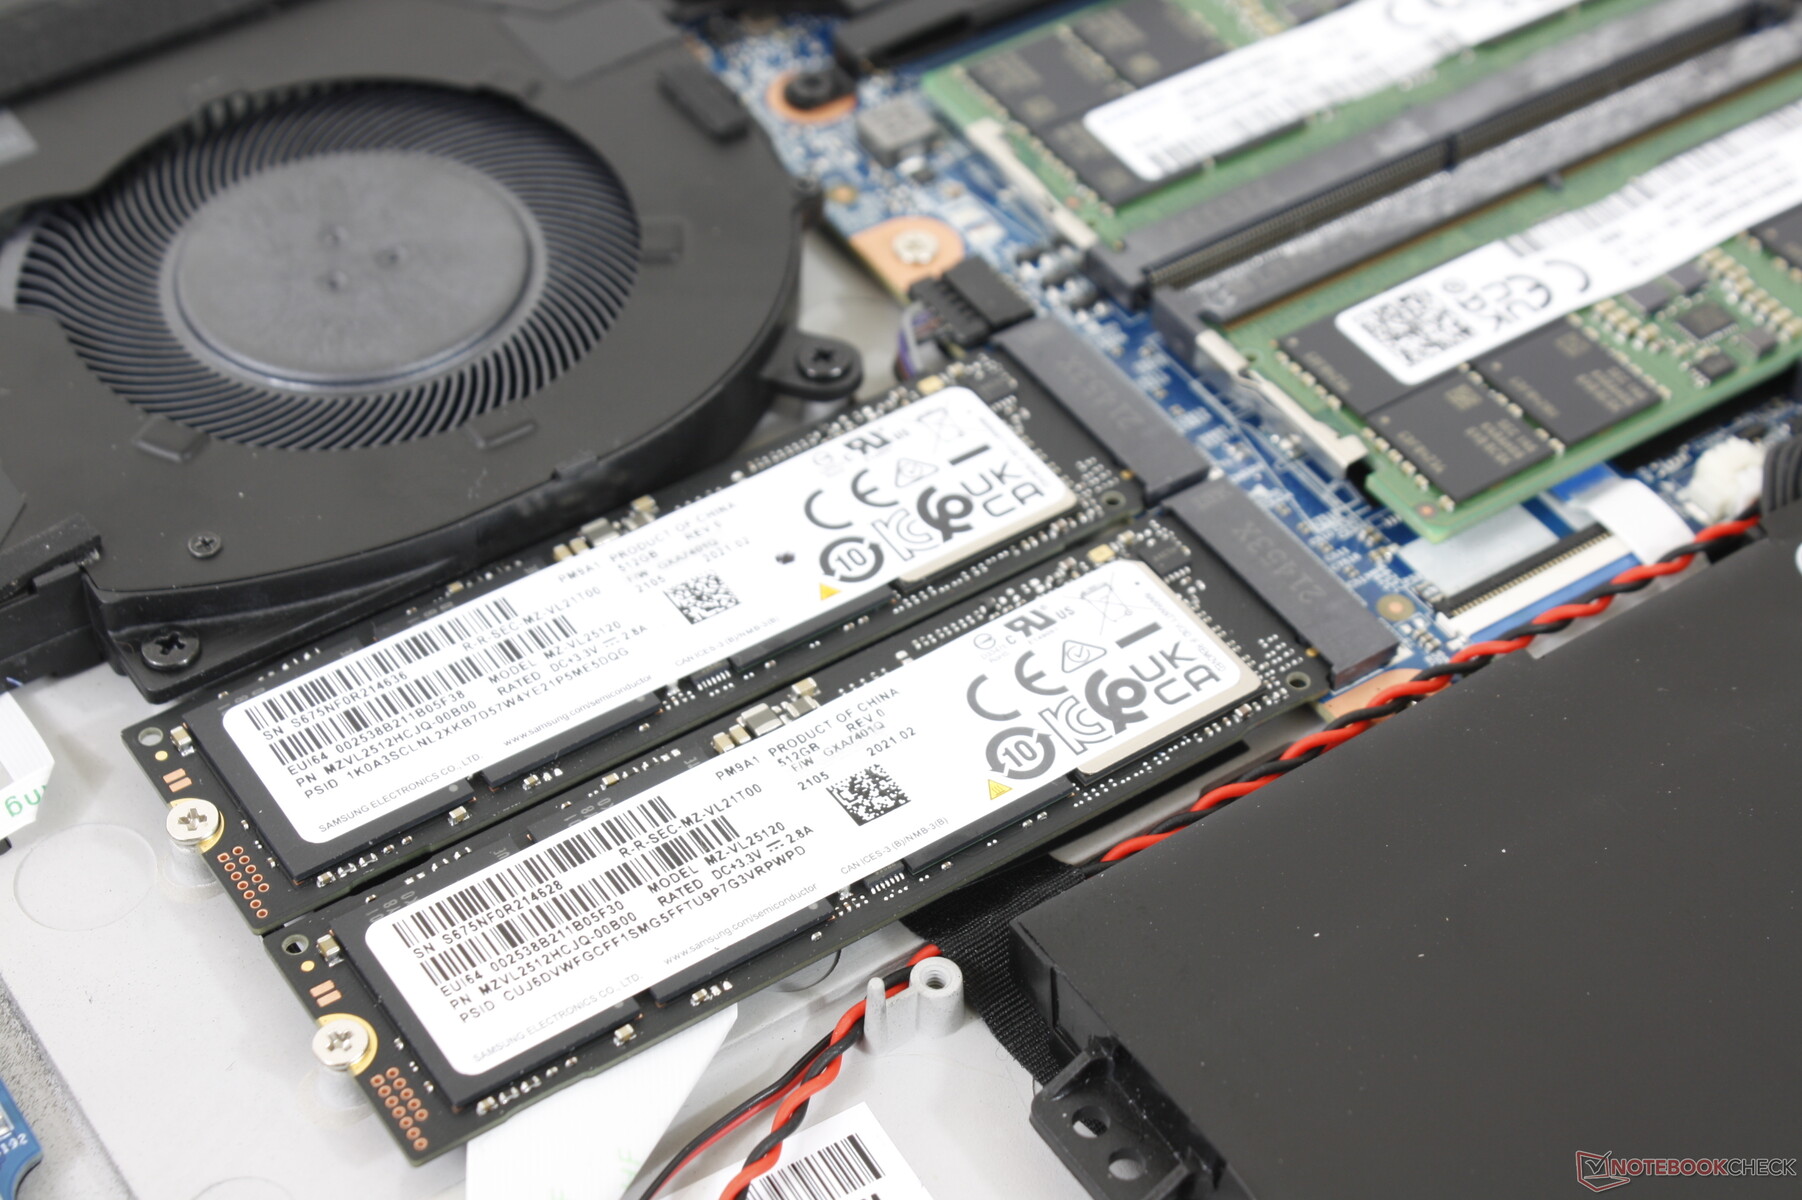
存储设备 - 2x M.2 PCIe4 x4 NVMe固态硬盘
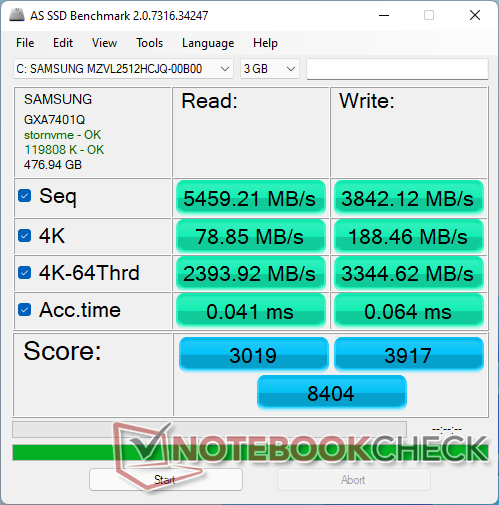
512GB的 三星PM9A1硬盘提供的连续读取和写入速度分别高达6900MB/s和5000MB/s。在循环运行DiskSpd时,我们能够达到接近最高速度,但性能最终会从悬崖上跌落,在测试结束时 "只有 "3200MB/s,如下图所示。结果表明,由于温度的限制,该硬盘可能无法长时间保持最高性能。

| Drive Performance rating - Percent | |
| Maingear Vector Pro MG-VCP17 | |
| Schenker XMG NEO 17 GM7TG8S | |
| MSI GS76 Stealth 11UH | |
| Schenker Uniwill Technology GM7AG8P | |
| Razer Blade 17 RTX 3070 | |
| Alienware x17 RTX 3080 P48E | |
* ... smaller is better
Disk Throttling: DiskSpd Read Loop, Queue Depth 8
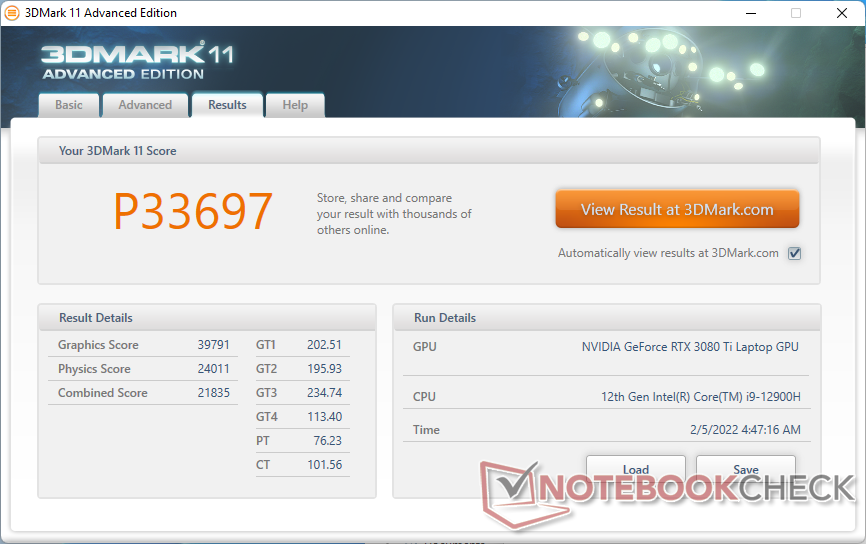
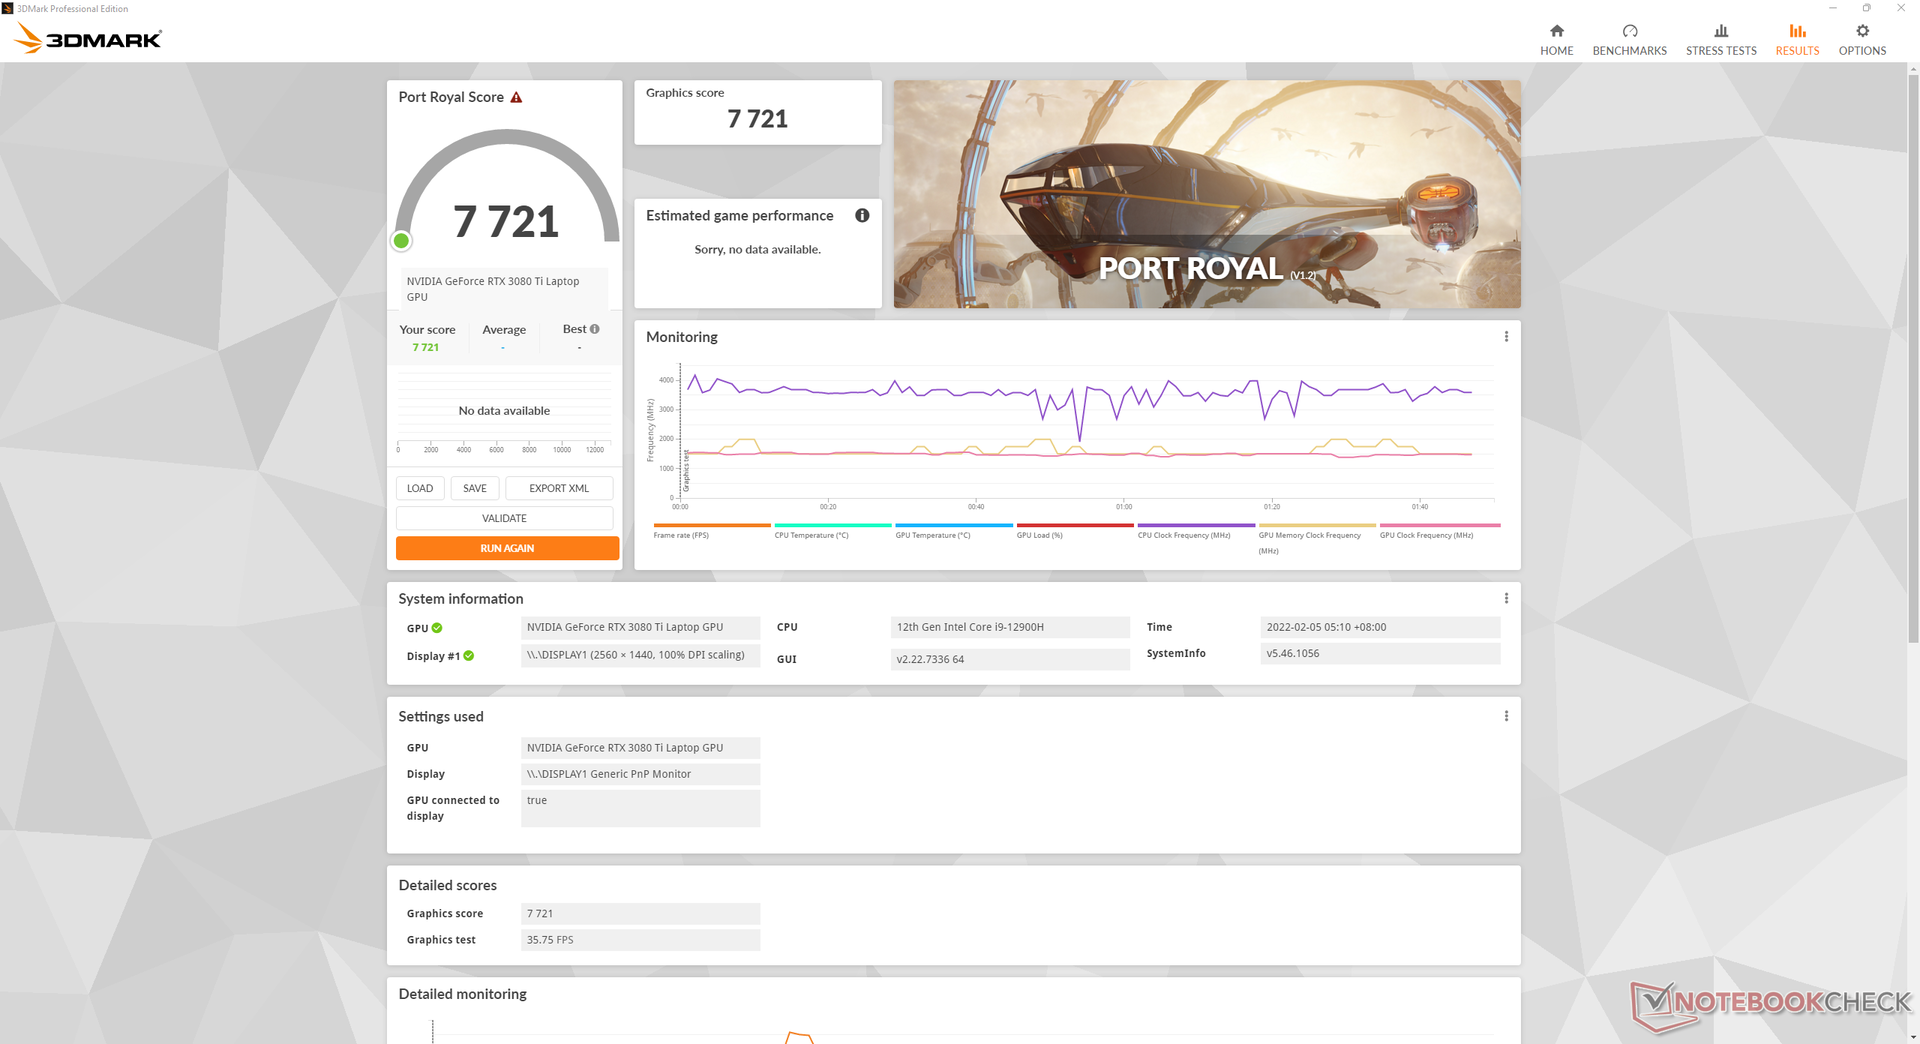
GPU性能--比移动版GeForce RTX 3080好一点
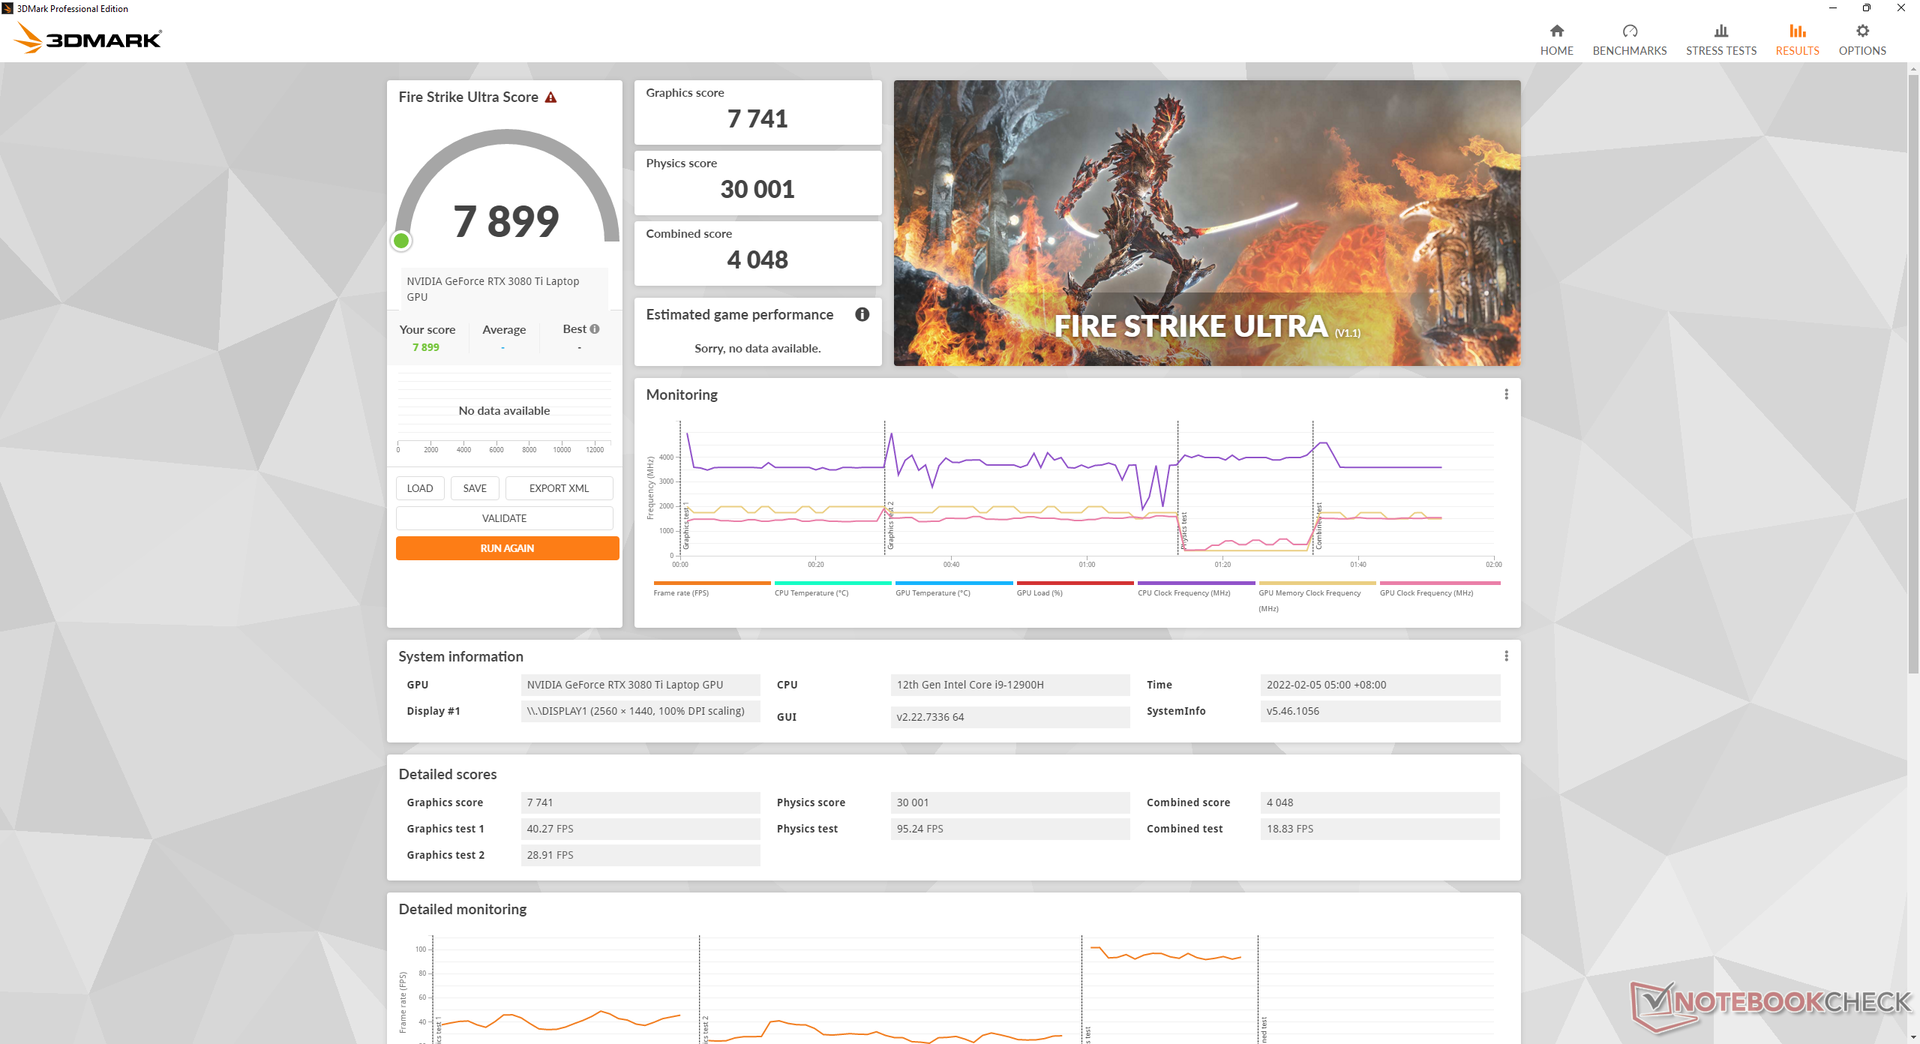
与台式机GeForce RTX 3080 Ti比台式机GeForce RTX 3080快约10%一样,笔记本GeForce RTX 3080 Ti也只比笔记本GeForce RTX 3080快约10%。预计性能与台式机GeForce RTX 3070最为相似,这与原生QHD 165 Hz显示屏完美契合。
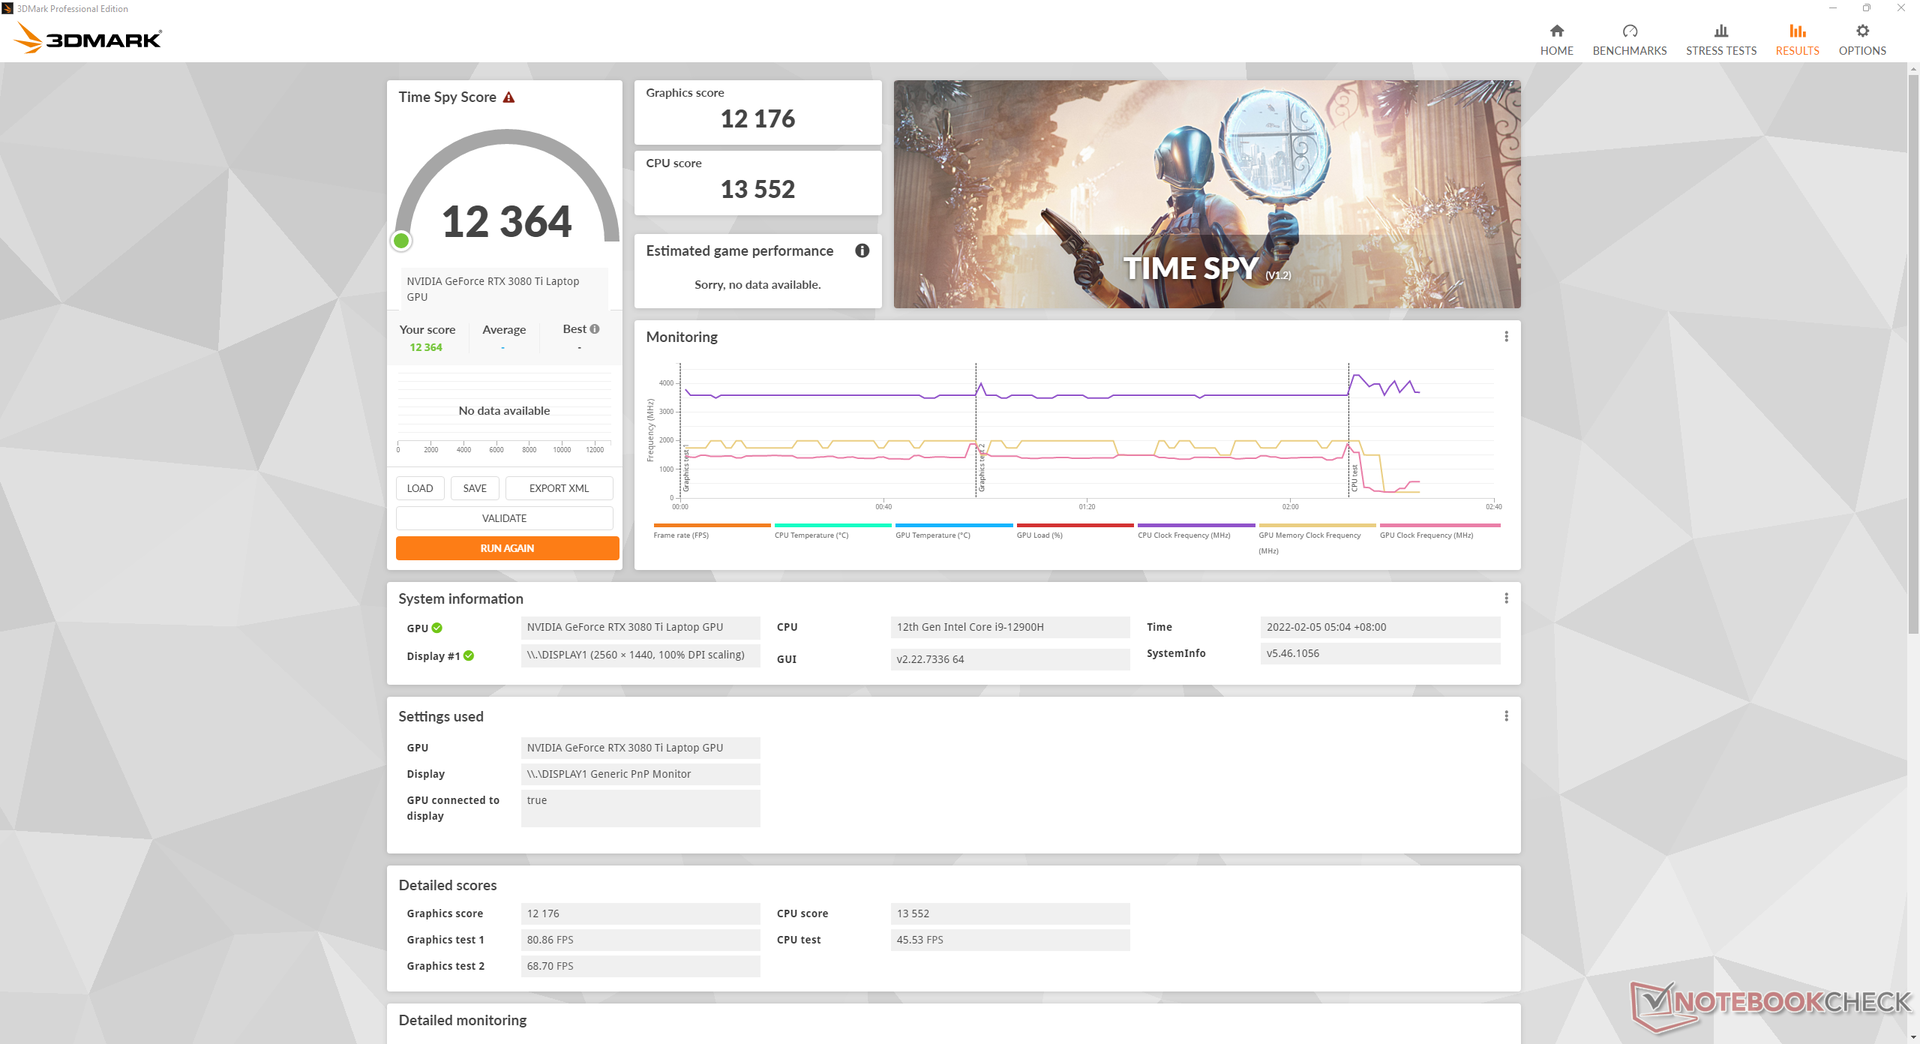
在MSHybrid模式而不是dGPU模式下运行将导致Time Spy GPU得分降低1.2%(12176分对12020分),以表明切换到MSHybrid时的性能下降几乎可以忽略不计。
当通过控制中心将GPU设置为175W时,我们的Time Spy 图形得分将增加到12714分,性能提升只有4%到5%。
| 3DMark | |
| 1920x1080 Fire Strike Graphics | |
| NVIDIA GeForce RTX 3080 Ti Founders Edition | |
| ASUS GeForce RTX 3080 ROG STRIX OC GAMING | |
| Schenker Uniwill Technology GM7AG8P | |
| MSI GeForce RTX 3070 Gaming X Trio | |
| Average NVIDIA GeForce RTX 3080 Ti Laptop GPU (6928 - 34439, n=43) | |
| Schenker XMG Pro 17 (Late 2021, RTX 3080) | |
| Asus ROG Strix RTX 2080 OC | |
| Schenker XMG Apex 17 M21 | |
| Schenker XMG Ultra 17 Comet Lake | |
| Alienware m17 R2 P41E | |
| Schenker XMG Focus 17 | |
| 2560x1440 Time Spy Graphics | |
| NVIDIA GeForce RTX 3080 Ti Founders Edition | |
| ASUS GeForce RTX 3080 ROG STRIX OC GAMING | |
| MSI GeForce RTX 3070 Gaming X Trio | |
| Schenker Uniwill Technology GM7AG8P | |
| Average NVIDIA GeForce RTX 3080 Ti Laptop GPU (4921 - 13835, n=43) | |
| Asus ROG Strix RTX 2080 OC | |
| Schenker XMG Ultra 17 Comet Lake | |
| Schenker XMG Apex 17 M21 | |
| Schenker XMG Pro 17 (Late 2021, RTX 3080) | |
| Alienware m17 R2 P41E | |
| Schenker XMG Focus 17 | |
| 3840x2160 Fire Strike Ultra Graphics | |
| NVIDIA GeForce RTX 3080 Ti Founders Edition | |
| ASUS GeForce RTX 3080 ROG STRIX OC GAMING | |
| MSI GeForce RTX 3070 Gaming X Trio | |
| Average NVIDIA GeForce RTX 3080 Ti Laptop GPU (6613 - 8613, n=17) | |
| Schenker Uniwill Technology GM7AG8P | |
| Asus ROG Strix RTX 2080 OC | |
| Alienware m17 R2 P41E | |
| 2560x1440 Port Royal Graphics | |
| NVIDIA GeForce RTX 3080 Ti Founders Edition | |
| ASUS GeForce RTX 3080 ROG STRIX OC GAMING | |
| MSI GeForce RTX 3070 Gaming X Trio | |
| Average NVIDIA GeForce RTX 3080 Ti Laptop GPU (6423 - 8462, n=28) | |
| Schenker Uniwill Technology GM7AG8P | |
| Schenker XMG Ultra 17 Comet Lake | |
| Schenker XMG Apex 17 M21 | |
| Alienware m17 R2 P41E | |
| Schenker XMG Focus 17 | |
| 3DMark 11 - 1280x720 Performance GPU | |
| NVIDIA GeForce RTX 3080 Ti Founders Edition | |
| ASUS GeForce RTX 3080 ROG STRIX OC GAMING | |
| MSI GeForce RTX 3070 Gaming X Trio | |
| Schenker Uniwill Technology GM7AG8P | |
| Asus ROG Strix RTX 2080 OC | |
| Average NVIDIA GeForce RTX 3080 Ti Laptop GPU (13920 - 45841, n=45) | |
| Schenker XMG Pro 17 (Late 2021, RTX 3080) | |
| Schenker XMG Apex 17 M21 | |
| Schenker XMG Ultra 17 Comet Lake | |
| Alienware m17 R2 P41E | |
| 3DMark 11 Performance | 33697 points | |
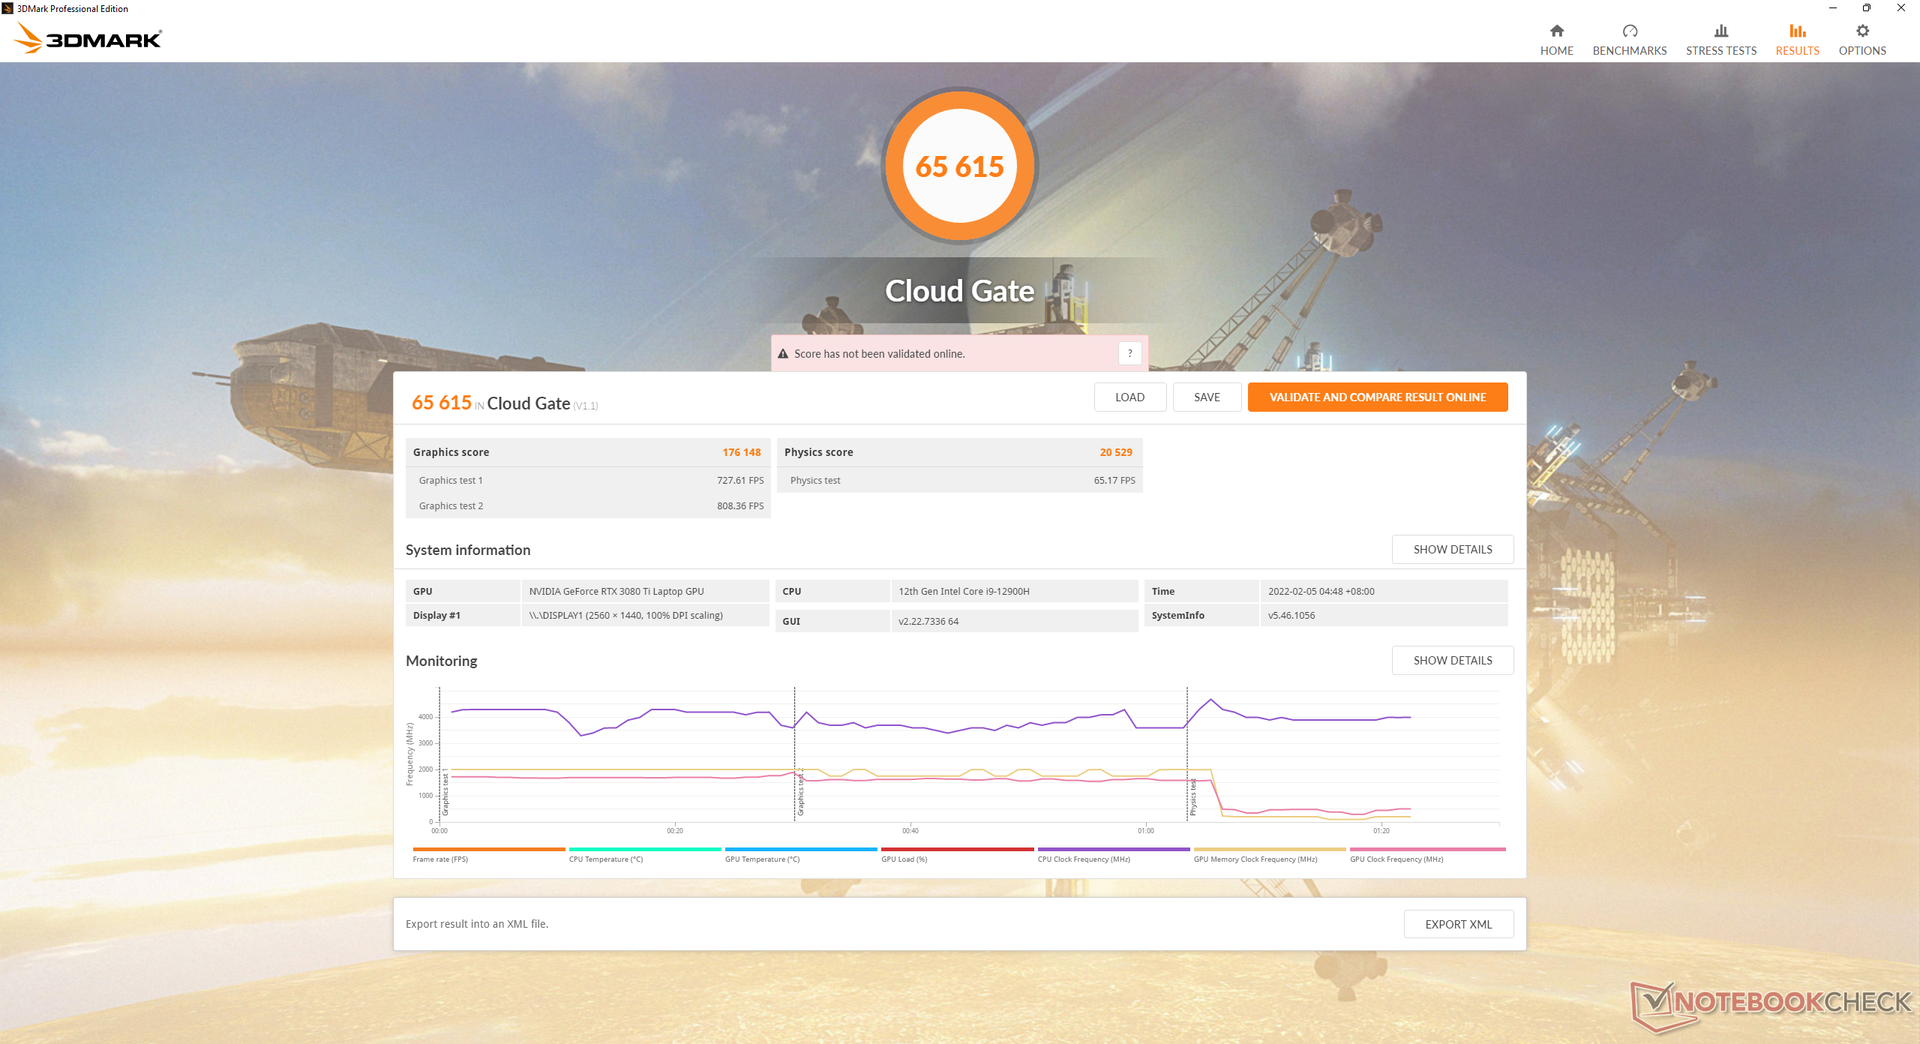
| 3DMark Cloud Gate Standard Score | 65615 points | |
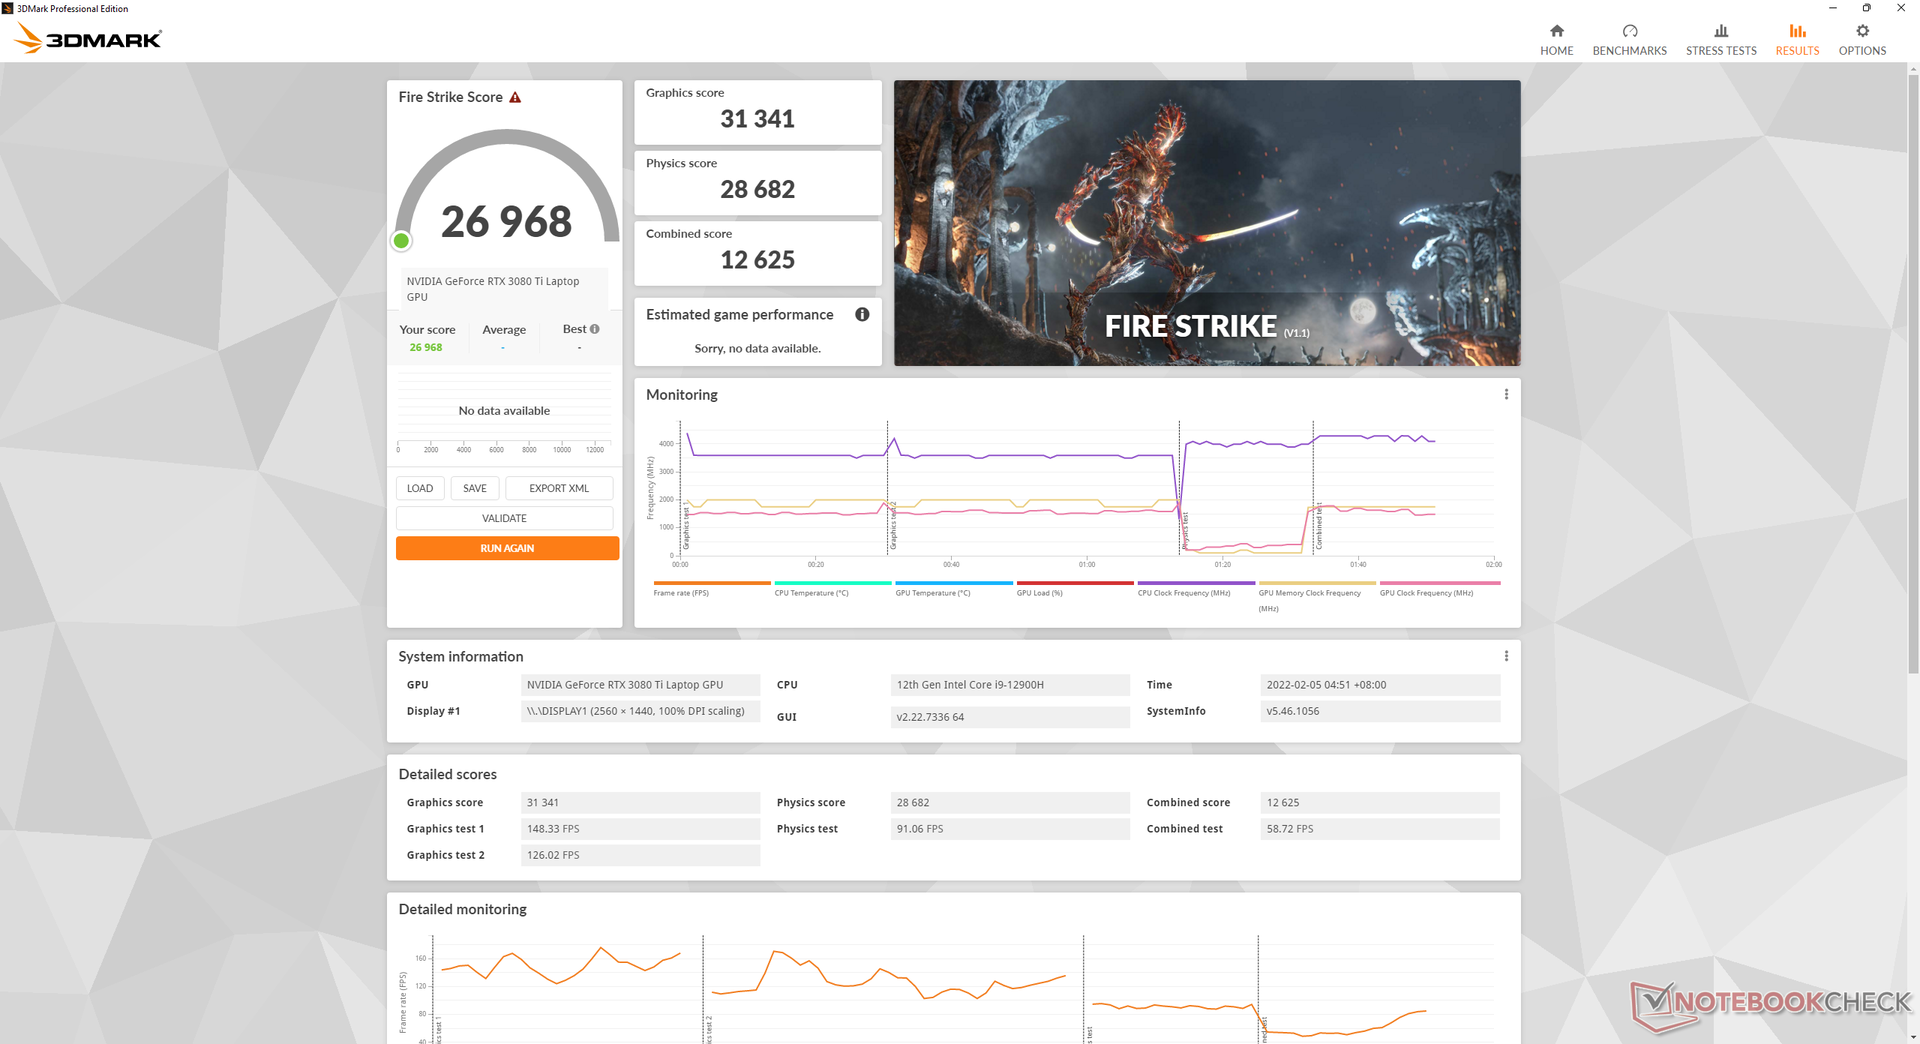
| 3DMark Fire Strike Score | 26968 points | |
| 3DMark Time Spy Score | 12364 points | |
Help | ||
Witcher 3 FPS Chart
| low | med. | high | ultra | QHD | |
|---|---|---|---|---|---|
| GTA V (2015) | 186 | 183 | 179 | 125 | 111 |
| The Witcher 3 (2015) | 472.4 | 368.4 | 236.3 | 117.2 | |
| Dota 2 Reborn (2015) | 186 | 172 | 166 | 159 | |
| Final Fantasy XV Benchmark (2018) | 167 | 155 | 117 | ||
| X-Plane 11.11 (2018) | 160 | 142 | 107 | ||
| Far Cry 5 (2018) | 186 | 160 | 150 | 138 | 120 |
| Strange Brigade (2018) | 472 | 290 | 231 | 203 | 151 |
| Hunt Showdown (2020) | 243.2 | 197.9 | 167.6 | 103.6 | |
| Doom Eternal (2020) | 491.8 | 321.3 | 292.4 | 279 | 210.6 |
| Gears Tactics (2020) | 366.3 | 270 | 195.5 | 136.5 | 97.1 |
| Horizon Zero Dawn (2020) | 162 | 141 | 130 | 118 | 98 |
| Watch Dogs Legion (2020) | 137 | 128 | 116 | 84 | 64 |
| Dirt 5 (2020) | 217.5 | 167.8 | 136.8 | 105.4 | 85.6 |
| Assassin´s Creed Valhalla (2020) | 166 | 118 | 99 | 85 | 68 |
| Hitman 3 (2021) | 297.5 | 228.9 | 211.9 | 201.8 | 133.9 |
| F1 2021 (2021) | 364 | 328 | 271 | 103 | 71 |
| Far Cry 6 (2021) | 158 | 131 | 117 | 107 | 88 |
| Guardians of the Galaxy (2021) | 157 | 157 | 157 | 152 | 122 |
| Riders Republic (2021) | 207 | 159 | 133 | 122 | 90 |
| Halo Infinite (2021) | 260.3 | 165.7 | 146.7 | 137.3 | 96.3 |
| God of War (2022) | 158.5 | 135.2 | 110.1 | 79 | 64.4 |
排放
系统噪音 - 不出所料的响亮
像大多数其他游戏笔记本一样,不需要很多屏幕上的活动就能让内部风扇旋转起来。像网页浏览或视频流等要求不高的动作会使风扇噪音达到30.8 dB(A),而静音背景为23.1 dB(A)。噪音的增加是明显的,但是在GM7AG8P上,风扇转速的调整通常是渐进的,而不是急剧的,因此更容易忍受。
运行更高的负载,如游戏,会导致噪音水平与我们在XMG Neo 17 GM7TG8S上观察到的非常相似。预计在这种情况下,风扇噪音会在50dB(A)的低到中的范围内,这是发烧级游戏笔记本的常见范围。风扇的声音很大,我们建议在玩《堡垒之夜》等游戏时戴上耳机,因为安静的音频提示对游戏至关重要。
Noise level
| Idle |
| 28.1 / 28.1 / 30.8 dB(A) |
| Load |
| 39.1 / 52.5 dB(A) |
 | ||
30 dB silent 40 dB(A) audible 50 dB(A) loud |
||
min: | ||
| Schenker Uniwill Technology GM7AG8P GeForce RTX 3080 Ti Laptop GPU, i9-12900H, Samsung PM9A1 MZVL2512HCJQ | Schenker XMG NEO 17 GM7TG8S GeForce RTX 3080 Laptop GPU, i7-11800H, Samsung SSD 980 Pro 1TB MZ-V8P1T0BW | Alienware x17 RTX 3080 P48E GeForce RTX 3080 Laptop GPU, i7-11800H, 2x WDC PC SN730 SDBPNTY-1T00 (RAID 0) | Razer Blade 17 RTX 3070 GeForce RTX 3070 Laptop GPU, i7-11800H, Samsung PM9A1 MZVL21T0HCLR | MSI GS76 Stealth 11UH GeForce RTX 3080 Laptop GPU, i9-11900H, Samsung PM9A1 MZVL22T0HBLB | Maingear Vector Pro MG-VCP17 GeForce RTX 3080 Laptop GPU, i7-11800H, Samsung PM9A1 MZVL21T0HCLR | |
|---|---|---|---|---|---|---|
| Noise | 7% | 6% | 4% | -2% | 6% | |
| off / environment * (dB) | 23.1 | 23 -0% | 24.9 -8% | 24.2 -5% | 24 -4% | 23.8 -3% |
| Idle Minimum * (dB) | 28.1 | 23 18% | 24.9 11% | 24.7 12% | 24 15% | 23.9 15% |
| Idle Average * (dB) | 28.1 | 23 18% | 24.9 11% | 24.7 12% | 25 11% | 23.9 15% |
| Idle Maximum * (dB) | 30.8 | 23 25% | 29.6 4% | 24.7 20% | 42 -36% | 23.9 22% |
| Load Average * (dB) | 39.1 | 39.5 -1% | 31.1 20% | 44.3 -13% | 46 -18% | 38 3% |
| Witcher 3 ultra * (dB) | 52.4 | 54.5 -4% | 49.7 5% | 56.3 -7% | 48 8% | 55.9 -7% |
| Load Maximum * (dB) | 52.5 | 55.09 -5% | 54.8 -4% | 47.7 9% | 48 9% | 55.9 -6% |
* ... smaller is better
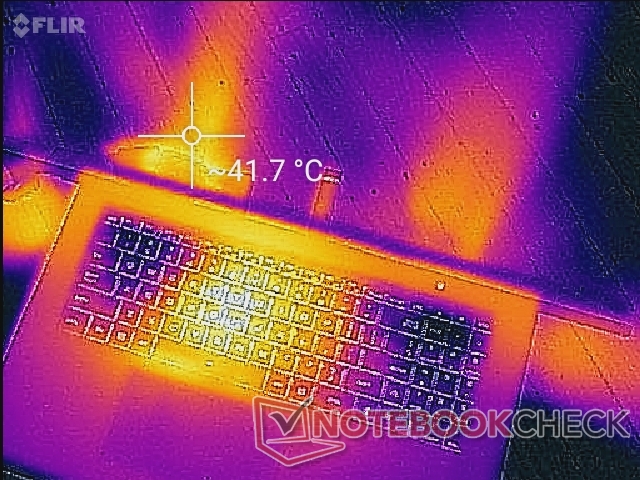
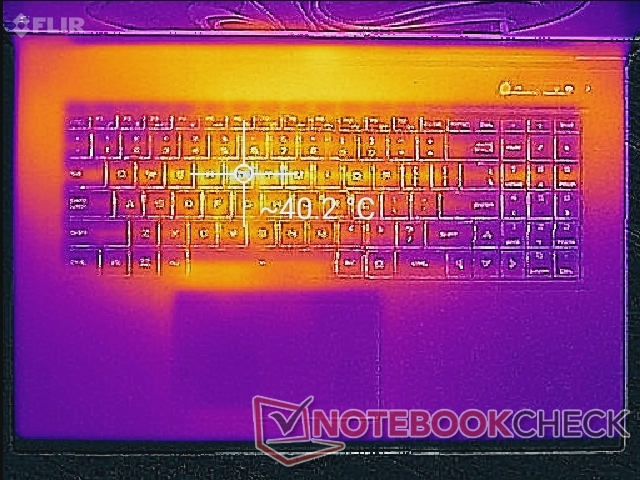
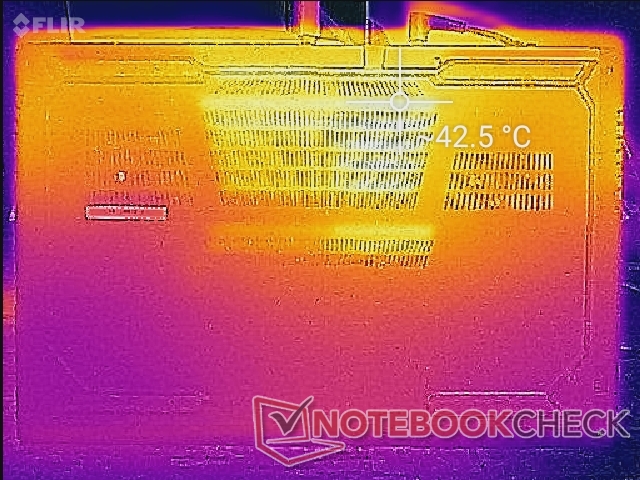
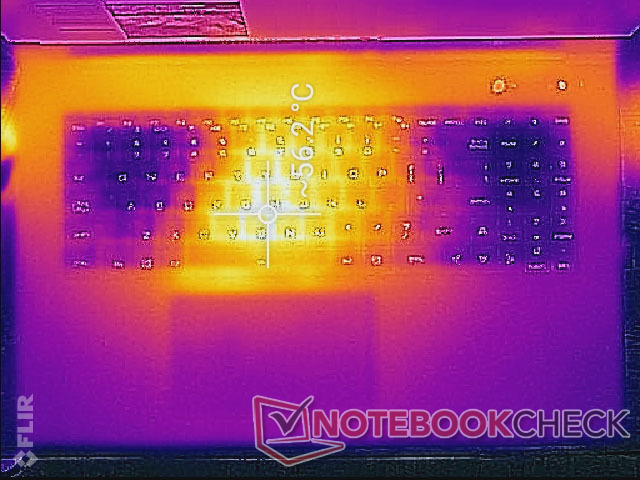
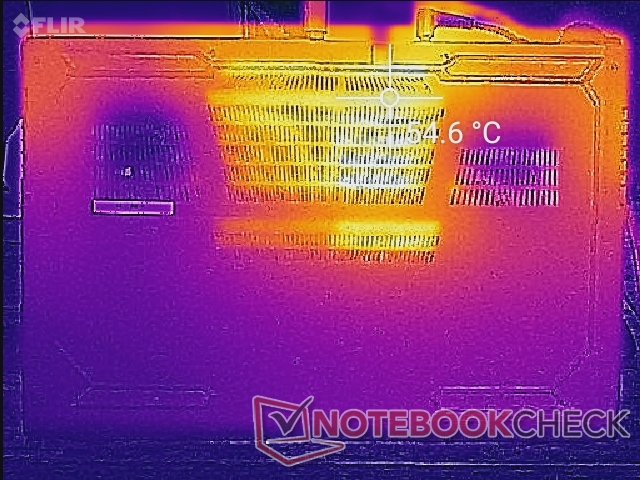
温度 - 热中心,冷角落
机箱中心区域的表面温度总是很高。例如,当在桌面上闲置,没有其他运行的应用程序时,键盘中心和底板后部的温度可以达到40℃。
平均表面温度通常比竞争者Razer Blade Pro 17的温度低,后者使用镁合金底盘而不是ABS塑料。因此,我们的GM7AG8P的掌托在游戏时能比Razer的掌托保持更凉爽和舒适,超过几摄氏度。
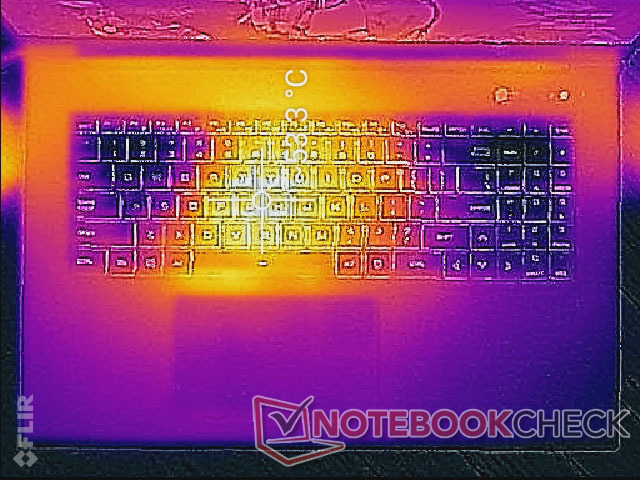
(-) The maximum temperature on the upper side is 56.8 °C / 134 F, compared to the average of 40.4 °C / 105 F, ranging from 21.2 to 68.8 °C for the class Gaming.
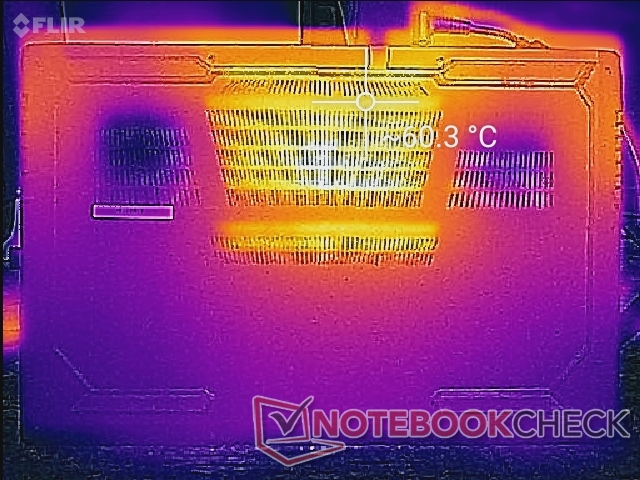
(-) The bottom heats up to a maximum of 60.2 °C / 140 F, compared to the average of 43.2 °C / 110 F
(+) In idle usage, the average temperature for the upper side is 31.1 °C / 88 F, compared to the device average of 33.9 °C / 93 F.
(±) Playing The Witcher 3, the average temperature for the upper side is 35.3 °C / 96 F, compared to the device average of 33.9 °C / 93 F.
(+) The palmrests and touchpad are cooler than skin temperature with a maximum of 30.2 °C / 86.4 F and are therefore cool to the touch.
(±) The average temperature of the palmrest area of similar devices was 28.8 °C / 83.8 F (-1.4 °C / -2.6 F).
| Schenker Uniwill Technology GM7AG8P Intel Core i9-12900H, NVIDIA GeForce RTX 3080 Ti Laptop GPU | Schenker XMG NEO 17 GM7TG8S Intel Core i7-11800H, NVIDIA GeForce RTX 3080 Laptop GPU | Alienware x17 RTX 3080 P48E Intel Core i7-11800H, NVIDIA GeForce RTX 3080 Laptop GPU | Razer Blade 17 RTX 3070 Intel Core i7-11800H, NVIDIA GeForce RTX 3070 Laptop GPU | MSI GS76 Stealth 11UH Intel Core i9-11900H, NVIDIA GeForce RTX 3080 Laptop GPU | Maingear Vector Pro MG-VCP17 Intel Core i7-11800H, NVIDIA GeForce RTX 3080 Laptop GPU | |
|---|---|---|---|---|---|---|
| Heat | 8% | 13% | 19% | 20% | 7% | |
| Maximum Upper Side * (°C) | 56.8 | 51 10% | 58.4 -3% | 41 28% | 49 14% | 54.2 5% |
| Maximum Bottom * (°C) | 60.2 | 62 -3% | 49 19% | 47.2 22% | 57 5% | 52.2 13% |
| Idle Upper Side * (°C) | 40.2 | 35 13% | 33.6 16% | 33.2 17% | 28 30% | 37.4 7% |
| Idle Bottom * (°C) | 43 | 38 12% | 34.6 20% | 39 9% | 30 30% | 41.4 4% |
* ... smaller is better
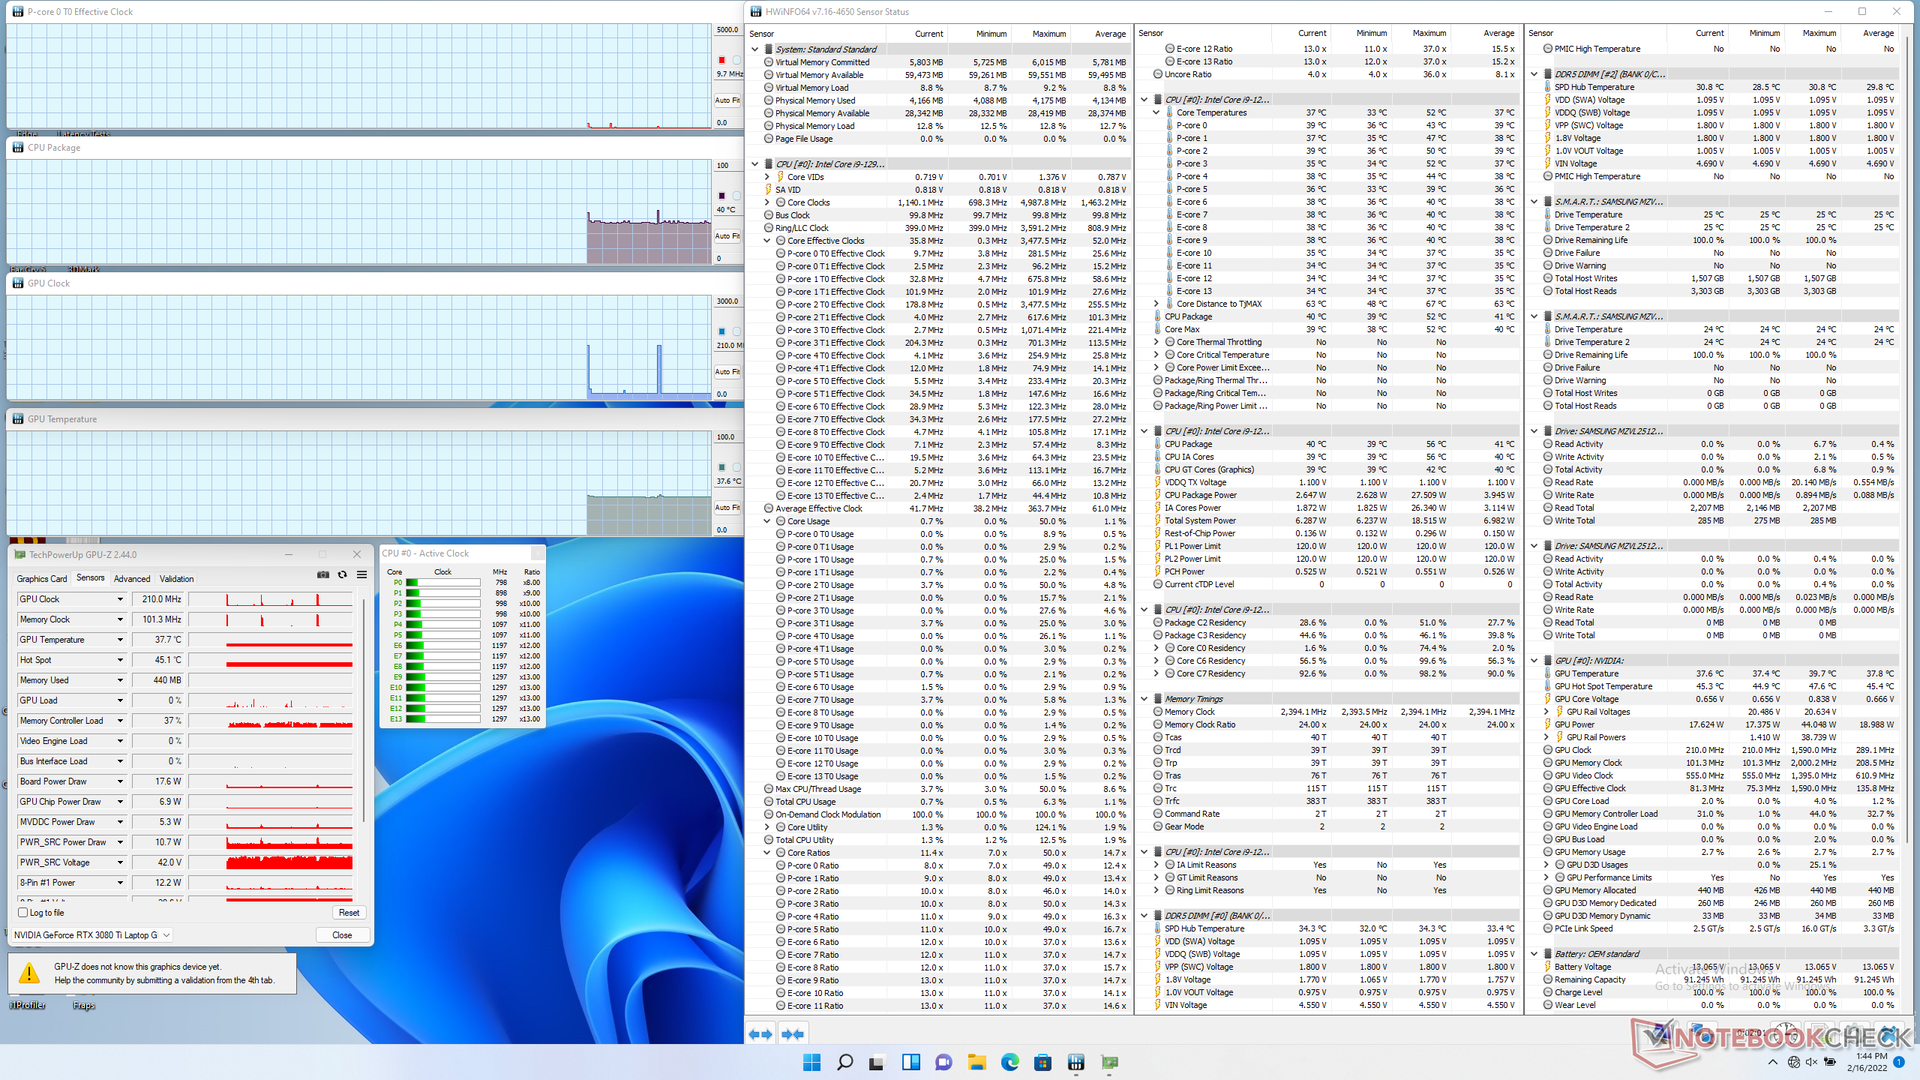
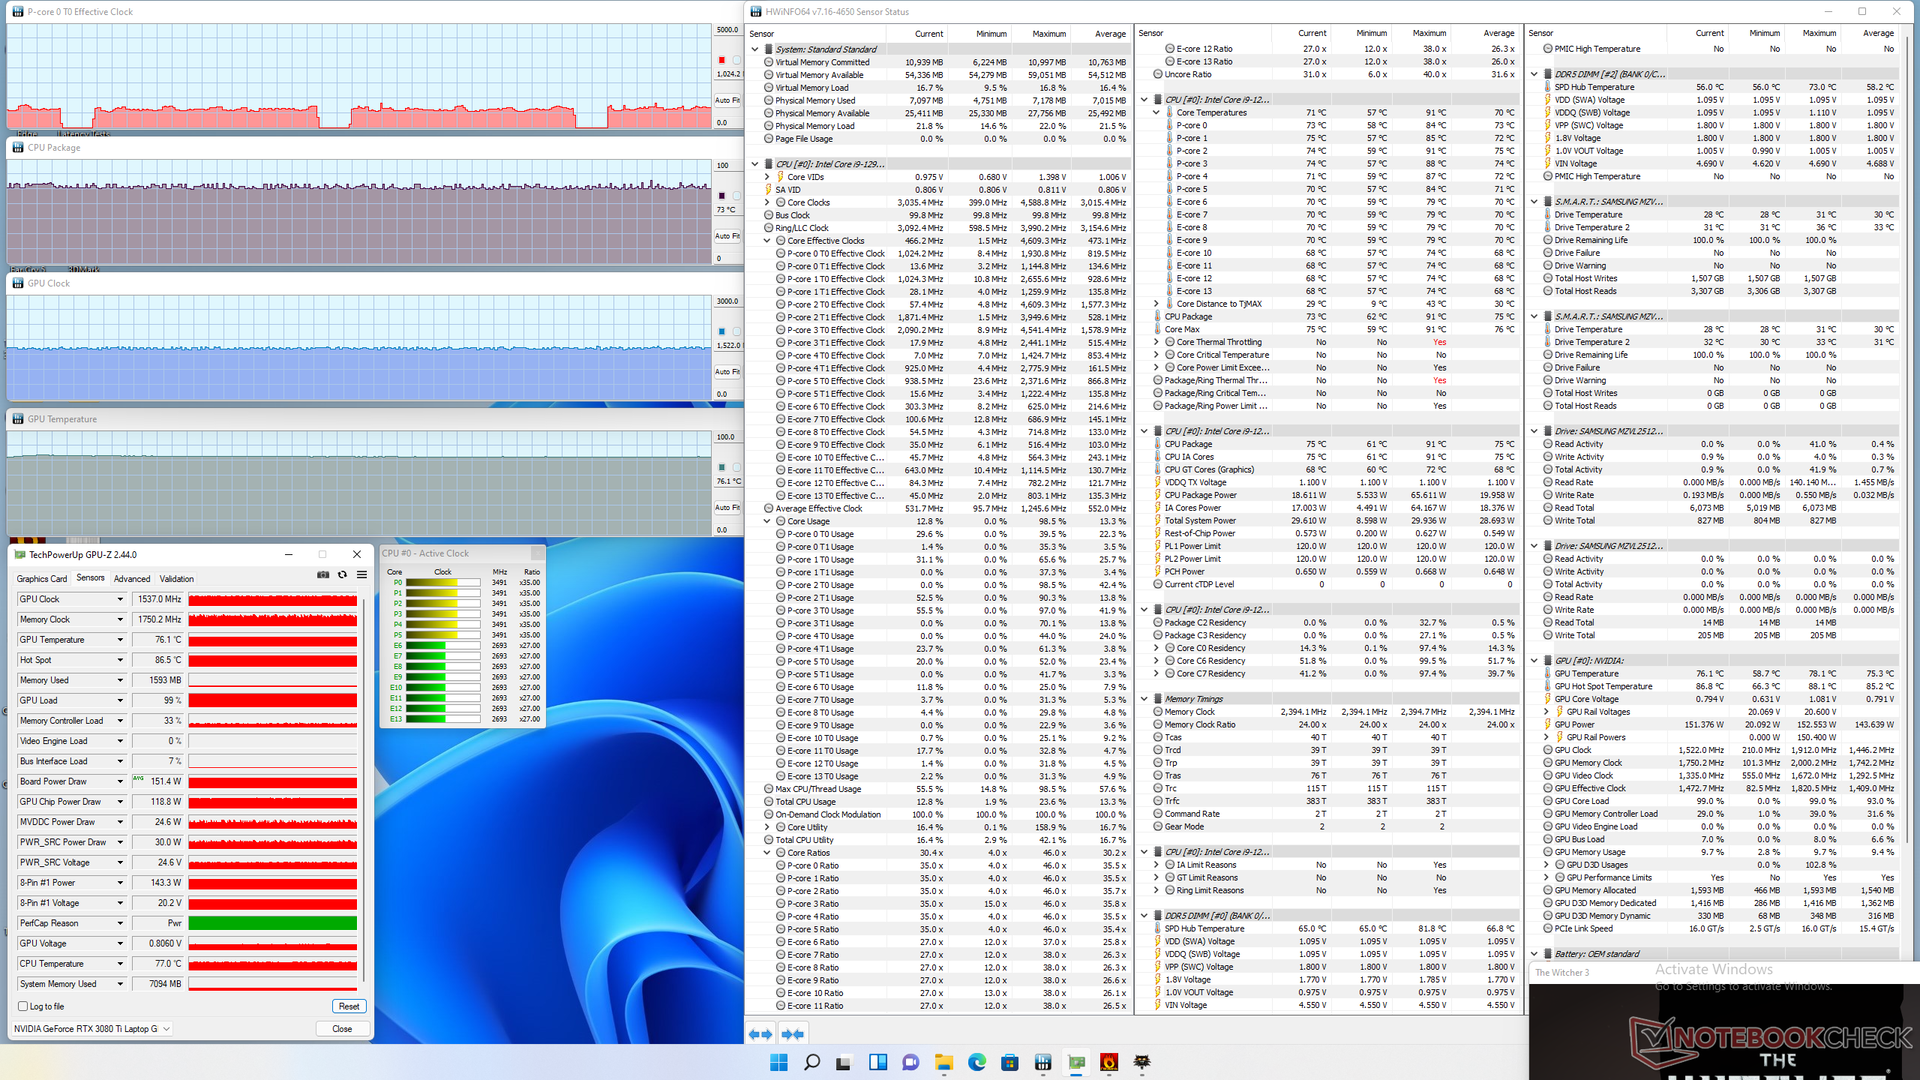
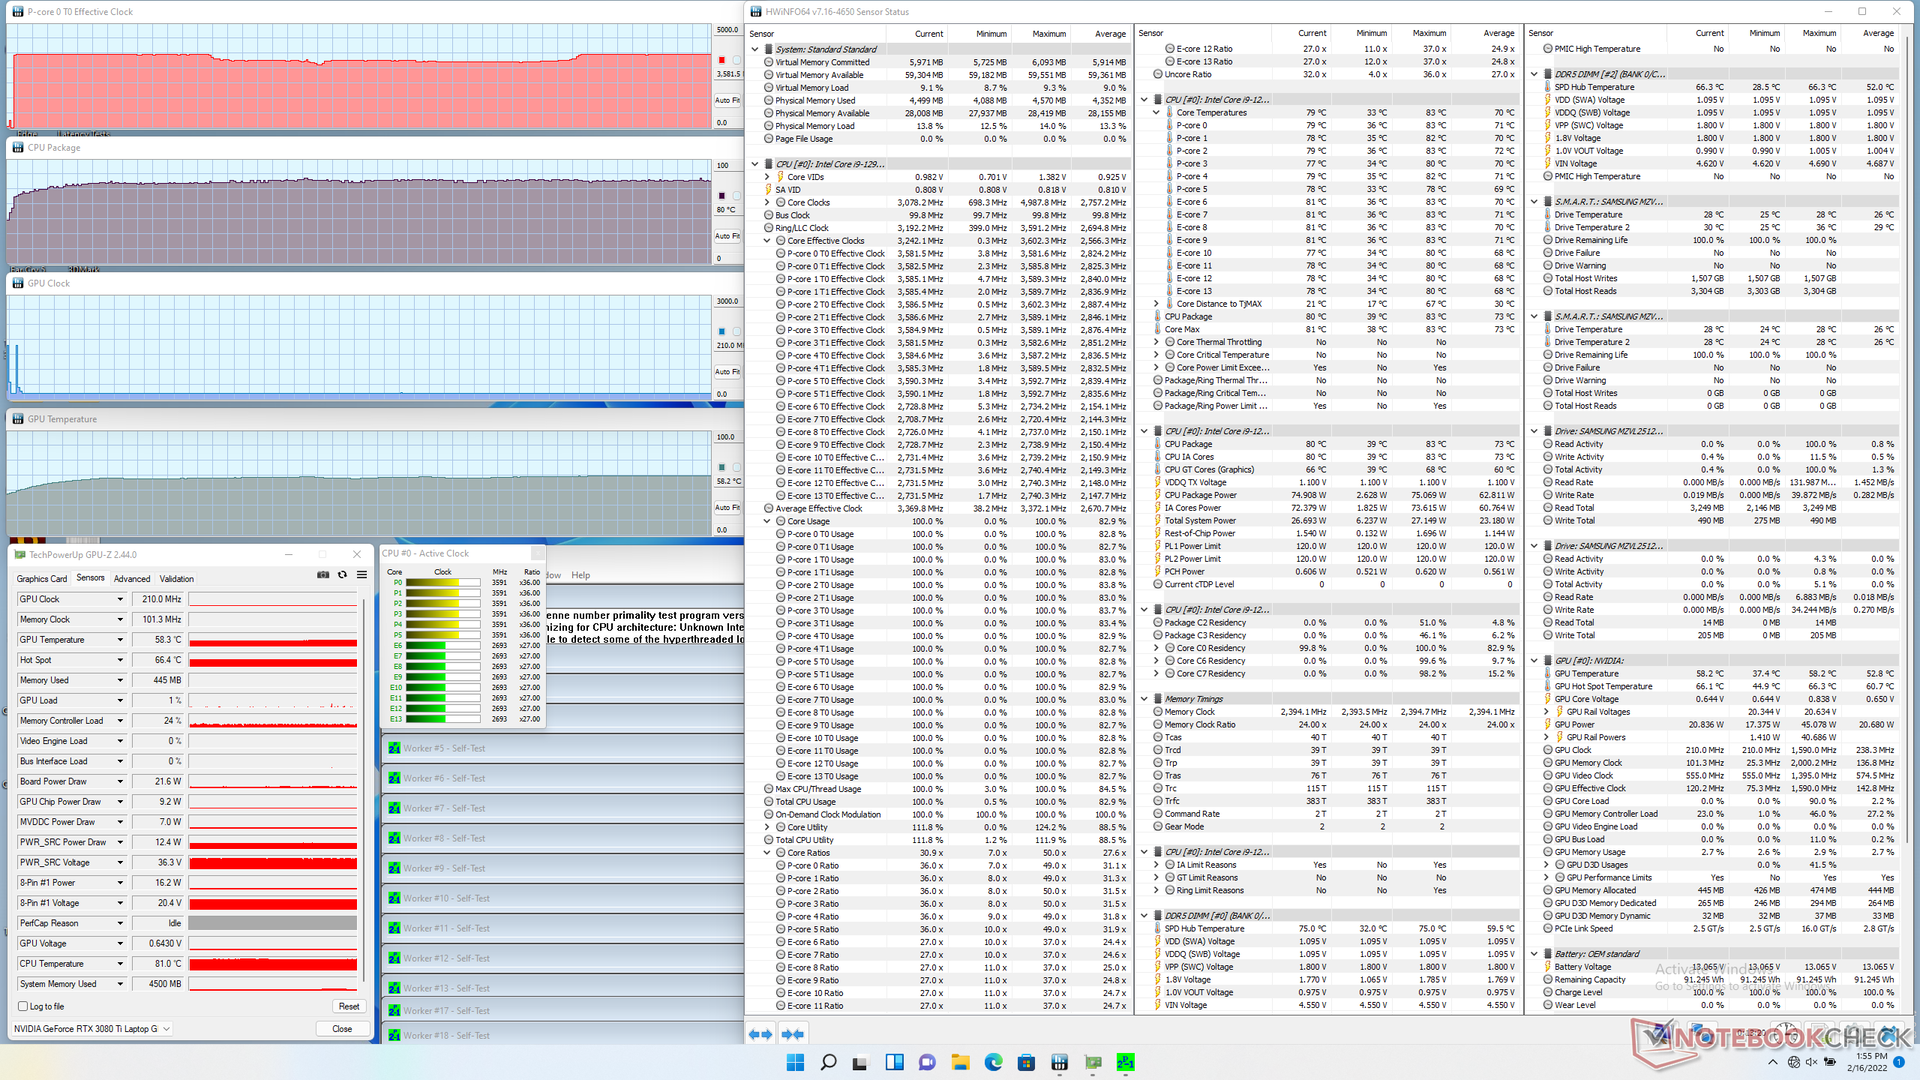
压力测试
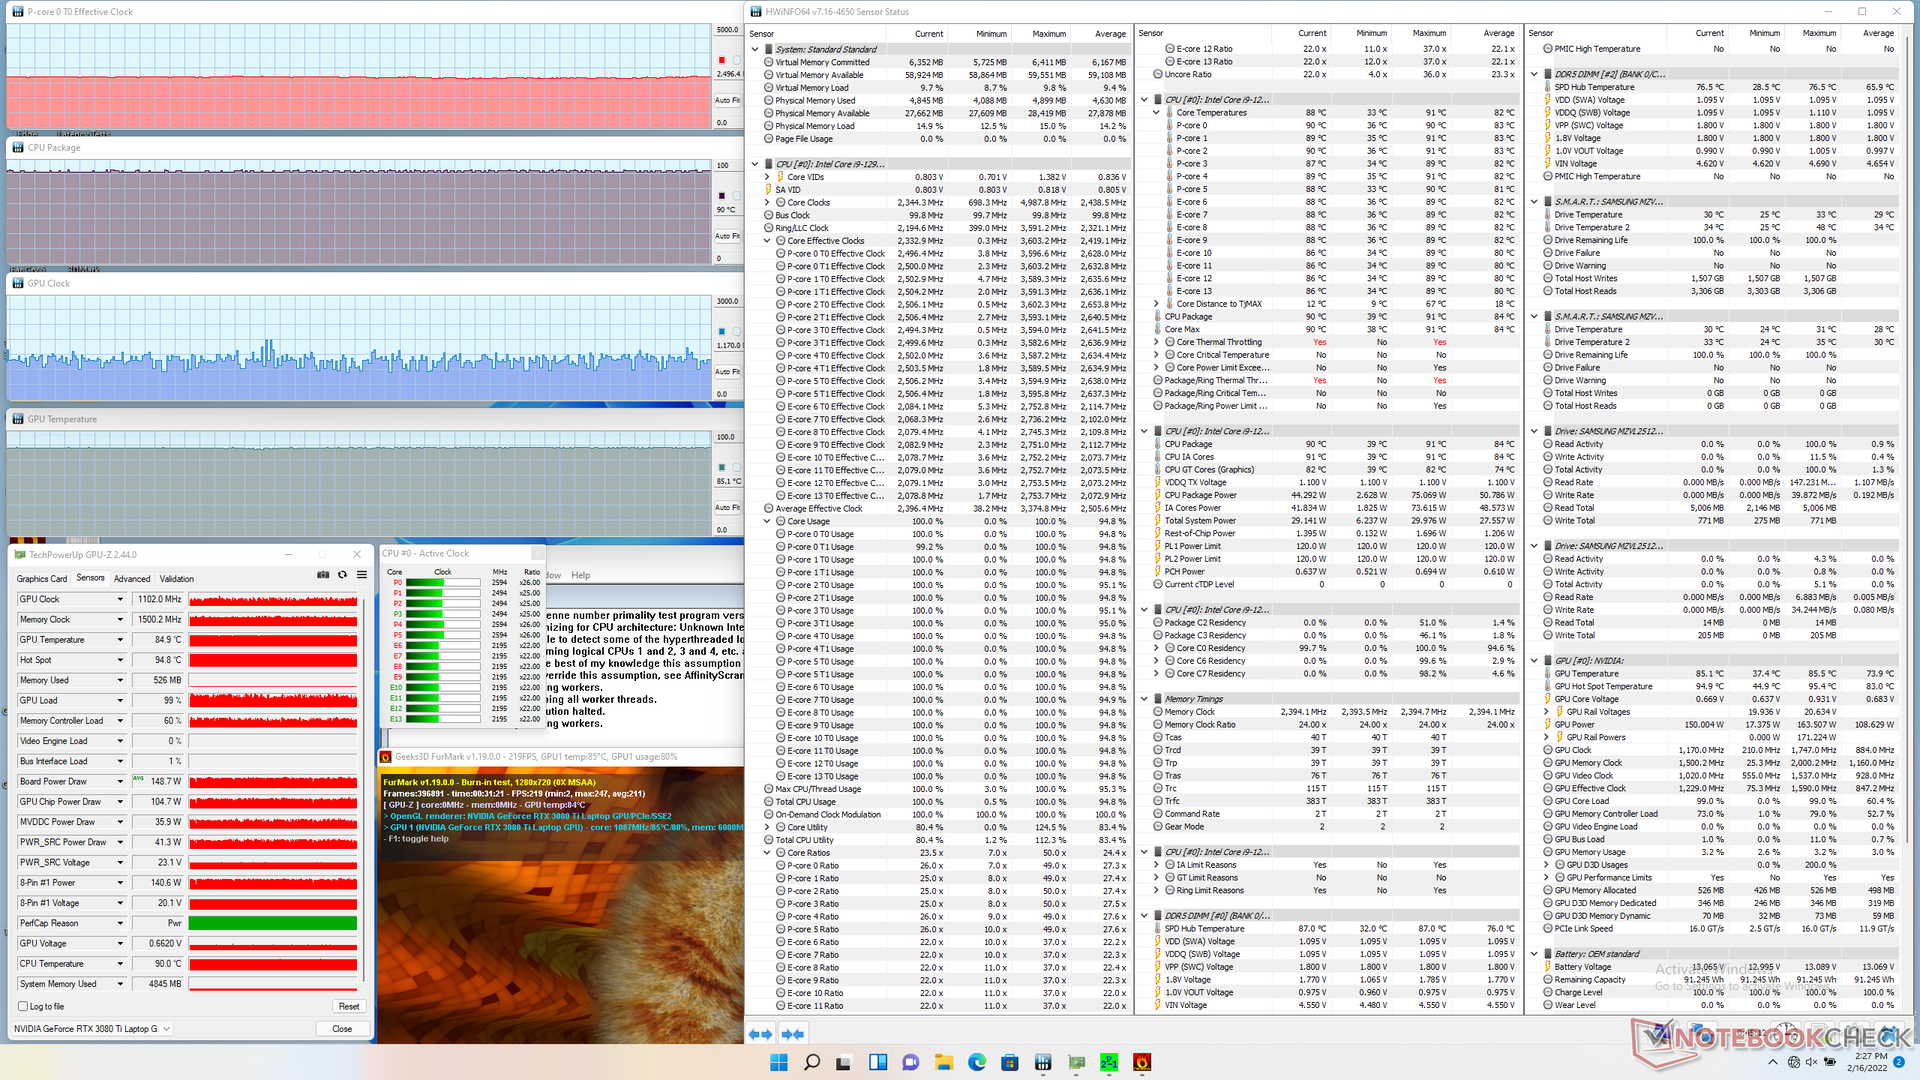
运行Prime95给CPU施加压力将导致时钟频率提升到3.2至3.6GHz的范围,并且核心温度稳定在80C。CPU封装的功率也将无限期地稳定在75W,这是默认的TDP设置。如果需要,用户可以通过控制中心将PL1和PL2的限制提高到120W。
运行时 Witcher 3根据GPU-Z的数据,在dGPU设置为默认的150W时,将导致GPU的稳定温度为76C,板子的耗电量约为150W。如果通过控制中心设置为175 W,内存时钟将从1750 MHz增加到1800 MHz,而GPU温度也将从76 C增加到86 C,主板功耗将稳定在170 W左右,或略微低于175 W的最大值。有趣的是,在150W或175W的TGP模式下,GPU时钟速率将保持在1500-1600MHz的范围内。
用电池供电运行将比预期的更大程度地限制性能。在dGPU和电池上进行的Time Spy 测试将返回物理和图形分数,分别为7150和897分,而在主电源上则为13552和12176分,即使禁用Nvidia Whisper Mode 2.0和Battery Boost。
| CPU时钟(GHz) | GPU时钟(MHz) | CPU平均温度(°C) | GPU平均温度(°C) | |
| 系统空闲 | -- | -- | 40 | 38 |
| Prime95压力 | 3.2 - 3.6 | -- | 80 | 58 |
| Prime95 + FurMark压力 | 2.5 | ~1102 | 90 | 85 |
| Witcher 3 应力(150 W TGP模式) | ~1.0 | ~1537 | 73 | 76 |
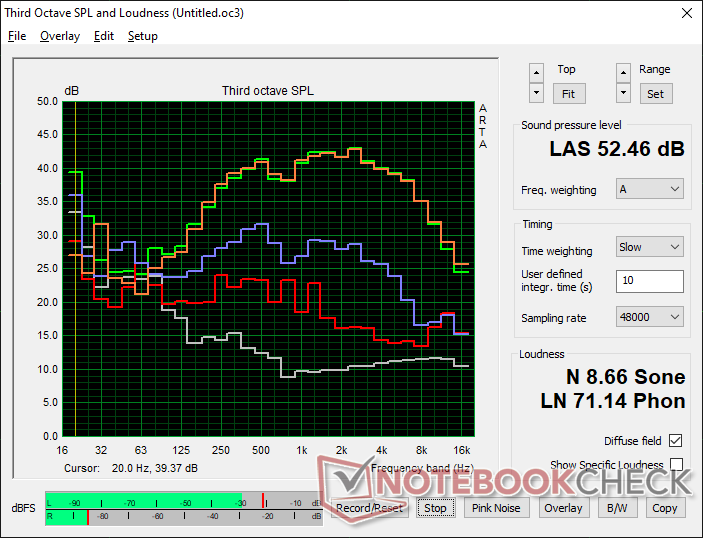
发言人
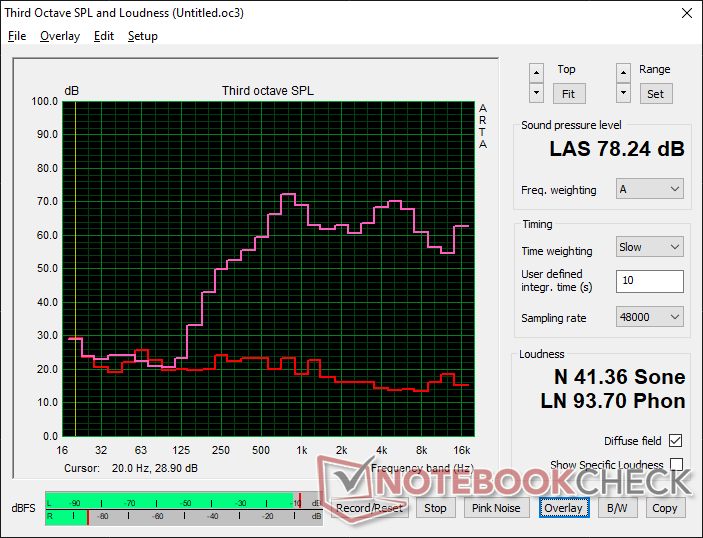
Schenker Uniwill Technology GM7AG8P audio analysis
(±) | speaker loudness is average but good (78.2 dB)
Bass 100 - 315 Hz
(-) | nearly no bass - on average 23.7% lower than median
(±) | linearity of bass is average (12.8% delta to prev. frequency)
Mids 400 - 2000 Hz
(+) | balanced mids - only 4.6% away from median
(±) | linearity of mids is average (9.2% delta to prev. frequency)
Highs 2 - 16 kHz
(+) | balanced highs - only 4.5% away from median
(±) | linearity of highs is average (8.6% delta to prev. frequency)
Overall 100 - 16.000 Hz
(±) | linearity of overall sound is average (24.1% difference to median)
Compared to same class
» 87% of all tested devices in this class were better, 4% similar, 9% worse
» The best had a delta of 6%, average was 18%, worst was 132%
Compared to all devices tested
» 73% of all tested devices were better, 6% similar, 21% worse
» The best had a delta of 4%, average was 23%, worst was 134%
Apple MacBook Pro 16 2021 M1 Pro audio analysis
(+) | speakers can play relatively loud (84.7 dB)
Bass 100 - 315 Hz
(+) | good bass - only 3.8% away from median
(+) | bass is linear (5.2% delta to prev. frequency)
Mids 400 - 2000 Hz
(+) | balanced mids - only 1.3% away from median
(+) | mids are linear (2.1% delta to prev. frequency)
Highs 2 - 16 kHz
(+) | balanced highs - only 1.9% away from median
(+) | highs are linear (2.7% delta to prev. frequency)
Overall 100 - 16.000 Hz
(+) | overall sound is linear (4.6% difference to median)
Compared to same class
» 0% of all tested devices in this class were better, 0% similar, 100% worse
» The best had a delta of 5%, average was 17%, worst was 45%
Compared to all devices tested
» 0% of all tested devices were better, 0% similar, 100% worse
» The best had a delta of 4%, average was 23%, worst was 134%
能源管理
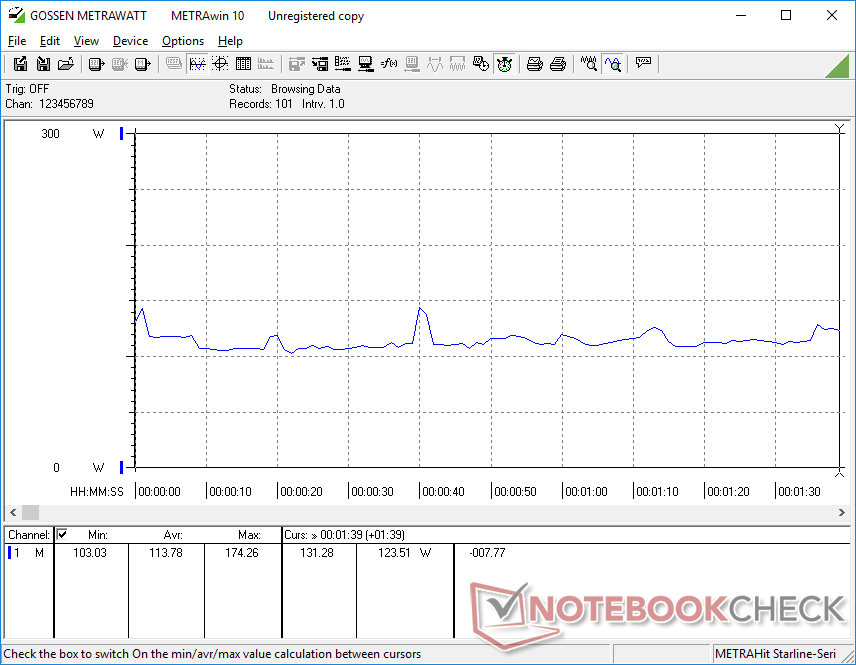
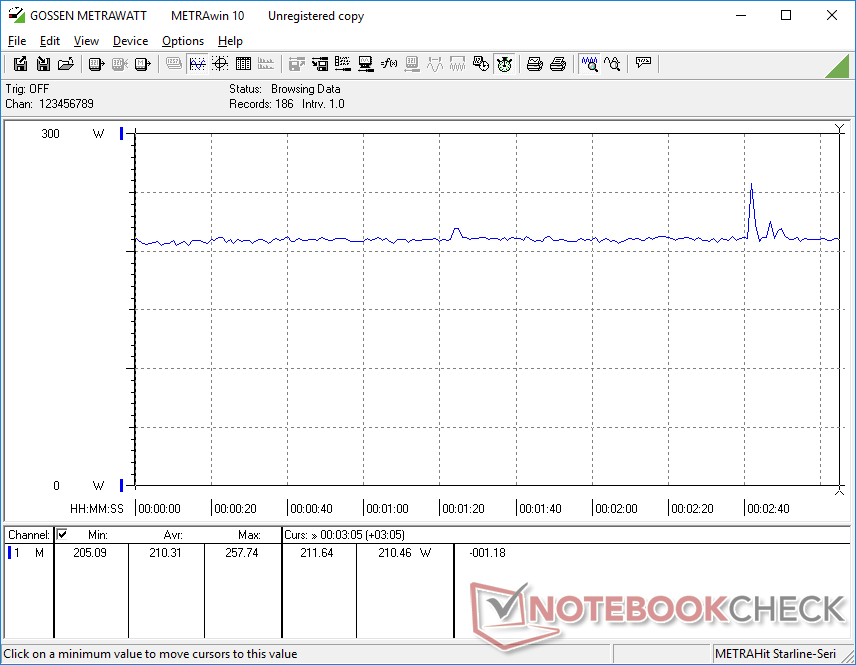
功率消耗--要求高的部件
我们上面的基准测试显示,与Core i9-11900H和GeForce RTX 3080相比,CPU性能提高了20%至30%,GPU性能提高了10%,这在Schenker XMG Neo 17 GM7TG8S.尽管如此,Metrahit的测量结果显示,在类似的条件下,我们的GM7AG8P比旧的GM7TG8S略微更耗电。尤其是运行Prime95时,GM7AG8P的耗电量增加了约10%至15%,这意味着上述CPU性能的提升并不是完全免费的。因此,与Tiger Lake-H相比,Alder Lake-H的每瓦性能并没有高出很多。
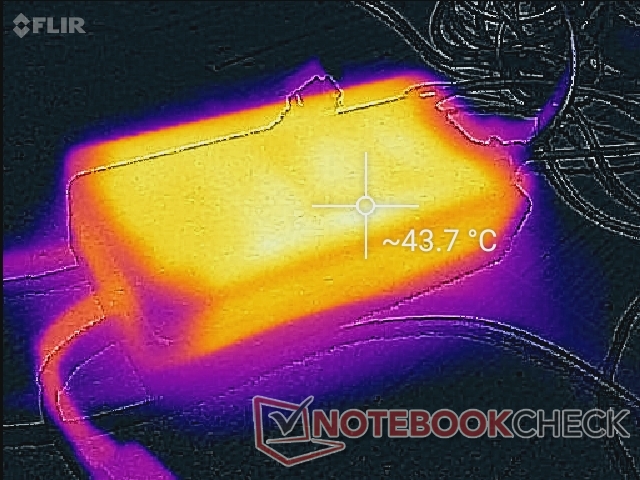
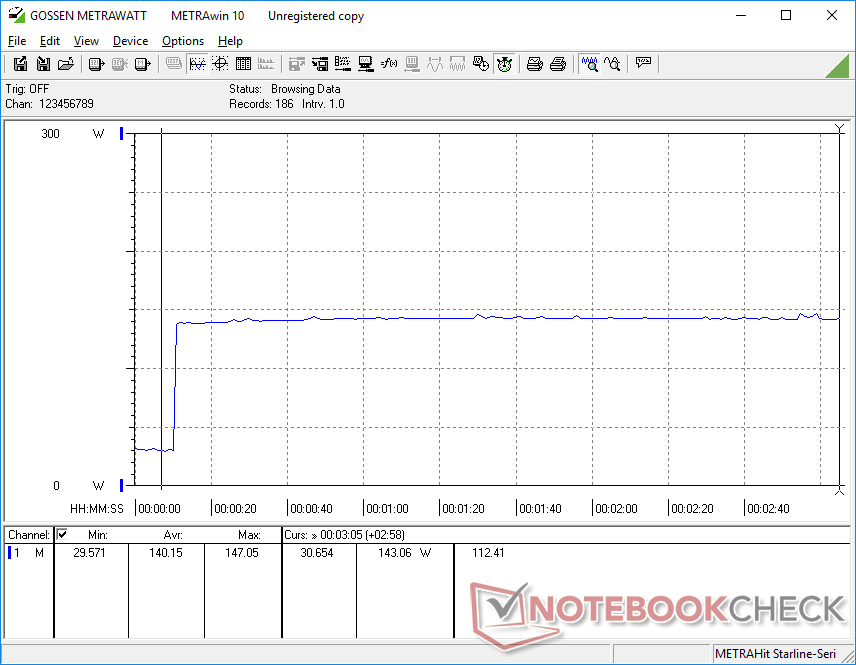
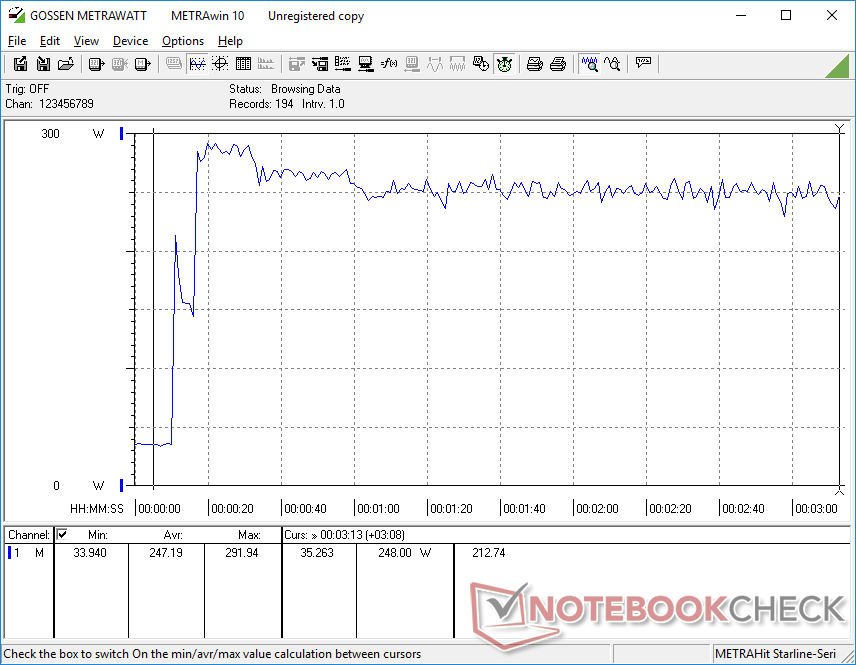
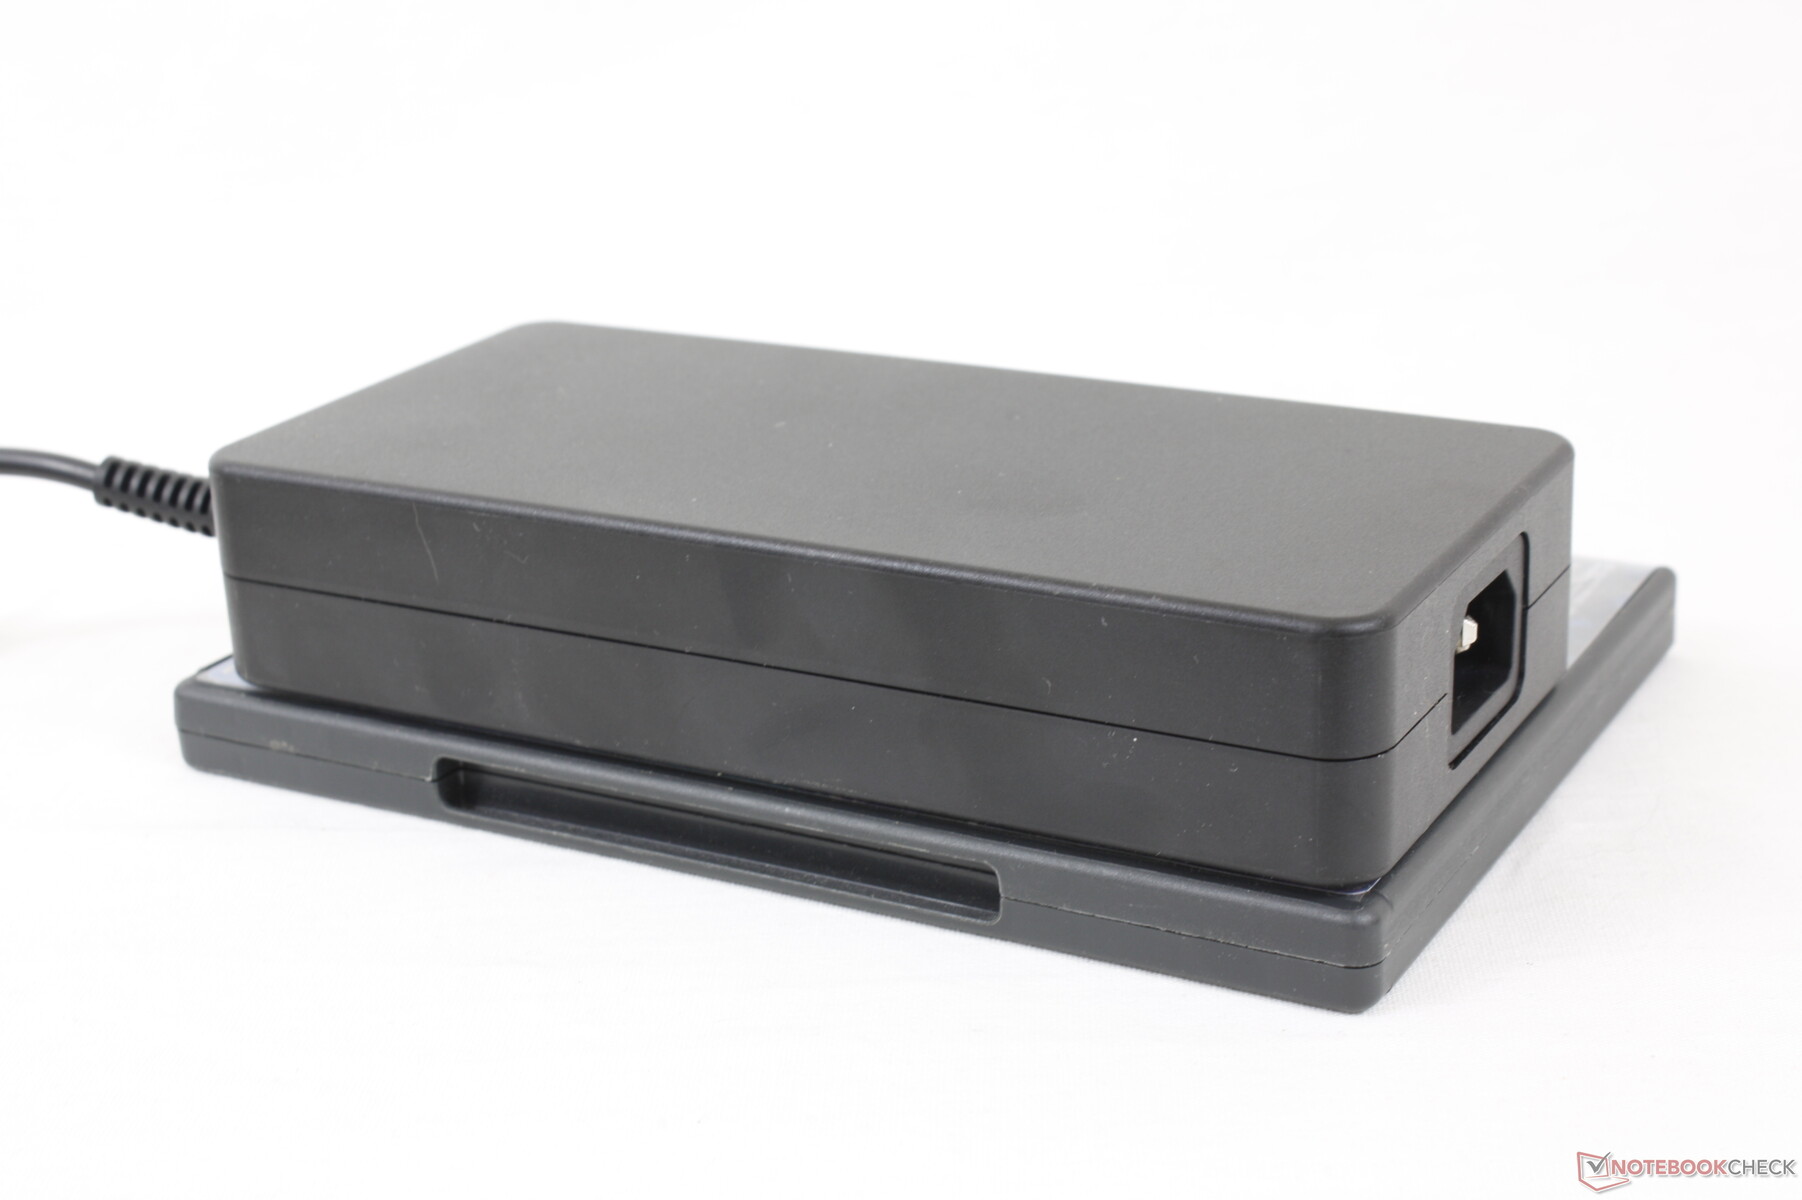
在同时运行Prime95和FurMark压力时,我们能够从大型(约18 x 8.5 x 3.5厘米)280瓦的AC适配器上记录到292瓦的临时最大耗电。如果手动将GPU设置为175 W模式,预计这一最大值甚至会高出20 W或更多。这一速度将持续约20秒,然后下降并稳定在250W左右,如我们下面的截图所示,可能是由于散热限制。
| Off / Standby | |
| Idle | |
| Load |
|
Key:
min: | |
| Schenker Uniwill Technology GM7AG8P i9-12900H, GeForce RTX 3080 Ti Laptop GPU, Samsung PM9A1 MZVL2512HCJQ, IPS, 2560x1440, 17.3" | Schenker XMG NEO 17 GM7TG8S i7-11800H, GeForce RTX 3080 Laptop GPU, Samsung SSD 980 Pro 1TB MZ-V8P1T0BW, IPS, 2560x1440, 17.3" | Alienware x17 RTX 3080 P48E i7-11800H, GeForce RTX 3080 Laptop GPU, 2x WDC PC SN730 SDBPNTY-1T00 (RAID 0), IPS, 3840x2160, 17.3" | Razer Blade 17 RTX 3070 i7-11800H, GeForce RTX 3070 Laptop GPU, Samsung PM9A1 MZVL21T0HCLR, IPS, 1920x1080, 17.3" | MSI GS76 Stealth 11UH i9-11900H, GeForce RTX 3080 Laptop GPU, Samsung PM9A1 MZVL22T0HBLB, IPS, 3840x2160, 17.3" | Maingear Vector Pro MG-VCP17 i7-11800H, GeForce RTX 3080 Laptop GPU, Samsung PM9A1 MZVL21T0HCLR, IPS, 2560x1440, 17.3" | |
|---|---|---|---|---|---|---|
| Power Consumption | 18% | 9% | 11% | 29% | 28% | |
| Idle Minimum * (Watt) | 29.7 | 19 36% | 10.2 66% | 20.9 30% | 14 53% | 11 63% |
| Idle Average * (Watt) | 33.6 | 25 26% | 21.2 37% | 25.1 25% | 19 43% | 15.6 54% |
| Idle Maximum * (Watt) | 35.5 | 28 21% | 48.4 -36% | 45 -27% | 31 13% | 34 4% |
| Load Average * (Watt) | 113.8 | 105 8% | 118.7 -4% | 102 10% | 97 15% | 81.2 29% |
| Witcher 3 ultra * (Watt) | 210 | 223 -6% | 249 -19% | 189 10% | 156 26% | 204 3% |
| Load Maximum * (Watt) | 292 | 226 23% | 262 10% | 234.8 20% | 231 21% | 257.3 12% |
* ... smaller is better
Power Consumption Witcher 3 / Stresstest
Power Consumption external Monitor
电池寿命
集成电池的功率相对较大,为91瓦,而采用11代英特尔的XMG Neo 17只有62瓦。尽管如此,电池寿命仍然很平庸,即使设置为平衡或办公电源配置文件,实际使用WLAN的时间也只有3小时。
用附带的交流适配器从空到满的充电时间比预期的3小时要慢得多。换句话说,在浏览网页时,系统的充电时间和耗电时间一样长。大多数超极本和其他游戏笔记本电脑可以在2小时或更短时间内完全充电。
可悲的是,该系统不能通过第三方USB-C适配器充电,这与雷蛇Blade Pro和华硕或Alienware的大多数其他游戏笔记本不同。
| Schenker Uniwill Technology GM7AG8P i9-12900H, GeForce RTX 3080 Ti Laptop GPU, 91 Wh | Schenker XMG NEO 17 GM7TG8S i7-11800H, GeForce RTX 3080 Laptop GPU, 62 Wh | Alienware x17 RTX 3080 P48E i7-11800H, GeForce RTX 3080 Laptop GPU, 87 Wh | Razer Blade 17 RTX 3070 i7-11800H, GeForce RTX 3070 Laptop GPU, 70 Wh | MSI GS76 Stealth 11UH i9-11900H, GeForce RTX 3080 Laptop GPU, 99.9 Wh | Maingear Vector Pro MG-VCP17 i7-11800H, GeForce RTX 3080 Laptop GPU, 91 Wh | |
|---|---|---|---|---|---|---|
| Battery runtime | -18% | -28% | -10% | -7% | 8% | |
| Reader / Idle (h) | 7 | 6.7 | 9.9 | |||
| WiFi v1.3 (h) | 6.4 | 3.7 -42% | 5.9 -8% | 5.2 -19% | 6.4 0% | 6.9 8% |
| Load (h) | 1.5 | 1.6 7% | 0.8 -47% | 1.5 0% | 1.3 -13% | |
| H.264 (h) | 3.7 |
Pros
Cons
结论--每体积的性能非常高
移动GeForce RTX 3070 Ti和 RTX 3080 Ti是为了在移动GeForce RTX 3000系列不可避免地推出之前延长其寿命而推出的,GeForce 4000系列。然而,在那之前,移动RTX 3080 Ti可以提供发烧友所渴望的额外性能提升。尽管该GPU只比移动RTX 3080 Ti快一点,但看到像GM7AG8P这样的超薄型号超过像微星GE76 10UH这样的更厚更重的替代产品的旧版RTX 3080,仍然令人印象深刻。
也许GM7AG8P更值得注意的方面是它能够维持150+W的TGP目标,尽管它的外形纤细,重量相对较低。这款 Razer Blade Pro和MSI GS76 Stealth根据我们对其他超薄游戏笔记本的经验,Uniwill Technology已经成功地安装了一个比我们最初预期更强大的GPU。
无论尺寸和重量如何,CPU和GPU在任何游戏笔记本电脑中都是最快的,但笨重的280瓦交流适配器使笔记本电脑原本轻薄便携的设计大打折扣。
至于 酷睿i9-12900HCPU,其性能提升超过了 酷睿i9-11900H比从移动RTX 3080到移动RTX 3080 Ti的跳跃更显著。代与代之间的改进足够大,足以舒适地取代AMD Zen 3 H系列,成为游戏笔记本电脑的顶级CPU。
GM7AG8P最大的缺点之一是它的大型280瓦砖,需要为里面的苛刻处理器供电。几乎整整一公斤,适配器和相关电缆与一些15.6英寸超极本一样重。令人遗憾的是,该系统不能通过USB-C充电,这迫使业主在旅行时携带庞大的适配器。相比之下,华硕ROG Zephyrus和Alienware笔记本电脑可以通过适合旅行的第三方USB-C适配器进行充电。游戏时预期会有很大的风扇噪音,这是这个特定类别中所有游戏笔记本的共同特征。
价格和可用性
联合利华科技的GM7AG8P还没有被广泛购买。像Schenker和Eluktronics这样的经销商可能会在未来的某一天采用类似规格的机箱。
Schenker Uniwill Technology GM7AG8P
- 02/22/2022 v7 (old)
Allen Ngo
Price comparison

