结论--华硕 Zenbook A16 的 1599 美元售价几乎无与伦比
新款 Zenbook A16 是一款非常有趣的 16 英寸笔记本电脑,有可能撼动 x86 竞争格局。设备本身的重量仅为 1.2 千克,轻巧而高品质的机身、良好的键盘和出色的 OLED 屏幕已经非常令人信服,但与全新的骁龙 X2 Elite Extreme 搭配使用,A16 的性能比 AMD 或英特尔的移动处理器强大得多。无论是单核还是多核性能都有很大提升,GPU 性能也基本上翻了一番。
当然,如果你想充分发挥 CPU 的性能,风扇的噪音会很大,但新 X2 Elite Extreme 的最大优势是在较低功耗限制下的良好性能。即使在风扇噪音不超过 30 dB(A) 的Whisper 模式下,CPU 性能仍然优于 AMD 和 Intel。Apple ,单核性能仍然领先,而 GPU 性能与 M5 相当,多核性能较低。
这里没有太多值得批评的地方。电池可以更大,但这会增加重量,而且读卡器不支持 SD-Express 标准。除此之外,这款笔记本电脑的整体配置非常出色,考虑到它的价格仅为 1599 美元,还配备了功能强大的 X2 Elite Extreme 和 48 GB 内存,我们不知道为什么在日常多媒体笔记本电脑这个细分市场中,你会买到更贵的 Windows 笔记本电脑。
Pros
Cons
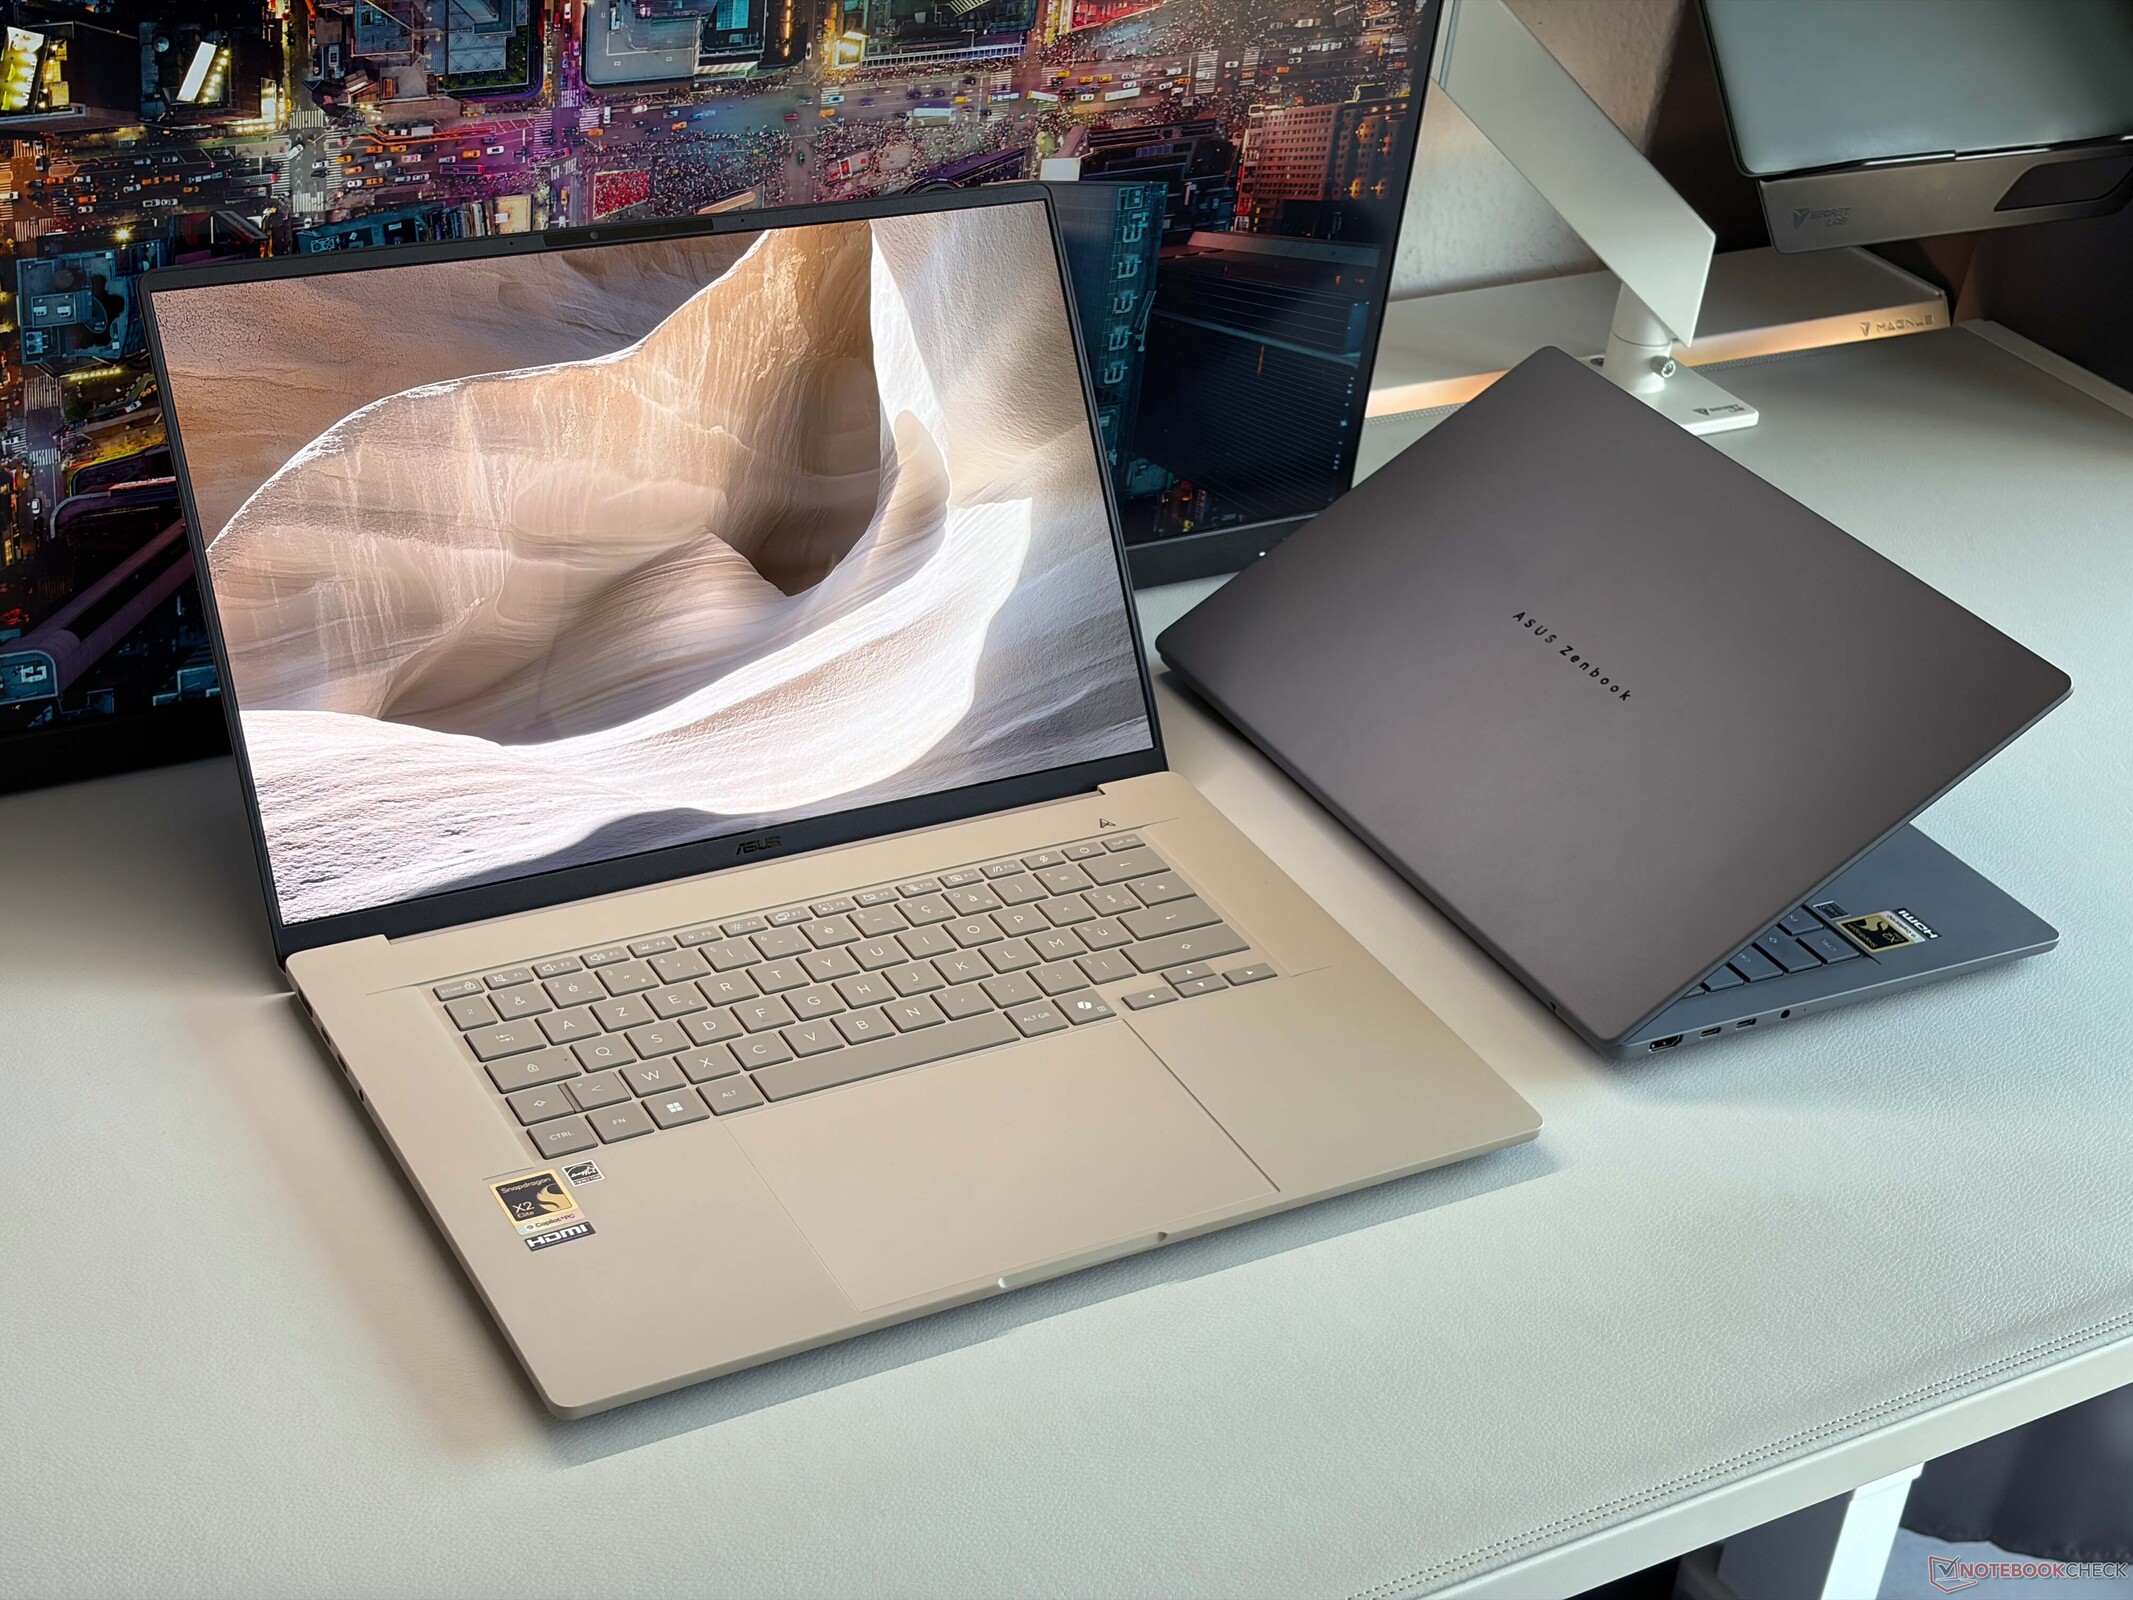
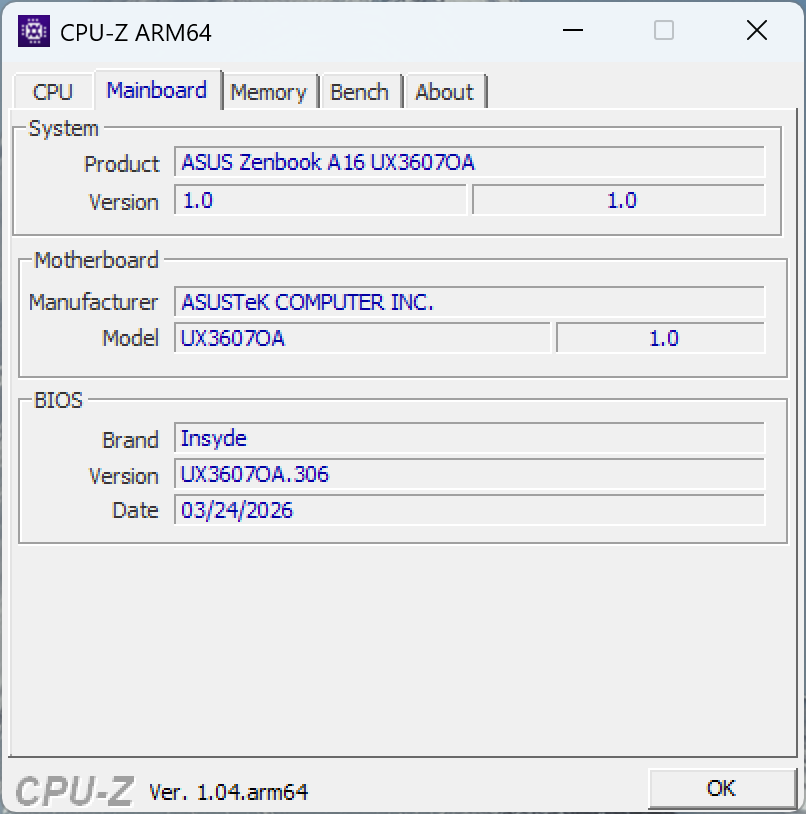
继 2024 年推出搭载骁龙处理器的 Zenbook A14 之后,华硕现在又推出了一款更大的 16 英寸机型,作为 Zenbook S16 和戴尔 XPS 16、三星Galaxy Book6 Pro 16 以及Apple 15 英寸 MacBook Air 等设备的直接竞争对手。新款 Zenbook A16 还采用了非常轻巧的机身,重量仅为 1.21 千克。只需 1599 美元就能获得全新的高通骁龙 X2 Elite Extreme 处理器、48 GB 内存、1 TB SSD 存储空间以及 120 Hz 和 2.8K 分辨率的 16 英寸 OLED 面板。更多详情,请参阅我们对新款骁龙 X2 Elite 芯片的分析:
规格
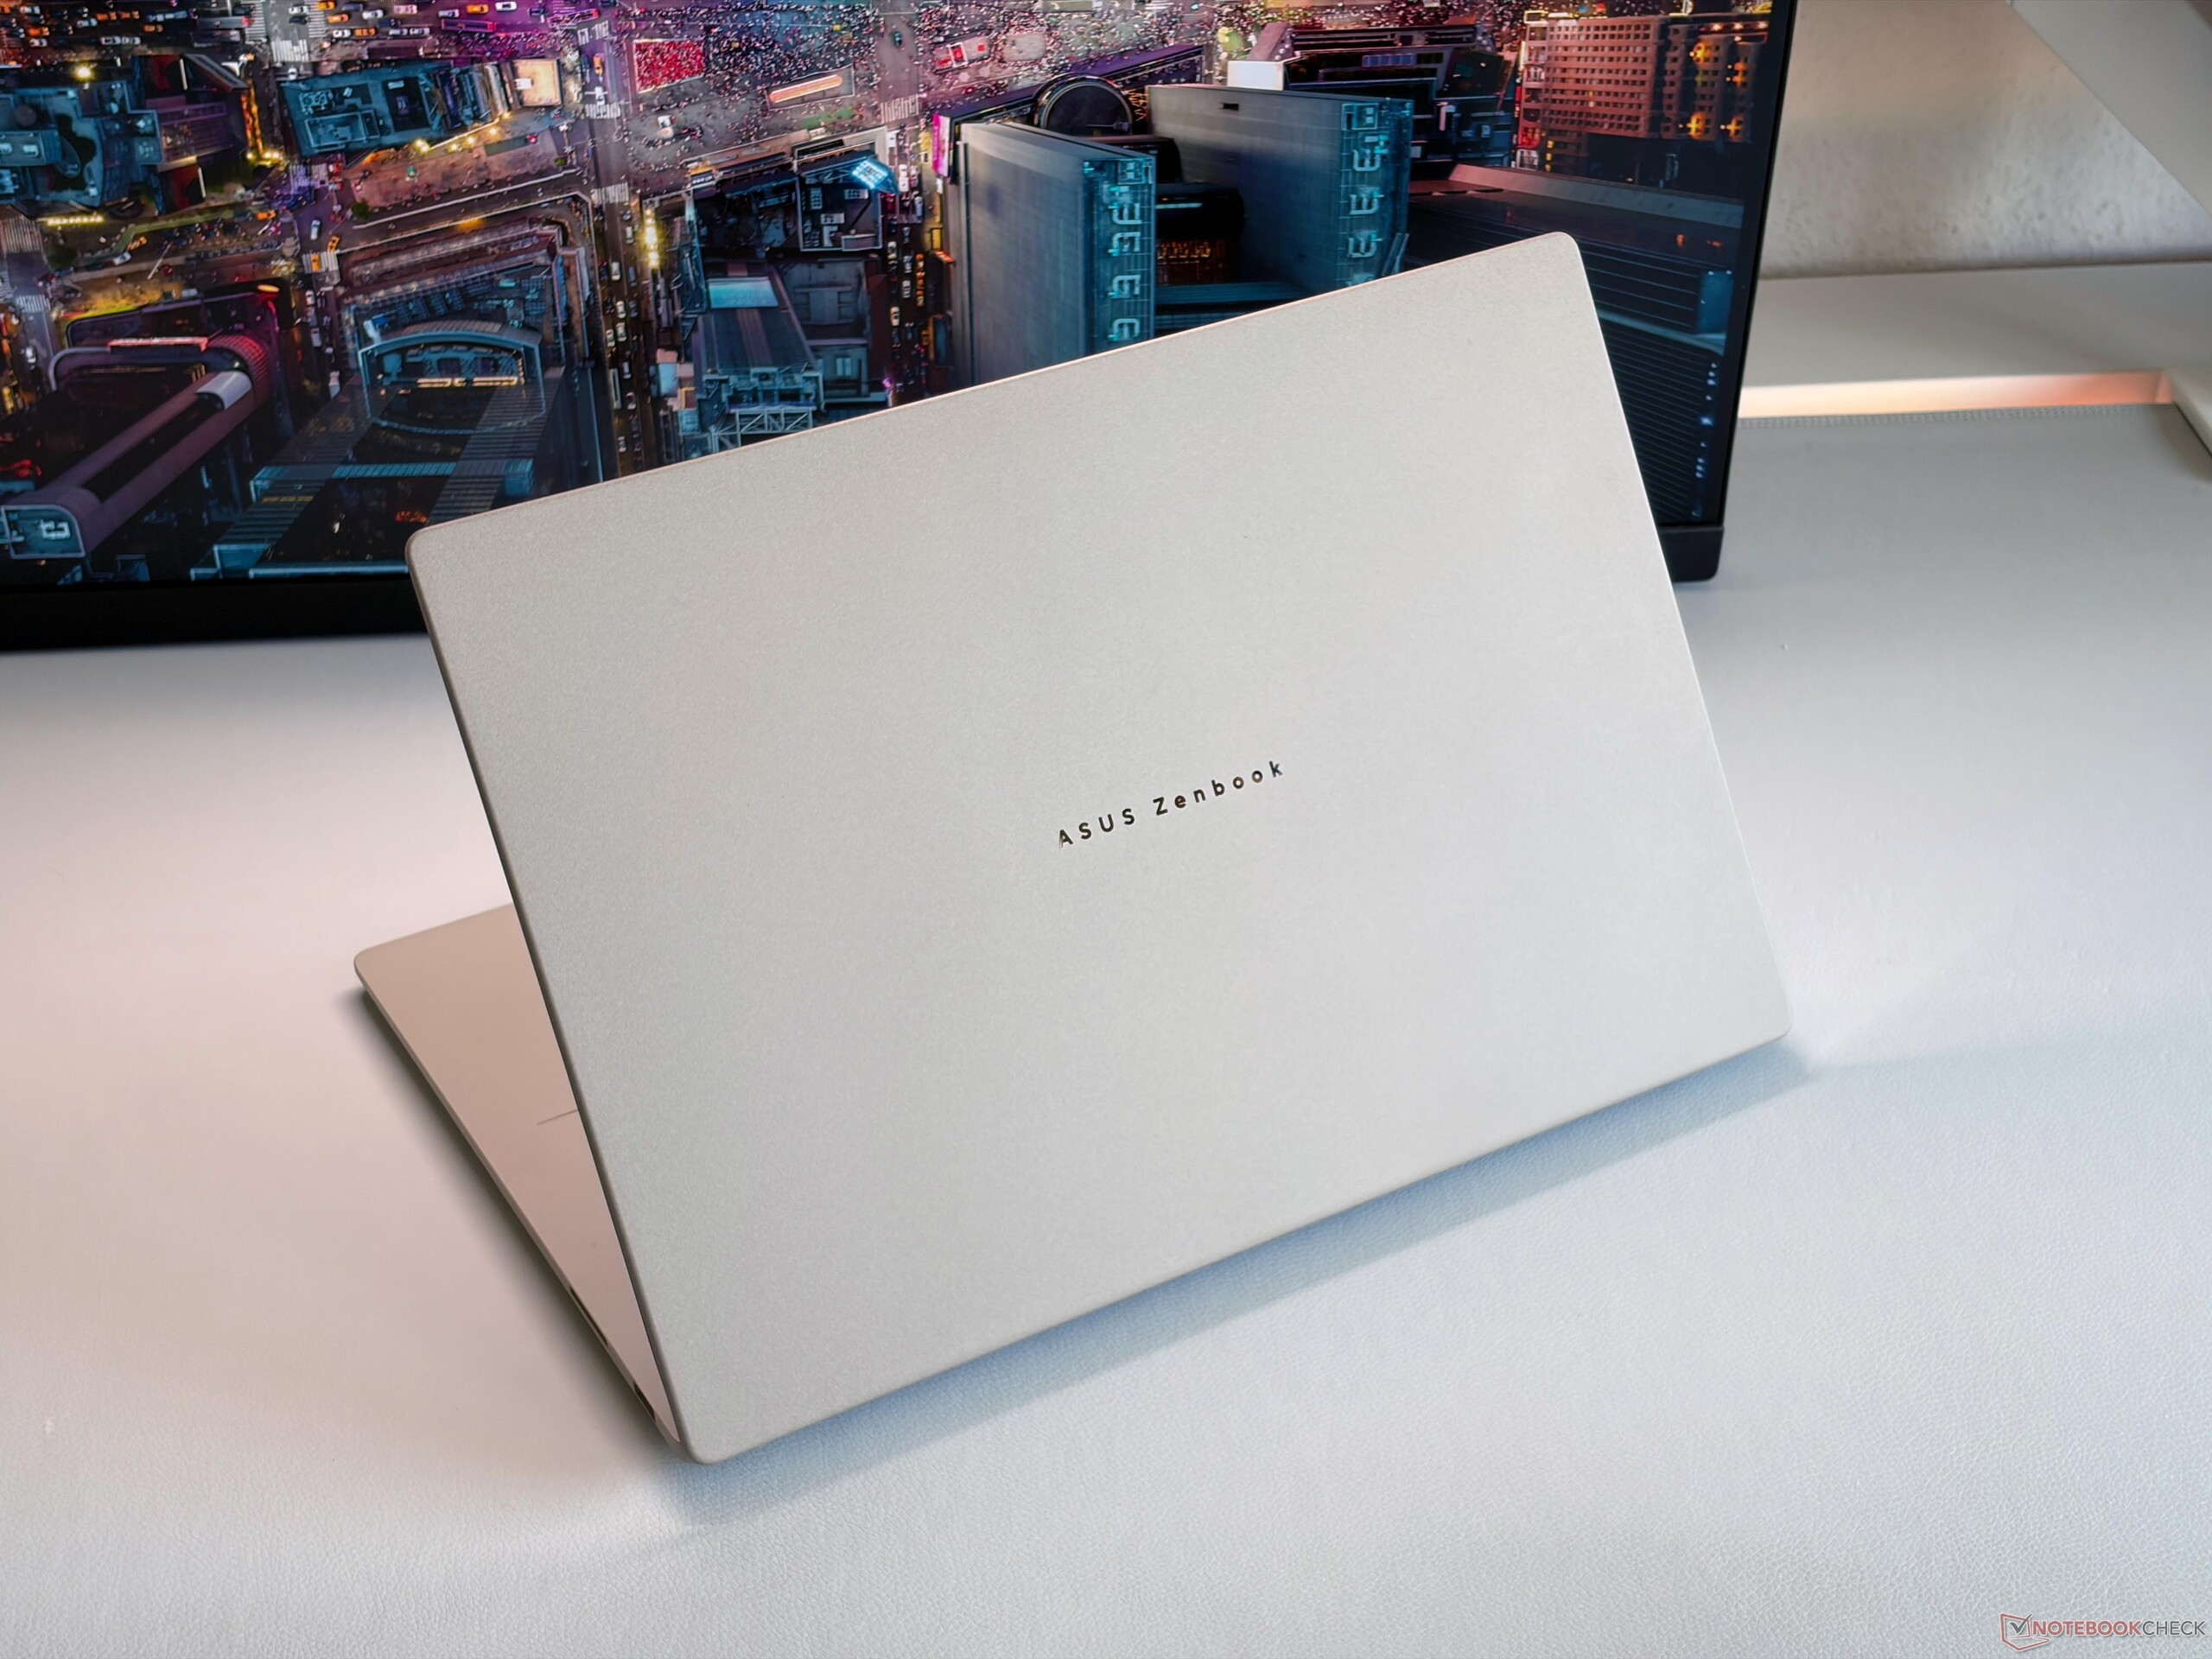
外壳 - Zenbook A16 仅重 1.2 千克
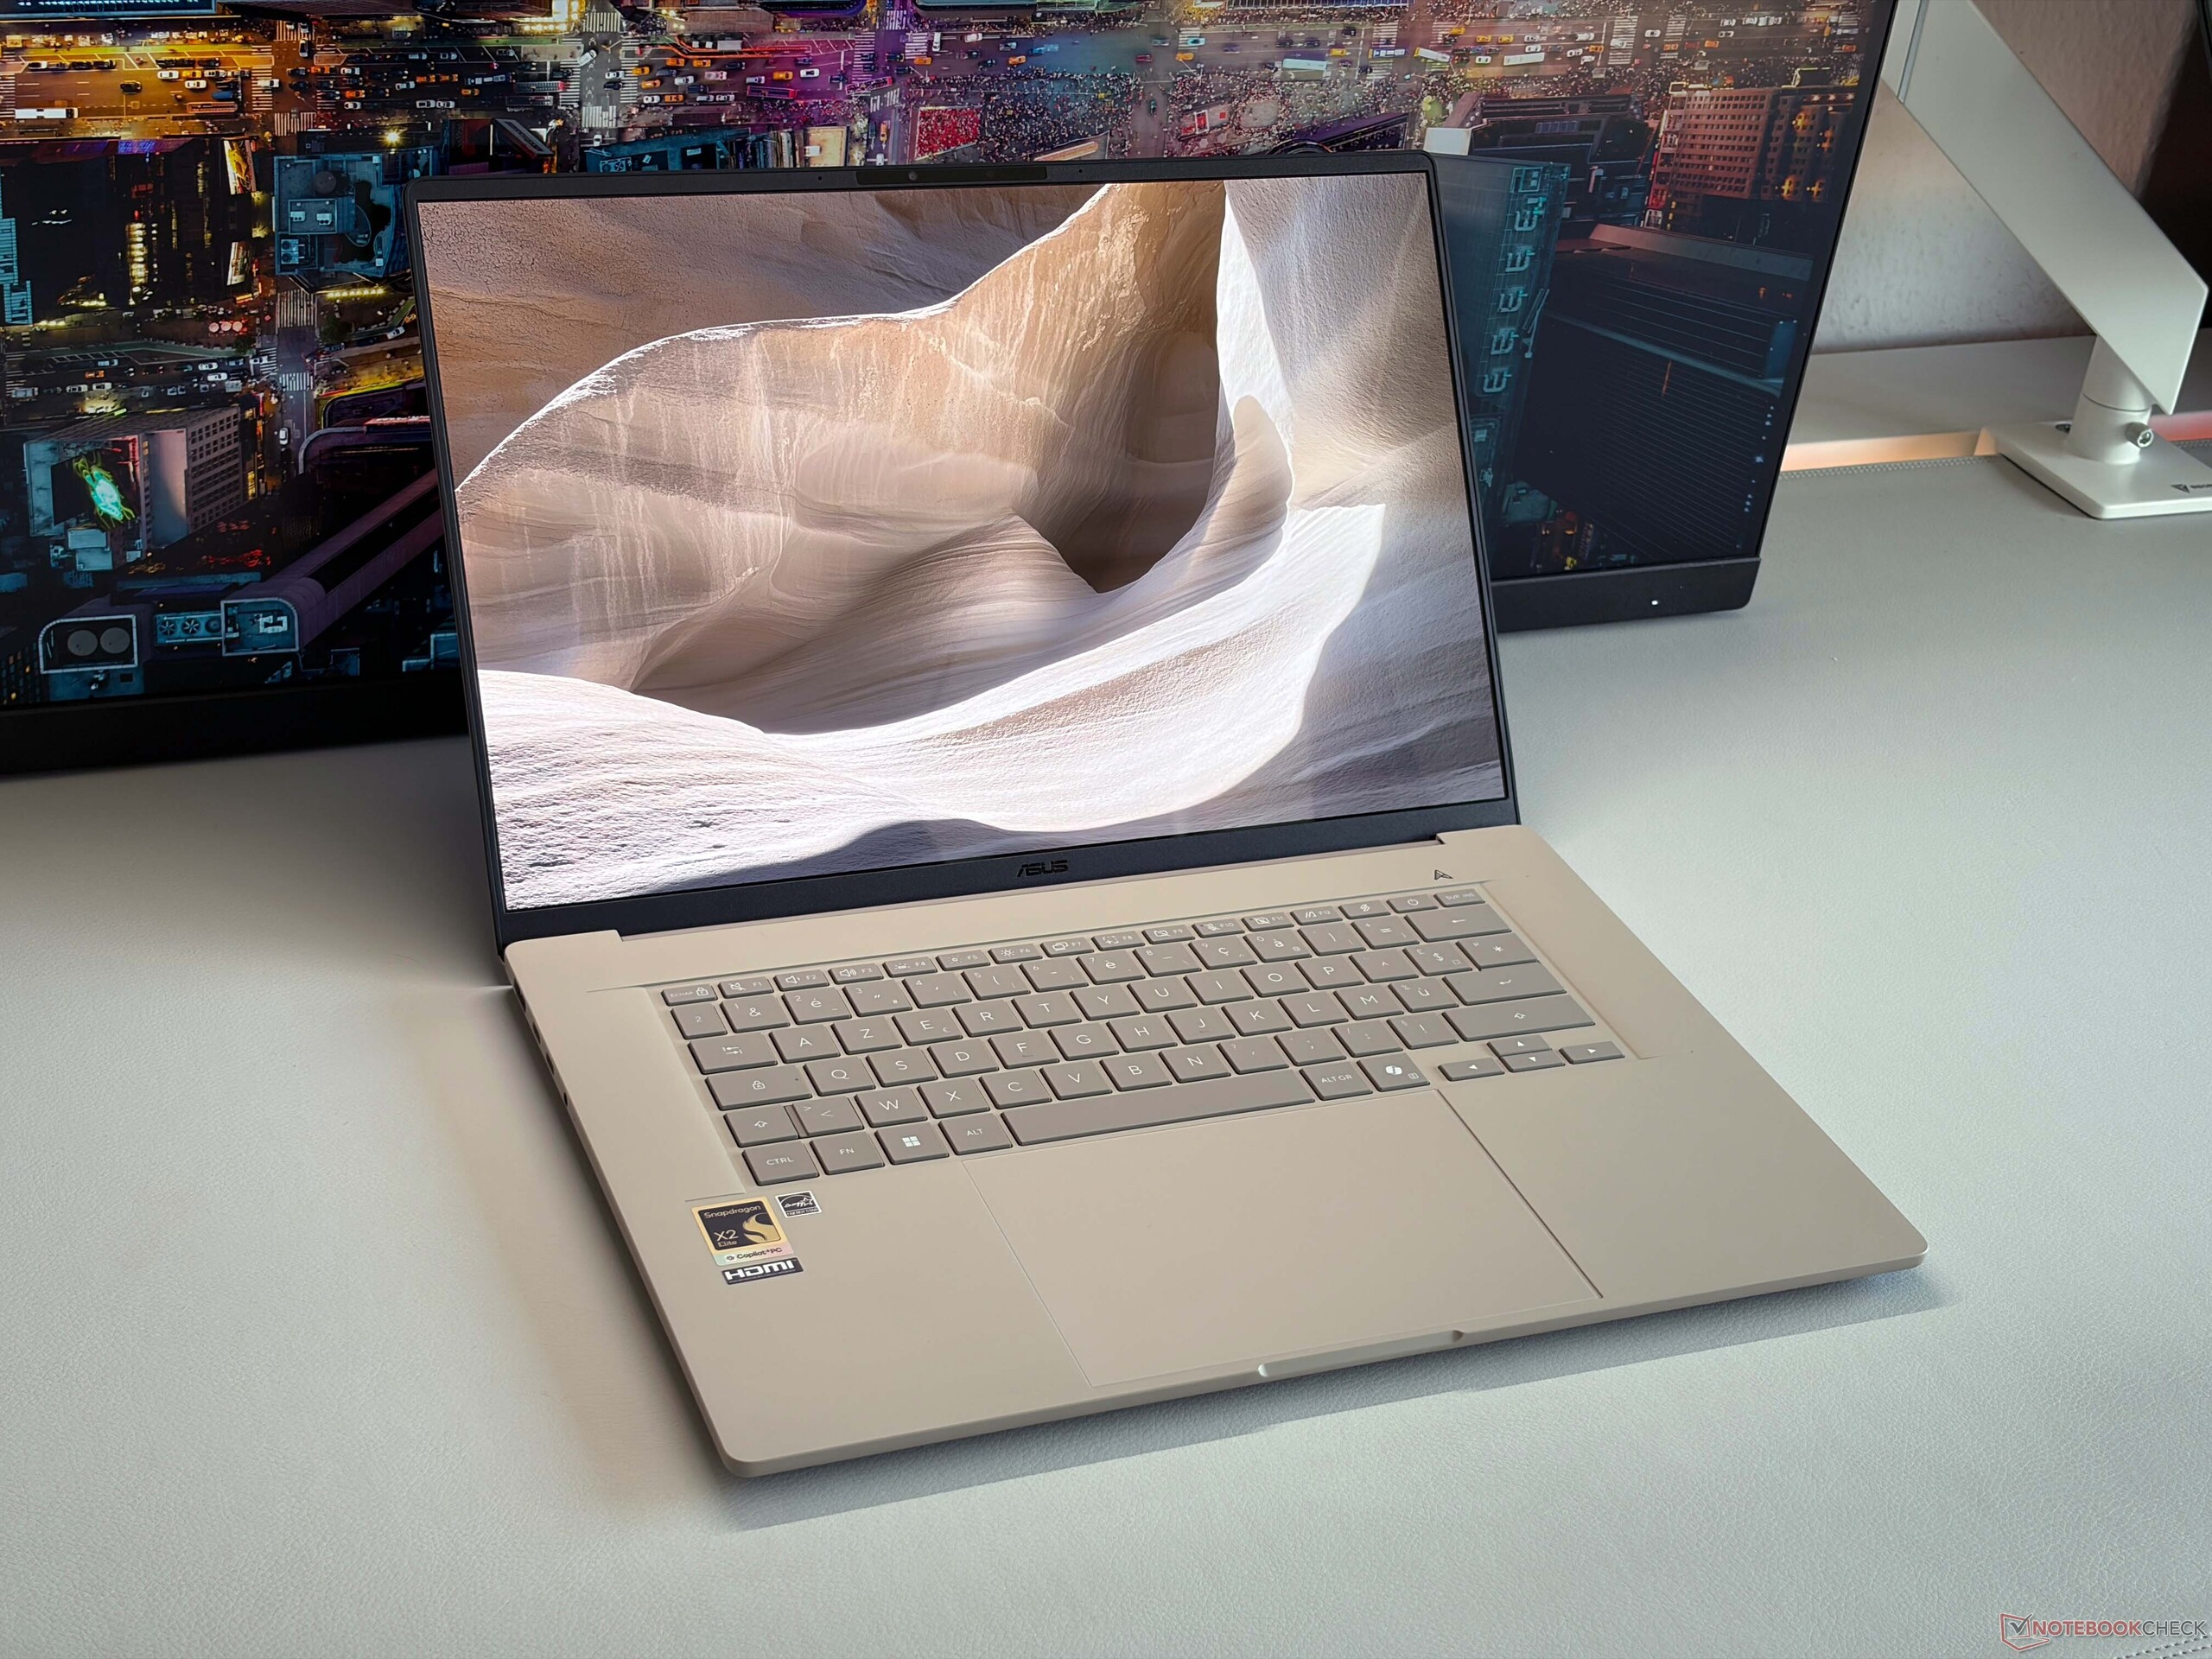
机身设计沿用了较小的 Zenbook A14,16 英寸的 Zenbook A16 也有我们熟悉的冰岛灰或扎布里斯基米色可供选择。与搭载 AMD 处理器的 Zenbook S16 相比,底座更加圆润,整体重量相差 300 多克,非常明显。虽然 A16 的机身很轻,但它仍然非常稳定和坚固,甚至感觉比更小的 Zenbook A14(不到 1 千克)密度更高一些。没有吱吱作响的声音,底座的稳定性非常好。盖子的灵活性稍差,但这不是问题。我们希望铰链的校准能更好一些(最大开启角度约为 135 度),因为盖子有点晃动。
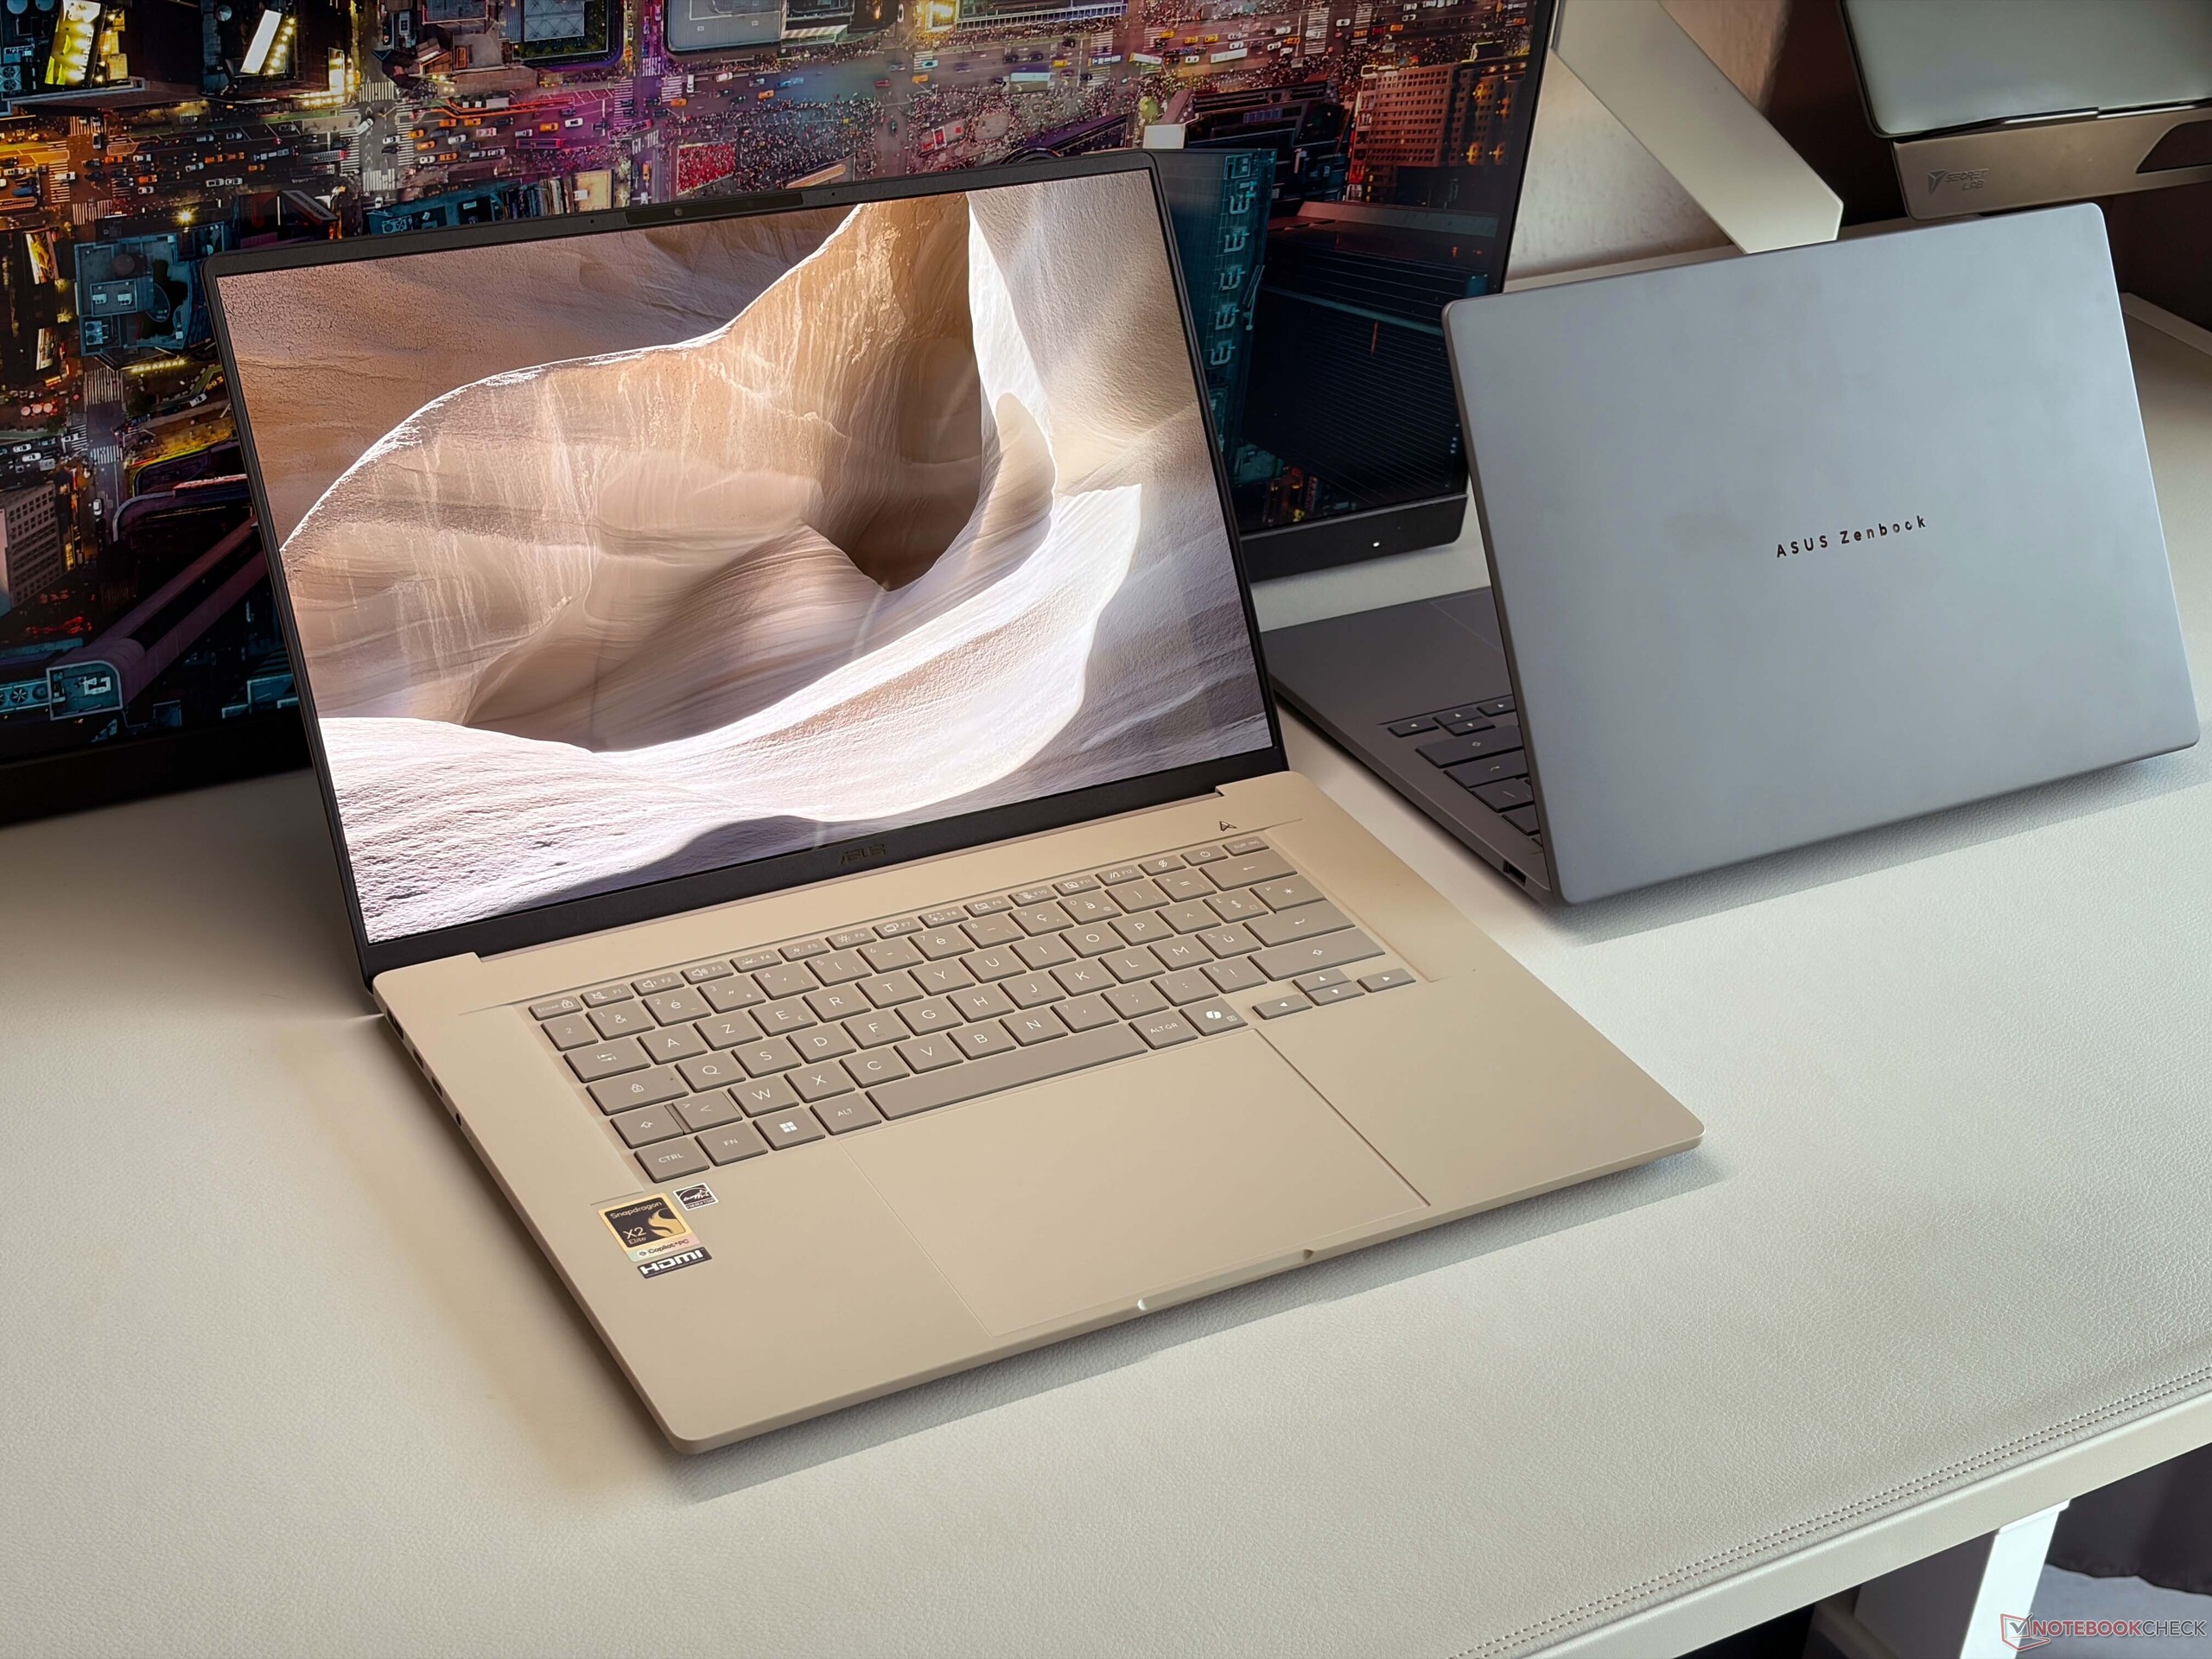
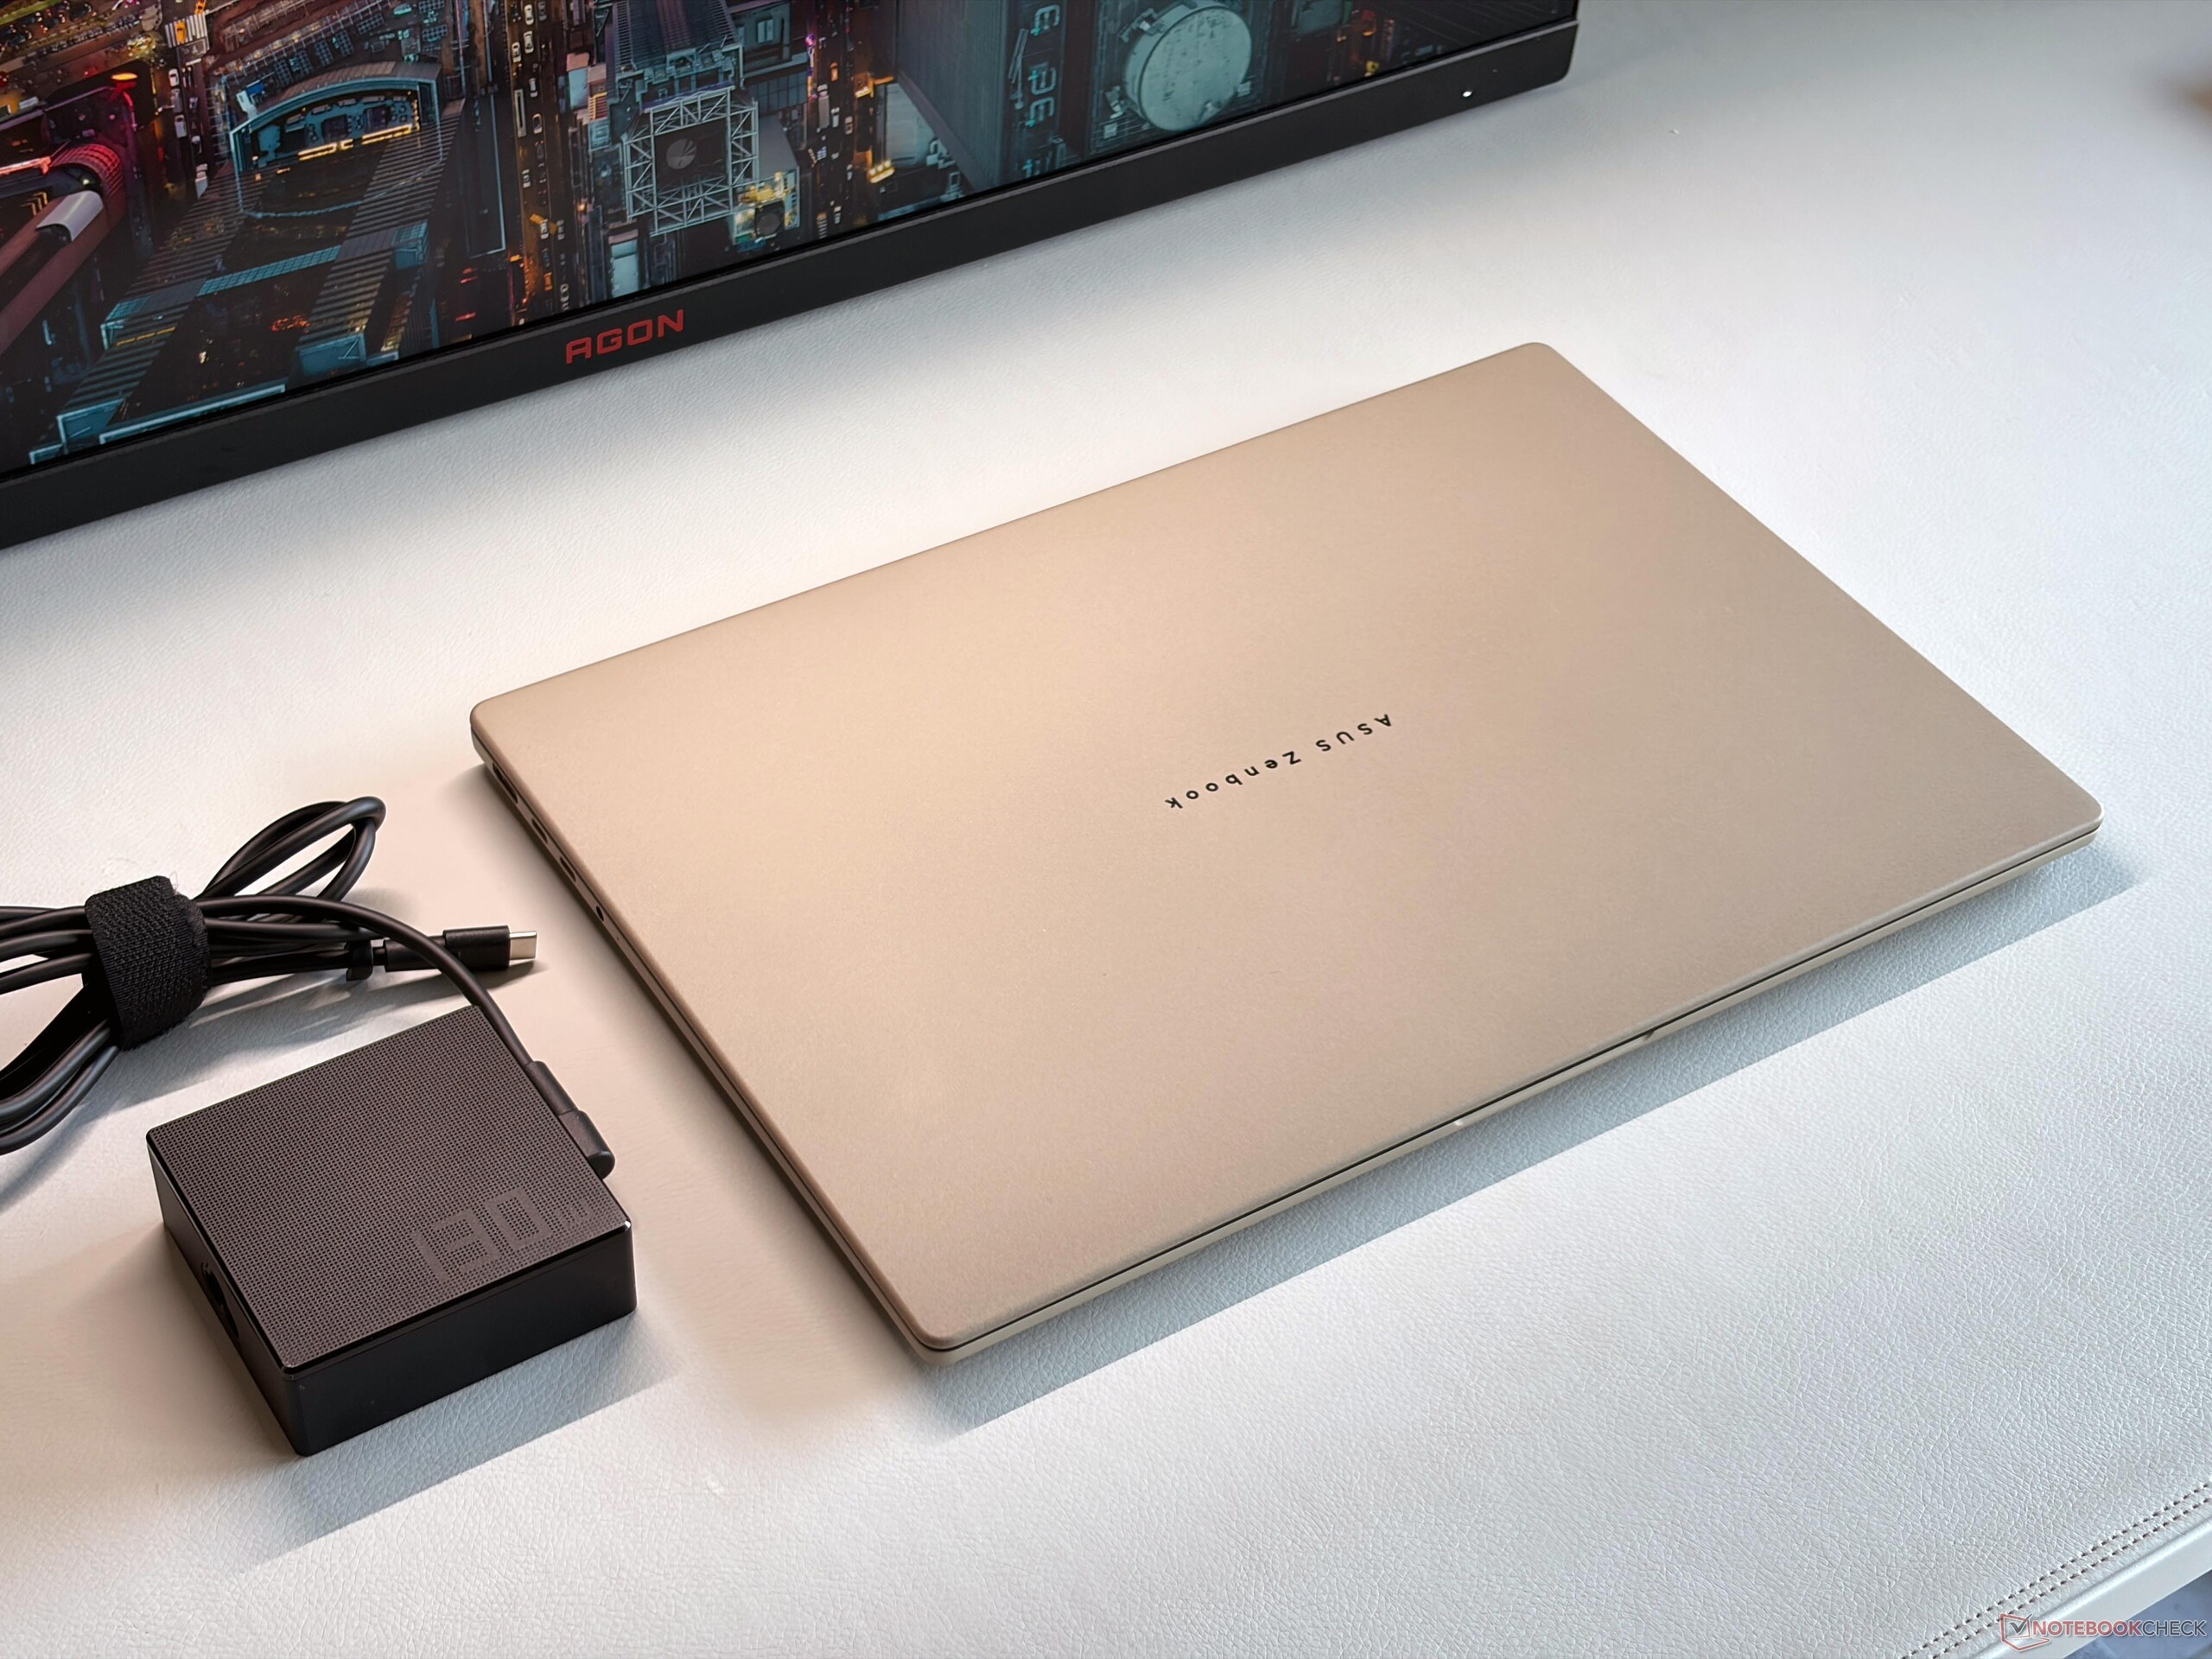
与竞争对手相比,Zenbook A16 的重量明显较轻,即使是较小的 15 英寸 MacBook Air 也要重 300 克。附带的 130 瓦电源则重达 469 克。
连接性
Zenbook A16 右侧提供两个 USB-C 4.0 端口、一个 HDMI 2.1 输出端口和一个普通的 USB-A 端口。我们希望能在右侧增加一个用于充电的 USB-C 端口,但大多数用户应该都能接受这样的端口数量。华硕还在右侧配备了一个全尺寸 SD 卡读卡器,结合我们的参考卡,传输速率超过 200 MB/s,但不支持速度更快的 SD-Express 标准。带有用于面部识别的红外传感器的 1080p 网络摄像头支持 Windows 的所有人工智能功能,但图像质量一般。


| SD Card Reader | |
| average JPG Copy Test (av. of 3 runs) | |
| Asus Zenbook A16 UX3607 (Angelbird AV Pro V60) | |
| Asus ZenBook S16 UM5606GA (Angelbird AV Pro V60) | |
| Average of class Multimedia (23 - 531, n=44, last 2 years) | |
| Microsoft Surface Laptop 15 Snapdragon X Elite (AV Pro SD microSD 128 GB V60) | |
| maximum AS SSD Seq Read Test (1GB) | |
| Asus Zenbook A16 UX3607 (Angelbird AV Pro V60) | |
| Asus ZenBook S16 UM5606GA (Angelbird AV Pro V60) | |
| Average of class Multimedia (27.9 - 1455, n=43, last 2 years) | |
| Microsoft Surface Laptop 15 Snapdragon X Elite (AV Pro SD microSD 128 GB V60) | |
| Networking | |
| Asus Zenbook A16 UX3607 | |
| iperf3 transmit RT-BE96U WiFi7 | |
| iperf3 receive RT-BE96U WiFi7 | |
| Apple MacBook Air 15 M5 | |
| iperf3 transmit AXE11000 | |
| iperf3 receive AXE11000 | |
| Lenovo ThinkPad X9-15 Aura Edition | |
| iperf3 transmit AXE11000 | |
| iperf3 receive AXE11000 | |
| Samsung Galaxy Book6 Pro | |
| iperf3 transmit AXE11000 | |
| iperf3 receive AXE11000 | |
| iperf3 transmit RT-BE96U WiFi7 | |
| iperf3 receive RT-BE96U WiFi7 | |
| Dell XPS 16 Core Ultra 5 325 | |
| iperf3 transmit AXE11000 | |
| iperf3 receive AXE11000 | |
| iperf3 transmit AXE11000 6GHz | |
| iperf3 receive AXE11000 6GHz | |
| Asus ZenBook S16 UM5606GA | |
| iperf3 transmit AXE11000 | |
| iperf3 receive AXE11000 | |
| Microsoft Surface Laptop 15 Snapdragon X Elite | |
| iperf3 transmit AXE11000 | |
| iperf3 receive AXE11000 | |
| iperf3 transmit AXE11000 6GHz | |
| iperf3 receive AXE11000 6GHz | |


维护
底板由 Torx T5 螺钉固定,拆卸没有问题。维护任务仅限于清洁风扇,必要时可以更换固态硬盘和电池,其他所有组件都是焊接的。


输入设备
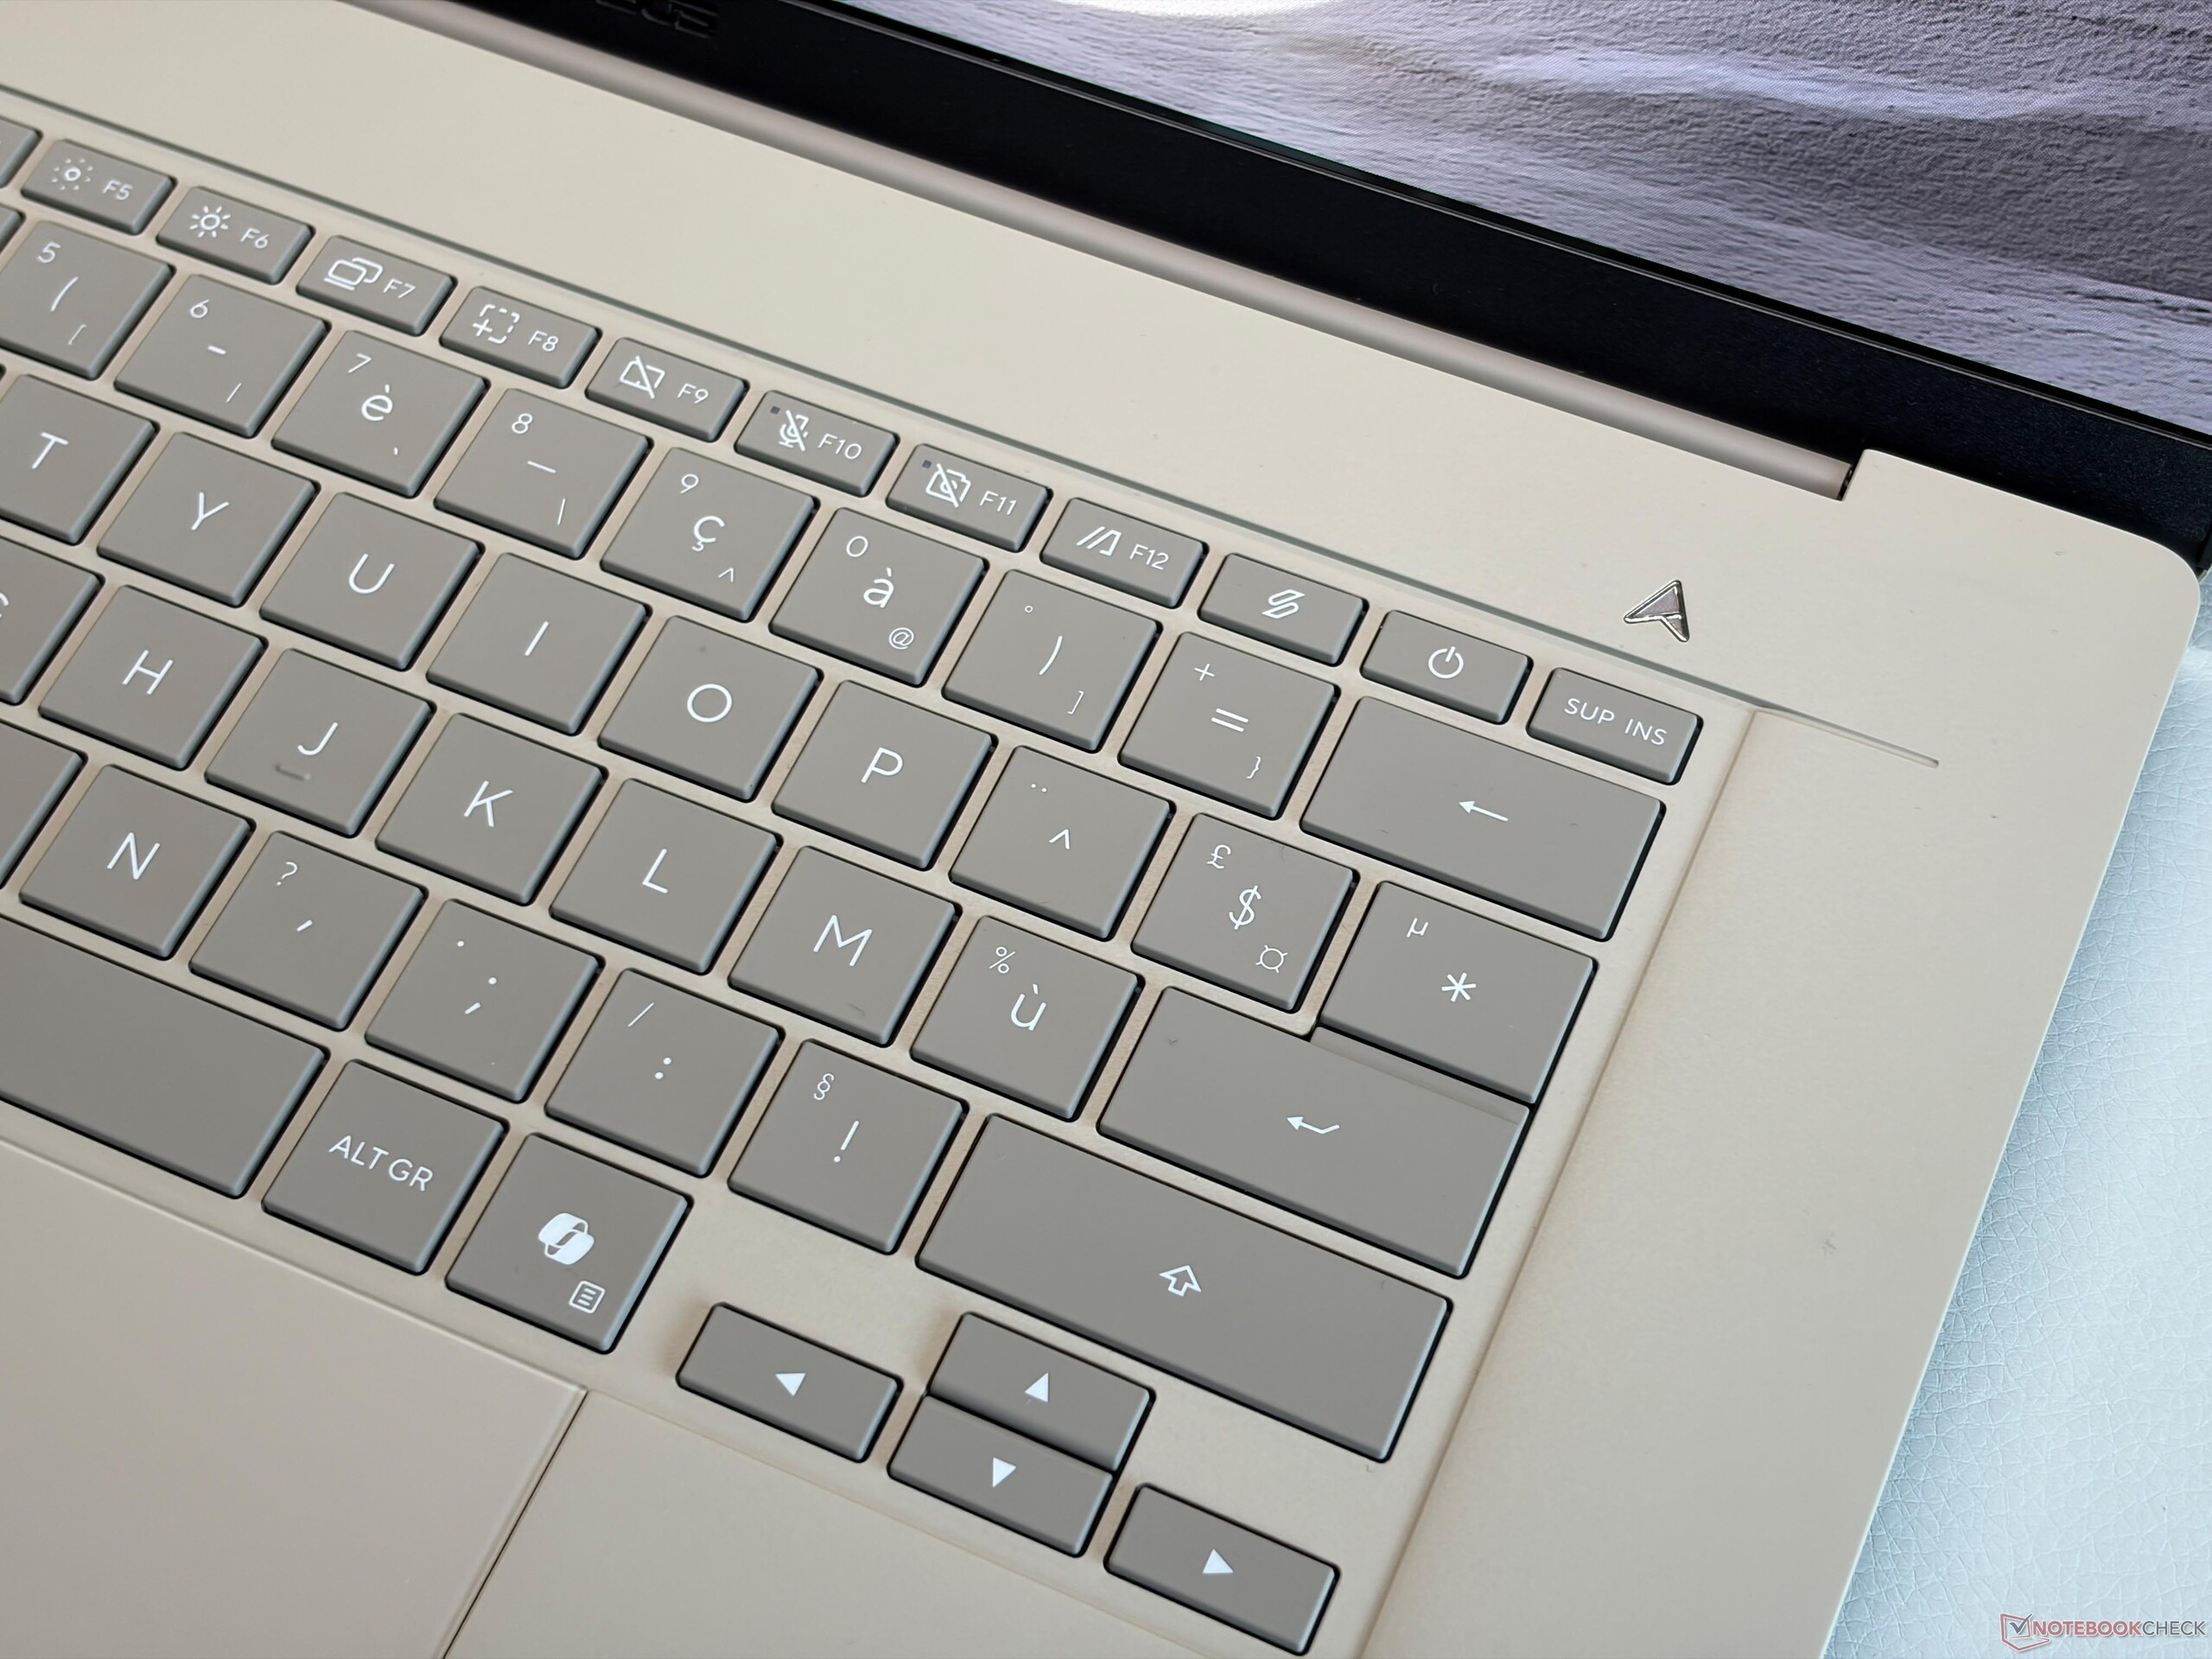
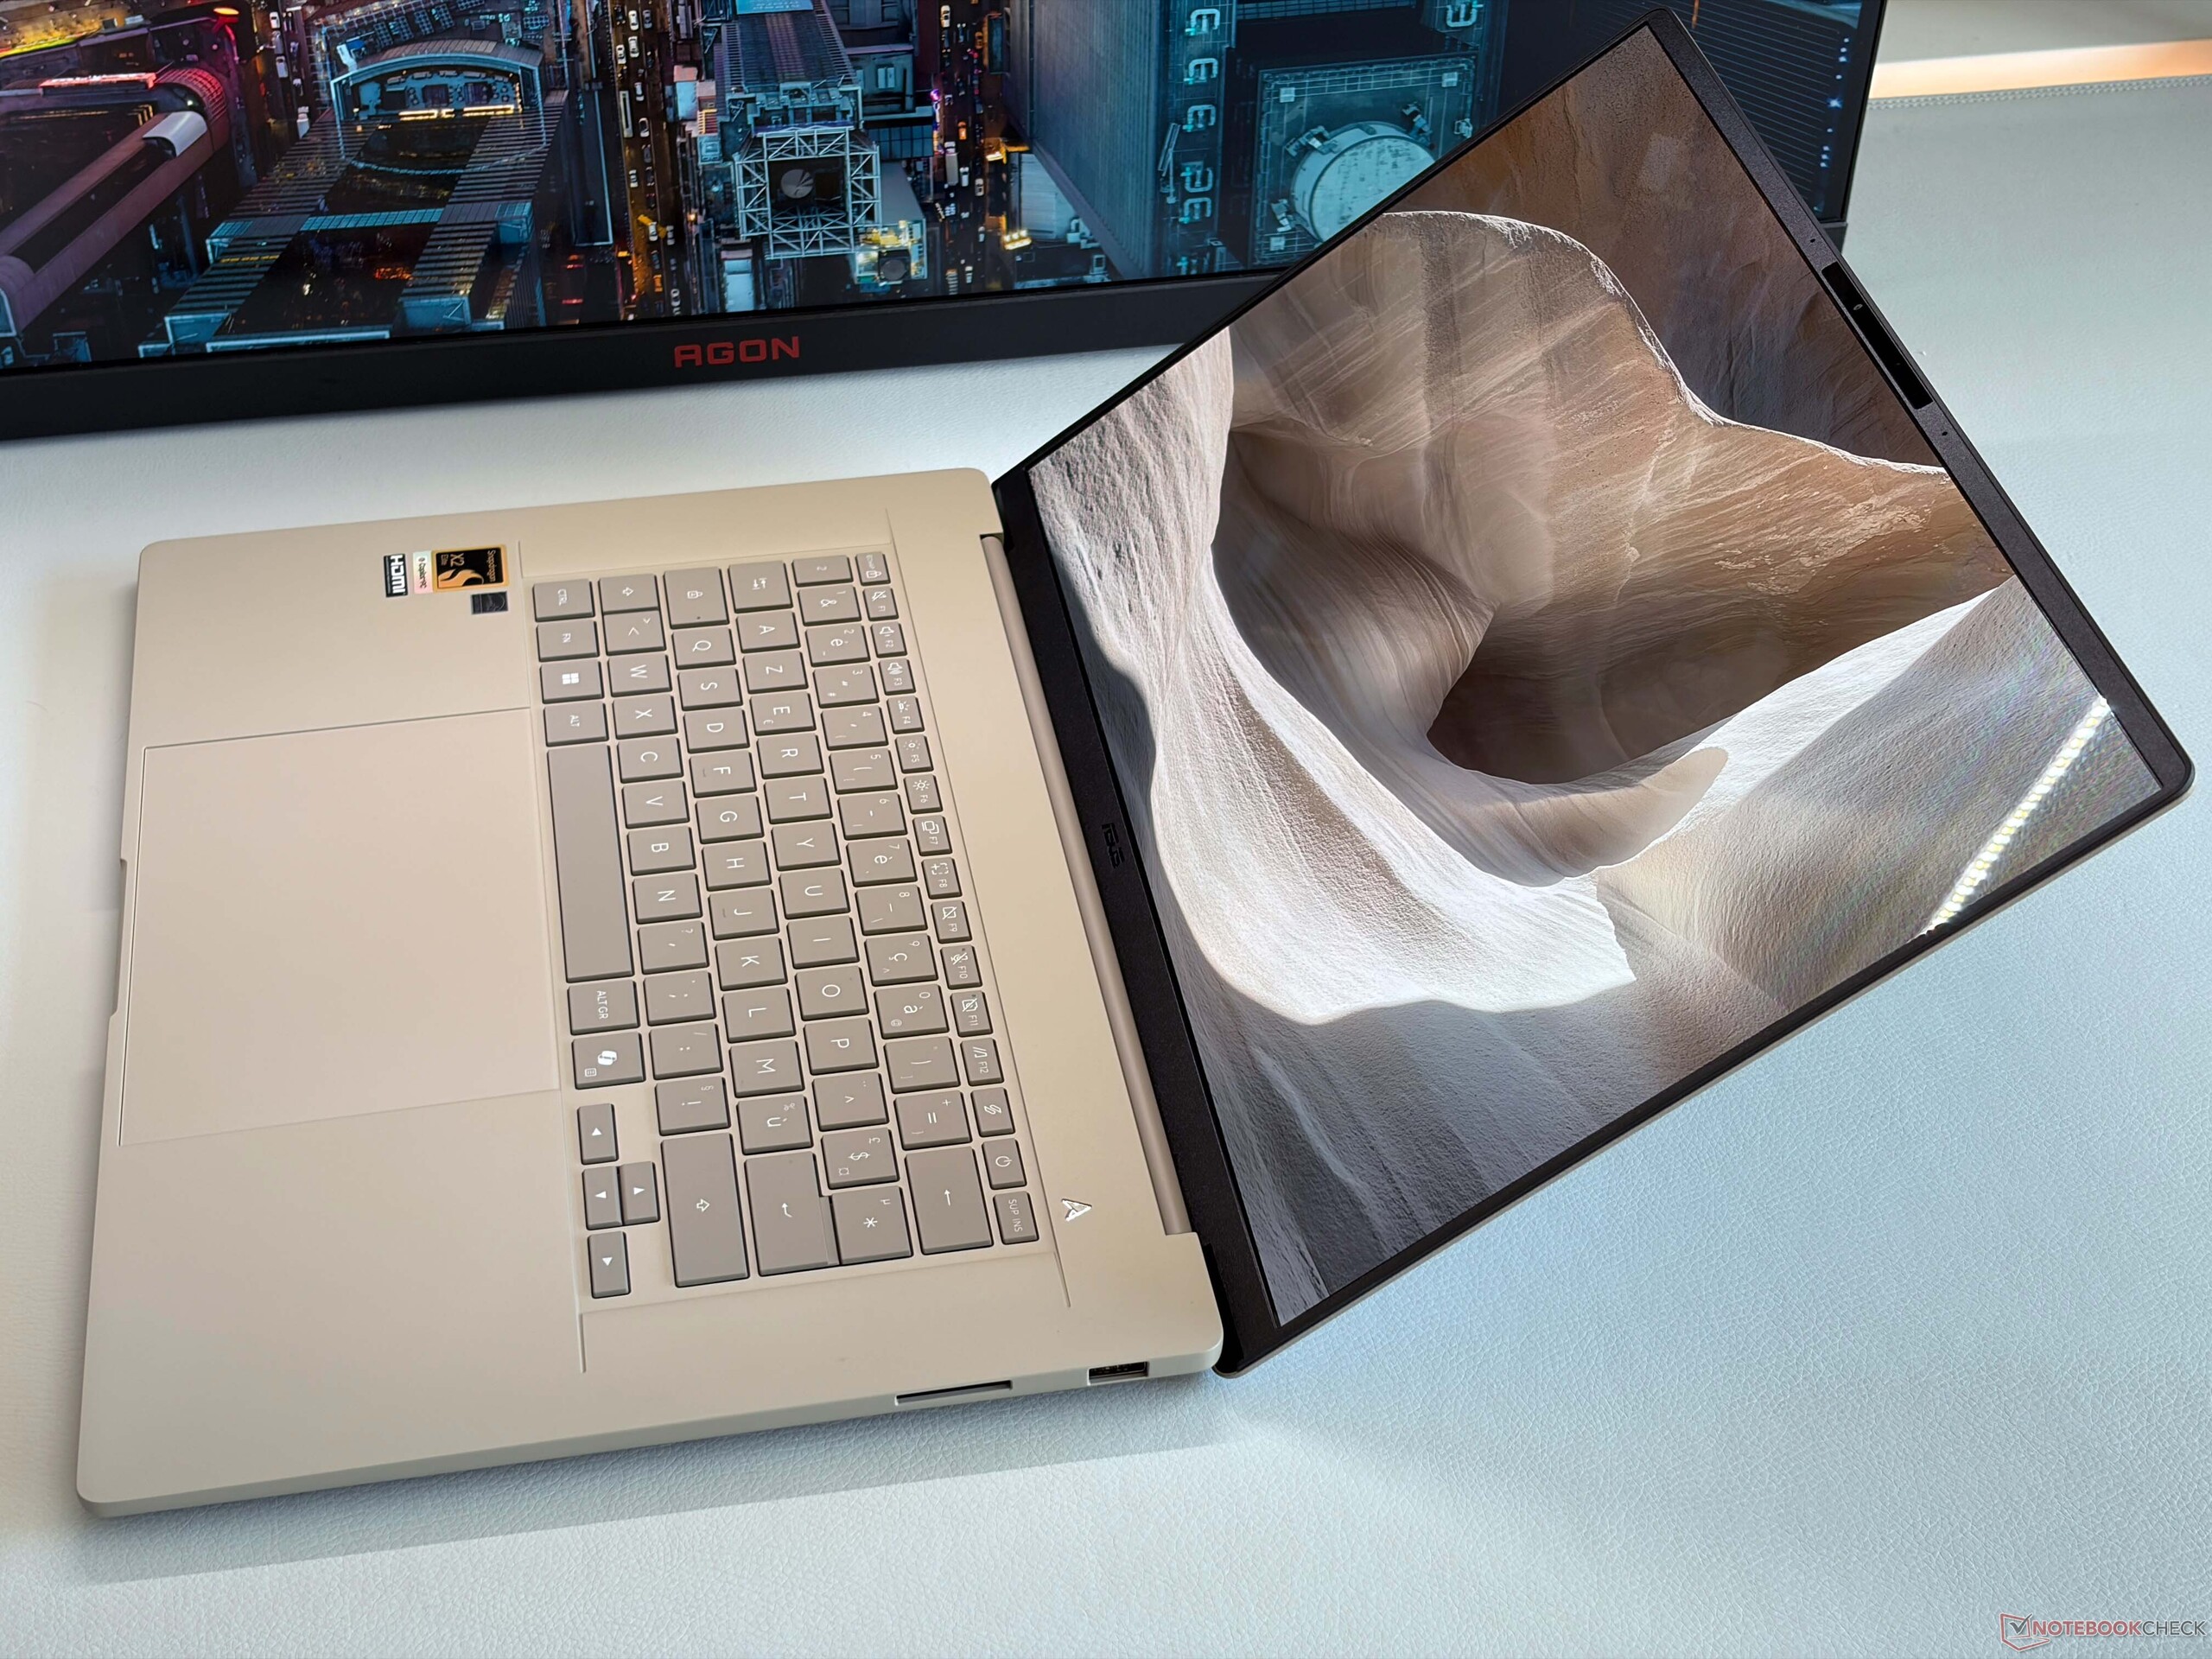
华硕使用的键盘行程为 1.3 毫米,但与较小的 Zenbook A14 相比,底座更加坚硬,整体输入体验更加舒适。白色背景照明与深色键帽配合得很好,而且可以通过传感器自动控制。宽大的点击板(15 x 10 厘米)具有出色的滑动能力,但下半部分的机械点击声音有点大。我们建议您使用轻触式点击。


显示屏 - 120 Hz OLED
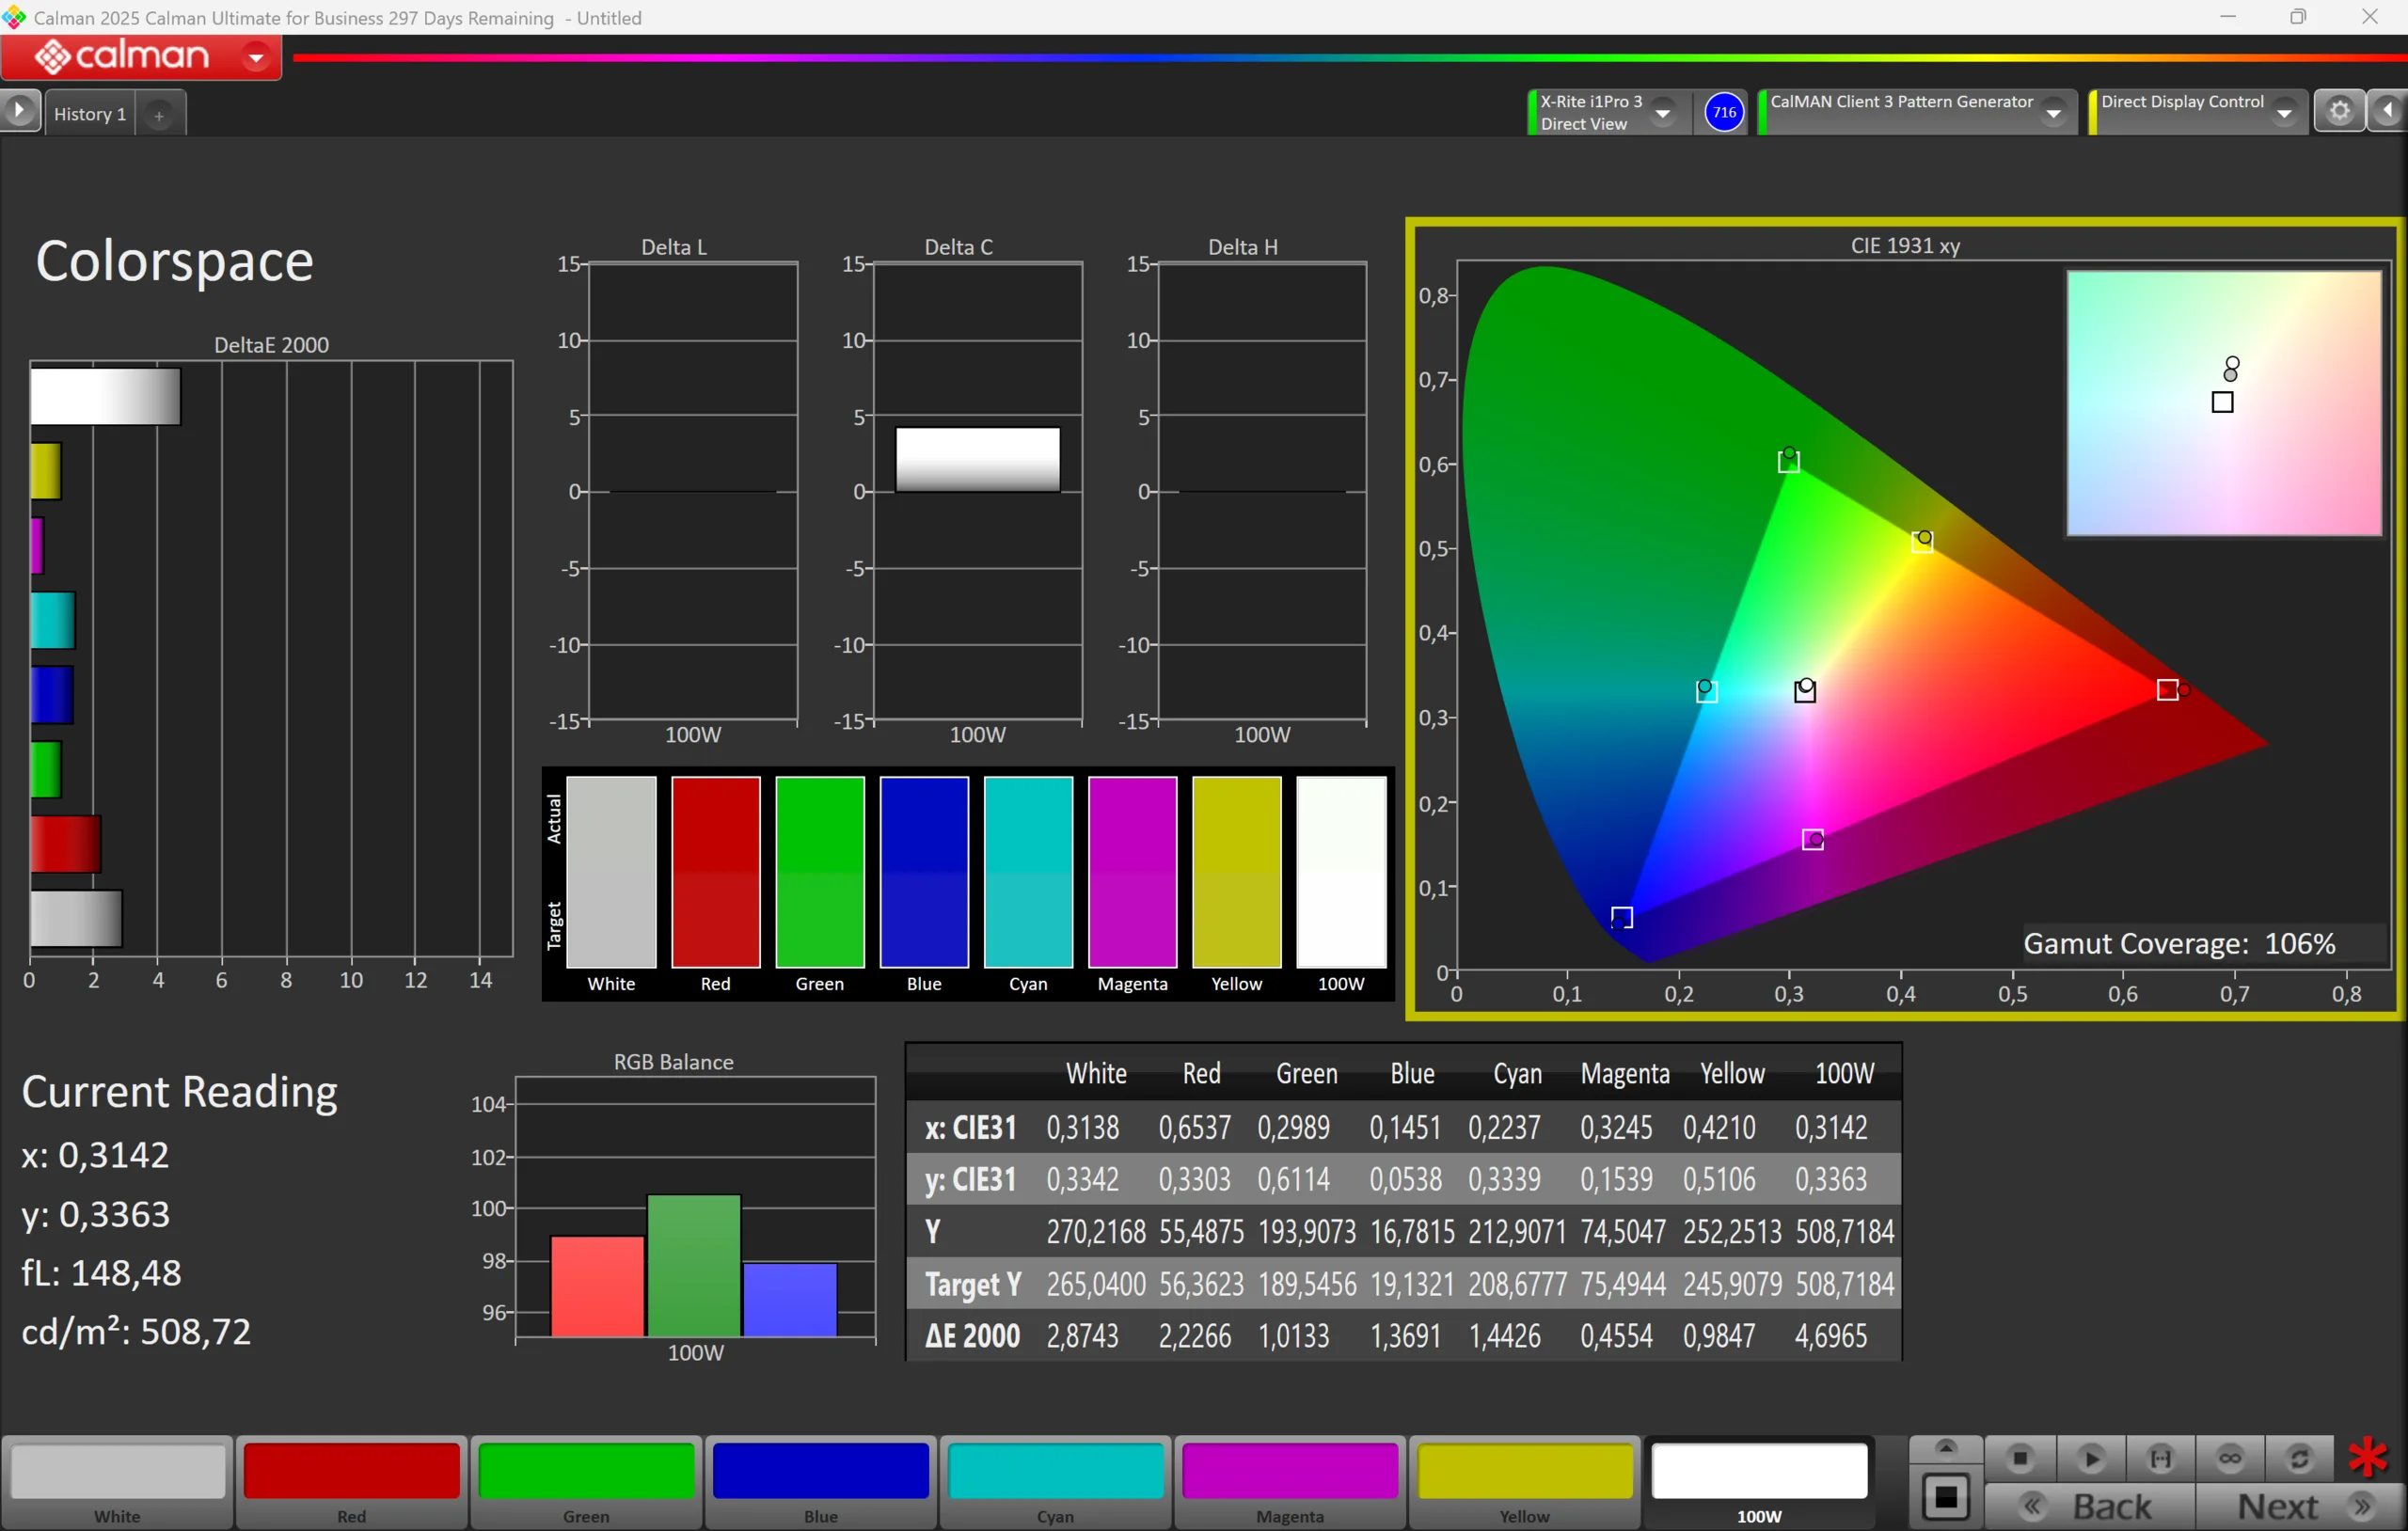
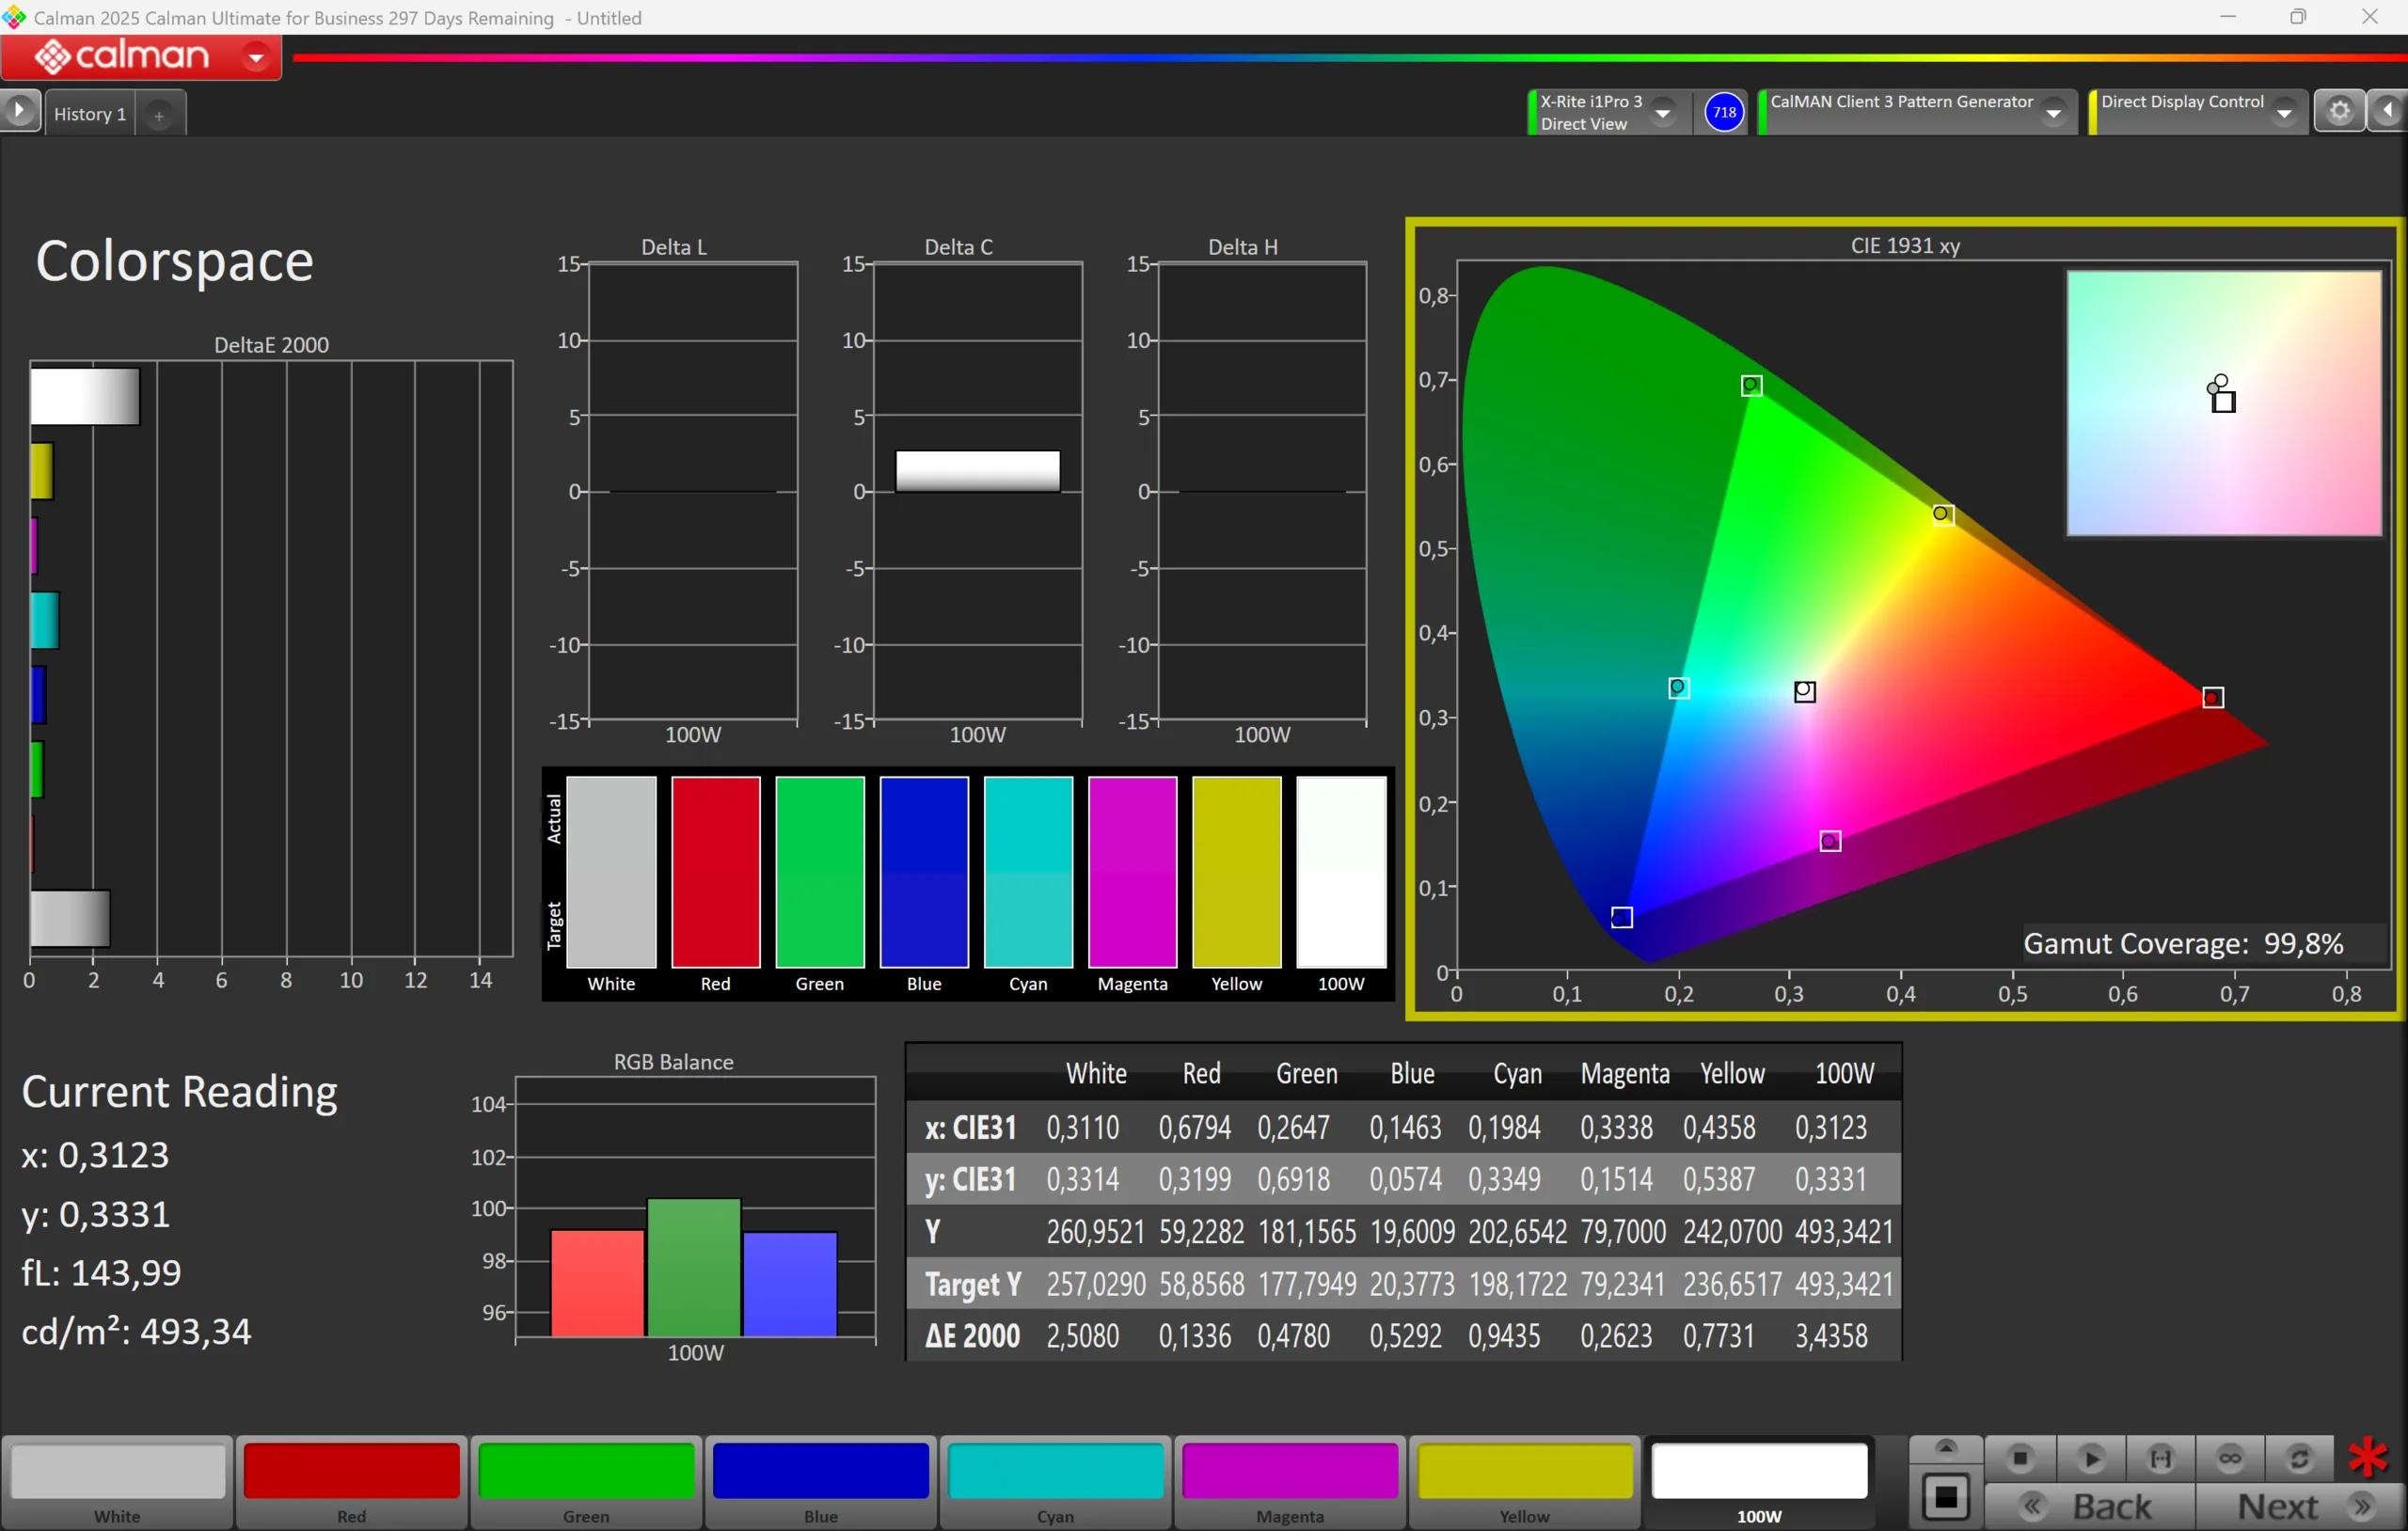
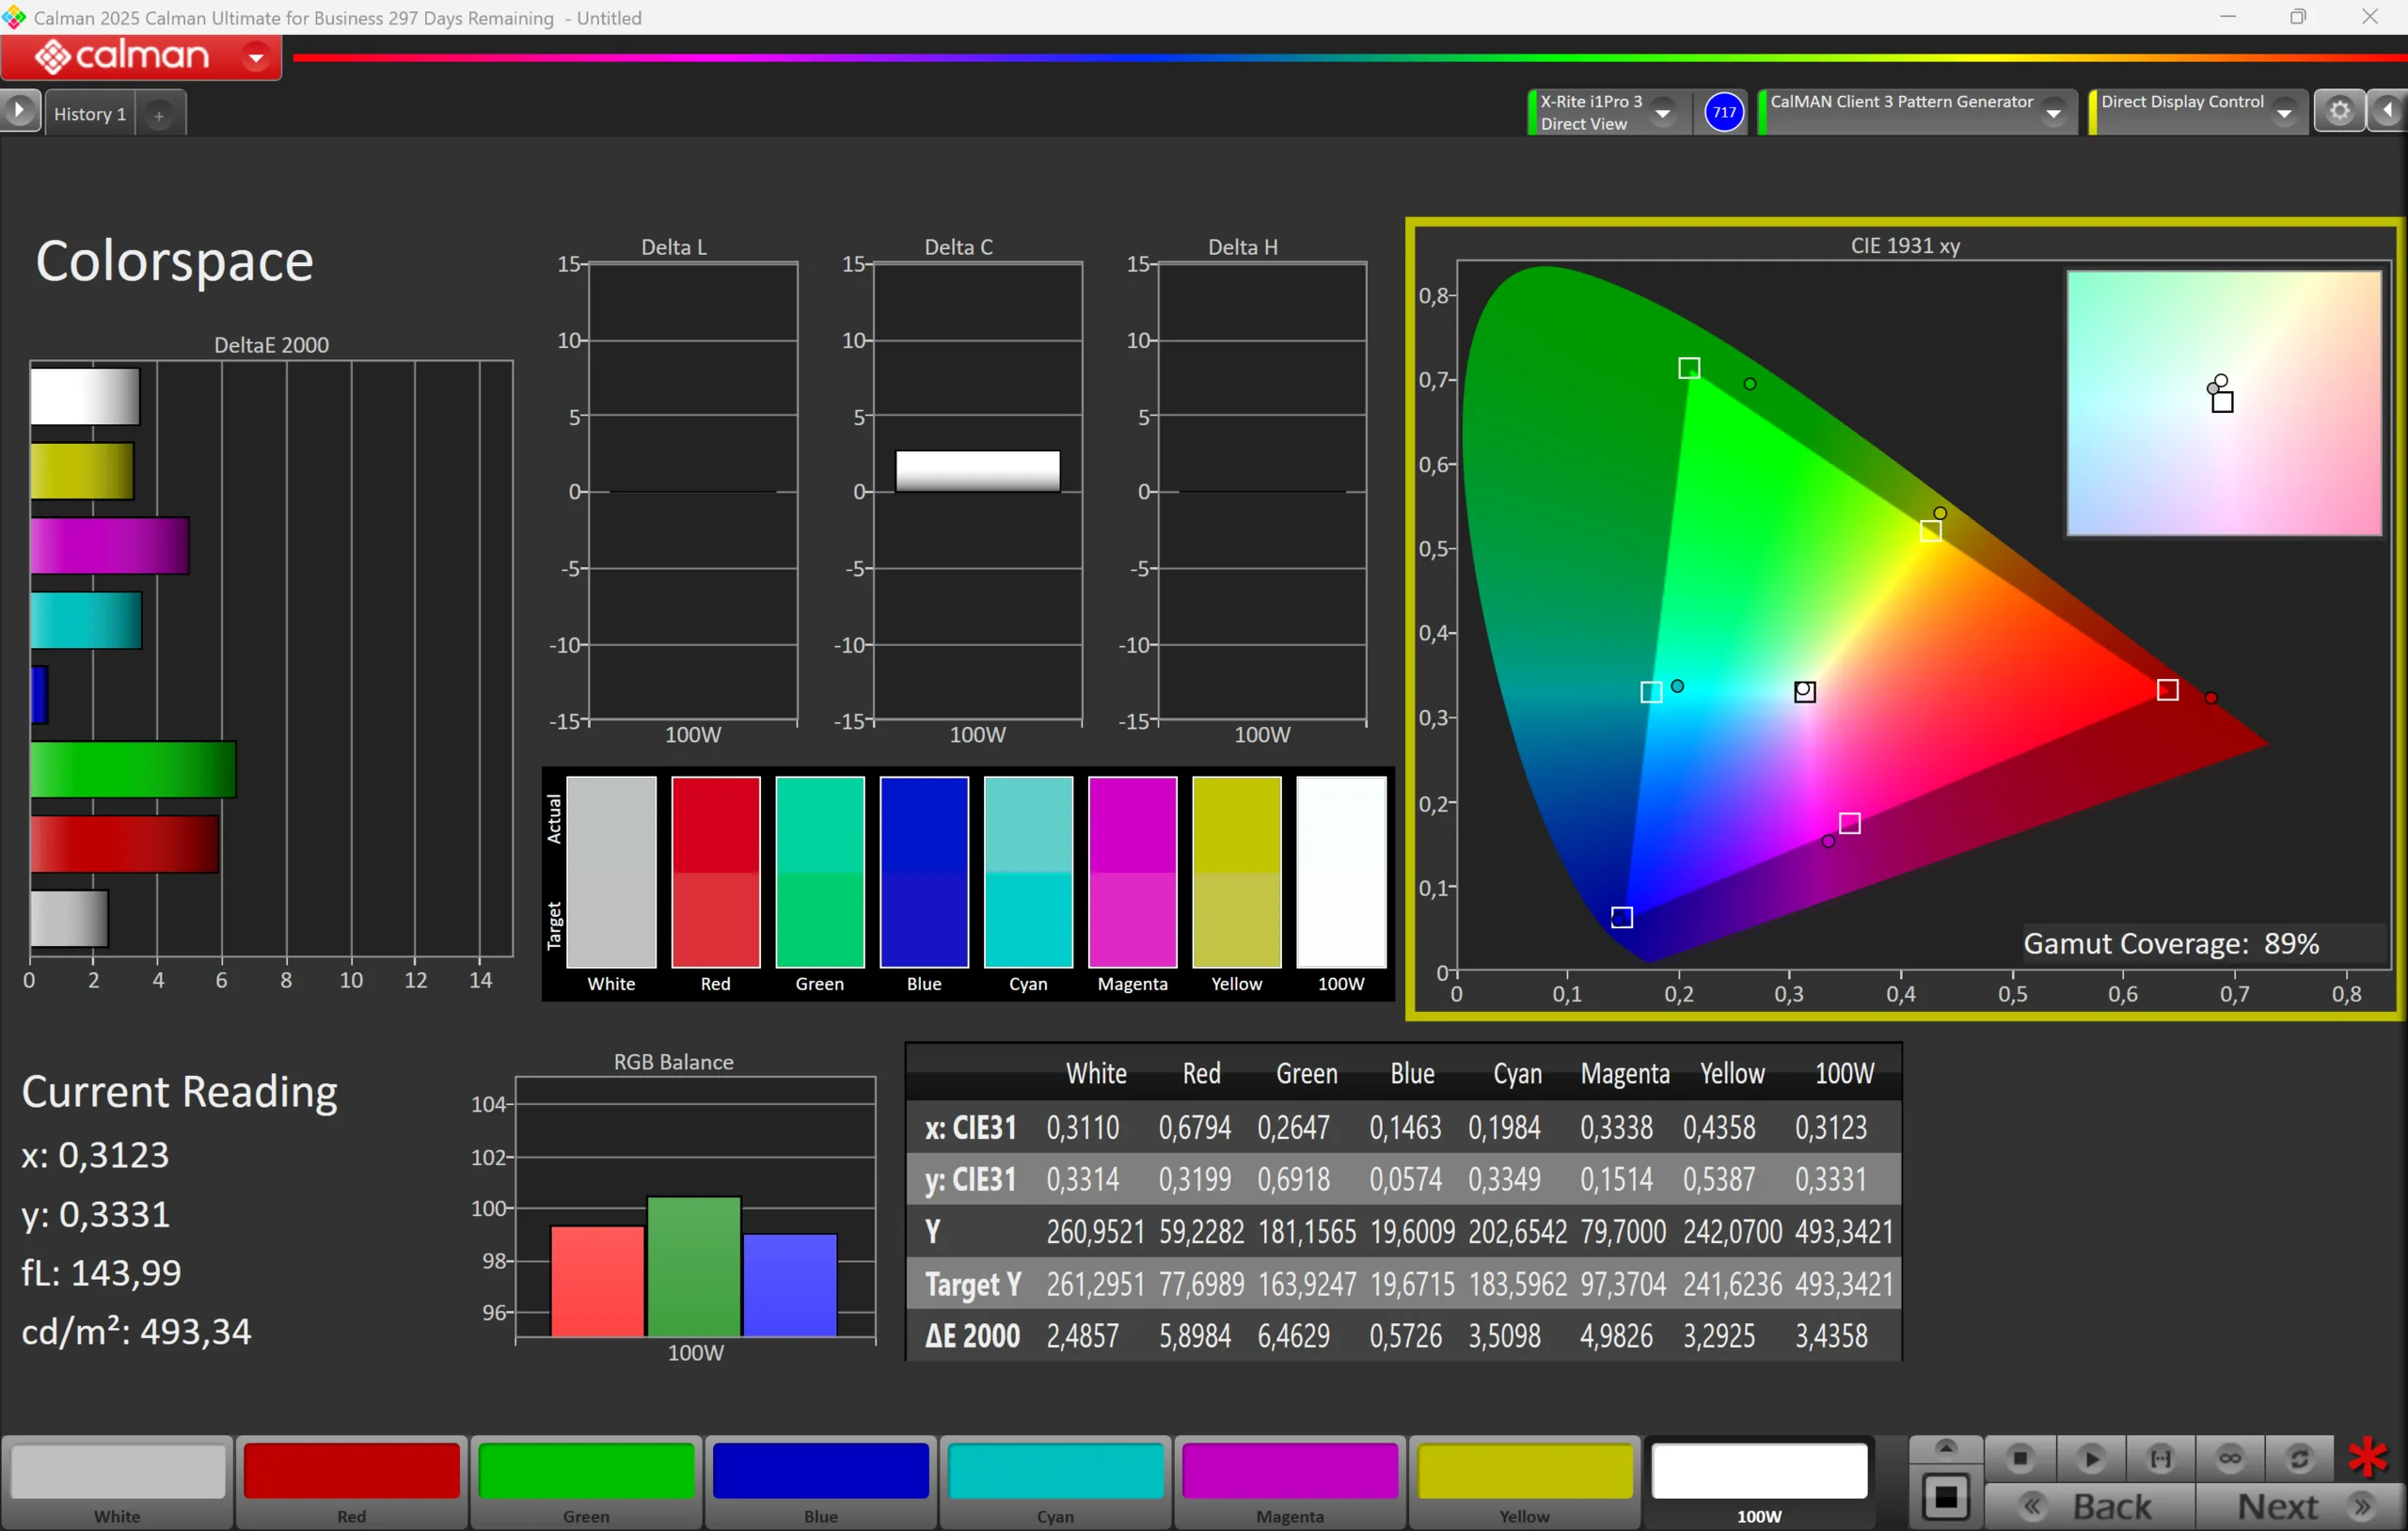
华硕使用的是三星的 2.8K OLED 屏幕(2880 x 1800 像素,16:10),刷新率为 120 Hz,这一点我们已经从采用 AMD 技术的 Zenbook S16 上了解到了。你也可以买到配备触摸屏的机型,但由于多了一层玻璃,这款机型要重 80 克左右。白色内容没有颗粒感,整体图像质量出色,黑色深邃,色彩丰富,对比度高。亮度和色温均可通过环境光线传感器进行控制。虽然存在 PWM 闪烁,但频率高达 960 Hz,而且华硕还提供了无闪烁 OLED 调光的软件解决方案,因此在较低亮度下也使用了危害较小的直流调光。
我们测得的平均 SDR 亮度为 495 尼特,在 HDR 模式下高达 1116 尼特(全白图像为 724 尼特)。华硕提供了不同的色彩配置文件,我们使用专业的 CalMAN 软件对其进行了分析。P3 和 sRGB 配置文件都能提供非常准确的色彩,因此图片编辑不成问题,但灰度表现并不理想。我们的校准软件与 Windows on ARM 不兼容,因此无法校准面板。
| |||||||||||||||||||||||||
Brightness Distribution: 98 %
Center on Battery: 493 cd/m²
Contrast: 24650:1 (Black: 0.02 cd/m²)
ΔE ColorChecker Calman: 1.1 | ∀{0.5-29.43 Ø4.72}
ΔE Greyscale Calman: 2.1 | ∀{0.09-98 Ø4.97}
89% AdobeRGB 1998 (Argyll 3D)
100% sRGB (Argyll 3D)
99.8% Display P3 (Argyll 3D)
Gamma: 2.15
CCT: 6544 K
| Asus Zenbook A16 UX3607 ATNA60HR07-0, OLED, 2880x1800, 16", 120 Hz | Apple MacBook Air 15 M5 IPS, 2880x1864, 15.3", 60 Hz | Lenovo ThinkPad X9-15 Aura Edition ATNA53JB01-0, OLED, 2880x1800, 15.3", 120 Hz | Samsung Galaxy Book6 Pro ATNA60HR05-0, OLED, 2880x1800, 16", 120 Hz | Dell XPS 16 Core Ultra 5 325 LG Philips 160WUX, IPS, 1920x1200, 16", 120 Hz | Asus ZenBook S16 UM5606GA ATNA60HR07-0, OLED, 2880x1800, 16", 120 Hz | Microsoft Surface Laptop 15 Snapdragon X Elite Sharp LQ150P1JX61, IPS, 2496x1664, 15", 120 Hz | |
|---|---|---|---|---|---|---|---|
| Display | -2% | 2% | -2% | -20% | 2% | ||
| Display P3 Coverage (%) | 99.8 | 97.5 -2% | 100 0% | 98.3 -2% | 66.2 -34% | 99.8 0% | |
| sRGB Coverage (%) | 100 | 98.3 -2% | 100 0% | 99.9 0% | 97.4 -3% | 100 0% | |
| AdobeRGB 1998 Coverage (%) | 89 | 86.3 -3% | 94.6 6% | 85.9 -3% | 67.7 -24% | 94 6% | |
| Response Times | -2229% | 32% | 3% | -3591% | 15% | -4167% | |
| Response Time Grey 50% / Grey 80% * (ms) | 2 ? | 26.9 ? -1245% | 1.46 ? 27% | 0.51 ? 74% | 39.3 ? -1865% | 1.27 ? 36% | 44.4 ? -2120% |
| Response Time Black / White * (ms) | 0.48 ? | 15.9 ? -3213% | 0.44 ? 8% | 0.41 ? 15% | 26 ? -5317% | 0.43 ? 10% | 30.3 ? -6213% |
| PWM Frequency (Hz) | 960 ? | 1200 ? | 240 ? | 960 ? | |||
| PWM Amplitude * (%) | 56 | 22 61% | 100 -79% | 56 -0% | |||
| Screen | -292% | 28% | 11% | -183% | 5% | -198% | |
| Brightness middle (cd/m²) | 493 | 538 9% | 509 3% | 502 2% | 534.6 8% | 465 -6% | 579.9 18% |
| Brightness (cd/m²) | 495 | 521 5% | 508 3% | 507 2% | 515 4% | 466 -6% | 576 16% |
| Brightness Distribution (%) | 98 | 90 -8% | 97 -1% | 97 -1% | 92 -6% | 99 1% | 92 -6% |
| Black Level * (cd/m²) | 0.02 | 0.44 -2100% | 0.01 50% | 0.26 -1200% | 0.34 -1600% | ||
| Contrast (:1) | 24650 | 1223 -95% | 50900 106% | 2056 -92% | 1706 -93% | ||
| Colorchecker dE 2000 * | 1.1 | 2.1 -91% | 1.1 -0% | 1 9% | 2.53 -130% | 1 9% | 0.96 13% |
| Colorchecker dE 2000 max. * | 3.9 | 4.1 -5% | 2.5 36% | 2.4 38% | 4.57 -17% | 3 23% | 2.39 39% |
| Greyscale dE 2000 * | 2.1 | 3.1 -48% | 1.5 29% | 1.8 14% | 2.7 -29% | 1.9 10% | 1.4 33% |
| Gamma | 2.15 102% | 2.19 100% | 2.28 96% | 2.24 98% | 2.32 95% | 2.19 100% | 2.13 103% |
| CCT | 6544 99% | 7075 92% | 6294 103% | 6435 101% | 6860 95% | 6458 101% | 6407 101% |
| Colorchecker dE 2000 calibrated * | 0.7 | 1.26 | |||||
| Total Average (Program / Settings) | -841% /
-523% | 21% /
23% | 4% /
6% | -1265% /
-670% | 7% /
7% | -2183% /
-991% |
* ... smaller is better


Display Response Times
| ↔ Response Time Black to White | ||
|---|---|---|
| 0.48 ms ... rise ↗ and fall ↘ combined | ↗ 0.23 ms rise | 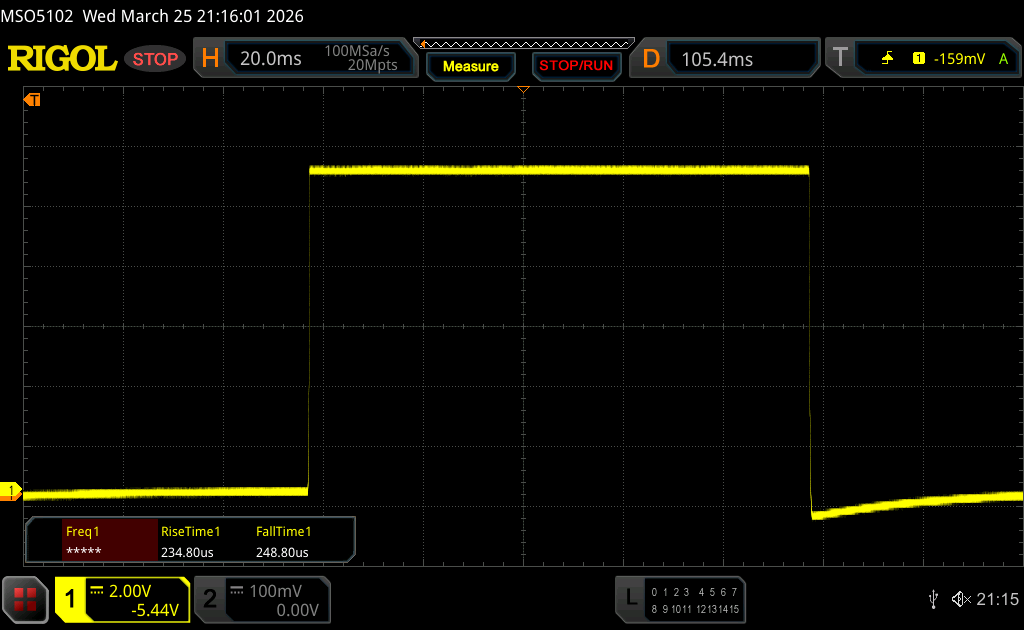 |
| ↘ 0.25 ms fall | ||
| The screen shows very fast response rates in our tests and should be very well suited for fast-paced gaming. In comparison, all tested devices range from 0.1 (minimum) to 240 (maximum) ms. » 1 % of all devices are better. This means that the measured response time is better than the average of all tested devices (19.8 ms). | ||
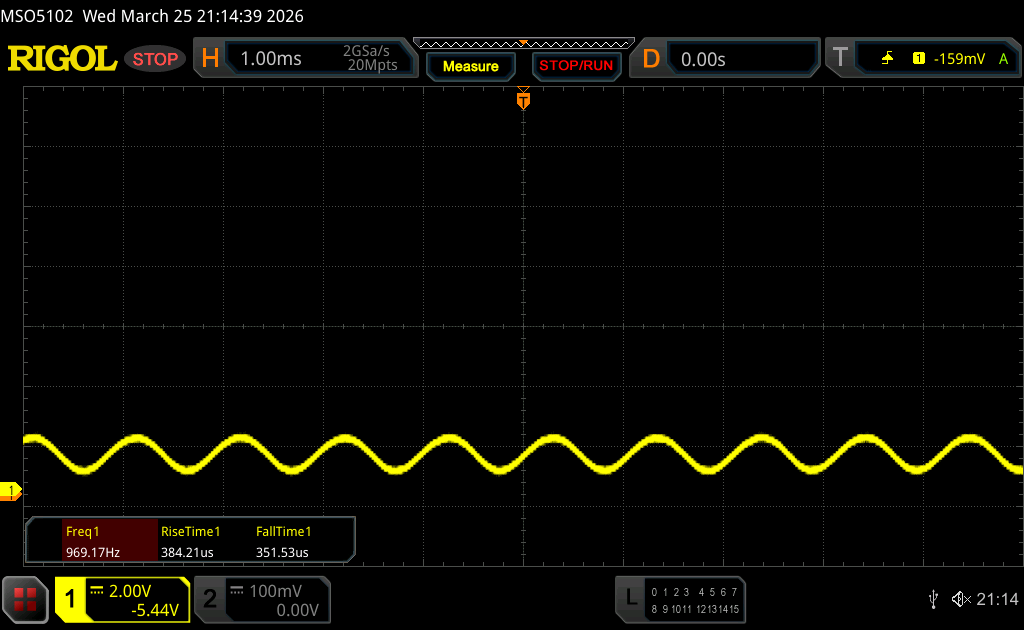
| ↔ Response Time 50% Grey to 80% Grey | ||
| 2 ms ... rise ↗ and fall ↘ combined | ↗ 1 ms rise | 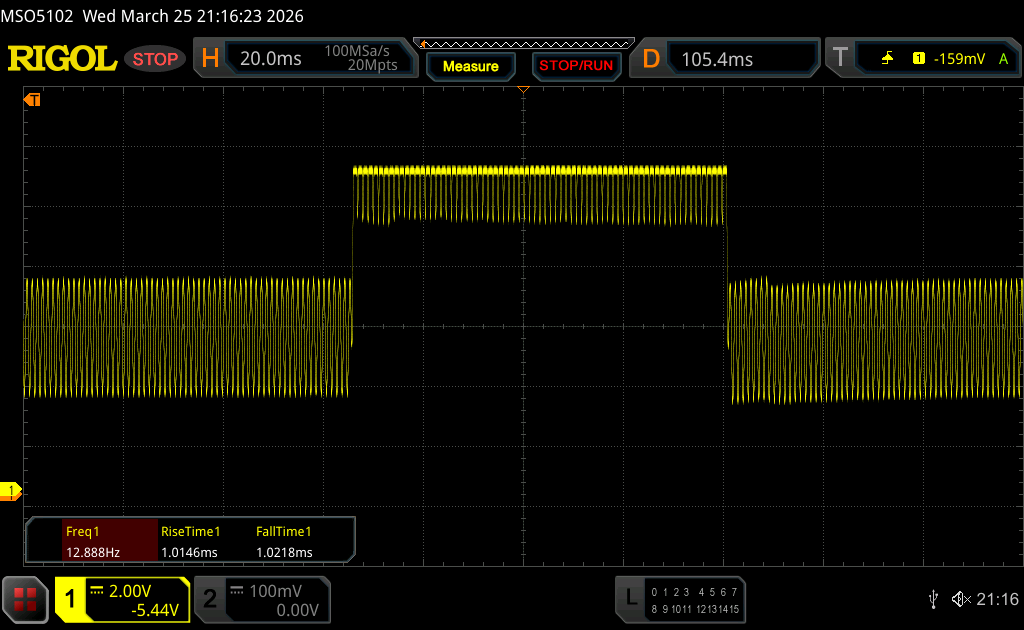 |
| ↘ 1 ms fall | ||
| The screen shows very fast response rates in our tests and should be very well suited for fast-paced gaming. In comparison, all tested devices range from 0.165 (minimum) to 636 (maximum) ms. » 10 % of all devices are better. This means that the measured response time is better than the average of all tested devices (31 ms). | ||
Screen Flickering / PWM (Pulse-Width Modulation)
| Screen flickering / PWM detected | 960 Hz Amplitude: 56 % | ≤ 100 % brightness setting | 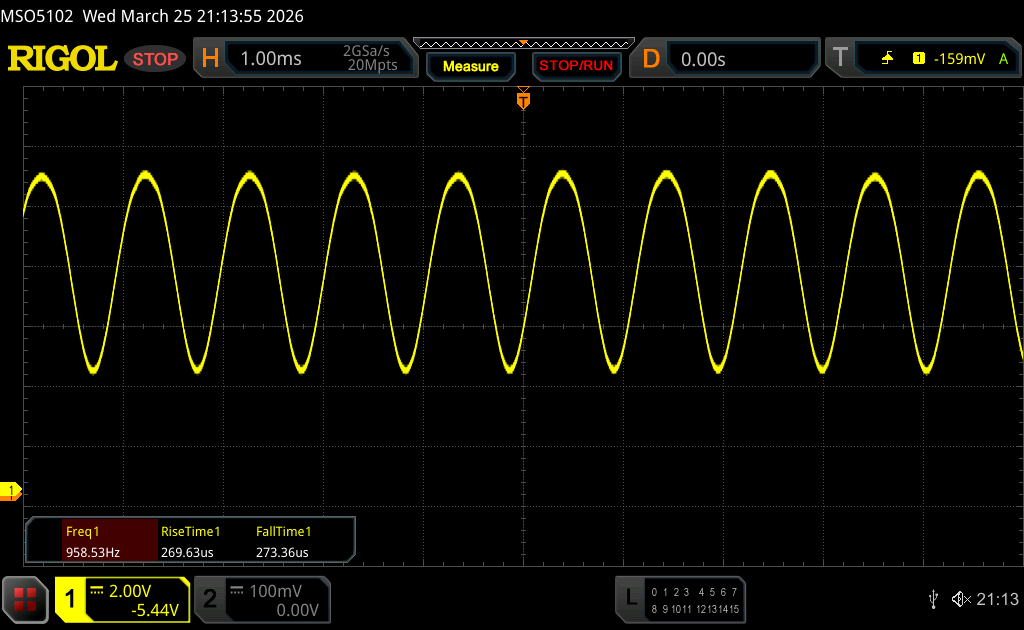 |
The display backlight flickers at 960 Hz (worst case, e.g., utilizing PWM) Flickering detected at a brightness setting of 100 % and below. There should be no flickering or PWM above this brightness setting. The frequency of 960 Hz is quite high, so most users sensitive to PWM should not notice any flickering. In comparison: 52 % of all tested devices do not use PWM to dim the display. If PWM was detected, an average of 7769 (minimum: 5 - maximum: 343500) Hz was measured. | |||


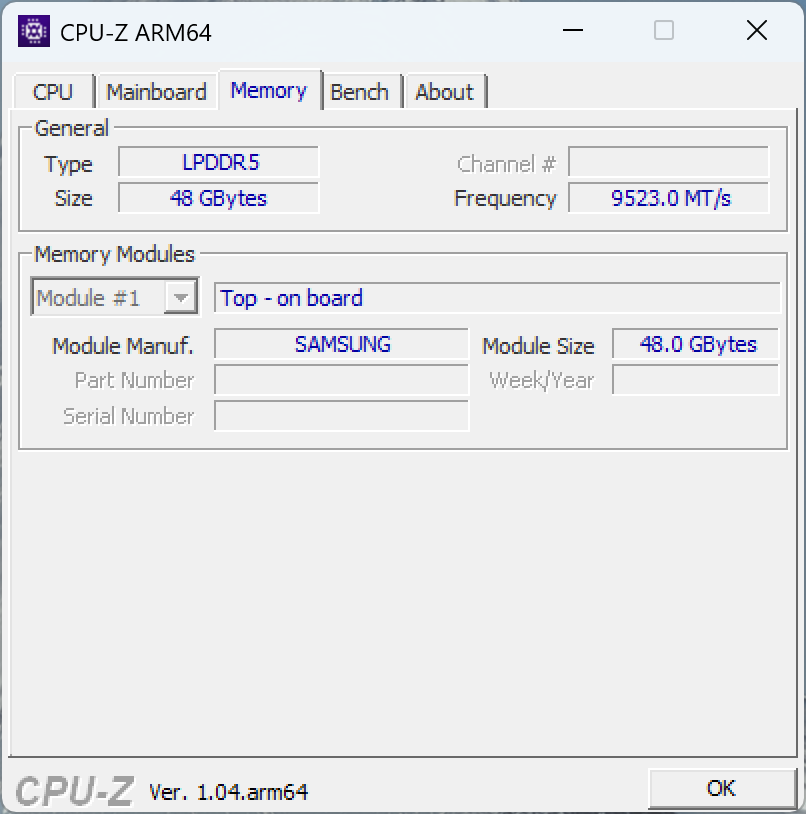
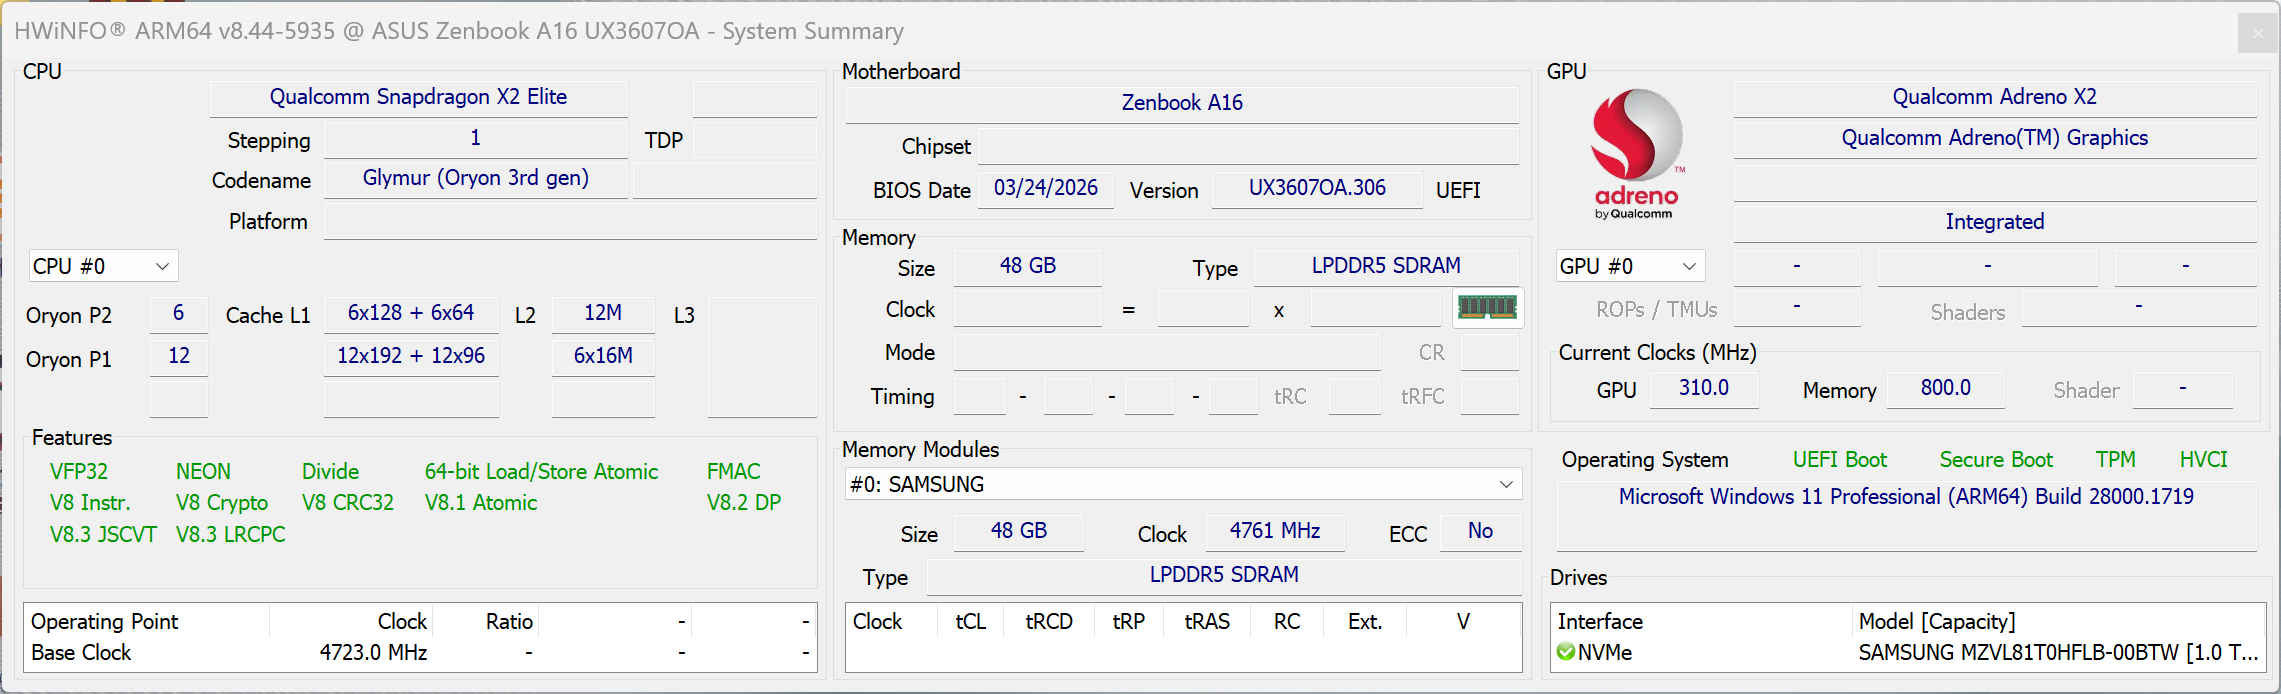
性能 - Snapdragon X2 Elite Extreme 和 48 GB 内存
测试条件
华硕提供了多种电源配置文件,还可以与 Windows 的电源模式同步。我们使用 "性能"模式来获得全新骁龙 X2 Elite Extreme 的最高性能,但在日常情况下,"耳语 "模式下的 CPU 性能仍比直接使用 Windows 的替代品以及 MacBook Air M5(多核情况下)高出约 20%。
| 电源模式 | TDP (瓦特) | Cinebench 2024 Multi (points) | Steel Nomad Light (points) | Cyberpunk 2077 1080p Med (fps) | 最大风扇噪音 (dB(A)) |
|---|---|---|---|---|---|
| Whisper | 52/31/18 | 1203 | 5060 | 36.4 | 30.5 |
| 标准 | 75/56/40 | 1619 | 5331 | 42.9 | 37.3 |
| 性能 | 97/72 | 1761 | 5492 | 50.3 | 51.1 |
| 电池 | 88/60 | 1617 | 5414 | 50.3 | 51.1 |
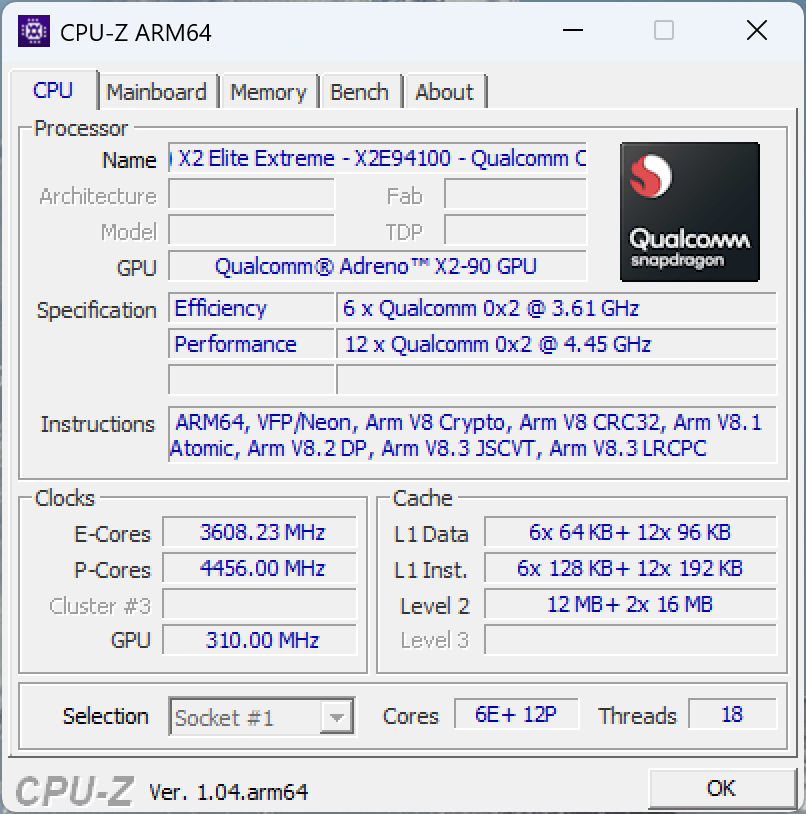
处理器 - X2E-94-100
骁龙 X2E-94-100 骁龙 X2E-94-100是第二快的 X2 CPU,与顶级的 X2E-96-100 相比,唯一的区别是单核涡轮增压降低了 300 MHz。X2E-94-100 的主频高达 4.7 GHz,共有 18 个 CPU 内核(2x 6 个主内核,6 个性能内核)。有关新芯片的更多技术信息,请参阅我们的分析。
新款骁龙 X2 芯片的性能非常出色,我们可以看到,在单核场景下,它的性能比上一代芯片高出约 20%,而且明显优于 AMD 和英特尔的所有 x86 竞争对手,包括最新的 Panther Lake 处理器。与Apple 相比,骁龙 X2 接近 M4 代,但当前的 M5 芯片仍然要快约 32%。
在多核场景下,这种情况发生了变化,新的 Zenbook A16 可以轻松击败所有对手,在极其安静的Whisper模式下,它甚至比所有对手快 20%。这与性能的稳定性一样令人印象深刻。在电池供电模式下,最高性能略有下降,但结果仍然非常出色(-8%)。请参阅 我们的深入分析文章了解更多基准测试和效率测量结果。
Cinebench R15 多回路运行
Cinebench 2024: CPU Multi Core | CPU Single Core
Geekbench 6.7: Multi-Core | Single-Core
| CPU Performance rating | |
| Asus Zenbook A16 UX3607 | |
| Average Qualcomm Snapdragon X2 Elite Extreme X2E-94-100 | |
| Apple MacBook Air 15 M5 | |
| Samsung Galaxy Book6 Pro | |
| Average of class Multimedia | |
| Asus ZenBook S16 UM5606GA | |
| Microsoft Surface Laptop 15 Snapdragon X Elite | |
| Lenovo ThinkPad X9-15 Aura Edition | |
| Dell XPS 16 Core Ultra 5 325 | |
| Cinebench 2024 / CPU Multi Core | |
| Asus Zenbook A16 UX3607 | |
| Average Qualcomm Snapdragon X2 Elite Extreme X2E-94-100 (1203 - 1761, n=3) | |
| Average of class Multimedia (327 - 2437, n=82, last 2 years) | |
| Samsung Galaxy Book6 Pro | |
| Apple MacBook Air 15 M5 | |
| Asus ZenBook S16 UM5606GA | |
| Microsoft Surface Laptop 15 Snapdragon X Elite | |
| Dell XPS 16 Core Ultra 5 325 | |
| Lenovo ThinkPad X9-15 Aura Edition | |
| Cinebench 2024 / CPU Single Core | |
| Apple MacBook Air 15 M5 | |
| Asus Zenbook A16 UX3607 | |
| Average Qualcomm Snapdragon X2 Elite Extreme X2E-94-100 (n=1) | |
| Average of class Multimedia (72.5 - 201, n=63, last 2 years) | |
| Microsoft Surface Laptop 15 Snapdragon X Elite | |
| Samsung Galaxy Book6 Pro | |
| Lenovo ThinkPad X9-15 Aura Edition | |
| Asus ZenBook S16 UM5606GA | |
| Dell XPS 16 Core Ultra 5 325 | |
| Geekbench 6.7 / Multi-Core | |
| Asus Zenbook A16 UX3607 | |
| Average Qualcomm Snapdragon X2 Elite Extreme X2E-94-100 (n=1) | |
| Apple MacBook Air 15 M5 | |
| Samsung Galaxy Book6 Pro | |
| Average of class Multimedia (4983 - 29415, n=76, last 2 years) | |
| Asus ZenBook S16 UM5606GA | |
| Microsoft Surface Laptop 15 Snapdragon X Elite | |
| Microsoft Surface Laptop 15 Snapdragon X Elite | |
| Microsoft Surface Laptop 15 Snapdragon X Elite | |
| Dell XPS 16 Core Ultra 5 325 | |
| Lenovo ThinkPad X9-15 Aura Edition | |
| Geekbench 6.7 / Single-Core | |
| Apple MacBook Air 15 M5 | |
| Asus Zenbook A16 UX3607 | |
| Average Qualcomm Snapdragon X2 Elite Extreme X2E-94-100 (n=1) | |
| Average of class Multimedia (1534 - 4335, n=75, last 2 years) | |
| Samsung Galaxy Book6 Pro | |
| Asus ZenBook S16 UM5606GA | |
| Microsoft Surface Laptop 15 Snapdragon X Elite | |
| Microsoft Surface Laptop 15 Snapdragon X Elite | |
| Microsoft Surface Laptop 15 Snapdragon X Elite | |
| Lenovo ThinkPad X9-15 Aura Edition | |
| Dell XPS 16 Core Ultra 5 325 | |
我们还加入了 Cinebench R23 等较旧的模拟基准测试。它们的运行没有问题,但性能略低于本机应用程序。
Cinebench R23: Multi Core | Single Core
Cinebench R20: CPU (Multi Core) | CPU (Single Core)
Cinebench R15: CPU Multi 64Bit | CPU Single 64Bit
Blender: v2.79 BMW27 CPU
7-Zip 18.03: 7z b 4 -mmt1
HWBOT x265 Benchmark v2.2: 4k Preset
LibreOffice : 20 Documents To PDF
R Benchmark 2.5: Overall mean
| CPU Performance rating | |
| Samsung Galaxy Book6 Pro | |
| Asus Zenbook A16 UX3607 | |
| Average Qualcomm Snapdragon X2 Elite Extreme X2E-94-100 | |
| Asus ZenBook S16 UM5606GA | |
| Average of class Multimedia | |
| Dell XPS 16 Core Ultra 5 325 | |
| Lenovo ThinkPad X9-15 Aura Edition | |
| Microsoft Surface Laptop 15 Snapdragon X Elite | |
| Cinebench R23 / Multi Core | |
| Asus Zenbook A16 UX3607 | |
| Average Qualcomm Snapdragon X2 Elite Extreme X2E-94-100 (n=1) | |
| Samsung Galaxy Book6 Pro | |
| Asus ZenBook S16 UM5606GA | |
| Average of class Multimedia (4861 - 33362, n=81, last 2 years) | |
| Dell XPS 16 Core Ultra 5 325 | |
| Microsoft Surface Laptop 15 Snapdragon X Elite | |
| Lenovo ThinkPad X9-15 Aura Edition | |
| Cinebench R23 / Single Core | |
| Samsung Galaxy Book6 Pro | |
| Asus ZenBook S16 UM5606GA | |
| Average of class Multimedia (1128 - 2459, n=73, last 2 years) | |
| Lenovo ThinkPad X9-15 Aura Edition | |
| Dell XPS 16 Core Ultra 5 325 | |
| Asus Zenbook A16 UX3607 | |
| Average Qualcomm Snapdragon X2 Elite Extreme X2E-94-100 (n=1) | |
| Microsoft Surface Laptop 15 Snapdragon X Elite | |
| Cinebench R20 / CPU (Multi Core) | |
| Asus Zenbook A16 UX3607 | |
| Average Qualcomm Snapdragon X2 Elite Extreme X2E-94-100 (n=1) | |
| Samsung Galaxy Book6 Pro | |
| Asus ZenBook S16 UM5606GA | |
| Average of class Multimedia (1887 - 12912, n=64, last 2 years) | |
| Dell XPS 16 Core Ultra 5 325 | |
| Lenovo ThinkPad X9-15 Aura Edition | |
| Microsoft Surface Laptop 15 Snapdragon X Elite | |
| Cinebench R20 / CPU (Single Core) | |
| Asus ZenBook S16 UM5606GA | |
| Samsung Galaxy Book6 Pro | |
| Average of class Multimedia (425 - 853, n=64, last 2 years) | |
| Lenovo ThinkPad X9-15 Aura Edition | |
| Dell XPS 16 Core Ultra 5 325 | |
| Asus Zenbook A16 UX3607 | |
| Average Qualcomm Snapdragon X2 Elite Extreme X2E-94-100 (n=1) | |
| Microsoft Surface Laptop 15 Snapdragon X Elite | |
| Cinebench R15 / CPU Multi 64Bit | |
| Asus Zenbook A16 UX3607 | |
| Average Qualcomm Snapdragon X2 Elite Extreme X2E-94-100 (n=1) | |
| Samsung Galaxy Book6 Pro | |
| Asus ZenBook S16 UM5606GA | |
| Average of class Multimedia (856 - 5224, n=68, last 2 years) | |
| Microsoft Surface Laptop 15 Snapdragon X Elite | |
| Dell XPS 16 Core Ultra 5 325 | |
| Lenovo ThinkPad X9-15 Aura Edition | |
| Cinebench R15 / CPU Single 64Bit | |
| Samsung Galaxy Book6 Pro | |
| Asus Zenbook A16 UX3607 | |
| Average Qualcomm Snapdragon X2 Elite Extreme X2E-94-100 (n=1) | |
| Lenovo ThinkPad X9-15 Aura Edition | |
| Average of class Multimedia (184.8 - 326, n=66, last 2 years) | |
| Dell XPS 16 Core Ultra 5 325 | |
| Microsoft Surface Laptop 15 Snapdragon X Elite | |
| Asus ZenBook S16 UM5606GA | |
| Blender / v2.79 BMW27 CPU | |
| Lenovo ThinkPad X9-15 Aura Edition | |
| Microsoft Surface Laptop 15 Snapdragon X Elite | |
| Dell XPS 16 Core Ultra 5 325 | |
| Average of class Multimedia (100 - 557, n=65, last 2 years) | |
| Samsung Galaxy Book6 Pro | |
| Asus ZenBook S16 UM5606GA | |
| Asus Zenbook A16 UX3607 | |
| Average Qualcomm Snapdragon X2 Elite Extreme X2E-94-100 (n=1) | |
| 7-Zip 18.03 / 7z b 4 -mmt1 | |
| Samsung Galaxy Book6 Pro | |
| Asus Zenbook A16 UX3607 | |
| Average Qualcomm Snapdragon X2 Elite Extreme X2E-94-100 (n=1) | |
| Asus ZenBook S16 UM5606GA | |
| Average of class Multimedia (3666 - 7545, n=63, last 2 years) | |
| Lenovo ThinkPad X9-15 Aura Edition | |
| Dell XPS 16 Core Ultra 5 325 | |
| Microsoft Surface Laptop 15 Snapdragon X Elite | |
| HWBOT x265 Benchmark v2.2 / 4k Preset | |
| Asus ZenBook S16 UM5606GA | |
| Samsung Galaxy Book6 Pro | |
| Average of class Multimedia (5.26 - 36.1, n=63, last 2 years) | |
| Dell XPS 16 Core Ultra 5 325 | |
| Asus Zenbook A16 UX3607 | |
| Average Qualcomm Snapdragon X2 Elite Extreme X2E-94-100 (n=1) | |
| Lenovo ThinkPad X9-15 Aura Edition | |
| Microsoft Surface Laptop 15 Snapdragon X Elite | |
| LibreOffice / 20 Documents To PDF | |
| Samsung Galaxy Book6 Pro | |
| Asus ZenBook S16 UM5606GA | |
| Microsoft Surface Laptop 15 Snapdragon X Elite | |
| Average of class Multimedia (23.9 - 146.7, n=64, last 2 years) | |
| Dell XPS 16 Core Ultra 5 325 | |
| Lenovo ThinkPad X9-15 Aura Edition | |
| Asus Zenbook A16 UX3607 | |
| Average Qualcomm Snapdragon X2 Elite Extreme X2E-94-100 (n=1) | |
| R Benchmark 2.5 / Overall mean | |
| Microsoft Surface Laptop 15 Snapdragon X Elite | |
| Asus Zenbook A16 UX3607 | |
| Average Qualcomm Snapdragon X2 Elite Extreme X2E-94-100 (n=1) | |
| Lenovo ThinkPad X9-15 Aura Edition | |
| Average of class Multimedia (0.3604 - 0.947, n=63, last 2 years) | |
| Samsung Galaxy Book6 Pro | |
| Dell XPS 16 Core Ultra 5 325 | |
| Asus ZenBook S16 UM5606GA | |
* ... smaller is better
AIDA64: FP32 Ray-Trace | FPU Julia | CPU SHA3 | CPU Queen | FPU SinJulia | FPU Mandel | CPU AES | CPU ZLib | FP64 Ray-Trace | CPU PhotoWorxx | CPU CheckMate
| Performance rating | |
| Asus ZenBook S16 UM5606GA -1! | |
| Samsung Galaxy Book6 Pro -1! | |
| Average of class Multimedia | |
| Asus Zenbook A16 UX3607 -1! | |
| Average Qualcomm Snapdragon X2 Elite Extreme X2E-94-100 -1! | |
| Dell XPS 16 Core Ultra 5 325 -1! | |
| Lenovo ThinkPad X9-15 Aura Edition | |
| Microsoft Surface Laptop 15 Snapdragon X Elite -1! | |
| AIDA64 / FP32 Ray-Trace | |
| Asus ZenBook S16 UM5606GA (v6.92.6600) | |
| Average of class Multimedia (2214 - 50388, n=60, last 2 years) | |
| Samsung Galaxy Book6 Pro (v8.20.8100) | |
| Asus Zenbook A16 UX3607 (v8.20.8100) | |
| Average Qualcomm Snapdragon X2 Elite Extreme X2E-94-100 (n=1) | |
| Lenovo ThinkPad X9-15 Aura Edition (v6.92.6600) | |
| Lenovo ThinkPad X9-15 Aura Edition (v6.92.6600) | |
| Lenovo ThinkPad X9-15 Aura Edition (v8.20.8100) | |
| Dell XPS 16 Core Ultra 5 325 (v8.20.8100) | |
| Microsoft Surface Laptop 15 Snapdragon X Elite (v6.92.6600) | |
| AIDA64 / FPU Julia | |
| Asus ZenBook S16 UM5606GA (v6.92.6600) | |
| Average of class Multimedia (12867 - 201874, n=61, last 2 years) | |
| Samsung Galaxy Book6 Pro (v8.20.8100) | |
| Dell XPS 16 Core Ultra 5 325 (v8.20.8100) | |
| Lenovo ThinkPad X9-15 Aura Edition (v6.92.6600) | |
| Lenovo ThinkPad X9-15 Aura Edition (v8.20.8100) | |
| Lenovo ThinkPad X9-15 Aura Edition (v6.92.6600) | |
| Asus Zenbook A16 UX3607 (v8.20.8100) | |
| Average Qualcomm Snapdragon X2 Elite Extreme X2E-94-100 (n=1) | |
| Microsoft Surface Laptop 15 Snapdragon X Elite (v6.92.6600) | |
| AIDA64 / CPU SHA3 | |
| Asus Zenbook A16 UX3607 (v8.20.8100) | |
| Average Qualcomm Snapdragon X2 Elite Extreme X2E-94-100 (n=1) | |
| Asus ZenBook S16 UM5606GA (v6.92.6600) | |
| Samsung Galaxy Book6 Pro (v8.20.8100) | |
| Average of class Multimedia (626 - 8623, n=61, last 2 years) | |
| Microsoft Surface Laptop 15 Snapdragon X Elite (v6.92.6600) | |
| Dell XPS 16 Core Ultra 5 325 (v8.20.8100) | |
| Lenovo ThinkPad X9-15 Aura Edition (v6.92.6600) | |
| Lenovo ThinkPad X9-15 Aura Edition (v8.20.8100) | |
| Lenovo ThinkPad X9-15 Aura Edition (v6.92.6600) | |
| AIDA64 / CPU Queen | |
| Asus ZenBook S16 UM5606GA (v6.92.6600) | |
| Average of class Multimedia (13483 - 181505, n=48, last 2 years) | |
| Microsoft Surface Laptop 15 Snapdragon X Elite (v6.92.6600) | |
| Lenovo ThinkPad X9-15 Aura Edition (v6.92.6600) | |
| Lenovo ThinkPad X9-15 Aura Edition (v6.92.6600) | |
| AIDA64 / FPU SinJulia | |
| Asus ZenBook S16 UM5606GA (v6.92.6600) | |
| Average of class Multimedia (886 - 28794, n=61, last 2 years) | |
| Samsung Galaxy Book6 Pro (v8.20.8100) | |
| Lenovo ThinkPad X9-15 Aura Edition (v8.20.8100) | |
| Lenovo ThinkPad X9-15 Aura Edition (v6.92.6600) | |
| Lenovo ThinkPad X9-15 Aura Edition (v6.92.6600) | |
| Dell XPS 16 Core Ultra 5 325 (v8.20.8100) | |
| Asus Zenbook A16 UX3607 (v8.20.8100) | |
| Average Qualcomm Snapdragon X2 Elite Extreme X2E-94-100 (n=1) | |
| Microsoft Surface Laptop 15 Snapdragon X Elite (v6.92.6600) | |
| AIDA64 / FPU Mandel | |
| Asus ZenBook S16 UM5606GA (v6.92.6600) | |
| Samsung Galaxy Book6 Pro (v8.20.8100) | |
| Average of class Multimedia (6395 - 105740, n=60, last 2 years) | |
| Dell XPS 16 Core Ultra 5 325 (v8.20.8100) | |
| Lenovo ThinkPad X9-15 Aura Edition (v6.92.6600) | |
| Lenovo ThinkPad X9-15 Aura Edition (v6.92.6600) | |
| Lenovo ThinkPad X9-15 Aura Edition (v8.20.8100) | |
| Asus Zenbook A16 UX3607 (v8.20.8100) | |
| Average Qualcomm Snapdragon X2 Elite Extreme X2E-94-100 (n=1) | |
| Microsoft Surface Laptop 15 Snapdragon X Elite (v6.92.6600) | |
| AIDA64 / CPU AES | |
| Asus Zenbook A16 UX3607 (v8.20.8100) | |
| Average Qualcomm Snapdragon X2 Elite Extreme X2E-94-100 (n=1) | |
| Asus ZenBook S16 UM5606GA (v6.92.6600) | |
| Average of class Multimedia (8171 - 126790, n=61, last 2 years) | |
| Samsung Galaxy Book6 Pro (v8.20.8100) | |
| Microsoft Surface Laptop 15 Snapdragon X Elite (v6.92.6600) | |
| Lenovo ThinkPad X9-15 Aura Edition (v8.20.8100) | |
| Lenovo ThinkPad X9-15 Aura Edition (v6.92.6600) | |
| Lenovo ThinkPad X9-15 Aura Edition (v6.92.6600) | |
| Dell XPS 16 Core Ultra 5 325 (v8.20.8100) | |
| AIDA64 / CPU ZLib | |
| Asus Zenbook A16 UX3607 (v8.20.8100) | |
| Average Qualcomm Snapdragon X2 Elite Extreme X2E-94-100 (n=1) | |
| Asus ZenBook S16 UM5606GA (v6.92.6600) | |
| Samsung Galaxy Book6 Pro (v8.20.8100) | |
| Average of class Multimedia (143.8 - 2022, n=61, last 2 years) | |
| Microsoft Surface Laptop 15 Snapdragon X Elite (v6.92.6600) | |
| Dell XPS 16 Core Ultra 5 325 (v8.20.8100) | |
| Lenovo ThinkPad X9-15 Aura Edition (v6.92.6600) | |
| Lenovo ThinkPad X9-15 Aura Edition (v8.20.8100) | |
| Lenovo ThinkPad X9-15 Aura Edition (v6.92.6600) | |
| AIDA64 / FP64 Ray-Trace | |
| Asus ZenBook S16 UM5606GA (v6.92.6600) | |
| Average of class Multimedia (1014 - 26875, n=61, last 2 years) | |
| Samsung Galaxy Book6 Pro (v8.20.8100) | |
| Asus Zenbook A16 UX3607 (v8.20.8100) | |
| Average Qualcomm Snapdragon X2 Elite Extreme X2E-94-100 (n=1) | |
| Lenovo ThinkPad X9-15 Aura Edition (v6.92.6600) | |
| Lenovo ThinkPad X9-15 Aura Edition (v6.92.6600) | |
| Lenovo ThinkPad X9-15 Aura Edition (v8.20.8100) | |
| Dell XPS 16 Core Ultra 5 325 (v8.20.8100) | |
| Microsoft Surface Laptop 15 Snapdragon X Elite (v6.92.6600) | |
| AIDA64 / CPU PhotoWorxx | |
| Samsung Galaxy Book6 Pro (v8.20.8100) | |
| Asus Zenbook A16 UX3607 (v8.20.8100) | |
| Average Qualcomm Snapdragon X2 Elite Extreme X2E-94-100 (n=1) | |
| Lenovo ThinkPad X9-15 Aura Edition (v8.20.8100) | |
| Lenovo ThinkPad X9-15 Aura Edition (v6.92.6600) | |
| Lenovo ThinkPad X9-15 Aura Edition (v6.92.6600) | |
| Dell XPS 16 Core Ultra 5 325 (v8.20.8100) | |
| Asus ZenBook S16 UM5606GA (v6.92.6600) | |
| Average of class Multimedia (8187 - 88154, n=61, last 2 years) | |
| Microsoft Surface Laptop 15 Snapdragon X Elite (v6.92.6600) | |
| AIDA64 / CPU CheckMate | |
| Samsung Galaxy Book6 Pro (v8.20.8100) | |
| Average of class Multimedia (569 - 4742, n=16, last 2 years) | |
| Dell XPS 16 Core Ultra 5 325 (v8.20.8100) | |
| Lenovo ThinkPad X9-15 Aura Edition (v8.20.8100) | |
| Asus Zenbook A16 UX3607 (v8.20.8100) | |
| Average Qualcomm Snapdragon X2 Elite Extreme X2E-94-100 (n=1) | |
系统性能
主观性能印象非常好,我们在评测期间没有遇到任何稳定性问题。与上一代骁龙 X1 相比,在我们的测试中,ARM 上的整个 Windows 体验要流畅得多,但与传统软件或专业软件的兼容性仍可能存在问题。例如,我们无法使用校准软件。我们建议您在购买骁龙笔记本电脑之前,检查一下您需要的所有应用程序是否都能正常运行。
CrossMark: Overall | Productivity | Creativity | Responsiveness
WebXPRT 3: Overall
WebXPRT 4: Overall
Mozilla Kraken 1.1: Total
| Performance rating | |
| Apple MacBook Air 15 M5 | |
| Asus Zenbook A16 UX3607 | |
| Average Qualcomm Snapdragon X2 Elite Extreme X2E-94-100, Qualcomm Adreno X2-90 | |
| Samsung Galaxy Book6 Pro | |
| Average of class Multimedia | |
| Microsoft Surface Laptop 15 Snapdragon X Elite | |
| Lenovo ThinkPad X9-15 Aura Edition | |
| Dell XPS 16 Core Ultra 5 325 | |
| Asus ZenBook S16 UM5606GA | |
| CrossMark / Overall | |
| Apple MacBook Air 15 M5 | |
| Samsung Galaxy Book6 Pro | |
| Asus Zenbook A16 UX3607 | |
| Average Qualcomm Snapdragon X2 Elite Extreme X2E-94-100, Qualcomm Adreno X2-90 (n=1) | |
| Average of class Multimedia (866 - 2728, n=67, last 2 years) | |
| Lenovo ThinkPad X9-15 Aura Edition | |
| Dell XPS 16 Core Ultra 5 325 | |
| Asus ZenBook S16 UM5606GA | |
| Microsoft Surface Laptop 15 Snapdragon X Elite | |
| CrossMark / Productivity | |
| Apple MacBook Air 15 M5 | |
| Samsung Galaxy Book6 Pro | |
| Average of class Multimedia (931 - 2489, n=67, last 2 years) | |
| Asus Zenbook A16 UX3607 | |
| Average Qualcomm Snapdragon X2 Elite Extreme X2E-94-100, Qualcomm Adreno X2-90 (n=1) | |
| Lenovo ThinkPad X9-15 Aura Edition | |
| Asus ZenBook S16 UM5606GA | |
| Dell XPS 16 Core Ultra 5 325 | |
| Microsoft Surface Laptop 15 Snapdragon X Elite | |
| CrossMark / Creativity | |
| Apple MacBook Air 15 M5 | |
| Samsung Galaxy Book6 Pro | |
| Asus Zenbook A16 UX3607 | |
| Average Qualcomm Snapdragon X2 Elite Extreme X2E-94-100, Qualcomm Adreno X2-90 (n=1) | |
| Average of class Multimedia (907 - 3465, n=67, last 2 years) | |
| Lenovo ThinkPad X9-15 Aura Edition | |
| Asus ZenBook S16 UM5606GA | |
| Dell XPS 16 Core Ultra 5 325 | |
| Microsoft Surface Laptop 15 Snapdragon X Elite | |
| CrossMark / Responsiveness | |
| Asus Zenbook A16 UX3607 | |
| Average Qualcomm Snapdragon X2 Elite Extreme X2E-94-100, Qualcomm Adreno X2-90 (n=1) | |
| Apple MacBook Air 15 M5 | |
| Samsung Galaxy Book6 Pro | |
| Average of class Multimedia (605 - 2024, n=67, last 2 years) | |
| Asus ZenBook S16 UM5606GA | |
| Dell XPS 16 Core Ultra 5 325 | |
| Lenovo ThinkPad X9-15 Aura Edition | |
| Microsoft Surface Laptop 15 Snapdragon X Elite | |
| WebXPRT 3 / Overall | |
| Apple MacBook Air 15 M5 | |
| Asus Zenbook A16 UX3607 | |
| Average Qualcomm Snapdragon X2 Elite Extreme X2E-94-100, Qualcomm Adreno X2-90 (n=1) | |
| Microsoft Surface Laptop 15 Snapdragon X Elite | |
| Average of class Multimedia (136.4 - 596, n=70, last 2 years) | |
| Asus ZenBook S16 UM5606GA | |
| Lenovo ThinkPad X9-15 Aura Edition | |
| Samsung Galaxy Book6 Pro | |
| Dell XPS 16 Core Ultra 5 325 | |
| WebXPRT 4 / Overall | |
| Asus Zenbook A16 UX3607 | |
| Average Qualcomm Snapdragon X2 Elite Extreme X2E-94-100, Qualcomm Adreno X2-90 (n=1) | |
| Apple MacBook Air 15 M5 | |
| Microsoft Surface Laptop 15 Snapdragon X Elite | |
| Average of class Multimedia (167.3 - 402, n=71, last 2 years) | |
| Lenovo ThinkPad X9-15 Aura Edition | |
| Samsung Galaxy Book6 Pro | |
| Dell XPS 16 Core Ultra 5 325 | |
| Asus ZenBook S16 UM5606GA | |
| Mozilla Kraken 1.1 / Total | |
| Dell XPS 16 Core Ultra 5 325 | |
| Asus ZenBook S16 UM5606GA | |
| Lenovo ThinkPad X9-15 Aura Edition | |
| Samsung Galaxy Book6 Pro | |
| Average of class Multimedia (228 - 835, n=73, last 2 years) | |
| Microsoft Surface Laptop 15 Snapdragon X Elite | |
| Asus Zenbook A16 UX3607 | |
| Average Qualcomm Snapdragon X2 Elite Extreme X2E-94-100, Qualcomm Adreno X2-90 (n=1) | |
| Apple MacBook Air 15 M5 | |
* ... smaller is better
| AIDA64 / Memory Copy | |
| Samsung Galaxy Book6 Pro | |
| Lenovo ThinkPad X9-15 Aura Edition | |
| Asus Zenbook A16 UX3607 | |
| Average Qualcomm Snapdragon X2 Elite Extreme X2E-94-100 (n=1) | |
| Dell XPS 16 Core Ultra 5 325 | |
| Asus ZenBook S16 UM5606GA | |
| Average of class Multimedia (11299 - 132135, n=61, last 2 years) | |
| Microsoft Surface Laptop 15 Snapdragon X Elite | |
| AIDA64 / Memory Read | |
| Asus Zenbook A16 UX3607 | |
| Average Qualcomm Snapdragon X2 Elite Extreme X2E-94-100 (n=1) | |
| Microsoft Surface Laptop 15 Snapdragon X Elite | |
| Samsung Galaxy Book6 Pro | |
| Asus ZenBook S16 UM5606GA | |
| Lenovo ThinkPad X9-15 Aura Edition | |
| Dell XPS 16 Core Ultra 5 325 | |
| Average of class Multimedia (11624 - 174586, n=61, last 2 years) | |
| AIDA64 / Memory Write | |
| Samsung Galaxy Book6 Pro | |
| Lenovo ThinkPad X9-15 Aura Edition | |
| Asus ZenBook S16 UM5606GA | |
| Dell XPS 16 Core Ultra 5 325 | |
| Average of class Multimedia (11755 - 134998, n=61, last 2 years) | |
| Asus Zenbook A16 UX3607 | |
| Average Qualcomm Snapdragon X2 Elite Extreme X2E-94-100 (n=1) | |
| Microsoft Surface Laptop 15 Snapdragon X Elite | |
DPC 延迟
我们无法进行标准延迟测试。4K 视频播放未出现丢帧现象。
存储设备
尽管有 16 英寸的大机身,Zenbook A16 却只为固态硬盘(PCIe 4.0)提供了一个 M.2-2280 插槽。我们的评测机配备了三星的 1 TB 硬盘,传输速率良好且基本稳定。

* ... smaller is better
磁盘节流DiskSpd 读取循环,队列深度 8
图形处理器性能
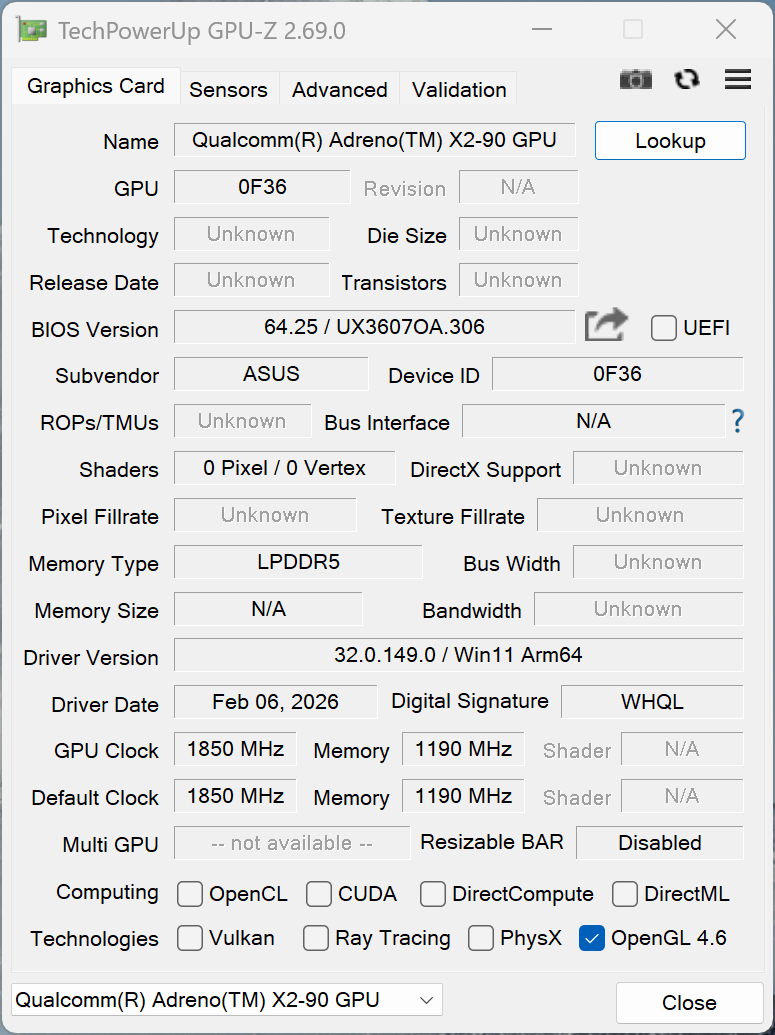
骁龙 X2E-94-100 配备了最快版本的 Adreno X2-90 GPU最高频率为 1850 MHz,功耗为 25 瓦。GPU 性能一直是上一代产品的薄弱环节,因此我们很高兴地报告,高通公司对 GPU 进行了大幅改进,其速度几乎是旧版 Adreno X1-85 的两倍(3.8 TFLOPS)。之前还有一个更快的版本,速度为 4.6 TFLOPS,但在Galaxy Book4 Edge 16 中非常罕见,实际上也快不了多少。在最高时钟频率为 1700 MHz 的 X2E-88-100 中,与 X2-90 相比,我们可以看到大约 15 % 的差异。
X2-90 比Apple 的 10 核 M5 GPU 以及英特尔的 Lunar Lake、Arrow Lake 和 AMD 的 Radeon 890M/880M 稍微快一些。英特尔最新的 Arc B370 和 B390 iGPU 的速度更快,但考虑到它们所需的功耗(37-43 瓦),速度并没有那么快。就我们目前看到的情况来看,XPS 16 或Galaxy Book6 Pro 等搭载新酷睿 Ultra X 芯片的 16 英寸对手显然在 2000 美元以北。
无论是在电池供电情况下,还是在持续工作负载情况下,图形性能都完全稳定。请参阅 我们的分析了解有关性能和效率的更多信息。
| 3DMark 06 Standard Score | 24681 points | |
| 3DMark Vantage P Result | 47555 points | |
| 3DMark 11 Performance | 13746 points | |
| 3DMark Fire Strike Score | 11139 points | |
| 3DMark Time Spy Score | 4533 points | |
| 3DMark Steel Nomad Score | 1264 points | |
| 3DMark Steel Nomad Light Score | 5492 points | |
| 3DMark Steel Nomad Light Unlimited Score | 5492 points | |
Help | ||
| Blender / v3.3 Classroom CPU | |
| Microsoft Surface Laptop 15 Snapdragon X Elite | |
| Lenovo ThinkPad X9-15 Aura Edition | |
| Dell XPS 16 Core Ultra 5 325 | |
| Average of class Multimedia (134.5 - 1042, n=67, last 2 years) | |
| Average Qualcomm Adreno X2-90 (320 - 406, n=3) | |
| Apple MacBook Air 15 M5 | |
| Samsung Galaxy Book6 Pro | |
| Asus Zenbook A16 UX3607 | |
| Asus ZenBook S16 UM5606GA | |
| Blender / v3.3 Classroom METAL | |
| Apple MacBook Air 15 M5 | |
| Average of class Multimedia (17.8 - 68, n=5, last 2 years) | |
| Blender / v3.3 Classroom oneAPI/Intel | |
| Average of class Multimedia (105 - 492, n=18, last 2 years) | |
| Dell XPS 16 Core Ultra 5 325 | |
* ... smaller is better
游戏性能
高通公司改进了与游戏的兼容性,现在支持 Game Pass 以及 Epic 的反作弊软件,因此您可以玩《堡垒之夜》等游戏。不过仍然会出现一些问题,首先是一些简单的问题,如图形错误(当您将细节设置为高时,会出现AC 阴影)或游戏根本无法启动(如F1 24或F1 25)。如果你想玩某个特定的游戏,一定要检查一下与 Windows on ARM 的兼容性。
例如,《赛博朋克 2077》或《博德之门 3》等受支持的游戏在 1080p 和高分辨率下运行非常出色。游戏性能也优于直接竞争对手,而你需要的是配备 Arc B370 或 Arc B390 iGPU 的 Panther Lake 芯片,这可能会大幅提高价格。即使使用电池供电,游戏性能也完全稳定。
| Strange Brigade - 1920x1080 ultra AA:ultra AF:16 | |
| Average of class Multimedia (13.3 - 303, n=66, last 2 years) | |
| Asus Zenbook A16 UX3607 | |
| Lenovo ThinkPad X9-15 Aura Edition | |
| Samsung Galaxy Book6 Pro | |
| Asus ZenBook S16 UM5606GA | |
| Dell XPS 16 Core Ultra 5 325 | |
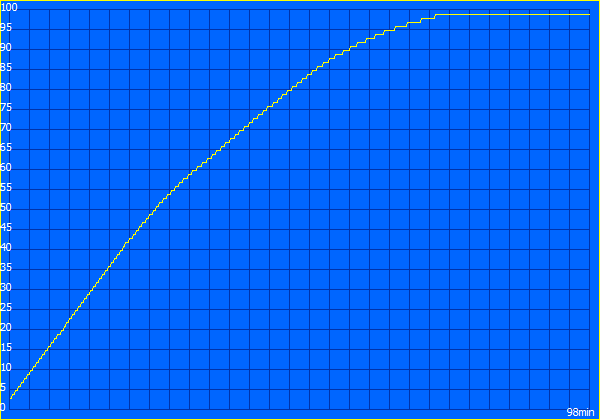
赛博朋克 2077》超 FPS 图表
| low | med. | high | ultra | QHD | |
|---|---|---|---|---|---|
| GTA V (2015) | 90.6 | 41.1 | 28.1 | ||
| Dota 2 Reborn (2015) | 103.5 | 86.3 | 80.3 | 70.7 | |
| Final Fantasy XV Benchmark (2018) | 110.5 | 65.6 | 34.5 | 26.7 | |
| X-Plane 11.11 (2018) | 54.4 | 47.7 | 42.6 | ||
| Far Cry 5 (2018) | 68 | 58 | 55 | 50 | 45 |
| Strange Brigade (2018) | 279 | 115.3 | 89.2 | 81.7 | 59 |
| Shadow of the Tomb Raider (2018) | 128 | 56 | 51 | 46 | 31 |
| Baldur's Gate 3 (2023) | 60 | 49.1 | 43.4 | 42.5 | 28.7 |
| Cyberpunk 2077 (2023) | 61.9 | 50.1 | 43 | 38.2 | 22.7 |
| Total War Pharaoh (2023) | 185.9 | 132.8 | 99.3 | 84.1 | 58.9 |
| Assassin's Creed Shadows (2025) | 27 | 25 | 21 | 16 |
排放--日常场景中的安静
系统噪音

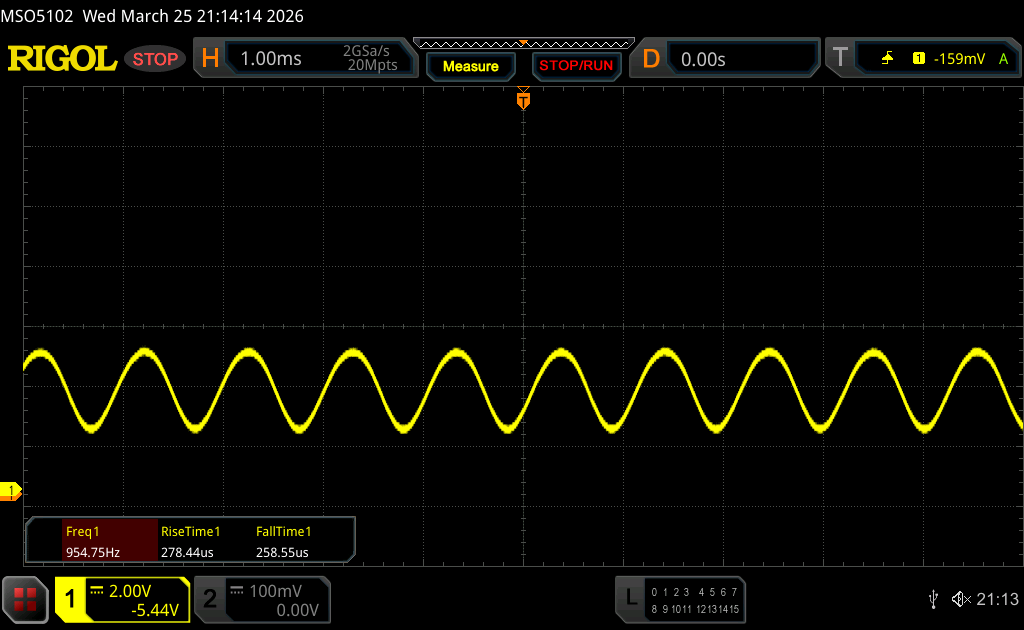
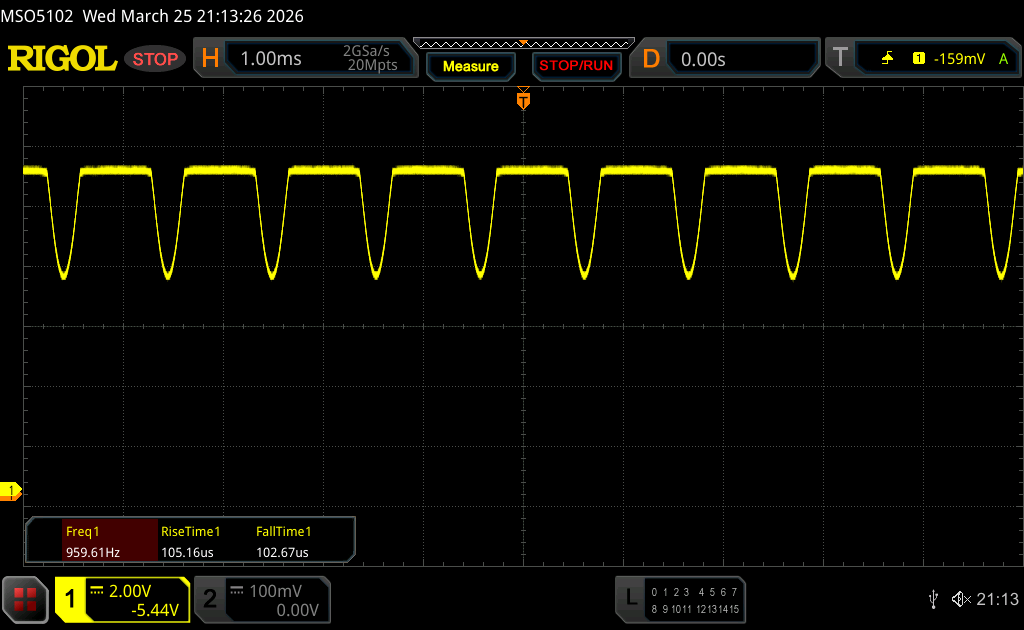
风扇噪音在很大程度上取决于电源模式,但正如我们之前所展示的,"耳语 "模式下的性能依然出色(最高可达 30.5 dB(A)),因此该模式对于日常任务来说绰绰有余。如果你真的想充分发挥新 X2 Elite Extreme 的性能,风扇噪音在负载情况下会增加到 51 dB(A),非常响亮。不过,负载结束后,风扇几乎会立即停止转动。我们没有听到任何电子噪音,如线圈啸叫。
Noise level
| Idle |
| 24.9 / 24.9 / 24.9 dB(A) |
| Load |
| 27.9 / 51.1 dB(A) |
 | ||
30 dB silent 40 dB(A) audible 50 dB(A) loud |
||
min: | ||
| Asus Zenbook A16 UX3607 X2E-94-100, X2-90 | Apple MacBook Air 15 M5 M5 10-Core, M5 10-Core GPU | Lenovo ThinkPad X9-15 Aura Edition Core Ultra 7 258V, Arc 140V | Samsung Galaxy Book6 Pro Ultra 7 356H, Intel Graphics 4 Xe3 PTL | Dell XPS 16 Core Ultra 5 325 Ultra 5 325, Intel Graphics 4 Xe3 PTL | Asus ZenBook S16 UM5606GA Ryzen AI 9 465, Radeon 880M | Microsoft Surface Laptop 15 Snapdragon X Elite SD X Elite X1E-80-100, Adreno X1-85 3.8 TFLOPS | |
|---|---|---|---|---|---|---|---|
| Noise | 2% | 4% | 6% | -8% | 15% | ||
| off / environment * (dB) | 24.9 | 24.4 2% | 25.3 -2% | 22.8 8% | 24.9 -0% | 23.3 6% | |
| Idle Minimum * (dB) | 24.9 | 24.4 2% | 25.3 -2% | 22.9 8% | 24.9 -0% | 23.3 6% | |
| Idle Average * (dB) | 24.9 | 24.4 2% | 25.3 -2% | 22.9 8% | 24.9 -0% | 23.3 6% | |
| Idle Maximum * (dB) | 24.9 | 24.4 2% | 25.3 -2% | 23.9 4% | 24.9 -0% | 23.3 6% | |
| Load Average * (dB) | 27.9 | 35.8 -28% | 31.8 -14% | 34.8 -25% | 45.7 -64% | 25.7 8% | |
| Cyberpunk 2077 ultra * (dB) | 51.1 | 39.4 23% | 38.4 25% | 38 26% | 49 4% | 31.1 39% | |
| Load Maximum * (dB) | 51.1 | 45 12% | 38.4 25% | 43.3 15% | 50.4 1% | 33.2 35% |
* ... smaller is better
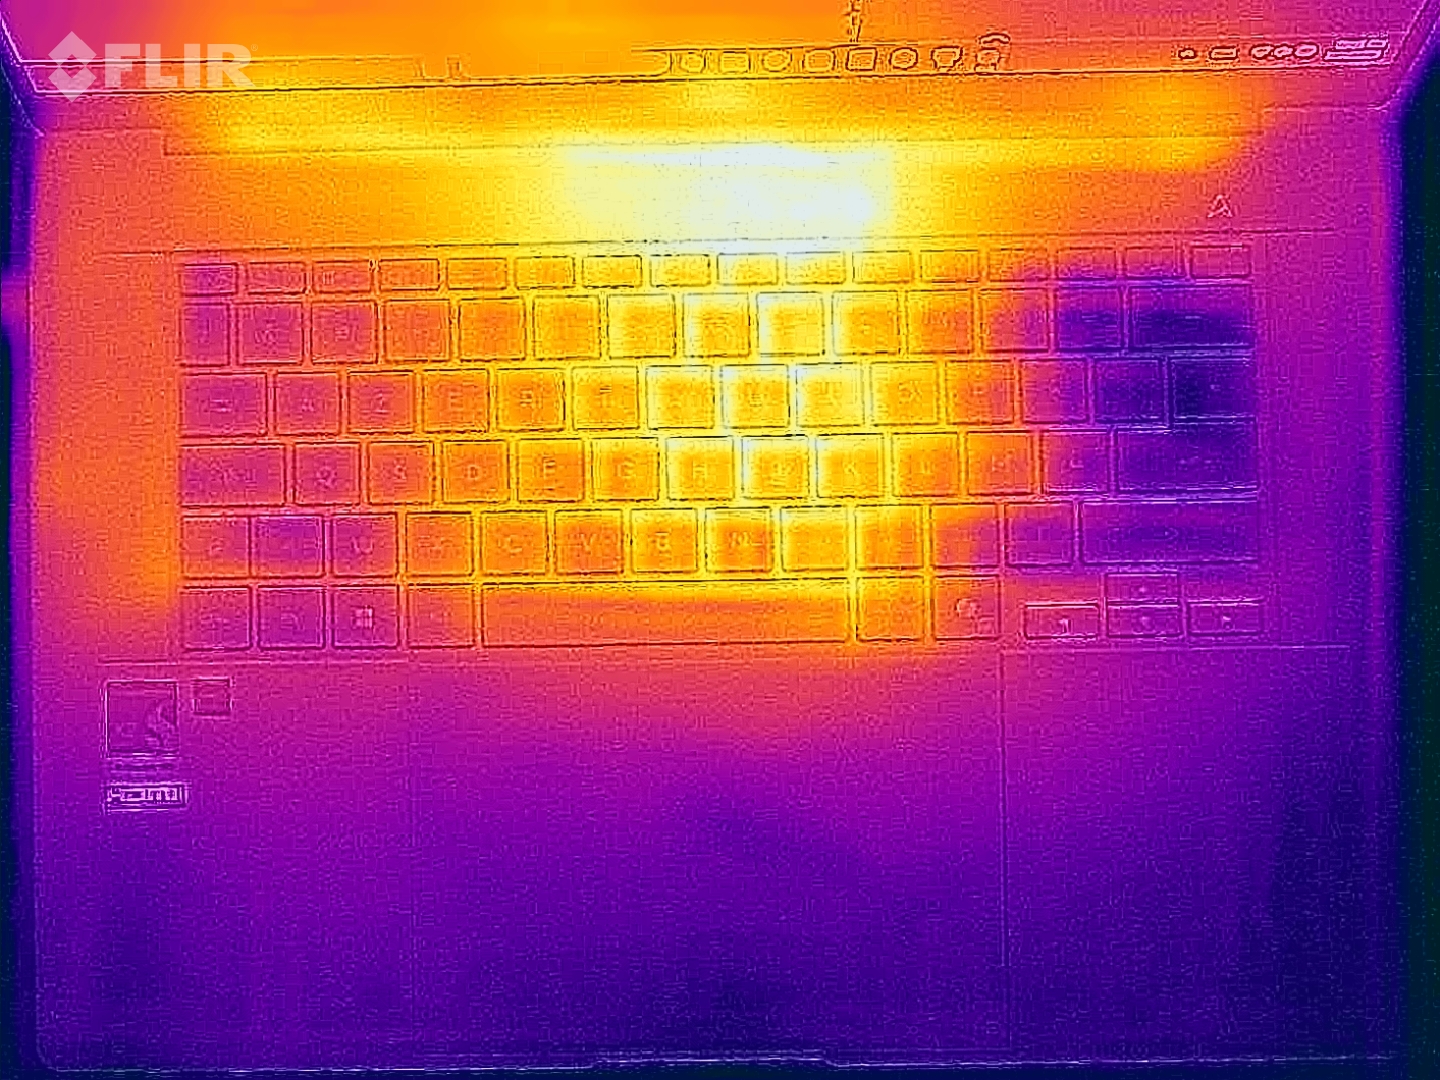
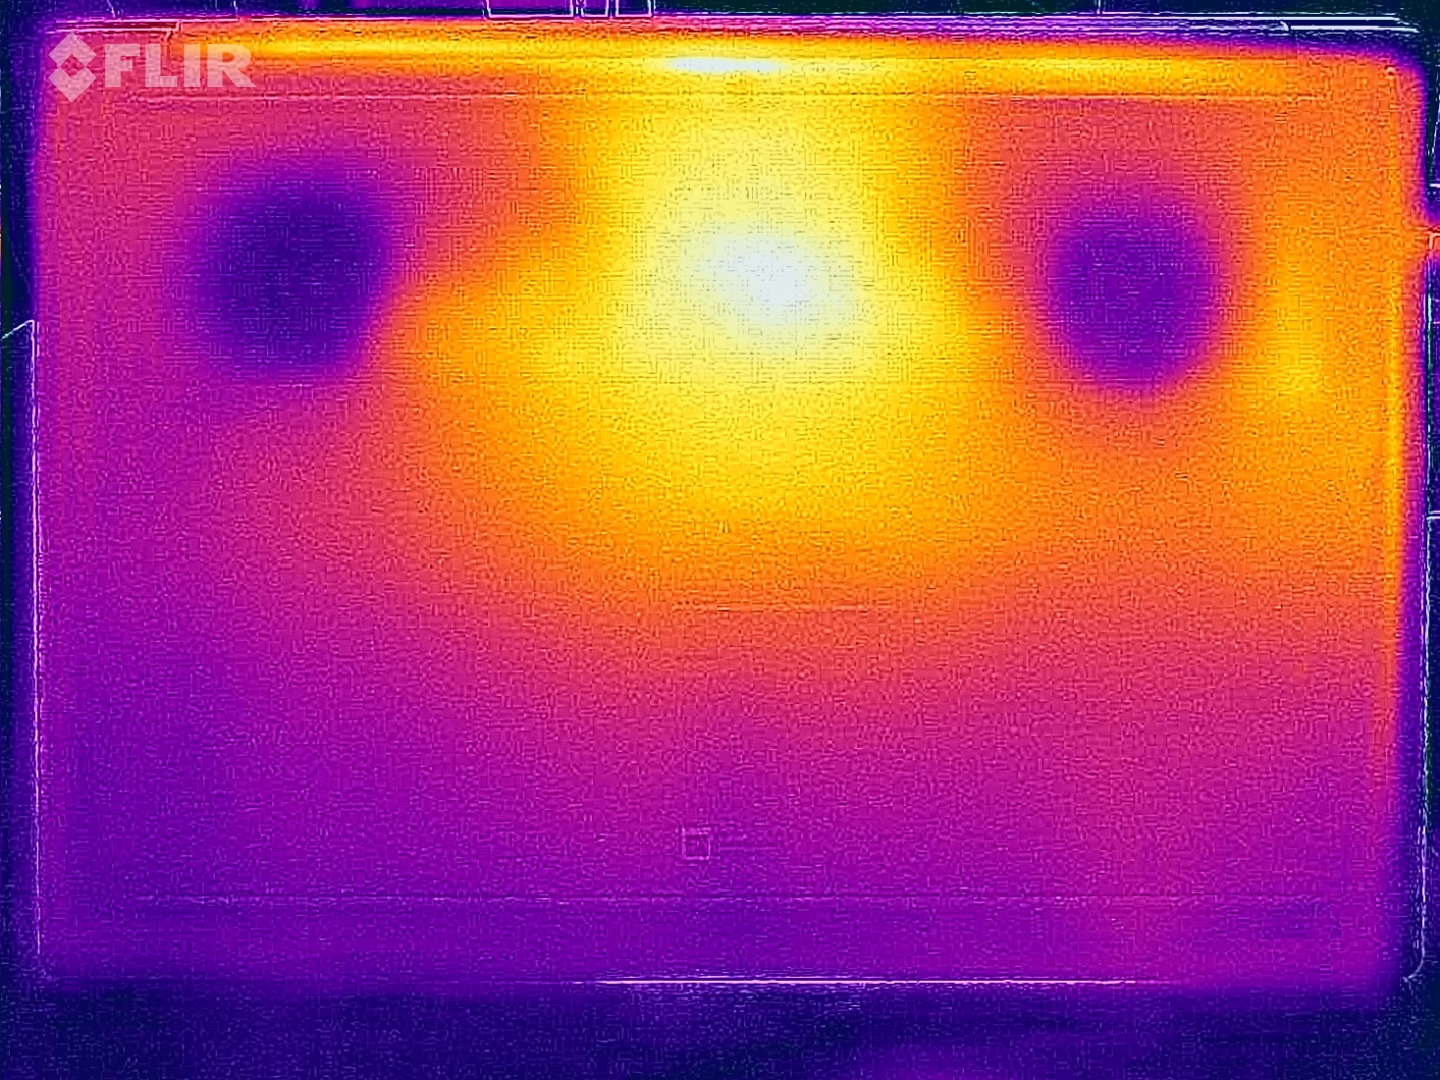
温度
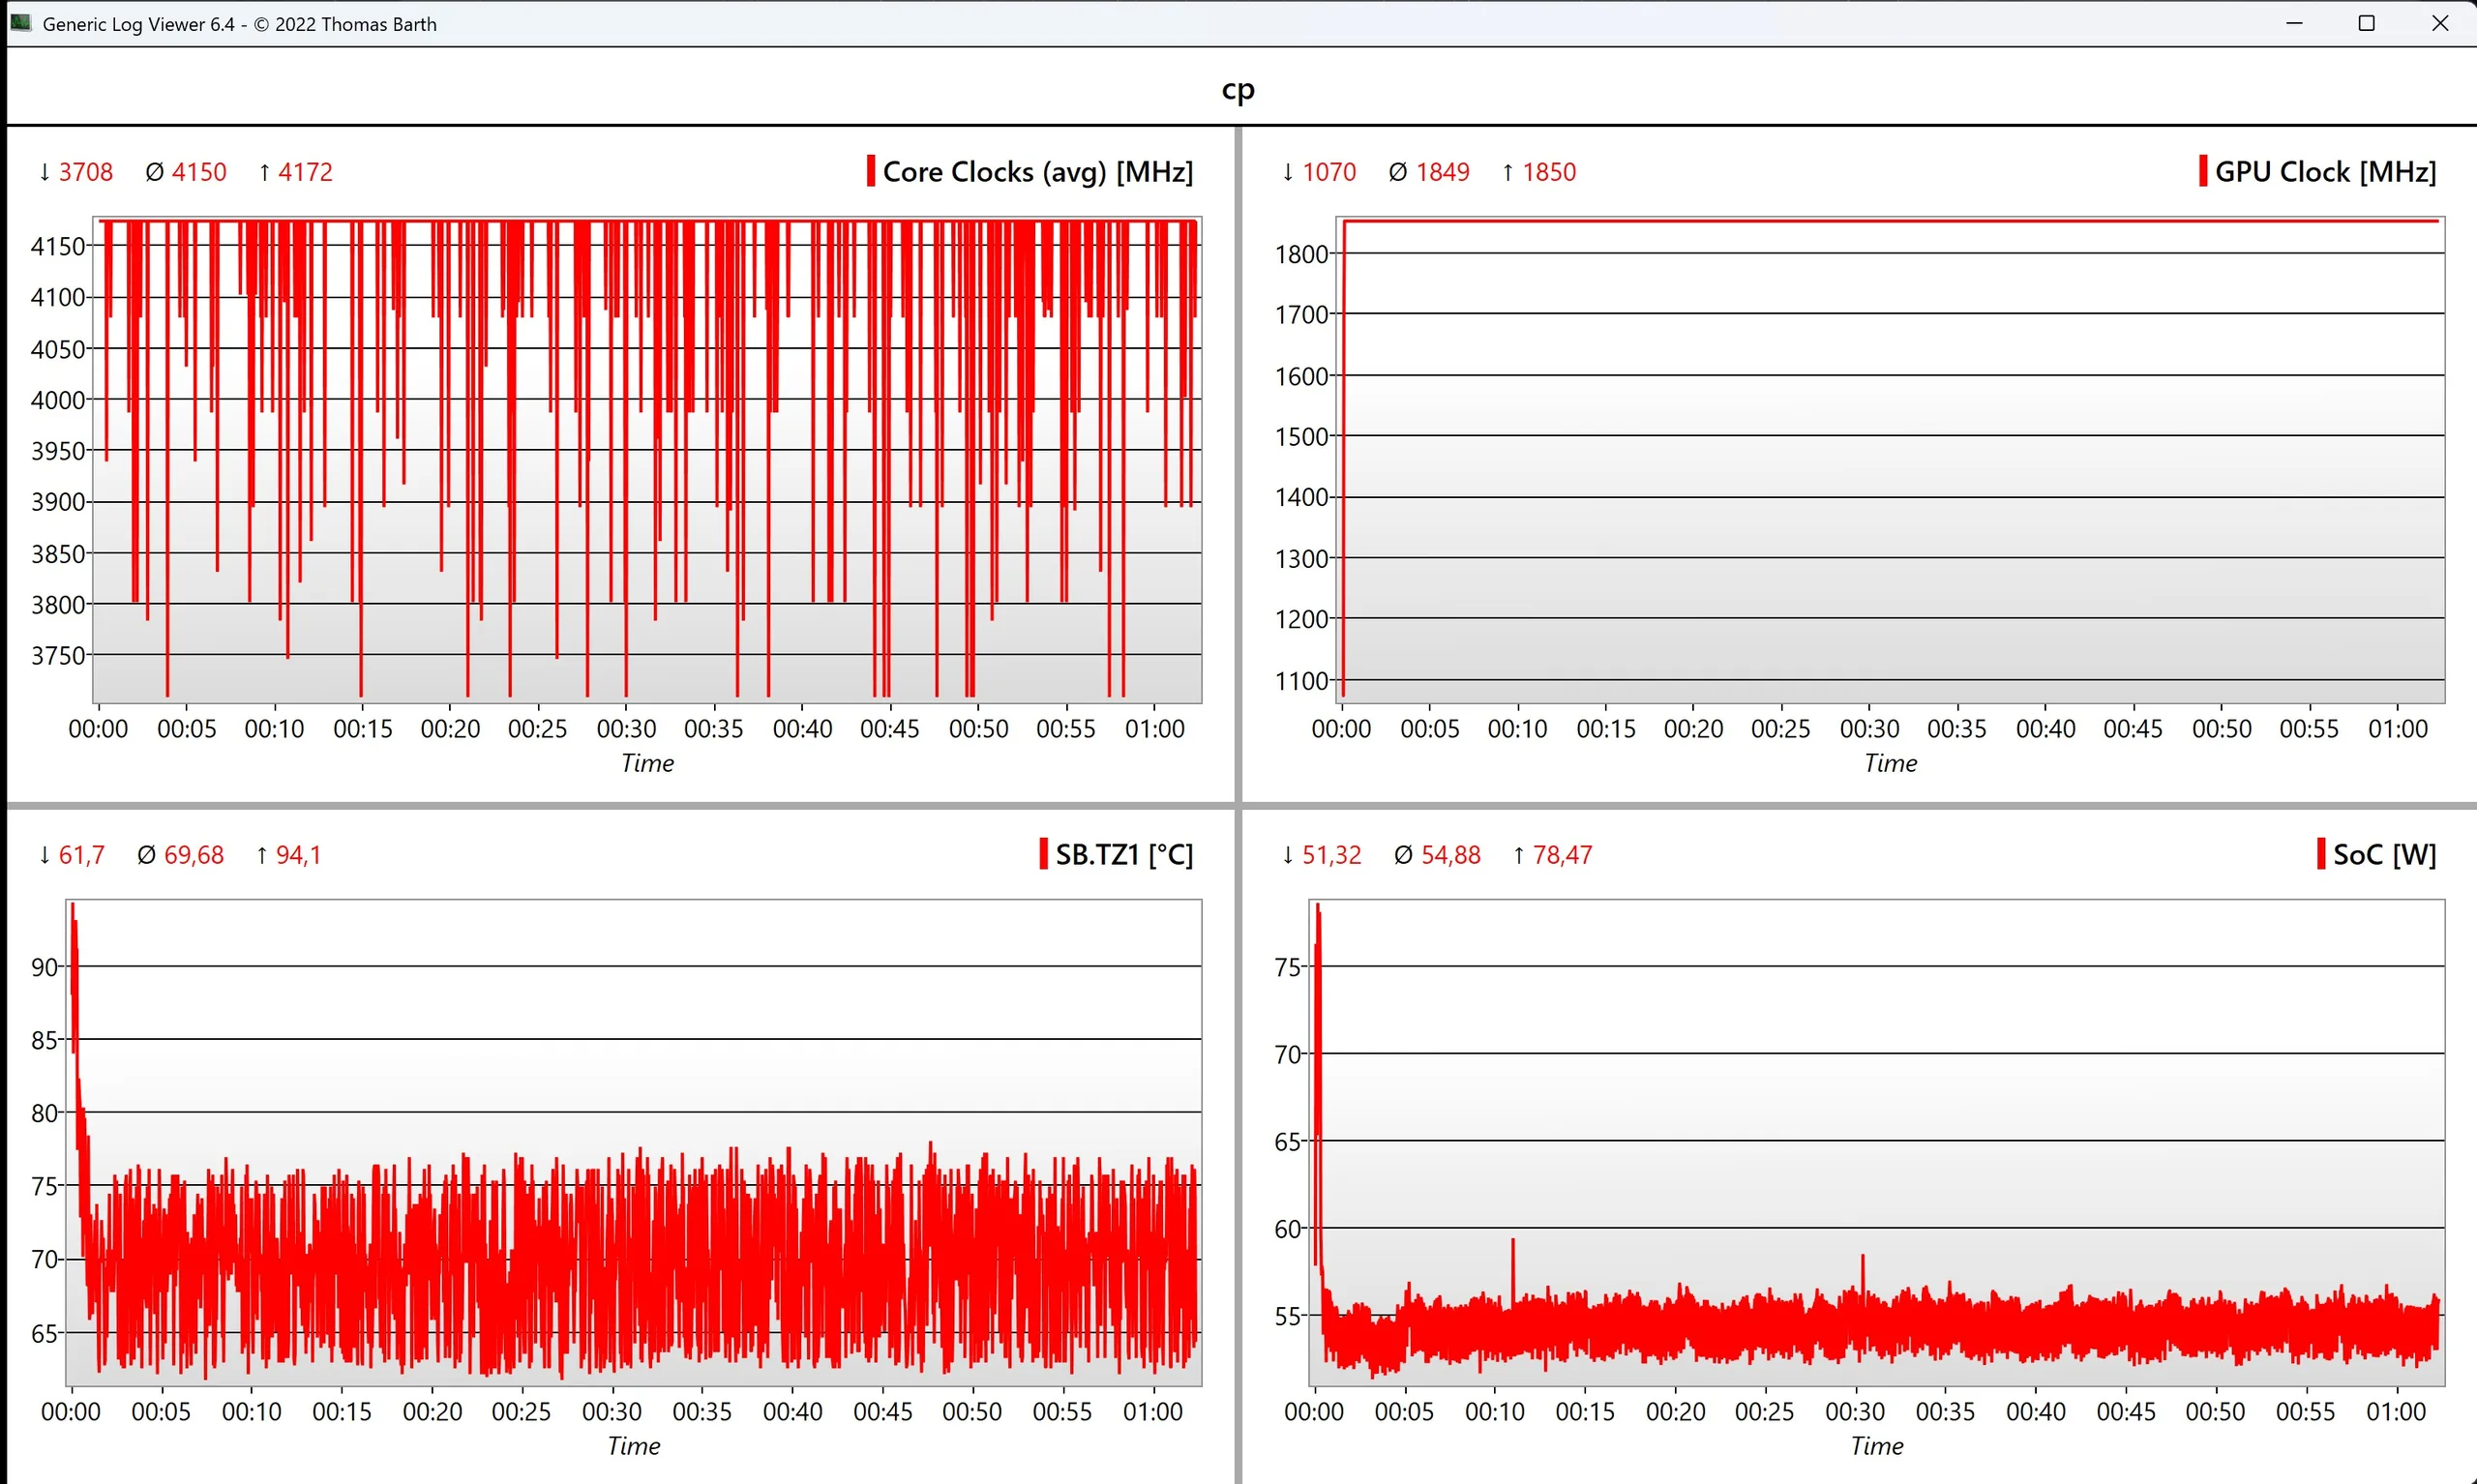
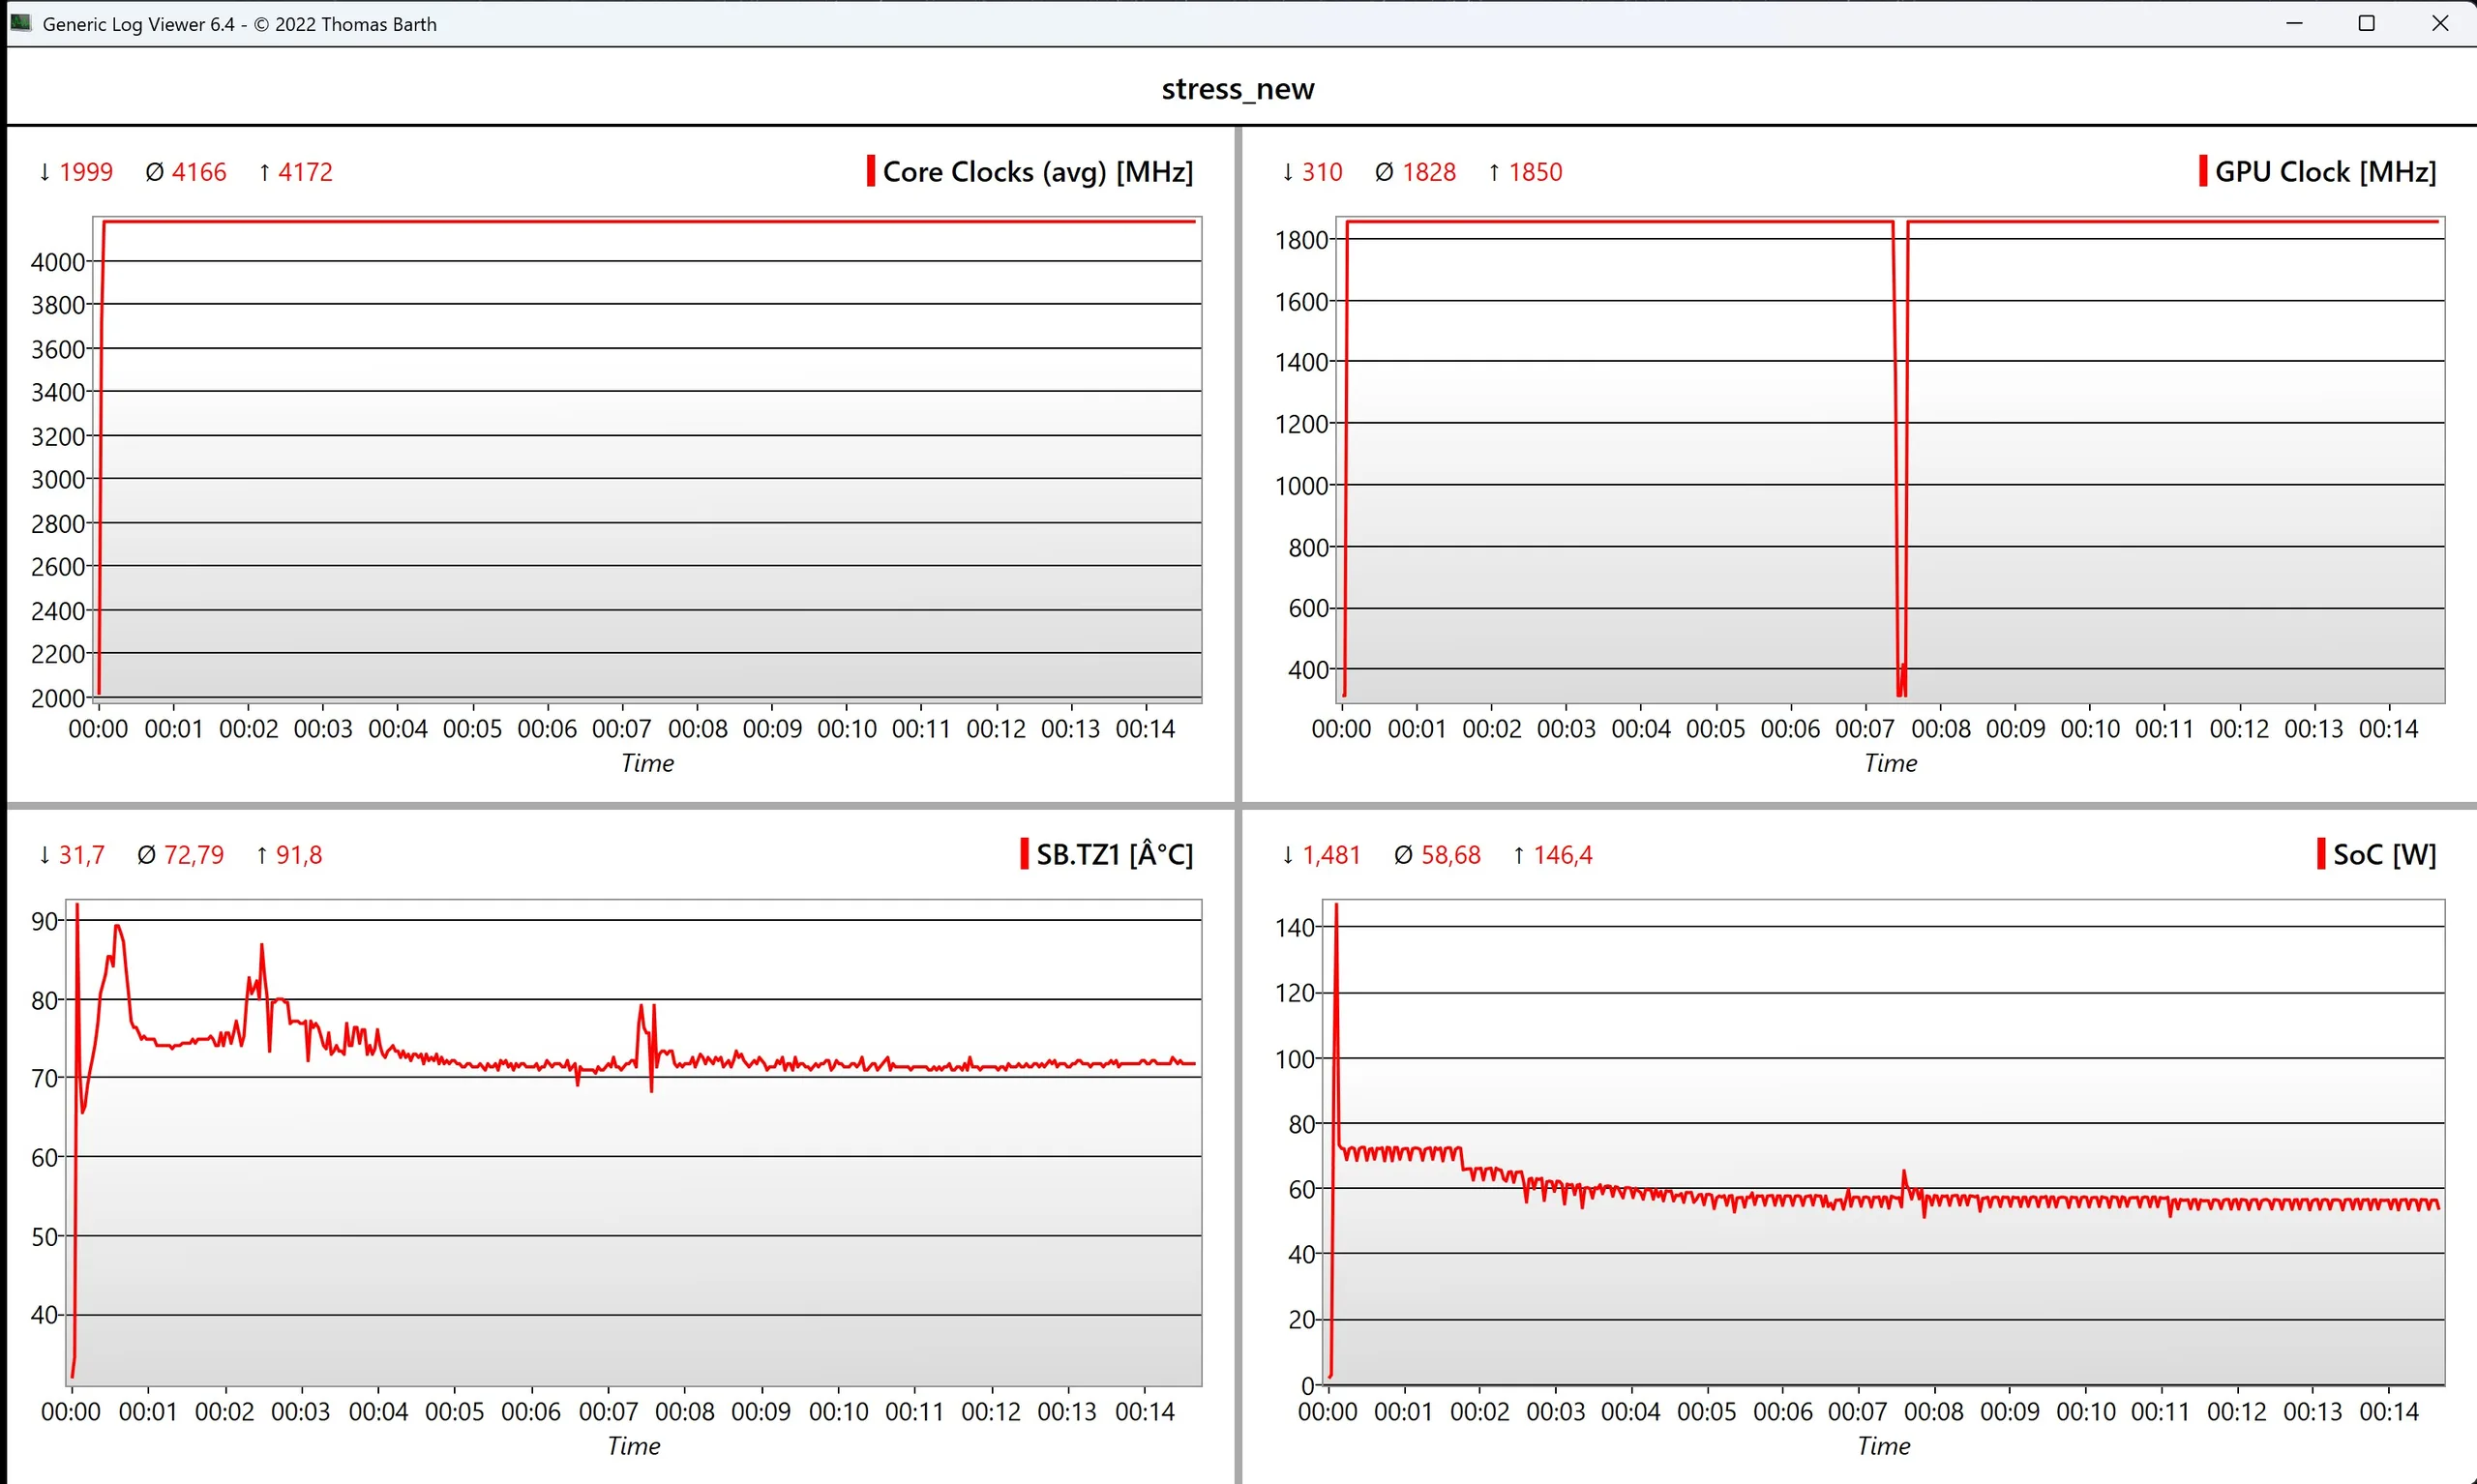
考虑到设备的性能和纤薄的机身,其表面温度总体很低。轻度工作负载通常不会产生任何可感知的热量,但即使在性能模式下对设备施加压力,我们也仅在几个位置测得超过 40 °C的温度。这非常了不起,意味着你可以一直把 Zenbook A16 放在腿上使用。在我们的压力测试中,SoC 的功耗最初为 146 瓦,但随后立即降至 72 瓦,五分钟后降至 56 瓦,并在整个压力测试过程中保持不变。
(±) The maximum temperature on the upper side is 43.2 °C / 110 F, compared to the average of 36.8 °C / 98 F, ranging from 21 to 71 °C for the class Multimedia.
(±) The bottom heats up to a maximum of 43.3 °C / 110 F, compared to the average of 39.1 °C / 102 F
(+) In idle usage, the average temperature for the upper side is 24.3 °C / 76 F, compared to the device average of 31.3 °C / 88 F.
(±) 3: The average temperature for the upper side is 32.8 °C / 91 F, compared to the average of 31.3 °C / 88 F for the class Multimedia.
(+) The palmrests and touchpad are cooler than skin temperature with a maximum of 26.6 °C / 79.9 F and are therefore cool to the touch.
(+) The average temperature of the palmrest area of similar devices was 28.7 °C / 83.7 F (+2.1 °C / 3.8 F).
| Asus Zenbook A16 UX3607 X2E-94-100, X2-90 | Apple MacBook Air 15 M5 M5 10-Core, M5 10-Core GPU | Lenovo ThinkPad X9-15 Aura Edition Core Ultra 7 258V, Arc 140V | Samsung Galaxy Book6 Pro Ultra 7 356H, Intel Graphics 4 Xe3 PTL | Dell XPS 16 Core Ultra 5 325 Ultra 5 325, Intel Graphics 4 Xe3 PTL | Asus ZenBook S16 UM5606GA Ryzen AI 9 465, Radeon 880M | Microsoft Surface Laptop 15 Snapdragon X Elite SD X Elite X1E-80-100, Adreno X1-85 3.8 TFLOPS | |
|---|---|---|---|---|---|---|---|
| Heat | 4% | 7% | 12% | 6% | -3% | 10% | |
| Maximum Upper Side * (°C) | 43.2 | 44.1 -2% | 42.1 3% | 37.8 13% | 43.8 -1% | 43.4 -0% | 45.4 -5% |
| Maximum Bottom * (°C) | 43.3 | 43.1 -0% | 39.5 9% | 40.1 7% | 42 3% | 46.2 -7% | 37.2 14% |
| Idle Upper Side * (°C) | 26.7 | 24 10% | 24.5 8% | 22.6 15% | 23.2 13% | 26.5 1% | 22.4 16% |
| Idle Bottom * (°C) | 26 | 23.9 8% | 24.4 6% | 22.8 12% | 23.6 9% | 27 -4% | 22 15% |
* ... smaller is better
发言人
配备 6 个模块的音响系统表现出色,但大多数竞争对手的音效都要更好一些。不过,Zenbook A16 的音质还是不会让你失望的。
Asus Zenbook A16 UX3607 audio analysis
(+) | speakers can play relatively loud (84.5 dB)
Bass 100 - 315 Hz
(±) | reduced bass - on average 6.4% lower than median
(±) | linearity of bass is average (8.3% delta to prev. frequency)
Mids 400 - 2000 Hz
(+) | balanced mids - only 3.9% away from median
(+) | mids are linear (4.2% delta to prev. frequency)
Highs 2 - 16 kHz
(+) | balanced highs - only 3.3% away from median
(+) | highs are linear (5% delta to prev. frequency)
Overall 100 - 16.000 Hz
(+) | overall sound is linear (9.8% difference to median)
Compared to same class
» 13% of all tested devices in this class were better, 2% similar, 85% worse
» The best had a delta of 5%, average was 17%, worst was 45%
Compared to all devices tested
» 4% of all tested devices were better, 1% similar, 95% worse
» The best had a delta of 4%, average was 24%, worst was 134%
Apple MacBook Air 15 M5 audio analysis
(+) | speakers can play relatively loud (84.8 dB)
Bass 100 - 315 Hz
(±) | reduced bass - on average 6.8% lower than median
(+) | bass is linear (6.6% delta to prev. frequency)
Mids 400 - 2000 Hz
(+) | balanced mids - only 2% away from median
(+) | mids are linear (3.3% delta to prev. frequency)
Highs 2 - 16 kHz
(+) | balanced highs - only 3.6% away from median
(+) | highs are linear (3.2% delta to prev. frequency)
Overall 100 - 16.000 Hz
(+) | overall sound is linear (7.7% difference to median)
Compared to same class
» 2% of all tested devices in this class were better, 0% similar, 98% worse
» The best had a delta of 5%, average was 18%, worst was 53%
Compared to all devices tested
» 1% of all tested devices were better, 0% similar, 98% worse
» The best had a delta of 4%, average was 24%, worst was 134%
Lenovo ThinkPad X9-15 Aura Edition audio analysis
(+) | speakers can play relatively loud (87.5 dB)
Bass 100 - 315 Hz
(±) | reduced bass - on average 12.5% lower than median
(+) | bass is linear (6.8% delta to prev. frequency)
Mids 400 - 2000 Hz
(+) | balanced mids - only 3.1% away from median
(+) | mids are linear (5.3% delta to prev. frequency)
Highs 2 - 16 kHz
(+) | balanced highs - only 2.4% away from median
(+) | highs are linear (3.3% delta to prev. frequency)
Overall 100 - 16.000 Hz
(+) | overall sound is linear (9.5% difference to median)
Compared to same class
» 1% of all tested devices in this class were better, 0% similar, 99% worse
» The best had a delta of 7%, average was 21%, worst was 53%
Compared to all devices tested
» 4% of all tested devices were better, 1% similar, 95% worse
» The best had a delta of 4%, average was 24%, worst was 134%
Samsung Galaxy Book6 Pro audio analysis
(±) | speaker loudness is average but good (81.1 dB)
Bass 100 - 315 Hz
(±) | reduced bass - on average 13.7% lower than median
(±) | linearity of bass is average (8.9% delta to prev. frequency)
Mids 400 - 2000 Hz
(+) | balanced mids - only 3.1% away from median
(+) | mids are linear (3.5% delta to prev. frequency)
Highs 2 - 16 kHz
(+) | balanced highs - only 1.3% away from median
(+) | highs are linear (2.7% delta to prev. frequency)
Overall 100 - 16.000 Hz
(+) | overall sound is linear (11% difference to median)
Compared to same class
» 16% of all tested devices in this class were better, 3% similar, 81% worse
» The best had a delta of 5%, average was 17%, worst was 45%
Compared to all devices tested
» 6% of all tested devices were better, 2% similar, 92% worse
» The best had a delta of 4%, average was 24%, worst was 134%
Dell XPS 16 Core Ultra 5 325 audio analysis
(+) | speakers can play relatively loud (85.3 dB)
Bass 100 - 315 Hz
(±) | reduced bass - on average 6.1% lower than median
(+) | bass is linear (5.6% delta to prev. frequency)
Mids 400 - 2000 Hz
(+) | balanced mids - only 3.2% away from median
(+) | mids are linear (4.6% delta to prev. frequency)
Highs 2 - 16 kHz
(+) | balanced highs - only 2.4% away from median
(+) | highs are linear (3.3% delta to prev. frequency)
Overall 100 - 16.000 Hz
(+) | overall sound is linear (7% difference to median)
Compared to same class
» 5% of all tested devices in this class were better, 1% similar, 94% worse
» The best had a delta of 5%, average was 17%, worst was 45%
Compared to all devices tested
» 1% of all tested devices were better, 0% similar, 99% worse
» The best had a delta of 4%, average was 24%, worst was 134%
Asus ZenBook S16 UM5606GA audio analysis
(±) | speaker loudness is average but good (78.2 dB)
Bass 100 - 315 Hz
(+) | good bass - only 4.6% away from median
(+) | bass is linear (6.2% delta to prev. frequency)
Mids 400 - 2000 Hz
(+) | balanced mids - only 1.9% away from median
(+) | mids are linear (5% delta to prev. frequency)
Highs 2 - 16 kHz
(+) | balanced highs - only 2.1% away from median
(+) | highs are linear (4.9% delta to prev. frequency)
Overall 100 - 16.000 Hz
(+) | overall sound is linear (7.6% difference to median)
Compared to same class
» 6% of all tested devices in this class were better, 2% similar, 92% worse
» The best had a delta of 5%, average was 17%, worst was 45%
Compared to all devices tested
» 1% of all tested devices were better, 0% similar, 98% worse
» The best had a delta of 4%, average was 24%, worst was 134%
Microsoft Surface Laptop 15 Snapdragon X Elite audio analysis
(±) | speaker loudness is average but good (81 dB)
Bass 100 - 315 Hz
(±) | reduced bass - on average 11.7% lower than median
(±) | linearity of bass is average (9.1% delta to prev. frequency)
Mids 400 - 2000 Hz
(+) | balanced mids - only 3.3% away from median
(+) | mids are linear (3.2% delta to prev. frequency)
Highs 2 - 16 kHz
(+) | balanced highs - only 3.1% away from median
(+) | highs are linear (6.3% delta to prev. frequency)
Overall 100 - 16.000 Hz
(+) | overall sound is linear (11.4% difference to median)
Compared to same class
» 3% of all tested devices in this class were better, 2% similar, 95% worse
» The best had a delta of 7%, average was 21%, worst was 53%
Compared to all devices tested
» 7% of all tested devices were better, 2% similar, 91% worse
» The best had a delta of 4%, average was 24%, worst was 134%
能源管理
耗电量

最大闲置功耗约为 8.4 瓦,相当一般,而其他 OLED 设备(如 ThinkPad X9 15 或Galaxy Book6 Pro)的功耗更高。在玩游戏时,功耗约为 60 瓦,而在压力测试中,130 瓦的电源适配器会在一瞬间限制功耗,然后降至约 100 瓦,最后降至约 90 瓦。因此,总体而言,130 瓦模块的功率是足够的,而且电池在持续工作负荷下也不会放电。
| Off / Standby | |
| Idle | |
| Load |
|
Key:
min: | |
| Asus Zenbook A16 UX3607 X2E-94-100, X2-90, Samsung PM9C1b MZVL81T0HFLB-00BTW, OLED, 2880x1800, 16" | Apple MacBook Air 15 M5 M5 10-Core, M5 10-Core GPU, Apple SSD AP2048Z, IPS, 2880x1864, 15.3" | Lenovo ThinkPad X9-15 Aura Edition Core Ultra 7 258V, Arc 140V, WD PC SN740 SDDQMQD-1T00, OLED, 2880x1800, 15.3" | Samsung Galaxy Book6 Pro Ultra 7 356H, Intel Graphics 4 Xe3 PTL, Samsung PM9C1b MZVL8512HFLU-00BLL, OLED, 2880x1800, 16" | Dell XPS 16 Core Ultra 5 325 Ultra 5 325, Intel Graphics 4 Xe3 PTL, SK hynix PVC10 HFS512GEM4X182N, IPS, 1920x1200, 16" | Asus ZenBook S16 UM5606GA Ryzen AI 9 465, Radeon 880M, SanDisk PC SN5100S, OLED, 2880x1800, 16" | Microsoft Surface Laptop 15 Snapdragon X Elite SD X Elite X1E-80-100, Adreno X1-85 3.8 TFLOPS, Samsung PM9B1 256GB MZ9L4256HCJQ, IPS, 2496x1664, 15" | Average Qualcomm Adreno X2-90 | Average of class Multimedia | |
|---|---|---|---|---|---|---|---|---|---|
| Power Consumption | 25% | 35% | 32% | 35% | 3% | 22% | 12% | -25% | |
| Idle Minimum * (Watt) | 5.1 | 2.2 57% | 2.4 53% | 2.5 51% | 1.3 75% | 3.7 27% | 3 41% | 4.3 ? 16% | 5.64 ? -11% |
| Idle Average * (Watt) | 8.1 | 11.7 -44% | 3.9 52% | 4.2 48% | 4.5 44% | 7.4 9% | 8.3 -2% | 6.47 ? 20% | 10 ? -23% |
| Idle Maximum * (Watt) | 8.4 | 11.8 -40% | 5.1 39% | 4.6 45% | 4.6 45% | 9.5 -13% | 8.4 -0% | 8.3 ? 1% | 12.2 ? -45% |
| Load Average * (Watt) | 40.5 | 36.2 11% | 42.5 -5% | 42.2 -4% | 36.5 10% | 57.9 -43% | 34.3 15% | 40.1 ? 1% | 64.8 ? -60% |
| Cyberpunk 2077 ultra * (Watt) | 56.9 | 23.5 59% | 43.5 24% | 52.7 7% | 47.9 16% | 58.5 -3% | 45.8 20% | ||
| Cyberpunk 2077 ultra external monitor * (Watt) | 58.2 | 21.7 63% | 40.2 31% | 40.6 30% | 45.4 22% | 57 2% | 41 30% | ||
| Load Maximum * (Watt) | 128.9 | 37.4 71% | 64.4 50% | 70.8 45% | 82.8 36% | 76.9 40% | 65.2 49% | 99.5 ? 23% | 111.7 ? 13% |
* ... smaller is better
功耗 赛博朋克/压力测试
外部显示器功耗
电池寿命
华硕使用的是 70 Wh 电池,电池续航时间尚可,但给我们留下的印象并不深刻。在 150 尼特的条件下,Wi-Fi 的运行时间为 13 小时,这并没有什么特别之处。这与配备 83 Wh 大容量电池的 Zenbook S16 不相上下,因此 A16 的效率很高,但用户仍然无法获得更长的运行时间。我们更希望电池容量更大,因为其他竞争对手的续航时间都在 16 小时左右。戴尔 XPS 16 的全高清 IPS 屏幕是个例外,但如果你想获得最大的电池续航时间,A16 也将配备全高清 OLED 屏幕。
电池的劣势还体现在最大面板亮度下的 Wi-Fi 测试中,我们仅记录了 6.5 小时。采用高亮度 IPS 屏幕的 MacBook Air 也有同样的问题,仅为 6.7 小时。在 150 尼特的条件下,本地视频播放可持续 16 小时以上,而如果你真的需要使用 CPU,则可在 1 小时内将电池电量耗尽。

| Asus Zenbook A16 UX3607 X2E-94-100, X2-90, 70 Wh | Apple MacBook Air 15 M5 M5 10-Core, M5 10-Core GPU, 66.5 Wh | Lenovo ThinkPad X9-15 Aura Edition Core Ultra 7 258V, Arc 140V, 80 Wh | Samsung Galaxy Book6 Pro Ultra 7 356H, Intel Graphics 4 Xe3 PTL, 78 Wh | Dell XPS 16 Core Ultra 5 325 Ultra 5 325, Intel Graphics 4 Xe3 PTL, 70 Wh | Asus ZenBook S16 UM5606GA Ryzen AI 9 465, Radeon 880M, 83 Wh | Microsoft Surface Laptop 15 Snapdragon X Elite SD X Elite X1E-80-100, Adreno X1-85 3.8 TFLOPS, 64 Wh | Average of class Multimedia | |
|---|---|---|---|---|---|---|---|---|
| Battery runtime | 32% | 73% | 25% | 105% | 1% | 52% | 26% | |
| H.264 (h) | 16.3 | 23 41% | 16.4 ? 1% | |||||
| WiFi v1.3 (h) | 13 | 17.2 32% | 17.5 35% | 16.3 25% | 26.6 105% | 13.1 1% | 14.8 14% | 12 ? -8% |
| Load (h) | 0.9 | 2.2 144% | 1.7 89% | 1.675 ? 86% | ||||
| Reader / Idle (h) | 31.7 | 25.2 ? |
笔记本检查评级
Asus Zenbook A16 UX3607
- 04/07/2026 v8
Andreas Osthoff
 Total Sustainability Score:
 潜在竞争对手比较
Image | Model / Review | Price | Weight | Height | Display |
|---|---|---|---|---|---|
1. 87.5% 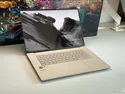 | Asus Zenbook A16 UX3607 Qualcomm Snapdragon X2 Elite Extreme X2E-94-100 ⎘ Qualcomm Adreno X2-90 ⎘ 48 GB Memory, 1000 GB SSD | Amazon: 1. $1,999.99 Asus Zenbook A16 UX3607 UX36... 2. $779.00 ASUS Zenbook A14; Copilot+ P... 3. $1,699.99 ASUS Zenbook Pro S 16 AI Lap... | 1.2 kg | 16.5 mm | 16.00" 2880x1800 212 PPI OLED |
2. 91.6%  | Apple MacBook Air 15 M5 Apple M5 10-Core ⎘ Apple M5 10-Core GPU ⎘ 32 GB Memory, 2048 GB SSD | Amazon: | 1.5 kg | 11.5 mm | 15.30" 2880x1864 224 PPI IPS |
3. 90.1%  | Lenovo ThinkPad X9-15 Aura Edition Intel Core Ultra 7 258V ⎘ Intel Arc Graphics 140V ⎘ 32 GB Memory, 1024 GB SSD | Amazon: List Price: 1989€ | 1.4 kg | 17.7 mm | 15.30" 2880x1800 222 PPI OLED |
4. 86.3%  | Samsung Galaxy Book6 Pro Intel Core Ultra 7 356H ⎘ Intel Graphics 4 Xe3 Panther Lake iGPU ⎘ 32 GB Memory, 512 GB SSD | Amazon: List Price: 2199€ | 1.6 kg | 11.9 mm | 16.00" 2880x1800 212 PPI OLED |
5. 84.2% 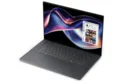 | Dell XPS 16 Core Ultra 5 325 Intel Core Ultra 5 325 ⎘ Intel Graphics 4 Xe3 Panther Lake iGPU ⎘ 16 GB Memory, 512 GB SSD | Amazon: 1. $2,499.00 Dell Premium 16 (XPS 16 2025... 2. $2,599.00 Dell Premium 16 (XPS 16 2025... 3. $1,977.99 Dell Premium 16 (Previously ... List Price: 1600 USD | 1.7 kg | 15.4 mm | 16.00" 1920x1200 142 PPI IPS |
6. 86.6%  | Asus ZenBook S16 UM5606GA AMD Ryzen AI 9 465 ⎘ AMD Radeon 880M ⎘ 32 GB Memory, 1024 GB SSD | Amazon: List Price: 1799€ | 1.5 kg | 12.9 mm | 16.00" 2880x1800 212 PPI OLED |
7. 84.3%  | Microsoft Surface Laptop 15 Snapdragon X Elite Qualcomm Snapdragon X Elite X1E-80-100 ⎘ Qualcomm SD X Adreno X1-85 3.8 TFLOPS ⎘ 16 GB Memory, 256 GB SSD | Amazon: List Price: 1100 USD | 1.7 kg | 18.29 mm | 15.00" 2496x1664 200 PPI IPS |
Transparency
The selection of devices to be reviewed is made by our editorial team. The test sample was provided to the author as a loan by the manufacturer or retailer for the purpose of this review. The lender had no influence on this review, nor did the manufacturer receive a copy of this review before publication. There was no obligation to publish this review. As an independent media company, Notebookcheck is not subjected to the authority of manufacturers, retailers or publishers.
This is how Notebookcheck is testing
Every year, Notebookcheck independently reviews hundreds of laptops and smartphones using standardized procedures to ensure that all results are comparable. We have continuously developed our test methods for around 20 years and set industry standards in the process. In our test labs, high-quality measuring equipment is utilized by experienced technicians and editors. These tests involve a multi-stage validation process. Our complex rating system is based on hundreds of well-founded measurements and benchmarks, which maintains objectivity. Further information on our test methods can be found here.

