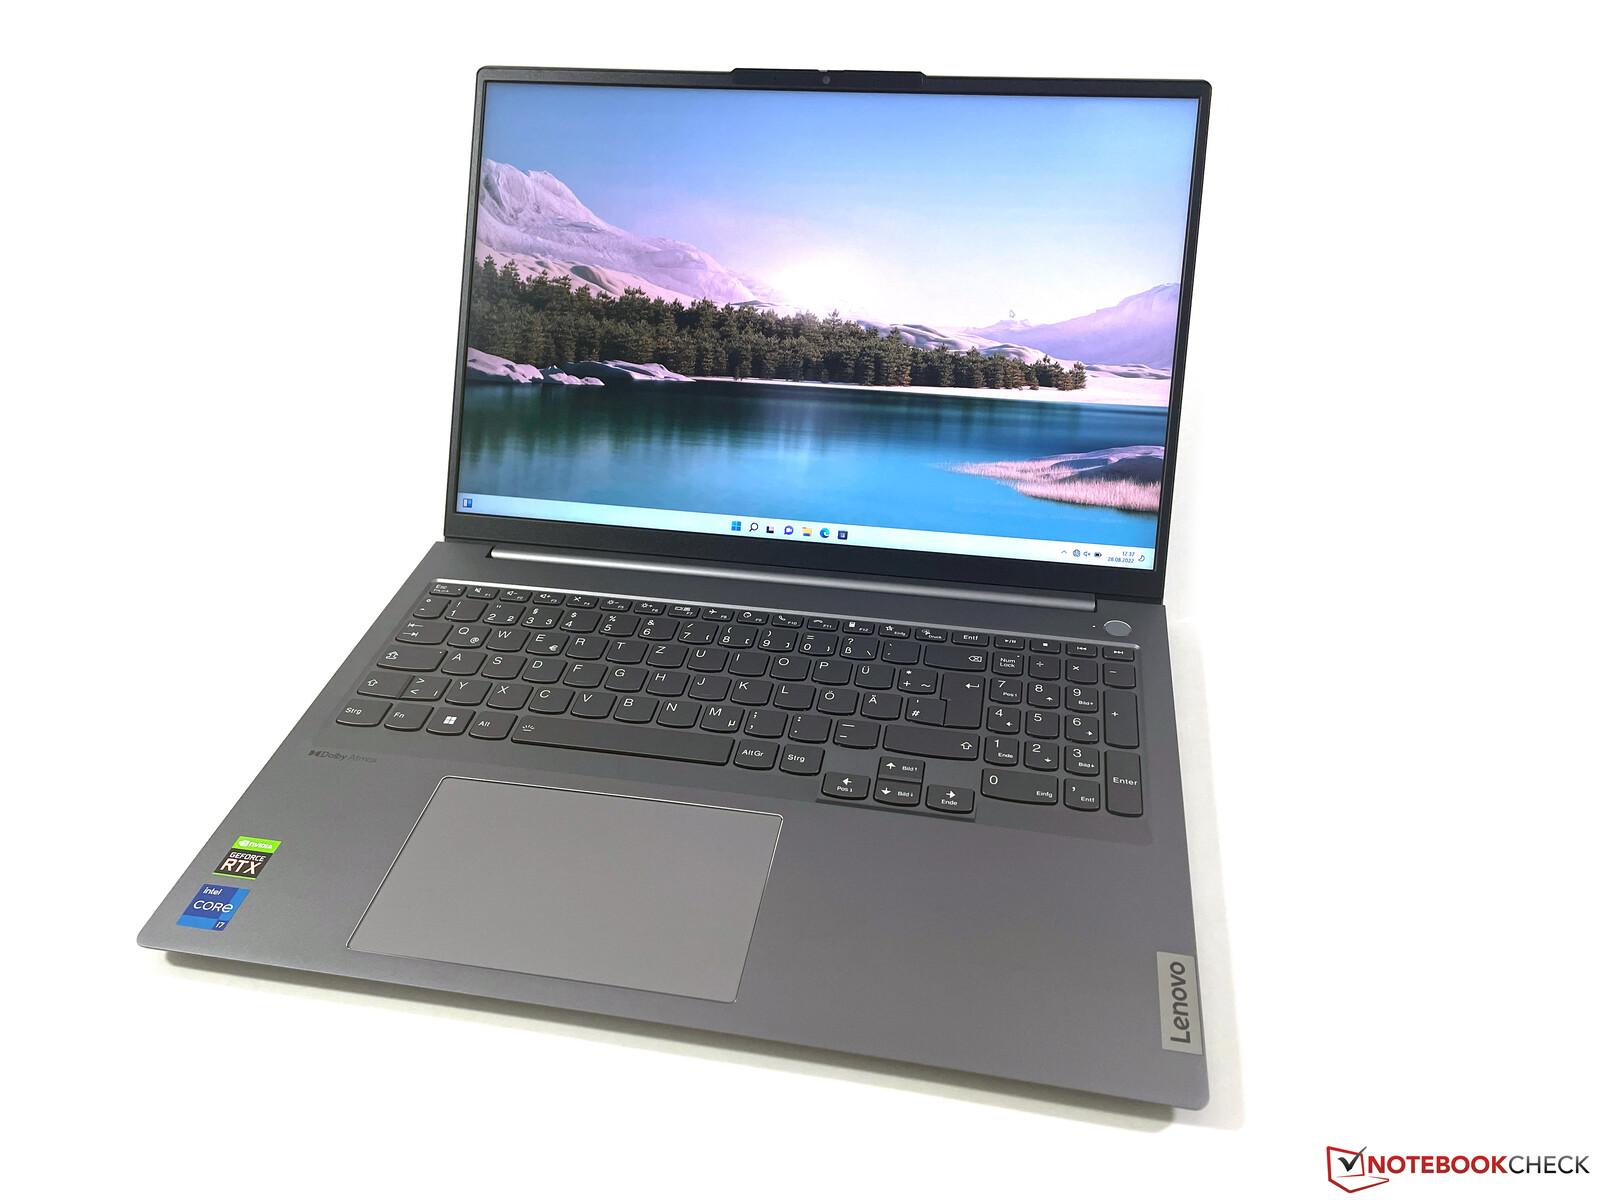
联想ThinkBook 16 G4+评测。优秀的多媒体笔记本电脑,功率大
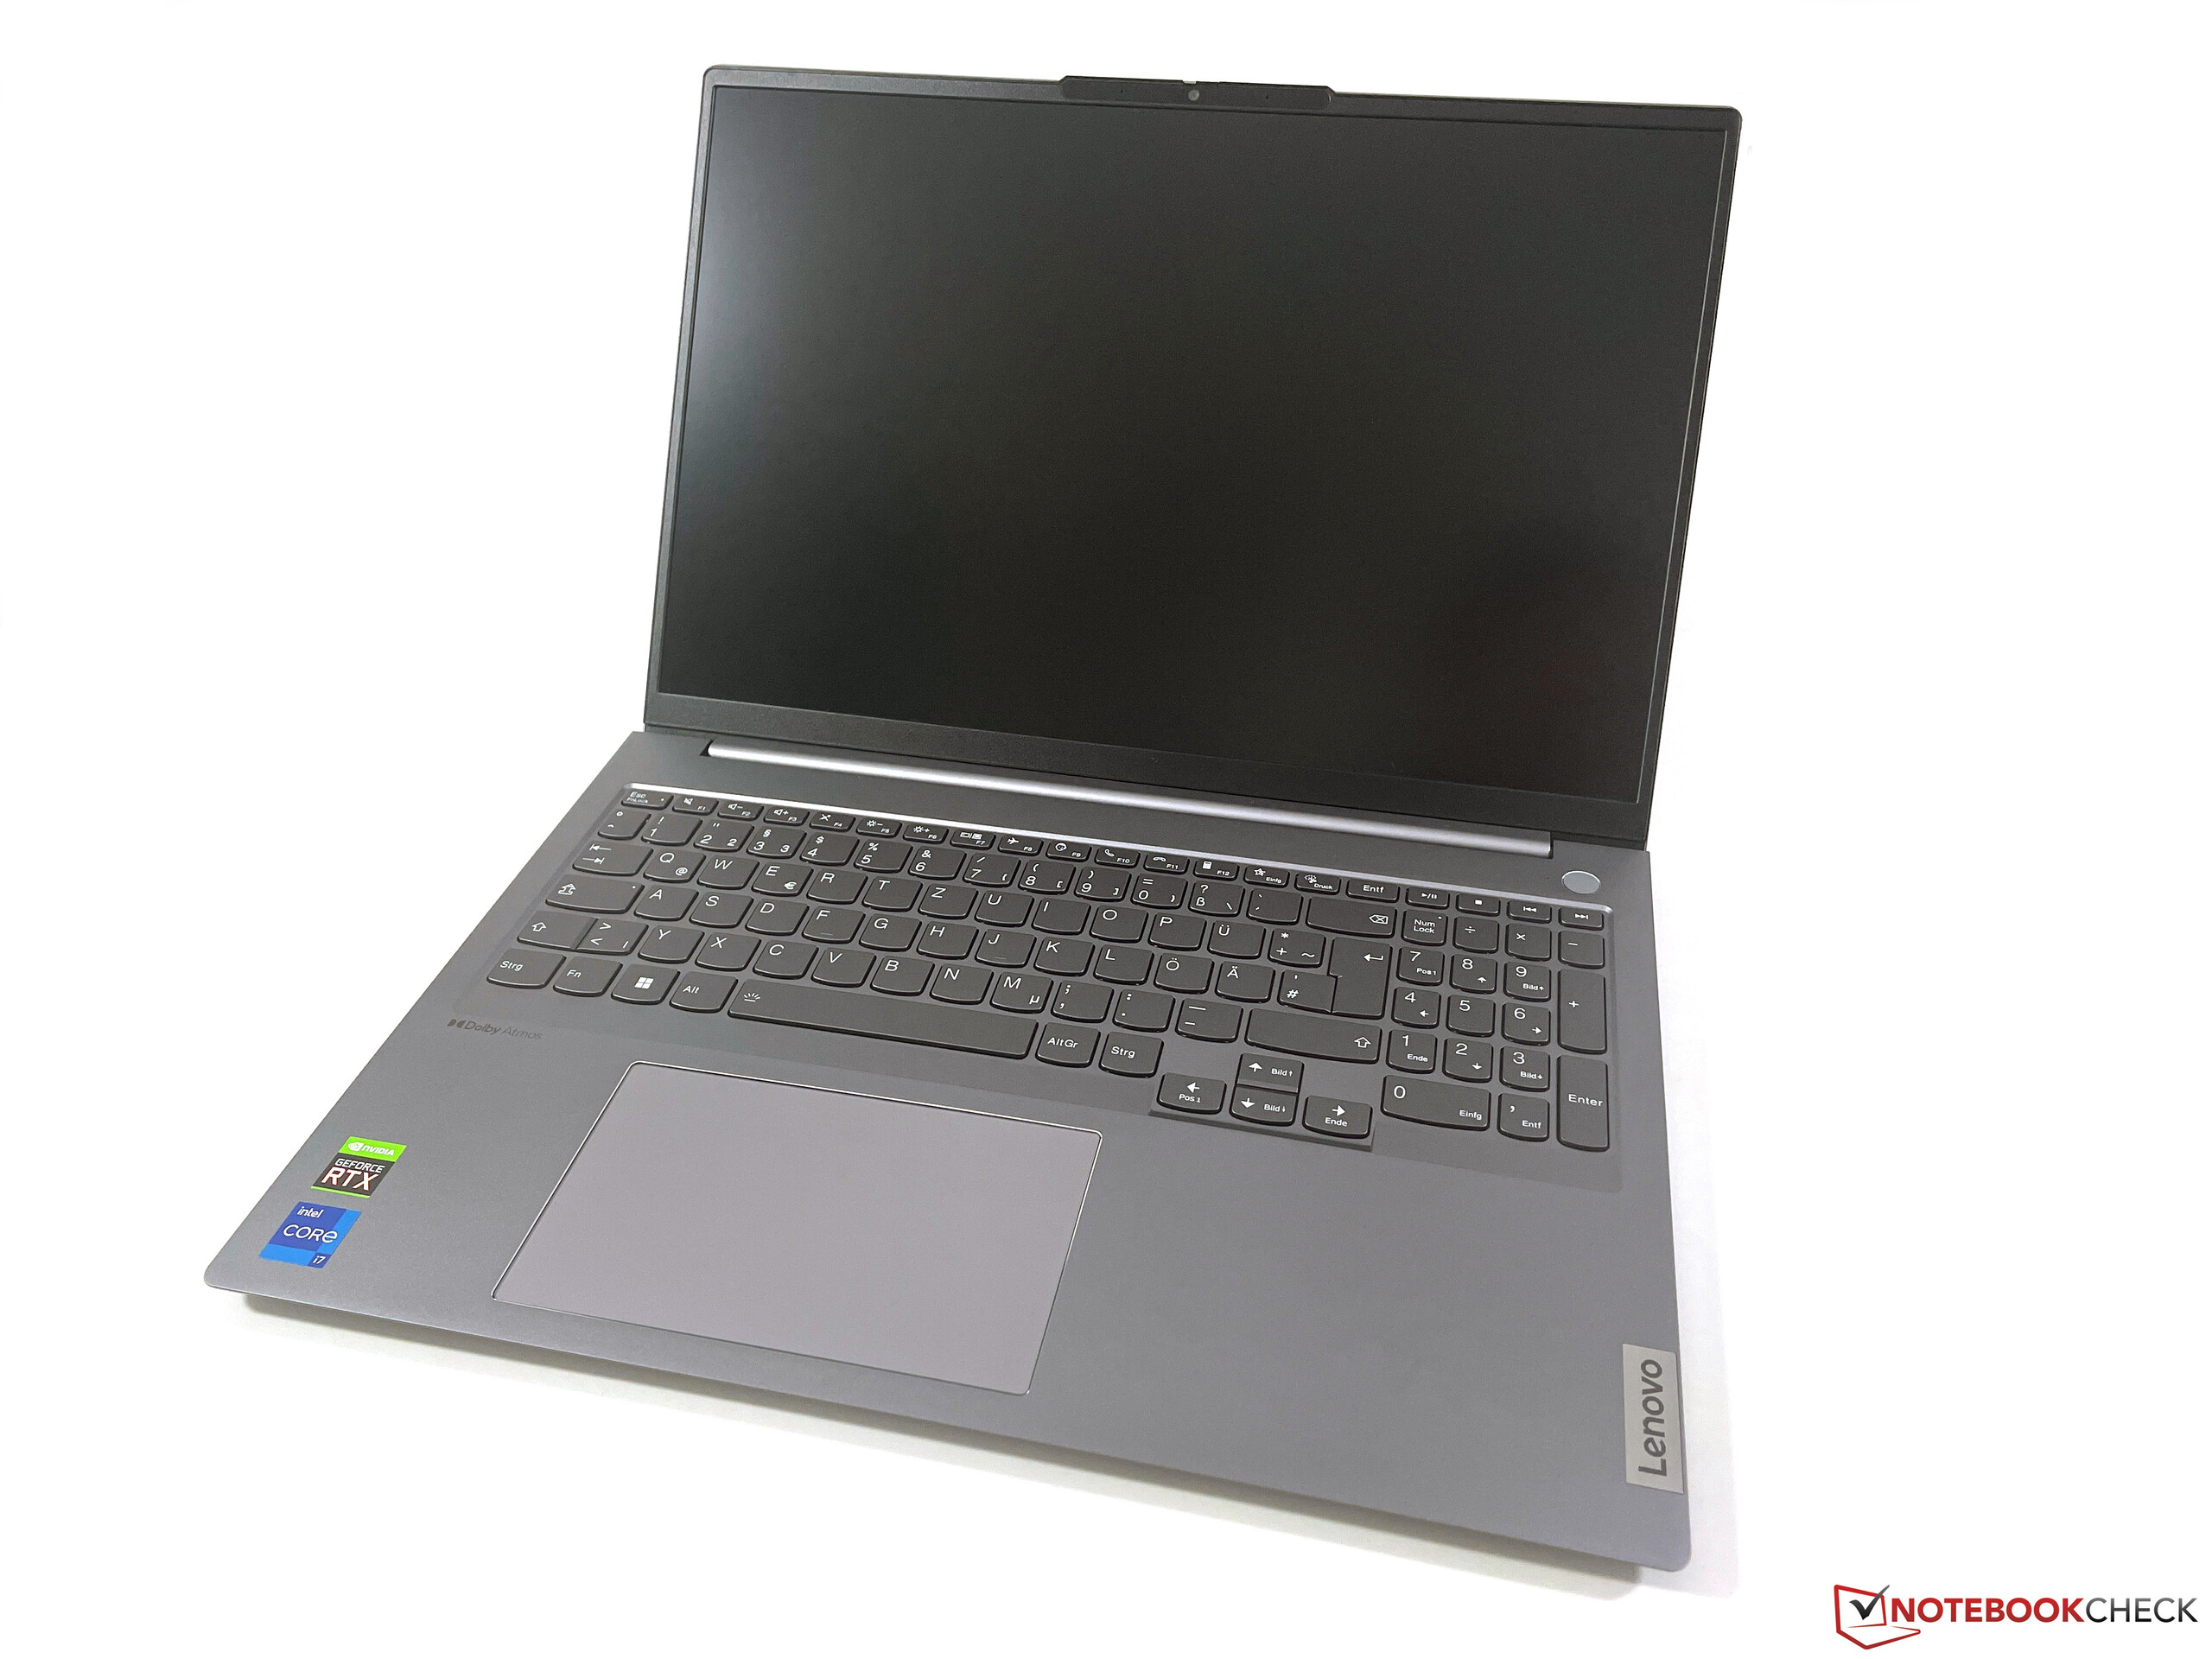
通过ThinkBook 16 G4+,联想推出了一款16英寸多媒体笔记本,拥有强大的组件和大量的现代功能,建议零售价为1200欧元(约合1200美元)。除了最新的英特尔酷睿i7-12700H处理器,还有Nvidia的专用GeForce RTX 2050,以及现代功能,如Thunderbolt 4、Wi-Fi 6E或PCIe 4.0。显示屏是哑光WQHD IPS面板,有一个大的1TB固态硬盘,以及16GB的内存。我们的审查样本是一个没有操作系统的校园模型。
潜在的竞争对手比较
Rating | Date | Model | Weight | Height | Size | Resolution | Price |
|---|---|---|---|---|---|---|---|
| 88.4 % v7 (old) | 09 / 2022 | Lenovo ThinkBook 16 G4+ IAP i7-12700H, GeForce RTX 2050 Mobile | 1.8 kg | 16.5 mm | 16.00" | 2560x1600 | |
| 87.4 % v7 (old) | 08 / 2022 | Dell Inspiron 16 Plus 7620 i7-12700H, GeForce RTX 3050 Ti Laptop GPU | 2.1 kg | 18.99 mm | 16.00" | 3072x1920 | |
| 86.2 % v7 (old) | 07 / 2022 | Acer Swift X SFX16-51G-5388 i5-11320H, GeForce RTX 3050 4GB Laptop GPU | 1.8 kg | 18.9 mm | 16.10" | 1920x1080 | |
v (old) | 12 / 2021 | Asus Vivobook Pro 16X-M7600QE R9 5900HX, GeForce RTX 3050 Ti Laptop GPU | 1.9 kg | 19 mm | 16.10" | 3840x2400 | |
| 83.6 % v7 (old) | 07 / 2022 | Huawei MateBook D 16 2022 i7-12700H, Iris Xe G7 96EUs | 1.7 kg | 18.4 mm | 16.00" | 1920x1200 | |
| 79.8 % v7 (old) | 08 / 2022 | Samsung Galaxy Book2 15 i7-1260P, A350M | 1.6 kg | 15 mm | 15.60" | 1920x1080 |
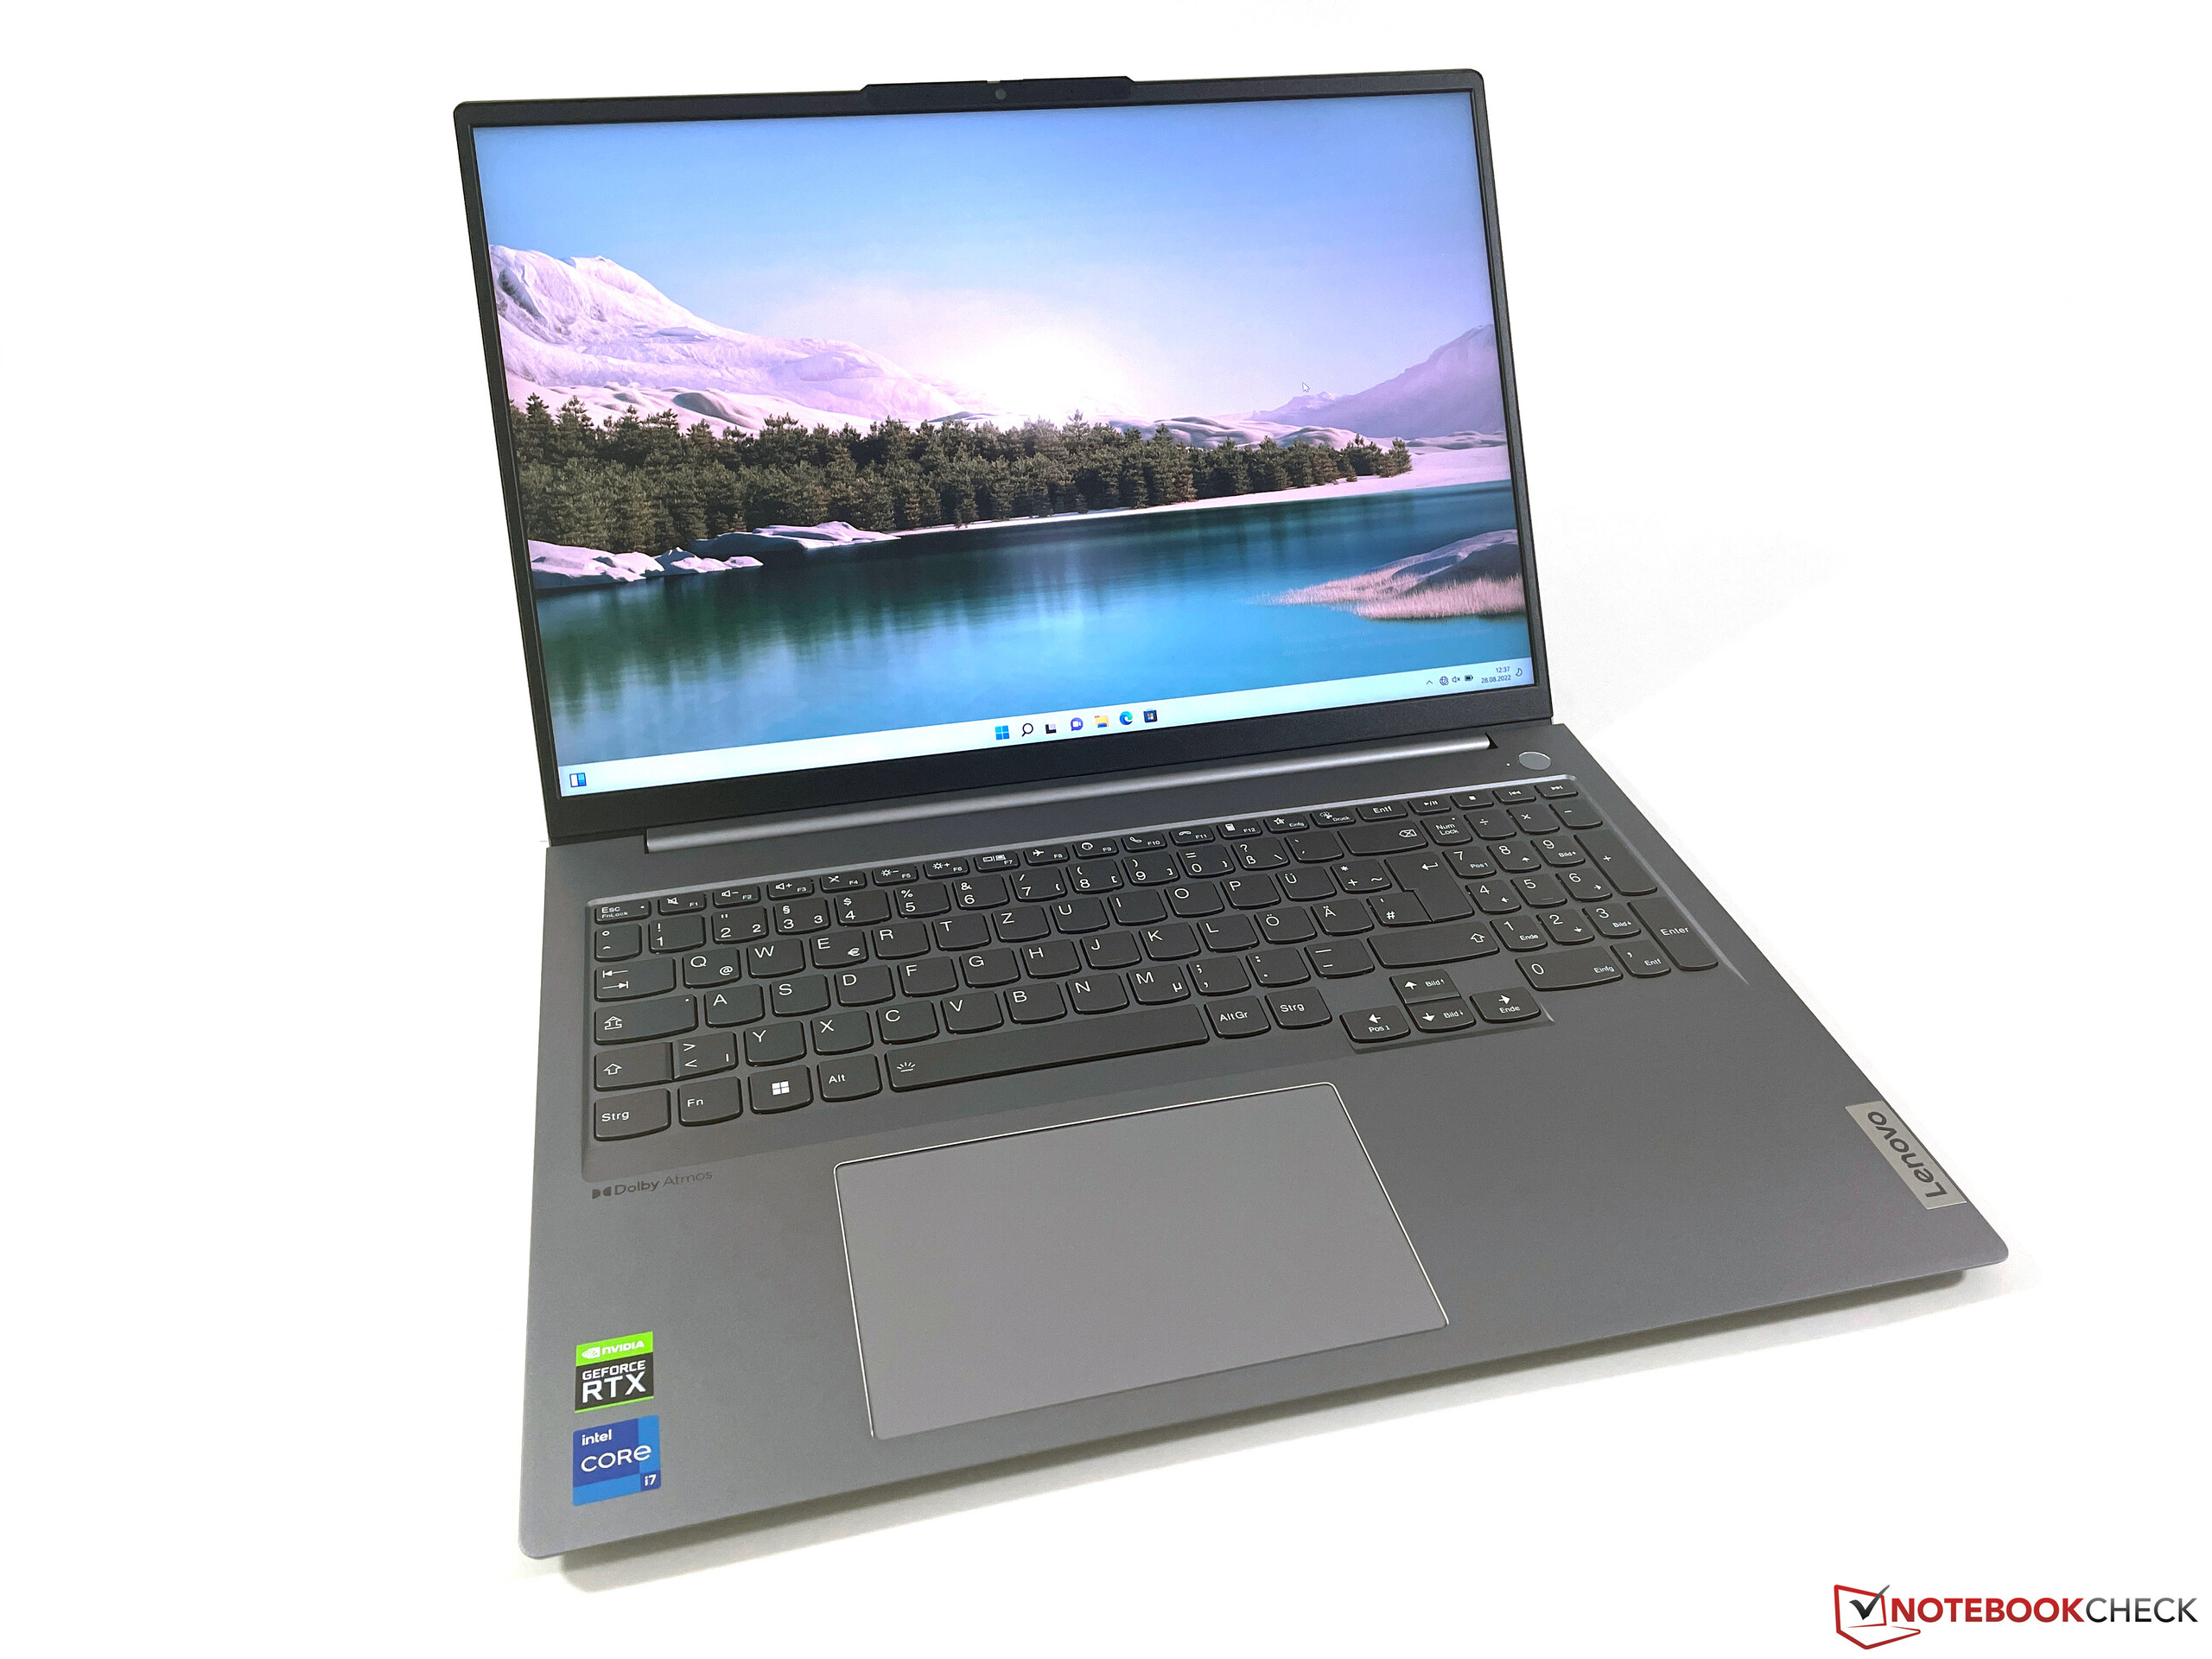
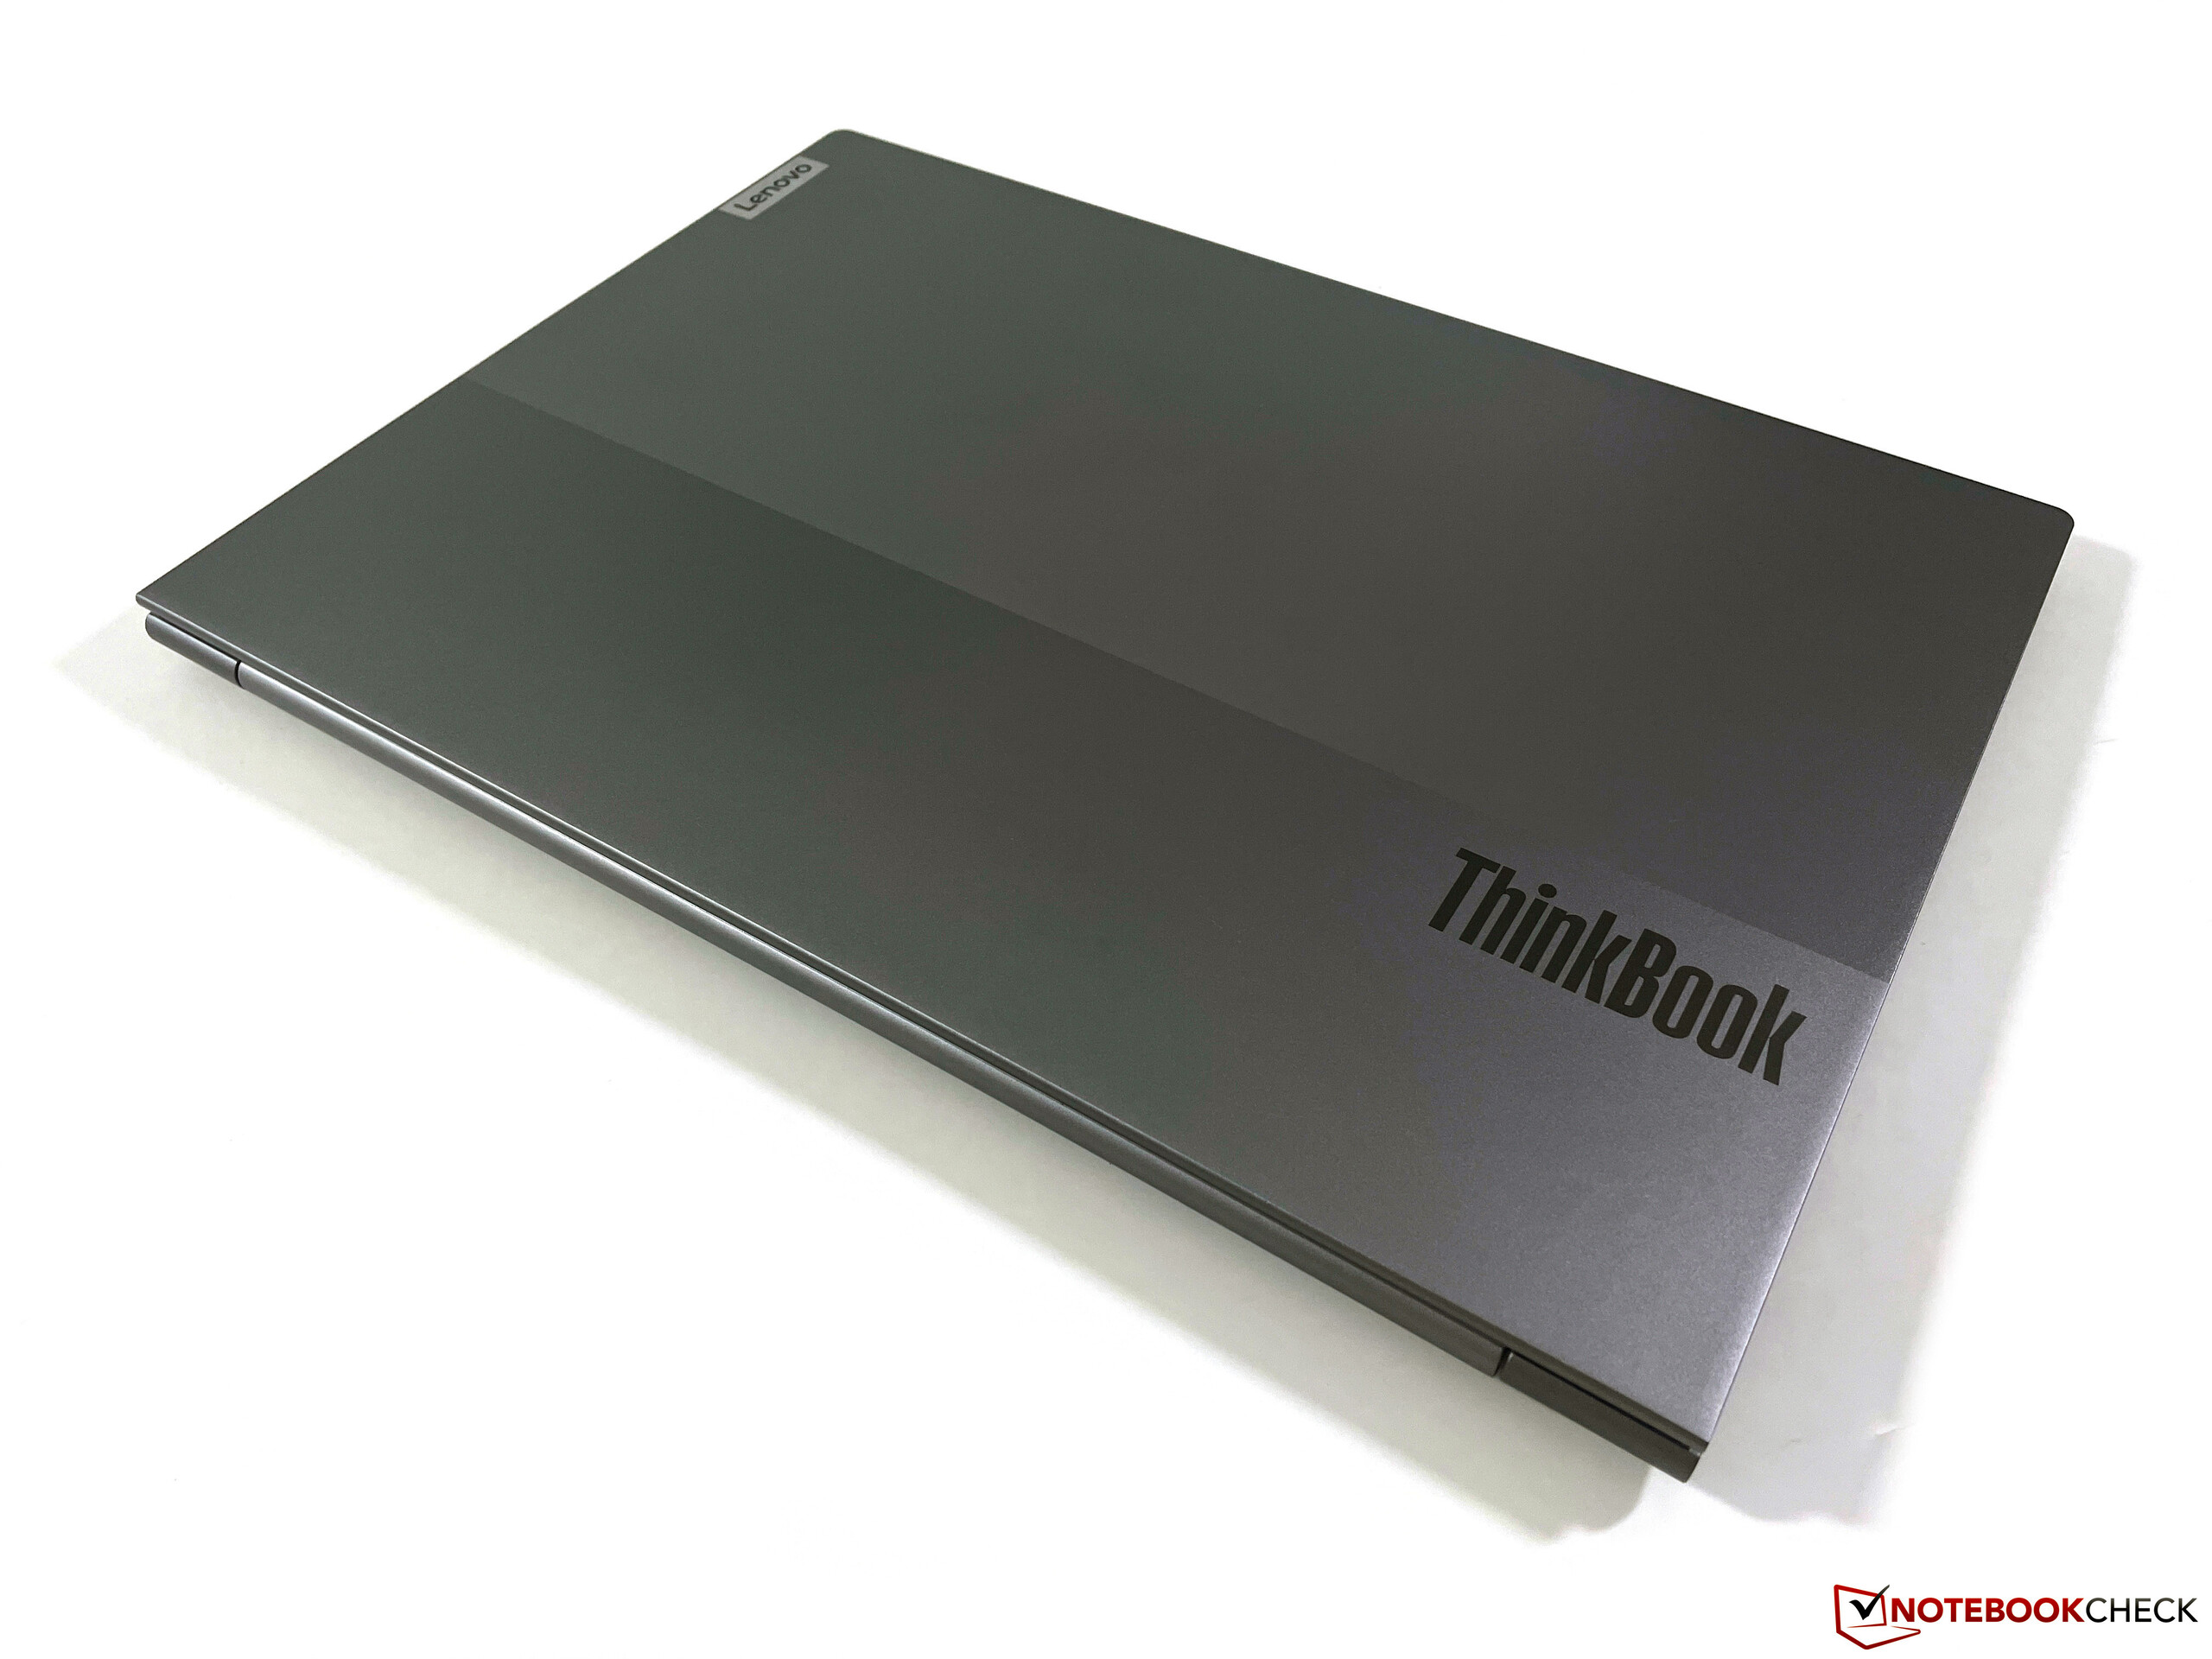
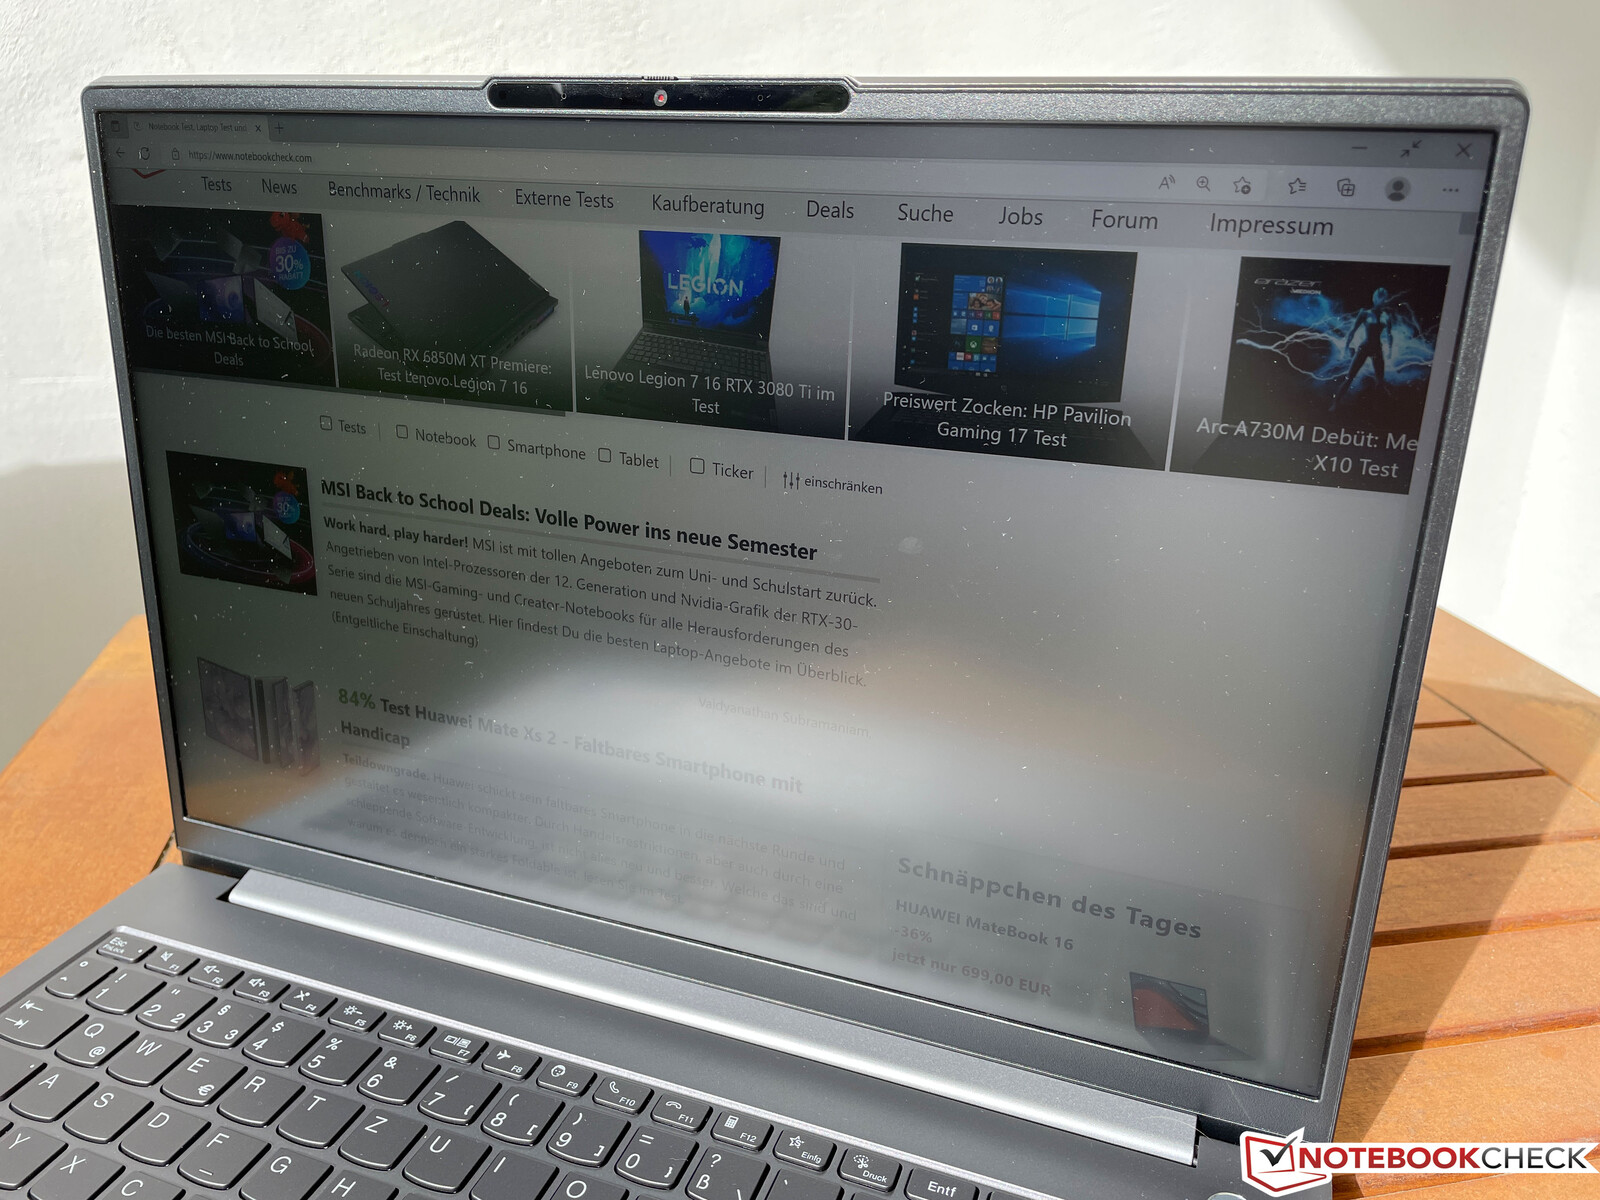
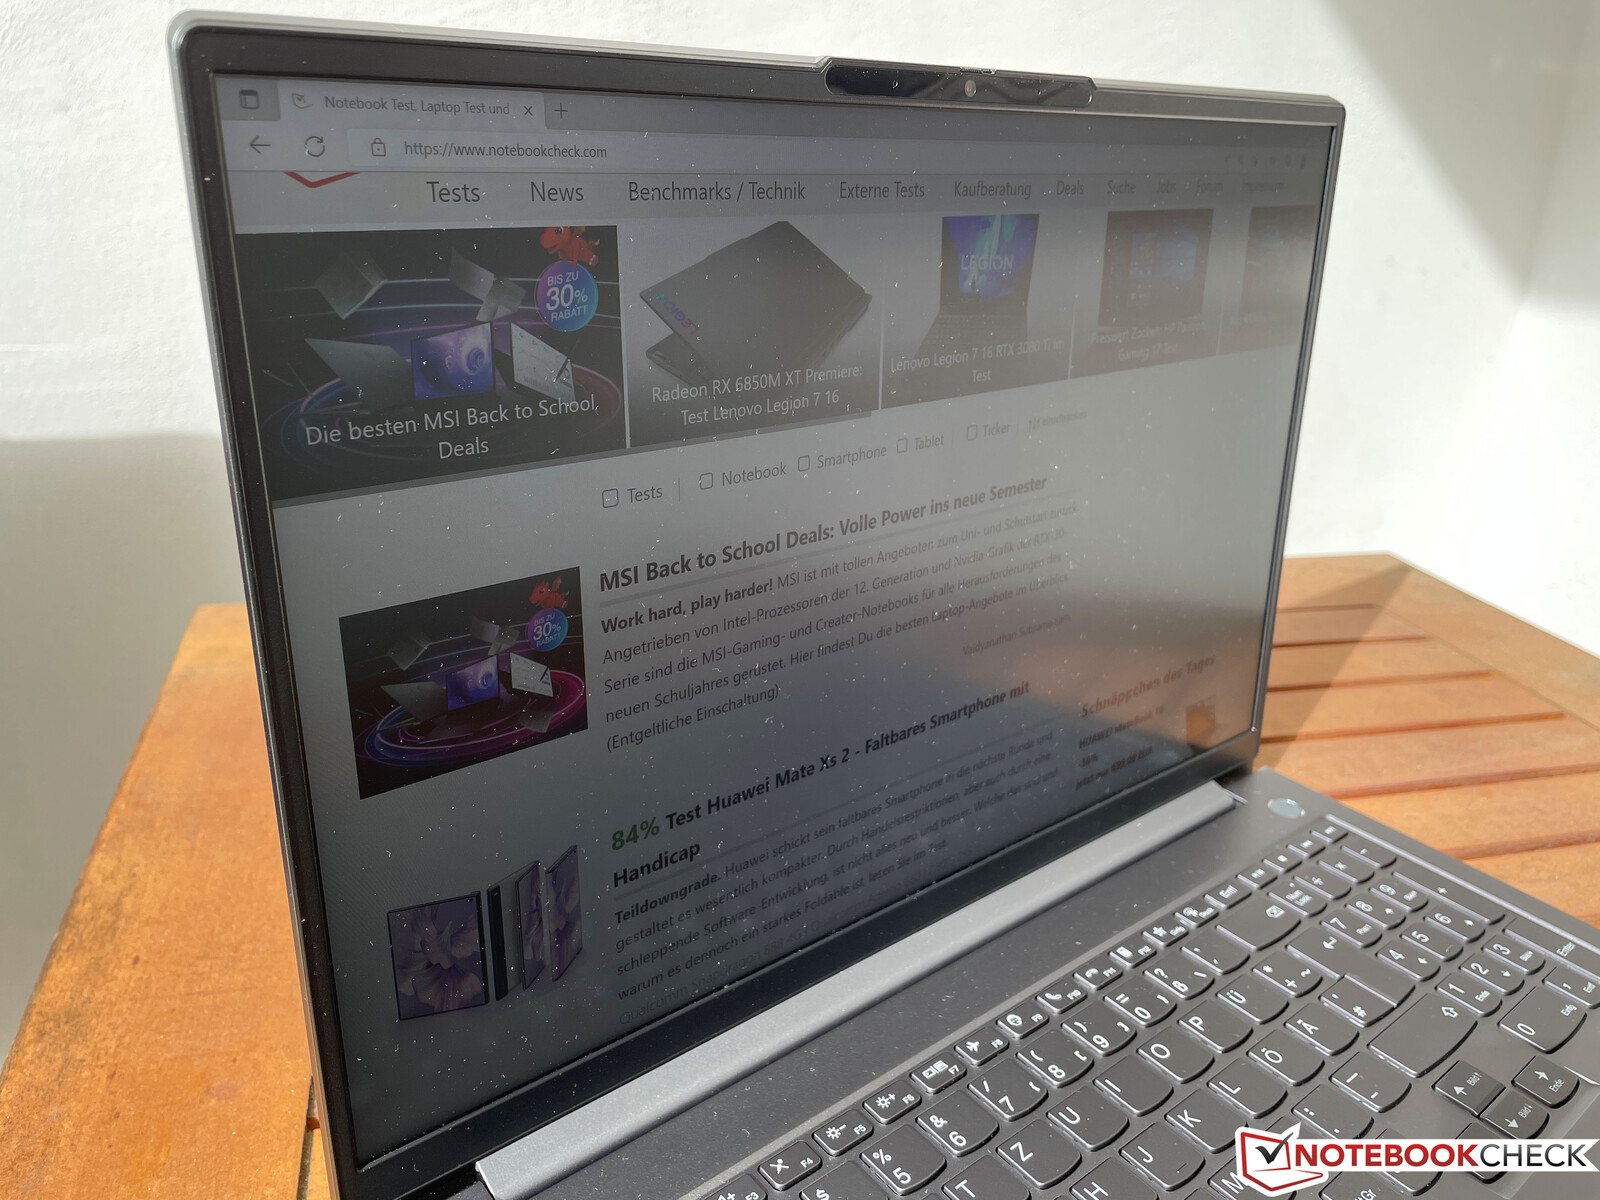
外壳 - 联想使用了铝材
联想主要使用铝制外壳(即盖子和底座单元),表面经过喷砂以及阳极氧化处理。光滑的表面让人感觉很舒服,并传达出高质量的印象。指纹可以比较快地被看到,但也可以很容易地被去除。在视觉上,银色的外壳看起来很优雅,很适合专业环境。唯一的视觉亮点是具有两种不同灰色调的双色显示屏盖子。
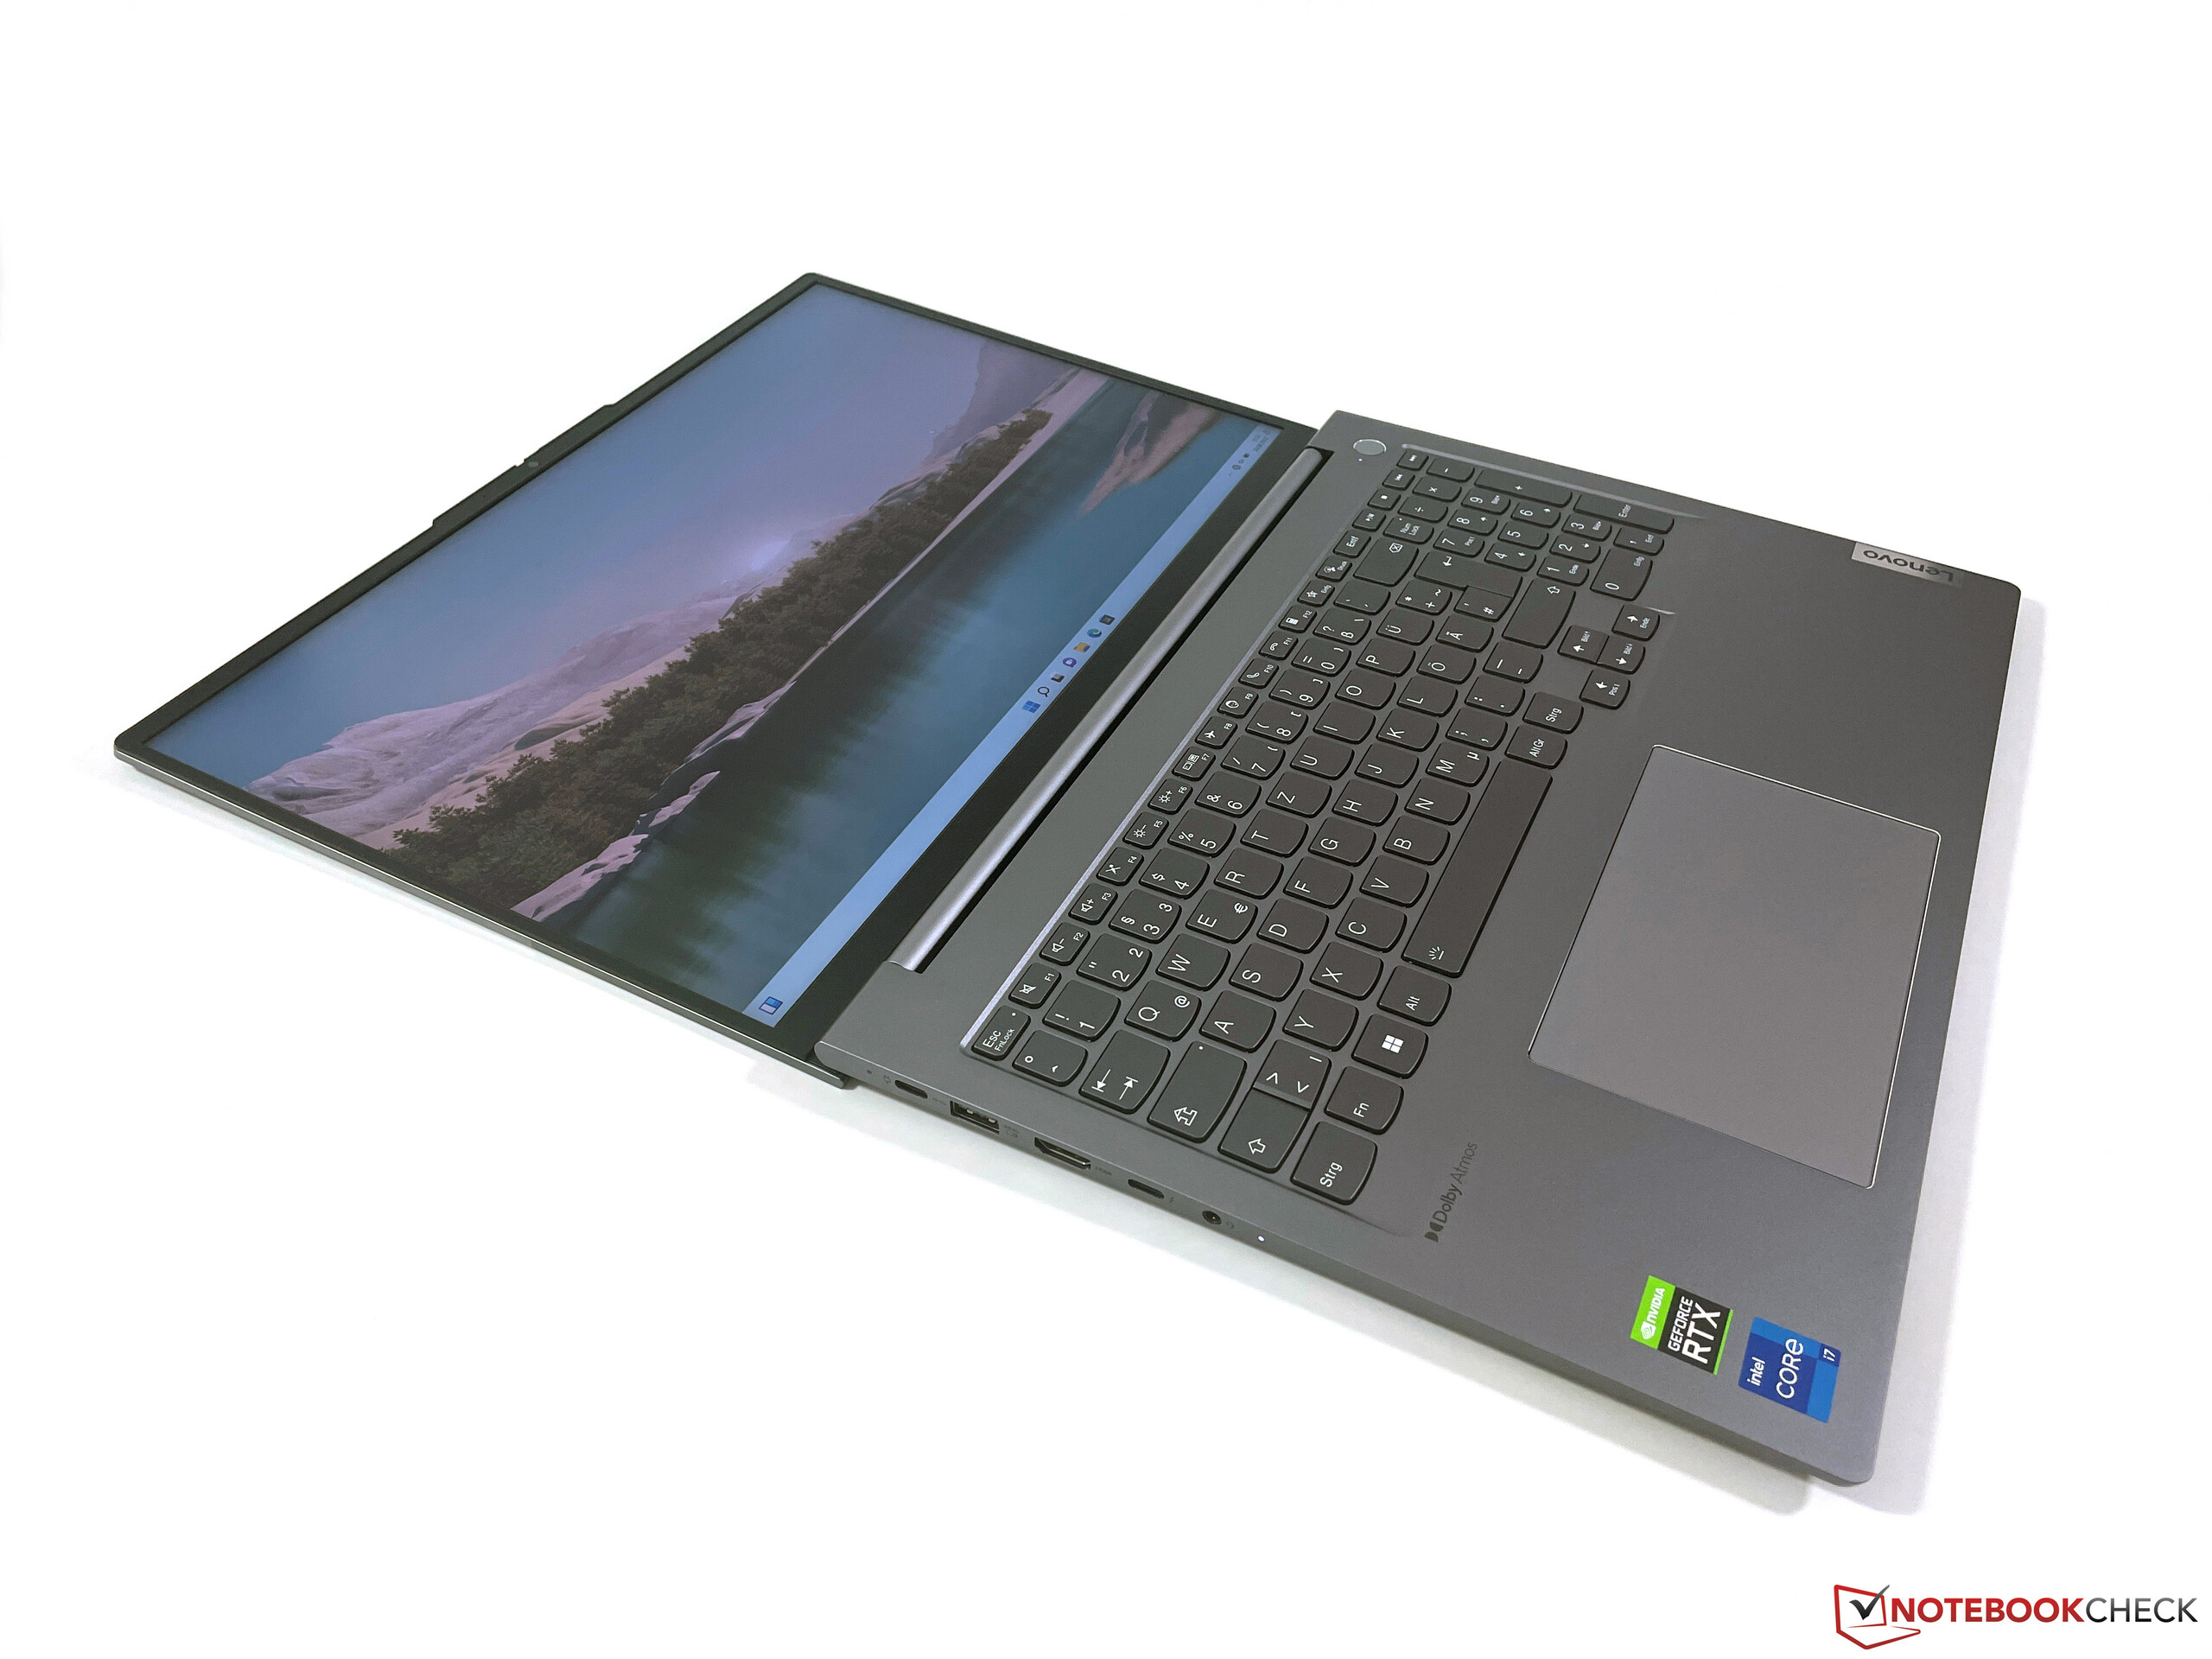
在做工方面,ThinkBook从根本上给人以良好的印象,但仍有改进的余地。我们能够从底座上引出安静的吱吱声,键盘区也能被压住。显示屏盖被证明是比较稳定的--我们无法带来任何图像错误,但是当打开的角度改变时,显示屏明显摇晃。最大的180度是可能的,铰链调整得很好,因为单手打开没有问题。
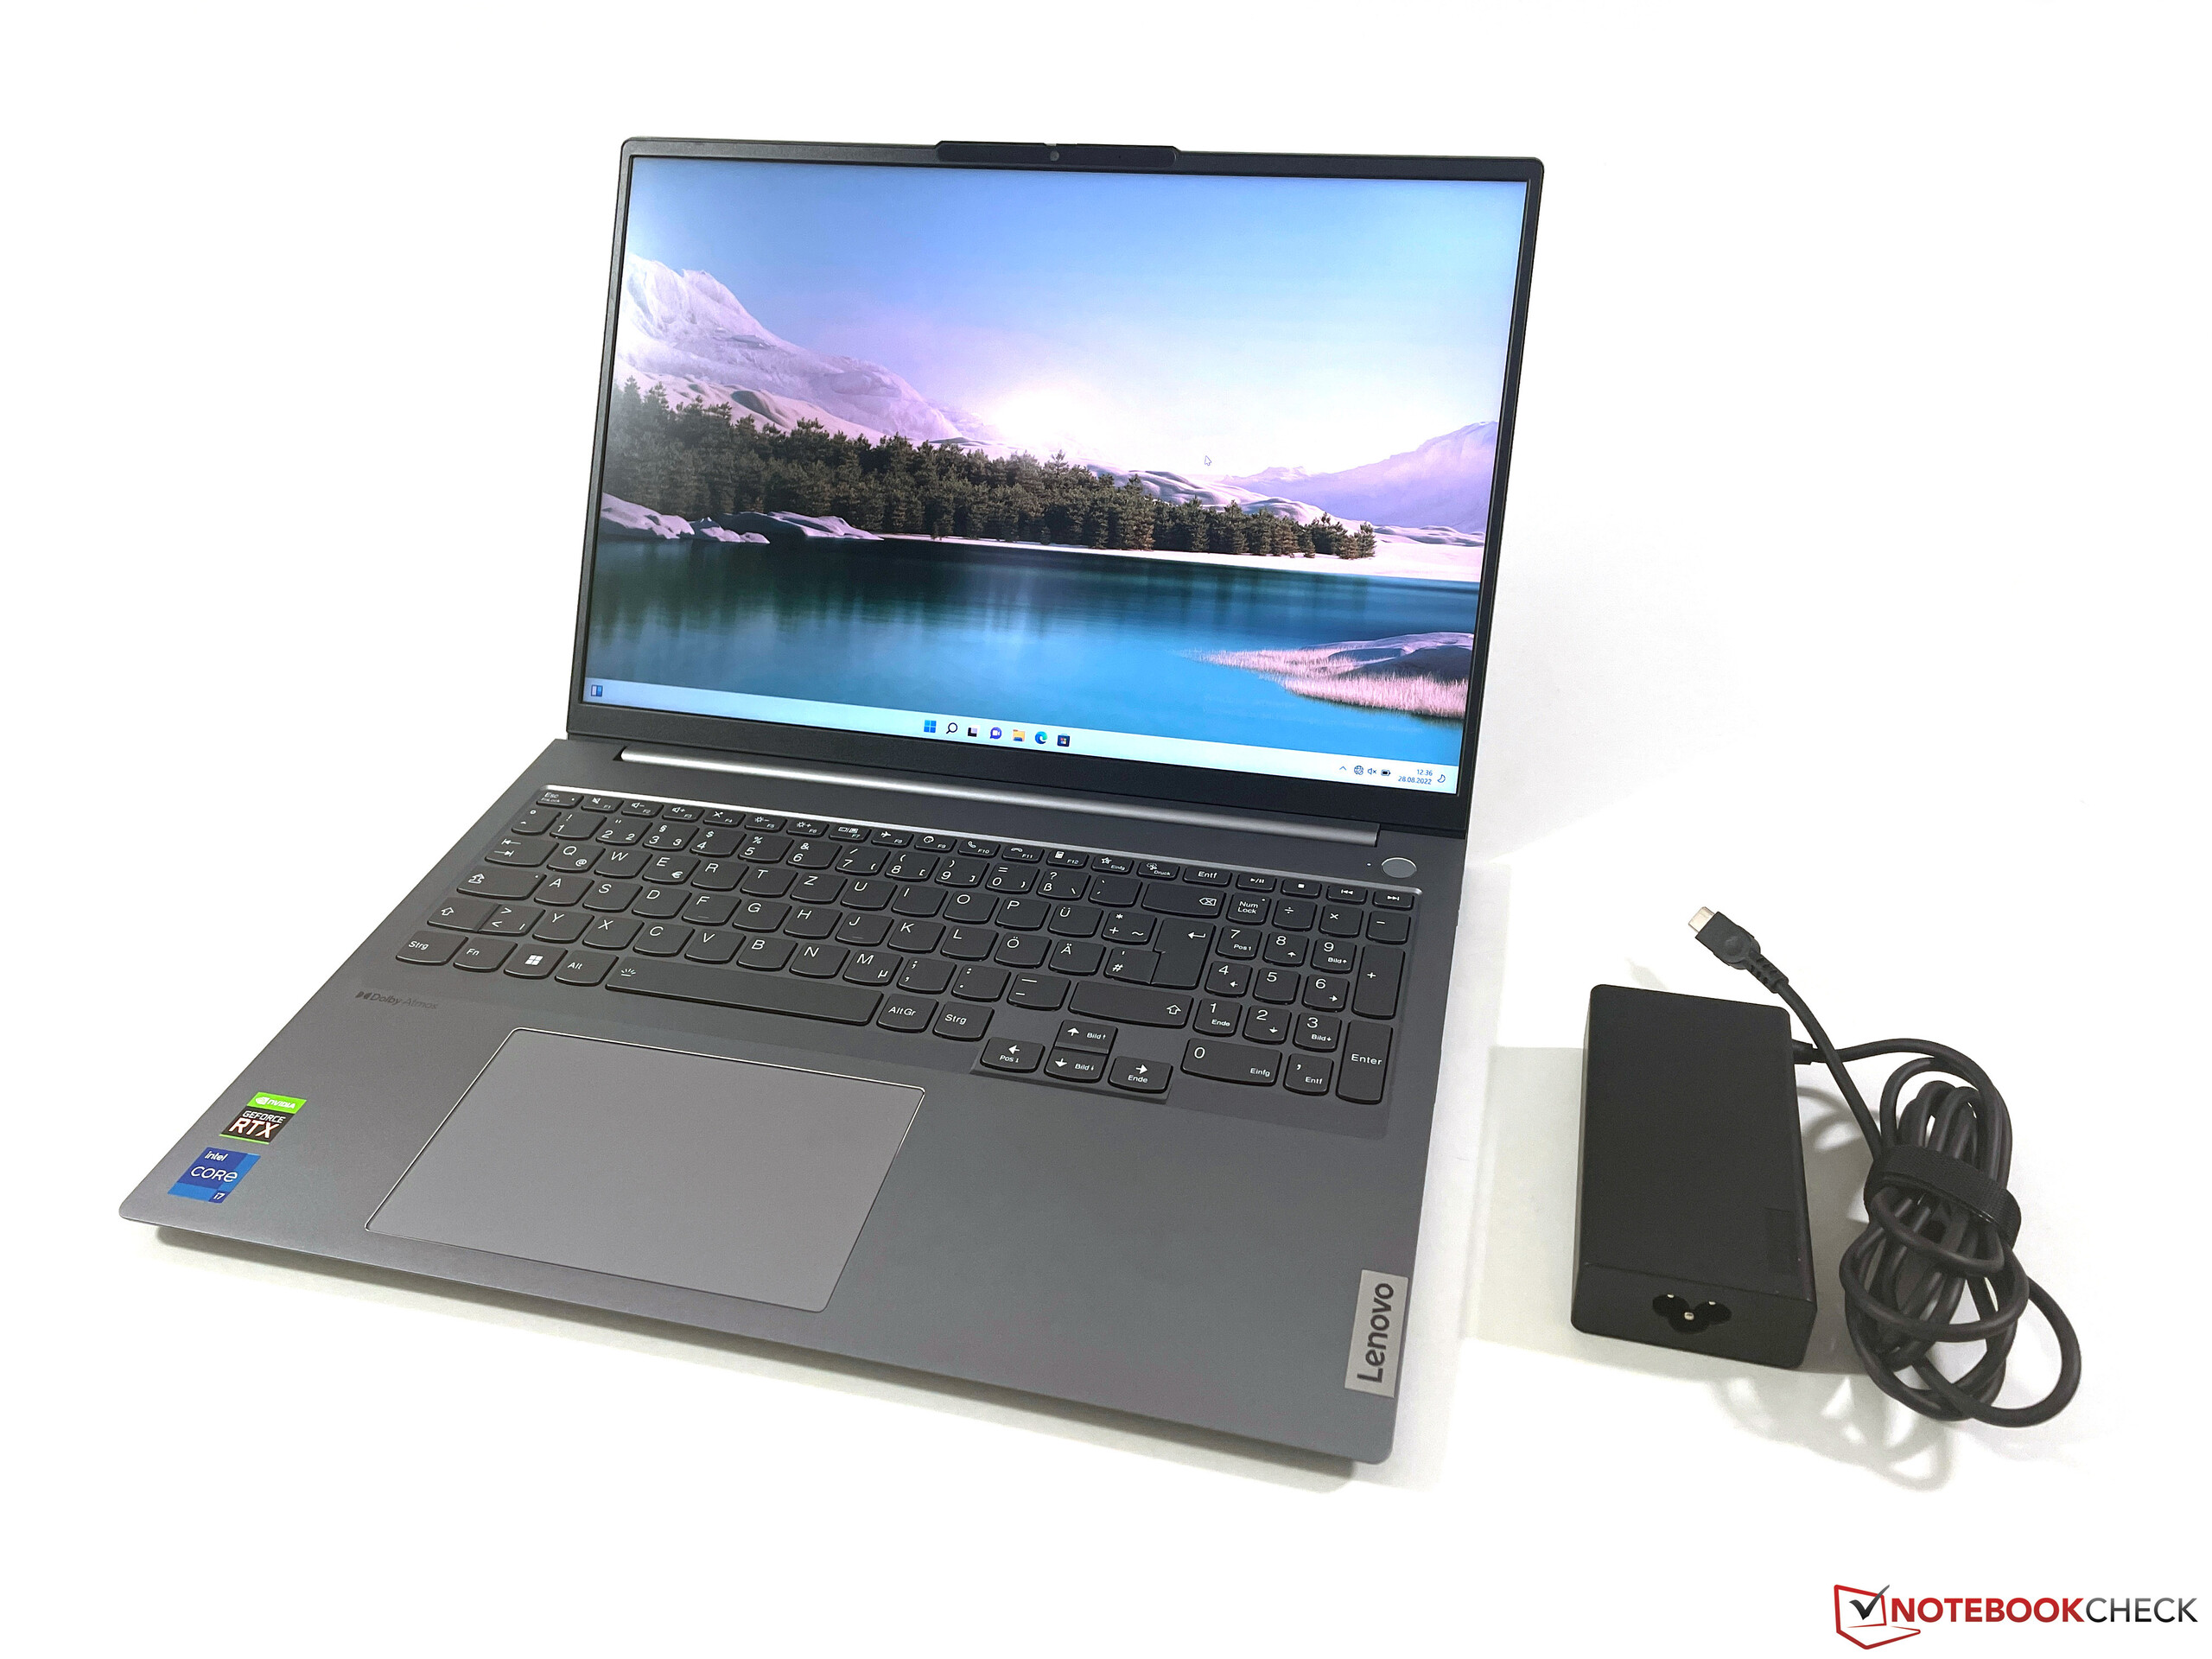

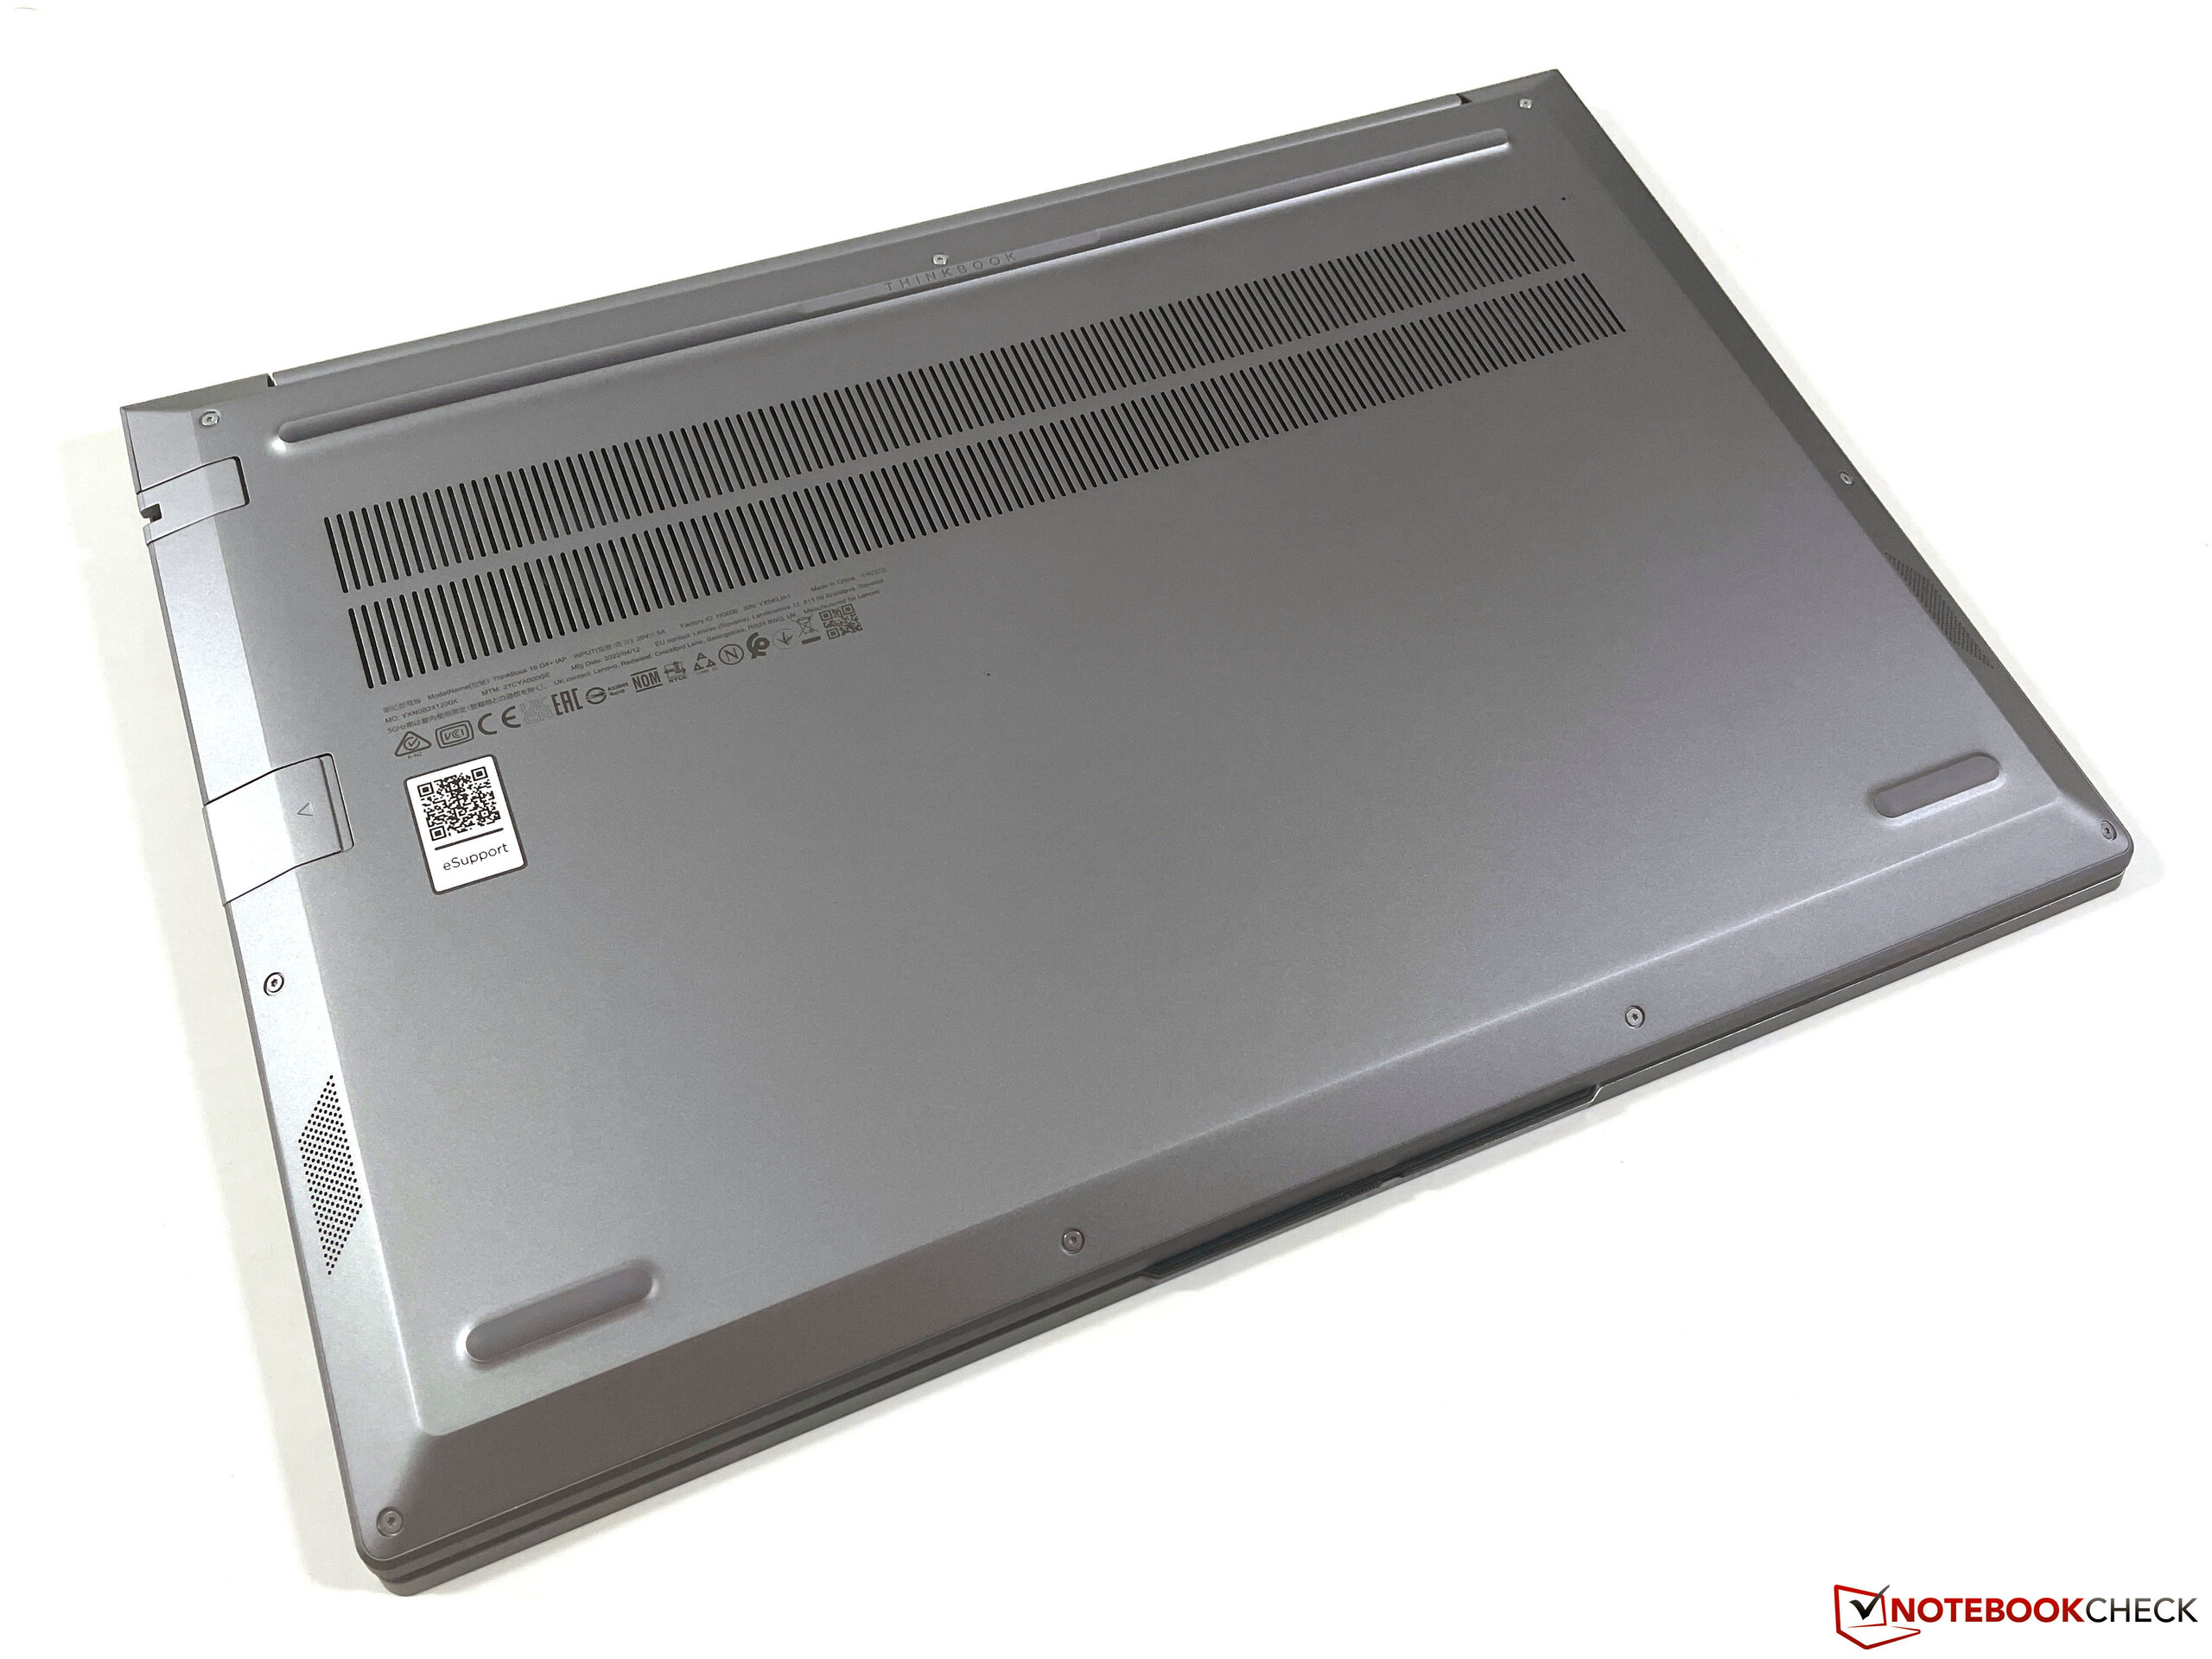
除了Acer Swift X,对比领域中的16英寸设备在尺寸上非常相似。然而,ThinkBook比大多数对手要薄一些,只有1.65厘米。重量为1.82公斤,不包括电源适配器的额外400克。
设备 - 带有Thunderbolt 4的ThinkBook
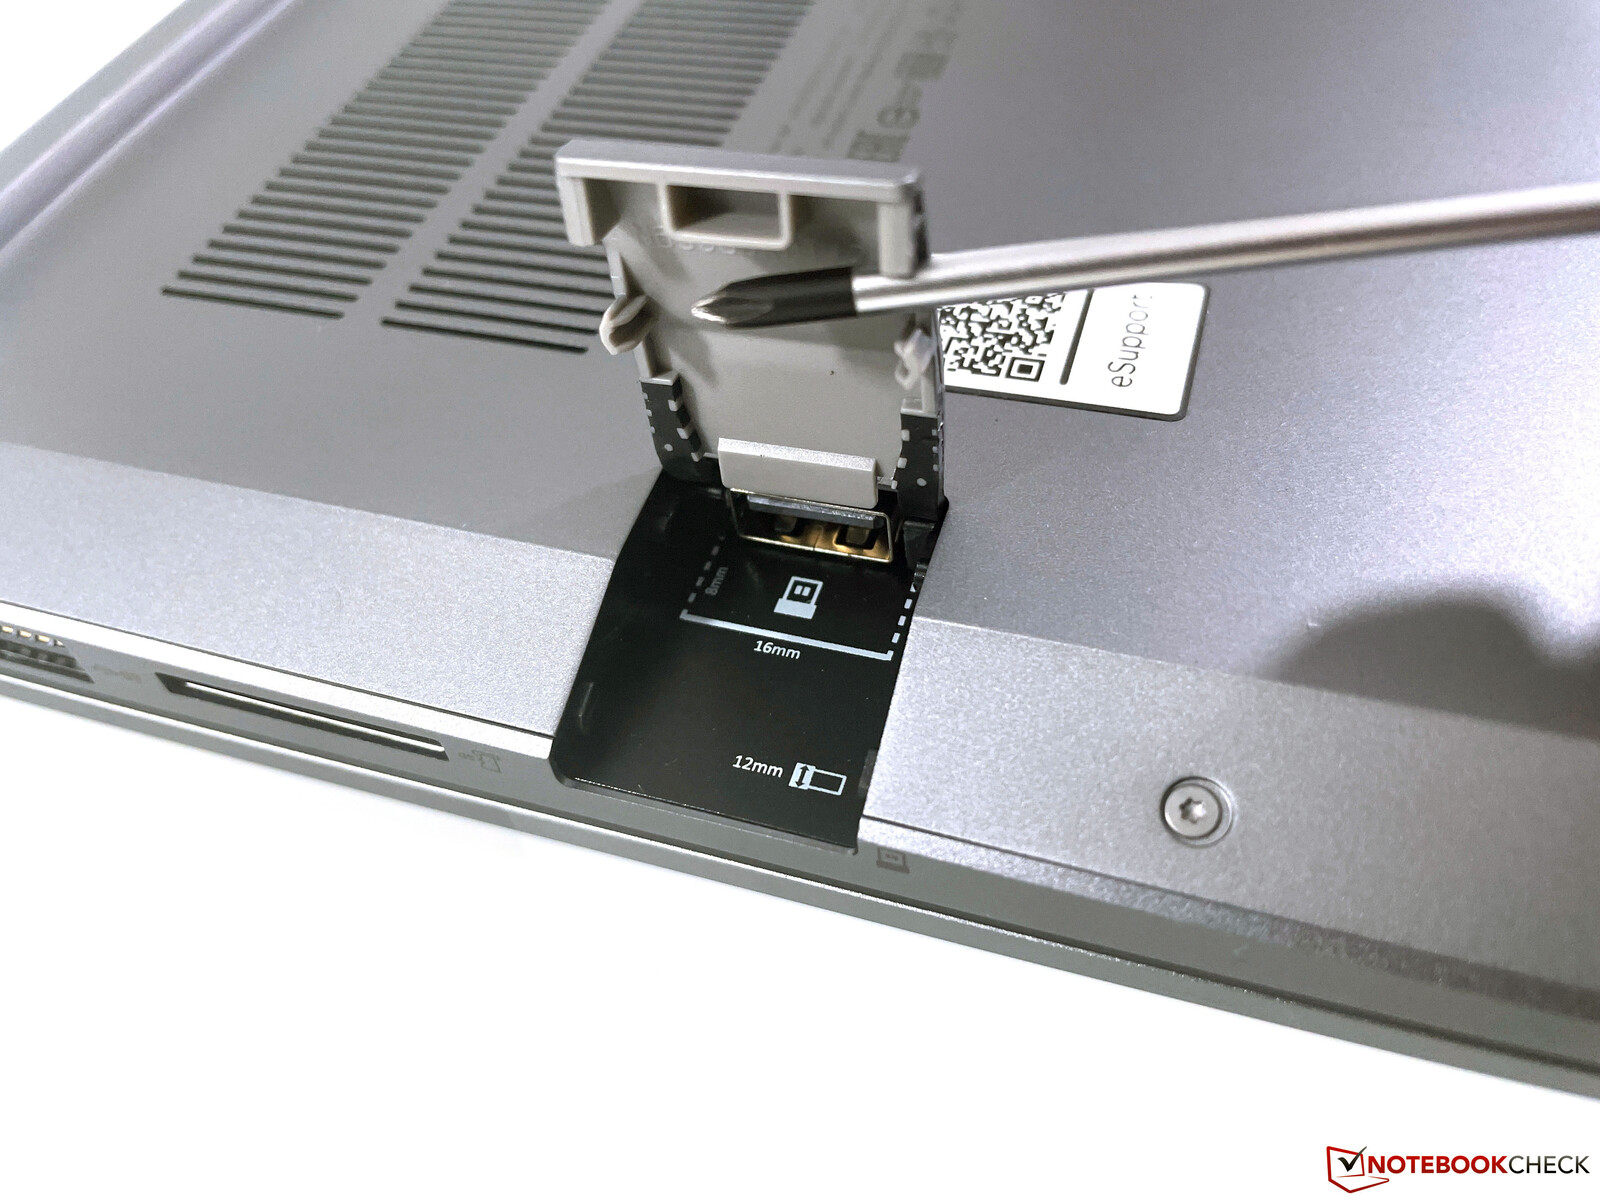
ThinkBook 16 G4+几乎提供了你所需要的所有端口。除了一个现代的Thunderbolt 4端口外,还有常规的USB-A端口、一个成熟的HDMI输出和一个千兆以太网端口。甚至在右侧的挡板下还有一个隐藏的USB端口,它只符合2.0标准,但对于永久连接的电子狗,如外部输入设备来说是完美的。
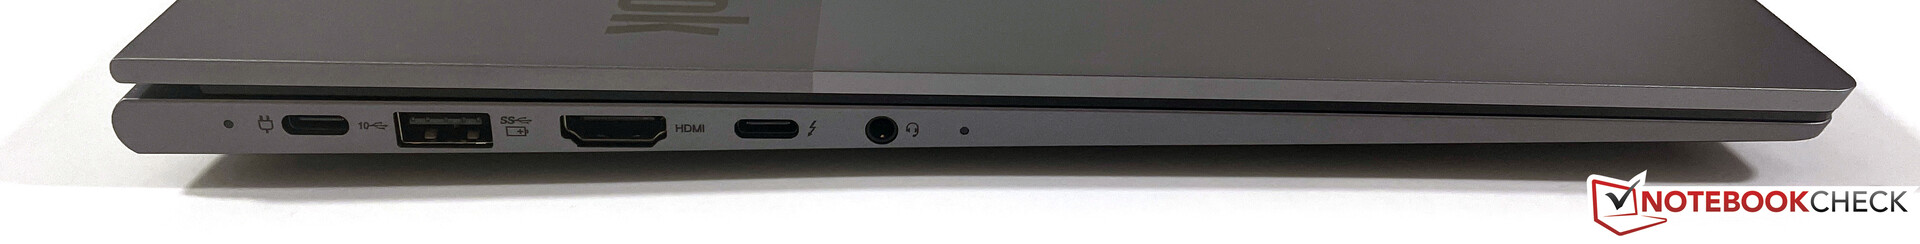
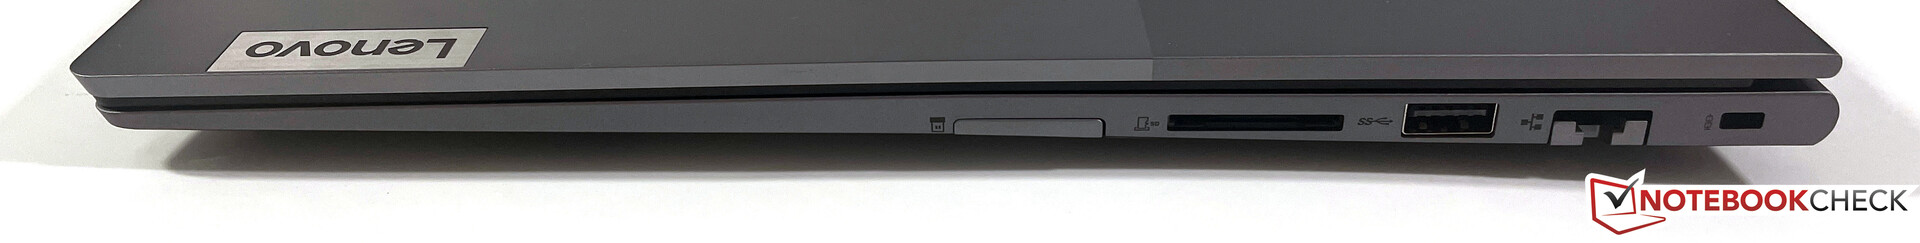
SD卡阅读器
右侧有一个SD读卡器,不能完全容纳存储卡(它们突出了约2厘米)。我们通过参考卡(Angelbird AV Pro V60 UHS-II)测得的传输速率几乎达到90MB/s,这使ThinkBook领先于那些读卡器只能通过USB 2.0功能的竞争对手。
| SD Card Reader | |
| average JPG Copy Test (av. of 3 runs) | |
| Average of class Multimedia (23 - 531, n=36, last 2 years) | |
| Lenovo ThinkBook 16 G4+ IAP (Angelbird AV Pro V60) | |
| Asus Vivobook Pro 16X-M7600QE (AV Pro SD microSD 128 GB V60) | |
| Dell Inspiron 16 Plus 7620 (Toshiba Exceria Pro SDXC 64 GB UHS-II) | |
| Samsung Galaxy Book2 15 (Angelbird AV Pro V60) | |
| maximum AS SSD Seq Read Test (1GB) | |
| Average of class Multimedia (37.3 - 1455, n=35, last 2 years) | |
| Lenovo ThinkBook 16 G4+ IAP (Angelbird AV Pro V60) | |
| Asus Vivobook Pro 16X-M7600QE (AV Pro SD microSD 128 GB V60) | |
| Dell Inspiron 16 Plus 7620 (Toshiba Exceria Pro SDXC 64 GB UHS-II) | |
| Samsung Galaxy Book2 15 (Angelbird AV Pro V60) | |
沟通
除了千兆以太网模块(英特尔I219-V),联想还安装了非常现代的英特尔AX211E Wi-Fi 6E模块,理论上支持最新的6GHz网络。然而,我们无法连接到华硕的参考路由器的6GHz网络。然而,在5GHz网络上的传输速率非常高而且稳定,这就是为什么在实践中没有真正的限制。
网络摄像头
ThinkBook提供了一个带有机械快门的1080p网络摄像头,比以前的720p模块提供更好的图像。此外,还有一个红外摄像头,用于通过Windows Hello进行人脸识别。


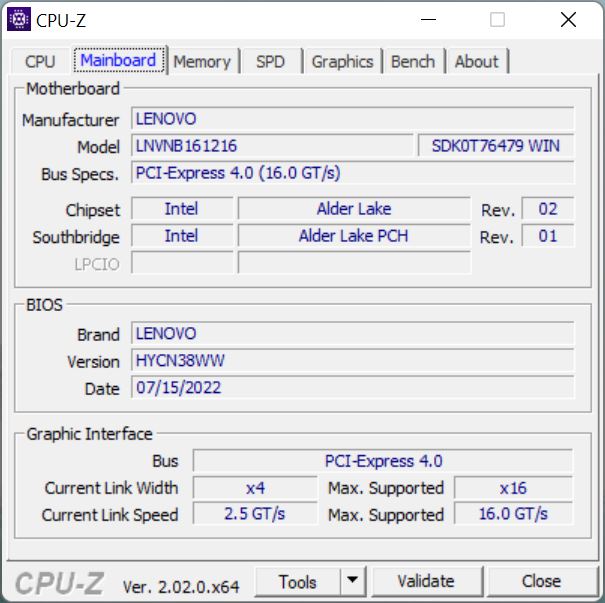
维护
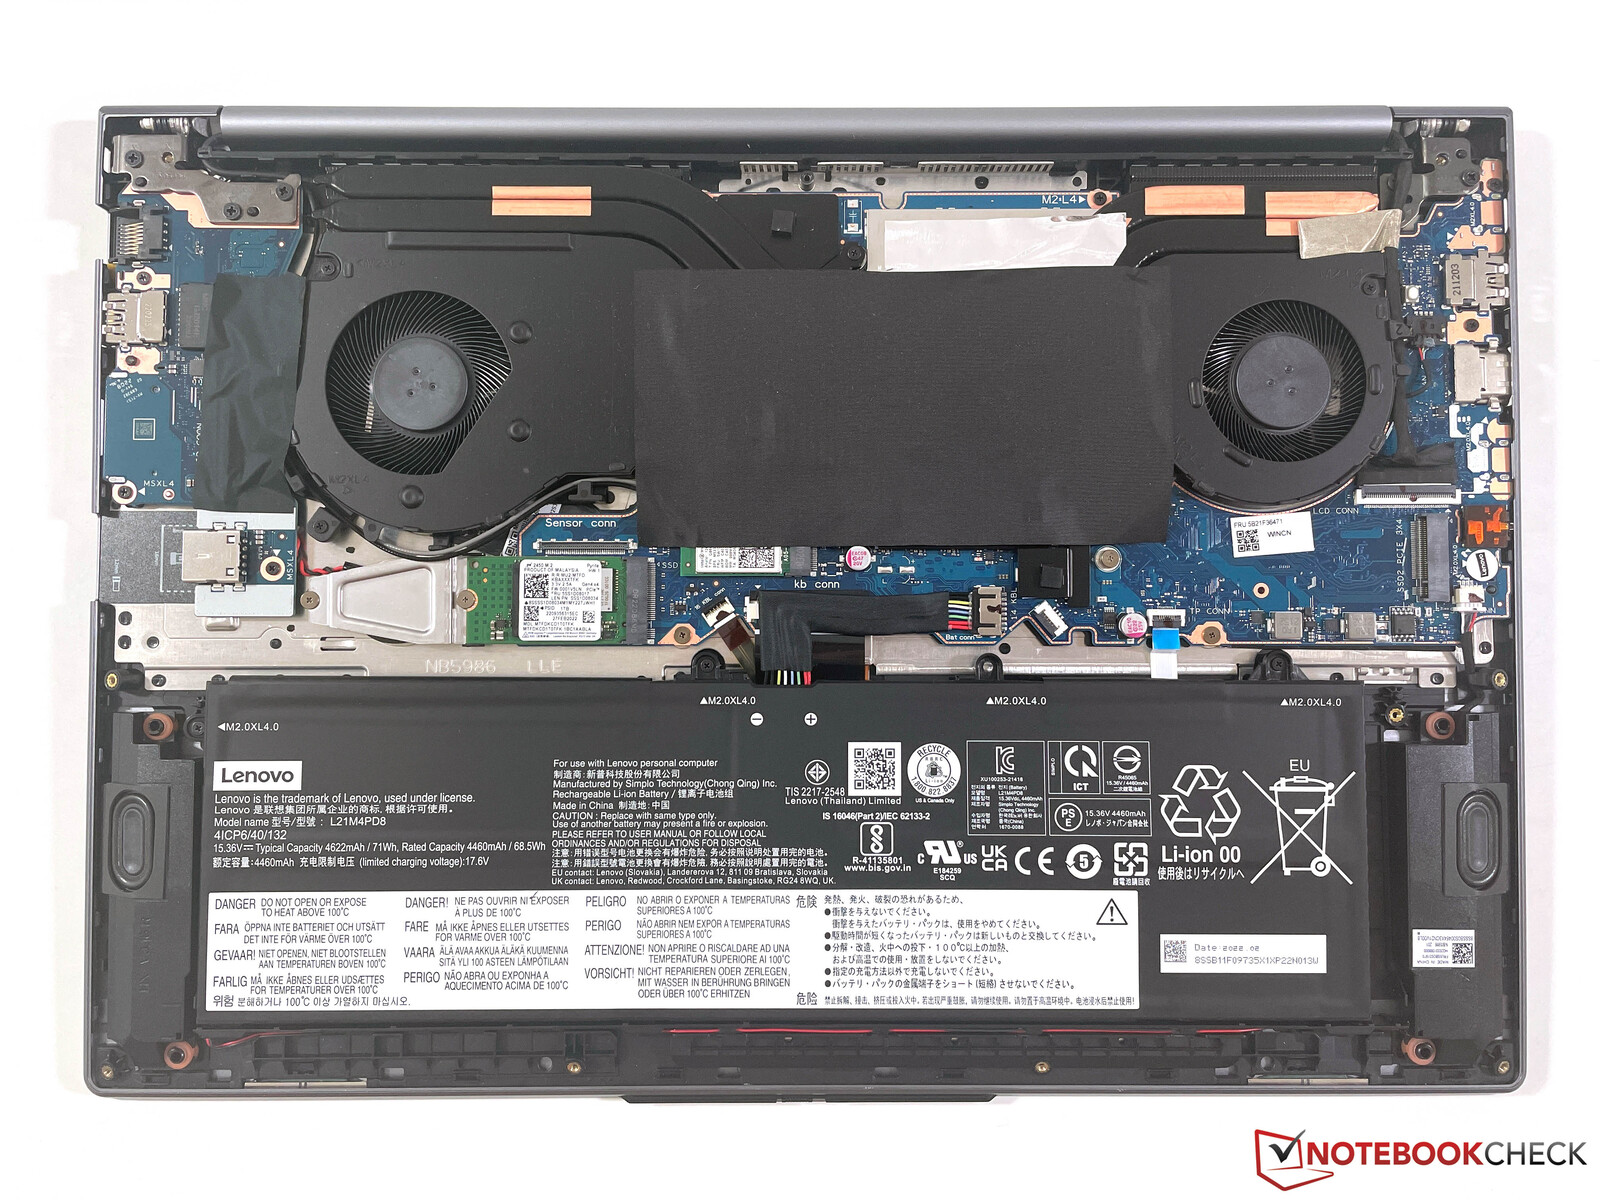
底板用总共10颗Torx螺钉(T5)固定,可以很容易地拆下来。之后,你可以清洁两个风扇,并接触到两个用于SSD的M.2-2280插槽。WLAN模块部分被粘住了,但原则上可以更换。只有内存是焊接的,不能升级。
输入设备 - 带有普通键盘的多媒体笔记本电脑
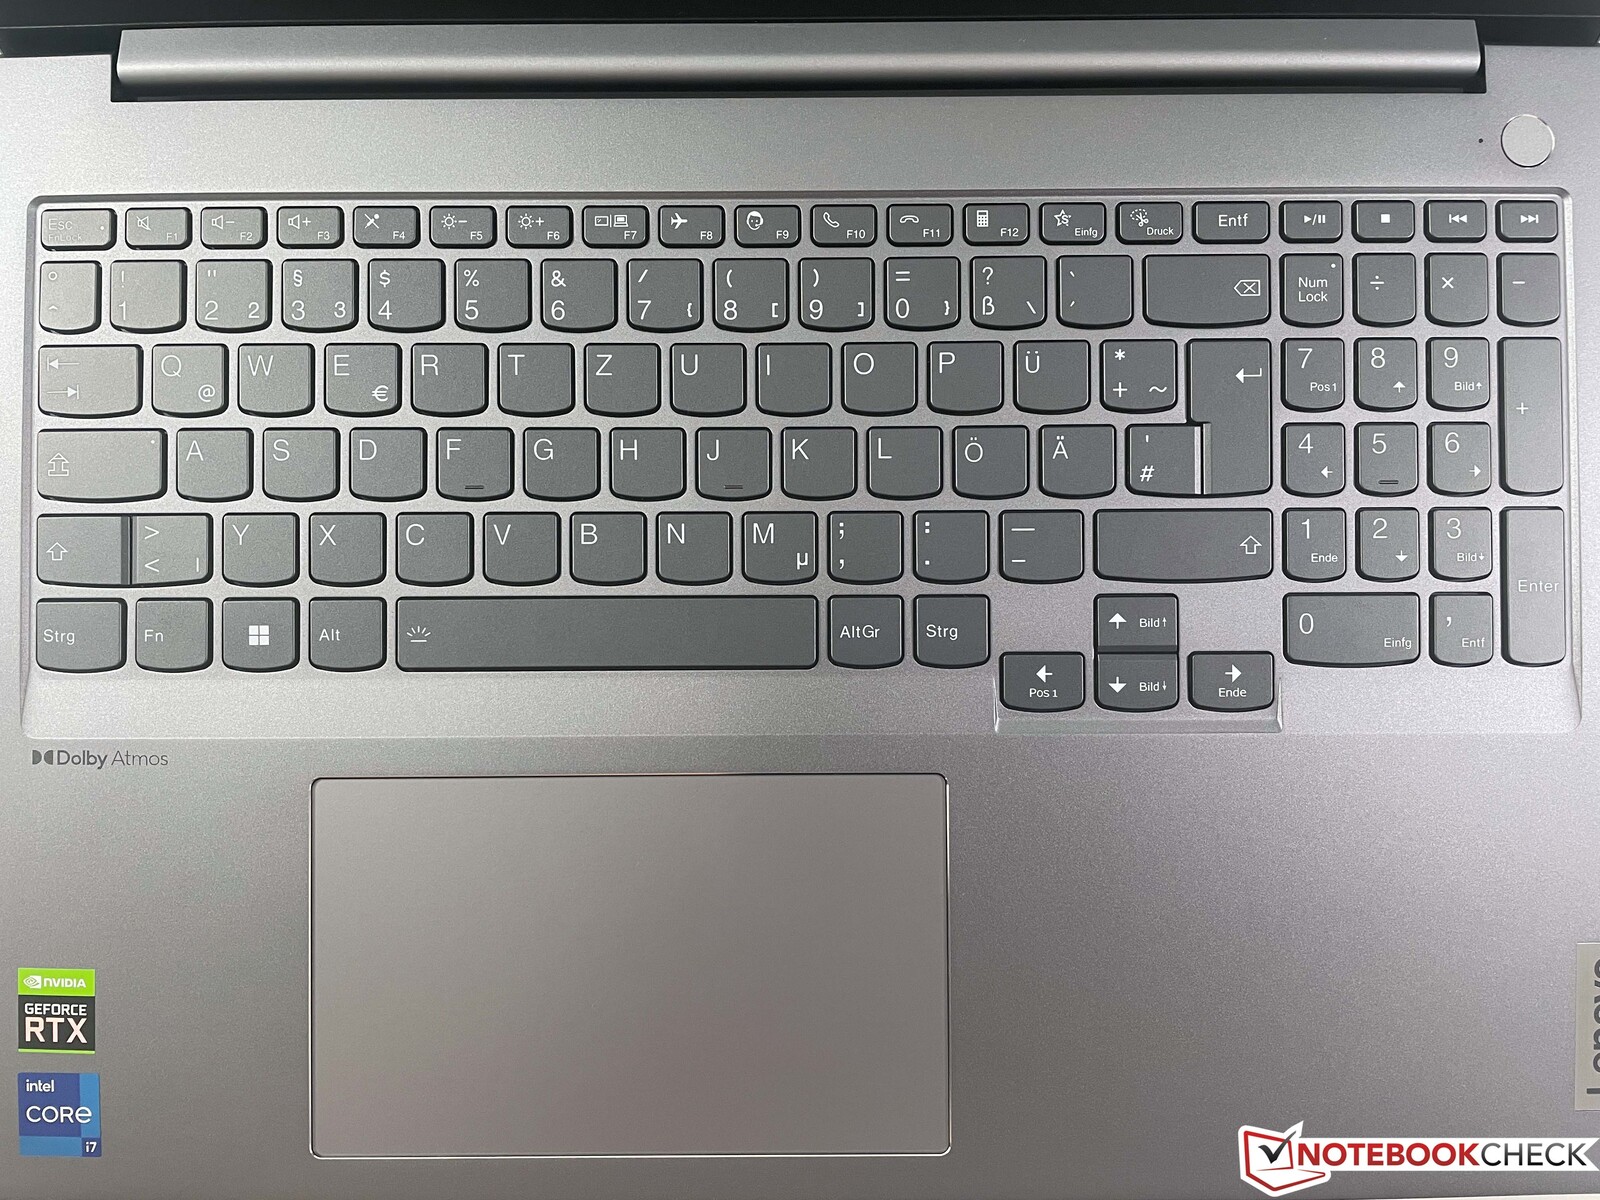
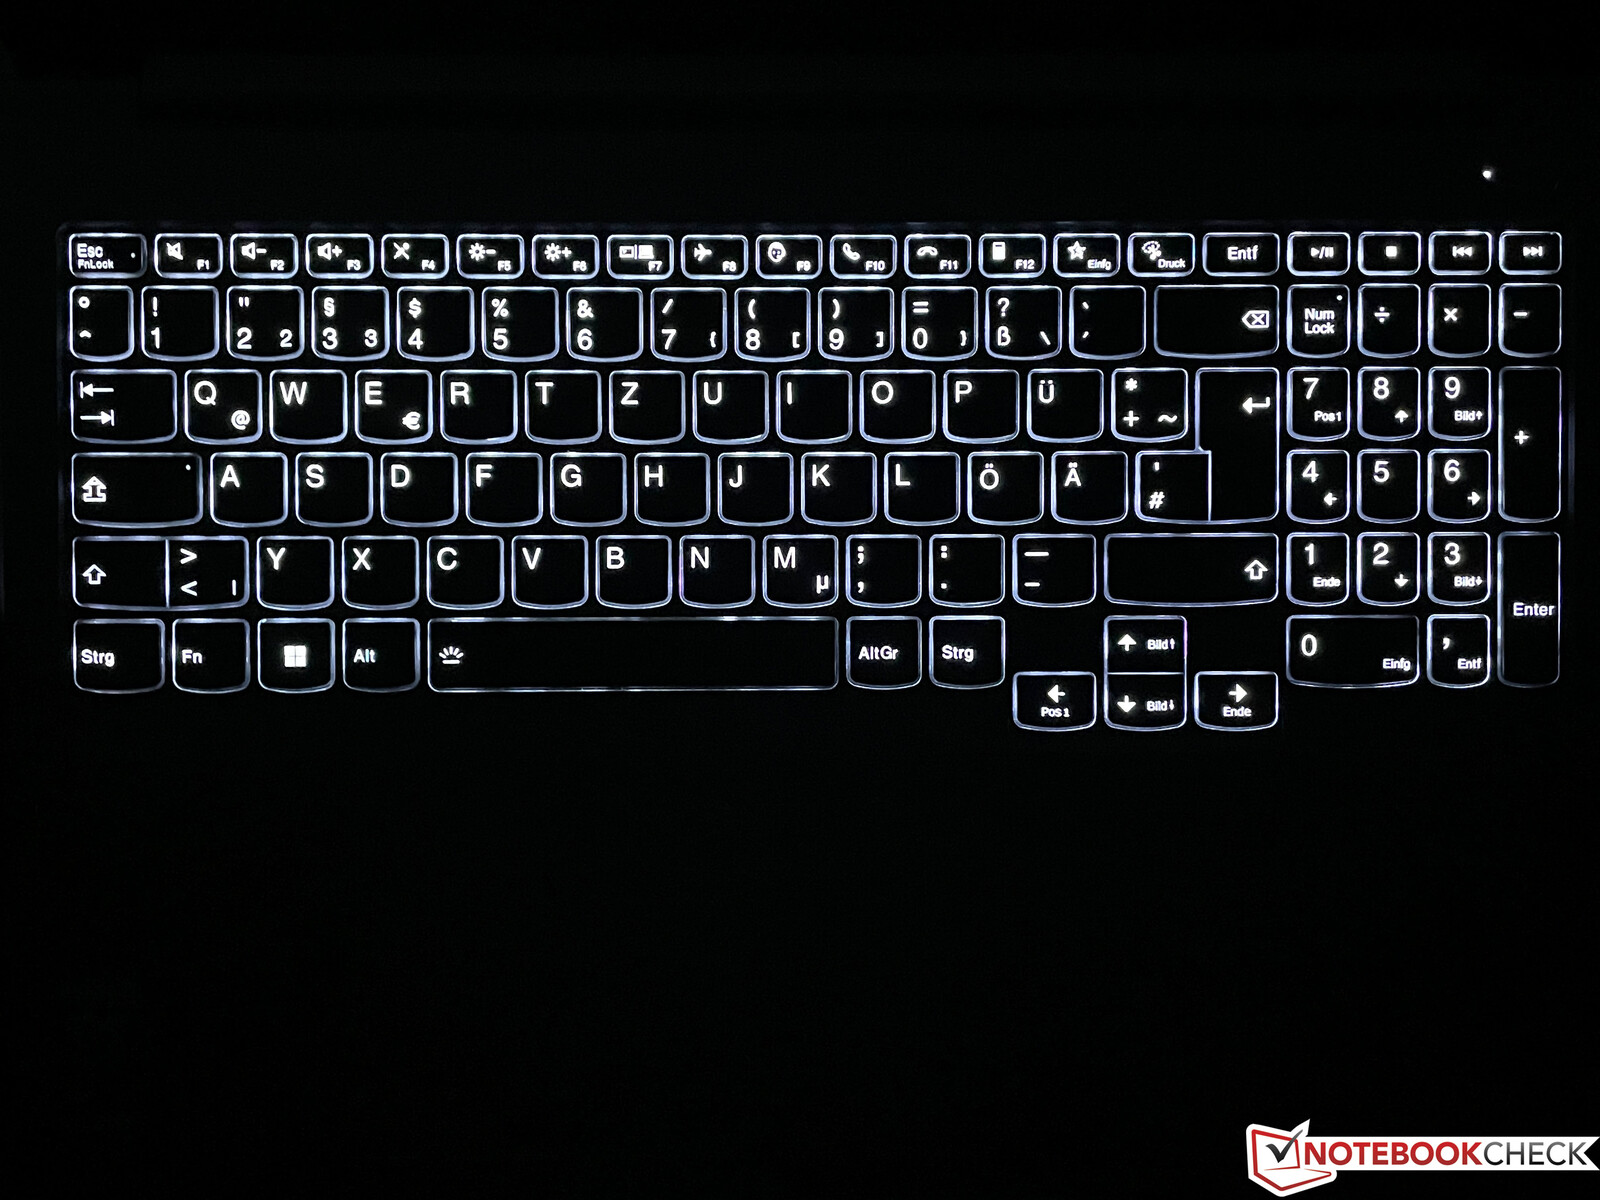
深灰色的键盘提供两级白色背光,以及右侧的专用数字键盘,尽管这里的按键有点窄。就打字的感觉而言,ThinkBook更像是制造商的IdeaPads,而不是ThinkPads的风格。按键行程相当短,但至少反馈非常精确,而且按键也没有响动。在我们看来,联想在这里浪费了一些潜力;如果你经常输入很长的文字,还有更舒适的输入方式。电源键位于键盘上方的右侧,包括一个指纹扫描仪。
大的ClickPad被稍微移到左边,12 x 7.5厘米,为指针导航和最多四个手指的手势提供了足够的空间。由于采用了微软的Precision 标准,这一点做得非常好,而且垫子也没有响动。下半部分可以用物理方式按压,但其特点是发出响亮而廉价的点击声,所以你应该只点击垫子(点击即可)。
显示屏 - 哑光的WQHD IPS面板
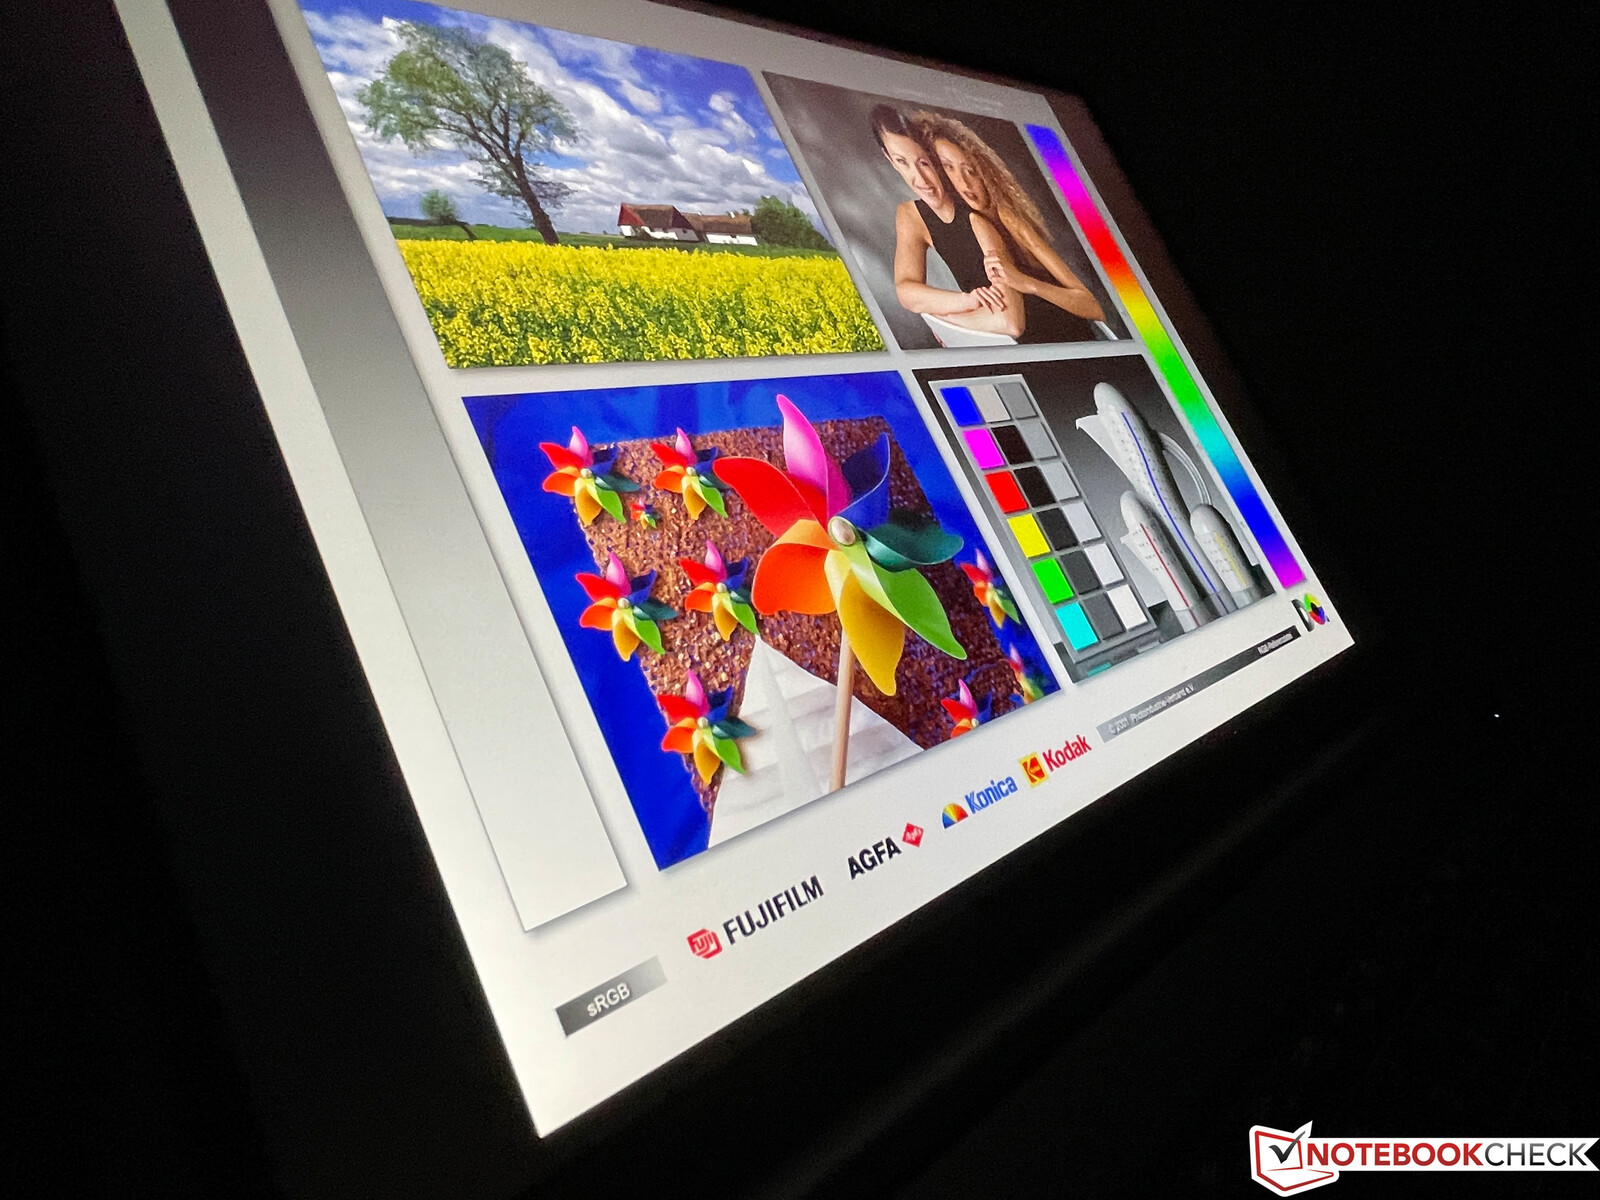
联想为ThinkBook 16 G4+配备了16:10格式的哑光WQHD面板,但有两个不同版本的IPS屏幕。我们的评测样本使用的是60赫兹面板,但根据规格表,还可以选择带有工厂色彩校准的120赫兹型号。
我们对哑光面板的主观图像印象非常好。内容显示清晰,色彩鲜艳,明亮的区域没有颗粒感。我们确定了一个非常好的对比度,接近1700:1(黑值0.23),这当然也有助于生动的图像印象。联想指定的亮度为350cd/m²,我们的面板刚好超过了这个数值。没有PWM闪烁,响应时间也不明显,但在高亮度水平下,黑暗背景上有明显的光晕。IPS显示屏的视角稳定性非常好,但不支持HDR内容。

| |||||||||||||||||||||||||
Brightness Distribution: 91 %
Center on Battery: 372 cd/m²
Contrast: 1613:1 (Black: 0.23 cd/m²)
ΔE ColorChecker Calman: 2.6 | ∀{0.5-29.43 Ø4.71}
calibrated: 1.3
ΔE Greyscale Calman: 3.7 | ∀{0.09-98 Ø4.96}
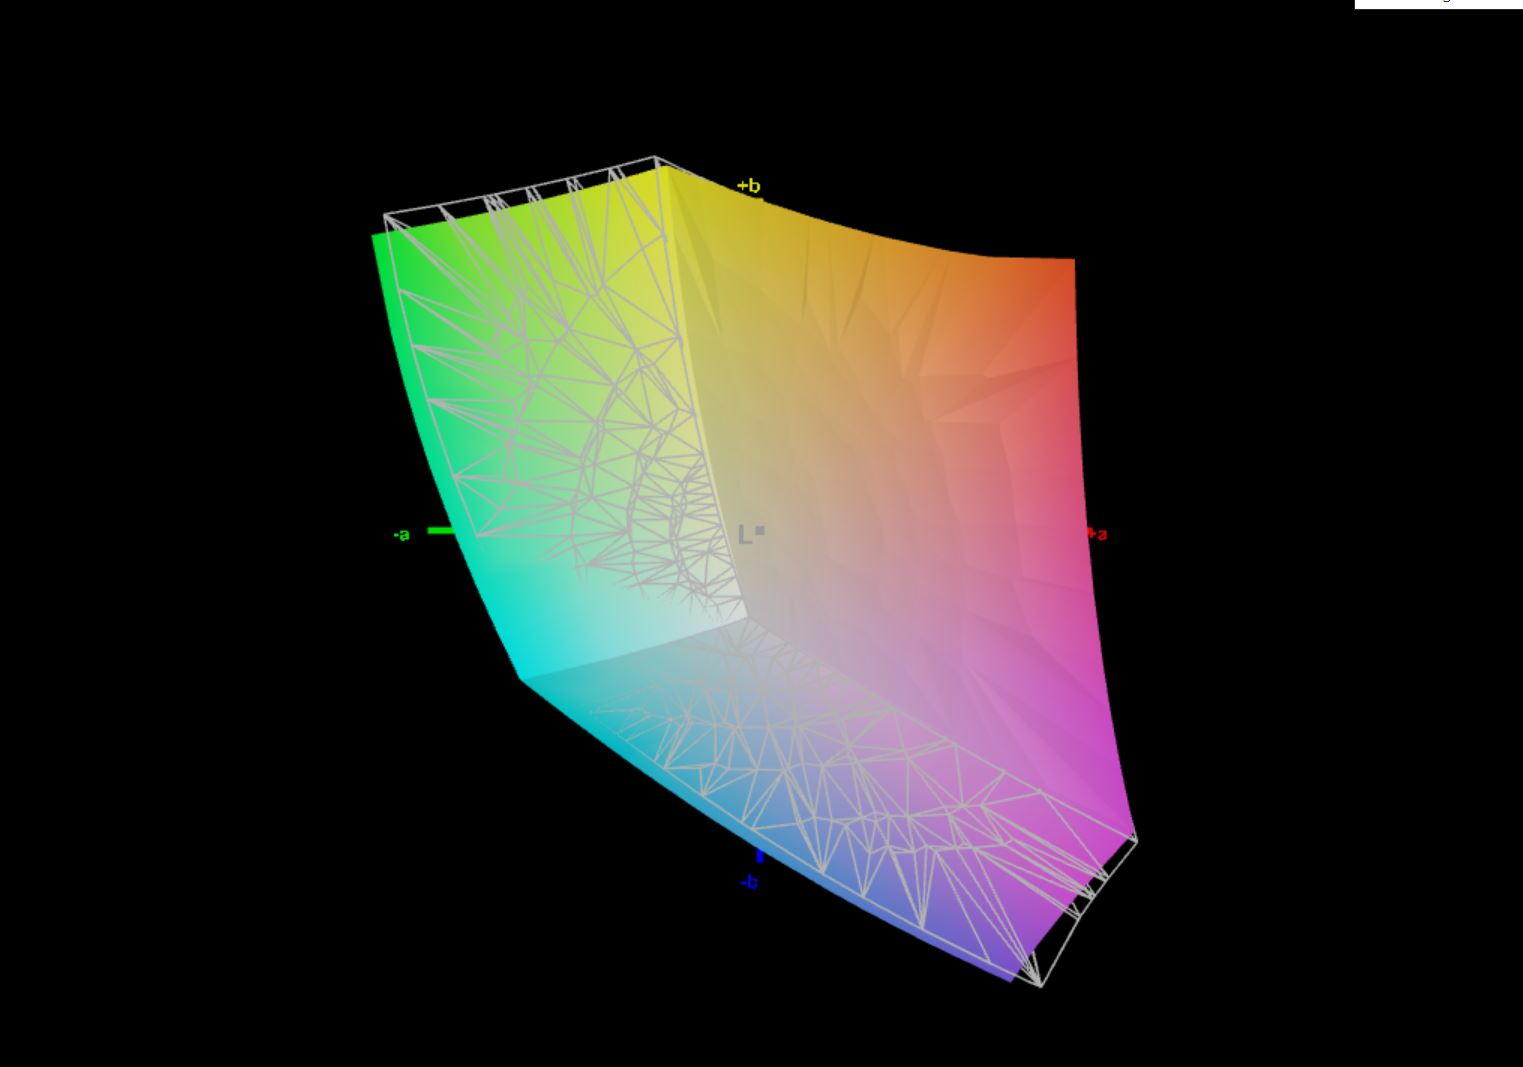
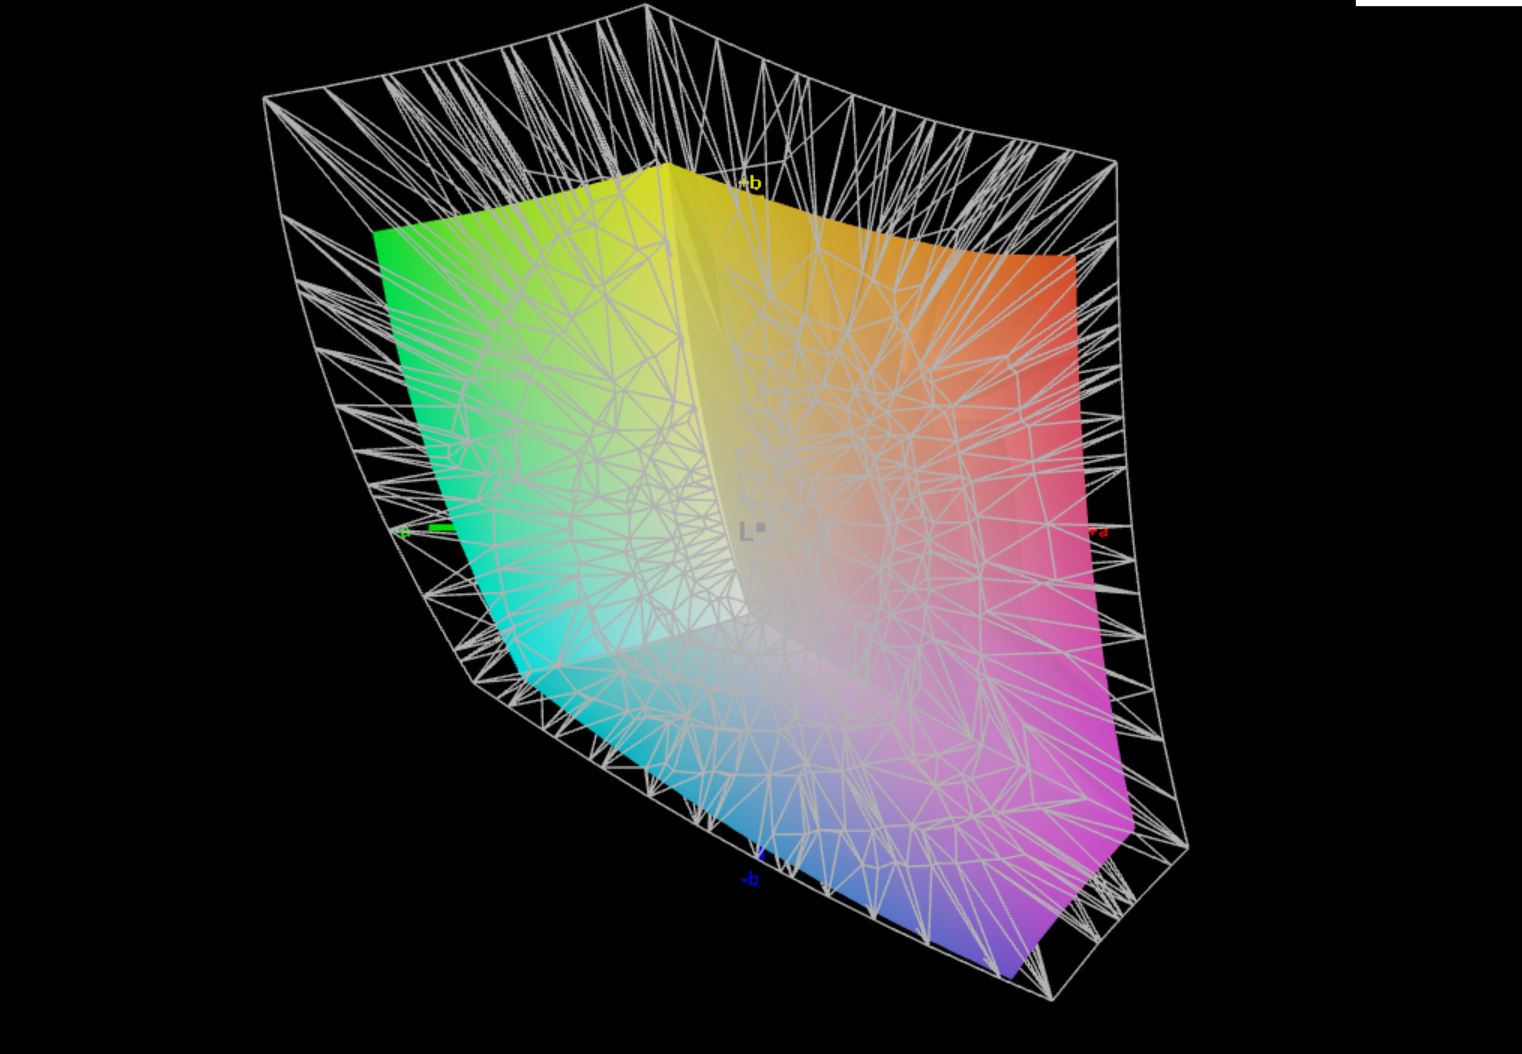
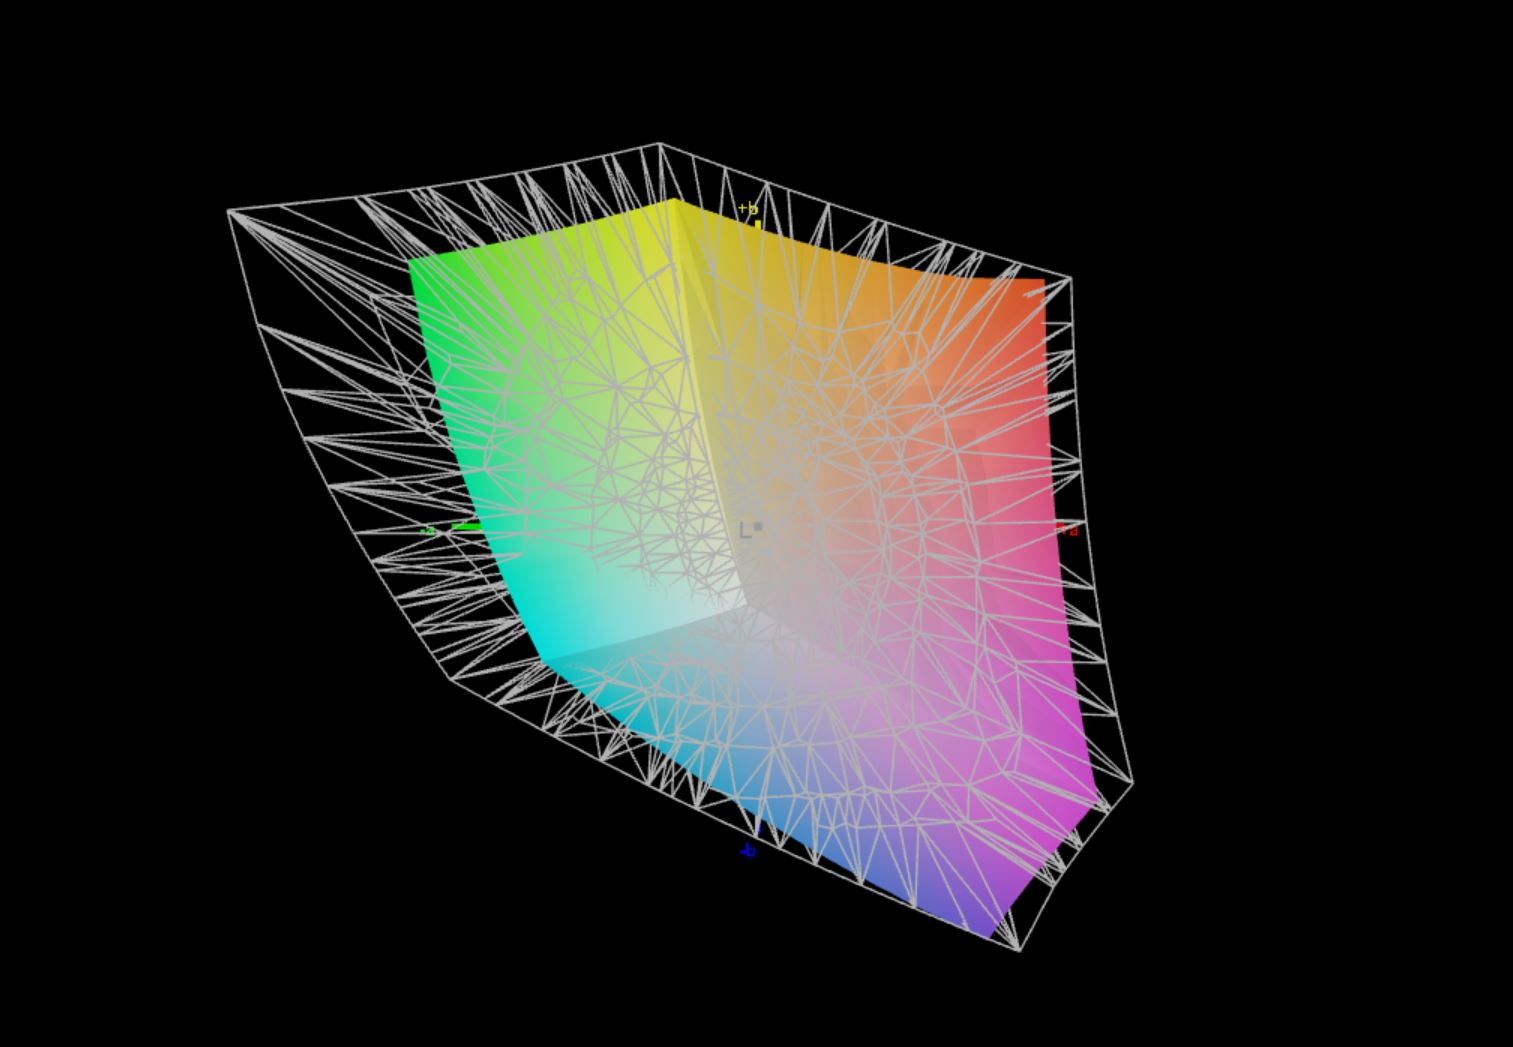
71.7% AdobeRGB 1998 (Argyll 3D)
97.5% sRGB (Argyll 3D)
69.6% Display P3 (Argyll 3D)
Gamma: 2.32
CCT: 7271 K
| Lenovo ThinkBook 16 G4+ IAP LEN160WQXGA, IPS, 2560x1600, 16" | Dell Inspiron 16 Plus 7620 BOE NE16N41, IPS, 3072x1920, 16" | Acer Swift X SFX16-51G-5388 Chi Mei N161HCA-EA3, , 1920x1080, 16.1" | Asus Vivobook Pro 16X-M7600QE Samsung ATNA60YV02-0, OLED, 3840x2400, 16.1" | Huawei MateBook D 16 2022 BOE NV160WUM-NH0, IPS, 1920x1200, 16" | Samsung Galaxy Book2 15 NE156FHM-NS0, IPS, 1920x1080, 15.6" | |
|---|---|---|---|---|---|---|
| Display | 2% | -5% | 27% | -4% | -27% | |
| Display P3 Coverage (%) | 69.6 | 70.8 2% | 65.1 -6% | 99.8 43% | 66.2 -5% | 49.6 -29% |
| sRGB Coverage (%) | 97.5 | 99.5 2% | 95.65 -2% | 100 3% | 96.4 -1% | 74.8 -23% |
| AdobeRGB 1998 Coverage (%) | 71.7 | 73.2 2% | 66.75 -7% | 96.9 35% | 68.3 -5% | 51.3 -28% |
| Response Times | -42% | -6% | 91% | -2% | -24% | |
| Response Time Grey 50% / Grey 80% * (ms) | 32.7 ? | 38 ? -16% | 30 ? 8% | 2 ? 94% | 30.5 ? 7% | 32.3 ? 1% |
| Response Time Black / White * (ms) | 16.8 ? | 28 ? -67% | 20 ? -19% | 2 ? 88% | 18.7 ? -11% | 25 ? -49% |
| PWM Frequency (Hz) | 60 ? | |||||
| Screen | 8% | 11% | 14% | -19% | -71% | |
| Brightness middle (cd/m²) | 371 | 288.9 -22% | 276 -26% | 392 6% | 319 -14% | 337 -9% |
| Brightness (cd/m²) | 357 | 276 -23% | 264 -26% | 396 11% | 317 -11% | 325 -9% |
| Brightness Distribution (%) | 91 | 92 1% | 85 -7% | 98 8% | 90 -1% | 89 -2% |
| Black Level * (cd/m²) | 0.23 | 0.26 -13% | 0.16 30% | 0.23 -0% | 0.4 -74% | |
| Contrast (:1) | 1613 | 1111 -31% | 1725 7% | 1387 -14% | 843 -48% | |
| Colorchecker dE 2000 * | 2.6 | 1.88 28% | 1.8 31% | 1.74 33% | 3.4 -31% | 4.7 -81% |
| Colorchecker dE 2000 max. * | 4.4 | 4.37 1% | 3.77 14% | 3.18 28% | 8.1 -84% | 15.7 -257% |
| Colorchecker dE 2000 calibrated * | 1.3 | 0.42 68% | 0.63 52% | 1.85 -42% | 0.8 38% | 2.8 -115% |
| Greyscale dE 2000 * | 3.7 | 1.4 62% | 2.76 25% | 1.77 52% | 5.7 -54% | 5.4 -46% |
| Gamma | 2.32 95% | 2.3 96% | 2.37 93% | 2.22 99% | 2.1 105% | 2.07 106% |
| CCT | 7271 89% | 6634 98% | 6564 99% | 6483 100% | 7433 87% | 7727 84% |
| Total Average (Program / Settings) | -11% /
-0% | 0% /
5% | 44% /
30% | -8% /
-13% | -41% /
-55% |
* ... smaller is better
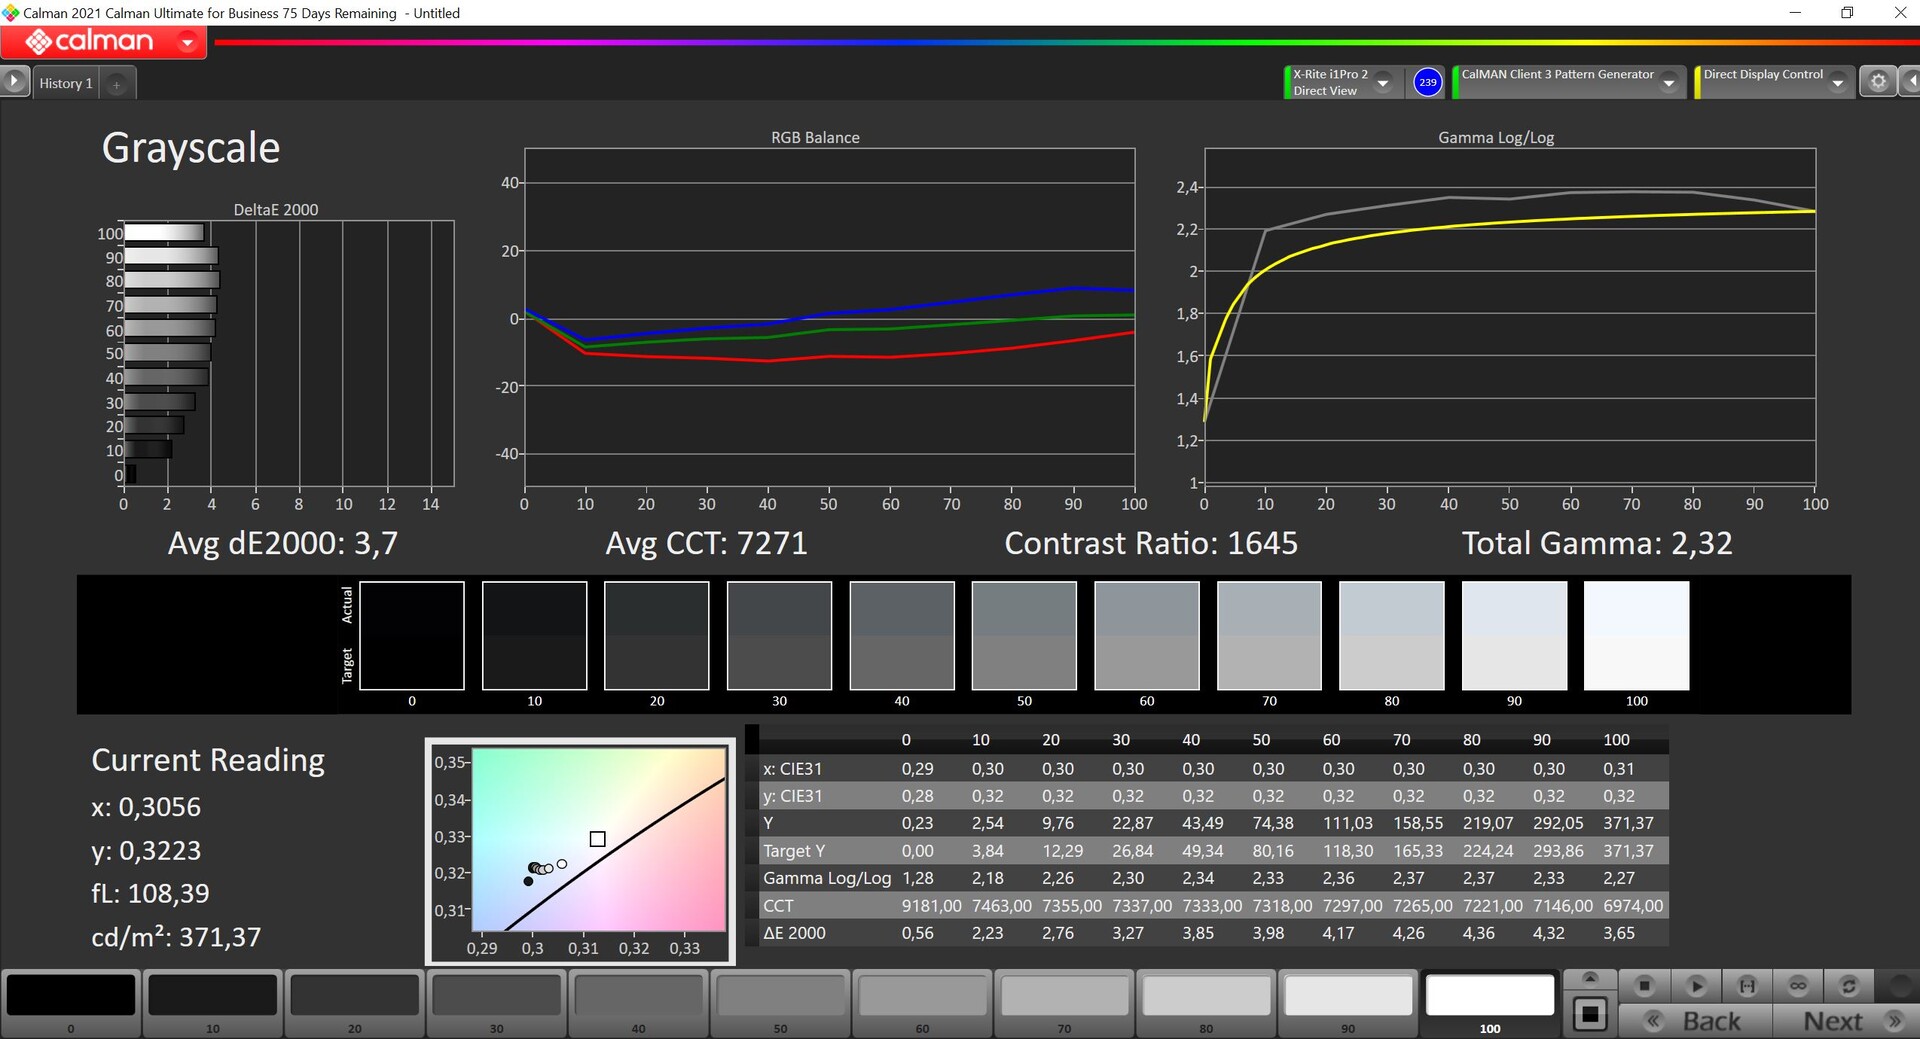
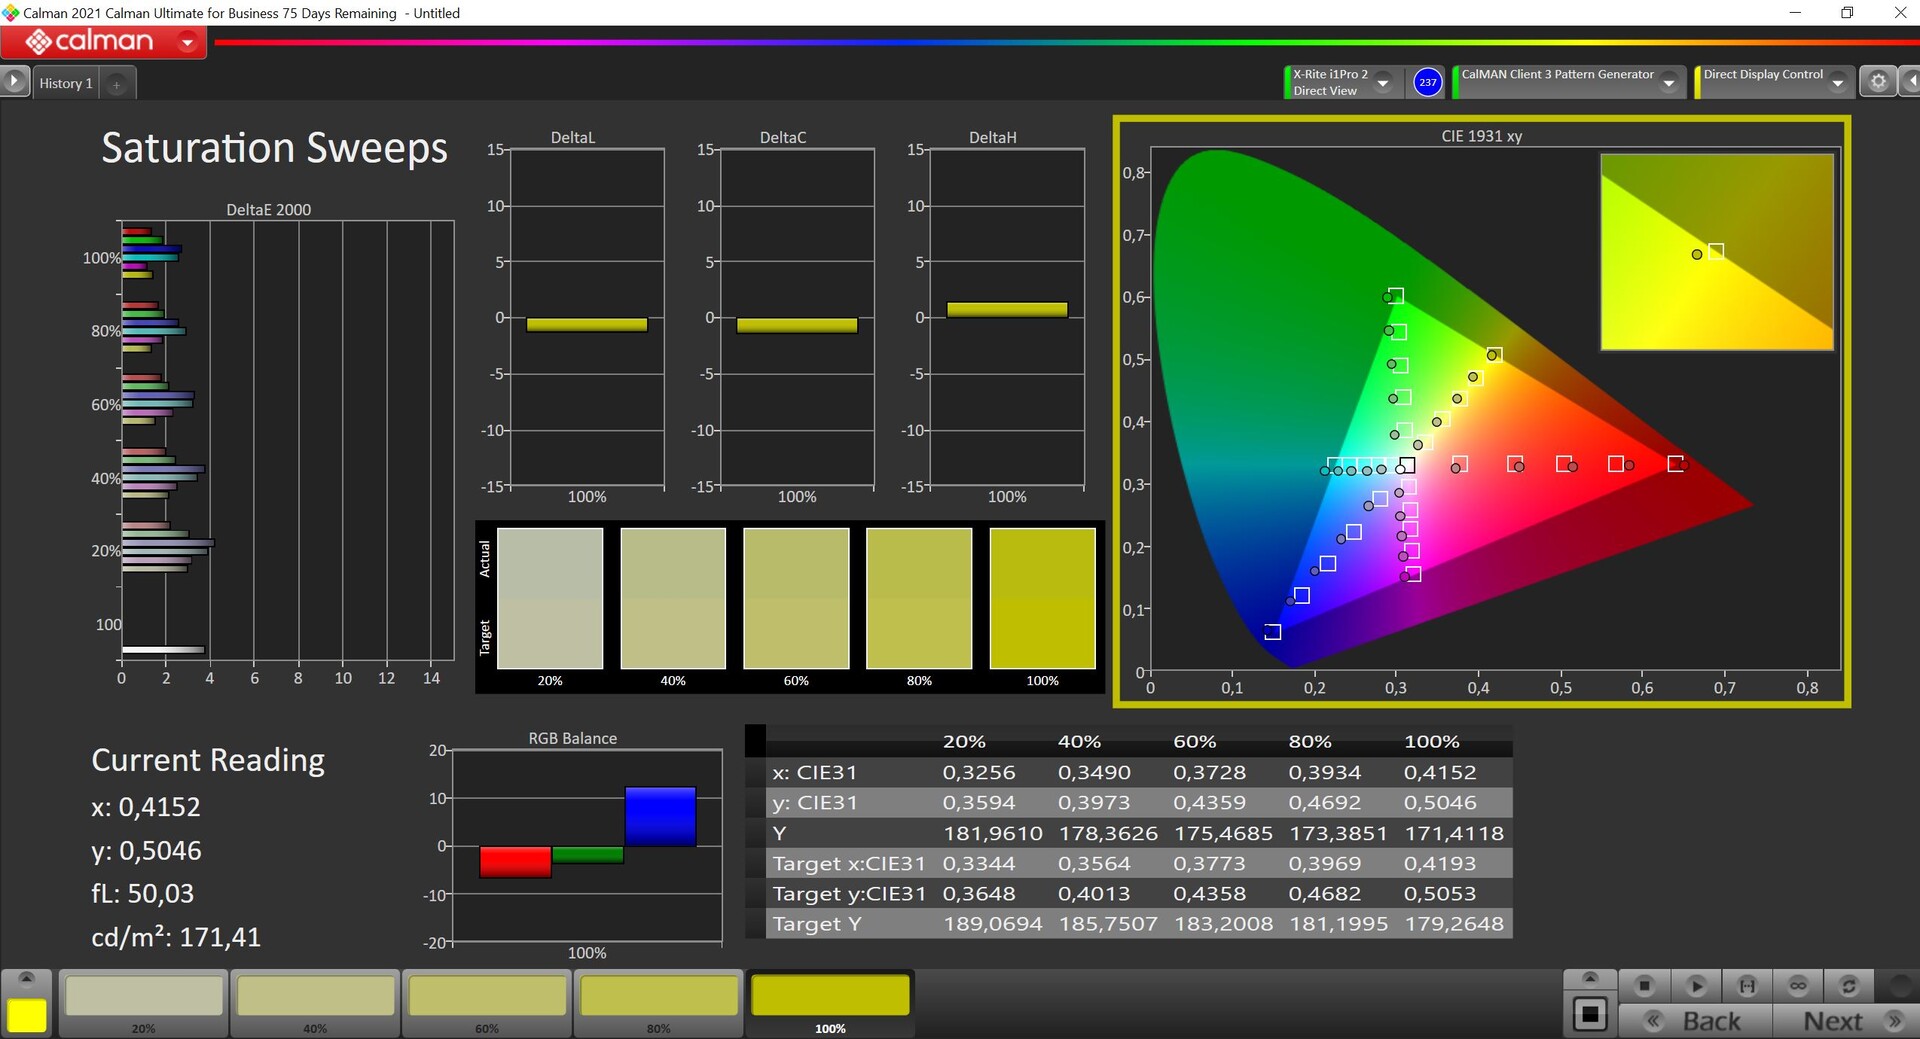
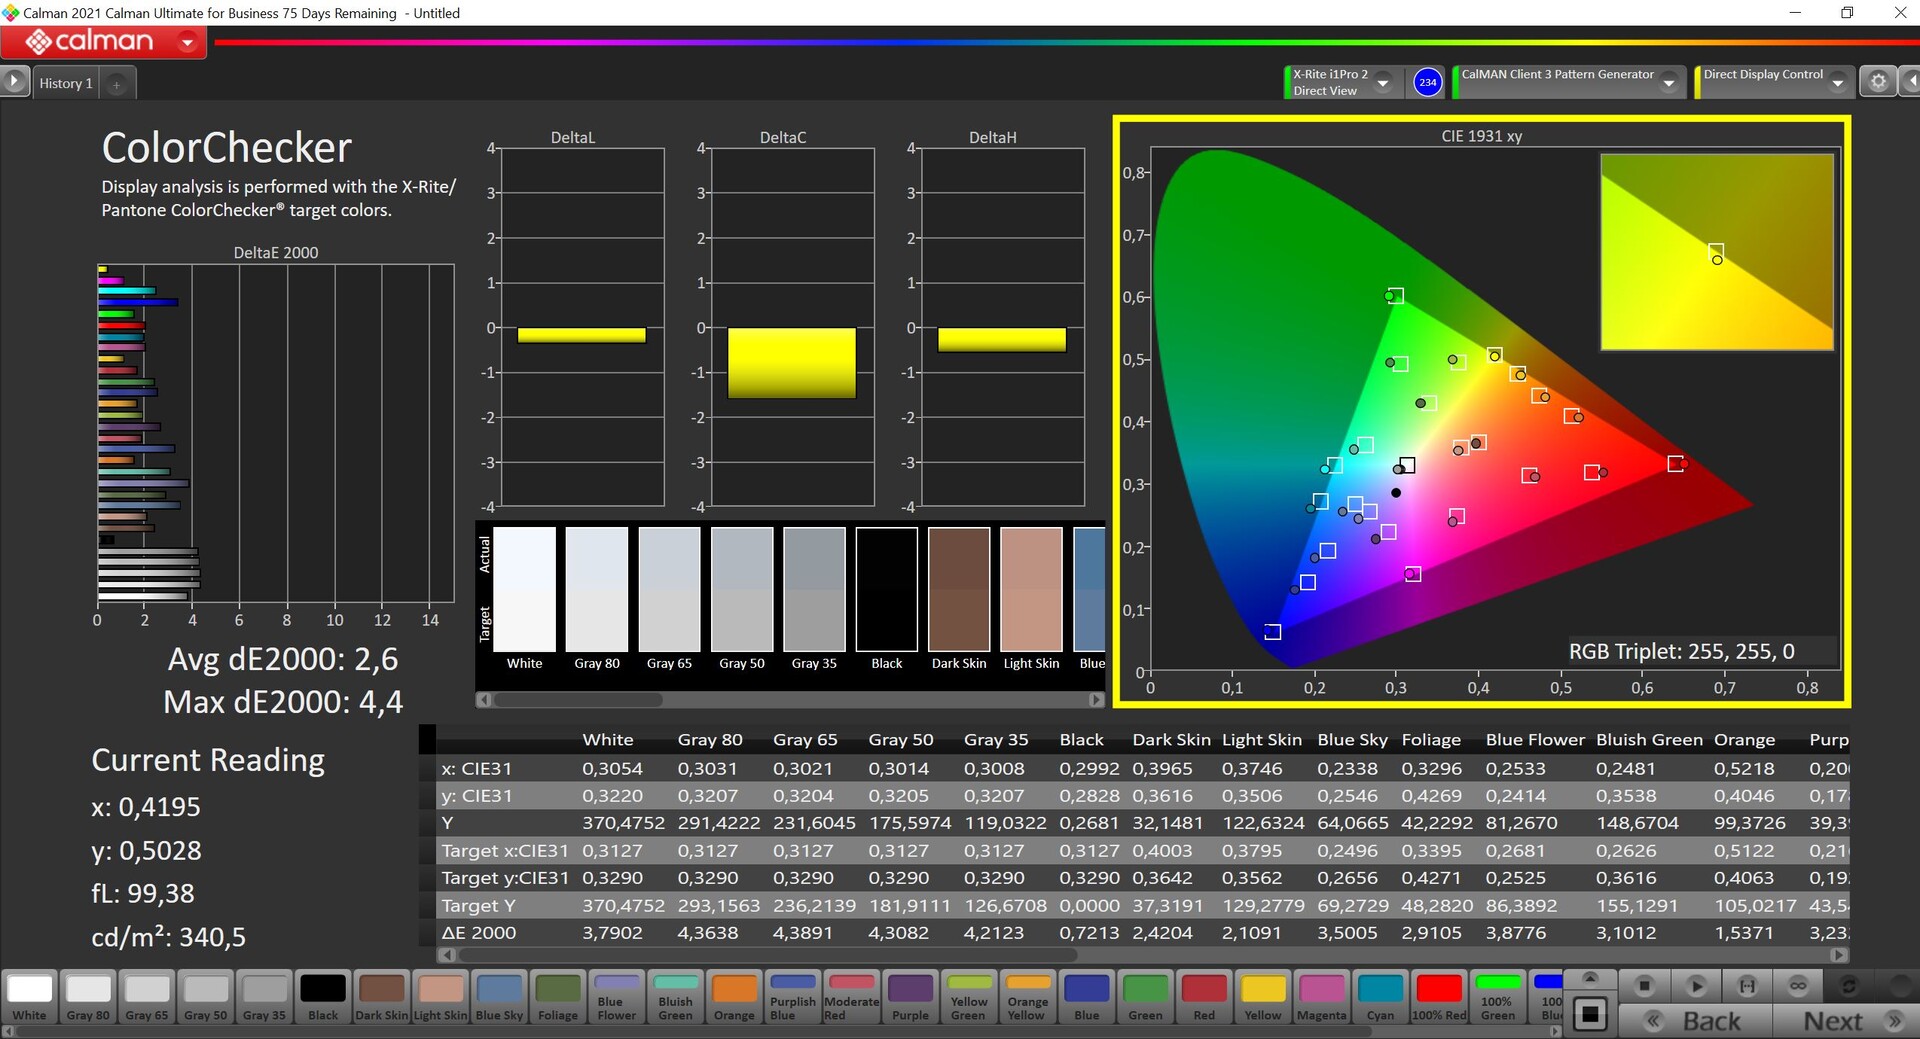
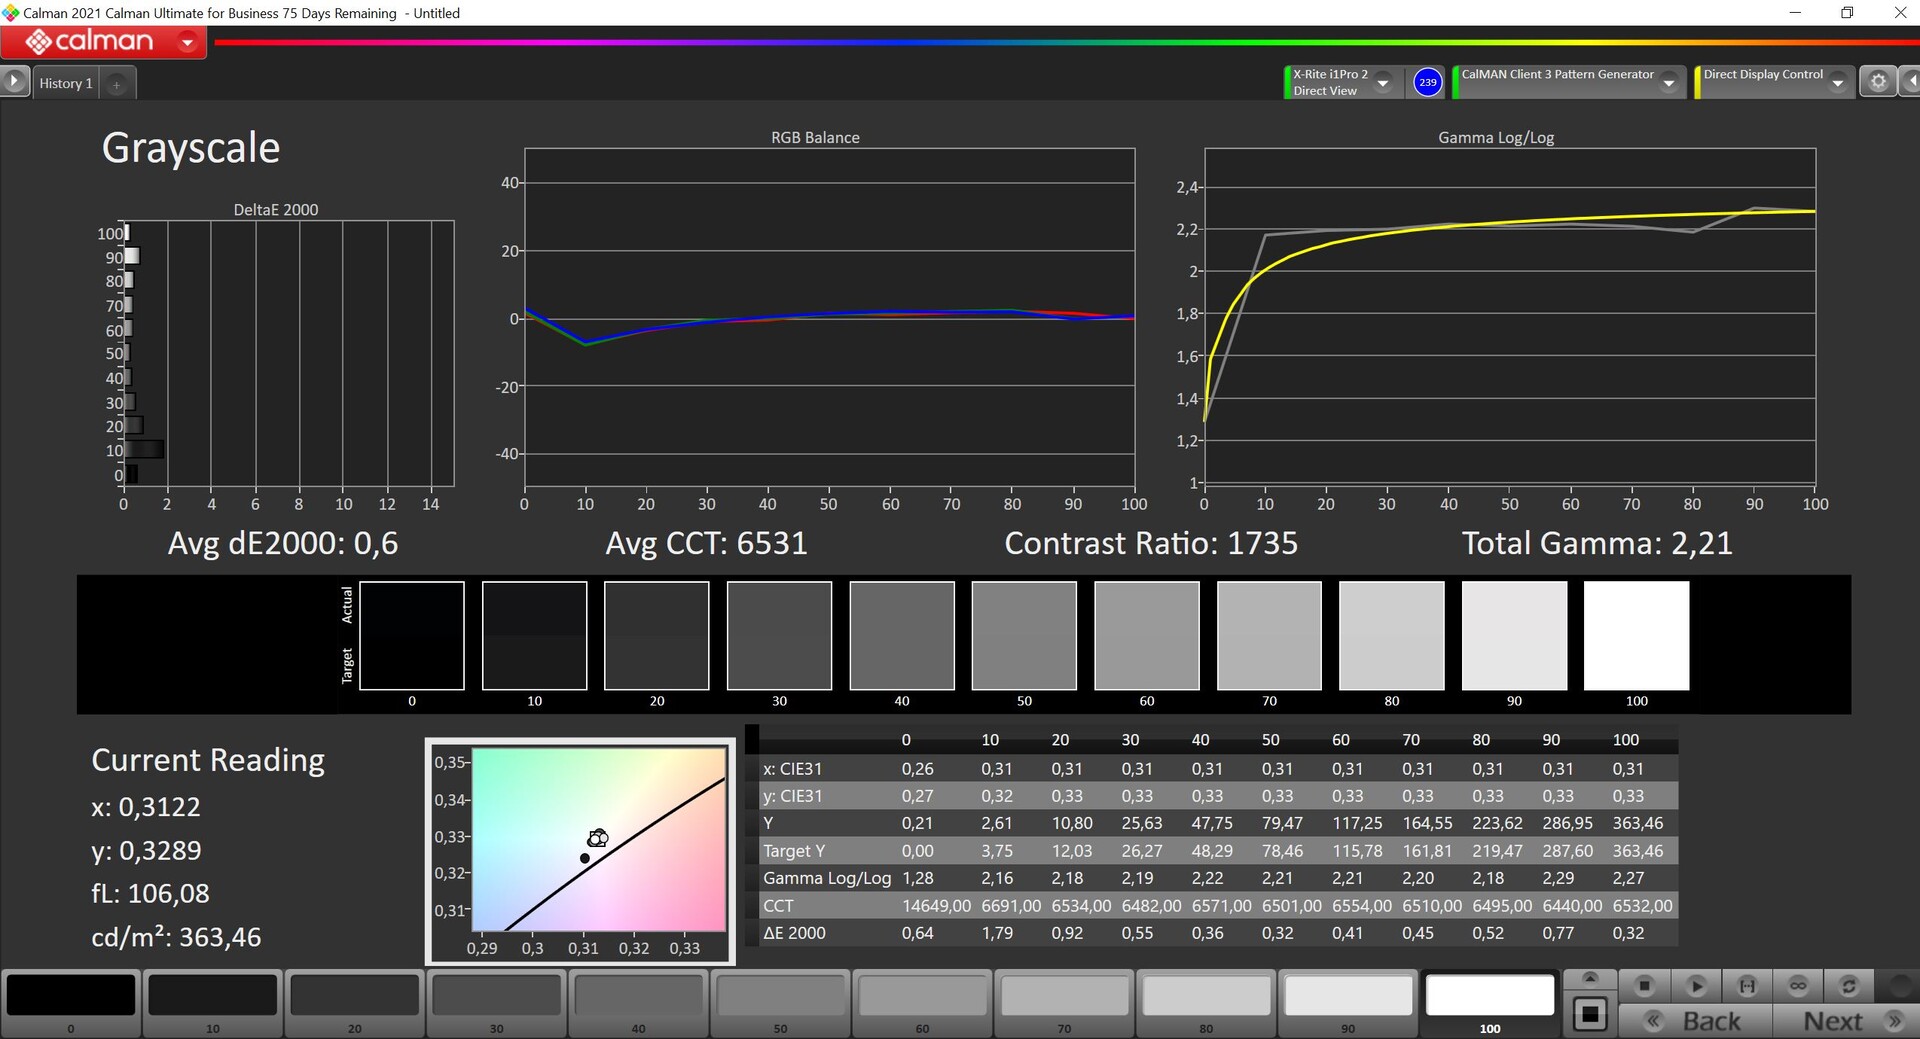
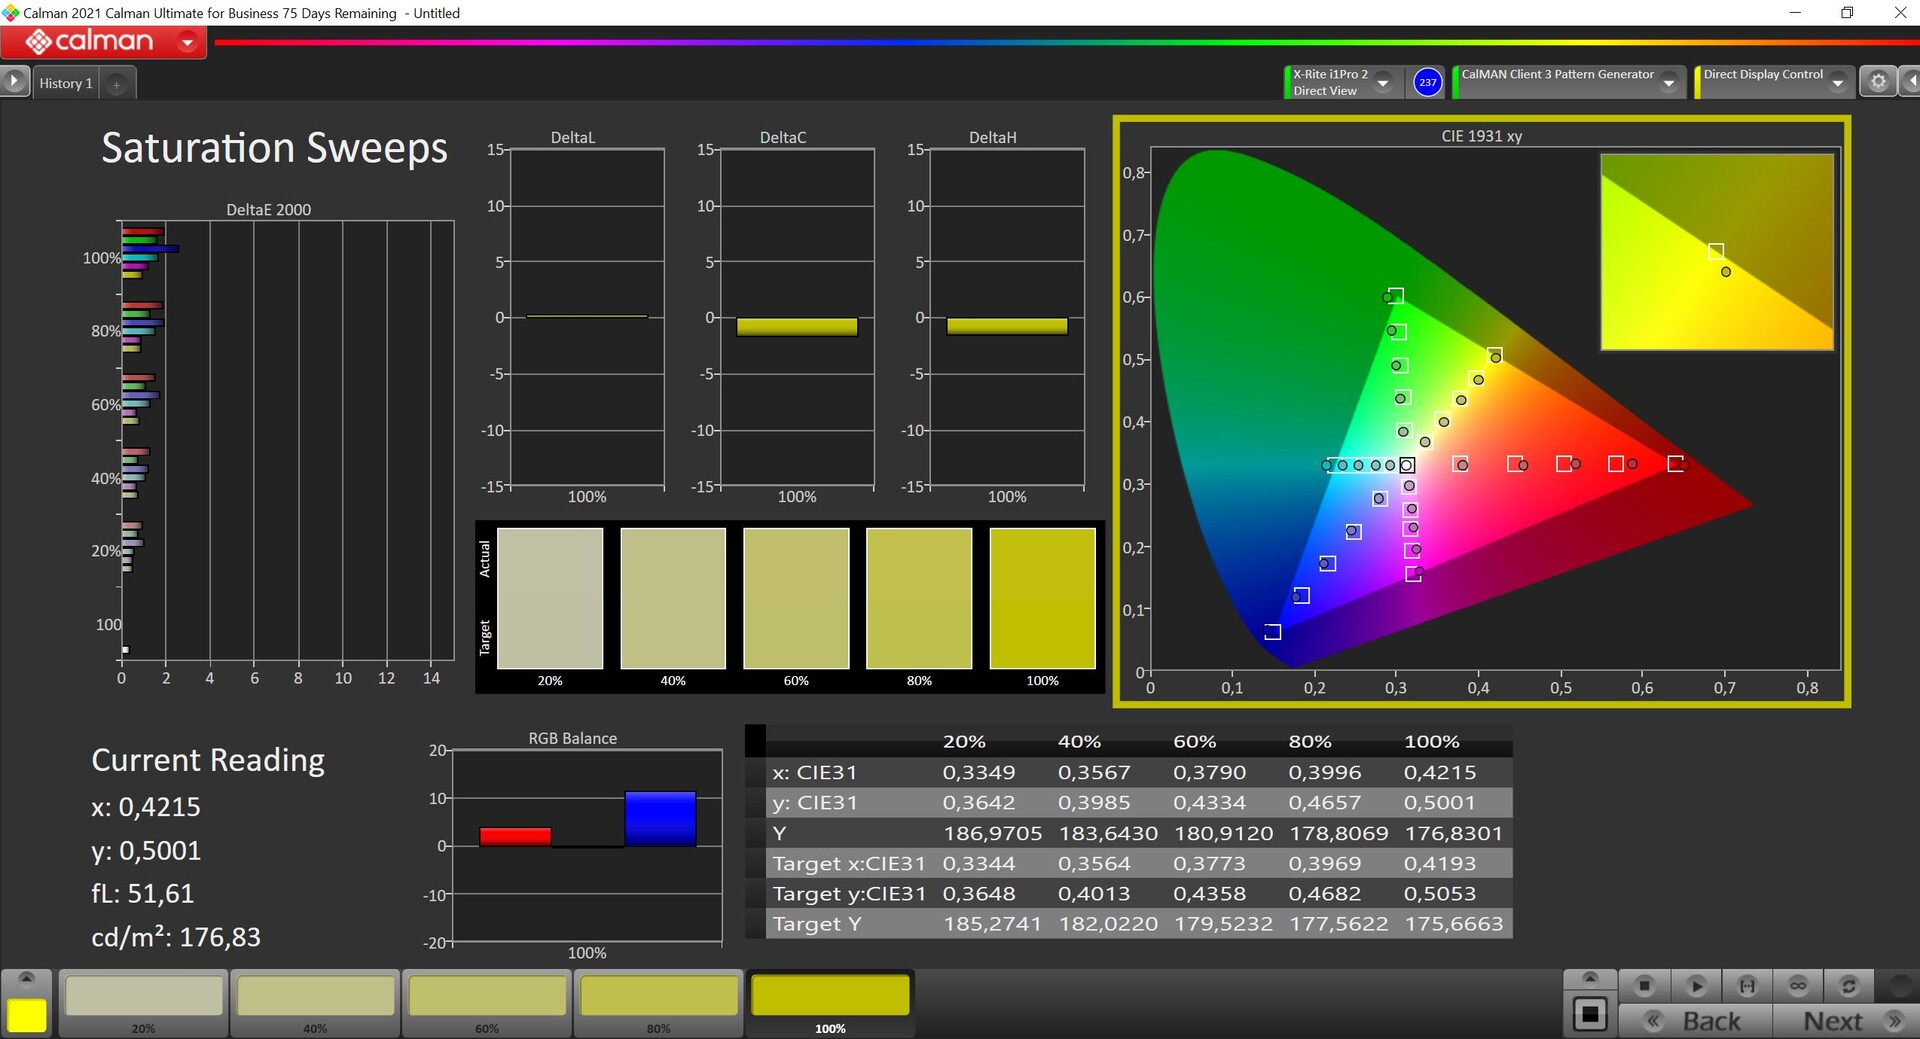
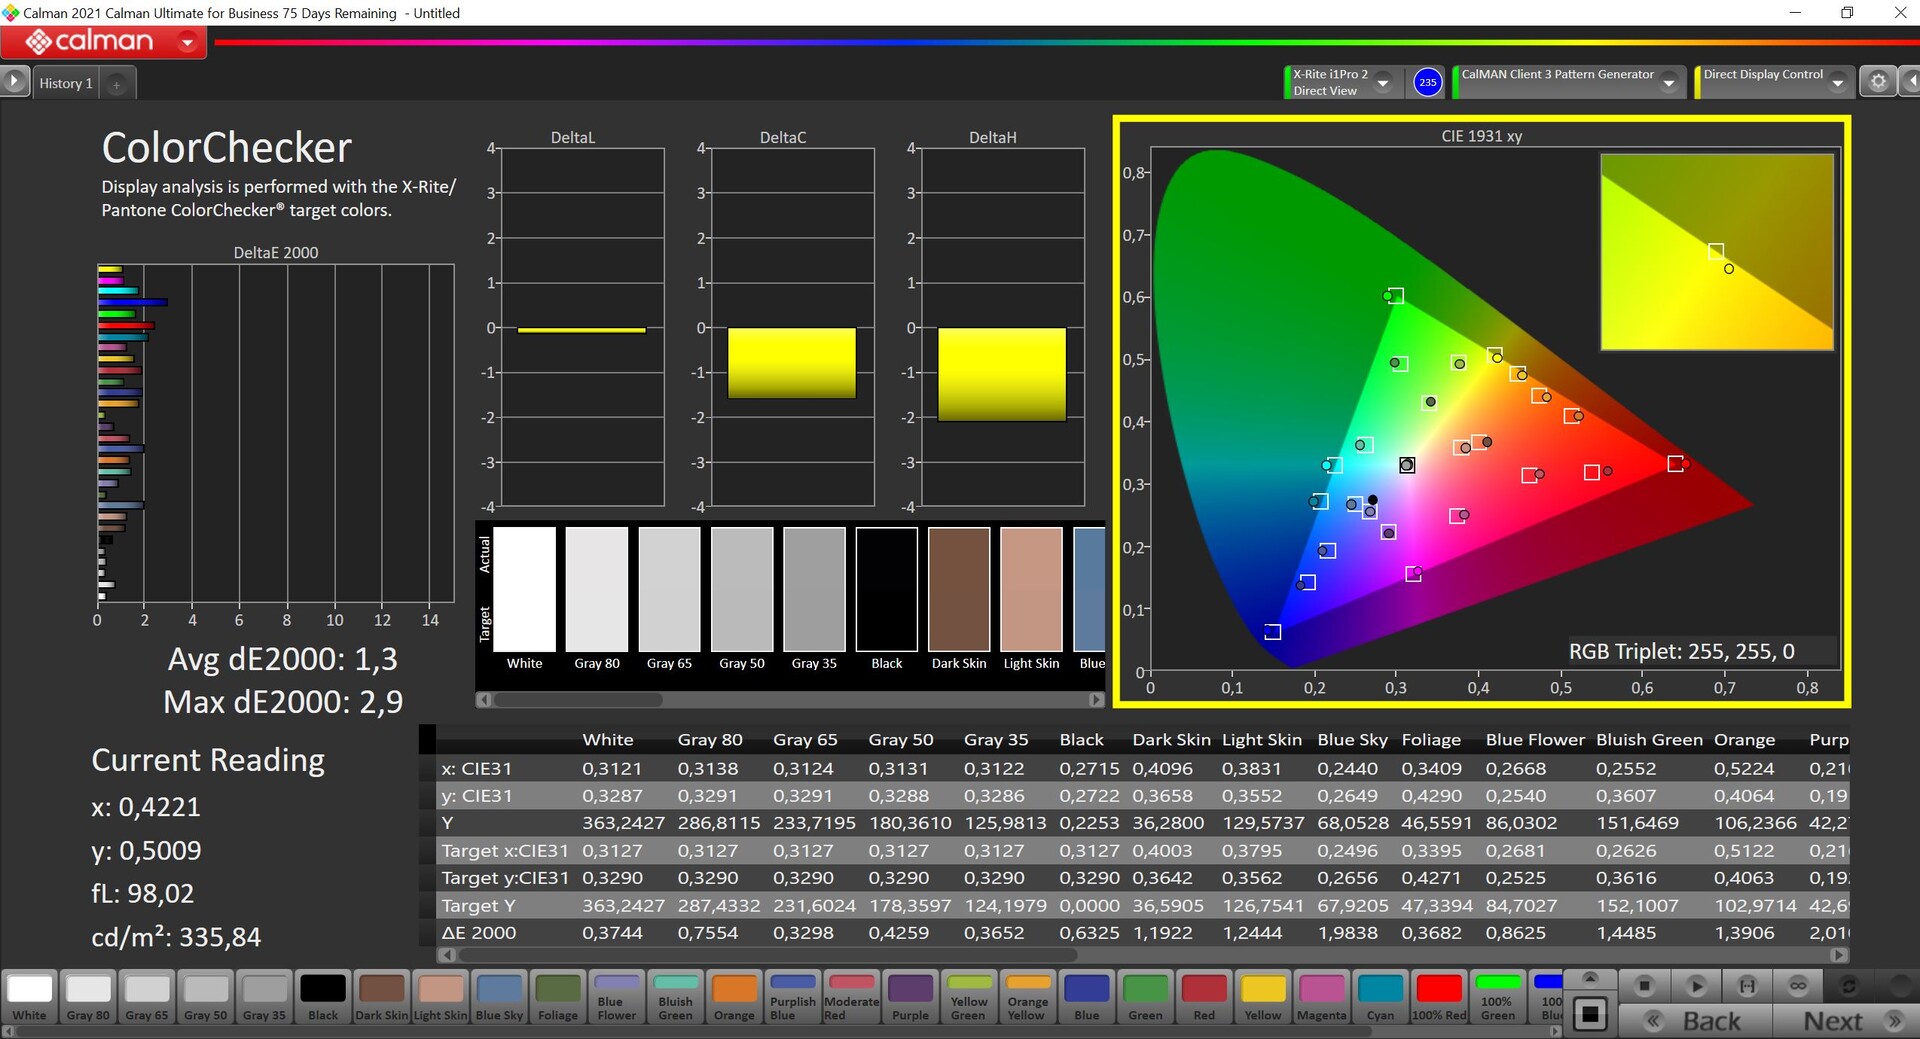
我们用专业的CalMAN软件(X-Rite i1 Pro 2)进行分析,发现有一点偏蓝的色调,同时色温也略微过冷。另一方面,与sRGB参考色彩空间相比,灰度和色彩的偏差已经相当低。如果你不想编辑图片,你不一定要校准面板,但这里仍有很大的潜力,在我们校准后,结果要好得多,所有的颜色都低于DeltaE-2000的重要偏差3。
Display Response Times
| ↔ Response Time Black to White | ||
|---|---|---|
| 16.8 ms ... rise ↗ and fall ↘ combined | ↗ 6.4 ms rise | 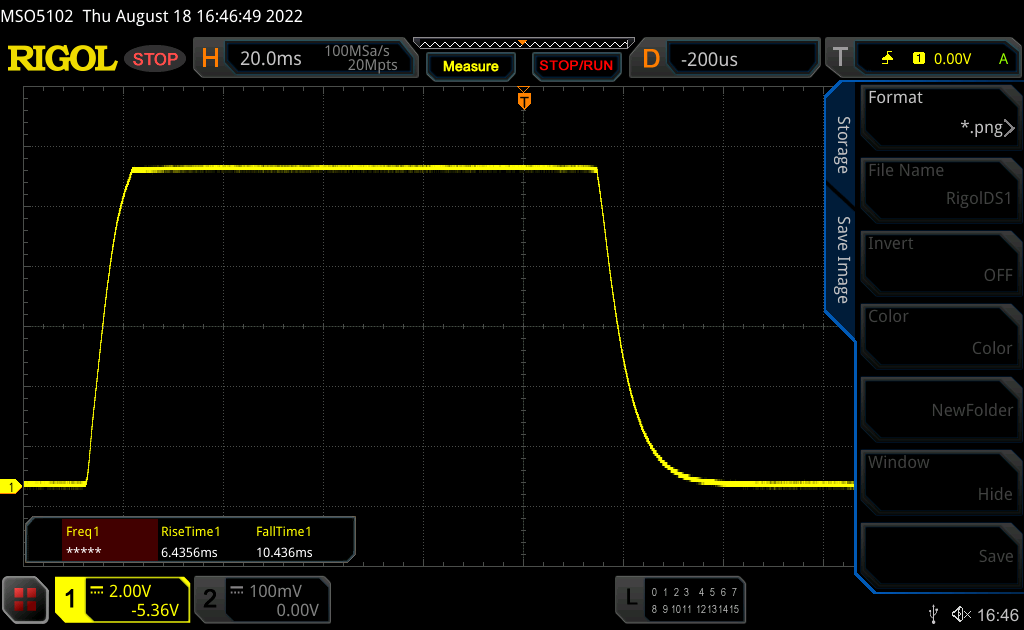 |
| ↘ 10.4 ms fall | ||
| The screen shows good response rates in our tests, but may be too slow for competitive gamers. In comparison, all tested devices range from 0.1 (minimum) to 240 (maximum) ms. » 39 % of all devices are better. This means that the measured response time is better than the average of all tested devices (19.8 ms). | ||
| ↔ Response Time 50% Grey to 80% Grey | ||
| 32.7 ms ... rise ↗ and fall ↘ combined | ↗ 15.7 ms rise | 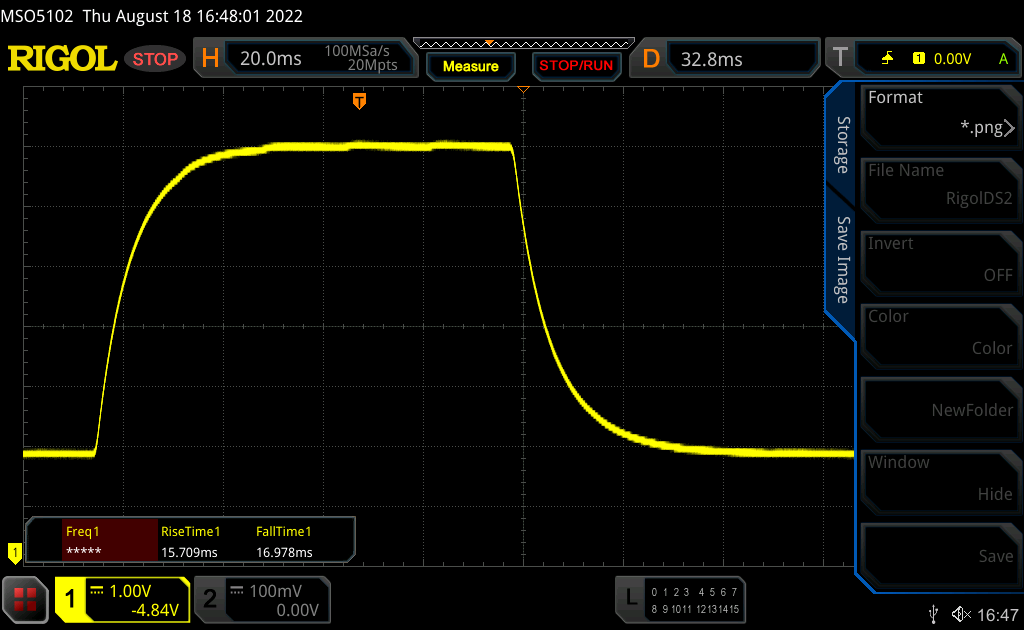 |
| ↘ 17 ms fall | ||
| The screen shows slow response rates in our tests and will be unsatisfactory for gamers. In comparison, all tested devices range from 0.165 (minimum) to 636 (maximum) ms. » 45 % of all devices are better. This means that the measured response time is similar to the average of all tested devices (30.9 ms). | ||
Screen Flickering / PWM (Pulse-Width Modulation)
| Screen flickering / PWM not detected | 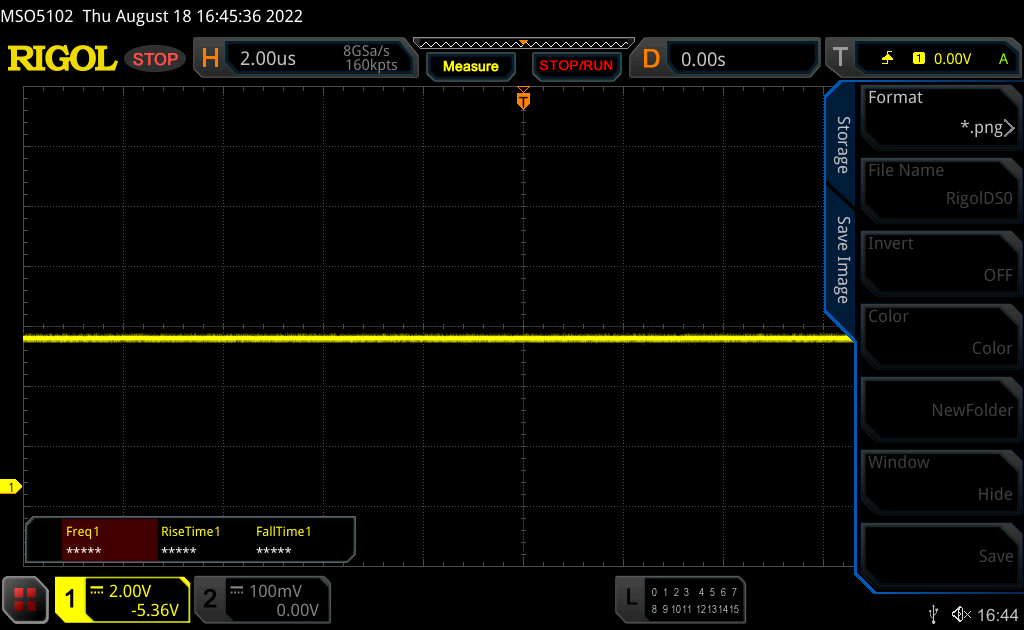 | ||
In comparison: 52 % of all tested devices do not use PWM to dim the display. If PWM was detected, an average of 7741 (minimum: 5 - maximum: 343500) Hz was measured. | |||
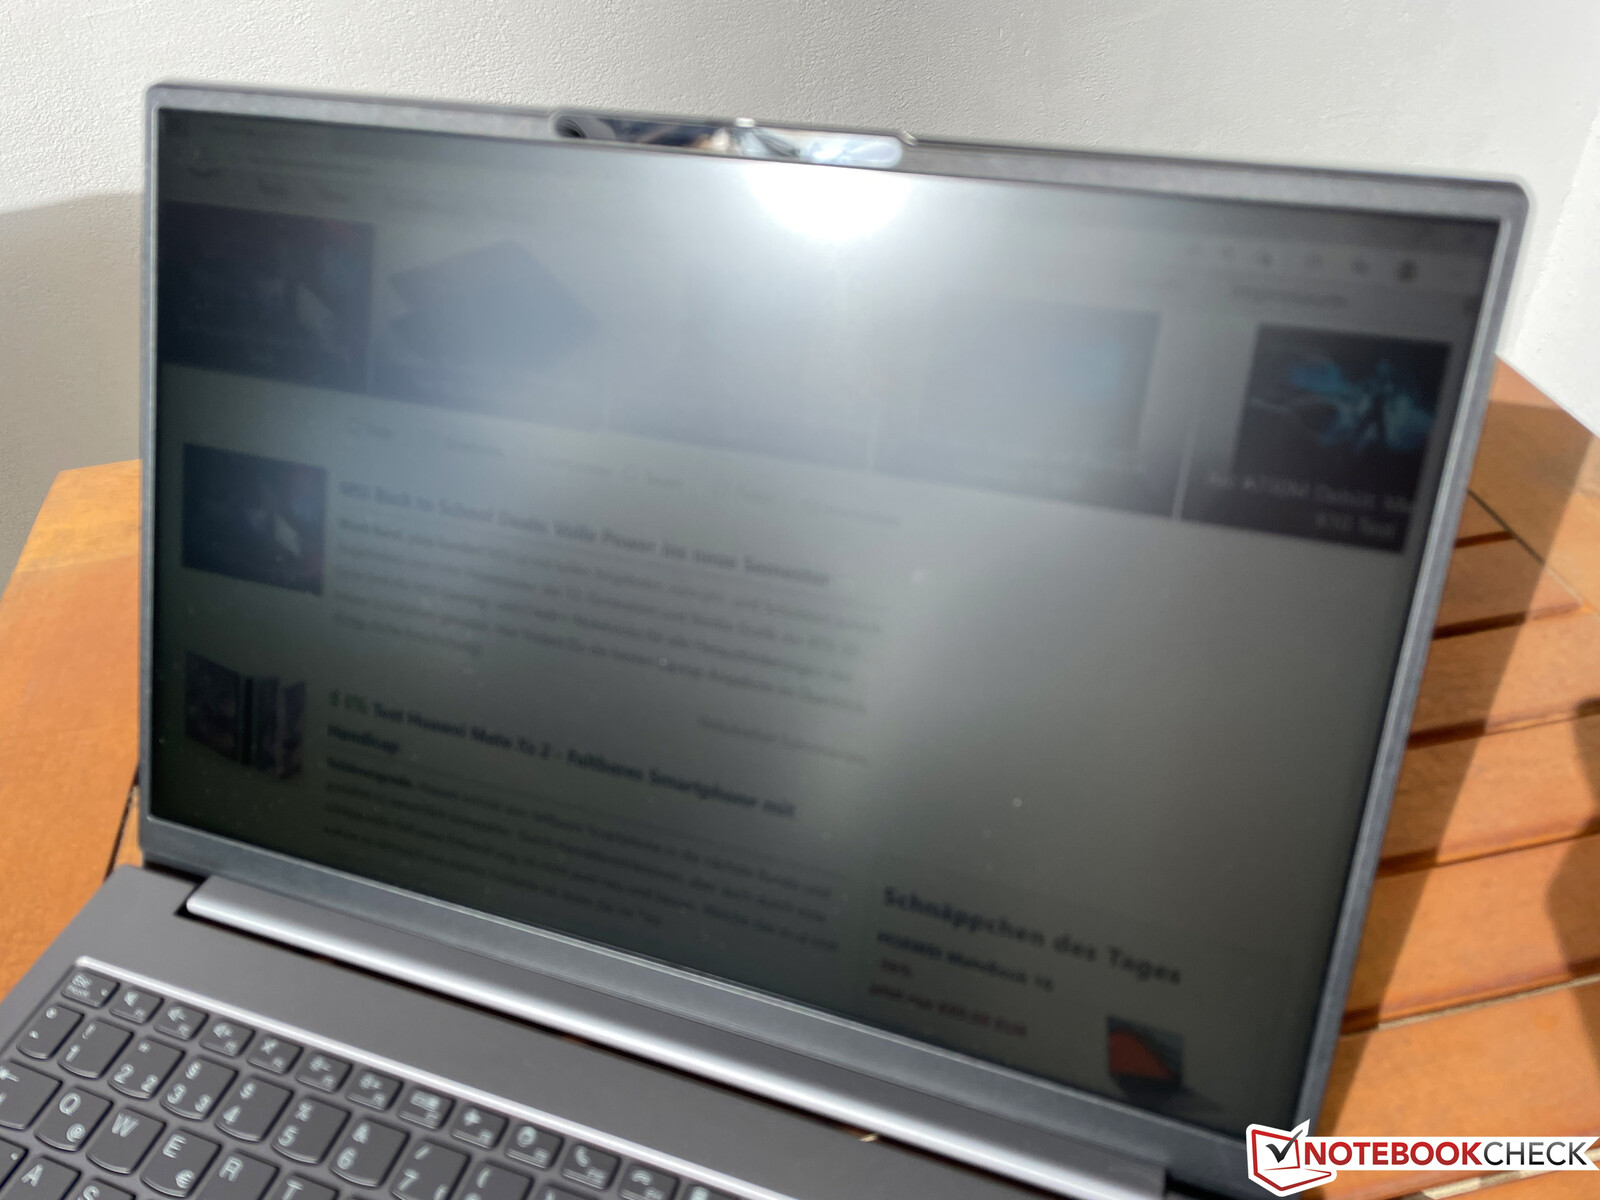
当然,哑光屏幕表面在户外也有帮助,你可以在阴天舒适地工作,但在非常明亮的日子里,显示屏需要更亮一点。
性能 - Alder Lake &GeForce RTX
测试条件
像往常一样,联想提供了自己的电源设置,可以通过预装的Vantage软件或Fn+P组合键来设置。我们在下面的表格中列出了CPU和GPU各自的TDP/TGP值。我们使用高性能 设置进行测试。
| 性能模式 | CPU负载 | GPU负载 | 压力测试 | 最大风扇音量 |
|---|---|---|---|---|
| 节省电池 | 64 -> 20瓦 | 20瓦 | CPU: 20瓦GPU : 20瓦 |
30.5 dB(A) |
| 智能冷却 | 72 -> 35瓦 | 36瓦 | CPU: 24瓦GPU :36瓦 |
43.7 dB(A) |
| 高性能 | 80 -> 55瓦 | 60瓦 | CPU: 20瓦GPU :50 瓦 |
47 dB(A) |
处理器
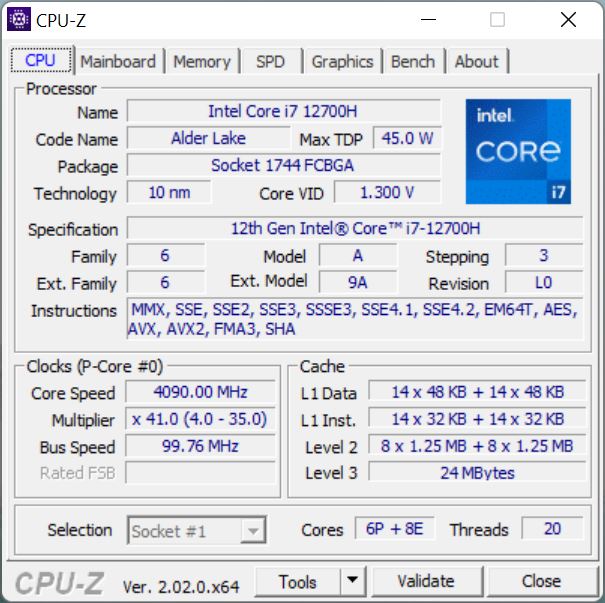
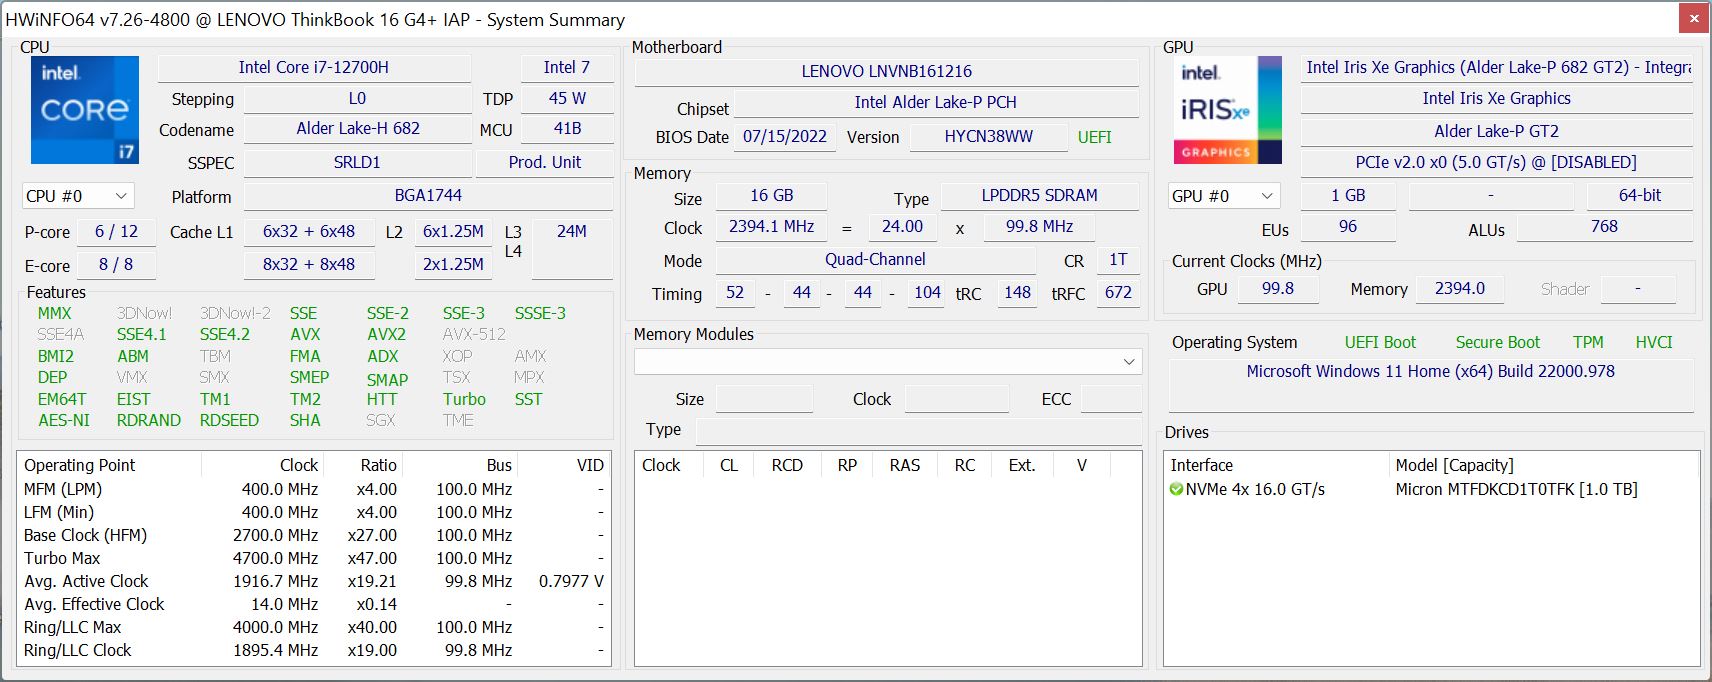
芯片 酷睿i7-12700H是英特尔目前Alder Lake一代的快速处理器,它依赖于一个具有6个快速性能和8个效率核心的混合架构。由于高功率限制,ThinkBook 16 G4+的性能产量非常好,CPU性能优于对手。即使在持续负载的情况下,该处理器仍保持在55瓦,并提供良好的效果。然而,在电池模式下,最大消耗被限制在70瓦,然后迅速达到64瓦,这就是为什么不插电时,多核性能降低了~12%。更多的CPU基准测试可在 这里.
Cinebench R15 Multi Sustained Load
Cinebench R23: Multi Core | Single Core
Cinebench R20: CPU (Multi Core) | CPU (Single Core)
Cinebench R15: CPU Multi 64Bit | CPU Single 64Bit
Blender: v2.79 BMW27 CPU
7-Zip 18.03: 7z b 4 | 7z b 4 -mmt1
Geekbench 5.5: Multi-Core | Single-Core
HWBOT x265 Benchmark v2.2: 4k Preset
LibreOffice : 20 Documents To PDF
R Benchmark 2.5: Overall mean
| CPU Performance rating | |
| Average of class Multimedia | |
| Lenovo ThinkBook 16 G4+ IAP | |
| Average Intel Core i7-12700H | |
| Dell Inspiron 16 Plus 7620 | |
| Huawei MateBook D 16 2022 | |
| Asus Vivobook Pro 16X-M7600QE | |
| Samsung Galaxy Book2 15 | |
| Acer Swift X SFX16-51G-5388 | |
| Cinebench R23 / Multi Core | |
| Average of class Multimedia (4861 - 33362, n=65, last 2 years) | |
| Lenovo ThinkBook 16 G4+ IAP | |
| Average Intel Core i7-12700H (4032 - 19330, n=64) | |
| Dell Inspiron 16 Plus 7620 | |
| Asus Vivobook Pro 16X-M7600QE | |
| Asus Vivobook Pro 16X-M7600QE | |
| Huawei MateBook D 16 2022 | |
| Samsung Galaxy Book2 15 | |
| Acer Swift X SFX16-51G-5388 | |
| Cinebench R23 / Single Core | |
| Average of class Multimedia (1128 - 2459, n=64, last 2 years) | |
| Lenovo ThinkBook 16 G4+ IAP | |
| Huawei MateBook D 16 2022 | |
| Samsung Galaxy Book2 15 | |
| Dell Inspiron 16 Plus 7620 | |
| Average Intel Core i7-12700H (778 - 1826, n=63) | |
| Asus Vivobook Pro 16X-M7600QE | |
| Asus Vivobook Pro 16X-M7600QE | |
| Acer Swift X SFX16-51G-5388 | |
| Cinebench R20 / CPU (Multi Core) | |
| Average of class Multimedia (1887 - 12912, n=56, last 2 years) | |
| Lenovo ThinkBook 16 G4+ IAP | |
| Average Intel Core i7-12700H (1576 - 7407, n=64) | |
| Dell Inspiron 16 Plus 7620 | |
| Asus Vivobook Pro 16X-M7600QE | |
| Asus Vivobook Pro 16X-M7600QE | |
| Huawei MateBook D 16 2022 | |
| Samsung Galaxy Book2 15 | |
| Acer Swift X SFX16-51G-5388 | |
| Cinebench R20 / CPU (Single Core) | |
| Average of class Multimedia (425 - 853, n=56, last 2 years) | |
| Lenovo ThinkBook 16 G4+ IAP | |
| Samsung Galaxy Book2 15 | |
| Dell Inspiron 16 Plus 7620 | |
| Average Intel Core i7-12700H (300 - 704, n=64) | |
| Huawei MateBook D 16 2022 | |
| Asus Vivobook Pro 16X-M7600QE | |
| Asus Vivobook Pro 16X-M7600QE | |
| Acer Swift X SFX16-51G-5388 | |
| Cinebench R15 / CPU Multi 64Bit | |
| Average of class Multimedia (856 - 5224, n=60, last 2 years) | |
| Average Intel Core i7-12700H (1379 - 2916, n=70) | |
| Lenovo ThinkBook 16 G4+ IAP | |
| Dell Inspiron 16 Plus 7620 | |
| Huawei MateBook D 16 2022 | |
| Huawei MateBook D 16 2022 | |
| Asus Vivobook Pro 16X-M7600QE | |
| Asus Vivobook Pro 16X-M7600QE | |
| Samsung Galaxy Book2 15 | |
| Acer Swift X SFX16-51G-5388 | |
| Cinebench R15 / CPU Single 64Bit | |
| Average of class Multimedia (184.8 - 326, n=58, last 2 years) | |
| Lenovo ThinkBook 16 G4+ IAP | |
| Huawei MateBook D 16 2022 | |
| Dell Inspiron 16 Plus 7620 | |
| Average Intel Core i7-12700H (113 - 263, n=65) | |
| Samsung Galaxy Book2 15 | |
| Asus Vivobook Pro 16X-M7600QE | |
| Asus Vivobook Pro 16X-M7600QE | |
| Acer Swift X SFX16-51G-5388 | |
| Blender / v2.79 BMW27 CPU | |
| Acer Swift X SFX16-51G-5388 | |
| Samsung Galaxy Book2 15 | |
| Huawei MateBook D 16 2022 | |
| Asus Vivobook Pro 16X-M7600QE | |
| Asus Vivobook Pro 16X-M7600QE | |
| Average of class Multimedia (100 - 557, n=57, last 2 years) | |
| Dell Inspiron 16 Plus 7620 | |
| Average Intel Core i7-12700H (168 - 732, n=63) | |
| Lenovo ThinkBook 16 G4+ IAP | |
| 7-Zip 18.03 / 7z b 4 | |
| Lenovo ThinkBook 16 G4+ IAP | |
| Average Intel Core i7-12700H (22844 - 73067, n=63) | |
| Dell Inspiron 16 Plus 7620 | |
| Asus Vivobook Pro 16X-M7600QE | |
| Asus Vivobook Pro 16X-M7600QE | |
| Average of class Multimedia (26062 - 130368, n=54, last 2 years) | |
| Huawei MateBook D 16 2022 | |
| Samsung Galaxy Book2 15 | |
| Acer Swift X SFX16-51G-5388 | |
| 7-Zip 18.03 / 7z b 4 -mmt1 | |
| Average of class Multimedia (3666 - 7545, n=55, last 2 years) | |
| Asus Vivobook Pro 16X-M7600QE | |
| Asus Vivobook Pro 16X-M7600QE | |
| Huawei MateBook D 16 2022 | |
| Lenovo ThinkBook 16 G4+ IAP | |
| Average Intel Core i7-12700H (2743 - 5972, n=63) | |
| Dell Inspiron 16 Plus 7620 | |
| Samsung Galaxy Book2 15 | |
| Acer Swift X SFX16-51G-5388 | |
| Geekbench 5.5 / Multi-Core | |
| Average of class Multimedia (4652 - 20422, n=55, last 2 years) | |
| Lenovo ThinkBook 16 G4+ IAP | |
| Dell Inspiron 16 Plus 7620 | |
| Average Intel Core i7-12700H (5144 - 13745, n=64) | |
| Huawei MateBook D 16 2022 | |
| Asus Vivobook Pro 16X-M7600QE | |
| Asus Vivobook Pro 16X-M7600QE | |
| Samsung Galaxy Book2 15 | |
| Acer Swift X SFX16-51G-5388 | |
| Geekbench 5.5 / Single-Core | |
| Average of class Multimedia (805 - 2974, n=55, last 2 years) | |
| Huawei MateBook D 16 2022 | |
| Lenovo ThinkBook 16 G4+ IAP | |
| Samsung Galaxy Book2 15 | |
| Dell Inspiron 16 Plus 7620 | |
| Average Intel Core i7-12700H (803 - 1851, n=64) | |
| Asus Vivobook Pro 16X-M7600QE | |
| Asus Vivobook Pro 16X-M7600QE | |
| Acer Swift X SFX16-51G-5388 | |
| HWBOT x265 Benchmark v2.2 / 4k Preset | |
| Average of class Multimedia (5.26 - 36.1, n=55, last 2 years) | |
| Lenovo ThinkBook 16 G4+ IAP | |
| Average Intel Core i7-12700H (4.67 - 21.8, n=64) | |
| Dell Inspiron 16 Plus 7620 | |
| Asus Vivobook Pro 16X-M7600QE | |
| Asus Vivobook Pro 16X-M7600QE | |
| Huawei MateBook D 16 2022 | |
| Samsung Galaxy Book2 15 | |
| Acer Swift X SFX16-51G-5388 | |
| LibreOffice / 20 Documents To PDF | |
| Asus Vivobook Pro 16X-M7600QE | |
| Asus Vivobook Pro 16X-M7600QE | |
| Acer Swift X SFX16-51G-5388 | |
| Average of class Multimedia (23.9 - 146.7, n=56, last 2 years) | |
| Lenovo ThinkBook 16 G4+ IAP | |
| Dell Inspiron 16 Plus 7620 | |
| Average Intel Core i7-12700H (34.2 - 95.3, n=63) | |
| Samsung Galaxy Book2 15 | |
| Huawei MateBook D 16 2022 | |
| R Benchmark 2.5 / Overall mean | |
| Acer Swift X SFX16-51G-5388 | |
| Asus Vivobook Pro 16X-M7600QE | |
| Asus Vivobook Pro 16X-M7600QE | |
| Dell Inspiron 16 Plus 7620 | |
| Average Intel Core i7-12700H (0.4441 - 1.052, n=63) | |
| Samsung Galaxy Book2 15 | |
| Average of class Multimedia (0.3604 - 0.947, n=55, last 2 years) | |
| Lenovo ThinkBook 16 G4+ IAP | |
| Huawei MateBook D 16 2022 | |
* ... smaller is better
AIDA64: FP32 Ray-Trace | FPU Julia | CPU SHA3 | CPU Queen | FPU SinJulia | FPU Mandel | CPU AES | CPU ZLib | FP64 Ray-Trace | CPU PhotoWorxx
| Performance rating | |
| Average of class Multimedia | |
| Asus Vivobook Pro 16X-M7600QE | |
| Lenovo ThinkBook 16 G4+ IAP | |
| Dell Inspiron 16 Plus 7620 | |
| Average Intel Core i7-12700H | |
| Huawei MateBook D 16 2022 | |
| Samsung Galaxy Book2 15 | |
| Acer Swift X SFX16-51G-5388 | |
| AIDA64 / FP32 Ray-Trace | |
| Average of class Multimedia (2214 - 50388, n=53, last 2 years) | |
| Lenovo ThinkBook 16 G4+ IAP | |
| Asus Vivobook Pro 16X-M7600QE | |
| Asus Vivobook Pro 16X-M7600QE | |
| Dell Inspiron 16 Plus 7620 | |
| Huawei MateBook D 16 2022 | |
| Average Intel Core i7-12700H (2585 - 17957, n=64) | |
| Acer Swift X SFX16-51G-5388 | |
| Samsung Galaxy Book2 15 | |
| AIDA64 / FPU Julia | |
| Asus Vivobook Pro 16X-M7600QE | |
| Asus Vivobook Pro 16X-M7600QE | |
| Average of class Multimedia (12867 - 201874, n=53, last 2 years) | |
| Lenovo ThinkBook 16 G4+ IAP | |
| Dell Inspiron 16 Plus 7620 | |
| Huawei MateBook D 16 2022 | |
| Average Intel Core i7-12700H (12439 - 90760, n=64) | |
| Acer Swift X SFX16-51G-5388 | |
| Samsung Galaxy Book2 15 | |
| AIDA64 / CPU SHA3 | |
| Average of class Multimedia (626 - 8623, n=53, last 2 years) | |
| Lenovo ThinkBook 16 G4+ IAP | |
| Asus Vivobook Pro 16X-M7600QE | |
| Asus Vivobook Pro 16X-M7600QE | |
| Average Intel Core i7-12700H (833 - 4242, n=64) | |
| Dell Inspiron 16 Plus 7620 | |
| Huawei MateBook D 16 2022 | |
| Acer Swift X SFX16-51G-5388 | |
| Samsung Galaxy Book2 15 | |
| AIDA64 / CPU Queen | |
| Lenovo ThinkBook 16 G4+ IAP | |
| Asus Vivobook Pro 16X-M7600QE | |
| Asus Vivobook Pro 16X-M7600QE | |
| Average Intel Core i7-12700H (57923 - 103202, n=63) | |
| Huawei MateBook D 16 2022 | |
| Dell Inspiron 16 Plus 7620 | |
| Average of class Multimedia (13483 - 181505, n=40, last 2 years) | |
| Samsung Galaxy Book2 15 | |
| Acer Swift X SFX16-51G-5388 | |
| AIDA64 / FPU SinJulia | |
| Asus Vivobook Pro 16X-M7600QE | |
| Asus Vivobook Pro 16X-M7600QE | |
| Lenovo ThinkBook 16 G4+ IAP | |
| Average Intel Core i7-12700H (3249 - 9939, n=64) | |
| Dell Inspiron 16 Plus 7620 | |
| Average of class Multimedia (886 - 28794, n=53, last 2 years) | |
| Huawei MateBook D 16 2022 | |
| Samsung Galaxy Book2 15 | |
| Acer Swift X SFX16-51G-5388 | |
| AIDA64 / FPU Mandel | |
| Asus Vivobook Pro 16X-M7600QE | |
| Asus Vivobook Pro 16X-M7600QE | |
| Average of class Multimedia (6395 - 105740, n=53, last 2 years) | |
| Lenovo ThinkBook 16 G4+ IAP | |
| Dell Inspiron 16 Plus 7620 | |
| Average Intel Core i7-12700H (7135 - 44760, n=64) | |
| Huawei MateBook D 16 2022 | |
| Acer Swift X SFX16-51G-5388 | |
| Samsung Galaxy Book2 15 | |
| AIDA64 / CPU AES | |
| Asus Vivobook Pro 16X-M7600QE | |
| Asus Vivobook Pro 16X-M7600QE | |
| Huawei MateBook D 16 2022 | |
| Average Intel Core i7-12700H (31839 - 144360, n=64) | |
| Lenovo ThinkBook 16 G4+ IAP | |
| Dell Inspiron 16 Plus 7620 | |
| Average of class Multimedia (8171 - 126790, n=53, last 2 years) | |
| Acer Swift X SFX16-51G-5388 | |
| Samsung Galaxy Book2 15 | |
| AIDA64 / CPU ZLib | |
| Lenovo ThinkBook 16 G4+ IAP | |
| Dell Inspiron 16 Plus 7620 | |
| Average Intel Core i7-12700H (305 - 1171, n=64) | |
| Average of class Multimedia (143.8 - 2022, n=53, last 2 years) | |
| Asus Vivobook Pro 16X-M7600QE | |
| Asus Vivobook Pro 16X-M7600QE | |
| Huawei MateBook D 16 2022 | |
| Samsung Galaxy Book2 15 | |
| Acer Swift X SFX16-51G-5388 | |
| AIDA64 / FP64 Ray-Trace | |
| Average of class Multimedia (1014 - 26875, n=53, last 2 years) | |
| Asus Vivobook Pro 16X-M7600QE | |
| Asus Vivobook Pro 16X-M7600QE | |
| Lenovo ThinkBook 16 G4+ IAP | |
| Dell Inspiron 16 Plus 7620 | |
| Average Intel Core i7-12700H (1437 - 9692, n=64) | |
| Huawei MateBook D 16 2022 | |
| Acer Swift X SFX16-51G-5388 | |
| Samsung Galaxy Book2 15 | |
| AIDA64 / CPU PhotoWorxx | |
| Average of class Multimedia (8187 - 88154, n=53, last 2 years) | |
| Samsung Galaxy Book2 15 | |
| Lenovo ThinkBook 16 G4+ IAP | |
| Huawei MateBook D 16 2022 | |
| Acer Swift X SFX16-51G-5388 | |
| Dell Inspiron 16 Plus 7620 | |
| Average Intel Core i7-12700H (12863 - 52207, n=64) | |
| Asus Vivobook Pro 16X-M7600QE | |
| Asus Vivobook Pro 16X-M7600QE | |
系统性能
在日常使用中,ThinkBook 16 G4+是一台反应极为迅速的笔记本电脑,鉴于其强大的组件,人们不应担心在未来几年出现性能瓶颈。我们无法在我们的评测样本中运行合成PCMark 10,因为它总是崩溃,尽管重新安装了几个程序,也重新安装了驱动程序。这是我们在测试过程中遇到的唯一问题,其他基准测试的结果非常好,符合预期。
WebXPRT 3: Overall
WebXPRT 4: Overall
Jetstream 2: 2.0 Total
Mozilla Kraken 1.1: Total
Octane V2: Total Score
LibreOffice : 20 Documents To PDF
| CrossMark / Overall | |
| Average of class Multimedia (866 - 2728, n=59, last 2 years) | |
| Huawei MateBook D 16 2022 | |
| Lenovo ThinkBook 16 G4+ IAP | |
| Average Intel Core i7-12700H, NVIDIA GeForce RTX 2050 Mobile (n=1) | |
| Dell Inspiron 16 Plus 7620 | |
| Acer Swift X SFX16-51G-5388 | |
| CrossMark / Productivity | |
| Huawei MateBook D 16 2022 | |
| Average of class Multimedia (931 - 2489, n=59, last 2 years) | |
| Lenovo ThinkBook 16 G4+ IAP | |
| Average Intel Core i7-12700H, NVIDIA GeForce RTX 2050 Mobile (n=1) | |
| Dell Inspiron 16 Plus 7620 | |
| Acer Swift X SFX16-51G-5388 | |
| CrossMark / Creativity | |
| Average of class Multimedia (907 - 3465, n=59, last 2 years) | |
| Huawei MateBook D 16 2022 | |
| Lenovo ThinkBook 16 G4+ IAP | |
| Average Intel Core i7-12700H, NVIDIA GeForce RTX 2050 Mobile (n=1) | |
| Dell Inspiron 16 Plus 7620 | |
| Acer Swift X SFX16-51G-5388 | |
| CrossMark / Responsiveness | |
| Huawei MateBook D 16 2022 | |
| Lenovo ThinkBook 16 G4+ IAP | |
| Average Intel Core i7-12700H, NVIDIA GeForce RTX 2050 Mobile (n=1) | |
| Average of class Multimedia (605 - 2024, n=59, last 2 years) | |
| Dell Inspiron 16 Plus 7620 | |
| Acer Swift X SFX16-51G-5388 | |
| WebXPRT 3 / Overall | |
| Average of class Multimedia (136.4 - 596, n=62, last 2 years) | |
| Huawei MateBook D 16 2022 | |
| Dell Inspiron 16 Plus 7620 | |
| Lenovo ThinkBook 16 G4+ IAP | |
| Average Intel Core i7-12700H, NVIDIA GeForce RTX 2050 Mobile (n=1) | |
| Asus Vivobook Pro 16X-M7600QE | |
| Samsung Galaxy Book2 15 | |
| Acer Swift X SFX16-51G-5388 | |
| WebXPRT 4 / Overall | |
| Average of class Multimedia (167.3 - 402, n=64, last 2 years) | |
| Huawei MateBook D 16 2022 | |
| Lenovo ThinkBook 16 G4+ IAP | |
| Average Intel Core i7-12700H, NVIDIA GeForce RTX 2050 Mobile (n=1) | |
| Dell Inspiron 16 Plus 7620 | |
| Samsung Galaxy Book2 15 | |
| Acer Swift X SFX16-51G-5388 | |
| Jetstream 2 / 2.0 Total | |
| Average of class Multimedia (287 - 481, n=30, last 2 years) | |
| Dell Inspiron 16 Plus 7620 | |
| Lenovo ThinkBook 16 G4+ IAP | |
| Average Intel Core i7-12700H, NVIDIA GeForce RTX 2050 Mobile (n=1) | |
| Huawei MateBook D 16 2022 | |
| Samsung Galaxy Book2 15 | |
| Acer Swift X SFX16-51G-5388 | |
| Mozilla Kraken 1.1 / Total | |
| Acer Swift X SFX16-51G-5388 | |
| Asus Vivobook Pro 16X-M7600QE | |
| Asus Vivobook Pro 16X-M7600QE | |
| Samsung Galaxy Book2 15 | |
| Dell Inspiron 16 Plus 7620 | |
| Huawei MateBook D 16 2022 | |
| Lenovo ThinkBook 16 G4+ IAP | |
| Average Intel Core i7-12700H, NVIDIA GeForce RTX 2050 Mobile (n=1) | |
| Average of class Multimedia (228 - 835, n=65, last 2 years) | |
| Octane V2 / Total Score | |
| Average of class Multimedia (79641 - 153175, n=29, last 2 years) | |
| Huawei MateBook D 16 2022 | |
| Lenovo ThinkBook 16 G4+ IAP | |
| Average Intel Core i7-12700H, NVIDIA GeForce RTX 2050 Mobile (n=1) | |
| Samsung Galaxy Book2 15 | |
| Acer Swift X SFX16-51G-5388 | |
| LibreOffice / 20 Documents To PDF | |
| Asus Vivobook Pro 16X-M7600QE | |
| Asus Vivobook Pro 16X-M7600QE | |
| Acer Swift X SFX16-51G-5388 | |
| Average of class Multimedia (23.9 - 146.7, n=56, last 2 years) | |
| Lenovo ThinkBook 16 G4+ IAP | |
| Average Intel Core i7-12700H, NVIDIA GeForce RTX 2050 Mobile (n=1) | |
| Dell Inspiron 16 Plus 7620 | |
| Samsung Galaxy Book2 15 | |
| Huawei MateBook D 16 2022 | |
* ... smaller is better
» No benchmarks for this notebook found!
| AIDA64 / Memory Copy | |
| Average of class Multimedia (11299 - 132135, n=53, last 2 years) | |
| Lenovo ThinkBook 16 G4+ IAP | |
| Samsung Galaxy Book2 15 | |
| Huawei MateBook D 16 2022 | |
| Acer Swift X SFX16-51G-5388 | |
| Dell Inspiron 16 Plus 7620 | |
| Average Intel Core i7-12700H (25615 - 80511, n=64) | |
| Asus Vivobook Pro 16X-M7600QE | |
| Asus Vivobook Pro 16X-M7600QE | |
| AIDA64 / Memory Read | |
| Average of class Multimedia (11624 - 174586, n=53, last 2 years) | |
| Lenovo ThinkBook 16 G4+ IAP | |
| Dell Inspiron 16 Plus 7620 | |
| Samsung Galaxy Book2 15 | |
| Average Intel Core i7-12700H (25586 - 79442, n=64) | |
| Huawei MateBook D 16 2022 | |
| Acer Swift X SFX16-51G-5388 | |
| Asus Vivobook Pro 16X-M7600QE | |
| Asus Vivobook Pro 16X-M7600QE | |
| AIDA64 / Memory Write | |
| Average of class Multimedia (11755 - 134998, n=53, last 2 years) | |
| Samsung Galaxy Book2 15 | |
| Acer Swift X SFX16-51G-5388 | |
| Huawei MateBook D 16 2022 | |
| Lenovo ThinkBook 16 G4+ IAP | |
| Dell Inspiron 16 Plus 7620 | |
| Average Intel Core i7-12700H (23679 - 88660, n=64) | |
| Asus Vivobook Pro 16X-M7600QE | |
| Asus Vivobook Pro 16X-M7600QE | |
| AIDA64 / Memory Latency | |
| Average of class Multimedia (7 - 535, n=52, last 2 years) | |
| Acer Swift X SFX16-51G-5388 | |
| Lenovo ThinkBook 16 G4+ IAP | |
| Huawei MateBook D 16 2022 | |
| Dell Inspiron 16 Plus 7620 | |
| Average Intel Core i7-12700H (76.2 - 133.9, n=62) | |
| Asus Vivobook Pro 16X-M7600QE | |
| Asus Vivobook Pro 16X-M7600QE | |
| Samsung Galaxy Book2 15 | |
* ... smaller is better
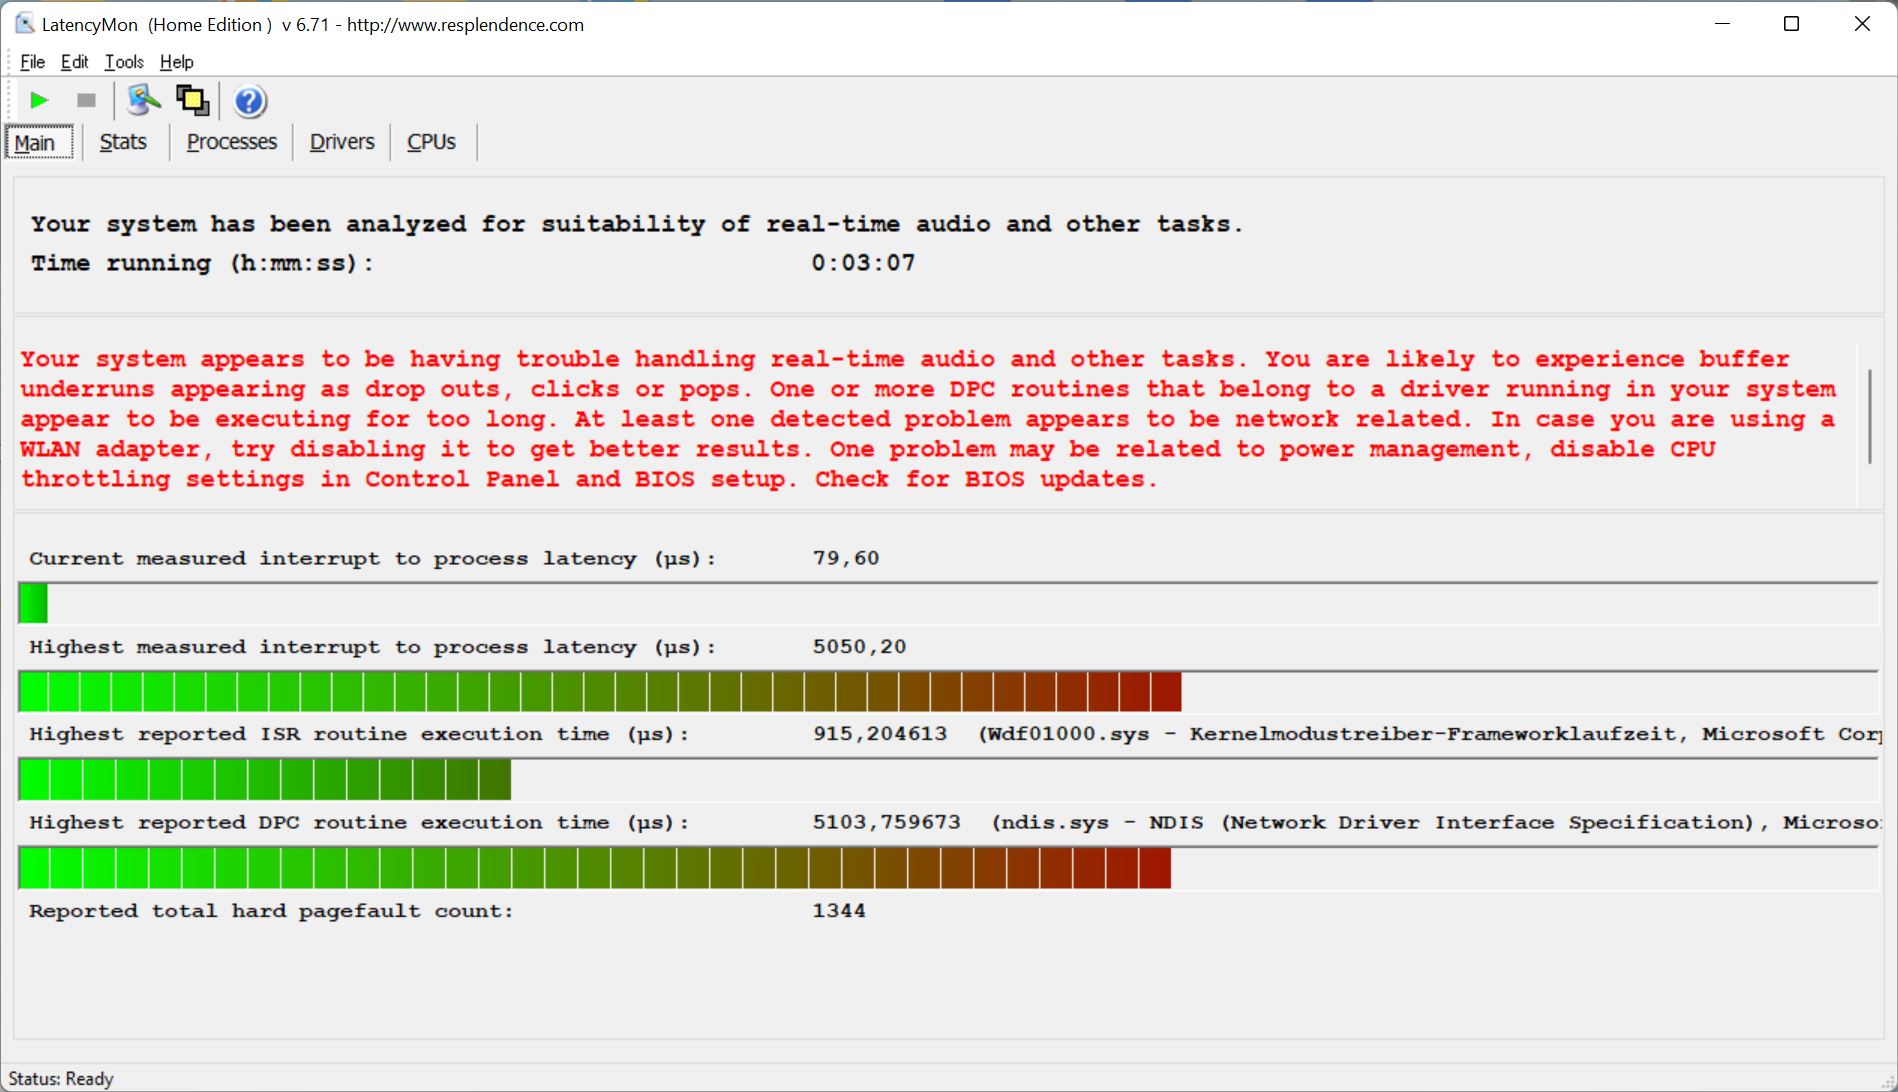
DPC延时
在我们的标准化延迟测试中(网页浏览、4K YouTube播放、CPU负载),ThinkBook 16 G4+显示出目前版本的严重限制,因此不适合使用实时音频应用程序。
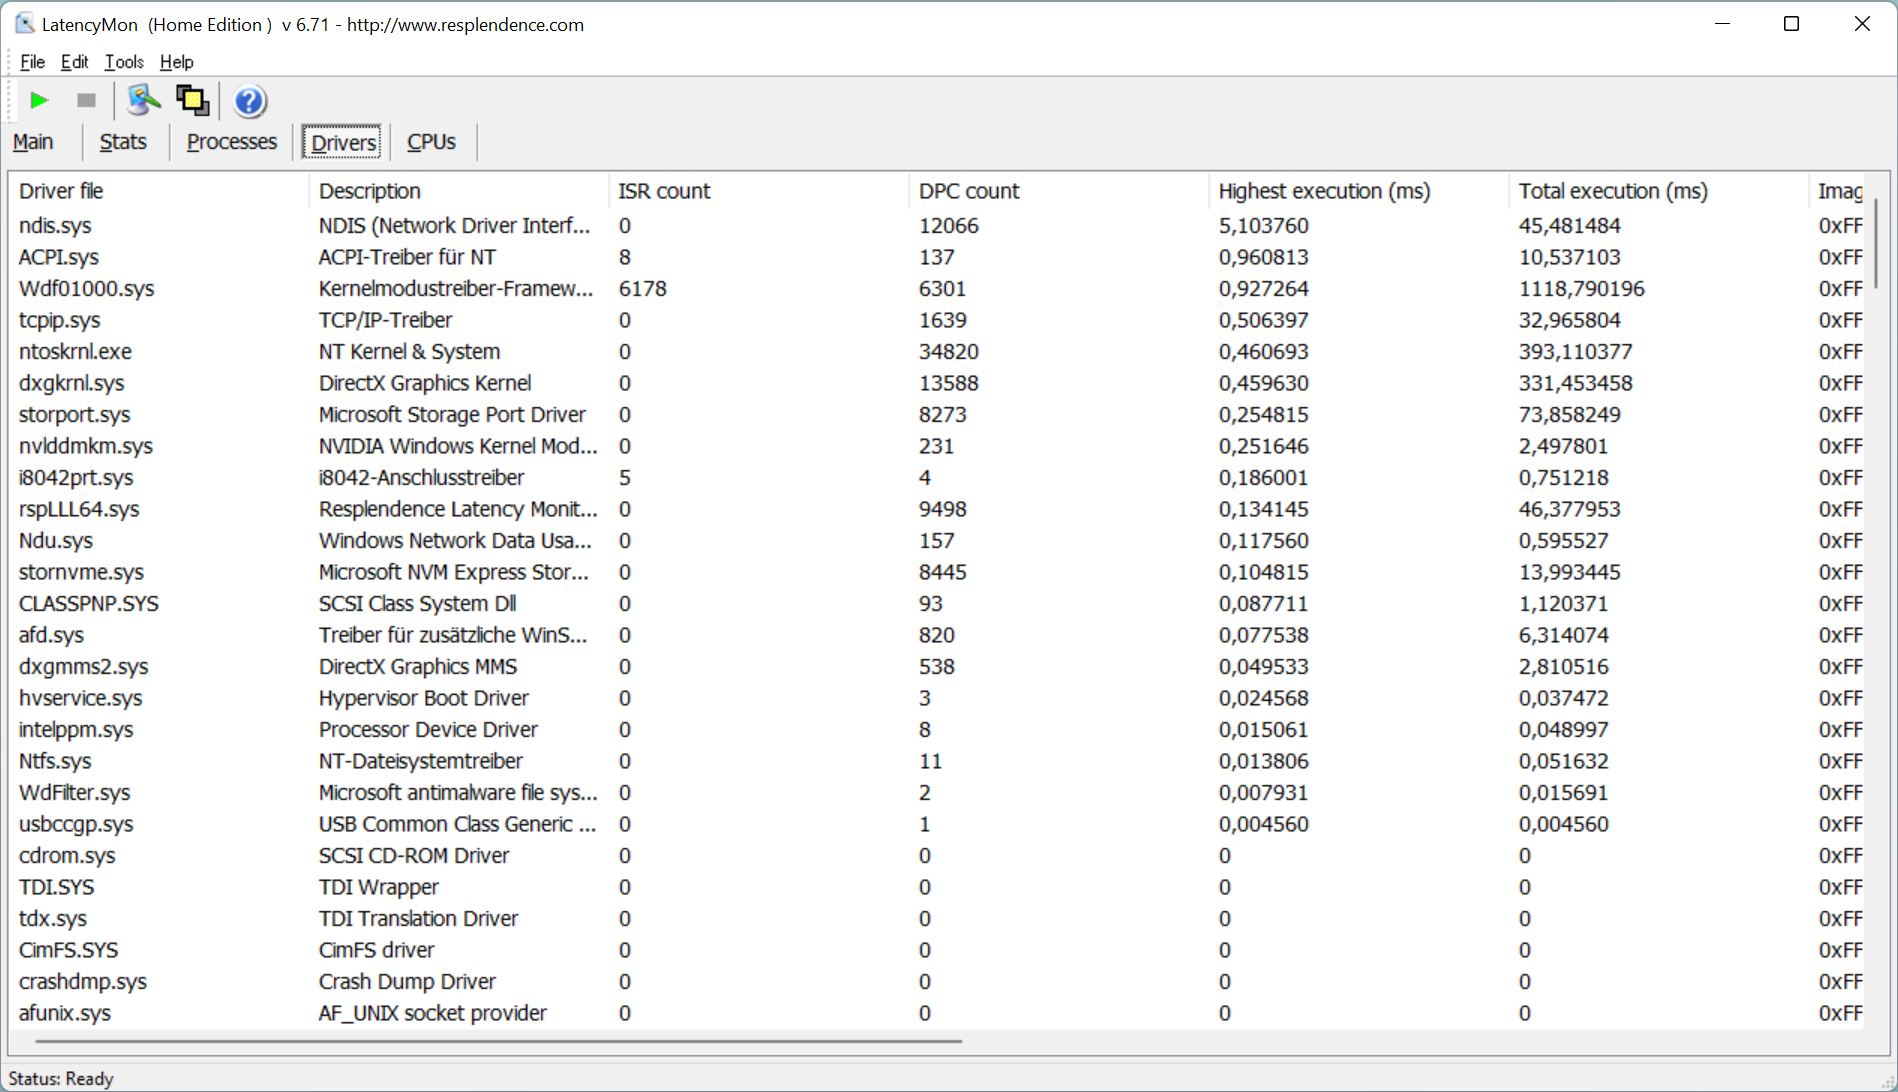
| DPC Latencies / LatencyMon - interrupt to process latency (max), Web, Youtube, Prime95 | |
| Acer Swift X SFX16-51G-5388 | |
| Lenovo ThinkBook 16 G4+ IAP | |
| Asus Vivobook Pro 16X-M7600QE | |
| Dell Inspiron 16 Plus 7620 | |
| Samsung Galaxy Book2 15 | |
| Huawei MateBook D 16 2022 | |
* ... smaller is better
医学专家
ThinkBook 16 G4+为SSD提供了两个M.2-2280插槽,其中一个使用快速的PCIe 4.0连接,另一个使用PCIe 3.0。我们的评测样本中安装了一个紧凑的美光2450(M.2-2242),这已经是一个PCIe 4.0固态硬盘,但这个硬盘不是最快的,因为制造商指定的最大传输速率为3.6GB/s。最终的结果是,你有一个PCIe 4.0固态硬盘的PCIe 3.0速度。然而,这在实践中没有真正的限制,即使在长时间的负载下,性能仍然稳定。该固态硬盘的容量为1TB,在第一次启动后仍有916GB可用。更多的SSD基准测试可在这里.

* ... smaller is better
Sustained Read Performance: DiskSpd Read Loop, Queue Depth 8
图形卡
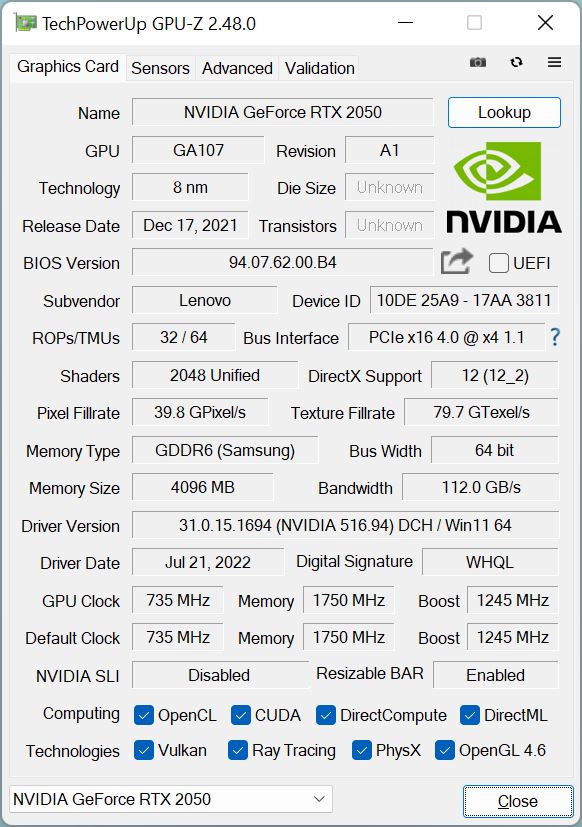
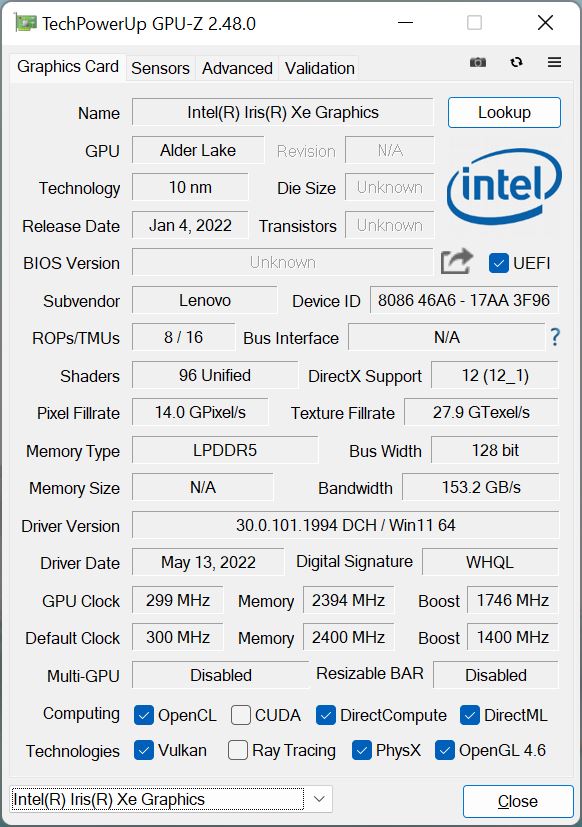
在日常使用中,图形计算通常由处理器的集成化处理。Iris Xe Graphics G7。.专用的 NvidiaGeForce RTX 2050只有在较高的负载下才会自动开启。原则上,这个GPU是一个 GeForce MX570,但也支持RayTracing和DLSS。TGP被设置为最大50瓦,据此,另外10瓦可由处理器使用。我们观察到最大的核心时钟为1,762 MHz。
在合成基准测试中,RTX 2050的排名通常仅次于 RTX 3050,后者的工作效率更高一些。此外,在苛刻的测试中,该GPU的速度是Iris Xe Graphics G7的两倍多。在长时间的负载下,性能没有下降,因为苛刻的Time Spy 压力测试以99.7%轻松通过。
然而,在电池模式下,GPU的能量消耗被限制在30瓦,这导致性能下降15%。更多的GPU基准测试可在我们的技术部分.
| V-Ray 5 Benchmark - GPU CUDA | |
| Average of class Multimedia (335 - 1482, n=5, last 2 years) | |
| Acer Swift X SFX16-51G-5388 | |
| Average NVIDIA GeForce RTX 2050 Mobile (169 - 214, n=3) | |
* ... smaller is better
| 3DMark Vantage P Result | 52669 points | |
| 3DMark 11 Performance | 15277 points | |
| 3DMark Cloud Gate Standard Score | 40781 points | |
| 3DMark Fire Strike Score | 9274 points | |
| 3DMark Time Spy Score | 4300 points | |
Help | ||
游戏性能
的游戏性能。RTX 2050很好,而ThinkBook 16 G4+再次排在RTX 2050的后面。 RTX 3050 Ti在许多情况下,也落后于 RTX 3050.因此,许多标题可以在全高清和高细节下顺利播放,在某些情况下,原生WQHD分辨率也是可能的。只有在要求较高的游戏中才需要减少FHD的细节,如《赛博点2077》。我们的Witcher 3 循环显示,在较长时间的游戏过程中,性能并没有下降。更多游戏基准测试可在 这里.
| The Witcher 3 | |
| 1920x1080 High Graphics & Postprocessing (Nvidia HairWorks Off) | |
| Dell Inspiron 16 Plus 7620 | |
| Lenovo ThinkBook 16 G4+ IAP | |
| Average of class Multimedia (22 - 157, n=5, last 2 years) | |
| Asus Vivobook Pro 16X-M7600QE | |
| Average NVIDIA GeForce RTX 2050 Mobile (46.7 - 78, n=8) | |
| Acer Swift X SFX16-51G-5388 | |
| Samsung Galaxy Book2 15 | |
| Huawei MateBook D 16 2022 | |
| 1920x1080 Ultra Graphics & Postprocessing (HBAO+) | |
| Dell Inspiron 16 Plus 7620 | |
| Asus Vivobook Pro 16X-M7600QE | |
| Average of class Multimedia (11 - 107, n=5, last 2 years) | |
| Lenovo ThinkBook 16 G4+ IAP | |
| Average NVIDIA GeForce RTX 2050 Mobile (24.3 - 39.6, n=9) | |
| Acer Swift X SFX16-51G-5388 | |
| Samsung Galaxy Book2 15 | |
| Huawei MateBook D 16 2022 | |
| Cyberpunk 2077 1.6 | |
| 1920x1080 High Preset | |
| Dell Inspiron 16 Plus 7620 | |
| Lenovo ThinkBook 16 G4+ IAP | |
| Average NVIDIA GeForce RTX 2050 Mobile (19.1 - 31, n=4) | |
| Samsung Galaxy Book2 15 | |
| 1920x1080 Ultra Preset | |
| Dell Inspiron 16 Plus 7620 | |
| Lenovo ThinkBook 16 G4+ IAP | |
| Average NVIDIA GeForce RTX 2050 Mobile (16.8 - 27.4, n=4) | |
| Samsung Galaxy Book2 15 | |
| F1 2021 | |
| 1920x1080 High Preset AA:T AF:16x | |
| Asus Vivobook Pro 16X-M7600QE | |
| Lenovo ThinkBook 16 G4+ IAP | |
| Average NVIDIA GeForce RTX 2050 Mobile (66.2 - 107.6, n=3) | |
| Samsung Galaxy Book2 15 | |
| Huawei MateBook D 16 2022 | |
| 1920x1080 Ultra High Preset + Raytracing AA:T AF:16x | |
| Asus Vivobook Pro 16X-M7600QE | |
| Average NVIDIA GeForce RTX 2050 Mobile (36.1 - 52.3, n=3) | |
| Lenovo ThinkBook 16 G4+ IAP | |
| Huawei MateBook D 16 2022 | |
| Samsung Galaxy Book2 15 | |
Witcher 3 FPS Chart
| low | med. | high | ultra | QHD | |
|---|---|---|---|---|---|
| GTA V (2015) | 179.1 | 175.3 | 108.1 | 52.9 | 37.3 |
| The Witcher 3 (2015) | 216 | 139 | 77 | 38.3 | |
| Dota 2 Reborn (2015) | 167.4 | 153.9 | 140 | 129.6 | |
| Final Fantasy XV Benchmark (2018) | 109.1 | 61 | 41.8 | 29 | |
| X-Plane 11.11 (2018) | 139.6 | 106.4 | 90.1 | ||
| Far Cry 5 (2018) | 118 | 68 | 62 | 60 | 39 |
| Strange Brigade (2018) | 196.9 | 86.8 | 71.5 | 63.1 | 46.5 |
| F1 2021 (2021) | 229 | 130.6 | 99.5 | 44.1 | 28.2 |
| Cyberpunk 2077 1.6 (2022) | 49 | 41 | 31 | 25 |
排放 - 游戏需要耳机
噪声
当空转或低负荷时,这两个风扇几乎总是保持停用状态,即使在高性能 模式下也是如此。然而,在这种模式下,它们在更高的负载下迅速达到最大速度,对应的噪音水平为47 dB(A)。这已经很明显可以听到了,因此我们建议在游戏时使用耳机。在智能冷却 模式下,笔记本电脑只是在游戏时稍微安静一些,略低于44 dB(A)。如果你对性能要求不高,你可以很容易地切换到省电模式,因为风扇很少启动,几乎听不到,但由于功率降低,这种模式很难适合游戏。没有检测到任何电子噪音。
Noise level
| Idle |
| 24.2 / 24.2 / 24.2 dB(A) |
| Load |
| 47 / 47 dB(A) |
 | ||
30 dB silent 40 dB(A) audible 50 dB(A) loud |
||
min: | ||
| Lenovo ThinkBook 16 G4+ IAP GeForce RTX 2050 Mobile, i7-12700H, Micron 2450 1TB MTFDKCD1T0TFK | Dell Inspiron 16 Plus 7620 GeForce RTX 3050 Ti Laptop GPU, i7-12700H, Kioxia BG5 KBG50ZNS512G | Acer Swift X SFX16-51G-5388 GeForce RTX 3050 4GB Laptop GPU, i5-11320H, Samsung PM991 MZVLQ512HBLU | Asus Vivobook Pro 16X-M7600QE GeForce RTX 3050 Ti Laptop GPU, R9 5900HX, SK Hynix HFM001TD3JX013N | Huawei MateBook D 16 2022 Iris Xe G7 96EUs, i7-12700H, Silicon Motion PCIe-8 SSD | Samsung Galaxy Book2 15 A350M, i7-1260P, Samsung PM991 MZVLQ512HBLU | |
|---|---|---|---|---|---|---|
| Noise | -6% | -3% | -5% | 2% | -4% | |
| off / environment * (dB) | 24.2 | 23.3 4% | 25.4 -5% | 26 -7% | 24.2 -0% | 24.3 -0% |
| Idle Minimum * (dB) | 24.2 | 25.7 -6% | 25.4 -5% | 27 -12% | 24.2 -0% | 24.3 -0% |
| Idle Average * (dB) | 24.2 | 26.1 -8% | 25.4 -5% | 27 -12% | 25.8 -7% | 24.3 -0% |
| Idle Maximum * (dB) | 24.2 | 30.6 -26% | 27.8 -15% | 27.5 -14% | 30.5 -26% | 29.8 -23% |
| Load Average * (dB) | 47 | 46.2 2% | 41 13% | 41.7 11% | 39.8 15% | 47.5 -1% |
| Witcher 3 ultra * (dB) | 47 | 49.2 -5% | 39.8 15% | 47.5 -1% | ||
| Load Maximum * (dB) | 47 | 49.4 -5% | 47 -0% | 45.3 4% | 39.8 15% | 47.5 -1% |
* ... smaller is better
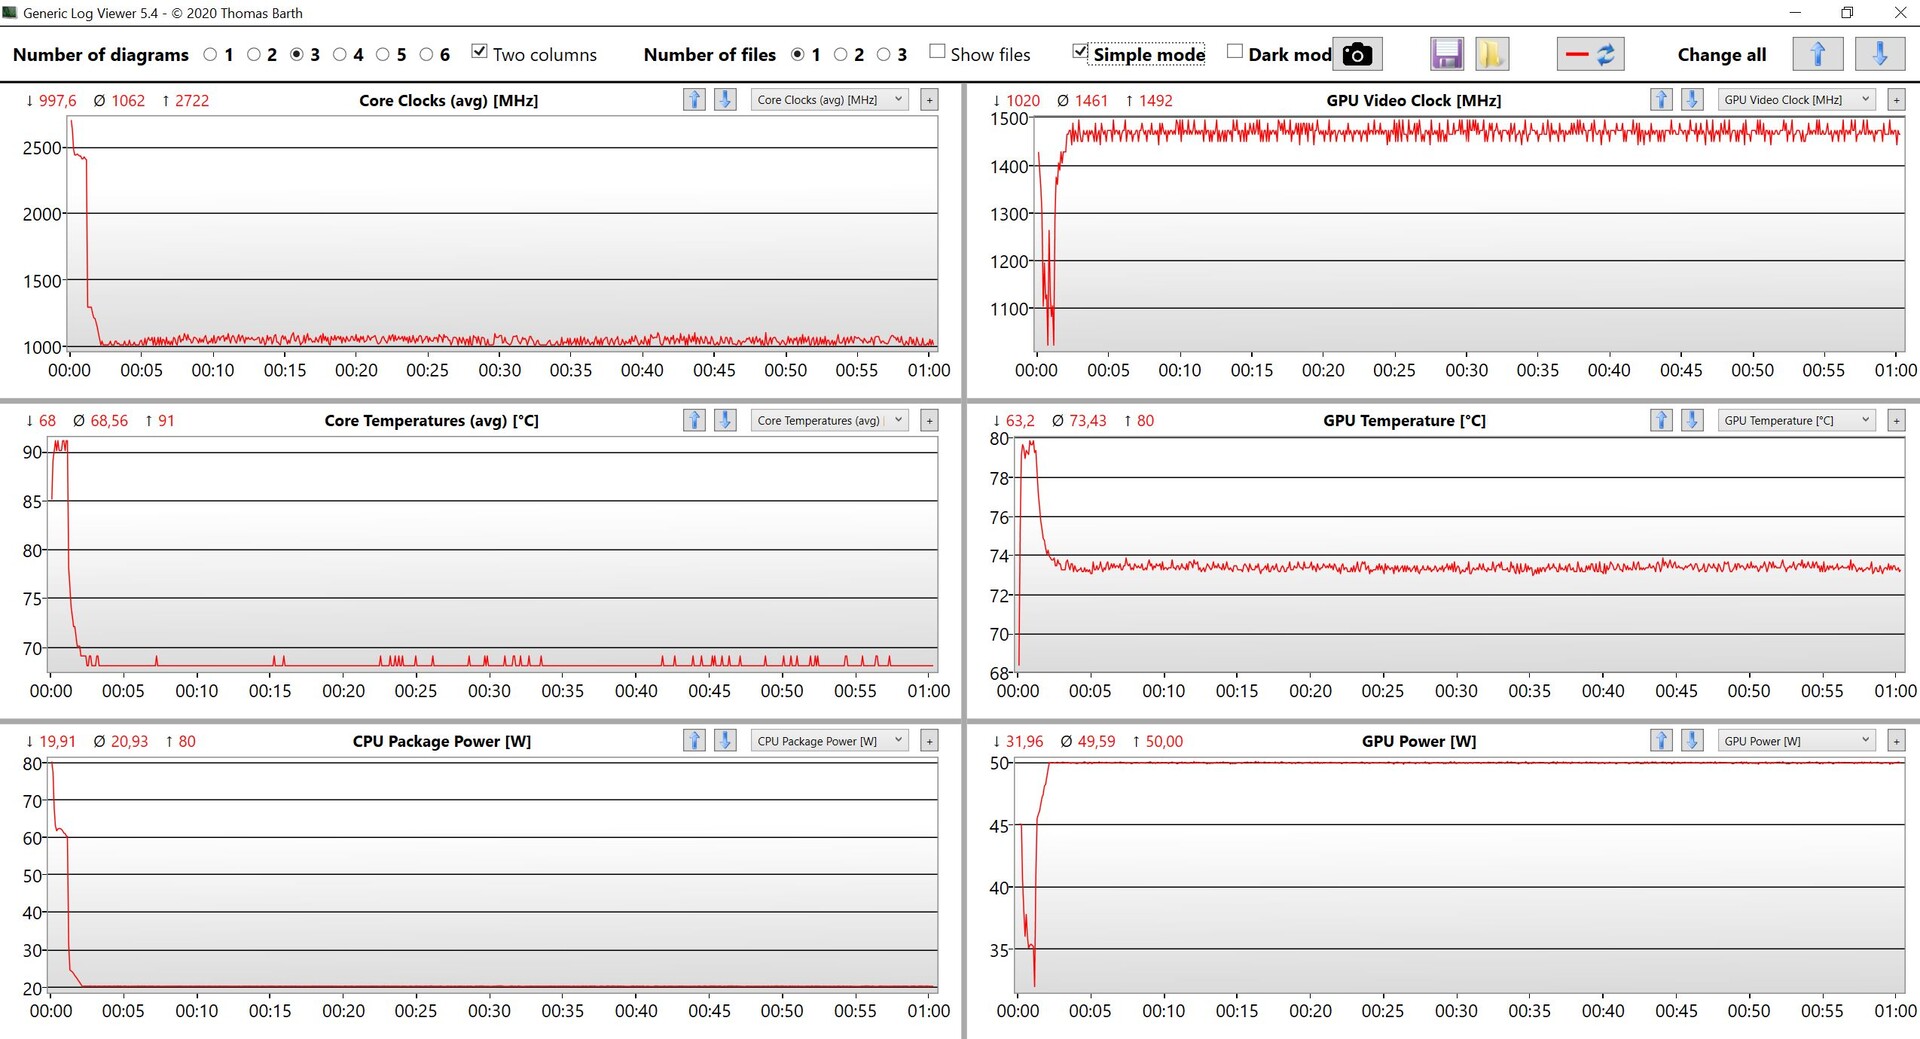
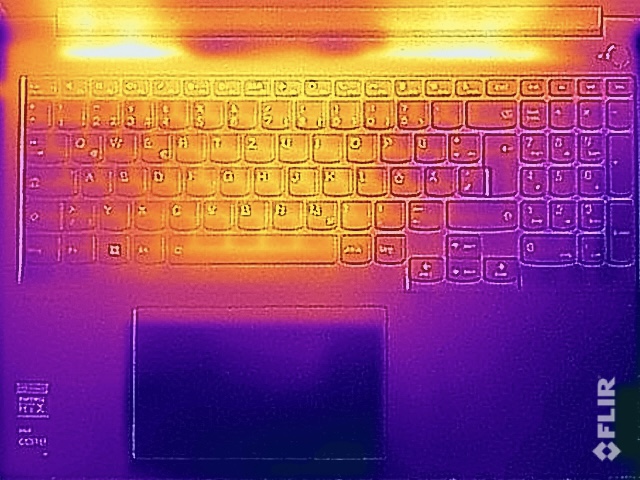
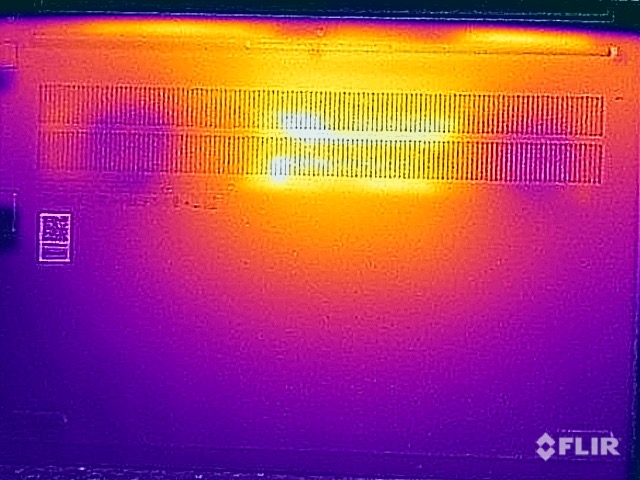
温度
铝制外壳在低负荷下根本不发热。只有在游戏或压力测试中才会明显发热。在基本单元的上侧,我们在中间/上部的键盘区域记录了大约42°C的温度,这在打字时也很明显,但并不令人不快。在底部,机箱后部中央区域有一个热点,我们在那里测量到了大约50℃。这里应该避免皮肤直接接触金属表面。
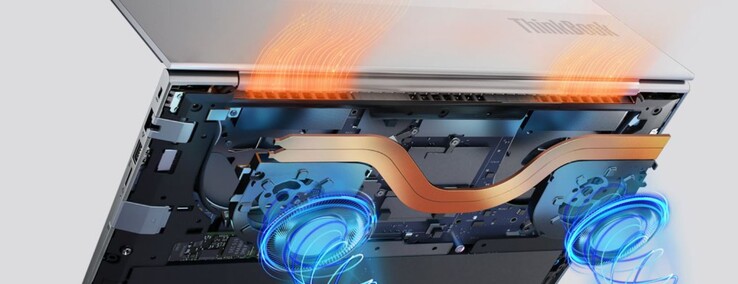
在压力测试中,处理器以全功率启动,几分钟后降至20瓦,而显卡则稳定在50瓦并保持在这一水平。因此,GPU在高性能模式下被优先考虑,而处理器在智能冷却 模式下被允许消耗更多一点的功率(24/36瓦)。
(±) The maximum temperature on the upper side is 42.9 °C / 109 F, compared to the average of 36.8 °C / 98 F, ranging from 21 to 71 °C for the class Multimedia.
(-) The bottom heats up to a maximum of 50.6 °C / 123 F, compared to the average of 39.1 °C / 102 F
(+) In idle usage, the average temperature for the upper side is 25.3 °C / 78 F, compared to the device average of 31.3 °C / 88 F.
(±) Playing The Witcher 3, the average temperature for the upper side is 36.1 °C / 97 F, compared to the device average of 31.3 °C / 88 F.
(+) The palmrests and touchpad are cooler than skin temperature with a maximum of 28.3 °C / 82.9 F and are therefore cool to the touch.
(±) The average temperature of the palmrest area of similar devices was 28.7 °C / 83.7 F (+0.4 °C / 0.8 F).
| Lenovo ThinkBook 16 G4+ IAP Intel Core i7-12700H, NVIDIA GeForce RTX 2050 Mobile | Dell Inspiron 16 Plus 7620 Intel Core i7-12700H, NVIDIA GeForce RTX 3050 Ti Laptop GPU | Acer Swift X SFX16-51G-5388 Intel Core i5-11320H, NVIDIA GeForce RTX 3050 4GB Laptop GPU | Asus Vivobook Pro 16X-M7600QE AMD Ryzen 9 5900HX, NVIDIA GeForce RTX 3050 Ti Laptop GPU | Huawei MateBook D 16 2022 Intel Core i7-12700H, Intel Iris Xe Graphics G7 96EUs | Samsung Galaxy Book2 15 Intel Core i7-1260P, Intel Arc A350M | |
|---|---|---|---|---|---|---|
| Heat | -7% | -13% | 3% | -3% | 1% | |
| Maximum Upper Side * (°C) | 42.9 | 46 -7% | 52.4 -22% | 39.4 8% | 41.8 3% | 44.6 -4% |
| Maximum Bottom * (°C) | 50.6 | 45.8 9% | 50 1% | 43.6 14% | 47.3 7% | 47.5 6% |
| Idle Upper Side * (°C) | 26 | 29.2 -12% | 30.3 -17% | 27.6 -6% | 28.3 -9% | 25.8 1% |
| Idle Bottom * (°C) | 26.5 | 31 -17% | 30.4 -15% | 27.5 -4% | 30.2 -14% | 26.1 2% |
* ... smaller is better
发言人
联想为ThinkBook 16 G4+配备了两个立体声扬声器(2x 2瓦),它们位于底座的前部区域,将声音向下引导。声音方面,这些模块的表现一般,与直接竞争对手戴尔Inspiron 16 Plus相当。 戴尔Inspiron 16 Plus,因为这两个型号都缺乏力量和低音。对于背景音乐或偶尔的视频,声音质量是足够的,甚至对于语音再现(如会议)也非常好,这要归功于高音/高音的线性再现。然而,在游戏或电影之夜,应使用外部扬声器或耳机。
Lenovo ThinkBook 16 G4+ IAP audio analysis
(±) | speaker loudness is average but good (77.6 dB)
Bass 100 - 315 Hz
(-) | nearly no bass - on average 17.3% lower than median
(±) | linearity of bass is average (10.3% delta to prev. frequency)
Mids 400 - 2000 Hz
(+) | balanced mids - only 4.6% away from median
(+) | mids are linear (4.6% delta to prev. frequency)
Highs 2 - 16 kHz
(+) | balanced highs - only 1.6% away from median
(+) | highs are linear (6.2% delta to prev. frequency)
Overall 100 - 16.000 Hz
(±) | linearity of overall sound is average (15.7% difference to median)
Compared to same class
» 39% of all tested devices in this class were better, 5% similar, 56% worse
» The best had a delta of 5%, average was 17%, worst was 45%
Compared to all devices tested
» 24% of all tested devices were better, 5% similar, 71% worse
» The best had a delta of 4%, average was 23%, worst was 134%
Dell Inspiron 16 Plus 7620 audio analysis
(+) | speakers can play relatively loud (87.8 dB)
Bass 100 - 315 Hz
(-) | nearly no bass - on average 22.2% lower than median
(±) | linearity of bass is average (9.7% delta to prev. frequency)
Mids 400 - 2000 Hz
(+) | balanced mids - only 3.3% away from median
(+) | mids are linear (5.3% delta to prev. frequency)
Highs 2 - 16 kHz
(+) | balanced highs - only 2.5% away from median
(+) | highs are linear (4.7% delta to prev. frequency)
Overall 100 - 16.000 Hz
(+) | overall sound is linear (13.4% difference to median)
Compared to same class
» 28% of all tested devices in this class were better, 5% similar, 68% worse
» The best had a delta of 5%, average was 17%, worst was 45%
Compared to all devices tested
» 14% of all tested devices were better, 4% similar, 82% worse
» The best had a delta of 4%, average was 23%, worst was 134%
能源管理--具有良好耐力的ThinkBook
消耗功率
考虑到大型WQHD面板,ThinkBook的空闲消耗值完全可以接受,最大约为12瓦。然而,附带的100瓦电源在负载情况下很快就成为一个限制因素。在极端情况下,WiYNFO工具在压力测试开始时输出的最大总消耗量为162瓦,在评估数据后,我们发现在短时间内还需要从电池中提取多达70瓦的能量。几分钟后,情况趋于稳定,但如果电池不得不在负载下一次又一次地被挖掘,这肯定不利于电池寿命。
| Off / Standby | |
| Idle | |
| Load |
|
Key:
min: | |
| Lenovo ThinkBook 16 G4+ IAP i7-12700H, GeForce RTX 2050 Mobile, Micron 2450 1TB MTFDKCD1T0TFK, IPS, 2560x1600, 16" | Dell Inspiron 16 Plus 7620 i7-12700H, GeForce RTX 3050 Ti Laptop GPU, Kioxia BG5 KBG50ZNS512G, IPS, 3072x1920, 16" | Acer Swift X SFX16-51G-5388 i5-11320H, GeForce RTX 3050 4GB Laptop GPU, Samsung PM991 MZVLQ512HBLU, , 1920x1080, 16.1" | Asus Vivobook Pro 16X-M7600QE R9 5900HX, GeForce RTX 3050 Ti Laptop GPU, SK Hynix HFM001TD3JX013N, OLED, 3840x2400, 16.1" | Huawei MateBook D 16 2022 i7-12700H, Iris Xe G7 96EUs, Silicon Motion PCIe-8 SSD, IPS, 1920x1200, 16" | Samsung Galaxy Book2 15 i7-1260P, A350M, Samsung PM991 MZVLQ512HBLU, IPS, 1920x1080, 15.6" | Average NVIDIA GeForce RTX 2050 Mobile | Average of class Multimedia | |
|---|---|---|---|---|---|---|---|---|
| Power Consumption | -29% | 0% | -22% | 12% | 30% | 11% | 1% | |
| Idle Minimum * (Watt) | 5 | 6.8 -36% | 7 -40% | 8.2 -64% | 6.1 -22% | 4 20% | 5.11 ? -2% | 5.62 ? -12% |
| Idle Average * (Watt) | 11.2 | 9.6 14% | 10.1 10% | 16.2 -45% | 10.6 5% | 7.8 30% | 9.15 ? 18% | 10.2 ? 9% |
| Idle Maximum * (Watt) | 11.6 | 17 -47% | 15 -29% | 19.7 -70% | 11.5 1% | 8.5 27% | 11.2 ? 3% | 12.5 ? -8% |
| Load Average * (Watt) | 89.3 | 117.5 -32% | 63.3 29% | 65.8 26% | 65.5 27% | 59.1 34% | 70.6 ? 21% | 65 ? 27% |
| Witcher 3 ultra * (Watt) | 83 | 113.1 -36% | 63.3 24% | 65.6 21% | 61.2 26% | 56.7 32% | ||
| Load Maximum * (Watt) | 102 | 137.4 -35% | 94 8% | 104 -2% | 68.4 33% | 62.4 39% | 87.4 ? 14% | 111.9 ? -10% |
* ... smaller is better
Power consumption Witcher 3 / Stress test
Power cosumption with an external monitor
电池寿命
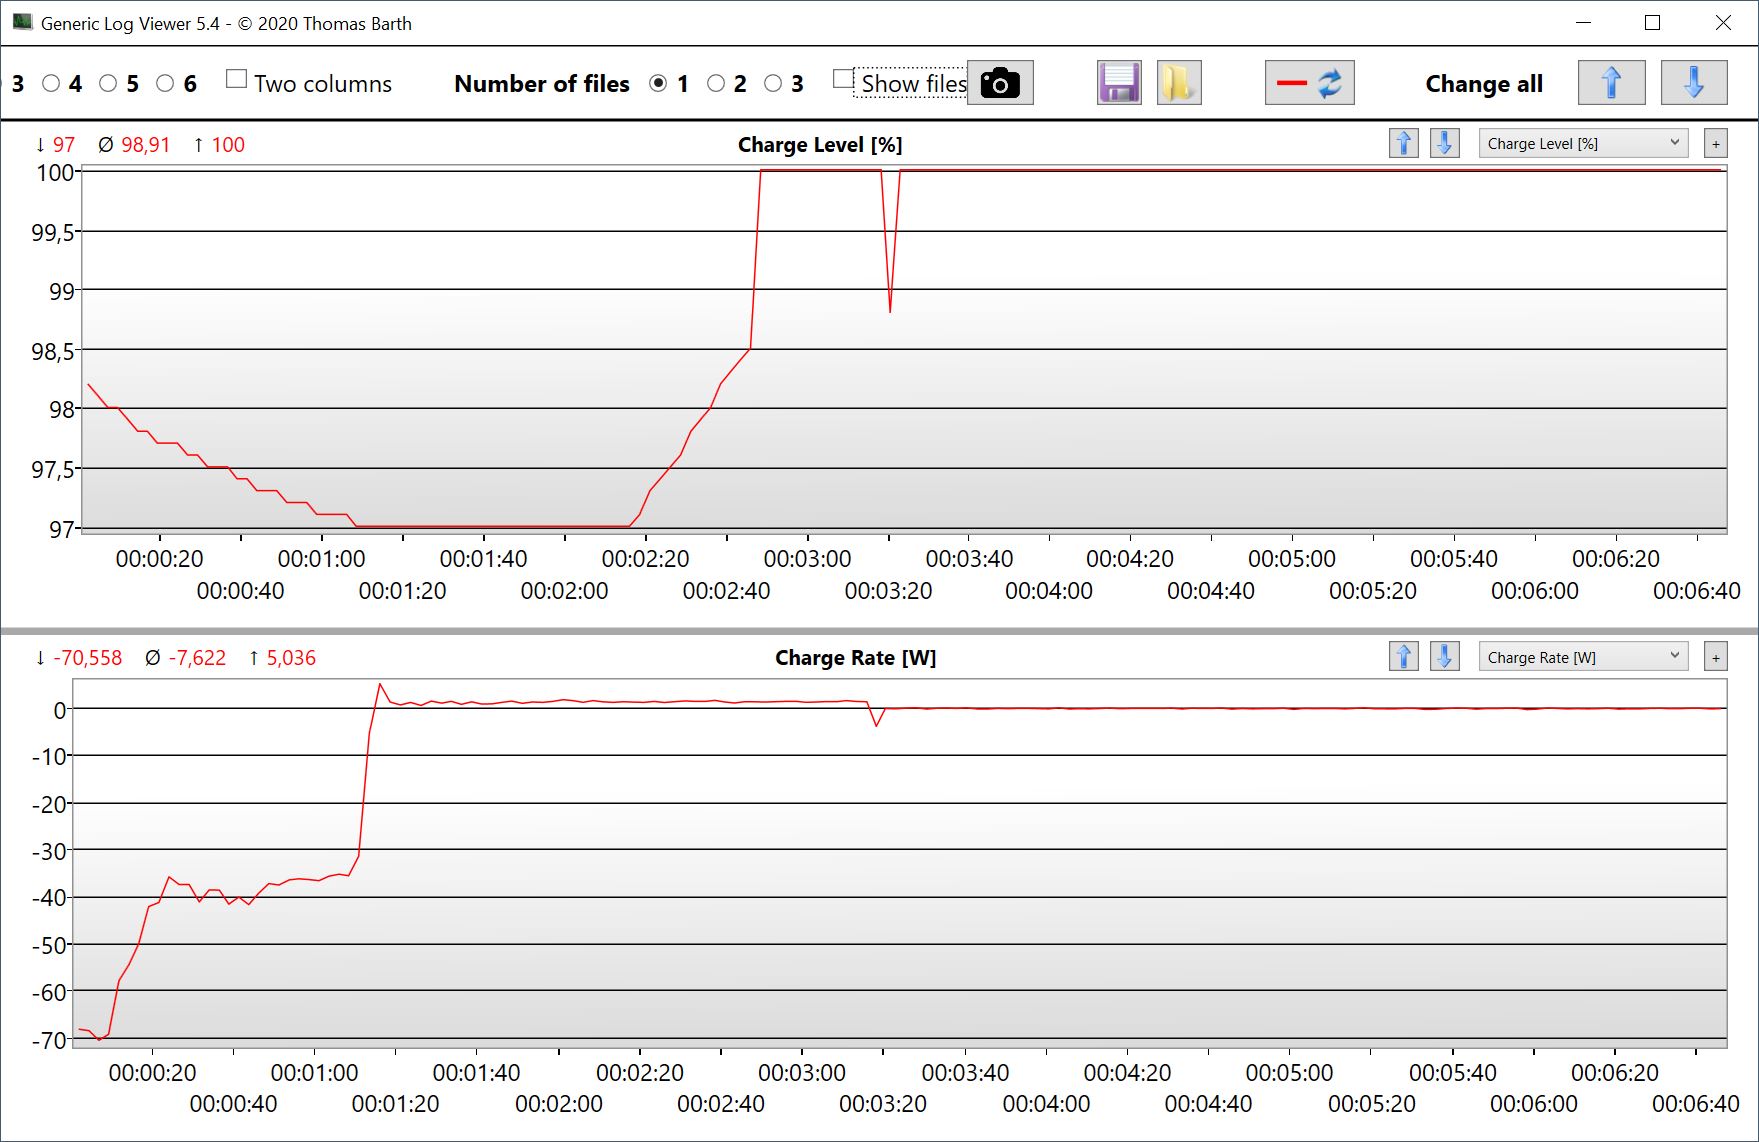
71瓦特的电池允许相当长的运行时间,因为我们的评测样品在WLAN测试中持续了6:43小时和8:09小时,这取决于屏幕亮度。在150cd/m²(相当于最大亮度的71%)的情况下,视频播放甚至可以超过12小时。与WLAN测试的这一巨大差异再次表明,目前的Alder Lake CPU的工作效率并不特别高,即使是在单核负荷下(即上网时)。
在设备开启的情况下,完整的充电过程大约需要100分钟,充电曲线呈线性,但也有一个快速充电选项,只需要73分钟(28分钟后已经可以达到60%)。
| Lenovo ThinkBook 16 G4+ IAP i7-12700H, GeForce RTX 2050 Mobile, 71 Wh | Dell Inspiron 16 Plus 7620 i7-12700H, GeForce RTX 3050 Ti Laptop GPU, 86 Wh | Acer Swift X SFX16-51G-5388 i5-11320H, GeForce RTX 3050 4GB Laptop GPU, 58.7 Wh | Asus Vivobook Pro 16X-M7600QE R9 5900HX, GeForce RTX 3050 Ti Laptop GPU, 96 Wh | Huawei MateBook D 16 2022 i7-12700H, Iris Xe G7 96EUs, 60 Wh | Samsung Galaxy Book2 15 i7-1260P, A350M, 54 Wh | Average of class Multimedia | |
|---|---|---|---|---|---|---|---|
| Battery runtime | -2% | -11% | 6% | -13% | -5% | 31% | |
| H.264 (h) | 12.6 | 8.4 -33% | 10.6 -16% | 16.8 ? 33% | |||
| WiFi v1.3 (h) | 8.2 | 9.6 17% | 8.1 -1% | 11.3 38% | 7.1 -13% | 8.2 0% | 12.3 ? 50% |
| Load (h) | 1.5 | 1.2 -20% | 1.5 0% | 1.1 -27% | 1.5 0% | 1.645 ? 10% |
Pros
Cons
结论 - ThinkBook 16 G4+是一款非常好的多媒体笔记本电脑

联想ThinkBook 16 G4+是一款非常扎实的多媒体笔记本,除了在高峰负荷时电源较弱外,几乎没有批评的地方。基本单元可以更稳定一些,联想在键盘方面也有改进的余地,但这些要点不会阻止我们购买它。
大型16英寸IPS显示屏提供了非常好的图像画质,不含PWM,尽管是哑光表面,但明亮的表面不会出现颗粒感。虽然这里缺乏额外的功能,如HDR、更高的刷新率或扩展的色彩空间,但该面板还是完全能够满足其预期的目的。性能值,由于结合了 英特尔酷睿i7-12700H和一个 NvidiaGeForce RTX 2050的组合,性能非常好。即使是游戏,对ThinkBook来说也不是一个问题。
在ThinkBook 16 G4+中,联想提供了一个非常好的多媒体笔记本,它没有任何主要的弱点,在日常使用中以其广泛的连接性、高性能和良好的IPS显示屏给人留下深刻印象。
竞争对手的设备,如 戴尔 Inspiron 16 Plus或 Acer Swift X,提供稍快和更有效的GPU,即 RTX 3050和 RTX 3050 Ti,但在较暗的显示器上却很难做到。总的来说,ThinkBook 16 G4+是一款非常坚实的笔记本电脑,从所有方面考虑,它都领先于其竞争对手。
价格和可用性
Lenovo ThinkBook 16 G4+ IAP
- 09/20/2022 v7 (old)
Andreas Osthoff
Price comparison

