华硕TUF游戏F17笔记本评测。良好的3D性能和电池寿命满足了暗淡的显示屏
继去年的小规模更新之后,华硕今年选择了对其经济实惠的17英寸游戏笔记本电脑进行大修。其结果是一个新设计和更新的外壳,一个支持DDR5内存的英特尔Alder Lake CPU,以及总共四个GPU选项,包括我们审查单位的GTX 3060。
除了其直接的第11代前辈,我们的对比组中还包括一些17英寸游戏笔记本,包括 联想Legion 5 17,以及 MSI GE76 Raider(相同的CPU), 微星 微星Katana GF76(相同的GPU与11代CPU),以及 申克XMG核心17(第十代CPU)。
潜在的竞争对手比较
Rating | Date | Model | Weight | Height | Size | Resolution | Price |
|---|---|---|---|---|---|---|---|
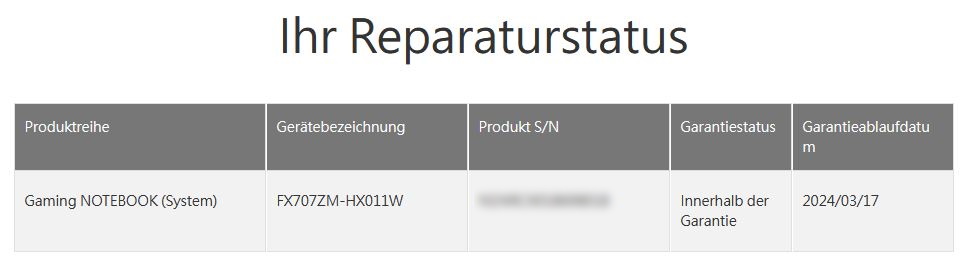
| 84.1 % v7 (old) | 04 / 2022 | Asus TUF Gaming F17 FX707Z-HX011W i7-12700H, GeForce RTX 3060 Laptop GPU | 2.5 kg | 25 mm | 17.30" | 1920x1080 | |
| 82.8 % v7 (old) | 10 / 2021 | Asus TUF Gaming F17 FX706HM i9-11900H, GeForce RTX 3060 Laptop GPU | 2.7 kg | 26 mm | 17.30" | 1920x1080 | |
| 85.2 % v7 (old) | 02 / 2022 | Lenovo Legion 5 17ACH6H-82JY0003GE R5 5600H, GeForce RTX 3060 Laptop GPU | 3.1 kg | 24.3 mm | 17.30" | 1920x1080 | |
| 87.5 % v7 (old) | 01 / 2022 | MSI GE76 Raider i9-12900HK, GeForce RTX 3080 Ti Laptop GPU | 3 kg | 26 mm | 17.30" | 1920x1080 | |
| 80.4 % v7 (old) | 09 / 2021 | MSI Katana GF76 11UE i7-11800H, GeForce RTX 3060 Laptop GPU | 2.7 kg | 25.2 mm | 17.30" | 1920x1080 | |
| 83.9 % v7 (old) | Schenker XMG Core 17 (Early 2021) i7-10870H, GeForce RTX 3060 Laptop GPU | 2.5 kg | 30.05 mm | 17.30" | 2560x1440 |
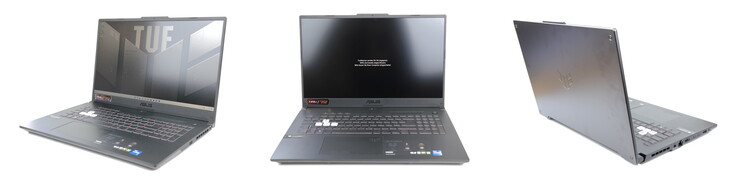
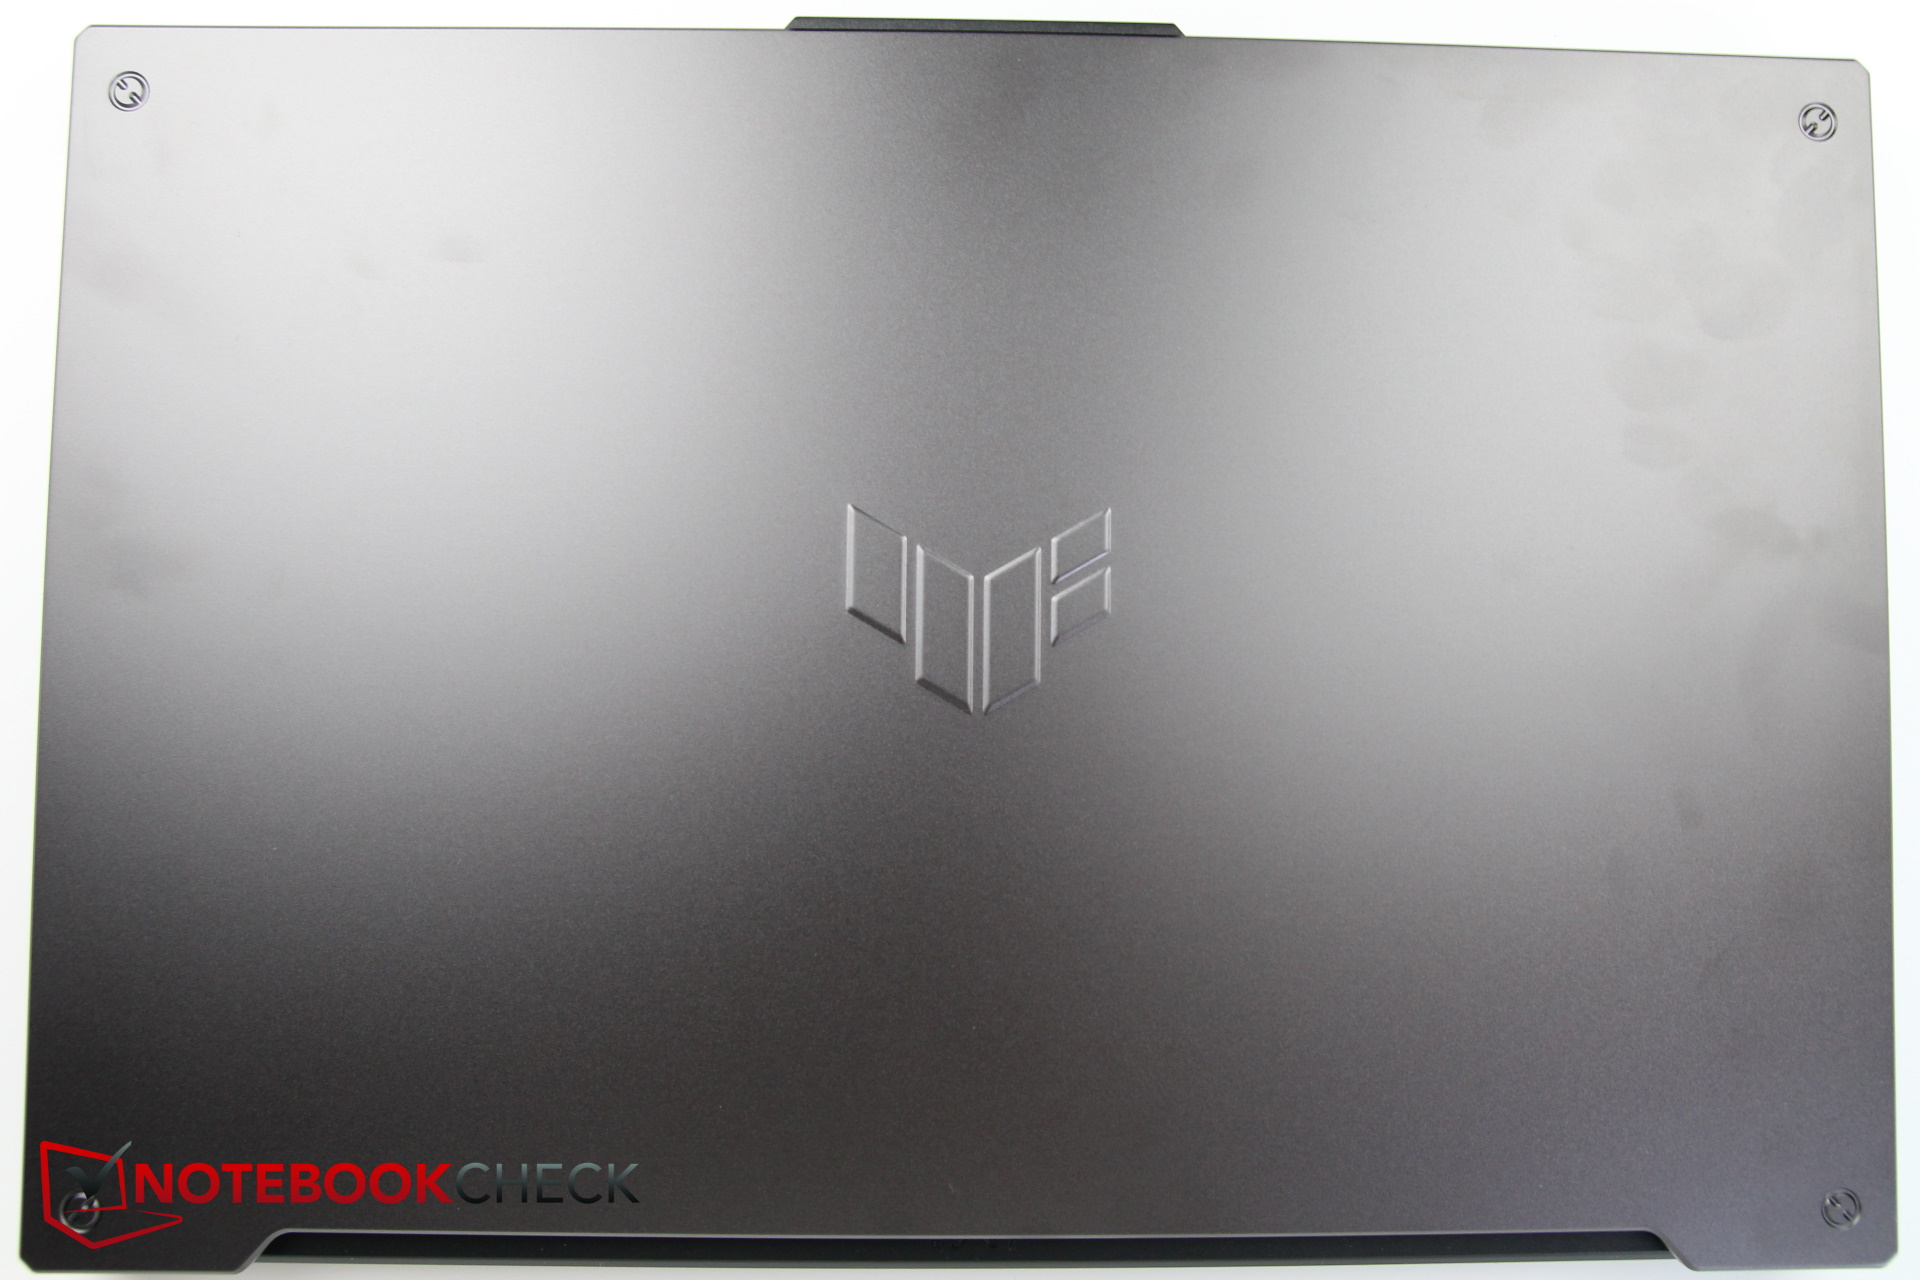
外壳 - 金属盖子,塑料底座
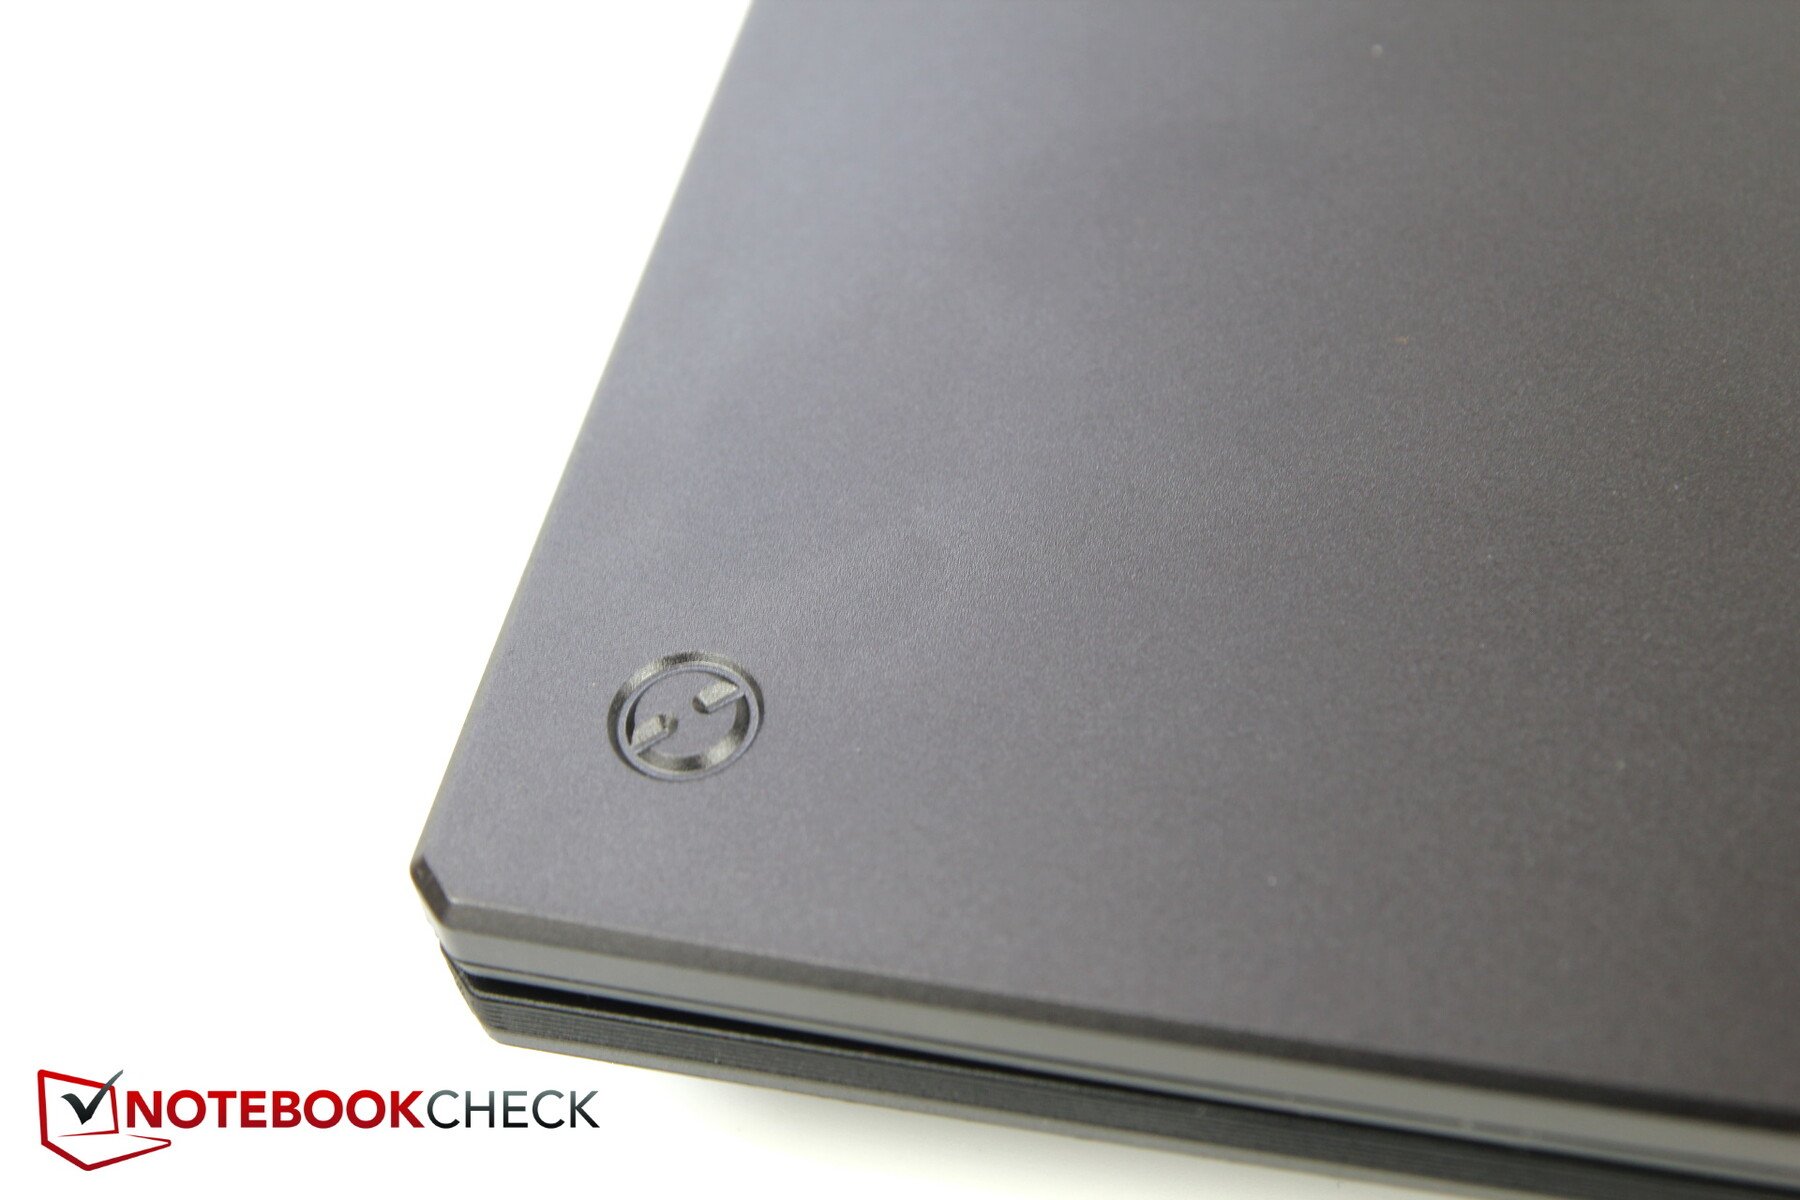
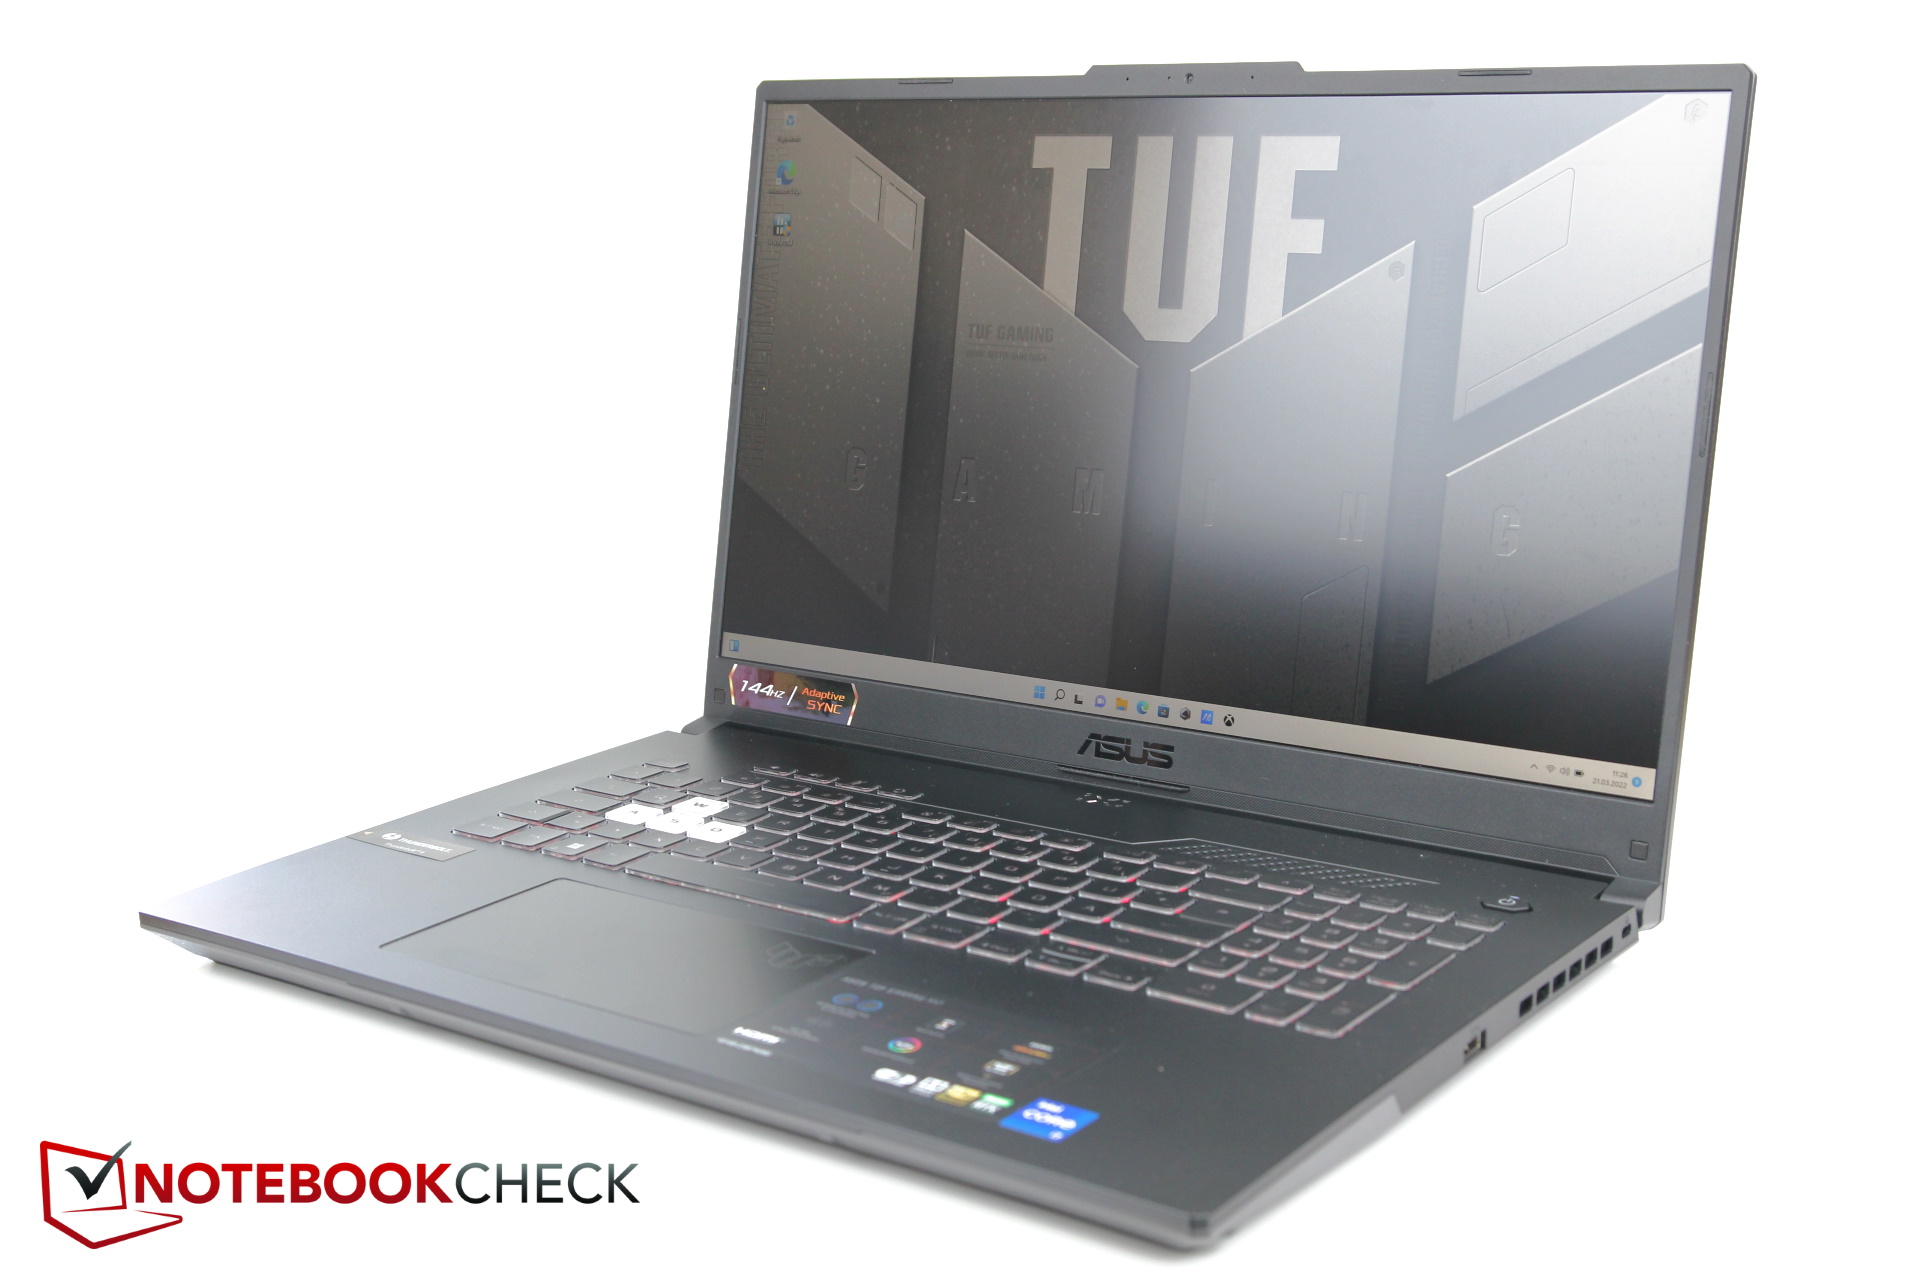
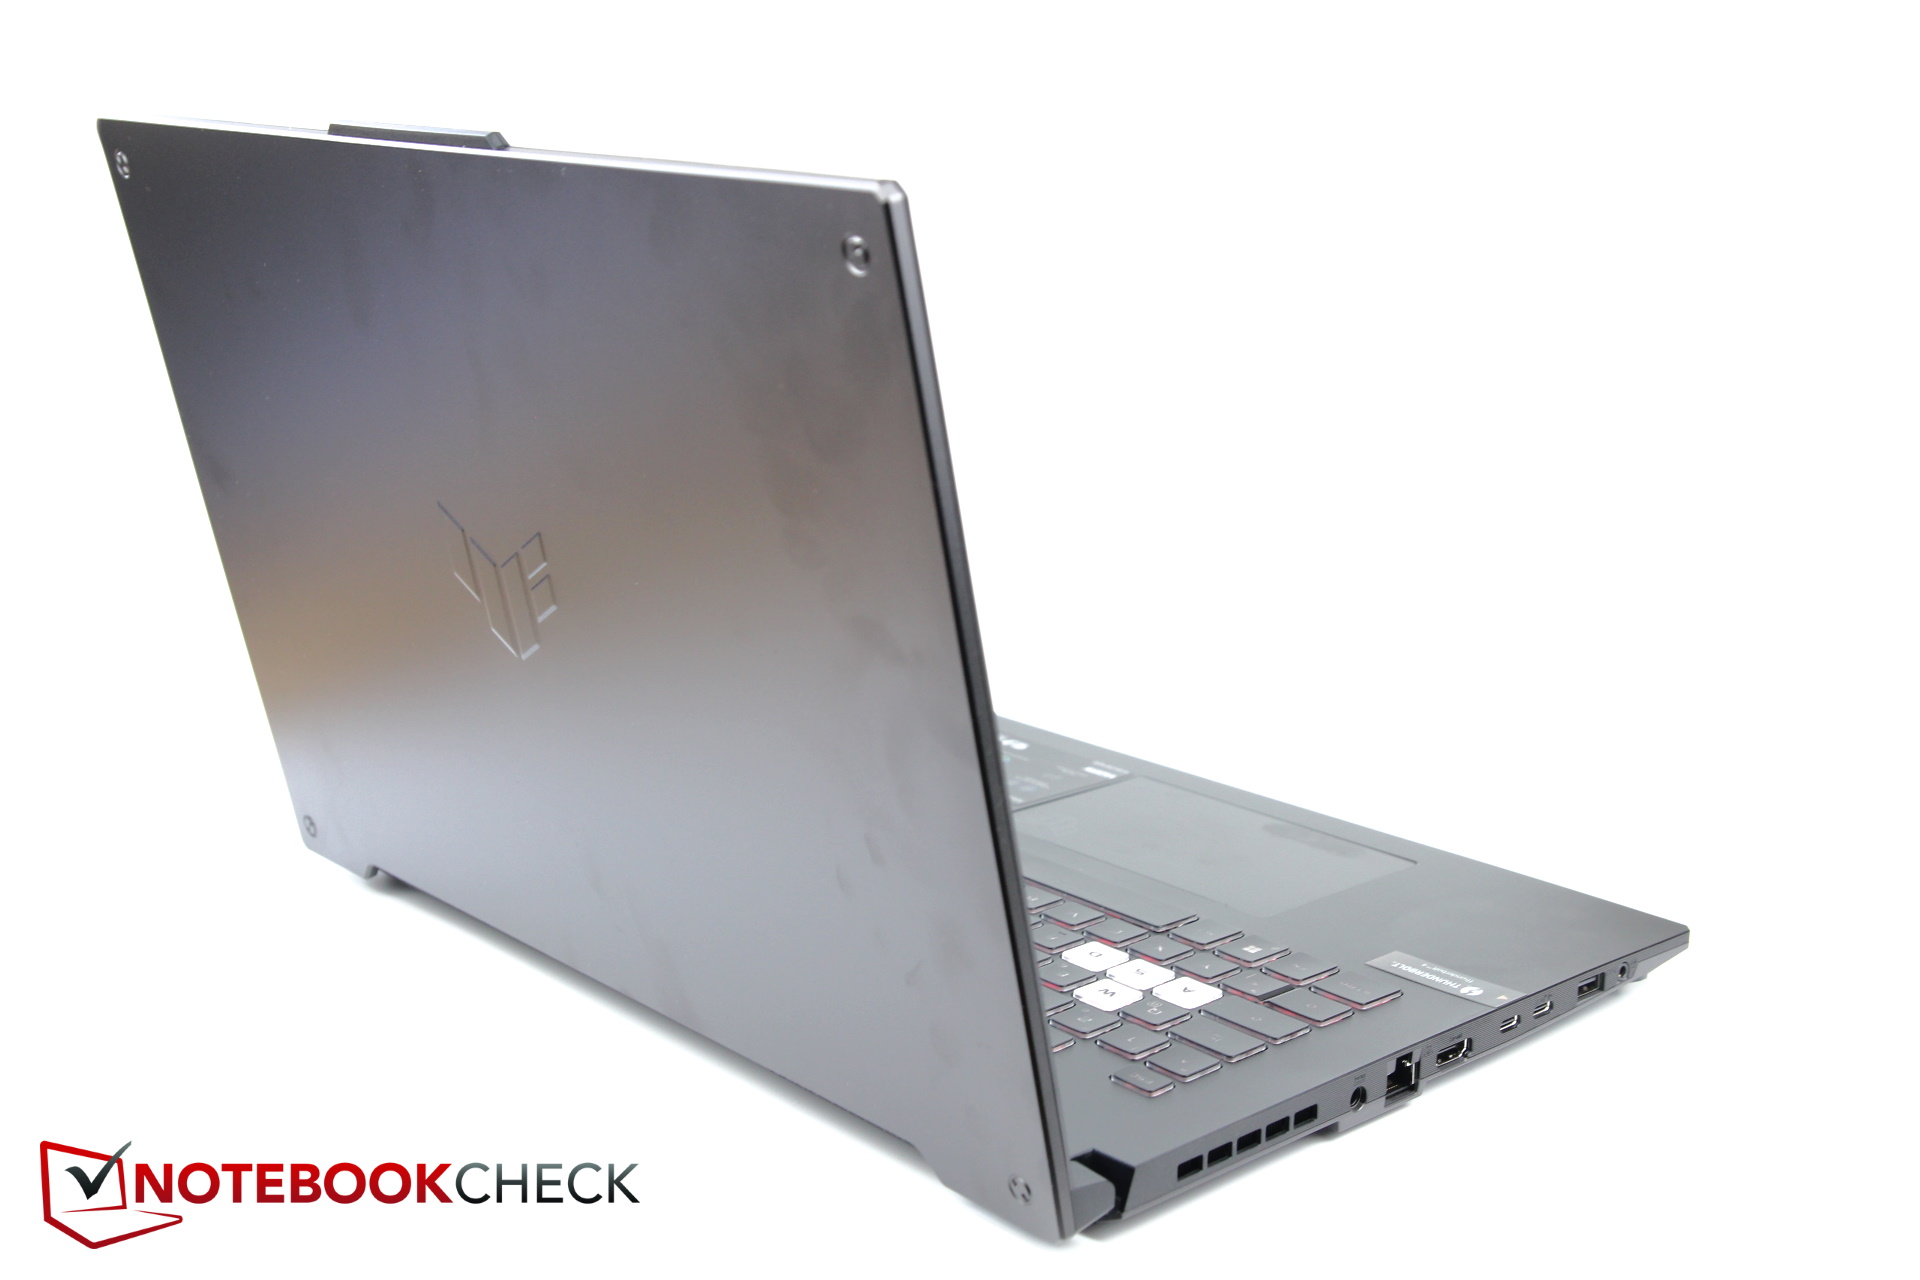
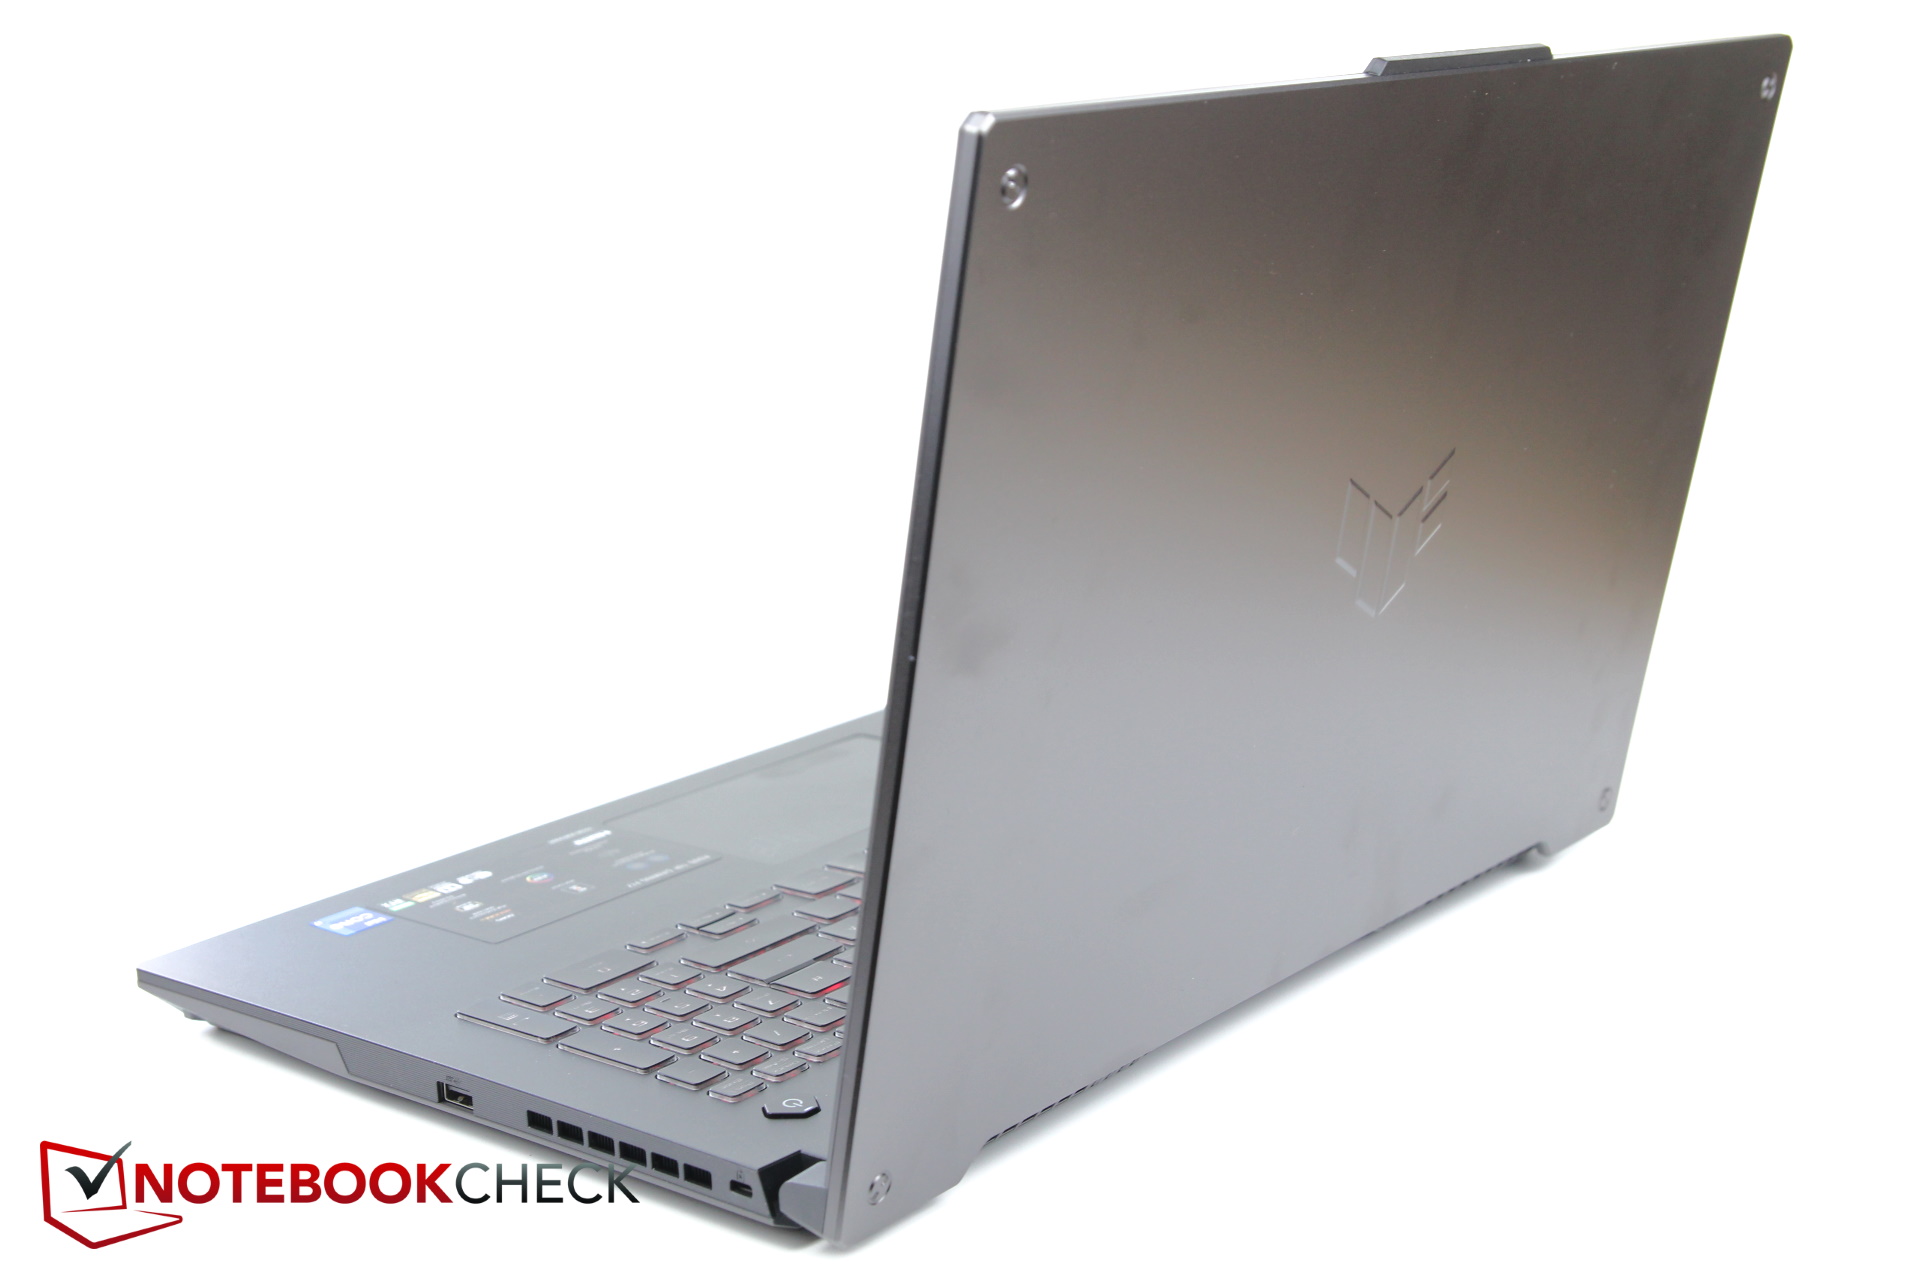
更新后的设计采用了与前代相似的颜色。之前非常突出的TUF标志已经被移除,取而代之的是金属显示盖中间一个小得多的突出印记。装饰有 "假螺丝 "的边角保持不变。
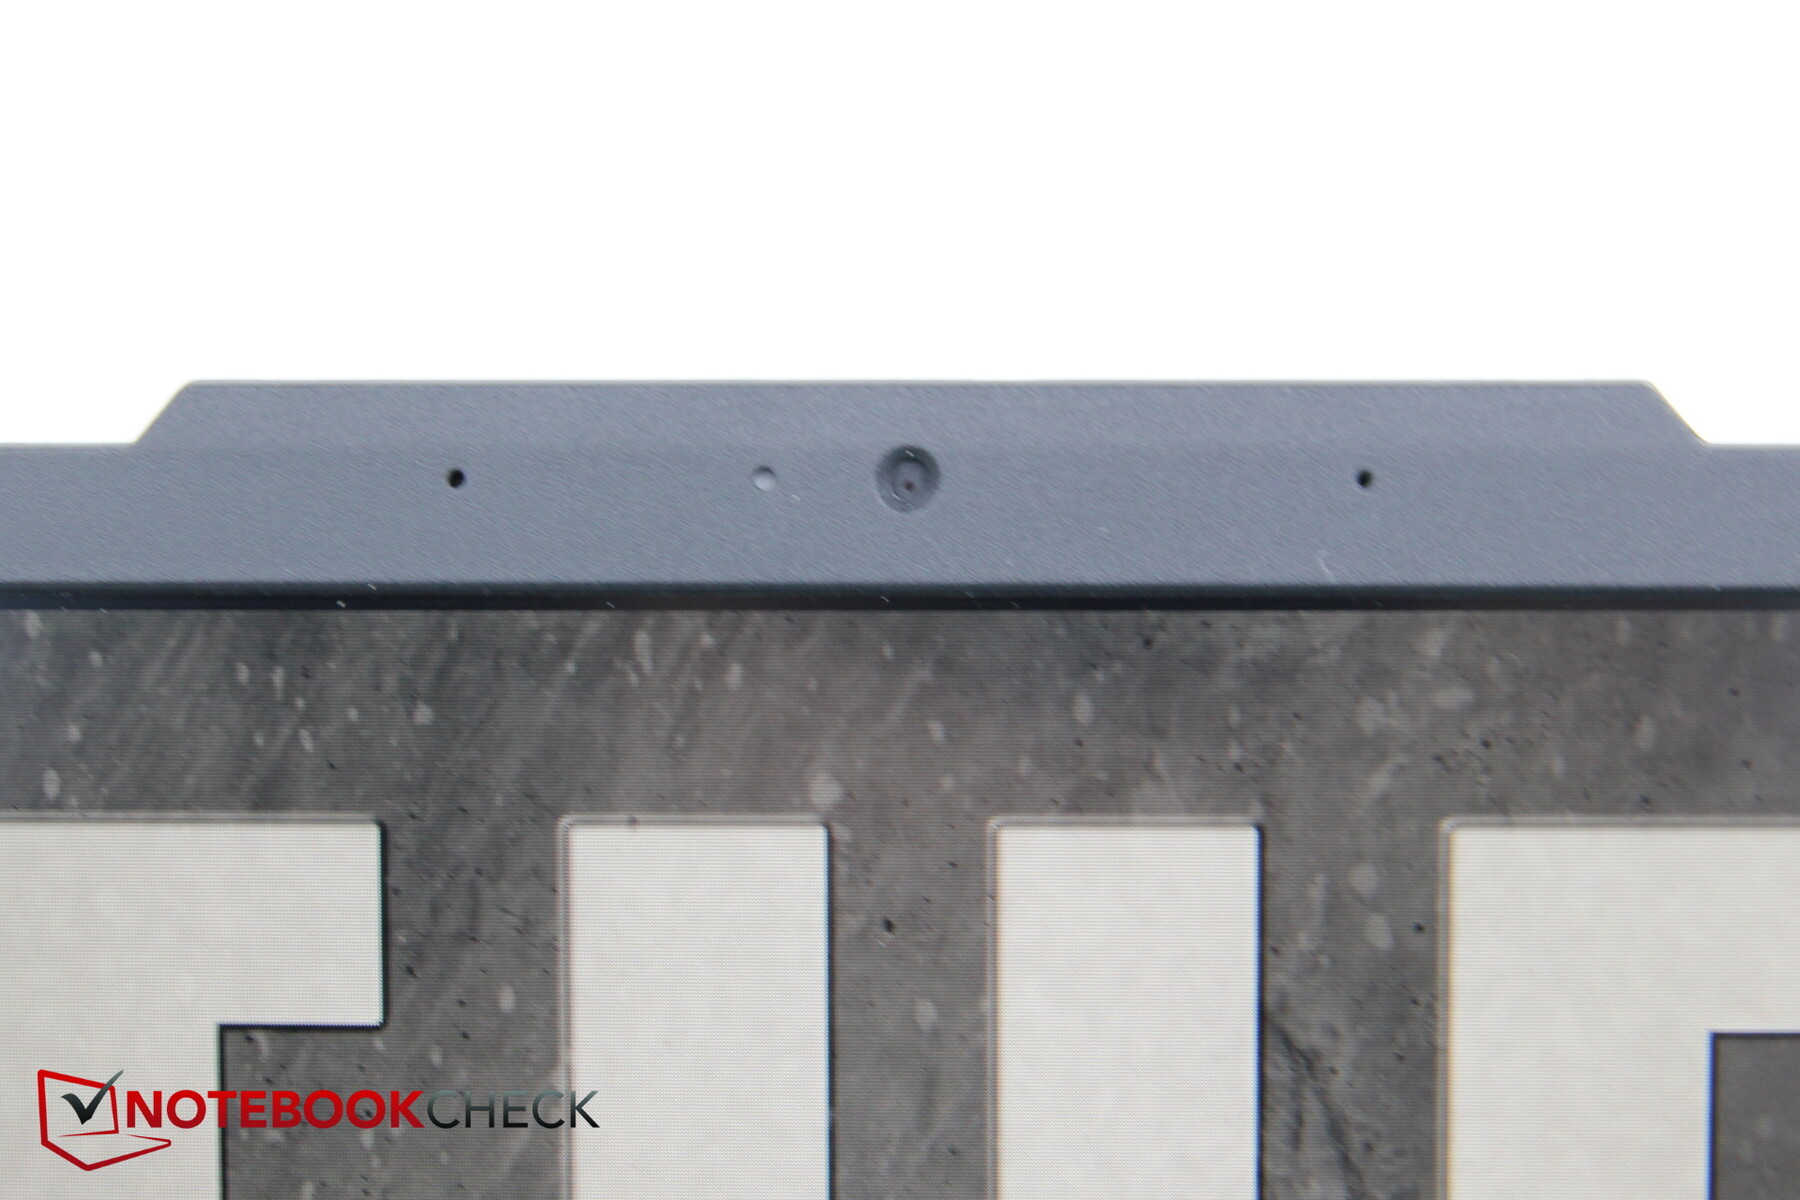
在顶部,我们发现一种突出的物理凹槽,容纳了摄像头和麦克风,作为打开显示盖的闩锁。没有办法只用一只手打开笔记本电脑;需要两只手。
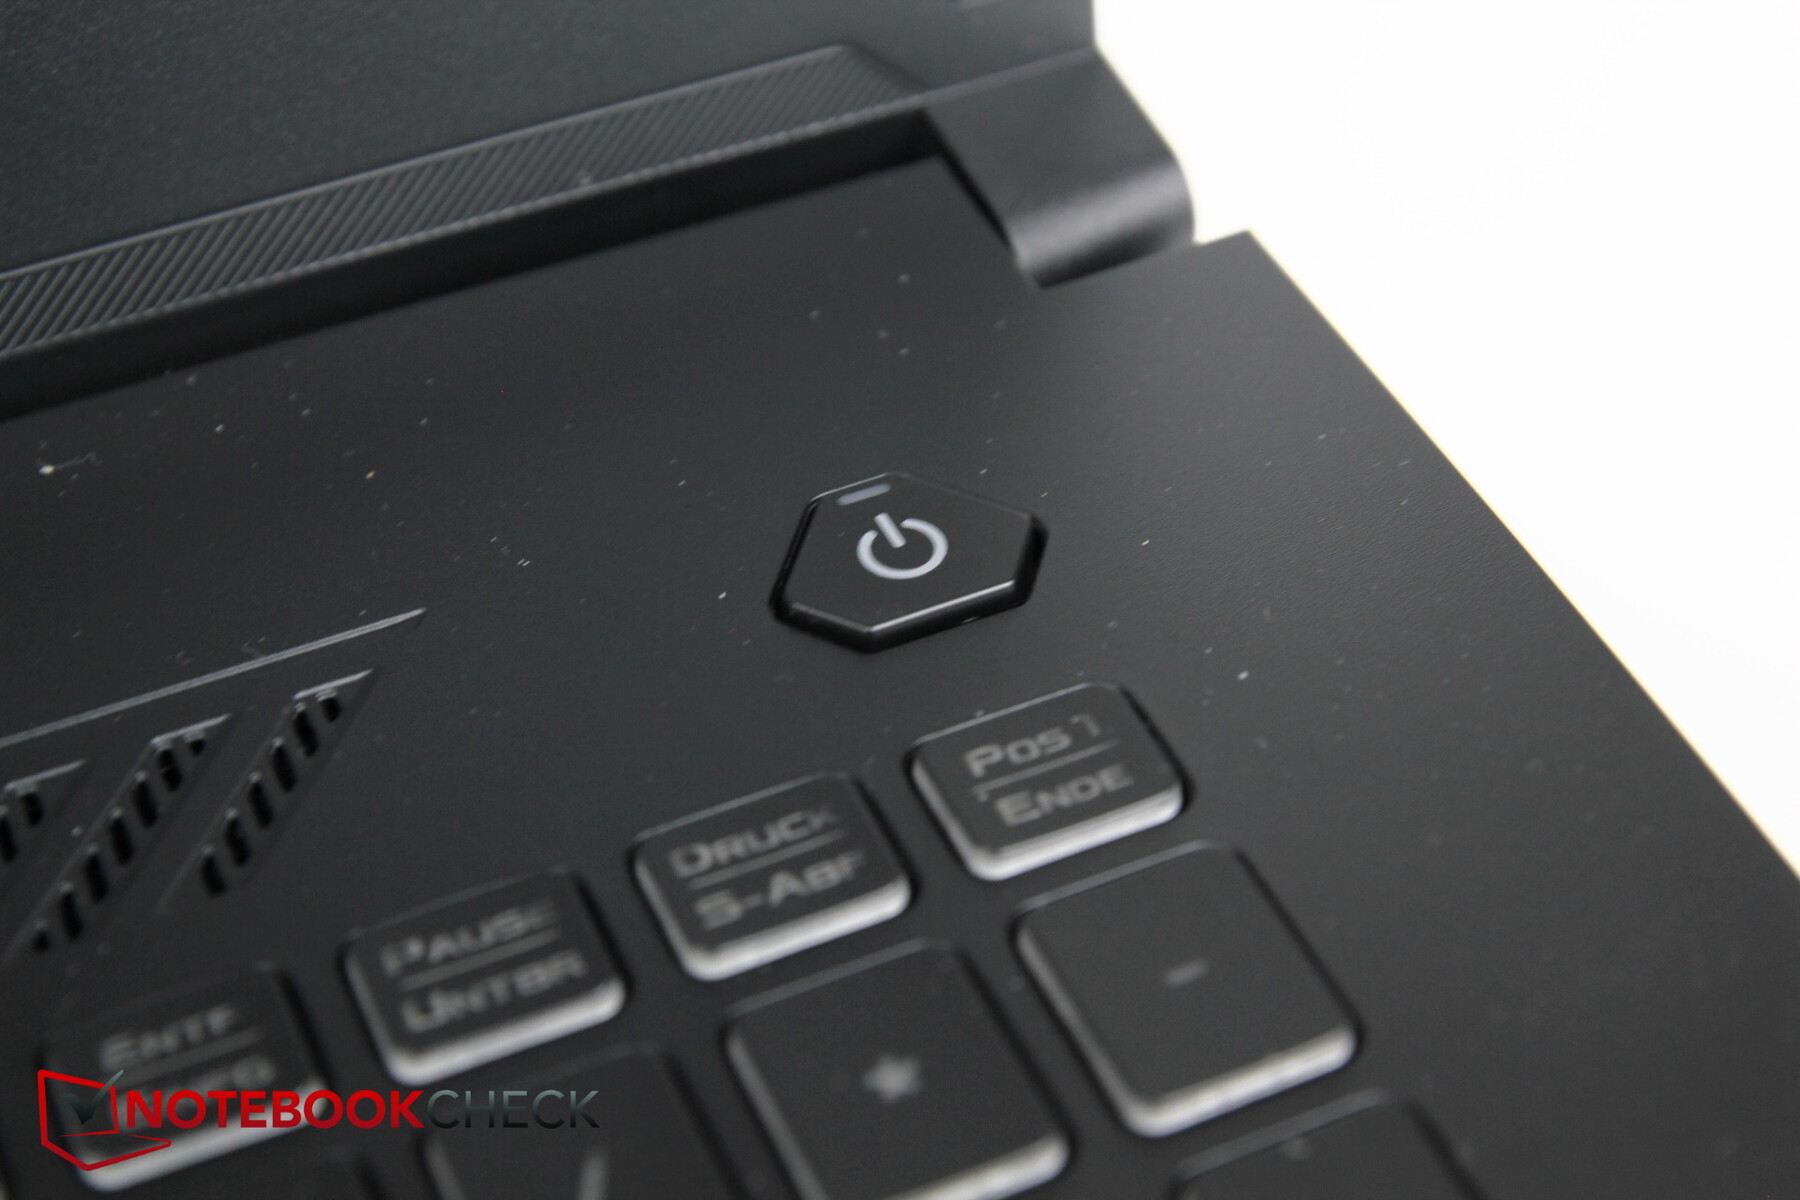
在显示屏盖子关闭的情况下,一个小的星形LED面板显示笔记本电脑的当前状态,例如,它是否正在充电或是否已置于飞行模式。
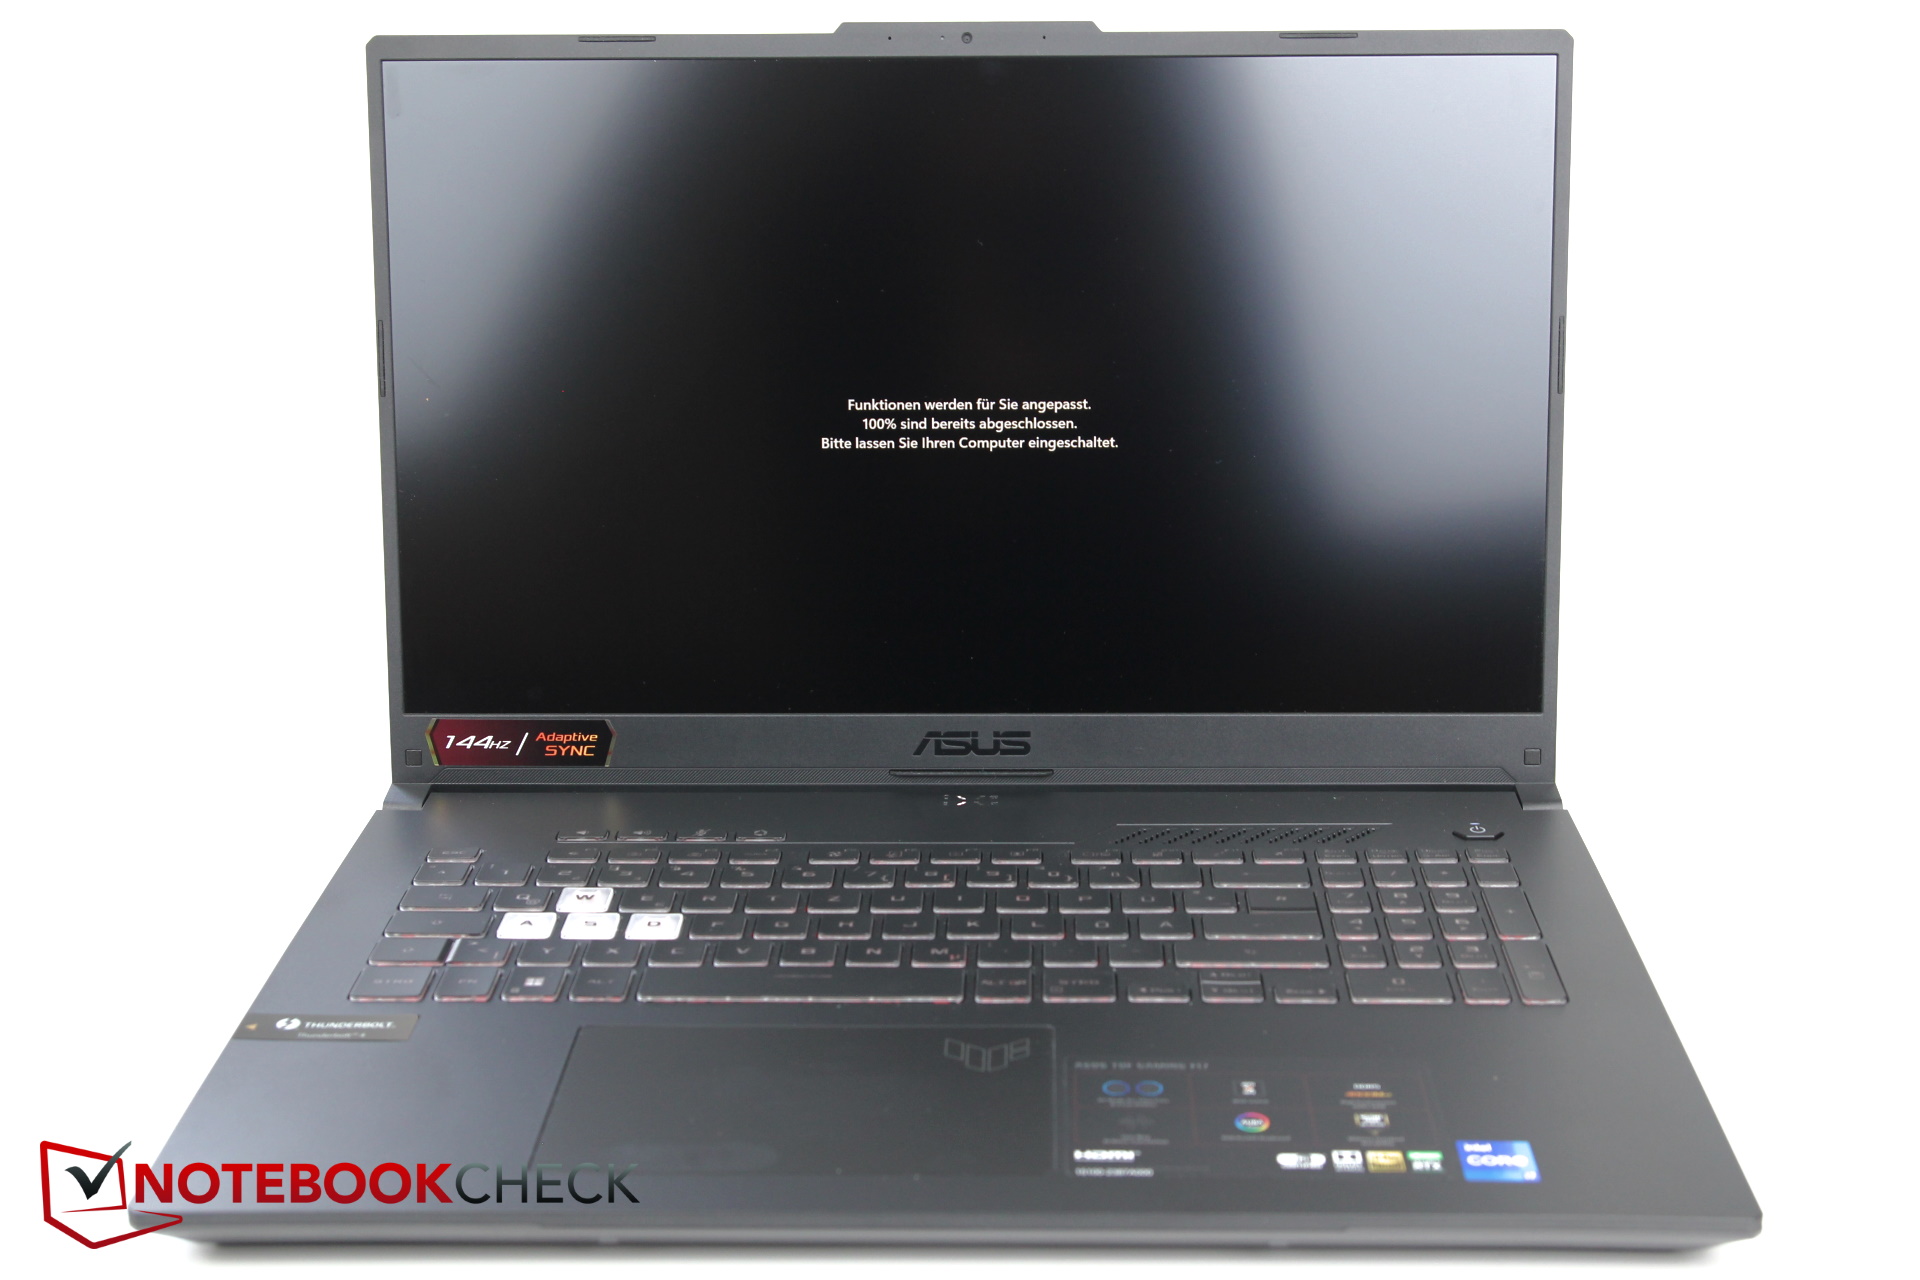
打开显示盖后,可以发现另一个不同之处。底座由坚固的塑料制成,不再有 "时尚 "的梯度装饰,而是完全水平,因此是平的。相应地,键盘也不再凹进到顶部的机箱中。
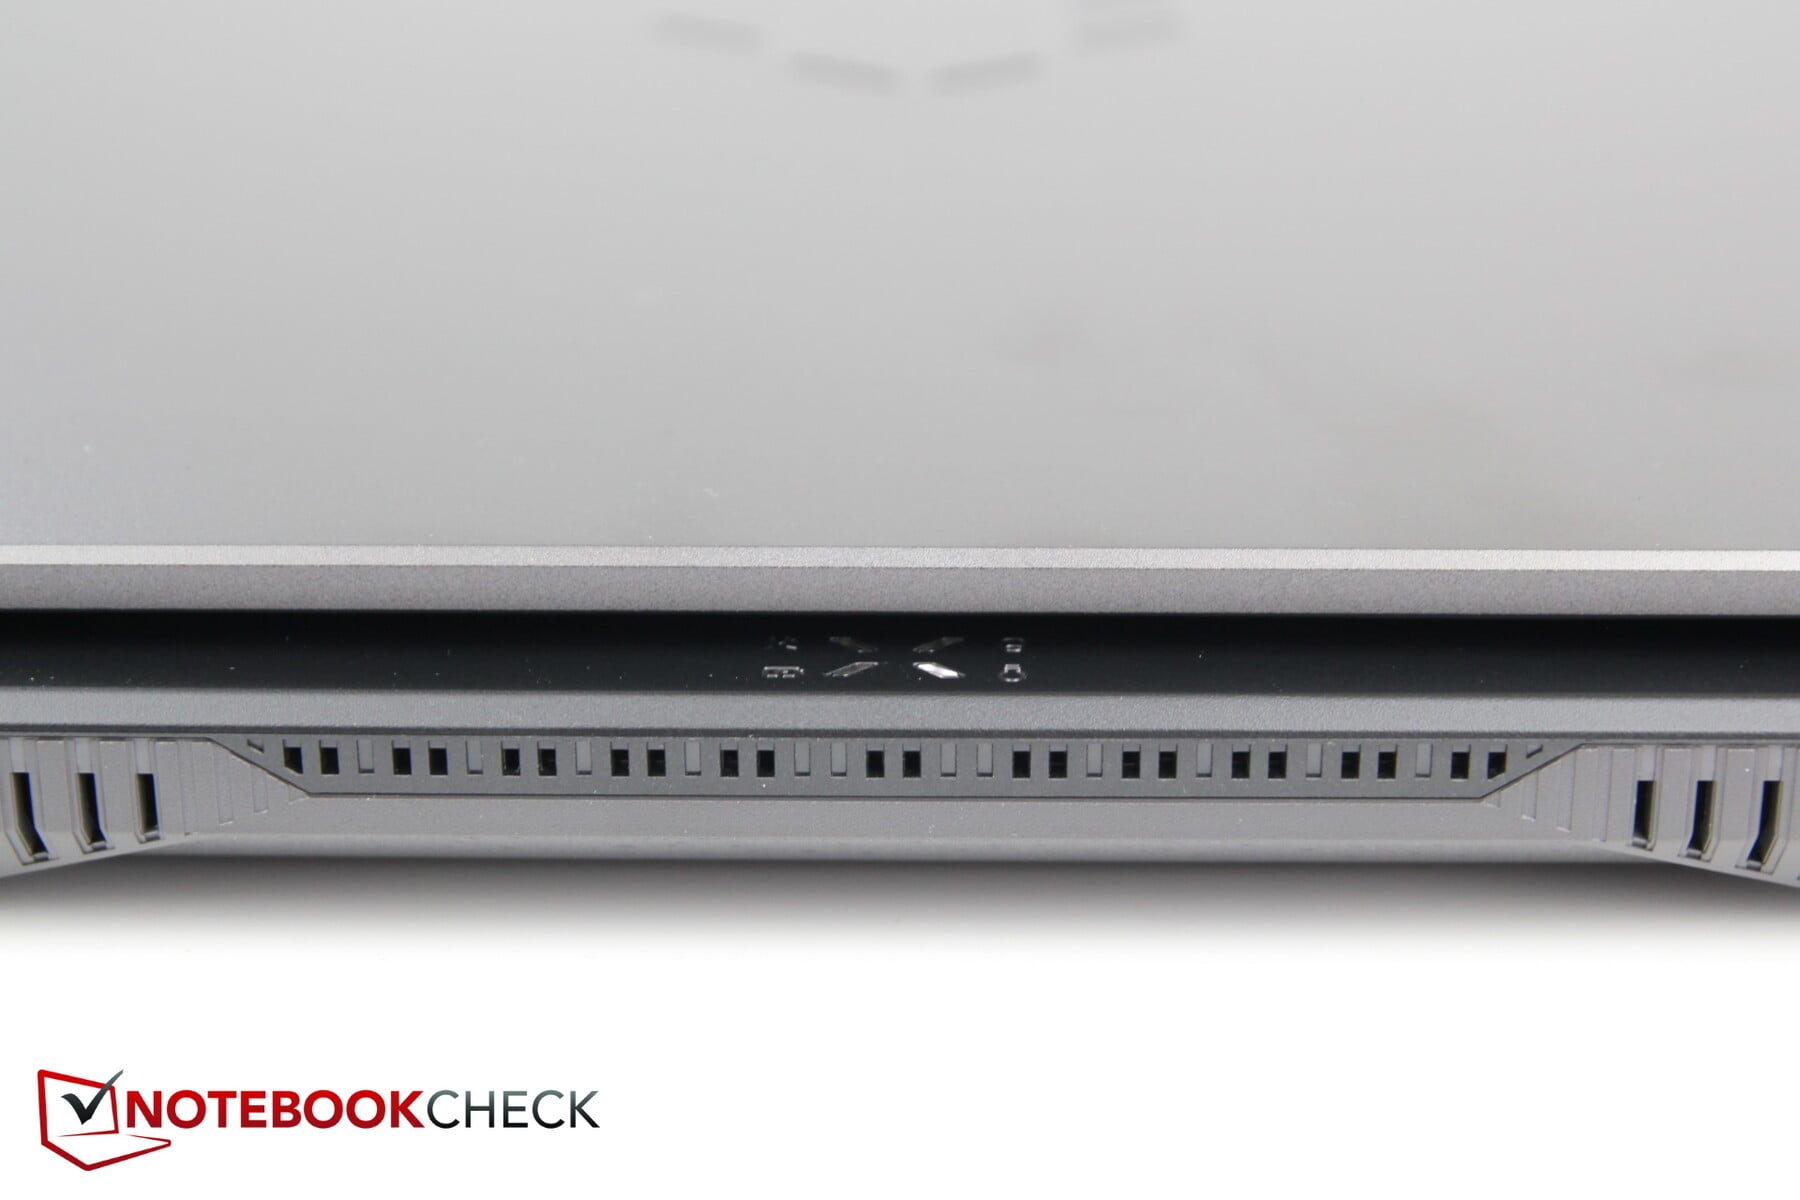
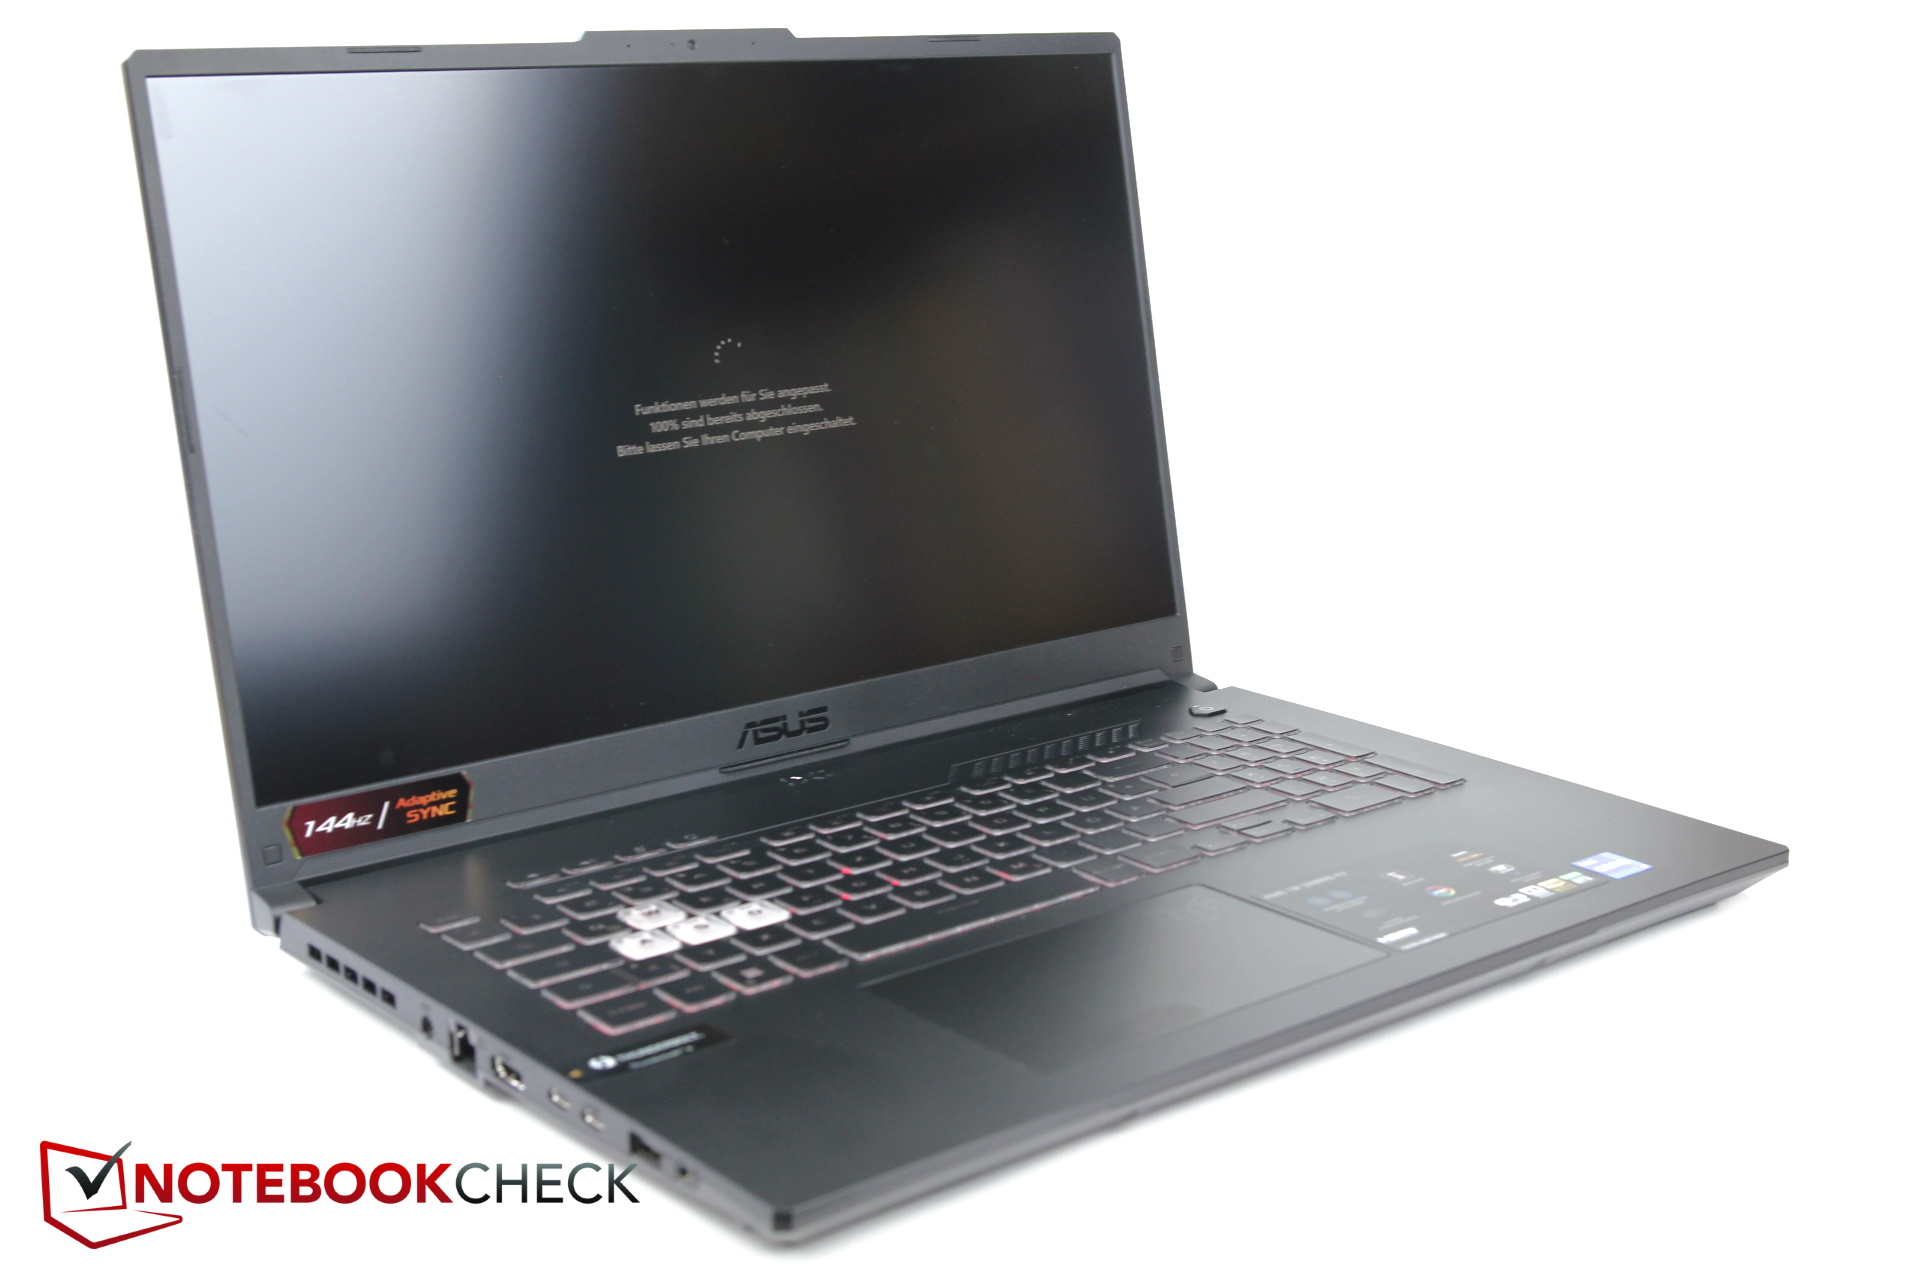
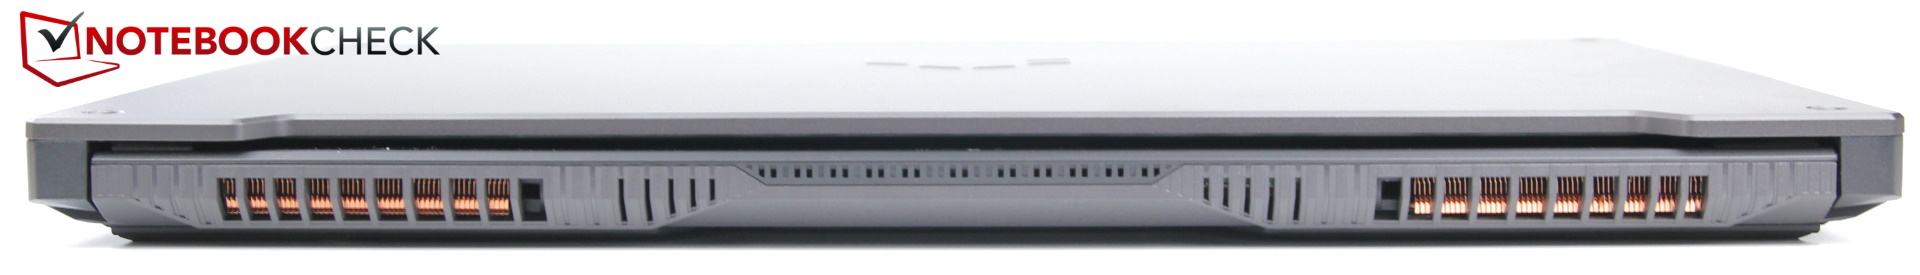
风扇通风口不再沿着设备的整个宽度定位,而是变得更小,现在位于右侧。

说到厚度,华硕的官方规格为22.9毫米,这很有欺骗性。它的最薄处可能只有这么厚,但是它的50%以上的表面又被提高了2-3毫米,导致实际厚度接近25毫米。
就占地面积而言,新设计比前代产品略窄几毫米,而且能够减轻约200克(7盎司)的重量。
它的大多数(公认的旧)竞争对手都更大,除了稍薄但明显更重的联想Legion 。
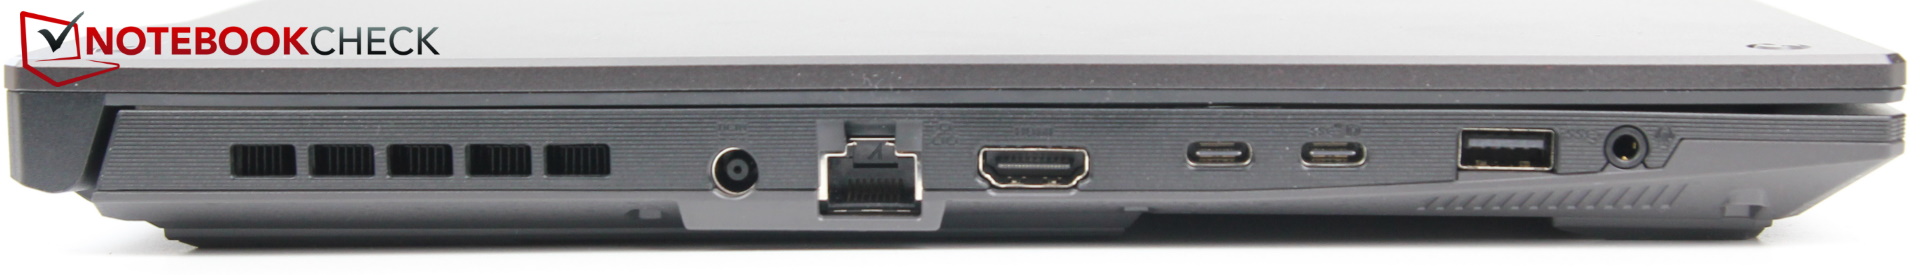
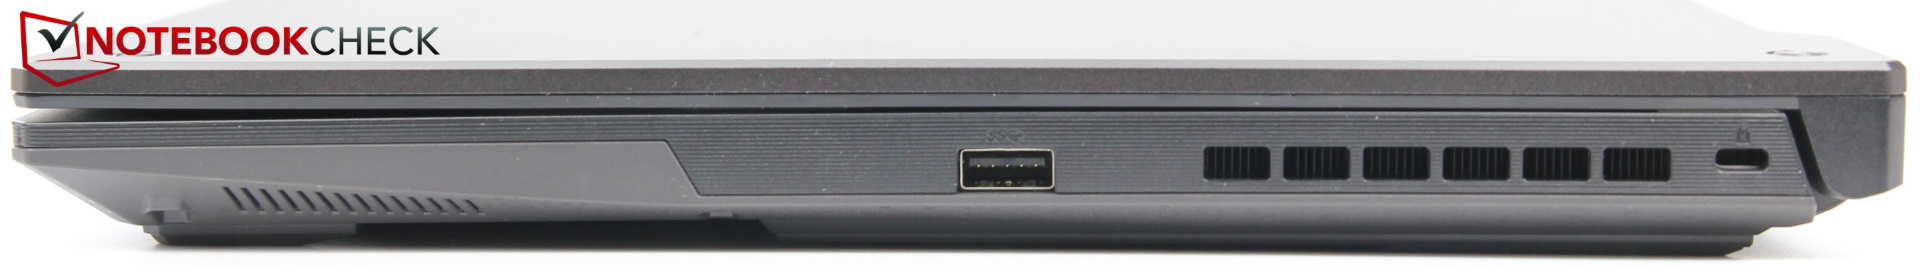
连接性 - Thunderbolt 4;Wi-Fi不佳
端口与前代产品基本保持一致,除了一个USB-A端口变成了USB-C端口外,总共有两个USB-C端口,其中一个与雷电4控制器相连。
此外,鉴于后部两侧配备了额外的风扇通风口,所有的端口都稍微向前移动。右撇子会很高兴听到该设备的右侧只配备了一个USB端口,而左撇子可能会对这个定位提出异议。我们还发现该设备的耳机插孔离USB-A端口太近。否则,端口间距总体上还可以。
沟通
有线通信由CPU的集成控制器处理,该控制器在2015年首次推出。相应地,它只支持高达1 Gbps的速度。相比之下,许多现代网络控制器支持2.5Gbps或更高的速度。
无线通信是由非常常见的英特尔AX201适配器处理的。不幸的是,F17的执行速度特别慢,传输速度只有其竞争对手的一半左右。这在其前辈身上已经存在,我们很失望地看到它没有得到解决和改进。
| Networking | |
| iperf3 transmit AX12 | |
| Schenker XMG Core 17 (Early 2021) | |
| MSI Katana GF76 11UE | |
| MSI GE76 Raider | |
| Average Intel Wi-Fi 6 AX201 (49.8 - 1775, n=324) | |
| Lenovo Legion 5 17ACH6H-82JY0003GE | |
| Asus TUF Gaming F17 FX706HM | |
| Asus TUF Gaming F17 FX707Z-HX011W | |
| iperf3 receive AX12 | |
| Schenker XMG Core 17 (Early 2021) | |
| MSI Katana GF76 11UE | |
| Average Intel Wi-Fi 6 AX201 (136 - 1743, n=324) | |
| MSI GE76 Raider | |
| Lenovo Legion 5 17ACH6H-82JY0003GE | |
| Asus TUF Gaming F17 FX706HM | |
| Asus TUF Gaming F17 FX707Z-HX011W | |
网络摄像头
F17配备了一个普通的720p网络摄像头,色彩不佳,整体图像质量很差。


安全问题
F17有一个Kensington锁以及TPM 2.0。其他安全功能,例如指纹识别器,并不具备。
配件和保修
就F17的价格范围而言,除了一个240瓦的电源外,盒子里没有其他配件。
欧洲客户得到24个月的有限保修,而美国客户又一次只满足于12个月。
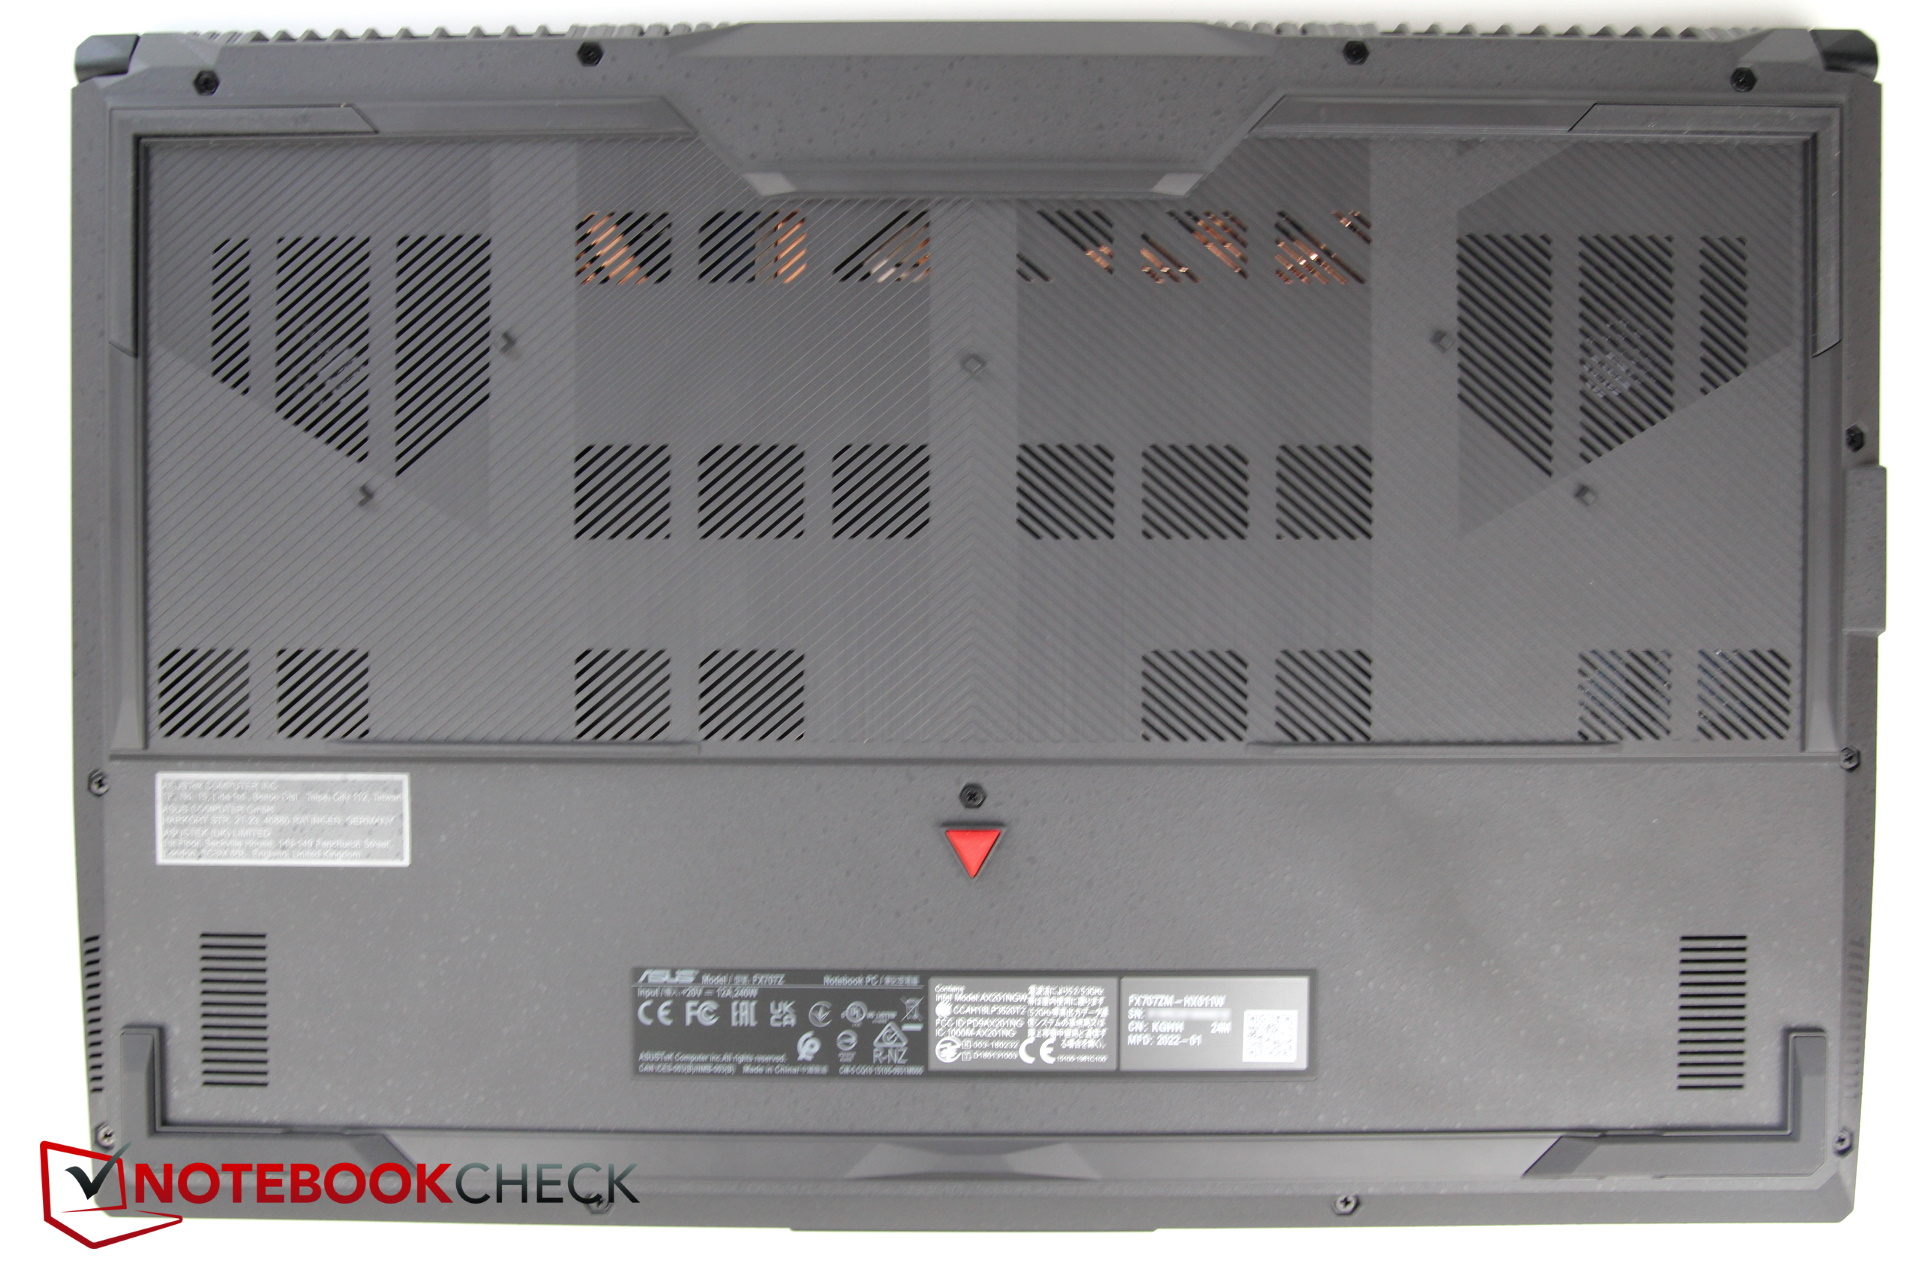
维护

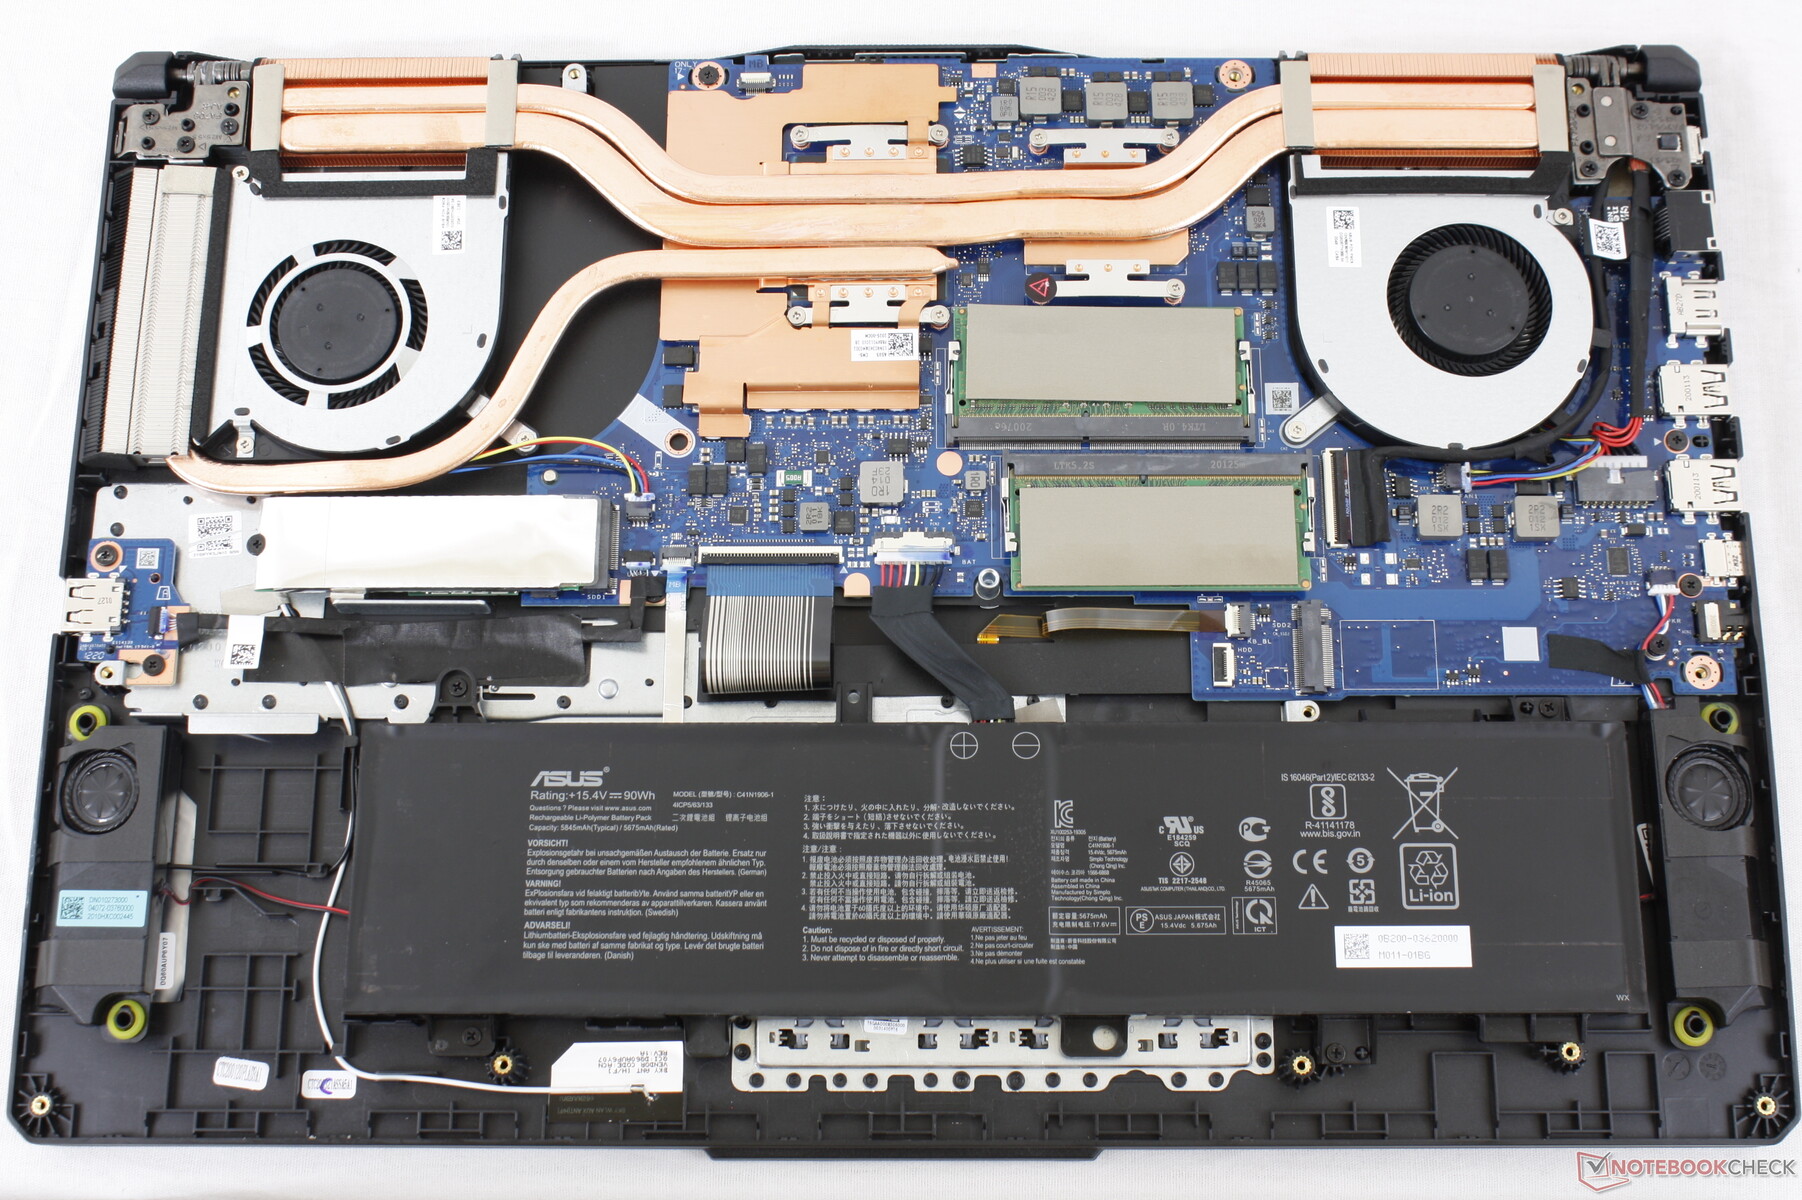
底盖是由12个容易看到的十字螺丝固定的。不幸的是,它们有三种不同的长度,所以你需要跟踪哪颗螺丝的位置。
撬开底盖原来是一个相对简单的经验。卸下盖子后,你可以接触到风扇、电池、SSD和RAM。后两者由一个黑色塑料盖子保护,用胶带固定,此外,固态硬盘也被某种金属箔覆盖,以改善散热。另外还有一个M.2插槽,可供额外的固态硬盘使用。
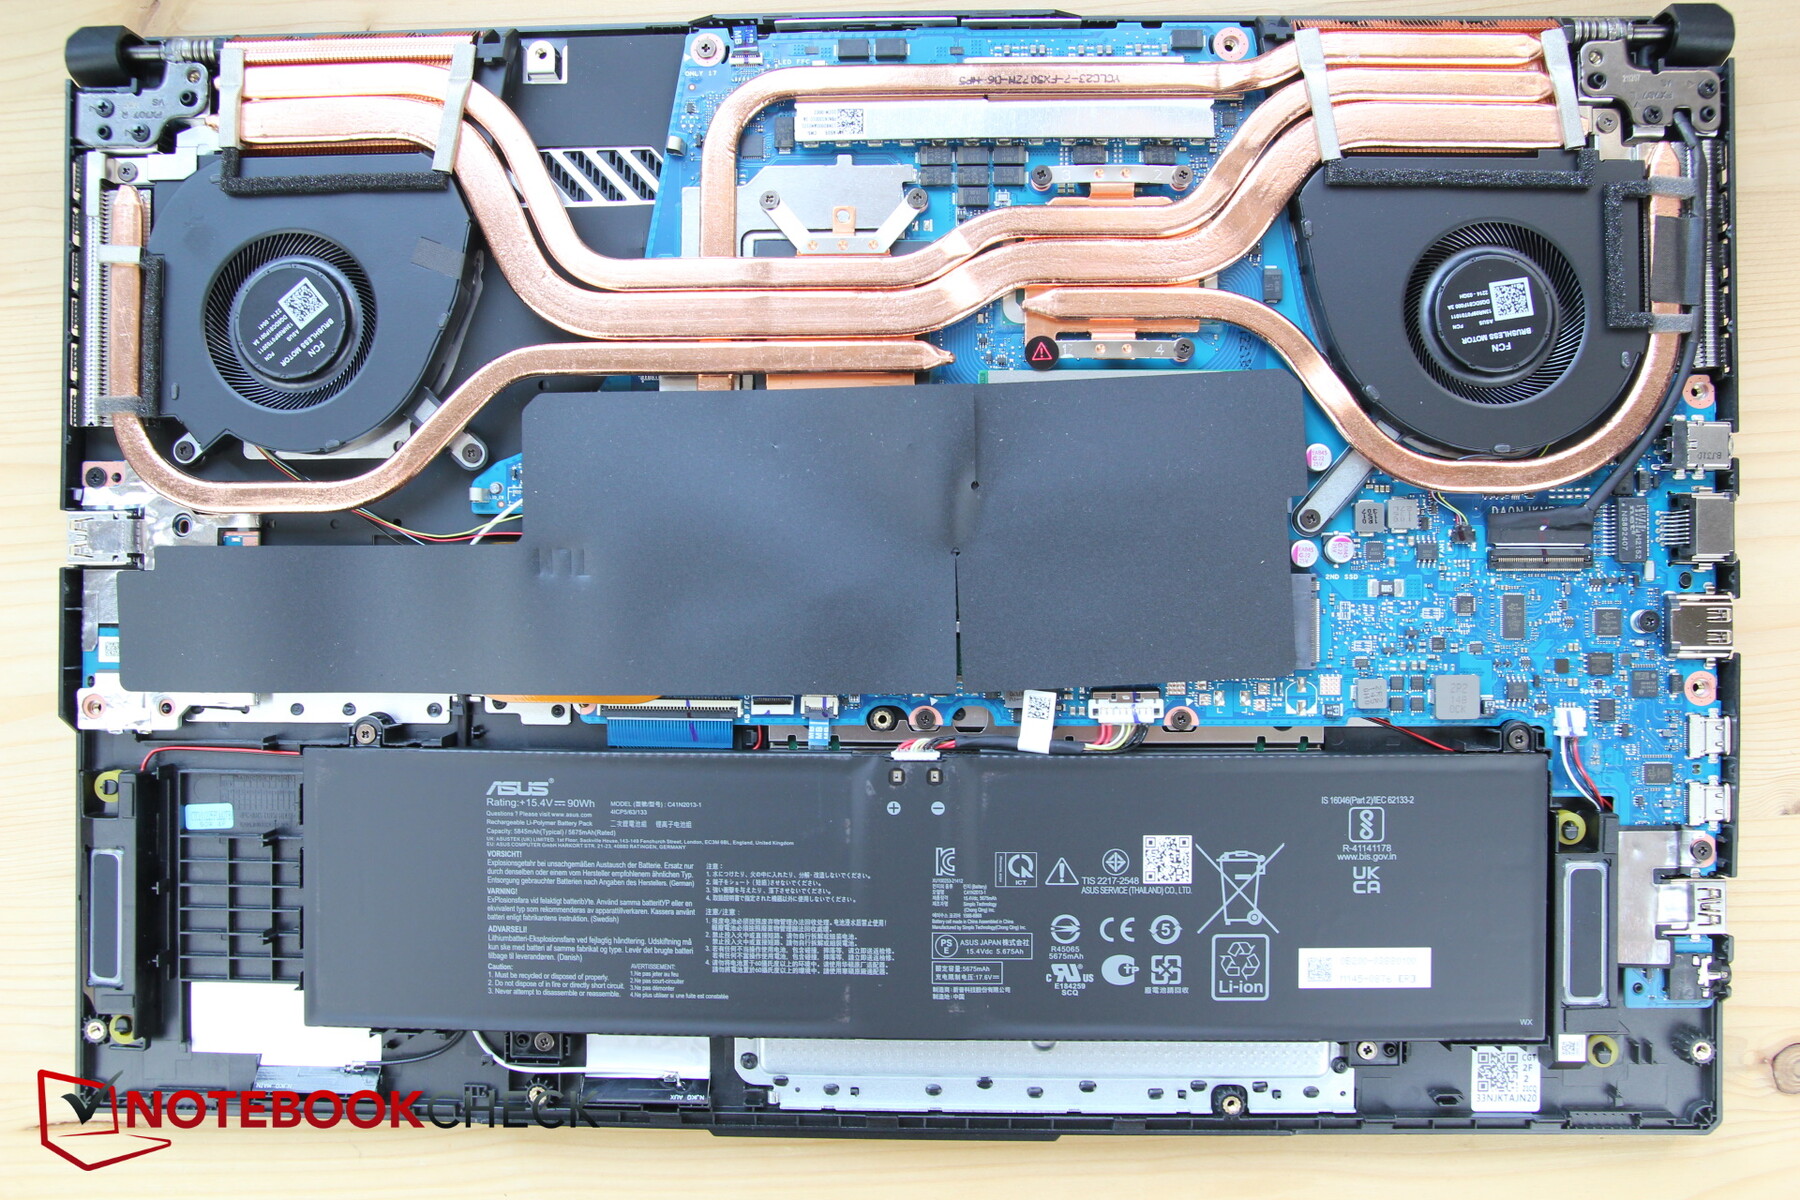
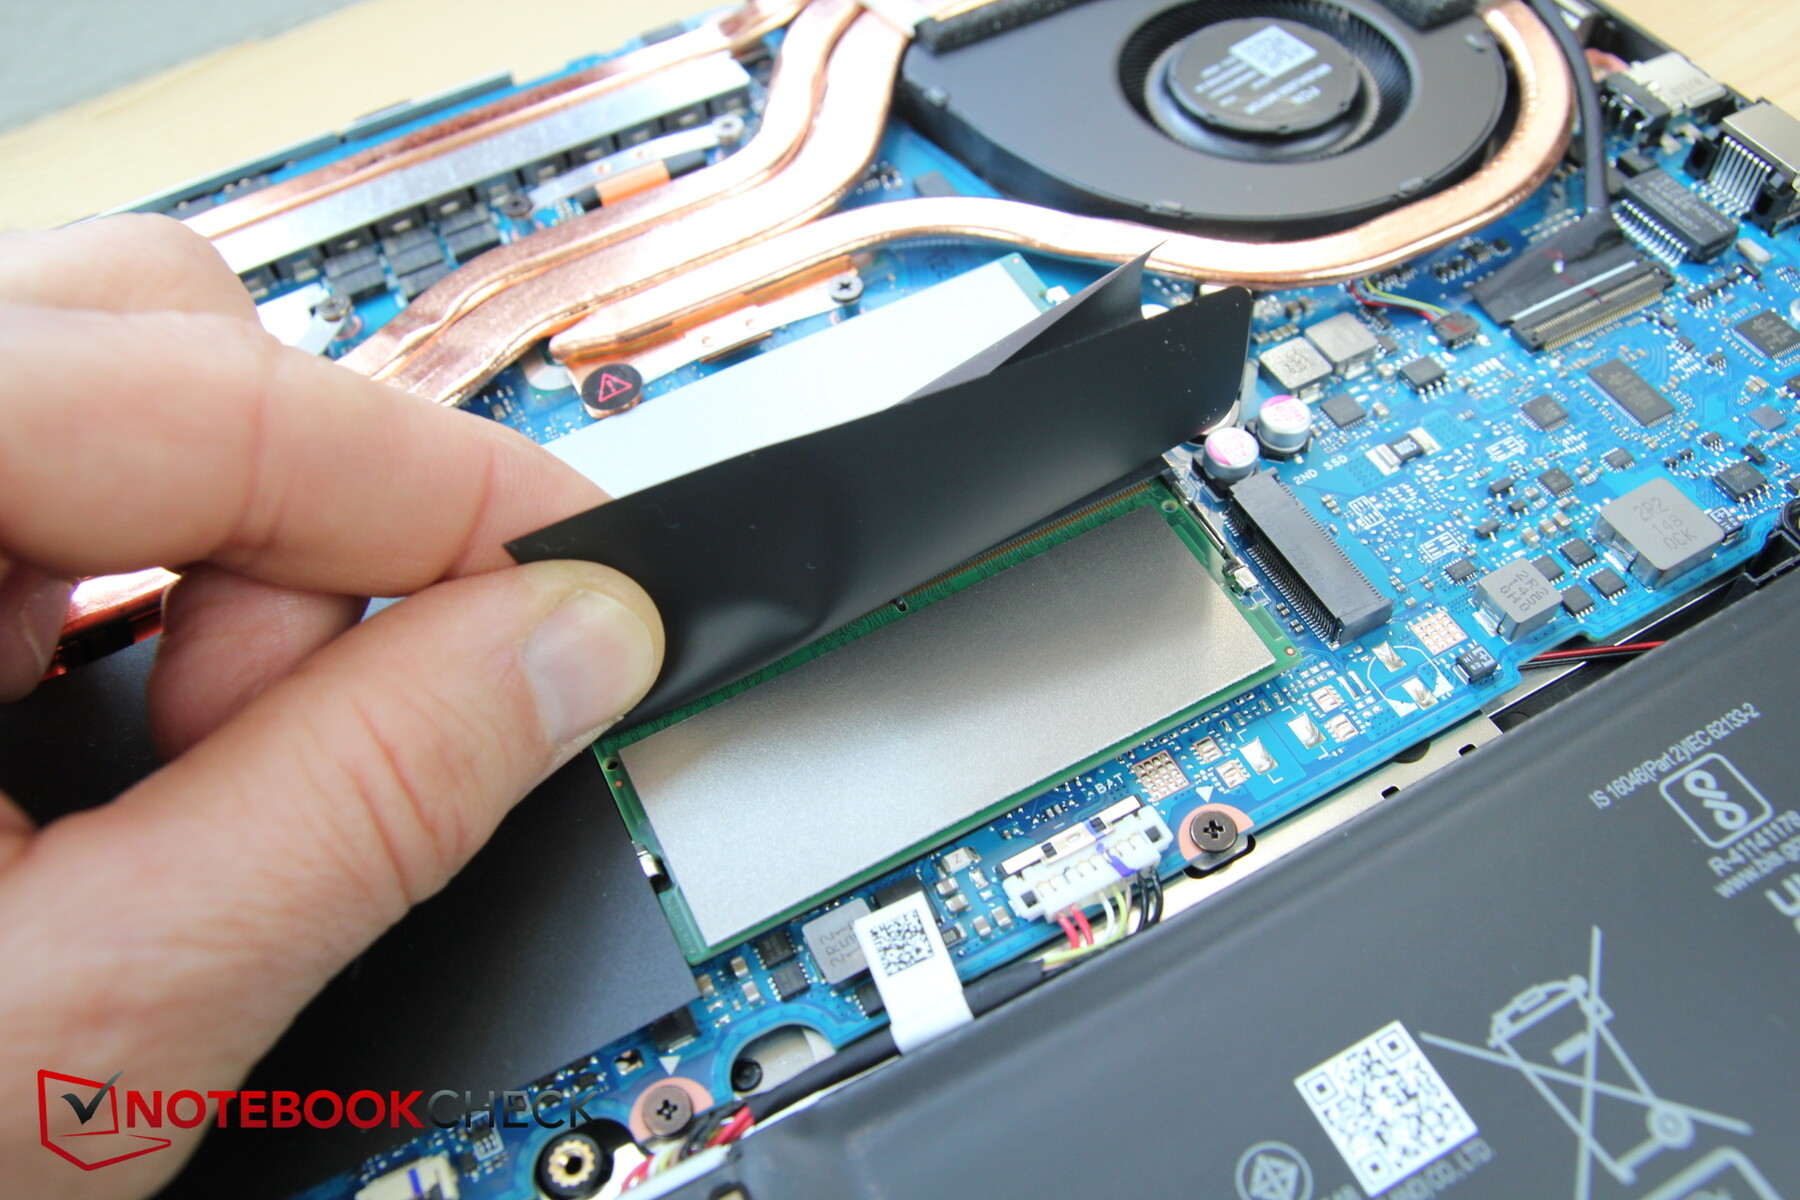
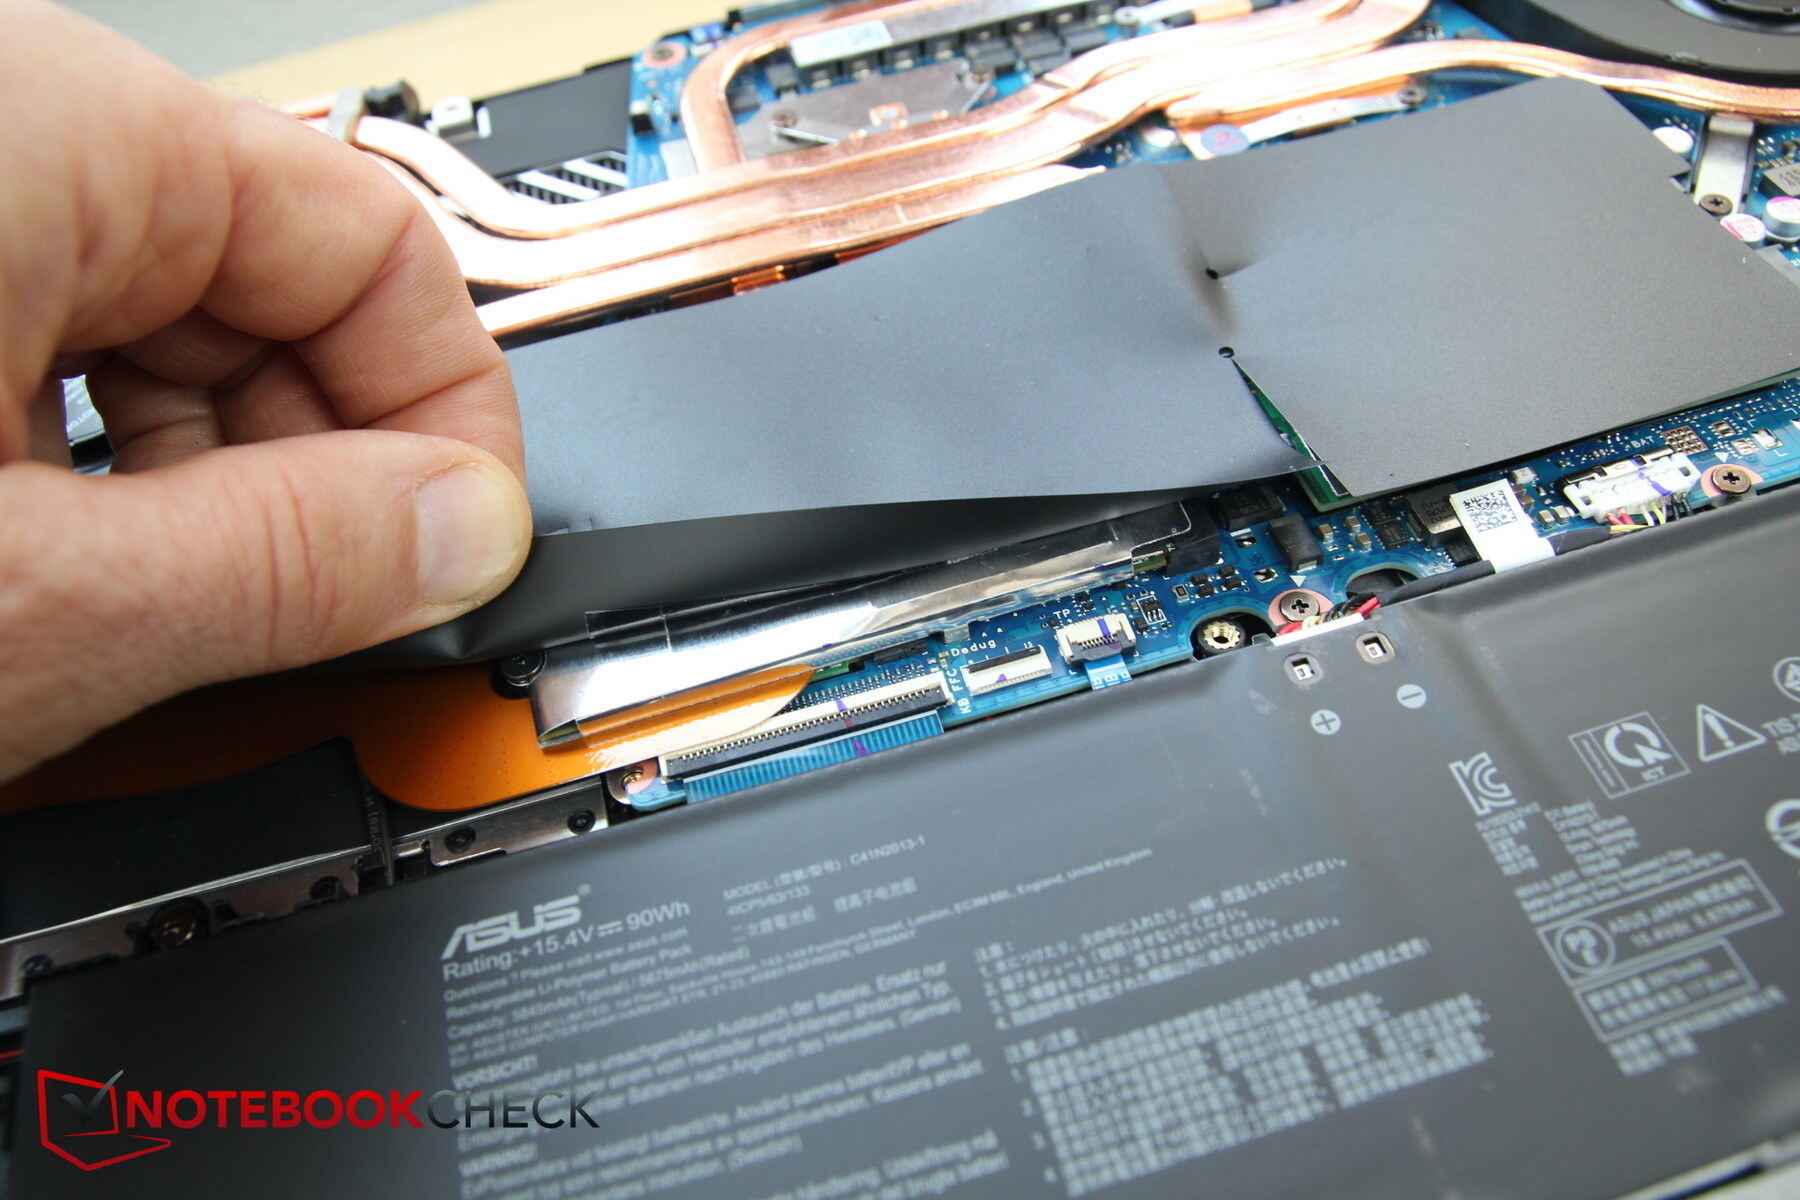
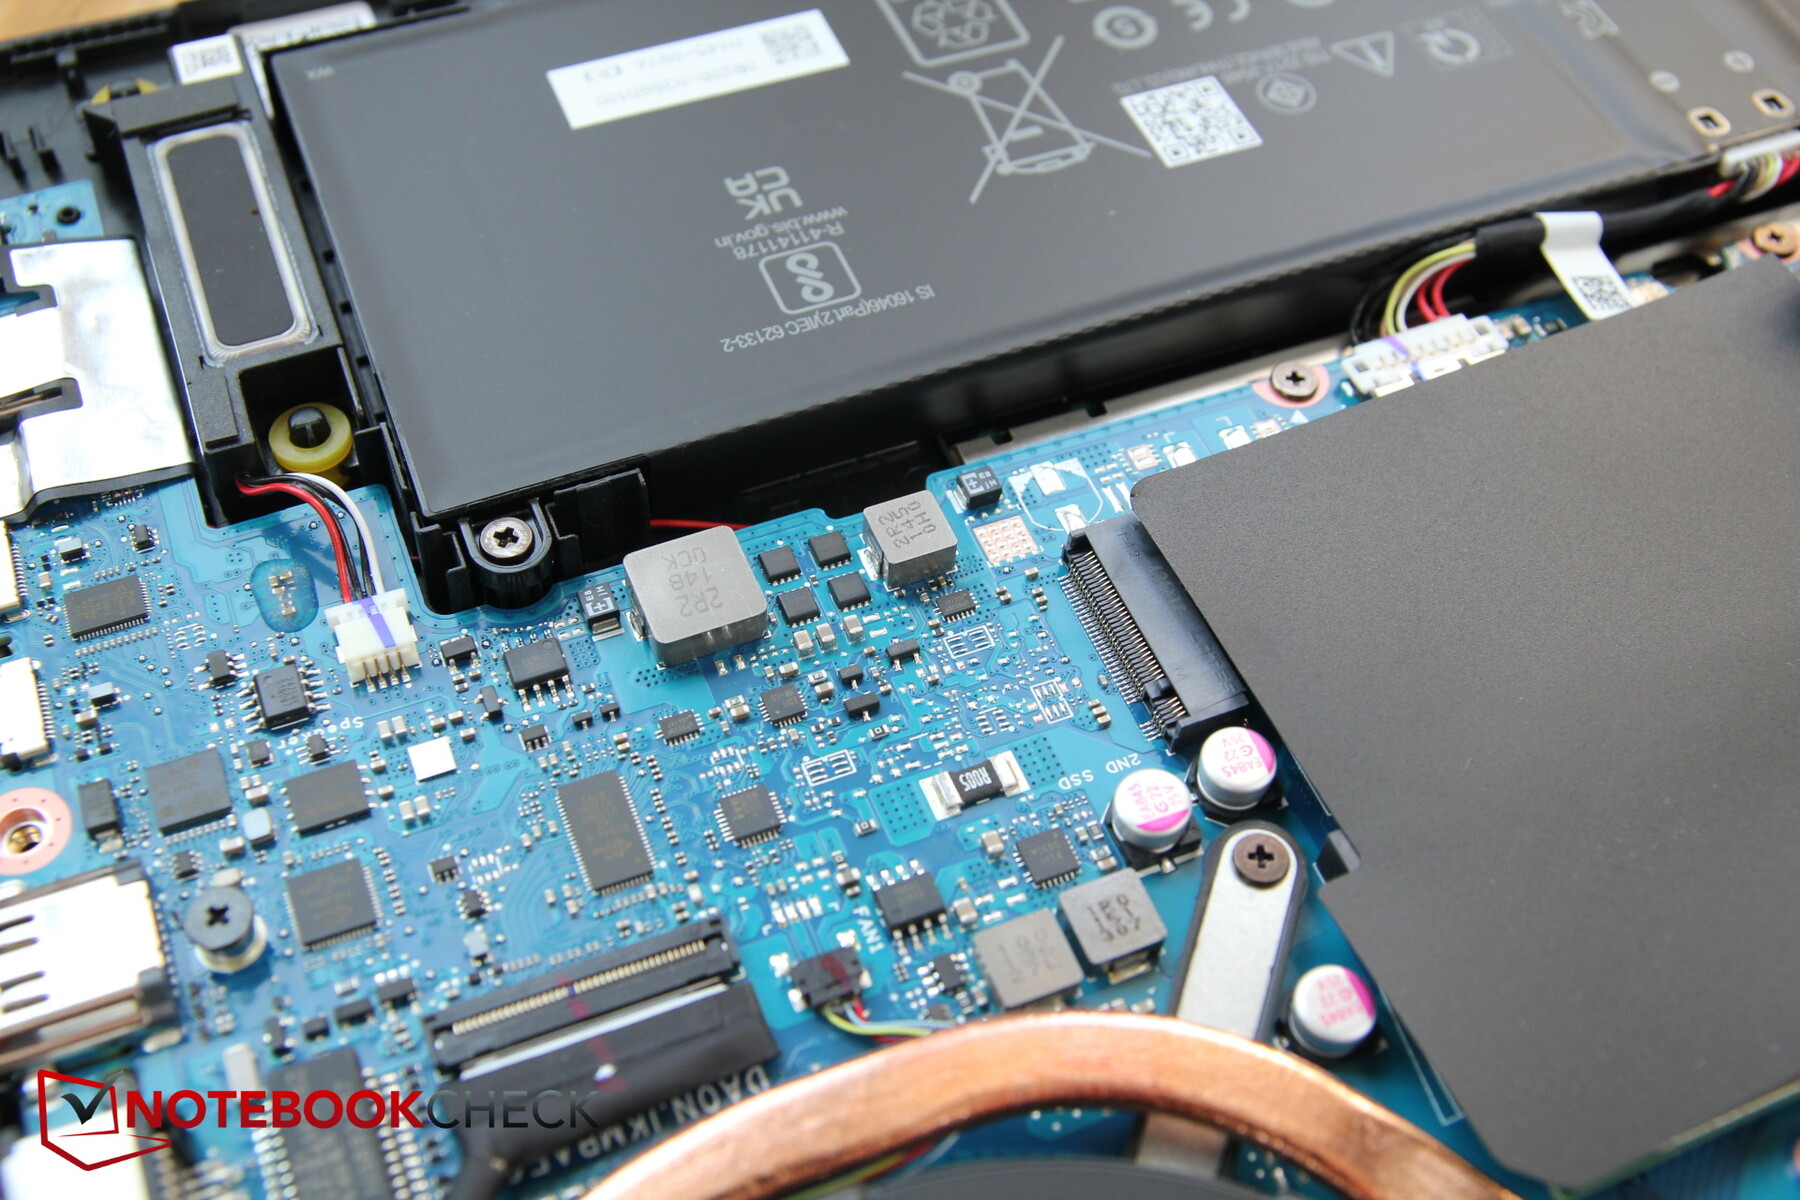
与FX706相比,新机型在内部看起来很不一样。值得注意的是,它有额外的热管,更大的扬声器,重新定位的SSD等等。

输入设备--小键盘
键盘
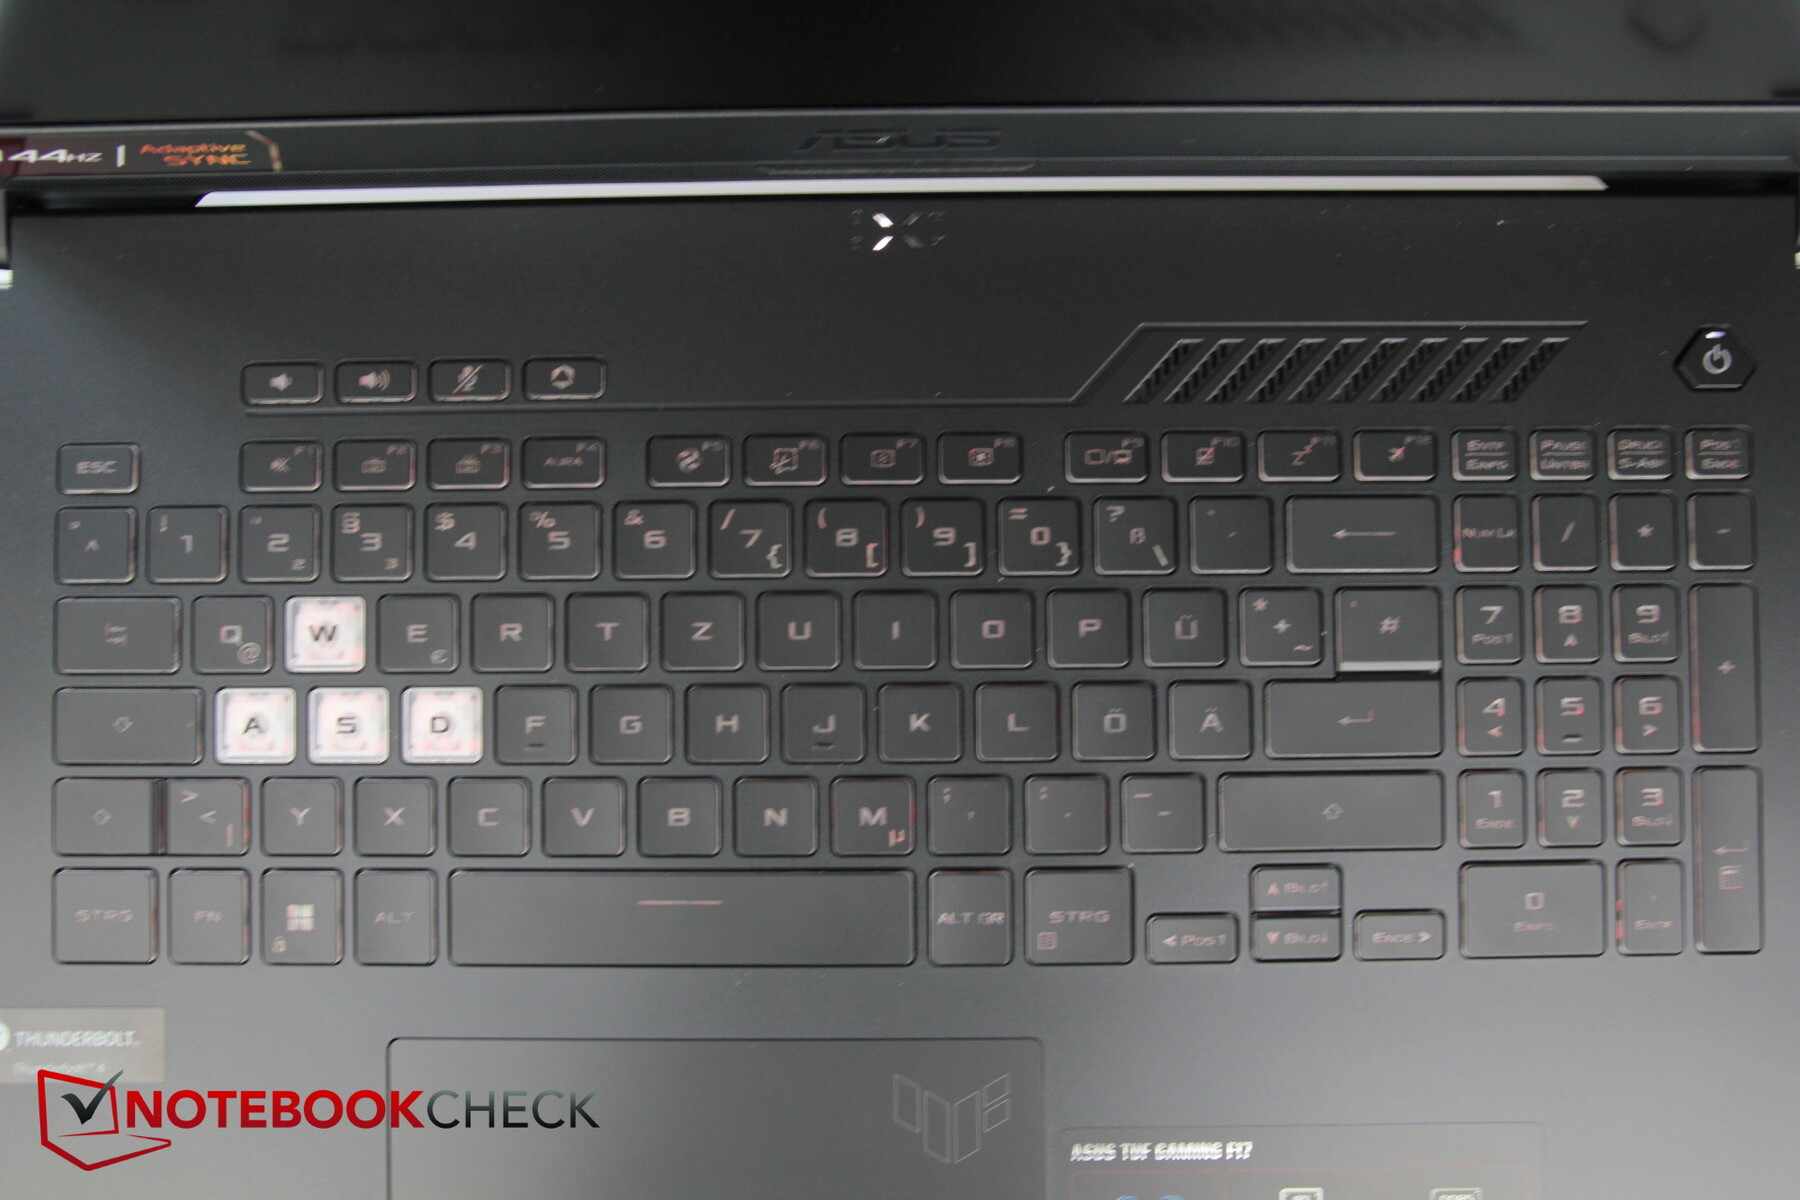
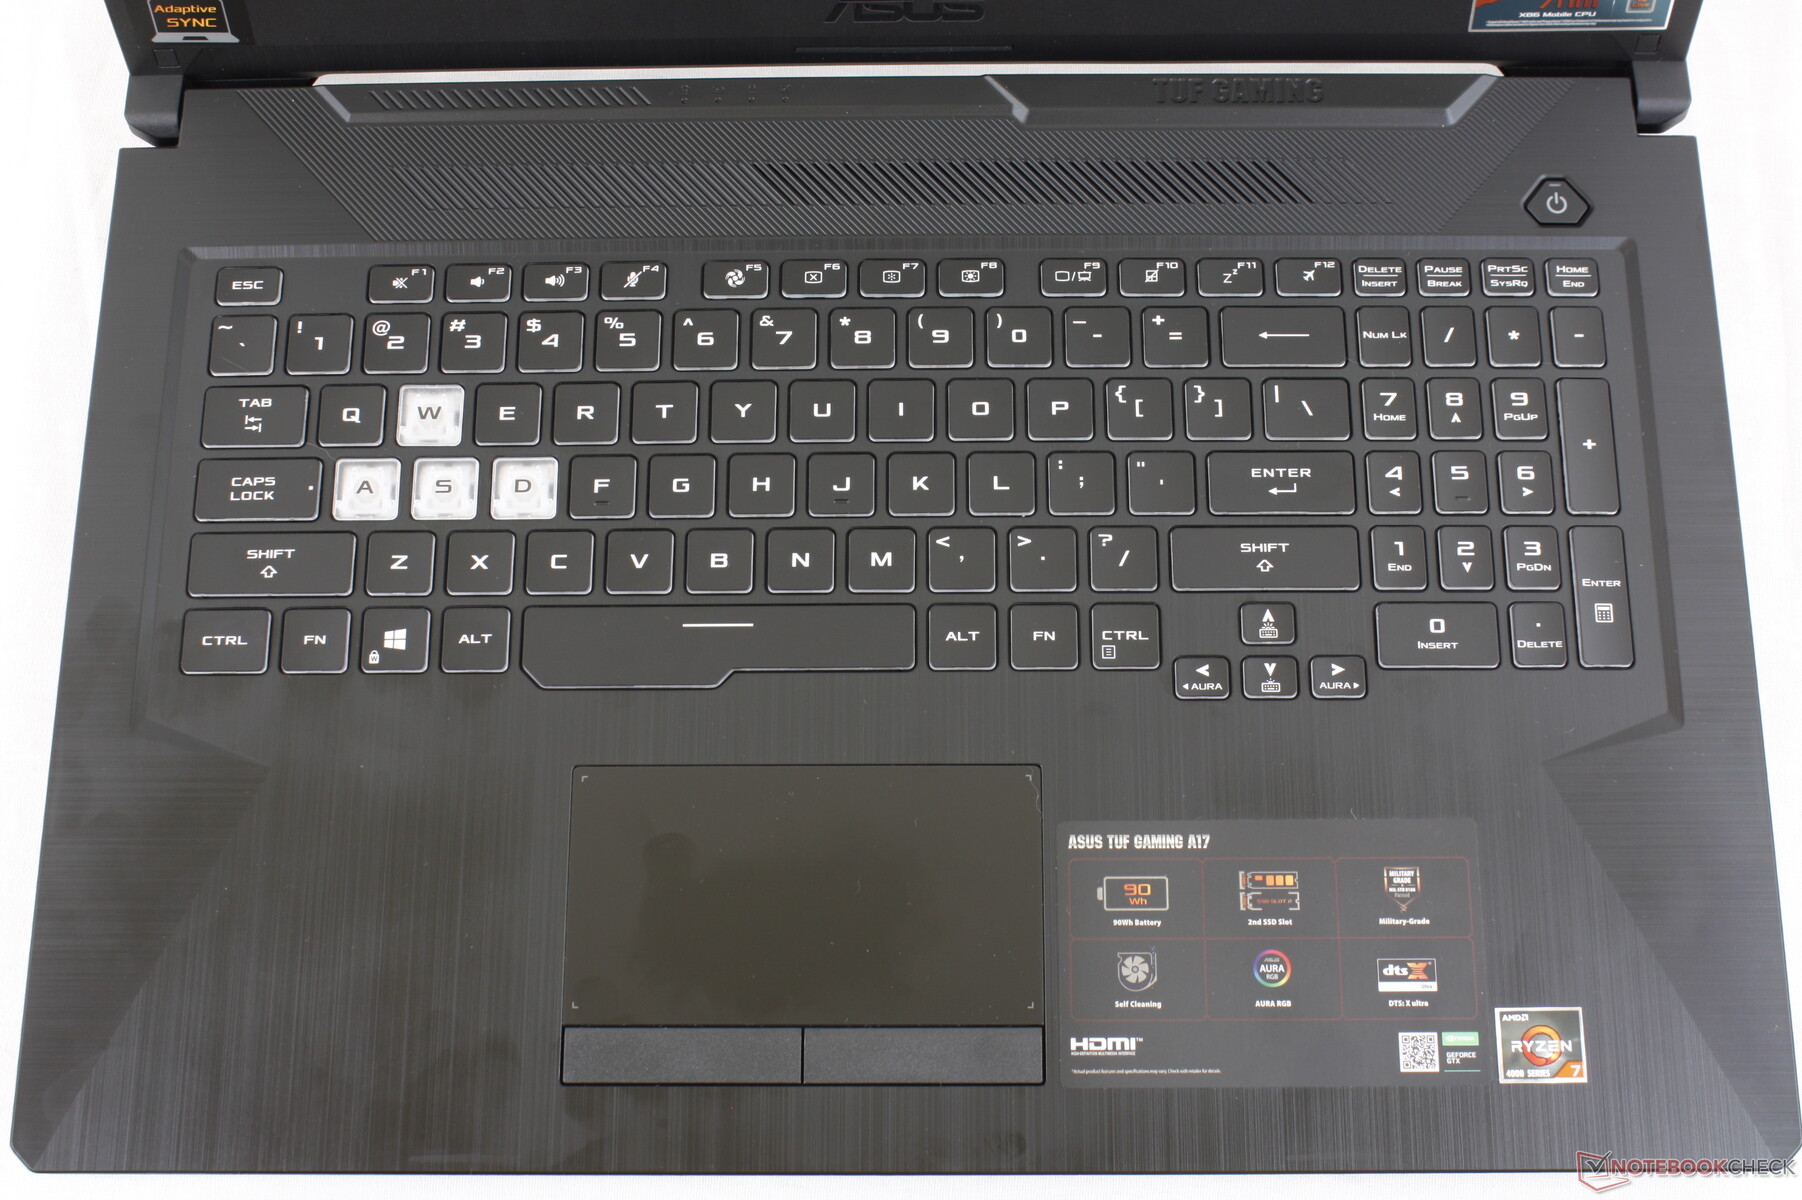
键盘布局仍然大体相同,对于17英寸的笔记本来说,它的数字键盘非常窄。光标键仍然只有普通键的一半大小;上/下键占用一个普通键的空间。
新的是位于键盘上方左上方的四个额外的功能键,用于调高和调低音量、静音和启动Armory Crate软件。和以前一样,电源键在右上角是一个专门的独立实体,而作为游戏笔记本上常见的WASD键有一个独立的半透明的白色,与键盘的其他部分形成鲜明的对比。
键盘采用三段式RGB背光,不能对每个键进行自定义,只能对每个区域进行自定义。
键程仍然相对较短,反馈明显但比前代产品更柔和。总的来说,这款键盘的打字感觉非常舒适,噪音排放适中。

触摸板
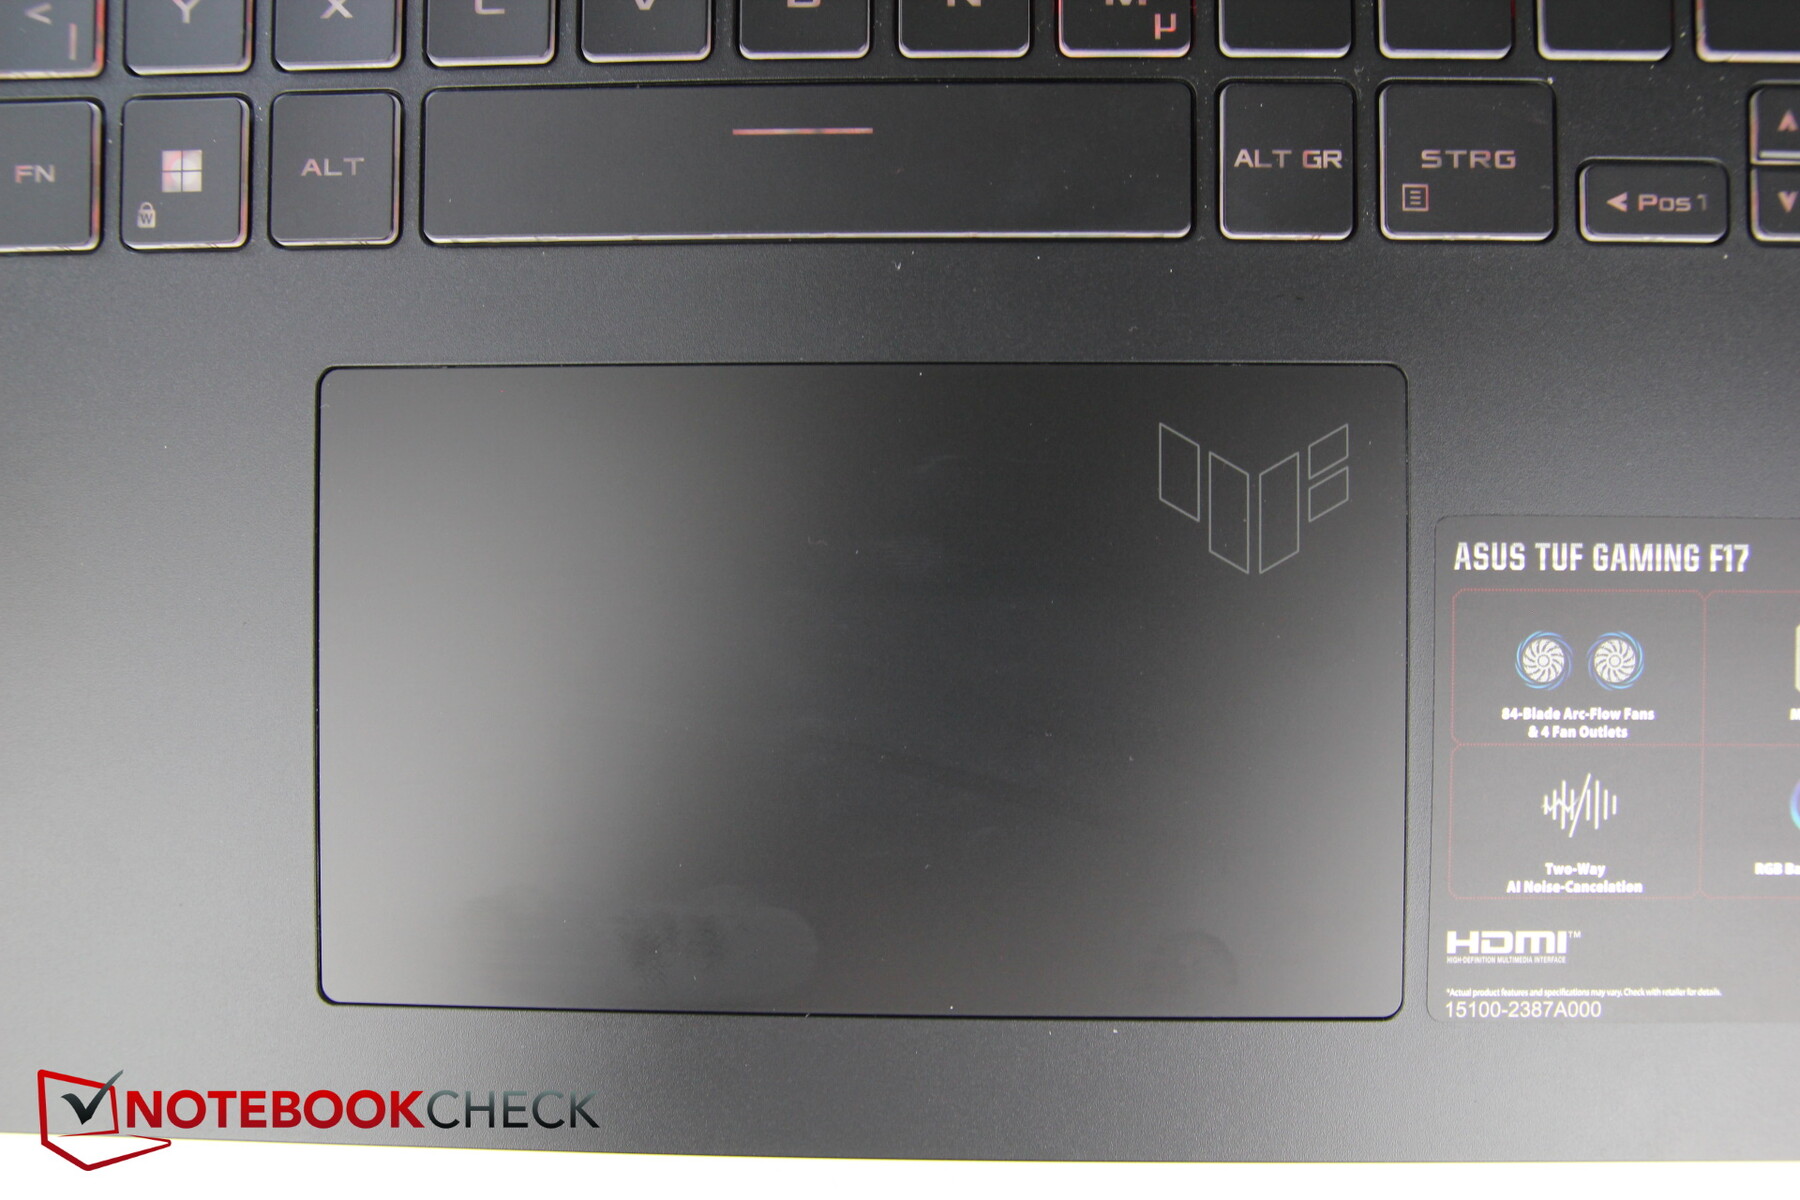
触摸板不再有专门的按钮,但现在比以前大一些(约13 x 7.7厘米/5.1 x 3英寸)。它的表面是令人愉快的光滑,只有在非常缓慢的移动中才会有轻微的粘性。我们还发现在右下角有一个小死角。
集成的按钮工作正常,没有任何问题,并且有适度的噪音排放。
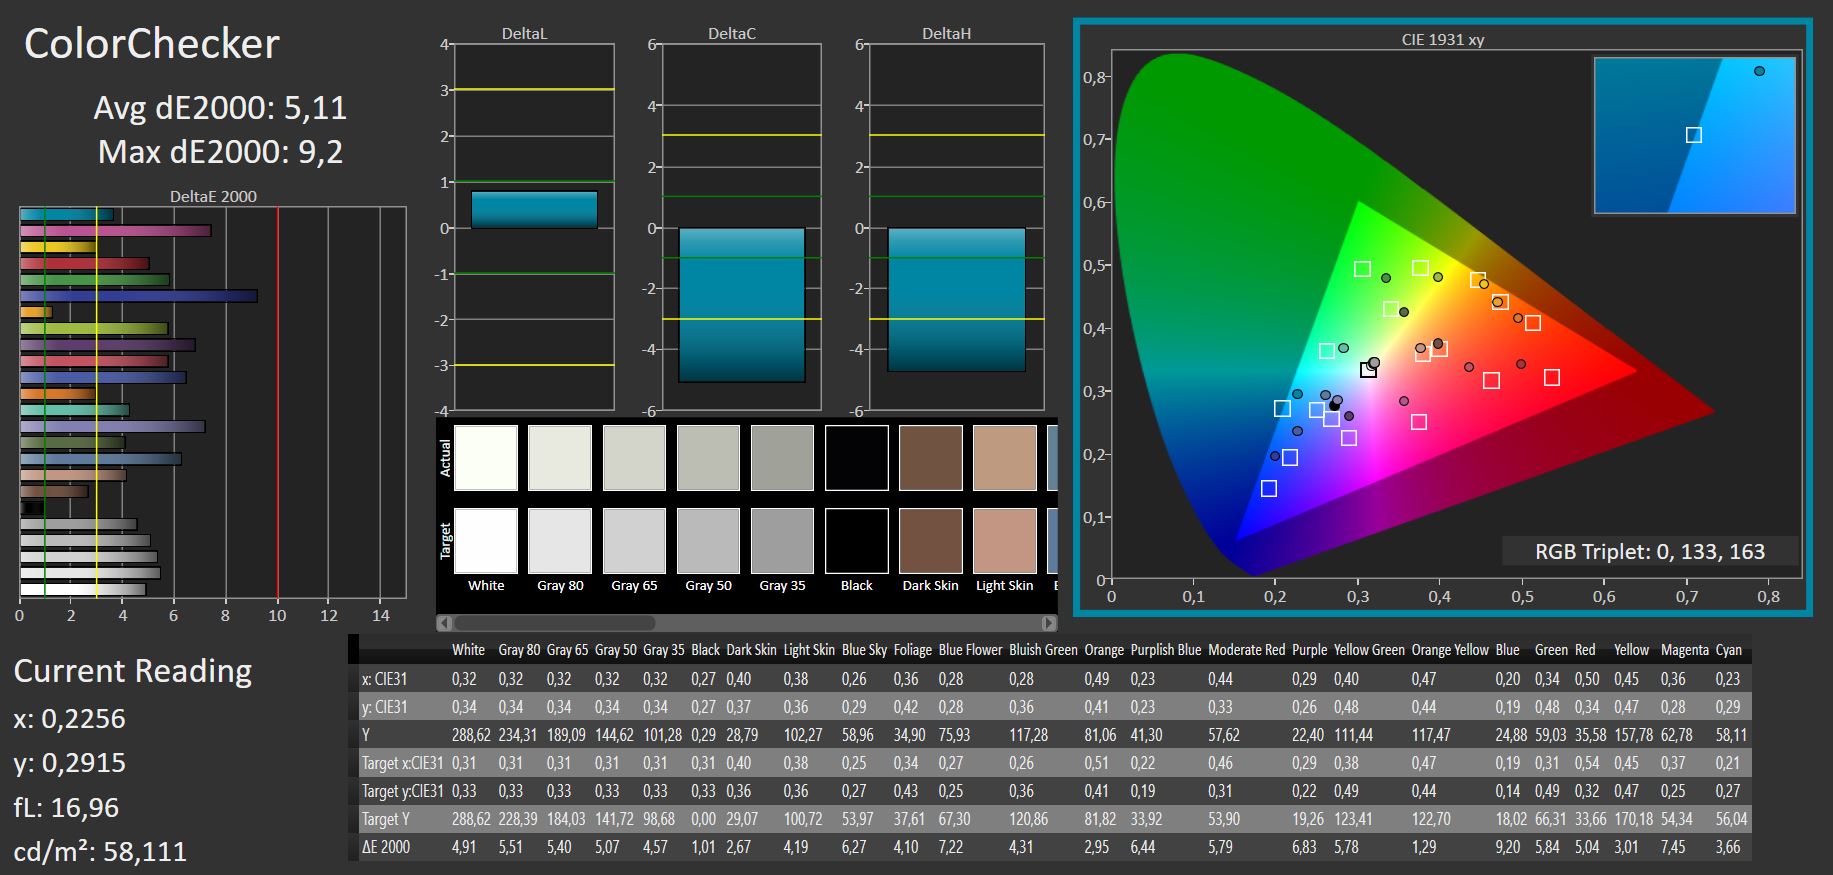
显示屏 - 昏暗,并非真正为游戏而设
华硕唯一的显示屏是由友达光电生产的FHD IPS 144 Hz面板。
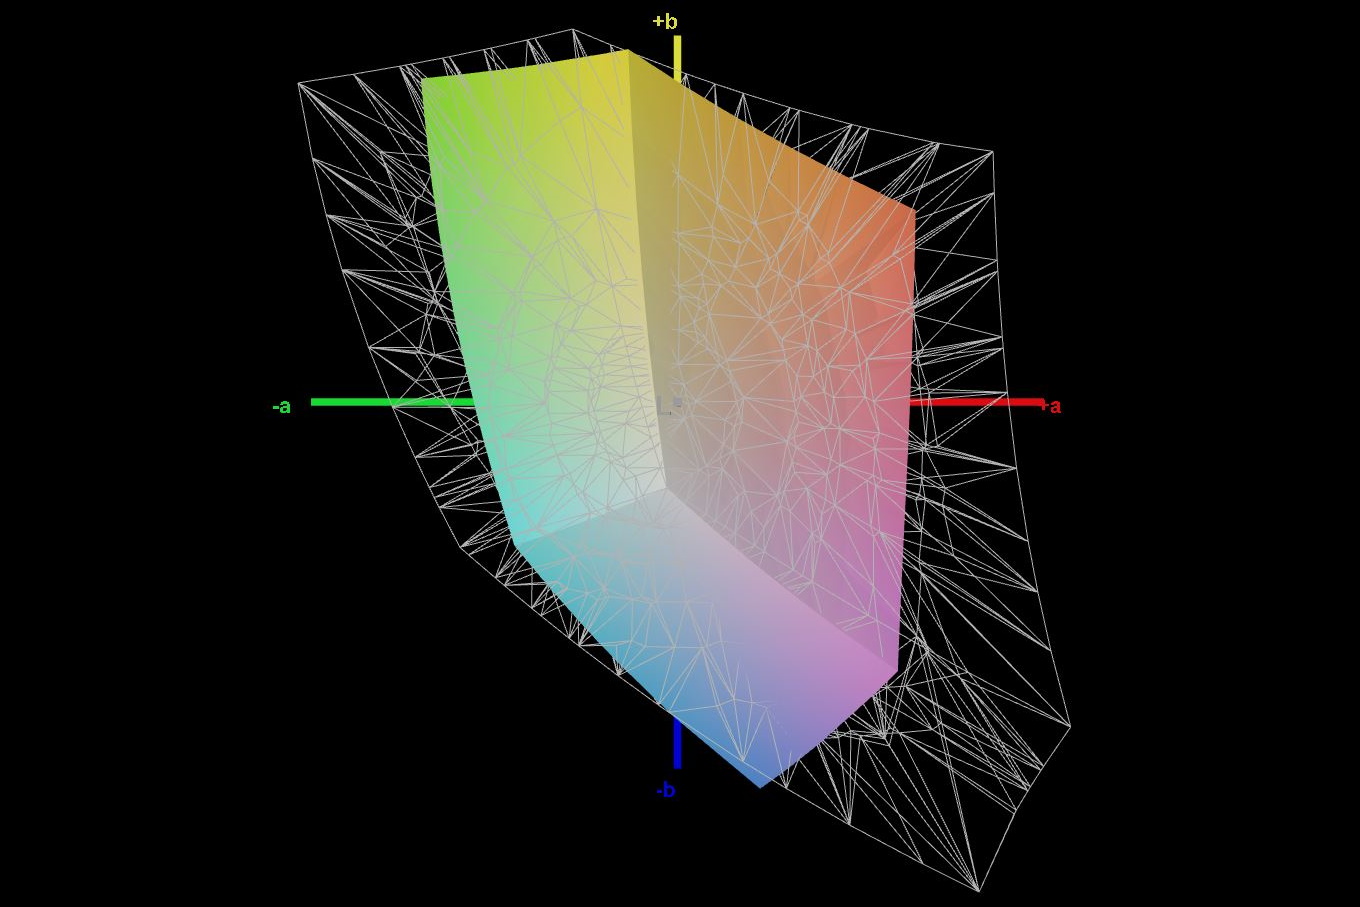
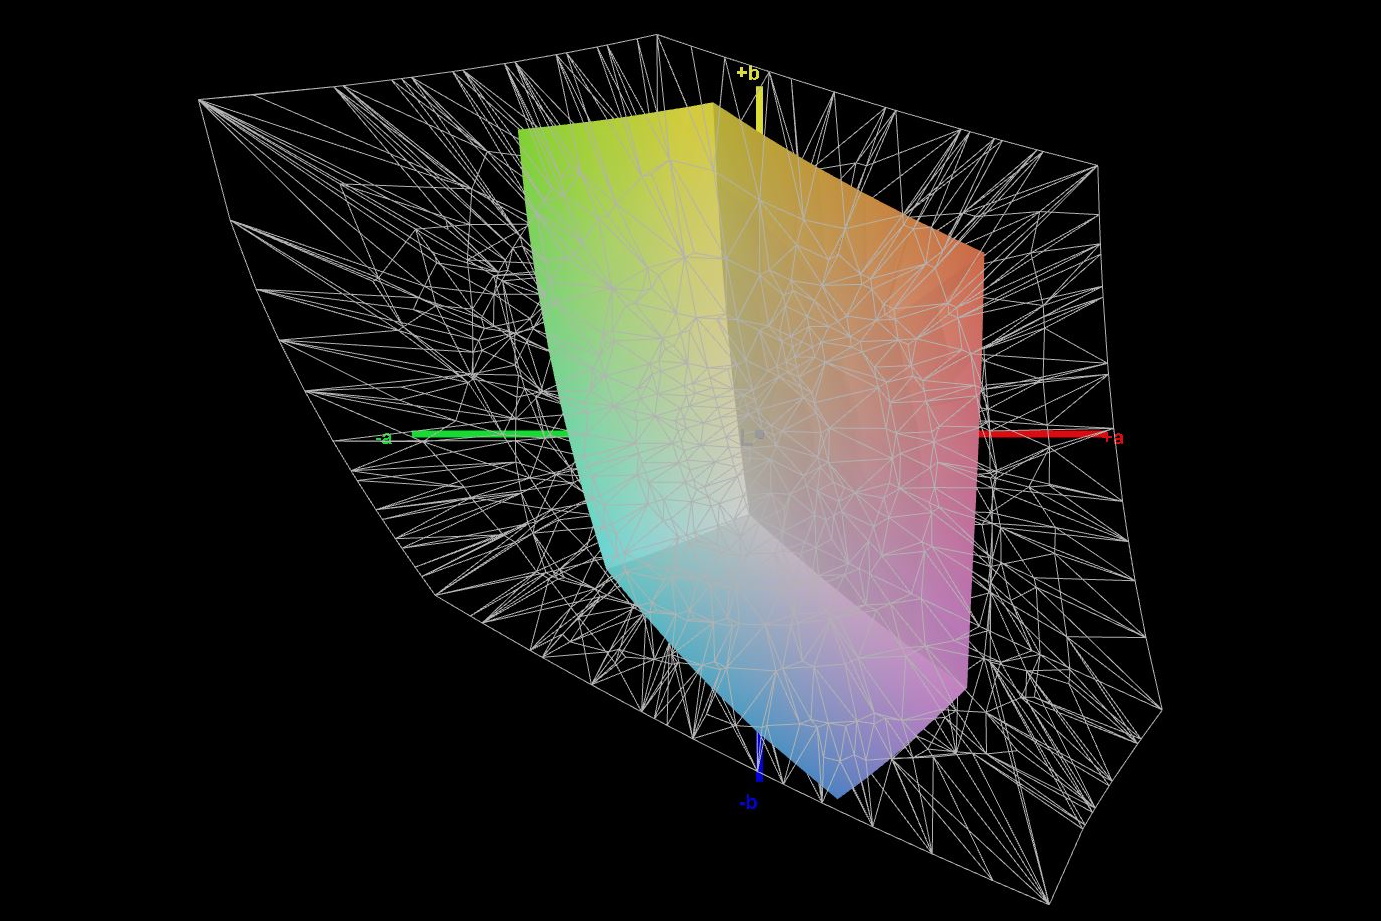
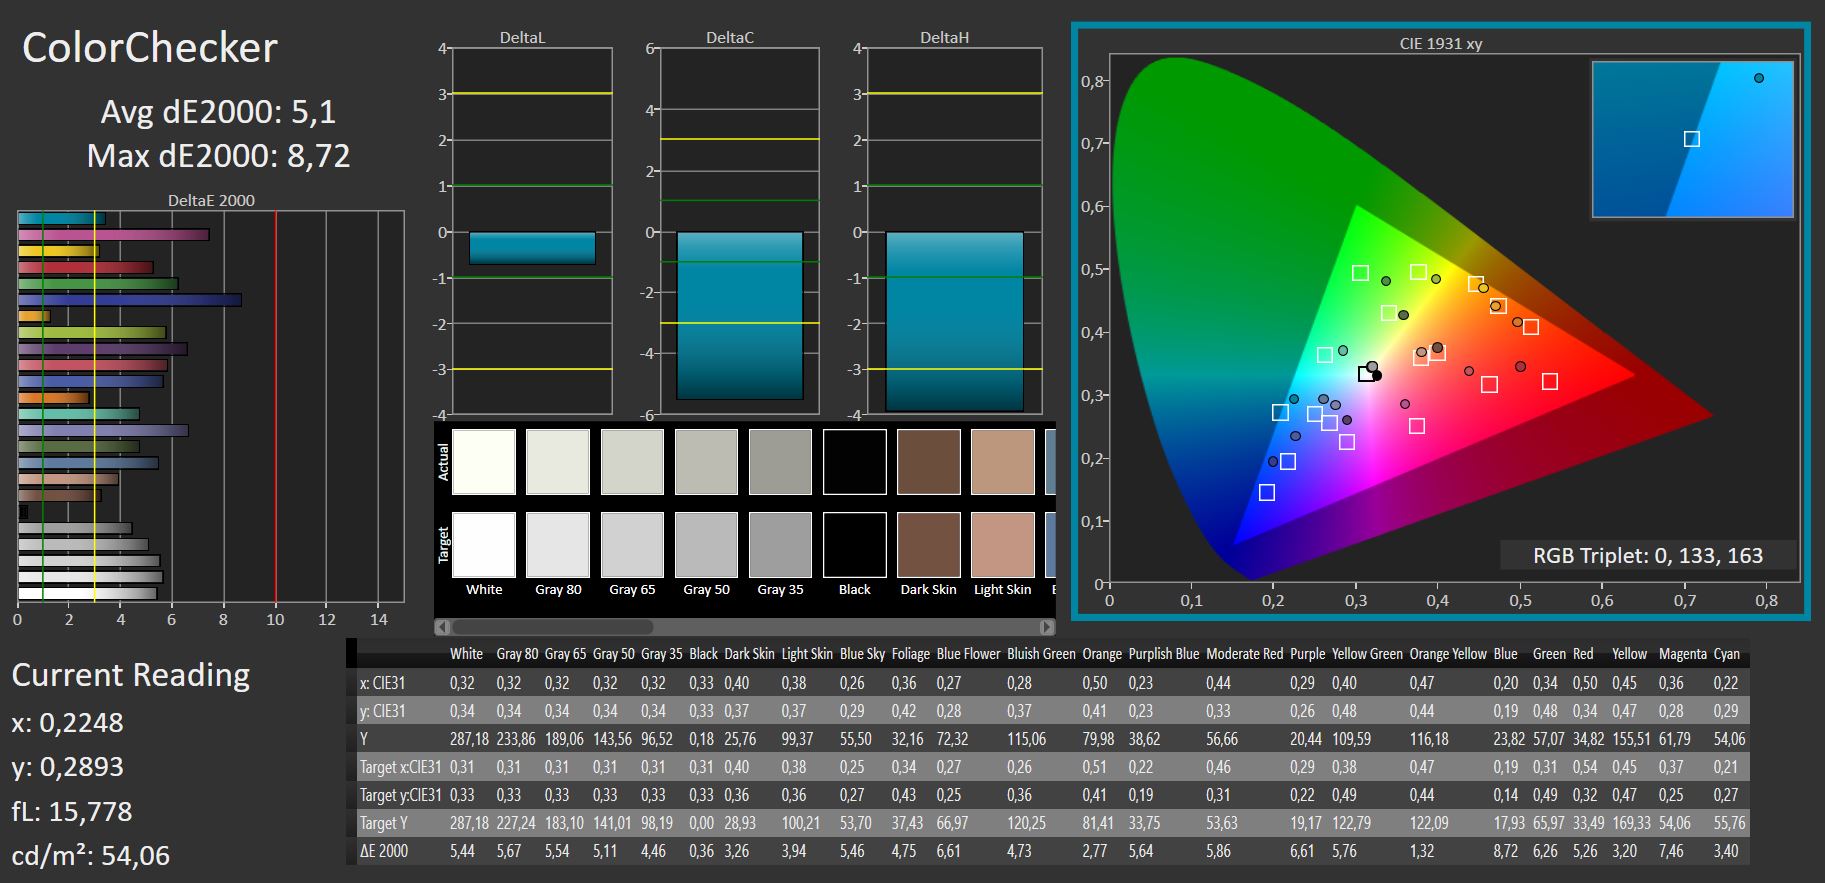
该面板是众所周知的,并且已经存在了相当长的一段时间,鉴于其低亮度只有268尼特,30-40毫秒的缓慢响应时间,以及60%的sRGB和大约41%的AdobeRGB的色彩空间覆盖率,我们已经习惯于看到它被用于更实惠的笔记本电脑,如微星GF75薄。
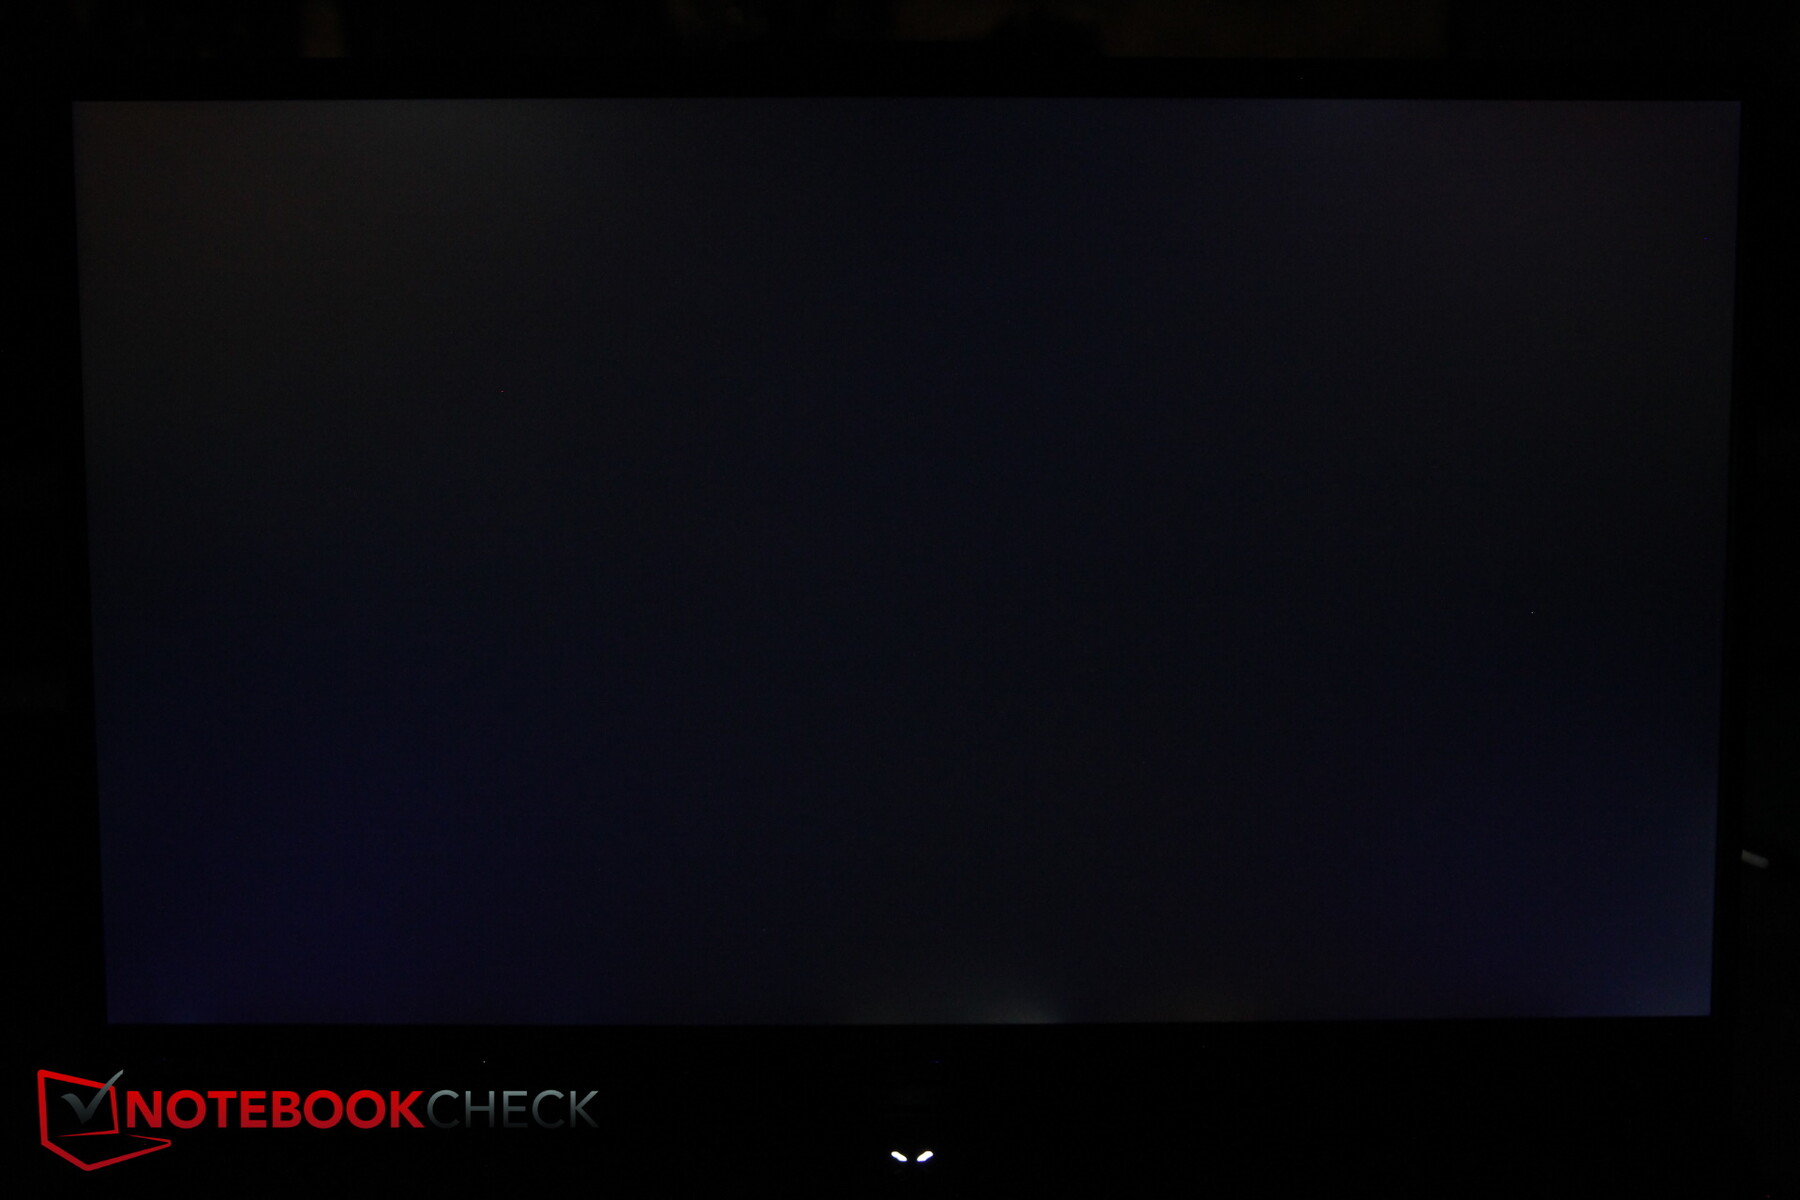
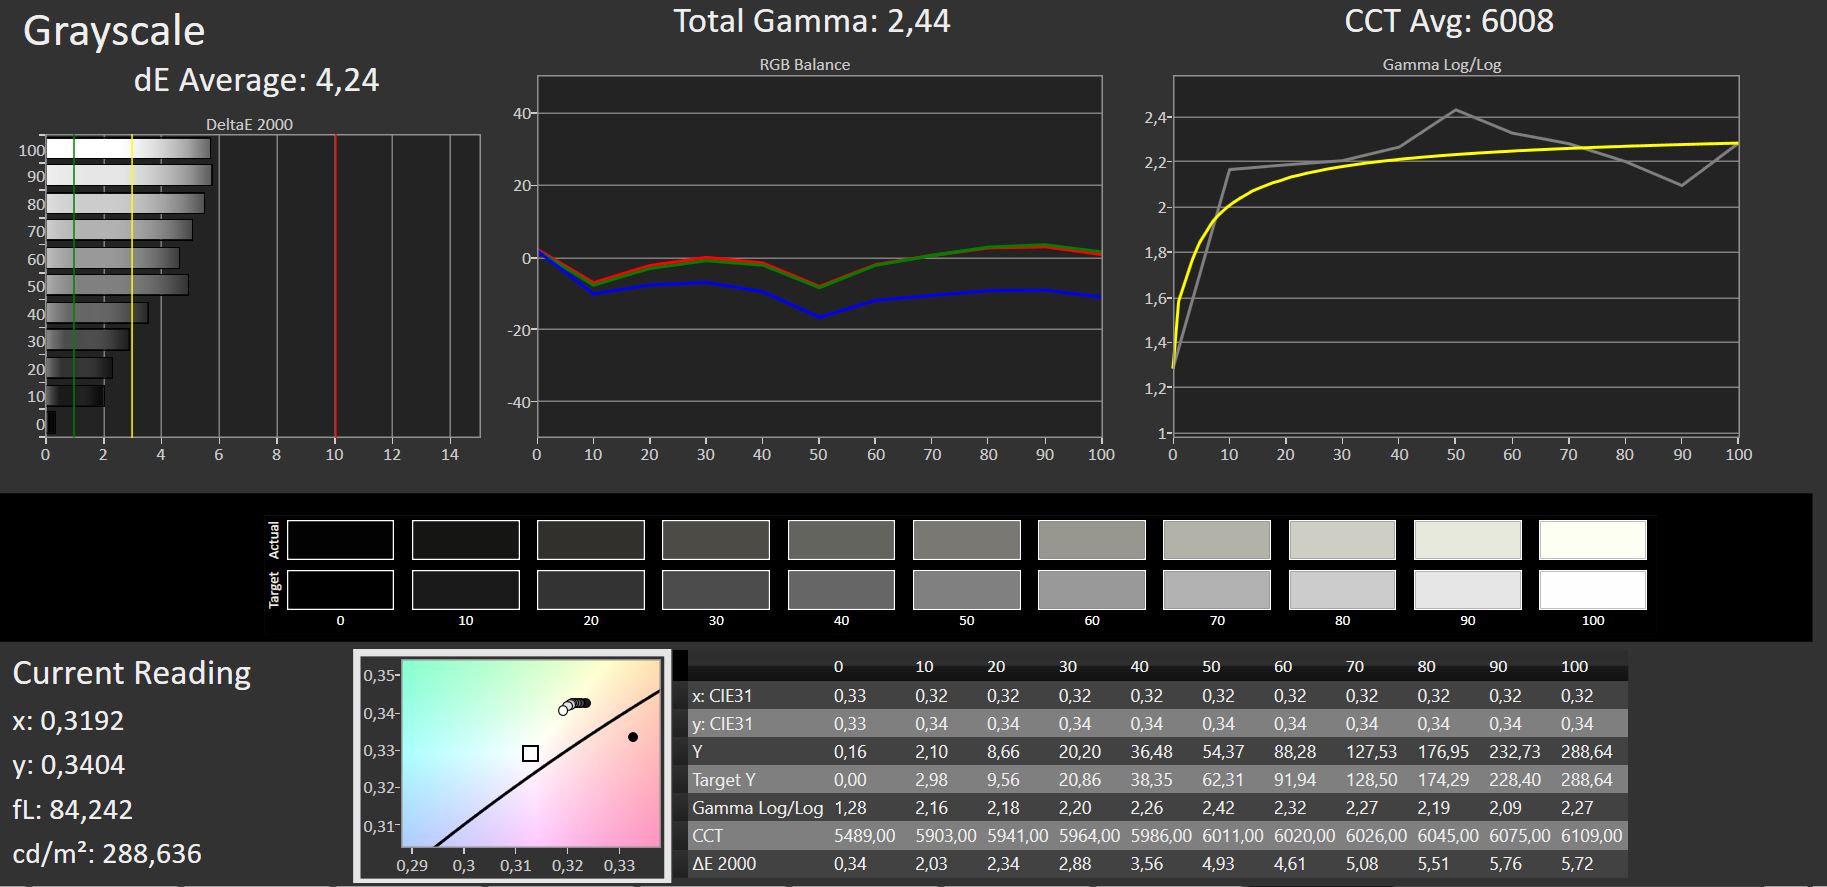
从正面看,由于整体亮度低,它的黑色水平相当低,使其对比度相对较高。光照度为89%,还算不错。
虽然该面板没有受到PWM闪烁的影响,但它确实受到了轻微但仍然明显的背光出血的影响,沿着其边缘。
| |||||||||||||||||||||||||
Brightness Distribution: 89 %
Contrast: 1688:1 (Black: 0.17 cd/m²)
ΔE ColorChecker Calman: 5.1 | ∀{0.5-29.43 Ø4.73}
calibrated: 5.1
ΔE Greyscale Calman: 4.24 | ∀{0.09-98 Ø4.97}
41.5% AdobeRGB 1998 (Argyll 3D)
59.7% sRGB (Argyll 3D)
40.2% Display P3 (Argyll 3D)
Gamma: 2.44
CCT: 6008 K
| Asus TUF Gaming F17 FX707Z-HX011W AU Optronics B173HAN04.9 (AUO4B9D), IPS, 1920x1080, 17.3" | Asus TUF Gaming F17 FX706HM AU Optronics AUI8294 (B173HAN04.9), IPS, 1920x1080, 17.3" | Lenovo Legion 5 17ACH6H-82JY0003GE LEN173FHD, IPS, 1920x1080, 17.3" | MSI GE76 Raider AU Optronics B173HAN05.4 (AUOE295), IPS-Level, 1920x1080, 17.3" | MSI Katana GF76 11UE AU Optronics B173HAN04.9, IPS, 1920x1080, 17.3" | Schenker XMG Core 17 (Early 2021) BOE CQ NE173QHM-NY2, IPS, 2560x1440, 17.3" | |
|---|---|---|---|---|---|---|
| Display | 0% | 62% | 57% | -1% | 67% | |
| Display P3 Coverage (%) | 40.2 | 40.1 0% | 64.8 61% | 63.1 57% | 39.8 -1% | 68.1 69% |
| sRGB Coverage (%) | 59.7 | 60 1% | 97.2 63% | 94 57% | 59.5 0% | 98.5 65% |
| AdobeRGB 1998 Coverage (%) | 41.5 | 41.4 0% | 66.7 61% | 65.2 57% | 41.12 -1% | 69.3 67% |
| Response Times | 21% | 66% | 77% | 9% | 62% | |
| Response Time Grey 50% / Grey 80% * (ms) | 39.2 ? | 32.4 17% | 15 ? 62% | 5.6 ? 86% | 36.8 ? 6% | 16.8 ? 57% |
| Response Time Black / White * (ms) | 29.6 ? | 22.4 24% | 9 ? 70% | 9.6 ? 68% | 26 ? 12% | 10 ? 66% |
| PWM Frequency (Hz) | ||||||
| Screen | -5% | 21% | 24% | -15% | 4% | |
| Brightness middle (cd/m²) | 287 | 266 -7% | 323 13% | 290 1% | 260 -9% | 370 29% |
| Brightness (cd/m²) | 268 | 264 -1% | 305 14% | 290 8% | 251 -6% | 333 24% |
| Brightness Distribution (%) | 89 | 79 -11% | 89 0% | 96 8% | 85 -4% | 84 -6% |
| Black Level * (cd/m²) | 0.17 | 0.32 -88% | 0.25 -47% | 0.23 -35% | 0.26 -53% | 0.38 -124% |
| Contrast (:1) | 1688 | 831 -51% | 1292 -23% | 1261 -25% | 1000 -41% | 974 -42% |
| Colorchecker dE 2000 * | 5.1 | 3.97 22% | 1.87 63% | 1.59 69% | 3.9 24% | 2.41 53% |
| Colorchecker dE 2000 max. * | 8.72 | 8.93 -2% | 4.84 44% | 3.17 64% | 20.64 -137% | 7.32 16% |
| Colorchecker dE 2000 calibrated * | 5.1 | 3.5 31% | 0.92 82% | 0.87 83% | 3.71 27% | 1.19 77% |
| Greyscale dE 2000 * | 4.24 | 1.8 58% | 2.57 39% | 2.5 41% | 1.6 62% | 3.9 8% |
| Gamma | 2.44 90% | 2.31 95% | 2.42 91% | 2.253 98% | 2.068 106% | 2.287 96% |
| CCT | 6008 108% | 6754 96% | 7012 93% | 6640 98% | 6511 100% | 7302 89% |
| Color Space (Percent of AdobeRGB 1998) (%) | 41.4 | 69 | ||||
| Color Space (Percent of sRGB) (%) | 60 | 93 | ||||
| Total Average (Program / Settings) | 5% /
-1% | 50% /
36% | 53% /
39% | -2% /
-9% | 44% /
26% |
* ... smaller is better
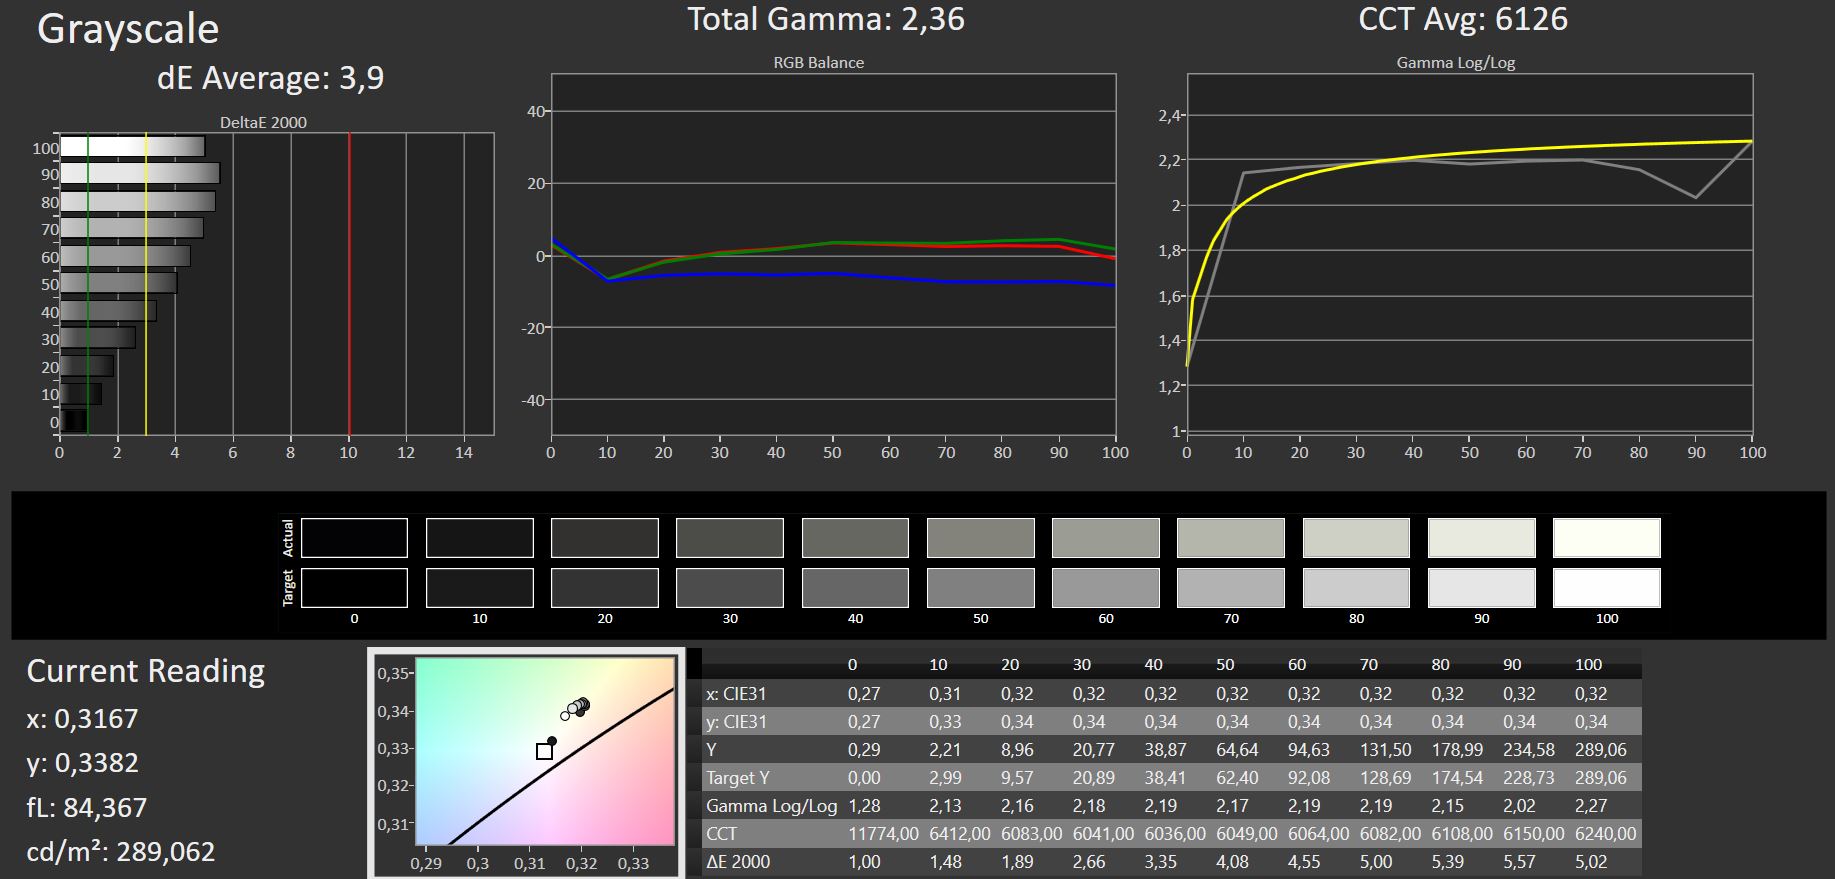
手动校准显示面板几乎没有改善其图像质量。虽然灰度精度略有提高,但我们发现色彩精度根本没有改善。

Display Response Times
| ↔ Response Time Black to White | ||
|---|---|---|
| 29.6 ms ... rise ↗ and fall ↘ combined | ↗ 15.4 ms rise | 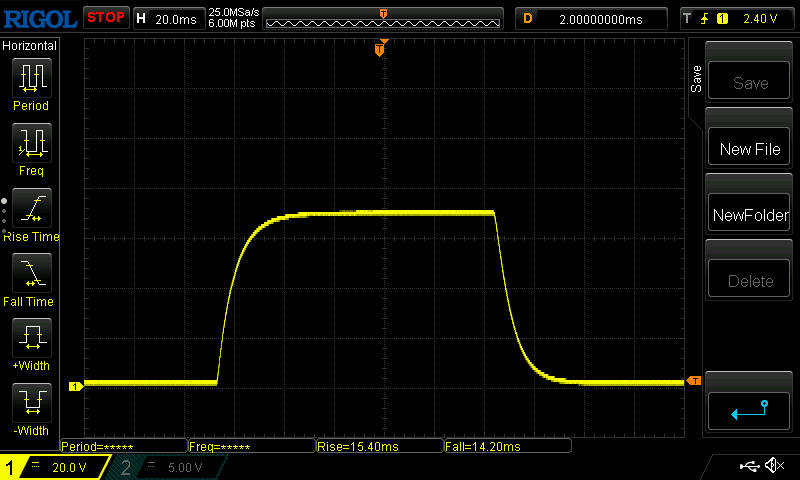 |
| ↘ 14.2 ms fall | ||
| The screen shows relatively slow response rates in our tests and may be too slow for gamers. In comparison, all tested devices range from 0.1 (minimum) to 240 (maximum) ms. » 79 % of all devices are better. This means that the measured response time is worse than the average of all tested devices (19.9 ms). | ||
| ↔ Response Time 50% Grey to 80% Grey | ||
| 39.2 ms ... rise ↗ and fall ↘ combined | ↗ 18.2 ms rise | 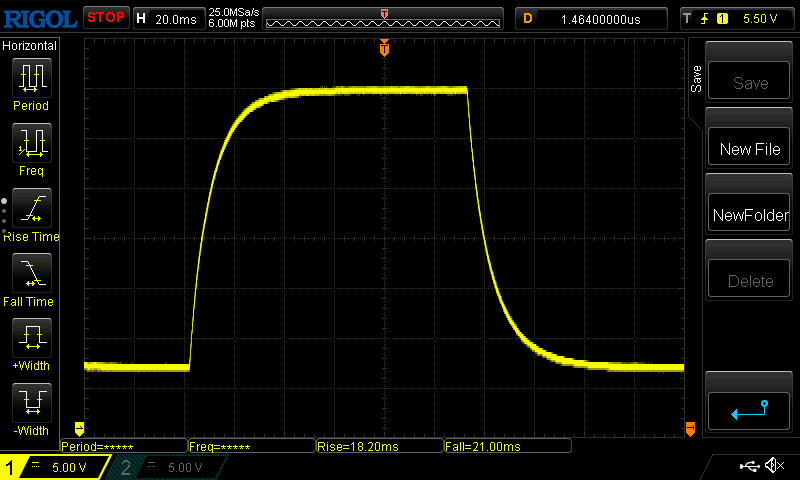 |
| ↘ 21 ms fall | ||
| The screen shows slow response rates in our tests and will be unsatisfactory for gamers. In comparison, all tested devices range from 0.165 (minimum) to 636 (maximum) ms. » 60 % of all devices are better. This means that the measured response time is worse than the average of all tested devices (31.1 ms). | ||
Screen Flickering / PWM (Pulse-Width Modulation)
| Screen flickering / PWM not detected | 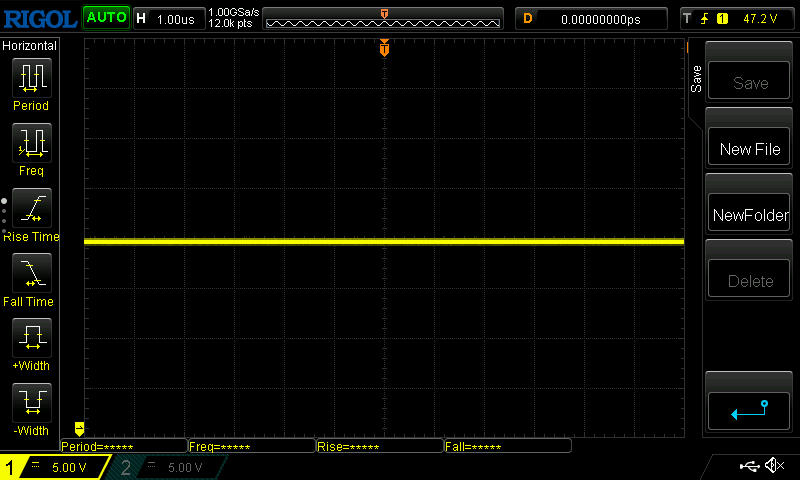 | ||
In comparison: 52 % of all tested devices do not use PWM to dim the display. If PWM was detected, an average of 7794 (minimum: 5 - maximum: 343500) Hz was measured. | |||
由于亮度低,户外使用性非常有限。图像太暗,在明亮的环境中根本无法阅读和使用。
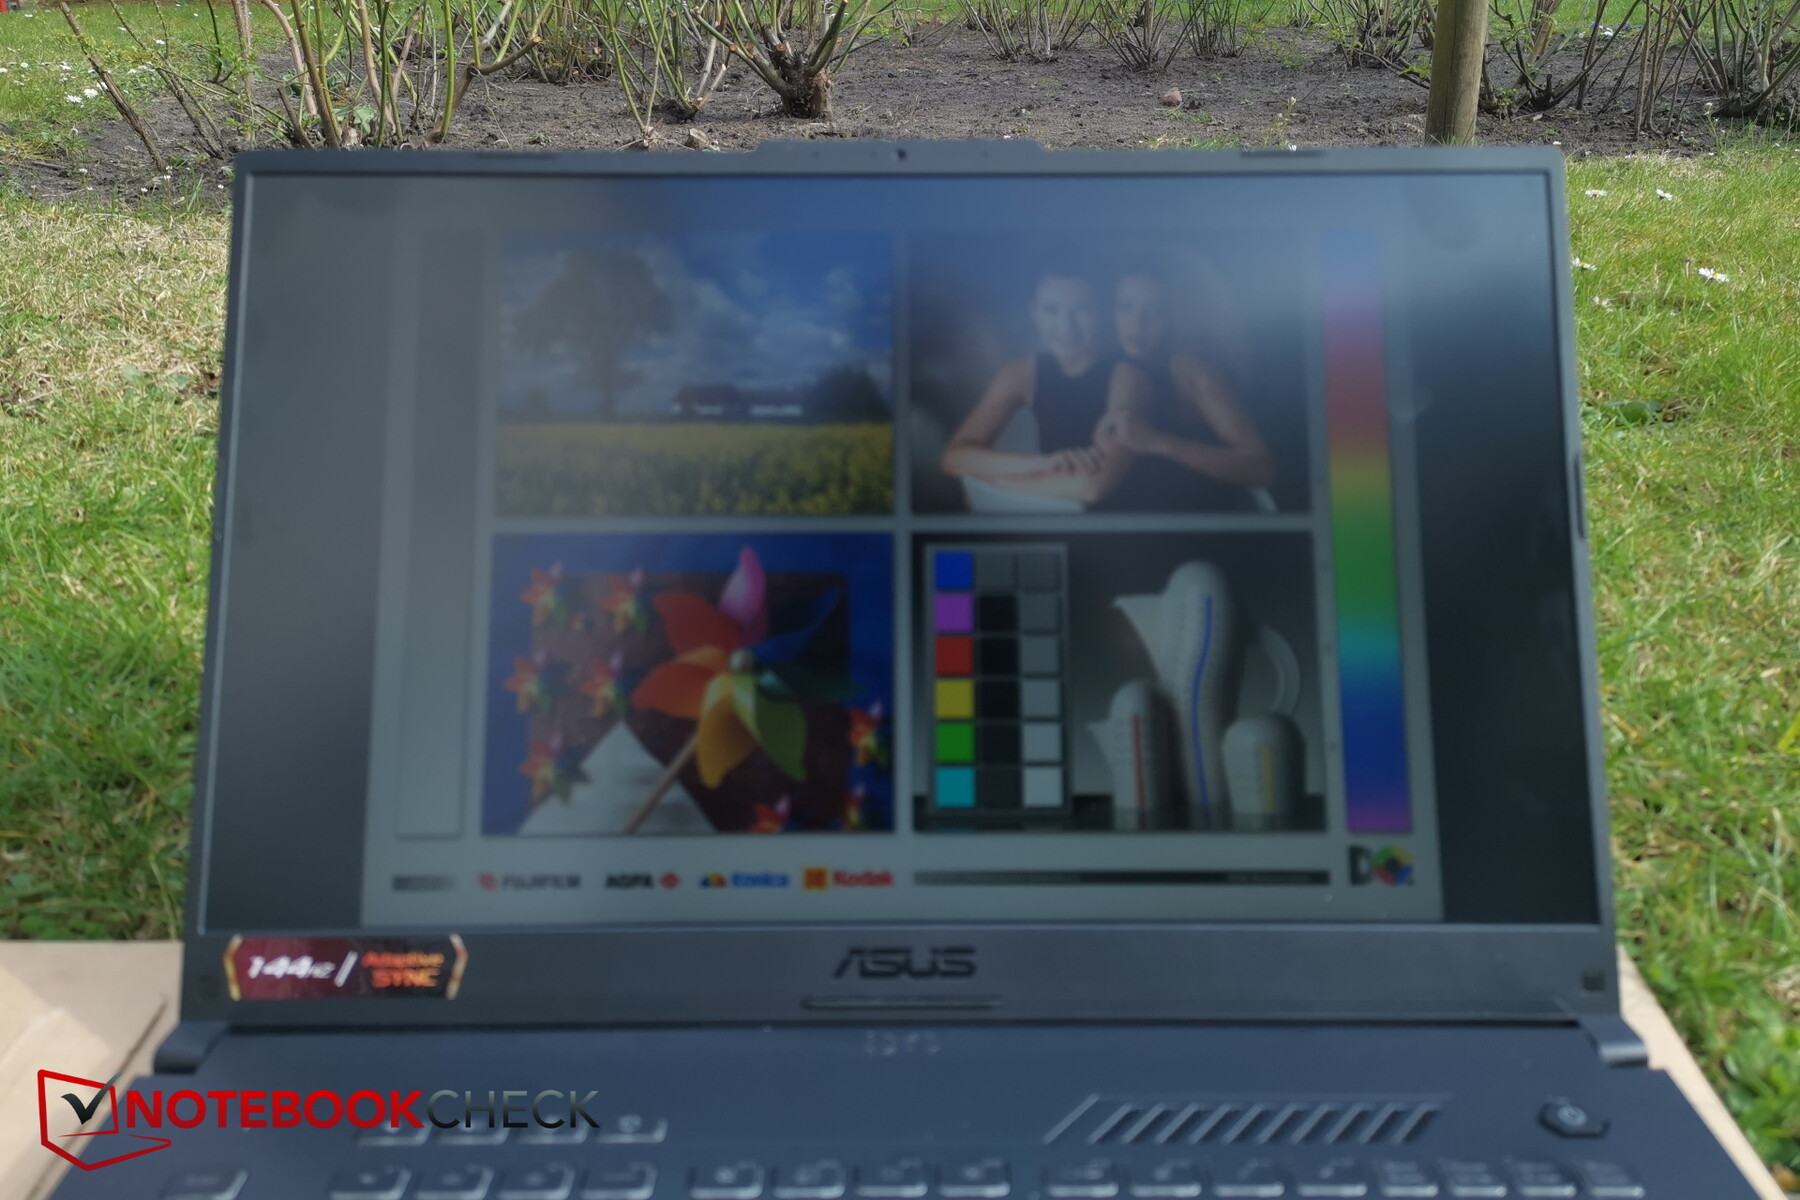
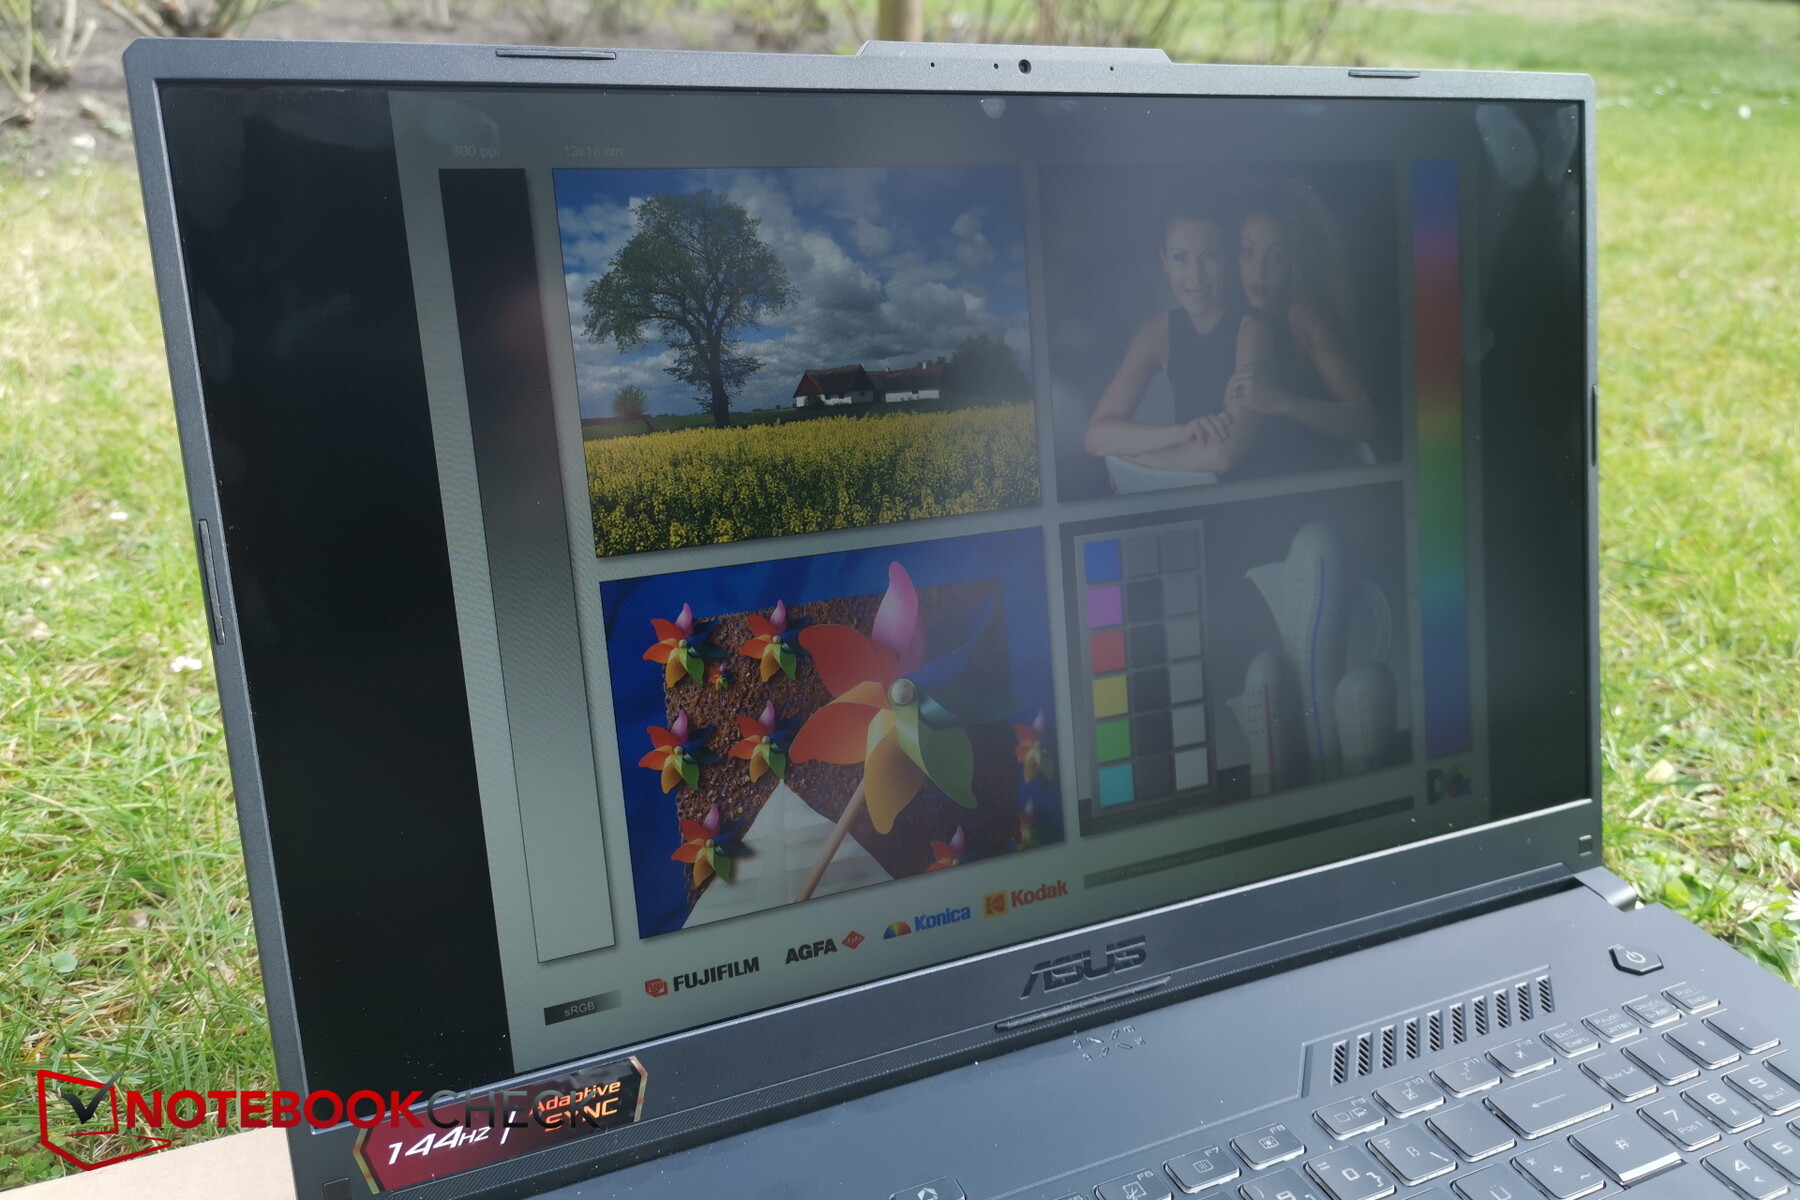
对于IPS面板,我们发现友达光电的面板提供了相对较差的可视角度,在极端角度下亮度明显下降,使这个已经很暗的显示屏更加暗淡,更无法使用。

性能 - 最大的3D性能
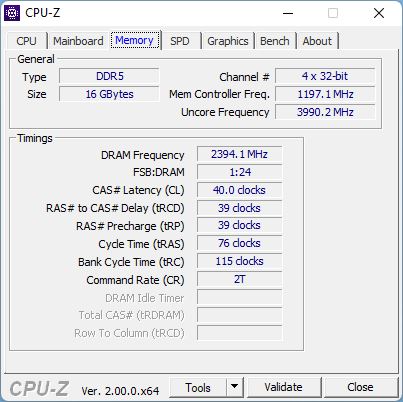
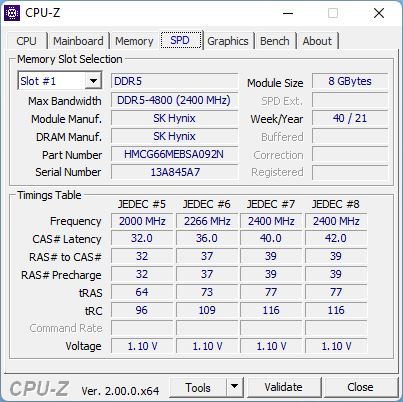
搭配了 英特尔酷睿i7-12700H和 Nvidia Geforce RTX 3060与16GB的DDR5内存搭配,应该足够强大,可以完成所有的任务和挑战,包括现代游戏,除了可能有一些例外,应该在原生FHD分辨率下以最大的细节完美流畅地运行。
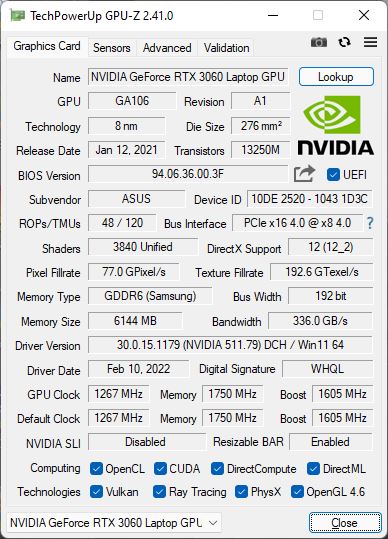
虽然所有SKU的处理器都是相同的,但GPU却不是,华硕提供了四种不同的GPU选择。RTX 3050、RTX 3050 Ti、RTX 3060和RTX 3070。

测试条件
为了达到可能的最佳效果,我们通过随附的Armory Crate软件将性能配置文件设置为 "涡轮"。
鉴于许多选项只能使用华硕自己的软件进行配置,用户基本上没有选择,只能使用它。请记住,一些制造商使用他们的软件来收集用户活动数据。
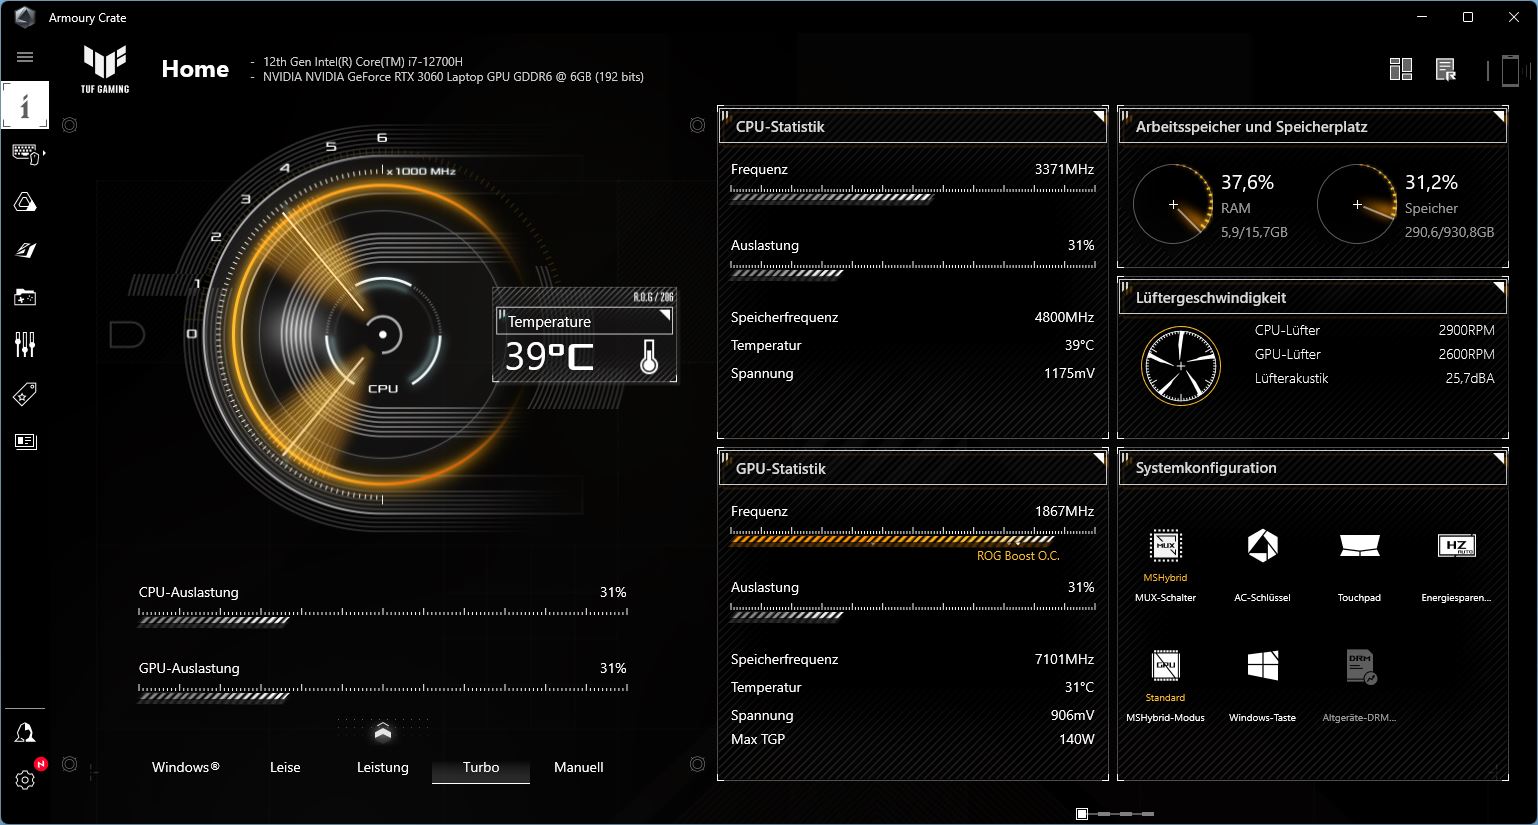
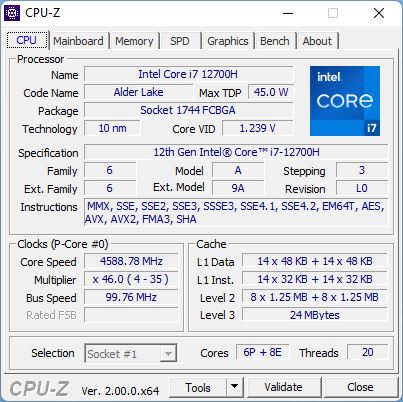
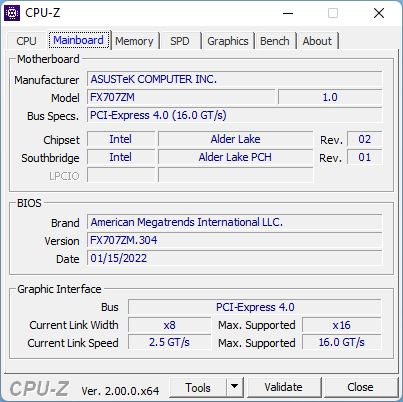
处理器
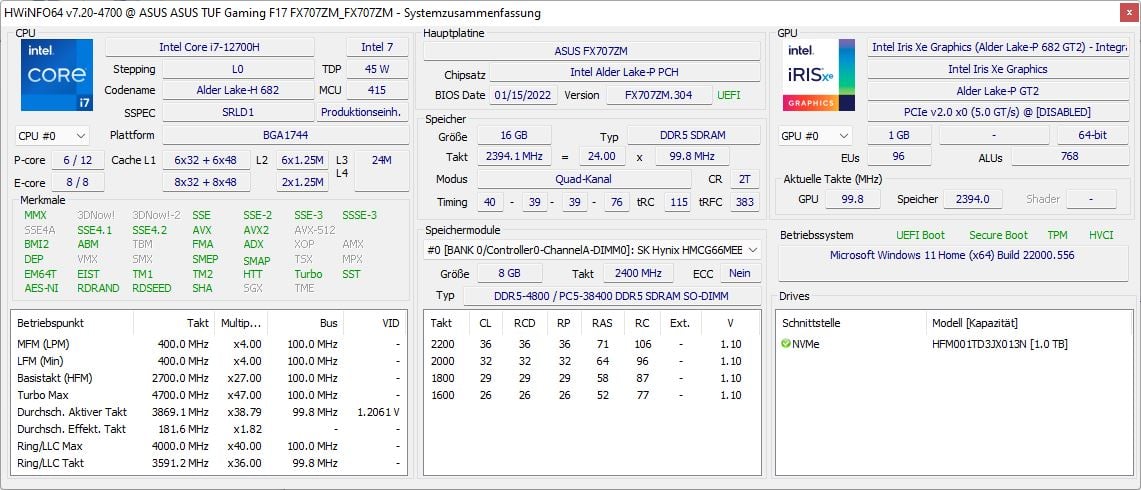
ǞǞǞ 英特尔酷睿i7-12700H是英特尔目前Alder Lake家族的成员,总共有14个内核(6个P核,8个E核),共有20个线程。其集成的英特尔Xe图形处理器具有96个EUs,运行速度高达1.4GHz。
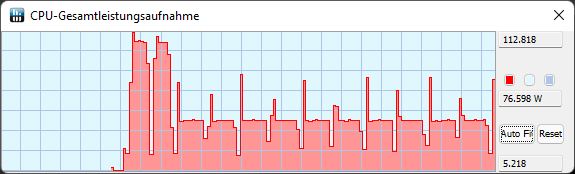
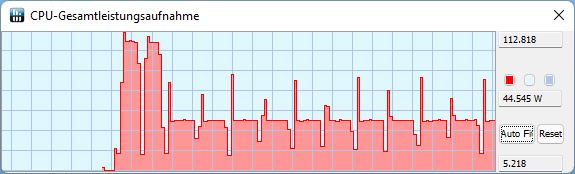
在我们30分钟的CineBench循环中,我们的i7-12700H开始时的水平与微星GE76 Raider的Core i9-12900HK相当,但随后迅速下降到更适合上一代的i9-11900H的水平。这在看CPU的TDP时变得非常明显。在前两次运行中,CPU的功耗在几秒钟内达到111W的峰值,然后降低到45W。从第三次迭代开始,峰值被记录为更低的75-80W,然后迅速降低到只有45W。
换句话说:短期爆发性能比前代产品快30%左右,而长期持续性能却没有。
在电池方面,性能从2820点(第一次运行)和1925点(第二次运行及以后)下降到只有1768点。这种性能下降是明显的,但仍然相对较小。
Cinebench R15 Multi Sustained Load
Cinebench R23: Multi Core | Single Core
Cinebench R20: CPU (Multi Core) | CPU (Single Core)
Cinebench R15: CPU Multi 64Bit | CPU Single 64Bit
Blender: v2.79 BMW27 CPU
7-Zip 18.03: 7z b 4 | 7z b 4 -mmt1
Geekbench 5.5: Multi-Core | Single-Core
HWBOT x265 Benchmark v2.2: 4k Preset
LibreOffice : 20 Documents To PDF
R Benchmark 2.5: Overall mean
| CPU Performance rating | |
| Average of class Gaming | |
| MSI GE76 Raider | |
| Average Intel Core i7-12700H | |
| Asus TUF Gaming F17 FX707Z-HX011W | |
| Asus TUF Gaming F17 FX706HM | |
| MSI Katana GF76 11UE | |
| Lenovo Legion 5 17ACH6H-82JY0003GE | |
| Schenker XMG Core 17 (Early 2021) | |
| Cinebench R23 / Multi Core | |
| Average of class Gaming (10488 - 40970, n=112, last 2 years) | |
| MSI GE76 Raider | |
| Average Intel Core i7-12700H (4032 - 19330, n=64) | |
| Asus TUF Gaming F17 FX707Z-HX011W | |
| Asus TUF Gaming F17 FX706HM | |
| MSI Katana GF76 11UE | |
| Lenovo Legion 5 17ACH6H-82JY0003GE | |
| Schenker XMG Core 17 (Early 2021) | |
| Cinebench R23 / Single Core | |
| Average of class Gaming (1166 - 2356, n=112, last 2 years) | |
| MSI GE76 Raider | |
| Asus TUF Gaming F17 FX707Z-HX011W | |
| Average Intel Core i7-12700H (778 - 1826, n=63) | |
| Asus TUF Gaming F17 FX706HM | |
| MSI Katana GF76 11UE | |
| Lenovo Legion 5 17ACH6H-82JY0003GE | |
| Schenker XMG Core 17 (Early 2021) | |
| Cinebench R20 / CPU (Multi Core) | |
| Average of class Gaming (4029 - 16108, n=111, last 2 years) | |
| MSI GE76 Raider | |
| Average Intel Core i7-12700H (1576 - 7407, n=64) | |
| Asus TUF Gaming F17 FX707Z-HX011W | |
| Asus TUF Gaming F17 FX706HM | |
| MSI Katana GF76 11UE | |
| Lenovo Legion 5 17ACH6H-82JY0003GE | |
| Schenker XMG Core 17 (Early 2021) | |
| Cinebench R20 / CPU (Single Core) | |
| Average of class Gaming (442 - 895, n=111, last 2 years) | |
| MSI GE76 Raider | |
| Asus TUF Gaming F17 FX707Z-HX011W | |
| Average Intel Core i7-12700H (300 - 704, n=64) | |
| Asus TUF Gaming F17 FX706HM | |
| MSI Katana GF76 11UE | |
| Lenovo Legion 5 17ACH6H-82JY0003GE | |
| Schenker XMG Core 17 (Early 2021) | |
| Cinebench R15 / CPU Multi 64Bit | |
| Average of class Gaming (1578 - 6271, n=111, last 2 years) | |
| MSI GE76 Raider | |
| Asus TUF Gaming F17 FX707Z-HX011W | |
| Average Intel Core i7-12700H (1379 - 2916, n=70) | |
| Asus TUF Gaming F17 FX706HM | |
| MSI Katana GF76 11UE | |
| Lenovo Legion 5 17ACH6H-82JY0003GE | |
| Schenker XMG Core 17 (Early 2021) | |
| Cinebench R15 / CPU Single 64Bit | |
| Average of class Gaming (188.8 - 343, n=111, last 2 years) | |
| MSI GE76 Raider | |
| Asus TUF Gaming F17 FX707Z-HX011W | |
| Average Intel Core i7-12700H (113 - 263, n=65) | |
| Asus TUF Gaming F17 FX706HM | |
| MSI Katana GF76 11UE | |
| Lenovo Legion 5 17ACH6H-82JY0003GE | |
| Schenker XMG Core 17 (Early 2021) | |
| Blender / v2.79 BMW27 CPU | |
| Schenker XMG Core 17 (Early 2021) | |
| Lenovo Legion 5 17ACH6H-82JY0003GE | |
| MSI Katana GF76 11UE | |
| Asus TUF Gaming F17 FX707Z-HX011W | |
| Asus TUF Gaming F17 FX706HM | |
| Average Intel Core i7-12700H (168 - 732, n=63) | |
| MSI GE76 Raider | |
| Average of class Gaming (80 - 330, n=109, last 2 years) | |
| 7-Zip 18.03 / 7z b 4 | |
| Average of class Gaming (33491 - 148086, n=110, last 2 years) | |
| MSI GE76 Raider | |
| Average Intel Core i7-12700H (22844 - 73067, n=63) | |
| Asus TUF Gaming F17 FX707Z-HX011W | |
| Asus TUF Gaming F17 FX706HM | |
| Lenovo Legion 5 17ACH6H-82JY0003GE | |
| MSI Katana GF76 11UE | |
| Schenker XMG Core 17 (Early 2021) | |
| 7-Zip 18.03 / 7z b 4 -mmt1 | |
| Average of class Gaming (4199 - 7436, n=110, last 2 years) | |
| MSI GE76 Raider | |
| Asus TUF Gaming F17 FX706HM | |
| Average Intel Core i7-12700H (2743 - 5972, n=63) | |
| Asus TUF Gaming F17 FX707Z-HX011W | |
| MSI Katana GF76 11UE | |
| Schenker XMG Core 17 (Early 2021) | |
| Lenovo Legion 5 17ACH6H-82JY0003GE | |
| Geekbench 5.5 / Multi-Core | |
| Average of class Gaming (6460 - 27010, n=110, last 2 years) | |
| MSI GE76 Raider | |
| Asus TUF Gaming F17 FX707Z-HX011W | |
| Average Intel Core i7-12700H (5144 - 13745, n=64) | |
| MSI Katana GF76 11UE | |
| Asus TUF Gaming F17 FX706HM | |
| Schenker XMG Core 17 (Early 2021) | |
| Lenovo Legion 5 17ACH6H-82JY0003GE | |
| Geekbench 5.5 / Single-Core | |
| Average of class Gaming (986 - 2474, n=110, last 2 years) | |
| MSI GE76 Raider | |
| Asus TUF Gaming F17 FX707Z-HX011W | |
| Average Intel Core i7-12700H (803 - 1851, n=64) | |
| Asus TUF Gaming F17 FX706HM | |
| MSI Katana GF76 11UE | |
| Lenovo Legion 5 17ACH6H-82JY0003GE | |
| Schenker XMG Core 17 (Early 2021) | |
| HWBOT x265 Benchmark v2.2 / 4k Preset | |
| Average of class Gaming (11.5 - 44.3, n=110, last 2 years) | |
| MSI GE76 Raider | |
| Average Intel Core i7-12700H (4.67 - 21.8, n=64) | |
| Asus TUF Gaming F17 FX706HM | |
| Asus TUF Gaming F17 FX707Z-HX011W | |
| MSI Katana GF76 11UE | |
| Lenovo Legion 5 17ACH6H-82JY0003GE | |
| Schenker XMG Core 17 (Early 2021) | |
| LibreOffice / 20 Documents To PDF | |
| Asus TUF Gaming F17 FX707Z-HX011W | |
| Schenker XMG Core 17 (Early 2021) | |
| Lenovo Legion 5 17ACH6H-82JY0003GE | |
| Average of class Gaming (19 - 88.8, n=110, last 2 years) | |
| MSI Katana GF76 11UE | |
| Average Intel Core i7-12700H (34.2 - 95.3, n=63) | |
| Asus TUF Gaming F17 FX706HM | |
| MSI GE76 Raider | |
| R Benchmark 2.5 / Overall mean | |
| Schenker XMG Core 17 (Early 2021) | |
| MSI Katana GF76 11UE | |
| Lenovo Legion 5 17ACH6H-82JY0003GE | |
| Asus TUF Gaming F17 FX706HM | |
| Average Intel Core i7-12700H (0.4441 - 1.052, n=63) | |
| Asus TUF Gaming F17 FX707Z-HX011W | |
| Average of class Gaming (0.3439 - 0.759, n=111, last 2 years) | |
| MSI GE76 Raider | |
* ... smaller is better
AIDA64: FP32 Ray-Trace | FPU Julia | CPU SHA3 | CPU Queen | FPU SinJulia | FPU Mandel | CPU AES | CPU ZLib | FP64 Ray-Trace | CPU PhotoWorxx
| Performance rating | |
| Average of class Gaming | |
| MSI GE76 Raider | |
| Average Intel Core i7-12700H | |
| Lenovo Legion 5 17ACH6H-82JY0003GE | |
| Asus TUF Gaming F17 FX707Z-HX011W | |
| Schenker XMG Core 17 (Early 2021) | |
| Asus TUF Gaming F17 FX706HM -9! | |
| MSI Katana GF76 11UE -9! | |
| AIDA64 / FP32 Ray-Trace | |
| Average of class Gaming (10227 - 85542, n=109, last 2 years) | |
| Lenovo Legion 5 17ACH6H-82JY0003GE | |
| Average Intel Core i7-12700H (2585 - 17957, n=64) | |
| Schenker XMG Core 17 (Early 2021) | |
| MSI GE76 Raider | |
| Asus TUF Gaming F17 FX707Z-HX011W | |
| AIDA64 / FPU Julia | |
| Average of class Gaming (51376 - 238426, n=109, last 2 years) | |
| Lenovo Legion 5 17ACH6H-82JY0003GE | |
| Average Intel Core i7-12700H (12439 - 90760, n=64) | |
| Schenker XMG Core 17 (Early 2021) | |
| MSI GE76 Raider | |
| Asus TUF Gaming F17 FX707Z-HX011W | |
| AIDA64 / CPU SHA3 | |
| Average of class Gaming (2180 - 9817, n=109, last 2 years) | |
| MSI GE76 Raider | |
| Average Intel Core i7-12700H (833 - 4242, n=64) | |
| Lenovo Legion 5 17ACH6H-82JY0003GE | |
| Schenker XMG Core 17 (Early 2021) | |
| Asus TUF Gaming F17 FX707Z-HX011W | |
| AIDA64 / CPU Queen | |
| Average of class Gaming (49785 - 173351, n=100, last 2 years) | |
| MSI GE76 Raider | |
| Asus TUF Gaming F17 FX707Z-HX011W | |
| Average Intel Core i7-12700H (57923 - 103202, n=63) | |
| Lenovo Legion 5 17ACH6H-82JY0003GE | |
| Schenker XMG Core 17 (Early 2021) | |
| AIDA64 / FPU SinJulia | |
| Average of class Gaming (4424 - 33636, n=109, last 2 years) | |
| MSI GE76 Raider | |
| Lenovo Legion 5 17ACH6H-82JY0003GE | |
| Average Intel Core i7-12700H (3249 - 9939, n=64) | |
| Schenker XMG Core 17 (Early 2021) | |
| Asus TUF Gaming F17 FX707Z-HX011W | |
| AIDA64 / FPU Mandel | |
| Average of class Gaming (25115 - 128721, n=109, last 2 years) | |
| Lenovo Legion 5 17ACH6H-82JY0003GE | |
| Average Intel Core i7-12700H (7135 - 44760, n=64) | |
| Schenker XMG Core 17 (Early 2021) | |
| MSI GE76 Raider | |
| Asus TUF Gaming F17 FX707Z-HX011W | |
| AIDA64 / CPU AES | |
| Average of class Gaming (39258 - 247074, n=109, last 2 years) | |
| MSI GE76 Raider | |
| Lenovo Legion 5 17ACH6H-82JY0003GE | |
| Average Intel Core i7-12700H (31839 - 144360, n=64) | |
| Asus TUF Gaming F17 FX707Z-HX011W | |
| Schenker XMG Core 17 (Early 2021) | |
| AIDA64 / CPU ZLib | |
| Average of class Gaming (574 - 2531, n=109, last 2 years) | |
| MSI GE76 Raider | |
| Average Intel Core i7-12700H (305 - 1171, n=64) | |
| Asus TUF Gaming F17 FX707Z-HX011W | |
| Lenovo Legion 5 17ACH6H-82JY0003GE | |
| Schenker XMG Core 17 (Early 2021) | |
| MSI Katana GF76 11UE | |
| Asus TUF Gaming F17 FX706HM | |
| AIDA64 / FP64 Ray-Trace | |
| Average of class Gaming (5509 - 45446, n=109, last 2 years) | |
| Lenovo Legion 5 17ACH6H-82JY0003GE | |
| Average Intel Core i7-12700H (1437 - 9692, n=64) | |
| Schenker XMG Core 17 (Early 2021) | |
| MSI GE76 Raider | |
| Asus TUF Gaming F17 FX707Z-HX011W | |
| AIDA64 / CPU PhotoWorxx | |
| Average of class Gaming (12271 - 89891, n=109, last 2 years) | |
| MSI GE76 Raider | |
| Average Intel Core i7-12700H (12863 - 52207, n=64) | |
| Asus TUF Gaming F17 FX707Z-HX011W | |
| Schenker XMG Core 17 (Early 2021) | |
| Lenovo Legion 5 17ACH6H-82JY0003GE | |
系统性能
在PCMark 10中,F17的表现比我们预期的要差得多,比同类系统的平均水平低6-15%。它只在数字内容创作中能够超过自己的前辈,但总体上表现得更慢。我们能够通过第二次运行测试来重现这些结果。
从主观上讲,该系统表现得非常平稳,没有任何明显的打嗝现象。
CrossMark: Overall | Productivity | Creativity | Responsiveness
| PCMark 10 / Score | |
| Average of class Gaming (5828 - 11574, n=95, last 2 years) | |
| MSI GE76 Raider | |
| Average Intel Core i7-12700H, NVIDIA GeForce RTX 3060 Laptop GPU (5986 - 8156, n=12) | |
| Asus TUF Gaming F17 FX706HM | |
| Lenovo Legion 5 17ACH6H-82JY0003GE | |
| MSI Katana GF76 11UE | |
| Asus TUF Gaming F17 FX707Z-HX011W | |
| Schenker XMG Core 17 (Early 2021) | |
| PCMark 10 / Essentials | |
| MSI GE76 Raider | |
| Average of class Gaming (8810 - 12600, n=99, last 2 years) | |
| Asus TUF Gaming F17 FX706HM | |
| Average Intel Core i7-12700H, NVIDIA GeForce RTX 3060 Laptop GPU (9289 - 12144, n=12) | |
| MSI Katana GF76 11UE | |
| Lenovo Legion 5 17ACH6H-82JY0003GE | |
| Asus TUF Gaming F17 FX707Z-HX011W | |
| Schenker XMG Core 17 (Early 2021) | |
| PCMark 10 / Productivity | |
| Average of class Gaming (6845 - 18766, n=97, last 2 years) | |
| MSI GE76 Raider | |
| Average Intel Core i7-12700H, NVIDIA GeForce RTX 3060 Laptop GPU (6161 - 10362, n=12) | |
| Asus TUF Gaming F17 FX706HM | |
| Lenovo Legion 5 17ACH6H-82JY0003GE | |
| MSI Katana GF76 11UE | |
| Schenker XMG Core 17 (Early 2021) | |
| Asus TUF Gaming F17 FX707Z-HX011W | |
| PCMark 10 / Digital Content Creation | |
| Average of class Gaming (7602 - 19657, n=97, last 2 years) | |
| MSI GE76 Raider | |
| Average Intel Core i7-12700H, NVIDIA GeForce RTX 3060 Laptop GPU (8950 - 12554, n=12) | |
| Asus TUF Gaming F17 FX707Z-HX011W | |
| Asus TUF Gaming F17 FX706HM | |
| Lenovo Legion 5 17ACH6H-82JY0003GE | |
| MSI Katana GF76 11UE | |
| Schenker XMG Core 17 (Early 2021) | |
| CrossMark / Overall | |
| Average of class Gaming (1366 - 2409, n=97, last 2 years) | |
| Average Intel Core i7-12700H, NVIDIA GeForce RTX 3060 Laptop GPU (1649 - 2017, n=11) | |
| Asus TUF Gaming F17 FX707Z-HX011W | |
| Lenovo Legion 5 17ACH6H-82JY0003GE | |
| CrossMark / Productivity | |
| Average of class Gaming (1386 - 2254, n=97, last 2 years) | |
| Average Intel Core i7-12700H, NVIDIA GeForce RTX 3060 Laptop GPU (1536 - 1958, n=11) | |
| Asus TUF Gaming F17 FX707Z-HX011W | |
| Lenovo Legion 5 17ACH6H-82JY0003GE | |
| CrossMark / Creativity | |
| Average of class Gaming (1343 - 2729, n=97, last 2 years) | |
| Asus TUF Gaming F17 FX707Z-HX011W | |
| Average Intel Core i7-12700H, NVIDIA GeForce RTX 3060 Laptop GPU (1816 - 2084, n=11) | |
| Lenovo Legion 5 17ACH6H-82JY0003GE | |
| CrossMark / Responsiveness | |
| Average of class Gaming (1226 - 2334, n=97, last 2 years) | |
| Average Intel Core i7-12700H, NVIDIA GeForce RTX 3060 Laptop GPU (1210 - 2207, n=11) | |
| Asus TUF Gaming F17 FX707Z-HX011W | |
| Lenovo Legion 5 17ACH6H-82JY0003GE | |
| PCMark 10 Score | 5986 points | |
Help | ||
| AIDA64 / Memory Copy | |
| Average of class Gaming (21750 - 129946, n=109, last 2 years) | |
| MSI GE76 Raider | |
| Average Intel Core i7-12700H (25615 - 80511, n=64) | |
| Asus TUF Gaming F17 FX707Z-HX011W | |
| Lenovo Legion 5 17ACH6H-82JY0003GE | |
| Schenker XMG Core 17 (Early 2021) | |
| AIDA64 / Memory Read | |
| Average of class Gaming (22956 - 118858, n=109, last 2 years) | |
| MSI GE76 Raider | |
| Asus TUF Gaming F17 FX707Z-HX011W | |
| Average Intel Core i7-12700H (25586 - 79442, n=64) | |
| Lenovo Legion 5 17ACH6H-82JY0003GE | |
| Schenker XMG Core 17 (Early 2021) | |
| AIDA64 / Memory Write | |
| Average of class Gaming (22297 - 135096, n=109, last 2 years) | |
| MSI GE76 Raider | |
| Asus TUF Gaming F17 FX707Z-HX011W | |
| Average Intel Core i7-12700H (23679 - 88660, n=64) | |
| Schenker XMG Core 17 (Early 2021) | |
| Lenovo Legion 5 17ACH6H-82JY0003GE | |
| AIDA64 / Memory Latency | |
| Average of class Gaming (75.3 - 259, n=109, last 2 years) | |
| MSI GE76 Raider | |
| Lenovo Legion 5 17ACH6H-82JY0003GE | |
| Average Intel Core i7-12700H (76.2 - 133.9, n=62) | |
| Schenker XMG Core 17 (Early 2021) | |
| MSI Katana GF76 11UE | |
| Asus TUF Gaming F17 FX706HM | |
| Asus TUF Gaming F17 FX707Z-HX011W | |
* ... smaller is better
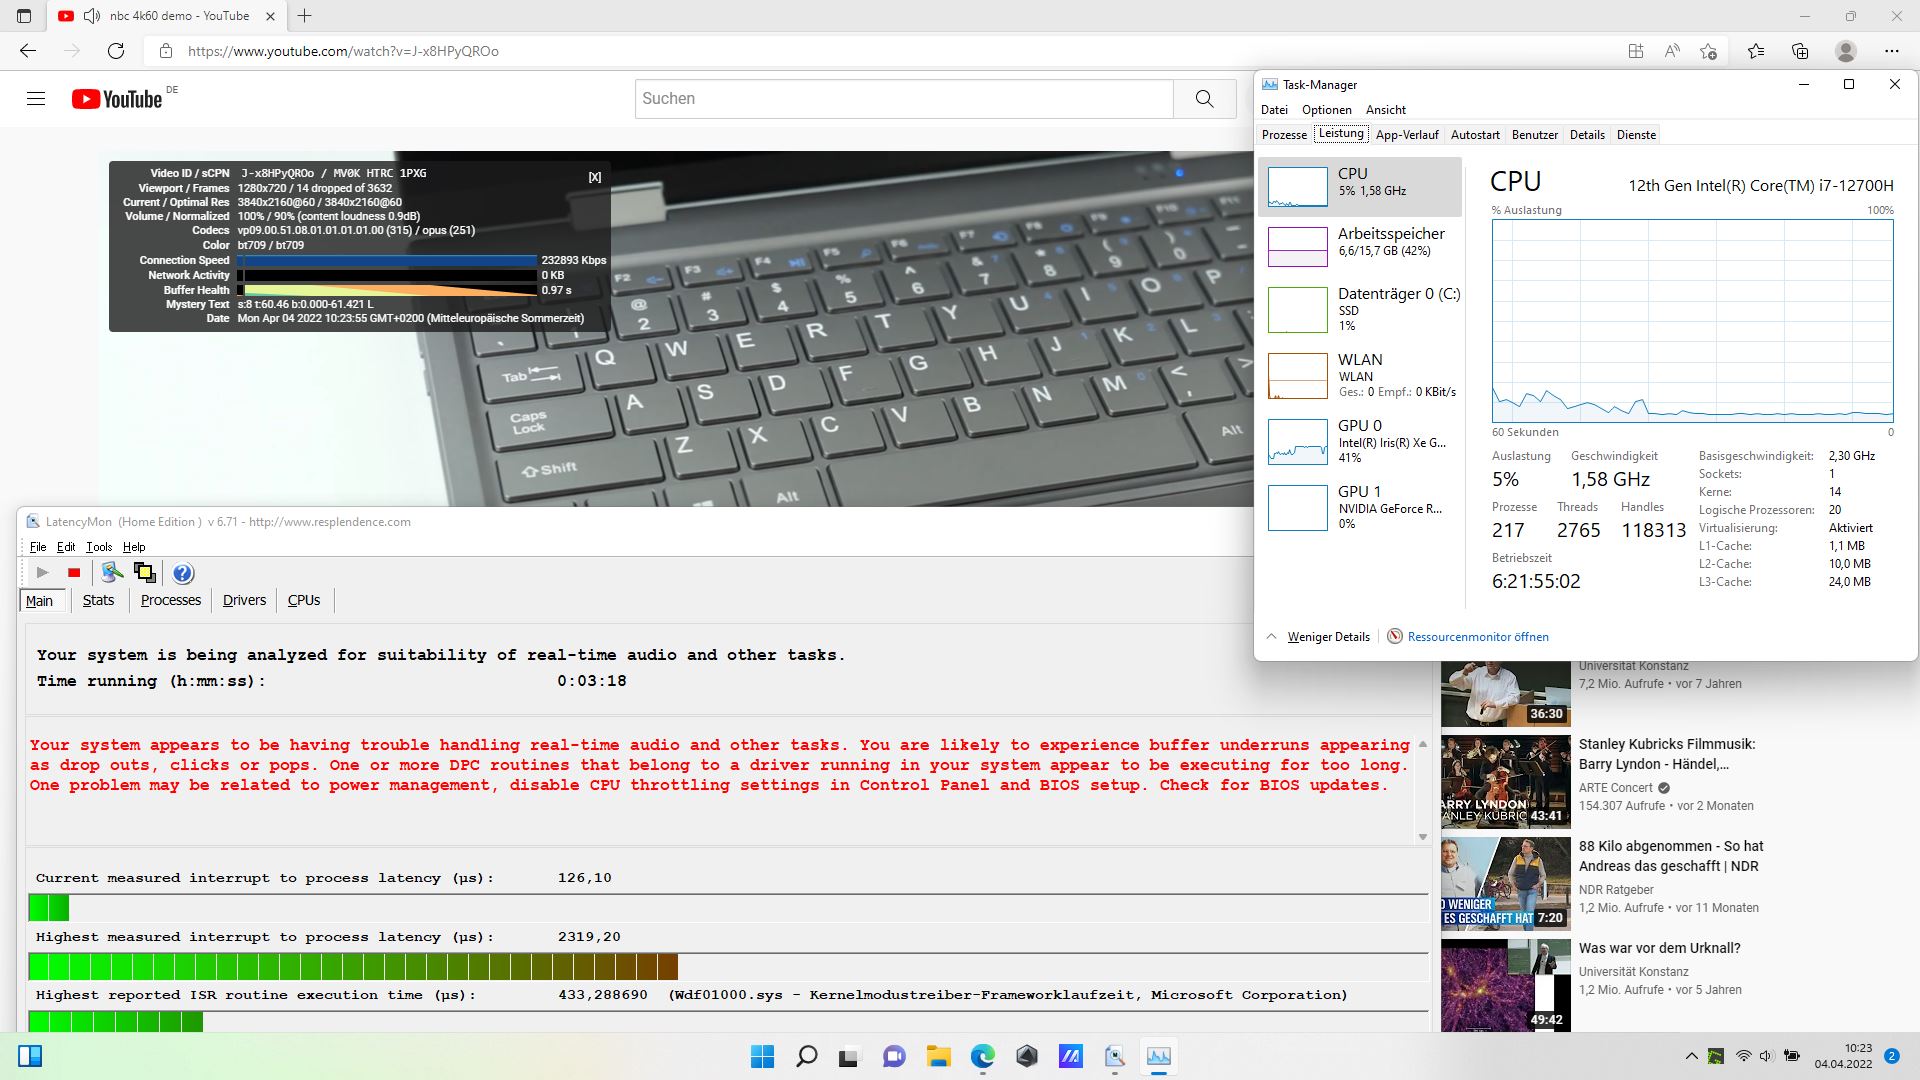
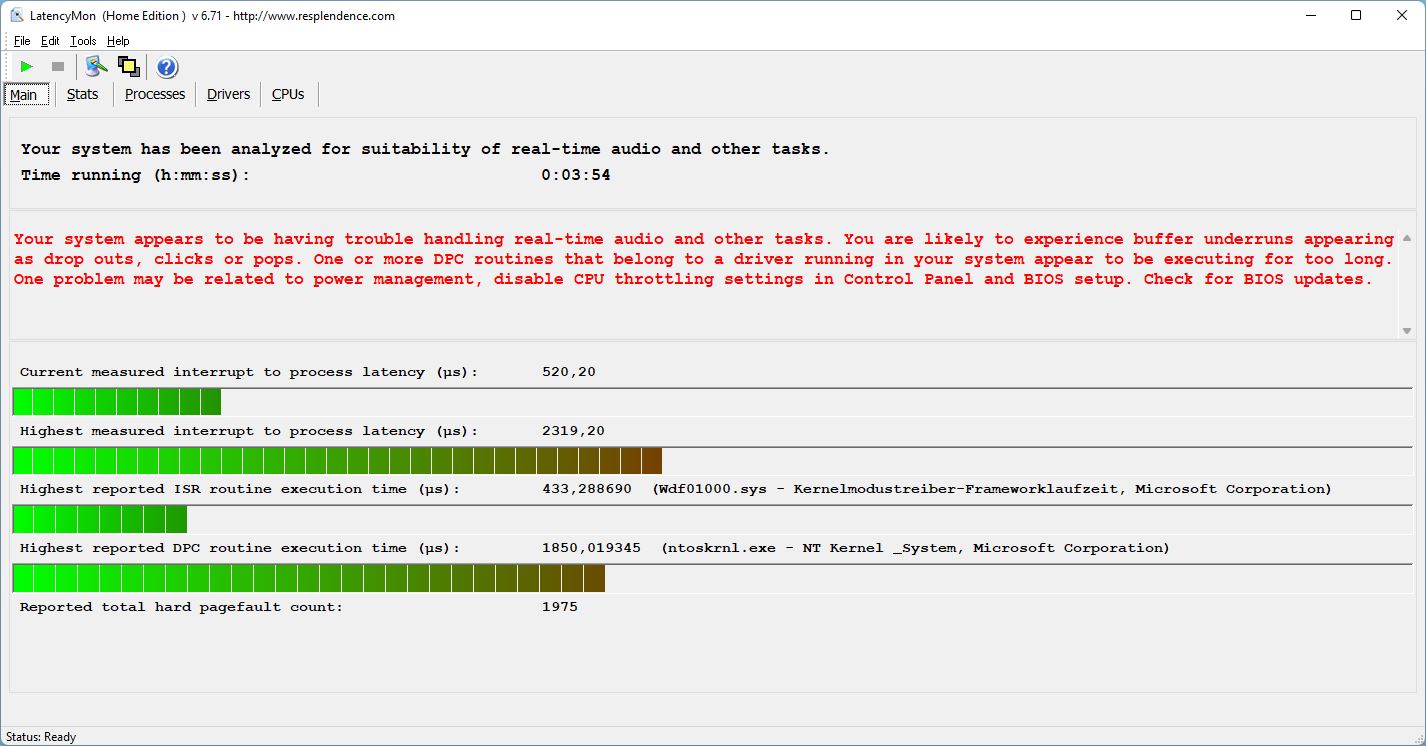
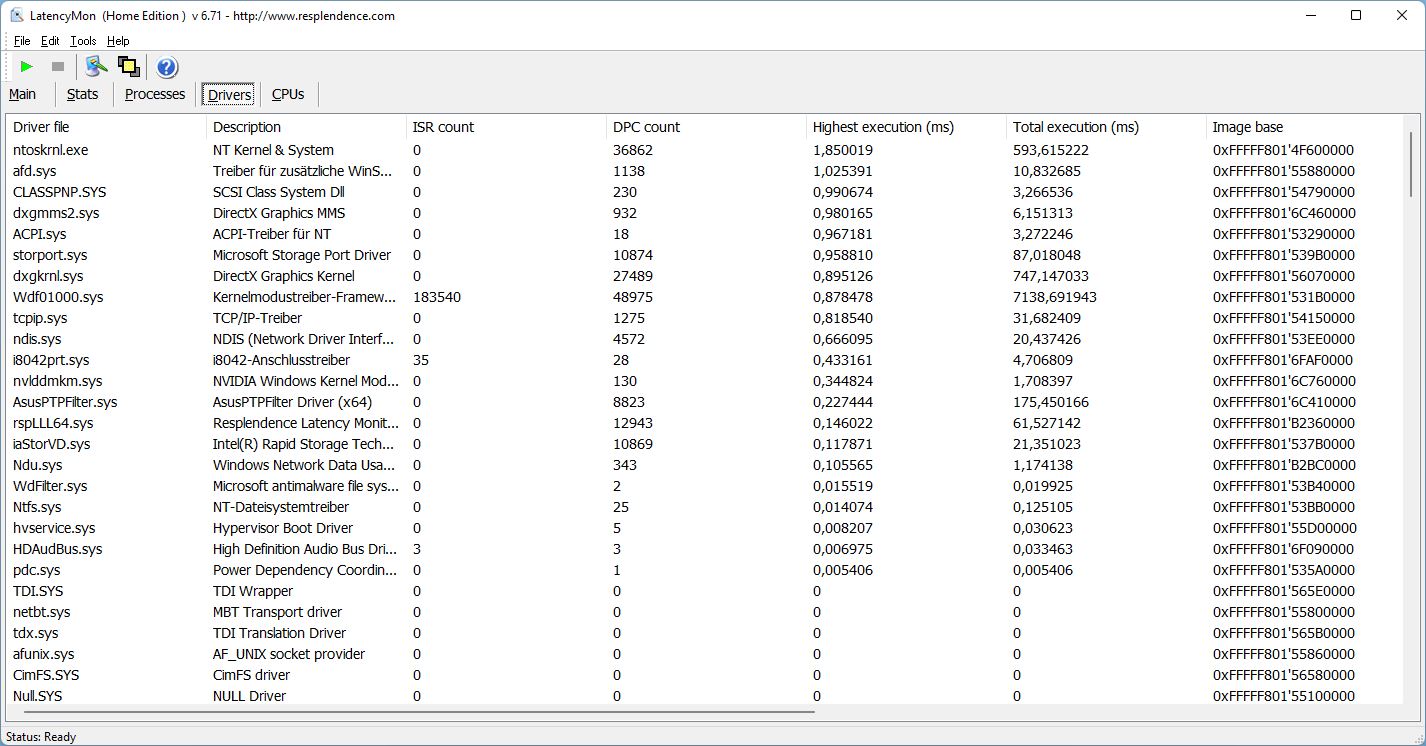
DPC延迟
不幸的是,我们在启动Edge浏览器时已经发现了明显的DPC延迟。积极的一面是,从那时起,无论我们进行什么测试,这些都没有变得更糟。这意味着我们的4K/60 FPS YouTube视频测试运行得不是很好,总共有14个丢帧。我们对这种行为的主要怀疑是NT的内核驱动。
| DPC Latencies / LatencyMon - interrupt to process latency (max), Web, Youtube, Prime95 | |
| MSI Katana GF76 11UE | |
| Asus TUF Gaming F17 FX707Z-HX011W | |
| MSI GE76 Raider | |
| Lenovo Legion 5 17ACH6H-82JY0003GE | |
| Asus TUF Gaming F17 FX706HM | |
| Schenker XMG Core 17 (Early 2021) | |
* ... smaller is better
存储设备
我们的评测单元配备了1TB SK Hynix PCIe 3 SSD,它在我们的SSD/HDD排行榜上排在第44位。 SSD/HDD排行榜的第44位.同样的SSD已经安装在F17的前身中。它总体表现良好,但无法跟上XMG Core或MSI Raider中的三星固态硬盘。
持续的读取性能原来是相当不稳定的,并在短时间内出现波动。这可能是其总体上低于PCMark平均性能的原因之一。

| Drive Performance rating - Percent | |
| MSI GE76 Raider | |
| Average of class Gaming | |
| Schenker XMG Core 17 (Early 2021) | |
| Asus TUF Gaming F17 FX707Z-HX011W | |
| Asus TUF Gaming F17 FX706HM | |
| Average SK Hynix HFM001TD3JX013N | |
| Lenovo Legion 5 17ACH6H-82JY0003GE | |
| MSI Katana GF76 11UE | |
* ... smaller is better
Sustained Read: DiskSpd Read Loop, Queue Depth 8
GPU性能
令我们(以及每个玩家)感到高兴的是,F17的 RTX 3060GPU被配置为使用其最大的140 W TGP(包括25 W动态提升)。因此,F17在3DMark中的表现比一般配备RTX 3060的笔记本电脑好,只有联想Legion ,能够勉强跟上。
在电池上,在FHD中以最大细节运行Witcher 3 ,帧率从80 FPS下降到只有35 FPS。这听起来可能过于戏剧化,但我们已经看到具有更强大GPU的笔记本电脑在电池上运行得更慢。
| 3DMark Performance rating - Percent | |
| Average of class Gaming | |
| MSI GE76 Raider | |
| Lenovo Legion 5 17ACH6H-82JY0003GE -1! | |
| Asus TUF Gaming F17 FX707Z-HX011W | |
| Average NVIDIA GeForce RTX 3060 Laptop GPU | |
| Schenker XMG Core 17 (Early 2021) | |
| Asus TUF Gaming F17 FX706HM | |
| MSI Katana GF76 11UE | |
| 3DMark 11 - 1280x720 Performance GPU | |
| Average of class Gaming (21841 - 80022, n=108, last 2 years) | |
| MSI GE76 Raider | |
| Asus TUF Gaming F17 FX707Z-HX011W | |
| Average NVIDIA GeForce RTX 3060 Laptop GPU (13799 - 30772, n=43) | |
| Schenker XMG Core 17 (Early 2021) | |
| Asus TUF Gaming F17 FX706HM | |
| MSI Katana GF76 11UE | |
| 3DMark | |
| 1280x720 Cloud Gate Standard Graphics | |
| MSI GE76 Raider | |
| Average of class Gaming (86886 - 223650, n=61, last 2 years) | |
| Lenovo Legion 5 17ACH6H-82JY0003GE | |
| MSI Katana GF76 11UE | |
| Asus TUF Gaming F17 FX706HM | |
| Asus TUF Gaming F17 FX707Z-HX011W | |
| Schenker XMG Core 17 (Early 2021) | |
| Average NVIDIA GeForce RTX 3060 Laptop GPU (33126 - 136826, n=38) | |
| 1920x1080 Fire Strike Graphics | |
| Average of class Gaming (12242 - 62849, n=120, last 2 years) | |
| MSI GE76 Raider | |
| Asus TUF Gaming F17 FX707Z-HX011W | |
| Lenovo Legion 5 17ACH6H-82JY0003GE | |
| Average NVIDIA GeForce RTX 3060 Laptop GPU (16354 - 23109, n=49) | |
| Schenker XMG Core 17 (Early 2021) | |
| Asus TUF Gaming F17 FX706HM | |
| MSI Katana GF76 11UE | |
| 2560x1440 Time Spy Graphics | |
| Average of class Gaming (5012 - 26212, n=119, last 2 years) | |
| MSI GE76 Raider | |
| Asus TUF Gaming F17 FX707Z-HX011W | |
| Lenovo Legion 5 17ACH6H-82JY0003GE | |
| Average NVIDIA GeForce RTX 3060 Laptop GPU (6285 - 9235, n=49) | |
| Schenker XMG Core 17 (Early 2021) | |
| Asus TUF Gaming F17 FX706HM | |
| MSI Katana GF76 11UE | |
| 3DMark 11 Performance | 28010 points | |
| 3DMark Cloud Gate Standard Score | 55142 points | |
| 3DMark Fire Strike Score | 21179 points | |
| 3DMark Time Spy Score | 9490 points | |
Help | ||
游戏性能
在我们的Witcher 3 测试中与竞争对手相比,F17成功地获得了第一名。即使是搭载RTX 3080的微星Raider也只快了50%。平均而言,F17比配备RTX 3060的普通笔记本电脑快6%至10%,比配备130W RTX 3060 GPU的联想Legion 5快15%左右。
Far Cry 5在FHD和最大细节下的运行速度超过100 FPS,这意味着F17也是第一名。
赛博朋克2077 1.5在禁用Raytracing的情况下,在最大细节上实现了78FPS的好成绩。
总的来说,目前的每一个游戏都应该在华硕TUF Gaming上以最大的细节在FHD下非常流畅地运行,在我们的游戏基准测试中,它比大多数的竞争对手表现得更好。
| Far Cry 5 | |
| 1920x1080 Medium Preset AA:T | |
| Average of class Gaming (84 - 173, n=10, last 2 years) | |
| Asus TUF Gaming F17 FX707Z-HX011W | |
| Average NVIDIA GeForce RTX 3060 Laptop GPU (88 - 135, n=25) | |
| Schenker XMG Core 17 (Early 2021) | |
| Lenovo Legion 5 17ACH6H-82JY0003GE | |
| Asus TUF Gaming F17 FX706HM | |
| MSI Katana GF76 11UE | |
| 1920x1080 High Preset AA:T | |
| Average of class Gaming (82 - 163, n=10, last 2 years) | |
| Asus TUF Gaming F17 FX707Z-HX011W | |
| Schenker XMG Core 17 (Early 2021) | |
| Average NVIDIA GeForce RTX 3060 Laptop GPU (85 - 129, n=29) | |
| Lenovo Legion 5 17ACH6H-82JY0003GE | |
| Asus TUF Gaming F17 FX706HM | |
| MSI Katana GF76 11UE | |
| 1920x1080 Ultra Preset AA:T | |
| Asus TUF Gaming F17 FX707Z-HX011W | |
| Average of class Gaming (70 - 151, n=10, last 2 years) | |
| Schenker XMG Core 17 (Early 2021) | |
| Average NVIDIA GeForce RTX 3060 Laptop GPU (80 - 120, n=31) | |
| Lenovo Legion 5 17ACH6H-82JY0003GE | |
| Asus TUF Gaming F17 FX706HM | |
| MSI Katana GF76 11UE | |
| Cyberpunk 2077 1.6 | |
| 1920x1080 Medium Preset | |
| Average NVIDIA GeForce RTX 3060 Laptop GPU (68 - 118, n=14) | |
| Asus TUF Gaming F17 FX707Z-HX011W | |
| 1920x1080 High Preset | |
| Asus TUF Gaming F17 FX707Z-HX011W | |
| Average NVIDIA GeForce RTX 3060 Laptop GPU (42.2 - 87.7, n=14) | |
| 1920x1080 Ultra Preset | |
| Asus TUF Gaming F17 FX707Z-HX011W | |
| Average NVIDIA GeForce RTX 3060 Laptop GPU (40 - 78.8, n=16) | |
| 1920x1080 Ray Tracing Ultra Preset (DLSS off) | |
| Asus TUF Gaming F17 FX707Z-HX011W | |
| Average NVIDIA GeForce RTX 3060 Laptop GPU (12.6 - 28.9, n=7) | |
| GTA V | |
| 1920x1080 Normal/Off AF:4x | |
| MSI GE76 Raider | |
| Average of class Gaming (121.4 - 191.2, n=35, last 2 years) | |
| Average NVIDIA GeForce RTX 3060 Laptop GPU (146 - 183.7, n=33) | |
| Schenker XMG Core 17 (Early 2021) | |
| Lenovo Legion 5 17ACH6H-82JY0003GE | |
| Asus TUF Gaming F17 FX707Z-HX011W | |
| Asus TUF Gaming F17 FX706HM | |
| 1920x1080 High/On (Advanced Graphics Off) AA:2xMSAA + FX AF:8x | |
| MSI GE76 Raider | |
| Average of class Gaming (110.7 - 189, n=71, last 2 years) | |
| Asus TUF Gaming F17 FX707Z-HX011W | |
| Average NVIDIA GeForce RTX 3060 Laptop GPU (120 - 179.4, n=42) | |
| Schenker XMG Core 17 (Early 2021) | |
| Lenovo Legion 5 17ACH6H-82JY0003GE | |
| MSI Katana GF76 11UE | |
| Asus TUF Gaming F17 FX706HM | |
| 1920x1080 Highest AA:4xMSAA + FX AF:16x | |
| Average of class Gaming (48.3 - 186.9, n=102, last 2 years) | |
| MSI GE76 Raider | |
| Asus TUF Gaming F17 FX707Z-HX011W | |
| Average NVIDIA GeForce RTX 3060 Laptop GPU (69.2 - 109.8, n=46) | |
| Schenker XMG Core 17 (Early 2021) | |
| MSI Katana GF76 11UE | |
| Asus TUF Gaming F17 FX706HM | |
| Lenovo Legion 5 17ACH6H-82JY0003GE | |
| Dota 2 Reborn | |
| 1920x1080 high (2/3) | |
| Average of class Gaming (82.8 - 275, n=111, last 2 years) | |
| MSI GE76 Raider | |
| Asus TUF Gaming F17 FX707Z-HX011W | |
| MSI Katana GF76 11UE | |
| Asus TUF Gaming F17 FX706HM | |
| Average NVIDIA GeForce RTX 3060 Laptop GPU (98.9 - 169.2, n=49) | |
| Schenker XMG Core 17 (Early 2021) | |
| Lenovo Legion 5 17ACH6H-82JY0003GE | |
| 1920x1080 ultra (3/3) best looking | |
| MSI GE76 Raider | |
| Average of class Gaming (84.8 - 248, n=112, last 2 years) | |
| Asus TUF Gaming F17 FX707Z-HX011W | |
| MSI Katana GF76 11UE | |
| Average NVIDIA GeForce RTX 3060 Laptop GPU (90.7 - 154.8, n=49) | |
| Asus TUF Gaming F17 FX706HM | |
| Schenker XMG Core 17 (Early 2021) | |
| Lenovo Legion 5 17ACH6H-82JY0003GE | |
| Final Fantasy XV Benchmark | |
| 1280x720 Lite Quality | |
| Average of class Gaming (117.4 - 235, n=70, last 2 years) | |
| Asus TUF Gaming F17 FX707Z-HX011W | |
| MSI Katana GF76 11UE | |
| Lenovo Legion 5 17ACH6H-82JY0003GE | |
| Average NVIDIA GeForce RTX 3060 Laptop GPU (122.5 - 214, n=33) | |
| Schenker XMG Core 17 (Early 2021) | |
| Asus TUF Gaming F17 FX706HM | |
| 1920x1080 Standard Quality | |
| Average of class Gaming (85.7 - 236, n=89, last 2 years) | |
| MSI GE76 Raider | |
| Lenovo Legion 5 17ACH6H-82JY0003GE | |
| Average NVIDIA GeForce RTX 3060 Laptop GPU (70.4 - 133.5, n=37) | |
| Schenker XMG Core 17 (Early 2021) | |
| Asus TUF Gaming F17 FX707Z-HX011W | |
| MSI Katana GF76 11UE | |
| Asus TUF Gaming F17 FX706HM | |
| 1920x1080 High Quality | |
| Average of class Gaming (41 - 215, n=103, last 2 years) | |
| MSI GE76 Raider | |
| Lenovo Legion 5 17ACH6H-82JY0003GE | |
| Schenker XMG Core 17 (Early 2021) | |
| Average NVIDIA GeForce RTX 3060 Laptop GPU (55 - 100.9, n=42) | |
| Asus TUF Gaming F17 FX707Z-HX011W | |
| MSI Katana GF76 11UE | |
| Asus TUF Gaming F17 FX706HM | |
| Strange Brigade | |
| 1920x1080 medium AA:medium AF:4 | |
| Average of class Gaming (160.9 - 509, n=77, last 2 years) | |
| MSI GE76 Raider | |
| Lenovo Legion 5 17ACH6H-82JY0003GE | |
| Asus TUF Gaming F17 FX707Z-HX011W | |
| Average NVIDIA GeForce RTX 3060 Laptop GPU (154.9 - 242, n=38) | |
| Schenker XMG Core 17 (Early 2021) | |
| Asus TUF Gaming F17 FX706HM | |
| MSI Katana GF76 11UE | |
| 1920x1080 high AA:high AF:8 | |
| Average of class Gaming (129.5 - 485, n=79, last 2 years) | |
| MSI GE76 Raider | |
| Lenovo Legion 5 17ACH6H-82JY0003GE | |
| Asus TUF Gaming F17 FX707Z-HX011W | |
| Average NVIDIA GeForce RTX 3060 Laptop GPU (115.6 - 192.1, n=41) | |
| Schenker XMG Core 17 (Early 2021) | |
| Asus TUF Gaming F17 FX706HM | |
| MSI Katana GF76 11UE | |
| 1920x1080 ultra AA:ultra AF:16 | |
| Average of class Gaming (76.3 - 456, n=93, last 2 years) | |
| MSI GE76 Raider | |
| Lenovo Legion 5 17ACH6H-82JY0003GE | |
| Asus TUF Gaming F17 FX707Z-HX011W | |
| Average NVIDIA GeForce RTX 3060 Laptop GPU (102.2 - 166.3, n=43) | |
| Schenker XMG Core 17 (Early 2021) | |
| Asus TUF Gaming F17 FX706HM | |
| MSI Katana GF76 11UE | |
| X-Plane 11.11 | |
| 1280x720 low (fps_test=1) | |
| MSI GE76 Raider | |
| Average of class Gaming (70.1 - 209, n=100, last 2 years) | |
| Asus TUF Gaming F17 FX707Z-HX011W | |
| MSI Katana GF76 11UE | |
| Asus TUF Gaming F17 FX706HM | |
| Average NVIDIA GeForce RTX 3060 Laptop GPU (83.6 - 157.1, n=48) | |
| Lenovo Legion 5 17ACH6H-82JY0003GE | |
| Schenker XMG Core 17 (Early 2021) | |
| 1920x1080 med (fps_test=2) | |
| MSI GE76 Raider | |
| Average of class Gaming (63.8 - 181.2, n=111, last 2 years) | |
| Asus TUF Gaming F17 FX707Z-HX011W | |
| MSI Katana GF76 11UE | |
| Average NVIDIA GeForce RTX 3060 Laptop GPU (73 - 138.3, n=48) | |
| Asus TUF Gaming F17 FX706HM | |
| Lenovo Legion 5 17ACH6H-82JY0003GE | |
| Schenker XMG Core 17 (Early 2021) | |
| 1920x1080 high (fps_test=3) | |
| MSI GE76 Raider | |
| Average of class Gaming (52.1 - 143.5, n=115, last 2 years) | |
| Asus TUF Gaming F17 FX707Z-HX011W | |
| MSI Katana GF76 11UE | |
| Average NVIDIA GeForce RTX 3060 Laptop GPU (61.9 - 109.3, n=48) | |
| Asus TUF Gaming F17 FX706HM | |
| Lenovo Legion 5 17ACH6H-82JY0003GE | |
| Schenker XMG Core 17 (Early 2021) | |
在Witcher 3 ,在我们进行测试的整整一个小时里,帧率保持一致,性能完全没有下降。
Witcher 3 FPS Graph
| low | med. | high | ultra | |
|---|---|---|---|---|
| GTA V (2015) | 177 | 171 | 161 | 97.5 |
| The Witcher 3 (2015) | 360 | 261.7 | 159 | 86.1 |
| Dota 2 Reborn (2015) | 168 | 154 | 144 | 135 |
| Final Fantasy XV Benchmark (2018) | 173 | 105 | 78 | |
| X-Plane 11.11 (2018) | 128 | 115 | 94.3 | |
| Far Cry 5 (2018) | 163 | 130 | 124 | 118 |
| Strange Brigade (2018) | 289 | 202 | 163 | 142 |
| Cyberpunk 2077 1.6 (2022) | 92 | 82 | 79.1 | 78.8 |
排放 - 相对安静和凉爽
噪声排放
闲置时,风扇大部分时间都是关闭的,即使是在涡轮模式下。在负载情况下,F17仍然比其几乎所有的竞争对手都要安静。在某些情况下,我们还能听到一些线圈的啸叫声,例如在运行3DMark 06时,只有当我们的耳朵离设备很近时才能注意到。
Noise level
| Idle |
| 24 / 24 / 24 dB(A) |
| Load |
| 42.6 / 46.84 dB(A) |
 | ||
30 dB silent 40 dB(A) audible 50 dB(A) loud |
||
min: | ||
| Asus TUF Gaming F17 FX707Z-HX011W GeForce RTX 3060 Laptop GPU, i7-12700H, SK Hynix HFM001TD3JX013N | Asus TUF Gaming F17 FX706HM GeForce RTX 3060 Laptop GPU, i9-11900H, SK Hynix HFM001TD3JX013N | Lenovo Legion 5 17ACH6H-82JY0003GE GeForce RTX 3060 Laptop GPU, R5 5600H, Samsung PM991a MZALQ512HBLU | MSI GE76 Raider GeForce RTX 3080 Ti Laptop GPU, i9-12900HK, Samsung PM9A1 MZVL22T0HBLB | MSI Katana GF76 11UE GeForce RTX 3060 Laptop GPU, i7-11800H, Kingston OM8PCP3512F-AB | Schenker XMG Core 17 (Early 2021) GeForce RTX 3060 Laptop GPU, i7-10870H, Samsung SSD 970 EVO Plus 1TB | |
|---|---|---|---|---|---|---|
| Noise | -14% | -6% | -20% | -26% | -23% | |
| off / environment * (dB) | 24 | 25 -4% | 25 -4% | 26 -8% | 25 -4% | 25 -4% |
| Idle Minimum * (dB) | 24 | 26 -8% | 25 -4% | 26 -8% | 33 -38% | 30 -25% |
| Idle Average * (dB) | 24 | 31 -29% | 25 -4% | 27 -13% | 34 -42% | 32 -33% |
| Idle Maximum * (dB) | 24 | 33 -38% | 30.5 -27% | 40 -67% | 35 -46% | 36 -50% |
| Load Average * (dB) | 42.6 | 48 -13% | 37.5 12% | 50 -17% | 53 -24% | 53 -24% |
| Witcher 3 ultra * (dB) | 46.84 | 47 -0% | 53 -13% | 49 -5% | 51 -9% | |
| Load Maximum * (dB) | 46.84 | 49 -5% | 51 -9% | 53 -13% | 57 -22% | 54 -15% |
* ... smaller is better
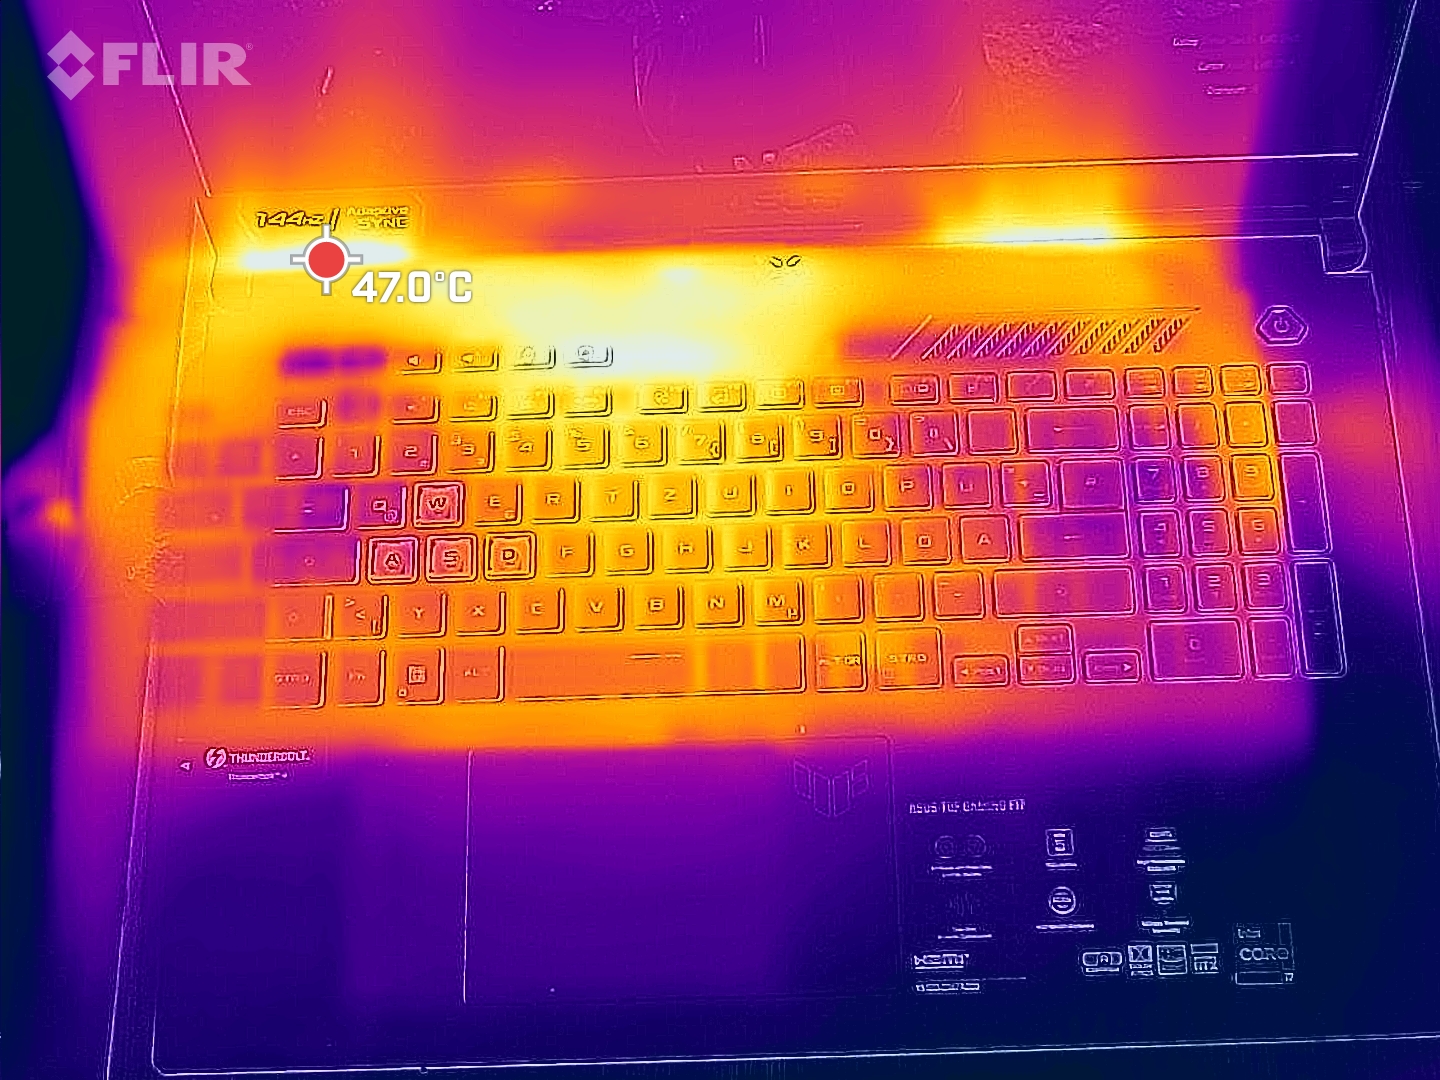
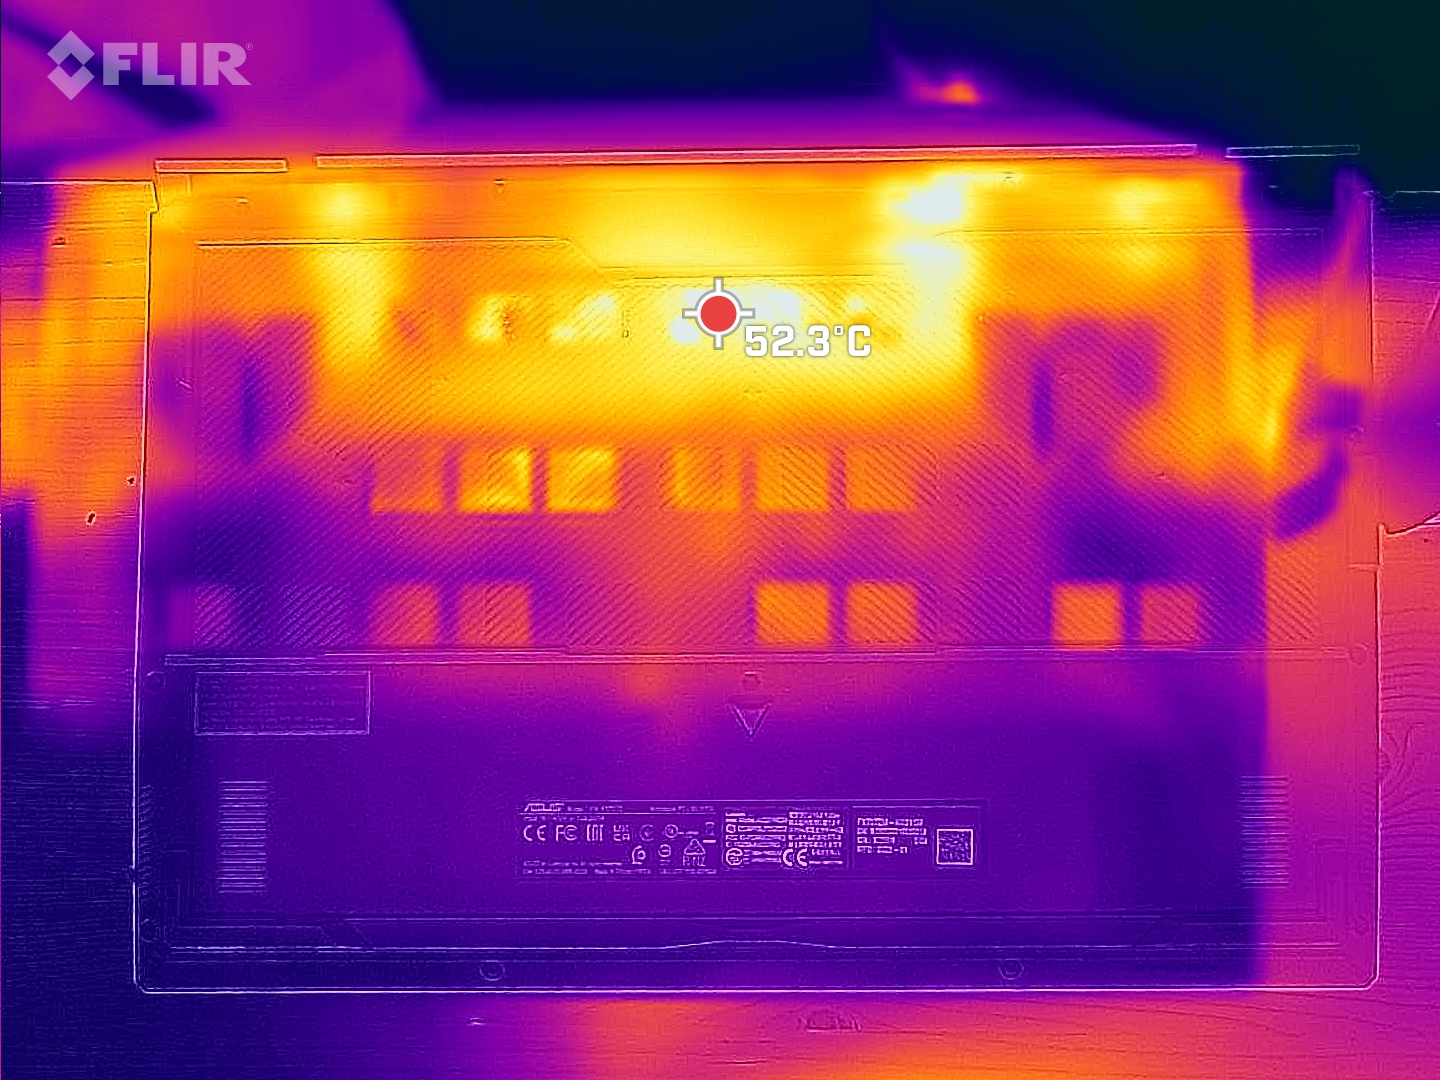
温度
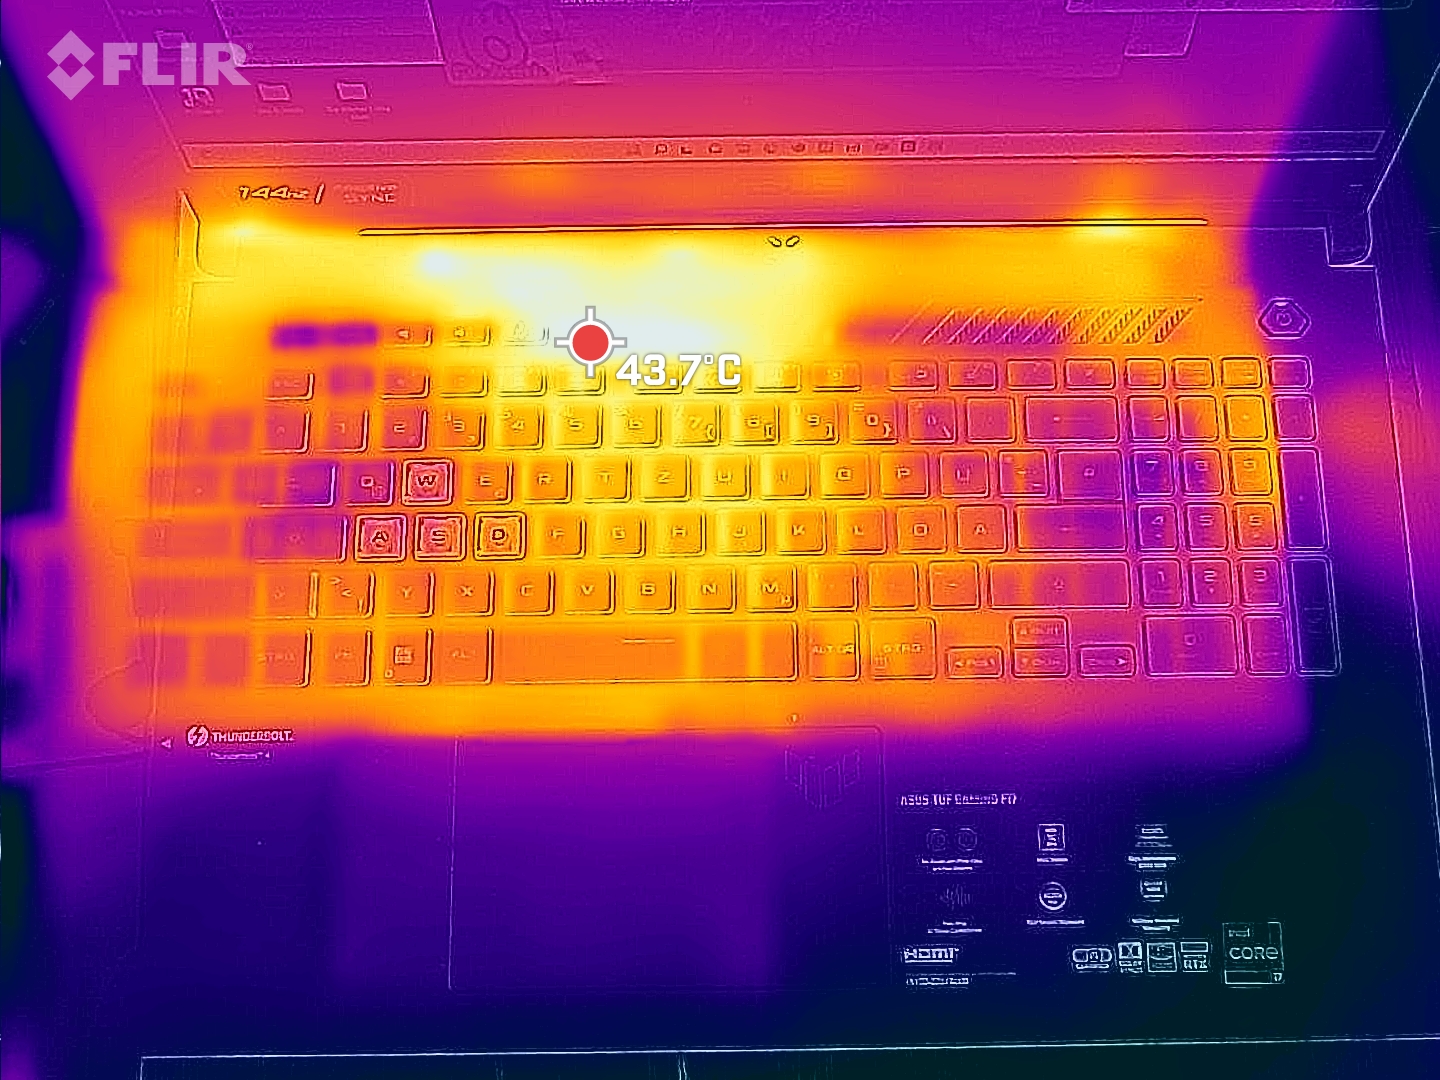
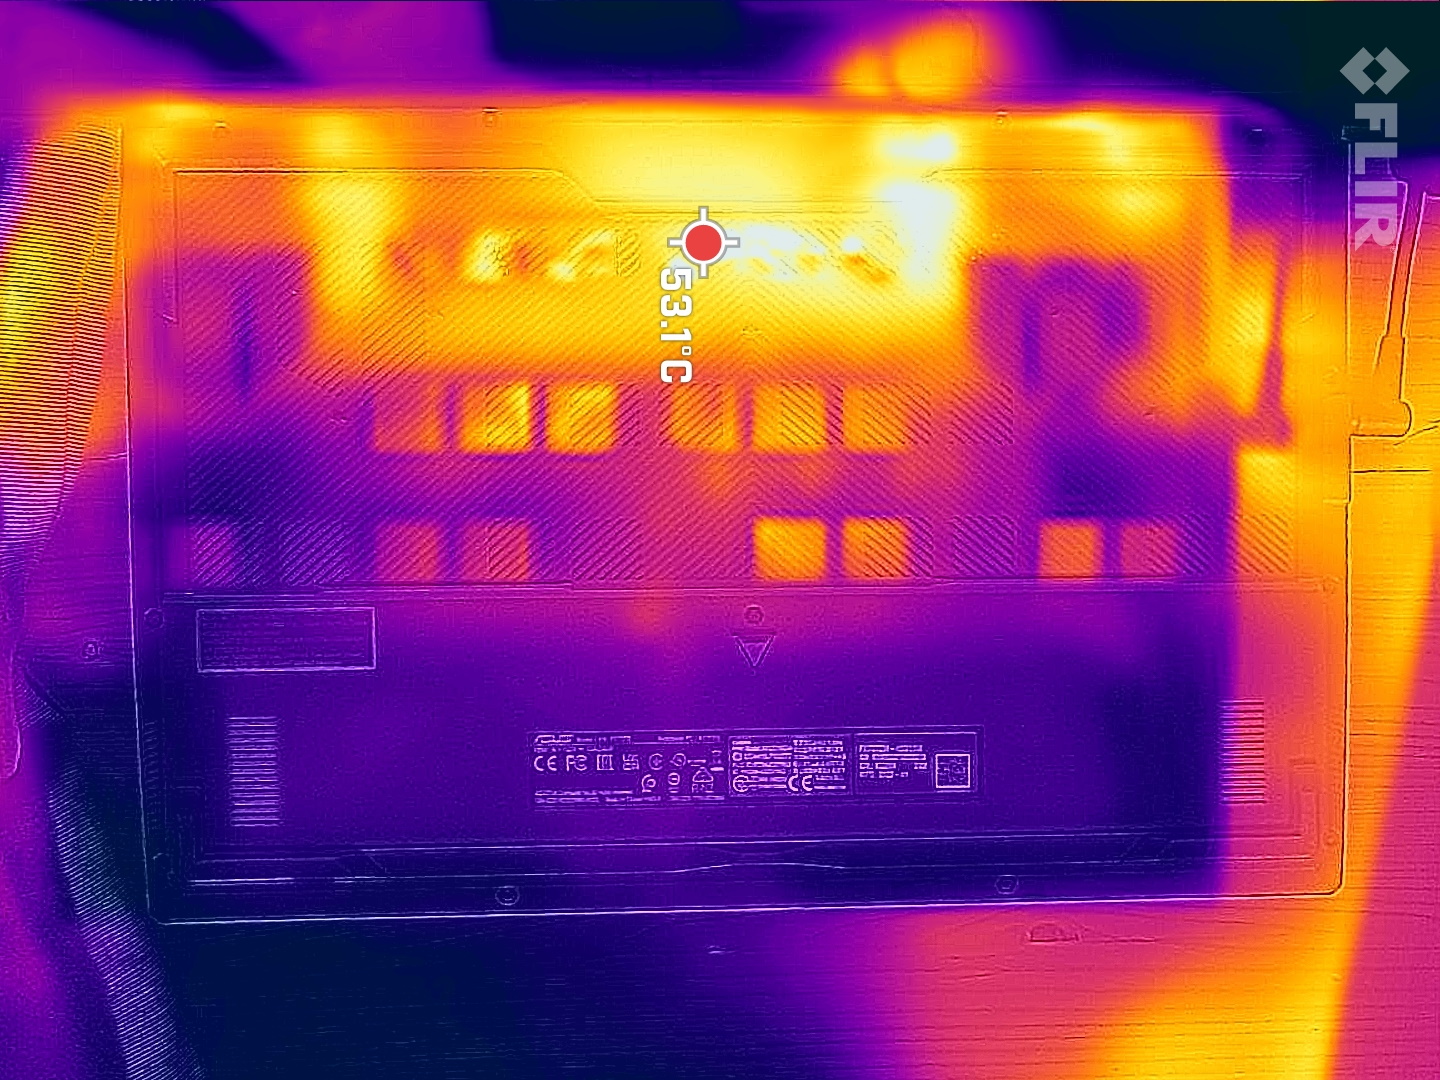
温度与其他17英寸游戏笔记本相似,明显低于F17的前代产品。热点位于顶部向后方,可以达到50℃。
掌托在任何时候都保持令人愉快的凉爽。在游戏时,WASD键周围的区域可以达到43℃的温暖但仍可接受的温度。
(-) The maximum temperature on the upper side is 52 °C / 126 F, compared to the average of 40.4 °C / 105 F, ranging from 21.2 to 68.8 °C for the class Gaming.
(-) The bottom heats up to a maximum of 47 °C / 117 F, compared to the average of 43.2 °C / 110 F
(+) In idle usage, the average temperature for the upper side is 28.8 °C / 84 F, compared to the device average of 33.9 °C / 93 F.
(-) Playing The Witcher 3, the average temperature for the upper side is 39.9 °C / 104 F, compared to the device average of 33.9 °C / 93 F.
(+) The palmrests and touchpad are cooler than skin temperature with a maximum of 30 °C / 86 F and are therefore cool to the touch.
(±) The average temperature of the palmrest area of similar devices was 28.8 °C / 83.8 F (-1.2 °C / -2.2 F).
| Asus TUF Gaming F17 FX707Z-HX011W Intel Core i7-12700H, NVIDIA GeForce RTX 3060 Laptop GPU | Asus TUF Gaming F17 FX706HM Intel Core i9-11900H, NVIDIA GeForce RTX 3060 Laptop GPU | Lenovo Legion 5 17ACH6H-82JY0003GE AMD Ryzen 5 5600H, NVIDIA GeForce RTX 3060 Laptop GPU | MSI GE76 Raider Intel Core i9-12900HK, NVIDIA GeForce RTX 3080 Ti Laptop GPU | MSI Katana GF76 11UE Intel Core i7-11800H, NVIDIA GeForce RTX 3060 Laptop GPU | Schenker XMG Core 17 (Early 2021) Intel Core i7-10870H, NVIDIA GeForce RTX 3060 Laptop GPU | |
|---|---|---|---|---|---|---|
| Heat | -22% | -1% | -2% | -2% | -1% | |
| Maximum Upper Side * (°C) | 52 | 58.5 -13% | 42.2 19% | 43 17% | 51 2% | 44 15% |
| Maximum Bottom * (°C) | 47 | 58.5 -24% | 50.9 -8% | 47 -0% | 52 -11% | 50 -6% |
| Idle Upper Side * (°C) | 31 | 38 -23% | 34.3 -11% | 33 -6% | 32 -3% | 30 3% |
| Idle Bottom * (°C) | 31 | 39 -26% | 32 -3% | 37 -19% | 29 6% | 36 -16% |
* ... smaller is better
压力测试
当我们进行一小时的压力测试时,CPU开始时所有核心的频率为3.6GHz,然后在不到一分钟后下降到2.5GHz,一小时后测试结束时为2.3GHz。记录的温度平均为83℃,峰值为87℃。
GPU开始时为1.6GHz,但随后降至1.3GHz,平均记录温度为81℃。
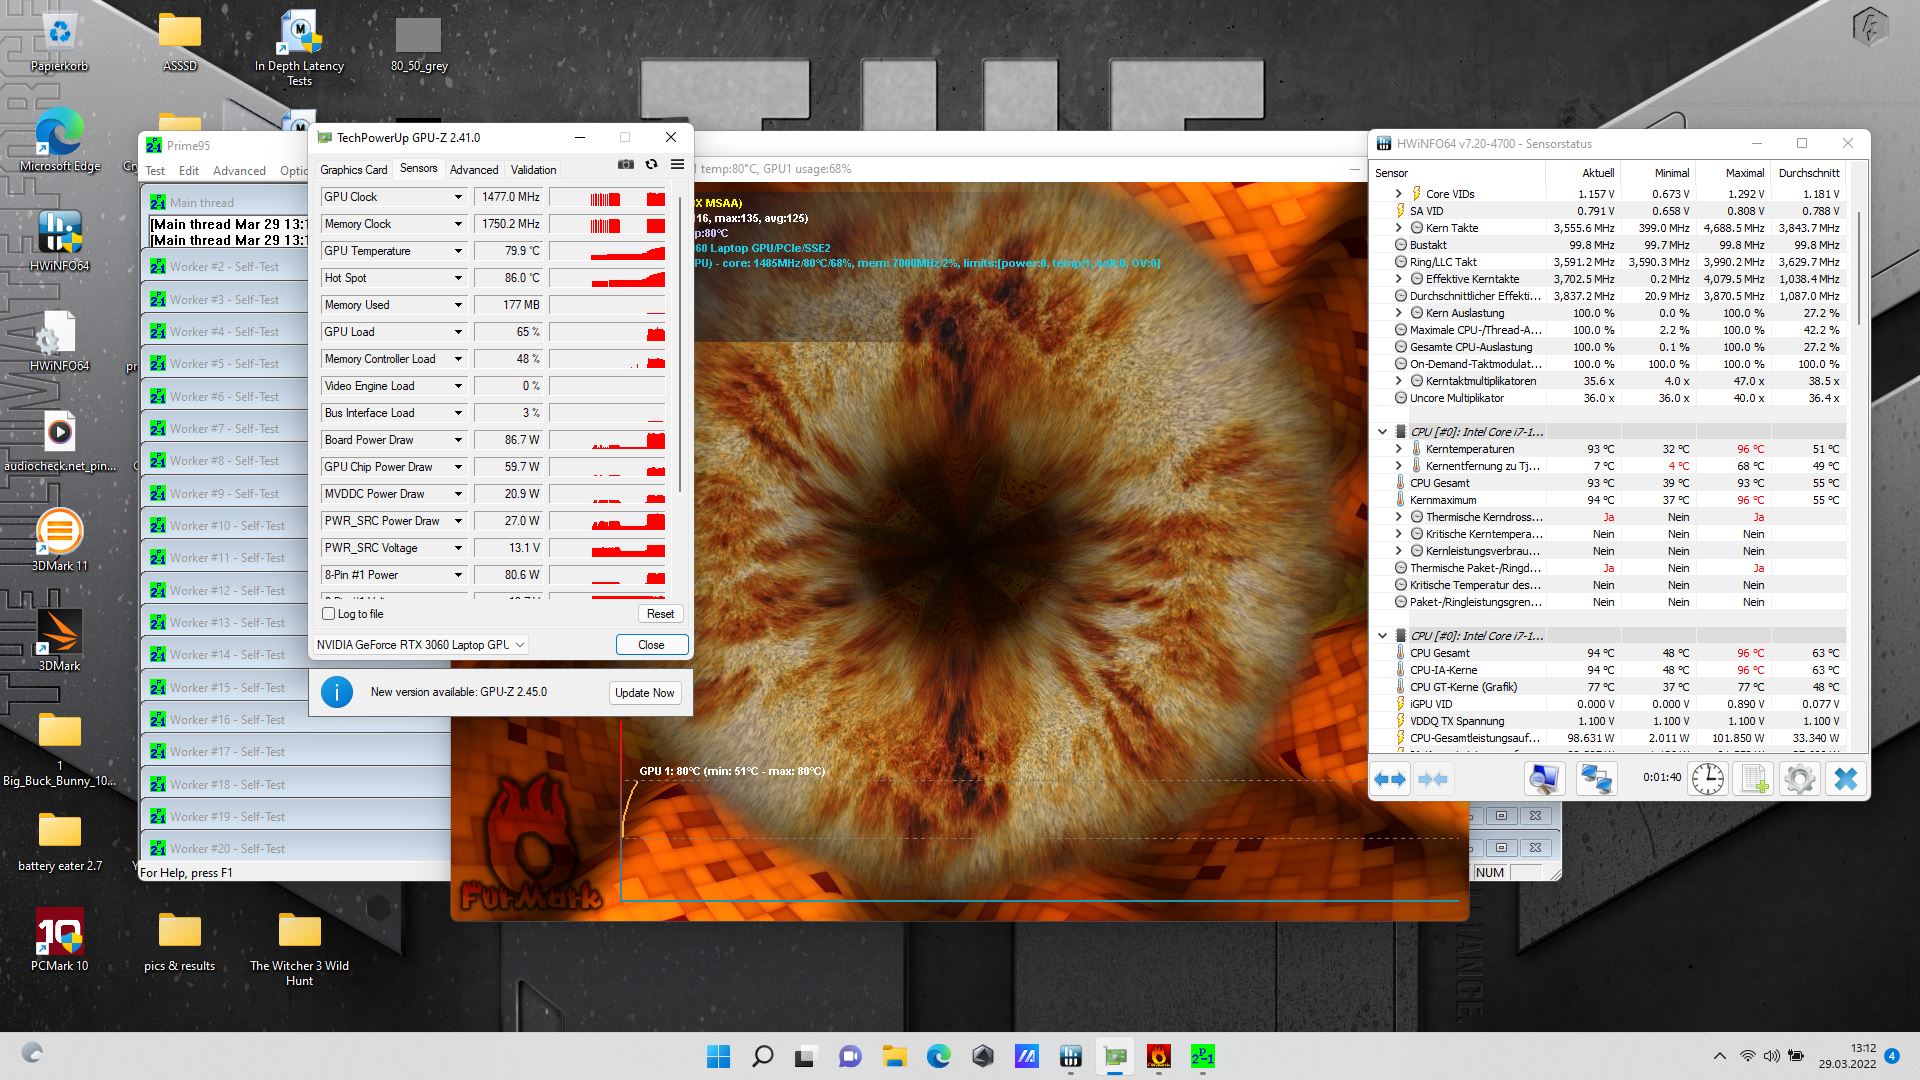
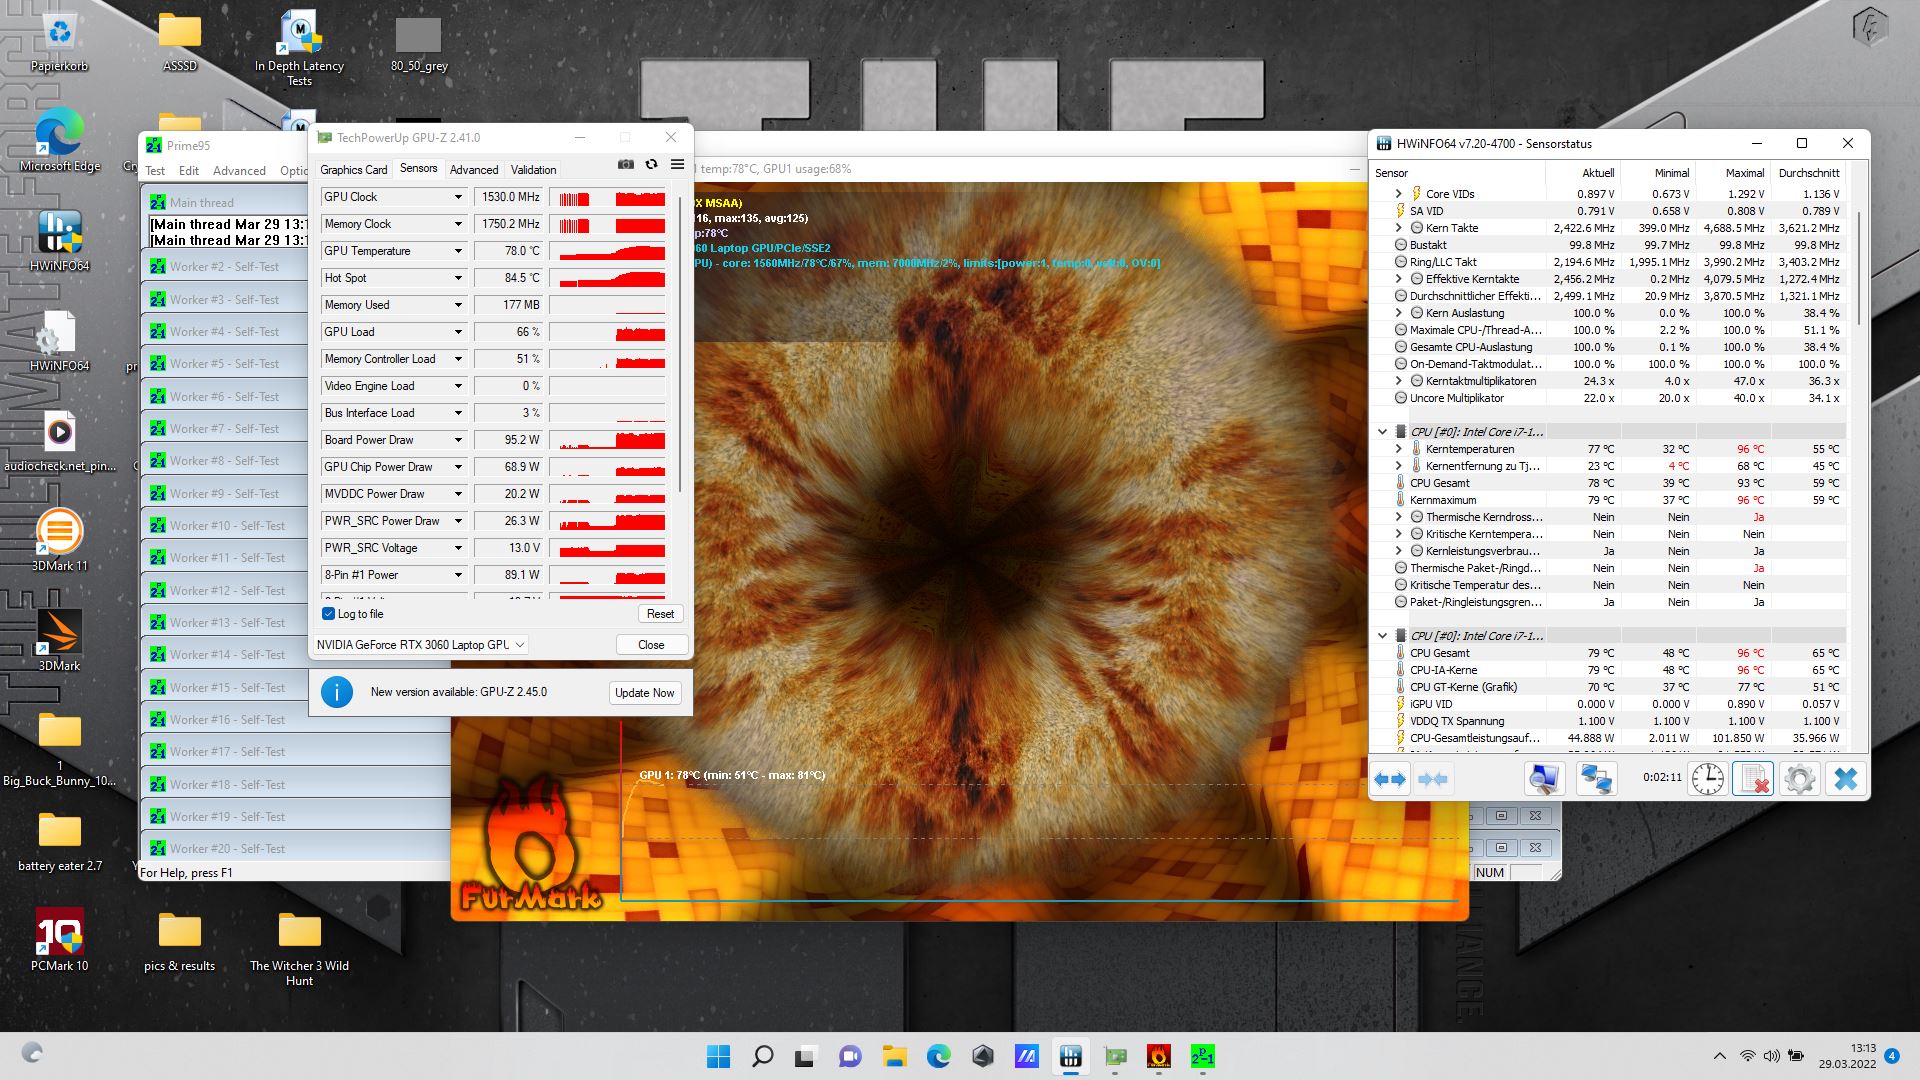
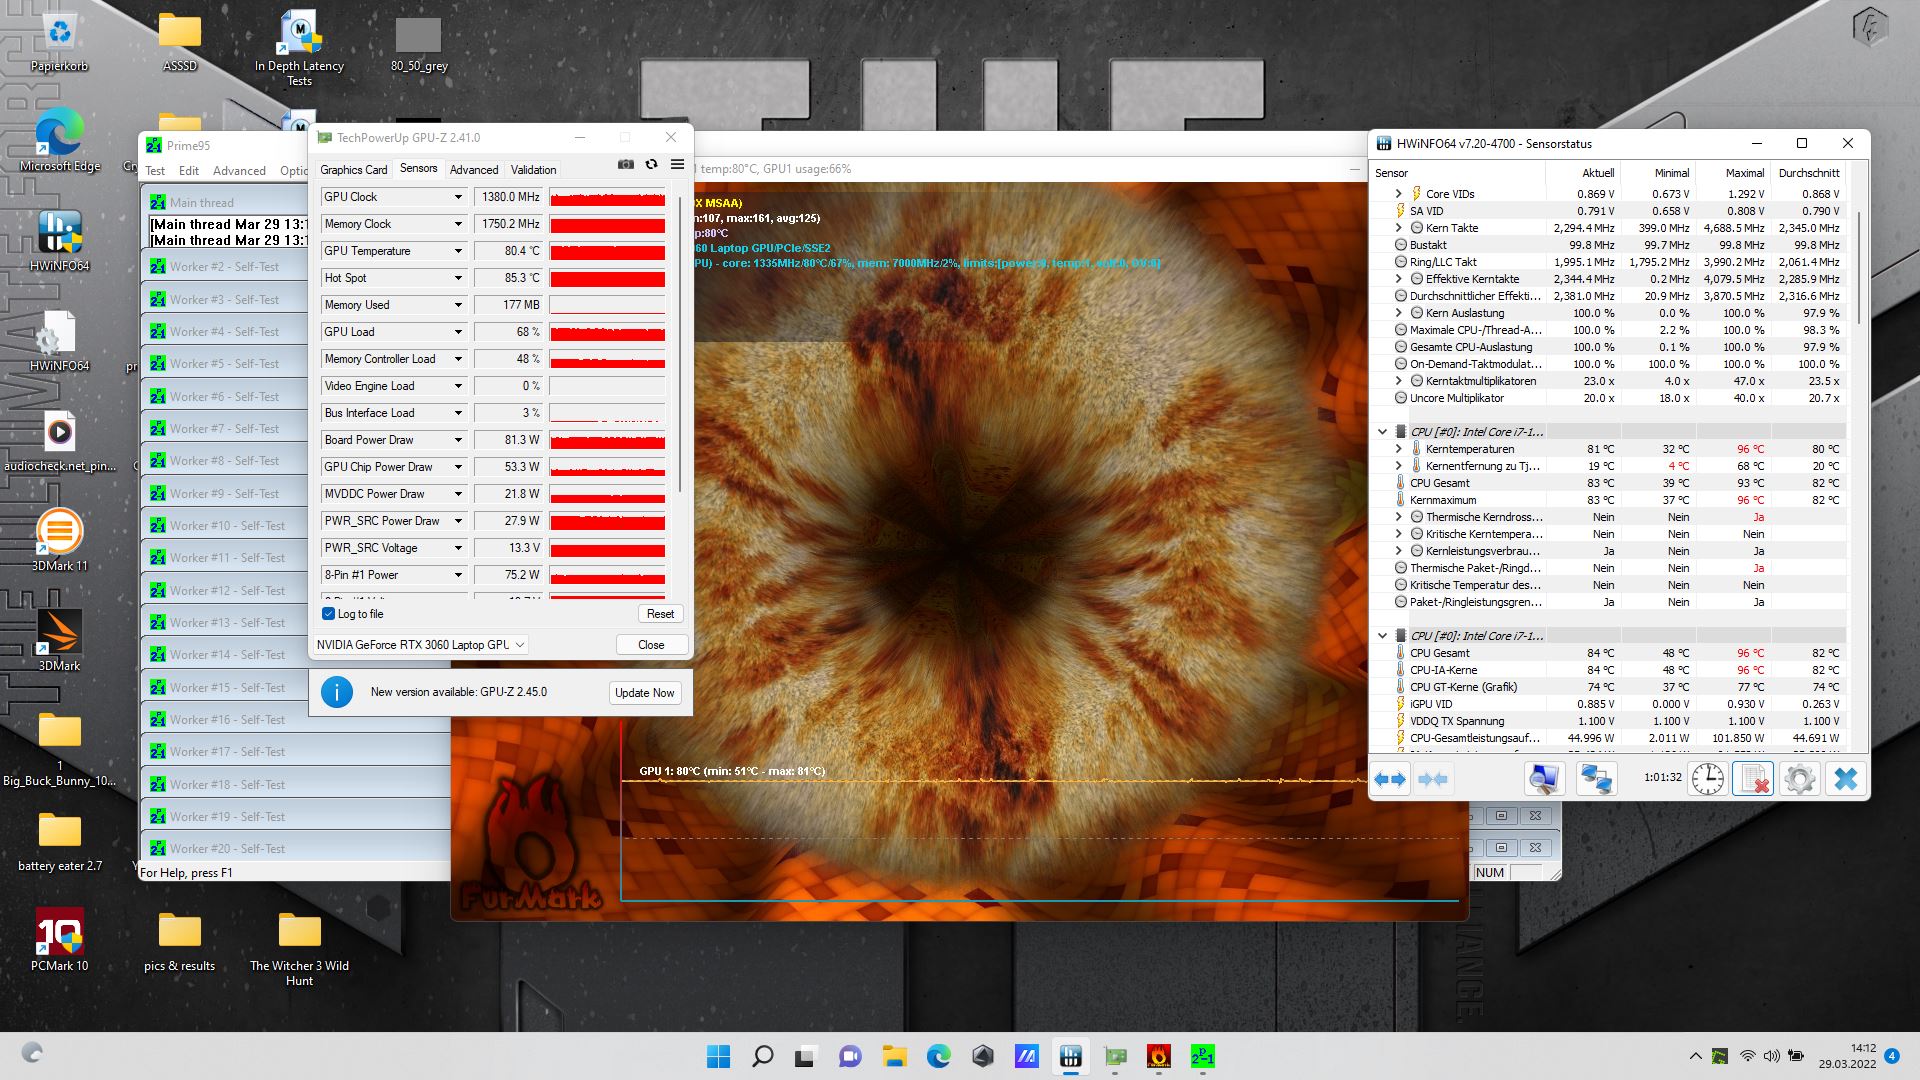
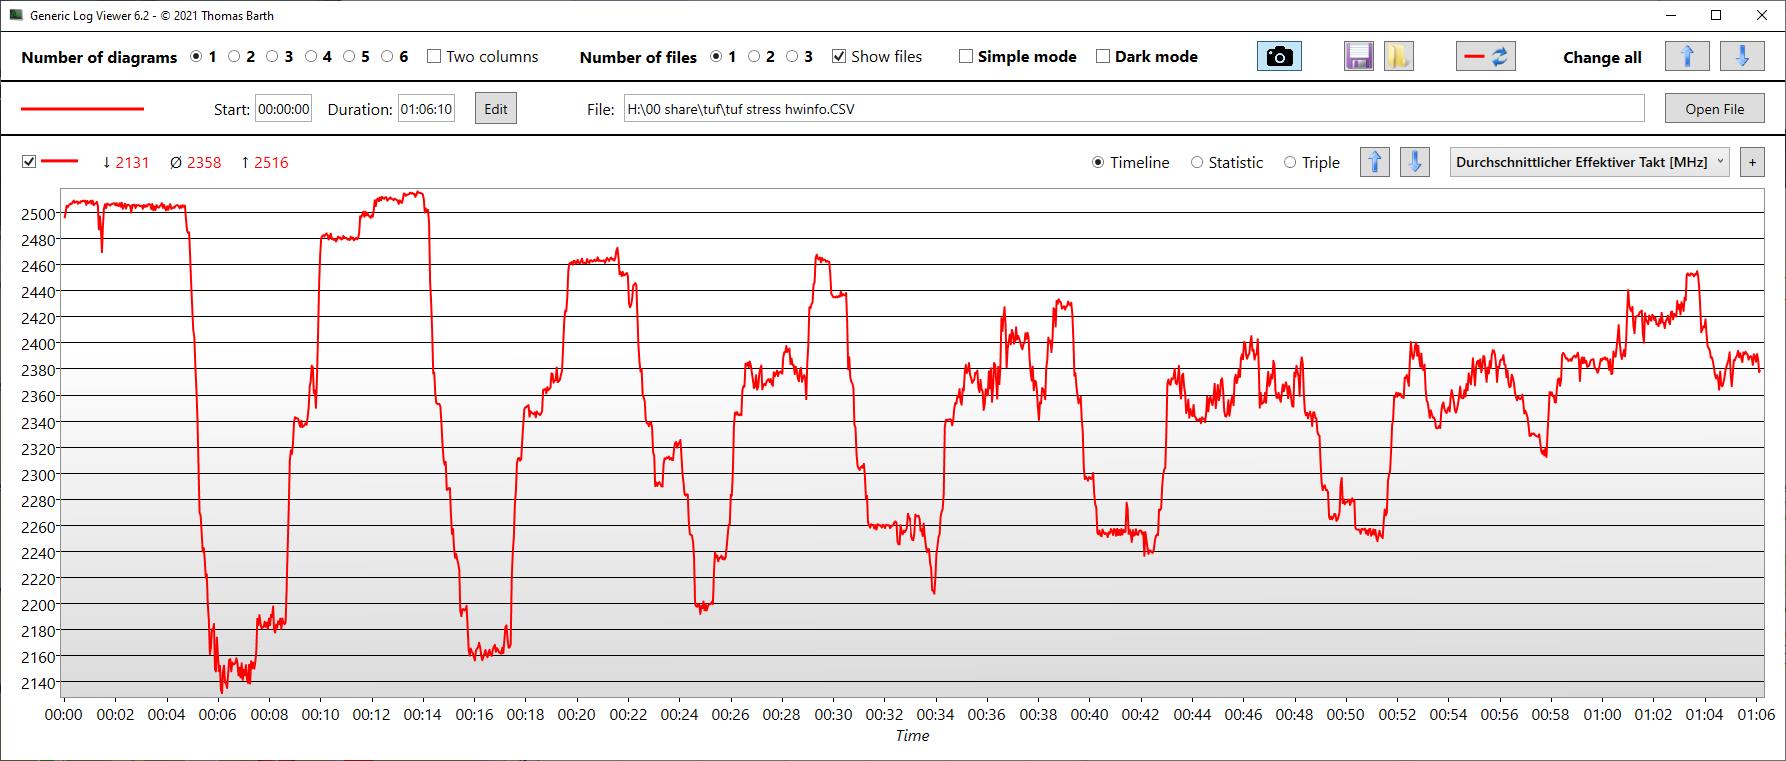
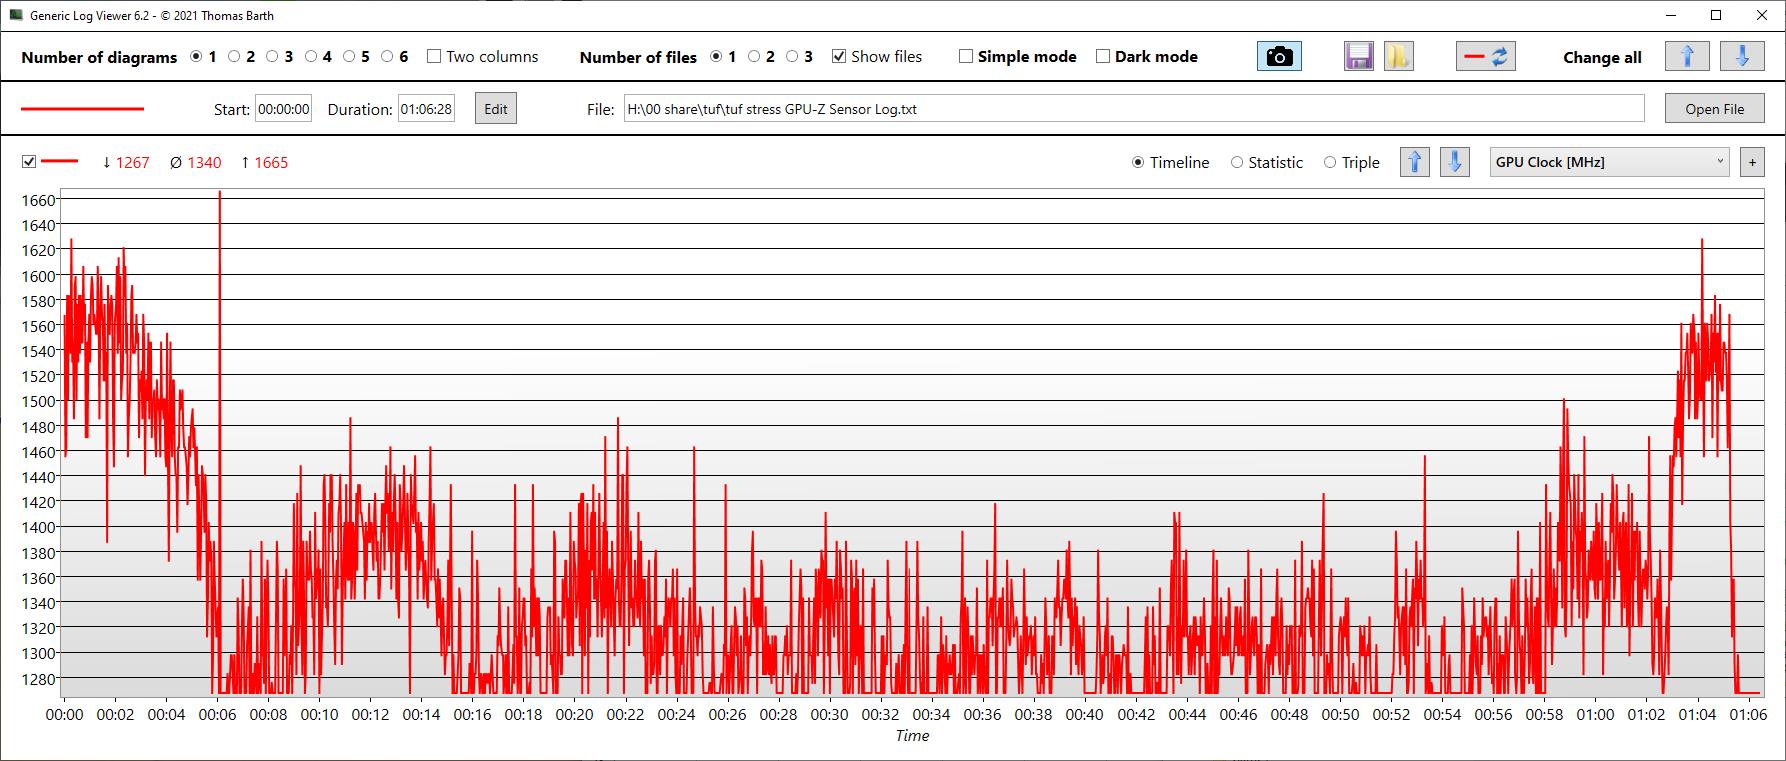
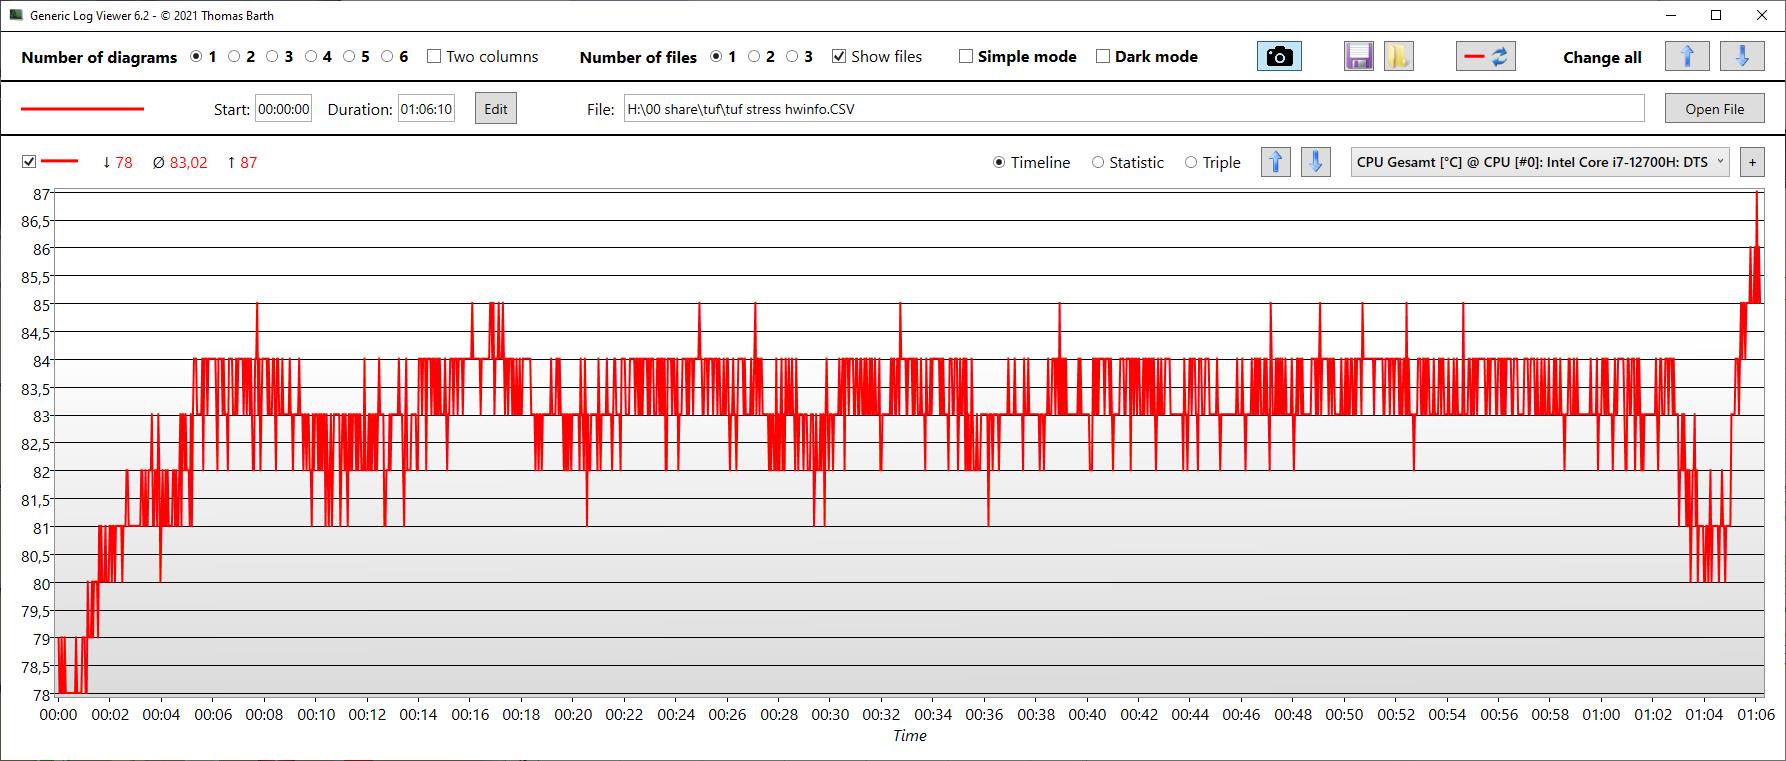
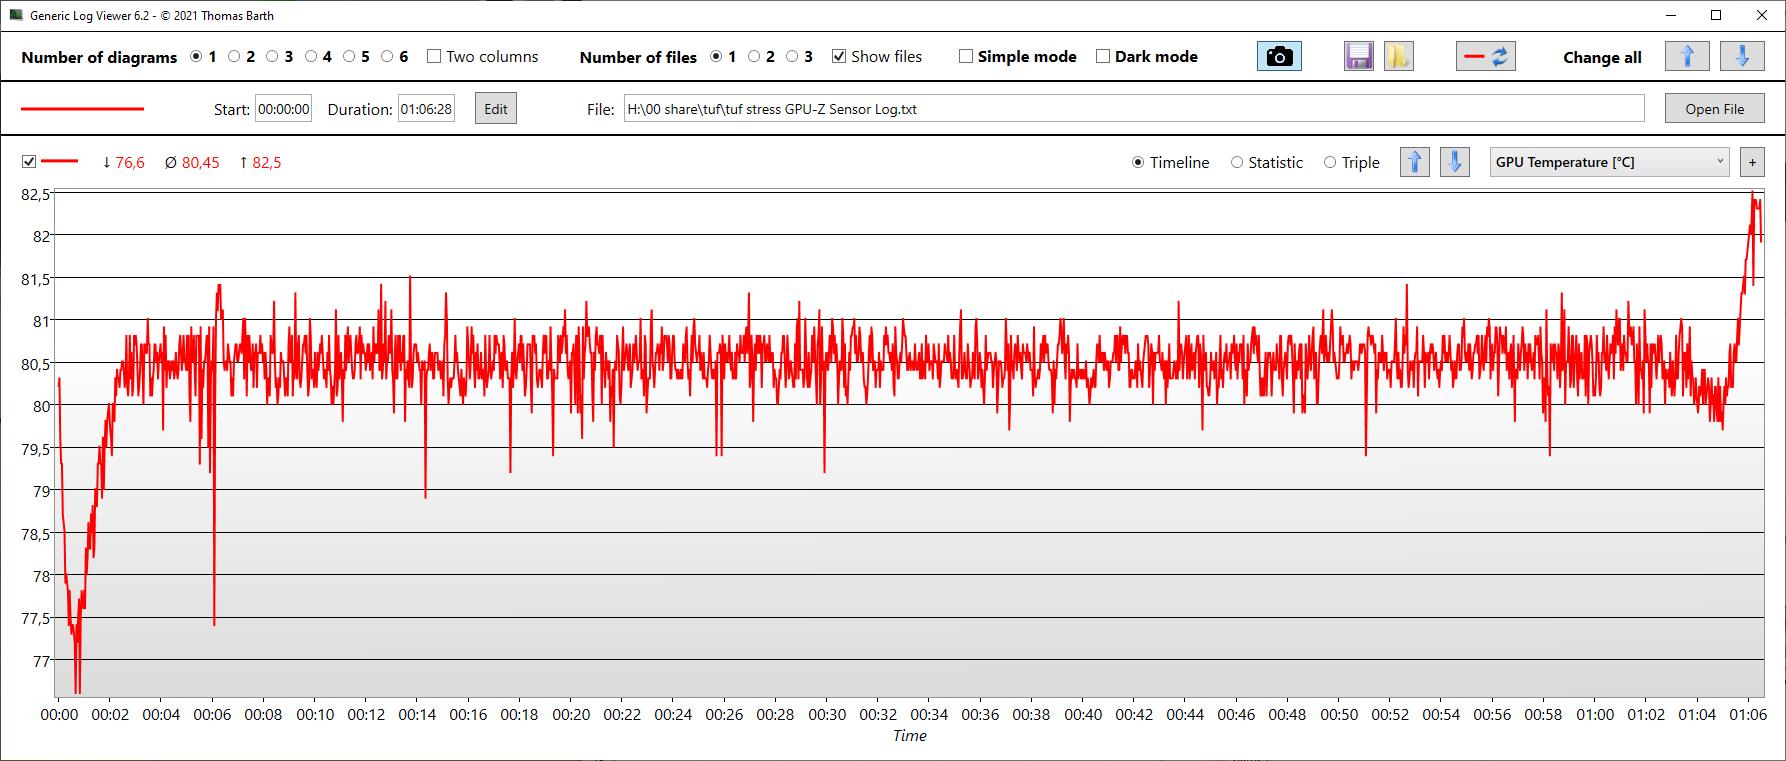
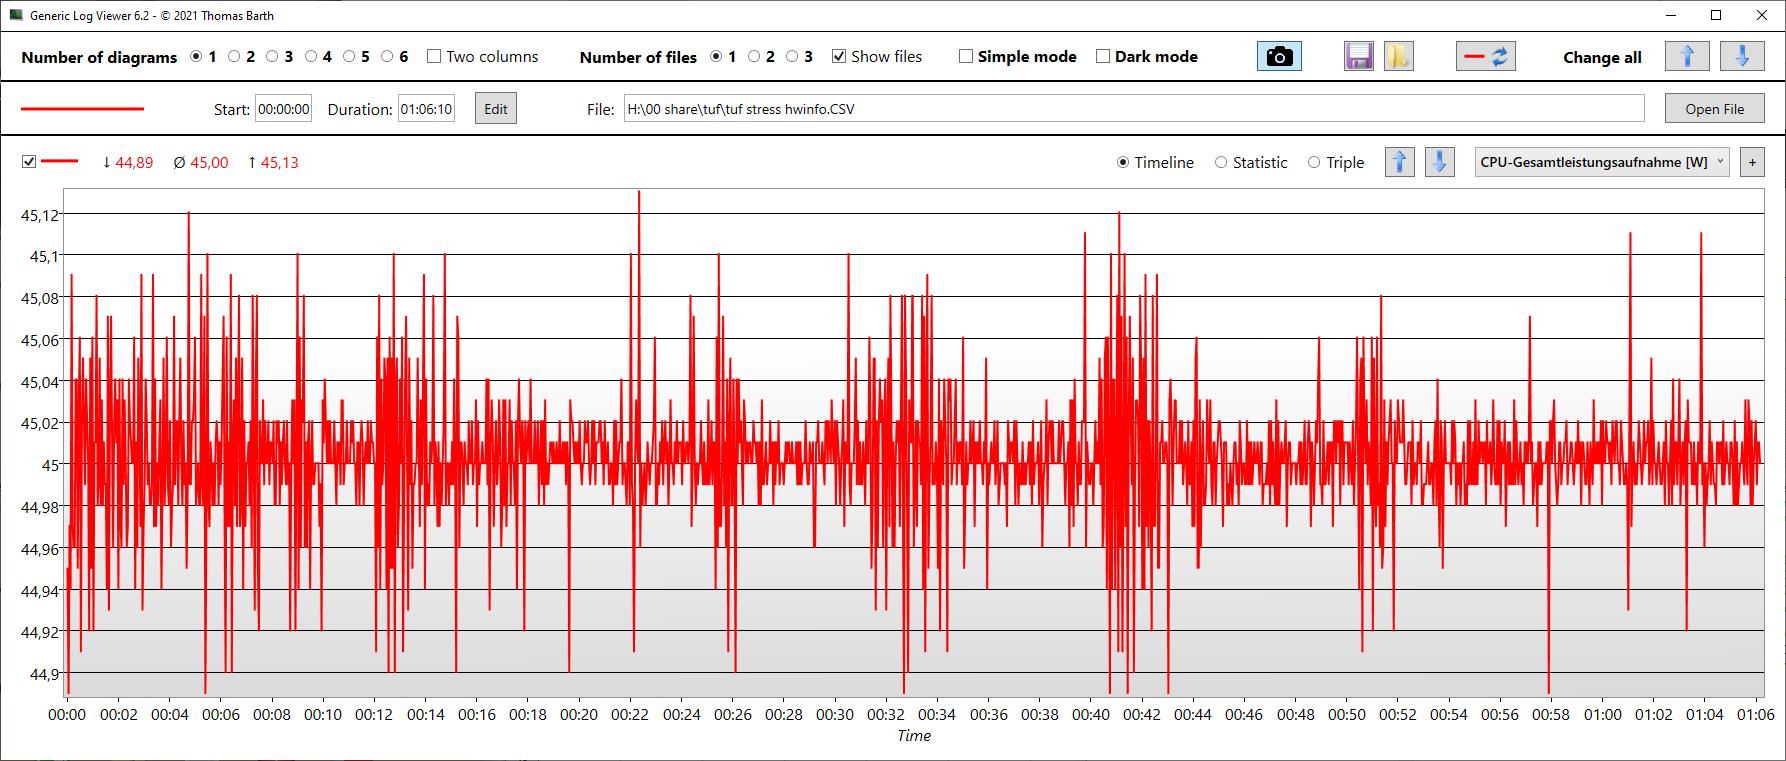
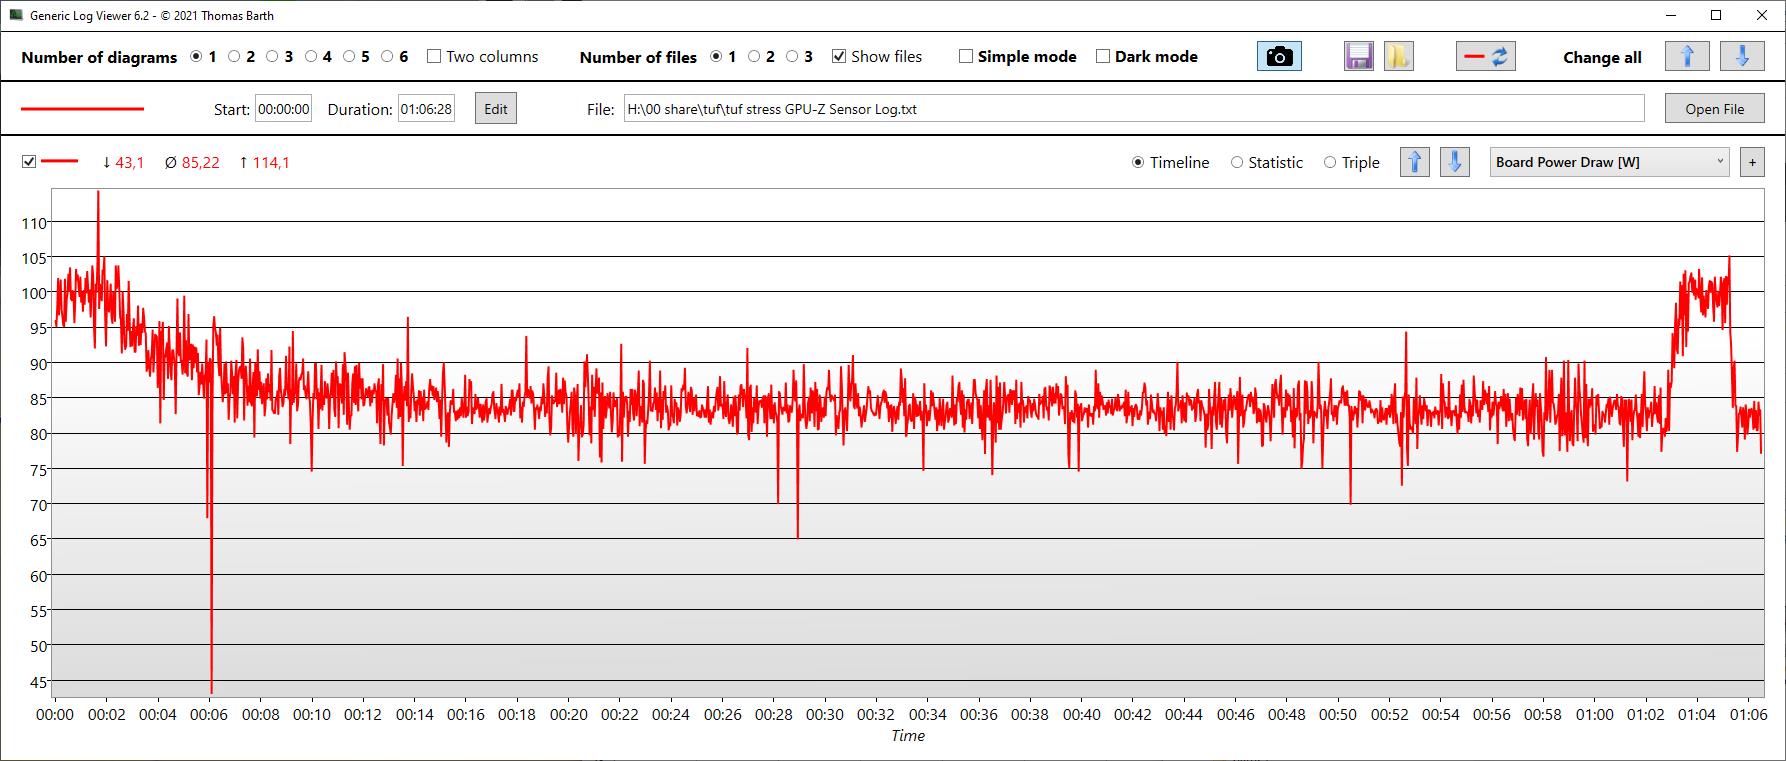
| CPU时钟(GHz) | GPU时钟(MHz) | CPU平均温度(℃) | GPU平均温度(℃) | |
| Prime95 + FurMark Stress | 2.4 | 1,340 | 83 | 81 |
发言人
与前代产品相比,扬声器的尺寸有所增加。不管怎么说,它们的性能充其量是平庸的,只有在低音方面有最小的改进。模拟扬声器和耳机可以连接到F17的3.5毫米音频插孔。
Asus TUF Gaming F17 FX707Z-HX011W audio analysis
(±) | speaker loudness is average but good (79.5 dB)
Bass 100 - 315 Hz
(±) | reduced bass - on average 13.1% lower than median
(±) | linearity of bass is average (9% delta to prev. frequency)
Mids 400 - 2000 Hz
(±) | higher mids - on average 9.1% higher than median
(±) | linearity of mids is average (7.8% delta to prev. frequency)
Highs 2 - 16 kHz
(+) | balanced highs - only 3.9% away from median
(±) | linearity of highs is average (9.1% delta to prev. frequency)
Overall 100 - 16.000 Hz
(±) | linearity of overall sound is average (20.4% difference to median)
Compared to same class
» 72% of all tested devices in this class were better, 6% similar, 22% worse
» The best had a delta of 6%, average was 18%, worst was 132%
Compared to all devices tested
» 53% of all tested devices were better, 8% similar, 39% worse
» The best had a delta of 4%, average was 24%, worst was 134%
Lenovo Legion 5 17ACH6H-82JY0003GE audio analysis
(±) | speaker loudness is average but good (78.3 dB)
Bass 100 - 315 Hz
(-) | nearly no bass - on average 19.1% lower than median
(±) | linearity of bass is average (13.8% delta to prev. frequency)
Mids 400 - 2000 Hz
(+) | balanced mids - only 3% away from median
(+) | mids are linear (5% delta to prev. frequency)
Highs 2 - 16 kHz
(+) | balanced highs - only 4.8% away from median
(+) | highs are linear (6.7% delta to prev. frequency)
Overall 100 - 16.000 Hz
(±) | linearity of overall sound is average (15.8% difference to median)
Compared to same class
» 37% of all tested devices in this class were better, 7% similar, 56% worse
» The best had a delta of 6%, average was 18%, worst was 132%
Compared to all devices tested
» 24% of all tested devices were better, 5% similar, 71% worse
» The best had a delta of 4%, average was 24%, worst was 134%
能源管理--电池寿命长
消耗功率
由于F17的显示屏很暗,空闲时的功耗非常低。
由于GPU的高TGP,负载下的耗电量相当高。在游戏时,F17可能超过了其竞争对手,但它也显示出比所有竞争对手都要高的功耗,除了Schenker Core,它的功耗更高,但性能比F17差。
| Idle | |
| Load |
|
Key:
min: | |
| Asus TUF Gaming F17 FX707Z-HX011W i7-12700H, GeForce RTX 3060 Laptop GPU, SK Hynix HFM001TD3JX013N, IPS, 1920x1080, 17.3" | Asus TUF Gaming F17 FX706HM i9-11900H, GeForce RTX 3060 Laptop GPU, SK Hynix HFM001TD3JX013N, IPS, 1920x1080, 17.3" | Lenovo Legion 5 17ACH6H-82JY0003GE R5 5600H, GeForce RTX 3060 Laptop GPU, Samsung PM991a MZALQ512HBLU, IPS, 1920x1080, 17.3" | MSI GE76 Raider i9-12900HK, GeForce RTX 3080 Ti Laptop GPU, Samsung PM9A1 MZVL22T0HBLB, IPS-Level, 1920x1080, 17.3" | MSI Katana GF76 11UE i7-11800H, GeForce RTX 3060 Laptop GPU, Kingston OM8PCP3512F-AB, IPS, 1920x1080, 17.3" | Schenker XMG Core 17 (Early 2021) i7-10870H, GeForce RTX 3060 Laptop GPU, Samsung SSD 970 EVO Plus 1TB, IPS, 2560x1440, 17.3" | Average NVIDIA GeForce RTX 3060 Laptop GPU | Average of class Gaming | |
|---|---|---|---|---|---|---|---|---|
| Power Consumption | -16% | -58% | -66% | -20% | -53% | -40% | -68% | |
| Idle Minimum * (Watt) | 6.6 | 10.3 -56% | 15.6 -136% | 12 -82% | 9 -36% | 13 -97% | 10.4 ? -58% | 13.2 ? -100% |
| Idle Average * (Watt) | 8.3 | 13.1 -58% | 20.7 -149% | 17 -105% | 13 -57% | 16 -93% | 14.5 ? -75% | 18.9 ? -128% |
| Idle Maximum * (Watt) | 11.8 | 14.1 -19% | 22.9 -94% | 28 -137% | 20 -69% | 29 -146% | 21.4 ? -81% | 24.3 ? -106% |
| Load Average * (Watt) | 119 | 110 8% | 134 -13% | 118 1% | 102 14% | 100 16% | 109.3 ? 8% | 108 ? 9% |
| Witcher 3 ultra * (Watt) | 169 | 138 18% | 135 20% | 252 -49% | 149 12% | 173 -2% | ||
| Load Maximum * (Watt) | 222 | 190 14% | 170 23% | 272 -23% | 187 16% | 213 4% | 206 ? 7% | 254 ? -14% |
* ... smaller is better
Power Consumption Witcher 3 / Stresstest
Power Consumption with External Display
电池寿命
TUF Gaming F17配备了一个相对较大的90Wh电池,目前的型号提供了令人印象深刻的整体电池寿命,就像前代产品一样。
在我们的视频播放测试中,该设备在降低亮度的情况下持续了7.5小时以上,在我们的Wi-Fi测试中,根据显示亮度,持续了7至8.5小时。
| Asus TUF Gaming F17 FX707Z-HX011W i7-12700H, GeForce RTX 3060 Laptop GPU, 90 Wh | Asus TUF Gaming F17 FX706HM i9-11900H, GeForce RTX 3060 Laptop GPU, 90 Wh | Lenovo Legion 5 17ACH6H-82JY0003GE R5 5600H, GeForce RTX 3060 Laptop GPU, 80 Wh | MSI GE76 Raider i9-12900HK, GeForce RTX 3080 Ti Laptop GPU, 99.99 Wh | MSI Katana GF76 11UE i7-11800H, GeForce RTX 3060 Laptop GPU, 53 Wh | Schenker XMG Core 17 (Early 2021) i7-10870H, GeForce RTX 3060 Laptop GPU, 62 Wh | Average of class Gaming | |
|---|---|---|---|---|---|---|---|
| Battery runtime | 2% | -40% | -41% | -50% | -42% | -16% | |
| H.264 (h) | 7.7 | 8.5 10% | 3.5 -55% | 3.9 -49% | 4.7 -39% | 8.26 ? 7% | |
| WiFi v1.3 (h) | 8.7 | 7.6 -13% | 4.4 -49% | 5.1 -41% | 3.7 -57% | 4.9 -44% | 7.02 ? -19% |
| Load (h) | 2.3 | 2.5 9% | 1.9 -17% | 1.3 -43% | 1.3 -43% | 1.47 ? -36% | |
| Reader / Idle (h) | 5.5 | 4.8 | 7.7 | 8.71 ? | |||
| Witcher 3 ultra (h) | 0.8 |
Pros
Cons
结论 - 优秀的3D性能,但没有游戏显示器
华硕TUF Gaming F17的亮点之一无疑是其出色的游戏性能。华硕将RTX 3060 GPU配置为其指定的最大功率140W的事实在我们的基准测试中立即变得很明显。对于一个17英寸的笔记本,F17还提供了非常长的电池寿命,这使得它在某种程度上是便携的。
反过来说是显示屏。它可能因其良好的整体对比度而得救,但其整体亮度实在太低,而且其响应时间对游戏设备来说太慢。F17的继任者需要在此基础上进行改进。
华硕TUF(Gaming F)17提供了相对较高的游戏性能,但却遭受了糟糕的显示屏和糟糕的Wi-Fi性能作为回报。
价格和可用性
在撰写本文时,更新的2022年华硕TUF Gaming F17尚未在北美上市。在目前供应链短缺的情况下,也不清楚这种情况何时会改变。
Asus TUF Gaming F17 FX707Z-HX011W
- 04/14/2022 v7 (old)
Christian Hintze
Price comparison

