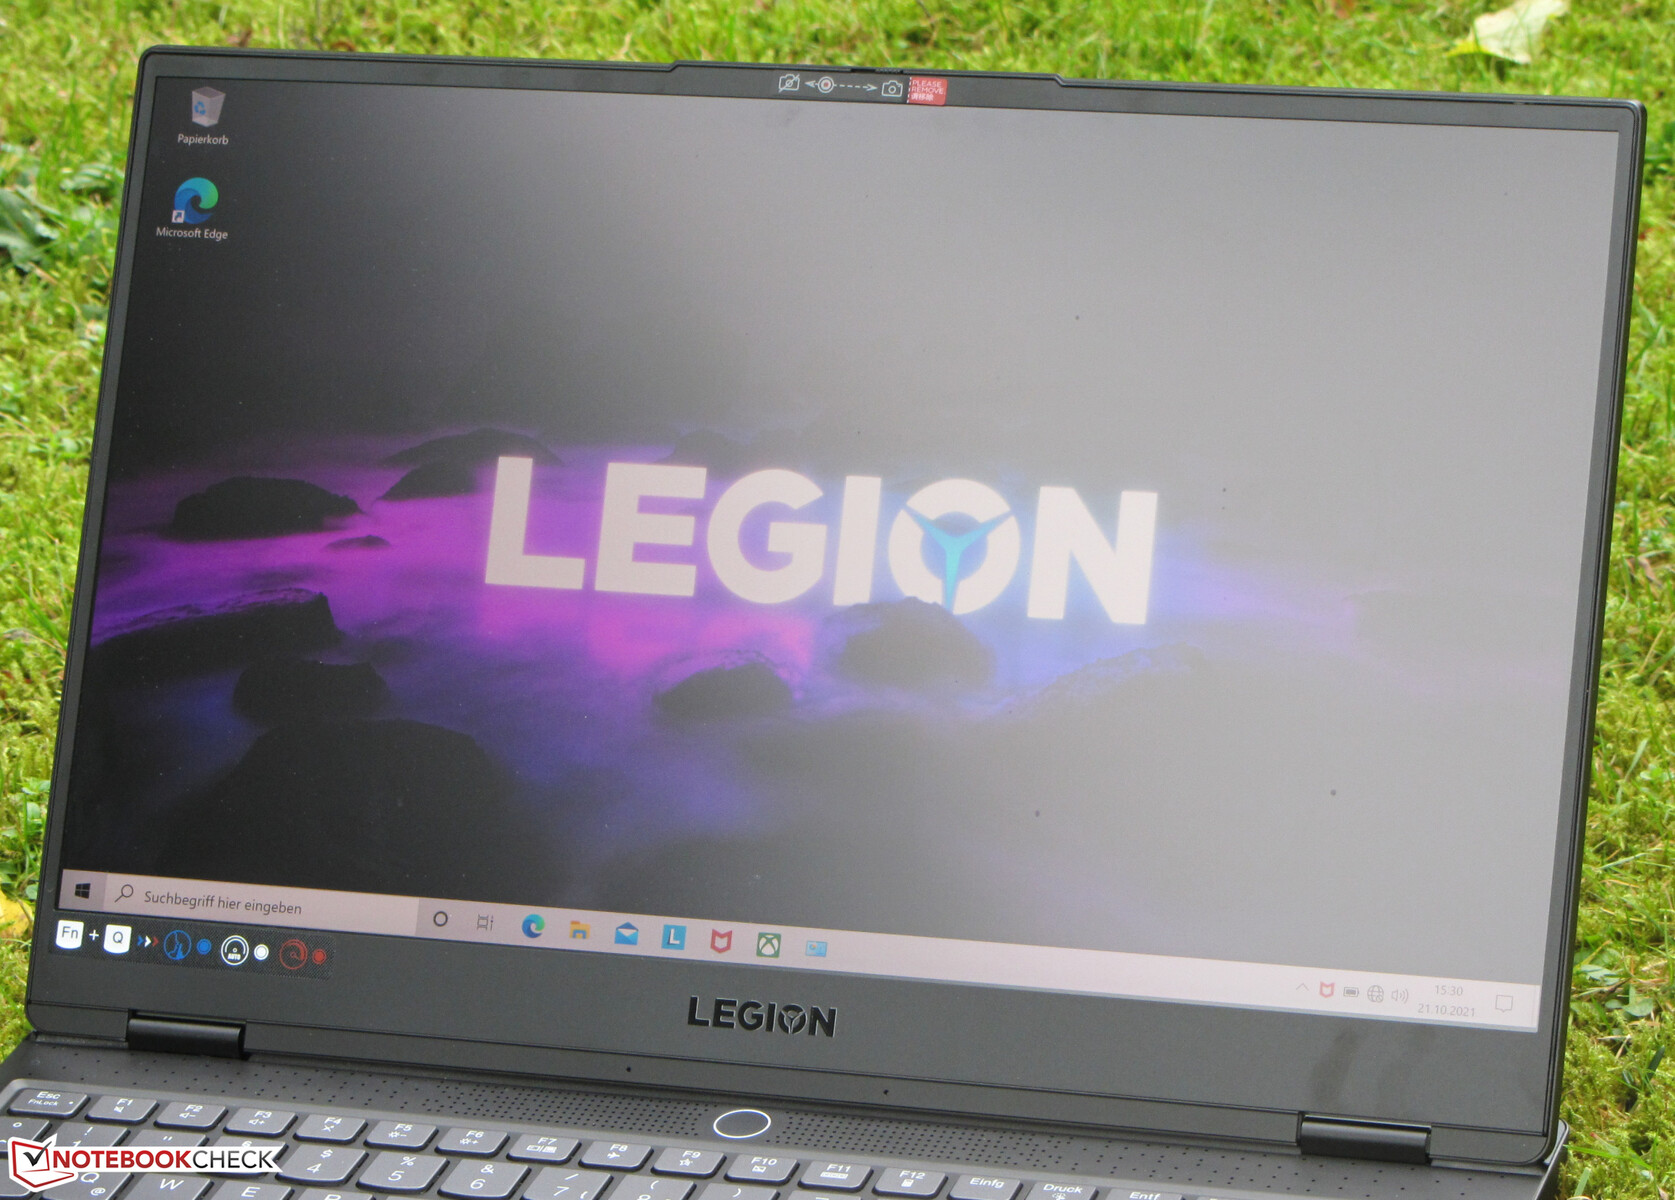
联想Legion S7 15ACH6在审查。具有良好电池寿命的4K游戏笔记本

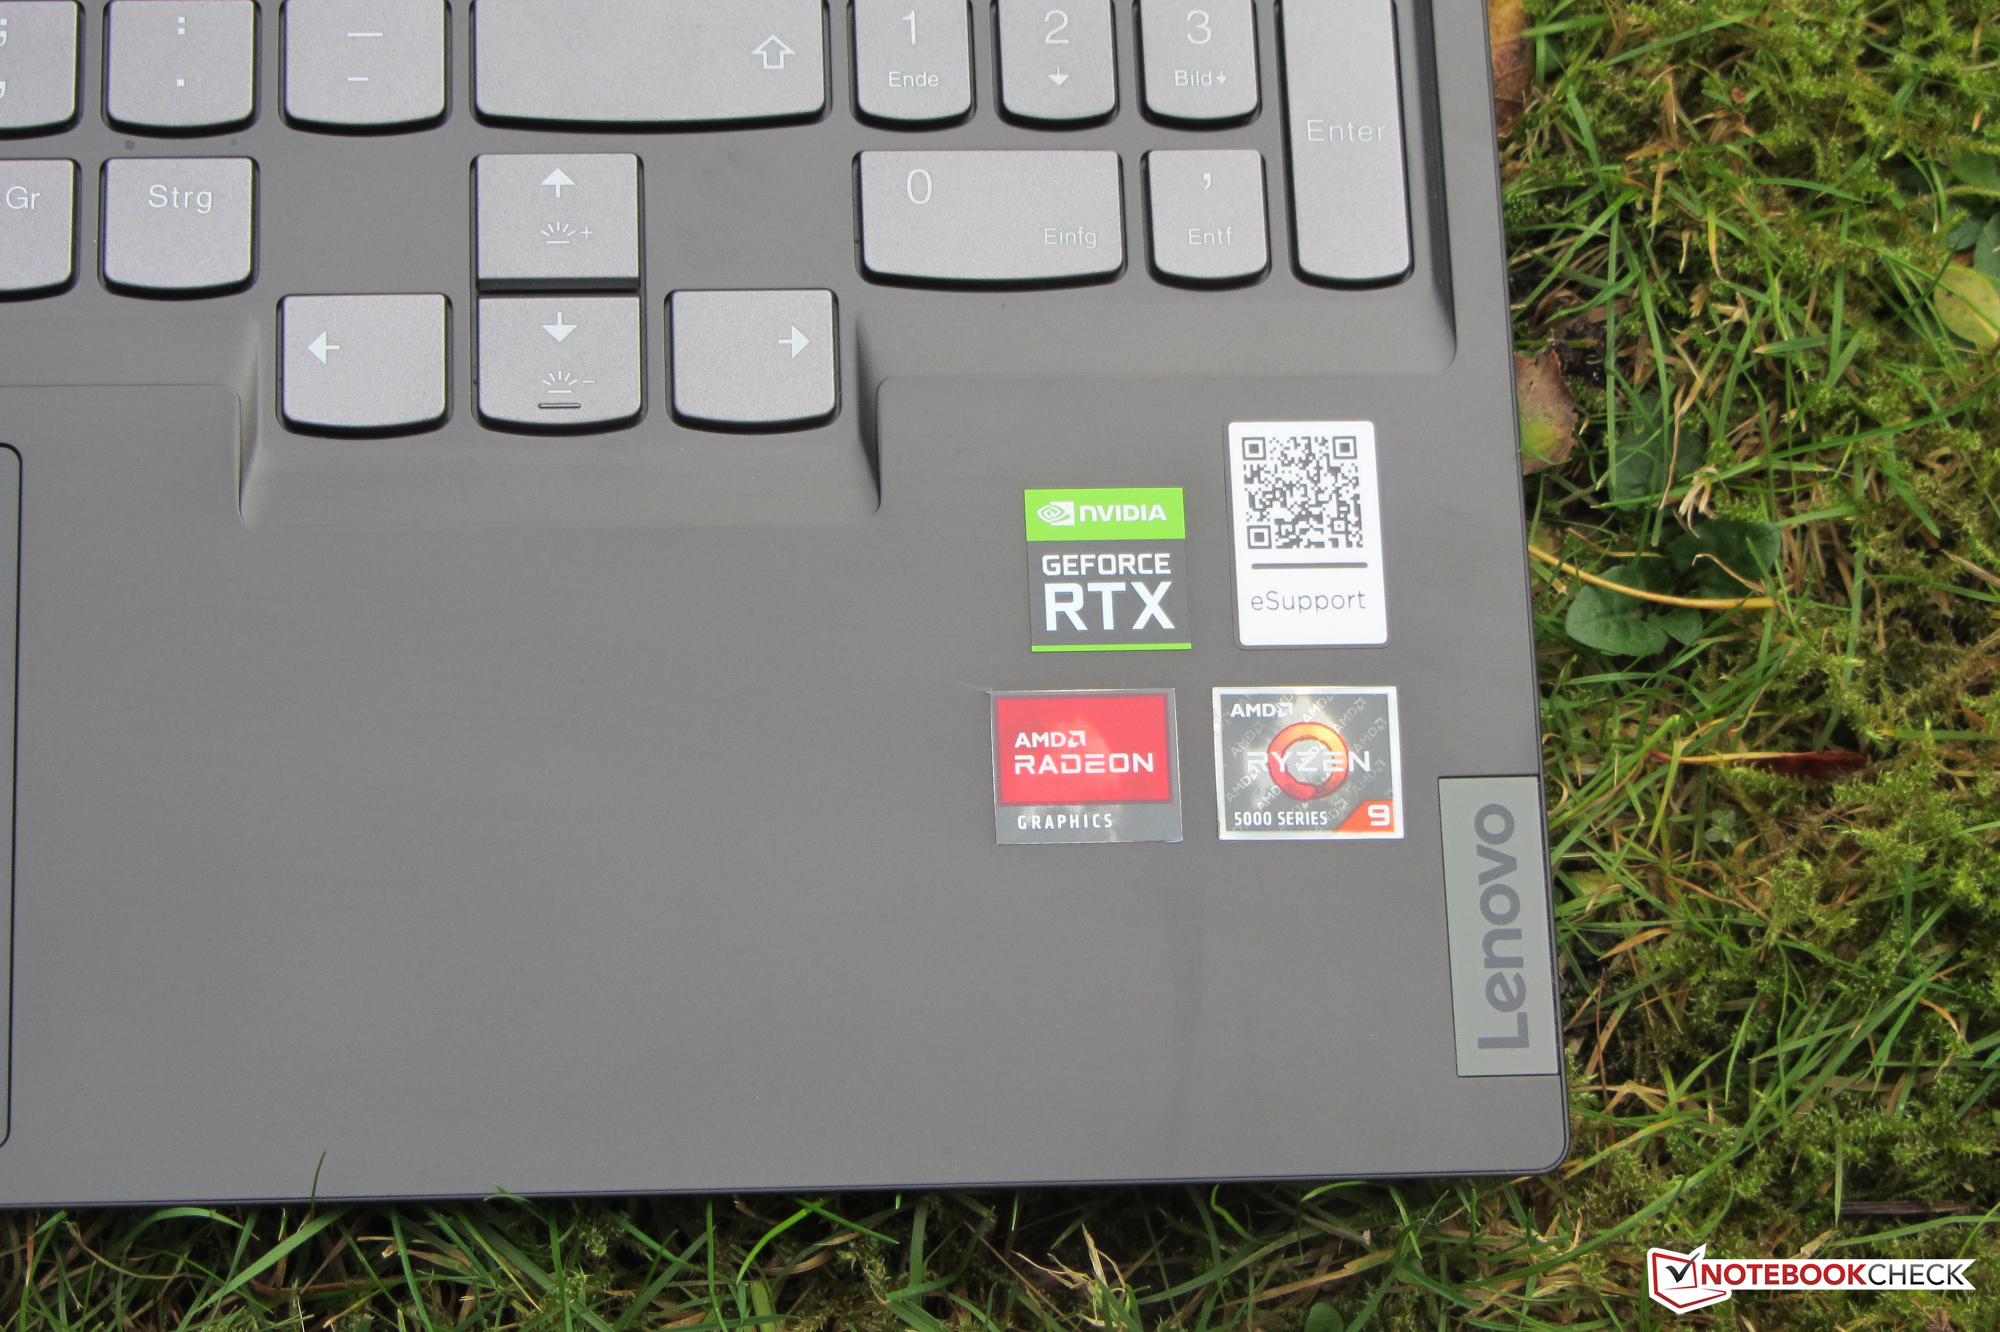
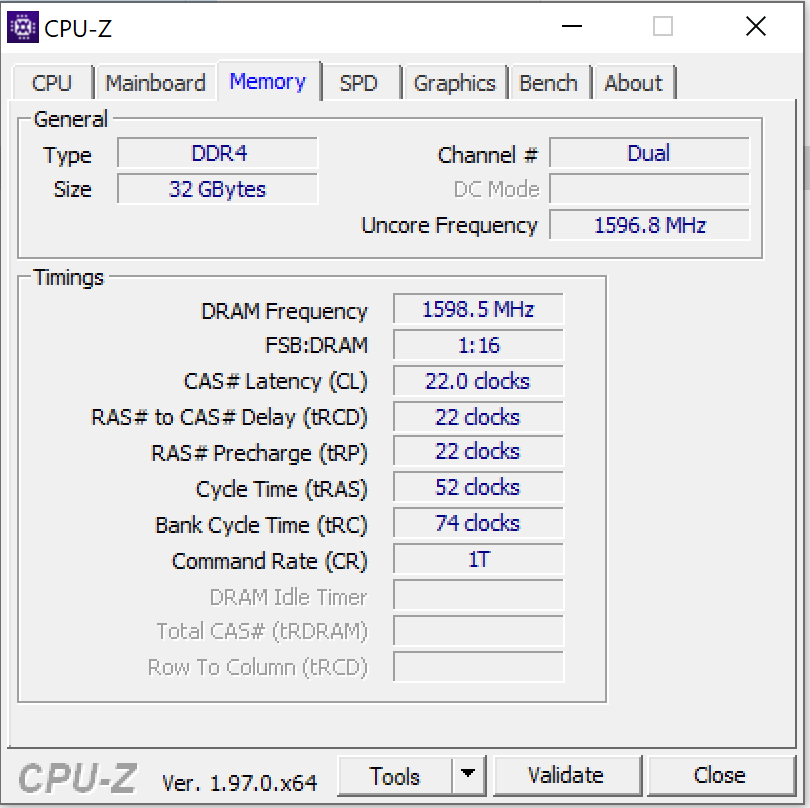
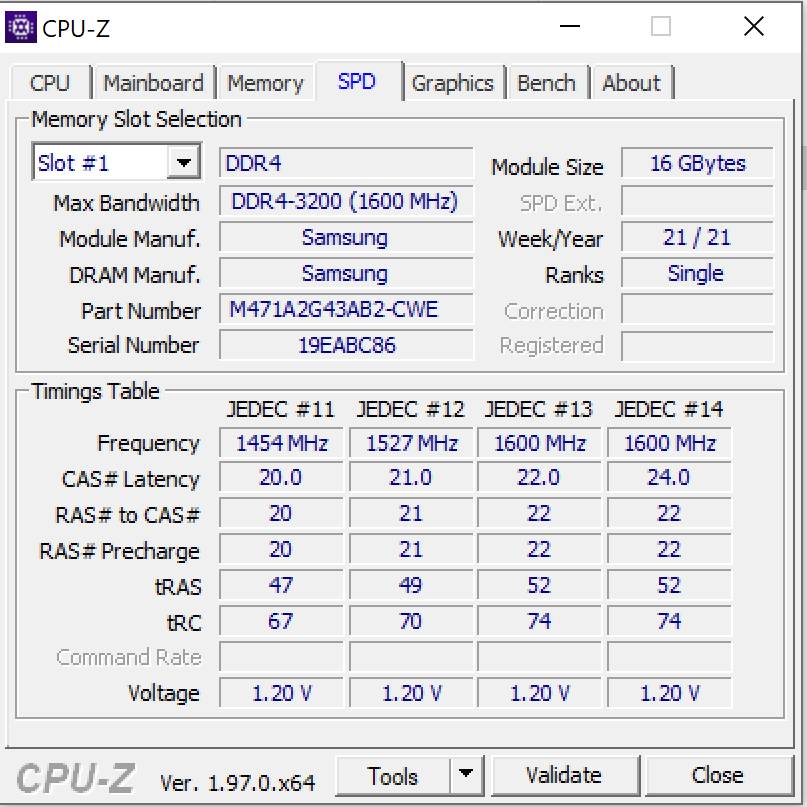
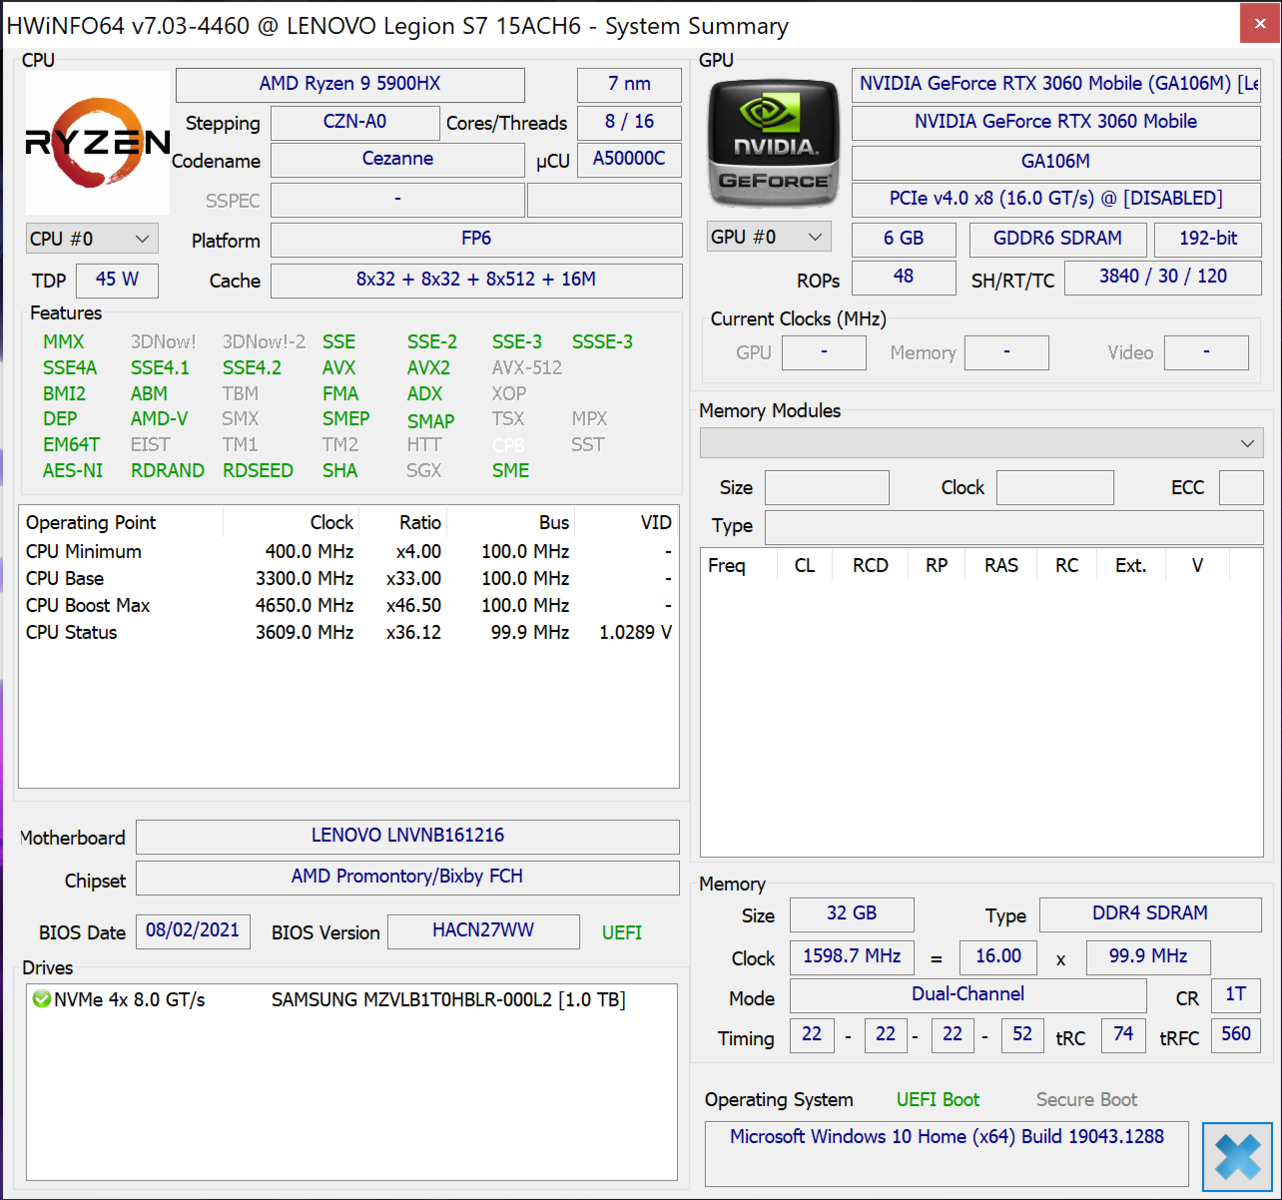
有了Legion S7,联想在其产品线中拥有一个紧凑和轻量级的15.6英寸游戏笔记本电脑。我们的评测样本--一个系列的顶级型号--应该在1900至2000欧元左右(约2194至2309美元)。其配置水平也相应不错。ARyzen 9 5900HXAPU, theGeForce RTX 3060笔记本GPU,32GB内存,以及1TB NVMe SSD。这款笔记本电脑的亮点是明亮的4K显示屏。
竞争者包括以下设备 Alienware m15 R5 Ryzen Edition竞争者包括Alienware m15 R5 Ryzen Edition、MSI Delta 15 A5EFK微星三角洲15 A5EFK,以及Acer Nitro 5 AN515-45,以及Razer Blade 15 Base Model 2021.
Possible contenders in comparison
Rating | Date | Model | Weight | Height | Size | Resolution | Price |
|---|---|---|---|---|---|---|---|
| 87.9 % v7 (old) | 11 / 2021 | Lenovo Legion S7 15ACH6 82K80030GE R9 5900HX, GeForce RTX 3060 Laptop GPU | 2 kg | 18.9 mm | 15.60" | 3840x2160 | |
| 85.5 % v7 (old) | 04 / 2021 | Razer Blade 15 Base Edition 2021, i7-10750H RTX 3060 i7-10750H, GeForce RTX 3060 Laptop GPU | 2.1 kg | 19.9 mm | 15.60" | 1920x1080 | |
| 82.9 % v7 (old) | 10 / 2021 | MSI Delta 15 A5EFK R9 5900HX, Radeon RX 6700M | 2 kg | 19 mm | 15.60" | 1920x1080 | |
| 84.7 % v7 (old) | 08 / 2025 | Alienware m15 R5 Ryzen Edition R7 5800H, GeForce RTX 3060 Laptop GPU | 2.5 kg | 22.85 mm | 15.60" | 1920x1080 | |
| 82.2 % v7 (old) | 08 / 2021 | Acer Nitro 5 AN515-45-R1JH R7 5800H, GeForce RTX 3070 Laptop GPU | 2.3 kg | 23.9 mm | 15.60" | 2560x1440 |
机箱 -Legion ,铝制机箱
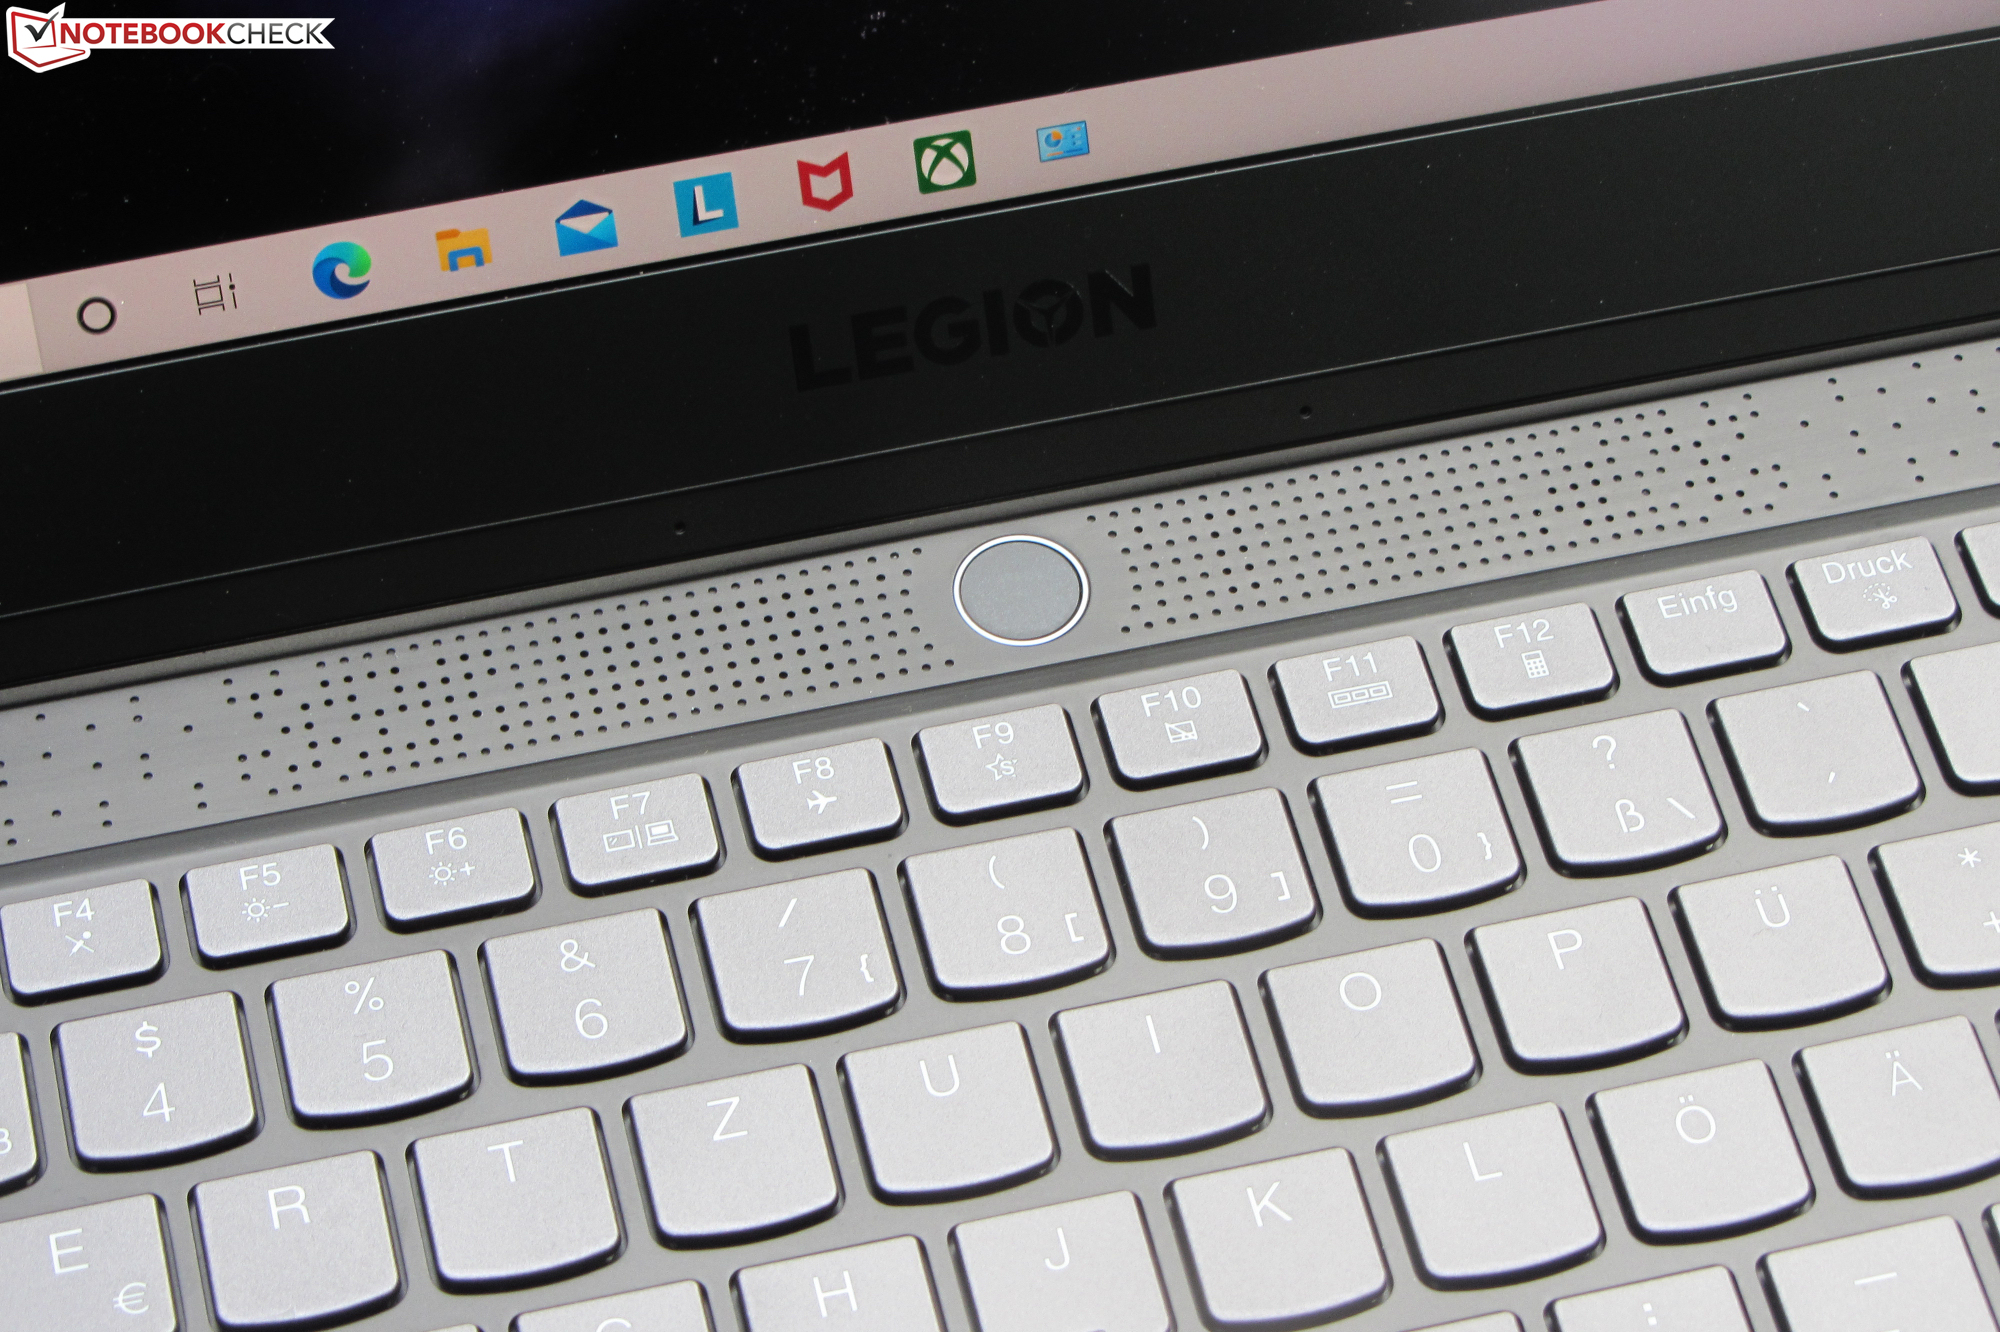
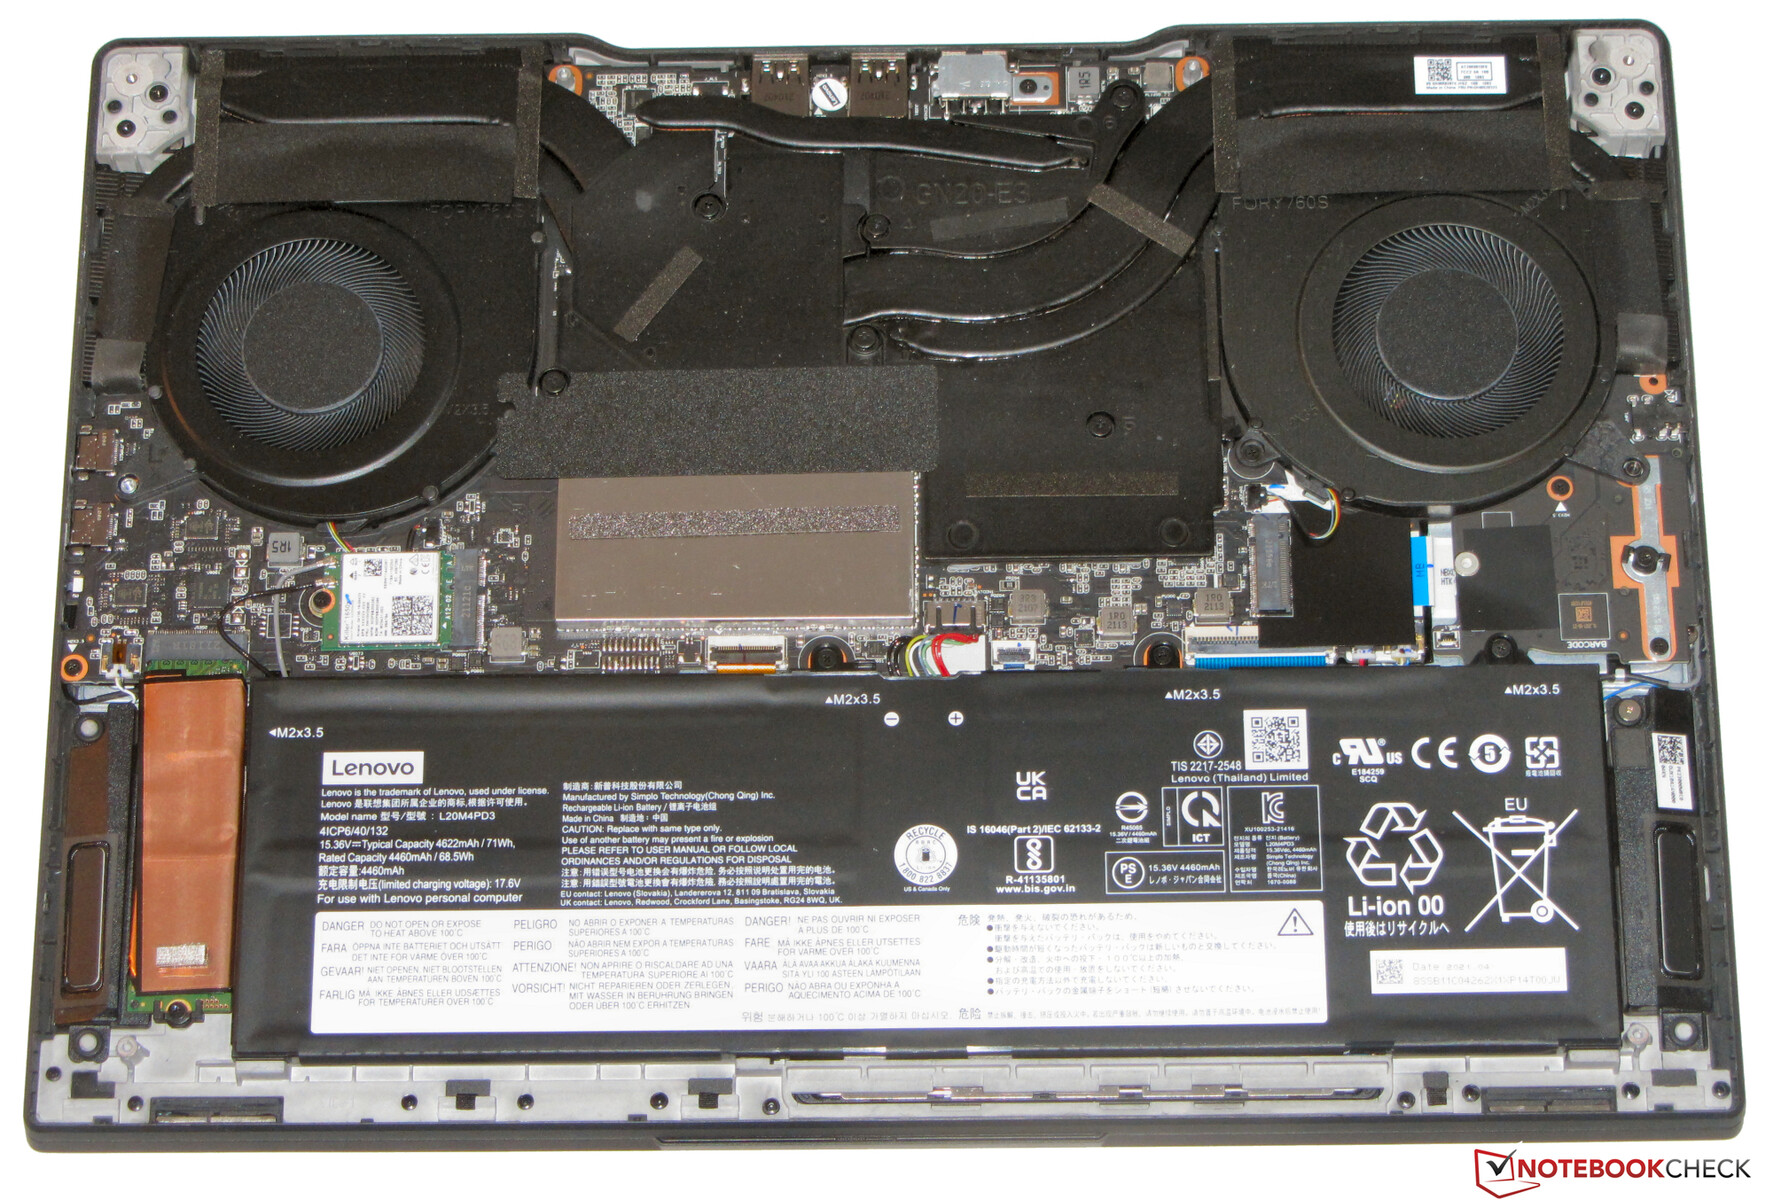
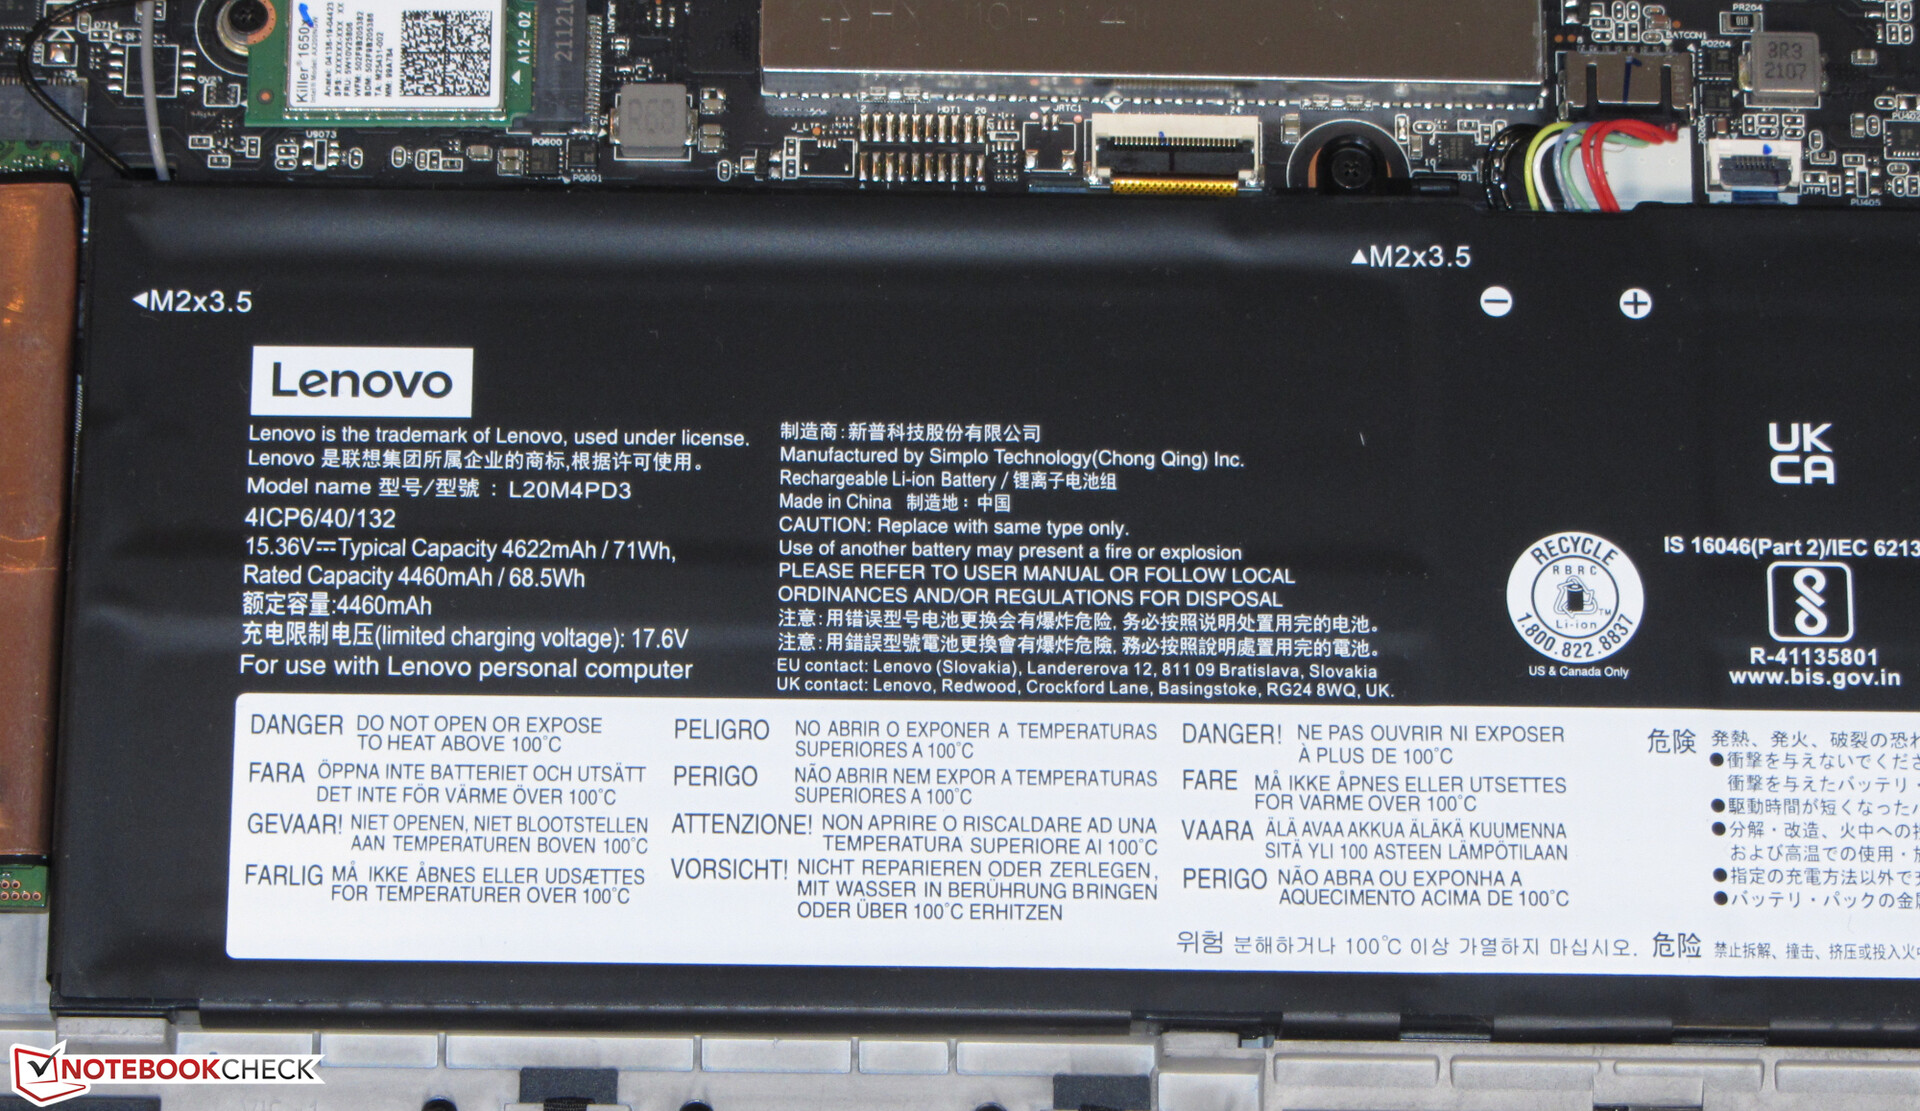
Legion S7的机身坚持了熟悉的联想Legion 设计。机盖没有与背部平齐,而是向键盘方向偏移了几毫米--就我们的测试设备而言,这只是不到20毫米。联想选择了一个黑色(影子黑)的铝制外壳,表面磨砂光滑。键盘的RGB灯光提供了一些颜色的点缀。电池被牢固地内置在设备中。取下底盖后,可以接触到内部结构。
这台笔记本电脑在做工和/或稳定性方面没有暴露出任何缺点。缝隙很准确,没有任何材料突起。底座和盖子都可以扭动一下,但整个情况仍在限制之内。紧密的铰链将盖子牢牢地固定在位置上,所以它几乎没有晃动。最大打开角度约为180度。单手打开盖子是可能的。
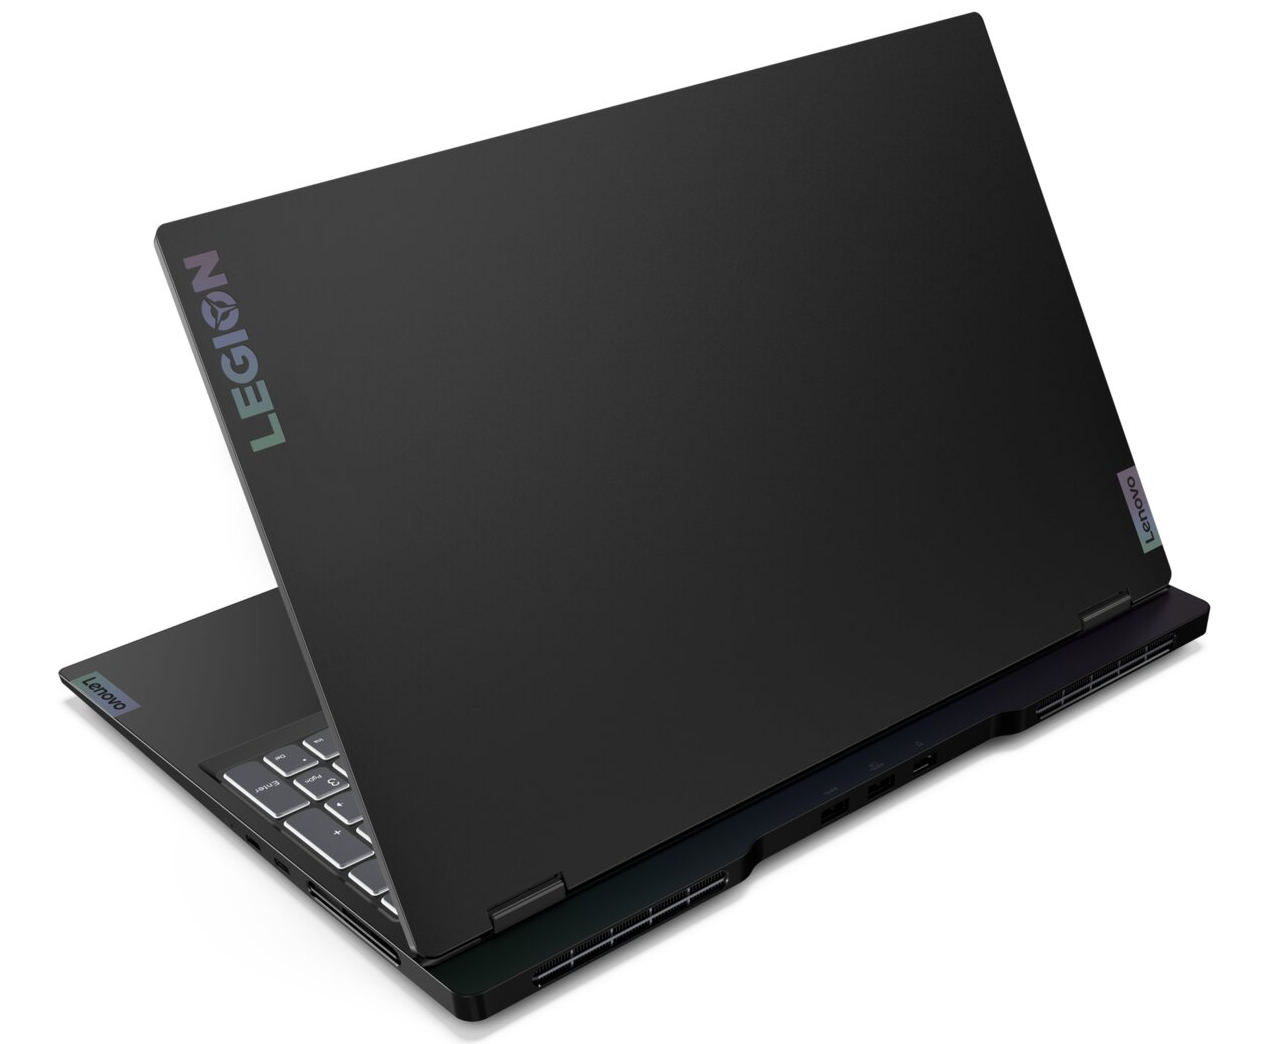
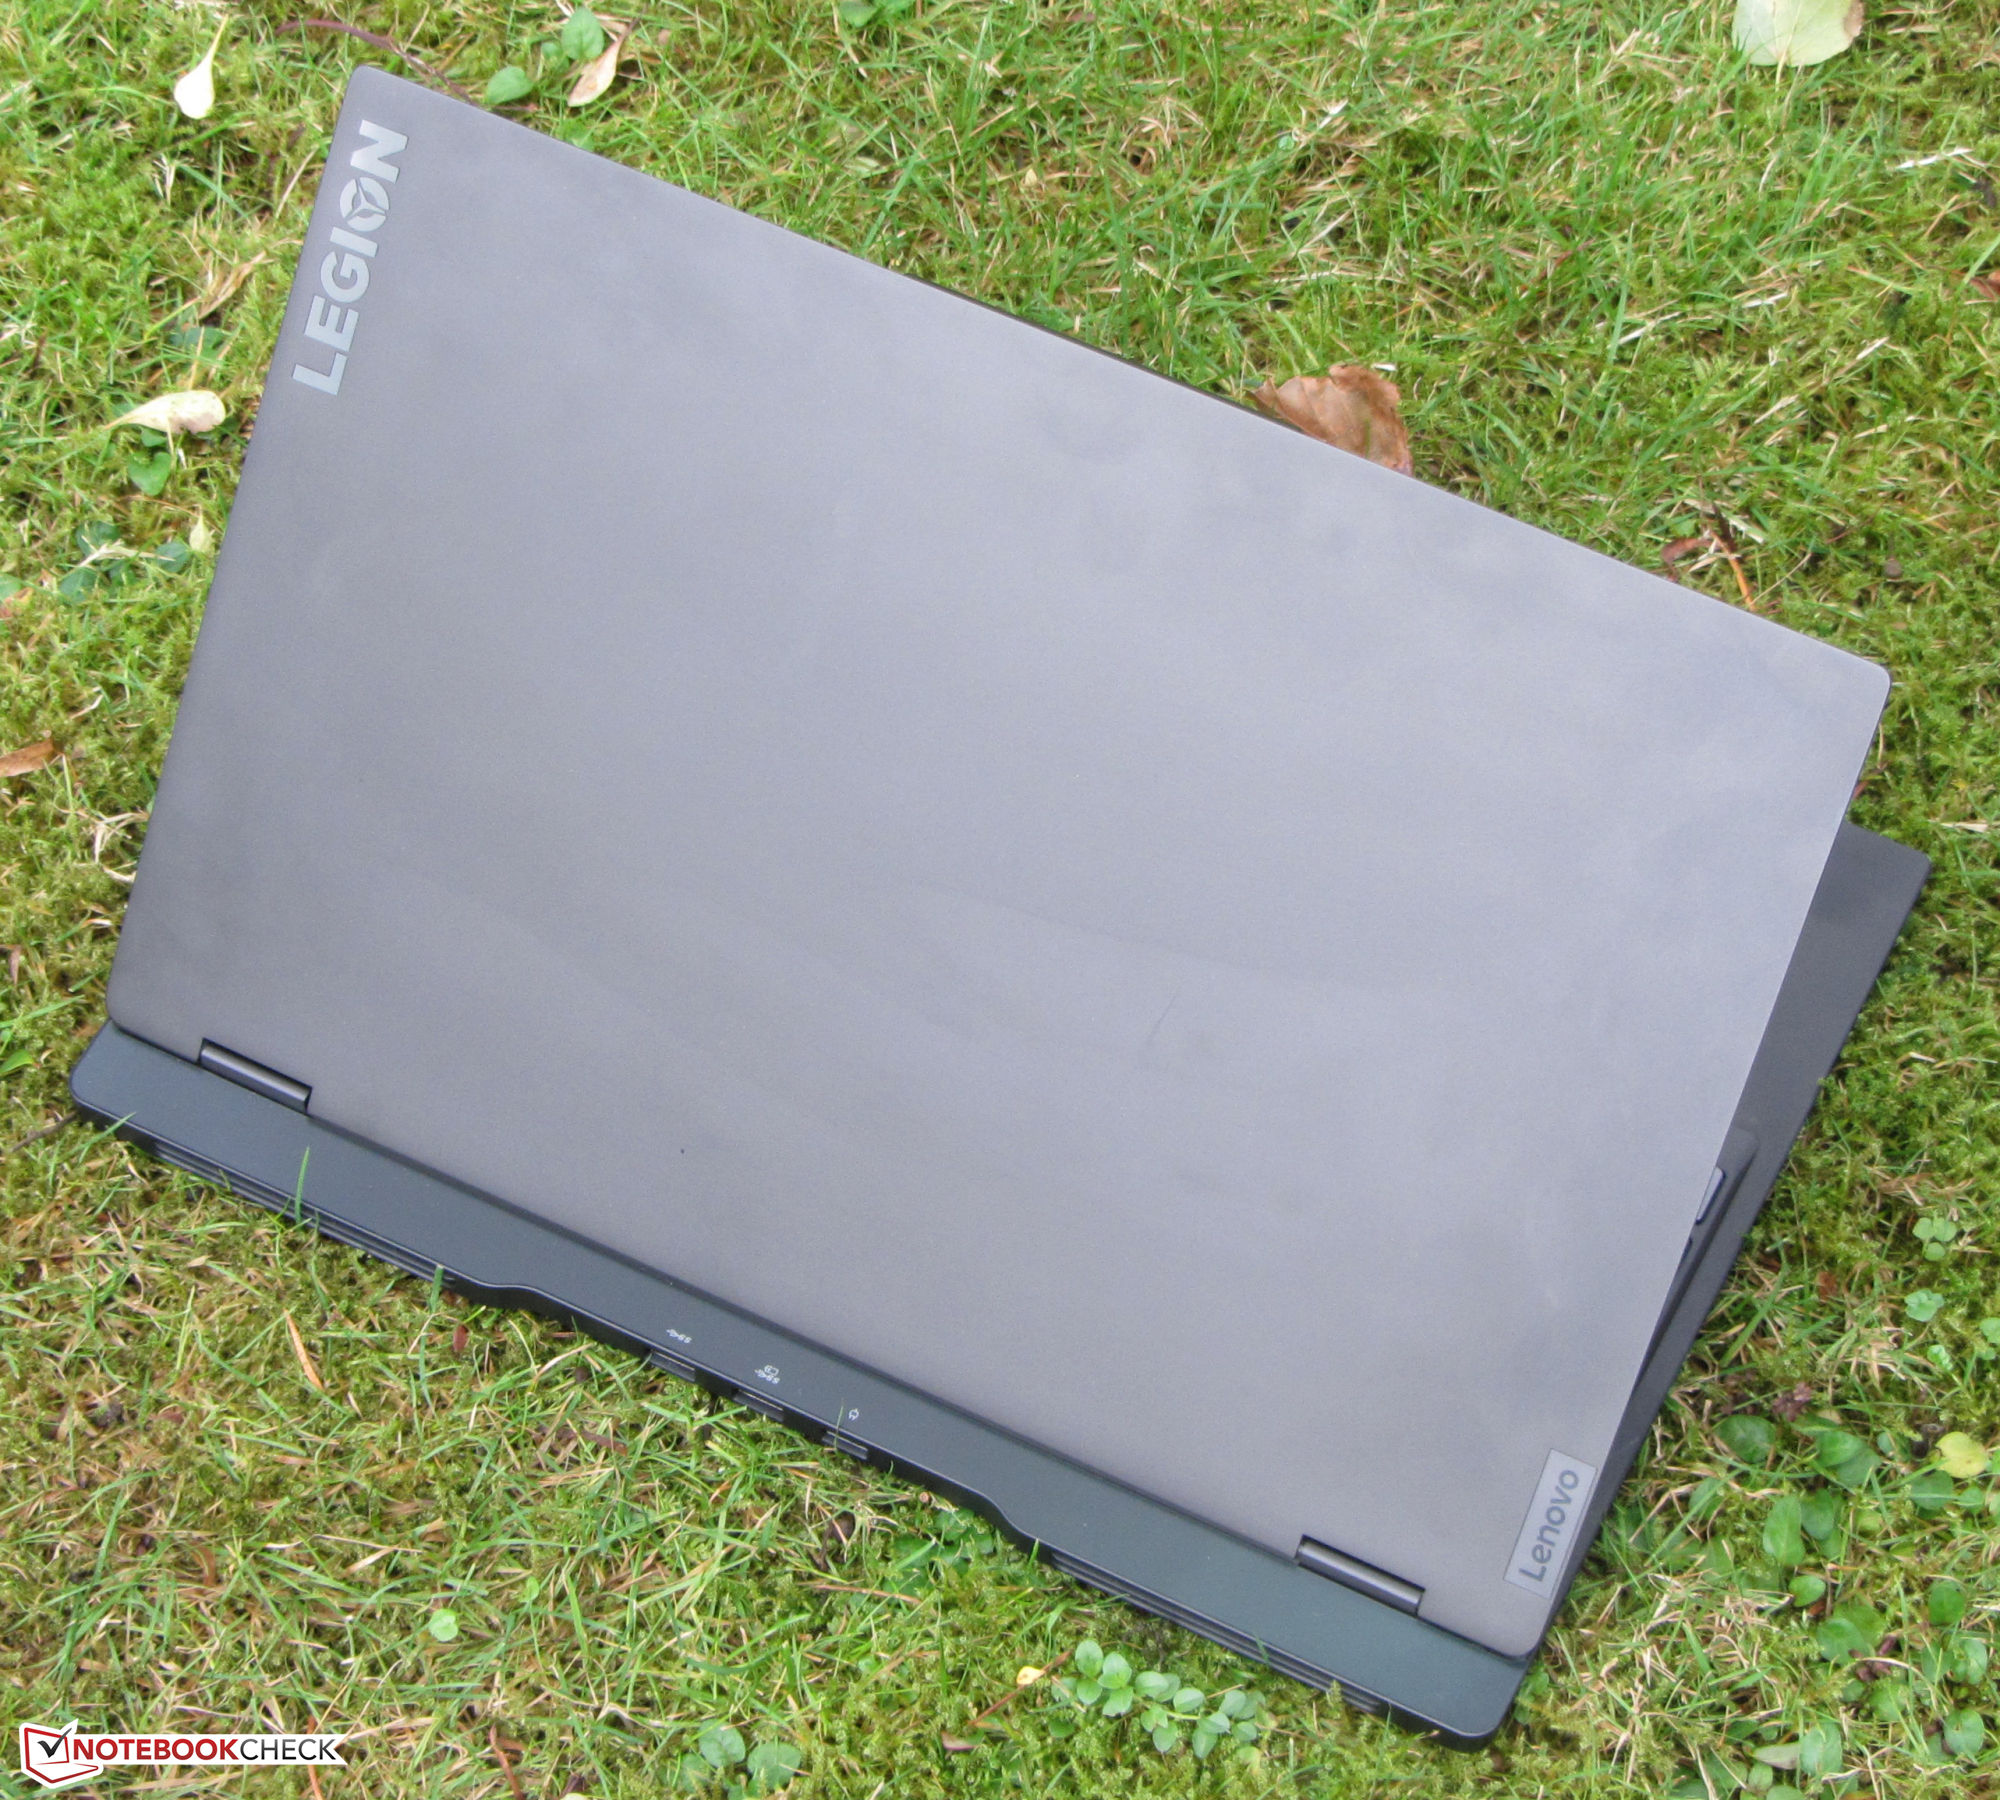
在我们的比较范围内,S7是最轻的设备之一,重量略低于2公斤,这略低于 Razer Blade 15.后者的尺寸比联想的笔记本电脑更紧凑。
连接性 - 联想S7不含Thunderbolt技术
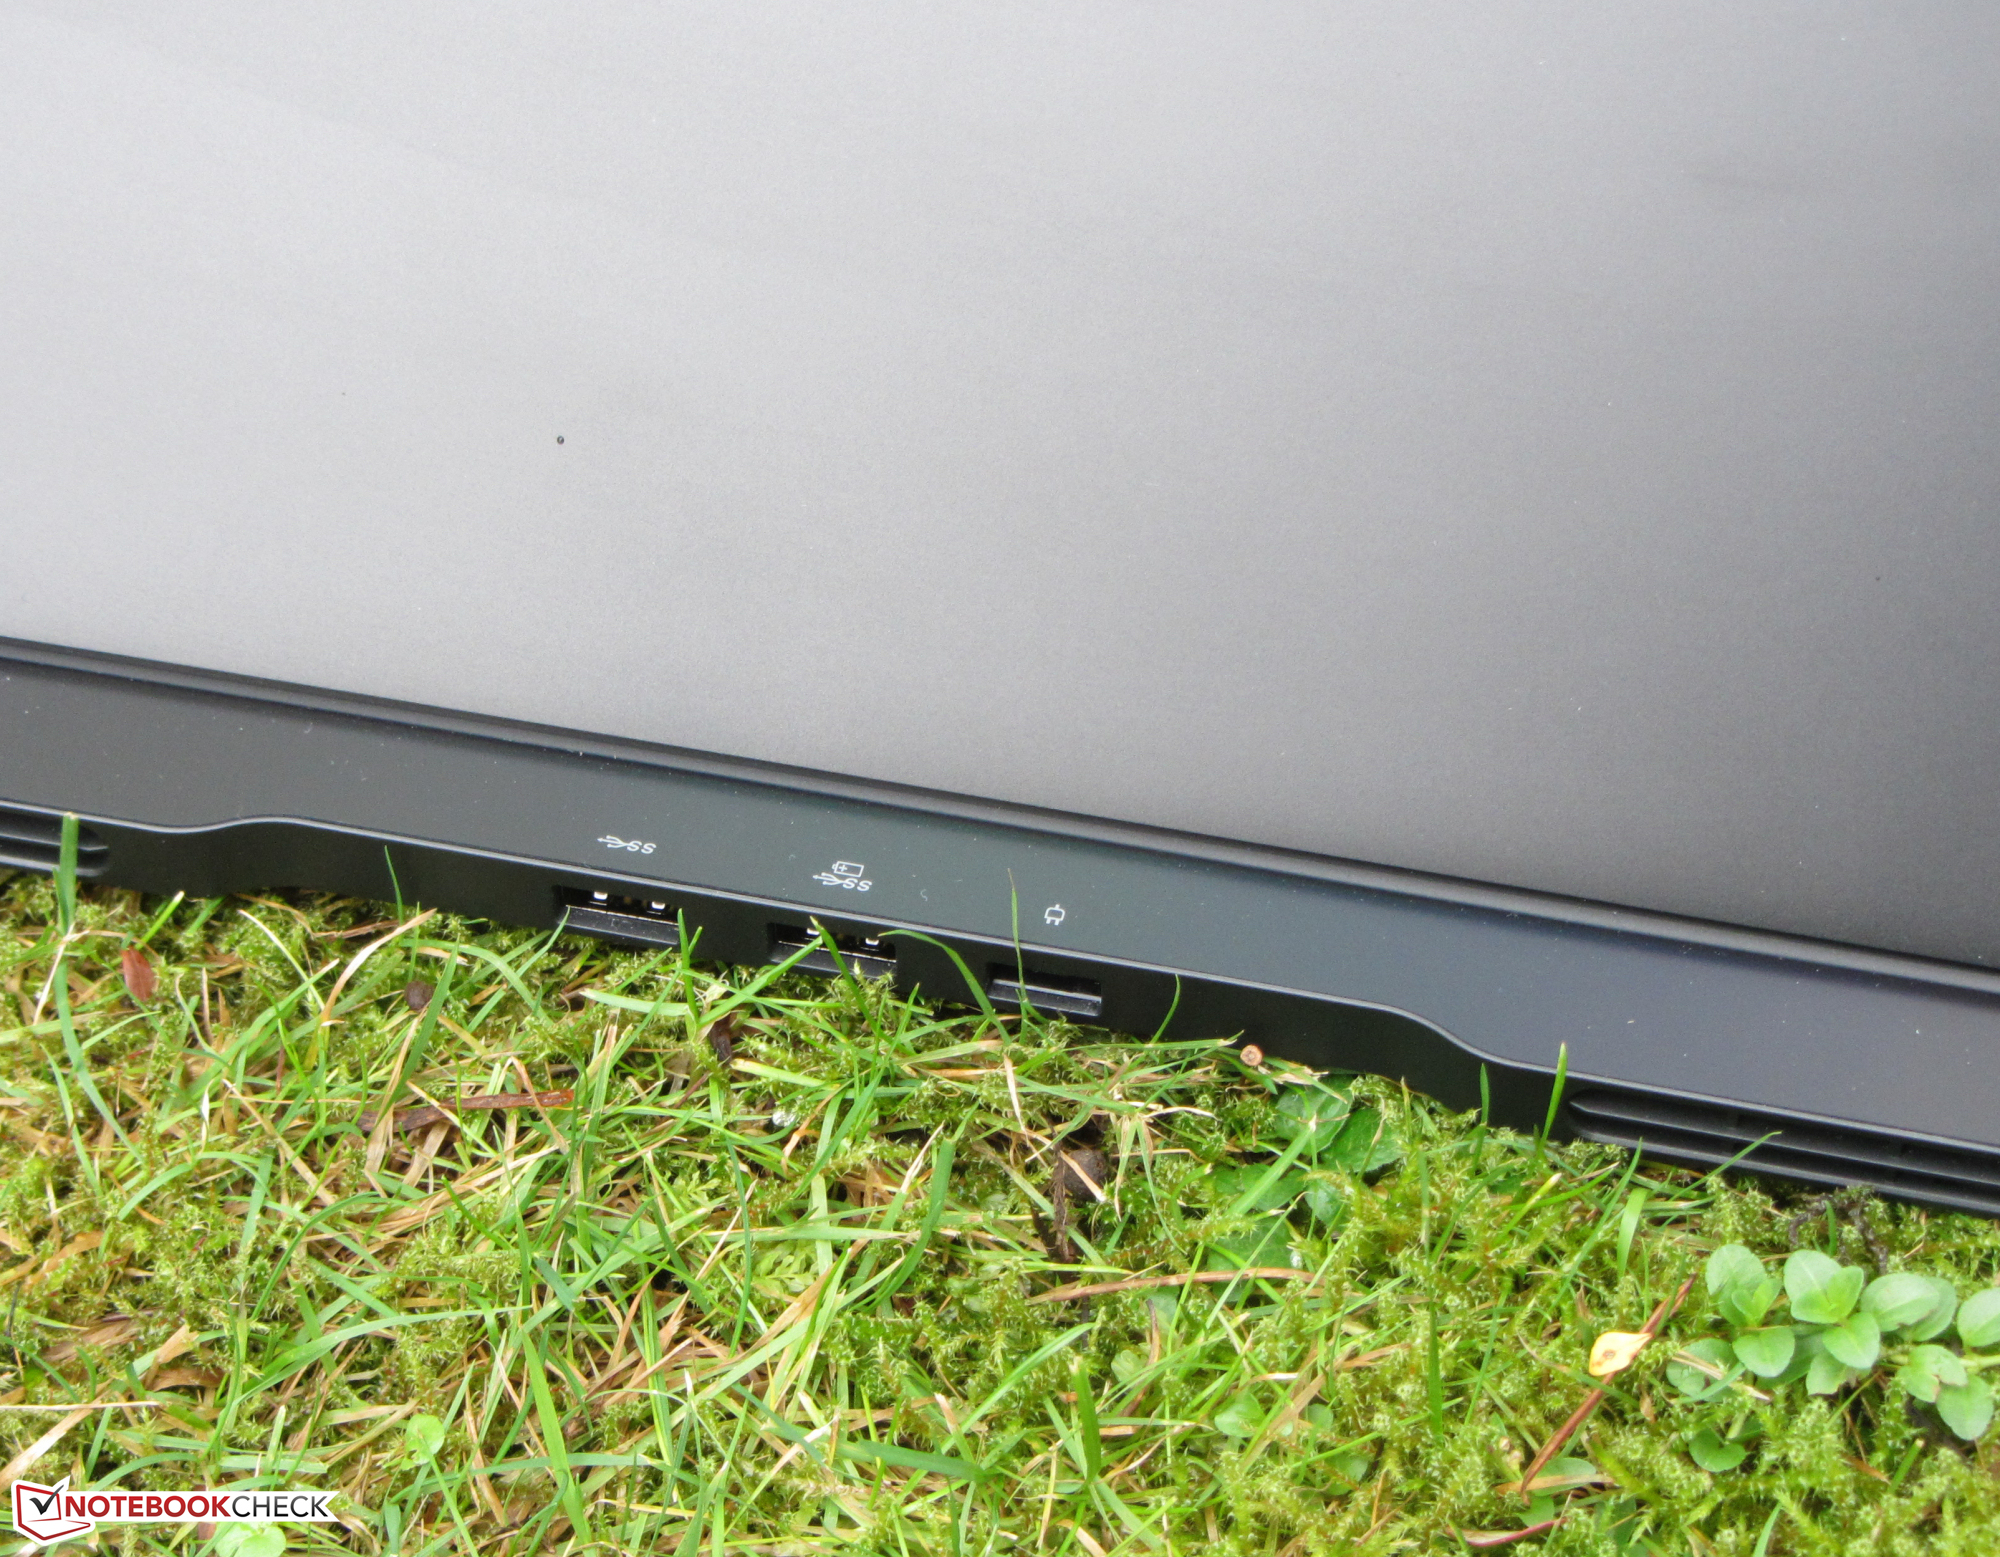
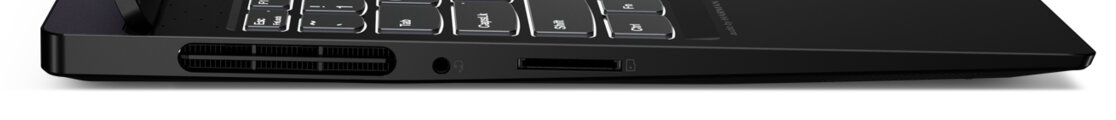
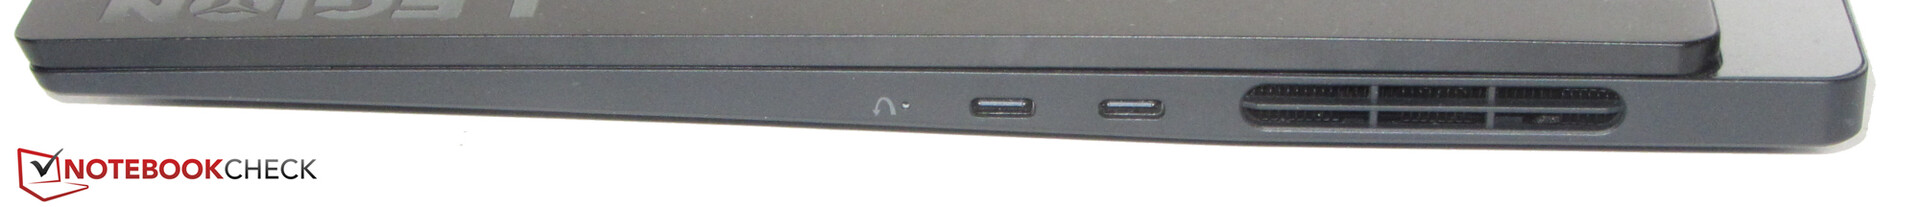
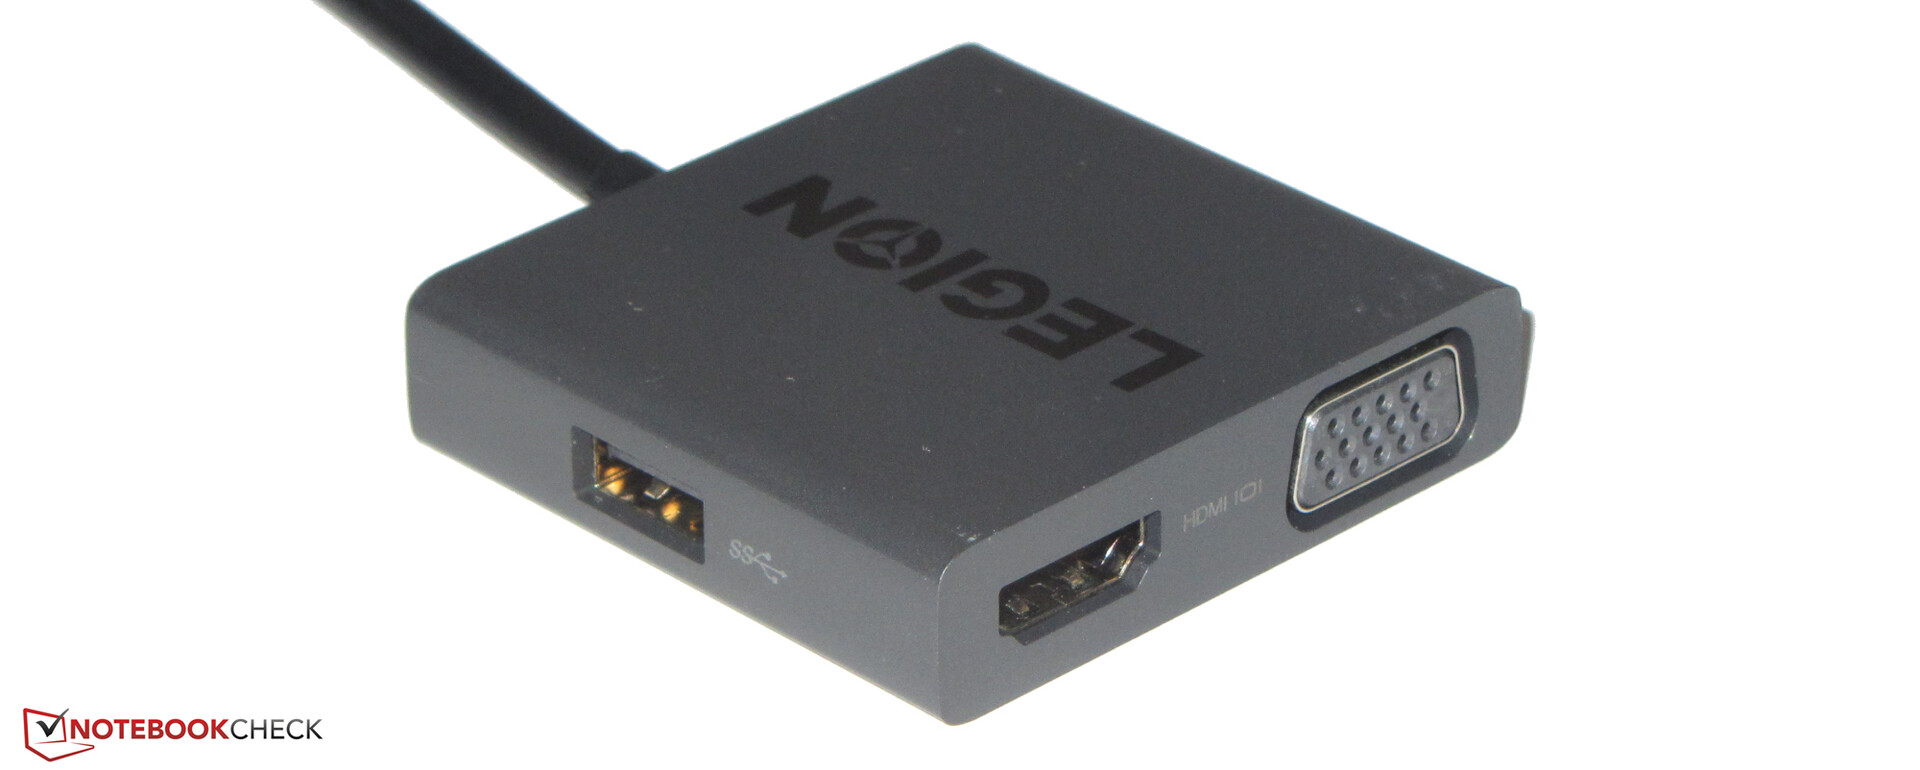
Slim 7的所有四个USB端口(2个USB-A,2个USB-C)都按照USB 3.2 Gen 2标准运行。两个USB-C端口支持Power Delivery和DisplayPort。这使笔记本电脑总共有两个视频输出。如果需要HDMI和/或VGA输出,附带的3合1集线器(USB-C到VGA、HDMI、USB-A)将派上用场。
USB-C端口还可以给电池充电。一个45瓦的USB-C电源适配器(20V,2.25A)足以在设备处于待机模式、闲置模式或关闭状态时为其充电。至少需要一个65瓦的电源适配器(20 V,3.25 A),以便在它打开时充电。笔记本电脑的完全供电是不可能的,因为目前通过USB-C的最大传输率是100瓦。
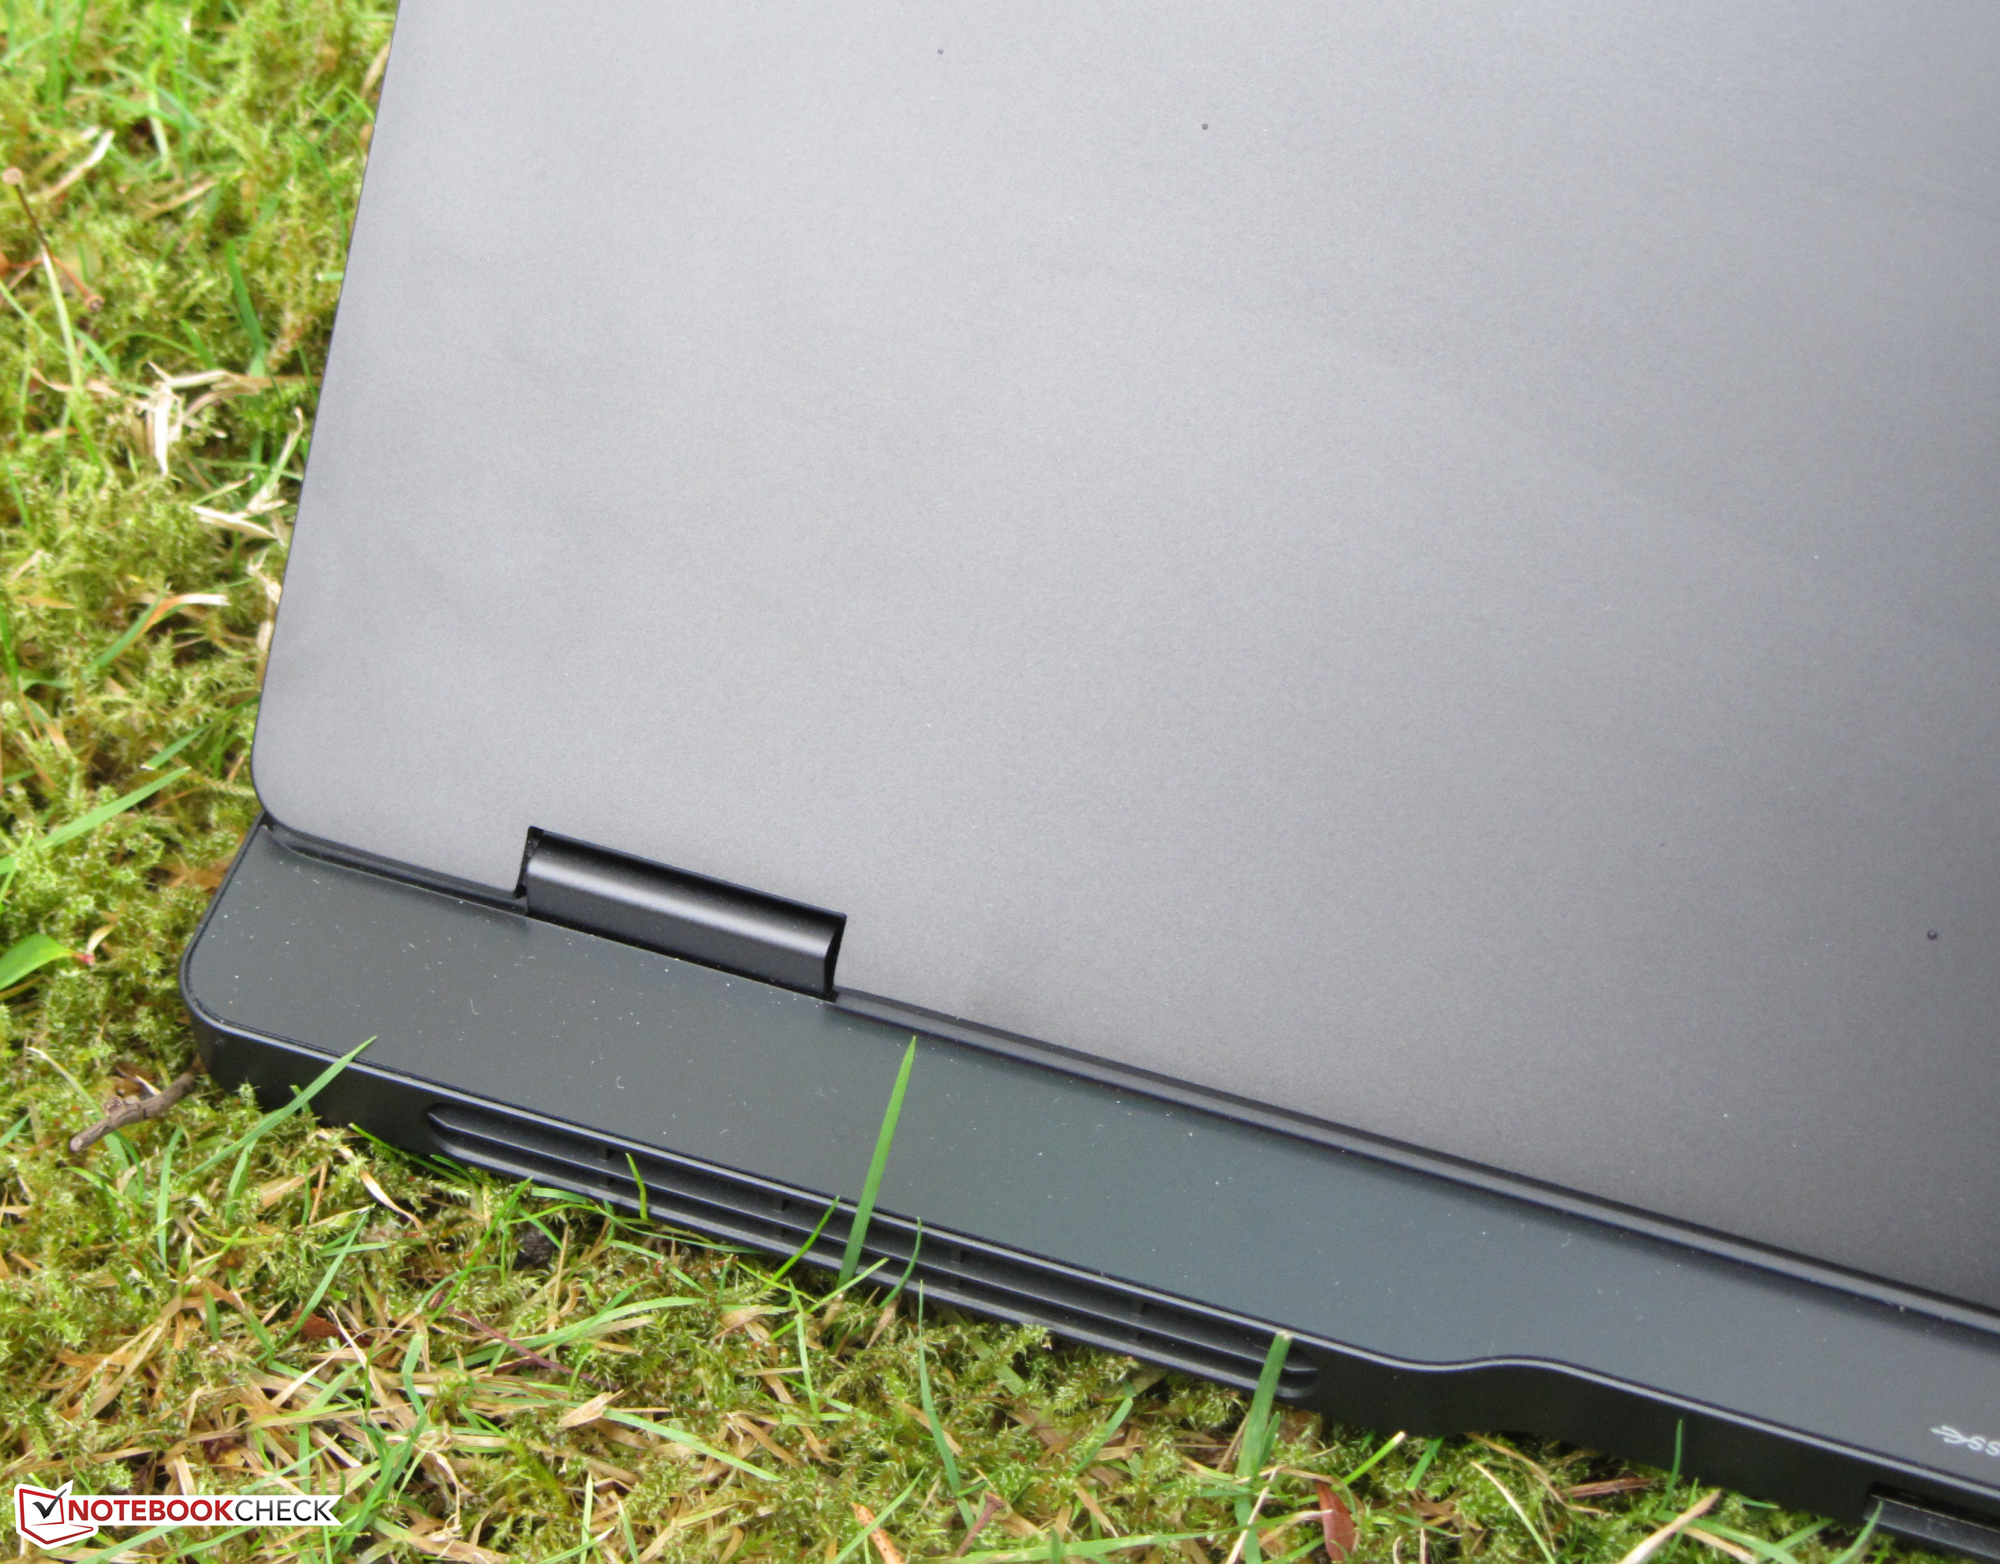
这些端口沿笔记本的三个侧面分布。电源连接和两个USB-A端口在后面。因此,连接的电缆向后面跑,不会碍事。积极的一面。背面端口的发光标签使它更容易在不看的情况下插入一个连接器。

SD卡阅读器
存储卡读卡器(参考卡:128 GB AV PRO SD V60)的传输速率为85 MB/s(复制大数据块)和79 MB/s(传输250个jpg图像文件,每个约5 MB),这意味着它提供中等速度。然而,这些速率仍然低于过去两年测试的游戏笔记本电脑的平均水平。与戴尔XPS 15的速率相比,证明可以达到更好的速度。读卡器不能完全容纳SD卡。它们突出了15毫米。
| SD Card Reader | |
| average JPG Copy Test (av. of 3 runs) | |
| Dell XPS 15 9510 i5 11400H FHD (AV Pro V60) | |
| Average of class Gaming (20.9 - 210, n=54, last 2 years) | |
| Lenovo Legion S7 15ACH6 82K80030GE (AV PRO microSD 128 GB V60) | |
| maximum AS SSD Seq Read Test (1GB) | |
| Dell XPS 15 9510 i5 11400H FHD (AV Pro V60) | |
| Average of class Gaming (25.5 - 261, n=51, last 2 years) | |
| Lenovo Legion S7 15ACH6 82K80030GE (AV PRO microSD 128 GB V60) | |
沟通
Killer WLAN模块配备了英特尔的芯片(AX200),支持802.11a/b/g/n/ac/ax标准。在最佳条件下(附近没有其他WLAN设备,笔记本电脑和服务器PC之间的距离较短)确定的传输速度从良好到非常好。Legion 没有千兆以太网端口--对于游戏笔记本电脑来说是不寻常的。如果需要使用局域网,这里必须使用一个适当的USB适配器。
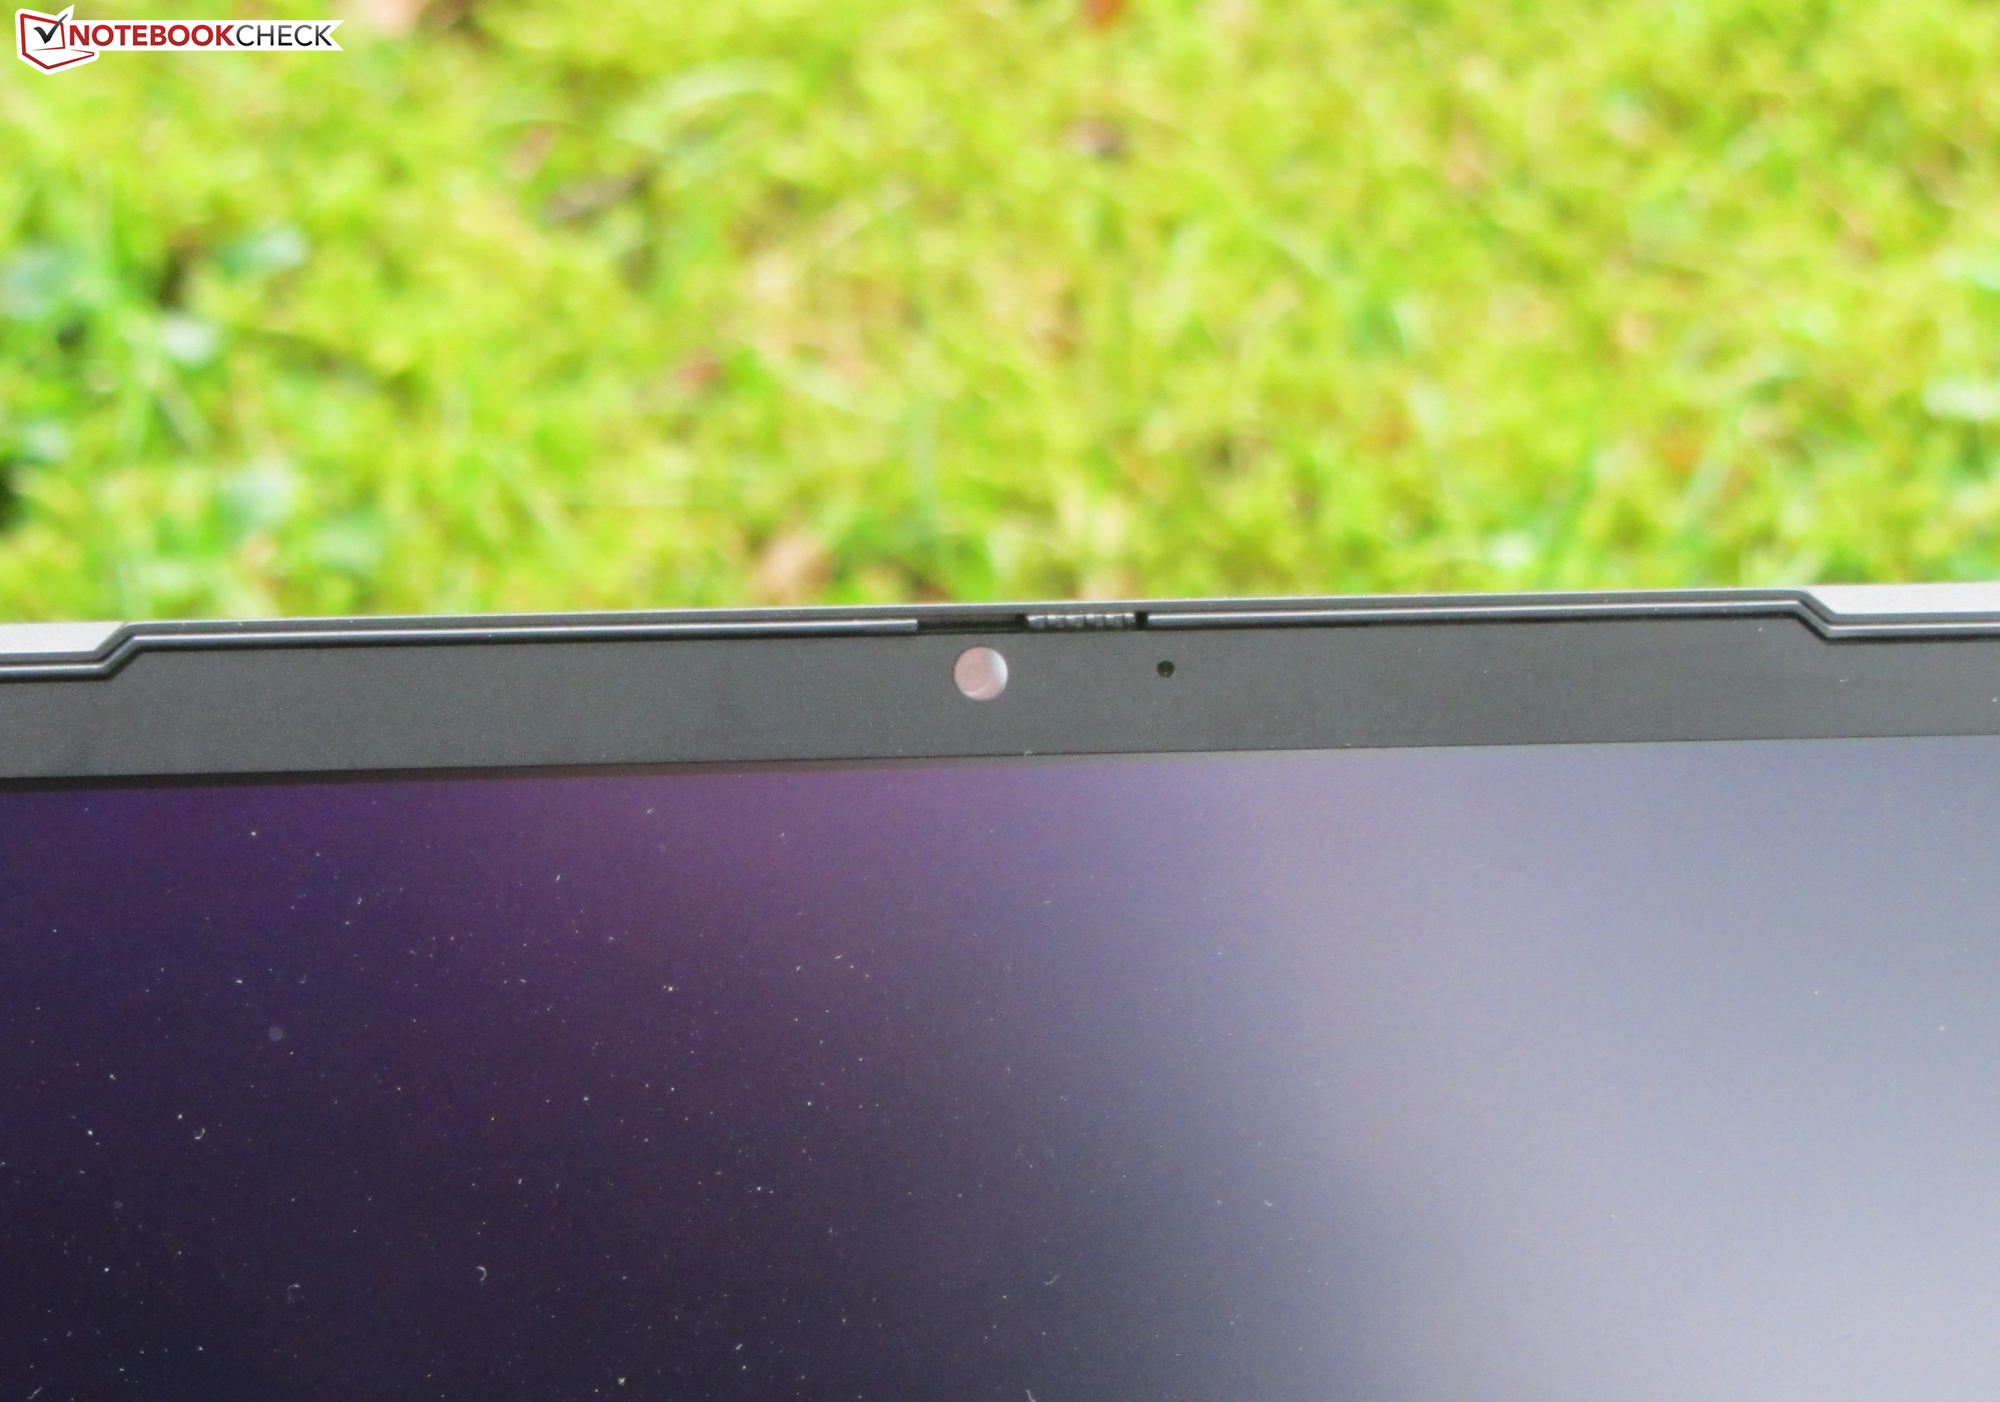
网络摄像头
网络摄像头(0.9MP)产生的图像最大分辨率为1280x720像素。色彩准确性是个问题:颜色明显偏离目标。


辅料
除了通常的文件(快速入门指南,保修信息),笔记本电脑还包括一个3合1集线器(USB-C到VGA,HDMI,USB-A)。
维护
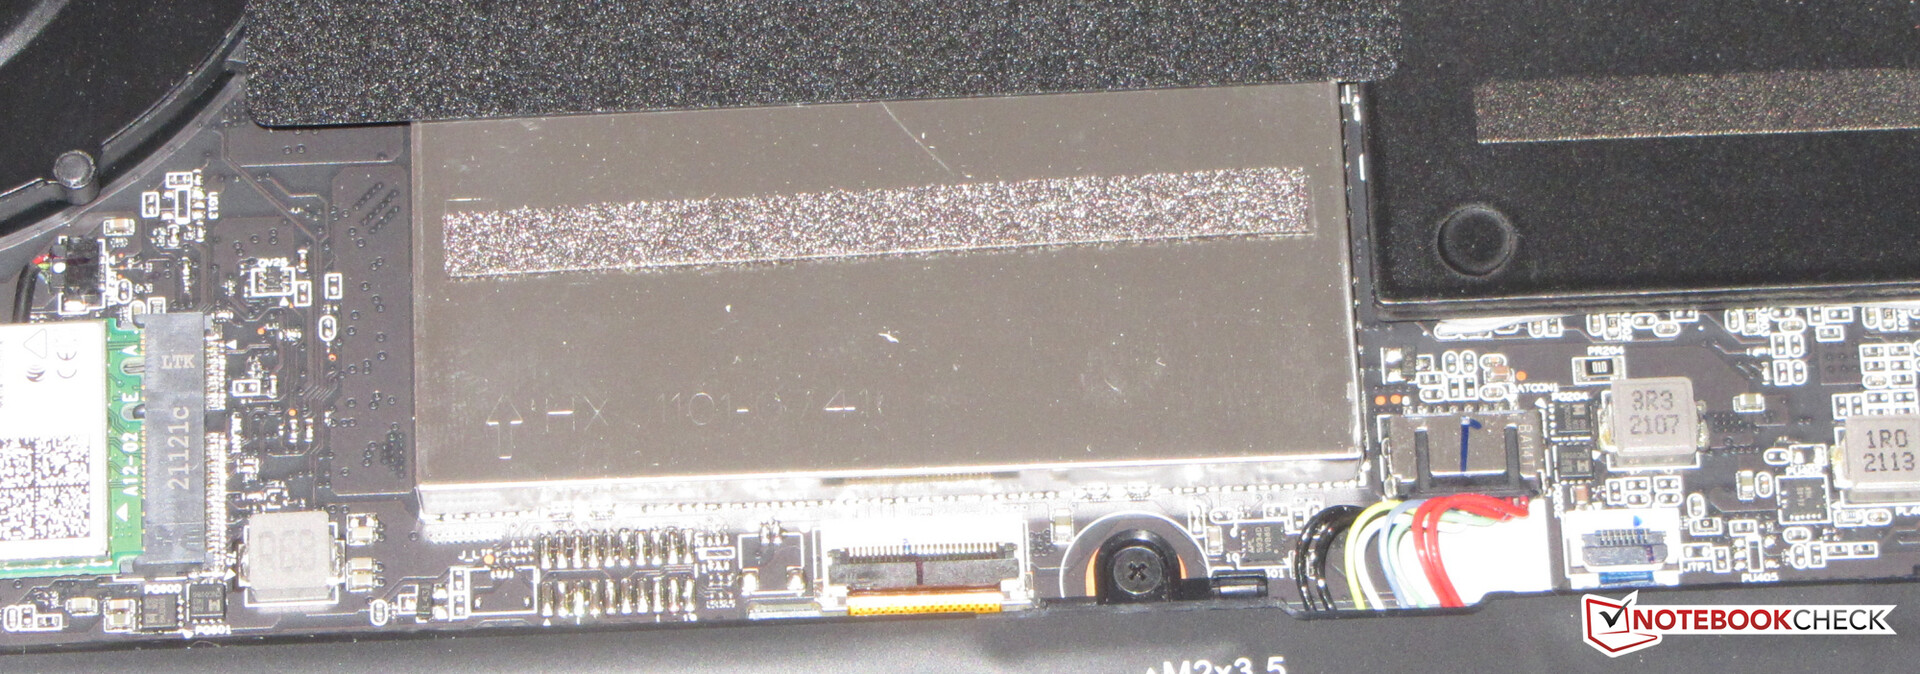
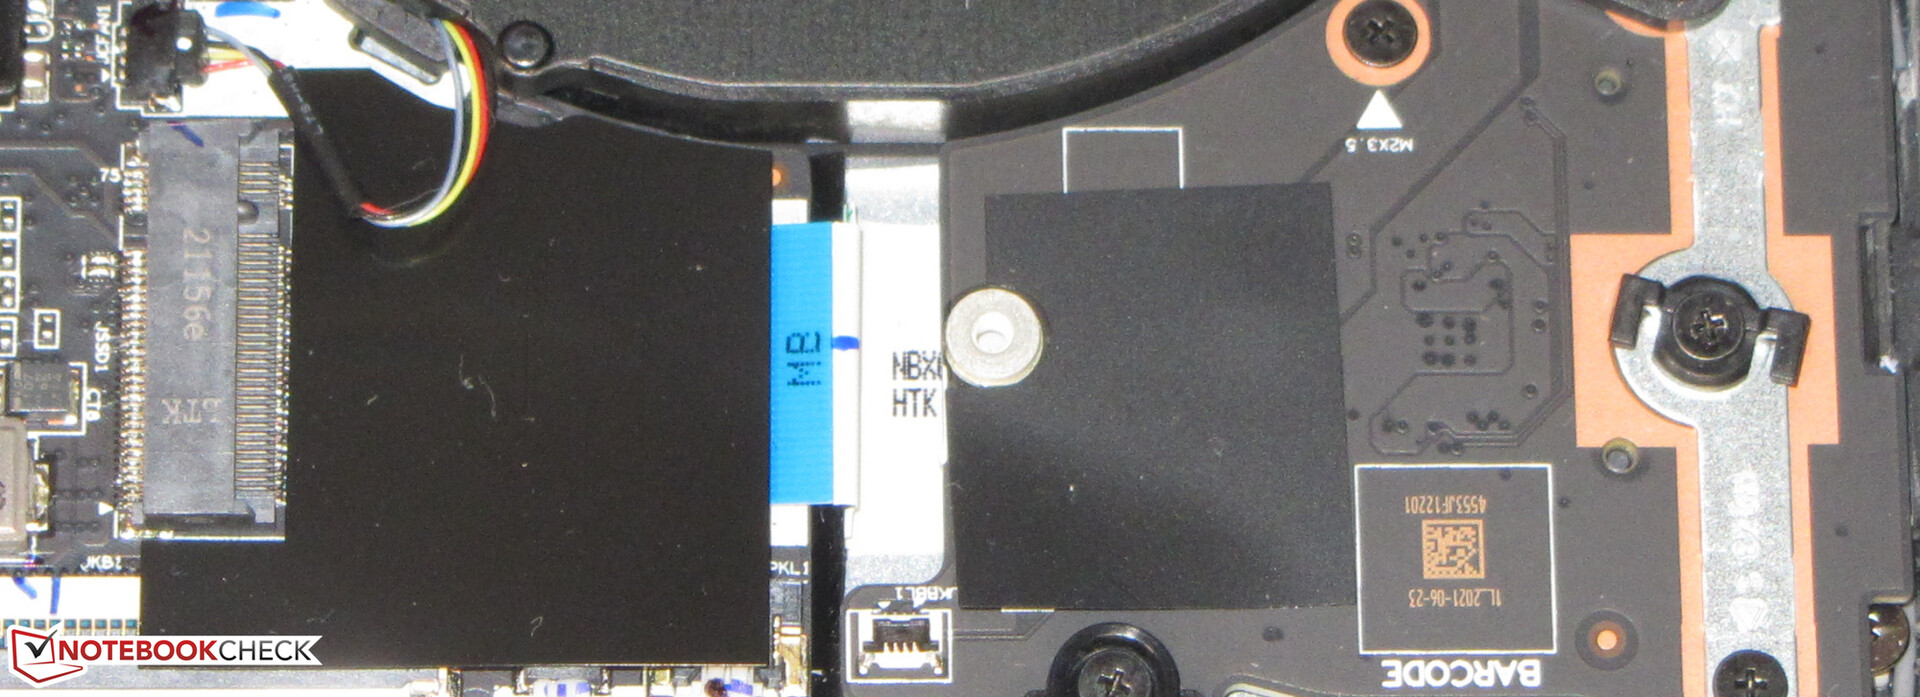
取下底盖后可以接触到内部结构。为此,需要卸下设备底部的所有螺钉。之后,可以用一个平铲子将底盖掀开。这样做时,你必须小心。底盖坐得很紧。然后你就可以接触到固态硬盘、第二个固态硬盘(NVMe;2280或2242)的插槽、风扇、内存模块(位于金属板后面)、WLAN模块和电池。
担保
联想为这台15.6英寸的机器提供了三年的现场保修。将保修期延长至四年将花费约50欧元(约58美元)。
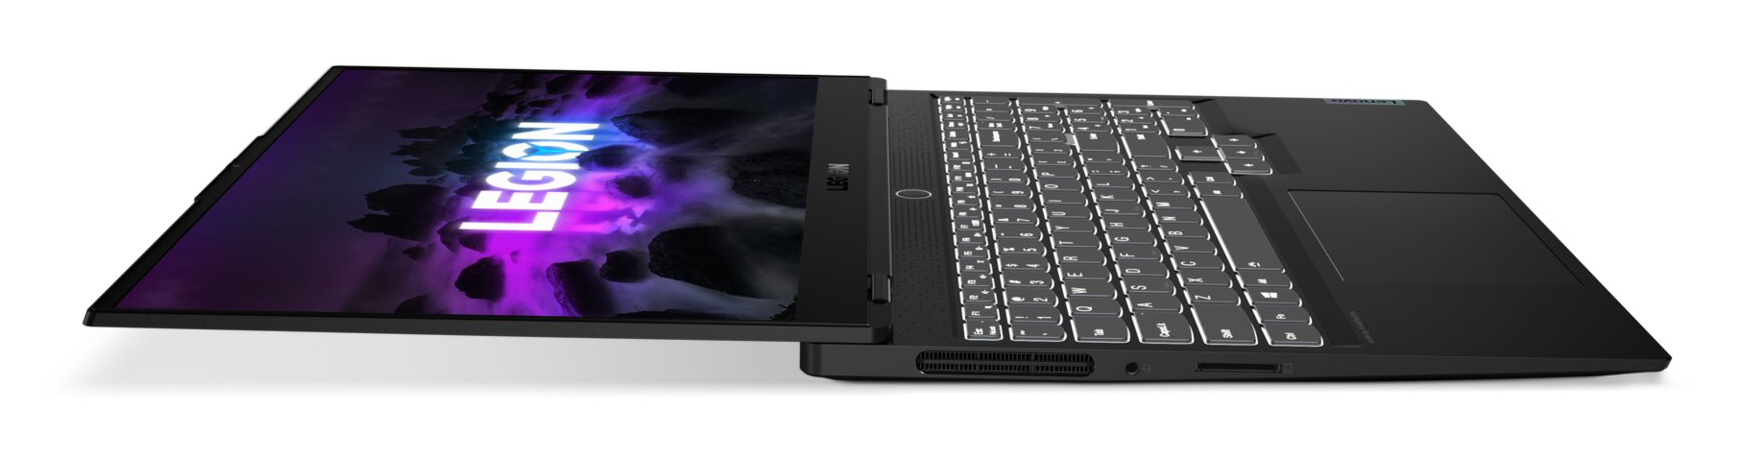
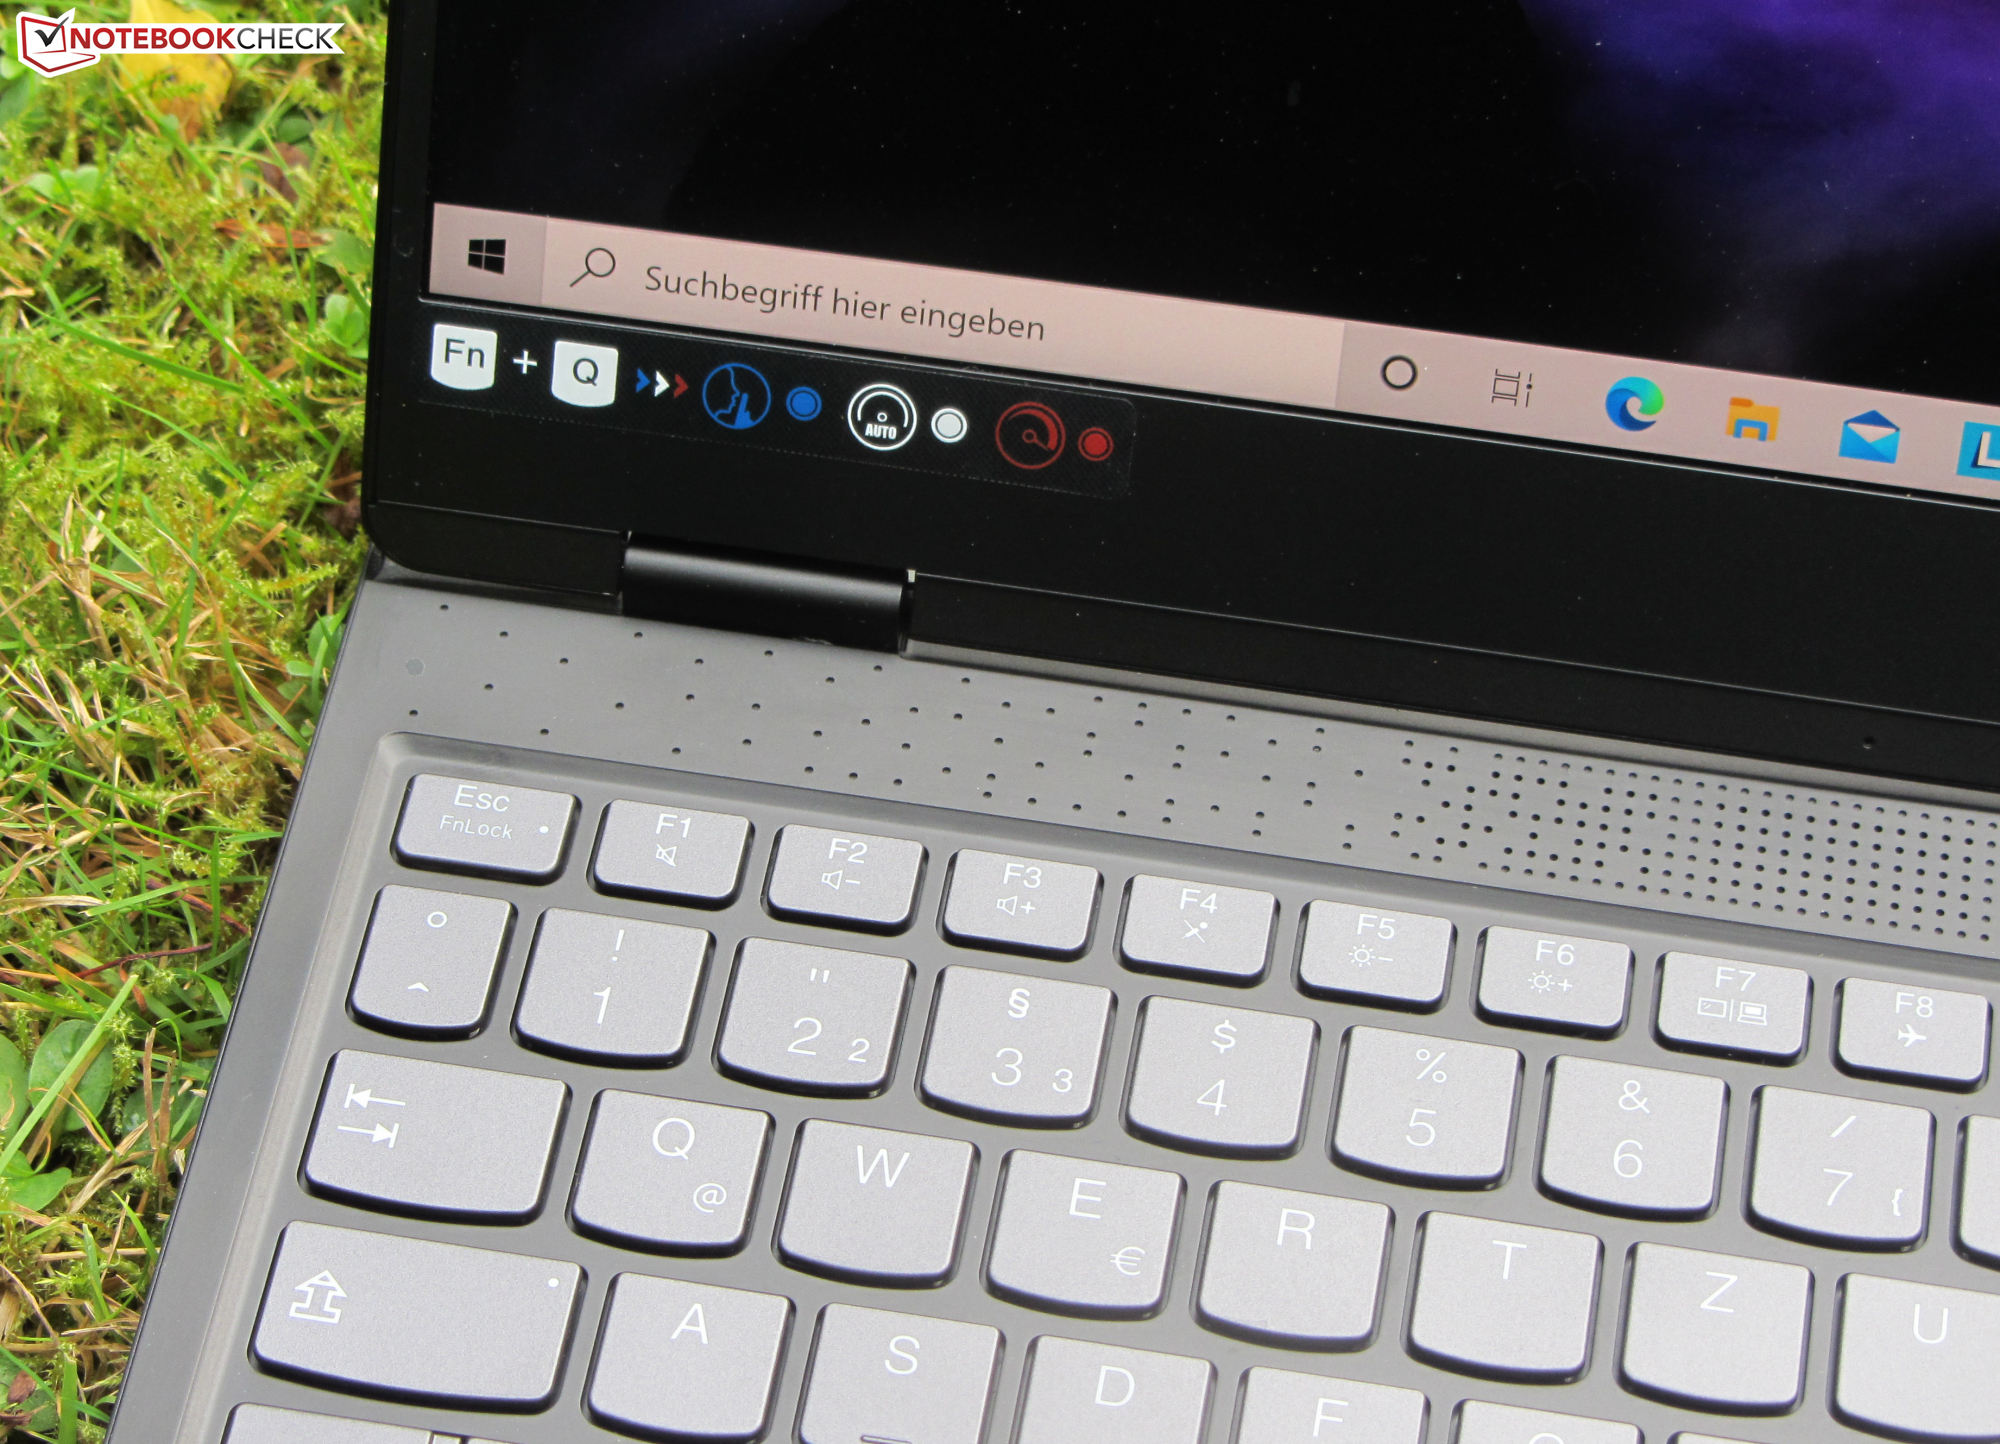
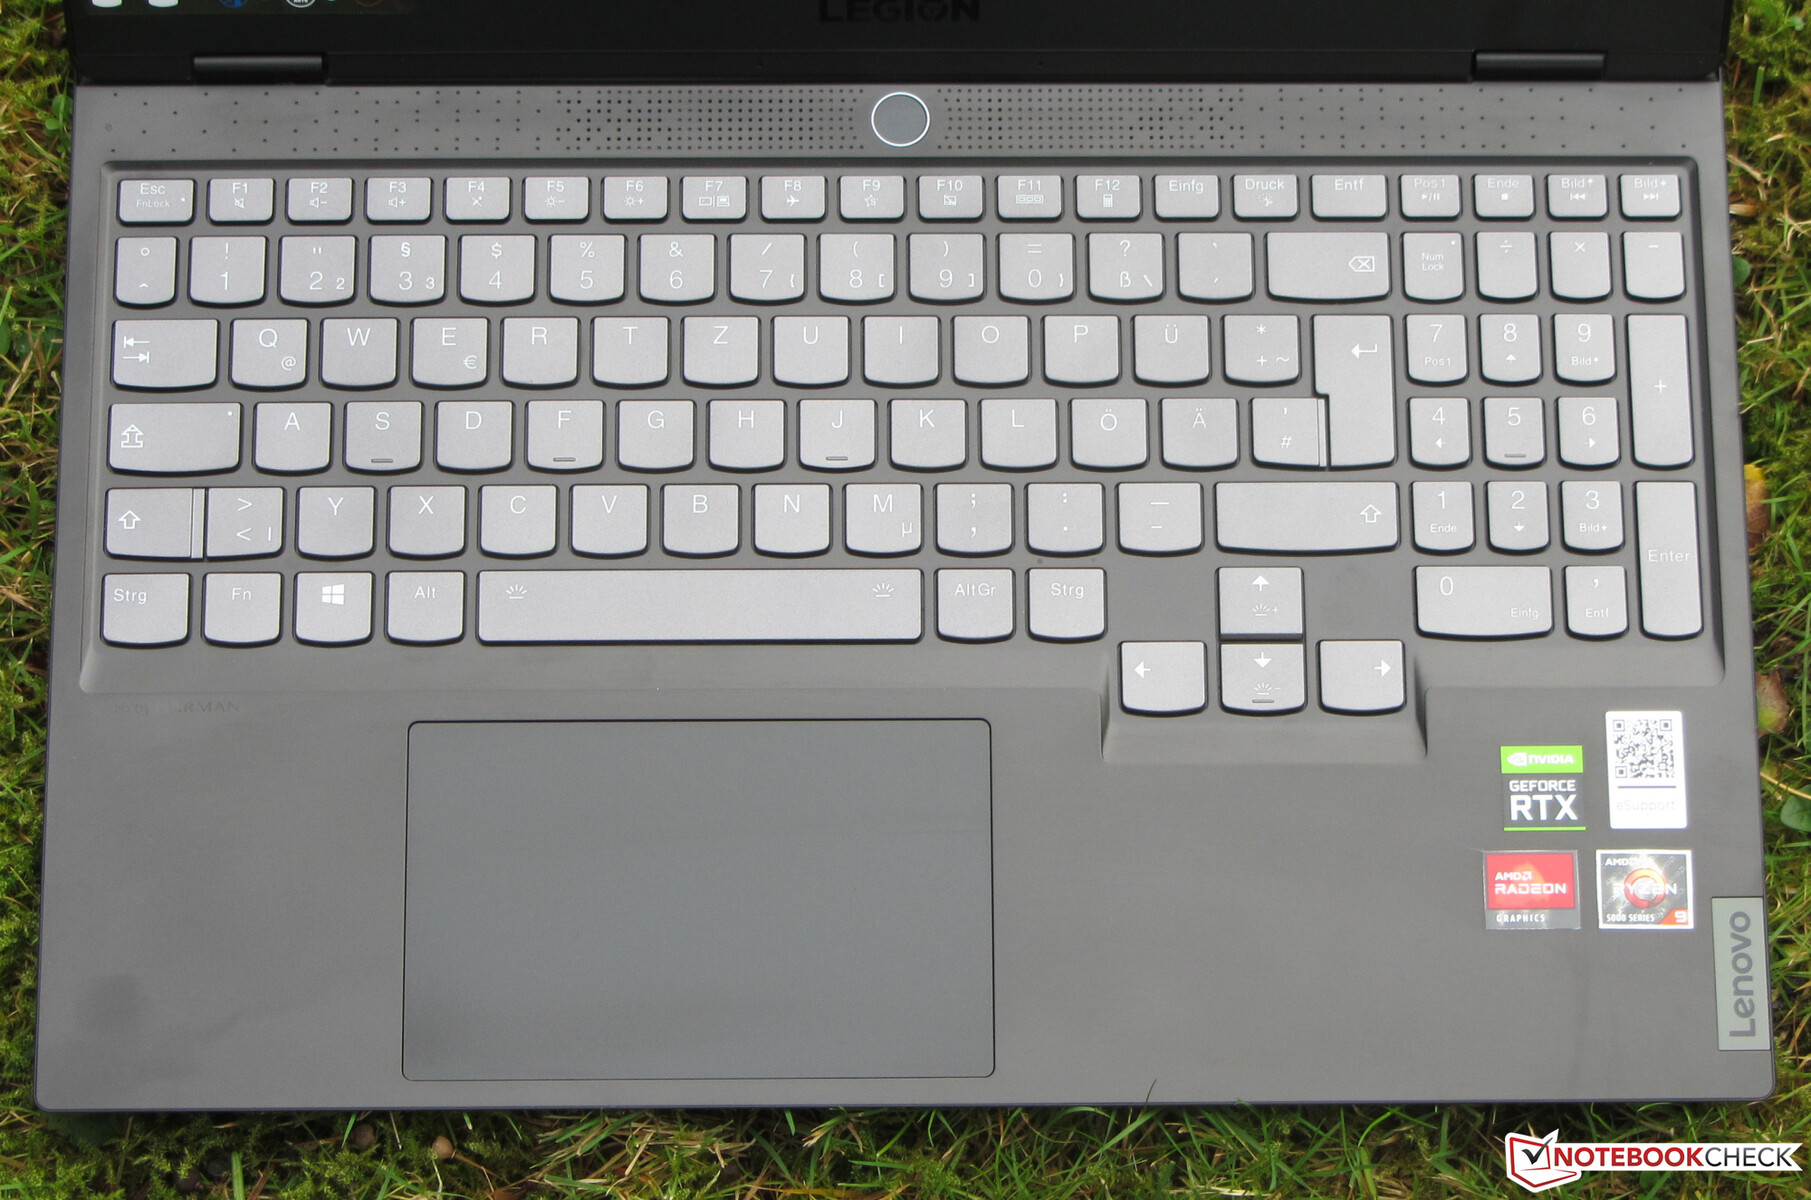
输入设备 - 联想笔记本电脑的键盘具有RGB照明功能
键盘
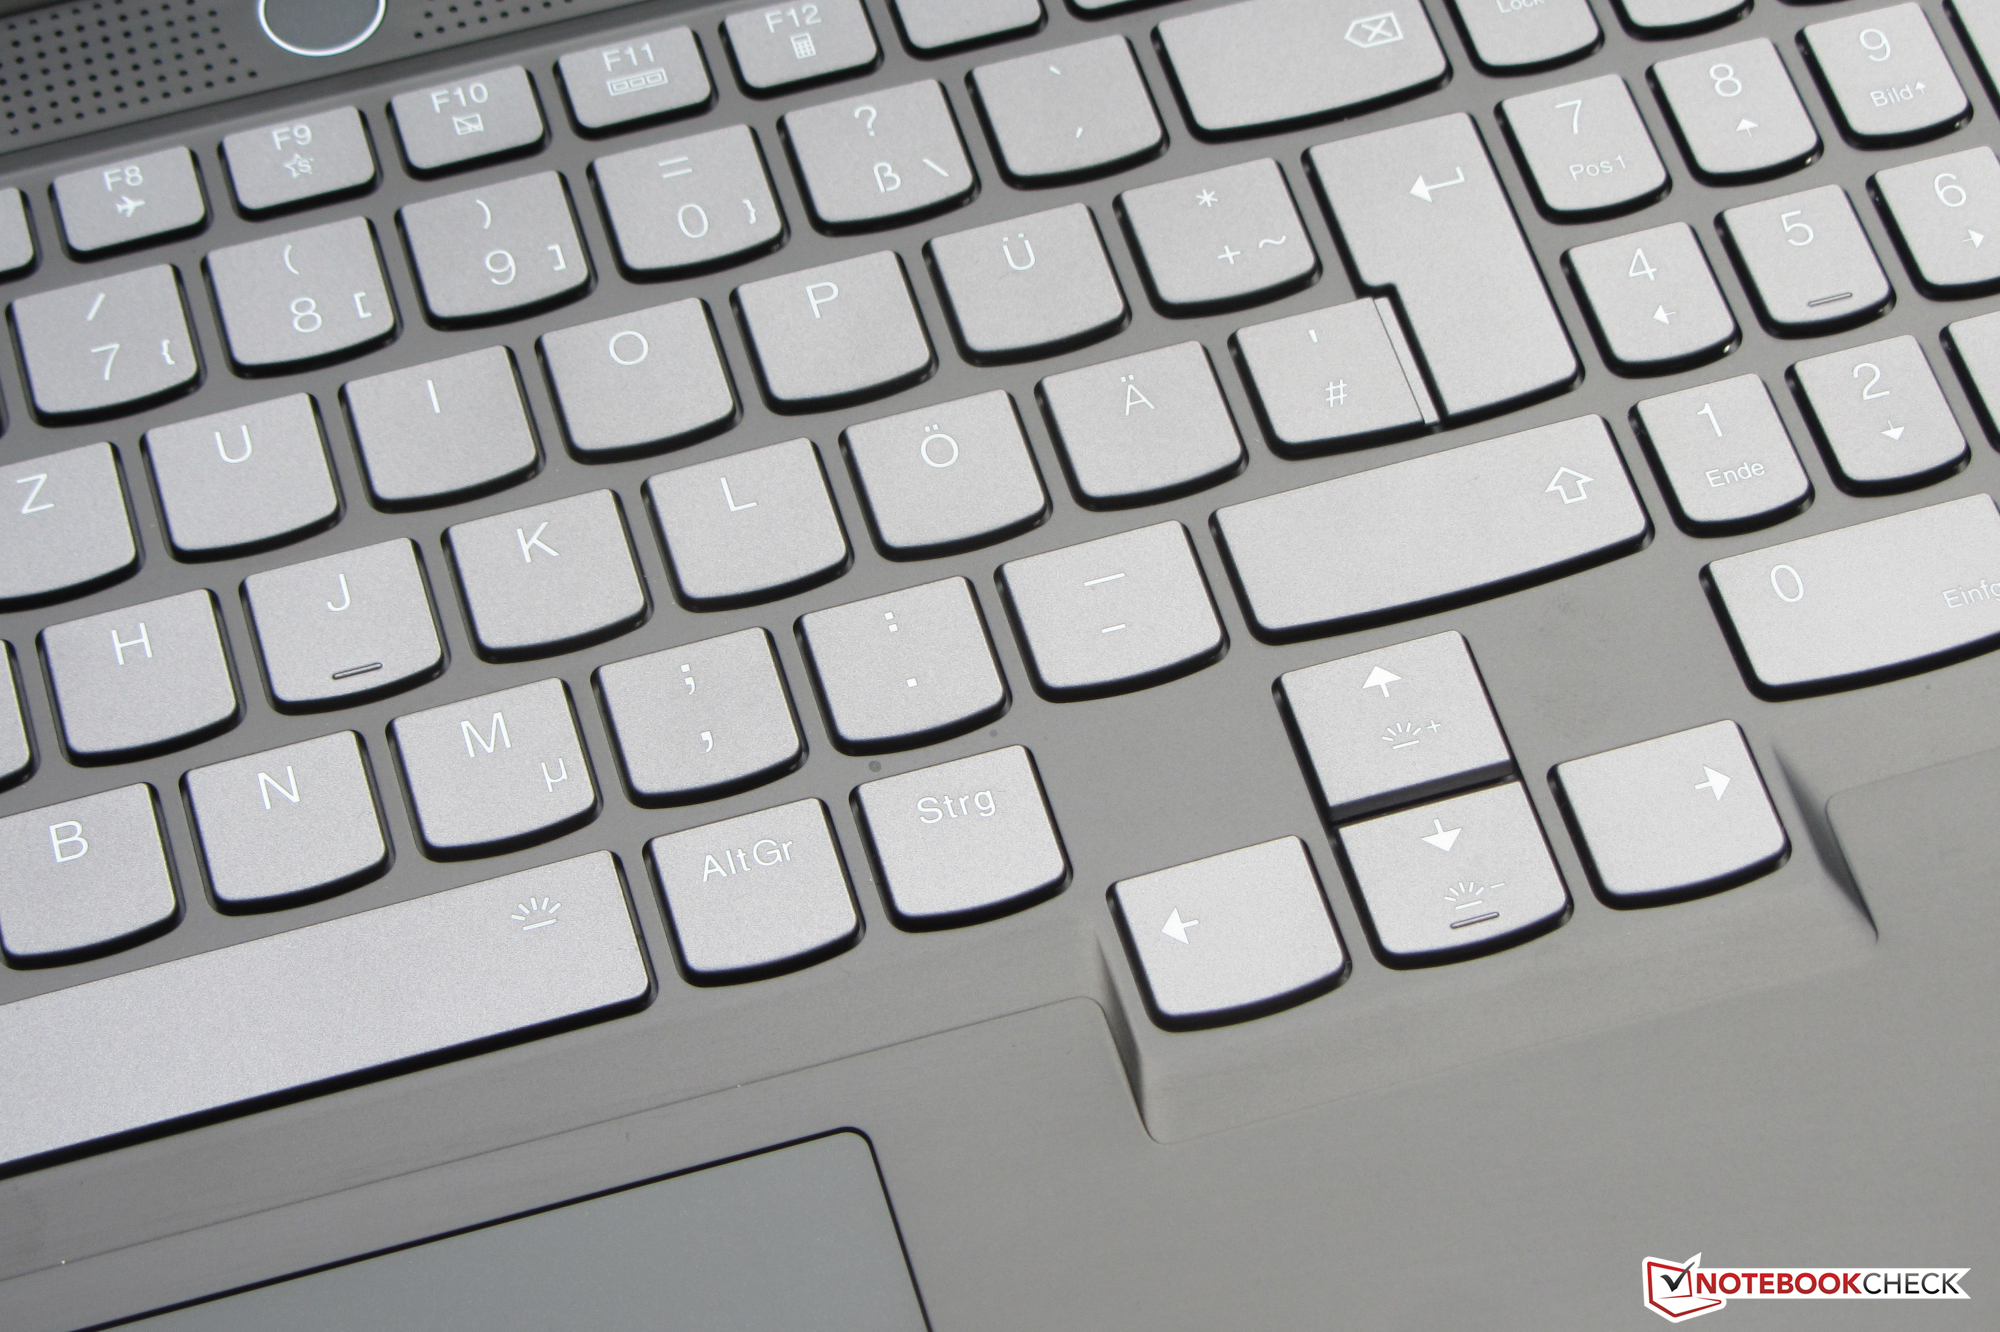
联想为Legion S7配备了一个背光的chiclet键盘(包括数字键盘),其按键行程短,压力点清晰。键盘提供的阻力是令人愉悦的。键盘在打字时最多只会产生很小的阻力。不过,事实证明这并不令人烦恼。三段式按键照明的亮度是由两个功能键控制的。总而言之,联想在这里提供了一个适合日常使用的键盘。
触摸板
一个具有多点触控功能的ClickPad(约12 x 7.5厘米)作为鼠标的替代品,它也对角落里的输入做出反应。光滑的表面并不妨碍手指的滑动。该垫子提供了一个短的行程和一个清晰的压力点。
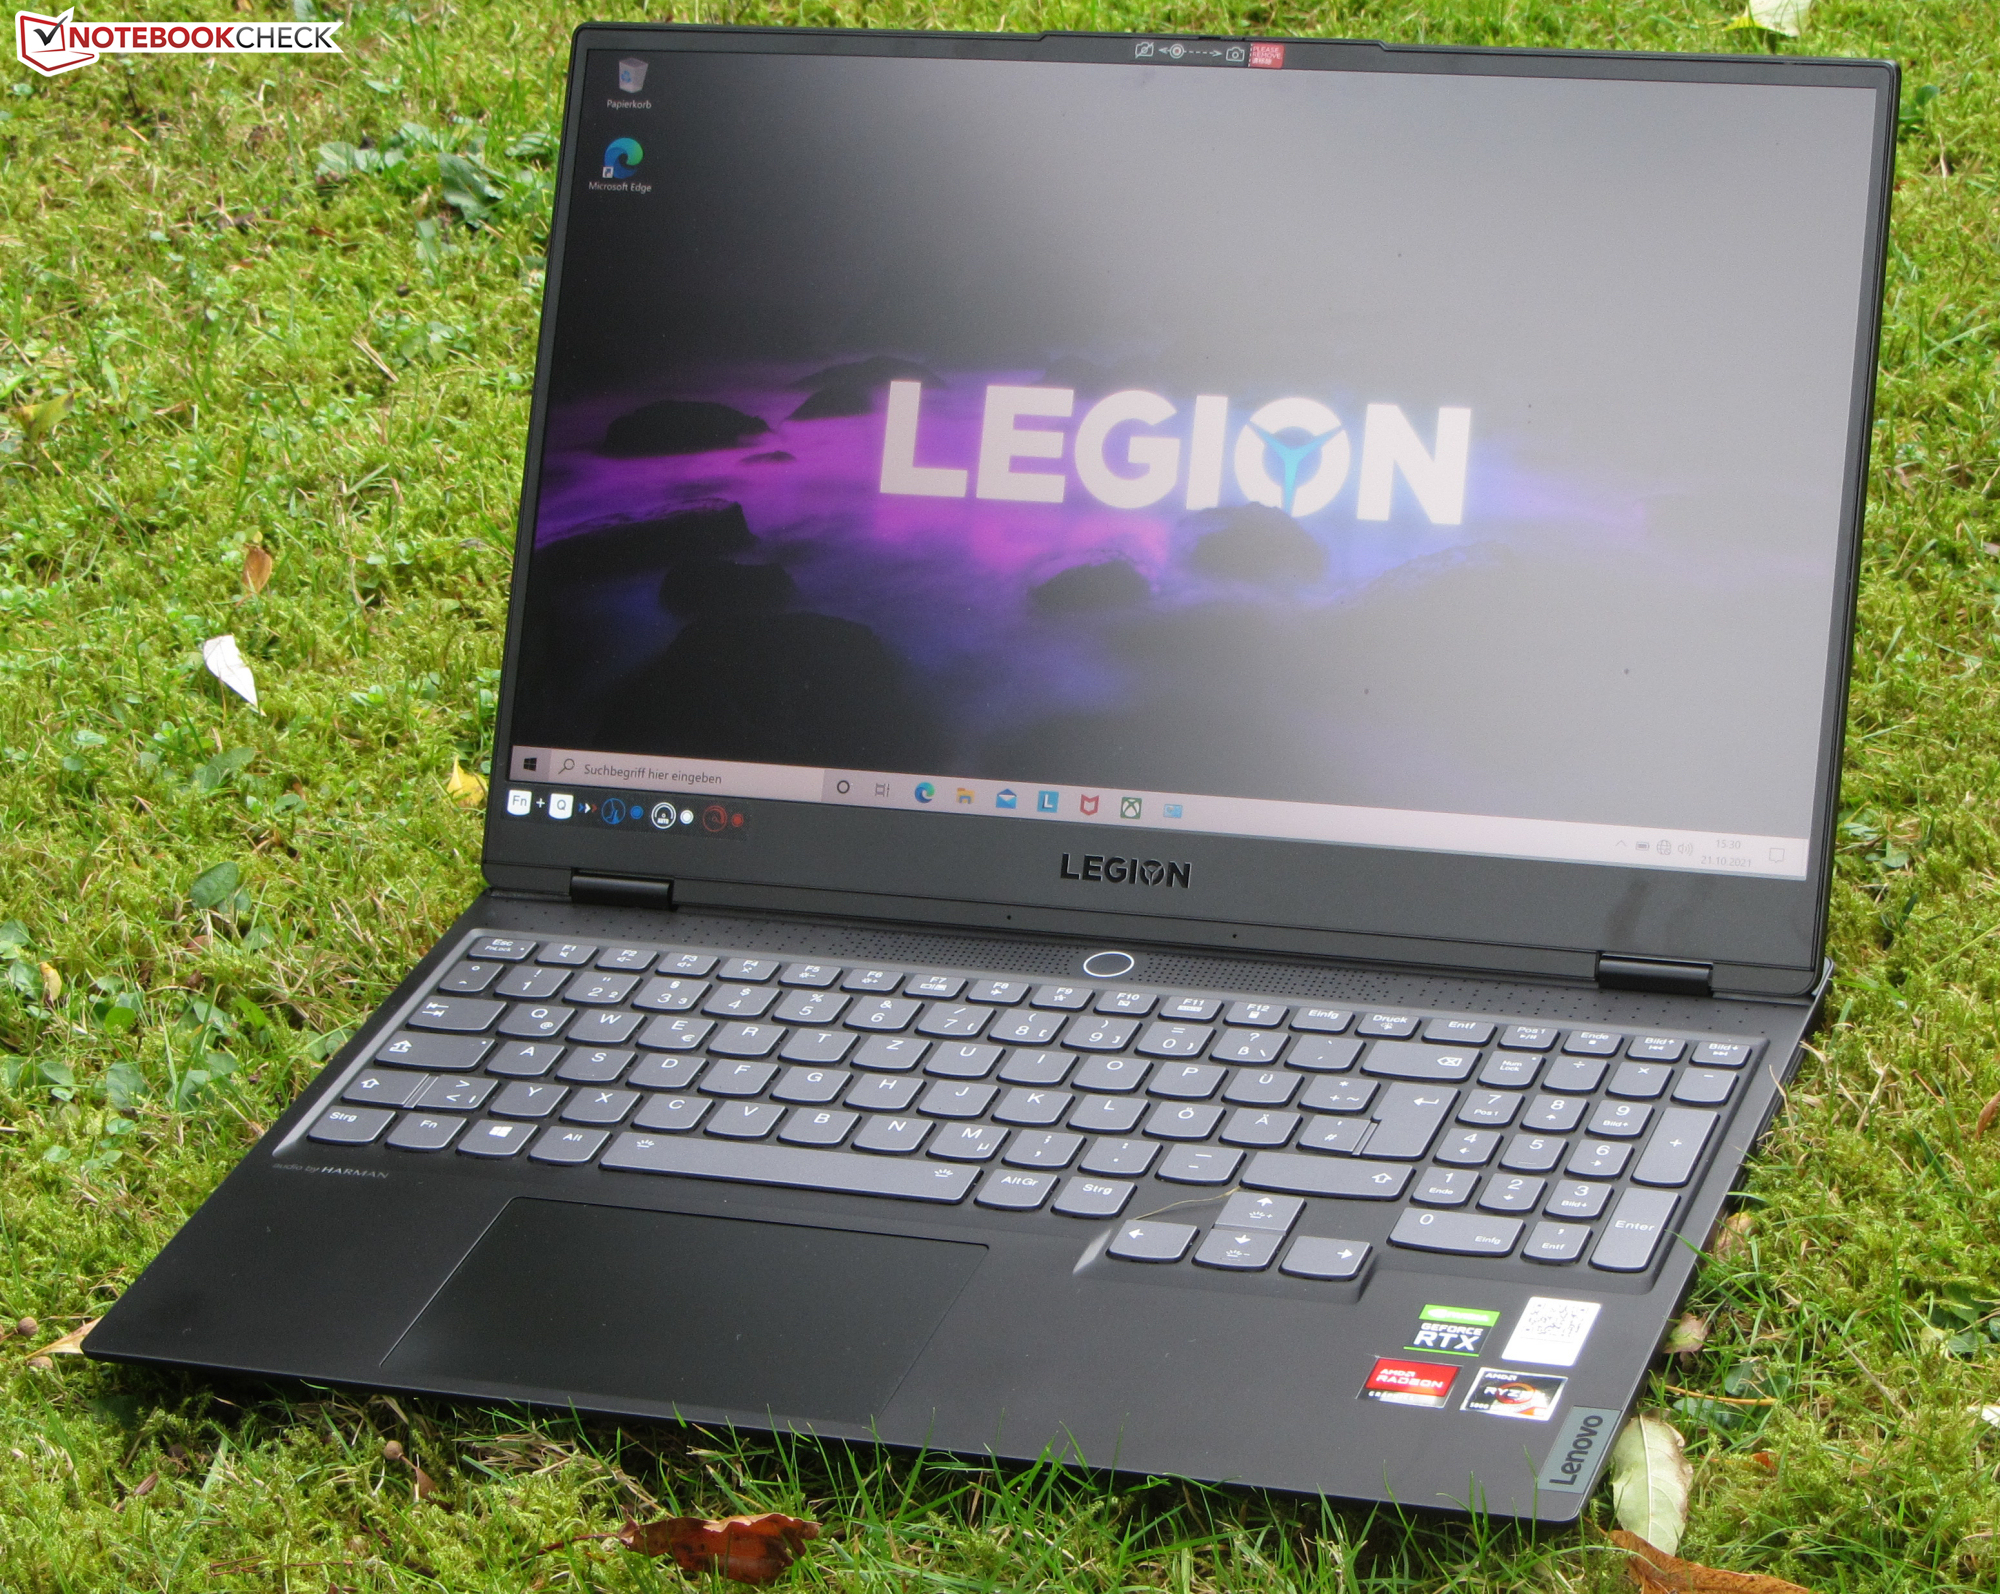
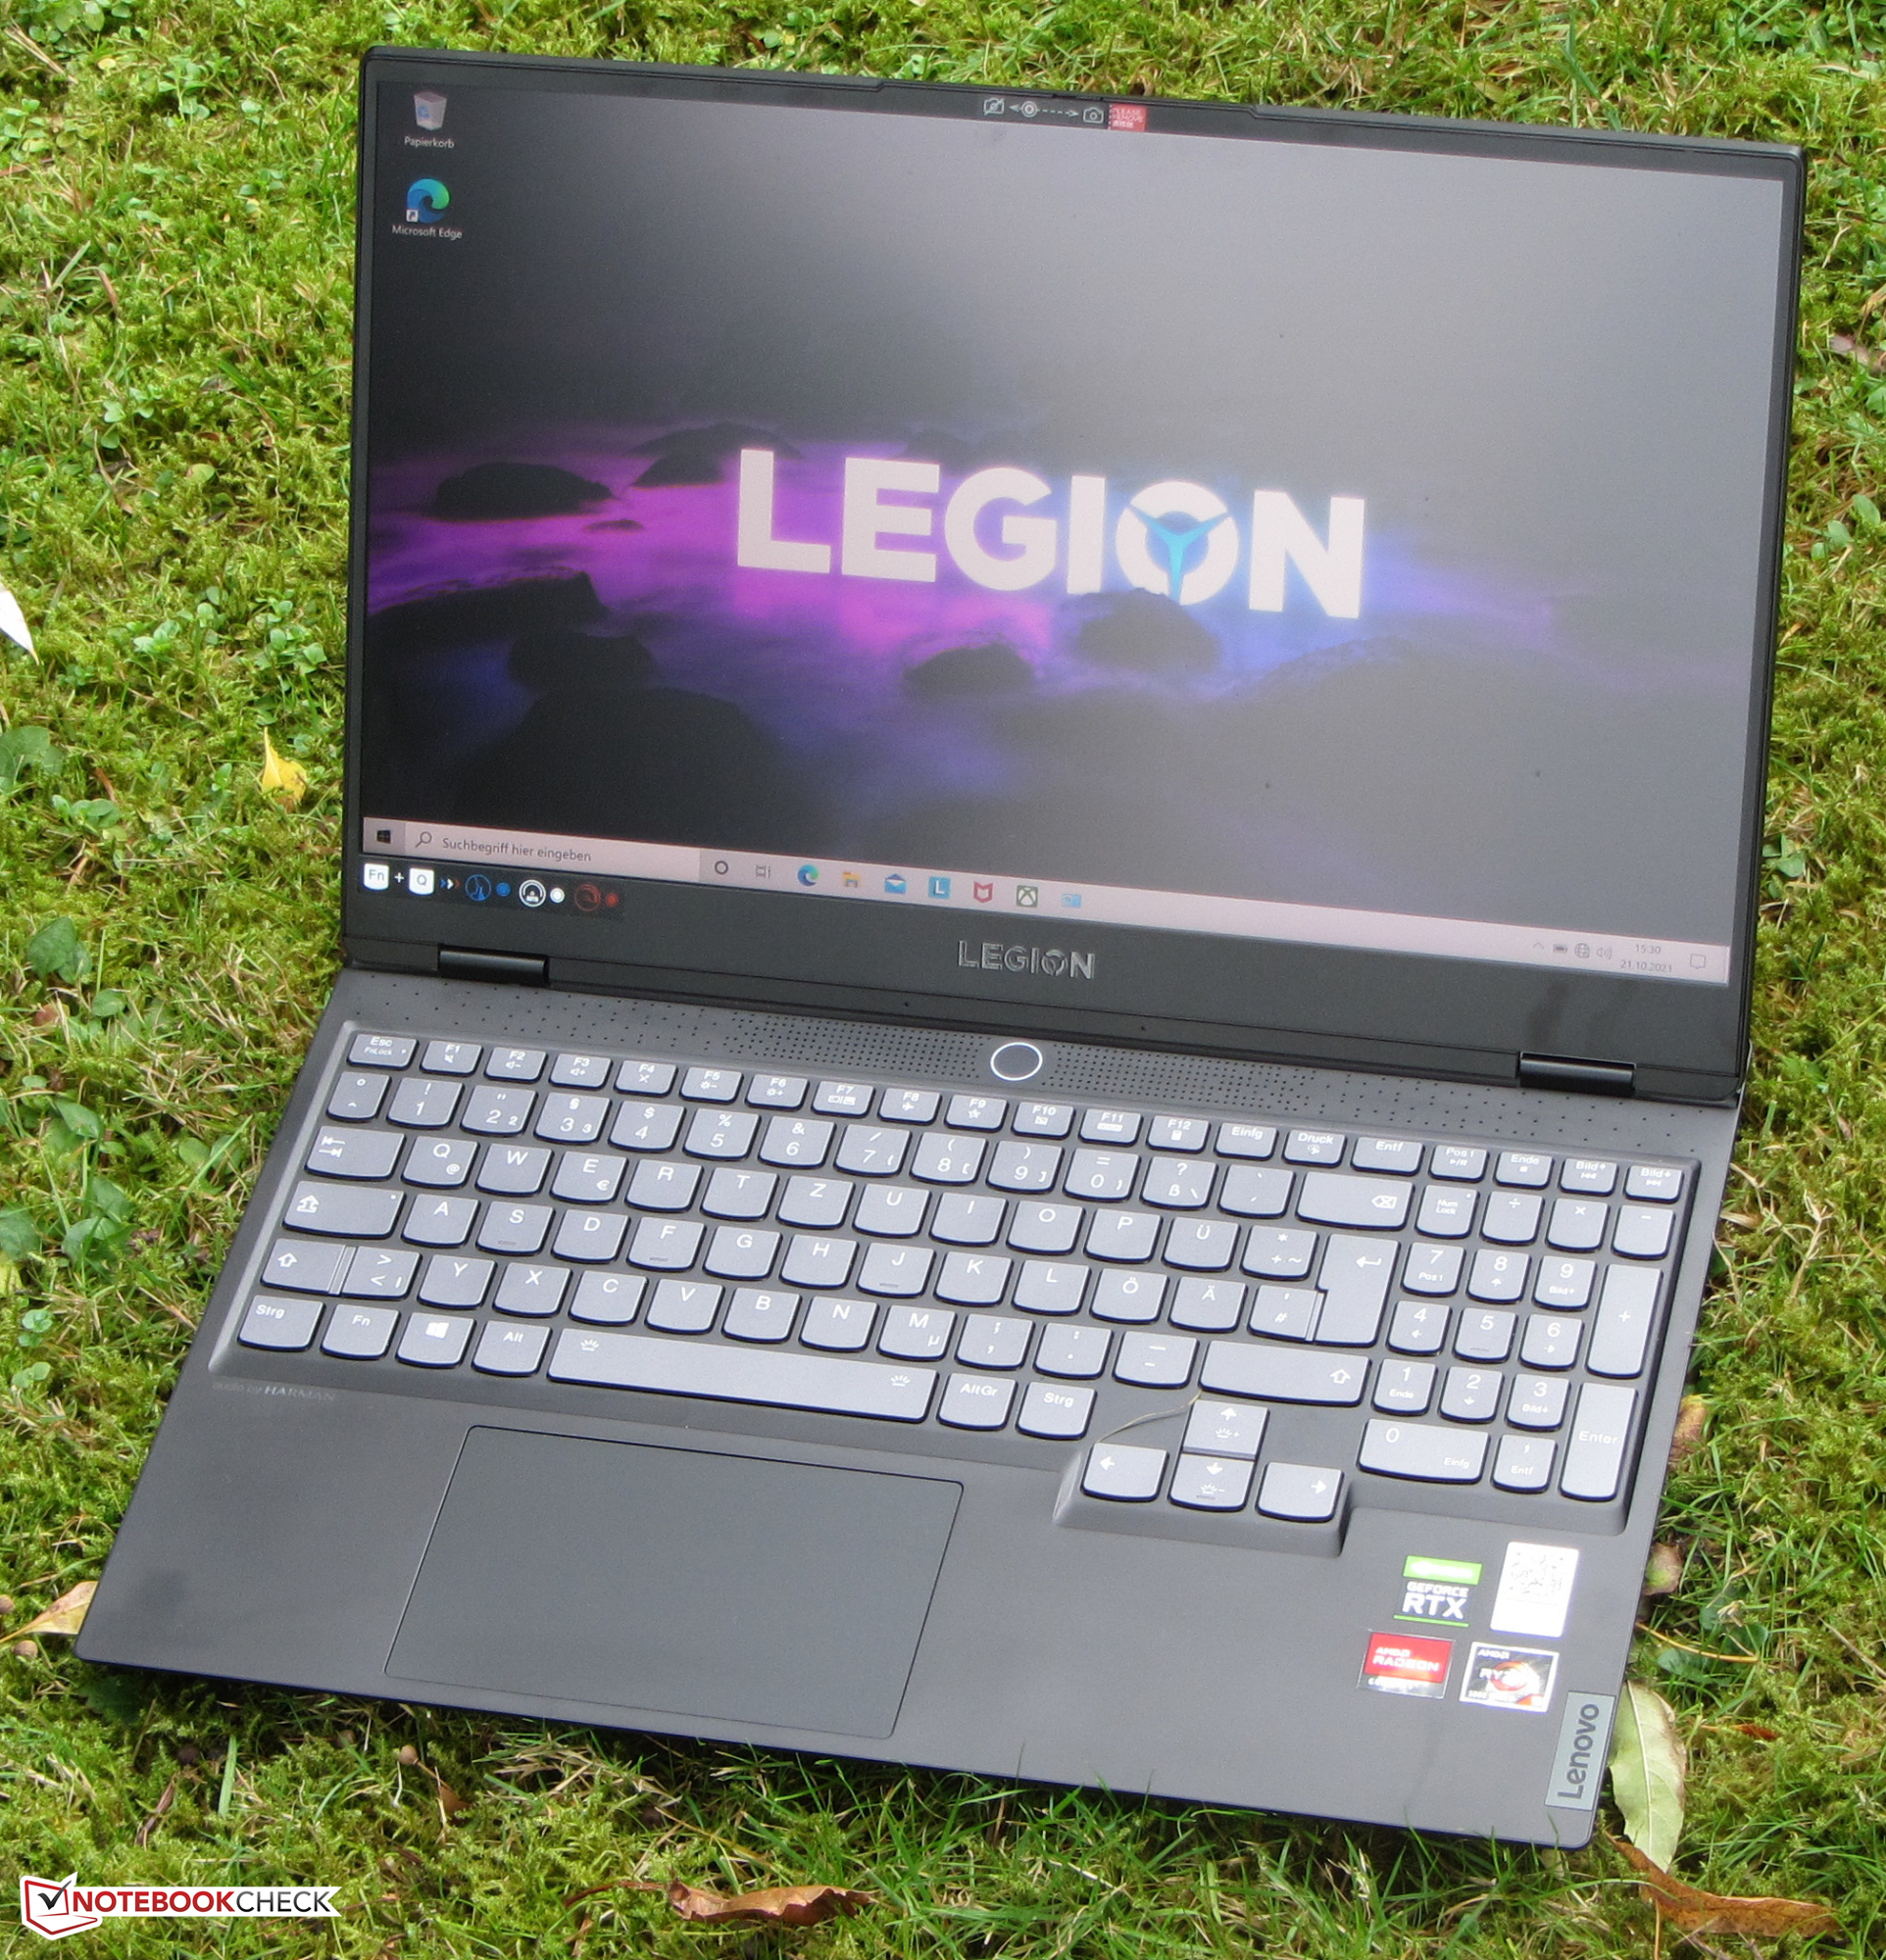
显示屏 - 带有明亮的4K面板的游戏笔记本电脑
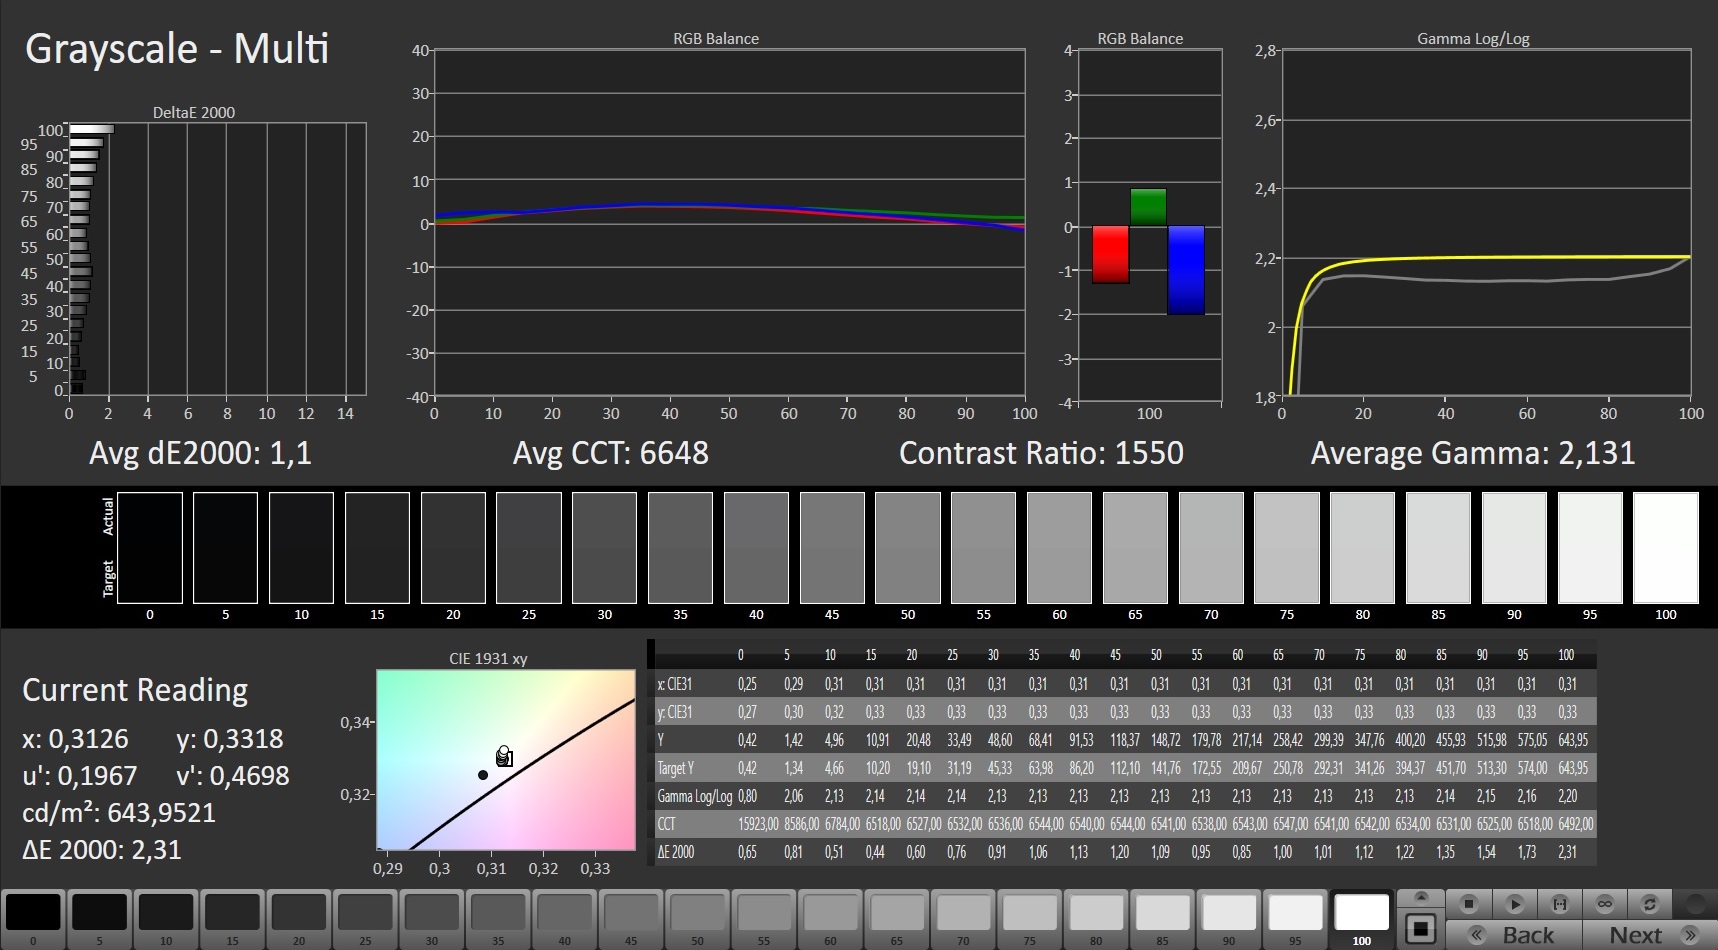
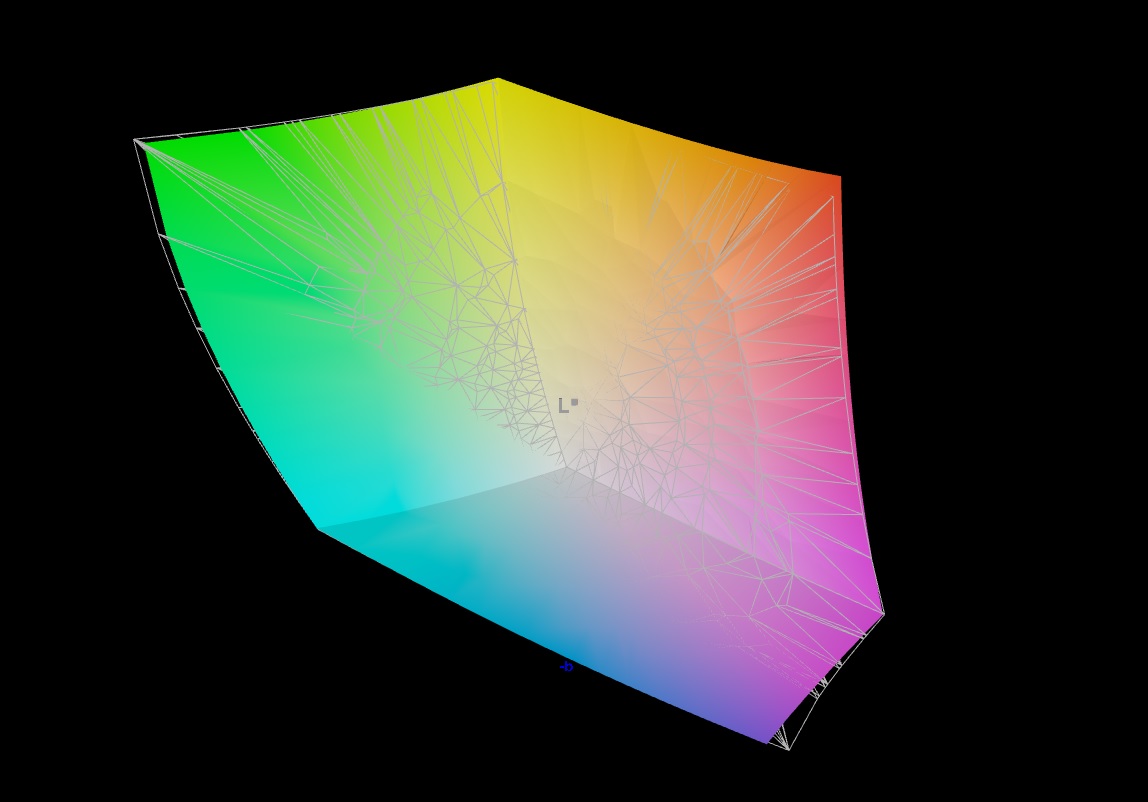
哑光15.6英寸显示屏(3840x2160像素)的亮度(605cd/m²)和对比度(1480:1)分别为优秀和良好。没有检测到PWM闪烁。该显示器支持AMD的自由同步技术。因此,显示器和GPU的刷新率是动态同步的。这应该能产生最流畅的画面--特别是在电脑游戏中。
S7有全高清或WQHD显示屏可供选择。这两种165赫兹的面板都比这里安装的60赫兹型号提供更好的响应时间。也支持自由同步和G-Sync(Nvidia的对应产品)。然而,亮度、对比度和色域覆盖率都比4K显示器低。
| |||||||||||||||||||||||||
Brightness Distribution: 93 %
Center on Battery: 607 cd/m²
Contrast: 1480:1 (Black: 0.41 cd/m²)
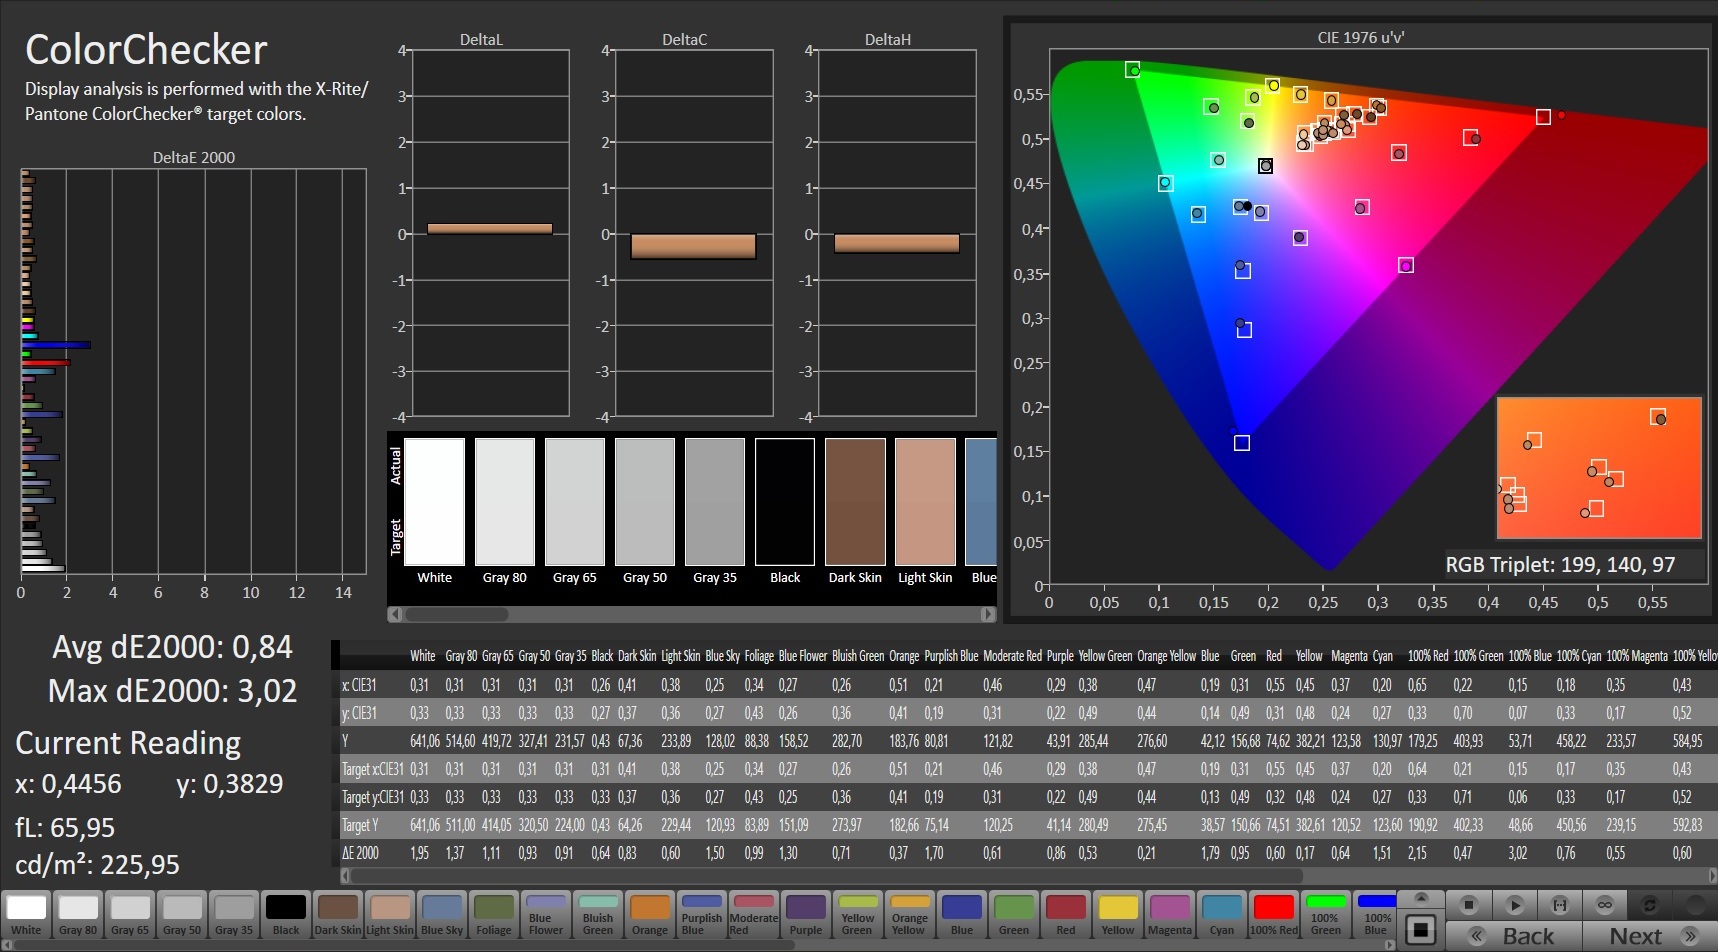
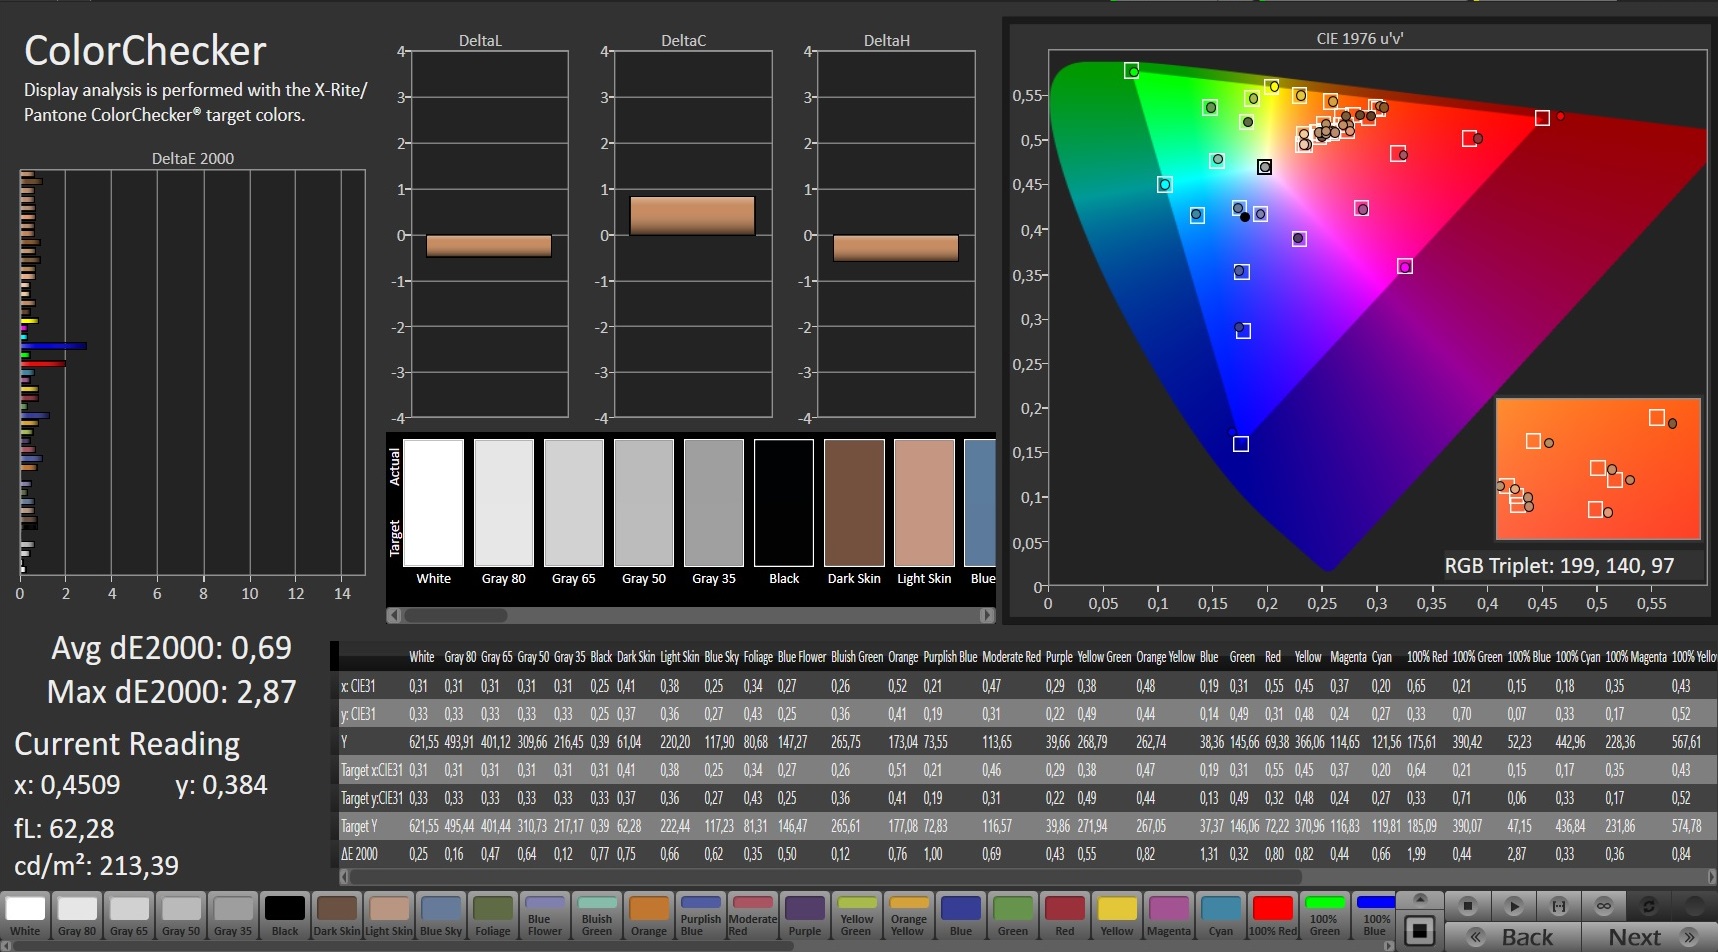
ΔE ColorChecker Calman: 0.84 | ∀{0.5-29.43 Ø4.71}
calibrated: 0.69
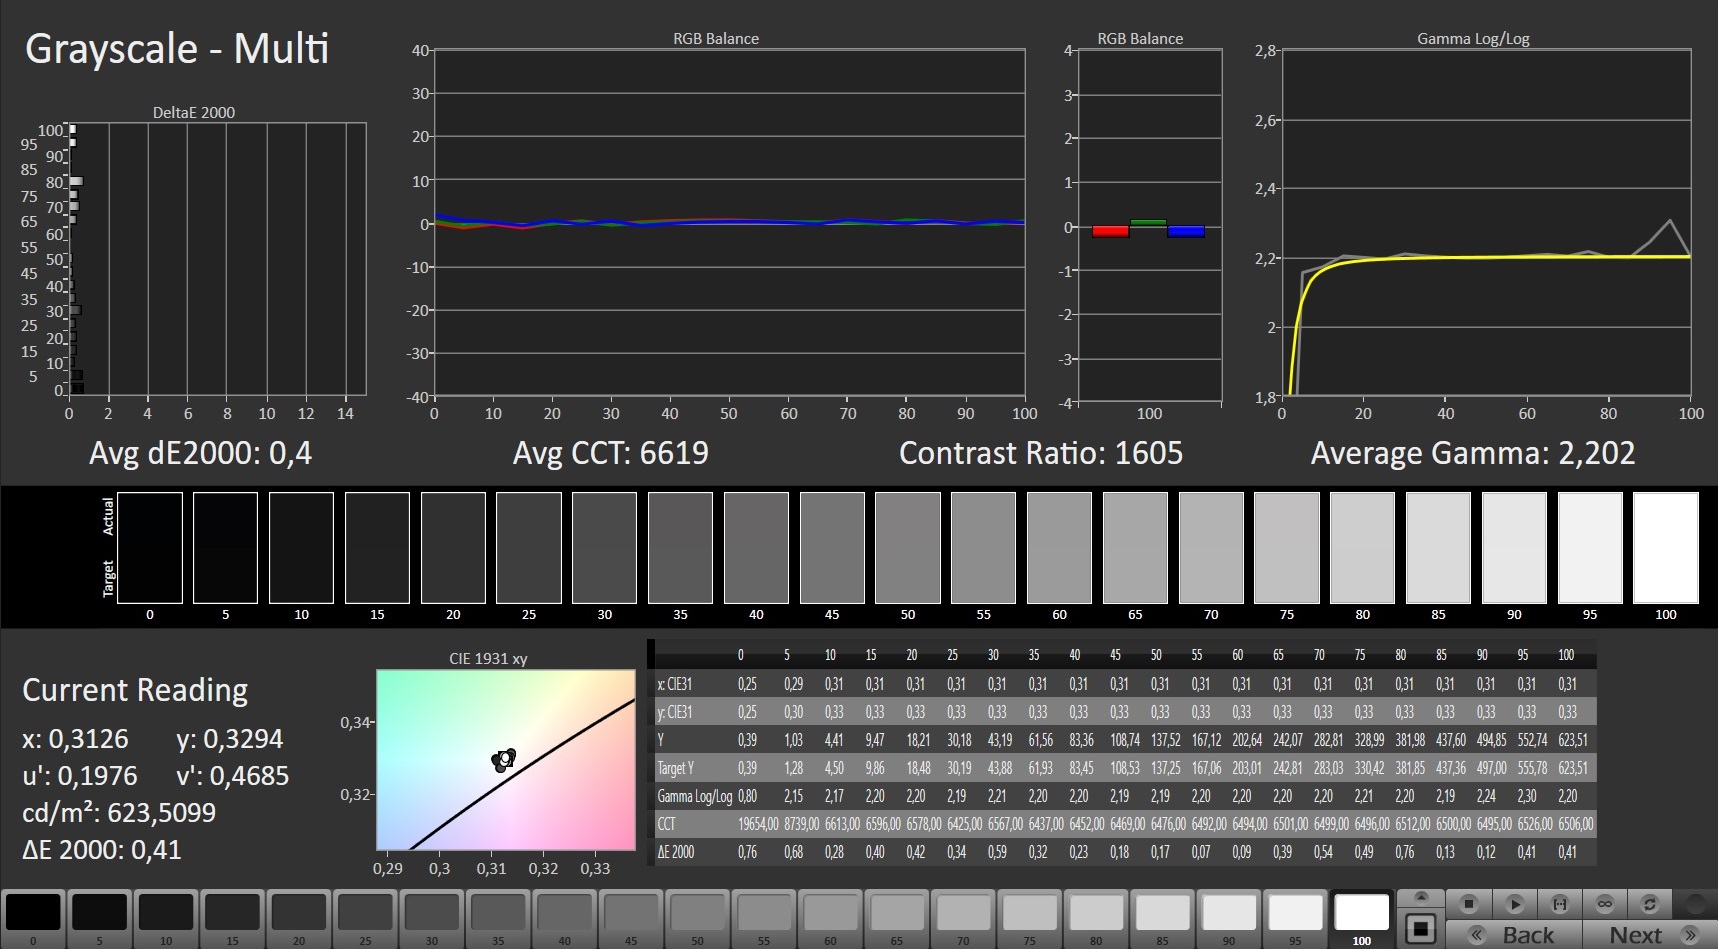
ΔE Greyscale Calman: 1.1 | ∀{0.09-98 Ø4.96}
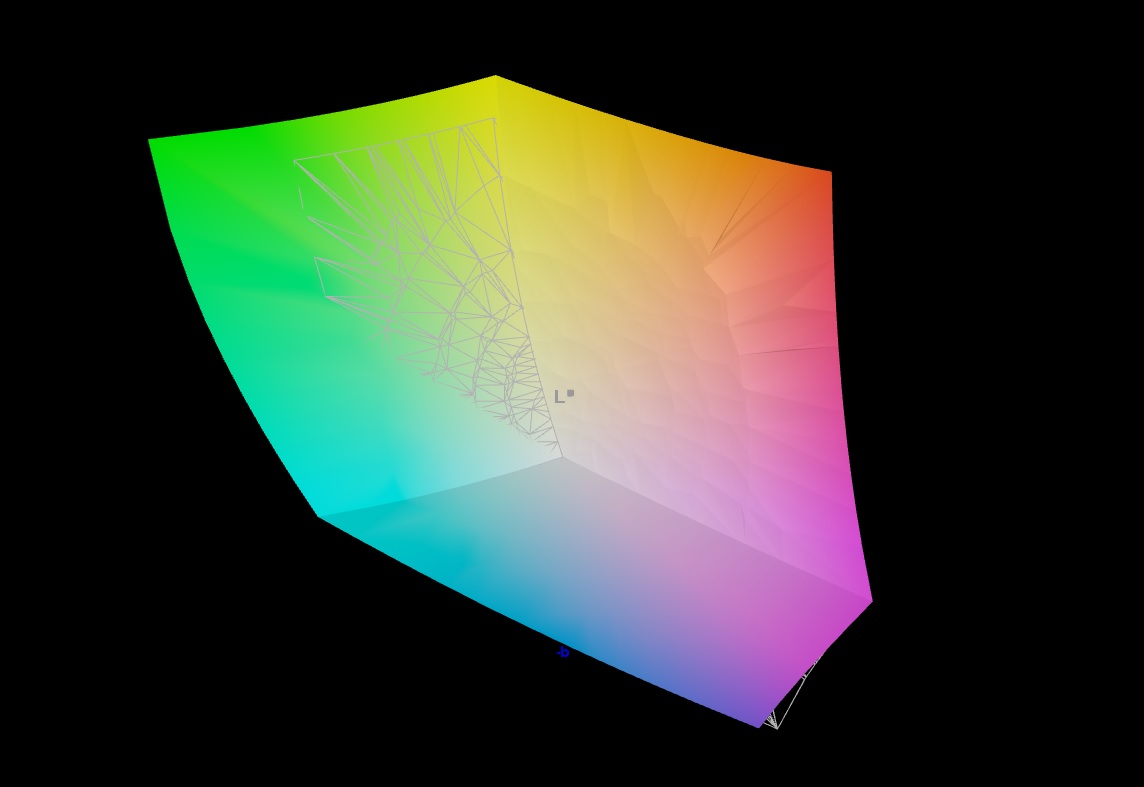
98.2% AdobeRGB 1998 (Argyll 3D)
98.8% sRGB (Argyll 3D)
85.2% Display P3 (Argyll 3D)
Gamma: 2.131
CCT: 6648 K
| Lenovo Legion S7 15ACH6 82K80030GE CSOT T3 MNF601EA1-6, IPS, 3840x2160, 15.6" | Razer Blade 15 Base Edition 2021, i7-10750H RTX 3060 BOE NV156FHM-N4K, IPS, 1920x1080, 15.6" | MSI Delta 15 A5EFK LQ156M1JW03 (SHP155D), IPS-Level, 1920x1080, 15.6" | Alienware m15 R5 Ryzen Edition B156HAN, IPS, 1920x1080, 15.6" | Acer Nitro 5 AN515-45-R1JH BOE BOE09B8, IPS, 2560x1440, 15.6" | |
|---|---|---|---|---|---|
| Display | -22% | -18% | -19% | ||
| Display P3 Coverage (%) | 85.2 | 64.3 -25% | 66.5 -22% | 66.2 -22% | |
| sRGB Coverage (%) | 98.8 | 91.8 -7% | 97.8 -1% | 96.3 -3% | |
| AdobeRGB 1998 Coverage (%) | 98.2 | 65.5 -33% | 67.6 -31% | 67.1 -32% | |
| Response Times | 55% | 47% | 67% | 53% | |
| Response Time Grey 50% / Grey 80% * (ms) | 31.6 ? | 8.8 ? 72% | 12.8 ? 59% | 4 ? 87% | 14 ? 56% |
| Response Time Black / White * (ms) | 16 ? | 10 ? 37% | 10.4 ? 35% | 8.4 ? 47% | 8 ? 50% |
| PWM Frequency (Hz) | 1000 ? | 23580 ? | |||
| Screen | -138% | -96% | -70% | -130% | |
| Brightness middle (cd/m²) | 607 | 317.2 -48% | 291 -52% | 329 -46% | 349 -43% |
| Brightness (cd/m²) | 605 | 306 -49% | 266 -56% | 321 -47% | 304 -50% |
| Brightness Distribution (%) | 93 | 89 -4% | 88 -5% | 92 -1% | 79 -15% |
| Black Level * (cd/m²) | 0.41 | 0.31 24% | 0.36 12% | 0.27 34% | 0.535 -30% |
| Contrast (:1) | 1480 | 1023 -31% | 808 -45% | 1219 -18% | 652 -56% |
| Colorchecker dE 2000 * | 0.84 | 4.37 -420% | 2.98 -255% | 2.78 -231% | 3.11 -270% |
| Colorchecker dE 2000 max. * | 3.02 | 6.62 -119% | 7.59 -151% | 4.88 -62% | 9.57 -217% |
| Colorchecker dE 2000 calibrated * | 0.69 | 2.67 -287% | 0.91 -32% | 1.63 -136% | |
| Greyscale dE 2000 * | 1.1 | 4.5 -309% | 4.2 -282% | 2.5 -127% | 5 -355% |
| Gamma | 2.131 103% | 2.4 92% | 2.293 96% | 2.106 104% | 2.36 93% |
| CCT | 6648 98% | 7418 88% | 7624 85% | 6201 105% | 6976 93% |
| Color Space (Percent of AdobeRGB 1998) (%) | 59.2 | 76 | |||
| Color Space (Percent of sRGB) (%) | 91.4 | 99 | |||
| Total Average (Program / Settings) | -35% /
-86% | -22% /
-59% | -2% /
-45% | -32% /
-76% |
* ... smaller is better
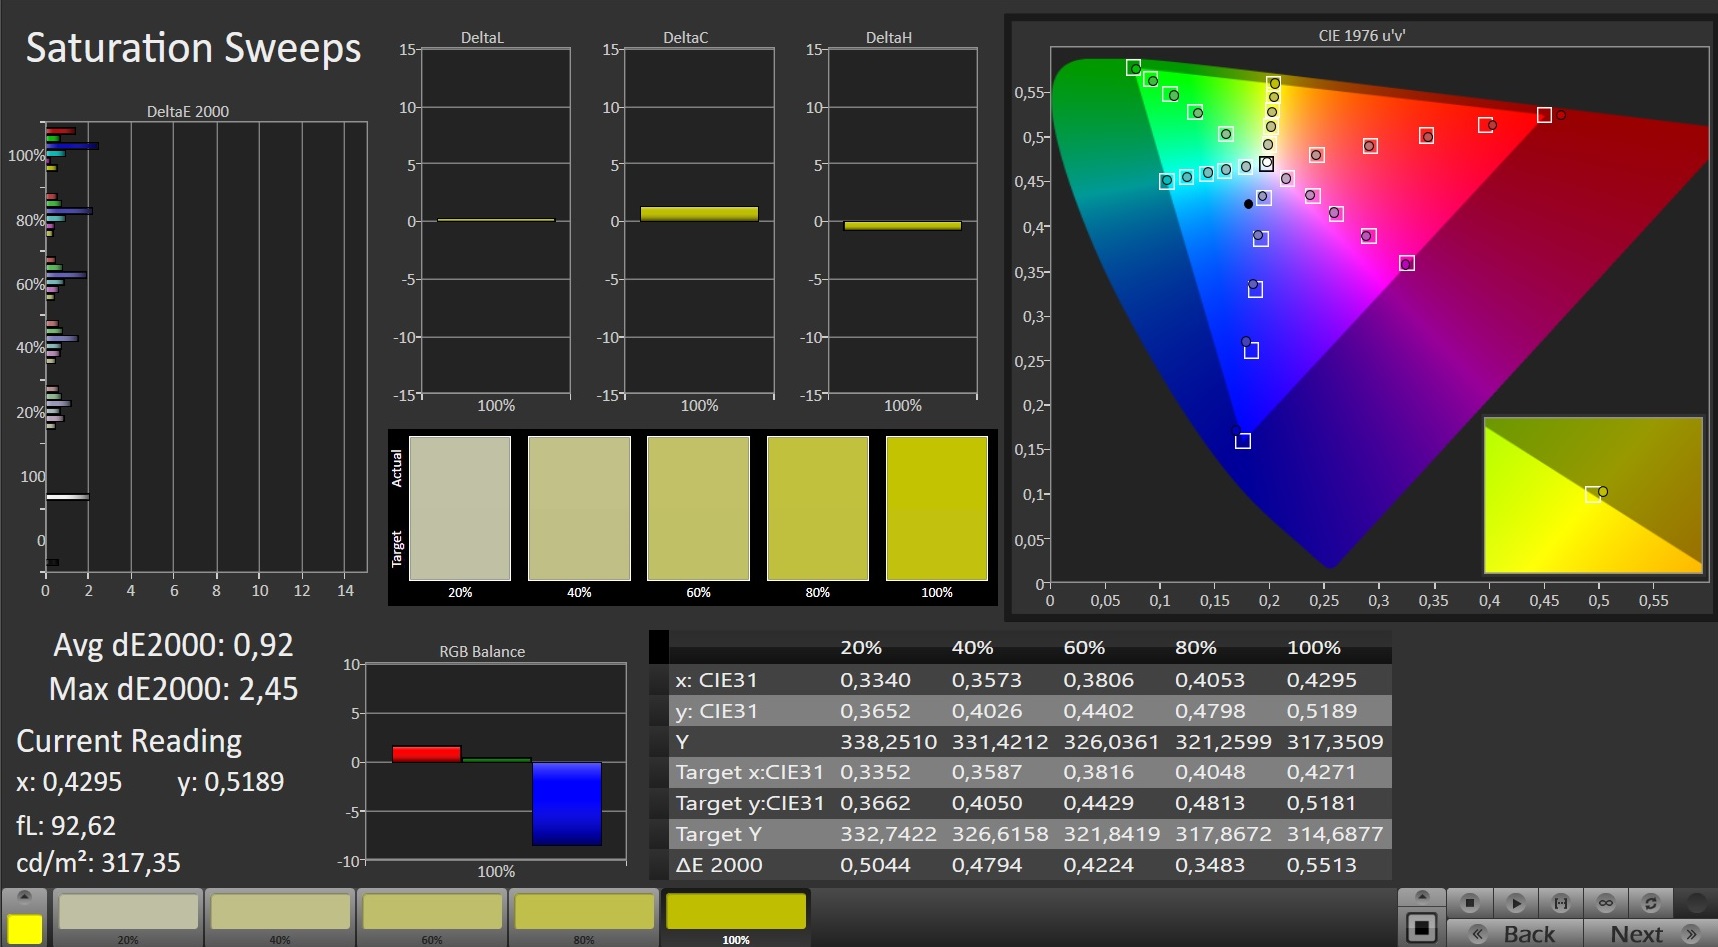
该显示器的X-Rite Pantone认证保证了非常自然的色彩再现。开箱后,颜色只在很小的程度上偏离了目标--你甚至无法察觉到这一点。显示器不会出现蓝色的色调。此外,校准可以使这些比率提高一些。色彩空间的覆盖率也令人印象深刻。AdobeRGB 1998和sRGB色彩空间的再现率为99%,而DCI-P3色彩空间的再现率为85%。

Display Response Times
| ↔ Response Time Black to White | ||
|---|---|---|
| 16 ms ... rise ↗ and fall ↘ combined | ↗ 4 ms rise | 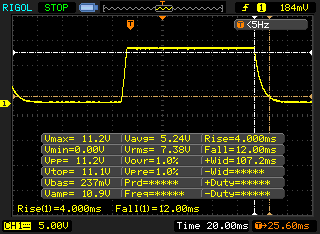 |
| ↘ 12 ms fall | ||
| The screen shows good response rates in our tests, but may be too slow for competitive gamers. In comparison, all tested devices range from 0.1 (minimum) to 240 (maximum) ms. » 37 % of all devices are better. This means that the measured response time is better than the average of all tested devices (19.8 ms). | ||
| ↔ Response Time 50% Grey to 80% Grey | ||
| 31.6 ms ... rise ↗ and fall ↘ combined | ↗ 8 ms rise | 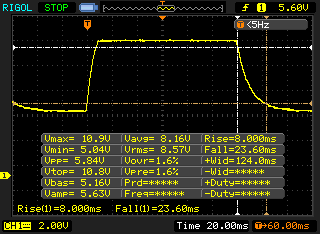 |
| ↘ 23.6 ms fall | ||
| The screen shows slow response rates in our tests and will be unsatisfactory for gamers. In comparison, all tested devices range from 0.165 (minimum) to 636 (maximum) ms. » 43 % of all devices are better. This means that the measured response time is similar to the average of all tested devices (30.9 ms). | ||
Screen Flickering / PWM (Pulse-Width Modulation)
| Screen flickering / PWM not detected | 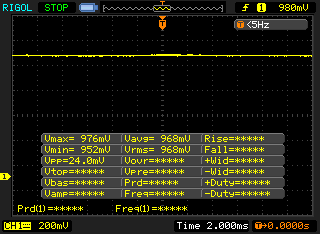 | ||
In comparison: 52 % of all tested devices do not use PWM to dim the display. If PWM was detected, an average of 7744 (minimum: 5 - maximum: 343500) Hz was measured. | |||
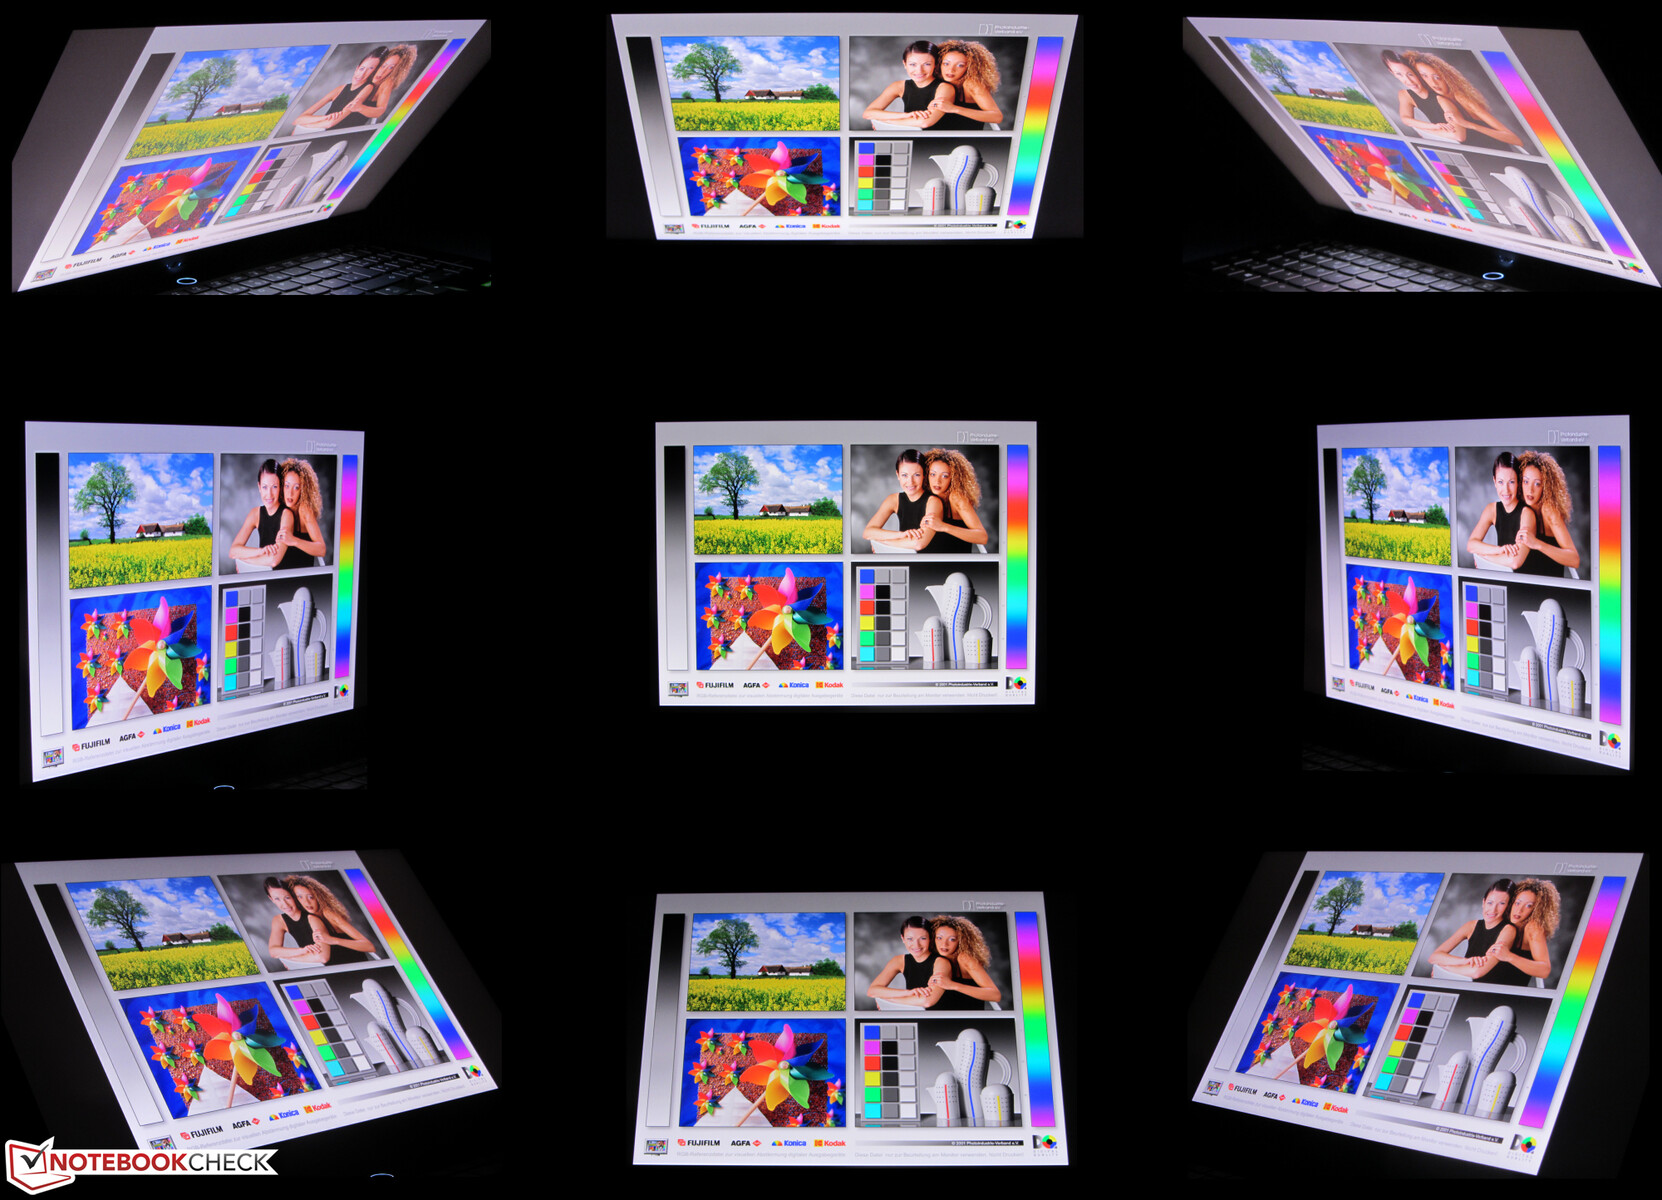
视角稳定的IPS面板在任何位置都能看清。由于高亮度,户外可读性是可能的。
性能 - 足以应付未来几年的需要
联想Legion S7 15ACH6将每一个现代游戏流畅地呈现在屏幕上,并且在其他所有的应用领域也有出色的表现。
测试条件
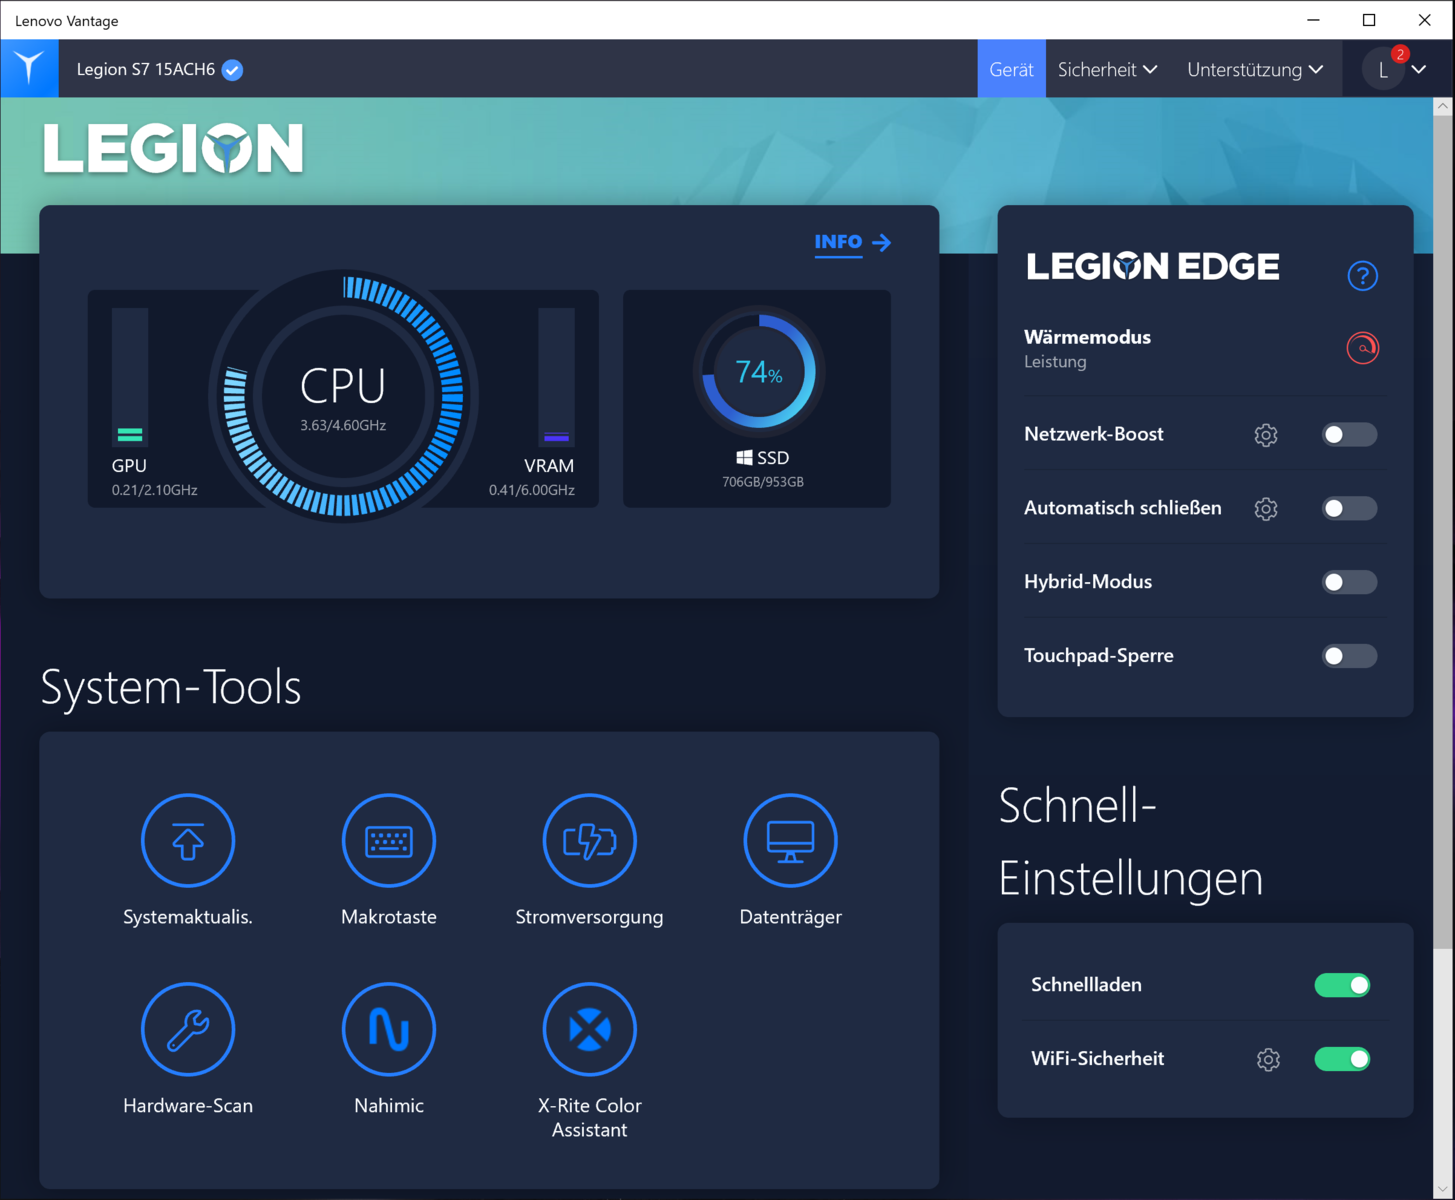
审查是使用 "性能模式 "配置文件进行的,它只在插电时可用。在电池测试中使用了 "平衡模式 "配置文件。此外,Nvidia的Optimus图形切换解决方案被激活。你可以使用组合键("Fn "+"Q")或联想预装的Vantage软件在三个笔记本配置文件(性能模式、平衡模式、静音模式)之间切换。电源按钮周围的LED环的颜色表明哪个配置文件处于活动状态。
| 性能模式 | 平衡模式 | 静音模式 | |
|---|---|---|---|
| 功率限制1 | 87.8瓦 | 54瓦 | 30瓦 |
| 功率限制2 | 87.8瓦 | 65瓦 | 38.4瓦 |
此外,还在禁用图形切换解决方案和启用超频功能的情况下进行了一些基准测试。结果可以在对比表中找到。iGPU(因此也包括Optimus)可以通过联想的Vantage软件("混合模式")禁用。

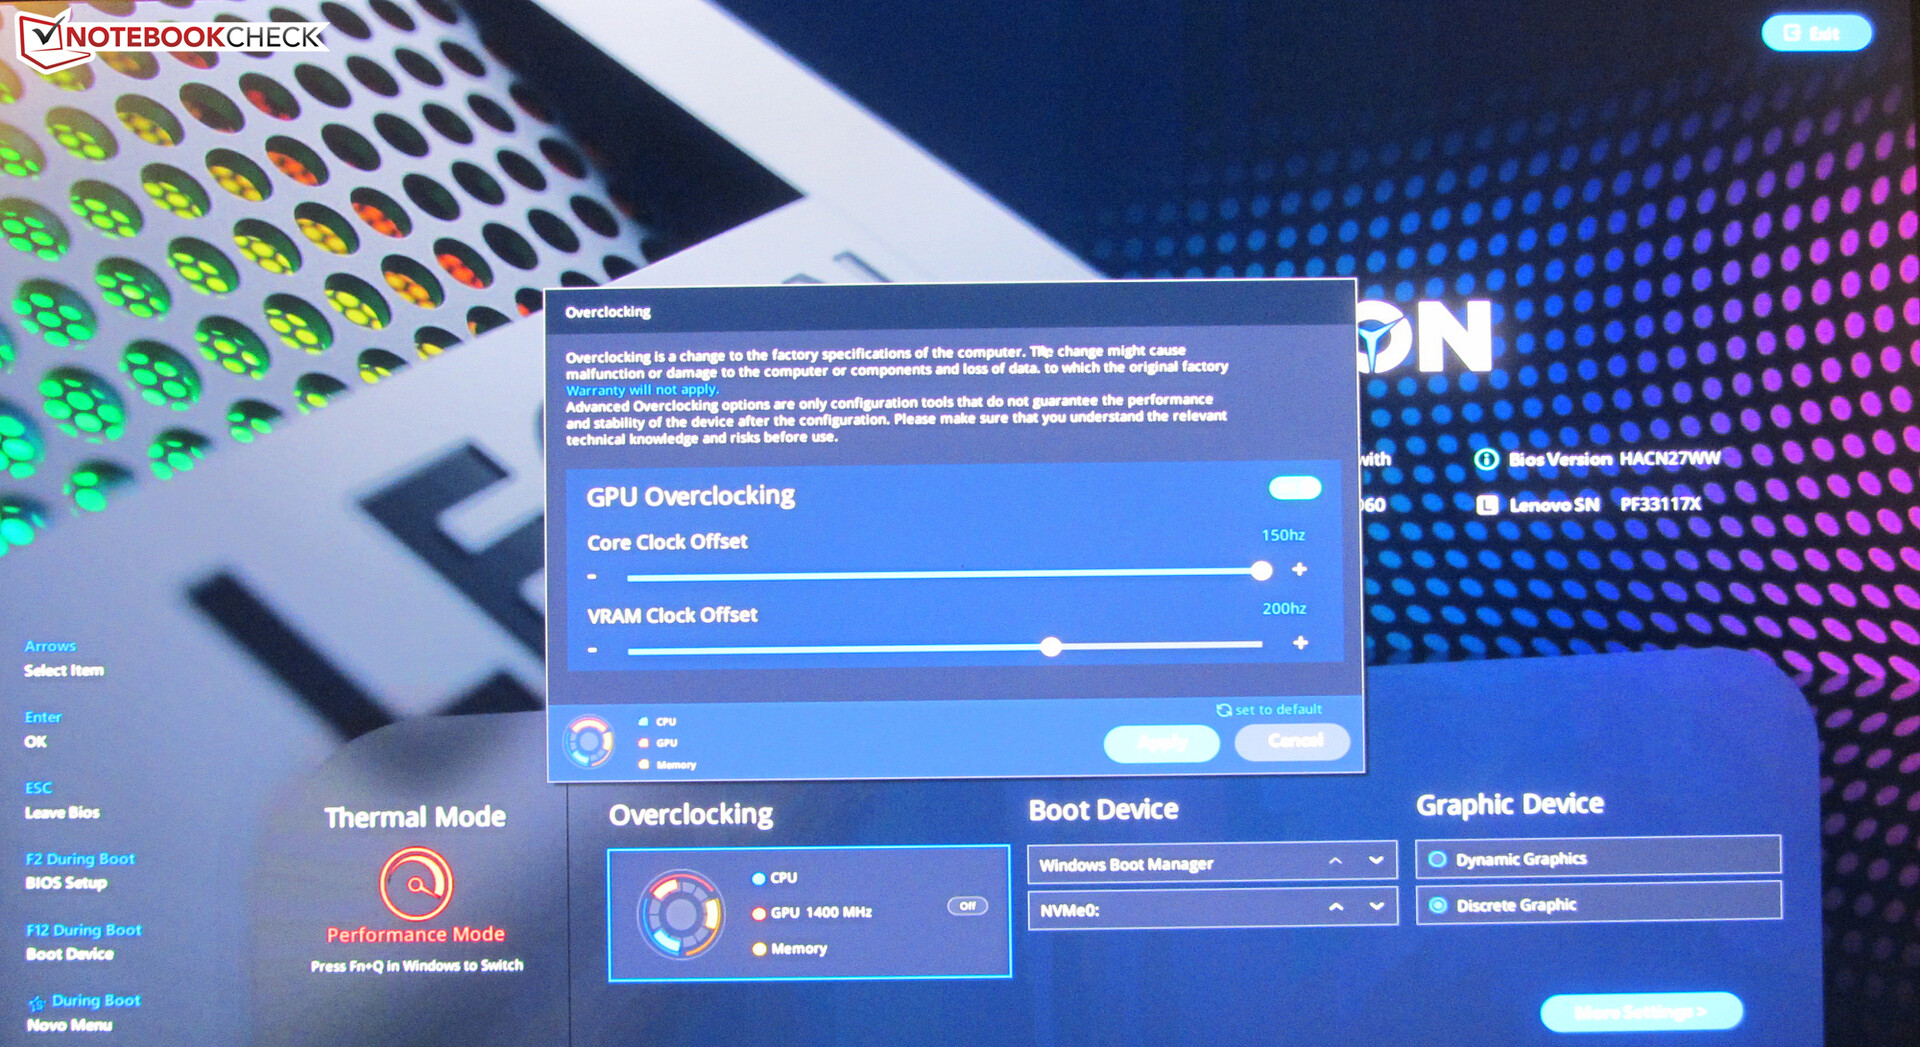
超频
笔记本电脑的BIOS提供了对GPU和显存进行超频的选项。我们对此进行了测试,并使用了系统提供的数值。在我们的测试设备中没有出现问题。系统保持稳定。超频总是在用户自己的风险下进行。

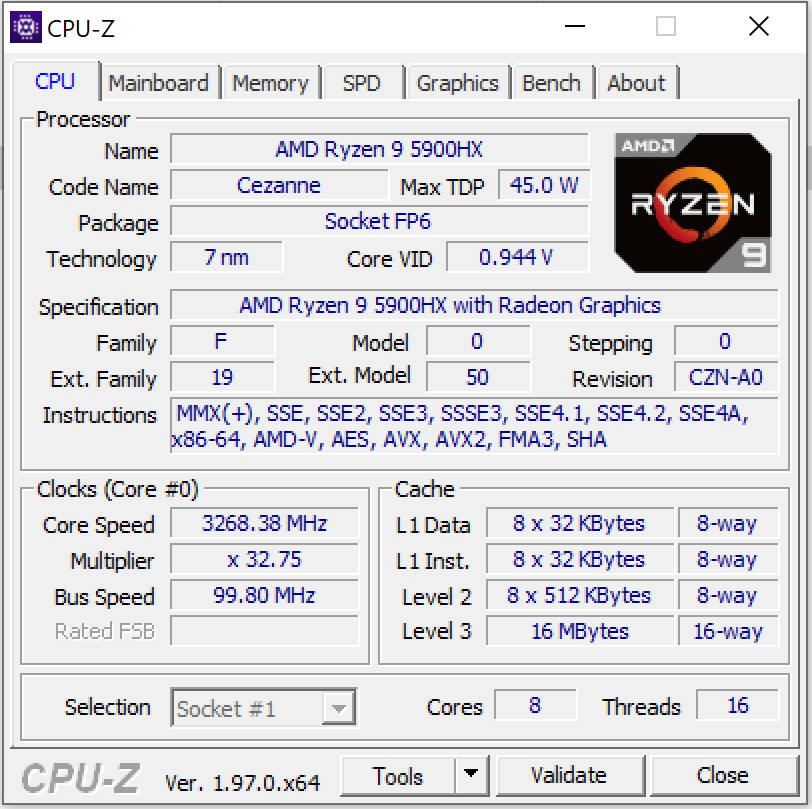
处理器
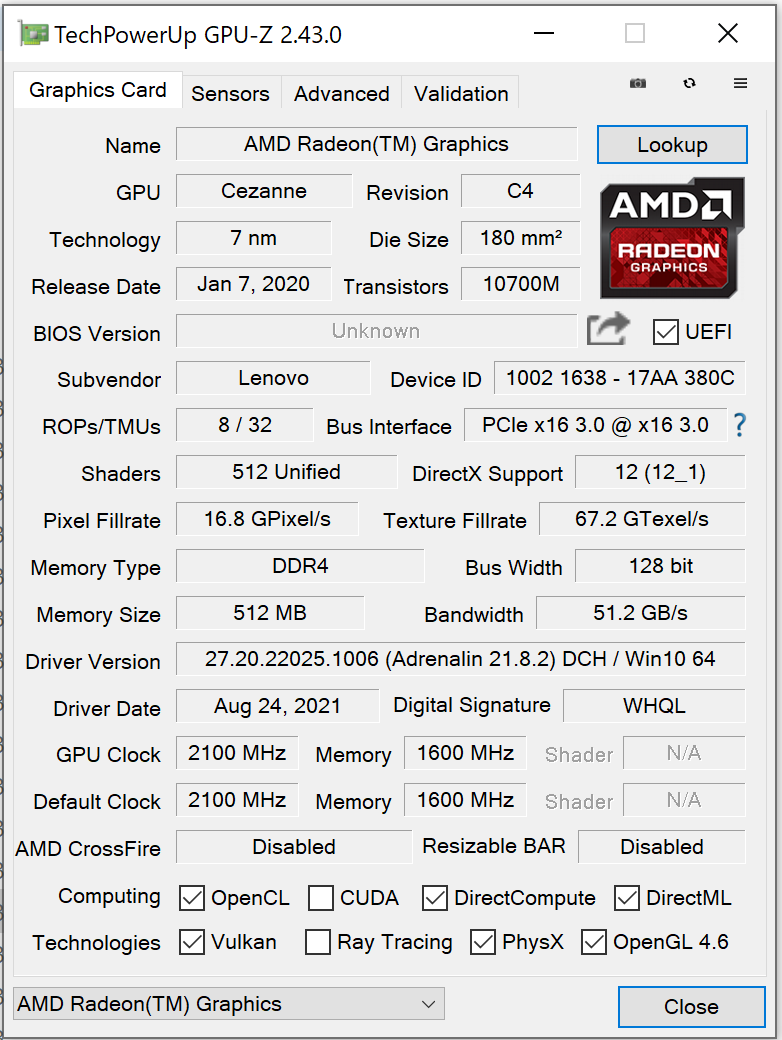
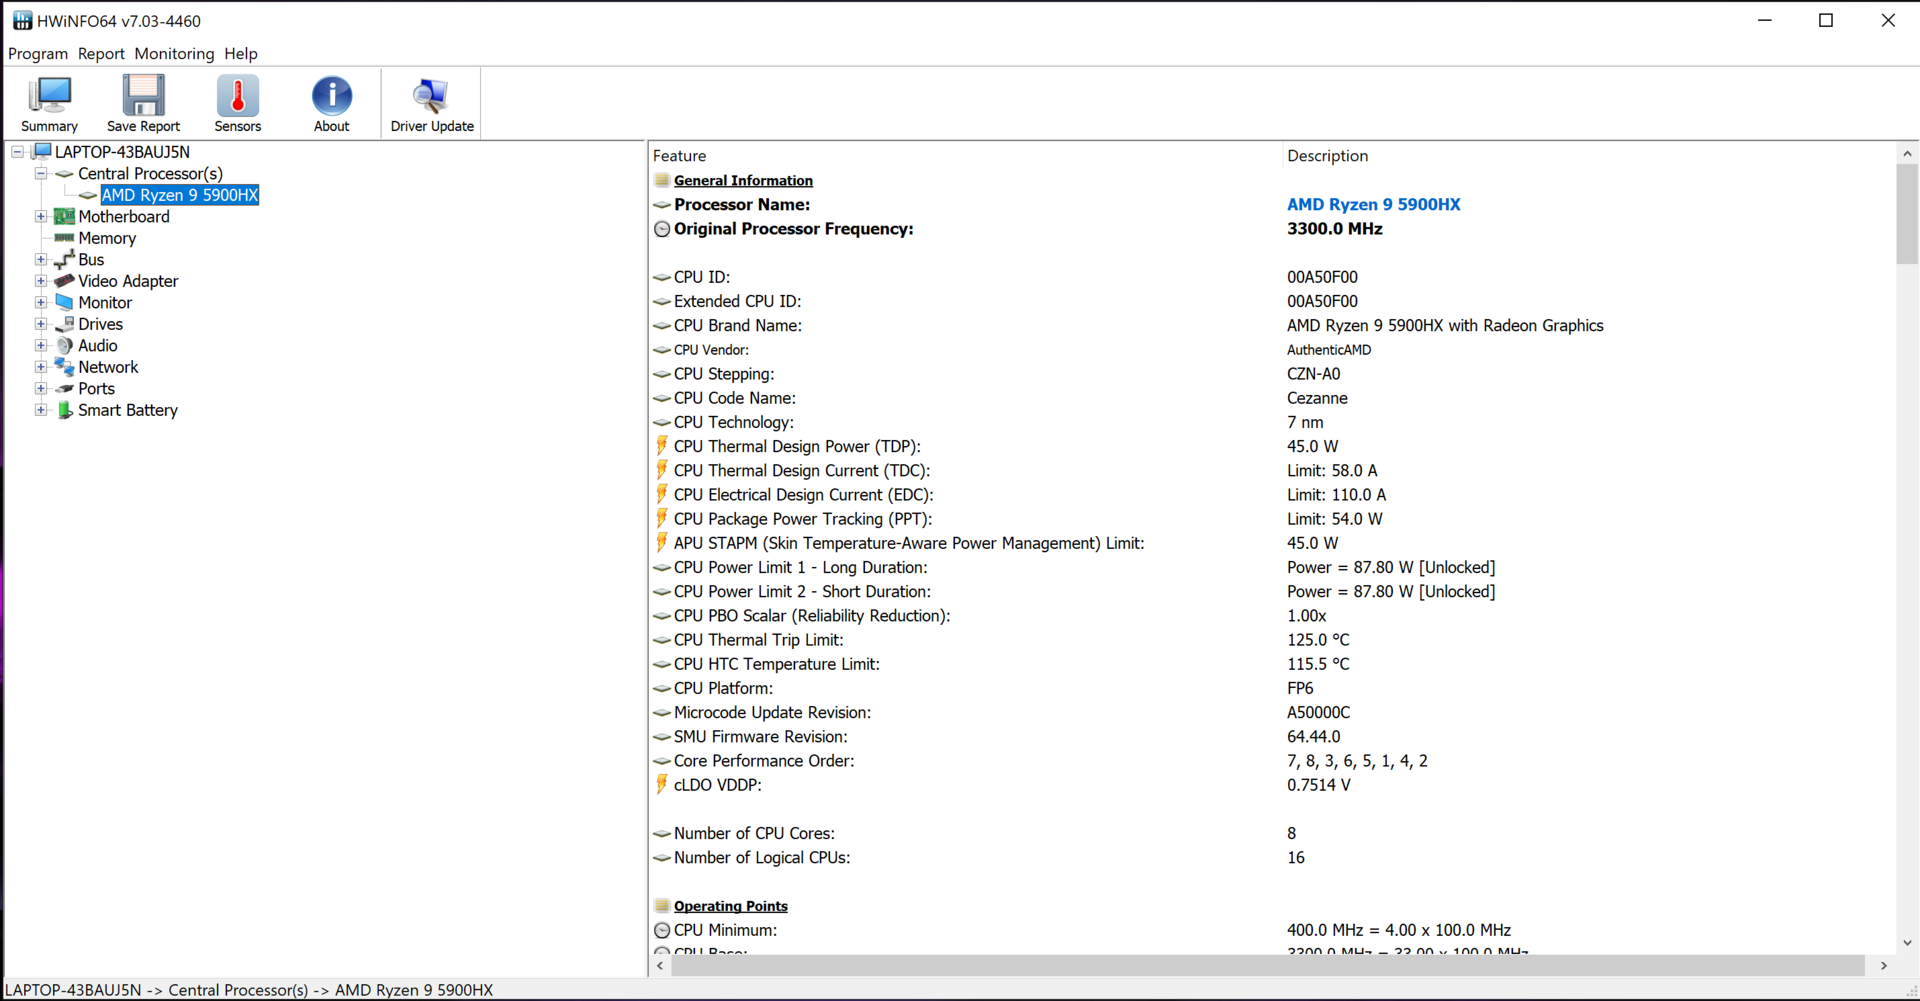
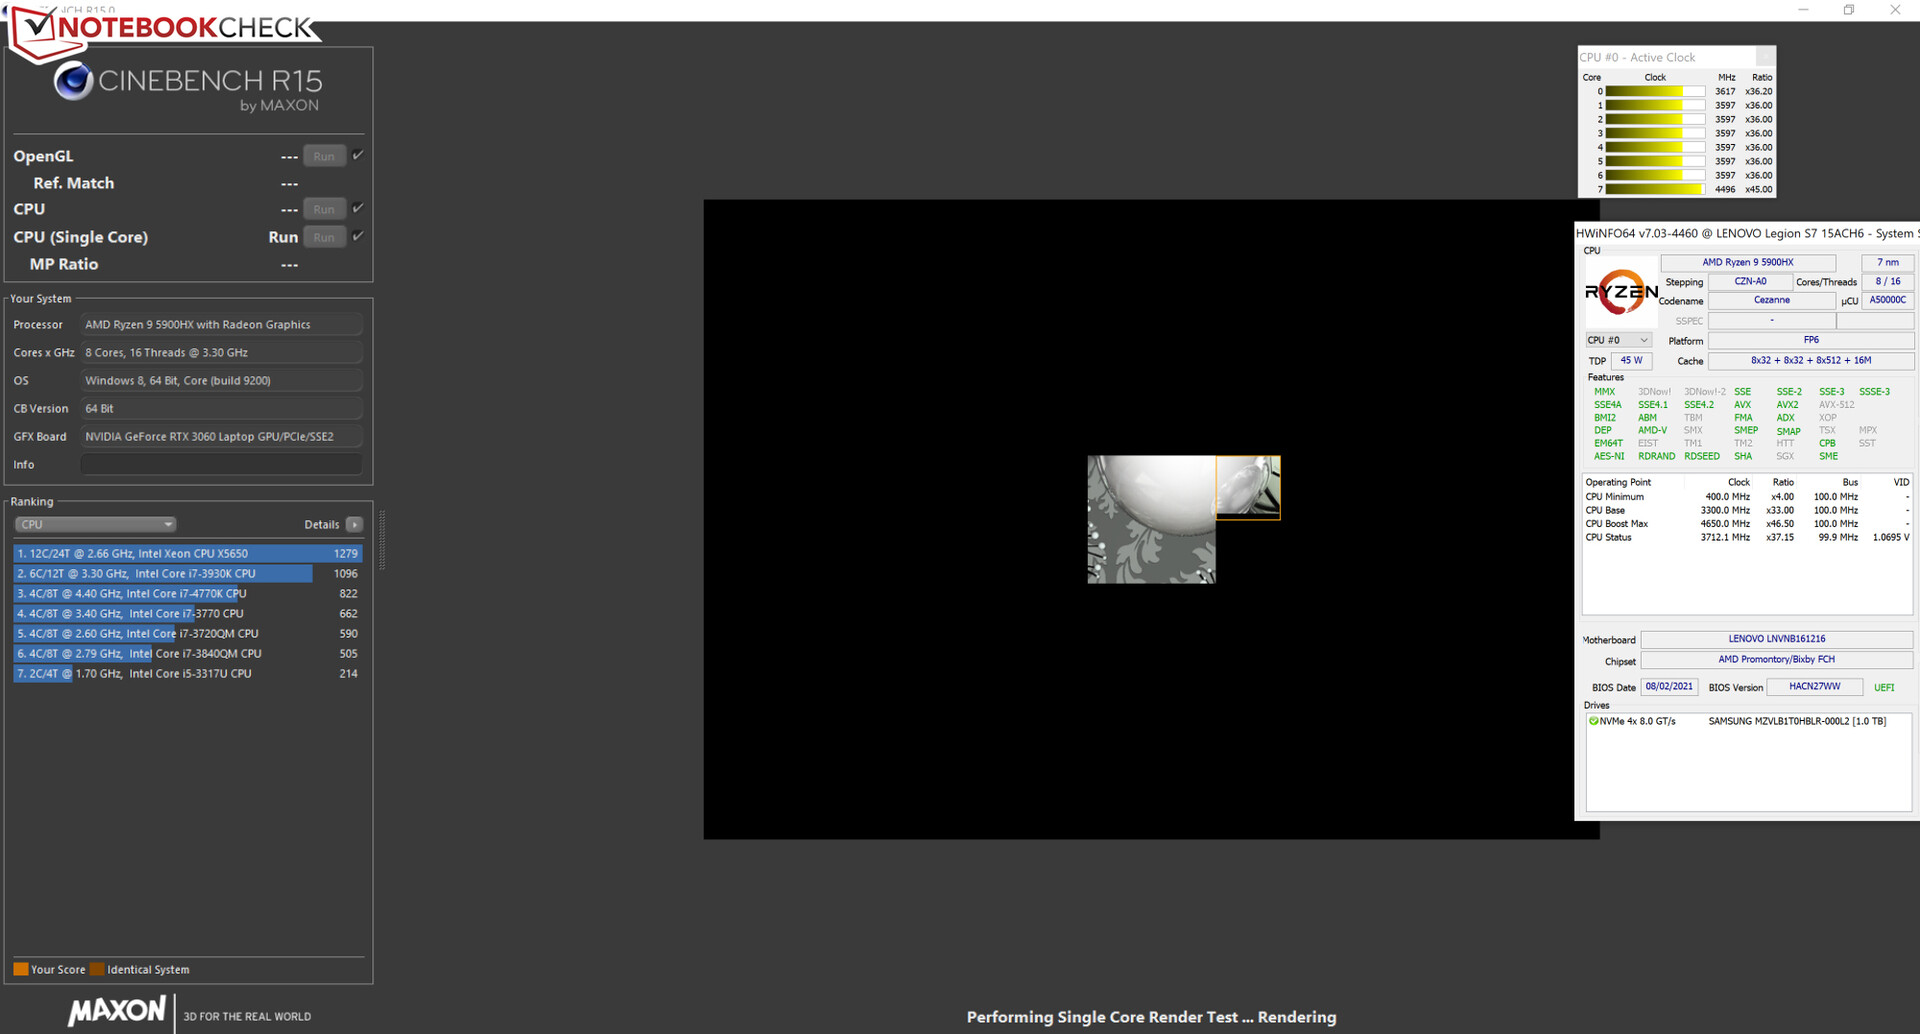
的CPU部分Ryzen 9 5900HXAPU(Cezanne)包括一个八核处理器,其基本时钟速度为3.3 GHz。通过Turbo可以提高到4.7GHz。支持同步多线程(每个核心两个线程)。
Cinebench R15基准的多线程CPU测试分别以4.1至4.3 GHz(插电)和3至3.2 GHz(电池供电)处理。单线程测试总是在3.6至4.5GHz下运行。
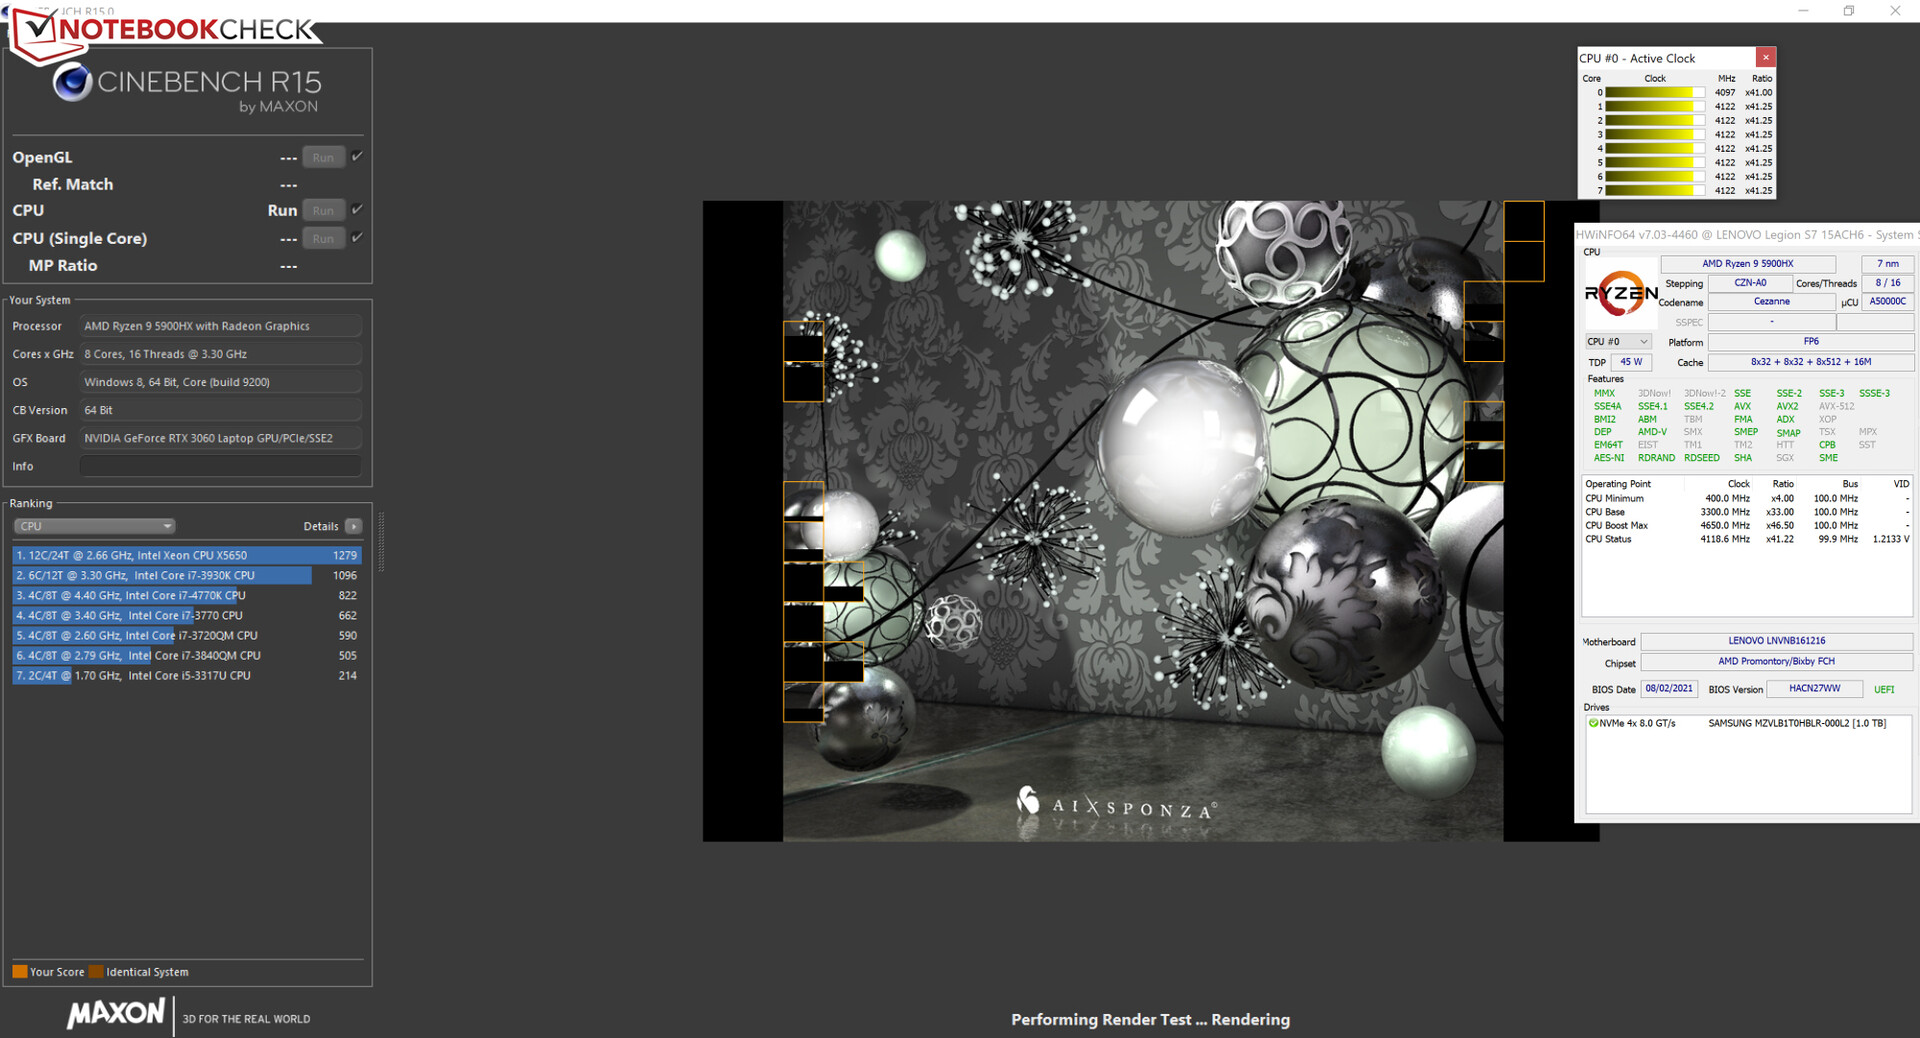
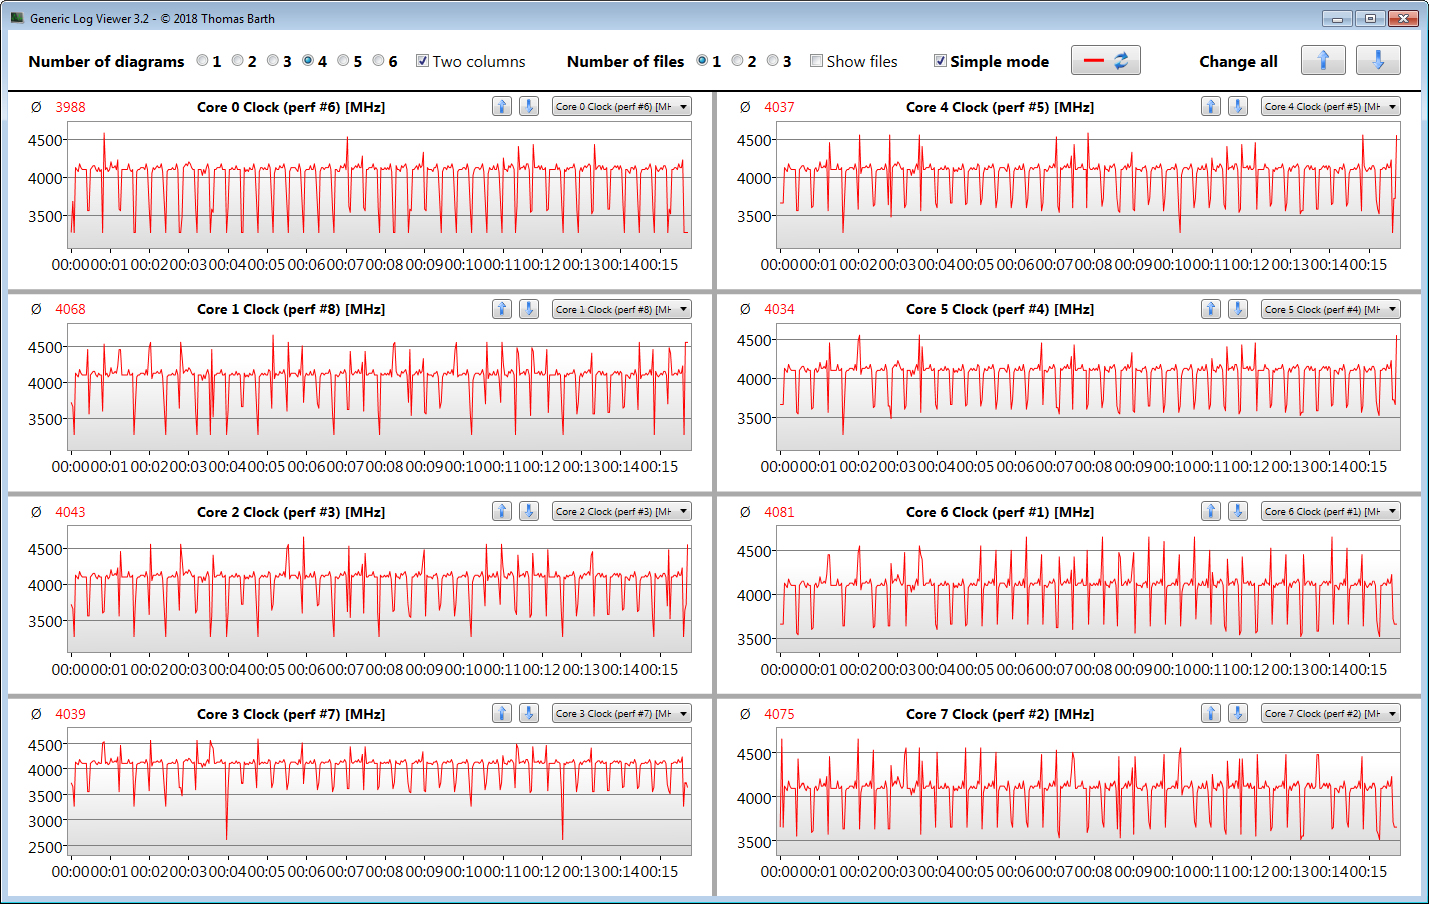
我们通过连续循环运行Cinebench R15基准的多线程测试至少30分钟来验证CPU Turbo在插电时是否被持续使用。Turbo在很大程度上被使用。
Cinebench R15 Multi endurance test
* ... smaller is better
AIDA64: FP32 Ray-Trace | FPU Julia | CPU SHA3 | CPU Queen | FPU SinJulia | FPU Mandel | CPU AES | CPU ZLib | FP64 Ray-Trace | CPU PhotoWorxx
| Performance rating | |
| Average of class Gaming | |
| Lenovo Legion S7 15ACH6 82K80030GE | |
| MSI Delta 15 A5EFK | |
| Average AMD Ryzen 9 5900HX | |
| Acer Nitro 5 AN515-45-R1JH | |
| Alienware m15 R5 Ryzen Edition | |
| AIDA64 / FP32 Ray-Trace | |
| Average of class Gaming (10227 - 85542, n=102, last 2 years) | |
| Lenovo Legion S7 15ACH6 82K80030GE (v6.33.5700) | |
| MSI Delta 15 A5EFK (v6.33.5700) | |
| Average AMD Ryzen 9 5900HX (12470 - 16014, n=26) | |
| Alienware m15 R5 Ryzen Edition (v6.33.5700) | |
| Acer Nitro 5 AN515-45-R1JH (v6.33.5700) | |
| AIDA64 / FPU Julia | |
| Average of class Gaming (51376 - 372155, n=102, last 2 years) | |
| Lenovo Legion S7 15ACH6 82K80030GE (v6.33.5700) | |
| MSI Delta 15 A5EFK (v6.33.5700) | |
| Average AMD Ryzen 9 5900HX (79554 - 101008, n=26) | |
| Alienware m15 R5 Ryzen Edition (v6.33.5700) | |
| Acer Nitro 5 AN515-45-R1JH (v6.33.5700) | |
| AIDA64 / CPU SHA3 | |
| Average of class Gaming (2180 - 10115, n=102, last 2 years) | |
| Lenovo Legion S7 15ACH6 82K80030GE (v6.33.5700) | |
| MSI Delta 15 A5EFK (v6.33.5700) | |
| Average AMD Ryzen 9 5900HX (2754 - 3444, n=26) | |
| Alienware m15 R5 Ryzen Edition (v6.33.5700) | |
| Acer Nitro 5 AN515-45-R1JH (v6.33.5700) | |
| AIDA64 / CPU Queen | |
| Average of class Gaming (49785 - 173351, n=86, last 2 years) | |
| MSI Delta 15 A5EFK (v6.33.5700) | |
| Lenovo Legion S7 15ACH6 82K80030GE (v6.33.5700) | |
| Average AMD Ryzen 9 5900HX (87865 - 105123, n=26) | |
| Acer Nitro 5 AN515-45-R1JH (v6.33.5700) | |
| Alienware m15 R5 Ryzen Edition (v6.33.5700) | |
| AIDA64 / FPU SinJulia | |
| Average of class Gaming (4424 - 33636, n=102, last 2 years) | |
| MSI Delta 15 A5EFK (v6.33.5700) | |
| Lenovo Legion S7 15ACH6 82K80030GE (v6.33.5700) | |
| Average AMD Ryzen 9 5900HX (10899 - 12806, n=26) | |
| Acer Nitro 5 AN515-45-R1JH (v6.33.5700) | |
| Alienware m15 R5 Ryzen Edition (v6.33.5700) | |
| AIDA64 / FPU Mandel | |
| Average of class Gaming (25115 - 196829, n=102, last 2 years) | |
| Lenovo Legion S7 15ACH6 82K80030GE (v6.33.5700) | |
| MSI Delta 15 A5EFK (v6.33.5700) | |
| Average AMD Ryzen 9 5900HX (43685 - 55702, n=26) | |
| Acer Nitro 5 AN515-45-R1JH (v6.33.5700) | |
| Alienware m15 R5 Ryzen Edition (v6.33.5700) | |
| AIDA64 / CPU AES | |
| Lenovo Legion S7 15ACH6 82K80030GE (v6.33.5700) | |
| MSI Delta 15 A5EFK (v6.33.5700) | |
| Average AMD Ryzen 9 5900HX (109927 - 137901, n=26) | |
| Alienware m15 R5 Ryzen Edition (v6.33.5700) | |
| Acer Nitro 5 AN515-45-R1JH (v6.33.5700) | |
| Average of class Gaming (39258 - 247074, n=102, last 2 years) | |
| AIDA64 / CPU ZLib | |
| Average of class Gaming (574 - 2531, n=102, last 2 years) | |
| Lenovo Legion S7 15ACH6 82K80030GE (v6.33.5700) | |
| MSI Delta 15 A5EFK (v6.33.5700) | |
| Average AMD Ryzen 9 5900HX (706 - 878, n=26) | |
| Alienware m15 R5 Ryzen Edition (v6.33.5700) | |
| Acer Nitro 5 AN515-45-R1JH (v6.33.5700) | |
| AIDA64 / FP64 Ray-Trace | |
| Average of class Gaming (5509 - 45446, n=102, last 2 years) | |
| Lenovo Legion S7 15ACH6 82K80030GE (v6.33.5700) | |
| Average AMD Ryzen 9 5900HX (6664 - 8644, n=26) | |
| MSI Delta 15 A5EFK (v6.33.5700) | |
| Alienware m15 R5 Ryzen Edition (v6.33.5700) | |
| Acer Nitro 5 AN515-45-R1JH (v6.33.5700) | |
| AIDA64 / CPU PhotoWorxx | |
| Average of class Gaming (12271 - 89891, n=102, last 2 years) | |
| MSI Delta 15 A5EFK (v6.33.5700) | |
| Lenovo Legion S7 15ACH6 82K80030GE (v6.33.5700) | |
| Average AMD Ryzen 9 5900HX (14344 - 25533, n=26) | |
| Acer Nitro 5 AN515-45-R1JH (v6.33.5700) | |
| Alienware m15 R5 Ryzen Edition (v6.33.5700) | |
系统性能
快速而流畅的系统为未来几年的游戏、视频编辑和图像处理等苛刻的应用提供了足够的计算能力。伴随着这一点的是非常好的PCMark结果。
| PCMark 8 Home Score Accelerated v2 | 4537 points | |
| PCMark 8 Creative Score Accelerated v2 | 5749 points | |
| PCMark 8 Work Score Accelerated v2 | 4936 points | |
| PCMark 10 Score | 6505 points | |
Help | ||
| PCMark 10 / Score | |
| Average of class Gaming (5828 - 12414, n=93, last 2 years) | |
| MSI Delta 15 A5EFK | |
| Acer Nitro 5 AN515-45-R1JH | |
| Average AMD Ryzen 9 5900HX, NVIDIA GeForce RTX 3060 Laptop GPU (6505 - 6725, n=2) | |
| Lenovo Legion S7 15ACH6 82K80030GE | |
| Alienware m15 R5 Ryzen Edition | |
| Razer Blade 15 Base Edition 2021, i7-10750H RTX 3060 | |
| PCMark 10 / Essentials | |
| Average of class Gaming (8810 - 11935, n=97, last 2 years) | |
| MSI Delta 15 A5EFK | |
| Razer Blade 15 Base Edition 2021, i7-10750H RTX 3060 | |
| Average AMD Ryzen 9 5900HX, NVIDIA GeForce RTX 3060 Laptop GPU (9827 - 10324, n=2) | |
| Acer Nitro 5 AN515-45-R1JH | |
| Lenovo Legion S7 15ACH6 82K80030GE | |
| Alienware m15 R5 Ryzen Edition | |
| PCMark 10 / Productivity | |
| Average of class Gaming (6845 - 25323, n=95, last 2 years) | |
| MSI Delta 15 A5EFK | |
| Acer Nitro 5 AN515-45-R1JH | |
| Average AMD Ryzen 9 5900HX, NVIDIA GeForce RTX 3060 Laptop GPU (8803 - 9128, n=2) | |
| Alienware m15 R5 Ryzen Edition | |
| Lenovo Legion S7 15ACH6 82K80030GE | |
| Razer Blade 15 Base Edition 2021, i7-10750H RTX 3060 | |
| PCMark 10 / Digital Content Creation | |
| Average of class Gaming (7602 - 19954, n=95, last 2 years) | |
| MSI Delta 15 A5EFK | |
| Acer Nitro 5 AN515-45-R1JH | |
| Average AMD Ryzen 9 5900HX, NVIDIA GeForce RTX 3060 Laptop GPU (8634 - 8759, n=2) | |
| Lenovo Legion S7 15ACH6 82K80030GE | |
| Alienware m15 R5 Ryzen Edition | |
| Razer Blade 15 Base Edition 2021, i7-10750H RTX 3060 | |
| AIDA64 / Memory Copy | |
| Average of class Gaming (21750 - 129946, n=102, last 2 years) | |
| MSI Delta 15 A5EFK (v6.33.5700) | |
| Lenovo Legion S7 15ACH6 82K80030GE (v6.33.5700) | |
| Average AMD Ryzen 9 5900HX (36725 - 43318, n=26) | |
| Alienware m15 R5 Ryzen Edition (v6.33.5700) | |
| Acer Nitro 5 AN515-45-R1JH (v6.33.5700) | |
| AIDA64 / Memory Read | |
| Average of class Gaming (22956 - 118858, n=102, last 2 years) | |
| MSI Delta 15 A5EFK (v6.33.5700) | |
| Average AMD Ryzen 9 5900HX (41378 - 47593, n=26) | |
| Lenovo Legion S7 15ACH6 82K80030GE (v6.33.5700) | |
| Alienware m15 R5 Ryzen Edition (v6.33.5700) | |
| Acer Nitro 5 AN515-45-R1JH (v6.33.5700) | |
| AIDA64 / Memory Write | |
| Average of class Gaming (22297 - 135096, n=102, last 2 years) | |
| MSI Delta 15 A5EFK (v6.33.5700) | |
| Average AMD Ryzen 9 5900HX (32536 - 46718, n=26) | |
| Lenovo Legion S7 15ACH6 82K80030GE (v6.33.5700) | |
| Alienware m15 R5 Ryzen Edition (v6.33.5700) | |
| Acer Nitro 5 AN515-45-R1JH (v6.33.5700) | |
| AIDA64 / Memory Latency | |
| Average of class Gaming (75.3 - 165.4, n=102, last 2 years) | |
| Average AMD Ryzen 9 5900HX (73.5 - 97.1, n=26) | |
| Lenovo Legion S7 15ACH6 82K80030GE (v6.33.5700) | |
| Alienware m15 R5 Ryzen Edition (v6.33.5700) | |
| MSI Delta 15 A5EFK (v6.33.5700) | |
| Acer Nitro 5 AN515-45-R1JH (v6.33.5700) | |
* ... smaller is better
DPC延迟
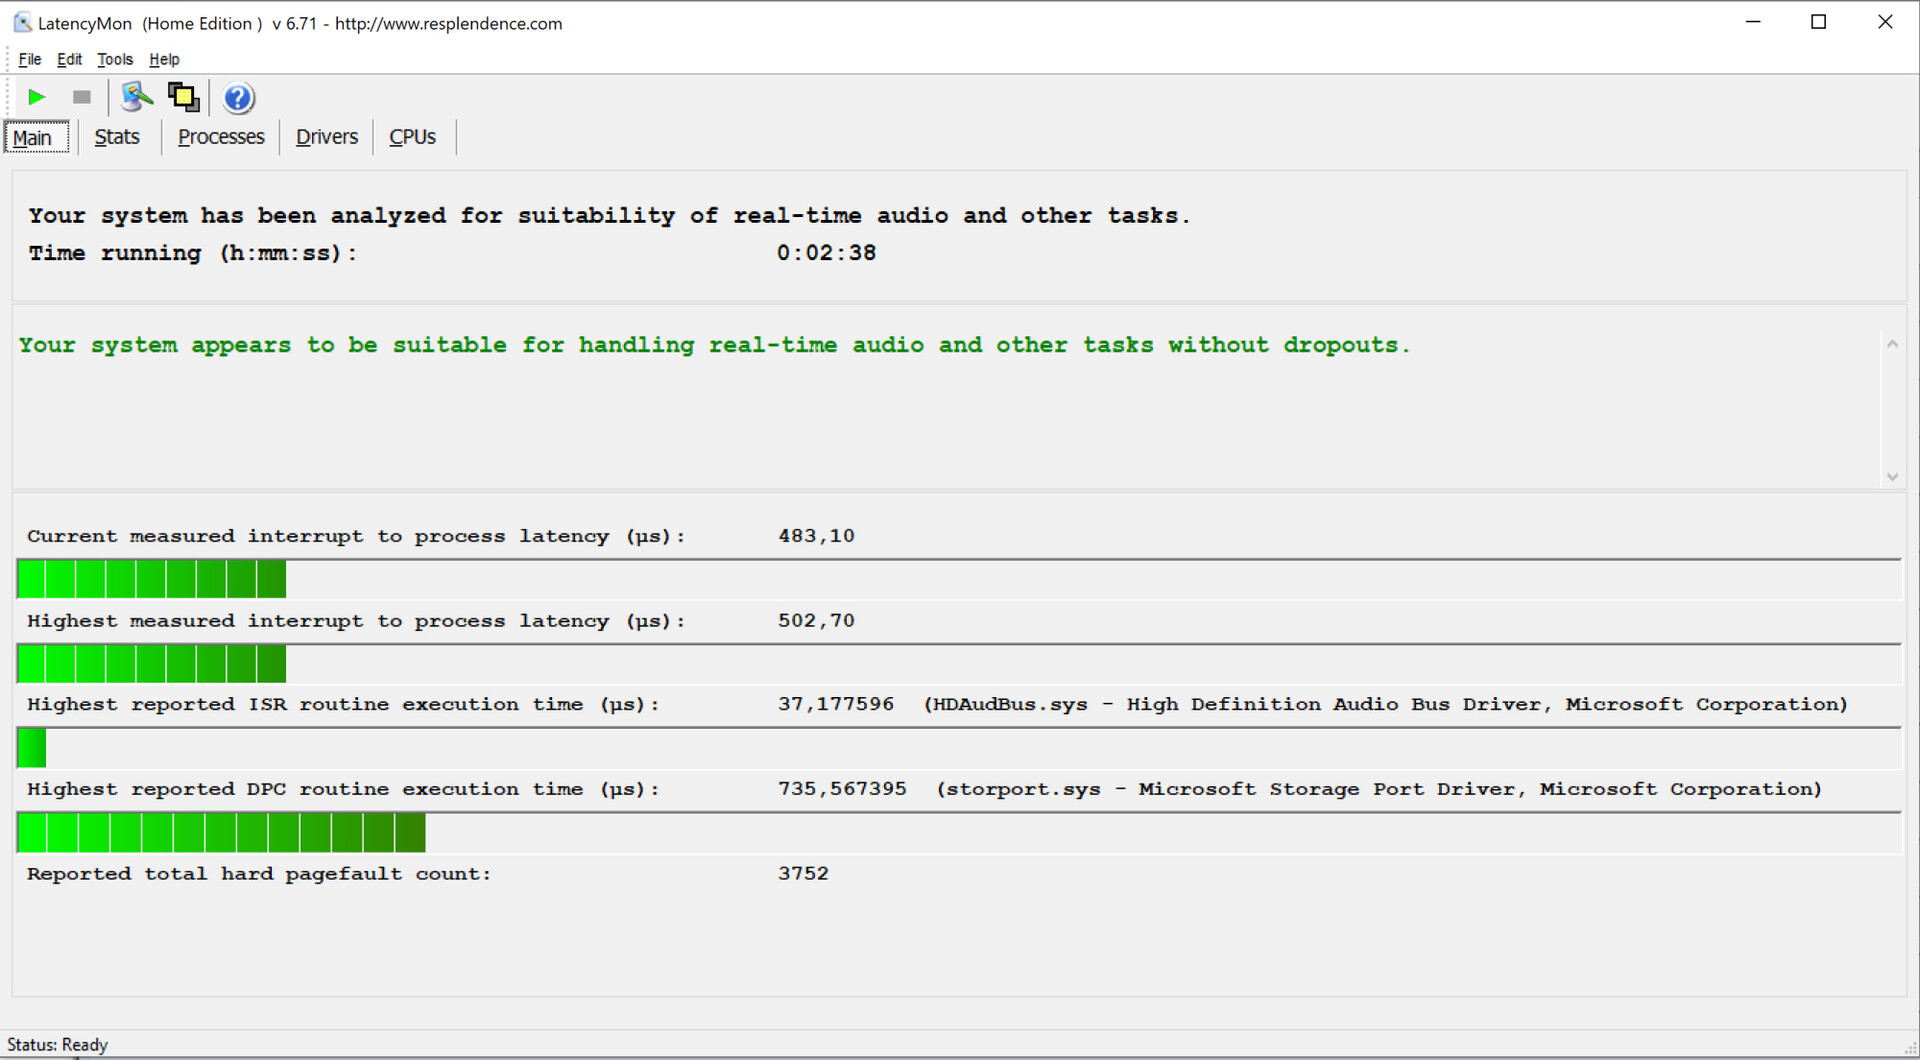
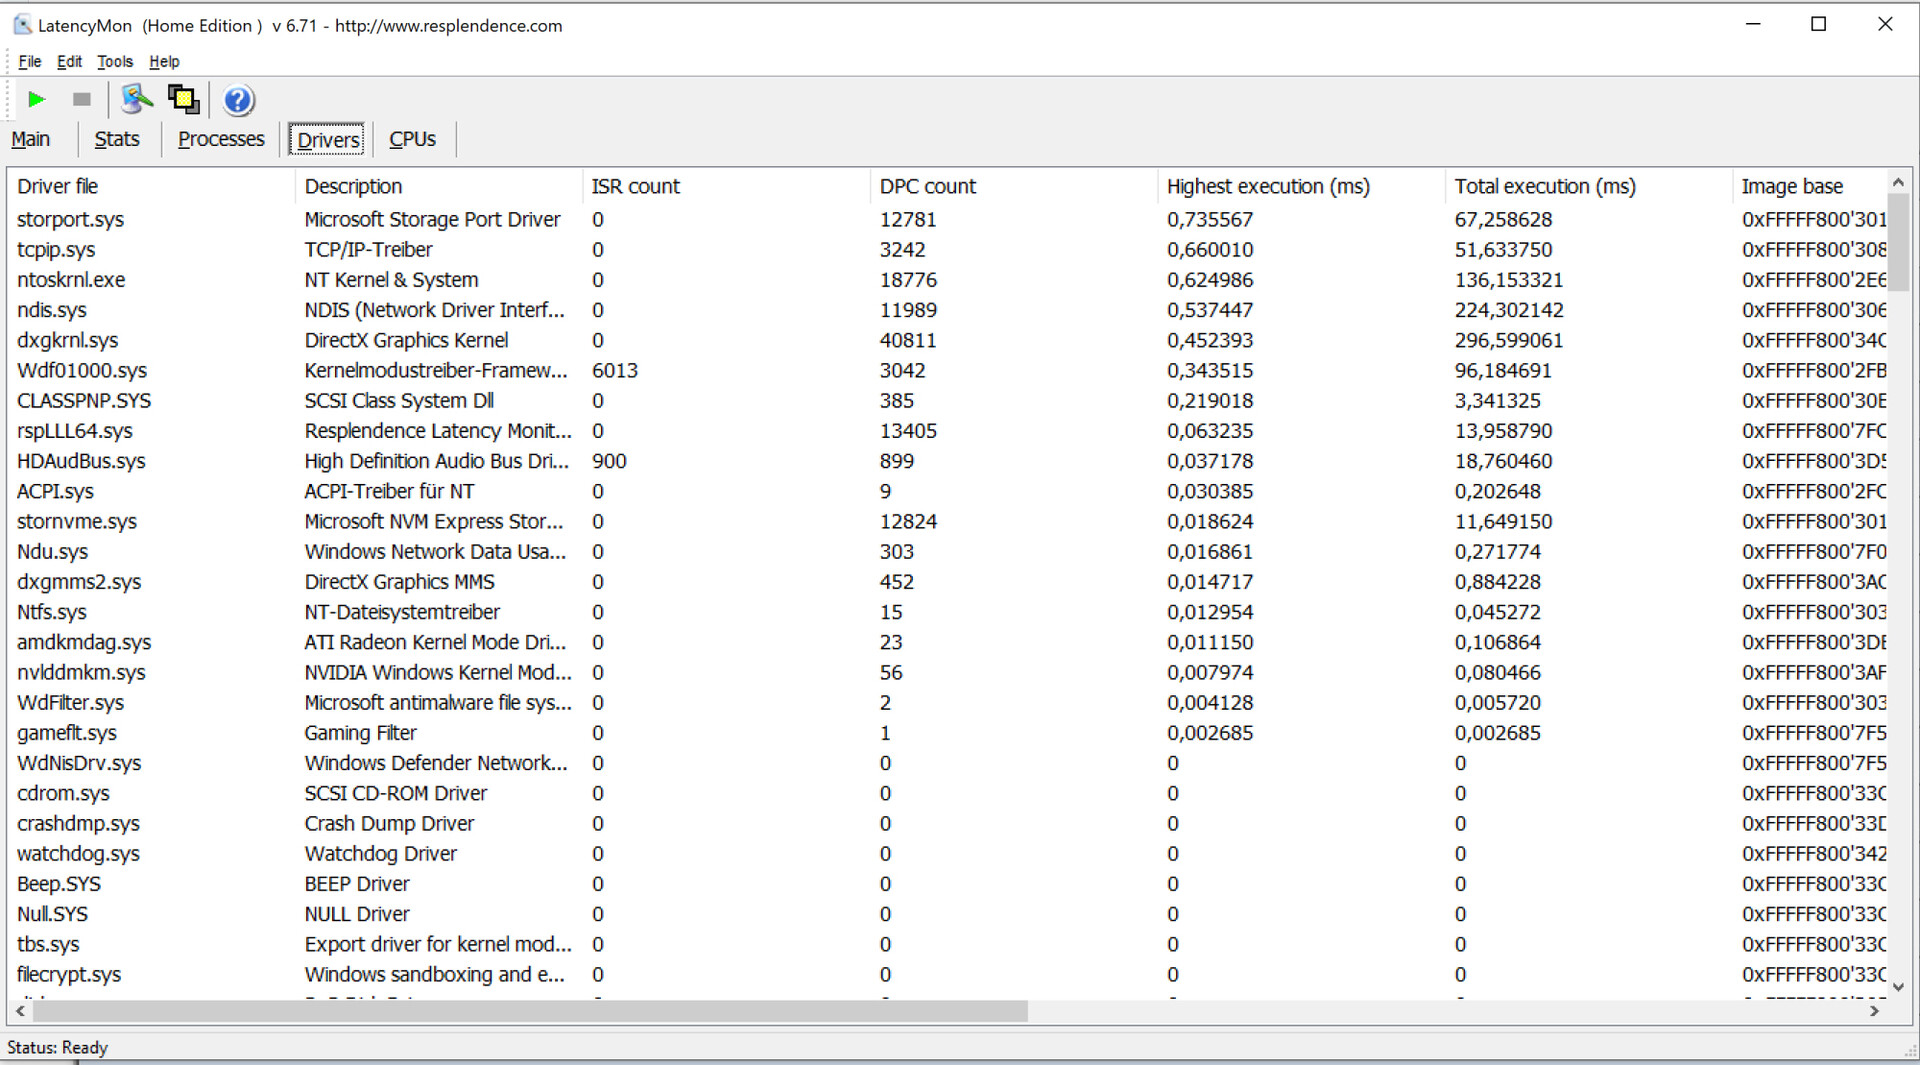
标准化的延迟监测测试(网络冲浪、4K视频播放、高负荷的Prime95)没有发现DPC延迟的任何不正常现象。该系统似乎适用于实时视频和音频编辑。这一声明是基于我们在测试时运行最新软件的审查设备。未来的更新可能会导致性能的改善或甚至更差。
| DPC Latencies / LatencyMon - interrupt to process latency (max), Web, Youtube, Prime95 | |
| MSI Delta 15 A5EFK | |
| Razer Blade 15 Base Edition 2021, i7-10750H RTX 3060 | |
| Lenovo Legion S7 15ACH6 82K80030GE | |
| Alienware m15 R5 Ryzen Edition | |
| Acer Nitro 5 AN515-45-R1JH | |
* ... smaller is better
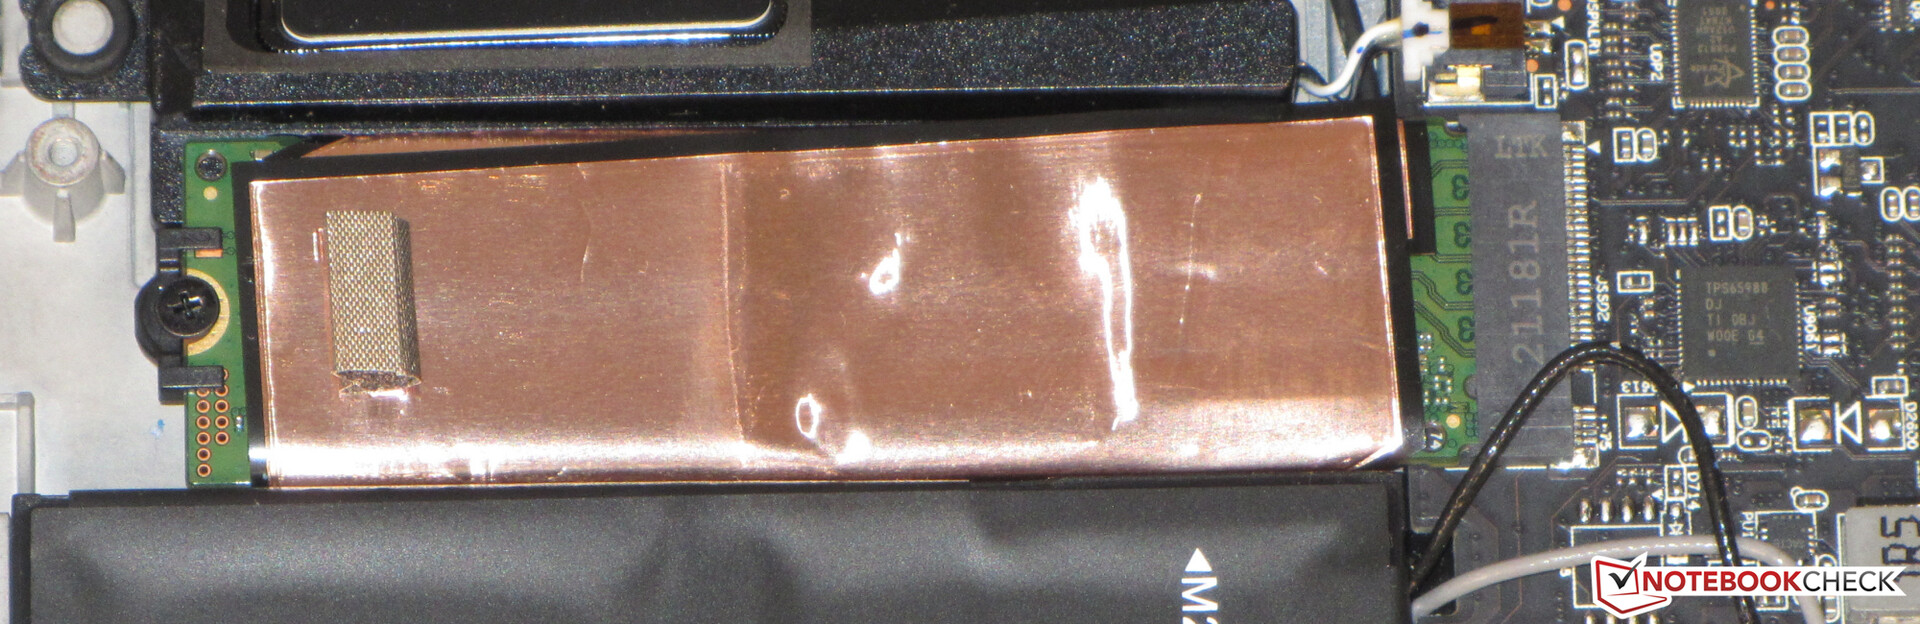
储存
三星的NVMe SSD(M.2 2280;2242型号也适用)作为系统驱动器。它提供1TB的存储空间,并提供良好的传输速率。笔记本电脑可以容纳第二个NVMe SSD(M.2 2280/M.2 2242)。
* ... smaller is better

Continuous load read: DiskSpd Read Loop, Queue Depth 8
图形卡
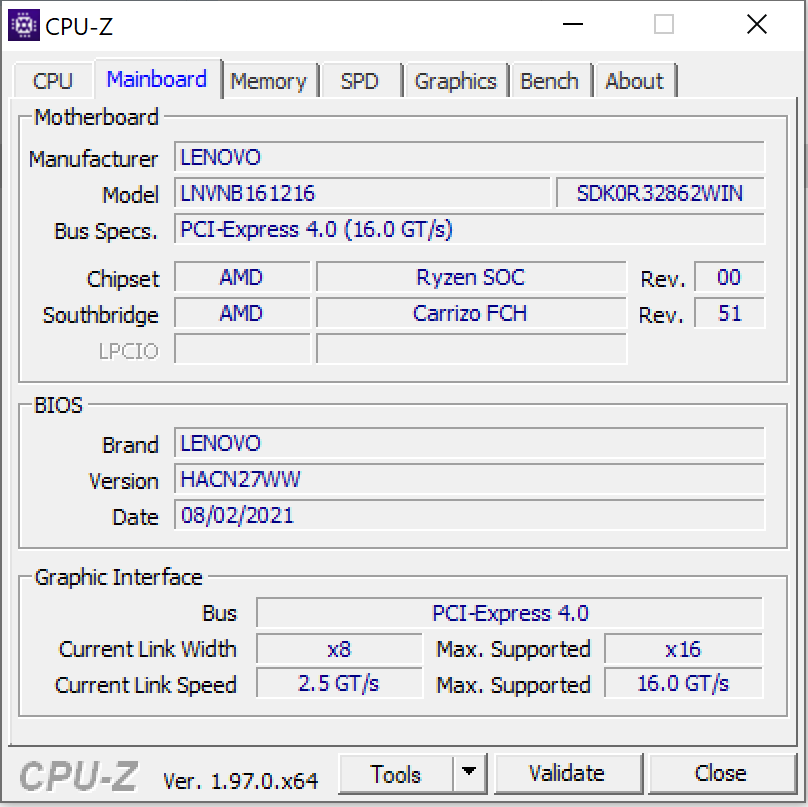
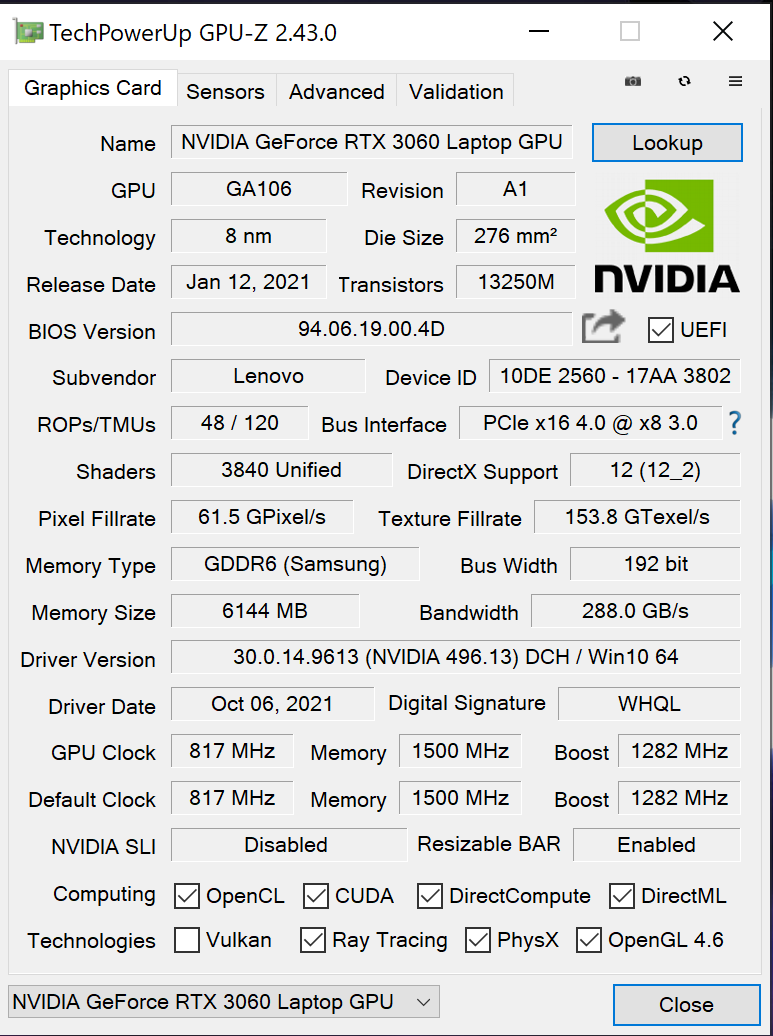
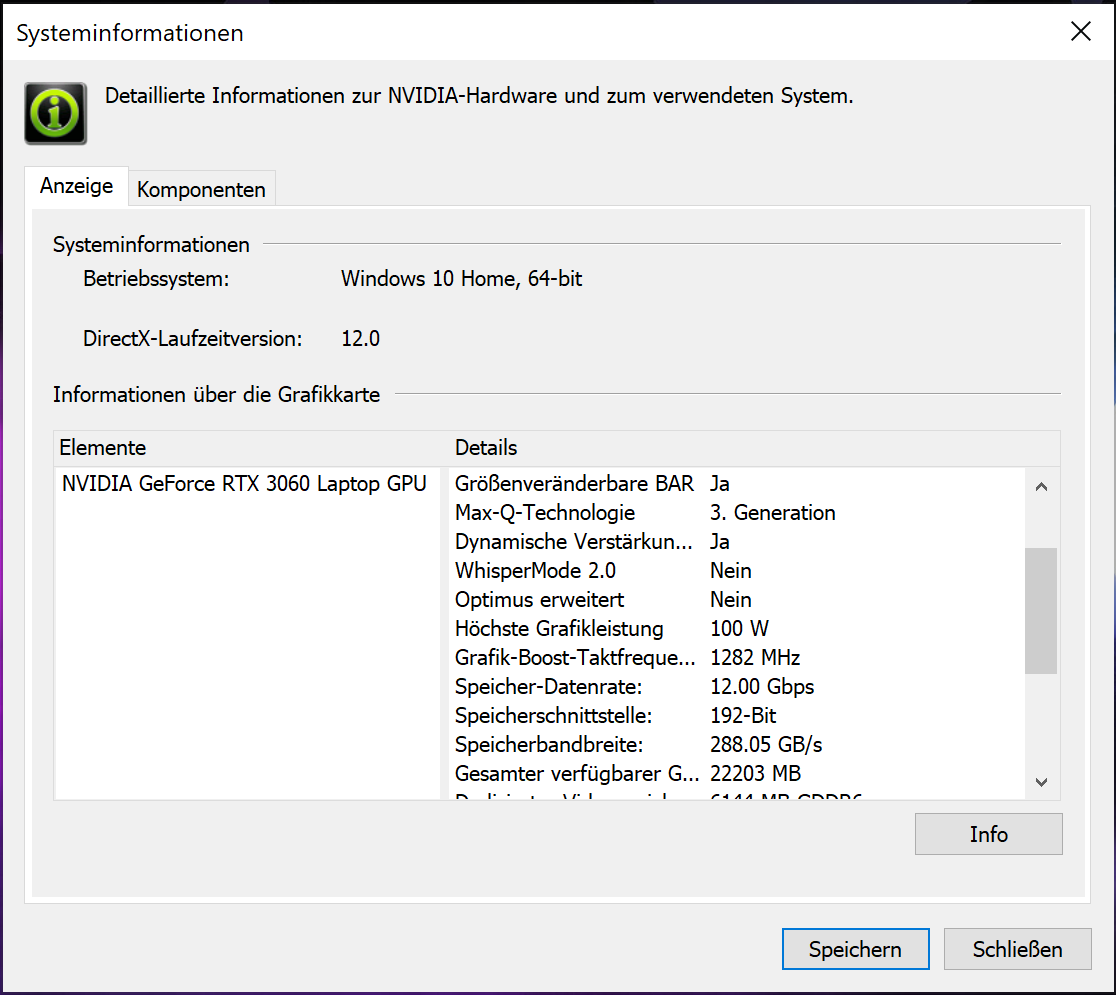
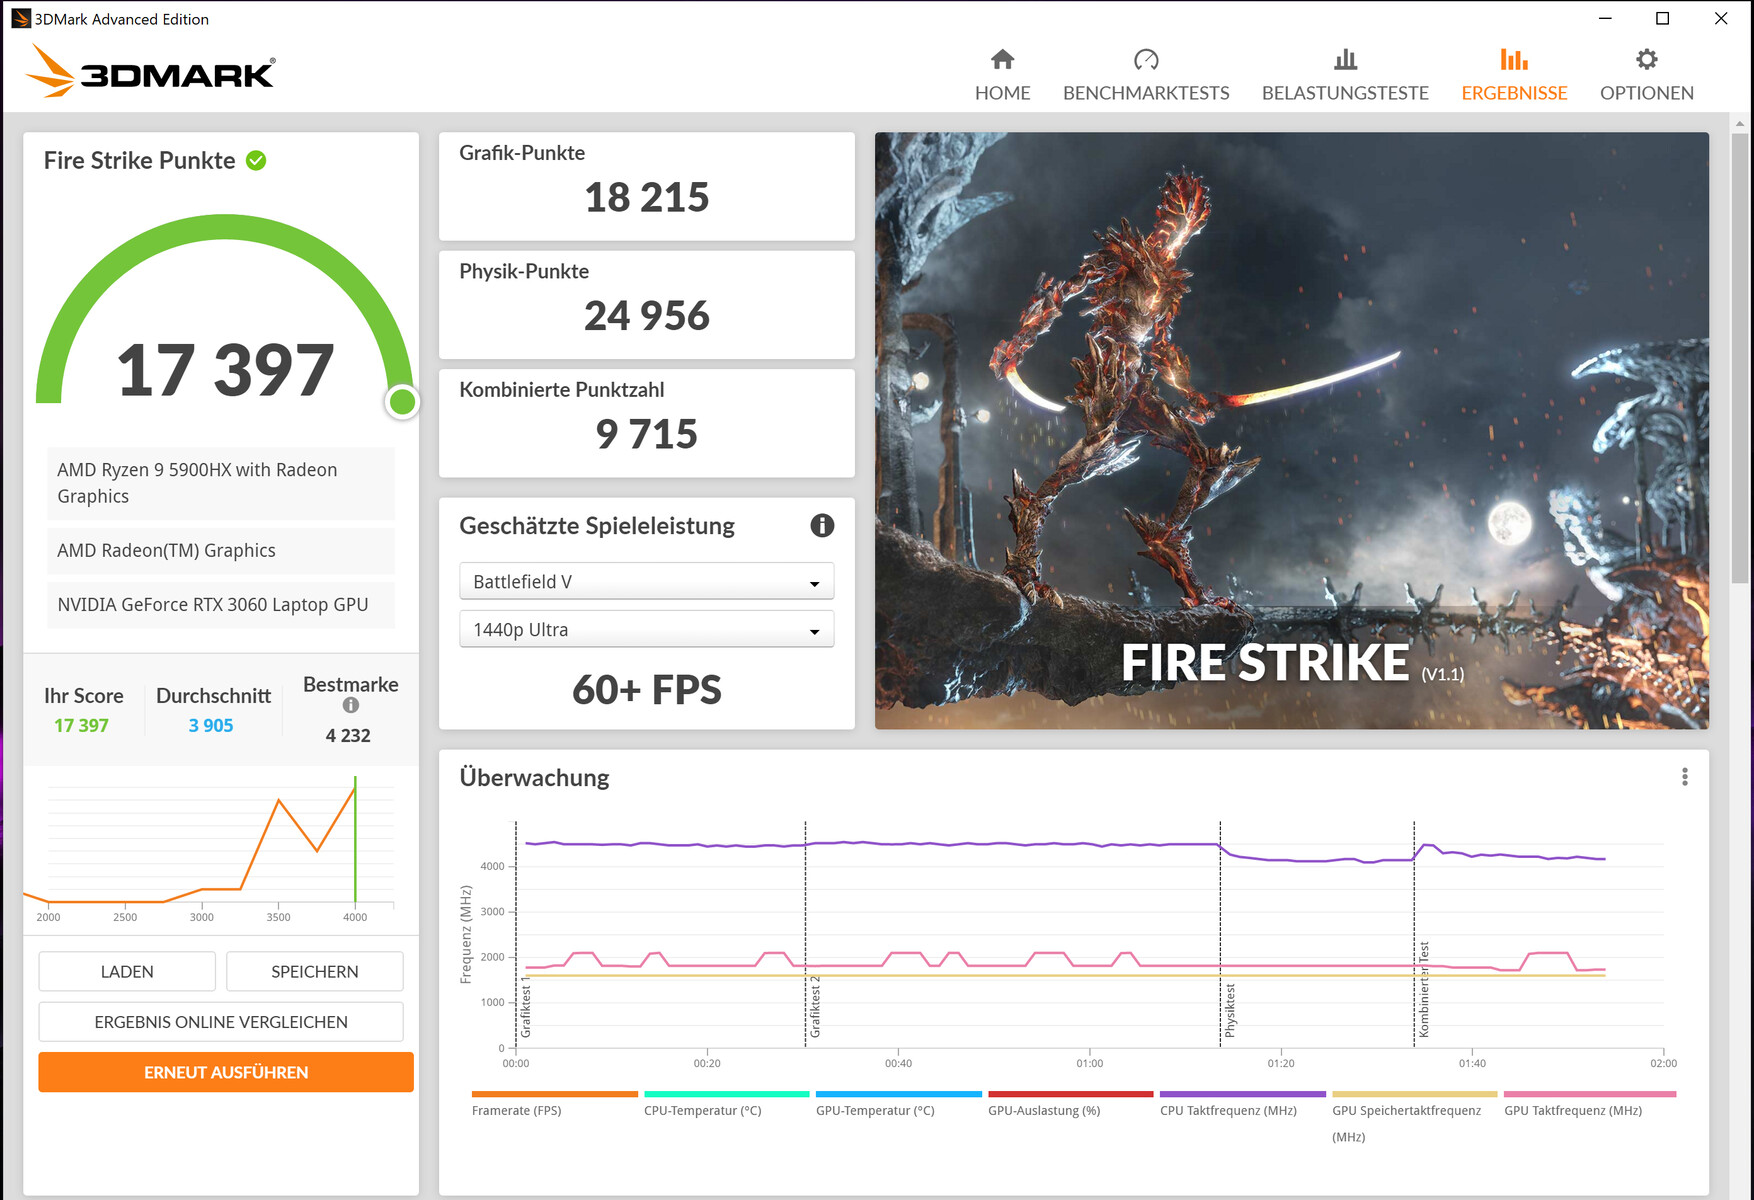
RTX 3000 GPU的实际性能取决于几个因素。冷却,内存配置,以及笔记本制造商在Nvidia定义的限制范围内设定的最大TGP。联想授予GeForce RTX 3060笔记本电脑GPU (所有RTX 3060笔记本电脑的概述,包括其TGPs)的最大TGP为100瓦。该GPU可以访问快速的GDDR6图形存储器(6144MB)。
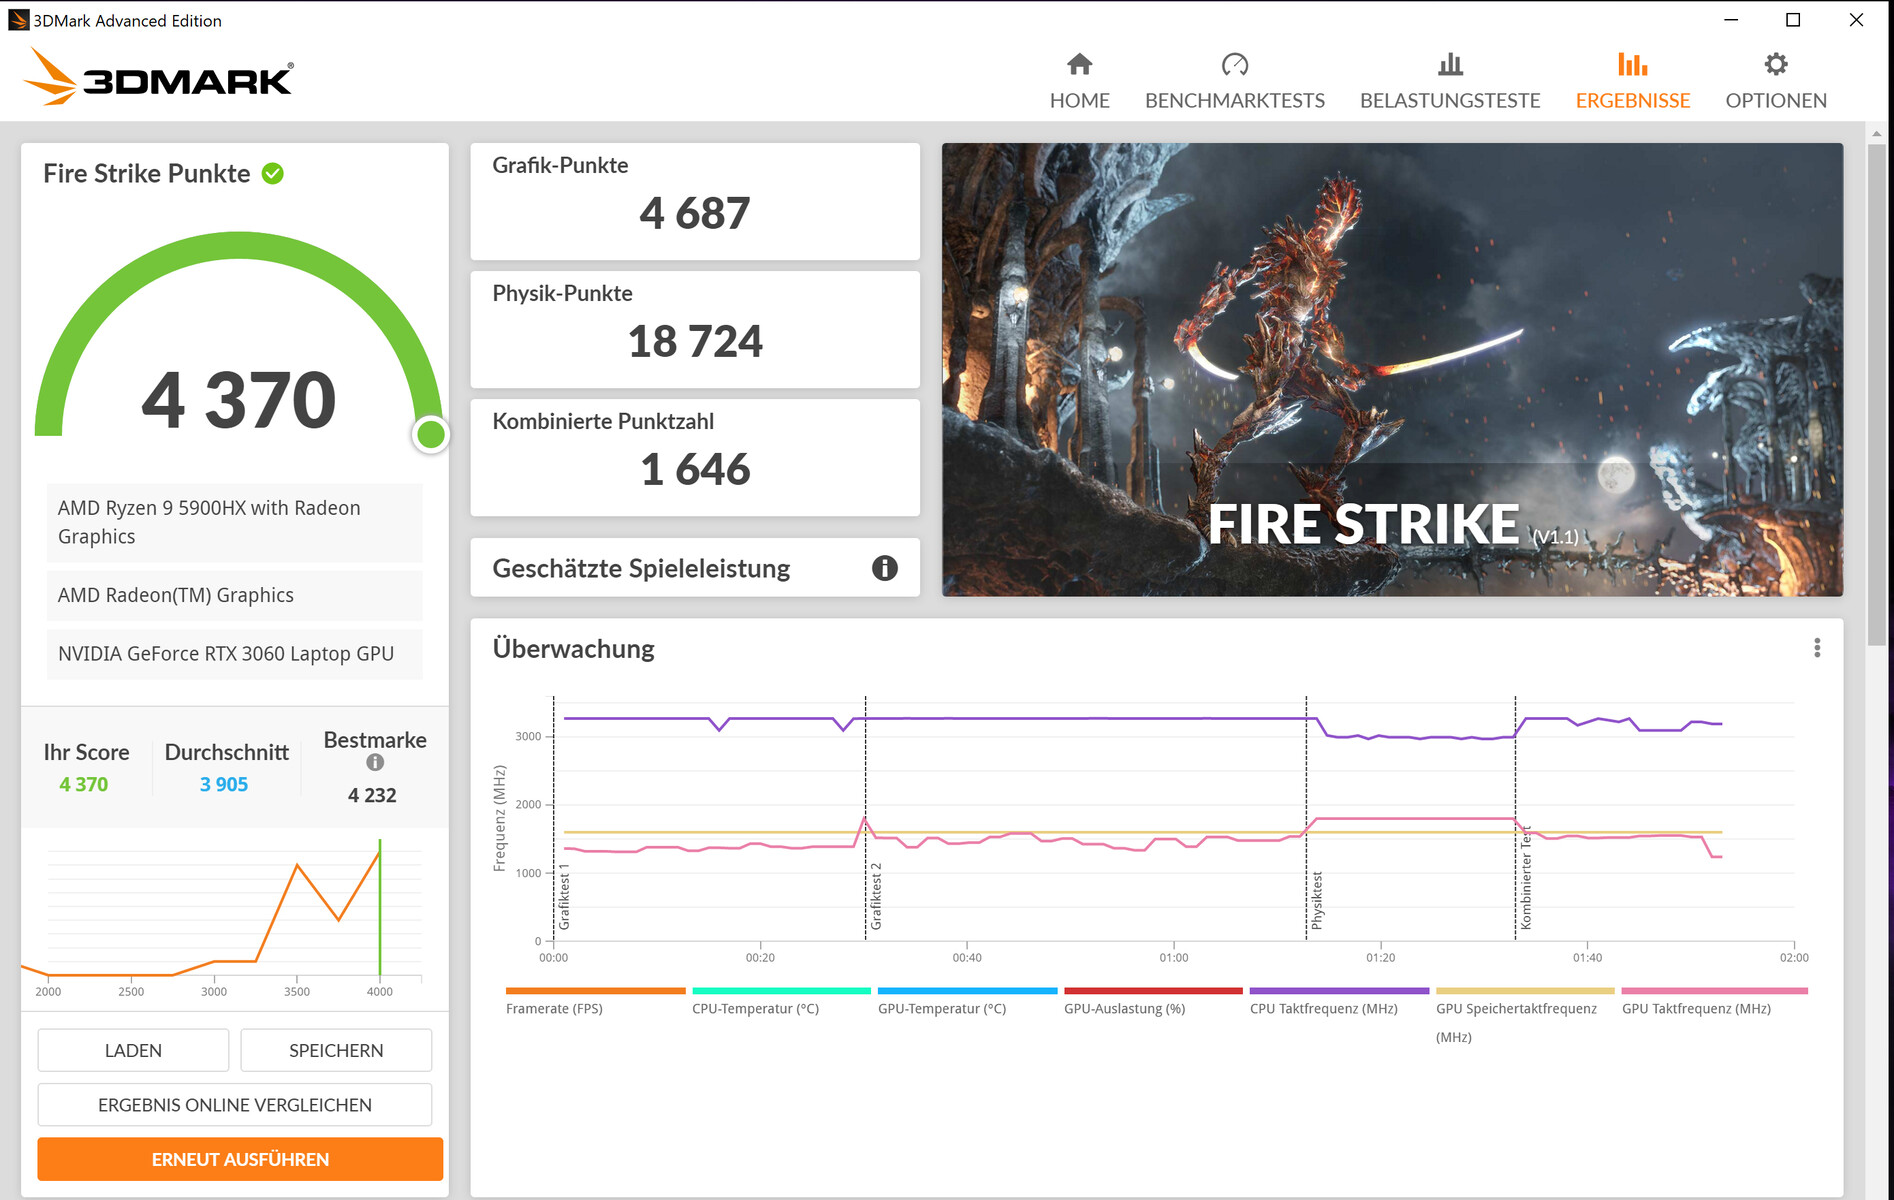
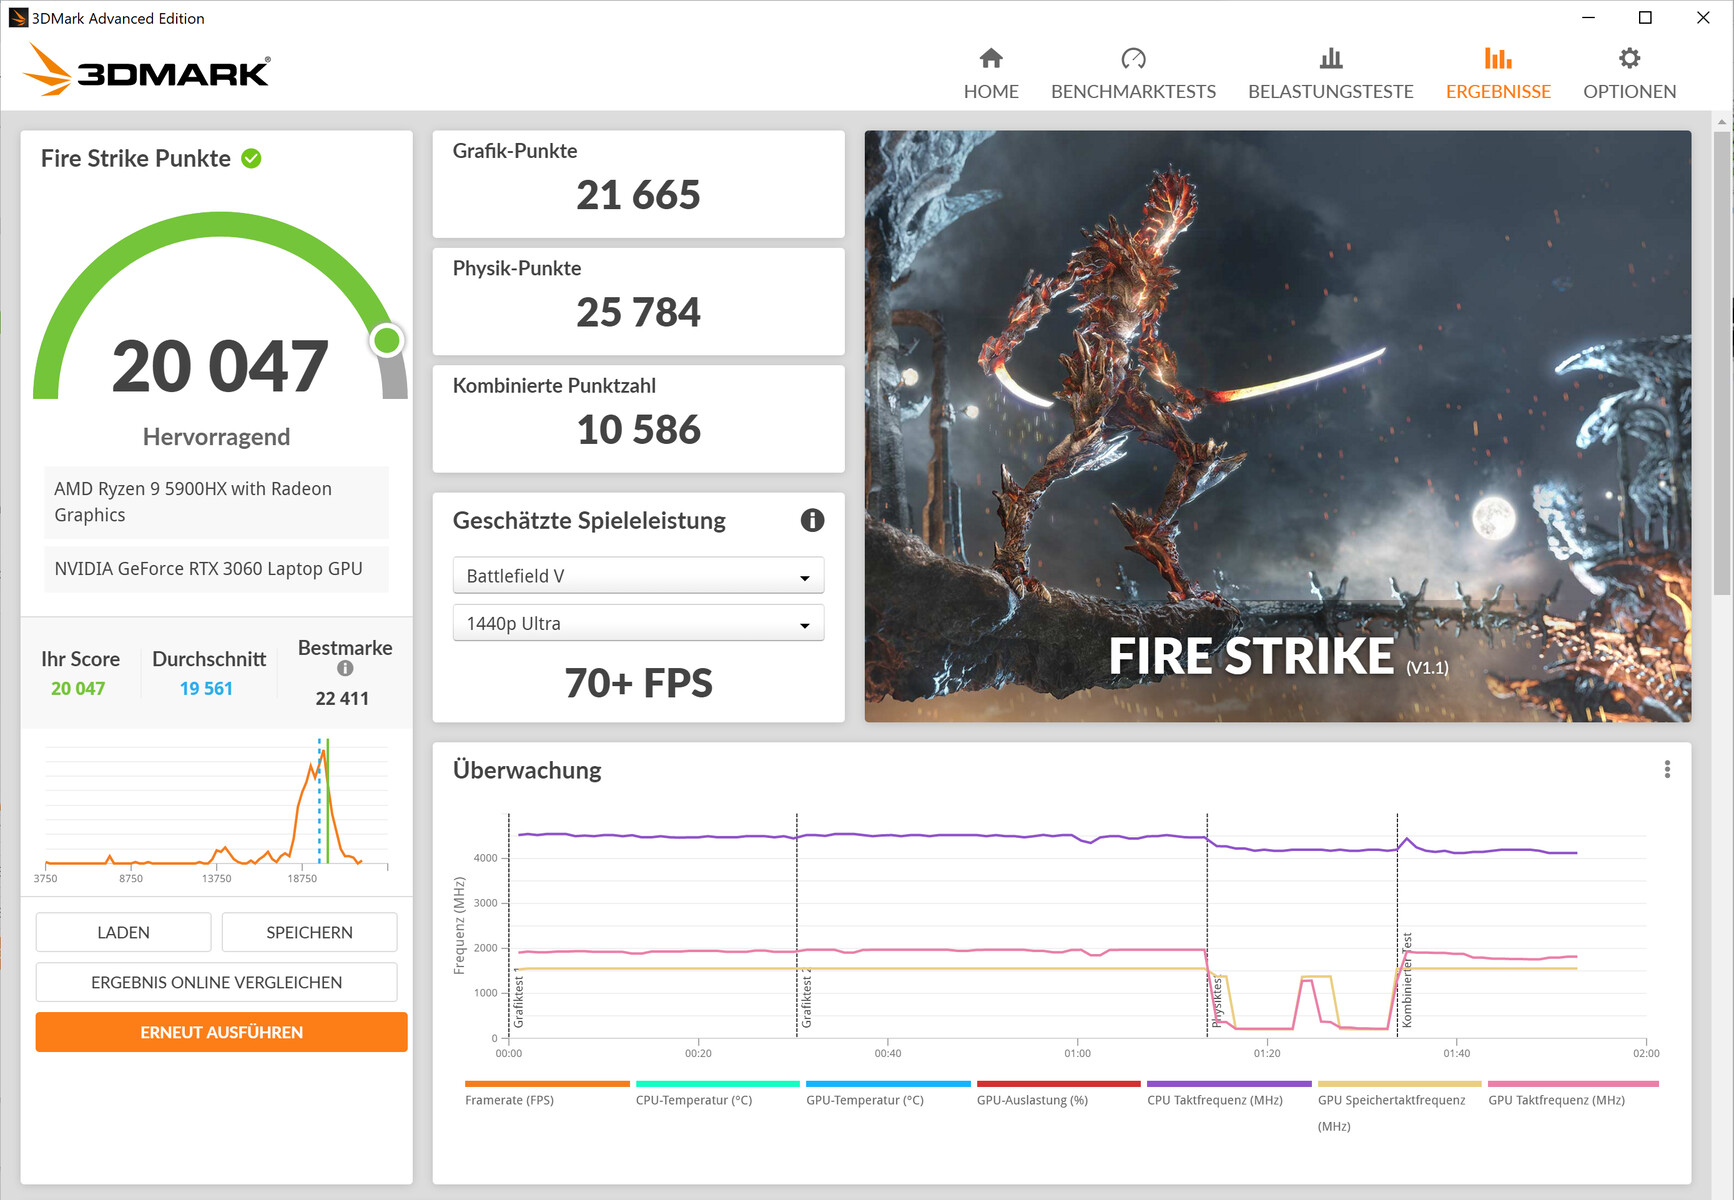
3DMark的结果略高于或低于迄今为止确定的RTX 3060的平均水平,这取决于基准测试。禁用集成GPU(混合模式关闭)会导致图形性能的小幅提高。激活BIOS中的超频功能可提供额外的性能提升。

| 3DMark 06 Standard Score | 46503 points | |
| 3DMark 11 Performance | 23694 points | |
| 3DMark Fire Strike Score | 17397 points | |
| 3DMark Time Spy Score | 8325 points | |
Help | ||
| 3DMark Performance rating - Percent | |
| Average of class Gaming | |
| MSI Delta 15 A5EFK -1! | |
| Acer Nitro 5 AN515-45-R1JH | |
| Lenovo Legion S7 15ACH6 82K80030GE -1! | |
| Lenovo Legion S7 15ACH6 82K80030GE -2! | |
| Alienware m15 R5 Ryzen Edition | |
| Average NVIDIA GeForce RTX 3060 Laptop GPU | |
| Lenovo Legion S7 15ACH6 82K80030GE | |
| Razer Blade 15 Base Edition 2021, i7-10750H RTX 3060 | |
游戏性能
这款笔记本电脑将所有全高清分辨率(1920x1080像素)和最高质量设置的现代游戏顺利带到屏幕上。即使是全屏分辨率(3840x2160像素),理论上也可以使用。但许多游戏将需要大幅降低质量水平。与其他RTX 3060设备相比,帧率略高于平均水平。的速率。Alienware m15 R5 Ryzen Edition竞争对手持平。
游戏基准测试反映了与3DMark基准测试相同的行为。禁用集成GPU(混合模式关闭)并同时激活BIOS中的超频功能,会导致性能提高。平均而言,帧率提高5%到10%应该是现实的。
| The Witcher 3 - 1920x1080 Ultra Graphics & Postprocessing (HBAO+) | |
| Average of class Gaming (104.7 - 240, n=7, last 2 years) | |
| MSI Delta 15 A5EFK | |
| Lenovo Legion S7 15ACH6 82K80030GE (Hybrid Mode off, OC) | |
| Acer Nitro 5 AN515-45-R1JH | |
| Razer Blade 15 Base Edition 2021, i7-10750H RTX 3060 | |
| Lenovo Legion S7 15ACH6 82K80030GE | |
| Average NVIDIA GeForce RTX 3060 Laptop GPU (58.2 - 91.5, n=48) | |
| Alienware m15 R5 Ryzen Edition | |
| Dota 2 Reborn | |
| 1920x1080 ultra (3/3) best looking | |
| Average of class Gaming (84.8 - 252, n=104, last 2 years) | |
| Average NVIDIA GeForce RTX 3060 Laptop GPU (90.7 - 154.8, n=49) | |
| Lenovo Legion S7 15ACH6 82K80030GE (Hybrid Mode off) | |
| Lenovo Legion S7 15ACH6 82K80030GE (Hybrid Mode off, OC) | |
| Razer Blade 15 Base Edition 2021, i7-10750H RTX 3060 | |
| Lenovo Legion S7 15ACH6 82K80030GE | |
| MSI Delta 15 A5EFK | |
| Acer Nitro 5 AN515-45-R1JH | |
| Alienware m15 R5 Ryzen Edition | |
| 3840x2160 ultra (3/3) best looking | |
| Average of class Gaming (114.9 - 199.2, n=32, last 2 years) | |
| Lenovo Legion S7 15ACH6 82K80030GE (Hybrid Mode off, OC) | |
| Lenovo Legion S7 15ACH6 82K80030GE (Hybrid Mode off) | |
| Lenovo Legion S7 15ACH6 82K80030GE | |
| Average NVIDIA GeForce RTX 3060 Laptop GPU (46.9 - 107, n=11) | |
| X-Plane 11.11 | |
| 1920x1080 high (fps_test=3) | |
| Average of class Gaming (55.5 - 148.5, n=106, last 2 years) | |
| Average NVIDIA GeForce RTX 3060 Laptop GPU (61.9 - 109.3, n=48) | |
| Lenovo Legion S7 15ACH6 82K80030GE (Hybrid Mode off, OC) | |
| Lenovo Legion S7 15ACH6 82K80030GE (Hybrid Mode off) | |
| Razer Blade 15 Base Edition 2021, i7-10750H RTX 3060 | |
| Lenovo Legion S7 15ACH6 82K80030GE | |
| Acer Nitro 5 AN515-45-R1JH | |
| Alienware m15 R5 Ryzen Edition | |
| 3840x2160 high (fps_test=3) | |
| Average of class Gaming (60 - 124.1, n=32, last 2 years) | |
| Average NVIDIA GeForce RTX 3060 Laptop GPU (58.5 - 92.3, n=12) | |
| Lenovo Legion S7 15ACH6 82K80030GE (Hybrid Mode off, OC) | |
| Lenovo Legion S7 15ACH6 82K80030GE (Hybrid Mode off) | |
| Lenovo Legion S7 15ACH6 82K80030GE | |
| Strange Brigade | |
| 1920x1080 ultra AA:ultra AF:16 | |
| Average of class Gaming (113.6 - 458, n=83, last 2 years) | |
| MSI Delta 15 A5EFK (1.47.22.14 D3D12) | |
| Lenovo Legion S7 15ACH6 82K80030GE (1.47.22.14 D3D12, Hybrid Mode off, OC) | |
| Razer Blade 15 Base Edition 2021, i7-10750H RTX 3060 (1.47.22.14 D3D12) | |
| Acer Nitro 5 AN515-45-R1JH (1.47.22.14 D3D12) | |
| Lenovo Legion S7 15ACH6 82K80030GE (1.47.22.14 D3D12, Hybrid Mode off) | |
| Average NVIDIA GeForce RTX 3060 Laptop GPU (102.2 - 166.3, n=43) | |
| Lenovo Legion S7 15ACH6 82K80030GE (1.47.22.14 D3D12) | |
| Alienware m15 R5 Ryzen Edition (1.47.22.14 D3D12) | |
| 2560x1440 ultra AA:ultra AF:16 | |
| Average of class Gaming (103.8 - 354, n=72, last 2 years) | |
| Lenovo Legion S7 15ACH6 82K80030GE (1.47.22.14 D3D12, Hybrid Mode off, OC) | |
| Acer Nitro 5 AN515-45-R1JH (1.47.22.14 D3D12) | |
| Lenovo Legion S7 15ACH6 82K80030GE (1.47.22.14 D3D12, Hybrid Mode off) | |
| Lenovo Legion S7 15ACH6 82K80030GE (1.47.22.14 D3D12) | |
| Average NVIDIA GeForce RTX 3060 Laptop GPU (75.4 - 118.4, n=17) | |
| 3840x2160 ultra AA:ultra AF:16 | |
| Average of class Gaming (83 - 187.2, n=34, last 2 years) | |
| Lenovo Legion S7 15ACH6 82K80030GE (1.47.22.14 D3D12, Hybrid Mode off, OC) | |
| Lenovo Legion S7 15ACH6 82K80030GE (1.47.22.14 D3D12) | |
| Lenovo Legion S7 15ACH6 82K80030GE (1.47.22.14 D3D12, Hybrid Mode off) | |
| Average NVIDIA GeForce RTX 3060 Laptop GPU (40 - 63.5, n=4) | |
| Call of Duty Black Ops Cold War | |
| 1920x1080 Highest Settings | |
| Lenovo Legion S7 15ACH6 82K80030GE | |
| Average NVIDIA GeForce RTX 3060 Laptop GPU (59.4 - 85.9, n=2) | |
| 1920x1080 Highest Settings + Ultra Ray Tracing | |
| Lenovo Legion S7 15ACH6 82K80030GE | |
| Average NVIDIA GeForce RTX 3060 Laptop GPU (39.6 - 47.5, n=2) | |
| F1 2021 | |
| 1920x1080 Ultra High Preset + Raytracing AA:T AF:16x | |
| MSI Delta 15 A5EFK | |
| Lenovo Legion S7 15ACH6 82K80030GE (815237) | |
| Average NVIDIA GeForce RTX 3060 Laptop GPU (67 - 112.8, n=9) | |
| 2560x1440 Ultra High Preset + Raytracing AA:T AF:16x | |
| Lenovo Legion S7 15ACH6 82K80030GE (815237) | |
| Average NVIDIA GeForce RTX 3060 Laptop GPU (47.5 - 70.2, n=2) | |
| 3840x2160 Ultra High Preset + Raytracing AA:T AF:16x | |
| Lenovo Legion S7 15ACH6 82K80030GE (815237) | |
| Average NVIDIA GeForce RTX 3060 Laptop GPU (25.9 - 38, n=2) | |
| Deathloop | |
| 1920x1080 Ultra Preset | |
| Lenovo Legion S7 15ACH6 82K80030GE | |
| MSI Delta 15 A5EFK | |
| Average NVIDIA GeForce RTX 3060 Laptop GPU (63.5 - 82.4, n=3) | |
| 2560x1440 Ultra Preset | |
| Average NVIDIA GeForce RTX 3060 Laptop GPU (49.9 - 58.7, n=2) | |
| Lenovo Legion S7 15ACH6 82K80030GE | |
| 3840x2160 Ultra Preset | |
| Average NVIDIA GeForce RTX 3060 Laptop GPU (28 - 32.8, n=2) | |
| Lenovo Legion S7 15ACH6 82K80030GE | |
| New World | |
| 1920x1080 Very High Video Quality | |
| MSI Delta 15 A5EFK | |
| Lenovo Legion S7 15ACH6 82K80030GE | |
| Average NVIDIA GeForce RTX 3060 Laptop GPU (62.3 - 84, n=4) | |
| 2560x1440 Very High Video Quality | |
| Lenovo Legion S7 15ACH6 82K80030GE | |
| Average NVIDIA GeForce RTX 3060 Laptop GPU (52.9 - 54.2, n=3) | |
| 3840x2160 Very High Video Quality | |
| Average NVIDIA GeForce RTX 3060 Laptop GPU (28.2 - 29.7, n=2) | |
| Lenovo Legion S7 15ACH6 82K80030GE | |
| Alan Wake Remastered | |
| 1920x1080 High Preset | |
| Average NVIDIA GeForce RTX 3060 Laptop GPU (81.5 - 89.3, n=3) | |
| Lenovo Legion S7 15ACH6 82K80030GE | |
| 2560x1440 High Preset | |
| Average NVIDIA GeForce RTX 3060 Laptop GPU (77 - 82.9, n=2) | |
| Lenovo Legion S7 15ACH6 82K80030GE | |
| 3840x2160 High Preset | |
| Average NVIDIA GeForce RTX 3060 Laptop GPU (46.5 - 50.9, n=2) | |
| Lenovo Legion S7 15ACH6 82K80030GE | |
| Far Cry 6 | |
| 1920x1080 Ultra Graphics Quality + HD Textures AA:T | |
| Average of class Gaming (n=1last 2 years) | |
| Lenovo Legion S7 15ACH6 82K80030GE | |
| Average NVIDIA GeForce RTX 3060 Laptop GPU (59.8 - 94.3, n=6) | |
| MSI Delta 15 A5EFK | |
| 2560x1440 Ultra Graphics Quality + HD Textures AA:T | |
| Average of class Gaming (n=1last 2 years) | |
| Average NVIDIA GeForce RTX 3060 Laptop GPU (61 - 70.3, n=4) | |
| Lenovo Legion S7 15ACH6 82K80030GE | |
| 1920x1080 Ultra Graphics Quality + HD Textures + DXR AA:T | |
| Average of class Gaming (n=1last 2 years) | |
| Lenovo Legion S7 15ACH6 82K80030GE | |
| MSI Delta 15 A5EFK | |
| Average NVIDIA GeForce RTX 3060 Laptop GPU (34 - 66, n=2) | |
| Back 4 Blood | |
| 1920x1080 Epic Preset (DX12) AA:T | |
| Average NVIDIA GeForce RTX 3060 Laptop GPU (152 - 163, n=3) | |
| Lenovo Legion S7 15ACH6 82K80030GE | |
| MSI Delta 15 A5EFK | |
| 2560x1440 Epic Preset (DX12) AA:T | |
| Average NVIDIA GeForce RTX 3060 Laptop GPU (104 - 111, n=2) | |
| Lenovo Legion S7 15ACH6 82K80030GE | |
| 3840x2160 Epic Preset (DX12) AA:T | |
| Average NVIDIA GeForce RTX 3060 Laptop GPU (53.3 - 57.2, n=2) | |
| Lenovo Legion S7 15ACH6 82K80030GE | |
| Guardians of the Galaxy | |
| 1920x1080 Ultra Preset | |
| Lenovo Legion S7 15ACH6 82K80030GE | |
| Average NVIDIA GeForce RTX 3060 Laptop GPU (87 - 110, n=4) | |
| 2560x1440 Ultra Preset | |
| Average NVIDIA GeForce RTX 3060 Laptop GPU (76 - 79, n=2) | |
| Lenovo Legion S7 15ACH6 82K80030GE | |
| 3840x2160 Ultra Preset | |
| Average NVIDIA GeForce RTX 3060 Laptop GPU (35 - 44, n=2) | |
| Lenovo Legion S7 15ACH6 82K80030GE | |
| 1920x1080 Ultra Preset + Ultra Ray-Tracing | |
| Average NVIDIA GeForce RTX 3060 Laptop GPU (28 - 58, n=3) | |
| Lenovo Legion S7 15ACH6 82K80030GE | |
| Riders Republic | |
| 1920x1080 Ultra Preset | |
| Average NVIDIA GeForce RTX 3060 Laptop GPU (80 - 86, n=3) | |
| Lenovo Legion S7 15ACH6 82K80030GE | |
| 2560x1440 Ultra Preset | |
| Average NVIDIA GeForce RTX 3060 Laptop GPU (58 - 60, n=2) | |
| Lenovo Legion S7 15ACH6 82K80030GE | |
| 3840x2160 Ultra Preset | |
| Average NVIDIA GeForce RTX 3060 Laptop GPU (30 - 31, n=2) | |
| Lenovo Legion S7 15ACH6 82K80030GE | |
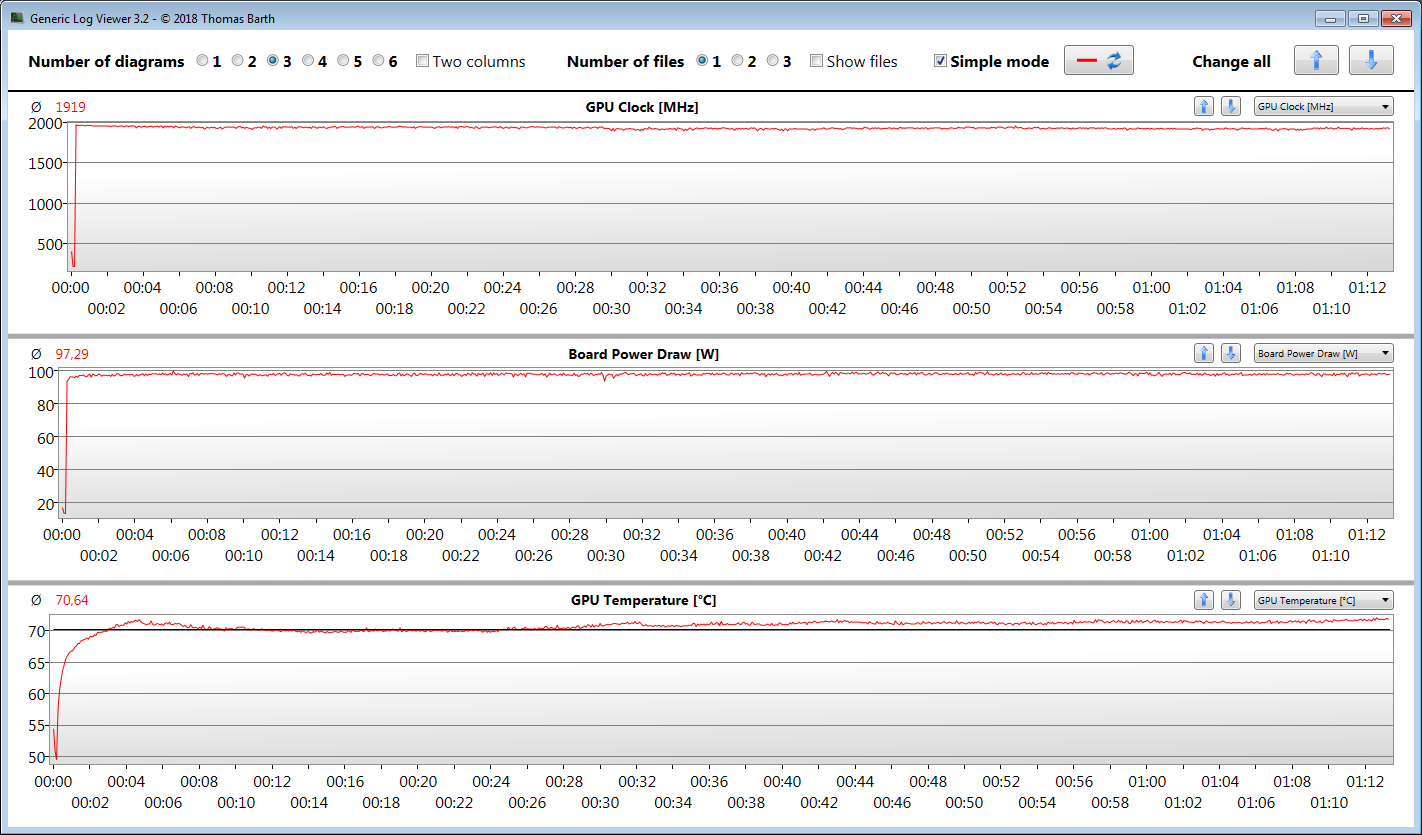
为了验证帧率是否在很长一段时间内保持基本稳定,我们让游戏《Witcher 3》在全高清分辨率和最高质量设置下运行了约60分钟。角色没有被移动。没有发现帧率的下降。
The Witcher 3 FPS diagram
| low | med. | high | ultra | QHD | 4K | |
|---|---|---|---|---|---|---|
| GTA V (2015) | 179 | 172 | 153 | 92.6 | 72 | 70 |
| The Witcher 3 (2015) | 295 | 218 | 141 | 79.3 | 55.3 | |
| Dota 2 Reborn (2015) | 144 | 138 | 123 | 119 | 95.5 | |
| Final Fantasy XV Benchmark (2018) | 163 | 103 | 77.1 | 58.4 | 34.3 | |
| X-Plane 11.11 (2018) | 103 | 88.2 | 72.6 | 58.5 | ||
| Far Cry 5 (2018) | 142 | 118 | 113 | 106 | 82 | 44 |
| Strange Brigade (2018) | 361 | 194 | 155 | 135 | 101 | 59.9 |
| Call of Duty Black Ops Cold War (2020) | 188 | 102 | 93 | 85.9 | 62.4 | 32.6 |
| F1 2021 (2021) | 290 | 181 | 157 | 93.4 | 70.2 | 38 |
| Deathloop (2021) | 132 | 102 | 81.8 | 82.4 | 49.9 | 28 |
| New World (2021) | 90.5 | 75.8 | 76.1 | 71.1 | 54.2 | 28.2 |
| Alan Wake Remastered (2021) | 93.7 | 86.2 | 81.5 | 77 | 46.5 | |
| Far Cry 6 (2021) | 118 | 105 | 97 | 84 | 63 | |
| Back 4 Blood (2021) | 293 | 190 | 170 | 152 | 104 | 53.3 |
| Guardians of the Galaxy (2021) | 110 | 107 | 107 | 105 | 76 | 35 |
| Riders Republic (2021) | 159 | 106 | 88 | 81 | 58 | 30 |
排放物 - 联想笔记本电脑可能会变得非常热
噪声排放
在日常使用中(办公室、互联网),噪音发展在限制范围内。风扇通常以低速运转,有时是空转的。然而,在负载情况下,事情变得相当响亮,最大声压级分别为54 dB(A)(压力测试)和53 dB(A)(TheWitcher 3测试)。取决于你有多敏感,风扇的噪音肯定还是可以忍受的。
Noise level
| Idle |
| 25 / 30 / 36 dB(A) |
| Load |
| 42 / 54 dB(A) |
 | ||
30 dB silent 40 dB(A) audible 50 dB(A) loud |
||
min: | ||
| Lenovo Legion S7 15ACH6 82K80030GE R9 5900HX, GeForce RTX 3060 Laptop GPU | Razer Blade 15 Base Edition 2021, i7-10750H RTX 3060 i7-10750H, GeForce RTX 3060 Laptop GPU | MSI Delta 15 A5EFK R9 5900HX, Radeon RX 6700M | Alienware m15 R5 Ryzen Edition R7 5800H, GeForce RTX 3060 Laptop GPU | Acer Nitro 5 AN515-45-R1JH R7 5800H, GeForce RTX 3070 Laptop GPU | Average of class Gaming | |
|---|---|---|---|---|---|---|
| Noise | 9% | -1% | 6% | 5% | 3% | |
| off / environment * (dB) | 25 | 25.3 -1% | 25 -0% | 24 4% | 25 -0% | 24.1 ? 4% |
| Idle Minimum * (dB) | 25 | 25.4 -2% | 25 -0% | 24 4% | 25 -0% | 25.9 ? -4% |
| Idle Average * (dB) | 30 | 25.4 15% | 30 -0% | 25 17% | 25 17% | 27.4 ? 9% |
| Idle Maximum * (dB) | 36 | 25.4 29% | 40 -11% | 35 3% | 32.2 11% | 30.1 ? 16% |
| Load Average * (dB) | 42 | 42.5 -1% | 47 -12% | 44 -5% | 45.8 -9% | 43.7 ? -4% |
| Witcher 3 ultra * (dB) | 53 | 42 21% | 48 9% | 48 9% | ||
| Load Maximum * (dB) | 54 | 52.2 3% | 51 6% | 50 7% | 49.1 9% | 54.3 ? -1% |
* ... smaller is better
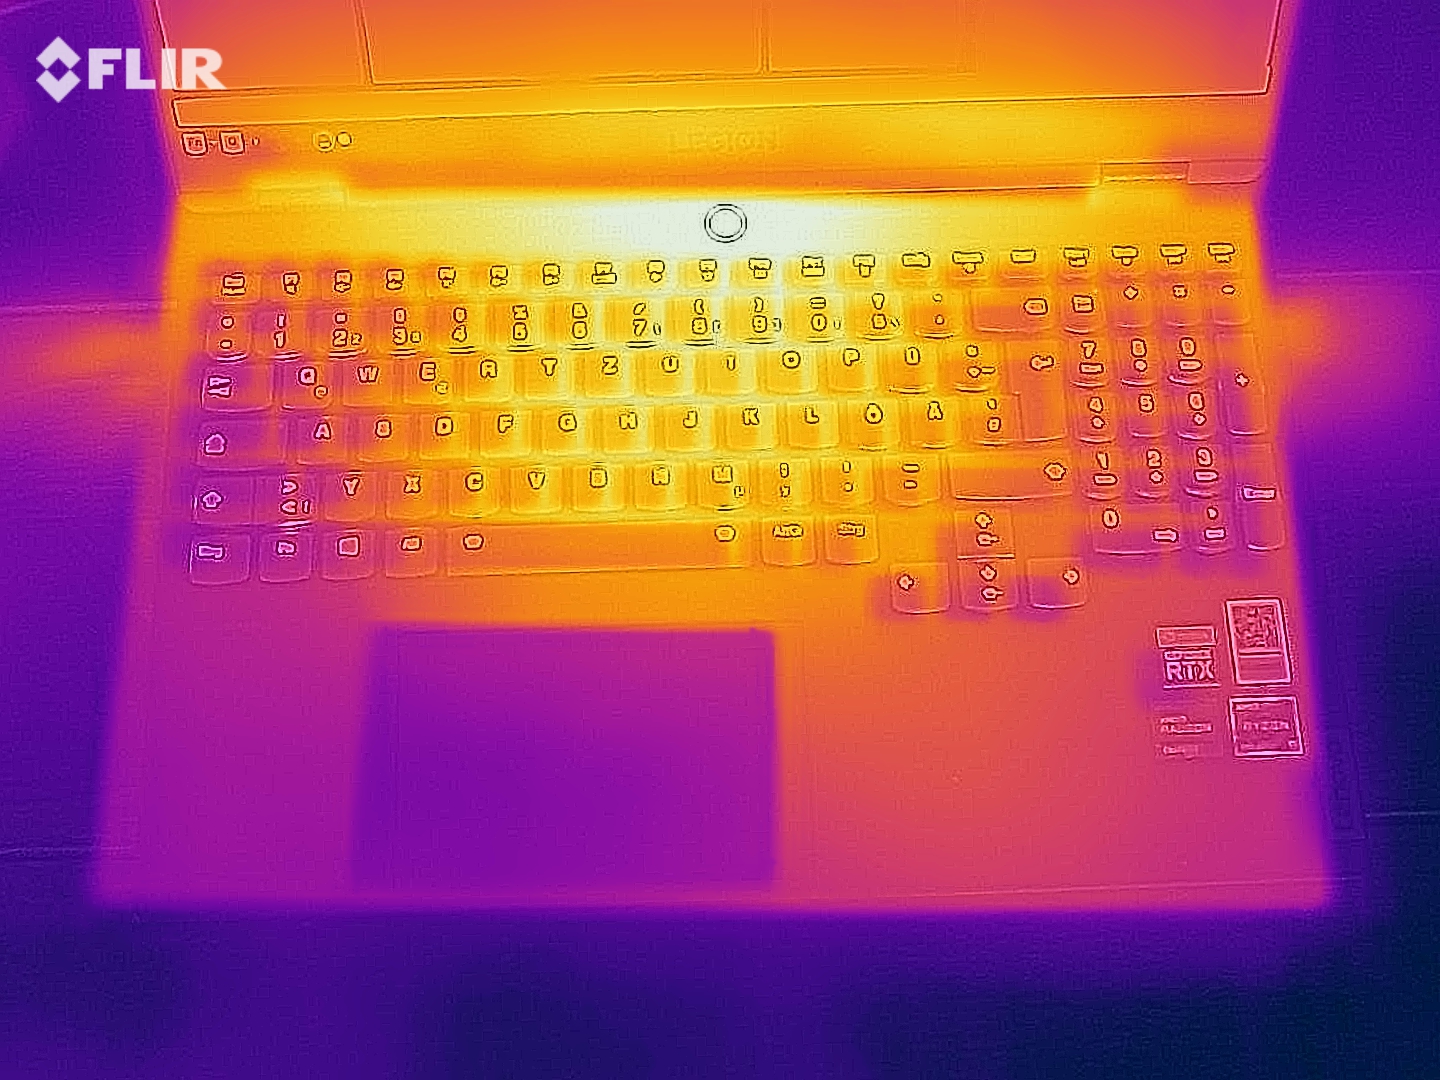
温度
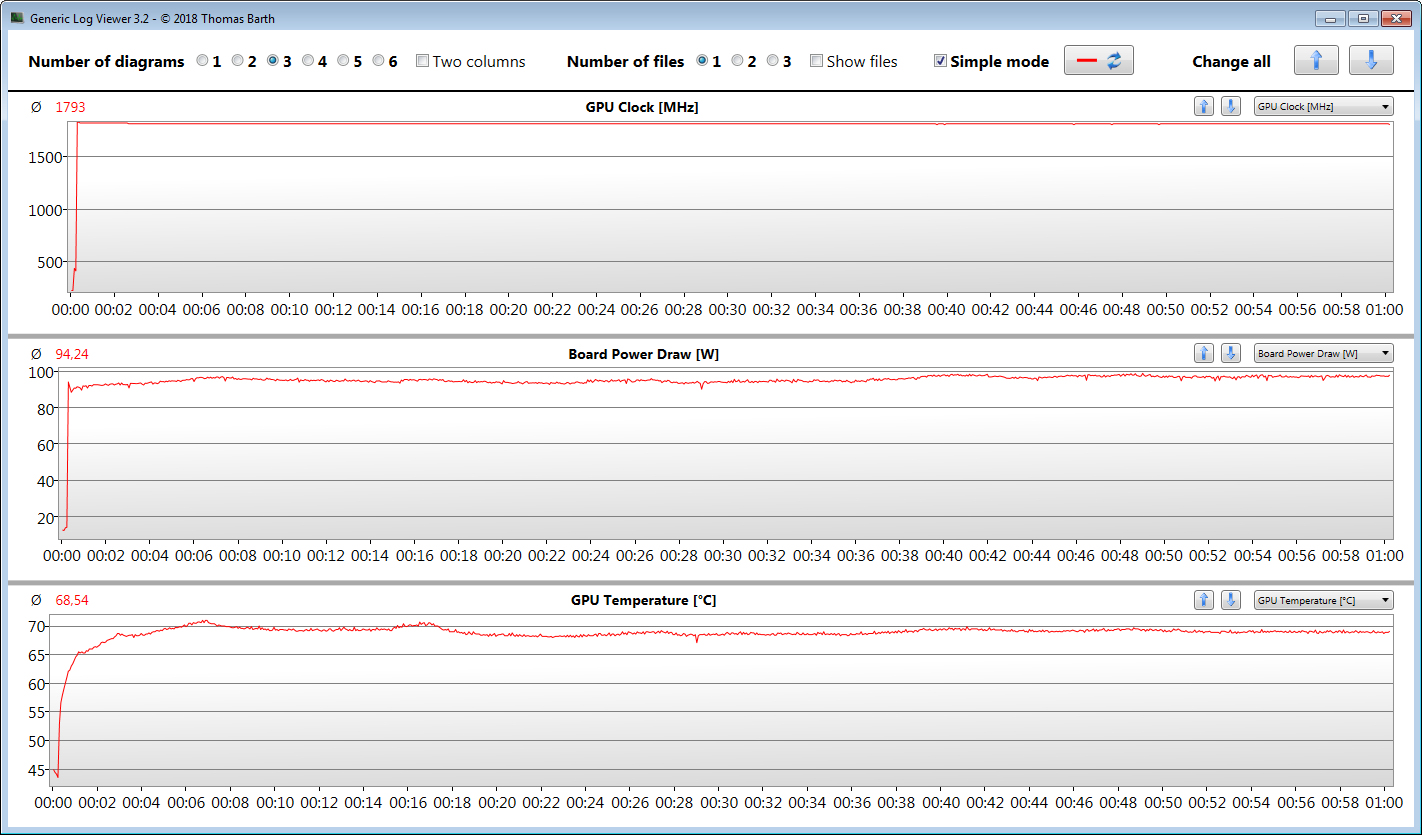
日常办公和互联网应用不会对硬件造成太大的压力。因此,机箱温度保持在绿色范围内。笔记本电脑在负载下会明显发热--在我们的TheWitcher 3测试中最为明显。CPU温度仍然在可接受的范围内,平均为82℃(约180°F)(TheWitcher 3测试)和94℃(约201°F)(压力测试)。
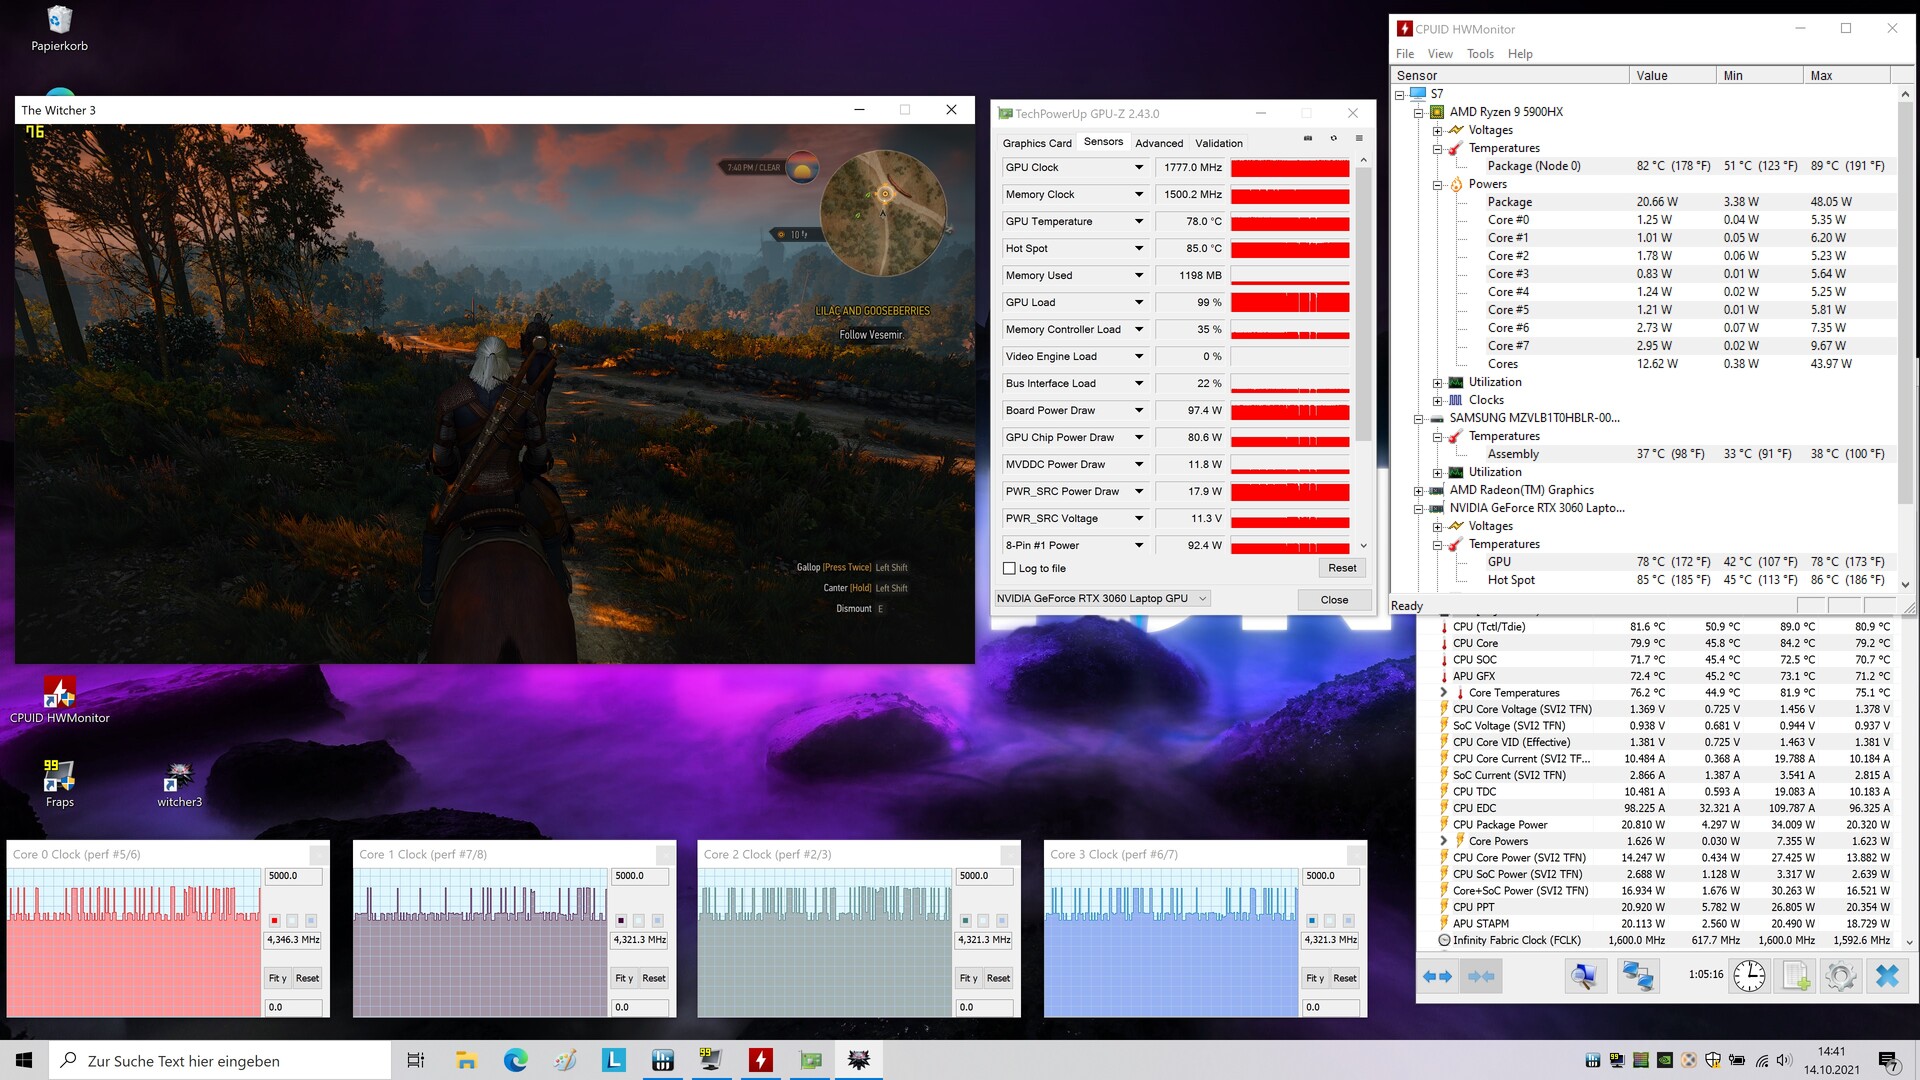
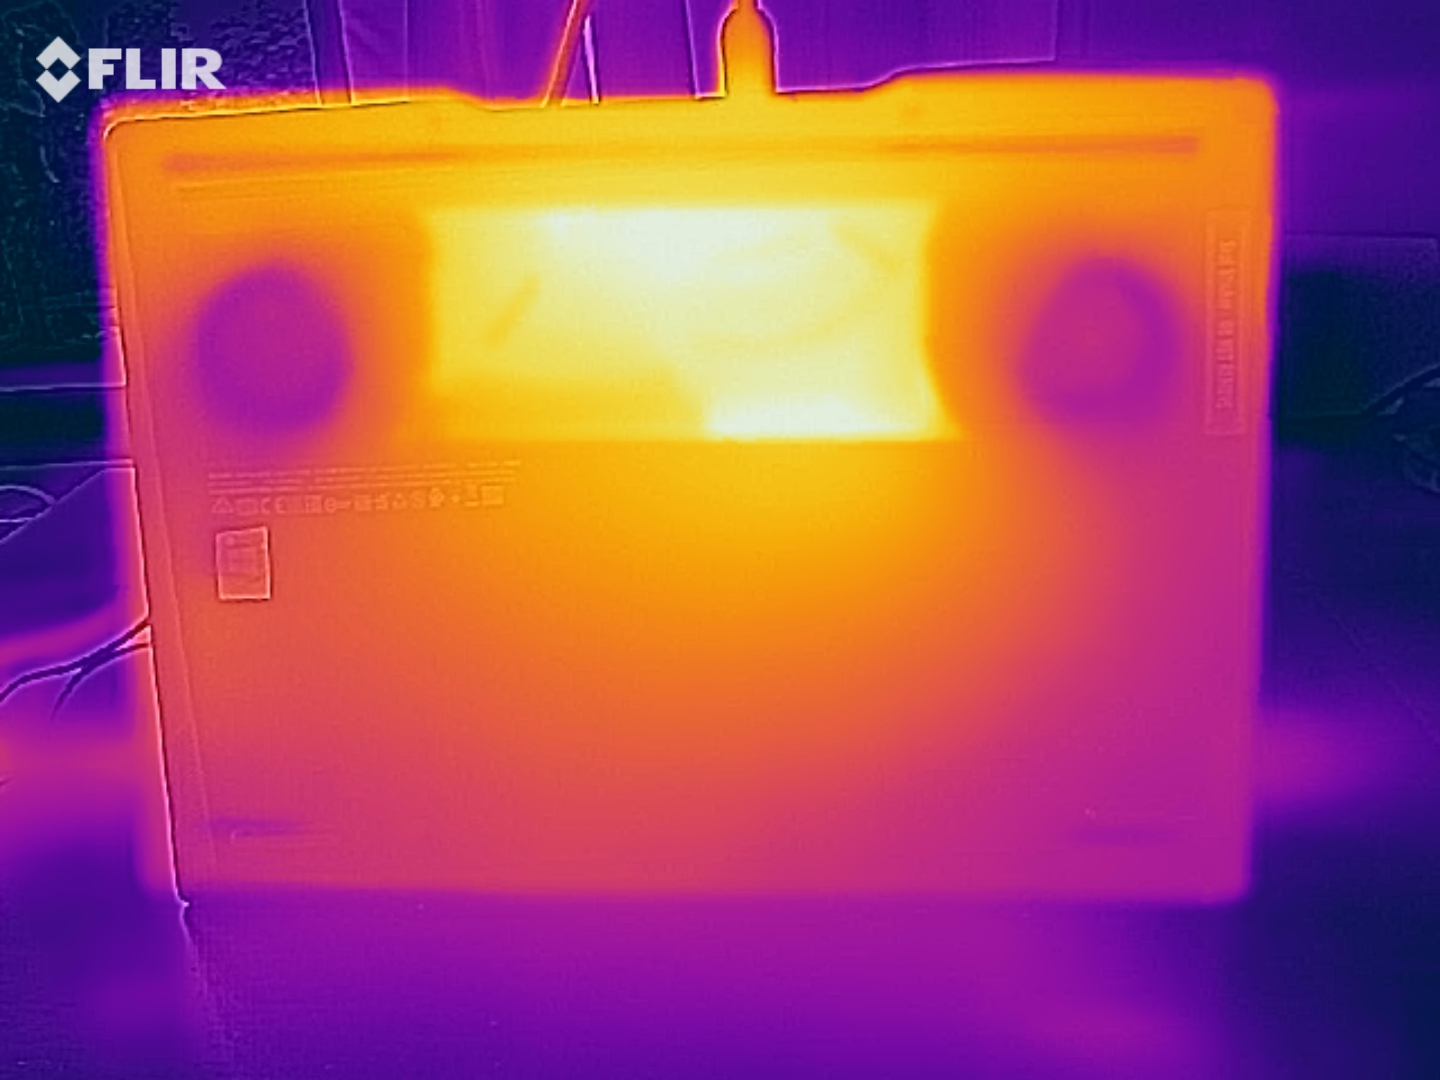
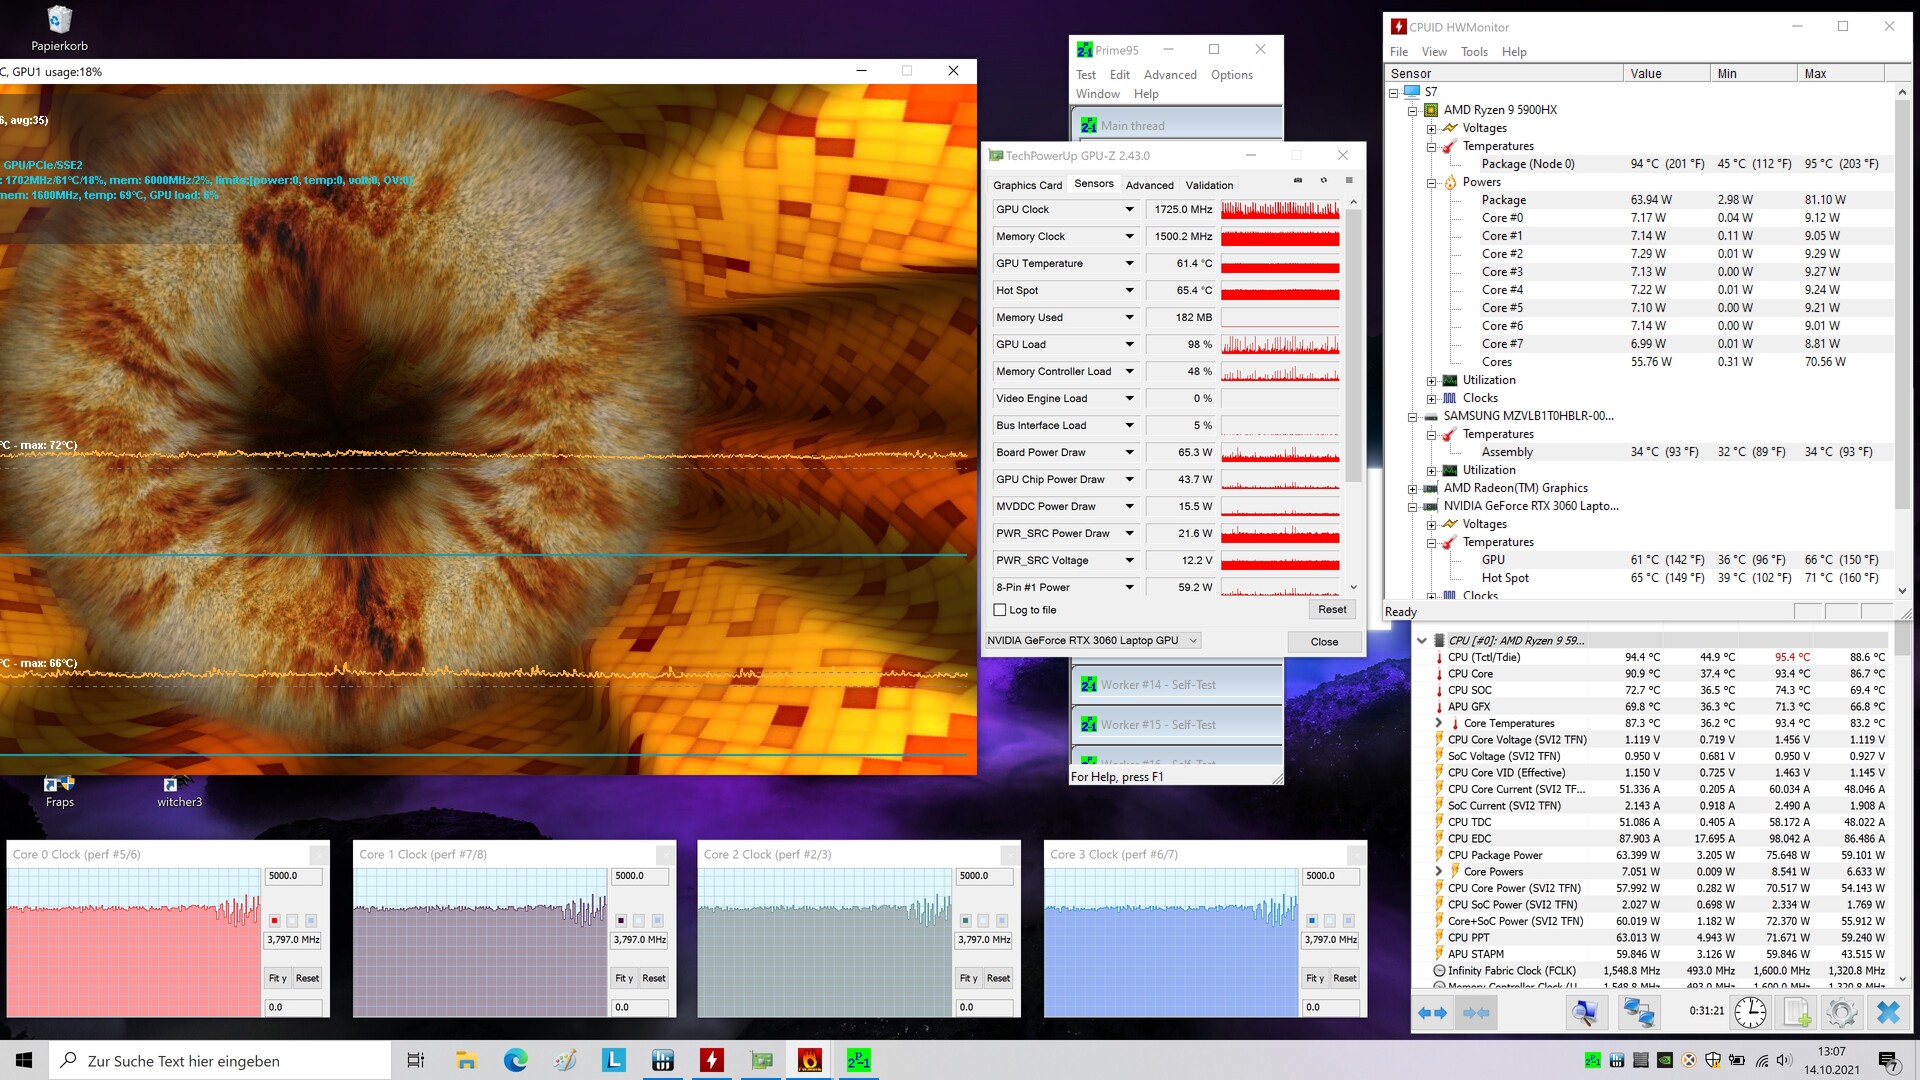
CPU完成压力测试(Prime95和FurMark至少运行一个小时)的时钟速度约为3.8GHz,而图形核心以严重波动的速度工作。这也可以解释为什么设备在压力测试期间发热较小。压力测试代表一种极端情况。我们用这个测试来检查系统是否在全负荷下保持稳定。
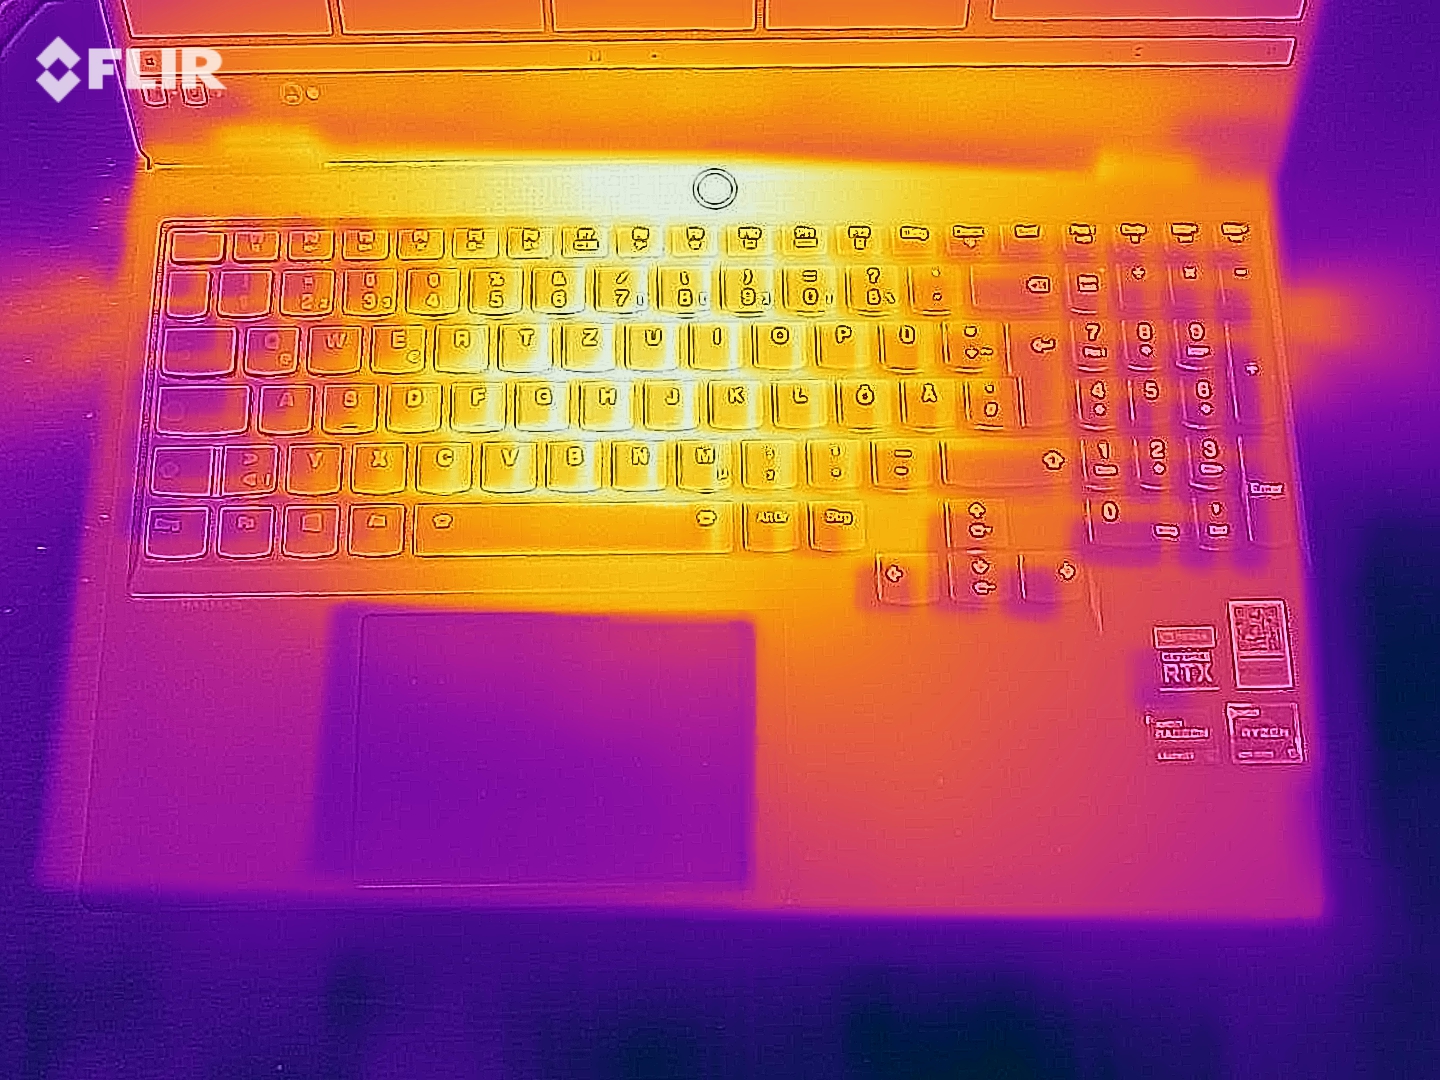
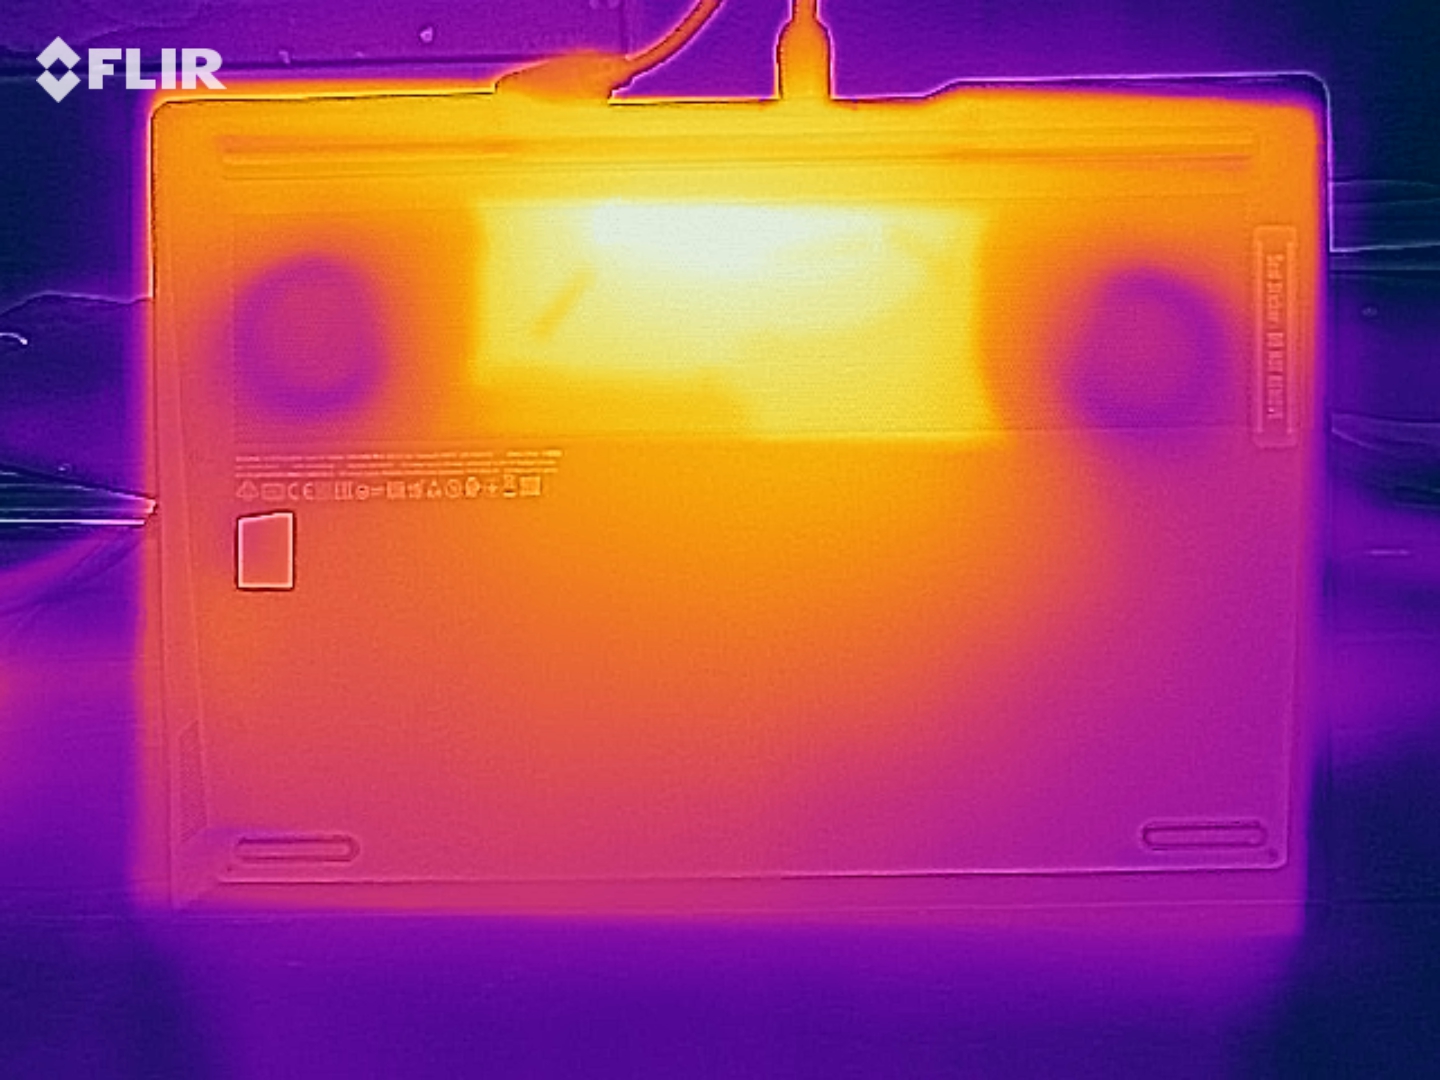
(-) The maximum temperature on the upper side is 49 °C / 120 F, compared to the average of 40.4 °C / 105 F, ranging from 21.2 to 68.8 °C for the class Gaming.
(-) The bottom heats up to a maximum of 50 °C / 122 F, compared to the average of 43.2 °C / 110 F
(+) In idle usage, the average temperature for the upper side is 27.9 °C / 82 F, compared to the device average of 33.9 °C / 93 F.
(-) Playing The Witcher 3, the average temperature for the upper side is 44.8 °C / 113 F, compared to the device average of 33.9 °C / 93 F.
(±) The palmrests and touchpad can get very hot to the touch with a maximum of 39 °C / 102.2 F.
(-) The average temperature of the palmrest area of similar devices was 28.8 °C / 83.8 F (-10.2 °C / -18.4 F).
| Lenovo Legion S7 15ACH6 82K80030GE R9 5900HX, GeForce RTX 3060 Laptop GPU | Razer Blade 15 Base Edition 2021, i7-10750H RTX 3060 i7-10750H, GeForce RTX 3060 Laptop GPU | MSI Delta 15 A5EFK R9 5900HX, Radeon RX 6700M | Alienware m15 R5 Ryzen Edition R7 5800H, GeForce RTX 3060 Laptop GPU | Acer Nitro 5 AN515-45-R1JH R7 5800H, GeForce RTX 3070 Laptop GPU | Average of class Gaming | |
|---|---|---|---|---|---|---|
| Heat | -8% | -5% | -21% | -8% | -2% | |
| Maximum Upper Side * (°C) | 49 | 45.2 8% | 50 -2% | 62 -27% | 53.2 -9% | 45.1 ? 8% |
| Maximum Bottom * (°C) | 50 | 48 4% | 55 -10% | 61 -22% | 58.2 -16% | 48.1 ? 4% |
| Idle Upper Side * (°C) | 29 | 34.4 -19% | 31 -7% | 36 -24% | 29.5 -2% | 31 ? -7% |
| Idle Bottom * (°C) | 30 | 37.2 -24% | 30 -0% | 33 -10% | 31.2 -4% | 34.2 ? -14% |
* ... smaller is better
发言人
立体声扬声器产生了非常体面的声音,但几乎没有任何低音。建议使用耳机或外部扬声器以获得更好的音频体验。
Lenovo Legion S7 15ACH6 82K80030GE audio analysis
(+) | speakers can play relatively loud (82 dB)
Bass 100 - 315 Hz
(-) | nearly no bass - on average 16.4% lower than median
(±) | linearity of bass is average (9.3% delta to prev. frequency)
Mids 400 - 2000 Hz
(+) | balanced mids - only 2.9% away from median
(+) | mids are linear (3.4% delta to prev. frequency)
Highs 2 - 16 kHz
(+) | balanced highs - only 3% away from median
(+) | highs are linear (6.4% delta to prev. frequency)
Overall 100 - 16.000 Hz
(+) | overall sound is linear (13.4% difference to median)
Compared to same class
» 19% of all tested devices in this class were better, 7% similar, 74% worse
» The best had a delta of 6%, average was 18%, worst was 132%
Compared to all devices tested
» 14% of all tested devices were better, 4% similar, 82% worse
» The best had a delta of 4%, average was 23%, worst was 134%
MSI Delta 15 A5EFK audio analysis
(±) | speaker loudness is average but good (80 dB)
Bass 100 - 315 Hz
(±) | reduced bass - on average 12.9% lower than median
(±) | linearity of bass is average (10.3% delta to prev. frequency)
Mids 400 - 2000 Hz
(+) | balanced mids - only 4.8% away from median
(+) | mids are linear (5.3% delta to prev. frequency)
Highs 2 - 16 kHz
(+) | balanced highs - only 4.1% away from median
(±) | linearity of highs is average (9.4% delta to prev. frequency)
Overall 100 - 16.000 Hz
(±) | linearity of overall sound is average (16.2% difference to median)
Compared to same class
» 40% of all tested devices in this class were better, 7% similar, 53% worse
» The best had a delta of 6%, average was 18%, worst was 132%
Compared to all devices tested
» 26% of all tested devices were better, 6% similar, 68% worse
» The best had a delta of 4%, average was 23%, worst was 134%
能源管理 - 联想S7提供令人印象深刻的电池寿命
能源消耗
Legion S7在能源消耗方面没有任何令人惊讶的地方。对于安装在这里的硬件来说,在整个负载范围内,耗电量处于正常水平。电源适配器的额定输出功率为230瓦。下图说明了在我们的《Witcher 3》测试中,笔记本电脑的稳定耗电量。
| Off / Standby | |
| Idle | |
| Load |
|
Key:
min: | |
Energy consumption during The Witcher 3 / stress test
| Lenovo Legion S7 15ACH6 82K80030GE R9 5900HX, GeForce RTX 3060 Laptop GPU | Razer Blade 15 Base Edition 2021, i7-10750H RTX 3060 i7-10750H, GeForce RTX 3060 Laptop GPU | MSI Delta 15 A5EFK R9 5900HX, Radeon RX 6700M | Alienware m15 R5 Ryzen Edition R7 5800H, GeForce RTX 3060 Laptop GPU | Acer Nitro 5 AN515-45-R1JH R7 5800H, GeForce RTX 3070 Laptop GPU | Average of class Gaming | |
|---|---|---|---|---|---|---|
| Power Consumption | -2% | -7% | -7% | 13% | -16% | |
| Idle Minimum * (Watt) | 13 | 11.7 10% | 10 23% | 11 15% | 8.8 32% | 13.1 ? -1% |
| Idle Average * (Watt) | 16 | 16 -0% | 18 -13% | 14 12% | 13 19% | 19 ? -19% |
| Idle Maximum * (Watt) | 23 | 29.3 -27% | 25 -9% | 25 -9% | 14.6 37% | 24.6 ? -7% |
| Load Average * (Watt) | 95 | 95.6 -1% | 101 -6% | 123 -29% | 133 -40% | 111.3 ? -17% |
| Witcher 3 ultra * (Watt) | 156 | 141.3 9% | 187 -20% | 176 -13% | 134 14% | |
| Load Maximum * (Watt) | 191 | 197 -3% | 217 -14% | 226 -18% | 164 14% | 260 ? -36% |
* ... smaller is better
电池寿命
在Wi-Fi测试(通过脚本访问网站)和视频测试(短片Big Buck Bunny(H.264编码,全高清)循环运行)中,这台15.6英寸的笔记本电脑分别达到了7:01小时和7:29小时的运行时间。在这两项测试中,笔记本电脑的省电功能被禁用,显示亮度被设置为约150 cd/m²。在视频测试中,无线模块也被禁用。
| Lenovo Legion S7 15ACH6 82K80030GE R9 5900HX, GeForce RTX 3060 Laptop GPU, 71 Wh | Razer Blade 15 Base Edition 2021, i7-10750H RTX 3060 i7-10750H, GeForce RTX 3060 Laptop GPU, 65 Wh | MSI Delta 15 A5EFK R9 5900HX, Radeon RX 6700M, 82 Wh | Alienware m15 R5 Ryzen Edition R7 5800H, GeForce RTX 3060 Laptop GPU, 86 Wh | Acer Nitro 5 AN515-45-R1JH R7 5800H, GeForce RTX 3070 Laptop GPU, 57.5 Wh | Average of class Gaming | |
|---|---|---|---|---|---|---|
| Battery runtime | -17% | 8% | -8% | -20% | -2% | |
| Reader / Idle (h) | 14 | 7.8 -44% | 11.1 -21% | 14.7 5% | 9.2 -34% | 7.84 ? -44% |
| H.264 (h) | 7.5 | 8.8 17% | 6.9 -8% | 8.27 ? 10% | ||
| WiFi v1.3 (h) | 7 | 4.8 -31% | 7.9 13% | 5.1 -27% | 5.7 -19% | 7.08 ? 1% |
| Load (h) | 1.2 | 1.5 25% | 1.6 33% | 0.9 -25% | 1 -17% | 1.496 ? 25% |
| Witcher 3 ultra (h) | 1.6 |
Pros
Cons
结论 - 联想Legion S7 15ACH6不仅是为游戏玩家准备的,也是为创作者准备的。
联想推出了一款轻巧的游戏笔记本电脑,在性能发展方面没有发现任何问题。这款Ryzen 9 5900HXAPU和GeForce RTX 3060笔记本电脑GPU(最大TGP:100瓦)可以在持续的高时钟速率下运行。GPU的性能仍然可以通过超频提高一些。
轻、薄、快--联想在Legion S7 15ACH6上做得很好。
该硬件将几乎所有最新的游戏都流畅地带到了4K屏幕上。通常可以使用全分辨率--但并不总是在高至最高质量设置下。S7在游戏模式下的热量和噪音发展对安装在这里的硬件来说是正常的。这款笔记本电脑在日常使用中绝对可以安静地运行,同时只在小范围内发热。
联想值得称赞的是15.6英寸的哑光s显示屏(4K,IPS,60赫兹)。它以高亮度、良好的对比度、HDR、稳定的可视角度、出色的色彩还原和良好的色域覆盖率而获得分数。此外,还支持自由同步。不过,在响应时间方面还有改进的余地。
真实世界的电池运行时间约为7小时,对于配备4K显示屏的游戏笔记本电脑来说,是可以接受的。Legion 的全高清变体应该能多坚持几分钟。很好。该电池可以使用通用的USB-C电源适配器(至少45瓦)进行充电。这意味着,笨重的230瓦电源适配器不一定要随身携带。
Legion S7的一个替代品是 微星Delta 15 A5EFK,比如说。它有一个更强大的图形核心(包括10GB的视频内存),并提供稍好的电池寿命。它的弱点是显示屏不大,可维护性有限。
价格和可用性
在撰写本文时,你可以在联想的网上商店找到我们测试配置中的联想Legion S7 15ACH6(Ryzen 9 5900HX APU,GeForce RTX 3060笔记本GPU,32GB内存,60Hz 4K显示屏),2TB的SSD存储空间,优惠价为1899.99美元。.这里还有其他几个配置,包括价格较低的Ryzen 7 5800H和RTX 3050 Ti的配置。你还可以在百思买上找到其他配置。,例如。
Lenovo Legion S7 15ACH6 82K80030GE
- 10/31/2021 v7 (old)
Sascha Mölck
Price comparison

