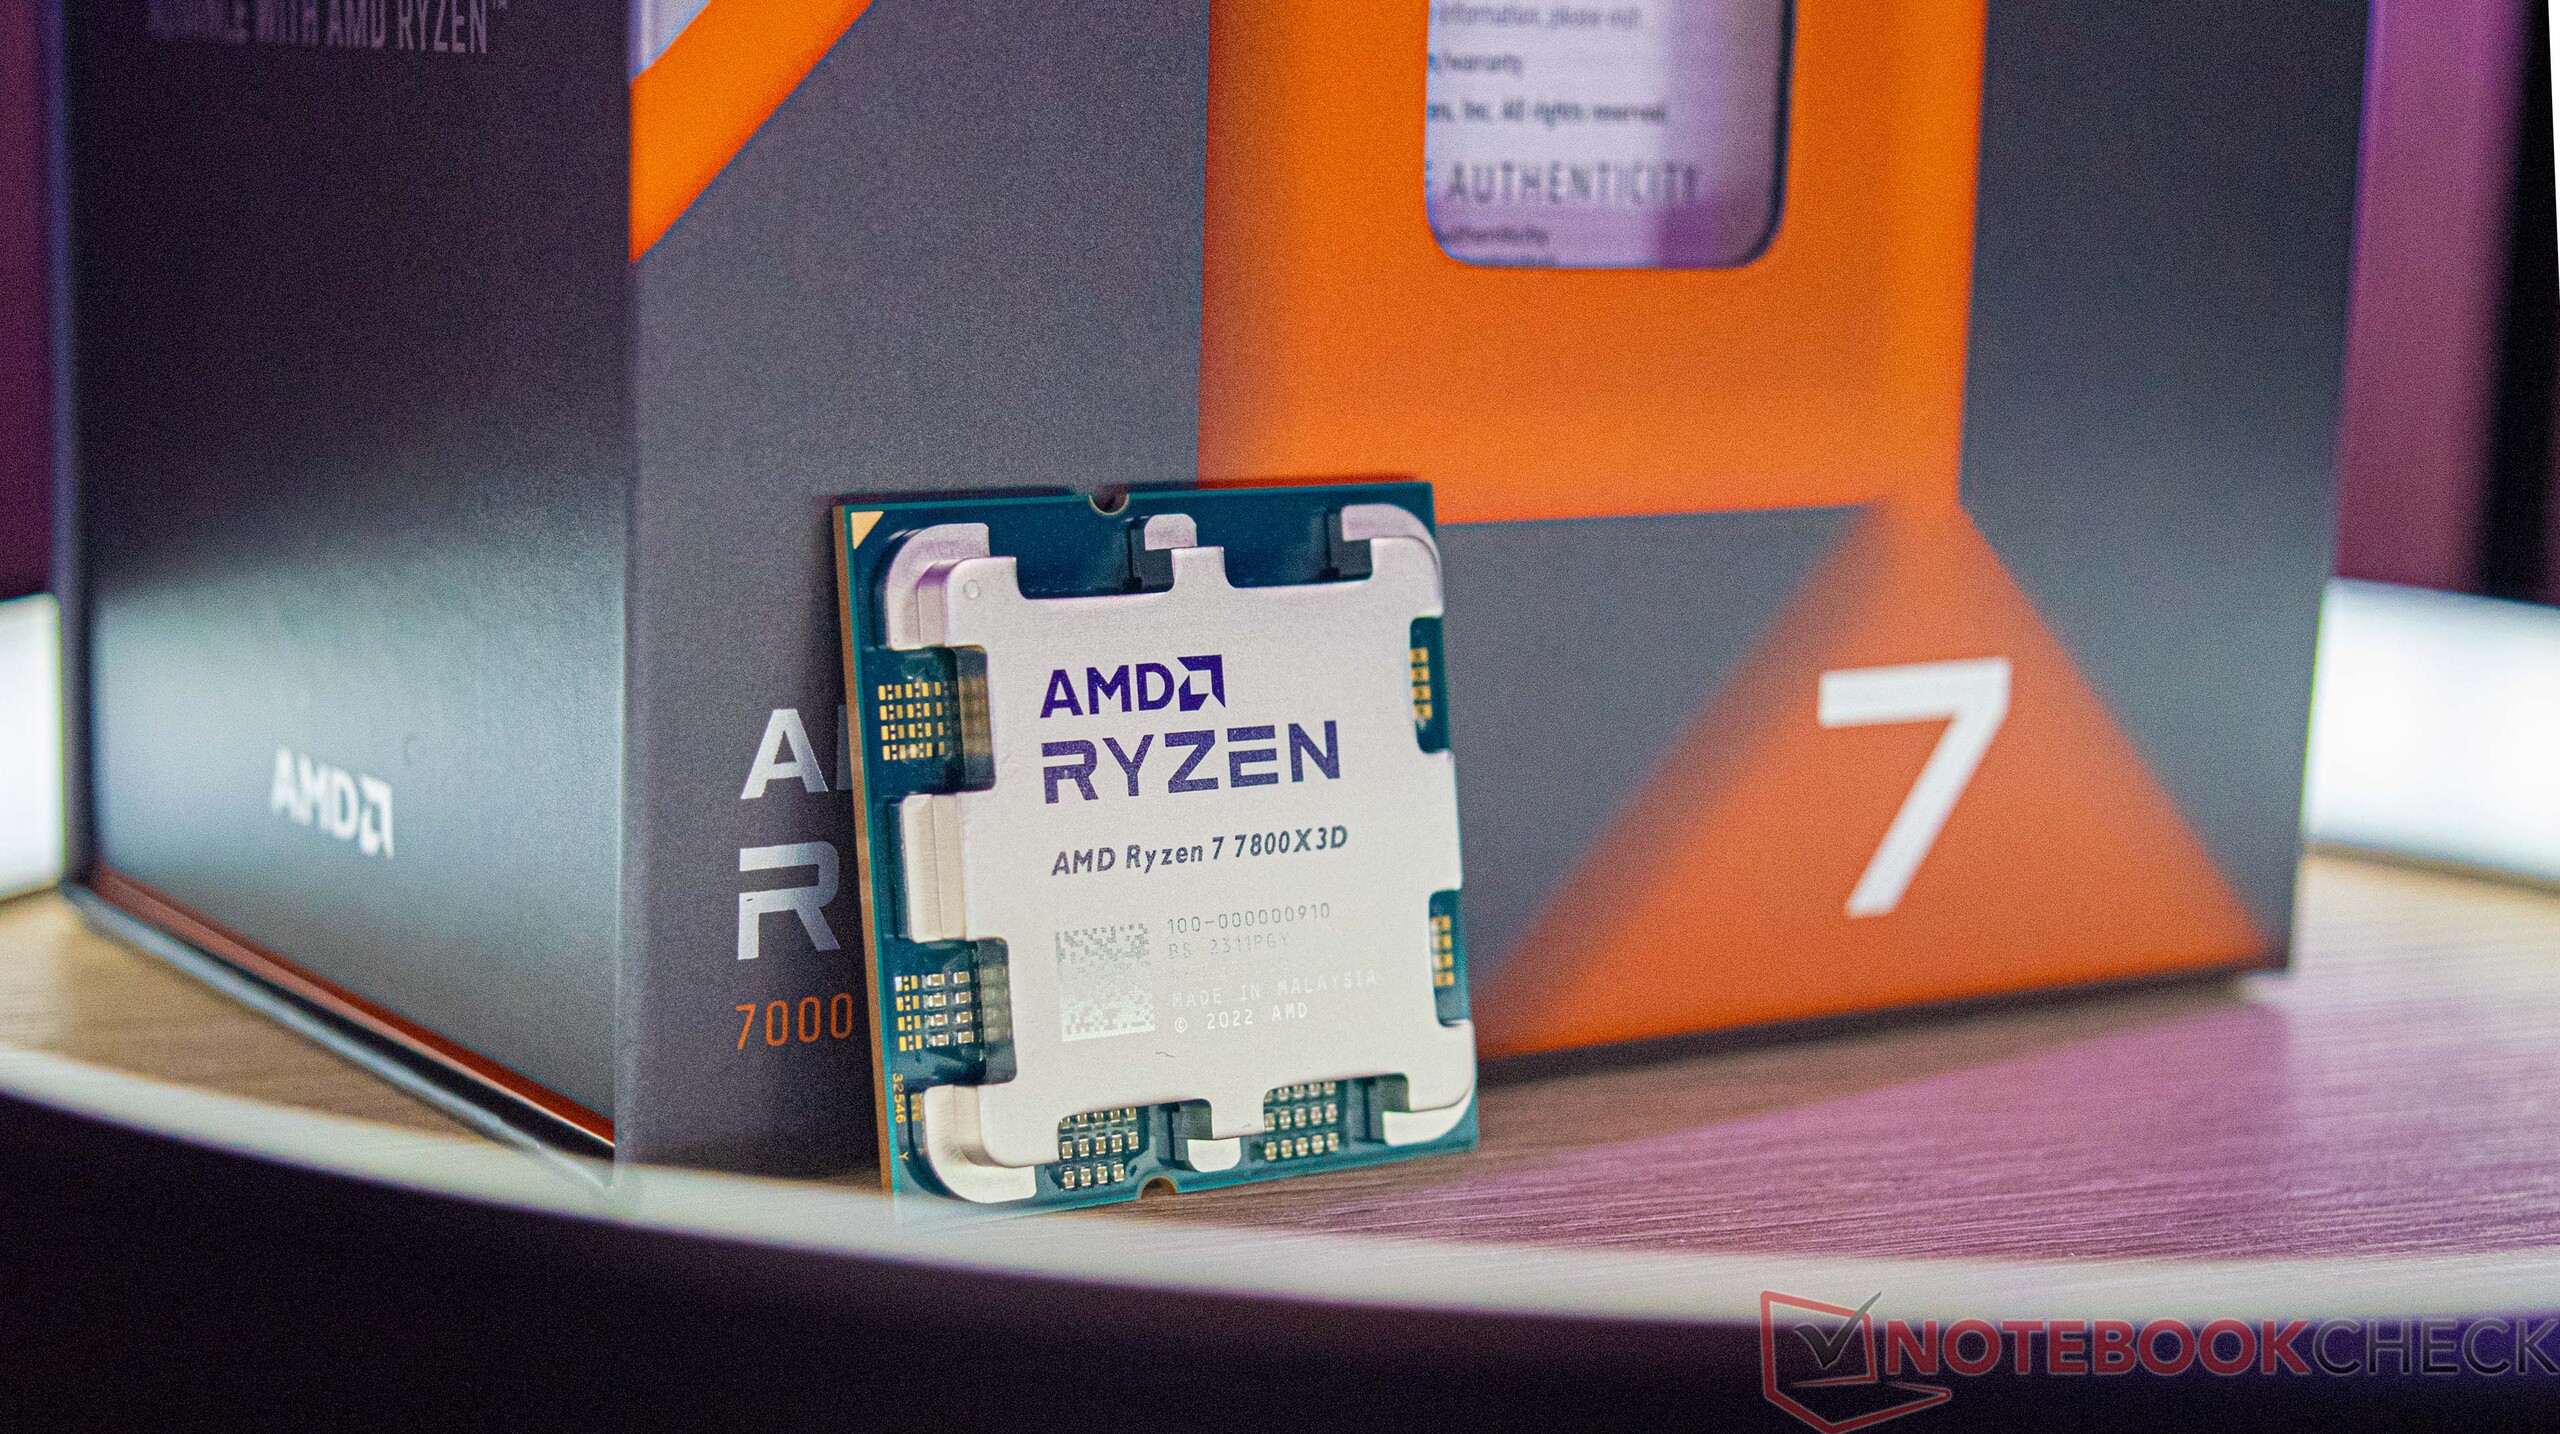
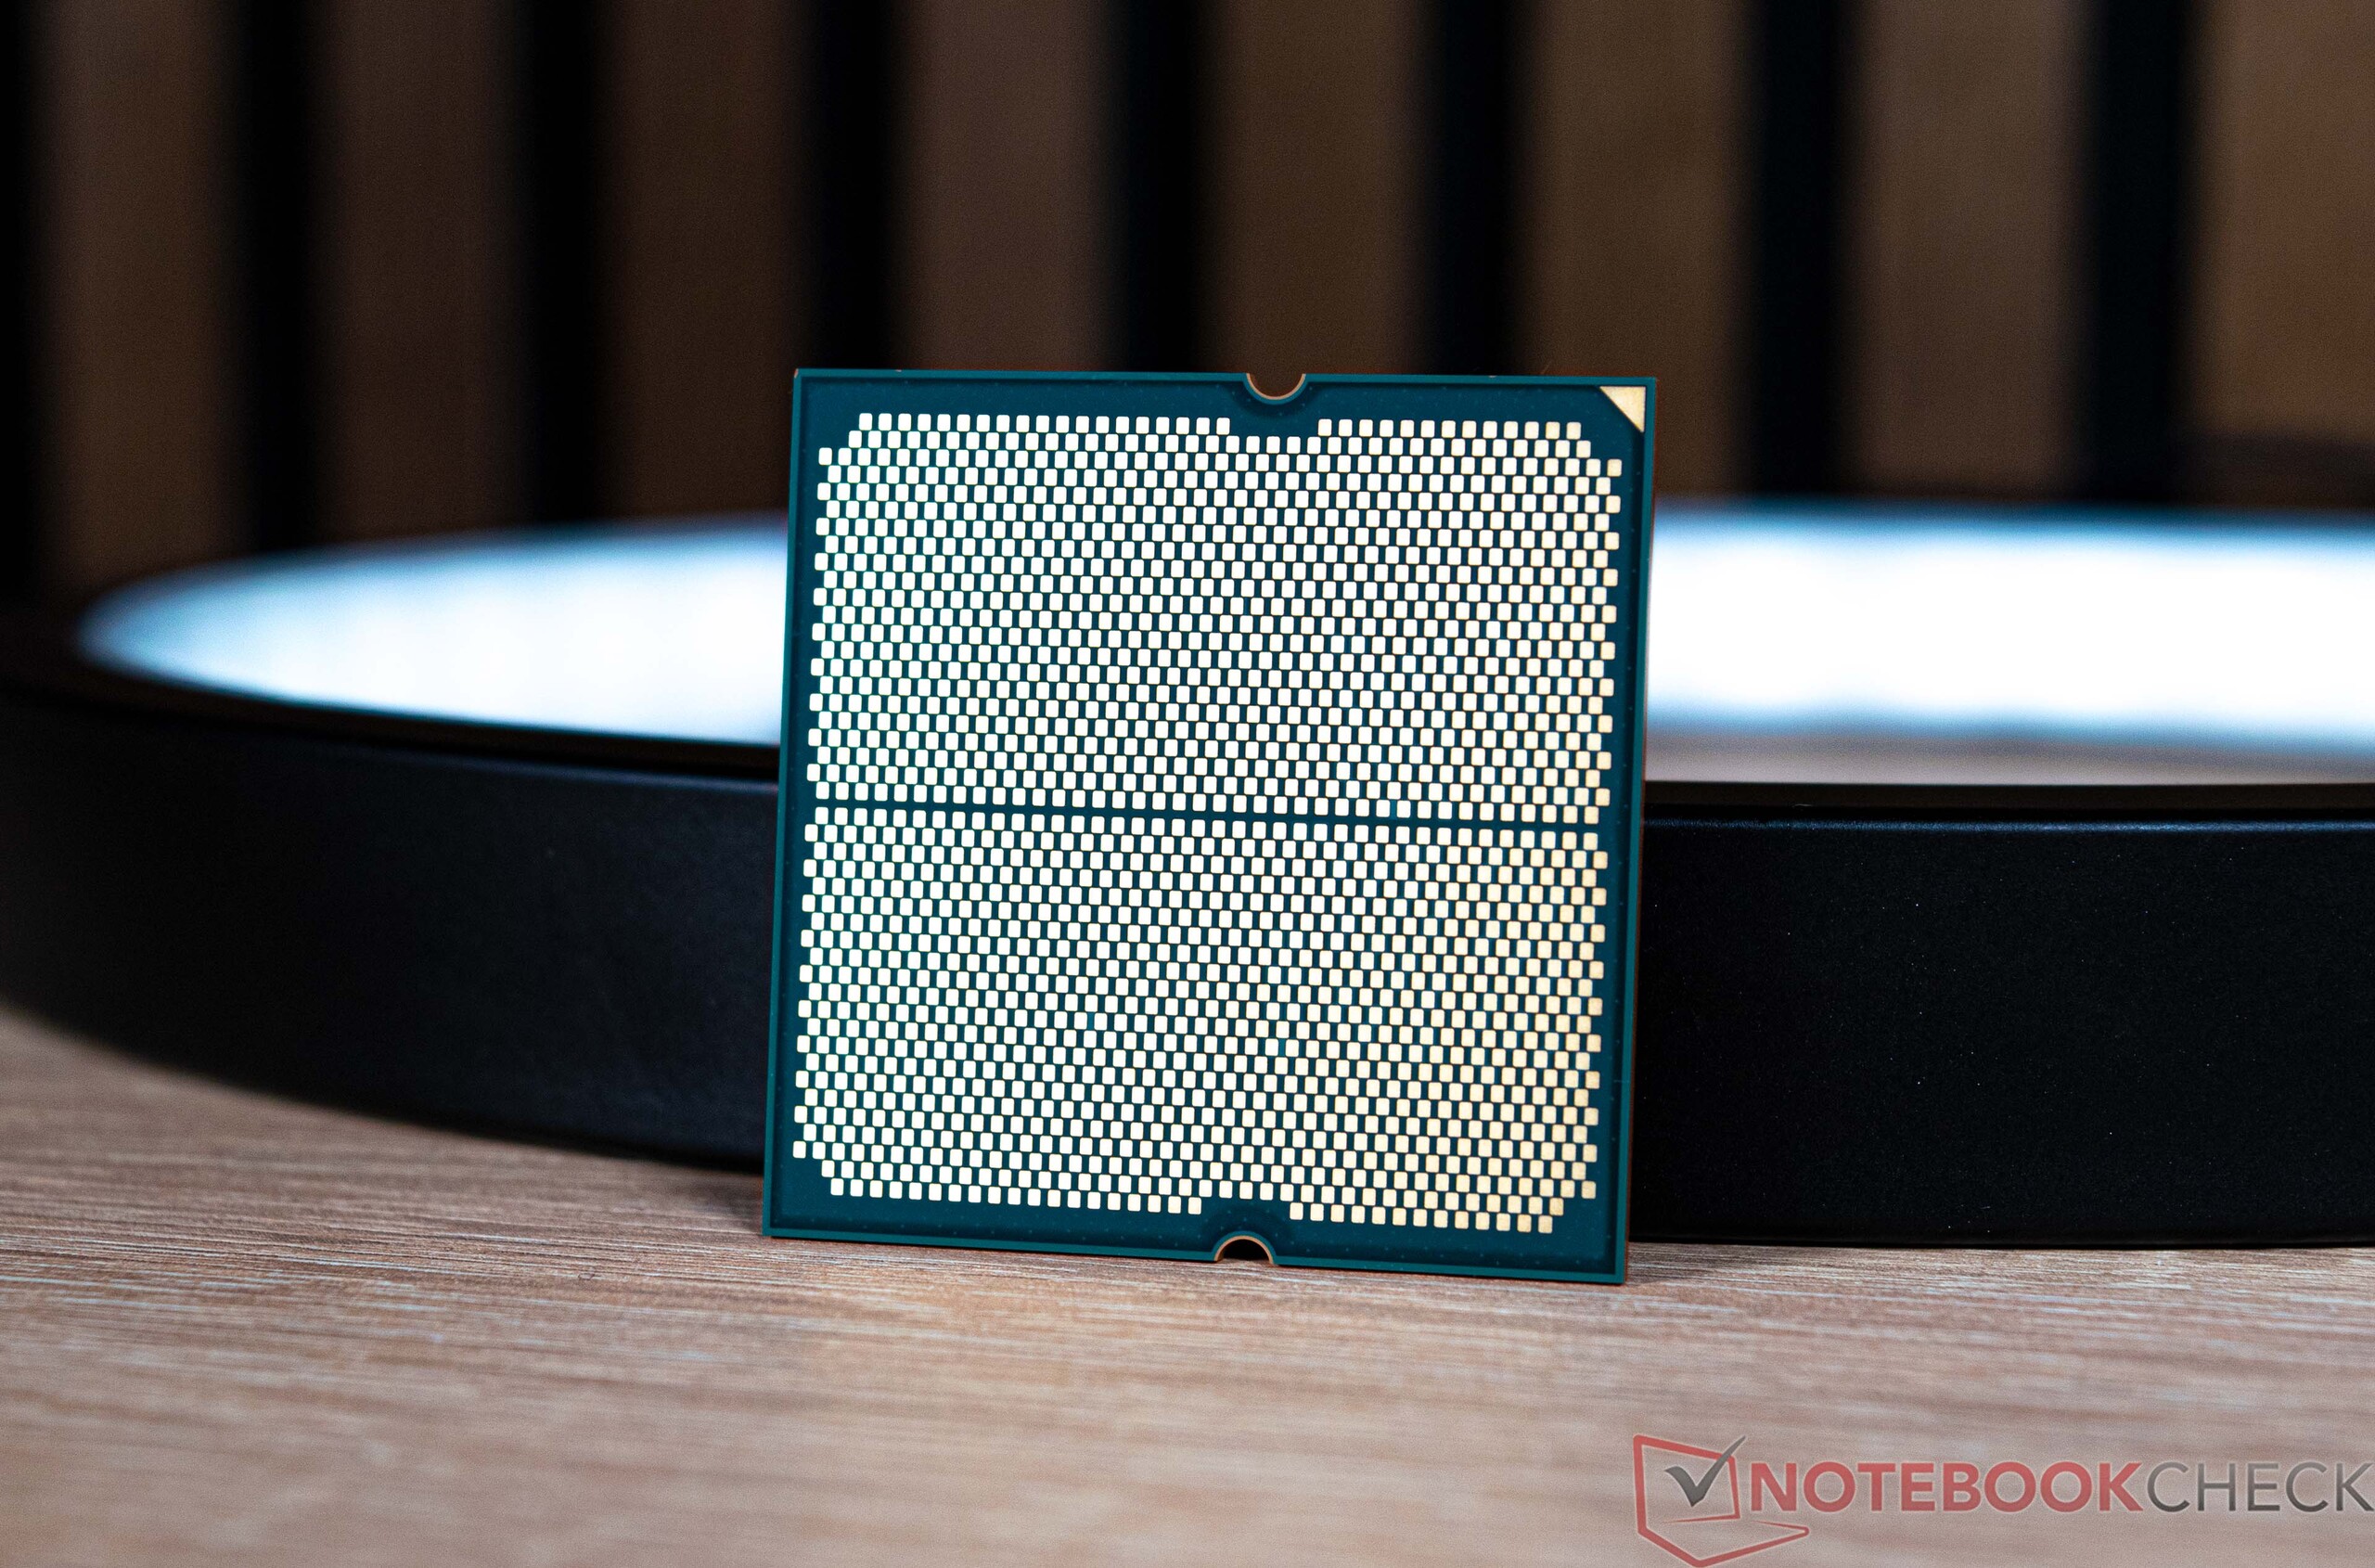
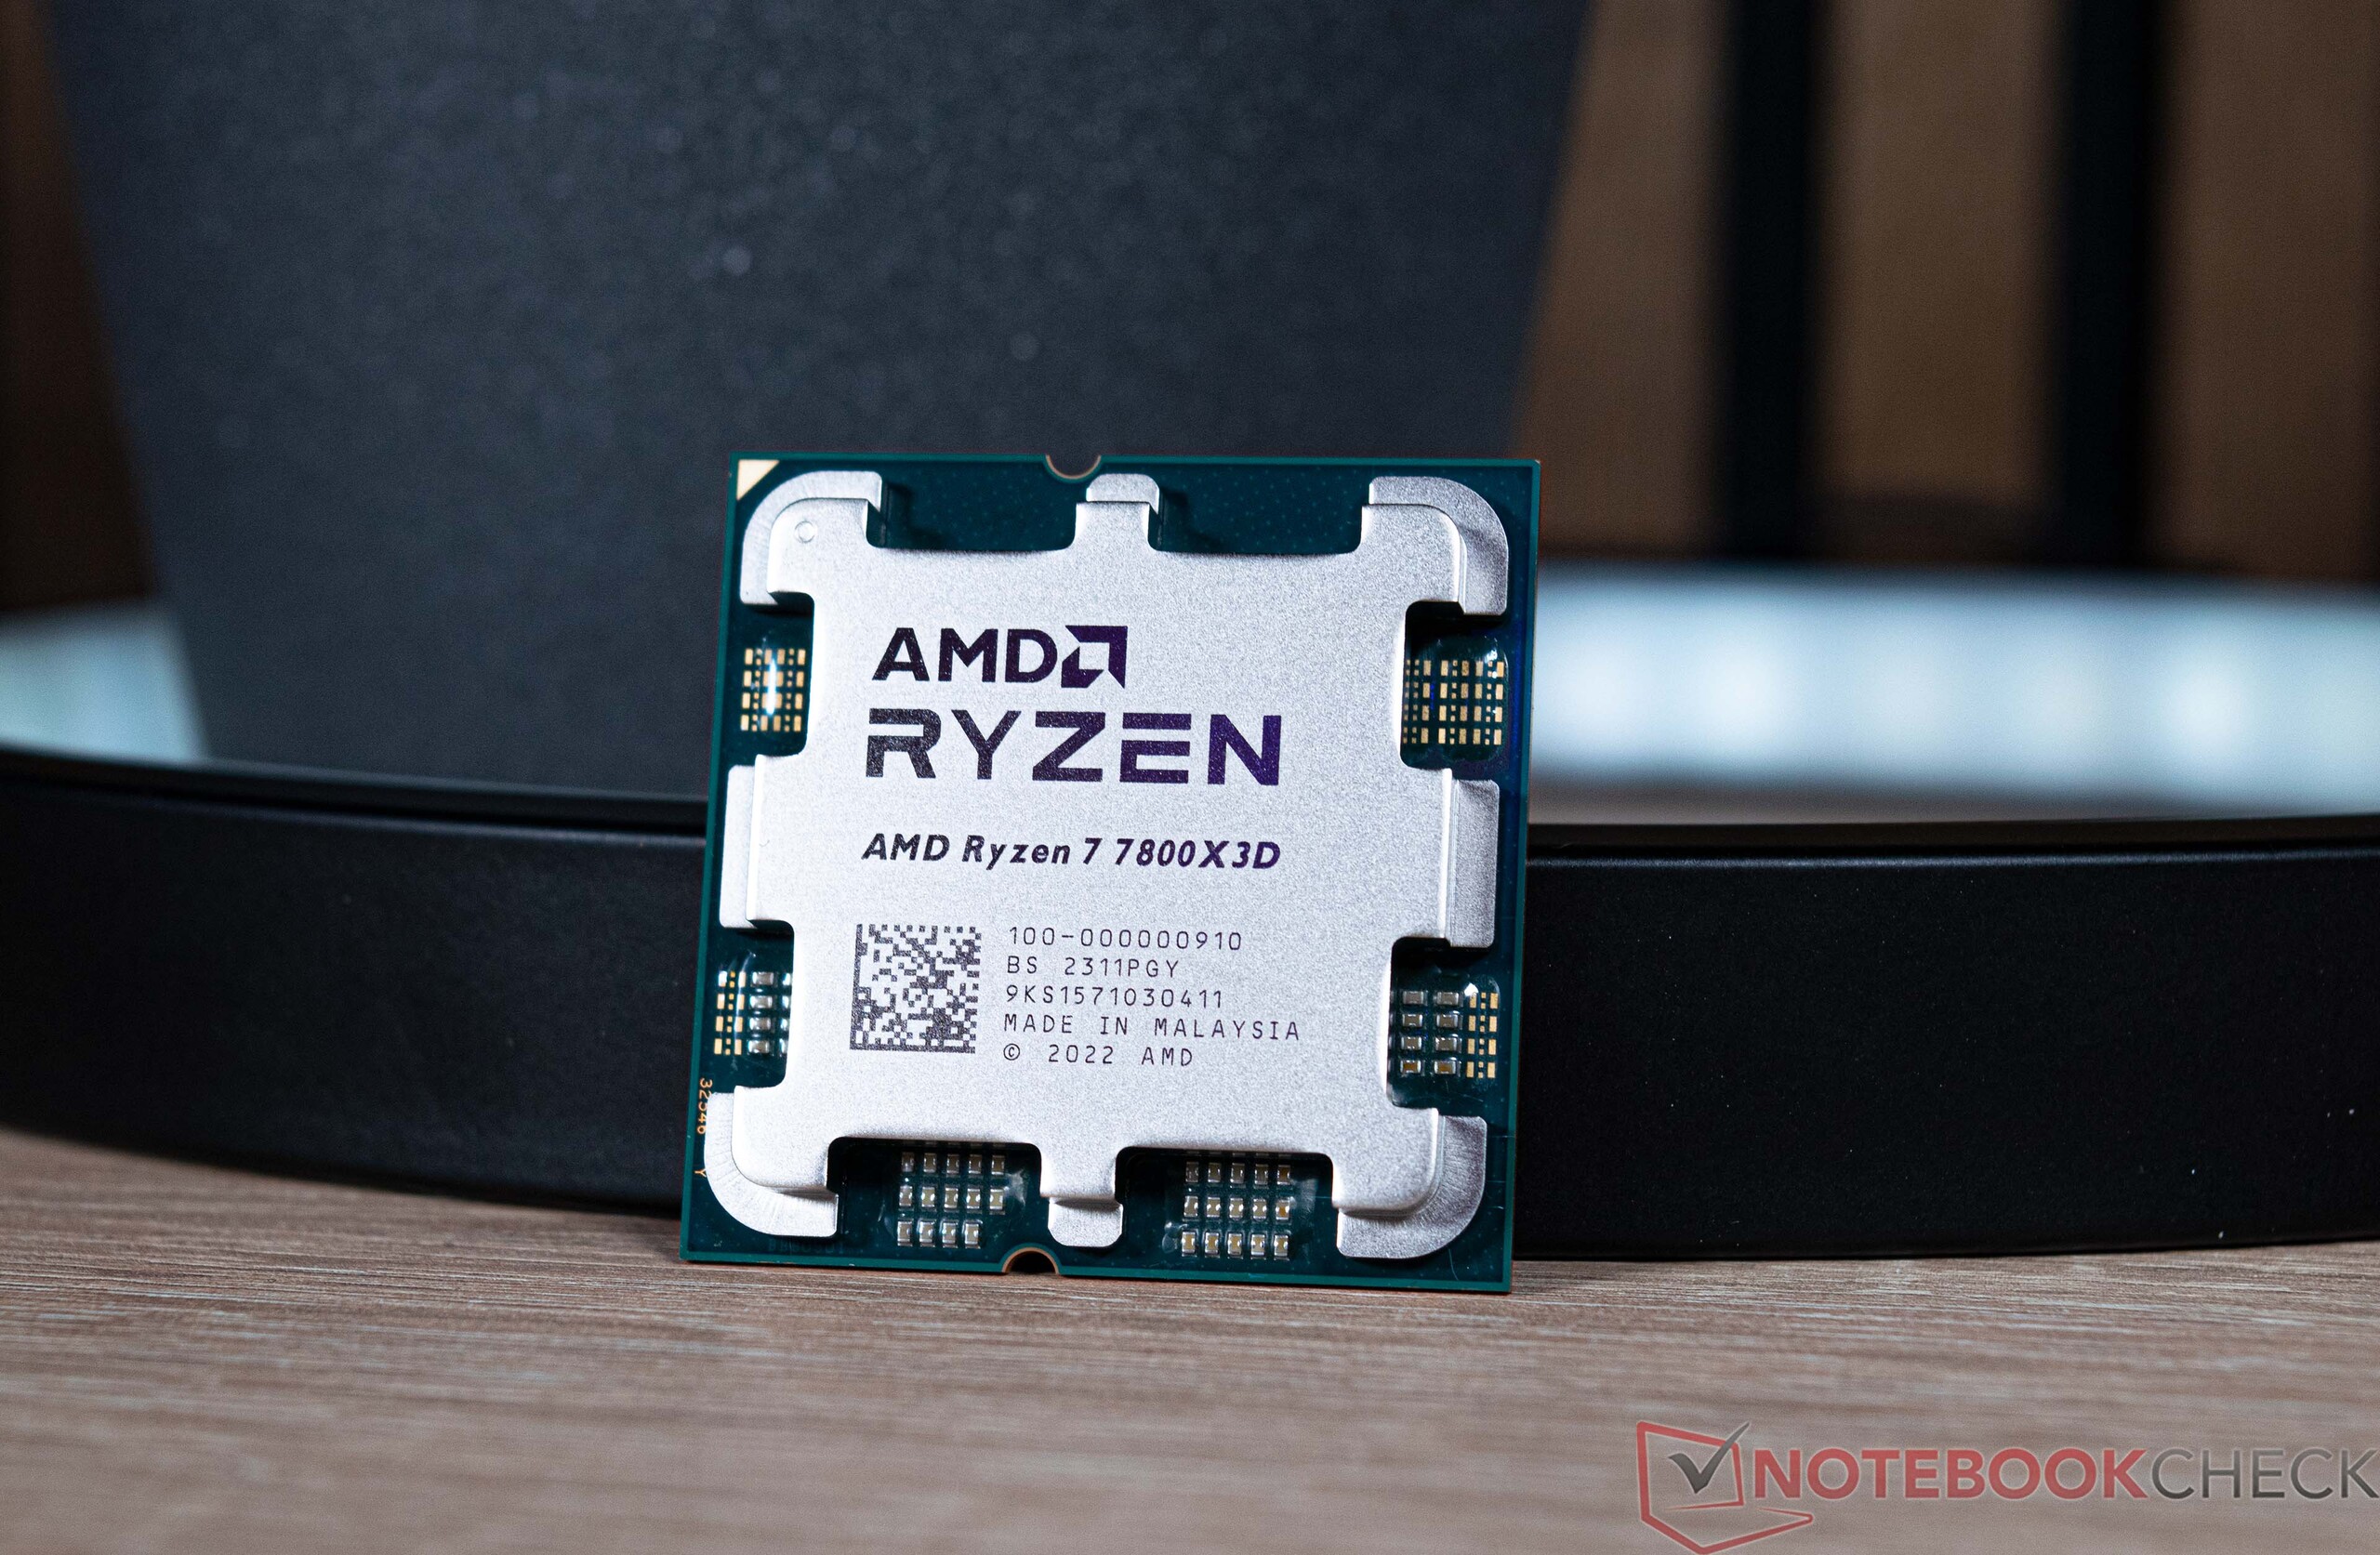
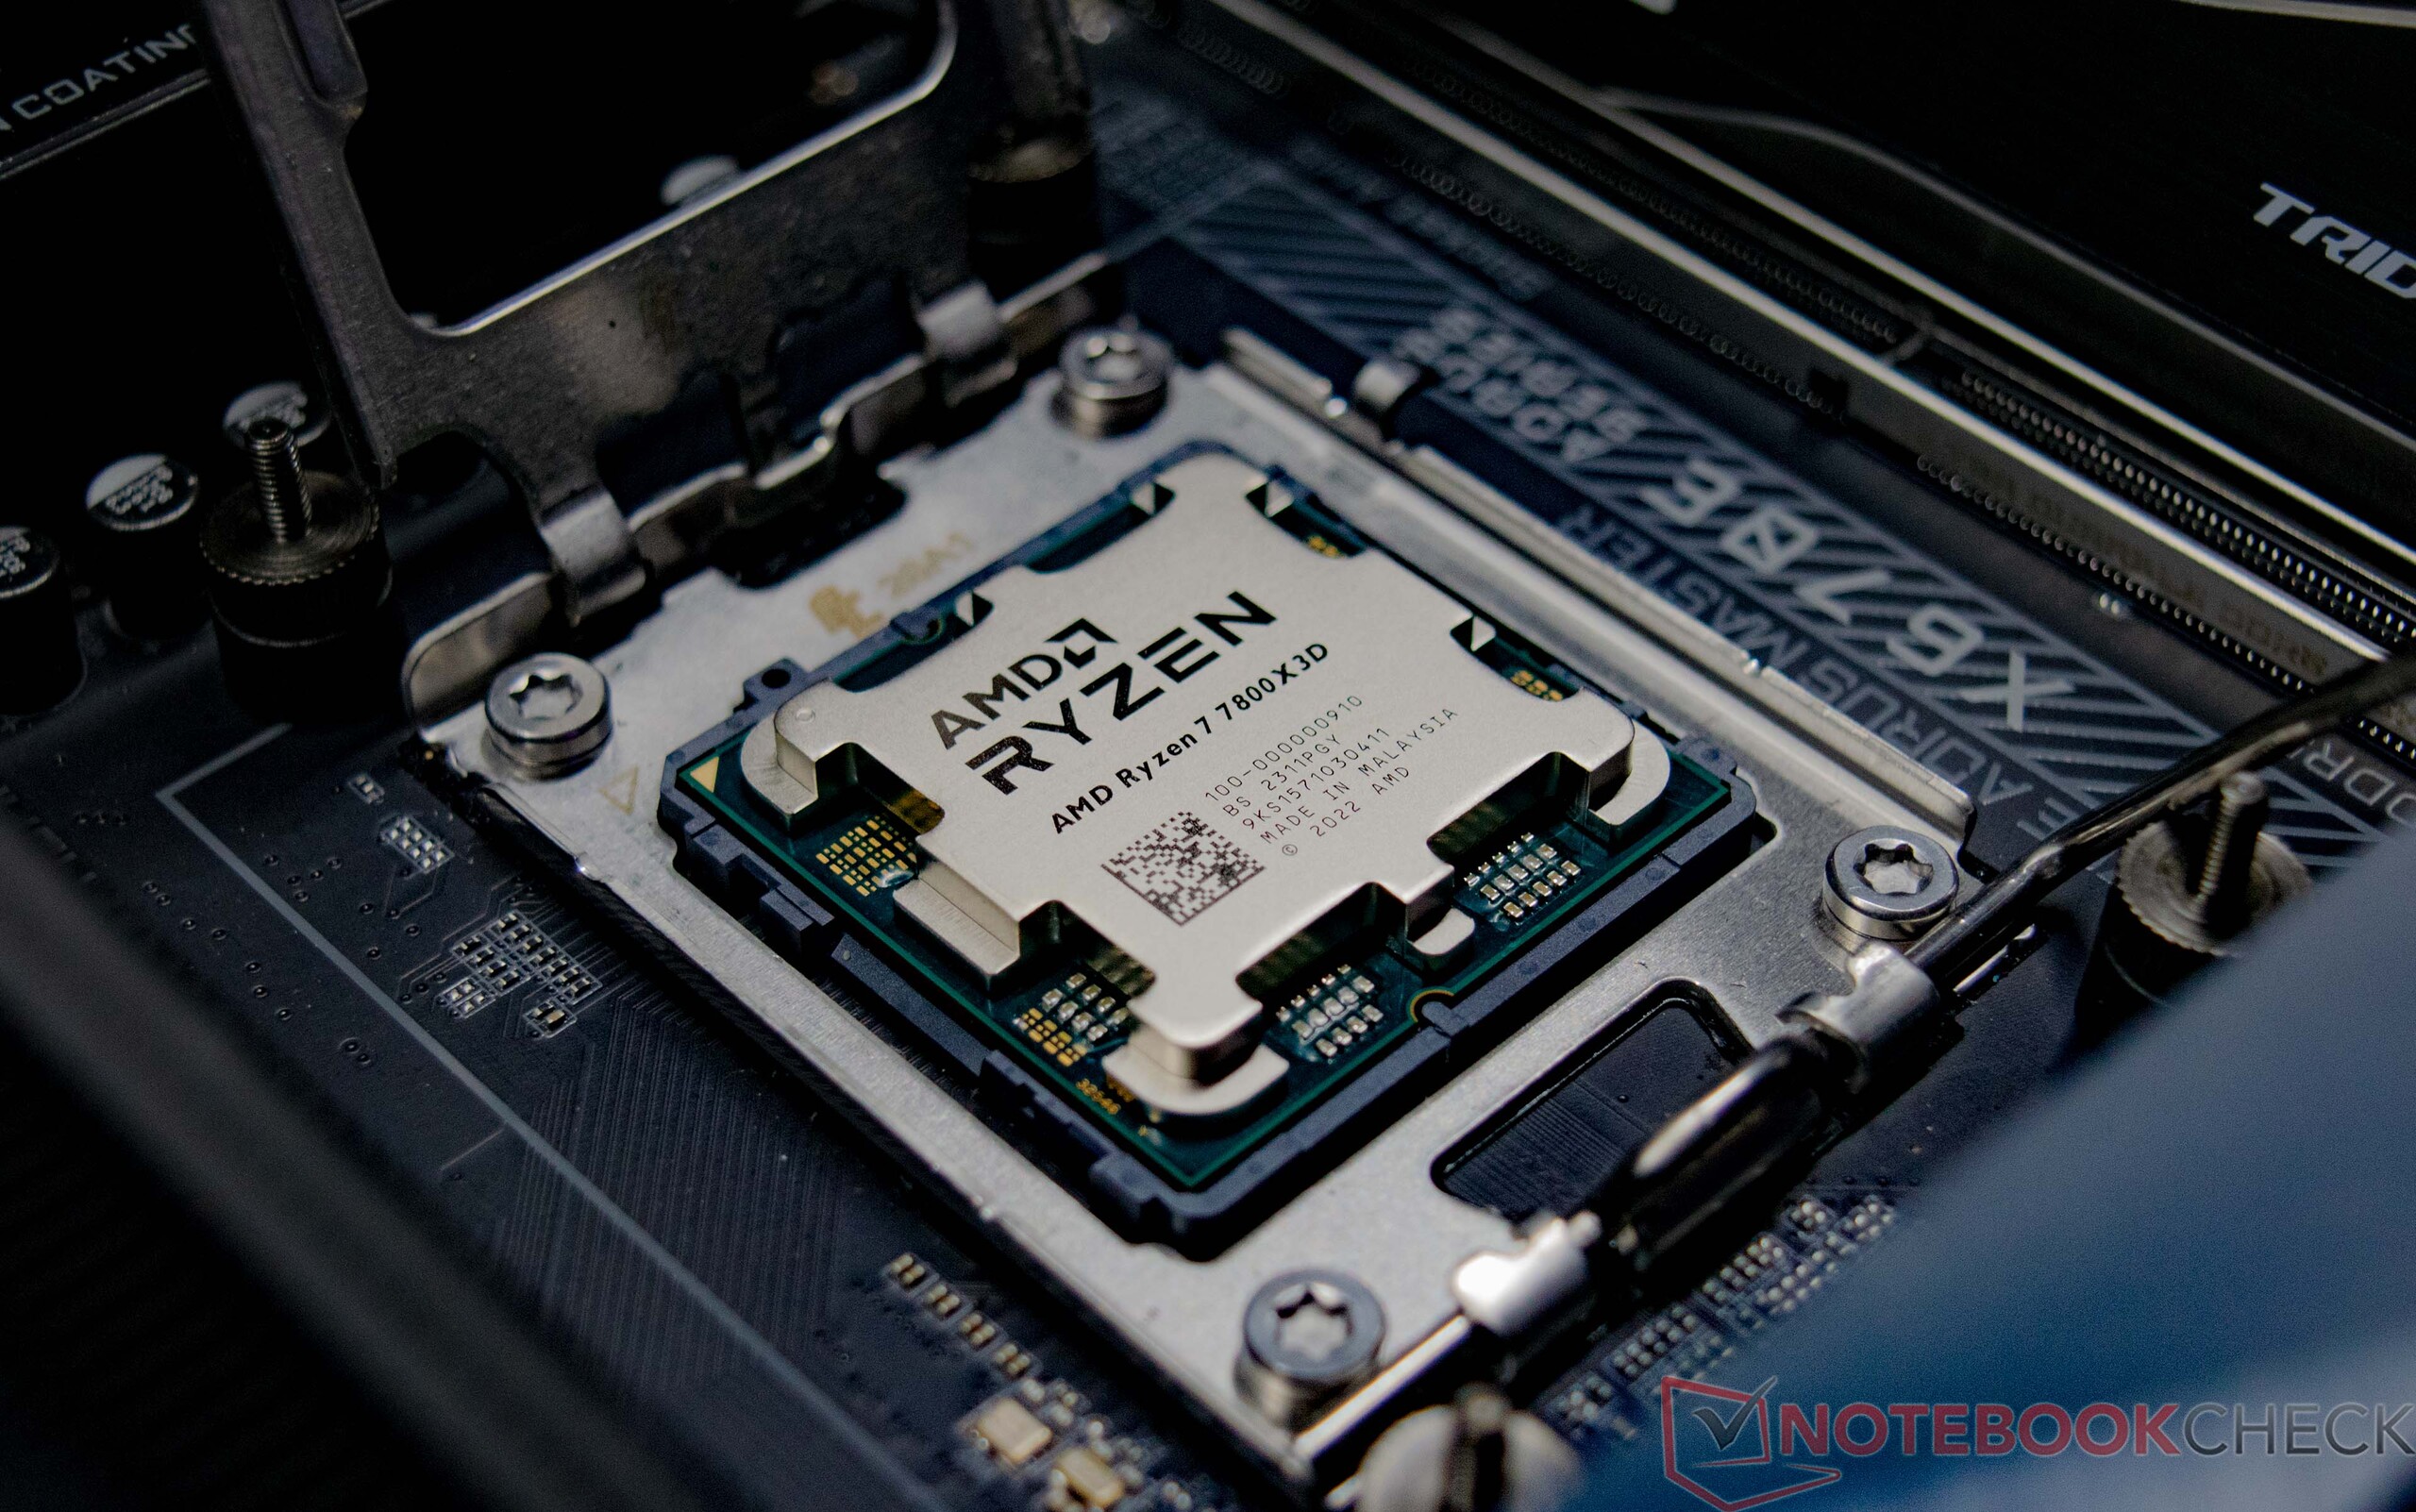
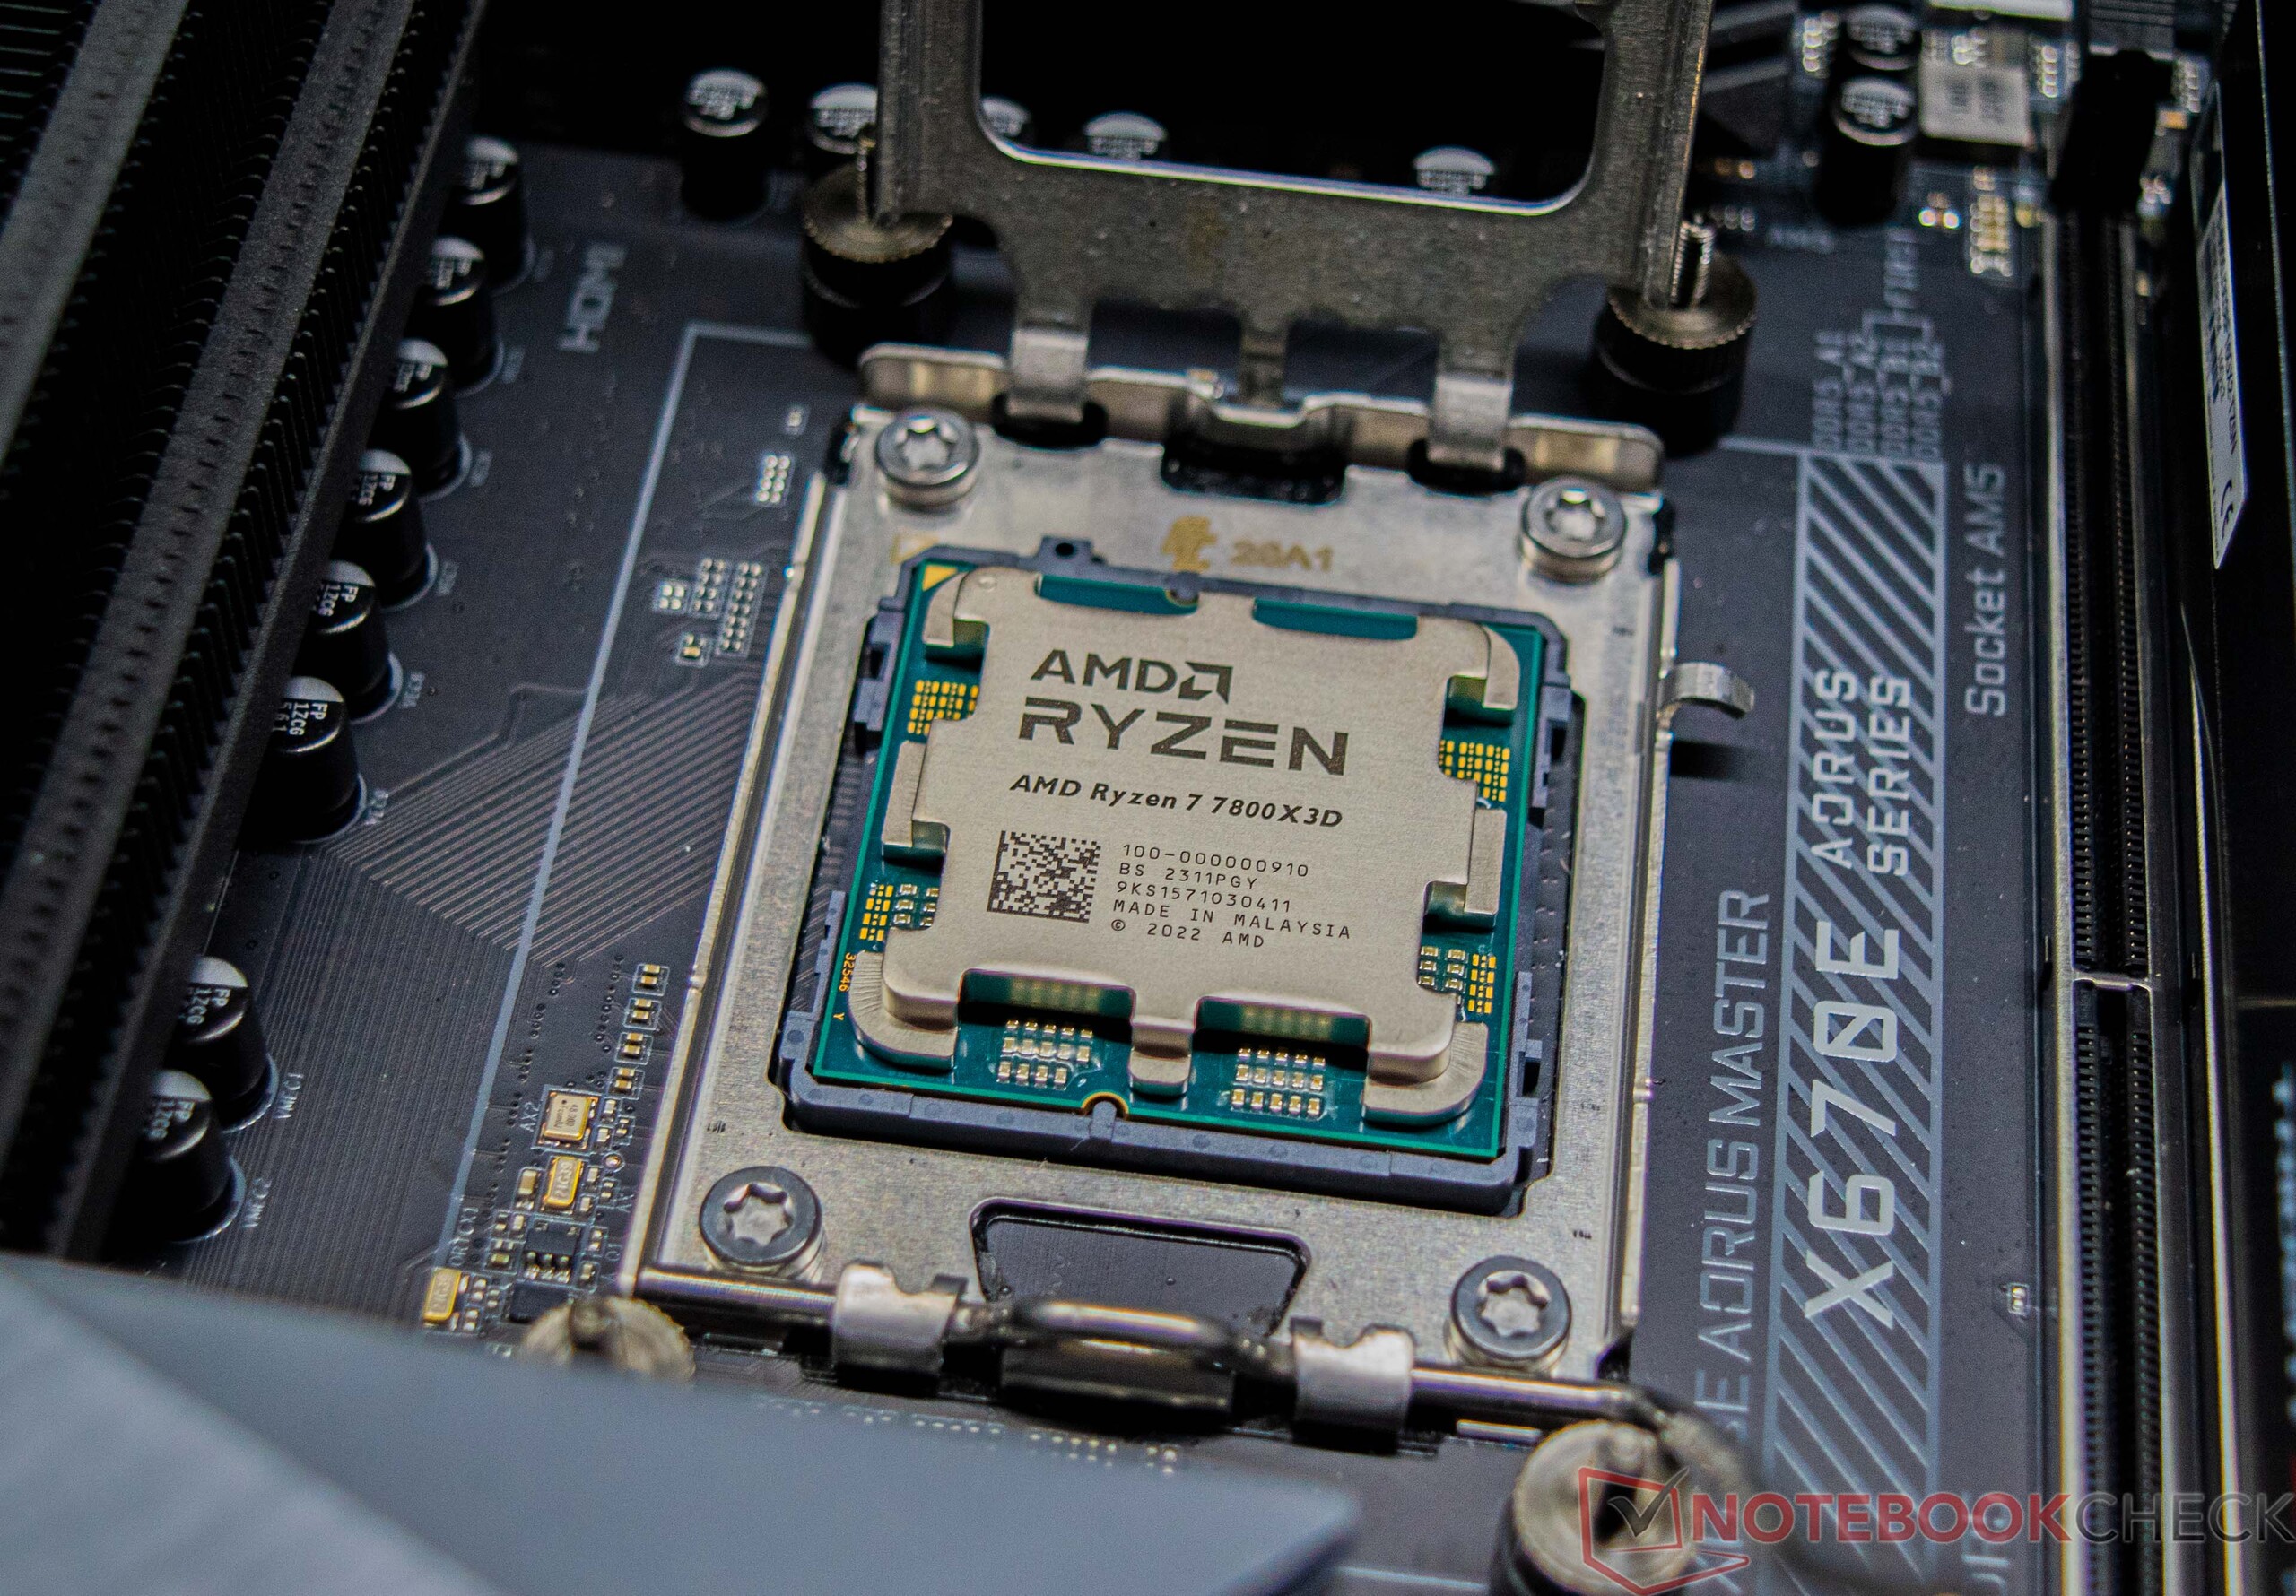
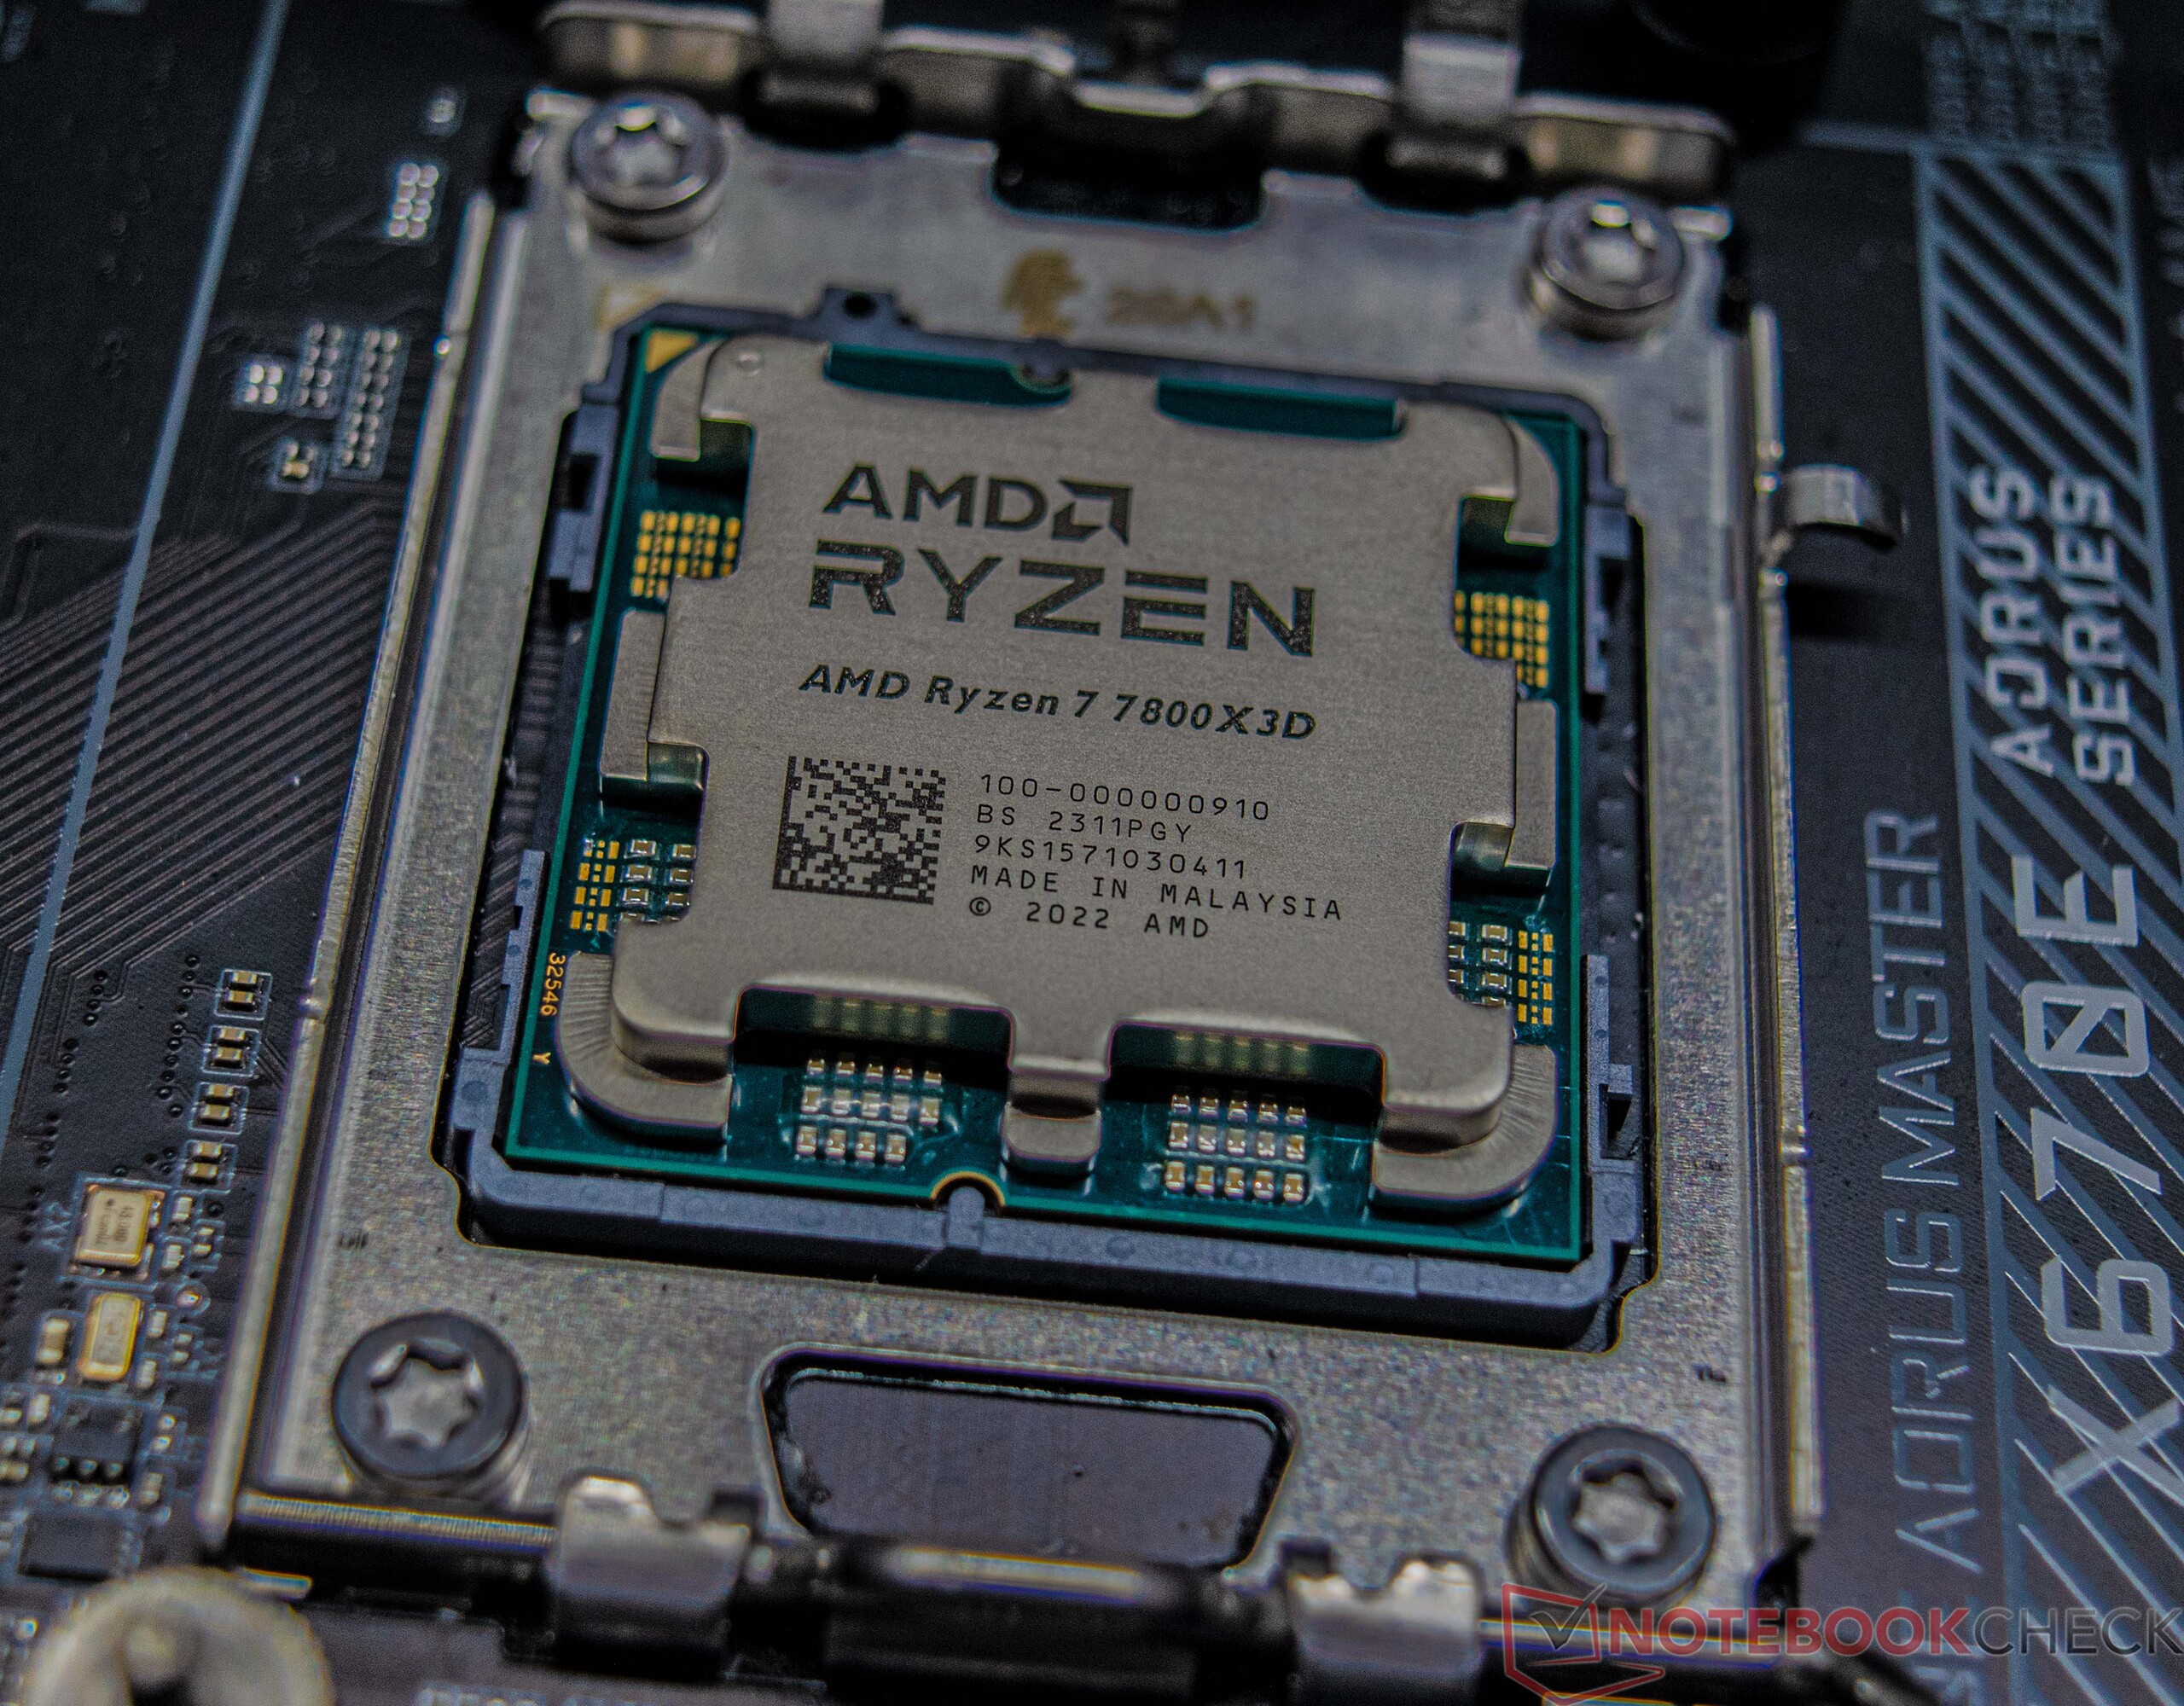
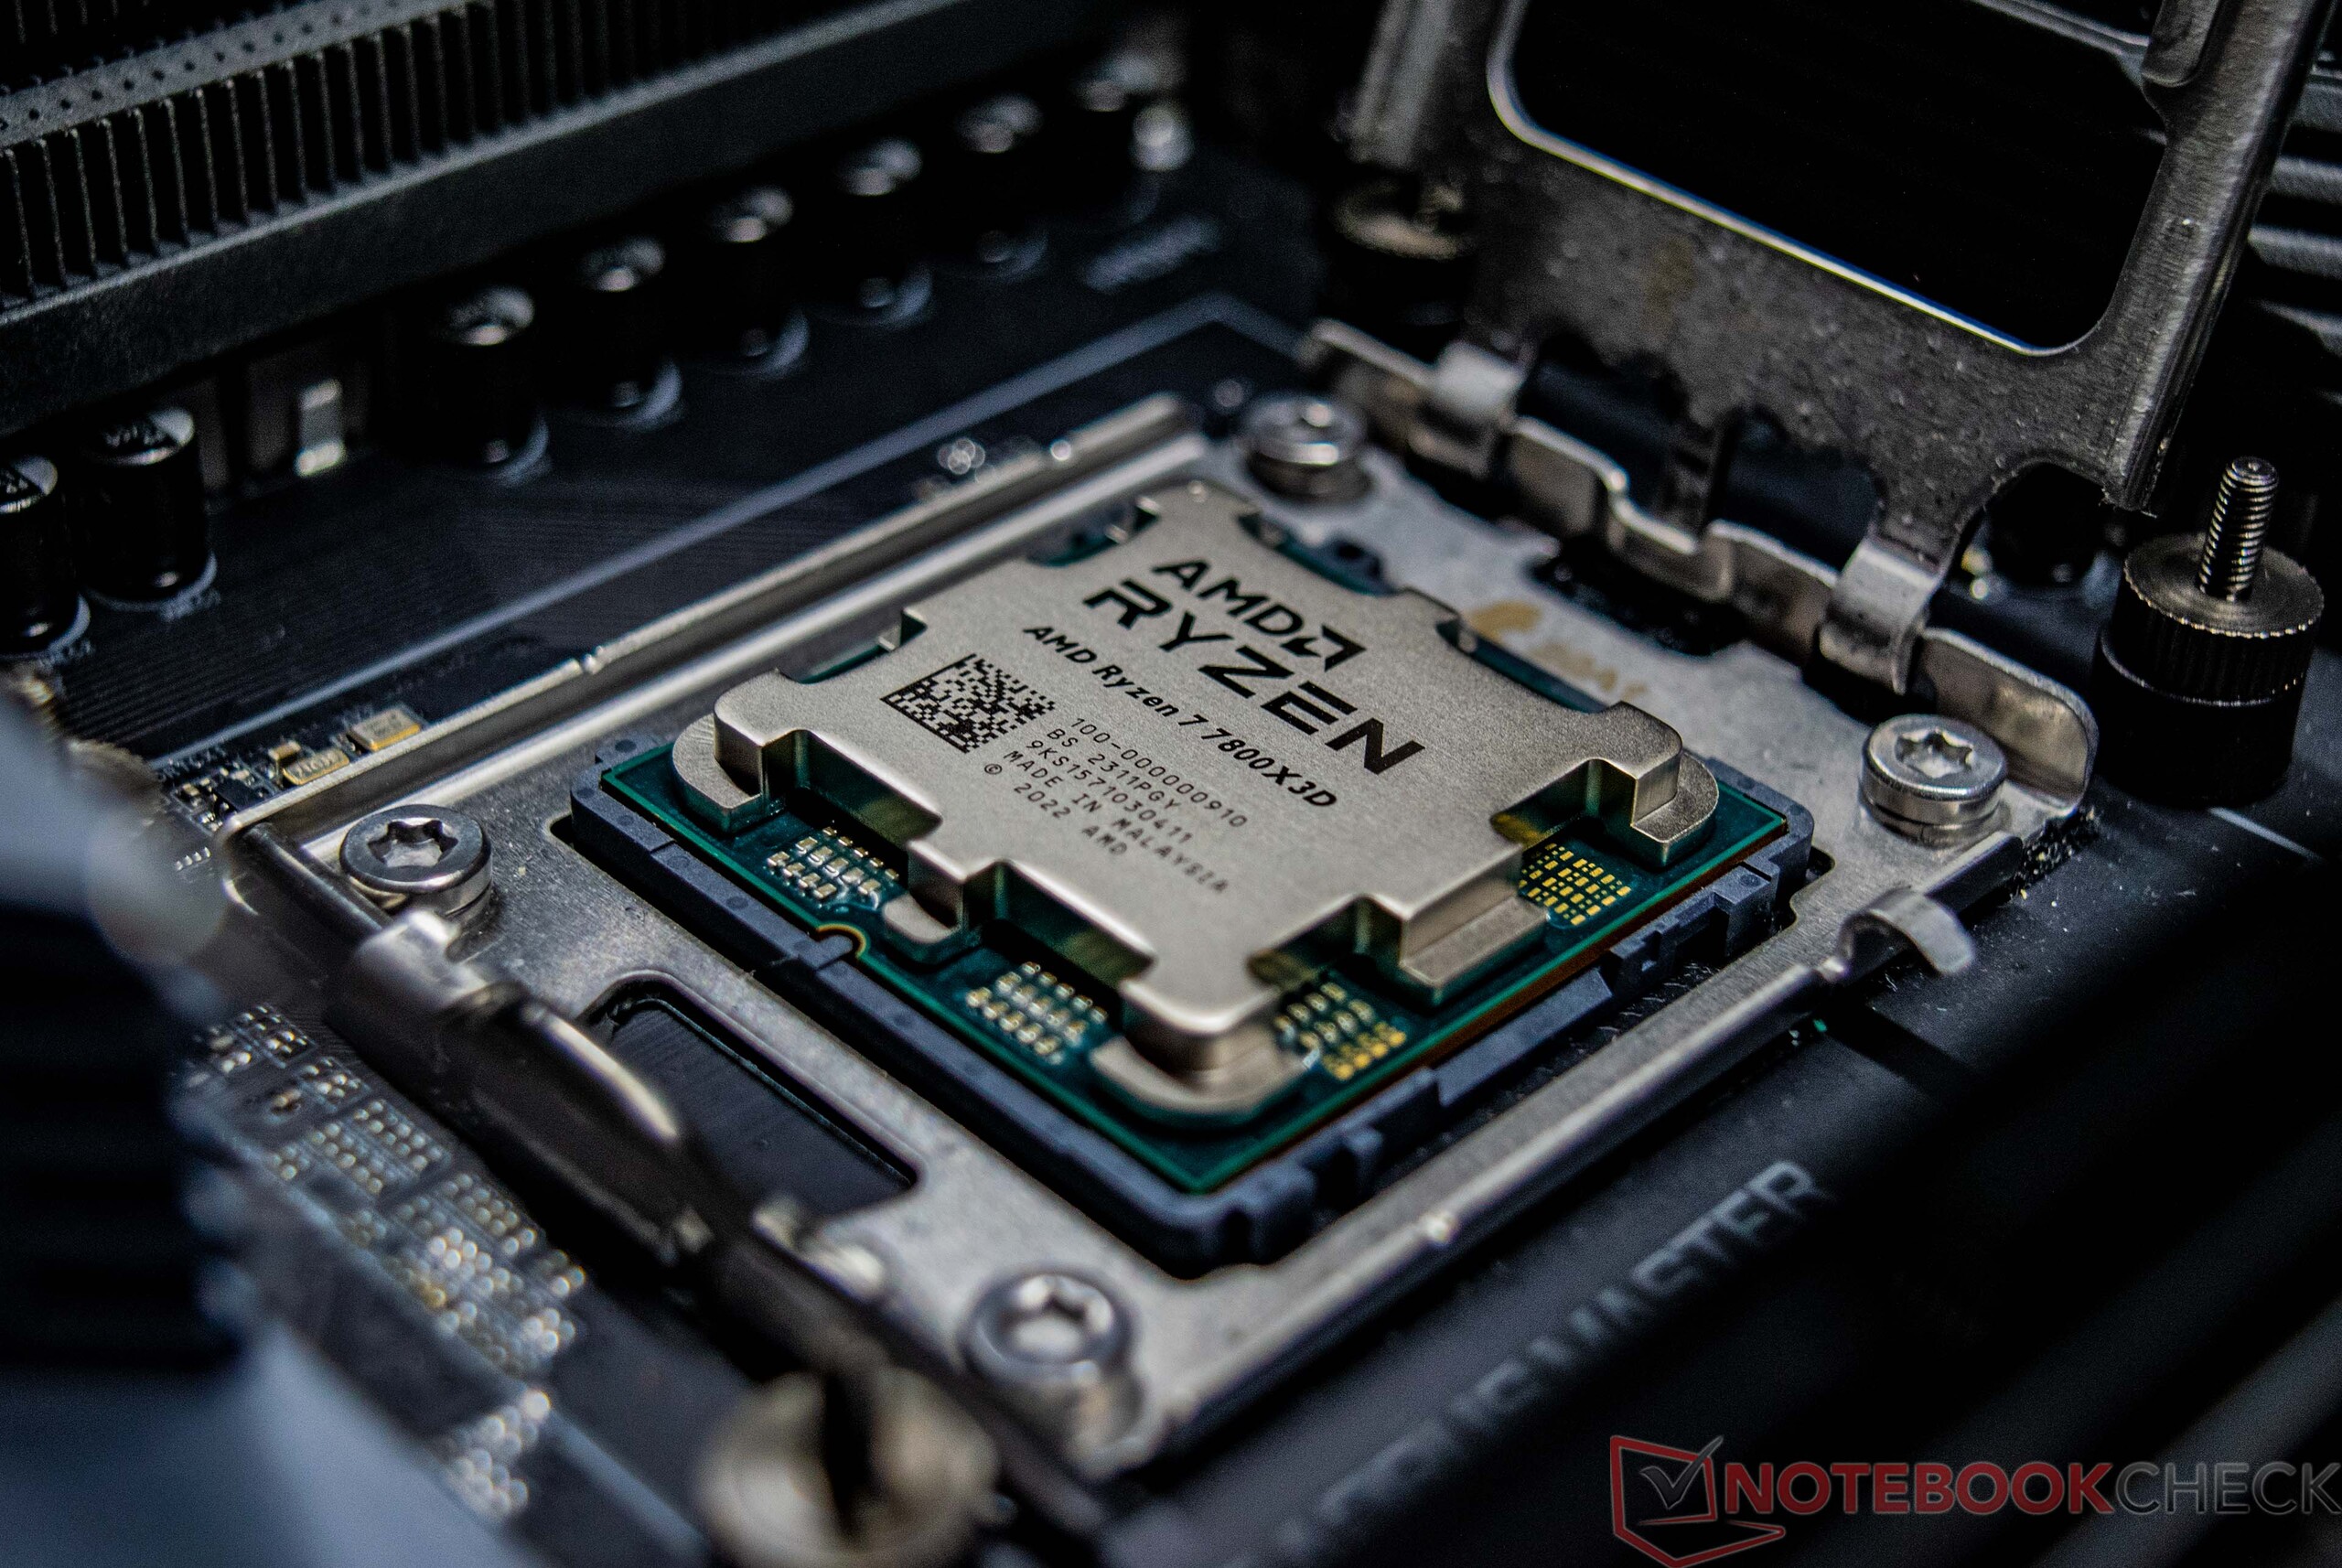
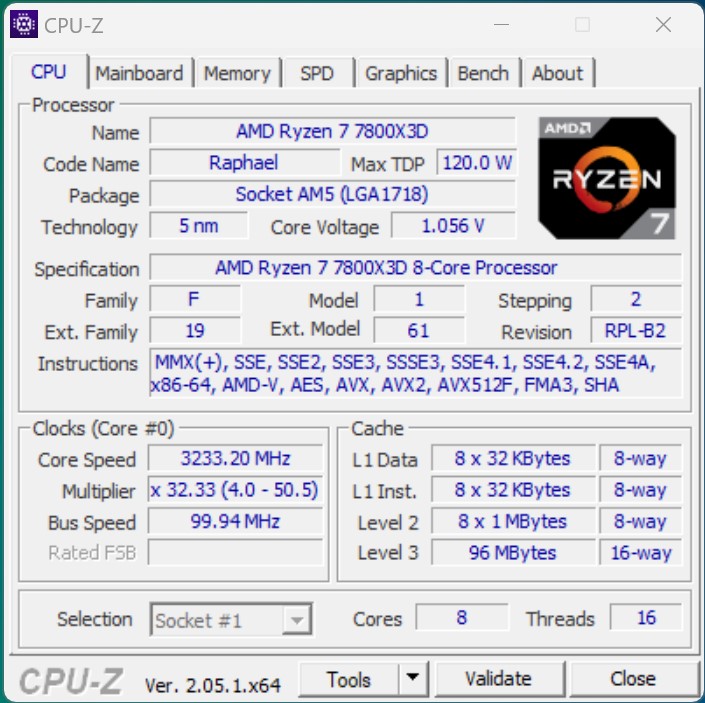
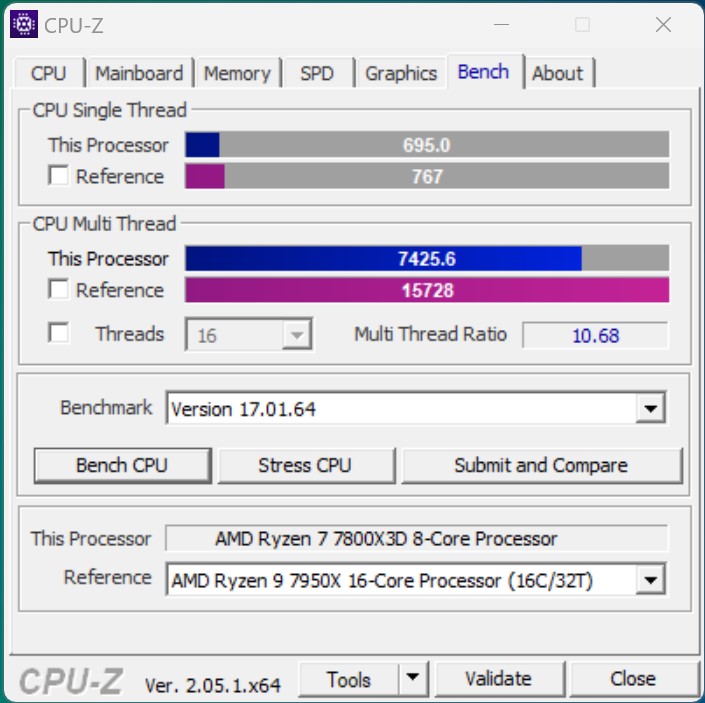
Notebookcheck Logo

AMD Ryzen 7 7800X3D台式机CPU评测:得益于3D V-Cache和仅有的8个核心,速度比酷睿i9-13900K更快

完美的游戏CPU? AMD Ryzen 7 7800X3D拥有8个核心和16个线程,这意味着它在核心数量方面仅次于顶级型号。但在我们的测试中,8核组件显示出其不容小觑的性能。在本次评测中,我们将把它的性能与其内部竞争对手以及英特尔的竞争对手进行比较。
AMD Zen 4 Gaming Desktop Ryzen (Zen)
AMD Ryzen 7 7800X3D - 8核心/16线程

AMD Ryzen 7 7800X3D是继Ryzen 9和Ryzen 9 7950X3D之后,AMD推出的第三款基于AM 5的3D V-Sync处理器。AMD Ryzen 9 7950X3D和AMD Ryzen 9 7900X3D)之后,第三款基于AM 5的3D V-Sync处理器。今年1月在拉斯维加斯举行的CES展会上,原生8核处理器与两款更大的型号一起亮相。尽管如此,在2023年4月6日该产品最终上市之前,用户仍需等待一段时间。

我们已经 测试了我们已经对AMD Ryzen 9 7950X3D进行了全面测试,其出色的性能和低功耗给我们留下了深刻的印象。我们将拭目以待AMD Ryzen 7 7800X3D的表现。一般来说,其3D V-Cache应该会带来性能的提升,这意味着AMD Ryzen 7 5800X3D基于AM4的AMD Ryzen 7 5800X3D应该仍然很受欢迎。然而,它的内部构造与Ryzen 9的两款型号相比有所不同,Ryzen 9拥有3D V-Cache。AMD Ryzen 7 7800X3D只有一个CCD,包含快速缓存在内有8个核心,而Ryzen 9型号则有两个CCD,分别有6个和8个CPU核心。但是,只有一个CCD配备了3D V-Cache,而另一个CCD则是众所周知的3D V-Cache。AMD Ryzen 9 7950X.CCD是散热器下的CPU芯片,最多可集成8个核心。

AMD Ryzen 7 7800X3D与Ryzen 7000系列的所有处理器一样,需要AM5插座(1718个触点)。从5000系列或更老的Ryzen处理器升级意味着购买新的主板和投资新的内存。关于功耗,制造商指出TDP为120瓦。然而,其最大功耗被PPT(封装功率跟踪)限制在162瓦。

AMD Ryzen 7 7800X3D
Processor
AMD Ryzen 7 7800X3D 8 x 4.2 - 5 GHz, 162 W PL2 / Short Burst, 120 W PL1 / Sustained, Raphael (Zen4)
Graphics adapter
NVIDIA GeForce RTX 4090 - 24 GB VRAM, Core: 2610 MHz, Memory: 1313 MHz, 450 W TDP, GDDR6X, 536.40
Memory
32 GB 
, DDR5-6000 (EXPO)
Mainboard
AMD X670E
Storage
Corsair MP600, 2048 GB 
Operating System
Microsoft Windows 11 Pro
Price
449 Euro
Note: The manufacturer may use components from different suppliers including display panels, drives or memory sticks with similar specifications.


AMD-Ryzen-7000系列产品一览

型号 核心/线程 基本时钟 Turbo clock 二级缓存 三级缓存 TDP PPT 上市价格
Ryzen 9 7950X3D 16/32 4.2 GHz 5.7 GHz 16x 1 MB 128 MB 120 watts 162 watts 699 USD
Ryzen 9 7950X 16/32 4.5 GHz 5.7 GHz 16x 1 MB 64 MB 170 瓦 230 瓦 699 美元
Ryzen 9 7900X3D 12/24 4.4 GHz 5.6 GHz 12x 1 MB 128 MB 120 瓦 162 瓦 599 美元
Ryzen 9 7900X 12/24 4.7 GHz 5.6 GHz 12x 1 MB 64 MB 170 瓦 230 瓦 549 美元
Ryzen 7 7800X3D 8/16 4.2 GHz 5.0 GHz 8x1 MB 96MB 120 瓦 162 549美元
Ryzen 7 7700X 8/16 4.5 GHz 5.4 GHz 8x 1 MB 32 MB 105 瓦 142 瓦 399 美元
Ryzen 5 7600X 6/12 4.7 GHz 5.3 GHz 6x 1 MB 32 MB 105 瓦 142 瓦 299 美元
AMD Ryzen 7 7800X3D
AMD Ryzen 7 7800X3D
AMD Ryzen 7 7800X3D
AMD Ryzen 7 7800X3D
AMD Ryzen 7 7800X3D
AMD Ryzen 7 7800X3D
AMD Ryzen 7 7800X3D
AMD Ryzen 7 7800X3D
AMD Ryzen 7 7800X3D
AMD Ryzen 7 7800X3D
AMD Ryzen 7 7800X3D
AMD Ryzen 7 7800X3D
AMD Ryzen 7 7800X3D
AMD Ryzen 7 7800X3D
AMD Ryzen 7 7800X3D
AMD Ryzen 7 7800X3D
AMD Ryzen 7 7800X3D
AMD Ryzen 7 7800X3D
AMD Ryzen 7 7800X3D

测试条件

我们使用 "最高性能 "能耗配置文件进行了所有性能测试。我们仅在功耗测量时偏离了这一设定。本次测试使用了DeepCool LT360 AiO解决方案作为散热装置。根据制造商提供的信息,该散热器属于AMD Ryzen 7000处理器的兼容散热器。因此,您可以放心使用,以免违反制造商的规范。

处理器基准测试 - 平均 Ryzen 7 7800X3D

在进行游戏基准测试之前,我们先来看看这款处理器的纯CPU性能。在各种基准测试的帮助下,我们注意到AMD Ryzen 7 7800X3D的性能评级与AMD Ryzen 9 5950X3D相当。AMD Ryzen 9 5950X.与英特尔相比,这足以击败AMD Ryzen 9 5950X.在这一点上,我们要重申的是,AMD Ryzen 7 7800X3D是一款8核处理器。这意味着它在多线程基准测试中的表现要比很多竞争对手差很多。

AMD Ryzen 9 7950X3D 相比,较小的Ryzen 7 7800X3D落后约24%。在这一阶段,Intel Core i9-13900K 的表现最好,比AMD之前的顶级型号高出一个百分点。

更多处理器基准测试结果请访问Mobile Processors - Benchmark List

CPU-Z
CPU-Z
CPU-Z
CPU-Z
CPU-Z
CPU-Z
Performance Rating - Percent
Intel Core i9-13900K
i9-13900K, 3000 MHz
74.5 pt
AMD Ryzen 9 7950X3D
R9 7950X3D, 4200 MHz
73.7 pt
AMD Ryzen 9 7950X
R9 7950X, 4500 MHz
73.5 pt
AMD Ryzen 9 7900X
R9 7900X, 4700 MHz
68.4 pt
Intel Core i7-13700K
i7-13700K, 3400 MHz
67.2 pt
Intel Core i5-13600K
i5-13600K, 3500 MHz
62.6 pt
AMD Ryzen 9 5950X
R9 5950X, 3400 MHz
61.8 pt
AMD Ryzen 7 7800X3D
R7 7800X3D, 4200 MHz
60.6 pt
Intel Core i7-12700
i7-12700, 3300 MHz
58.8 pt
Intel Core i5-12600K
i5-12600K, 2800 MHz
55.8 pt
Intel Core i5-13400
i5-13400, 2500 MHz
53.2 pt
Cinebench R15
CPU Single 64Bit
Intel Core i9-13900K
i9-13900K, 3000 MHz
327 Points +12%
AMD Ryzen 9 7950X3D
R9 7950X3D, 4200 MHz
326 Points +12%
AMD Ryzen 9 7900X
R9 7900X, 4700 MHz
324 Points +11%
AMD Ryzen 9 7950X
R9 7950X, 4500 MHz
317 Points +9%
Intel Core i7-13700K
i7-13700K, 3400 MHz
303 Points +4%
AMD Ryzen 7 7800X3D
R7 7800X3D, 4200 MHz
291 Points
Intel Core i5-13600K
i5-13600K, 3500 MHz
289 Points -1%
Intel Core i5-12600K
i5-12600K, 2800 MHz
275 Points -5%
AMD Ryzen 9 5950X
R9 5950X, 3400 MHz
272 Points -7%
Intel Core i7-12700
i7-12700, 3300 MHz
272 Points -7%
Intel Core i5-13400
i5-13400, 2500 MHz
257 Points -12%
CPU Multi 64Bit
AMD Ryzen 9 7950X
R9 7950X, 4500 MHz
6236 (6091.06min - 6236.36max) Points +110%
Intel Core i9-13900K
i9-13900K, 3000 MHz
6191 Points +108%
AMD Ryzen 9 7950X3D
R9 7950X3D, 4200 MHz
5974 Points +101%
AMD Ryzen 9 7900X
R9 7900X, 4700 MHz
4856 Points +63%
Intel Core i7-13700K
i7-13700K, 3400 MHz
4577 Points +54%
AMD Ryzen 9 5950X
R9 5950X, 3400 MHz
4492 Points +51%
Intel Core i5-13600K
i5-13600K, 3500 MHz
3643 Points +22%
Intel Core i7-12700
i7-12700, 3300 MHz
3151 Points +6%
AMD Ryzen 7 7800X3D
R7 7800X3D, 4200 MHz
2974 Points
Intel Core i5-12600K
i5-12600K, 2800 MHz
2555 Points -14%
Intel Core i5-13400
i5-13400, 2500 MHz
2358 Points -21%
Cinebench R20
CPU (Single Core)
Intel Core i9-13900K
i9-13900K, 3000 MHz
828 Points +17%
Intel Core i7-13700K
i7-13700K, 3400 MHz
815 Points +15%
AMD Ryzen 9 7950X3D
R9 7950X3D, 4200 MHz
795 Points +12%
AMD Ryzen 9 7900X
R9 7900X, 4700 MHz
786 Points +11%
AMD Ryzen 9 7950X
R9 7950X, 4500 MHz
783 Points +10%
Intel Core i5-13600K
i5-13600K, 3500 MHz
775 Points +9%
Intel Core i5-12600K
i5-12600K, 2800 MHz
734 Points +4%
Intel Core i7-12700
i7-12700, 3300 MHz
731 Points +3%
AMD Ryzen 7 7800X3D
R7 7800X3D, 4200 MHz
709 Points
Intel Core i5-13400
i5-13400, 2500 MHz
688 Points -3%
AMD Ryzen 9 5950X
R9 5950X, 3400 MHz
641 Points -10%
CPU (Multi Core)
Intel Core i9-13900K
i9-13900K, 3000 MHz
15181 Points +113%
AMD Ryzen 9 7950X
R9 7950X, 4500 MHz
14891 Points +109%
AMD Ryzen 9 7950X3D
R9 7950X3D, 4200 MHz
14188 Points +99%
Intel Core i7-13700K
i7-13700K, 3400 MHz
11742 Points +65%
AMD Ryzen 9 7900X
R9 7900X, 4700 MHz
11563 Points +62%
AMD Ryzen 9 5950X
R9 5950X, 3400 MHz
10482 Points +47%
Intel Core i5-13600K
i5-13600K, 3500 MHz
9265 Points +30%
Intel Core i7-12700
i7-12700, 3300 MHz
8338 Points +17%
AMD Ryzen 7 7800X3D
R7 7800X3D, 4200 MHz
7121 Points
Intel Core i5-12600K
i5-12600K, 2800 MHz
6692 Points -6%
Intel Core i5-13400
i5-13400, 2500 MHz
6135 Points -14%
Cinebench R23
Single Core
Intel Core i9-13900K
i9-13900K, 3000 MHz
2267 Points +25%
Intel Core i7-13700K
i7-13700K, 3400 MHz
2114 Points +16%
AMD Ryzen 9 7950X3D
R9 7950X3D, 4200 MHz
2053 Points +13%
AMD Ryzen 9 7900X
R9 7900X, 4700 MHz
2039 Points +12%
AMD Ryzen 9 7950X
R9 7950X, 4500 MHz
2017 Points +11%
Intel Core i5-13600K
i5-13600K, 3500 MHz
2010 Points +10%
Intel Core i5-12600K
i5-12600K, 2800 MHz
1907 Points +5%
Intel Core i7-12700
i7-12700, 3300 MHz
1894 Points +4%
AMD Ryzen 7 7800X3D
R7 7800X3D, 4200 MHz
1820 Points
Intel Core i5-13400
i5-13400, 2500 MHz
1786 Points -2%
AMD Ryzen 9 5950X
R9 5950X, 3400 MHz
1649 Points -9%
Multi Core
Intel Core i9-13900K
i9-13900K, 3000 MHz
40103 Points +122%
AMD Ryzen 9 7950X
R9 7950X, 4500 MHz
38248 Points +111%
AMD Ryzen 9 7950X3D
R9 7950X3D, 4200 MHz
36291 Points +101%
Intel Core i7-13700K
i7-13700K, 3400 MHz
30753 Points +70%
AMD Ryzen 9 7900X
R9 7900X, 4700 MHz
29480 Points +63%
AMD Ryzen 9 5950X
R9 5950X, 3400 MHz
27062 Points +50%
Intel Core i5-13600K
i5-13600K, 3500 MHz
24268 Points +34%
Intel Core i7-12700
i7-12700, 3300 MHz
21751 Points +20%
AMD Ryzen 7 7800X3D
R7 7800X3D, 4200 MHz
18086 Points
Intel Core i5-12600K
i5-12600K, 2800 MHz
17491 Points -3%
Intel Core i5-13400
i5-13400, 2500 MHz
15953 Points -12%
Cinebench R11.5
CPU Single 64Bit
Intel Core i9-13900K
i9-13900K, 3000 MHz
3.92 Points +14%
AMD Ryzen 9 7950X3D
R9 7950X3D, 4200 MHz
3.86 Points +13%
AMD Ryzen 9 7900X
R9 7900X, 4700 MHz
3.83 Points +12%
AMD Ryzen 9 7950X
R9 7950X, 4500 MHz
3.7 Points +8%
Intel Core i7-13700K
i7-13700K, 3400 MHz
3.66 Points +7%
Intel Core i5-13600K
i5-13600K, 3500 MHz
3.48 Points +1%
AMD Ryzen 7 7800X3D
R7 7800X3D, 4200 MHz
3.43 Points
Intel Core i5-12600K
i5-12600K, 2800 MHz
3.31 Points -3%
Intel Core i7-12700
i7-12700, 3300 MHz
3.28 Points -4%
AMD Ryzen 9 5950X
R9 5950X, 3400 MHz
3.14 Points -8%
Intel Core i5-13400
i5-13400, 2500 MHz
3.1 Points -10%
CPU Multi 64Bit
Intel Core i9-13900K
i9-13900K, 3000 MHz
70.78 Points +111%
AMD Ryzen 9 7950X
R9 7950X, 4500 MHz
69.26 Points +107%
AMD Ryzen 9 7950X3D
R9 7950X3D, 4200 MHz
64.59 Points +93%
AMD Ryzen 9 7900X
R9 7900X, 4700 MHz
54.51 Points +63%
Intel Core i7-13700K
i7-13700K, 3400 MHz
52.98 Points +58%
AMD Ryzen 9 5950X
R9 5950X, 3400 MHz
49.6 Points +48%
Intel Core i5-13600K
i5-13600K, 3500 MHz
42.38 Points +27%
Intel Core i7-12700
i7-12700, 3300 MHz
36.92 Points +10%
AMD Ryzen 7 7800X3D
R7 7800X3D, 4200 MHz
33.48 Points
Intel Core i5-12600K
i5-12600K, 2800 MHz
30.01 Points -10%
Intel Core i5-13400
i5-13400, 2500 MHz
27.36 Points -18%
Blender - v2.79 BMW27 CPU
Intel Core i5-13400
i5-13400, 2500 MHz
206 Seconds * -22%
Intel Core i5-12600K
i5-12600K, 2800 MHz
189.5 Seconds * -12%
AMD Ryzen 7 7800X3D
R7 7800X3D, 4200 MHz
169 Seconds *
Intel Core i7-12700
i7-12700, 3300 MHz
151 Seconds * +11%
Intel Core i5-13600K
i5-13600K, 3500 MHz
135 Seconds * +20%
AMD Ryzen 9 5950X
R9 5950X, 3400 MHz
112.8 Seconds * +33%
AMD Ryzen 9 7900X
R9 7900X, 4700 MHz
106 Seconds * +37%
Intel Core i7-13700K
i7-13700K, 3400 MHz
106 Seconds * +37%
AMD Ryzen 9 7950X3D
R9 7950X3D, 4200 MHz
86 Seconds * +49%
AMD Ryzen 9 7950X
R9 7950X, 4500 MHz
82 Seconds * +51%
Intel Core i9-13900K
i9-13900K, 3000 MHz
80 Seconds * +53%
wPrime 2.10
32m
Intel Core i5-12600K
i5-12600K, 2800 MHz
4.725 s * -94%
Intel Core i5-13400
i5-13400, 2500 MHz
3.474 s * -43%
Intel Core i7-12700
i7-12700, 3300 MHz
2.897 s * -19%
AMD Ryzen 9 5950X
R9 5950X, 3400 MHz
2.538 s * -4%
Intel Core i5-13600K
i5-13600K, 3500 MHz
2.527 s * -4%
AMD Ryzen 7 7800X3D
R7 7800X3D, 4200 MHz
2.435 s *
Intel Core i7-13700K
i7-13700K, 3400 MHz
2.312 s * +5%
AMD Ryzen 9 7950X3D
R9 7950X3D, 4200 MHz
2.007 s * +18%
Intel Core i9-13900K
i9-13900K, 3000 MHz
1.818 s * +25%
AMD Ryzen 9 7900X
R9 7900X, 4700 MHz
1.781 s * +27%
AMD Ryzen 9 7950X
R9 7950X, 4500 MHz
1.557 s * +36%
1024m
Intel Core i5-13400
i5-13400, 2500 MHz
452.309 s * -621%
Intel Core i7-12700
i7-12700, 3300 MHz
272.823 s * -335%
Intel Core i5-12600K
i5-12600K, 2800 MHz
202.7 s * -223%
Intel Core i5-13600K
i5-13600K, 3500 MHz
177.592 s * -183%
Intel Core i7-13700K
i7-13700K, 3400 MHz
170.219 s * -171%
Intel Core i9-13900K
i9-13900K, 3000 MHz
79.738 s * -27%
AMD Ryzen 9 5950X
R9 5950X, 3400 MHz
64.9 s * -3%
AMD Ryzen 7 7800X3D
R7 7800X3D, 4200 MHz
62.733 s *
AMD Ryzen 9 7900X
R9 7900X, 4700 MHz
39.954 s * +36%
AMD Ryzen 9 7950X3D
R9 7950X3D, 4200 MHz
33.879 s * +46%
AMD Ryzen 9 7950X
R9 7950X, 4500 MHz
30.427 s * +51%
X264 HD Benchmark 4.0
Pass 1
Intel Core i9-13900K
i9-13900K, 3000 MHz
412 (410min - 417max) fps +20%
Intel Core i7-13700K
i7-13700K, 3400 MHz
406 (405min - 407max) fps +18%
AMD Ryzen 9 7950X3D
R9 7950X3D, 4200 MHz
392.5 (391min - 397max) fps +14%
Intel Core i5-13600K
i5-13600K, 3500 MHz
388 (386min - 388max) fps +13%
AMD Ryzen 9 7950X
R9 7950X, 4500 MHz
383 (381min - 386max) fps +11%
AMD Ryzen 9 7900X
R9 7900X, 4700 MHz
376 (369min - 378max) fps +9%
Intel Core i7-12700
i7-12700, 3300 MHz
347 fps +1%
AMD Ryzen 7 7800X3D
R7 7800X3D, 4200 MHz
344 (339min - 346max) fps
AMD Ryzen 9 5950X
R9 5950X, 3400 MHz
338.5 (337min - 340max) fps -2%
Intel Core i5-12600K
i5-12600K, 2800 MHz
333.5 (332min - 336max) fps -3%
Intel Core i5-13400
i5-13400, 2500 MHz
311 (310min - 312max) fps -10%
Pass 2
AMD Ryzen 9 7950X
R9 7950X, 4500 MHz
274 (272min - 274max) fps +62%
Intel Core i9-13900K
i9-13900K, 3000 MHz
267 (266min - 271max) fps +58%
AMD Ryzen 9 7950X3D
R9 7950X3D, 4200 MHz
265.5 (263min - 266max) fps +57%
AMD Ryzen 9 7900X
R9 7900X, 4700 MHz
241 (240min - 242max) fps +42%
Intel Core i7-13700K
i7-13700K, 3400 MHz
232 (231min - 233max) fps +37%
AMD Ryzen 9 5950X
R9 5950X, 3400 MHz
221 (220min - 221max) fps +31%
Intel Core i5-13600K
i5-13600K, 3500 MHz
199 (198.5min - 199.4max) fps +18%
Intel Core i7-12700
i7-12700, 3300 MHz
172.35 (171.5min - 173.4max) fps +2%
AMD Ryzen 7 7800X3D
R7 7800X3D, 4200 MHz
169.25 (169.1min - 170max) fps
Intel Core i5-12600K
i5-12600K, 2800 MHz
148 (147min - 148max) fps -13%
Intel Core i5-13400
i5-13400, 2500 MHz
135.8 (135.7min - 135.9max) fps -20%
WinRAR - Result
AMD Ryzen 9 7900X
R9 7900X, 4700 MHz
17225 KB/s +4%
AMD Ryzen 7 7800X3D
R7 7800X3D, 4200 MHz
16585 KB/s
AMD Ryzen 9 7950X3D
R9 7950X3D, 4200 MHz
15779 KB/s -5%
AMD Ryzen 9 7950X
R9 7950X, 4500 MHz
15449 KB/s -7%
Intel Core i9-13900K
i9-13900K, 3000 MHz
14836 KB/s -11%
Intel Core i7-13700K
i7-13700K, 3400 MHz
12835 KB/s -23%
AMD Ryzen 9 5950X
R9 5950X, 3400 MHz
12503 KB/s -25%
Intel Core i5-13600K
i5-13600K, 3500 MHz
10937 KB/s -34%
Intel Core i7-12700
i7-12700, 3300 MHz
9328 KB/s -44%
Intel Core i5-13400
i5-13400, 2500 MHz
7979 KB/s -52%
Intel Core i5-12600K
i5-12600K, 2800 MHz
6239 KB/s -62%
TrueCrypt
AES Mean 100MB
AMD Ryzen 9 7950X
R9 7950X, 4500 MHz
32.5 GB/s +112%
Intel Core i9-13900K
i9-13900K, 3000 MHz
27 GB/s +76%
AMD Ryzen 9 5950X
R9 5950X, 3400 MHz
26.9 GB/s +76%
AMD Ryzen 9 7950X3D
R9 7950X3D, 4200 MHz
26.9 GB/s +76%
Intel Core i5-13600K
i5-13600K, 3500 MHz
18.8 GB/s +23%
Intel Core i7-13700K
i7-13700K, 3400 MHz
15.8 GB/s +3%
AMD Ryzen 7 7800X3D
R7 7800X3D, 4200 MHz
15.3 GB/s
AMD Ryzen 9 7900X
R9 7900X, 4700 MHz
14.8 GB/s -3%
Intel Core i7-12700
i7-12700, 3300 MHz
14.5 GB/s -5%
Intel Core i5-12600K
i5-12600K, 2800 MHz
12.8 GB/s -16%
Intel Core i5-13400
i5-13400, 2500 MHz
11.8 GB/s -23%
Twofish Mean 100MB
Intel Core i9-13900K
i9-13900K, 3000 MHz
5.4 GB/s +157%
AMD Ryzen 9 7950X
R9 7950X, 4500 MHz
4.6 GB/s +119%
AMD Ryzen 9 7950X3D
R9 7950X3D, 4200 MHz
4.2 GB/s +100%
Intel Core i7-13700K
i7-13700K, 3400 MHz
4 GB/s +90%
AMD Ryzen 9 5950X
R9 5950X, 3400 MHz
3.7 GB/s +76%
Intel Core i5-13600K
i5-13600K, 3500 MHz
3.1 GB/s +48%
AMD Ryzen 9 7900X
R9 7900X, 4700 MHz
2.8 GB/s +33%
Intel Core i7-12700
i7-12700, 3300 MHz
2.7 GB/s +29%
Intel Core i5-12600K
i5-12600K, 2800 MHz
2.2 GB/s +5%
AMD Ryzen 7 7800X3D
R7 7800X3D, 4200 MHz
2.1 GB/s
Intel Core i5-13400
i5-13400, 2500 MHz
2 GB/s -5%
Serpent Mean 100MB
Intel Core i9-13900K
i9-13900K, 3000 MHz
3 GB/s +131%
AMD Ryzen 9 7950X
R9 7950X, 4500 MHz
2.9 GB/s +123%
AMD Ryzen 9 7950X3D
R9 7950X3D, 4200 MHz
2.8 GB/s +115%
AMD Ryzen 9 5950X
R9 5950X, 3400 MHz
2.4 GB/s +85%
Intel Core i7-13700K
i7-13700K, 3400 MHz
2.2 GB/s +69%
Intel Core i5-13600K
i5-13600K, 3500 MHz
1.7 GB/s +31%
AMD Ryzen 9 7900X
R9 7900X, 4700 MHz
1.5 GB/s +15%
Intel Core i7-12700
i7-12700, 3300 MHz
1.5 GB/s +15%
Intel Core i5-12600K
i5-12600K, 2800 MHz
1.3 GB/s 0%
AMD Ryzen 7 7800X3D
R7 7800X3D, 4200 MHz
1.3 GB/s
Intel Core i5-13400
i5-13400, 2500 MHz
1.2 GB/s -8%
Geekbench 5.5
Multi-Core
AMD Ryzen 9 7950X3D
R9 7950X3D, 4200 MHz
24343 Points +71%
Intel Core i9-13900K
i9-13900K, 3000 MHz
24157 Points +69%
AMD Ryzen 9 7950X
R9 7950X, 4500 MHz
23948 Points +68%
AMD Ryzen 9 7900X
R9 7900X, 4700 MHz
19987 Points +40%
Intel Core i7-13700K
i7-13700K, 3400 MHz
19719 Points +38%
AMD Ryzen 9 5950X
R9 5950X, 3400 MHz
16891 Points +19%
Intel Core i5-13600K
i5-13600K, 3500 MHz
16651 Points +17%
Intel Core i7-12700
i7-12700, 3300 MHz
14961 Points +5%
AMD Ryzen 7 7800X3D
R7 7800X3D, 4200 MHz
14252 Points
Intel Core i5-12600K
i5-12600K, 2800 MHz
12797 Points -10%
Intel Core i5-13400
i5-13400, 2500 MHz
12107 Points -15%
Single-Core
AMD Ryzen 9 7950X3D
R9 7950X3D, 4200 MHz
2311 Points +14%
Intel Core i9-13900K
i9-13900K, 3000 MHz
2290 Points +13%
AMD Ryzen 9 7900X
R9 7900X, 4700 MHz
2274 Points +12%
AMD Ryzen 9 7950X
R9 7950X, 4500 MHz
2241 Points +11%
Intel Core i7-13700K
i7-13700K, 3400 MHz
2081 Points +3%
AMD Ryzen 7 7800X3D
R7 7800X3D, 4200 MHz
2027 Points
Intel Core i5-13600K
i5-13600K, 3500 MHz
1967 Points -3%
Intel Core i7-12700
i7-12700, 3300 MHz
1924 Points -5%
Intel Core i5-12600K
i5-12600K, 2800 MHz
1904 Points -6%
Intel Core i5-13400
i5-13400, 2500 MHz
1795 Points -11%
AMD Ryzen 9 5950X
R9 5950X, 3400 MHz
1682 Points -17%
Geekbench 5.0
5.0 Multi-Core
Intel Core i9-13900K
i9-13900K, 3000 MHz
24021 Points +73%
AMD Ryzen 9 7950X3D
R9 7950X3D, 4200 MHz
23720 Points +71%
AMD Ryzen 9 7950X
R9 7950X, 4500 MHz
22891 Points +65%
AMD Ryzen 9 7900X
R9 7900X, 4700 MHz
19975 Points +44%
Intel Core i7-13700K
i7-13700K, 3400 MHz
19217 Points +38%
Intel Core i5-13600K
i5-13600K, 3500 MHz
16635 Points +20%
AMD Ryzen 9 5950X
R9 5950X, 3400 MHz
16570 Points +19%
Intel Core i7-12700
i7-12700, 3300 MHz
14883 Points +7%
AMD Ryzen 7 7800X3D
R7 7800X3D, 4200 MHz
13888 Points
Intel Core i5-12600K
i5-12600K, 2800 MHz
12746 Points -8%
Intel Core i5-13400
i5-13400, 2500 MHz
11801 Points -15%
5.0 Single-Core
Intel Core i9-13900K
i9-13900K, 3000 MHz
2214 Points +14%
AMD Ryzen 9 7900X
R9 7900X, 4700 MHz
2194 Points +13%
AMD Ryzen 9 7950X3D
R9 7950X3D, 4200 MHz
2183 Points +13%
AMD Ryzen 9 7950X
R9 7950X, 4500 MHz
2156 Points +11%
Intel Core i7-13700K
i7-13700K, 3400 MHz
2064 Points +7%
AMD Ryzen 7 7800X3D
R7 7800X3D, 4200 MHz
1938 Points
Intel Core i5-13600K
i5-13600K, 3500 MHz
1931 Points 0%
Intel Core i7-12700
i7-12700, 3300 MHz
1845 Points -5%
Intel Core i5-12600K
i5-12600K, 2800 MHz
1821 Points -6%
Intel Core i5-13400
i5-13400, 2500 MHz
1706 Points -12%
AMD Ryzen 9 5950X
R9 5950X, 3400 MHz
1683 Points -13%
Geekbench 4.4
64 Bit Single-Core Score
Intel Core i9-13900K
i9-13900K, 3000 MHz
9598 Points +6%
AMD Ryzen 9 7950X3D
R9 7950X3D, 4200 MHz
9240 Points +2%
AMD Ryzen 9 7900X
R9 7900X, 4700 MHz
9193 Points +1%
AMD Ryzen 7 7800X3D
R7 7800X3D, 4200 MHz
9097 Points
AMD Ryzen 9 7950X
R9 7950X, 4500 MHz
9023 Points -1%
Intel Core i7-13700K
i7-13700K, 3400 MHz
8955 Points -2%
Intel Core i5-13600K
i5-13600K, 3500 MHz
8618 Points -5%
Intel Core i5-12600K
i5-12600K, 2800 MHz
8223 Points -10%
Intel Core i7-12700
i7-12700, 3300 MHz
8059 Points -11%
Intel Core i5-13400
i5-13400, 2500 MHz
7683 Points -16%
AMD Ryzen 9 5950X
R9 5950X, 3400 MHz
7216 Points -21%
64 Bit Multi-Core Score
AMD Ryzen 9 7950X3D
R9 7950X3D, 4200 MHz
87922 Points +60%
Intel Core i9-13900K
i9-13900K, 3000 MHz
86695 Points +58%
AMD Ryzen 9 7950X
R9 7950X, 4500 MHz
85554 Points +56%
AMD Ryzen 9 7900X
R9 7900X, 4700 MHz
74731 Points +36%
Intel Core i7-13700K
i7-13700K, 3400 MHz
69210 Points +26%
AMD Ryzen 9 5950X
R9 5950X, 3400 MHz
63233 Points +15%
Intel Core i5-13600K
i5-13600K, 3500 MHz
60407 Points +10%
AMD Ryzen 7 7800X3D
R7 7800X3D, 4200 MHz
54840 Points
Intel Core i7-12700
i7-12700, 3300 MHz
52676 Points -4%
Intel Core i5-12600K
i5-12600K, 2800 MHz
46557 Points -15%
Intel Core i5-13400
i5-13400, 2500 MHz
42509 Points -22%
3DMark 11 - 1280x720 Performance Physics
AMD Ryzen 9 7950X3D
R9 7950X3D, 4200 MHz
36991 Points +5%
AMD Ryzen 7 7800X3D
R7 7800X3D, 4200 MHz
35127 Points
AMD Ryzen 9 7950X
R9 7950X, 4500 MHz
34239 Points -3%
Intel Core i9-13900K
i9-13900K, 3000 MHz
32273 Points -8%
Intel Core i7-13700K
i7-13700K, 3400 MHz
31214 Points -11%
Intel Core i5-13600K
i5-13600K, 3500 MHz
30480 Points -13%
AMD Ryzen 9 7900X
R9 7900X, 4700 MHz
28618 Points -19%
Intel Core i7-12700
i7-12700, 3300 MHz
27022 Points -23%
AMD Ryzen 9 5950X
R9 5950X, 3400 MHz
25367 Points -28%
Intel Core i5-12600K
i5-12600K, 2800 MHz
25017 Points -29%
Intel Core i5-13400
i5-13400, 2500 MHz
23120 Points -34%
7-Zip 18.03
7z b 4
AMD Ryzen 9 7950X3D
R9 7950X3D, 4200 MHz
159341 MIPS +87%
AMD Ryzen 9 7950X
R9 7950X, 4500 MHz
158242 MIPS +86%
Intel Core i9-13900K
i9-13900K, 3000 MHz
147068 MIPS +73%
AMD Ryzen 9 5950X
R9 5950X, 3400 MHz
127792 MIPS +50%
AMD Ryzen 9 7900X
R9 7900X, 4700 MHz
124975 MIPS +47%
Intel Core i7-13700K
i7-13700K, 3400 MHz
112359 MIPS +32%
Intel Core i5-13600K
i5-13600K, 3500 MHz
89647 MIPS +5%
AMD Ryzen 7 7800X3D
R7 7800X3D, 4200 MHz
85067 MIPS
Intel Core i7-12700
i7-12700, 3300 MHz
78331 MIPS -8%
Intel Core i5-12600K
i5-12600K, 2800 MHz
64260 MIPS -24%
Intel Core i5-13400
i5-13400, 2500 MHz
59510 MIPS -30%
7z b 4 -mmt1
AMD Ryzen 9 7950X3D
R9 7950X3D, 4200 MHz
8321 MIPS +1%
AMD Ryzen 9 7900X
R9 7900X, 4700 MHz
8282 MIPS +1%
AMD Ryzen 7 7800X3D
R7 7800X3D, 4200 MHz
8235 MIPS
AMD Ryzen 9 7950X
R9 7950X, 4500 MHz
8211 MIPS 0%
Intel Core i9-13900K
i9-13900K, 3000 MHz
7272 MIPS -12%
Intel Core i7-13700K
i7-13700K, 3400 MHz
7062 MIPS -14%
AMD Ryzen 9 5950X
R9 5950X, 3400 MHz
6974 MIPS -15%
Intel Core i5-13600K
i5-13600K, 3500 MHz
6502 MIPS -21%
Intel Core i7-12700
i7-12700, 3300 MHz
6292 MIPS -24%
Intel Core i5-12600K
i5-12600K, 2800 MHz
5944 MIPS -28%
Intel Core i5-13400
i5-13400, 2500 MHz
5829 MIPS -29%
HWBOT x265 Benchmark v2.2 - 4k Preset
AMD Ryzen 9 7950X
R9 7950X, 4500 MHz
44 fps +80%
Intel Core i9-13900K
i9-13900K, 3000 MHz
42.6 fps +75%
AMD Ryzen 9 7950X3D
R9 7950X3D, 4200 MHz
42.4 fps +74%
AMD Ryzen 9 7900X
R9 7900X, 4700 MHz
36.2 fps +48%
Intel Core i7-13700K
i7-13700K, 3400 MHz
34 fps +39%
AMD Ryzen 9 5950X
R9 5950X, 3400 MHz
31.8 fps +30%
Intel Core i5-12600K
i5-12600K, 2800 MHz
30.1 fps +23%
Intel Core i5-13600K
i5-13600K, 3500 MHz
27.6 fps +13%
Intel Core i7-12700
i7-12700, 3300 MHz
25.5 fps +5%
AMD Ryzen 7 7800X3D
R7 7800X3D, 4200 MHz
24.4 fps
Intel Core i5-13400
i5-13400, 2500 MHz
19.1 fps -22%
R Benchmark 2.5 - Overall mean
Intel Core i5-13400
i5-13400, 2500 MHz
0.4654 sec * -12%
AMD Ryzen 9 5950X
R9 5950X, 3400 MHz
0.4556 sec * -10%
Intel Core i5-12600K
i5-12600K, 2800 MHz
0.4456 sec * -7%
Intel Core i7-12700
i7-12700, 3300 MHz
0.4357 sec * -5%
AMD Ryzen 7 7800X3D
R7 7800X3D, 4200 MHz
0.4152 sec *
Intel Core i5-13600K
i5-13600K, 3500 MHz
0.405 sec * +2%
Intel Core i7-13700K
i7-13700K, 3400 MHz
0.3899 sec * +6%
AMD Ryzen 9 7950X
R9 7950X, 4500 MHz
0.3776 sec * +9%
AMD Ryzen 9 7900X
R9 7900X, 4700 MHz
0.3736 sec * +10%
AMD Ryzen 9 7950X3D
R9 7950X3D, 4200 MHz
0.372 sec * +10%
Intel Core i9-13900K
i9-13900K, 3000 MHz
0.3539 sec * +15%
LibreOffice - 20 Documents To PDF
Intel Core i5-12600K
i5-12600K, 2800 MHz
71.8 s * -76%
AMD Ryzen 9 5950X
R9 5950X, 3400 MHz
45.97 s * -13%
AMD Ryzen 7 7800X3D
R7 7800X3D, 4200 MHz
40.7 s *
Intel Core i5-13400
i5-13400, 2500 MHz
38.7 s * +5%
AMD Ryzen 9 7950X3D
R9 7950X3D, 4200 MHz
38.6 s * +5%
Intel Core i7-12700
i7-12700, 3300 MHz
38.3 s * +6%
Intel Core i9-13900K
i9-13900K, 3000 MHz
36.6 s * +10%
AMD Ryzen 9 7950X
R9 7950X, 4500 MHz
36.6 s * +10%
Intel Core i5-13600K
i5-13600K, 3500 MHz
35 s * +14%
AMD Ryzen 9 7900X
R9 7900X, 4700 MHz
34.9 s * +14%
Intel Core i7-13700K
i7-13700K, 3400 MHz
33 s * +19%
WebXPRT 3 - Overall
AMD Ryzen 9 7950X3D
R9 7950X3D, 4200 MHz
383 Points +8%
AMD Ryzen 9 7900X
R9 7900X, 4700 MHz
371 Points +5%
Intel Core i9-13900K
i9-13900K, 3000 MHz
361 Points +2%
AMD Ryzen 9 7950X
R9 7950X, 4500 MHz
358 Points +1%
AMD Ryzen 7 7800X3D
R7 7800X3D, 4200 MHz
353 Points
Intel Core i7-13700K
i7-13700K, 3400 MHz
348 Points -1%
Intel Core i5-13600K
i5-13600K, 3500 MHz
333 Points -6%
Intel Core i7-12700
i7-12700, 3300 MHz
314 Points -11%
Intel Core i5-13400
i5-13400, 2500 MHz
306 Points -13%
Intel Core i5-12600K
i5-12600K, 2800 MHz
293 Points -17%
AMD Ryzen 9 5950X
R9 5950X, 3400 MHz
291 Points -18%
Mozilla Kraken 1.1 - Total
AMD Ryzen 9 5950X
R9 5950X, 3400 MHz
558 ms * -15%
Intel Core i5-13400
i5-13400, 2500 MHz
535 ms * -10%
Intel Core i5-12600K
i5-12600K, 2800 MHz
511 ms * -5%
Intel Core i7-12700
i7-12700, 3300 MHz
508 ms * -4%
AMD Ryzen 7 7800X3D
R7 7800X3D, 4200 MHz
487 ms *
Intel Core i5-13600K
i5-13600K, 3500 MHz
469 ms * +4%
Intel Core i7-13700K
i7-13700K, 3400 MHz
449 ms * +8%
AMD Ryzen 9 7950X
R9 7950X, 4500 MHz
444 ms * +9%
AMD Ryzen 9 7950X3D
R9 7950X3D, 4200 MHz
437 ms * +10%
Intel Core i9-13900K
i9-13900K, 3000 MHz
432 ms * +11%
AMD Ryzen 9 7900X
R9 7900X, 4700 MHz
431 ms * +11%
3DMark
1920x1080 Fire Strike Physics
Intel Core i9-13900K
i9-13900K, 3000 MHz
53853 Points +62%
AMD Ryzen 9 7950X
R9 7950X, 4500 MHz
46597 Points +40%
Intel Core i7-13700K
i7-13700K, 3400 MHz
45127 Points +35%
AMD Ryzen 9 7950X3D
R9 7950X3D, 4200 MHz
44787 Points +34%
AMD Ryzen 9 7900X
R9 7900X, 4700 MHz
42682 Points +28%
AMD Ryzen 9 5950X
R9 5950X, 3400 MHz
39600 Points +19%
Intel Core i5-13600K
i5-13600K, 3500 MHz
35386 Points +6%
Intel Core i7-12700
i7-12700, 3300 MHz
34681 Points +4%
AMD Ryzen 7 7800X3D
R7 7800X3D, 4200 MHz
33345 Points
Intel Core i5-12600K
i5-12600K, 2800 MHz
29671 Points -11%
Intel Core i5-13400
i5-13400, 2500 MHz
27135 Points -19%
2560x1440 Time Spy CPU
Intel Core i9-13900K
i9-13900K, 3000 MHz
19392 Points +38%
Intel Core i7-13700K
i7-13700K, 3400 MHz
18897 Points +34%
AMD Ryzen 9 7950X3D
R9 7950X3D, 4200 MHz
17206 Points +22%
Intel Core i5-13600K
i5-13600K, 3500 MHz
17124 Points +21%
AMD Ryzen 9 7900X
R9 7900X, 4700 MHz
16616 Points +18%
Intel Core i7-12700
i7-12700, 3300 MHz
16400 Points +16%
AMD Ryzen 9 7950X
R9 7950X, 4500 MHz
15856 Points +12%
AMD Ryzen 7 7800X3D
R7 7800X3D, 4200 MHz
14098 Points
Intel Core i5-12600K
i5-12600K, 2800 MHz
13869 Points -2%
AMD Ryzen 9 5950X
R9 5950X, 3400 MHz
13650 Points -3%
Intel Core i5-13400
i5-13400, 2500 MHz
12948 Points -8%

* ... smaller is better

AMD Ryzen 7 7800X3D与Cinebench R15多循环对比

在Cinebench R15 Multi Loop的帮助下,我们可以看到DeepCool散热系统足以对AMD Ryzen 7 7800X3D进行可靠的散热。我们需要说明的是,所有的测试都是在关闭机箱的情况下进行的。在我们的测试系统中,联力O11 Dynamic的空气循环并不是最好的,因为没有安装风扇,无法获得新鲜空气。

2917.23117.23317.23517.23717.23917.24117.24317.24517.24717.24917.25117.25317.25517.25717.25917.26117.2Tooltip
AMD Ryzen 7 7800X3D AMD Ryzen 7 7800X3D, AMD Ryzen 7 7800X3D: Ø2967 (2917.15-3006.39)
AMD Ryzen 9 7950X AMD Ryzen 9 7950X, AMD Ryzen 9 7950X: Ø6157 (6091.06-6236.36)
Intel Core i9-13900K Intel Core i9-13900K, Intel Core i9-13900K: Ø6182 (6045.95-6213.11)
Intel Core i7-13700K Intel Core i7-13700K, Intel Core i7-13700K: Ø4544 (4497.92-4570.91)
AMD Ryzen 9 7900X AMD Ryzen 9 7900X, AMD Ryzen 9 7900X: Ø4785 (4739.9-4829.17)
AMD Ryzen 9 5950X AMD Ryzen 9 5950X, AMD Ryzen 9 5950X: Ø4467 (4442.47-4510.09)
AMD Ryzen 9 7950X3D AMD Ryzen 9 7950X3D, AMD Ryzen 9 7950X3D: Ø5942 (5923.29-5966.59)

合成基准和应用性能

AMD Ryzen 7 7800X3D的合成应用基准测试看起来已经比其CPU基准测试要好一些。它并没有远远落后于英特尔酷睿i5-13600KAMD Ryzen 9 5950X在内存测试中,我们认为AMD Ryzen 950X的性能要比Intel Core i5-13600K高出一些。

在内存测试中,我们本以为结果会与AMD Ryzen 9 7950X3D ,因为测试平台相同,其内存时钟频率也保持在6000MT/s。但是,您应该知道,当启用EXPO配置文件时,AMD Ryzen 7 7800X3D的运行超出了制造商的规格。AMD Ryzen 7 7800X3D的通常时钟频率为5,200 MT/s。

Performance Rating - Percent
Intel Core i9-13900K
96.3 pt
AMD Ryzen 9 7950X
92.3 pt
AMD Ryzen 9 7950X3D
91.8 pt
Intel Core i7-13700K
90.9 pt
AMD Ryzen 9 7900X
88 pt
Intel Core i5-13600K
85.4 pt
AMD Ryzen 7 7800X3D
83.3 pt
Intel Core i7-12700
79.4 pt
AMD Ryzen 9 5950X
74.4 pt
Intel Core i5-13400
70.2 pt
PCMark 10
Productivity
AMD Ryzen 9 7950X3D
12576 Points +4%
AMD Ryzen 9 7950X
12564 Points +4%
Intel Core i7-13700K
12244 Points +1%
AMD Ryzen 7 7800X3D
12108 Points
AMD Ryzen 9 7900X
11853 Points -2%
Intel Core i5-13600K
11630 Points -4%
Intel Core i9-13900K
11370 Points -6%
Intel Core i7-12700
11307 Points -7%
AMD Ryzen 9 5950X
11163 Points -8%
Intel Core i5-13400
10893 Points -10%
Essentials
Intel Core i9-13900K
12868 Points +14%
AMD Ryzen 9 7900X
12651 Points +12%
AMD Ryzen 9 7950X
12421 Points +10%
Intel Core i5-13600K
12306 Points +9%
AMD Ryzen 9 7950X3D
12130 Points +7%
Intel Core i7-13700K
11908 Points +5%
AMD Ryzen 7 7800X3D
11337 Points
AMD Ryzen 9 5950X
11255 Points -1%
Intel Core i7-12700
11156 Points -2%
Intel Core i5-13400
10635 Points -6%
3DMark
1920x1080 Fire Strike Physics
Intel Core i9-13900K
53853 Points +62%
AMD Ryzen 9 7950X
46597 Points +40%
Intel Core i7-13700K
45127 Points +35%
AMD Ryzen 9 7950X3D
44787 Points +34%
AMD Ryzen 9 7900X
42682 Points +28%
AMD Ryzen 9 5950X
39600 Points +19%
Intel Core i5-13600K
35386 Points +6%
Intel Core i7-12700
34681 Points +4%
AMD Ryzen 7 7800X3D
33345 Points
Intel Core i5-13400
27135 Points -19%
2560x1440 Time Spy CPU
Intel Core i9-13900K
19392 Points +38%
Intel Core i7-13700K
18897 Points +34%
AMD Ryzen 9 7950X3D
17206 Points +22%
Intel Core i5-13600K
17124 Points +21%
AMD Ryzen 9 7900X
16616 Points +18%
Intel Core i7-12700
16400 Points +16%
AMD Ryzen 9 7950X
15856 Points +12%
AMD Ryzen 7 7800X3D
14098 Points
AMD Ryzen 9 5950X
13650 Points -3%
Intel Core i5-13400
12948 Points -8%
3DMark 11 - 1280x720 Performance Physics
AMD Ryzen 9 7950X3D
36991 Points +5%
AMD Ryzen 7 7800X3D
35127 Points
AMD Ryzen 9 7950X
34239 Points -3%
Intel Core i9-13900K
32273 Points -8%
Intel Core i7-13700K
31214 Points -11%
Intel Core i5-13600K
30480 Points -13%
AMD Ryzen 9 7900X
28618 Points -19%
Intel Core i7-12700
27022 Points -23%
AMD Ryzen 9 5950X
25367 Points -28%
Intel Core i5-13400
23120 Points -34%
CrossMark - Overall
Intel Core i9-13900K
2589 Points +17%
AMD Ryzen 9 7950X
2495 Points +13%
AMD Ryzen 9 7900X
2405 Points +9%
Intel Core i7-13700K
2325 Points +5%
Intel Core i5-13600K
2271 Points +2%
AMD Ryzen 7 7800X3D
2216 Points
AMD Ryzen 9 7950X3D
2193 Points -1%
Intel Core i7-12700
2016 Points -9%
Intel Core i5-13400
1877 Points -15%
AMD Ryzen 9 5950X
1495 Points -33%
AIDA64 / Memory Copy
Intel Core i9-13900K
Intel Core i9-13900K, NVIDIA GeForce RTX 3090
74937 MB/s +18%
AMD Ryzen 9 7950X3D
AMD Ryzen 9 7950X3D, NVIDIA GeForce RTX 4090
73868 MB/s +17%
Intel Core i7-13700K
Intel Core i7-13700K, NVIDIA GeForce RTX 4090
73472 MB/s +16%
Intel Core i7-12700
Intel Core i7-12700, NVIDIA GeForce RTX 4090
72758 MB/s +15%
Intel Core i5-13400
Intel Core i5-13400, NVIDIA GeForce RTX 4090
71766 MB/s +13%
Intel Core i5-13600K
Intel Core i5-13600K, NVIDIA GeForce RTX 3090
71725 MB/s +13%
Intel Core i5-12600K
Intel Core i5-12600K, NVIDIA Titan RTX
70749 MB/s +12%
AMD Ryzen 9 7900X
AMD Ryzen 9 7900X, NVIDIA GeForce RTX 3090
69140 MB/s +9%
AMD Ryzen 9 7950X
AMD Ryzen 9 7950X, NVIDIA GeForce RTX 3090
68526 MB/s +8%
AMD Ryzen 7 7800X3D
AMD Ryzen 7 7800X3D, NVIDIA GeForce RTX 4090
63242 MB/s
AMD Ryzen 9 5950X
AMD Ryzen 9 5950X, NVIDIA Titan RTX
59171 MB/s -6%
Average of class
  (4514 - 234662, n=1598)
45924 MB/s -27%
AIDA64 / Memory Read
Intel Core i9-13900K
Intel Core i9-13900K, NVIDIA GeForce RTX 3090
83883 MB/s +34%
Intel Core i7-13700K
Intel Core i7-13700K, NVIDIA GeForce RTX 4090
81317 MB/s +30%
Intel Core i7-12700
Intel Core i7-12700, NVIDIA GeForce RTX 4090
81248 MB/s +30%
AMD Ryzen 9 7950X3D
AMD Ryzen 9 7950X3D, NVIDIA GeForce RTX 4090
80946 MB/s +29%
Intel Core i5-13400
Intel Core i5-13400, NVIDIA GeForce RTX 4090
77867 MB/s +25%
Intel Core i5-12600K
Intel Core i5-12600K, NVIDIA Titan RTX
76864 MB/s +23%
Intel Core i5-13600K
Intel Core i5-13600K, NVIDIA GeForce RTX 3090
75757 MB/s +21%
AMD Ryzen 9 7950X
AMD Ryzen 9 7950X, NVIDIA GeForce RTX 3090
75590 MB/s +21%
AMD Ryzen 9 7900X
AMD Ryzen 9 7900X, NVIDIA GeForce RTX 3090
75338 MB/s +20%
AMD Ryzen 9 5950X
AMD Ryzen 9 5950X, NVIDIA Titan RTX
62991 MB/s +1%
AMD Ryzen 7 7800X3D
AMD Ryzen 7 7800X3D, NVIDIA GeForce RTX 4090
62528 MB/s
Average of class
  (4031 - 271066, n=1559)
48172 MB/s -23%
AIDA64 / Memory Write
AMD Ryzen 7 7800X3D
AMD Ryzen 7 7800X3D, NVIDIA GeForce RTX 4090
87412 MB/s
Intel Core i7-12700
Intel Core i7-12700, NVIDIA GeForce RTX 4090
87172 MB/s 0%
AMD Ryzen 9 7950X3D
AMD Ryzen 9 7950X3D, NVIDIA GeForce RTX 4090
85951 MB/s -2%
AMD Ryzen 9 7900X
AMD Ryzen 9 7900X, NVIDIA GeForce RTX 3090
76967 MB/s -12%
AMD Ryzen 9 7950X
AMD Ryzen 9 7950X, NVIDIA GeForce RTX 3090
76515 MB/s -12%
Intel Core i9-13900K
Intel Core i9-13900K, NVIDIA GeForce RTX 3090
74140 MB/s -15%
Intel Core i5-13400
Intel Core i5-13400, NVIDIA GeForce RTX 4090
74029 MB/s -15%
Intel Core i5-12600K
Intel Core i5-12600K, NVIDIA Titan RTX
73824 MB/s -16%
Intel Core i5-13600K
Intel Core i5-13600K, NVIDIA GeForce RTX 3090
73484 MB/s -16%
Intel Core i7-13700K
Intel Core i7-13700K, NVIDIA GeForce RTX 4090
73447 MB/s -16%
Average of class
  (3506 - 242868, n=1564)
48976 MB/s -44%
AMD Ryzen 9 5950X
AMD Ryzen 9 5950X, NVIDIA Titan RTX
48748 MB/s -44%
AIDA64 / Memory Latency
Average of class
  (10.2 - 346, n=1635)
84.6 ns * -24%
Intel Core i5-13600K
Intel Core i5-13600K, NVIDIA GeForce RTX 3090
81.1 ns * -19%
Intel Core i5-13400
Intel Core i5-13400, NVIDIA GeForce RTX 4090
77.2 ns * -14%
Intel Core i9-13900K
Intel Core i9-13900K, NVIDIA GeForce RTX 3090
76.5 ns * -13%
Intel Core i7-12700
Intel Core i7-12700, NVIDIA GeForce RTX 4090
73.5 ns * -8%
Intel Core i7-13700K
Intel Core i7-13700K, NVIDIA GeForce RTX 4090
71.1 ns * -5%
AMD Ryzen 7 7800X3D
AMD Ryzen 7 7800X3D, NVIDIA GeForce RTX 4090
68 ns *
AMD Ryzen 9 5950X
AMD Ryzen 9 5950X, NVIDIA Titan RTX
67.7 ns * -0%
AMD Ryzen 9 7950X3D
AMD Ryzen 9 7950X3D, NVIDIA GeForce RTX 4090
65.6 ns * +4%
AMD Ryzen 9 7950X
AMD Ryzen 9 7950X, NVIDIA GeForce RTX 3090
65.3 ns * +4%
AMD Ryzen 9 7900X
AMD Ryzen 9 7900X, NVIDIA GeForce RTX 3090
63.3 ns * +7%

* ... smaller is better

游戏基准测试 - 仅有8个内核,速度却非常快

在我们的游戏测试中,我们注意到AMD Ryzen 7 7800X3D在完成其主要任务方面表现出色。这款8核处理器甚至能够将自家的旗舰产品从第一名的位置上挤下来,将其排在第二位。当然,它的领先优势微乎其微,在日常使用中并不明显--但当涉及到性能之王的加冕时,我们必须坚持纯粹的数字。我们的测试样品在与英特尔酷睿i9-13900K的对比中轻松胜出,领先13个百分点。

在我们测试的一些游戏中,AMD Ryzen 9 7950X3D有时会在两个CCD之间的负载分配问题上挣扎,因为我们知道,16核组件中只有一个CCD具有3D-V缓存。AMD Ryzen 7 7800X3D不存在这个问题,这可能就是它的游戏性能略胜一筹的原因。根据CPU基准测试结果,我们可以将我们的测试样品与Intel Core i7-12700 。它之前与AMD Ryzen 7 7800X3D不相上下,但现在我们可以记录下30%的差距。

结合PalitGeForce RTX 4090 GameRock OC ,基于AMD Ryzen 7 7800X3D的AM5平台目前在纯游戏方面提供了最佳组合。我们对使用该平台测试的所有游戏进行了概述,结果显示,目前所有游戏都可以在2160p分辨率下以最高细节流畅运行。原则上,使用Intel Core i9-13900KAMD Ryzen 9 7590X3D 也可以实现这一效果。不过,您需要为这两款产品支付更高的价格。

Performance Rating - Percent
AMD Ryzen 7 7800X3D
NVIDIA GeForce RTX 4090, R7 7800X3D, Corsair MP600
99 pt
AMD Ryzen 9 7950X3D
NVIDIA GeForce RTX 4090, R9 7950X3D
95.8 pt
Intel Core i9-13900K
NVIDIA GeForce RTX 4090, i9-13900K, Samsung SSD 980 Pro 2TB MZ-V8P2T0
87.3 pt
Intel Core i7-13700K
NVIDIA GeForce RTX 4090, i7-13700K, Intel Optane 905P 480GB 2.5
84.4 pt
Intel Core i7-13700
NVIDIA GeForce RTX 4090, i7-13700, Intel Optane 905P 480GB 2.5
83.7 pt
Intel Core i7-12700
NVIDIA GeForce RTX 4090, i7-12700, Intel Optane 905P 480GB 2.5
75.5 pt
Intel Core i5-13400
NVIDIA GeForce RTX 4090, i5-13400, Intel Optane 905P 480GB 2.5
69.7 pt
Intel Core i5-12400F
NVIDIA GeForce RTX 4090, i5-12400F, Intel Optane 905P 480GB 2.5
65.9 pt
F1 22
1920x1080 Low Preset AA:T AF:16x
AMD Ryzen 7 7800X3D
NVIDIA GeForce RTX 4090, R7 7800X3D, Corsair MP600
533 (380min, 288P1 - 637max) fps
AMD Ryzen 9 7950X3D
NVIDIA GeForce RTX 4090, R9 7950X3D
475 (338min, 264P1 - 542max) fps -11%
Intel Core i9-13900K
NVIDIA GeForce RTX 4090, i9-13900K, Samsung SSD 980 Pro 2TB MZ-V8P2T0
415 (291min, 220P1 - 500max) fps -22%
Intel Core i7-13700K
NVIDIA GeForce RTX 4090, i7-13700K, Intel Optane 905P 480GB 2.5
380 (280min, 217P1 - 437max) fps -29%
Intel Core i7-13700
NVIDIA GeForce RTX 4090, i7-13700, Intel Optane 905P 480GB 2.5
378 (244min, 212P1 - 430max) fps -29%
Intel Core i7-12700
NVIDIA GeForce RTX 4090, i7-12700, Intel Optane 905P 480GB 2.5
313 (235min, 185P1 - 364max) fps -41%
Intel Core i5-12400F
NVIDIA GeForce RTX 4090, i5-12400F, Intel Optane 905P 480GB 2.5
271 (200min, 165P1 - 305max) fps -49%
Intel Core i5-13400
NVIDIA GeForce RTX 4090, i5-13400, Intel Optane 905P 480GB 2.5
249 (197min, 152P1 - 284max) fps -53%
3840x2160 Ultra High Preset AA:T AF:16x
AMD Ryzen 7 7800X3D
NVIDIA GeForce RTX 4090, R7 7800X3D, Corsair MP600
84.5 (72min, 71P1 - 97max) fps
Intel Core i7-13700K
NVIDIA GeForce RTX 4090, i7-13700K, Intel Optane 905P 480GB 2.5
82.4 (72min, 71P1 - 95max) fps -2%
AMD Ryzen 9 7950X3D
NVIDIA GeForce RTX 4090, R9 7950X3D
82.3 (71min, 70P1 - 94max) fps -3%
Intel Core i5-12400F
NVIDIA GeForce RTX 4090, i5-12400F, Intel Optane 905P 480GB 2.5
81.7 (71min, 70P1 - 95max) fps -3%
Intel Core i7-13700
NVIDIA GeForce RTX 4090, i7-13700, Intel Optane 905P 480GB 2.5
81.6 (71min, 70P1 - 93max) fps -3%
Intel Core i7-12700
NVIDIA GeForce RTX 4090, i7-12700, Intel Optane 905P 480GB 2.5
81.3 (71min, 68P1 - 93max) fps -4%
Intel Core i5-13400
NVIDIA GeForce RTX 4090, i5-13400, Intel Optane 905P 480GB 2.5
81.2 (72min, 67P1 - 93max) fps -4%
Intel Core i9-13900K
NVIDIA GeForce RTX 4090, i9-13900K, Samsung SSD 980 Pro 2TB MZ-V8P2T0
81.1 (71min, 70P1 - 93max) fps -4%
Far Cry 5
1280x720 Low Preset AA:T
AMD Ryzen 7 7800X3D
NVIDIA GeForce RTX 4090, R7 7800X3D, Corsair MP600
344 (220min - 464max) fps
AMD Ryzen 9 7950X3D
NVIDIA GeForce RTX 4090, R9 7950X3D
299 (201min - 390max) fps -13%
Intel Core i7-13700K
NVIDIA GeForce RTX 4090, i7-13700K, Intel Optane 905P 480GB 2.5
242 (183min - 317max) fps -30%
Intel Core i9-13900K
NVIDIA GeForce RTX 4090, i9-13900K, Samsung SSD 980 Pro 2TB MZ-V8P2T0
240 (184min - 302max) fps -30%
Intel Core i7-13700
NVIDIA GeForce RTX 4090, i7-13700, Intel Optane 905P 480GB 2.5
232 (161min - 306max) fps -33%
Intel Core i7-12700
NVIDIA GeForce RTX 4090, i7-12700, Intel Optane 905P 480GB 2.5
204 (156min - 270max) fps -41%
Intel Core i5-13400
NVIDIA GeForce RTX 4090, i5-13400, Intel Optane 905P 480GB 2.5
185 (144min - 241max) fps -46%
Intel Core i5-12400F
NVIDIA GeForce RTX 4090, i5-12400F, Intel Optane 905P 480GB 2.5
173 (124min - 232max) fps -50%
3840x2160 Ultra Preset AA:T
AMD Ryzen 7 7800X3D
NVIDIA GeForce RTX 4090, R7 7800X3D, Corsair MP600
187 (166min - 215max) fps
AMD Ryzen 9 7950X3D
NVIDIA GeForce RTX 4090, R9 7950X3D
182 (157min - 212max) fps -3%
Intel Core i9-13900K
NVIDIA GeForce RTX 4090, i9-13900K, Samsung SSD 980 Pro 2TB MZ-V8P2T0
173 (144min - 205max) fps -7%
Intel Core i7-13700K
NVIDIA GeForce RTX 4090, i7-13700K, Intel Optane 905P 480GB 2.5
172 (137min - 206max) fps -8%
Intel Core i7-13700
NVIDIA GeForce RTX 4090, i7-13700, Intel Optane 905P 480GB 2.5
171 (140min - 207max) fps -9%
Intel Core i7-12700
NVIDIA GeForce RTX 4090, i7-12700, Intel Optane 905P 480GB 2.5
153 (117min - 203max) fps -18%
Intel Core i5-13400
NVIDIA GeForce RTX 4090, i5-13400, Intel Optane 905P 480GB 2.5
142 (108min - 190max) fps -24%
Intel Core i5-12400F
NVIDIA GeForce RTX 4090, i5-12400F, Intel Optane 905P 480GB 2.5
131 (97min - 177max) fps -30%
X-Plane 11.11
1280x720 low (fps_test=1)
Intel Core i9-13900K
NVIDIA GeForce RTX 4090, i9-13900K, Samsung SSD 980 Pro 2TB MZ-V8P2T0
237 fps +8%
AMD Ryzen 9 7950X3D
NVIDIA GeForce RTX 4090, R9 7950X3D
225 fps +3%
Intel Core i7-13700K
NVIDIA GeForce RTX 4090, i7-13700K, Intel Optane 905P 480GB 2.5
224 fps +2%
AMD Ryzen 7 7800X3D
NVIDIA GeForce RTX 4090, R7 7800X3D, Corsair MP600
219 fps
Intel Core i7-13700
NVIDIA GeForce RTX 4090, i7-13700, Intel Optane 905P 480GB 2.5
218 fps 0%
Intel Core i7-12700
NVIDIA GeForce RTX 4090, i7-12700, Intel Optane 905P 480GB 2.5
181.4 fps -17%
Intel Core i5-13400
NVIDIA GeForce RTX 4090, i5-13400, Intel Optane 905P 480GB 2.5
155.7 fps -29%
Intel Core i5-12400F
NVIDIA GeForce RTX 4090, i5-12400F, Intel Optane 905P 480GB 2.5
113 fps -48%
3840x2160 high (fps_test=3)
AMD Ryzen 7 7800X3D
NVIDIA GeForce RTX 4090, R7 7800X3D, Corsair MP600
160.5 fps
AMD Ryzen 9 7950X3D
NVIDIA GeForce RTX 4090, R9 7950X3D
158.4 fps -1%
Intel Core i9-13900K
NVIDIA GeForce RTX 4090, i9-13900K, Samsung SSD 980 Pro 2TB MZ-V8P2T0
139.3 fps -13%
Intel Core i7-13700K
NVIDIA GeForce RTX 4090, i7-13700K, Intel Optane 905P 480GB 2.5
121.8 fps -24%
Intel Core i7-13700
NVIDIA GeForce RTX 4090, i7-13700, Intel Optane 905P 480GB 2.5
119.3 fps -26%
Intel Core i7-12700
NVIDIA GeForce RTX 4090, i7-12700, Intel Optane 905P 480GB 2.5
105.4 fps -34%
Intel Core i5-13400
NVIDIA GeForce RTX 4090, i5-13400, Intel Optane 905P 480GB 2.5
95 fps -41%
Intel Core i5-12400F
NVIDIA GeForce RTX 4090, i5-12400F, Intel Optane 905P 480GB 2.5
77 fps -52%
Final Fantasy XV Benchmark
1280x720 Lite Quality
Intel Core i7-13700
NVIDIA GeForce RTX 4090, i7-13700, Intel Optane 905P 480GB 2.5
236 fps 0%
Intel Core i7-13700K
NVIDIA GeForce RTX 4090, i7-13700K, Intel Optane 905P 480GB 2.5
236 fps 0%
AMD Ryzen 7 7800X3D
NVIDIA GeForce RTX 4090, R7 7800X3D, Corsair MP600
236 fps
Intel Core i9-13900K
NVIDIA GeForce RTX 4090, i9-13900K, Samsung SSD 980 Pro 2TB MZ-V8P2T0
234 fps -1%
AMD Ryzen 9 7950X3D
NVIDIA GeForce RTX 4090, R9 7950X3D
234 fps -1%
Intel Core i7-12700
NVIDIA GeForce RTX 4090, i7-12700, Intel Optane 905P 480GB 2.5
232 fps -2%
Intel Core i5-12400F
NVIDIA GeForce RTX 4090, i5-12400F, Intel Optane 905P 480GB 2.5
217 fps -8%
Intel Core i5-13400
NVIDIA GeForce RTX 4090, i5-13400, Intel Optane 905P 480GB 2.5
217 fps -8%
3840x2160 High Quality
AMD Ryzen 7 7800X3D
NVIDIA GeForce RTX 4090, R7 7800X3D, Corsair MP600
158.2 fps
Intel Core i7-13700
NVIDIA GeForce RTX 4090, i7-13700, Intel Optane 905P 480GB 2.5
157.9 fps 0%
AMD Ryzen 9 7950X3D
NVIDIA GeForce RTX 4090, R9 7950X3D
157.6 fps 0%
Intel Core i7-13700K
NVIDIA GeForce RTX 4090, i7-13700K, Intel Optane 905P 480GB 2.5
155.9 fps -1%
Intel Core i9-13900K
NVIDIA GeForce RTX 4090, i9-13900K, Samsung SSD 980 Pro 2TB MZ-V8P2T0
155.7 fps -2%
Intel Core i7-12700
NVIDIA GeForce RTX 4090, i7-12700, Intel Optane 905P 480GB 2.5
153.4 fps -3%
Intel Core i5-12400F
NVIDIA GeForce RTX 4090, i5-12400F, Intel Optane 905P 480GB 2.5
151.9 fps -4%
Intel Core i5-13400
NVIDIA GeForce RTX 4090, i5-13400, Intel Optane 905P 480GB 2.5
149.8 fps -5%
Dota 2 Reborn
1280x720 min (0/3) fastest
AMD Ryzen 7 7800X3D
NVIDIA GeForce RTX 4090, R7 7800X3D, Corsair MP600
322.9 (268min) fps
AMD Ryzen 9 7950X3D
NVIDIA GeForce RTX 4090, R9 7950X3D
314.1 (261.7min) fps -3%
Intel Core i9-13900K
NVIDIA GeForce RTX 4090, i9-13900K, Samsung SSD 980 Pro 2TB MZ-V8P2T0
287.9 (250.6min) fps -11%
Intel Core i7-13700K
NVIDIA GeForce RTX 4090, i7-13700K, Intel Optane 905P 480GB 2.5
251.2 (215.9min) fps -22%
Intel Core i7-13700
NVIDIA GeForce RTX 4090, i7-13700, Intel Optane 905P 480GB 2.5
245 (213.8min) fps -24%
Intel Core i7-12700
NVIDIA GeForce RTX 4090, i7-12700, Intel Optane 905P 480GB 2.5
202.4 (178min) fps -37%
Intel Core i5-12400F
NVIDIA GeForce RTX 4090, i5-12400F, Intel Optane 905P 480GB 2.5
182.1 (159.5min) fps -44%
Intel Core i5-13400
NVIDIA GeForce RTX 4090, i5-13400, Intel Optane 905P 480GB 2.5
182.1 (160.5min) fps -44%
3840x2160 ultra (3/3) best looking
AMD Ryzen 7 7800X3D
NVIDIA GeForce RTX 4090, R7 7800X3D, Corsair MP600
258.2 (201.3min) fps
AMD Ryzen 9 7950X3D
NVIDIA GeForce RTX 4090, R9 7950X3D
245.4 (195.9min) fps -5%
Intel Core i9-13900K
NVIDIA GeForce RTX 4090, i9-13900K, Samsung SSD 980 Pro 2TB MZ-V8P2T0
226.8 (185.7min) fps -12%
Intel Core i7-13700K
NVIDIA GeForce RTX 4090, i7-13700K, Intel Optane 905P 480GB 2.5
200.2 (165.5min) fps -22%
Intel Core i7-13700
NVIDIA GeForce RTX 4090, i7-13700, Intel Optane 905P 480GB 2.5
196.8 (166.7min) fps -24%
Intel Core i7-12700
NVIDIA GeForce RTX 4090, i7-12700, Intel Optane 905P 480GB 2.5
163.7 (141.2min) fps -37%
Intel Core i5-12400F
NVIDIA GeForce RTX 4090, i5-12400F, Intel Optane 905P 480GB 2.5
150.3 (129.4min) fps -42%
Intel Core i5-13400
NVIDIA GeForce RTX 4090, i5-13400, Intel Optane 905P 480GB 2.5
149.8 (129.3min) fps -42%
The Witcher 3
1024x768 Low Graphics & Postprocessing
AMD Ryzen 9 7950X3D
NVIDIA GeForce RTX 4090, R9 7950X3D
864.7 fps +1%
AMD Ryzen 7 7800X3D
NVIDIA GeForce RTX 4090, R7 7800X3D, Corsair MP600
858.4 fps
Intel Core i9-13900K
NVIDIA GeForce RTX 4090, i9-13900K, Samsung SSD 980 Pro 2TB MZ-V8P2T0
731.4 fps -15%
Intel Core i7-13700K
NVIDIA GeForce RTX 4090, i7-13700K, Intel Optane 905P 480GB 2.5
687.5 fps -20%
Intel Core i7-13700
NVIDIA GeForce RTX 4090, i7-13700, Intel Optane 905P 480GB 2.5
670.4 fps -22%
Intel Core i7-12700
NVIDIA GeForce RTX 4090, i7-12700, Intel Optane 905P 480GB 2.5
522 fps -39%
Intel Core i5-13400
NVIDIA GeForce RTX 4090, i5-13400, Intel Optane 905P 480GB 2.5
451.7 fps -47%
Intel Core i5-12400F
NVIDIA GeForce RTX 4090, i5-12400F, Intel Optane 905P 480GB 2.5
414 fps -52%
3840x2160 High Graphics & Postprocessing (Nvidia HairWorks Off)
Intel Core i5-13400
NVIDIA GeForce RTX 4090, i5-13400, Intel Optane 905P 480GB 2.5
282.2 fps 0%
Intel Core i7-13700
NVIDIA GeForce RTX 4090, i7-13700, Intel Optane 905P 480GB 2.5
282.1 fps 0%
Intel Core i7-12700
NVIDIA GeForce RTX 4090, i7-12700, Intel Optane 905P 480GB 2.5
282 fps 0%
Intel Core i9-13900K
NVIDIA GeForce RTX 4090, i9-13900K, Samsung SSD 980 Pro 2TB MZ-V8P2T0
282 fps 0%
AMD Ryzen 7 7800X3D
NVIDIA GeForce RTX 4090, R7 7800X3D, Corsair MP600
281 fps
Intel Core i7-13700K
NVIDIA GeForce RTX 4090, i7-13700K, Intel Optane 905P 480GB 2.5
278.9 fps -1%
AMD Ryzen 9 7950X3D
NVIDIA GeForce RTX 4090, R9 7950X3D
275.2 fps -2%
Intel Core i5-12400F
NVIDIA GeForce RTX 4090, i5-12400F, Intel Optane 905P 480GB 2.5
254 fps -10%
F1 2021
3840x2160 Ultra High Preset + Raytracing AA:T AF:16x
AMD Ryzen 7 7800X3D
NVIDIA GeForce RTX 4090, R7 7800X3D, Corsair MP600
207 (179min, 176P1 - 230max) fps
AMD Ryzen 9 7950X3D
NVIDIA GeForce RTX 4090, R9 7950X3D
203 (169min, 169P1 - 225max) fps -2%
Intel Core i7-13700K
NVIDIA GeForce RTX 4090, i7-13700K, Intel Optane 905P 480GB 2.5
197.5 (169min, 158P1 - 222max) fps -5%
Intel Core i7-13700
NVIDIA GeForce RTX 4090, i7-13700, Intel Optane 905P 480GB 2.5
196.8 (166min, 156P1 - 217max) fps -5%
Intel Core i9-13900K
NVIDIA GeForce RTX 4090, i9-13900K, Samsung SSD 980 Pro 2TB MZ-V8P2T0
196.6 (167min, 156P1 - 219max) fps -5%
Intel Core i7-12700
NVIDIA GeForce RTX 4090, i7-12700, Intel Optane 905P 480GB 2.5
193.1 (162min, 137P1 - 211max) fps -7%
Intel Core i5-12400F
NVIDIA GeForce RTX 4090, i5-12400F, Intel Optane 905P 480GB 2.5
185 (153min, 132P1 - 197max) fps -11%
Intel Core i5-13400
NVIDIA GeForce RTX 4090, i5-13400, Intel Optane 905P 480GB 2.5
176.2 (144min, 127P1 - 189max) fps -15%
1280x720 Ultra Low Preset
AMD Ryzen 7 7800X3D
NVIDIA GeForce RTX 4090, R7 7800X3D, Corsair MP600
830 (632min, 515P1 - 919max) fps
AMD Ryzen 9 7950X3D
NVIDIA GeForce RTX 4090, R9 7950X3D
682 (522min, 418P1 - 767max) fps -18%
Intel Core i9-13900K
NVIDIA GeForce RTX 4090, i9-13900K, Samsung SSD 980 Pro 2TB MZ-V8P2T0
632 (477min, 398P1 - 685max) fps -24%
Intel Core i7-13700K
NVIDIA GeForce RTX 4090, i7-13700K, Intel Optane 905P 480GB 2.5
588 (466min, 371P1 - 639max) fps -29%
Intel Core i7-13700
NVIDIA GeForce RTX 4090, i7-13700, Intel Optane 905P 480GB 2.5
572 (447min, 359P1 - 620max) fps -31%
Intel Core i7-12700
NVIDIA GeForce RTX 4090, i7-12700, Intel Optane 905P 480GB 2.5
448 (363min, 297P1 - 477max) fps -46%
Intel Core i5-12400F
NVIDIA GeForce RTX 4090, i5-12400F, Intel Optane 905P 480GB 2.5
393 (309min, 274P1 - 416max) fps -53%
Intel Core i5-13400
NVIDIA GeForce RTX 4090, i5-13400, Intel Optane 905P 480GB 2.5
337 (277min, 237P1 - 358max) fps -59%
Shadow of the Tomb Raider
1280x720 Lowest Preset
AMD Ryzen 7 7800X3D
NVIDIA GeForce RTX 4090, R7 7800X3D, Corsair MP600
407 fps
AMD Ryzen 9 7950X3D
NVIDIA GeForce RTX 4090, R9 7950X3D
383 fps -6%
Intel Core i9-13900K
NVIDIA GeForce RTX 4090, i9-13900K, Samsung SSD 980 Pro 2TB MZ-V8P2T0
300 fps -26%
Intel Core i7-13700
NVIDIA GeForce RTX 4090, i7-13700, Intel Optane 905P 480GB 2.5
272 fps -33%
Intel Core i7-13700K
NVIDIA GeForce RTX 4090, i7-13700K, Intel Optane 905P 480GB 2.5
272 fps -33%
Intel Core i7-12700
NVIDIA GeForce RTX 4090, i7-12700, Intel Optane 905P 480GB 2.5
231 fps -43%
Intel Core i5-13400
NVIDIA GeForce RTX 4090, i5-13400, Intel Optane 905P 480GB 2.5
204 fps -50%
Intel Core i5-12400F
NVIDIA GeForce RTX 4090, i5-12400F, Intel Optane 905P 480GB 2.5
196.4 fps -52%
3840x2160 Highest Preset AA:T
Intel Core i7-13700K
NVIDIA GeForce RTX 4090, i7-13700K, Intel Optane 905P 480GB 2.5
187.8 fps 0%
AMD Ryzen 7 7800X3D
NVIDIA GeForce RTX 4090, R7 7800X3D, Corsair MP600
187.7 fps
Intel Core i7-13700
NVIDIA GeForce RTX 4090, i7-13700, Intel Optane 905P 480GB 2.5
187.6 fps 0%
AMD Ryzen 9 7950X3D
NVIDIA GeForce RTX 4090, R9 7950X3D
187.6 fps 0%
Intel Core i9-13900K
NVIDIA GeForce RTX 4090, i9-13900K, Samsung SSD 980 Pro 2TB MZ-V8P2T0
186 fps -1%
Intel Core i7-12700
NVIDIA GeForce RTX 4090, i7-12700, Intel Optane 905P 480GB 2.5
184.5 fps -2%
Intel Core i5-13400
NVIDIA GeForce RTX 4090, i5-13400, Intel Optane 905P 480GB 2.5
173.1 fps -8%
Intel Core i5-12400F
NVIDIA GeForce RTX 4090, i5-12400F, Intel Optane 905P 480GB 2.5
168.4 fps -10%
Borderlands 3
1280x720 Very Low Overall Quality (DX11)
AMD Ryzen 7 7800X3D
NVIDIA GeForce RTX 4090, R7 7800X3D, Corsair MP600
310 fps
AMD Ryzen 9 7950X3D
NVIDIA GeForce RTX 4090, R9 7950X3D
308 fps -1%
Intel Core i9-13900K
NVIDIA GeForce RTX 4090, i9-13900K, Samsung SSD 980 Pro 2TB MZ-V8P2T0
243 fps -22%
Intel Core i7-13700
NVIDIA GeForce RTX 4090, i7-13700, Intel Optane 905P 480GB 2.5
222 fps -28%
Intel Core i7-13700K
NVIDIA GeForce RTX 4090, i7-13700K, Intel Optane 905P 480GB 2.5
222 fps -28%
Intel Core i7-12700
NVIDIA GeForce RTX 4090, i7-12700, Intel Optane 905P 480GB 2.5
185.6 fps -40%
Intel Core i5-13400
NVIDIA GeForce RTX 4090, i5-13400, Intel Optane 905P 480GB 2.5
169 fps -45%
Intel Core i5-12400F
NVIDIA GeForce RTX 4090, i5-12400F, Intel Optane 905P 480GB 2.5
155 fps -50%
3840x2160 Badass Overall Quality (DX11)
Intel Core i7-13700K
NVIDIA GeForce RTX 4090, i7-13700K, Intel Optane 905P 480GB 2.5
143.4 fps +4%
AMD Ryzen 7 7800X3D
NVIDIA GeForce RTX 4090, R7 7800X3D, Corsair MP600
137.4 fps
AMD Ryzen 9 7950X3D
NVIDIA GeForce RTX 4090, R9 7950X3D
136.4 fps -1%
Intel Core i9-13900K
NVIDIA GeForce RTX 4090, i9-13900K, Samsung SSD 980 Pro 2TB MZ-V8P2T0
132.9 fps -3%
Intel Core i7-13700
NVIDIA GeForce RTX 4090, i7-13700, Intel Optane 905P 480GB 2.5
132.4 fps -4%
Intel Core i7-12700
NVIDIA GeForce RTX 4090, i7-12700, Intel Optane 905P 480GB 2.5
125.5 fps -9%
Intel Core i5-13400
NVIDIA GeForce RTX 4090, i5-13400, Intel Optane 905P 480GB 2.5
120.5 fps -12%
Intel Core i5-12400F
NVIDIA GeForce RTX 4090, i5-12400F, Intel Optane 905P 480GB 2.5
114.4 fps -17%
Tiny Tina's Wonderlands
1280x720 Lowest Preset (DX12)
AMD Ryzen 7 7800X3D
NVIDIA GeForce RTX 4090, R7 7800X3D, Corsair MP600
548 fps
AMD Ryzen 9 7950X3D
NVIDIA GeForce RTX 4090, R9 7950X3D
535 fps -2%
Intel Core i9-13900K
NVIDIA GeForce RTX 4090, i9-13900K, Samsung SSD 980 Pro 2TB MZ-V8P2T0
435 fps -21%
Intel Core i7-13700
NVIDIA GeForce RTX 4090, i7-13700, Intel Optane 905P 480GB 2.5
410 fps -25%
Intel Core i7-13700K
NVIDIA GeForce RTX 4090, i7-13700K, Intel Optane 905P 480GB 2.5
404 fps -26%
Intel Core i7-12700
NVIDIA GeForce RTX 4090, i7-12700, Intel Optane 905P 480GB 2.5
342 fps -38%
Intel Core i5-13400
NVIDIA GeForce RTX 4090, i5-13400, Intel Optane 905P 480GB 2.5
299 fps -45%
Intel Core i5-12400F
NVIDIA GeForce RTX 4090, i5-12400F, Intel Optane 905P 480GB 2.5
244 fps -55%
3840x2160 Badass Preset (DX12)
AMD Ryzen 9 7950X3D
NVIDIA GeForce RTX 4090, R9 7950X3D
131.3 fps +1%
Intel Core i7-13700
NVIDIA GeForce RTX 4090, i7-13700, Intel Optane 905P 480GB 2.5
130.2 fps 0%
AMD Ryzen 7 7800X3D
NVIDIA GeForce RTX 4090, R7 7800X3D, Corsair MP600
129.8 fps
Intel Core i7-12700
NVIDIA GeForce RTX 4090, i7-12700, Intel Optane 905P 480GB 2.5
129.7 fps 0%
Intel Core i5-13400
NVIDIA GeForce RTX 4090, i5-13400, Intel Optane 905P 480GB 2.5
129.7 fps 0%
Intel Core i7-13700K
NVIDIA GeForce RTX 4090, i7-13700K, Intel Optane 905P 480GB 2.5
129.6 fps 0%
Intel Core i9-13900K
NVIDIA GeForce RTX 4090, i9-13900K, Samsung SSD 980 Pro 2TB MZ-V8P2T0
128.4 fps -1%
Intel Core i5-12400F
NVIDIA GeForce RTX 4090, i5-12400F, Intel Optane 905P 480GB 2.5
114.2 fps -12%
God of War
1280x720 Low Preset
AMD Ryzen 9 7950X3D
NVIDIA GeForce RTX 4090, R9 7950X3D
346 (44min, 102.3P0.1, 205P1 - 606max) fps +13%
AMD Ryzen 7 7800X3D
NVIDIA GeForce RTX 4090, R7 7800X3D, Corsair MP600
306 (95.8min, 135.2P0.1, 183.9P1 - 756max) fps
Intel Core i9-13900K
NVIDIA GeForce RTX 4090, i9-13900K, Samsung SSD 980 Pro 2TB MZ-V8P2T0
263 (136min, 156.2P0.1, 178.2P1 - 610max) fps -14%
Intel Core i7-13700K
NVIDIA GeForce RTX 4090, i7-13700K, Intel Optane 905P 480GB 2.5
249 (142.1min, 158.3P0.1, 182.3P1 - 571max) fps -19%
Intel Core i7-13700
NVIDIA GeForce RTX 4090, i7-13700, Intel Optane 905P 480GB 2.5
246 (121.3min, 142.2P0.1, 167.6P1 - 530max) fps -20%
Intel Core i7-12700
NVIDIA GeForce RTX 4090, i7-12700, Intel Optane 905P 480GB 2.5
209 (57.6min, 132.9P0.1, 153.5P1 - 426max) fps -32%
Intel Core i5-13400
NVIDIA GeForce RTX 4090, i5-13400, Intel Optane 905P 480GB 2.5
183.6 (80.4min, 108.2P0.1, 129.4P1 - 421max) fps -40%
Intel Core i5-12400F
NVIDIA GeForce RTX 4090, i5-12400F, Intel Optane 905P 480GB 2.5
159.5 (72.3min, 91.2P0.1, 108.5P1 - 304max) fps -48%
3840x2160 Ultra Preset
AMD Ryzen 7 7800X3D
NVIDIA GeForce RTX 4090, R7 7800X3D, Corsair MP600
132 (61.5min, 79.8P0.1, 111P1 - 271max) fps
AMD Ryzen 9 7950X3D
NVIDIA GeForce RTX 4090, R9 7950X3D
130.1 (61.3min, 65.9P0.1, 106.9P1 - 488max) fps -1%
Intel Core i7-13700
NVIDIA GeForce RTX 4090, i7-13700, Intel Optane 905P 480GB 2.5
126.3 (96.6min, 101.8P0.1, 109.4P1 - 161.8max) fps -4%
Intel Core i5-13400
NVIDIA GeForce RTX 4090, i5-13400, Intel Optane 905P 480GB 2.5
126.2 (98.3min, 103.4P0.1, 108.3P1 - 193.2max) fps -4%
Intel Core i7-13700K
NVIDIA GeForce RTX 4090, i7-13700K, Intel Optane 905P 480GB 2.5
125.4 (79.4min, 101.8P0.1, 109.3P1 - 261max) fps -5%
Intel Core i9-13900K
NVIDIA GeForce RTX 4090, i9-13900K, Samsung SSD 980 Pro 2TB MZ-V8P2T0
125.1 (51.8min, 101.4P0.1, 108.1P1 - 185max) fps -5%
Intel Core i7-12700
NVIDIA GeForce RTX 4090, i7-12700, Intel Optane 905P 480GB 2.5
124.5 (76.4min, 97.5P0.1, 107.7P1 - 268max) fps -6%
Intel Core i5-12400F
NVIDIA GeForce RTX 4090, i5-12400F, Intel Optane 905P 480GB 2.5
123.7 (68.5min, 82.3P0.1, 97P1 - 198max) fps -6%
Far Cry New Dawn
1280x720 Low Preset
AMD Ryzen 7 7800X3D
NVIDIA GeForce RTX 4090, R7 7800X3D, Corsair MP600
291 (218min - 442max) fps
AMD Ryzen 9 7950X3D
NVIDIA GeForce RTX 4090, R9 7950X3D
255 (145min - 381max) fps -12%
Intel Core i9-13900K
NVIDIA GeForce RTX 4090, i9-13900K, Samsung SSD 980 Pro 2TB MZ-V8P2T0
206 (155min - 302max) fps -29%
Intel Core i7-13700
NVIDIA GeForce RTX 4090, i7-13700, Intel Optane 905P 480GB 2.5
203 (144min - 297max) fps -30%
Intel Core i7-13700K
NVIDIA GeForce RTX 4090, i7-13700K, Intel Optane 905P 480GB 2.5
203 (157min - 304max) fps -30%
Intel Core i7-12700
NVIDIA GeForce RTX 4090, i7-12700, Intel Optane 905P 480GB 2.5
174 (103min - 253max) fps -40%
Intel Core i5-13400
NVIDIA GeForce RTX 4090, i5-13400, Intel Optane 905P 480GB 2.5
159 (110min - 233max) fps -45%
Intel Core i5-12400F
NVIDIA GeForce RTX 4090, i5-12400F, Intel Optane 905P 480GB 2.5
147 (102min - 216max) fps -49%
3840x2160 Ultra Preset
AMD Ryzen 7 7800X3D
NVIDIA GeForce RTX 4090, R7 7800X3D, Corsair MP600
180 (147min - 219max) fps
AMD Ryzen 9 7950X3D
NVIDIA GeForce RTX 4090, R9 7950X3D
171 (130min - 219max) fps -5%
Intel Core i9-13900K
NVIDIA GeForce RTX 4090, i9-13900K, Samsung SSD 980 Pro 2TB MZ-V8P2T0
152 (113min - 216max) fps -16%
Intel Core i7-13700
NVIDIA GeForce RTX 4090, i7-13700, Intel Optane 905P 480GB 2.5
145 (106min - 212max) fps -19%
Intel Core i7-13700K
NVIDIA GeForce RTX 4090, i7-13700K, Intel Optane 905P 480GB 2.5
145 (109min - 213max) fps -19%
Intel Core i7-12700
NVIDIA GeForce RTX 4090, i7-12700, Intel Optane 905P 480GB 2.5
127 (92min - 198max) fps -29%
Intel Core i5-13400
NVIDIA GeForce RTX 4090, i5-13400, Intel Optane 905P 480GB 2.5
119 (88min - 182max) fps -34%
Intel Core i5-12400F
NVIDIA GeForce RTX 4090, i5-12400F, Intel Optane 905P 480GB 2.5
110 (79min - 170max) fps -39%
Far Cry 6
1280x720 Low Graphics Quality
AMD Ryzen 7 7800X3D
NVIDIA GeForce RTX 4090, R7 7800X3D, Corsair MP600
285 (214min - 367max) fps
AMD Ryzen 9 7950X3D
NVIDIA GeForce RTX 4090, R9 7950X3D
255 (199min - 318max) fps -11%
Intel Core i9-13900K
NVIDIA GeForce RTX 4090, i9-13900K, Samsung SSD 980 Pro 2TB MZ-V8P2T0
213 (186min - 281max) fps -25%
Intel Core i7-13700
NVIDIA GeForce RTX 4090, i7-13700, Intel Optane 905P 480GB 2.5
207 (178min - 279max) fps -27%
Intel Core i7-13700K
NVIDIA GeForce RTX 4090, i7-13700K, Intel Optane 905P 480GB 2.5
207 (181min - 271max) fps -27%
Intel Core i7-12700
NVIDIA GeForce RTX 4090, i7-12700, Intel Optane 905P 480GB 2.5
173.5 (152min - 213max) fps -39%
Intel Core i5-13400
NVIDIA GeForce RTX 4090, i5-13400, Intel Optane 905P 480GB 2.5
156.6 (135min - 191max) fps -45%
Intel Core i5-12400F
NVIDIA GeForce RTX 4090, i5-12400F, Intel Optane 905P 480GB 2.5
141 (123min - 183max) fps -51%
3840x2160 Ultra Graphics Quality + HD Textures AA:T
AMD Ryzen 7 7800X3D
NVIDIA GeForce RTX 4090, R7 7800X3D, Corsair MP600
141.4 (131min - 151max) fps
AMD Ryzen 9 7950X3D
NVIDIA GeForce RTX 4090, R9 7950X3D
140.9 (131min - 150max) fps 0%
Intel Core i7-13700K
NVIDIA GeForce RTX 4090, i7-13700K, Intel Optane 905P 480GB 2.5
134.1 (123min - 148max) fps -5%
Intel Core i7-13700
NVIDIA GeForce RTX 4090, i7-13700, Intel Optane 905P 480GB 2.5
133.8 (123min - 149max) fps -5%
Intel Core i9-13900K
NVIDIA GeForce RTX 4090, i9-13900K, Samsung SSD 980 Pro 2TB MZ-V8P2T0
133.4 (119min - 144max) fps -6%
Intel Core i7-12700
NVIDIA GeForce RTX 4090, i7-12700, Intel Optane 905P 480GB 2.5
122.2 (104min - 143max) fps -14%
Intel Core i5-13400
NVIDIA GeForce RTX 4090, i5-13400, Intel Optane 905P 480GB 2.5
108.8 (93min - 132max) fps -23%
Intel Core i5-12400F
NVIDIA GeForce RTX 4090, i5-12400F, Intel Optane 905P 480GB 2.5
102.8 (85min - 124max) fps -27%

AMD Ryzen 7 78003D with an Nvidia GeForce RTX 4090

low med. high ultraQHD4K DLSS4K
GTA V (2015) 188.5 188.5 188.1 182 181.1 188
The Witcher 3 (2015) 858.4 820.4 658.8 314.3 281
Dota 2 Reborn (2015) 322.9 299.6 288.9 267.5 258.2
Final Fantasy XV Benchmark (2018) 236 234 233 231 158.2
X-Plane 11.11 (2018) 219 214 188.1 160.5
Far Cry 5 (2018) 344 303 303 278 268 187
Strange Brigade (2018) 760 618 601 589 534 289
Shadow of the Tomb Raider (2018) 407 383 387 375 322 187.7
Far Cry New Dawn (2019) 291 258 253 226 223 180
Metro Exodus (2019) 374 326 268 219 199.8 141.6
Control (2019) 240 240 240 220 137.5 114
Borderlands 3 (2019) 310 271 252 241 224 137.4
F1 2020 (2020) 681 571 563 503 446 288
F1 2021 (2021) 830 763 667 369 324 207
Far Cry 6 (2021) 285 256 230 223 211 141.4
Guardians of the Galaxy (2021) 268 266 267 267 263 194
God of War (2022) 315 313 287 212 181.5 132
Cyberpunk 2077 1.6 (2022) 272 268 251 241 166.6 82.3
Tiny Tina's Wonderlands (2022) 506 434 371 309 233 129.8
F1 22 (2022) 533 483 477 221 162.9 84.5
The Quarry (2022) 462 355 309 267 198.1 82.6
A Plague Tale Requiem (2022) 231 209 189.9 168.8 132.5 148.3 76.3
Uncharted Legacy of Thieves Collection (2022) 159.8 164.5 163 156.9 155.8 103.5
Spider-Man Miles Morales (2022) 233 233 196.7 191.6 245 134.9
The Callisto Protocol (2022) 279.1 279.7 280.8 281.1 274.5 237.1
High On Life (2023) 446 404 345 312 225 107.8
The Witcher 3 v4.00 (2023) 367 300 279 261 260 169.9
Dead Space Remake (2023) 291 282 262 259 201 106.7
Hogwarts Legacy (2023) 218 200 164.4 163.3 146.7 82.4
Returnal (2023) 262 256 237 211 172 112
Atomic Heart (2023) 360 306 274 228 184.1 112.4
Company of Heroes 3 (2023) 465.1 429.6 376.5 373.3 314.6 215.4
Sons of the Forest (2023) 184.7 176.4 171.4 165.4 159.1 132.1
Resident Evil 4 Remake (2023) 383 344 336 237 199.9 124.2
The Last of Us (2023) 241 215 202 191.1 146 122.9 82.6
Dead Island 2 (2023) 379 369 336 315 284 161.6
Star Wars Jedi Survivor (2023) 197.7 197.3 196.1 193.8 157.6 82.3
Diablo 4 (2023) 399 399 398 397 390 238 216
F1 23 (2023) 576 594 542 226 152 80

功耗 - 节俭,但良好的空气流通是必须的

所有7000系列X3D处理器的最大功耗限制为162瓦(PPT)。因此,我们的AMD Ryzen 7 7800X3D也是如此。在空闲模式下,我们注意到在120瓦时没有记录数值,但与AMD Ryzen 9 7950X3D相比,我们的测量值几乎相同。在游戏模式下,我们记录的平均功率为 497 瓦。 Witcher 3游戏场景。这意味着我们的测试系统与基于英特尔酷睿i5-13400.在我们的Prime95压力测试中,基于AMD Ryzen 7 7800X3D的系统实际上是最省钱的。它的中值仅为218瓦。

对于我们的负载测量,您必须考虑显卡的功耗。我们的PalitGeForce RTX 4090 GameRock OC就已经消耗了450瓦。

我们注意到相当高的温度,这是由于糟糕的机箱散热造成的。在这种最糟糕的情况下,AMD Ryzen 7 7800X3D达到了散热极限,不得不进行节流。为了不伪造测量结果,我们没有打开机箱进行测试。我们拆下了侧面部件,这导致 CPU 温度迅速下降到非临界值。空气流通良好的机箱可以很好地冷却8核处理器。但是,我们不建议放弃AiO。在此阶段,我们建议您查看制造商的冷却器推荐列表。AMD Ryzen 7000处理器的推荐散热器列表。

测试系统功耗 - 空闲模式
测试系统功耗 - 空闲模式
测试系统功耗 - Cinebench R15 nT
测试系统功耗 - Cinebench R23 nT
测试系统功耗 - 压力测试 Prime95
测试系统功耗 - FurMark压力测试
测试系统功耗 - 压力测试 Prime95 + FurMark
测试系统功耗 - 游戏 (Witcher 3 Ultra 预设值)
 
压力测试 - Prime95单机版
压力测试 - Prime95单机版
压力测试 - Prime95 + FurMark
Power Consumption / Cinebench R15 Multi (external Monitor)
SCHENKER XMG SECTOR, i9 13900K, RTX 4090
NVIDIA GeForce RTX 4090, i9-13900K, Samsung SSD 980 Pro 2TB MZ-V8P2T0
386 (377min, 377P1 - 426max) Watt * -86%
Intel Core i7-13700
NVIDIA GeForce RTX 4090, i7-13700, Intel Optane 905P 480GB 2.5
365 (363min, 363P1 - 367max) Watt * -76%
Intel Core i7-13700K
NVIDIA GeForce RTX 4090, i7-13700K, Intel Optane 905P 480GB 2.5
357 (356min, 356P1 - 362max) Watt * -72%
Intel Core i7-12700
NVIDIA GeForce RTX 4090, i7-12700, Intel Optane 905P 480GB 2.5
284 (282min, 282P1 - 287max) Watt * -37%
AMD Ryzen 9 7950X3D
NVIDIA GeForce RTX 4090, R9 7950X3D
273 (264min, 264P1 - 304max) Watt * -32%
AMD Ryzen 7 7800X3D
NVIDIA GeForce RTX 4090, R7 7800X3D, Corsair MP600
207 (203min, 203P1 - 216max) Watt *
Intel Core i5-13400
NVIDIA GeForce RTX 4090, i5-13400, Intel Optane 905P 480GB 2.5
196.6 (194.6min, 194.6P1 - 207max) Watt * +5%
Intel Core i5-12400F
NVIDIA GeForce RTX 4090, i5-12400F, Intel Optane 905P 480GB 2.5
194.4 (192.3min, 192.3P1 - 200max) Watt * +6%
Power Consumption / Cinebench R15 Multi Efficiency (external Monitor)
AMD Ryzen 9 7950X3D
NVIDIA GeForce RTX 4090, R9 7950X3D
21.9 Points per Watt +52%
AMD Ryzen 7 7800X3D
NVIDIA GeForce RTX 4090, R7 7800X3D, Corsair MP600
14.4 Points per Watt
Power Consumption / Prime95 V2810 Stress (external Monitor)
Intel Core i7-13700
NVIDIA GeForce RTX 4090, i7-13700, Intel Optane 905P 480GB 2.5
386 (363min, 364P1 - 487max) Watt * -77%
SCHENKER XMG SECTOR, i9 13900K, RTX 4090
NVIDIA GeForce RTX 4090, i9-13900K, Samsung SSD 980 Pro 2TB MZ-V8P2T0
363 (338min, 339P1 - 401max) Watt * -67%
Intel Core i7-13700K
NVIDIA GeForce RTX 4090, i7-13700K, Intel Optane 905P 480GB 2.5
357 (341min, 342P1 - 458max) Watt * -64%
Intel Core i7-12700
NVIDIA GeForce RTX 4090, i7-12700, Intel Optane 905P 480GB 2.5
327 (304min, 305P1 - 394max) Watt * -50%
AMD Ryzen 9 7950X3D
NVIDIA GeForce RTX 4090, R9 7950X3D
276 (267min, 267P1 - 329max) Watt * -27%
Intel Core i5-12400F
NVIDIA GeForce RTX 4090, i5-12400F, Intel Optane 905P 480GB 2.5
239 (225min, 226P1 - 252max) Watt * -10%
Intel Core i5-13400
NVIDIA GeForce RTX 4090, i5-13400, Intel Optane 905P 480GB 2.5
229 (224min, 224P1 - 247max) Watt * -5%
AMD Ryzen 7 7800X3D
NVIDIA GeForce RTX 4090, R7 7800X3D, Corsair MP600
218 (214min, 215P1 - 223max) Watt *
Power Consumption / The Witcher 3 ultra (external Monitor)
Intel Core i7-13700
NVIDIA GeForce RTX 4090, i7-13700, Intel Optane 905P 480GB 2.5
540 (528min, 530P1 - 585max) Watt * -9%
Intel Core i7-13700K
NVIDIA GeForce RTX 4090, i7-13700K, Intel Optane 905P 480GB 2.5
537 (518min, 522P1 - 560max) Watt * -8%
AMD Ryzen 9 7950X3D
NVIDIA GeForce RTX 4090, R9 7950X3D
517 (508min, 510P1 - 539max) Watt * -4%
SCHENKER XMG SECTOR, i9 13900K, RTX 4090
NVIDIA GeForce RTX 4090, i9-13900K, Samsung SSD 980 Pro 2TB MZ-V8P2T0
511 (466min, 491P1 - 596max) Watt * -3%
Intel Core i7-12700
NVIDIA GeForce RTX 4090, i7-12700, Intel Optane 905P 480GB 2.5
508 (498min, 500P1 - 540max) Watt * -2%
Intel Core i5-13400
NVIDIA GeForce RTX 4090, i5-13400, Intel Optane 905P 480GB 2.5
498 (476min, 490P1 - 507max) Watt * -0%
AMD Ryzen 7 7800X3D
NVIDIA GeForce RTX 4090, R7 7800X3D, Corsair MP600
497 (482min, 484P1 - 510max) Watt *
Intel Core i5-12400F
NVIDIA GeForce RTX 4090, i5-12400F, Intel Optane 905P 480GB 2.5
440 (410min, 419P1 - 455max) Watt * +11%

* ... smaller is better

Power Consumption - Cinebench R15 Multi Efficiency (external Monitor)
AMD Ryzen 9 7950X3D
21.9 Points per Watt +52%
AMD Ryzen 9 5950X
19.9 Points per Watt +38%
AMD Ryzen 9 7950X
17.1 Points per Watt +19%
AMD Ryzen 9 7900X
15.5 Points per Watt +8%
AMD Ryzen 7 7800X3D
14.4 Points per Watt
Intel Core i9-13900K
12.9 Points per Watt -10%

Power consumption with external monitor

03570105140175210245280315350385420455490525560595Tooltip
AMD Ryzen 7 7800X3D NVIDIA GeForce RTX 4090, R7 7800X3D, Corsair MP600; Prime95 V2810 Stress (external Monitor): Ø218 (214-223)
AMD Ryzen 9 7950X3D NVIDIA GeForce RTX 4090, R9 7950X3D; Prime95 V2810 Stress (external Monitor): Ø276 (267-329)
AMD Ryzen 7 7800X3D NVIDIA GeForce RTX 4090, R7 7800X3D, Corsair MP600; Cinebench R15 Multi (external Monitor): Ø207 (203-216)
AMD Ryzen 9 7950X3D NVIDIA GeForce RTX 4090, R9 7950X3D; Cinebench R15 Multi (external Monitor): Ø273 (264-304)
AMD Ryzen 7 7800X3D NVIDIA GeForce RTX 4090, R7 7800X3D, Corsair MP600; 1280x720 FurMark 1.19 GPU Stress Test (external Monitor): Ø600 (571-612)
AMD Ryzen 9 7950X3D NVIDIA GeForce RTX 4090, R9 7950X3D; 1280x720 FurMark 1.19 GPU Stress Test (external Monitor): Ø573 (553-608)
AMD Ryzen 7 7800X3D NVIDIA GeForce RTX 4090, R7 7800X3D, Corsair MP600; 1920x1080 The Witcher 3 ultra (external Monitor): Ø497 (482-510)
AMD Ryzen 9 7950X3D NVIDIA GeForce RTX 4090, R9 7950X3D; 1920x1080 The Witcher 3 ultra (external Monitor): Ø517 (508-539)
AMD Ryzen 7 7800X3D NVIDIA GeForce RTX 4090, R7 7800X3D, Corsair MP600; Idle 1min (external Monitor): Ø121.6 (119.2-124.3)
AMD Ryzen 9 7950X3D NVIDIA GeForce RTX 4090, R9 7950X3D; Idle 1min (external Monitor): Ø118.4 (112.2-133.2)

Pros

+ 惊人的游戏性能
+ 现代5纳米制造工艺与3D V-高速缓存
+ 非常节能
+ 面向未来
+ 支持PCI Express 5.0

Cons

- 好贵

结论 - 适合高要求玩家的优秀游戏CPU

AMD Ryzen 7 7800X3D评测

在本次评测中,我们对AMD Ryzen 7 7800X3D--全新AM5平台的首款全X3D处理器--进行了近距离的观察。我们的意思是,这是一款不采用混合设计的全新处理器--相反,它只有一个CCD芯片,即3D V-Cache。这对于很多游戏来说是一个优势,因此,这款8核处理器能够略微领先于AMD Ryzen 9 7950X3D。

这并不意味着AMD Ryzen 7 7800X3D是一款全能处理器。这款8核处理器在CPU性能测试中表现不够理想,由于其多核性能有限,该组件无法赶上高端型号。但是,它不必如此。作为一款纯粹的游戏CPU,7800X3D完全可以实现它的开发目标。一个积极的方面是它的低功耗。

AMD Ryzen 7 7800X3D具有出色的游戏性能。从价格上看,这款8核处理器目前仍然很难说服买家选择这一型号。

总之,我们可以说AMD Ryzen 7 7800X3D是目前市场上最快的游戏CPU之一。我们不能说它是最快的处理器,例如AMD Ryzen 9 7950X3D只要正确分配线程,就能充分发挥CPU的性能。由于采用3D V-Cache的Ryzen 9型号是混合结构,因此并不能保证3D V-Cache的CCD总是优先。在此,AMD Ryzen 7 7800X3D因其更简单的内部结构而受益。虽然,这只是最高级别的抱怨--无论使用何种CPU,我们测试的所有游戏都可以运行。

在我们看来,该组件目前最大的问题是其价格。目前,它的最低售价为441.99美元。一个英特尔酷睿i7-13700K价格差不多,性能水平也差不多--但是,它能提供更好的CPU总性能。如果我们考虑到这些处理器的未来性,那么没有人能够击败AMD。不管你信不信,传言称AM5平台将持续支持到2025年。目前英特尔系统所采用的1700插槽很可能在明年被其后继者所取代,届时将不会再发布1700插槽的处理器。

价格和供货情况

目前,您可以从亚马逊以441.99美元的价格购买AMD Ryzen 7 7800X3D。

Transparency

The present review sample was freely purchased by the author at his/her own expense. The manufacturer did not receive a copy of this review before publication, nor was there any obligation to publish it.

Please share our article, every link counts!
> Notebookcheck中文版(NBC中国) > 评测 > AMD Ryzen 7 7800X3D台式机CPU评测:得益于3D V-Cache和仅有的8个核心,速度比酷睿i9-13900K更快
Sebastian Bade, 2023-07-16 (Update: 2023-07-16)