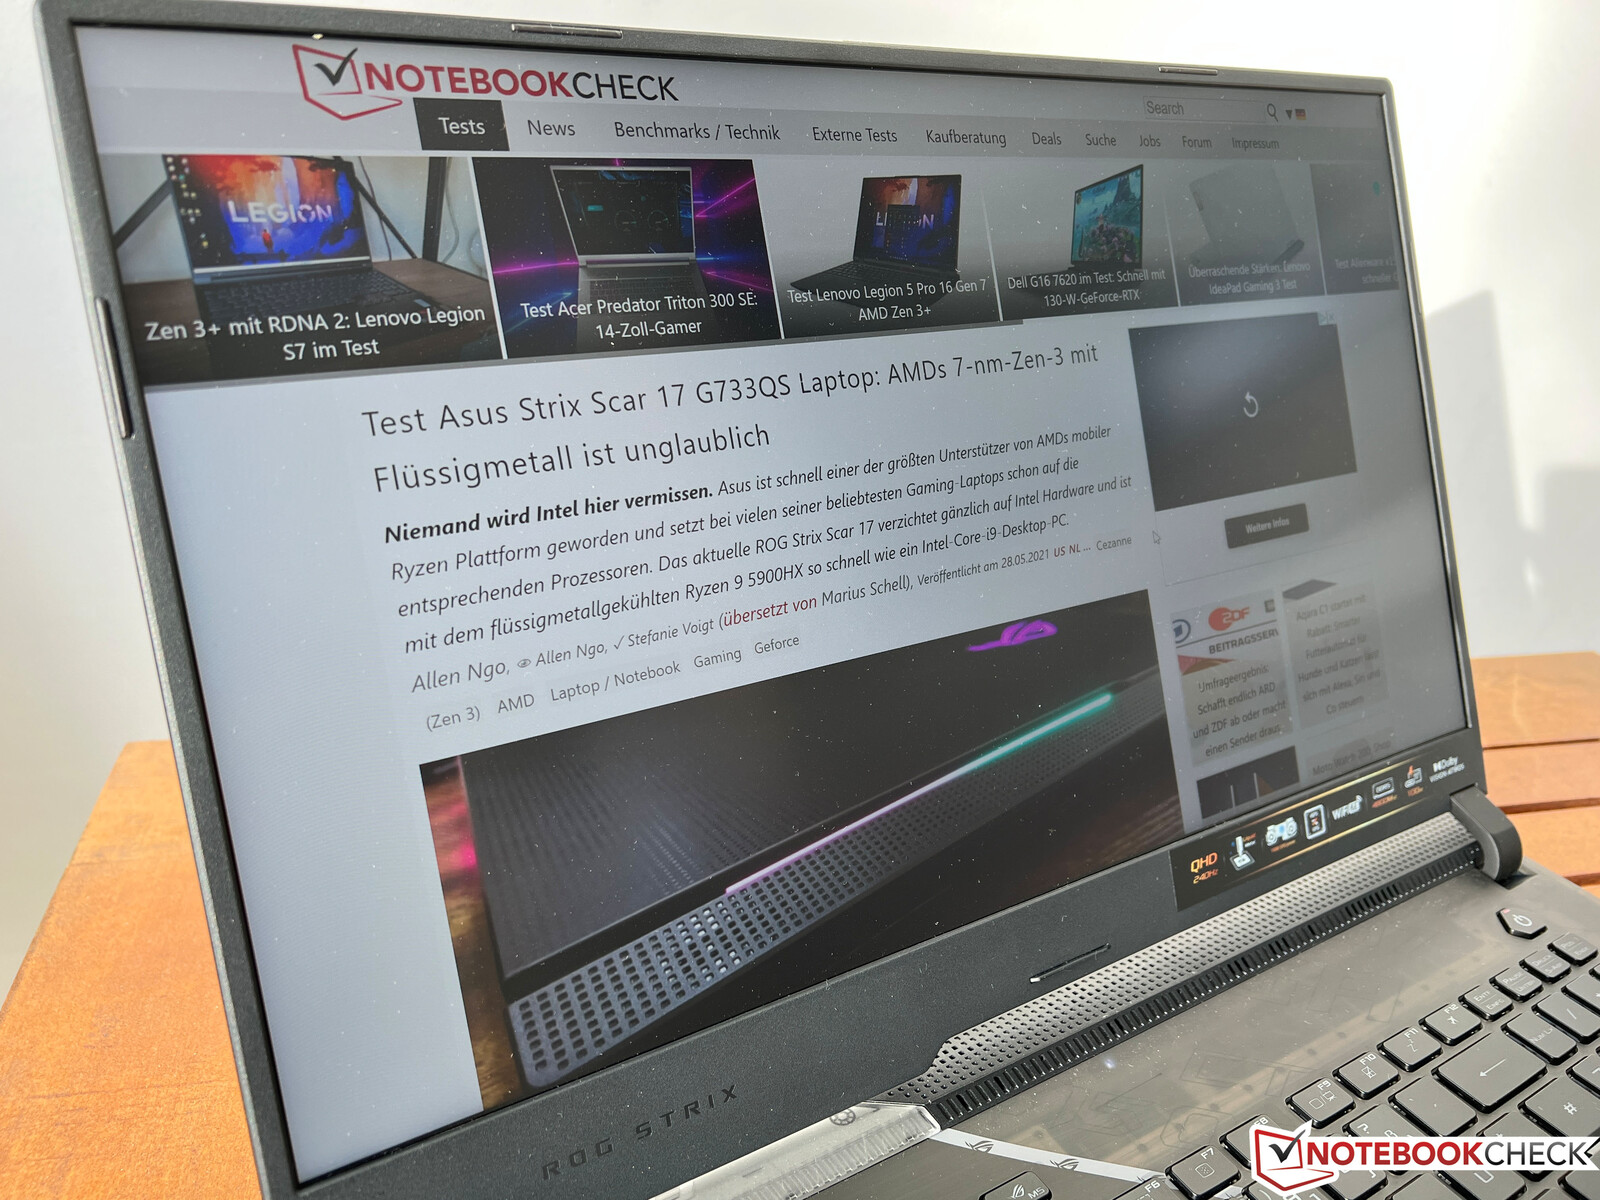
华硕ROG Strix Scar 17 SE评测--配备RTX 3080 Ti的全功能游戏笔记本
ROG Strix Scar SE是华硕的游戏旗舰,在2022年也是如此,它再次配备了目前市场上最快的组件。我们测试了G733CX顶级型号,配备了英特尔酷睿i9-12950HX,NvidiaGeForce RTX 3080 Ti,两个来自三星的2TB SSD,以及一个快速的QHD面板,刷新率为240-Hz。价格也很高端,因为我们的测试设备的建议零售价为3,999欧元(约4,129美元)。
潜在的竞争对手比较
Rating | Date | Model | Weight | Height | Size | Resolution | Price |
|---|---|---|---|---|---|---|---|
| 86.9 % v7 (old) | 11 / 2022 | Asus ROG Strix Scar 17 SE G733CX-LL014W i9-12950HX, GeForce RTX 3080 Ti Laptop GPU | 2.9 kg | 28.3 mm | 17.30" | 2560x1440 | |
| 88.9 % v7 (old) | 09 / 2022 | Lenovo Legion 7 16IAX7-82TD004SGE i9-12900HX, GeForce RTX 3080 Ti Laptop GPU | 2.6 kg | 20 mm | 16.00" | 2560x1600 | |
| 88.3 % v7 (old) | 08 / 2022 | MSI Titan GT77 12UHS i9-12900HX, GeForce RTX 3080 Ti Laptop GPU | 3.3 kg | 23 mm | 17.30" | 1920x1080 | |
| 87.6 % v7 (old) | 09 / 2022 | Schenker XMG Neo 17 M22 R9 6900HX, GeForce RTX 3080 Ti Laptop GPU | 2.8 kg | 27 mm | 17.00" | 2560x1600 | |
| 89.2 % v7 (old) | 05 / 2022 | Alienware x17 R2 P48E i9-12900HK, GeForce RTX 3080 Ti Laptop GPU | 3.1 kg | 20.9 mm | 17.30" | 1920x1080 |
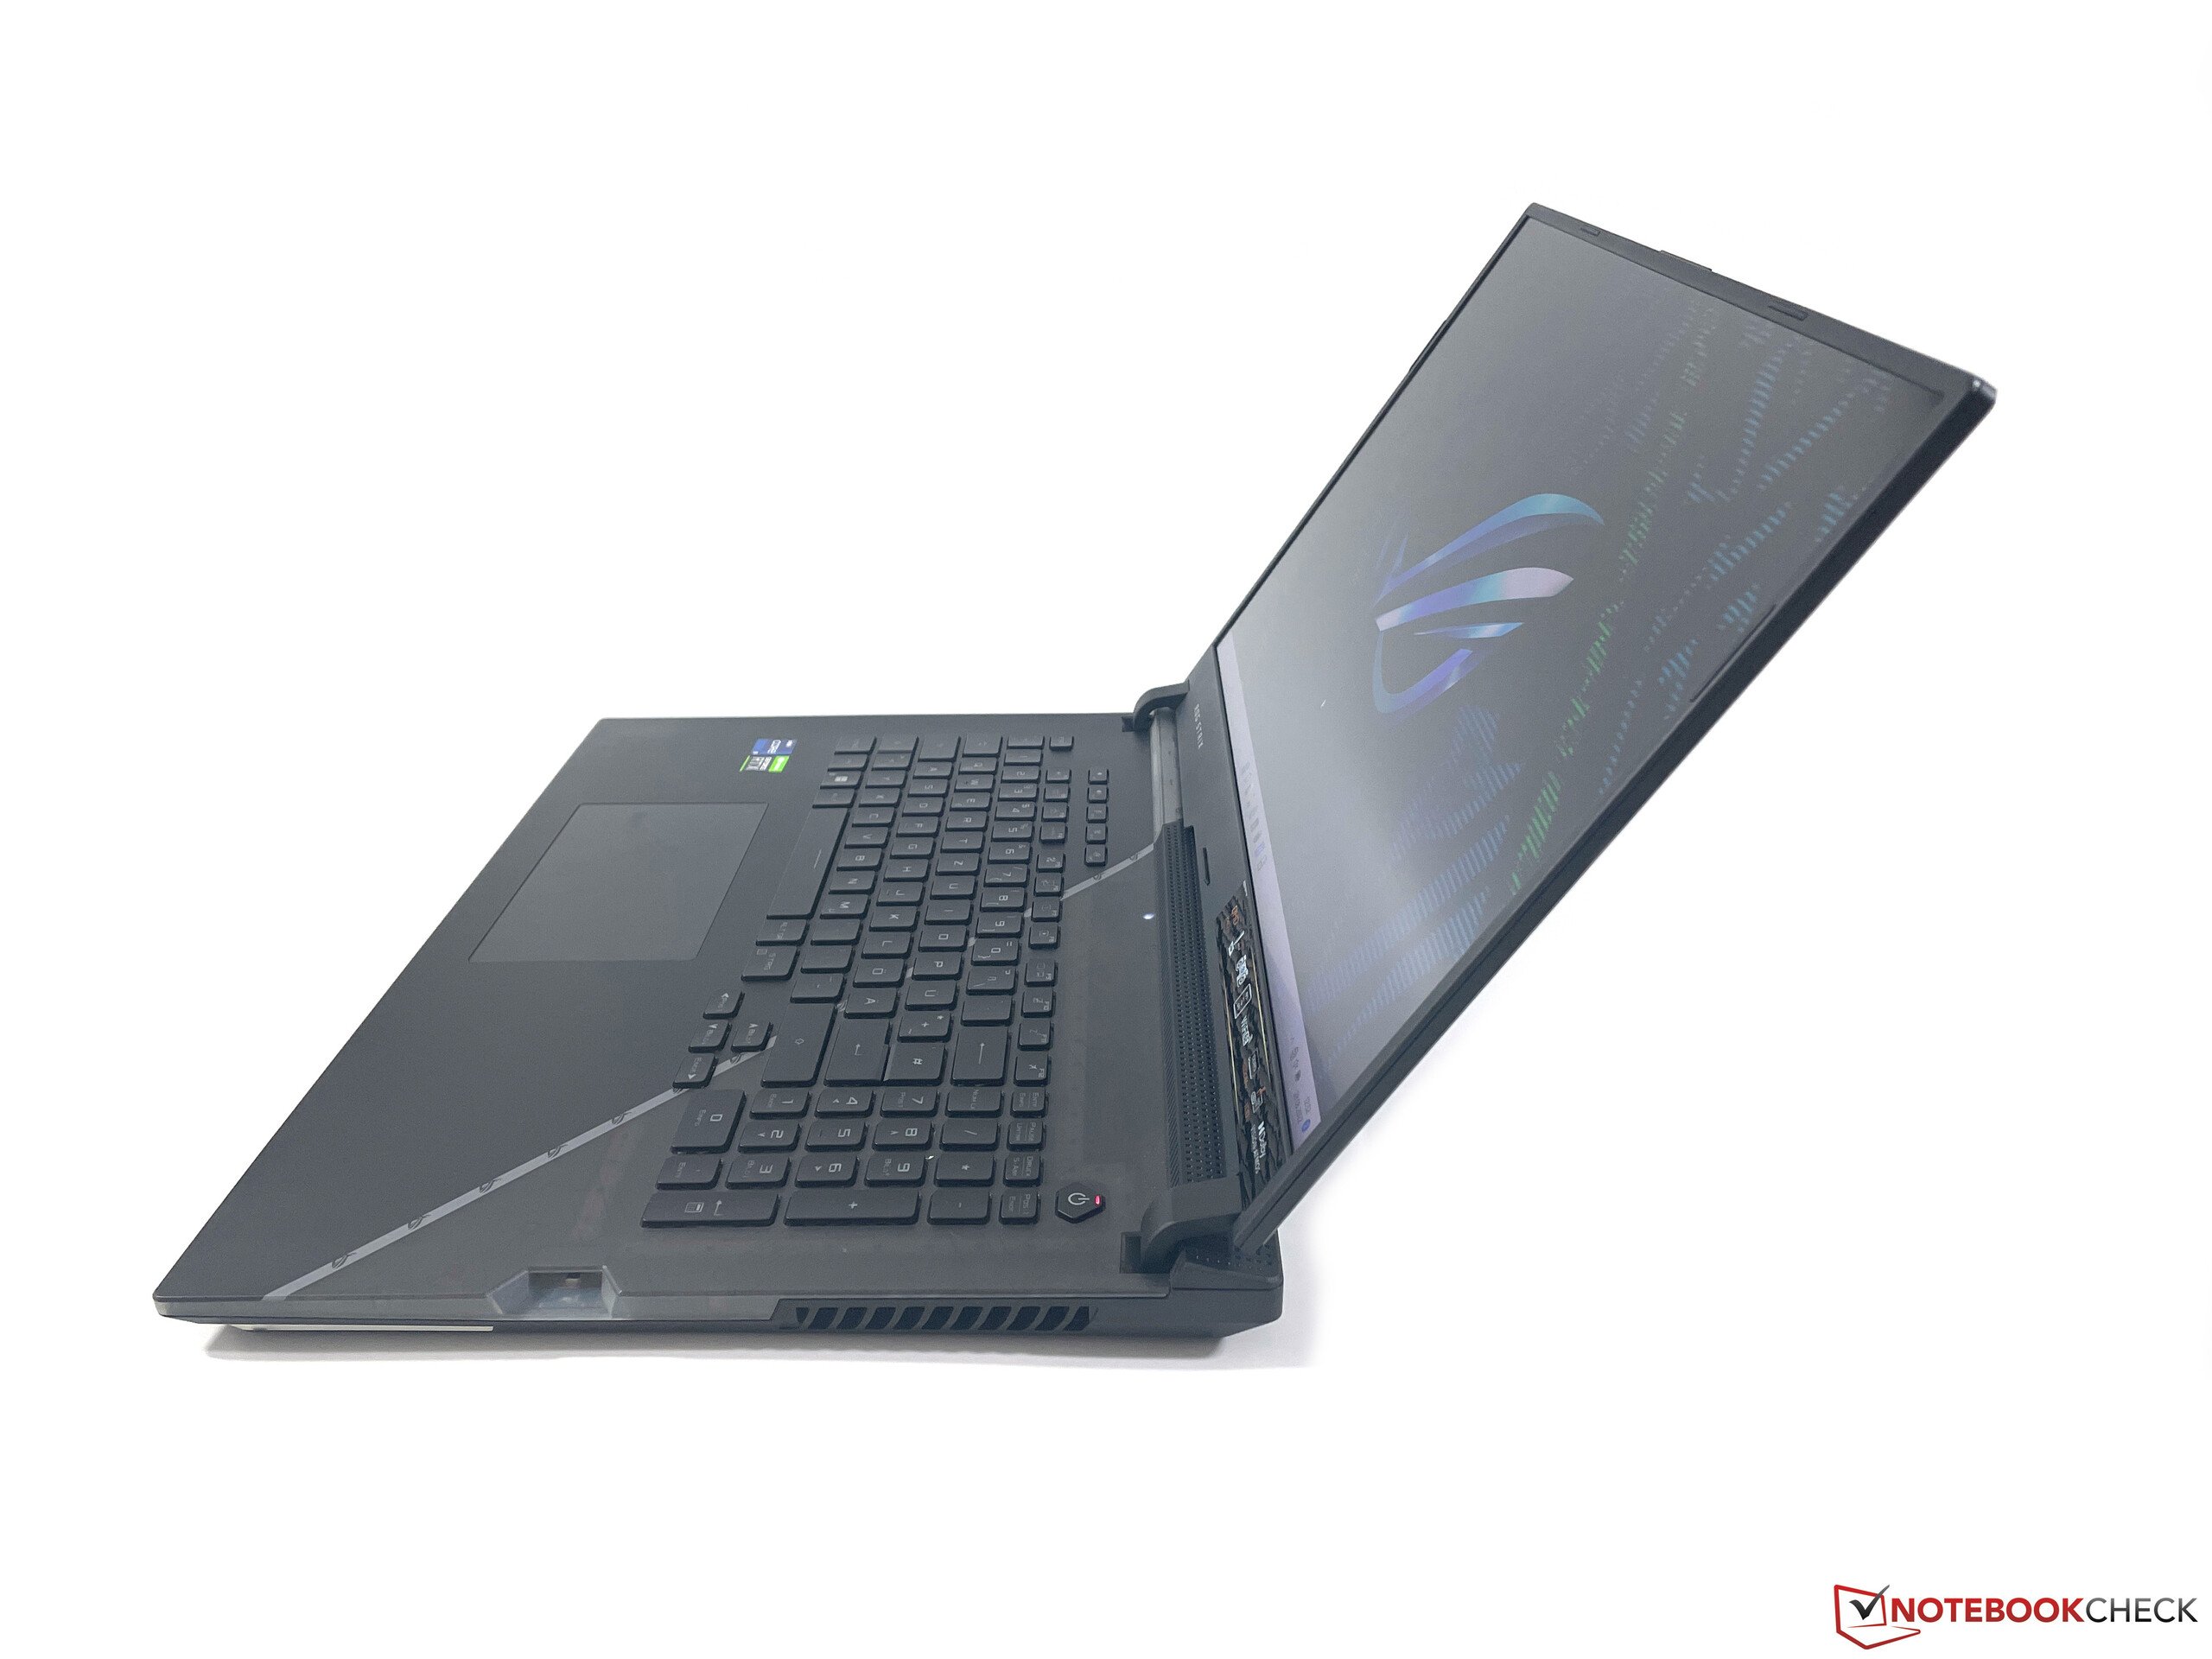
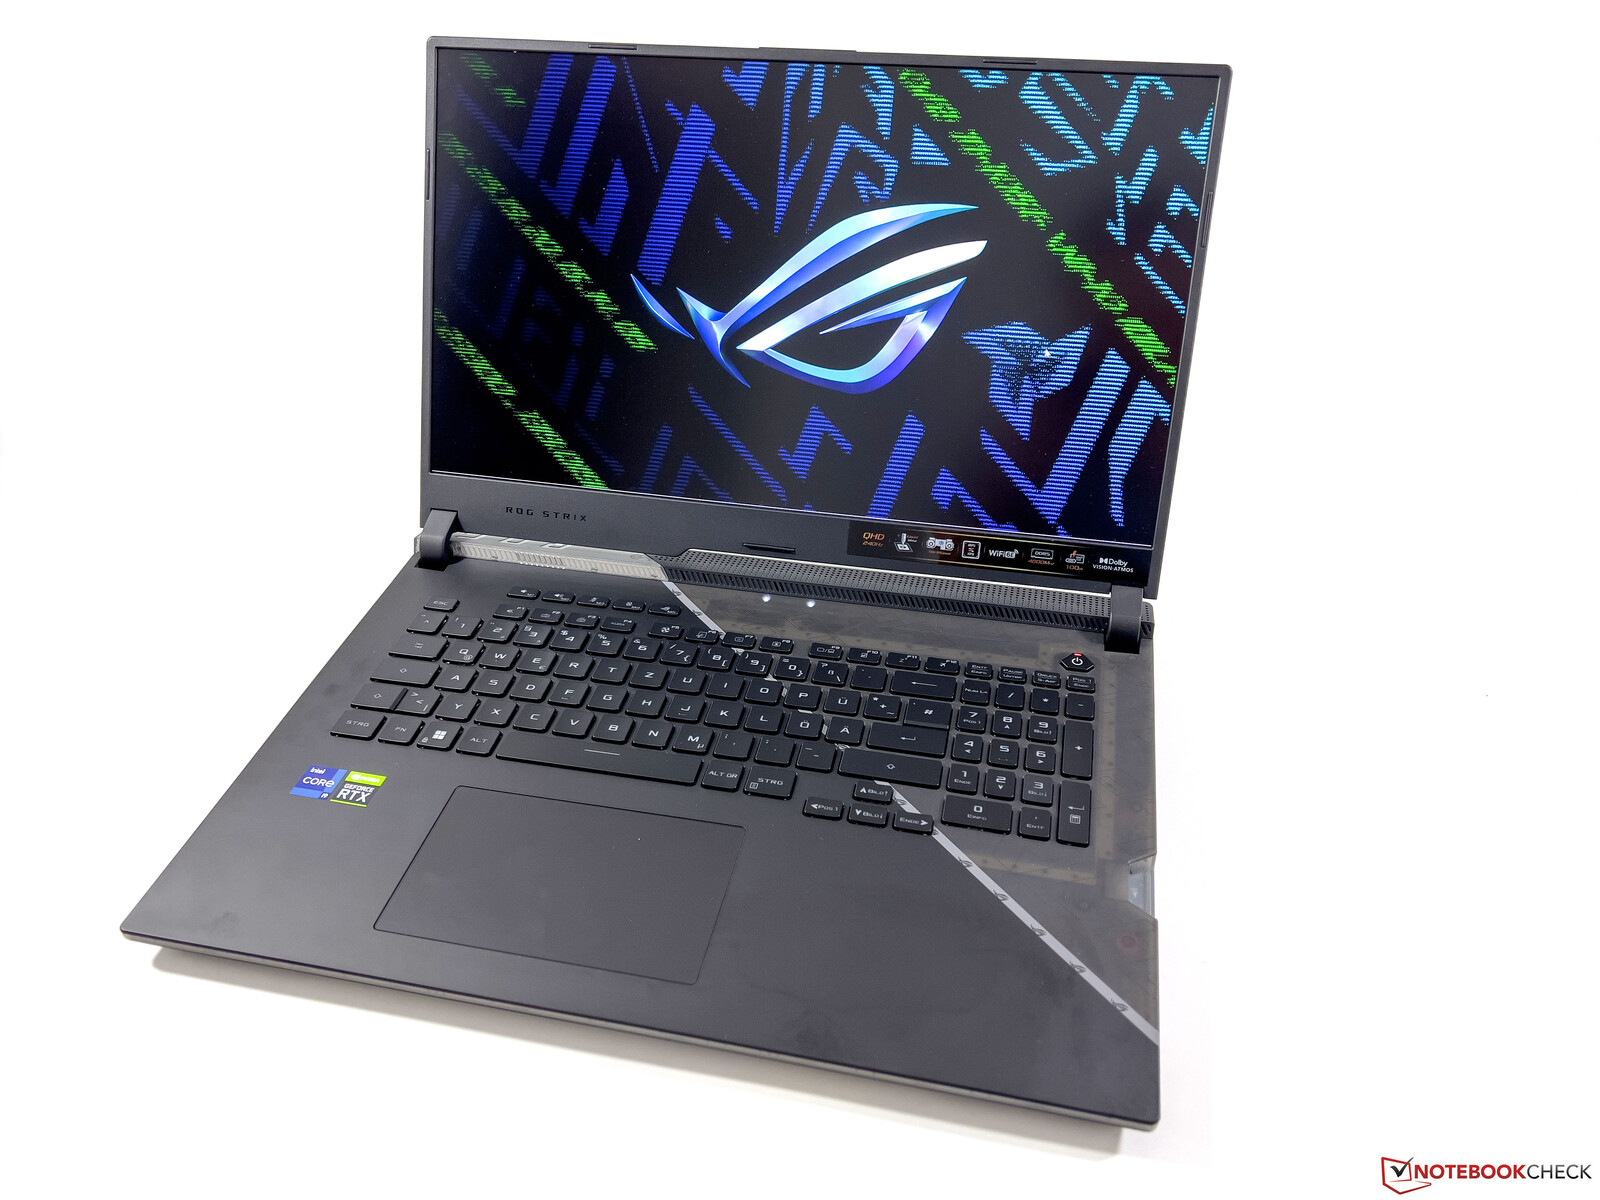
外壳--游戏笔记本的设计引人注目,并具有广泛的照明效果
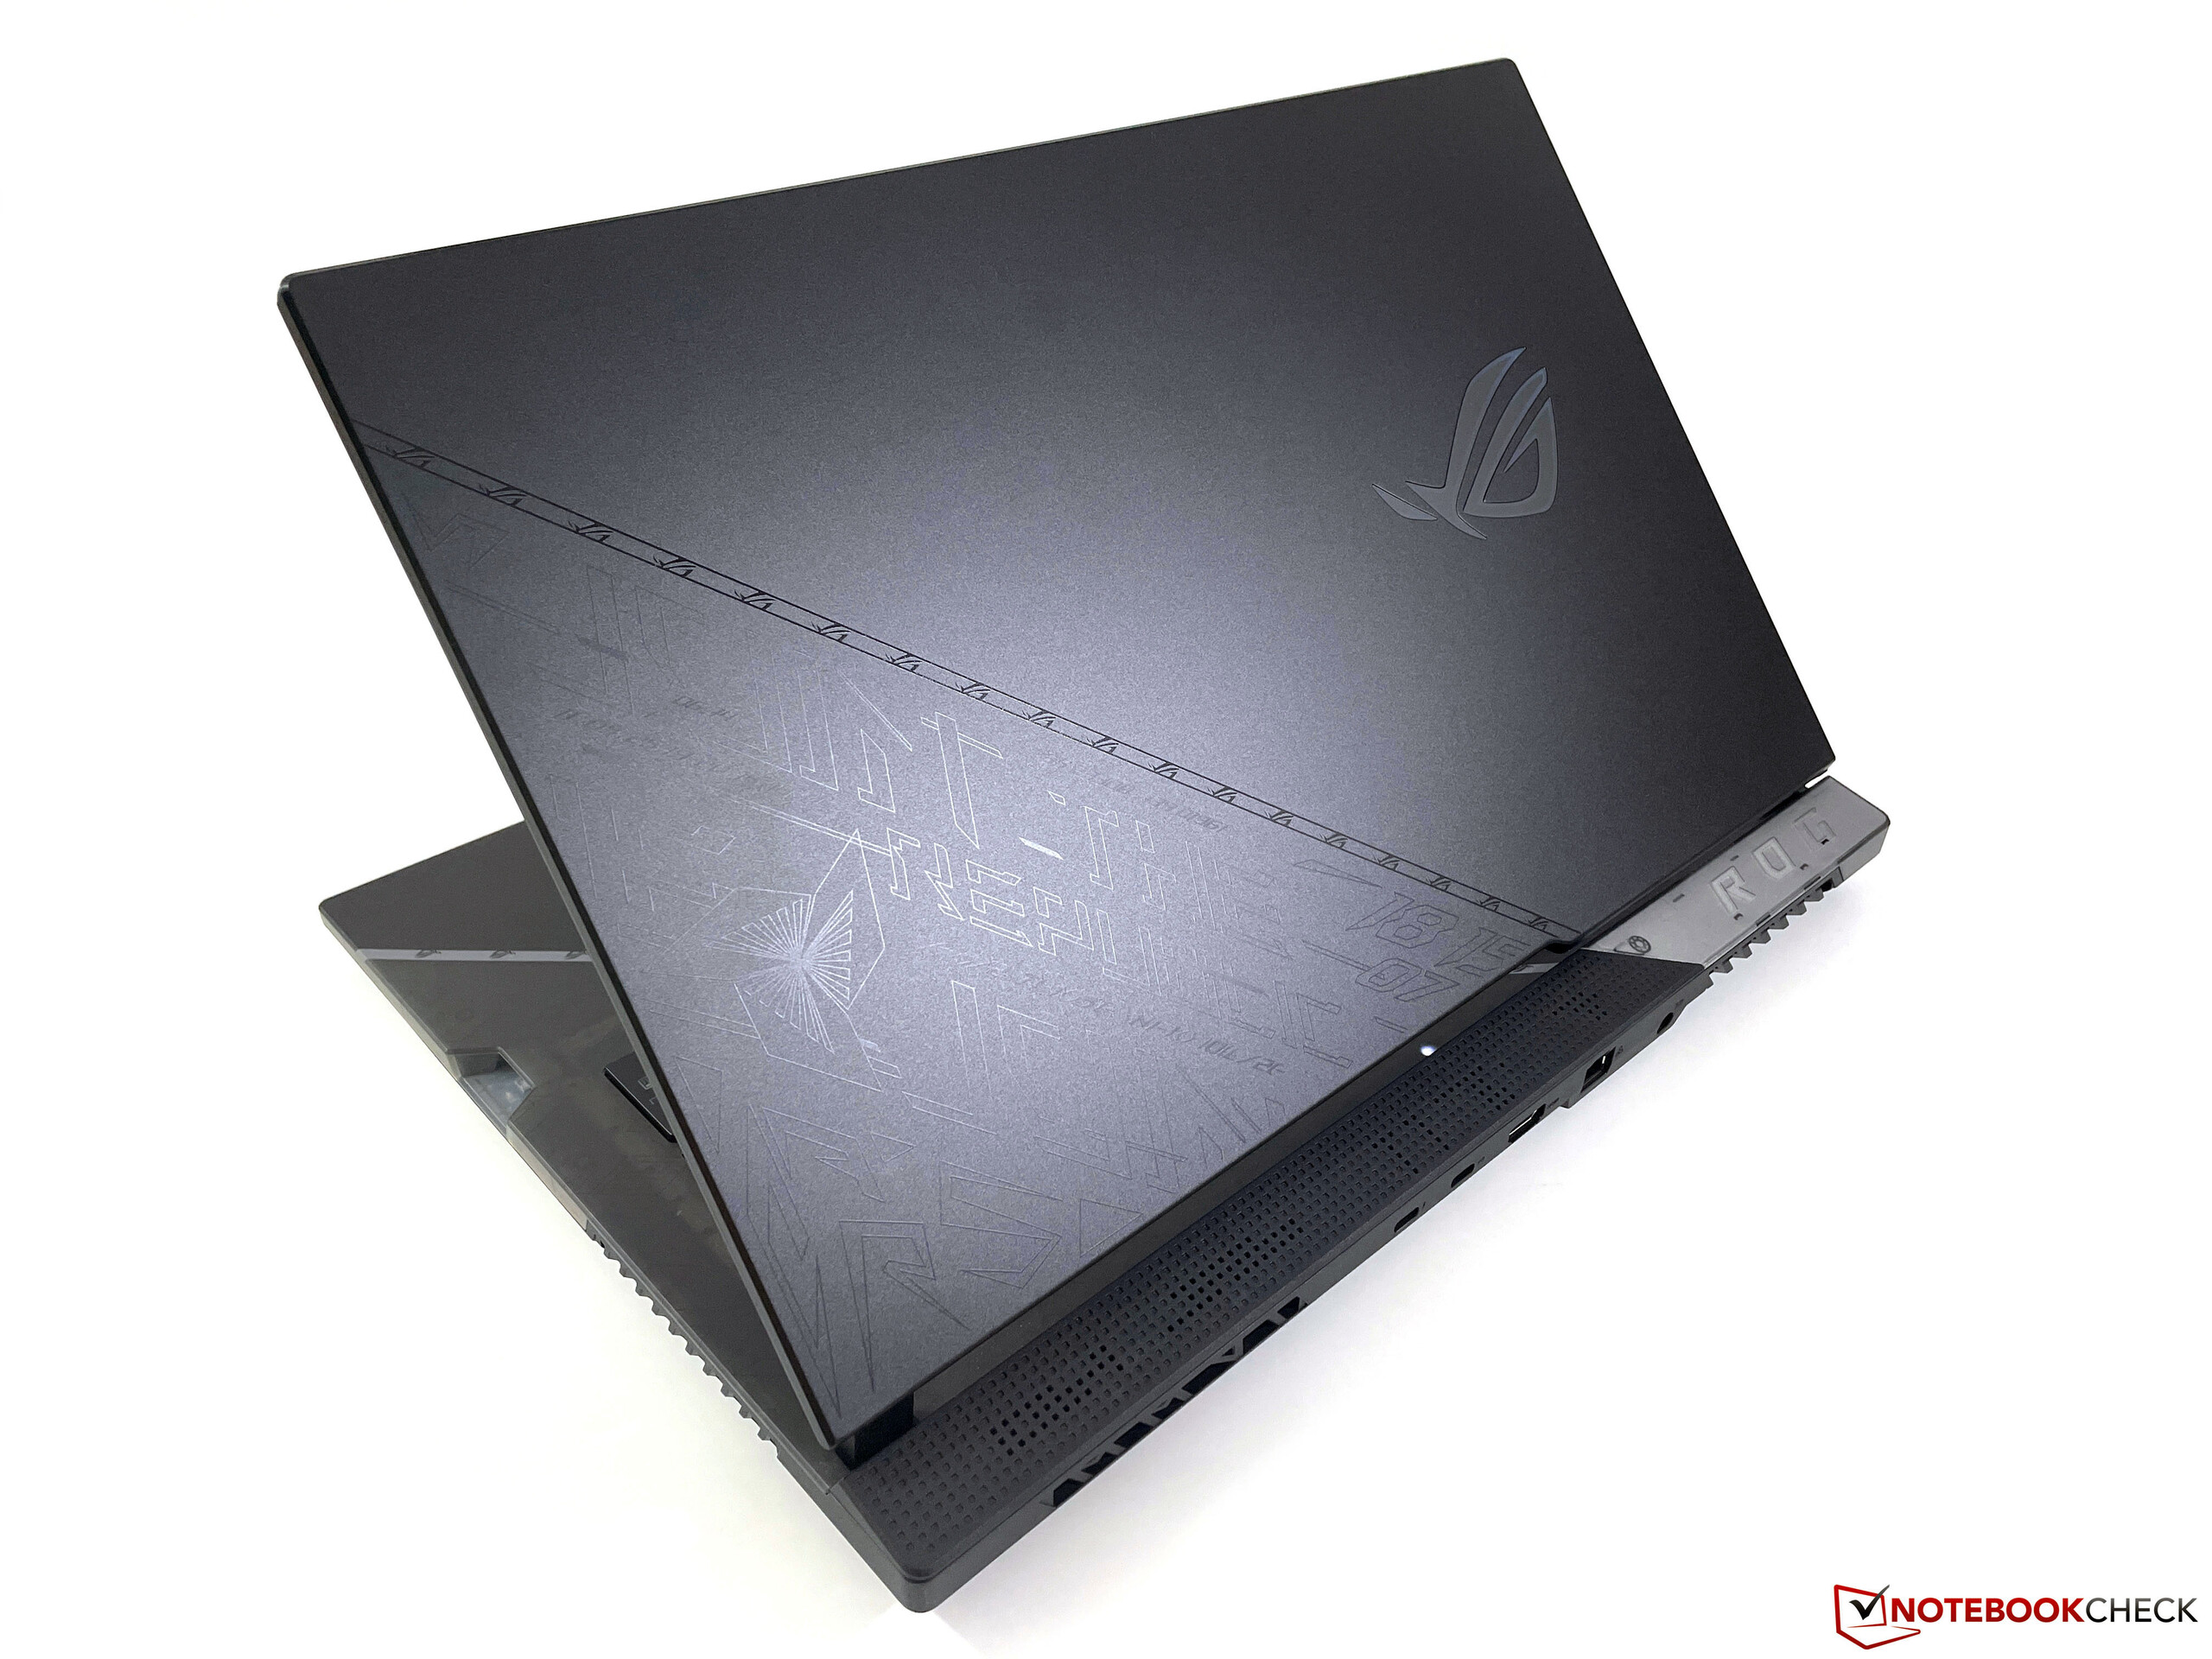
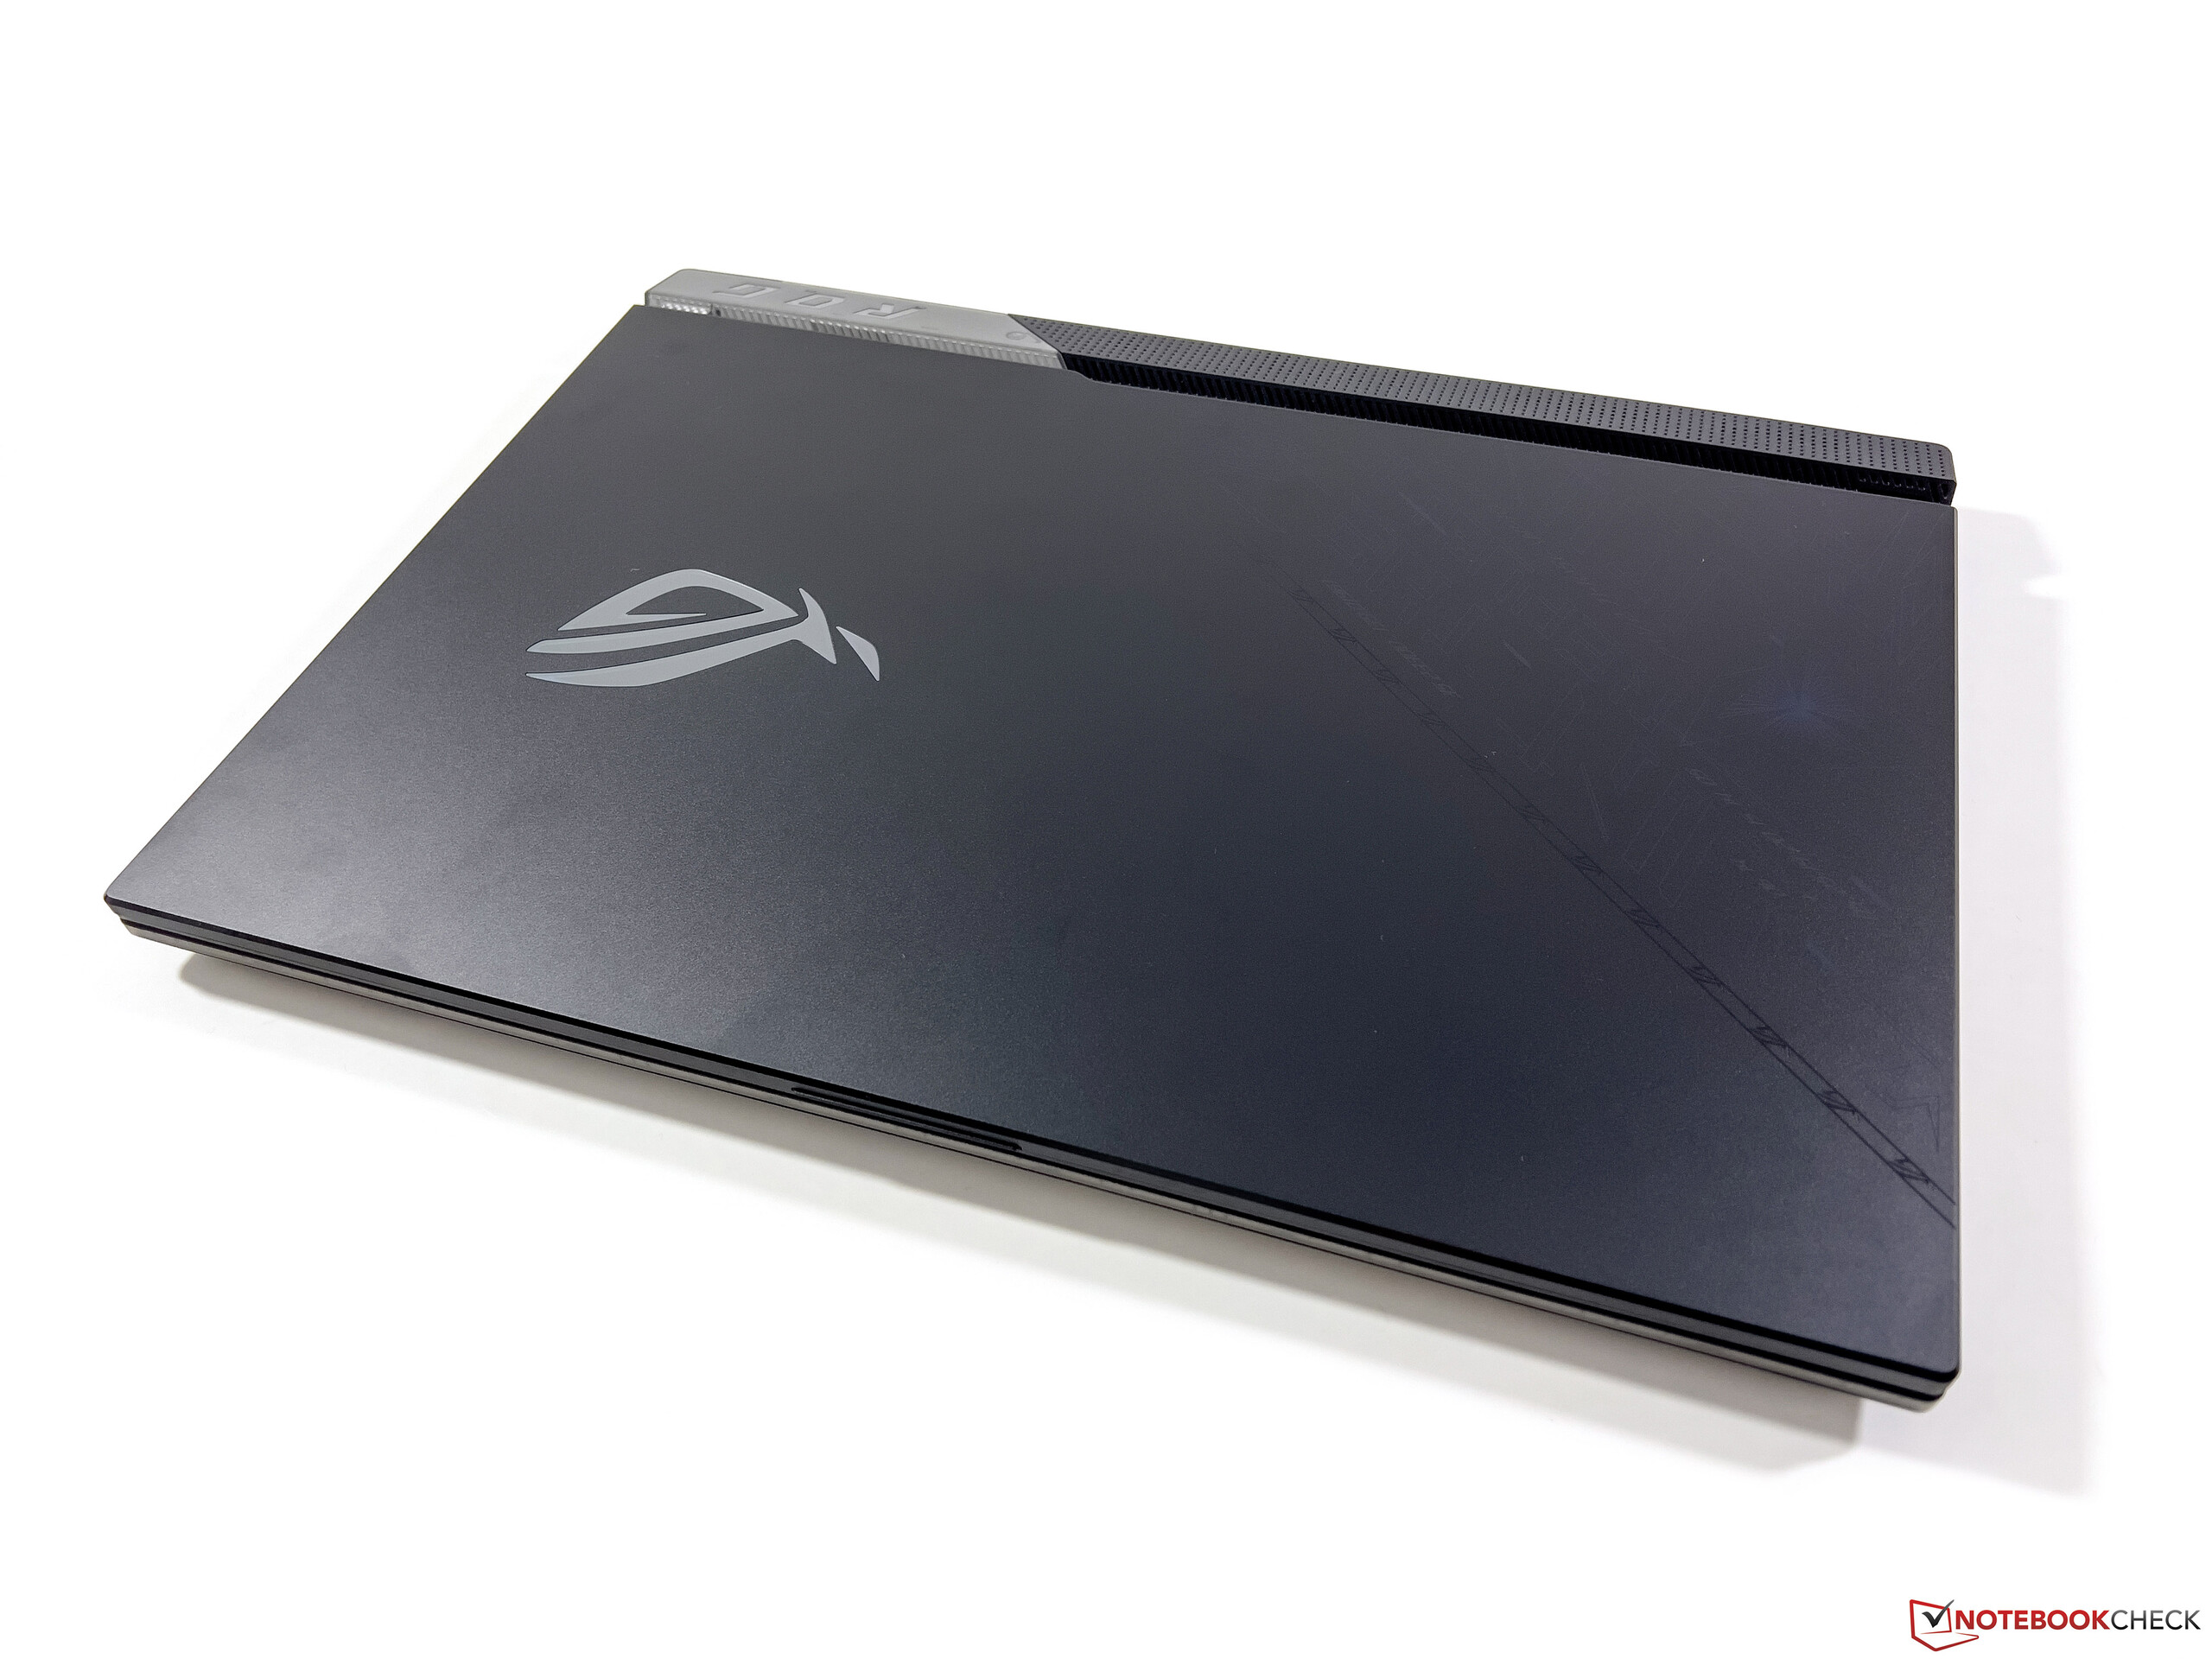
ROG Strix Scar 17显然是一款完全不掩饰其野心的游戏笔记本电脑。这款机箱在很大程度上与去年的G733QS相同。 去年的G733QS而基本单元的一个部分又是透明的。此外,还有广泛的照明元素和一些额外的设计元素或噱头,如盖子上的特殊文字,只有当你用紫外线照射时才能看到。
塑料外壳的质量总体上是好的,尽管表面仍然容易留下指纹,例如在打开显示屏时,你可能会偶尔听到轻微的吱嘎声。厚厚的底座单元的稳定性还不错,但在键盘的中央区域,你仍然可以把底座单元压得很低。虽然相对较薄的显示屏盖子做得很好,但铰链仍然无法防止笔记本电脑移动后的一些轻微晃动,例如。
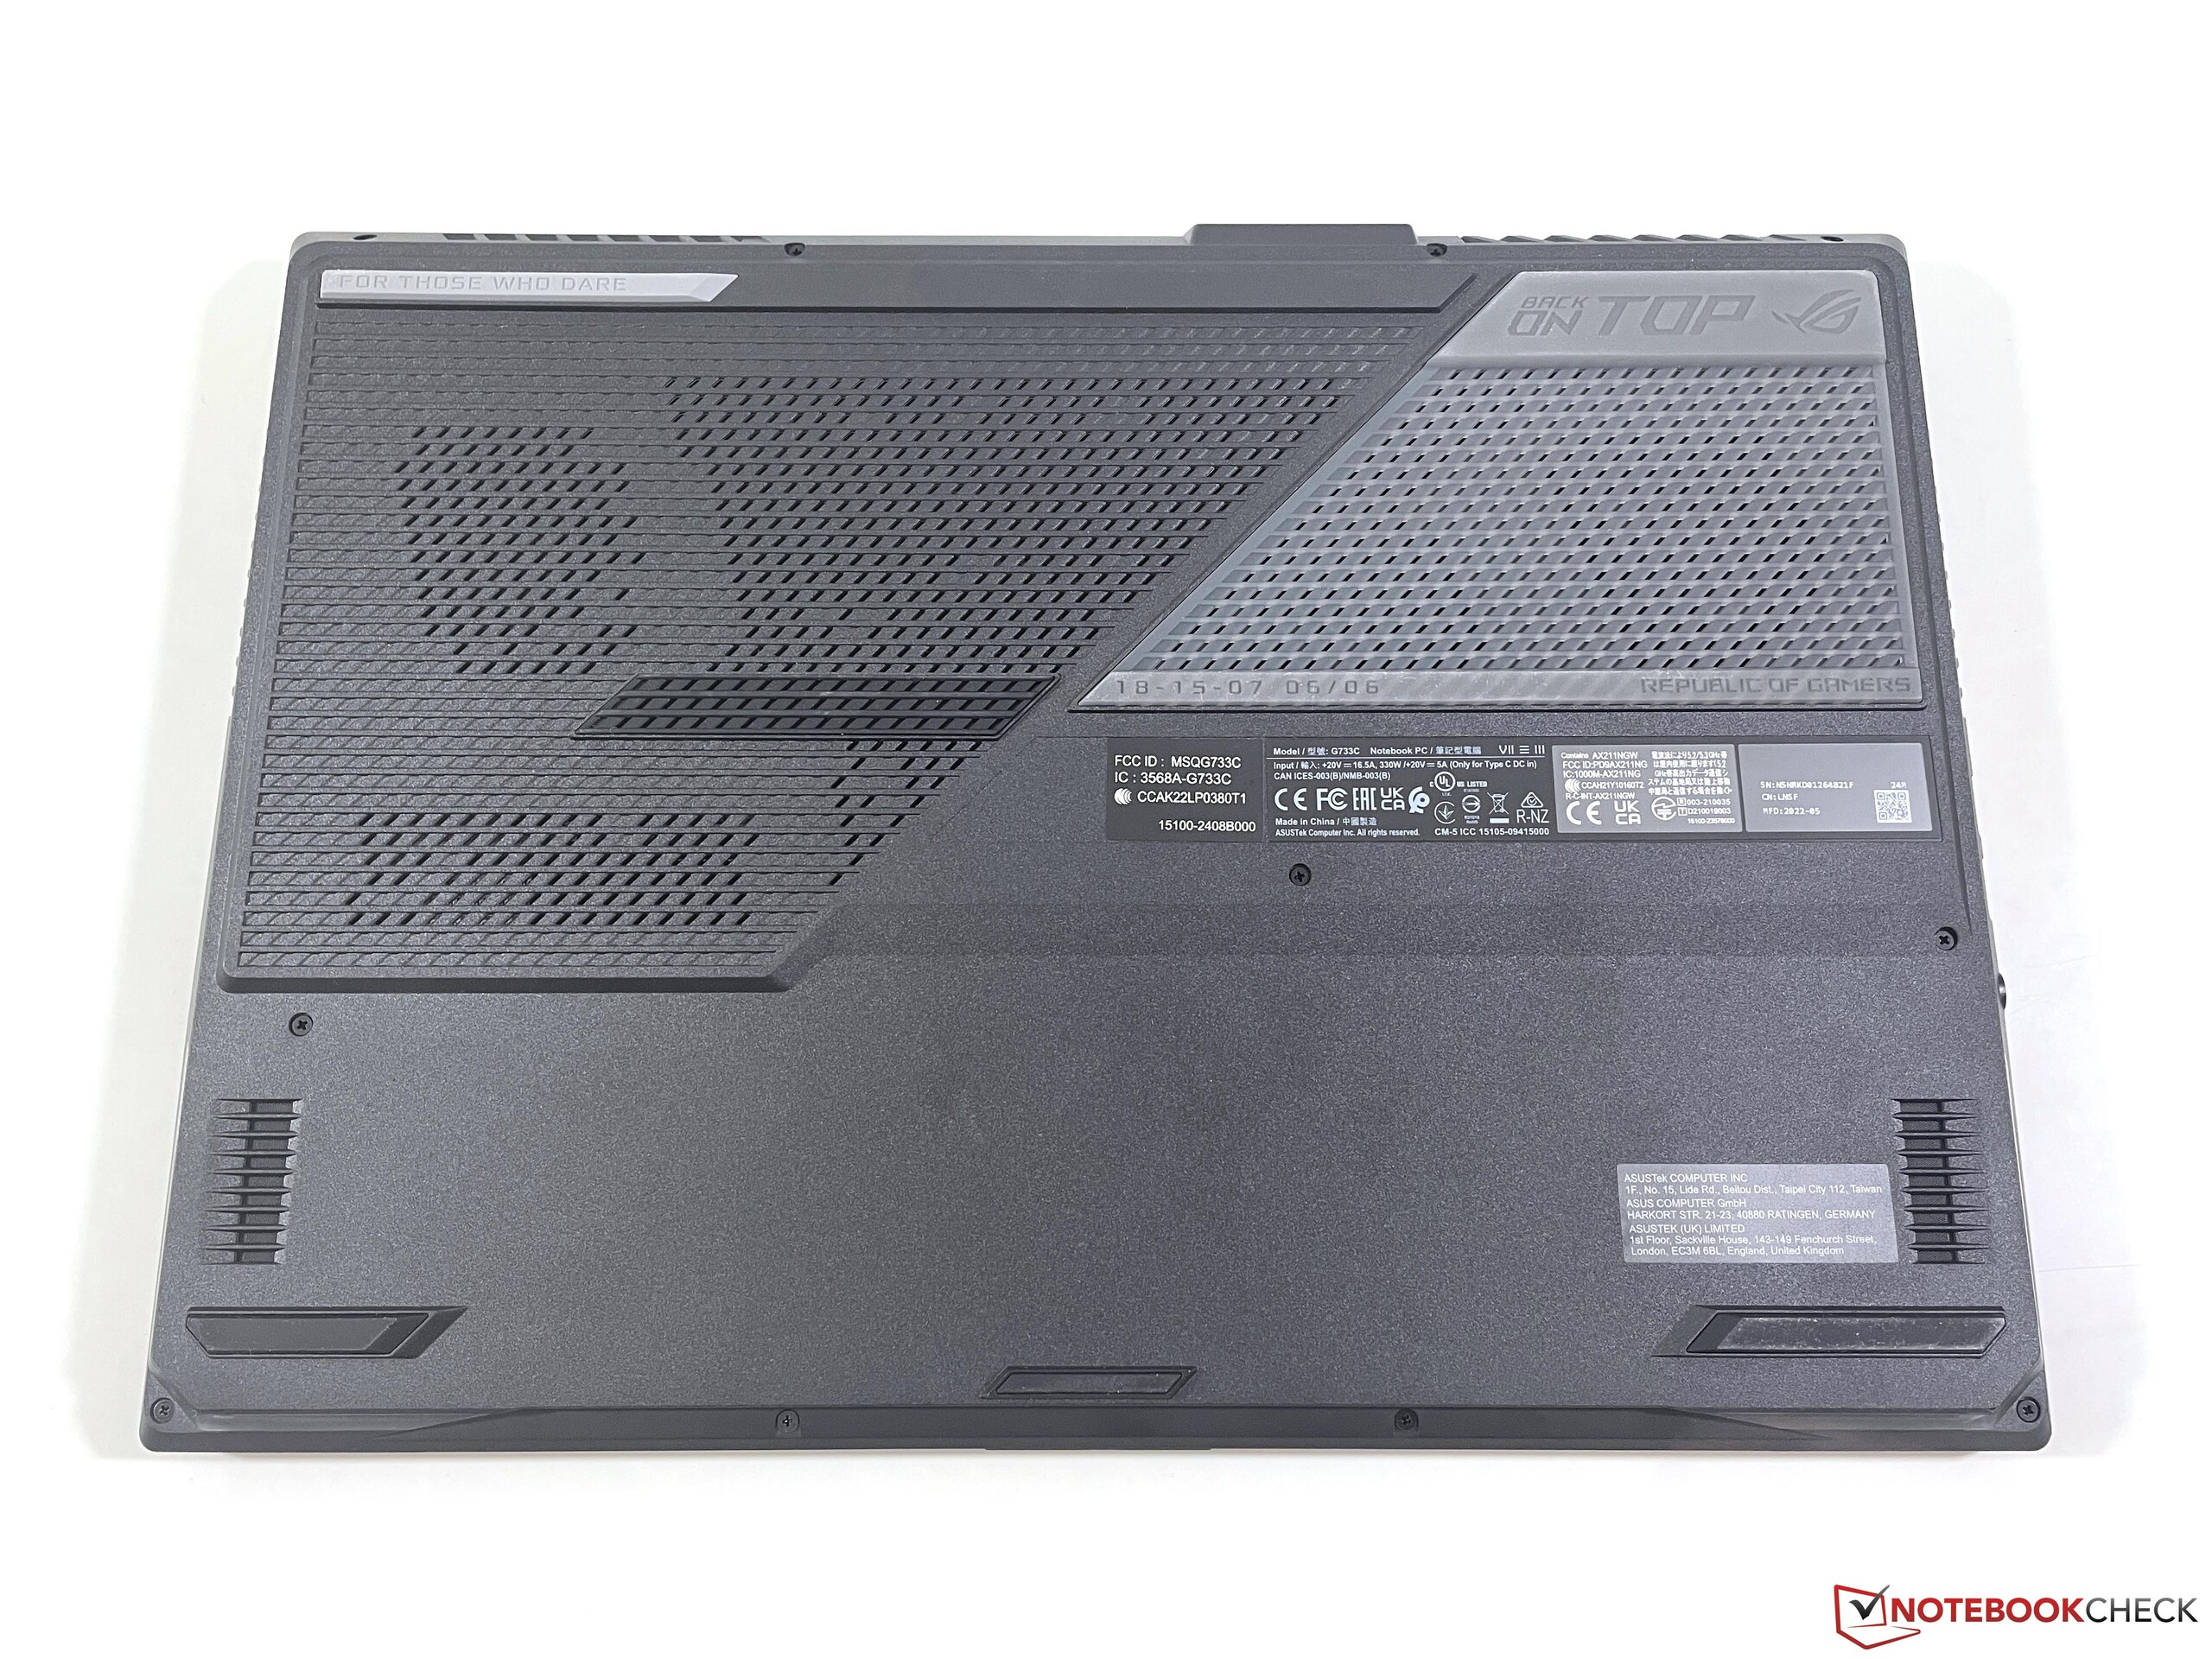
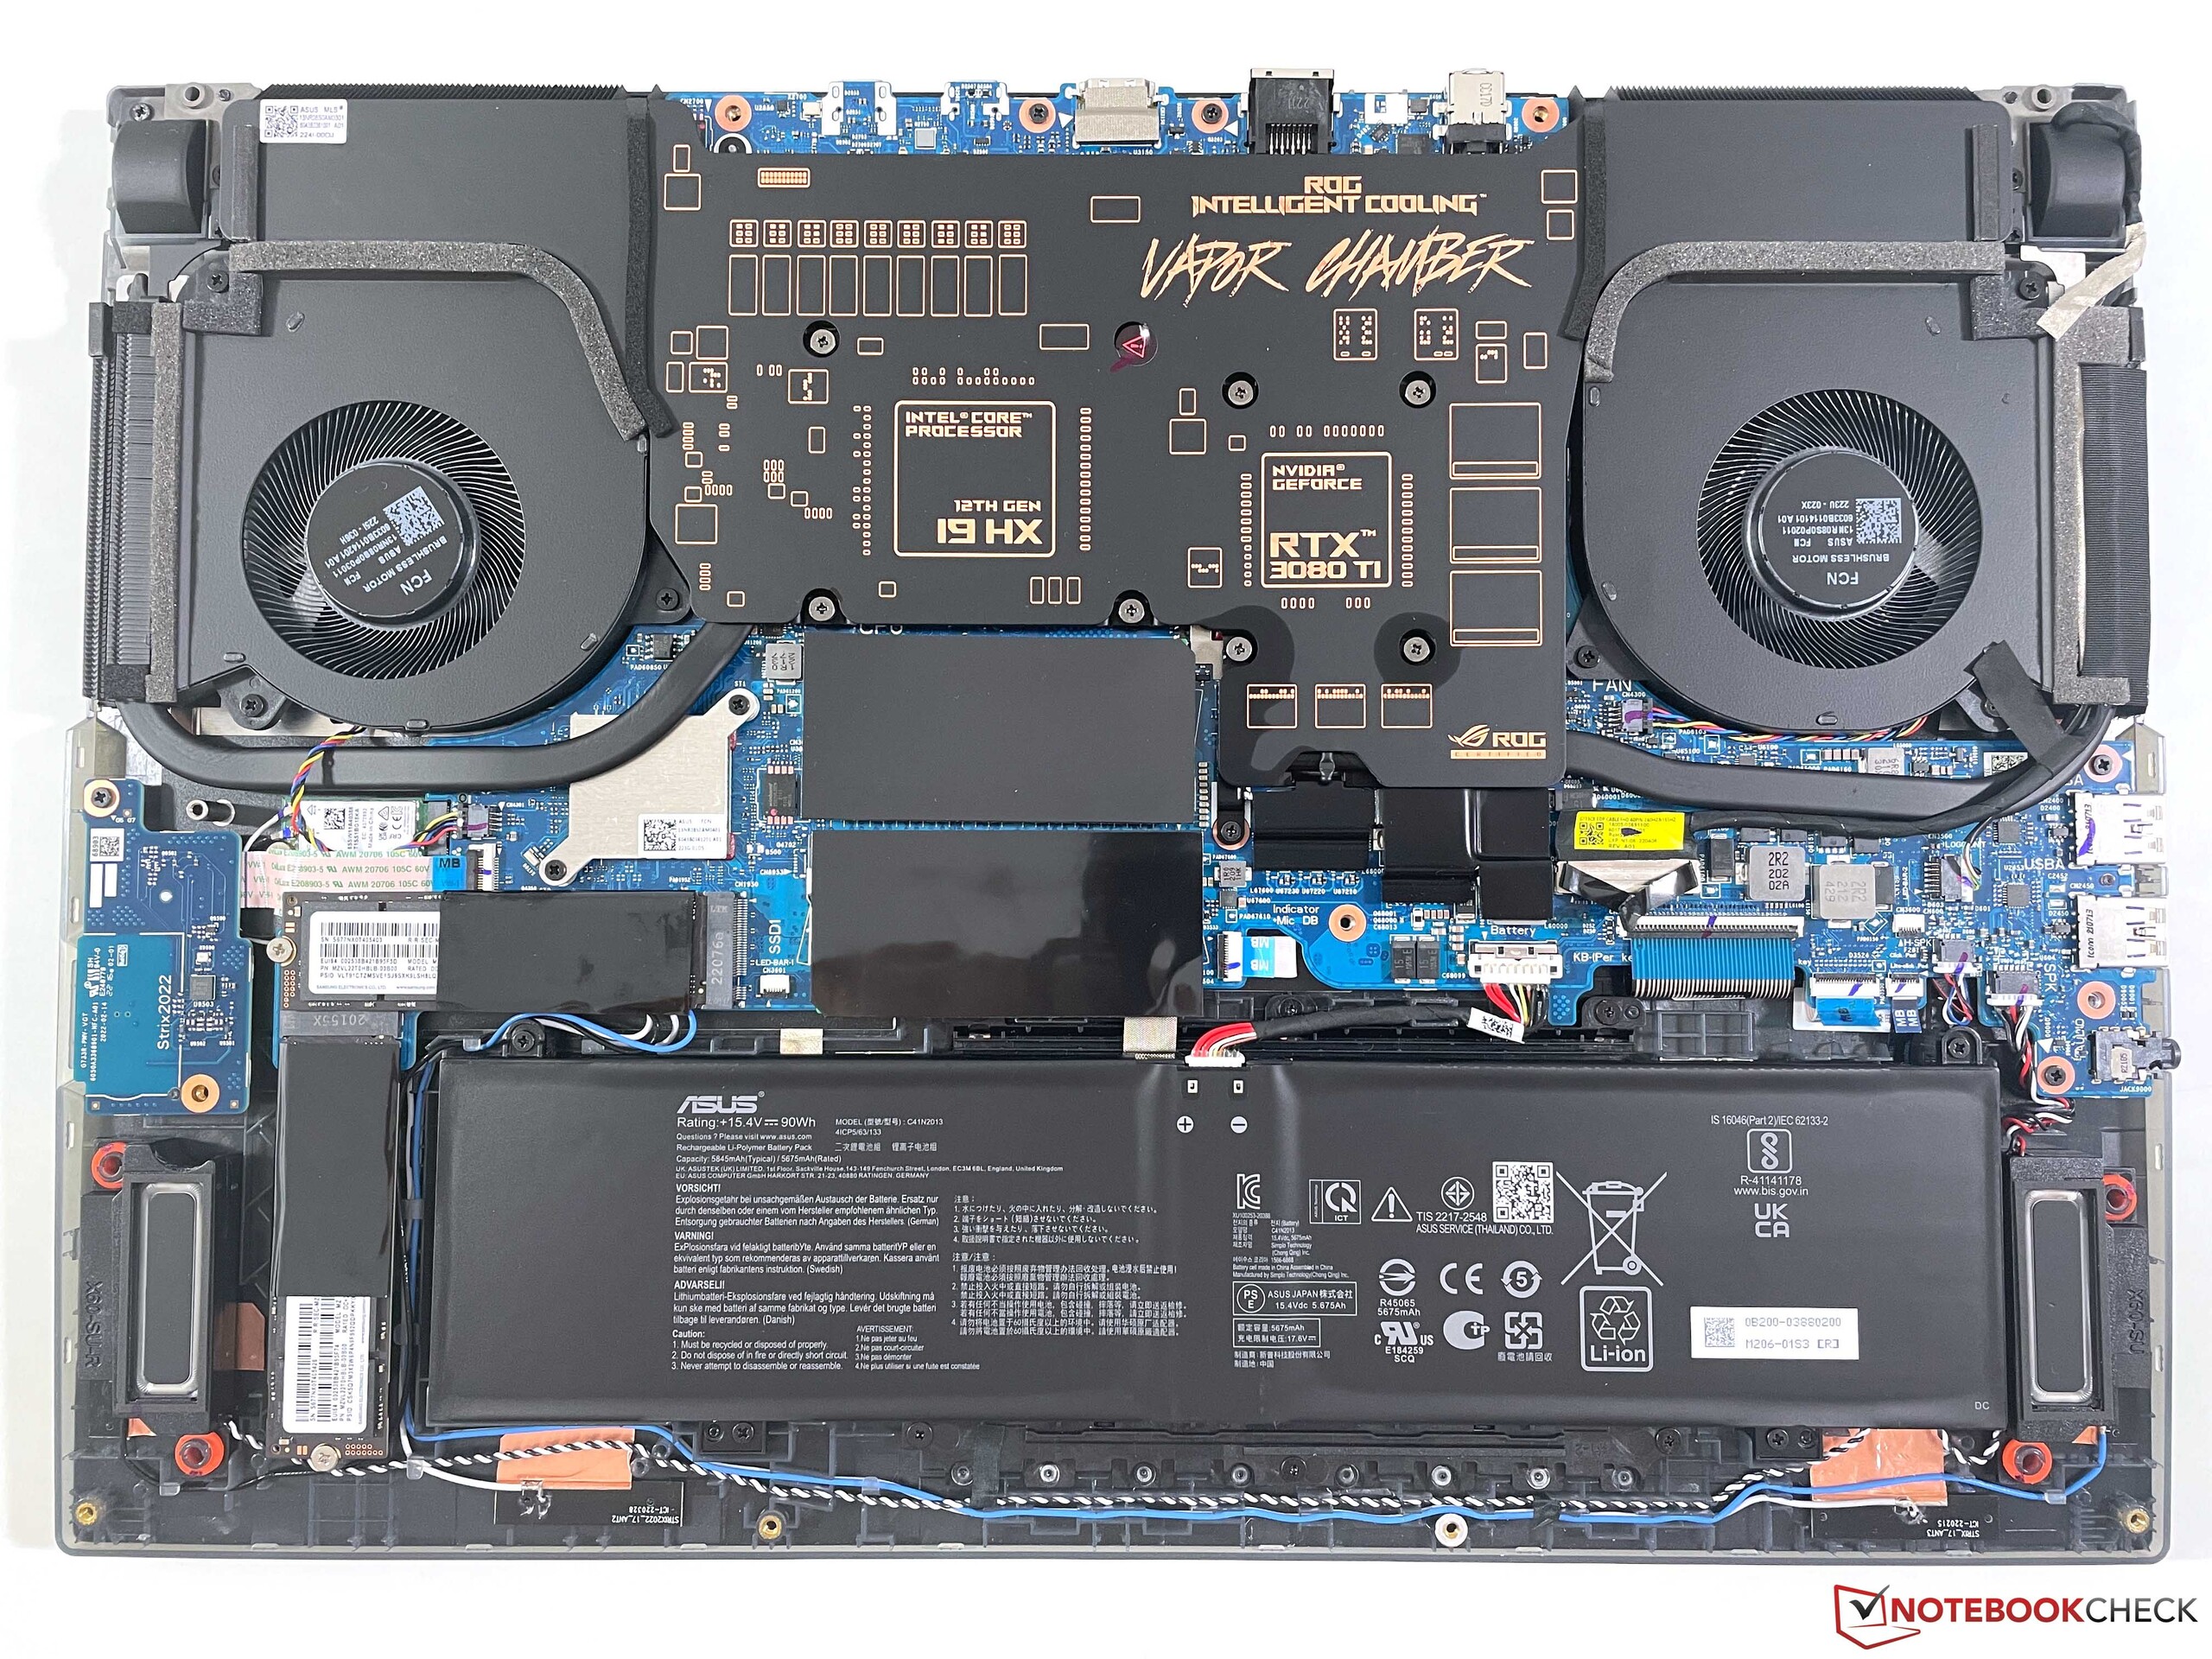
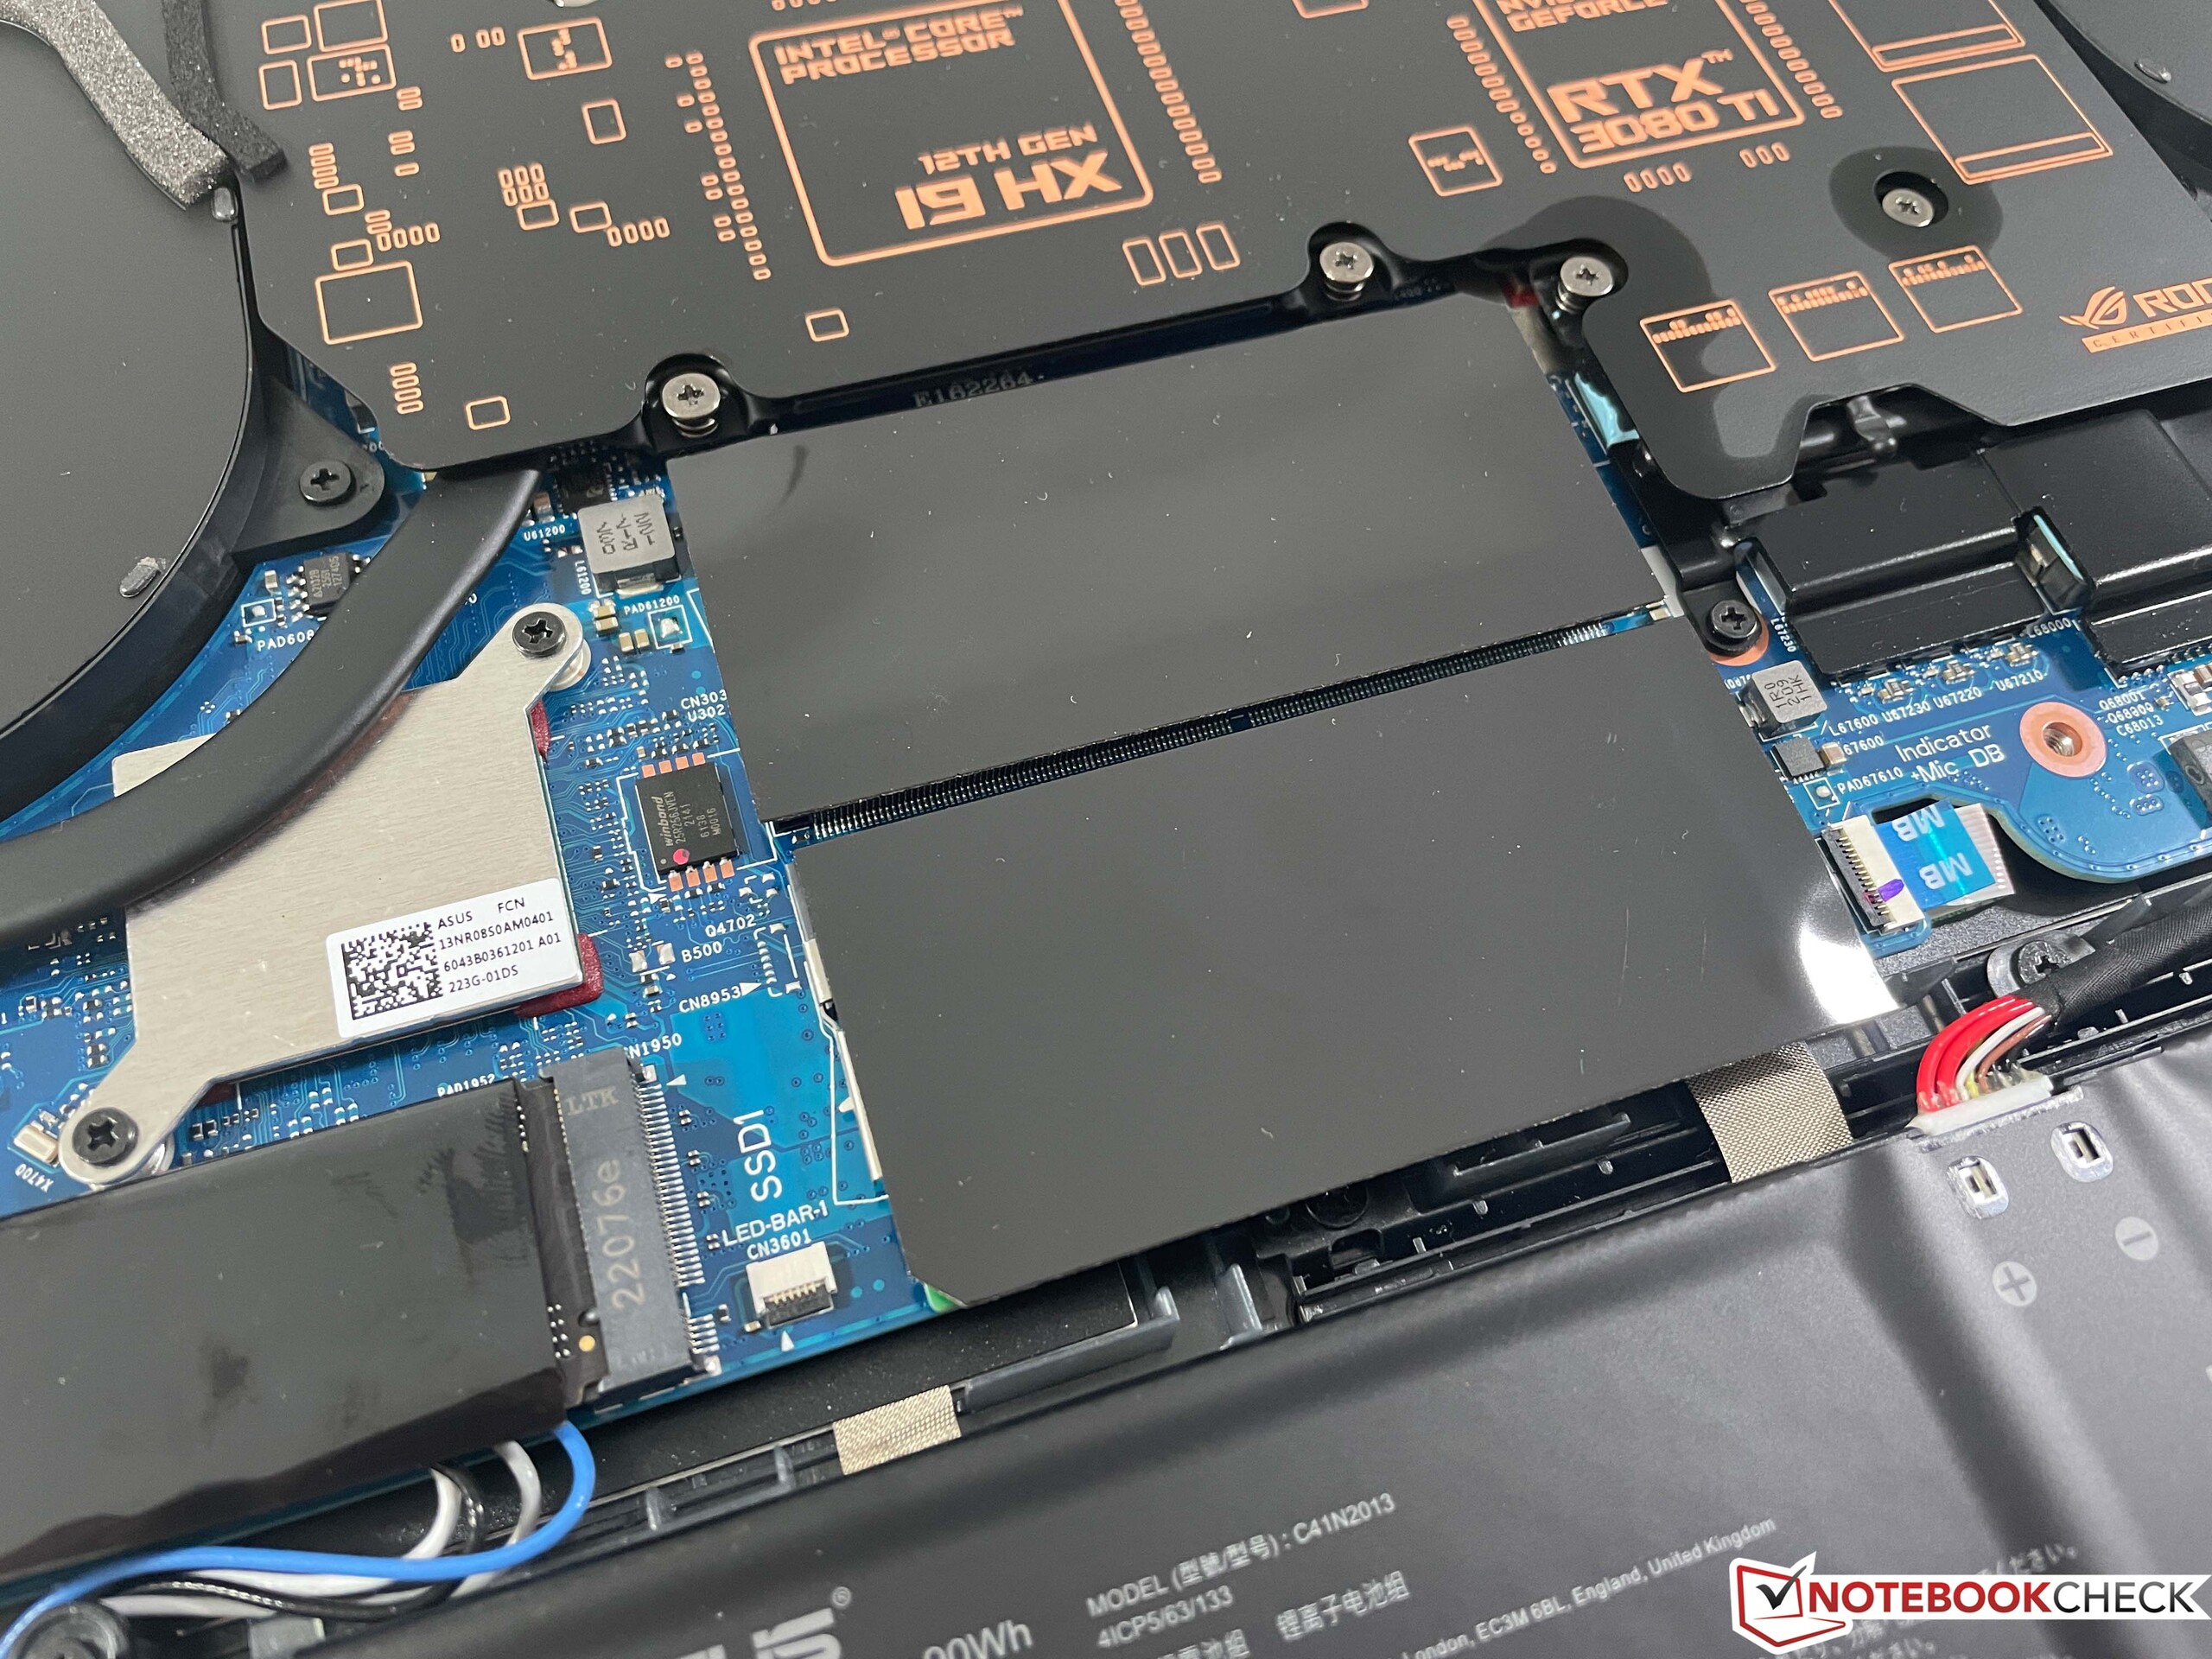
即使机箱的底盖可以被拆下,但你必须小心行事。由于照明装置集成在该部件中,你首先要断开两条小的扁平电缆,然后才能拆下盖子。由于可以接触到风扇、两个固态硬盘、两个内存模块和WLAN模块,所以维护选项很好。
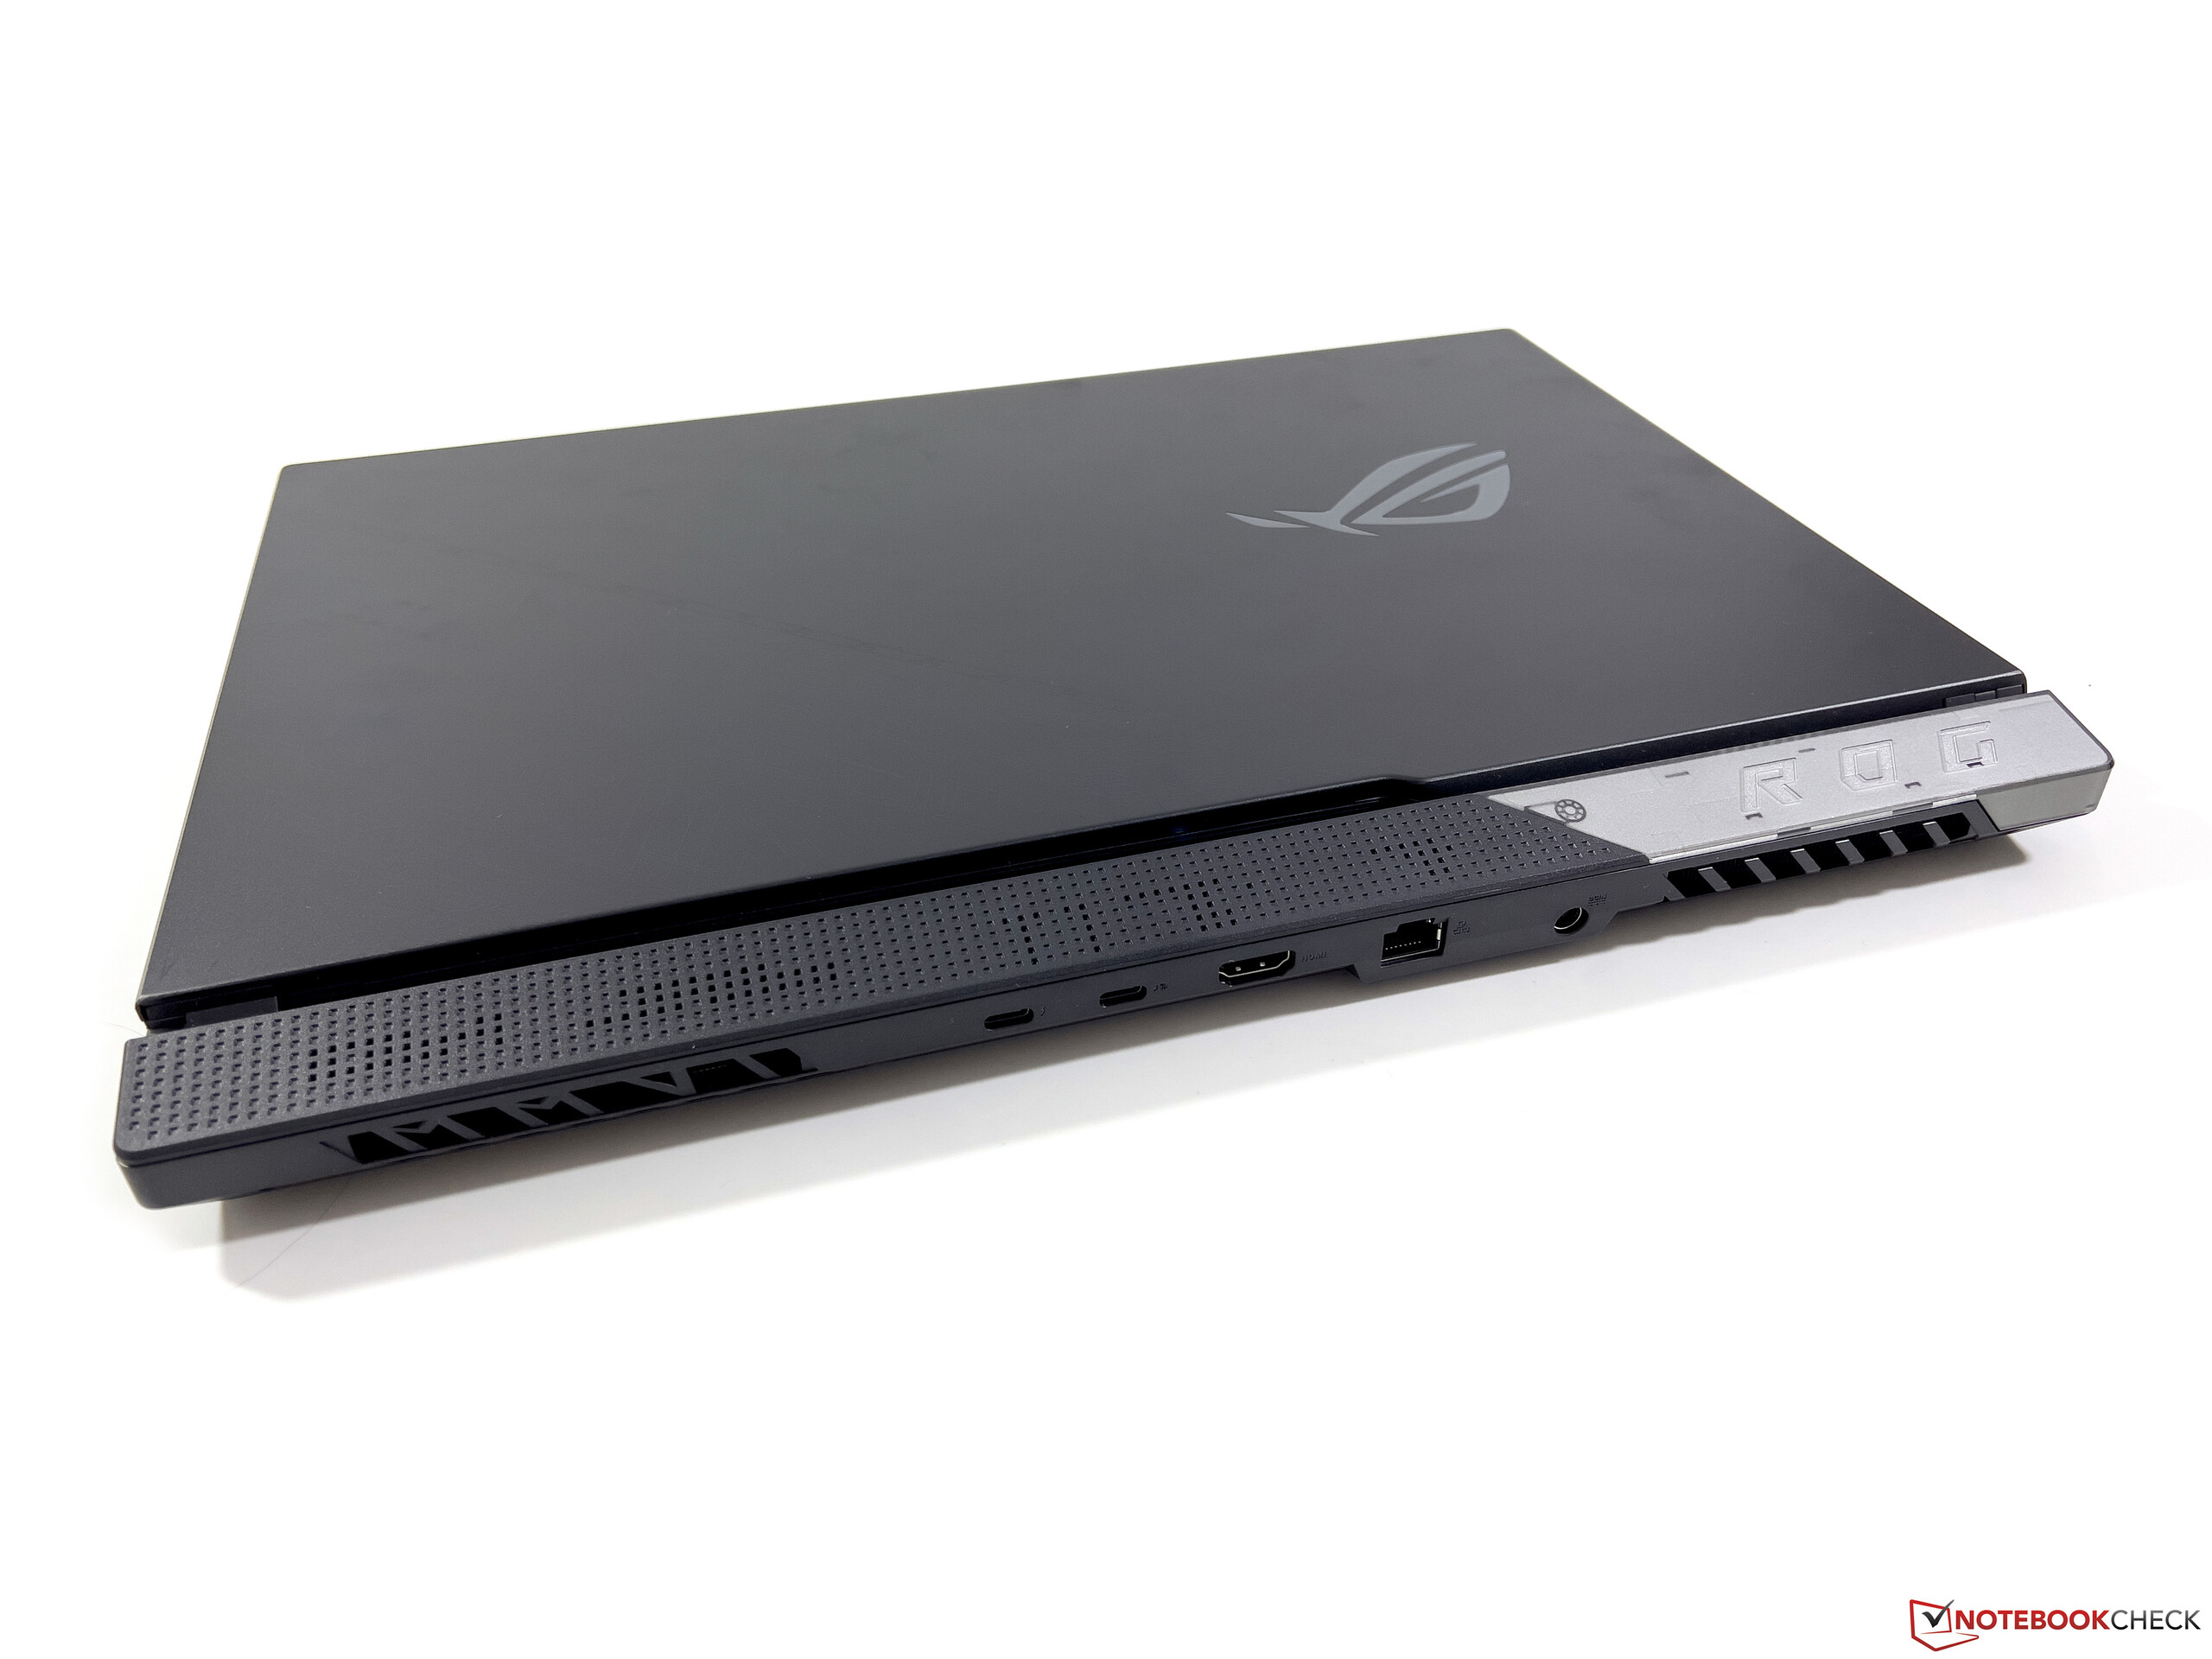
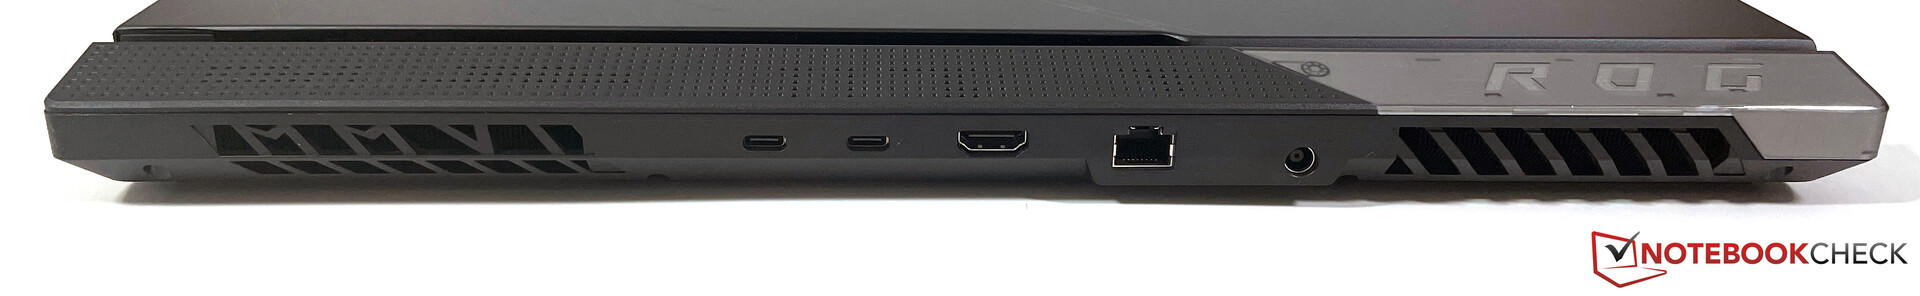
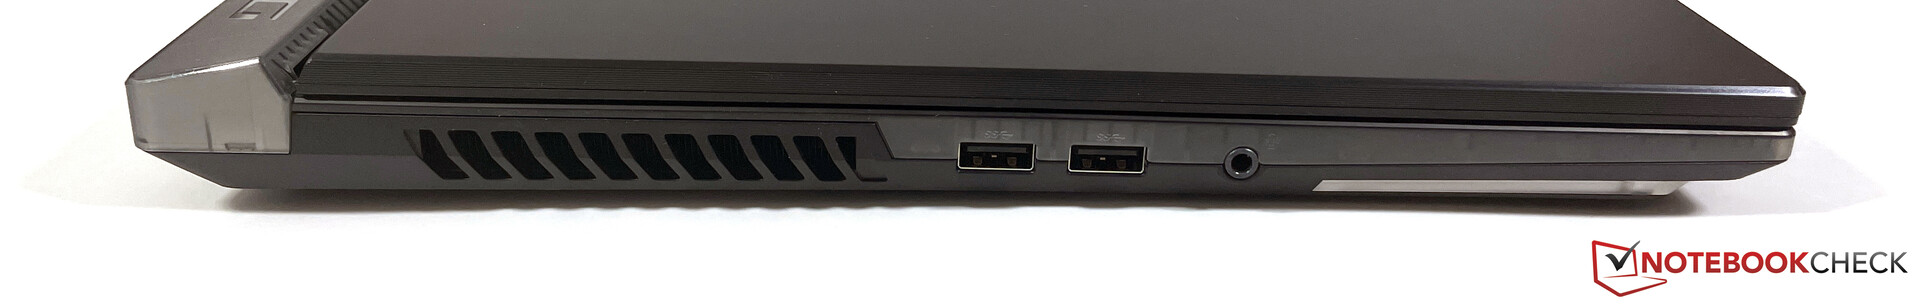
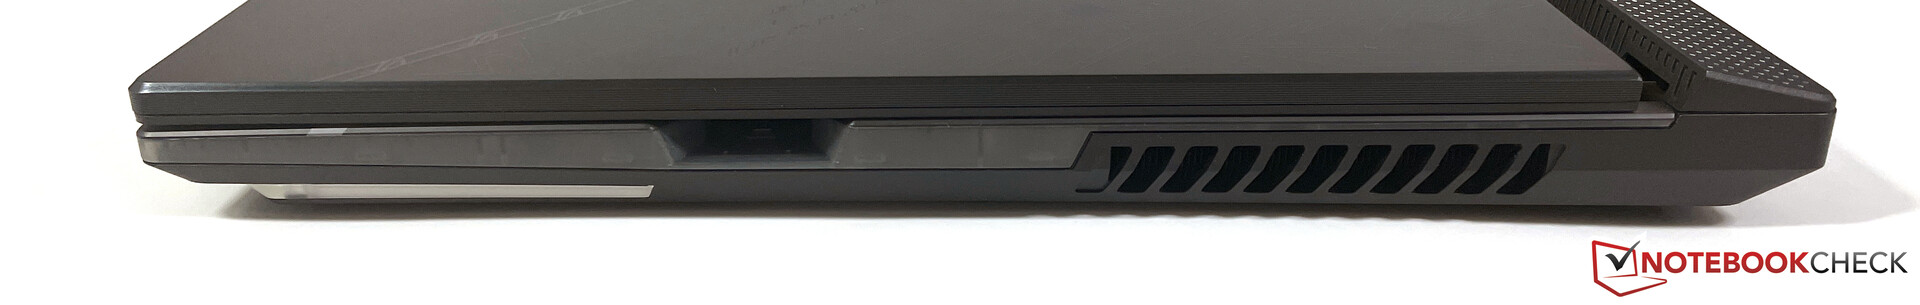
设备 - ROG Strix Scar 17,配备HDMI 2.1和Wi-Fi 6E
除了Thunderbolt连接外,G733CX还提供了一个HDMI 2.1端口,背面的USB端口也可用于在路上充电(最大100瓦)。大部分连接都在后面,你只能在左侧找到两个普通的USB-A端口和3.5毫米音频端口。右侧还提供了一个华硕键鼠的插槽,允许你存储系统设置和数据。
采用英特尔AX211的无线局域网性能非常好,我们也能够毫无困难地连接到华硕参考路由器的6GHz网络。还有一个2.5Gbit/s的以太网连接用于有线连接。ROG Strix Scar 17的用户必须没有网络摄像头,但如果有必要,制造商提供了一个相应的外部网络摄像头(ROG Eye S)。
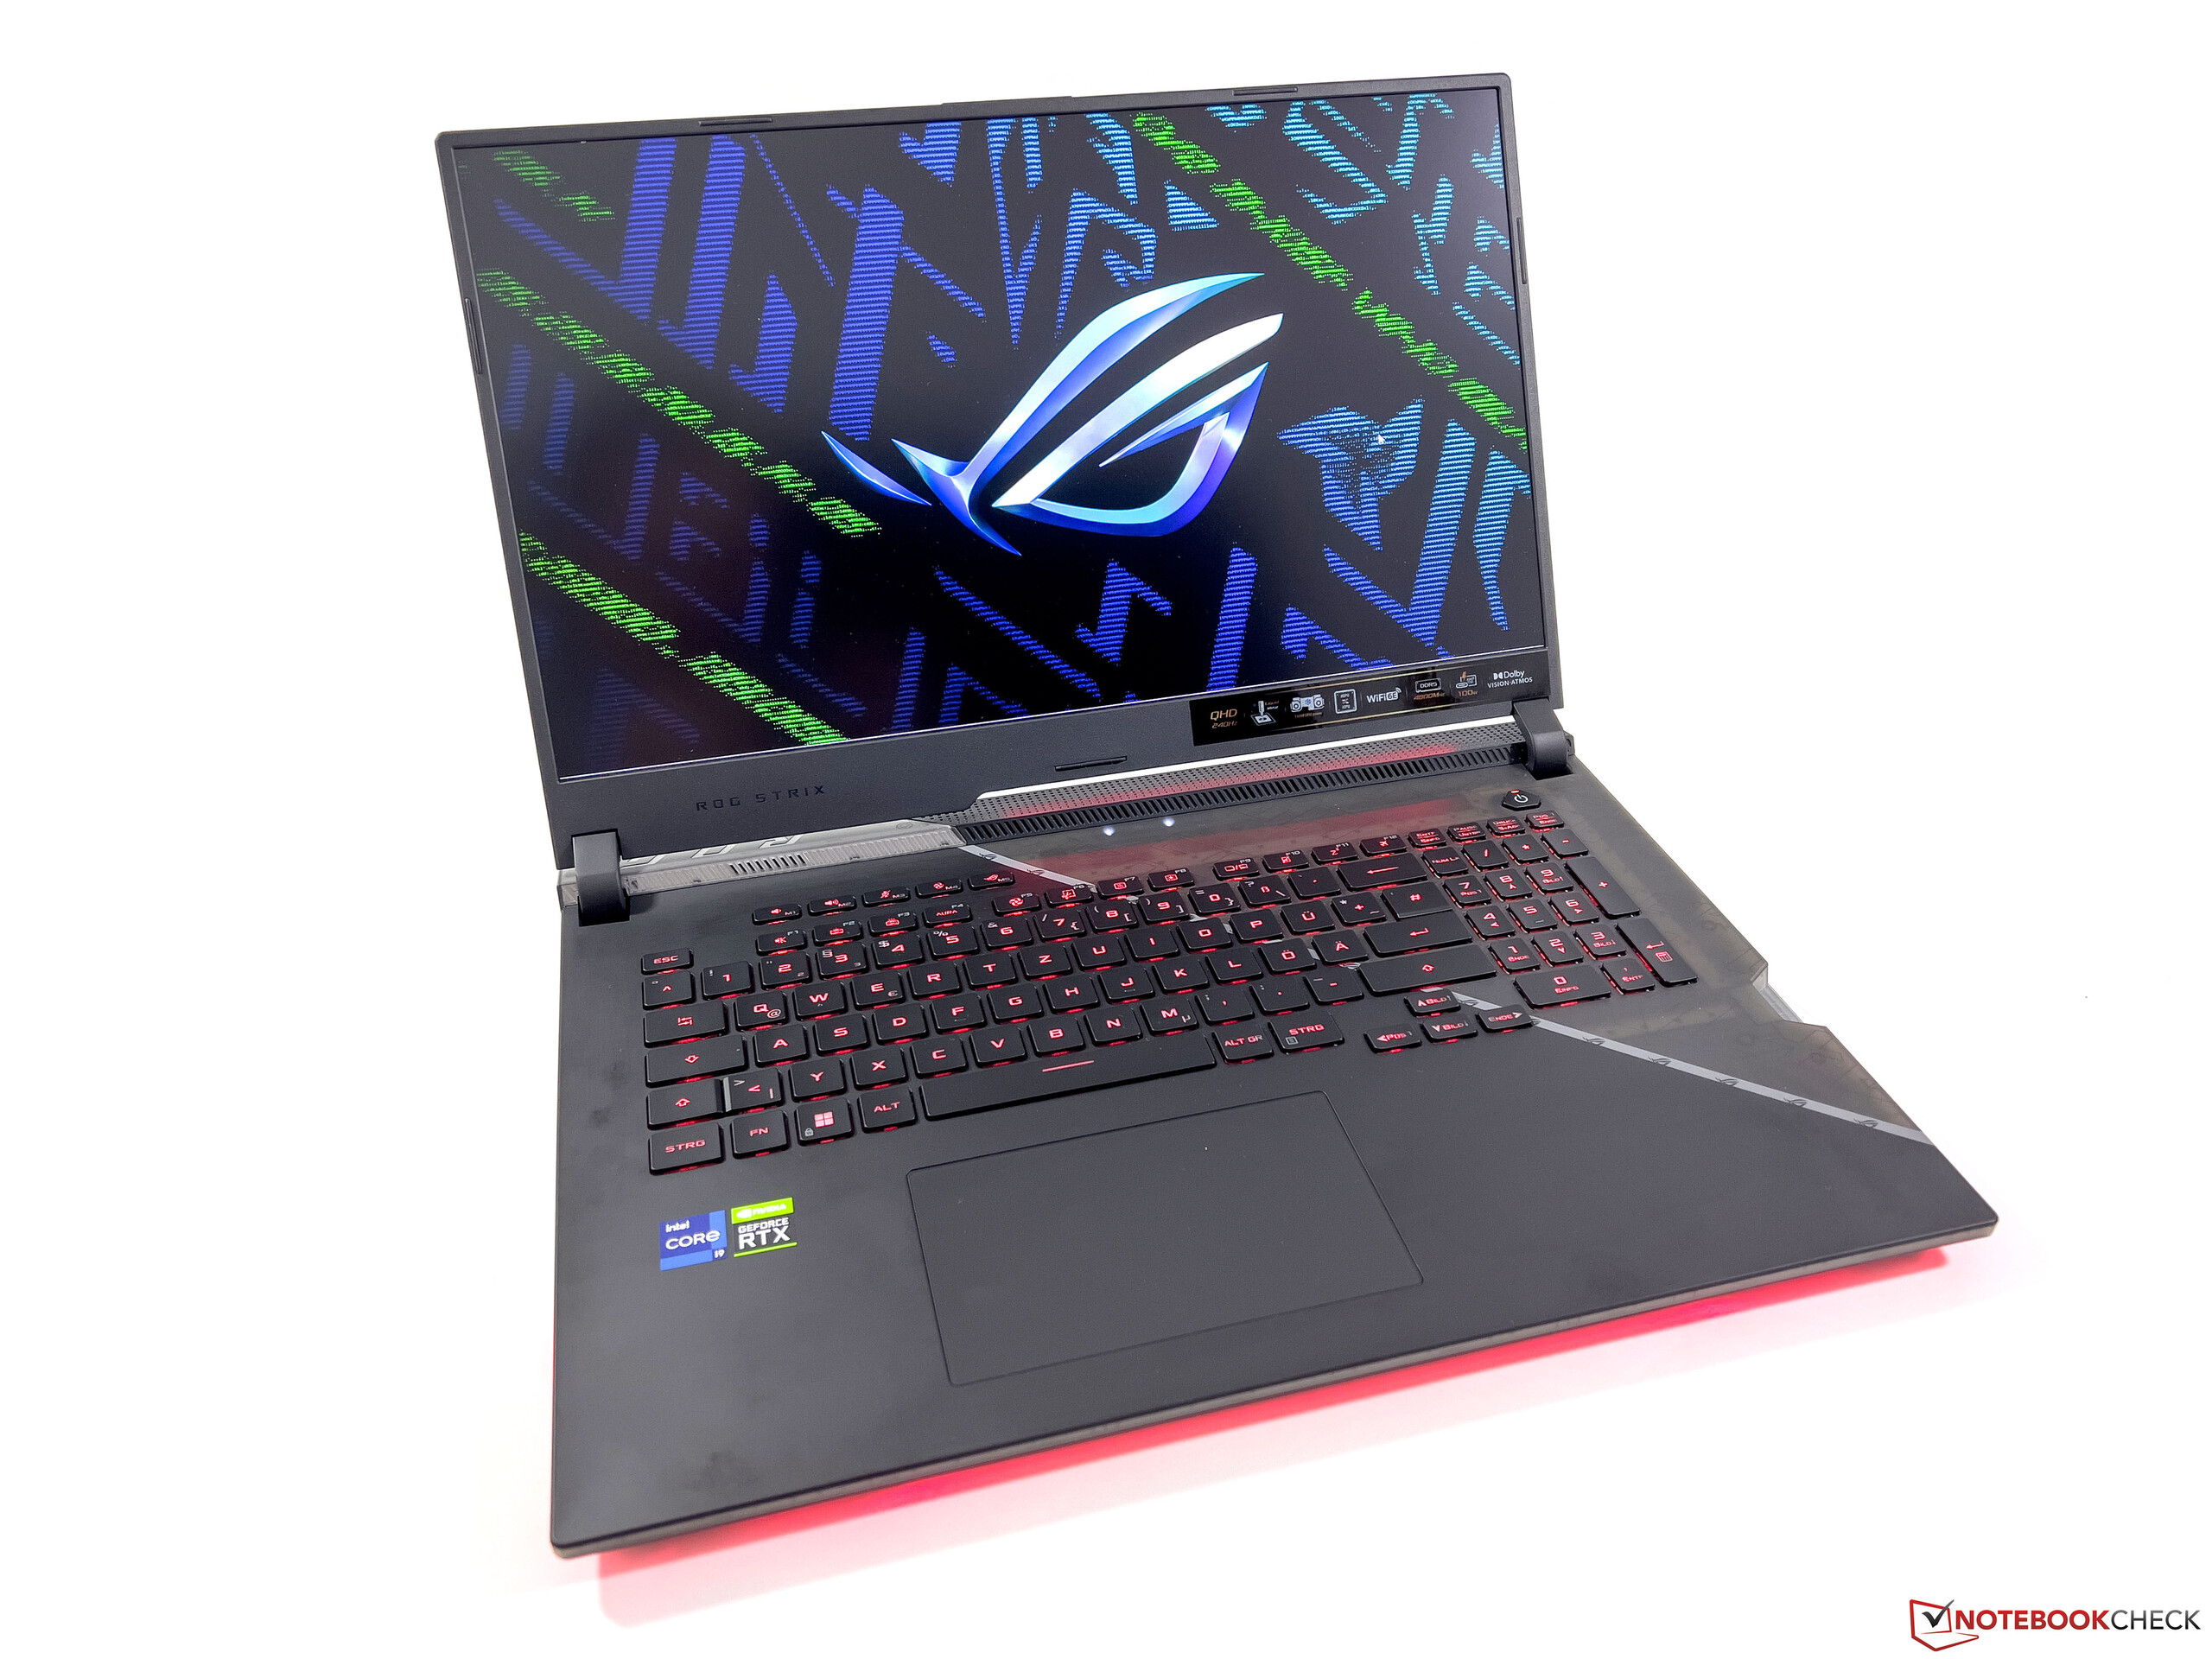
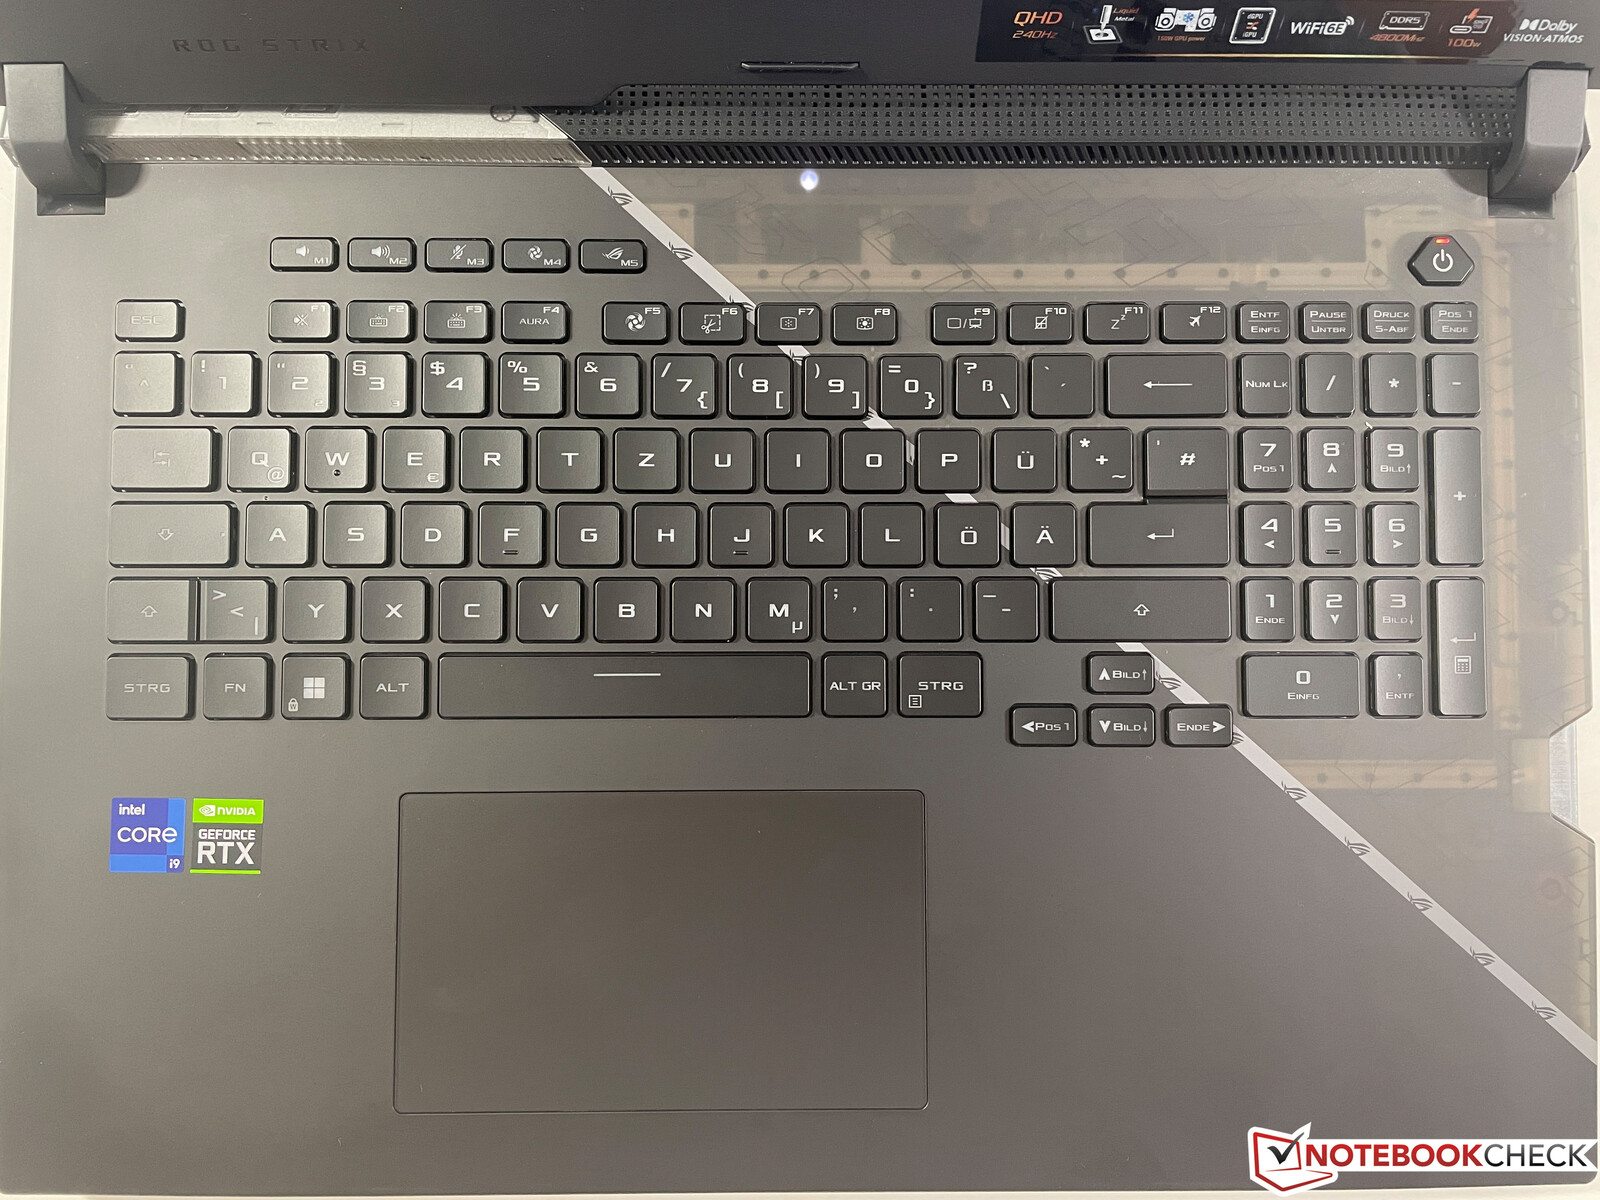
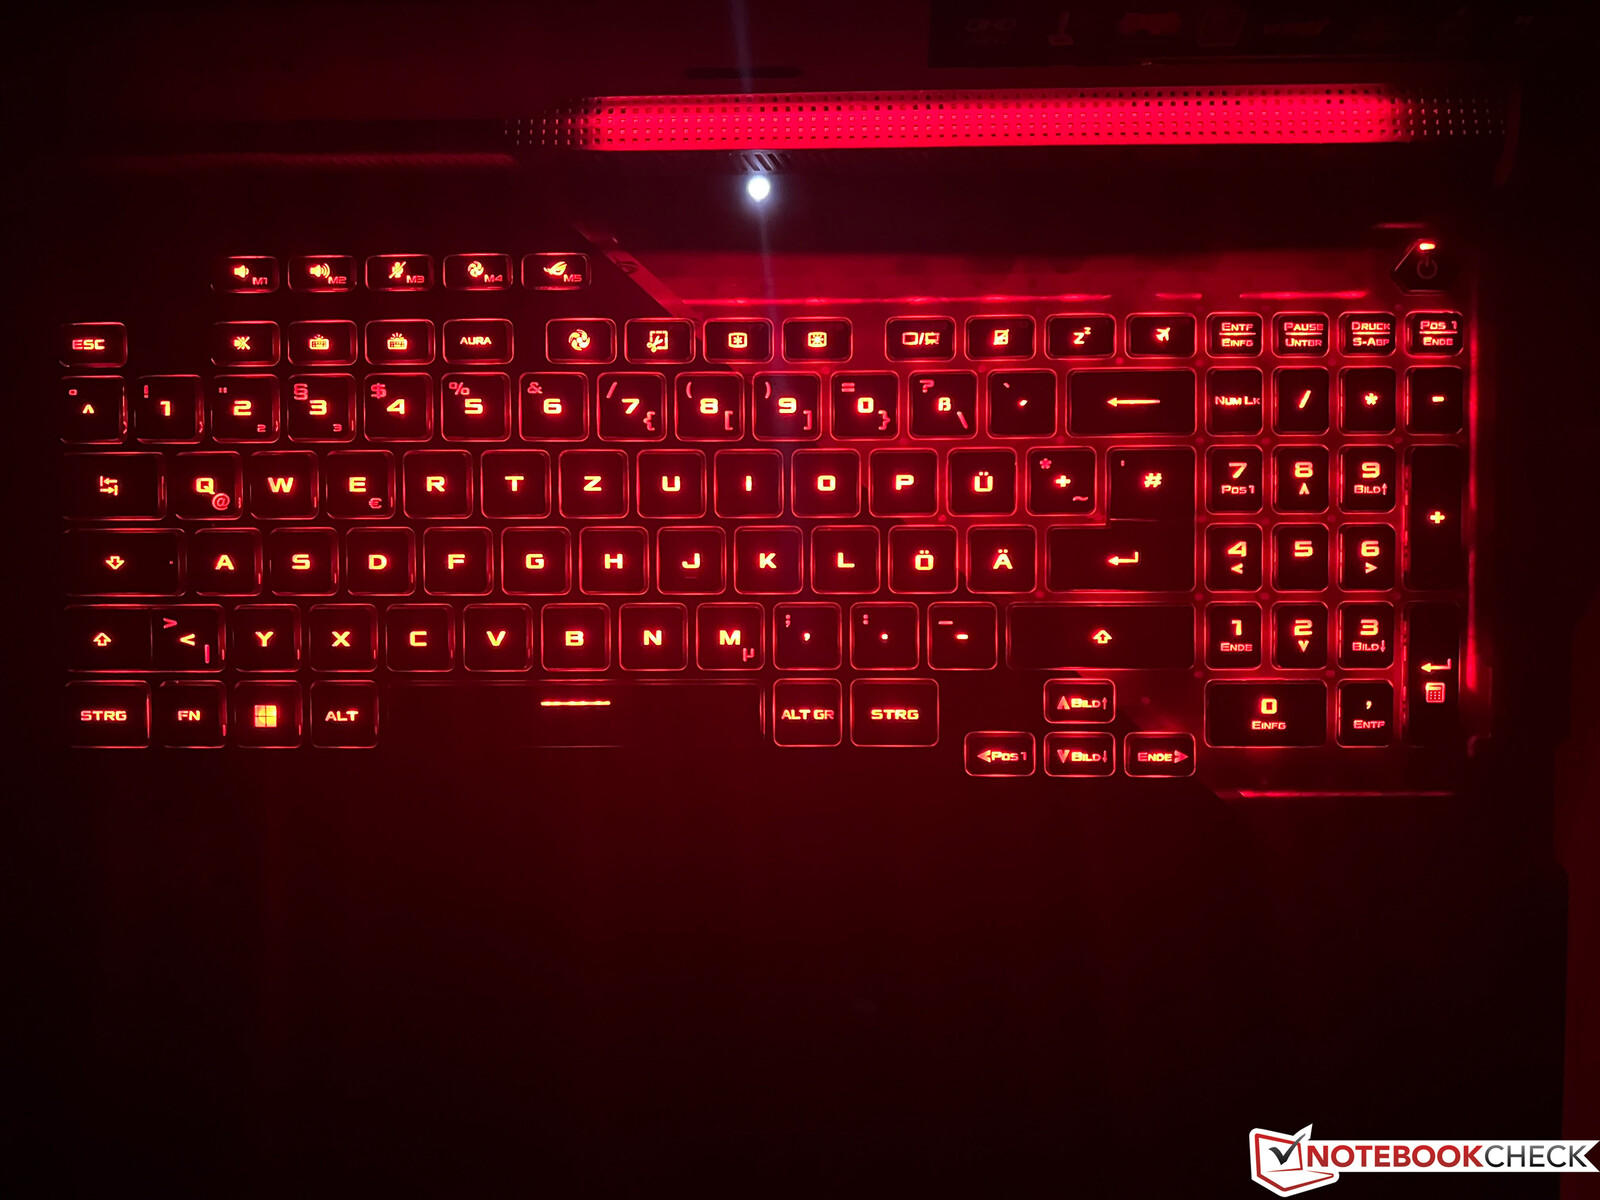
输入设备 - 带有良好键盘的华硕
华硕再次改变了键盘布局,现在采用了更传统的布局,特殊键更小。还有一个 "常规 "的数字块再次出现,这也意味着方向键稍微向左移动,现在更小。并非所有用户都会喜欢这样。然而,键盘的质量非常好,有2毫米长的轮毂,而且你可以疯狂地使用照明,它允许你单独配置每个键,包括通过AuraSync技术的游戏特定模式。大的ClickPad提供了良好的滑动特性,并且工作可靠,但当你按下它时,它也相当响。
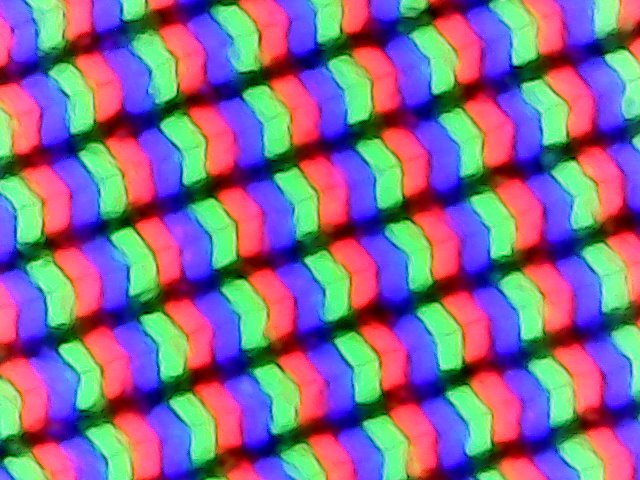
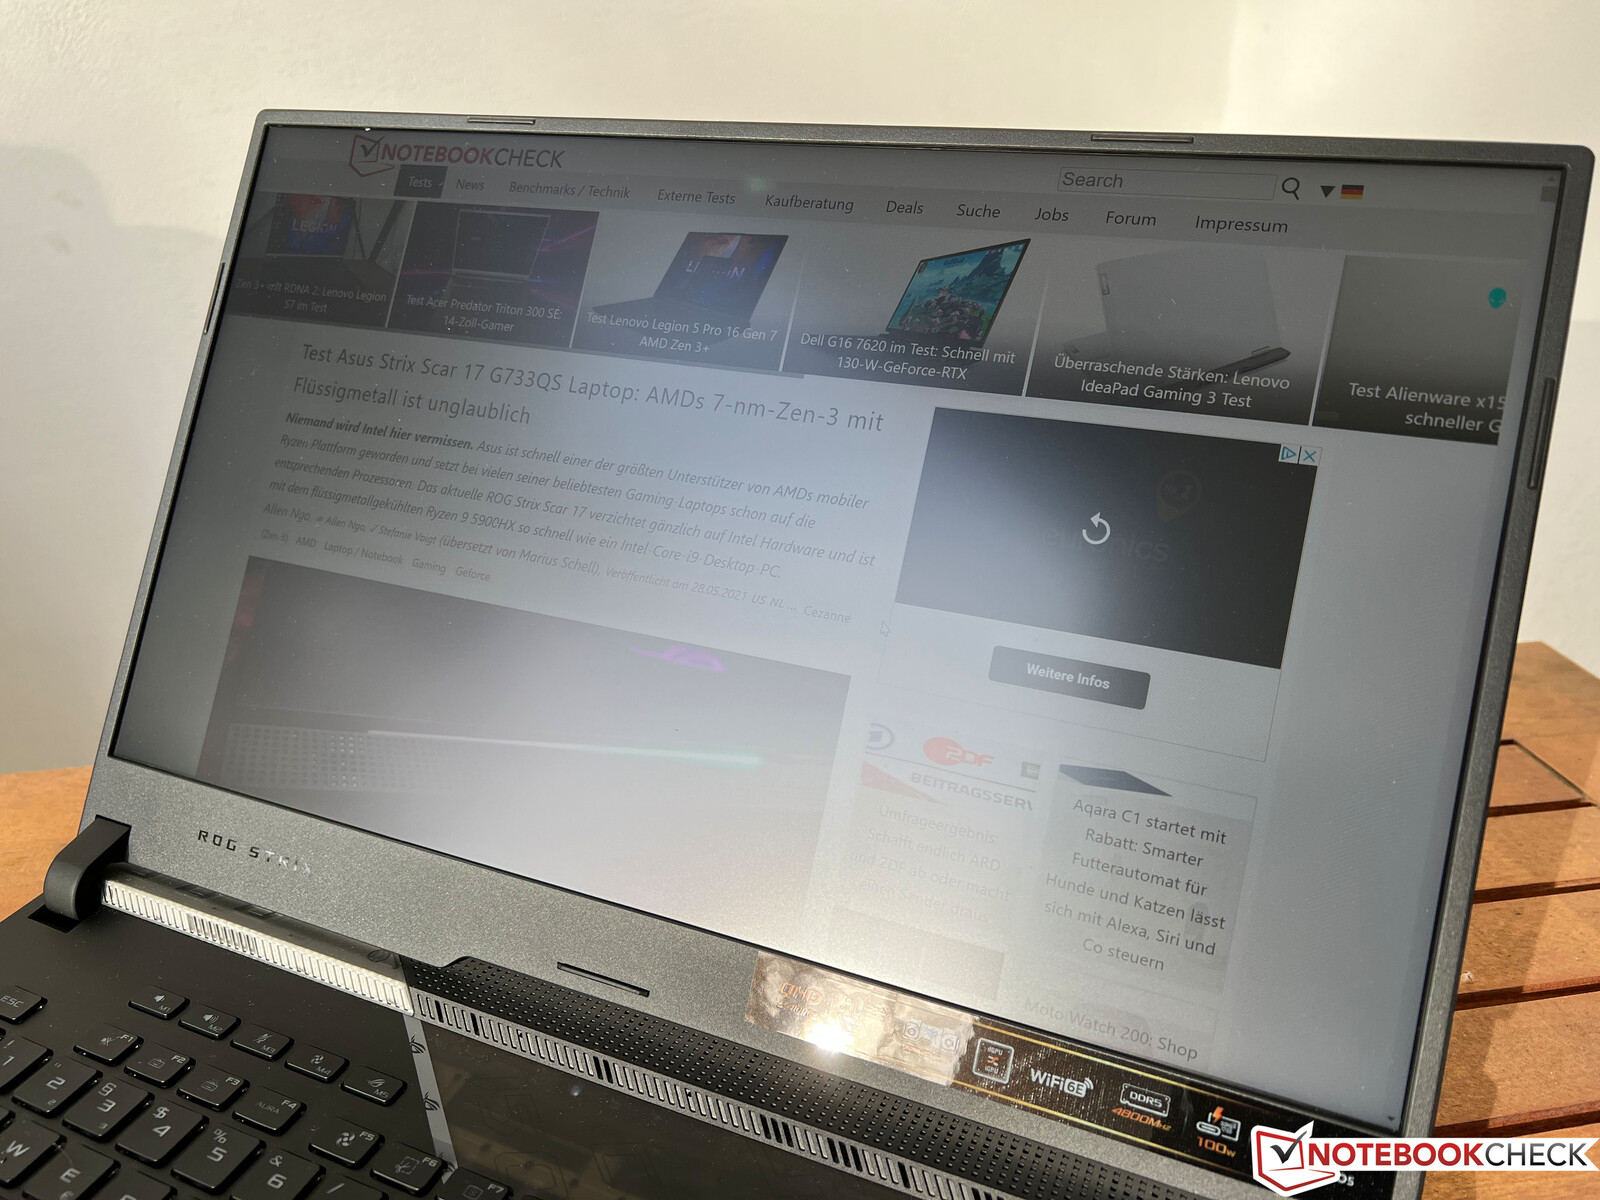
显示屏 - QHD,240赫兹
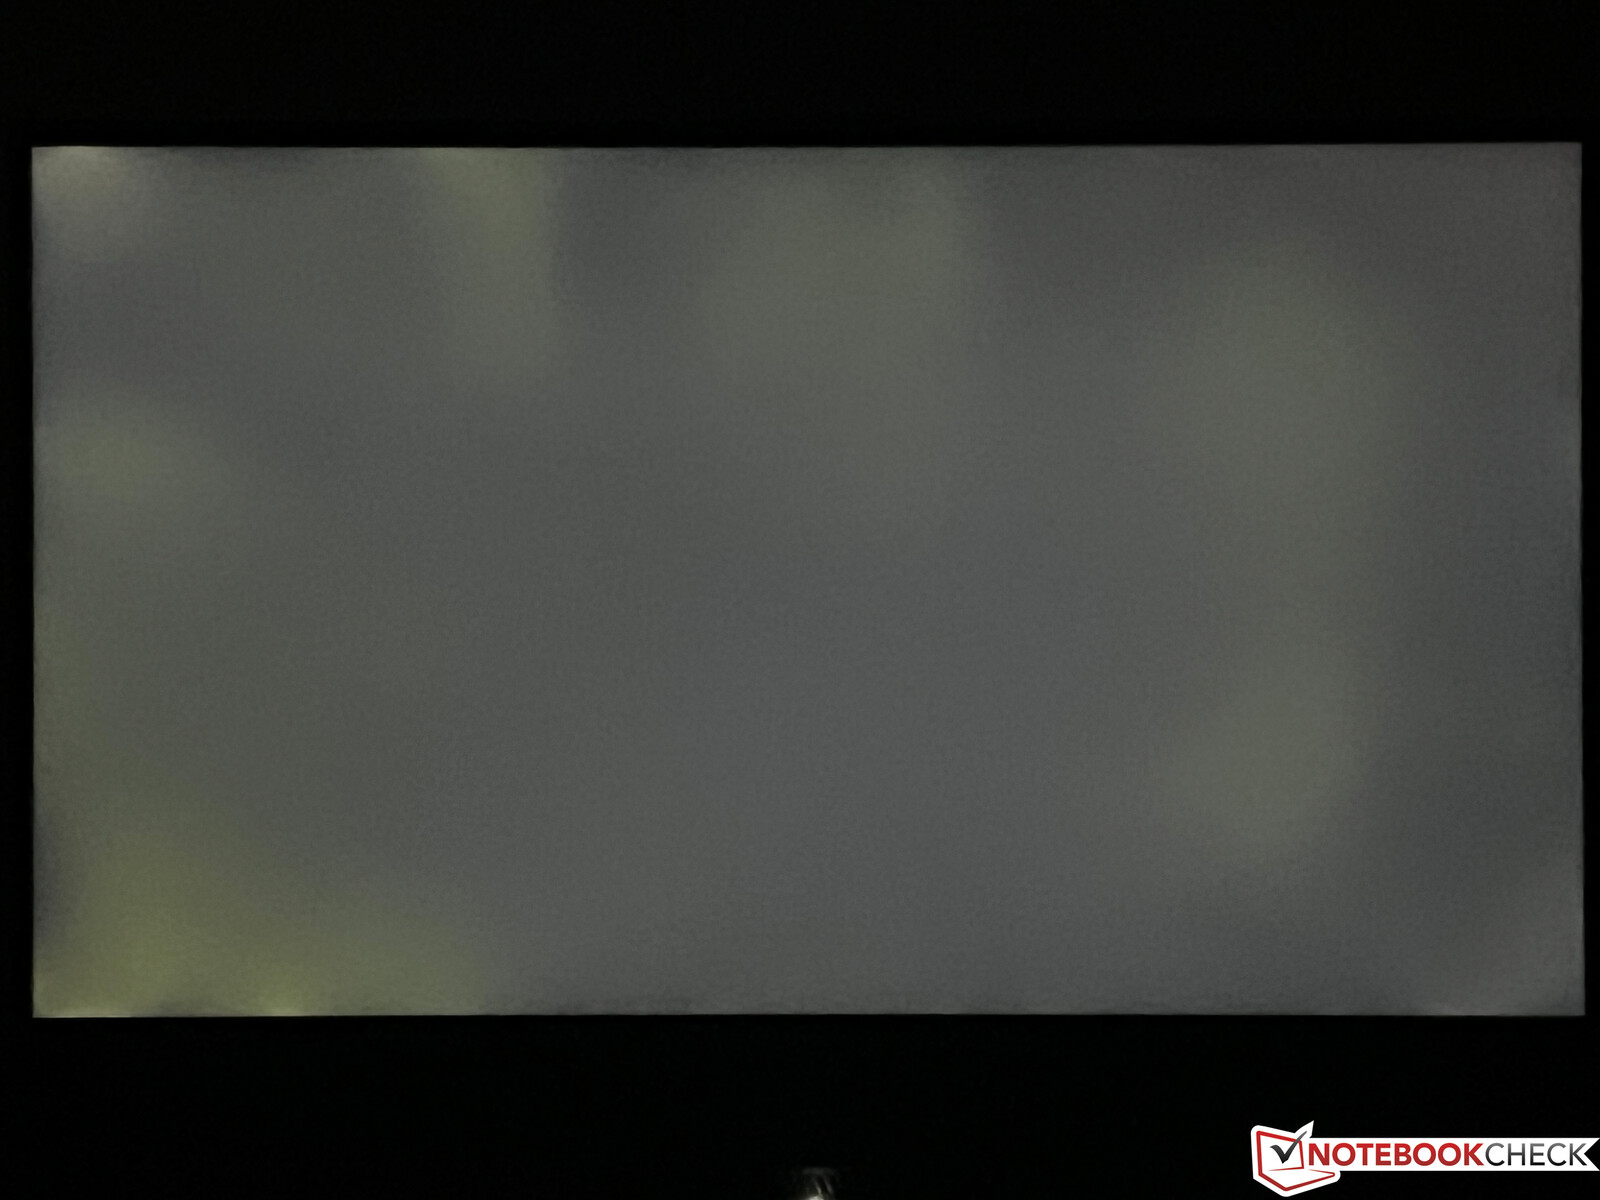
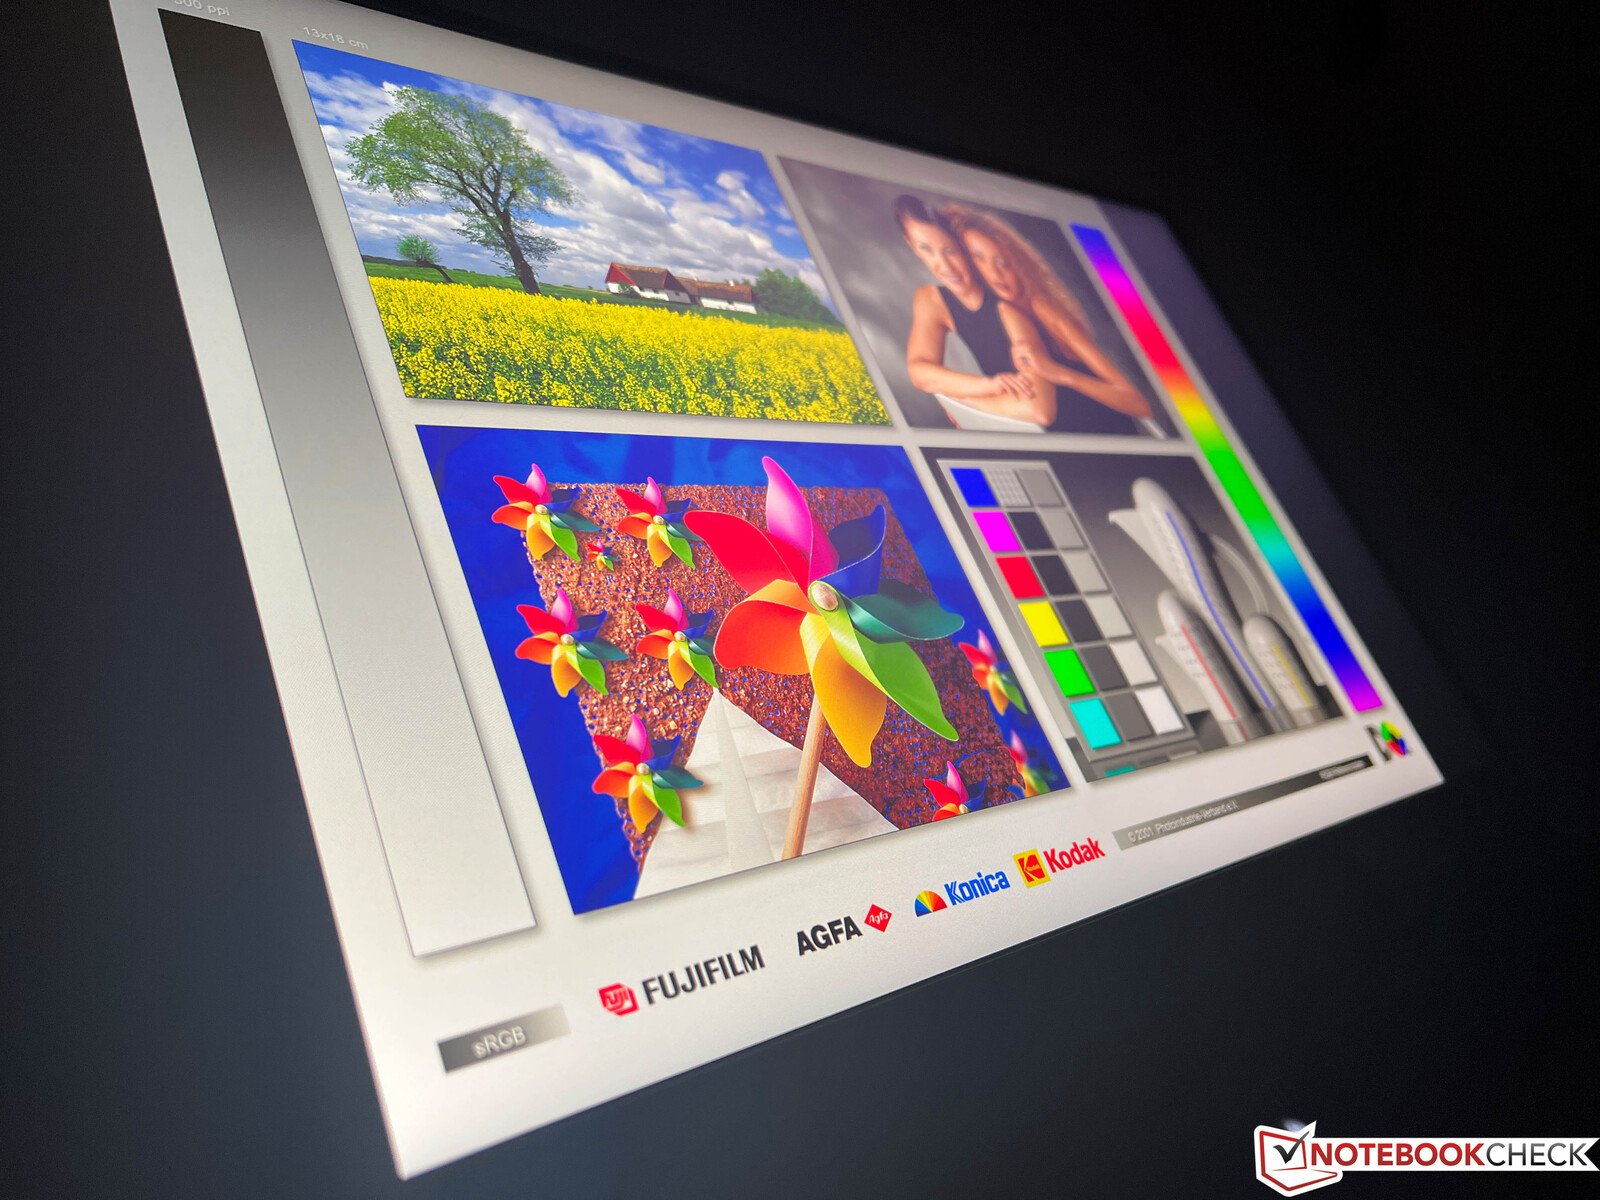
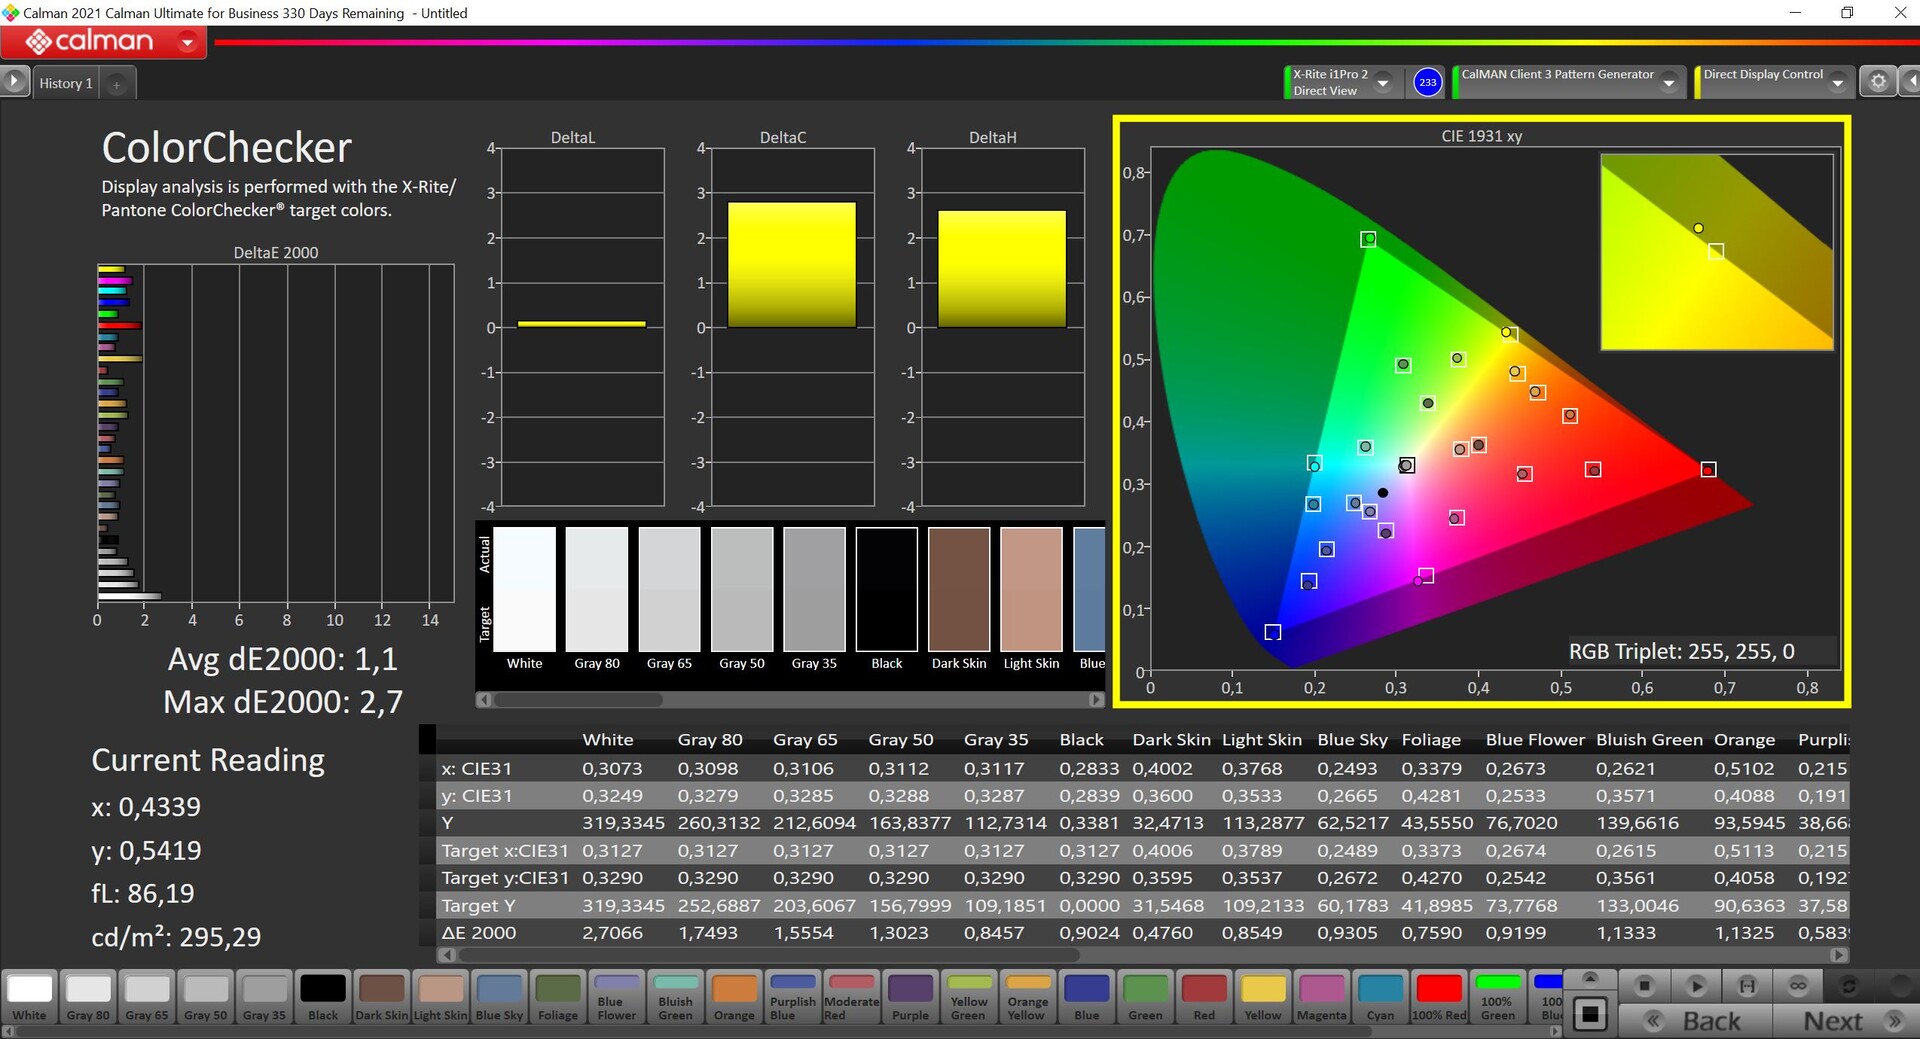
除了我们在去年的Scar 17 G733QS中测试的360赫兹全高清面板外,还有 去年的Scar 17 G733QS华硕还提供了一个刷新率为240赫兹的QHD面板,这就是我们测试单元中的面板。哑光IPS面板(2560 x 1440像素,16:9)的主观图像印象非常好,除了杜比视界HDR之外,还支持自适应同步。响应时间非常快,而且没有使用PWM。亮度平均约为300cd/m²,这也与360Hz的全高清面板的水平相同。另一方面,黑值有点高,也导致了1000:1左右的平庸的对比度。
| |||||||||||||||||||||||||
Brightness Distribution: 87 %
Center on Battery: 320 cd/m²
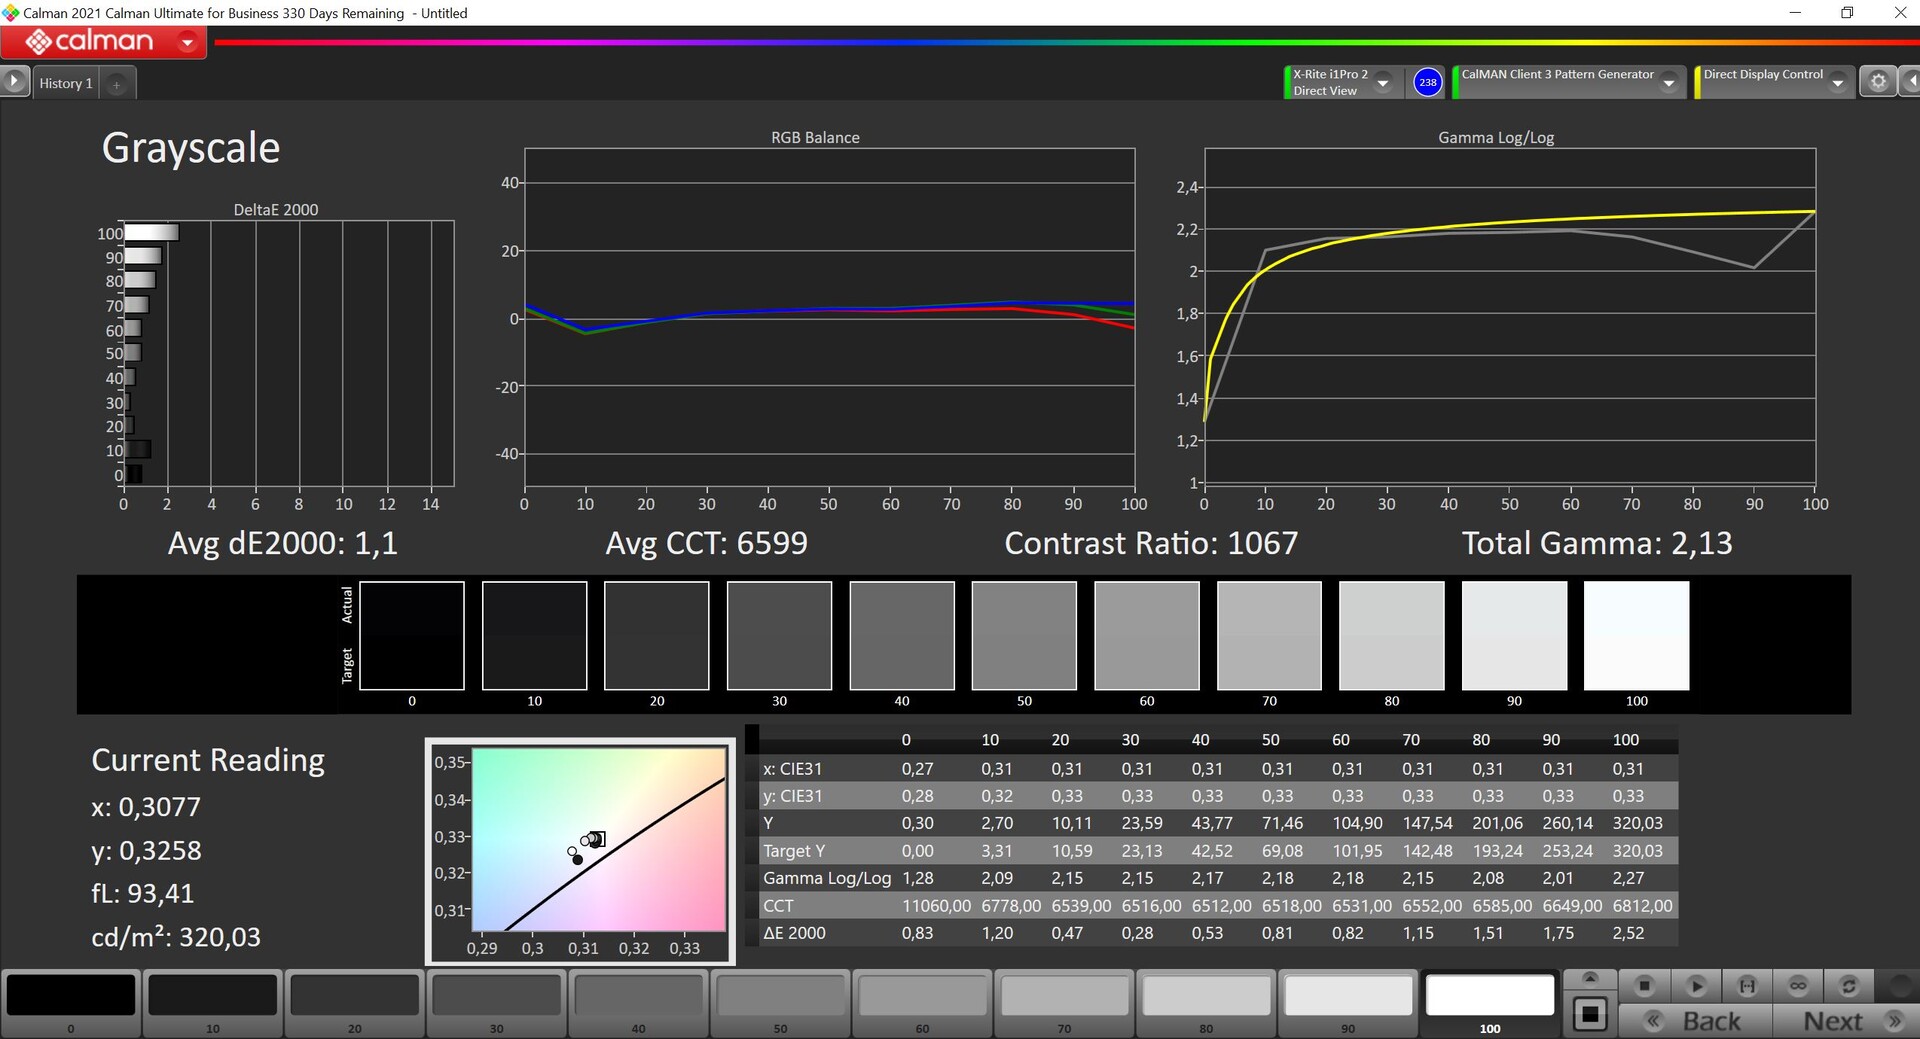
Contrast: 1067:1 (Black: 0.3 cd/m²)
ΔE ColorChecker Calman: 1.1 | ∀{0.5-29.43 Ø4.72}
ΔE Greyscale Calman: 1.1 | ∀{0.09-98 Ø4.97}
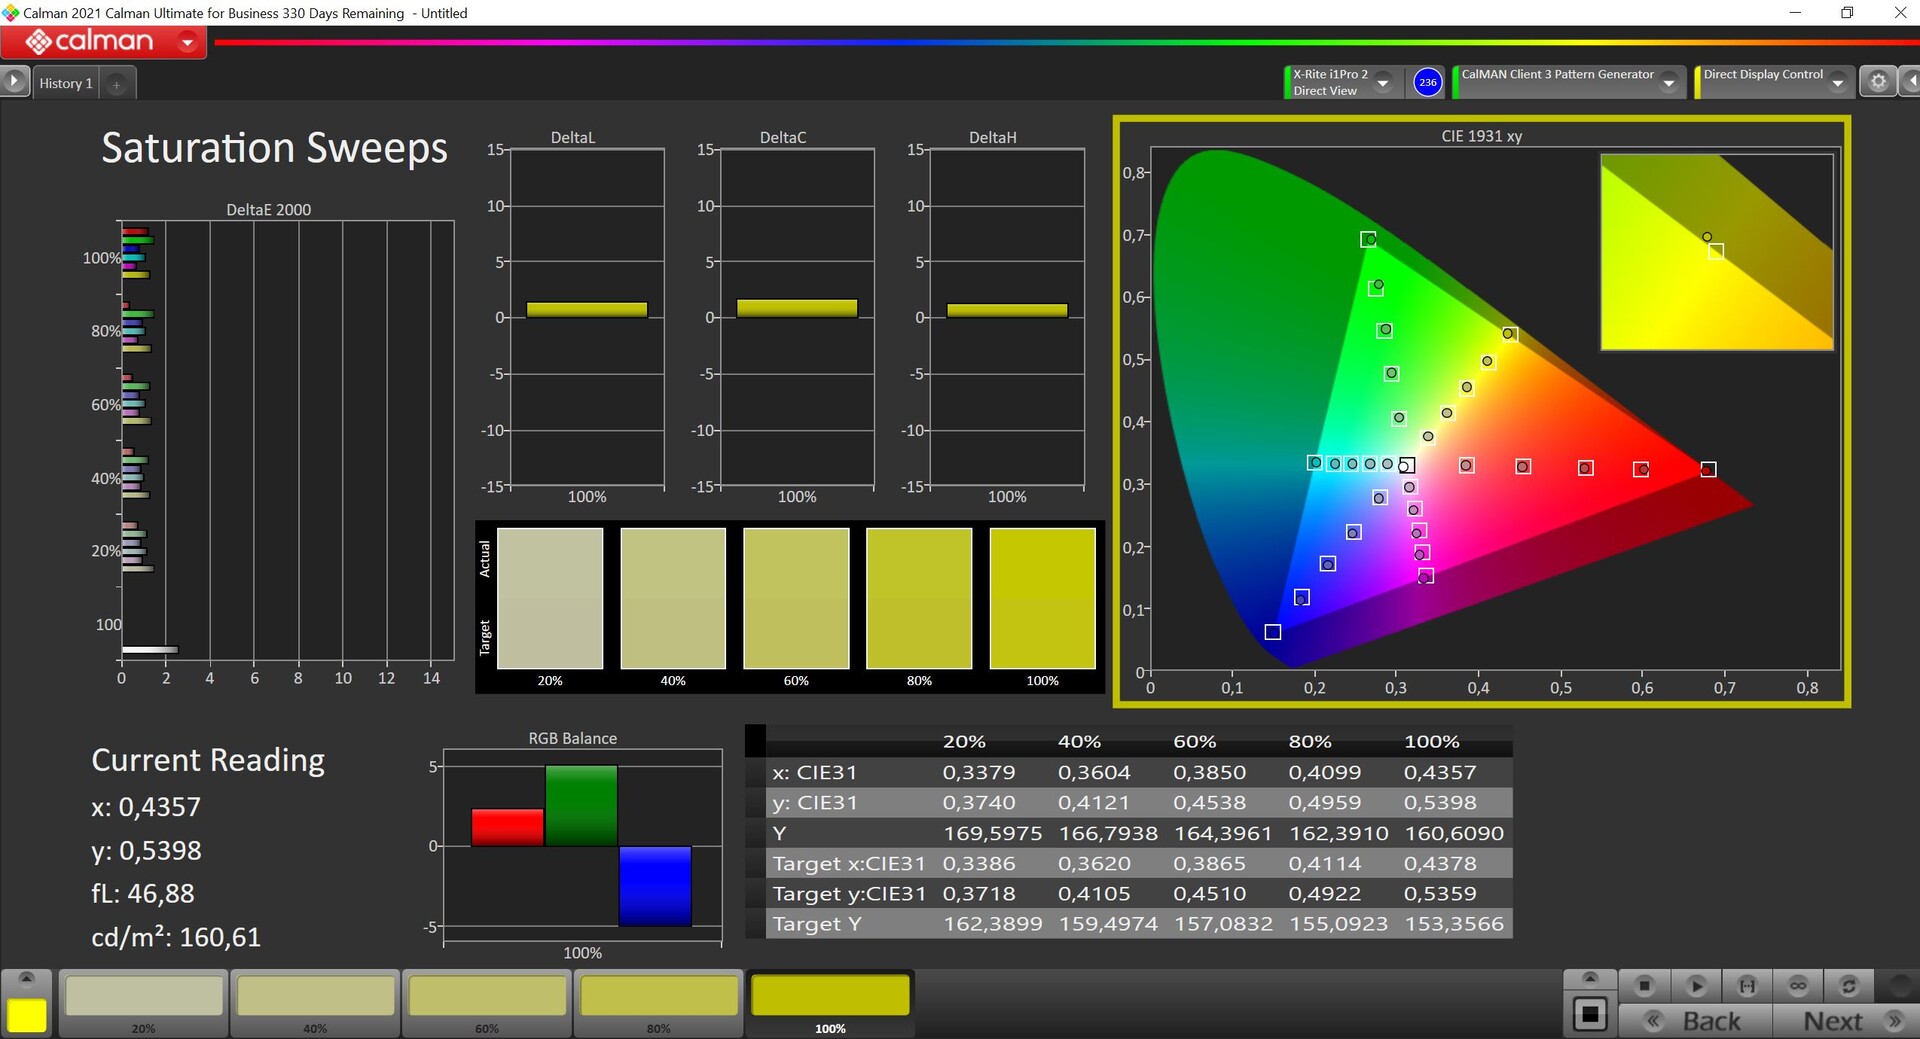
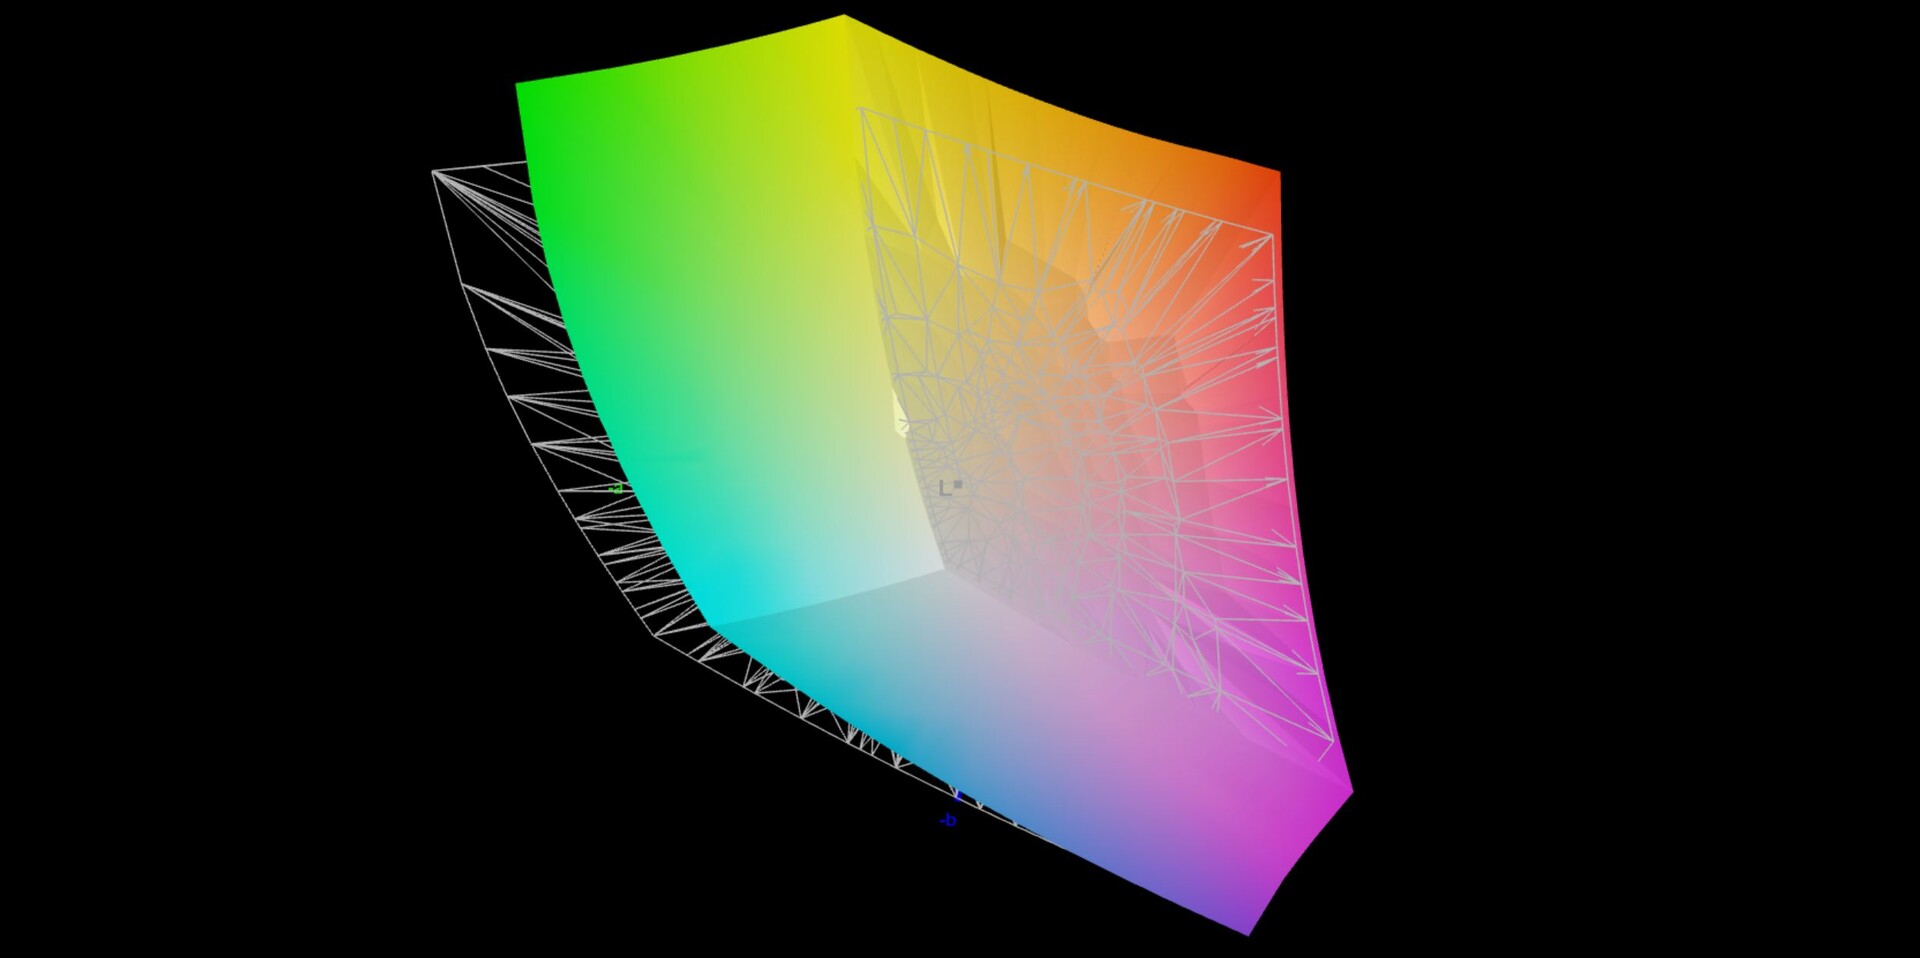
84.8% AdobeRGB 1998 (Argyll 3D)
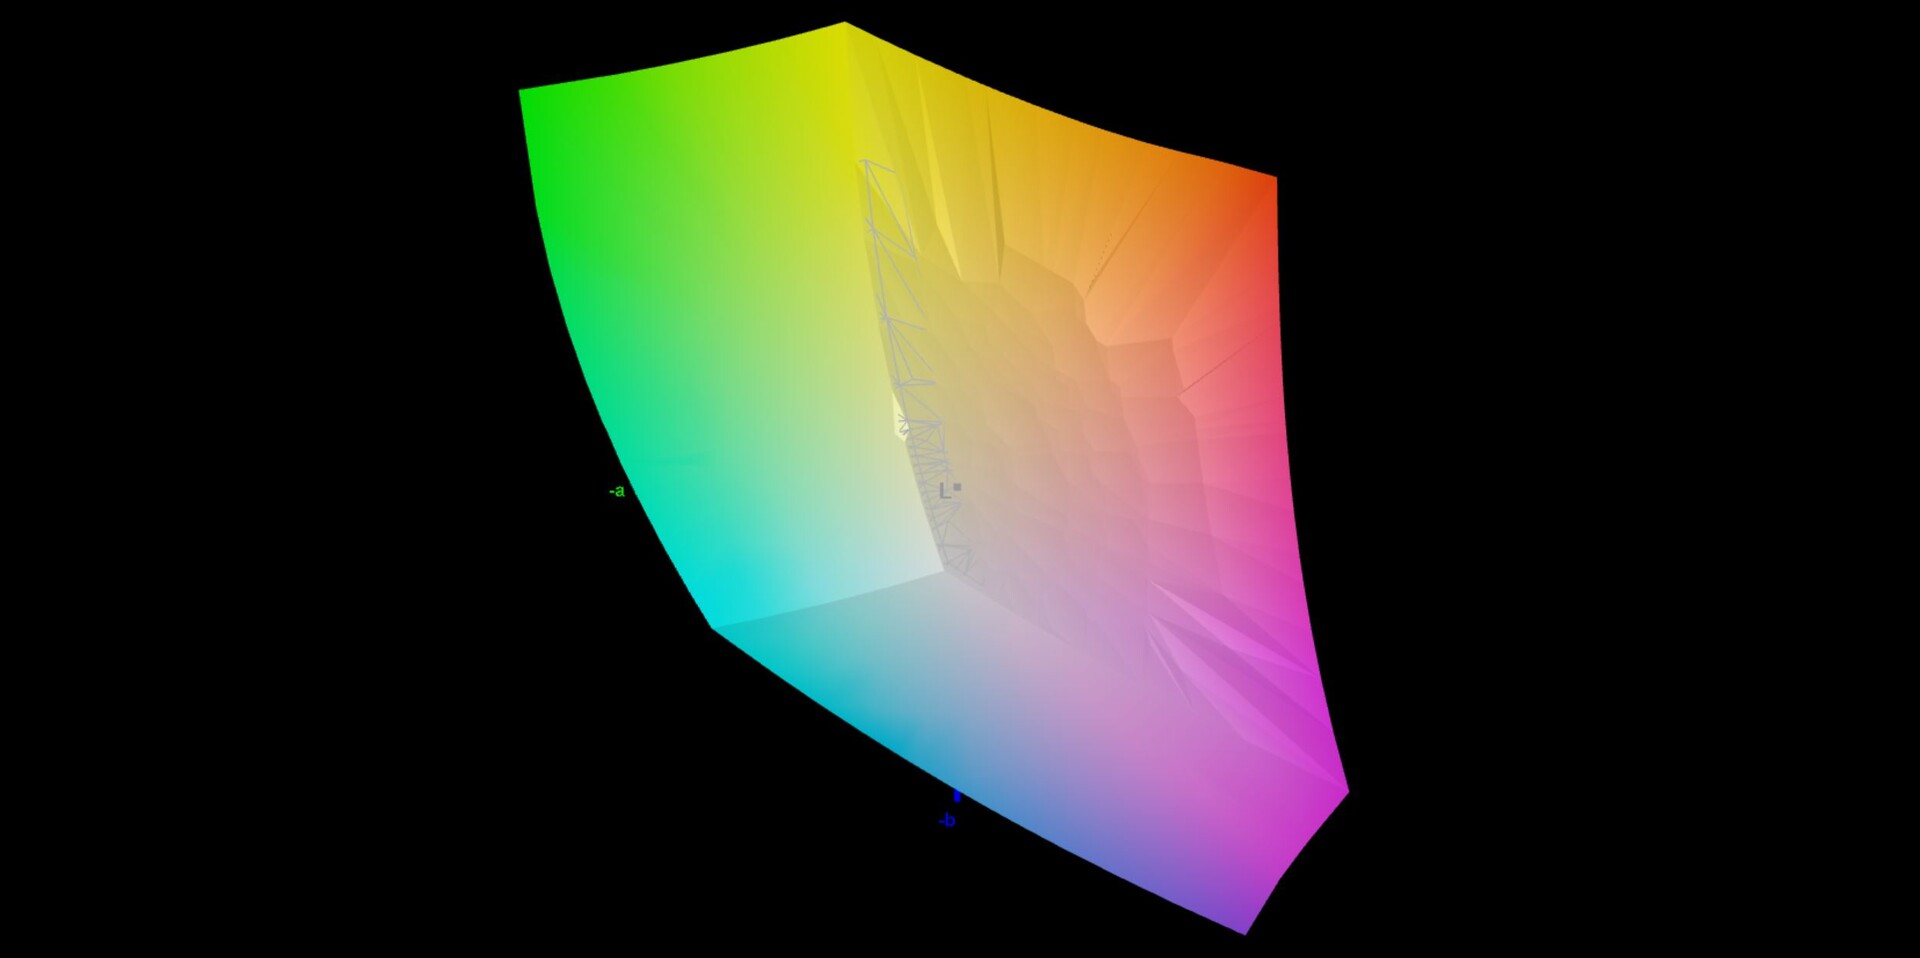
99.9% sRGB (Argyll 3D)
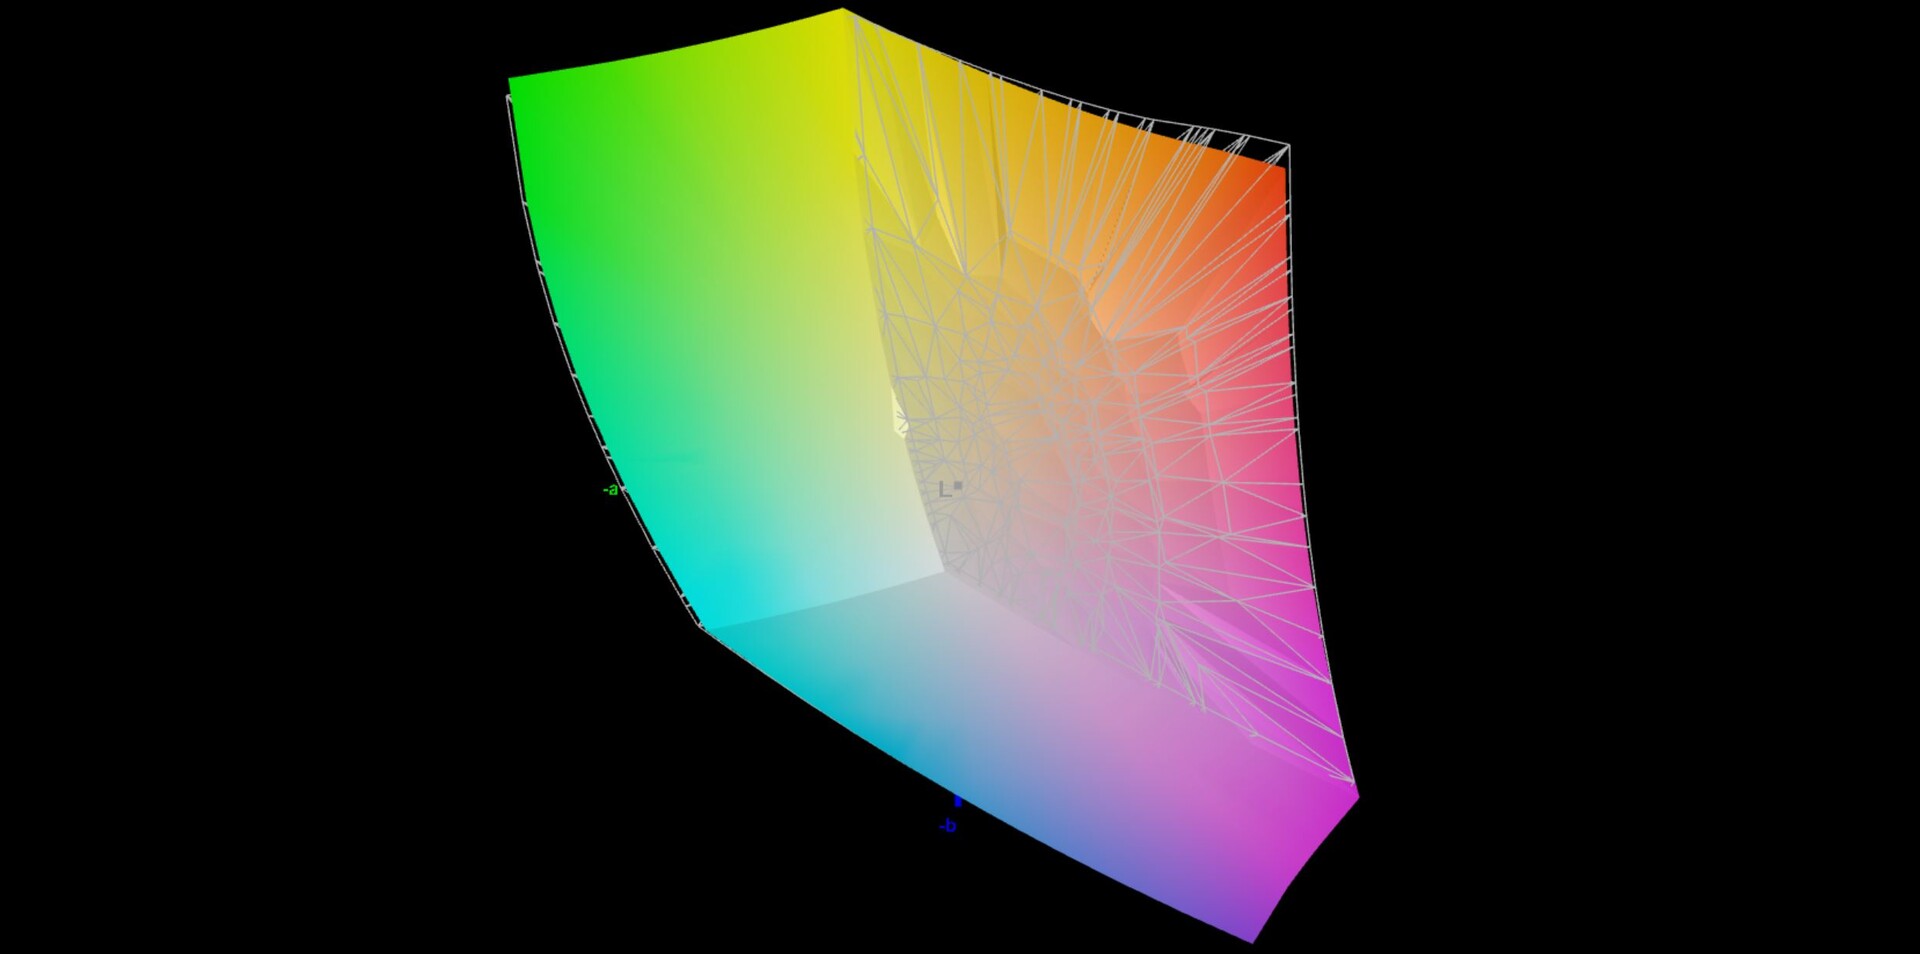
97.1% Display P3 (Argyll 3D)
Gamma: 2.13
CCT: 6599 K
| Asus ROG Strix Scar 17 SE G733CX-LL014W NE173QHM-NZ2, IPS, 2560x1440, 17.3" | Lenovo Legion 7 16IAX7-82TD004SGE NE160QDM-NY1, IPS, 2560x1600, 16" | MSI Titan GT77 12UHS Sharp SHP1544 LQ173M1JW08, IPS-Level, 1920x1080, 17.3" | Schenker XMG Neo 17 M22 BOE0A99, IPS, 2560x1600, 17" | Alienware x17 R2 P48E AU Optronics B173HAN, IPS, 1920x1080, 17.3" | Asus Strix Scar 17 G733QSA-XS99 AU Optronics B173HAN05.4, IPS, 1920x1080, 17.3" | |
|---|---|---|---|---|---|---|
| Display | -16% | -14% | -16% | -8% | -14% | |
| Display P3 Coverage (%) | 97.1 | 69.3 -29% | 70.8 -27% | 69 -29% | 79.2 -18% | 71 -27% |
| sRGB Coverage (%) | 99.9 | 98.2 -2% | 98.9 -1% | 99.8 0% | 99.8 0% | 99.4 -1% |
| AdobeRGB 1998 Coverage (%) | 84.8 | 70.8 -17% | 73 -14% | 69.6 -18% | 79.6 -6% | 72.2 -15% |
| Response Times | -38% | 48% | -25% | -55% | -12% | |
| Response Time Grey 50% / Grey 80% * (ms) | 5.7 ? | 12.6 ? -121% | 3.03 ? 47% | 10.8 ? -89% | 12.4 ? -118% | 6.6 ? -16% |
| Response Time Black / White * (ms) | 10.1 ? | 5.6 ? 45% | 5.28 ? 48% | 6.1 ? 40% | 9.2 ? 9% | 10.8 ? -7% |
| PWM Frequency (Hz) | ||||||
| Screen | -41% | -63% | -9% | -89% | -25% | |
| Brightness middle (cd/m²) | 320 | 547 71% | 280 -12% | 415 30% | 365.4 14% | 303.8 -5% |
| Brightness (cd/m²) | 303 | 523 73% | 275 -9% | 399 32% | 344 14% | 292 -4% |
| Brightness Distribution (%) | 87 | 88 1% | 79 -9% | 90 3% | 85 -2% | 85 -2% |
| Black Level * (cd/m²) | 0.3 | 0.44 -47% | 0.4 -33% | 0.43 -43% | 0.29 3% | 0.23 23% |
| Contrast (:1) | 1067 | 1243 16% | 700 -34% | 965 -10% | 1260 18% | 1321 24% |
| Colorchecker dE 2000 * | 1.1 | 2.1 -91% | 2.1 -91% | 1.44 -31% | 3.17 -188% | 1.87 -70% |
| Colorchecker dE 2000 max. * | 2.7 | 7 -159% | 5.83 -116% | 2.33 14% | 7.69 -185% | 3.26 -21% |
| Greyscale dE 2000 * | 1.1 | 3.2 -191% | 3.3 -200% | 1.8 -64% | 5.3 -382% | 2.7 -145% |
| Gamma | 2.13 103% | 2.23 99% | 2.13 103% | 2.132 103% | 2.18 101% | 2.26 97% |
| CCT | 6599 98% | 6979 93% | 7060 92% | 6327 103% | 5879 111% | 6436 101% |
| Colorchecker dE 2000 calibrated * | 0.9 | 1.58 | 0.89 | 0.51 | 1.45 | |
| Color Space (Percent of AdobeRGB 1998) (%) | 65.6 | |||||
| Color Space (Percent of sRGB) (%) | 99.4 | |||||
| Total Average (Program / Settings) | -32% /
-35% | -10% /
-35% | -17% /
-13% | -51% /
-65% | -17% /
-20% |
* ... smaller is better
该显示器涵盖了P3色彩空间,我们用专业的CalMAN软件进行的分析表明,该屏幕在交付状态下已经非常准确。也没有色差,我们自己的校准也没有导致任何额外的改进,所以我们在这里不为你提供一个配置文件。这款QHD面板适用于图像和视频处理,没有任何限制。
Display Response Times
| ↔ Response Time Black to White | ||
|---|---|---|
| 10.1 ms ... rise ↗ and fall ↘ combined | ↗ 5 ms rise | 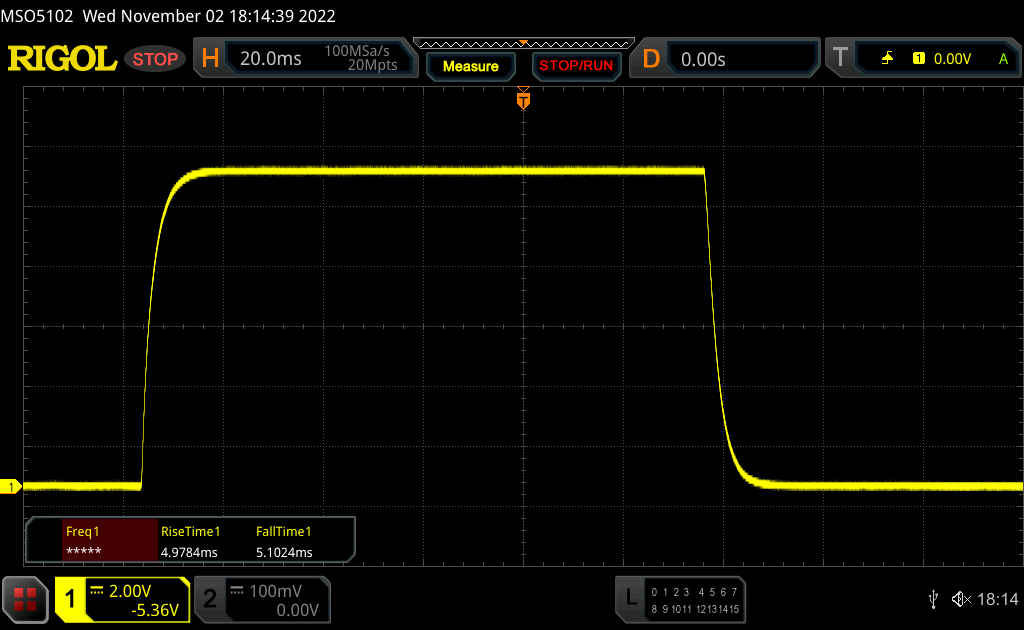 |
| ↘ 5.1 ms fall | ||
| The screen shows good response rates in our tests, but may be too slow for competitive gamers. In comparison, all tested devices range from 0.1 (minimum) to 240 (maximum) ms. » 28 % of all devices are better. This means that the measured response time is better than the average of all tested devices (19.8 ms). | ||
| ↔ Response Time 50% Grey to 80% Grey | ||
| 5.7 ms ... rise ↗ and fall ↘ combined | ↗ 2.7 ms rise | 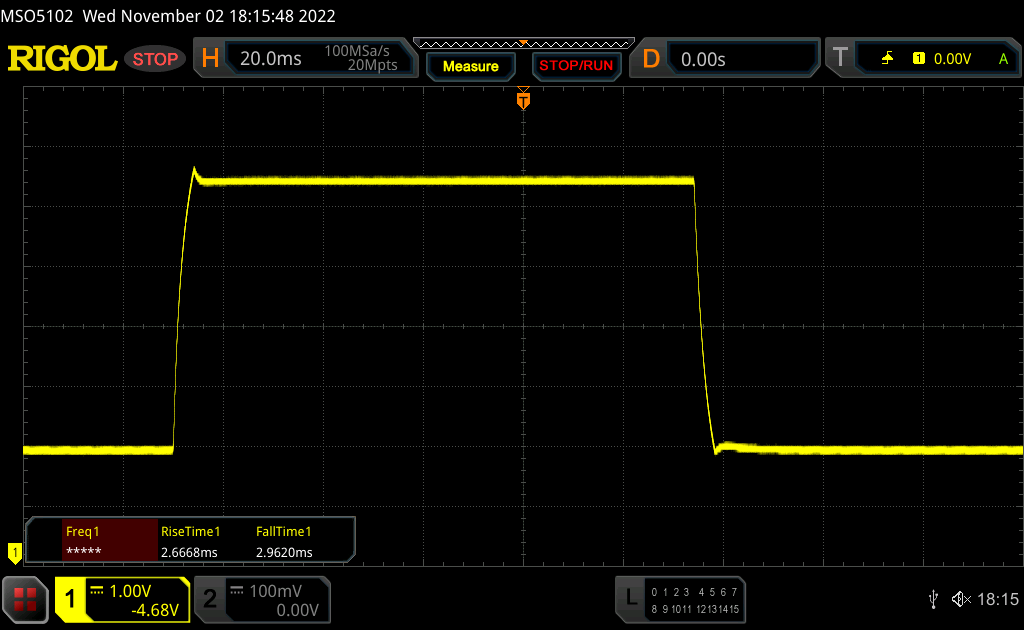 |
| ↘ 3 ms fall | ||
| The screen shows very fast response rates in our tests and should be very well suited for fast-paced gaming. In comparison, all tested devices range from 0.165 (minimum) to 636 (maximum) ms. » 18 % of all devices are better. This means that the measured response time is better than the average of all tested devices (31 ms). | ||
Screen Flickering / PWM (Pulse-Width Modulation)
| Screen flickering / PWM not detected | 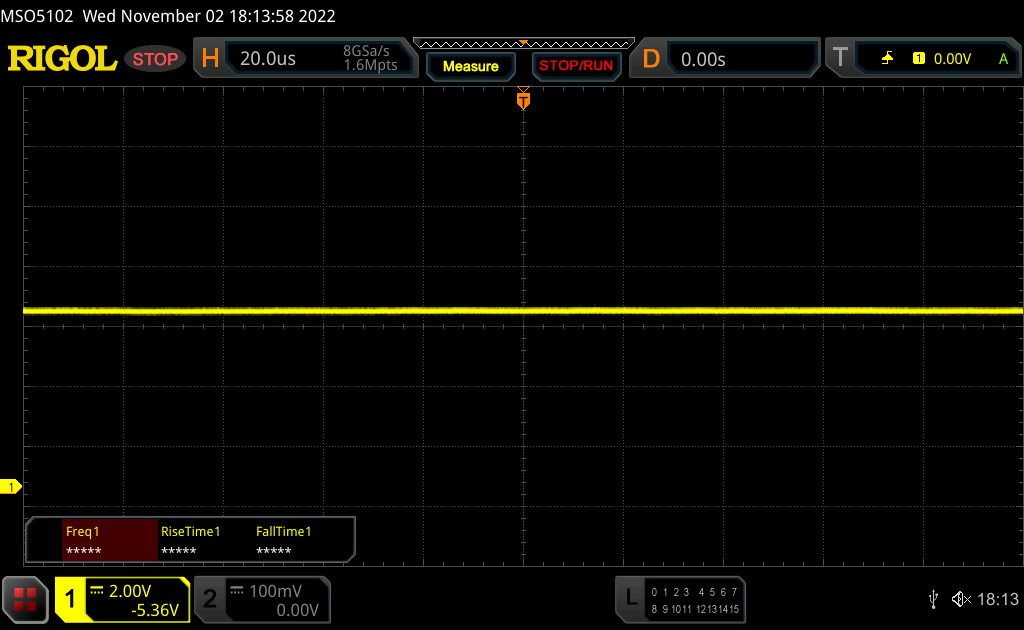 | ||
In comparison: 52 % of all tested devices do not use PWM to dim the display. If PWM was detected, an average of 7753 (minimum: 5 - maximum: 343500) Hz was measured. | |||
性能 - 刹车后的英特尔HX
测试条件
ROG软件提供广泛的配置选项和电源配置文件。例如,你可以完全停用集成GPU(MUX)或手动设置CPU和GPU的功率值。对于我们下面的基准和测量,我们使用性能配置文件,因为这已经使全部GPU性能可用。虽然在Turbo模式下,CPU的性能甚至略高,但在我们看来,这并不能证明风扇噪音的显著提高。
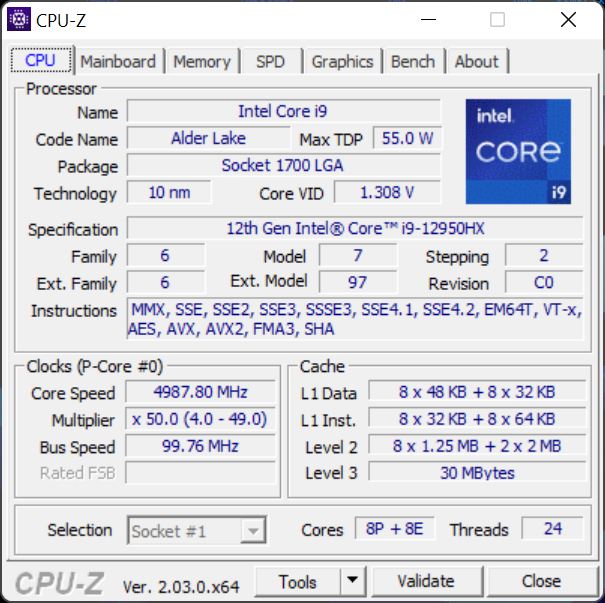
处理器 - 酷睿i9-12950HX
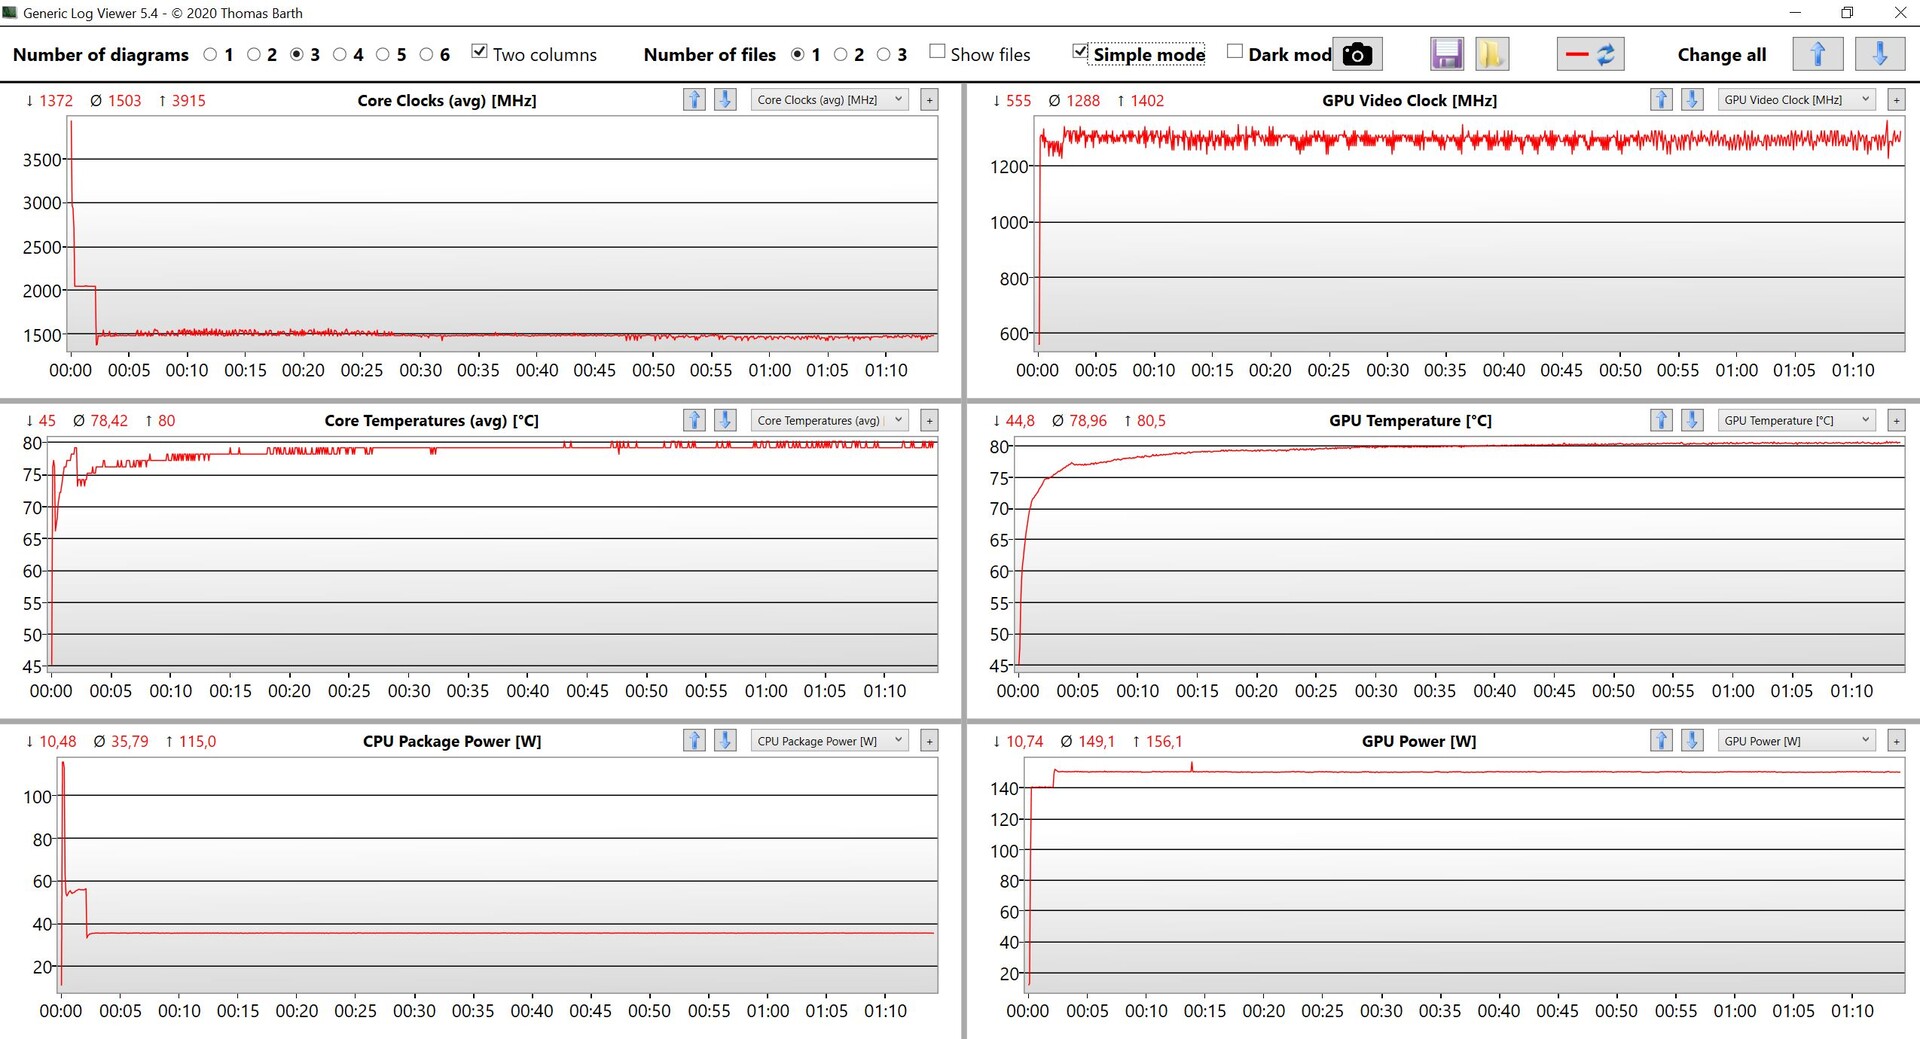
芯片英特尔酷睿i9-12950HX是目前英特尔最快的移动处理器。尽管它能够消耗高达175瓦的功率,但在我们的测试装置中,它远远没有达到这个数值。相反,我们看到最大消耗为115瓦(即使是在涡轮模式下),在某些时候,该值达到了70瓦(涡轮模式下为105瓦)。虽然CPU的性能一点也不差,但你也可以用普通的酷睿i9获得这样的性能,而HX芯片的额外溢价并不值得额外花费。
在电池运行时,功耗被限制在35瓦,导致多核性能降低约40%。你可以在我们相应的技术部分找到更多的CPU基准测试 我们相应的技术部分.
Cinebench R15 Multi Constant Load Test
Cinebench R23: Multi Core | Single Core
Cinebench R20: CPU (Multi Core) | CPU (Single Core)
Cinebench R15: CPU Multi 64Bit | CPU Single 64Bit
Blender: v2.79 BMW27 CPU
7-Zip 18.03: 7z b 4 | 7z b 4 -mmt1
Geekbench 5.5: Multi-Core | Single-Core
HWBOT x265 Benchmark v2.2: 4k Preset
LibreOffice : 20 Documents To PDF
R Benchmark 2.5: Overall mean
| CPU Performance rating | |
| Average of class Gaming | |
| Lenovo Legion 7 16IAX7-82TD004SGE | |
| MSI Titan GT77 12UHS | |
| Asus ROG Strix Scar 17 SE G733CX-LL014W | |
| Average Intel Core i9-12950HX | |
| Alienware x17 R2 P48E | |
| Schenker XMG Neo 17 M22 | |
| Asus Strix Scar 17 G733QSA-XS99 | |
| Cinebench R23 / Multi Core | |
| Average of class Gaming (10488 - 40970, n=108, last 2 years) | |
| MSI Titan GT77 12UHS | |
| Lenovo Legion 7 16IAX7-82TD004SGE | |
| Asus ROG Strix Scar 17 SE G733CX-LL014W | |
| Average Intel Core i9-12950HX (16277 - 23113, n=7) | |
| Alienware x17 R2 P48E | |
| Schenker XMG Neo 17 M22 | |
| Asus Strix Scar 17 G733QSA-XS99 | |
| Cinebench R23 / Single Core | |
| Average of class Gaming (1166 - 2356, n=108, last 2 years) | |
| Lenovo Legion 7 16IAX7-82TD004SGE | |
| MSI Titan GT77 12UHS | |
| Alienware x17 R2 P48E | |
| Asus ROG Strix Scar 17 SE G733CX-LL014W | |
| Average Intel Core i9-12950HX (1465 - 1922, n=7) | |
| Schenker XMG Neo 17 M22 | |
| Asus Strix Scar 17 G733QSA-XS99 | |
| Cinebench R20 / CPU (Multi Core) | |
| Average of class Gaming (4029 - 16108, n=107, last 2 years) | |
| MSI Titan GT77 12UHS | |
| Lenovo Legion 7 16IAX7-82TD004SGE | |
| Average Intel Core i9-12950HX (6625 - 8777, n=7) | |
| Asus ROG Strix Scar 17 SE G733CX-LL014W | |
| Alienware x17 R2 P48E | |
| Schenker XMG Neo 17 M22 | |
| Asus Strix Scar 17 G733QSA-XS99 | |
| Cinebench R20 / CPU (Single Core) | |
| Average of class Gaming (442 - 895, n=107, last 2 years) | |
| Lenovo Legion 7 16IAX7-82TD004SGE | |
| Asus ROG Strix Scar 17 SE G733CX-LL014W | |
| MSI Titan GT77 12UHS | |
| Alienware x17 R2 P48E | |
| Average Intel Core i9-12950HX (703 - 741, n=7) | |
| Schenker XMG Neo 17 M22 | |
| Asus Strix Scar 17 G733QSA-XS99 | |
| Cinebench R15 / CPU Multi 64Bit | |
| Average of class Gaming (1578 - 6271, n=106, last 2 years) | |
| MSI Titan GT77 12UHS | |
| Lenovo Legion 7 16IAX7-82TD004SGE | |
| Asus ROG Strix Scar 17 SE G733CX-LL014W | |
| Average Intel Core i9-12950HX (2464 - 3530, n=7) | |
| Alienware x17 R2 P48E | |
| Schenker XMG Neo 17 M22 | |
| Asus Strix Scar 17 G733QSA-XS99 | |
| Cinebench R15 / CPU Single 64Bit | |
| Average of class Gaming (188.8 - 343, n=107, last 2 years) | |
| Lenovo Legion 7 16IAX7-82TD004SGE | |
| MSI Titan GT77 12UHS | |
| Asus ROG Strix Scar 17 SE G733CX-LL014W | |
| Alienware x17 R2 P48E | |
| Average Intel Core i9-12950HX (167 - 276, n=7) | |
| Schenker XMG Neo 17 M22 | |
| Asus Strix Scar 17 G733QSA-XS99 | |
| Blender / v2.79 BMW27 CPU | |
| Asus Strix Scar 17 G733QSA-XS99 | |
| Schenker XMG Neo 17 M22 | |
| Asus ROG Strix Scar 17 SE G733CX-LL014W | |
| Alienware x17 R2 P48E | |
| Average Intel Core i9-12950HX (138 - 193, n=7) | |
| Average of class Gaming (80 - 330, n=105, last 2 years) | |
| Lenovo Legion 7 16IAX7-82TD004SGE | |
| MSI Titan GT77 12UHS | |
| 7-Zip 18.03 / 7z b 4 | |
| Average of class Gaming (33491 - 148086, n=106, last 2 years) | |
| Lenovo Legion 7 16IAX7-82TD004SGE | |
| MSI Titan GT77 12UHS | |
| Average Intel Core i9-12950HX (65637 - 85019, n=7) | |
| Asus ROG Strix Scar 17 SE G733CX-LL014W | |
| Alienware x17 R2 P48E | |
| Schenker XMG Neo 17 M22 | |
| Asus Strix Scar 17 G733QSA-XS99 | |
| 7-Zip 18.03 / 7z b 4 -mmt1 | |
| Average of class Gaming (4199 - 7436, n=106, last 2 years) | |
| Lenovo Legion 7 16IAX7-82TD004SGE | |
| MSI Titan GT77 12UHS | |
| Asus ROG Strix Scar 17 SE G733CX-LL014W | |
| Average Intel Core i9-12950HX (6022 - 6318, n=7) | |
| Schenker XMG Neo 17 M22 | |
| Alienware x17 R2 P48E | |
| Asus Strix Scar 17 G733QSA-XS99 | |
| Geekbench 5.5 / Multi-Core | |
| Average of class Gaming (6460 - 27010, n=106, last 2 years) | |
| Lenovo Legion 7 16IAX7-82TD004SGE | |
| MSI Titan GT77 12UHS | |
| Asus ROG Strix Scar 17 SE G733CX-LL014W | |
| Average Intel Core i9-12950HX (14028 - 16009, n=7) | |
| Alienware x17 R2 P48E | |
| Schenker XMG Neo 17 M22 | |
| Asus Strix Scar 17 G733QSA-XS99 | |
| Geekbench 5.5 / Single-Core | |
| Average of class Gaming (986 - 2474, n=106, last 2 years) | |
| MSI Titan GT77 12UHS | |
| Average Intel Core i9-12950HX (1847 - 1945, n=7) | |
| Alienware x17 R2 P48E | |
| Lenovo Legion 7 16IAX7-82TD004SGE | |
| Asus ROG Strix Scar 17 SE G733CX-LL014W | |
| Schenker XMG Neo 17 M22 | |
| Asus Strix Scar 17 G733QSA-XS99 | |
| HWBOT x265 Benchmark v2.2 / 4k Preset | |
| Average of class Gaming (11.5 - 44.3, n=106, last 2 years) | |
| MSI Titan GT77 12UHS | |
| Lenovo Legion 7 16IAX7-82TD004SGE | |
| Asus ROG Strix Scar 17 SE G733CX-LL014W | |
| Average Intel Core i9-12950HX (18.6 - 26.5, n=7) | |
| Alienware x17 R2 P48E | |
| Schenker XMG Neo 17 M22 | |
| Asus Strix Scar 17 G733QSA-XS99 | |
| LibreOffice / 20 Documents To PDF | |
| Schenker XMG Neo 17 M22 | |
| Average of class Gaming (33.2 - 88.8, n=106, last 2 years) | |
| Asus Strix Scar 17 G733QSA-XS99 | |
| Alienware x17 R2 P48E | |
| Average Intel Core i9-12950HX (34.7 - 45.4, n=7) | |
| MSI Titan GT77 12UHS | |
| Asus ROG Strix Scar 17 SE G733CX-LL014W | |
| Lenovo Legion 7 16IAX7-82TD004SGE | |
| R Benchmark 2.5 / Overall mean | |
| Asus Strix Scar 17 G733QSA-XS99 | |
| Schenker XMG Neo 17 M22 | |
| Average Intel Core i9-12950HX (0.4251 - 0.4515, n=7) | |
| Alienware x17 R2 P48E | |
| Average of class Gaming (0.3439 - 0.759, n=107, last 2 years) | |
| Asus ROG Strix Scar 17 SE G733CX-LL014W | |
| Lenovo Legion 7 16IAX7-82TD004SGE | |
| MSI Titan GT77 12UHS | |
* ... smaller is better
AIDA64: FP32 Ray-Trace | FPU Julia | CPU SHA3 | CPU Queen | FPU SinJulia | FPU Mandel | CPU AES | CPU ZLib | FP64 Ray-Trace | CPU PhotoWorxx
| Performance rating | |
| Average of class Gaming | |
| MSI Titan GT77 12UHS | |
| Asus ROG Strix Scar 17 SE G733CX-LL014W | |
| Average Intel Core i9-12950HX | |
| Schenker XMG Neo 17 M22 | |
| Asus Strix Scar 17 G733QSA-XS99 | |
| Lenovo Legion 7 16IAX7-82TD004SGE | |
| Alienware x17 R2 P48E | |
| AIDA64 / FP32 Ray-Trace | |
| Average of class Gaming (10227 - 85542, n=105, last 2 years) | |
| MSI Titan GT77 12UHS | |
| Average Intel Core i9-12950HX (15499 - 22868, n=7) | |
| Asus ROG Strix Scar 17 SE G733CX-LL014W | |
| Schenker XMG Neo 17 M22 | |
| Asus Strix Scar 17 G733QSA-XS99 | |
| Lenovo Legion 7 16IAX7-82TD004SGE | |
| Alienware x17 R2 P48E | |
| AIDA64 / FPU Julia | |
| Average of class Gaming (51376 - 238426, n=105, last 2 years) | |
| MSI Titan GT77 12UHS | |
| Asus Strix Scar 17 G733QSA-XS99 | |
| Schenker XMG Neo 17 M22 | |
| Average Intel Core i9-12950HX (77846 - 115907, n=7) | |
| Asus ROG Strix Scar 17 SE G733CX-LL014W | |
| Lenovo Legion 7 16IAX7-82TD004SGE | |
| Alienware x17 R2 P48E | |
| AIDA64 / CPU SHA3 | |
| Average of class Gaming (2180 - 9817, n=105, last 2 years) | |
| MSI Titan GT77 12UHS | |
| Lenovo Legion 7 16IAX7-82TD004SGE | |
| Asus ROG Strix Scar 17 SE G733CX-LL014W | |
| Average Intel Core i9-12950HX (3426 - 5069, n=7) | |
| Alienware x17 R2 P48E | |
| Asus Strix Scar 17 G733QSA-XS99 | |
| Schenker XMG Neo 17 M22 | |
| AIDA64 / CPU Queen | |
| Average of class Gaming (49785 - 173351, n=92, last 2 years) | |
| Alienware x17 R2 P48E | |
| Asus ROG Strix Scar 17 SE G733CX-LL014W | |
| Average Intel Core i9-12950HX (102752 - 104726, n=7) | |
| Asus Strix Scar 17 G733QSA-XS99 | |
| MSI Titan GT77 12UHS | |
| Schenker XMG Neo 17 M22 | |
| Lenovo Legion 7 16IAX7-82TD004SGE | |
| AIDA64 / FPU SinJulia | |
| Average of class Gaming (4424 - 33636, n=105, last 2 years) | |
| Lenovo Legion 7 16IAX7-82TD004SGE | |
| MSI Titan GT77 12UHS | |
| Schenker XMG Neo 17 M22 | |
| Asus Strix Scar 17 G733QSA-XS99 | |
| Average Intel Core i9-12950HX (10134 - 12823, n=7) | |
| Asus ROG Strix Scar 17 SE G733CX-LL014W | |
| Alienware x17 R2 P48E | |
| AIDA64 / FPU Mandel | |
| Average of class Gaming (25115 - 128721, n=105, last 2 years) | |
| Asus Strix Scar 17 G733QSA-XS99 | |
| Schenker XMG Neo 17 M22 | |
| MSI Titan GT77 12UHS | |
| Average Intel Core i9-12950HX (37146 - 57340, n=7) | |
| Asus ROG Strix Scar 17 SE G733CX-LL014W | |
| Lenovo Legion 7 16IAX7-82TD004SGE | |
| Alienware x17 R2 P48E | |
| AIDA64 / CPU AES | |
| MSI Titan GT77 12UHS | |
| Asus ROG Strix Scar 17 SE G733CX-LL014W | |
| Schenker XMG Neo 17 M22 | |
| Asus Strix Scar 17 G733QSA-XS99 | |
| Lenovo Legion 7 16IAX7-82TD004SGE | |
| Average Intel Core i9-12950HX (72599 - 181128, n=7) | |
| Average of class Gaming (39258 - 247074, n=105, last 2 years) | |
| Alienware x17 R2 P48E | |
| AIDA64 / CPU ZLib | |
| Average of class Gaming (574 - 2531, n=105, last 2 years) | |
| Lenovo Legion 7 16IAX7-82TD004SGE | |
| MSI Titan GT77 12UHS | |
| Asus ROG Strix Scar 17 SE G733CX-LL014W | |
| Alienware x17 R2 P48E | |
| Average Intel Core i9-12950HX (996 - 1417, n=7) | |
| Asus Strix Scar 17 G733QSA-XS99 | |
| Schenker XMG Neo 17 M22 | |
| AIDA64 / FP64 Ray-Trace | |
| Average of class Gaming (5509 - 45446, n=105, last 2 years) | |
| MSI Titan GT77 12UHS | |
| Average Intel Core i9-12950HX (8455 - 12432, n=7) | |
| Asus ROG Strix Scar 17 SE G733CX-LL014W | |
| Asus Strix Scar 17 G733QSA-XS99 | |
| Schenker XMG Neo 17 M22 | |
| Lenovo Legion 7 16IAX7-82TD004SGE | |
| Alienware x17 R2 P48E | |
| AIDA64 / CPU PhotoWorxx | |
| Average of class Gaming (12271 - 89891, n=105, last 2 years) | |
| Asus ROG Strix Scar 17 SE G733CX-LL014W | |
| MSI Titan GT77 12UHS | |
| Average Intel Core i9-12950HX (35479 - 42655, n=7) | |
| Lenovo Legion 7 16IAX7-82TD004SGE | |
| Alienware x17 R2 P48E | |
| Schenker XMG Neo 17 M22 | |
| Asus Strix Scar 17 G733QSA-XS99 | |
系统性能
主观性能印象很好,这也被良好的基准测试结果所证实。在测试过程中,我们完全没有注意到任何问题。
CrossMark: Overall | Productivity | Creativity | Responsiveness
| PCMark 10 / Score | |
| Lenovo Legion 7 16IAX7-82TD004SGE | |
| Average of class Gaming (5828 - 11574, n=94, last 2 years) | |
| MSI Titan GT77 12UHS | |
| Alienware x17 R2 P48E | |
| Asus ROG Strix Scar 17 SE G733CX-LL014W | |
| Average Intel Core i9-12950HX, NVIDIA GeForce RTX 3080 Ti Laptop GPU (n=1) | |
| Asus Strix Scar 17 G733QSA-XS99 | |
| Schenker XMG Neo 17 M22 | |
| PCMark 10 / Essentials | |
| Alienware x17 R2 P48E | |
| Lenovo Legion 7 16IAX7-82TD004SGE | |
| MSI Titan GT77 12UHS | |
| Average of class Gaming (8810 - 11935, n=98, last 2 years) | |
| Asus Strix Scar 17 G733QSA-XS99 | |
| Asus ROG Strix Scar 17 SE G733CX-LL014W | |
| Average Intel Core i9-12950HX, NVIDIA GeForce RTX 3080 Ti Laptop GPU (n=1) | |
| Schenker XMG Neo 17 M22 | |
| PCMark 10 / Productivity | |
| Average of class Gaming (6845 - 21327, n=96, last 2 years) | |
| Lenovo Legion 7 16IAX7-82TD004SGE | |
| MSI Titan GT77 12UHS | |
| Alienware x17 R2 P48E | |
| Asus ROG Strix Scar 17 SE G733CX-LL014W | |
| Average Intel Core i9-12950HX, NVIDIA GeForce RTX 3080 Ti Laptop GPU (n=1) | |
| Asus Strix Scar 17 G733QSA-XS99 | |
| Schenker XMG Neo 17 M22 | |
| PCMark 10 / Digital Content Creation | |
| Lenovo Legion 7 16IAX7-82TD004SGE | |
| Average of class Gaming (7602 - 19657, n=96, last 2 years) | |
| MSI Titan GT77 12UHS | |
| Alienware x17 R2 P48E | |
| Asus ROG Strix Scar 17 SE G733CX-LL014W | |
| Average Intel Core i9-12950HX, NVIDIA GeForce RTX 3080 Ti Laptop GPU (n=1) | |
| Asus Strix Scar 17 G733QSA-XS99 | |
| Schenker XMG Neo 17 M22 | |
| CrossMark / Overall | |
| Lenovo Legion 7 16IAX7-82TD004SGE | |
| Asus ROG Strix Scar 17 SE G733CX-LL014W | |
| Average Intel Core i9-12950HX, NVIDIA GeForce RTX 3080 Ti Laptop GPU (n=1) | |
| MSI Titan GT77 12UHS | |
| Average of class Gaming (1366 - 2409, n=94, last 2 years) | |
| Alienware x17 R2 P48E | |
| Schenker XMG Neo 17 M22 | |
| CrossMark / Productivity | |
| Lenovo Legion 7 16IAX7-82TD004SGE | |
| MSI Titan GT77 12UHS | |
| Asus ROG Strix Scar 17 SE G733CX-LL014W | |
| Average Intel Core i9-12950HX, NVIDIA GeForce RTX 3080 Ti Laptop GPU (n=1) | |
| Average of class Gaming (1386 - 2254, n=94, last 2 years) | |
| Alienware x17 R2 P48E | |
| Schenker XMG Neo 17 M22 | |
| CrossMark / Creativity | |
| Asus ROG Strix Scar 17 SE G733CX-LL014W | |
| Average Intel Core i9-12950HX, NVIDIA GeForce RTX 3080 Ti Laptop GPU (n=1) | |
| Lenovo Legion 7 16IAX7-82TD004SGE | |
| MSI Titan GT77 12UHS | |
| Average of class Gaming (1343 - 2729, n=94, last 2 years) | |
| Alienware x17 R2 P48E | |
| Schenker XMG Neo 17 M22 | |
| CrossMark / Responsiveness | |
| Lenovo Legion 7 16IAX7-82TD004SGE | |
| MSI Titan GT77 12UHS | |
| Asus ROG Strix Scar 17 SE G733CX-LL014W | |
| Average Intel Core i9-12950HX, NVIDIA GeForce RTX 3080 Ti Laptop GPU (n=1) | |
| Average of class Gaming (1226 - 2334, n=94, last 2 years) | |
| Alienware x17 R2 P48E | |
| Schenker XMG Neo 17 M22 | |
| PCMark 10 Score | 7208 points | |
Help | ||
| AIDA64 / Memory Copy | |
| Average of class Gaming (21750 - 129946, n=105, last 2 years) | |
| MSI Titan GT77 12UHS | |
| Lenovo Legion 7 16IAX7-82TD004SGE | |
| Asus ROG Strix Scar 17 SE G733CX-LL014W | |
| Average Intel Core i9-12950HX (59731 - 64732, n=7) | |
| Alienware x17 R2 P48E | |
| Schenker XMG Neo 17 M22 | |
| Asus Strix Scar 17 G733QSA-XS99 | |
| AIDA64 / Memory Read | |
| Average of class Gaming (22956 - 118858, n=105, last 2 years) | |
| Lenovo Legion 7 16IAX7-82TD004SGE | |
| Asus ROG Strix Scar 17 SE G733CX-LL014W | |
| Average Intel Core i9-12950HX (59744 - 70359, n=7) | |
| MSI Titan GT77 12UHS | |
| Alienware x17 R2 P48E | |
| Schenker XMG Neo 17 M22 | |
| Asus Strix Scar 17 G733QSA-XS99 | |
| AIDA64 / Memory Write | |
| Average of class Gaming (22297 - 135096, n=105, last 2 years) | |
| Asus ROG Strix Scar 17 SE G733CX-LL014W | |
| Lenovo Legion 7 16IAX7-82TD004SGE | |
| Average Intel Core i9-12950HX (57750 - 67899, n=7) | |
| MSI Titan GT77 12UHS | |
| Schenker XMG Neo 17 M22 | |
| Alienware x17 R2 P48E | |
| Asus Strix Scar 17 G733QSA-XS99 | |
| AIDA64 / Memory Latency | |
| Average of class Gaming (75.3 - 259, n=105, last 2 years) | |
| Alienware x17 R2 P48E | |
| Schenker XMG Neo 17 M22 | |
| MSI Titan GT77 12UHS | |
| Average Intel Core i9-12950HX (84.5 - 92.2, n=7) | |
| Lenovo Legion 7 16IAX7-82TD004SGE | |
| Asus ROG Strix Scar 17 SE G733CX-LL014W | |
| Asus Strix Scar 17 G733QSA-XS99 | |
* ... smaller is better
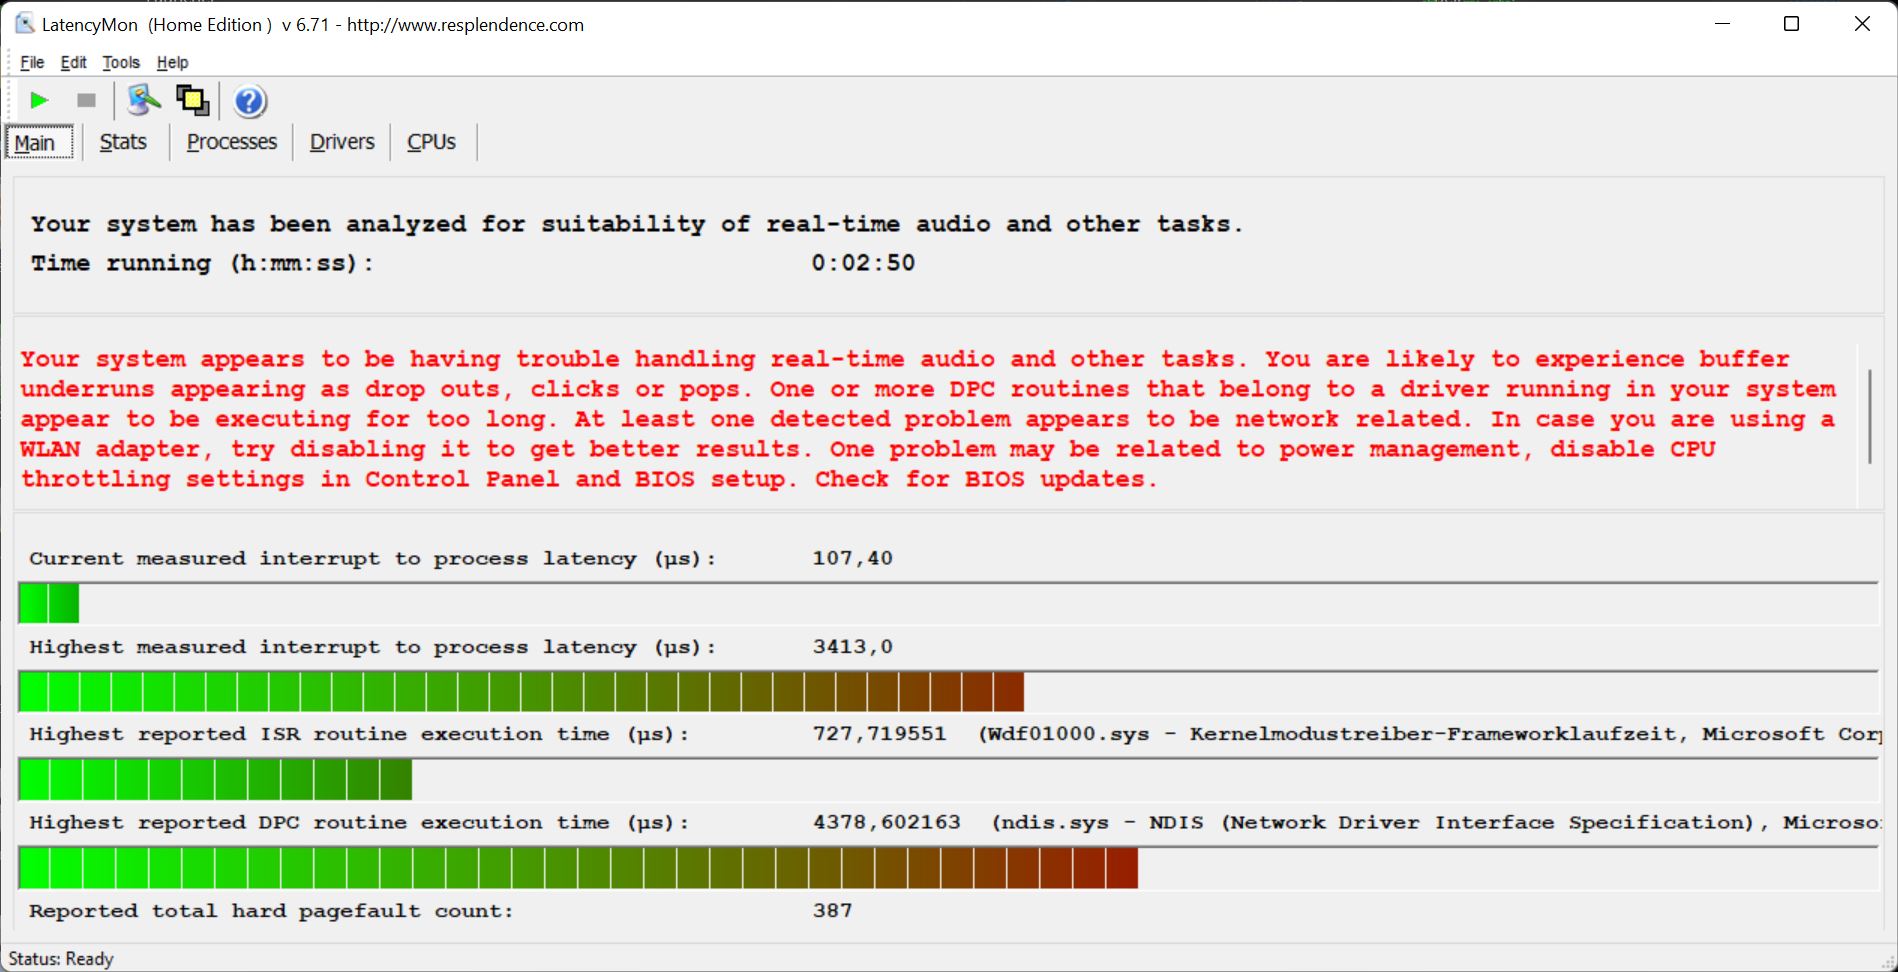
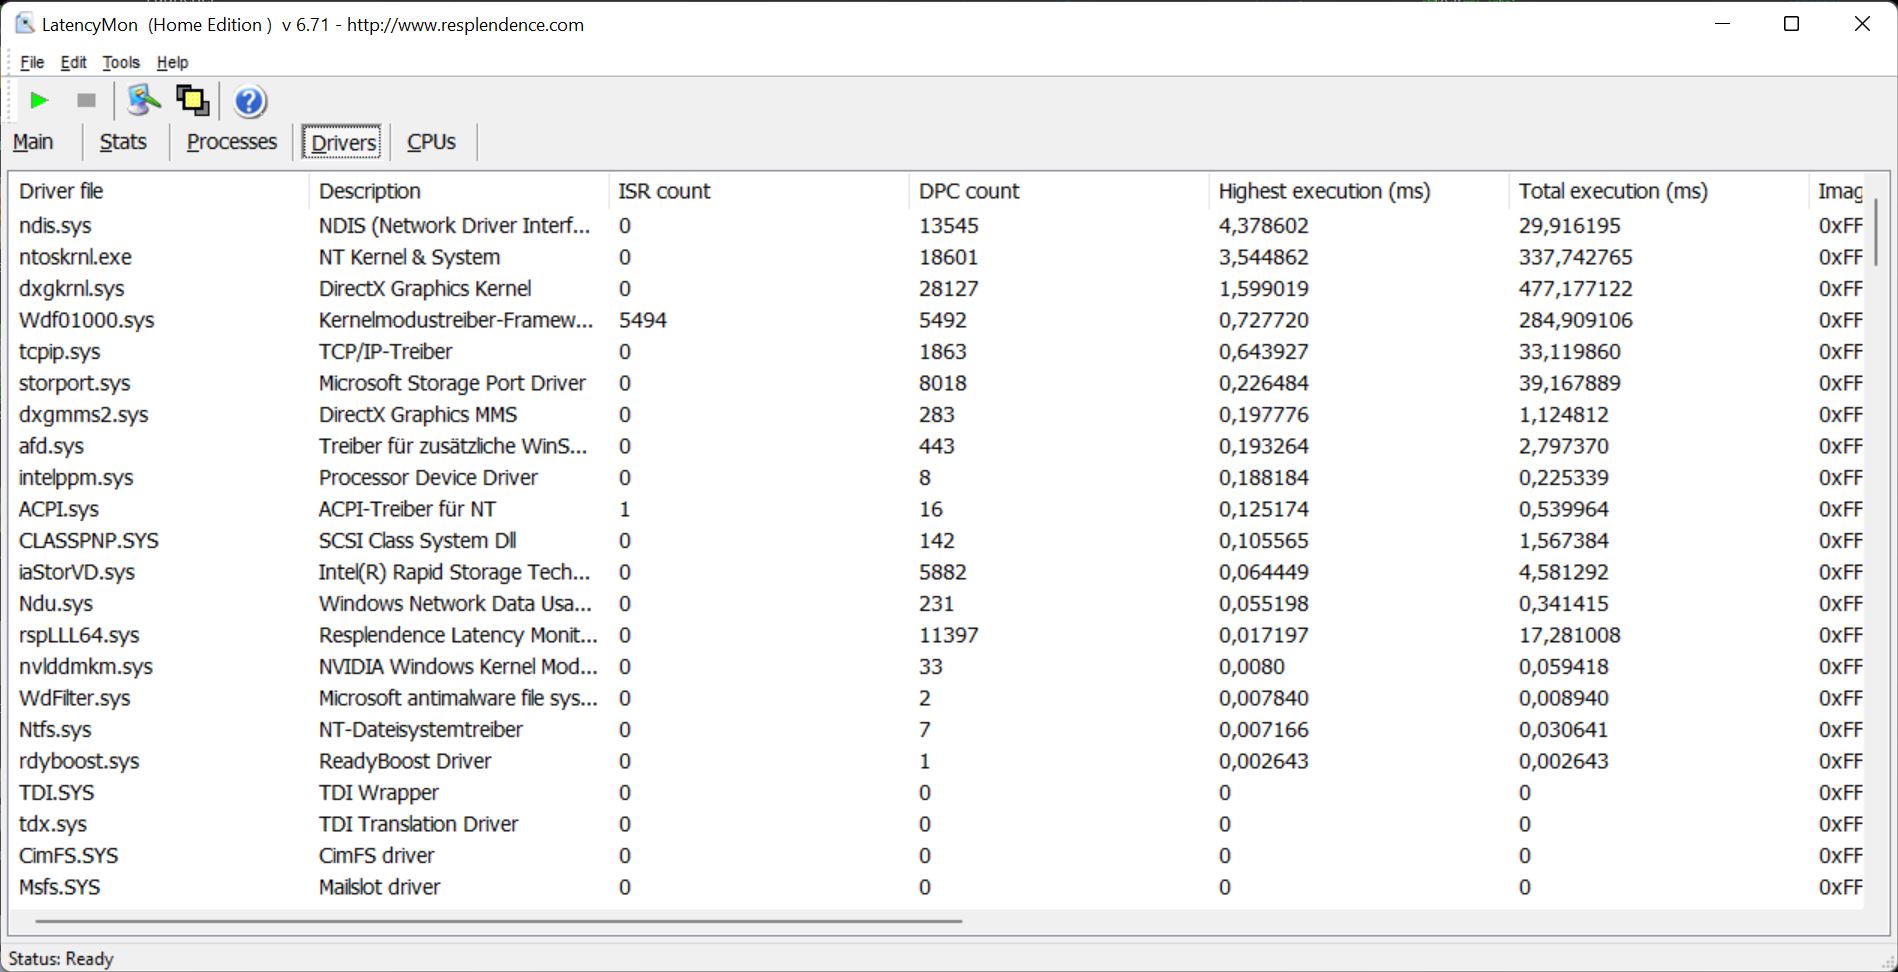
DPC延迟
在我们的标准化延迟测试中(上网,4K YouTube视频,CPU负载),我们的测试装置与其BIOS版本有一些问题,所以它不适合实时视频和音频处理。
| DPC Latencies / LatencyMon - interrupt to process latency (max), Web, Youtube, Prime95 | |
| Schenker XMG Neo 17 M22 | |
| Asus ROG Strix Scar 17 SE G733CX-LL014W | |
| MSI Titan GT77 12UHS | |
| MSI Titan GT77 12UHS | |
| Lenovo Legion 7 16IAX7-82TD004SGE | |
| Alienware x17 R2 P48E | |
| Asus Strix Scar 17 G733QSA-XS99 | |
* ... smaller is better
存储解决方案
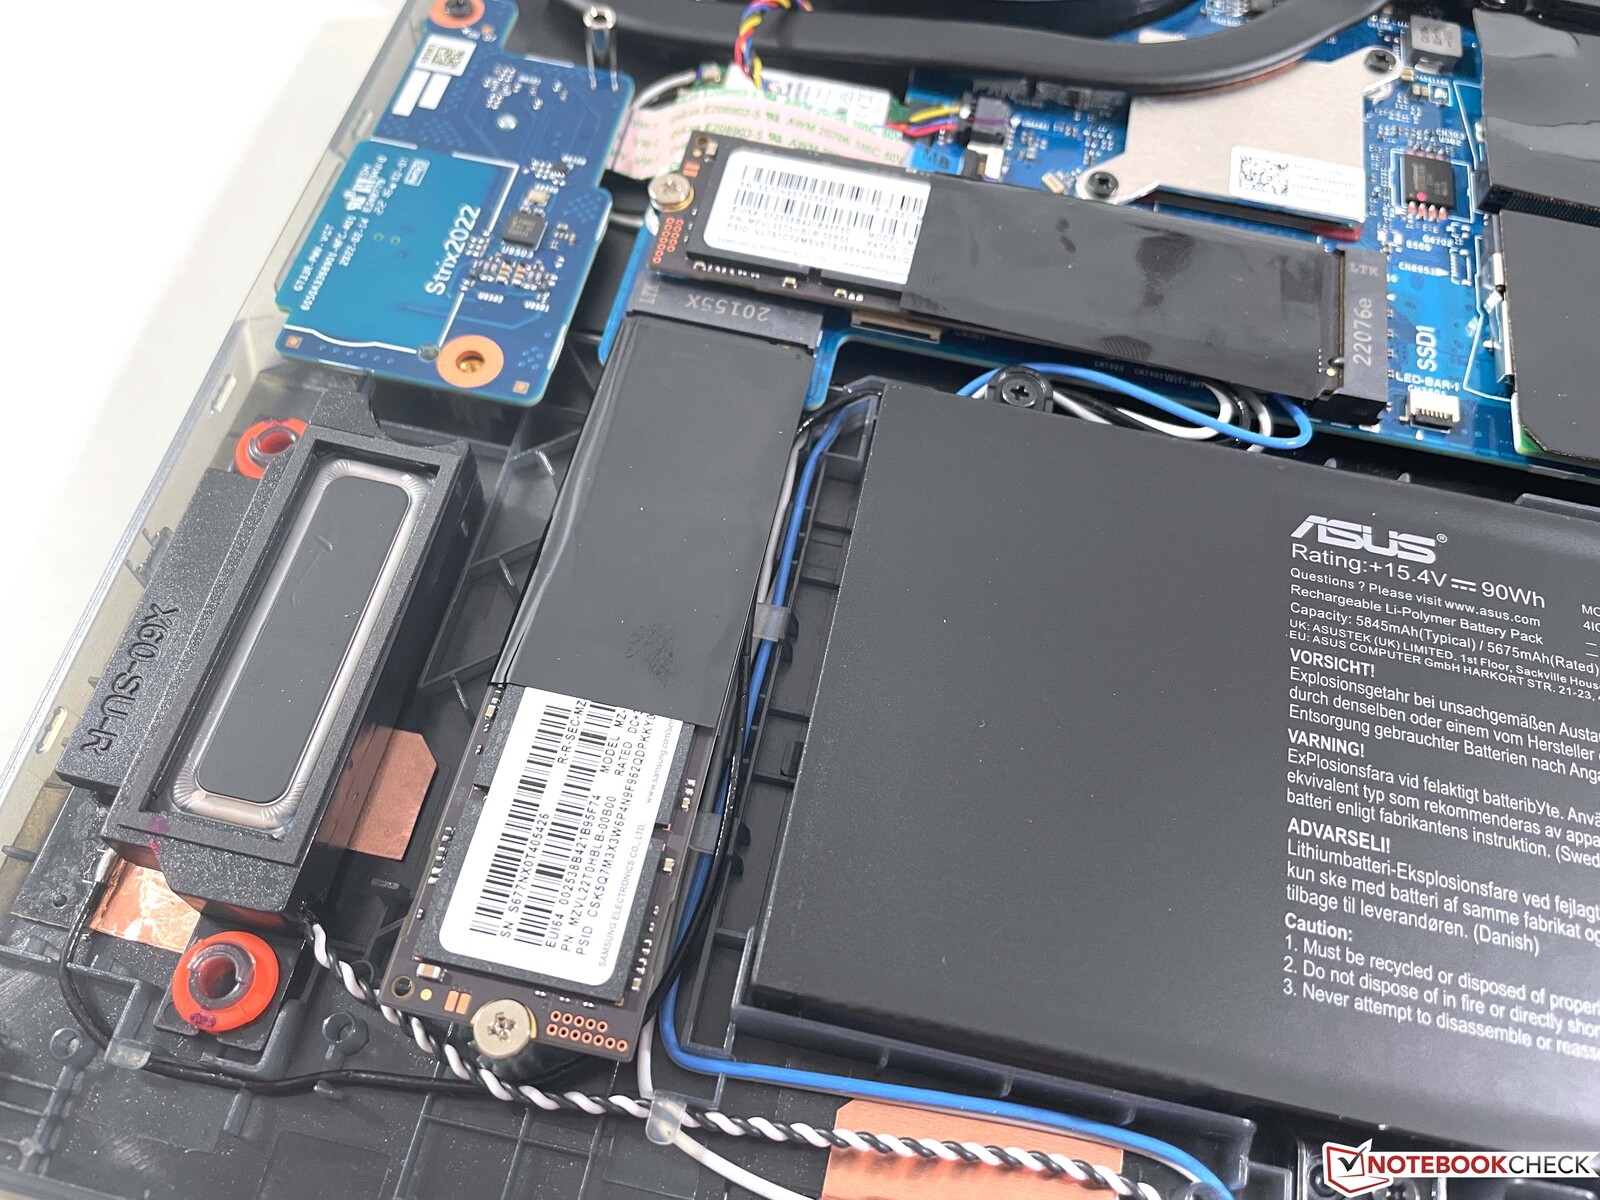
华硕在这里使用了两个来自三星的快速2TB固态硬盘(PM91A)的RAID 0配置。这允许超过10GB/s的极高传输率。然而,在恒定的负载下,性能并不稳定,反而大量下降。但这在日常游戏中不应该造成任何限制。你可以找到更多的SSD基准测试 这里.

* ... smaller is better
Disk Throttling: DiskSpd Read Loop, Queue Depth 8
图形卡
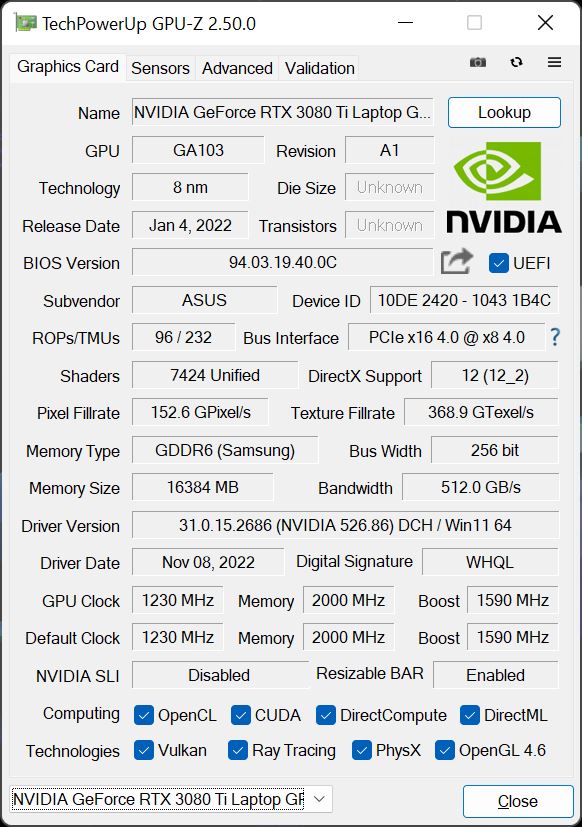
华硕使用GeForce RTX 3080 Ti版本,其TGP为150瓦,而且GPU还能使用处理器的额外25瓦动态提升。它在性能模式下也能达到这个数值(175瓦),所以没有必要使用涡轮模式。还有一个MUX,允许你完全停用集成GPU(需要重新启动),这可以改善游戏时的延迟,但对图形性能本身没有太大影响。
图形性能属于顶级性能组,也高于我们数据库中RTX 3080 Ti的平均数值。此外,图形性能保持完全稳定。3DMarkTime Spy 压力测试顺利通过,在我们的TheWitcher 3 恒定负载测试中也没有性能下降。游戏性能很容易满足原生QHD分辨率下的最大细节,即使在要求很高的游戏中也是如此。
在电池操作中,允许GPU最大消耗44瓦,这相当于性能下降了约70%。你可以在这里找到额外的GPU基准测试移动显示芯片——基准测试成绩列表 。
| 3DMark 11 Performance | 35997 points | |
| 3DMark Fire Strike Score | 28793 points | |
| 3DMark Time Spy Score | 12904 points | |
Help | ||
| Blender / v3.3 Classroom OPTIX/RTX | |
| Average NVIDIA GeForce RTX 3080 Ti Laptop GPU (20 - 28, n=13) | |
| Lenovo Legion 7 16IAX7-82TD004SGE | |
| Asus ROG Strix Scar 17 SE G733CX-LL014W | |
| MSI Titan GT77 12UHS | |
| Average of class Gaming (9 - 32, n=107, last 2 years) | |
| Blender / v3.3 Classroom CUDA | |
| Lenovo Legion 7 16IAX7-82TD004SGE | |
| Average NVIDIA GeForce RTX 3080 Ti Laptop GPU (32 - 41, n=13) | |
| Average of class Gaming (15 - 233, n=108, last 2 years) | |
| Asus ROG Strix Scar 17 SE G733CX-LL014W | |
| MSI Titan GT77 12UHS | |
| Blender / v3.3 Classroom CPU | |
| Asus ROG Strix Scar 17 SE G733CX-LL014W | |
| Average NVIDIA GeForce RTX 3080 Ti Laptop GPU (261 - 429, n=13) | |
| Lenovo Legion 7 16IAX7-82TD004SGE | |
| MSI Titan GT77 12UHS | |
| Average of class Gaming (122 - 565, n=103, last 2 years) | |
* ... smaller is better
| The Witcher 3 - 1920x1080 Ultra Graphics & Postprocessing (HBAO+) | |
| Average of class Gaming (95 - 240, n=7, last 2 years) | |
| MSI Titan GT77 12UHS | |
| Alienware x17 R2 P48E | |
| Schenker XMG Neo 17 M22 | |
| Asus ROG Strix Scar 17 SE G733CX-LL014W | |
| Lenovo Legion 7 16IAX7-82TD004SGE | |
| Average NVIDIA GeForce RTX 3080 Ti Laptop GPU (30 - 130.6, n=43) | |
| Asus Strix Scar 17 G733QSA-XS99 | |
| F1 22 | |
| 1920x1080 Ultra High Preset AA:T AF:16x | |
| Schenker XMG Neo 17 M22 | |
| Average NVIDIA GeForce RTX 3080 Ti Laptop GPU (78.9 - 91, n=4) | |
| MSI Titan GT77 12UHS | |
| Asus ROG Strix Scar 17 SE G733CX-LL014W | |
| Average of class Gaming (40.1 - 121.2, n=5, last 2 years) | |
| 2560x1440 Ultra High Preset AA:T AF:16x | |
| Schenker XMG Neo 17 M22 | |
| Average NVIDIA GeForce RTX 3080 Ti Laptop GPU (52.9 - 62, n=2) | |
| Average of class Gaming (42 - 77.8, n=3, last 2 years) | |
| Asus ROG Strix Scar 17 SE G733CX-LL014W | |
The Witcher 3 FPS Chart
| low | med. | high | ultra | QHD | |
|---|---|---|---|---|---|
| GTA V (2015) | 186.8 | 180.7 | 126.7 | 114.1 | |
| The Witcher 3 (2015) | 118.8 | ||||
| Dota 2 Reborn (2015) | 211 | 191 | 180.8 | 169.8 | |
| Final Fantasy XV Benchmark (2018) | 173.3 | 156.2 | 118.5 | 92.8 | |
| X-Plane 11.11 (2018) | 165.3 | 143.5 | 116.2 | ||
| Strange Brigade (2018) | 236 | 211 | 157.7 | ||
| F1 2021 (2021) | 236 | 211 | 132.8 | 106.2 | |
| Cyberpunk 2077 1.6 (2022) | 103 | 101 | 98 | 87 | 56 |
| F1 22 (2022) | 235 | 235 | 199.7 | 78.9 | 52.9 |
| Call of Duty Modern Warfare 2 2022 (2022) | 135 | 109 | 107 | 78 |
排放和电源管理
噪声水平
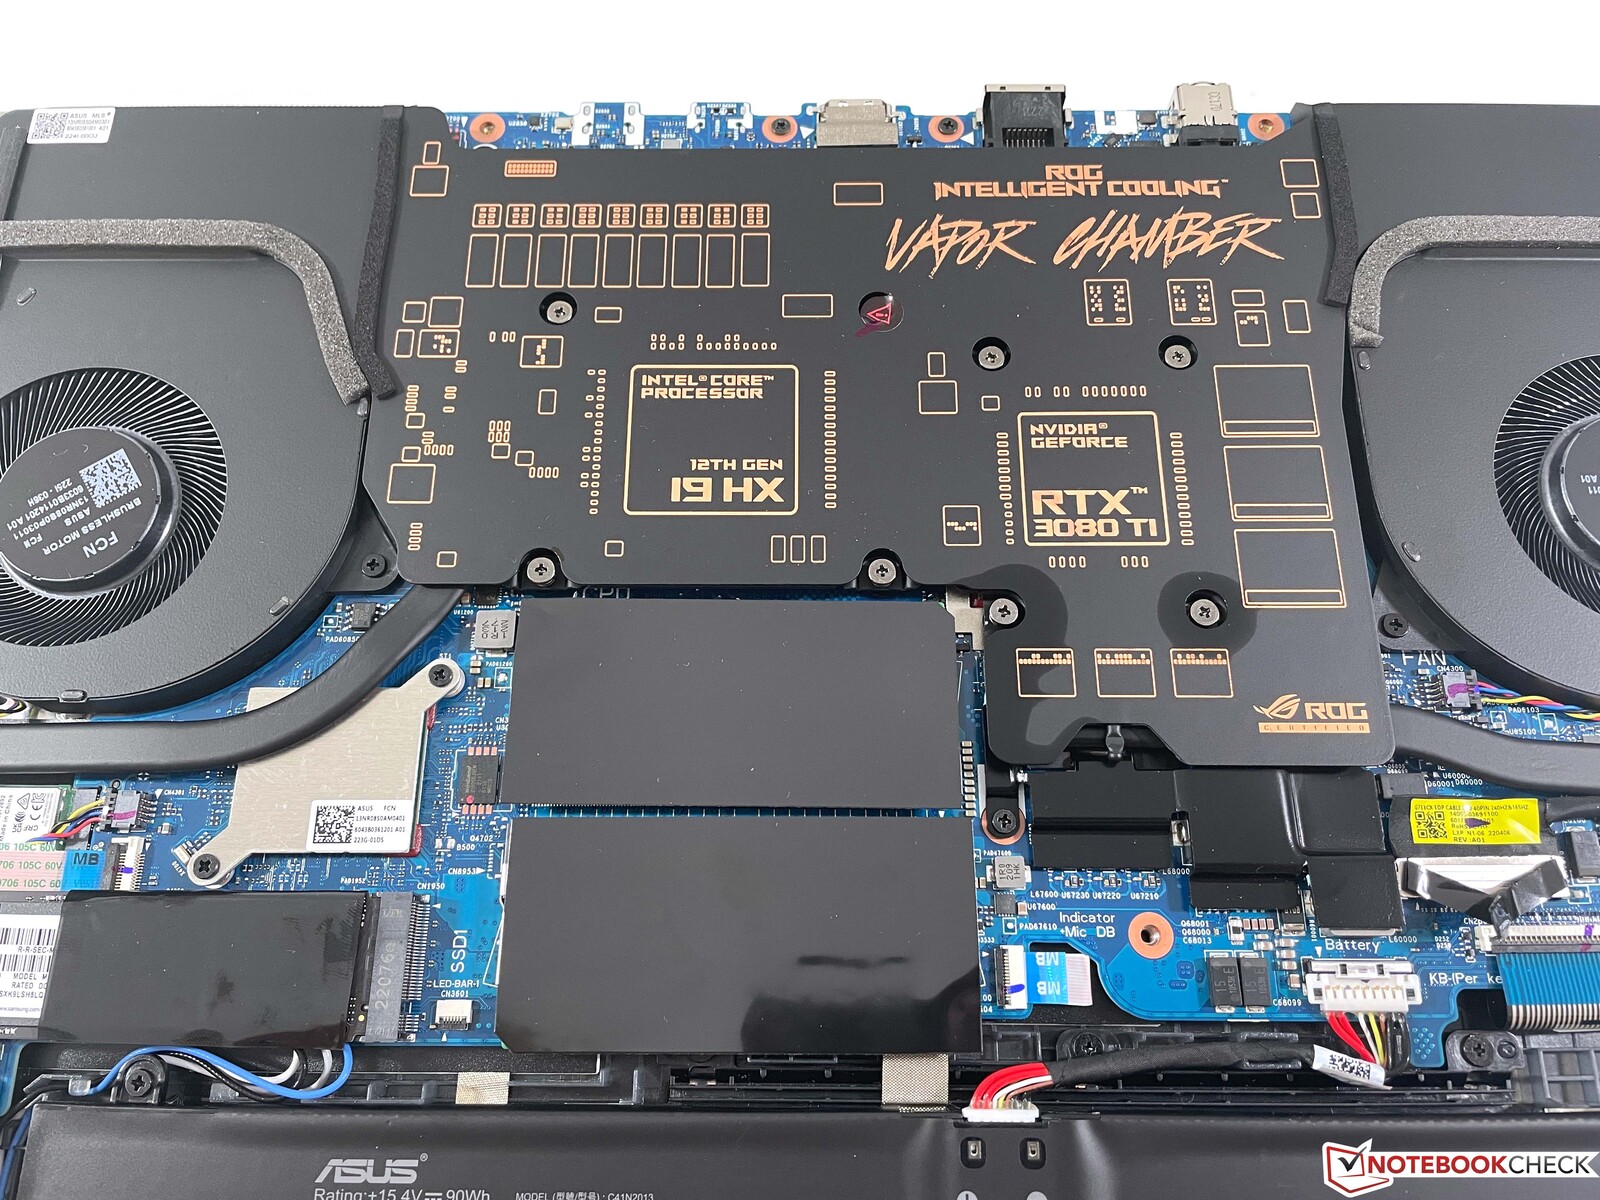
华硕在这里使用了一个蒸气室冷却系统。在高性能电源模式下,该设备也保持相对安静,在压力测试和游戏时,我们能够测量到最大46分贝(A)。当然,这仍然是明显的,但我们的测试设备仍然比竞争对手明显更安静。在Turbo模式下,游戏性能只是微不足道的提高,但两个运行中的风扇产生了54 dB(A)的噪音。在空闲运行时,风扇经常保持关闭状态,但我们几乎总是注意到一些安静的电子噪音。在负载情况下,我们猜测也有一些可听的线圈啸叫声来自GPU。
Noise level
| Idle |
| 23.9 / 23.9 / 23.9 dB(A) |
| Load |
| 34.3 / 45.9 dB(A) |
 | ||
30 dB silent 40 dB(A) audible 50 dB(A) loud |
||
min: | ||
| Asus ROG Strix Scar 17 SE G733CX-LL014W GeForce RTX 3080 Ti Laptop GPU, i9-12950HX, Samsung PM9A1 MZVL22T0HBLB | Lenovo Legion 7 16IAX7-82TD004SGE GeForce RTX 3080 Ti Laptop GPU, i9-12900HX, Micron 3400 1TB MTFDKBA1T0TFH | MSI Titan GT77 12UHS GeForce RTX 3080 Ti Laptop GPU, i9-12900HX, Samsung PM9A1 MZVL21T0HCLR | Schenker XMG Neo 17 M22 GeForce RTX 3080 Ti Laptop GPU, R9 6900HX, Samsung SSD 980 Pro 1TB MZ-V8P1T0BW | Alienware x17 R2 P48E GeForce RTX 3080 Ti Laptop GPU, i9-12900HK, 2x Samsung PM9A1 1TB (RAID 0) | Asus Strix Scar 17 G733QSA-XS99 GeForce RTX 3080 Laptop GPU, R9 5900HX, 2x Samsung PM981a MZVLB1T0HBLR (RAID 0) | |
|---|---|---|---|---|---|---|
| Noise | -19% | -9% | -27% | 1% | -4% | |
| off / environment * (dB) | 23.9 | 24.5 -3% | 21.9 8% | 26 -9% | 22.7 5% | 25 -5% |
| Idle Minimum * (dB) | 23.9 | 24.5 -3% | 24.53 -3% | 26 -9% | 23.1 3% | 25.2 -5% |
| Idle Average * (dB) | 23.9 | 30 -26% | 24.53 -3% | 29 -21% | 23.1 3% | 25.2 -5% |
| Idle Maximum * (dB) | 23.9 | 32.5 -36% | 24.53 -3% | 40 -67% | 23.1 3% | 25.2 -5% |
| Load Average * (dB) | 34.3 | 43.9 -28% | 46.25 -35% | 47 -37% | 31.9 7% | 30.7 10% |
| Load Maximum * (dB) | 45.9 | 54.2 -18% | 54.25 -18% | 54 -18% | 52.5 -14% | 51.3 -12% |
| Witcher 3 ultra * (dB) | 48.8 | 56.86 | 52 | 52.5 | 51.3 |
* ... smaller is better
温度
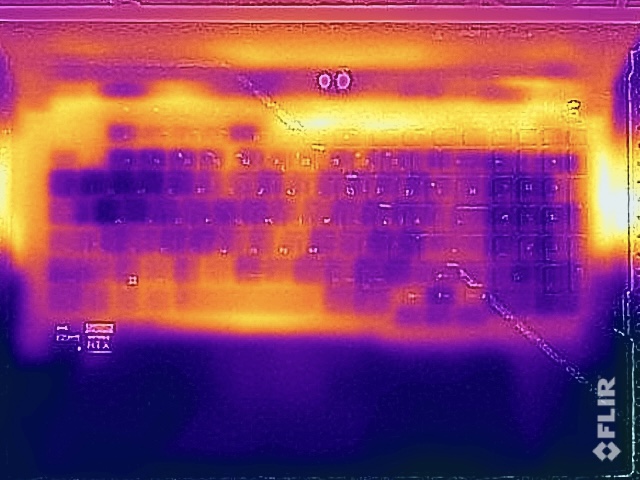
尽管风扇相对安静,但表面温度没有理由让人担心。尽管我们在一些孤立的地方测量到了超过50°C(122°F)的负载,但键盘仍然非常凉爽,在游戏过程中也没有任何限制。
在压力测试中,GPU得到了优先处理,当处理器的功率达到36瓦时,它就稳定地运行在150瓦。在压力测试之后,性能并没有下降。
(-) The maximum temperature on the upper side is 48.8 °C / 120 F, compared to the average of 40.4 °C / 105 F, ranging from 21.2 to 68.8 °C for the class Gaming.
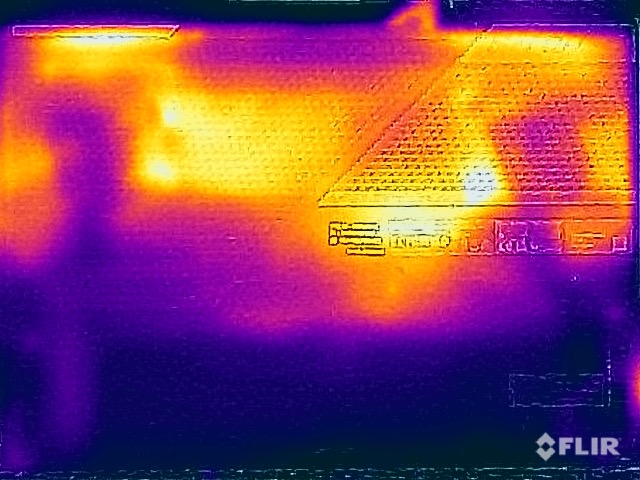
(-) The bottom heats up to a maximum of 52.4 °C / 126 F, compared to the average of 43.2 °C / 110 F
(+) In idle usage, the average temperature for the upper side is 28.6 °C / 83 F, compared to the device average of 33.9 °C / 93 F.
(±) Playing The Witcher 3, the average temperature for the upper side is 35.1 °C / 95 F, compared to the device average of 33.9 °C / 93 F.
(+) The palmrests and touchpad are cooler than skin temperature with a maximum of 26 °C / 78.8 F and are therefore cool to the touch.
(+) The average temperature of the palmrest area of similar devices was 28.8 °C / 83.8 F (+2.8 °C / 5 F).
| Asus ROG Strix Scar 17 SE G733CX-LL014W Intel Core i9-12950HX, NVIDIA GeForce RTX 3080 Ti Laptop GPU | Lenovo Legion 7 16IAX7-82TD004SGE Intel Core i9-12900HX, NVIDIA GeForce RTX 3080 Ti Laptop GPU | MSI Titan GT77 12UHS Intel Core i9-12900HX, NVIDIA GeForce RTX 3080 Ti Laptop GPU | Schenker XMG Neo 17 M22 AMD Ryzen 9 6900HX, NVIDIA GeForce RTX 3080 Ti Laptop GPU | Alienware x17 R2 P48E Intel Core i9-12900HK, NVIDIA GeForce RTX 3080 Ti Laptop GPU | Asus Strix Scar 17 G733QSA-XS99 AMD Ryzen 9 5900HX, NVIDIA GeForce RTX 3080 Laptop GPU | |
|---|---|---|---|---|---|---|
| Heat | -8% | -3% | 1% | 7% | 4% | |
| Maximum Upper Side * (°C) | 48.8 | 44.4 9% | 40.8 16% | 49 -0% | 49.6 -2% | 40 18% |
| Maximum Bottom * (°C) | 52.4 | 60.8 -16% | 52.4 -0% | 52 1% | 42.4 19% | 39.8 24% |
| Idle Upper Side * (°C) | 30.4 | 33.8 -11% | 34.6 -14% | 30 1% | 29.2 4% | 34.6 -14% |
| Idle Bottom * (°C) | 34.1 | 38.8 -14% | 38.4 -13% | 33 3% | 32 6% | 38.4 -13% |
* ... smaller is better
发言人
该音响系统由总共四个模块组成,能产生强大而宽敞的声音。尽管扬声器不是市场上最响亮的,但总体来说质量非常好。然而,由于游戏时的风扇噪音很大,我们仍然建议使用耳机。
Asus ROG Strix Scar 17 SE G733CX-LL014W audio analysis
(±) | speaker loudness is average but good (73.3 dB)
Bass 100 - 315 Hz
(±) | reduced bass - on average 6.2% lower than median
(±) | linearity of bass is average (7.5% delta to prev. frequency)
Mids 400 - 2000 Hz
(+) | balanced mids - only 2% away from median
(+) | mids are linear (3.9% delta to prev. frequency)
Highs 2 - 16 kHz
(+) | balanced highs - only 3.5% away from median
(±) | linearity of highs is average (9.3% delta to prev. frequency)
Overall 100 - 16.000 Hz
(+) | overall sound is linear (13.6% difference to median)
Compared to same class
» 20% of all tested devices in this class were better, 7% similar, 73% worse
» The best had a delta of 6%, average was 18%, worst was 132%
Compared to all devices tested
» 15% of all tested devices were better, 4% similar, 82% worse
» The best had a delta of 4%, average was 23%, worst was 134%
MSI Titan GT77 12UHS audio analysis
(+) | speakers can play relatively loud (83.4 dB)
Bass 100 - 315 Hz
(-) | nearly no bass - on average 71.8% lower than median
(+) | bass is linear (0% delta to prev. frequency)
Mids 400 - 2000 Hz
(-) | nearly no mids - on average 71.8% lower than median
(+) | mids are linear (0% delta to prev. frequency)
Highs 2 - 16 kHz
(-) | nearly no highs - on average 71.8% lower than median
(+) | highs are linear (0% delta to prev. frequency)
Overall 100 - 16.000 Hz
(-) | overall sound is not linear (107.7% difference to median)
Compared to same class
» 100% of all tested devices in this class were better, 0% similar, 0% worse
» The best had a delta of 6%, average was 18%, worst was 132%
Compared to all devices tested
» 96% of all tested devices were better, 0% similar, 4% worse
» The best had a delta of 4%, average was 23%, worst was 134%
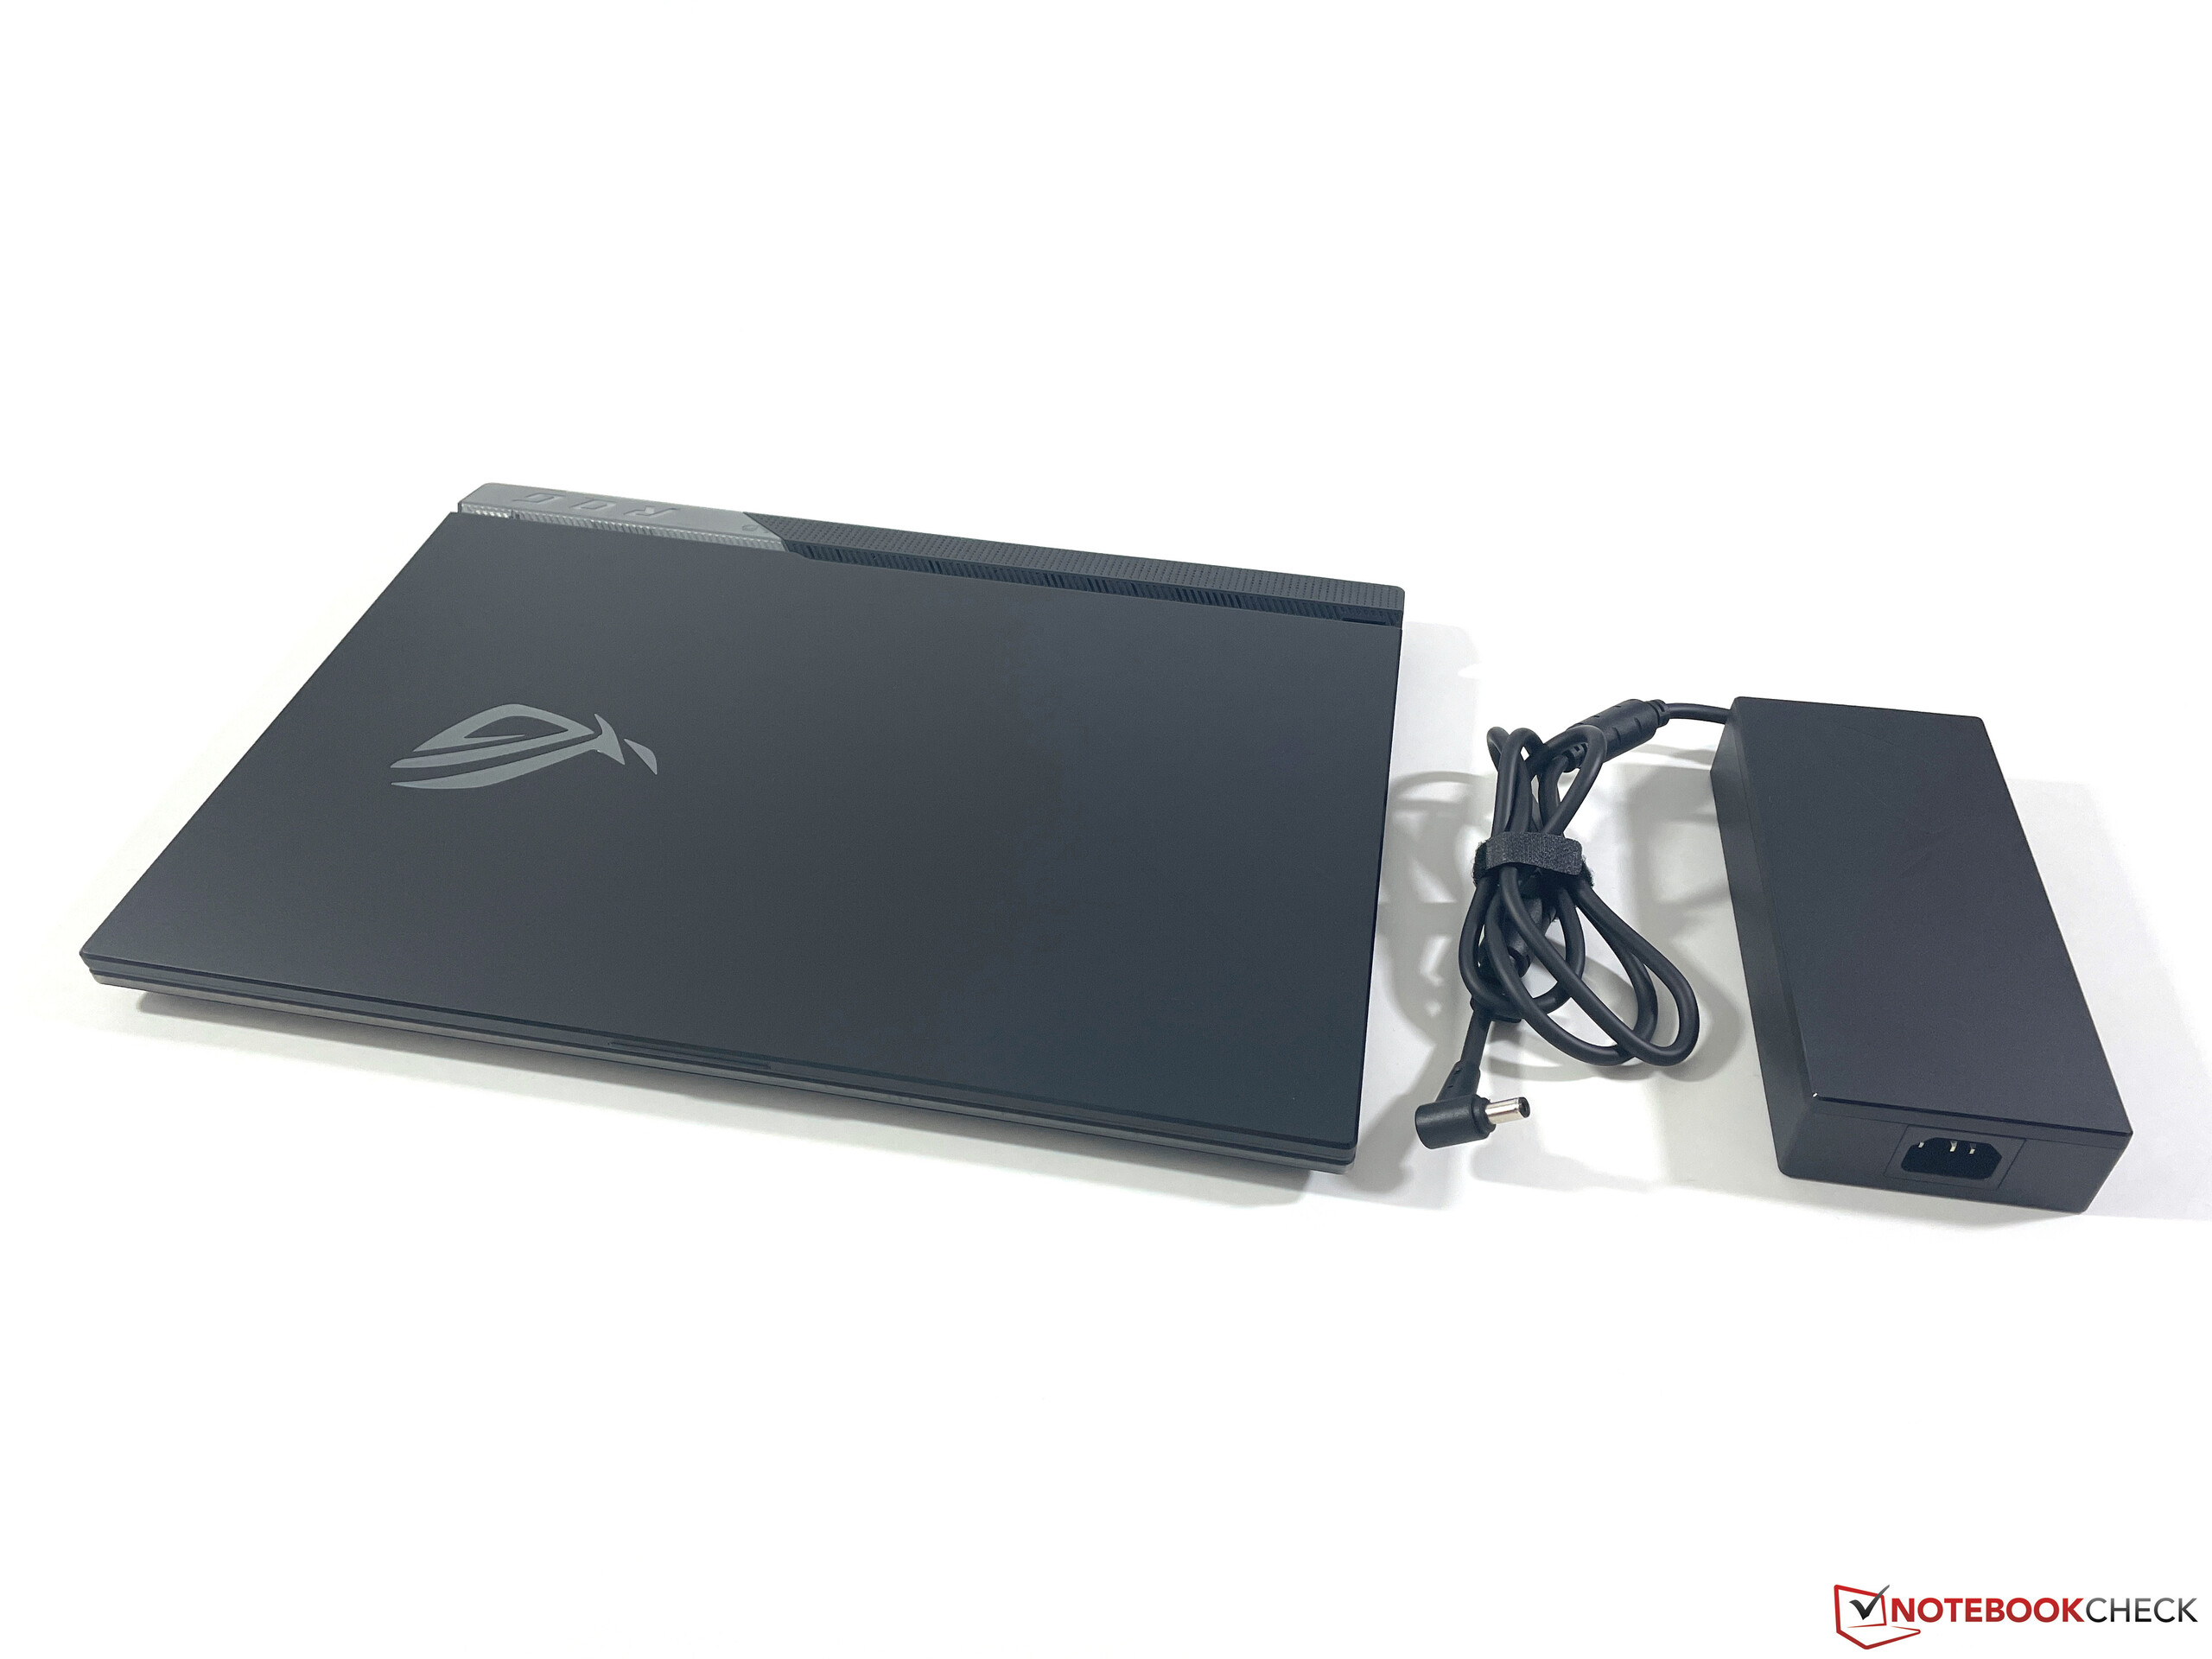
消耗功率
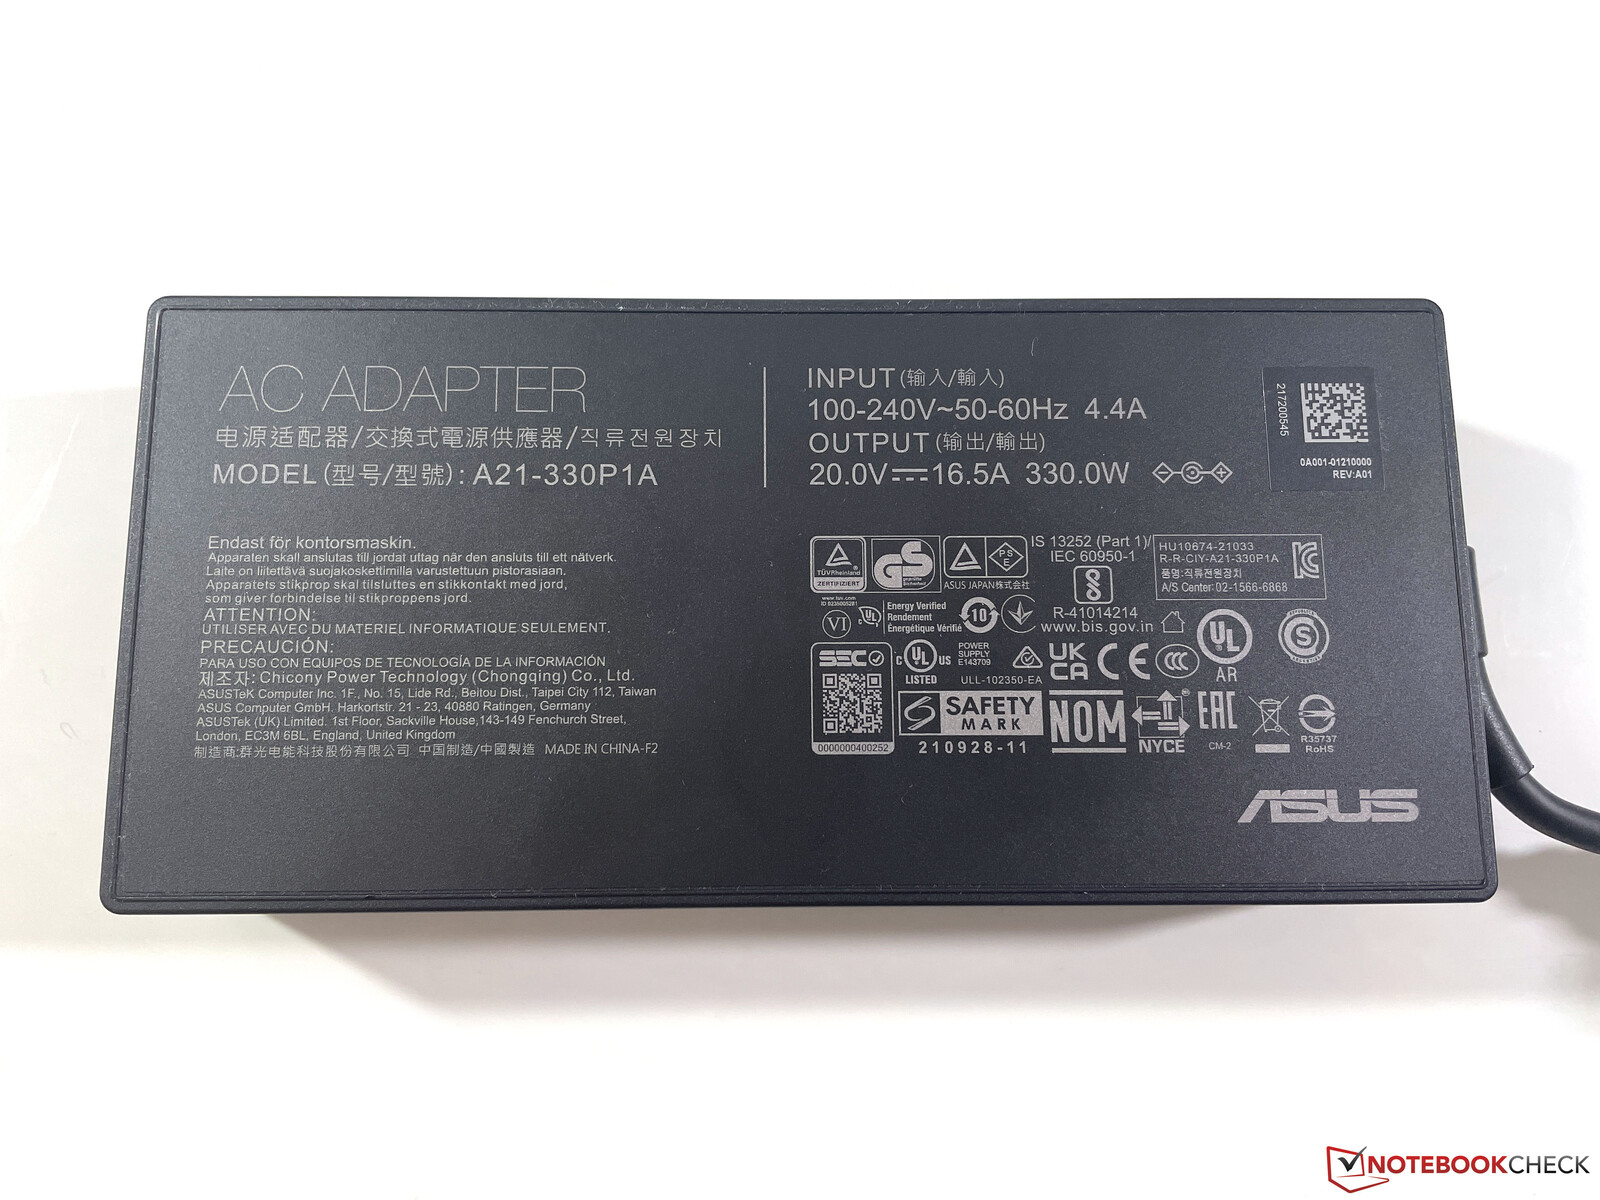
ROG Strix Scar 17 SE并不是一个非常高效的笔记本电脑,考虑到强大的硬件,这并不十分令人惊讶。我们已经测量到空闲运行时的功率高达27瓦,而在游戏时,该值增加到约230瓦。因此,330瓦的电源已经足够大了。待机消耗也相当高,为2.6瓦,但这是由于默认激活的照明效果。
| Off / Standby | |
| Idle | |
| Load |
|
Key:
min: | |
Power Consumption The Witcher 3 / Stress Test
Power Consumption With External Monitor
电池寿命
在我们的WLAN运行时间测试中,在150cd/m²(相当于最大亮度的48%)下,我们的测试设备只持续了约4小时。考虑到高消耗值,这并不十分令人惊讶。一些竞争对手在这里持续的时间明显更长,如果你需要弥补离开插座的时间。游戏可以持续一小时左右,但性能会有明显下降。完全为90瓦时的电池充电需要大约100分钟,大约53分钟后,80%的容量已经可用。
Pros
Cons
结论 - 一个装备齐全的快速游戏笔记本电脑
目前,华硕ROG Strix Scar 17 SE提供了真正的一切游戏玩家的心愿。一个快速的QHD面板,240赫兹,加上GeForce RTX 3080 Ti,这也为原生分辨率的最大细节提供了足够的动力。虽然CPU性能对于游戏笔记本来说也很好,但HX处理器的潜力不能完全发挥。因此,你应该为自己省去购买更强大的处理器的额外溢价,直接选择普通的Core i9。
其他优点包括非常准确的色彩,如果你必须直接进行视频处理,例如,适度的表面温度,以及游戏期间相对安静的风扇。虽然有一个涡轮模式,它也会变得非常响亮,但这对游戏性能没有太大的影响,所以在我们看来,这并不值得。
新的华硕ROG Strix Scar 17 SE提供了大量的性能和游戏功能,但你应该节省英特尔HX处理器的额外溢价。
游戏市场上的竞争对手提供类似的性能规格,但也有更明亮的显示器部分和不那么华丽的外壳。此外,从长远来看,电子噪音会变得很烦人。
价格和可用性
我们的测试配置ROG Strix Scar 17 SE可从亚马逊,售价3899美元和一个较小的配置,与常规的酷睿i9-12900H也可在那里$2278.
Asus ROG Strix Scar 17 SE G733CX-LL014W
- 11/18/2022 v7 (old)
Andreas Osthoff
Price comparison

