微星Titan GT77 12UHS 4K评论。UHD DTR笔记本电脑中的精英
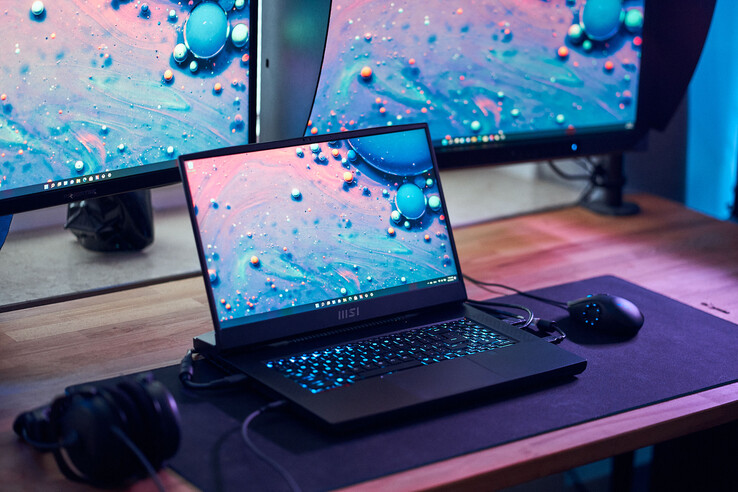
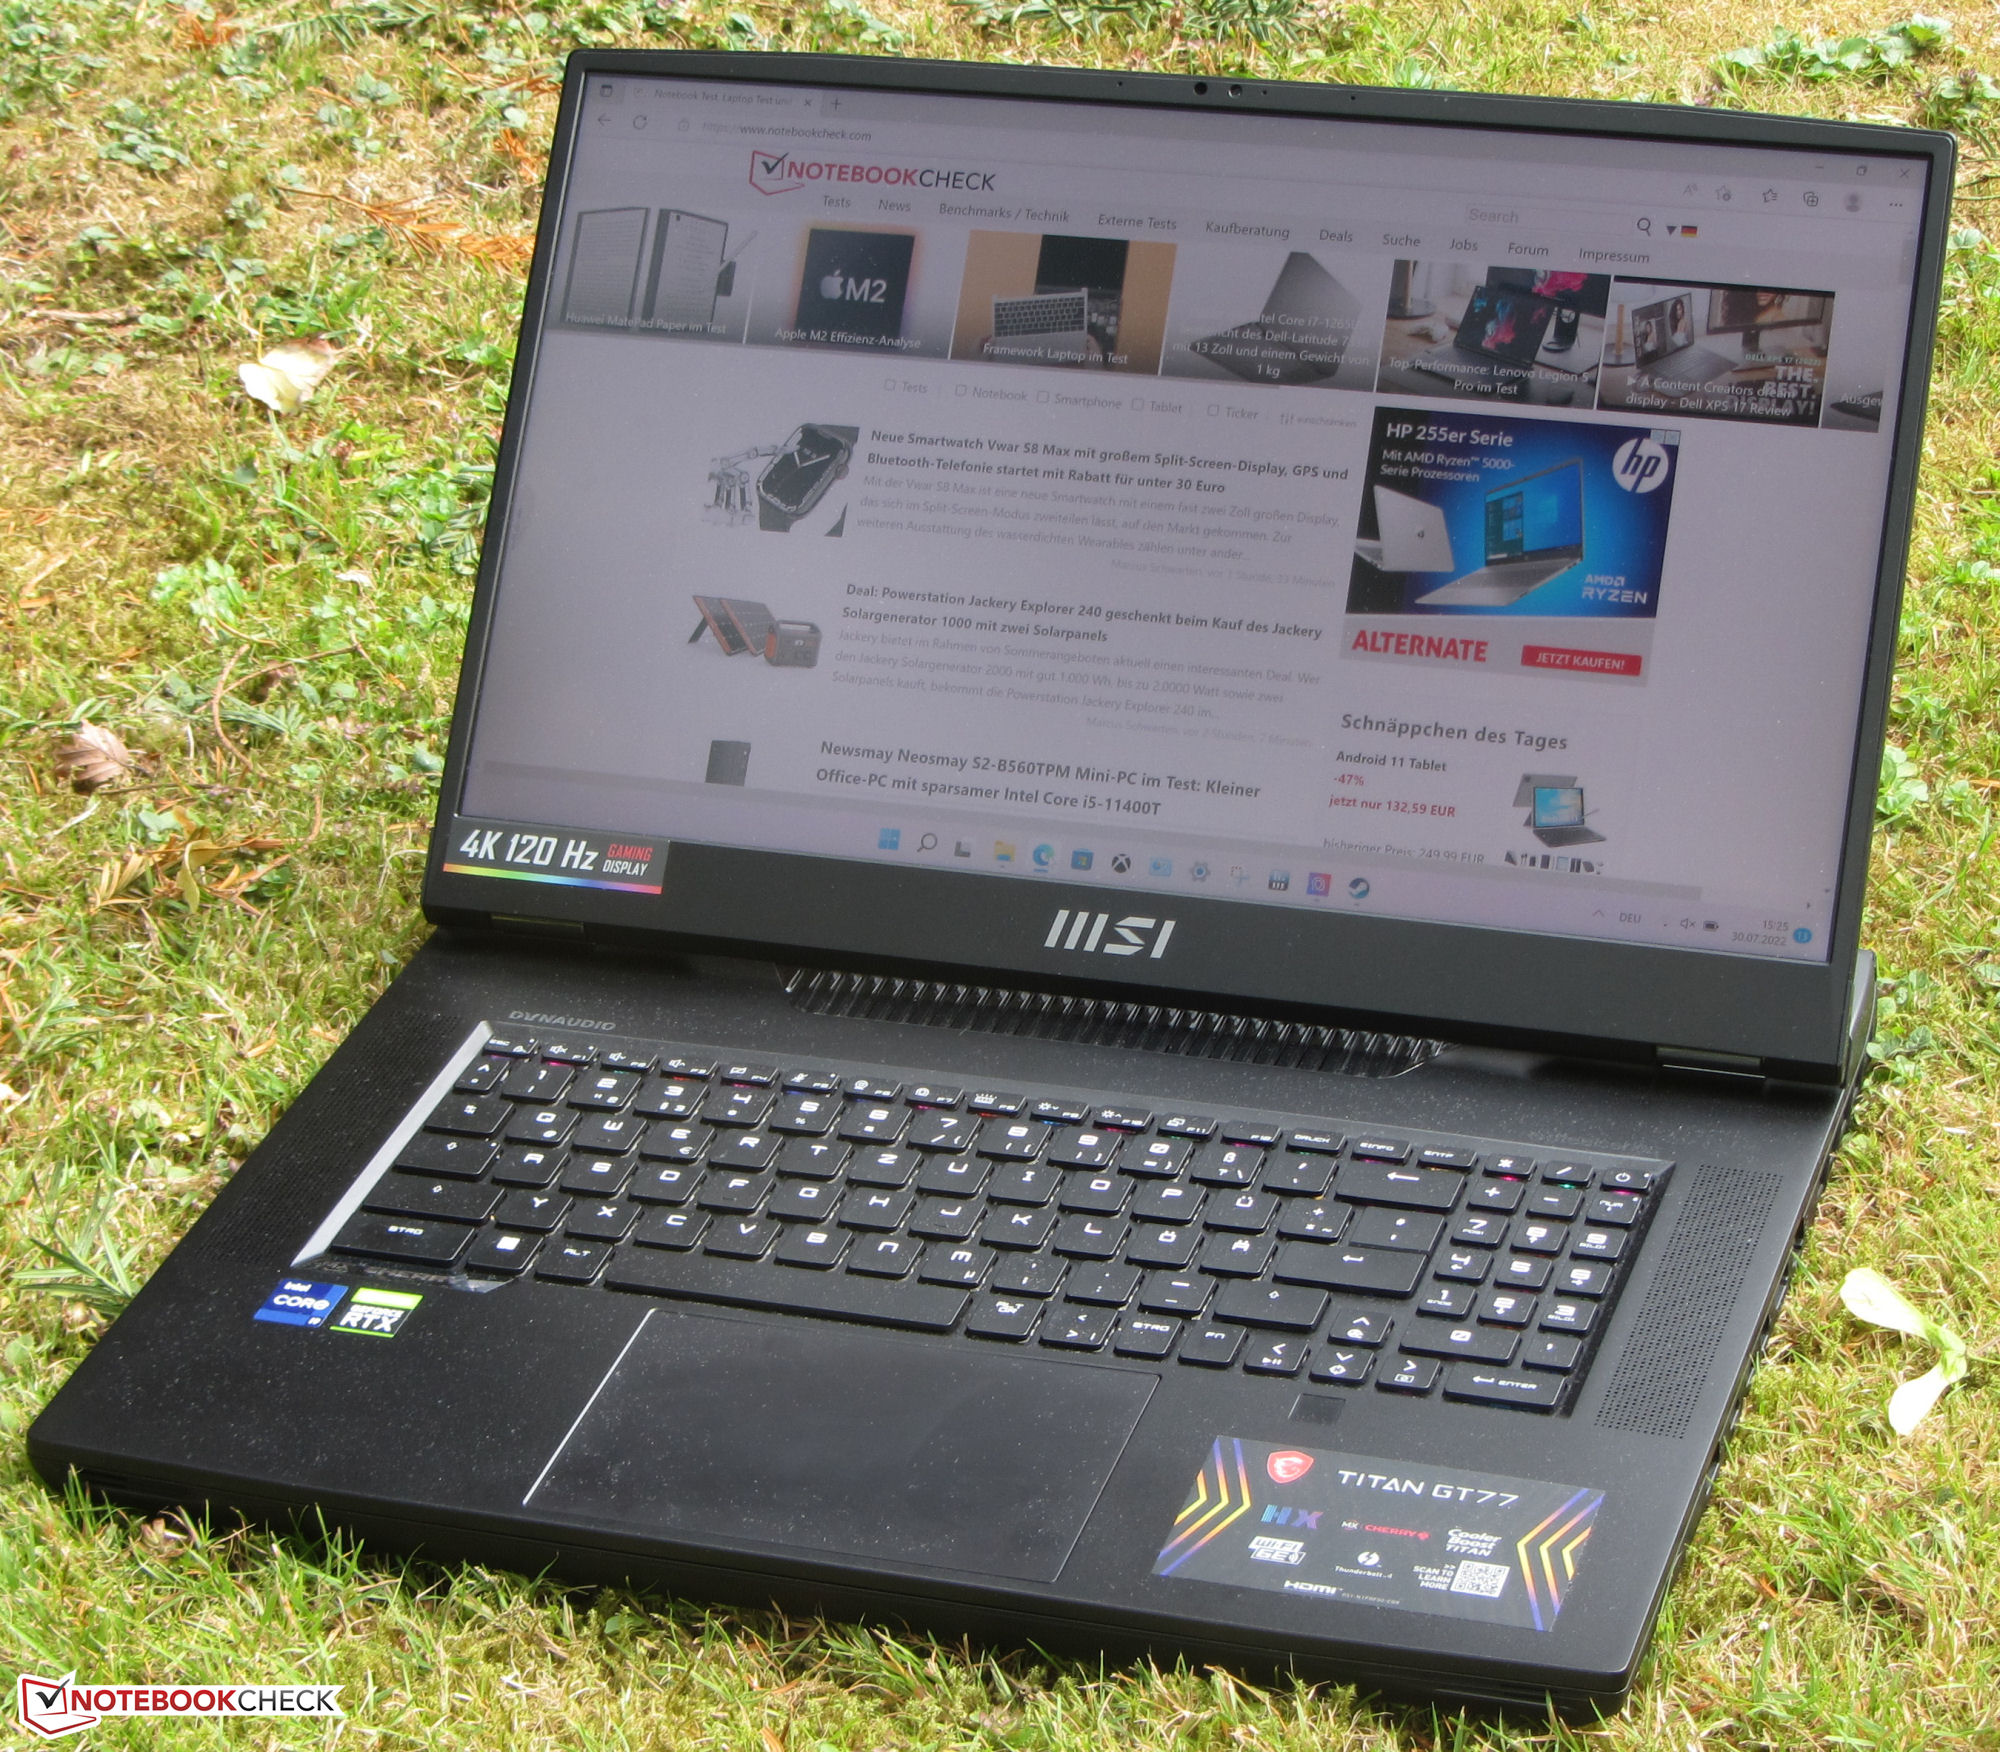
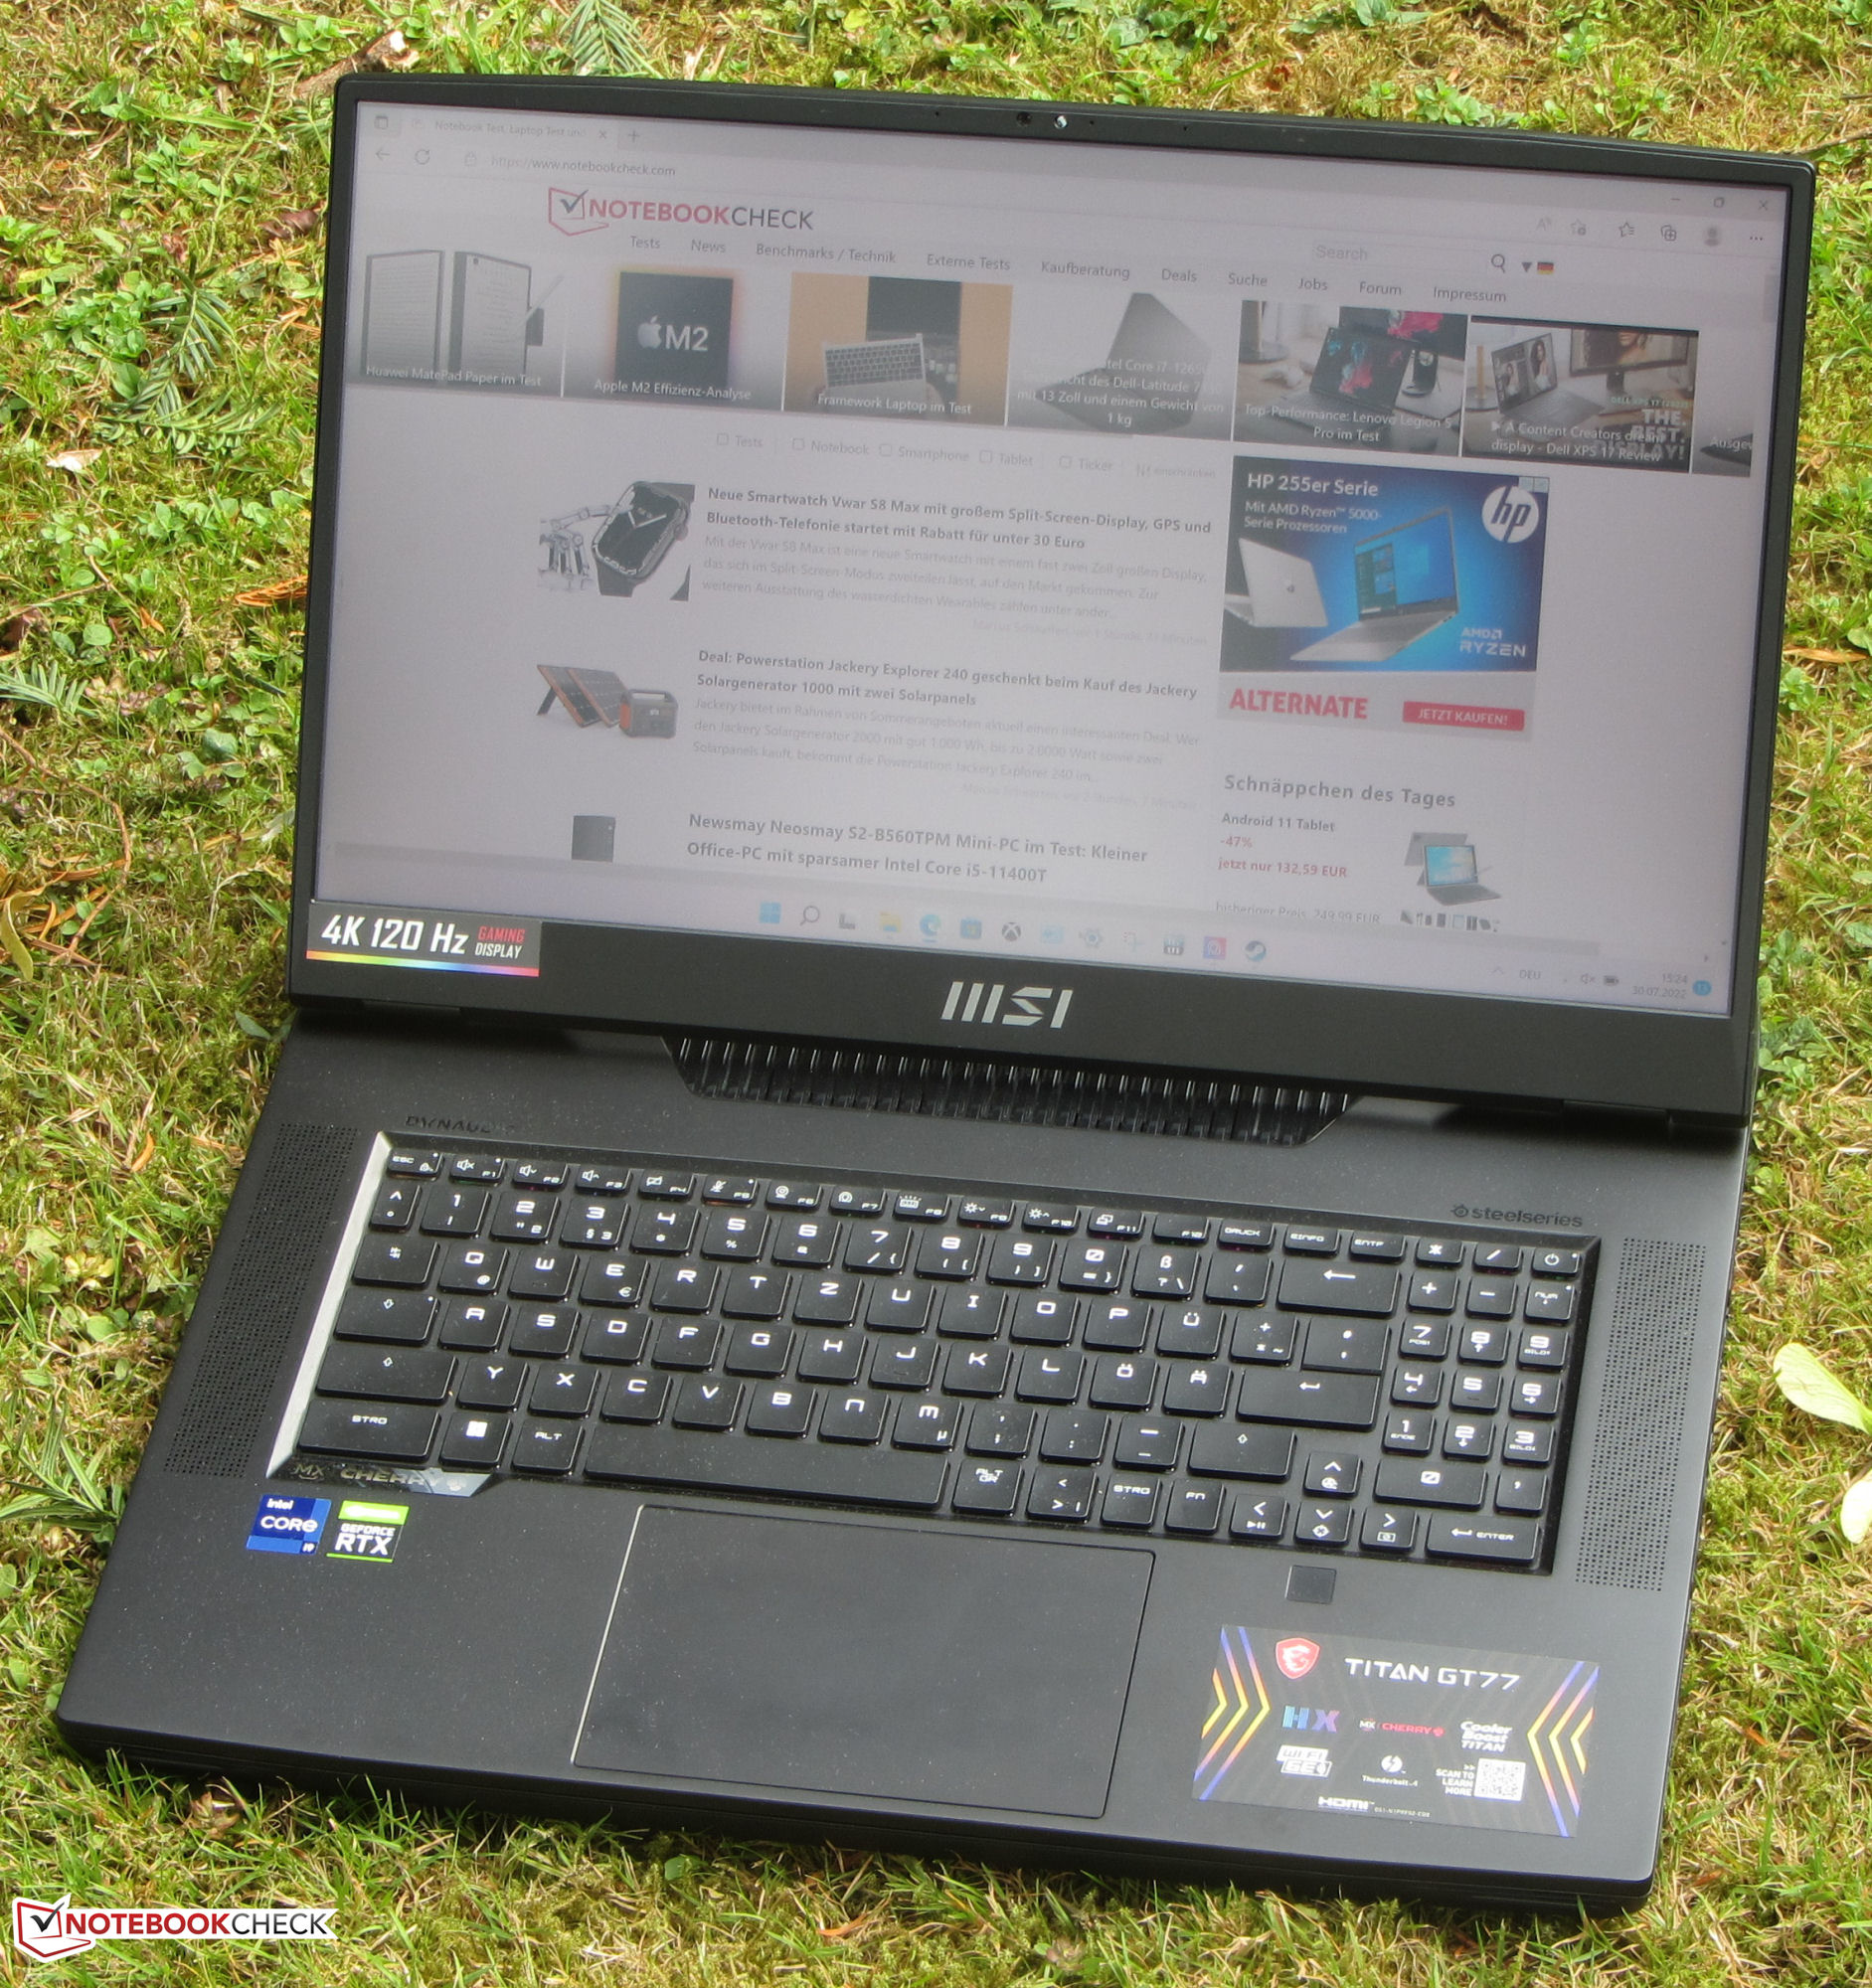
游戏玩家和创意者都是微星Titan GT77 12UHS的目标受众的一部分--这是一款桌面替代(DTR)笔记本电脑。高端规格(Core i9-12900HX,GeForce RTX 3080 Ti Laptop和64GB内存)将笔记本电脑的价格推到5600欧元左右(5980美元)。显示屏是该设备和其 FHD兄弟姐妹机型的主要区别:目前的评测单位有一个4K面板。它的一些竞争对手包括 申克XMG Ultra 17,以及 Razer Blade 17和 Alienware x17 R2.
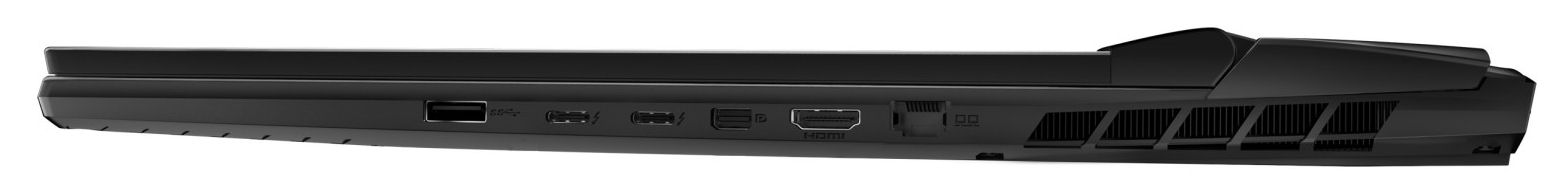
因为这款设备和它的FHD对应产品的构造相同,你可以阅读我们对 微星Titan GT77 12UHS (Core i9, FHD)以了解关于机箱、输入设备和扬声器的更多信息。
潜在的竞争对手比较
Rating | Date | Model | Weight | Height | Size | Resolution | Price |
|---|---|---|---|---|---|---|---|
| 87.8 % v7 (old) | 09 / 2022 | MSI Titan GT77 12UHS i9-12900HX, GeForce RTX 3080 Ti Laptop GPU | 3.4 kg | 23 mm | 17.30" | 3840x2160 | |
| 89.9 % v7 (old) | 07 / 2022 | Razer Blade 17 Early 2022 i9-12900H, GeForce RTX 3080 Ti Laptop GPU | 2.8 kg | 19.9 mm | 17.30" | 3840x2160 | |
| 89.2 % v7 (old) | 05 / 2022 | Alienware x17 R2 P48E i9-12900HK, GeForce RTX 3080 Ti Laptop GPU | 3.1 kg | 20.9 mm | 17.30" | 1920x1080 | |
| 84.9 % v7 (old) | Schenker XMG Ultra 17 Rocket Lake i9-11900K, GeForce RTX 3080 Laptop GPU | 4.7 kg | 43.5 mm | 17.30" | 1920x1080 |

| SD Card Reader - average JPG Copy Test (av. of 3 runs) | |
| Schenker XMG Ultra 17 Rocket Lake | |
| Alienware x17 R2 P48E (AV Pro V60) | |
| Razer Blade 17 Early 2022 (AV PRO microSD 128 GB V60) | |
| Average of class Gaming (20.9 - 210, n=54, last 2 years) | |
| MSI Titan GT77 12UHS (AV PRO microSD 128 GB V60) | |
| MSI Titan GT77 12UHS 4k (AV PRO microSD 128 GB V60) | |
| Networking | |
| iperf3 receive AXE11000 | |
| MSI Titan GT77 12UHS | |
| MSI Titan GT77 12UHS 4k | |
| Razer Blade 17 Early 2022 | |
| Average Killer Wi-Fi 6E AX1675i 160MHz Wireless Network Adapter (872 - 1714, n=29) | |
| Average of class Gaming (680 - 1745, n=88, last 2 years) | |
| iperf3 transmit AXE11000 | |
| MSI Titan GT77 12UHS | |
| Average Killer Wi-Fi 6E AX1675i 160MHz Wireless Network Adapter (797 - 1622, n=27) | |
| MSI Titan GT77 12UHS 4k | |
| Average of class Gaming (560 - 1862, n=88, last 2 years) | |
| iperf3 receive AX12 | |
| Schenker XMG Ultra 17 Rocket Lake | |
| Alienware x17 R2 P48E | |
| Average Killer Wi-Fi 6E AX1675i 160MHz Wireless Network Adapter (1137 - 1270, n=2) | |
| iperf3 transmit AX12 | |
| Schenker XMG Ultra 17 Rocket Lake | |
| Alienware x17 R2 P48E | |
| Average Killer Wi-Fi 6E AX1675i 160MHz Wireless Network Adapter (986 - 1257, n=2) | |


显示屏 - 具有高DCI-P3覆盖率的明亮面板
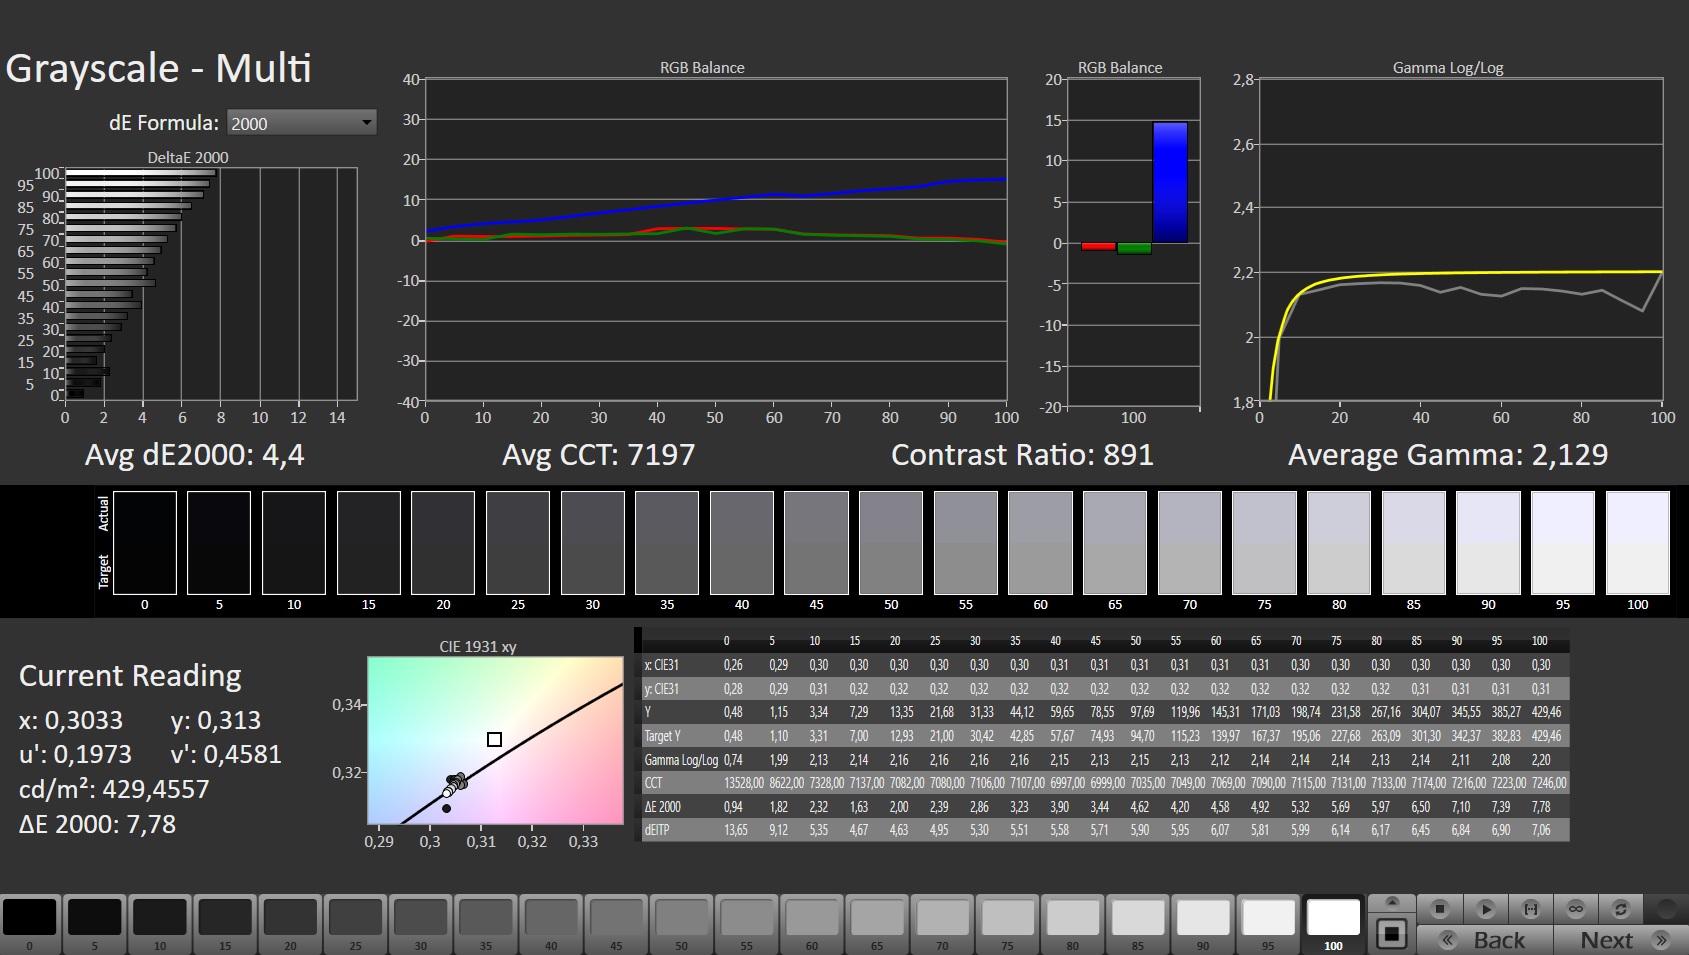
目前评测设备上的哑光4K面板(3840 x 2160像素)提供的峰值亮度明显高于其兄弟型号上的FHD显示屏。 它的兄弟姐妹型号(401 cd/m² vs. 275.1 cd/m²)。
然而,在对比度方面仍有改进的余地(871:1 vs. 700:1):两块显示屏都没有达到我们认为的良好数值(>1000:1)。虽然这两块面板都有很强的反应能力,但FHD型号提供的刷新率要高得多(120赫兹对360赫兹)。在我们的测量中,我们没有观察到任何PWM闪烁。
| |||||||||||||||||||||||||
Brightness Distribution: 91 %
Center on Battery: 418 cd/m²
Contrast: 871:1 (Black: 0.48 cd/m²)
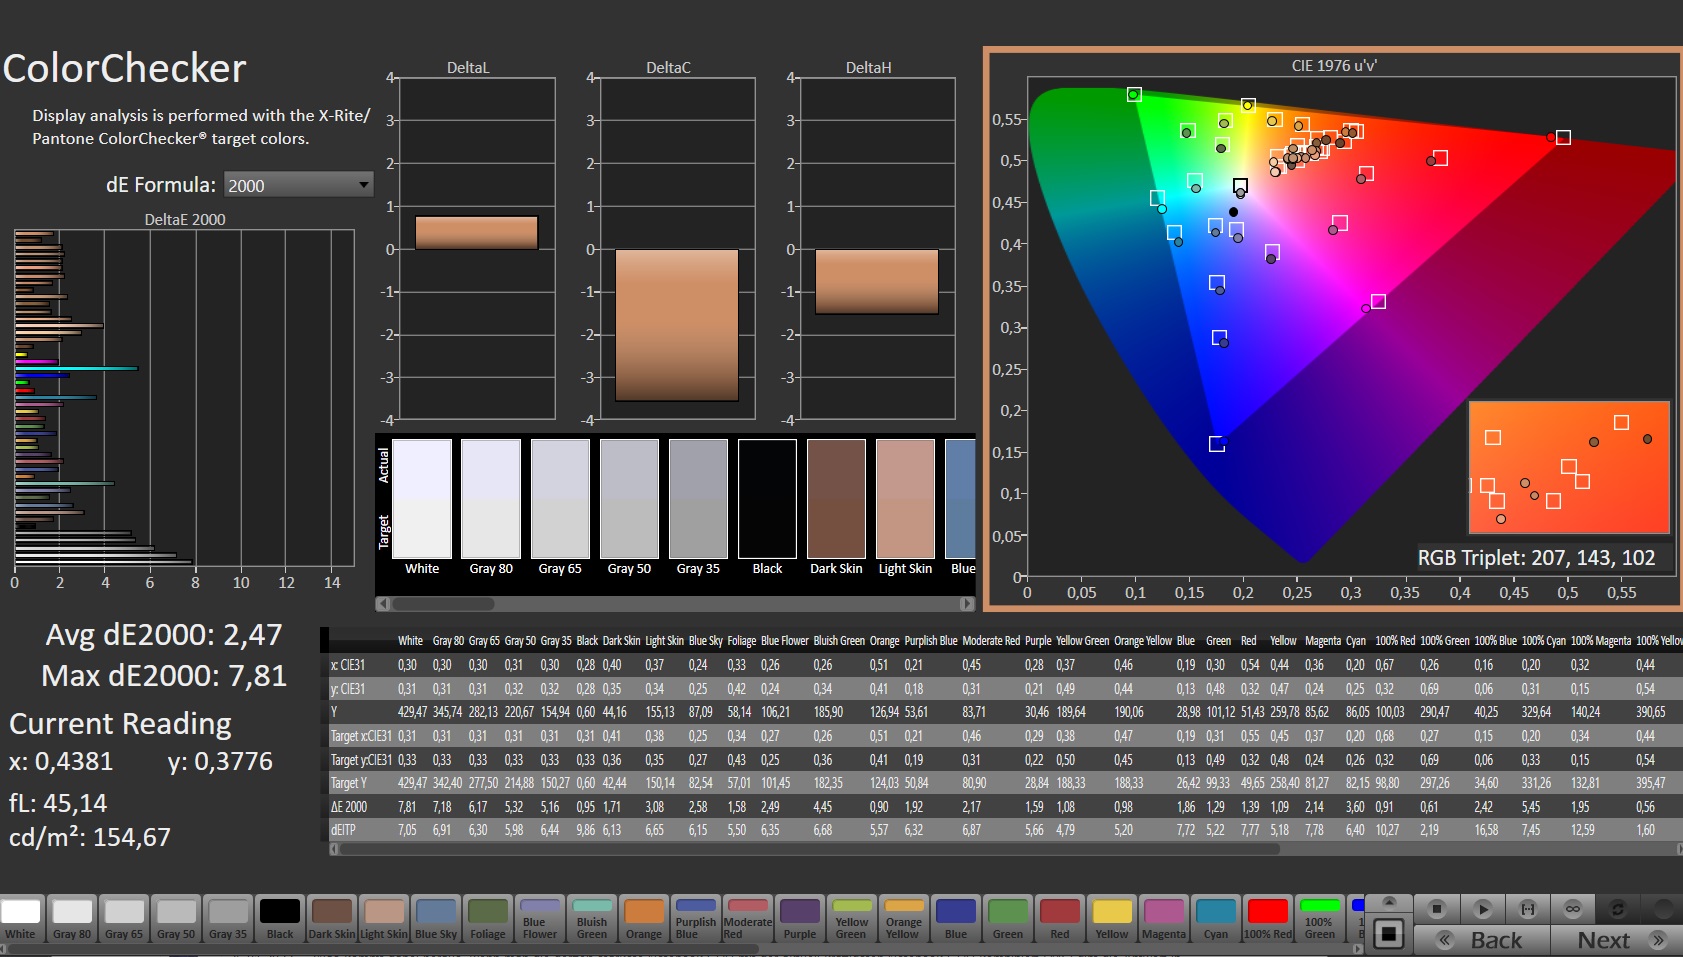
ΔE ColorChecker Calman: 2.47 | ∀{0.5-29.43 Ø4.71}
calibrated: 0.66
ΔE Greyscale Calman: 4.4 | ∀{0.09-98 Ø4.96}
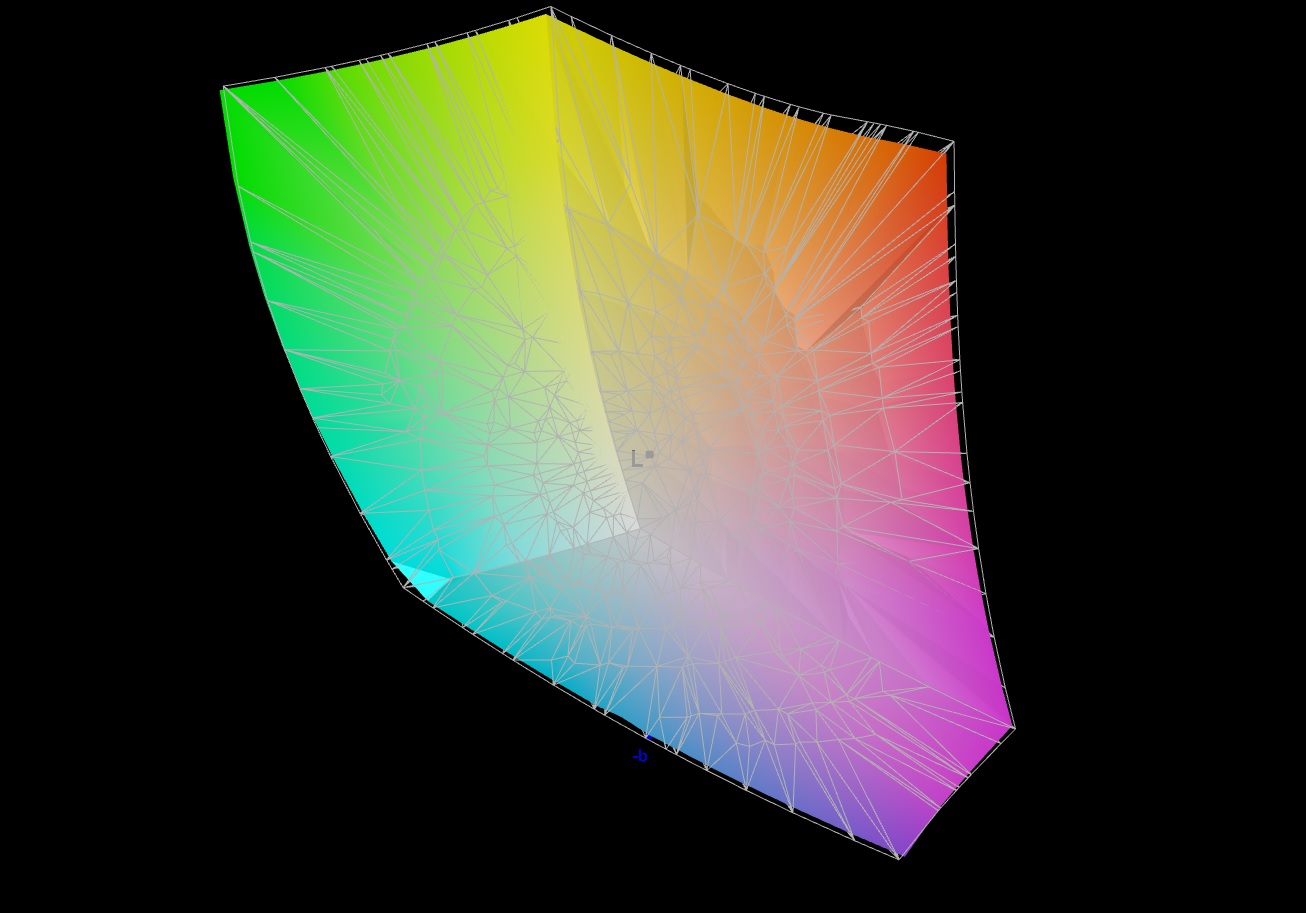
86.2% AdobeRGB 1998 (Argyll 3D)
99.8% sRGB (Argyll 3D)
97% Display P3 (Argyll 3D)
Gamma: 2.129
CCT: 7197 K
| MSI Titan GT77 12UHS 4k AU Optronics B173ZAN06.1, IPS, 3840x2160, 17.3" | Razer Blade 17 Early 2022 AU Optronics B173ZAN06.9, IPS, 3840x2160, 17.3" | Alienware x17 R2 P48E AU Optronics B173HAN, IPS, 1920x1080, 17.3" | Schenker XMG Ultra 17 Rocket Lake AU Optronics B173HAN05.1, IPS, 1920x1080, 17.3" | MSI Titan GT77 12UHS Sharp SHP1544 LQ173M1JW08, IPS-Level, 1920x1080, 17.3" | |
|---|---|---|---|---|---|
| Display | 1% | -9% | -16% | -14% | |
| Display P3 Coverage (%) | 97 | 99.4 2% | 79.2 -18% | 69.8 -28% | 70.8 -27% |
| sRGB Coverage (%) | 99.8 | 100 0% | 99.8 0% | 97.2 -3% | 98.9 -1% |
| AdobeRGB 1998 Coverage (%) | 86.2 | 87.3 1% | 79.6 -8% | 72 -16% | 73 -15% |
| Response Times | -27% | -109% | -44% | 19% | |
| Response Time Grey 50% / Grey 80% * (ms) | 5.2 ? | 7.5 ? -44% | 12.4 ? -138% | 5.6 ? -8% | 3.03 ? 42% |
| Response Time Black / White * (ms) | 5.1 ? | 5.6 ? -10% | 9.2 ? -80% | 9.2 ? -80% | 5.28 ? -4% |
| PWM Frequency (Hz) | |||||
| Screen | 28% | 3% | 9% | -17% | |
| Brightness middle (cd/m²) | 418 | 503 20% | 365.4 -13% | 306 -27% | 280 -33% |
| Brightness (cd/m²) | 401 | 486 21% | 344 -14% | 299 -25% | 275 -31% |
| Brightness Distribution (%) | 91 | 84 -8% | 85 -7% | 93 2% | 79 -13% |
| Black Level * (cd/m²) | 0.48 | 0.44 8% | 0.29 40% | 0.22 54% | 0.4 17% |
| Contrast (:1) | 871 | 1143 31% | 1260 45% | 1391 60% | 700 -20% |
| Colorchecker dE 2000 * | 2.47 | 1.08 56% | 3.17 -28% | 1.92 22% | 2.1 15% |
| Colorchecker dE 2000 max. * | 7.81 | 4.54 42% | 7.69 2% | 4.78 39% | 5.83 25% |
| Colorchecker dE 2000 calibrated * | 0.66 | 0.6 9% | 0.51 23% | 1.34 -103% | 1.58 -139% |
| Greyscale dE 2000 * | 4.4 | 1.3 70% | 5.3 -20% | 2 55% | 3.3 25% |
| Gamma | 2.129 103% | 2.151 102% | 2.18 101% | 2.153 102% | 2.13 103% |
| CCT | 7197 90% | 6541 99% | 5879 111% | 6738 96% | 7060 92% |
| Color Space (Percent of AdobeRGB 1998) (%) | 72 | ||||
| Color Space (Percent of sRGB) (%) | 93 | ||||
| Total Average (Program / Settings) | 1% /
14% | -38% /
-15% | -17% /
-4% | -4% /
-11% |
* ... smaller is better
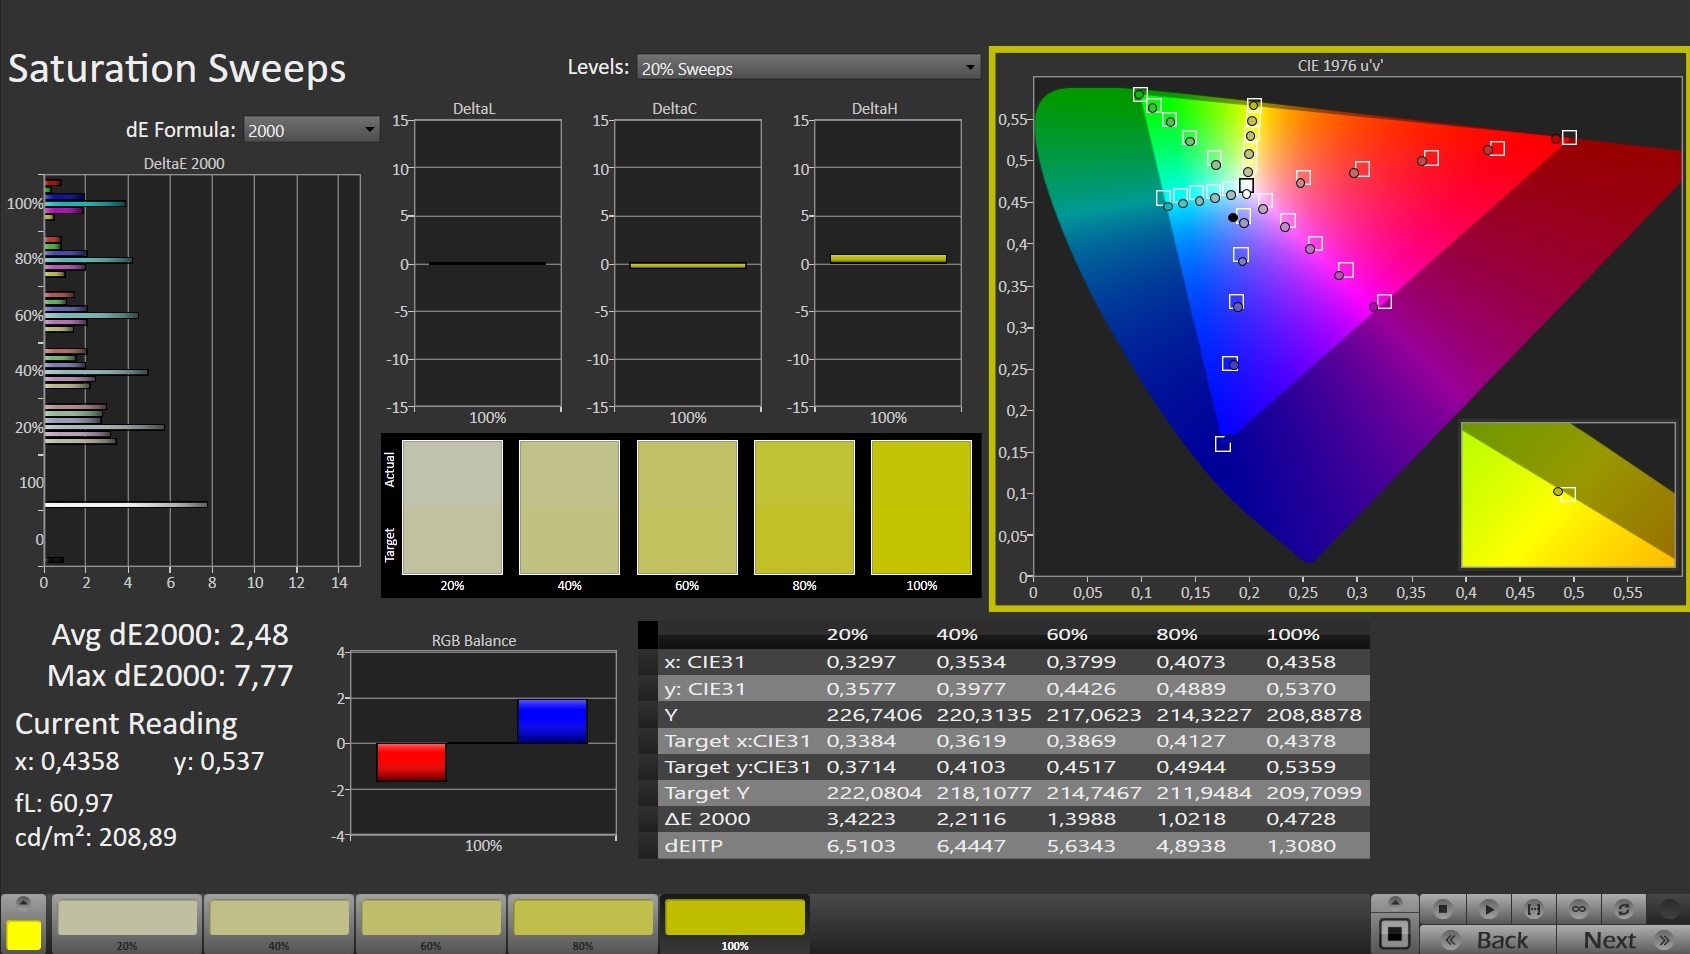
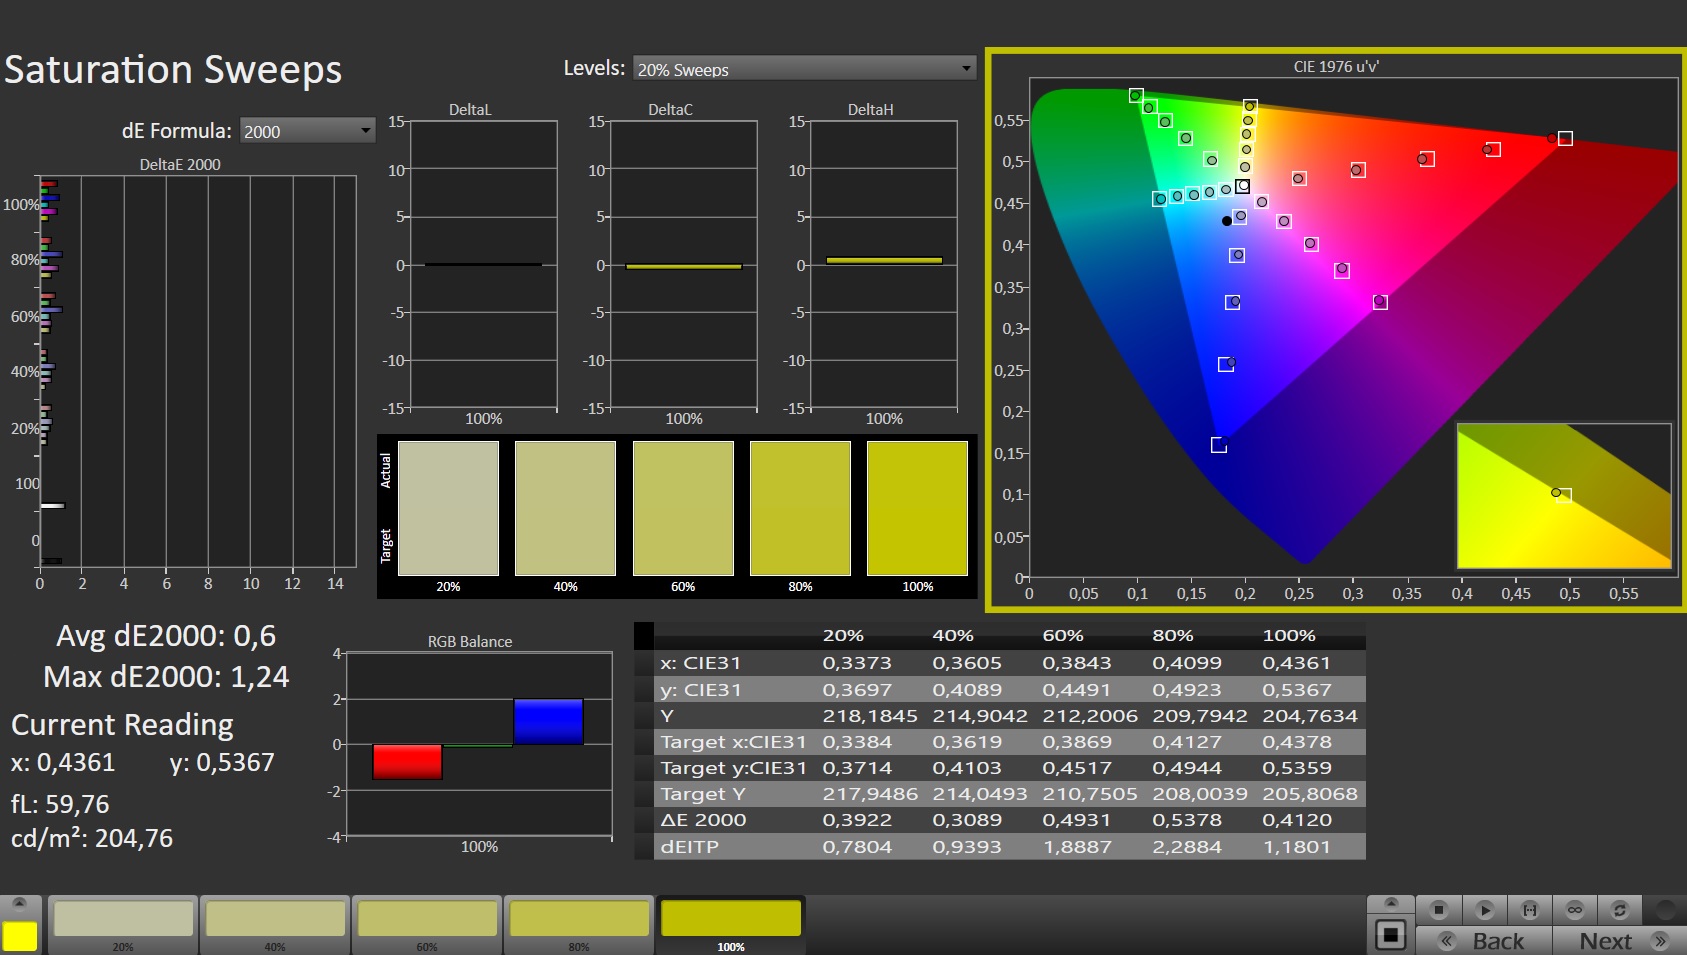
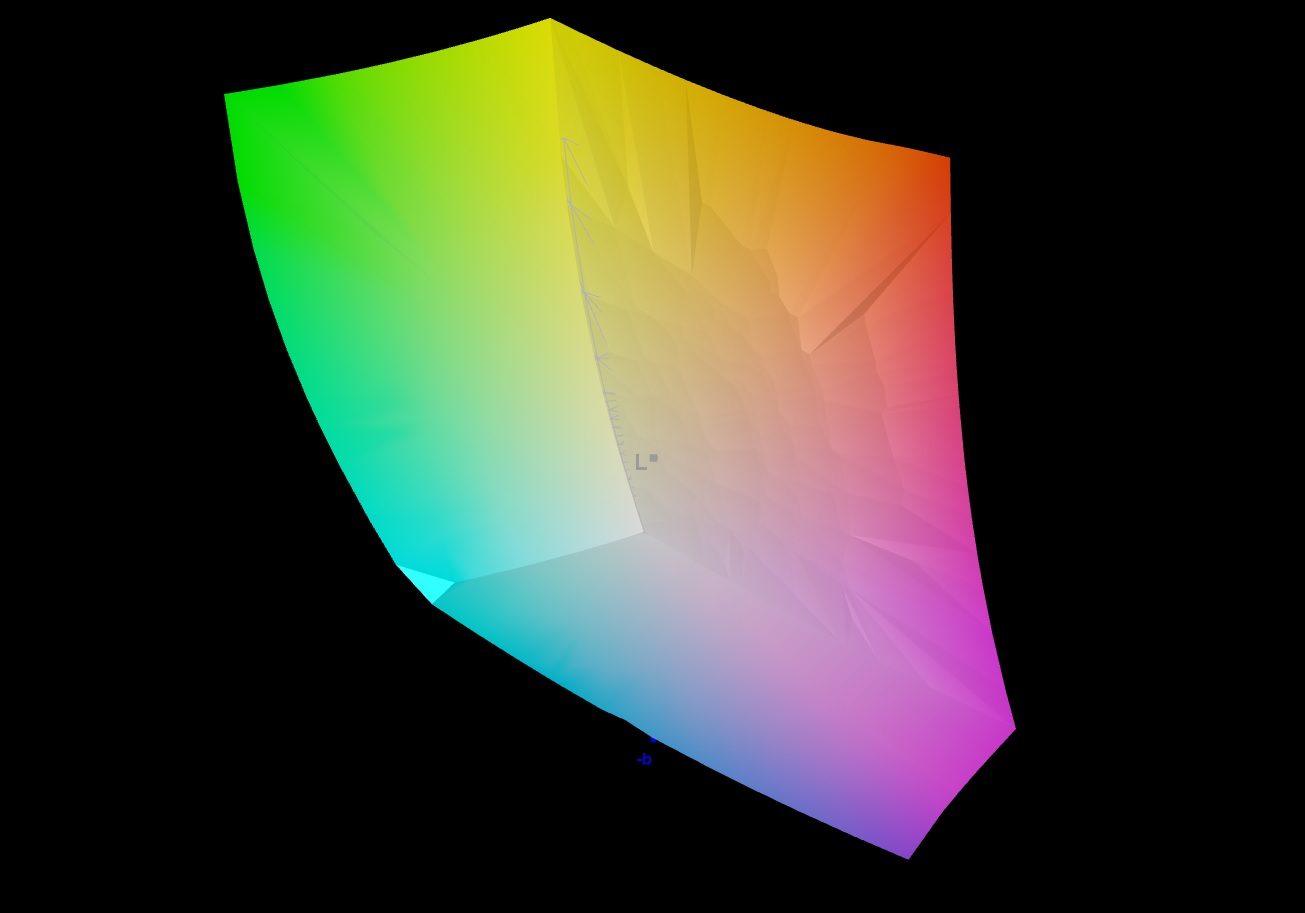
4K显示器几乎涵盖了整个sRGB(99.8%)和DCI-P3(97%)色彩空间,以及高达86%的AdobeRGB。微星Titan GT77 12UHS笔记本电脑评测。桤木湖-HX的海报儿童,具有无阻碍的桌面级性能
的兄弟姐妹机型上的FHD面板在这方面无法跟上(sRGB:97%,AdobeRGB:73%,DCI-P3:71%)。这意味着如果色彩准确性对你很重要的话,4K面板是最佳选择。
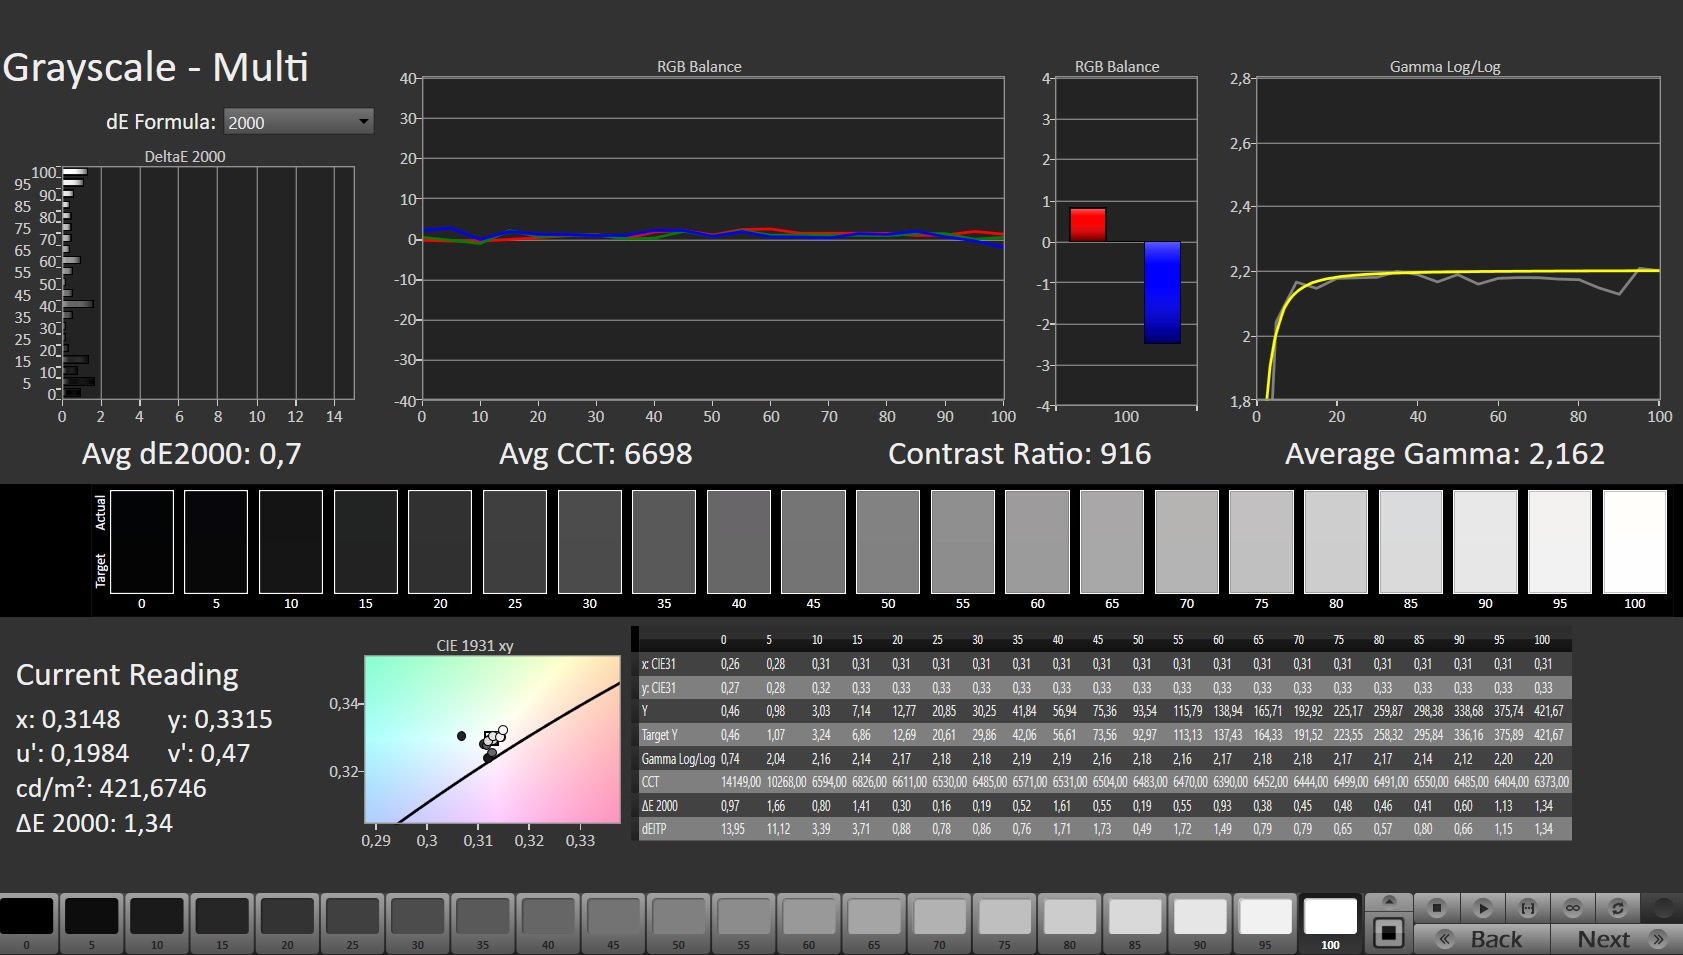
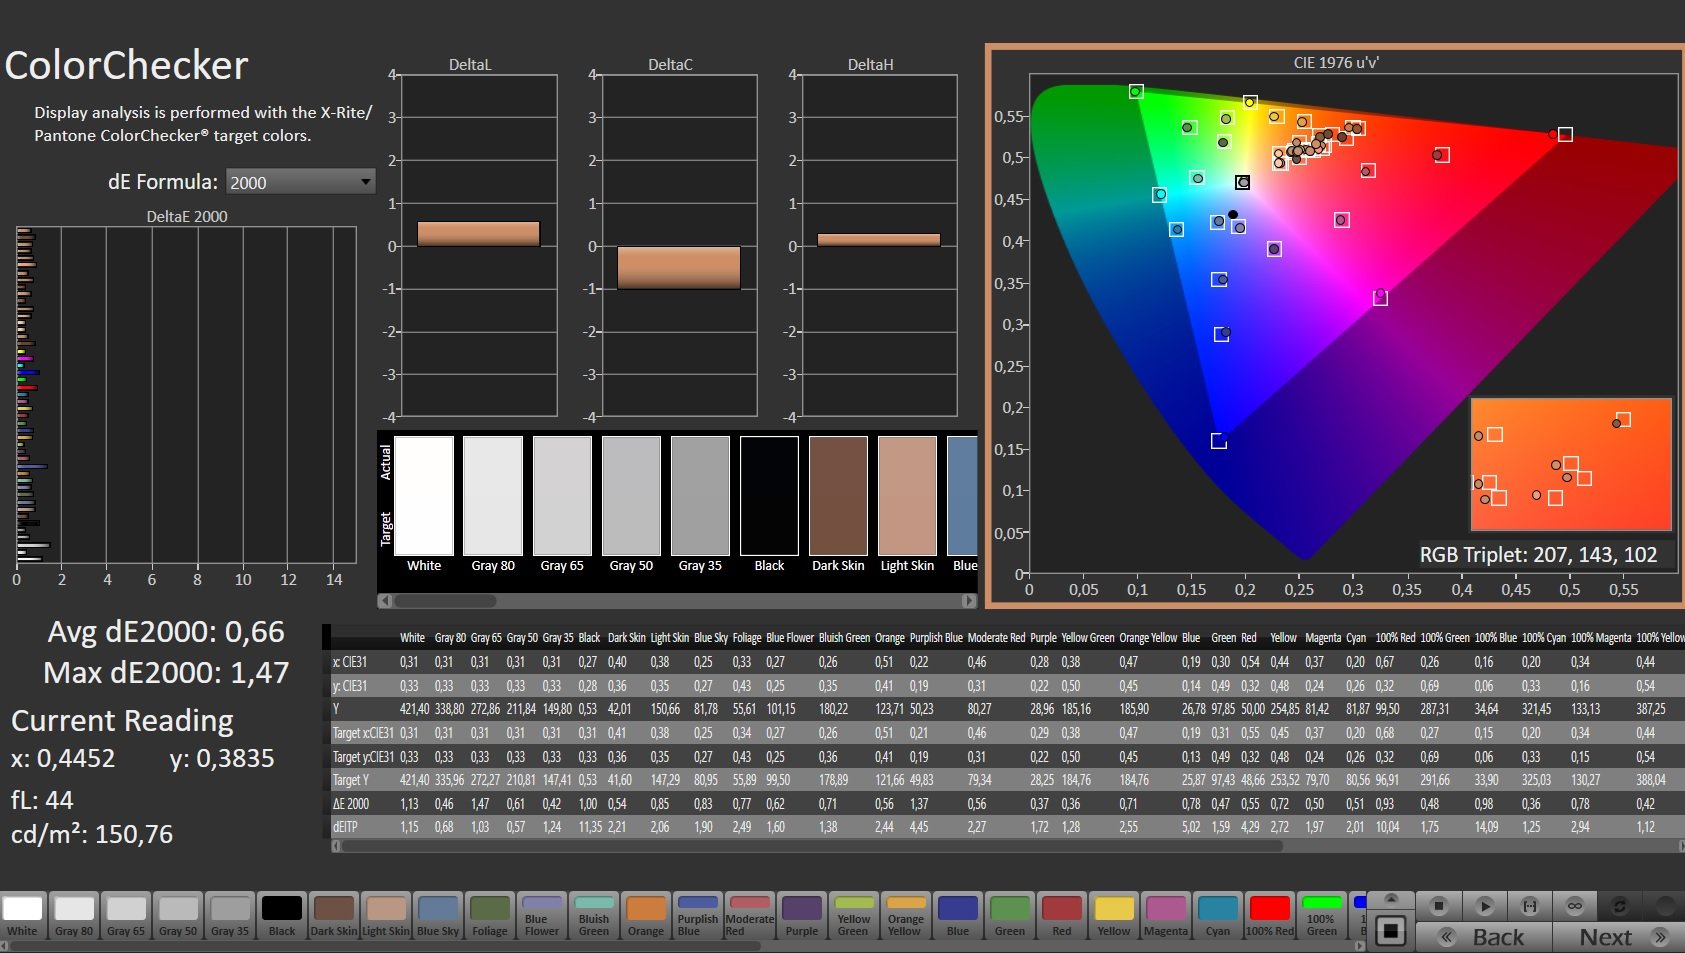
这些屏幕在开箱后就已经有了良好的色彩再现:UHD和FHD显示器分别以2.47和2.1的不可察觉的色差达到了预期值(Delta E < 3)。校准屏幕使其灰度再现更加平衡,并将色差分别降至0.66和1.58。在每个显示器的信息框中,你可以找到一个链接,可以免费下载我们创建的颜色配置文件。
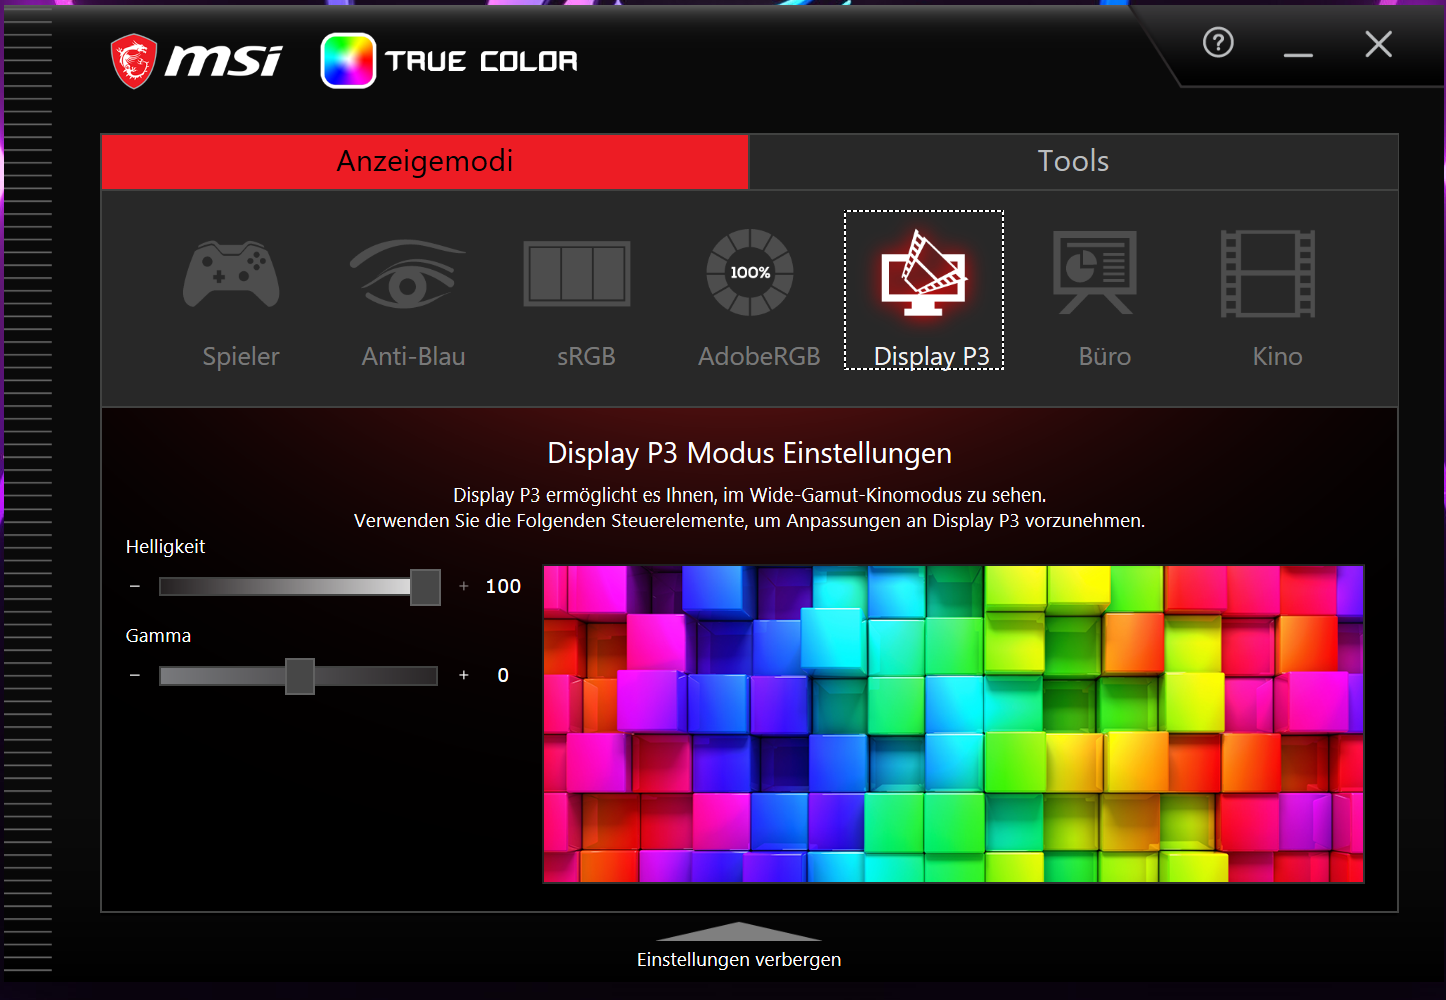
注意:微星真彩软件允许你调整颜色以更好地适应色域或定义的使用场景。我们选择了预设的 "Display P3"。

Display Response Times
| ↔ Response Time Black to White | ||
|---|---|---|
| 5.1 ms ... rise ↗ and fall ↘ combined | ↗ 1.5 ms rise | 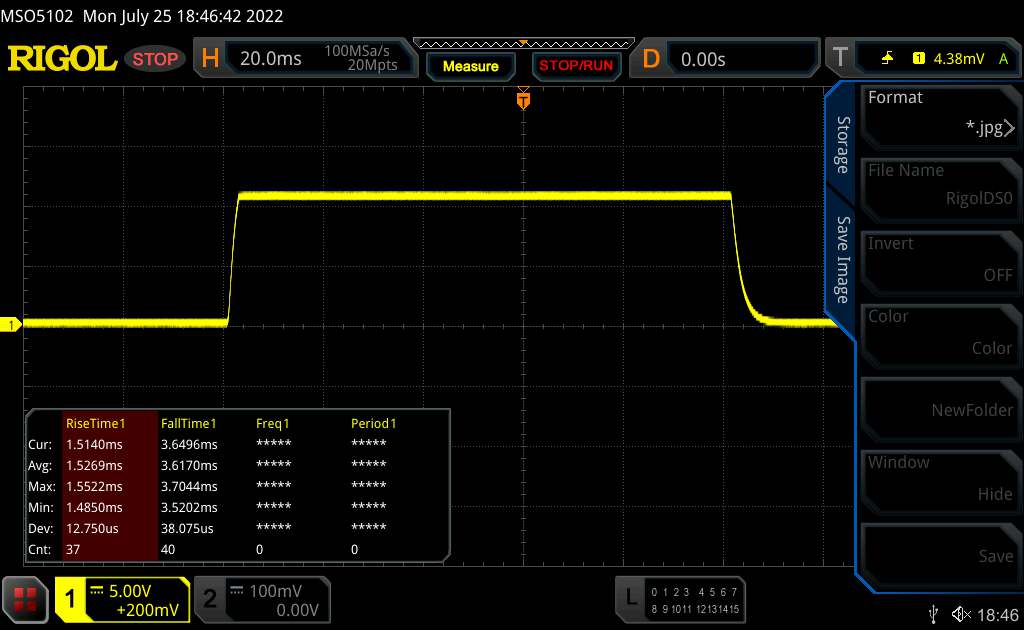 |
| ↘ 3.6 ms fall | ||
| The screen shows very fast response rates in our tests and should be very well suited for fast-paced gaming. In comparison, all tested devices range from 0.1 (minimum) to 240 (maximum) ms. » 18 % of all devices are better. This means that the measured response time is better than the average of all tested devices (19.8 ms). | ||
| ↔ Response Time 50% Grey to 80% Grey | ||
| 5.2 ms ... rise ↗ and fall ↘ combined | ↗ 1.2 ms rise |  |
| ↘ 4 ms fall | ||
| The screen shows very fast response rates in our tests and should be very well suited for fast-paced gaming. In comparison, all tested devices range from 0.165 (minimum) to 636 (maximum) ms. » 18 % of all devices are better. This means that the measured response time is better than the average of all tested devices (31 ms). | ||
Screen Flickering / PWM (Pulse-Width Modulation)
| Screen flickering / PWM not detected |  | ||
In comparison: 52 % of all tested devices do not use PWM to dim the display. If PWM was detected, an average of 7754 (minimum: 5 - maximum: 343500) Hz was measured. | |||
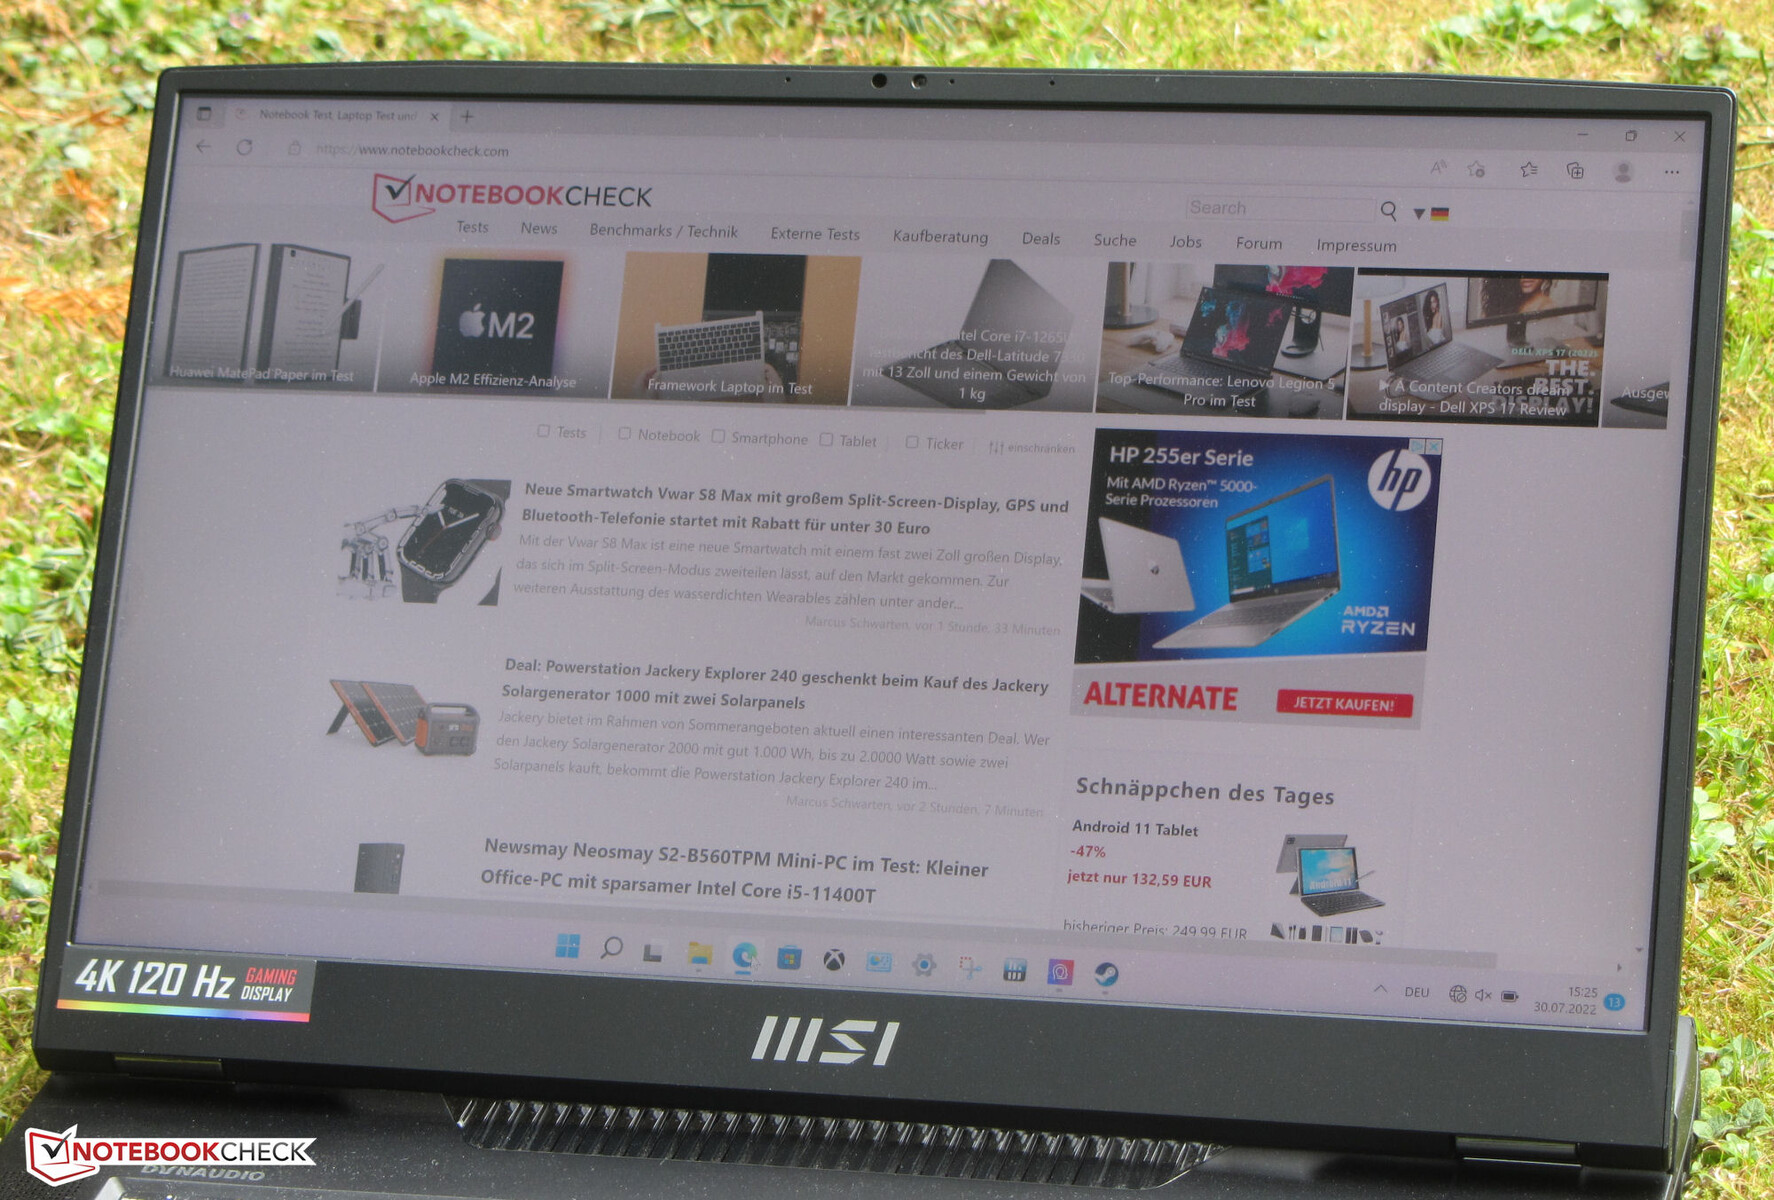
IPS面板提供了一个稳定的视角,因此可以从任何位置轻松观看。该显示屏在户外也非常容易阅读。

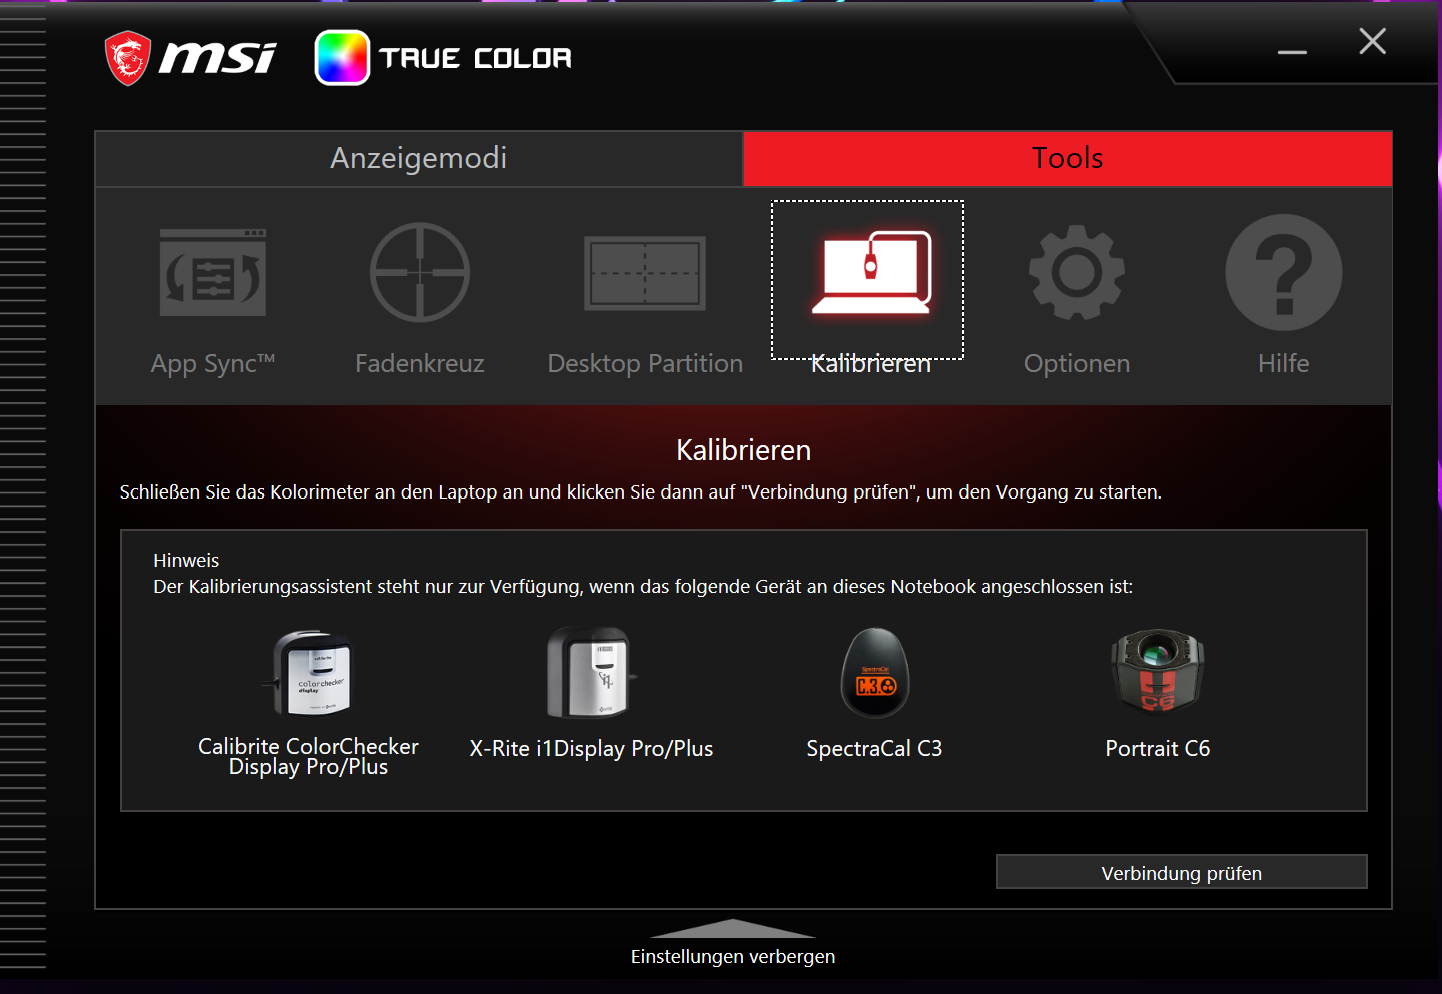
由于软件问题导致色彩再现不准确
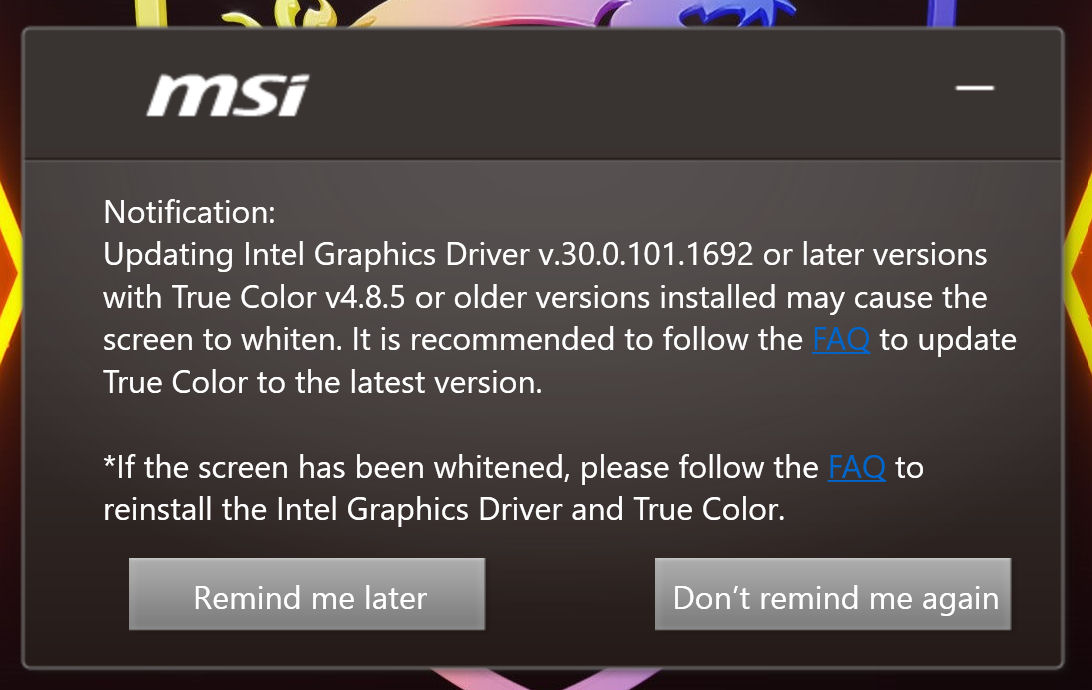
真彩软件和iGPU驱动程序的某些组合可能会导致图像的不准确再现。当这种情况发生时,所有显示的颜色都会出现扭曲和泛白。微星公司建议完全卸载,然后重新安装这两个组件。在试过之后,我们发现这个方法可以解决这个问题。
性能--安培和阿尔德湖提供大量的动力。
通过Titan GT77 12UHS,微星在其产品系列中拥有一个非常强大的17.3英寸笔记本电脑,在各种苛刻的使用场景中表现良好。
测试条件
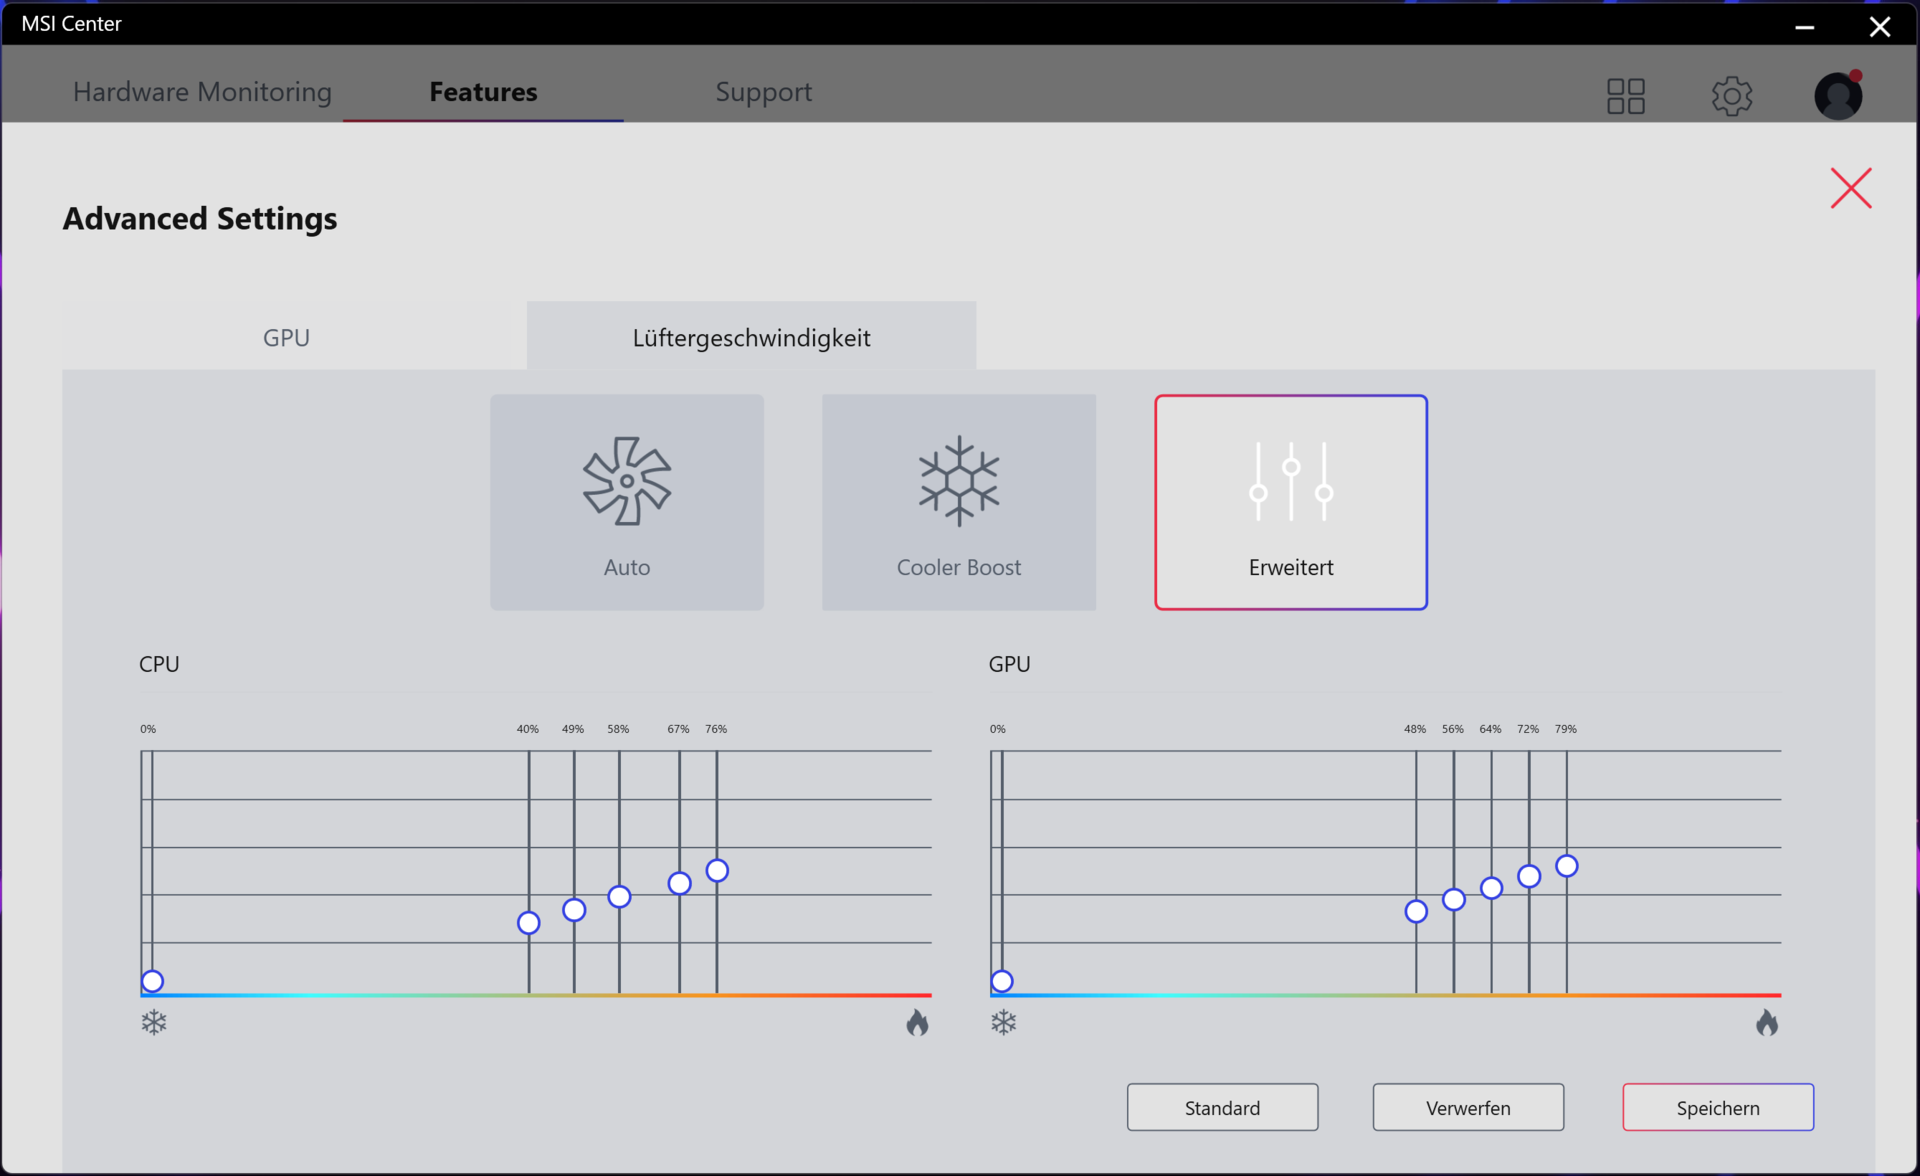
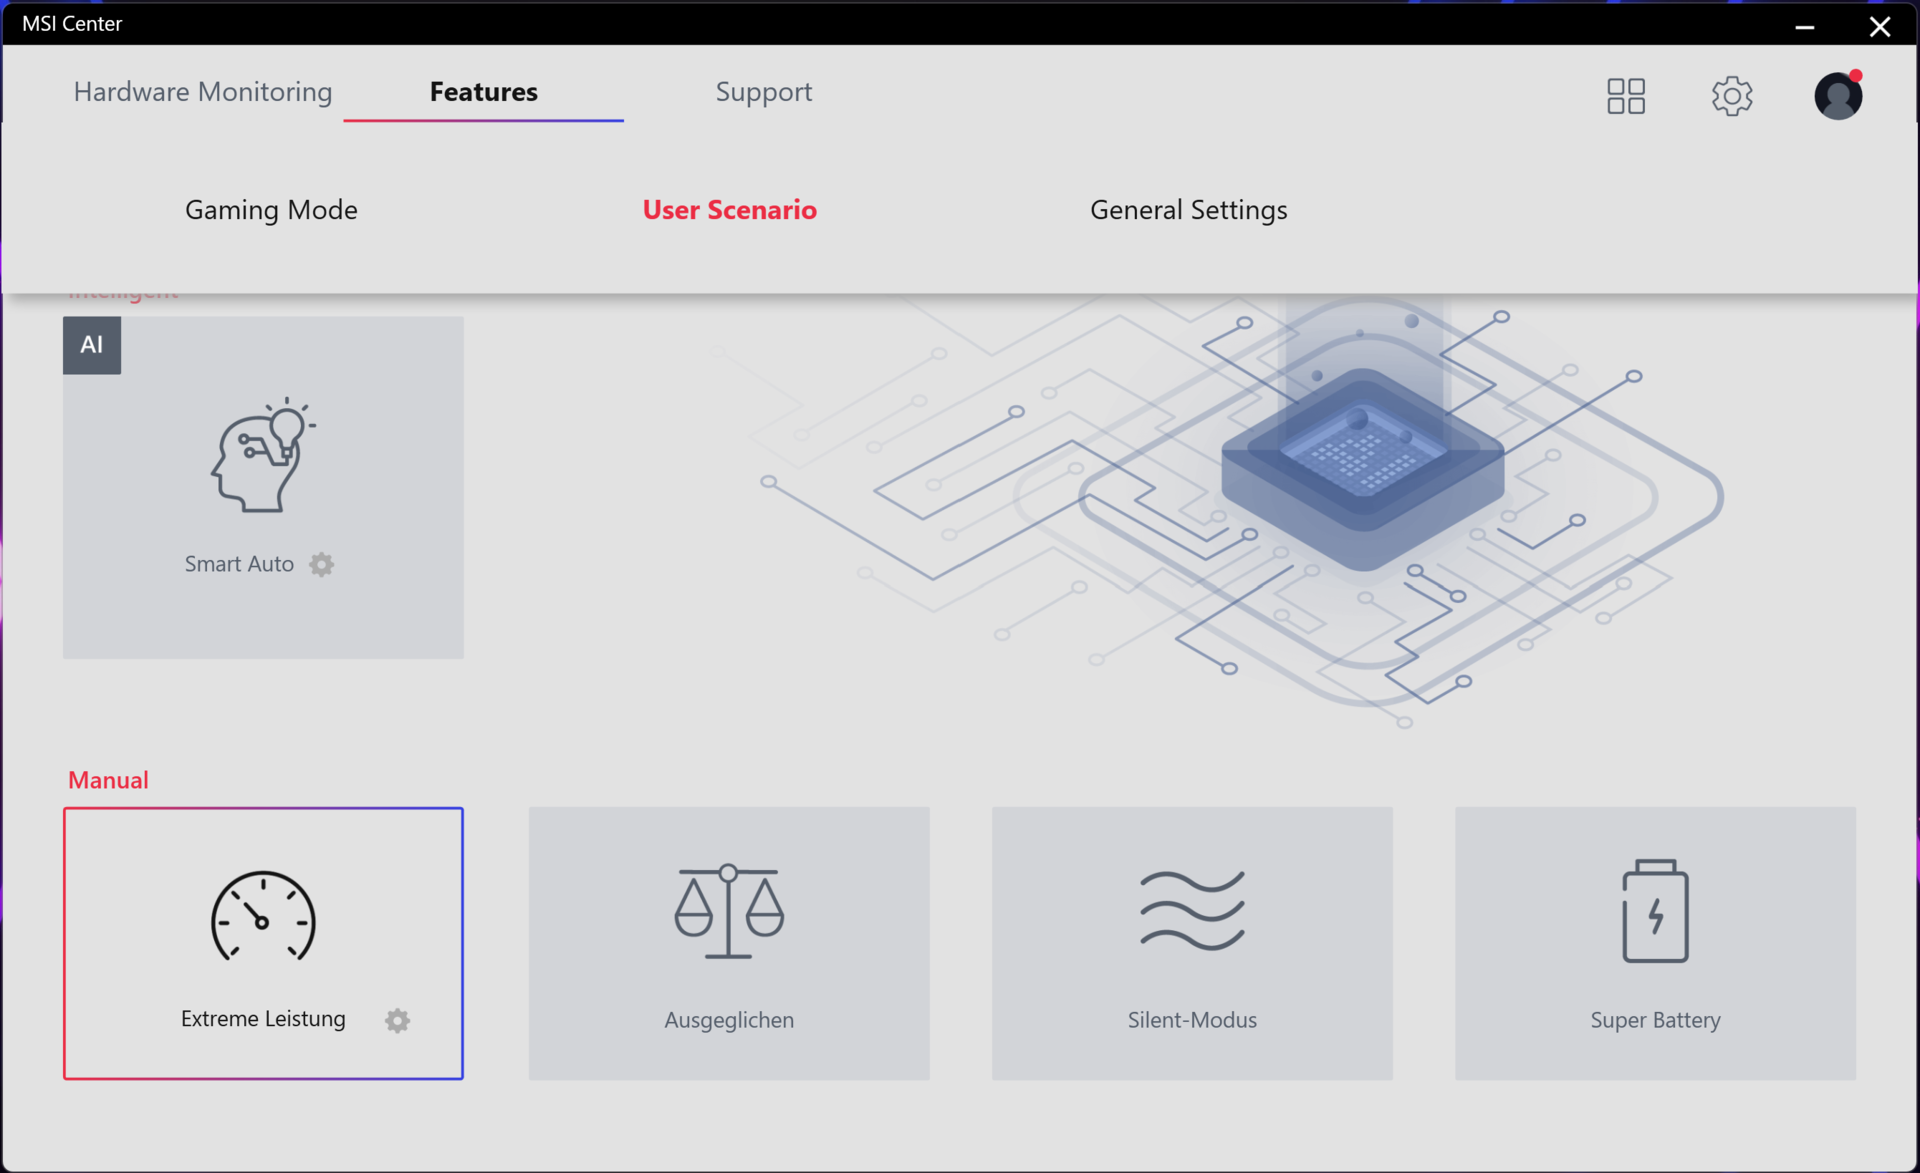
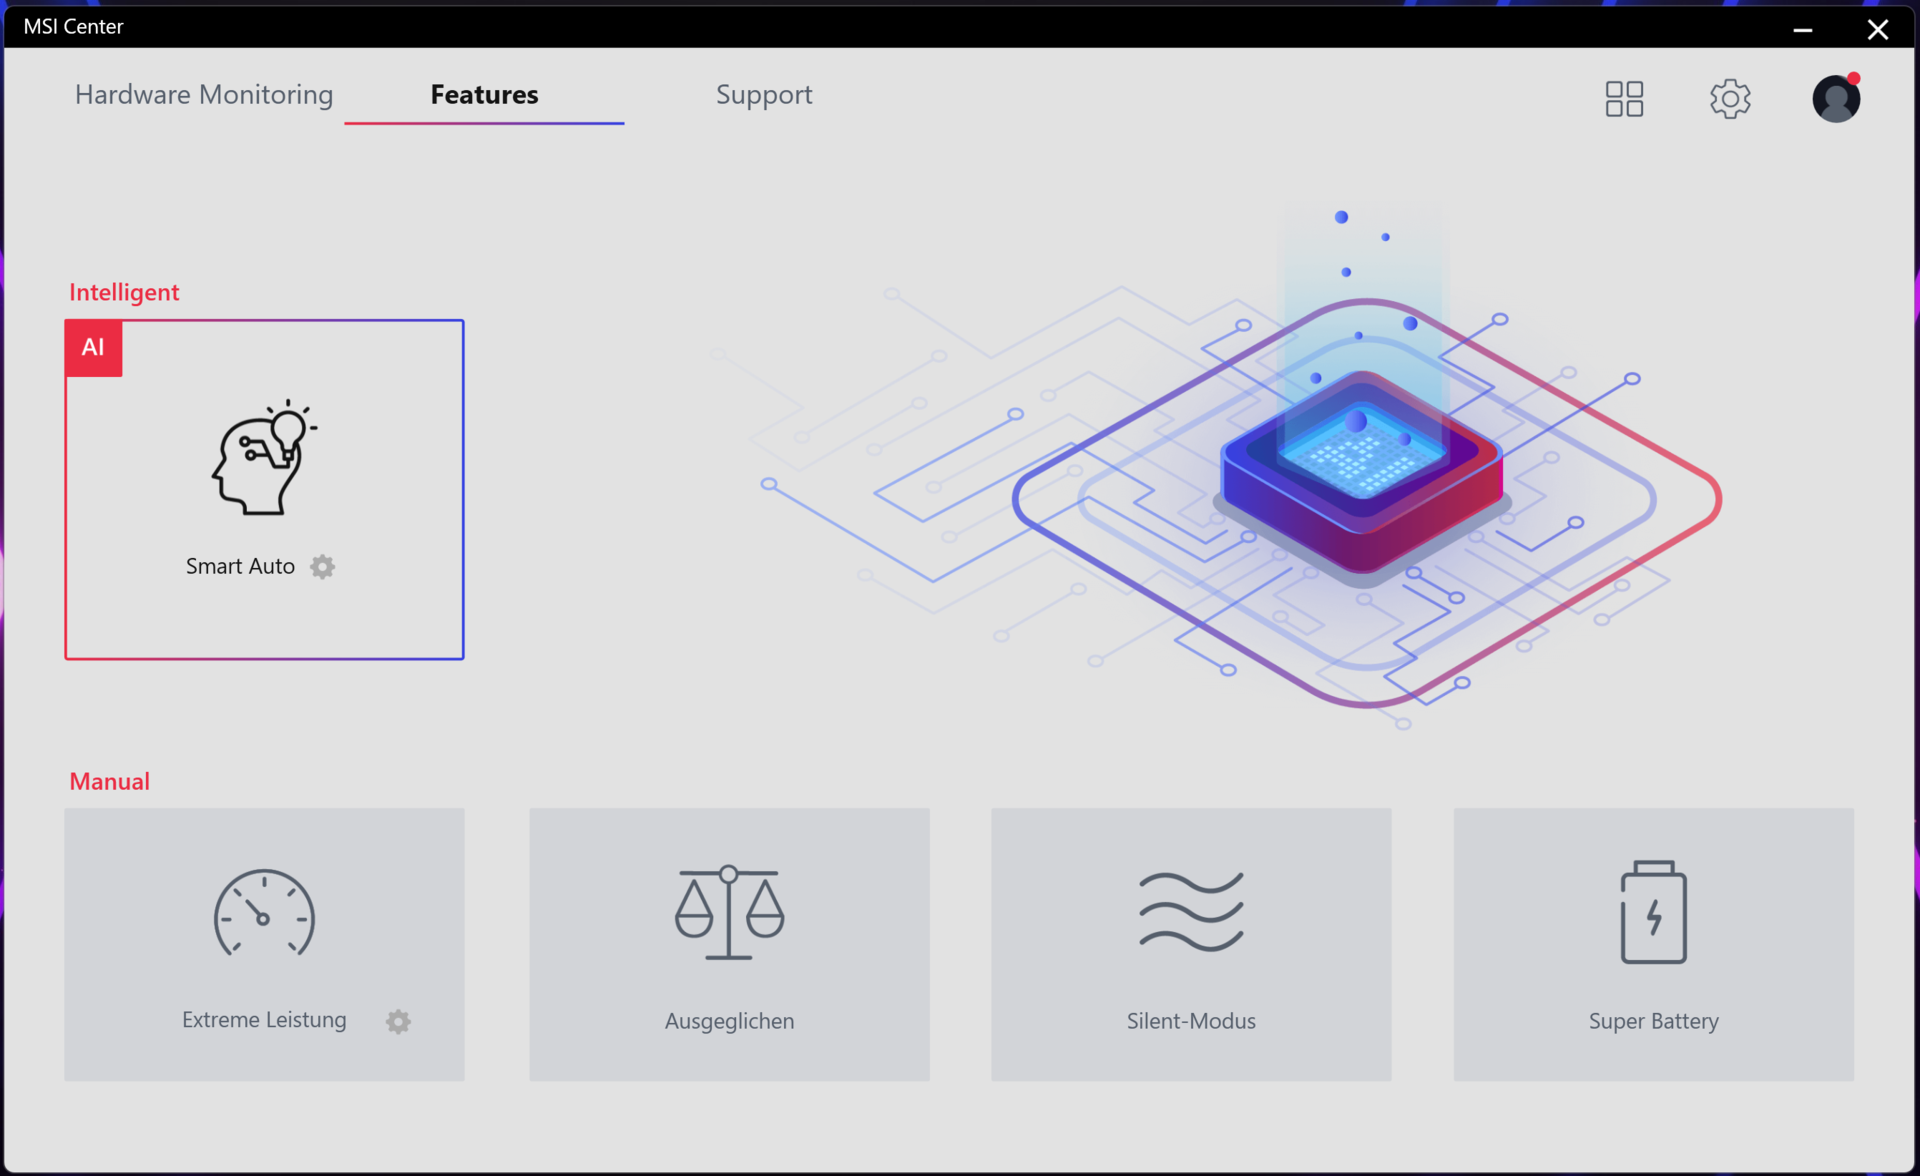
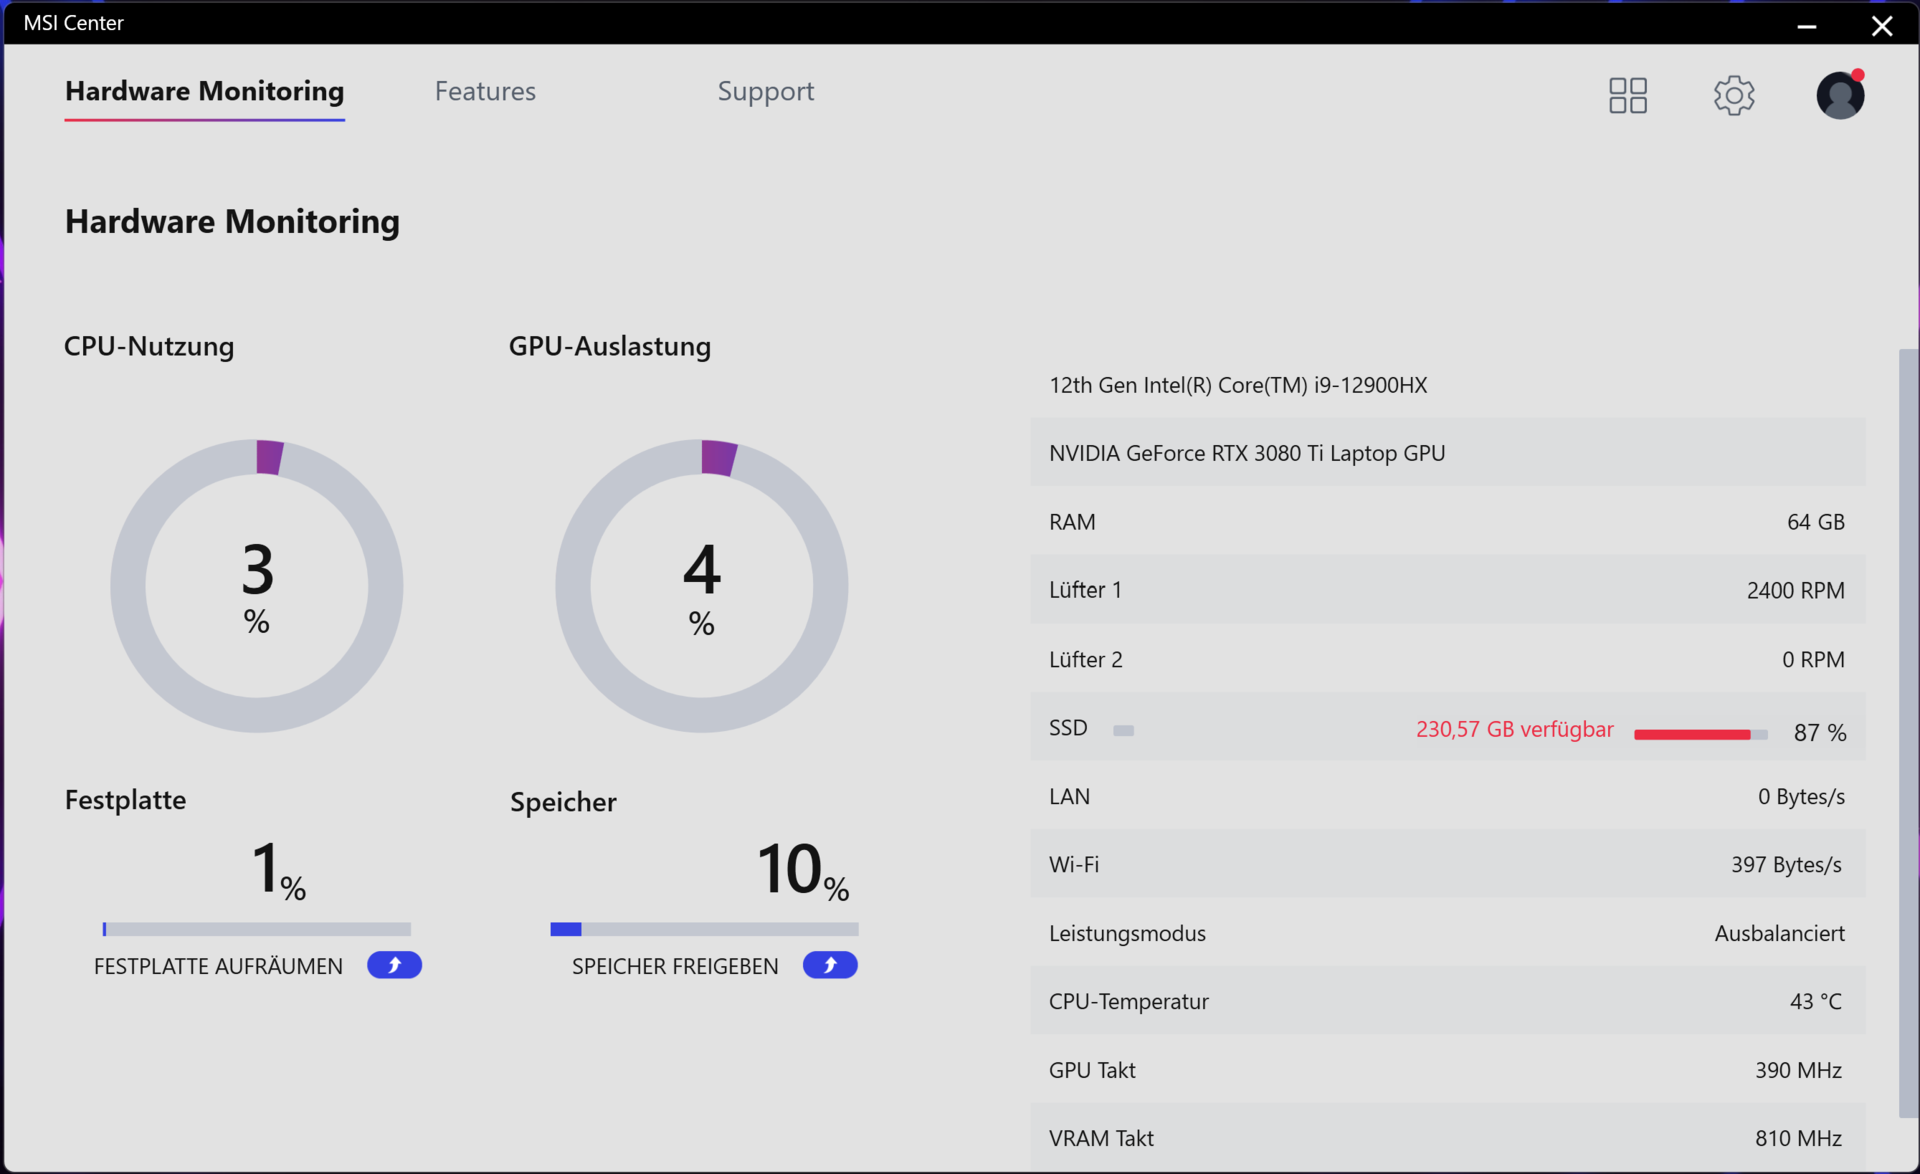
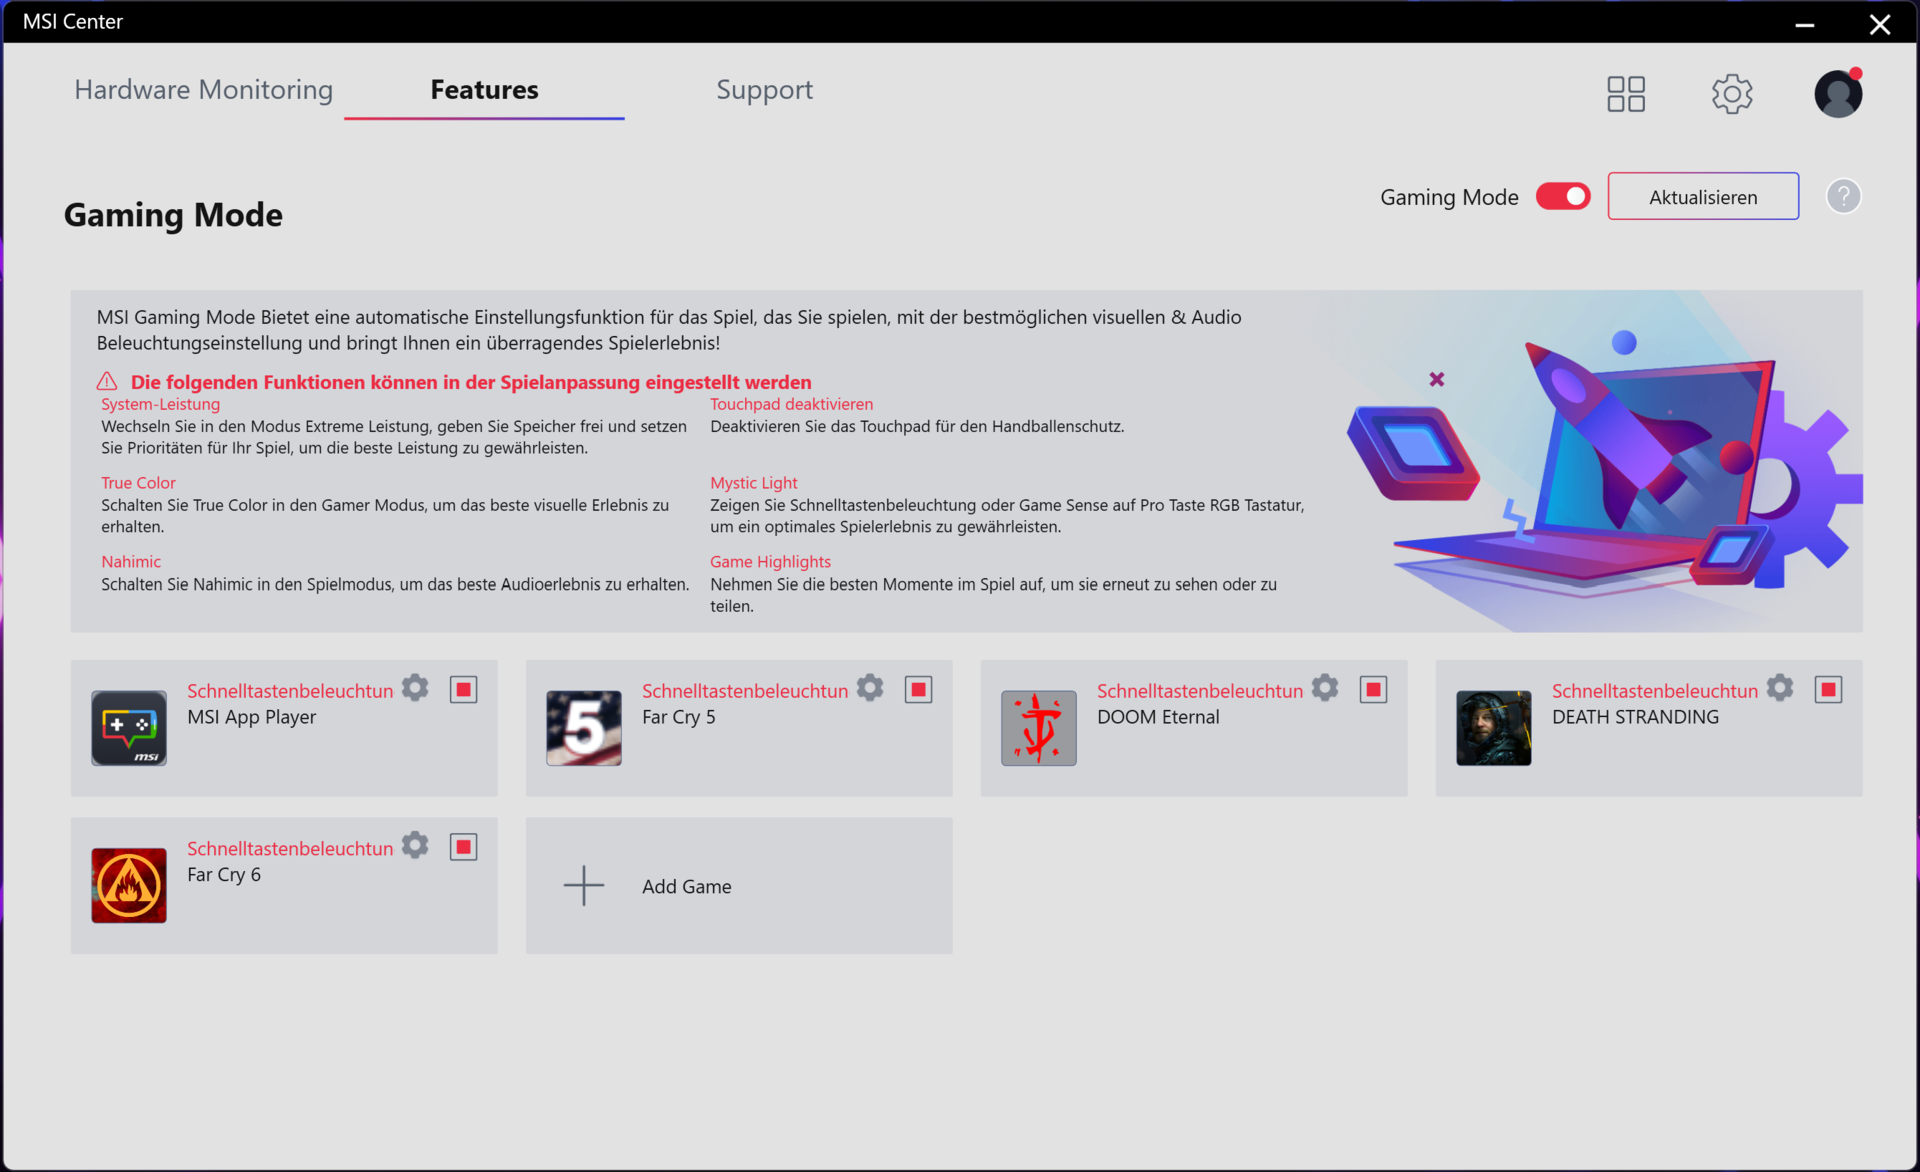
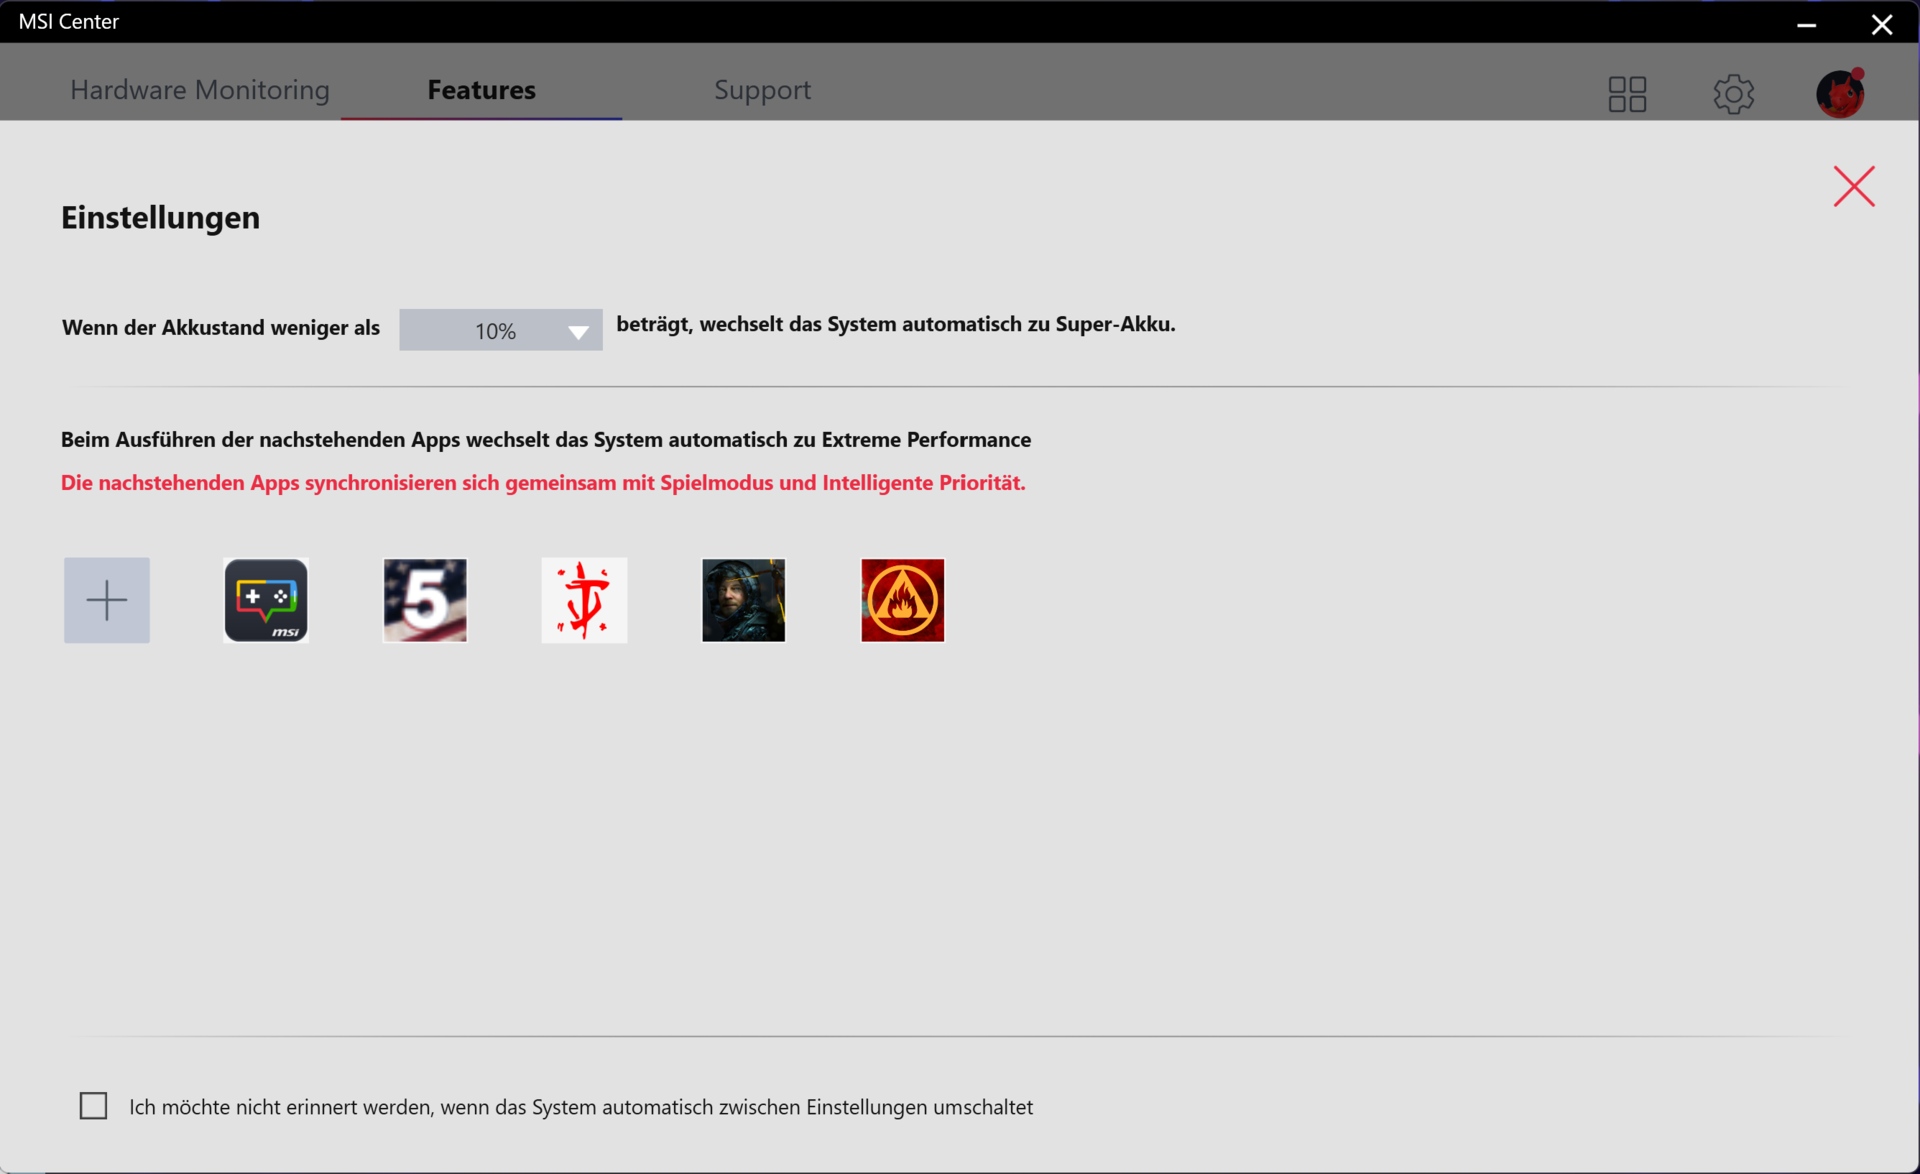
你可以使用预装的MSI中心(见图片)或按Fn+F7组合键在四个性能配置文件之间进行切换。如果更高级别的、基于人工智能的 "智能自动 "功能被激活(如我们的情况),微星中心将自动选择适合当前情况的配置文件。
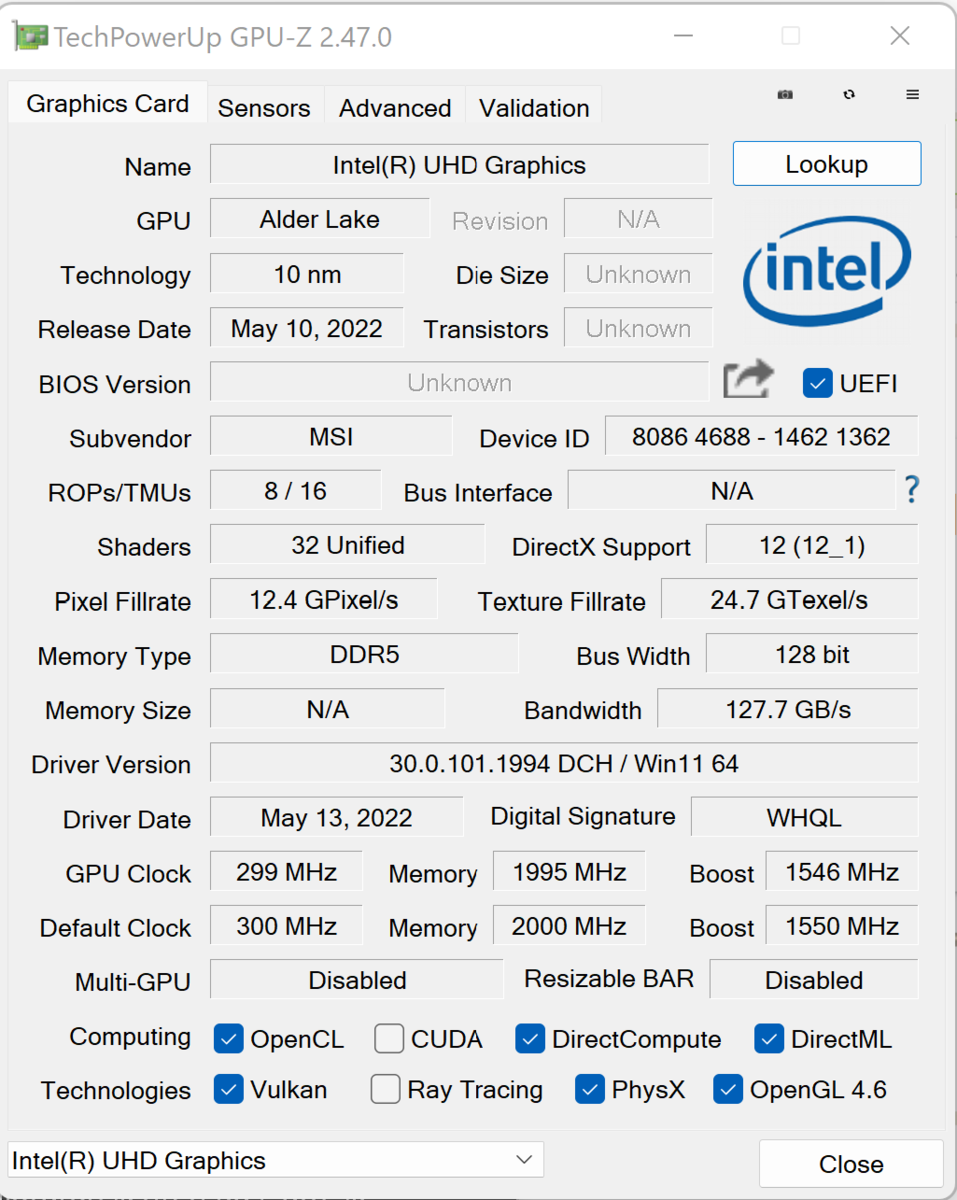
我们测试了激活dGPU模式的FHD型号。相比之下,在我们对当前设备的审查中,Nvidia Optimus被启用。因此,测量结果不一定具有直接可比性。
处理器
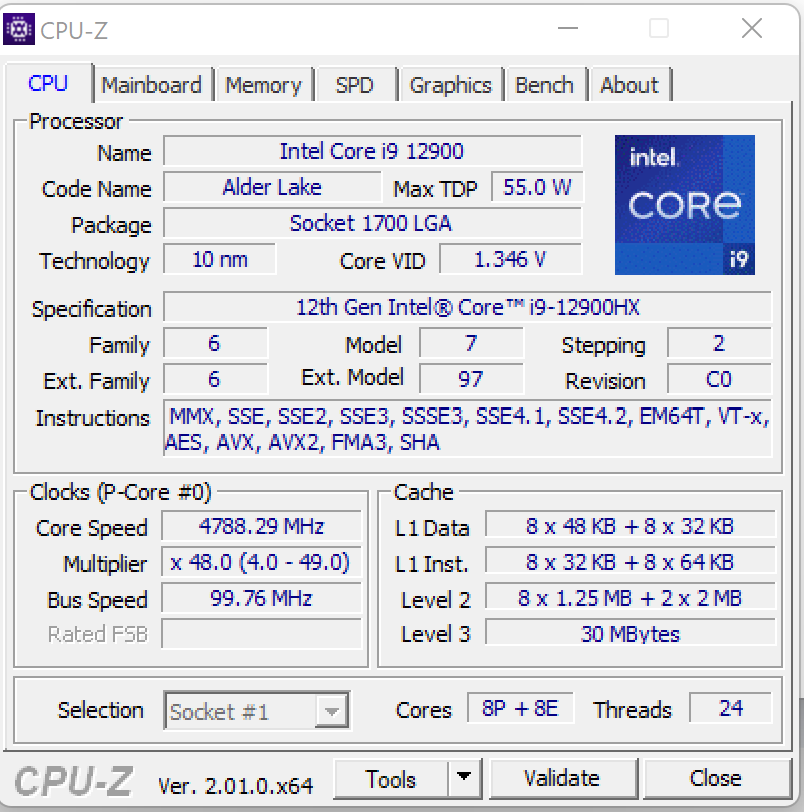
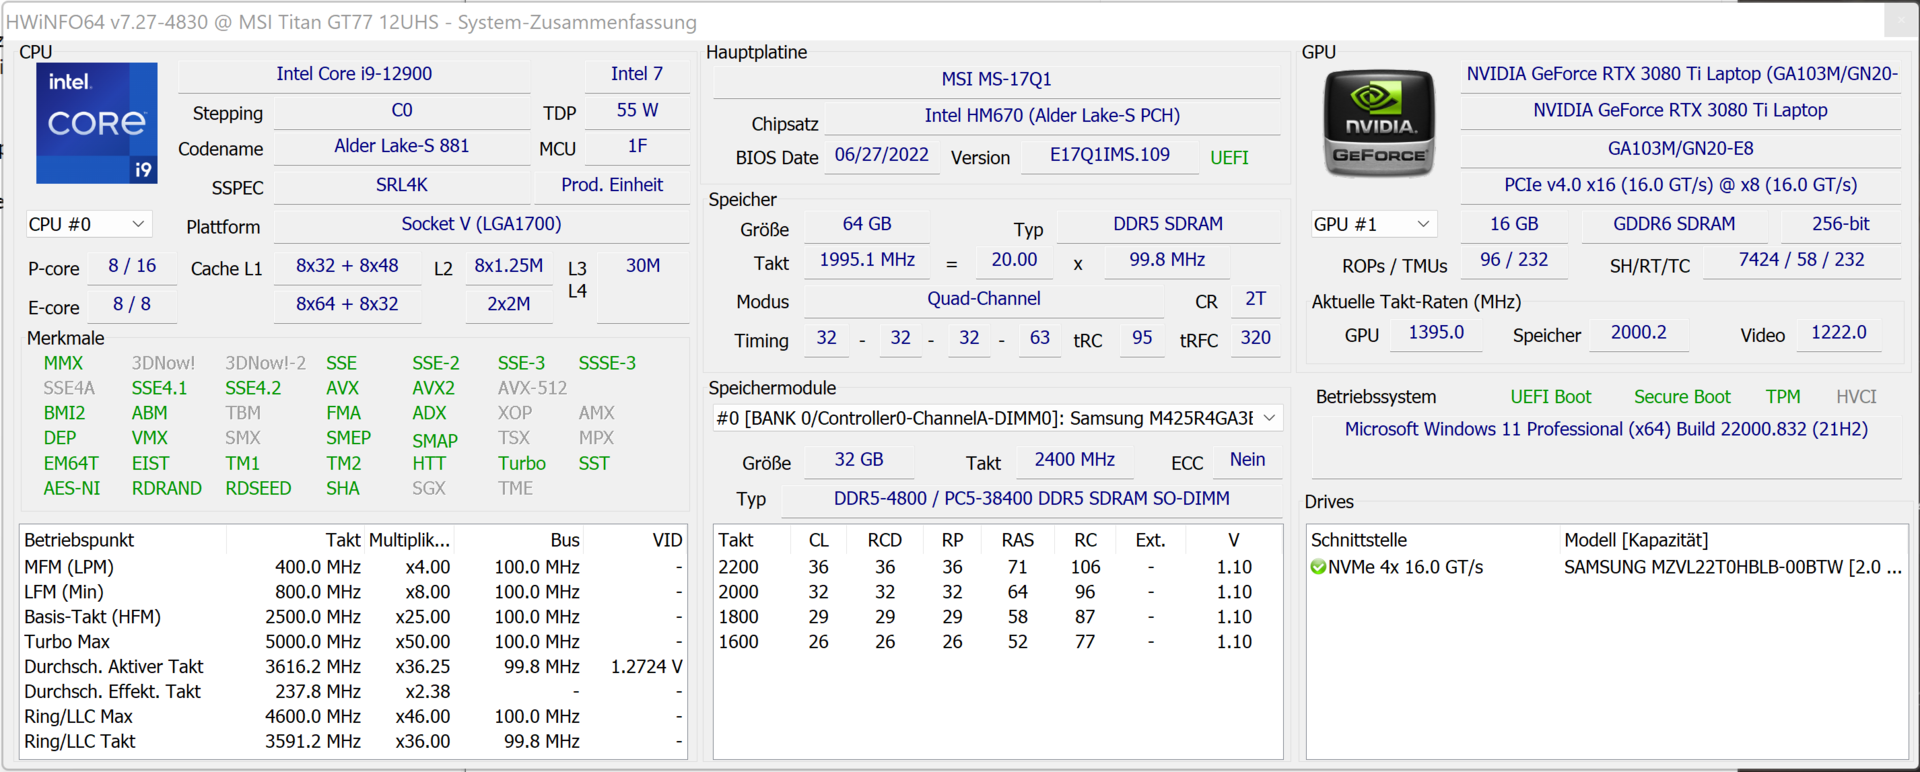
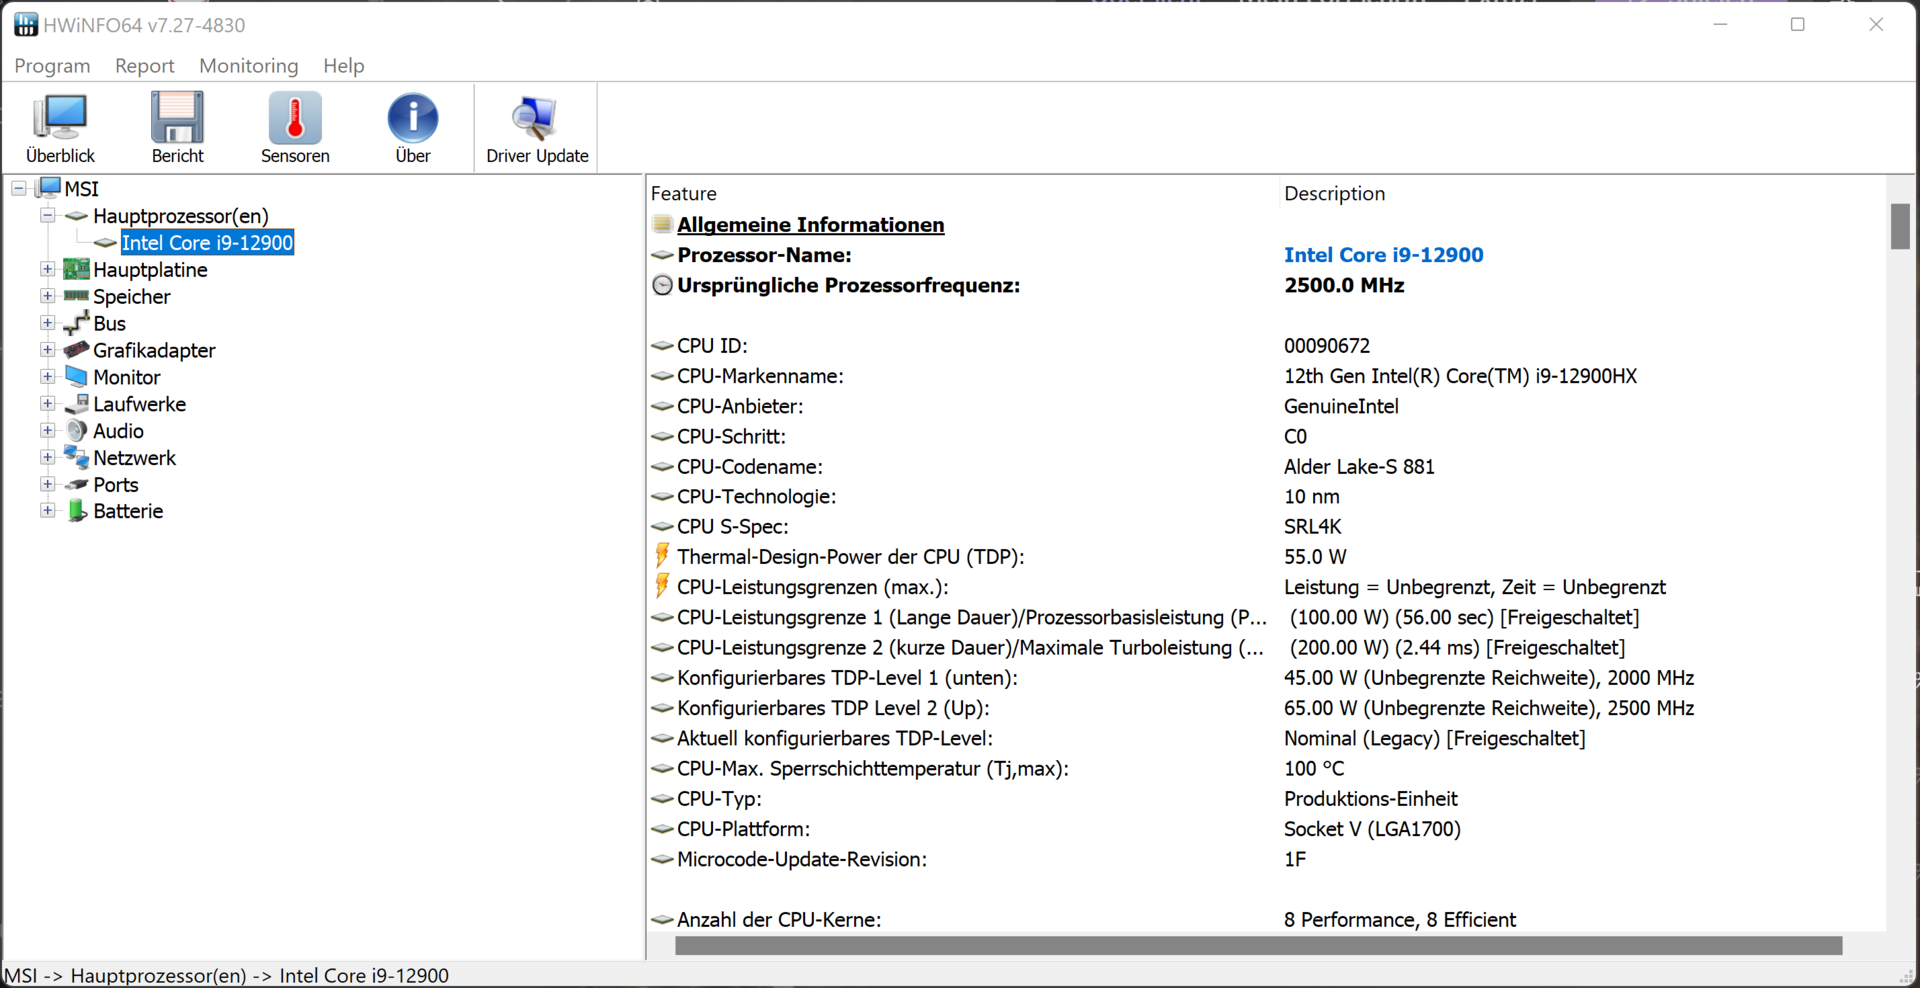
酷睿i9-12900HX处理器(Alder Lake)由八个性能核心(超线程,2.3至5GHz)和八个效率核心(无超线程,1.7至3.6GHz)组成,总共有24个线程。
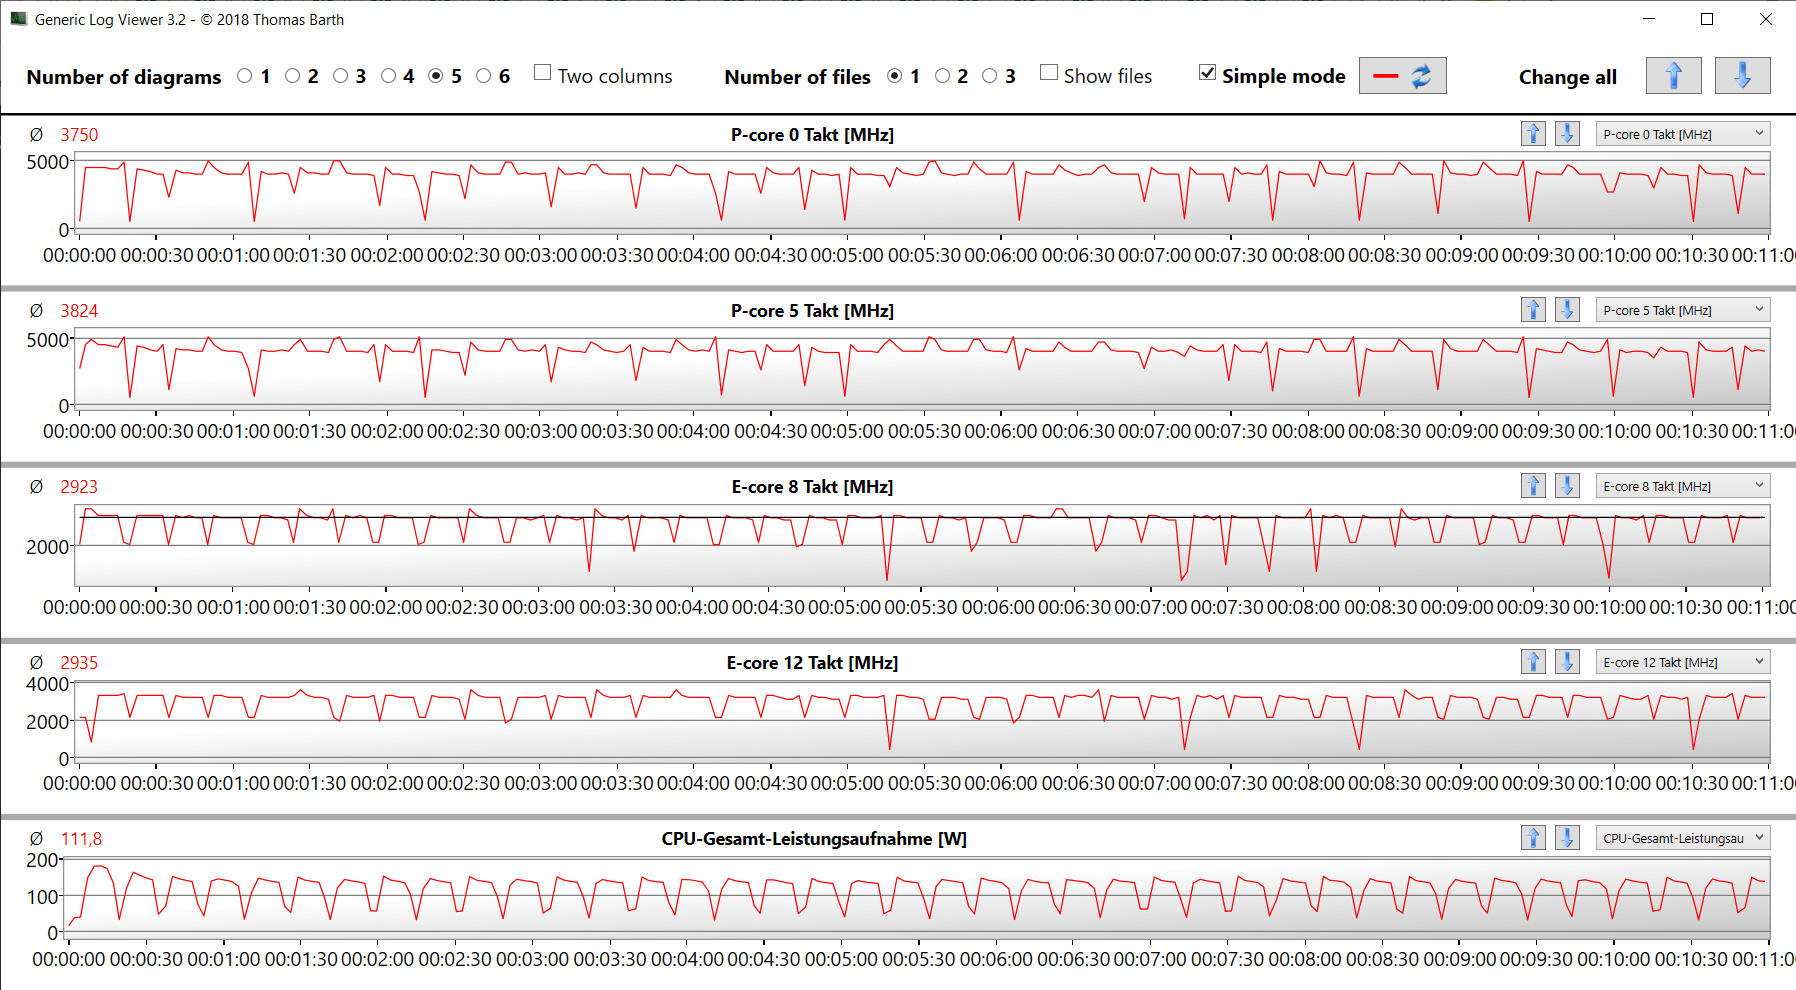
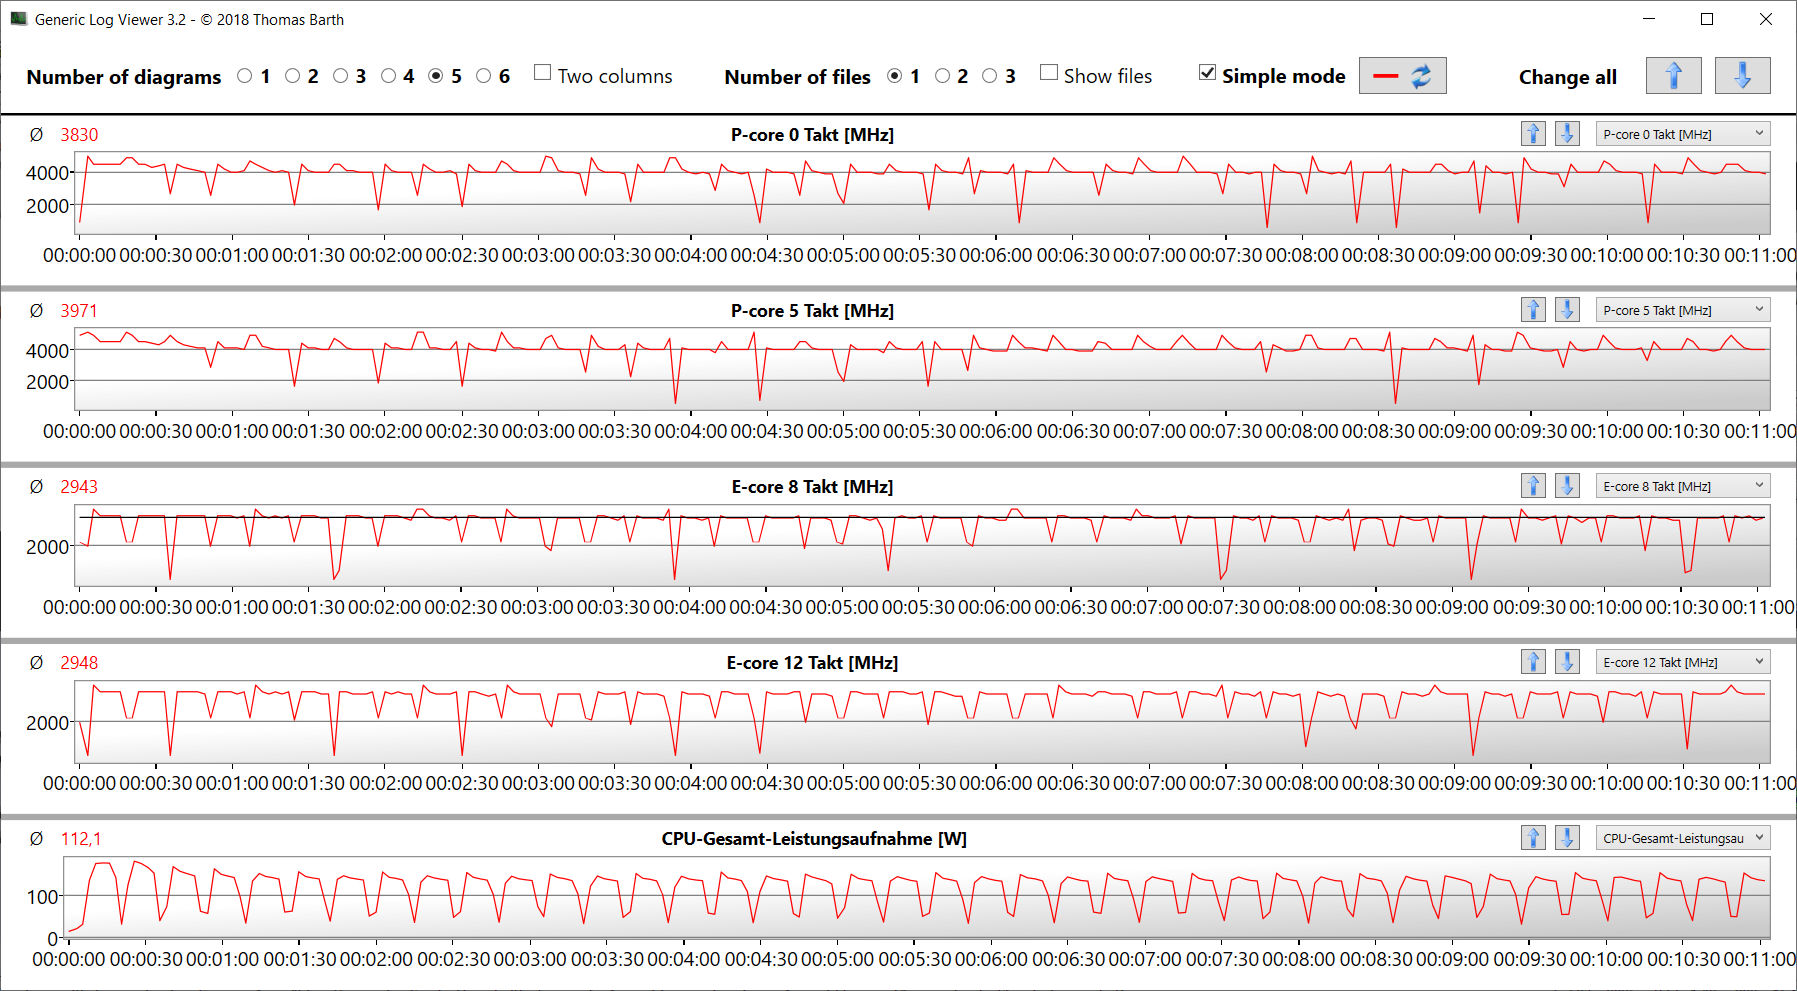
在Cinebench R15中,该CPU在高时钟速度下完成了多线程测试(P-cores:4.4 GHz,E-cores:3.3 GHz)和单线程测试(P-cores:500 MHz至5 GHz,E-cores:400 MHz至3.6 GHz)。它在电池电量方面的表现略显迟缓。
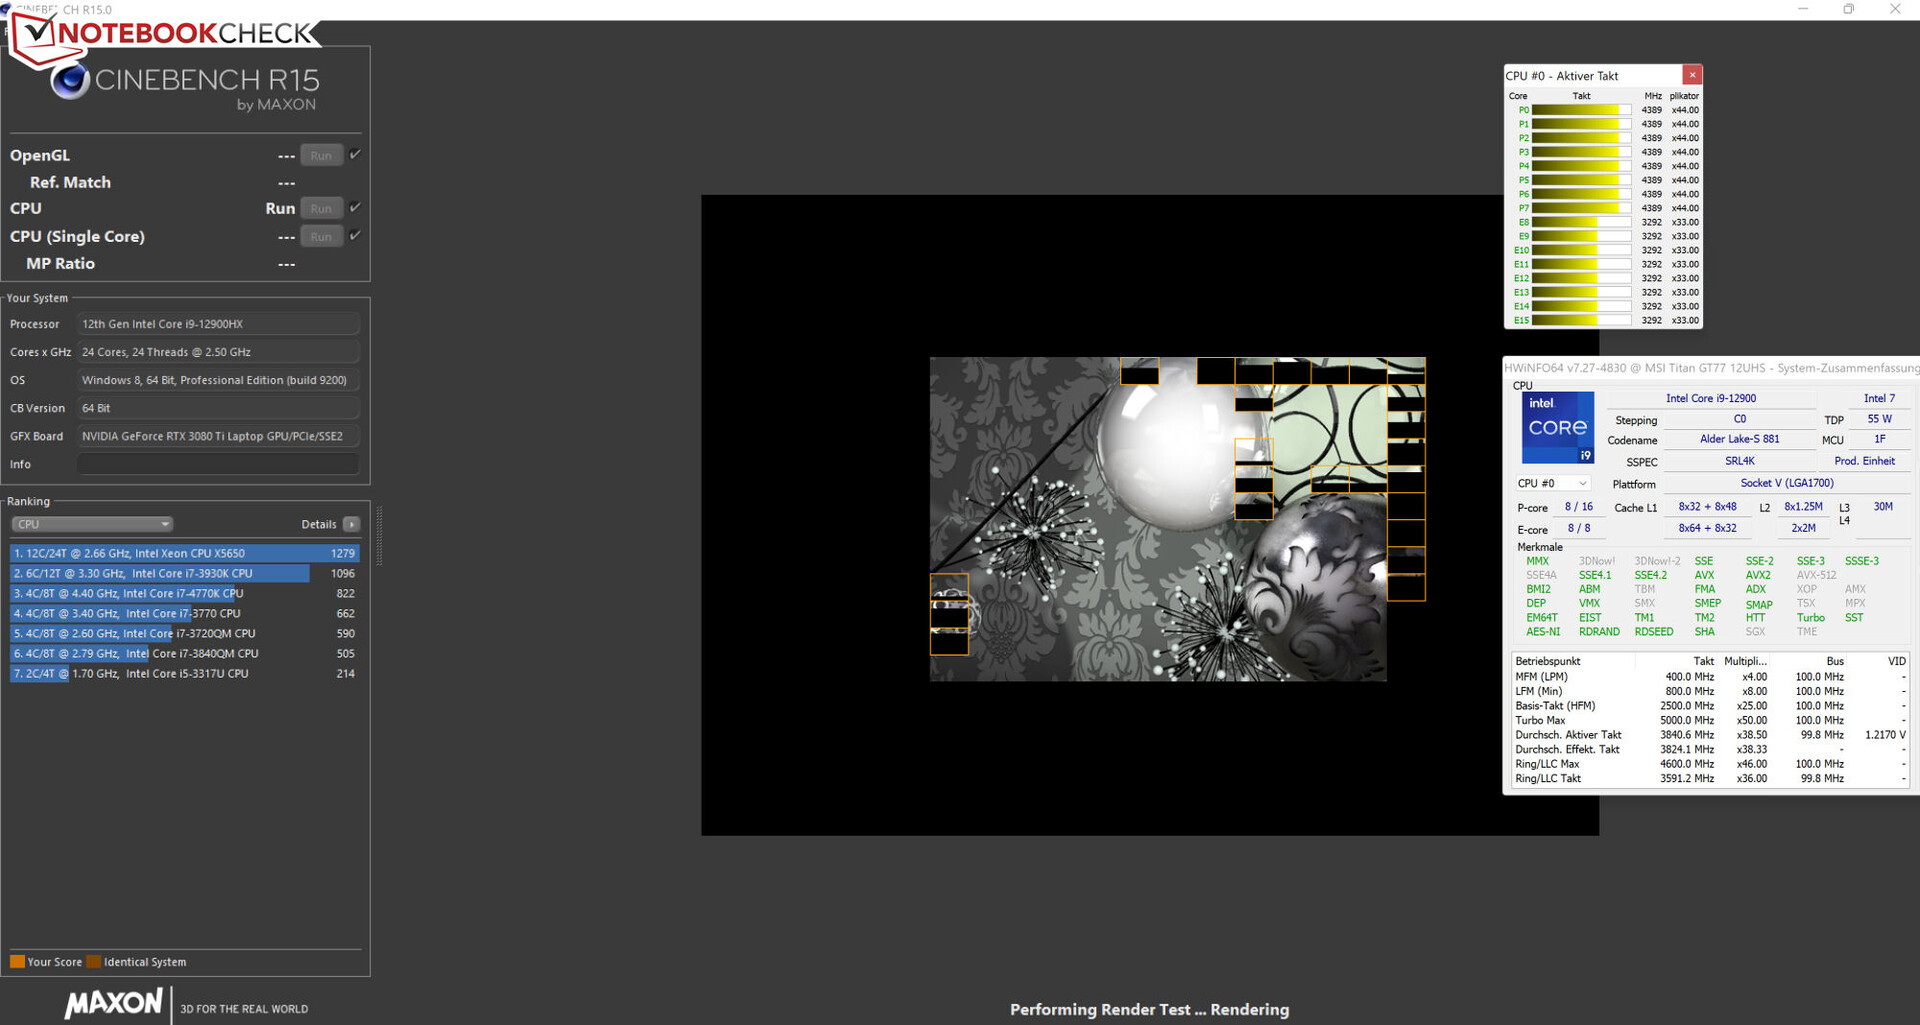
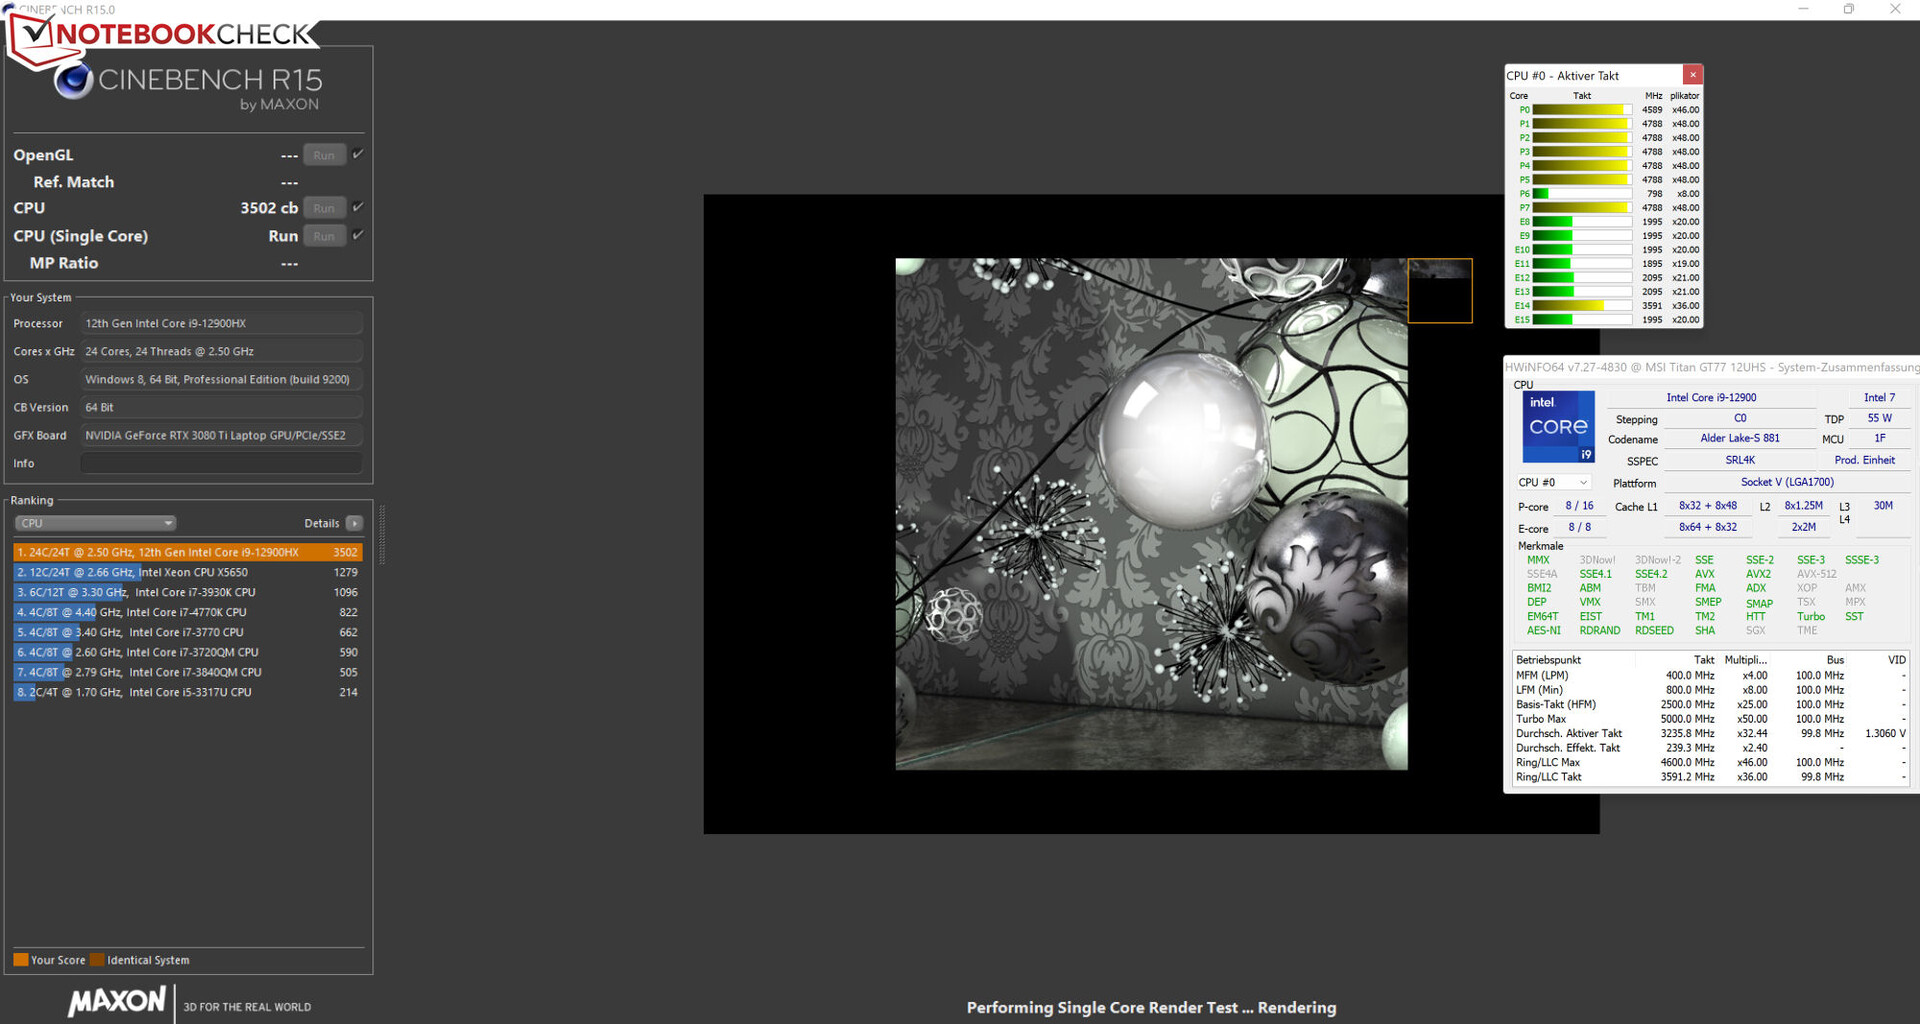
Cinebench 15循环测试显示,该CPU能够在高时钟速度下连续运行。使用 "极限性能 "配置文件使性能略微稳定一些。
Cinebench R15 Multi continuous test
| CPU Performance rating - Percent | |
| Average of class Gaming | |
| MSI Titan GT77 12UHS 4k | |
| MSI Titan GT77 12UHS | |
| MSI Titan GT77 12UHS | |
| Average Intel Core i9-12900HX | |
| Alienware x17 R2 P48E | |
| Schenker XMG Ultra 17 Rocket Lake | |
| Razer Blade 17 Early 2022 | |
| Cinebench R23 | |
| Multi Core | |
| Average of class Gaming (10488 - 42661, n=107, last 2 years) | |
| MSI Titan GT77 12UHS 4k | |
| MSI Titan GT77 12UHS (4k, Extreme Leistung, Cooler Boost) | |
| MSI Titan GT77 12UHS | |
| Average Intel Core i9-12900HX (18337 - 23482, n=8) | |
| Alienware x17 R2 P48E | |
| Schenker XMG Ultra 17 Rocket Lake | |
| Razer Blade 17 Early 2022 | |
| Single Core | |
| Average of class Gaming (1166 - 2415, n=107, last 2 years) | |
| MSI Titan GT77 12UHS 4k | |
| Average Intel Core i9-12900HX (1897 - 1936, n=8) | |
| MSI Titan GT77 12UHS | |
| MSI Titan GT77 12UHS (4k, Extreme Leistung, Cooler Boost) | |
| Razer Blade 17 Early 2022 | |
| Alienware x17 R2 P48E | |
| Schenker XMG Ultra 17 Rocket Lake | |
| Cinebench R20 | |
| CPU (Multi Core) | |
| Average of class Gaming (4029 - 16433, n=106, last 2 years) | |
| MSI Titan GT77 12UHS 4k | |
| MSI Titan GT77 12UHS (4k, Extreme Leistung, Cooler Boost) | |
| MSI Titan GT77 12UHS | |
| Average Intel Core i9-12900HX (7037 - 9042, n=8) | |
| Alienware x17 R2 P48E | |
| Schenker XMG Ultra 17 Rocket Lake | |
| Razer Blade 17 Early 2022 | |
| CPU (Single Core) | |
| Average of class Gaming (442 - 913, n=106, last 2 years) | |
| MSI Titan GT77 12UHS 4k | |
| MSI Titan GT77 12UHS | |
| Average Intel Core i9-12900HX (728 - 745, n=8) | |
| MSI Titan GT77 12UHS (4k, Extreme Leistung, Cooler Boost) | |
| Alienware x17 R2 P48E | |
| Razer Blade 17 Early 2022 | |
| Schenker XMG Ultra 17 Rocket Lake | |
| Cinebench R15 | |
| CPU Multi 64Bit | |
| Average of class Gaming (1578 - 6330, n=105, last 2 years) | |
| MSI Titan GT77 12UHS 4k | |
| MSI Titan GT77 12UHS (4k, Extreme Leistung, Cooler Boost) | |
| MSI Titan GT77 12UHS | |
| Average Intel Core i9-12900HX (2830 - 3652, n=8) | |
| Alienware x17 R2 P48E | |
| Schenker XMG Ultra 17 Rocket Lake | |
| Razer Blade 17 Early 2022 | |
| CPU Single 64Bit | |
| Average of class Gaming (188.8 - 350, n=106, last 2 years) | |
| MSI Titan GT77 12UHS 4k | |
| MSI Titan GT77 12UHS | |
| MSI Titan GT77 12UHS (4k, Extreme Leistung, Cooler Boost) | |
| Average Intel Core i9-12900HX (274 - 282, n=8) | |
| Alienware x17 R2 P48E | |
| Razer Blade 17 Early 2022 | |
| Schenker XMG Ultra 17 Rocket Lake | |
| Blender - v2.79 BMW27 CPU | |
| Razer Blade 17 Early 2022 | |
| Schenker XMG Ultra 17 Rocket Lake | |
| Alienware x17 R2 P48E | |
| Average Intel Core i9-12900HX (144 - 201, n=8) | |
| Average of class Gaming (79 - 330, n=104, last 2 years) | |
| MSI Titan GT77 12UHS 4k | |
| MSI Titan GT77 12UHS | |
| MSI Titan GT77 12UHS (4k, Extreme Leistung, Cooler Boost) | |
| 7-Zip 18.03 | |
| 7z b 4 | |
| Average of class Gaming (33491 - 148086, n=105, last 2 years) | |
| MSI Titan GT77 12UHS 4k | |
| MSI Titan GT77 12UHS (4k, Extreme Leistung, Cooler Boost) | |
| MSI Titan GT77 12UHS | |
| Average Intel Core i9-12900HX (69778 - 88128, n=7) | |
| Alienware x17 R2 P48E | |
| Schenker XMG Ultra 17 Rocket Lake | |
| Razer Blade 17 Early 2022 | |
| 7z b 4 -mmt1 | |
| Average of class Gaming (4199 - 7436, n=105, last 2 years) | |
| MSI Titan GT77 12UHS 4k | |
| Average Intel Core i9-12900HX (6165 - 6358, n=7) | |
| MSI Titan GT77 12UHS | |
| MSI Titan GT77 12UHS | |
| Schenker XMG Ultra 17 Rocket Lake | |
| Razer Blade 17 Early 2022 | |
| Alienware x17 R2 P48E | |
| Geekbench 5.5 | |
| Multi-Core | |
| Average of class Gaming (6460 - 28263, n=105, last 2 years) | |
| MSI Titan GT77 12UHS 4k | |
| MSI Titan GT77 12UHS (4k, Extreme Leistung, Cooler Boost) | |
| MSI Titan GT77 12UHS | |
| Average Intel Core i9-12900HX (15116 - 16925, n=8) | |
| Alienware x17 R2 P48E | |
| Schenker XMG Ultra 17 Rocket Lake | |
| Razer Blade 17 Early 2022 | |
| Single-Core | |
| Average of class Gaming (986 - 2474, n=105, last 2 years) | |
| MSI Titan GT77 12UHS | |
| MSI Titan GT77 12UHS 4k | |
| MSI Titan GT77 12UHS (4k, Extreme Leistung, Cooler Boost) | |
| Average Intel Core i9-12900HX (1874 - 1949, n=8) | |
| Alienware x17 R2 P48E | |
| Razer Blade 17 Early 2022 | |
| Schenker XMG Ultra 17 Rocket Lake | |
| HWBOT x265 Benchmark v2.2 - 4k Preset | |
| Average of class Gaming (11.5 - 44.4, n=105, last 2 years) | |
| MSI Titan GT77 12UHS 4k | |
| MSI Titan GT77 12UHS (4k, Extreme Leistung, Cooler Boost) | |
| MSI Titan GT77 12UHS | |
| Average Intel Core i9-12900HX (19.6 - 26.6, n=7) | |
| Alienware x17 R2 P48E | |
| Schenker XMG Ultra 17 Rocket Lake | |
| Razer Blade 17 Early 2022 | |
| LibreOffice - 20 Documents To PDF | |
| Average of class Gaming (33.2 - 88.8, n=105, last 2 years) | |
| Alienware x17 R2 P48E | |
| Schenker XMG Ultra 17 Rocket Lake | |
| Razer Blade 17 Early 2022 | |
| MSI Titan GT77 12UHS | |
| MSI Titan GT77 12UHS 4k | |
| Average Intel Core i9-12900HX (33.6 - 42.4, n=7) | |
| MSI Titan GT77 12UHS (4k, Extreme Leistung, Cooler Boost) | |
| R Benchmark 2.5 - Overall mean | |
| Schenker XMG Ultra 17 Rocket Lake | |
| Razer Blade 17 Early 2022 | |
| Alienware x17 R2 P48E | |
| Average of class Gaming (0.3439 - 0.759, n=106, last 2 years) | |
| MSI Titan GT77 12UHS 4k | |
| MSI Titan GT77 12UHS (4k, Extreme Leistung, Cooler Boost) | |
| Average Intel Core i9-12900HX (0.4159 - 0.4242, n=7) | |
| MSI Titan GT77 12UHS | |
* ... smaller is better
AIDA64: FP32 Ray-Trace | FPU Julia | CPU SHA3 | CPU Queen | FPU SinJulia | FPU Mandel | CPU AES | CPU ZLib | FP64 Ray-Trace | CPU PhotoWorxx
| Performance rating | |
| Average of class Gaming | |
| MSI Titan GT77 12UHS 4k | |
| MSI Titan GT77 12UHS | |
| MSI Titan GT77 12UHS | |
| Average Intel Core i9-12900HX | |
| Schenker XMG Ultra 17 Rocket Lake | |
| Alienware x17 R2 P48E | |
| Razer Blade 17 Early 2022 | |
| AIDA64 / FP32 Ray-Trace | |
| Average of class Gaming (10227 - 85542, n=105, last 2 years) | |
| MSI Titan GT77 12UHS 4k (v6.70.6000) | |
| MSI Titan GT77 12UHS (v6.70.6000, 4k, Extreme Leistung, Cooler Boost) | |
| MSI Titan GT77 12UHS (v6.70.6000) | |
| Average Intel Core i9-12900HX (11535 - 22183, n=7) | |
| Schenker XMG Ultra 17 Rocket Lake (v6.32.5600) | |
| Alienware x17 R2 P48E (v6.50.5800) | |
| Razer Blade 17 Early 2022 (v6.50.5800) | |
| AIDA64 / FPU Julia | |
| Average of class Gaming (51376 - 238426, n=105, last 2 years) | |
| MSI Titan GT77 12UHS 4k (v6.70.6000) | |
| MSI Titan GT77 12UHS (v6.70.6000) | |
| MSI Titan GT77 12UHS (v6.70.6000, 4k, Extreme Leistung, Cooler Boost) | |
| Average Intel Core i9-12900HX (52916 - 110093, n=7) | |
| Schenker XMG Ultra 17 Rocket Lake (v6.32.5600) | |
| Alienware x17 R2 P48E (v6.50.5800) | |
| Razer Blade 17 Early 2022 (v6.50.5800) | |
| AIDA64 / CPU SHA3 | |
| Average of class Gaming (2180 - 10115, n=105, last 2 years) | |
| MSI Titan GT77 12UHS 4k (v6.70.6000) | |
| MSI Titan GT77 12UHS (v6.70.6000, 4k, Extreme Leistung, Cooler Boost) | |
| MSI Titan GT77 12UHS (v6.70.6000) | |
| Schenker XMG Ultra 17 Rocket Lake (v6.32.5600) | |
| Average Intel Core i9-12900HX (3559 - 5123, n=7) | |
| Alienware x17 R2 P48E (v6.50.5800) | |
| Razer Blade 17 Early 2022 (v6.50.5800) | |
| AIDA64 / CPU Queen | |
| Average of class Gaming (49785 - 173351, n=90, last 2 years) | |
| Alienware x17 R2 P48E (v6.50.5800) | |
| Schenker XMG Ultra 17 Rocket Lake (v6.32.5600) | |
| MSI Titan GT77 12UHS (v6.70.6000) | |
| MSI Titan GT77 12UHS 4k (v6.70.6000) | |
| MSI Titan GT77 12UHS (v6.70.6000, 4k, Extreme Leistung, Cooler Boost) | |
| Average Intel Core i9-12900HX (101029 - 104457, n=7) | |
| Razer Blade 17 Early 2022 (v6.50.5800) | |
| AIDA64 / FPU SinJulia | |
| Average of class Gaming (4424 - 33636, n=105, last 2 years) | |
| MSI Titan GT77 12UHS 4k (v6.70.6000) | |
| MSI Titan GT77 12UHS (v6.70.6000, 4k, Extreme Leistung, Cooler Boost) | |
| MSI Titan GT77 12UHS (v6.70.6000) | |
| Average Intel Core i9-12900HX (10475 - 13062, n=7) | |
| Schenker XMG Ultra 17 Rocket Lake (v6.32.5600) | |
| Alienware x17 R2 P48E (v6.50.5800) | |
| Razer Blade 17 Early 2022 (v6.50.5800) | |
| AIDA64 / FPU Mandel | |
| Average of class Gaming (25115 - 128721, n=105, last 2 years) | |
| MSI Titan GT77 12UHS 4k (v6.70.6000) | |
| MSI Titan GT77 12UHS (v6.70.6000, 4k, Extreme Leistung, Cooler Boost) | |
| MSI Titan GT77 12UHS (v6.70.6000) | |
| Average Intel Core i9-12900HX (31779 - 53628, n=7) | |
| Schenker XMG Ultra 17 Rocket Lake (v6.32.5600) | |
| Alienware x17 R2 P48E (v6.50.5800) | |
| Razer Blade 17 Early 2022 (v6.50.5800) | |
| AIDA64 / CPU AES | |
| MSI Titan GT77 12UHS (v6.70.6000, 4k, Extreme Leistung, Cooler Boost) | |
| MSI Titan GT77 12UHS | |
| MSI Titan GT77 12UHS 4k (v6.70.6000) | |
| Average Intel Core i9-12900HX (125268 - 183146, n=7) | |
| Schenker XMG Ultra 17 Rocket Lake (v6.32.5600) | |
| Average of class Gaming (39258 - 247074, n=105, last 2 years) | |
| Alienware x17 R2 P48E (v6.50.5800) | |
| Razer Blade 17 Early 2022 (v6.50.5800) | |
| AIDA64 / CPU ZLib | |
| Average of class Gaming (574 - 2531, n=105, last 2 years) | |
| MSI Titan GT77 12UHS 4k (v6.70.6000) | |
| MSI Titan GT77 12UHS (v6.70.6000, 4k, Extreme Leistung, Cooler Boost) | |
| MSI Titan GT77 12UHS (v6.70.6000) | |
| Average Intel Core i9-12900HX (990 - 1408, n=7) | |
| Alienware x17 R2 P48E (v6.50.5800) | |
| Schenker XMG Ultra 17 Rocket Lake (v6.32.5600) | |
| Razer Blade 17 Early 2022 (v6.50.5800) | |
| AIDA64 / FP64 Ray-Trace | |
| Average of class Gaming (5509 - 45446, n=105, last 2 years) | |
| MSI Titan GT77 12UHS 4k (v6.70.6000) | |
| MSI Titan GT77 12UHS (v6.70.6000, 4k, Extreme Leistung, Cooler Boost) | |
| MSI Titan GT77 12UHS (v6.70.6000) | |
| Average Intel Core i9-12900HX (6663 - 11913, n=7) | |
| Schenker XMG Ultra 17 Rocket Lake (v6.32.5600) | |
| Alienware x17 R2 P48E (v6.50.5800) | |
| Razer Blade 17 Early 2022 (v6.50.5800) | |
| AIDA64 / CPU PhotoWorxx | |
| Average of class Gaming (12271 - 89891, n=105, last 2 years) | |
| Average Intel Core i9-12900HX (40239 - 47710, n=7) | |
| MSI Titan GT77 12UHS (v6.70.6000) | |
| MSI Titan GT77 12UHS 4k (v6.70.6000) | |
| MSI Titan GT77 12UHS (v6.70.6000, 4k, Extreme Leistung, Cooler Boost) | |
| Razer Blade 17 Early 2022 (v6.50.5800) | |
| Alienware x17 R2 P48E (v6.50.5800) | |
| Schenker XMG Ultra 17 Rocket Lake (v6.32.5600) | |
系统性能
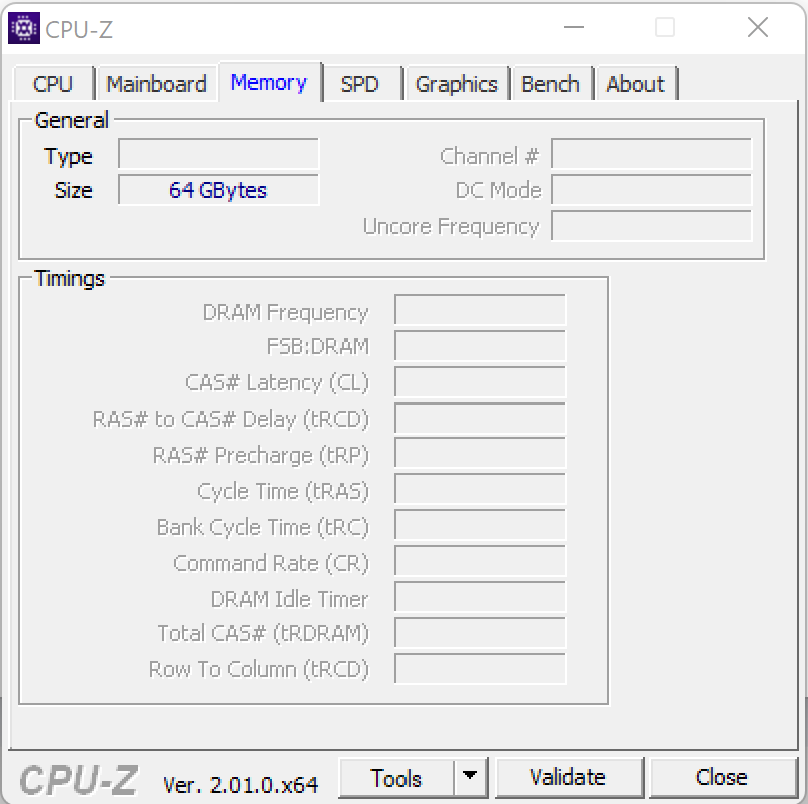
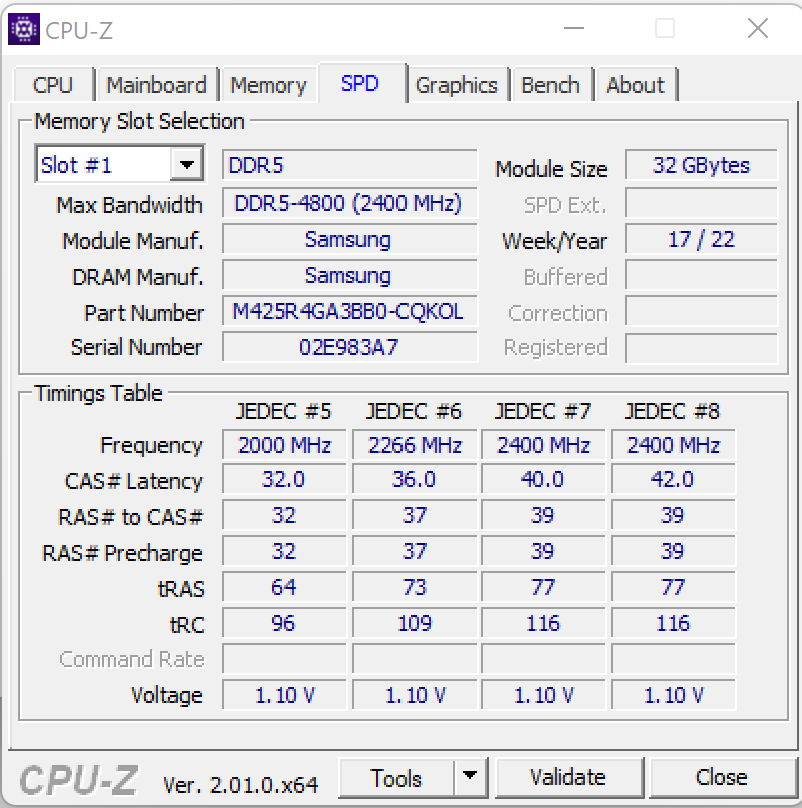
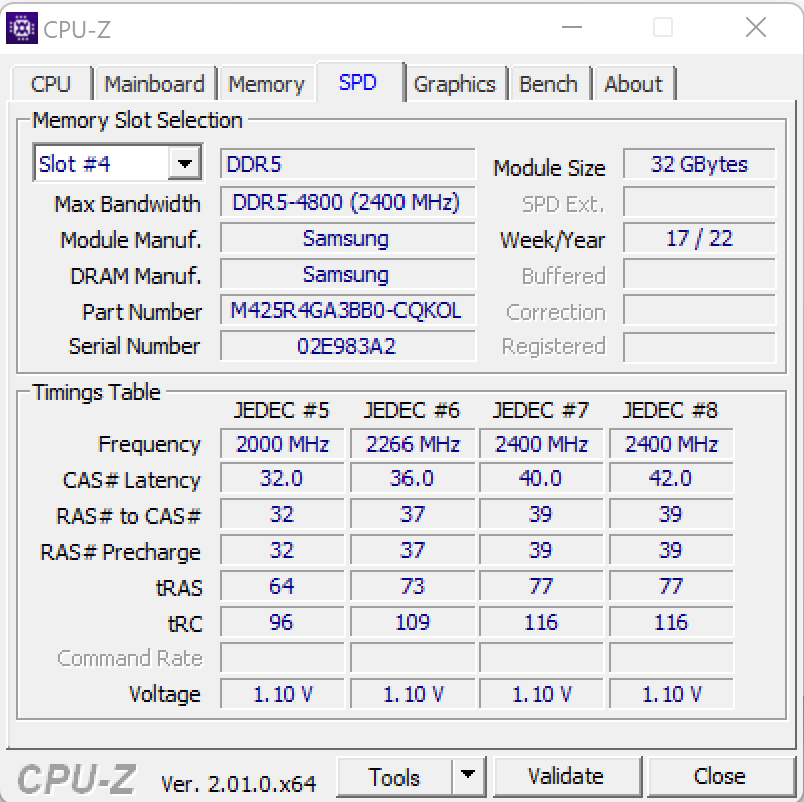
GT77并不缺乏计算能力--这一点只需看看它的规格就能立即明白。这款17英寸的笔记本电脑可以轻松地处理游戏、渲染和更多的工作。内存传输率符合DDR4-4800内存的通常性能水平。该系统在PCMark中也获得了良好的结果。
CrossMark: Overall | Productivity | Creativity | Responsiveness
| PCMark 10 / Score | |
| Average of class Gaming (5828 - 12414, n=93, last 2 years) | |
| MSI Titan GT77 12UHS (dGPU, Extreme Leistung) | |
| MSI Titan GT77 12UHS | |
| Alienware x17 R2 P48E | |
| Average Intel Core i9-12900HX, NVIDIA GeForce RTX 3080 Ti Laptop GPU (6812 - 8636, n=6) | |
| Schenker XMG Ultra 17 Rocket Lake | |
| Razer Blade 17 Early 2022 | |
| MSI Titan GT77 12UHS 4k | |
| PCMark 10 / Essentials | |
| Alienware x17 R2 P48E | |
| MSI Titan GT77 12UHS (dGPU, Extreme Leistung) | |
| MSI Titan GT77 12UHS | |
| Schenker XMG Ultra 17 Rocket Lake | |
| Average of class Gaming (8810 - 11935, n=97, last 2 years) | |
| Average Intel Core i9-12900HX, NVIDIA GeForce RTX 3080 Ti Laptop GPU (9598 - 11192, n=6) | |
| Razer Blade 17 Early 2022 | |
| MSI Titan GT77 12UHS 4k | |
| PCMark 10 / Productivity | |
| Average of class Gaming (6845 - 25323, n=95, last 2 years) | |
| MSI Titan GT77 12UHS (dGPU, Extreme Leistung) | |
| Average Intel Core i9-12900HX, NVIDIA GeForce RTX 3080 Ti Laptop GPU (9365 - 10932, n=6) | |
| MSI Titan GT77 12UHS | |
| Alienware x17 R2 P48E | |
| Schenker XMG Ultra 17 Rocket Lake | |
| MSI Titan GT77 12UHS 4k | |
| Razer Blade 17 Early 2022 | |
| PCMark 10 / Digital Content Creation | |
| Average of class Gaming (7602 - 19954, n=95, last 2 years) | |
| MSI Titan GT77 12UHS (dGPU, Extreme Leistung) | |
| MSI Titan GT77 12UHS | |
| Alienware x17 R2 P48E | |
| Average Intel Core i9-12900HX, NVIDIA GeForce RTX 3080 Ti Laptop GPU (9543 - 14291, n=6) | |
| Schenker XMG Ultra 17 Rocket Lake | |
| Razer Blade 17 Early 2022 | |
| MSI Titan GT77 12UHS 4k | |
| CrossMark / Overall | |
| MSI Titan GT77 12UHS 4k | |
| Average Intel Core i9-12900HX, NVIDIA GeForce RTX 3080 Ti Laptop GPU (2108 - 2170, n=5) | |
| MSI Titan GT77 12UHS | |
| Average of class Gaming (1366 - 2409, n=94, last 2 years) | |
| Alienware x17 R2 P48E | |
| Razer Blade 17 Early 2022 | |
| CrossMark / Productivity | |
| MSI Titan GT77 12UHS 4k | |
| Average Intel Core i9-12900HX, NVIDIA GeForce RTX 3080 Ti Laptop GPU (1978 - 2047, n=5) | |
| MSI Titan GT77 12UHS | |
| Average of class Gaming (1386 - 2254, n=94, last 2 years) | |
| Alienware x17 R2 P48E | |
| Razer Blade 17 Early 2022 | |
| CrossMark / Creativity | |
| MSI Titan GT77 12UHS 4k | |
| Average Intel Core i9-12900HX, NVIDIA GeForce RTX 3080 Ti Laptop GPU (2288 - 2366, n=5) | |
| MSI Titan GT77 12UHS | |
| Average of class Gaming (1343 - 2786, n=94, last 2 years) | |
| Alienware x17 R2 P48E | |
| Razer Blade 17 Early 2022 | |
| CrossMark / Responsiveness | |
| MSI Titan GT77 12UHS 4k | |
| Average Intel Core i9-12900HX, NVIDIA GeForce RTX 3080 Ti Laptop GPU (1991 - 2090, n=5) | |
| MSI Titan GT77 12UHS | |
| Average of class Gaming (1226 - 2334, n=94, last 2 years) | |
| Alienware x17 R2 P48E | |
| Razer Blade 17 Early 2022 | |
| PCMark 8 Home Score Accelerated v2 | 4166 points | |
| PCMark 8 Creative Score Accelerated v2 | 6677 points | |
| PCMark 8 Work Score Accelerated v2 | 5165 points | |
| PCMark 10 Score | 6812 points | |
Help | ||
| AIDA64 / Memory Copy | |
| Average of class Gaming (21750 - 129946, n=105, last 2 years) | |
| Average Intel Core i9-12900HX (62852 - 70863, n=7) | |
| MSI Titan GT77 12UHS | |
| MSI Titan GT77 12UHS 4k | |
| Razer Blade 17 Early 2022 | |
| Alienware x17 R2 P48E | |
| Schenker XMG Ultra 17 Rocket Lake | |
| AIDA64 / Memory Read | |
| Average of class Gaming (22956 - 118858, n=105, last 2 years) | |
| Average Intel Core i9-12900HX (62140 - 72930, n=7) | |
| MSI Titan GT77 12UHS 4k | |
| Razer Blade 17 Early 2022 | |
| MSI Titan GT77 12UHS | |
| Alienware x17 R2 P48E | |
| Schenker XMG Ultra 17 Rocket Lake | |
| AIDA64 / Memory Write | |
| Average of class Gaming (22297 - 135096, n=105, last 2 years) | |
| Average Intel Core i9-12900HX (60001 - 68782, n=7) | |
| MSI Titan GT77 12UHS 4k | |
| MSI Titan GT77 12UHS | |
| Razer Blade 17 Early 2022 | |
| Alienware x17 R2 P48E | |
| Schenker XMG Ultra 17 Rocket Lake | |
| AIDA64 / Memory Latency | |
| Average of class Gaming (75.3 - 259, n=105, last 2 years) | |
| Alienware x17 R2 P48E | |
| MSI Titan GT77 12UHS 4k | |
| MSI Titan GT77 12UHS | |
| Average Intel Core i9-12900HX (83.9 - 93.4, n=7) | |
| Schenker XMG Ultra 17 Rocket Lake | |
* ... smaller is better
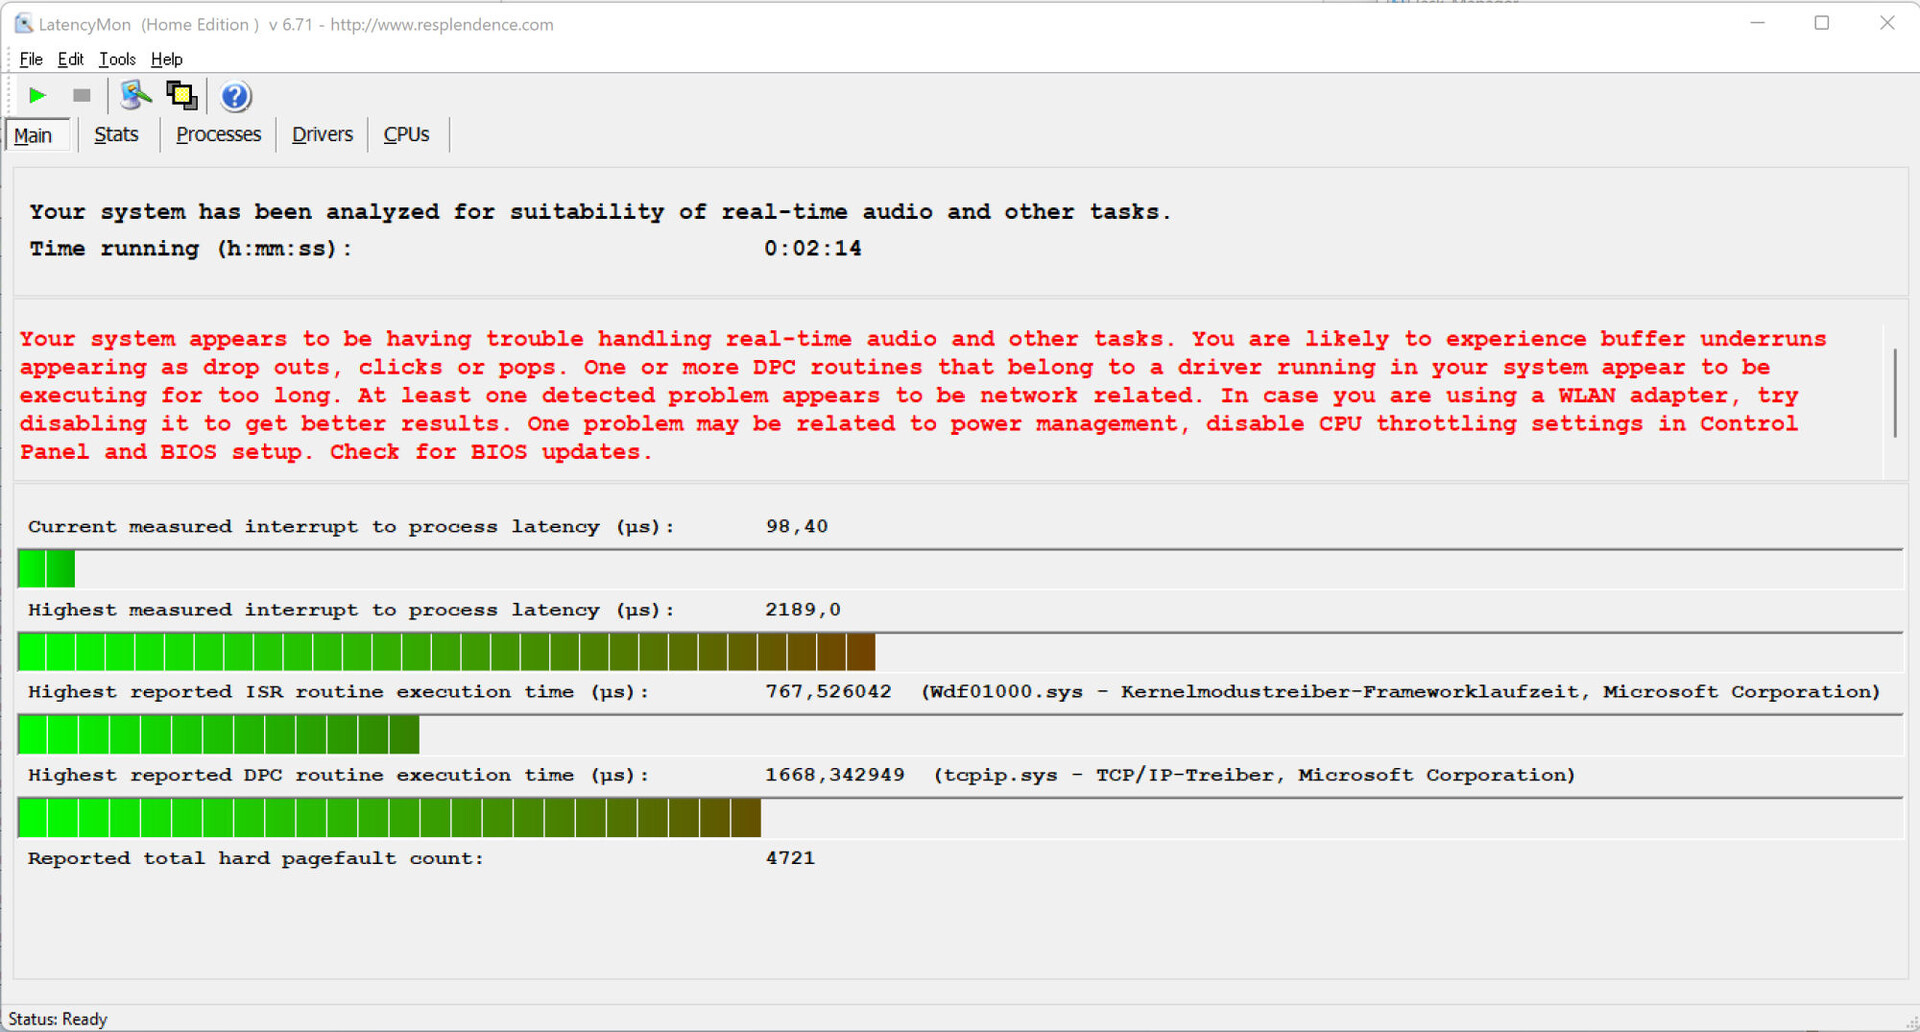
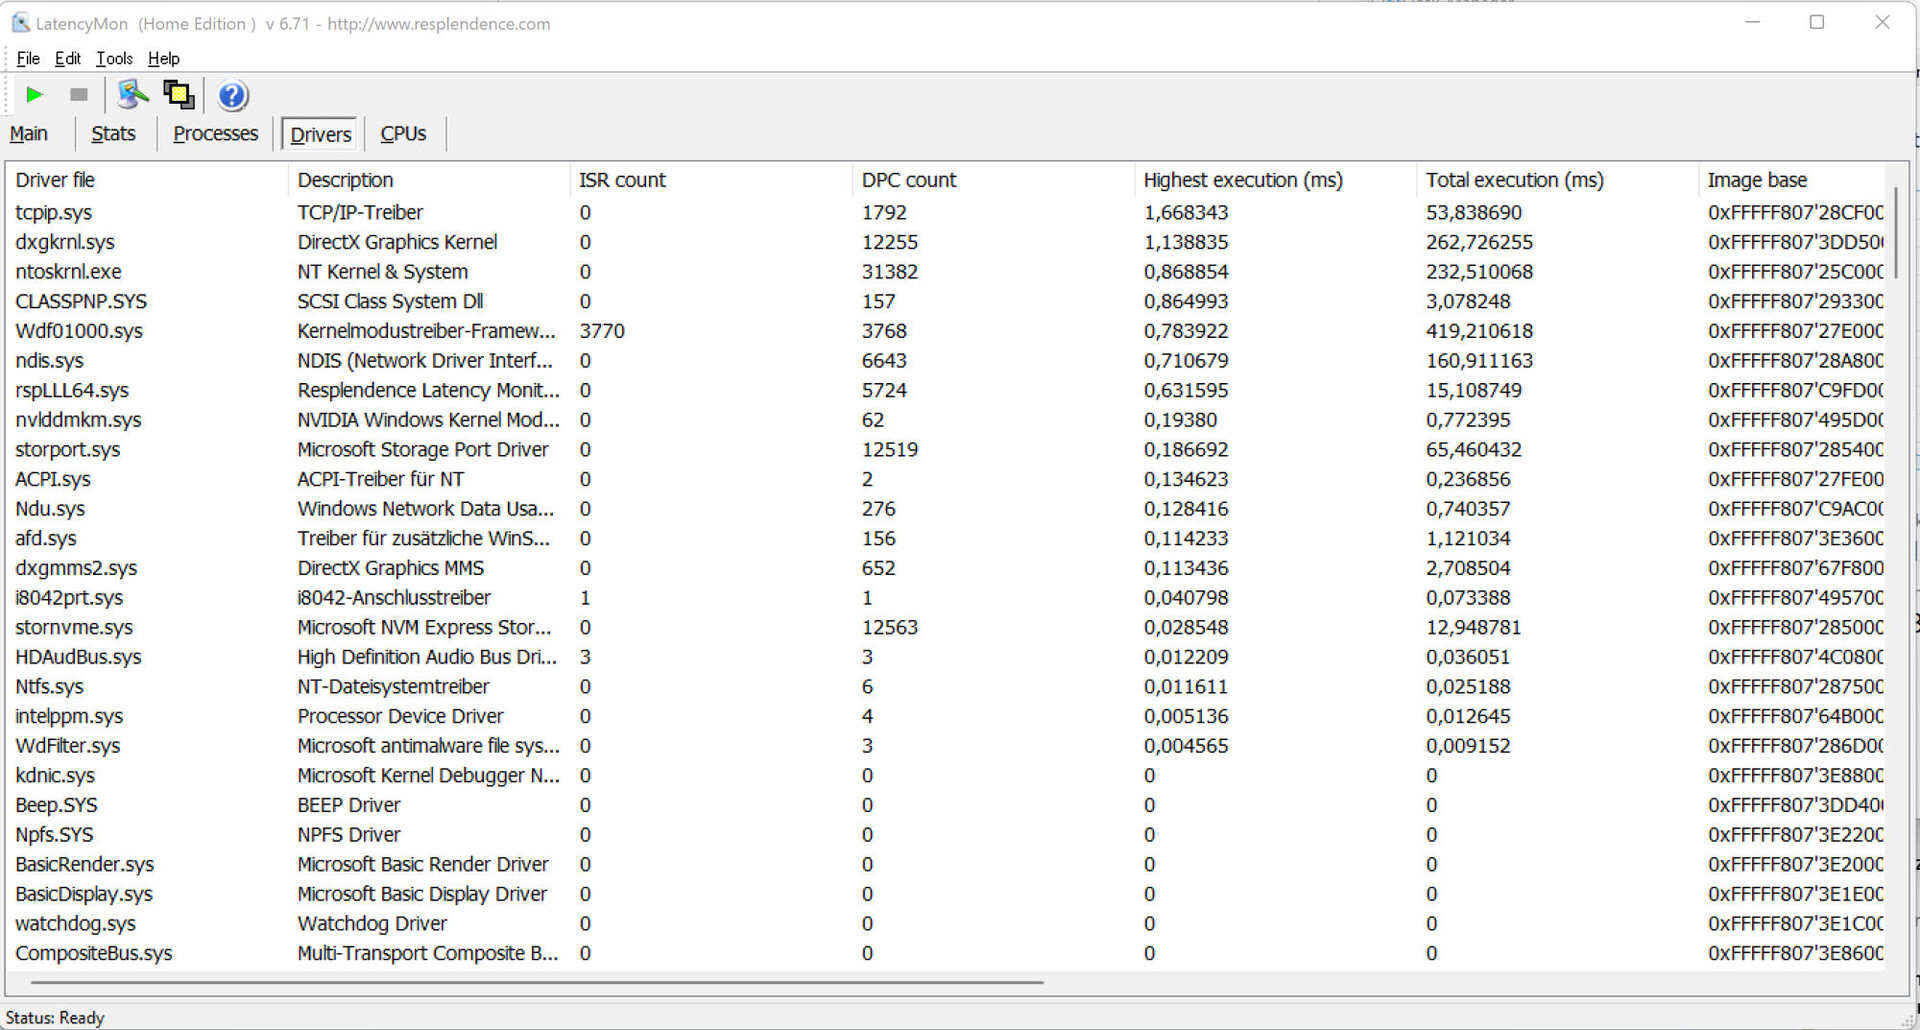
DPC延时
我们的标准化延迟监测测试(互联网浏览、4K视频播放、Prime95高负载)显示了DPC延迟的一些问题。该系统似乎并不适合于实时视频和音频处理。未来的软件更新可能会改善甚至恶化这个问题。
| DPC Latencies / LatencyMon - interrupt to process latency (max), Web, Youtube, Prime95 | |
| MSI Titan GT77 12UHS | |
| MSI Titan GT77 12UHS | |
| MSI Titan GT77 12UHS 4k | |
| Alienware x17 R2 P48E | |
| Schenker XMG Ultra 17 Rocket Lake | |
| Razer Blade 17 Early 2022 | |
* ... smaller is better
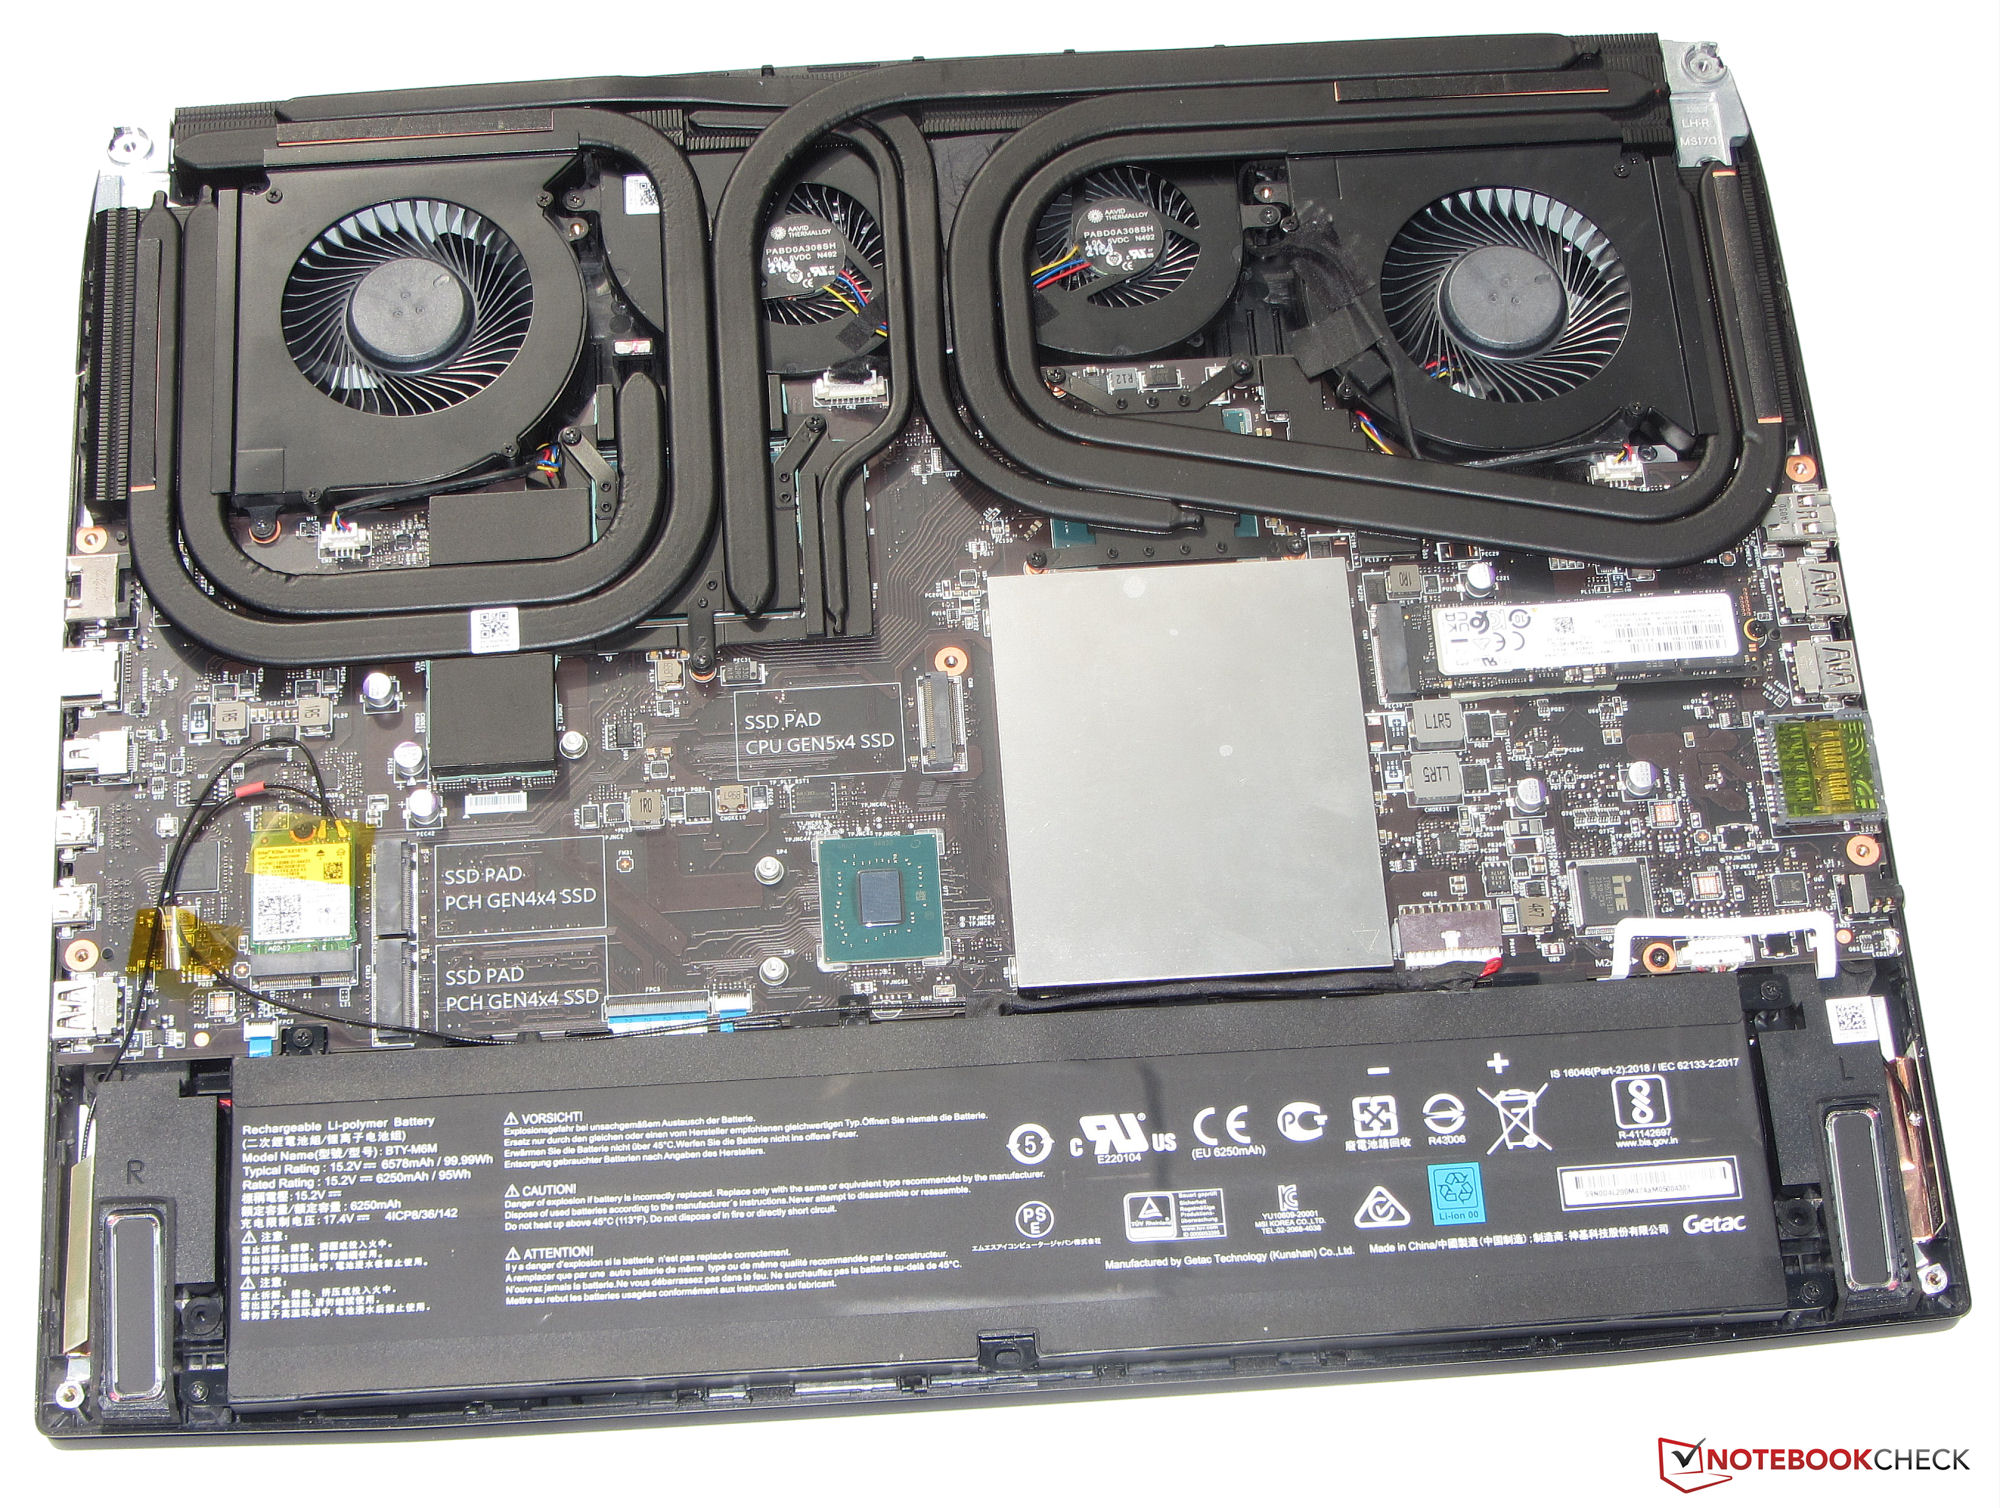
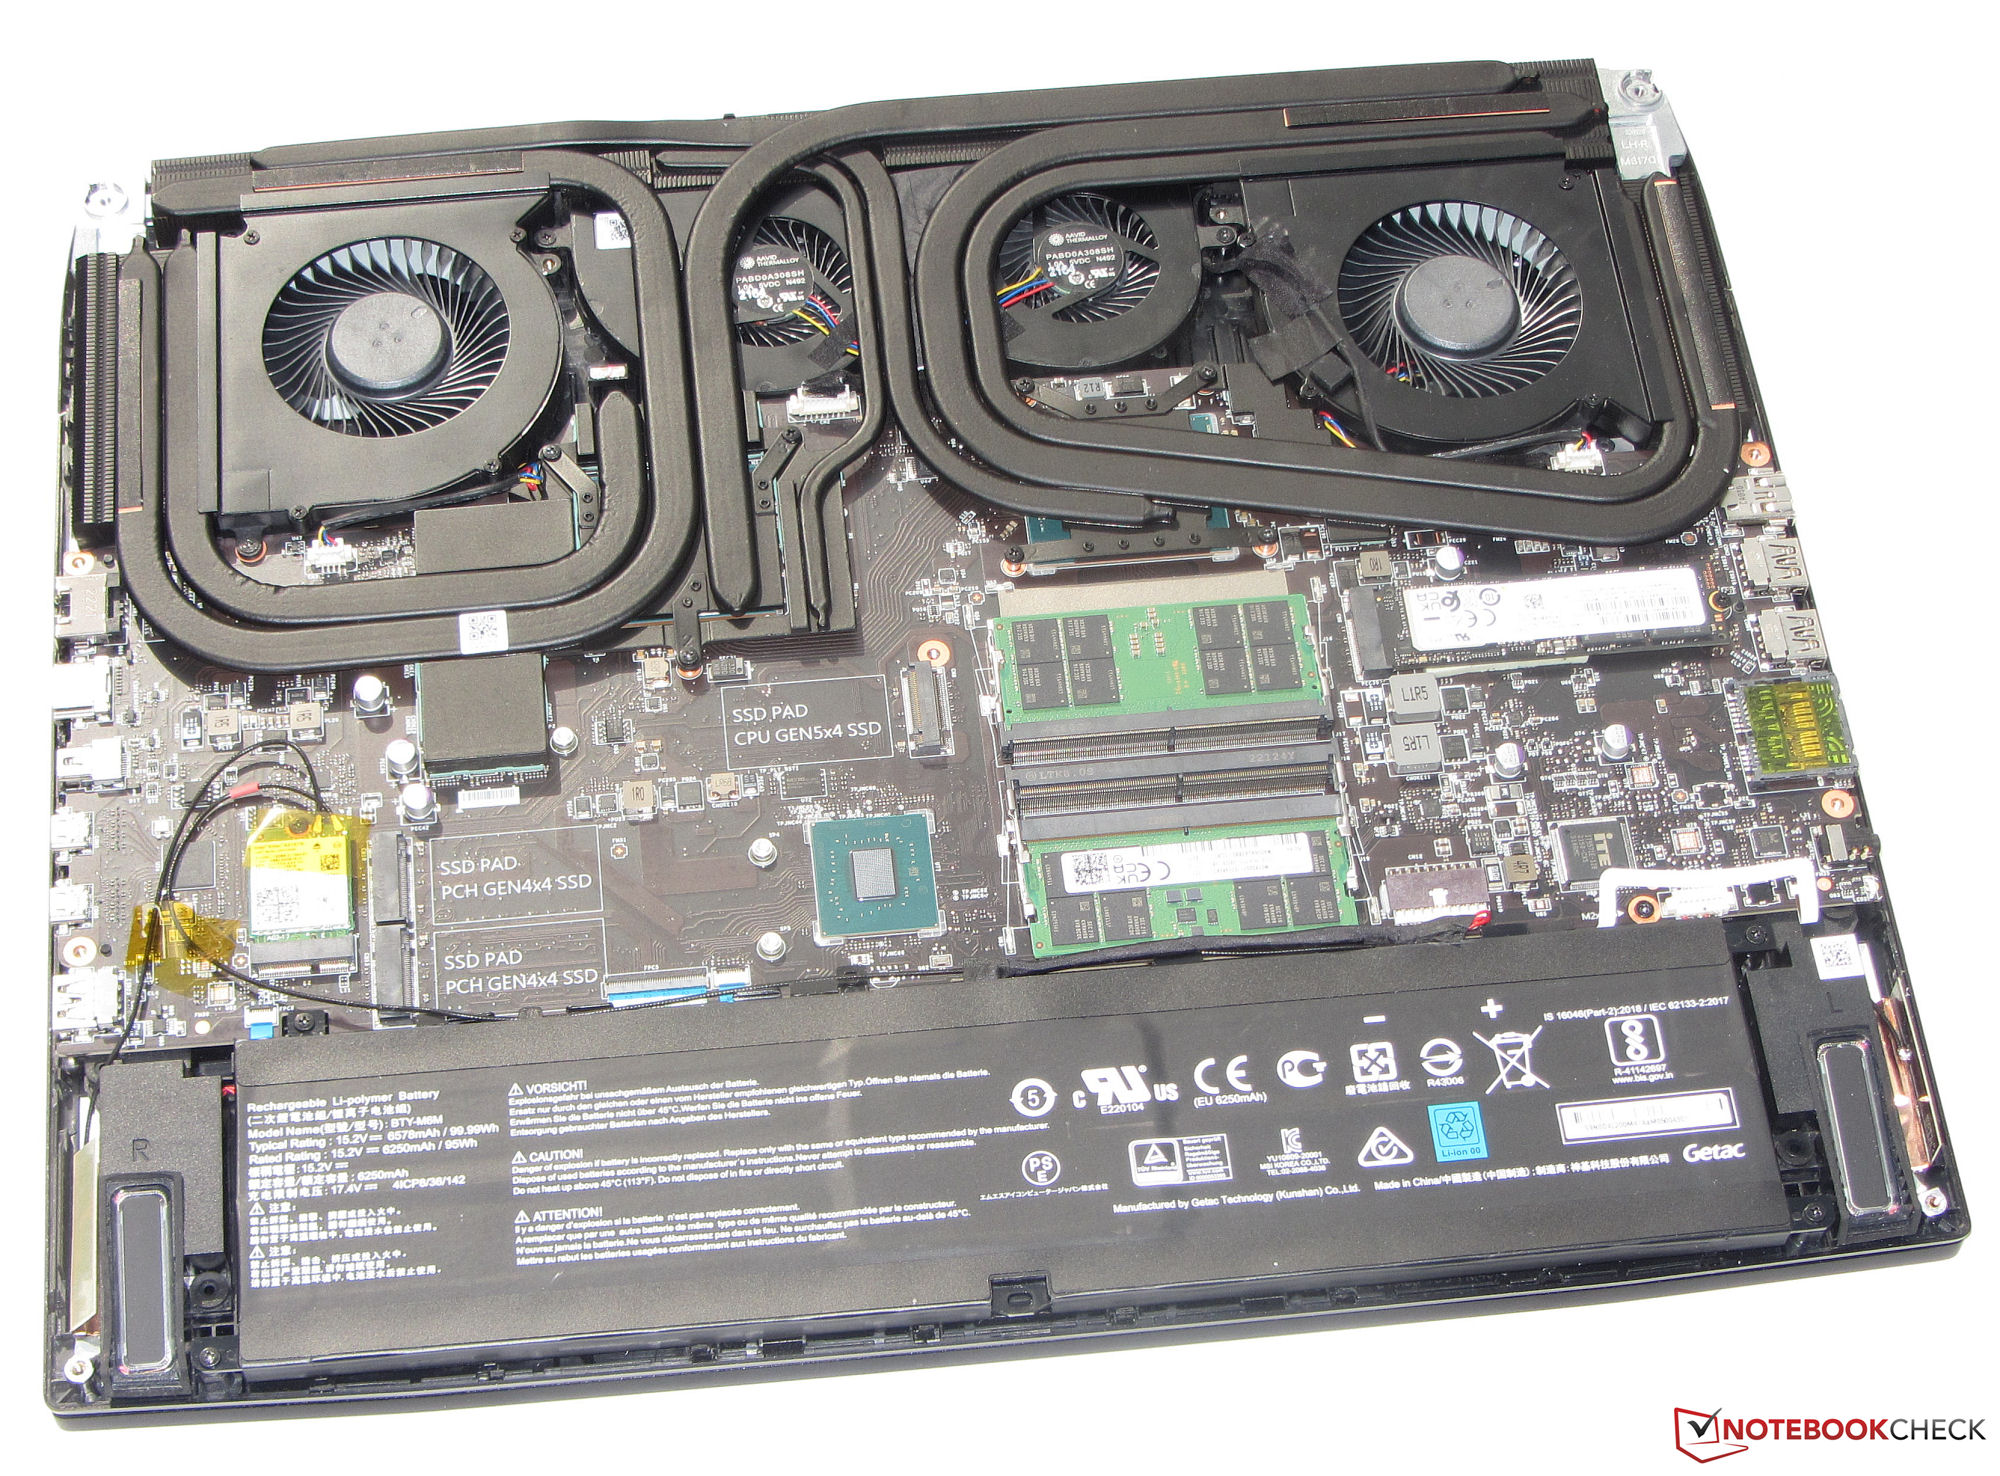
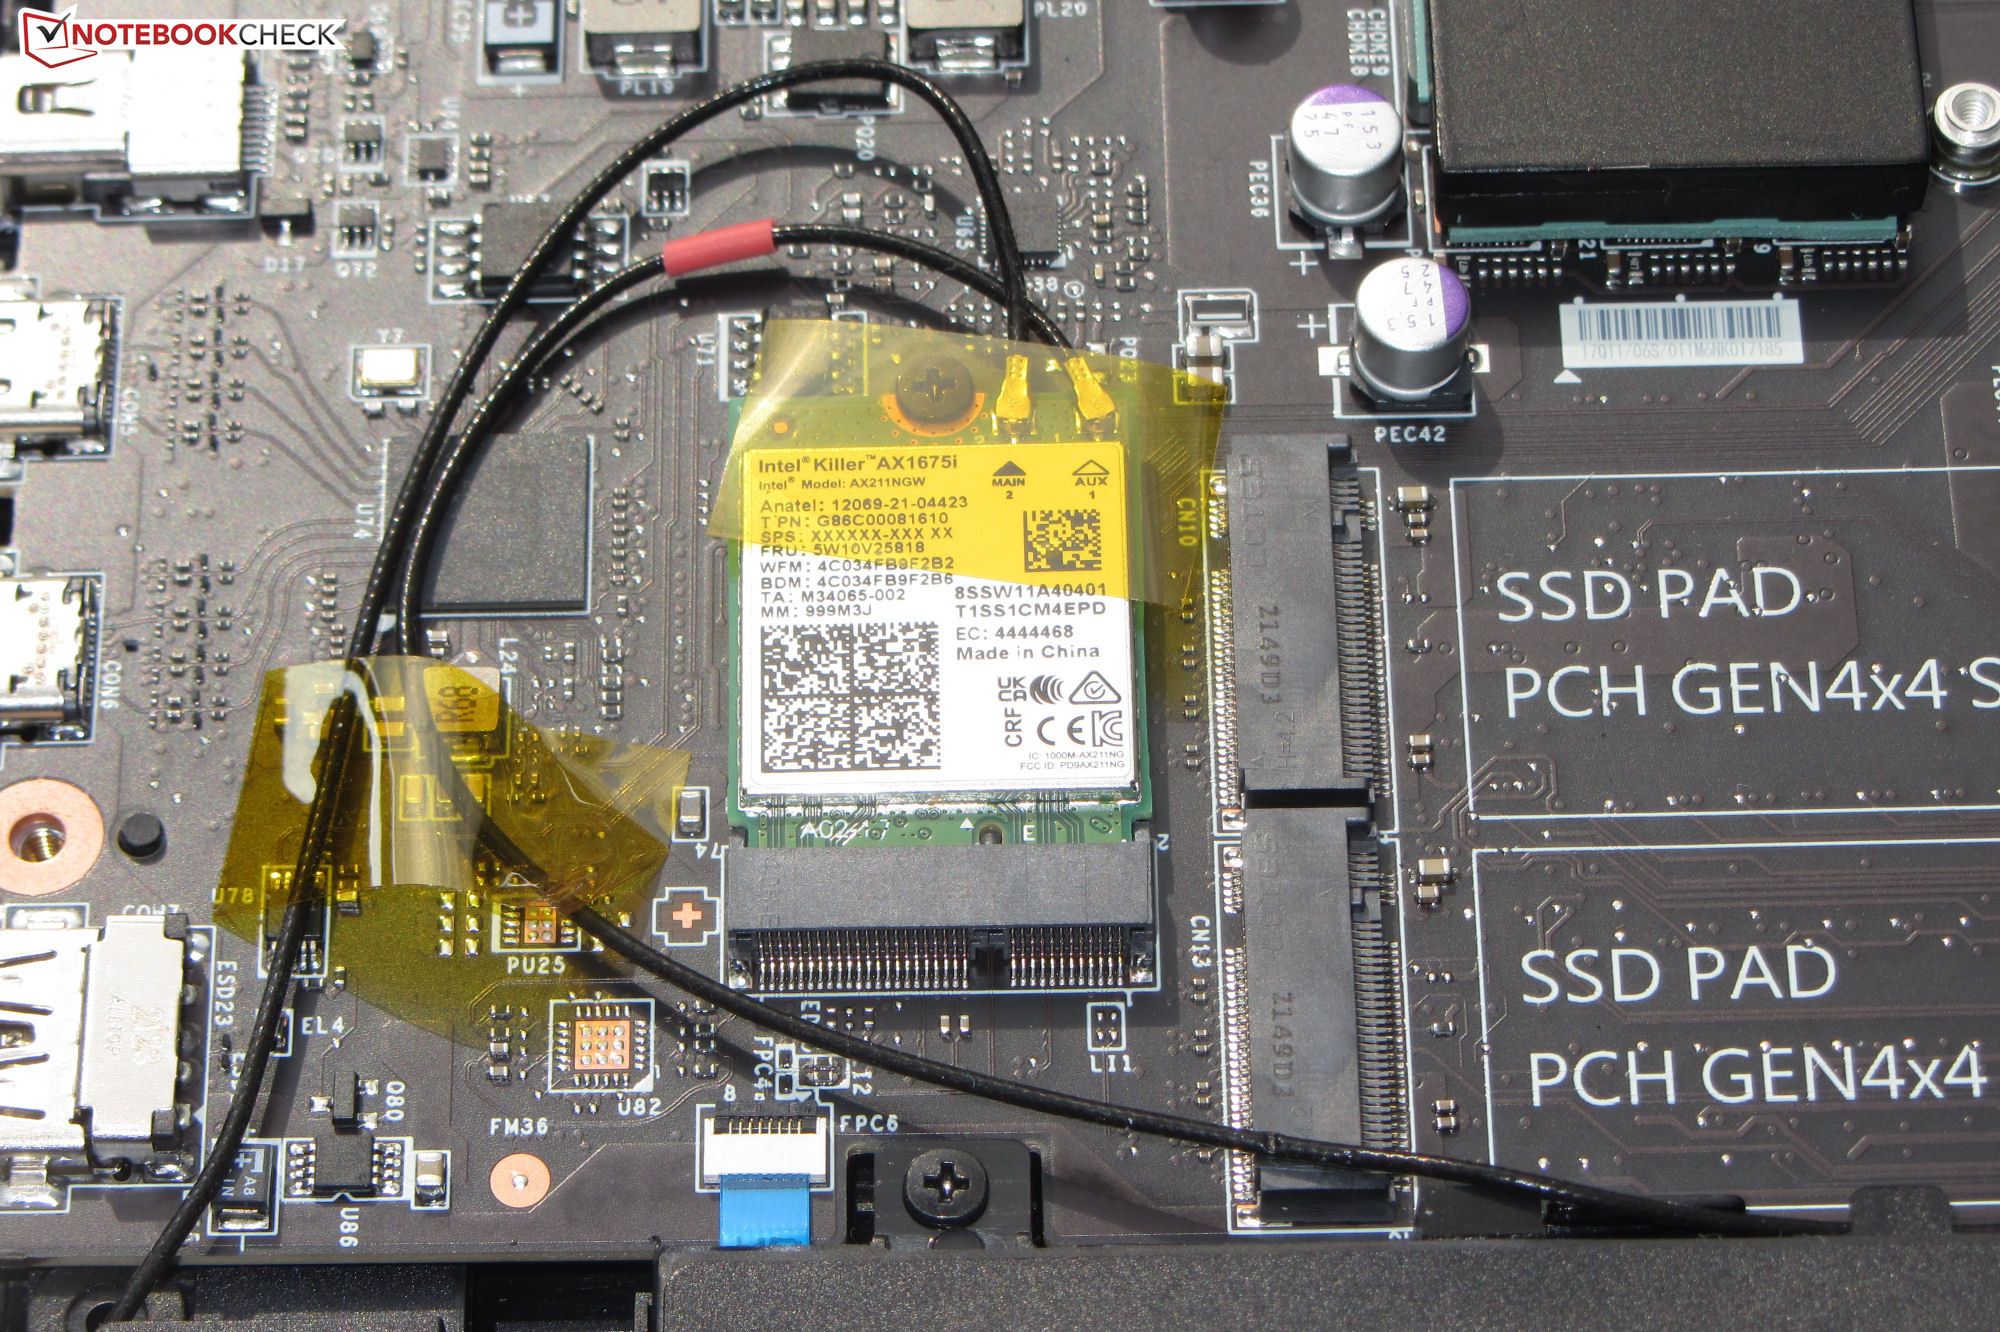
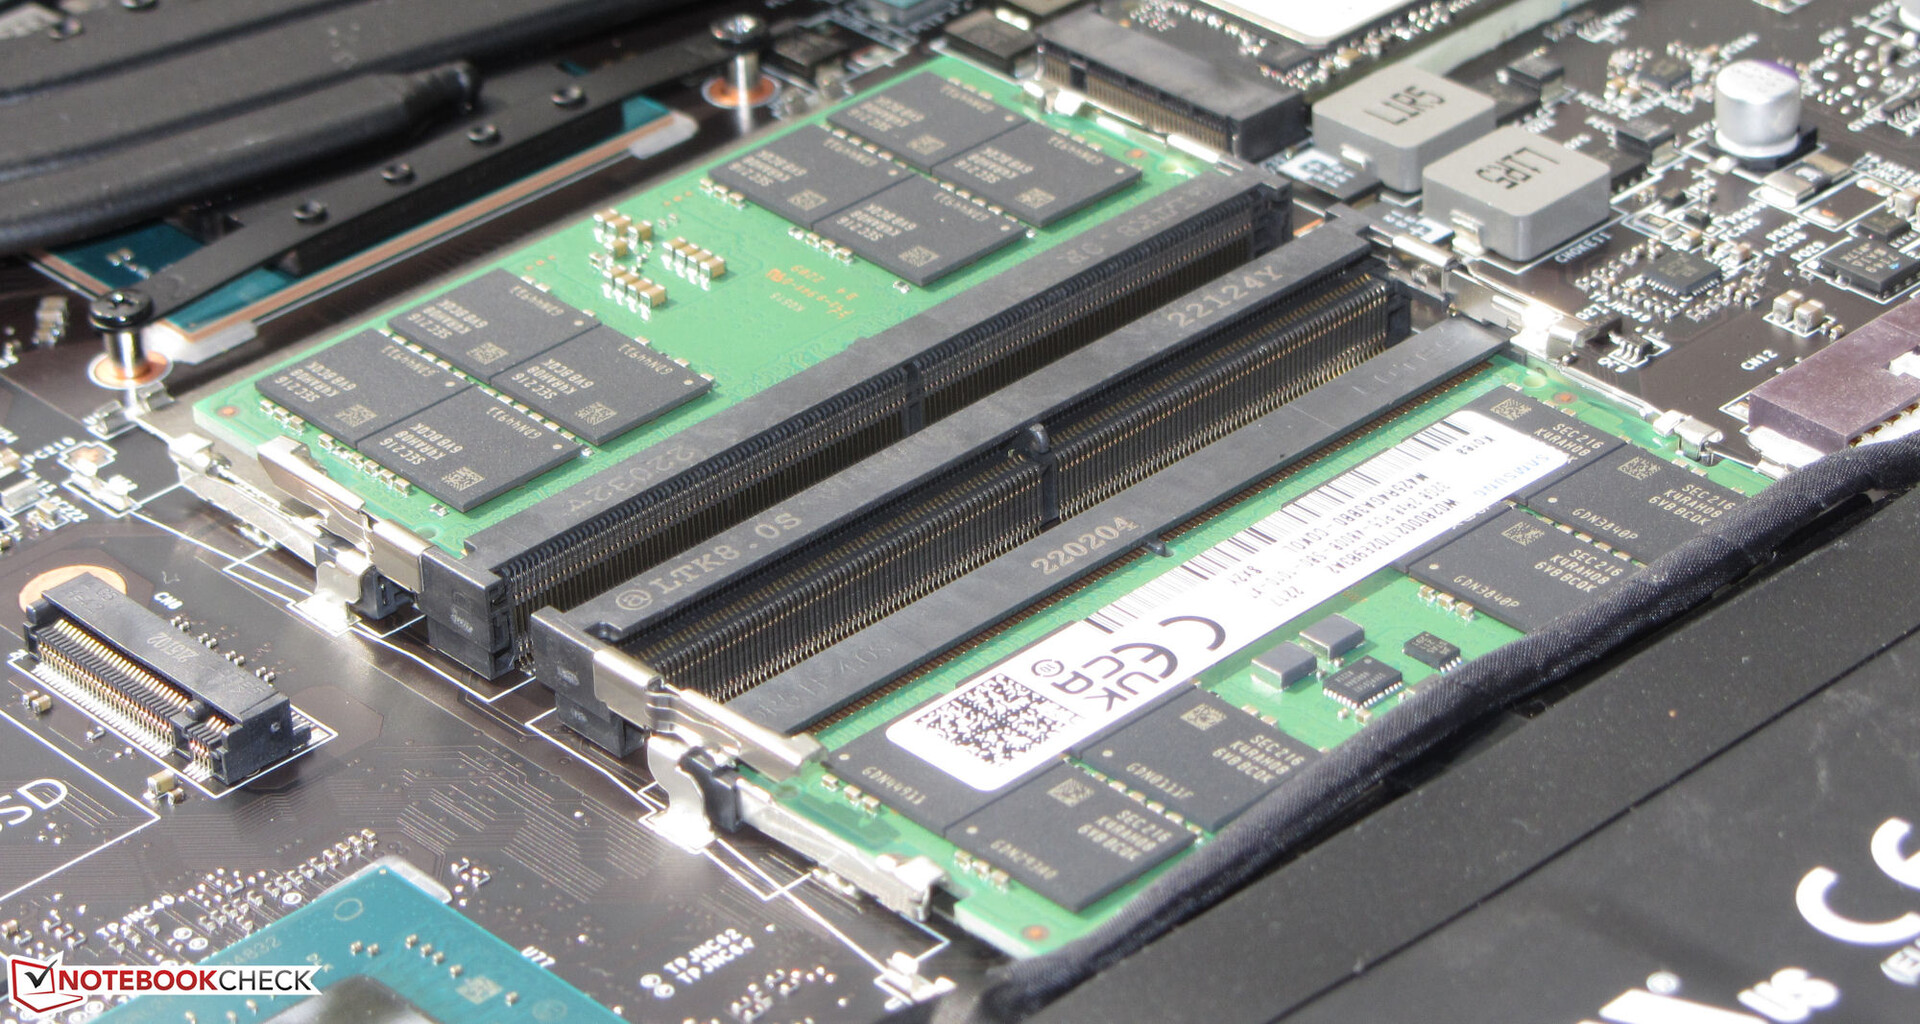
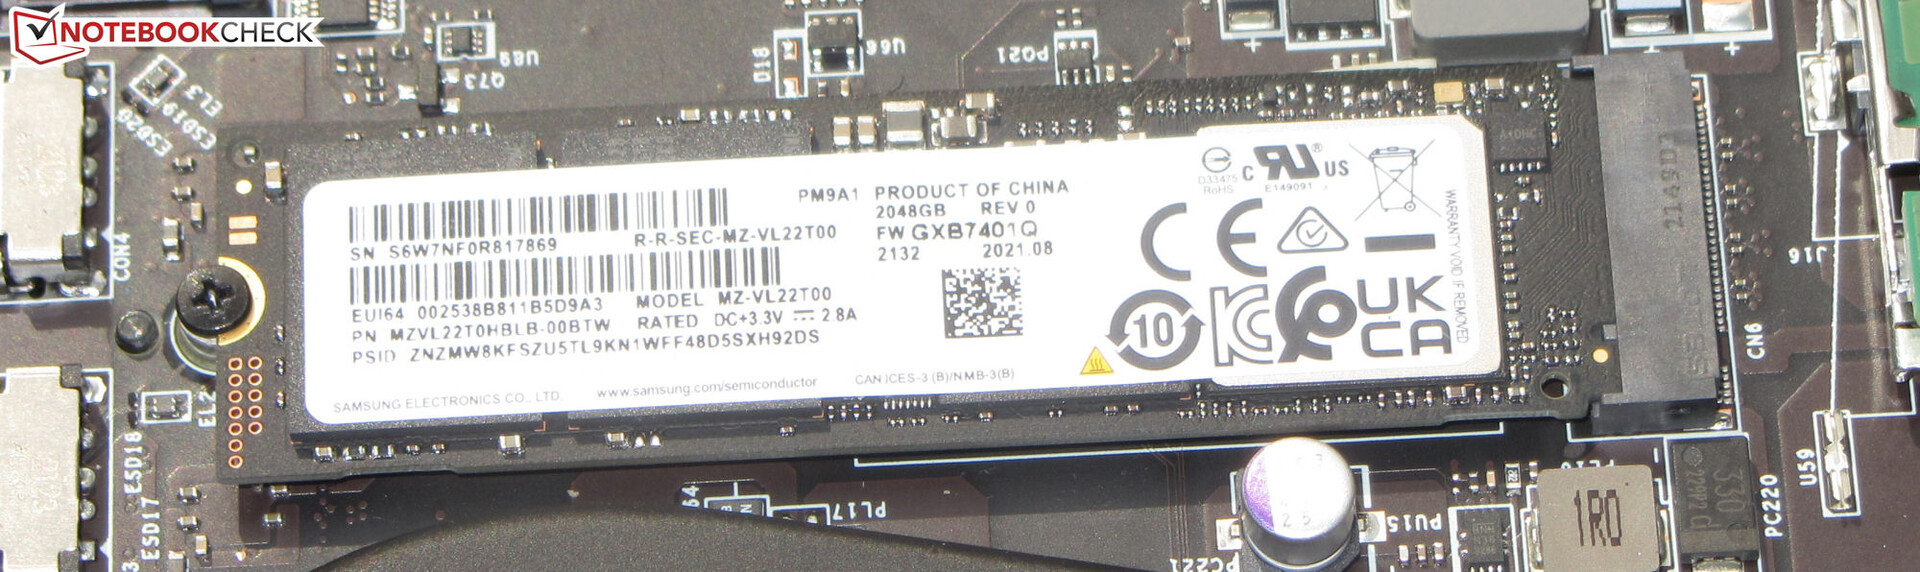
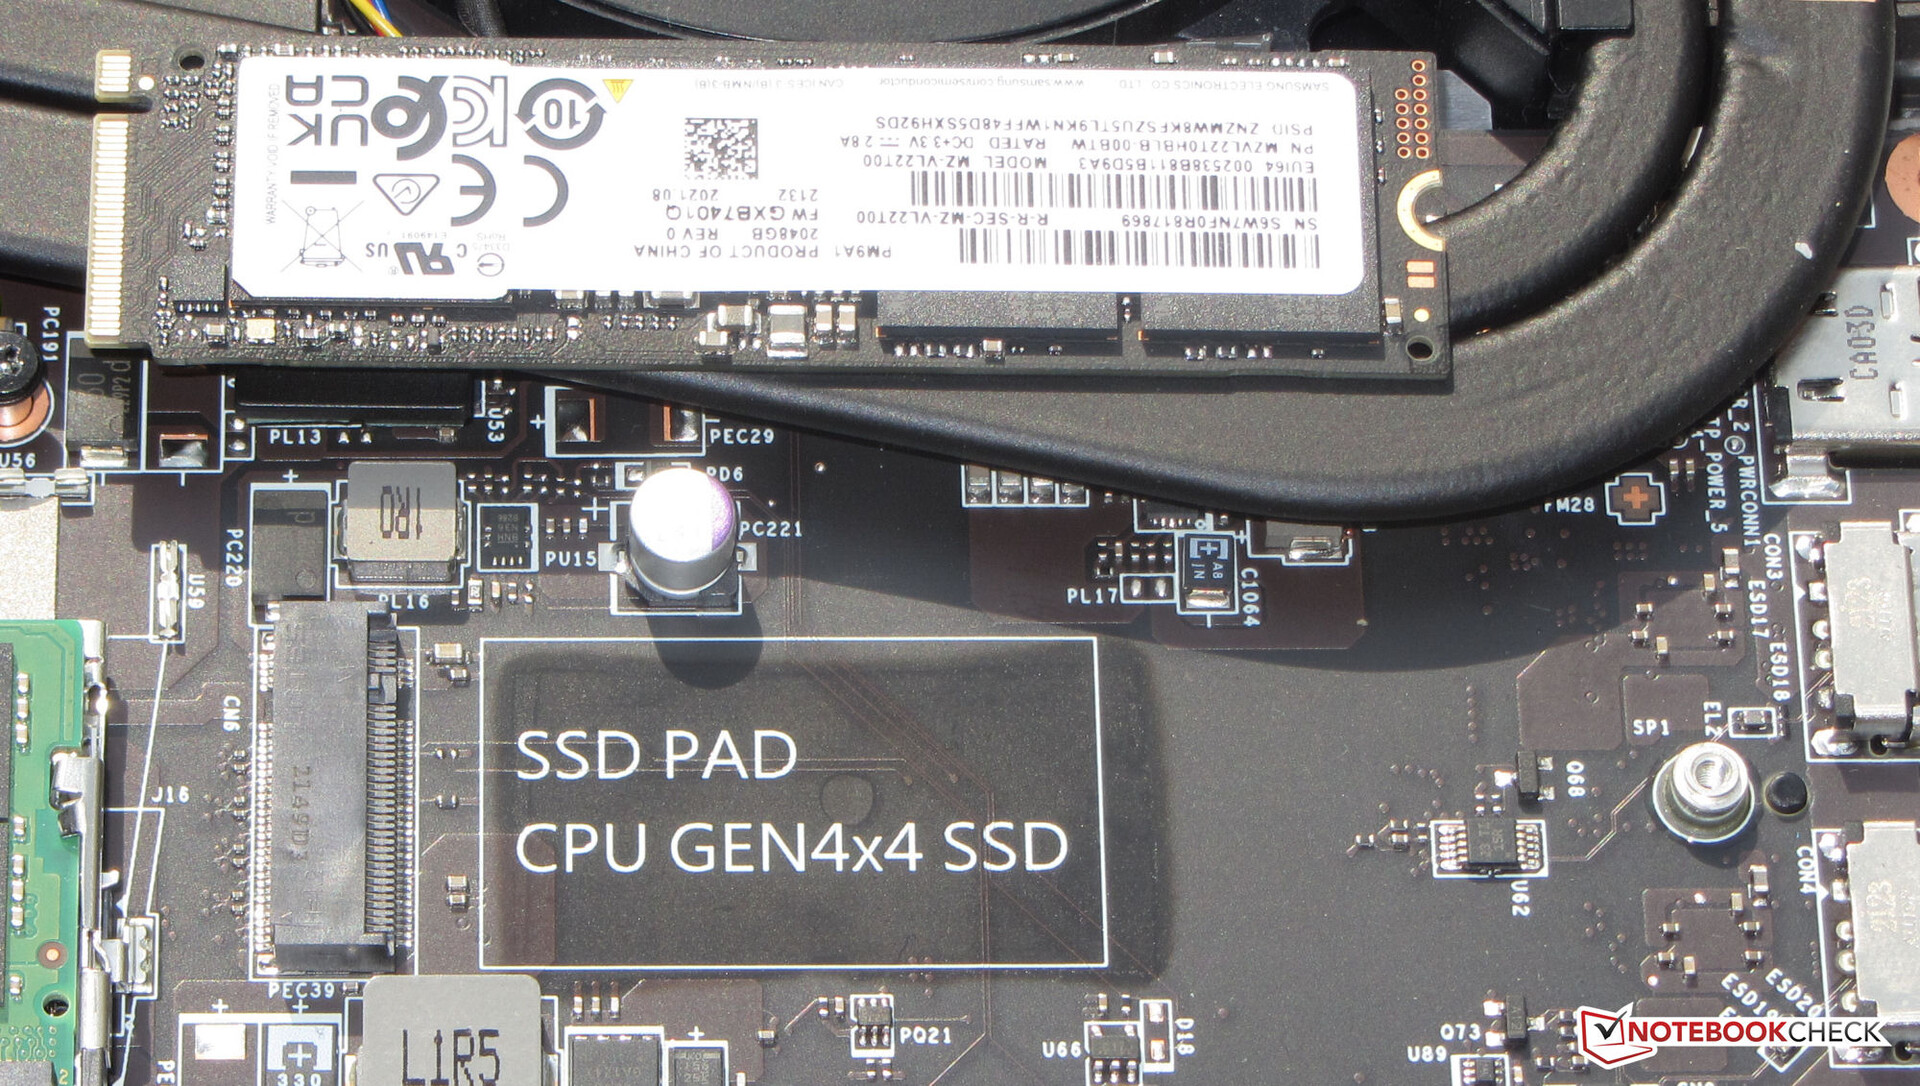
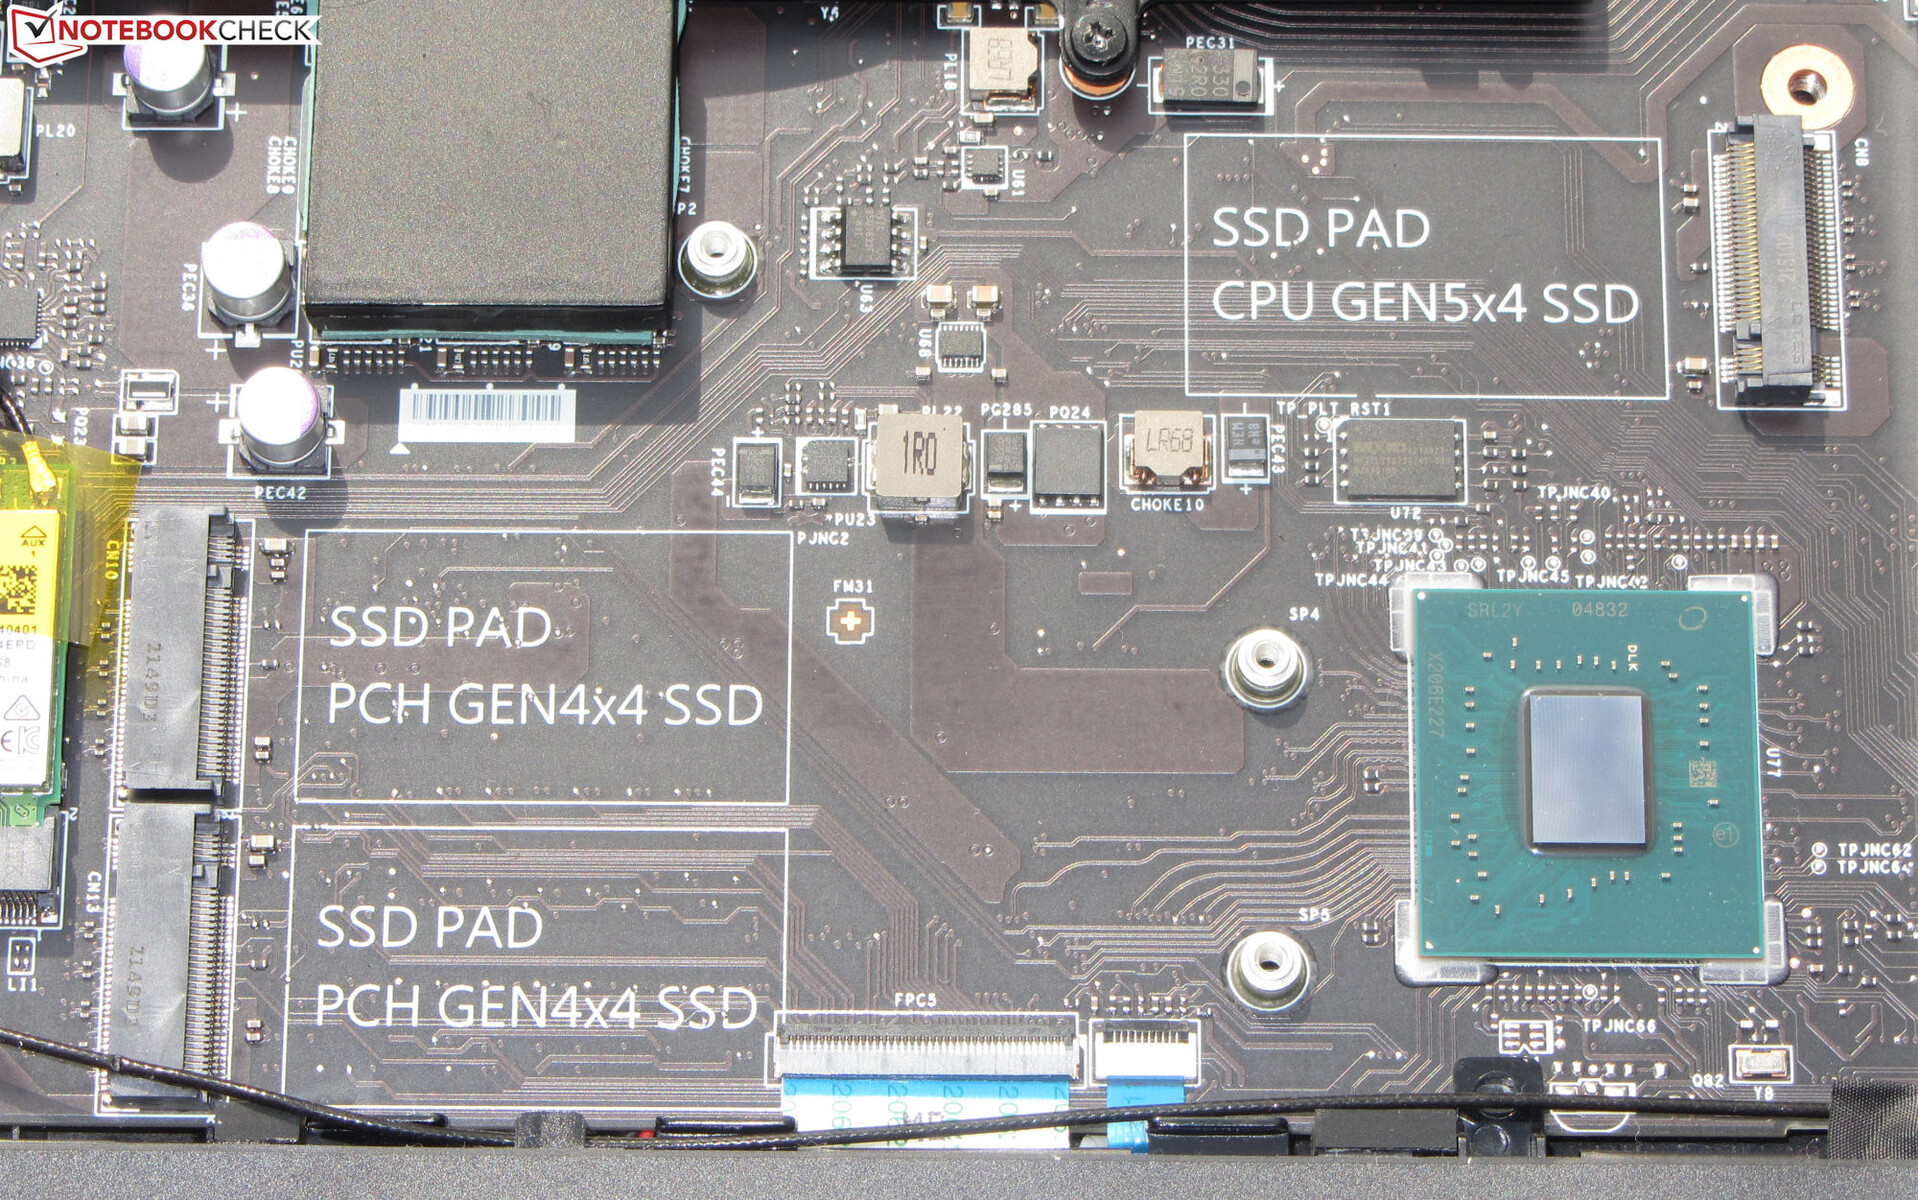
大容量存储
泰坦可以容纳四个M.2 2280固态硬盘(3x PCIe 4, 1x PCIe 5)。包括的2TB三星固态硬盘(PCIe 4)能够提供出色的传输速度。
在FHD模型,装有操作系统的固态硬盘(也是由三星制造)由于热节流而出现性能下降。也许是安装在笔记本电脑中的其他三块固态硬盘阻碍了最佳的空气流通。我们目前评测单位的固态硬盘并没有表现出任何性能下降。

| Drive Performance rating - Percent | |
| MSI Titan GT77 12UHS 4k | |
| MSI Titan GT77 12UHS | |
| Razer Blade 17 Early 2022 | |
| Schenker XMG Ultra 17 Rocket Lake | |
| Average Samsung PM9A1 MZVL22T0HBLB | |
| Average of class Gaming | |
| Alienware x17 R2 P48E | |
* ... smaller is better
Continuous read: DiskSpd Read Loop, Queue Depth 8
图形卡
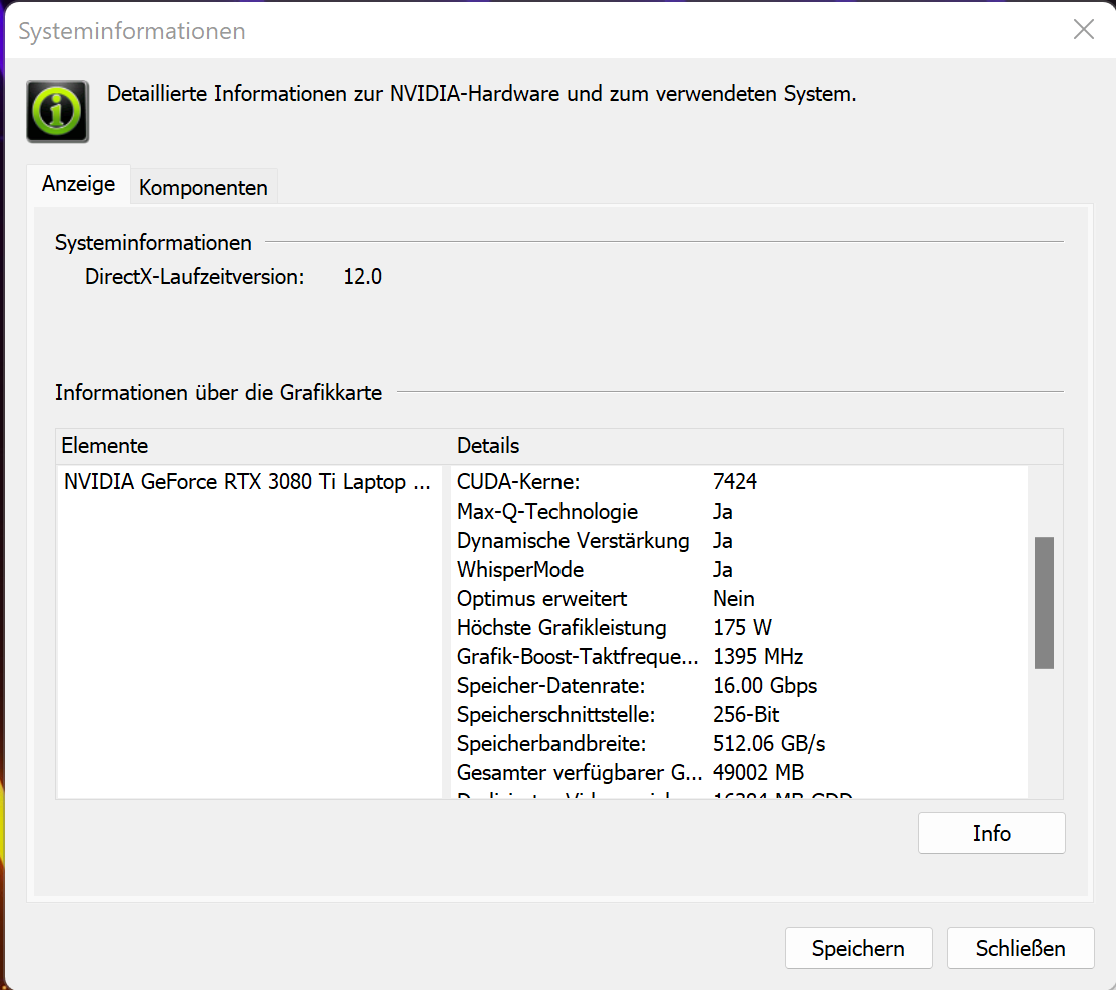
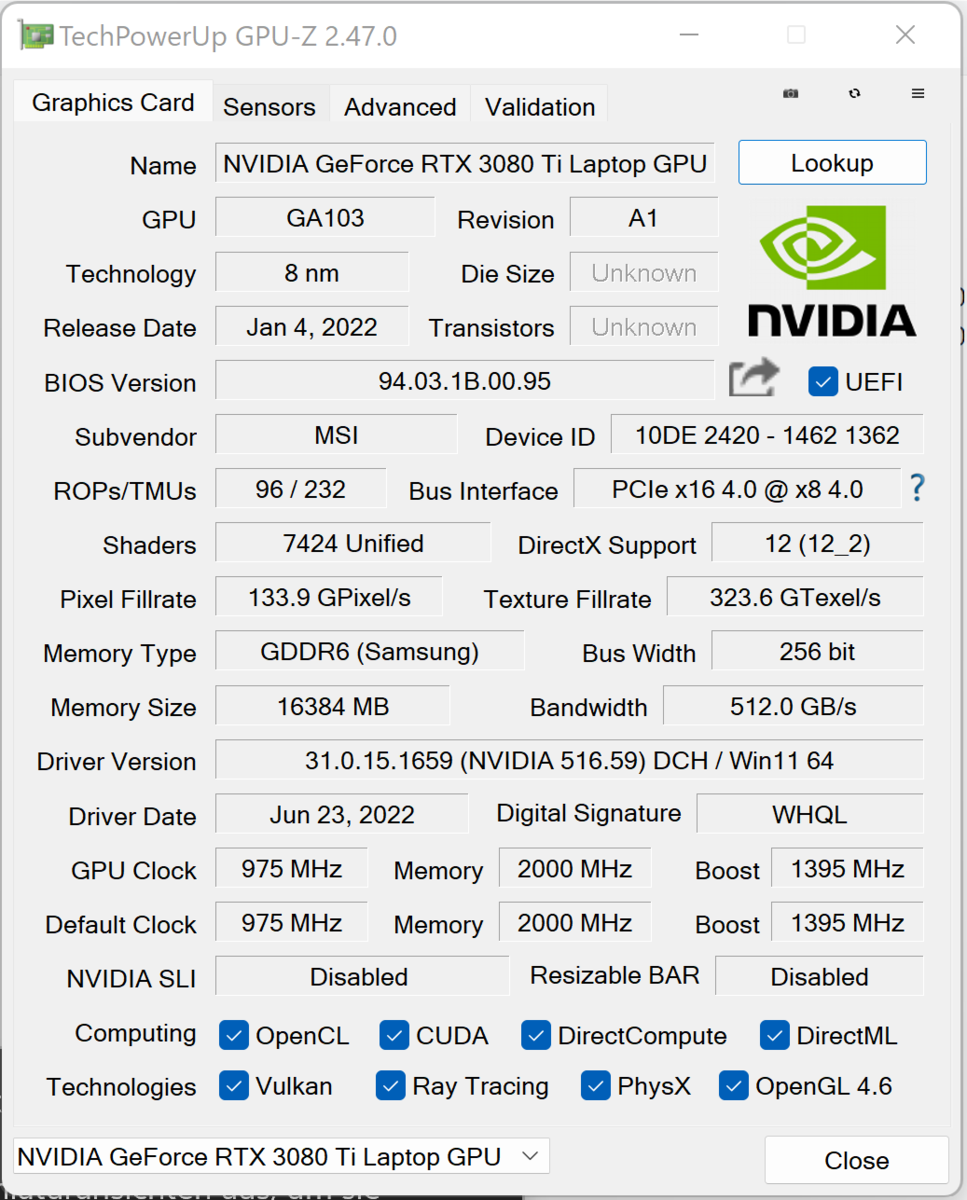
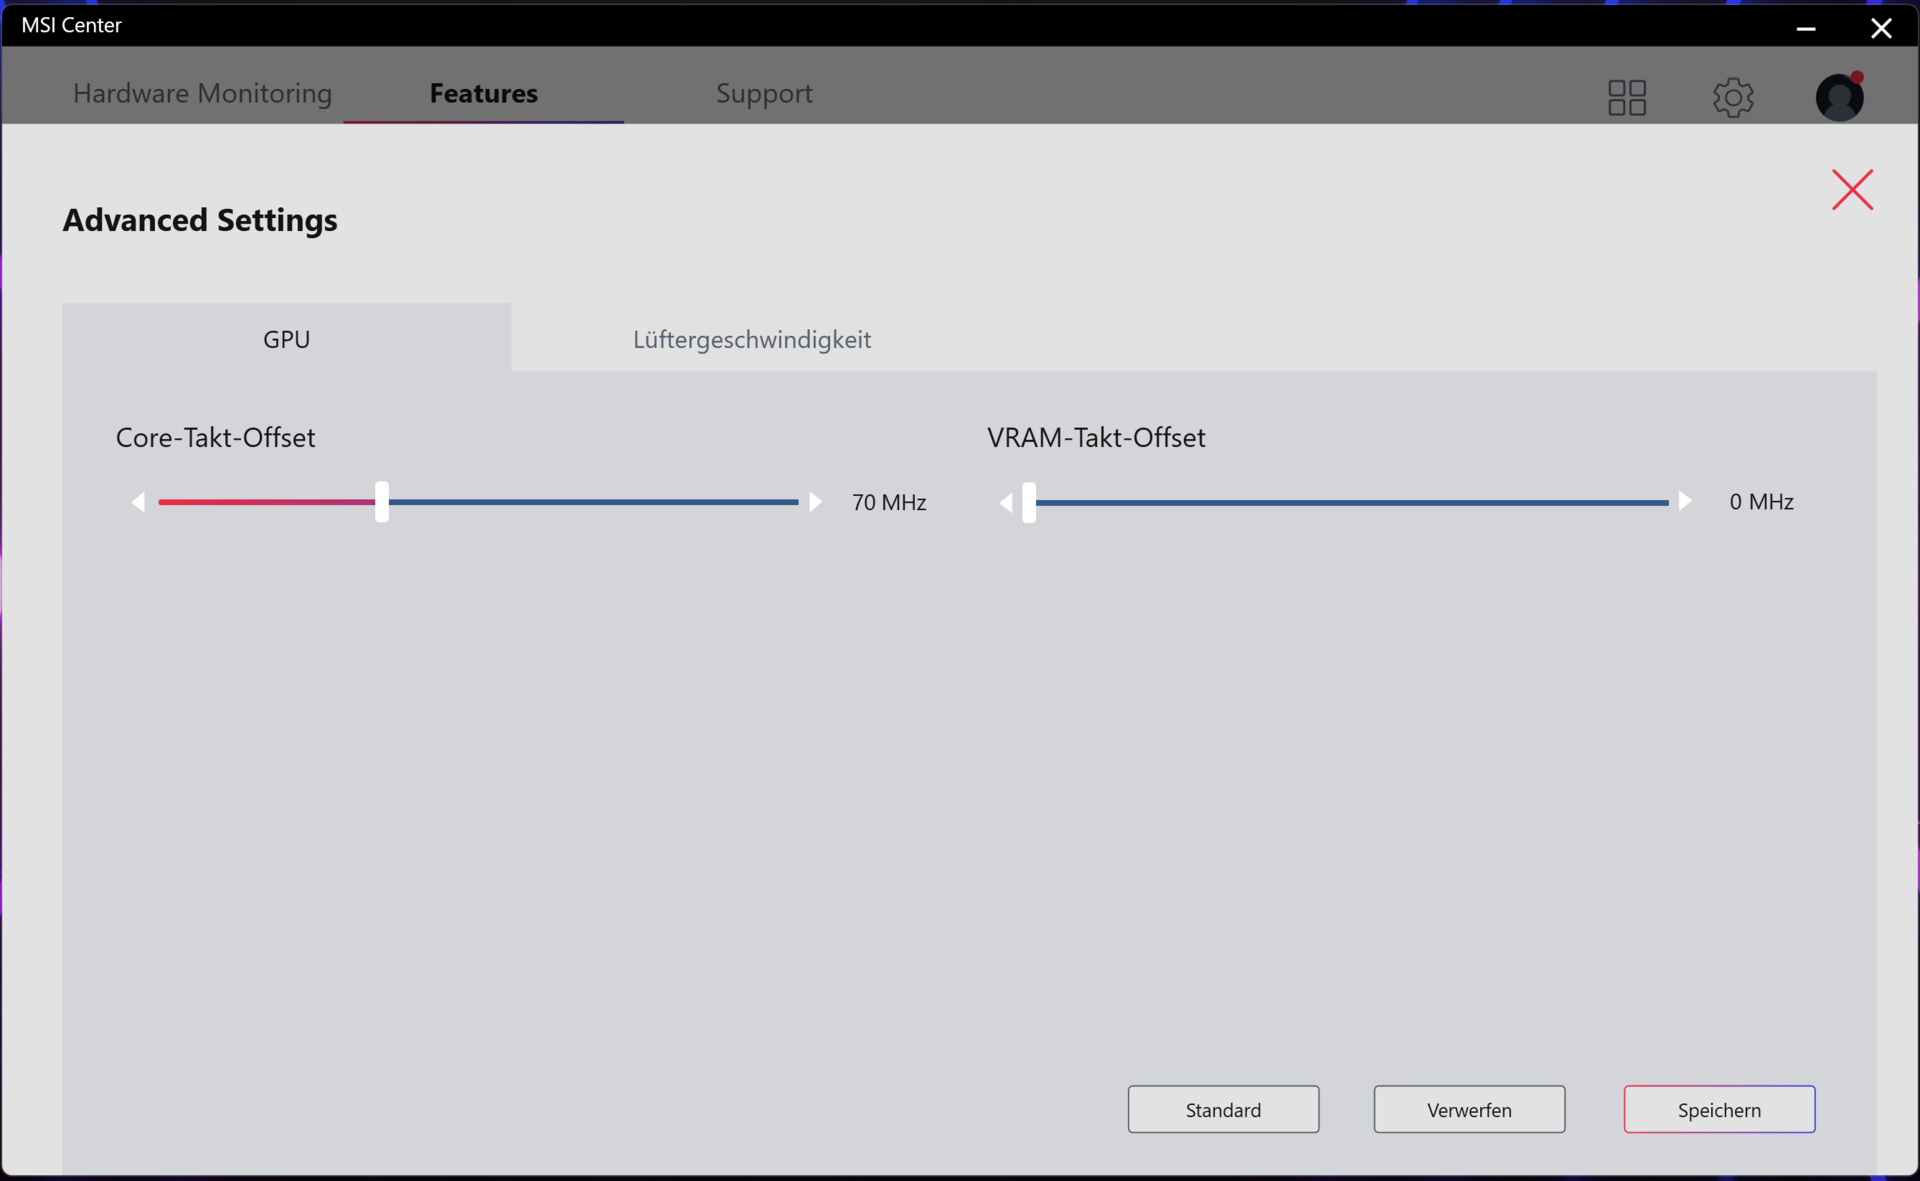
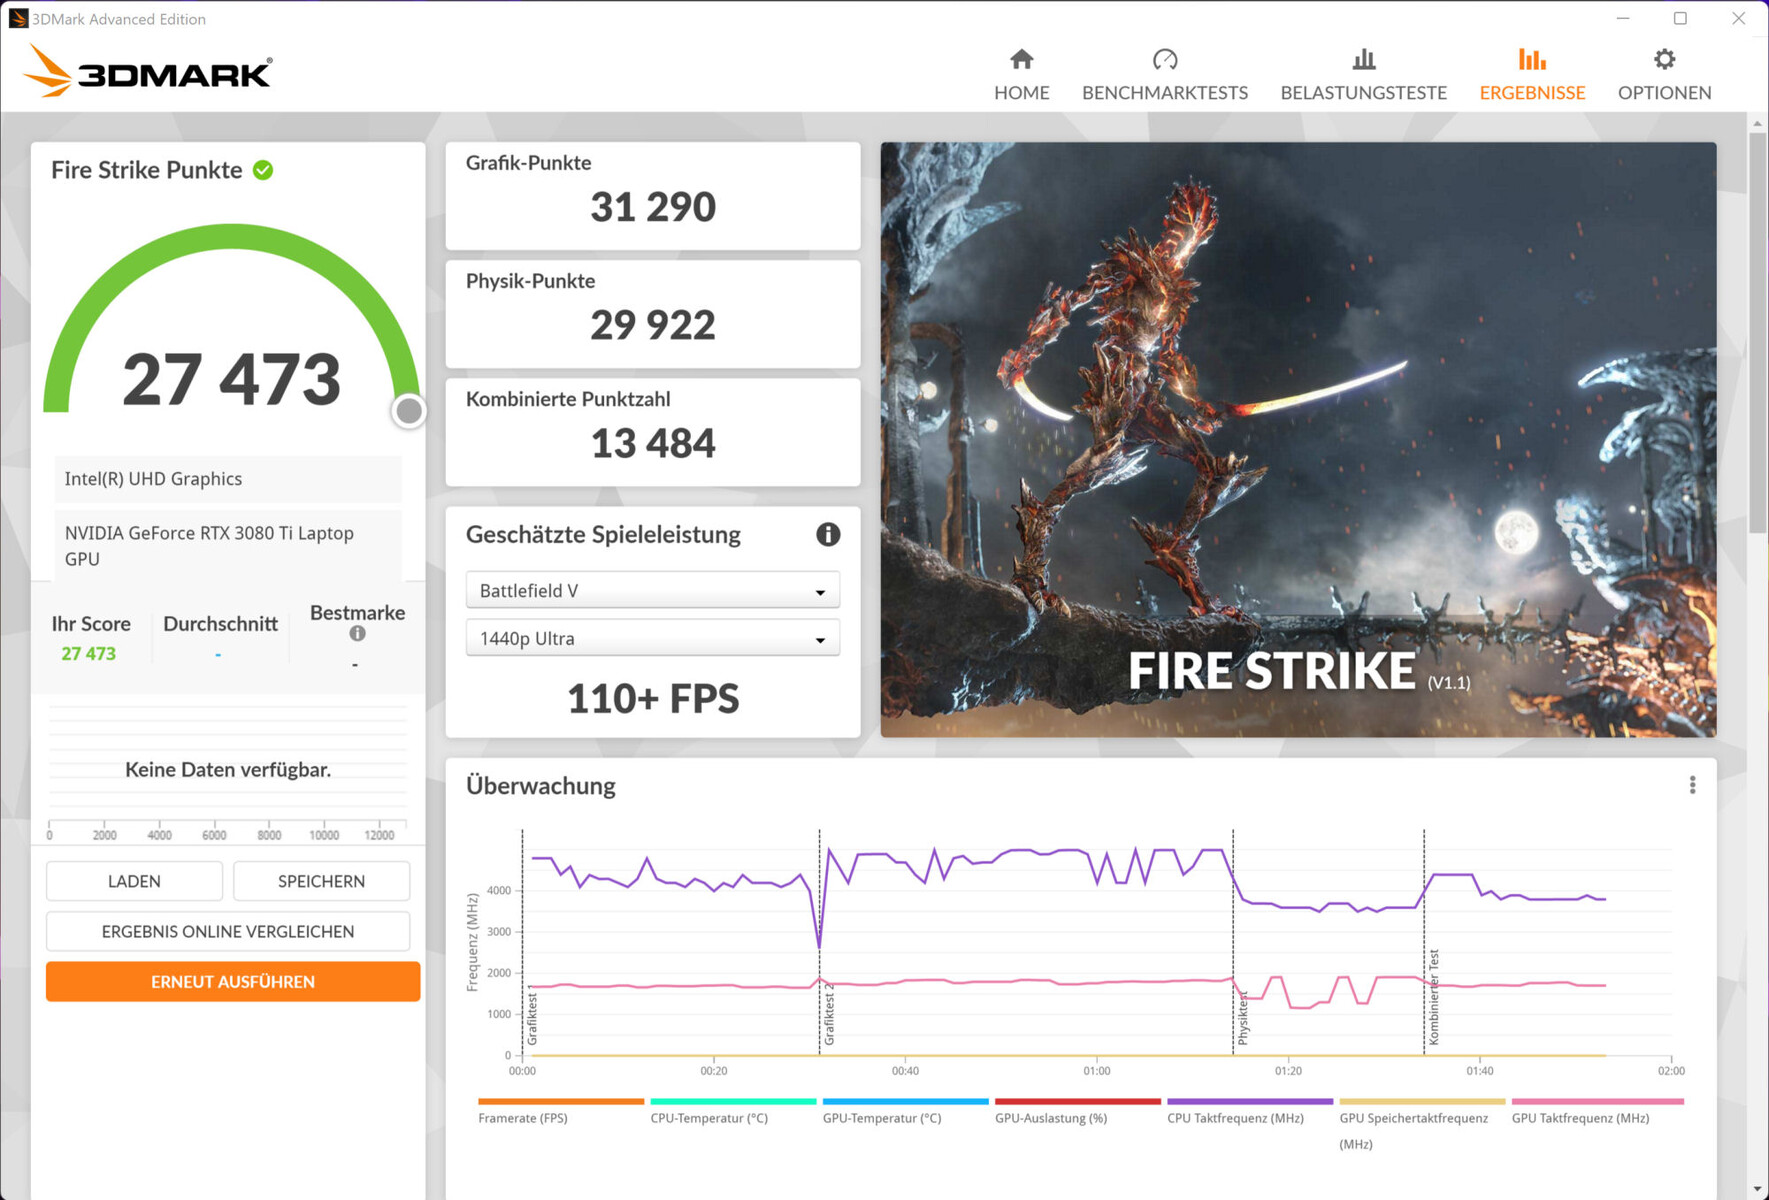
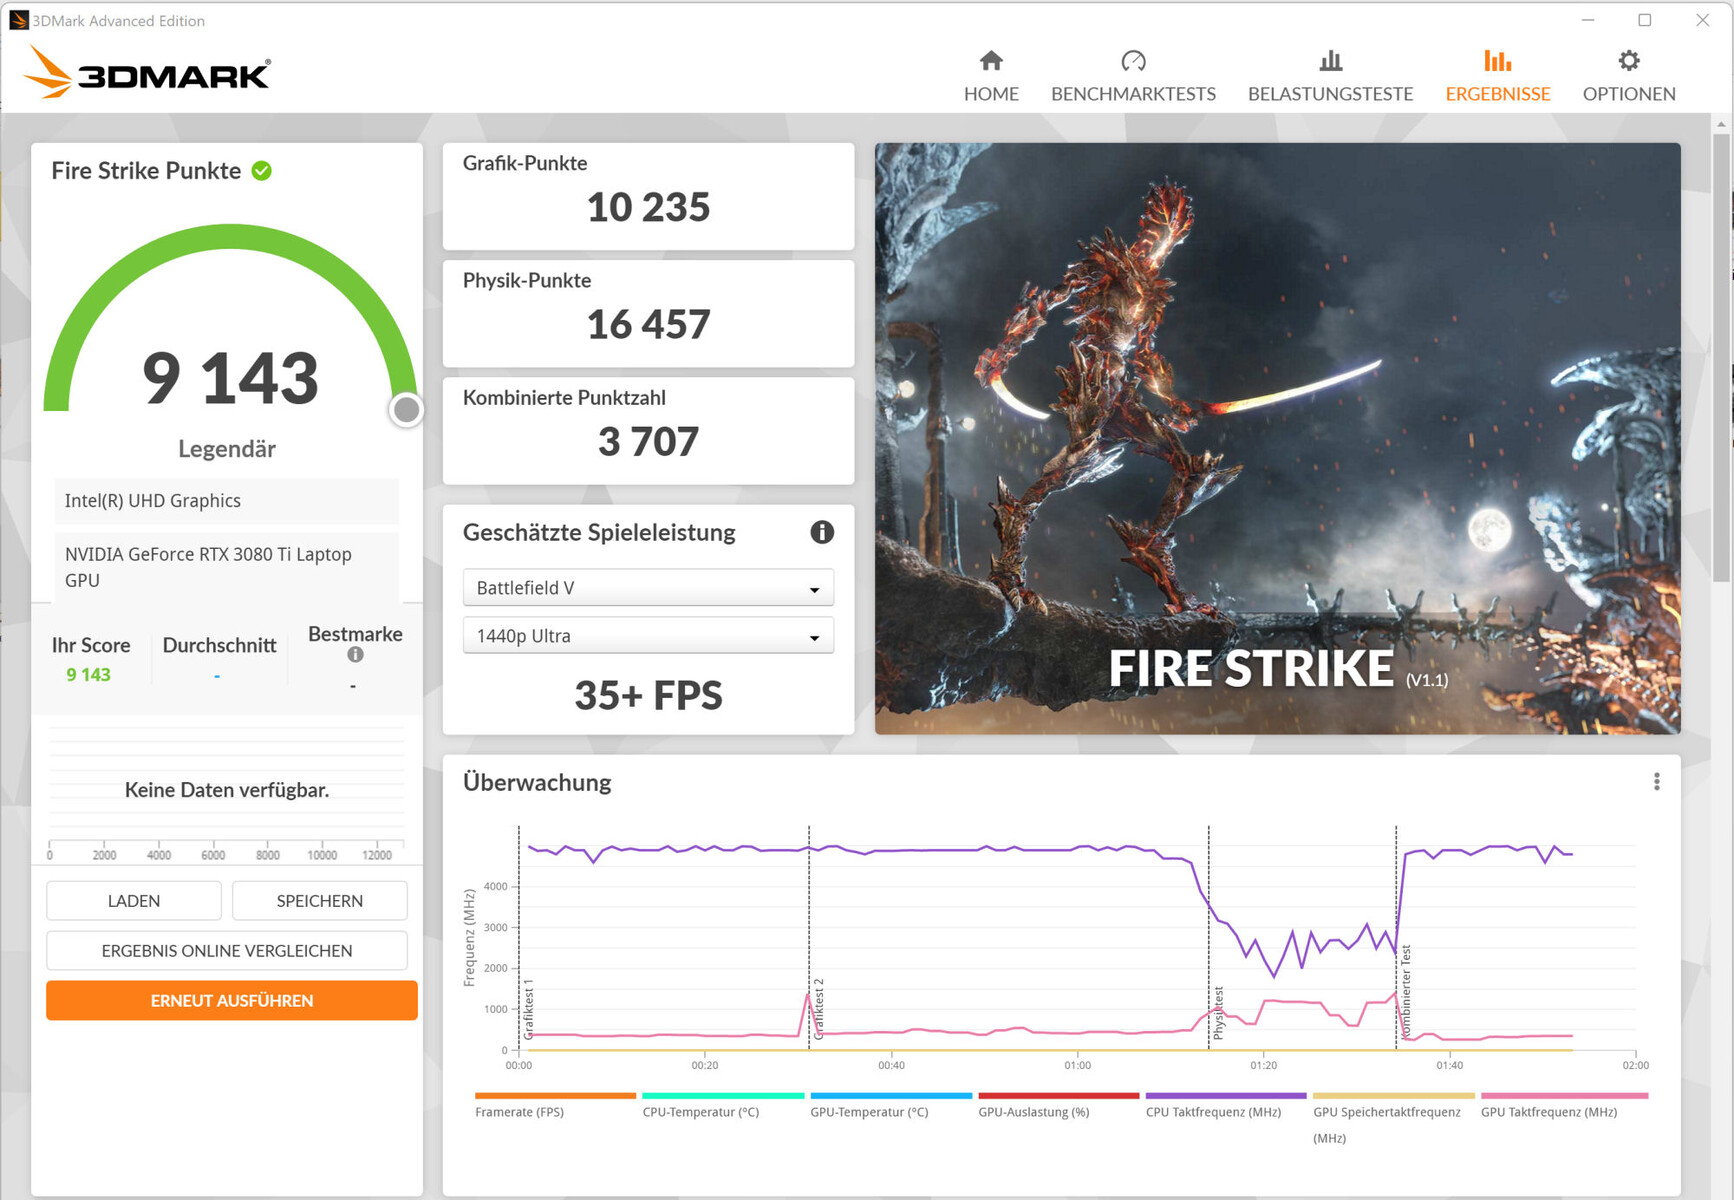
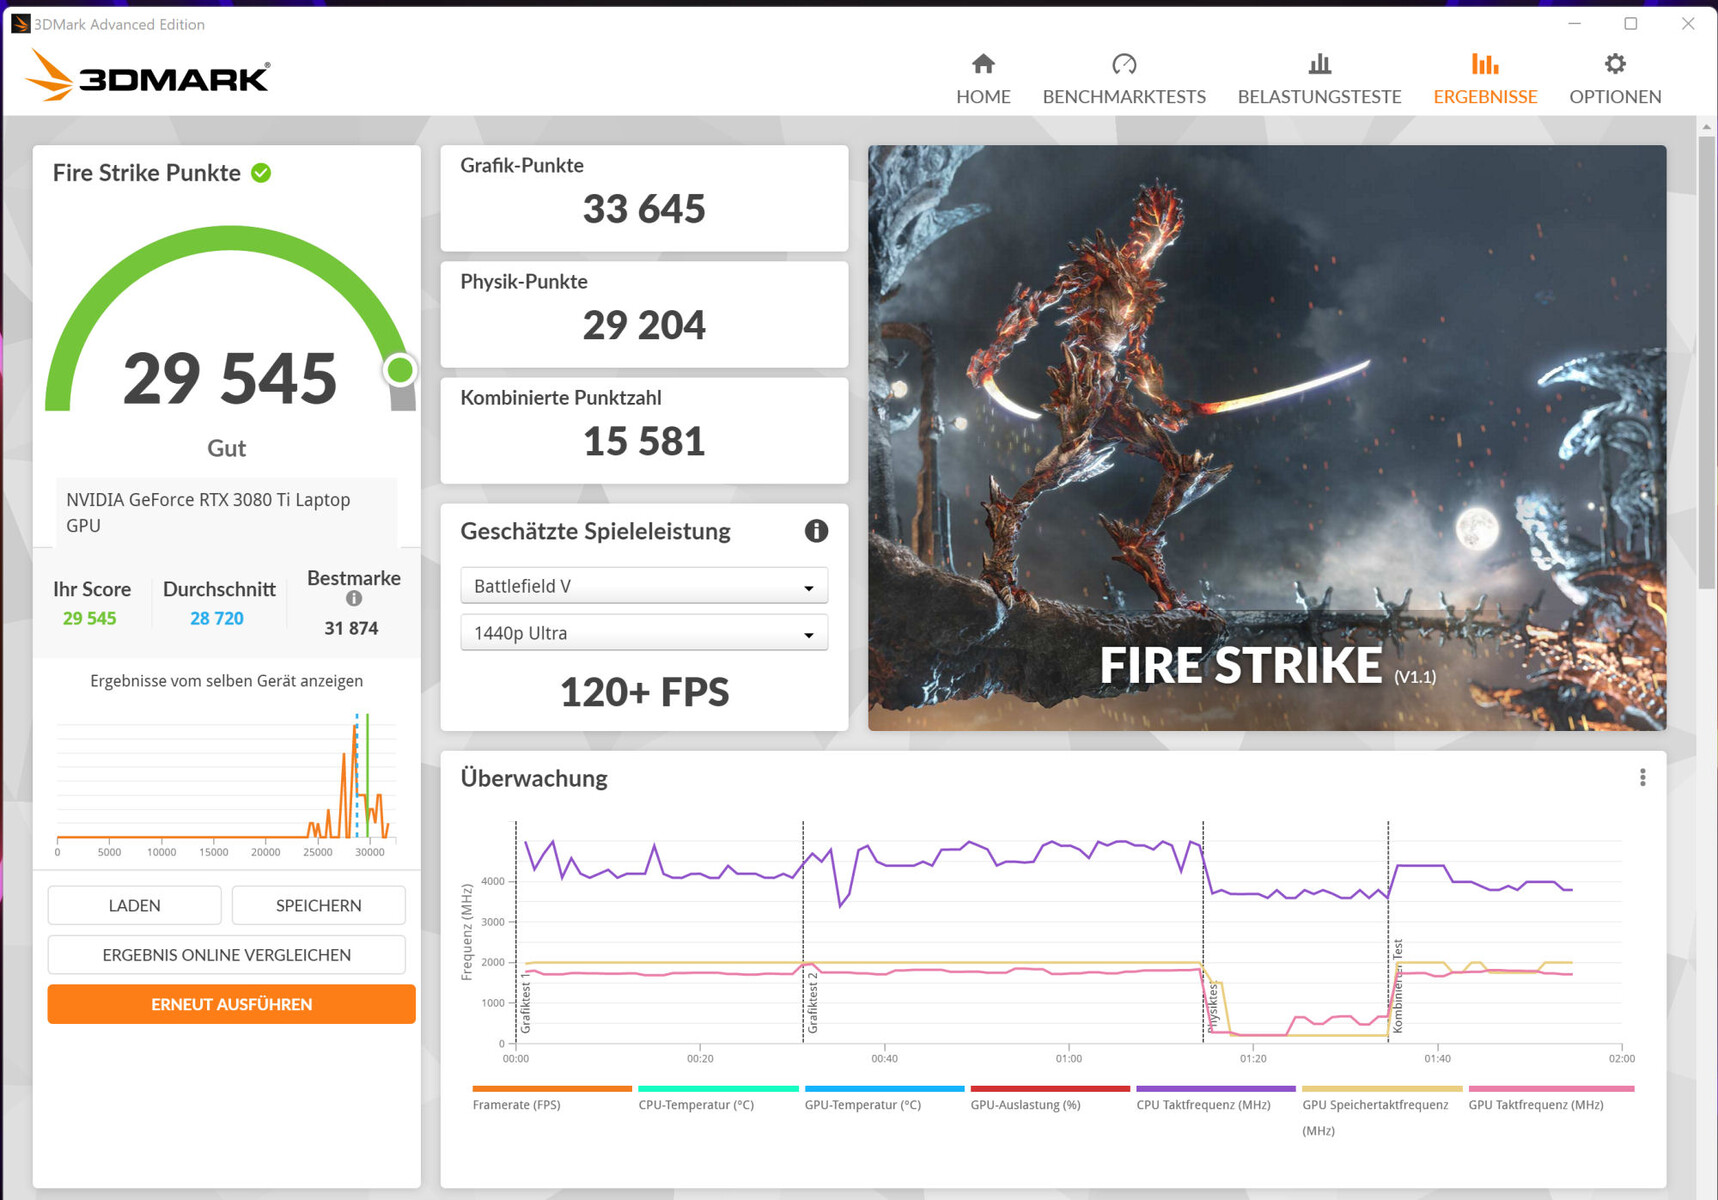
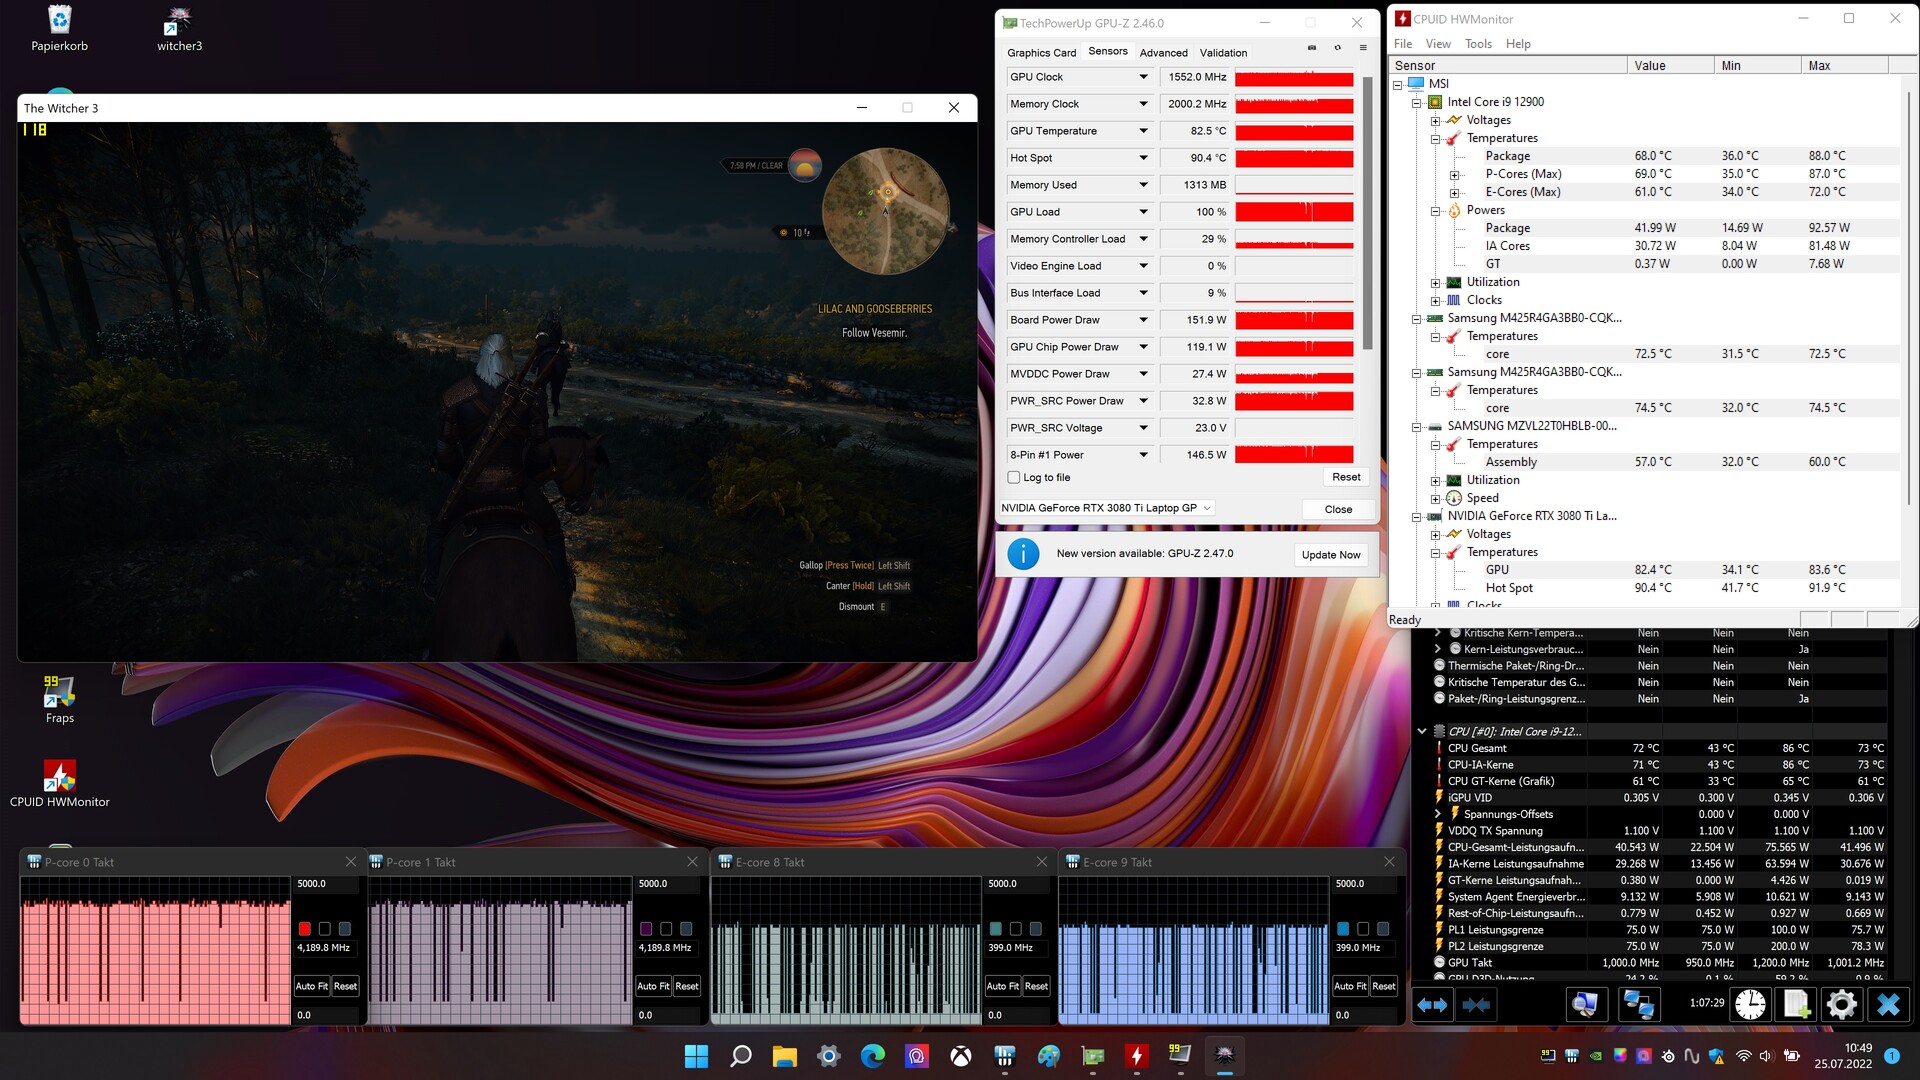
笔记本电脑 GeForce RTX 3080 Ti Laptop(微星Titan GT77中的TGP:175瓦,16GB GDDR6 VRAM)产生了一些我们迄今为止从该GPU看到的最好的分数。然而,正如Witcher 3 测试所显示的那样,TGP没有得到充分的利用。极限性能 "配置文件提供了对GPU和显存进行超频的选项。不支持Advanced Optimus。在dGPU和Optimus之间切换总是需要重新启动计算机。
| 3DMark Performance rating - Percent | |
| Average of class Gaming | |
| MSI Titan GT77 12UHS | |
| Alienware x17 R2 P48E | |
| MSI Titan GT77 12UHS | |
| MSI Titan GT77 12UHS 4k -1! | |
| Razer Blade 17 Early 2022 | |
| Schenker XMG Ultra 17 Rocket Lake | |
| Average NVIDIA GeForce RTX 3080 Ti Laptop GPU | |
| 3DMark 11 - 1280x720 Performance GPU | |
| Average of class Gaming (21841 - 80022, n=104, last 2 years) | |
| MSI Titan GT77 12UHS | |
| Alienware x17 R2 P48E | |
| MSI Titan GT77 12UHS 4k | |
| Razer Blade 17 Early 2022 | |
| MSI Titan GT77 12UHS (dGPU, Extreme Leistung) | |
| Schenker XMG Ultra 17 Rocket Lake | |
| Average NVIDIA GeForce RTX 3080 Ti Laptop GPU (13920 - 45841, n=45) | |
| 3DMark | |
| 1920x1080 Fire Strike Graphics | |
| Average of class Gaming (12242 - 62849, n=115, last 2 years) | |
| MSI Titan GT77 12UHS | |
| MSI Titan GT77 12UHS (dGPU, Extreme Leistung) | |
| Alienware x17 R2 P48E | |
| MSI Titan GT77 12UHS 4k | |
| Razer Blade 17 Early 2022 | |
| Schenker XMG Ultra 17 Rocket Lake | |
| Average NVIDIA GeForce RTX 3080 Ti Laptop GPU (6928 - 34439, n=43) | |
| 2560x1440 Time Spy Graphics | |
| Average of class Gaming (5012 - 26212, n=115, last 2 years) | |
| MSI Titan GT77 12UHS | |
| Alienware x17 R2 P48E | |
| MSI Titan GT77 12UHS (dGPU, Extreme Leistung) | |
| Schenker XMG Ultra 17 Rocket Lake | |
| MSI Titan GT77 12UHS 4k | |
| Razer Blade 17 Early 2022 | |
| Average NVIDIA GeForce RTX 3080 Ti Laptop GPU (4921 - 13835, n=43) | |
| 2560x1440 Port Royal Graphics | |
| Average of class Gaming (4395 - 17286, n=71, last 2 years) | |
| Alienware x17 R2 P48E | |
| MSI Titan GT77 12UHS | |
| MSI Titan GT77 12UHS (dGPU, Extreme Leistung) | |
| Razer Blade 17 Early 2022 | |
| Schenker XMG Ultra 17 Rocket Lake | |
| Average NVIDIA GeForce RTX 3080 Ti Laptop GPU (6423 - 8462, n=28) | |
| Geekbench 5.5 - OpenCL Score | |
| Average of class Gaming (80702 - 277970, n=101, last 2 years) | |
| Alienware x17 R2 P48E | |
| MSI Titan GT77 12UHS (dGPU, Extreme Leistung) | |
| MSI Titan GT77 12UHS 4k | |
| Asus ROG Zephyrus Duo 16 GX650RX | |
| Schenker XMG Ultra 17 Rocket Lake | |
| Average NVIDIA GeForce RTX 3080 Ti Laptop GPU (88580 - 151633, n=41) | |
| MSI Titan GT77 12UHS | |
| Razer Blade 17 Early 2022 | |
| Gigabyte Aero 16 YE5 | |
| V-Ray Benchmark Next 4.10 | |
| GPU | |
| Average of class Gaming (427 - 1627, n=99, last 2 years) | |
| MSI Titan GT77 12UHS (v4.10.07, dGPU, Extreme Leistung) | |
| MSI Titan GT77 12UHS (v4.10.07 ) | |
| Asus ROG Zephyrus Duo 16 GX650RX (v4.10.07 ) | |
| MSI Titan GT77 12UHS 4k (v4.10.07 ) | |
| Average NVIDIA GeForce RTX 3080 Ti Laptop GPU (311 - 552, n=35) | |
| Razer Blade 17 Early 2022 (v4.10.07 ) | |
| Gigabyte Aero 16 YE5 (v4.10.07 ) | |
| Schenker XMG Ultra 17 Rocket Lake (v4.10.07 ) | |
| CPU | |
| Average of class Gaming (10048 - 45327, n=97, last 2 years) | |
| MSI Titan GT77 12UHS 4k (v4.10.07 ) | |
| MSI Titan GT77 12UHS (v4.10.07, dGPU, Extreme Leistung) | |
| MSI Titan GT77 12UHS (v4.10.07 ) | |
| Average NVIDIA GeForce RTX 3080 Ti Laptop GPU (5564 - 23947, n=35) | |
| Gigabyte Aero 16 YE5 (v4.10.07 ) | |
| Schenker XMG Ultra 17 Rocket Lake (v4.10.07 ) | |
| Asus ROG Zephyrus Duo 16 GX650RX (v4.10.07 ) | |
| Razer Blade 17 Early 2022 (v4.10.07 ) | |
| Blender | |
| v3.3 Classroom CUDA | |
| MSI Titan GT77 12UHS 4k | |
| MSI Titan GT77 12UHS (dGPU, Extreme Leistung) | |
| Average NVIDIA GeForce RTX 3080 Ti Laptop GPU (32 - 41, n=13) | |
| Average of class Gaming (15 - 228, n=106, last 2 years) | |
| MSI Titan GT77 12UHS | |
| v3.3 Classroom OPTIX/RTX | |
| MSI Titan GT77 12UHS 4k | |
| Average NVIDIA GeForce RTX 3080 Ti Laptop GPU (20 - 28, n=13) | |
| MSI Titan GT77 12UHS | |
| MSI Titan GT77 12UHS (dGPU, Extreme Leistung) | |
| Average of class Gaming (9 - 32, n=106, last 2 years) | |
* ... smaller is better
| 3DMark 11 Performance | 35867 points | |
| 3DMark Cloud Gate Standard Score | 53629 points | |
| 3DMark Fire Strike Score | 27273 points | |
| 3DMark Fire Strike Extreme Score | 15613 points | |
| 3DMark Time Spy Score | 12865 points | |
Help | ||
游戏性能
该硬件是为高至最高设置的4K游戏而设计的。帧率高于RTX 3080 Ti的平均能力。当GeForce GPU直接驱动显示器时,它经常产生我们迄今为止从RTX 3080 Ti看到的最佳帧率。在任何情况下,正如Witcher 3 测试所证明的那样,该笔记本电脑提供了良好和稳定的结果。
| The Witcher 3 | |
| 1920x1080 Ultra Graphics & Postprocessing (HBAO+) | |
| Average of class Gaming (104.7 - 240, n=7, last 2 years) | |
| MSI Titan GT77 12UHS (dGPU, Extreme Leistung) | |
| MSI Titan GT77 12UHS | |
| Alienware x17 R2 P48E | |
| MSI Titan GT77 12UHS 4k | |
| Schenker XMG Ultra 17 Rocket Lake | |
| Razer Blade 17 Early 2022 | |
| Average NVIDIA GeForce RTX 3080 Ti Laptop GPU (30 - 130.6, n=43) | |
| 3840x2160 Ultra Graphics & Postprocessing (HBAO+) | |
| Average of class Gaming (112.4 - 114.8, n=2, last 2 years) | |
| MSI Titan GT77 12UHS (dGPU, Extreme Leistung) | |
| MSI Titan GT77 12UHS 4k | |
| Razer Blade 17 Early 2022 | |
| Average NVIDIA GeForce RTX 3080 Ti Laptop GPU (44.8 - 62.7, n=5) | |
| Dota 2 Reborn | |
| 1920x1080 ultra (3/3) best looking | |
| MSI Titan GT77 12UHS | |
| MSI Titan GT77 12UHS (dGPU, Extreme Leistung) | |
| MSI Titan GT77 12UHS 4k | |
| Alienware x17 R2 P48E | |
| Schenker XMG Ultra 17 Rocket Lake | |
| Average of class Gaming (84.8 - 248, n=107, last 2 years) | |
| Average NVIDIA GeForce RTX 3080 Ti Laptop GPU (29.9 - 170.5, n=45) | |
| Razer Blade 17 Early 2022 | |
| 3840x2160 ultra (3/3) best looking | |
| Average of class Gaming (114.9 - 199.2, n=32, last 2 years) | |
| MSI Titan GT77 12UHS (dGPU, Extreme Leistung) | |
| MSI Titan GT77 12UHS 4k | |
| Average NVIDIA GeForce RTX 3080 Ti Laptop GPU (70.8 - 155.6, n=19) | |
| Razer Blade 17 Early 2022 | |
| X-Plane 11.11 | |
| 3840x2160 high (fps_test=3) | |
| MSI Titan GT77 12UHS (dGPU, Extreme Leistung) | |
| MSI Titan GT77 12UHS 4k | |
| Average of class Gaming (60 - 124.1, n=32, last 2 years) | |
| Average NVIDIA GeForce RTX 3080 Ti Laptop GPU (32.9 - 109.5, n=20) | |
| Razer Blade 17 Early 2022 | |
| 1920x1080 high (fps_test=3) | |
| MSI Titan GT77 12UHS | |
| MSI Titan GT77 12UHS (dGPU, Extreme Leistung) | |
| MSI Titan GT77 12UHS 4k | |
| Schenker XMG Ultra 17 Rocket Lake | |
| Alienware x17 R2 P48E | |
| Average NVIDIA GeForce RTX 3080 Ti Laptop GPU (32.6 - 127, n=45) | |
| Average of class Gaming (55.5 - 143.5, n=109, last 2 years) | |
| Razer Blade 17 Early 2022 | |
| Final Fantasy XV Benchmark | |
| 3840x2160 High Quality | |
| Average of class Gaming (49.1 - 111.8, n=33, last 2 years) | |
| MSI Titan GT77 12UHS (1.3, dGPU, Extreme Leistung) | |
| MSI Titan GT77 12UHS 4k (1.3) | |
| Razer Blade 17 Early 2022 (1.3) | |
| Average NVIDIA GeForce RTX 3080 Ti Laptop GPU (35.1 - 61.2, n=18) | |
| 1920x1080 High Quality | |
| Average of class Gaming (41 - 215, n=95, last 2 years) | |
| MSI Titan GT77 12UHS (1.3, dGPU, Extreme Leistung) | |
| MSI Titan GT77 12UHS (1.3) | |
| MSI Titan GT77 12UHS 4k (1.3) | |
| Alienware x17 R2 P48E (1.3) | |
| Average NVIDIA GeForce RTX 3080 Ti Laptop GPU (30.7 - 140.6, n=42) | |
| Razer Blade 17 Early 2022 (1.3) | |
| GTA V | |
| 3840x2160 Highest AA:4xMSAA + FX AF:16x | |
| Average of class Gaming (53.9 - 123.2, n=25, last 2 years) | |
| MSI Titan GT77 12UHS (dGPU, Extreme Leistung) | |
| MSI Titan GT77 12UHS 4k | |
| Razer Blade 17 Early 2022 | |
| Average NVIDIA GeForce RTX 3080 Ti Laptop GPU (37.7 - 67.2, n=14) | |
| 1920x1080 Highest AA:4xMSAA + FX AF:16x | |
| MSI Titan GT77 12UHS 4k | |
| MSI Titan GT77 12UHS (dGPU, Extreme Leistung) | |
| Average of class Gaming (48.3 - 186.9, n=94, last 2 years) | |
| MSI Titan GT77 12UHS | |
| Alienware x17 R2 P48E | |
| Average NVIDIA GeForce RTX 3080 Ti Laptop GPU (30 - 139.2, n=42) | |
| Razer Blade 17 Early 2022 | |
| Strange Brigade | |
| 3840x2160 ultra AA:ultra AF:16 | |
| Average of class Gaming (83 - 187.2, n=34, last 2 years) | |
| MSI Titan GT77 12UHS (1.47.22.14 D3D12, dGPU, Extreme Leistung) | |
| MSI Titan GT77 12UHS 4k (1.47.22.14 D3D12) | |
| Razer Blade 17 Early 2022 (1.47.22.14 D3D12) | |
| Average NVIDIA GeForce RTX 3080 Ti Laptop GPU (61.7 - 100.7, n=15) | |
| 1920x1080 ultra AA:ultra AF:16 | |
| Average of class Gaming (76.3 - 458, n=87, last 2 years) | |
| MSI Titan GT77 12UHS (1.47.22.14 D3D12) | |
| MSI Titan GT77 12UHS (1.47.22.14 D3D12, dGPU, Extreme Leistung) | |
| Alienware x17 R2 P48E (1.47.22.14 D3D12) | |
| MSI Titan GT77 12UHS 4k (1.47.22.14 D3D12) | |
| Razer Blade 17 Early 2022 (1.47.22.14 D3D12) | |
| Average NVIDIA GeForce RTX 3080 Ti Laptop GPU (42.3 - 224, n=41) | |
| F1 2021 | |
| 3840x2160 Ultra High Preset + Raytracing AA:T AF:16x | |
| MSI Titan GT77 12UHS (874931, dGPU, Extreme Leistung) | |
| MSI Titan GT77 12UHS 4k (874931) | |
| Razer Blade 17 Early 2022 (874931) | |
| Average NVIDIA GeForce RTX 3080 Ti Laptop GPU (41.1 - 70.2, n=18) | |
| 1920x1080 Ultra High Preset + Raytracing AA:T AF:16x | |
| MSI Titan GT77 12UHS (874931) | |
| MSI Titan GT77 12UHS (874931, dGPU, Extreme Leistung) | |
| Razer Blade 17 Early 2022 (874931) | |
| MSI Titan GT77 12UHS 4k (874931) | |
| Average NVIDIA GeForce RTX 3080 Ti Laptop GPU (30.2 - 160.6, n=30) | |
| Far Cry 5 | |
| 3840x2160 Ultra Preset AA:T | |
| Average of class Gaming (n=1last 2 years) | |
| MSI Titan GT77 12UHS 4k | |
| MSI Titan GT77 12UHS (dGPU, Extreme Leistung) | |
| Razer Blade 17 Early 2022 | |
| Average NVIDIA GeForce RTX 3080 Ti Laptop GPU (45 - 76, n=9) | |
| 1920x1080 Ultra Preset AA:T | |
| MSI Titan GT77 12UHS (dGPU, Extreme Leistung) | |
| MSI Titan GT77 12UHS | |
| MSI Titan GT77 12UHS 4k | |
| Schenker XMG Ultra 17 Rocket Lake | |
| Average NVIDIA GeForce RTX 3080 Ti Laptop GPU (111 - 162, n=24) | |
| Razer Blade 17 Early 2022 | |
| Average of class Gaming (70 - 151, n=6, last 2 years) | |
Witcher 3 FPS graph
| low | med. | high | ultra | QHD | 4K | |
|---|---|---|---|---|---|---|
| GTA V (2015) | 187.3 | 186.6 | 182.3 | 134.4 | 117.8 | 121.7 |
| The Witcher 3 (2015) | 480 | 379 | 240 | 123.7 | 91.9 | |
| Dota 2 Reborn (2015) | 199.9 | 180.7 | 169.7 | 162.7 | 139.9 | |
| Final Fantasy XV Benchmark (2018) | 220 | 174.1 | 131 | 100.3 | 58.3 | |
| X-Plane 11.11 (2018) | 170.8 | 150.8 | 118.3 | 100.9 | ||
| Far Cry 5 (2018) | 199 | 169 | 161 | 151 | 134 | 76 |
| Strange Brigade (2018) | 519 | 286 | 233 | 206 | 156.2 | 93.7 |
| F1 2021 (2021) | 348 | 237 | 205 | 130.4 | 103.4 | 62.8 |
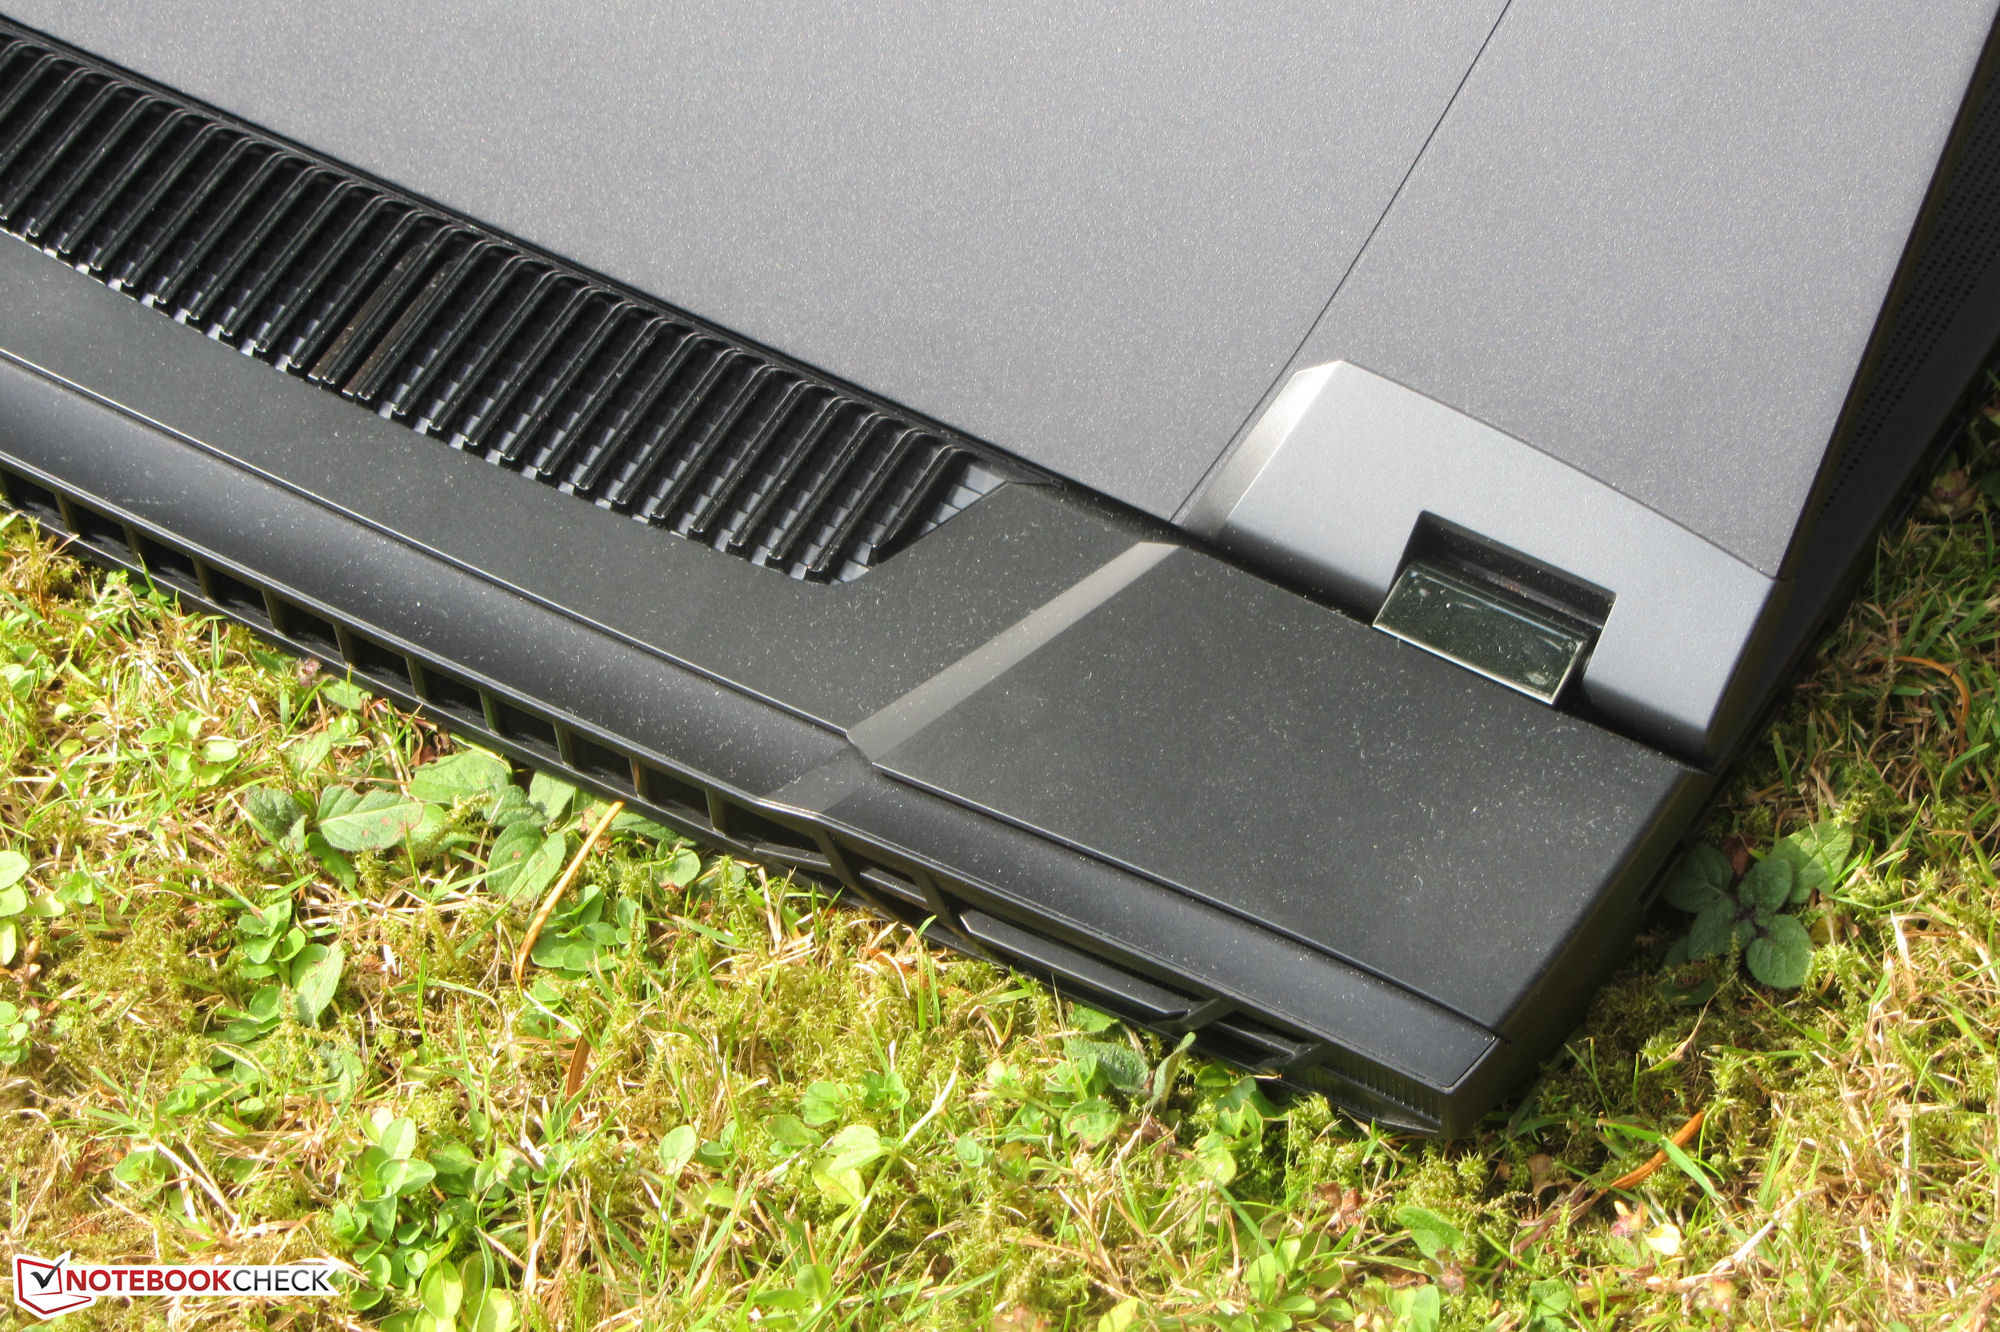
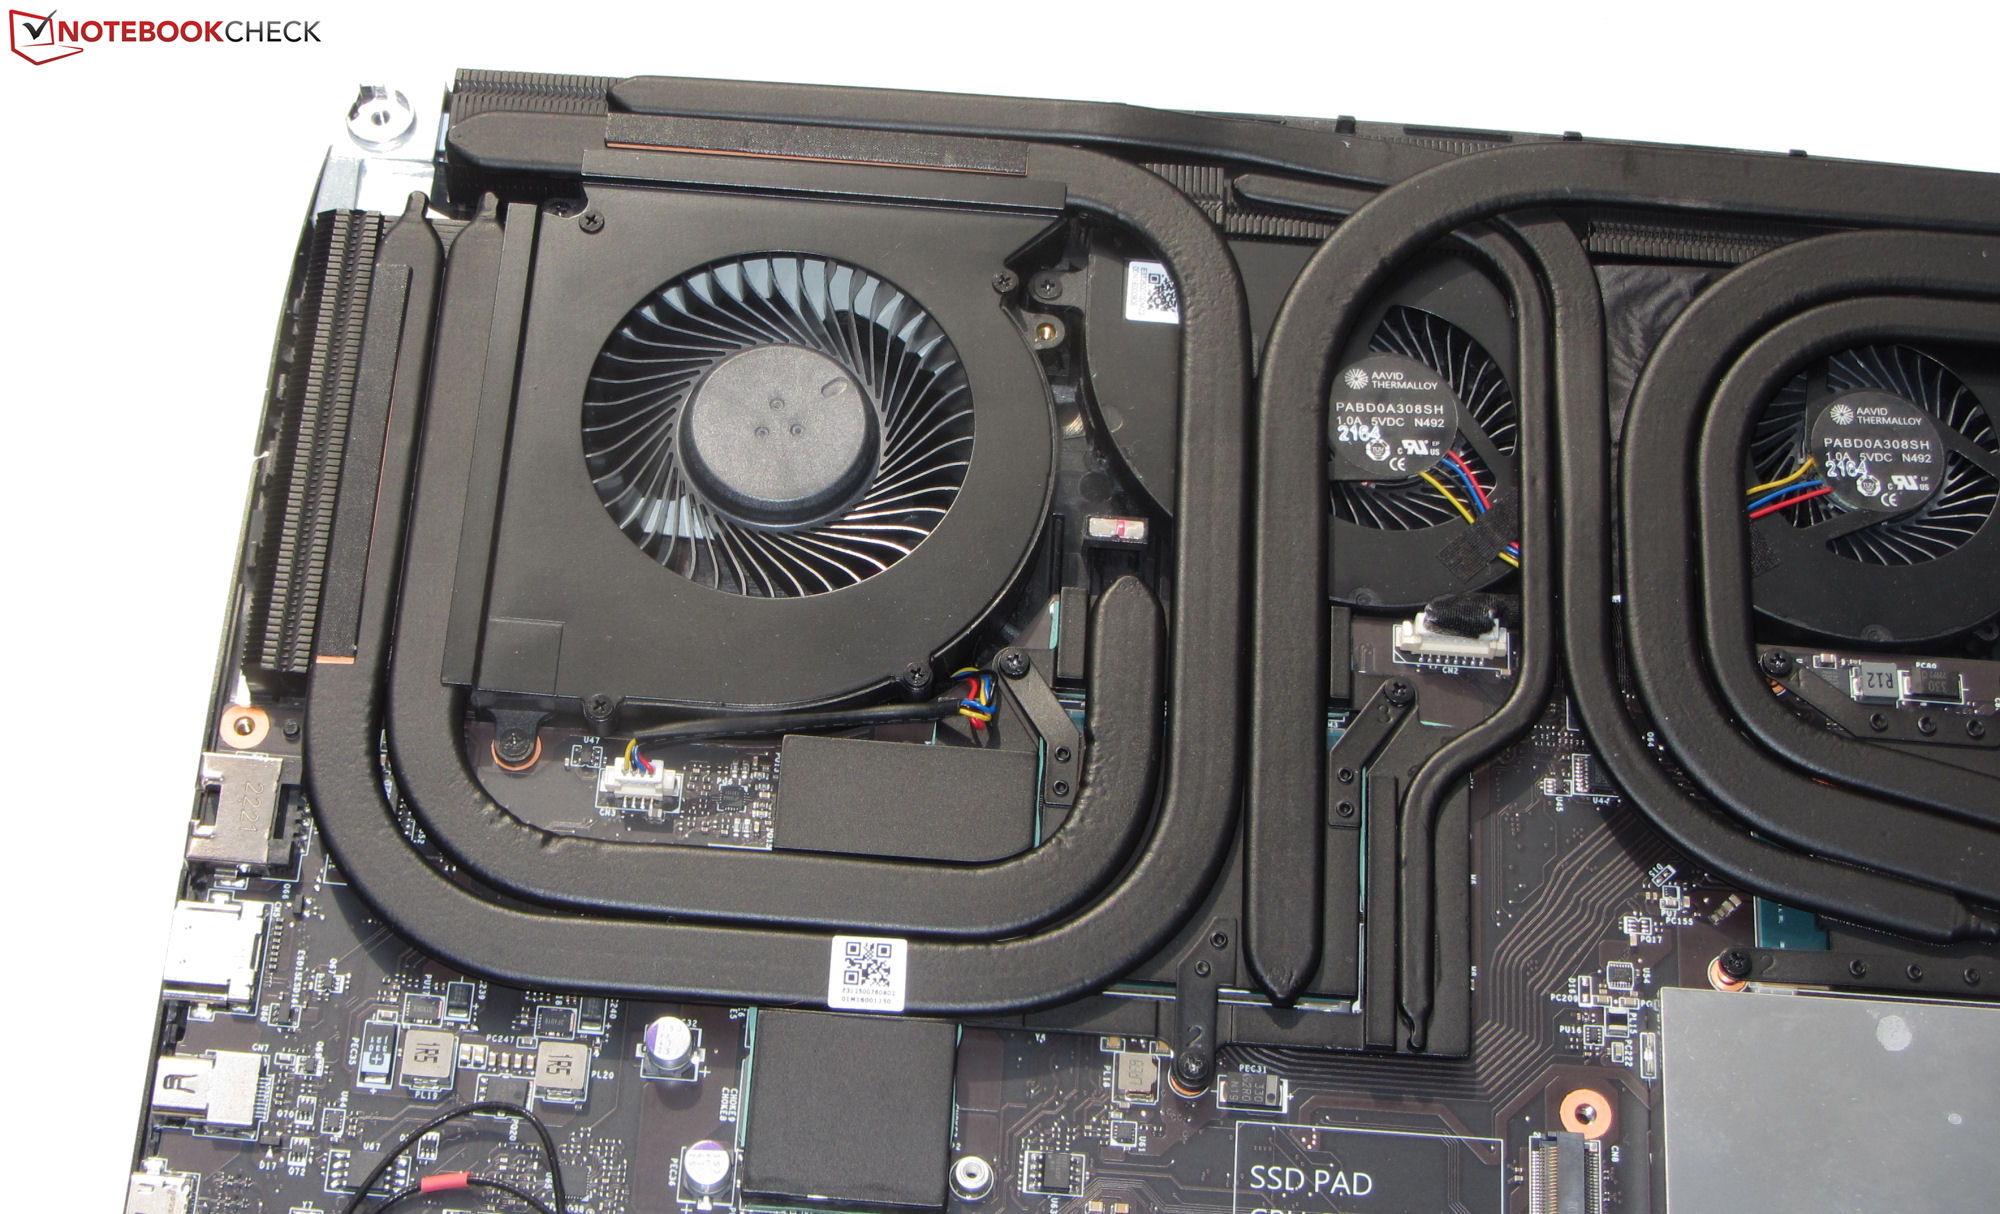
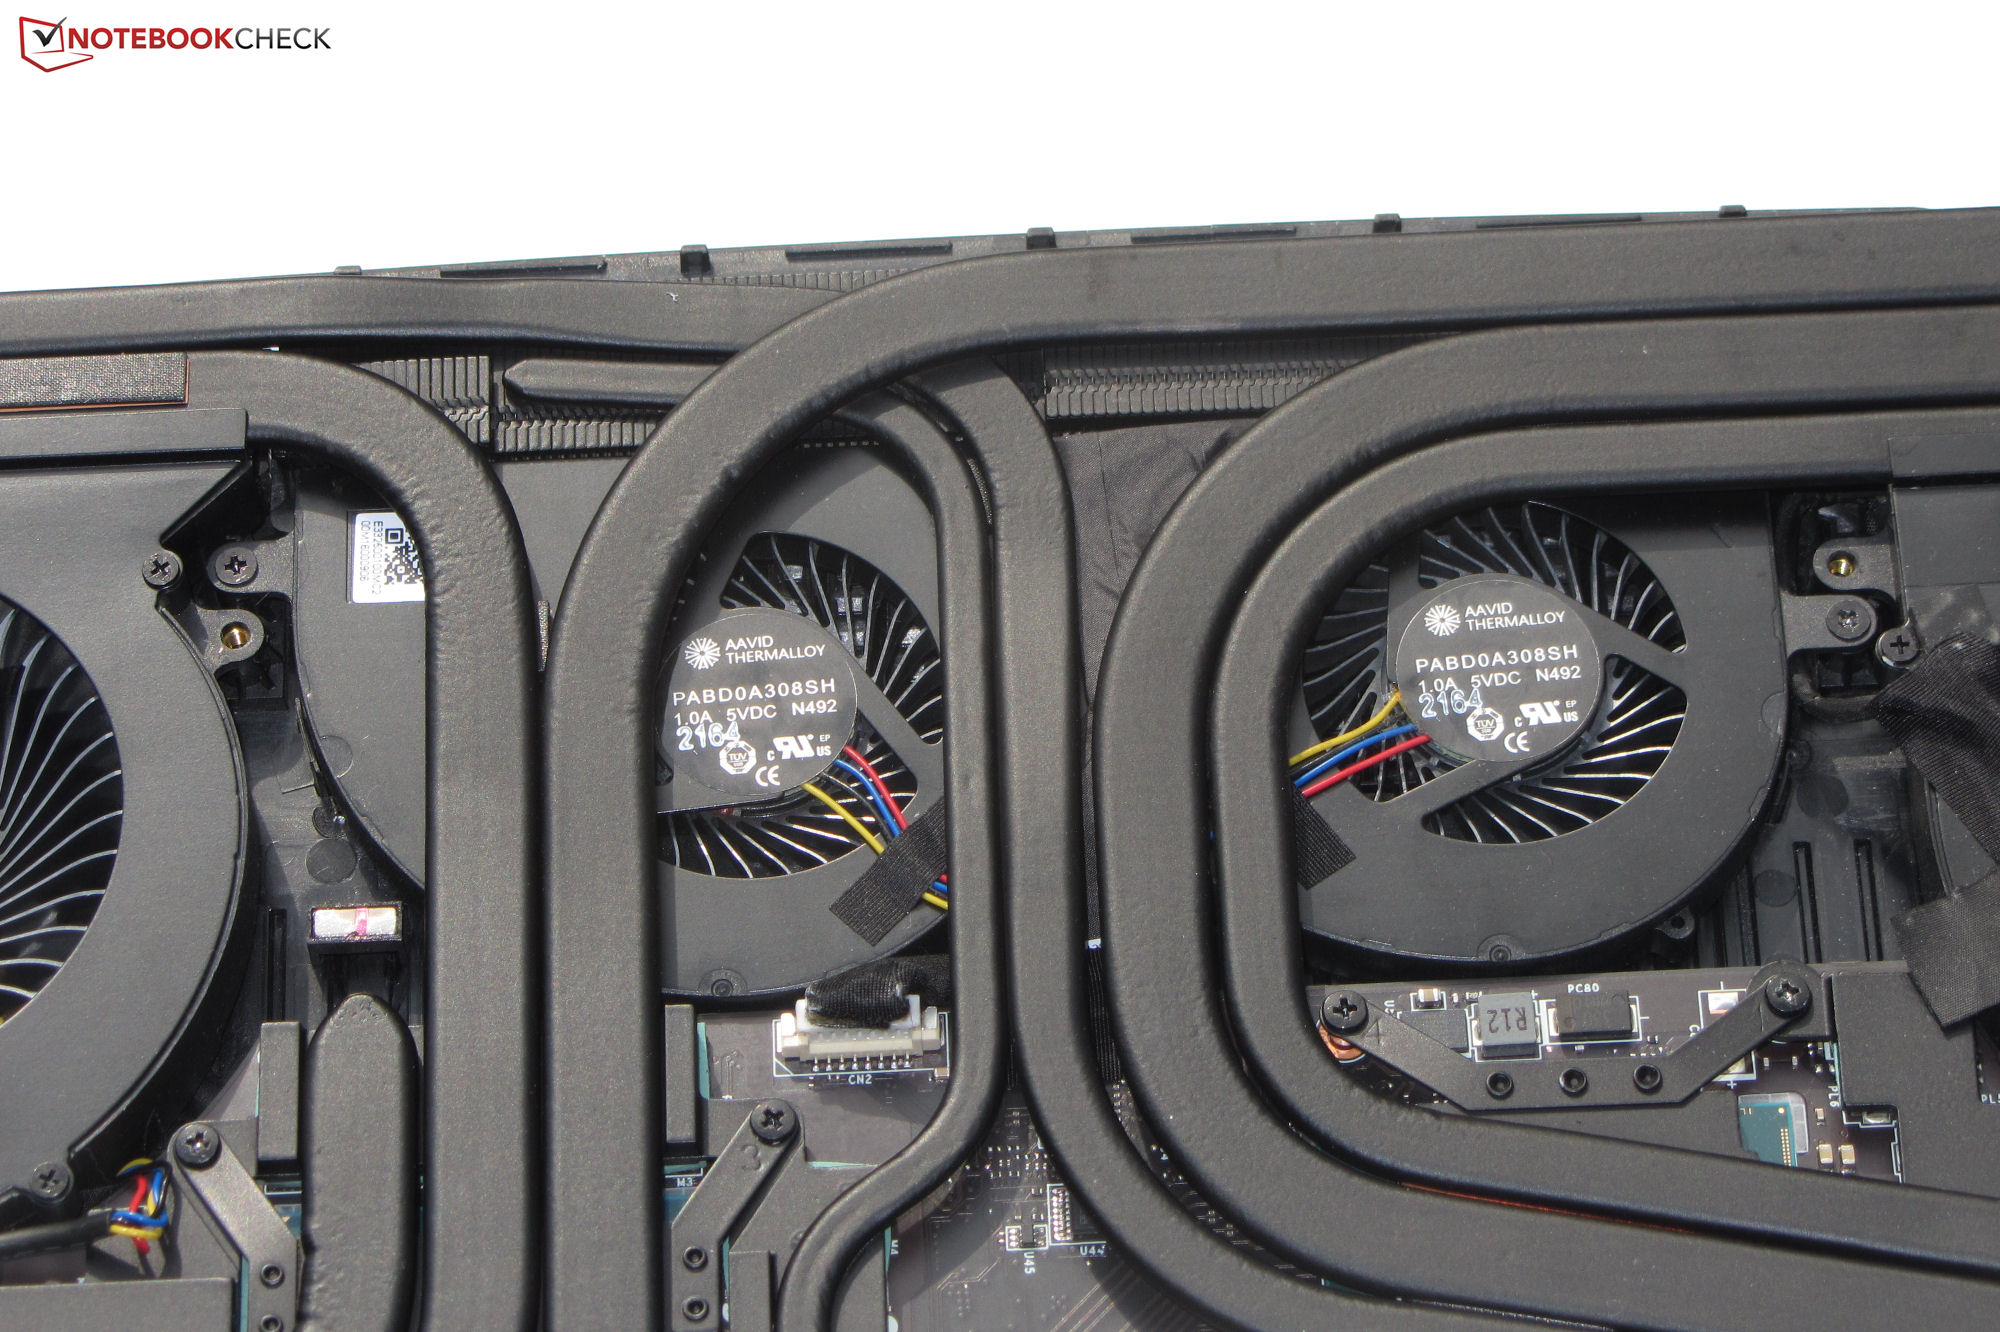
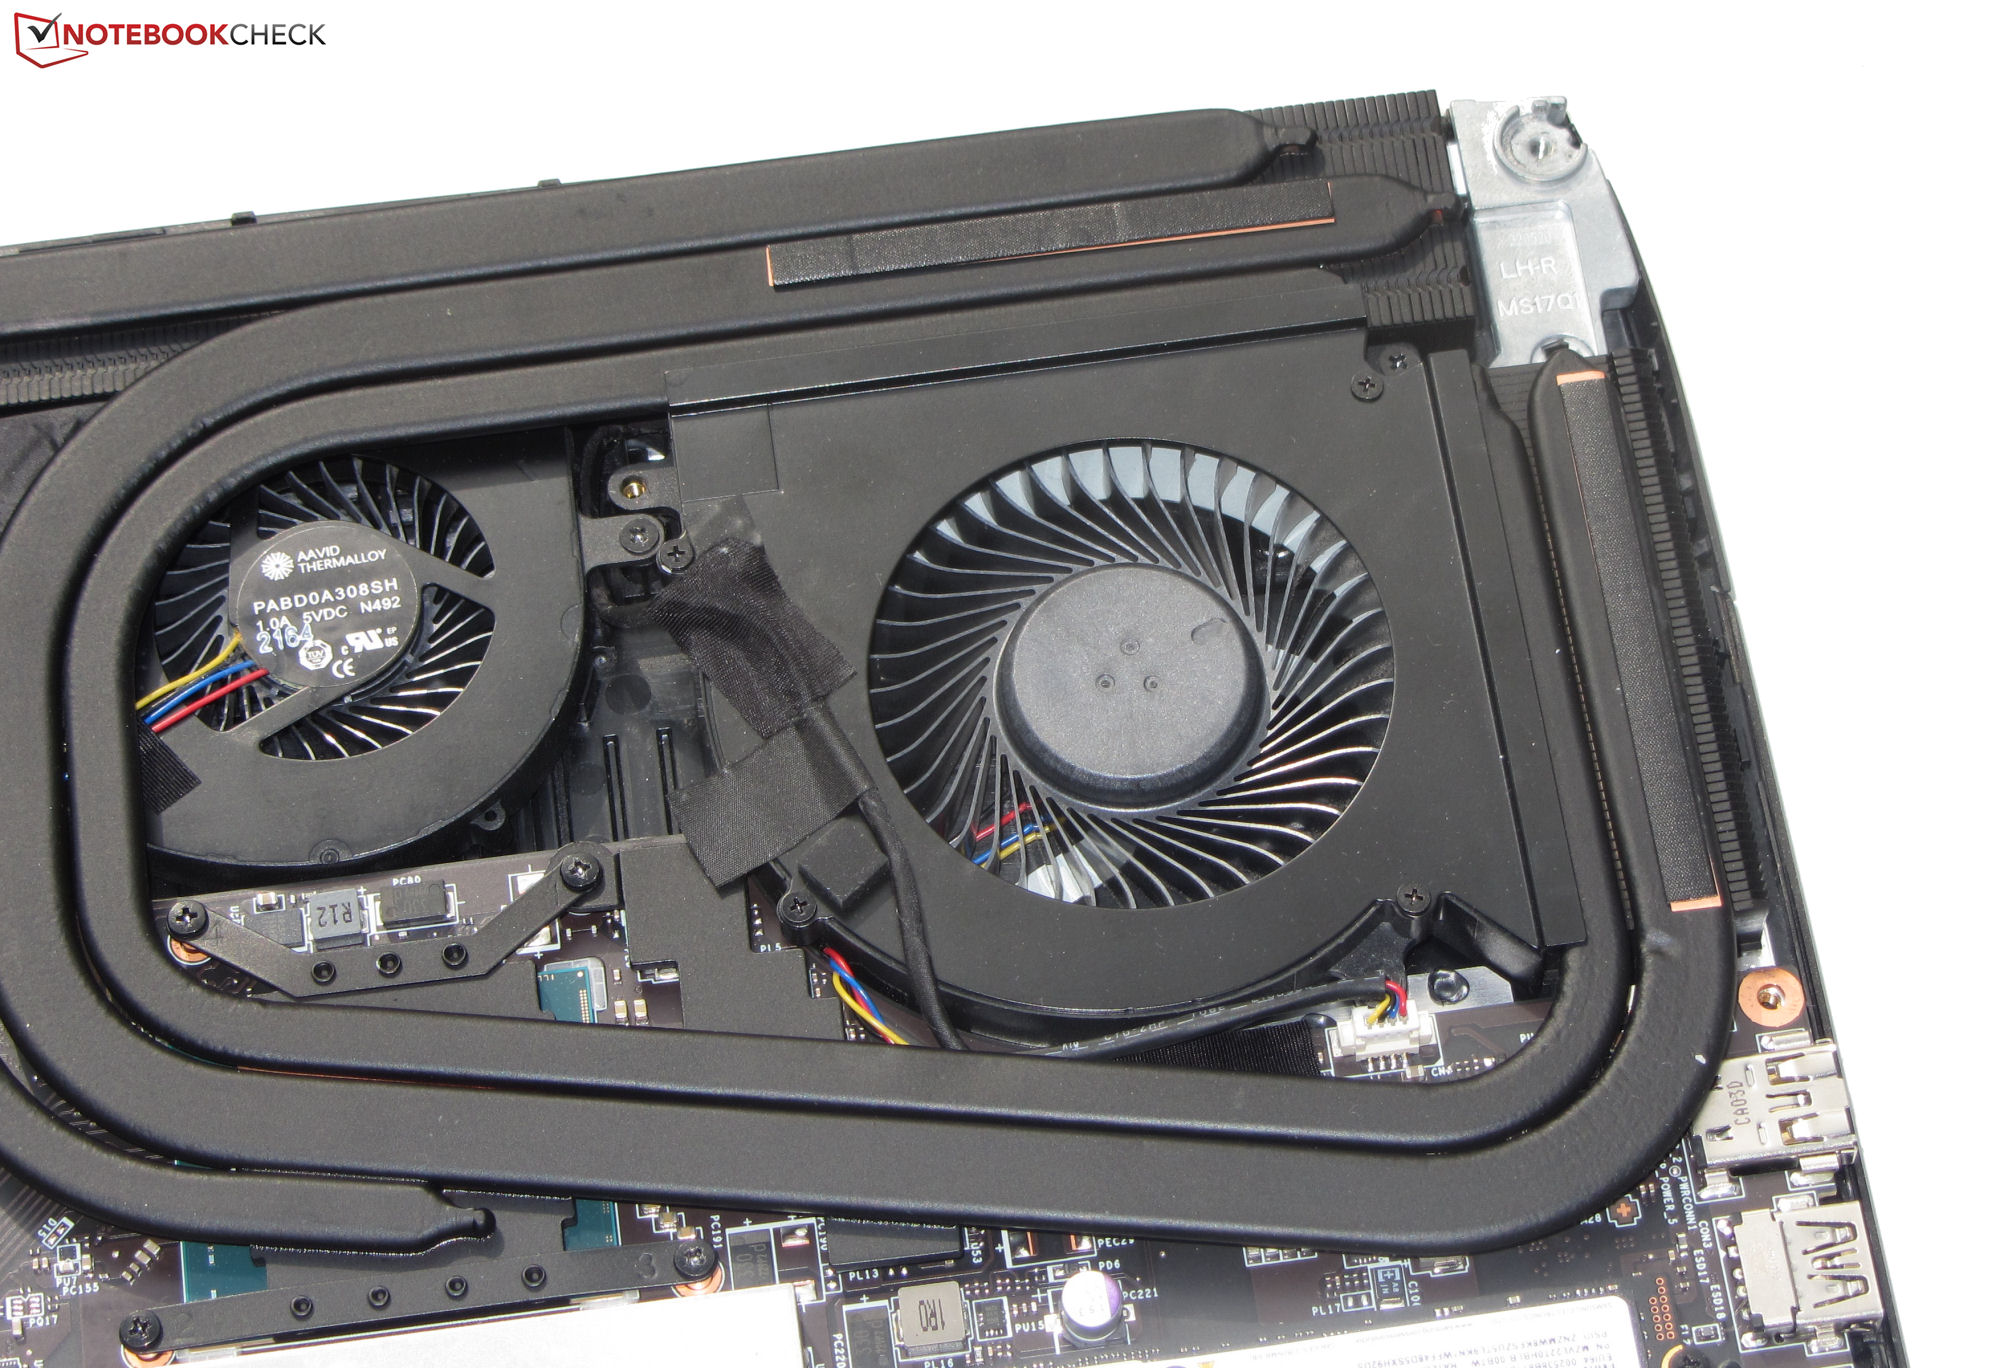
排放 - 微星GT77有四个风扇
噪声排放
四个风扇可以产生相当大的噪音:在负载情况下,Witcher 3 测试时噪音水平达到53 dB(A),压力测试时达到56 dB(A)。在空闲或低负荷状态下,通常至少有一个风扇在旋转,风扇噪音可以达到42 dB(A)。然而,FHD Titan ,没有受到这种影响。一个可能的解释是,由于活跃的 "智能自动 "功能,4K机型上的风扇控制可能会更烦躁一些。静音模式 "配置文件有助于减少系统运行时的噪音量--以牺牲计算能力为代价。
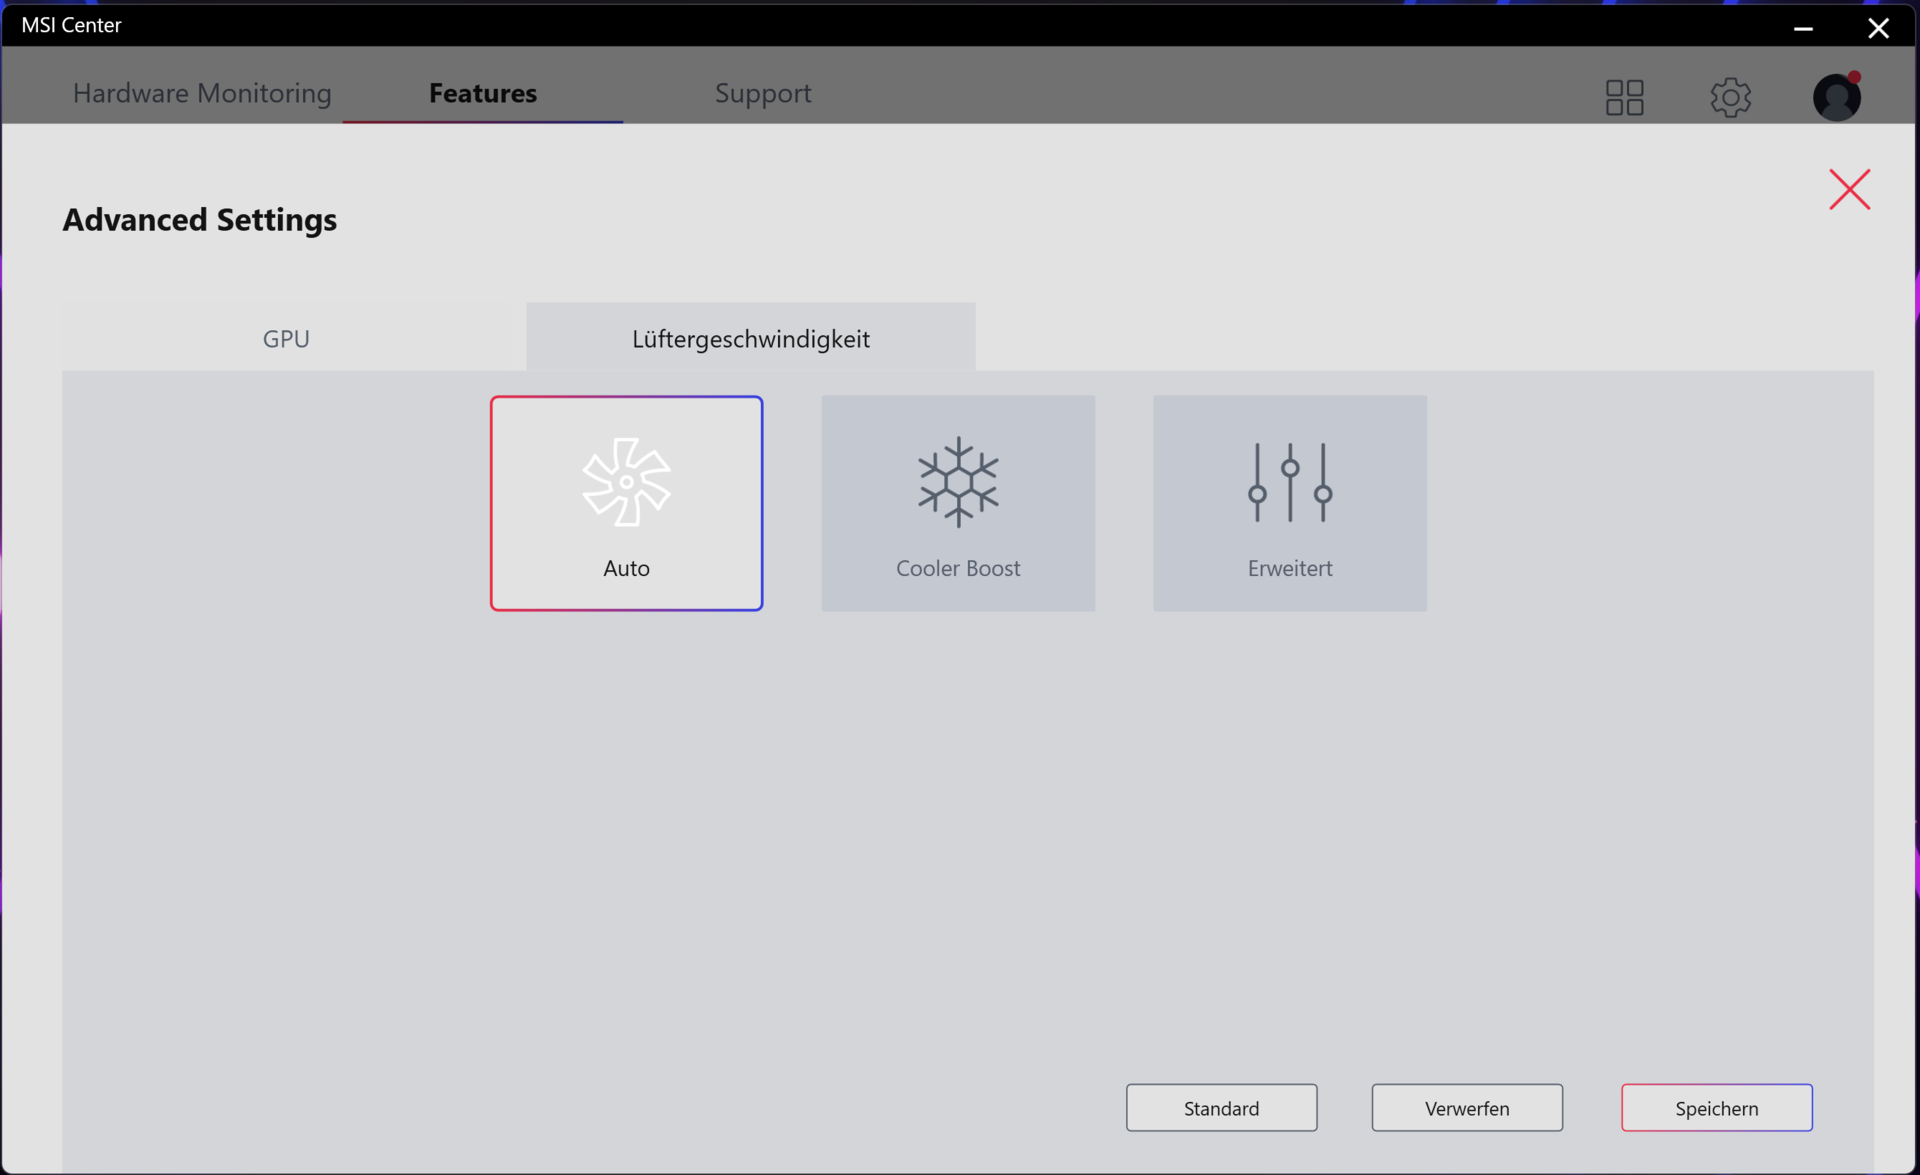
极限性能 "配置文件让你修改风扇控制。可用的选项包括 "自动"、"冷却器提升"(风扇以最大速度运行)和 "高级"(自定义风扇曲线)。
Noise level
| Idle |
| 29 / 30 / 42 dB(A) |
| Load |
| 54 / 56 dB(A) |
 | ||
30 dB silent 40 dB(A) audible 50 dB(A) loud |
||
min: | ||
| MSI Titan GT77 12UHS 4k i9-12900HX, GeForce RTX 3080 Ti Laptop GPU | Razer Blade 17 Early 2022 i9-12900H, GeForce RTX 3080 Ti Laptop GPU | Alienware x17 R2 P48E i9-12900HK, GeForce RTX 3080 Ti Laptop GPU | Schenker XMG Ultra 17 Rocket Lake i9-11900K, GeForce RTX 3080 Laptop GPU | MSI Titan GT77 12UHS i9-12900HX, GeForce RTX 3080 Ti Laptop GPU | |
|---|---|---|---|---|---|
| Noise | 9% | 21% | -12% | 14% | |
| off / environment * (dB) | 26 | 26 -0% | 22.7 13% | 24 8% | 21.9 16% |
| Idle Minimum * (dB) | 29 | 26 10% | 23.1 20% | 30 -3% | 24.53 15% |
| Idle Average * (dB) | 30 | 27 10% | 23.1 23% | 31 -3% | 24.53 18% |
| Idle Maximum * (dB) | 42 | 32 24% | 23.1 45% | 57 -36% | 24.53 42% |
| Load Average * (dB) | 54 | 50 7% | 31.9 41% | 63 -17% | 46.25 14% |
| Witcher 3 ultra * (dB) | 52 | 51 2% | 52.5 -1% | 61 -17% | 56.86 -9% |
| Load Maximum * (dB) | 56 | 51 9% | 52.5 6% | 63 -13% | 54.25 3% |
* ... smaller is better
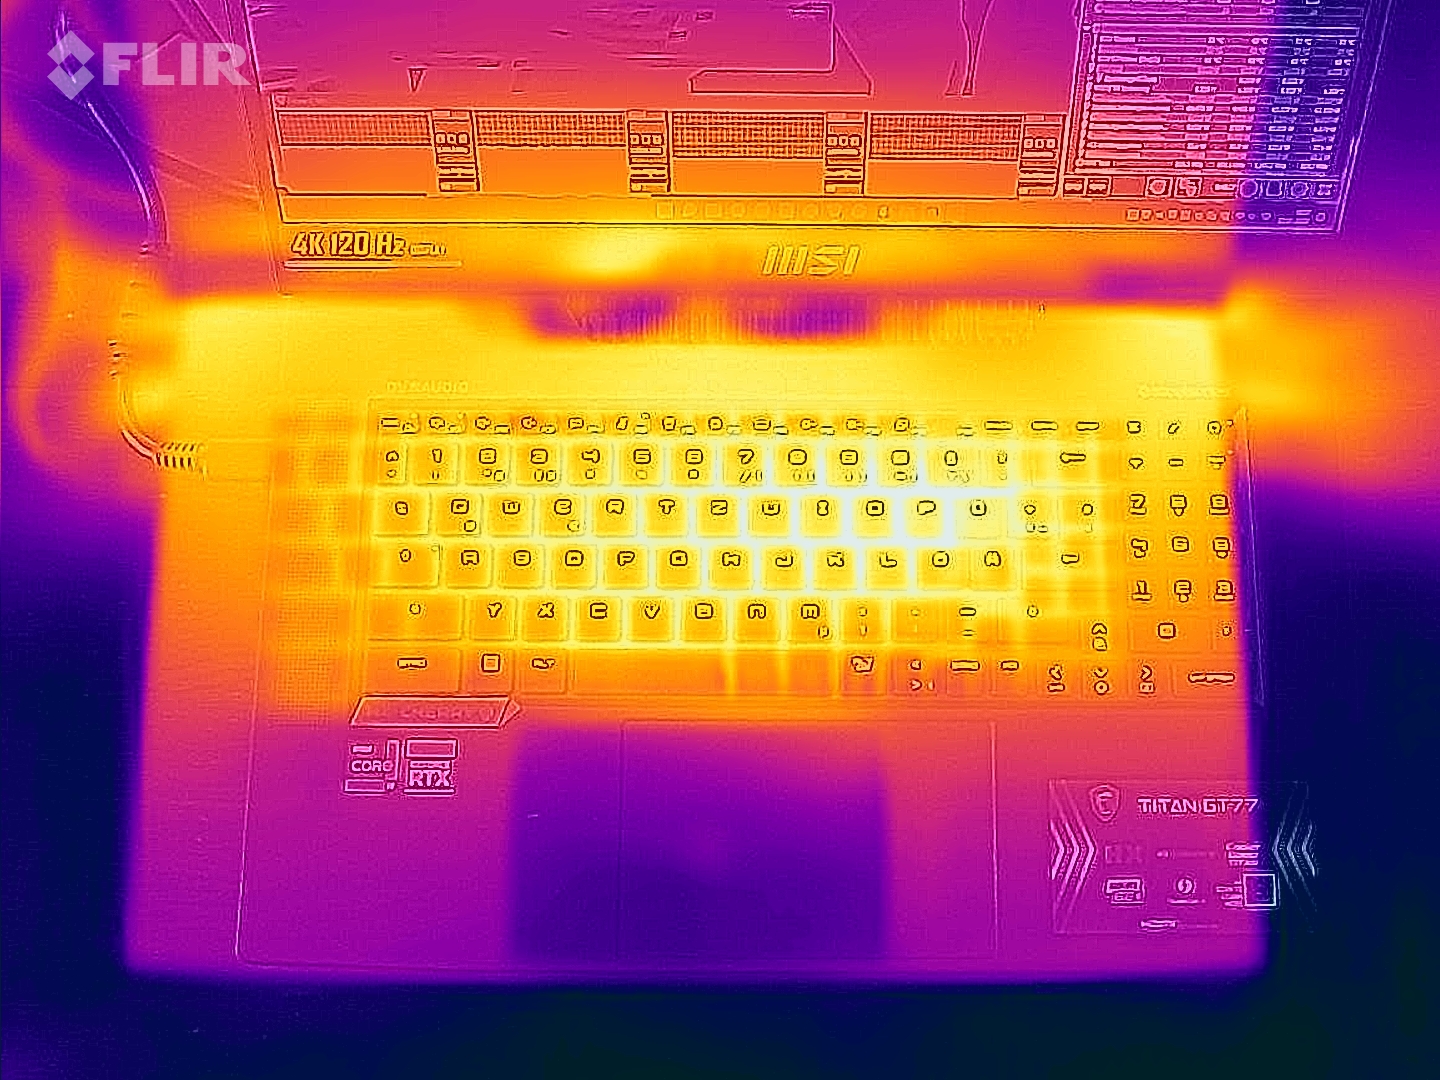
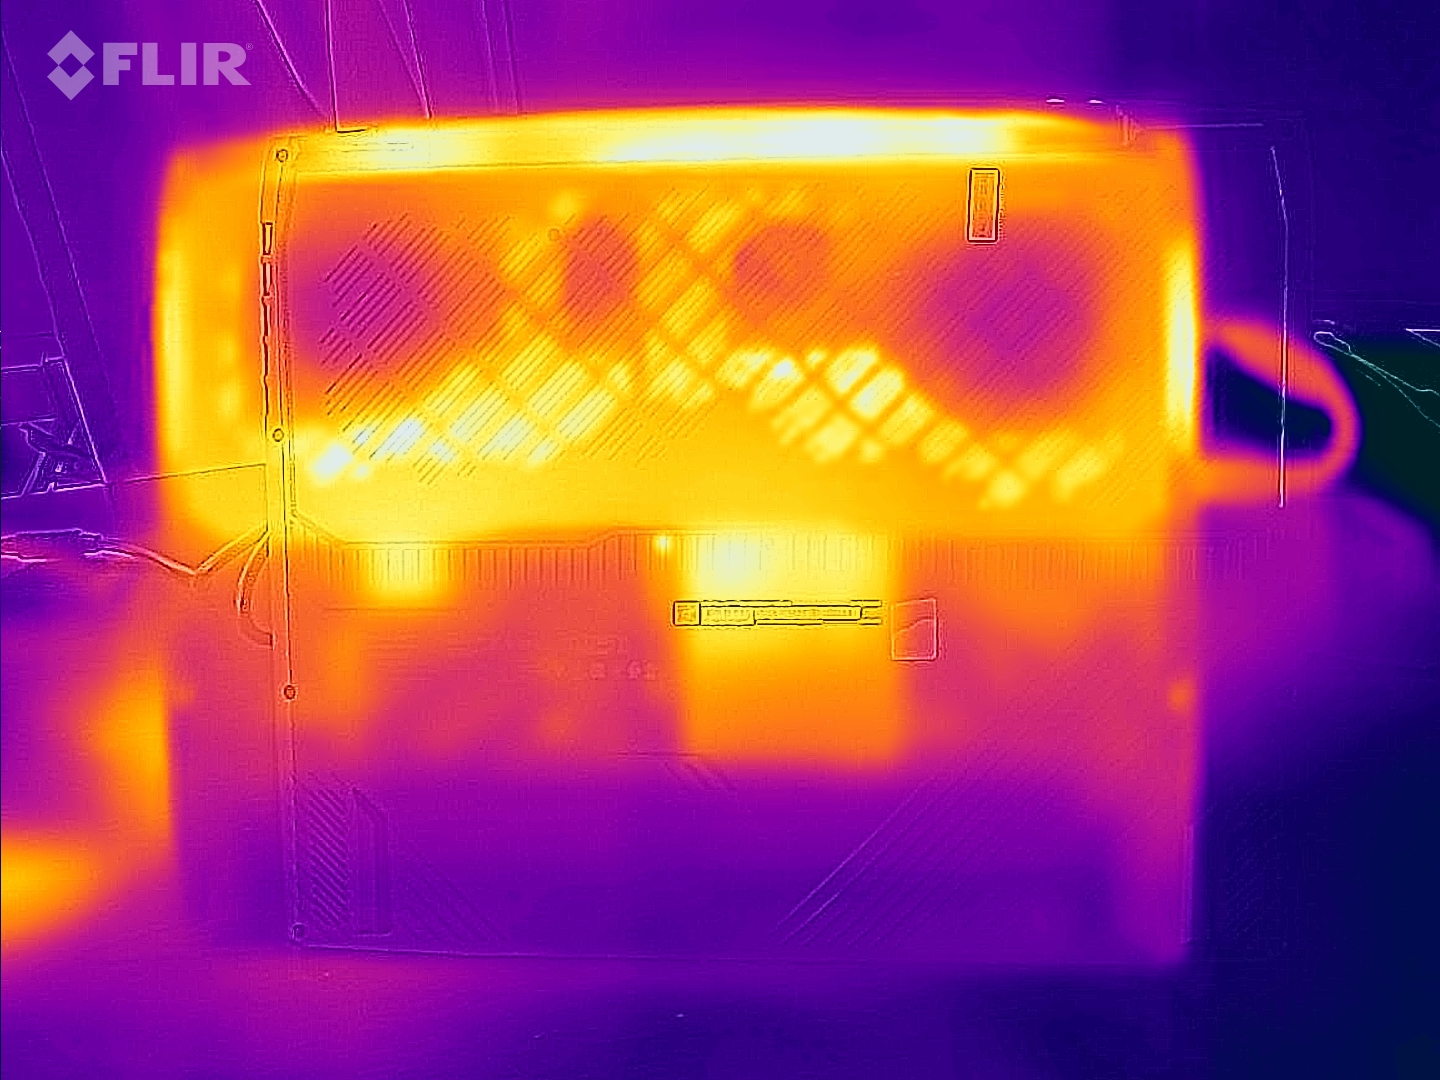
温度
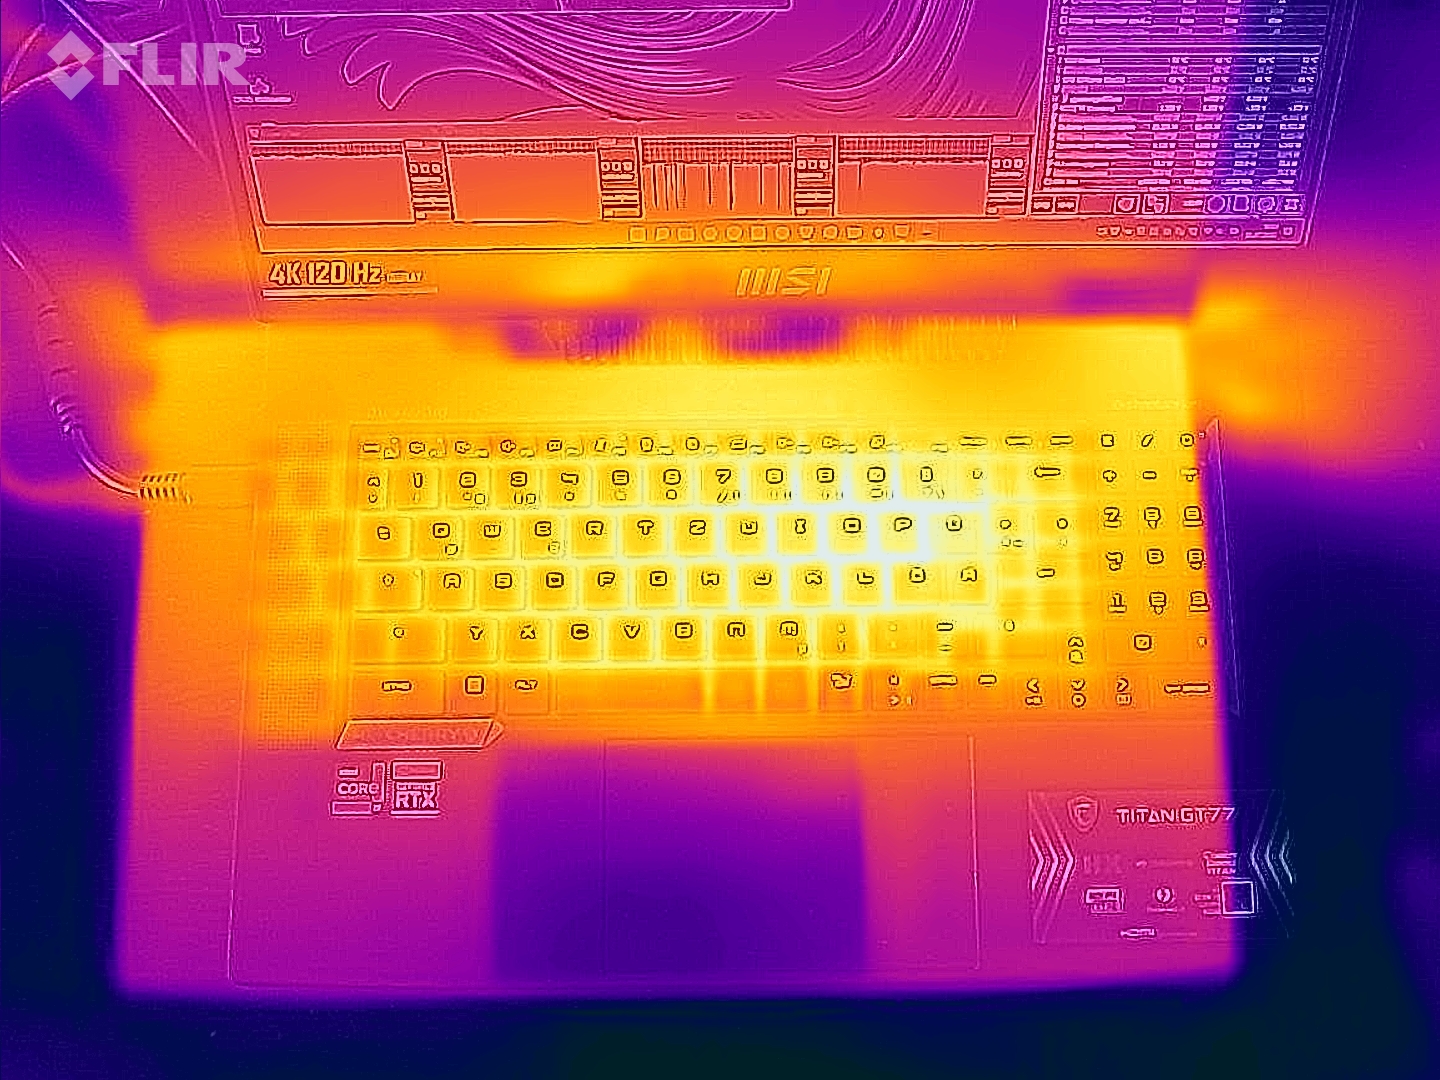
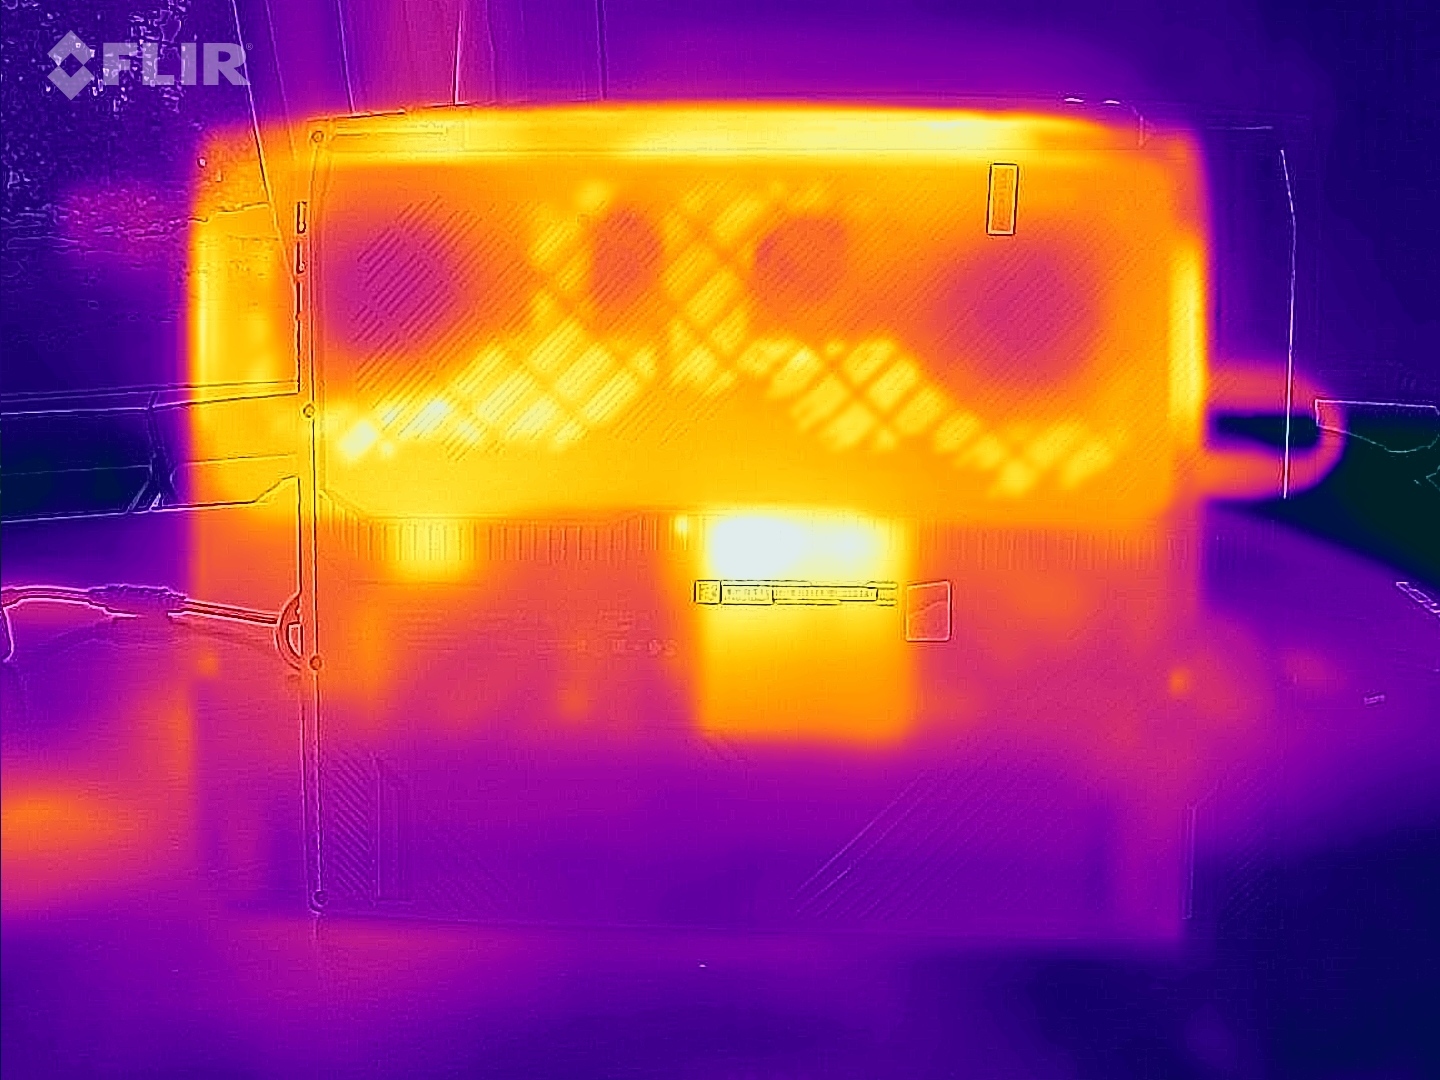
在日常使用中(办公室工作、互联网浏览),机箱的温度保持在一个可接受的范围内。在负载情况下(压力测试,Witcher 3 测试),笔记本电脑的温度明显升高,但不是太热。当涉及到CPU温度时,没有理由担心。
(-) The maximum temperature on the upper side is 49 °C / 120 F, compared to the average of 40.4 °C / 105 F, ranging from 21.2 to 68.8 °C for the class Gaming.
(-) The bottom heats up to a maximum of 50 °C / 122 F, compared to the average of 43.2 °C / 110 F
(±) In idle usage, the average temperature for the upper side is 33.2 °C / 92 F, compared to the device average of 33.9 °C / 93 F.
(-) Playing The Witcher 3, the average temperature for the upper side is 48.1 °C / 119 F, compared to the device average of 33.9 °C / 93 F.
(-) The palmrests and touchpad can get very hot to the touch with a maximum of 43 °C / 109.4 F.
(-) The average temperature of the palmrest area of similar devices was 28.8 °C / 83.8 F (-14.2 °C / -25.6 F).
| MSI Titan GT77 12UHS 4k Intel Core i9-12900HX, NVIDIA GeForce RTX 3080 Ti Laptop GPU | Razer Blade 17 Early 2022 Intel Core i9-12900H, NVIDIA GeForce RTX 3080 Ti Laptop GPU | Alienware x17 R2 P48E Intel Core i9-12900HK, NVIDIA GeForce RTX 3080 Ti Laptop GPU | Schenker XMG Ultra 17 Rocket Lake Intel Core i9-11900K, NVIDIA GeForce RTX 3080 Laptop GPU | MSI Titan GT77 12UHS Intel Core i9-12900HX, NVIDIA GeForce RTX 3080 Ti Laptop GPU | |
|---|---|---|---|---|---|
| Heat | -5% | 11% | 8% | 2% | |
| Maximum Upper Side * (°C) | 49 | 50 -2% | 49.6 -1% | 34 31% | 40.8 17% |
| Maximum Bottom * (°C) | 50 | 56 -12% | 42.4 15% | 43 14% | 52.4 -5% |
| Idle Upper Side * (°C) | 34 | 36 -6% | 29.2 14% | 38 -12% | 34.6 -2% |
| Idle Bottom * (°C) | 38 | 38 -0% | 32 16% | 39 -3% | 38.4 -1% |
* ... smaller is better
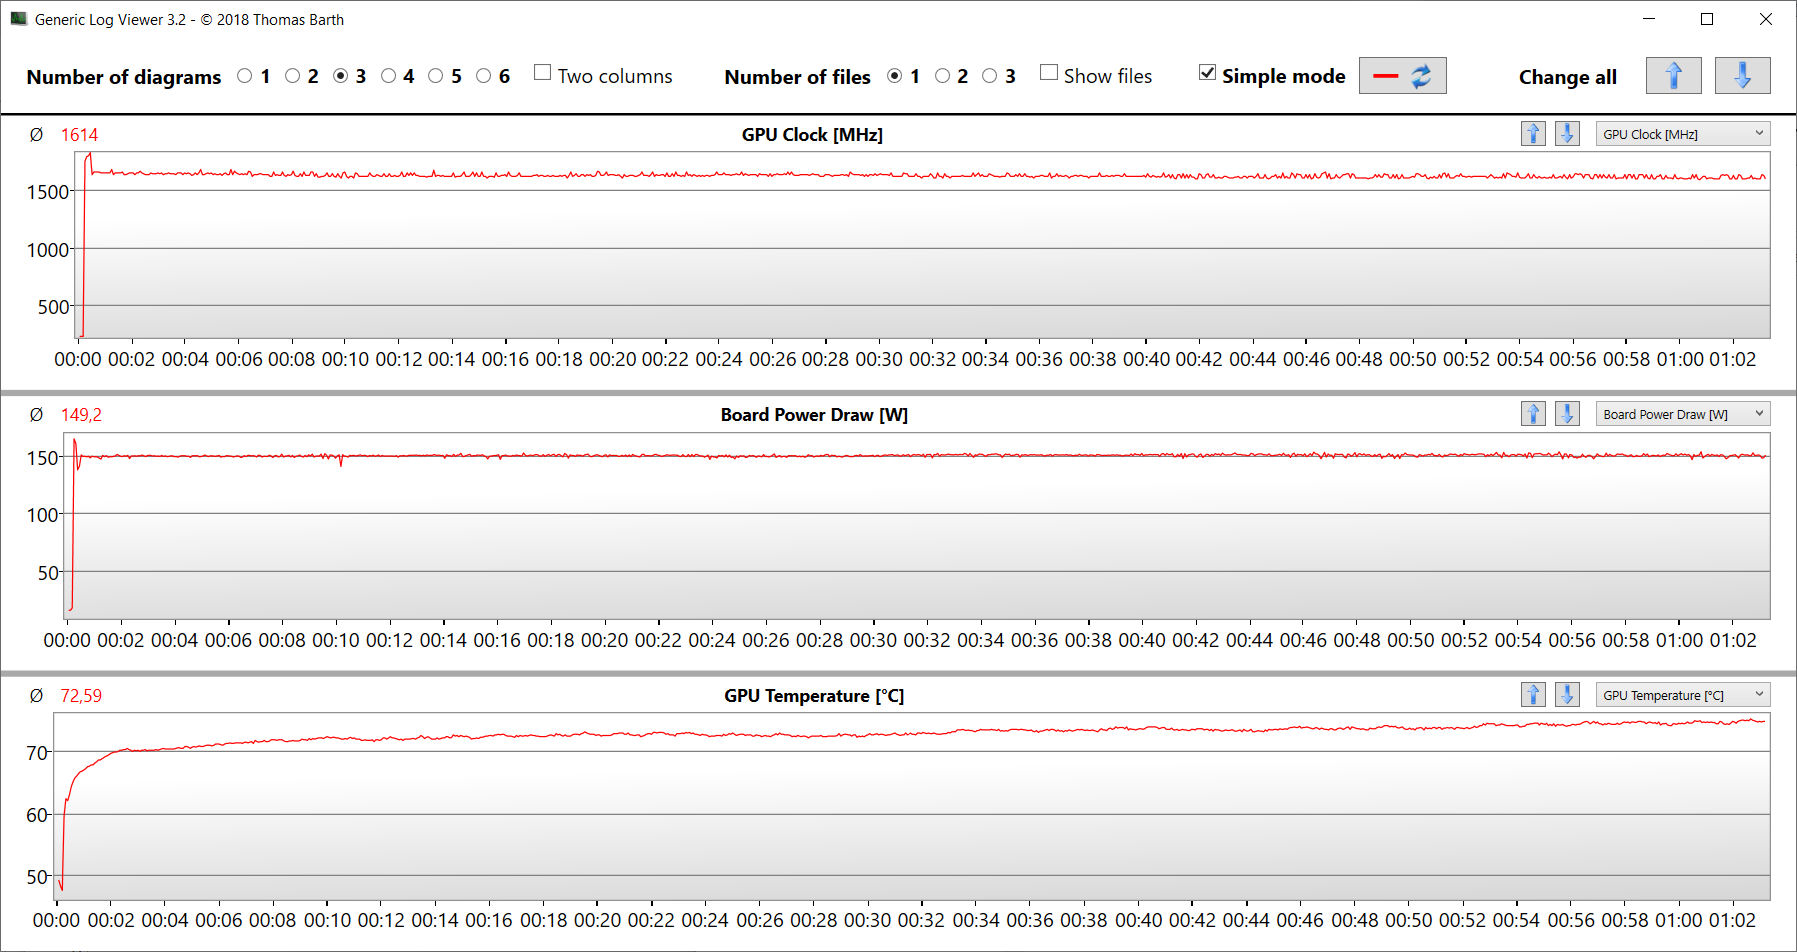
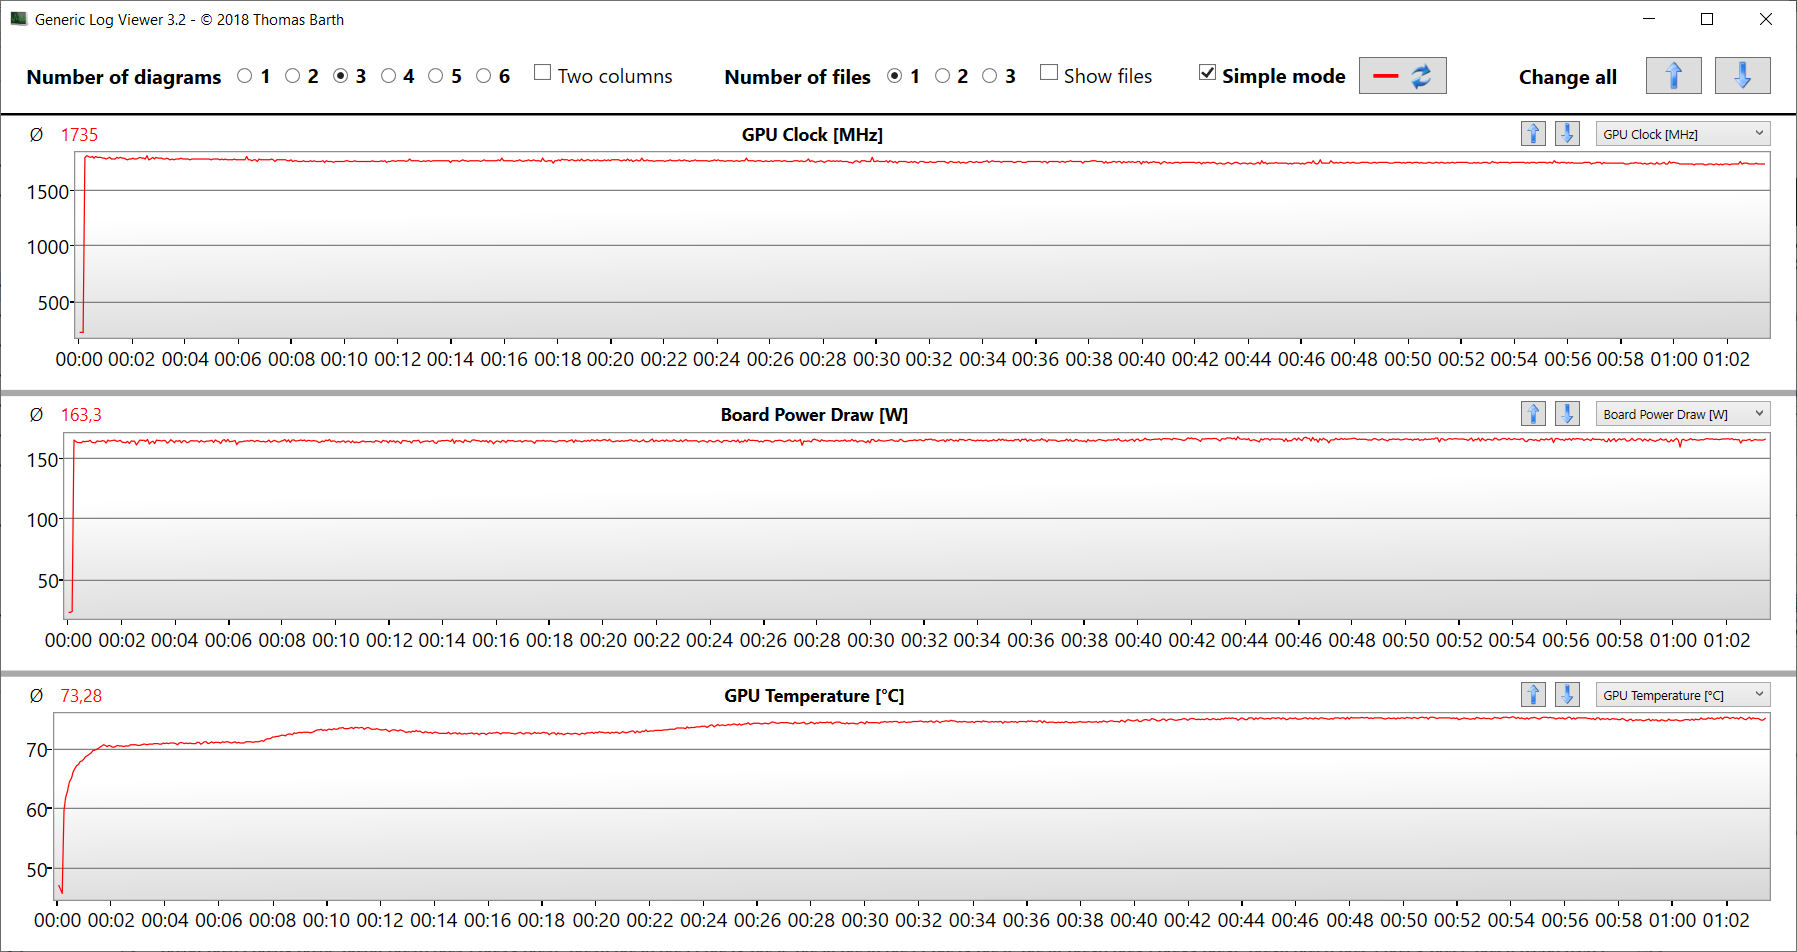
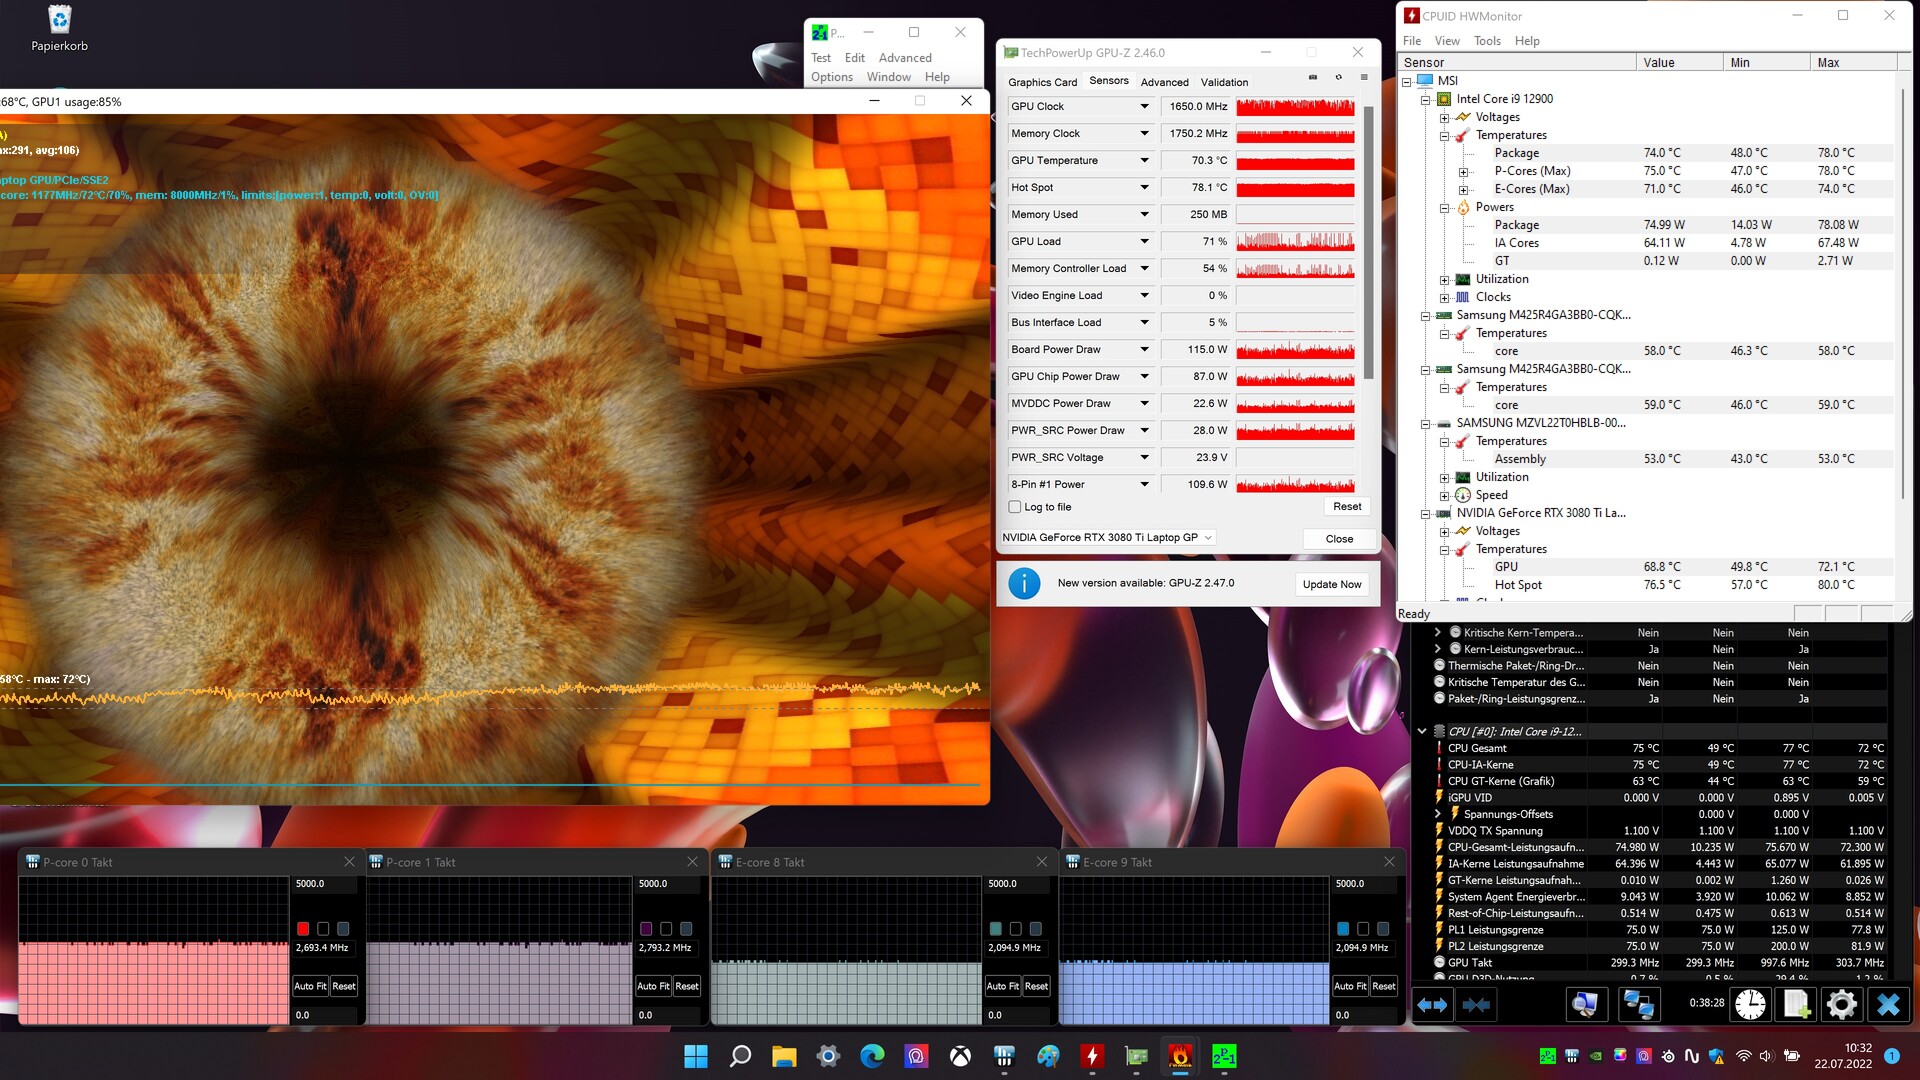
压力测试
CPU以中等处理速度完成了压力测试(运行Prime95和FurMark至少一个小时),而GPU能够达到最大的时钟速度。压力测试代表了一种极端情况。我们进行这项测试是为了检查系统在满负荷运行时是否稳定。
发言人
MSI Titan GT77 12UHS audio analysis
(+) | speakers can play relatively loud (91 dB)
Bass 100 - 315 Hz
(±) | reduced bass - on average 13.9% lower than median
(±) | linearity of bass is average (9.7% delta to prev. frequency)
Mids 400 - 2000 Hz
(+) | balanced mids - only 4% away from median
(+) | mids are linear (3.6% delta to prev. frequency)
Highs 2 - 16 kHz
(+) | balanced highs - only 1.8% away from median
(+) | highs are linear (3.9% delta to prev. frequency)
Overall 100 - 16.000 Hz
(+) | overall sound is linear (11.4% difference to median)
Compared to same class
» 9% of all tested devices in this class were better, 3% similar, 88% worse
» The best had a delta of 6%, average was 18%, worst was 132%
Compared to all devices tested
» 7% of all tested devices were better, 2% similar, 90% worse
» The best had a delta of 4%, average was 23%, worst was 134%
Alienware x17 R2 P48E audio analysis
(+) | speakers can play relatively loud (84.3 dB)
Bass 100 - 315 Hz
(±) | reduced bass - on average 9.7% lower than median
(+) | bass is linear (5.5% delta to prev. frequency)
Mids 400 - 2000 Hz
(+) | balanced mids - only 1.6% away from median
(+) | mids are linear (3% delta to prev. frequency)
Highs 2 - 16 kHz
(±) | higher highs - on average 5% higher than median
(±) | linearity of highs is average (7.6% delta to prev. frequency)
Overall 100 - 16.000 Hz
(+) | overall sound is linear (9.3% difference to median)
Compared to same class
» 3% of all tested devices in this class were better, 2% similar, 95% worse
» The best had a delta of 6%, average was 18%, worst was 132%
Compared to all devices tested
» 3% of all tested devices were better, 1% similar, 96% worse
» The best had a delta of 4%, average was 23%, worst was 134%
电源管理 - 微星笔记本电脑提供了体面的电池寿命
消耗功率
这台笔记本电脑的功耗在其内部硬件的正常范围内。在Witcher 3 测试和压力测试期间,其功耗增加到平均236瓦,峰值为309瓦。在这两次测试中,该设备使用的电量是恒定的。
注:该 FHD型号是在dGPU模式激活的情况下测试的。这解释了为什么它在空闲时消耗更多的功率。
| Off / Standby | |
| Idle | |
| Load |
|
Key:
min: | |
| MSI Titan GT77 12UHS i9-12900HX, GeForce RTX 3080 Ti Laptop GPU | Razer Blade 17 Early 2022 i9-12900H, GeForce RTX 3080 Ti Laptop GPU | Alienware x17 R2 P48E i9-12900HK, GeForce RTX 3080 Ti Laptop GPU | Schenker XMG Ultra 17 Rocket Lake i9-11900K, GeForce RTX 3080 Laptop GPU | MSI Titan GT77 12UHS i9-12900HX, GeForce RTX 3080 Ti Laptop GPU | Average NVIDIA GeForce RTX 3080 Ti Laptop GPU | Average of class Gaming | |
|---|---|---|---|---|---|---|---|
| Power Consumption | -7% | -44% | -146% | -41% | -10% | 8% | |
| Idle Minimum * (Watt) | 12 | 17 -42% | 24.1 -101% | 62 -417% | 30.21 -152% | 17.2 ? -43% | 13 ? -8% |
| Idle Average * (Watt) | 18 | 23 -28% | 28.5 -58% | 64 -256% | 32.42 -80% | 23.3 ? -29% | 19 ? -6% |
| Idle Maximum * (Watt) | 30 | 34 -13% | 60 -100% | 69 -130% | 33.7 -12% | 30.8 ? -3% | 24.6 ? 18% |
| Load Average * (Watt) | 141 | 120 15% | 128.7 9% | 183 -30% | 125.09 11% | 121.2 ? 14% | 110.7 ? 21% |
| Witcher 3 ultra * (Watt) | 236 | 229 3% | 254 -8% | 297 -26% | 256 -8% | ||
| Load Maximum * (Watt) | 309 | 243 21% | 323 -5% | 368 -19% | 321.88 -4% | 276 ? 11% | 259 ? 16% |
* ... smaller is better
Power consumption Witcher 3 / stress test
Power consumption with external monitor
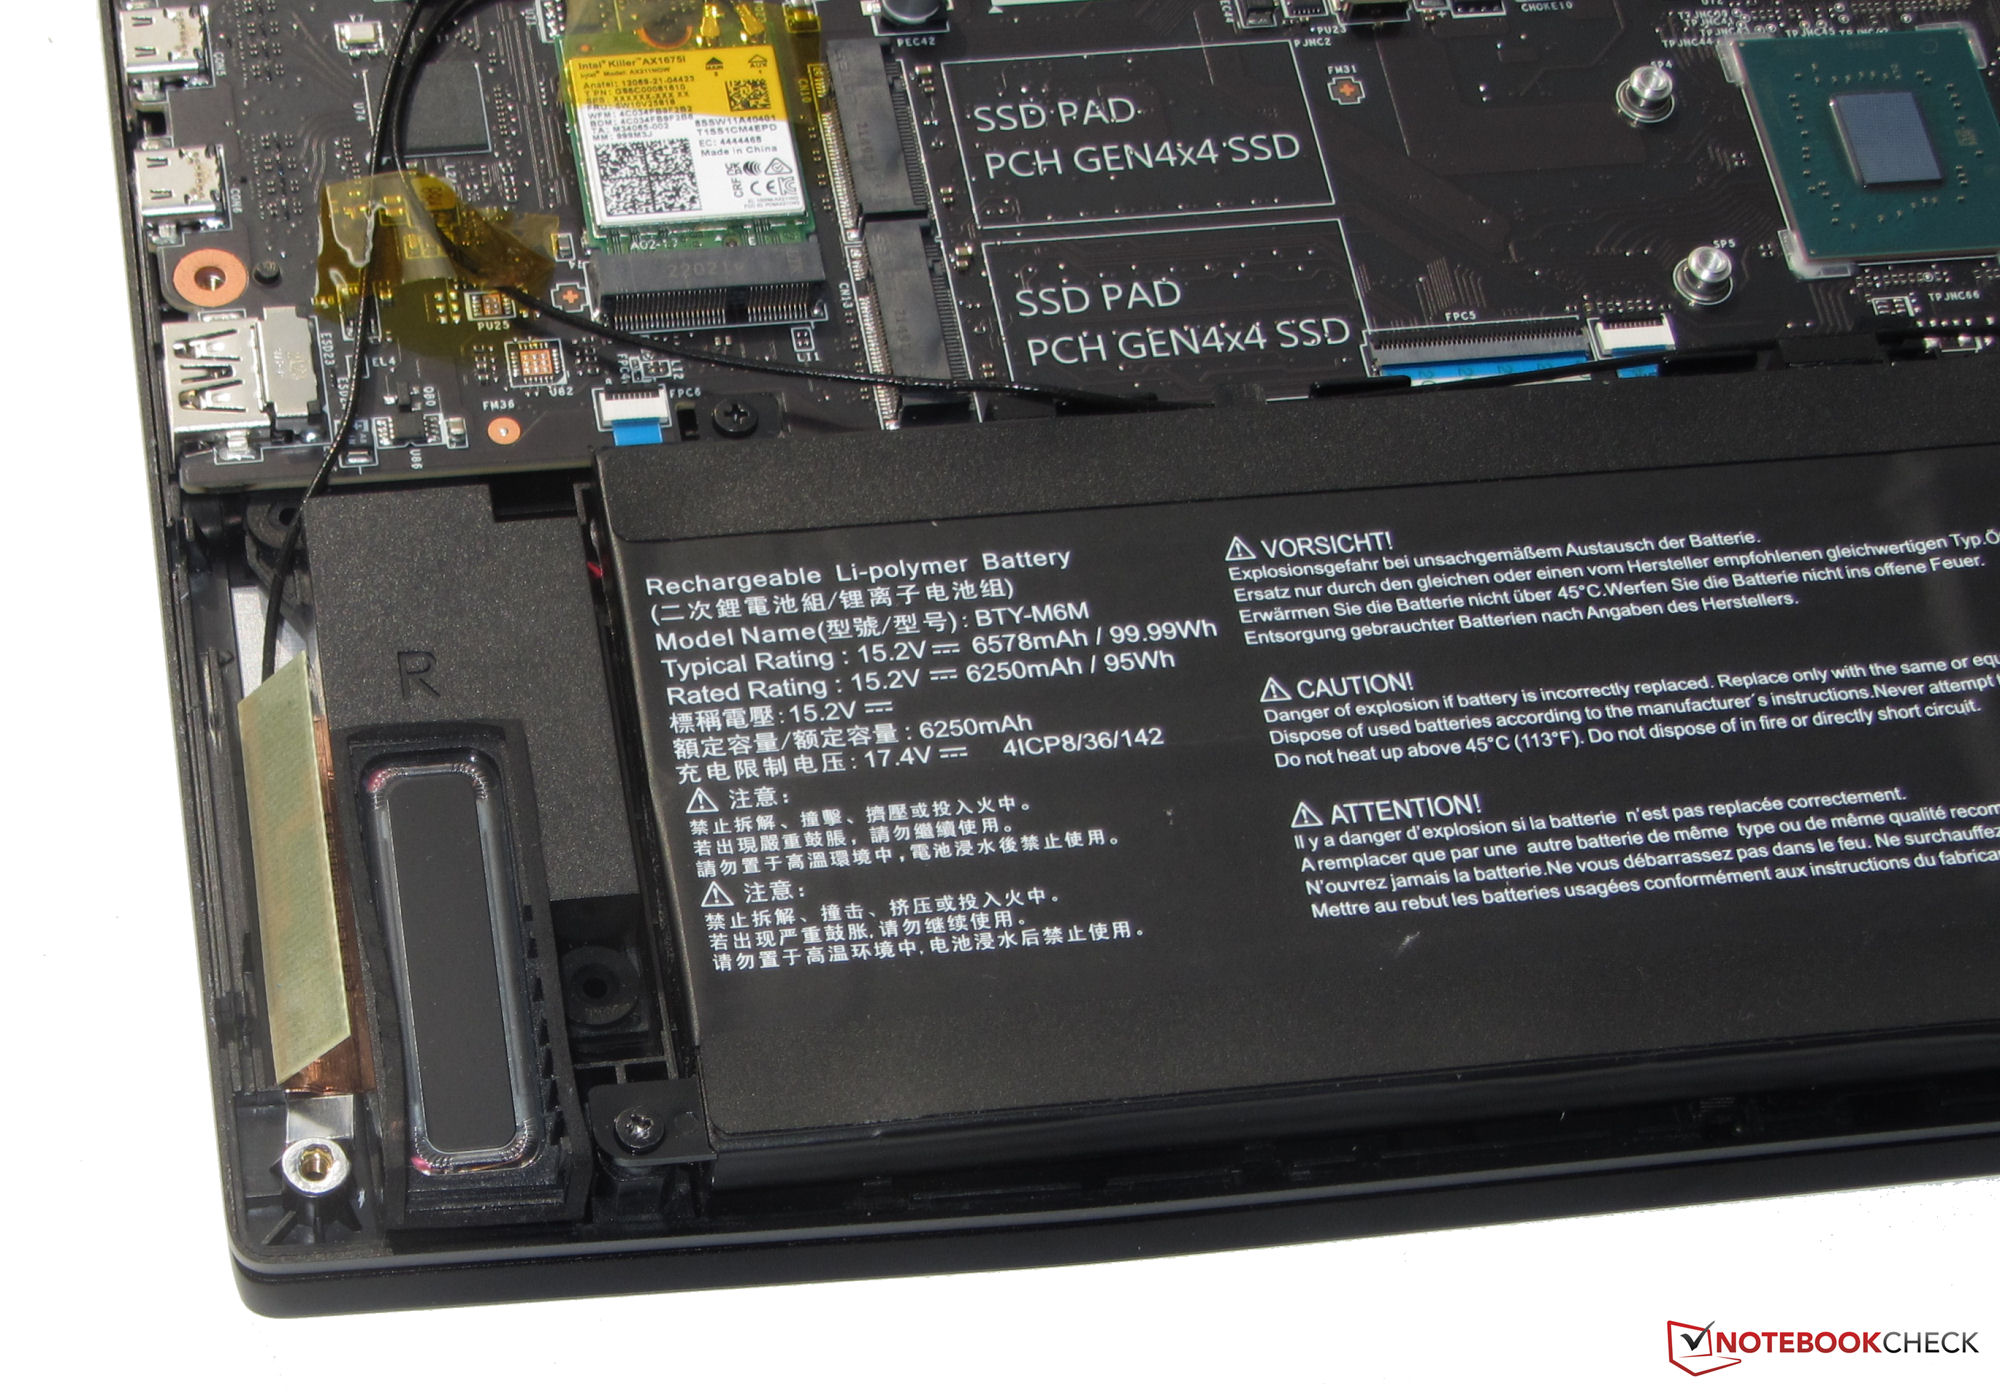
电池寿命
对于我们的Wi-Fi测试(使用脚本自动访问网站)和视频测试(循环播放短片Big Buck Bunny(H.264编码,FHD)),17.3英寸笔记本电脑分别成功运行了5:52小时和6:50小时。这款 FHD的兄弟姐妹型号由于其较低的屏幕分辨率,持续时间稍长。
| MSI Titan GT77 12UHS 4k i9-12900HX, GeForce RTX 3080 Ti Laptop GPU, 99.99 Wh | Razer Blade 17 Early 2022 i9-12900H, GeForce RTX 3080 Ti Laptop GPU, 82 Wh | Alienware x17 R2 P48E i9-12900HK, GeForce RTX 3080 Ti Laptop GPU, 87 Wh | Schenker XMG Ultra 17 Rocket Lake i9-11900K, GeForce RTX 3080 Laptop GPU, 97 Wh | MSI Titan GT77 12UHS i9-12900HX, GeForce RTX 3080 Ti Laptop GPU, 99.9 Wh | Average of class Gaming | |
|---|---|---|---|---|---|---|
| Battery runtime | -16% | -55% | -58% | 5% | 11% | |
| Reader / Idle (h) | 8.2 | 7.1 -13% | 3.9 -52% | 3 -63% | 8.27 ? 1% | |
| H.264 (h) | 6.8 | 4.8 -29% | 1.9 -72% | 7.2 6% | 8.32 ? 22% | |
| WiFi v1.3 (h) | 5.9 | 3.8 -36% | 2 -66% | 1.8 -69% | 6.9 17% | 7.11 ? 21% |
| Load (h) | 1.5 | 1.7 13% | 0.8 -47% | 1.1 -27% | 1.4 -7% | 1.502 ? 0% |
| Witcher 3 ultra (h) | 1.5 |
Pros
Cons
结论 - 有了4K显示屏,效果会更好
通过Titan GT77,微星公司正在提供目前性能最好的DTR笔记本电脑之一。它是为需要密集计算能力和大量内存的使用场景而设计的,如渲染和游戏。
微星泰坦GT77--目前性能最好的笔记本电脑之一。
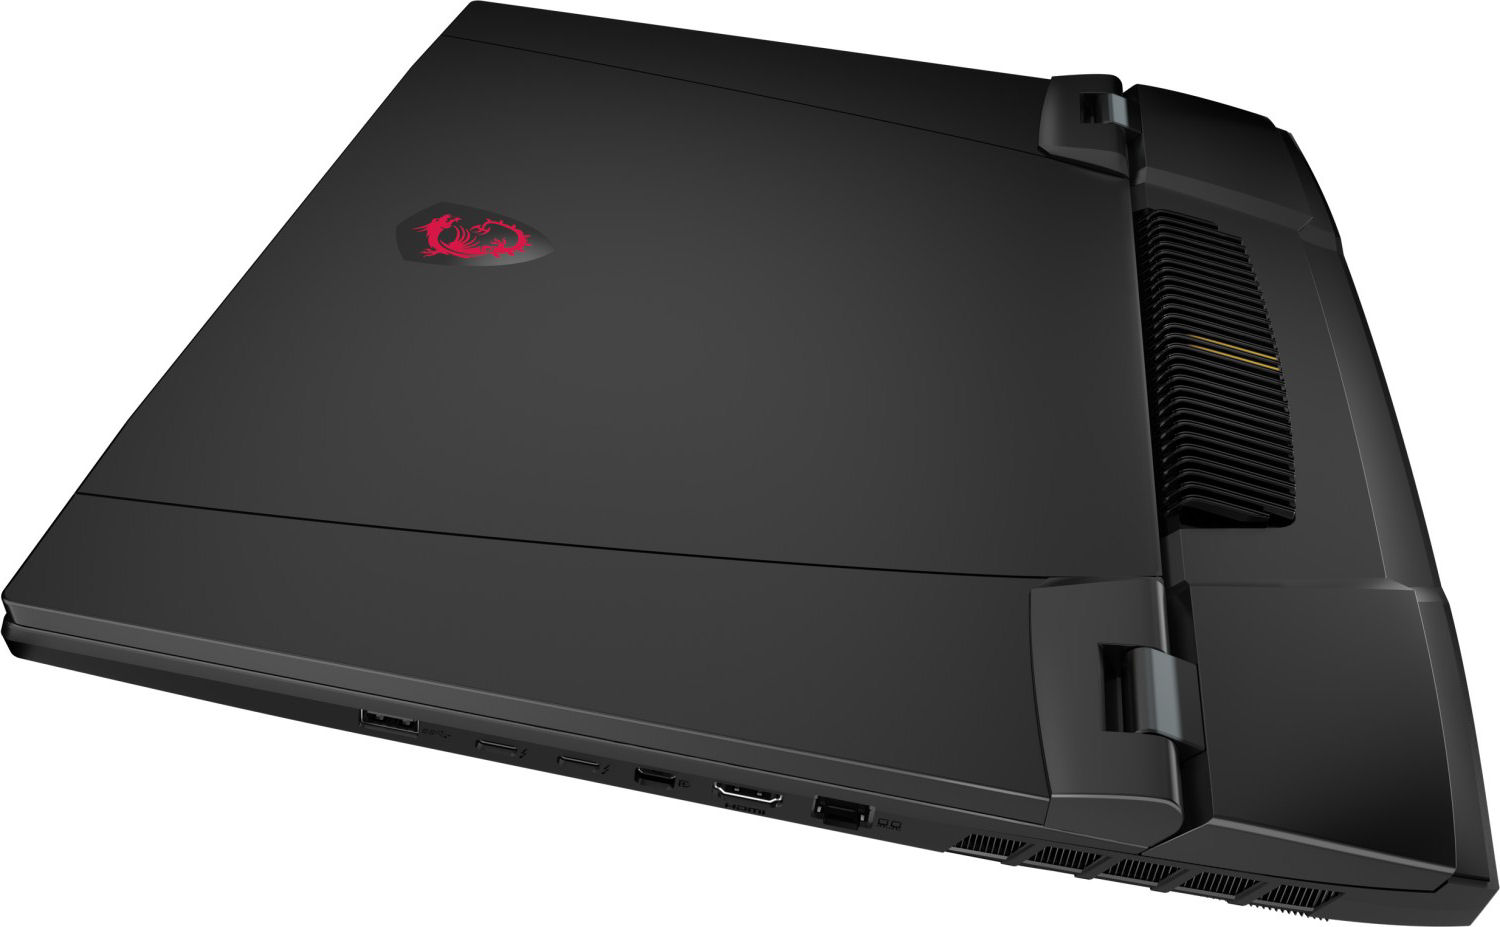
该 酷睿i9-12900HX和 GeForce RTX 3080 Ti笔记本电脑(175瓦的TGP,16GB的VRAM)能够在高时钟速度下稳定运行。笔记本电脑会产生相当多的热量和噪音,这是这个级别硬件的典型特征。两个Thunderbolt 4端口提供了扩展选项(如外部GPU、对接解决方案)。此外,这款笔记本电脑有一个精心设计的机械键盘和非常体面的电池寿命。这些都是目前这个变体与它的 的兄弟姐妹型号我们之前的评论。
显示屏是两台泰坦型号之间的主要区别:目前评测单位上的4K面板(120赫兹)在分辨率、峰值亮度和色彩覆盖率(几乎100%的DCI-P3)方面优于另一型号上的FHD面板(360赫兹)。因此,如果色彩准确性对你很重要的话,它是最佳选择。另一方面,FHD显示屏提供了非常高的刷新率,应该能够让许多游戏玩家满意。不幸的是,这两种显示器都缺乏对比度。
Alienware x17 R2 在性能方面是Titan的一个值得替代的产品。然而,它提供的扩展选项较少,而且电池寿命较差。
价格和可用性
微星Titan GT77 12UHS在零售商处有售,如Amazon.com。.我们评测的配置售价约为5,600欧元(5,980美元)。
MSI Titan GT77 12UHS
- 08/28/2022 v7 (old)
Sascha Mölck
Price comparison

